Sapporo Holdings Ltd.
39
1/39 URL http://www.sapporoholdings.jp/english 2016 Sapporo Group Business Results Presentation for the Six Months Ended June 30, 2016 August 4, 2016 Copyright, 2016 SAPPORO HOLDINGS LTD. All rights reserved. Sapporo Holdings Ltd.
-
Upload
khangminh22 -
Category
Documents
-
view
0 -
download
0
Transcript of Sapporo Holdings Ltd.
1/39
URL http://www.sapporoholdings.jp/english
2016Sapporo Group Business Results Presentation
for the Six Months Ended June 30, 2016
August 4, 2016
Copyright, 2016 SAPPORO HOLDINGS LTD. All rights reserved.
Sapporo Holdings Ltd.
2/39
Contents
1. Overview of First-Half 2016 Results
2. Towards Third- and Fourth-Quarters 2016
3. Vision of Medium-term Portfolio
Appendix: Collection of Data by Business
Copyright, 2016 SAPPORO HOLDINGS LTD. All rights reserved
3/39
1. First-Half 2016 Topics1. First-Half 2016 Topics
Copyright, 2016 SAPPORO HOLDINGS LTD. All rights reserved
4/39Copyright, 2016 SAPPORO HOLDINGS LTD. All rights reserved.
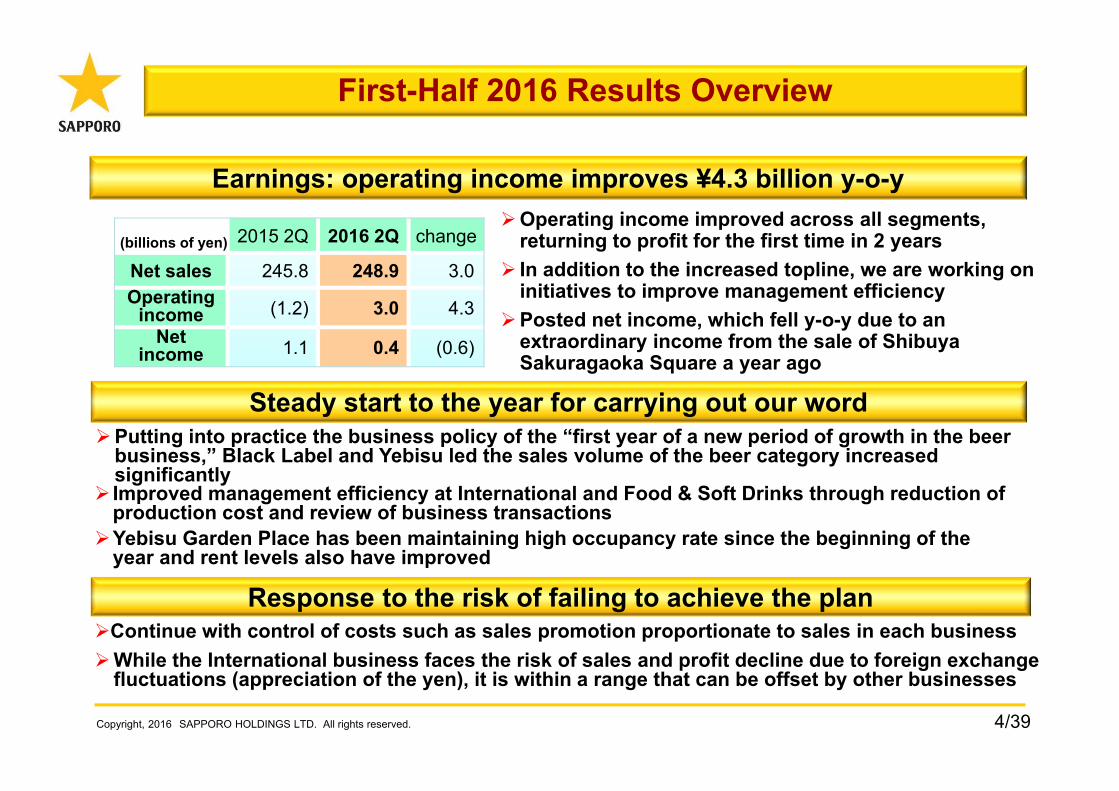
First-Half 2016 Results Overview
Steady start to the year for carrying out our word
Response to the risk of failing to achieve the plan
Yebisu Garden Place has been maintaining high occupancy rate since the beginning of the year and rent levels also have improved
Putting into practice the business policy of the “first year of a new period of growth in the beer business,” Black Label and Yebisu led the sales volume of the beer category increased significantly
Continue with control of costs such as sales promotion proportionate to sales in each business
Earnings: operating income improves ¥4.3 billion y-o-yOperating income improved across all segments,
returning to profit for the first time in 2 years In addition to the increased topline, we are working on
initiatives to improve management efficiencyPosted net income, which fell y-o-y due to an
extraordinary income from the sale of Shibuya Sakuragaoka Square a year ago
Improved management efficiency at International and Food & Soft Drinks through reduction of production cost and review of business transactions
While the International business faces the risk of sales and profit decline due to foreign exchange fluctuations (appreciation of the yen), it is within a range that can be offset by other businesses
(billions of yen) 2015 2Q 2016 2Q change
Net sales 245.8 248.9 3.0Operating
income (1.2) 3.0 4.3Net
income 1.1 0.4 (0.6)
5/39Copyright, 2016 SAPPORO HOLDINGS LTD. All rights reserved.
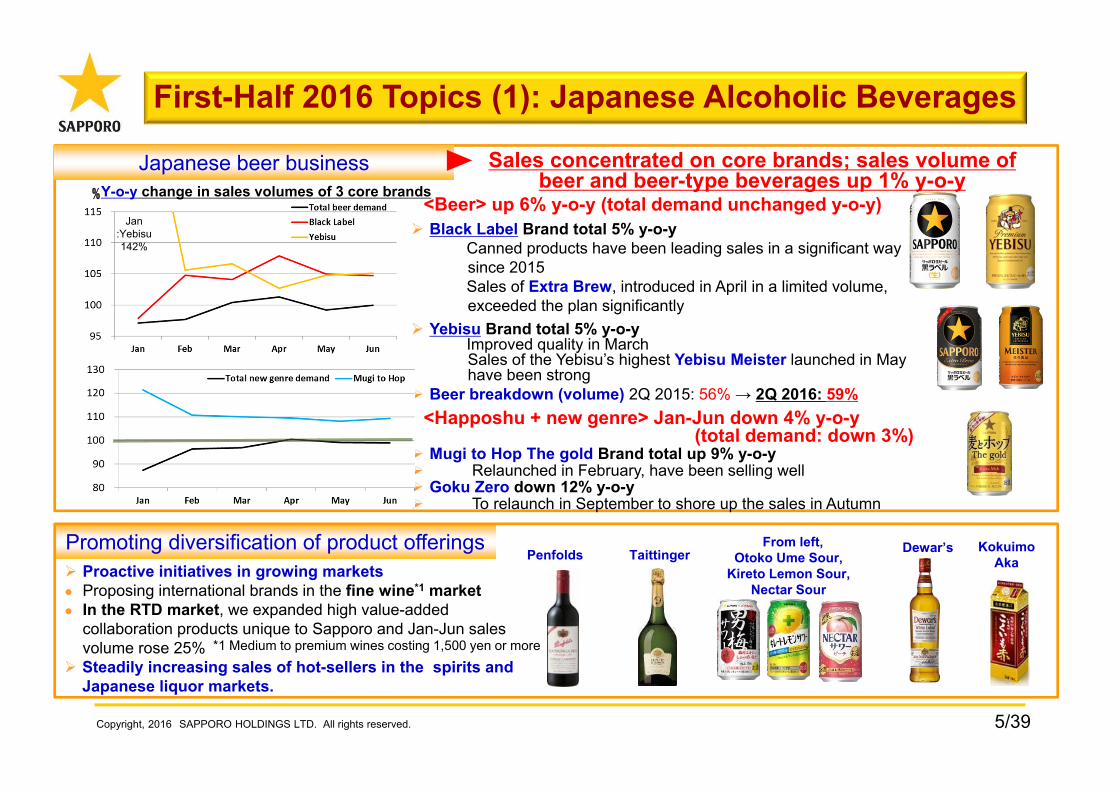
Sales concentrated on core brands; sales volume of beer and beer-type beverages up 1% y-o-y
Japanese beer business
Promoting diversification of product offerings Proactive initiatives in growing markets Proposing international brands in the fine wine*1 market In the RTD market, we expanded high value-added
collaboration products unique to Sapporo and Jan-Jun sales volume rose 25%
First-Half 2016 Topics (1): Japanese Alcoholic Beverages
Steadily increasing sales of hot-sellers in the spirits and Japanese liquor markets.
From left, Otoko Ume Sour,
Kireto Lemon Sour, Nectar Sour
KokuimoAka
<Beer> up 6% y-o-y (total demand unchanged y-o-y) Black Label Brand total 5% y-o-y
Canned products have been leading sales in a significant way since 2015Sales of Extra Brew, introduced in April in a limited volume, exceeded the plan significantly
Yebisu Brand total 5% y-o-y Improved quality in March Sales of the Yebisu’s highest Yebisu Meister launched in May have been strong
Beer breakdown (volume) 2Q 2015: 56% → 2Q 2016: 59%<Happoshu + new genre> Jan-Jun down 4% y-o-y
(total demand: down 3%) Mugi to Hop The gold Brand total up 9% y-o-y Relaunched in February, have been selling well Goku Zero down 12% y-o-y To relaunch in September to shore up the sales in Autumn
TaittingerPenfolds Dewar’s
*1 Medium to premium wines costing 1,500 yen or more
%Y-o-y change in sales volumes of 3 core brands
Jan :Yebisu142%
6/39Copyright, 2016 SAPPORO HOLDINGS LTD. All rights reserved.
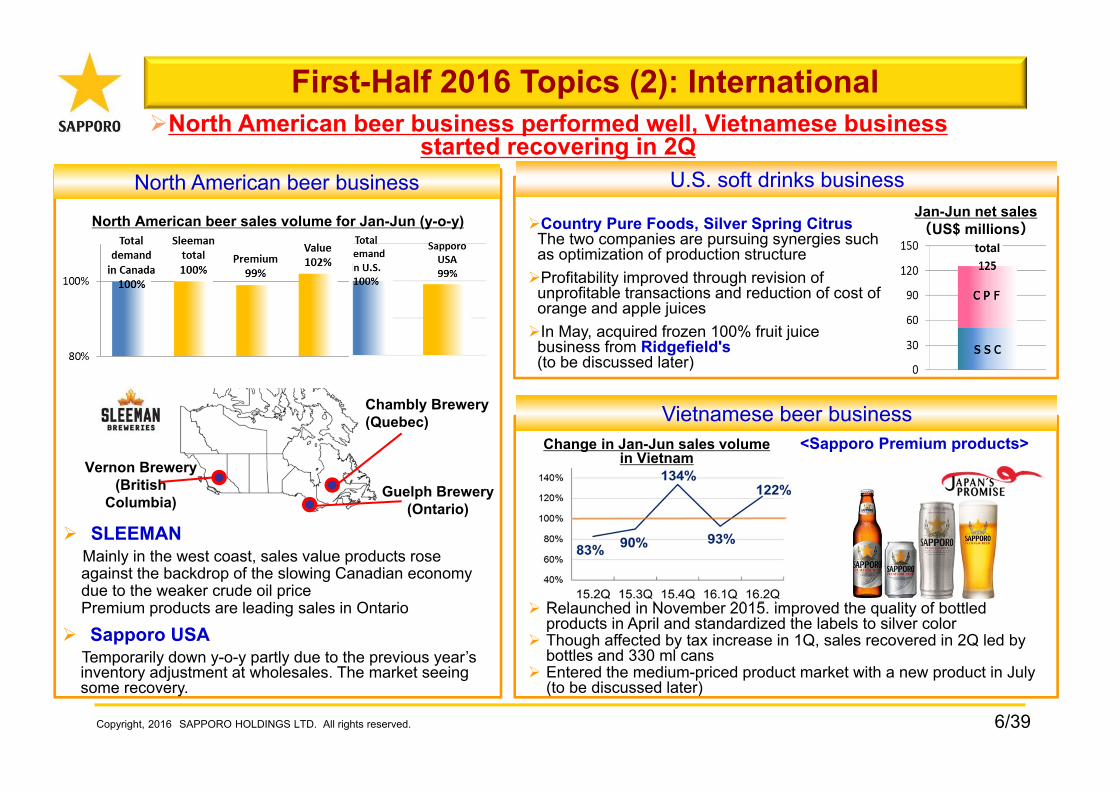
North American beer business performed well, Vietnamese business started recovering in 2Q
Relaunched in November 2015. improved the quality of bottled products in April and standardized the labels to silver color
Though affected by tax increase in 1Q, sales recovered in 2Q led by bottles and 330 ml cans
Entered the medium-priced product market with a new product in July (to be discussed later)
First-Half 2016 Topics (2): International
<Sapporo Premium products>
North American beer business U.S. soft drinks business
Vietnamese beer business
SLEEMANMainly in the west coast, sales value products rose against the backdrop of the slowing Canadian economy due to the weaker crude oil pricePremium products are leading sales in Ontario
Sapporo USATemporarily down y-o-y partly due to the previous year’s inventory adjustment at wholesales. The market seeing some recovery.
Jan-Jun net sales(US$ millions)
total
Country Pure Foods, Silver Spring CitrusThe two companies are pursuing synergies such as optimization of production structure Profitability improved through revision of
unprofitable transactions and reduction of cost of orange and apple juicesIn May, acquired frozen 100% fruit juice
business from Ridgefield's(to be discussed later)
Vernon Brewery (British
Columbia)
Chambly Brewery(Quebec)
Guelph Brewery(Ontario)
North American beer sales volume for Jan-Jun (y-o-y)
Change in Jan-Jun sales volume in Vietnam
7/39Copyright, 2016 SAPPORO HOLDINGS LTD. All rights reserved.
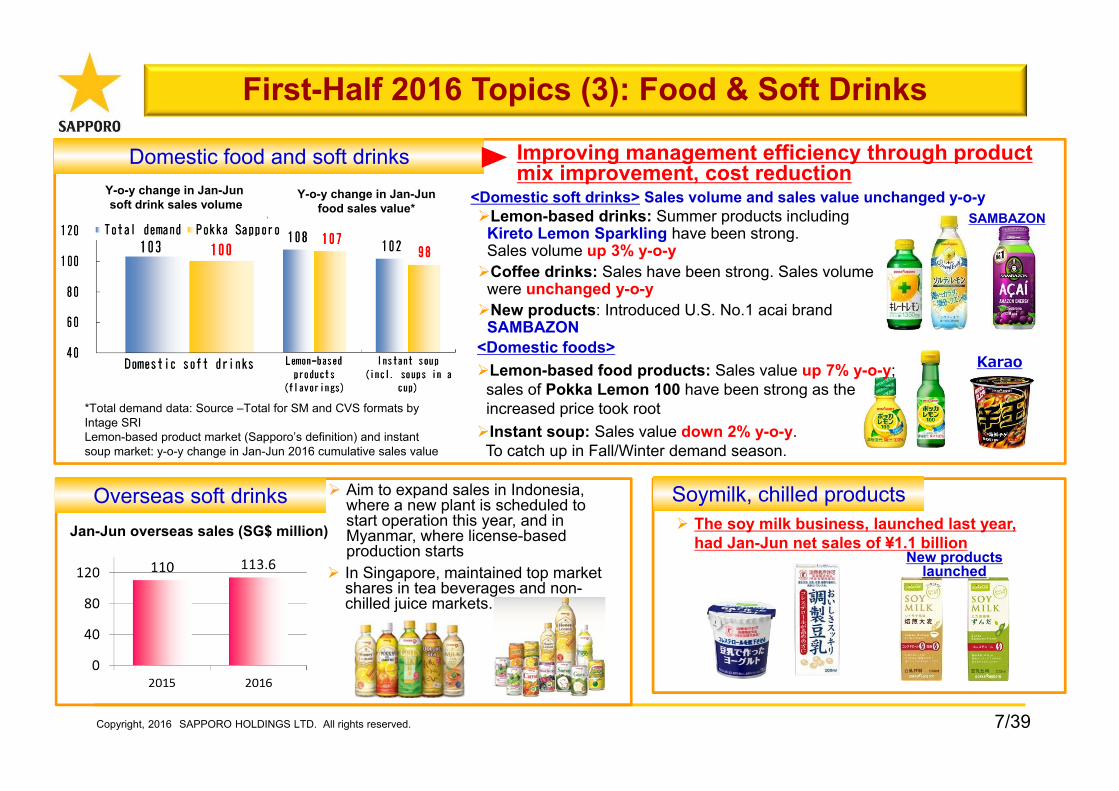
Improving management efficiency through product mix improvement, cost reduction
First-Half 2016 Topics (3): Food & Soft Drinks
Karao
Soymilk, chilled products
SAMBAZON
Domestic food and soft drinks
New products launched
The soy milk business, launched last year, had Jan-Jun net sales of ¥1.1 billion
<Domestic soft drinks> Sales volume and sales value unchanged y-o-yLemon-based drinks: Summer products including
Kireto Lemon Sparkling have been strong. Sales volume up 3% y-o-yCoffee drinks: Sales have been strong. Sales volume
were unchanged y-o-yNew products: Introduced U.S. No.1 acai brand
SAMBAZON<Domestic foods>Lemon-based food products: Sales value up 7% y-o-y;
sales of Pokka Lemon 100 have been strong as the increased price took rootInstant soup: Sales value down 2% y-o-y. To catch up in Fall/Winter demand season.
Aim to expand sales in Indonesia, where a new plant is scheduled to start operation this year, and in Myanmar, where license-based production starts
In Singapore, maintained top market shares in tea beverages and non-chilled juice markets.
Jan-Jun overseas sales (SG$ million)
Overseas soft drinks
Y-o-y change in Jan-Junsoft drink sales volume
Y-o-y change in Jan-Jun food sales value*
*Total demand data: Source –Total for SM and CVS formats by Intage SRI Lemon-based product market (Sapporo’s definition) and instant soup market: y-o-y change in Jan-Jun 2016 cumulative sales value
8/39Copyright, 2016 SAPPORO HOLDINGS LTD. All rights reserved.
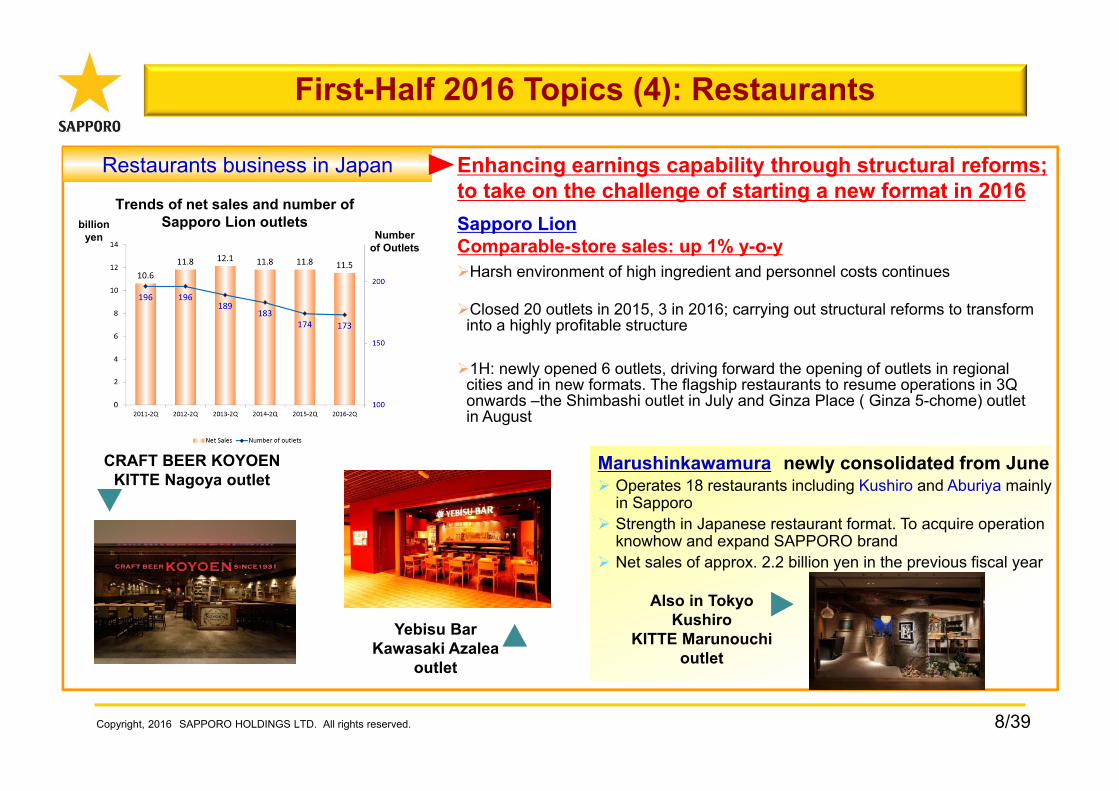
Enhancing earnings capability through structural reforms; to take on the challenge of starting a new format in 2016
Marushinkawamura newly consolidated from June Operates 18 restaurants including Kushiro and Aburiya mainly
in Sapporo Strength in Japanese restaurant format. To acquire operation
knowhow and expand SAPPORO brand Net sales of approx. 2.2 billion yen in the previous fiscal year
Also in TokyoKushiro
KITTE Marunouchioutlet
CRAFT BEER KOYOENKITTE Nagoya outlet
Yebisu BarKawasaki Azalea
outlet
First-Half 2016 Topics (4): Restaurants
Restaurants business in Japan
Sapporo LionComparable-store sales: up 1% y-o-yHarsh environment of high ingredient and personnel costs continues
Closed 20 outlets in 2015, 3 in 2016; carrying out structural reforms to transform into a highly profitable structure
1H: newly opened 6 outlets, driving forward the opening of outlets in regional cities and in new formats. The flagship restaurants to resume operations in 3Q onwards –the Shimbashi outlet in July and Ginza Place ( Ginza 5-chome) outlet in August
Trends of net sales and number of Sapporo Lion outletsbillion
yen Number of Outlets
9/39Copyright, 2016 SAPPORO HOLDINGS LTD. All rights reserved.
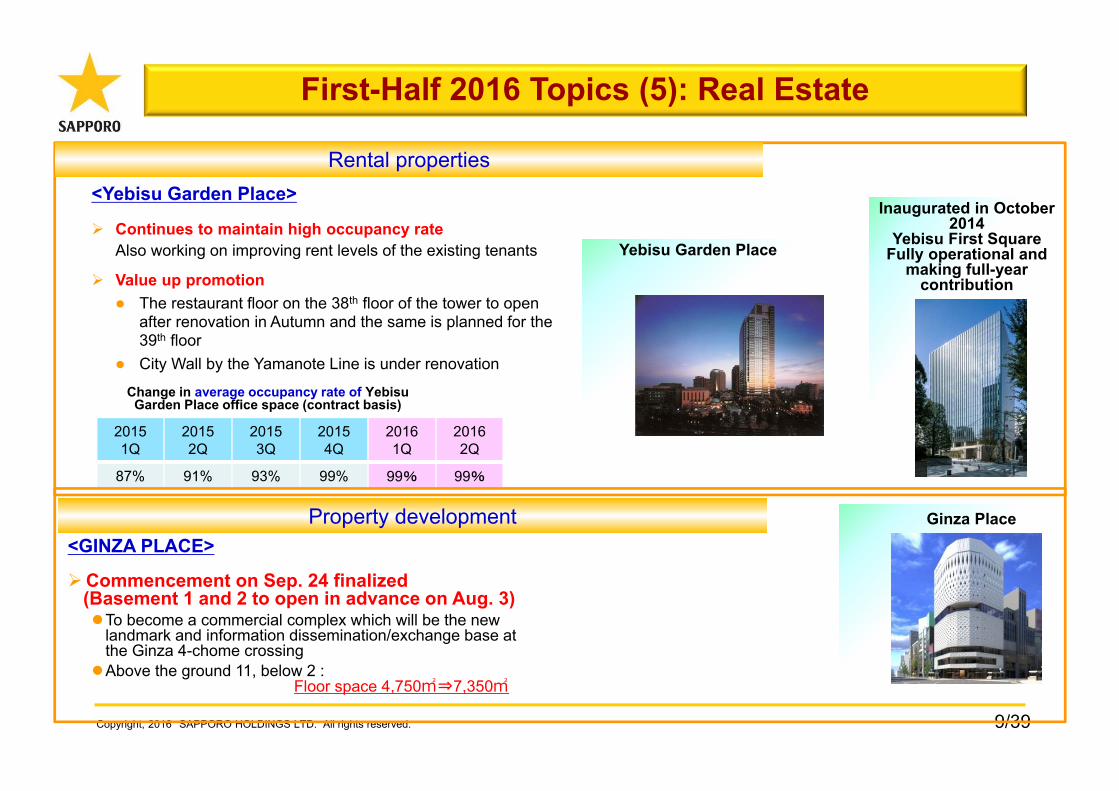
<Yebisu Garden Place>
Continues to maintain high occupancy rateAlso working on improving rent levels of the existing tenants
Value up promotion The restaurant floor on the 38th floor of the tower to open
after renovation in Autumn and the same is planned for the 39th floor
City Wall by the Yamanote Line is under renovation
Inaugurated in October 2014
Yebisu First SquareFully operational and
making full-year contribution
First-Half 2016 Topics (5): Real Estate
Rental properties
20151Q
20152Q
20153Q
20154Q
20161Q
20162Q
87% 91% 93% 99% 99% 99%
Change in average occupancy rate of Yebisu Garden Place office space (contract basis)
<GINZA PLACE>
Commencement on Sep. 24 finalized(Basement 1 and 2 to open in advance on Aug. 3)To become a commercial complex which will be the new
landmark and information dissemination/exchange base at the Ginza 4-chome crossingAbove the ground 11, below 2 :
Floor space 4,750㎡⇒7,350㎡
Property development
Yebisu Garden Place
Ginza Place
10/39
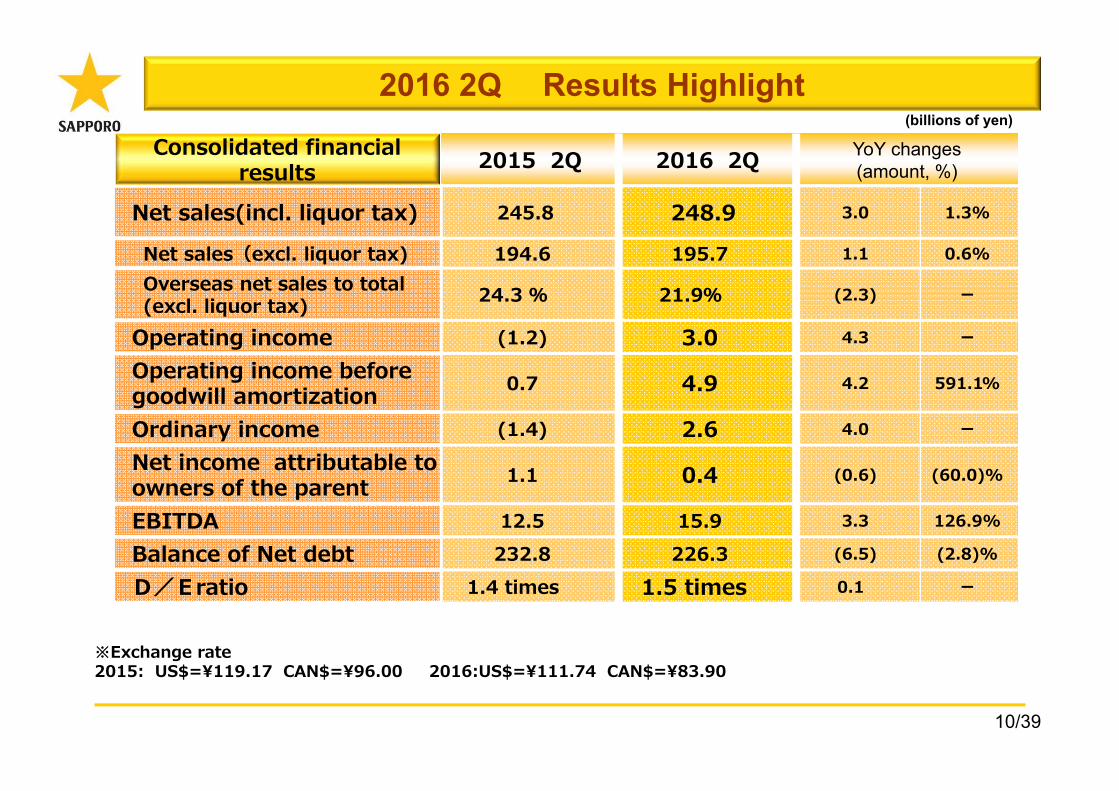
2016 2Q Results Highlight
2015 2Q 2016 2Q YoY changes(amount, %)
Net sales(incl. liquor tax) 245.8 248.9 3.0 1.3%
Net sales(excl. liquor tax) 194.6 195.7 1.1 0.6%
Overseas net sales to total (excl. liquor tax) 24.3 % 21.9% (2.3) ー
Operating income (1.2) 3.0 4.3 ー
Operating income before goodwill amortization 0.7 4.9 4.2 591.1%
Ordinary income (1.4) 2.6 4.0 ー
Net income attributable to owners of the parent 1.1 0.4 (0.6) (60.0)%
EBITDA 12.5 15.9 3.3 126.9%
Balance of Net debt 232.8 226.3 (6.5) (2.8)%
D/Eratio 1.4 times 1.5 times 0.1 ー
※Exchange rate2015: US$=¥119.17 CAN$=¥96.00 2016:US$=¥111.74 CAN$=¥83.90
Consolidated financial results
(billions of yen)
11/39
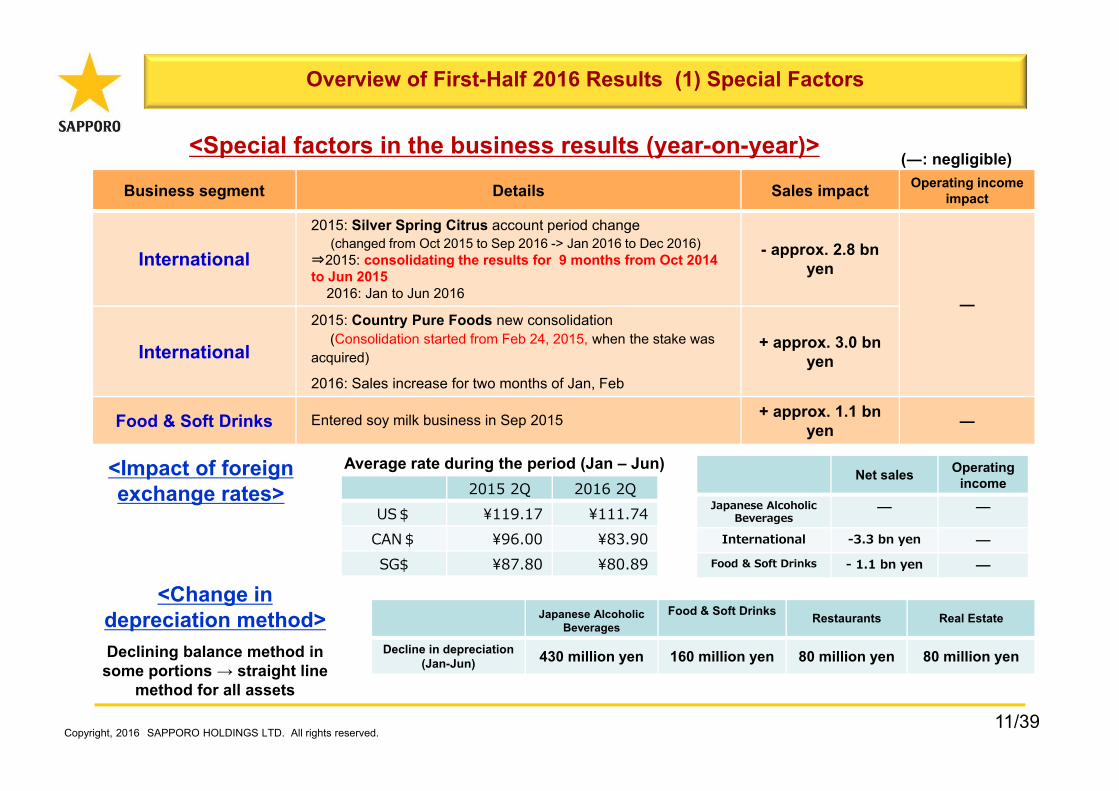
Business segment Details Sales impact Operating income impact
International
2015: Silver Spring Citrus account period change(changed from Oct 2015 to Sep 2016 -> Jan 2016 to Dec 2016)
⇒2015: consolidating the results for 9 months from Oct 2014 to Jun 2015
2016: Jan to Jun 2016
- approx. 2.8 bn yen
―
International
2015: Country Pure Foods new consolidation(Consolidation started from Feb 24, 2015, when the stake was
acquired)
2016: Sales increase for two months of Jan, Feb
+ approx. 3.0 bn yen
Food & Soft Drinks Entered soy milk business in Sep 2015 + approx. 1.1 bn yen ―
Overview of First-Half 2016 Results (1) Special Factors
<Impact of foreign exchange rates>
Average rate during the period (Jan – Jun)2015 2Q 2016 2Q
US$ ¥119.17 ¥111.74CAN$ ¥96.00 ¥83.90SG$ ¥87.80 ¥80.89
Net sales Operating income
Japanese AlcoholicBeverages
― ―
International -3.3 bn yen ―Food & Soft Drinks - 1.1 bn yen ―
<Special factors in the business results (year-on-year)>(―: negligible)
Copyright, 2016 SAPPORO HOLDINGS LTD. All rights reserved.
<Change in depreciation method>Declining balance method in some portions → straight line
method for all assets
Japanese Alcoholic Beverages
Food & Soft Drinks Restaurants Real Estate
Decline in depreciation(Jan-Jun) 430 million yen 160 million yen 80 million yen 80 million yen
12/39
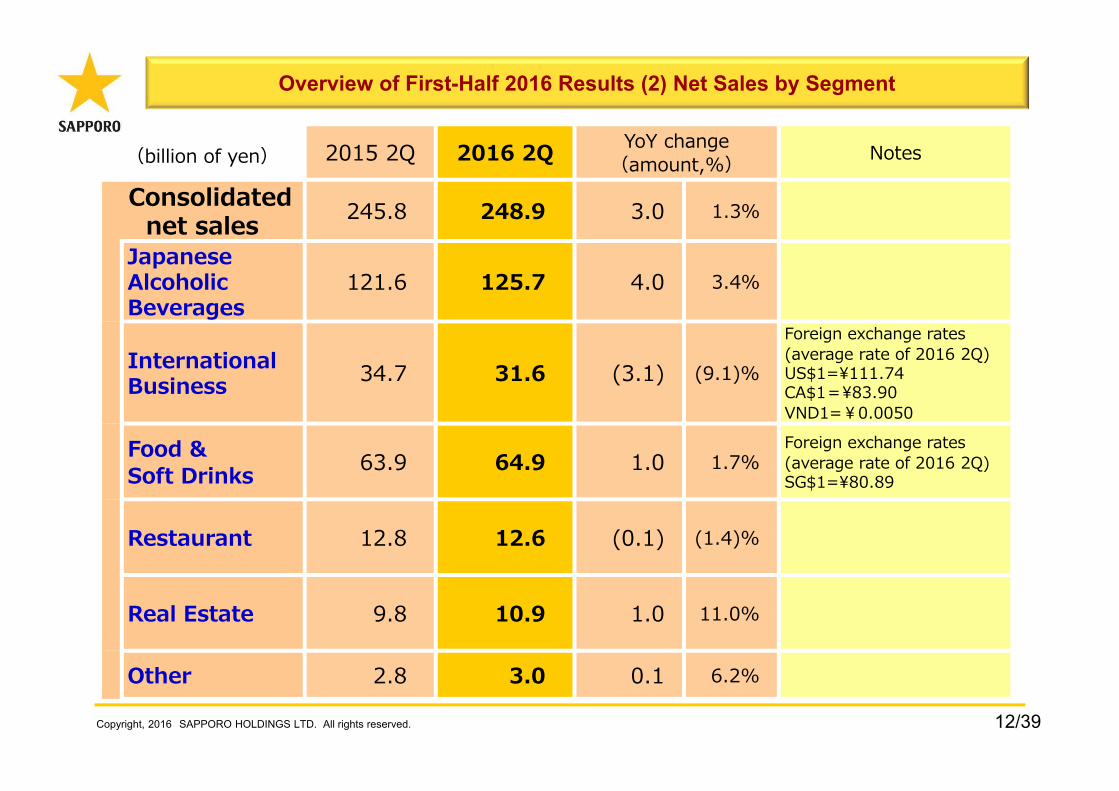
Overview of First-Half 2016 Results (2) Net Sales by Segment
Copyright, 2016 SAPPORO HOLDINGS LTD. All rights reserved.
2015 2Q 2016 2Q YoY change(amount,%) Notes
Consolidated net sales 245.8 248.9 3.0 1.3%
Japanese Alcoholic Beverages
121.6 125.7 4.0 3.4%
International Business 34.7 31.6 (3.1) (9.1)%
Foreign exchange rates(average rate of 2016 2Q)US$1=¥111.74CA$1=¥83.90VND1=¥0.0050
Food & Soft Drinks 63.9 64.9 1.0 1.7%
Foreign exchange rates(average rate of 2016 2Q)SG$1=¥80.89
Restaurant 12.8 12.6 (0.1) (1.4)%
Real Estate 9.8 10.9 1.0 11.0%
Other 2.8 3.0 0.1 6.2%
(billion of yen)

13/39
Real Estate
Copyright, 2016 SAPPORO HOLDINGS LTD. All rights reserved.
Beer sales volume
increase
Japanese Alcoholic Beverages Food & Soft DrinksInternational
Overview of First-Half 2016 Results(3) Factors Contributing to Change in Net Sales
Foreign exchange
Soy milk business
sales increase
YGPsales
increase
245.8 billion yen
2016 2Q consolidated
net sales248.9
billion yen
RTD・Wine・
Japanese liquor
sales s volume increase
4.0 (3.1) 1.0 1.0
Nihon Beans consolidation
4.2
3.0
(3.3)
(2.8)1.0
1.1
1.2
0.7(1.1)
+3.0 billion yen
<Main Factors Contributing to Changes in Net Sales>
(1.4)Overseas/
Coffee shop chain
0.3
Decrease
Progress in 2Q
1.5
(0.5)
HapposhuNew genre beer
sales volumedecrease
0.9
(1.0)
0.5
(0.4)
0.6
New consolidation
of CPF: 2 months
3.1
0.7
SSC account period
change: reduction
of 3 months
(2.8)
Increase Decrease[billions of yen]
2015 2Q consolidated
net sales
Progress in 1Q
Increase
Foreign exchange
14/39
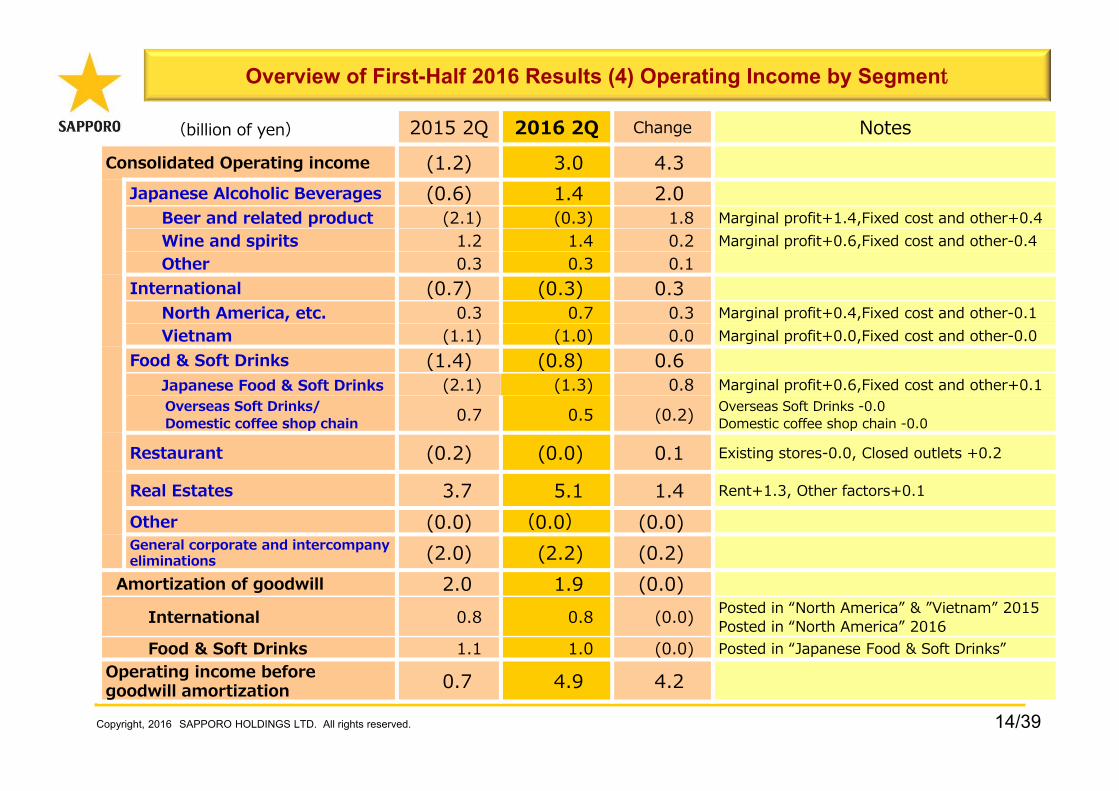
Overview of First-Half 2016 Results (4) Operating Income by Segment
Copyright, 2016 SAPPORO HOLDINGS LTD. All rights reserved.
2015 2Q 2016 2Q Change NotesConsolidated Operating income (1.2) 3.0 4.3
Japanese Alcoholic Beverages (0.6) 1.4 2.0Beer and related product (2.1) (0.3) 1.8 Marginal profit+1.4,Fixed cost and other+0.4Wine and spirits 1.2 1.4 0.2 Marginal profit+0.6,Fixed cost and other-0.4Other 0.3 0.3 0.1
International (0.7) (0.3) 0.3North America, etc. 0.3 0.7 0.3 Marginal profit+0.4,Fixed cost and other-0.1Vietnam (1.1) (1.0) 0.0 Marginal profit+0.0,Fixed cost and other-0.0
Food & Soft Drinks (1.4) (0.8) 0.6Japanese Food & Soft Drinks (2.1) (1.3) 0.8 Marginal profit+0.6,Fixed cost and other+0.1Overseas Soft Drinks/Domestic coffee shop chain 0.7 0.5 (0.2) Overseas Soft Drinks -0.0
Domestic coffee shop chain -0.0
Restaurant (0.2) (0.0) 0.1 Existing stores-0.0, Closed outlets +0.2
Real Estates 3.7 5.1 1.4 Rent+1.3, Other factors+0.1
Other (0.0) (0.0) (0.0)General corporate and intercompany eliminations (2.0) (2.2) (0.2)
Amortization of goodwill 2.0 1.9 (0.0)International 0.8 0.8 (0.0) Posted in “North America” & ”Vietnam” 2015
Posted in “North America” 2016Food & Soft Drinks 1.1 1.0 (0.0) Posted in “Japanese Food & Soft Drinks”
Operating income before goodwill amortization 0.7 4.9 4.2
(billion of yen)
15/39Copyright, 2016 SAPPORO HOLDINGS LTD. All rights reserved.
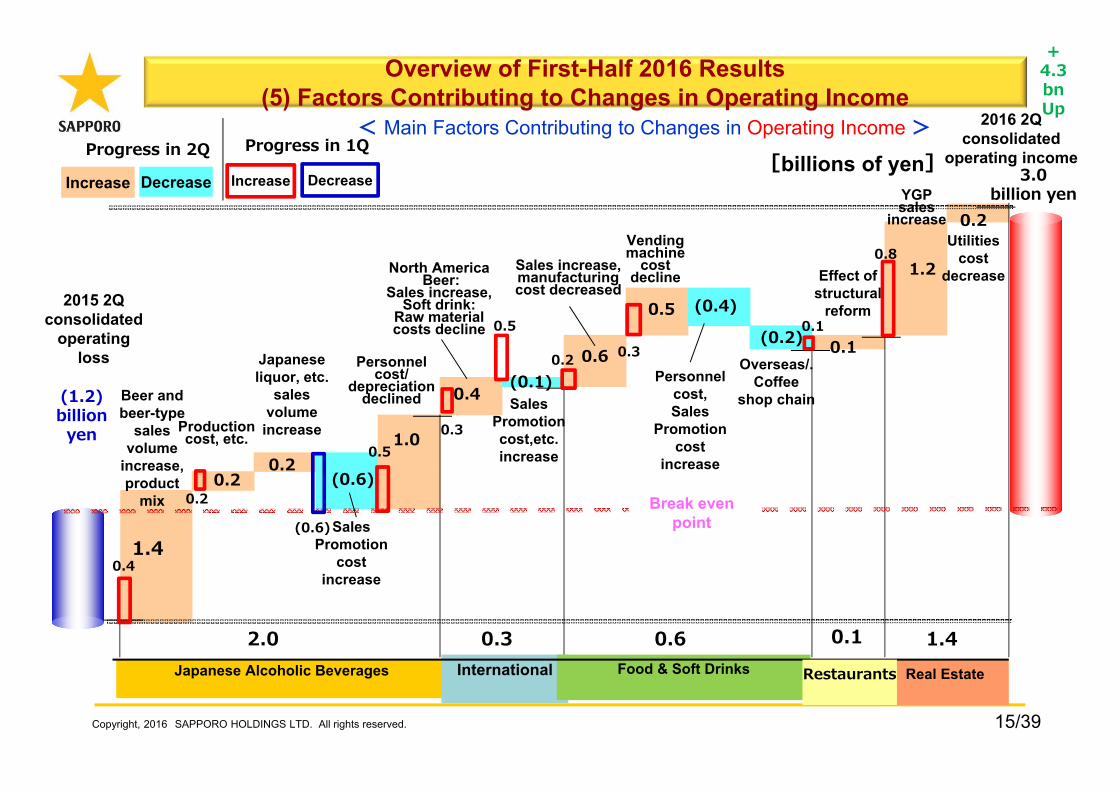
Overview of First-Half 2016 Results (5) Factors Contributing to Changes in Operating Income
Beer and beer-type
sales volume
increase, product
mix
Personnel cost/
depreciation declined
Sales Promotion
cost increase
Vending machine
cost decline
Utilitiescost
decrease2015 2Q
consolidated operating
loss
(1.2)billion yen
2016 2Q consolidated
operating income3.0
billion yen
Production cost, etc.
Sales increase,manufacturing cost decreased
North AmericaBeer:
Sales increase,Soft drink:
Raw material costs decline
2.0 0.6 1.40.3 0.1
1.4
0.5
1.0
DecreaseIncrease[billions of yen]
0.2
0.4
(0.6)
1.2
0.1(0.2)
(0.1)
0.2
Effect of structural
reform
YGPsales
increase
< Main Factors Contributing to Changes in Operating Income >
Sales Promotion cost,etc. increase
Japanese liquor, etc.
sales volume
increase
0.2
0.6
(0.4)
Personnel cost, Sales
Promotion cost
increase
Overseas/. Coffee
shop chain
Break even point
0.4
0.30.2
0.5
0.8
(0.6)
0.5
0.3
0.2
0.1
Progress in 2Q Progress in 1Q
DecreaseIncrease
+ 4.3bn Up
Japanese Alcoholic Beverages International Food & Soft Drinks Real EstateRestaurants
16/39
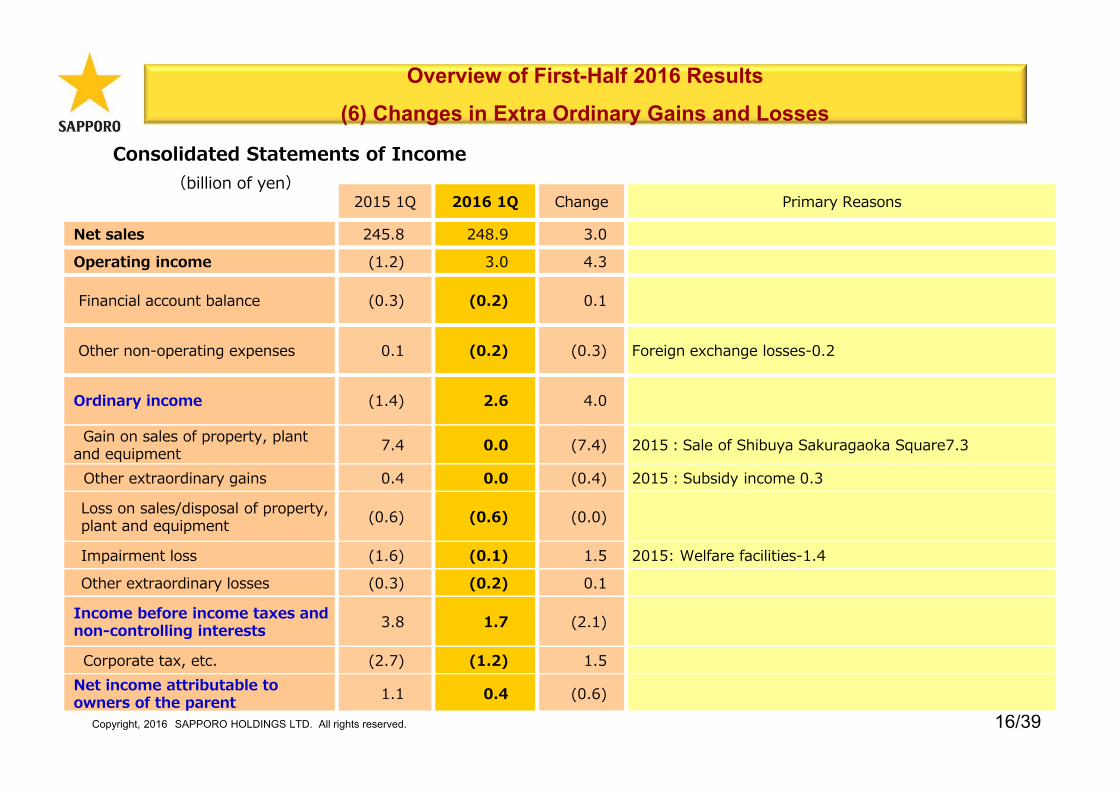
Overview of First-Half 2016 Results
(6) Changes in Extra Ordinary Gains and Losses
Copyright, 2016 SAPPORO HOLDINGS LTD. All rights reserved.
Consolidated Statements of Income
2015 1Q 2016 1Q Change Primary Reasons
Net sales 245.8 248.9 3.0
Operating income (1.2) 3.0 4.3
Financial account balance (0.3) (0.2) 0.1
Other non-operating expenses 0.1 (0.2) (0.3) Foreign exchange losses-0.2
Ordinary income (1.4) 2.6 4.0
Gain on sales of property, plant and equipment 7.4 0.0 (7.4) 2015:Sale of Shibuya Sakuragaoka Square7.3
Other extraordinary gains 0.4 0.0 (0.4) 2015:Subsidy income 0.3
Loss on sales/disposal of property, plant and equipment (0.6) (0.6) (0.0)
Impairment loss (1.6) (0.1) 1.5 2015: Welfare facilities-1.4
Other extraordinary losses (0.3) (0.2) 0.1
Income before income taxes and non-controlling interests 3.8 1.7 (2.1)
Corporate tax, etc. (2.7) (1.2) 1.5Net income attributable to owners of the parent 1.1 0.4 (0.6)
(billion of yen)
17/39
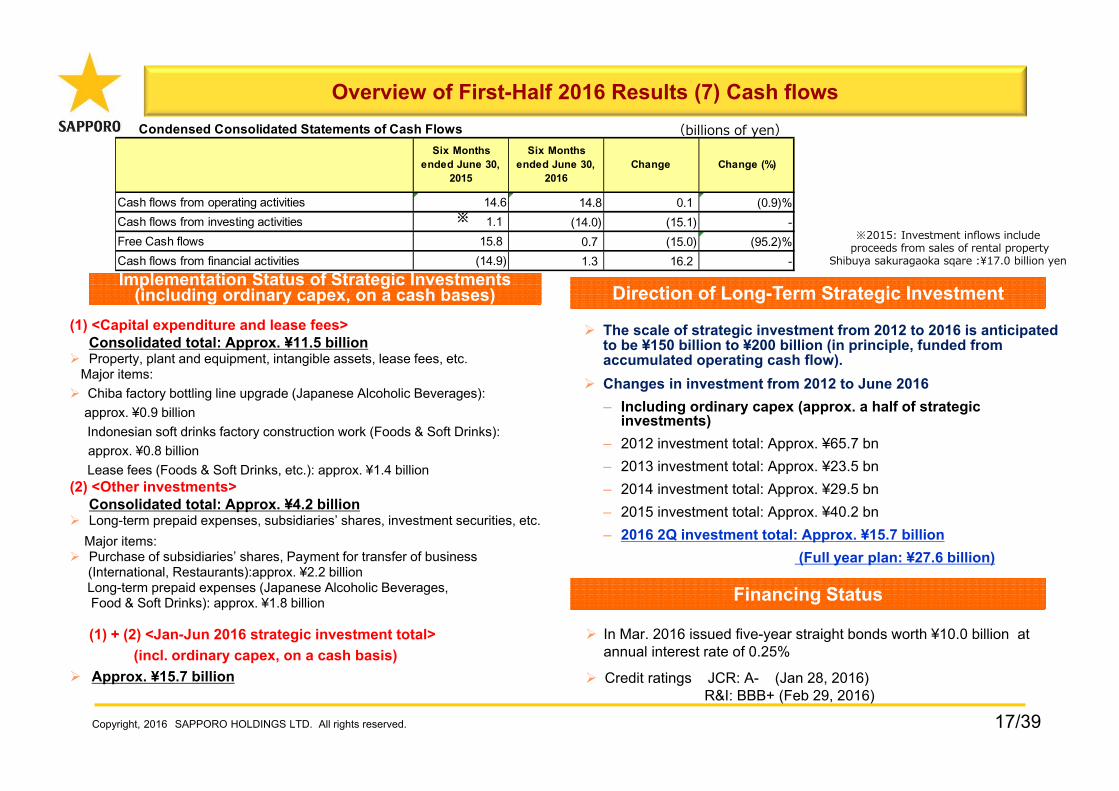
Overview of First-Half 2016 Results (7) Cash flows
Copyright, 2016 SAPPORO HOLDINGS LTD. All rights reserved.
※2015: Investment inflows includeproceeds from sales of rental property
Shibuya sakuragaoka sqare :¥17.0 billion yen
※
(billions of yen)
Implementation Status of Strategic Investments (including ordinary capex, on a cash bases)
Implementation Status of Strategic Investments (including ordinary capex, on a cash bases) Direction of Long-Term Strategic InvestmentDirection of Long-Term Strategic Investment
Financing StatusFinancing Status
(1) <Capital expenditure and lease fees> Consolidated total: Approx. ¥11.5 billion
Property, plant and equipment, intangible assets, lease fees, etc.Major items: Chiba factory bottling line upgrade (Japanese Alcoholic Beverages):
approx. ¥0.9 billionIndonesian soft drinks factory construction work (Foods & Soft Drinks): approx. ¥0.8 billion Lease fees (Foods & Soft Drinks, etc.): approx. ¥1.4 billion
(2) <Other investments> Consolidated total: Approx. ¥4.2 billion
Long-term prepaid expenses, subsidiaries’ shares, investment securities, etc. Major items:
Purchase of subsidiaries’ shares, Payment for transfer of business(International, Restaurants):approx. ¥2.2 billionLong-term prepaid expenses (Japanese Alcoholic Beverages,Food & Soft Drinks): approx. ¥1.8 billion
(1) + (2) <Jan-Jun 2016 strategic investment total> (incl. ordinary capex, on a cash basis)
Approx. ¥15.7 billion
The scale of strategic investment from 2012 to 2016 is anticipated to be ¥150 billion to ¥200 billion (in principle, funded from accumulated operating cash flow).
Changes in investment from 2012 to June 2016– Including ordinary capex (approx. a half of strategic
investments)– 2012 investment total: Approx. ¥65.7 bn– 2013 investment total: Approx. ¥23.5 bn– 2014 investment total: Approx. ¥29.5 bn– 2015 investment total: Approx. ¥40.2 bn– 2016 2Q investment total: Approx. ¥15.7 billion
(Full year plan: ¥27.6 billion)
In Mar. 2016 issued five-year straight bonds worth ¥10.0 billion at annual interest rate of 0.25%
Credit ratings JCR: A- (Jan 28, 2016)R&I: BBB+ (Feb 29, 2016)
Condensed Consolidated Statements of Cash Flows
14.6 14.8 0.1 (0.9)%1.1 (14.0) (15.1) -
Free Cash flows 15.8 0.7 (15.0) (95.2)%Cash flows from financial activities (14.9) 1.3 16.2 -
Change (%)
Cash flows from operating activitiesCash flows from investing activities
Six Monthsended June 30,
2015
Six Monthsended June 30,
2016Change
18/39
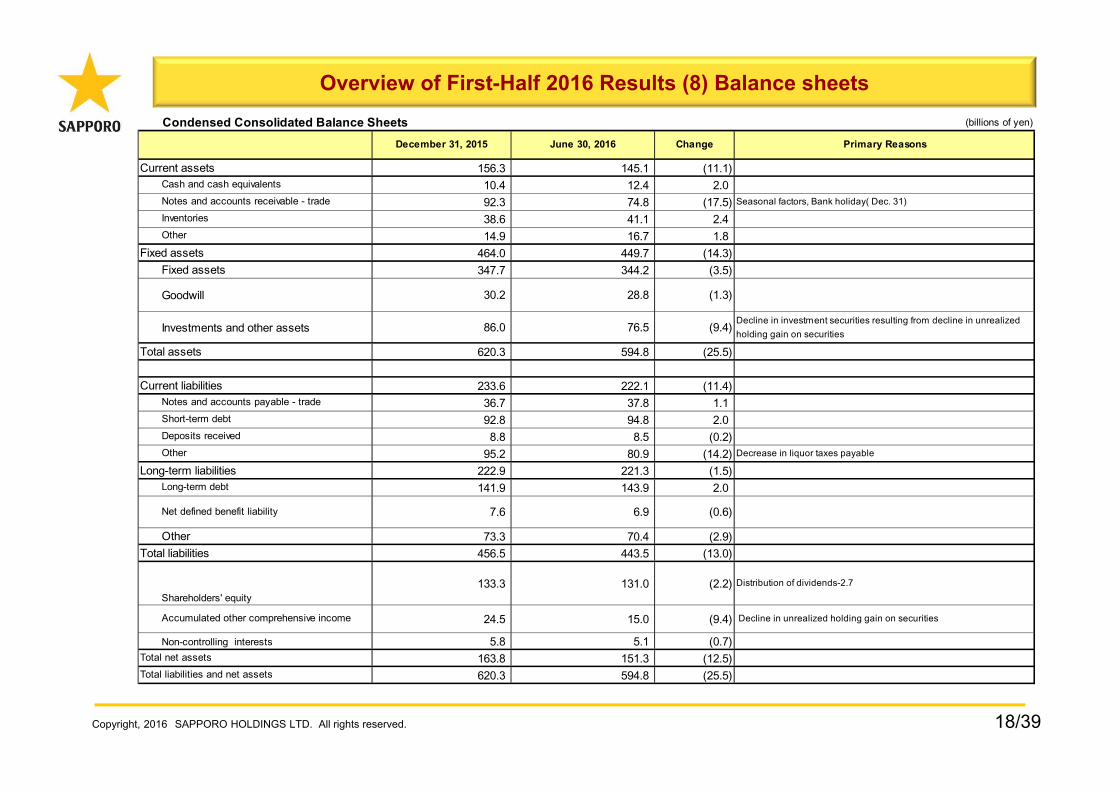
Overview of First-Half 2016 Results (8) Balance sheets
Copyright, 2016 SAPPORO HOLDINGS LTD. All rights reserved.
Condensed Consolidated Balance Sheets (billions of yen)
Current assets 156.3 145.1 (11.1)Cash and cash equivalents 10.4 12.4 2.0Notes and accounts receivable - trade 92.3 74.8 (17.5)Inventories 38.6 41.1 2.4Other 14.9 16.7 1.8
Fixed assets 464.0 449.7 (14.3)Fixed assets 347.7 344.2 (3.5)
Goodwill 30.2 28.8 (1.3)
Investments and other assets 86.0 76.5 (9.4)
Total assets 620.3 594.8 (25.5)
Current liabilities 233.6 222.1 (11.4)Notes and accounts payable - trade 36.7 37.8 1.1Short-term debt 92.8 94.8 2.0Deposits received 8.8 8.5 (0.2)Other 95.2 80.9 (14.2)
Long-term liabilities 222.9 221.3 (1.5)Long-term debt 141.9 143.9 2.0
Net defined benefit liability 7.6 6.9 (0.6)
Other 73.3 70.4 (2.9)Total liabilities 456.5 443.5 (13.0)
Shareholders' equity133.3 131.0 (2.2)
Accumulated other comprehensive income 24.5 15.0 (9.4)
Non-controlling interests 5.8 5.1 (0.7)Total net assets 163.8 151.3 (12.5)
620.3 594.8 (25.5)
Change Primary Reasons
Decline in investment securities resulting from decline in unrealizedholding gain on securities
December 31, 2015 June 30, 2016
Seasonal factors, Bank holiday( Dec. 31)
Decrease in liquor taxes payable
Decline in unrealized holding gain on securities
Distribution of dividends-2.7
Total liabilities and net assets
19/39
2. Towards Third- and Fourth-Quarters 20162. Towards Third- and Fourth-Quarters 2016
Copyright, 2016 SAPPORO HOLDINGS LTD. All rights reserved
20/39
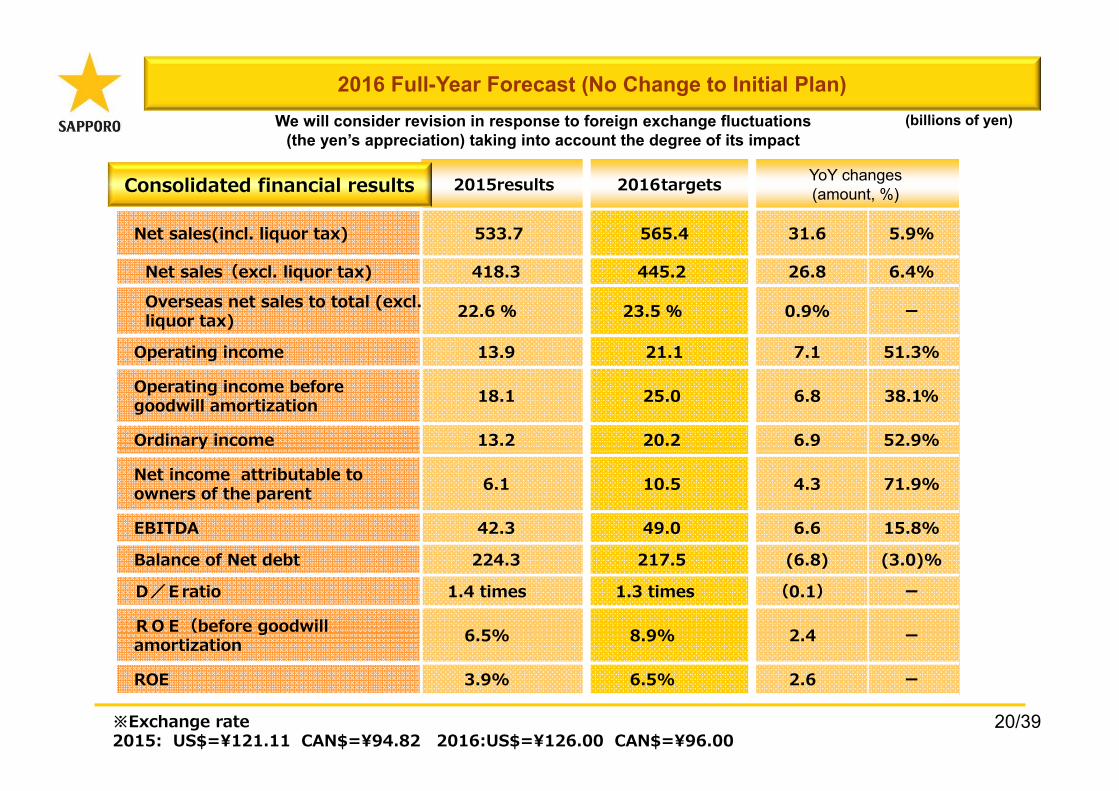
2016 Full-Year Forecast (No Change to Initial Plan)
2015results 2016targets YoY changes(amount, %)
Net sales(incl. liquor tax) 533.7 565.4 31.6 5.9%
Net sales(excl. liquor tax) 418.3 445.2 26.8 6.4%Overseas net sales to total (excl. liquor tax) 22.6 % 23.5 % 0.9% ー
Operating income 13.9 21.1 7.1 51.3%
Operating income before goodwill amortization 18.1 25.0 6.8 38.1%
Ordinary income 13.2 20.2 6.9 52.9%
Net income attributable to owners of the parent 6.1 10.5 4.3 71.9%
EBITDA 42.3 49.0 6.6 15.8%
Balance of Net debt 224.3 217.5 (6.8) (3.0)%
D/Eratio 1.4 times 1.3 times (0.1) ー
ROE(before goodwill amortization 6.5% 8.9% 2.4 ー
ROE 3.9% 6.5% 2.6 ー
※Exchange rate2015: US$=¥121.11 CAN$=¥94.82 2016:US$=¥126.00 CAN$=¥96.00
Consolidated financial results
(billions of yen)We will consider revision in response to foreign exchange fluctuations (the yen’s appreciation) taking into account the degree of its impact
21/39
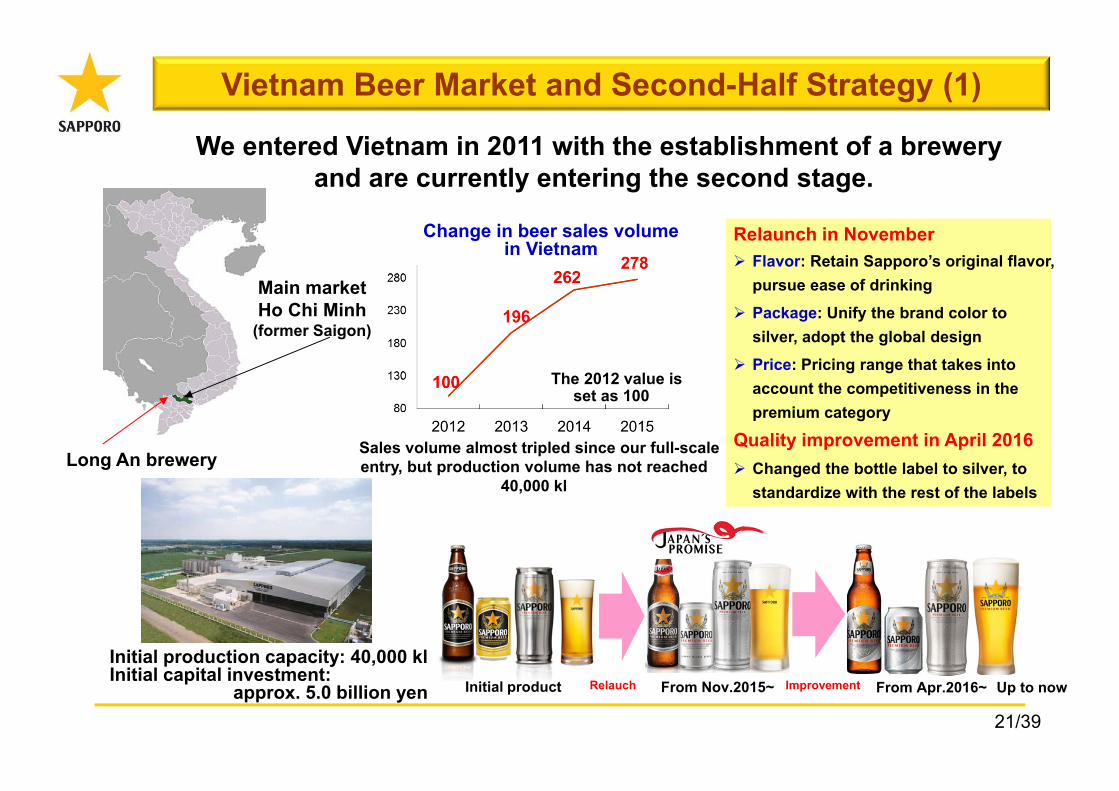
Main marketHo Chi Minh
(former Saigon)
Long An brewery
We entered Vietnam in 2011 with the establishment of a breweryand are currently entering the second stage.
Initial production capacity: 40,000 klInitial capital investment:
approx. 5.0 billion yen
Change in beer sales volumein Vietnam
The 2012 value isset as 100
Sales volume almost tripled since our full-scale entry, but production volume has not reached
40,000 kl
Relaunch in November Flavor: Retain Sapporo’s original flavor,
pursue ease of drinking Package: Unify the brand color to
silver, adopt the global design Price: Pricing range that takes into
account the competitiveness in the premium category
Quality improvement in April 2016 Changed the bottle label to silver, to
standardize with the rest of the labels
Vietnam Beer Market and Second-Half Strategy (1)
Initial product From Nov.2015~Relauch Improvement From Apr.2016~ Up to now
22/39
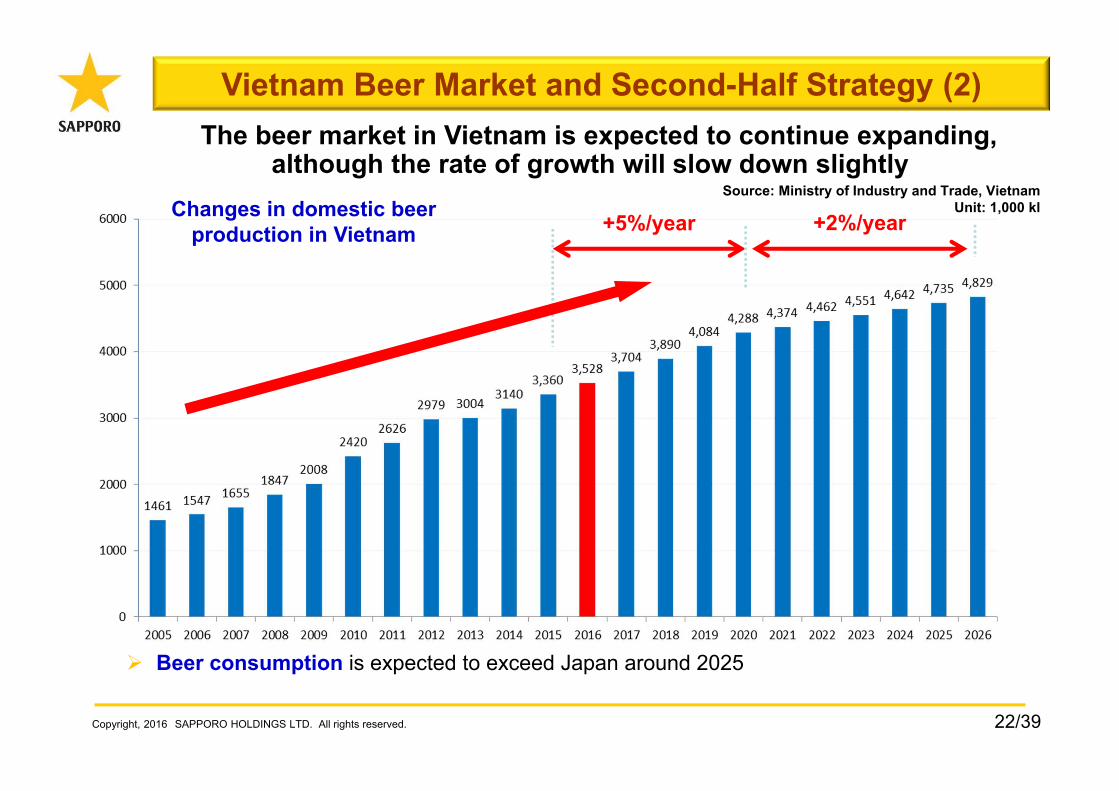
Vietnam Beer Market and Second-Half Strategy (2)
Copyright, 2016 SAPPORO HOLDINGS LTD. All rights reserved.
+2%/year+5%/yearSource: Ministry of Industry and Trade, Vietnam
Unit: 1,000 kl
The beer market in Vietnam is expected to continue expanding, although the rate of growth will slow down slightly
Changes in domestic beer production in Vietnam
Beer consumption is expected to exceed Japan around 2025
23/39
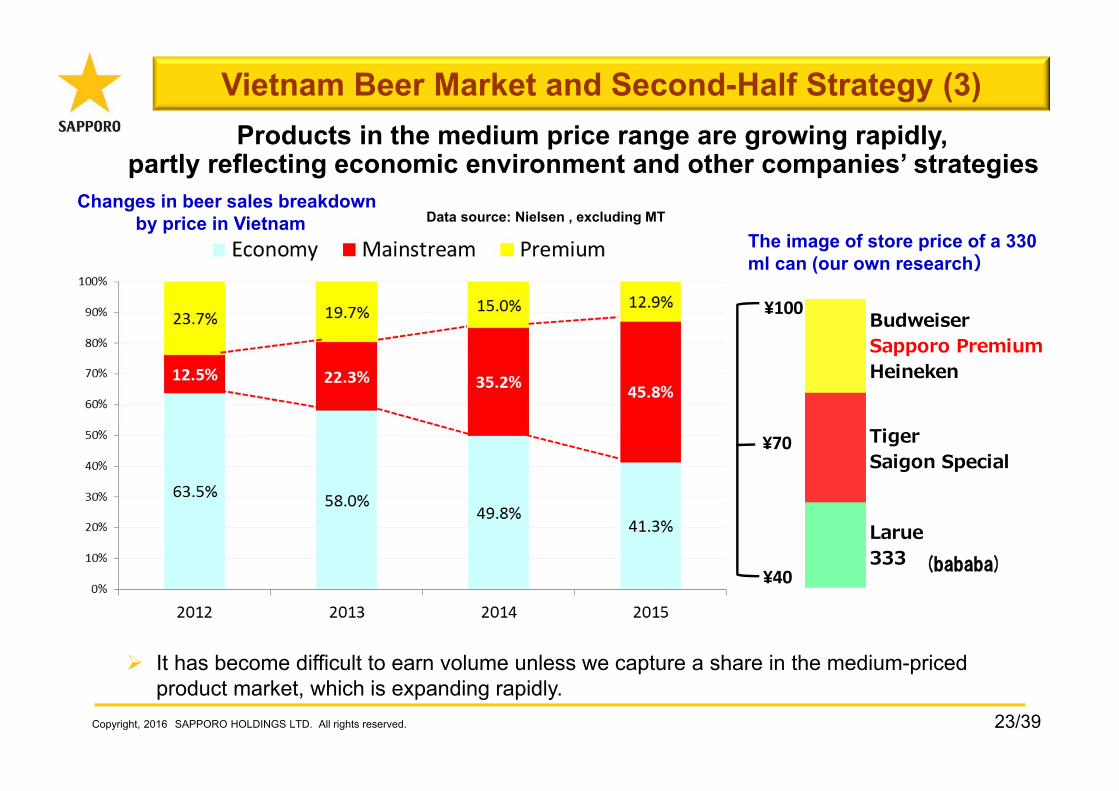
Vietnam Beer Market and Second-Half Strategy (3)
Copyright, 2016 SAPPORO HOLDINGS LTD. All rights reserved.
Data source: Nielsen , excluding MT
Products in the medium price range are growing rapidly, partly reflecting economic environment and other companies’ strategies
Changes in beer sales breakdown by price in Vietnam
The image of store price of a 330 ml can (our own research)
It has become difficult to earn volume unless we capture a share in the medium-priced product market, which is expanding rapidly.
BudweiserSapporo PremiumHeineken
TigerSaigon Special
Larue333(バーバーバー)
¥100
¥40
¥70
(bababa)
24/39
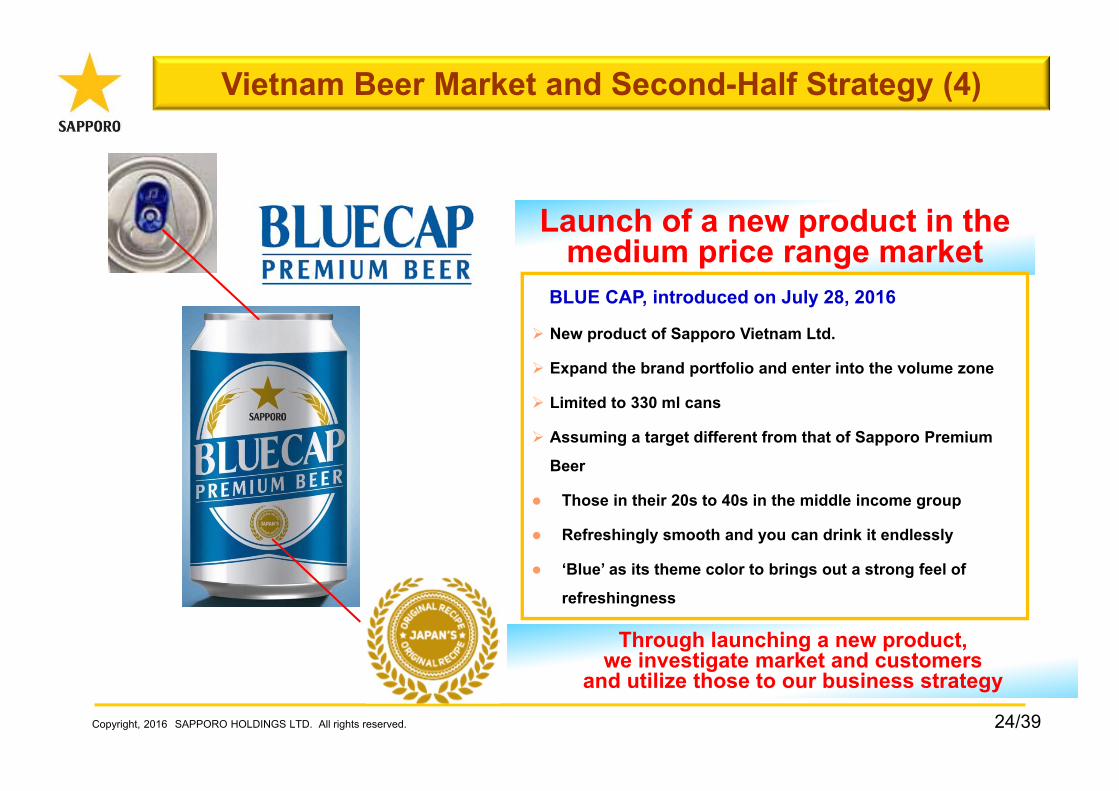
Vietnam Beer Market and Second-Half Strategy (4)
Copyright, 2016 SAPPORO HOLDINGS LTD. All rights reserved.
Launch of a new product in the medium price range market
BLUE CAP, introduced on July 28, 2016
New product of Sapporo Vietnam Ltd.
Expand the brand portfolio and enter into the volume zone
Limited to 330 ml cans
Assuming a target different from that of Sapporo Premium
Beer
Those in their 20s to 40s in the middle income group
Refreshingly smooth and you can drink it endlessly
‘Blue’ as its theme color to brings out a strong feel of
refreshingness
Through launching a new product, we investigate market and customers
and utilize those to our business strategy
25/39
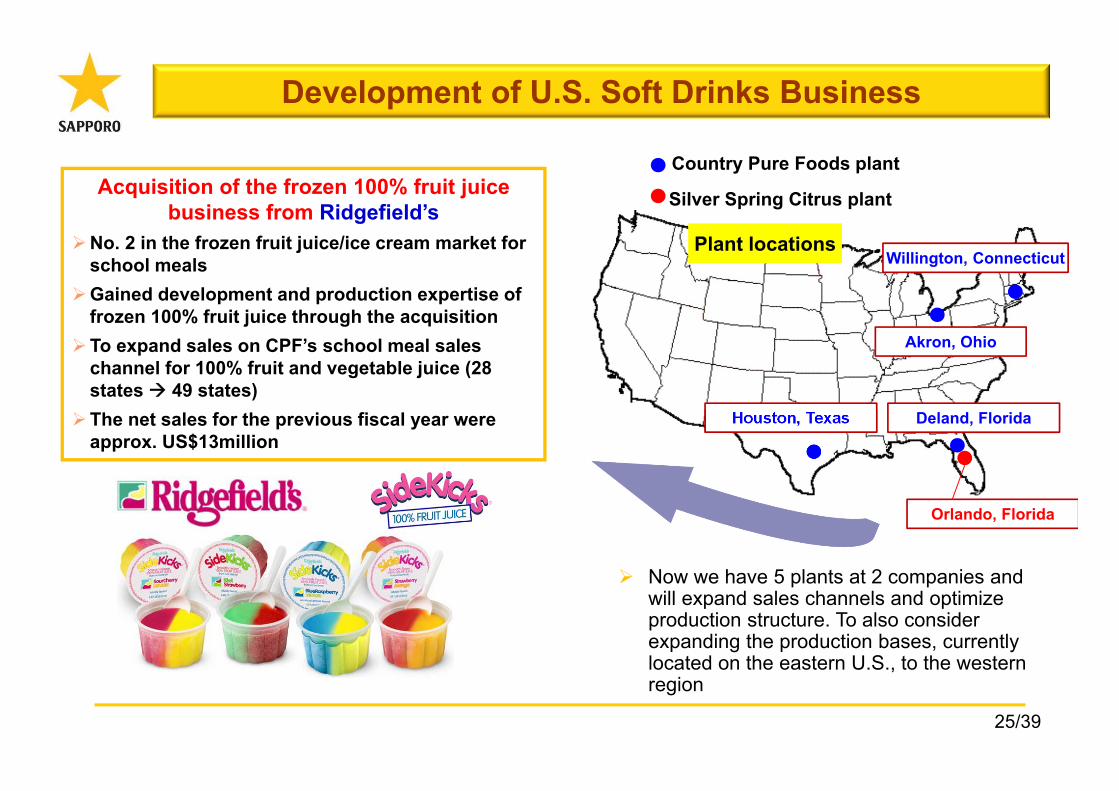
Development of U.S. Soft Drinks Business
Akron, Ohio
Houston, Texas Deland, Florida
Willington, Connecticut
Orlando, Florida
Plant locations
Silver Spring Citrus plant
Country Pure Foods plantAcquisition of the frozen 100% fruit juice
business from Ridgefield’sNo. 2 in the frozen fruit juice/ice cream market for
school mealsGained development and production expertise of
frozen 100% fruit juice through the acquisitionTo expand sales on CPF’s school meal sales
channel for 100% fruit and vegetable juice (28 states 49 states)
The net sales for the previous fiscal year were approx. US$13million
Now we have 5 plants at 2 companies and will expand sales channels and optimize production structure. To also consider expanding the production bases, currently located on the eastern U.S., to the western region
26/39
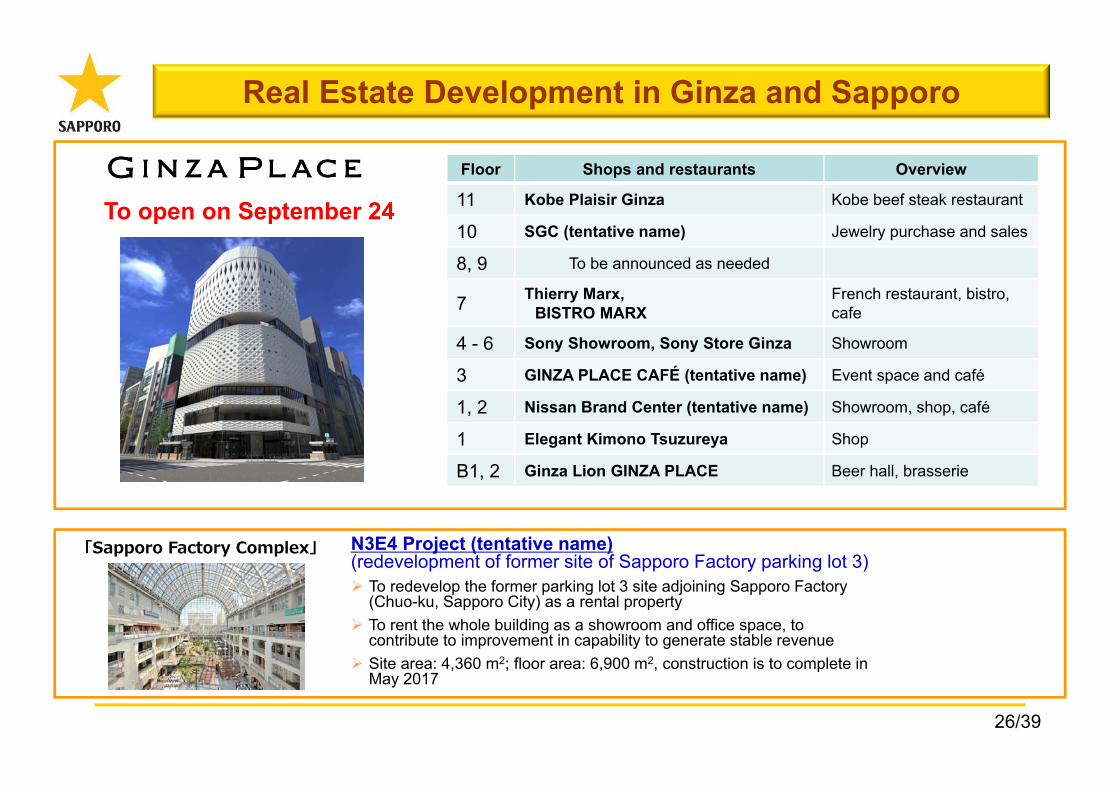
To open on September 24
Floor Shops and restaurants Overview
11 Kobe Plaisir Ginza Kobe beef steak restaurant
10 SGC (tentative name) Jewelry purchase and sales
8, 9 To be announced as needed
7 Thierry Marx, BISTRO MARX
French restaurant, bistro, cafe
4 - 6 Sony Showroom, Sony Store Ginza Showroom
3 GINZA PLACE CAFÉ (tentative name) Event space and café
1, 2 Nissan Brand Center (tentative name) Showroom, shop, café
1 Elegant Kimono Tsuzureya Shop
B1, 2 Ginza Lion GINZA PLACE Beer hall, brasserie
Real Estate Development in Ginza and Sapporo
N3E4 Project (tentative name)(redevelopment of former site of Sapporo Factory parking lot 3) To redevelop the former parking lot 3 site adjoining Sapporo Factory
(Chuo-ku, Sapporo City) as a rental property To rent the whole building as a showroom and office space, to
contribute to improvement in capability to generate stable revenue Site area: 4,360 m2; floor area: 6,900 m2, construction is to complete in
May 2017
「Sapporo Factory Complex」
27/39
3. Vision of Medium-term Portfolio3. Vision of Medium-term Portfolio
Copyright, 2016 SAPPORO HOLDINGS LTD. All rights reserved
28/39Copyright, 2016SAPPORO HOLDINGS LTD. All rights reserved.
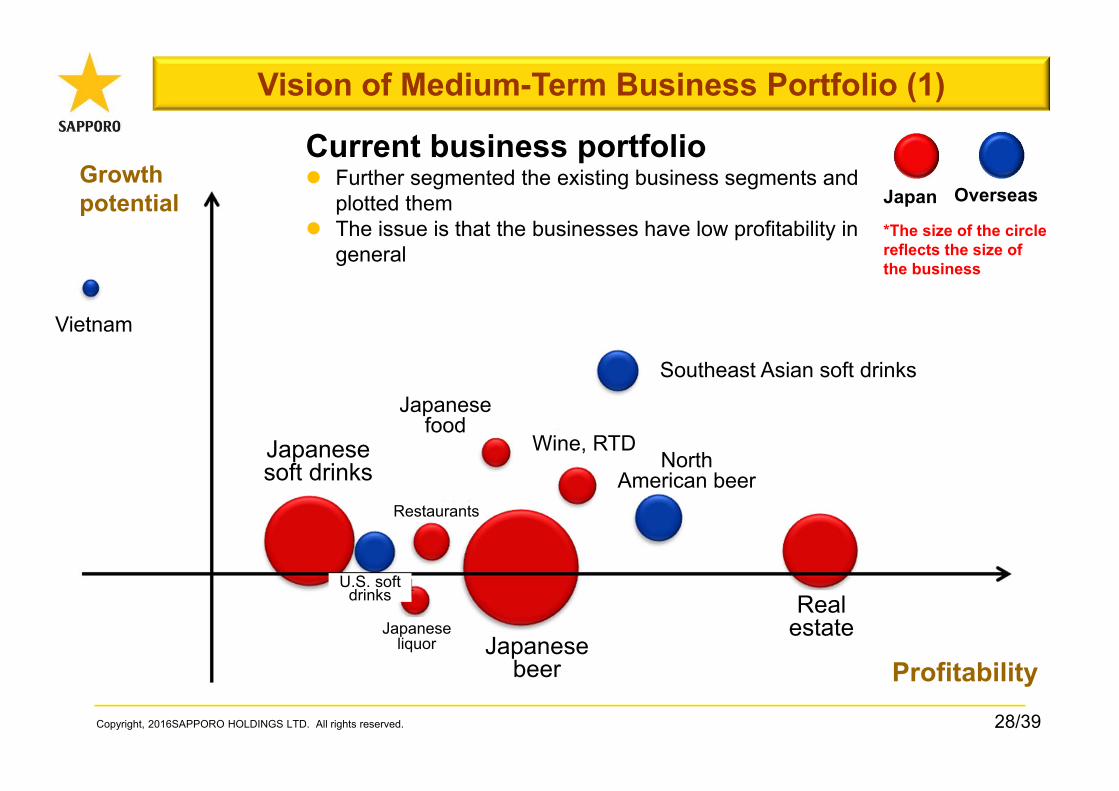
Vision of Medium-Term Business Portfolio (1)
Growth potential
Profitability
Current business portfolio Further segmented the existing business segments and
plotted them The issue is that the businesses have low profitability in
general
Japan Overseas
*The size of the circle reflects the size of the business
Vietnam
Japanese food
North American beer
Wine, RTD
U.S. soft drinks
Restaurants
Southeast Asian soft drinks
Japanese liquor Japanese
beer
Japanese soft drinks
Real estate
29/39Copyright, 2016SAPPORO HOLDINGS LTD. All rights reserved.
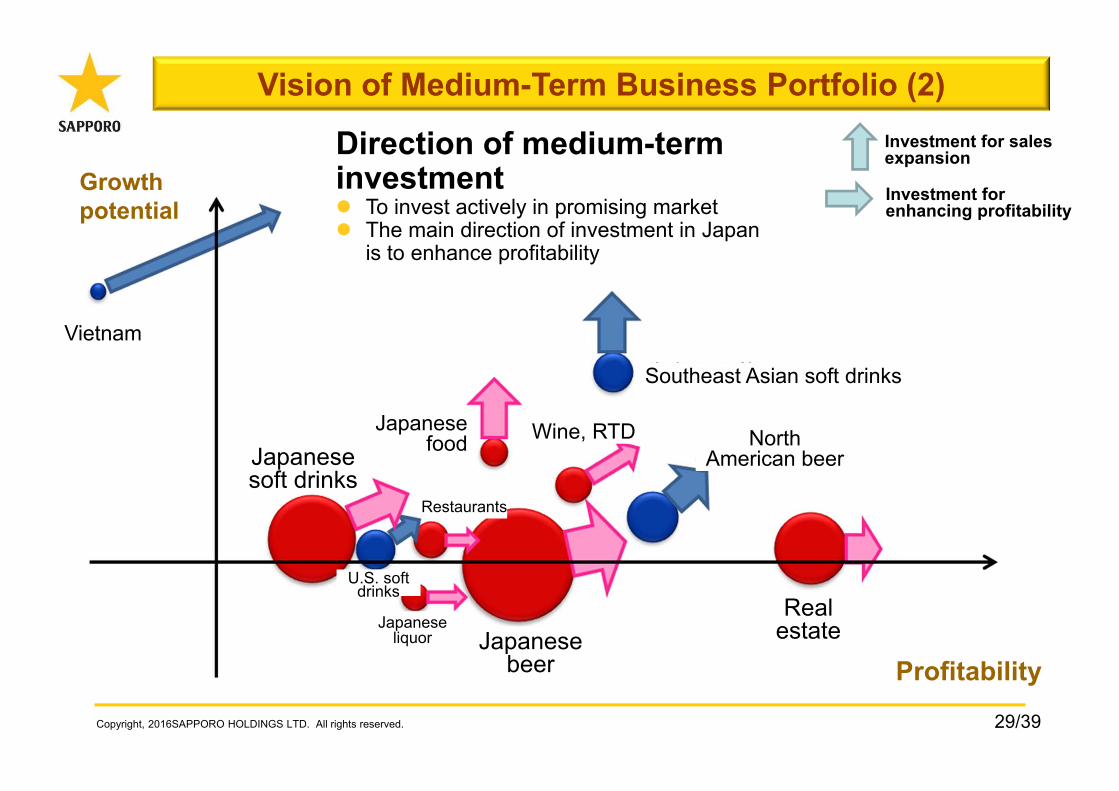
Vision of Medium-Term Business Portfolio (2)
Direction of medium-term investment To invest actively in promising market The main direction of investment in Japan
is to enhance profitability
Investment for sales expansion
Investment for enhancing profitability
Growth potential
Profitability
Vietnam
Japanese food North
American beerWine, RTD
U.S. soft drinks
Restaurants
Southeast Asian soft drinks
Japanese liquor Japanese
beer
Japanese soft drinks
Real estate
30/39Copyright, 2016SAPPORO HOLDINGS LTD. All rights reserved.
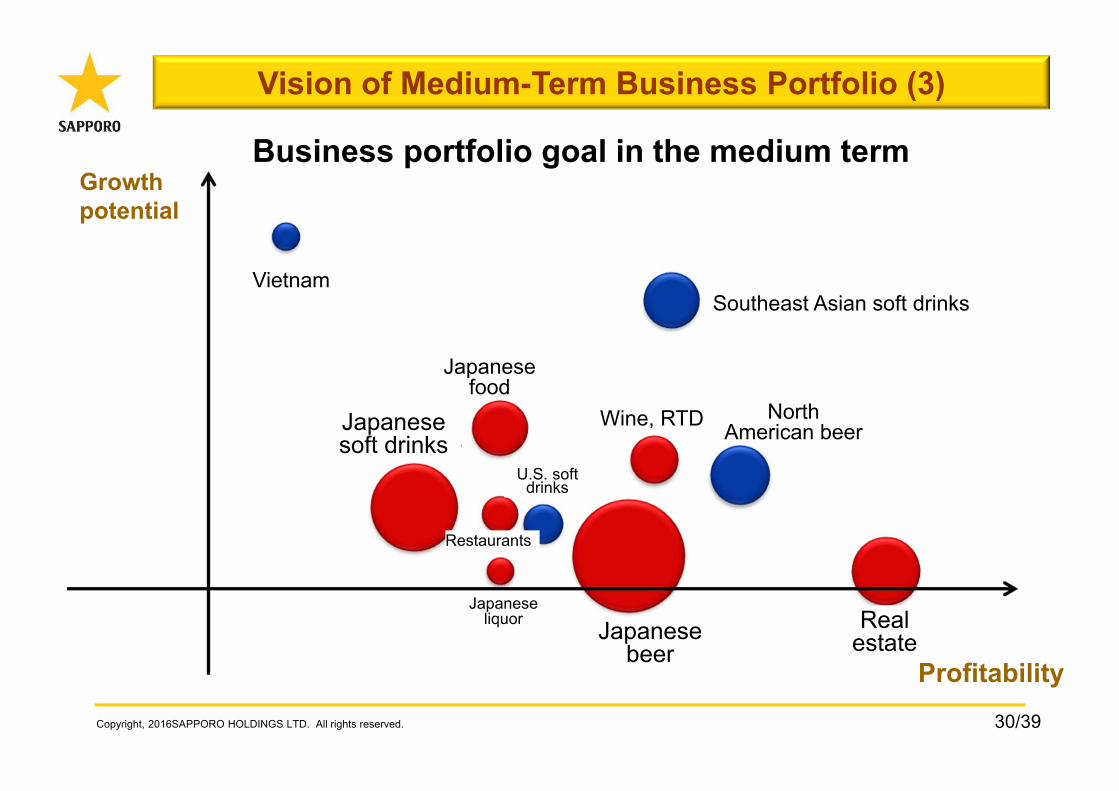
Vision of Medium-Term Business Portfolio (3)
Business portfolio goal in the medium termGrowth potential
Vietnam
Japanese food
Wine, RTD
U.S. soft drinks
Restaurants
Southeast Asian soft drinks
Japanese liquor Japanese
beer
Japanese soft drinks
Real estate
Profitability
North American beer
31/39
Appendix: Collection of Data by BusinessAppendix: Collection of Data by Business
Copyright, 2016 SAPPORO HOLDINGS LTD. All rights reserved.
32/39
2016 2Q:Major Sales and Sales Volume (YoY)
Copyright, 2016 SAPPORO HOLDINGS LTD. All rights reserved.
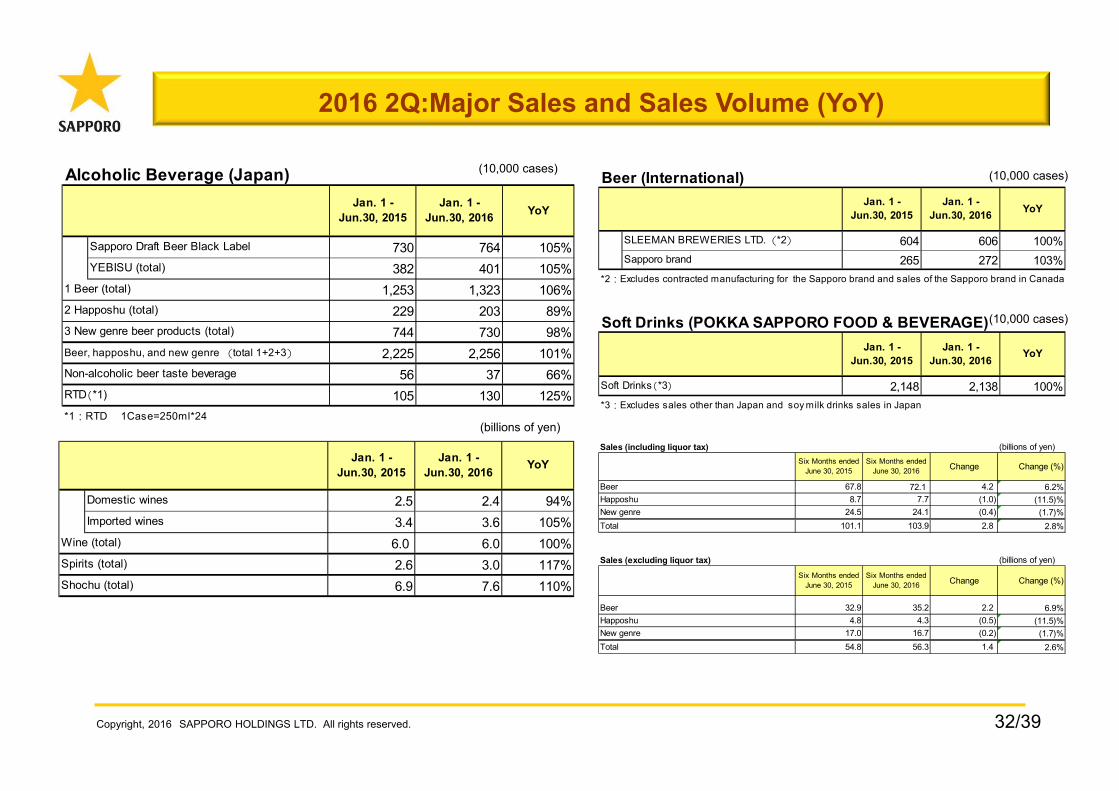
Alcoholic Beverage (Japan)
Sapporo Draft Beer Black Label 730 764 105%YEBISU (total) 382 401 105%
1 Beer (total) 1,253 1,323 106%2 Happoshu (total) 229 203 89%3 New genre beer products (total) 744 730 98%Beer, happoshu, and new genre (total 1+2+3) 2,225 2,256 101%Non-alcoholic beer taste beverage 56 37 66%RTD(*1) 105 130 125%*1:RTD 1Case=250ml*24
Jan. 1 -Jun.30, 2015 YoYJan. 1 -
Jun.30, 2016
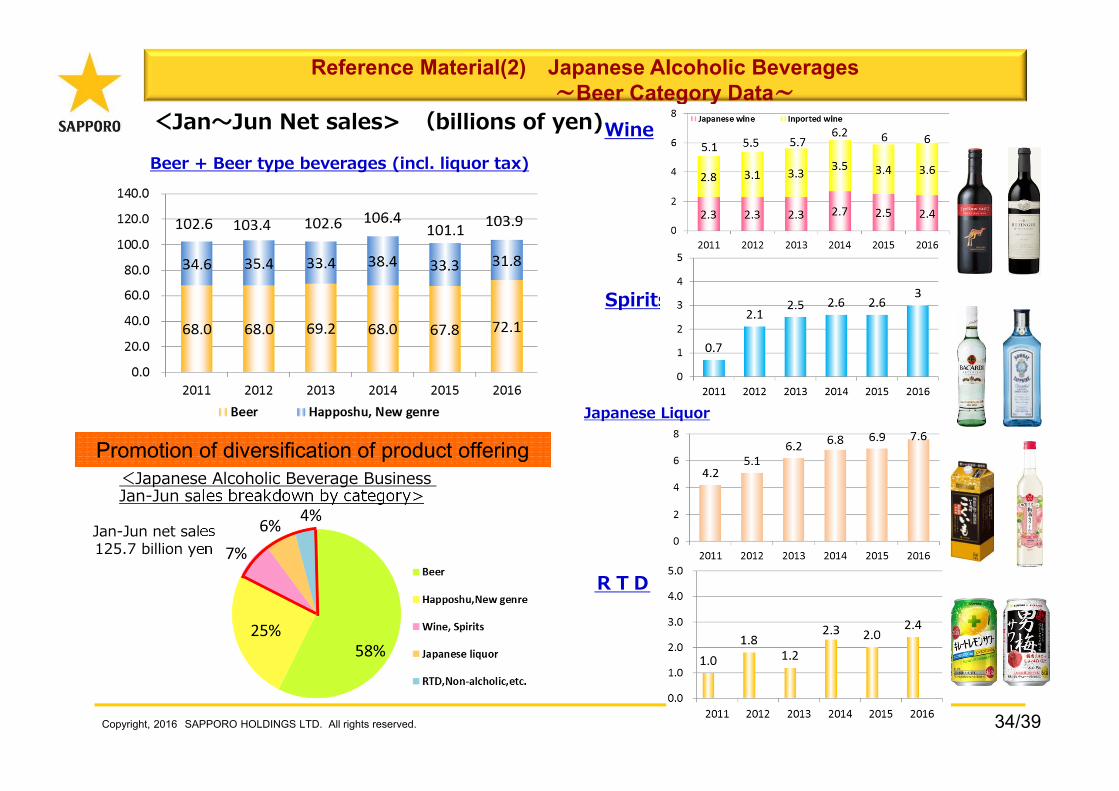
Domestic wines 2.5 2.4 94%Imported wines 3.4 3.6 105%
6.0 6.0 100%2.6 3.0 117%6.9 7.6 110%
Jan. 1 -Jun.30, 2016
Jan. 1 -Jun.30, 2015 YoY
Wine (total)
Spirits (total)
Shochu (total)
Beer (International)
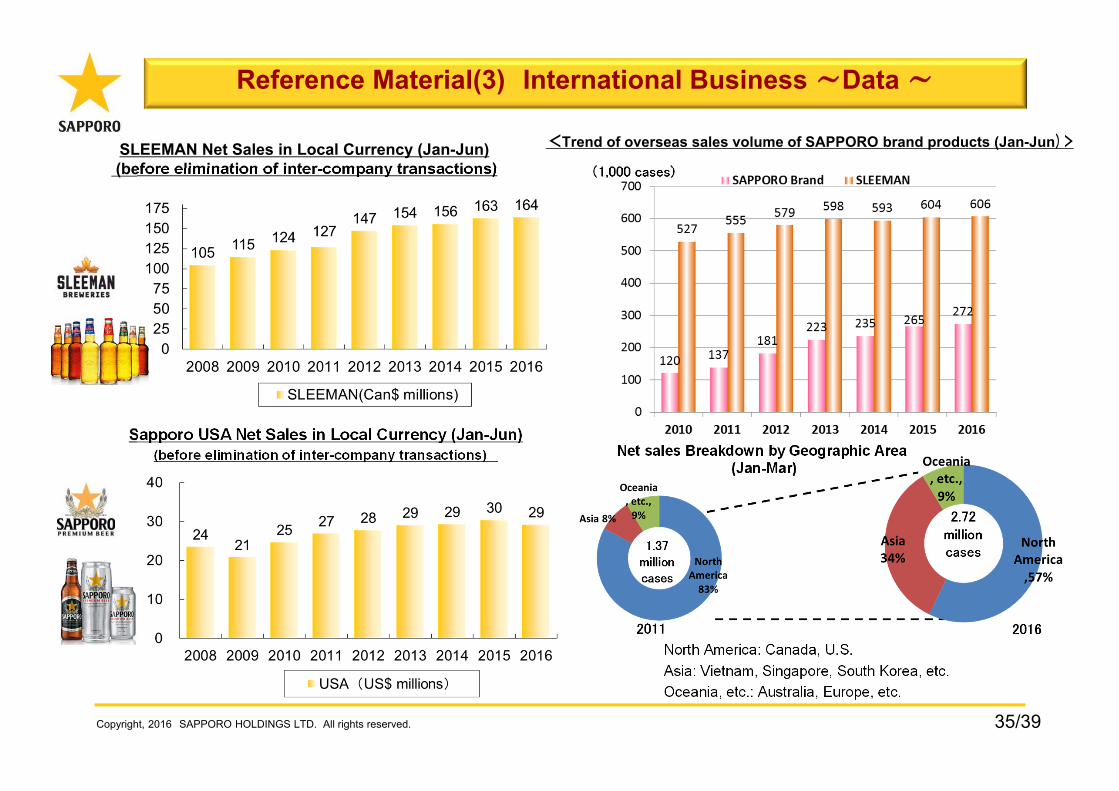
SLEEMAN BREWERIES LTD.(*2) 604 606 100%Sapporo brand 265 272 103%
*2:Excludes contracted manufacturing for the Sapporo brand and sales of the Sapporo brand in Canada
Jan. 1 -Jun.30, 2016
Jan. 1 -Jun.30, 2015 YoY
Soft Drinks (POKKA SAPPORO FOOD & BEVERAGE)
2,148 2,138 100%*3:Excludes sales other than Japan and soy milk drinks sales in Japan
Jan. 1 -Jun.30, 2016
Soft Drinks(*3)
Jan. 1 -Jun.30, 2015 YoY
Sales (including liquor tax) (billions of yen)Six Months ended
June 30, 2015Six Months ended
June 30, 2016 Change Change (%)
Beer 67.8 72.1 4.2 6.2%Happoshu 8.7 7.7 (1.0) (11.5)%New genre 24.5 24.1 (0.4) (1.7)%Total 101.1 103.9 2.8 2.8%
Sales (excluding liquor tax) (billions of yen)
Six Months endedJune 30, 2015
Six Months endedJune 30, 2016 Change Change (%)
Beer 32.9 35.2 2.2 6.9%Happoshu 4.8 4.3 (0.5) (11.5)%New genre 17.0 16.7 (0.2) (1.7)%Total 54.8 56.3 1.4 2.6%
(10,000 cases)
(billions of yen)
(10,000 cases)
(10,000 cases)
33/39Copyright, 2016 SAPPORO HOLDINGS LTD. All rights reserved.
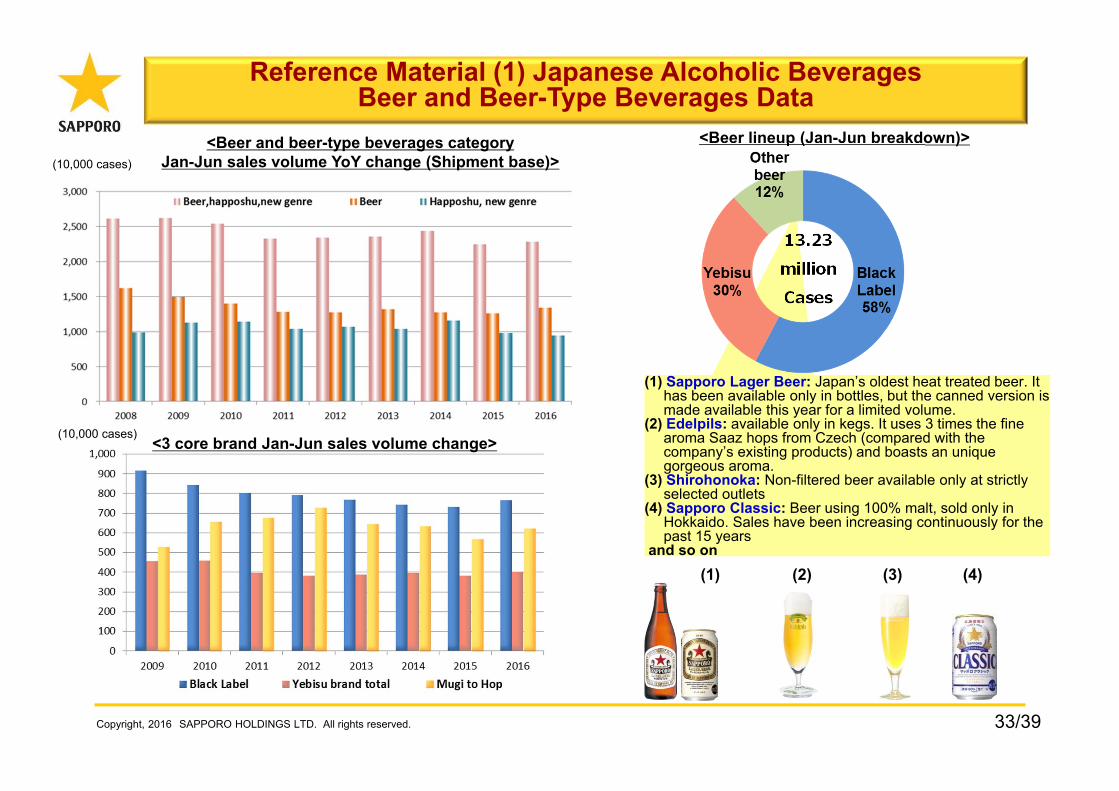
Reference Material (1) Japanese Alcoholic BeveragesBeer and Beer-Type Beverages Data
<Beer and beer-type beverages category Jan-Jun sales volume YoY change (Shipment base)>
<Beer lineup (Jan-Jun breakdown)>
(1) (2) (3) (4)
(1) Sapporo Lager Beer: Japan’s oldest heat treated beer. It has been available only in bottles, but the canned version is made available this year for a limited volume.
(2) Edelpils: available only in kegs. It uses 3 times the fine aroma Saaz hops from Czech (compared with the company’s existing products) and boasts an unique gorgeous aroma.
(3) Shirohonoka: Non-filtered beer available only at strictly selected outlets
(4) Sapporo Classic: Beer using 100% malt, sold only in Hokkaido. Sales have been increasing continuously for the past 15 years
and so on
13.23million Cases
<3 core brand Jan-Jun sales volume change>(10,000 cases)
(10,000 cases)
34/39Copyright, 2016 SAPPORO HOLDINGS LTD. All rights reserved.
Spirits
RTD
Reference Material(2) Japanese Alcoholic Beverages~Beer Category Data~
Promotion of diversification of product offeringPromotion of diversification of product offering
Wine<Jan〜Jun Net sales> (billions of yen)Beer + Beer type beverages (incl. liquor tax)
<Japanese Alcoholic Beverage Business Jan-Jun sales breakdown by category>
Jan-Jun net sales125.7 billion yen
Japanese Liquor
35/39
Reference Material(3) International Business ~Data ~
20162011
Copyright, 2016 SAPPORO HOLDINGS LTD. All rights reserved.
SLEEMAN Net Sales in Local Currency (Jan-Jun)(before elimination of inter-company transactions)
Sapporo USA Net Sales in Local Currency (Jan-Jun)(before elimination of inter-company transactions)
<Trend of overseas sales volume of SAPPORO brand products (Jan-Jun)>
Net sales Breakdown by Geographic Area (Jan-Mar)
North America: Canada, U.S.Asia: Vietnam, Singapore, South Korea, etc.Oceania, etc.: Australia, Europe, etc.
(1,000 cases)
1.37million cases
2.72million cases
36/39
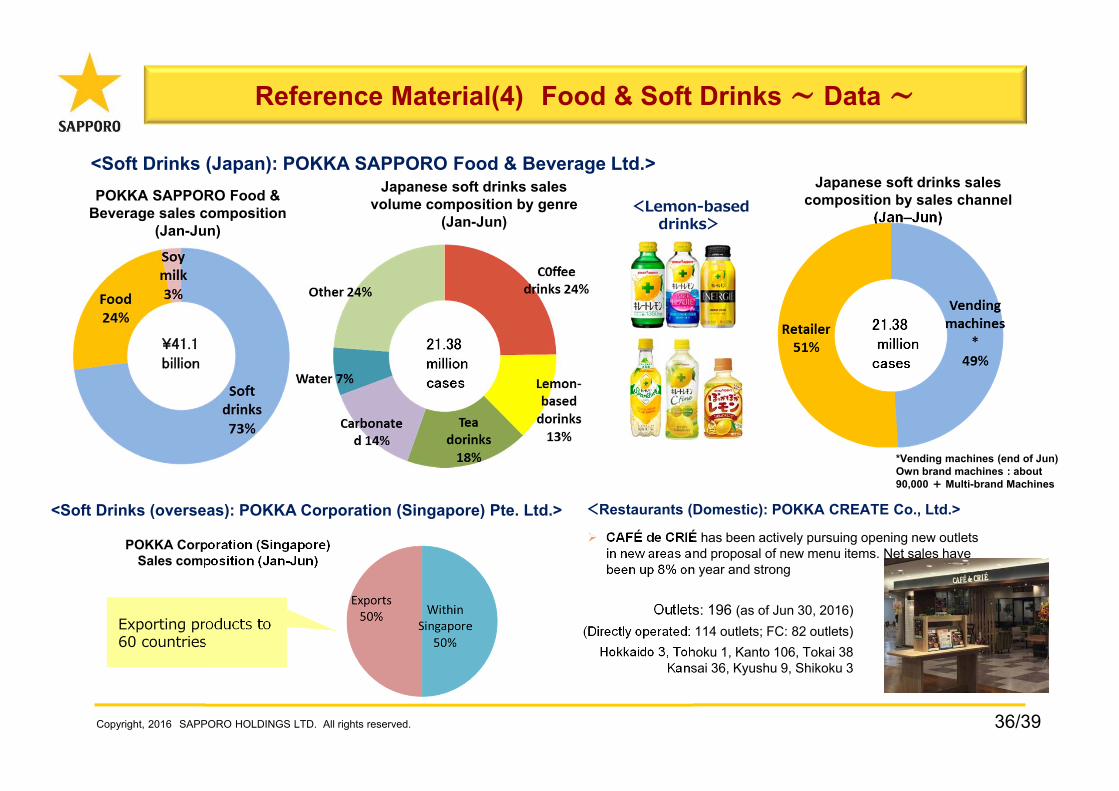
Reference Material(4) Food & Soft Drinks ~ Data ~
21.38million
cases21.38million cases
Copyright, 2016 SAPPORO HOLDINGS LTD. All rights reserved.
Exporting products to 60 countries
<Soft Drinks (Japan): POKKA SAPPORO Food & Beverage Ltd.>POKKA SAPPORO Food &
Beverage sales composition (Jan-Jun)
Japanese soft drinks sales volume composition by genre
(Jan-Jun)<Lemon-based
drinks>
Japanese soft drinks sales composition by sales channel
(Jan–Jun)
*Vending machines (end of Jun)Own brand machines : about 90,000 + Multi-brand Machines
<Soft Drinks (overseas): POKKA Corporation (Singapore) Pte. Ltd.> <Restaurants (Domestic): POKKA CREATE Co., Ltd.>
POKKA Corporation (Singapore)Sales composition (Jan-Jun)
CAFÉ de CRIÉ has been actively pursuing opening new outlets in new areas and proposal of new menu items. Net sales have been up 8% on year and strong
Outlets: 196 (as of Jun 30, 2016)(Directly operated: 114 outlets; FC: 82 outlets)
Hokkaido 3, Tohoku 1, Kanto 106, Tokai 38Kansai 36, Kyushu 9, Shikoku 3
¥41.1 billion
37/39
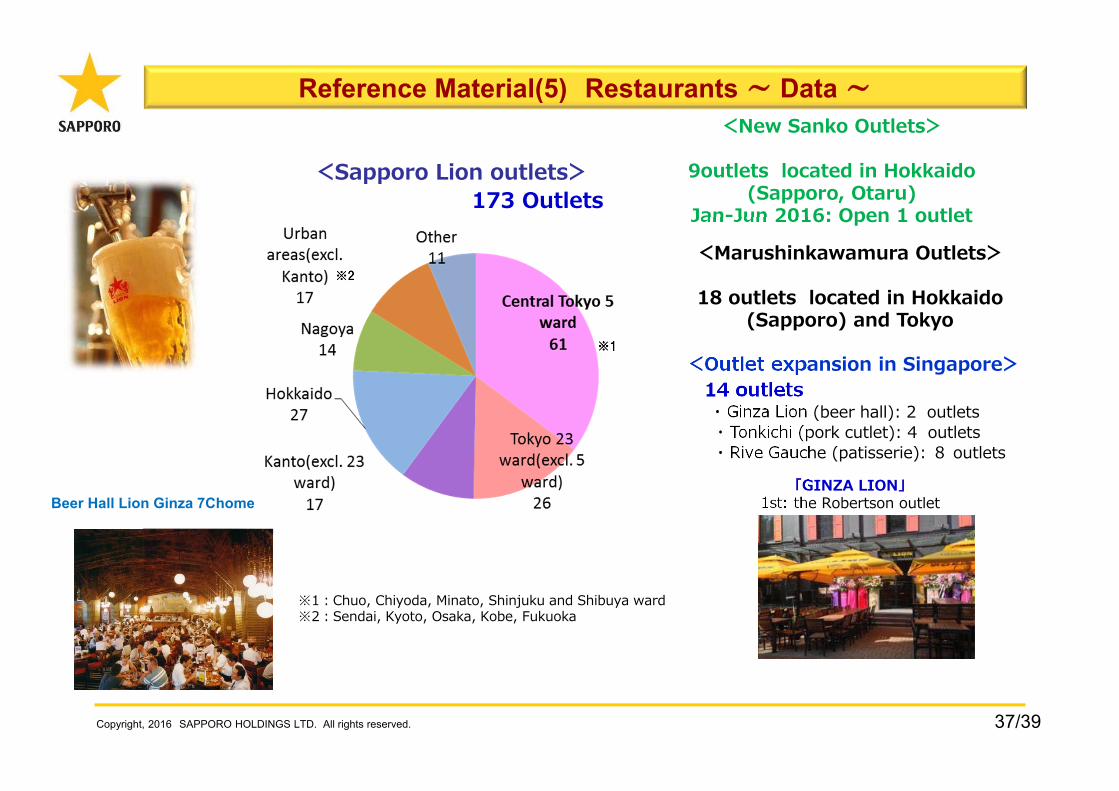
Reference Material(5) Restaurants ~ Data ~
Copyright, 2016 SAPPORO HOLDINGS LTD. All rights reserved.
※1
※2
※1:Chuo, Chiyoda, Minato, Shinjuku and Shibuya ward※2:Sendai, Kyoto, Osaka, Kobe, Fukuoka
<Sapporo Lion outlets>173 Outlets
<New Sanko Outlets>
9outlets located in Hokkaido(Sapporo, Otaru)
Jan-Jun 2016: Open 1 outlet
14 outlets・ Ginza Lion (beer hall): 2 outlets・ Tonkichi (pork cutlet): 4 outlets・ Rive Gauche (patisserie): 8 outlets
<Outlet expansion in Singapore>
「GINZA LION」1st: the Robertson outlet
<Marushinkawamura Outlets>
18 outlets located in Hokkaido(Sapporo) and Tokyo
Beer Hall Lion Ginza 7Chome
38/39
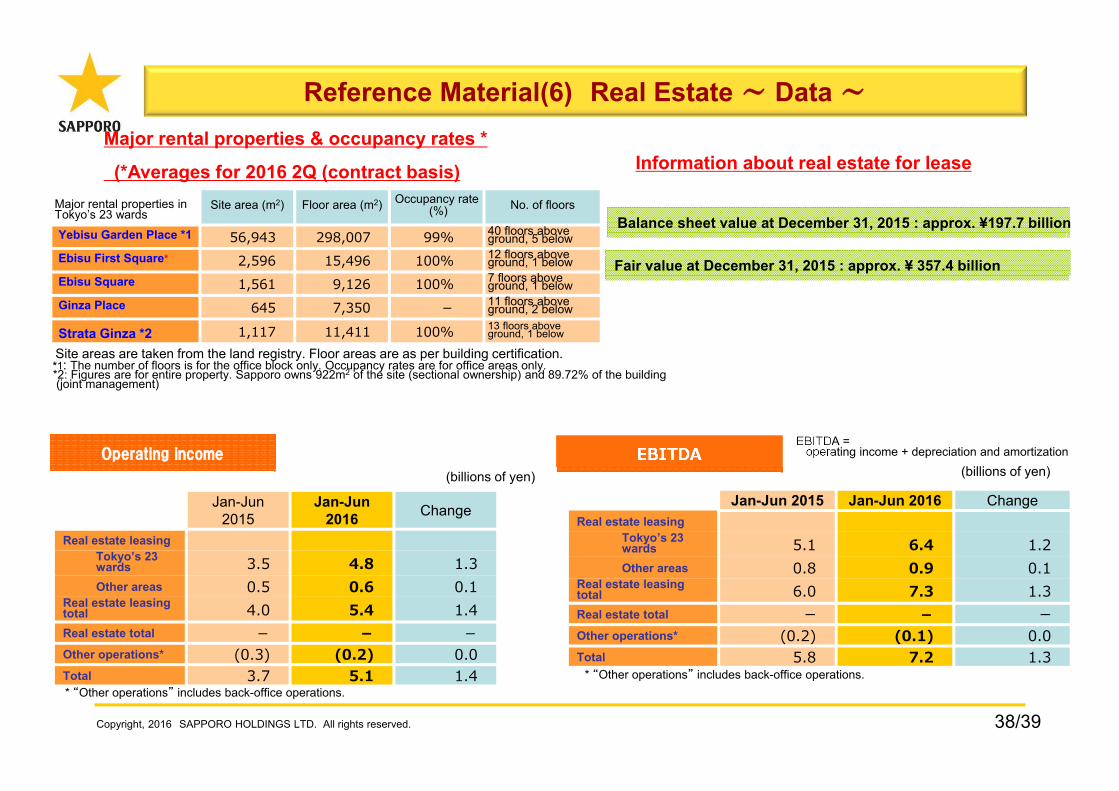
Reference Material(6) Real Estate ~ Data ~
Balance sheet value at December 31, 2015 : approx. ¥197.7 billion
Fair value at December 31, 2015 : approx. ¥ 357.4 billion
Operating incomeOperating income EBITDAEBITDA
Copyright, 2016 SAPPORO HOLDINGS LTD. All rights reserved.
Major rental properties & occupancy rates *
(*Averages for 2016 2Q (contract basis) Information about real estate for lease
Site areas are taken from the land registry. Floor areas are as per building certification.*1: The number of floors is for the office block only. Occupancy rates are for office areas only.*2: Figures are for entire property. Sapporo owns 922m2 of the site (sectional ownership) and 89.72% of the building(joint management)
EBITDA =operating income + depreciation and amortization
(billions of yen) (billions of yen)
* “Other operations” includes back-office operations. * “Other operations” includes back-office operations.
Major rental properties inTokyo’s 23 wards
Site area (m2) Floor area (m2) Occupancy rate(%) No. of floors
Yebisu Garden Place *1 56,943 298,007 99% 40 floors aboveground, 5 below
Ebisu First Square* 2,596 15,496 100% 12 floors aboveground, 1 below
Ebisu Square 1,561 9,126 100% 7 floors aboveground, 1 below
Ginza Place 645 7,350 - 11 floors aboveground, 2 below
Strata Ginza *2 1,117 11,411 100% 13 floors aboveground, 1 below
Jan-Jun 2015
Jan-Jun 2016 Change
Real estate leasingTokyo’s 23 wards 3.5 4.8 1.3Other areas 0.5 0.6 0.1
Real estate leasing total 4.0 5.4 1.4Real estate total - - -Other operations* (0.3) (0.2) 0.0Total 3.7 5.1 1.4
Jan-Jun 2015 Jan-Jun 2016 ChangeReal estate leasing
Tokyo’s 23 wards 5.1 6.4 1.2Other areas 0.8 0.9 0.1
Real estate leasing total 6.0 7.3 1.3Real estate total ー - ーOther operations* (0.2) (0.1) 0.0Total 5.8 7.2 1.3
* “Other operations” includes back-office operations.
39/39
The earnings forecasts and forward-looking statements appearing in this document were prepared by theSAPPORO Group based on currently available information and its best assessment of potential risks anduncertainties. Actual outcomes may differ materially from forecasts due to changes in various underlyingfactors.
As an intrinsic part of people's lives, Sapporo will contribute to the evolution of creative, enriching and rewarding lifestyles.
Copyright, 2015 SAPPORO HOLDINGS LTD. All rights reserved.