PARKSON HOLDINGS BERHAD - I3investor
14
PARKSON HOLDINGS BERHAD (Incorporated in Malaysia) (89194-P) Interim Financial Report Condensed Consolidated Statement of Profit or Loss 1 Condensed Consolidated Statement of Other Comprehensive Income 2 Condensed Consolidated Statement of Financial Position 3 Condensed Consolidated Statement of Changes in Equity 4 Condensed Consolidated Statement of Cash Flows 5 Notes to the Condensed Financial Statements 6 - 13 for the Second Quarter Ended 31 December 2020
-
Upload
khangminh22 -
Category
Documents
-
view
2 -
download
0
Transcript of PARKSON HOLDINGS BERHAD - I3investor
PARKSON HOLDINGS BERHAD (Incorporated in Malaysia) (89194-P)
Interim Financial Report
Condensed Consolidated Statement of Profit or Loss 1
Condensed Consolidated Statement of Other Comprehensive Income 2
Condensed Consolidated Statement of Financial Position 3
Condensed Consolidated Statement of Changes in Equity 4
Condensed Consolidated Statement of Cash Flows 5
Notes to the Condensed Financial Statements 6 - 13
for the Second Quarter Ended
31 December 2020
PARKSON HOLDINGS BERHADRegistration No. 198201009470 (89194-P)
(Incorporated in Malaysia)
(The figures have not been audited)
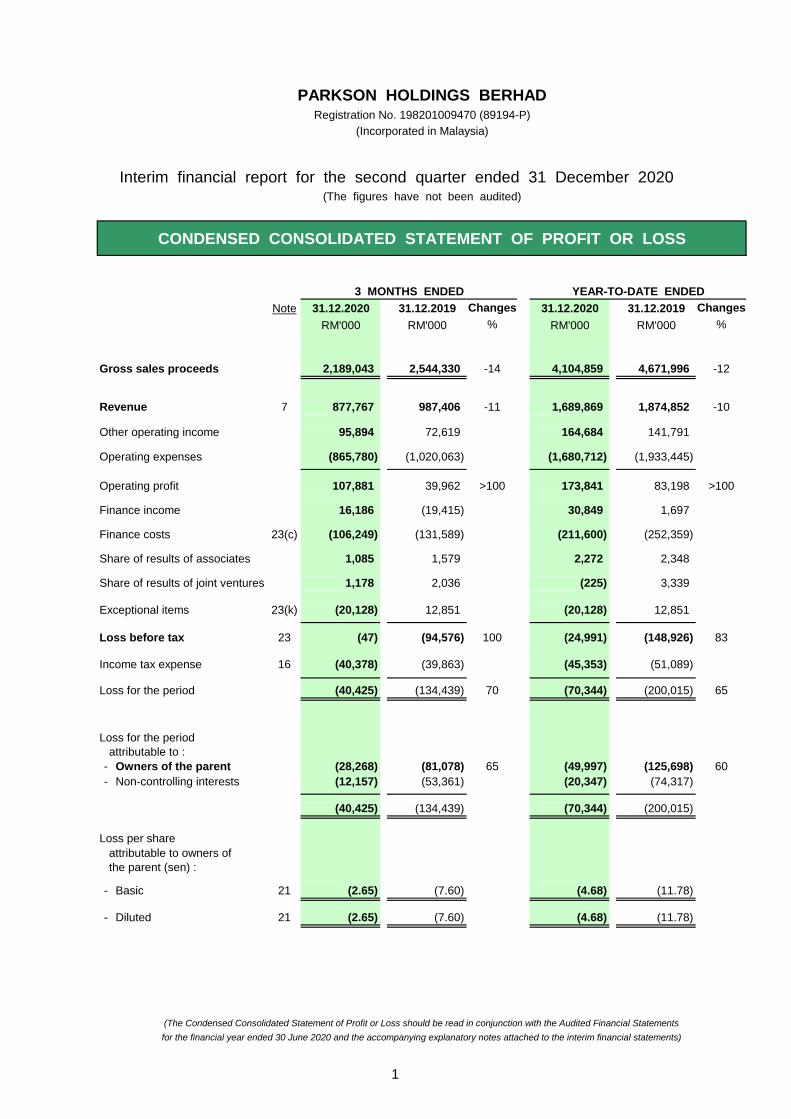
CONDENSED CONSOLIDATED STATEMENT OF PROFIT OR LOSS
3 MONTHS ENDED YEAR-TO-DATE ENDED
Note 31.12.2020 31.12.2019 Changes 31.12.2020 31.12.2019 Changes
RM'000 RM'000 % RM'000 RM'000 %
Gross sales proceeds 2,189,043 2,544,330 -14 4,104,859 4,671,996 -12
Revenue 7 877,767 987,406 -11 1,689,869 1,874,852 -10
Other operating income 95,894 72,619 164,684 141,791
Operating expenses (865,780) (1,020,063) (1,680,712) (1,933,445)
Operating profit 107,881 39,962 >100 173,841 83,198 >100
Finance income 16,186 (19,415) 30,849 1,697
Finance costs 23(c) (106,249) (131,589) (211,600) (252,359)
Share of results of associates 1,085 1,579 2,272 2,348
Share of results of joint ventures 1,178 2,036 (225) 3,339
Exceptional items 23(k) (20,128) 12,851 (20,128) 12,851
Loss before tax 23 (47) (94,576) 100 (24,991) (148,926) 83
Income tax expense 16 (40,378) (39,863) (45,353) (51,089)
Loss for the period (40,425) (134,439) 70 (70,344) (200,015) 65
Loss for the period
attributable to :
- Owners of the parent (28,268) (81,078) 65 (49,997) (125,698) 60
- Non-controlling interests (12,157) (53,361) (20,347) (74,317)
(40,425) (134,439) (70,344) (200,015)
Loss per share
attributable to owners of
the parent (sen) :
- Basic 21 (2.65) (7.60) (4.68) (11.78)
- Diluted 21 (2.65) (7.60) (4.68) (11.78)
(The Condensed Consolidated Statement of Profit or Loss should be read in conjunction with the Audited Financial Statements
for the financial year ended 30 June 2020 and the accompanying explanatory notes attached to the interim financial statements)
Interim financial report for the second quarter ended 31 December 2020
1
PARKSON HOLDINGS BERHADRegistration No. 198201009470 (89194-P)
(Incorporated in Malaysia)
(The figures have not been audited)
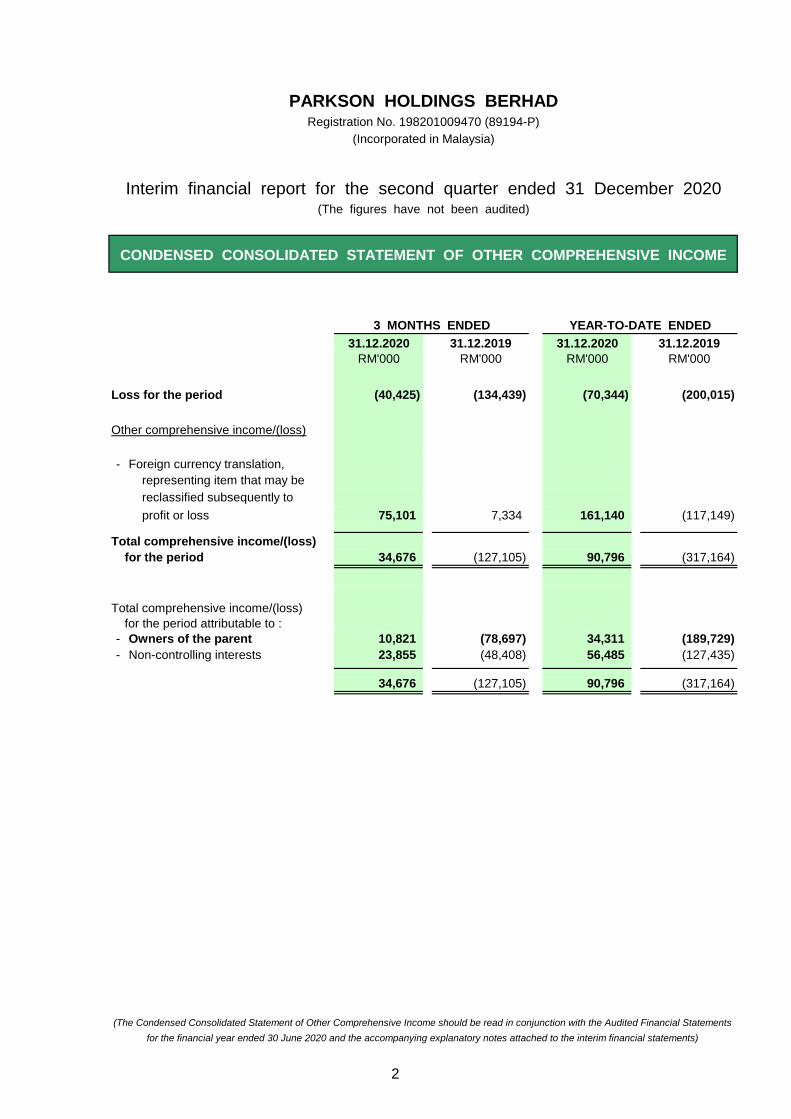
CONDENSED CONSOLIDATED STATEMENT OF OTHER COMPREHENSIVE INCOME
3 MONTHS ENDED YEAR-TO-DATE ENDED
31.12.2020 31.12.2019 31.12.2020 31.12.2019
RM'000 RM'000 RM'000 RM'000
Loss for the period (40,425) (134,439) (70,344) (200,015)
Other comprehensive income/(loss)
- Foreign currency translation,
representing item that may be
reclassified subsequently to
profit or loss 75,101 7,334 161,140 (117,149)
Total comprehensive income/(loss)
for the period 34,676 (127,105) 90,796 (317,164)
Total comprehensive income/(loss)
for the period attributable to :
- Owners of the parent 10,821 (78,697) 34,311 (189,729)
- Non-controlling interests 23,855 (48,408) 56,485 (127,435)
34,676 (127,105) 90,796 (317,164)
(The Condensed Consolidated Statement of Other Comprehensive Income should be read in conjunction with the Audited Financial Statements
for the financial year ended 30 June 2020 and the accompanying explanatory notes attached to the interim financial statements)
Interim financial report for the second quarter ended 31 December 2020
2
PARKSON HOLDINGS BERHADRegistration No. 198201009470 (89194-P)
(Incorporated in Malaysia)
(The figures have not been audited)
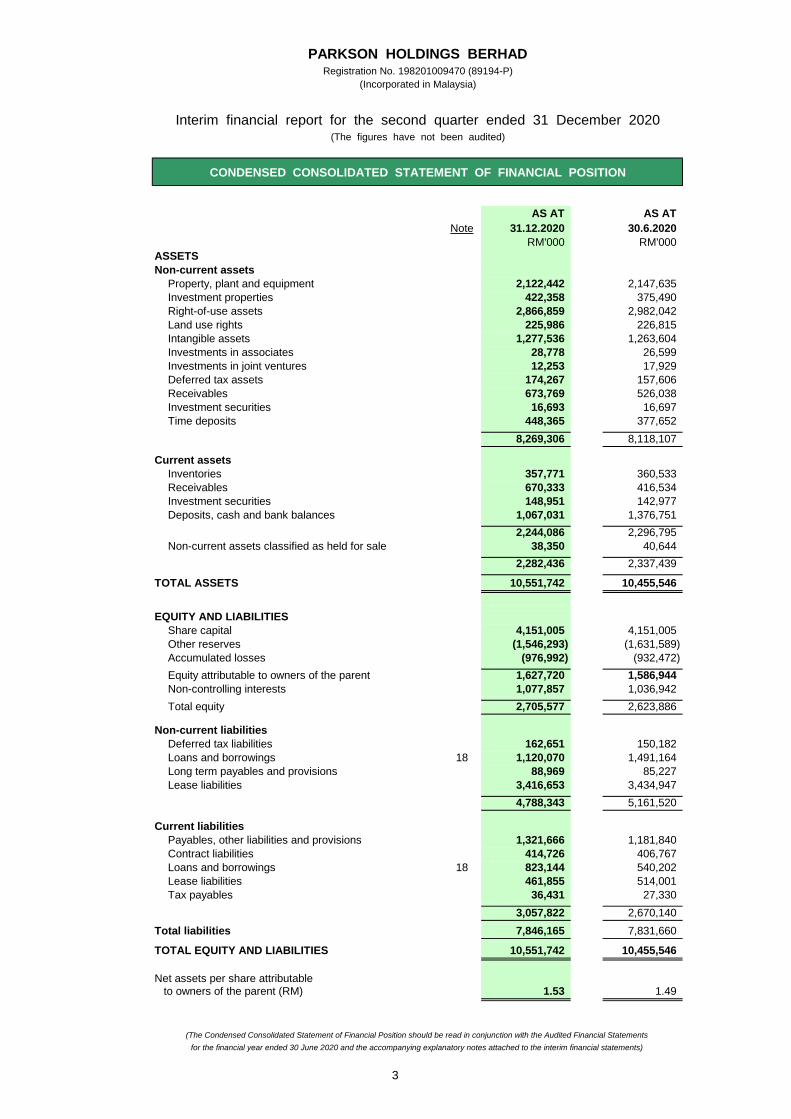
CONDENSED CONSOLIDATED STATEMENT OF FINANCIAL POSITION
AS AT AS AT
Note 31.12.2020 30.6.2020
RM'000 RM'000
ASSETS
Non-current assets
Property, plant and equipment 2,122,442 2,147,635
Investment properties 422,358 375,490
Right-of-use assets 2,866,859 2,982,042
Land use rights 225,986 226,815
Intangible assets 1,277,536 1,263,604
Investments in associates 28,778 26,599
Investments in joint ventures 12,253 17,929
Deferred tax assets 174,267 157,606
Receivables 673,769 526,038
Investment securities 16,693 16,697
Time deposits 448,365 377,652
8,269,306 8,118,107
Current assets
Inventories 357,771 360,533
Receivables 670,333 416,534
Investment securities 148,951 142,977
Deposits, cash and bank balances 1,067,031 1,376,751
2,244,086 2,296,795
Non-current assets classified as held for sale 38,350 40,644
2,282,436 2,337,439
TOTAL ASSETS 10,551,742 10,455,546
EQUITY AND LIABILITIES
Share capital 4,151,005 4,151,005
Other reserves (1,546,293) (1,631,589)
Accumulated losses (976,992) (932,472)
Equity attributable to owners of the parent 1,627,720 1,586,944
Non-controlling interests 1,077,857 1,036,942
Total equity 2,705,577 2,623,886
Non-current liabilities
Deferred tax liabilities 162,651 150,182
Loans and borrowings 18 1,120,070 1,491,164
Long term payables and provisions 88,969 85,227
Lease liabilities 3,416,653 3,434,947
4,788,343 5,161,520
Current liabilities
Payables, other liabilities and provisions 1,321,666 1,181,840
Contract liabilities 414,726 406,767
Loans and borrowings 18 823,144 540,202
Lease liabilities 461,855 514,001
Tax payables 36,431 27,330
3,057,822 2,670,140
Total liabilities 7,846,165 7,831,660
TOTAL EQUITY AND LIABILITIES 10,551,742 10,455,546
Net assets per share attributable to owners of the parent (RM) 1.53 1.49
(The Condensed Consolidated Statement of Financial Position should be read in conjunction with the Audited Financial Statements
for the financial year ended 30 June 2020 and the accompanying explanatory notes attached to the interim financial statements)
Interim financial report for the second quarter ended 31 December 2020
3
PARKSON HOLDINGS BERHADRegistration No. 198201009470 (89194-P)
(Incorporated in Malaysia)
(The figures have not been audited)
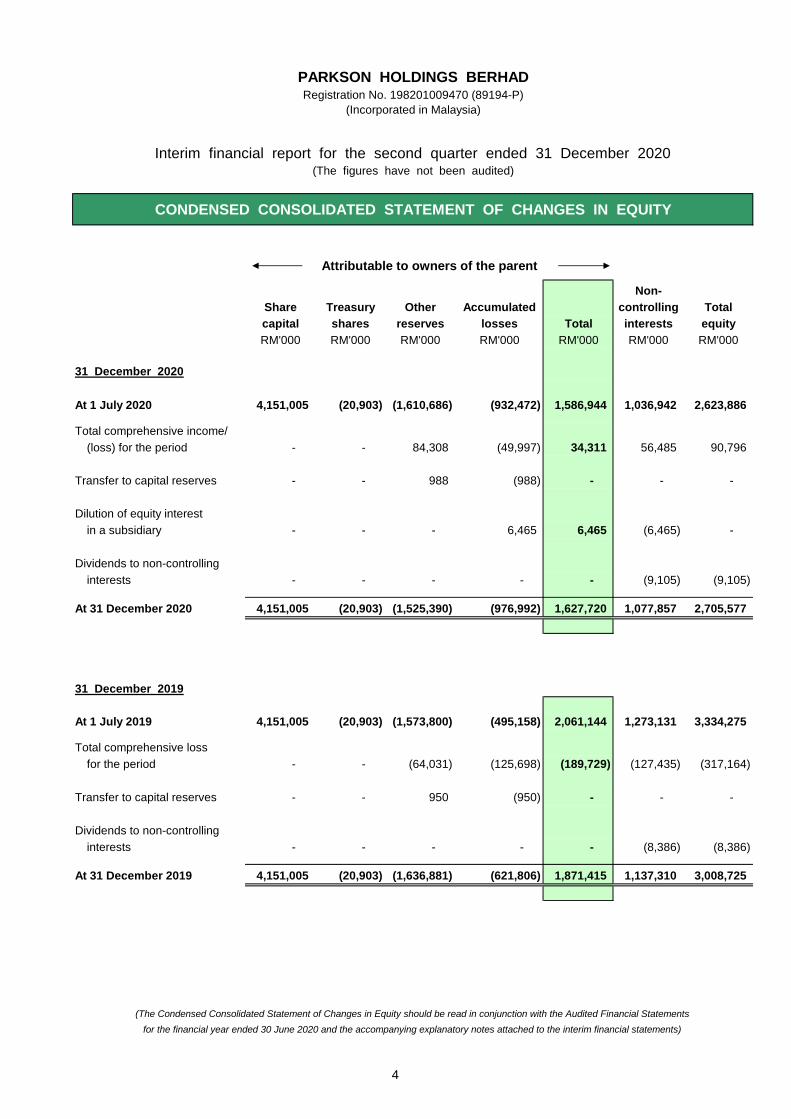
CONDENSED CONSOLIDATED STATEMENT OF CHANGES IN EQUITY
Attributable to owners of the parent
Non-
Share Treasury Other Accumulated controlling Total
capital shares reserves losses Total interests equity
RM'000 RM'000 RM'000 RM'000 RM'000 RM'000 RM'000
31 December 2020
At 1 July 2020 4,151,005 (20,903) (1,610,686) (932,472) 1,586,944 1,036,942 2,623,886
Total comprehensive income/
(loss) for the period - - 84,308 (49,997) 34,311 56,485 90,796
Transfer to capital reserves - - 988 (988) - - -
Dilution of equity interest
in a subsidiary - - - 6,465 6,465 (6,465) -
Dividends to non-controlling
interests - - - - - (9,105) (9,105)
At 31 December 2020 4,151,005 (20,903) (1,525,390) (976,992) 1,627,720 1,077,857 2,705,577
31 December 2019
At 1 July 2019 4,151,005 (20,903) (1,573,800) (495,158) 2,061,144 1,273,131 3,334,275
Total comprehensive loss
for the period - - (64,031) (125,698) (189,729) (127,435) (317,164)
Transfer to capital reserves - - 950 (950) - - -
Dividends to non-controlling
interests - - - - - (8,386) (8,386)
At 31 December 2019 4,151,005 (20,903) (1,636,881) (621,806) 1,871,415 1,137,310 3,008,725
(The Condensed Consolidated Statement of Changes in Equity should be read in conjunction with the Audited Financial Statements
for the financial year ended 30 June 2020 and the accompanying explanatory notes attached to the interim financial statements)
Interim financial report for the second quarter ended 31 December 2020
4
PARKSON HOLDINGS BERHADRegistration No. 198201009470 (89194-P)
(Incorporated in Malaysia)
(The figures have not been audited)
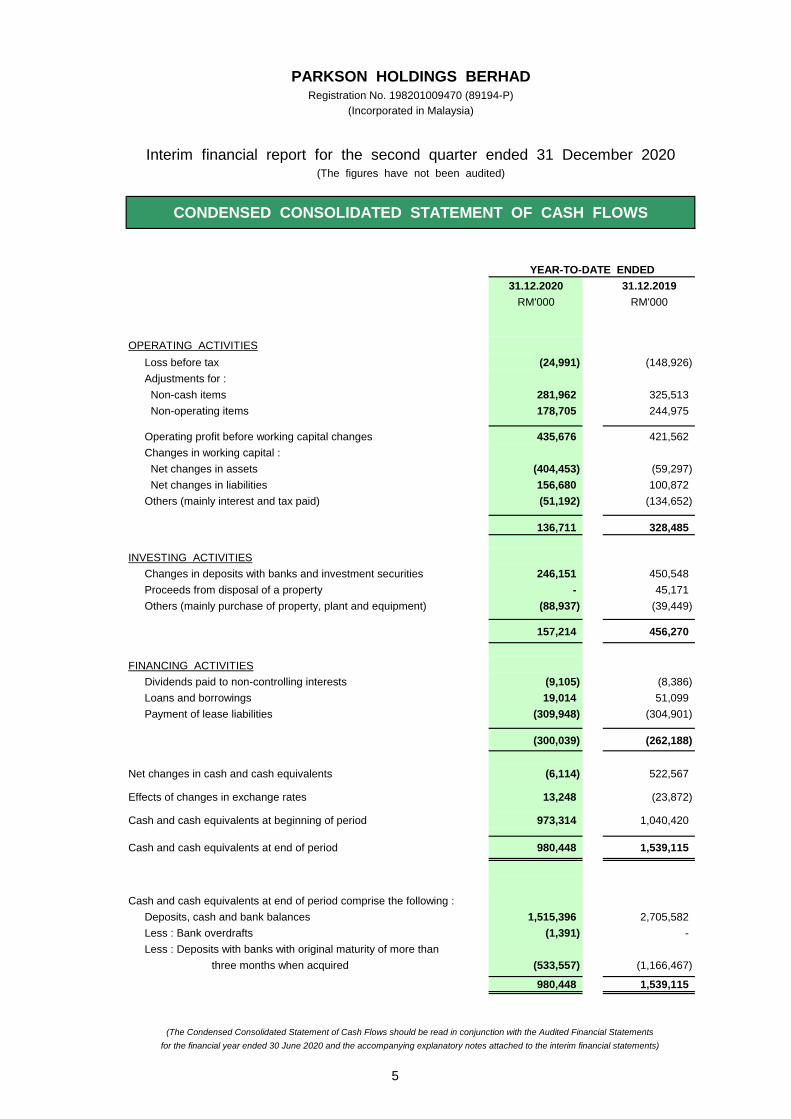
CONDENSED CONSOLIDATED STATEMENT OF CASH FLOWS
YEAR-TO-DATE ENDED
31.12.2020 31.12.2019
RM'000 RM'000
OPERATING ACTIVITIES
Loss before tax (24,991) (148,926)
Adjustments for :
Non-cash items 281,962 325,513
Non-operating items 178,705 244,975
Operating profit before working capital changes 435,676 421,562
Changes in working capital :
Net changes in assets (404,453) (59,297)
Net changes in liabilities 156,680 100,872
Others (mainly interest and tax paid) (51,192) (134,652)
136,711 328,485
INVESTING ACTIVITIES
Changes in deposits with banks and investment securities 246,151 450,548
Proceeds from disposal of a property - 45,171
Others (mainly purchase of property, plant and equipment) (88,937) (39,449)
157,214 456,270
FINANCING ACTIVITIES
Dividends paid to non-controlling interests (9,105) (8,386)
Loans and borrowings 19,014 51,099
Payment of lease liabilities (309,948) (304,901)
(300,039) (262,188)
Net changes in cash and cash equivalents (6,114) 522,567
Effects of changes in exchange rates 13,248 (23,872)
Cash and cash equivalents at beginning of period 973,314 1,040,420
Cash and cash equivalents at end of period 980,448 1,539,115
Cash and cash equivalents at end of period comprise the following :
Deposits, cash and bank balances 1,515,396 2,705,582
Less : Bank overdrafts (1,391) -
Less : Deposits with banks with original maturity of more than
three months when acquired (533,557) (1,166,467)
980,448 1,539,115
(The Condensed Consolidated Statement of Cash Flows should be read in conjunction with the Audited Financial Statements
for the financial year ended 30 June 2020 and the accompanying explanatory notes attached to the interim financial statements)
Interim financial report for the second quarter ended 31 December 2020
5
PARKSON HOLDINGS BERHADRegistration No. 198201009470 (89194-P)
(Incorporated in Malaysia)
(The figures have not been audited)
NOTES TO THE INTERIM FINANCIAL REPORT
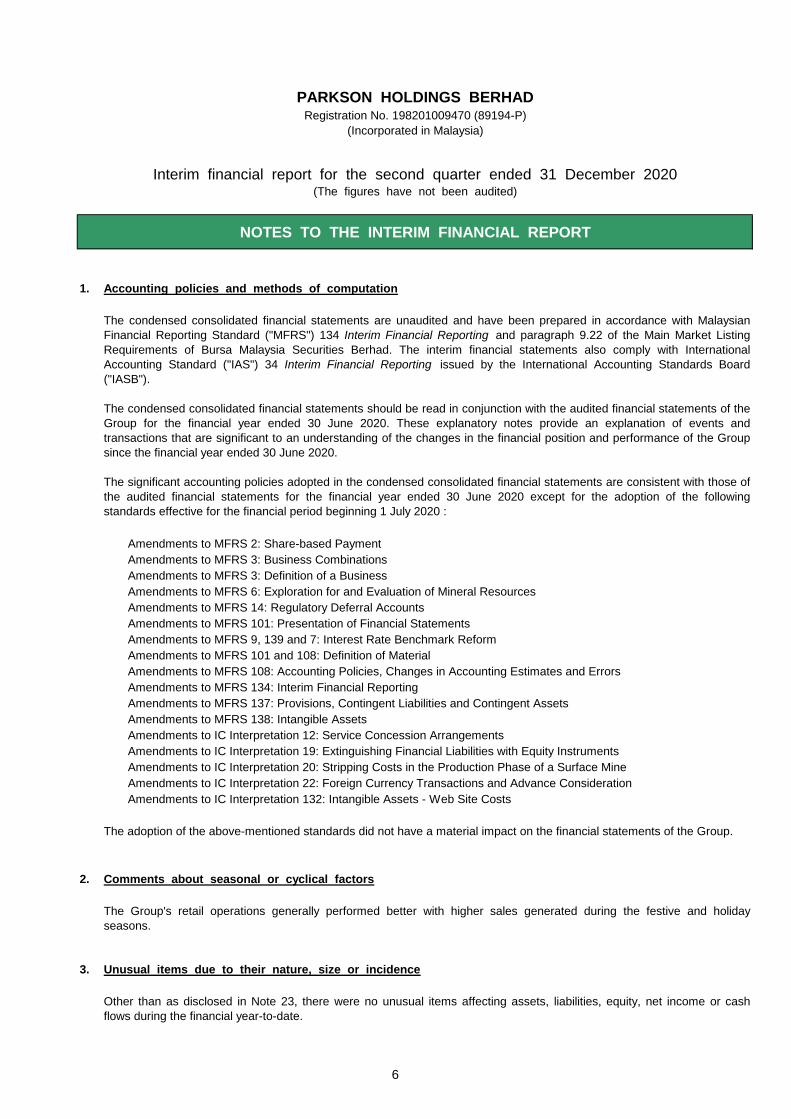
1. Accounting policies and methods of computation
Amendments to MFRS 2: Share-based Payment
Amendments to MFRS 3: Business Combinations
Amendments to MFRS 3: Definition of a Business
Amendments to MFRS 6: Exploration for and Evaluation of Mineral Resources
Amendments to MFRS 14: Regulatory Deferral Accounts
Amendments to MFRS 101: Presentation of Financial Statements
Amendments to MFRS 9, 139 and 7: Interest Rate Benchmark Reform
Amendments to MFRS 101 and 108: Definition of Material
Amendments to MFRS 108: Accounting Policies, Changes in Accounting Estimates and Errors
Amendments to MFRS 134: Interim Financial Reporting
Amendments to MFRS 137: Provisions, Contingent Liabilities and Contingent Assets
Amendments to MFRS 138: Intangible Assets
Amendments to IC Interpretation 12: Service Concession Arrangements
Amendments to IC Interpretation 19: Extinguishing Financial Liabilities with Equity Instruments
Amendments to IC Interpretation 20: Stripping Costs in the Production Phase of a Surface Mine
Amendments to IC Interpretation 22: Foreign Currency Transactions and Advance Consideration
Amendments to IC Interpretation 132: Intangible Assets - Web Site Costs
2. Comments about seasonal or cyclical factors
3. Unusual items due to their nature, size or incidence
Interim financial report for the second quarter ended 31 December 2020
The condensed consolidated financial statements are unaudited and have been prepared in accordance with Malaysian
Financial Reporting Standard ("MFRS") 134 Interim Financial Reporting and paragraph 9.22 of the Main Market Listing
Requirements of Bursa Malaysia Securities Berhad. The interim financial statements also comply with International
Accounting Standard ("IAS") 34 Interim Financial Reporting issued by the International Accounting Standards Board
("IASB").
The condensed consolidated financial statements should be read in conjunction with the audited financial statements of the
Group for the financial year ended 30 June 2020. These explanatory notes provide an explanation of events and
transactions that are significant to an understanding of the changes in the financial position and performance of the Group
since the financial year ended 30 June 2020.
The significant accounting policies adopted in the condensed consolidated financial statements are consistent with those of
the audited financial statements for the financial year ended 30 June 2020 except for the adoption of the following
standards effective for the financial period beginning 1 July 2020 :
The Group's retail operations generally performed better with higher sales generated during the festive and holiday
seasons.
Other than as disclosed in Note 23, there were no unusual items affecting assets, liabilities, equity, net income or cash
flows during the financial year-to-date.
The adoption of the above-mentioned standards did not have a material impact on the financial statements of the Group.
6
PHB (Dec-2020)
4. Changes in estimates
5. Debt and equity securities
6. Dividend paid
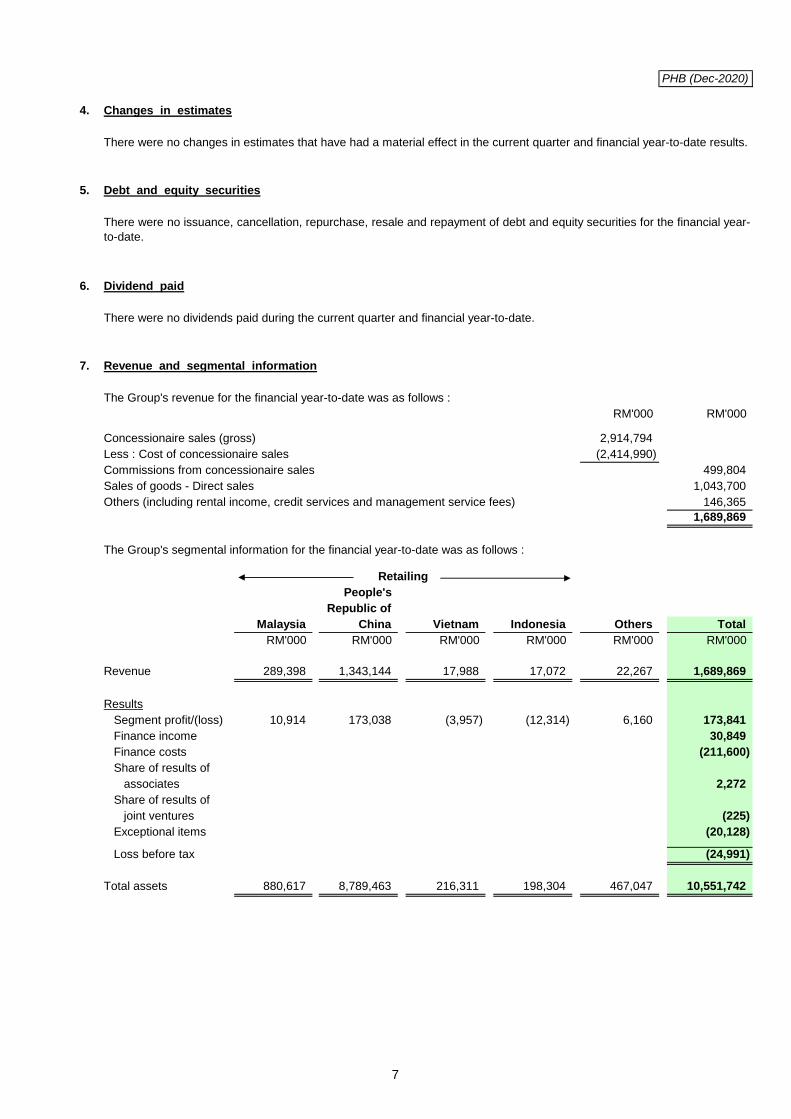
7. Revenue and segmental information
The Group's revenue for the financial year-to-date was as follows :
RM'000 RM'000
Concessionaire sales (gross) 2,914,794
Less : Cost of concessionaire sales (2,414,990)
Commissions from concessionaire sales 499,804
Sales of goods - Direct sales 1,043,700
Others (including rental income, credit services and management service fees) 146,365
1,689,869
Retailing
People's
Republic of
Malaysia China Vietnam Indonesia Others Total
RM'000 RM'000 RM'000 RM'000 RM'000 RM'000
Revenue 289,398 1,343,144 17,988 17,072 22,267 1,689,869
Results
Segment profit/(loss) 10,914 173,038 (3,957) (12,314) 6,160 173,841
Finance income 30,849
Finance costs (211,600)
Share of results of
associates 2,272
Share of results of
joint ventures (225)
Exceptional items (20,128)
Loss before tax (24,991)
Total assets 880,617 8,789,463 216,311 198,304 467,047 10,551,742
The Group's segmental information for the financial year-to-date was as follows :
There were no changes in estimates that have had a material effect in the current quarter and financial year-to-date results.
There were no dividends paid during the current quarter and financial year-to-date.
There were no issuance, cancellation, repurchase, resale and repayment of debt and equity securities for the financial year-
to-date.
7
PHB (Dec-2020)
8. Subsequent events
9. Changes in composition of the Group
10. Changes in contingent liabilities and contingent assets
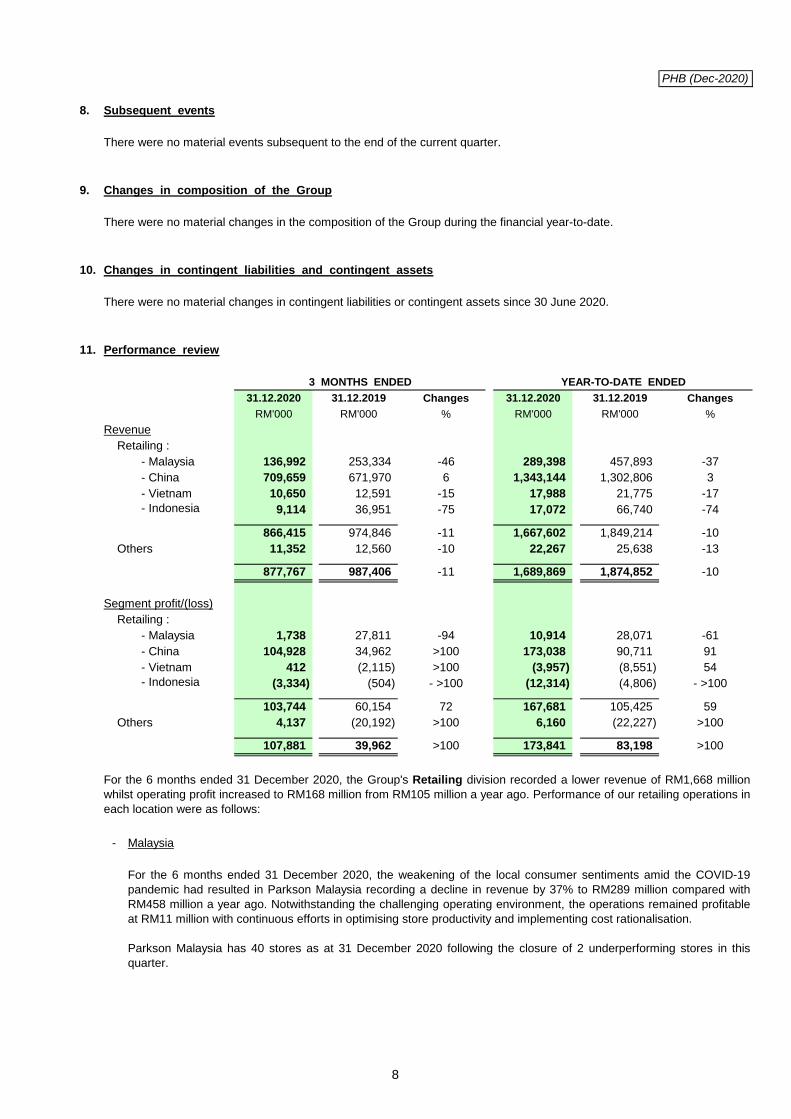
11. Performance review
3 MONTHS ENDED YEAR-TO-DATE ENDED
31.12.2020 31.12.2019 Changes 31.12.2020 31.12.2019 Changes
RM'000 RM'000 % RM'000 RM'000 %
Revenue
Retailing :
- Malaysia 136,992 253,334 -46 289,398 457,893 -37
- China 709,659 671,970 6 1,343,144 1,302,806 3
- Vietnam 10,650 12,591 -15 17,988 21,775 -17
- Indonesia 9,114 36,951 -75 17,072 66,740 -74
866,415 974,846 -11 1,667,602 1,849,214 -10
Others 11,352 12,560 -10 22,267 25,638 -13
877,767 987,406 -11 1,689,869 1,874,852 -10
Segment profit/(loss)
Retailing :
- Malaysia 1,738 27,811 -94 10,914 28,071 -61
- China 104,928 34,962 >100 173,038 90,711 91
- Vietnam 412 (2,115) >100 (3,957) (8,551) 54
- Indonesia (3,334) (504) - >100 (12,314) (4,806) - >100
103,744 60,154 72 167,681 105,425 59
Others 4,137 (20,192) >100 6,160 (22,227) >100
107,881 39,962 >100 173,841 83,198 >100
- Malaysia
For the 6 months ended 31 December 2020, the Group's Retailing division recorded a lower revenue of RM1,668 million
whilst operating profit increased to RM168 million from RM105 million a year ago. Performance of our retailing operations in
each location were as follows:
There were no material events subsequent to the end of the current quarter.
There were no material changes in the composition of the Group during the financial year-to-date.
There were no material changes in contingent liabilities or contingent assets since 30 June 2020.
For the 6 months ended 31 December 2020, the weakening of the local consumer sentiments amid the COVID-19
pandemic had resulted in Parkson Malaysia recording a decline in revenue by 37% to RM289 million compared with
RM458 million a year ago. Notwithstanding the challenging operating environment, the operations remained profitable
at RM11 million with continuous efforts in optimising store productivity and implementing cost rationalisation.
Parkson Malaysia has 40 stores as at 31 December 2020 following the closure of 2 underperforming stores in this
quarter.
8

PHB (Dec-2020)
11. Performance review (Cont'd.)
- China
- Vietnam
- Indonesia
12. Comment on material change in profit
Immediate
Current Preceding
Quarter Quarter
31.12.2020 30.9.2020 Changes
RM'000 RM'000 %
Revenue 877,767 812,102 8
Operating profit 107,881 65,960 64
Loss before tax (47) (24,944) 99.8
Results of the Others division were mainly derived from the consumer financing business, operation of food and beverage
("F&B") business and investment holding. For the 6 months ended 31 December 2020, the Group's consumer financing
business continued to increase its revenue and operating profit; whilst the F&B operations reported a lower revenue
following the closure of certain loss-making outlets. Operating profit in the current financial year-to-date included a foreign
exchange gain of RM5 million arising from the strengthening of the Ringgit Malaysia against the United States Dollar,
compared with a foreign exchange loss of RM14 million a year ago.
The COVID-19 pandemic continued to impact negatively on the Group's performance for the 6 months ended 31
December 2020. With certain of the Group's retailing stores operating under restricted operating hours, revenue
contracted significantly to RM17 million as compared with RM67 million a year ago. Consequently, the Group's
Indonesia operations reported a higher operating loss of RM12 million for the current financial year-to-date.
The Group operated 14 stores in Indonesia as at 31 December 2020.
For the 6 months ended 31 December 2020, while the Chinese consumers have become more cautious in
consumption since the onset of the pandemic, Parkson China registered a revenue growth of 3% to RM1,343 million
following tactical promotional activities and continuous efforts in expanding its income sources. The higher revenue
coupled with improved operating efficiencies and cost control measures have resulted in operating profit increasing to
RM173 million.
As at 31 December 2020, the Group has a network coverage of 42 stores in 28 cities across China.
For the 6 months ended 31 December 2020, amid the increasingly competitive retail scene, our Vietnam operations
have also faced challenges due to the impact of the COVID-19 pandemic, resulting in a lower revenue of RM18 million.
The operations, however, registered a lower operating loss of RM4 million on the back of continuous efforts in
optimising operational efficiency and implementing cost rationalisation.
As at 31 December 2020, the Group has 4 stores in Vietnam.
For the current quarter under review, Parkson China, the major contributor of the Group's retailing operations, enjoyed
encouraging sales growth attributable to higher consumer spending during the year-end festivities and holiday seasons.
Accordingly, the Group registered a revenue growth of 8% to RM878 million.
The higher revenue coupled with improved operating efficiencies and cost control measures have resulted in operating
profit increasing by 64% to RM108 million. Included in the loss before tax in the current quarter under review were
impairment losses on assets amounting to RM20 million.
9
PHB (Dec-2020)
13. a) Prospects
b) Forecast or target previously announced
The disclosure requirements are not applicable for the current quarter and financial year-to-date.
14. Statement of the Board of Directors' opinion on achievement of forecast or target
The disclosure requirements are not applicable for the current quarter and financial year-to-date.
15. Profit forecast or profit guarantee
No profit forecast or profit guarantee was published.
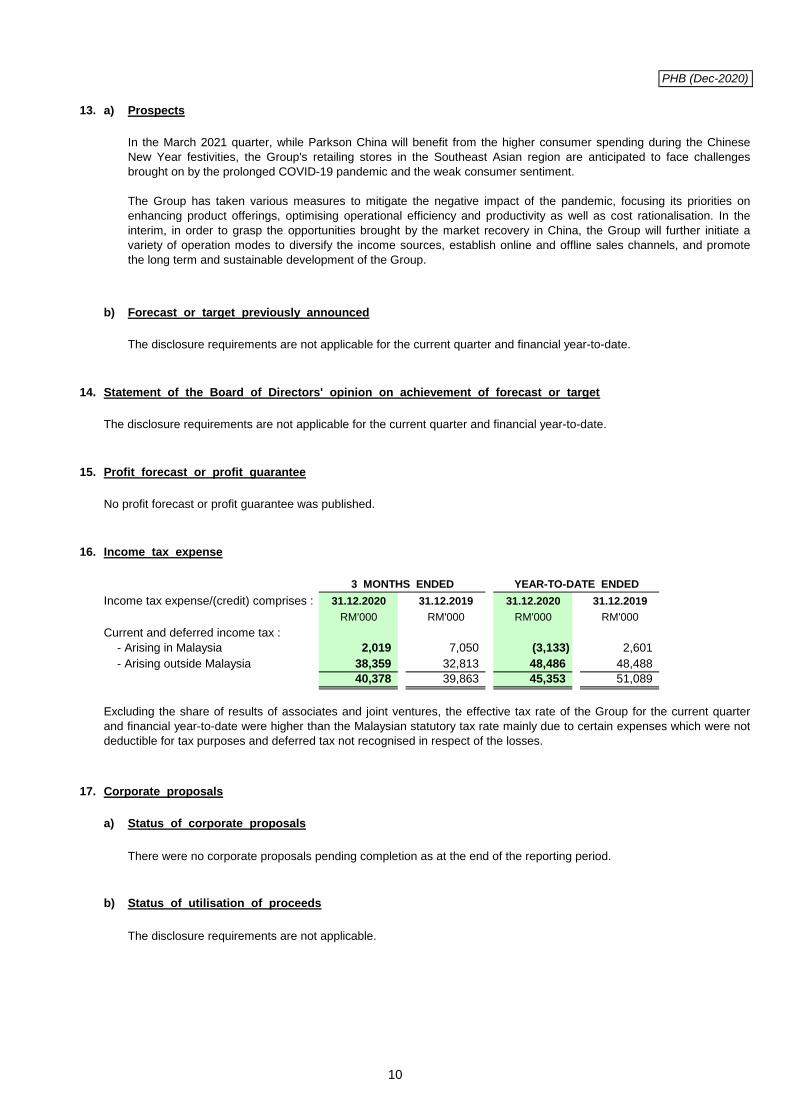
16. Income tax expense
3 MONTHS ENDED YEAR-TO-DATE ENDED
Income tax expense/(credit) comprises : 31.12.2020 31.12.2019 31.12.2020 31.12.2019
RM'000 RM'000 RM'000 RM'000
Current and deferred income tax :
- Arising in Malaysia 2,019 7,050 (3,133) 2,601
- Arising outside Malaysia 38,359 32,813 48,486 48,488
40,378 39,863 45,353 51,089
17. Corporate proposals
a) Status of corporate proposals
There were no corporate proposals pending completion as at the end of the reporting period.
b) Status of utilisation of proceeds
The disclosure requirements are not applicable.
In the March 2021 quarter, while Parkson China will benefit from the higher consumer spending during the Chinese
New Year festivities, the Group's retailing stores in the Southeast Asian region are anticipated to face challenges
brought on by the prolonged COVID-19 pandemic and the weak consumer sentiment.
The Group has taken various measures to mitigate the negative impact of the pandemic, focusing its priorities on
enhancing product offerings, optimising operational efficiency and productivity as well as cost rationalisation. In the
interim, in order to grasp the opportunities brought by the market recovery in China, the Group will further initiate a
variety of operation modes to diversify the income sources, establish online and offline sales channels, and promote
the long term and sustainable development of the Group.
Excluding the share of results of associates and joint ventures, the effective tax rate of the Group for the current quarter
and financial year-to-date were higher than the Malaysian statutory tax rate mainly due to certain expenses which were not
deductible for tax purposes and deferred tax not recognised in respect of the losses.
10
PHB (Dec-2020)
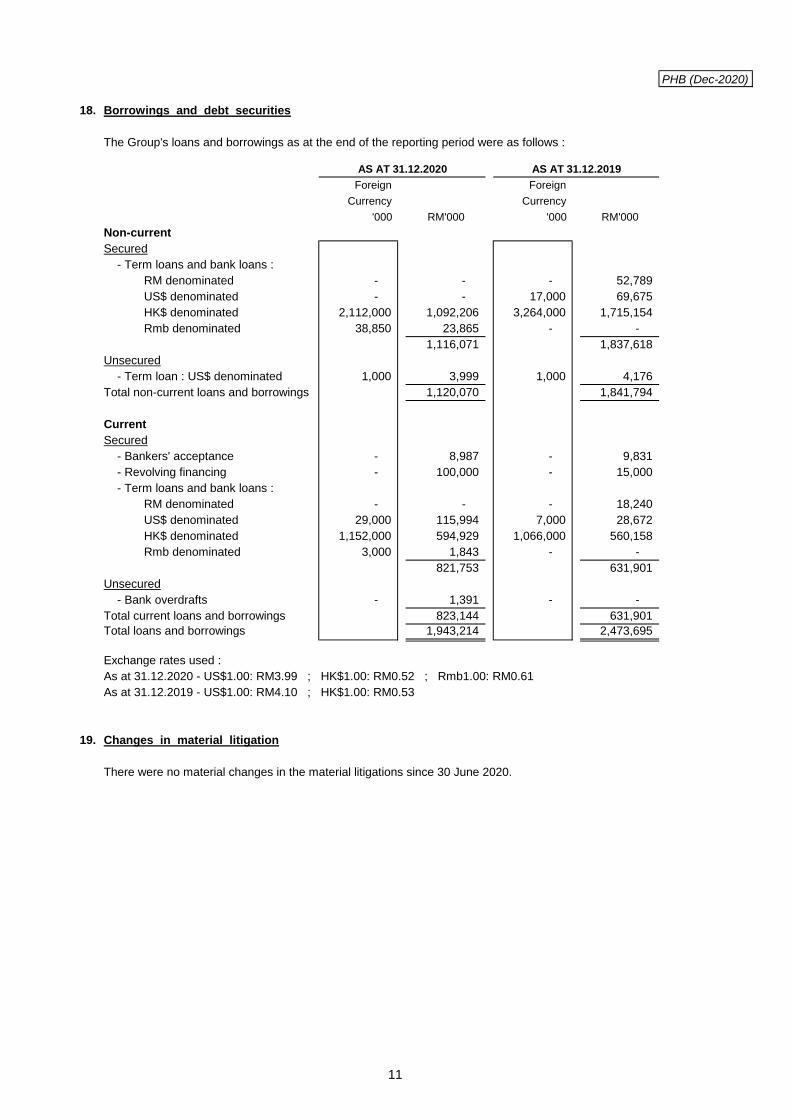
18. Borrowings and debt securities
The Group's loans and borrowings as at the end of the reporting period were as follows :
AS AT 31.12.2020 AS AT 31.12.2019
Foreign Foreign
Currency Currency
'000 RM'000 '000 RM'000
Non-current
Secured
- Term loans and bank loans :
RM denominated - - - 52,789
US$ denominated - - 17,000 69,675
HK$ denominated 2,112,000 1,092,206 3,264,000 1,715,154
Rmb denominated 38,850 23,865 - -
1,116,071 1,837,618
Unsecured
- Term loan : US$ denominated 1,000 3,999 1,000 4,176
Total non-current loans and borrowings 1,120,070 1,841,794
Current
Secured
- Bankers' acceptance - 8,987 - 9,831
- Revolving financing - 100,000 - 15,000
- Term loans and bank loans :
RM denominated - - - 18,240
US$ denominated 29,000 115,994 7,000 28,672
HK$ denominated 1,152,000 594,929 1,066,000 560,158
Rmb denominated 3,000 1,843 - -
821,753 631,901
Unsecured
- Bank overdrafts - 1,391 - -
Total current loans and borrowings 823,144 631,901
Total loans and borrowings 1,943,214 2,473,695
Exchange rates used :
As at 31.12.2020 - US$1.00: RM3.99 ; HK$1.00: RM0.52 ; Rmb1.00: RM0.61
As at 31.12.2019 - US$1.00: RM4.10 ; HK$1.00: RM0.53
19. Changes in material litigation
There were no material changes in the material litigations since 30 June 2020.
11
PHB (Dec-2020)
20. Dividend proposed
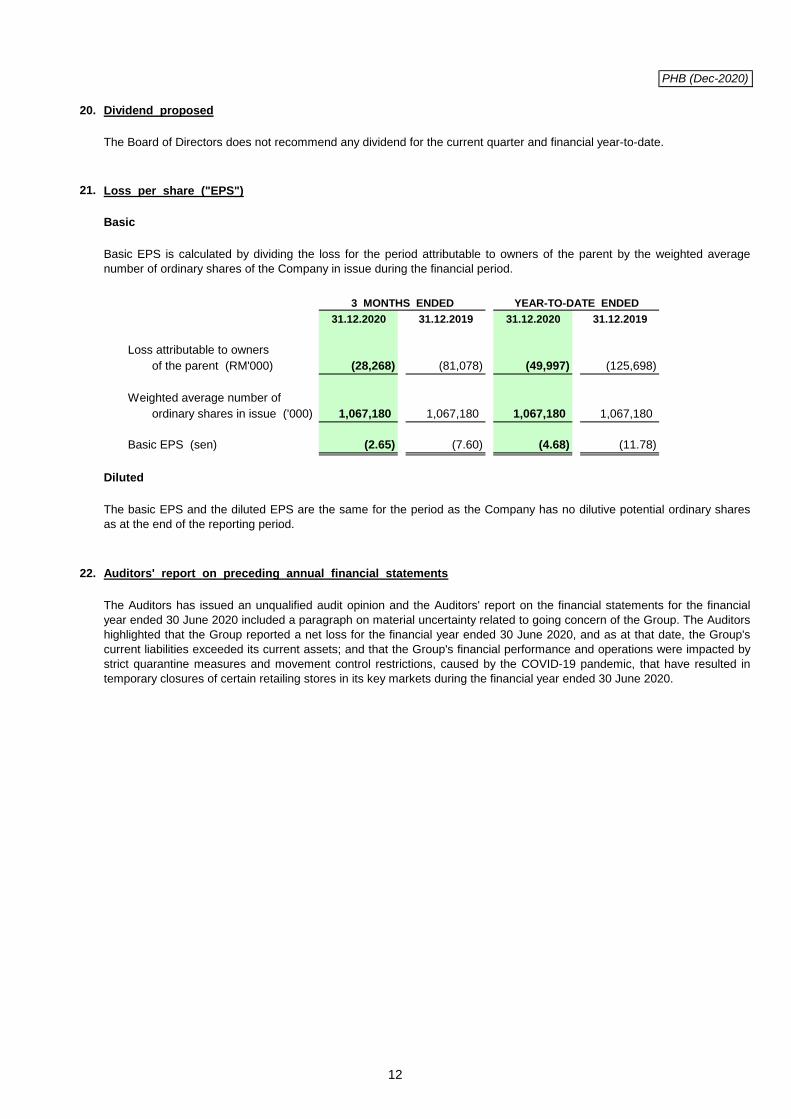
21. Loss per share ("EPS")
Basic
3 MONTHS ENDED YEAR-TO-DATE ENDED
31.12.2020 31.12.2019 31.12.2020 31.12.2019
Loss attributable to owners
of the parent (RM'000) (28,268) (81,078) (49,997) (125,698)
Weighted average number of
ordinary shares in issue ('000) 1,067,180 1,067,180 1,067,180 1,067,180
Basic EPS (sen) (2.65) (7.60) (4.68) (11.78)
Diluted
22. Auditors' report on preceding annual financial statements
The Auditors has issued an unqualified audit opinion and the Auditors' report on the financial statements for the financial
year ended 30 June 2020 included a paragraph on material uncertainty related to going concern of the Group. The Auditors
highlighted that the Group reported a net loss for the financial year ended 30 June 2020, and as at that date, the Group's
current liabilities exceeded its current assets; and that the Group's financial performance and operations were impacted by
strict quarantine measures and movement control restrictions, caused by the COVID-19 pandemic, that have resulted in
temporary closures of certain retailing stores in its key markets during the financial year ended 30 June 2020.
The basic EPS and the diluted EPS are the same for the period as the Company has no dilutive potential ordinary shares
as at the end of the reporting period.
Basic EPS is calculated by dividing the loss for the period attributable to owners of the parent by the weighted average
number of ordinary shares of the Company in issue during the financial period.
The Board of Directors does not recommend any dividend for the current quarter and financial year-to-date.
12
PHB (Dec-2020)
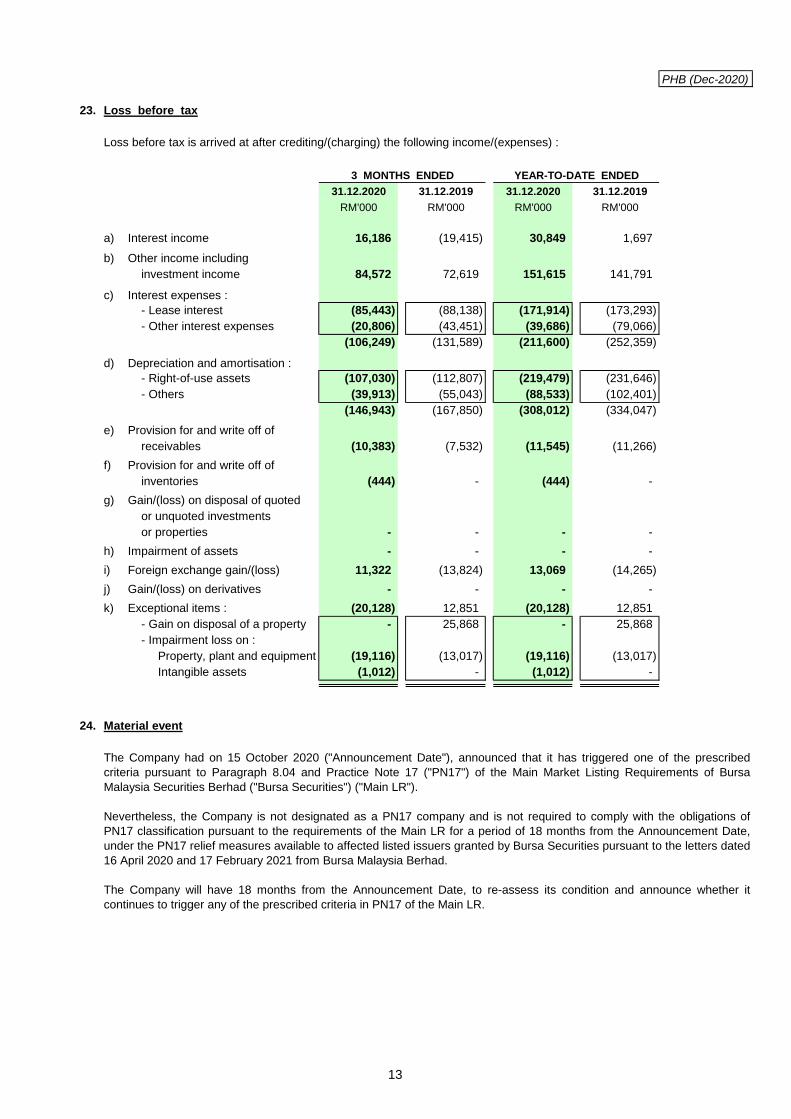
23. Loss before tax
Loss before tax is arrived at after crediting/(charging) the following income/(expenses) :
3 MONTHS ENDED YEAR-TO-DATE ENDED
31.12.2020 31.12.2019 31.12.2020 31.12.2019
RM'000 RM'000 RM'000 RM'000
a) Interest income 16,186 (19,415) 30,849 1,697
b) Other income including
investment income 84,572 72,619 151,615 141,791
c) Interest expenses :
- Lease interest (85,443) (88,138) (171,914) (173,293)
- Other interest expenses (20,806) (43,451) (39,686) (79,066)
(106,249) (131,589) (211,600) (252,359)
d) Depreciation and amortisation :
- Right-of-use assets (107,030) (112,807) (219,479) (231,646)
- Others (39,913) (55,043) (88,533) (102,401)
(146,943) (167,850) (308,012) (334,047)
e) Provision for and write off of
receivables (10,383) (7,532) (11,545) (11,266)
f) Provision for and write off of
inventories (444) - (444) -
g) Gain/(loss) on disposal of quoted
or unquoted investments
or properties - - - -
h) Impairment of assets - - - -
i) Foreign exchange gain/(loss) 11,322 (13,824) 13,069 (14,265)
j) Gain/(loss) on derivatives - - - -
k) Exceptional items : (20,128) 12,851 (20,128) 12,851
- Gain on disposal of a property - 25,868 - 25,868
- Impairment loss on :
Property, plant and equipment (19,116) (13,017) (19,116) (13,017)
Intangible assets (1,012) - (1,012) -
24. Material event
The Company had on 15 October 2020 ("Announcement Date"), announced that it has triggered one of the prescribed
criteria pursuant to Paragraph 8.04 and Practice Note 17 ("PN17") of the Main Market Listing Requirements of Bursa
Malaysia Securities Berhad ("Bursa Securities") ("Main LR").
Nevertheless, the Company is not designated as a PN17 company and is not required to comply with the obligations of
PN17 classification pursuant to the requirements of the Main LR for a period of 18 months from the Announcement Date,
under the PN17 relief measures available to affected listed issuers granted by Bursa Securities pursuant to the letters dated
16 April 2020 and 17 February 2021 from Bursa Malaysia Berhad.
The Company will have 18 months from the Announcement Date, to re-assess its condition and announce whether it
continues to trigger any of the prescribed criteria in PN17 of the Main LR.
13