Tsit Wing International Holdings Ltd
40
ed-TH / sa– CS / DL / CW BUY (Initiate coverage) Last Traded Price ( 12 Jul 2018):HK$1.56 (HSI : 28,481) Price Target 12-mth: HK$2.38 (53% upside) Analyst Alison FOK +852 2971 1938 [email protected] Alice HUI CFA, +852 2971 1960 [email protected] Price Relative Forecasts and Valuation FY Dec (HK$ m) 2017A 2018F 2019F 2020F Turnover 955 1,073 1,186 1,318 EBITDA 124 153 171 190 Pre-tax Profit 64 119 145 163 Net Profit 46 88 109 122 Ne t Pft (Pre Ex) (core profit) 77 95 109 122 EPS (HK$) 0.06 0.12 0.14 0.16 EPS Gth (%) (27.1) 91.2 23.4 12.4 Core EPS Gth (%) 23.6 24.1 14.3 12.4 Diluted EPS (HK$) 0.06 0.12 0.14 0.16 DPS (HK$) 0.02 0.05 0.05 0.06 BV Per Share (HK$) 0.28 0.67 0.78 0.89 PE (X) 25.7 13.5 10.9 9.7 Core PE (X) 15.5 12.5 10.9 9.7 P/Cash Flow (X) 44.3 13.1 10.9 9.9 P/Free CF (X) 104.5 17.8 14.1 12.6 EV/EBITDA (X) 10.9 7.1 6.0 5.1 Net Div Yield (%) 1.2 3.4 3.2 3.6 P/Book Value (X) 5.5 2.3 2.0 1.8 Net Debt/Equity (X) 0.6 CASH CASH CASH ROAE (%) 18.7 24.3 19.8 19.4 Earnings Rev (%): New New New S ource of all data on this page: Company, DBS Bank (Hong Kong) Limited (“DBS HK”), Thomson Reuters, HKEX Banking on a lifestyle addiction Leading integrated B2B beverage solutions provider in Hong Kong, China and Macau Expect growth to be driven by rising demand of coffee and tea as well as drinks variety Initiate with Buy and TP at HK$2.38/sh Leading integrated B2B beverage solutions provider. Tsit Wing is a one-stop coffee and tea solutions provider in Hong Kong, China and Macau. With dominant market shares in key channels in Hong Kong, the Company seeks to leverage on its knowledge and expertise to expand in China. We forecast sales to grow by 12.4% in 2018, mainly driven by higher volumes in both tea and milk as well as the foods business, driven by a combination of new and existing customers. We expect the Group to achieve earnings CAGR of 17% in FY17-20F . Initiate with a Buy rating and TP at HK$2.38/sh, pegged to 17x FY19F PE, supported by a c.3.2% dividend yield. With the successful IPO listing, the Company successfully raised c.HK$233.7m (inclusive of over-allot ment option exercised). We expect the Company to turn net cash by end-FY18F (Dec’17: net gearing of 68%). Ride on the coffee and tea culture. With increasing popularity of a coffee and HK milk tea culture, and rising stringent requirement in the supply chain by catering establishment s, we expect the B2B beverage solutions market will face growing demand going forward. In addition, the Company has been proactive in launching innovative products with key customers. According to Frost & Sullivan, the coffee and black tea market in Hong Kong and the PRC are expected to grow at a compound annual growth rate (CAGR) of 4.2% and 11.0% to HK$1,364m and RMB11.4bn respectively in 2017-21E, with a stronger growth trajectory from coffee. Key catalyst drivers. This includes volume growth in coffee and tea category driven by old and new customers, and favourable raw material prices. Long term driver include potential development with strategic partners, NH Foods and Fraser & Neave. Valuation: We initiate coverage with a BUY rating, and TP at HK$2.38/sh, pegged to 17x FY19F PE. This is equivalent to a 32% discount to F&B sector average. Key Risks to Our View: Key risks include raw material price volatility, and food safety concerns. At A Glance Issued Capital (m shrs) 761 Mkt Cap (HK$m/US$m) 1,187 / 151 Major Shareholders (%) Wong (Tat Tong) 63.8 Free Float (%) 36.2 3m Avg. Daily Val. (US$m) 7.0 ICB Industry: Consumer Goods / Food Producers 72 92 112 132 152 172 192 212 1.4 1.5 1.6 1.7 1.8 1.9 2.0 2.1 2.2 2.3 2.4 Jun-18 Relative Index HK$ Tsit Wing International Holdings Ltd (LHS) Relative HSI (RHS) DBS Group Research . Equity 12 Jul 2018 China / Hong Kong Company Guide Tsit Wing International Holdings Ltd Version 1 | Bloomberg: 2119 HK Equity | Reuters: 2119.HK Refer to important disclosures at the end of this report
-
Upload
khangminh22 -
Category
Documents
-
view
0 -
download
0
Transcript of Tsit Wing International Holdings Ltd

ed-TH / sa– CS / DL / CW
BUY (Initiate coverage)
Last Traded Price ( 12 Jul 2018):HK$1.56 (HSI : 28,481)
Price Target 12-mth: HK$2.38 (53% upside) Analyst Alison FOK +852 2971 1938 a [email protected]
Alice HUI CFA, +852 2971 1960 a [email protected]
Price Relative
Forecasts and Valuation FY Dec (HK$ m) 2017A 2018F 2019F 2020F Turnover 955 1,073 1,186 1,318 EBITDA 124 153 171 190
Pre-tax Profit 64 119 145 163 Net Profit 46 88 109 122 Net Pft (Pre Ex) (core profit) 77 95 109 122
EPS (HK$) 0.06 0.12 0.14 0.16 EPS Gth (%) (27.1) 91.2 23.4 12.4 Core EPS Gth (%) 23.6 24.1 14.3 12.4
Diluted EPS (HK$) 0.06 0.12 0.14 0.16 DPS (HK$) 0.02 0.05 0.05 0.06
BV Per Share (HK$) 0.28 0.67 0.78 0.89
PE (X) 25.7 13.5 10.9 9.7 Core PE (X) 15.5 12.5 10.9 9.7
P/Cash Flow (X) 44.3 13.1 10.9 9.9 P/Free CF (X) 104.5 17.8 14.1 12.6 EV/EBITDA (X) 10.9 7.1 6.0 5.1
Net Div Yie ld (%) 1.2 3.4 3.2 3.6 P/Book Value (X) 5.5 2.3 2.0 1.8 Net Debt/Equity (X) 0.6 CASH CASH CASH ROAE (%) 18.7 24.3 19.8 19.4
Earnings Rev (%): New New New
Source of all data on this page: Company, DBS Bank (Hong Kong) Limited (“DBS HK”), Thomson Reuters, HKEX
Banking on a lifestyle addiction Leading integrated B2B beverage solutions provider in
Hong Kong, China and Macau
Expect growth to be driven by rising demand of coffee and
tea as well as drinks variety
Initiate with Buy and TP at HK$2.38/sh
Leading integrated B2B beverage solutions provider. Tsit Wing is a one-stop coffee and tea solutions provider in Hong Kong, China
and Macau. With dominant market shares in key channels in Hong
Kong, the Company seeks to leverage on its knowledge and
expertise to expand in China. We forecast sales to grow by 12.4% in 2018, mainly driven by higher volumes in both tea and milk as
well as the foods business, driven by a combinat ion of new and
existing customers. We expect the Group to achieve earnings
CAGR of 17% in FY17-20F . Initiate with a Buy rating and TP at HK$2.38/sh, pegged to 17x FY19F PE, supported by a c.3.2%
div idend y ield. With the successful IPO listing, the Company
successfully raised c.HK$233.7m (inclusive of over-allotment option
exercised). We expect the Company to turn net cash by end-FY18F (Dec’17: net gearing of 68%). Ride on the coffee and tea culture. With increasing popularity of a
coffee and HK milk tea culture, and rising stringent requirement in
the supply chain by catering establishments, we expect the B2B
beverage solutions market will face growing demand going forward. In addition, the Company has been proactive in launching
innovative products with key customers. According to Frost &
Sullivan, the coffee and black tea market in Hong Kong and the
PRC are expected to grow at a compound annual growth rate (CAGR) of 4.2% and 11.0% to HK$1,364m and RMB11.4bn
respectively in 2017-21E, with a stronger growth trajectory from
coffee. Key catalyst drivers. This includes volume growth in coffee and tea
category driven by old and new customers, and favourable raw material prices. Long term driver include potential development
with strategic partners, NH Foods and Fraser & Neave.
Valuation: We initiate coverage with a BUY rating, and TP at HK$2.38/sh, pegged to 17x FY19F PE. This is equivalent to a 32% discount to F&B sector average.
Key Risks to Our View:
Key risks include raw material price volatility , and food safety
concerns.
A t A Glance
Is sued Capita l (m shrs) 761 Mkt Cap (HK$m/US$m) 1,187 / 151 Major Shareholders (%)
Wong (Tat Tong) 63.8 Free Float (%) 36.2
3m Avg. Daily Val. (US$m) 7.0 ICB Industry: Consumer Goods / Food Producers
72
92
112
132
152
172
192
212
1.4
1.5
1.6
1.7
1.8
1.9
2.0
2.1
2.2
2.3
2.4
Jun-18
Relative IndexHK$
Tsit Wing International Holdings Ltd (LHS) Relative HSI (RHS)
DBS Group Research . Equity
12 Jul 2018
China / Hong Kong Company Guide
Tsit Wing International Holdings Ltd Version 1 | Bloomberg: 2119 HK Equity | Reuters: 2119.HK
Refer to important disclosures at the end of this report

Company Guide
Tsit Wing International Holdings Ltd
Page 2
Table of Contents
Investment summary 3
SWOT Analysis 4
Profile of Tsit Wing 5
History of Tsit Wing 10
Competitor strength 11
Growth strategies – Go wide, go deep 14
Financial analysis 20
Valuation 26

Company Guide
Tsit Wing International Holdings Ltd
Page 3
Investment summary
Tsit Wing is a leading integrated B2B coffee and black tea
solutions provider in Hong Kong, the PRC and Macau. In
the B2B coffee and black tea solutions market, based on
2016 data, Tsit Wing is ranked first in Hong Kong (by
revenue), fourth in the PRC (by revenue), and third in
Macau (by revenue), according to Frost and Sullivan. It is
also the largest importer of Sri Lankan teas in Hong Kong
and third largest in the PRC by volume. Besides beverage
solutions, Tsit Wing also imports frozen meat and frozen
processed food and supplies these to its customers in Hong
Kong and the PRC. In May’18, the Company successfully
listed in the Hong Kong Stock Exchange with market
capitalisation of HK$1,504m and offer price at HK$1.98/sh,
with overall net proceeds reaching HK$233.7m (inclusive of
over-allotment option exercised).
Tsit Wing’s market coverage in Hong Kong is extensive,
reaching c.60% of food outlets in Hong Kong, and has
especially high coverage in fast food stores, Cha Chaan
Tengs, and cafes of 77.6%/ 70.3%/ 78.7% respectively .
The company has developed a stable and diverse group of
customers, including reputable names such as franchised
business of McDonald’s, Café de Coral, Fairwood, The
Spaghetti House, Yoshinoya, Tsui Wah, Tai Hing and 7-
Eleven.
Tsit Wing’s strength lies in its ability to provide total
beverage solutions to its customers, starting from market
analysis and recipe design, through sourcing, production as
well as after sales serv ice of coffee machines. Coupled
with its capability of producing customised tea and coffee
products of consistent quality , we believe customers’
stickiness is relatively high. We expect Tsit Wing to
continue to benefit from rising demand for tea and coffee
products in HK and the PRC, with the B2B market to be
driven by greater emphasis on food safety and quality
requirements from chain operators. Beverage solutions
accounted for 74.5% of the company’s total revenue, of
which tea and coffee contributed 44.7% to total sales in
2017.
The Hong Kong coffee and black tea market, despite
already well developed, is expected to sustain a decent 4-
year CAGR of 4.2% to achieve HK$1,364m in 2021E,
based on Frost and Sullivan. For the past three years, the
Company’s coffee production in Hong Kong has reached
full capacity exceeding 100%, which the Company plans to
build new production lines to meet demand. As the
leading player, Tsit Wing should be well positioned to
capture the growth, with room to further enhance its
market share and deepen customer relationships through
developing higher value-added SKUs. The Company will
also expand its product offerings in milk, syrup, frozen
meat and more to its existing customers.
Market potential in PRC is even stronger, with the B2B
coffee and black tea market expected to grow at a stronger
4-year CAGR of 11.0% to reach RMB11.4bn in 2021E.
Leveraging on its position as one of the major players, Tsit
Wing aims to expand its sales channels mainly in the Pearl
River Delta and Yangtze River Delta. In particular, the
company will focus on first and second tier cities such as
Shanghai, Beijing, Hangzhou, Guangzhou, Shenzhen, and
Dongguan through expanding its sales network and
customer base. Besides this, Tsit Wing plans to set up its
online platform via Tmall and JD, and potentially expand
overseas.
To diversify its product offerings, Tsit Wing expanded into
frozen food in Hong Kong and the PRC in 2013 and frozen
processed food in 2015 in Hong Kong, and 2016 in the
PRC. Hong Kong and PRC frozen meats market is expected
to grow at a CAGR of 6% and 7.8% in 2017-21E to
HK$8,356m and RMB290bn respectively , while frozen
processed food is expected to stage a stronger CAGR of
11.6% and 16.8% over the same period to HK$2,021m
and RMB56bn in 2021E respectively . In July -2017, the
company forged a strategic agreement with NH Foods to
jointly develop food products in Hong Kong, Macau and
the PRC, which should further enhance its product
offerings as well as margins.
We forecast earnings CAGR at 17% in 2017-20F, driven by
(i) solid market growth; (ii) enhanced product offerings; and
(iii) improving operating leverage. Without any listed peers
in the HK, there is no direct comparable. As such, we
benchmark Tsit Wing against its customers (restaurants) as
well as Hong Kong/China food staples and other listed
global B2B food solutions providers at a discount due to its
focus on B2B. We initiate coverage with a Buy rating and
TP at HK$2.38/sh, pegged to 17x FY19F PE. This is
supported by a div idend y ield c.3.2%.
Company Guide
Tsit Wing International Holdings Ltd
Page 4
SWOT Analysis
St rengths Weaknesses
Leading integrated B2B coffee and black tea solutions
provider in Hong Kong, Macau and the PRC
Strong beverage customising capability and established food
products business supported by a worldwide sourcing
network
Stable and diversified customer base supported by multi-
channel distribution network
Ability to deliver tailor-made products in mass volume with
strong track record of quality control
Dependent on major suppliers. Its five largest suppliers
account for 44.3% of total cost of sales in 2017. Of
which, the largest supplier accounted for 22.8% of
total cost of sales in 2017
Tsit Wing does not enter into long-term contracts with
its customers, distributors and suppliers, which means
any sudden disruption in their business could cause
volatility in Tsit Wing’s income
Opportunities Threats
The increase in coffee and tea consumption in the PRC
should benefit the Company. Based on Frost & Sullivan, B2B
coffee and black tea market is expected to grow at a CAGR
of 11.0% in 2017-21E
Well-positioned to benefit from the steady growth in B2B
coffee and tea consumption in Hong Kong, and Macau,
supported by continual product upgrades
Expansion of its frozen food business to leverage on its
existing relationships with customers in coffee and tea
segment
Rising competition is likely in the B2B beverage
solutions industry in the PRC
Profitability is directly impacted by raw material price
volatility in coffee and Sri-Lankan tea, as well as selling
prices by its customer
Any negative news on the brand could adversely
impact sales
Source: DBS HK

Company Guide
Tsit Wing International Holdings Ltd
Page 5
Profile of Tsit Wing
Background
Tsit Wing is a leading integrated B2B beverage solutions
provider in Hong Kong, Macau and the PRC, with a
specialisation in coffee and black tea. With a history dating
back 85 years ago, the company was listed on the SGX-ST in
2001, and later privatised in 2013.
In B2B revenue terms, Tsit Wing was the largest B2B coffee
and black tea solutions provider in Hong Kong, ranked
fourth in PRC, and third in Macau in 2016 according to
Frost & Sullivan. Tsit Wing is also the largest importer of Sri
Lankan tea in Hong Kong, and the third-largest in the PRC
in terms of volume.
Besides roasted coffee and blended tea, Tsit Wing also
offers complementary beverage solutions such as all-in-one
packet mixes (coffee, tea, yuan yeung), milk, syrups, and
coffee machines. The company is the distributor of Lipton
yellow label tea in HK. It also exclusively imports French
syrup brand ‘Monin’ and solely distributes Rex-Royal coffee
machines in HK and Macau.
Tsit Wing boasts a multi-channel distribution network that
reaches c.60% of the food outlets in Hong Kong. Its
customer base includes reputable names such as franchised
business of McDonald’s in the PRC and Hong Kong,
Yoshinoya, 7-Eleven, Café de Coral, Fairwood, Tsui Wah, Tai
Hing, and Spaghetti House, among others.
Since 2013, Tsit Wing has further broadened its business
scope to include frozen meat products. The company now
supplies imported frozen meat as well as customised frozen
processed food to its customers in HK and the PRC. In July
2017, the company entered a strategic cooperation with NH
Foods, a leading food provider in Japan which has
operations in 90 locations in 19 countries, to jointly develop
food products in Hong Kong, Macau, and the PRC.
By product, beverage solutions (coffee, tea, milk & others)
represented 74.5% of the company’s 2017 sales, with a
relatively diversified split between tea, coffee, milk and
others. Food products (frozen meat & frozen processed
food), a newer business segment for Tsit Wing, accounted
for 25.5%. Geographically , Hong Kong remains Tsit Wing’s
largest market representing c.73% of its total 2017 revenue
with the balance coming from PRC, Macau, and others.
Revenue breakdown by product segment (2017) Revenue breakdown by region (2017)
Coffee
21%
Tea
24%
Milk
10%
Others
20%
Frozen
meat24%
Frozen
processed food
2%
Hong Kong
73.1%
PRC
25.0%
Macau
1.2%
Others
0.8%
Source: Company data Source: Company data
Company Guide
Tsit Wing International Holdings Ltd
Page 6
Busines segments
Tsit Wing offers a variety of beverage solutions, including
roasted coffee, blended tea, all-in-one packet mixes and
other beverage solutions items such as Lipton yellow label
tea, and coffee machines. In the past few years, the
company has expanded its product offerings to include
frozen meat and frozen processed food. Prev iously , the
company was also involved in ice-cream and prune
businesses but those were disposed of in 2015 and 2016
respectively .
Beverage solutions (74.5% of 2017 sales)
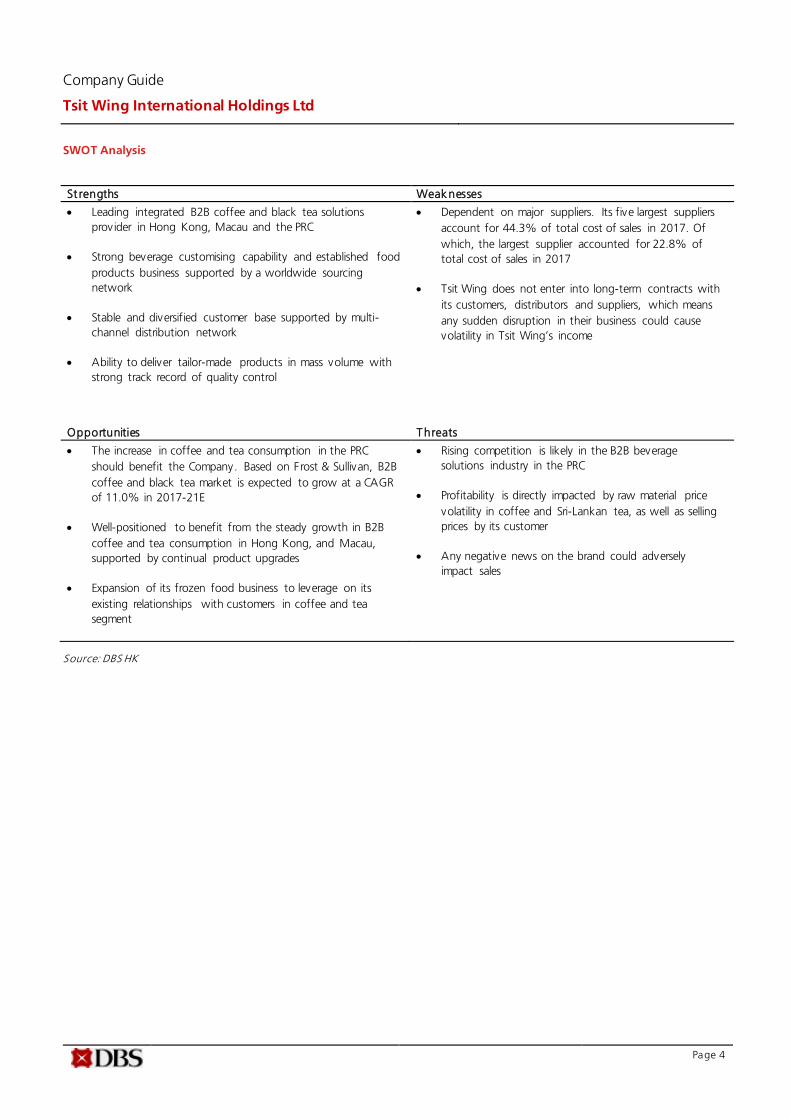
Cof fee. Aside from a small volume of green coffee beans
which are sold directly to customers without processing,
most are sold as roasted coffee beans, ground coffee
powder, and drip coffee bags produced in Tsit Wing’s
production plants. In addition, by offering a one-stop
serv ice to consumers, the company also provides coffee
machines, which comes with 24-hour round-the-clock
serv icing, as well as designing details of the preparation
techniques.
Coffee products
Source: Company data
T ea. Tea products are blended tea processed in Tsit Wing’s
production plants. The company works with its customers to
develop customised recipes to produce tailor-made tea
products. Tsit Wing’s expertise in the Hong Kong-sty le milk
tea, a traditional tea typically consumed in Cha Chaan Tengs
in Hong Kong, is also getting increasingly popular in other
food outlets as well as in the PRC.
Tea products
Source: Company data
A ll-in-one. All-in-one beverage mix comprise of coffee
powder, tea and yuan yeung products. These are primarily
sold through retail stores such as supermarkets and
convenience stores.
All-in-one beverage mix
Source: Company data
Other beverage solution products. Aside from processing
coffee beans and tea for customers, Tsit Wing also provides
other beverage related products such as milk, sugar and
syrup. The company is a distributor for Lipton yellow label
tea in Hong Kong. It is also the sole authorised agent of
Monin products, a French luxury syrup brand, as well as the
sole distributor of Rex-Royal coffee machines, in Hong Kong
and Macau. Such products are complimentary to its core
portfolio.
Other beverage solutions
Source: Company data

Company Guide
Tsit Wing International Holdings Ltd
Page 7
Food products (25.5% of 2017 sales)
F rozen meats. To broaden its product portfolio, Tsit Wing
has expanded into the frozen meat category since 2013 v ia
acquisition. The company imports frozen beef, pork, lamb
and poultry from Brazil, New Zealand, Japan, the US,
Thailand etc. to its wholesale customers who eventually sell
those to fast food restaurants and Cha Chaan Tengs.
F rozen processed food. To improve profitability , Tsit Wing
has diversified its meat portfolio to include frozen processed
food, which is of higher value-added. The company has its
own OEM brand, “Papa Chef,” which offers a variety of
frozen processed food products such as roasted chicken,
skewers, hash brown, breaded pork and seafood. The
company aims to expand this business through its
partnership with Japan’s NH Foods in Hong Kong, the PRC
and Macau.
Distribution network
Tsit Wing sells its products mainly through direct sales,
which accounted for 91.7% of FY17 sales respectively .
Direct sales accounted for 88.8% of FY17 beverage solution
sales, while all of its food products (frozen meat and frozen
processed foods) are sold through direct sales.
Sales breakdown by distribution
68.5% 67.7% 66.2%
7.2% 7.5% 8.3%
24.3% 24.8% 25.5%
0%
20%
40%
60%
80%
100%
2015 2016 2017
Food products - direct Beverage solutions - indirect
Beverage solutions - direct
Source: Company data
Direct sales
Tsit Wing has a well-established sales network in Hong
Kong directly dealing with customers, which is grouped
under six div isions–Hong Kong, Kowloon and New
Territories, as well as Hotels and Institutions, Fast Moving
Consumer Goods (FMCG), and import and export div isions.
Hong Kong Island, Kowloon and New Territories are
responsible for catering sales to fast food chains and other
food outlets, while Hotel and Institution and FMCG oversee
their respective sectors.
In the PRC, the company has been focusing its efforts in first
tier and second tier cities in Eastern and Southern China,
particularly in Beijing, Shanghai, Guangzhou, Zhuhai,
Dongguan, Hangzhou and Shenzhen, with regional sales
and distribution offices being set up in respective cities.
Besides the core markets, Tsit Wing also exports to Taiwan
and other overseas countries including Canada, Australia,
the United States, Malaysia and Philippines through
distributors.
Sales by channels
Source: Company data
Ts it Wing
Direct salesDesignated distribution
centerDistributors

Company Guide
Tsit Wing International Holdings Ltd
Page 8
Dist ributors
As of 2017, Tsit Wing has a total of 157 distributors, a
reduction from 170 distributors in Dec’16, as the company
shifted more FMCG sales to direct sales, and increased
efforts to target larger players, as well as natural attrition.
Number of distributors
162
170
157
150
155
160
165
170
175
2015 2016 2017
No. of distributors
Source: Company data
While businesses in Macau and the PRC are relatively less
mature, the company has secured contracts with hotels, fast
food chains, including McDonald’s outlets in the PRC and
domestic airlines.
Production facilities
Tsit Wing processes its own coffee, blended tea, and all-in-
one products (coffee, tea and yuan yeung) in its own
production facilities in Hong Kong and Dongguan.
Hong Kong - Hong Kong’s production plant houses 2
roasted coffee production lines, and 2 blended tea
production lines, which operate c.10 hours per day and 5.5
days a week. The facility is at near/full capacity for coffee
and tea products. In 2017, coffee and tea utilisation rate
reached 101% and 86% respectively .
Dongguan- The newer Dongguan plant, on the other hand,
has 2 roasted coffee production lines, 2 blended tea
production lines, and 4 all-in-one beverage production lines.
Utilisation rates for coffee, tea, and all-in-one were 83%,
53% and 42% respectively in 2017.
In the future, Tsit Wing plans to shift some of its Hong
Kong’s production to its Dongguan facility . This should help
level off the utilisation rate differences in these facilities and
hence help to improve overall cost efficiency.
Production capacity
Description
Ap proximate
g ross floor a rea (sq ft)
Ho ng Kong
- 2 roasted coffee production lines 23,086
- 2 blended tea production line
24 production staff as of 2017
Do ngguan 51,600
- 2 roasted coffee production lines
- 2 blended tea production lines
- 4 a ll-in-one beverage production lines
93 production staffs as of 2017
Source: Company data
Tsit Wing also leases 17 warehouses in Hong Kong,
including five temperature controlled warehouses for its
food business as of 2017.

Company Guide
Tsit Wing International Holdings Ltd
Page 9
Production capacity
# 2015 2016 2017
Hong Kong
Coffee
Designed production capacity (lbs) # 4,464,706 4,464,706 4,464,706
Actual production volume (lbs) # 4,458,835 4,630,628 4,489,144
Utilisation rate (%) # 100% 104% 101%
Tea
Designed production capacity (lbs) # 3,970,588 3,970,588 3,970,588
Actual production volume (lbs) # 3,829,797 3,579,843 3,432,554
Utilisation rate (%) # 96% 90% 86%
Dongguan
Coffee
Designed production capacity (lbs) # 2,807,470 2,807,470 2,807,470
Actual production volume (lbs) # 1,937,769 1,956,274 2,334,879
Utilisation rate (%) # 69% 70% 83%
Tea
Designed production capacity (lbs) # 2,028,604 3,955,774 6,011,872
Actual production volume (lbs) # 1,739,927 2,481,254 3,183,282
Utilisation rate (%) # 86% 63% 53%
All-in-one
Designed production capacity (lbs) # 9,324,201 9,324,201 9,324,201
Actual production volume (lbs) # 3,735,102 3,406,916 3,915,983
Utilisation rate (%) # 40% 37% 42%
Source: Company data
OEM contractors
Tsit Wing also engages with OEM contractors based in Lithuania, Czech Republic and Thailand for certain SKUs.
This includes milk products for beverage solutions, and some frozen processed foods. As of 2017, the company has 11 OEM contractors, with most having more than two years of business relationships with the company.
Typically , Tsit Wing enters into master OEM agreements with their contractors with a term ranging from one to three years on cost and freight terms, where the OEM contractor will cover all costs, except insurance, to deliver the products to the port of destination. Purchases from OEM contractors amounted to 7.6% of total cost of sales in FY17.
OEM distributors
8 10 11
10.4%
11.8%
7.6%
0.0%
2.0%
4.0%
6.0%
8.0%
10.0%
12.0%
14.0%
0
2
4
6
8
10
12
2015 2016 2017
No. of contractors (LHS)
% of cost of sales (RHS)
Source: Company data

Company Guide
Tsit Wing International Holdings Ltd
Page 10
History of Tsit Wing
History of Tsit Wing
Year Event
1932 Establishment of the Group, primarily engaged in the business trading principally as a wholesaler in the supply of coffee and
tea products
1956 Incorporation of Tsit Wing Hong Kong Company Limited
1963 Acquisition of Tsit Wing's owned factory in Beech Street, Kowloon for coffee roasting and packaging
1980 Acquisition of properties in Kwai Tak Industrial Centre in Kwai Chung, New Territories, Hong Kong for production and as
head's office
1982 Adoption of computerized coffee processing plants and machineries from the United States
2000 Incorpration of Tsit Wing
2001 Tsit Wing was listed on the main board of Singapore Stock Exchange
Aggregate consideration for the listing was SGD0.29 per share or SGD46.4m. In terms of PE valuation on listing: (i) total
consideration/2000 earnings of SGD6.942m was 6.68x, while P/NTA stood at 1.70x
2008 Zhuhai Tsit Wing Food Co. Ltd was designated as the Beijing Olympic Games' Official Coffee and black tea supplier
2009 Establishment of Dongguan production and service center
2013 Tsit Wing was privatised and delisted from SGX-ST.
Aggregate consideration for the privatisation was SGD0.3075 per share or SGD65.5m. In terms of PE valuation on privatisation:
(i) total consideration/2012 earnings of HK$22.5m was 18x (Trailing PE at 16.6x) ; while P/NTA stood at 1.3x
Incorporation of Whole Sun for the business and assets of Oriole Properties Limited, which marked the commencement of
frozen food business
2015 Expanded food market business to importing frozen processed food
2017 Strategic coorperation agreement with NH Foods
Source: Company, DBS

Company Guide
Tsit Wing International Holdings Ltd
Page 11
Competitor strength
(1) Strong heritage with longstanding relationships with reputable customers
With 85 years of operating history, Tsit Wing is a leading
integrated B2B coffee and black tea solutions provider in
Hong Kong, Macau and the PRC. In Hong Kong, the
company’s market coverage is extensive, reaching c.60% of
food outlets in total, and covering over 70% of fast-food
stores, Cha Chaan Tengs and cafés. The company has
developed a stable and diverse group of customers,
including reputable names such as franchised businesses of
McDonald’s in the PRC and HK, Café de Coral, Fairwood,
The Spaghetti House, Yoshinoya, Tsui Wah, Tai Hing, and 7-
Eleven.
Tsit Wing’s market coverage by type of F&B serving
establishments in Hong Kong
60.0%
78.7% 77.6%70.3% 66.7% 65.8%
51.3%
32.8%
0%
20%
40%
60%
80%
100%
Ove
rall
Café
Fast
fo
od
sto
re
Cha C
haan
Teng
Hote
l
Wes
tern
res
taura
nt
Oth
er
F&B
Chin
ese
rest
aura
nts
Source: Frost & Sullivan
(2) Strong market shares
Tsit Wing is ranked number 1 in the B2B coffee and black
tea beverage solutions market, accounting for 24.5% of
total market share (by B2B revenue) in Hong Kong.
Combining the top 4 players (including Tsit Wing), total
market share is concentrated at 70.8% in terms of revenue.
There is increasing demand for one-stop serv ices but
requirements for suppliers are also stringent, hence the B2B
beverage solutions market should stay favourable to the top
players.
Market share of top 5 players in terms of revenue in the Hong Kong B2B coffee and black tea products market
(2016)
Source: Frost & Sullivan
In PRC, Tsit Wing had a market share of 1.23% in terms of
revenue, and ranked number 4th in 2016. The top five
players command a total market share of 14.8%, which
suggests China market is highly fragmented. On the other
hand, the company is also the third largest importer of Sri
Lankan tea in the PRC. Sri-Lanka was the largest black tea
exporting country by export value and the second largest by
export volume in 2016. Tsit Wing’s imported 69.2 tons in
2016, and accounts for 9.2% of the imported black tea
market in the PRC.
Market share of top 5 players in terms of revenue in the Greater China B2B coffee and black tea products market
(2016)
6.12%
3.84%
2.39%
1.23% 1.20%
0%
1%
2%
3%
4%
5%
6%
7%
8%
E F A TheCompany
G
Market size of the PRC B2B
coffee and black tea products market is valued at
approximately RMB990.5m
Source: Frost & Sullivan
24.5%
15.9%
11.9% 11.1%
7.4%
0%
5%
10%
15%
20%
25%
30%
The Company
A B C D
Market size of the HK B2B coffee and black tea products market is valued at HK$782.1m

Company Guide
Tsit Wing International Holdings Ltd
Page 12
In Macau, Tsit Wing ranks number 3 in terms of operating
revenue, representing 9.91% of the total market in 2016.
Market share of top 5 players in terms of operating revenue in the Macau B2B coffee and black tea products
market (2016)
Source: Frost & Sullivan
(3) One-stop service for customers
Tsit Wing provides a one-stop serv ice for commercial
customers with solutions covering the entire concept to
market process, ranging from market analysis, recipe
development, sourcing, production, all the way to
marketing and after sales serv ices, which includes customer
training and equipment maintenance.
The company constantly develops new beverage concepts,
and helps design seasonal and new beverage items for its
customers. Besides catering for customers on developing
unique recipes on coffee and black tea, the company also
provides coffee machines and design procedural techniques
to fast food chains and Cha Chaan Tengs to serve fresh
brewed coffee and espresso drinks.
Providing these value-added solutions has helped to
enhance customer stickiness, as illustrated by its long
working relationship with customers, as well as benefiting
margins. Sales of coffee and tea products, which accounts
for 64.6% of total gross profit in 2017, commanded
margins of above 40% in 2015-2017.
Gross margin by product segment
45.249.2
44.2
49.1 49.2
43.5
14.518.5 19.4
0
10
20
30
40
50
60
2015 2016 2017
Coffee Tea Other SKUs*
%
Source: Company data *milk, other beverage solutions, frozen meat, frozen processed food
(4) Customisation, consistency in mass volume
We believe one key competitive advantage that Tsit Wing
has is its ability to provide tailor made products with strong
consistency and in mass volume. This, coupled with its
stringent quality assurance, are important attributes for
chain food and beverage providers which are enforcing
stricter food quality requirements nowadays.
Tsit Wing’s production process is of high automation with
limited offline manual procedures, i.e. less exposure to
human errors with production staff representing only 23%
of its total workforce of 506. The company has a
comprehensive traceability system, and offers scientific tests
and online monitoring to ensure product quality
consistency. The company has also adopted an integrated
business intelligence system to support production planning,
supply chain management, and business analysis. With such
data, this enables more up-to-date market information for
sales personnel to engage in more effective cross-selling
opportunities.
13.90%
10.56%9.91%
8.78%
6.43%
0%
2%
4%
6%
8%
10%
12%
14%
16%
18%
H I The Company
J A
Market size of the Macau B2B coffee and black tea products market is valued at MOP34.2m

Company Guide
Tsit Wing International Holdings Ltd
Page 13
(5) Strong sourcing capabilities
Tsit Wing has a comprehensive global sourcing network,
including many globally renowned ones with internationally
accredited quality certifications such as HACCP, ISO
9001:2008, ISO 14001:2004 and ISO 22000:2005, and an
average of over ten years of procurement experience with
its major suppliers. The company sources coffee and tea
from Brazil, Colombia and Sri Lanka; it is the largest Sri
Lankan tea importer in HK (by volume) and among the
largest in the PRC (by volume). Its ability to secure exclusive
rights with strategic partners such as Monin are also
illustrations of its strong sourcing capability .
The company has a close collaboration with its suppliers,
and thus enables it to obtain better market information,
leading to advantages in forecasting market prices and
acquiring supply at more competitive pricings.
Worldwide sourcing network
Source: Company, DBS HK

Company Guide
Tsit Wing International Holdings Ltd
Page 14
Growth strategies – Go wide, go deep
The key growth drivers would include rising consumer
preferences towards coffee and HK’s milk tea culture, an
increase in coffee and tea offerings at food and beverage
chains as well as the growing number of boutique coffee
shops, special tea lounges for handcrafted beverages, and
lastly , increasingly stringent requirements in the supply chain
placed by catering establishments, favouring established
B2B players.
(1) Low coffee and tea consumption per capita offers
opportunity for growth in China
Despite the rising popularity towards coffee, China still lags
behind significantly in terms of coffee consumption at only
0.1kg/capita per year, based on our estimates. This is
extremely low when compared to global peers as well as tea
consumption per capita in China. Assuming 10g of coffee
per cup, we estimate the average Chinese consumes only
0.04 cup per day versus 1.43 cups in the EU per day.
2016 coffee consumption per capita - China
Source: USDA, DBS HK
As China has a stronger tea drinking culture, tea
consumption is higher at 1.04 kg/capita per year, based on
FAOSTAT (2013). Black tea, the specialty of Twit Wing,
commands a market share of c.7.8% among all the tea
categories in China.
Tea consumption per capita - China
0.38 0.40.44
0.50.57
0.630.7
0.790.87
0.95
1.04
0.00
0.20
0.40
0.60
0.80
1.00
1.20
20
03
20
04
20
05
20
06
20
07
20
08
20
09
20
10
20
11
20
12
20
13
kg/capita
Source: FAOSTAT
5.24.7
5.9
3.9 4.2
1.8
0.1
0
1
2
3
4
5
6
7
EU
US
Bra
zil
Jap
an
Ph
ilip
pin
es
Vie
tnam
Ch
ina
Kg/capita

Company Guide
Tsit Wing International Holdings Ltd
Page 15
(2) Explosion of the coffee chain phenomena in PRC
While instant coffee accounts for bulk of the coffee
consumption, the rise in coffee culture is best illustrated by
the explosive growth of foreign coffee chains in China.
Starbucks has identified China as one of its key growth
drivers, and targets to open 5,000 outlets by 2021, imply ing
more than one new store per day and a CAGR of 34% in
2017-21E. Costa Coffee, which has been fully controlled by
Whitbread since Oct 17, targets to open up to 700 stores by
2020 (>400 stores as of FY16/17), suggesting CAGR of
21% in 2017-20E.
Starbucks store opening in China (Company operated
stores)
408614
8231026
1272206
209
203
246
268
0
200
400
600
800
1000
1200
1400
1600
1800
2013 2014 2015 2016 2017
Stores Net opening
Source: Starbucks company data
Costa Coffee’s store plan in China
250
326 344380
76
1836
20
0
50
100
150
200
250
300
350
400
450
2013/14 2014/15 2015/16 2016/17
Stores Net opening
Source: Whitbread Company data
Already one of the leading B2B players, Tsit Wing currently
caters to more than 800 hotels, fast food chains and food
establishments, as well as 7 domestic airlines (out of 24
domestic airlines) in the PRC.
The company intends to strengthen its market positioning in
first and second tier cities in eastern and southern China,
such as Shanghai, Beijing, Hangzhou, Guangzhou,
Shenzhen, and Dongguan through expanding its sales team
and sales offices in China. Tsit Wing can also leverage on its
existing strong customer relationships in Hong Kong to
expand into the PRC.
In 2012-16, the B2B coffee market size in China doubled
with the surge in popularity in coffee products, and
achieved a CAGR of 20.3% to RMB4.4bn. The B2B coffee
market is expected to grow at a CAGR of 13.2% to
RMB8.2bn in 2017-21E. Combining black tea and coffee
products in China, the market size is expected to grow at a
CAGR of 11% in 2017-21E to RMB11.4bn.
B2B coffee and black tea market size in China (2012-
2021E)
1.7 1.8 1.9 2.1 2.3 2.5 2.7 2.8 3.0 3.2
2.1 2.4 2.93.6
4.45.0
5.76.4
7.38.2
0
2
4
6
8
10
12
20
12
20
13
20
14
20
15
20
16
20
17
E
20
18
E
20
19
E
20
20
E
20
21
E
Rmb bn
B2B Tea B2B Coffee
2012-16 CAGR
15.2%
2017-21E CAGR
11.0%
Source: Frost & Sullivan
Company Guide
Tsit Wing International Holdings Ltd
Page 16
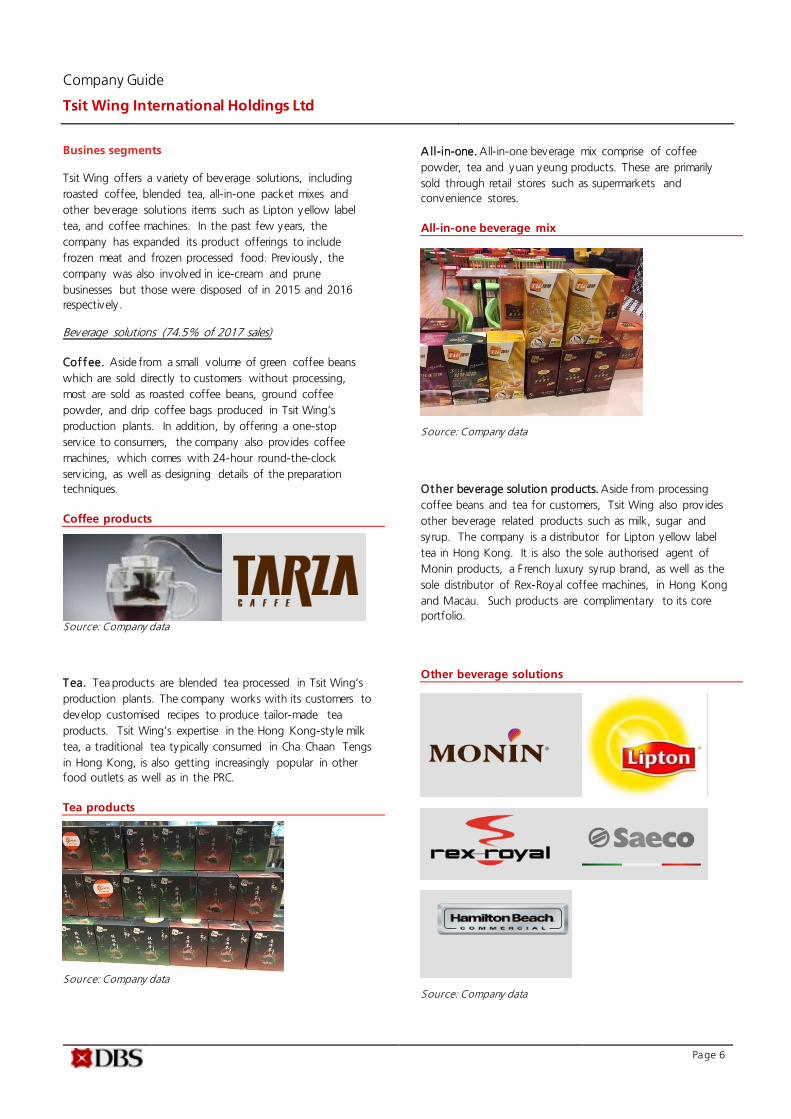
(3) Riding on key customer’s growth in China
We expect Tsit Wing to continue to ride on the strong
growth of its customers in China. Case in point being the
franchised business of McDonald’s, one of Tsit Wing’s key
customers, which is expected to accelerate its expansion
plan in China following the recent conclusion of a strategic
cooperation deal with property developers such as Country
Garden and Evergrande Group.
In August 2017, McDonald’s unveiled plans with its strategic
partners, CITIC Limited, CITIC Capital Partners and The
Carly le Group, to expand its store count from 2,500 to
4,500 by the end of 2022E, meaning the pace of store
openings will double from 250 p.a. in 2017 to 500 p.a.
during 2018-2022E. McDonald’s aims to increase its
portfolio significantly in tier 3-4 cities, which will account for
45% of its store portfolio in China The accelerated
expansion should benefit Tsit Wing, who has been supply ing
to McDonald’s in China for more than 10 years.
McDonald’s store count expansion plan in China
Source: McDonald’s presentation
Tsit Wing’s top 5 largest customers accounted for 23.9% of
2017 sales respectively . Of which, its largest customer,
accounted for 15.4% of 2017 sales. Tsit Wing’s top 5
largest customers include fast food chains, restaurants, a
food and beverage distributor, and a food processing
company, which hold long relationships with the company
for 3-10 years. The established and stable relationships
suggest strong trust and credibility between Tsit Wing and
its customers.
Revenue breakdown by customers (2017)
Top
customer15%
Top 2-5
customers9%
Others
76%
Source: Company data
2,500
4,500
0
500
1,000
1,500
2,000
2,500
3,000
3,500
4,000
4,500
5,000
2017E 2022E
2017-22E CAGR of 12.5%
No. of outlets

Company Guide
Tsit Wing International Holdings Ltd
Page 17
(4) Further strengthen position in the coffee and black
tea market in Hong Kong
According to a survey conducted by Frost & Sullivan, Tsit
Wing is the most well-recognised top quality coffee and
black tea brand among restaurants in Hong Kong. In fact,
the company supplies to 9 out of 11 major fast food chains,
and 34 of the 240 hotels in Hong Kong. This roughly
translates to c.60% of the food outlets in Hong Kong.
Tsit Wing’s market coverage by type of F&B
establishments
60.0%
78.7% 77.6%70.3% 66.7% 65.8%
51.3%
32.8%
0%
20%
40%
60%
80%
100%
Ove
rall
Café
Fast
fo
od
sto
re
Cha C
haan
Teng
Hote
l
Wes
tern
res
taura
nt
Oth
er
F&B
Chin
ese
rest
aura
nts
Source: Frost & Sullivan
With strong global sourcing capabilities, as well as
established relationships with customers, there are
opportunities for Tsit Wing to expand further in the
premium coffee and tea segment to better ride on the
changing consumer trends, such as the organic certified
SKUs or promotion of sustainability trends. Tsit Wing also
works closely with its customers to offer seasonal coffee and
specialty beverages.
Innovative beverage offerings by customers
Customers B everage offerings McDonald's -
McCafe
Matcha x OREO - A New Twist - includes Matcha
Chocolate OREO Cookies Drink, Iced Matcha Chocolate OREO Cookies Drink
Yoshinoya Tea Set Special - Iced Matcha Tea Red Bean Drink/ Iced Milk Tea Red Bean Drink
7-Eleven Daily Café - Coffee offerings Café de Coral Tea & coffee
Spaghetti House Offerings include handcrafted coffee, special drinks , freshly brewed coffee
Source: Company data, DBS HK
The Hong Kong B2B coffee and black tea products market
has expanded at a CAGR of 4.5% in 2012-16, and is
expected to continue with a CAGR of 4.2% in 2017-21E.
B2B coffee and black tea market size in Hong Kong
(2012-2021E)
Source: Frost & Sullivan
656 679 695 735 791 833 873 912 953 992
271 281 292 303314 326 338 350 361 372
0
200
400
600
800
1000
1200
1400
1600
20
12
20
13
20
14
20
15
20
16
20
17
E
20
18
E
20
19
E
20
20
E
20
21
E
Rmb bn
B2B Coffee B2B Tea
2012-16 CAGR 4.5%
2017-21E CAGR 4.2%
Company Guide
Tsit Wing International Holdings Ltd
Page 18
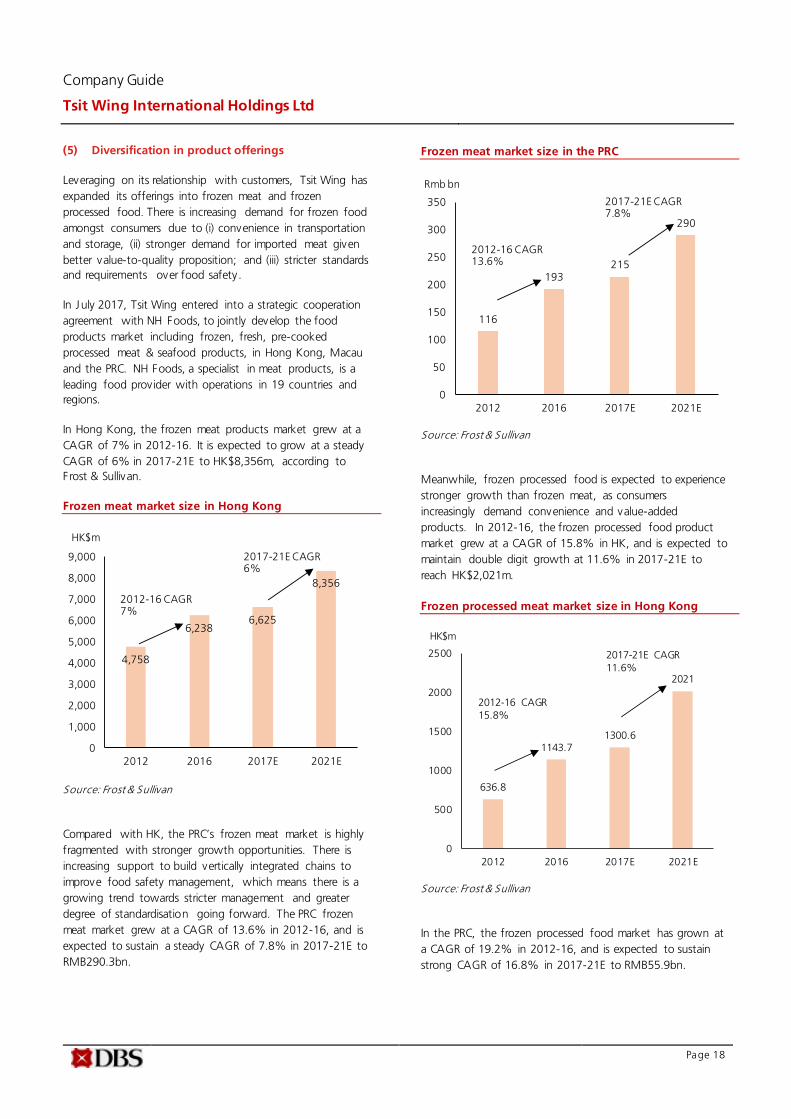
(5) Diversification in product offerings
Leveraging on its relationship with customers, Tsit Wing has
expanded its offerings into frozen meat and frozen
processed food. There is increasing demand for frozen food
amongst consumers due to (i) convenience in transportation
and storage, (ii) stronger demand for imported meat given
better value-to-quality proposition; and (iii) stricter standards
and requirements over food safety.
In July 2017, Tsit Wing entered into a strategic cooperation
agreement with NH Foods, to jointly develop the food
products market including frozen, fresh, pre-cooked
processed meat & seafood products, in Hong Kong, Macau
and the PRC. NH Foods, a specialist in meat products, is a
leading food provider with operations in 19 countries and
regions.
In Hong Kong, the frozen meat products market grew at a
CAGR of 7% in 2012-16. It is expected to grow at a steady
CAGR of 6% in 2017-21E to HK$8,356m, according to
Frost & Sullivan.
Frozen meat market size in Hong Kong
Source: Frost & Sullivan
Compared with HK, the PRC’s frozen meat market is highly
fragmented with stronger growth opportunities. There is
increasing support to build vertically integrated chains to
improve food safety management, which means there is a
growing trend towards stricter management and greater
degree of standardisation going forward. The PRC frozen
meat market grew at a CAGR of 13.6% in 2012-16, and is
expected to sustain a steady CAGR of 7.8% in 2017-21E to
RMB290.3bn.
Frozen meat market size in the PRC
Source: Frost & Sullivan
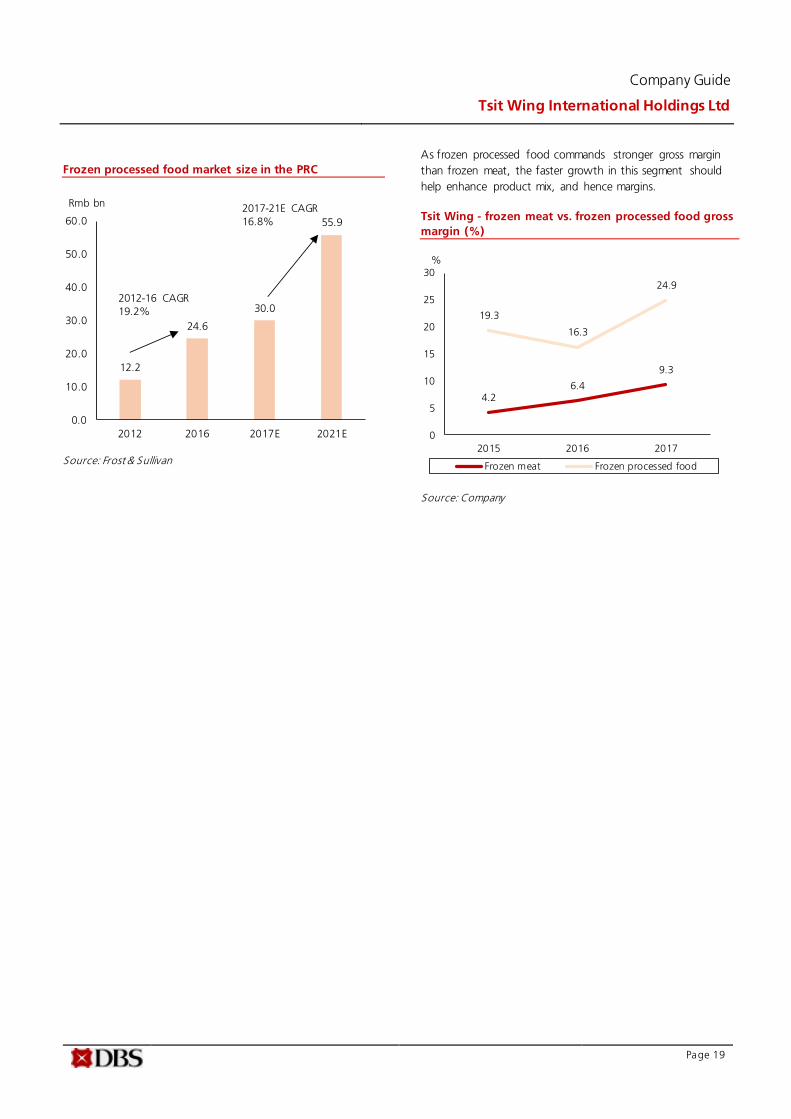
Meanwhile, frozen processed food is expected to experience
stronger growth than frozen meat, as consumers
increasingly demand convenience and value-added
products. In 2012-16, the frozen processed food product
market grew at a CAGR of 15.8% in HK, and is expected to
maintain double digit growth at 11.6% in 2017-21E to
reach HK$2,021m.
Frozen processed meat market size in Hong Kong
636.8
1143.71300.6
2021
0
500
1000
1500
2000
2500
2012 2016 2017E 2021E
HK$m
2012-16 CAGR
15.8%
2017-21E CAGR
11.6%
Source: Frost & Sullivan
In the PRC, the frozen processed food market has grown at
a CAGR of 19.2% in 2012-16, and is expected to sustain
strong CAGR of 16.8% in 2017-21E to RMB55.9bn.
4,758
6,2386,625
8,356
0
1,000
2,000
3,000
4,000
5,000
6,000
7,000
8,000
9,000
2012 2016 2017E 2021E
HK$m
2012-16 CAGR 7%
2017-21E CAGR 6%
116
193215
290
0
50
100
150
200
250
300
350
2012 2016 2017E 2021E
Rmb bn
2012-16 CAGR 13.6%
2017-21E CAGR 7.8%
Company Guide
Tsit Wing International Holdings Ltd
Page 19
Frozen processed food market size in the PRC
12.2
24.6
30.0
55.9
0.0
10.0
20.0
30.0
40.0
50.0
60.0
2012 2016 2017E 2021E
Rmb bn
2012-16 CAGR
19.2%
2017-21E CAGR
16.8%
Source: Frost & Sullivan
As frozen processed food commands stronger gross margin
than frozen meat, the faster growth in this segment should
help enhance product mix, and hence margins.
Tsit Wing - frozen meat vs. frozen processed food gross
margin (%)
4.26.4
9.3
19.3
16.3
24.9
0
5
10
15
20
25
30
2015 2016 2017
Frozen meat Frozen processed food
%
Source: Company

Company Guide
Tsit Wing International Holdings Ltd
Page 20
Financial analysis
Rev enue. In 2016, revenue rose by 1.4% y -o-y, with
growth seen in both product segments. Beverage solution
segment rose 1% due to an increase in milk sales volume on
higher promotion activ ities in Hong Kong and the PRC. This
was partly offset by the decrease in the tea sales volume in
the PRC, and by the decrease in the average selling price of
milk products. Food product sales grew 3.5% y -o-y, driven
by sales volume.
In 2017, revenue rose 12.3% y -o-y to HK$954.6m, driven
by beverage solution sales (+11.3% y -o-y) and frozen
product sales (+15.5% y-o-y). Tea, in particular, saw strong
volume growth from both key customers and new customer
growth, as well as ASP increase (+5% y -o-y). In frozen
product, frozen meat sales grew 12.1% on rising demand
for US and New Zealand products.
Revenue by product segment
Revenue breakdown by product segment (%)
195 190 198
189 191 229
80 93 97
171 166 188
202 202 227
8
17
0
200
400
600
800
1,000
1,200
2015 2016 2017
HK$m
Coffee Tea
Milk Others
Frozen meat Frozen processed food
23% 22% 21%
23% 22% 24%
10% 11% 10%
20% 20% 20%
24% 24% 24%
1% 2%
0%
20%
40%
60%
80%
100%
120%
2015 2016 2017
Coffee Tea
Milk Others
Frozen meat Frozen processed food
Source: Company data Source: Company data
Revenue by region
Revenue breakdown by region (%)
613 629 697
206 204 239 20 17
18
0
200
400
600
800
1,000
1,200
2015 2016 2017
HK$m
Hong Kong PRC Macau & Others
73% 74% 73%
25% 24% 25%
2% 2% 2%
0%
20%
40%
60%
80%
100%
120%
2015 2016 2017
Hong Kong PRC Macau & Others
Source: Company data Source: Company data

Company Guide
Tsit Wing International Holdings Ltd
Page 21
Gross profit
Tsit Wing’s cost of goods sold (COGS) comprises of mainly
material costs, which accounted for 92% of 2017 COGS.
Packaging, labour, overhead and depreciation costs
accounted for the remaining 8% of COGS.
Breakdown of costs by expenses (2017)
92%
3%2%
1%
2%
Material costs Packaging costs Direct labour
Overhead Depreciation
Source: Company data
How to set pricing. The company sets its pricing based on a
percentage of gross margin, which is determined by product
costs (raw material and packaging materials), overheads,
commodity prices, relative pricing with competing products,
production capacity, bargaining power, and the cost of
after-sale serv ices for coffee machines. On a case by case
basis, the company may offer volume discounts to
customers.
For one of its five largest customers, the company enters
into a fixed price agreement nine months in advance for the
sale of coffee products for the coming 3-12 months, using
coffee bean future pricing on the New York Board of Trade
as a reference.
Cof fee: To manage costs, coffee bean prices are generally
managed through an inventory management system. For
Arabica coffee beans, the company maintains three months
of inventory at the warehouse, and 3-6 months on way
shipment. This represents 6-9 months of inventory. As for
Robusta coffee, the company maintains 1.5 months of
supply. Aside from this, the company also negotiates and
fixes different contracts with coffee suppliers to further
manage procurement costs.
Based on our sensitiv ity analysis, a 5% change in average
coffee procurement prices with no adjustment in ASP,
would have a c.5% impact on 2018 earnings. In the past,
Tsit Wing had engaged in some hedging activ ities when
appropriate, which helped to mitigate some of the impact.
T ea. For tea, Tsit Wing deals mainly with suppliers who bid
in auctions for tea. Given its long-standing relationships
with suppliers and huge volume requirements, Tsit Wing can
procure tea at a discount. Our sensitiv ity analysis indicates
that a 5% change in average tea procurement prices with
no adjustment in ASP, would result in a c.6% impact on
2018 earnings.
Coffee ASP vs. gross margin (%)
30.4 29.4 29.6
45.2
49.2
44.2
41
42
43
44
45
46
47
48
49
50
28.0
29.0
30.0
31.0
2015 2016 2017
Coffee (ASP) (LHS) Coffee gross margin (RHS)
%
Source: Company data
Tea ASP vs. gross margin
27.2 27.2 28.6
49.1 49.2
43.5
40
41
42
43
44
45
46
47
48
49
50
26.0
27.0
28.0
29.0
2015 2016 2017
Tea (ASP) Tea gross margin
%
Source: Company data

Company Guide
Tsit Wing International Holdings Ltd
Page 22
Cost of sales
HK$m % HK$m % HK$m %
Material costs 547.8 93% 528.9 92% 613.6 92%
Packaging costs 14.4 2% 15.0 3% 18.7 3%
Direct labour 8.6 1% 9.7 2% 10.8 2%
Overhead 6.3 1% 6.6 1% 8.0 1%
Depreciation 14.6 2% 15.5 3% 13.9 2%
591.7 100% 575.6 100% 665.0 100%
20162015 2017
Source: Company data
In 2016, gross profit increased by 11.2% y -o-y to
HK$274.1m, driven by lower coffee bean and milk
procurement prices which declined 11.5% and 12.9%
respectively . As a result, gross profit margins on coffee and
milk beverages expanded by 4.0ppts and 13.9ppts to
49.2% and 29.2% respectively . Overall gross margin
expanded 2.9ppts to 32.3%.
In 2017, gross profit increased by 6.0% y -o-y to HK$290m
with gross profit margin contracted 1.9ppts to 30.3%,
dragged by a rebound in raw material costs in beverages.
Coffee and processed tea average procurement prices rose
by 11% and 16% to HK$10.3/lb and HK$13.5/lb
respectively in 2017.
Gross margin by product segment – Beverage solutions
Gross margin by product segment – Food
45.249.2
44.2
49.1 49.2
43.5
15.4
29.2
24.8
26.1 27.4 28.3
0
10
20
30
40
50
60
2015 2016 2017
%
Coffee Tea Milk Other
4.26.4
9.3
19.3
16.3
24.9
0
5
10
15
20
25
30
2015 2016 2017
%
Frozen meat Frozen processed food
Source: Company data
*Other SKUs include groceries and others, FMCG and instant beverage mix, Monin Products, and coffee and tea machines.
Source: Company data

Company Guide
Tsit Wing International Holdings Ltd
Page 23
Gross profit by product segment
Gross profit breakdown by product segment (%)
88 93 88
93 94 100
12 27 24
45 45 53 8 13 21 1
4
0
50
100
150
200
250
300
350
2015 2016 2017
HK$m
Coffee Tea
Milk Others
Frozen meat Frozen processed food
36% 34% 30%
38%34%
34%
5% 10%8%
18% 17%18%
3% 5% 7%
0% 1%
0%
20%
40%
60%
80%
100%
2015 2016 2017
Coffee Tea
Milk Others
Frozen meat Frozen processed food
Arabica coffee prices
Robusta coffee prices
Green coffee prices
Black tea prices (Kenya)
200
250
300
350
400
450
Feb-1
1
Feb-1
2
Feb-1
3
Feb-1
4
Feb-1
5
Feb-1
6
Feb-1
7
US cent/kg
Source: Company data
100
120
140
160
180
200
220
Mar-
14
Jun-1
4
Sep-1
4
Dec
-14
Mar-
15
Jun-1
5
Sep-1
5
Dec
-15
Mar-
16
Jun-1
6
Sep-1
6
Dec
-16
Mar-
17
Jun-1
7
Sep-1
7
Dec
-17
Mar-
18
Jun-1
8
USD/lbs
1600
1700
1800
1900
2000
2100
2200
2300
Feb-1
7
May-
17
Aug-1
7
Nov-
17
Feb-1
8
May-
18
USD/MT
100
120
140
160
180
200
Nov-
15
Feb-1
6
May-
16
Aug-1
6
Nov-
16
Feb-1
7
May-
17
Aug-1
7
Nov-
17
Feb-1
8
May-
18
USD/lbs
Company Guide
Tsit Wing International Holdings Ltd
Page 24
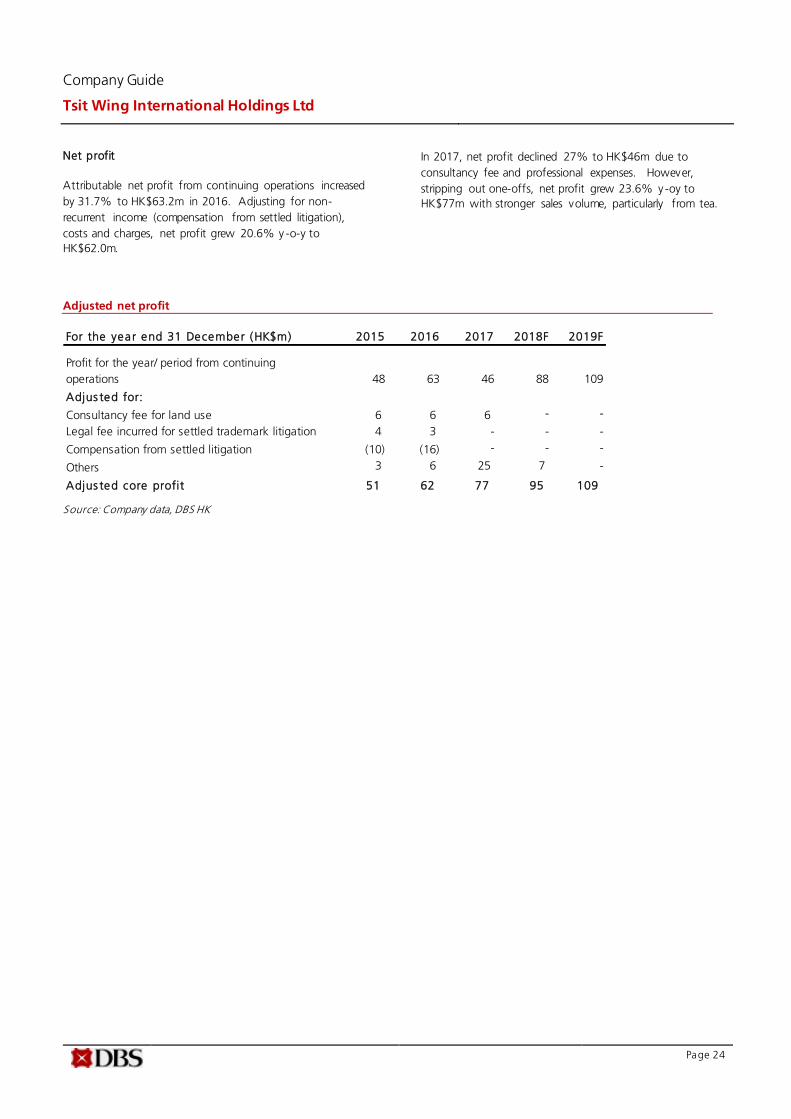
Net profit
Attributable net profit from continuing operations increased
by 31.7% to HK$63.2m in 2016. Adjusting for non-
recurrent income (compensation from settled litigation),
costs and charges, net profit grew 20.6% y -o-y to
HK$62.0m.
In 2017, net profit declined 27% to HK$46m due to
consultancy fee and professional expenses. However,
stripping out one-offs, net profit grew 23.6% y -oy to
HK$77m with stronger sales volume, particularly from tea.
Adjusted net profit
For the year end 31 December (HK$m) 2015 2016 2017 2018F 2019F
Profit for the year/ period from continuing
operations 48 63 46 88 109
Adjus ted for:
Consultancy fee for land use 6 6 6 - -
Legal fee incurred for settled trademark litigation 4 3 - - -
Compensation from settled litigation (10) (16) - - -
Others 3 6 25 7 -
Adjus ted core profit 51 62 77 95 109
Source: Company data, DBS HK

Company Guide
Tsit Wing International Holdings Ltd
Page 25
Net gearing ratio
Net gearing ratio expanded from 46% in Dec’15 to 68% in
Dec’17. Over the same period, total cash declined by
HK$59.9m to HK$45.6m, while total debt rose by
HK$175m to HK$192m. Equity attributable to owners of
the Parent declined by 23.3% on the distribution of
div idend to ultimate holding company of HK$122.9m.
Gearing ratio (Dec’15-Dec’17)
For the year end 31 December
(HK$m) 2015 2016 2017
Borrowings 174.8 173.9 191.6
Less: cash and cash
equivalents
59.9 48.1 45.6
Net debt 114.9 125.8 145.9
Equity attributable to owners
of the Parent 247.4 279.3 214.2
Net gearing ratio 46% 45% 68%
Source: Company data
Cash f low
In 2017, net cash from operating activ ities declined by 77%
to HK$26.8m. Aside from higher base from FY16, the
decline was largely due to higher working capital
requirement. Inventories increased by HK$45.3m on higher
tea storage in light of expected increase in tea prices. Trade
receivables also grew with the expansion of frozen food
business. Net cash used in investing activ ities amounted to
HK$26.6m, which mainly included purchases of property,
plant and equipment (HK$15.4m).
Summary cash flow statements (2015-2017)
For the year end 31 December
(HK$m) 2015 2016 2017
Net cash flows generated
from operating activities
82.7 118.7 26.8
Net cash flows used in
investing activities
(20.0) (112.0) (26.6)
Net cash generated
from/(used in) financing
activities
(88.2) (17.7) (3.7)
Net increase/ (decrease) in
cash and cash equivalents
(25.4) (10.9) (3.5)
Cash and cash equivalents at
beginning of the year
86.9 59.9 48.1
Effects of foreign exchange
rate changes, net
(1.5) (0.9) 1.0
Cash and cash equivalents at
the end of the year
59.9 48.1 45.6
Source: Company data

Company Guide
Tsit Wing International Holdings Ltd
Page 26
Valuation
Specialising in B2B beverage solutions, Tsit Wing’s direct
peers are mostly unlisted companies. This includes privately
held B2B players such as Dehong Hogood Coffee Co.,
Jascaffee, and the HK-based Hiang Kie Coffee Group, as
well as specialty coffee chains such as Starbucks Coffee,
UBC Coffee, Costa Coffee (Whitbread), C Straits Café,
among others.
There are not many coffee or tea players listed in HK. Tenfu
Group (6868.HK), while having similar revenue size, focuses
on Chinese tea (vs Tsit Wing’s focus on black tea) and the
retail market (vs Tsit Wing’s B2B focus).
Given lack of any direct listed comparable, we have opted to
take reference to a list of overseas listed B2B food serv ice
providers, which serves as a better comparable to Tsit Wing
in terms of business model and supply chain. While Tsit
Wing is significantly smaller in scale, this should be largely
compensated by its market dominance in the Hong Kong
market and growth potential in the B2B beverage solution
business in the PRC. This group of companies’ trade at an
average PE of 19x.
When compared to other HK-listed F&B players, Tsit Wing
earnings growth of 17% (FY17-20 CAGR) and ROE of 19%
(FY19F) are similar to sector average of 19% and 16%
respectively . Hence, despite its smaller size, partly due to its
focus in the B2B market, we applied a discount of 32% to
the sector average of 25x FY19F PE
Tsit Wing also generates steady cash flow. As such, a
discounted-cashflow valuation methodology serves as a
good valuation barometer. Based on a WACC of 8.4% and
terminal growth rate of 2.0%, our DCF valuation values Tsit
Wing at HK$1,983m.
As such, we value Tsit Wing at HK$2.38/sh, pegged to 17x FY19F PE.
Peers valuation
Source: Thomson Reuters, DBS HK
Target Mkt PE PE Yield Y ield P/Bk P/Bk ROE ROE
Price Price Cap F iscal 18F 19F 18F 19F 18F 19F 18F 19F
Company Name Code Local$ Local$ US$m Yr x x % % x x % %
B2B food serv ice prov ider
Us Foods Holding USFD US 38.78 n.a. 8,376 Dec 18.8 16.4 0.0 0.0 2.7 2.4 14.8 15.0
Sysco SYY US 69.4 n.a. 36,157 Jun 23.1 19.9 2.0 2.1 15.1 12.5 63.8 70.1
Performance Food Group PFGC US 36.9 n.a. 3,847 Jun 23.0 19.2 0.0 0.0 3.4 2.8 17.0 16.2
Internat ional QSRs
Starbucks SBUX US 50.14 n.a. 69,193 Sep 20.8 18.8 2.5 2.8 13.1 11.4 79.5 148.7
Mcdonalds MCD US 158.62 n.a. 124,545 Dec 20.7 19.2 2.6 2.8 n.a. n.a. (143.9) (81.1)
Yum China Holdings YUMC US 36.3 n.a. 14,015 Dec 22.6 20.6 1.2 1.3 4.4 3.8 21.1 20.1
Restaurants/ F &B related
Tsui Wah Holdings# 1314 HK 0.98 n.a. 177 Mar 14.0 9.8 5.1 6.1 0.9 0.8 n.a. n.a.
Fulum Group Holdings# 1443 HK 0.67 n.a. 111 Mar n.a. n.a. n.a. n.a. n.a. n.a. n.a. n.a.
Cafe De Coral Hdg.*# 341 HK 18.78 24.00 1,407 Mar 19.0 n.a. 4.5 0.0 3.0 n.a. 16.1 0.0
Fairwood Holdings# 52 HK 29.35 n.a. 482 Mar 14.0 12.7 4.9 5.0 4.7 4.6 34.5 36.5
Farmer Brothers FARM US 30.25 n.a. 512 Jun n.a. 42.2 n.a. n.a. 2.5 2.4 (11.4) 4.6
Company Guide
Tsit Wing International Holdings Ltd
Page 27
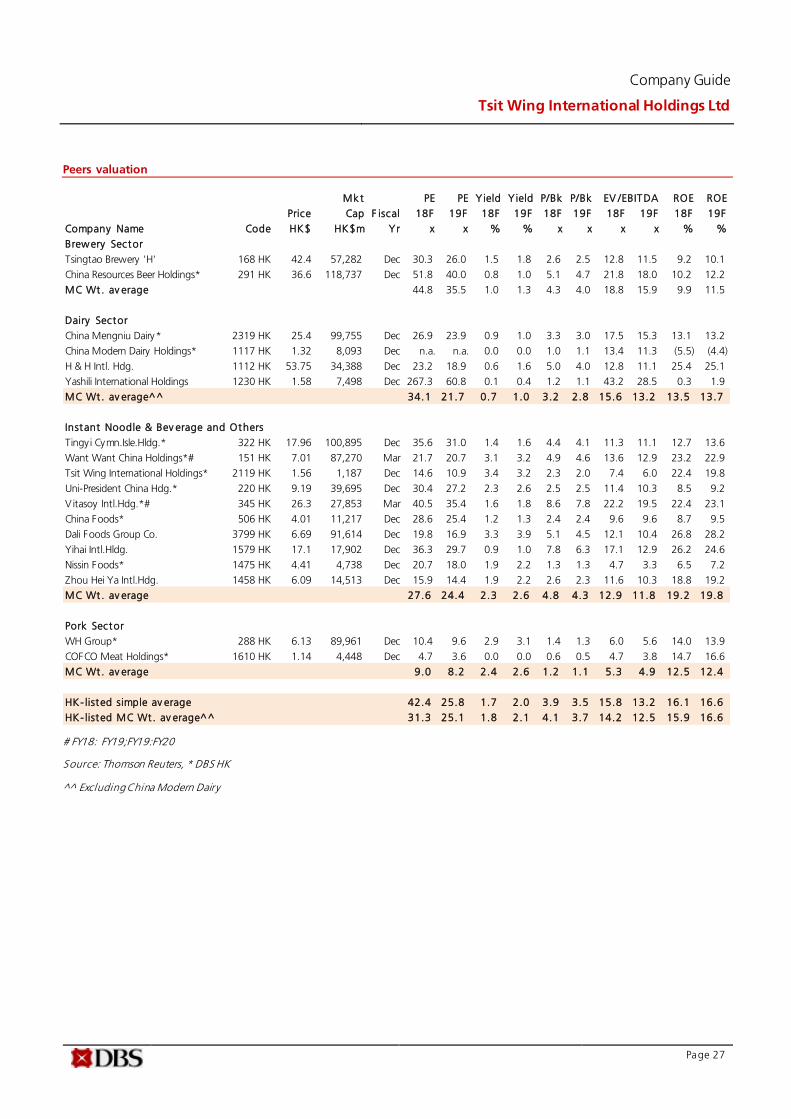
Peers valuation
# FY18: FY19;FY19:FY20
Source: Thomson Reuters, * DBS HK
^^ Excluding China Modern Dairy
Mkt PE PE Yield Y ield P/Bk P/Bk EV /EBITDA ROE ROE
Price Cap F iscal 18F 19F 18F 19F 18F 19F 18F 19F 18F 19F
Company Name Code HK$ HK$m Yr x x % % x x x x % %
Brewery Sector
Tsingtao Brewery 'H' 168 HK 42.4 57,282 Dec 30.3 26.0 1.5 1.8 2.6 2.5 12.8 11.5 9.2 10.1
China Resources Beer Holdings* 291 HK 36.6 118,737 Dec 51.8 40.0 0.8 1.0 5.1 4.7 21.8 18.0 10.2 12.2
MC Wt. av erage 44.8 35.5 1.0 1.3 4.3 4.0 18.8 15.9 9.9 11.5
Dairy Sector
China Mengniu Dairy* 2319 HK 25.4 99,755 Dec 26.9 23.9 0.9 1.0 3.3 3.0 17.5 15.3 13.1 13.2
China Modern Dairy Holdings* 1117 HK 1.32 8,093 Dec n.a. n.a. 0.0 0.0 1.0 1.1 13.4 11.3 (5.5) (4.4)
H & H Intl. Hdg. 1112 HK 53.75 34,388 Dec 23.2 18.9 0.6 1.6 5.0 4.0 12.8 11.1 25.4 25.1
Yashili International Holdings 1230 HK 1.58 7,498 Dec 267.3 60.8 0.1 0.4 1.2 1.1 43.2 28.5 0.3 1.9
MC Wt. av erage^^ 34.1 21.7 0.7 1.0 3.2 2.8 15.6 13.2 13.5 13.7
Instant Noodle & Bev erage and Others
Tingyi Cymn.Isle.Hldg.* 322 HK 17.96 100,895 Dec 35.6 31.0 1.4 1.6 4.4 4.1 11.3 11.1 12.7 13.6
Want Want China Holdings*# 151 HK 7.01 87,270 Mar 21.7 20.7 3.1 3.2 4.9 4.6 13.6 12.9 23.2 22.9
Tsit Wing International Holdings* 2119 HK 1.56 1,187 Dec 14.6 10.9 3.4 3.2 2.3 2.0 7.4 6.0 22.4 19.8
Uni-President China Hdg.* 220 HK 9.19 39,695 Dec 30.4 27.2 2.3 2.6 2.5 2.5 11.4 10.3 8.5 9.2
Vitasoy Intl.Hdg.*# 345 HK 26.3 27,853 Mar 40.5 35.4 1.6 1.8 8.6 7.8 22.2 19.5 22.4 23.1
China Foods* 506 HK 4.01 11,217 Dec 28.6 25.4 1.2 1.3 2.4 2.4 9.6 9.6 8.7 9.5
Dali Foods Group Co. 3799 HK 6.69 91,614 Dec 19.8 16.9 3.3 3.9 5.1 4.5 12.1 10.4 26.8 28.2
Yihai Intl.Hldg. 1579 HK 17.1 17,902 Dec 36.3 29.7 0.9 1.0 7.8 6.3 17.1 12.9 26.2 24.6
Nissin Foods* 1475 HK 4.41 4,738 Dec 20.7 18.0 1.9 2.2 1.3 1.3 4.7 3.3 6.5 7.2
Zhou Hei Ya Intl.Hdg. 1458 HK 6.09 14,513 Dec 15.9 14.4 1.9 2.2 2.6 2.3 11.6 10.3 18.8 19.2
MC Wt. av erage 27.6 24.4 2.3 2.6 4.8 4.3 12.9 11.8 19.2 19.8
Pork Sector
WH Group* 288 HK 6.13 89,961 Dec 10.4 9.6 2.9 3.1 1.4 1.3 6.0 5.6 14.0 13.9
COFCO Meat Holdings* 1610 HK 1.14 4,448 Dec 4.7 3.6 0.0 0.0 0.6 0.5 4.7 3.8 14.7 16.6
MC Wt. av erage 9.0 8.2 2.4 2.6 1.2 1.1 5.3 4.9 12.5 12.4
HK- listed simple av erage 42.4 25.8 1.7 2.0 3.9 3.5 15.8 13.2 16.1 16.6
HK- listed MC Wt. av erage^^ 31.3 25.1 1.8 2.1 4.1 3.7 14.2 12.5 15.9 16.6

Company Guide
Tsit Wing International Holdings Ltd
Page 28
CRITICAL FACTORS TO WATCH
Critical Factors
Cof fee volume growth. Beverage solutions account for 75%
and 65% of FY17 sales and gross profit respectively . Of which,
coffee sales and gross profit accounted for c.21% and 30% of
total. Driven by new customer orders and rising coffee and tea
drinking culture in Hong Kong and China, we expect Tsit Wing’s
coffee volume to deliver a CAGR of 6% in FY17-20E.
Tea volume growth. Tea FY17 sales and gross profit account
for 24% and 34% respectively . Driven by new customer orders
(Muji in China) and rising coffee and tea drinking culture in
Hong Kong and China, we expect Tsit Wing’s tea volume to
deliver a CAGR of 7% in FY17-20E.
Raw material price volatility. Tsit Wing’s cost of goods sold is
comprised of mainly material costs (92%), with the remainder
as packaging, labour, overhead and depreciation costs. Of
which, we expect coffee bean and tea account for bulk of the
purchases. Based on our sensitiv ity analysis, 5% change in
procurement cost in coffee and tea would impact earnings by
5%/6% respectively in FY18F. We expect overall margin to
expand by 1.1ppt to 31.4% in FY18F on lower tea prices, partly
diluted to by expanding frozen food business sales.
Use of proceeds. The Company successfully listed on 11th of
May and raised HK$233.7m of net proceeds, inclusive of over-
allotment of 15% of offer shares. The Company has plans to
build its own proprietary milk tea machine to supply to its B2B
customers, to be launched in 2019. Second, the Company has
successfully garnered two strategic shareholders such as NH
Food and F&N, which could offer more expansionary plans in
the future.
Sales breakdown (%)
21%
24%
10%
20%
24%
2%
Coffee Tea Milk Others Frozen meat Frozen processed food
Volume growth (%)
0%
2%
4%
6%
8%
10%
12%
14%
16%
2015 2016 2017 2018 2019 2020
Coffee Tea
Gross profit margin (%)
28%
28%
29%
29%
30%
30%
31%
31%
32%
32%
33%
2015 2016 2017 2018 2019 2020
Net cash (debt) position
-200
-150
-100
-50
0
50
100
150
200
250
2015 2016 2017 2018 2019 2020
Source: Company, DBS HK

Company Guide
Tsit Wing International Holdings Ltd
Page 29
Balance Sheet:
Low spending needed. The Company listed on May 11th 2018, at
HK$1.98/sh with a market capitalization of c.HK$1,505m, with
net proceeds of HK$233.7m (inclusive of over-allotment option
exercised or 15% of offer shares). The Company expects to spend
HK$23.8m including (i) HK$12.4m on plant and machinery such
as coffee machines to be leased to customers, (ii) HK$2.1m on
furniture and fixtures and (iii) HK$2.3m on delivery trucks and
executive cars . The Company has commited to payout not less
than 35% of net profit. We estimate the Company to turn net
cash by end-FY18F, helped by funds raised from public listing.
(Dec’17: net gearing: 68.1%)
Share Price Drivers:
New customer intake to drive volume growth. Tsit Wing is
dependent on new customers to drive volume growth in the
coffee and black tea business in Hong Kong and China.
F avourable raw material price. With favourable raw material prices
such as coffee and black tea, we expect this should drive margin
expansion.
Key Risks:
Key risks include supplie and customer concentration risks, raw
material price volatility , pricing pressure and food safety concerns.
Company Background:
Tsit Wing is a leading integrated B2B beverage solutions provider
in Hong Kong, Macau and the PRC, with a specialization in coffee
and black tea. With a history dating back 85 years ago, the
company was listed on the SGX-ST in 2001, and later privatized in
2013.
Leverage & Asset Turnover (x)
Capital Expenditure
ROE
Forward PE Band
PB Band
Source: Company, DBS HK
1.2
1.3
1.4
1.5
1.6
1.7
0.00
0.10
0.20
0.30
0.40
0.50
0.60
0.70
0.80
0.90
2016A 2017A 2018F 2019F 2020F
Gross Debt to Equity (LHS) Asset Turnover (RHS)
0.0
5.0
10.0
15.0
20.0
25.0
30.0
2016A 2017A 2018F 2019F 2020F
Capital Expenditure (-)
HK$m
0.0%
5.0%
10.0%
15.0%
20.0%
2016A 2017A 2018F 2019F 2020F
Avg: 14.1x
+1sd: 15.8x
+2sd: 17.4x
-1sd: 12.4x
-2sd: 10.7x
9.6
10.6
11.6
12.6
13.6
14.6
15.6
16.6
17.6
18.6
Jun-18
(x)
Avg: 4.01x
+1sd: 4.57x
+2sd: 5.12x
-1sd: 3.46x
-2sd: 2.91x
2.6
3.1
3.6
4.1
4.6
5.1
5.6
Jun-18
(x)

Company Guide
Tsit Wing International Holdings Ltd
Page 30
Segmental Breakdown (HK$ m)
FY Dec 2015A 2016A 2017A 2018F 2019F 2020F
R e venues (HK$ m) Beverage Solutions 619 635 639 711 781 837 Food products 263 203 211 243 291 350 T otal 838 850 955 1, 073 1, 186 1, 318 Source: Company, DBS HK
Income Statement (HK$ m) FY Dec 2015A 2016A 2017A 2018F 2019F 2020F
Revenue 838 850 955 1,073 1,186 1,318
Cost of Goods Sold (592) (576) (665) (736) (814) (907)
Gross Profit 246 274 290 336 372 411
Other Opng (Exp)/Inc (179) (190) (191) (205) (223) (244)
O pe rating Profit 68 84 99 131 149 167
Other Non Opg (Exp)/Inc 0 0 0 0 0 0
Associates & JV Inc 0 0 0 0 0 0
Net Interest (Exp)/Inc (5) (4) (4) (6) (4) (4)
Dividend Income 0 0 0 0 0 0
Exceptional Gain/(Loss) (3) 1 (31) (7) 0 0
Pre - tax Profi t 59 82 64 119 145 163
Tax (13) (17) (16) (30) (36) (41)
Minority Interest 1 (1) (2) (1) 0 0
Preference Dividend 0 0 0 0 0 0
Ne t Profit 48 63 46 88 109 122
Net Prof it before Except. 51 62 77 95 109 122
EB ITDA 95 112 124 153 171 190
Growth
Revenue Gth (%) N/A 1.4 12.3 12.4 10.6 11.1
EB ITDA Gth (%) N/A 17.9 10.2 23.6 11.9 10.9
Opg Prof it Gth (%) N/A 24.6 17.1 33.0 13.6 12.1
Net Prof it Gth (%) N/A 31.7 (27.1) 91.2 23.4 12.4
M a rgins & Ratio
Gross Margins (%) 29.4 32.3 30.3 31.4 31.3 31.2
Opg Prof it Margin (%) 8.1 9.9 10.4 12.3 12.6 12.7
Net Prof it Margin (%) 5.7 7.4 4.8 8.2 9.2 9.3
ROAE (%) N/A 24.0 18.7 24.3 19.8 19.4
ROA (%) N/A 10.9 7.9 11.9 11.5 11.7
ROCE (%) N/A 14.4 16.5 17.1 14.6 14.8
Div Payout Ratio (%) 0.0 0.0 31.5 46.3 35.0 35.0
Net Interest Cover (x) 13.9 21.1 24.0 23.5 34.7 38.8
Source: Company, DBS HK

Company Guide
Tsit Wing International Holdings Ltd
Page 31
Interim Income Statement (HK$ m) FY Dec 1H2016 2H2016 1H2017 2H2017
Revenue 407 443 458 497 Cost of Goods Sold (275) (301) (317) (348) Gross Profit 132 142 141 149 Other Oper. (Exp)/Inc (91) (98) (89) (102)
O pe rating Profit 41 44 52 47 Other Non Opg (Exp)/Inc 0 0 0 0 Associates & JV Inc 0 0 0 0 Net Interest (Exp)/Inc (2) (2) (2) (2) Exceptional Gain/(Loss) 10 (9) (9) (21) Pre - tax Profi t 49 33 41 23 Tax (10) (7) (8) (7) Minority Interest 0 (1) (1) (1) Ne t Profit 39 25 32 14 Net prof it bef Except. 28 34 41 36 Growth Revenue Gth (%) N/A N/A 12.5 12.2 Opg Prof it Gth (%) N/A N/A 28.2 6.8 Net Prof it Gth (%) N/A N/A (17.3) (42.5) M a rgins Gross Margins (%) 32.4 32.1 30.8 29.9 Opg Prof it Margins (%) 10.0 9.9 11.4 9.4 Net Prof it Margins (%) 9.5 5.6 7.0 2.9 Source: Company, DBS HK

Company Guide
Tsit Wing International Holdings Ltd
Page 32
Balance Sheet (HK$ m)
FY Dec 2015A 2016A 2017A 2018F 2019F 2020F
Net Fixed Assets 124 111 108 110 113 116 Invts in Associates & JVs 0 0 0 0 0 0 Other LT Assets 57 40 39 38 38 37 Cash & ST Invts 60 48 46 316 365 418 Inventory 164 147 195 216 239 266 Debtors 135 129 170 191 212 235 Other Current Assets 25 116 23 23 23 23 T otal Assets 565 591 581 895 991 1, 096 ST Debt
115 131 139 139 139 139
Creditors 114 112 151 167 185 206 Other Current Liab 6 3 2 2 2 2 LT Debt 59 43 53 53 53 53 Other LT Liabilities 5 5 5 5 5 5 Shareholder’s Equity 247 279 214 511 589 674 Minority Interests 17 18 18 18 18 18 T otal Cap. & Liab. 565 591 581 895 991 1, 096
Non-Cash Wkg. Capital 203 277 235 261 287 317 Net Cash/(Debt) (115) (126) (146) 124 173 226 Debtors Turn (avg days) 6.2 6.6 5.6 5.6 5.6 5.6 Creditors Turn (avg days) 7.9 8.3 7.3 7.3 7.3 7.3 Inventory Turn (avg days) 50.5 98.6 94.0 102.0 102.1 101.8 Asset Turnover (x) NM 1.5 1.6 1.5 1.3 1.3 Current Ratio (x) 1.6 1.8 1.5 2.4 2.6 2.7 Quick Ratio (x) 0.8 0.7 0.7 1.6 1.8 1.9 Net Debt/Equity (X) 0.4 0.4 0.6 CASH CASH CASH Net Debt/Equity ex MI (X) 0.5 0.5 0.7 (0.2) (0.3) (0.3) Capex to Debt (%) 12.9 13.6 8.1 12.4 13.1 13.1 Z-Score (X) NA NA NA NA NA NA Source: Company, DBS HK

Company Guide
Tsit Wing International Holdings Ltd
Page 33
Cash Flow Statement (HK$ m) FY Dec 2015A 2016A 2017A 2018F 2019F 2020F
Pre-Tax Prof it 59 82 64 119 145 163 Dep. & Amort. 27 28 25 22 22 23 Tax Paid (17) (20) (20) (30) (36) (41) Assoc. & JV Inc/(loss) 0 0 0 0 0 0
(Pf t)/ Loss on disposal of FAs 0 0 0 0 0 0 Chg in Wkg.Cap. (1) 18 (48) (26) (26) (30) Other Operating CF 13 11 5 6 4 4 Ne t Operating CF 83 119 27 90 109 119 Capital Exp.(net) (23) (24) (15) (24) (25) (25) Other Invts.(net) (45) (48) (7) 0 0 0 Invts in Assoc. & JV 0 0 0 0 0 0 Div f rom Assoc & JV 0 0 0 0 0 0 Other Investing CF 48 (41) (4) 0 0 0 Ne t Investing CF ( 20) ( 112) ( 27) ( 24) ( 25) ( 25) Div Paid (28) (13) (15) (25) (31) (38) Chg in Gross Debt (55) (1) 17 0 0 0 Capital I ssues 0 0 0 234 0 0 Other Financing CF (6) (5) (5) (6) (4) (3) Ne t Financing CF ( 90) ( 19) ( 3 ) 204 ( 35) ( 41) Currency Adjustments 0 0 0 0 0 0 Chg in Cash (27) (12) (2) 270 49 53 Opg CFPS (HK$) 0.11 0.13 0.10 0.15 0.18 0.20 Free CFPS (HK$) 0.08 0.13 0.01 0.09 0.11 0.12 Source: Company, DBS HK

Company Guide
Tsit Wing International Holdings Ltd
Page 34
Appendix – Other products distribution
Source: Company data
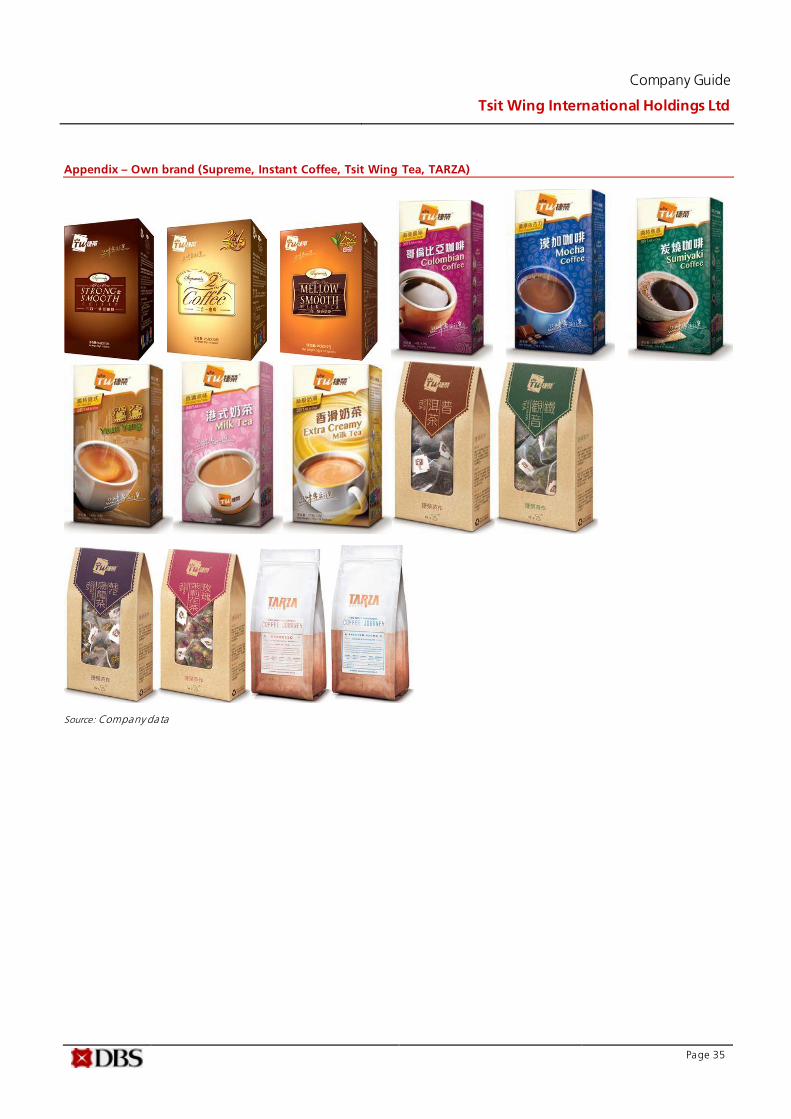
Company Guide
Tsit Wing International Holdings Ltd
Page 35
Appendix – Own brand (Supreme, Instant Coffee, Tsit Wing Tea, TARZA)
Source: Company data

Company Guide
Tsit Wing International Holdings Ltd
Page 36
DBS HK recommendations are based an Absolute Total Return* Rating system, defined as follows:
S TRONG BUY (>20% total return over the next 3 months, with identifiable share price catalysts within this time frame)
B UY (>15% total return over the next 12 months for small caps, >10% for large caps)
HO LD (-10% to +15% total return over the next 12 months for small caps, -10% to +10% for large caps)
FULLY VALUED (negative total return i.e. > -10% over the next 12 months)
S ELL (negative total return of > -20% over the next 3 months, with identifiable catalysts within this time frame)
Share price appreciation + dividends
Completed Date: 12 Jul 2018 19:00:57 (HKT)
Dissemination Date: 12 Jul 2018 19:38:53 (HKT) Sources for a ll charts and tables are DBS HK unless otherwise specified. GENERAL DISCLOSURE/DISCLAIMER Th is report is prepared by DBS Bank (Hong Kong) Limited (“DBS HK”). This report is solely intended for the clients of DBS Bank Ltd., DBS HK, DBS
Vickers (Hong Kong) Limited (“DBSV HK”), and DBS Vickers Securities (Singapore) Pte Ltd. (“DBSVS”), its respective connected and associated corporations and affiliates only and no part of this document may be (i) copied, photocopied or duplicated in any form or by any means or (ii) redistributed without the prior written consent of DBS HK. The research set out in this report is based on information obtained from sources believed to be reliable, but we (which collectively refers to DBS Bank Ltd., DBS HK, DBSV HK, DBSVS, its respective connected and associated corporations, affi liates and their respective directors, officers,
employees and agents (collectively, the “DBS Group”) have not conducted due diligence on any of the companies, verified any information or
sources or taken into account any other factors which we may consider to be relevant or appropriate in preparing the research. Accordingly, we do not make any representation or warranty as to the accuracy, completeness or correctness of the research set out in this report. Opinions
expressed are subject to change without notice. This research is prepared for general circulation. Any recommendation contained in this document does not have regard to the specific investment objectives, financial situation and the particular needs of any specific addressee. This document is for the information of addressees only and is not to be taken in substitution for the exercise of judgement by addressees, wh o should obtain
separate independent legal or financial advice. The DBS Group accepts no liabil ity whatsoever for any direct, indirect and/or consequential loss (including any claims for loss of profit) arising from any use of and/or reliance upon this document and/or further communica tion given in relation
to this document. This document is not to be construed as an offer or a solicitation of an offer to buy or sell any securities. The DBS Group, a long
with its affi l iates and/or persons associated with any of them may from time to time have interests in the securities mention ed in this document. The DBS Group, may have positions in, and may effect transactions in securities mentioned herein and may also perform or seek to pe rform
broking, investment banking and other banking services for these companies. Any valuations, opinions, estimates, forecasts, ratings or risk assessments herein constitutes a judgment as of the date of this report, and there can be no assurance that future results or events will be consistent with any such valuations, opinions, estimates, forecasts, ra tings or risk assessments.
The information in this document is subject to change without notice, its accuracy is not guaranteed, it may be incomplete or condensed, it may not contain a ll material information concerning the company (or companies) referred to in this report and the DBS Group is under no obligation to
update the information in this report. This publication has not been reviewed or authorized by any regulatory authority in S ingapore, Hong Kong or e lsewhere. There is no planned
schedule or frequency for updating research publication relating to any issuer. The valuations, opinions, estimates, forecasts , ratings or risk assessments described in this report were based upon a number of estimates and assumptions and are inherently subject to s ignificant uncertainties and contingencies. It can be expected that one or more of the estimates on
which the valuations, opinions, estimates, forecasts, ratings or risk assessments were based will not materialize or will var y s ignificantly from actual results. Therefore, the inclusion of the valuations, opinions, estimates, forecasts, ratings or risk assessments described herein IS NOT TO BE RELIED
UPON as a representation and/or warranty by the DBS Group (and/or any persons associated with the aforesaid entities), that: (a) such valuations, opinions, estimates, forecasts , ratings or risk assessments or their underlying assumptions will be achieved, and
(b) there is any assurance that future results or events will be consistent with any such valuations, opinions, estimates, forecasts, ratings or risk assessments stated therein.
Please contact the primary analyst for valuation methodologies and assumptions associated with the covered companies or price targets. Any assumptions made in this report that refers to commodities, are for the purposes of making forecasts for the company (or companies)
mentioned herein. They are not to be construed as recommendations to trade in the physical commodity or in the futures contract re lating to the commodity referred to in this report. DBS Vickers Securities (USA) Inc (“DBSVUSA”), a US-registered broker-dealer, does not have its own investment banking or research department, has not participated in any public offering of securities as a manager or co-manager or in any other investment banking transaction in the past twelve months and does not engage in market-making.

Company Guide
Tsit Wing International Holdings Ltd
Page 37
ANALYST CERTIFICATION
The research analyst(s) primarily responsible for the content of this research report, in part or in whole, certifies that th e views about the companies and their securities expressed in this report accurately reflect his/her personal views. The analyst(s) a lso certifies tha t no part of his /her
compensation was, is, or will be, directly or indirectly, related to specific recommendations or views expressed in the report. The research analyst (s)
primarily responsible for the content of this research report, in part or in whole, certifies that he or his associate1 does not serve as an officer of
the is suer or the new listing applicant (which includes in the case of a real estate investment trust, an officer of the management company of the
real estate investment trust; and in the case of any other entity, an officer or its equivalent counterparty of the entity wh o is responsible for the management of the is suer or the new listing applicant) and the research analyst(s) primarily responsible for the content of this research report or
his associate does not have financial interests2 in relation to an issuer or a new listing applicant that the analyst reviews. DBS Group has
procedures in place to e liminate, avoid and manage any potential conflicts of interests that may arise in connection with the production of research reports. The research analyst(s) responsible for this report operates as part of a separate and independent team to the investment banking function of the DBS Group and procedures are in place to ensure that confidential information held by e ither the research or investment banking function is handled appropriately. There is no direct l ink of DBS Group's compensation to any specific investment banking function of the
DBS Group.
CO MPANY-SPECIFIC / REGULATORY DISCLOSURES
1. DBS Bank Ltd, DBS HK, DBSVS or their subsidiaries and/or other affi l iates have proprietary positions in Ts ingtao Brewery Company
Limited (168 HK) and China Mengniu Dairy Company Limited (2319 HK) recommended in this report as of 10 Jul 2018.
2. Neither DBS Bank Ltd nor DBS HK market makes in equity securities of the issuer(s) or company(ies) mentioned in this Research Report.
3. Co mpensation for investment banking services:
DBS Bank Ltd, DBS HK, DBSVS, their subsidiaries and/or other affil iates of DBSVUSA have received compensation, within the past 12
months for investment banking services from Ts it Wing International (2119 HK) and China Mengniu Dairy Company Limited (2319
HK) as of 30 Jun 2018.
DBS Bank Ltd, DBS HK, DBSVS, their subsidiaries and/or other affil iates of DBSVUSA, within the next 3 months , will receive or intend to seek compensation for investment banking services from Ts it Wing International (2119 HK) as of 30 Jun 2018.
4. DBS Bank Ltd, DBS HK, DBSVS, their subsidiaries and/or other affil iates of DBSVUSA have managed or co-managed a public offering of securities for Tsit Wing International (2119 HK) in the past 12 months, as of 30 Jun 2018.
DBSVUSA does not have its own investment banking or research department, nor has it participated in any public offering of securities
as a manager or co-manager or in any other investment banking transaction in the past twelve months. Any US persons wishing to
obtain further information, including any clarification on disclosures in this disclaimer, or to effect a transaction in any security
discussed in this document should contact DBSVUSA exclusively.
5. D isclosure of previous investment recommendation produced: DBS Bank Ltd, DBSVS, DBS HK, their subsidiaries and/or other affil iates of DBSVUSA may have published other investment recommendations in respect of the same securities / instruments recommended in this research report during the preceding 12 months . Please contact the primary analyst l isted in the first page of this report to view previous investment recommendations published by DBS Bank Ltd, DBS HK, DBSVS, their subsidiaries and/or other affi liates of DBSVUSA in the preceding 12 months.
1 An associate is defined as (i) the spouse, or any minor child (natural or adopted) or minor s tep -child, of the analys t; (ii) the trustee of a trust of
which the analys t, his spouse, minor child (natural or adopted) or minor s tep -child, is a beneficiary or discretionary object; or (iii ) another person accustomed or obliged to act in accordance with the directions or instructions of the analyst.
2 Financial interest is defined as interests that are commonly known financial interest, such as investment in the securities i n respect of an issuer or
a new lis ting applicant, or financial accommodation arrangement between the issuer or the new lis ting applicant and the firm or analys is. This term does not include commercial lending conducted at arm's length, or investments in any collective investment scheme other than an issuer or
new listing applicant notwithstanding the fact that the scheme has investm ents in securities in respect of an issuer or a new listing applicant.
Company Guide
Tsit Wing International Holdings Ltd
Page 38
R ESTRICTIONS ON DISTRIBUTION
Ge neral This report is not directed to, or intended for distribution to or use by, any person or entity who is a citizen or resident of or
located in any locality, s tate, country or other jurisdiction where such distribution, publication, availabil ity or use would be contrary to law or regulation.
Australia This report is being distributed in Australia by DBS Bank Ltd. or DBSVS. DBS Bank Ltd holds Australian Financial Services
Licence no. 475946.
DBSVS is exempted from the requirement to hold an Australian Financial Services Licence under the Corporation Act 2001 (“CA”) in respect of financial services provided to the recipients . Both DBS Bank Ltd and DBSVS are regulated by the
Monetary Authority of S ingapore under the laws of S ingapore, and DBS HK is regulated by the Hong Kong Monetary Authority under the laws of Hong Kong, which differ from Australian laws.
Distribution of this report is intended only for “wholesale investors” within the meaning o f the CA.
Ho ng Kong This report is being distributed in Hong Kong by DBS Bank Ltd, DBS Bank (Hong Kong) Limited and DBS Vickers (Hong Kong)
Limited, a ll of which are registered with or l icensed by the Hong Kong Securities and Futures Commission to carry o ut the
regulated activity of advising on securities.
I ndonesia This report is being distributed in Indonesia by PT DBS Vickers Sekuritas Indonesia.
Malaysia This report is distributed in Malaysia by AllianceDBS Research Sdn Bhd ("ADBSR"). Recipients of this report, received from ADBSR are to contact the undersigned at 603-2604 3333 in respect of any matters arising from or in connection with this
report. In addition to the General Disclosure/Disclaimer found at the preceding page, recipients of this r eport are advised that ADBSR (the preparer of this report), its holding company Alliance Investment Bank Berhad, their respective connected and associated corporations, affi l iates, their directors, officers, employees, agents and parties related or associa ted with any
of them may have positions in, and may effect transactions in the securities mentioned herein and may also perform or seek
to perform broking, investment banking/corporate advisory and other services for the subject companies. They may also have received compensation and/or seek to obtain compensation for broking, investment banking/corporate advisory and
other services from the subject companies.
Wong Ming Tek, Executive Director, ADBSR
S ingapore This report is distributed in S ingapore by DBS Bank Ltd (Company Regn. No. 196800306E) or DBSVS (Company Regn No. 198600294G), both of which are Exempt Financial Advisers as defined in the Financial Advisers Act and regulated by the
Monetary Authority of S ingapore. DBS Bank Ltd and/or DBSVS, may distribute reports produced by its respective foreign entities, affi liates or other foreign research houses pursuant to an arrangement under Regulation 32C of the Financial Advisers Regulations. Where the report is distributed in S ingapore to a person who is not an Accredited Investor, Expert
Investor or an Institutional Investor, DBS Bank Ltd accepts legal responsibility for the contents of the report to such persons only to the extent required by law. S ingapore recipients should contact DBS Bank Ltd at 6327 2288 for matters arising from,
or in connection with the report.
Th ailand This report is being distributed in Thailand by DBS Vickers Securities (Thailand) Co Ltd.
United
Ki ngdom
This report is produced by DBS HK which is regulated by the Hong Kong Monetary Authority This report is disseminated in the United Kingdom by DBS Vickers Securities (UK) Ltd (“DBSVUK”). DBSVUK is authorised
and regulated by the Financial Conduct Authority in the United Kingdom. In respect of the United Kingdom, this report is solely intended for the clients of DBSVUK, its respective connected and associated corporations and affiliates only and no part of this document may be (i) copied, photocopied or duplicated in any
form or by any means or (i i) redistributed without the prior written consent of DBSVUK. This communication is directed at persons having professional experience in matters relating to investments . Any investment activity following from this communication will only be engaged in with such persons. Persons who do not have professional experience in matters
re lating to investments should not re ly on this communication.
Du bai I n ternational
Fi nancial Centre
This research report is being distributed by DBS Bank Ltd., (DIFC Branch) having its office at PO Box 506538, 3rd Floor,
Building 3, East Wing, Gate Precinct, Dubai International Financial Centre (DIFC), Dubai, United Arab Emirates. DBS Bank
Ltd., (DIFC Branch) is regulated by The Dubai Financial Services Authority. This research report is intended only fo r professional clients (as defined in the DFSA rulebook) and no other person may act upon it.

Company Guide
Tsit Wing International Holdings Ltd
Page 39
United Arab
Em irates
This report is provided by DBS Bank Ltd (Company Regn. No. 196800306E) which is an Exempt Financial Adviser as defined
in the Financial Advisers Act and regulated by the Monetary Authority of S ingapore. This report is for information purposes only and should not be relied upon or acted on by the recipient or considered as a solicitation or inducement to buy or sell
any financial product. It does not constitute a personal recommendation or take into account the particular investment objectives, financial situation, or needs of individual clients. You should contact your relationship manager or investment adviser if you need advice on the merits of buying, selling or holding a particular investment. You should note that the
information in this report may be out of date and it is not represented or warranted to be accurate, timely or complete. This report or any portion thereof may not be reprinted, sold or redistributed without our written consent.
United States This report was prepared by DBS HK. DBSVUSA did not participate in its preparation. The research analyst(s) named on this
report are not registered as research analysts with FINRA and are not associated persons of DBSVUSA. The research analyst(s) are not subject to FINRA Rule 2241 restrictions on analyst compensation, communications with a subject company, public appearances and trading securities held by a research analyst. This report is being distributed in the United States by
DBSVUSA, which accepts responsibility for its contents . This report may only be distributed to Major U.S. Institutional Investors (as defined in SEC Rule 15a-6) and to such other institutional investors and qualified persons as DBSVUSA may
authorize. Any U.S. person receiving this report who wishes to effect transactions in any securities referred to herein shou ld contact DBSVUSA directly and not its affil iate.
O ther
j urisdictions
In any other jurisdictions, except if otherwise restricted by laws or regulations, this report is intended only for qualified,
professional, institutional or sophisticated investors as defined in the laws and regulations of such jurisdictions.
DBS Bank (Hong Kong) Limited
18th Floor Man Yee building, 68 Des Voeux Road Central, Central, Hong Kong
Tel: (852) 2820-4888, Fax: (852) 2521-1812
Company Guide
Tsit Wing International Holdings Ltd
Page 40
DBS Regional Research Offices
HO NG KONG
DBS Bank (Hong Kong) Ltd Co ntact: Carol Wu 18th Floor Man Yee Building
68 Des Voeux Road Central Central, Hong Kong
Tel: 852 2820 4888 Fax: 852 2521 1812 e-mail: [email protected]
MALAYSIA
A llianceDBS Research Sdn Bhd Co ntact: Wong Ming Tek (128540 U) 19th Floor, Menara Multi-Purpose,
Capita l Square, 8 Ja lan Munshi Abdullah 50100
Kuala Lumpur, Malaysia. Tel.: 603 2604 3333 Fax: 603 2604 3921
e-mail: [email protected]
S INGAPORE
DBS Bank Ltd Co ntact: Janice Chua 12 Marina Boulevard,
Marina Bay Financial Centre Tower 3 S ingapore 018982
Tel: 65 6878 8888 Fax: 65 65353 418 e-mail: [email protected]
Company Regn. No. 196800306E
I NDONESIA
PT DBS Vickers Sekuritas (Indonesia) Co ntact: Maynard Priajaya Arif DBS Bank Tower
Ciputra World 1, 32/F
Jl. Prof. Dr. Satrio Kav. 3-5 Jakarta 12940, Indonesia
Tel: 62 21 3003 4900 Fax: 6221 3003 4943
e-mail: [email protected]
THAILAND
DBS Vickers Securities (Thailand) Co Ltd Co ntact: Chanpen Sirithanarattanakul 989 Siam Piwat Tower Building,
9th, 14th-15th Floor
Rama 1 Road, Pathumwan, Bangkok Thailand 10330
Tel. 66 2 857 7831 Fax: 66 2 658 1269
e-mail: [email protected]
Company Regn. No 0105539127012 Securities and Exchange Commission, Thailand