Quarterly flipbook - HDFC securities
205
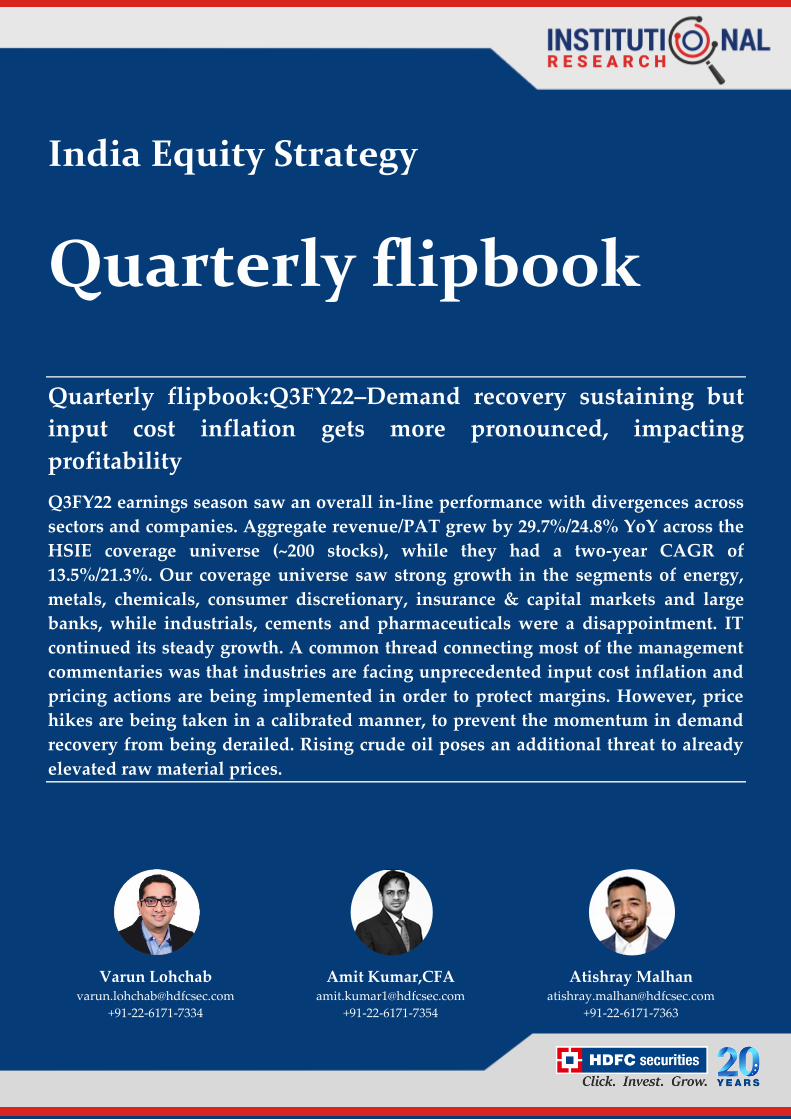
India Equity Strategy Quarterly flipbook Quarterly flipbook:Q3FY22–Demand recovery sustaining but input cost inflation gets more pronounced, impacting profitability Q3FY22 earnings season saw an overall in-line performance with divergences across sectors and companies. Aggregate revenue/PAT grew by 29.7%/24.8% YoY across the HSIE coverage universe (~200 stocks), while they had a two-year CAGR of 13.5%/21.3%. Our coverage universe saw strong growth in the segments of energy, metals, chemicals, consumer discretionary, insurance & capital markets and large banks, while industrials, cements and pharmaceuticals were a disappointment. IT continued its steady growth. A common thread connecting most of the management commentaries was that industries are facing unprecedented input cost inflation and pricing actions are being implemented in order to protect margins. However, price hikes are being taken in a calibrated manner, to prevent the momentum in demand recovery from being derailed. Rising crude oil poses an additional threat to already elevated raw material prices. Varun Lohchab [email protected] +91-22-6171-7334 Amit Kumar,CFA [email protected] +91-22-6171-7354 Atishray Malhan [email protected] +91-22-6171-7363
-
Upload
khangminh22 -
Category
Documents
-
view
1 -
download
0
Transcript of Quarterly flipbook - HDFC securities
India Equity Strategy
Quarterly flipbook
Quarterly flipbook:Q3FY22–Demand recovery sustaining but
input cost inflation gets more pronounced, impacting
profitability
Q3FY22 earnings season saw an overall in-line performance with divergences across
sectors and companies. Aggregate revenue/PAT grew by 29.7%/24.8% YoY across the
HSIE coverage universe (~200 stocks), while they had a two-year CAGR of
13.5%/21.3%. Our coverage universe saw strong growth in the segments of energy,
metals, chemicals, consumer discretionary, insurance & capital markets and large
banks, while industrials, cements and pharmaceuticals were a disappointment. IT
continued its steady growth. A common thread connecting most of the management
commentaries was that industries are facing unprecedented input cost inflation and
pricing actions are being implemented in order to protect margins. However, price
hikes are being taken in a calibrated manner, to prevent the momentum in demand
recovery from being derailed. Rising crude oil poses an additional threat to already
elevated raw material prices.
Varun Lohchab [email protected]
+91-22-6171-7334
Amit Kumar,CFA [email protected]
+91-22-6171-7354
Atishray Malhan [email protected]
+91-22-6171-7363
25 February 2022 Strategy
India Equity Strategy
d
HSIE Research is also available on Bloomberg ERH HDF <GO> & Thomson Reuters
Quarterly flipbook:Q3FY22–Demand recovery sustaining but input
cost inflation gets more pronounced, impacting profitability
Q3FY22 earnings season saw an overall in-line performance with divergences
across sectors and companies. Aggregate revenue/PAT grew by 29.7%/24.8% YoY
across the HSIE coverage universe (~200 stocks), while they had a two-year CAGR
of 13.5%/21.3%. Our coverage universe saw strong growth in the segments of
energy, metals, chemicals, consumer discretionary, insurance & capital markets
and large banks, while industrials, cements and pharmaceuticals were a
disappointment. IT continued its steady growth. A common thread connecting
most of the management commentaries was that industries are facing
unprecedented input cost inflation and pricing actions are being implemented in
order to protect margins. However, price hikes are being taken in a calibrated
manner, to prevent the momentum in demand recovery from being derailed.
Rising crude oil poses an additional threat to already elevated raw material prices.
~48% of our coverage stocks have beaten earnings estimates (vs. ~57% in Q2FY22).
Overall, the slight beat for the coverage universe (2.7%) was led by energy and
metal sectors, given their high combined weightages (~35%) in the aggregate
profit pool. Acknowledging the ground reality that input price inflation may take
longer than desired to subside, most of the sectors witnessed earning cuts with the
exception of large banks, technology, chemicals, energy, metal, insurance, and
capital markets. Consequently, overall earnings estimates were largely
maintained. Earnings upgrades were led by commodities and energy while
consumption faced margin headwinds. For the HSIE coverage universe, FY22/FY23
earnings growth stands at 31.7%/21.2%, leading to doubling of earnings over FY20-
23, post 28% YoY earnings growth in FY21. However, FY23 earnings could be at
risk, as we feel the stronger earnings momentum expected in FY23 has advanced
to FY22. Furthermore, Nifty consensus FY22 EPS remains largely unchanged. Nifty
is trading at ~22.9x FY22 EPS and ~20.6x FY23 EPS.
Sector highlights: Consumer staples demand remained muted due to subdued rural
recovery and witnessed price-led revenue growth. Consumer discretionary revival,
on the other hand, continued, given the wedding season and opening up of
shopping centres (after the unlock). Most large banks demonstrated asset quality
improvements, lower slippages, and higher recoveries that led to impressive PPOP
growth. Consequently, lending accelerated, resulting in promising credit growth.
Technology companies sustained their ride on cloud migration and digital adoption
wave, but unprecedented attrition persisted. Product price erosion in developed
markets impacted growth of pharma, while chemicals grew, led by higher price
realisations. Higher crude realisations helped growth of upstream oil & gas
companies, but city gas companies faced headwinds due to higher spot gas prices.
Higher presales growth and reducing leverage of realty companies adds to the
optimism prevailing in the housing and building materials sector. However, cement
companies faced difficulty in passing costs to consumers due to moderate demand in
the quarter. Infrastructure order books remained healthy. Power and auto sectors
continued their green journey with increased focus on renewable and EV.
Our preferred sectors continue to be large cap banks and IT, industrial & real
estate, insurance, and capital markets, while we remain underweight on
consumption (staples, discretionary, and autos), NBFCs, and small banks.
Q3FY22 results snapshot: Overall, it was an encouraging quarter, indicating a
sustained earnings momentum. In terms of stocks, notable earnings upgrades were
visible in CAMS, Apollo Hospitals, Navin Fluorine, V-mart, Kotak Bank, Dr Reddy’s
Lab, Dalmia Bharat, Jubilant Foodworks, Cadila, Shree Cement, and Tata Power.
Model portfolio: We maintain bias towards economy-facing and value sectors.
Stocks added/weight increased Stocks removed/weight reduced
Axis Bank, Cipla, ITC, Cummins India Radico Khaitan, CDSL, Ajanta Pharma
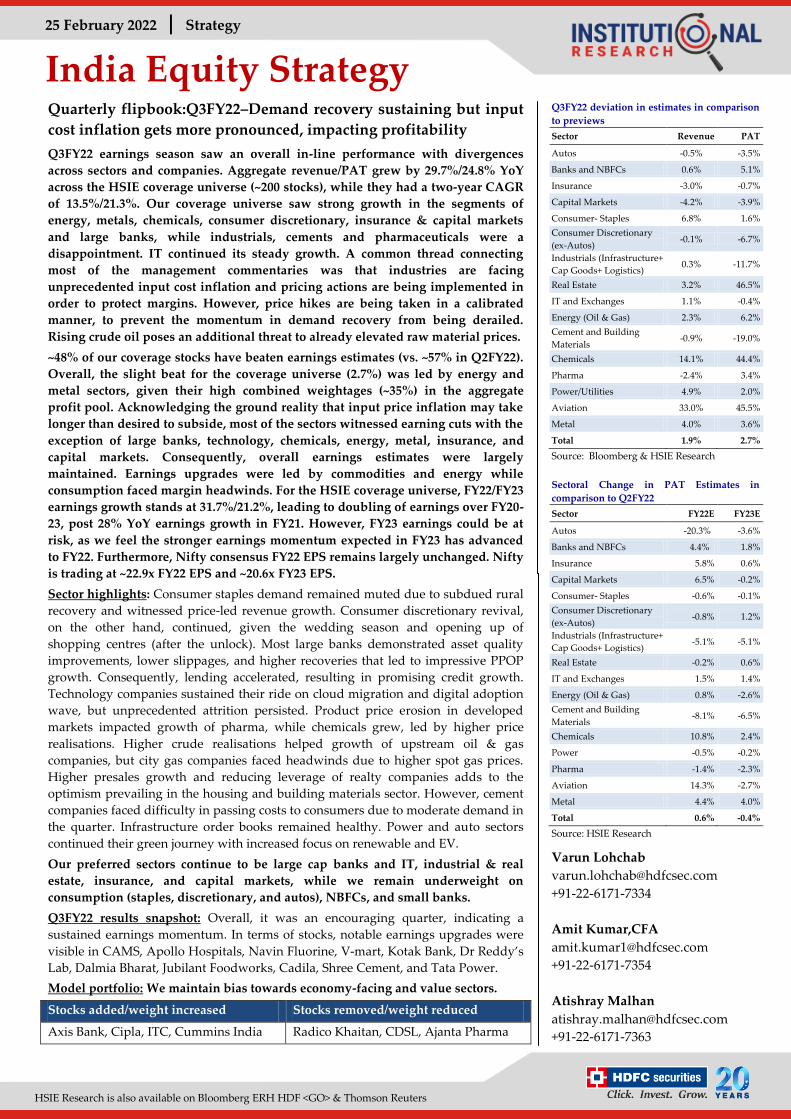
Q3FY22 deviation in estimates in comparison
to previews
Sector Revenue PAT
Autos -0.5% -3.5%
Banks and NBFCs 0.6% 5.1%
Insurance -3.0% -0.7%
Capital Markets -4.2% -3.9%
Consumer- Staples 6.8% 1.6%
Consumer Discretionary
(ex-Autos) -0.1% -6.7%
Industrials (Infrastructure+
Cap Goods+ Logistics) 0.3% -11.7%
Real Estate 3.2% 46.5%
IT and Exchanges 1.1% -0.4%
Energy (Oil & Gas) 2.3% 6.2%
Cement and Building
Materials -0.9% -19.0%
Chemicals 14.1% 44.4%
Pharma -2.4% 3.4%
Power/Utilities 4.9% 2.0%
Aviation 33.0% 45.5%
Metal 4.0% 3.6%
Total 1.9% 2.7%
Source: Bloomberg & HSIE Research
Sectoral Change in PAT Estimates in
comparison to Q2FY22
Sector FY22E FY23E
Autos -20.3% -3.6%
Banks and NBFCs 4.4% 1.8%
Insurance 5.8% 0.6%
Capital Markets 6.5% -0.2%
Consumer- Staples -0.6% -0.1%
Consumer Discretionary
(ex-Autos) -0.8% 1.2%
Industrials (Infrastructure+
Cap Goods+ Logistics) -5.1% -5.1%
Real Estate -0.2% 0.6%
IT and Exchanges 1.5% 1.4%
Energy (Oil & Gas) 0.8% -2.6%
Cement and Building
Materials -8.1% -6.5%
Chemicals 10.8% 2.4%
Power -0.5% -0.2%
Pharma -1.4% -2.3%
Aviation 14.3% -2.7%
Metal 4.4% 4.0%
Total 0.6% -0.4%
Source: HSIE Research
Varun Lohchab
+91-22-6171-7334
Amit Kumar,CFA
+91-22-6171-7354
Atishray Malhan
+91-22-6171-7363
P a g e | 2
Strategy
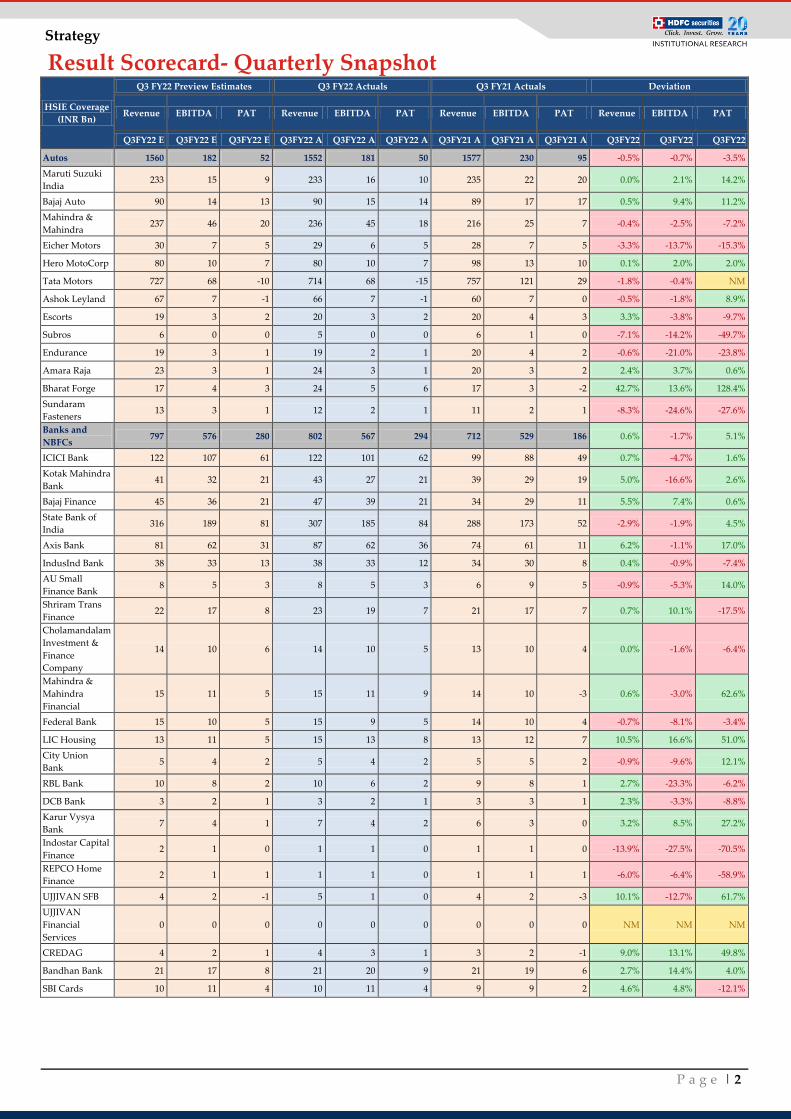
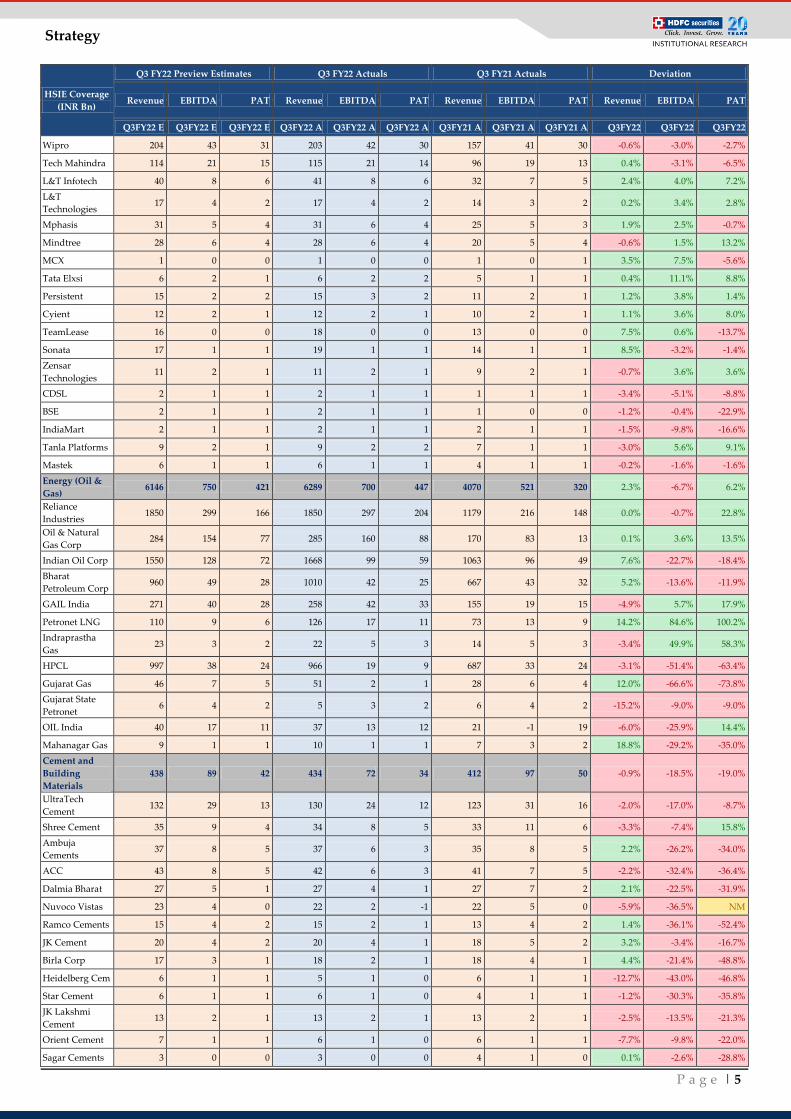
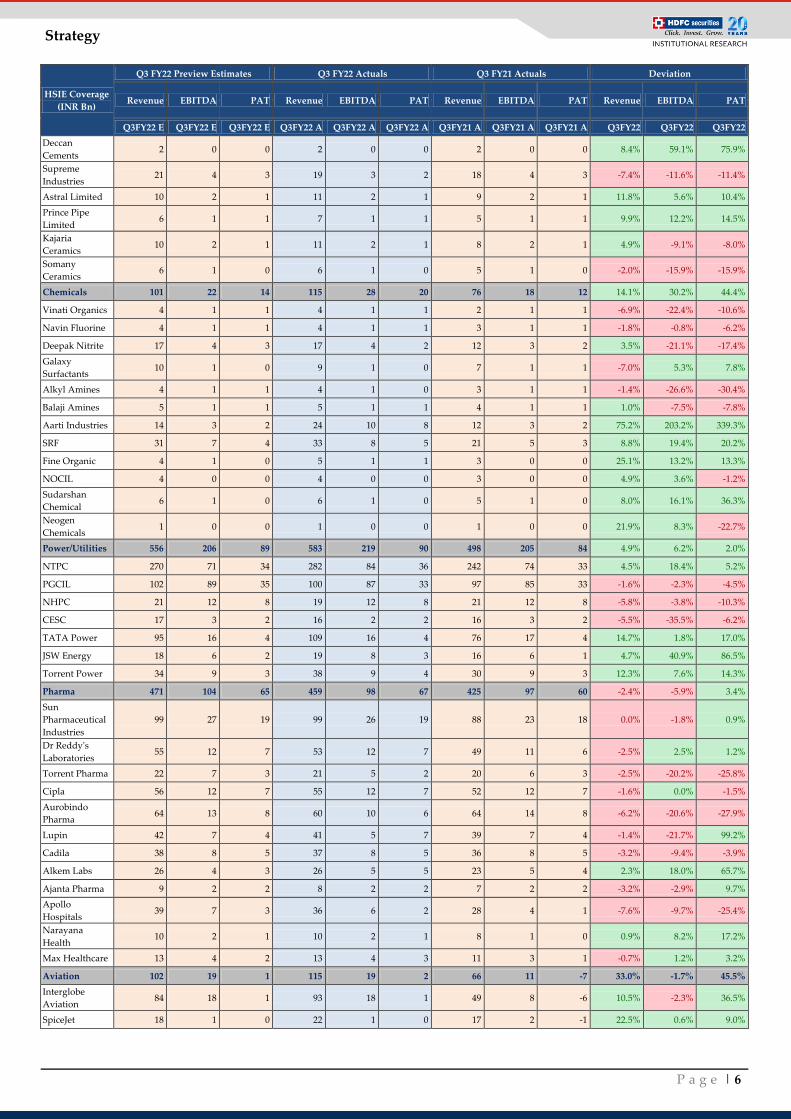
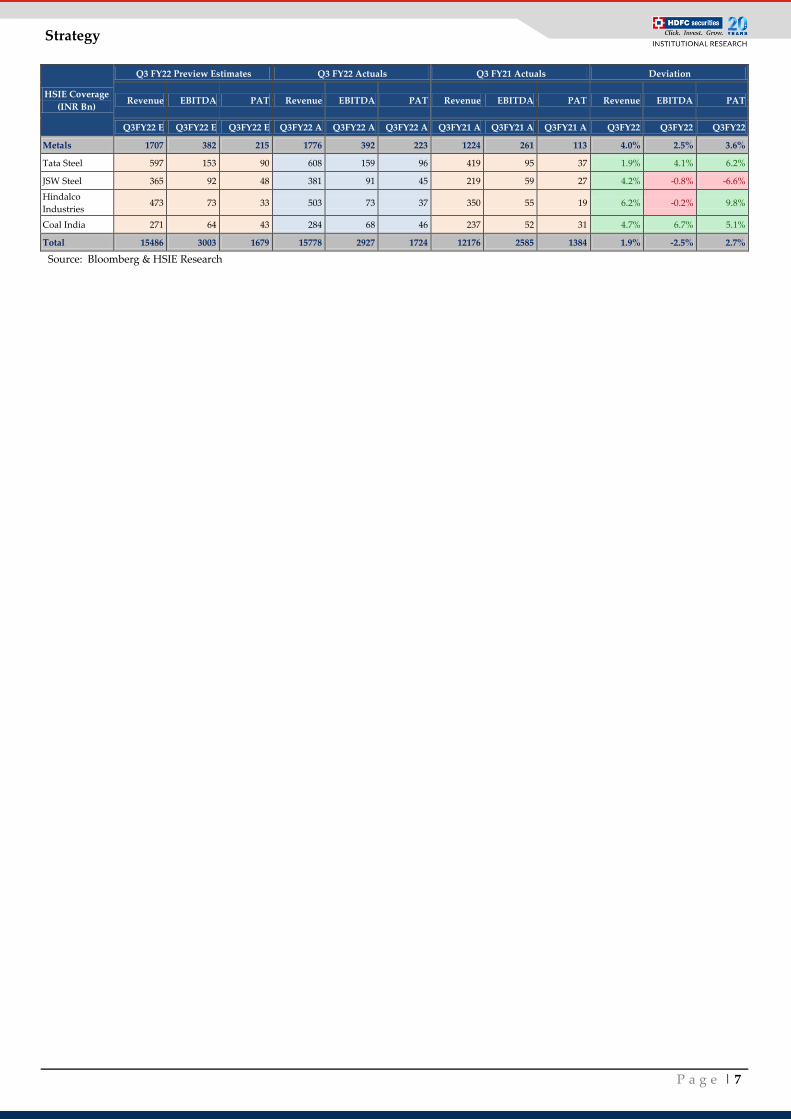
Result Scorecard- Quarterly Snapshot
HSIE Coverage
(INR Bn)
Q3 FY22 Preview Estimates Q3 FY22 Actuals Q3 FY21 Actuals Deviation
Revenue EBITDA PAT Revenue EBITDA PAT Revenue EBITDA PAT Revenue EBITDA PAT
Q3FY22 E Q3FY22 E Q3FY22 E Q3FY22 A Q3FY22 A Q3FY22 A Q3FY21 A Q3FY21 A Q3FY21 A Q3FY22 Q3FY22 Q3FY22
Autos 1560 182 52 1552 181 50 1577 230 95 -0.5% -0.7% -3.5%
Maruti Suzuki
India 233 15 9 233 16 10 235 22 20 0.0% 2.1% 14.2%
Bajaj Auto 90 14 13 90 15 14 89 17 17 0.5% 9.4% 11.2%
Mahindra &
Mahindra 237 46 20 236 45 18 216 25 7 -0.4% -2.5% -7.2%
Eicher Motors 30 7 5 29 6 5 28 7 5 -3.3% -13.7% -15.3%
Hero MotoCorp 80 10 7 80 10 7 98 13 10 0.1% 2.0% 2.0%
Tata Motors 727 68 -10 714 68 -15 757 121 29 -1.8% -0.4% NM
Ashok Leyland 67 7 -1 66 7 -1 60 7 0 -0.5% -1.8% 8.9%
Escorts 19 3 2 20 3 2 20 4 3 3.3% -3.8% -9.7%
Subros 6 0 0 5 0 0 6 1 0 -7.1% -14.2% -49.7%
Endurance 19 3 1 19 2 1 20 4 2 -0.6% -21.0% -23.8%
Amara Raja 23 3 1 24 3 1 20 3 2 2.4% 3.7% 0.6%
Bharat Forge 17 4 3 24 5 6 17 3 -2 42.7% 13.6% 128.4%
Sundaram
Fasteners 13 3 1 12 2 1 11 2 1 -8.3% -24.6% -27.6%
Banks and
NBFCs 797 576 280 802 567 294 712 529 186 0.6% -1.7% 5.1%
ICICI Bank 122 107 61 122 101 62 99 88 49 0.7% -4.7% 1.6%
Kotak Mahindra
Bank 41 32 21 43 27 21 39 29 19 5.0% -16.6% 2.6%
Bajaj Finance 45 36 21 47 39 21 34 29 11 5.5% 7.4% 0.6%
State Bank of
India 316 189 81 307 185 84 288 173 52 -2.9% -1.9% 4.5%
Axis Bank 81 62 31 87 62 36 74 61 11 6.2% -1.1% 17.0%
IndusInd Bank 38 33 13 38 33 12 34 30 8 0.4% -0.9% -7.4%
AU Small
Finance Bank 8 5 3 8 5 3 6 9 5 -0.9% -5.3% 14.0%
Shriram Trans
Finance 22 17 8 23 19 7 21 17 7 0.7% 10.1% -17.5%
Cholamandalam
Investment &
Finance
Company
14 10 6 14 10 5 13 10 4 0.0% -1.6% -6.4%
Mahindra &
Mahindra
Financial
15 11 5 15 11 9 14 10 -3 0.6% -3.0% 62.6%
Federal Bank 15 10 5 15 9 5 14 10 4 -0.7% -8.1% -3.4%
LIC Housing 13 11 5 15 13 8 13 12 7 10.5% 16.6% 51.0%
City Union
Bank 5 4 2 5 4 2 5 5 2 -0.9% -9.6% 12.1%
RBL Bank 10 8 2 10 6 2 9 8 1 2.7% -23.3% -6.2%
DCB Bank 3 2 1 3 2 1 3 3 1 2.3% -3.3% -8.8%
Karur Vysya
Bank 7 4 1 7 4 2 6 3 0 3.2% 8.5% 27.2%
Indostar Capital
Finance 2 1 0 1 1 0 1 1 0 -13.9% -27.5% -70.5%
REPCO Home
Finance 2 1 1 1 1 0 1 1 1 -6.0% -6.4% -58.9%
UJJIVAN SFB 4 2 -1 5 1 0 4 2 -3 10.1% -12.7% 61.7%
UJJIVAN
Financial
Services
0 0 0 0 0 0 0 0 0 NM NM NM
CREDAG 4 2 1 4 3 1 3 2 -1 9.0% 13.1% 49.8%
Bandhan Bank 21 17 8 21 20 9 21 19 6 2.7% 14.4% 4.0%
SBI Cards 10 11 4 10 11 4 9 9 2 4.6% 4.8% -12.1%
P a g e | 3
Strategy
HSIE Coverage
(INR Bn)
Q3 FY22 Preview Estimates Q3 FY22 Actuals Q3 FY21 Actuals Deviation
Revenue EBITDA PAT Revenue EBITDA PAT Revenue EBITDA PAT Revenue EBITDA PAT
Q3FY22 E Q3FY22 E Q3FY22 E Q3FY22 A Q3FY22 A Q3FY22 A Q3FY21 A Q3FY21 A Q3FY21 A Q3FY22 Q3FY22 Q3FY22
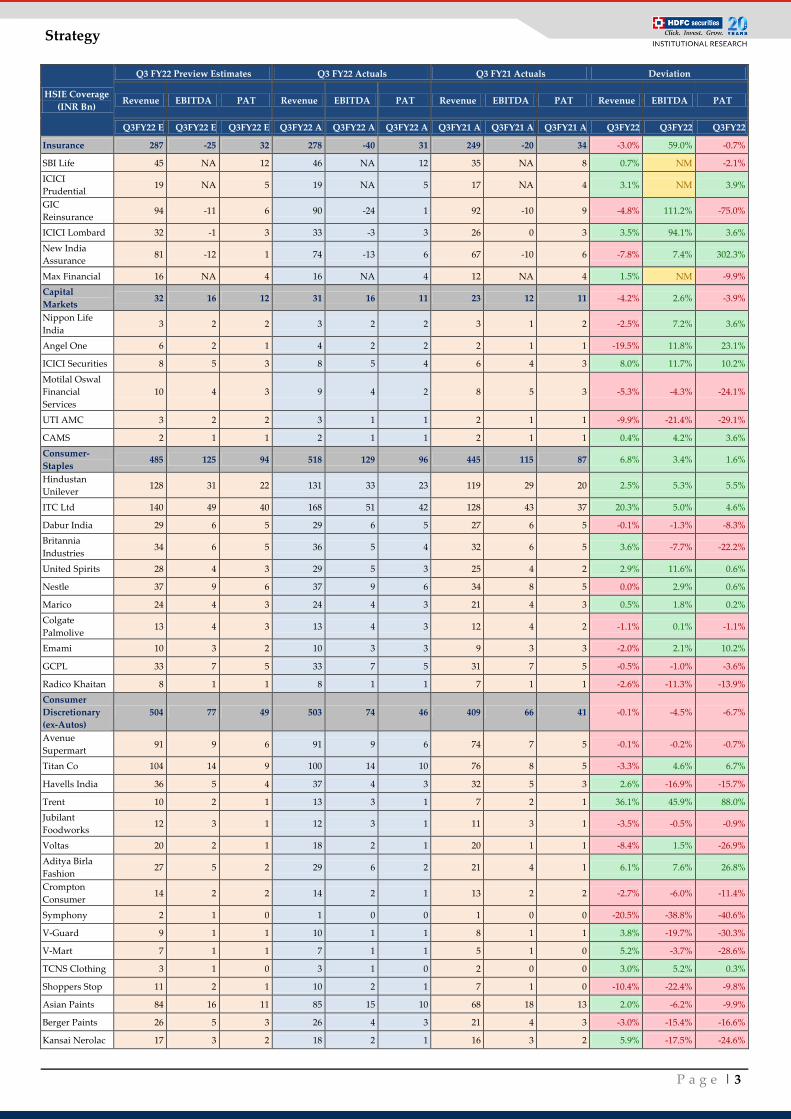
Insurance 287 -25 32 278 -40 31 249 -20 34 -3.0% 59.0% -0.7%
SBI Life 45 NA 12 46 NA 12 35 NA 8 0.7% NM -2.1%
ICICI
Prudential 19 NA 5 19 NA 5 17 NA 4 3.1% NM 3.9%
GIC
Reinsurance 94 -11 6 90 -24 1 92 -10 9 -4.8% 111.2% -75.0%
ICICI Lombard 32 -1 3 33 -3 3 26 0 3 3.5% 94.1% 3.6%
New India
Assurance 81 -12 1 74 -13 6 67 -10 6 -7.8% 7.4% 302.3%
Max Financial 16 NA 4 16 NA 4 12 NA 4 1.5% NM -9.9%
Capital
Markets 32 16 12 31 16 11 23 12 11 -4.2% 2.6% -3.9%
Nippon Life
India 3 2 2 3 2 2 3 1 2 -2.5% 7.2% 3.6%
Angel One 6 2 1 4 2 2 2 1 1 -19.5% 11.8% 23.1%
ICICI Securities 8 5 3 8 5 4 6 4 3 8.0% 11.7% 10.2%
Motilal Oswal
Financial
Services
10 4 3 9 4 2 8 5 3 -5.3% -4.3% -24.1%
UTI AMC 3 2 2 3 1 1 2 1 1 -9.9% -21.4% -29.1%
CAMS 2 1 1 2 1 1 2 1 1 0.4% 4.2% 3.6%
Consumer-
Staples 485 125 94 518 129 96 445 115 87 6.8% 3.4% 1.6%
Hindustan
Unilever 128 31 22 131 33 23 119 29 20 2.5% 5.3% 5.5%
ITC Ltd 140 49 40 168 51 42 128 43 37 20.3% 5.0% 4.6%
Dabur India 29 6 5 29 6 5 27 6 5 -0.1% -1.3% -8.3%
Britannia
Industries 34 6 5 36 5 4 32 6 5 3.6% -7.7% -22.2%
United Spirits 28 4 3 29 5 3 25 4 2 2.9% 11.6% 0.6%
Nestle 37 9 6 37 9 6 34 8 5 0.0% 2.9% 0.6%
Marico 24 4 3 24 4 3 21 4 3 0.5% 1.8% 0.2%
Colgate
Palmolive 13 4 3 13 4 3 12 4 2 -1.1% 0.1% -1.1%
Emami 10 3 2 10 3 3 9 3 3 -2.0% 2.1% 10.2%
GCPL 33 7 5 33 7 5 31 7 5 -0.5% -1.0% -3.6%
Radico Khaitan 8 1 1 8 1 1 7 1 1 -2.6% -11.3% -13.9%
Consumer
Discretionary
(ex-Autos)
504 77 49 503 74 46 409 66 41 -0.1% -4.5% -6.7%
Avenue
Supermart 91 9 6 91 9 6 74 7 5 -0.1% -0.2% -0.7%
Titan Co 104 14 9 100 14 10 76 8 5 -3.3% 4.6% 6.7%
Havells India 36 5 4 37 4 3 32 5 3 2.6% -16.9% -15.7%
Trent 10 2 1 13 3 1 7 2 1 36.1% 45.9% 88.0%
Jubilant
Foodworks 12 3 1 12 3 1 11 3 1 -3.5% -0.5% -0.9%
Voltas 20 2 1 18 2 1 20 1 1 -8.4% 1.5% -26.9%
Aditya Birla
Fashion 27 5 2 29 6 2 21 4 1 6.1% 7.6% 26.8%
Crompton
Consumer 14 2 2 14 2 1 13 2 2 -2.7% -6.0% -11.4%
Symphony 2 1 0 1 0 0 1 0 0 -20.5% -38.8% -40.6%
V-Guard 9 1 1 10 1 1 8 1 1 3.8% -19.7% -30.3%
V-Mart 7 1 1 7 1 1 5 1 0 5.2% -3.7% -28.6%
TCNS Clothing 3 1 0 3 1 0 2 0 0 3.0% 5.2% 0.3%
Shoppers Stop 11 2 1 10 2 1 7 1 0 -10.4% -22.4% -9.8%
Asian Paints 84 16 11 85 15 10 68 18 13 2.0% -6.2% -9.9%
Berger Paints 26 5 3 26 4 3 21 4 3 -3.0% -15.4% -16.6%
Kansai Nerolac 17 3 2 18 2 1 16 3 2 5.9% -17.5% -24.6%
P a g e | 4
Strategy
HSIE Coverage
(INR Bn)
Q3 FY22 Preview Estimates Q3 FY22 Actuals Q3 FY21 Actuals Deviation
Revenue EBITDA PAT Revenue EBITDA PAT Revenue EBITDA PAT Revenue EBITDA PAT
Q3FY22 E Q3FY22 E Q3FY22 E Q3FY22 A Q3FY22 A Q3FY22 A Q3FY21 A Q3FY21 A Q3FY21 A Q3FY22 Q3FY22 Q3FY22
Bata India 9 3 1 8 2 1 6 1 0 -11.3% -35.3% -48.7%
Relaxo
Footwears 8 2 1 7 1 1 7 1 1 -7.7% -20.5% -26.2%
TTK Prestige 7 1 1 7 1 1 7 1 1 -3.0% 1.7% -1.3%
Orient Electric 7 1 0 7 1 0 6 1 1 1.3% -7.4% -10.8%
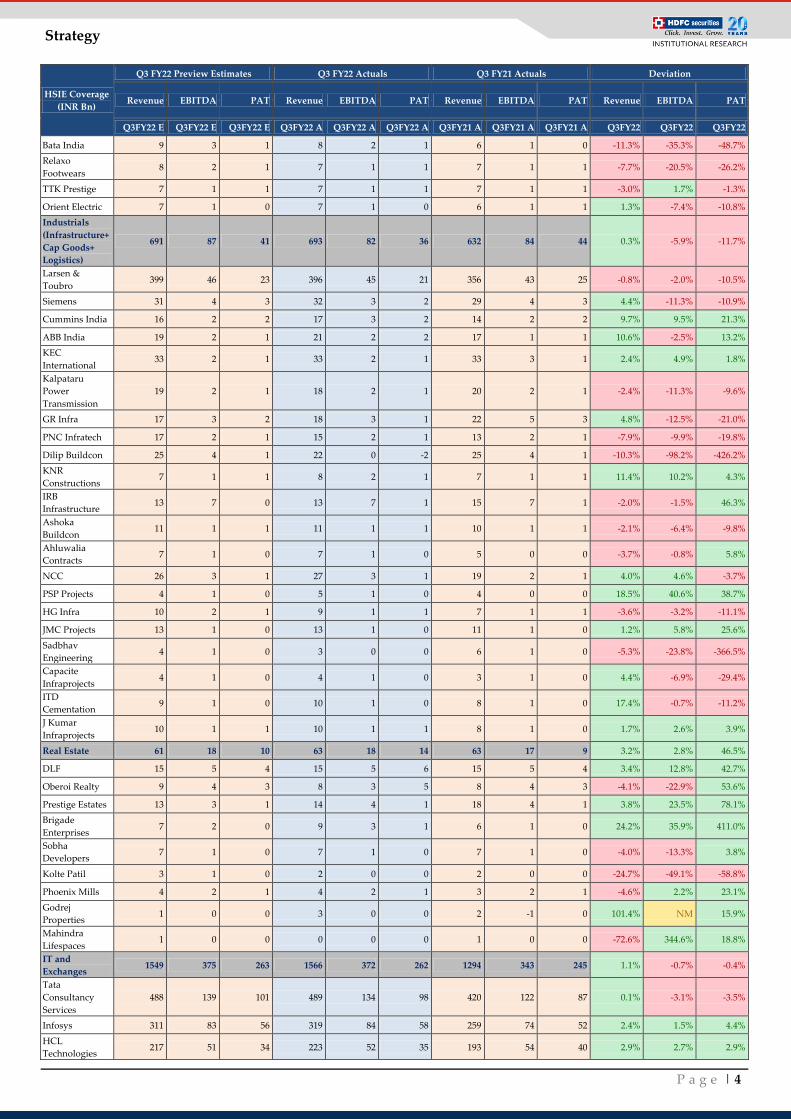
Industrials
(Infrastructure+
Cap Goods+
Logistics)
691 87 41 693 82 36 632 84 44 0.3% -5.9% -11.7%
Larsen &
Toubro 399 46 23 396 45 21 356 43 25 -0.8% -2.0% -10.5%
Siemens 31 4 3 32 3 2 29 4 3 4.4% -11.3% -10.9%
Cummins India 16 2 2 17 3 2 14 2 2 9.7% 9.5% 21.3%
ABB India 19 2 1 21 2 2 17 1 1 10.6% -2.5% 13.2%
KEC
International 33 2 1 33 2 1 33 3 1 2.4% 4.9% 1.8%
Kalpataru
Power
Transmission
19 2 1 18 2 1 20 2 1 -2.4% -11.3% -9.6%
GR Infra 17 3 2 18 3 1 22 5 3 4.8% -12.5% -21.0%
PNC Infratech 17 2 1 15 2 1 13 2 1 -7.9% -9.9% -19.8%
Dilip Buildcon 25 4 1 22 0 -2 25 4 1 -10.3% -98.2% -426.2%
KNR
Constructions 7 1 1 8 2 1 7 1 1 11.4% 10.2% 4.3%
IRB
Infrastructure 13 7 0 13 7 1 15 7 1 -2.0% -1.5% 46.3%
Ashoka
Buildcon 11 1 1 11 1 1 10 1 1 -2.1% -6.4% -9.8%
Ahluwalia
Contracts 7 1 0 7 1 0 5 0 0 -3.7% -0.8% 5.8%
NCC 26 3 1 27 3 1 19 2 1 4.0% 4.6% -3.7%
PSP Projects 4 1 0 5 1 0 4 0 0 18.5% 40.6% 38.7%
HG Infra 10 2 1 9 1 1 7 1 1 -3.6% -3.2% -11.1%
JMC Projects 13 1 0 13 1 0 11 1 0 1.2% 5.8% 25.6%
Sadbhav
Engineering 4 1 0 3 0 0 6 1 0 -5.3% -23.8% -366.5%
Capacite
Infraprojects 4 1 0 4 1 0 3 1 0 4.4% -6.9% -29.4%
ITD
Cementation 9 1 0 10 1 0 8 1 0 17.4% -0.7% -11.2%
J Kumar
Infraprojects 10 1 1 10 1 1 8 1 0 1.7% 2.6% 3.9%
Real Estate 61 18 10 63 18 14 63 17 9 3.2% 2.8% 46.5%
DLF 15 5 4 15 5 6 15 5 4 3.4% 12.8% 42.7%
Oberoi Realty 9 4 3 8 3 5 8 4 3 -4.1% -22.9% 53.6%
Prestige Estates 13 3 1 14 4 1 18 4 1 3.8% 23.5% 78.1%
Brigade
Enterprises 7 2 0 9 3 1 6 1 0 24.2% 35.9% 411.0%
Sobha
Developers 7 1 0 7 1 0 7 1 0 -4.0% -13.3% 3.8%
Kolte Patil 3 1 0 2 0 0 2 0 0 -24.7% -49.1% -58.8%
Phoenix Mills 4 2 1 4 2 1 3 2 1 -4.6% 2.2% 23.1%
Godrej
Properties 1 0 0 3 0 0 2 -1 0 101.4% NM 15.9%
Mahindra
Lifespaces 1 0 0 0 0 0 1 0 0 -72.6% 344.6% 18.8%
IT and
Exchanges 1549 375 263 1566 372 262 1294 343 245 1.1% -0.7% -0.4%
Tata
Consultancy
Services
488 139 101 489 134 98 420 122 87 0.1% -3.1% -3.5%
Infosys 311 83 56 319 84 58 259 74 52 2.4% 1.5% 4.4%
HCL
Technologies 217 51 34 223 52 35 193 54 40 2.9% 2.7% 2.9%
P a g e | 5
Strategy
HSIE Coverage
(INR Bn)
Q3 FY22 Preview Estimates Q3 FY22 Actuals Q3 FY21 Actuals Deviation
Revenue EBITDA PAT Revenue EBITDA PAT Revenue EBITDA PAT Revenue EBITDA PAT
Q3FY22 E Q3FY22 E Q3FY22 E Q3FY22 A Q3FY22 A Q3FY22 A Q3FY21 A Q3FY21 A Q3FY21 A Q3FY22 Q3FY22 Q3FY22
Wipro 204 43 31 203 42 30 157 41 30 -0.6% -3.0% -2.7%
Tech Mahindra 114 21 15 115 21 14 96 19 13 0.4% -3.1% -6.5%
L&T Infotech 40 8 6 41 8 6 32 7 5 2.4% 4.0% 7.2%
L&T
Technologies 17 4 2 17 4 2 14 3 2 0.2% 3.4% 2.8%
Mphasis 31 5 4 31 6 4 25 5 3 1.9% 2.5% -0.7%
Mindtree 28 6 4 28 6 4 20 5 4 -0.6% 1.5% 13.2%
MCX 1 0 0 1 0 0 1 0 1 3.5% 7.5% -5.6%
Tata Elxsi 6 2 1 6 2 2 5 1 1 0.4% 11.1% 8.8%
Persistent 15 2 2 15 3 2 11 2 1 1.2% 3.8% 1.4%
Cyient 12 2 1 12 2 1 10 2 1 1.1% 3.6% 8.0%
TeamLease 16 0 0 18 0 0 13 0 0 7.5% 0.6% -13.7%
Sonata 17 1 1 19 1 1 14 1 1 8.5% -3.2% -1.4%
Zensar
Technologies 11 2 1 11 2 1 9 2 1 -0.7% 3.6% 3.6%
CDSL 2 1 1 2 1 1 1 1 1 -3.4% -5.1% -8.8%
BSE 2 1 1 2 1 1 1 0 0 -1.2% -0.4% -22.9%
IndiaMart 2 1 1 2 1 1 2 1 1 -1.5% -9.8% -16.6%
Tanla Platforms 9 2 1 9 2 2 7 1 1 -3.0% 5.6% 9.1%
Mastek 6 1 1 6 1 1 4 1 1 -0.2% -1.6% -1.6%
Energy (Oil &
Gas) 6146 750 421 6289 700 447 4070 521 320 2.3% -6.7% 6.2%
Reliance
Industries 1850 299 166 1850 297 204 1179 216 148 0.0% -0.7% 22.8%
Oil & Natural
Gas Corp 284 154 77 285 160 88 170 83 13 0.1% 3.6% 13.5%
Indian Oil Corp 1550 128 72 1668 99 59 1063 96 49 7.6% -22.7% -18.4%
Bharat
Petroleum Corp 960 49 28 1010 42 25 667 43 32 5.2% -13.6% -11.9%
GAIL India 271 40 28 258 42 33 155 19 15 -4.9% 5.7% 17.9%
Petronet LNG 110 9 6 126 17 11 73 13 9 14.2% 84.6% 100.2%
Indraprastha
Gas 23 3 2 22 5 3 14 5 3 -3.4% 49.9% 58.3%
HPCL 997 38 24 966 19 9 687 33 24 -3.1% -51.4% -63.4%
Gujarat Gas 46 7 5 51 2 1 28 6 4 12.0% -66.6% -73.8%
Gujarat State
Petronet 6 4 2 5 3 2 6 4 2 -15.2% -9.0% -9.0%
OIL India 40 17 11 37 13 12 21 -1 19 -6.0% -25.9% 14.4%
Mahanagar Gas 9 1 1 10 1 1 7 3 2 18.8% -29.2% -35.0%
Cement and
Building
Materials
438 89 42 434 72 34 412 97 50 -0.9% -18.5% -19.0%
UltraTech
Cement 132 29 13 130 24 12 123 31 16 -2.0% -17.0% -8.7%
Shree Cement 35 9 4 34 8 5 33 11 6 -3.3% -7.4% 15.8%
Ambuja
Cements 37 8 5 37 6 3 35 8 5 2.2% -26.2% -34.0%
ACC 43 8 5 42 6 3 41 7 5 -2.2% -32.4% -36.4%
Dalmia Bharat 27 5 1 27 4 1 27 7 2 2.1% -22.5% -31.9%
Nuvoco Vistas 23 4 0 22 2 -1 22 5 0 -5.9% -36.5% NM
Ramco Cements 15 4 2 15 2 1 13 4 2 1.4% -36.1% -52.4%
JK Cement 20 4 2 20 4 1 18 5 2 3.2% -3.4% -16.7%
Birla Corp 17 3 1 18 2 1 18 4 1 4.4% -21.4% -48.8%
Heidelberg Cem 6 1 1 5 1 0 6 1 1 -12.7% -43.0% -46.8%
Star Cement 6 1 1 6 1 0 4 1 1 -1.2% -30.3% -35.8%
JK Lakshmi
Cement 13 2 1 13 2 1 13 2 1 -2.5% -13.5% -21.3%
Orient Cement 7 1 1 6 1 0 6 1 1 -7.7% -9.8% -22.0%
Sagar Cements 3 0 0 3 0 0 4 1 0 0.1% -2.6% -28.8%
P a g e | 6
Strategy
HSIE Coverage
(INR Bn)
Q3 FY22 Preview Estimates Q3 FY22 Actuals Q3 FY21 Actuals Deviation
Revenue EBITDA PAT Revenue EBITDA PAT Revenue EBITDA PAT Revenue EBITDA PAT
Q3FY22 E Q3FY22 E Q3FY22 E Q3FY22 A Q3FY22 A Q3FY22 A Q3FY21 A Q3FY21 A Q3FY21 A Q3FY22 Q3FY22 Q3FY22
Deccan
Cements 2 0 0 2 0 0 2 0 0 8.4% 59.1% 75.9%
Supreme
Industries 21 4 3 19 3 2 18 4 3 -7.4% -11.6% -11.4%
Astral Limited 10 2 1 11 2 1 9 2 1 11.8% 5.6% 10.4%
Prince Pipe
Limited 6 1 1 7 1 1 5 1 1 9.9% 12.2% 14.5%
Kajaria
Ceramics 10 2 1 11 2 1 8 2 1 4.9% -9.1% -8.0%
Somany
Ceramics 6 1 0 6 1 0 5 1 0 -2.0% -15.9% -15.9%
Chemicals 101 22 14 115 28 20 76 18 12 14.1% 30.2% 44.4%
Vinati Organics 4 1 1 4 1 1 2 1 1 -6.9% -22.4% -10.6%
Navin Fluorine 4 1 1 4 1 1 3 1 1 -1.8% -0.8% -6.2%
Deepak Nitrite 17 4 3 17 4 2 12 3 2 3.5% -21.1% -17.4%
Galaxy
Surfactants 10 1 0 9 1 0 7 1 1 -7.0% 5.3% 7.8%
Alkyl Amines 4 1 1 4 1 0 3 1 1 -1.4% -26.6% -30.4%
Balaji Amines 5 1 1 5 1 1 4 1 1 1.0% -7.5% -7.8%
Aarti Industries 14 3 2 24 10 8 12 3 2 75.2% 203.2% 339.3%
SRF 31 7 4 33 8 5 21 5 3 8.8% 19.4% 20.2%
Fine Organic 4 1 0 5 1 1 3 0 0 25.1% 13.2% 13.3%
NOCIL 4 0 0 4 0 0 3 0 0 4.9% 3.6% -1.2%
Sudarshan
Chemical 6 1 0 6 1 0 5 1 0 8.0% 16.1% 36.3%
Neogen
Chemicals 1 0 0 1 0 0 1 0 0 21.9% 8.3% -22.7%
Power/Utilities 556 206 89 583 219 90 498 205 84 4.9% 6.2% 2.0%
NTPC 270 71 34 282 84 36 242 74 33 4.5% 18.4% 5.2%
PGCIL 102 89 35 100 87 33 97 85 33 -1.6% -2.3% -4.5%
NHPC 21 12 8 19 12 8 21 12 8 -5.8% -3.8% -10.3%
CESC 17 3 2 16 2 2 16 3 2 -5.5% -35.5% -6.2%
TATA Power 95 16 4 109 16 4 76 17 4 14.7% 1.8% 17.0%
JSW Energy 18 6 2 19 8 3 16 6 1 4.7% 40.9% 86.5%
Torrent Power 34 9 3 38 9 4 30 9 3 12.3% 7.6% 14.3%
Pharma 471 104 65 459 98 67 425 97 60 -2.4% -5.9% 3.4%
Sun
Pharmaceutical
Industries
99 27 19 99 26 19 88 23 18 0.0% -1.8% 0.9%
Dr Reddy's
Laboratories 55 12 7 53 12 7 49 11 6 -2.5% 2.5% 1.2%
Torrent Pharma 22 7 3 21 5 2 20 6 3 -2.5% -20.2% -25.8%
Cipla 56 12 7 55 12 7 52 12 7 -1.6% 0.0% -1.5%
Aurobindo
Pharma 64 13 8 60 10 6 64 14 8 -6.2% -20.6% -27.9%
Lupin 42 7 4 41 5 7 39 7 4 -1.4% -21.7% 99.2%
Cadila 38 8 5 37 8 5 36 8 5 -3.2% -9.4% -3.9%
Alkem Labs 26 4 3 26 5 5 23 5 4 2.3% 18.0% 65.7%
Ajanta Pharma 9 2 2 8 2 2 7 2 2 -3.2% -2.9% 9.7%
Apollo
Hospitals 39 7 3 36 6 2 28 4 1 -7.6% -9.7% -25.4%
Narayana
Health 10 2 1 10 2 1 8 1 0 0.9% 8.2% 17.2%
Max Healthcare 13 4 2 13 4 3 11 3 1 -0.7% 1.2% 3.2%
Aviation 102 19 1 115 19 2 66 11 -7 33.0% -1.7% 45.5%
Interglobe
Aviation 84 18 1 93 18 1 49 8 -6 10.5% -2.3% 36.5%
SpiceJet 18 1 0 22 1 0 17 2 -1 22.5% 0.6% 9.0%
P a g e | 7
Strategy
HSIE Coverage
(INR Bn)
Q3 FY22 Preview Estimates Q3 FY22 Actuals Q3 FY21 Actuals Deviation
Revenue EBITDA PAT Revenue EBITDA PAT Revenue EBITDA PAT Revenue EBITDA PAT
Q3FY22 E Q3FY22 E Q3FY22 E Q3FY22 A Q3FY22 A Q3FY22 A Q3FY21 A Q3FY21 A Q3FY21 A Q3FY22 Q3FY22 Q3FY22
Metals 1707 382 215 1776 392 223 1224 261 113 4.0% 2.5% 3.6%
Tata Steel 597 153 90 608 159 96 419 95 37 1.9% 4.1% 6.2%
JSW Steel 365 92 48 381 91 45 219 59 27 4.2% -0.8% -6.6%
Hindalco
Industries 473 73 33 503 73 37 350 55 19 6.2% -0.2% 9.8%
Coal India 271 64 43 284 68 46 237 52 31 4.7% 6.7% 5.1%
Total 15486 3003 1679 15778 2927 1724 12176 2585 1384 1.9% -2.5% 2.7%
Source: Bloomberg & HSIE Research
P a g e | 8
Strategy
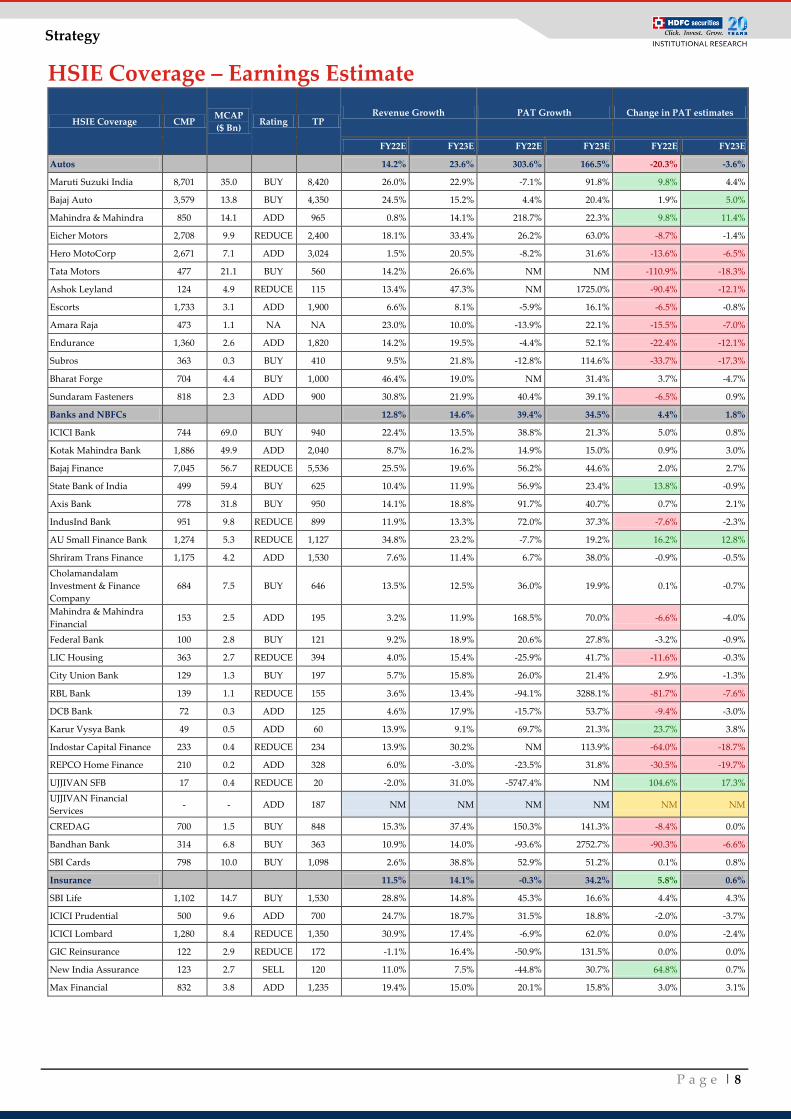
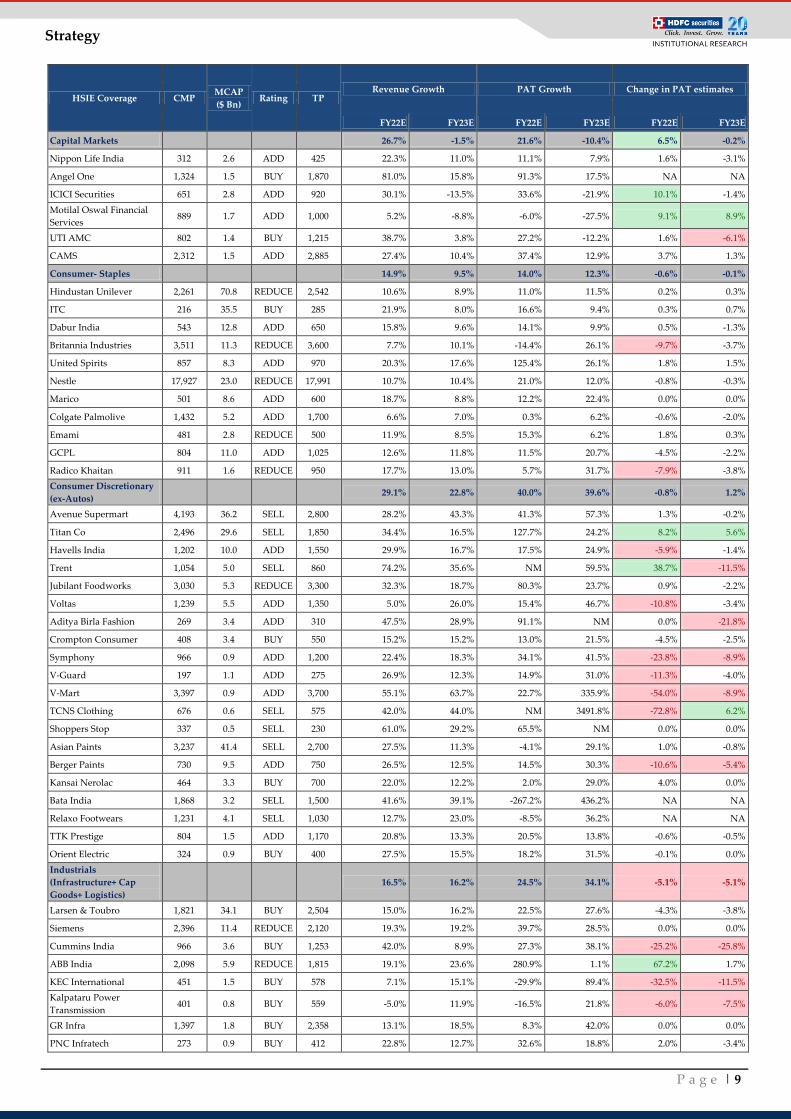
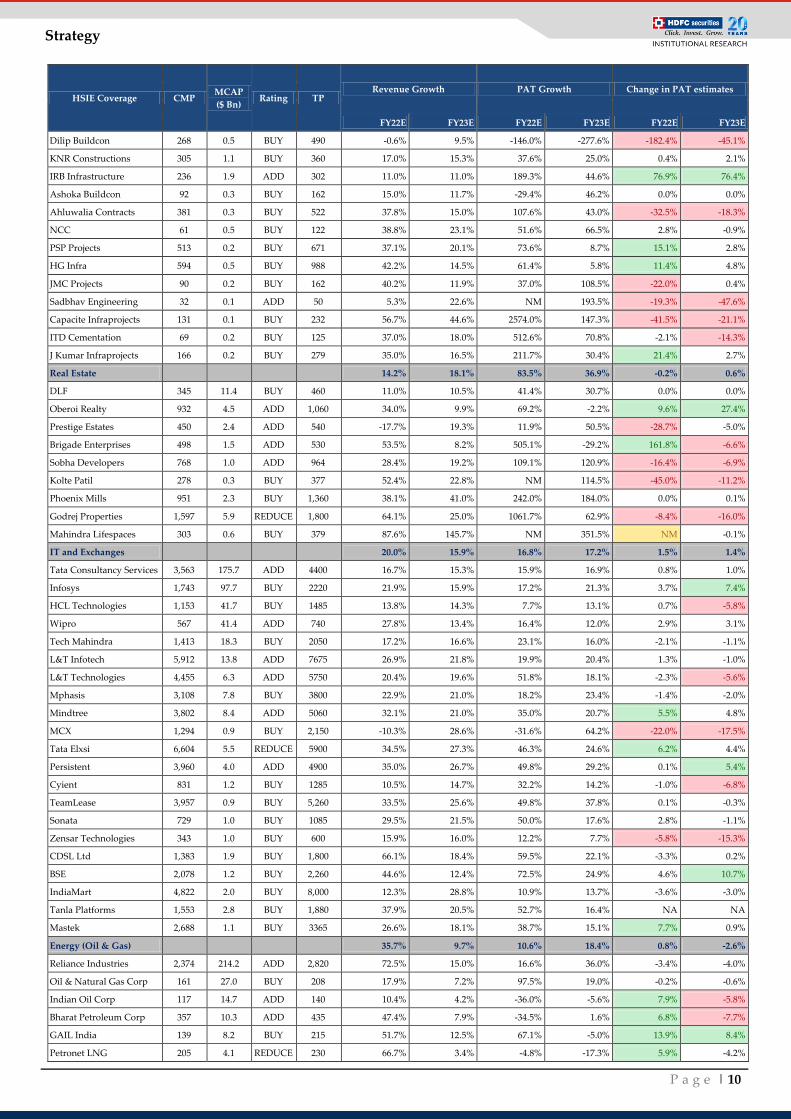
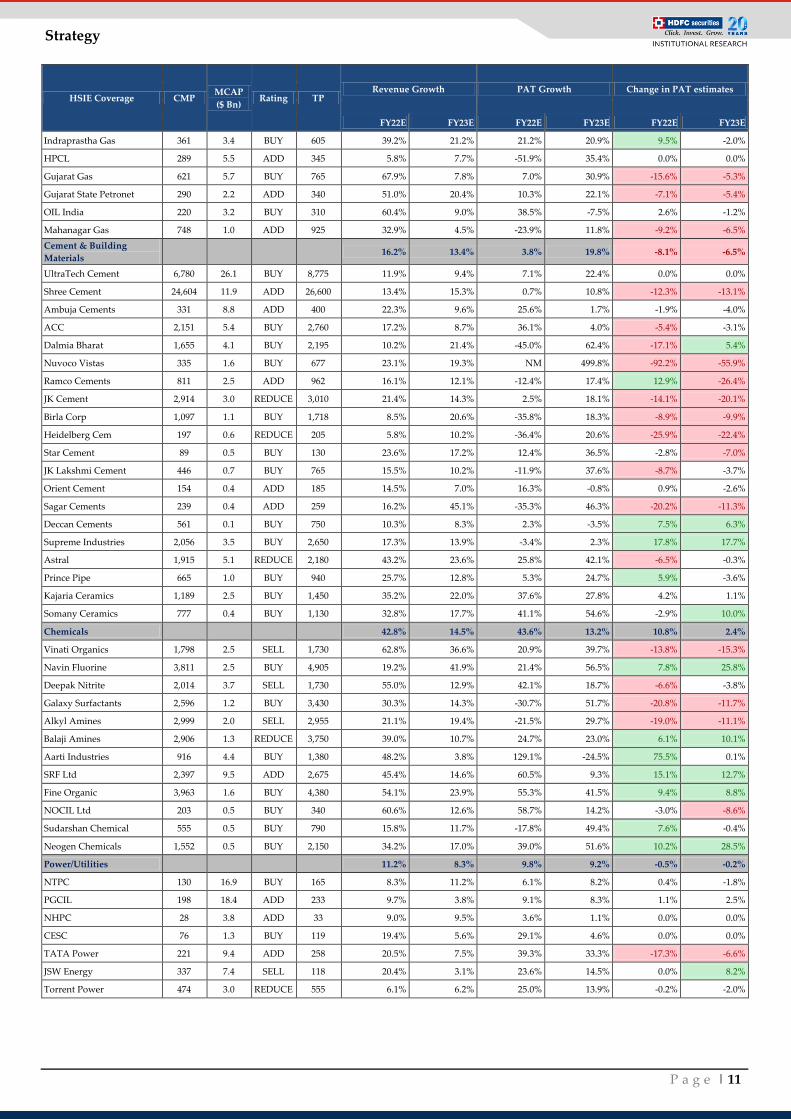
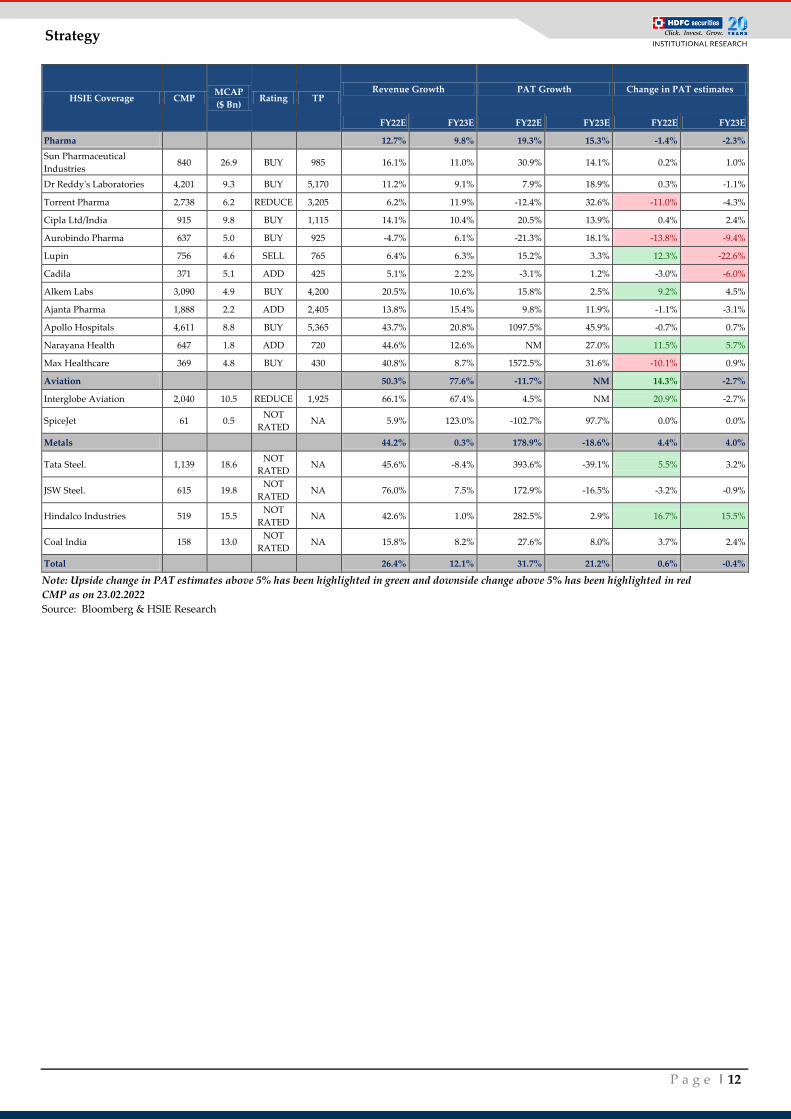
HSIE Coverage – Earnings Estimate
HSIE Coverage CMP MCAP
($ Bn) Rating TP
Revenue Growth PAT Growth Change in PAT estimates
FY22E FY23E FY22E FY23E FY22E FY23E
Autos
14.2% 23.6% 303.6% 166.5% -20.3% -3.6%
Maruti Suzuki India 8,701 35.0 BUY 8,420 26.0% 22.9% -7.1% 91.8% 9.8% 4.4%
Bajaj Auto 3,579 13.8 BUY 4,350 24.5% 15.2% 4.4% 20.4% 1.9% 5.0%
Mahindra & Mahindra 850 14.1 ADD 965 0.8% 14.1% 218.7% 22.3% 9.8% 11.4%
Eicher Motors 2,708 9.9 REDUCE 2,400 18.1% 33.4% 26.2% 63.0% -8.7% -1.4%
Hero MotoCorp 2,671 7.1 ADD 3,024 1.5% 20.5% -8.2% 31.6% -13.6% -6.5%
Tata Motors 477 21.1 BUY 560 14.2% 26.6% NM NM -110.9% -18.3%
Ashok Leyland 124 4.9 REDUCE 115 13.4% 47.3% NM 1725.0% -90.4% -12.1%
Escorts 1,733 3.1 ADD 1,900 6.6% 8.1% -5.9% 16.1% -6.5% -0.8%
Amara Raja 473 1.1 NA NA 23.0% 10.0% -13.9% 22.1% -15.5% -7.0%
Endurance 1,360 2.6 ADD 1,820 14.2% 19.5% -4.4% 52.1% -22.4% -12.1%
Subros 363 0.3 BUY 410 9.5% 21.8% -12.8% 114.6% -33.7% -17.3%
Bharat Forge 704 4.4 BUY 1,000 46.4% 19.0% NM 31.4% 3.7% -4.7%
Sundaram Fasteners 818 2.3 ADD 900 30.8% 21.9% 40.4% 39.1% -6.5% 0.9%
Banks and NBFCs
12.8% 14.6% 39.4% 34.5% 4.4% 1.8%
ICICI Bank 744 69.0 BUY 940 22.4% 13.5% 38.8% 21.3% 5.0% 0.8%
Kotak Mahindra Bank 1,886 49.9 ADD 2,040 8.7% 16.2% 14.9% 15.0% 0.9% 3.0%
Bajaj Finance 7,045 56.7 REDUCE 5,536 25.5% 19.6% 56.2% 44.6% 2.0% 2.7%
State Bank of India 499 59.4 BUY 625 10.4% 11.9% 56.9% 23.4% 13.8% -0.9%
Axis Bank 778 31.8 BUY 950 14.1% 18.8% 91.7% 40.7% 0.7% 2.1%
IndusInd Bank 951 9.8 REDUCE 899 11.9% 13.3% 72.0% 37.3% -7.6% -2.3%
AU Small Finance Bank 1,274 5.3 REDUCE 1,127 34.8% 23.2% -7.7% 19.2% 16.2% 12.8%
Shriram Trans Finance 1,175 4.2 ADD 1,530 7.6% 11.4% 6.7% 38.0% -0.9% -0.5%
Cholamandalam
Investment & Finance
Company
684 7.5 BUY 646 13.5% 12.5% 36.0% 19.9% 0.1% -0.7%
Mahindra & Mahindra
Financial 153 2.5 ADD 195 3.2% 11.9% 168.5% 70.0% -6.6% -4.0%
Federal Bank 100 2.8 BUY 121 9.2% 18.9% 20.6% 27.8% -3.2% -0.9%
LIC Housing 363 2.7 REDUCE 394 4.0% 15.4% -25.9% 41.7% -11.6% -0.3%
City Union Bank 129 1.3 BUY 197 5.7% 15.8% 26.0% 21.4% 2.9% -1.3%
RBL Bank 139 1.1 REDUCE 155 3.6% 13.4% -94.1% 3288.1% -81.7% -7.6%
DCB Bank 72 0.3 ADD 125 4.6% 17.9% -15.7% 53.7% -9.4% -3.0%
Karur Vysya Bank 49 0.5 ADD 60 13.9% 9.1% 69.7% 21.3% 23.7% 3.8%
Indostar Capital Finance 233 0.4 REDUCE 234 13.9% 30.2% NM 113.9% -64.0% -18.7%
REPCO Home Finance 210 0.2 ADD 328 6.0% -3.0% -23.5% 31.8% -30.5% -19.7%
UJJIVAN SFB 17 0.4 REDUCE 20 -2.0% 31.0% -5747.4% NM 104.6% 17.3%
UJJIVAN Financial
Services - - ADD 187 NM NM NM NM NM NM
CREDAG 700 1.5 BUY 848 15.3% 37.4% 150.3% 141.3% -8.4% 0.0%
Bandhan Bank 314 6.8 BUY 363 10.9% 14.0% -93.6% 2752.7% -90.3% -6.6%
SBI Cards 798 10.0 BUY 1,098 2.6% 38.8% 52.9% 51.2% 0.1% 0.8%
Insurance
11.5% 14.1% -0.3% 34.2% 5.8% 0.6%
SBI Life 1,102 14.7 BUY 1,530 28.8% 14.8% 45.3% 16.6% 4.4% 4.3%
ICICI Prudential 500 9.6 ADD 700 24.7% 18.7% 31.5% 18.8% -2.0% -3.7%
ICICI Lombard 1,280 8.4 REDUCE 1,350 30.9% 17.4% -6.9% 62.0% 0.0% -2.4%
GIC Reinsurance 122 2.9 REDUCE 172 -1.1% 16.4% -50.9% 131.5% 0.0% 0.0%
New India Assurance 123 2.7 SELL 120 11.0% 7.5% -44.8% 30.7% 64.8% 0.7%
Max Financial 832 3.8 ADD 1,235 19.4% 15.0% 20.1% 15.8% 3.0% 3.1%
P a g e | 9
Strategy
HSIE Coverage CMP MCAP
($ Bn) Rating TP
Revenue Growth PAT Growth Change in PAT estimates
FY22E FY23E FY22E FY23E FY22E FY23E
Capital Markets
26.7% -1.5% 21.6% -10.4% 6.5% -0.2%
Nippon Life India 312 2.6 ADD 425 22.3% 11.0% 11.1% 7.9% 1.6% -3.1%
Angel One 1,324 1.5 BUY 1,870 81.0% 15.8% 91.3% 17.5% NA NA
ICICI Securities 651 2.8 ADD 920 30.1% -13.5% 33.6% -21.9% 10.1% -1.4%
Motilal Oswal Financial
Services 889 1.7 ADD 1,000 5.2% -8.8% -6.0% -27.5% 9.1% 8.9%
UTI AMC 802 1.4 BUY 1,215 38.7% 3.8% 27.2% -12.2% 1.6% -6.1%
CAMS 2,312 1.5 ADD 2,885 27.4% 10.4% 37.4% 12.9% 3.7% 1.3%
Consumer- Staples
14.9% 9.5% 14.0% 12.3% -0.6% -0.1%
Hindustan Unilever 2,261 70.8 REDUCE 2,542 10.6% 8.9% 11.0% 11.5% 0.2% 0.3%
ITC 216 35.5 BUY 285 21.9% 8.0% 16.6% 9.4% 0.3% 0.7%
Dabur India 543 12.8 ADD 650 15.8% 9.6% 14.1% 9.9% 0.5% -1.3%
Britannia Industries 3,511 11.3 REDUCE 3,600 7.7% 10.1% -14.4% 26.1% -9.7% -3.7%
United Spirits 857 8.3 ADD 970 20.3% 17.6% 125.4% 26.1% 1.8% 1.5%
Nestle 17,927 23.0 REDUCE 17,991 10.7% 10.4% 21.0% 12.0% -0.8% -0.3%
Marico 501 8.6 ADD 600 18.7% 8.8% 12.2% 22.4% 0.0% 0.0%
Colgate Palmolive 1,432 5.2 ADD 1,700 6.6% 7.0% 0.3% 6.2% -0.6% -2.0%
Emami 481 2.8 REDUCE 500 11.9% 8.5% 15.3% 6.2% 1.8% 0.3%
GCPL 804 11.0 ADD 1,025 12.6% 11.8% 11.5% 20.7% -4.5% -2.2%
Radico Khaitan 911 1.6 REDUCE 950 17.7% 13.0% 5.7% 31.7% -7.9% -3.8%
Consumer Discretionary
(ex-Autos) 29.1% 22.8% 40.0% 39.6% -0.8% 1.2%
Avenue Supermart 4,193 36.2 SELL 2,800 28.2% 43.3% 41.3% 57.3% 1.3% -0.2%
Titan Co 2,496 29.6 SELL 1,850 34.4% 16.5% 127.7% 24.2% 8.2% 5.6%
Havells India 1,202 10.0 ADD 1,550 29.9% 16.7% 17.5% 24.9% -5.9% -1.4%
Trent 1,054 5.0 SELL 860 74.2% 35.6% NM 59.5% 38.7% -11.5%
Jubilant Foodworks 3,030 5.3 REDUCE 3,300 32.3% 18.7% 80.3% 23.7% 0.9% -2.2%
Voltas 1,239 5.5 ADD 1,350 5.0% 26.0% 15.4% 46.7% -10.8% -3.4%
Aditya Birla Fashion 269 3.4 ADD 310 47.5% 28.9% 91.1% NM 0.0% -21.8%
Crompton Consumer 408 3.4 BUY 550 15.2% 15.2% 13.0% 21.5% -4.5% -2.5%
Symphony 966 0.9 ADD 1,200 22.4% 18.3% 34.1% 41.5% -23.8% -8.9%
V-Guard 197 1.1 ADD 275 26.9% 12.3% 14.9% 31.0% -11.3% -4.0%
V-Mart 3,397 0.9 ADD 3,700 55.1% 63.7% 22.7% 335.9% -54.0% -8.9%
TCNS Clothing 676 0.6 SELL 575 42.0% 44.0% NM 3491.8% -72.8% 6.2%
Shoppers Stop 337 0.5 SELL 230 61.0% 29.2% 65.5% NM 0.0% 0.0%
Asian Paints 3,237 41.4 SELL 2,700 27.5% 11.3% -4.1% 29.1% 1.0% -0.8%
Berger Paints 730 9.5 ADD 750 26.5% 12.5% 14.5% 30.3% -10.6% -5.4%
Kansai Nerolac 464 3.3 BUY 700 22.0% 12.2% 2.0% 29.0% 4.0% 0.0%
Bata India 1,868 3.2 SELL 1,500 41.6% 39.1% -267.2% 436.2% NA NA
Relaxo Footwears 1,231 4.1 SELL 1,030 12.7% 23.0% -8.5% 36.2% NA NA
TTK Prestige 804 1.5 ADD 1,170 20.8% 13.3% 20.5% 13.8% -0.6% -0.5%
Orient Electric 324 0.9 BUY 400 27.5% 15.5% 18.2% 31.5% -0.1% 0.0%
Industrials
(Infrastructure+ Cap
Goods+ Logistics)
16.5% 16.2% 24.5% 34.1% -5.1% -5.1%
Larsen & Toubro 1,821 34.1 BUY 2,504 15.0% 16.2% 22.5% 27.6% -4.3% -3.8%
Siemens 2,396 11.4 REDUCE 2,120 19.3% 19.2% 39.7% 28.5% 0.0% 0.0%
Cummins India 966 3.6 BUY 1,253 42.0% 8.9% 27.3% 38.1% -25.2% -25.8%
ABB India 2,098 5.9 REDUCE 1,815 19.1% 23.6% 280.9% 1.1% 67.2% 1.7%
KEC International 451 1.5 BUY 578 7.1% 15.1% -29.9% 89.4% -32.5% -11.5%
Kalpataru Power
Transmission 401 0.8 BUY 559 -5.0% 11.9% -16.5% 21.8% -6.0% -7.5%
GR Infra 1,397 1.8 BUY 2,358 13.1% 18.5% 8.3% 42.0% 0.0% 0.0%
PNC Infratech 273 0.9 BUY 412 22.8% 12.7% 32.6% 18.8% 2.0% -3.4%
P a g e | 10
Strategy
HSIE Coverage CMP MCAP
($ Bn) Rating TP
Revenue Growth PAT Growth Change in PAT estimates
FY22E FY23E FY22E FY23E FY22E FY23E
Dilip Buildcon 268 0.5 BUY 490 -0.6% 9.5% -146.0% -277.6% -182.4% -45.1%
KNR Constructions 305 1.1 BUY 360 17.0% 15.3% 37.6% 25.0% 0.4% 2.1%
IRB Infrastructure 236 1.9 ADD 302 11.0% 11.0% 189.3% 44.6% 76.9% 76.4%
Ashoka Buildcon 92 0.3 BUY 162 15.0% 11.7% -29.4% 46.2% 0.0% 0.0%
Ahluwalia Contracts 381 0.3 BUY 522 37.8% 15.0% 107.6% 43.0% -32.5% -18.3%
NCC 61 0.5 BUY 122 38.8% 23.1% 51.6% 66.5% 2.8% -0.9%
PSP Projects 513 0.2 BUY 671 37.1% 20.1% 73.6% 8.7% 15.1% 2.8%
HG Infra 594 0.5 BUY 988 42.2% 14.5% 61.4% 5.8% 11.4% 4.8%
JMC Projects 90 0.2 BUY 162 40.2% 11.9% 37.0% 108.5% -22.0% 0.4%
Sadbhav Engineering 32 0.1 ADD 50 5.3% 22.6% NM 193.5% -19.3% -47.6%
Capacite Infraprojects 131 0.1 BUY 232 56.7% 44.6% 2574.0% 147.3% -41.5% -21.1%
ITD Cementation 69 0.2 BUY 125 37.0% 18.0% 512.6% 70.8% -2.1% -14.3%
J Kumar Infraprojects 166 0.2 BUY 279 35.0% 16.5% 211.7% 30.4% 21.4% 2.7%
Real Estate
14.2% 18.1% 83.5% 36.9% -0.2% 0.6%
DLF 345 11.4 BUY 460 11.0% 10.5% 41.4% 30.7% 0.0% 0.0%
Oberoi Realty 932 4.5 ADD 1,060 34.0% 9.9% 69.2% -2.2% 9.6% 27.4%
Prestige Estates 450 2.4 ADD 540 -17.7% 19.3% 11.9% 50.5% -28.7% -5.0%
Brigade Enterprises 498 1.5 ADD 530 53.5% 8.2% 505.1% -29.2% 161.8% -6.6%
Sobha Developers 768 1.0 ADD 964 28.4% 19.2% 109.1% 120.9% -16.4% -6.9%
Kolte Patil 278 0.3 BUY 377 52.4% 22.8% NM 114.5% -45.0% -11.2%
Phoenix Mills 951 2.3 BUY 1,360 38.1% 41.0% 242.0% 184.0% 0.0% 0.1%
Godrej Properties 1,597 5.9 REDUCE 1,800 64.1% 25.0% 1061.7% 62.9% -8.4% -16.0%
Mahindra Lifespaces 303 0.6 BUY 379 87.6% 145.7% NM 351.5% NM -0.1%
IT and Exchanges
20.0% 15.9% 16.8% 17.2% 1.5% 1.4%
Tata Consultancy Services 3,563 175.7 ADD 4400 16.7% 15.3% 15.9% 16.9% 0.8% 1.0%
Infosys 1,743 97.7 BUY 2220 21.9% 15.9% 17.2% 21.3% 3.7% 7.4%
HCL Technologies 1,153 41.7 BUY 1485 13.8% 14.3% 7.7% 13.1% 0.7% -5.8%
Wipro 567 41.4 ADD 740 27.8% 13.4% 16.4% 12.0% 2.9% 3.1%
Tech Mahindra 1,413 18.3 BUY 2050 17.2% 16.6% 23.1% 16.0% -2.1% -1.1%
L&T Infotech 5,912 13.8 ADD 7675 26.9% 21.8% 19.9% 20.4% 1.3% -1.0%
L&T Technologies 4,455 6.3 ADD 5750 20.4% 19.6% 51.8% 18.1% -2.3% -5.6%
Mphasis 3,108 7.8 BUY 3800 22.9% 21.0% 18.2% 23.4% -1.4% -2.0%
Mindtree 3,802 8.4 ADD 5060 32.1% 21.0% 35.0% 20.7% 5.5% 4.8%
MCX 1,294 0.9 BUY 2,150 -10.3% 28.6% -31.6% 64.2% -22.0% -17.5%
Tata Elxsi 6,604 5.5 REDUCE 5900 34.5% 27.3% 46.3% 24.6% 6.2% 4.4%
Persistent 3,960 4.0 ADD 4900 35.0% 26.7% 49.8% 29.2% 0.1% 5.4%
Cyient 831 1.2 BUY 1285 10.5% 14.7% 32.2% 14.2% -1.0% -6.8%
TeamLease 3,957 0.9 BUY 5,260 33.5% 25.6% 49.8% 37.8% 0.1% -0.3%
Sonata 729 1.0 BUY 1085 29.5% 21.5% 50.0% 17.6% 2.8% -1.1%
Zensar Technologies 343 1.0 BUY 600 15.9% 16.0% 12.2% 7.7% -5.8% -15.3%
CDSL Ltd 1,383 1.9 BUY 1,800 66.1% 18.4% 59.5% 22.1% -3.3% 0.2%
BSE 2,078 1.2 BUY 2,260 44.6% 12.4% 72.5% 24.9% 4.6% 10.7%
IndiaMart 4,822 2.0 BUY 8,000 12.3% 28.8% 10.9% 13.7% -3.6% -3.0%
Tanla Platforms 1,553 2.8 BUY 1,880 37.9% 20.5% 52.7% 16.4% NA NA
Mastek 2,688 1.1 BUY 3365 26.6% 18.1% 38.7% 15.1% 7.7% 0.9%
Energy (Oil & Gas)
35.7% 9.7% 10.6% 18.4% 0.8% -2.6%
Reliance Industries 2,374 214.2 ADD 2,820 72.5% 15.0% 16.6% 36.0% -3.4% -4.0%
Oil & Natural Gas Corp 161 27.0 BUY 208 17.9% 7.2% 97.5% 19.0% -0.2% -0.6%
Indian Oil Corp 117 14.7 ADD 140 10.4% 4.2% -36.0% -5.6% 7.9% -5.8%
Bharat Petroleum Corp 357 10.3 ADD 435 47.4% 7.9% -34.5% 1.6% 6.8% -7.7%
GAIL India 139 8.2 BUY 215 51.7% 12.5% 67.1% -5.0% 13.9% 8.4%
Petronet LNG 205 4.1 REDUCE 230 66.7% 3.4% -4.8% -17.3% 5.9% -4.2%
P a g e | 11
Strategy
HSIE Coverage CMP MCAP
($ Bn) Rating TP
Revenue Growth PAT Growth Change in PAT estimates
FY22E FY23E FY22E FY23E FY22E FY23E
Indraprastha Gas 361 3.4 BUY 605 39.2% 21.2% 21.2% 20.9% 9.5% -2.0%
HPCL 289 5.5 ADD 345 5.8% 7.7% -51.9% 35.4% 0.0% 0.0%
Gujarat Gas 621 5.7 BUY 765 67.9% 7.8% 7.0% 30.9% -15.6% -5.3%
Gujarat State Petronet 290 2.2 ADD 340 51.0% 20.4% 10.3% 22.1% -7.1% -5.4%
OIL India 220 3.2 BUY 310 60.4% 9.0% 38.5% -7.5% 2.6% -1.2%
Mahanagar Gas 748 1.0 ADD 925 32.9% 4.5% -23.9% 11.8% -9.2% -6.5%
Cement & Building
Materials 16.2% 13.4% 3.8% 19.8% -8.1% -6.5%
UltraTech Cement 6,780 26.1 BUY 8,775 11.9% 9.4% 7.1% 22.4% 0.0% 0.0%
Shree Cement 24,604 11.9 ADD 26,600 13.4% 15.3% 0.7% 10.8% -12.3% -13.1%
Ambuja Cements 331 8.8 ADD 400 22.3% 9.6% 25.6% 1.7% -1.9% -4.0%
ACC 2,151 5.4 BUY 2,760 17.2% 8.7% 36.1% 4.0% -5.4% -3.1%
Dalmia Bharat 1,655 4.1 BUY 2,195 10.2% 21.4% -45.0% 62.4% -17.1% 5.4%
Nuvoco Vistas 335 1.6 BUY 677 23.1% 19.3% NM 499.8% -92.2% -55.9%
Ramco Cements 811 2.5 ADD 962 16.1% 12.1% -12.4% 17.4% 12.9% -26.4%
JK Cement 2,914 3.0 REDUCE 3,010 21.4% 14.3% 2.5% 18.1% -14.1% -20.1%
Birla Corp 1,097 1.1 BUY 1,718 8.5% 20.6% -35.8% 18.3% -8.9% -9.9%
Heidelberg Cem 197 0.6 REDUCE 205 5.8% 10.2% -36.4% 20.6% -25.9% -22.4%
Star Cement 89 0.5 BUY 130 23.6% 17.2% 12.4% 36.5% -2.8% -7.0%
JK Lakshmi Cement 446 0.7 BUY 765 15.5% 10.2% -11.9% 37.6% -8.7% -3.7%
Orient Cement 154 0.4 ADD 185 14.5% 7.0% 16.3% -0.8% 0.9% -2.6%
Sagar Cements 239 0.4 ADD 259 16.2% 45.1% -35.3% 46.3% -20.2% -11.3%
Deccan Cements 561 0.1 BUY 750 10.3% 8.3% 2.3% -3.5% 7.5% 6.3%
Supreme Industries 2,056 3.5 BUY 2,650 17.3% 13.9% -3.4% 2.3% 17.8% 17.7%
Astral 1,915 5.1 REDUCE 2,180 43.2% 23.6% 25.8% 42.1% -6.5% -0.3%
Prince Pipe 665 1.0 BUY 940 25.7% 12.8% 5.3% 24.7% 5.9% -3.6%
Kajaria Ceramics 1,189 2.5 BUY 1,450 35.2% 22.0% 37.6% 27.8% 4.2% 1.1%
Somany Ceramics 777 0.4 BUY 1,130 32.8% 17.7% 41.1% 54.6% -2.9% 10.0%
Chemicals
42.8% 14.5% 43.6% 13.2% 10.8% 2.4%
Vinati Organics 1,798 2.5 SELL 1,730 62.8% 36.6% 20.9% 39.7% -13.8% -15.3%
Navin Fluorine 3,811 2.5 BUY 4,905 19.2% 41.9% 21.4% 56.5% 7.8% 25.8%
Deepak Nitrite 2,014 3.7 SELL 1,730 55.0% 12.9% 42.1% 18.7% -6.6% -3.8%
Galaxy Surfactants 2,596 1.2 BUY 3,430 30.3% 14.3% -30.7% 51.7% -20.8% -11.7%
Alkyl Amines 2,999 2.0 SELL 2,955 21.1% 19.4% -21.5% 29.7% -19.0% -11.1%
Balaji Amines 2,906 1.3 REDUCE 3,750 39.0% 10.7% 24.7% 23.0% 6.1% 10.1%
Aarti Industries 916 4.4 BUY 1,380 48.2% 3.8% 129.1% -24.5% 75.5% 0.1%
SRF Ltd 2,397 9.5 ADD 2,675 45.4% 14.6% 60.5% 9.3% 15.1% 12.7%
Fine Organic 3,963 1.6 BUY 4,380 54.1% 23.9% 55.3% 41.5% 9.4% 8.8%
NOCIL Ltd 203 0.5 BUY 340 60.6% 12.6% 58.7% 14.2% -3.0% -8.6%
Sudarshan Chemical 555 0.5 BUY 790 15.8% 11.7% -17.8% 49.4% 7.6% -0.4%
Neogen Chemicals 1,552 0.5 BUY 2,150 34.2% 17.0% 39.0% 51.6% 10.2% 28.5%
Power/Utilities
11.2% 8.3% 9.8% 9.2% -0.5% -0.2%
NTPC 130 16.9 BUY 165 8.3% 11.2% 6.1% 8.2% 0.4% -1.8%
PGCIL 198 18.4 ADD 233 9.7% 3.8% 9.1% 8.3% 1.1% 2.5%
NHPC 28 3.8 ADD 33 9.0% 9.5% 3.6% 1.1% 0.0% 0.0%
CESC 76 1.3 BUY 119 19.4% 5.6% 29.1% 4.6% 0.0% 0.0%
TATA Power 221 9.4 ADD 258 20.5% 7.5% 39.3% 33.3% -17.3% -6.6%
JSW Energy 337 7.4 SELL 118 20.4% 3.1% 23.6% 14.5% 0.0% 8.2%
Torrent Power 474 3.0 REDUCE 555 6.1% 6.2% 25.0% 13.9% -0.2% -2.0%
P a g e | 12
Strategy
HSIE Coverage CMP MCAP
($ Bn) Rating TP
Revenue Growth PAT Growth Change in PAT estimates
FY22E FY23E FY22E FY23E FY22E FY23E
Pharma
12.7% 9.8% 19.3% 15.3% -1.4% -2.3%
Sun Pharmaceutical
Industries 840 26.9 BUY 985 16.1% 11.0% 30.9% 14.1% 0.2% 1.0%
Dr Reddy's Laboratories 4,201 9.3 BUY 5,170 11.2% 9.1% 7.9% 18.9% 0.3% -1.1%
Torrent Pharma 2,738 6.2 REDUCE 3,205 6.2% 11.9% -12.4% 32.6% -11.0% -4.3%
Cipla Ltd/India 915 9.8 BUY 1,115 14.1% 10.4% 20.5% 13.9% 0.4% 2.4%
Aurobindo Pharma 637 5.0 BUY 925 -4.7% 6.1% -21.3% 18.1% -13.8% -9.4%
Lupin 756 4.6 SELL 765 6.4% 6.3% 15.2% 3.3% 12.3% -22.6%
Cadila 371 5.1 ADD 425 5.1% 2.2% -3.1% 1.2% -3.0% -6.0%
Alkem Labs 3,090 4.9 BUY 4,200 20.5% 10.6% 15.8% 2.5% 9.2% 4.5%
Ajanta Pharma 1,888 2.2 ADD 2,405 13.8% 15.4% 9.8% 11.9% -1.1% -3.1%
Apollo Hospitals 4,611 8.8 BUY 5,365 43.7% 20.8% 1097.5% 45.9% -0.7% 0.7%
Narayana Health 647 1.8 ADD 720 44.6% 12.6% NM 27.0% 11.5% 5.7%
Max Healthcare 369 4.8 BUY 430 40.8% 8.7% 1572.5% 31.6% -10.1% 0.9%
Aviation
50.3% 77.6% -11.7% NM 14.3% -2.7%
Interglobe Aviation 2,040 10.5 REDUCE 1,925 66.1% 67.4% 4.5% NM 20.9% -2.7%
SpiceJet 61 0.5 NOT
RATED NA 5.9% 123.0% -102.7% 97.7% 0.0% 0.0%
Metals
44.2% 0.3% 178.9% -18.6% 4.4% 4.0%
Tata Steel. 1,139 18.6 NOT
RATED NA 45.6% -8.4% 393.6% -39.1% 5.5% 3.2%
JSW Steel. 615 19.8 NOT
RATED NA 76.0% 7.5% 172.9% -16.5% -3.2% -0.9%
Hindalco Industries 519 15.5 NOT
RATED NA 42.6% 1.0% 282.5% 2.9% 16.7% 15.5%
Coal India 158 13.0 NOT
RATED NA 15.8% 8.2% 27.6% 8.0% 3.7% 2.4%
Total
26.4% 12.1% 31.7% 21.2% 0.6% -0.4%
Note: Upside change in PAT estimates above 5% has been highlighted in green and downside change above 5% has been highlighted in red
CMP as on 23.02.2022
Source: Bloomberg & HSIE Research
P a g e | 13
Strategy
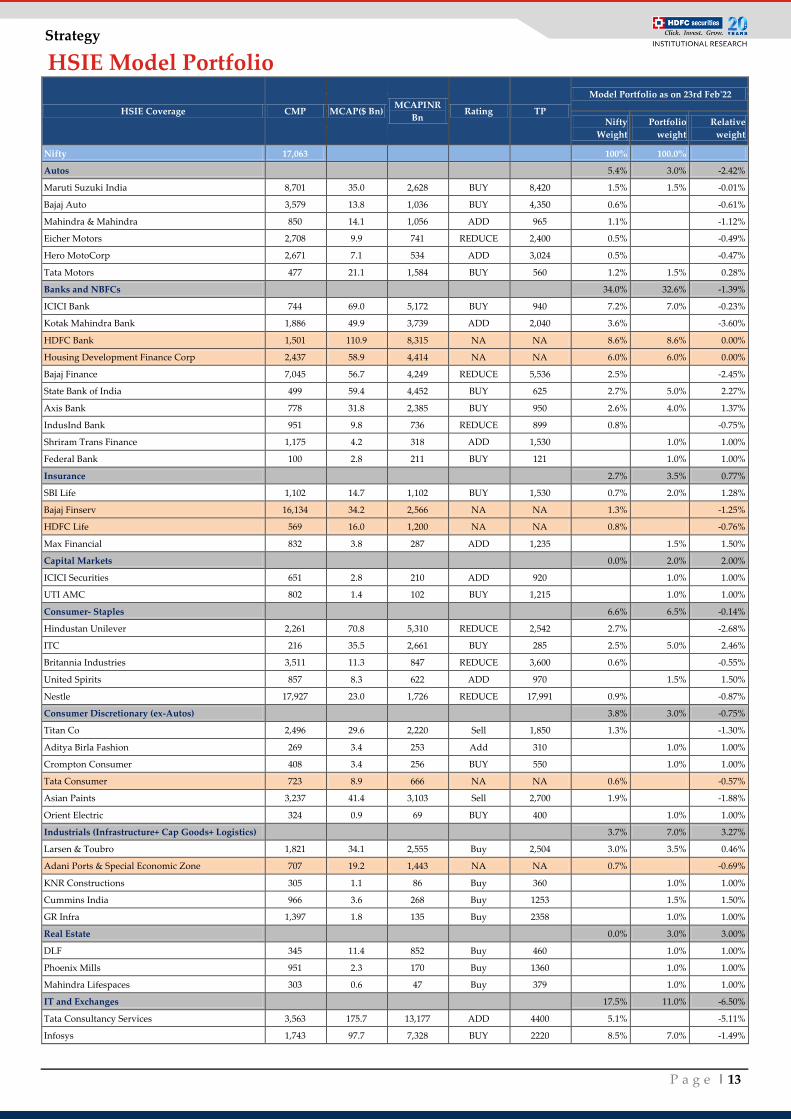
HSIE Model Portfolio
HSIE Coverage CMP MCAP($ Bn) MCAPINR
Bn Rating TP
Model Portfolio as on 23rd Feb'22
Nifty
Weight
Portfolio
weight
Relative
weight
Nifty 17,063
100% 100.0%
Autos
5.4% 3.0% -2.42%
Maruti Suzuki India 8,701 35.0 2,628 BUY 8,420 1.5% 1.5% -0.01%
Bajaj Auto 3,579 13.8 1,036 BUY 4,350 0.6% -0.61%
Mahindra & Mahindra 850 14.1 1,056 ADD 965 1.1% -1.12%
Eicher Motors 2,708 9.9 741 REDUCE 2,400 0.5% -0.49%
Hero MotoCorp 2,671 7.1 534 ADD 3,024 0.5% -0.47%
Tata Motors 477 21.1 1,584 BUY 560 1.2% 1.5% 0.28%
Banks and NBFCs
34.0% 32.6% -1.39%
ICICI Bank 744 69.0 5,172 BUY 940 7.2% 7.0% -0.23%
Kotak Mahindra Bank 1,886 49.9 3,739 ADD 2,040 3.6% -3.60%
HDFC Bank 1,501 110.9 8,315 NA NA 8.6% 8.6% 0.00%
Housing Development Finance Corp 2,437 58.9 4,414 NA NA 6.0% 6.0% 0.00%
Bajaj Finance 7,045 56.7 4,249 REDUCE 5,536 2.5% -2.45%
State Bank of India 499 59.4 4,452 BUY 625 2.7% 5.0% 2.27%
Axis Bank 778 31.8 2,385 BUY 950 2.6% 4.0% 1.37%
IndusInd Bank 951 9.8 736 REDUCE 899 0.8% -0.75%
Shriram Trans Finance 1,175 4.2 318 ADD 1,530 1.0% 1.00%
Federal Bank 100 2.8 211 BUY 121 1.0% 1.00%
Insurance
2.7% 3.5% 0.77%
SBI Life 1,102 14.7 1,102 BUY 1,530 0.7% 2.0% 1.28%
Bajaj Finserv 16,134 34.2 2,566 NA NA 1.3% -1.25%
HDFC Life 569 16.0 1,200 NA NA 0.8% -0.76%
Max Financial 832 3.8 287 ADD 1,235 1.5% 1.50%
Capital Markets
0.0% 2.0% 2.00%
ICICI Securities 651 2.8 210 ADD 920 1.0% 1.00%
UTI AMC 802 1.4 102 BUY 1,215 1.0% 1.00%
Consumer- Staples
6.6% 6.5% -0.14%
Hindustan Unilever 2,261 70.8 5,310 REDUCE 2,542 2.7% -2.68%
ITC 216 35.5 2,661 BUY 285 2.5% 5.0% 2.46%
Britannia Industries 3,511 11.3 847 REDUCE 3,600 0.6% -0.55%
United Spirits 857 8.3 622 ADD 970 1.5% 1.50%
Nestle 17,927 23.0 1,726 REDUCE 17,991 0.9% -0.87%
Consumer Discretionary (ex-Autos)
3.8% 3.0% -0.75%
Titan Co 2,496 29.6 2,220 Sell 1,850 1.3% -1.30%
Aditya Birla Fashion 269 3.4 253 Add 310 1.0% 1.00%
Crompton Consumer 408 3.4 256 BUY 550 1.0% 1.00%
Tata Consumer 723 8.9 666 NA NA 0.6% -0.57%
Asian Paints 3,237 41.4 3,103 Sell 2,700 1.9% -1.88%
Orient Electric 324 0.9 69 BUY 400 1.0% 1.00%
Industrials (Infrastructure+ Cap Goods+ Logistics)
3.7% 7.0% 3.27%
Larsen & Toubro 1,821 34.1 2,555 Buy 2,504 3.0% 3.5% 0.46%
Adani Ports & Special Economic Zone 707 19.2 1,443 NA NA 0.7% -0.69%
KNR Constructions 305 1.1 86 Buy 360 1.0% 1.00%
Cummins India 966 3.6 268 Buy 1253 1.5% 1.50%
GR Infra 1,397 1.8 135 Buy 2358 1.0% 1.00%
Real Estate
0.0% 3.0% 3.00%
DLF 345 11.4 852 Buy 460 1.0% 1.00%
Phoenix Mills 951 2.3 170 Buy 1360 1.0% 1.00%
Mahindra Lifespaces 303 0.6 47 Buy 379 1.0% 1.00%
IT and Exchanges
17.5% 11.0% -6.50%
Tata Consultancy Services 3,563 175.7 13,177 ADD 4400 5.1% -5.11%
Infosys 1,743 97.7 7,328 BUY 2220 8.5% 7.0% -1.49%
P a g e | 14
Strategy
HSIE Coverage CMP MCAP($ Bn) MCAPINR
Bn Rating TP
Model Portfolio as on 23rd Feb'22
Nifty
Weight
Portfolio
weight
Relative
weight
HCL Technologies 1,153 41.7 3,130 BUY 1485 1.6% -1.57%
Wipro 567 41.4 3,107 ADD 740 1.1% -1.12%
Tech Mahindra 1,413 18.3 1,372 BUY 2050 1.2% 2.0% 0.79%
Cyient 831 1.2 92 BUY 1285 1.0% 1.00%
TeamLease 3,957 0.9 68 BUY 5260 1.0% 1.00%
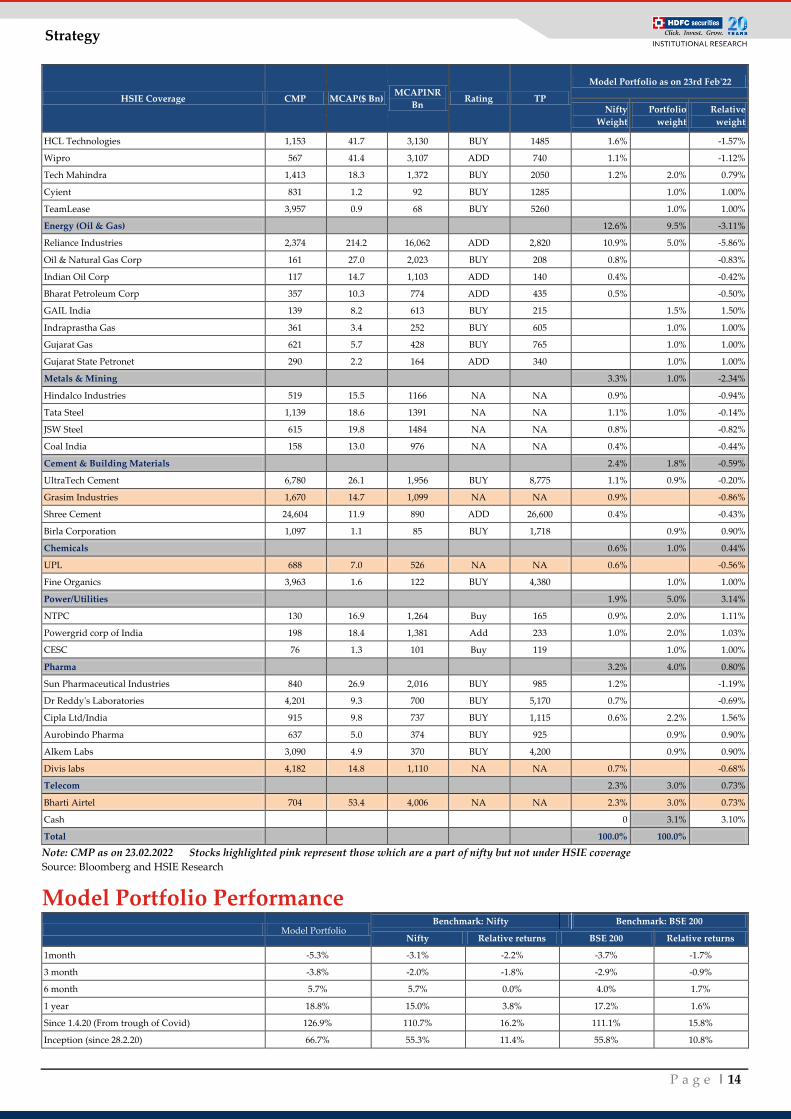
Energy (Oil & Gas) 12.6% 9.5% -3.11%
Reliance Industries 2,374 214.2 16,062 ADD 2,820 10.9% 5.0% -5.86%
Oil & Natural Gas Corp 161 27.0 2,023 BUY 208 0.8% -0.83%
Indian Oil Corp 117 14.7 1,103 ADD 140 0.4% -0.42%
Bharat Petroleum Corp 357 10.3 774 ADD 435 0.5% -0.50%
GAIL India 139 8.2 613 BUY 215 1.5% 1.50%
Indraprastha Gas 361 3.4 252 BUY 605 1.0% 1.00%
Gujarat Gas 621 5.7 428 BUY 765 1.0% 1.00%
Gujarat State Petronet 290 2.2 164 ADD 340 1.0% 1.00%
Metals & Mining 3.3% 1.0% -2.34%
Hindalco Industries 519 15.5 1166 NA NA 0.9% -0.94%
Tata Steel 1,139 18.6 1391 NA NA 1.1% 1.0% -0.14%
JSW Steel 615 19.8 1484 NA NA 0.8% -0.82%
Coal India 158 13.0 976 NA NA 0.4% -0.44%
Cement & Building Materials 2.4% 1.8% -0.59%
UltraTech Cement 6,780 26.1 1,956 BUY 8,775 1.1% 0.9% -0.20%
Grasim Industries 1,670 14.7 1,099 NA NA 0.9% -0.86%
Shree Cement 24,604 11.9 890 ADD 26,600 0.4% -0.43%
Birla Corporation 1,097 1.1 85 BUY 1,718 0.9% 0.90%
Chemicals 0.6% 1.0% 0.44%
UPL 688 7.0 526 NA NA 0.6% -0.56%
Fine Organics 3,963 1.6 122 BUY 4,380 1.0% 1.00%
Power/Utilities 1.9% 5.0% 3.14%
NTPC 130 16.9 1,264 Buy 165 0.9% 2.0% 1.11%
Powergrid corp of India 198 18.4 1,381 Add 233 1.0% 2.0% 1.03%
CESC 76 1.3 101 Buy 119 1.0% 1.00%
Pharma 3.2% 4.0% 0.80%
Sun Pharmaceutical Industries 840 26.9 2,016 BUY 985 1.2% -1.19%
Dr Reddy's Laboratories 4,201 9.3 700 BUY 5,170 0.7% -0.69%
Cipla Ltd/India 915 9.8 737 BUY 1,115 0.6% 2.2% 1.56%
Aurobindo Pharma 637 5.0 374 BUY 925 0.9% 0.90%
Alkem Labs 3,090 4.9 370 BUY 4,200 0.9% 0.90%
Divis labs 4,182 14.8 1,110 NA NA 0.7% -0.68%
Telecom 2.3% 3.0% 0.73%
Bharti Airtel 704 53.4 4,006 NA NA 2.3% 3.0% 0.73%
Cash 0 3.1% 3.10%
Total 100.0% 100.0%
Note: CMP as on 23.02.2022 Stocks highlighted pink represent those which are a part of nifty but not under HSIE coverage
Source: Bloomberg and HSIE Research
Model Portfolio Performance Model Portfolio
Benchmark: Nifty Benchmark: BSE 200
Nifty Relative returns BSE 200 Relative returns
1month -5.3% -3.1% -2.2% -3.7% -1.7%
3 month -3.8% -2.0% -1.8% -2.9% -0.9%
6 month 5.7% 5.7% 0.0% 4.0% 1.7%
1 year 18.8% 15.0% 3.8% 17.2% 1.6%
Since 1.4.20 (From trough of Covid) 126.9% 110.7% 16.2% 111.1% 15.8%
Inception (since 28.2.20) 66.7% 55.3% 11.4% 55.8% 10.8%
P a g e | 15
Strategy
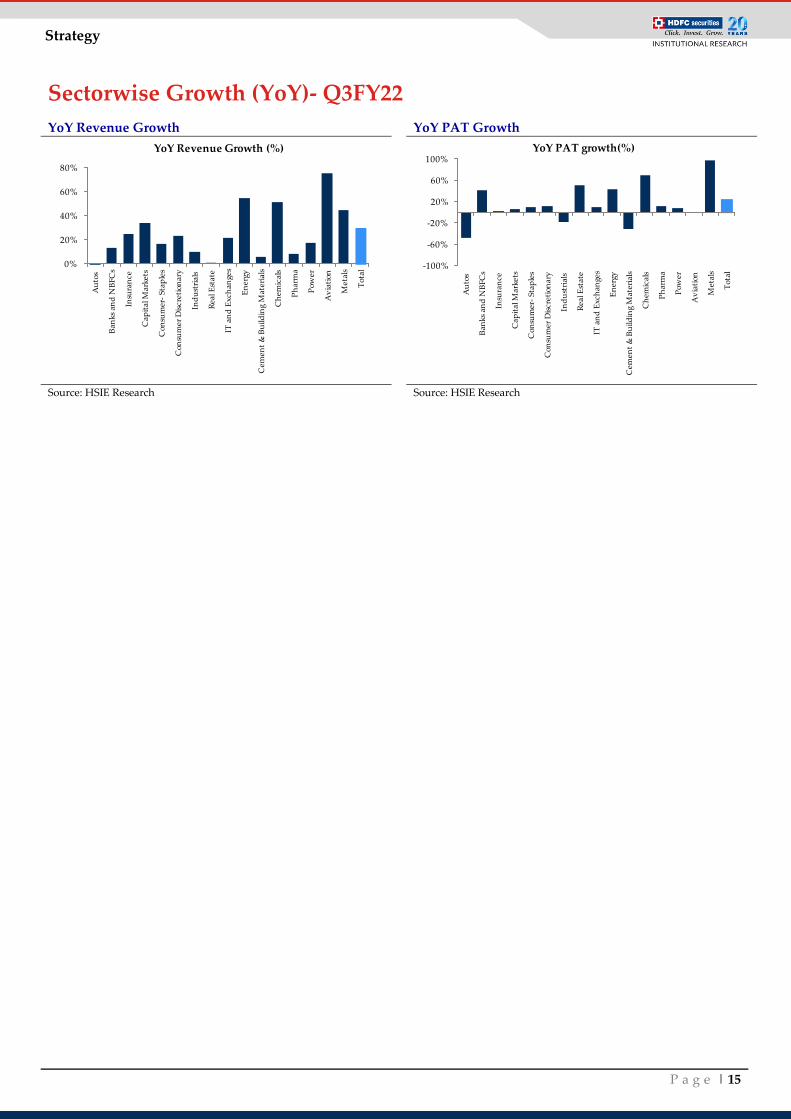
Sectorwise Growth (YoY)- Q3FY22
YoY Revenue Growth YoY PAT Growth
Source: HSIE Research Source: HSIE Research
0%
20%
40%
60%
80%
Au
tos
Ban
ks a
nd
NB
FCs
Insu
ran
ce
Cap
ital
Mar
kets
Con
sum
er-
Stap
les
Con
sum
er D
iscr
etio
nar
y
Ind
ust
rial
s
Rea
l Est
ate
IT a
nd
Exc
han
ges
En
ergy
Cem
ent
& B
uild
ing
Mat
eria
ls
Ch
emic
als
Ph
arm
a
Pow
er
Av
iati
on
Met
als
Tot
al
YoY Revenue Growth (%)
-100%
-60%
-20%
20%
60%
100%
Au
tos
Ban
ks a
nd
NB
FCs
Insu
ran
ce
Cap
ital
Mar
kets
Con
sum
er-
Stap
les
Con
sum
er D
iscr
etio
nar
y
Ind
ust
rial
s
Rea
l Est
ate
IT a
nd
Exc
han
ges
En
ergy
Cem
ent
& B
uild
ing
Mat
eria
ls
Ch
emic
als
Ph
arm
a
Pow
er
Av
iati
on
Met
als
Tot
al
YoY PAT growth(%)
P a g e | 16
HSIE Results Daily
BFSI
P a g e | 17
HSIE Results Daily
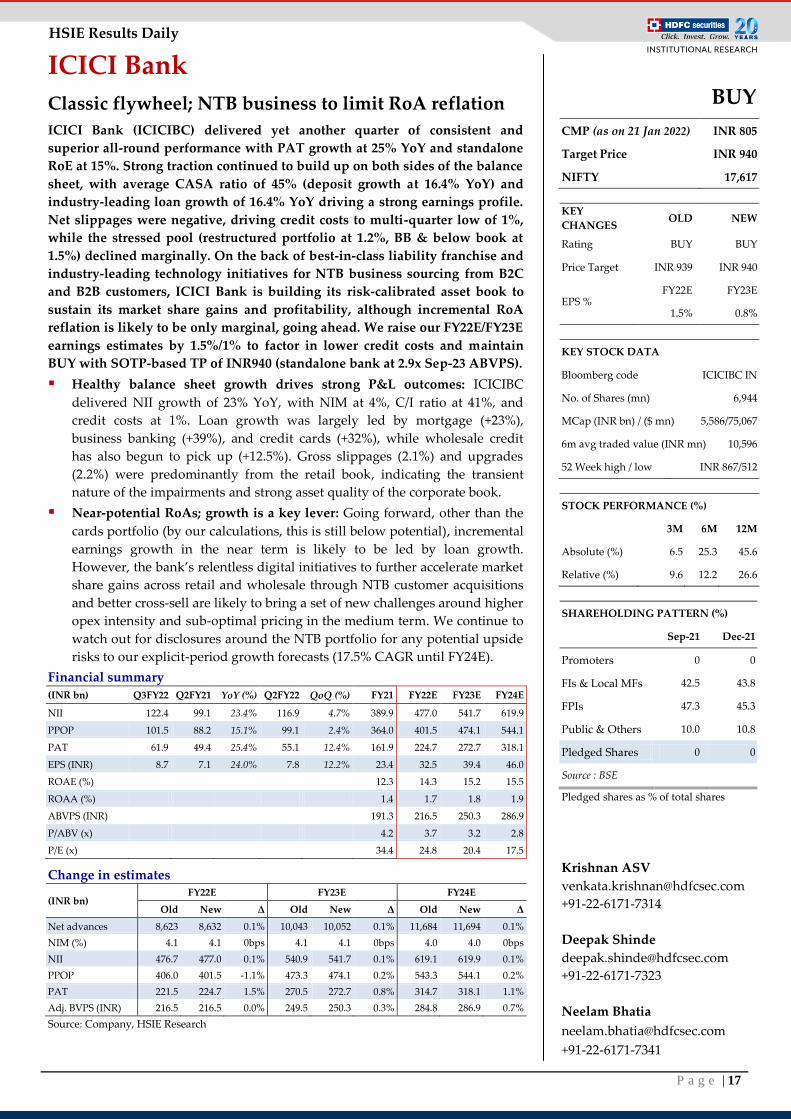
ICICI Bank
Classic flywheel; NTB business to limit RoA reflation
ICICI Bank (ICICIBC) delivered yet another quarter of consistent and
superior all-round performance with PAT growth at 25% YoY and standalone
RoE at 15%. Strong traction continued to build up on both sides of the balance
sheet, with average CASA ratio of 45% (deposit growth at 16.4% YoY) and
industry-leading loan growth of 16.4% YoY driving a strong earnings profile.
Net slippages were negative, driving credit costs to multi-quarter low of 1%,
while the stressed pool (restructured portfolio at 1.2%, BB & below book at
1.5%) declined marginally. On the back of best-in-class liability franchise and
industry-leading technology initiatives for NTB business sourcing from B2C
and B2B customers, ICICI Bank is building its risk-calibrated asset book to
sustain its market share gains and profitability, although incremental RoA
reflation is likely to be only marginal, going ahead. We raise our FY22E/FY23E
earnings estimates by 1.5%/1% to factor in lower credit costs and maintain
BUY with SOTP-based TP of INR940 (standalone bank at 2.9x Sep-23 ABVPS).
Healthy balance sheet growth drives strong P&L outcomes: ICICIBC
delivered NII growth of 23% YoY, with NIM at 4%, C/I ratio at 41%, and
credit costs at 1%. Loan growth was largely led by mortgage (+23%),
business banking (+39%), and credit cards (+32%), while wholesale credit
has also begun to pick up (+12.5%). Gross slippages (2.1%) and upgrades
(2.2%) were predominantly from the retail book, indicating the transient
nature of the impairments and strong asset quality of the corporate book.
Near-potential RoAs; growth is a key lever: Going forward, other than the
cards portfolio (by our calculations, this is still below potential), incremental
earnings growth in the near term is likely to be led by loan growth.
However, the bank’s relentless digital initiatives to further accelerate market
share gains across retail and wholesale through NTB customer acquisitions
and better cross-sell are likely to bring a set of new challenges around higher
opex intensity and sub-optimal pricing in the medium term. We continue to
watch out for disclosures around the NTB portfolio for any potential upside
risks to our explicit-period growth forecasts (17.5% CAGR until FY24E).
Financial summary
(INR bn) Q3FY22 Q2FY21 YoY (%) Q2FY22 QoQ (%) FY21 FY22E FY23E FY24E
NII 122.4 99.1 23.4% 116.9 4.7% 389.9 477.0 541.7 619.9
PPOP 101.5 88.2 15.1% 99.1 2.4% 364.0 401.5 474.1 544.1
PAT 61.9 49.4 25.4% 55.1 12.4% 161.9 224.7 272.7 318.1
EPS (INR) 8.7 7.1 24.0% 7.8 12.2% 23.4 32.5 39.4 46.0
ROAE (%) 12.3 14.3 15.2 15.5
ROAA (%) 1.4 1.7 1.8 1.9
ABVPS (INR) 191.3 216.5 250.3 286.9
P/ABV (x) 4.2 3.7 3.2 2.8
P/E (x) 34.4 24.8 20.4 17.5
Change in estimates
(INR bn) FY22E FY23E FY24E
Old New Δ Old New Δ Old New Δ
Net advances 8,623 8,632 0.1% 10,043 10,052 0.1% 11,684 11,694 0.1%
NIM (%) 4.1 4.1 0bps 4.1 4.1 0bps 4.0 4.0 0bps
NII 476.7 477.0 0.1% 540.9 541.7 0.1% 619.1 619.9 0.1%
PPOP 406.0 401.5 -1.1% 473.3 474.1 0.2% 543.3 544.1 0.2%
PAT 221.5 224.7 1.5% 270.5 272.7 0.8% 314.7 318.1 1.1%
Adj. BVPS (INR) 216.5 216.5 0.0% 249.5 250.3 0.3% 284.8 286.9 0.7%
Source: Company, HSIE Research
BUY
CMP (as on 21 Jan 2022) INR 805
Target Price INR 940
NIFTY 17,617
KEY
CHANGES OLD NEW
Rating BUY BUY
Price Target INR 939 INR 940
EPS % FY22E FY23E
1.5% 0.8%
KEY STOCK DATA
Bloomberg code ICICIBC IN
No. of Shares (mn) 6,944
MCap (INR bn) / ($ mn) 5,586/75,067
6m avg traded value (INR mn) 10,596
52 Week high / low INR 867/512
STOCK PERFORMANCE (%)
3M 6M 12M
Absolute (%) 6.5 25.3 45.6
Relative (%) 9.6 12.2 26.6
SHAREHOLDING PATTERN (%)
Sep-21 Dec-21
Promoters 0 0
FIs & Local MFs 42.5 43.8
FPIs 47.3 45.3
Public & Others 10.0 10.8
Pledged Shares 0 0
Source : BSE
Pledged shares as % of total shares
Krishnan ASV
+91-22-6171-7314
Deepak Shinde
+91-22-6171-7323
Neelam Bhatia
+91-22-6171-7341
P a g e | 18
HSIE Results Daily
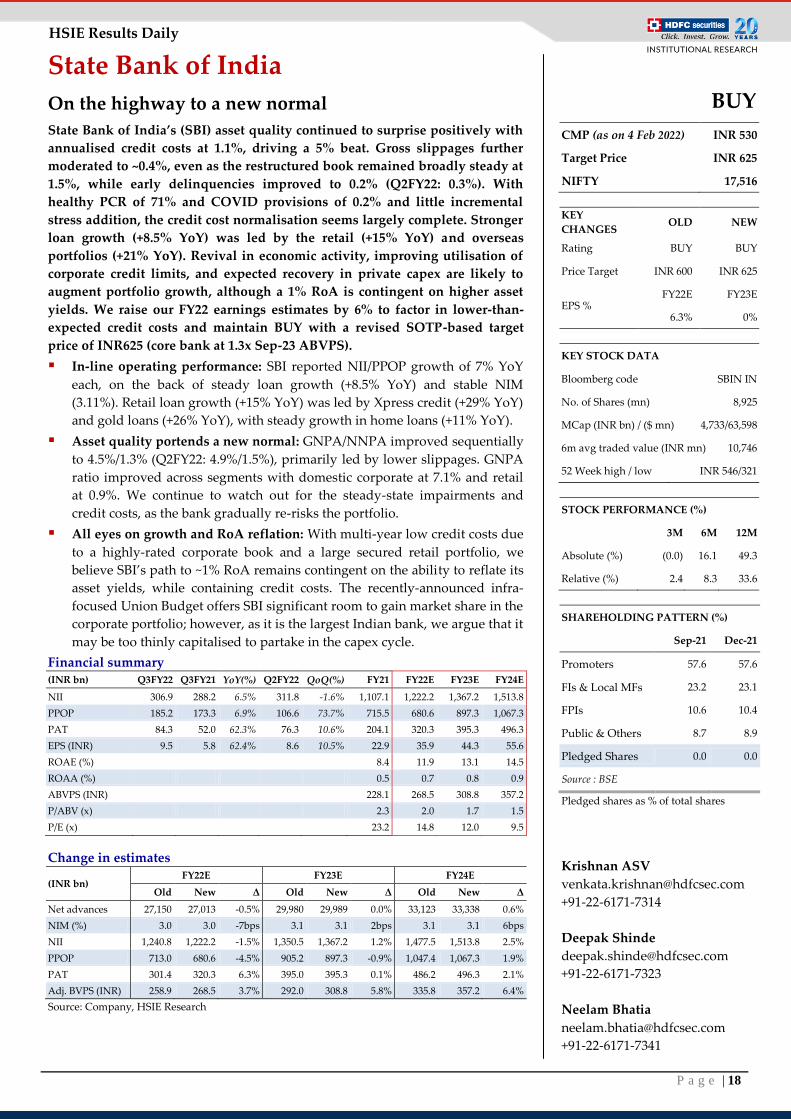
State Bank of India
On the highway to a new normal
State Bank of India’s (SBI) asset quality continued to surprise positively with
annualised credit costs at 1.1%, driving a 5% beat. Gross slippages further
moderated to ~0.4%, even as the restructured book remained broadly steady at
1.5%, while early delinquencies improved to 0.2% (Q2FY22: 0.3%). With
healthy PCR of 71% and COVID provisions of 0.2% and little incremental
stress addition, the credit cost normalisation seems largely complete. Stronger
loan growth (+8.5% YoY) was led by the retail (+15% YoY) and overseas
portfolios (+21% YoY). Revival in economic activity, improving utilisation of
corporate credit limits, and expected recovery in private capex are likely to
augment portfolio growth, although a 1% RoA is contingent on higher asset
yields. We raise our FY22 earnings estimates by 6% to factor in lower-than-
expected credit costs and maintain BUY with a revised SOTP-based target
price of INR625 (core bank at 1.3x Sep-23 ABVPS).
In-line operating performance: SBI reported NII/PPOP growth of 7% YoY
each, on the back of steady loan growth (+8.5% YoY) and stable NIM
(3.11%). Retail loan growth (+15% YoY) was led by Xpress credit (+29% YoY)
and gold loans (+26% YoY), with steady growth in home loans (+11% YoY).
Asset quality portends a new normal: GNPA/NNPA improved sequentially
to 4.5%/1.3% (Q2FY22: 4.9%/1.5%), primarily led by lower slippages. GNPA
ratio improved across segments with domestic corporate at 7.1% and retail
at 0.9%. We continue to watch out for the steady-state impairments and
credit costs, as the bank gradually re-risks the portfolio.
All eyes on growth and RoA reflation: With multi-year low credit costs due
to a highly-rated corporate book and a large secured retail portfolio, we
believe SBI’s path to ~1% RoA remains contingent on the ability to reflate its
asset yields, while containing credit costs. The recently-announced infra-
focused Union Budget offers SBI significant room to gain market share in the
corporate portfolio; however, as it is the largest Indian bank, we argue that it
may be too thinly capitalised to partake in the capex cycle.
Financial summary (INR bn) Q3FY22 Q3FY21 YoY(%) Q2FY22 QoQ(%) FY21 FY22E FY23E FY24E
NII 306.9 288.2 6.5% 311.8 -1.6% 1,107.1 1,222.2 1,367.2 1,513.8
PPOP 185.2 173.3 6.9% 106.6 73.7% 715.5 680.6 897.3 1,067.3
PAT 84.3 52.0 62.3% 76.3 10.6% 204.1 320.3 395.3 496.3
EPS (INR) 9.5 5.8 62.4% 8.6 10.5% 22.9 35.9 44.3 55.6
ROAE (%) 8.4 11.9 13.1 14.5
ROAA (%) 0.5 0.7 0.8 0.9
ABVPS (INR) 228.1 268.5 308.8 357.2
P/ABV (x) 2.3 2.0 1.7 1.5
P/E (x) 23.2 14.8 12.0 9.5
Change in estimates
(INR bn) FY22E FY23E FY24E
Old New Δ Old New Δ Old New Δ
Net advances 27,150 27,013 -0.5% 29,980 29,989 0.0% 33,123 33,338 0.6%
NIM (%) 3.0 3.0 -7bps 3.1 3.1 2bps 3.1 3.1 6bps
NII 1,240.8 1,222.2 -1.5% 1,350.5 1,367.2 1.2% 1,477.5 1,513.8 2.5%
PPOP 713.0 680.6 -4.5% 905.2 897.3 -0.9% 1,047.4 1,067.3 1.9%
PAT 301.4 320.3 6.3% 395.0 395.3 0.1% 486.2 496.3 2.1%
Adj. BVPS (INR) 258.9 268.5 3.7% 292.0 308.8 5.8% 335.8 357.2 6.4%
Source: Company, HSIE Research
BUY
CMP (as on 4 Feb 2022) INR 530
Target Price INR 625
NIFTY 17,516
KEY
CHANGES OLD NEW
Rating BUY BUY
Price Target INR 600 INR 625
EPS % FY22E FY23E
6.3% 0%
KEY STOCK DATA
Bloomberg code SBIN IN
No. of Shares (mn) 8,925
MCap (INR bn) / ($ mn) 4,733/63,598
6m avg traded value (INR mn) 10,746
52 Week high / low INR 546/321
STOCK PERFORMANCE (%)
3M 6M 12M
Absolute (%) (0.0) 16.1 49.3
Relative (%) 2.4 8.3 33.6
SHAREHOLDING PATTERN (%)
Sep-21 Dec-21
Promoters 57.6 57.6
FIs & Local MFs 23.2 23.1
FPIs 10.6 10.4
Public & Others 8.7 8.9
Pledged Shares 0.0 0.0
Source : BSE
Pledged shares as % of total shares
Krishnan ASV
+91-22-6171-7314
Deepak Shinde
+91-22-6171-7323
Neelam Bhatia
+91-22-6171-7341
P a g e | 19
HSIE Results Daily
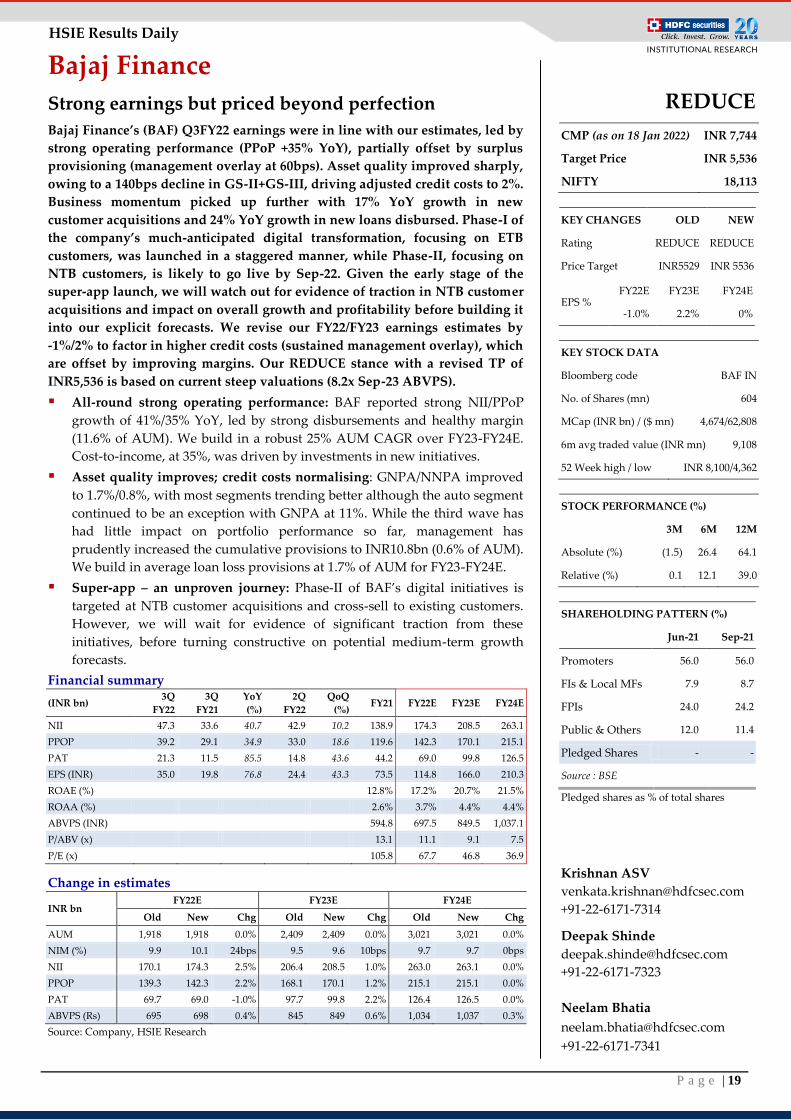
Bajaj Finance
Strong earnings but priced beyond perfection
Bajaj Finance’s (BAF) Q3FY22 earnings were in line with our estimates, led by
strong operating performance (PPoP +35% YoY), partially offset by surplus
provisioning (management overlay at 60bps). Asset quality improved sharply,
owing to a 140bps decline in GS-II+GS-III, driving adjusted credit costs to 2%.
Business momentum picked up further with 17% YoY growth in new
customer acquisitions and 24% YoY growth in new loans disbursed. Phase-I of
the company’s much-anticipated digital transformation, focusing on ETB
customers, was launched in a staggered manner, while Phase-II, focusing on
NTB customers, is likely to go live by Sep-22. Given the early stage of the
super-app launch, we will watch out for evidence of traction in NTB customer
acquisitions and impact on overall growth and profitability before building it
into our explicit forecasts. We revise our FY22/FY23 earnings estimates by
-1%/2% to factor in higher credit costs (sustained management overlay), which
are offset by improving margins. Our REDUCE stance with a revised TP of
INR5,536 is based on current steep valuations (8.2x Sep-23 ABVPS).
All-round strong operating performance: BAF reported strong NII/PPoP
growth of 41%/35% YoY, led by strong disbursements and healthy margin
(11.6% of AUM). We build in a robust 25% AUM CAGR over FY23-FY24E.
Cost-to-income, at 35%, was driven by investments in new initiatives.
Asset quality improves; credit costs normalising: GNPA/NNPA improved
to 1.7%/0.8%, with most segments trending better although the auto segment
continued to be an exception with GNPA at 11%. While the third wave has
had little impact on portfolio performance so far, management has
prudently increased the cumulative provisions to INR10.8bn (0.6% of AUM).
We build in average loan loss provisions at 1.7% of AUM for FY23-FY24E.
Super-app – an unproven journey: Phase-II of BAF’s digital initiatives is
targeted at NTB customer acquisitions and cross-sell to existing customers.
However, we will wait for evidence of significant traction from these
initiatives, before turning constructive on potential medium-term growth
forecasts.
Financial summary
(INR bn) 3Q
FY22
3Q
FY21
YoY
(%)
2Q
FY22
QoQ
(%) FY21 FY22E FY23E FY24E
NII 47.3 33.6 40.7 42.9 10.2 138.9 174.3 208.5 263.1
PPOP 39.2 29.1 34.9 33.0 18.6 119.6 142.3 170.1 215.1
PAT 21.3 11.5 85.5 14.8 43.6 44.2 69.0 99.8 126.5
EPS (INR) 35.0 19.8 76.8 24.4 43.3 73.5 114.8 166.0 210.3
ROAE (%) 12.8% 17.2% 20.7% 21.5%
ROAA (%) 2.6% 3.7% 4.4% 4.4%
ABVPS (INR) 594.8 697.5 849.5 1,037.1
P/ABV (x) 13.1 11.1 9.1 7.5
P/E (x) 105.8 67.7 46.8 36.9
Change in estimates
INR bn FY22E FY23E FY24E
Old New Chg Old New Chg Old New Chg
AUM 1,918 1,918 0.0% 2,409 2,409 0.0% 3,021 3,021 0.0%
NIM (%) 9.9 10.1 24bps 9.5 9.6 10bps 9.7 9.7 0bps
NII 170.1 174.3 2.5% 206.4 208.5 1.0% 263.0 263.1 0.0%
PPOP 139.3 142.3 2.2% 168.1 170.1 1.2% 215.1 215.1 0.0%
PAT 69.7 69.0 -1.0% 97.7 99.8 2.2% 126.4 126.5 0.0%
ABVPS (Rs) 695 698 0.4% 845 849 0.6% 1,034 1,037 0.3%
Source: Company, HSIE Research
REDUCE
CMP (as on 18 Jan 2022) INR 7,744
Target Price INR 5,536
NIFTY 18,113
KEY CHANGES OLD NEW
Rating REDUCE REDUCE
Price Target INR5529 INR 5536
EPS % FY22E FY23E FY24E
-1.0% 2.2% 0%
KEY STOCK DATA
Bloomberg code BAF IN
No. of Shares (mn) 604
MCap (INR bn) / ($ mn) 4,674/62,808
6m avg traded value (INR mn) 9,108
52 Week high / low INR 8,100/4,362
STOCK PERFORMANCE (%)
3M 6M 12M
Absolute (%) (1.5) 26.4 64.1
Relative (%) 0.1 12.1 39.0
SHAREHOLDING PATTERN (%)
Jun-21 Sep-21
Promoters 56.0 56.0
FIs & Local MFs 7.9 8.7
FPIs 24.0 24.2
Public & Others 12.0 11.4
Pledged Shares - -
Source : BSE
Pledged shares as % of total shares
Krishnan ASV
+91-22-6171-7314
Deepak Shinde
+91-22-6171-7323
Neelam Bhatia
+91-22-6171-7341
P a g e | 20
HSIE Results Daily
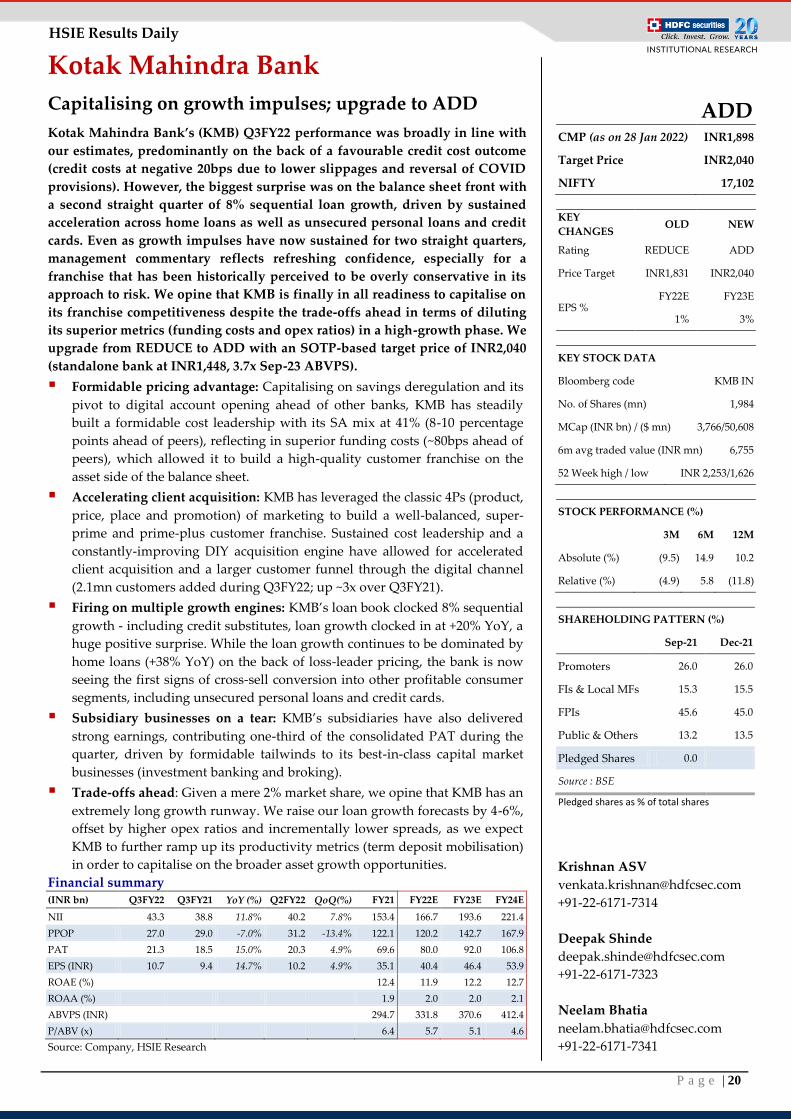
Kotak Mahindra Bank
Capitalising on growth impulses; upgrade to ADD
Kotak Mahindra Bank’s (KMB) Q3FY22 performance was broadly in line with
our estimates, predominantly on the back of a favourable credit cost outcome
(credit costs at negative 20bps due to lower slippages and reversal of COVID
provisions). However, the biggest surprise was on the balance sheet front with
a second straight quarter of 8% sequential loan growth, driven by sustained
acceleration across home loans as well as unsecured personal loans and credit
cards. Even as growth impulses have now sustained for two straight quarters,
management commentary reflects refreshing confidence, especially for a
franchise that has been historically perceived to be overly conservative in its
approach to risk. We opine that KMB is finally in all readiness to capitalise on
its franchise competitiveness despite the trade-offs ahead in terms of diluting
its superior metrics (funding costs and opex ratios) in a high-growth phase. We
upgrade from REDUCE to ADD with an SOTP-based target price of INR2,040
(standalone bank at INR1,448, 3.7x Sep-23 ABVPS).
Formidable pricing advantage: Capitalising on savings deregulation and its
pivot to digital account opening ahead of other banks, KMB has steadily
built a formidable cost leadership with its SA mix at 41% (8-10 percentage
points ahead of peers), reflecting in superior funding costs (~80bps ahead of
peers), which allowed it to build a high-quality customer franchise on the
asset side of the balance sheet.
Accelerating client acquisition: KMB has leveraged the classic 4Ps (product,
price, place and promotion) of marketing to build a well-balanced, super-
prime and prime-plus customer franchise. Sustained cost leadership and a
constantly-improving DIY acquisition engine have allowed for accelerated
client acquisition and a larger customer funnel through the digital channel
(2.1mn customers added during Q3FY22; up ~3x over Q3FY21).
Firing on multiple growth engines: KMB’s loan book clocked 8% sequential
growth - including credit substitutes, loan growth clocked in at +20% YoY, a
huge positive surprise. While the loan growth continues to be dominated by
home loans (+38% YoY) on the back of loss-leader pricing, the bank is now
seeing the first signs of cross-sell conversion into other profitable consumer
segments, including unsecured personal loans and credit cards.
Subsidiary businesses on a tear: KMB’s subsidiaries have also delivered
strong earnings, contributing one-third of the consolidated PAT during the
quarter, driven by formidable tailwinds to its best-in-class capital market
businesses (investment banking and broking).
Trade-offs ahead: Given a mere 2% market share, we opine that KMB has an
extremely long growth runway. We raise our loan growth forecasts by 4-6%,
offset by higher opex ratios and incrementally lower spreads, as we expect
KMB to further ramp up its productivity metrics (term deposit mobilisation)
in order to capitalise on the broader asset growth opportunities.
Financial summary (INR bn) Q3FY22 Q3FY21 YoY (%) Q2FY22 QoQ(%) FY21 FY22E FY23E FY24E
NII 43.3 38.8 11.8% 40.2 7.8% 153.4 166.7 193.6 221.4
PPOP 27.0 29.0 -7.0% 31.2 -13.4% 122.1 120.2 142.7 167.9
PAT 21.3 18.5 15.0% 20.3 4.9% 69.6 80.0 92.0 106.8
EPS (INR) 10.7 9.4 14.7% 10.2 4.9% 35.1 40.4 46.4 53.9
ROAE (%) 12.4 11.9 12.2 12.7
ROAA (%) 1.9 2.0 2.0 2.1
ABVPS (INR) 294.7 331.8 370.6 412.4
P/ABV (x) 6.4 5.7 5.1 4.6
Source: Company, HSIE Research
ADD CMP (as on 28 Jan 2022) INR1,898
Target Price INR2,040
NIFTY 17,102
KEY
CHANGES OLD NEW
Rating REDUCE ADD
Price Target INR1,831 INR2,040
EPS % FY22E FY23E
1% 3%
KEY STOCK DATA
Bloomberg code KMB IN
No. of Shares (mn) 1,984
MCap (INR bn) / ($ mn) 3,766/50,608
6m avg traded value (INR mn) 6,755
52 Week high / low INR 2,253/1,626
STOCK PERFORMANCE (%)
3M 6M 12M
Absolute (%) (9.5) 14.9 10.2
Relative (%) (4.9) 5.8 (11.8)
SHAREHOLDING PATTERN (%)
Sep-21 Dec-21
Promoters 26.0 26.0
FIs & Local MFs 15.3 15.5
FPIs 45.6 45.0
Public & Others 13.2 13.5
Pledged Shares 0.0
Source : BSE
Pledged shares as % of total shares
Krishnan ASV
+91-22-6171-7314
Deepak Shinde
+91-22-6171-7323
Neelam Bhatia
+91-22-6171-7341
P a g e | 21
HSIE Results Daily
Axis Bank
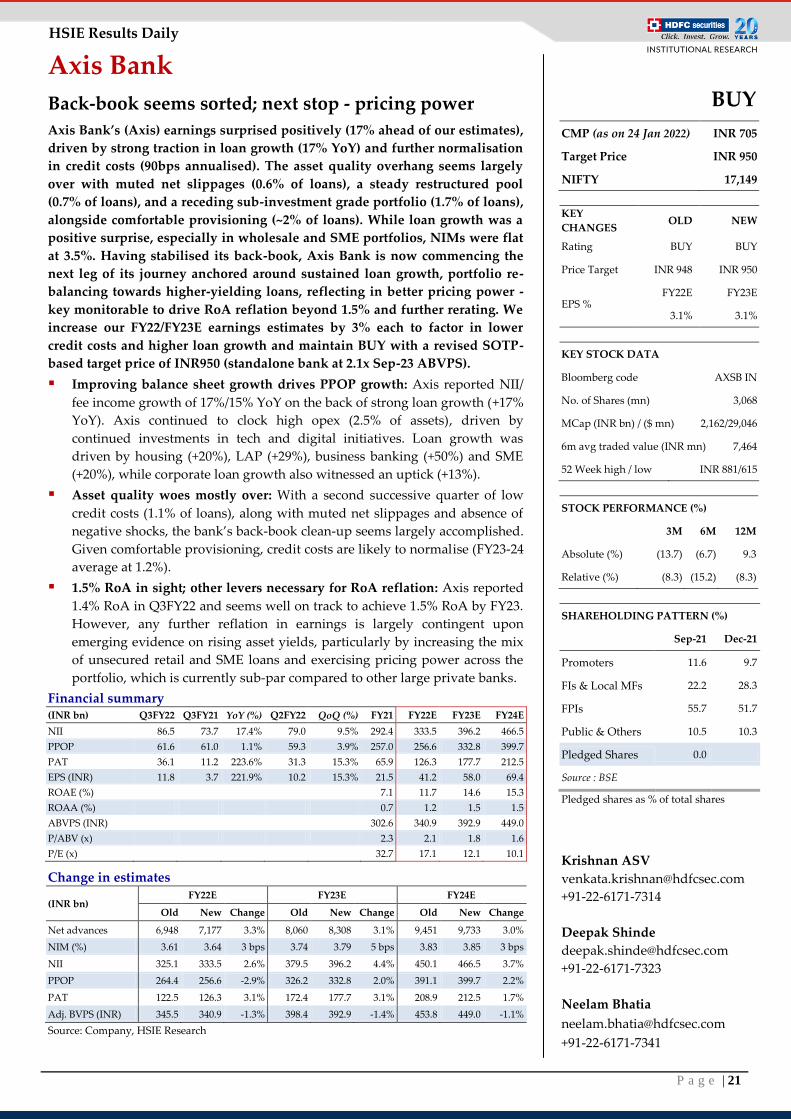
Back-book seems sorted; next stop - pricing power
Axis Bank’s (Axis) earnings surprised positively (17% ahead of our estimates),
driven by strong traction in loan growth (17% YoY) and further normalisation
in credit costs (90bps annualised). The asset quality overhang seems largely
over with muted net slippages (0.6% of loans), a steady restructured pool
(0.7% of loans), and a receding sub-investment grade portfolio (1.7% of loans),
alongside comfortable provisioning (~2% of loans). While loan growth was a
positive surprise, especially in wholesale and SME portfolios, NIMs were flat
at 3.5%. Having stabilised its back-book, Axis Bank is now commencing the
next leg of its journey anchored around sustained loan growth, portfolio re-
balancing towards higher-yielding loans, reflecting in better pricing power -
key monitorable to drive RoA reflation beyond 1.5% and further rerating. We
increase our FY22/FY23E earnings estimates by 3% each to factor in lower
credit costs and higher loan growth and maintain BUY with a revised SOTP-
based target price of INR950 (standalone bank at 2.1x Sep-23 ABVPS).
Improving balance sheet growth drives PPOP growth: Axis reported NII/
fee income growth of 17%/15% YoY on the back of strong loan growth (+17%
YoY). Axis continued to clock high opex (2.5% of assets), driven by
continued investments in tech and digital initiatives. Loan growth was
driven by housing (+20%), LAP (+29%), business banking (+50%) and SME
(+20%), while corporate loan growth also witnessed an uptick (+13%).
Asset quality woes mostly over: With a second successive quarter of low
credit costs (1.1% of loans), along with muted net slippages and absence of
negative shocks, the bank’s back-book clean-up seems largely accomplished.
Given comfortable provisioning, credit costs are likely to normalise (FY23-24
average at 1.2%).
1.5% RoA in sight; other levers necessary for RoA reflation: Axis reported
1.4% RoA in Q3FY22 and seems well on track to achieve 1.5% RoA by FY23.
However, any further reflation in earnings is largely contingent upon
emerging evidence on rising asset yields, particularly by increasing the mix
of unsecured retail and SME loans and exercising pricing power across the
portfolio, which is currently sub-par compared to other large private banks.
Financial summary (INR bn) Q3FY22 Q3FY21 YoY (%) Q2FY22 QoQ (%) FY21 FY22E FY23E FY24E
NII 86.5 73.7 17.4% 79.0 9.5% 292.4 333.5 396.2 466.5
PPOP 61.6 61.0 1.1% 59.3 3.9% 257.0 256.6 332.8 399.7
PAT 36.1 11.2 223.6% 31.3 15.3% 65.9 126.3 177.7 212.5
EPS (INR) 11.8 3.7 221.9% 10.2 15.3% 21.5 41.2 58.0 69.4
ROAE (%) 7.1 11.7 14.6 15.3
ROAA (%) 0.7 1.2 1.5 1.5
ABVPS (INR) 302.6 340.9 392.9 449.0
P/ABV (x) 2.3 2.1 1.8 1.6
P/E (x) 32.7 17.1 12.1 10.1
Change in estimates
(INR bn) FY22E FY23E FY24E
Old New Change Old New Change Old New Change
Net advances 6,948 7,177 3.3% 8,060 8,308 3.1% 9,451 9,733 3.0%
NIM (%) 3.61 3.64 3 bps 3.74 3.79 5 bps 3.83 3.85 3 bps
NII 325.1 333.5 2.6% 379.5 396.2 4.4% 450.1 466.5 3.7%
PPOP 264.4 256.6 -2.9% 326.2 332.8 2.0% 391.1 399.7 2.2%
PAT 122.5 126.3 3.1% 172.4 177.7 3.1% 208.9 212.5 1.7%
Adj. BVPS (INR) 345.5 340.9 -1.3% 398.4 392.9 -1.4% 453.8 449.0 -1.1%
Source: Company, HSIE Research
BUY
CMP (as on 24 Jan 2022) INR 705
Target Price INR 950
NIFTY 17,149
KEY
CHANGES OLD NEW
Rating BUY BUY
Price Target INR 948 INR 950
EPS % FY22E FY23E
3.1% 3.1%
KEY STOCK DATA
Bloomberg code AXSB IN
No. of Shares (mn) 3,068
MCap (INR bn) / ($ mn) 2,162/29,046
6m avg traded value (INR mn) 7,464
52 Week high / low INR 881/615
STOCK PERFORMANCE (%)
3M 6M 12M
Absolute (%) (13.7) (6.7) 9.3
Relative (%) (8.3) (15.2) (8.3)
SHAREHOLDING PATTERN (%)
Sep-21 Dec-21
Promoters 11.6 9.7
FIs & Local MFs 22.2 28.3
FPIs 55.7 51.7
Public & Others 10.5 10.3
Pledged Shares 0.0
Source : BSE
Pledged shares as % of total shares
Krishnan ASV
+91-22-6171-7314
Deepak Shinde
+91-22-6171-7323
Neelam Bhatia
+91-22-6171-7341
P a g e | 22
HSIE Results Daily
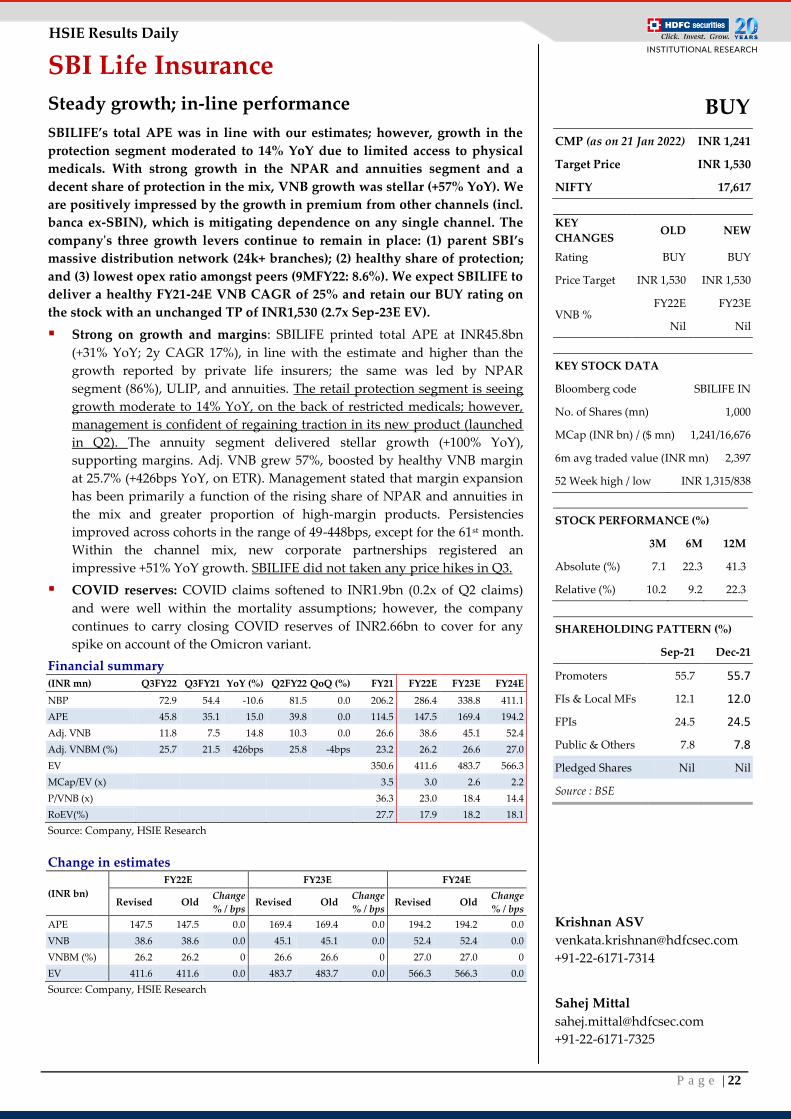
SBI Life Insurance
Steady growth; in-line performance SBILIFE’s total APE was in line with our estimates; however, growth in the
protection segment moderated to 14% YoY due to limited access to physical
medicals. With strong growth in the NPAR and annuities segment and a
decent share of protection in the mix, VNB growth was stellar (+57% YoY). We
are positively impressed by the growth in premium from other channels (incl.
banca ex-SBIN), which is mitigating dependence on any single channel. The
company's three growth levers continue to remain in place: (1) parent SBI’s
massive distribution network (24k+ branches); (2) healthy share of protection;
and (3) lowest opex ratio amongst peers (9MFY22: 8.6%). We expect SBILIFE to
deliver a healthy FY21-24E VNB CAGR of 25% and retain our BUY rating on
the stock with an unchanged TP of INR1,530 (2.7x Sep-23E EV).
Strong on growth and margins: SBILIFE printed total APE at INR45.8bn
(+31% YoY; 2y CAGR 17%), in line with the estimate and higher than the
growth reported by private life insurers; the same was led by NPAR
segment (86%), ULIP, and annuities. The retail protection segment is seeing
growth moderate to 14% YoY, on the back of restricted medicals; however,
management is confident of regaining traction in its new product (launched
in Q2). The annuity segment delivered stellar growth (+100% YoY),
supporting margins. Adj. VNB grew 57%, boosted by healthy VNB margin
at 25.7% (+426bps YoY, on ETR). Management stated that margin expansion
has been primarily a function of the rising share of NPAR and annuities in
the mix and greater proportion of high-margin products. Persistencies
improved across cohorts in the range of 49-448bps, except for the 61st month.
Within the channel mix, new corporate partnerships registered an
impressive +51% YoY growth. SBILIFE did not taken any price hikes in Q3.
COVID reserves: COVID claims softened to INR1.9bn (0.2x of Q2 claims)
and were well within the mortality assumptions; however, the company
continues to carry closing COVID reserves of INR2.66bn to cover for any
spike on account of the Omicron variant.
Financial summary (INR mn) Q3FY22 Q3FY21 YoY (%) Q2FY22 QoQ (%) FY21 FY22E FY23E FY24E
NBP 72.9 54.4 -10.6 81.5 0.0 206.2 286.4 338.8 411.1
APE 45.8 35.1 15.0 39.8 0.0 114.5 147.5 169.4 194.2
Adj. VNB 11.8 7.5 14.8 10.3 0.0 26.6 38.6 45.1 52.4
Adj. VNBM (%) 25.7 21.5 426bps 25.8 -4bps 23.2 26.2 26.6 27.0
EV
350.6 411.6 483.7 566.3
MCap/EV (x)
3.5 3.0 2.6 2.2
P/VNB (x)
36.3 23.0 18.4 14.4
RoEV(%)
27.7 17.9 18.2 18.1
Source: Company, HSIE Research
Change in estimates
(INR bn)
FY22E FY23E FY24E
Revised Old Change
% / bps Revised Old
Change
% / bps Revised Old
Change
% / bps
APE 147.5 147.5 0.0 169.4 169.4 0.0 194.2 194.2 0.0
VNB 38.6 38.6 0.0 45.1 45.1 0.0 52.4 52.4 0.0
VNBM (%) 26.2 26.2 0 26.6 26.6 0 27.0 27.0 0
EV 411.6 411.6 0.0 483.7 483.7 0.0 566.3 566.3 0.0
Source: Company, HSIE Research
BUY
CMP (as on 21 Jan 2022) INR 1,241
Target Price INR 1,530
NIFTY 17,617
KEY
CHANGES OLD NEW
Rating BUY BUY
Price Target INR 1,530 INR 1,530
VNB % FY22E FY23E
Nil Nil
KEY STOCK DATA
Bloomberg code SBILIFE IN
No. of Shares (mn) 1,000
MCap (INR bn) / ($ mn) 1,241/16,676
6m avg traded value (INR mn) 2,397
52 Week high / low INR 1,315/838
STOCK PERFORMANCE (%)
3M 6M 12M
Absolute (%) 7.1 22.3 41.3
Relative (%) 10.2 9.2 22.3
SHAREHOLDING PATTERN (%)
Sep-21 Dec-21
Promoters 55.7 55.7
FIs & Local MFs 12.1 12.0
FPIs 24.5 24.5
Public & Others 7.8 7.8
Pledged Shares Nil Nil
Source : BSE
Krishnan ASV
+91-22-6171-7314
Sahej Mittal
+91-22-6171-7325
P a g e | 23
HSIE Results Daily
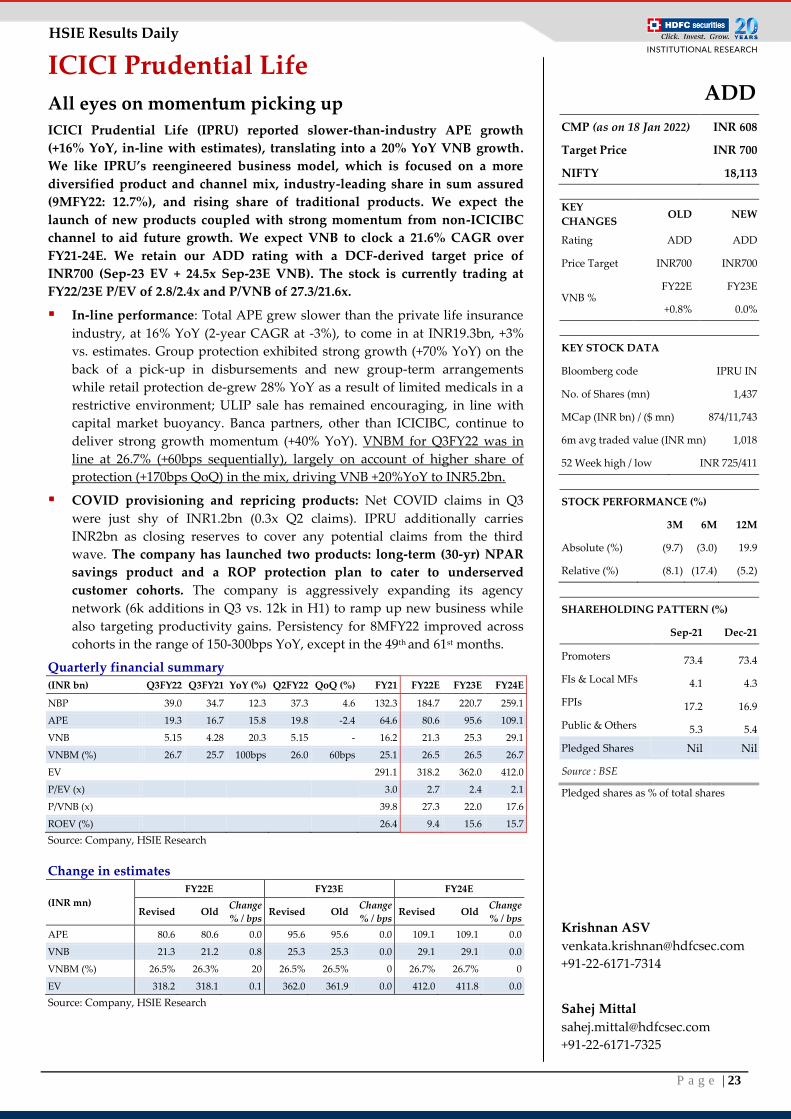
ICICI Prudential Life
All eyes on momentum picking up
ICICI Prudential Life (IPRU) reported slower-than-industry APE growth
(+16% YoY, in-line with estimates), translating into a 20% YoY VNB growth.
We like IPRU’s reengineered business model, which is focused on a more
diversified product and channel mix, industry-leading share in sum assured
(9MFY22: 12.7%), and rising share of traditional products. We expect the
launch of new products coupled with strong momentum from non-ICICIBC
channel to aid future growth. We expect VNB to clock a 21.6% CAGR over
FY21-24E. We retain our ADD rating with a DCF-derived target price of
INR700 (Sep-23 EV + 24.5x Sep-23E VNB). The stock is currently trading at
FY22/23E P/EV of 2.8/2.4x and P/VNB of 27.3/21.6x.
In-line performance: Total APE grew slower than the private life insurance
industry, at 16% YoY (2-year CAGR at -3%), to come in at INR19.3bn, +3%
vs. estimates. Group protection exhibited strong growth (+70% YoY) on the
back of a pick-up in disbursements and new group-term arrangements
while retail protection de-grew 28% YoY as a result of limited medicals in a
restrictive environment; ULIP sale has remained encouraging, in line with
capital market buoyancy. Banca partners, other than ICICIBC, continue to
deliver strong growth momentum (+40% YoY). VNBM for Q3FY22 was in
line at 26.7% (+60bps sequentially), largely on account of higher share of
protection (+170bps QoQ) in the mix, driving VNB +20%YoY to INR5.2bn.
COVID provisioning and repricing products: Net COVID claims in Q3
were just shy of INR1.2bn (0.3x Q2 claims). IPRU additionally carries
INR2bn as closing reserves to cover any potential claims from the third
wave. The company has launched two products: long-term (30-yr) NPAR
savings product and a ROP protection plan to cater to underserved
customer cohorts. The company is aggressively expanding its agency
network (6k additions in Q3 vs. 12k in H1) to ramp up new business while
also targeting productivity gains. Persistency for 8MFY22 improved across
cohorts in the range of 150-300bps YoY, except in the 49th and 61st months.
Quarterly financial summary
(INR bn) Q3FY22 Q3FY21 YoY (%) Q2FY22 QoQ (%) FY21 FY22E FY23E FY24E
NBP 39.0 34.7 12.3 37.3 4.6 132.3 184.7 220.7 259.1
APE 19.3 16.7 15.8 19.8 -2.4 64.6 80.6 95.6 109.1
VNB 5.15 4.28 20.3 5.15 - 16.2 21.3 25.3 29.1
VNBM (%) 26.7 25.7 100bps 26.0 60bps 25.1 26.5 26.5 26.7
EV
291.1 318.2 362.0 412.0
P/EV (x)
3.0 2.7 2.4 2.1
P/VNB (x)
39.8 27.3 22.0 17.6
ROEV (%)
26.4 9.4 15.6 15.7
Source: Company, HSIE Research
Change in estimates
(INR mn)
FY22E FY23E FY24E
Revised Old Change
% / bps Revised Old
Change
% / bps Revised Old
Change
% / bps
APE 80.6 80.6 0.0 95.6 95.6 0.0 109.1 109.1 0.0
VNB 21.3 21.2 0.8 25.3 25.3 0.0 29.1 29.1 0.0
VNBM (%) 26.5% 26.3% 20 26.5% 26.5% 0 26.7% 26.7% 0
EV 318.2 318.1 0.1 362.0 361.9 0.0 412.0 411.8 0.0
Source: Company, HSIE Research
ADD
CMP (as on 18 Jan 2022) INR 608
Target Price INR 700
NIFTY 18,113
KEY
CHANGES OLD NEW
Rating ADD ADD
Price Target INR700 INR700
VNB % FY22E FY23E
+0.8% 0.0%
KEY STOCK DATA
Bloomberg code IPRU IN
No. of Shares (mn) 1,437
MCap (INR bn) / ($ mn) 874/11,743
6m avg traded value (INR mn) 1,018
52 Week high / low INR 725/411
STOCK PERFORMANCE (%)
3M 6M 12M
Absolute (%) (9.7) (3.0) 19.9
Relative (%) (8.1) (17.4) (5.2)
SHAREHOLDING PATTERN (%)
Sep-21 Dec-21
Promoters 73.4 73.4
FIs & Local MFs 4.1 4.3
FPIs 17.2 16.9
Public & Others 5.3 5.4
Pledged Shares Nil Nil
Source : BSE
Pledged shares as % of total shares
Krishnan ASV
+91-22-6171-7314
Sahej Mittal
+91-22-6171-7325
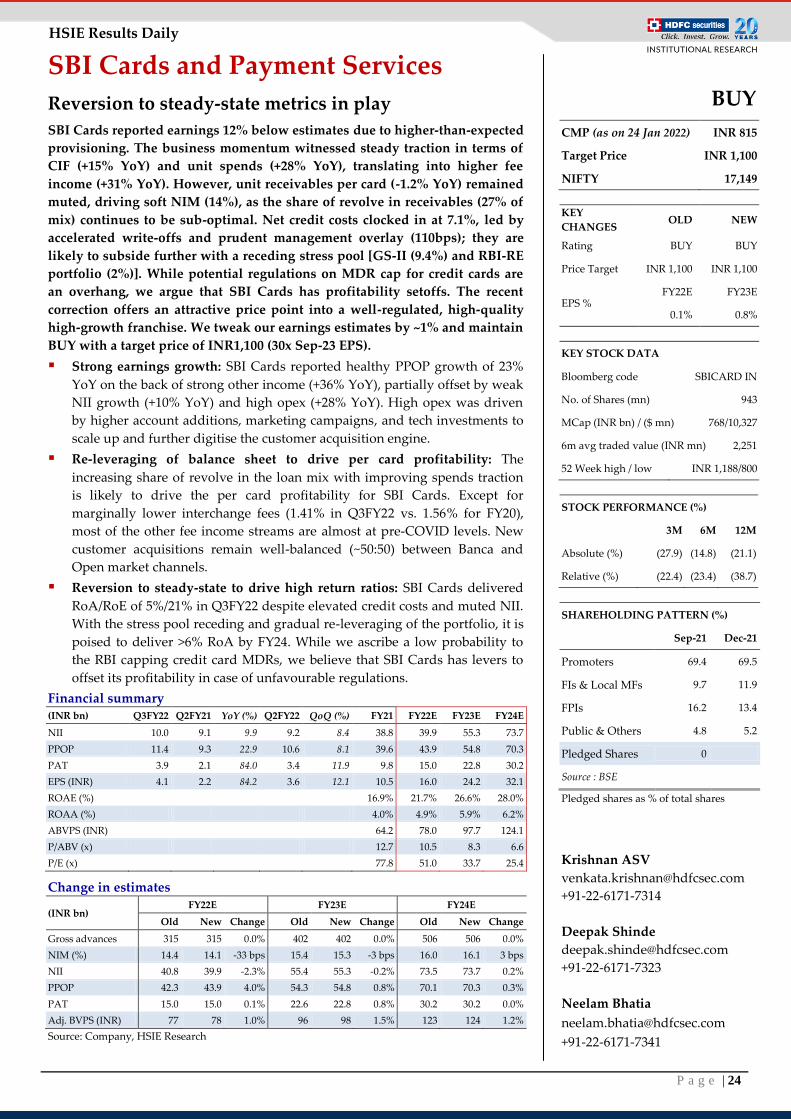
P a g e | 24
HSIE Results Daily
SBI Cards and Payment Services
Reversion to steady-state metrics in play
SBI Cards reported earnings 12% below estimates due to higher-than-expected
provisioning. The business momentum witnessed steady traction in terms of
CIF (+15% YoY) and unit spends (+28% YoY), translating into higher fee
income (+31% YoY). However, unit receivables per card (-1.2% YoY) remained
muted, driving soft NIM (14%), as the share of revolve in receivables (27% of
mix) continues to be sub-optimal. Net credit costs clocked in at 7.1%, led by
accelerated write-offs and prudent management overlay (110bps); they are
likely to subside further with a receding stress pool [GS-II (9.4%) and RBI-RE
portfolio (2%)]. While potential regulations on MDR cap for credit cards are
an overhang, we argue that SBI Cards has profitability setoffs. The recent
correction offers an attractive price point into a well-regulated, high-quality
high-growth franchise. We tweak our earnings estimates by ~1% and maintain
BUY with a target price of INR1,100 (30x Sep-23 EPS).
Strong earnings growth: SBI Cards reported healthy PPOP growth of 23%
YoY on the back of strong other income (+36% YoY), partially offset by weak
NII growth (+10% YoY) and high opex (+28% YoY). High opex was driven
by higher account additions, marketing campaigns, and tech investments to
scale up and further digitise the customer acquisition engine.
Re-leveraging of balance sheet to drive per card profitability: The
increasing share of revolve in the loan mix with improving spends traction
is likely to drive the per card profitability for SBI Cards. Except for
marginally lower interchange fees (1.41% in Q3FY22 vs. 1.56% for FY20),
most of the other fee income streams are almost at pre-COVID levels. New
customer acquisitions remain well-balanced (~50:50) between Banca and
Open market channels.
Reversion to steady-state to drive high return ratios: SBI Cards delivered
RoA/RoE of 5%/21% in Q3FY22 despite elevated credit costs and muted NII.
With the stress pool receding and gradual re-leveraging of the portfolio, it is
poised to deliver >6% RoA by FY24. While we ascribe a low probability to
the RBI capping credit card MDRs, we believe that SBI Cards has levers to
offset its profitability in case of unfavourable regulations.
Financial summary (INR bn) Q3FY22 Q2FY21 YoY (%) Q2FY22 QoQ (%) FY21 FY22E FY23E FY24E
NII 10.0 9.1 9.9 9.2 8.4 38.8 39.9 55.3 73.7
PPOP 11.4 9.3 22.9 10.6 8.1 39.6 43.9 54.8 70.3
PAT 3.9 2.1 84.0 3.4 11.9 9.8 15.0 22.8 30.2
EPS (INR) 4.1 2.2 84.2 3.6 12.1 10.5 16.0 24.2 32.1
ROAE (%) 16.9% 21.7% 26.6% 28.0%
ROAA (%) 4.0% 4.9% 5.9% 6.2%
ABVPS (INR) 64.2 78.0 97.7 124.1
P/ABV (x) 12.7 10.5 8.3 6.6
P/E (x) 77.8 51.0 33.7 25.4
Change in estimates
(INR bn) FY22E FY23E FY24E
Old New Change Old New Change Old New Change
Gross advances 315 315 0.0% 402 402 0.0% 506 506 0.0%
NIM (%) 14.4 14.1 -33 bps 15.4 15.3 -3 bps 16.0 16.1 3 bps
NII 40.8 39.9 -2.3% 55.4 55.3 -0.2% 73.5 73.7 0.2%
PPOP 42.3 43.9 4.0% 54.3 54.8 0.8% 70.1 70.3 0.3%
PAT 15.0 15.0 0.1% 22.6 22.8 0.8% 30.2 30.2 0.0%
Adj. BVPS (INR) 77 78 1.0% 96 98 1.5% 123 124 1.2%
Source: Company, HSIE Research
BUY
CMP (as on 24 Jan 2022) INR 815
Target Price INR 1,100
NIFTY 17,149
KEY
CHANGES OLD NEW
Rating BUY BUY
Price Target INR 1,100 INR 1,100
EPS % FY22E FY23E
0.1% 0.8%
KEY STOCK DATA
Bloomberg code SBICARD IN
No. of Shares (mn) 943
MCap (INR bn) / ($ mn) 768/10,327
6m avg traded value (INR mn) 2,251
52 Week high / low INR 1,188/800
STOCK PERFORMANCE (%)
3M 6M 12M
Absolute (%) (27.9) (14.8) (21.1)
Relative (%) (22.4) (23.4) (38.7)
SHAREHOLDING PATTERN (%)
Sep-21 Dec-21
Promoters 69.4 69.5
FIs & Local MFs 9.7 11.9
FPIs 16.2 13.4
Public & Others 4.8 5.2
Pledged Shares 0
Source : BSE
Pledged shares as % of total shares
Krishnan ASV
+91-22-6171-7314
Deepak Shinde
+91-22-6171-7323
Neelam Bhatia
+91-22-6171-7341
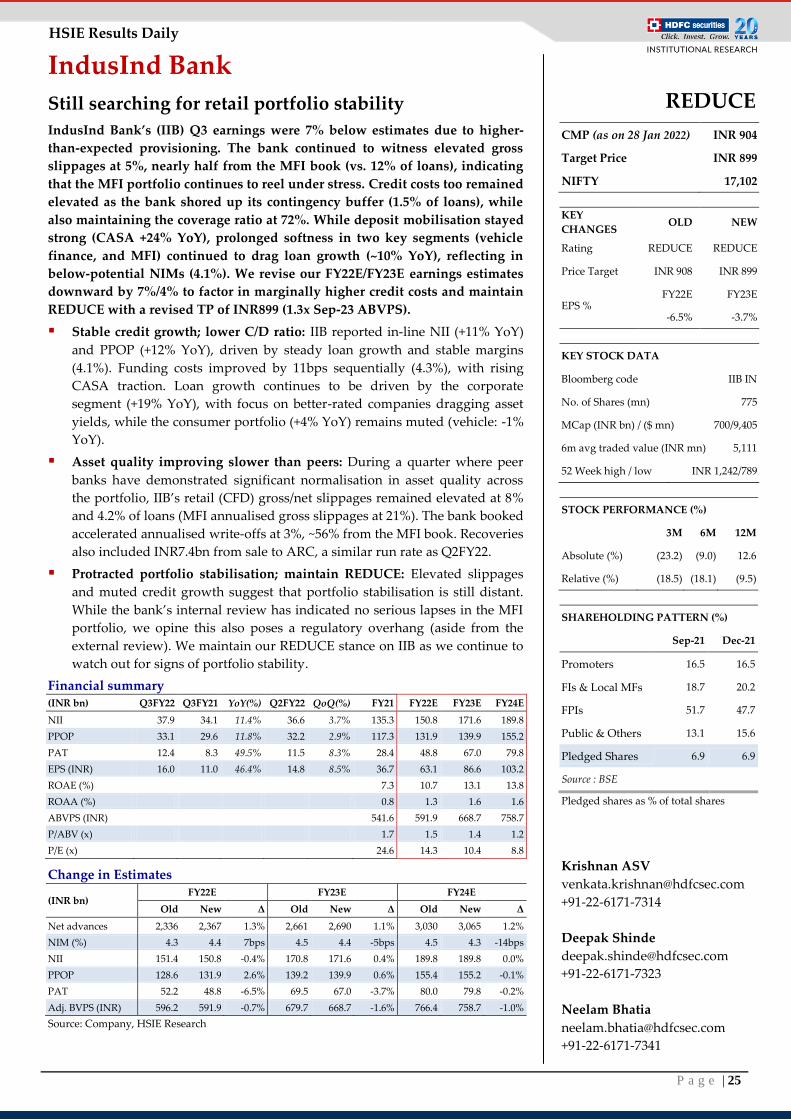
P a g e | 25
HSIE Results Daily
IndusInd Bank
Still searching for retail portfolio stability
IndusInd Bank’s (IIB) Q3 earnings were 7% below estimates due to higher-
than-expected provisioning. The bank continued to witness elevated gross
slippages at 5%, nearly half from the MFI book (vs. 12% of loans), indicating
that the MFI portfolio continues to reel under stress. Credit costs too remained
elevated as the bank shored up its contingency buffer (1.5% of loans), while
also maintaining the coverage ratio at 72%. While deposit mobilisation stayed
strong (CASA +24% YoY), prolonged softness in two key segments (vehicle
finance, and MFI) continued to drag loan growth (~10% YoY), reflecting in
below-potential NIMs (4.1%). We revise our FY22E/FY23E earnings estimates
downward by 7%/4% to factor in marginally higher credit costs and maintain
REDUCE with a revised TP of INR899 (1.3x Sep-23 ABVPS).
Stable credit growth; lower C/D ratio: IIB reported in-line NII (+11% YoY)
and PPOP (+12% YoY), driven by steady loan growth and stable margins
(4.1%). Funding costs improved by 11bps sequentially (4.3%), with rising
CASA traction. Loan growth continues to be driven by the corporate
segment (+19% YoY), with focus on better-rated companies dragging asset
yields, while the consumer portfolio (+4% YoY) remains muted (vehicle: -1%
YoY).
Asset quality improving slower than peers: During a quarter where peer
banks have demonstrated significant normalisation in asset quality across
the portfolio, IIB’s retail (CFD) gross/net slippages remained elevated at 8%
and 4.2% of loans (MFI annualised gross slippages at 21%). The bank booked
accelerated annualised write-offs at 3%, ~56% from the MFI book. Recoveries
also included INR7.4bn from sale to ARC, a similar run rate as Q2FY22.
Protracted portfolio stabilisation; maintain REDUCE: Elevated slippages
and muted credit growth suggest that portfolio stabilisation is still distant.
While the bank’s internal review has indicated no serious lapses in the MFI
portfolio, we opine this also poses a regulatory overhang (aside from the
external review). We maintain our REDUCE stance on IIB as we continue to
watch out for signs of portfolio stability.
Financial summary (INR bn) Q3FY22 Q3FY21 YoY(%) Q2FY22 QoQ(%) FY21 FY22E FY23E FY24E
NII 37.9 34.1 11.4% 36.6 3.7% 135.3 150.8 171.6 189.8
PPOP 33.1 29.6 11.8% 32.2 2.9% 117.3 131.9 139.9 155.2
PAT 12.4 8.3 49.5% 11.5 8.3% 28.4 48.8 67.0 79.8
EPS (INR) 16.0 11.0 46.4% 14.8 8.5% 36.7 63.1 86.6 103.2
ROAE (%) 7.3 10.7 13.1 13.8
ROAA (%) 0.8 1.3 1.6 1.6
ABVPS (INR) 541.6 591.9 668.7 758.7
P/ABV (x) 1.7 1.5 1.4 1.2
P/E (x) 24.6 14.3 10.4 8.8
Change in Estimates
(INR bn) FY22E FY23E FY24E
Old New Δ Old New Δ Old New Δ
Net advances 2,336 2,367 1.3% 2,661 2,690 1.1% 3,030 3,065 1.2%
NIM (%) 4.3 4.4 7bps 4.5 4.4 -5bps 4.5 4.3 -14bps
NII 151.4 150.8 -0.4% 170.8 171.6 0.4% 189.8 189.8 0.0%
PPOP 128.6 131.9 2.6% 139.2 139.9 0.6% 155.4 155.2 -0.1%
PAT 52.2 48.8 -6.5% 69.5 67.0 -3.7% 80.0 79.8 -0.2%
Adj. BVPS (INR) 596.2 591.9 -0.7% 679.7 668.7 -1.6% 766.4 758.7 -1.0%
Source: Company, HSIE Research
REDUCE
CMP (as on 28 Jan 2022) INR 904
Target Price INR 899
NIFTY 17,102
KEY
CHANGES OLD NEW
Rating REDUCE REDUCE
Price Target INR 908 INR 899
EPS % FY22E FY23E
-6.5% -3.7%
KEY STOCK DATA
Bloomberg code IIB IN
No. of Shares (mn) 775
MCap (INR bn) / ($ mn) 700/9,405
6m avg traded value (INR mn) 5,111
52 Week high / low INR 1,242/789
STOCK PERFORMANCE (%)
3M 6M 12M
Absolute (%) (23.2) (9.0) 12.6
Relative (%) (18.5) (18.1) (9.5)
SHAREHOLDING PATTERN (%)
Sep-21 Dec-21
Promoters 16.5 16.5
FIs & Local MFs 18.7 20.2
FPIs 51.7 47.7
Public & Others 13.1 15.6
Pledged Shares 6.9 6.9
Source : BSE
Pledged shares as % of total shares
Krishnan ASV
+91-22-6171-7314
Deepak Shinde
+91-22-6171-7323
Neelam Bhatia
+91-22-6171-7341
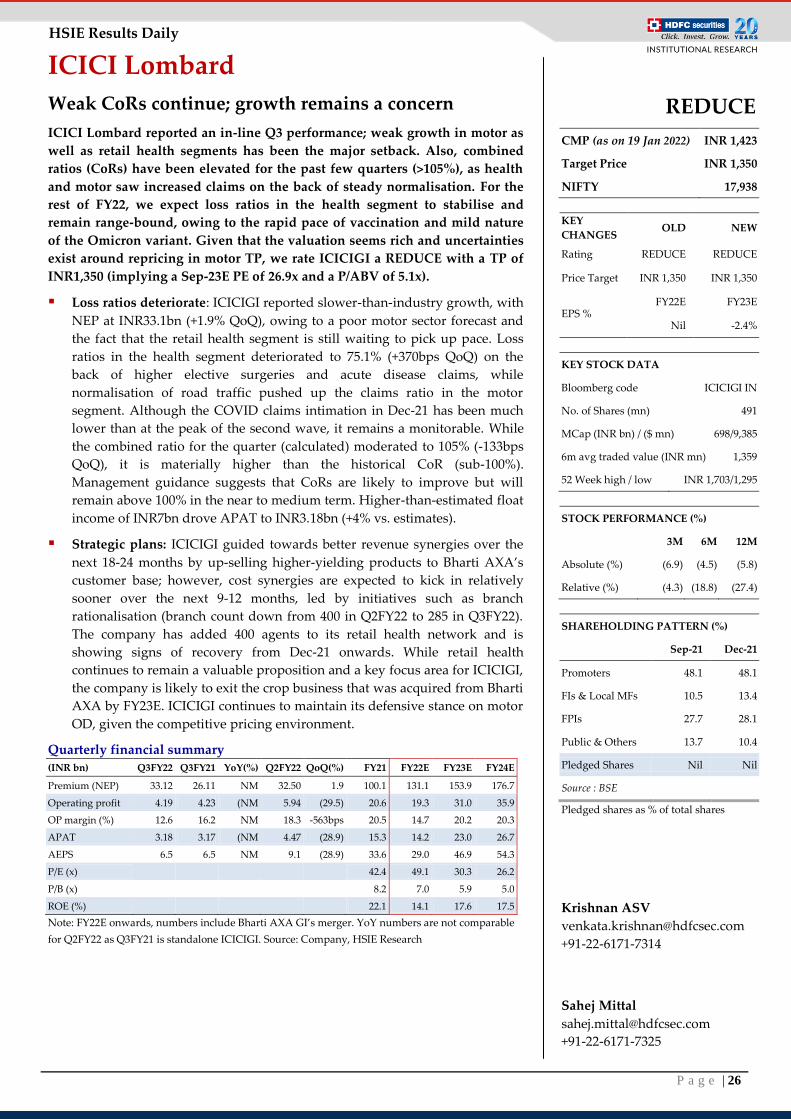
P a g e | 26
HSIE Results Daily
ICICI Lombard
Weak CoRs continue; growth remains a concern
ICICI Lombard reported an in-line Q3 performance; weak growth in motor as
well as retail health segments has been the major setback. Also, combined
ratios (CoRs) have been elevated for the past few quarters (>105%), as health
and motor saw increased claims on the back of steady normalisation. For the
rest of FY22, we expect loss ratios in the health segment to stabilise and
remain range-bound, owing to the rapid pace of vaccination and mild nature
of the Omicron variant. Given that the valuation seems rich and uncertainties
exist around repricing in motor TP, we rate ICICIGI a REDUCE with a TP of
INR1,350 (implying a Sep-23E PE of 26.9x and a P/ABV of 5.1x).
Loss ratios deteriorate: ICICIGI reported slower-than-industry growth, with
NEP at INR33.1bn (+1.9% QoQ), owing to a poor motor sector forecast and
the fact that the retail health segment is still waiting to pick up pace. Loss
ratios in the health segment deteriorated to 75.1% (+370bps QoQ) on the
back of higher elective surgeries and acute disease claims, while
normalisation of road traffic pushed up the claims ratio in the motor
segment. Although the COVID claims intimation in Dec-21 has been much
lower than at the peak of the second wave, it remains a monitorable. While
the combined ratio for the quarter (calculated) moderated to 105% (-133bps
QoQ), it is materially higher than the historical CoR (sub-100%).
Management guidance suggests that CoRs are likely to improve but will
remain above 100% in the near to medium term. Higher-than-estimated float
income of INR7bn drove APAT to INR3.18bn (+4% vs. estimates).
Strategic plans: ICICIGI guided towards better revenue synergies over the
next 18-24 months by up-selling higher-yielding products to Bharti AXA’s
customer base; however, cost synergies are expected to kick in relatively
sooner over the next 9-12 months, led by initiatives such as branch
rationalisation (branch count down from 400 in Q2FY22 to 285 in Q3FY22).
The company has added 400 agents to its retail health network and is
showing signs of recovery from Dec-21 onwards. While retail health
continues to remain a valuable proposition and a key focus area for ICICIGI,
the company is likely to exit the crop business that was acquired from Bharti
AXA by FY23E. ICICIGI continues to maintain its defensive stance on motor
OD, given the competitive pricing environment.
Quarterly financial summary
(INR bn) Q3FY22 Q3FY21 YoY(%) Q2FY22 QoQ(%) FY21 FY22E FY23E FY24E
Premium (NEP) 33.12 26.11 NM 32.50 1.9 100.1 131.1 153.9 176.7
Operating profit 4.19 4.23 (NM 5.94 (29.5) 20.6 19.3 31.0 35.9
OP margin (%) 12.6 16.2 NM 18.3 -563bps 20.5 14.7 20.2 20.3
APAT 3.18 3.17 (NM 4.47 (28.9) 15.3 14.2 23.0 26.7
AEPS 6.5 6.5 NM 9.1 (28.9) 33.6 29.0 46.9 54.3
P/E (x)
42.4 49.1 30.3 26.2
P/B (x)
8.2 7.0 5.9 5.0
ROE (%)
22.1 14.1 17.6 17.5
Note: FY22E onwards, numbers include Bharti AXA GI’s merger. YoY numbers are not comparable
for Q2FY22 as Q3FY21 is standalone ICICIGI. Source: Company, HSIE Research
REDUCE
CMP (as on 19 Jan 2022) INR 1,423
Target Price INR 1,350
NIFTY 17,938
KEY
CHANGES OLD NEW
Rating REDUCE REDUCE
Price Target INR 1,350 INR 1,350
EPS % FY22E FY23E
Nil -2.4%
KEY STOCK DATA
Bloomberg code ICICIGI IN
No. of Shares (mn) 491
MCap (INR bn) / ($ mn) 698/9,385
6m avg traded value (INR mn) 1,359
52 Week high / low INR 1,703/1,295
STOCK PERFORMANCE (%)
3M 6M 12M
Absolute (%) (6.9) (4.5) (5.8)
Relative (%) (4.3) (18.8) (27.4)
SHAREHOLDING PATTERN (%)
Sep-21 Dec-21
Promoters 48.1 48.1
FIs & Local MFs 10.5 13.4
FPIs 27.7 28.1
Public & Others 13.7 10.4
Pledged Shares Nil Nil
Source : BSE
Pledged shares as % of total shares
Krishnan ASV
+91-22-6171-7314
Sahej Mittal
+91-22-6171-7325
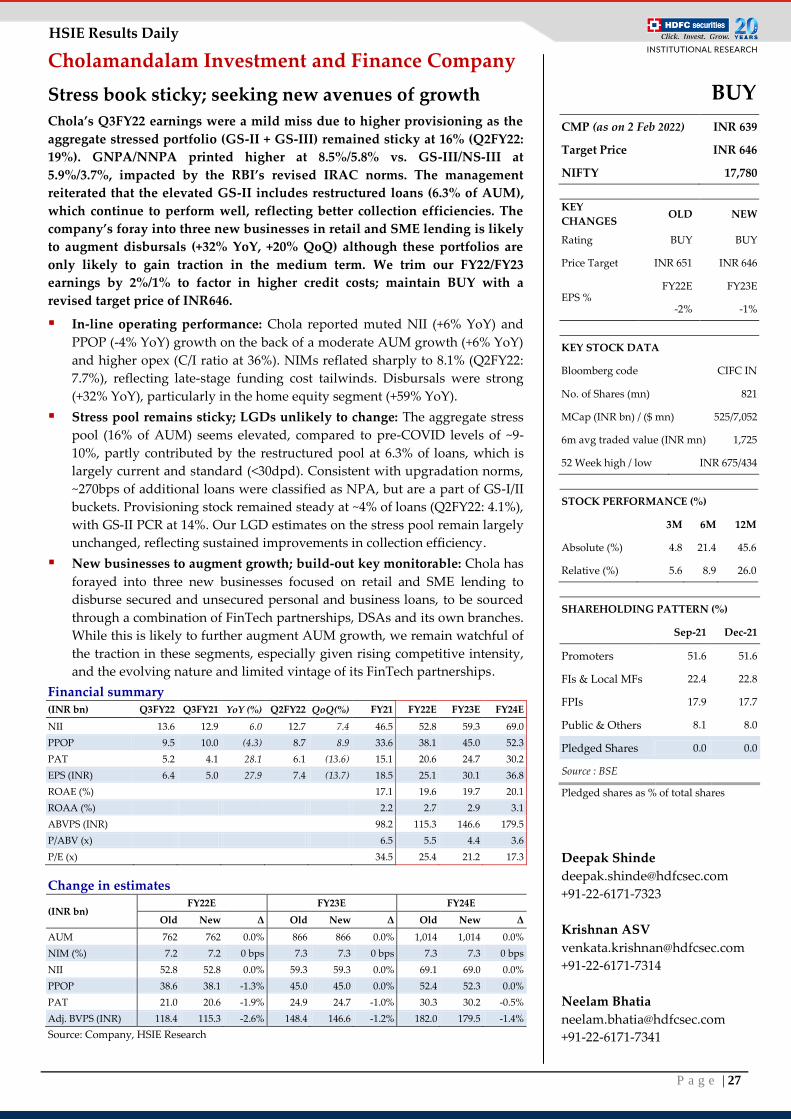
P a g e | 27
HSIE Results Daily
Cholamandalam Investment and Finance Company
Stress book sticky; seeking new avenues of growth
Chola’s Q3FY22 earnings were a mild miss due to higher provisioning as the
aggregate stressed portfolio (GS-II + GS-III) remained sticky at 16% (Q2FY22:
19%). GNPA/NNPA printed higher at 8.5%/5.8% vs. GS-III/NS-III at
5.9%/3.7%, impacted by the RBI’s revised IRAC norms. The management
reiterated that the elevated GS-II includes restructured loans (6.3% of AUM),
which continue to perform well, reflecting better collection efficiencies. The
company’s foray into three new businesses in retail and SME lending is likely
to augment disbursals (+32% YoY, +20% QoQ) although these portfolios are
only likely to gain traction in the medium term. We trim our FY22/FY23
earnings by 2%/1% to factor in higher credit costs; maintain BUY with a
revised target price of INR646.
In-line operating performance: Chola reported muted NII (+6% YoY) and
PPOP (-4% YoY) growth on the back of a moderate AUM growth (+6% YoY)
and higher opex (C/I ratio at 36%). NIMs reflated sharply to 8.1% (Q2FY22:
7.7%), reflecting late-stage funding cost tailwinds. Disbursals were strong
(+32% YoY), particularly in the home equity segment (+59% YoY).
Stress pool remains sticky; LGDs unlikely to change: The aggregate stress
pool (16% of AUM) seems elevated, compared to pre-COVID levels of ~9-
10%, partly contributed by the restructured pool at 6.3% of loans, which is
largely current and standard (<30dpd). Consistent with upgradation norms,
~270bps of additional loans were classified as NPA, but are a part of GS-I/II
buckets. Provisioning stock remained steady at ~4% of loans (Q2FY22: 4.1%),
with GS-II PCR at 14%. Our LGD estimates on the stress pool remain largely
unchanged, reflecting sustained improvements in collection efficiency.
New businesses to augment growth; build-out key monitorable: Chola has
forayed into three new businesses focused on retail and SME lending to
disburse secured and unsecured personal and business loans, to be sourced
through a combination of FinTech partnerships, DSAs and its own branches.
While this is likely to further augment AUM growth, we remain watchful of
the traction in these segments, especially given rising competitive intensity,
and the evolving nature and limited vintage of its FinTech partnerships.
Financial summary (INR bn) Q3FY22 Q3FY21 YoY (%) Q2FY22 QoQ(%) FY21 FY22E FY23E FY24E
NII 13.6 12.9 6.0 12.7 7.4 46.5 52.8 59.3 69.0
PPOP 9.5 10.0 (4.3) 8.7 8.9 33.6 38.1 45.0 52.3
PAT 5.2 4.1 28.1 6.1 (13.6) 15.1 20.6 24.7 30.2
EPS (INR) 6.4 5.0 27.9 7.4 (13.7) 18.5 25.1 30.1 36.8
ROAE (%) 17.1 19.6 19.7 20.1
ROAA (%) 2.2 2.7 2.9 3.1
ABVPS (INR) 98.2 115.3 146.6 179.5
P/ABV (x) 6.5 5.5 4.4 3.6
P/E (x) 34.5 25.4 21.2 17.3
Change in estimates
(INR bn) FY22E FY23E FY24E
Old New Δ Old New Δ Old New Δ
AUM 762 762 0.0% 866 866 0.0% 1,014 1,014 0.0%
NIM (%) 7.2 7.2 0 bps 7.3 7.3 0 bps 7.3 7.3 0 bps
NII 52.8 52.8 0.0% 59.3 59.3 0.0% 69.1 69.0 0.0%
PPOP 38.6 38.1 -1.3% 45.0 45.0 0.0% 52.4 52.3 0.0%
PAT 21.0 20.6 -1.9% 24.9 24.7 -1.0% 30.3 30.2 -0.5%
Adj. BVPS (INR) 118.4 115.3 -2.6% 148.4 146.6 -1.2% 182.0 179.5 -1.4%
Source: Company, HSIE Research
BUY
CMP (as on 2 Feb 2022) INR 639
Target Price INR 646
NIFTY 17,780
KEY
CHANGES OLD NEW
Rating BUY BUY
Price Target INR 651 INR 646
EPS % FY22E FY23E
-2% -1%
KEY STOCK DATA
Bloomberg code CIFC IN
No. of Shares (mn) 821
MCap (INR bn) / ($ mn) 525/7,052
6m avg traded value (INR mn) 1,725
52 Week high / low INR 675/434
STOCK PERFORMANCE (%)
3M 6M 12M
Absolute (%) 4.8 21.4 45.6
Relative (%) 5.6 8.9 26.0
SHAREHOLDING PATTERN (%)
Sep-21 Dec-21
Promoters 51.6 51.6
FIs & Local MFs 22.4 22.8
FPIs 17.9 17.7
Public & Others 8.1 8.0
Pledged Shares 0.0 0.0
Source : BSE
Pledged shares as % of total shares
Deepak Shinde
+91-22-6171-7323
Krishnan ASV
+91-22-6171-7314
Neelam Bhatia
+91-22-6171-7341
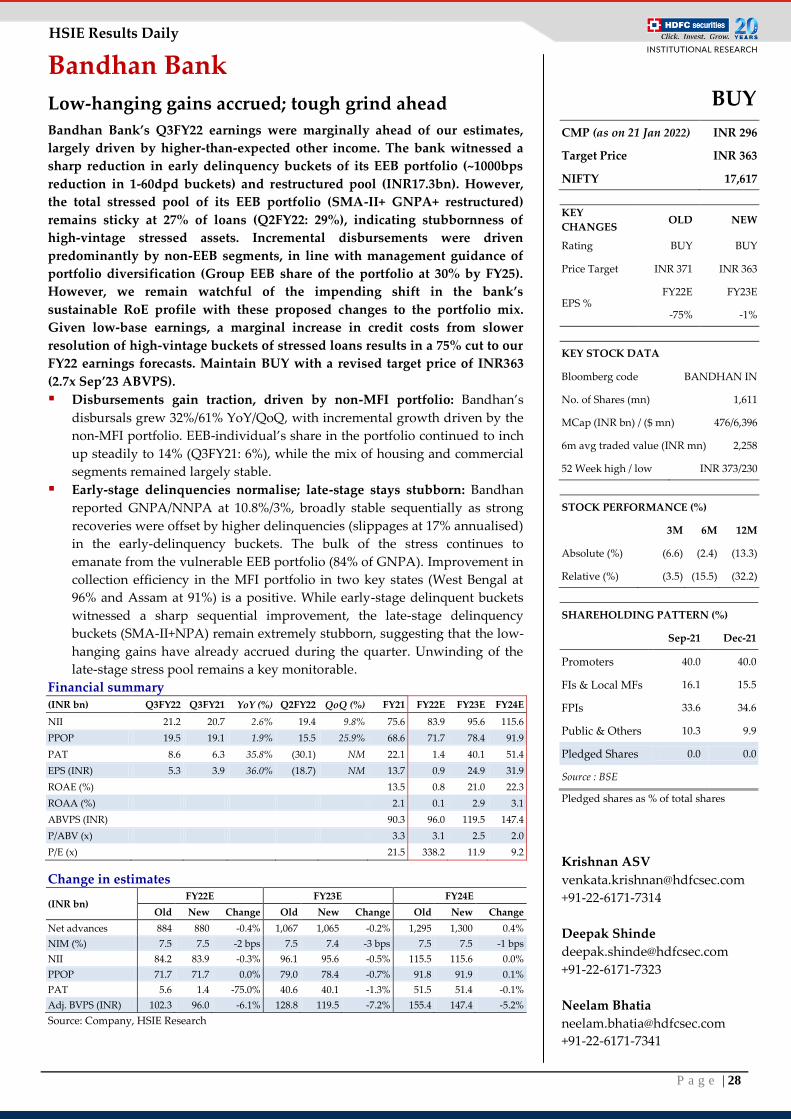
P a g e | 28
HSIE Results Daily
Bandhan Bank
Low-hanging gains accrued; tough grind ahead
Bandhan Bank’s Q3FY22 earnings were marginally ahead of our estimates,
largely driven by higher-than-expected other income. The bank witnessed a
sharp reduction in early delinquency buckets of its EEB portfolio (~1000bps
reduction in 1-60dpd buckets) and restructured pool (INR17.3bn). However,
the total stressed pool of its EEB portfolio (SMA-II+ GNPA+ restructured)
remains sticky at 27% of loans (Q2FY22: 29%), indicating stubbornness of
high-vintage stressed assets. Incremental disbursements were driven
predominantly by non-EEB segments, in line with management guidance of
portfolio diversification (Group EEB share of the portfolio at 30% by FY25).
However, we remain watchful of the impending shift in the bank’s
sustainable RoE profile with these proposed changes to the portfolio mix.
Given low-base earnings, a marginal increase in credit costs from slower
resolution of high-vintage buckets of stressed loans results in a 75% cut to our
FY22 earnings forecasts. Maintain BUY with a revised target price of INR363
(2.7x Sep’23 ABVPS).
Disbursements gain traction, driven by non-MFI portfolio: Bandhan’s
disbursals grew 32%/61% YoY/QoQ, with incremental growth driven by the
non-MFI portfolio. EEB-individual’s share in the portfolio continued to inch
up steadily to 14% (Q3FY21: 6%), while the mix of housing and commercial
segments remained largely stable.
Early-stage delinquencies normalise; late-stage stays stubborn: Bandhan
reported GNPA/NNPA at 10.8%/3%, broadly stable sequentially as strong
recoveries were offset by higher delinquencies (slippages at 17% annualised)
in the early-delinquency buckets. The bulk of the stress continues to
emanate from the vulnerable EEB portfolio (84% of GNPA). Improvement in
collection efficiency in the MFI portfolio in two key states (West Bengal at
96% and Assam at 91%) is a positive. While early-stage delinquent buckets
witnessed a sharp sequential improvement, the late-stage delinquency
buckets (SMA-II+NPA) remain extremely stubborn, suggesting that the low-
hanging gains have already accrued during the quarter. Unwinding of the
late-stage stress pool remains a key monitorable.
Financial summary (INR bn) Q3FY22 Q3FY21 YoY (%) Q2FY22 QoQ (%) FY21 FY22E FY23E FY24E
NII 21.2 20.7 2.6% 19.4 9.8% 75.6 83.9 95.6 115.6
PPOP 19.5 19.1 1.9% 15.5 25.9% 68.6 71.7 78.4 91.9
PAT 8.6 6.3 35.8% (30.1) NM 22.1 1.4 40.1 51.4
EPS (INR) 5.3 3.9 36.0% (18.7) NM 13.7 0.9 24.9 31.9
ROAE (%) 13.5 0.8 21.0 22.3
ROAA (%) 2.1 0.1 2.9 3.1
ABVPS (INR) 90.3 96.0 119.5 147.4
P/ABV (x) 3.3 3.1 2.5 2.0
P/E (x) 21.5 338.2 11.9 9.2
Change in estimates
(INR bn) FY22E FY23E FY24E
Old New Change Old New Change Old New Change
Net advances 884 880 -0.4% 1,067 1,065 -0.2% 1,295 1,300 0.4%
NIM (%) 7.5 7.5 -2 bps 7.5 7.4 -3 bps 7.5 7.5 -1 bps
NII 84.2 83.9 -0.3% 96.1 95.6 -0.5% 115.5 115.6 0.0%
PPOP 71.7 71.7 0.0% 79.0 78.4 -0.7% 91.8 91.9 0.1%
PAT 5.6 1.4 -75.0% 40.6 40.1 -1.3% 51.5 51.4 -0.1%
Adj. BVPS (INR) 102.3 96.0 -6.1% 128.8 119.5 -7.2% 155.4 147.4 -5.2%
Source: Company, HSIE Research
BUY
CMP (as on 21 Jan 2022) INR 296
Target Price INR 363
NIFTY 17,617
KEY
CHANGES OLD NEW
Rating BUY BUY
Price Target INR 371 INR 363
EPS % FY22E FY23E
-75% -1%
KEY STOCK DATA
Bloomberg code BANDHAN IN
No. of Shares (mn) 1,611
MCap (INR bn) / ($ mn) 476/6,396
6m avg traded value (INR mn) 2,258
52 Week high / low INR 373/230
STOCK PERFORMANCE (%)
3M 6M 12M
Absolute (%) (6.6) (2.4) (13.3)
Relative (%) (3.5) (15.5) (32.2)
SHAREHOLDING PATTERN (%)
Sep-21 Dec-21
Promoters 40.0 40.0
FIs & Local MFs 16.1 15.5
FPIs 33.6 34.6
Public & Others 10.3 9.9
Pledged Shares 0.0 0.0
Source : BSE
Pledged shares as % of total shares
Krishnan ASV
+91-22-6171-7314
Deepak Shinde
+91-22-6171-7323
Neelam Bhatia
+91-22-6171-7341
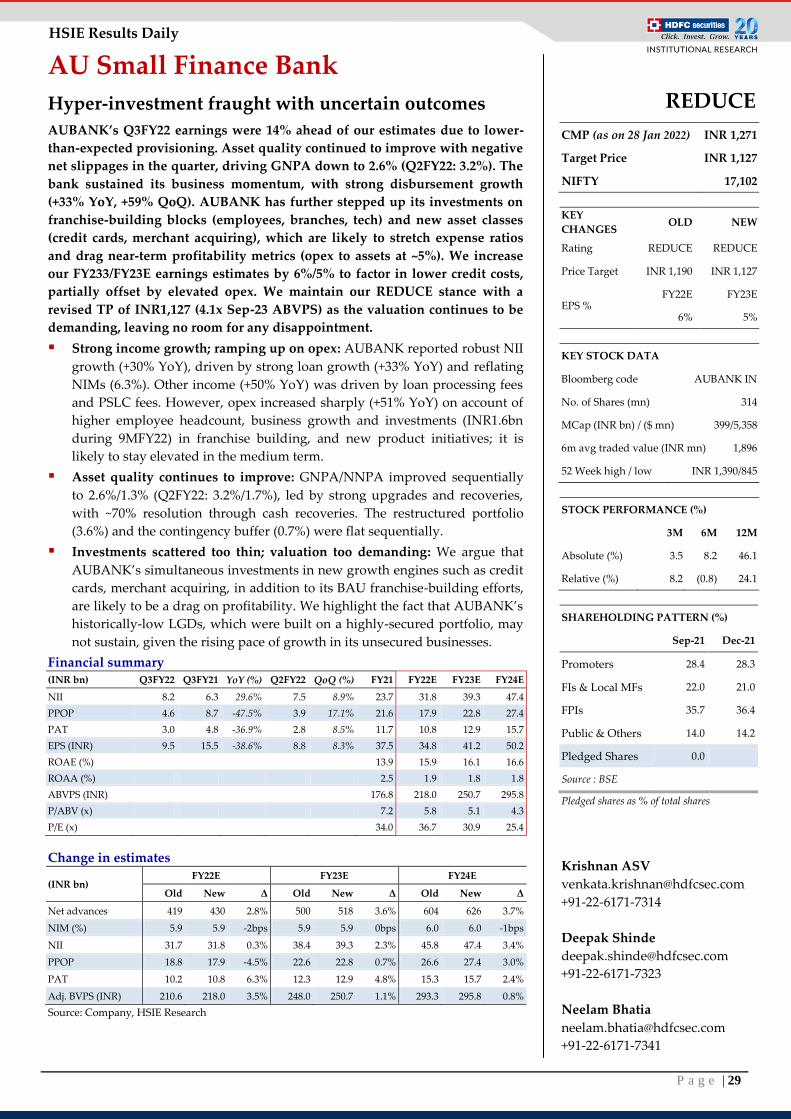
P a g e | 29
HSIE Results Daily
AU Small Finance Bank
Hyper-investment fraught with uncertain outcomes
AUBANK’s Q3FY22 earnings were 14% ahead of our estimates due to lower-
than-expected provisioning. Asset quality continued to improve with negative
net slippages in the quarter, driving GNPA down to 2.6% (Q2FY22: 3.2%). The
bank sustained its business momentum, with strong disbursement growth
(+33% YoY, +59% QoQ). AUBANK has further stepped up its investments on
franchise-building blocks (employees, branches, tech) and new asset classes
(credit cards, merchant acquiring), which are likely to stretch expense ratios
and drag near-term profitability metrics (opex to assets at ~5%). We increase
our FY233/FY23E earnings estimates by 6%/5% to factor in lower credit costs,
partially offset by elevated opex. We maintain our REDUCE stance with a
revised TP of INR1,127 (4.1x Sep-23 ABVPS) as the valuation continues to be
demanding, leaving no room for any disappointment.
Strong income growth; ramping up on opex: AUBANK reported robust NII
growth (+30% YoY), driven by strong loan growth (+33% YoY) and reflating
NIMs (6.3%). Other income (+50% YoY) was driven by loan processing fees
and PSLC fees. However, opex increased sharply (+51% YoY) on account of
higher employee headcount, business growth and investments (INR1.6bn
during 9MFY22) in franchise building, and new product initiatives; it is
likely to stay elevated in the medium term.
Asset quality continues to improve: GNPA/NNPA improved sequentially
to 2.6%/1.3% (Q2FY22: 3.2%/1.7%), led by strong upgrades and recoveries,
with ~70% resolution through cash recoveries. The restructured portfolio
(3.6%) and the contingency buffer (0.7%) were flat sequentially.
Investments scattered too thin; valuation too demanding: We argue that
AUBANK’s simultaneous investments in new growth engines such as credit
cards, merchant acquiring, in addition to its BAU franchise-building efforts,
are likely to be a drag on profitability. We highlight the fact that AUBANK’s
historically-low LGDs, which were built on a highly-secured portfolio, may
not sustain, given the rising pace of growth in its unsecured businesses.
Financial summary (INR bn) Q3FY22 Q3FY21 YoY (%) Q2FY22 QoQ (%) FY21 FY22E FY23E FY24E
NII 8.2 6.3 29.6% 7.5 8.9% 23.7 31.8 39.3 47.4
PPOP 4.6 8.7 -47.5% 3.9 17.1% 21.6 17.9 22.8 27.4
PAT 3.0 4.8 -36.9% 2.8 8.5% 11.7 10.8 12.9 15.7
EPS (INR) 9.5 15.5 -38.6% 8.8 8.3% 37.5 34.8 41.2 50.2
ROAE (%) 13.9 15.9 16.1 16.6
ROAA (%) 2.5 1.9 1.8 1.8
ABVPS (INR) 176.8 218.0 250.7 295.8
P/ABV (x) 7.2 5.8 5.1 4.3
P/E (x) 34.0 36.7 30.9 25.4
Change in estimates
(INR bn) FY22E FY23E FY24E
Old New Δ Old New Δ Old New Δ
Net advances 419 430 2.8% 500 518 3.6% 604 626 3.7%
NIM (%) 5.9 5.9 -2bps 5.9 5.9 0bps 6.0 6.0 -1bps
NII 31.7 31.8 0.3% 38.4 39.3 2.3% 45.8 47.4 3.4%
PPOP 18.8 17.9 -4.5% 22.6 22.8 0.7% 26.6 27.4 3.0%
PAT 10.2 10.8 6.3% 12.3 12.9 4.8% 15.3 15.7 2.4%
Adj. BVPS (INR) 210.6 218.0 3.5% 248.0 250.7 1.1% 293.3 295.8 0.8%
Source: Company, HSIE Research
REDUCE
CMP (as on 28 Jan 2022) INR 1,271
Target Price INR 1,127
NIFTY 17,102
KEY
CHANGES OLD NEW
Rating REDUCE REDUCE
Price Target INR 1,190 INR 1,127
EPS % FY22E FY23E
6% 5%
KEY STOCK DATA
Bloomberg code AUBANK IN
No. of Shares (mn) 314
MCap (INR bn) / ($ mn) 399/5,358
6m avg traded value (INR mn) 1,896
52 Week high / low INR 1,390/845
STOCK PERFORMANCE (%)
3M 6M 12M
Absolute (%) 3.5 8.2 46.1
Relative (%) 8.2 (0.8) 24.1
SHAREHOLDING PATTERN (%)
Sep-21 Dec-21
Promoters 28.4 28.3
FIs & Local MFs 22.0 21.0
FPIs 35.7 36.4
Public & Others 14.0 14.2
Pledged Shares 0.0
Source : BSE
Pledged shares as % of total shares
Krishnan ASV
+91-22-6171-7314
Deepak Shinde
+91-22-6171-7323
Neelam Bhatia
+91-22-6171-7341
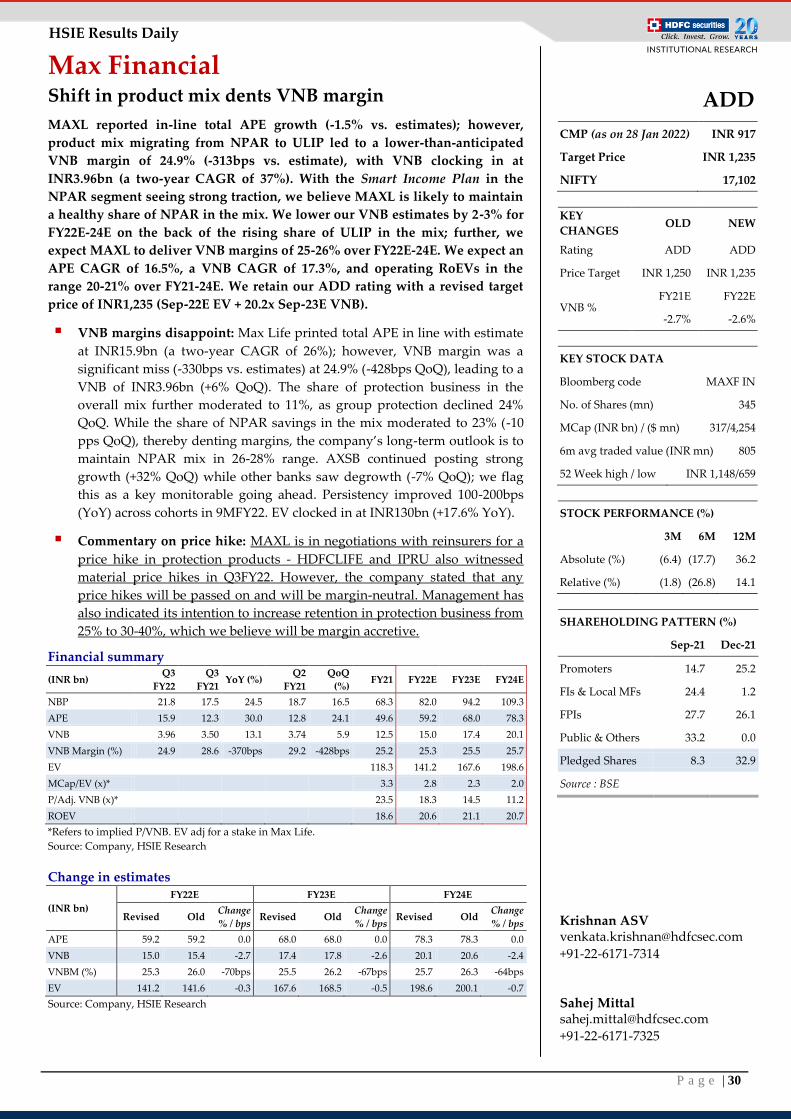
P a g e | 30
HSIE Results Daily
Max Financial Shift in product mix dents VNB margin
MAXL reported in-line total APE growth (-1.5% vs. estimates); however,
product mix migrating from NPAR to ULIP led to a lower-than-anticipated
VNB margin of 24.9% (-313bps vs. estimate), with VNB clocking in at
INR3.96bn (a two-year CAGR of 37%). With the Smart Income Plan in the
NPAR segment seeing strong traction, we believe MAXL is likely to maintain
a healthy share of NPAR in the mix. We lower our VNB estimates by 2-3% for
FY22E-24E on the back of the rising share of ULIP in the mix; further, we
expect MAXL to deliver VNB margins of 25-26% over FY22E-24E. We expect an
APE CAGR of 16.5%, a VNB CAGR of 17.3%, and operating RoEVs in the
range 20-21% over FY21-24E. We retain our ADD rating with a revised target
price of INR1,235 (Sep-22E EV + 20.2x Sep-23E VNB).
VNB margins disappoint: Max Life printed total APE in line with estimate
at INR15.9bn (a two-year CAGR of 26%); however, VNB margin was a
significant miss (-330bps vs. estimates) at 24.9% (-428bps QoQ), leading to a
VNB of INR3.96bn (+6% QoQ). The share of protection business in the
overall mix further moderated to 11%, as group protection declined 24%
QoQ. While the share of NPAR savings in the mix moderated to 23% (-10
pps QoQ), thereby denting margins, the company’s long-term outlook is to
maintain NPAR mix in 26-28% range. AXSB continued posting strong
growth (+32% QoQ) while other banks saw degrowth (-7% QoQ); we flag
this as a key monitorable going ahead. Persistency improved 100-200bps
(YoY) across cohorts in 9MFY22. EV clocked in at INR130bn (+17.6% YoY).
Commentary on price hike: MAXL is in negotiations with reinsurers for a
price hike in protection products - HDFCLIFE and IPRU also witnessed
material price hikes in Q3FY22. However, the company stated that any
price hikes will be passed on and will be margin-neutral. Management has
also indicated its intention to increase retention in protection business from
25% to 30-40%, which we believe will be margin accretive.
Financial summary
(INR bn) Q3
FY22
Q3
FY21 YoY (%)
Q2
FY21
QoQ
(%) FY21 FY22E FY23E FY24E
NBP 21.8 17.5 24.5 18.7 16.5 68.3 82.0 94.2 109.3
APE 15.9 12.3 30.0 12.8 24.1 49.6 59.2 68.0 78.3
VNB 3.96 3.50 13.1 3.74 5.9 12.5 15.0 17.4 20.1
VNB Margin (%) 24.9 28.6 -370bps 29.2 -428bps 25.2 25.3 25.5 25.7
EV
118.3 141.2 167.6 198.6
MCap/EV (x)*
3.3 2.8 2.3 2.0
P/Adj. VNB (x)*
23.5 18.3 14.5 11.2
ROEV
18.6 20.6 21.1 20.7
*Refers to implied P/VNB. EV adj for a stake in Max Life.
Source: Company, HSIE Research
Change in estimates
(INR bn)
FY22E FY23E FY24E
Revised Old Change
% / bps Revised Old
Change
% / bps Revised Old
Change
% / bps
APE 59.2 59.2 0.0 68.0 68.0 0.0 78.3 78.3 0.0
VNB 15.0 15.4 -2.7 17.4 17.8 -2.6 20.1 20.6 -2.4
VNBM (%) 25.3 26.0 -70bps 25.5 26.2 -67bps 25.7 26.3 -64bps
EV 141.2 141.6 -0.3 167.6 168.5 -0.5 198.6 200.1 -0.7
Source: Company, HSIE Research
ADD
CMP (as on 28 Jan 2022) INR 917
Target Price INR 1,235
NIFTY 17,102
KEY
CHANGES OLD NEW
Rating ADD ADD
Price Target INR 1,250 INR 1,235
VNB % FY21E FY22E
-2.7% -2.6%
KEY STOCK DATA
Bloomberg code MAXF IN
No. of Shares (mn) 345
MCap (INR bn) / ($ mn) 317/4,254
6m avg traded value (INR mn) 805
52 Week high / low INR 1,148/659
STOCK PERFORMANCE (%)
3M 6M 12M
Absolute (%) (6.4) (17.7) 36.2
Relative (%) (1.8) (26.8) 14.1
SHAREHOLDING PATTERN (%)
Sep-21 Dec-21
Promoters 14.7 25.2
FIs & Local MFs 24.4 1.2
FPIs 27.7 26.1
Public & Others 33.2 0.0
Pledged Shares 8.3 32.9
Source : BSE
Krishnan ASV [email protected]
+91-22-6171-7314 Sahej Mittal [email protected]
+91-22-6171-7325
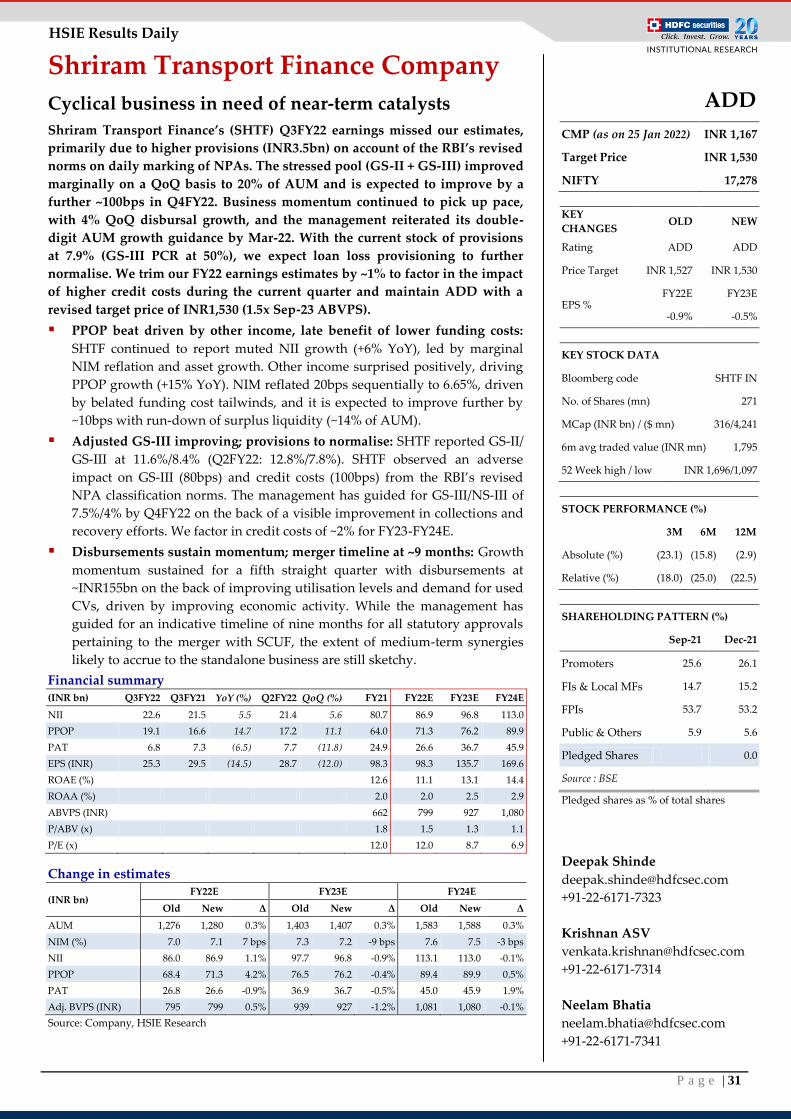
P a g e | 31
HSIE Results Daily
Shriram Transport Finance Company
Cyclical business in need of near-term catalysts
Shriram Transport Finance’s (SHTF) Q3FY22 earnings missed our estimates,
primarily due to higher provisions (INR3.5bn) on account of the RBI’s revised
norms on daily marking of NPAs. The stressed pool (GS-II + GS-III) improved
marginally on a QoQ basis to 20% of AUM and is expected to improve by a
further ~100bps in Q4FY22. Business momentum continued to pick up pace,
with 4% QoQ disbursal growth, and the management reiterated its double-
digit AUM growth guidance by Mar-22. With the current stock of provisions
at 7.9% (GS-III PCR at 50%), we expect loan loss provisioning to further
normalise. We trim our FY22 earnings estimates by ~1% to factor in the impact
of higher credit costs during the current quarter and maintain ADD with a
revised target price of INR1,530 (1.5x Sep-23 ABVPS).
PPOP beat driven by other income, late benefit of lower funding costs:
SHTF continued to report muted NII growth (+6% YoY), led by marginal
NIM reflation and asset growth. Other income surprised positively, driving
PPOP growth (+15% YoY). NIM reflated 20bps sequentially to 6.65%, driven
by belated funding cost tailwinds, and it is expected to improve further by
~10bps with run-down of surplus liquidity (~14% of AUM).
Adjusted GS-III improving; provisions to normalise: SHTF reported GS-II/
GS-III at 11.6%/8.4% (Q2FY22: 12.8%/7.8%). SHTF observed an adverse
impact on GS-III (80bps) and credit costs (100bps) from the RBI’s revised
NPA classification norms. The management has guided for GS-III/NS-III of
7.5%/4% by Q4FY22 on the back of a visible improvement in collections and
recovery efforts. We factor in credit costs of ~2% for FY23-FY24E.
Disbursements sustain momentum; merger timeline at ~9 months: Growth
momentum sustained for a fifth straight quarter with disbursements at
~INR155bn on the back of improving utilisation levels and demand for used
CVs, driven by improving economic activity. While the management has
guided for an indicative timeline of nine months for all statutory approvals
pertaining to the merger with SCUF, the extent of medium-term synergies
likely to accrue to the standalone business are still sketchy.
Financial summary (INR bn) Q3FY22 Q3FY21 YoY (%) Q2FY22 QoQ (%) FY21 FY22E FY23E FY24E
NII 22.6 21.5 5.5 21.4 5.6 80.7 86.9 96.8 113.0
PPOP 19.1 16.6 14.7 17.2 11.1 64.0 71.3 76.2 89.9
PAT 6.8 7.3 (6.5) 7.7 (11.8) 24.9 26.6 36.7 45.9
EPS (INR) 25.3 29.5 (14.5) 28.7 (12.0) 98.3 98.3 135.7 169.6
ROAE (%) 12.6 11.1 13.1 14.4
ROAA (%) 2.0 2.0 2.5 2.9
ABVPS (INR) 662 799 927 1,080
P/ABV (x) 1.8 1.5 1.3 1.1
P/E (x) 12.0 12.0 8.7 6.9
Change in estimates
(INR bn) FY22E FY23E FY24E
Old New Δ Old New Δ Old New Δ
AUM 1,276 1,280 0.3% 1,403 1,407 0.3% 1,583 1,588 0.3%
NIM (%) 7.0 7.1 7 bps 7.3 7.2 -9 bps 7.6 7.5 -3 bps
NII 86.0 86.9 1.1% 97.7 96.8 -0.9% 113.1 113.0 -0.1%
PPOP 68.4 71.3 4.2% 76.5 76.2 -0.4% 89.4 89.9 0.5%
PAT 26.8 26.6 -0.9% 36.9 36.7 -0.5% 45.0 45.9 1.9%
Adj. BVPS (INR) 795 799 0.5% 939 927 -1.2% 1,081 1,080 -0.1%
Source: Company, HSIE Research
ADD
CMP (as on 25 Jan 2022) INR 1,167
Target Price INR 1,530
NIFTY 17,278
KEY
CHANGES OLD NEW
Rating ADD ADD
Price Target INR 1,527 INR 1,530
EPS % FY22E FY23E
-0.9% -0.5%
KEY STOCK DATA
Bloomberg code SHTF IN
No. of Shares (mn) 271
MCap (INR bn) / ($ mn) 316/4,241
6m avg traded value (INR mn) 1,795
52 Week high / low INR 1,696/1,097
STOCK PERFORMANCE (%)
3M 6M 12M
Absolute (%) (23.1) (15.8) (2.9)
Relative (%) (18.0) (25.0) (22.5)
SHAREHOLDING PATTERN (%)
Sep-21 Dec-21
Promoters 25.6 26.1
FIs & Local MFs 14.7 15.2
FPIs 53.7 53.2
Public & Others 5.9 5.6
Pledged Shares 0.0
Source : BSE
Pledged shares as % of total shares
Deepak Shinde
+91-22-6171-7323
Krishnan ASV
+91-22-6171-7314
Neelam Bhatia
+91-22-6171-7341
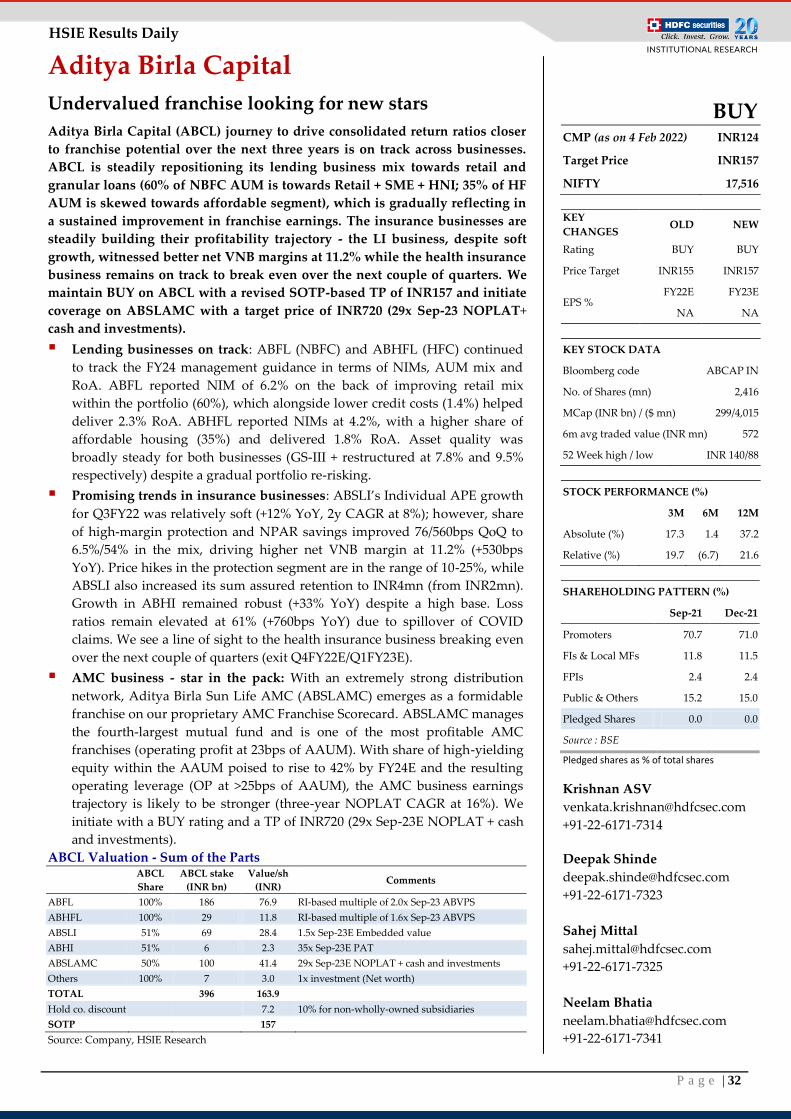
P a g e | 32
HSIE Results Daily
Aditya Birla Capital
Undervalued franchise looking for new stars
Aditya Birla Capital (ABCL) journey to drive consolidated return ratios closer
to franchise potential over the next three years is on track across businesses.
ABCL is steadily repositioning its lending business mix towards retail and
granular loans (60% of NBFC AUM is towards Retail + SME + HNI; 35% of HF
AUM is skewed towards affordable segment), which is gradually reflecting in
a sustained improvement in franchise earnings. The insurance businesses are
steadily building their profitability trajectory - the LI business, despite soft
growth, witnessed better net VNB margins at 11.2% while the health insurance
business remains on track to break even over the next couple of quarters. We
maintain BUY on ABCL with a revised SOTP-based TP of INR157 and initiate
coverage on ABSLAMC with a target price of INR720 (29x Sep-23 NOPLAT+
cash and investments).
Lending businesses on track: ABFL (NBFC) and ABHFL (HFC) continued
to track the FY24 management guidance in terms of NIMs, AUM mix and
RoA. ABFL reported NIM of 6.2% on the back of improving retail mix
within the portfolio (60%), which alongside lower credit costs (1.4%) helped
deliver 2.3% RoA. ABHFL reported NIMs at 4.2%, with a higher share of
affordable housing (35%) and delivered 1.8% RoA. Asset quality was
broadly steady for both businesses (GS-III + restructured at 7.8% and 9.5%
respectively) despite a gradual portfolio re-risking.
Promising trends in insurance businesses: ABSLI’s Individual APE growth
for Q3FY22 was relatively soft (+12% YoY, 2y CAGR at 8%); however, share
of high-margin protection and NPAR savings improved 76/560bps QoQ to
6.5%/54% in the mix, driving higher net VNB margin at 11.2% (+530bps
YoY). Price hikes in the protection segment are in the range of 10-25%, while
ABSLI also increased its sum assured retention to INR4mn (from INR2mn).
Growth in ABHI remained robust (+33% YoY) despite a high base. Loss
ratios remain elevated at 61% (+760bps YoY) due to spillover of COVID
claims. We see a line of sight to the health insurance business breaking even
over the next couple of quarters (exit Q4FY22E/Q1FY23E).
AMC business - star in the pack: With an extremely strong distribution
network, Aditya Birla Sun Life AMC (ABSLAMC) emerges as a formidable
franchise on our proprietary AMC Franchise Scorecard. ABSLAMC manages
the fourth-largest mutual fund and is one of the most profitable AMC
franchises (operating profit at 23bps of AAUM). With share of high-yielding
equity within the AAUM poised to rise to 42% by FY24E and the resulting
operating leverage (OP at >25bps of AAUM), the AMC business earnings
trajectory is likely to be stronger (three-year NOPLAT CAGR at 16%). We
initiate with a BUY rating and a TP of INR720 (29x Sep-23E NOPLAT + cash
and investments).
ABCL Valuation - Sum of the Parts
ABCL
Share
ABCL stake
(INR bn)
Value/sh
(INR) Comments
ABFL 100% 186 76.9 RI-based multiple of 2.0x Sep-23 ABVPS
ABHFL 100% 29 11.8 RI-based multiple of 1.6x Sep-23 ABVPS
ABSLI 51% 69 28.4 1.5x Sep-23E Embedded value
ABHI 51% 6 2.3 35x Sep-23E PAT
ABSLAMC 50% 100 41.4 29x Sep-23E NOPLAT + cash and investments
Others 100% 7 3.0 1x investment (Net worth)
TOTAL
396 163.9
Hold co. discount
7.2 10% for non-wholly-owned subsidiaries
SOTP
157
Source: Company, HSIE Research
BUY CMP (as on 4 Feb 2022) INR124
Target Price INR157
NIFTY 17,516
KEY
CHANGES OLD NEW
Rating BUY BUY
Price Target INR155 INR157
EPS % FY22E FY23E
NA NA
KEY STOCK DATA
Bloomberg code ABCAP IN
No. of Shares (mn) 2,416
MCap (INR bn) / ($ mn) 299/4,015
6m avg traded value (INR mn) 572
52 Week high / low INR 140/88
STOCK PERFORMANCE (%)
3M 6M 12M
Absolute (%) 17.3 1.4 37.2
Relative (%) 19.7 (6.7) 21.6
SHAREHOLDING PATTERN (%)
Sep-21 Dec-21
Promoters 70.7 71.0
FIs & Local MFs 11.8 11.5
FPIs 2.4 2.4
Public & Others 15.2 15.0
Pledged Shares 0.0 0.0
Source : BSE
Pledged shares as % of total shares
Krishnan ASV
+91-22-6171-7314
Deepak Shinde
+91-22-6171-7323
Sahej Mittal
+91-22-6171-7325
Neelam Bhatia
+91-22-6171-7341
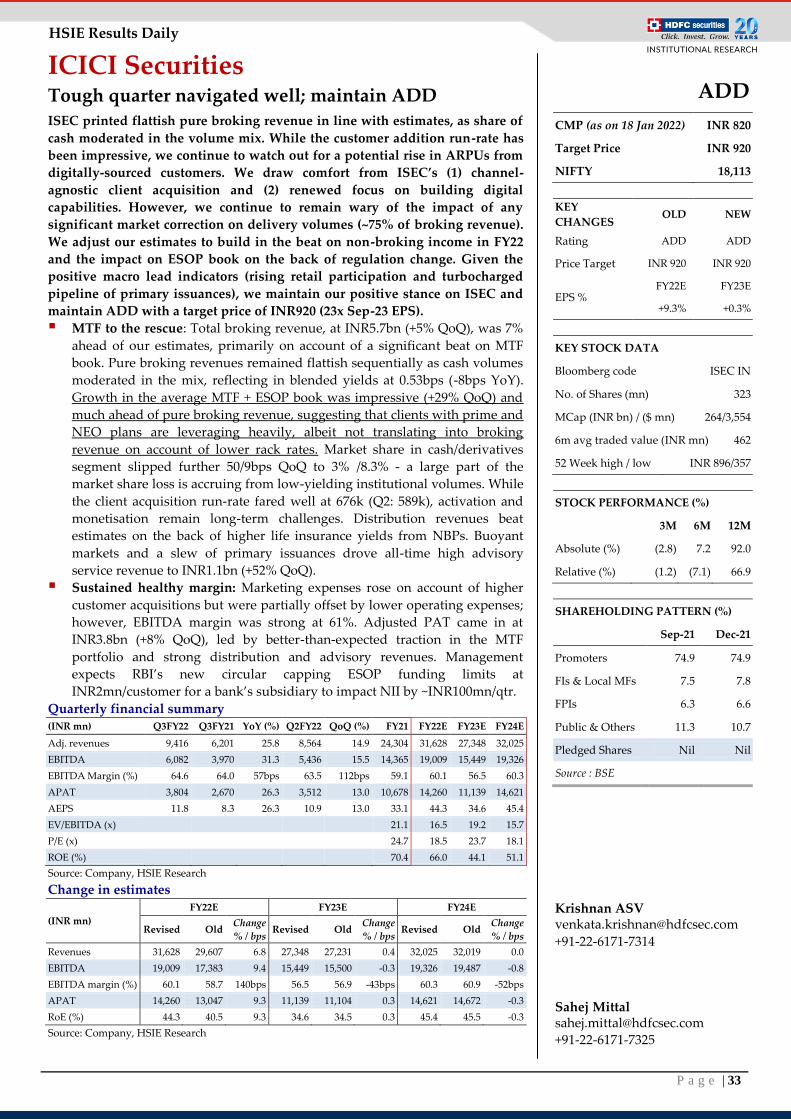
P a g e | 33
HSIE Results Daily
ICICI Securities Tough quarter navigated well; maintain ADD ISEC printed flattish pure broking revenue in line with estimates, as share of
cash moderated in the volume mix. While the customer addition run-rate has
been impressive, we continue to watch out for a potential rise in ARPUs from
digitally-sourced customers. We draw comfort from ISEC’s (1) channel-
agnostic client acquisition and (2) renewed focus on building digital
capabilities. However, we continue to remain wary of the impact of any
significant market correction on delivery volumes (~75% of broking revenue).
We adjust our estimates to build in the beat on non-broking income in FY22
and the impact on ESOP book on the back of regulation change. Given the
positive macro lead indicators (rising retail participation and turbocharged
pipeline of primary issuances), we maintain our positive stance on ISEC and
maintain ADD with a target price of INR920 (23x Sep-23 EPS).
MTF to the rescue: Total broking revenue, at INR5.7bn (+5% QoQ), was 7%
ahead of our estimates, primarily on account of a significant beat on MTF
book. Pure broking revenues remained flattish sequentially as cash volumes
moderated in the mix, reflecting in blended yields at 0.53bps (-8bps YoY).
Growth in the average MTF + ESOP book was impressive (+29% QoQ) and
much ahead of pure broking revenue, suggesting that clients with prime and
NEO plans are leveraging heavily, albeit not translating into broking
revenue on account of lower rack rates. Market share in cash/derivatives
segment slipped further 50/9bps QoQ to 3% /8.3% - a large part of the
market share loss is accruing from low-yielding institutional volumes. While
the client acquisition run-rate fared well at 676k (Q2: 589k), activation and
monetisation remain long-term challenges. Distribution revenues beat
estimates on the back of higher life insurance yields from NBPs. Buoyant
markets and a slew of primary issuances drove all-time high advisory
service revenue to INR1.1bn (+52% QoQ).
Sustained healthy margin: Marketing expenses rose on account of higher
customer acquisitions but were partially offset by lower operating expenses;
however, EBITDA margin was strong at 61%. Adjusted PAT came in at
INR3.8bn (+8% QoQ), led by better-than-expected traction in the MTF
portfolio and strong distribution and advisory revenues. Management
expects RBI’s new circular capping ESOP funding limits at
INR2mn/customer for a bank’s subsidiary to impact NII by ~INR100mn/qtr.
Quarterly financial summary (INR mn) Q3FY22 Q3FY21 YoY (%) Q2FY22 QoQ (%) FY21 FY22E FY23E FY24E
Adj. revenues 9,416 6,201 25.8 8,564 14.9 24,304 31,628 27,348 32,025
EBITDA 6,082 3,970 31.3 5,436 15.5 14,365 19,009 15,449 19,326
EBITDA Margin (%) 64.6 64.0 57bps 63.5 112bps 59.1 60.1 56.5 60.3
APAT 3,804 2,670 26.3 3,512 13.0 10,678 14,260 11,139 14,621
AEPS 11.8 8.3 26.3 10.9 13.0 33.1 44.3 34.6 45.4
EV/EBITDA (x)
21.1 16.5 19.2 15.7
P/E (x)
24.7 18.5 23.7 18.1
ROE (%)
70.4 66.0 44.1 51.1
Source: Company, HSIE Research
Change in estimates
(INR mn)
FY22E FY23E FY24E
Revised Old Change
% / bps Revised Old
Change
% / bps Revised Old
Change
% / bps
Revenues 31,628 29,607 6.8 27,348 27,231 0.4 32,025 32,019 0.0
EBITDA 19,009 17,383 9.4 15,449 15,500 -0.3 19,326 19,487 -0.8
EBITDA margin (%) 60.1 58.7 140bps 56.5 56.9 -43bps 60.3 60.9 -52bps
APAT 14,260 13,047 9.3 11,139 11,104 0.3 14,621 14,672 -0.3
RoE (%) 44.3 40.5 9.3 34.6 34.5 0.3 45.4 45.5 -0.3
Source: Company, HSIE Research
ADD
CMP (as on 18 Jan 2022) INR 820
Target Price INR 920
NIFTY 18,113
KEY
CHANGES OLD NEW
Rating ADD ADD
Price Target INR 920 INR 920
EPS % FY22E FY23E
+9.3% +0.3%
KEY STOCK DATA
Bloomberg code ISEC IN
No. of Shares (mn) 323
MCap (INR bn) / ($ mn) 264/3,554
6m avg traded value (INR mn) 462
52 Week high / low INR 896/357
STOCK PERFORMANCE (%)
3M 6M 12M
Absolute (%) (2.8) 7.2 92.0
Relative (%) (1.2) (7.1) 66.9
SHAREHOLDING PATTERN (%)
Sep-21 Dec-21
Promoters 74.9 74.9
FIs & Local MFs 7.5 7.8
FPIs 6.3 6.6
Public & Others 11.3 10.7
Pledged Shares Nil Nil
Source : BSE
Krishnan ASV [email protected]
+91-22-6171-7314 Sahej Mittal [email protected]
+91-22-6171-7325
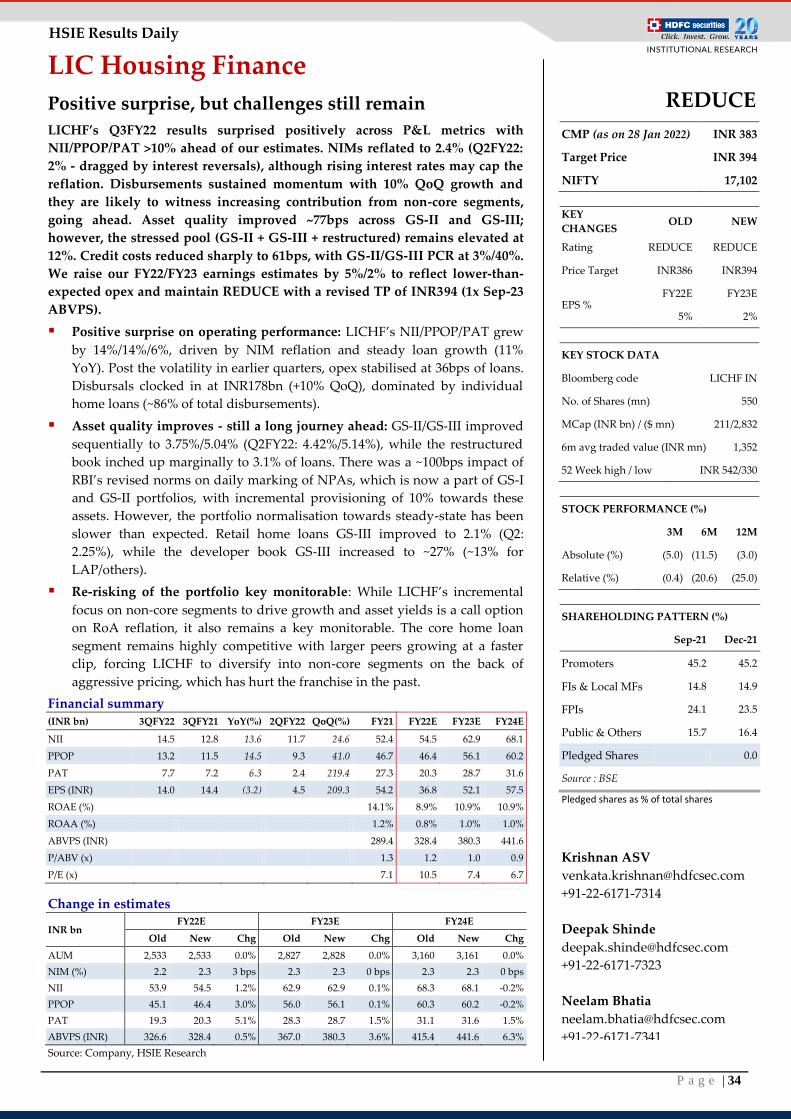
P a g e | 34
HSIE Results Daily
LIC Housing Finance Positive surprise, but challenges still remain
LICHF’s Q3FY22 results surprised positively across P&L metrics with
NII/PPOP/PAT >10% ahead of our estimates. NIMs reflated to 2.4% (Q2FY22:
2% - dragged by interest reversals), although rising interest rates may cap the
reflation. Disbursements sustained momentum with 10% QoQ growth and
they are likely to witness increasing contribution from non-core segments,
going ahead. Asset quality improved ~77bps across GS-II and GS-III;
however, the stressed pool (GS-II + GS-III + restructured) remains elevated at
12%. Credit costs reduced sharply to 61bps, with GS-II/GS-III PCR at 3%/40%.
We raise our FY22/FY23 earnings estimates by 5%/2% to reflect lower-than-
expected opex and maintain REDUCE with a revised TP of INR394 (1x Sep-23
ABVPS).
Positive surprise on operating performance: LICHF’s NII/PPOP/PAT grew
by 14%/14%/6%, driven by NIM reflation and steady loan growth (11%
YoY). Post the volatility in earlier quarters, opex stabilised at 36bps of loans.
Disbursals clocked in at INR178bn (+10% QoQ), dominated by individual
home loans (~86% of total disbursements).
Asset quality improves - still a long journey ahead: GS-II/GS-III improved
sequentially to 3.75%/5.04% (Q2FY22: 4.42%/5.14%), while the restructured
book inched up marginally to 3.1% of loans. There was a ~100bps impact of
RBI’s revised norms on daily marking of NPAs, which is now a part of GS-I
and GS-II portfolios, with incremental provisioning of 10% towards these
assets. However, the portfolio normalisation towards steady-state has been
slower than expected. Retail home loans GS-III improved to 2.1% (Q2:
2.25%), while the developer book GS-III increased to ~27% (~13% for
LAP/others).
Re-risking of the portfolio key monitorable: While LICHF’s incremental
focus on non-core segments to drive growth and asset yields is a call option
on RoA reflation, it also remains a key monitorable. The core home loan
segment remains highly competitive with larger peers growing at a faster
clip, forcing LICHF to diversify into non-core segments on the back of
aggressive pricing, which has hurt the franchise in the past.
Financial summary
(INR bn) 3QFY22 3QFY21 YoY(%) 2QFY22 QoQ(%) FY21 FY22E FY23E FY24E
NII 14.5 12.8 13.6 11.7 24.6 52.4 54.5 62.9 68.1
PPOP 13.2 11.5 14.5 9.3 41.0 46.7 46.4 56.1 60.2
PAT 7.7 7.2 6.3 2.4 219.4 27.3 20.3 28.7 31.6
EPS (INR) 14.0 14.4 (3.2) 4.5 209.3 54.2 36.8 52.1 57.5
ROAE (%) 14.1% 8.9% 10.9% 10.9%
ROAA (%) 1.2% 0.8% 1.0% 1.0%
ABVPS (INR) 289.4 328.4 380.3 441.6
P/ABV (x) 1.3 1.2 1.0 0.9
P/E (x) 7.1 10.5 7.4 6.7
Change in estimates
INR bn FY22E FY23E FY24E
Old New Chg Old New Chg Old New Chg
AUM 2,533 2,533 0.0% 2,827 2,828 0.0% 3,160 3,161 0.0%
NIM (%) 2.2 2.3 3 bps 2.3 2.3 0 bps 2.3 2.3 0 bps
NII 53.9 54.5 1.2% 62.9 62.9 0.1% 68.3 68.1 -0.2%
PPOP 45.1 46.4 3.0% 56.0 56.1 0.1% 60.3 60.2 -0.2%
PAT 19.3 20.3 5.1% 28.3 28.7 1.5% 31.1 31.6 1.5%
ABVPS (INR) 326.6 328.4 0.5% 367.0 380.3 3.6% 415.4 441.6 6.3%
Source: Company, HSIE Research
REDUCE
CMP (as on 28 Jan 2022) INR 383
Target Price INR 394
NIFTY 17,102
KEY
CHANGES OLD NEW
Rating REDUCE REDUCE
Price Target INR386 INR394
EPS % FY22E FY23E
5% 2%
KEY STOCK DATA
Bloomberg code LICHF IN
No. of Shares (mn) 550
MCap (INR bn) / ($ mn) 211/2,832
6m avg traded value (INR mn) 1,352
52 Week high / low INR 542/330
STOCK PERFORMANCE (%)
3M 6M 12M
Absolute (%) (5.0) (11.5) (3.0)
Relative (%) (0.4) (20.6) (25.0)
SHAREHOLDING PATTERN (%)
Sep-21 Dec-21
Promoters 45.2 45.2
FIs & Local MFs 14.8 14.9
FPIs 24.1 23.5
Public & Others 15.7 16.4
Pledged Shares 0.0
Source : BSE
Pledged shares as % of total shares
Krishnan ASV
+91-22-6171-7314
Deepak Shinde
+91-22-6171-7323
Neelam Bhatia
+91-22-6171-7341
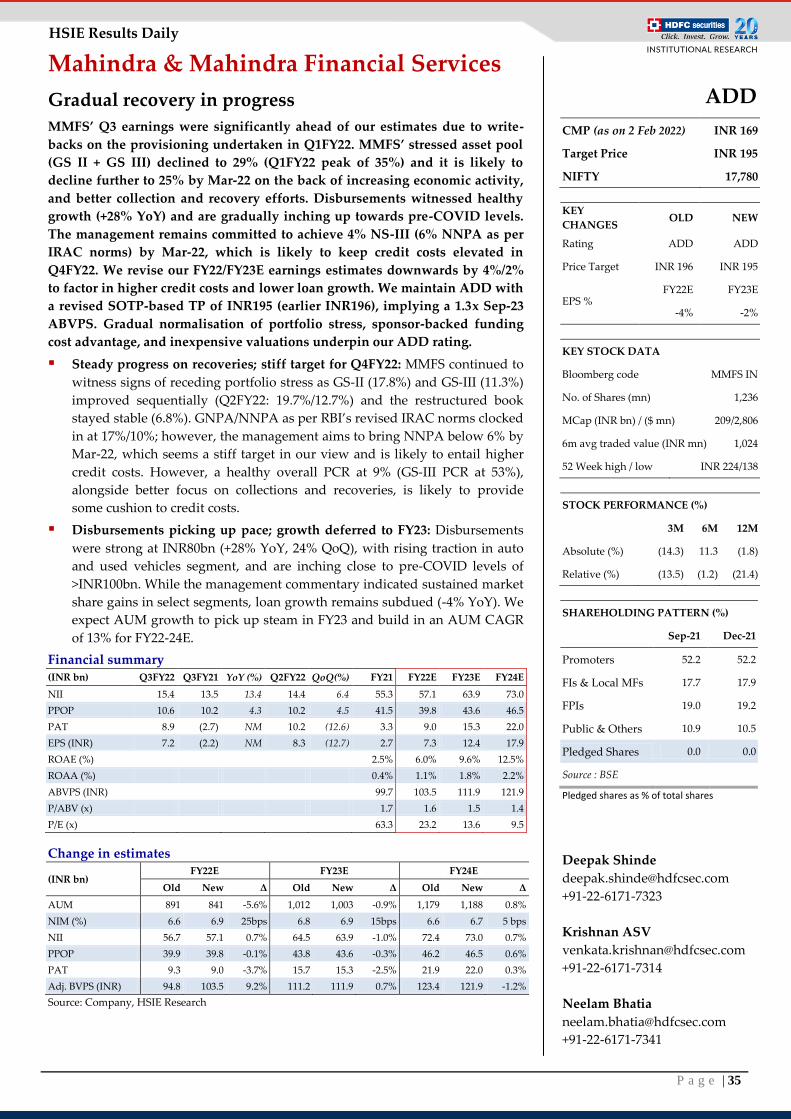
P a g e | 35
HSIE Results Daily
Mahindra & Mahindra Financial Services
Gradual recovery in progress
MMFS’ Q3 earnings were significantly ahead of our estimates due to write-
backs on the provisioning undertaken in Q1FY22. MMFS’ stressed asset pool
(GS II + GS III) declined to 29% (Q1FY22 peak of 35%) and it is likely to
decline further to 25% by Mar-22 on the back of increasing economic activity,
and better collection and recovery efforts. Disbursements witnessed healthy
growth (+28% YoY) and are gradually inching up towards pre-COVID levels.
The management remains committed to achieve 4% NS-III (6% NNPA as per
IRAC norms) by Mar-22, which is likely to keep credit costs elevated in
Q4FY22. We revise our FY22/FY23E earnings estimates downwards by 4%/2%
to factor in higher credit costs and lower loan growth. We maintain ADD with
a revised SOTP-based TP of INR195 (earlier INR196), implying a 1.3x Sep-23
ABVPS. Gradual normalisation of portfolio stress, sponsor-backed funding
cost advantage, and inexpensive valuations underpin our ADD rating.
Steady progress on recoveries; stiff target for Q4FY22: MMFS continued to
witness signs of receding portfolio stress as GS-II (17.8%) and GS-III (11.3%)
improved sequentially (Q2FY22: 19.7%/12.7%) and the restructured book
stayed stable (6.8%). GNPA/NNPA as per RBI’s revised IRAC norms clocked
in at 17%/10%; however, the management aims to bring NNPA below 6% by
Mar-22, which seems a stiff target in our view and is likely to entail higher
credit costs. However, a healthy overall PCR at 9% (GS-III PCR at 53%),
alongside better focus on collections and recoveries, is likely to provide
some cushion to credit costs.
Disbursements picking up pace; growth deferred to FY23: Disbursements
were strong at INR80bn (+28% YoY, 24% QoQ), with rising traction in auto
and used vehicles segment, and are inching close to pre-COVID levels of
>INR100bn. While the management commentary indicated sustained market
share gains in select segments, loan growth remains subdued (-4% YoY). We
expect AUM growth to pick up steam in FY23 and build in an AUM CAGR
of 13% for FY22-24E.
Financial summary (INR bn) Q3FY22 Q3FY21 YoY (%) Q2FY22 QoQ(%) FY21 FY22E FY23E FY24E
NII 15.4 13.5 13.4 14.4 6.4 55.3 57.1 63.9 73.0
PPOP 10.6 10.2 4.3 10.2 4.5 41.5 39.8 43.6 46.5
PAT 8.9 (2.7) NM 10.2 (12.6) 3.3 9.0 15.3 22.0
EPS (INR) 7.2 (2.2) NM 8.3 (12.7) 2.7 7.3 12.4 17.9
ROAE (%) 2.5% 6.0% 9.6% 12.5%
ROAA (%) 0.4% 1.1% 1.8% 2.2%
ABVPS (INR) 99.7 103.5 111.9 121.9
P/ABV (x) 1.7 1.6 1.5 1.4
P/E (x) 63.3 23.2 13.6 9.5
Change in estimates
(INR bn) FY22E FY23E FY24E
Old New Δ Old New Δ Old New Δ
AUM 891 841 -5.6% 1,012 1,003 -0.9% 1,179 1,188 0.8%
NIM (%) 6.6 6.9 25bps 6.8 6.9 15bps 6.6 6.7 5 bps
NII 56.7 57.1 0.7% 64.5 63.9 -1.0% 72.4 73.0 0.7%
PPOP 39.9 39.8 -0.1% 43.8 43.6 -0.3% 46.2 46.5 0.6%
PAT 9.3 9.0 -3.7% 15.7 15.3 -2.5% 21.9 22.0 0.3%
Adj. BVPS (INR) 94.8 103.5 9.2% 111.2 111.9 0.7% 123.4 121.9 -1.2%
Source: Company, HSIE Research
ADD
CMP (as on 2 Feb 2022) INR 169
Target Price INR 195
NIFTY 17,780
KEY
CHANGES OLD NEW
Rating ADD ADD
Price Target INR 196 INR 195
EPS % FY22E FY23E
-4% -2%
KEY STOCK DATA
Bloomberg code MMFS IN
No. of Shares (mn) 1,236
MCap (INR bn) / ($ mn) 209/2,806
6m avg traded value (INR mn) 1,024
52 Week high / low INR 224/138
STOCK PERFORMANCE (%)
3M 6M 12M
Absolute (%) (14.3) 11.3 (1.8)
Relative (%) (13.5) (1.2) (21.4)
SHAREHOLDING PATTERN (%)
Sep-21 Dec-21
Promoters 52.2 52.2
FIs & Local MFs 17.7 17.9
FPIs 19.0 19.2
Public & Others 10.9 10.5
Pledged Shares 0.0 0.0
Source : BSE
Pledged shares as % of total shares
Deepak Shinde
+91-22-6171-7323
Krishnan ASV
+91-22-6171-7314
Neelam Bhatia
+91-22-6171-7341
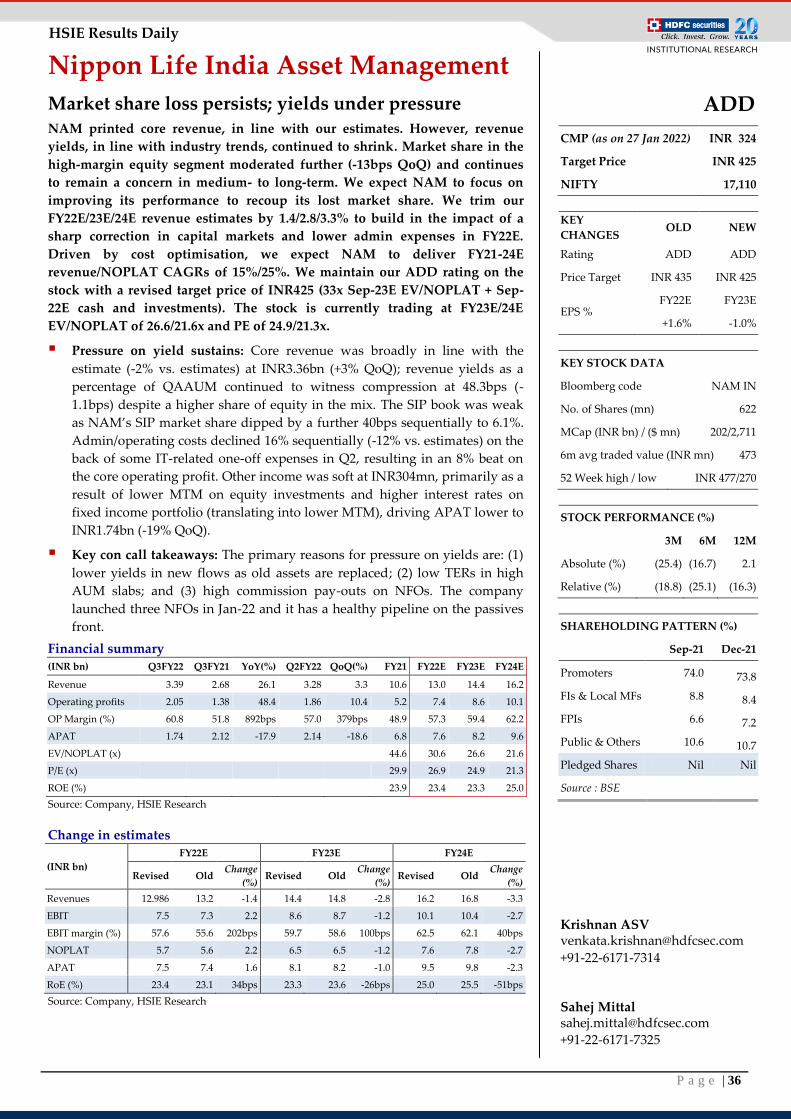
P a g e | 36
HSIE Results Daily
Nippon Life India Asset Management
Market share loss persists; yields under pressure NAM printed core revenue, in line with our estimates. However, revenue
yields, in line with industry trends, continued to shrink. Market share in the
high-margin equity segment moderated further (-13bps QoQ) and continues
to remain a concern in medium- to long-term. We expect NAM to focus on
improving its performance to recoup its lost market share. We trim our
FY22E/23E/24E revenue estimates by 1.4/2.8/3.3% to build in the impact of a
sharp correction in capital markets and lower admin expenses in FY22E.
Driven by cost optimisation, we expect NAM to deliver FY21-24E
revenue/NOPLAT CAGRs of 15%/25%. We maintain our ADD rating on the
stock with a revised target price of INR425 (33x Sep-23E EV/NOPLAT + Sep-
22E cash and investments). The stock is currently trading at FY23E/24E
EV/NOPLAT of 26.6/21.6x and PE of 24.9/21.3x.
Pressure on yield sustains: Core revenue was broadly in line with the
estimate (-2% vs. estimates) at INR3.36bn (+3% QoQ); revenue yields as a
percentage of QAAUM continued to witness compression at 48.3bps (-
1.1bps) despite a higher share of equity in the mix. The SIP book was weak
as NAM’s SIP market share dipped by a further 40bps sequentially to 6.1%.
Admin/operating costs declined 16% sequentially (-12% vs. estimates) on the
back of some IT-related one-off expenses in Q2, resulting in an 8% beat on
the core operating profit. Other income was soft at INR304mn, primarily as a
result of lower MTM on equity investments and higher interest rates on
fixed income portfolio (translating into lower MTM), driving APAT lower to
INR1.74bn (-19% QoQ).
Key con call takeaways: The primary reasons for pressure on yields are: (1)
lower yields in new flows as old assets are replaced; (2) low TERs in high
AUM slabs; and (3) high commission pay-outs on NFOs. The company
launched three NFOs in Jan-22 and it has a healthy pipeline on the passives
front.
Financial summary
(INR bn) Q3FY22 Q3FY21 YoY(%) Q2FY22 QoQ(%) FY21 FY22E FY23E FY24E
Revenue 3.39 2.68 26.1 3.28 3.3 10.6 13.0 14.4 16.2
Operating profits 2.05 1.38 48.4 1.86 10.4 5.2 7.4 8.6 10.1
OP Margin (%) 60.8 51.8 892bps 57.0 379bps 48.9 57.3 59.4 62.2
APAT 1.74 2.12 -17.9 2.14 -18.6 6.8 7.6 8.2 9.6
EV/NOPLAT (x)
44.6 30.6 26.6 21.6
P/E (x)
29.9 26.9 24.9 21.3
ROE (%)
23.9 23.4 23.3 25.0
Source: Company, HSIE Research
Change in estimates
(INR bn)
FY22E FY23E FY24E
Revised Old Change
(%) Revised Old
Change
(%) Revised Old
Change
(%)
Revenues 12.986 13.2 -1.4 14.4 14.8 -2.8 16.2 16.8 -3.3
EBIT 7.5 7.3 2.2 8.6 8.7 -1.2 10.1 10.4 -2.7
EBIT margin (%) 57.6 55.6 202bps 59.7 58.6 100bps 62.5 62.1 40bps
NOPLAT 5.7 5.6 2.2 6.5 6.5 -1.2 7.6 7.8 -2.7
APAT 7.5 7.4 1.6 8.1 8.2 -1.0 9.5 9.8 -2.3
RoE (%) 23.4 23.1 34bps 23.3 23.6 -26bps 25.0 25.5 -51bps
Source: Company, HSIE Research
ADD
CMP (as on 27 Jan 2022) INR 324
Target Price INR 425
NIFTY 17,110
KEY
CHANGES OLD NEW
Rating ADD ADD
Price Target INR 435 INR 425
EPS % FY22E FY23E
+1.6% -1.0%
KEY STOCK DATA
Bloomberg code NAM IN
No. of Shares (mn) 622
MCap (INR bn) / ($ mn) 202/2,711
6m avg traded value (INR mn) 473
52 Week high / low INR 477/270
STOCK PERFORMANCE (%)
3M 6M 12M
Absolute (%) (25.4) (16.7) 2.1
Relative (%) (18.8) (25.1) (16.3)
SHAREHOLDING PATTERN (%)
Sep-21 Dec-21
Promoters 74.0 73.8
FIs & Local MFs 8.8 8.4
FPIs 6.6 7.2
Public & Others 10.6 10.7
Pledged Shares Nil Nil
Source : BSE
Krishnan ASV [email protected]
+91-22-6171-7314 Sahej Mittal [email protected]
+91-22-6171-7325
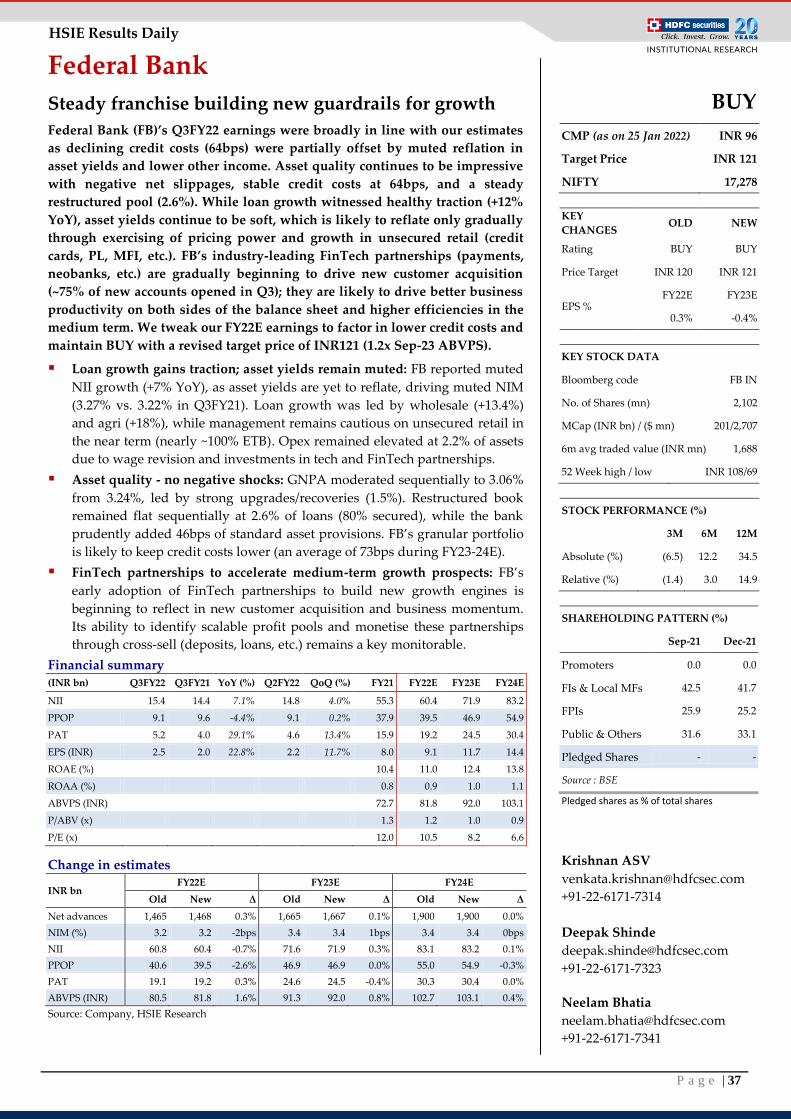
P a g e | 37
HSIE Results Daily
Federal Bank
Steady franchise building new guardrails for growth
Federal Bank (FB)’s Q3FY22 earnings were broadly in line with our estimates
as declining credit costs (64bps) were partially offset by muted reflation in
asset yields and lower other income. Asset quality continues to be impressive
with negative net slippages, stable credit costs at 64bps, and a steady
restructured pool (2.6%). While loan growth witnessed healthy traction (+12%
YoY), asset yields continue to be soft, which is likely to reflate only gradually
through exercising of pricing power and growth in unsecured retail (credit
cards, PL, MFI, etc.). FB’s industry-leading FinTech partnerships (payments,
neobanks, etc.) are gradually beginning to drive new customer acquisition
(~75% of new accounts opened in Q3); they are likely to drive better business
productivity on both sides of the balance sheet and higher efficiencies in the
medium term. We tweak our FY22E earnings to factor in lower credit costs and
maintain BUY with a revised target price of INR121 (1.2x Sep-23 ABVPS).
Loan growth gains traction; asset yields remain muted: FB reported muted
NII growth (+7% YoY), as asset yields are yet to reflate, driving muted NIM
(3.27% vs. 3.22% in Q3FY21). Loan growth was led by wholesale (+13.4%)
and agri (+18%), while management remains cautious on unsecured retail in
the near term (nearly ~100% ETB). Opex remained elevated at 2.2% of assets
due to wage revision and investments in tech and FinTech partnerships.
Asset quality - no negative shocks: GNPA moderated sequentially to 3.06%
from 3.24%, led by strong upgrades/recoveries (1.5%). Restructured book
remained flat sequentially at 2.6% of loans (80% secured), while the bank
prudently added 46bps of standard asset provisions. FB’s granular portfolio
is likely to keep credit costs lower (an average of 73bps during FY23-24E).
FinTech partnerships to accelerate medium-term growth prospects: FB’s
early adoption of FinTech partnerships to build new growth engines is
beginning to reflect in new customer acquisition and business momentum.
Its ability to identify scalable profit pools and monetise these partnerships
through cross-sell (deposits, loans, etc.) remains a key monitorable.
Financial summary (INR bn) Q3FY22 Q3FY21 YoY (%) Q2FY22 QoQ (%) FY21 FY22E FY23E FY24E
NII 15.4 14.4 7.1% 14.8 4.0% 55.3 60.4 71.9 83.2
PPOP 9.1 9.6 -4.4% 9.1 0.2% 37.9 39.5 46.9 54.9
PAT 5.2 4.0 29.1% 4.6 13.4% 15.9 19.2 24.5 30.4
EPS (INR) 2.5 2.0 22.8% 2.2 11.7% 8.0 9.1 11.7 14.4
ROAE (%) 10.4 11.0 12.4 13.8
ROAA (%) 0.8 0.9 1.0 1.1
ABVPS (INR) 72.7 81.8 92.0 103.1
P/ABV (x) 1.3 1.2 1.0 0.9
P/E (x) 12.0 10.5 8.2 6.6
Change in estimates
INR bn FY22E FY23E FY24E
Old New Δ Old New Δ Old New Δ
Net advances 1,465 1,468 0.3% 1,665 1,667 0.1% 1,900 1,900 0.0%
NIM (%) 3.2 3.2 -2bps 3.4 3.4 1bps 3.4 3.4 0bps
NII 60.8 60.4 -0.7% 71.6 71.9 0.3% 83.1 83.2 0.1%
PPOP 40.6 39.5 -2.6% 46.9 46.9 0.0% 55.0 54.9 -0.3%
PAT 19.1 19.2 0.3% 24.6 24.5 -0.4% 30.3 30.4 0.0%
ABVPS (INR) 80.5 81.8 1.6% 91.3 92.0 0.8% 102.7 103.1 0.4%
Source: Company, HSIE Research
BUY
CMP (as on 25 Jan 2022) INR 96
Target Price INR 121
NIFTY 17,278
KEY
CHANGES OLD NEW
Rating BUY BUY
Price Target INR 120 INR 121
EPS % FY22E FY23E
0.3% -0.4%
KEY STOCK DATA
Bloomberg code FB IN
No. of Shares (mn) 2,102
MCap (INR bn) / ($ mn) 201/2,707
6m avg traded value (INR mn) 1,688
52 Week high / low INR 108/69
STOCK PERFORMANCE (%)
3M 6M 12M
Absolute (%) (6.5) 12.2 34.5
Relative (%) (1.4) 3.0 14.9
SHAREHOLDING PATTERN (%)
Sep-21 Dec-21
Promoters 0.0 0.0
FIs & Local MFs 42.5 41.7
FPIs 25.9 25.2
Public & Others 31.6 33.1
Pledged Shares - -
Source : BSE
Pledged shares as % of total shares
Krishnan ASV
+91-22-6171-7314
Deepak Shinde
+91-22-6171-7323
Neelam Bhatia
+91-22-6171-7341
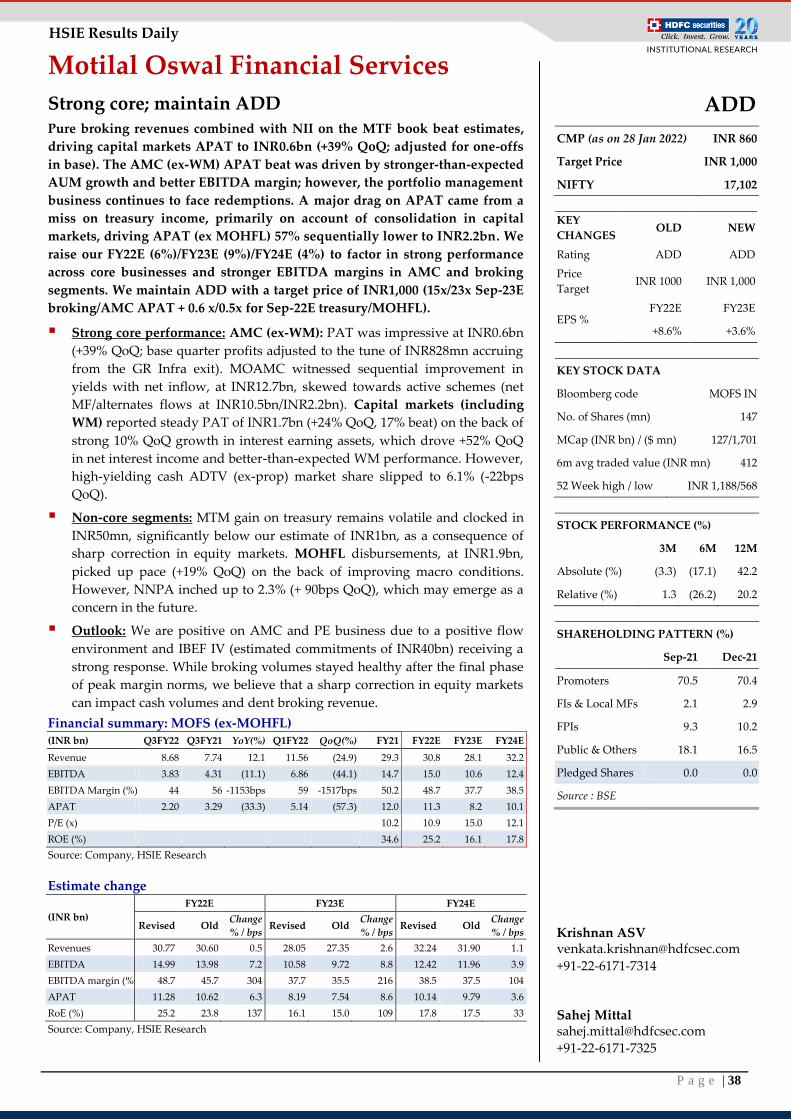
P a g e | 38
HSIE Results Daily
Motilal Oswal Financial Services
Strong core; maintain ADD Pure broking revenues combined with NII on the MTF book beat estimates,
driving capital markets APAT to INR0.6bn (+39% QoQ; adjusted for one-offs
in base). The AMC (ex-WM) APAT beat was driven by stronger-than-expected
AUM growth and better EBITDA margin; however, the portfolio management
business continues to face redemptions. A major drag on APAT came from a
miss on treasury income, primarily on account of consolidation in capital
markets, driving APAT (ex MOHFL) 57% sequentially lower to INR2.2bn. We
raise our FY22E (6%)/FY23E (9%)/FY24E (4%) to factor in strong performance
across core businesses and stronger EBITDA margins in AMC and broking
segments. We maintain ADD with a target price of INR1,000 (15x/23x Sep-23E
broking/AMC APAT + 0.6 x/0.5x for Sep-22E treasury/MOHFL).
Strong core performance: AMC (ex-WM): PAT was impressive at INR0.6bn
(+39% QoQ; base quarter profits adjusted to the tune of INR828mn accruing
from the GR Infra exit). MOAMC witnessed sequential improvement in
yields with net inflow, at INR12.7bn, skewed towards active schemes (net
MF/alternates flows at INR10.5bn/INR2.2bn). Capital markets (including
WM) reported steady PAT of INR1.7bn (+24% QoQ, 17% beat) on the back of
strong 10% QoQ growth in interest earning assets, which drove +52% QoQ
in net interest income and better-than-expected WM performance. However,
high-yielding cash ADTV (ex-prop) market share slipped to 6.1% (-22bps
QoQ).
Non-core segments: MTM gain on treasury remains volatile and clocked in
INR50mn, significantly below our estimate of INR1bn, as a consequence of
sharp correction in equity markets. MOHFL disbursements, at INR1.9bn,
picked up pace (+19% QoQ) on the back of improving macro conditions.
However, NNPA inched up to 2.3% (+ 90bps QoQ), which may emerge as a
concern in the future.
Outlook: We are positive on AMC and PE business due to a positive flow
environment and IBEF IV (estimated commitments of INR40bn) receiving a
strong response. While broking volumes stayed healthy after the final phase
of peak margin norms, we believe that a sharp correction in equity markets
can impact cash volumes and dent broking revenue.
Financial summary: MOFS (ex-MOHFL) (INR bn) Q3FY22 Q3FY21 YoY(%) Q1FY22 QoQ(%) FY21 FY22E FY23E FY24E
Revenue 8.68 7.74 12.1 11.56 (24.9) 29.3 30.8 28.1 32.2
EBITDA 3.83 4.31 (11.1) 6.86 (44.1) 14.7 15.0 10.6 12.4
EBITDA Margin (%) 44 56 -1153bps 59 -1517bps 50.2 48.7 37.7 38.5
APAT 2.20 3.29 (33.3) 5.14 (57.3) 12.0 11.3 8.2 10.1
P/E (x)
10.2 10.9 15.0 12.1
ROE (%)
34.6 25.2 16.1 17.8
Source: Company, HSIE Research
Estimate change
(INR bn)
FY22E FY23E FY24E
Revised Old Change
% / bps Revised Old
Change
% / bps Revised Old
Change
% / bps
Revenues 30.77 30.60 0.5 28.05 27.35 2.6 32.24 31.90 1.1
EBITDA 14.99 13.98 7.2 10.58 9.72 8.8 12.42 11.96 3.9
EBITDA margin (%) 48.7 45.7 304 37.7 35.5 216 38.5 37.5 104
APAT 11.28 10.62 6.3 8.19 7.54 8.6 10.14 9.79 3.6
RoE (%) 25.2 23.8 137 16.1 15.0 109 17.8 17.5 33
Source: Company, HSIE Research
ADD
CMP (as on 28 Jan 2022) INR 860
Target Price INR 1,000
NIFTY 17,102
KEY
CHANGES OLD NEW
Rating ADD ADD
Price
Target INR 1000 INR 1,000
EPS % FY22E FY23E
+8.6% +3.6%
KEY STOCK DATA
Bloomberg code MOFS IN
No. of Shares (mn) 147
MCap (INR bn) / ($ mn) 127/1,701
6m avg traded value (INR mn) 412
52 Week high / low INR 1,188/568
STOCK PERFORMANCE (%)
3M 6M 12M
Absolute (%) (3.3) (17.1) 42.2
Relative (%) 1.3 (26.2) 20.2
SHAREHOLDING PATTERN (%)
Sep-21 Dec-21
Promoters 70.5 70.4
FIs & Local MFs 2.1 2.9
FPIs 9.3 10.2
Public & Others 18.1 16.5
Pledged Shares 0.0 0.0
Source : BSE
Krishnan ASV [email protected]
+91-22-6171-7314 Sahej Mittal [email protected]
+91-22-6171-7325
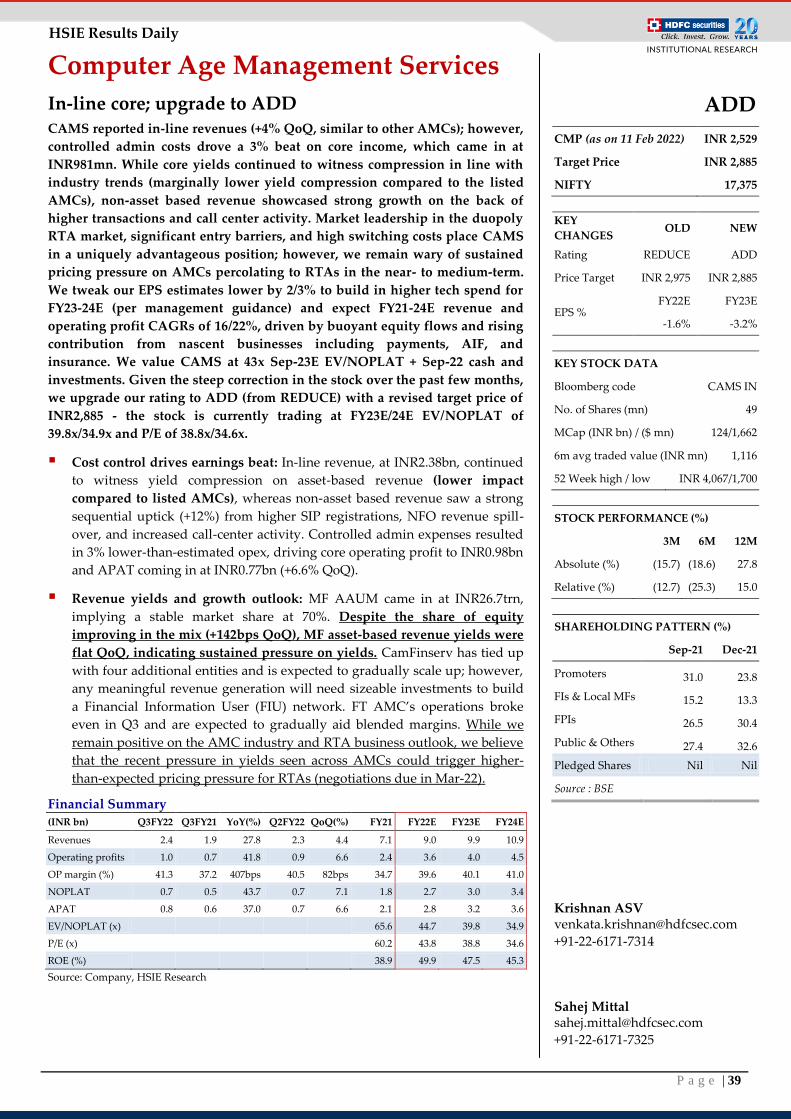
P a g e | 39
HSIE Results Daily
Computer Age Management Services
In-line core; upgrade to ADD CAMS reported in-line revenues (+4% QoQ, similar to other AMCs); however,
controlled admin costs drove a 3% beat on core income, which came in at
INR981mn. While core yields continued to witness compression in line with
industry trends (marginally lower yield compression compared to the listed
AMCs), non-asset based revenue showcased strong growth on the back of
higher transactions and call center activity. Market leadership in the duopoly
RTA market, significant entry barriers, and high switching costs place CAMS
in a uniquely advantageous position; however, we remain wary of sustained
pricing pressure on AMCs percolating to RTAs in the near- to medium-term.
We tweak our EPS estimates lower by 2/3% to build in higher tech spend for
FY23-24E (per management guidance) and expect FY21-24E revenue and
operating profit CAGRs of 16/22%, driven by buoyant equity flows and rising
contribution from nascent businesses including payments, AIF, and
insurance. We value CAMS at 43x Sep-23E EV/NOPLAT + Sep-22 cash and
investments. Given the steep correction in the stock over the past few months,
we upgrade our rating to ADD (from REDUCE) with a revised target price of
INR2,885 - the stock is currently trading at FY23E/24E EV/NOPLAT of
39.8x/34.9x and P/E of 38.8x/34.6x.
Cost control drives earnings beat: In-line revenue, at INR2.38bn, continued
to witness yield compression on asset-based revenue (lower impact
compared to listed AMCs), whereas non-asset based revenue saw a strong
sequential uptick (+12%) from higher SIP registrations, NFO revenue spill-
over, and increased call-center activity. Controlled admin expenses resulted
in 3% lower-than-estimated opex, driving core operating profit to INR0.98bn
and APAT coming in at INR0.77bn (+6.6% QoQ).
Revenue yields and growth outlook: MF AAUM came in at INR26.7trn,
implying a stable market share at 70%. Despite the share of equity
improving in the mix (+142bps QoQ), MF asset-based revenue yields were
flat QoQ, indicating sustained pressure on yields. CamFinserv has tied up
with four additional entities and is expected to gradually scale up; however,
any meaningful revenue generation will need sizeable investments to build
a Financial Information User (FIU) network. FT AMC’s operations broke
even in Q3 and are expected to gradually aid blended margins. While we
remain positive on the AMC industry and RTA business outlook, we believe
that the recent pressure in yields seen across AMCs could trigger higher-
than-expected pricing pressure for RTAs (negotiations due in Mar-22).
Financial Summary
(INR bn) Q3FY22 Q3FY21 YoY(%) Q2FY22 QoQ(%) FY21 FY22E FY23E FY24E
Revenues 2.4 1.9 27.8 2.3 4.4 7.1 9.0 9.9 10.9
Operating profits 1.0 0.7 41.8 0.9 6.6 2.4 3.6 4.0 4.5
OP margin (%) 41.3 37.2 407bps 40.5 82bps 34.7 39.6 40.1 41.0
NOPLAT 0.7 0.5 43.7 0.7 7.1 1.8 2.7 3.0 3.4
APAT 0.8 0.6 37.0 0.7 6.6 2.1 2.8 3.2 3.6
EV/NOPLAT (x)
65.6 44.7 39.8 34.9
P/E (x)
60.2 43.8 38.8 34.6
ROE (%)
38.9 49.9 47.5 45.3
Source: Company, HSIE Research
ADD
CMP (as on 11 Feb 2022) INR 2,529
Target Price INR 2,885
NIFTY 17,375
KEY
CHANGES OLD NEW
Rating REDUCE ADD
Price Target INR 2,975 INR 2,885
EPS % FY22E FY23E
-1.6% -3.2%
KEY STOCK DATA
Bloomberg code CAMS IN
No. of Shares (mn) 49
MCap (INR bn) / ($ mn) 124/1,662
6m avg traded value (INR mn) 1,116
52 Week high / low INR 4,067/1,700
STOCK PERFORMANCE (%)
3M 6M 12M
Absolute (%) (15.7) (18.6) 27.8
Relative (%) (12.7) (25.3) 15.0
SHAREHOLDING PATTERN (%)
Sep-21 Dec-21
Promoters 31.0 23.8
FIs & Local MFs 15.2 13.3
FPIs 26.5 30.4
Public & Others 27.4 32.6
Pledged Shares Nil Nil
Source : BSE
Krishnan ASV [email protected]
+91-22-6171-7314 Sahej Mittal [email protected]
+91-22-6171-7325
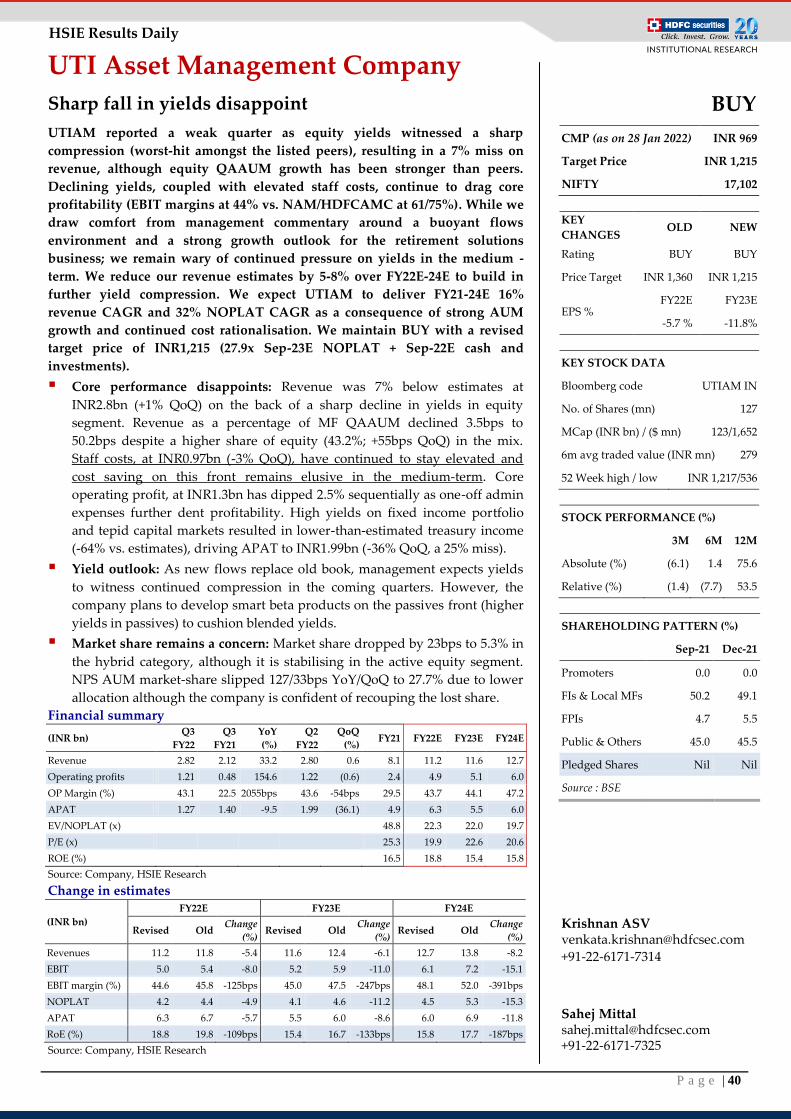
P a g e | 40
HSIE Results Daily
UTI Asset Management Company
Sharp fall in yields disappoint
UTIAM reported a weak quarter as equity yields witnessed a sharp
compression (worst-hit amongst the listed peers), resulting in a 7% miss on
revenue, although equity QAAUM growth has been stronger than peers.
Declining yields, coupled with elevated staff costs, continue to drag core
profitability (EBIT margins at 44% vs. NAM/HDFCAMC at 61/75%). While we
draw comfort from management commentary around a buoyant flows
environment and a strong growth outlook for the retirement solutions
business; we remain wary of continued pressure on yields in the medium -
term. We reduce our revenue estimates by 5-8% over FY22E-24E to build in
further yield compression. We expect UTIAM to deliver FY21-24E 16%
revenue CAGR and 32% NOPLAT CAGR as a consequence of strong AUM
growth and continued cost rationalisation. We maintain BUY with a revised
target price of INR1,215 (27.9x Sep-23E NOPLAT + Sep-22E cash and
investments).
Core performance disappoints: Revenue was 7% below estimates at
INR2.8bn (+1% QoQ) on the back of a sharp decline in yields in equity
segment. Revenue as a percentage of MF QAAUM declined 3.5bps to
50.2bps despite a higher share of equity (43.2%; +55bps QoQ) in the mix.
Staff costs, at INR0.97bn (-3% QoQ), have continued to stay elevated and
cost saving on this front remains elusive in the medium-term. Core
operating profit, at INR1.3bn has dipped 2.5% sequentially as one-off admin
expenses further dent profitability. High yields on fixed income portfolio
and tepid capital markets resulted in lower-than-estimated treasury income
(-64% vs. estimates), driving APAT to INR1.99bn (-36% QoQ, a 25% miss).
Yield outlook: As new flows replace old book, management expects yields
to witness continued compression in the coming quarters. However, the
company plans to develop smart beta products on the passives front (higher
yields in passives) to cushion blended yields.
Market share remains a concern: Market share dropped by 23bps to 5.3% in
the hybrid category, although it is stabilising in the active equity segment.
NPS AUM market-share slipped 127/33bps YoY/QoQ to 27.7% due to lower
allocation although the company is confident of recouping the lost share.
Financial summary
(INR bn) Q3
FY22
Q3
FY21
YoY
(%)
Q2
FY22
QoQ
(%) FY21 FY22E FY23E FY24E
Revenue 2.82 2.12 33.2 2.80 0.6 8.1 11.2 11.6 12.7
Operating profits 1.21 0.48 154.6 1.22 (0.6) 2.4 4.9 5.1 6.0
OP Margin (%) 43.1 22.5 2055bps 43.6 -54bps 29.5 43.7 44.1 47.2
APAT 1.27 1.40 -9.5 1.99 (36.1) 4.9 6.3 5.5 6.0
EV/NOPLAT (x)
48.8 22.3 22.0 19.7
P/E (x)
25.3 19.9 22.6 20.6
ROE (%)
16.5 18.8 15.4 15.8
Source: Company, HSIE Research
Change in estimates
(INR bn)
FY22E FY23E FY24E
Revised Old Change
(%) Revised Old
Change
(%) Revised Old
Change
(%)
Revenues 11.2 11.8 -5.4 11.6 12.4 -6.1 12.7 13.8 -8.2
EBIT 5.0 5.4 -8.0 5.2 5.9 -11.0 6.1 7.2 -15.1
EBIT margin (%) 44.6 45.8 -125bps 45.0 47.5 -247bps 48.1 52.0 -391bps
NOPLAT 4.2 4.4 -4.9 4.1 4.6 -11.2 4.5 5.3 -15.3
APAT 6.3 6.7 -5.7 5.5 6.0 -8.6 6.0 6.9 -11.8
RoE (%) 18.8 19.8 -109bps 15.4 16.7 -133bps 15.8 17.7 -187bps
Source: Company, HSIE Research
BUY
CMP (as on 28 Jan 2022) INR 969
Target Price INR 1,215
NIFTY 17,102
KEY
CHANGES OLD NEW
Rating BUY BUY
Price Target INR 1,360 INR 1,215
EPS % FY22E FY23E
-5.7 % -11.8%
KEY STOCK DATA
Bloomberg code UTIAM IN
No. of Shares (mn) 127
MCap (INR bn) / ($ mn) 123/1,652
6m avg traded value (INR mn) 279
52 Week high / low INR 1,217/536
STOCK PERFORMANCE (%)
3M 6M 12M
Absolute (%) (6.1) 1.4 75.6
Relative (%) (1.4) (7.7) 53.5
SHAREHOLDING PATTERN (%)
Sep-21 Dec-21
Promoters 0.0 0.0
FIs & Local MFs 50.2 49.1
FPIs 4.7 5.5
Public & Others 45.0 45.5
Pledged Shares Nil Nil
Source : BSE
Krishnan ASV [email protected]
+91-22-6171-7314
Sahej Mittal [email protected] +91-22-6171-7325
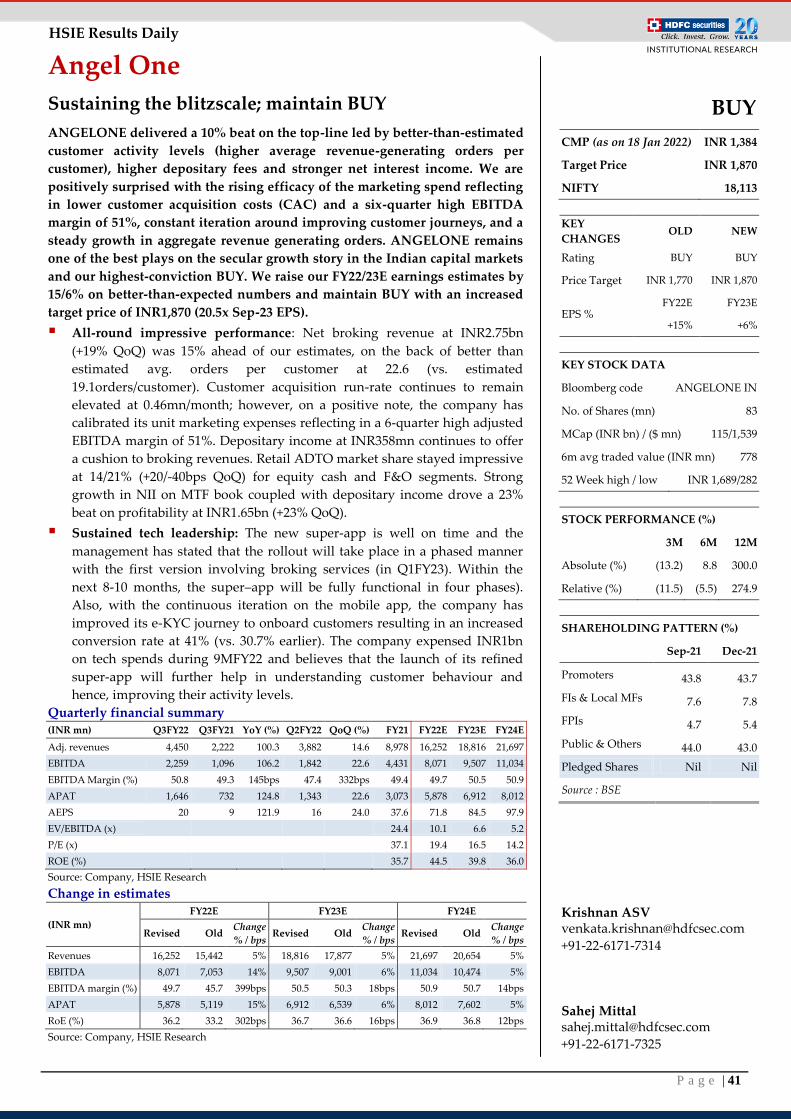
P a g e | 41
HSIE Results Daily
Angel One
Sustaining the blitzscale; maintain BUY
ANGELONE delivered a 10% beat on the top-line led by better-than-estimated
customer activity levels (higher average revenue-generating orders per
customer), higher depositary fees and stronger net interest income. We are
positively surprised with the rising efficacy of the marketing spend reflecting
in lower customer acquisition costs (CAC) and a six-quarter high EBITDA
margin of 51%, constant iteration around improving customer journeys, and a
steady growth in aggregate revenue generating orders. ANGELONE remains
one of the best plays on the secular growth story in the Indian capital markets
and our highest-conviction BUY. We raise our FY22/23E earnings estimates by
15/6% on better-than-expected numbers and maintain BUY with an increased
target price of INR1,870 (20.5x Sep-23 EPS).
All-round impressive performance: Net broking revenue at INR2.75bn
(+19% QoQ) was 15% ahead of our estimates, on the back of better than
estimated avg. orders per customer at 22.6 (vs. estimated
19.1orders/customer). Customer acquisition run-rate continues to remain
elevated at 0.46mn/month; however, on a positive note, the company has
calibrated its unit marketing expenses reflecting in a 6-quarter high adjusted
EBITDA margin of 51%. Depositary income at INR358mn continues to offer
a cushion to broking revenues. Retail ADTO market share stayed impressive
at 14/21% (+20/-40bps QoQ) for equity cash and F&O segments. Strong
growth in NII on MTF book coupled with depositary income drove a 23%
beat on profitability at INR1.65bn (+23% QoQ).
Sustained tech leadership: The new super-app is well on time and the
management has stated that the rollout will take place in a phased manner
with the first version involving broking services (in Q1FY23). Within the
next 8-10 months, the super–app will be fully functional in four phases).
Also, with the continuous iteration on the mobile app, the company has
improved its e-KYC journey to onboard customers resulting in an increased
conversion rate at 41% (vs. 30.7% earlier). The company expensed INR1bn
on tech spends during 9MFY22 and believes that the launch of its refined
super-app will further help in understanding customer behaviour and
hence, improving their activity levels.
Quarterly financial summary
(INR mn) Q3FY22 Q3FY21 YoY (%) Q2FY22 QoQ (%) FY21 FY22E FY23E FY24E
Adj. revenues 4,450 2,222 100.3 3,882 14.6 8,978 16,252 18,816 21,697
EBITDA 2,259 1,096 106.2 1,842 22.6 4,431 8,071 9,507 11,034
EBITDA Margin (%) 50.8 49.3 145bps 47.4 332bps 49.4 49.7 50.5 50.9
APAT 1,646 732 124.8 1,343 22.6 3,073 5,878 6,912 8,012
AEPS 20 9 121.9 16 24.0 37.6 71.8 84.5 97.9
EV/EBITDA (x)
24.4 10.1 6.6 5.2
P/E (x)
37.1 19.4 16.5 14.2
ROE (%)
35.7 44.5 39.8 36.0
Source: Company, HSIE Research
Change in estimates
(INR mn)
FY22E FY23E FY24E
Revised Old Change
% / bps Revised Old
Change
% / bps Revised Old
Change
% / bps
Revenues 16,252 15,442 5% 18,816 17,877 5% 21,697 20,654 5%
EBITDA 8,071 7,053 14% 9,507 9,001 6% 11,034 10,474 5%
EBITDA margin (%) 49.7 45.7 399bps 50.5 50.3 18bps 50.9 50.7 14bps
APAT 5,878 5,119 15% 6,912 6,539 6% 8,012 7,602 5%
RoE (%) 36.2 33.2 302bps 36.7 36.6 16bps 36.9 36.8 12bps
Source: Company, HSIE Research
BUY
CMP (as on 18 Jan 2022) INR 1,384
Target Price INR 1,870
NIFTY 18,113
KEY
CHANGES OLD NEW
Rating BUY BUY
Price Target INR 1,770 INR 1,870
EPS % FY22E FY23E
+15% +6%
KEY STOCK DATA
Bloomberg code ANGELONE IN
No. of Shares (mn) 83
MCap (INR bn) / ($ mn) 115/1,539
6m avg traded value (INR mn) 778
52 Week high / low INR 1,689/282
STOCK PERFORMANCE (%)
3M 6M 12M
Absolute (%) (13.2) 8.8 300.0
Relative (%) (11.5) (5.5) 274.9
SHAREHOLDING PATTERN (%)
Sep-21 Dec-21
Promoters 43.8 43.7
FIs & Local MFs 7.6 7.8
FPIs 4.7 5.4
Public & Others 44.0 43.0
Pledged Shares Nil Nil
Source : BSE
Krishnan ASV [email protected]
+91-22-6171-7314 Sahej Mittal [email protected]
+91-22-6171-7325
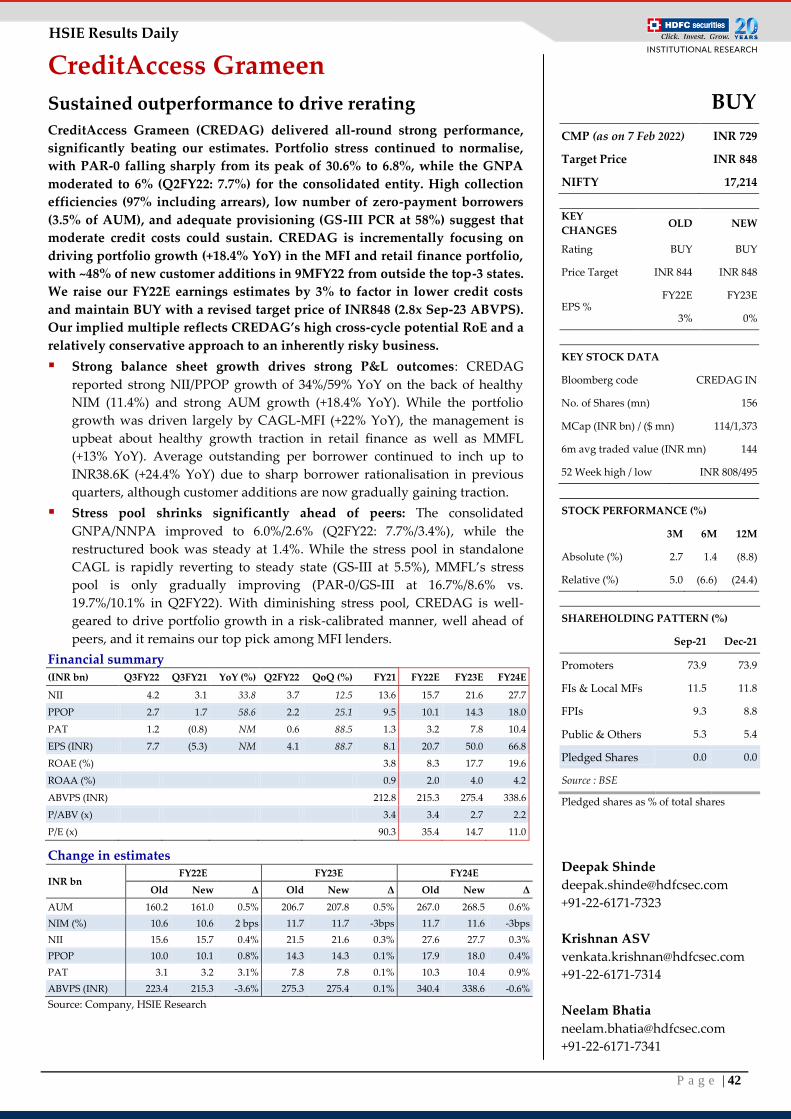
P a g e | 42
HSIE Results Daily
CreditAccess Grameen
Sustained outperformance to drive rerating
CreditAccess Grameen (CREDAG) delivered all-round strong performance,
significantly beating our estimates. Portfolio stress continued to normalise,
with PAR-0 falling sharply from its peak of 30.6% to 6.8%, while the GNPA
moderated to 6% (Q2FY22: 7.7%) for the consolidated entity. High collection
efficiencies (97% including arrears), low number of zero-payment borrowers
(3.5% of AUM), and adequate provisioning (GS-III PCR at 58%) suggest that
moderate credit costs could sustain. CREDAG is incrementally focusing on
driving portfolio growth (+18.4% YoY) in the MFI and retail finance portfolio,
with ~48% of new customer additions in 9MFY22 from outside the top-3 states.
We raise our FY22E earnings estimates by 3% to factor in lower credit costs
and maintain BUY with a revised target price of INR848 (2.8x Sep-23 ABVPS).
Our implied multiple reflects CREDAG’s high cross-cycle potential RoE and a
relatively conservative approach to an inherently risky business.
Strong balance sheet growth drives strong P&L outcomes: CREDAG
reported strong NII/PPOP growth of 34%/59% YoY on the back of healthy
NIM (11.4%) and strong AUM growth (+18.4% YoY). While the portfolio
growth was driven largely by CAGL-MFI (+22% YoY), the management is
upbeat about healthy growth traction in retail finance as well as MMFL
(+13% YoY). Average outstanding per borrower continued to inch up to
INR38.6K (+24.4% YoY) due to sharp borrower rationalisation in previous
quarters, although customer additions are now gradually gaining traction.
Stress pool shrinks significantly ahead of peers: The consolidated
GNPA/NNPA improved to 6.0%/2.6% (Q2FY22: 7.7%/3.4%), while the
restructured book was steady at 1.4%. While the stress pool in standalone
CAGL is rapidly reverting to steady state (GS-III at 5.5%), MMFL’s stress
pool is only gradually improving (PAR-0/GS-III at 16.7%/8.6% vs.
19.7%/10.1% in Q2FY22). With diminishing stress pool, CREDAG is well-
geared to drive portfolio growth in a risk-calibrated manner, well ahead of
peers, and it remains our top pick among MFI lenders.
Financial summary
(INR bn) Q3FY22 Q3FY21 YoY (%) Q2FY22 QoQ (%) FY21 FY22E FY23E FY24E
NII 4.2 3.1 33.8 3.7 12.5 13.6 15.7 21.6 27.7
PPOP 2.7 1.7 58.6 2.2 25.1 9.5 10.1 14.3 18.0
PAT 1.2 (0.8) NM 0.6 88.5 1.3 3.2 7.8 10.4
EPS (INR) 7.7 (5.3) NM 4.1 88.7 8.1 20.7 50.0 66.8
ROAE (%) 3.8 8.3 17.7 19.6
ROAA (%) 0.9 2.0 4.0 4.2
ABVPS (INR) 212.8 215.3 275.4 338.6
P/ABV (x) 3.4 3.4 2.7 2.2
P/E (x) 90.3 35.4 14.7 11.0
Change in estimates
INR bn FY22E FY23E FY24E
Old New Δ Old New Δ Old New Δ
AUM 160.2 161.0 0.5% 206.7 207.8 0.5% 267.0 268.5 0.6%
NIM (%) 10.6 10.6 2 bps 11.7 11.7 -3bps 11.7 11.6 -3bps
NII 15.6 15.7 0.4% 21.5 21.6 0.3% 27.6 27.7 0.3%
PPOP 10.0 10.1 0.8% 14.3 14.3 0.1% 17.9 18.0 0.4%
PAT 3.1 3.2 3.1% 7.8 7.8 0.1% 10.3 10.4 0.9%
ABVPS (INR) 223.4 215.3 -3.6% 275.3 275.4 0.1% 340.4 338.6 -0.6%
Source: Company, HSIE Research
BUY
CMP (as on 7 Feb 2022) INR 729
Target Price INR 848
NIFTY 17,214
KEY
CHANGES OLD NEW
Rating BUY BUY
Price Target INR 844 INR 848
EPS % FY22E FY23E
3% 0%
KEY STOCK DATA
Bloomberg code CREDAG IN
No. of Shares (mn) 156
MCap (INR bn) / ($ mn) 114/1,373
6m avg traded value (INR mn) 144
52 Week high / low INR 808/495
STOCK PERFORMANCE (%)
3M 6M 12M
Absolute (%) 2.7 1.4 (8.8)
Relative (%) 5.0 (6.6) (24.4)
SHAREHOLDING PATTERN (%)
Sep-21 Dec-21
Promoters 73.9 73.9
FIs & Local MFs 11.5 11.8
FPIs 9.3 8.8
Public & Others 5.3 5.4
Pledged Shares 0.0 0.0
Source : BSE
Pledged shares as % of total shares
Deepak Shinde
+91-22-6171-7323
Krishnan ASV
+91-22-6171-7314
Neelam Bhatia
+91-22-6171-7341
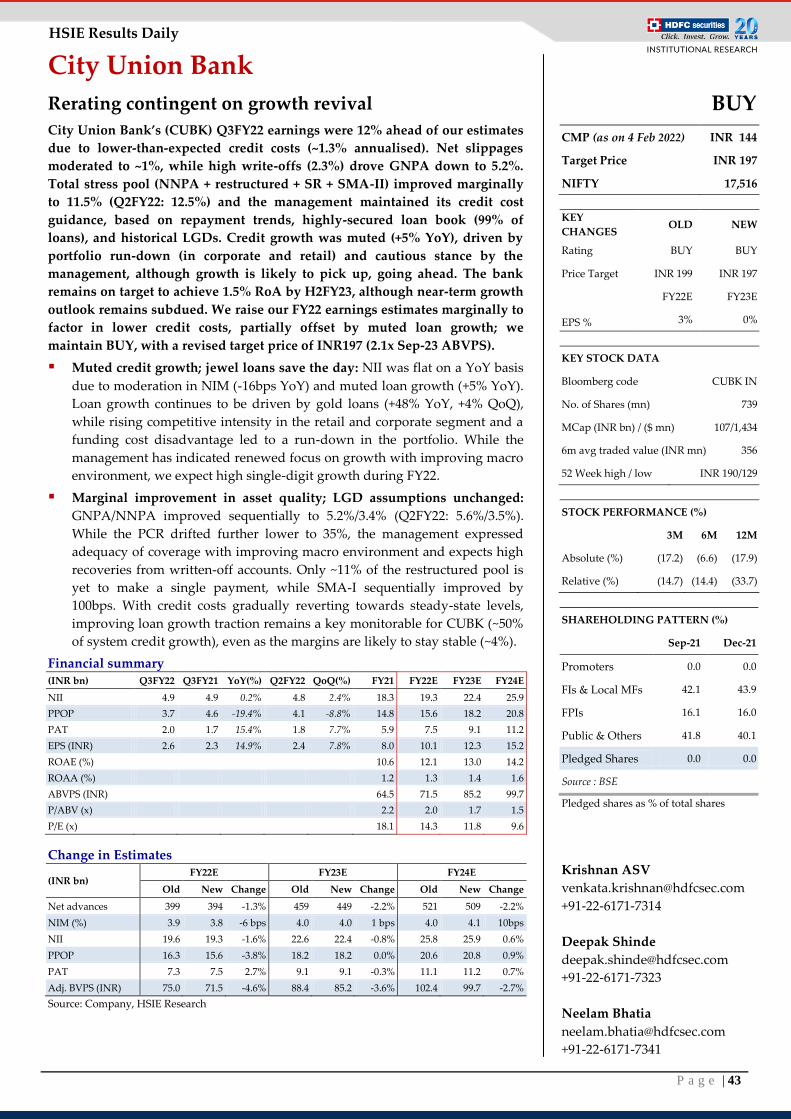
P a g e | 43
HSIE Results Daily
City Union Bank
Rerating contingent on growth revival
City Union Bank’s (CUBK) Q3FY22 earnings were 12% ahead of our estimates
due to lower-than-expected credit costs (~1.3% annualised). Net slippages
moderated to ~1%, while high write-offs (2.3%) drove GNPA down to 5.2%.
Total stress pool (NNPA + restructured + SR + SMA-II) improved marginally
to 11.5% (Q2FY22: 12.5%) and the management maintained its credit cost
guidance, based on repayment trends, highly-secured loan book (99% of
loans), and historical LGDs. Credit growth was muted (+5% YoY), driven by
portfolio run-down (in corporate and retail) and cautious stance by the
management, although growth is likely to pick up, going ahead. The bank
remains on target to achieve 1.5% RoA by H2FY23, although near-term growth
outlook remains subdued. We raise our FY22 earnings estimates marginally to
factor in lower credit costs, partially offset by muted loan growth; we
maintain BUY, with a revised target price of INR197 (2.1x Sep-23 ABVPS).
Muted credit growth; jewel loans save the day: NII was flat on a YoY basis
due to moderation in NIM (-16bps YoY) and muted loan growth (+5% YoY).
Loan growth continues to be driven by gold loans (+48% YoY, +4% QoQ),
while rising competitive intensity in the retail and corporate segment and a
funding cost disadvantage led to a run-down in the portfolio. While the
management has indicated renewed focus on growth with improving macro
environment, we expect high single-digit growth during FY22.
Marginal improvement in asset quality; LGD assumptions unchanged:
GNPA/NNPA improved sequentially to 5.2%/3.4% (Q2FY22: 5.6%/3.5%).
While the PCR drifted further lower to 35%, the management expressed
adequacy of coverage with improving macro environment and expects high
recoveries from written-off accounts. Only ~11% of the restructured pool is
yet to make a single payment, while SMA-I sequentially improved by
100bps. With credit costs gradually reverting towards steady-state levels,
improving loan growth traction remains a key monitorable for CUBK (~50%
of system credit growth), even as the margins are likely to stay stable (~4%).
Financial summary (INR bn) Q3FY22 Q3FY21 YoY(%) Q2FY22 QoQ(%) FY21 FY22E FY23E FY24E
NII 4.9 4.9 0.2% 4.8 2.4% 18.3 19.3 22.4 25.9
PPOP 3.7 4.6 -19.4% 4.1 -8.8% 14.8 15.6 18.2 20.8
PAT 2.0 1.7 15.4% 1.8 7.7% 5.9 7.5 9.1 11.2
EPS (INR) 2.6 2.3 14.9% 2.4 7.8% 8.0 10.1 12.3 15.2
ROAE (%) 10.6 12.1 13.0 14.2
ROAA (%) 1.2 1.3 1.4 1.6
ABVPS (INR) 64.5 71.5 85.2 99.7
P/ABV (x) 2.2 2.0 1.7 1.5
P/E (x) 18.1 14.3 11.8 9.6
Change in Estimates
(INR bn) FY22E FY23E FY24E
Old New Change Old New Change Old New Change
Net advances 399 394 -1.3% 459 449 -2.2% 521 509 -2.2%
NIM (%) 3.9 3.8 -6 bps 4.0 4.0 1 bps 4.0 4.1 10bps
NII 19.6 19.3 -1.6% 22.6 22.4 -0.8% 25.8 25.9 0.6%
PPOP 16.3 15.6 -3.8% 18.2 18.2 0.0% 20.6 20.8 0.9%
PAT 7.3 7.5 2.7% 9.1 9.1 -0.3% 11.1 11.2 0.7%
Adj. BVPS (INR) 75.0 71.5 -4.6% 88.4 85.2 -3.6% 102.4 99.7 -2.7%
Source: Company, HSIE Research
BUY
CMP (as on 4 Feb 2022) INR 144
Target Price INR 197
NIFTY 17,516
KEY
CHANGES OLD NEW
Rating BUY BUY
Price Target INR 199 INR 197
EPS %
FY22E FY23E
3% 0%
KEY STOCK DATA
Bloomberg code CUBK IN
No. of Shares (mn) 739
MCap (INR bn) / ($ mn) 107/1,434
6m avg traded value (INR mn) 356
52 Week high / low INR 190/129
STOCK PERFORMANCE (%)
3M 6M 12M
Absolute (%) (17.2) (6.6) (17.9)
Relative (%) (14.7) (14.4) (33.7)
SHAREHOLDING PATTERN (%)
Sep-21 Dec-21
Promoters 0.0 0.0
FIs & Local MFs 42.1 43.9
FPIs 16.1 16.0
Public & Others 41.8 40.1
Pledged Shares 0.0 0.0
Source : BSE
Pledged shares as % of total shares
Krishnan ASV
+91-22-6171-7314
Deepak Shinde
+91-22-6171-7323
Neelam Bhatia
+91-22-6171-7341
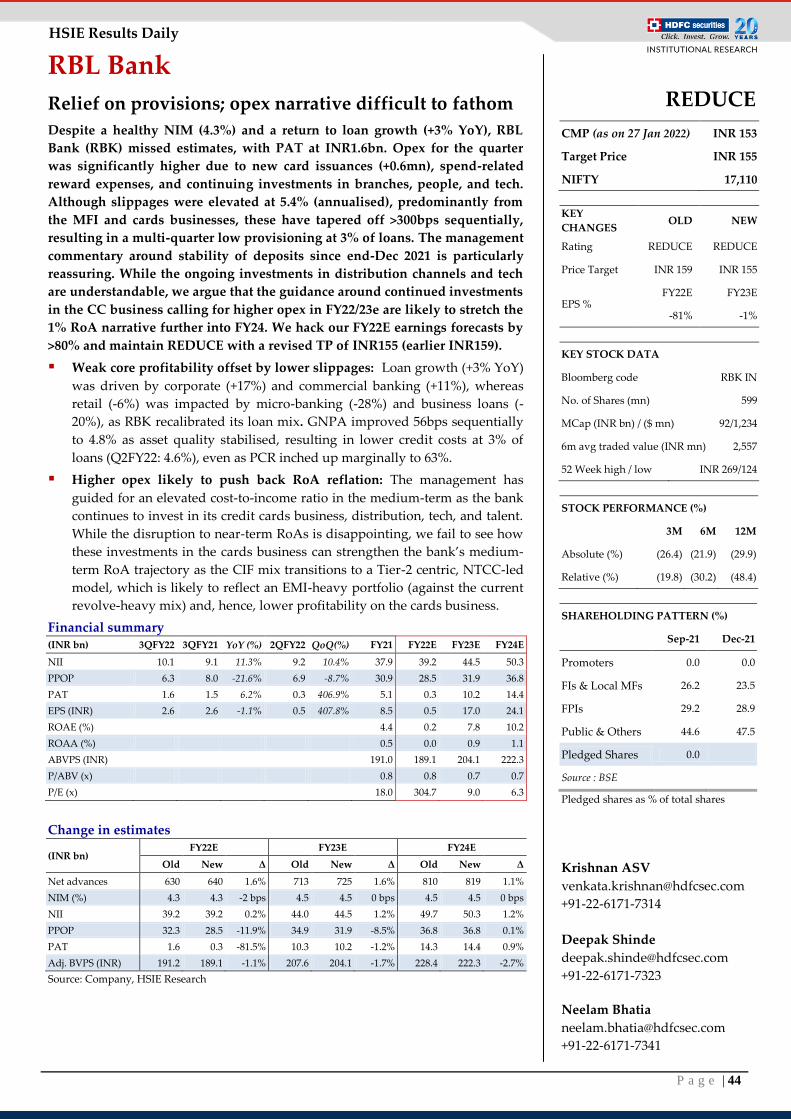
P a g e | 44
HSIE Results Daily
RBL Bank
Relief on provisions; opex narrative difficult to fathom
Despite a healthy NIM (4.3%) and a return to loan growth (+3% YoY), RBL
Bank (RBK) missed estimates, with PAT at INR1.6bn. Opex for the quarter
was significantly higher due to new card issuances (+0.6mn), spend-related
reward expenses, and continuing investments in branches, people, and tech.
Although slippages were elevated at 5.4% (annualised), predominantly from
the MFI and cards businesses, these have tapered off >300bps sequentially,
resulting in a multi-quarter low provisioning at 3% of loans. The management
commentary around stability of deposits since end-Dec 2021 is particularly
reassuring. While the ongoing investments in distribution channels and tech
are understandable, we argue that the guidance around continued investments
in the CC business calling for higher opex in FY22/23e are likely to stretch the
1% RoA narrative further into FY24. We hack our FY22E earnings forecasts by
>80% and maintain REDUCE with a revised TP of INR155 (earlier INR159).
Weak core profitability offset by lower slippages: Loan growth (+3% YoY)
was driven by corporate (+17%) and commercial banking (+11%), whereas
retail (-6%) was impacted by micro-banking (-28%) and business loans (-
20%), as RBK recalibrated its loan mix. GNPA improved 56bps sequentially
to 4.8% as asset quality stabilised, resulting in lower credit costs at 3% of
loans (Q2FY22: 4.6%), even as PCR inched up marginally to 63%.
Higher opex likely to push back RoA reflation: The management has
guided for an elevated cost-to-income ratio in the medium-term as the bank
continues to invest in its credit cards business, distribution, tech, and talent.
While the disruption to near-term RoAs is disappointing, we fail to see how
these investments in the cards business can strengthen the bank’s medium-
term RoA trajectory as the CIF mix transitions to a Tier-2 centric, NTCC-led
model, which is likely to reflect an EMI-heavy portfolio (against the current
revolve-heavy mix) and, hence, lower profitability on the cards business.
Financial summary (INR bn) 3QFY22 3QFY21 YoY (%) 2QFY22 QoQ(%) FY21 FY22E FY23E FY24E
NII 10.1 9.1 11.3% 9.2 10.4% 37.9 39.2 44.5 50.3
PPOP 6.3 8.0 -21.6% 6.9 -8.7% 30.9 28.5 31.9 36.8
PAT 1.6 1.5 6.2% 0.3 406.9% 5.1 0.3 10.2 14.4
EPS (INR) 2.6 2.6 -1.1% 0.5 407.8% 8.5 0.5 17.0 24.1
ROAE (%) 4.4 0.2 7.8 10.2
ROAA (%) 0.5 0.0 0.9 1.1
ABVPS (INR) 191.0 189.1 204.1 222.3
P/ABV (x) 0.8 0.8 0.7 0.7
P/E (x) 18.0 304.7 9.0 6.3
Change in estimates
(INR bn) FY22E FY23E FY24E
Old New Δ Old New Δ Old New Δ
Net advances 630 640 1.6% 713 725 1.6% 810 819 1.1%
NIM (%) 4.3 4.3 -2 bps 4.5 4.5 0 bps 4.5 4.5 0 bps
NII 39.2 39.2 0.2% 44.0 44.5 1.2% 49.7 50.3 1.2%
PPOP 32.3 28.5 -11.9% 34.9 31.9 -8.5% 36.8 36.8 0.1%
PAT 1.6 0.3 -81.5% 10.3 10.2 -1.2% 14.3 14.4 0.9%
Adj. BVPS (INR) 191.2 189.1 -1.1% 207.6 204.1 -1.7% 228.4 222.3 -2.7%
Source: Company, HSIE Research
REDUCE
CMP (as on 27 Jan 2022) INR 153
Target Price INR 155
NIFTY 17,110
KEY
CHANGES OLD NEW
Rating REDUCE REDUCE
Price Target INR 159 INR 155
EPS % FY22E FY23E
-81% -1%
KEY STOCK DATA
Bloomberg code RBK IN
No. of Shares (mn) 599
MCap (INR bn) / ($ mn) 92/1,234
6m avg traded value (INR mn) 2,557
52 Week high / low INR 269/124
STOCK PERFORMANCE (%)
3M 6M 12M
Absolute (%) (26.4) (21.9) (29.9)
Relative (%) (19.8) (30.2) (48.4)
SHAREHOLDING PATTERN (%)
Sep-21 Dec-21
Promoters 0.0 0.0
FIs & Local MFs 26.2 23.5
FPIs 29.2 28.9
Public & Others 44.6 47.5
Pledged Shares 0.0
Source : BSE
Pledged shares as % of total shares
Krishnan ASV
+91-22-6171-7314
Deepak Shinde
+91-22-6171-7323
Neelam Bhatia
+91-22-6171-7341
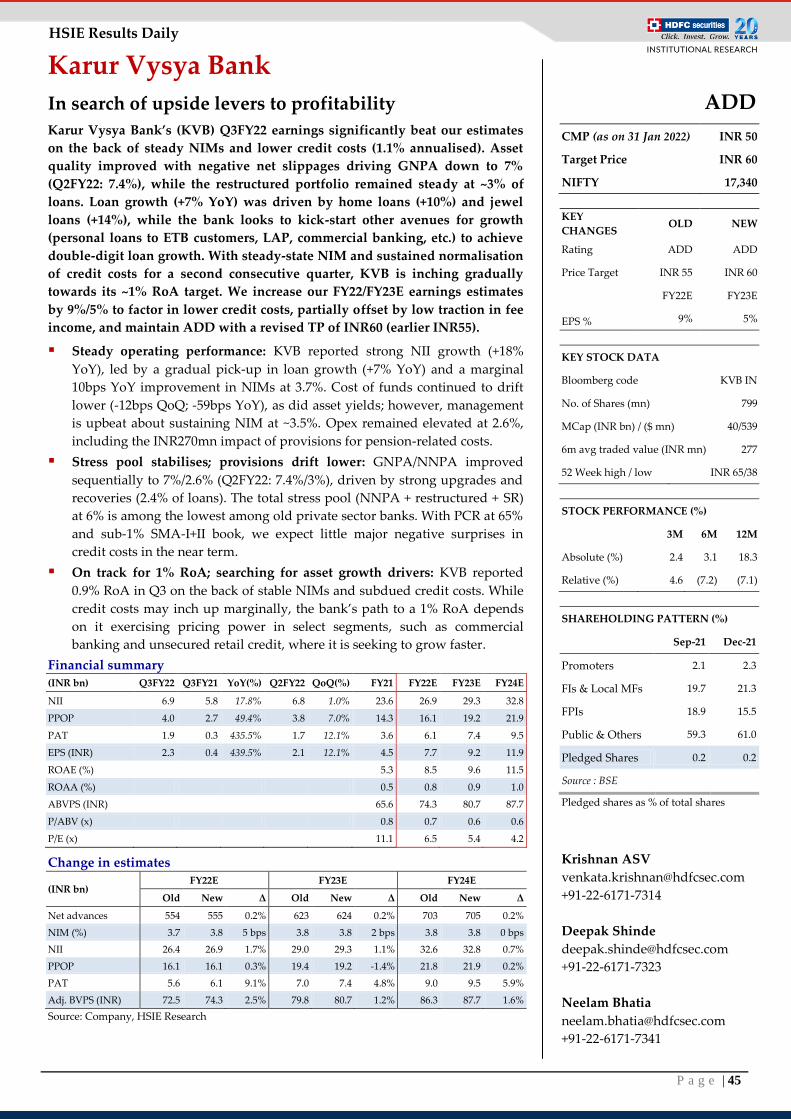
P a g e | 45
HSIE Results Daily
Karur Vysya Bank
In search of upside levers to profitability
Karur Vysya Bank’s (KVB) Q3FY22 earnings significantly beat our estimates
on the back of steady NIMs and lower credit costs (1.1% annualised). Asset
quality improved with negative net slippages driving GNPA down to 7%
(Q2FY22: 7.4%), while the restructured portfolio remained steady at ~3% of
loans. Loan growth (+7% YoY) was driven by home loans (+10%) and jewel
loans (+14%), while the bank looks to kick-start other avenues for growth
(personal loans to ETB customers, LAP, commercial banking, etc.) to achieve
double-digit loan growth. With steady-state NIM and sustained normalisation
of credit costs for a second consecutive quarter, KVB is inching gradually
towards its ~1% RoA target. We increase our FY22/FY23E earnings estimates
by 9%/5% to factor in lower credit costs, partially offset by low traction in fee
income, and maintain ADD with a revised TP of INR60 (earlier INR55).
Steady operating performance: KVB reported strong NII growth (+18%
YoY), led by a gradual pick-up in loan growth (+7% YoY) and a marginal
10bps YoY improvement in NIMs at 3.7%. Cost of funds continued to drift
lower (-12bps QoQ; -59bps YoY), as did asset yields; however, management
is upbeat about sustaining NIM at ~3.5%. Opex remained elevated at 2.6%,
including the INR270mn impact of provisions for pension-related costs.
Stress pool stabilises; provisions drift lower: GNPA/NNPA improved
sequentially to 7%/2.6% (Q2FY22: 7.4%/3%), driven by strong upgrades and
recoveries (2.4% of loans). The total stress pool (NNPA + restructured + SR)
at 6% is among the lowest among old private sector banks. With PCR at 65%
and sub-1% SMA-I+II book, we expect little major negative surprises in
credit costs in the near term.
On track for 1% RoA; searching for asset growth drivers: KVB reported
0.9% RoA in Q3 on the back of stable NIMs and subdued credit costs. While
credit costs may inch up marginally, the bank’s path to a 1% RoA depends
on it exercising pricing power in select segments, such as commercial
banking and unsecured retail credit, where it is seeking to grow faster.
Financial summary
(INR bn) Q3FY22 Q3FY21 YoY(%) Q2FY22 QoQ(%) FY21 FY22E FY23E FY24E
NII 6.9 5.8 17.8% 6.8 1.0% 23.6 26.9 29.3 32.8
PPOP 4.0 2.7 49.4% 3.8 7.0% 14.3 16.1 19.2 21.9
PAT 1.9 0.3 435.5% 1.7 12.1% 3.6 6.1 7.4 9.5
EPS (INR) 2.3 0.4 439.5% 2.1 12.1% 4.5 7.7 9.2 11.9
ROAE (%) 5.3 8.5 9.6 11.5
ROAA (%) 0.5 0.8 0.9 1.0
ABVPS (INR) 65.6 74.3 80.7 87.7
P/ABV (x) 0.8 0.7 0.6 0.6
P/E (x) 11.1 6.5 5.4 4.2
Change in estimates
(INR bn) FY22E FY23E FY24E
Old New Δ Old New Δ Old New Δ
Net advances 554 555 0.2% 623 624 0.2% 703 705 0.2%
NIM (%) 3.7 3.8 5 bps 3.8 3.8 2 bps 3.8 3.8 0 bps
NII 26.4 26.9 1.7% 29.0 29.3 1.1% 32.6 32.8 0.7%
PPOP 16.1 16.1 0.3% 19.4 19.2 -1.4% 21.8 21.9 0.2%
PAT 5.6 6.1 9.1% 7.0 7.4 4.8% 9.0 9.5 5.9%
Adj. BVPS (INR) 72.5 74.3 2.5% 79.8 80.7 1.2% 86.3 87.7 1.6%
Source: Company, HSIE Research
ADD
CMP (as on 31 Jan 2022) INR 50
Target Price INR 60
NIFTY 17,340
KEY
CHANGES OLD NEW
Rating ADD ADD
Price Target INR 55 INR 60
EPS %
FY22E FY23E
9% 5%
KEY STOCK DATA
Bloomberg code KVB IN
No. of Shares (mn) 799
MCap (INR bn) / ($ mn) 40/539
6m avg traded value (INR mn) 277
52 Week high / low INR 65/38
STOCK PERFORMANCE (%)
3M 6M 12M
Absolute (%) 2.4 3.1 18.3
Relative (%) 4.6 (7.2) (7.1)
SHAREHOLDING PATTERN (%)
Sep-21 Dec-21
Promoters 2.1 2.3
FIs & Local MFs 19.7 21.3
FPIs 18.9 15.5
Public & Others 59.3 61.0
Pledged Shares 0.2 0.2
Source : BSE
Pledged shares as % of total shares
Krishnan ASV
+91-22-6171-7314
Deepak Shinde
+91-22-6171-7323
Neelam Bhatia
+91-22-6171-7341
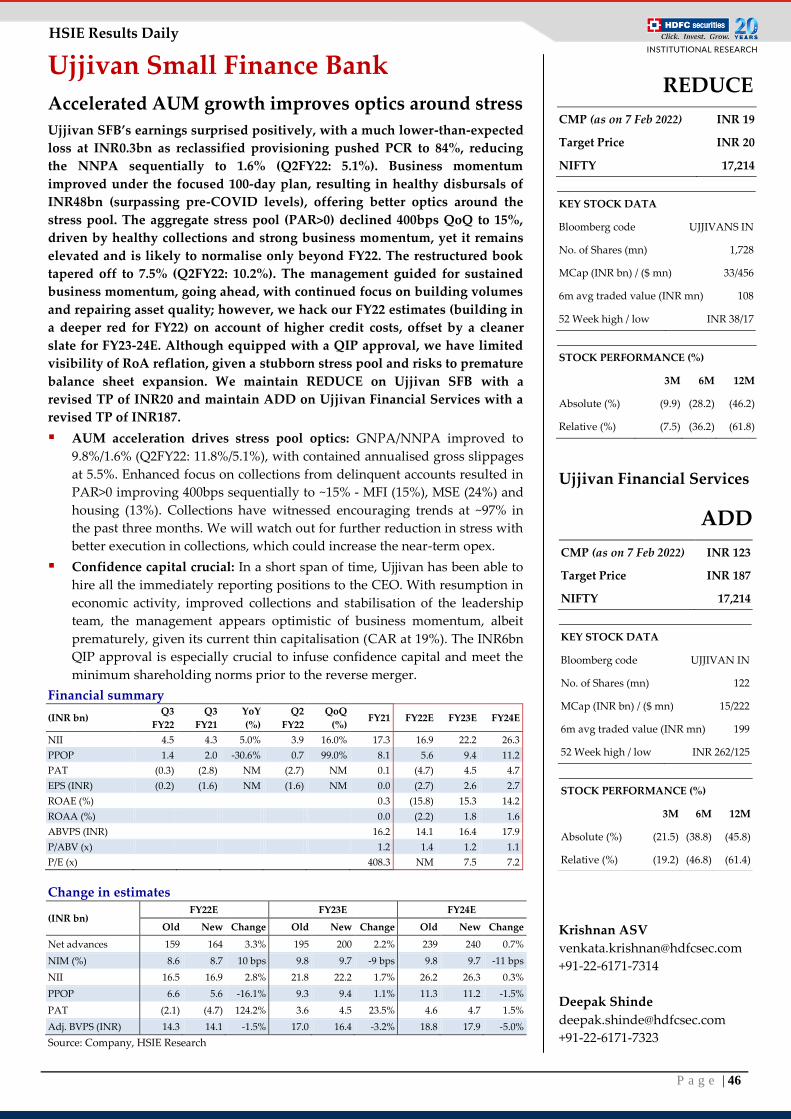
P a g e | 46
HSIE Results Daily
Ujjivan Small Finance Bank
Accelerated AUM growth improves optics around stress
Ujjivan SFB’s earnings surprised positively, with a much lower-than-expected
loss at INR0.3bn as reclassified provisioning pushed PCR to 84%, reducing
the NNPA sequentially to 1.6% (Q2FY22: 5.1%). Business momentum
improved under the focused 100-day plan, resulting in healthy disbursals of
INR48bn (surpassing pre-COVID levels), offering better optics around the
stress pool. The aggregate stress pool (PAR>0) declined 400bps QoQ to 15%,
driven by healthy collections and strong business momentum, yet it remains
elevated and is likely to normalise only beyond FY22. The restructured book
tapered off to 7.5% (Q2FY22: 10.2%). The management guided for sustained
business momentum, going ahead, with continued focus on building volumes
and repairing asset quality; however, we hack our FY22 estimates (building in
a deeper red for FY22) on account of higher credit costs, offset by a cleaner
slate for FY23-24E. Although equipped with a QIP approval, we have limited
visibility of RoA reflation, given a stubborn stress pool and risks to premature
balance sheet expansion. We maintain REDUCE on Ujjivan SFB with a
revised TP of INR20 and maintain ADD on Ujjivan Financial Services with a
revised TP of INR187.
AUM acceleration drives stress pool optics: GNPA/NNPA improved to
9.8%/1.6% (Q2FY22: 11.8%/5.1%), with contained annualised gross slippages
at 5.5%. Enhanced focus on collections from delinquent accounts resulted in
PAR>0 improving 400bps sequentially to ~15% - MFI (15%), MSE (24%) and
housing (13%). Collections have witnessed encouraging trends at ~97% in
the past three months. We will watch out for further reduction in stress with
better execution in collections, which could increase the near-term opex.
Confidence capital crucial: In a short span of time, Ujjivan has been able to
hire all the immediately reporting positions to the CEO. With resumption in
economic activity, improved collections and stabilisation of the leadership
team, the management appears optimistic of business momentum, albeit
prematurely, given its current thin capitalisation (CAR at 19%). The INR6bn
QIP approval is especially crucial to infuse confidence capital and meet the
minimum shareholding norms prior to the reverse merger.
Financial summary
(INR bn) Q3
FY22
Q3
FY21
YoY
(%)
Q2
FY22
QoQ
(%) FY21 FY22E FY23E FY24E
NII 4.5 4.3 5.0% 3.9 16.0% 17.3 16.9 22.2 26.3
PPOP 1.4 2.0 -30.6% 0.7 99.0% 8.1 5.6 9.4 11.2
PAT (0.3) (2.8) NM (2.7) NM 0.1 (4.7) 4.5 4.7
EPS (INR) (0.2) (1.6) NM (1.6) NM 0.0 (2.7) 2.6 2.7
ROAE (%) 0.3 (15.8) 15.3 14.2
ROAA (%) 0.0 (2.2) 1.8 1.6
ABVPS (INR) 16.2 14.1 16.4 17.9
P/ABV (x) 1.2 1.4 1.2 1.1
P/E (x) 408.3 NM 7.5 7.2
Change in estimates
(INR bn) FY22E FY23E FY24E
Old New Change Old New Change Old New Change
Net advances 159 164 3.3% 195 200 2.2% 239 240 0.7%
NIM (%) 8.6 8.7 10 bps 9.8 9.7 -9 bps 9.8 9.7 -11 bps
NII 16.5 16.9 2.8% 21.8 22.2 1.7% 26.2 26.3 0.3%
PPOP 6.6 5.6 -16.1% 9.3 9.4 1.1% 11.3 11.2 -1.5%
PAT (2.1) (4.7) 124.2% 3.6 4.5 23.5% 4.6 4.7 1.5%
Adj. BVPS (INR) 14.3 14.1 -1.5% 17.0 16.4 -3.2% 18.8 17.9 -5.0%
Source: Company, HSIE Research
REDUCE
CMP (as on 7 Feb 2022) INR 19
Target Price INR 20
NIFTY 17,214
KEY STOCK DATA
Bloomberg code UJJIVANS IN
No. of Shares (mn) 1,728
MCap (INR bn) / ($ mn) 33/456
6m avg traded value (INR mn) 108
52 Week high / low INR 38/17
STOCK PERFORMANCE (%)
3M 6M 12M
Absolute (%) (9.9) (28.2) (46.2)
Relative (%) (7.5) (36.2) (61.8)
Ujjivan Financial Services
ADD
CMP (as on 7 Feb 2022) INR 123
Target Price INR 187
NIFTY 17,214
KEY STOCK DATA
Bloomberg code UJJIVAN IN
No. of Shares (mn) 122
MCap (INR bn) / ($ mn) 15/222
6m avg traded value (INR mn) 199
52 Week high / low INR 262/125
STOCK PERFORMANCE (%)
3M 6M 12M
Absolute (%) (21.5) (38.8) (45.8)
Relative (%) (19.2) (46.8) (61.4)
Krishnan ASV
+91-22-6171-7314
Deepak Shinde
+91-22-6171-7323
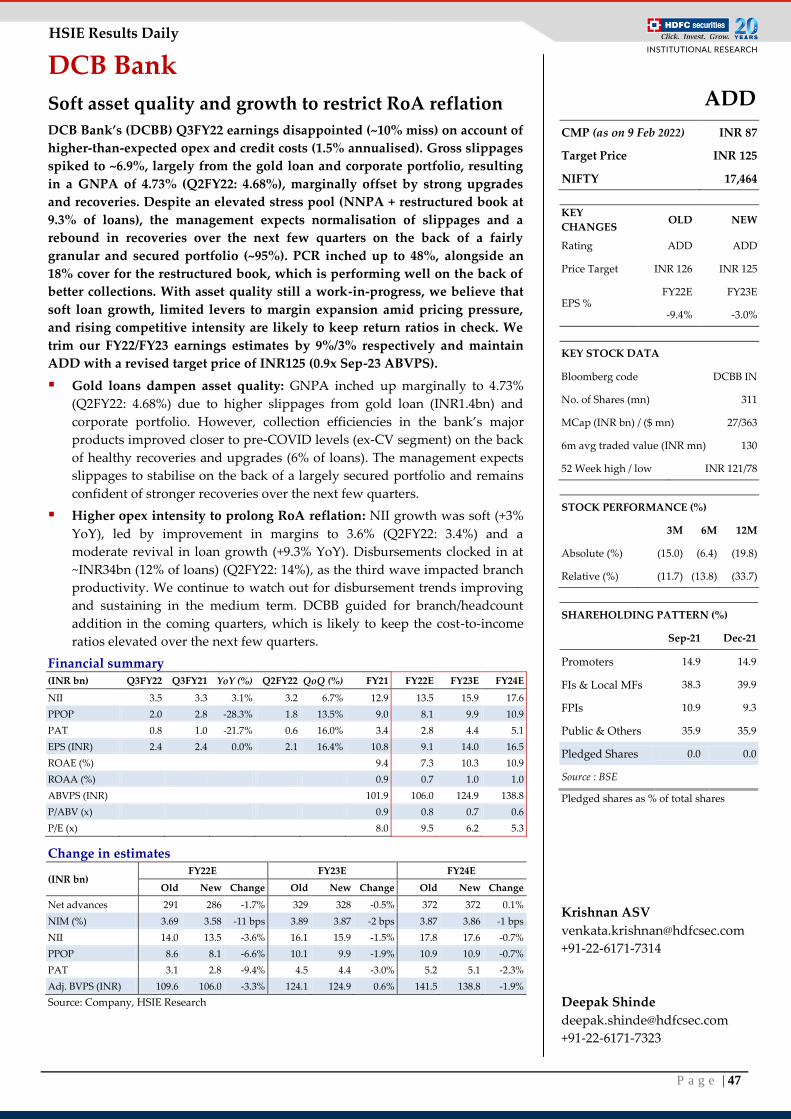
P a g e | 47
HSIE Results Daily
DCB Bank
Soft asset quality and growth to restrict RoA reflation
DCB Bank’s (DCBB) Q3FY22 earnings disappointed (~10% miss) on account of
higher-than-expected opex and credit costs (1.5% annualised). Gross slippages
spiked to ~6.9%, largely from the gold loan and corporate portfolio, resulting
in a GNPA of 4.73% (Q2FY22: 4.68%), marginally offset by strong upgrades
and recoveries. Despite an elevated stress pool (NNPA + restructured book at
9.3% of loans), the management expects normalisation of slippages and a
rebound in recoveries over the next few quarters on the back of a fairly
granular and secured portfolio (~95%). PCR inched up to 48%, alongside an
18% cover for the restructured book, which is performing well on the back of
better collections. With asset quality still a work-in-progress, we believe that
soft loan growth, limited levers to margin expansion amid pricing pressure,
and rising competitive intensity are likely to keep return ratios in check. We
trim our FY22/FY23 earnings estimates by 9%/3% respectively and maintain
ADD with a revised target price of INR125 (0.9x Sep-23 ABVPS).
Gold loans dampen asset quality: GNPA inched up marginally to 4.73%
(Q2FY22: 4.68%) due to higher slippages from gold loan (INR1.4bn) and
corporate portfolio. However, collection efficiencies in the bank’s major
products improved closer to pre-COVID levels (ex-CV segment) on the back
of healthy recoveries and upgrades (6% of loans). The management expects
slippages to stabilise on the back of a largely secured portfolio and remains
confident of stronger recoveries over the next few quarters.
Higher opex intensity to prolong RoA reflation: NII growth was soft (+3%
YoY), led by improvement in margins to 3.6% (Q2FY22: 3.4%) and a
moderate revival in loan growth (+9.3% YoY). Disbursements clocked in at
~INR34bn (12% of loans) (Q2FY22: 14%), as the third wave impacted branch
productivity. We continue to watch out for disbursement trends improving
and sustaining in the medium term. DCBB guided for branch/headcount
addition in the coming quarters, which is likely to keep the cost-to-income
ratios elevated over the next few quarters.
Financial summary (INR bn) Q3FY22 Q3FY21 YoY (%) Q2FY22 QoQ (%) FY21 FY22E FY23E FY24E
NII 3.5 3.3 3.1% 3.2 6.7% 12.9 13.5 15.9 17.6
PPOP 2.0 2.8 -28.3% 1.8 13.5% 9.0 8.1 9.9 10.9
PAT 0.8 1.0 -21.7% 0.6 16.0% 3.4 2.8 4.4 5.1
EPS (INR) 2.4 2.4 0.0% 2.1 16.4% 10.8 9.1 14.0 16.5
ROAE (%) 9.4 7.3 10.3 10.9
ROAA (%) 0.9 0.7 1.0 1.0
ABVPS (INR) 101.9 106.0 124.9 138.8
P/ABV (x) 0.9 0.8 0.7 0.6
P/E (x) 8.0 9.5 6.2 5.3
Change in estimates
(INR bn) FY22E FY23E FY24E
Old New Change Old New Change Old New Change
Net advances 291 286 -1.7% 329 328 -0.5% 372 372 0.1%
NIM (%) 3.69 3.58 -11 bps 3.89 3.87 -2 bps 3.87 3.86 -1 bps
NII 14.0 13.5 -3.6% 16.1 15.9 -1.5% 17.8 17.6 -0.7%
PPOP 8.6 8.1 -6.6% 10.1 9.9 -1.9% 10.9 10.9 -0.7%
PAT 3.1 2.8 -9.4% 4.5 4.4 -3.0% 5.2 5.1 -2.3%
Adj. BVPS (INR) 109.6 106.0 -3.3% 124.1 124.9 0.6% 141.5 138.8 -1.9%
Source: Company, HSIE Research
ADD
CMP (as on 9 Feb 2022) INR 87
Target Price INR 125
NIFTY 17,464
KEY
CHANGES OLD NEW
Rating ADD ADD
Price Target INR 126 INR 125
EPS % FY22E FY23E
-9.4% -3.0%
KEY STOCK DATA
Bloomberg code DCBB IN
No. of Shares (mn) 311
MCap (INR bn) / ($ mn) 27/363
6m avg traded value (INR mn) 130
52 Week high / low INR 121/78
STOCK PERFORMANCE (%)
3M 6M 12M
Absolute (%) (15.0) (6.4) (19.8)
Relative (%) (11.7) (13.8) (33.7)
SHAREHOLDING PATTERN (%)
Sep-21 Dec-21
Promoters 14.9 14.9
FIs & Local MFs 38.3 39.9
FPIs 10.9 9.3
Public & Others 35.9 35.9
Pledged Shares 0.0 0.0
Source : BSE
Pledged shares as % of total shares
Krishnan ASV
+91-22-6171-7314
Deepak Shinde
+91-22-6171-7323
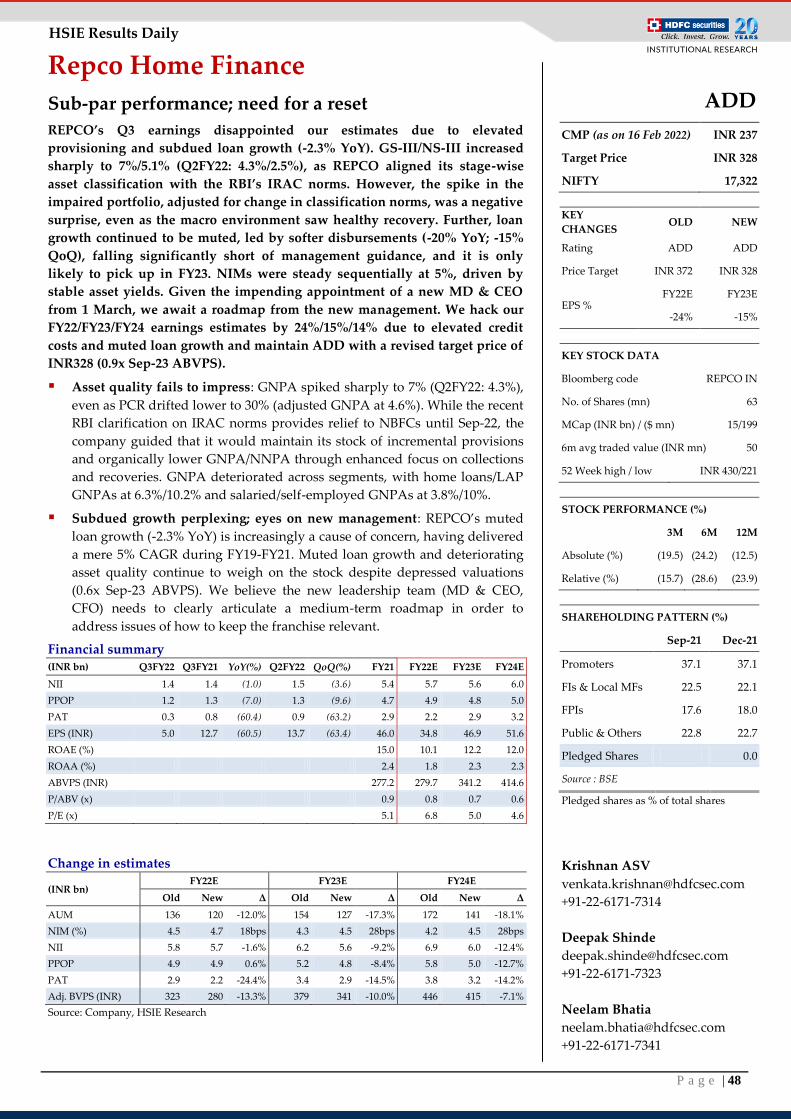
P a g e | 48
HSIE Results Daily
Repco Home Finance
Sub-par performance; need for a reset
REPCO’s Q3 earnings disappointed our estimates due to elevated
provisioning and subdued loan growth (-2.3% YoY). GS-III/NS-III increased
sharply to 7%/5.1% (Q2FY22: 4.3%/2.5%), as REPCO aligned its stage-wise
asset classification with the RBI’s IRAC norms. However, the spike in the
impaired portfolio, adjusted for change in classification norms, was a negative
surprise, even as the macro environment saw healthy recovery. Further, loan
growth continued to be muted, led by softer disbursements (-20% YoY; -15%
QoQ), falling significantly short of management guidance, and it is only
likely to pick up in FY23. NIMs were steady sequentially at 5%, driven by
stable asset yields. Given the impending appointment of a new MD & CEO
from 1 March, we await a roadmap from the new management. We hack our
FY22/FY23/FY24 earnings estimates by 24%/15%/14% due to elevated credit
costs and muted loan growth and maintain ADD with a revised target price of
INR328 (0.9x Sep-23 ABVPS).
Asset quality fails to impress: GNPA spiked sharply to 7% (Q2FY22: 4.3%),
even as PCR drifted lower to 30% (adjusted GNPA at 4.6%). While the recent
RBI clarification on IRAC norms provides relief to NBFCs until Sep-22, the
company guided that it would maintain its stock of incremental provisions
and organically lower GNPA/NNPA through enhanced focus on collections
and recoveries. GNPA deteriorated across segments, with home loans/LAP
GNPAs at 6.3%/10.2% and salaried/self-employed GNPAs at 3.8%/10%.
Subdued growth perplexing; eyes on new management: REPCO’s muted
loan growth (-2.3% YoY) is increasingly a cause of concern, having delivered
a mere 5% CAGR during FY19-FY21. Muted loan growth and deteriorating
asset quality continue to weigh on the stock despite depressed valuations
(0.6x Sep-23 ABVPS). We believe the new leadership team (MD & CEO,
CFO) needs to clearly articulate a medium-term roadmap in order to
address issues of how to keep the franchise relevant.
Financial summary (INR bn) Q3FY22 Q3FY21 YoY(%) Q2FY22 QoQ(%) FY21 FY22E FY23E FY24E
NII 1.4 1.4 (1.0) 1.5 (3.6) 5.4 5.7 5.6 6.0
PPOP 1.2 1.3 (7.0) 1.3 (9.6) 4.7 4.9 4.8 5.0
PAT 0.3 0.8 (60.4) 0.9 (63.2) 2.9 2.2 2.9 3.2
EPS (INR) 5.0 12.7 (60.5) 13.7 (63.4) 46.0 34.8 46.9 51.6
ROAE (%) 15.0 10.1 12.2 12.0
ROAA (%) 2.4 1.8 2.3 2.3
ABVPS (INR) 277.2 279.7 341.2 414.6
P/ABV (x) 0.9 0.8 0.7 0.6
P/E (x) 5.1 6.8 5.0 4.6
Change in estimates
(INR bn) FY22E FY23E FY24E
Old New Δ Old New Δ Old New Δ
AUM 136 120 -12.0% 154 127 -17.3% 172 141 -18.1%
NIM (%) 4.5 4.7 18bps 4.3 4.5 28bps 4.2 4.5 28bps
NII 5.8 5.7 -1.6% 6.2 5.6 -9.2% 6.9 6.0 -12.4%
PPOP 4.9 4.9 0.6% 5.2 4.8 -8.4% 5.8 5.0 -12.7%
PAT 2.9 2.2 -24.4% 3.4 2.9 -14.5% 3.8 3.2 -14.2%
Adj. BVPS (INR) 323 280 -13.3% 379 341 -10.0% 446 415 -7.1%
Source: Company, HSIE Research
ADD
CMP (as on 16 Feb 2022) INR 237
Target Price INR 328
NIFTY 17,322
KEY
CHANGES OLD NEW
Rating ADD ADD
Price Target INR 372 INR 328
EPS % FY22E FY23E
-24% -15%
KEY STOCK DATA
Bloomberg code REPCO IN
No. of Shares (mn) 63
MCap (INR bn) / ($ mn) 15/199
6m avg traded value (INR mn) 50
52 Week high / low INR 430/221
STOCK PERFORMANCE (%)
3M 6M 12M
Absolute (%) (19.5) (24.2) (12.5)
Relative (%) (15.7) (28.6) (23.9)
SHAREHOLDING PATTERN (%)
Sep-21 Dec-21
Promoters 37.1 37.1
FIs & Local MFs 22.5 22.1
FPIs 17.6 18.0
Public & Others 22.8 22.7
Pledged Shares 0.0
Source : BSE
Pledged shares as % of total shares
Krishnan ASV
+91-22-6171-7314
Deepak Shinde
+91-22-6171-7323
Neelam Bhatia
+91-22-6171-7341
P a g e | 49
HSIE Results Daily
Capital Goods
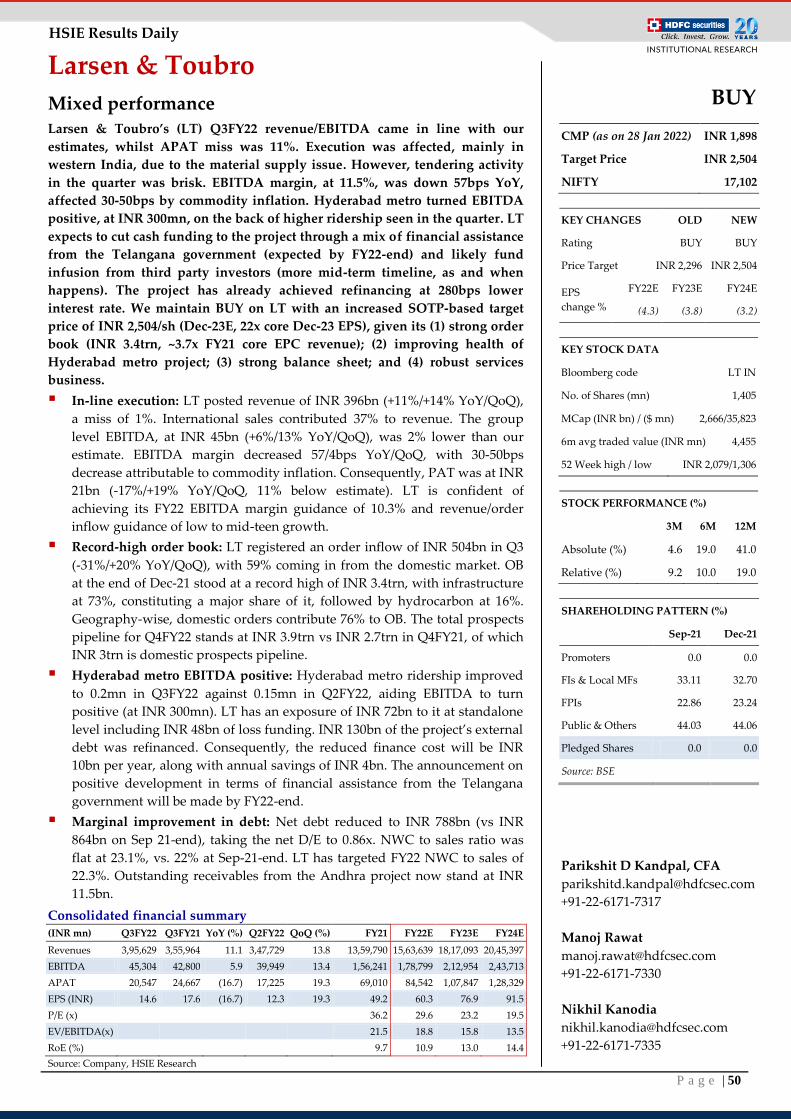
P a g e | 50
HSIE Results Daily
Larsen & Toubro
Mixed performance Larsen & Toubro’s (LT) Q3FY22 revenue/EBITDA came in line with our
estimates, whilst APAT miss was 11%. Execution was affected, mainly in
western India, due to the material supply issue. However, tendering activity
in the quarter was brisk. EBITDA margin, at 11.5%, was down 57bps YoY,
affected 30-50bps by commodity inflation. Hyderabad metro turned EBITDA
positive, at INR 300mn, on the back of higher ridership seen in the quarter. LT
expects to cut cash funding to the project through a mix of financial assistance
from the Telangana government (expected by FY22-end) and likely fund
infusion from third party investors (more mid-term timeline, as and when
happens). The project has already achieved refinancing at 280bps lower
interest rate. We maintain BUY on LT with an increased SOTP-based target
price of INR 2,504/sh (Dec-23E, 22x core Dec-23 EPS), given its (1) strong order
book (INR 3.4trn, ~3.7x FY21 core EPC revenue); (2) improving health of
Hyderabad metro project; (3) strong balance sheet; and (4) robust services
business.
In-line execution: LT posted revenue of INR 396bn (+11%/+14% YoY/QoQ),
a miss of 1%. International sales contributed 37% to revenue. The group
level EBITDA, at INR 45bn (+6%/13% YoY/QoQ), was 2% lower than our
estimate. EBITDA margin decreased 57/4bps YoY/QoQ, with 30-50bps
decrease attributable to commodity inflation. Consequently, PAT was at INR
21bn (-17%/+19% YoY/QoQ, 11% below estimate). LT is confident of
achieving its FY22 EBITDA margin guidance of 10.3% and revenue/order
inflow guidance of low to mid-teen growth.
Record-high order book: LT registered an order inflow of INR 504bn in Q3
(-31%/+20% YoY/QoQ), with 59% coming in from the domestic market. OB
at the end of Dec-21 stood at a record high of INR 3.4trn, with infrastructure
at 73%, constituting a major share of it, followed by hydrocarbon at 16%.
Geography-wise, domestic orders contribute 76% to OB. The total prospects
pipeline for Q4FY22 stands at INR 3.9trn vs INR 2.7trn in Q4FY21, of which
INR 3trn is domestic prospects pipeline.
Hyderabad metro EBITDA positive: Hyderabad metro ridership improved
to 0.2mn in Q3FY22 against 0.15mn in Q2FY22, aiding EBITDA to turn
positive (at INR 300mn). LT has an exposure of INR 72bn to it at standalone
level including INR 48bn of loss funding. INR 130bn of the project’s external
debt was refinanced. Consequently, the reduced finance cost will be INR
10bn per year, along with annual savings of INR 4bn. The announcement on
positive development in terms of financial assistance from the Telangana
government will be made by FY22-end.
Marginal improvement in debt: Net debt reduced to INR 788bn (vs INR
864bn on Sep 21-end), taking the net D/E to 0.86x. NWC to sales ratio was
flat at 23.1%, vs. 22% at Sep-21-end. LT has targeted FY22 NWC to sales of
22.3%. Outstanding receivables from the Andhra project now stand at INR
11.5bn.
Consolidated financial summary (INR mn) Q3FY22 Q3FY21 YoY (%) Q2FY22 QoQ (%) FY21 FY22E FY23E FY24E
Revenues 3,95,629 3,55,964 11.1 3,47,729 13.8 13,59,790 15,63,639 18,17,093 20,45,397
EBITDA 45,304 42,800 5.9 39,949 13.4 1,56,241 1,78,799 2,12,954 2,43,713
APAT 20,547 24,667 (16.7) 17,225 19.3 69,010 84,542 1,07,847 1,28,329
EPS (INR) 14.6 17.6 (16.7) 12.3 19.3 49.2 60.3 76.9 91.5
P/E (x)
36.2 29.6 23.2 19.5
EV/EBITDA(x)
21.5 18.8 15.8 13.5
RoE (%)
9.7 10.9 13.0 14.4
Source: Company, HSIE Research
BUY
CMP (as on 28 Jan 2022) INR 1,898
Target Price INR 2,504
NIFTY 17,102
KEY CHANGES OLD NEW
Rating BUY BUY
Price Target INR 2,296 INR 2,504
EPS
change %
FY22E FY23E FY24E
(4.3) (3.8) (3.2)
KEY STOCK DATA
Bloomberg code LT IN
No. of Shares (mn) 1,405
MCap (INR bn) / ($ mn) 2,666/35,823
6m avg traded value (INR mn) 4,455
52 Week high / low INR 2,079/1,306
STOCK PERFORMANCE (%)
3M 6M 12M
Absolute (%) 4.6 19.0 41.0
Relative (%) 9.2 10.0 19.0
SHAREHOLDING PATTERN (%)
Sep-21 Dec-21
Promoters 0.0 0.0
FIs & Local MFs 33.11 32.70
FPIs 22.86 23.24
Public & Others 44.03 44.06
Pledged Shares 0.0 0.0
Source: BSE
Parikshit D Kandpal, CFA
+91-22-6171-7317
Manoj Rawat
+91-22-6171-7330
Nikhil Kanodia
+91-22-6171-7335
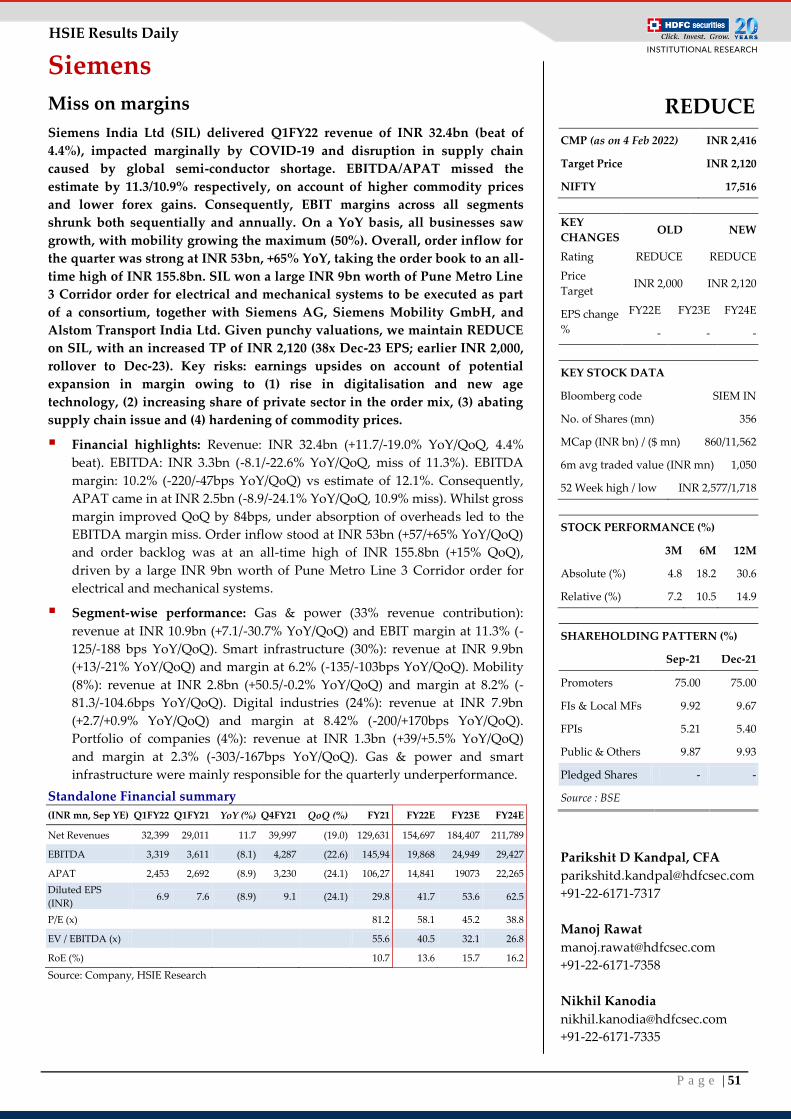
P a g e | 51
HSIE Results Daily
Siemens
Miss on margins
Siemens India Ltd (SIL) delivered Q1FY22 revenue of INR 32.4bn (beat of
4.4%), impacted marginally by COVID-19 and disruption in supply chain
caused by global semi-conductor shortage. EBITDA/APAT missed the
estimate by 11.3/10.9% respectively, on account of higher commodity prices
and lower forex gains. Consequently, EBIT margins across all segments
shrunk both sequentially and annually. On a YoY basis, all businesses saw
growth, with mobility growing the maximum (50%). Overall, order inflow for
the quarter was strong at INR 53bn, +65% YoY, taking the order book to an all-
time high of INR 155.8bn. SIL won a large INR 9bn worth of Pune Metro Line
3 Corridor order for electrical and mechanical systems to be executed as part
of a consortium, together with Siemens AG, Siemens Mobility GmbH, and
Alstom Transport India Ltd. Given punchy valuations, we maintain REDUCE
on SIL, with an increased TP of INR 2,120 (38x Dec-23 EPS; earlier INR 2,000,
rollover to Dec-23). Key risks: earnings upsides on account of potential
expansion in margin owing to (1) rise in digitalisation and new age
technology, (2) increasing share of private sector in the order mix, (3) abating
supply chain issue and (4) hardening of commodity prices.
Financial highlights: Revenue: INR 32.4bn (+11.7/-19.0% YoY/QoQ, 4.4%
beat). EBITDA: INR 3.3bn (-8.1/-22.6% YoY/QoQ, miss of 11.3%). EBITDA
margin: 10.2% (-220/-47bps YoY/QoQ) vs estimate of 12.1%. Consequently,
APAT came in at INR 2.5bn (-8.9/-24.1% YoY/QoQ, 10.9% miss). Whilst gross
margin improved QoQ by 84bps, under absorption of overheads led to the
EBITDA margin miss. Order inflow stood at INR 53bn (+57/+65% YoY/QoQ)
and order backlog was at an all-time high of INR 155.8bn (+15% QoQ),
driven by a large INR 9bn worth of Pune Metro Line 3 Corridor order for
electrical and mechanical systems.
Segment-wise performance: Gas & power (33% revenue contribution):
revenue at INR 10.9bn (+7.1/-30.7% YoY/QoQ) and EBIT margin at 11.3% (-
125/-188 bps YoY/QoQ). Smart infrastructure (30%): revenue at INR 9.9bn
(+13/-21% YoY/QoQ) and margin at 6.2% (-135/-103bps YoY/QoQ). Mobility
(8%): revenue at INR 2.8bn (+50.5/-0.2% YoY/QoQ) and margin at 8.2% (-
81.3/-104.6bps YoY/QoQ). Digital industries (24%): revenue at INR 7.9bn
(+2.7/+0.9% YoY/QoQ) and margin at 8.42% (-200/+170bps YoY/QoQ).
Portfolio of companies (4%): revenue at INR 1.3bn (+39/+5.5% YoY/QoQ)
and margin at 2.3% (-303/-167bps YoY/QoQ). Gas & power and smart
infrastructure were mainly responsible for the quarterly underperformance.
Standalone Financial summary
(INR mn, Sep YE) Q1FY22 Q1FY21 YoY (%) Q4FY21 QoQ (%) FY21 FY22E FY23E FY24E
Net Revenues 32,399 29,011 11.7 39,997 (19.0) 129,631 154,697 184,407 211,789
EBITDA 3,319 3,611 (8.1) 4,287 (22.6) 145,94 19,868 24,949 29,427
APAT 2,453 2,692 (8.9) 3,230 (24.1) 106,27 14,841 19073 22,265
Diluted EPS
(INR) 6.9 7.6 (8.9) 9.1 (24.1) 29.8 41.7 53.6 62.5
P/E (x)
81.2 58.1 45.2 38.8
EV / EBITDA (x)
55.6 40.5 32.1 26.8
RoE (%)
10.7 13.6 15.7 16.2
Source: Company, HSIE Research
REDUCE
CMP (as on 4 Feb 2022) INR 2,416
Target Price INR 2,120
NIFTY 17,516
KEY
CHANGES OLD NEW
Rating REDUCE REDUCE
Price
Target INR 2,000 INR 2,120
EPS change
%
FY22E FY23E FY24E
- - -
KEY STOCK DATA
Bloomberg code SIEM IN
No. of Shares (mn) 356
MCap (INR bn) / ($ mn) 860/11,562
6m avg traded value (INR mn) 1,050
52 Week high / low INR 2,577/1,718
STOCK PERFORMANCE (%)
3M 6M 12M
Absolute (%) 4.8 18.2 30.6
Relative (%) 7.2 10.5 14.9
SHAREHOLDING PATTERN (%)
Sep-21 Dec-21
Promoters 75.00 75.00
FIs & Local MFs 9.92 9.67
FPIs 5.21 5.40
Public & Others 9.87 9.93
Pledged Shares - -
Source : BSE
Parikshit D Kandpal, CFA
+91-22-6171-7317
Manoj Rawat
+91-22-6171-7358
Nikhil Kanodia
+91-22-6171-7335
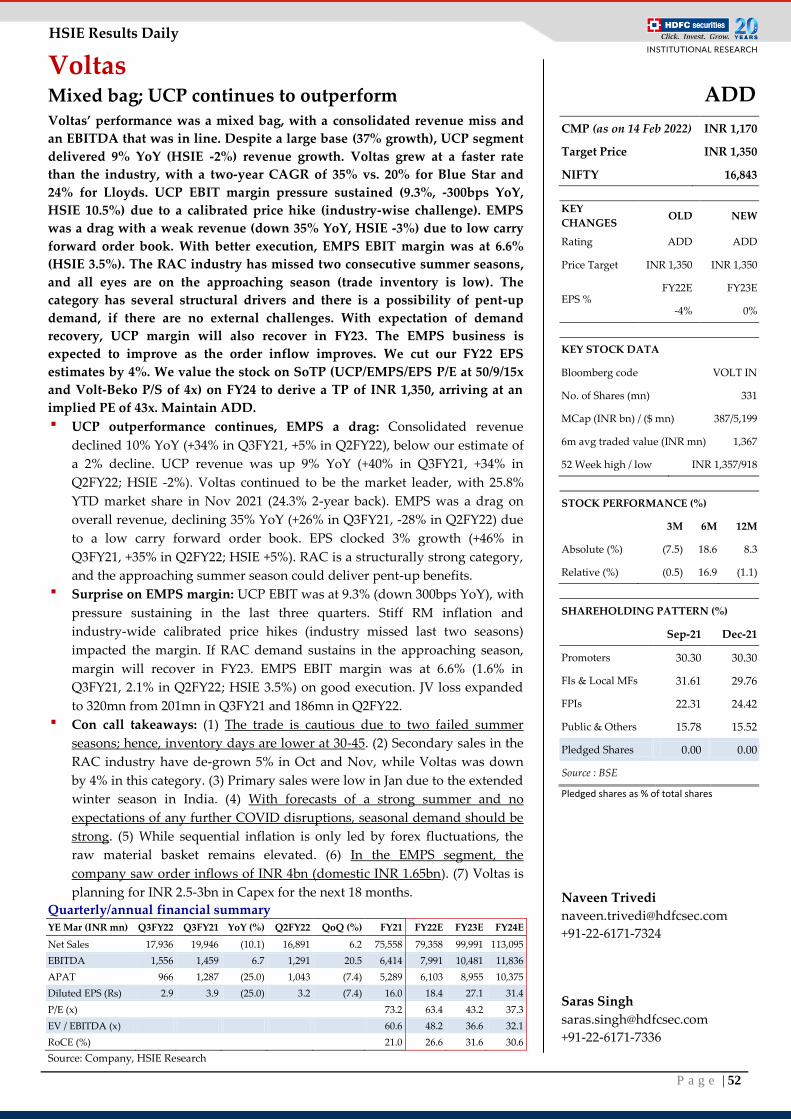
P a g e | 52
HSIE Results Daily
Voltas Mixed bag; UCP continues to outperform Voltas’ performance was a mixed bag, with a consolidated revenue miss and
an EBITDA that was in line. Despite a large base (37% growth), UCP segment
delivered 9% YoY (HSIE -2%) revenue growth. Voltas grew at a faster rate
than the industry, with a two-year CAGR of 35% vs. 20% for Blue Star and
24% for Lloyds. UCP EBIT margin pressure sustained (9.3%, -300bps YoY,
HSIE 10.5%) due to a calibrated price hike (industry-wise challenge). EMPS
was a drag with a weak revenue (down 35% YoY, HSIE -3%) due to low carry
forward order book. With better execution, EMPS EBIT margin was at 6.6%
(HSIE 3.5%). The RAC industry has missed two consecutive summer seasons,
and all eyes are on the approaching season (trade inventory is low). The
category has several structural drivers and there is a possibility of pent-up
demand, if there are no external challenges. With expectation of demand
recovery, UCP margin will also recover in FY23. The EMPS business is
expected to improve as the order inflow improves. We cut our FY22 EPS
estimates by 4%. We value the stock on SoTP (UCP/EMPS/EPS P/E at 50/9/15x
and Volt-Beko P/S of 4x) on FY24 to derive a TP of INR 1,350, arriving at an
implied PE of 43x. Maintain ADD.
▪ UCP outperformance continues, EMPS a drag: Consolidated revenue
declined 10% YoY (+34% in Q3FY21, +5% in Q2FY22), below our estimate of
a 2% decline. UCP revenue was up 9% YoY (+40% in Q3FY21, +34% in
Q2FY22; HSIE -2%). Voltas continued to be the market leader, with 25.8%
YTD market share in Nov 2021 (24.3% 2-year back). EMPS was a drag on
overall revenue, declining 35% YoY (+26% in Q3FY21, -28% in Q2FY22) due
to a low carry forward order book. EPS clocked 3% growth (+46% in
Q3FY21, +35% in Q2FY22; HSIE +5%). RAC is a structurally strong category,
and the approaching summer season could deliver pent-up benefits.
▪ Surprise on EMPS margin: UCP EBIT was at 9.3% (down 300bps YoY), with
pressure sustaining in the last three quarters. Stiff RM inflation and
industry-wide calibrated price hikes (industry missed last two seasons)
impacted the margin. If RAC demand sustains in the approaching season,
margin will recover in FY23. EMPS EBIT margin was at 6.6% (1.6% in
Q3FY21, 2.1% in Q2FY22; HSIE 3.5%) on good execution. JV loss expanded
to 320mn from 201mn in Q3FY21 and 186mn in Q2FY22.
▪ Con call takeaways: (1) The trade is cautious due to two failed summer
seasons; hence, inventory days are lower at 30-45. (2) Secondary sales in the
RAC industry have de-grown 5% in Oct and Nov, while Voltas was down
by 4% in this category. (3) Primary sales were low in Jan due to the extended
winter season in India. (4) With forecasts of a strong summer and no
expectations of any further COVID disruptions, seasonal demand should be
strong. (5) While sequential inflation is only led by forex fluctuations, the
raw material basket remains elevated. (6) In the EMPS segment, the
company saw order inflows of INR 4bn (domestic INR 1.65bn). (7) Voltas is
planning for INR 2.5-3bn in Capex for the next 18 months.
Quarterly/annual financial summary YE Mar (INR mn) Q3FY22 Q3FY21 YoY (%) Q2FY22 QoQ (%) FY21 FY22E FY23E FY24E
Net Sales 17,936 19,946 (10.1) 16,891 6.2 75,558 79,358 99,991 113,095
EBITDA 1,556 1,459 6.7 1,291 20.5 6,414 7,991 10,481 11,836
APAT 966 1,287 (25.0) 1,043 (7.4) 5,289 6,103 8,955 10,375
Diluted EPS (Rs) 2.9 3.9 (25.0) 3.2 (7.4) 16.0 18.4 27.1 31.4
P/E (x) 73.2 63.4 43.2 37.3
EV / EBITDA (x) 60.6 48.2 36.6 32.1
RoCE (%) 21.0 26.6 31.6 30.6
Source: Company, HSIE Research
ADD
CMP (as on 14 Feb 2022) INR 1,170
Target Price INR 1,350
NIFTY 16,843
KEY
CHANGES OLD NEW
Rating ADD ADD
Price Target INR 1,350 INR 1,350
EPS % FY22E FY23E
-4% 0%
KEY STOCK DATA
Bloomberg code VOLT IN
No. of Shares (mn) 331
MCap (INR bn) / ($ mn) 387/5,199
6m avg traded value (INR mn) 1,367
52 Week high / low INR 1,357/918
STOCK PERFORMANCE (%)
3M 6M 12M
Absolute (%) (7.5) 18.6 8.3
Relative (%) (0.5) 16.9 (1.1)
SHAREHOLDING PATTERN (%)
Sep-21 Dec-21
Promoters 30.30 30.30
FIs & Local MFs 31.61 29.76
FPIs 22.31 24.42
Public & Others 15.78 15.52
Pledged Shares 0.00 0.00
Source : BSE
Pledged shares as % of total shares
Naveen Trivedi
+91-22-6171-7324
Saras Singh
+91-22-6171-7336
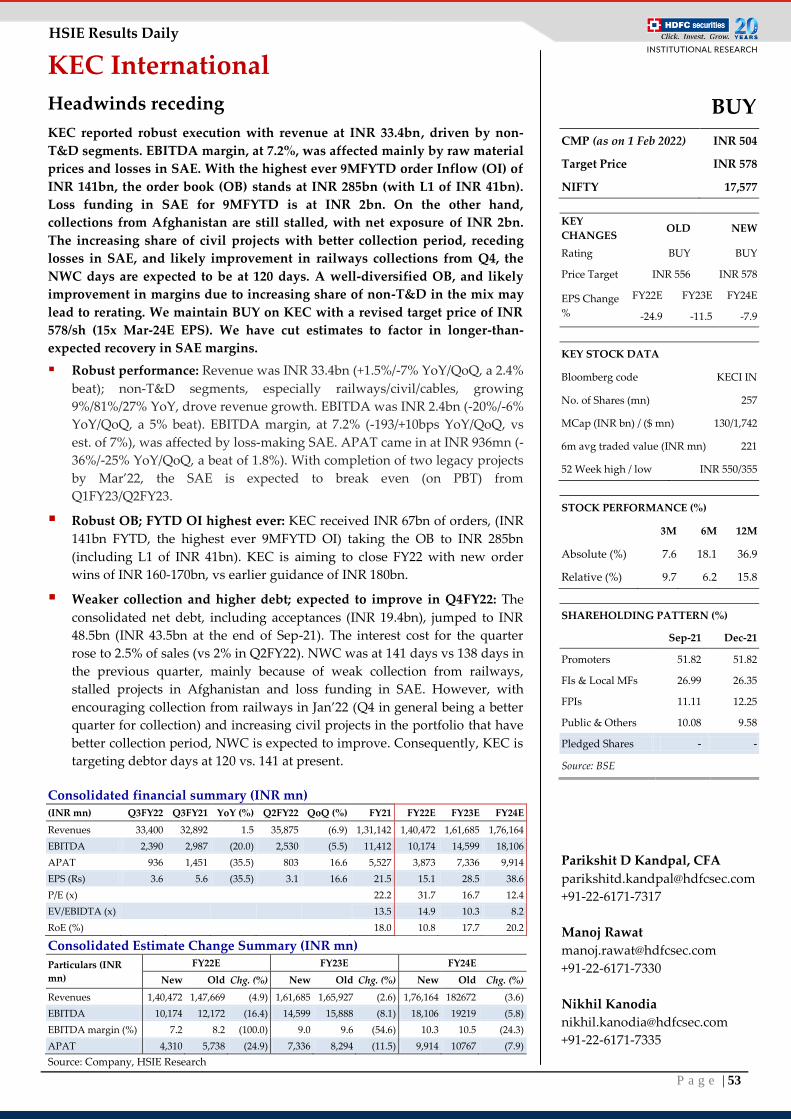
P a g e | 53
HSIE Results Daily
KEC International
Headwinds receding
KEC reported robust execution with revenue at INR 33.4bn, driven by non-
T&D segments. EBITDA margin, at 7.2%, was affected mainly by raw material
prices and losses in SAE. With the highest ever 9MFYTD order Inflow (OI) of
INR 141bn, the order book (OB) stands at INR 285bn (with L1 of INR 41bn).
Loss funding in SAE for 9MFYTD is at INR 2bn. On the other hand,
collections from Afghanistan are still stalled, with net exposure of INR 2bn.
The increasing share of civil projects with better collection period, receding
losses in SAE, and likely improvement in railways collections from Q4, the
NWC days are expected to be at 120 days. A well-diversified OB, and likely
improvement in margins due to increasing share of non-T&D in the mix may
lead to rerating. We maintain BUY on KEC with a revised target price of INR
578/sh (15x Mar-24E EPS). We have cut estimates to factor in longer-than-
expected recovery in SAE margins.
Robust performance: Revenue was INR 33.4bn (+1.5%/-7% YoY/QoQ, a 2.4%
beat); non-T&D segments, especially railways/civil/cables, growing
9%/81%/27% YoY, drove revenue growth. EBITDA was INR 2.4bn (-20%/-6%
YoY/QoQ, a 5% beat). EBITDA margin, at 7.2% (-193/+10bps YoY/QoQ, vs
est. of 7%), was affected by loss-making SAE. APAT came in at INR 936mn (-
36%/-25% YoY/QoQ, a beat of 1.8%). With completion of two legacy projects
by Mar’22, the SAE is expected to break even (on PBT) from
Q1FY23/Q2FY23.
Robust OB; FYTD OI highest ever: KEC received INR 67bn of orders, (INR
141bn FYTD, the highest ever 9MFYTD OI) taking the OB to INR 285bn
(including L1 of INR 41bn). KEC is aiming to close FY22 with new order
wins of INR 160-170bn, vs earlier guidance of INR 180bn.
Weaker collection and higher debt; expected to improve in Q4FY22: The
consolidated net debt, including acceptances (INR 19.4bn), jumped to INR
48.5bn (INR 43.5bn at the end of Sep-21). The interest cost for the quarter
rose to 2.5% of sales (vs 2% in Q2FY22). NWC was at 141 days vs 138 days in
the previous quarter, mainly because of weak collection from railways,
stalled projects in Afghanistan and loss funding in SAE. However, with
encouraging collection from railways in Jan’22 (Q4 in general being a better
quarter for collection) and increasing civil projects in the portfolio that have
better collection period, NWC is expected to improve. Consequently, KEC is
targeting debtor days at 120 vs. 141 at present.
Consolidated financial summary (INR mn) (INR mn) Q3FY22 Q3FY21 YoY (%) Q2FY22 QoQ (%) FY21 FY22E FY23E FY24E
Revenues 33,400 32,892 1.5 35,875 (6.9) 1,31,142 1,40,472 1,61,685 1,76,164
EBITDA 2,390 2,987 (20.0) 2,530 (5.5) 11,412 10,174 14,599 18,106
APAT 936 1,451 (35.5) 803 16.6 5,527 3,873 7,336 9,914
EPS (Rs) 3.6 5.6 (35.5) 3.1 16.6 21.5 15.1 28.5 38.6
P/E (x)
22.2 31.7 16.7 12.4
EV/EBIDTA (x)
13.5 14.9 10.3 8.2
RoE (%)
18.0 10.8 17.7 20.2
Consolidated Estimate Change Summary (INR mn)
Particulars (INR
mn)
FY22E FY23E FY24E
New Old Chg. (%) New Old Chg. (%) New Old Chg. (%)
Revenues 1,40,472 1,47,669 (4.9) 1,61,685 1,65,927 (2.6) 1,76,164 182672 (3.6)
EBITDA 10,174 12,172 (16.4) 14,599 15,888 (8.1) 18,106 19219 (5.8)
EBITDA margin (%) 7.2 8.2 (100.0) 9.0 9.6 (54.6) 10.3 10.5 (24.3)
APAT 4,310 5,738 (24.9) 7,336 8,294 (11.5) 9,914 10767 (7.9)
Source: Company, HSIE Research
BUY
CMP (as on 1 Feb 2022) INR 504
Target Price INR 578
NIFTY 17,577
KEY
CHANGES OLD NEW
Rating BUY BUY
Price Target INR 556 INR 578
EPS Change
%
FY22E FY23E FY24E
-24.9 -11.5 -7.9
KEY STOCK DATA
Bloomberg code KECI IN
No. of Shares (mn) 257
MCap (INR bn) / ($ mn) 130/1,742
6m avg traded value (INR mn) 221
52 Week high / low INR 550/355
STOCK PERFORMANCE (%)
3M 6M 12M
Absolute (%) 7.6 18.1 36.9
Relative (%) 9.7 6.2 15.8
SHAREHOLDING PATTERN (%)
Sep-21 Dec-21
Promoters 51.82 51.82
FIs & Local MFs 26.99 26.35
FPIs 11.11 12.25
Public & Others 10.08 9.58
Pledged Shares - -
Source: BSE
Parikshit D Kandpal, CFA
+91-22-6171-7317
Manoj Rawat
+91-22-6171-7330
Nikhil Kanodia
+91-22-6171-7335
P a g e | 54
HSIE Results Daily
Cement, Building Materials
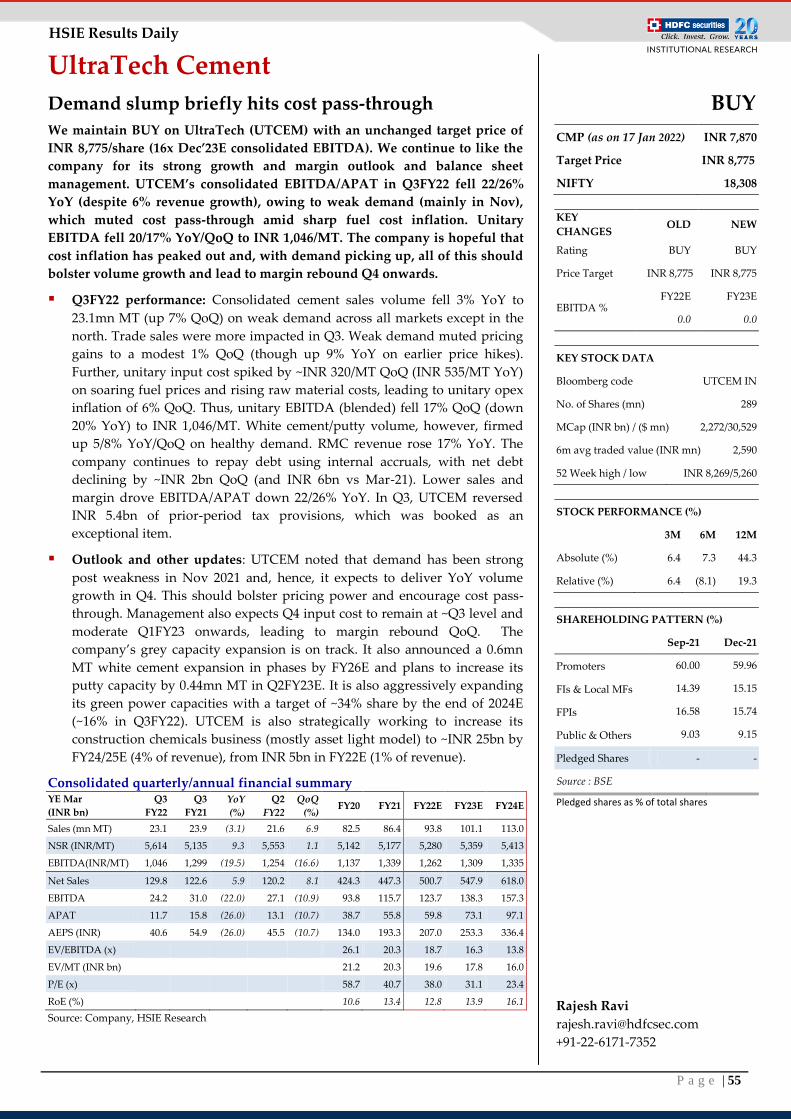
P a g e | 55
HSIE Results Daily
UltraTech Cement
Demand slump briefly hits cost pass-through
We maintain BUY on UltraTech (UTCEM) with an unchanged target price of
INR 8,775/share (16x Dec’23E consolidated EBITDA). We continue to like the
company for its strong growth and margin outlook and balance sheet
management. UTCEM’s consolidated EBITDA/APAT in Q3FY22 fell 22/26%
YoY (despite 6% revenue growth), owing to weak demand (mainly in Nov),
which muted cost pass-through amid sharp fuel cost inflation. Unitary
EBITDA fell 20/17% YoY/QoQ to INR 1,046/MT. The company is hopeful that
cost inflation has peaked out and, with demand picking up, all of this should
bolster volume growth and lead to margin rebound Q4 onwards.
Q3FY22 performance: Consolidated cement sales volume fell 3% YoY to
23.1mn MT (up 7% QoQ) on weak demand across all markets except in the
north. Trade sales were more impacted in Q3. Weak demand muted pricing
gains to a modest 1% QoQ (though up 9% YoY on earlier price hikes).
Further, unitary input cost spiked by ~INR 320/MT QoQ (INR 535/MT YoY)
on soaring fuel prices and rising raw material costs, leading to unitary opex
inflation of 6% QoQ. Thus, unitary EBITDA (blended) fell 17% QoQ (down
20% YoY) to INR 1,046/MT. White cement/putty volume, however, firmed
up 5/8% YoY/QoQ on healthy demand. RMC revenue rose 17% YoY. The
company continues to repay debt using internal accruals, with net debt
declining by ~INR 2bn QoQ (and INR 6bn vs Mar-21). Lower sales and
margin drove EBITDA/APAT down 22/26% YoY. In Q3, UTCEM reversed
INR 5.4bn of prior-period tax provisions, which was booked as an
exceptional item.
Outlook and other updates: UTCEM noted that demand has been strong
post weakness in Nov 2021 and, hence, it expects to deliver YoY volume
growth in Q4. This should bolster pricing power and encourage cost pass-
through. Management also expects Q4 input cost to remain at ~Q3 level and
moderate Q1FY23 onwards, leading to margin rebound QoQ. The
company’s grey capacity expansion is on track. It also announced a 0.6mn
MT white cement expansion in phases by FY26E and plans to increase its
putty capacity by 0.44mn MT in Q2FY23E. It is also aggressively expanding
its green power capacities with a target of ~34% share by the end of 2024E
(~16% in Q3FY22). UTCEM is also strategically working to increase its
construction chemicals business (mostly asset light model) to ~INR 25bn by
FY24/25E (4% of revenue), from INR 5bn in FY22E (1% of revenue).
Consolidated quarterly/annual financial summary YE Mar
(INR bn)
Q3
FY22
Q3
FY21
YoY
(%)
Q2
FY22
QoQ
(%) FY20 FY21 FY22E FY23E FY24E
Sales (mn MT) 23.1 23.9 (3.1) 21.6 6.9 82.5 86.4 93.8 101.1 113.0
NSR (INR/MT) 5,614 5,135 9.3 5,553 1.1 5,142 5,177 5,280 5,359 5,413
EBITDA(INR/MT) 1,046 1,299 (19.5) 1,254 (16.6) 1,137 1,339 1,262 1,309 1,335
Net Sales 129.8 122.6 5.9 120.2 8.1 424.3 447.3 500.7 547.9 618.0
EBITDA 24.2 31.0 (22.0) 27.1 (10.9) 93.8 115.7 123.7 138.3 157.3
APAT 11.7 15.8 (26.0) 13.1 (10.7) 38.7 55.8 59.8 73.1 97.1
AEPS (INR) 40.6 54.9 (26.0) 45.5 (10.7) 134.0 193.3 207.0 253.3 336.4
EV/EBITDA (x)
26.1 20.3 18.7 16.3 13.8
EV/MT (INR bn)
21.2 20.3 19.6 17.8 16.0
P/E (x)
58.7 40.7 38.0 31.1 23.4
RoE (%)
10.6 13.4 12.8 13.9 16.1
Source: Company, HSIE Research
BUY
CMP (as on 17 Jan 2022) INR 7,870
Target Price INR 8,775
NIFTY 18,308
KEY
CHANGES OLD NEW
Rating BUY BUY
Price Target INR 8,775 INR 8,775
EBITDA % FY22E FY23E
0.0 0.0
KEY STOCK DATA
Bloomberg code UTCEM IN
No. of Shares (mn) 289
MCap (INR bn) / ($ mn) 2,272/30,529
6m avg traded value (INR mn) 2,590
52 Week high / low INR 8,269/5,260
STOCK PERFORMANCE (%)
3M 6M 12M
Absolute (%) 6.4 7.3 44.3
Relative (%) 6.4 (8.1) 19.3
SHAREHOLDING PATTERN (%)
Sep-21 Dec-21
Promoters 60.00 59.96
FIs & Local MFs 14.39 15.15
FPIs 16.58 15.74
Public & Others 9.03 9.15
Pledged Shares - -
Source : BSE
Pledged shares as % of total shares
Rajesh Ravi
+91-22-6171-7352
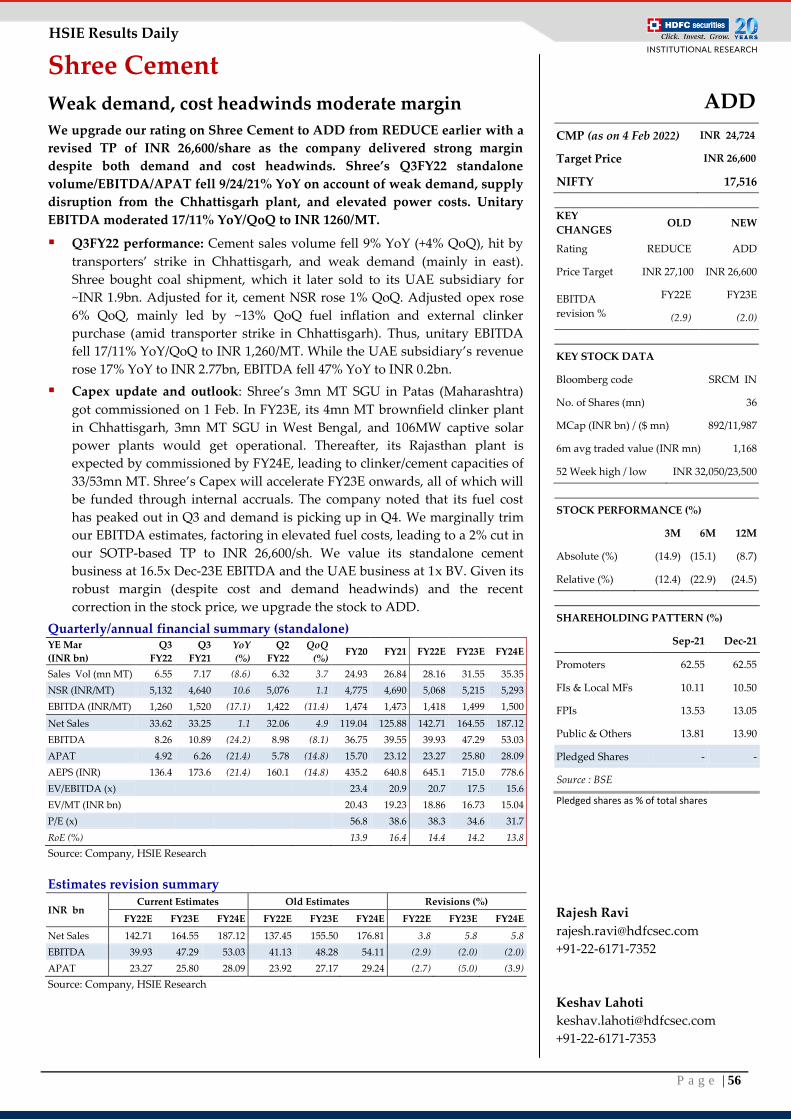
P a g e | 56
HSIE Results Daily
Shree Cement
Weak demand, cost headwinds moderate margin
We upgrade our rating on Shree Cement to ADD from REDUCE earlier with a
revised TP of INR 26,600/share as the company delivered strong margin
despite both demand and cost headwinds. Shree’s Q3FY22 standalone
volume/EBITDA/APAT fell 9/24/21% YoY on account of weak demand, supply
disruption from the Chhattisgarh plant, and elevated power costs. Unitary
EBITDA moderated 17/11% YoY/QoQ to INR 1260/MT.
Q3FY22 performance: Cement sales volume fell 9% YoY (+4% QoQ), hit by
transporters’ strike in Chhattisgarh, and weak demand (mainly in east).
Shree bought coal shipment, which it later sold to its UAE subsidiary for
~INR 1.9bn. Adjusted for it, cement NSR rose 1% QoQ. Adjusted opex rose
6% QoQ, mainly led by ~13% QoQ fuel inflation and external clinker
purchase (amid transporter strike in Chhattisgarh). Thus, unitary EBITDA
fell 17/11% YoY/QoQ to INR 1,260/MT. While the UAE subsidiary’s revenue
rose 17% YoY to INR 2.77bn, EBITDA fell 47% YoY to INR 0.2bn.
Capex update and outlook: Shree’s 3mn MT SGU in Patas (Maharashtra)
got commissioned on 1 Feb. In FY23E, its 4mn MT brownfield clinker plant
in Chhattisgarh, 3mn MT SGU in West Bengal, and 106MW captive solar
power plants would get operational. Thereafter, its Rajasthan plant is
expected by commissioned by FY24E, leading to clinker/cement capacities of
33/53mn MT. Shree’s Capex will accelerate FY23E onwards, all of which will
be funded through internal accruals. The company noted that its fuel cost
has peaked out in Q3 and demand is picking up in Q4. We marginally trim
our EBITDA estimates, factoring in elevated fuel costs, leading to a 2% cut in
our SOTP-based TP to INR 26,600/sh. We value its standalone cement
business at 16.5x Dec-23E EBITDA and the UAE business at 1x BV. Given its
robust margin (despite cost and demand headwinds) and the recent
correction in the stock price, we upgrade the stock to ADD.
Quarterly/annual financial summary (standalone) YE Mar
(INR bn)
Q3
FY22
Q3
FY21
YoY
(%)
Q2
FY22
QoQ
(%) FY20 FY21 FY22E FY23E FY24E
Sales Vol (mn MT) 6.55 7.17 (8.6) 6.32 3.7 24.93 26.84 28.16 31.55 35.35
NSR (INR/MT) 5,132 4,640 10.6 5,076 1.1 4,775 4,690 5,068 5,215 5,293
EBITDA (INR/MT) 1,260 1,520 (17.1) 1,422 (11.4) 1,474 1,473 1,418 1,499 1,500
Net Sales 33.62 33.25 1.1 32.06 4.9 119.04 125.88 142.71 164.55 187.12
EBITDA 8.26 10.89 (24.2) 8.98 (8.1) 36.75 39.55 39.93 47.29 53.03
APAT 4.92 6.26 (21.4) 5.78 (14.8) 15.70 23.12 23.27 25.80 28.09
AEPS (INR) 136.4 173.6 (21.4) 160.1 (14.8) 435.2 640.8 645.1 715.0 778.6
EV/EBITDA (x)
23.4 20.9 20.7 17.5 15.6
EV/MT (INR bn)
20.43 19.23 18.86 16.73 15.04
P/E (x)
56.8 38.6 38.3 34.6 31.7
RoE (%)
13.9 16.4 14.4 14.2 13.8
Source: Company, HSIE Research
Estimates revision summary
INR bn Current Estimates Old Estimates Revisions (%)
FY22E FY23E FY24E FY22E FY23E FY24E FY22E FY23E FY24E
Net Sales 142.71 164.55 187.12 137.45 155.50 176.81 3.8 5.8 5.8
EBITDA 39.93 47.29 53.03 41.13 48.28 54.11 (2.9) (2.0) (2.0)
APAT 23.27 25.80 28.09 23.92 27.17 29.24 (2.7) (5.0) (3.9)
Source: Company, HSIE Research
ADD
CMP (as on 4 Feb 2022) INR 24,724
Target Price INR 26,600
NIFTY 17,516
KEY
CHANGES OLD NEW
Rating REDUCE ADD
Price Target INR 27,100 INR 26,600
EBITDA
revision %
FY22E FY23E
(2.9) (2.0)
KEY STOCK DATA
Bloomberg code SRCM IN
No. of Shares (mn) 36
MCap (INR bn) / ($ mn) 892/11,987
6m avg traded value (INR mn) 1,168
52 Week high / low INR 32,050/23,500
STOCK PERFORMANCE (%)
3M 6M 12M
Absolute (%) (14.9) (15.1) (8.7)
Relative (%) (12.4) (22.9) (24.5)
SHAREHOLDING PATTERN (%)
Sep-21 Dec-21
Promoters 62.55 62.55
FIs & Local MFs 10.11 10.50
FPIs 13.53 13.05
Public & Others 13.81 13.90
Pledged Shares - -
Source : BSE
Pledged shares as % of total shares
Rajesh Ravi
+91-22-6171-7352
Keshav Lahoti
+91-22-6171-7353
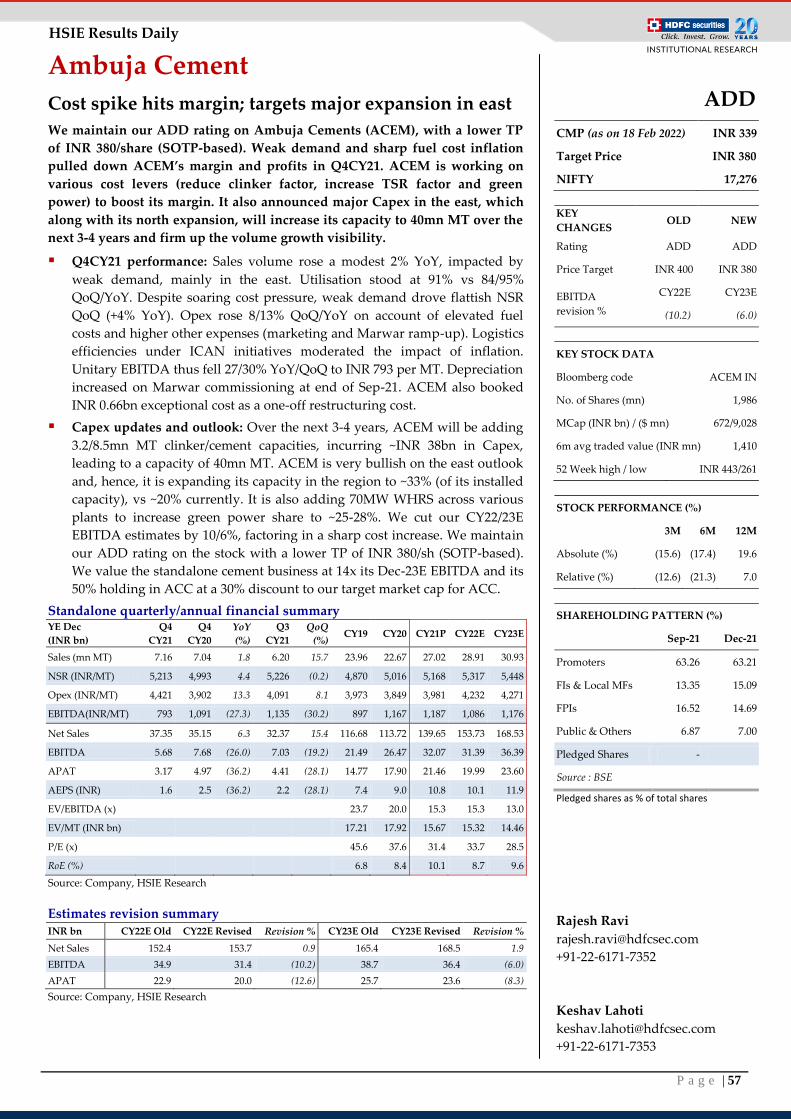
P a g e | 57
HSIE Results Daily
Ambuja Cement
Cost spike hits margin; targets major expansion in east
We maintain our ADD rating on Ambuja Cements (ACEM), with a lower TP
of INR 380/share (SOTP-based). Weak demand and sharp fuel cost inflation
pulled down ACEM’s margin and profits in Q4CY21. ACEM is working on
various cost levers (reduce clinker factor, increase TSR factor and green
power) to boost its margin. It also announced major Capex in the east, which
along with its north expansion, will increase its capacity to 40mn MT over the
next 3-4 years and firm up the volume growth visibility.
Q4CY21 performance: Sales volume rose a modest 2% YoY, impacted by
weak demand, mainly in the east. Utilisation stood at 91% vs 84/95%
QoQ/YoY. Despite soaring cost pressure, weak demand drove flattish NSR
QoQ (+4% YoY). Opex rose 8/13% QoQ/YoY on account of elevated fuel
costs and higher other expenses (marketing and Marwar ramp-up). Logistics
efficiencies under ICAN initiatives moderated the impact of inflation.
Unitary EBITDA thus fell 27/30% YoY/QoQ to INR 793 per MT. Depreciation
increased on Marwar commissioning at end of Sep-21. ACEM also booked
INR 0.66bn exceptional cost as a one-off restructuring cost.
Capex updates and outlook: Over the next 3-4 years, ACEM will be adding
3.2/8.5mn MT clinker/cement capacities, incurring ~INR 38bn in Capex,
leading to a capacity of 40mn MT. ACEM is very bullish on the east outlook
and, hence, it is expanding its capacity in the region to ~33% (of its installed
capacity), vs ~20% currently. It is also adding 70MW WHRS across various
plants to increase green power share to ~25-28%. We cut our CY22/23E
EBITDA estimates by 10/6%, factoring in a sharp cost increase. We maintain
our ADD rating on the stock with a lower TP of INR 380/sh (SOTP-based).
We value the standalone cement business at 14x its Dec-23E EBITDA and its
50% holding in ACC at a 30% discount to our target market cap for ACC.
Standalone quarterly/annual financial summary YE Dec
(INR bn)
Q4
CY21
Q4
CY20
YoY
(%)
Q3
CY21
QoQ
(%) CY19 CY20 CY21P CY22E CY23E
Sales (mn MT) 7.16 7.04 1.8 6.20 15.7 23.96 22.67 27.02 28.91 30.93
NSR (INR/MT) 5,213 4,993 4.4 5,226 (0.2) 4,870 5,016 5,168 5,317 5,448
Opex (INR/MT) 4,421 3,902 13.3 4,091 8.1 3,973 3,849 3,981 4,232 4,271
EBITDA(INR/MT) 793 1,091 (27.3) 1,135 (30.2) 897 1,167 1,187 1,086 1,176
Net Sales 37.35 35.15 6.3 32.37 15.4 116.68 113.72 139.65 153.73 168.53
EBITDA 5.68 7.68 (26.0) 7.03 (19.2) 21.49 26.47 32.07 31.39 36.39
APAT 3.17 4.97 (36.2) 4.41 (28.1) 14.77 17.90 21.46 19.99 23.60
AEPS (INR) 1.6 2.5 (36.2) 2.2 (28.1) 7.4 9.0 10.8 10.1 11.9
EV/EBITDA (x)
23.7 20.0 15.3 15.3 13.0
EV/MT (INR bn)
17.21 17.92 15.67 15.32 14.46
P/E (x)
45.6 37.6 31.4 33.7 28.5
RoE (%)
6.8 8.4 10.1 8.7 9.6
Source: Company, HSIE Research
Estimates revision summary INR bn CY22E Old CY22E Revised Revision % CY23E Old CY23E Revised Revision %
Net Sales 152.4 153.7 0.9 165.4 168.5 1.9
EBITDA 34.9 31.4 (10.2) 38.7 36.4 (6.0)
APAT 22.9 20.0 (12.6) 25.7 23.6 (8.3)
Source: Company, HSIE Research
ADD
CMP (as on 18 Feb 2022) INR 339
Target Price INR 380
NIFTY 17,276
KEY
CHANGES OLD NEW
Rating ADD ADD
Price Target INR 400 INR 380
EBITDA
revision %
CY22E CY23E
(10.2) (6.0)
KEY STOCK DATA
Bloomberg code ACEM IN
No. of Shares (mn) 1,986
MCap (INR bn) / ($ mn) 672/9,028
6m avg traded value (INR mn) 1,410
52 Week high / low INR 443/261
STOCK PERFORMANCE (%)
3M 6M 12M
Absolute (%) (15.6) (17.4) 19.6
Relative (%) (12.6) (21.3) 7.0
SHAREHOLDING PATTERN (%)
Sep-21 Dec-21
Promoters 63.26 63.21
FIs & Local MFs 13.35 15.09
FPIs 16.52 14.69
Public & Others 6.87 7.00
Pledged Shares -
Source : BSE
Pledged shares as % of total shares
Rajesh Ravi
+91-22-6171-7352
Keshav Lahoti
+91-22-6171-7353
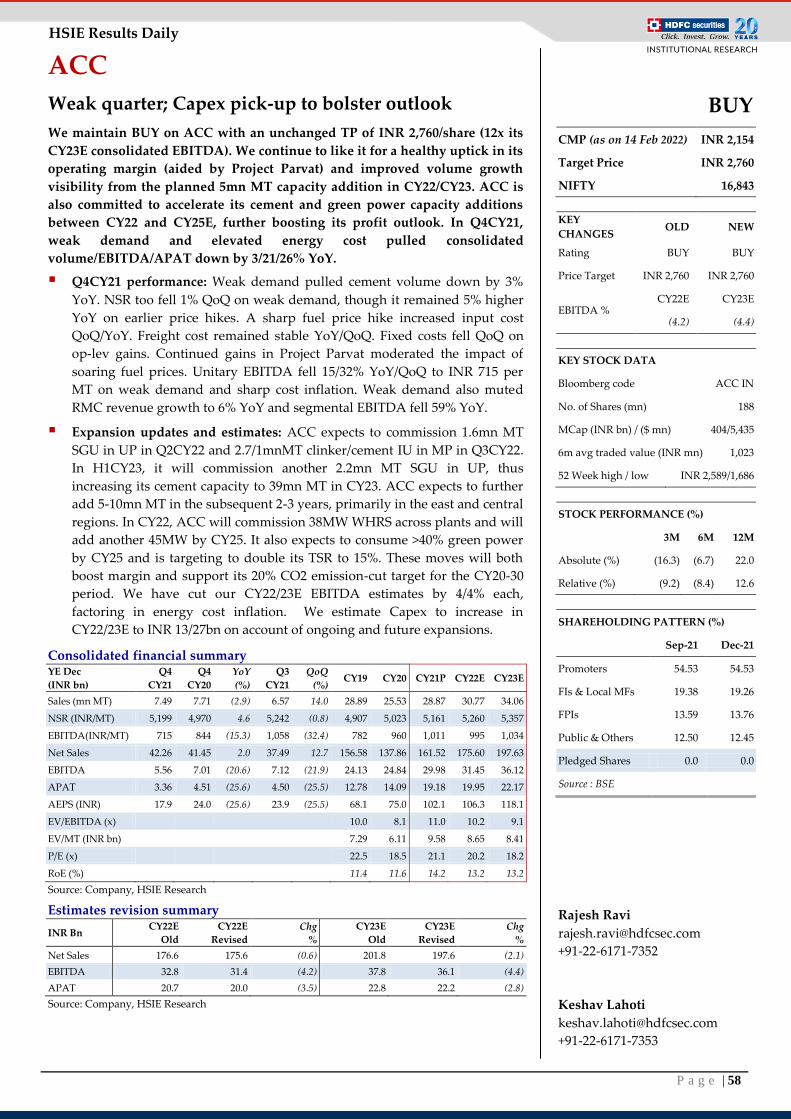
P a g e | 58
HSIE Results Daily
ACC
Weak quarter; Capex pick-up to bolster outlook
We maintain BUY on ACC with an unchanged TP of INR 2,760/share (12x its
CY23E consolidated EBITDA). We continue to like it for a healthy uptick in its
operating margin (aided by Project Parvat) and improved volume growth
visibility from the planned 5mn MT capacity addition in CY22/CY23. ACC is
also committed to accelerate its cement and green power capacity additions
between CY22 and CY25E, further boosting its profit outlook. In Q4CY21,
weak demand and elevated energy cost pulled consolidated
volume/EBITDA/APAT down by 3/21/26% YoY.
Q4CY21 performance: Weak demand pulled cement volume down by 3%
YoY. NSR too fell 1% QoQ on weak demand, though it remained 5% higher
YoY on earlier price hikes. A sharp fuel price hike increased input cost
QoQ/YoY. Freight cost remained stable YoY/QoQ. Fixed costs fell QoQ on
op-lev gains. Continued gains in Project Parvat moderated the impact of
soaring fuel prices. Unitary EBITDA fell 15/32% YoY/QoQ to INR 715 per
MT on weak demand and sharp cost inflation. Weak demand also muted
RMC revenue growth to 6% YoY and segmental EBITDA fell 59% YoY.
Expansion updates and estimates: ACC expects to commission 1.6mn MT
SGU in UP in Q2CY22 and 2.7/1mnMT clinker/cement IU in MP in Q3CY22.
In H1CY23, it will commission another 2.2mn MT SGU in UP, thus
increasing its cement capacity to 39mn MT in CY23. ACC expects to further
add 5-10mn MT in the subsequent 2-3 years, primarily in the east and central
regions. In CY22, ACC will commission 38MW WHRS across plants and will
add another 45MW by CY25. It also expects to consume >40% green power
by CY25 and is targeting to double its TSR to 15%. These moves will both
boost margin and support its 20% CO2 emission-cut target for the CY20-30
period. We have cut our CY22/23E EBITDA estimates by 4/4% each,
factoring in energy cost inflation. We estimate Capex to increase in
CY22/23E to INR 13/27bn on account of ongoing and future expansions.
Consolidated financial summary YE Dec
(INR bn)
Q4
CY21
Q4
CY20
YoY
(%)
Q3
CY21
QoQ
(%) CY19 CY20 CY21P CY22E CY23E
Sales (mn MT) 7.49 7.71 (2.9) 6.57 14.0 28.89 25.53 28.87 30.77 34.06
NSR (INR/MT) 5,199 4,970 4.6 5,242 (0.8) 4,907 5,023 5,161 5,260 5,357
EBITDA(INR/MT) 715 844 (15.3) 1,058 (32.4) 782 960 1,011 995 1,034
Net Sales 42.26 41.45 2.0 37.49 12.7 156.58 137.86 161.52 175.60 197.63
EBITDA 5.56 7.01 (20.6) 7.12 (21.9) 24.13 24.84 29.98 31.45 36.12
APAT 3.36 4.51 (25.6) 4.50 (25.5) 12.78 14.09 19.18 19.95 22.17
AEPS (INR) 17.9 24.0 (25.6) 23.9 (25.5) 68.1 75.0 102.1 106.3 118.1
EV/EBITDA (x)
10.0 8.1 11.0 10.2 9.1
EV/MT (INR bn)
7.29 6.11 9.58 8.65 8.41
P/E (x)
22.5 18.5 21.1 20.2 18.2
RoE (%)
11.4 11.6 14.2 13.2 13.2
Source: Company, HSIE Research
Estimates revision summary
INR Bn CY22E
Old
CY22E
Revised
Chg
%
CY23E
Old
CY23E
Revised
Chg
%
Net Sales 176.6 175.6 (0.6) 201.8 197.6 (2.1)
EBITDA 32.8 31.4 (4.2) 37.8 36.1 (4.4)
APAT 20.7 20.0 (3.5) 22.8 22.2 (2.8)
Source: Company, HSIE Research
BUY
CMP (as on 14 Feb 2022) INR 2,154
Target Price INR 2,760
NIFTY 16,843
KEY
CHANGES OLD NEW
Rating BUY BUY
Price Target INR 2,760 INR 2,760
EBITDA % CY22E CY23E
(4.2) (4.4)
KEY STOCK DATA
Bloomberg code ACC IN
No. of Shares (mn) 188
MCap (INR bn) / ($ mn) 404/5,435
6m avg traded value (INR mn) 1,023
52 Week high / low INR 2,589/1,686
STOCK PERFORMANCE (%)
3M 6M 12M
Absolute (%) (16.3) (6.7) 22.0
Relative (%) (9.2) (8.4) 12.6
SHAREHOLDING PATTERN (%)
Sep-21 Dec-21
Promoters 54.53 54.53
FIs & Local MFs 19.38 19.26
FPIs 13.59 13.76
Public & Others 12.50 12.45
Pledged Shares 0.0 0.0
Source : BSE
Rajesh Ravi
+91-22-6171-7352
Keshav Lahoti
+91-22-6171-7353
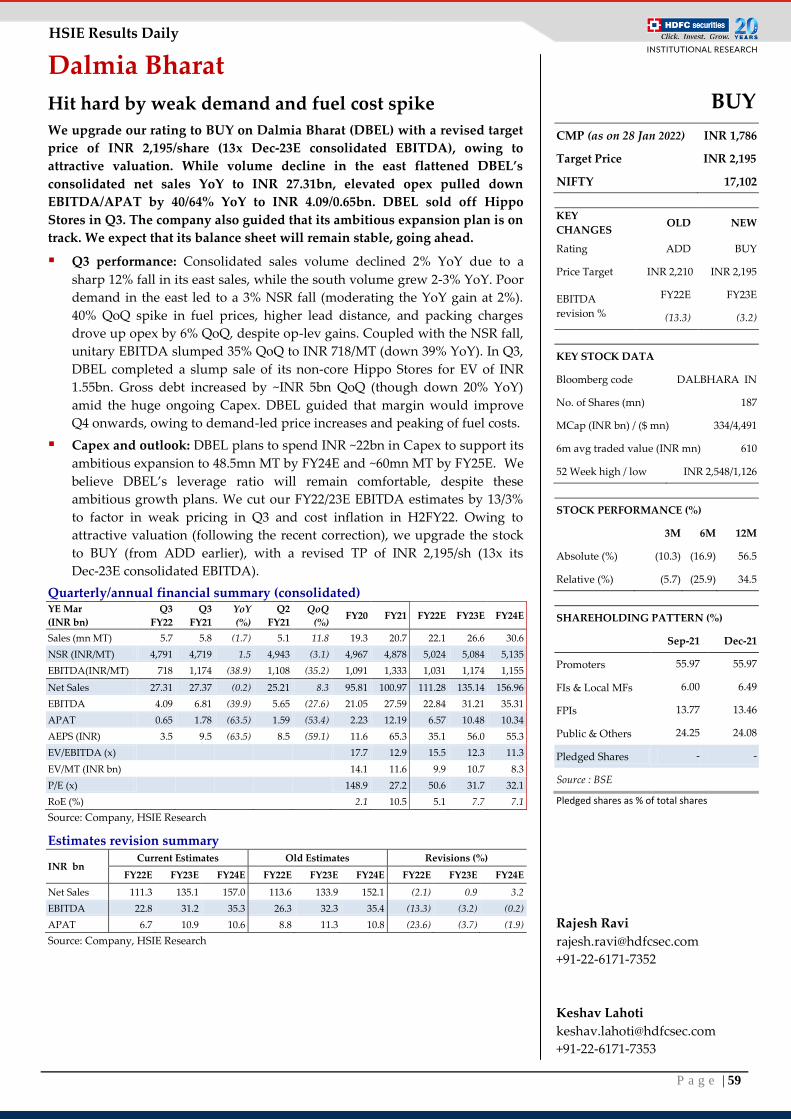
P a g e | 59
HSIE Results Daily
Dalmia Bharat
Hit hard by weak demand and fuel cost spike
We upgrade our rating to BUY on Dalmia Bharat (DBEL) with a revised target
price of INR 2,195/share (13x Dec-23E consolidated EBITDA), owing to
attractive valuation. While volume decline in the east flattened DBEL’s
consolidated net sales YoY to INR 27.31bn, elevated opex pulled down
EBITDA/APAT by 40/64% YoY to INR 4.09/0.65bn. DBEL sold off Hippo
Stores in Q3. The company also guided that its ambitious expansion plan is on
track. We expect that its balance sheet will remain stable, going ahead.
Q3 performance: Consolidated sales volume declined 2% YoY due to a
sharp 12% fall in its east sales, while the south volume grew 2-3% YoY. Poor
demand in the east led to a 3% NSR fall (moderating the YoY gain at 2%).
40% QoQ spike in fuel prices, higher lead distance, and packing charges
drove up opex by 6% QoQ, despite op-lev gains. Coupled with the NSR fall,
unitary EBITDA slumped 35% QoQ to INR 718/MT (down 39% YoY). In Q3,
DBEL completed a slump sale of its non-core Hippo Stores for EV of INR
1.55bn. Gross debt increased by ~INR 5bn QoQ (though down 20% YoY)
amid the huge ongoing Capex. DBEL guided that margin would improve
Q4 onwards, owing to demand-led price increases and peaking of fuel costs.
Capex and outlook: DBEL plans to spend INR ~22bn in Capex to support its
ambitious expansion to 48.5mn MT by FY24E and ~60mn MT by FY25E. We
believe DBEL’s leverage ratio will remain comfortable, despite these
ambitious growth plans. We cut our FY22/23E EBITDA estimates by 13/3%
to factor in weak pricing in Q3 and cost inflation in H2FY22. Owing to
attractive valuation (following the recent correction), we upgrade the stock
to BUY (from ADD earlier), with a revised TP of INR 2,195/sh (13x its
Dec-23E consolidated EBITDA).
Quarterly/annual financial summary (consolidated) YE Mar
(INR bn)
Q3
FY22
Q3
FY21
YoY
(%)
Q2
FY21
QoQ
(%) FY20 FY21 FY22E FY23E FY24E
Sales (mn MT) 5.7 5.8 (1.7) 5.1 11.8 19.3 20.7 22.1 26.6 30.6
NSR (INR/MT) 4,791 4,719 1.5 4,943 (3.1) 4,967 4,878 5,024 5,084 5,135
EBITDA(INR/MT) 718 1,174 (38.9) 1,108 (35.2) 1,091 1,333 1,031 1,174 1,155
Net Sales 27.31 27.37 (0.2) 25.21 8.3 95.81 100.97 111.28 135.14 156.96
EBITDA 4.09 6.81 (39.9) 5.65 (27.6) 21.05 27.59 22.84 31.21 35.31
APAT 0.65 1.78 (63.5) 1.59 (53.4) 2.23 12.19 6.57 10.48 10.34
AEPS (INR) 3.5 9.5 (63.5) 8.5 (59.1) 11.6 65.3 35.1 56.0 55.3
EV/EBITDA (x)
17.7 12.9 15.5 12.3 11.3
EV/MT (INR bn)
14.1 11.6 9.9 10.7 8.3
P/E (x)
148.9 27.2 50.6 31.7 32.1
RoE (%)
2.1 10.5 5.1 7.7 7.1
Source: Company, HSIE Research
Estimates revision summary
INR bn Current Estimates Old Estimates Revisions (%)
FY22E FY23E FY24E FY22E FY23E FY24E FY22E FY23E FY24E
Net Sales 111.3 135.1 157.0 113.6 133.9 152.1 (2.1) 0.9 3.2
EBITDA 22.8 31.2 35.3 26.3 32.3 35.4 (13.3) (3.2) (0.2)
APAT 6.7 10.9 10.6 8.8 11.3 10.8 (23.6) (3.7) (1.9)
Source: Company, HSIE Research
BUY
CMP (as on 28 Jan 2022) INR 1,786
Target Price INR 2,195
NIFTY 17,102
KEY
CHANGES OLD NEW
Rating ADD BUY
Price Target INR 2,210 INR 2,195
EBITDA
revision %
FY22E FY23E
(13.3) (3.2)
KEY STOCK DATA
Bloomberg code DALBHARA IN
No. of Shares (mn) 187
MCap (INR bn) / ($ mn) 334/4,491
6m avg traded value (INR mn) 610
52 Week high / low INR 2,548/1,126
STOCK PERFORMANCE (%)
3M 6M 12M
Absolute (%) (10.3) (16.9) 56.5
Relative (%) (5.7) (25.9) 34.5
SHAREHOLDING PATTERN (%)
Sep-21 Dec-21
Promoters 55.97 55.97
FIs & Local MFs 6.00 6.49
FPIs 13.77 13.46
Public & Others 24.25 24.08
Pledged Shares - -
Source : BSE
Pledged shares as % of total shares
Rajesh Ravi
+91-22-6171-7352
Keshav Lahoti
+91-22-6171-7353
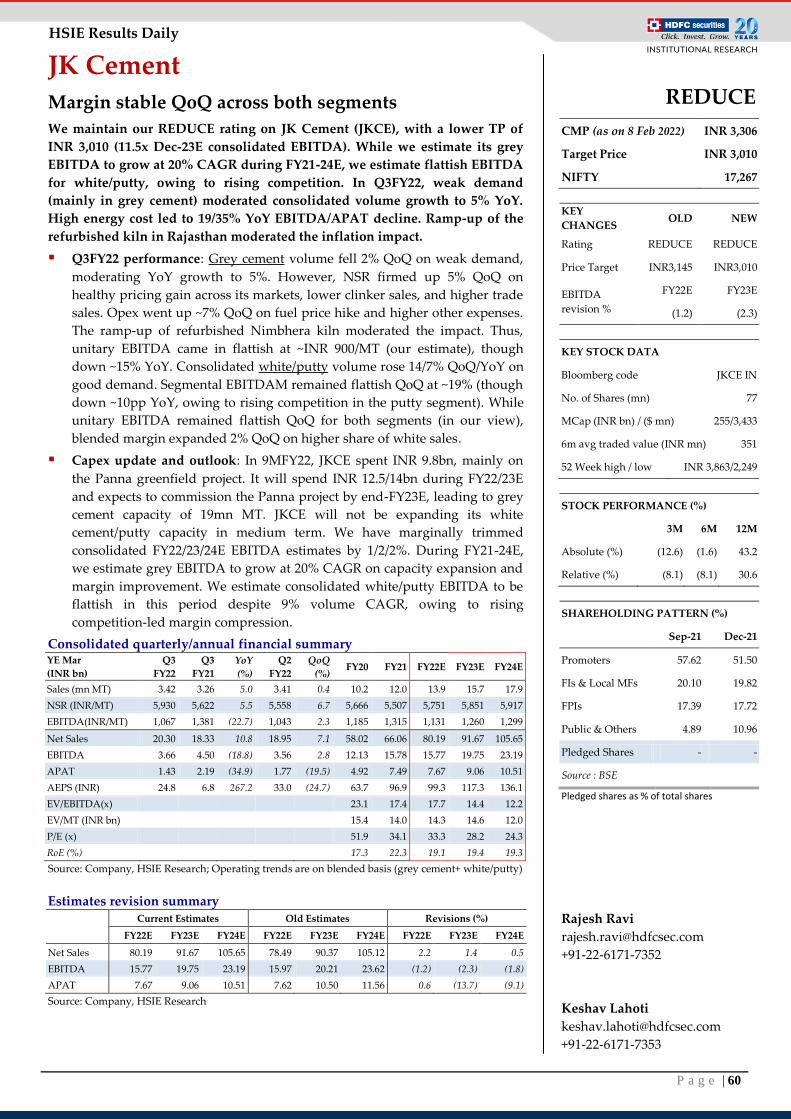
P a g e | 60
HSIE Results Daily
JK Cement
Margin stable QoQ across both segments
We maintain our REDUCE rating on JK Cement (JKCE), with a lower TP of
INR 3,010 (11.5x Dec-23E consolidated EBITDA). While we estimate its grey
EBITDA to grow at 20% CAGR during FY21-24E, we estimate flattish EBITDA
for white/putty, owing to rising competition. In Q3FY22, weak demand
(mainly in grey cement) moderated consolidated volume growth to 5% YoY.
High energy cost led to 19/35% YoY EBITDA/APAT decline. Ramp-up of the
refurbished kiln in Rajasthan moderated the inflation impact.
Q3FY22 performance: Grey cement volume fell 2% QoQ on weak demand,
moderating YoY growth to 5%. However, NSR firmed up 5% QoQ on
healthy pricing gain across its markets, lower clinker sales, and higher trade
sales. Opex went up ~7% QoQ on fuel price hike and higher other expenses.
The ramp-up of refurbished Nimbhera kiln moderated the impact. Thus,
unitary EBITDA came in flattish at ~INR 900/MT (our estimate), though
down ~15% YoY. Consolidated white/putty volume rose 14/7% QoQ/YoY on
good demand. Segmental EBITDAM remained flattish QoQ at ~19% (though
down ~10pp YoY, owing to rising competition in the putty segment). While
unitary EBITDA remained flattish QoQ for both segments (in our view),
blended margin expanded 2% QoQ on higher share of white sales.
Capex update and outlook: In 9MFY22, JKCE spent INR 9.8bn, mainly on
the Panna greenfield project. It will spend INR 12.5/14bn during FY22/23E
and expects to commission the Panna project by end-FY23E, leading to grey
cement capacity of 19mn MT. JKCE will not be expanding its white
cement/putty capacity in medium term. We have marginally trimmed
consolidated FY22/23/24E EBITDA estimates by 1/2/2%. During FY21-24E,
we estimate grey EBITDA to grow at 20% CAGR on capacity expansion and
margin improvement. We estimate consolidated white/putty EBITDA to be
flattish in this period despite 9% volume CAGR, owing to rising
competition-led margin compression.
Consolidated quarterly/annual financial summary YE Mar
(INR bn)
Q3
FY22
Q3
FY21
YoY
(%)
Q2
FY22
QoQ
(%) FY20 FY21 FY22E FY23E FY24E
Sales (mn MT) 3.42 3.26 5.0 3.41 0.4 10.2 12.0 13.9 15.7 17.9
NSR (INR/MT) 5,930 5,622 5.5 5,558 6.7 5,666 5,507 5,751 5,851 5,917
EBITDA(INR/MT) 1,067 1,381 (22.7) 1,043 2.3 1,185 1,315 1,131 1,260 1,299
Net Sales 20.30 18.33 10.8 18.95 7.1 58.02 66.06 80.19 91.67 105.65
EBITDA 3.66 4.50 (18.8) 3.56 2.8 12.13 15.78 15.77 19.75 23.19
APAT 1.43 2.19 (34.9) 1.77 (19.5) 4.92 7.49 7.67 9.06 10.51
AEPS (INR) 24.8 6.8 267.2 33.0 (24.7) 63.7 96.9 99.3 117.3 136.1
EV/EBITDA(x)
23.1 17.4 17.7 14.4 12.2
EV/MT (INR bn)
15.4 14.0 14.3 14.6 12.0
P/E (x)
51.9 34.1 33.3 28.2 24.3
RoE (%)
17.3 22.3 19.1 19.4 19.3
Source: Company, HSIE Research; Operating trends are on blended basis (grey cement+ white/putty)
Estimates revision summary
Current Estimates Old Estimates Revisions (%)
FY22E FY23E FY24E FY22E FY23E FY24E FY22E FY23E FY24E
Net Sales 80.19 91.67 105.65 78.49 90.37 105.12 2.2 1.4 0.5
EBITDA 15.77 19.75 23.19 15.97 20.21 23.62 (1.2) (2.3) (1.8)
APAT 7.67 9.06 10.51 7.62 10.50 11.56 0.6 (13.7) (9.1)
Source: Company, HSIE Research
REDUCE
CMP (as on 8 Feb 2022) INR 3,306
Target Price INR 3,010
NIFTY 17,267
KEY
CHANGES OLD NEW
Rating REDUCE REDUCE
Price Target INR3,145 INR3,010
EBITDA
revision %
FY22E FY23E
(1.2) (2.3)
KEY STOCK DATA
Bloomberg code JKCE IN
No. of Shares (mn) 77
MCap (INR bn) / ($ mn) 255/3,433
6m avg traded value (INR mn) 351
52 Week high / low INR 3,863/2,249
STOCK PERFORMANCE (%)
3M 6M 12M
Absolute (%) (12.6) (1.6) 43.2
Relative (%) (8.1) (8.1) 30.6
SHAREHOLDING PATTERN (%)
Sep-21 Dec-21
Promoters 57.62 51.50
FIs & Local MFs 20.10 19.82
FPIs 17.39 17.72
Public & Others 4.89 10.96
Pledged Shares - -
Source : BSE
Pledged shares as % of total shares
Rajesh Ravi
+91-22-6171-7352
Keshav Lahoti
+91-22-6171-7353
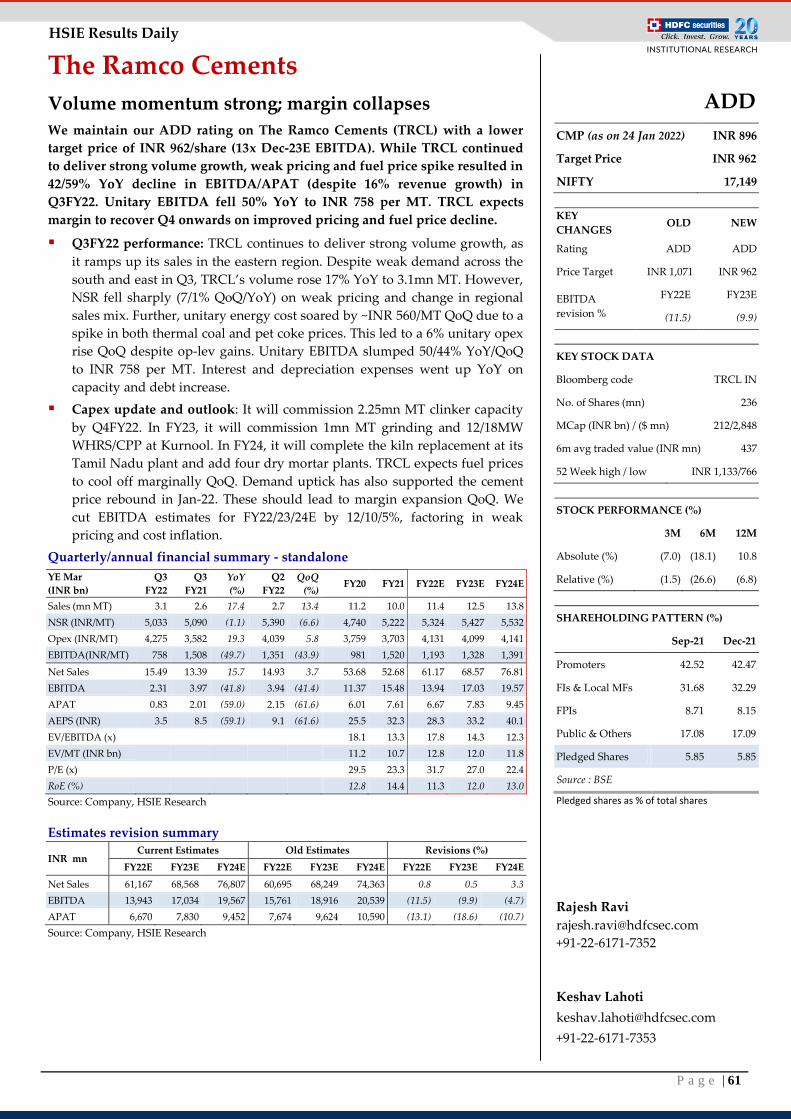
P a g e | 61
HSIE Results Daily
The Ramco Cements
Volume momentum strong; margin collapses
We maintain our ADD rating on The Ramco Cements (TRCL) with a lower
target price of INR 962/share (13x Dec-23E EBITDA). While TRCL continued
to deliver strong volume growth, weak pricing and fuel price spike resulted in
42/59% YoY decline in EBITDA/APAT (despite 16% revenue growth) in
Q3FY22. Unitary EBITDA fell 50% YoY to INR 758 per MT. TRCL expects
margin to recover Q4 onwards on improved pricing and fuel price decline.
Q3FY22 performance: TRCL continues to deliver strong volume growth, as
it ramps up its sales in the eastern region. Despite weak demand across the
south and east in Q3, TRCL’s volume rose 17% YoY to 3.1mn MT. However,
NSR fell sharply (7/1% QoQ/YoY) on weak pricing and change in regional
sales mix. Further, unitary energy cost soared by ~INR 560/MT QoQ due to a
spike in both thermal coal and pet coke prices. This led to a 6% unitary opex
rise QoQ despite op-lev gains. Unitary EBITDA slumped 50/44% YoY/QoQ
to INR 758 per MT. Interest and depreciation expenses went up YoY on
capacity and debt increase.
Capex update and outlook: It will commission 2.25mn MT clinker capacity
by Q4FY22. In FY23, it will commission 1mn MT grinding and 12/18MW
WHRS/CPP at Kurnool. In FY24, it will complete the kiln replacement at its
Tamil Nadu plant and add four dry mortar plants. TRCL expects fuel prices
to cool off marginally QoQ. Demand uptick has also supported the cement
price rebound in Jan-22. These should lead to margin expansion QoQ. We
cut EBITDA estimates for FY22/23/24E by 12/10/5%, factoring in weak
pricing and cost inflation.
Quarterly/annual financial summary - standalone
YE Mar
(INR bn)
Q3
FY22
Q3
FY21
YoY
(%)
Q2
FY22
QoQ
(%) FY20 FY21 FY22E FY23E FY24E
Sales (mn MT) 3.1 2.6 17.4 2.7 13.4 11.2 10.0 11.4 12.5 13.8
NSR (INR/MT) 5,033 5,090 (1.1) 5,390 (6.6) 4,740 5,222 5,324 5,427 5,532
Opex (INR/MT) 4,275 3,582 19.3 4,039 5.8 3,759 3,703 4,131 4,099 4,141
EBITDA(INR/MT) 758 1,508 (49.7) 1,351 (43.9) 981 1,520 1,193 1,328 1,391
Net Sales 15.49 13.39 15.7 14.93 3.7 53.68 52.68 61.17 68.57 76.81
EBITDA 2.31 3.97 (41.8) 3.94 (41.4) 11.37 15.48 13.94 17.03 19.57
APAT 0.83 2.01 (59.0) 2.15 (61.6) 6.01 7.61 6.67 7.83 9.45
AEPS (INR) 3.5 8.5 (59.1) 9.1 (61.6) 25.5 32.3 28.3 33.2 40.1
EV/EBITDA (x)
18.1 13.3 17.8 14.3 12.3
EV/MT (INR bn)
11.2 10.7 12.8 12.0 11.8
P/E (x)
29.5 23.3 31.7 27.0 22.4
RoE (%)
12.8 14.4 11.3 12.0 13.0
Source: Company, HSIE Research
Estimates revision summary
INR mn Current Estimates Old Estimates Revisions (%)
FY22E FY23E FY24E FY22E FY23E FY24E FY22E FY23E FY24E
Net Sales 61,167 68,568 76,807 60,695 68,249 74,363 0.8 0.5 3.3
EBITDA 13,943 17,034 19,567 15,761 18,916 20,539 (11.5) (9.9) (4.7)
APAT 6,670 7,830 9,452 7,674 9,624 10,590 (13.1) (18.6) (10.7)
Source: Company, HSIE Research
ADD
CMP (as on 24 Jan 2022) INR 896
Target Price INR 962
NIFTY 17,149
KEY
CHANGES OLD NEW
Rating ADD ADD
Price Target INR 1,071 INR 962
EBITDA
revision %
FY22E FY23E
(11.5) (9.9)
KEY STOCK DATA
Bloomberg code TRCL IN
No. of Shares (mn) 236
MCap (INR bn) / ($ mn) 212/2,848
6m avg traded value (INR mn) 437
52 Week high / low INR 1,133/766
STOCK PERFORMANCE (%)
3M 6M 12M
Absolute (%) (7.0) (18.1) 10.8
Relative (%) (1.5) (26.6) (6.8)
SHAREHOLDING PATTERN (%)
Sep-21 Dec-21
Promoters 42.52 42.47
FIs & Local MFs 31.68 32.29
FPIs 8.71 8.15
Public & Others 17.08 17.09
Pledged Shares 5.85 5.85
Source : BSE
Pledged shares as % of total shares
Rajesh Ravi
+91-22-6171-7352
Keshav Lahoti
+91-22-6171-7353
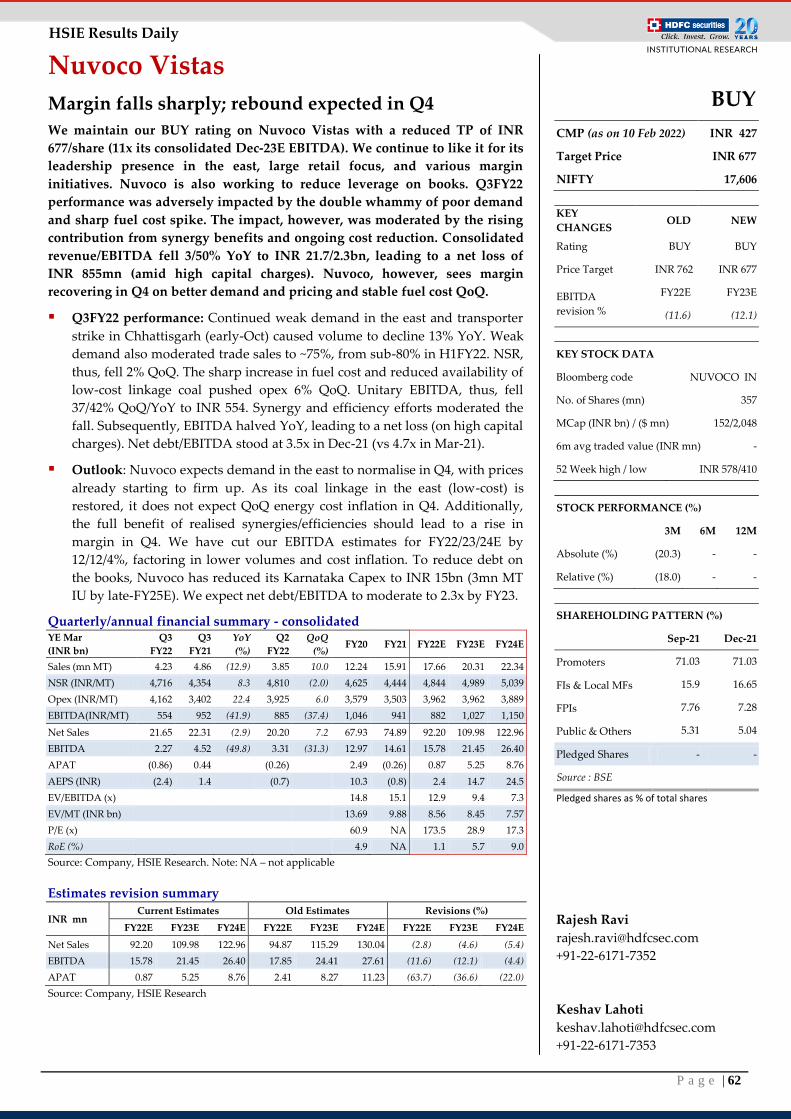
P a g e | 62
HSIE Results Daily
Nuvoco Vistas
Margin falls sharply; rebound expected in Q4
We maintain our BUY rating on Nuvoco Vistas with a reduced TP of INR
677/share (11x its consolidated Dec-23E EBITDA). We continue to like it for its
leadership presence in the east, large retail focus, and various margin
initiatives. Nuvoco is also working to reduce leverage on books. Q3FY22
performance was adversely impacted by the double whammy of poor demand
and sharp fuel cost spike. The impact, however, was moderated by the rising
contribution from synergy benefits and ongoing cost reduction. Consolidated
revenue/EBITDA fell 3/50% YoY to INR 21.7/2.3bn, leading to a net loss of
INR 855mn (amid high capital charges). Nuvoco, however, sees margin
recovering in Q4 on better demand and pricing and stable fuel cost QoQ.
Q3FY22 performance: Continued weak demand in the east and transporter
strike in Chhattisgarh (early-Oct) caused volume to decline 13% YoY. Weak
demand also moderated trade sales to ~75%, from sub-80% in H1FY22. NSR,
thus, fell 2% QoQ. The sharp increase in fuel cost and reduced availability of
low-cost linkage coal pushed opex 6% QoQ. Unitary EBITDA, thus, fell
37/42% QoQ/YoY to INR 554. Synergy and efficiency efforts moderated the
fall. Subsequently, EBITDA halved YoY, leading to a net loss (on high capital
charges). Net debt/EBITDA stood at 3.5x in Dec-21 (vs 4.7x in Mar-21).
Outlook: Nuvoco expects demand in the east to normalise in Q4, with prices
already starting to firm up. As its coal linkage in the east (low-cost) is
restored, it does not expect QoQ energy cost inflation in Q4. Additionally,
the full benefit of realised synergies/efficiencies should lead to a rise in
margin in Q4. We have cut our EBITDA estimates for FY22/23/24E by
12/12/4%, factoring in lower volumes and cost inflation. To reduce debt on
the books, Nuvoco has reduced its Karnataka Capex to INR 15bn (3mn MT
IU by late-FY25E). We expect net debt/EBITDA to moderate to 2.3x by FY23.
Quarterly/annual financial summary - consolidated YE Mar
(INR bn)
Q3
FY22
Q3
FY21
YoY
(%)
Q2
FY22
QoQ
(%) FY20 FY21 FY22E FY23E FY24E
Sales (mn MT) 4.23 4.86 (12.9) 3.85 10.0 12.24 15.91 17.66 20.31 22.34
NSR (INR/MT) 4,716 4,354 8.3 4,810 (2.0) 4,625 4,444 4,844 4,989 5,039
Opex (INR/MT) 4,162 3,402 22.4 3,925 6.0 3,579 3,503 3,962 3,962 3,889
EBITDA(INR/MT) 554 952 (41.9) 885 (37.4) 1,046 941 882 1,027 1,150
Net Sales 21.65 22.31 (2.9) 20.20 7.2 67.93 74.89 92.20 109.98 122.96
EBITDA 2.27 4.52 (49.8) 3.31 (31.3) 12.97 14.61 15.78 21.45 26.40
APAT (0.86) 0.44
(0.26)
2.49 (0.26) 0.87 5.25 8.76
AEPS (INR) (2.4) 1.4
(0.7)
10.3 (0.8) 2.4 14.7 24.5
EV/EBITDA (x)
14.8 15.1 12.9 9.4 7.3
EV/MT (INR bn)
13.69 9.88 8.56 8.45 7.57
P/E (x)
60.9 NA 173.5 28.9 17.3
RoE (%)
4.9 NA 1.1 5.7 9.0
Source: Company, HSIE Research. Note: NA – not applicable
Estimates revision summary
INR mn Current Estimates Old Estimates Revisions (%)
FY22E FY23E FY24E FY22E FY23E FY24E FY22E FY23E FY24E
Net Sales 92.20 109.98 122.96 94.87 115.29 130.04 (2.8) (4.6) (5.4)
EBITDA 15.78 21.45 26.40 17.85 24.41 27.61 (11.6) (12.1) (4.4)
APAT 0.87 5.25 8.76 2.41 8.27 11.23 (63.7) (36.6) (22.0)
Source: Company, HSIE Research
BUY
CMP (as on 10 Feb 2022) INR 427
Target Price INR 677
NIFTY 17,606
KEY
CHANGES OLD NEW
Rating BUY BUY
Price Target INR 762 INR 677
EBITDA
revision %
FY22E FY23E
(11.6) (12.1)
KEY STOCK DATA
Bloomberg code NUVOCO IN
No. of Shares (mn) 357
MCap (INR bn) / ($ mn) 152/2,048
6m avg traded value (INR mn) -
52 Week high / low INR 578/410
STOCK PERFORMANCE (%)
3M 6M 12M
Absolute (%) (20.3) - -
Relative (%) (18.0) - -
SHAREHOLDING PATTERN (%)
Sep-21 Dec-21
Promoters 71.03 71.03
FIs & Local MFs 15.9 16.65
FPIs 7.76 7.28
Public & Others 5.31 5.04
Pledged Shares - -
Source : BSE
Pledged shares as % of total shares
Rajesh Ravi
+91-22-6171-7352
Keshav Lahoti
+91-22-6171-7353
Rajesh Ravi
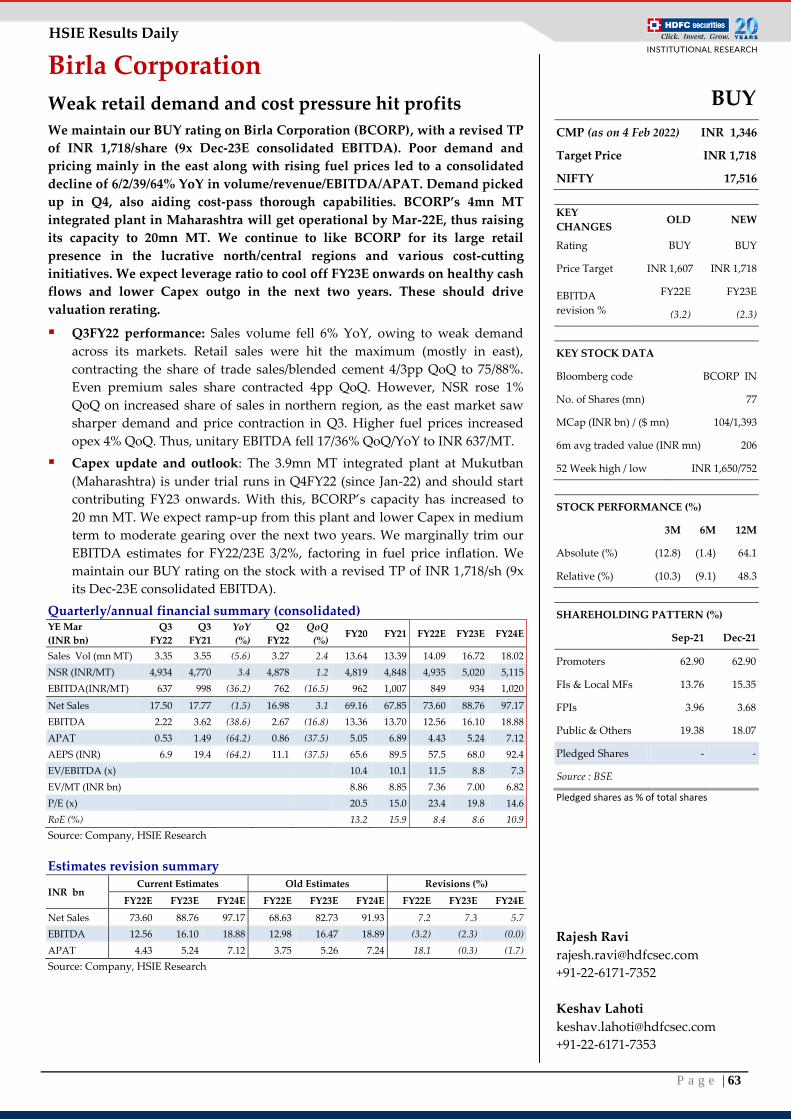
P a g e | 63
HSIE Results Daily
Birla Corporation
Weak retail demand and cost pressure hit profits
We maintain our BUY rating on Birla Corporation (BCORP), with a revised TP
of INR 1,718/share (9x Dec-23E consolidated EBITDA). Poor demand and
pricing mainly in the east along with rising fuel prices led to a consolidated
decline of 6/2/39/64% YoY in volume/revenue/EBITDA/APAT. Demand picked
up in Q4, also aiding cost-pass thorough capabilities. BCORP’s 4mn MT
integrated plant in Maharashtra will get operational by Mar-22E, thus raising
its capacity to 20mn MT. We continue to like BCORP for its large retail
presence in the lucrative north/central regions and various cost-cutting
initiatives. We expect leverage ratio to cool off FY23E onwards on healthy cash
flows and lower Capex outgo in the next two years. These should drive
valuation rerating.
Q3FY22 performance: Sales volume fell 6% YoY, owing to weak demand
across its markets. Retail sales were hit the maximum (mostly in east),
contracting the share of trade sales/blended cement 4/3pp QoQ to 75/88%.
Even premium sales share contracted 4pp QoQ. However, NSR rose 1%
QoQ on increased share of sales in northern region, as the east market saw
sharper demand and price contraction in Q3. Higher fuel prices increased
opex 4% QoQ. Thus, unitary EBITDA fell 17/36% QoQ/YoY to INR 637/MT.
Capex update and outlook: The 3.9mn MT integrated plant at Mukutban
(Maharashtra) is under trial runs in Q4FY22 (since Jan-22) and should start
contributing FY23 onwards. With this, BCORP’s capacity has increased to
20 mn MT. We expect ramp-up from this plant and lower Capex in medium
term to moderate gearing over the next two years. We marginally trim our
EBITDA estimates for FY22/23E 3/2%, factoring in fuel price inflation. We
maintain our BUY rating on the stock with a revised TP of INR 1,718/sh (9x
its Dec-23E consolidated EBITDA).
Quarterly/annual financial summary (consolidated) YE Mar
(INR bn)
Q3
FY22
Q3
FY21
YoY
(%)
Q2
FY22
QoQ
(%) FY20 FY21 FY22E FY23E FY24E
Sales Vol (mn MT) 3.35 3.55 (5.6) 3.27 2.4 13.64 13.39 14.09 16.72 18.02
NSR (INR/MT) 4,934 4,770 3.4 4,878 1.2 4,819 4,848 4,935 5,020 5,115
EBITDA(INR/MT) 637 998 (36.2) 762 (16.5) 962 1,007 849 934 1,020
Net Sales 17.50 17.77 (1.5) 16.98 3.1 69.16 67.85 73.60 88.76 97.17
EBITDA 2.22 3.62 (38.6) 2.67 (16.8) 13.36 13.70 12.56 16.10 18.88
APAT 0.53 1.49 (64.2) 0.86 (37.5) 5.05 6.89 4.43 5.24 7.12
AEPS (INR) 6.9 19.4 (64.2) 11.1 (37.5) 65.6 89.5 57.5 68.0 92.4
EV/EBITDA (x)
10.4 10.1 11.5 8.8 7.3
EV/MT (INR bn)
8.86 8.85 7.36 7.00 6.82
P/E (x)
20.5 15.0 23.4 19.8 14.6
RoE (%)
13.2 15.9 8.4 8.6 10.9
Source: Company, HSIE Research
Estimates revision summary
INR bn Current Estimates Old Estimates Revisions (%)
FY22E FY23E FY24E FY22E FY23E FY24E FY22E FY23E FY24E
Net Sales 73.60 88.76 97.17 68.63 82.73 91.93 7.2 7.3 5.7
EBITDA 12.56 16.10 18.88 12.98 16.47 18.89 (3.2) (2.3) (0.0)
APAT 4.43 5.24 7.12 3.75 5.26 7.24 18.1 (0.3) (1.7)
Source: Company, HSIE Research
BUY
CMP (as on 4 Feb 2022) INR 1,346
Target Price INR 1,718
NIFTY 17,516
KEY
CHANGES OLD NEW
Rating BUY BUY
Price Target INR 1,607 INR 1,718
EBITDA
revision %
FY22E FY23E
(3.2) (2.3)
KEY STOCK DATA
Bloomberg code BCORP IN
No. of Shares (mn) 77
MCap (INR bn) / ($ mn) 104/1,393
6m avg traded value (INR mn) 206
52 Week high / low INR 1,650/752
STOCK PERFORMANCE (%)
3M 6M 12M
Absolute (%) (12.8) (1.4) 64.1
Relative (%) (10.3) (9.1) 48.3
SHAREHOLDING PATTERN (%)
Sep-21 Dec-21
Promoters 62.90 62.90
FIs & Local MFs 13.76 15.35
FPIs 3.96 3.68
Public & Others 19.38 18.07
Pledged Shares - -
Source : BSE
Pledged shares as % of total shares
Rajesh Ravi
+91-22-6171-7352
Keshav Lahoti
+91-22-6171-7353
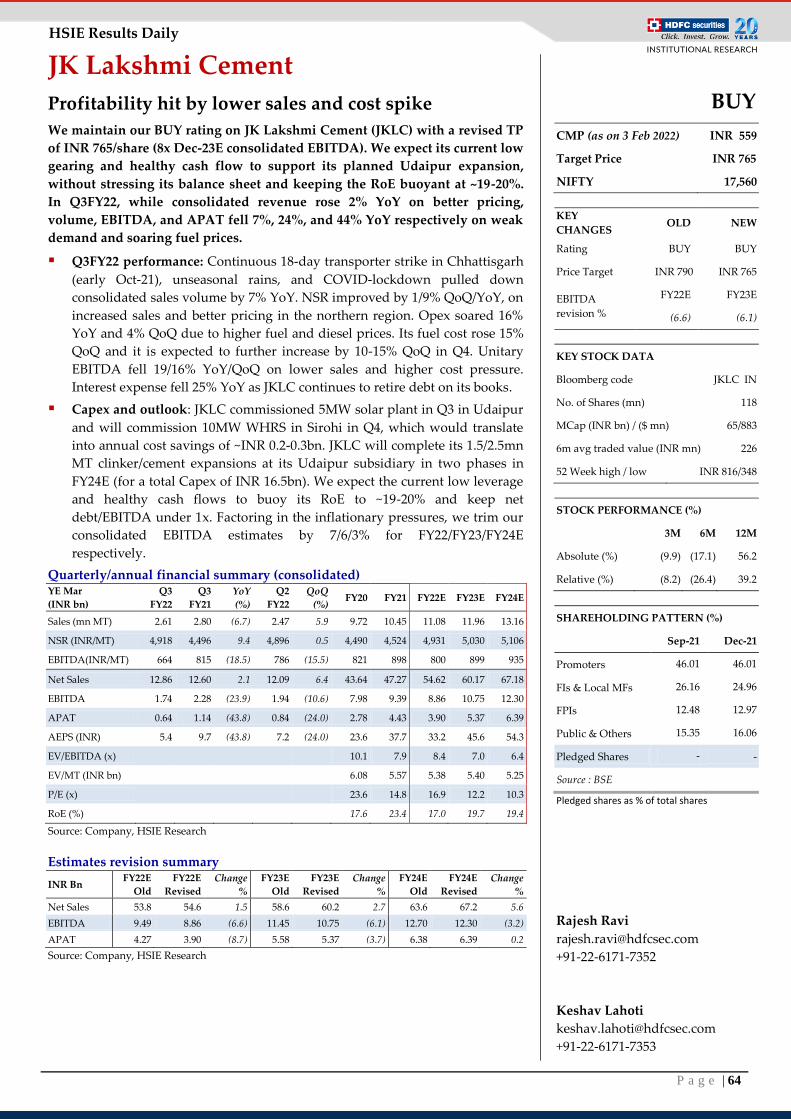
P a g e | 64
HSIE Results Daily
JK Lakshmi Cement
Profitability hit by lower sales and cost spike
We maintain our BUY rating on JK Lakshmi Cement (JKLC) with a revised TP
of INR 765/share (8x Dec-23E consolidated EBITDA). We expect its current low
gearing and healthy cash flow to support its planned Udaipur expansion,
without stressing its balance sheet and keeping the RoE buoyant at ~19-20%.
In Q3FY22, while consolidated revenue rose 2% YoY on better pricing,
volume, EBITDA, and APAT fell 7%, 24%, and 44% YoY respectively on weak
demand and soaring fuel prices.
Q3FY22 performance: Continuous 18-day transporter strike in Chhattisgarh
(early Oct-21), unseasonal rains, and COVID-lockdown pulled down
consolidated sales volume by 7% YoY. NSR improved by 1/9% QoQ/YoY, on
increased sales and better pricing in the northern region. Opex soared 16%
YoY and 4% QoQ due to higher fuel and diesel prices. Its fuel cost rose 15%
QoQ and it is expected to further increase by 10-15% QoQ in Q4. Unitary
EBITDA fell 19/16% YoY/QoQ on lower sales and higher cost pressure.
Interest expense fell 25% YoY as JKLC continues to retire debt on its books.
Capex and outlook: JKLC commissioned 5MW solar plant in Q3 in Udaipur
and will commission 10MW WHRS in Sirohi in Q4, which would translate
into annual cost savings of ~INR 0.2-0.3bn. JKLC will complete its 1.5/2.5mn
MT clinker/cement expansions at its Udaipur subsidiary in two phases in
FY24E (for a total Capex of INR 16.5bn). We expect the current low leverage
and healthy cash flows to buoy its RoE to ~19-20% and keep net
debt/EBITDA under 1x. Factoring in the inflationary pressures, we trim our
consolidated EBITDA estimates by 7/6/3% for FY22/FY23/FY24E
respectively.
Quarterly/annual financial summary (consolidated) YE Mar
(INR bn)
Q3
FY22
Q3
FY21
YoY
(%)
Q2
FY22
QoQ
(%) FY20 FY21 FY22E FY23E FY24E
Sales (mn MT) 2.61 2.80 (6.7) 2.47 5.9 9.72 10.45 11.08 11.96 13.16
NSR (INR/MT) 4,918 4,496 9.4 4,896 0.5 4,490 4,524 4,931 5,030 5,106
EBITDA(INR/MT) 664 815 (18.5) 786 (15.5) 821 898 800 899 935
Net Sales 12.86 12.60 2.1 12.09 6.4 43.64 47.27 54.62 60.17 67.18
EBITDA 1.74 2.28 (23.9) 1.94 (10.6) 7.98 9.39 8.86 10.75 12.30
APAT 0.64 1.14 (43.8) 0.84 (24.0) 2.78 4.43 3.90 5.37 6.39
AEPS (INR) 5.4 9.7 (43.8) 7.2 (24.0) 23.6 37.7 33.2 45.6 54.3
EV/EBITDA (x)
10.1 7.9 8.4 7.0 6.4
EV/MT (INR bn)
6.08 5.57 5.38 5.40 5.25
P/E (x)
23.6 14.8 16.9 12.2 10.3
RoE (%)
17.6 23.4 17.0 19.7 19.4
Source: Company, HSIE Research
Estimates revision summary
INR Bn FY22E
Old
FY22E
Revised
Change
%
FY23E
Old
FY23E
Revised
Change
%
FY24E
Old
FY24E
Revised
Change
%
Net Sales 53.8 54.6 1.5 58.6 60.2 2.7 63.6 67.2 5.6
EBITDA 9.49 8.86 (6.6) 11.45 10.75 (6.1) 12.70 12.30 (3.2)
APAT 4.27 3.90 (8.7) 5.58 5.37 (3.7) 6.38 6.39 0.2
Source: Company, HSIE Research
BUY
CMP (as on 3 Feb 2022) INR 559
Target Price INR 765
NIFTY 17,560
KEY
CHANGES OLD NEW
Rating BUY BUY
Price Target INR 790 INR 765
EBITDA
revision %
FY22E FY23E
(6.6) (6.1)
KEY STOCK DATA
Bloomberg code JKLC IN
No. of Shares (mn) 118
MCap (INR bn) / ($ mn) 65/883
6m avg traded value (INR mn) 226
52 Week high / low INR 816/348
STOCK PERFORMANCE (%)
3M 6M 12M
Absolute (%) (9.9) (17.1) 56.2
Relative (%) (8.2) (26.4) 39.2
SHAREHOLDING PATTERN (%)
Sep-21 Dec-21
Promoters 46.01 46.01
FIs & Local MFs 26.16 24.96
FPIs 12.48 12.97
Public & Others 15.35 16.06
Pledged Shares - -
Source : BSE
Pledged shares as % of total shares
Rajesh Ravi
+91-22-6171-7352
Keshav Lahoti
+91-22-6171-7353
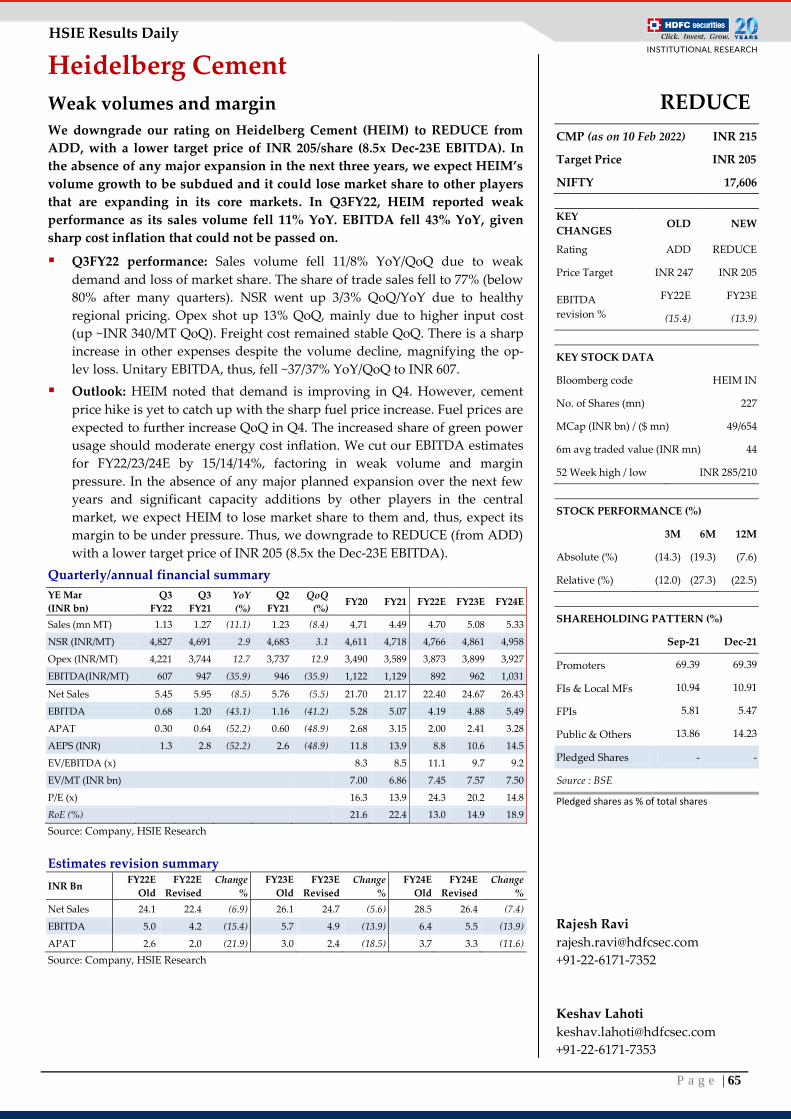
P a g e | 65
HSIE Results Daily
Heidelberg Cement
Weak volumes and margin
We downgrade our rating on Heidelberg Cement (HEIM) to REDUCE from
ADD, with a lower target price of INR 205/share (8.5x Dec-23E EBITDA). In
the absence of any major expansion in the next three years, we expect HEIM’s
volume growth to be subdued and it could lose market share to other players
that are expanding in its core markets. In Q3FY22, HEIM reported weak
performance as its sales volume fell 11% YoY. EBITDA fell 43% YoY, given
sharp cost inflation that could not be passed on.
Q3FY22 performance: Sales volume fell 11/8% YoY/QoQ due to weak
demand and loss of market share. The share of trade sales fell to 77% (below
80% after many quarters). NSR went up 3/3% QoQ/YoY due to healthy
regional pricing. Opex shot up 13% QoQ, mainly due to higher input cost
(up ~INR 340/MT QoQ). Freight cost remained stable QoQ. There is a sharp
increase in other expenses despite the volume decline, magnifying the op-
lev loss. Unitary EBITDA, thus, fell ~37/37% YoY/QoQ to INR 607.
Outlook: HEIM noted that demand is improving in Q4. However, cement
price hike is yet to catch up with the sharp fuel price increase. Fuel prices are
expected to further increase QoQ in Q4. The increased share of green power
usage should moderate energy cost inflation. We cut our EBITDA estimates
for FY22/23/24E by 15/14/14%, factoring in weak volume and margin
pressure. In the absence of any major planned expansion over the next few
years and significant capacity additions by other players in the central
market, we expect HEIM to lose market share to them and, thus, expect its
margin to be under pressure. Thus, we downgrade to REDUCE (from ADD)
with a lower target price of INR 205 (8.5x the Dec-23E EBITDA).
Quarterly/annual financial summary
YE Mar
(INR bn)
Q3
FY22
Q3
FY21
YoY
(%)
Q2
FY21
QoQ
(%) FY20 FY21 FY22E FY23E FY24E
Sales (mn MT) 1.13 1.27 (11.1) 1.23 (8.4) 4.71 4.49 4.70 5.08 5.33
NSR (INR/MT) 4,827 4,691 2.9 4,683 3.1 4,611 4,718 4,766 4,861 4,958
Opex (INR/MT) 4,221 3,744 12.7 3,737 12.9 3,490 3,589 3,873 3,899 3,927
EBITDA(INR/MT) 607 947 (35.9) 946 (35.9) 1,122 1,129 892 962 1,031
Net Sales 5.45 5.95 (8.5) 5.76 (5.5) 21.70 21.17 22.40 24.67 26.43
EBITDA 0.68 1.20 (43.1) 1.16 (41.2) 5.28 5.07 4.19 4.88 5.49
APAT 0.30 0.64 (52.2) 0.60 (48.9) 2.68 3.15 2.00 2.41 3.28
AEPS (INR) 1.3 2.8 (52.2) 2.6 (48.9) 11.8 13.9 8.8 10.6 14.5
EV/EBITDA (x)
8.3 8.5 11.1 9.7 9.2
EV/MT (INR bn)
7.00 6.86 7.45 7.57 7.50
P/E (x)
16.3 13.9 24.3 20.2 14.8
RoE (%)
21.6 22.4 13.0 14.9 18.9
Source: Company, HSIE Research
Estimates revision summary
INR Bn FY22E
Old
FY22E
Revised
Change
%
FY23E
Old
FY23E
Revised
Change
%
FY24E
Old
FY24E
Revised
Change
%
Net Sales 24.1 22.4 (6.9) 26.1 24.7 (5.6) 28.5 26.4 (7.4)
EBITDA 5.0 4.2 (15.4) 5.7 4.9 (13.9) 6.4 5.5 (13.9)
APAT 2.6 2.0 (21.9) 3.0 2.4 (18.5) 3.7 3.3 (11.6)
Source: Company, HSIE Research
REDUCE
CMP (as on 10 Feb 2022) INR 215
Target Price INR 205
NIFTY 17,606
KEY
CHANGES OLD NEW
Rating ADD REDUCE
Price Target INR 247 INR 205
EBITDA
revision %
FY22E FY23E
(15.4) (13.9)
KEY STOCK DATA
Bloomberg code HEIM IN
No. of Shares (mn) 227
MCap (INR bn) / ($ mn) 49/654
6m avg traded value (INR mn) 44
52 Week high / low INR 285/210
STOCK PERFORMANCE (%)
3M 6M 12M
Absolute (%) (14.3) (19.3) (7.6)
Relative (%) (12.0) (27.3) (22.5)
SHAREHOLDING PATTERN (%)
Sep-21 Dec-21
Promoters 69.39 69.39
FIs & Local MFs 10.94 10.91
FPIs 5.81 5.47
Public & Others 13.86 14.23
Pledged Shares - -
Source : BSE
Pledged shares as % of total shares
Rajesh Ravi
+91-22-6171-7352
Keshav Lahoti
+91-22-6171-7353
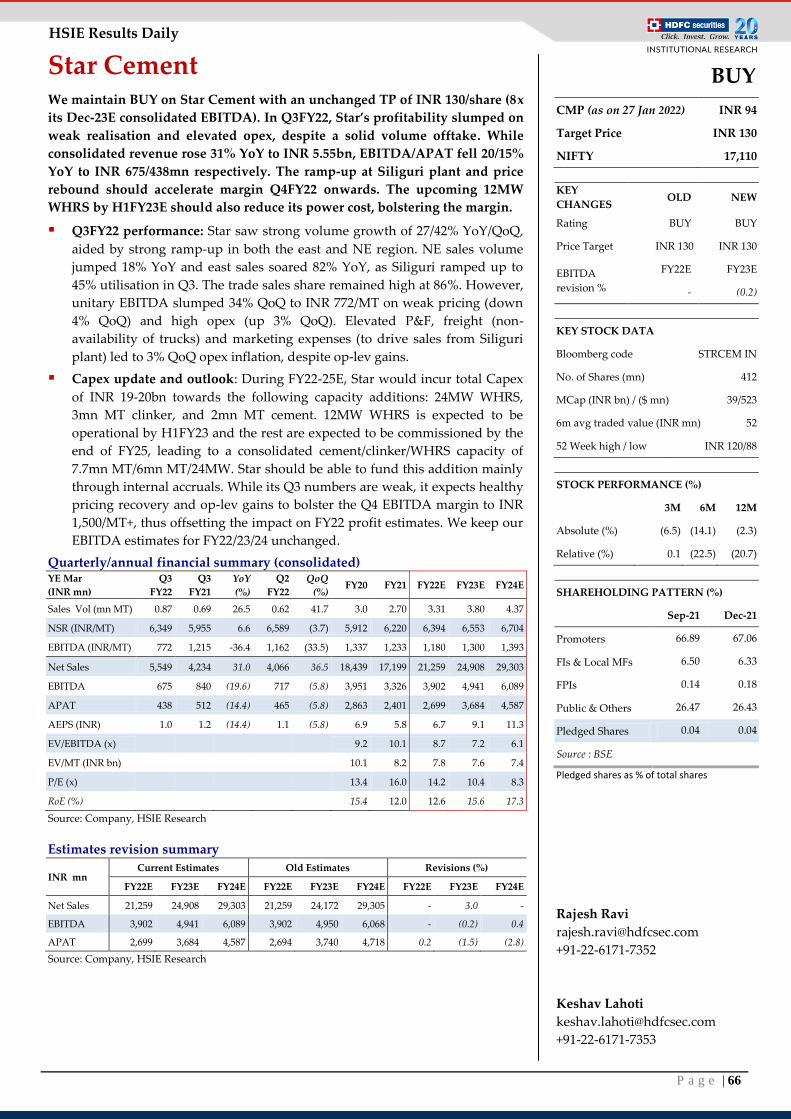
P a g e | 66
HSIE Results Daily
Star Cement We maintain BUY on Star Cement with an unchanged TP of INR 130/share (8x
its Dec-23E consolidated EBITDA). In Q3FY22, Star’s profitability slumped on
weak realisation and elevated opex, despite a solid volume offtake. While
consolidated revenue rose 31% YoY to INR 5.55bn, EBITDA/APAT fell 20/15%
YoY to INR 675/438mn respectively. The ramp-up at Siliguri plant and price
rebound should accelerate margin Q4FY22 onwards. The upcoming 12MW
WHRS by H1FY23E should also reduce its power cost, bolstering the margin.
Q3FY22 performance: Star saw strong volume growth of 27/42% YoY/QoQ,
aided by strong ramp-up in both the east and NE region. NE sales volume
jumped 18% YoY and east sales soared 82% YoY, as Siliguri ramped up to
45% utilisation in Q3. The trade sales share remained high at 86%. However,
unitary EBITDA slumped 34% QoQ to INR 772/MT on weak pricing (down
4% QoQ) and high opex (up 3% QoQ). Elevated P&F, freight (non-
availability of trucks) and marketing expenses (to drive sales from Siliguri
plant) led to 3% QoQ opex inflation, despite op-lev gains.
Capex update and outlook: During FY22-25E, Star would incur total Capex
of INR 19-20bn towards the following capacity additions: 24MW WHRS,
3mn MT clinker, and 2mn MT cement. 12MW WHRS is expected to be
operational by H1FY23 and the rest are expected to be commissioned by the
end of FY25, leading to a consolidated cement/clinker/WHRS capacity of
7.7mn MT/6mn MT/24MW. Star should be able to fund this addition mainly
through internal accruals. While its Q3 numbers are weak, it expects healthy
pricing recovery and op-lev gains to bolster the Q4 EBITDA margin to INR
1,500/MT+, thus offsetting the impact on FY22 profit estimates. We keep our
EBITDA estimates for FY22/23/24 unchanged.
Quarterly/annual financial summary (consolidated) YE Mar
(INR mn)
Q3
FY22
Q3
FY21
YoY
(%)
Q2
FY22
QoQ
(%) FY20 FY21 FY22E FY23E FY24E
Sales Vol (mn MT) 0.87 0.69 26.5 0.62 41.7 3.0 2.70 3.31 3.80 4.37
NSR (INR/MT) 6,349 5,955 6.6 6,589 (3.7) 5,912 6,220 6,394 6,553 6,704
EBITDA (INR/MT) 772 1,215 -36.4 1,162 (33.5) 1,337 1,233 1,180 1,300 1,393
Net Sales 5,549 4,234 31.0 4,066 36.5 18,439 17,199 21,259 24,908 29,303
EBITDA 675 840 (19.6) 717 (5.8) 3,951 3,326 3,902 4,941 6,089
APAT 438 512 (14.4) 465 (5.8) 2,863 2,401 2,699 3,684 4,587
AEPS (INR) 1.0 1.2 (14.4) 1.1 (5.8) 6.9 5.8 6.7 9.1 11.3
EV/EBITDA (x)
9.2 10.1 8.7 7.2 6.1
EV/MT (INR bn)
10.1 8.2 7.8 7.6 7.4
P/E (x)
13.4 16.0 14.2 10.4 8.3
RoE (%)
15.4 12.0 12.6 15.6 17.3
Source: Company, HSIE Research
Estimates revision summary
INR mn Current Estimates Old Estimates Revisions (%)
FY22E FY23E FY24E FY22E FY23E FY24E FY22E FY23E FY24E
Net Sales 21,259 24,908 29,303 21,259 24,172 29,305 - 3.0 -
EBITDA 3,902 4,941 6,089 3,902 4,950 6,068 - (0.2) 0.4
APAT 2,699 3,684 4,587 2,694 3,740 4,718 0.2 (1.5) (2.8)
Source: Company, HSIE Research
BUY
CMP (as on 27 Jan 2022) INR 94
Target Price INR 130
NIFTY 17,110
KEY
CHANGES OLD NEW
Rating BUY BUY
Price Target INR 130 INR 130
EBITDA
revision %
FY22E FY23E
- (0.2)
KEY STOCK DATA
Bloomberg code STRCEM IN
No. of Shares (mn) 412
MCap (INR bn) / ($ mn) 39/523
6m avg traded value (INR mn) 52
52 Week high / low INR 120/88
STOCK PERFORMANCE (%)
3M 6M 12M
Absolute (%) (6.5) (14.1) (2.3)
Relative (%) 0.1 (22.5) (20.7)
SHAREHOLDING PATTERN (%)
Sep-21 Dec-21
Promoters 66.89 67.06
FIs & Local MFs 6.50 6.33
FPIs 0.14 0.18
Public & Others 26.47 26.43
Pledged Shares 0.04 0.04
Source : BSE
Pledged shares as % of total shares
Rajesh Ravi
+91-22-6171-7352
Keshav Lahoti
+91-22-6171-7353
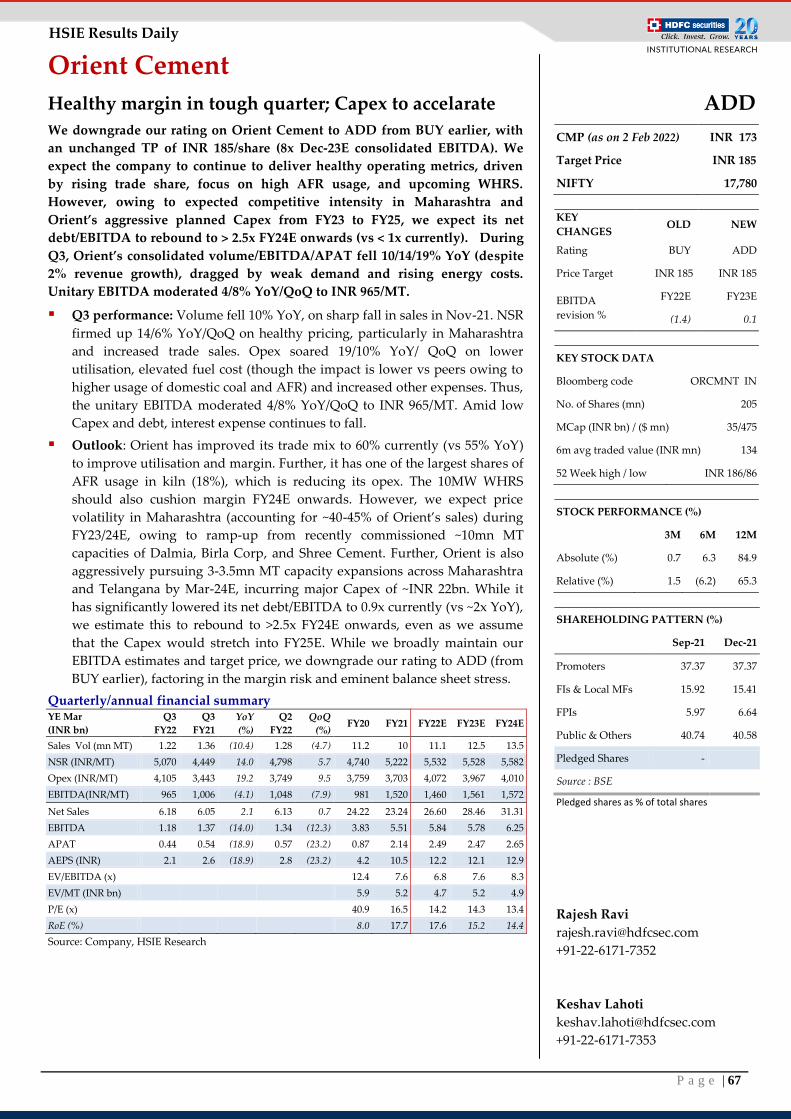
P a g e | 67
HSIE Results Daily
Orient Cement
Healthy margin in tough quarter; Capex to accelarate
We downgrade our rating on Orient Cement to ADD from BUY earlier, with
an unchanged TP of INR 185/share (8x Dec-23E consolidated EBITDA). We
expect the company to continue to deliver healthy operating metrics, driven
by rising trade share, focus on high AFR usage, and upcoming WHRS.
However, owing to expected competitive intensity in Maharashtra and
Orient’s aggressive planned Capex from FY23 to FY25, we expect its net
debt/EBITDA to rebound to > 2.5x FY24E onwards (vs < 1x currently). During
Q3, Orient’s consolidated volume/EBITDA/APAT fell 10/14/19% YoY (despite
2% revenue growth), dragged by weak demand and rising energy costs.
Unitary EBITDA moderated 4/8% YoY/QoQ to INR 965/MT.
Q3 performance: Volume fell 10% YoY, on sharp fall in sales in Nov-21. NSR
firmed up 14/6% YoY/QoQ on healthy pricing, particularly in Maharashtra
and increased trade sales. Opex soared 19/10% YoY/ QoQ on lower
utilisation, elevated fuel cost (though the impact is lower vs peers owing to
higher usage of domestic coal and AFR) and increased other expenses. Thus,
the unitary EBITDA moderated 4/8% YoY/QoQ to INR 965/MT. Amid low
Capex and debt, interest expense continues to fall.
Outlook: Orient has improved its trade mix to 60% currently (vs 55% YoY)
to improve utilisation and margin. Further, it has one of the largest shares of
AFR usage in kiln (18%), which is reducing its opex. The 10MW WHRS
should also cushion margin FY24E onwards. However, we expect price
volatility in Maharashtra (accounting for ~40-45% of Orient’s sales) during
FY23/24E, owing to ramp-up from recently commissioned ~10mn MT
capacities of Dalmia, Birla Corp, and Shree Cement. Further, Orient is also
aggressively pursuing 3-3.5mn MT capacity expansions across Maharashtra
and Telangana by Mar-24E, incurring major Capex of ~INR 22bn. While it
has significantly lowered its net debt/EBITDA to 0.9x currently (vs ~2x YoY),
we estimate this to rebound to >2.5x FY24E onwards, even as we assume
that the Capex would stretch into FY25E. While we broadly maintain our
EBITDA estimates and target price, we downgrade our rating to ADD (from
BUY earlier), factoring in the margin risk and eminent balance sheet stress.
Quarterly/annual financial summary YE Mar
(INR bn)
Q3
FY22
Q3
FY21
YoY
(%)
Q2
FY22
QoQ
(%) FY20 FY21 FY22E FY23E FY24E
Sales Vol (mn MT) 1.22 1.36 (10.4) 1.28 (4.7) 11.2 10 11.1 12.5 13.5
NSR (INR/MT) 5,070 4,449 14.0 4,798 5.7 4,740 5,222 5,532 5,528 5,582
Opex (INR/MT) 4,105 3,443 19.2 3,749 9.5 3,759 3,703 4,072 3,967 4,010
EBITDA(INR/MT) 965 1,006 (4.1) 1,048 (7.9) 981 1,520 1,460 1,561 1,572
Net Sales 6.18 6.05 2.1 6.13 0.7 24.22 23.24 26.60 28.46 31.31
EBITDA 1.18 1.37 (14.0) 1.34 (12.3) 3.83 5.51 5.84 5.78 6.25
APAT 0.44 0.54 (18.9) 0.57 (23.2) 0.87 2.14 2.49 2.47 2.65
AEPS (INR) 2.1 2.6 (18.9) 2.8 (23.2) 4.2 10.5 12.2 12.1 12.9
EV/EBITDA (x)
12.4 7.6 6.8 7.6 8.3
EV/MT (INR bn)
5.9 5.2 4.7 5.2 4.9
P/E (x)
40.9 16.5 14.2 14.3 13.4
RoE (%)
8.0 17.7 17.6 15.2 14.4
Source: Company, HSIE Research
ADD
CMP (as on 2 Feb 2022) INR 173
Target Price INR 185
NIFTY 17,780
KEY
CHANGES OLD NEW
Rating BUY ADD
Price Target INR 185 INR 185
EBITDA
revision %
FY22E FY23E
(1.4) 0.1
KEY STOCK DATA
Bloomberg code ORCMNT IN
No. of Shares (mn) 205
MCap (INR bn) / ($ mn) 35/475
6m avg traded value (INR mn) 134
52 Week high / low INR 186/86
STOCK PERFORMANCE (%)
3M 6M 12M
Absolute (%) 0.7 6.3 84.9
Relative (%) 1.5 (6.2) 65.3
SHAREHOLDING PATTERN (%)
Sep-21 Dec-21
Promoters 37.37 37.37
FIs & Local MFs 15.92 15.41
FPIs 5.97 6.64
Public & Others 40.74 40.58
Pledged Shares -
Source : BSE
Pledged shares as % of total shares
Rajesh Ravi
+91-22-6171-7352
Keshav Lahoti
+91-22-6171-7353
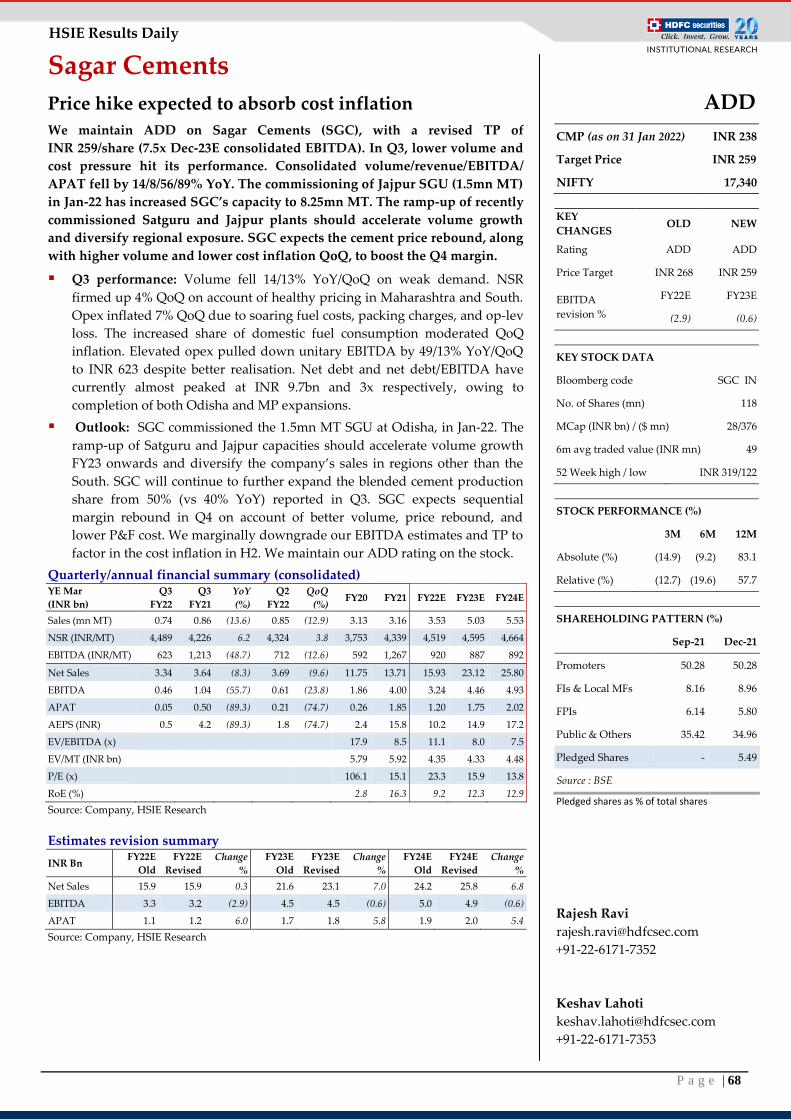
P a g e | 68
HSIE Results Daily
Sagar Cements
Price hike expected to absorb cost inflation
We maintain ADD on Sagar Cements (SGC), with a revised TP of
INR 259/share (7.5x Dec-23E consolidated EBITDA). In Q3, lower volume and
cost pressure hit its performance. Consolidated volume/revenue/EBITDA/
APAT fell by 14/8/56/89% YoY. The commissioning of Jajpur SGU (1.5mn MT)
in Jan-22 has increased SGC’s capacity to 8.25mn MT. The ramp-up of recently
commissioned Satguru and Jajpur plants should accelerate volume growth
and diversify regional exposure. SGC expects the cement price rebound, along
with higher volume and lower cost inflation QoQ, to boost the Q4 margin.
Q3 performance: Volume fell 14/13% YoY/QoQ on weak demand. NSR
firmed up 4% QoQ on account of healthy pricing in Maharashtra and South.
Opex inflated 7% QoQ due to soaring fuel costs, packing charges, and op-lev
loss. The increased share of domestic fuel consumption moderated QoQ
inflation. Elevated opex pulled down unitary EBITDA by 49/13% YoY/QoQ
to INR 623 despite better realisation. Net debt and net debt/EBITDA have
currently almost peaked at INR 9.7bn and 3x respectively, owing to
completion of both Odisha and MP expansions.
Outlook: SGC commissioned the 1.5mn MT SGU at Odisha, in Jan-22. The
ramp-up of Satguru and Jajpur capacities should accelerate volume growth
FY23 onwards and diversify the company’s sales in regions other than the
South. SGC will continue to further expand the blended cement production
share from 50% (vs 40% YoY) reported in Q3. SGC expects sequential
margin rebound in Q4 on account of better volume, price rebound, and
lower P&F cost. We marginally downgrade our EBITDA estimates and TP to
factor in the cost inflation in H2. We maintain our ADD rating on the stock.
Quarterly/annual financial summary (consolidated) YE Mar
(INR bn)
Q3
FY22
Q3
FY21
YoY
(%)
Q2
FY22
QoQ
(%) FY20 FY21 FY22E FY23E FY24E
Sales (mn MT) 0.74 0.86 (13.6) 0.85 (12.9) 3.13 3.16 3.53 5.03 5.53
NSR (INR/MT) 4,489 4,226 6.2 4,324 3.8 3,753 4,339 4,519 4,595 4,664
EBITDA (INR/MT) 623 1,213 (48.7) 712 (12.6) 592 1,267 920 887 892
Net Sales 3.34 3.64 (8.3) 3.69 (9.6) 11.75 13.71 15.93 23.12 25.80
EBITDA 0.46 1.04 (55.7) 0.61 (23.8) 1.86 4.00 3.24 4.46 4.93
APAT 0.05 0.50 (89.3) 0.21 (74.7) 0.26 1.85 1.20 1.75 2.02
AEPS (INR) 0.5 4.2 (89.3) 1.8 (74.7) 2.4 15.8 10.2 14.9 17.2
EV/EBITDA (x)
17.9 8.5 11.1 8.0 7.5
EV/MT (INR bn)
5.79 5.92 4.35 4.33 4.48
P/E (x)
106.1 15.1 23.3 15.9 13.8
RoE (%)
2.8 16.3 9.2 12.3 12.9
Source: Company, HSIE Research
Estimates revision summary
INR Bn FY22E
Old
FY22E
Revised
Change
%
FY23E
Old
FY23E
Revised
Change
%
FY24E
Old
FY24E
Revised
Change
%
Net Sales 15.9 15.9 0.3 21.6 23.1 7.0 24.2 25.8 6.8
EBITDA 3.3 3.2 (2.9) 4.5 4.5 (0.6) 5.0 4.9 (0.6)
APAT 1.1 1.2 6.0 1.7 1.8 5.8 1.9 2.0 5.4
Source: Company, HSIE Research
ADD
CMP (as on 31 Jan 2022) INR 238
Target Price INR 259
NIFTY 17,340
KEY
CHANGES OLD NEW
Rating ADD ADD
Price Target INR 268 INR 259
EBITDA
revision %
FY22E FY23E
(2.9) (0.6)
KEY STOCK DATA
Bloomberg code SGC IN
No. of Shares (mn) 118
MCap (INR bn) / ($ mn) 28/376
6m avg traded value (INR mn) 49
52 Week high / low INR 319/122
STOCK PERFORMANCE (%)
3M 6M 12M
Absolute (%) (14.9) (9.2) 83.1
Relative (%) (12.7) (19.6) 57.7
SHAREHOLDING PATTERN (%)
Sep-21 Dec-21
Promoters 50.28 50.28
FIs & Local MFs 8.16 8.96
FPIs 6.14 5.80
Public & Others 35.42 34.96
Pledged Shares - 5.49
Source : BSE
Pledged shares as % of total shares
Rajesh Ravi
+91-22-6171-7352
Keshav Lahoti
+91-22-6171-7353
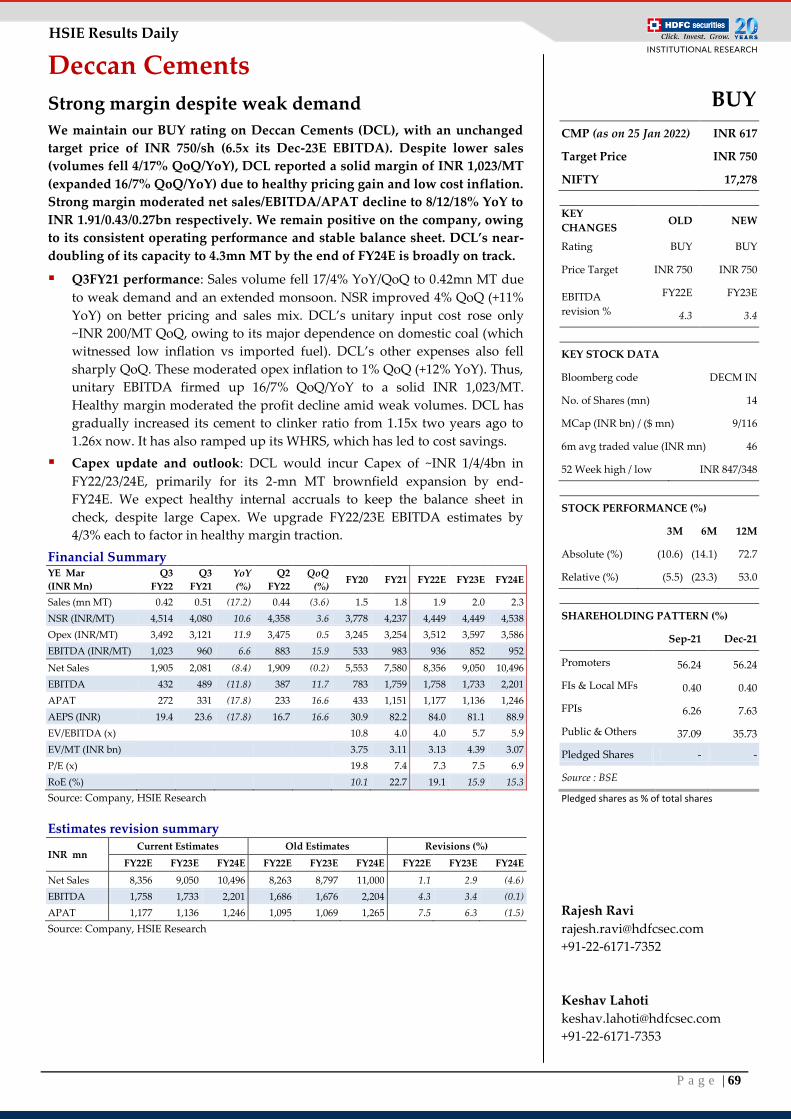
P a g e | 69
HSIE Results Daily
Deccan Cements
Strong margin despite weak demand
We maintain our BUY rating on Deccan Cements (DCL), with an unchanged
target price of INR 750/sh (6.5x its Dec-23E EBITDA). Despite lower sales
(volumes fell 4/17% QoQ/YoY), DCL reported a solid margin of INR 1,023/MT
(expanded 16/7% QoQ/YoY) due to healthy pricing gain and low cost inflation.
Strong margin moderated net sales/EBITDA/APAT decline to 8/12/18% YoY to
INR 1.91/0.43/0.27bn respectively. We remain positive on the company, owing
to its consistent operating performance and stable balance sheet. DCL’s near-
doubling of its capacity to 4.3mn MT by the end of FY24E is broadly on track.
Q3FY21 performance: Sales volume fell 17/4% YoY/QoQ to 0.42mn MT due
to weak demand and an extended monsoon. NSR improved 4% QoQ (+11%
YoY) on better pricing and sales mix. DCL’s unitary input cost rose only
~INR 200/MT QoQ, owing to its major dependence on domestic coal (which
witnessed low inflation vs imported fuel). DCL’s other expenses also fell
sharply QoQ. These moderated opex inflation to 1% QoQ (+12% YoY). Thus,
unitary EBITDA firmed up 16/7% QoQ/YoY to a solid INR 1,023/MT.
Healthy margin moderated the profit decline amid weak volumes. DCL has
gradually increased its cement to clinker ratio from 1.15x two years ago to
1.26x now. It has also ramped up its WHRS, which has led to cost savings.
Capex update and outlook: DCL would incur Capex of ~INR 1/4/4bn in
FY22/23/24E, primarily for its 2-mn MT brownfield expansion by end-
FY24E. We expect healthy internal accruals to keep the balance sheet in
check, despite large Capex. We upgrade FY22/23E EBITDA estimates by
4/3% each to factor in healthy margin traction.
Financial Summary YE Mar
(INR Mn)
Q3
FY22
Q3
FY21
YoY
(%)
Q2
FY22
QoQ
(%) FY20 FY21 FY22E FY23E FY24E
Sales (mn MT) 0.42 0.51 (17.2) 0.44 (3.6) 1.5 1.8 1.9 2.0 2.3
NSR (INR/MT) 4,514 4,080 10.6 4,358 3.6 3,778 4,237 4,449 4,449 4,538
Opex (INR/MT) 3,492 3,121 11.9 3,475 0.5 3,245 3,254 3,512 3,597 3,586
EBITDA (INR/MT) 1,023 960 6.6 883 15.9 533 983 936 852 952
Net Sales 1,905 2,081 (8.4) 1,909 (0.2) 5,553 7,580 8,356 9,050 10,496
EBITDA 432 489 (11.8) 387 11.7 783 1,759 1,758 1,733 2,201
APAT 272 331 (17.8) 233 16.6 433 1,151 1,177 1,136 1,246
AEPS (INR) 19.4 23.6 (17.8) 16.7 16.6 30.9 82.2 84.0 81.1 88.9
EV/EBITDA (x)
10.8 4.0 4.0 5.7 5.9
EV/MT (INR bn)
3.75 3.11 3.13 4.39 3.07
P/E (x)
19.8 7.4 7.3 7.5 6.9
RoE (%)
10.1 22.7 19.1 15.9 15.3
Source: Company, HSIE Research
Estimates revision summary
INR mn Current Estimates Old Estimates Revisions (%)
FY22E FY23E FY24E FY22E FY23E FY24E FY22E FY23E FY24E
Net Sales 8,356 9,050 10,496 8,263 8,797 11,000 1.1 2.9 (4.6)
EBITDA 1,758 1,733 2,201 1,686 1,676 2,204 4.3 3.4 (0.1)
APAT 1,177 1,136 1,246 1,095 1,069 1,265 7.5 6.3 (1.5)
Source: Company, HSIE Research
BUY
CMP (as on 25 Jan 2022) INR 617
Target Price INR 750
NIFTY 17,278
KEY
CHANGES OLD NEW
Rating BUY BUY
Price Target INR 750 INR 750
EBITDA
revision %
FY22E FY23E
4.3 3.4
KEY STOCK DATA
Bloomberg code DECM IN
No. of Shares (mn) 14
MCap (INR bn) / ($ mn) 9/116
6m avg traded value (INR mn) 46
52 Week high / low INR 847/348
STOCK PERFORMANCE (%)
3M 6M 12M
Absolute (%) (10.6) (14.1) 72.7
Relative (%) (5.5) (23.3) 53.0
SHAREHOLDING PATTERN (%)
Sep-21 Dec-21
Promoters 56.24 56.24
FIs & Local MFs 0.40 0.40
FPIs 6.26 7.63
Public & Others 37.09 35.73
Pledged Shares - -
Source : BSE
Pledged shares as % of total shares
Rajesh Ravi
+91-22-6171-7352
Keshav Lahoti
+91-22-6171-7353
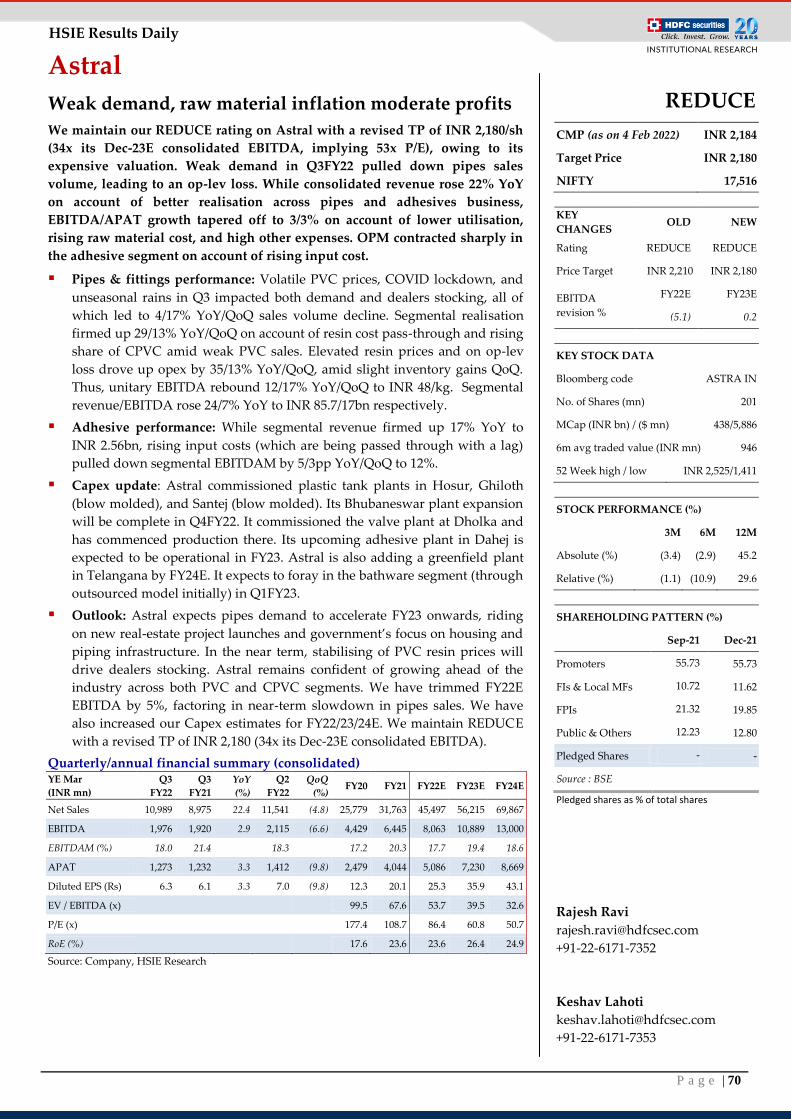
P a g e | 70
HSIE Results Daily
Astral
Weak demand, raw material inflation moderate profits
We maintain our REDUCE rating on Astral with a revised TP of INR 2,180/sh
(34x its Dec-23E consolidated EBITDA, implying 53x P/E), owing to its
expensive valuation. Weak demand in Q3FY22 pulled down pipes sales
volume, leading to an op-lev loss. While consolidated revenue rose 22% YoY
on account of better realisation across pipes and adhesives business,
EBITDA/APAT growth tapered off to 3/3% on account of lower utilisation,
rising raw material cost, and high other expenses. OPM contracted sharply in
the adhesive segment on account of rising input cost.
Pipes & fittings performance: Volatile PVC prices, COVID lockdown, and
unseasonal rains in Q3 impacted both demand and dealers stocking, all of
which led to 4/17% YoY/QoQ sales volume decline. Segmental realisation
firmed up 29/13% YoY/QoQ on account of resin cost pass-through and rising
share of CPVC amid weak PVC sales. Elevated resin prices and on op-lev
loss drove up opex by 35/13% YoY/QoQ, amid slight inventory gains QoQ.
Thus, unitary EBITDA rebound 12/17% YoY/QoQ to INR 48/kg. Segmental
revenue/EBITDA rose 24/7% YoY to INR 85.7/17bn respectively.
Adhesive performance: While segmental revenue firmed up 17% YoY to
INR 2.56bn, rising input costs (which are being passed through with a lag)
pulled down segmental EBITDAM by 5/3pp YoY/QoQ to 12%.
Capex update: Astral commissioned plastic tank plants in Hosur, Ghiloth
(blow molded), and Santej (blow molded). Its Bhubaneswar plant expansion
will be complete in Q4FY22. It commissioned the valve plant at Dholka and
has commenced production there. Its upcoming adhesive plant in Dahej is
expected to be operational in FY23. Astral is also adding a greenfield plant
in Telangana by FY24E. It expects to foray in the bathware segment (through
outsourced model initially) in Q1FY23.
Outlook: Astral expects pipes demand to accelerate FY23 onwards, riding
on new real-estate project launches and government’s focus on housing and
piping infrastructure. In the near term, stabilising of PVC resin prices will
drive dealers stocking. Astral remains confident of growing ahead of the
industry across both PVC and CPVC segments. We have trimmed FY22E
EBITDA by 5%, factoring in near-term slowdown in pipes sales. We have
also increased our Capex estimates for FY22/23/24E. We maintain REDUCE
with a revised TP of INR 2,180 (34x its Dec-23E consolidated EBITDA).
Quarterly/annual financial summary (consolidated) YE Mar
(INR mn)
Q3
FY22
Q3
FY21
YoY
(%)
Q2
FY22
QoQ
(%) FY20 FY21 FY22E FY23E FY24E
Net Sales 10,989 8,975 22.4 11,541 (4.8) 25,779 31,763 45,497 56,215 69,867
EBITDA 1,976 1,920 2.9 2,115 (6.6) 4,429 6,445 8,063 10,889 13,000
EBITDAM (%) 18.0 21.4
18.3
17.2 20.3 17.7 19.4 18.6
APAT 1,273 1,232 3.3 1,412 (9.8) 2,479 4,044 5,086 7,230 8,669
Diluted EPS (Rs) 6.3 6.1 3.3 7.0 (9.8) 12.3 20.1 25.3 35.9 43.1
EV / EBITDA (x)
99.5 67.6 53.7 39.5 32.6
P/E (x)
177.4 108.7 86.4 60.8 50.7
RoE (%)
17.6 23.6 23.6 26.4 24.9
Source: Company, HSIE Research
REDUCE
CMP (as on 4 Feb 2022) INR 2,184
Target Price INR 2,180
NIFTY 17,516
KEY
CHANGES OLD NEW
Rating REDUCE REDUCE
Price Target INR 2,210 INR 2,180
EBITDA
revision %
FY22E FY23E
(5.1) 0.2
KEY STOCK DATA
Bloomberg code ASTRA IN
No. of Shares (mn) 201
MCap (INR bn) / ($ mn) 438/5,886
6m avg traded value (INR mn) 946
52 Week high / low INR 2,525/1,411
STOCK PERFORMANCE (%)
3M 6M 12M
Absolute (%) (3.4) (2.9) 45.2
Relative (%) (1.1) (10.9) 29.6
SHAREHOLDING PATTERN (%)
Sep-21 Dec-21
Promoters 55.73 55.73
FIs & Local MFs 10.72 11.62
FPIs 21.32 19.85
Public & Others 12.23 12.80
Pledged Shares - -
Source : BSE
Pledged shares as % of total shares
Rajesh Ravi
+91-22-6171-7352
Keshav Lahoti
+91-22-6171-7353
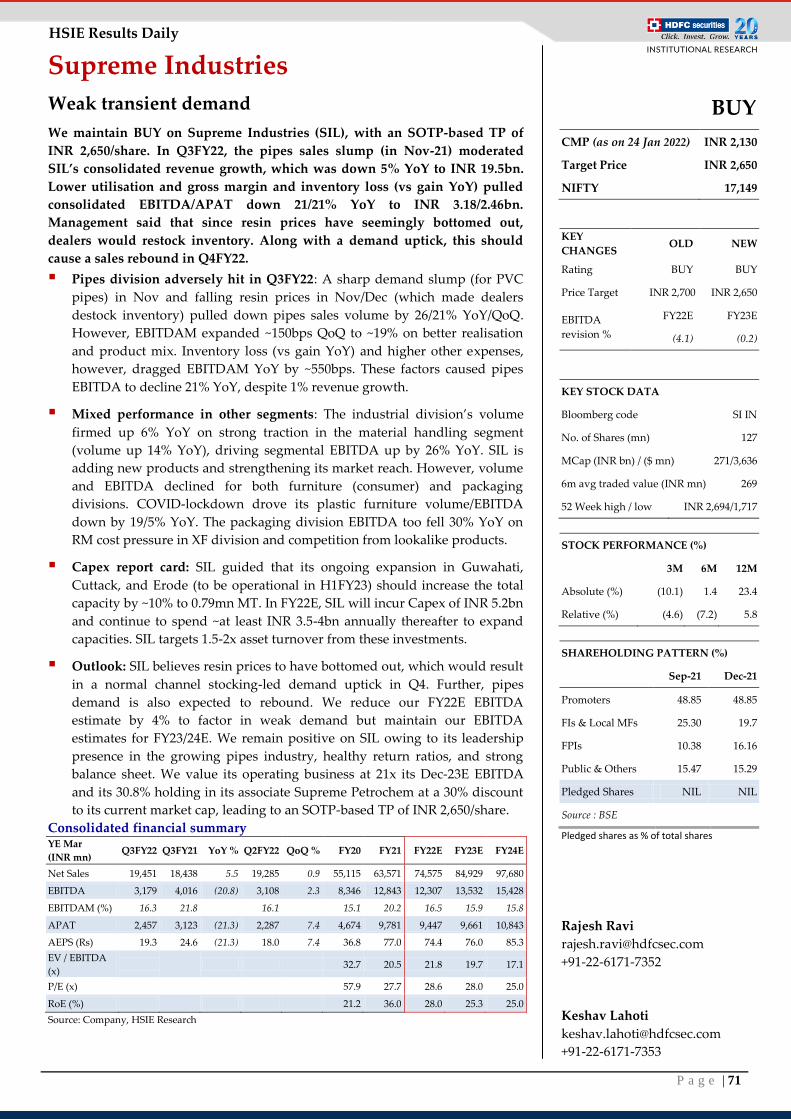
P a g e | 71
HSIE Results Daily
Supreme Industries
Weak transient demand
We maintain BUY on Supreme Industries (SIL), with an SOTP-based TP of
INR 2,650/share. In Q3FY22, the pipes sales slump (in Nov-21) moderated
SIL’s consolidated revenue growth, which was down 5% YoY to INR 19.5bn.
Lower utilisation and gross margin and inventory loss (vs gain YoY) pulled
consolidated EBITDA/APAT down 21/21% YoY to INR 3.18/2.46bn.
Management said that since resin prices have seemingly bottomed out,
dealers would restock inventory. Along with a demand uptick, this should
cause a sales rebound in Q4FY22.
Pipes division adversely hit in Q3FY22: A sharp demand slump (for PVC
pipes) in Nov and falling resin prices in Nov/Dec (which made dealers
destock inventory) pulled down pipes sales volume by 26/21% YoY/QoQ.
However, EBITDAM expanded ~150bps QoQ to ~19% on better realisation
and product mix. Inventory loss (vs gain YoY) and higher other expenses,
however, dragged EBITDAM YoY by ~550bps. These factors caused pipes
EBITDA to decline 21% YoY, despite 1% revenue growth.
Mixed performance in other segments: The industrial division’s volume
firmed up 6% YoY on strong traction in the material handling segment
(volume up 14% YoY), driving segmental EBITDA up by 26% YoY. SIL is
adding new products and strengthening its market reach. However, volume
and EBITDA declined for both furniture (consumer) and packaging
divisions. COVID-lockdown drove its plastic furniture volume/EBITDA
down by 19/5% YoY. The packaging division EBITDA too fell 30% YoY on
RM cost pressure in XF division and competition from lookalike products.
Capex report card: SIL guided that its ongoing expansion in Guwahati,
Cuttack, and Erode (to be operational in H1FY23) should increase the total
capacity by ~10% to 0.79mn MT. In FY22E, SIL will incur Capex of INR 5.2bn
and continue to spend ~at least INR 3.5-4bn annually thereafter to expand
capacities. SIL targets 1.5-2x asset turnover from these investments.
Outlook: SIL believes resin prices to have bottomed out, which would result
in a normal channel stocking-led demand uptick in Q4. Further, pipes
demand is also expected to rebound. We reduce our FY22E EBITDA
estimate by 4% to factor in weak demand but maintain our EBITDA
estimates for FY23/24E. We remain positive on SIL owing to its leadership
presence in the growing pipes industry, healthy return ratios, and strong
balance sheet. We value its operating business at 21x its Dec-23E EBITDA
and its 30.8% holding in its associate Supreme Petrochem at a 30% discount
to its current market cap, leading to an SOTP-based TP of INR 2,650/share.
Consolidated financial summary YE Mar
(INR mn) Q3FY22 Q3FY21 YoY % Q2FY22 QoQ % FY20 FY21 FY22E FY23E FY24E
Net Sales 19,451 18,438 5.5 19,285 0.9 55,115 63,571 74,575 84,929 97,680
EBITDA 3,179 4,016 (20.8) 3,108 2.3 8,346 12,843 12,307 13,532 15,428
EBITDAM (%) 16.3 21.8 16.1 15.1 20.2 16.5 15.9 15.8
APAT 2,457 3,123 (21.3) 2,287 7.4 4,674 9,781 9,447 9,661 10,843
AEPS (Rs) 19.3 24.6 (21.3) 18.0 7.4 36.8 77.0 74.4 76.0 85.3
EV / EBITDA
(x)
32.7 20.5 21.8 19.7 17.1
P/E (x)
57.9 27.7 28.6 28.0 25.0
RoE (%)
21.2 36.0 28.0 25.3 25.0
Source: Company, HSIE Research
BUY
CMP (as on 24 Jan 2022) INR 2,130
Target Price INR 2,650
NIFTY 17,149
KEY
CHANGES OLD NEW
Rating BUY BUY
Price Target INR 2,700 INR 2,650
EBITDA
revision %
FY22E FY23E
(4.1) (0.2)
KEY STOCK DATA
Bloomberg code SI IN
No. of Shares (mn) 127
MCap (INR bn) / ($ mn) 271/3,636
6m avg traded value (INR mn) 269
52 Week high / low INR 2,694/1,717
STOCK PERFORMANCE (%)
3M 6M 12M
Absolute (%) (10.1) 1.4 23.4
Relative (%) (4.6) (7.2) 5.8
SHAREHOLDING PATTERN (%)
Sep-21 Dec-21
Promoters 48.85 48.85
FIs & Local MFs 25.30 19.7
FPIs 10.38 16.16
Public & Others 15.47 15.29
Pledged Shares NIL NIL
Source : BSE
Pledged shares as % of total shares
Rajesh Ravi
+91-22-6171-7352
Keshav Lahoti
+91-22-6171-7353
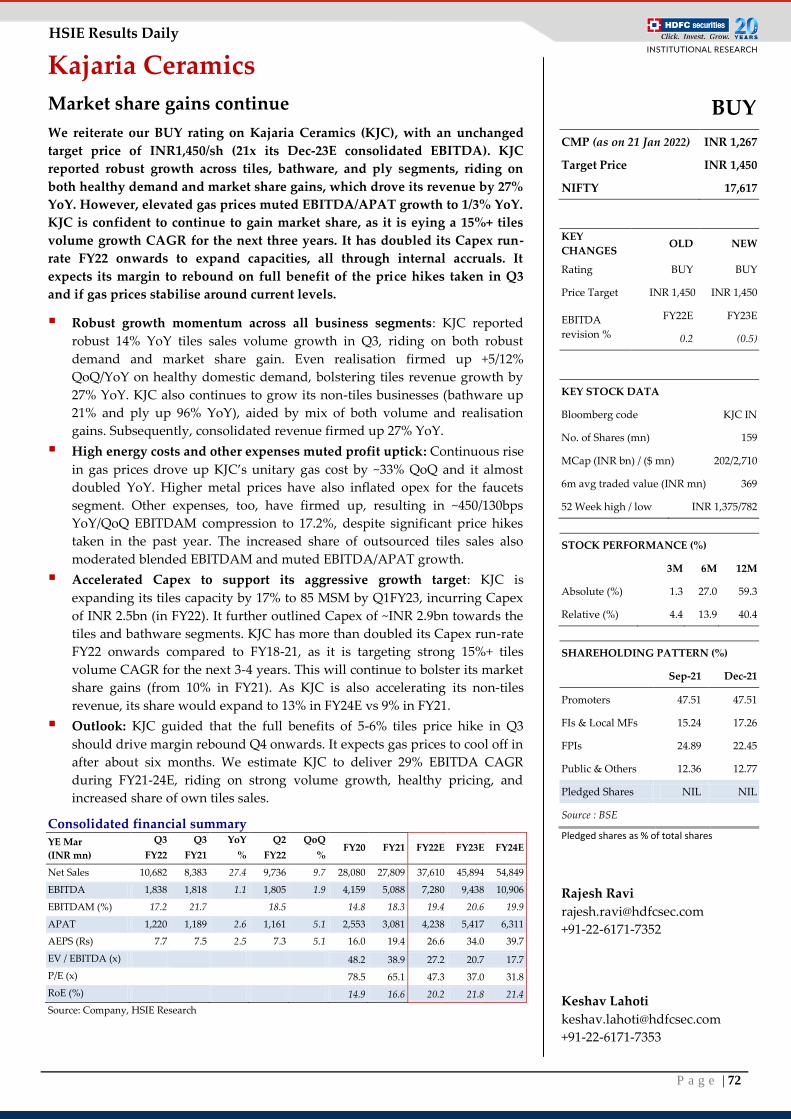
P a g e | 72
HSIE Results Daily
Kajaria Ceramics
Market share gains continue
We reiterate our BUY rating on Kajaria Ceramics (KJC), with an unchanged
target price of INR1,450/sh (21x its Dec-23E consolidated EBITDA). KJC
reported robust growth across tiles, bathware, and ply segments, riding on
both healthy demand and market share gains, which drove its revenue by 27%
YoY. However, elevated gas prices muted EBITDA/APAT growth to 1/3% YoY.
KJC is confident to continue to gain market share, as it is eying a 15%+ tiles
volume growth CAGR for the next three years. It has doubled its Capex run-
rate FY22 onwards to expand capacities, all through internal accruals. It
expects its margin to rebound on full benefit of the price hikes taken in Q3
and if gas prices stabilise around current levels.
Robust growth momentum across all business segments: KJC reported
robust 14% YoY tiles sales volume growth in Q3, riding on both robust
demand and market share gain. Even realisation firmed up +5/12%
QoQ/YoY on healthy domestic demand, bolstering tiles revenue growth by
27% YoY. KJC also continues to grow its non-tiles businesses (bathware up
21% and ply up 96% YoY), aided by mix of both volume and realisation
gains. Subsequently, consolidated revenue firmed up 27% YoY.
High energy costs and other expenses muted profit uptick: Continuous rise
in gas prices drove up KJC’s unitary gas cost by ~33% QoQ and it almost
doubled YoY. Higher metal prices have also inflated opex for the faucets
segment. Other expenses, too, have firmed up, resulting in ~450/130bps
YoY/QoQ EBITDAM compression to 17.2%, despite significant price hikes
taken in the past year. The increased share of outsourced tiles sales also
moderated blended EBITDAM and muted EBITDA/APAT growth.
Accelerated Capex to support its aggressive growth target: KJC is
expanding its tiles capacity by 17% to 85 MSM by Q1FY23, incurring Capex
of INR 2.5bn (in FY22). It further outlined Capex of ~INR 2.9bn towards the
tiles and bathware segments. KJC has more than doubled its Capex run-rate
FY22 onwards compared to FY18-21, as it is targeting strong 15%+ tiles
volume CAGR for the next 3-4 years. This will continue to bolster its market
share gains (from 10% in FY21). As KJC is also accelerating its non-tiles
revenue, its share would expand to 13% in FY24E vs 9% in FY21.
Outlook: KJC guided that the full benefits of 5-6% tiles price hike in Q3
should drive margin rebound Q4 onwards. It expects gas prices to cool off in
after about six months. We estimate KJC to deliver 29% EBITDA CAGR
during FY21-24E, riding on strong volume growth, healthy pricing, and
increased share of own tiles sales.
Consolidated financial summary
YE Mar
(INR mn)
Q3
FY22
Q3
FY21
YoY
%
Q2
FY22
QoQ
% FY20 FY21 FY22E FY23E FY24E
Net Sales 10,682 8,383 27.4 9,736 9.7 28,080 27,809 37,610 45,894 54,849
EBITDA 1,838 1,818 1.1 1,805 1.9 4,159 5,088 7,280 9,438 10,906
EBITDAM (%) 17.2 21.7 18.5 14.8 18.3 19.4 20.6 19.9
APAT 1,220 1,189 2.6 1,161 5.1 2,553 3,081 4,238 5,417 6,311
AEPS (Rs) 7.7 7.5 2.5 7.3 5.1 16.0 19.4 26.6 34.0 39.7
EV / EBITDA (x)
48.2 38.9 27.2 20.7 17.7
P/E (x)
78.5 65.1 47.3 37.0 31.8
RoE (%)
14.9 16.6 20.2 21.8 21.4
Source: Company, HSIE Research
BUY
CMP (as on 21 Jan 2022) INR 1,267
Target Price INR 1,450
NIFTY 17,617
KEY
CHANGES OLD NEW
Rating BUY BUY
Price Target INR 1,450 INR 1,450
EBITDA
revision %
FY22E FY23E
0.2 (0.5)
KEY STOCK DATA
Bloomberg code KJC IN
No. of Shares (mn) 159
MCap (INR bn) / ($ mn) 202/2,710
6m avg traded value (INR mn) 369
52 Week high / low INR 1,375/782
STOCK PERFORMANCE (%)
3M 6M 12M
Absolute (%) 1.3 27.0 59.3
Relative (%) 4.4 13.9 40.4
SHAREHOLDING PATTERN (%)
Sep-21 Dec-21
Promoters 47.51 47.51
FIs & Local MFs 15.24 17.26
FPIs 24.89 22.45
Public & Others 12.36 12.77
Pledged Shares NIL NIL
Source : BSE
Pledged shares as % of total shares
Rajesh Ravi
+91-22-6171-7352
Keshav Lahoti
+91-22-6171-7353
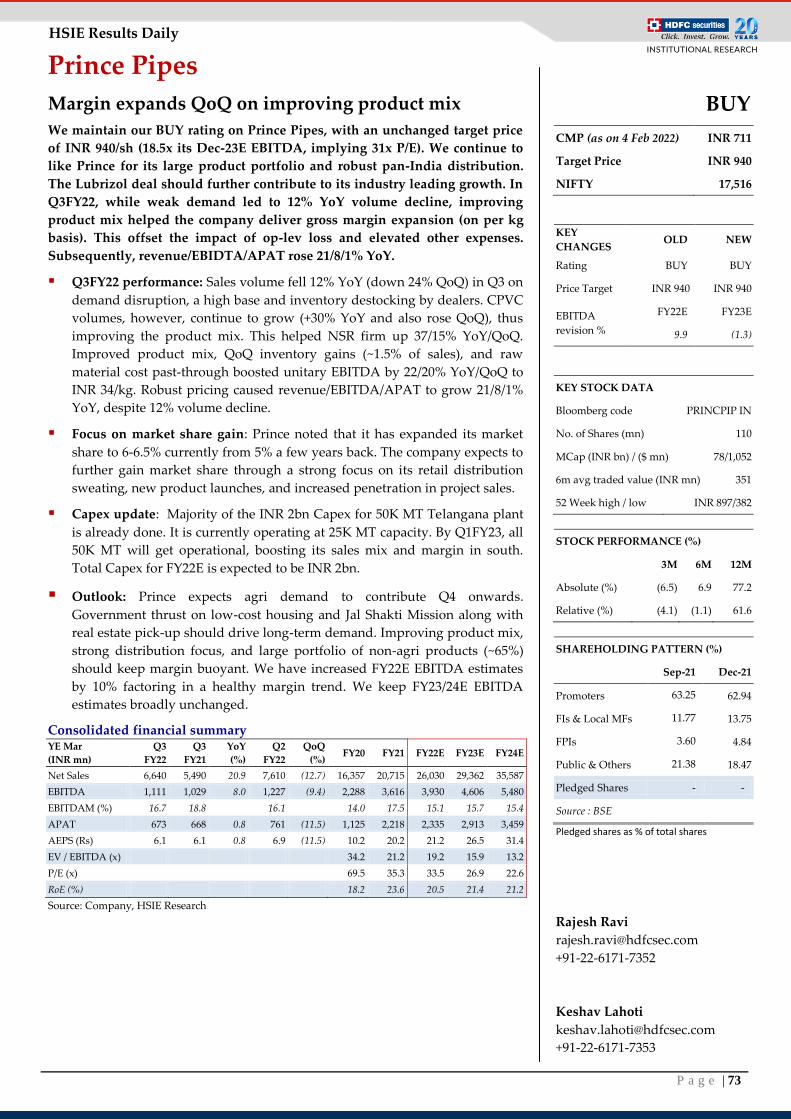
P a g e | 73
HSIE Results Daily
Prince Pipes
Margin expands QoQ on improving product mix
We maintain our BUY rating on Prince Pipes, with an unchanged target price
of INR 940/sh (18.5x its Dec-23E EBITDA, implying 31x P/E). We continue to
like Prince for its large product portfolio and robust pan-India distribution.
The Lubrizol deal should further contribute to its industry leading growth. In
Q3FY22, while weak demand led to 12% YoY volume decline, improving
product mix helped the company deliver gross margin expansion (on per kg
basis). This offset the impact of op-lev loss and elevated other expenses.
Subsequently, revenue/EBIDTA/APAT rose 21/8/1% YoY.
Q3FY22 performance: Sales volume fell 12% YoY (down 24% QoQ) in Q3 on
demand disruption, a high base and inventory destocking by dealers. CPVC
volumes, however, continue to grow (+30% YoY and also rose QoQ), thus
improving the product mix. This helped NSR firm up 37/15% YoY/QoQ.
Improved product mix, QoQ inventory gains (~1.5% of sales), and raw
material cost past-through boosted unitary EBITDA by 22/20% YoY/QoQ to
INR 34/kg. Robust pricing caused revenue/EBITDA/APAT to grow 21/8/1%
YoY, despite 12% volume decline.
Focus on market share gain: Prince noted that it has expanded its market
share to 6-6.5% currently from 5% a few years back. The company expects to
further gain market share through a strong focus on its retail distribution
sweating, new product launches, and increased penetration in project sales.
Capex update: Majority of the INR 2bn Capex for 50K MT Telangana plant
is already done. It is currently operating at 25K MT capacity. By Q1FY23, all
50K MT will get operational, boosting its sales mix and margin in south.
Total Capex for FY22E is expected to be INR 2bn.
Outlook: Prince expects agri demand to contribute Q4 onwards.
Government thrust on low-cost housing and Jal Shakti Mission along with
real estate pick-up should drive long-term demand. Improving product mix,
strong distribution focus, and large portfolio of non-agri products (~65%)
should keep margin buoyant. We have increased FY22E EBITDA estimates
by 10% factoring in a healthy margin trend. We keep FY23/24E EBITDA
estimates broadly unchanged.
Consolidated financial summary YE Mar
(INR mn)
Q3
FY22
Q3
FY21
YoY
(%)
Q2
FY22
QoQ
(%) FY20 FY21 FY22E FY23E FY24E
Net Sales 6,640 5,490 20.9 7,610 (12.7) 16,357 20,715 26,030 29,362 35,587
EBITDA 1,111 1,029 8.0 1,227 (9.4) 2,288 3,616 3,930 4,606 5,480
EBITDAM (%) 16.7 18.8 16.1 14.0 17.5 15.1 15.7 15.4
APAT 673 668 0.8 761 (11.5) 1,125 2,218 2,335 2,913 3,459
AEPS (Rs) 6.1 6.1 0.8 6.9 (11.5) 10.2 20.2 21.2 26.5 31.4
EV / EBITDA (x)
34.2 21.2 19.2 15.9 13.2
P/E (x)
69.5 35.3 33.5 26.9 22.6
RoE (%)
18.2 23.6 20.5 21.4 21.2
Source: Company, HSIE Research
BUY
CMP (as on 4 Feb 2022) INR 711
Target Price INR 940
NIFTY 17,516
KEY
CHANGES OLD NEW
Rating BUY BUY
Price Target INR 940 INR 940
EBITDA
revision %
FY22E FY23E
9.9 (1.3)
KEY STOCK DATA
Bloomberg code PRINCPIP IN
No. of Shares (mn) 110
MCap (INR bn) / ($ mn) 78/1,052
6m avg traded value (INR mn) 351
52 Week high / low INR 897/382
STOCK PERFORMANCE (%)
3M 6M 12M
Absolute (%) (6.5) 6.9 77.2
Relative (%) (4.1) (1.1) 61.6
SHAREHOLDING PATTERN (%)
Sep-21 Dec-21
Promoters 63.25 62.94
FIs & Local MFs 11.77 13.75
FPIs 3.60 4.84
Public & Others 21.38 18.47
Pledged Shares - -
Source : BSE
Pledged shares as % of total shares
Rajesh Ravi
+91-22-6171-7352
Keshav Lahoti
+91-22-6171-7353
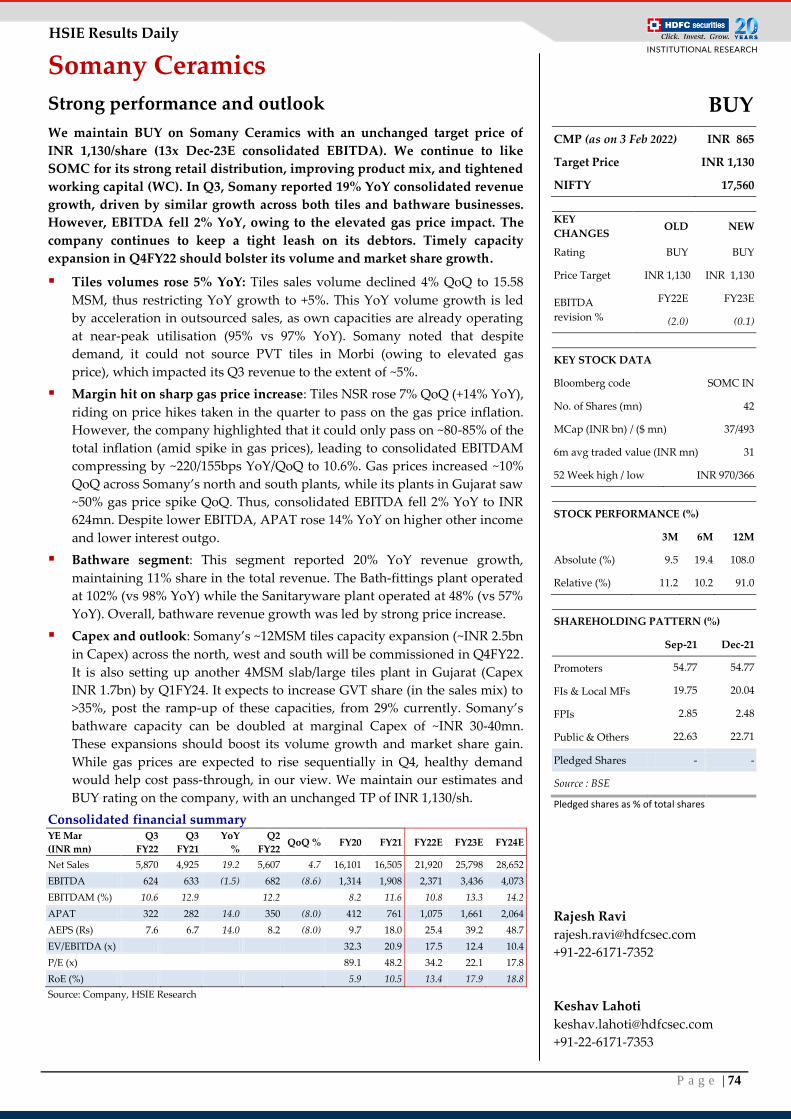
P a g e | 74
HSIE Results Daily
Somany Ceramics
Strong performance and outlook
We maintain BUY on Somany Ceramics with an unchanged target price of
INR 1,130/share (13x Dec-23E consolidated EBITDA). We continue to like
SOMC for its strong retail distribution, improving product mix, and tightened
working capital (WC). In Q3, Somany reported 19% YoY consolidated revenue
growth, driven by similar growth across both tiles and bathware businesses.
However, EBITDA fell 2% YoY, owing to the elevated gas price impact. The
company continues to keep a tight leash on its debtors. Timely capacity
expansion in Q4FY22 should bolster its volume and market share growth.
Tiles volumes rose 5% YoY: Tiles sales volume declined 4% QoQ to 15.58
MSM, thus restricting YoY growth to +5%. This YoY volume growth is led
by acceleration in outsourced sales, as own capacities are already operating
at near-peak utilisation (95% vs 97% YoY). Somany noted that despite
demand, it could not source PVT tiles in Morbi (owing to elevated gas
price), which impacted its Q3 revenue to the extent of ~5%.
Margin hit on sharp gas price increase: Tiles NSR rose 7% QoQ (+14% YoY),
riding on price hikes taken in the quarter to pass on the gas price inflation.
However, the company highlighted that it could only pass on ~80-85% of the
total inflation (amid spike in gas prices), leading to consolidated EBITDAM
compressing by ~220/155bps YoY/QoQ to 10.6%. Gas prices increased ~10%
QoQ across Somany’s north and south plants, while its plants in Gujarat saw
~50% gas price spike QoQ. Thus, consolidated EBITDA fell 2% YoY to INR
624mn. Despite lower EBITDA, APAT rose 14% YoY on higher other income
and lower interest outgo.
Bathware segment: This segment reported 20% YoY revenue growth,
maintaining 11% share in the total revenue. The Bath-fittings plant operated
at 102% (vs 98% YoY) while the Sanitaryware plant operated at 48% (vs 57%
YoY). Overall, bathware revenue growth was led by strong price increase.
Capex and outlook: Somany’s ~12MSM tiles capacity expansion (~INR 2.5bn
in Capex) across the north, west and south will be commissioned in Q4FY22.
It is also setting up another 4MSM slab/large tiles plant in Gujarat (Capex
INR 1.7bn) by Q1FY24. It expects to increase GVT share (in the sales mix) to
>35%, post the ramp-up of these capacities, from 29% currently. Somany’s
bathware capacity can be doubled at marginal Capex of ~INR 30-40mn.
These expansions should boost its volume growth and market share gain.
While gas prices are expected to rise sequentially in Q4, healthy demand
would help cost pass-through, in our view. We maintain our estimates and
BUY rating on the company, with an unchanged TP of INR 1,130/sh.
Consolidated financial summary YE Mar
(INR mn)
Q3
FY22
Q3
FY21
YoY
%
Q2
FY22 QoQ % FY20 FY21 FY22E FY23E FY24E
Net Sales 5,870 4,925 19.2 5,607 4.7 16,101 16,505 21,920 25,798 28,652
EBITDA 624 633 (1.5) 682 (8.6) 1,314 1,908 2,371 3,436 4,073
EBITDAM (%) 10.6 12.9 12.2 8.2 11.6 10.8 13.3 14.2
APAT 322 282 14.0 350 (8.0) 412 761 1,075 1,661 2,064
AEPS (Rs) 7.6 6.7 14.0 8.2 (8.0) 9.7 18.0 25.4 39.2 48.7
EV/EBITDA (x)
32.3 20.9 17.5 12.4 10.4
P/E (x)
89.1 48.2 34.2 22.1 17.8
RoE (%)
5.9 10.5 13.4 17.9 18.8
Source: Company, HSIE Research
BUY
CMP (as on 3 Feb 2022) INR 865
Target Price INR 1,130
NIFTY 17,560
KEY
CHANGES OLD NEW
Rating BUY BUY
Price Target INR 1,130 INR 1,130
EBITDA
revision %
FY22E FY23E
(2.0) (0.1)
KEY STOCK DATA
Bloomberg code SOMC IN
No. of Shares (mn) 42
MCap (INR bn) / ($ mn) 37/493
6m avg traded value (INR mn) 31
52 Week high / low INR 970/366
STOCK PERFORMANCE (%)
3M 6M 12M
Absolute (%) 9.5 19.4 108.0
Relative (%) 11.2 10.2 91.0
SHAREHOLDING PATTERN (%)
Sep-21 Dec-21
Promoters 54.77 54.77
FIs & Local MFs 19.75 20.04
FPIs 2.85 2.48
Public & Others 22.63 22.71
Pledged Shares - -
Source : BSE
Pledged shares as % of total shares
Rajesh Ravi
+91-22-6171-7352
Keshav Lahoti
+91-22-6171-7353

P a g e | 75
HSIE Results Daily
Chemicals
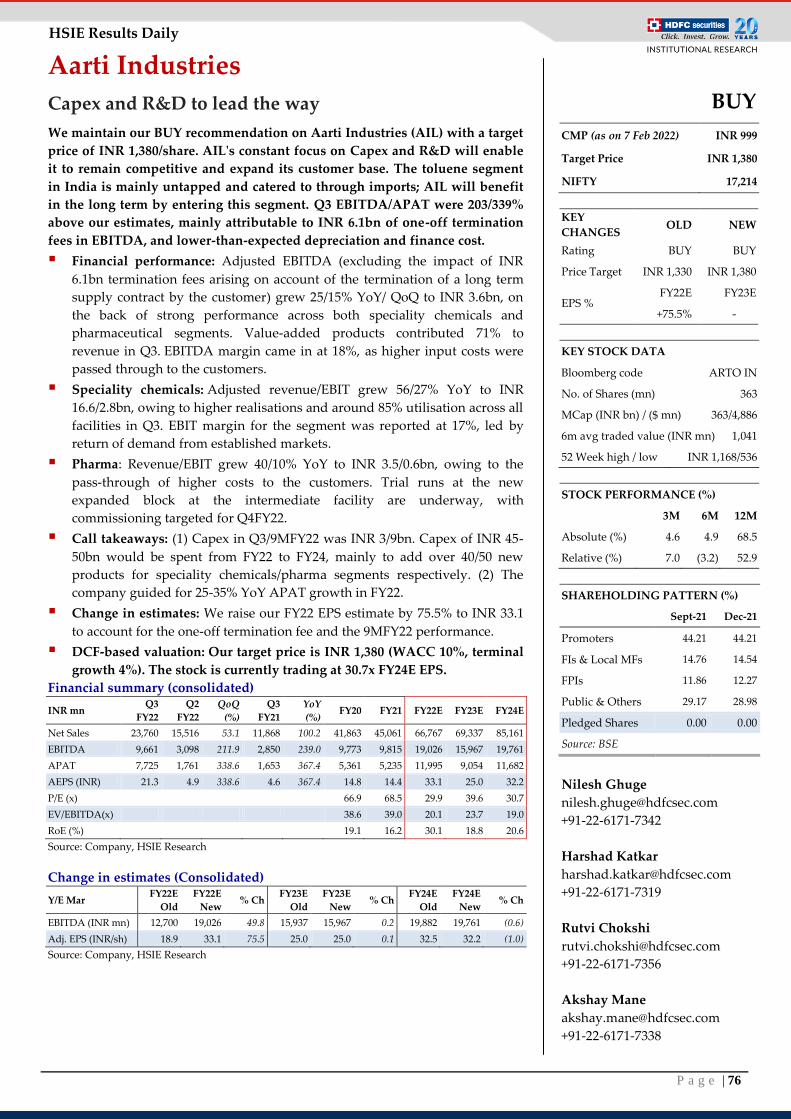
P a g e | 76
HSIE Results Daily
Aarti Industries
Capex and R&D to lead the way
We maintain our BUY recommendation on Aarti Industries (AIL) with a target
price of INR 1,380/share. AIL's constant focus on Capex and R&D will enable
it to remain competitive and expand its customer base. The toluene segment
in India is mainly untapped and catered to through imports; AIL will benefit
in the long term by entering this segment. Q3 EBITDA/APAT were 203/339%
above our estimates, mainly attributable to INR 6.1bn of one-off termination
fees in EBITDA, and lower-than-expected depreciation and finance cost.
Financial performance: Adjusted EBITDA (excluding the impact of INR
6.1bn termination fees arising on account of the termination of a long term
supply contract by the customer) grew 25/15% YoY/ QoQ to INR 3.6bn, on
the back of strong performance across both speciality chemicals and
pharmaceutical segments. Value-added products contributed 71% to
revenue in Q3. EBITDA margin came in at 18%, as higher input costs were
passed through to the customers.
Speciality chemicals: Adjusted revenue/EBIT grew 56/27% YoY to INR
16.6/2.8bn, owing to higher realisations and around 85% utilisation across all
facilities in Q3. EBIT margin for the segment was reported at 17%, led by
return of demand from established markets.
Pharma: Revenue/EBIT grew 40/10% YoY to INR 3.5/0.6bn, owing to the
pass-through of higher costs to the customers. Trial runs at the new
expanded block at the intermediate facility are underway, with
commissioning targeted for Q4FY22.
Call takeaways: (1) Capex in Q3/9MFY22 was INR 3/9bn. Capex of INR 45-
50bn would be spent from FY22 to FY24, mainly to add over 40/50 new
products for speciality chemicals/pharma segments respectively. (2) The
company guided for 25-35% YoY APAT growth in FY22.
Change in estimates: We raise our FY22 EPS estimate by 75.5% to INR 33.1
to account for the one-off termination fee and the 9MFY22 performance.
DCF-based valuation: Our target price is INR 1,380 (WACC 10%, terminal
growth 4%). The stock is currently trading at 30.7x FY24E EPS.
Financial summary (consolidated)
INR mn Q3
FY22
Q2
FY22
QoQ
(%)
Q3
FY21
YoY
(%) FY20 FY21 FY22E FY23E FY24E
Net Sales 23,760 15,516 53.1 11,868 100.2 41,863 45,061 66,767 69,337 85,161
EBITDA 9,661 3,098 211.9 2,850 239.0 9,773 9,815 19,026 15,967 19,761
APAT 7,725 1,761 338.6 1,653 367.4 5,361 5,235 11,995 9,054 11,682
AEPS (INR) 21.3 4.9 338.6 4.6 367.4 14.8 14.4 33.1 25.0 32.2
P/E (x)
66.9 68.5 29.9 39.6 30.7
EV/EBITDA(x) 38.6 39.0 20.1 23.7 19.0
RoE (%)
19.1 16.2 30.1 18.8 20.6
Source: Company, HSIE Research
Change in estimates (Consolidated)
Y/E Mar FY22E
Old
FY22E
New % Ch
FY23E
Old
FY23E
New % Ch
FY24E
Old
FY24E
New % Ch
EBITDA (INR mn) 12,700 19,026 49.8 15,937 15,967 0.2 19,882 19,761 (0.6)
Adj. EPS (INR/sh) 18.9 33.1 75.5 25.0 25.0 0.1 32.5 32.2 (1.0)
Source: Company, HSIE Research
BUY
CMP (as on 7 Feb 2022) INR 999
Target Price INR 1,380
NIFTY 17,214
KEY
CHANGES OLD NEW
Rating BUY BUY
Price Target INR 1,330 INR 1,380
EPS % FY22E FY23E
+75.5% -
KEY STOCK DATA
Bloomberg code ARTO IN
No. of Shares (mn) 363
MCap (INR bn) / ($ mn) 363/4,886
6m avg traded value (INR mn) 1,041
52 Week high / low INR 1,168/536
STOCK PERFORMANCE (%)
3M 6M 12M
Absolute (%) 4.6 4.9 68.5
Relative (%) 7.0 (3.2) 52.9
SHAREHOLDING PATTERN (%)
Sept-21 Dec-21
Promoters 44.21 44.21
FIs & Local MFs 14.76 14.54
FPIs 11.86 12.27
Public & Others 29.17 28.98
Pledged Shares 0.00 0.00
Source: BSE
Nilesh Ghuge
+91-22-6171-7342
Harshad Katkar
+91-22-6171-7319
Rutvi Chokshi
+91-22-6171-7356
Akshay Mane
+91-22-6171-7338
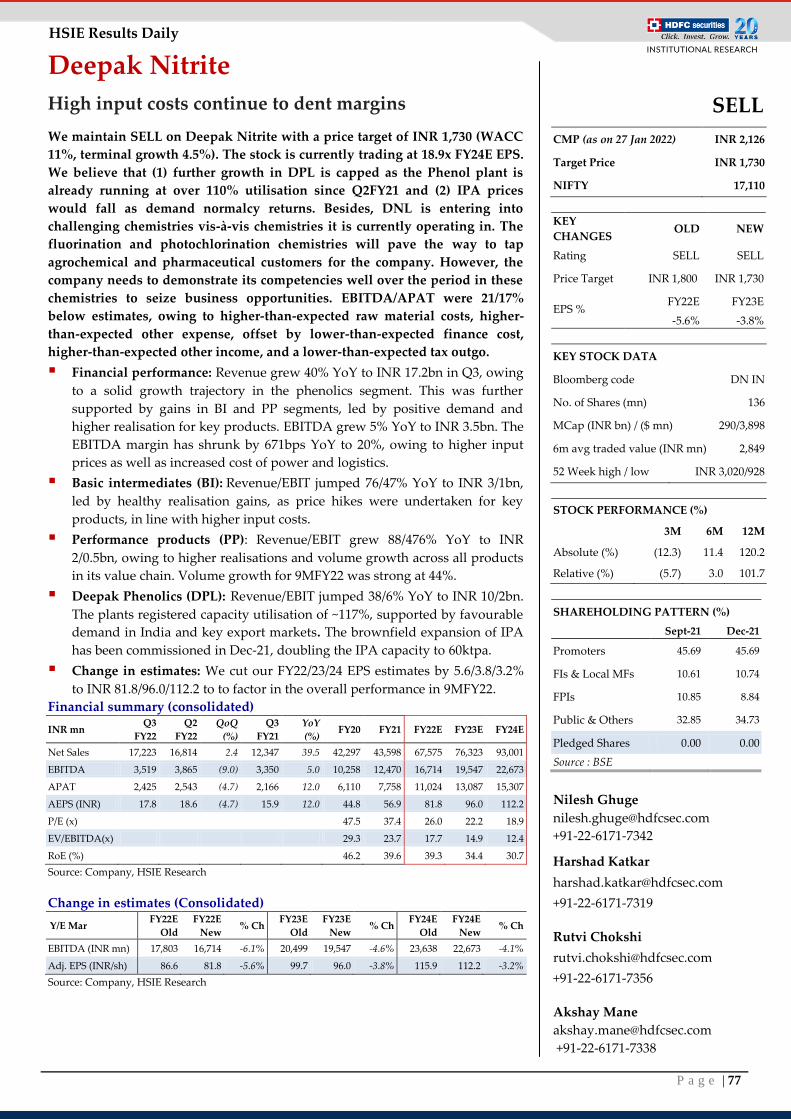
P a g e | 77
HSIE Results Daily
Deepak Nitrite
High input costs continue to dent margins
We maintain SELL on Deepak Nitrite with a price target of INR 1,730 (WACC
11%, terminal growth 4.5%). The stock is currently trading at 18.9x FY24E EPS.
We believe that (1) further growth in DPL is capped as the Phenol plant is
already running at over 110% utilisation since Q2FY21 and (2) IPA prices
would fall as demand normalcy returns. Besides, DNL is entering into
challenging chemistries vis-à-vis chemistries it is currently operating in. The
fluorination and photochlorination chemistries will pave the way to tap
agrochemical and pharmaceutical customers for the company. However, the
company needs to demonstrate its competencies well over the period in these
chemistries to seize business opportunities. EBITDA/APAT were 21/17%
below estimates, owing to higher-than-expected raw material costs, higher-
than-expected other expense, offset by lower-than-expected finance cost,
higher-than-expected other income, and a lower-than-expected tax outgo.
Financial performance: Revenue grew 40% YoY to INR 17.2bn in Q3, owing
to a solid growth trajectory in the phenolics segment. This was further
supported by gains in BI and PP segments, led by positive demand and
higher realisation for key products. EBITDA grew 5% YoY to INR 3.5bn. The
EBITDA margin has shrunk by 671bps YoY to 20%, owing to higher input
prices as well as increased cost of power and logistics.
Basic intermediates (BI): Revenue/EBIT jumped 76/47% YoY to INR 3/1bn,
led by healthy realisation gains, as price hikes were undertaken for key
products, in line with higher input costs.
Performance products (PP): Revenue/EBIT grew 88/476% YoY to INR
2/0.5bn, owing to higher realisations and volume growth across all products
in its value chain. Volume growth for 9MFY22 was strong at 44%.
Deepak Phenolics (DPL): Revenue/EBIT jumped 38/6% YoY to INR 10/2bn.
The plants registered capacity utilisation of ~117%, supported by favourable
demand in India and key export markets. The brownfield expansion of IPA
has been commissioned in Dec-21, doubling the IPA capacity to 60ktpa.
Change in estimates: We cut our FY22/23/24 EPS estimates by 5.6/3.8/3.2%
to INR 81.8/96.0/112.2 to to factor in the overall performance in 9MFY22. Financial summary (consolidated)
INR mn Q3
FY22
Q2
FY22
QoQ
(%)
Q3
FY21
YoY
(%) FY20 FY21 FY22E FY23E FY24E
Net Sales 17,223 16,814 2.4 12,347 39.5 42,297 43,598 67,575 76,323 93,001
EBITDA 3,519 3,865 (9.0) 3,350 5.0 10,258 12,470 16,714 19,547 22,673
APAT 2,425 2,543 (4.7) 2,166 12.0 6,110 7,758 11,024 13,087 15,307
AEPS (INR) 17.8 18.6 (4.7) 15.9 12.0 44.8 56.9 81.8 96.0 112.2
P/E (x)
47.5 37.4 26.0 22.2 18.9
EV/EBITDA(x) 29.3 23.7 17.7 14.9 12.4
RoE (%)
46.2 39.6 39.3 34.4 30.7
Source: Company, HSIE Research
Change in estimates (Consolidated)
Y/E Mar FY22E
Old
FY22E
New % Ch
FY23E
Old
FY23E
New % Ch
FY24E
Old
FY24E
New % Ch
EBITDA (INR mn) 17,803 16,714 -6.1% 20,499 19,547 -4.6% 23,638 22,673 -4.1%
Adj. EPS (INR/sh) 86.6 81.8 -5.6% 99.7 96.0 -3.8% 115.9 112.2 -3.2%
Source: Company, HSIE Research
SELL
CMP (as on 27 Jan 2022) INR 2,126
Target Price INR 1,730
NIFTY 17,110
KEY
CHANGES OLD NEW
Rating SELL SELL
Price Target INR 1,800 INR 1,730
EPS % FY22E FY23E
-5.6% -3.8%
KEY STOCK DATA
Bloomberg code DN IN
No. of Shares (mn) 136
MCap (INR bn) / ($ mn) 290/3,898
6m avg traded value (INR mn) 2,849
52 Week high / low INR 3,020/928
STOCK PERFORMANCE (%)
3M 6M 12M
Absolute (%) (12.3) 11.4 120.2
Relative (%) (5.7) 3.0 101.7
SHAREHOLDING PATTERN (%)
Sept-21 Dec-21
Promoters 45.69 45.69
FIs & Local MFs 10.61 10.74
FPIs 10.85 8.84
Public & Others 32.85 34.73
Pledged Shares 0.00 0.00
Source : BSE
Nilesh Ghuge
+91-22-6171-7342
Harshad Katkar
+91-22-6171-7319
Rutvi Chokshi
+91-22-6171-7356
Akshay Mane
+91-22-6171-7338
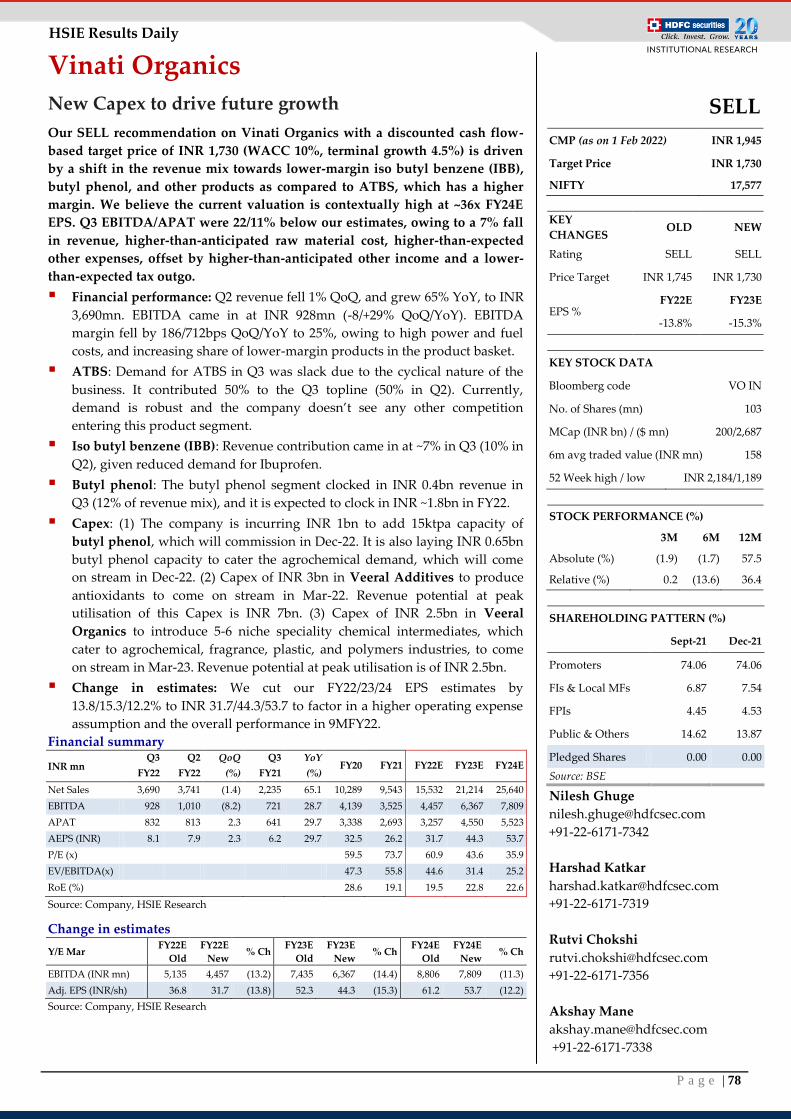
P a g e | 78
HSIE Results Daily
Vinati Organics
New Capex to drive future growth
Our SELL recommendation on Vinati Organics with a discounted cash flow-
based target price of INR 1,730 (WACC 10%, terminal growth 4.5%) is driven
by a shift in the revenue mix towards lower-margin iso butyl benzene (IBB),
butyl phenol, and other products as compared to ATBS, which has a higher
margin. We believe the current valuation is contextually high at ~36x FY24E
EPS. Q3 EBITDA/APAT were 22/11% below our estimates, owing to a 7% fall
in revenue, higher-than-anticipated raw material cost, higher-than-expected
other expenses, offset by higher-than-anticipated other income and a lower-
than-expected tax outgo.
Financial performance: Q2 revenue fell 1% QoQ, and grew 65% YoY, to INR
3,690mn. EBITDA came in at INR 928mn (-8/+29% QoQ/YoY). EBITDA
margin fell by 186/712bps QoQ/YoY to 25%, owing to high power and fuel
costs, and increasing share of lower-margin products in the product basket.
ATBS: Demand for ATBS in Q3 was slack due to the cyclical nature of the
business. It contributed 50% to the Q3 topline (50% in Q2). Currently,
demand is robust and the company doesn’t see any other competition
entering this product segment.
Iso butyl benzene (IBB): Revenue contribution came in at ~7% in Q3 (10% in
Q2), given reduced demand for Ibuprofen.
Butyl phenol: The butyl phenol segment clocked in INR 0.4bn revenue in
Q3 (12% of revenue mix), and it is expected to clock in INR ~1.8bn in FY22.
Capex: (1) The company is incurring INR 1bn to add 15ktpa capacity of
butyl phenol, which will commission in Dec-22. It is also laying INR 0.65bn
butyl phenol capacity to cater the agrochemical demand, which will come
on stream in Dec-22. (2) Capex of INR 3bn in Veeral Additives to produce
antioxidants to come on stream in Mar-22. Revenue potential at peak
utilisation of this Capex is INR 7bn. (3) Capex of INR 2.5bn in Veeral
Organics to introduce 5-6 niche speciality chemical intermediates, which
cater to agrochemical, fragrance, plastic, and polymers industries, to come
on stream in Mar-23. Revenue potential at peak utilisation is of INR 2.5bn.
Change in estimates: We cut our FY22/23/24 EPS estimates by
13.8/15.3/12.2% to INR 31.7/44.3/53.7 to factor in a higher operating expense
assumption and the overall performance in 9MFY22.
Financial summary
INR mn Q3
FY22
Q2
FY22
QoQ
(%)
Q3
FY21
YoY
(%) FY20 FY21 FY22E FY23E FY24E
Net Sales 3,690 3,741 (1.4) 2,235 65.1 10,289 9,543 15,532 21,214 25,640
EBITDA 928 1,010 (8.2) 721 28.7 4,139 3,525 4,457 6,367 7,809
APAT 832 813 2.3 641 29.7 3,338 2,693 3,257 4,550 5,523
AEPS (INR) 8.1 7.9 2.3 6.2 29.7 32.5 26.2 31.7 44.3 53.7
P/E (x)
59.5 73.7 60.9 43.6 35.9
EV/EBITDA(x) 47.3 55.8 44.6 31.4 25.2
RoE (%)
28.6 19.1 19.5 22.8 22.6
Source: Company, HSIE Research
Change in estimates
Y/E Mar FY22E
Old
FY22E
New % Ch
FY23E
Old
FY23E
New % Ch
FY24E
Old
FY24E
New % Ch
EBITDA (INR mn) 5,135 4,457 (13.2) 7,435 6,367 (14.4) 8,806 7,809 (11.3)
Adj. EPS (INR/sh) 36.8 31.7 (13.8) 52.3 44.3 (15.3) 61.2 53.7 (12.2)
Source: Company, HSIE Research
SELL
CMP (as on 1 Feb 2022) INR 1,945
Target Price INR 1,730
NIFTY 17,577
KEY
CHANGES OLD NEW
Rating SELL SELL
Price Target INR 1,745 INR 1,730
EPS % FY22E FY23E
-13.8% -15.3%
KEY STOCK DATA
Bloomberg code VO IN
No. of Shares (mn) 103
MCap (INR bn) / ($ mn) 200/2,687
6m avg traded value (INR mn) 158
52 Week high / low INR 2,184/1,189
STOCK PERFORMANCE (%)
3M 6M 12M
Absolute (%) (1.9) (1.7) 57.5
Relative (%) 0.2 (13.6) 36.4
SHAREHOLDING PATTERN (%)
Sept-21 Dec-21
Promoters 74.06 74.06
FIs & Local MFs 6.87 7.54
FPIs 4.45 4.53
Public & Others 14.62 13.87
Pledged Shares 0.00 0.00
Source: BSE
Nilesh Ghuge
+91-22-6171-7342
Harshad Katkar
+91-22-6171-7319
Rutvi Chokshi
+91-22-6171-7356
Akshay Mane
+91-22-6171-7338
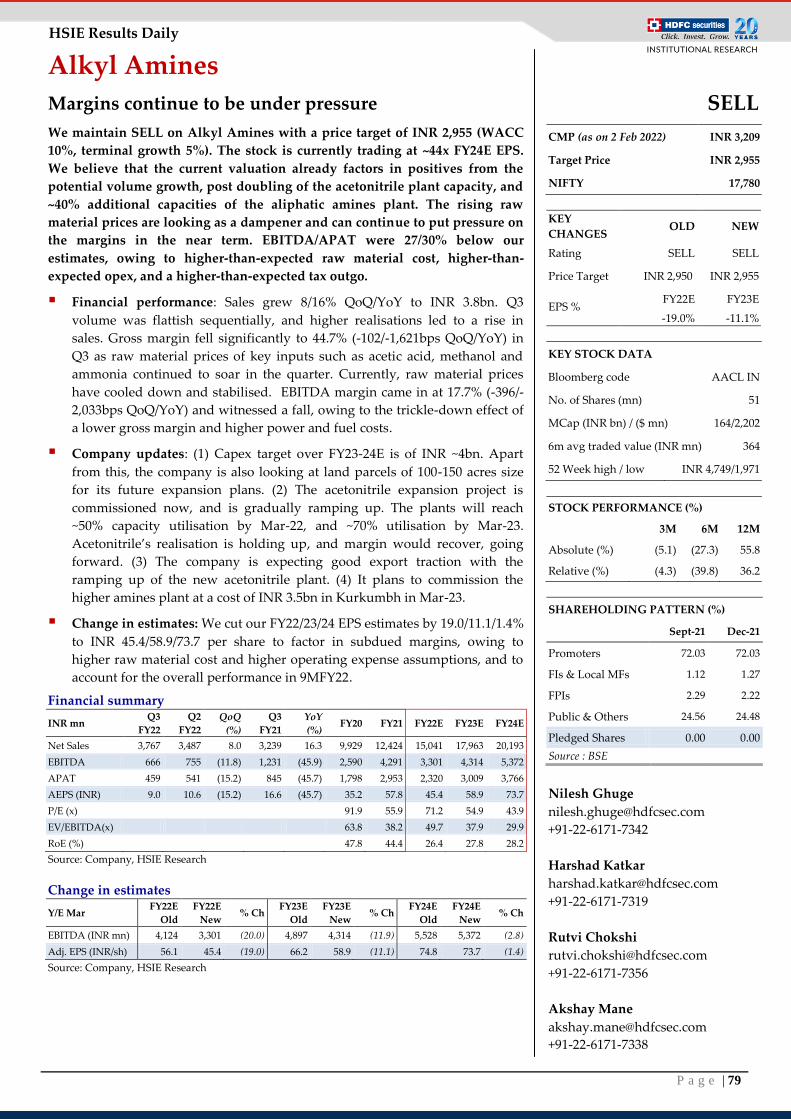
P a g e | 79
HSIE Results Daily
Alkyl Amines
Margins continue to be under pressure
We maintain SELL on Alkyl Amines with a price target of INR 2,955 (WACC
10%, terminal growth 5%). The stock is currently trading at ~44x FY24E EPS.
We believe that the current valuation already factors in positives from the
potential volume growth, post doubling of the acetonitrile plant capacity, and
~40% additional capacities of the aliphatic amines plant. The rising raw
material prices are looking as a dampener and can continue to put pressure on
the margins in the near term. EBITDA/APAT were 27/30% below our
estimates, owing to higher-than-expected raw material cost, higher-than-
expected opex, and a higher-than-expected tax outgo.
Financial performance: Sales grew 8/16% QoQ/YoY to INR 3.8bn. Q3
volume was flattish sequentially, and higher realisations led to a rise in
sales. Gross margin fell significantly to 44.7% (-102/-1,621bps QoQ/YoY) in
Q3 as raw material prices of key inputs such as acetic acid, methanol and
ammonia continued to soar in the quarter. Currently, raw material prices
have cooled down and stabilised. EBITDA margin came in at 17.7% (-396/-
2,033bps QoQ/YoY) and witnessed a fall, owing to the trickle-down effect of
a lower gross margin and higher power and fuel costs.
Company updates: (1) Capex target over FY23-24E is of INR ~4bn. Apart
from this, the company is also looking at land parcels of 100-150 acres size
for its future expansion plans. (2) The acetonitrile expansion project is
commissioned now, and is gradually ramping up. The plants will reach
~50% capacity utilisation by Mar-22, and ~70% utilisation by Mar-23.
Acetonitrile’s realisation is holding up, and margin would recover, going
forward. (3) The company is expecting good export traction with the
ramping up of the new acetonitrile plant. (4) It plans to commission the
higher amines plant at a cost of INR 3.5bn in Kurkumbh in Mar-23.
Change in estimates: We cut our FY22/23/24 EPS estimates by 19.0/11.1/1.4%
to INR 45.4/58.9/73.7 per share to factor in subdued margins, owing to
higher raw material cost and higher operating expense assumptions, and to
account for the overall performance in 9MFY22.
Financial summary
INR mn Q3
FY22
Q2
FY22
QoQ
(%)
Q3
FY21
YoY
(%) FY20 FY21 FY22E FY23E FY24E
Net Sales 3,767 3,487 8.0 3,239 16.3 9,929 12,424 15,041 17,963 20,193
EBITDA 666 755 (11.8) 1,231 (45.9) 2,590 4,291 3,301 4,314 5,372
APAT 459 541 (15.2) 845 (45.7) 1,798 2,953 2,320 3,009 3,766
AEPS (INR) 9.0 10.6 (15.2) 16.6 (45.7) 35.2 57.8 45.4 58.9 73.7
P/E (x)
91.9 55.9 71.2 54.9 43.9
EV/EBITDA(x) 63.8 38.2 49.7 37.9 29.9
RoE (%)
47.8 44.4 26.4 27.8 28.2
Source: Company, HSIE Research
Change in estimates
Y/E Mar FY22E
Old
FY22E
New % Ch
FY23E
Old
FY23E
New % Ch
FY24E
Old
FY24E
New % Ch
EBITDA (INR mn) 4,124 3,301 (20.0) 4,897 4,314 (11.9) 5,528 5,372 (2.8)
Adj. EPS (INR/sh) 56.1 45.4 (19.0) 66.2 58.9 (11.1) 74.8 73.7 (1.4)
Source: Company, HSIE Research
SELL
CMP (as on 2 Feb 2022) INR 3,209
Target Price INR 2,955
NIFTY 17,780
KEY
CHANGES OLD NEW
Rating SELL SELL
Price Target INR 2,950 INR 2,955
EPS % FY22E FY23E
-19.0% -11.1%
KEY STOCK DATA
Bloomberg code AACL IN
No. of Shares (mn) 51
MCap (INR bn) / ($ mn) 164/2,202
6m avg traded value (INR mn) 364
52 Week high / low INR 4,749/1,971
STOCK PERFORMANCE (%)
3M 6M 12M
Absolute (%) (5.1) (27.3) 55.8
Relative (%) (4.3) (39.8) 36.2
SHAREHOLDING PATTERN (%)
Sept-21 Dec-21
Promoters 72.03 72.03
FIs & Local MFs 1.12 1.27
FPIs 2.29 2.22
Public & Others 24.56 24.48
Pledged Shares 0.00 0.00
Source : BSE
Nilesh Ghuge
+91-22-6171-7342
Harshad Katkar
+91-22-6171-7319
Rutvi Chokshi
+91-22-6171-7356
Akshay Mane
+91-22-6171-7338
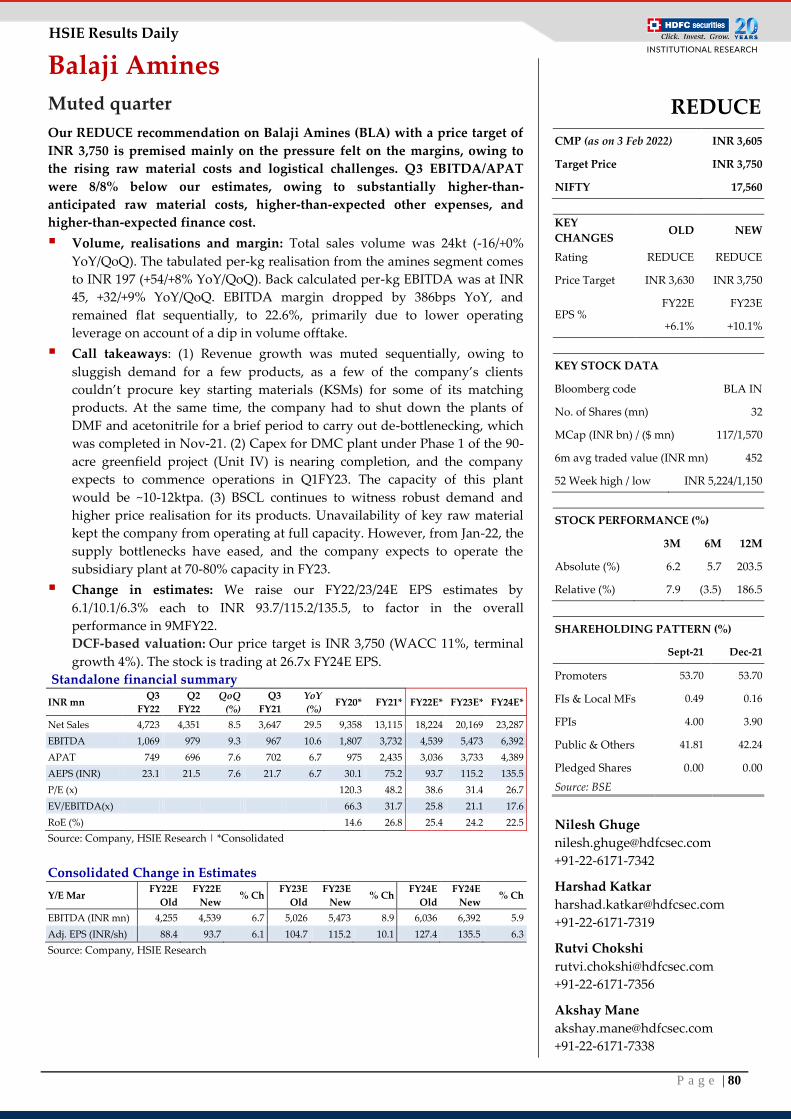
P a g e | 80
HSIE Results Daily
Balaji Amines
Muted quarter
Our REDUCE recommendation on Balaji Amines (BLA) with a price target of
INR 3,750 is premised mainly on the pressure felt on the margins, owing to
the rising raw material costs and logistical challenges. Q3 EBITDA/APAT
were 8/8% below our estimates, owing to substantially higher-than-
anticipated raw material costs, higher-than-expected other expenses, and
higher-than-expected finance cost.
Volume, realisations and margin: Total sales volume was 24kt (-16/+0%
YoY/QoQ). The tabulated per-kg realisation from the amines segment comes
to INR 197 (+54/+8% YoY/QoQ). Back calculated per-kg EBITDA was at INR
45, +32/+9% YoY/QoQ. EBITDA margin dropped by 386bps YoY, and
remained flat sequentially, to 22.6%, primarily due to lower operating
leverage on account of a dip in volume offtake.
Call takeaways: (1) Revenue growth was muted sequentially, owing to
sluggish demand for a few products, as a few of the company’s clients
couldn’t procure key starting materials (KSMs) for some of its matching
products. At the same time, the company had to shut down the plants of
DMF and acetonitrile for a brief period to carry out de-bottlenecking, which
was completed in Nov-21. (2) Capex for DMC plant under Phase 1 of the 90-
acre greenfield project (Unit IV) is nearing completion, and the company
expects to commence operations in Q1FY23. The capacity of this plant
would be ~10-12ktpa. (3) BSCL continues to witness robust demand and
higher price realisation for its products. Unavailability of key raw material
kept the company from operating at full capacity. However, from Jan-22, the
supply bottlenecks have eased, and the company expects to operate the
subsidiary plant at 70-80% capacity in FY23.
Change in estimates: We raise our FY22/23/24E EPS estimates by
6.1/10.1/6.3% each to INR 93.7/115.2/135.5, to factor in the overall
performance in 9MFY22.
DCF-based valuation: Our price target is INR 3,750 (WACC 11%, terminal
growth 4%). The stock is trading at 26.7x FY24E EPS.
Standalone financial summary
INR mn Q3
FY22
Q2
FY22
QoQ
(%)
Q3
FY21
YoY
(%) FY20* FY21* FY22E* FY23E* FY24E*
Net Sales 4,723 4,351 8.5 3,647 29.5 9,358 13,115 18,224 20,169 23,287
EBITDA 1,069 979 9.3 967 10.6 1,807 3,732 4,539 5,473 6,392
APAT 749 696 7.6 702 6.7 975 2,435 3,036 3,733 4,389
AEPS (INR) 23.1 21.5 7.6 21.7 6.7 30.1 75.2 93.7 115.2 135.5
P/E (x)
120.3 48.2 38.6 31.4 26.7
EV/EBITDA(x) 66.3 31.7 25.8 21.1 17.6
RoE (%)
14.6 26.8 25.4 24.2 22.5
Source: Company, HSIE Research | *Consolidated
Consolidated Change in Estimates
Y/E Mar FY22E
Old
FY22E
New % Ch
FY23E
Old
FY23E
New % Ch
FY24E
Old
FY24E
New % Ch
EBITDA (INR mn) 4,255 4,539 6.7 5,026 5,473 8.9 6,036 6,392 5.9
Adj. EPS (INR/sh) 88.4 93.7 6.1 104.7 115.2 10.1 127.4 135.5 6.3
Source: Company, HSIE Research
REDUCE
CMP (as on 3 Feb 2022) INR 3,605
Target Price INR 3,750
NIFTY 17,560
KEY
CHANGES OLD NEW
Rating REDUCE REDUCE
Price Target INR 3,630 INR 3,750
EPS % FY22E FY23E
+6.1% +10.1%
KEY STOCK DATA
Bloomberg code BLA IN
No. of Shares (mn) 32
MCap (INR bn) / ($ mn) 117/1,570
6m avg traded value (INR mn) 452
52 Week high / low INR 5,224/1,150
STOCK PERFORMANCE (%)
3M 6M 12M
Absolute (%) 6.2 5.7 203.5
Relative (%) 7.9 (3.5) 186.5
SHAREHOLDING PATTERN (%)
Sept-21 Dec-21
Promoters 53.70 53.70
FIs & Local MFs 0.49 0.16
FPIs 4.00 3.90
Public & Others 41.81 42.24
Pledged Shares 0.00 0.00
Source: BSE
Nilesh Ghuge
+91-22-6171-7342
Harshad Katkar
+91-22-6171-7319
Rutvi Chokshi
+91-22-6171-7356
Akshay Mane
+91-22-6171-7338
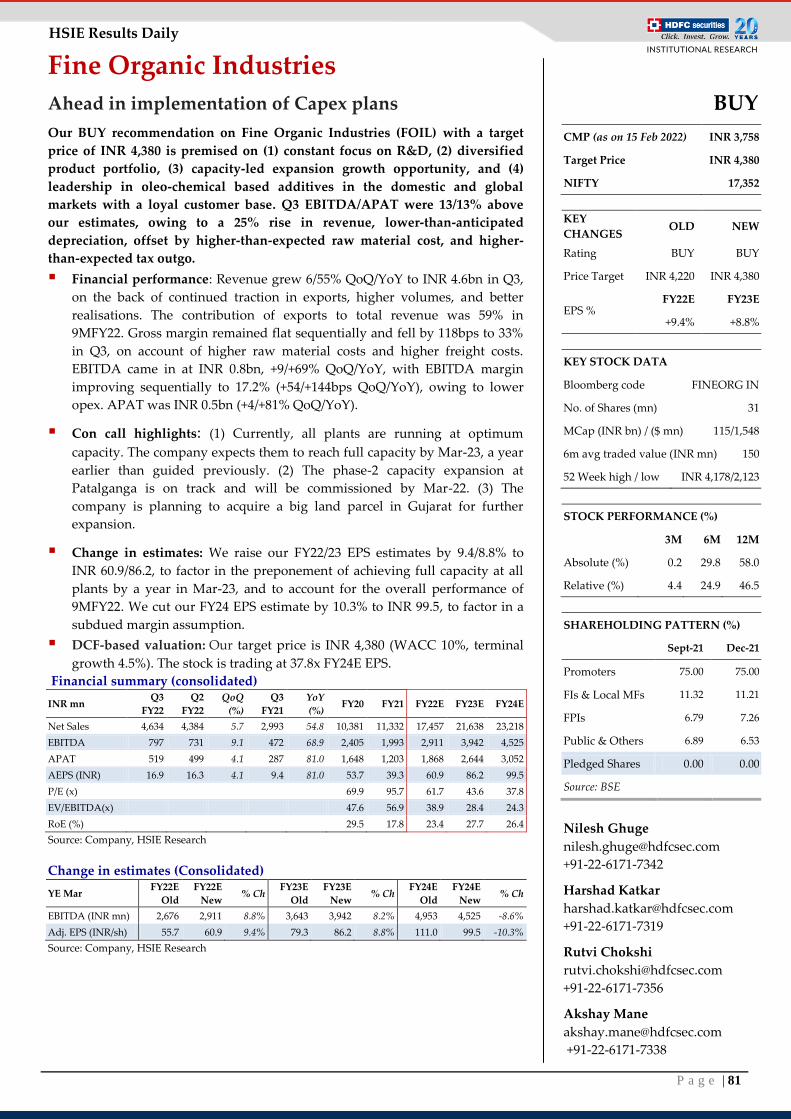
P a g e | 81
HSIE Results Daily
Fine Organic Industries
Ahead in implementation of Capex plans
Our BUY recommendation on Fine Organic Industries (FOIL) with a target
price of INR 4,380 is premised on (1) constant focus on R&D, (2) diversified
product portfolio, (3) capacity-led expansion growth opportunity, and (4)
leadership in oleo-chemical based additives in the domestic and global
markets with a loyal customer base. Q3 EBITDA/APAT were 13/13% above
our estimates, owing to a 25% rise in revenue, lower-than-anticipated
depreciation, offset by higher-than-expected raw material cost, and higher-
than-expected tax outgo.
Financial performance: Revenue grew 6/55% QoQ/YoY to INR 4.6bn in Q3,
on the back of continued traction in exports, higher volumes, and better
realisations. The contribution of exports to total revenue was 59% in
9MFY22. Gross margin remained flat sequentially and fell by 118bps to 33%
in Q3, on account of higher raw material costs and higher freight costs.
EBITDA came in at INR 0.8bn, +9/+69% QoQ/YoY, with EBITDA margin
improving sequentially to 17.2% (+54/+144bps QoQ/YoY), owing to lower
opex. APAT was INR 0.5bn (+4/+81% QoQ/YoY).
Con call highlights: (1) Currently, all plants are running at optimum
capacity. The company expects them to reach full capacity by Mar-23, a year
earlier than guided previously. (2) The phase-2 capacity expansion at
Patalganga is on track and will be commissioned by Mar-22. (3) The
company is planning to acquire a big land parcel in Gujarat for further
expansion.
Change in estimates: We raise our FY22/23 EPS estimates by 9.4/8.8% to
INR 60.9/86.2, to factor in the preponement of achieving full capacity at all
plants by a year in Mar-23, and to account for the overall performance of
9MFY22. We cut our FY24 EPS estimate by 10.3% to INR 99.5, to factor in a
subdued margin assumption.
DCF-based valuation: Our target price is INR 4,380 (WACC 10%, terminal
growth 4.5%). The stock is trading at 37.8x FY24E EPS. Financial summary (consolidated)
INR mn Q3
FY22
Q2
FY22
QoQ
(%)
Q3
FY21
YoY
(%) FY20 FY21 FY22E FY23E FY24E
Net Sales 4,634 4,384 5.7 2,993 54.8 10,381 11,332 17,457 21,638 23,218
EBITDA 797 731 9.1 472 68.9 2,405 1,993 2,911 3,942 4,525
APAT 519 499 4.1 287 81.0 1,648 1,203 1,868 2,644 3,052
AEPS (INR) 16.9 16.3 4.1 9.4 81.0 53.7 39.3 60.9 86.2 99.5
P/E (x)
69.9 95.7 61.7 43.6 37.8
EV/EBITDA(x) 47.6 56.9 38.9 28.4 24.3
RoE (%)
29.5 17.8 23.4 27.7 26.4
Source: Company, HSIE Research
Change in estimates (Consolidated)
YE Mar FY22E
Old
FY22E
New % Ch
FY23E
Old
FY23E
New % Ch
FY24E
Old
FY24E
New % Ch
EBITDA (INR mn) 2,676 2,911 8.8% 3,643 3,942 8.2% 4,953 4,525 -8.6%
Adj. EPS (INR/sh) 55.7 60.9 9.4% 79.3 86.2 8.8% 111.0 99.5 -10.3%
Source: Company, HSIE Research
BUY
CMP (as on 15 Feb 2022) INR 3,758
Target Price INR 4,380
NIFTY 17,352
KEY
CHANGES OLD NEW
Rating BUY BUY
Price Target INR 4,220 INR 4,380
EPS % FY22E FY23E
+9.4% +8.8%
KEY STOCK DATA
Bloomberg code FINEORG IN
No. of Shares (mn) 31
MCap (INR bn) / ($ mn) 115/1,548
6m avg traded value (INR mn) 150
52 Week high / low INR 4,178/2,123
STOCK PERFORMANCE (%)
3M 6M 12M
Absolute (%) 0.2 29.8 58.0
Relative (%) 4.4 24.9 46.5
SHAREHOLDING PATTERN (%)
Sept-21 Dec-21
Promoters 75.00 75.00
FIs & Local MFs 11.32 11.21
FPIs 6.79 7.26
Public & Others 6.89 6.53
Pledged Shares 0.00 0.00
Source: BSE
Nilesh Ghuge
+91-22-6171-7342
Harshad Katkar
+91-22-6171-7319
Rutvi Chokshi
+91-22-6171-7356
Akshay Mane
+91-22-6171-7338
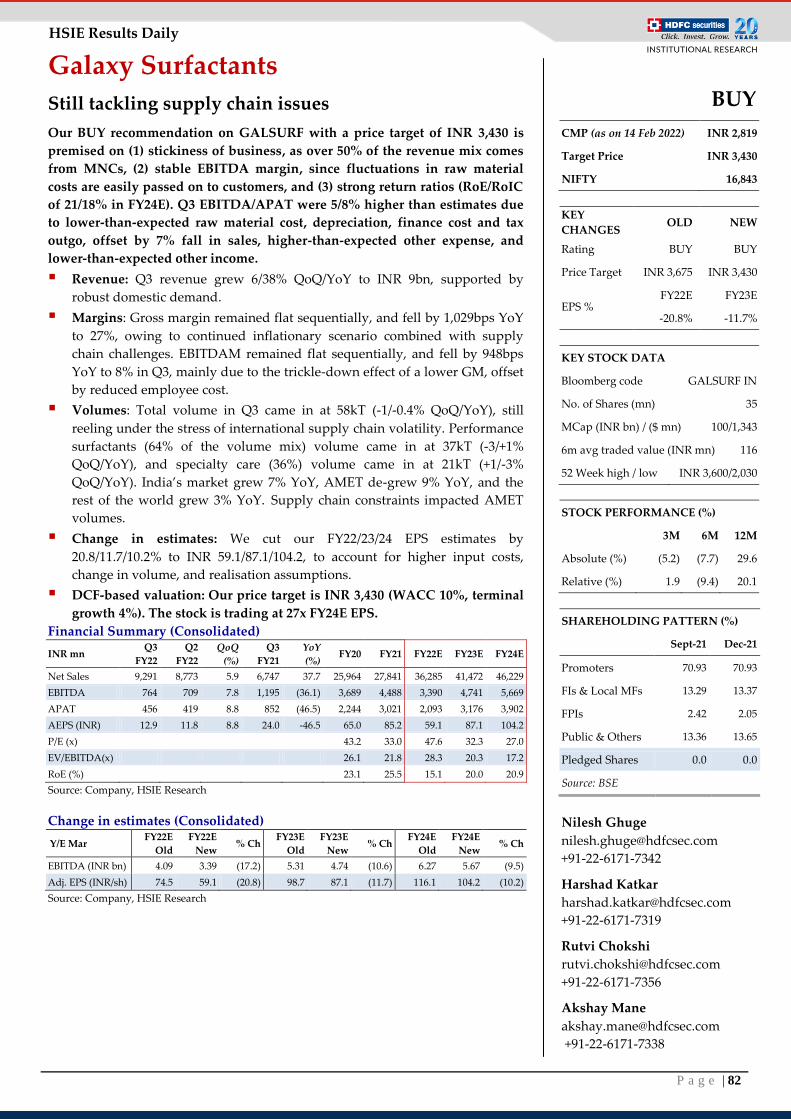
P a g e | 82
HSIE Results Daily
Galaxy Surfactants
Still tackling supply chain issues
Our BUY recommendation on GALSURF with a price target of INR 3,430 is
premised on (1) stickiness of business, as over 50% of the revenue mix comes
from MNCs, (2) stable EBITDA margin, since fluctuations in raw material
costs are easily passed on to customers, and (3) strong return ratios (RoE/RoIC
of 21/18% in FY24E). Q3 EBITDA/APAT were 5/8% higher than estimates due
to lower-than-expected raw material cost, depreciation, finance cost and tax
outgo, offset by 7% fall in sales, higher-than-expected other expense, and
lower-than-expected other income.
Revenue: Q3 revenue grew 6/38% QoQ/YoY to INR 9bn, supported by
robust domestic demand.
Margins: Gross margin remained flat sequentially, and fell by 1,029bps YoY
to 27%, owing to continued inflationary scenario combined with supply
chain challenges. EBITDAM remained flat sequentially, and fell by 948bps
YoY to 8% in Q3, mainly due to the trickle-down effect of a lower GM, offset
by reduced employee cost.
Volumes: Total volume in Q3 came in at 58kT (-1/-0.4% QoQ/YoY), still
reeling under the stress of international supply chain volatility. Performance
surfactants (64% of the volume mix) volume came in at 37kT (-3/+1%
QoQ/YoY), and specialty care (36%) volume came in at 21kT (+1/-3%
QoQ/YoY). India’s market grew 7% YoY, AMET de-grew 9% YoY, and the
rest of the world grew 3% YoY. Supply chain constraints impacted AMET
volumes.
Change in estimates: We cut our FY22/23/24 EPS estimates by
20.8/11.7/10.2% to INR 59.1/87.1/104.2, to account for higher input costs,
change in volume, and realisation assumptions.
DCF-based valuation: Our price target is INR 3,430 (WACC 10%, terminal
growth 4%). The stock is trading at 27x FY24E EPS.
Financial Summary (Consolidated)
INR mn Q3
FY22
Q2
FY22
QoQ
(%)
Q3
FY21
YoY
(%) FY20 FY21 FY22E FY23E FY24E
Net Sales 9,291 8,773 5.9 6,747 37.7 25,964 27,841 36,285 41,472 46,229
EBITDA 764 709 7.8 1,195 (36.1) 3,689 4,488 3,390 4,741 5,669
APAT 456 419 8.8 852 (46.5) 2,244 3,021 2,093 3,176 3,902
AEPS (INR) 12.9 11.8 8.8 24.0 -46.5 65.0 85.2 59.1 87.1 104.2
P/E (x)
43.2 33.0 47.6 32.3 27.0
EV/EBITDA(x) 26.1 21.8 28.3 20.3 17.2
RoE (%)
23.1 25.5 15.1 20.0 20.9
Source: Company, HSIE Research
Change in estimates (Consolidated)
Y/E Mar FY22E
Old
FY22E
New % Ch
FY23E
Old
FY23E
New % Ch
FY24E
Old
FY24E
New % Ch
EBITDA (INR bn) 4.09 3.39 (17.2) 5.31 4.74 (10.6) 6.27 5.67 (9.5)
Adj. EPS (INR/sh) 74.5 59.1 (20.8) 98.7 87.1 (11.7) 116.1 104.2 (10.2)
Source: Company, HSIE Research
BUY
CMP (as on 14 Feb 2022) INR 2,819
Target Price INR 3,430
NIFTY 16,843
KEY
CHANGES OLD NEW
Rating BUY BUY
Price Target INR 3,675 INR 3,430
EPS % FY22E FY23E
-20.8% -11.7%
KEY STOCK DATA
Bloomberg code GALSURF IN
No. of Shares (mn) 35
MCap (INR bn) / ($ mn) 100/1,343
6m avg traded value (INR mn) 116
52 Week high / low INR 3,600/2,030
STOCK PERFORMANCE (%)
3M 6M 12M
Absolute (%) (5.2) (7.7) 29.6
Relative (%) 1.9 (9.4) 20.1
SHAREHOLDING PATTERN (%)
Sept-21 Dec-21
Promoters 70.93 70.93
FIs & Local MFs 13.29 13.37
FPIs 2.42 2.05
Public & Others 13.36 13.65
Pledged Shares 0.0 0.0
Source: BSE
Nilesh Ghuge
+91-22-6171-7342
Harshad Katkar
+91-22-6171-7319
Rutvi Chokshi
+91-22-6171-7356
Akshay Mane
+91-22-6171-7338
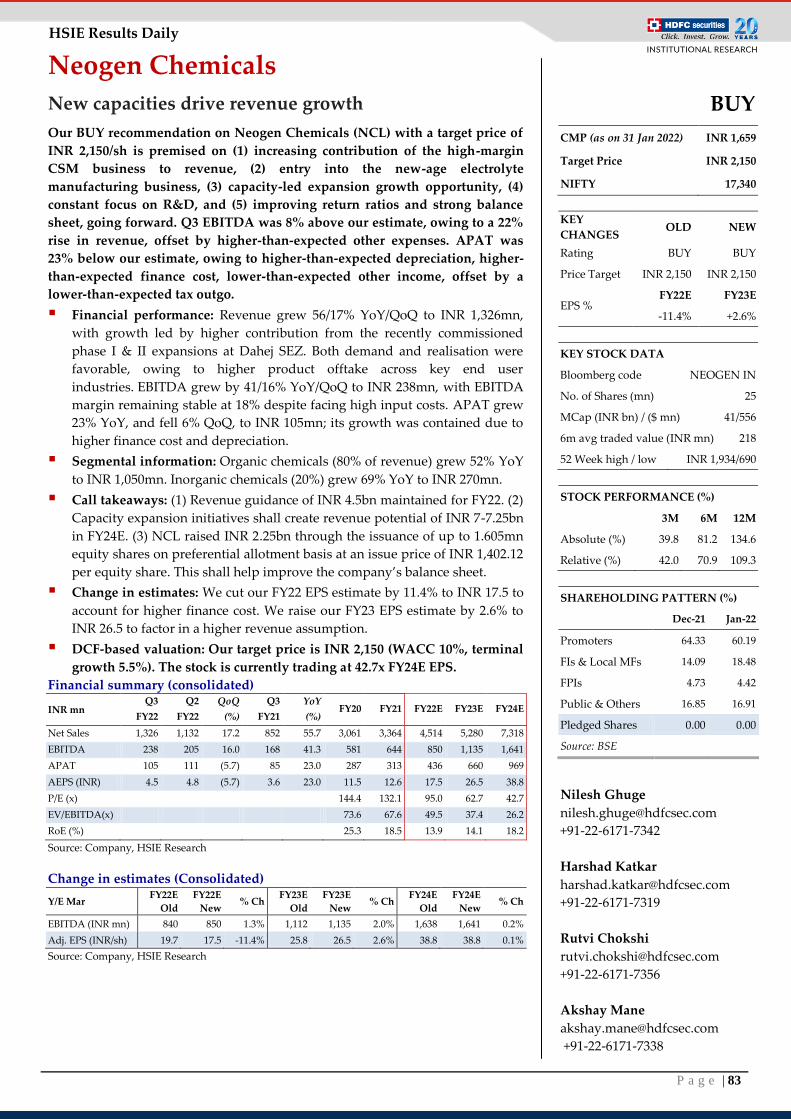
P a g e | 83
HSIE Results Daily
Neogen Chemicals
New capacities drive revenue growth
Our BUY recommendation on Neogen Chemicals (NCL) with a target price of
INR 2,150/sh is premised on (1) increasing contribution of the high-margin
CSM business to revenue, (2) entry into the new-age electrolyte
manufacturing business, (3) capacity-led expansion growth opportunity, (4)
constant focus on R&D, and (5) improving return ratios and strong balance
sheet, going forward. Q3 EBITDA was 8% above our estimate, owing to a 22%
rise in revenue, offset by higher-than-expected other expenses. APAT was
23% below our estimate, owing to higher-than-expected depreciation, higher-
than-expected finance cost, lower-than-expected other income, offset by a
lower-than-expected tax outgo.
Financial performance: Revenue grew 56/17% YoY/QoQ to INR 1,326mn,
with growth led by higher contribution from the recently commissioned
phase I & II expansions at Dahej SEZ. Both demand and realisation were
favorable, owing to higher product offtake across key end user
industries. EBITDA grew by 41/16% YoY/QoQ to INR 238mn, with EBITDA
margin remaining stable at 18% despite facing high input costs. APAT grew
23% YoY, and fell 6% QoQ, to INR 105mn; its growth was contained due to
higher finance cost and depreciation.
Segmental information: Organic chemicals (80% of revenue) grew 52% YoY
to INR 1,050mn. Inorganic chemicals (20%) grew 69% YoY to INR 270mn.
Call takeaways: (1) Revenue guidance of INR 4.5bn maintained for FY22. (2)
Capacity expansion initiatives shall create revenue potential of INR 7-7.25bn
in FY24E. (3) NCL raised INR 2.25bn through the issuance of up to 1.605mn
equity shares on preferential allotment basis at an issue price of INR 1,402.12
per equity share. This shall help improve the company’s balance sheet.
Change in estimates: We cut our FY22 EPS estimate by 11.4% to INR 17.5 to
account for higher finance cost. We raise our FY23 EPS estimate by 2.6% to
INR 26.5 to factor in a higher revenue assumption.
DCF-based valuation: Our target price is INR 2,150 (WACC 10%, terminal
growth 5.5%). The stock is currently trading at 42.7x FY24E EPS.
Financial summary (consolidated)
INR mn Q3
FY22
Q2
FY22
QoQ
(%)
Q3
FY21
YoY
(%) FY20 FY21 FY22E FY23E FY24E
Net Sales 1,326 1,132 17.2 852 55.7 3,061 3,364 4,514 5,280 7,318
EBITDA 238 205 16.0 168 41.3 581 644 850 1,135 1,641
APAT 105 111 (5.7) 85 23.0 287 313 436 660 969
AEPS (INR) 4.5 4.8 (5.7) 3.6 23.0 11.5 12.6 17.5 26.5 38.8
P/E (x)
144.4 132.1 95.0 62.7 42.7
EV/EBITDA(x) 73.6 67.6 49.5 37.4 26.2
RoE (%)
25.3 18.5 13.9 14.1 18.2
Source: Company, HSIE Research
Change in estimates (Consolidated)
Y/E Mar FY22E
Old
FY22E
New % Ch
FY23E
Old
FY23E
New % Ch
FY24E
Old
FY24E
New % Ch
EBITDA (INR mn) 840 850 1.3% 1,112 1,135 2.0% 1,638 1,641 0.2%
Adj. EPS (INR/sh) 19.7 17.5 -11.4% 25.8 26.5 2.6% 38.8 38.8 0.1%
Source: Company, HSIE Research
BUY
CMP (as on 31 Jan 2022) INR 1,659
Target Price INR 2,150
NIFTY 17,340
KEY
CHANGES OLD NEW
Rating BUY BUY
Price Target INR 2,150 INR 2,150
EPS % FY22E FY23E
-11.4% +2.6%
KEY STOCK DATA
Bloomberg code NEOGEN IN
No. of Shares (mn) 25
MCap (INR bn) / ($ mn) 41/556
6m avg traded value (INR mn) 218
52 Week high / low INR 1,934/690
STOCK PERFORMANCE (%)
3M 6M 12M
Absolute (%) 39.8 81.2 134.6
Relative (%) 42.0 70.9 109.3
SHAREHOLDING PATTERN (%)
Dec-21 Jan-22
Promoters 64.33 60.19
FIs & Local MFs 14.09 18.48
FPIs 4.73 4.42
Public & Others 16.85 16.91
Pledged Shares 0.00 0.00
Source: BSE
Nilesh Ghuge
+91-22-6171-7342
Harshad Katkar
+91-22-6171-7319
Rutvi Chokshi
+91-22-6171-7356
Akshay Mane
+91-22-6171-7338
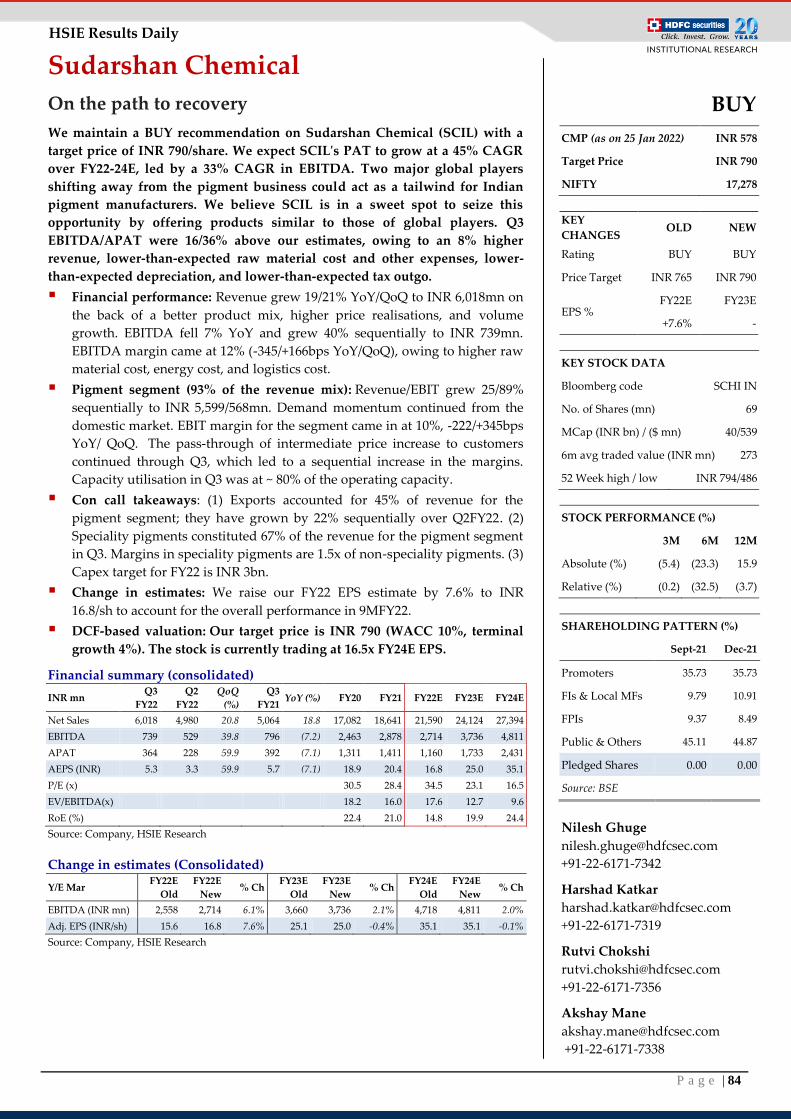
P a g e | 84
HSIE Results Daily
Sudarshan Chemical
On the path to recovery
We maintain a BUY recommendation on Sudarshan Chemical (SCIL) with a
target price of INR 790/share. We expect SCIL's PAT to grow at a 45% CAGR
over FY22-24E, led by a 33% CAGR in EBITDA. Two major global players
shifting away from the pigment business could act as a tailwind for Indian
pigment manufacturers. We believe SCIL is in a sweet spot to seize this
opportunity by offering products similar to those of global players. Q3
EBITDA/APAT were 16/36% above our estimates, owing to an 8% higher
revenue, lower-than-expected raw material cost and other expenses, lower-
than-expected depreciation, and lower-than-expected tax outgo.
Financial performance: Revenue grew 19/21% YoY/QoQ to INR 6,018mn on
the back of a better product mix, higher price realisations, and volume
growth. EBITDA fell 7% YoY and grew 40% sequentially to INR 739mn.
EBITDA margin came at 12% (-345/+166bps YoY/QoQ), owing to higher raw
material cost, energy cost, and logistics cost.
Pigment segment (93% of the revenue mix): Revenue/EBIT grew 25/89%
sequentially to INR 5,599/568mn. Demand momentum continued from the
domestic market. EBIT margin for the segment came in at 10%, -222/+345bps
YoY/ QoQ. The pass-through of intermediate price increase to customers
continued through Q3, which led to a sequential increase in the margins.
Capacity utilisation in Q3 was at ~ 80% of the operating capacity.
Con call takeaways: (1) Exports accounted for 45% of revenue for the
pigment segment; they have grown by 22% sequentially over Q2FY22. (2)
Speciality pigments constituted 67% of the revenue for the pigment segment
in Q3. Margins in speciality pigments are 1.5x of non-speciality pigments. (3)
Capex target for FY22 is INR 3bn.
Change in estimates: We raise our FY22 EPS estimate by 7.6% to INR
16.8/sh to account for the overall performance in 9MFY22.
DCF-based valuation: Our target price is INR 790 (WACC 10%, terminal
growth 4%). The stock is currently trading at 16.5x FY24E EPS.
Financial summary (consolidated)
INR mn Q3
FY22
Q2
FY22
QoQ
(%)
Q3
FY21 YoY (%) FY20 FY21 FY22E FY23E FY24E
Net Sales 6,018 4,980 20.8 5,064 18.8 17,082 18,641 21,590 24,124 27,394
EBITDA 739 529 39.8 796 (7.2) 2,463 2,878 2,714 3,736 4,811
APAT 364 228 59.9 392 (7.1) 1,311 1,411 1,160 1,733 2,431
AEPS (INR) 5.3 3.3 59.9 5.7 (7.1) 18.9 20.4 16.8 25.0 35.1
P/E (x)
30.5 28.4 34.5 23.1 16.5
EV/EBITDA(x) 18.2 16.0 17.6 12.7 9.6
RoE (%)
22.4 21.0 14.8 19.9 24.4
Source: Company, HSIE Research
Change in estimates (Consolidated)
Y/E Mar FY22E
Old
FY22E
New % Ch
FY23E
Old
FY23E
New % Ch
FY24E
Old
FY24E
New % Ch
EBITDA (INR mn) 2,558 2,714 6.1% 3,660 3,736 2.1% 4,718 4,811 2.0%
Adj. EPS (INR/sh) 15.6 16.8 7.6% 25.1 25.0 -0.4% 35.1 35.1 -0.1%
Source: Company, HSIE Research
BUY
CMP (as on 25 Jan 2022) INR 578
Target Price INR 790
NIFTY 17,278
KEY
CHANGES OLD NEW
Rating BUY BUY
Price Target INR 765 INR 790
EPS % FY22E FY23E
+7.6% -
KEY STOCK DATA
Bloomberg code SCHI IN
No. of Shares (mn) 69
MCap (INR bn) / ($ mn) 40/539
6m avg traded value (INR mn) 273
52 Week high / low INR 794/486
STOCK PERFORMANCE (%)
3M 6M 12M
Absolute (%) (5.4) (23.3) 15.9
Relative (%) (0.2) (32.5) (3.7)
SHAREHOLDING PATTERN (%)
Sept-21 Dec-21
Promoters 35.73 35.73
FIs & Local MFs 9.79 10.91
FPIs 9.37 8.49
Public & Others 45.11 44.87
Pledged Shares 0.00 0.00
Source: BSE
Nilesh Ghuge
+91-22-6171-7342
Harshad Katkar
+91-22-6171-7319
Rutvi Chokshi
+91-22-6171-7356
Akshay Mane
+91-22-6171-7338
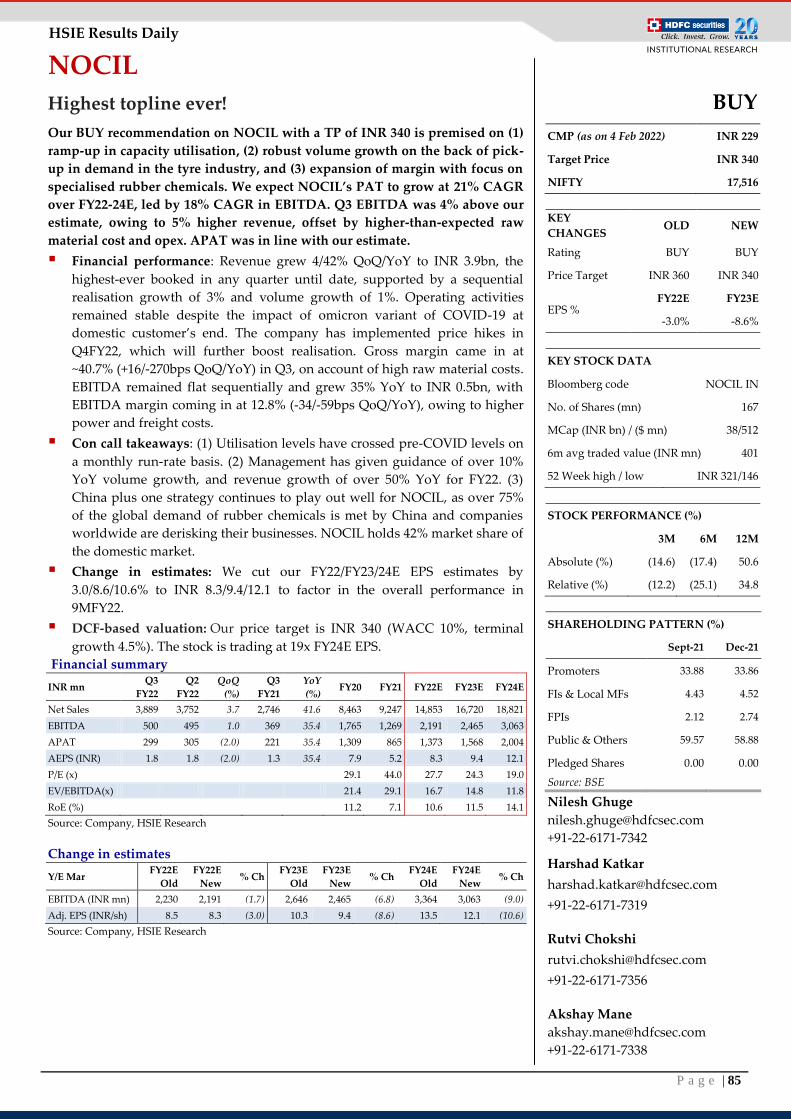
P a g e | 85
HSIE Results Daily
NOCIL
Highest topline ever!
Our BUY recommendation on NOCIL with a TP of INR 340 is premised on (1)
ramp-up in capacity utilisation, (2) robust volume growth on the back of pick-
up in demand in the tyre industry, and (3) expansion of margin with focus on
specialised rubber chemicals. We expect NOCIL’s PAT to grow at 21% CAGR
over FY22-24E, led by 18% CAGR in EBITDA. Q3 EBITDA was 4% above our
estimate, owing to 5% higher revenue, offset by higher-than-expected raw
material cost and opex. APAT was in line with our estimate.
Financial performance: Revenue grew 4/42% QoQ/YoY to INR 3.9bn, the
highest-ever booked in any quarter until date, supported by a sequential
realisation growth of 3% and volume growth of 1%. Operating activities
remained stable despite the impact of omicron variant of COVID-19 at
domestic customer’s end. The company has implemented price hikes in
Q4FY22, which will further boost realisation. Gross margin came in at
~40.7% (+16/-270bps QoQ/YoY) in Q3, on account of high raw material costs.
EBITDA remained flat sequentially and grew 35% YoY to INR 0.5bn, with
EBITDA margin coming in at 12.8% (-34/-59bps QoQ/YoY), owing to higher
power and freight costs.
Con call takeaways: (1) Utilisation levels have crossed pre-COVID levels on
a monthly run-rate basis. (2) Management has given guidance of over 10%
YoY volume growth, and revenue growth of over 50% YoY for FY22. (3)
China plus one strategy continues to play out well for NOCIL, as over 75%
of the global demand of rubber chemicals is met by China and companies
worldwide are derisking their businesses. NOCIL holds 42% market share of
the domestic market.
Change in estimates: We cut our FY22/FY23/24E EPS estimates by
3.0/8.6/10.6% to INR 8.3/9.4/12.1 to factor in the overall performance in
9MFY22.
DCF-based valuation: Our price target is INR 340 (WACC 10%, terminal
growth 4.5%). The stock is trading at 19x FY24E EPS. Financial summary
INR mn Q3
FY22
Q2
FY22
QoQ
(%)
Q3
FY21
YoY
(%) FY20 FY21 FY22E FY23E FY24E
Net Sales 3,889 3,752 3.7 2,746 41.6 8,463 9,247 14,853 16,720 18,821
EBITDA 500 495 1.0 369 35.4 1,765 1,269 2,191 2,465 3,063
APAT 299 305 (2.0) 221 35.4 1,309 865 1,373 1,568 2,004
AEPS (INR) 1.8 1.8 (2.0) 1.3 35.4 7.9 5.2 8.3 9.4 12.1
P/E (x)
29.1 44.0 27.7 24.3 19.0
EV/EBITDA(x) 21.4 29.1 16.7 14.8 11.8
RoE (%)
11.2 7.1 10.6 11.5 14.1
Source: Company, HSIE Research
Change in estimates
Y/E Mar FY22E
Old
FY22E
New % Ch
FY23E
Old
FY23E
New % Ch
FY24E
Old
FY24E
New % Ch
EBITDA (INR mn) 2,230 2,191 (1.7) 2,646 2,465 (6.8) 3,364 3,063 (9.0)
Adj. EPS (INR/sh) 8.5 8.3 (3.0) 10.3 9.4 (8.6) 13.5 12.1 (10.6)
Source: Company, HSIE Research
BUY
CMP (as on 4 Feb 2022) INR 229
Target Price INR 340
NIFTY 17,516
KEY
CHANGES OLD NEW
Rating BUY BUY
Price Target INR 360 INR 340
EPS % FY22E FY23E
-3.0% -8.6%
KEY STOCK DATA
Bloomberg code NOCIL IN
No. of Shares (mn) 167
MCap (INR bn) / ($ mn) 38/512
6m avg traded value (INR mn) 401
52 Week high / low INR 321/146
STOCK PERFORMANCE (%)
3M 6M 12M
Absolute (%) (14.6) (17.4) 50.6
Relative (%) (12.2) (25.1) 34.8
SHAREHOLDING PATTERN (%)
Sept-21 Dec-21
Promoters 33.88 33.86
FIs & Local MFs 4.43 4.52
FPIs 2.12 2.74
Public & Others 59.57 58.88
Pledged Shares 0.00 0.00
Source: BSE
Nilesh Ghuge
+91-22-6171-7342
Harshad Katkar
+91-22-6171-7319
Rutvi Chokshi
+91-22-6171-7356
Akshay Mane
+91-22-6171-7338
P a g e | 86
HSIE Results Daily
Consumer Discretionary
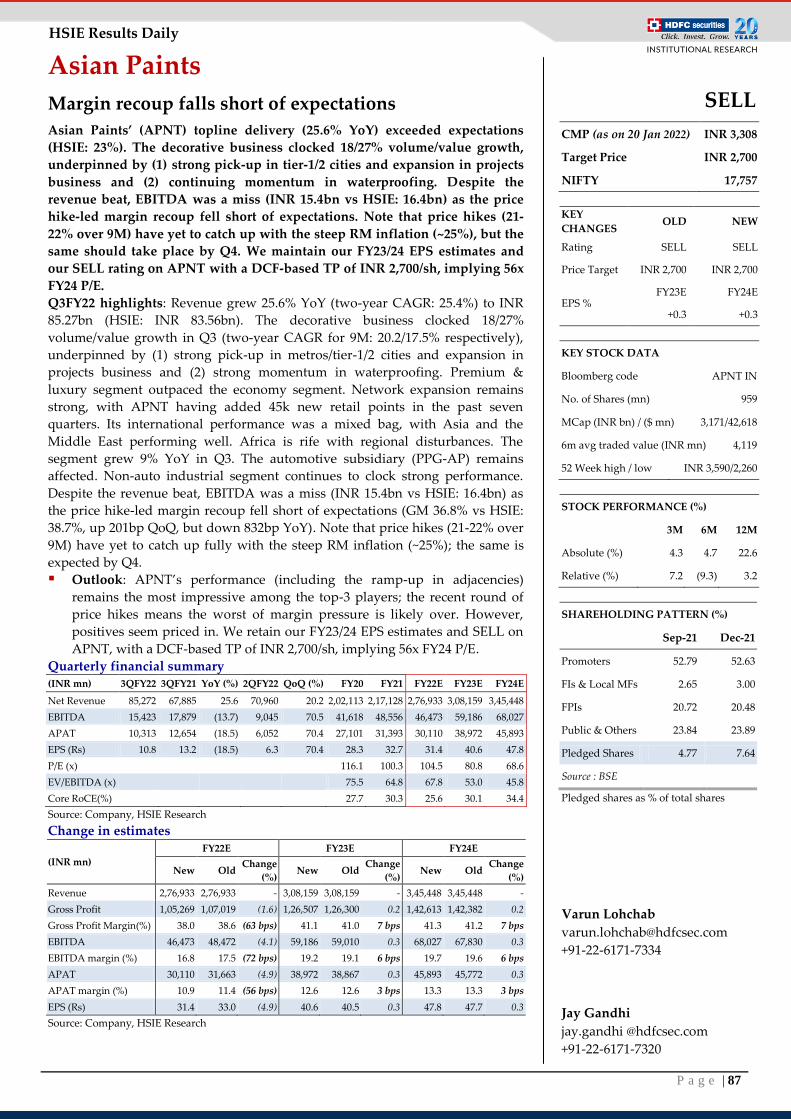
P a g e | 87
HSIE Results Daily
Asian Paints
Margin recoup falls short of expectations
Asian Paints’ (APNT) topline delivery (25.6% YoY) exceeded expectations
(HSIE: 23%). The decorative business clocked 18/27% volume/value growth,
underpinned by (1) strong pick-up in tier-1/2 cities and expansion in projects
business and (2) continuing momentum in waterproofing. Despite the
revenue beat, EBITDA was a miss (INR 15.4bn vs HSIE: 16.4bn) as the price
hike-led margin recoup fell short of expectations. Note that price hikes (21-
22% over 9M) have yet to catch up with the steep RM inflation (~25%), but the
same should take place by Q4. We maintain our FY23/24 EPS estimates and
our SELL rating on APNT with a DCF-based TP of INR 2,700/sh, implying 56x
FY24 P/E.
Q3FY22 highlights: Revenue grew 25.6% YoY (two-year CAGR: 25.4%) to INR
85.27bn (HSIE: INR 83.56bn). The decorative business clocked 18/27%
volume/value growth in Q3 (two-year CAGR for 9M: 20.2/17.5% respectively),
underpinned by (1) strong pick-up in metros/tier-1/2 cities and expansion in
projects business and (2) strong momentum in waterproofing. Premium &
luxury segment outpaced the economy segment. Network expansion remains
strong, with APNT having added 45k new retail points in the past seven
quarters. Its international performance was a mixed bag, with Asia and the
Middle East performing well. Africa is rife with regional disturbances. The
segment grew 9% YoY in Q3. The automotive subsidiary (PPG-AP) remains
affected. Non-auto industrial segment continues to clock strong performance.
Despite the revenue beat, EBITDA was a miss (INR 15.4bn vs HSIE: 16.4bn) as
the price hike-led margin recoup fell short of expectations (GM 36.8% vs HSIE:
38.7%, up 201bp QoQ, but down 832bp YoY). Note that price hikes (21-22% over
9M) have yet to catch up fully with the steep RM inflation (~25%); the same is
expected by Q4.
Outlook: APNT’s performance (including the ramp-up in adjacencies)
remains the most impressive among the top-3 players; the recent round of
price hikes means the worst of margin pressure is likely over. However,
positives seem priced in. We retain our FY23/24 EPS estimates and SELL on
APNT, with a DCF-based TP of INR 2,700/sh, implying 56x FY24 P/E.
Quarterly financial summary (INR mn) 3QFY22 3QFY21 YoY (%) 2QFY22 QoQ (%) FY20 FY21 FY22E FY23E FY24E
Net Revenue 85,272 67,885 25.6 70,960 20.2 2,02,113 2,17,128 2,76,933 3,08,159 3,45,448
EBITDA 15,423 17,879 (13.7) 9,045 70.5 41,618 48,556 46,473 59,186 68,027
APAT 10,313 12,654 (18.5) 6,052 70.4 27,101 31,393 30,110 38,972 45,893
EPS (Rs) 10.8 13.2 (18.5) 6.3 70.4 28.3 32.7 31.4 40.6 47.8
P/E (x)
116.1 100.3 104.5 80.8 68.6
EV/EBITDA (x)
75.5 64.8 67.8 53.0 45.8
Core RoCE(%)
27.7 30.3 25.6 30.1 34.4
Source: Company, HSIE Research
Change in estimates
(INR mn)
FY22E FY23E FY24E
New Old Change
(%) New Old
Change
(%) New Old
Change
(%)
Revenue 2,76,933 2,76,933 - 3,08,159 3,08,159 - 3,45,448 3,45,448 -
Gross Profit 1,05,269 1,07,019 (1.6) 1,26,507 1,26,300 0.2 1,42,613 1,42,382 0.2
Gross Profit Margin(%) 38.0 38.6 (63 bps) 41.1 41.0 7 bps 41.3 41.2 7 bps
EBITDA 46,473 48,472 (4.1) 59,186 59,010 0.3 68,027 67,830 0.3
EBITDA margin (%) 16.8 17.5 (72 bps) 19.2 19.1 6 bps 19.7 19.6 6 bps
APAT 30,110 31,663 (4.9) 38,972 38,867 0.3 45,893 45,772 0.3
APAT margin (%) 10.9 11.4 (56 bps) 12.6 12.6 3 bps 13.3 13.3 3 bps
EPS (Rs) 31.4 33.0 (4.9) 40.6 40.5 0.3 47.8 47.7 0.3
Source: Company, HSIE Research
SELL
CMP (as on 20 Jan 2022) INR 3,308
Target Price INR 2,700
NIFTY 17,757
KEY
CHANGES OLD NEW
Rating SELL SELL
Price Target INR 2,700 INR 2,700
EPS % FY23E FY24E
+0.3 +0.3
KEY STOCK DATA
Bloomberg code APNT IN
No. of Shares (mn) 959
MCap (INR bn) / ($ mn) 3,171/42,618
6m avg traded value (INR mn) 4,119
52 Week high / low INR 3,590/2,260
STOCK PERFORMANCE (%)
3M 6M 12M
Absolute (%) 4.3 4.7 22.6
Relative (%) 7.2 (9.3) 3.2
SHAREHOLDING PATTERN (%)
Sep-21 Dec-21
Promoters 52.79 52.63
FIs & Local MFs 2.65 3.00
FPIs 20.72 20.48
Public & Others 23.84 23.89
Pledged Shares 4.77 7.64
Source : BSE
Pledged shares as % of total shares
Varun Lohchab
+91-22-6171-7334
Jay Gandhi
jay.gandhi @hdfcsec.com
+91-22-6171-7320
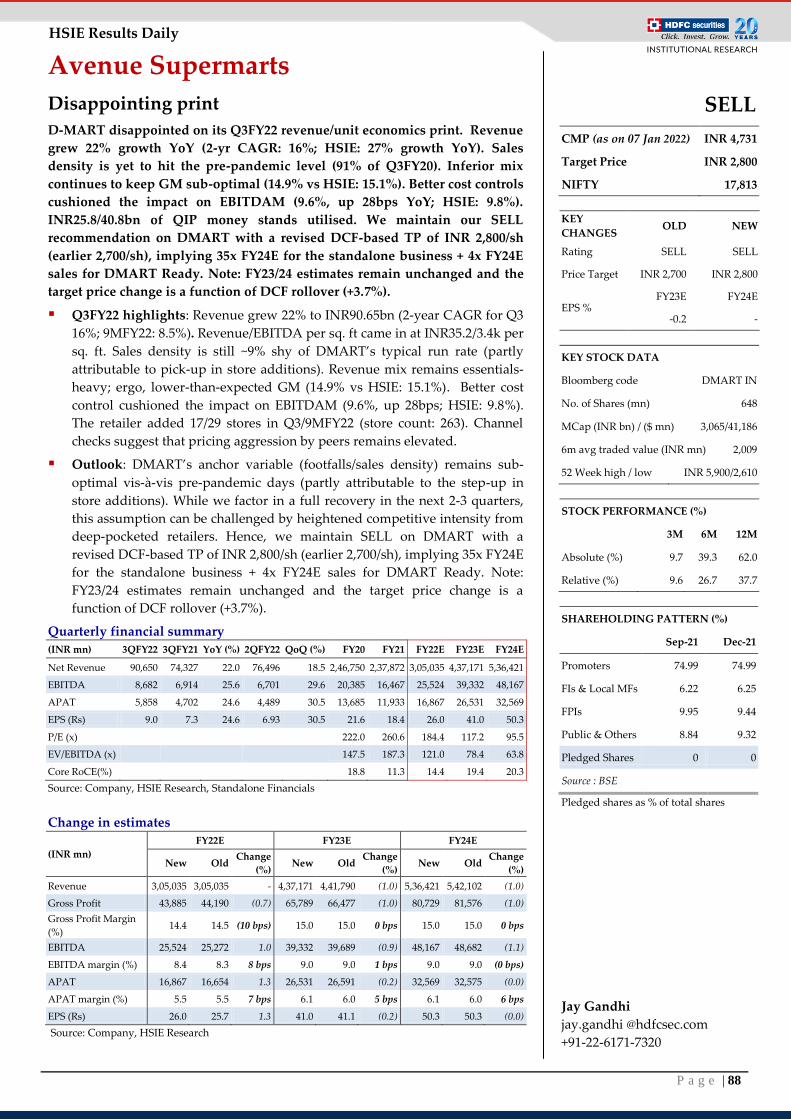
P a g e | 88
HSIE Results Daily
Avenue Supermarts
Disappointing print
D-MART disappointed on its Q3FY22 revenue/unit economics print. Revenue
grew 22% growth YoY (2-yr CAGR: 16%; HSIE: 27% growth YoY). Sales
density is yet to hit the pre-pandemic level (91% of Q3FY20). Inferior mix
continues to keep GM sub-optimal (14.9% vs HSIE: 15.1%). Better cost controls
cushioned the impact on EBITDAM (9.6%, up 28bps YoY; HSIE: 9.8%).
INR25.8/40.8bn of QIP money stands utilised. We maintain our SELL
recommendation on DMART with a revised DCF-based TP of INR 2,800/sh
(earlier 2,700/sh), implying 35x FY24E for the standalone business + 4x FY24E
sales for DMART Ready. Note: FY23/24 estimates remain unchanged and the
target price change is a function of DCF rollover (+3.7%).
Q3FY22 highlights: Revenue grew 22% to INR90.65bn (2-year CAGR for Q3
16%; 9MFY22: 8.5%). Revenue/EBITDA per sq. ft came in at INR35.2/3.4k per
sq. ft. Sales density is still ~9% shy of DMART’s typical run rate (partly
attributable to pick-up in store additions). Revenue mix remains essentials-
heavy; ergo, lower-than-expected GM (14.9% vs HSIE: 15.1%). Better cost
control cushioned the impact on EBITDAM (9.6%, up 28bps; HSIE: 9.8%).
The retailer added 17/29 stores in Q3/9MFY22 (store count: 263). Channel
checks suggest that pricing aggression by peers remains elevated.
Outlook: DMART’s anchor variable (footfalls/sales density) remains sub-
optimal vis-à-vis pre-pandemic days (partly attributable to the step-up in
store additions). While we factor in a full recovery in the next 2-3 quarters,
this assumption can be challenged by heightened competitive intensity from
deep-pocketed retailers. Hence, we maintain SELL on DMART with a
revised DCF-based TP of INR 2,800/sh (earlier 2,700/sh), implying 35x FY24E
for the standalone business + 4x FY24E sales for DMART Ready. Note:
FY23/24 estimates remain unchanged and the target price change is a
function of DCF rollover (+3.7%).
Quarterly financial summary
(INR mn) 3QFY22 3QFY21 YoY (%) 2QFY22 QoQ (%) FY20 FY21 FY22E FY23E FY24E
Net Revenue 90,650 74,327 22.0 76,496 18.5 2,46,750 2,37,872 3,05,035 4,37,171 5,36,421
EBITDA 8,682 6,914 25.6 6,701 29.6 20,385 16,467 25,524 39,332 48,167
APAT 5,858 4,702 24.6 4,489 30.5 13,685 11,933 16,867 26,531 32,569
EPS (Rs) 9.0 7.3 24.6 6.93 30.5 21.6 18.4 26.0 41.0 50.3
P/E (x)
222.0 260.6 184.4 117.2 95.5
EV/EBITDA (x)
147.5 187.3 121.0 78.4 63.8
Core RoCE(%)
18.8 11.3 14.4 19.4 20.3
Source: Company, HSIE Research, Standalone Financials
Change in estimates
(INR mn)
FY22E FY23E FY24E
New Old Change
(%) New Old
Change
(%) New Old
Change
(%)
Revenue 3,05,035 3,05,035 - 4,37,171 4,41,790 (1.0) 5,36,421 5,42,102 (1.0)
Gross Profit 43,885 44,190 (0.7) 65,789 66,477 (1.0) 80,729 81,576 (1.0)
Gross Profit Margin
(%) 14.4 14.5 (10 bps) 15.0 15.0 0 bps 15.0 15.0 0 bps
EBITDA 25,524 25,272 1.0 39,332 39,689 (0.9) 48,167 48,682 (1.1)
EBITDA margin (%) 8.4 8.3 8 bps 9.0 9.0 1 bps 9.0 9.0 (0 bps)
APAT 16,867 16,654 1.3 26,531 26,591 (0.2) 32,569 32,575 (0.0)
APAT margin (%) 5.5 5.5 7 bps 6.1 6.0 5 bps 6.1 6.0 6 bps
EPS (Rs) 26.0 25.7 1.3 41.0 41.1 (0.2) 50.3 50.3 (0.0)
Source: Company, HSIE Research
SELL
CMP (as on 07 Jan 2022) INR 4,731
Target Price INR 2,800
NIFTY 17,813
KEY
CHANGES OLD NEW
Rating SELL SELL
Price Target INR 2,700 INR 2,800
EPS % FY23E FY24E
-0.2 -
KEY STOCK DATA
Bloomberg code DMART IN
No. of Shares (mn) 648
MCap (INR bn) / ($ mn) 3,065/41,186
6m avg traded value (INR mn) 2,009
52 Week high / low INR 5,900/2,610
STOCK PERFORMANCE (%)
3M 6M 12M
Absolute (%) 9.7 39.3 62.0
Relative (%) 9.6 26.7 37.7
SHAREHOLDING PATTERN (%)
Sep-21 Dec-21
Promoters 74.99 74.99
FIs & Local MFs 6.22 6.25
FPIs 9.95 9.44
Public & Others 8.84 9.32
Pledged Shares 0 0
Source : BSE
Pledged shares as % of total shares
Jay Gandhi
jay.gandhi @hdfcsec.com
+91-22-6171-7320
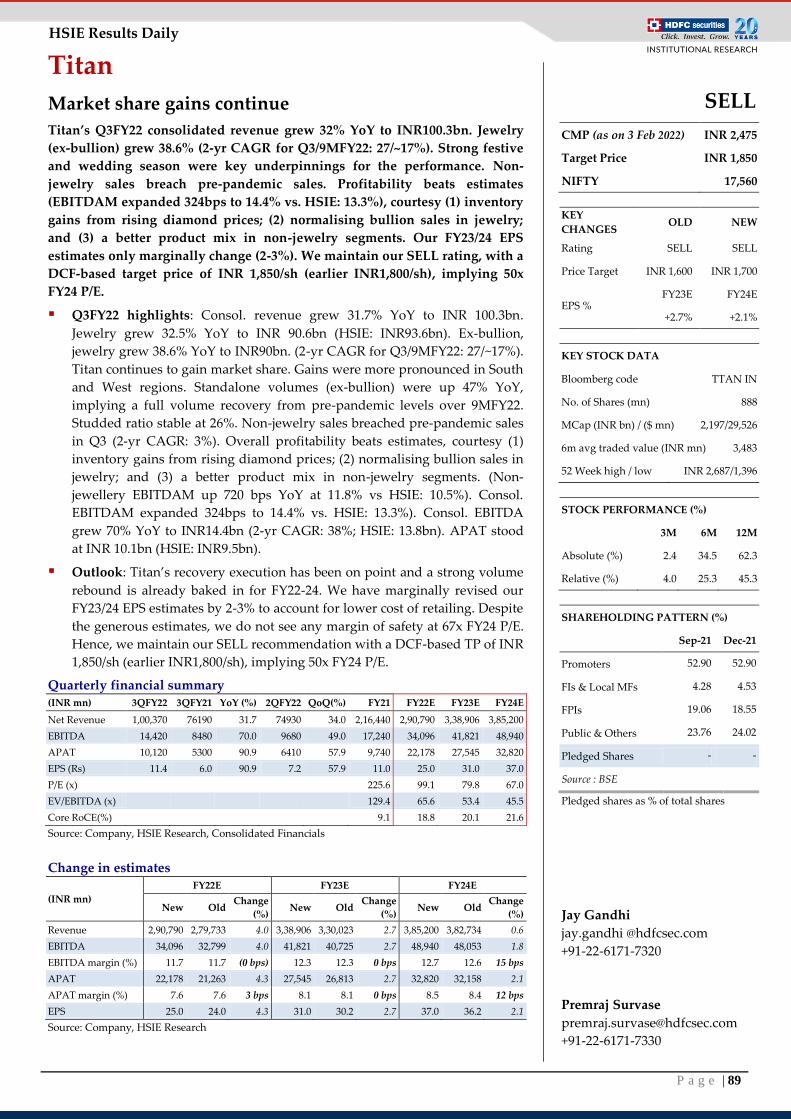
P a g e | 89
HSIE Results Daily
Titan
Market share gains continue
Titan’s Q3FY22 consolidated revenue grew 32% YoY to INR100.3bn. Jewelry
(ex-bullion) grew 38.6% (2-yr CAGR for Q3/9MFY22: 27/~17%). Strong festive
and wedding season were key underpinnings for the performance. Non-
jewelry sales breach pre-pandemic sales. Profitability beats estimates
(EBITDAM expanded 324bps to 14.4% vs. HSIE: 13.3%), courtesy (1) inventory
gains from rising diamond prices; (2) normalising bullion sales in jewelry;
and (3) a better product mix in non-jewelry segments. Our FY23/24 EPS
estimates only marginally change (2-3%). We maintain our SELL rating, with a
DCF-based target price of INR 1,850/sh (earlier INR1,800/sh), implying 50x
FY24 P/E.
Q3FY22 highlights: Consol. revenue grew 31.7% YoY to INR 100.3bn.
Jewelry grew 32.5% YoY to INR 90.6bn (HSIE: INR93.6bn). Ex-bullion,
jewelry grew 38.6% YoY to INR90bn. (2-yr CAGR for Q3/9MFY22: 27/~17%).
Titan continues to gain market share. Gains were more pronounced in South
and West regions. Standalone volumes (ex-bullion) were up 47% YoY,
implying a full volume recovery from pre-pandemic levels over 9MFY22.
Studded ratio stable at 26%. Non-jewelry sales breached pre-pandemic sales
in Q3 (2-yr CAGR: 3%). Overall profitability beats estimates, courtesy (1)
inventory gains from rising diamond prices; (2) normalising bullion sales in
jewelry; and (3) a better product mix in non-jewelry segments. (Non-
jewellery EBITDAM up 720 bps YoY at 11.8% vs HSIE: 10.5%). Consol.
EBITDAM expanded 324bps to 14.4% vs. HSIE: 13.3%). Consol. EBITDA
grew 70% YoY to INR14.4bn (2-yr CAGR: 38%; HSIE: 13.8bn). APAT stood
at INR 10.1bn (HSIE: INR9.5bn).
Outlook: Titan’s recovery execution has been on point and a strong volume
rebound is already baked in for FY22-24. We have marginally revised our
FY23/24 EPS estimates by 2-3% to account for lower cost of retailing. Despite
the generous estimates, we do not see any margin of safety at 67x FY24 P/E.
Hence, we maintain our SELL recommendation with a DCF-based TP of INR
1,850/sh (earlier INR1,800/sh), implying 50x FY24 P/E.
Quarterly financial summary (INR mn) 3QFY22 3QFY21 YoY (%) 2QFY22 QoQ(%) FY21 FY22E FY23E FY24E
Net Revenue 1,00,370 76190 31.7 74930 34.0 2,16,440 2,90,790 3,38,906 3,85,200
EBITDA 14,420 8480 70.0 9680 49.0 17,240 34,096 41,821 48,940
APAT 10,120 5300 90.9 6410 57.9 9,740 22,178 27,545 32,820
EPS (Rs) 11.4 6.0 90.9 7.2 57.9 11.0 25.0 31.0 37.0
P/E (x)
225.6 99.1 79.8 67.0
EV/EBITDA (x)
129.4 65.6 53.4 45.5
Core RoCE(%)
9.1 18.8 20.1 21.6
Source: Company, HSIE Research, Consolidated Financials
Change in estimates
(INR mn)
FY22E FY23E FY24E
New Old Change
(%) New Old
Change
(%) New Old
Change
(%)
Revenue 2,90,790 2,79,733 4.0 3,38,906 3,30,023 2.7 3,85,200 3,82,734 0.6
EBITDA 34,096 32,799 4.0 41,821 40,725 2.7 48,940 48,053 1.8
EBITDA margin (%) 11.7 11.7 (0 bps) 12.3 12.3 0 bps 12.7 12.6 15 bps
APAT 22,178 21,263 4.3 27,545 26,813 2.7 32,820 32,158 2.1
APAT margin (%) 7.6 7.6 3 bps 8.1 8.1 0 bps 8.5 8.4 12 bps
EPS 25.0 24.0 4.3 31.0 30.2 2.7 37.0 36.2 2.1
Source: Company, HSIE Research
SELL
CMP (as on 3 Feb 2022) INR 2,475
Target Price INR 1,850
NIFTY 17,560
KEY
CHANGES OLD NEW
Rating SELL SELL
Price Target INR 1,600 INR 1,700
EPS % FY23E FY24E
+2.7% +2.1%
KEY STOCK DATA
Bloomberg code TTAN IN
No. of Shares (mn) 888
MCap (INR bn) / ($ mn) 2,197/29,526
6m avg traded value (INR mn) 3,483
52 Week high / low INR 2,687/1,396
STOCK PERFORMANCE (%)
3M 6M 12M
Absolute (%) 2.4 34.5 62.3
Relative (%) 4.0 25.3 45.3
SHAREHOLDING PATTERN (%)
Sep-21 Dec-21
Promoters 52.90 52.90
FIs & Local MFs 4.28 4.53
FPIs 19.06 18.55
Public & Others 23.76 24.02
Pledged Shares - -
Source : BSE
Pledged shares as % of total shares
Jay Gandhi
jay.gandhi @hdfcsec.com
+91-22-6171-7320
Premraj Survase
+91-22-6171-7330
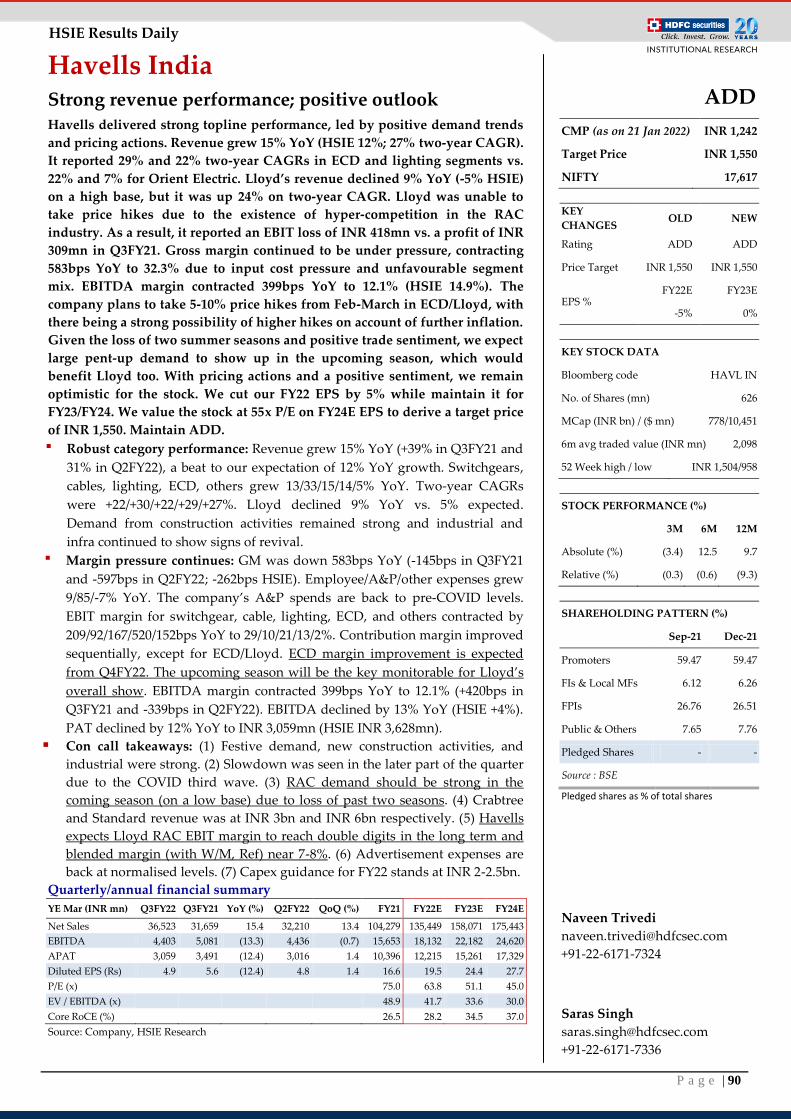
P a g e | 90
HSIE Results Daily
Havells India Strong revenue performance; positive outlook Havells delivered strong topline performance, led by positive demand trends
and pricing actions. Revenue grew 15% YoY (HSIE 12%; 27% two-year CAGR).
It reported 29% and 22% two-year CAGRs in ECD and lighting segments vs.
22% and 7% for Orient Electric. Lloyd’s revenue declined 9% YoY (-5% HSIE)
on a high base, but it was up 24% on two-year CAGR. Lloyd was unable to
take price hikes due to the existence of hyper-competition in the RAC
industry. As a result, it reported an EBIT loss of INR 418mn vs. a profit of INR
309mn in Q3FY21. Gross margin continued to be under pressure, contracting
583bps YoY to 32.3% due to input cost pressure and unfavourable segment
mix. EBITDA margin contracted 399bps YoY to 12.1% (HSIE 14.9%). The
company plans to take 5-10% price hikes from Feb-March in ECD/Lloyd, with
there being a strong possibility of higher hikes on account of further inflation.
Given the loss of two summer seasons and positive trade sentiment, we expect
large pent-up demand to show up in the upcoming season, which would
benefit Lloyd too. With pricing actions and a positive sentiment, we remain
optimistic for the stock. We cut our FY22 EPS by 5% while maintain it for
FY23/FY24. We value the stock at 55x P/E on FY24E EPS to derive a target price
of INR 1,550. Maintain ADD.
▪ Robust category performance: Revenue grew 15% YoY (+39% in Q3FY21 and
31% in Q2FY22), a beat to our expectation of 12% YoY growth. Switchgears,
cables, lighting, ECD, others grew 13/33/15/14/5% YoY. Two-year CAGRs
were +22/+30/+22/+29/+27%. Lloyd declined 9% YoY vs. 5% expected.
Demand from construction activities remained strong and industrial and
infra continued to show signs of revival.
▪ Margin pressure continues: GM was down 583bps YoY (-145bps in Q3FY21
and -597bps in Q2FY22; -262bps HSIE). Employee/A&P/other expenses grew
9/85/-7% YoY. The company’s A&P spends are back to pre-COVID levels.
EBIT margin for switchgear, cable, lighting, ECD, and others contracted by
209/92/167/520/152bps YoY to 29/10/21/13/2%. Contribution margin improved
sequentially, except for ECD/Lloyd. ECD margin improvement is expected
from Q4FY22. The upcoming season will be the key monitorable for Lloyd’s
overall show. EBITDA margin contracted 399bps YoY to 12.1% (+420bps in
Q3FY21 and -339bps in Q2FY22). EBITDA declined by 13% YoY (HSIE +4%).
PAT declined by 12% YoY to INR 3,059mn (HSIE INR 3,628mn).
Con call takeaways: (1) Festive demand, new construction activities, and
industrial were strong. (2) Slowdown was seen in the later part of the quarter
due to the COVID third wave. (3) RAC demand should be strong in the
coming season (on a low base) due to loss of past two seasons. (4) Crabtree
and Standard revenue was at INR 3bn and INR 6bn respectively. (5) Havells
expects Lloyd RAC EBIT margin to reach double digits in the long term and
blended margin (with W/M, Ref) near 7-8%. (6) Advertisement expenses are
back at normalised levels. (7) Capex guidance for FY22 stands at INR 2-2.5bn.
Quarterly/annual financial summary
YE Mar (INR mn) Q3FY22 Q3FY21 YoY (%) Q2FY22 QoQ (%) FY21 FY22E FY23E FY24E
Net Sales 36,523 31,659 15.4 32,210 13.4 104,279 135,449 158,071 175,443
EBITDA 4,403 5,081 (13.3) 4,436 (0.7) 15,653 18,132 22,182 24,620
APAT 3,059 3,491 (12.4) 3,016 1.4 10,396 12,215 15,261 17,329
Diluted EPS (Rs) 4.9 5.6 (12.4) 4.8 1.4 16.6 19.5 24.4 27.7
P/E (x) 75.0 63.8 51.1 45.0
EV / EBITDA (x)
48.9 41.7 33.6 30.0
Core RoCE (%)
26.5 28.2 34.5 37.0
Source: Company, HSIE Research
ADD
CMP (as on 21 Jan 2022) INR 1,242
Target Price INR 1,550
NIFTY 17,617
KEY
CHANGES OLD NEW
Rating ADD ADD
Price Target INR 1,550 INR 1,550
EPS % FY22E FY23E
-5% 0%
KEY STOCK DATA
Bloomberg code HAVL IN
No. of Shares (mn) 626
MCap (INR bn) / ($ mn) 778/10,451
6m avg traded value (INR mn) 2,098
52 Week high / low INR 1,504/958
STOCK PERFORMANCE (%)
3M 6M 12M
Absolute (%) (3.4) 12.5 9.7
Relative (%) (0.3) (0.6) (9.3)
SHAREHOLDING PATTERN (%)
Sep-21 Dec-21
Promoters 59.47 59.47
FIs & Local MFs 6.12 6.26
FPIs 26.76 26.51
Public & Others 7.65 7.76
Pledged Shares - -
Source : BSE
Pledged shares as % of total shares
Naveen Trivedi
+91-22-6171-7324
Saras Singh
+91-22-6171-7336
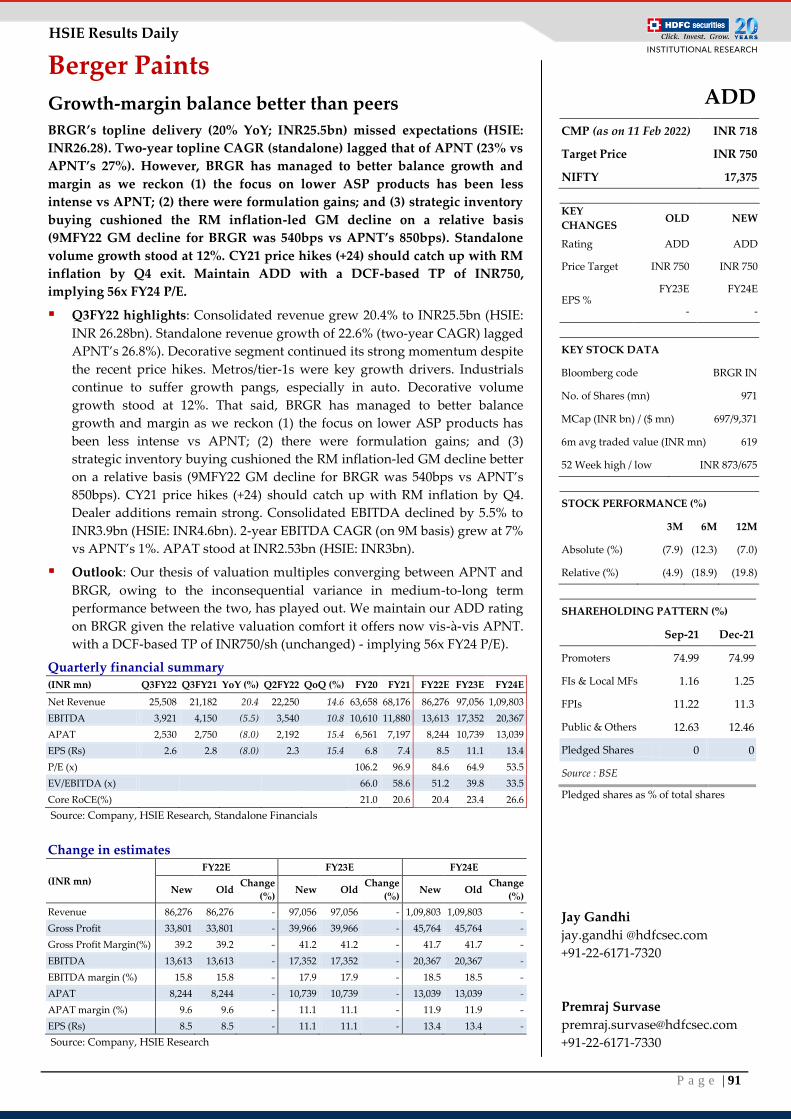
P a g e | 91
HSIE Results Daily
Berger Paints
Growth-margin balance better than peers
BRGR’s topline delivery (20% YoY; INR25.5bn) missed expectations (HSIE:
INR26.28). Two-year topline CAGR (standalone) lagged that of APNT (23% vs
APNT’s 27%). However, BRGR has managed to better balance growth and
margin as we reckon (1) the focus on lower ASP products has been less
intense vs APNT; (2) there were formulation gains; and (3) strategic inventory
buying cushioned the RM inflation-led GM decline on a relative basis
(9MFY22 GM decline for BRGR was 540bps vs APNT’s 850bps). Standalone
volume growth stood at 12%. CY21 price hikes (+24) should catch up with RM
inflation by Q4 exit. Maintain ADD with a DCF-based TP of INR750,
implying 56x FY24 P/E.
Q3FY22 highlights: Consolidated revenue grew 20.4% to INR25.5bn (HSIE:
INR 26.28bn). Standalone revenue growth of 22.6% (two-year CAGR) lagged
APNT’s 26.8%). Decorative segment continued its strong momentum despite
the recent price hikes. Metros/tier-1s were key growth drivers. Industrials
continue to suffer growth pangs, especially in auto. Decorative volume
growth stood at 12%. That said, BRGR has managed to better balance
growth and margin as we reckon (1) the focus on lower ASP products has
been less intense vs APNT; (2) there were formulation gains; and (3)
strategic inventory buying cushioned the RM inflation-led GM decline better
on a relative basis (9MFY22 GM decline for BRGR was 540bps vs APNT’s
850bps). CY21 price hikes (+24) should catch up with RM inflation by Q4.
Dealer additions remain strong. Consolidated EBITDA declined by 5.5% to
INR3.9bn (HSIE: INR4.6bn). 2-year EBITDA CAGR (on 9M basis) grew at 7%
vs APNT’s 1%. APAT stood at INR2.53bn (HSIE: INR3bn).
Outlook: Our thesis of valuation multiples converging between APNT and
BRGR, owing to the inconsequential variance in medium-to-long term
performance between the two, has played out. We maintain our ADD rating
on BRGR given the relative valuation comfort it offers now vis-à-vis APNT.
with a DCF-based TP of INR750/sh (unchanged) - implying 56x FY24 P/E).
Quarterly financial summary (INR mn) Q3FY22 Q3FY21 YoY (%) Q2FY22 QoQ (%) FY20 FY21 FY22E FY23E FY24E
Net Revenue 25,508 21,182 20.4 22,250 14.6 63,658 68,176 86,276 97,056 1,09,803
EBITDA 3,921 4,150 (5.5) 3,540 10.8 10,610 11,880 13,613 17,352 20,367
APAT 2,530 2,750 (8.0) 2,192 15.4 6,561 7,197 8,244 10,739 13,039
EPS (Rs) 2.6 2.8 (8.0) 2.3 15.4 6.8 7.4 8.5 11.1 13.4
P/E (x)
106.2 96.9 84.6 64.9 53.5
EV/EBITDA (x)
66.0 58.6 51.2 39.8 33.5
Core RoCE(%)
21.0 20.6 20.4 23.4 26.6
Source: Company, HSIE Research, Standalone Financials
Change in estimates
(INR mn)
FY22E FY23E FY24E
New Old Change
(%) New Old
Change
(%) New Old
Change
(%)
Revenue 86,276 86,276 - 97,056 97,056 - 1,09,803 1,09,803 -
Gross Profit 33,801 33,801 - 39,966 39,966 - 45,764 45,764 -
Gross Profit Margin(%) 39.2 39.2 - 41.2 41.2 - 41.7 41.7 -
EBITDA 13,613 13,613 - 17,352 17,352 - 20,367 20,367 -
EBITDA margin (%) 15.8 15.8 - 17.9 17.9 - 18.5 18.5 -
APAT 8,244 8,244 - 10,739 10,739 - 13,039 13,039 -
APAT margin (%) 9.6 9.6 - 11.1 11.1 - 11.9 11.9 -
EPS (Rs) 8.5 8.5 - 11.1 11.1 - 13.4 13.4 -
Source: Company, HSIE Research
ADD
CMP (as on 11 Feb 2022) INR 718
Target Price INR 750
NIFTY 17,375
KEY
CHANGES OLD NEW
Rating ADD ADD
Price Target INR 750 INR 750
EPS % FY23E FY24E
- -
KEY STOCK DATA
Bloomberg code BRGR IN
No. of Shares (mn) 971
MCap (INR bn) / ($ mn) 697/9,371
6m avg traded value (INR mn) 619
52 Week high / low INR 873/675
STOCK PERFORMANCE (%)
3M 6M 12M
Absolute (%) (7.9) (12.3) (7.0)
Relative (%) (4.9) (18.9) (19.8)
SHAREHOLDING PATTERN (%)
Sep-21 Dec-21
Promoters 74.99 74.99
FIs & Local MFs 1.16 1.25
FPIs 11.22 11.3
Public & Others 12.63 12.46
Pledged Shares 0 0
Source : BSE
Pledged shares as % of total shares
Jay Gandhi
jay.gandhi @hdfcsec.com
+91-22-6171-7320
Premraj Survase
+91-22-6171-7330
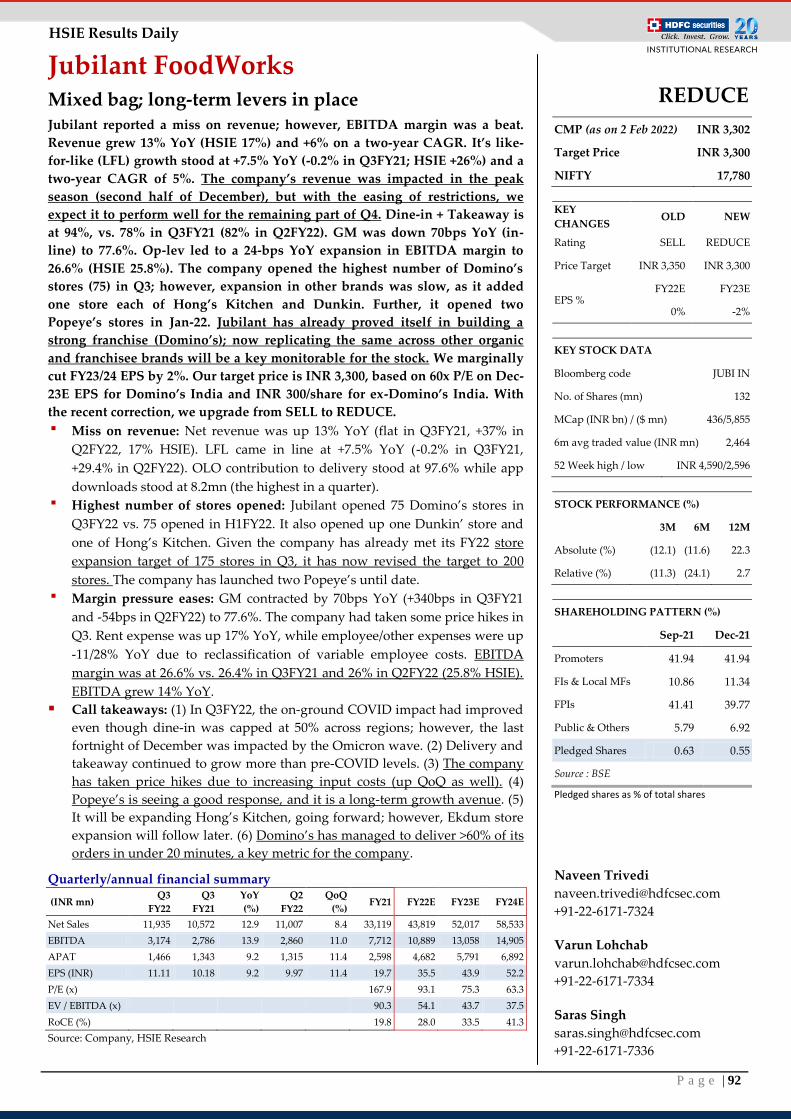
P a g e | 92
HSIE Results Daily
Jubilant FoodWorks Mixed bag; long-term levers in place Jubilant reported a miss on revenue; however, EBITDA margin was a beat.
Revenue grew 13% YoY (HSIE 17%) and +6% on a two-year CAGR. It’s like-
for-like (LFL) growth stood at +7.5% YoY (-0.2% in Q3FY21; HSIE +26%) and a
two-year CAGR of 5%. The company’s revenue was impacted in the peak
season (second half of December), but with the easing of restrictions, we
expect it to perform well for the remaining part of Q4. Dine-in + Takeaway is
at 94%, vs. 78% in Q3FY21 (82% in Q2FY22). GM was down 70bps YoY (in-
line) to 77.6%. Op-lev led to a 24-bps YoY expansion in EBITDA margin to
26.6% (HSIE 25.8%). The company opened the highest number of Domino’s
stores (75) in Q3; however, expansion in other brands was slow, as it added
one store each of Hong’s Kitchen and Dunkin. Further, it opened two
Popeye’s stores in Jan-22. Jubilant has already proved itself in building a
strong franchise (Domino’s); now replicating the same across other organic
and franchisee brands will be a key monitorable for the stock. We marginally
cut FY23/24 EPS by 2%. Our target price is INR 3,300, based on 60x P/E on Dec-
23E EPS for Domino’s India and INR 300/share for ex-Domino’s India. With
the recent correction, we upgrade from SELL to REDUCE.
▪ Miss on revenue: Net revenue was up 13% YoY (flat in Q3FY21, +37% in
Q2FY22, 17% HSIE). LFL came in line at +7.5% YoY (-0.2% in Q3FY21,
+29.4% in Q2FY22). OLO contribution to delivery stood at 97.6% while app
downloads stood at 8.2mn (the highest in a quarter).
▪ Highest number of stores opened: Jubilant opened 75 Domino’s stores in
Q3FY22 vs. 75 opened in H1FY22. It also opened up one Dunkin’ store and
one of Hong’s Kitchen. Given the company has already met its FY22 store
expansion target of 175 stores in Q3, it has now revised the target to 200
stores. The company has launched two Popeye’s until date.
▪ Margin pressure eases: GM contracted by 70bps YoY (+340bps in Q3FY21
and -54bps in Q2FY22) to 77.6%. The company had taken some price hikes in
Q3. Rent expense was up 17% YoY, while employee/other expenses were up
-11/28% YoY due to reclassification of variable employee costs. EBITDA
margin was at 26.6% vs. 26.4% in Q3FY21 and 26% in Q2FY22 (25.8% HSIE).
EBITDA grew 14% YoY.
Call takeaways: (1) In Q3FY22, the on-ground COVID impact had improved
even though dine-in was capped at 50% across regions; however, the last
fortnight of December was impacted by the Omicron wave. (2) Delivery and
takeaway continued to grow more than pre-COVID levels. (3) The company
has taken price hikes due to increasing input costs (up QoQ as well). (4)
Popeye’s is seeing a good response, and it is a long-term growth avenue. (5)
It will be expanding Hong’s Kitchen, going forward; however, Ekdum store
expansion will follow later. (6) Domino’s has managed to deliver >60% of its
orders in under 20 minutes, a key metric for the company.
Quarterly/annual financial summary
(INR mn) Q3
FY22
Q3
FY21
YoY
(%)
Q2
FY22
QoQ
(%) FY21 FY22E FY23E FY24E
Net Sales 11,935 10,572 12.9 11,007 8.4 33,119 43,819 52,017 58,533
EBITDA 3,174 2,786 13.9 2,860 11.0 7,712 10,889 13,058 14,905
APAT 1,466 1,343 9.2 1,315 11.4 2,598 4,682 5,791 6,892
EPS (INR) 11.11 10.18 9.2 9.97 11.4 19.7 35.5 43.9 52.2
P/E (x) 167.9 93.1 75.3 63.3
EV / EBITDA (x)
90.3 54.1 43.7 37.5
RoCE (%)
19.8 28.0 33.5 41.3
Source: Company, HSIE Research
REDUCE
CMP (as on 2 Feb 2022) INR 3,302
Target Price INR 3,300
NIFTY 17,780
KEY
CHANGES OLD NEW
Rating SELL REDUCE
Price Target INR 3,350 INR 3,300
EPS % FY22E FY23E
0% -2%
KEY STOCK DATA
Bloomberg code JUBI IN
No. of Shares (mn) 132
MCap (INR bn) / ($ mn) 436/5,855
6m avg traded value (INR mn) 2,464
52 Week high / low INR 4,590/2,596
STOCK PERFORMANCE (%)
3M 6M 12M
Absolute (%) (12.1) (11.6) 22.3
Relative (%) (11.3) (24.1) 2.7
SHAREHOLDING PATTERN (%)
Sep-21 Dec-21
Promoters 41.94 41.94
FIs & Local MFs 10.86 11.34
FPIs 41.41 39.77
Public & Others 5.79 6.92
Pledged Shares 0.63 0.55
Source : BSE
Pledged shares as % of total shares
Naveen Trivedi
+91-22-6171-7324
Varun Lohchab
+91-22-6171-7334
Saras Singh
+91-22-6171-7336
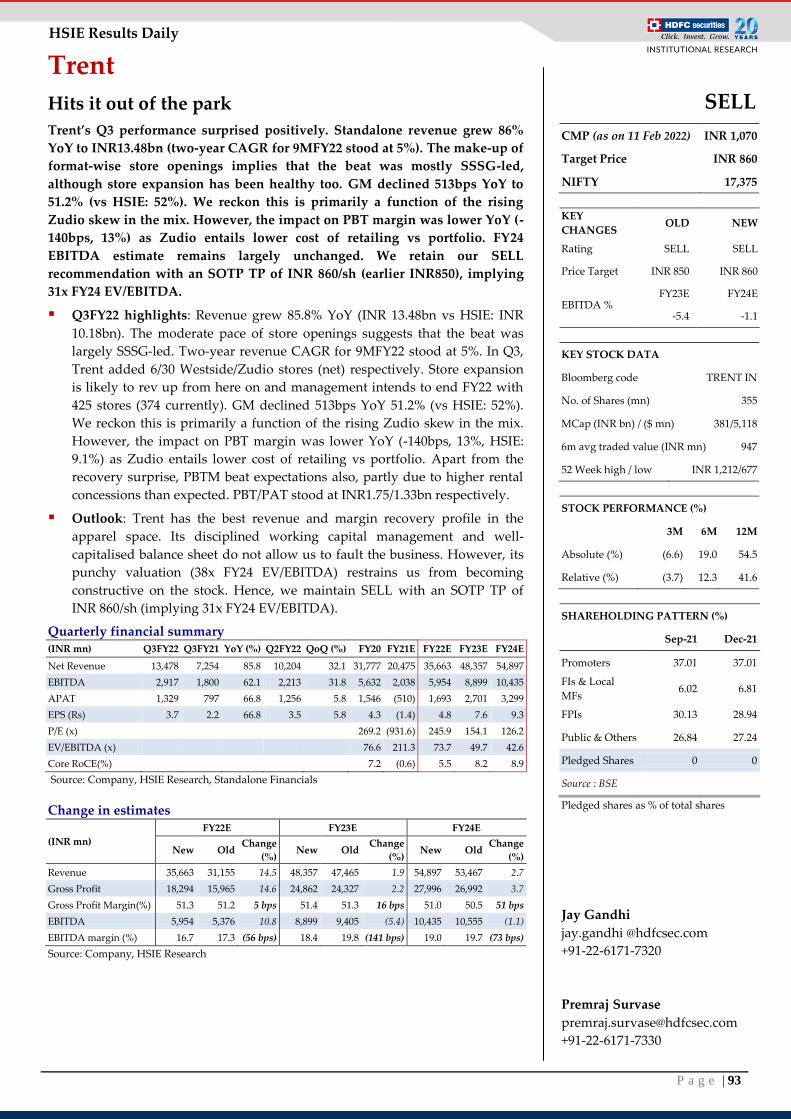
P a g e | 93
HSIE Results Daily
Trent
Hits it out of the park
Trent’s Q3 performance surprised positively. Standalone revenue grew 86%
YoY to INR13.48bn (two-year CAGR for 9MFY22 stood at 5%). The make-up of
format-wise store openings implies that the beat was mostly SSSG-led,
although store expansion has been healthy too. GM declined 513bps YoY to
51.2% (vs HSIE: 52%). We reckon this is primarily a function of the rising
Zudio skew in the mix. However, the impact on PBT margin was lower YoY (-
140bps, 13%) as Zudio entails lower cost of retailing vs portfolio. FY24
EBITDA estimate remains largely unchanged. We retain our SELL
recommendation with an SOTP TP of INR 860/sh (earlier INR850), implying
31x FY24 EV/EBITDA.
Q3FY22 highlights: Revenue grew 85.8% YoY (INR 13.48bn vs HSIE: INR
10.18bn). The moderate pace of store openings suggests that the beat was
largely SSSG-led. Two-year revenue CAGR for 9MFY22 stood at 5%. In Q3,
Trent added 6/30 Westside/Zudio stores (net) respectively. Store expansion
is likely to rev up from here on and management intends to end FY22 with
425 stores (374 currently). GM declined 513bps YoY 51.2% (vs HSIE: 52%).
We reckon this is primarily a function of the rising Zudio skew in the mix.
However, the impact on PBT margin was lower YoY (-140bps, 13%, HSIE:
9.1%) as Zudio entails lower cost of retailing vs portfolio. Apart from the
recovery surprise, PBTM beat expectations also, partly due to higher rental
concessions than expected. PBT/PAT stood at INR1.75/1.33bn respectively.
Outlook: Trent has the best revenue and margin recovery profile in the
apparel space. Its disciplined working capital management and well-
capitalised balance sheet do not allow us to fault the business. However, its
punchy valuation (38x FY24 EV/EBITDA) restrains us from becoming
constructive on the stock. Hence, we maintain SELL with an SOTP TP of
INR 860/sh (implying 31x FY24 EV/EBITDA).
Quarterly financial summary (INR mn) Q3FY22 Q3FY21 YoY (%) Q2FY22 QoQ (%) FY20 FY21E FY22E FY23E FY24E
Net Revenue 13,478 7,254 85.8 10,204 32.1 31,777 20,475 35,663 48,357 54,897
EBITDA 2,917 1,800 62.1 2,213 31.8 5,632 2,038 5,954 8,899 10,435
APAT 1,329 797 66.8 1,256 5.8 1,546 (510) 1,693 2,701 3,299
EPS (Rs) 3.7 2.2 66.8 3.5 5.8 4.3 (1.4) 4.8 7.6 9.3
P/E (x)
269.2 (931.6) 245.9 154.1 126.2
EV/EBITDA (x)
76.6 211.3 73.7 49.7 42.6
Core RoCE(%)
7.2 (0.6) 5.5 8.2 8.9
Source: Company, HSIE Research, Standalone Financials
Change in estimates
(INR mn)
FY22E FY23E FY24E
New Old Change
(%) New Old
Change
(%) New Old
Change
(%)
Revenue 35,663 31,155 14.5 48,357 47,465 1.9 54,897 53,467 2.7
Gross Profit 18,294 15,965 14.6 24,862 24,327 2.2 27,996 26,992 3.7
Gross Profit Margin(%) 51.3 51.2 5 bps 51.4 51.3 16 bps 51.0 50.5 51 bps
EBITDA 5,954 5,376 10.8 8,899 9,405 (5.4) 10,435 10,555 (1.1)
EBITDA margin (%) 16.7 17.3 (56 bps) 18.4 19.8 (141 bps) 19.0 19.7 (73 bps)
Source: Company, HSIE Research
SELL
CMP (as on 11 Feb 2022) INR 1,070
Target Price INR 860
NIFTY 17,375
KEY
CHANGES OLD NEW
Rating SELL SELL
Price Target INR 850 INR 860
EBITDA % FY23E FY24E
-5.4 -1.1
KEY STOCK DATA
Bloomberg code TRENT IN
No. of Shares (mn) 355
MCap (INR bn) / ($ mn) 381/5,118
6m avg traded value (INR mn) 947
52 Week high / low INR 1,212/677
STOCK PERFORMANCE (%)
3M 6M 12M
Absolute (%) (6.6) 19.0 54.5
Relative (%) (3.7) 12.3 41.6
SHAREHOLDING PATTERN (%)
Sep-21 Dec-21
Promoters 37.01 37.01
FIs & Local
MFs 6.02 6.81
FPIs 30.13 28.94
Public & Others 26.84 27.24
Pledged Shares 0 0
Source : BSE
Pledged shares as % of total shares
Jay Gandhi
jay.gandhi @hdfcsec.com
+91-22-6171-7320
Premraj Survase
+91-22-6171-7330
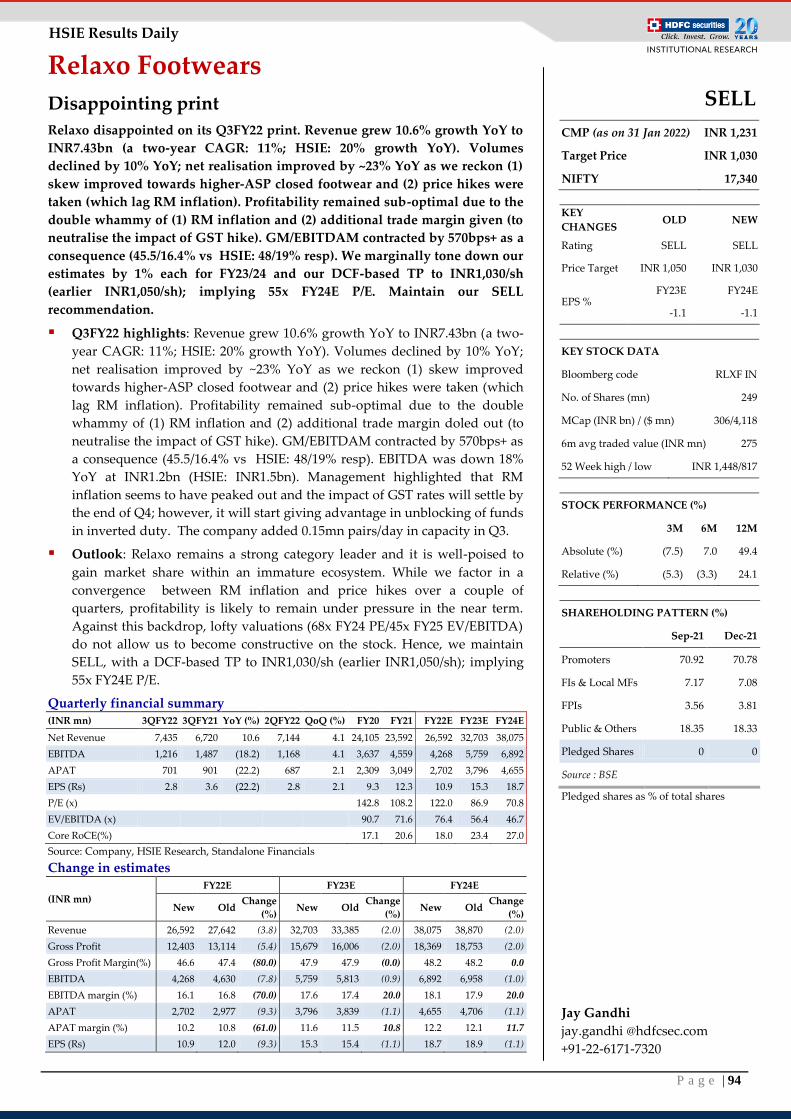
P a g e | 94
HSIE Results Daily
Relaxo Footwears
Disappointing print
Relaxo disappointed on its Q3FY22 print. Revenue grew 10.6% growth YoY to
INR7.43bn (a two-year CAGR: 11%; HSIE: 20% growth YoY). Volumes
declined by 10% YoY; net realisation improved by ~23% YoY as we reckon (1)
skew improved towards higher-ASP closed footwear and (2) price hikes were
taken (which lag RM inflation). Profitability remained sub-optimal due to the
double whammy of (1) RM inflation and (2) additional trade margin given (to
neutralise the impact of GST hike). GM/EBITDAM contracted by 570bps+ as a
consequence (45.5/16.4% vs HSIE: 48/19% resp). We marginally tone down our
estimates by 1% each for FY23/24 and our DCF-based TP to INR1,030/sh
(earlier INR1,050/sh); implying 55x FY24E P/E. Maintain our SELL
recommendation.
Q3FY22 highlights: Revenue grew 10.6% growth YoY to INR7.43bn (a two-
year CAGR: 11%; HSIE: 20% growth YoY). Volumes declined by 10% YoY;
net realisation improved by ~23% YoY as we reckon (1) skew improved
towards higher-ASP closed footwear and (2) price hikes were taken (which
lag RM inflation). Profitability remained sub-optimal due to the double
whammy of (1) RM inflation and (2) additional trade margin doled out (to
neutralise the impact of GST hike). GM/EBITDAM contracted by 570bps+ as
a consequence (45.5/16.4% vs HSIE: 48/19% resp). EBITDA was down 18%
YoY at INR1.2bn (HSIE: INR1.5bn). Management highlighted that RM
inflation seems to have peaked out and the impact of GST rates will settle by
the end of Q4; however, it will start giving advantage in unblocking of funds
in inverted duty. The company added 0.15mn pairs/day in capacity in Q3.
Outlook: Relaxo remains a strong category leader and it is well-poised to
gain market share within an immature ecosystem. While we factor in a
convergence between RM inflation and price hikes over a couple of
quarters, profitability is likely to remain under pressure in the near term.
Against this backdrop, lofty valuations (68x FY24 PE/45x FY25 EV/EBITDA)
do not allow us to become constructive on the stock. Hence, we maintain
SELL, with a DCF-based TP to INR1,030/sh (earlier INR1,050/sh); implying
55x FY24E P/E.
Quarterly financial summary (INR mn) 3QFY22 3QFY21 YoY (%) 2QFY22 QoQ (%) FY20 FY21 FY22E FY23E FY24E
Net Revenue 7,435 6,720 10.6 7,144 4.1 24,105 23,592 26,592 32,703 38,075
EBITDA 1,216 1,487 (18.2) 1,168 4.1 3,637 4,559 4,268 5,759 6,892
APAT 701 901 (22.2) 687 2.1 2,309 3,049 2,702 3,796 4,655
EPS (Rs) 2.8 3.6 (22.2) 2.8 2.1 9.3 12.3 10.9 15.3 18.7
P/E (x)
142.8 108.2 122.0 86.9 70.8
EV/EBITDA (x)
90.7 71.6 76.4 56.4 46.7
Core RoCE(%)
17.1 20.6 18.0 23.4 27.0
Source: Company, HSIE Research, Standalone Financials
Change in estimates
(INR mn)
FY22E FY23E FY24E
New Old Change
(%) New Old
Change
(%) New Old
Change
(%)
Revenue 26,592 27,642 (3.8) 32,703 33,385 (2.0) 38,075 38,870 (2.0)
Gross Profit 12,403 13,114 (5.4) 15,679 16,006 (2.0) 18,369 18,753 (2.0)
Gross Profit Margin(%) 46.6 47.4 (80.0) 47.9 47.9 (0.0) 48.2 48.2 0.0
EBITDA 4,268 4,630 (7.8) 5,759 5,813 (0.9) 6,892 6,958 (1.0)
EBITDA margin (%) 16.1 16.8 (70.0) 17.6 17.4 20.0 18.1 17.9 20.0
APAT 2,702 2,977 (9.3) 3,796 3,839 (1.1) 4,655 4,706 (1.1)
APAT margin (%) 10.2 10.8 (61.0) 11.6 11.5 10.8 12.2 12.1 11.7
EPS (Rs) 10.9 12.0 (9.3) 15.3 15.4 (1.1) 18.7 18.9 (1.1)
SELL
CMP (as on 31 Jan 2022) INR 1,231
Target Price INR 1,030
NIFTY 17,340
KEY
CHANGES OLD NEW
Rating SELL SELL
Price Target INR 1,050 INR 1,030
EPS % FY23E FY24E
-1.1 -1.1
KEY STOCK DATA
Bloomberg code RLXF IN
No. of Shares (mn) 249
MCap (INR bn) / ($ mn) 306/4,118
6m avg traded value (INR mn) 275
52 Week high / low INR 1,448/817
STOCK PERFORMANCE (%)
3M 6M 12M
Absolute (%) (7.5) 7.0 49.4
Relative (%) (5.3) (3.3) 24.1
SHAREHOLDING PATTERN (%)
Sep-21 Dec-21
Promoters 70.92 70.78
FIs & Local MFs 7.17 7.08
FPIs 3.56 3.81
Public & Others 18.35 18.33
Pledged Shares 0 0
Source : BSE
Pledged shares as % of total shares
Jay Gandhi
jay.gandhi @hdfcsec.com
+91-22-6171-7320
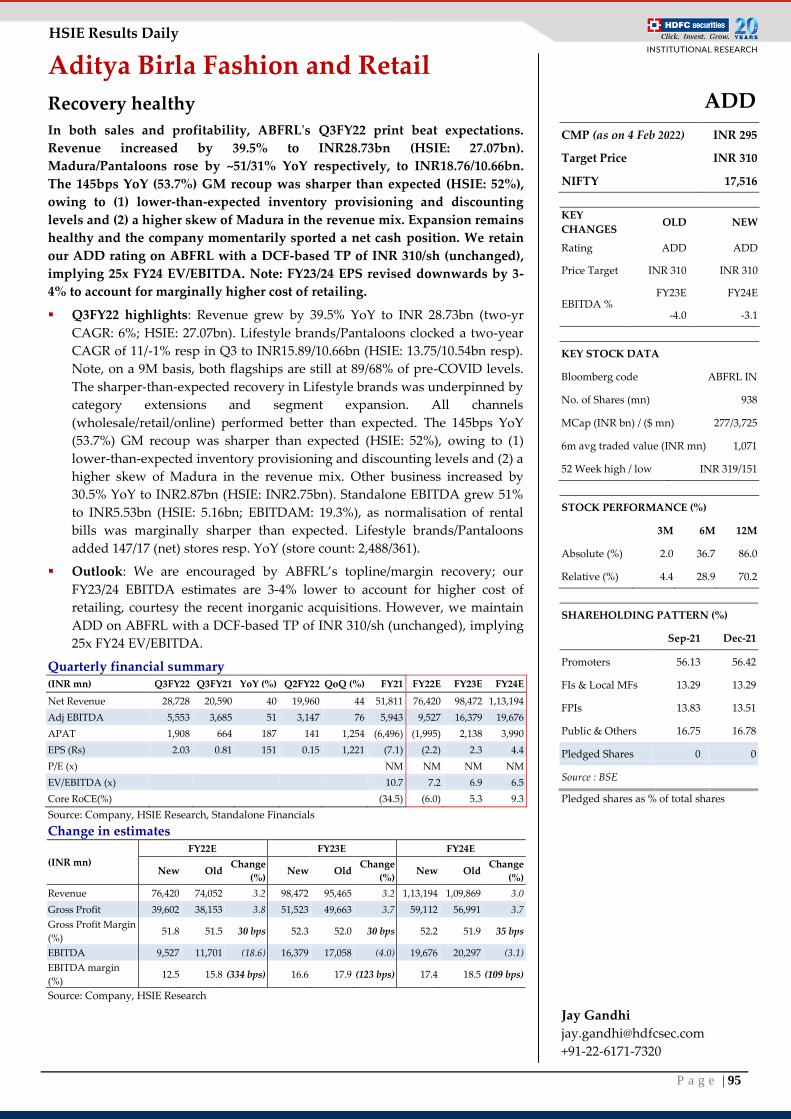
P a g e | 95
HSIE Results Daily
Aditya Birla Fashion and Retail
Recovery healthy
In both sales and profitability, ABFRL's Q3FY22 print beat expectations.
Revenue increased by 39.5% to INR28.73bn (HSIE: 27.07bn).
Madura/Pantaloons rose by ~51/31% YoY respectively, to INR18.76/10.66bn.
The 145bps YoY (53.7%) GM recoup was sharper than expected (HSIE: 52%),
owing to (1) lower-than-expected inventory provisioning and discounting
levels and (2) a higher skew of Madura in the revenue mix. Expansion remains
healthy and the company momentarily sported a net cash position. We retain
our ADD rating on ABFRL with a DCF-based TP of INR 310/sh (unchanged),
implying 25x FY24 EV/EBITDA. Note: FY23/24 EPS revised downwards by 3-
4% to account for marginally higher cost of retailing.
Q3FY22 highlights: Revenue grew by 39.5% YoY to INR 28.73bn (two-yr
CAGR: 6%; HSIE: 27.07bn). Lifestyle brands/Pantaloons clocked a two-year
CAGR of 11/-1% resp in Q3 to INR15.89/10.66bn (HSIE: 13.75/10.54bn resp).
Note, on a 9M basis, both flagships are still at 89/68% of pre-COVID levels.
The sharper-than-expected recovery in Lifestyle brands was underpinned by
category extensions and segment expansion. All channels
(wholesale/retail/online) performed better than expected. The 145bps YoY
(53.7%) GM recoup was sharper than expected (HSIE: 52%), owing to (1)
lower-than-expected inventory provisioning and discounting levels and (2) a
higher skew of Madura in the revenue mix. Other business increased by
30.5% YoY to INR2.87bn (HSIE: INR2.75bn). Standalone EBITDA grew 51%
to INR5.53bn (HSIE: 5.16bn; EBITDAM: 19.3%), as normalisation of rental
bills was marginally sharper than expected. Lifestyle brands/Pantaloons
added 147/17 (net) stores resp. YoY (store count: 2,488/361).
Outlook: We are encouraged by ABFRL’s topline/margin recovery; our
FY23/24 EBITDA estimates are 3-4% lower to account for higher cost of
retailing, courtesy the recent inorganic acquisitions. However, we maintain
ADD on ABFRL with a DCF-based TP of INR 310/sh (unchanged), implying
25x FY24 EV/EBITDA.
Quarterly financial summary (INR mn) Q3FY22 Q3FY21 YoY (%) Q2FY22 QoQ (%) FY21 FY22E FY23E FY24E
Net Revenue 28,728 20,590 40 19,960 44 51,811 76,420 98,472 1,13,194
Adj EBITDA 5,553 3,685 51 3,147 76 5,943 9,527 16,379 19,676
APAT 1,908 664 187 141 1,254 (6,496) (1,995) 2,138 3,990
EPS (Rs) 2.03 0.81 151 0.15 1,221 (7.1) (2.2) 2.3 4.4
P/E (x)
NM NM NM NM
EV/EBITDA (x)
10.7 7.2 6.9 6.5
Core RoCE(%)
(34.5) (6.0) 5.3 9.3
Source: Company, HSIE Research, Standalone Financials
Change in estimates
(INR mn)
FY22E FY23E FY24E
New Old Change
(%) New Old
Change
(%) New Old
Change
(%)
Revenue 76,420 74,052 3.2 98,472 95,465 3.2 1,13,194 1,09,869 3.0
Gross Profit 39,602 38,153 3.8 51,523 49,663 3.7 59,112 56,991 3.7
Gross Profit Margin
(%) 51.8 51.5 30 bps 52.3 52.0 30 bps 52.2 51.9 35 bps
EBITDA 9,527 11,701 (18.6) 16,379 17,058 (4.0) 19,676 20,297 (3.1)
EBITDA margin
(%) 12.5 15.8 (334 bps) 16.6 17.9 (123 bps) 17.4 18.5 (109 bps)
Source: Company, HSIE Research
ADD
CMP (as on 4 Feb 2022) INR 295
Target Price INR 310
NIFTY 17,516
KEY
CHANGES OLD NEW
Rating ADD ADD
Price Target INR 310 INR 310
EBITDA % FY23E FY24E
-4.0 -3.1
KEY STOCK DATA
Bloomberg code ABFRL IN
No. of Shares (mn) 938
MCap (INR bn) / ($ mn) 277/3,725
6m avg traded value (INR mn) 1,071
52 Week high / low INR 319/151
STOCK PERFORMANCE (%)
3M 6M 12M
Absolute (%) 2.0 36.7 86.0
Relative (%) 4.4 28.9 70.2
SHAREHOLDING PATTERN (%)
Sep-21 Dec-21
Promoters 56.13 56.42
FIs & Local MFs 13.29 13.29
FPIs 13.83 13.51
Public & Others 16.75 16.78
Pledged Shares 0 0
Source : BSE
Pledged shares as % of total shares
Jay Gandhi
+91-22-6171-7320
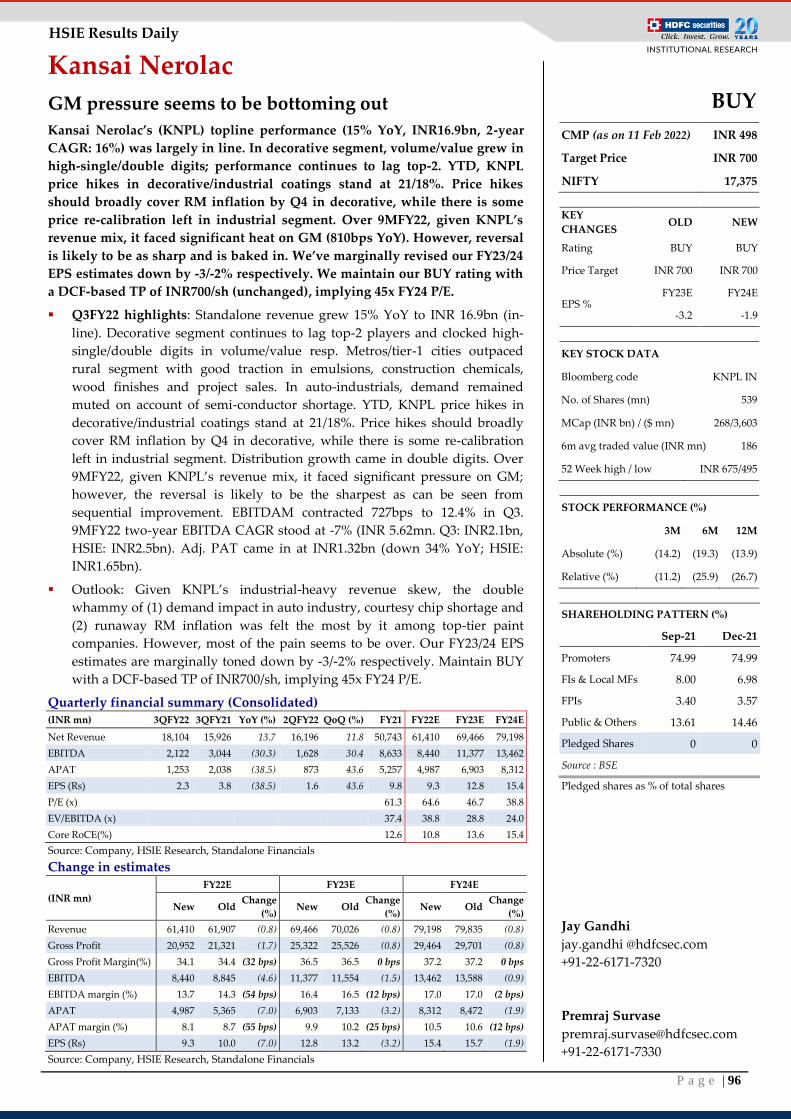
P a g e | 96
HSIE Results Daily
Kansai Nerolac
GM pressure seems to be bottoming out
Kansai Nerolac’s (KNPL) topline performance (15% YoY, INR16.9bn, 2-year
CAGR: 16%) was largely in line. In decorative segment, volume/value grew in
high-single/double digits; performance continues to lag top-2. YTD, KNPL
price hikes in decorative/industrial coatings stand at 21/18%. Price hikes
should broadly cover RM inflation by Q4 in decorative, while there is some
price re-calibration left in industrial segment. Over 9MFY22, given KNPL’s
revenue mix, it faced significant heat on GM (810bps YoY). However, reversal
is likely to be as sharp and is baked in. We’ve marginally revised our FY23/24
EPS estimates down by -3/-2% respectively. We maintain our BUY rating with
a DCF-based TP of INR700/sh (unchanged), implying 45x FY24 P/E.
Q3FY22 highlights: Standalone revenue grew 15% YoY to INR 16.9bn (in-
line). Decorative segment continues to lag top-2 players and clocked high-
single/double digits in volume/value resp. Metros/tier-1 cities outpaced
rural segment with good traction in emulsions, construction chemicals,
wood finishes and project sales. In auto-industrials, demand remained
muted on account of semi-conductor shortage. YTD, KNPL price hikes in
decorative/industrial coatings stand at 21/18%. Price hikes should broadly
cover RM inflation by Q4 in decorative, while there is some re-calibration
left in industrial segment. Distribution growth came in double digits. Over
9MFY22, given KNPL’s revenue mix, it faced significant pressure on GM;
however, the reversal is likely to be the sharpest as can be seen from
sequential improvement. EBITDAM contracted 727bps to 12.4% in Q3.
9MFY22 two-year EBITDA CAGR stood at -7% (INR 5.62mn. Q3: INR2.1bn,
HSIE: INR2.5bn). Adj. PAT came in at INR1.32bn (down 34% YoY; HSIE:
INR1.65bn).
Outlook: Given KNPL’s industrial-heavy revenue skew, the double
whammy of (1) demand impact in auto industry, courtesy chip shortage and
(2) runaway RM inflation was felt the most by it among top-tier paint
companies. However, most of the pain seems to be over. Our FY23/24 EPS
estimates are marginally toned down by -3/-2% respectively. Maintain BUY
with a DCF-based TP of INR700/sh, implying 45x FY24 P/E.
Quarterly financial summary (Consolidated) (INR mn) 3QFY22 3QFY21 YoY (%) 2QFY22 QoQ (%) FY21 FY22E FY23E FY24E
Net Revenue 18,104 15,926 13.7 16,196 11.8 50,743 61,410 69,466 79,198
EBITDA 2,122 3,044 (30.3) 1,628 30.4 8,633 8,440 11,377 13,462
APAT 1,253 2,038 (38.5) 873 43.6 5,257 4,987 6,903 8,312
EPS (Rs) 2.3 3.8 (38.5) 1.6 43.6 9.8 9.3 12.8 15.4
P/E (x)
61.3 64.6 46.7 38.8
EV/EBITDA (x)
37.4 38.8 28.8 24.0
Core RoCE(%)
12.6 10.8 13.6 15.4
Source: Company, HSIE Research, Standalone Financials
Change in estimates
(INR mn)
FY22E FY23E FY24E
New Old Change
(%) New Old
Change
(%) New Old
Change
(%)
Revenue 61,410 61,907 (0.8) 69,466 70,026 (0.8) 79,198 79,835 (0.8)
Gross Profit 20,952 21,321 (1.7) 25,322 25,526 (0.8) 29,464 29,701 (0.8)
Gross Profit Margin(%) 34.1 34.4 (32 bps) 36.5 36.5 0 bps 37.2 37.2 0 bps
EBITDA 8,440 8,845 (4.6) 11,377 11,554 (1.5) 13,462 13,588 (0.9)
EBITDA margin (%) 13.7 14.3 (54 bps) 16.4 16.5 (12 bps) 17.0 17.0 (2 bps)
APAT 4,987 5,365 (7.0) 6,903 7,133 (3.2) 8,312 8,472 (1.9)
APAT margin (%) 8.1 8.7 (55 bps) 9.9 10.2 (25 bps) 10.5 10.6 (12 bps)
EPS (Rs) 9.3 10.0 (7.0) 12.8 13.2 (3.2) 15.4 15.7 (1.9)
Source: Company, HSIE Research, Standalone Financials
BUY
CMP (as on 11 Feb 2022) INR 498
Target Price INR 700
NIFTY 17,375
KEY
CHANGES OLD NEW
Rating BUY BUY
Price Target INR 700 INR 700
EPS % FY23E FY24E
-3.2 -1.9
KEY STOCK DATA
Bloomberg code KNPL IN
No. of Shares (mn) 539
MCap (INR bn) / ($ mn) 268/3,603
6m avg traded value (INR mn) 186
52 Week high / low INR 675/495
STOCK PERFORMANCE (%)
3M 6M 12M
Absolute (%) (14.2) (19.3) (13.9)
Relative (%) (11.2) (25.9) (26.7)
SHAREHOLDING PATTERN (%)
Sep-21 Dec-21
Promoters 74.99 74.99
FIs & Local MFs 8.00 6.98
FPIs 3.40 3.57
Public & Others 13.61 14.46
Pledged Shares 0 0
Source : BSE
Pledged shares as % of total shares
Jay Gandhi
jay.gandhi @hdfcsec.com
+91-22-6171-7320
Premraj Survase
+91-22-6171-7330
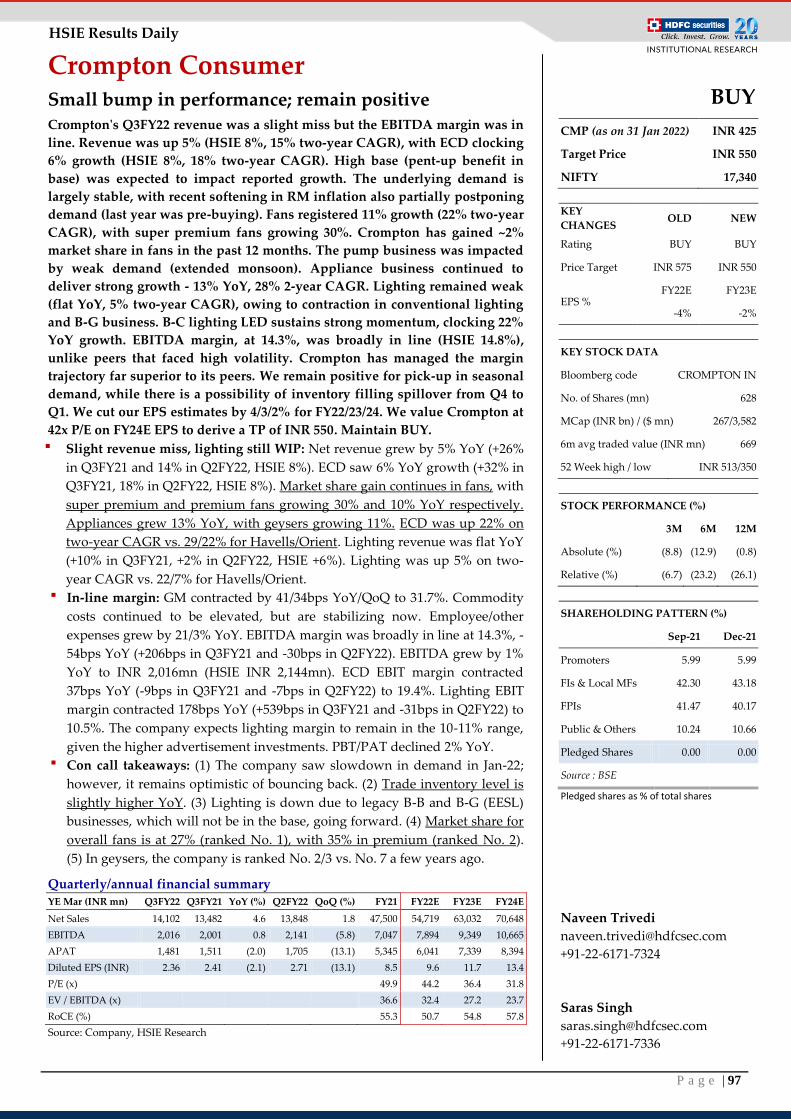
P a g e | 97
HSIE Results Daily
Crompton Consumer Small bump in performance; remain positive Crompton's Q3FY22 revenue was a slight miss but the EBITDA margin was in
line. Revenue was up 5% (HSIE 8%, 15% two-year CAGR), with ECD clocking
6% growth (HSIE 8%, 18% two-year CAGR). High base (pent-up benefit in
base) was expected to impact reported growth. The underlying demand is
largely stable, with recent softening in RM inflation also partially postponing
demand (last year was pre-buying). Fans registered 11% growth (22% two-year
CAGR), with super premium fans growing 30%. Crompton has gained ~2%
market share in fans in the past 12 months. The pump business was impacted
by weak demand (extended monsoon). Appliance business continued to
deliver strong growth - 13% YoY, 28% 2-year CAGR. Lighting remained weak
(flat YoY, 5% two-year CAGR), owing to contraction in conventional lighting
and B-G business. B-C lighting LED sustains strong momentum, clocking 22%
YoY growth. EBITDA margin, at 14.3%, was broadly in line (HSIE 14.8%),
unlike peers that faced high volatility. Crompton has managed the margin
trajectory far superior to its peers. We remain positive for pick-up in seasonal
demand, while there is a possibility of inventory filling spillover from Q4 to
Q1. We cut our EPS estimates by 4/3/2% for FY22/23/24. We value Crompton at
42x P/E on FY24E EPS to derive a TP of INR 550. Maintain BUY.
▪ Slight revenue miss, lighting still WIP: Net revenue grew by 5% YoY (+26%
in Q3FY21 and 14% in Q2FY22, HSIE 8%). ECD saw 6% YoY growth (+32% in
Q3FY21, 18% in Q2FY22, HSIE 8%). Market share gain continues in fans, with
super premium and premium fans growing 30% and 10% YoY respectively.
Appliances grew 13% YoY, with geysers growing 11%. ECD was up 22% on
two-year CAGR vs. 29/22% for Havells/Orient. Lighting revenue was flat YoY
(+10% in Q3FY21, +2% in Q2FY22, HSIE +6%). Lighting was up 5% on two-
year CAGR vs. 22/7% for Havells/Orient.
▪ In-line margin: GM contracted by 41/34bps YoY/QoQ to 31.7%. Commodity
costs continued to be elevated, but are stabilizing now. Employee/other
expenses grew by 21/3% YoY. EBITDA margin was broadly in line at 14.3%, -
54bps YoY (+206bps in Q3FY21 and -30bps in Q2FY22). EBITDA grew by 1%
YoY to INR 2,016mn (HSIE INR 2,144mn). ECD EBIT margin contracted
37bps YoY (-9bps in Q3FY21 and -7bps in Q2FY22) to 19.4%. Lighting EBIT
margin contracted 178bps YoY (+539bps in Q3FY21 and -31bps in Q2FY22) to
10.5%. The company expects lighting margin to remain in the 10-11% range,
given the higher advertisement investments. PBT/PAT declined 2% YoY.
▪ Con call takeaways: (1) The company saw slowdown in demand in Jan-22;
however, it remains optimistic of bouncing back. (2) Trade inventory level is
slightly higher YoY. (3) Lighting is down due to legacy B-B and B-G (EESL)
businesses, which will not be in the base, going forward. (4) Market share for
overall fans is at 27% (ranked No. 1), with 35% in premium (ranked No. 2).
(5) In geysers, the company is ranked No. 2/3 vs. No. 7 a few years ago.
Quarterly/annual financial summary YE Mar (INR mn) Q3FY22 Q3FY21 YoY (%) Q2FY22 QoQ (%) FY21 FY22E FY23E FY24E
Net Sales 14,102 13,482 4.6 13,848 1.8 47,500 54,719 63,032 70,648
EBITDA 2,016 2,001 0.8 2,141 (5.8) 7,047 7,894 9,349 10,665
APAT 1,481 1,511 (2.0) 1,705 (13.1) 5,345 6,041 7,339 8,394
Diluted EPS (INR) 2.36 2.41 (2.1) 2.71 (13.1) 8.5 9.6 11.7 13.4
P/E (x) 49.9 44.2 36.4 31.8
EV / EBITDA (x)
36.6 32.4 27.2 23.7
RoCE (%)
55.3 50.7 54.8 57.8
Source: Company, HSIE Research
BUY
CMP (as on 31 Jan 2022) INR 425
Target Price INR 550
NIFTY 17,340
KEY
CHANGES OLD NEW
Rating BUY BUY
Price Target INR 575 INR 550
EPS % FY22E FY23E
-4% -2%
KEY STOCK DATA
Bloomberg code CROMPTON IN
No. of Shares (mn) 628
MCap (INR bn) / ($ mn) 267/3,582
6m avg traded value (INR mn) 669
52 Week high / low INR 513/350
STOCK PERFORMANCE (%)
3M 6M 12M
Absolute (%) (8.8) (12.9) (0.8)
Relative (%) (6.7) (23.2) (26.1)
SHAREHOLDING PATTERN (%)
Sep-21 Dec-21
Promoters 5.99 5.99
FIs & Local MFs 42.30 43.18
FPIs 41.47 40.17
Public & Others 10.24 10.66
Pledged Shares 0.00 0.00
Source : BSE
Pledged shares as % of total shares
Naveen Trivedi
+91-22-6171-7324
Saras Singh
+91-22-6171-7336
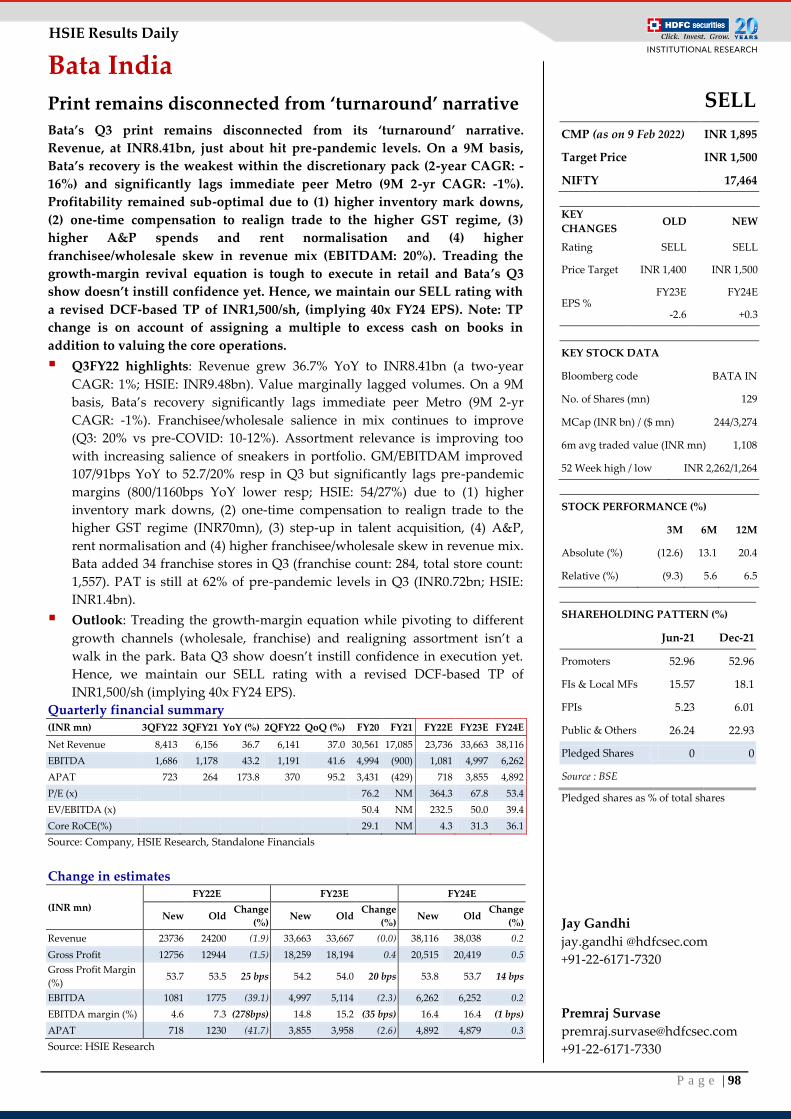
P a g e | 98
HSIE Results Daily
Bata India
Print remains disconnected from ‘turnaround’ narrative
Bata’s Q3 print remains disconnected from its ‘turnaround’ narrative.
Revenue, at INR8.41bn, just about hit pre-pandemic levels. On a 9M basis,
Bata’s recovery is the weakest within the discretionary pack (2-year CAGR: -
16%) and significantly lags immediate peer Metro (9M 2-yr CAGR: -1%).
Profitability remained sub-optimal due to (1) higher inventory mark downs,
(2) one-time compensation to realign trade to the higher GST regime, (3)
higher A&P spends and rent normalisation and (4) higher
franchisee/wholesale skew in revenue mix (EBITDAM: 20%). Treading the
growth-margin revival equation is tough to execute in retail and Bata’s Q3
show doesn’t instill confidence yet. Hence, we maintain our SELL rating with
a revised DCF-based TP of INR1,500/sh, (implying 40x FY24 EPS). Note: TP
change is on account of assigning a multiple to excess cash on books in
addition to valuing the core operations.
Q3FY22 highlights: Revenue grew 36.7% YoY to INR8.41bn (a two-year
CAGR: 1%; HSIE: INR9.48bn). Value marginally lagged volumes. On a 9M
basis, Bata’s recovery significantly lags immediate peer Metro (9M 2-yr
CAGR: -1%). Franchisee/wholesale salience in mix continues to improve
(Q3: 20% vs pre-COVID: 10-12%). Assortment relevance is improving too
with increasing salience of sneakers in portfolio. GM/EBITDAM improved
107/91bps YoY to 52.7/20% resp in Q3 but significantly lags pre-pandemic
margins (800/1160bps YoY lower resp; HSIE: 54/27%) due to (1) higher
inventory mark downs, (2) one-time compensation to realign trade to the
higher GST regime (INR70mn), (3) step-up in talent acquisition, (4) A&P,
rent normalisation and (4) higher franchisee/wholesale skew in revenue mix.
Bata added 34 franchise stores in Q3 (franchise count: 284, total store count:
1,557). PAT is still at 62% of pre-pandemic levels in Q3 (INR0.72bn; HSIE:
INR1.4bn).
Outlook: Treading the growth-margin equation while pivoting to different
growth channels (wholesale, franchise) and realigning assortment isn’t a
walk in the park. Bata Q3 show doesn’t instill confidence in execution yet.
Hence, we maintain our SELL rating with a revised DCF-based TP of
INR1,500/sh (implying 40x FY24 EPS).
Quarterly financial summary (INR mn) 3QFY22 3QFY21 YoY (%) 2QFY22 QoQ (%) FY20 FY21 FY22E FY23E FY24E
Net Revenue 8,413 6,156 36.7 6,141 37.0 30,561 17,085 23,736 33,663 38,116
EBITDA 1,686 1,178 43.2 1,191 41.6 4,994 (900) 1,081 4,997 6,262
APAT 723 264 173.8 370 95.2 3,431 (429) 718 3,855 4,892
P/E (x)
76.2 NM 364.3 67.8 53.4
EV/EBITDA (x)
50.4 NM 232.5 50.0 39.4
Core RoCE(%)
29.1 NM 4.3 31.3 36.1
Source: Company, HSIE Research, Standalone Financials
Change in estimates
(INR mn)
FY22E FY23E FY24E
New Old Change
(%) New Old
Change
(%) New Old
Change
(%)
Revenue 23736 24200 (1.9) 33,663 33,667 (0.0) 38,116 38,038 0.2
Gross Profit 12756 12944 (1.5) 18,259 18,194 0.4 20,515 20,419 0.5
Gross Profit Margin
(%) 53.7 53.5 25 bps 54.2 54.0 20 bps 53.8 53.7 14 bps
EBITDA 1081 1775 (39.1) 4,997 5,114 (2.3) 6,262 6,252 0.2
EBITDA margin (%) 4.6 7.3 (278bps) 14.8 15.2 (35 bps) 16.4 16.4 (1 bps)
APAT 718 1230 (41.7) 3,855 3,958 (2.6) 4,892 4,879 0.3
Source: HSIE Research
SELL
CMP (as on 9 Feb 2022) INR 1,895
Target Price INR 1,500
NIFTY 17,464
KEY
CHANGES OLD NEW
Rating SELL SELL
Price Target INR 1,400 INR 1,500
EPS % FY23E FY24E
-2.6 +0.3
KEY STOCK DATA
Bloomberg code BATA IN
No. of Shares (mn) 129
MCap (INR bn) / ($ mn) 244/3,274
6m avg traded value (INR mn) 1,108
52 Week high / low INR 2,262/1,264
STOCK PERFORMANCE (%)
3M 6M 12M
Absolute (%) (12.6) 13.1 20.4
Relative (%) (9.3) 5.6 6.5
SHAREHOLDING PATTERN (%)
Jun-21 Dec-21
Promoters 52.96 52.96
FIs & Local MFs 15.57 18.1
FPIs 5.23 6.01
Public & Others 26.24 22.93
Pledged Shares 0 0
Source : BSE
Pledged shares as % of total shares
Jay Gandhi
jay.gandhi @hdfcsec.com
+91-22-6171-7320
Premraj Survase
+91-22-6171-7330
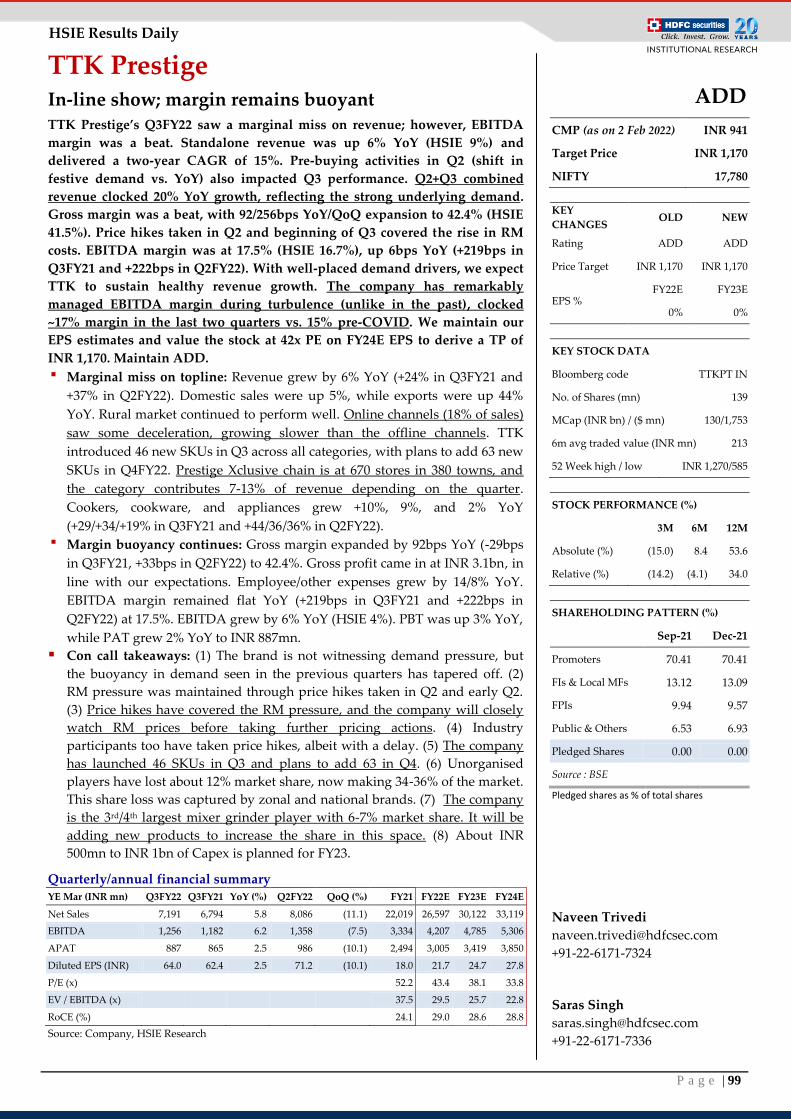
P a g e | 99
HSIE Results Daily
TTK Prestige In-line show; margin remains buoyant TTK Prestige’s Q3FY22 saw a marginal miss on revenue; however, EBITDA
margin was a beat. Standalone revenue was up 6% YoY (HSIE 9%) and
delivered a two-year CAGR of 15%. Pre-buying activities in Q2 (shift in
festive demand vs. YoY) also impacted Q3 performance. Q2+Q3 combined
revenue clocked 20% YoY growth, reflecting the strong underlying demand.
Gross margin was a beat, with 92/256bps YoY/QoQ expansion to 42.4% (HSIE
41.5%). Price hikes taken in Q2 and beginning of Q3 covered the rise in RM
costs. EBITDA margin was at 17.5% (HSIE 16.7%), up 6bps YoY (+219bps in
Q3FY21 and +222bps in Q2FY22). With well-placed demand drivers, we expect
TTK to sustain healthy revenue growth. The company has remarkably
managed EBITDA margin during turbulence (unlike in the past), clocked
~17% margin in the last two quarters vs. 15% pre-COVID. We maintain our
EPS estimates and value the stock at 42x PE on FY24E EPS to derive a TP of
INR 1,170. Maintain ADD.
▪ Marginal miss on topline: Revenue grew by 6% YoY (+24% in Q3FY21 and
+37% in Q2FY22). Domestic sales were up 5%, while exports were up 44%
YoY. Rural market continued to perform well. Online channels (18% of sales)
saw some deceleration, growing slower than the offline channels. TTK
introduced 46 new SKUs in Q3 across all categories, with plans to add 63 new
SKUs in Q4FY22. Prestige Xclusive chain is at 670 stores in 380 towns, and
the category contributes 7-13% of revenue depending on the quarter.
Cookers, cookware, and appliances grew +10%, 9%, and 2% YoY
(+29/+34/+19% in Q3FY21 and +44/36/36% in Q2FY22).
▪ Margin buoyancy continues: Gross margin expanded by 92bps YoY (-29bps
in Q3FY21, +33bps in Q2FY22) to 42.4%. Gross profit came in at INR 3.1bn, in
line with our expectations. Employee/other expenses grew by 14/8% YoY.
EBITDA margin remained flat YoY (+219bps in Q3FY21 and +222bps in
Q2FY22) at 17.5%. EBITDA grew by 6% YoY (HSIE 4%). PBT was up 3% YoY,
while PAT grew 2% YoY to INR 887mn.
Con call takeaways: (1) The brand is not witnessing demand pressure, but
the buoyancy in demand seen in the previous quarters has tapered off. (2)
RM pressure was maintained through price hikes taken in Q2 and early Q2.
(3) Price hikes have covered the RM pressure, and the company will closely
watch RM prices before taking further pricing actions. (4) Industry
participants too have taken price hikes, albeit with a delay. (5) The company
has launched 46 SKUs in Q3 and plans to add 63 in Q4. (6) Unorganised
players have lost about 12% market share, now making 34-36% of the market.
This share loss was captured by zonal and national brands. (7) The company
is the 3rd/4th largest mixer grinder player with 6-7% market share. It will be
adding new products to increase the share in this space. (8) About INR
500mn to INR 1bn of Capex is planned for FY23.
Quarterly/annual financial summary YE Mar (INR mn) Q3FY22 Q3FY21 YoY (%) Q2FY22 QoQ (%) FY21 FY22E FY23E FY24E
Net Sales 7,191 6,794 5.8 8,086 (11.1) 22,019 26,597 30,122 33,119
EBITDA 1,256 1,182 6.2 1,358 (7.5) 3,334 4,207 4,785 5,306
APAT 887 865 2.5 986 (10.1) 2,494 3,005 3,419 3,850
Diluted EPS (INR) 64.0 62.4 2.5 71.2 (10.1) 18.0 21.7 24.7 27.8
P/E (x) 52.2 43.4 38.1 33.8
EV / EBITDA (x)
37.5 29.5 25.7 22.8
RoCE (%)
24.1 29.0 28.6 28.8
Source: Company, HSIE Research
ADD
CMP (as on 2 Feb 2022) INR 941
Target Price INR 1,170
NIFTY 17,780
KEY
CHANGES OLD NEW
Rating ADD ADD
Price Target INR 1,170 INR 1,170
EPS % FY22E FY23E
0% 0%
KEY STOCK DATA
Bloomberg code TTKPT IN
No. of Shares (mn) 139
MCap (INR bn) / ($ mn) 130/1,753
6m avg traded value (INR mn) 213
52 Week high / low INR 1,270/585
STOCK PERFORMANCE (%)
3M 6M 12M
Absolute (%) (15.0) 8.4 53.6
Relative (%) (14.2) (4.1) 34.0
SHAREHOLDING PATTERN (%)
Sep-21 Dec-21
Promoters 70.41 70.41
FIs & Local MFs 13.12 13.09
FPIs 9.94 9.57
Public & Others 6.53 6.93
Pledged Shares 0.00 0.00
Source : BSE
Pledged shares as % of total shares
Naveen Trivedi
+91-22-6171-7324
Saras Singh
+91-22-6171-7336
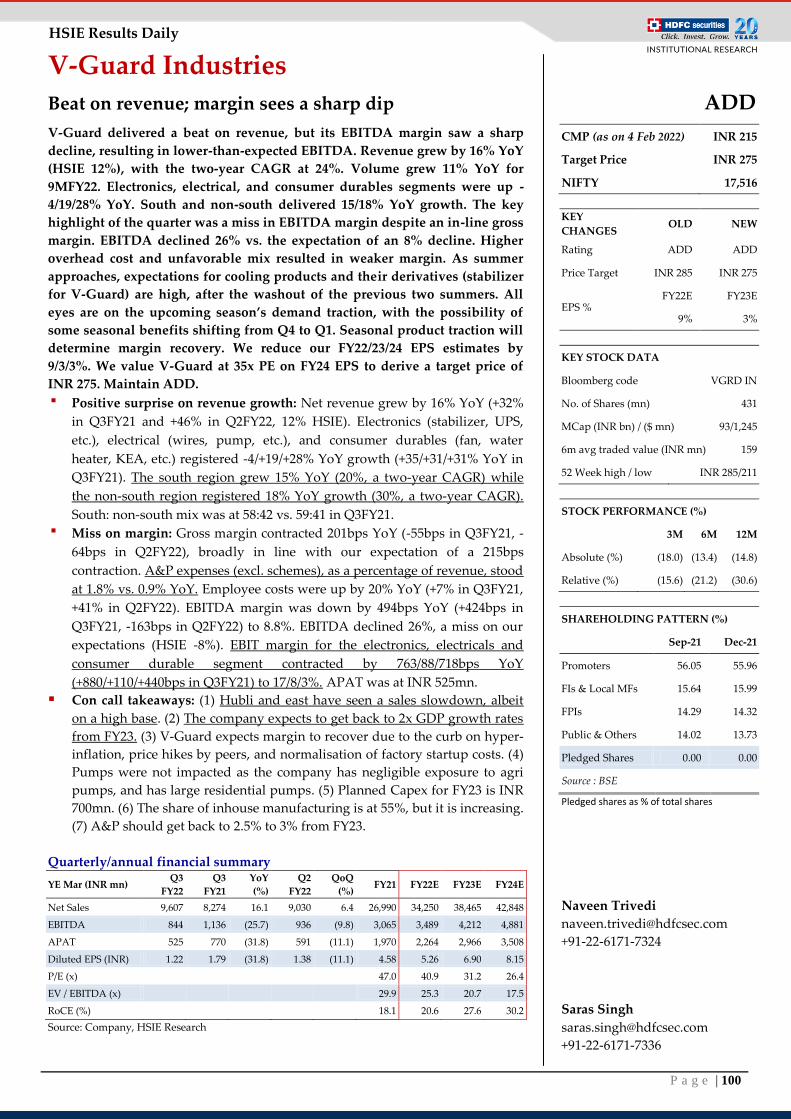
P a g e | 100
HSIE Results Daily
V-Guard Industries
Beat on revenue; margin sees a sharp dip
V-Guard delivered a beat on revenue, but its EBITDA margin saw a sharp
decline, resulting in lower-than-expected EBITDA. Revenue grew by 16% YoY
(HSIE 12%), with the two-year CAGR at 24%. Volume grew 11% YoY for
9MFY22. Electronics, electrical, and consumer durables segments were up -
4/19/28% YoY. South and non-south delivered 15/18% YoY growth. The key
highlight of the quarter was a miss in EBITDA margin despite an in-line gross
margin. EBITDA declined 26% vs. the expectation of an 8% decline. Higher
overhead cost and unfavorable mix resulted in weaker margin. As summer
approaches, expectations for cooling products and their derivatives (stabilizer
for V-Guard) are high, after the washout of the previous two summers. All
eyes are on the upcoming season’s demand traction, with the possibility of
some seasonal benefits shifting from Q4 to Q1. Seasonal product traction will
determine margin recovery. We reduce our FY22/23/24 EPS estimates by
9/3/3%. We value V-Guard at 35x PE on FY24 EPS to derive a target price of
INR 275. Maintain ADD.
▪ Positive surprise on revenue growth: Net revenue grew by 16% YoY (+32%
in Q3FY21 and +46% in Q2FY22, 12% HSIE). Electronics (stabilizer, UPS,
etc.), electrical (wires, pump, etc.), and consumer durables (fan, water
heater, KEA, etc.) registered -4/+19/+28% YoY growth (+35/+31/+31% YoY in
Q3FY21). The south region grew 15% YoY (20%, a two-year CAGR) while
the non-south region registered 18% YoY growth (30%, a two-year CAGR).
South: non-south mix was at 58:42 vs. 59:41 in Q3FY21.
▪ Miss on margin: Gross margin contracted 201bps YoY (-55bps in Q3FY21, -
64bps in Q2FY22), broadly in line with our expectation of a 215bps
contraction. A&P expenses (excl. schemes), as a percentage of revenue, stood
at 1.8% vs. 0.9% YoY. Employee costs were up by 20% YoY (+7% in Q3FY21,
+41% in Q2FY22). EBITDA margin was down by 494bps YoY (+424bps in
Q3FY21, -163bps in Q2FY22) to 8.8%. EBITDA declined 26%, a miss on our
expectations (HSIE -8%). EBIT margin for the electronics, electricals and
consumer durable segment contracted by 763/88/718bps YoY
(+880/+110/+440bps in Q3FY21) to 17/8/3%. APAT was at INR 525mn.
Con call takeaways: (1) Hubli and east have seen a sales slowdown, albeit
on a high base. (2) The company expects to get back to 2x GDP growth rates
from FY23. (3) V-Guard expects margin to recover due to the curb on hyper-
inflation, price hikes by peers, and normalisation of factory startup costs. (4)
Pumps were not impacted as the company has negligible exposure to agri
pumps, and has large residential pumps. (5) Planned Capex for FY23 is INR
700mn. (6) The share of inhouse manufacturing is at 55%, but it is increasing.
(7) A&P should get back to 2.5% to 3% from FY23.
Quarterly/annual financial summary
YE Mar (INR mn) Q3
FY22
Q3
FY21
YoY
(%)
Q2
FY22
QoQ
(%) FY21 FY22E FY23E FY24E
Net Sales 9,607 8,274 16.1 9,030 6.4 26,990 34,250 38,465 42,848
EBITDA 844 1,136 (25.7) 936 (9.8) 3,065 3,489 4,212 4,881
APAT 525 770 (31.8) 591 (11.1) 1,970 2,264 2,966 3,508
Diluted EPS (INR) 1.22 1.79 (31.8) 1.38 (11.1) 4.58 5.26 6.90 8.15
P/E (x) 47.0 40.9 31.2 26.4
EV / EBITDA (x)
29.9 25.3 20.7 17.5
RoCE (%)
18.1 20.6 27.6 30.2
Source: Company, HSIE Research
ADD
CMP (as on 4 Feb 2022) INR 215
Target Price INR 275
NIFTY 17,516
KEY
CHANGES OLD NEW
Rating ADD ADD
Price Target INR 285 INR 275
EPS % FY22E FY23E
9% 3%
KEY STOCK DATA
Bloomberg code VGRD IN
No. of Shares (mn) 431
MCap (INR bn) / ($ mn) 93/1,245
6m avg traded value (INR mn) 159
52 Week high / low INR 285/211
STOCK PERFORMANCE (%)
3M 6M 12M
Absolute (%) (18.0) (13.4) (14.8)
Relative (%) (15.6) (21.2) (30.6)
SHAREHOLDING PATTERN (%)
Sep-21 Dec-21
Promoters 56.05 55.96
FIs & Local MFs 15.64 15.99
FPIs 14.29 14.32
Public & Others 14.02 13.73
Pledged Shares 0.00 0.00
Source : BSE
Pledged shares as % of total shares
Naveen Trivedi
+91-22-6171-7324
Saras Singh
+91-22-6171-7336
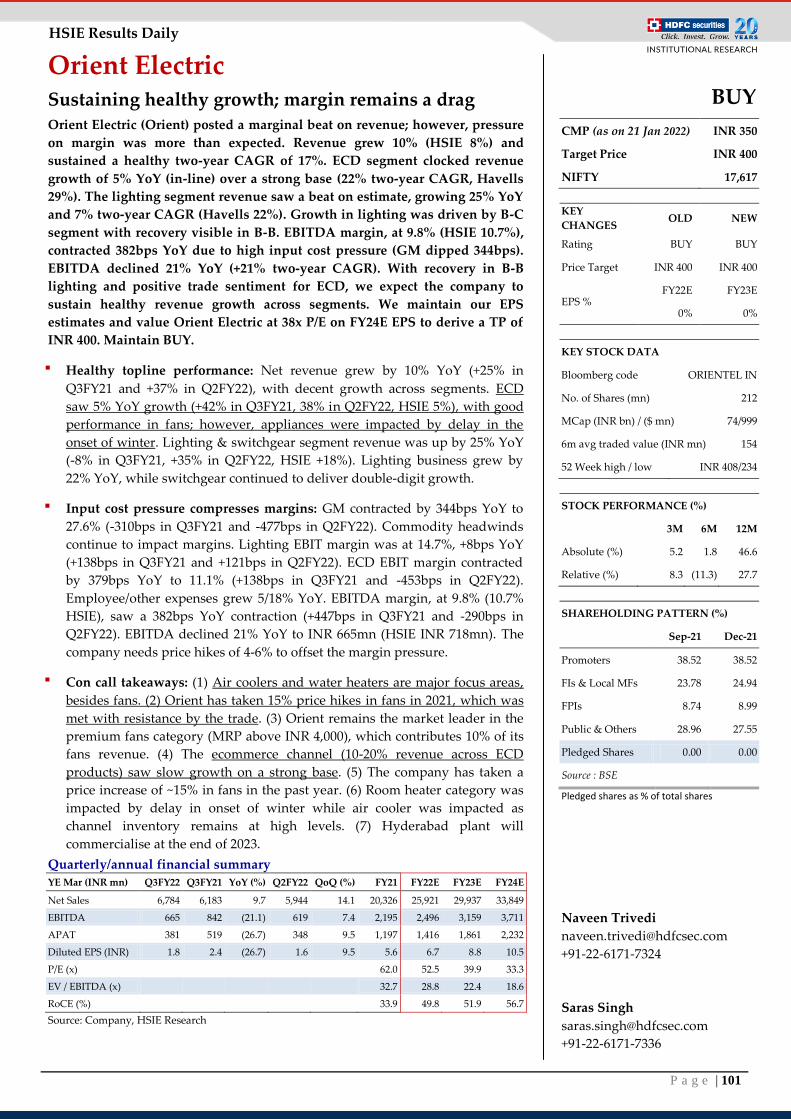
P a g e | 101
HSIE Results Daily
Orient Electric Sustaining healthy growth; margin remains a drag Orient Electric (Orient) posted a marginal beat on revenue; however, pressure
on margin was more than expected. Revenue grew 10% (HSIE 8%) and
sustained a healthy two-year CAGR of 17%. ECD segment clocked revenue
growth of 5% YoY (in-line) over a strong base (22% two-year CAGR, Havells
29%). The lighting segment revenue saw a beat on estimate, growing 25% YoY
and 7% two-year CAGR (Havells 22%). Growth in lighting was driven by B-C
segment with recovery visible in B-B. EBITDA margin, at 9.8% (HSIE 10.7%),
contracted 382bps YoY due to high input cost pressure (GM dipped 344bps).
EBITDA declined 21% YoY (+21% two-year CAGR). With recovery in B-B
lighting and positive trade sentiment for ECD, we expect the company to
sustain healthy revenue growth across segments. We maintain our EPS
estimates and value Orient Electric at 38x P/E on FY24E EPS to derive a TP of
INR 400. Maintain BUY.
▪ Healthy topline performance: Net revenue grew by 10% YoY (+25% in
Q3FY21 and +37% in Q2FY22), with decent growth across segments. ECD
saw 5% YoY growth (+42% in Q3FY21, 38% in Q2FY22, HSIE 5%), with good
performance in fans; however, appliances were impacted by delay in the
onset of winter. Lighting & switchgear segment revenue was up by 25% YoY
(-8% in Q3FY21, +35% in Q2FY22, HSIE +18%). Lighting business grew by
22% YoY, while switchgear continued to deliver double-digit growth.
▪ Input cost pressure compresses margins: GM contracted by 344bps YoY to
27.6% (-310bps in Q3FY21 and -477bps in Q2FY22). Commodity headwinds
continue to impact margins. Lighting EBIT margin was at 14.7%, +8bps YoY
(+138bps in Q3FY21 and +121bps in Q2FY22). ECD EBIT margin contracted
by 379bps YoY to 11.1% (+138bps in Q3FY21 and -453bps in Q2FY22).
Employee/other expenses grew 5/18% YoY. EBITDA margin, at 9.8% (10.7%
HSIE), saw a 382bps YoY contraction (+447bps in Q3FY21 and -290bps in
Q2FY22). EBITDA declined 21% YoY to INR 665mn (HSIE INR 718mn). The
company needs price hikes of 4-6% to offset the margin pressure.
▪ Con call takeaways: (1) Air coolers and water heaters are major focus areas,
besides fans. (2) Orient has taken 15% price hikes in fans in 2021, which was
met with resistance by the trade. (3) Orient remains the market leader in the
premium fans category (MRP above INR 4,000), which contributes 10% of its
fans revenue. (4) The ecommerce channel (10-20% revenue across ECD
products) saw slow growth on a strong base. (5) The company has taken a
price increase of ~15% in fans in the past year. (6) Room heater category was
impacted by delay in onset of winter while air cooler was impacted as
channel inventory remains at high levels. (7) Hyderabad plant will
commercialise at the end of 2023.
Quarterly/annual financial summary
YE Mar (INR mn) Q3FY22 Q3FY21 YoY (%) Q2FY22 QoQ (%) FY21 FY22E FY23E FY24E
Net Sales 6,784 6,183 9.7 5,944 14.1 20,326 25,921 29,937 33,849
EBITDA 665 842 (21.1) 619 7.4 2,195 2,496 3,159 3,711
APAT 381 519 (26.7) 348 9.5 1,197 1,416 1,861 2,232
Diluted EPS (INR) 1.8 2.4 (26.7) 1.6 9.5 5.6 6.7 8.8 10.5
P/E (x) 62.0 52.5 39.9 33.3
EV / EBITDA (x)
32.7 28.8 22.4 18.6
RoCE (%)
33.9 49.8 51.9 56.7
Source: Company, HSIE Research
BUY
CMP (as on 21 Jan 2022) INR 350
Target Price INR 400
NIFTY 17,617
KEY
CHANGES OLD NEW
Rating BUY BUY
Price Target INR 400 INR 400
EPS % FY22E FY23E
0% 0%
KEY STOCK DATA
Bloomberg code ORIENTEL IN
No. of Shares (mn) 212
MCap (INR bn) / ($ mn) 74/999
6m avg traded value (INR mn) 154
52 Week high / low INR 408/234
STOCK PERFORMANCE (%)
3M 6M 12M
Absolute (%) 5.2 1.8 46.6
Relative (%) 8.3 (11.3) 27.7
SHAREHOLDING PATTERN (%)
Sep-21 Dec-21
Promoters 38.52 38.52
FIs & Local MFs 23.78 24.94
FPIs 8.74 8.99
Public & Others 28.96 27.55
Pledged Shares 0.00 0.00
Source : BSE
Pledged shares as % of total shares
Naveen Trivedi
+91-22-6171-7324
Saras Singh
+91-22-6171-7336
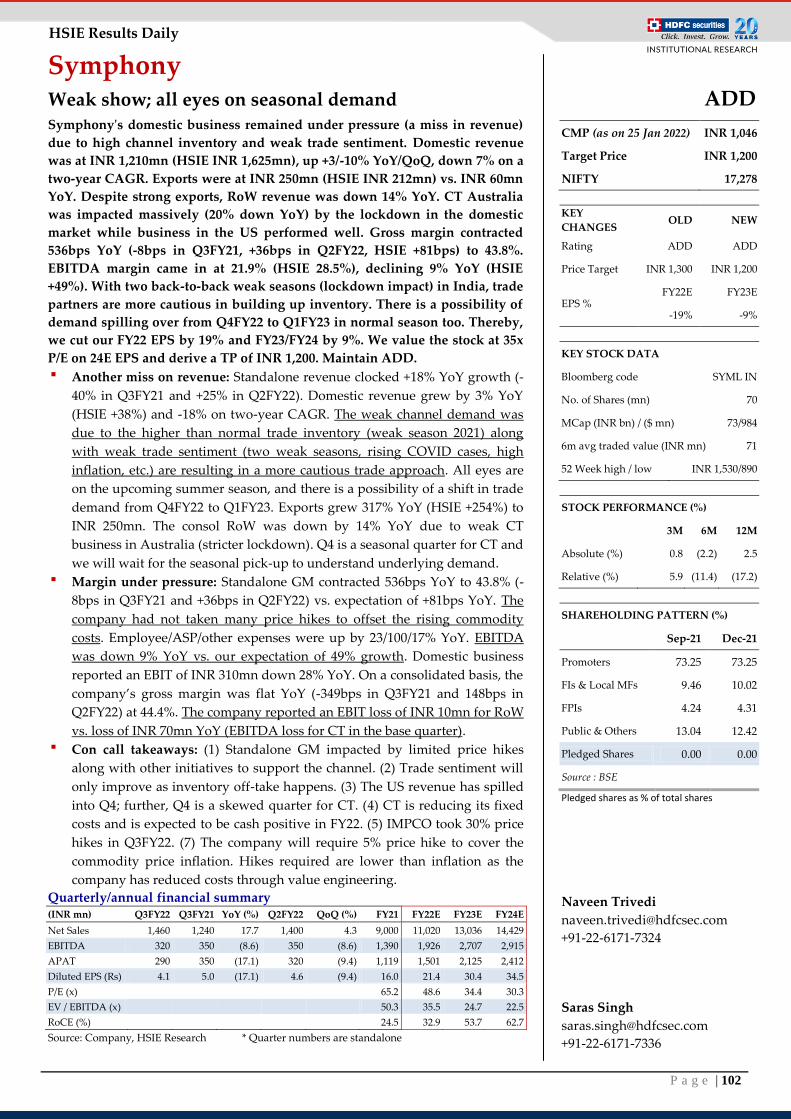
P a g e | 102
HSIE Results Daily
Symphony Weak show; all eyes on seasonal demand Symphony's domestic business remained under pressure (a miss in revenue)
due to high channel inventory and weak trade sentiment. Domestic revenue
was at INR 1,210mn (HSIE INR 1,625mn), up +3/-10% YoY/QoQ, down 7% on a
two-year CAGR. Exports were at INR 250mn (HSIE INR 212mn) vs. INR 60mn
YoY. Despite strong exports, RoW revenue was down 14% YoY. CT Australia
was impacted massively (20% down YoY) by the lockdown in the domestic
market while business in the US performed well. Gross margin contracted
536bps YoY (-8bps in Q3FY21, +36bps in Q2FY22, HSIE +81bps) to 43.8%.
EBITDA margin came in at 21.9% (HSIE 28.5%), declining 9% YoY (HSIE
+49%). With two back-to-back weak seasons (lockdown impact) in India, trade
partners are more cautious in building up inventory. There is a possibility of
demand spilling over from Q4FY22 to Q1FY23 in normal season too. Thereby,
we cut our FY22 EPS by 19% and FY23/FY24 by 9%. We value the stock at 35x
P/E on 24E EPS and derive a TP of INR 1,200. Maintain ADD.
▪ Another miss on revenue: Standalone revenue clocked +18% YoY growth (-
40% in Q3FY21 and +25% in Q2FY22). Domestic revenue grew by 3% YoY
(HSIE +38%) and -18% on two-year CAGR. The weak channel demand was
due to the higher than normal trade inventory (weak season 2021) along
with weak trade sentiment (two weak seasons, rising COVID cases, high
inflation, etc.) are resulting in a more cautious trade approach. All eyes are
on the upcoming summer season, and there is a possibility of a shift in trade
demand from Q4FY22 to Q1FY23. Exports grew 317% YoY (HSIE +254%) to
INR 250mn. The consol RoW was down by 14% YoY due to weak CT
business in Australia (stricter lockdown). Q4 is a seasonal quarter for CT and
we will wait for the seasonal pick-up to understand underlying demand.
▪ Margin under pressure: Standalone GM contracted 536bps YoY to 43.8% (-
8bps in Q3FY21 and +36bps in Q2FY22) vs. expectation of +81bps YoY. The
company had not taken many price hikes to offset the rising commodity
costs. Employee/ASP/other expenses were up by 23/100/17% YoY. EBITDA
was down 9% YoY vs. our expectation of 49% growth. Domestic business
reported an EBIT of INR 310mn down 28% YoY. On a consolidated basis, the
company’s gross margin was flat YoY (-349bps in Q3FY21 and 148bps in
Q2FY22) at 44.4%. The company reported an EBIT loss of INR 10mn for RoW
vs. loss of INR 70mn YoY (EBITDA loss for CT in the base quarter).
▪ Con call takeaways: (1) Standalone GM impacted by limited price hikes
along with other initiatives to support the channel. (2) Trade sentiment will
only improve as inventory off-take happens. (3) The US revenue has spilled
into Q4; further, Q4 is a skewed quarter for CT. (4) CT is reducing its fixed
costs and is expected to be cash positive in FY22. (5) IMPCO took 30% price
hikes in Q3FY22. (7) The company will require 5% price hike to cover the
commodity price inflation. Hikes required are lower than inflation as the
company has reduced costs through value engineering.
Quarterly/annual financial summary (INR mn) Q3FY22 Q3FY21 YoY (%) Q2FY22 QoQ (%) FY21 FY22E FY23E FY24E
Net Sales 1,460 1,240 17.7 1,400 4.3 9,000 11,020 13,036 14,429
EBITDA 320 350 (8.6) 350 (8.6) 1,390 1,926 2,707 2,915
APAT 290 350 (17.1) 320 (9.4) 1,119 1,501 2,125 2,412
Diluted EPS (Rs) 4.1 5.0 (17.1) 4.6 (9.4) 16.0 21.4 30.4 34.5
P/E (x) 65.2 48.6 34.4 30.3
EV / EBITDA (x)
50.3 35.5 24.7 22.5
RoCE (%)
24.5 32.9 53.7 62.7
Source: Company, HSIE Research * Quarter numbers are standalone
ADD
CMP (as on 25 Jan 2022) INR 1,046
Target Price INR 1,200
NIFTY 17,278
KEY
CHANGES OLD NEW
Rating ADD ADD
Price Target INR 1,300 INR 1,200
EPS % FY22E FY23E
-19% -9%
KEY STOCK DATA
Bloomberg code SYML IN
No. of Shares (mn) 70
MCap (INR bn) / ($ mn) 73/984
6m avg traded value (INR mn) 71
52 Week high / low INR 1,530/890
STOCK PERFORMANCE (%)
3M 6M 12M
Absolute (%) 0.8 (2.2) 2.5
Relative (%) 5.9 (11.4) (17.2)
SHAREHOLDING PATTERN (%)
Sep-21 Dec-21
Promoters 73.25 73.25
FIs & Local MFs 9.46 10.02
FPIs 4.24 4.31
Public & Others 13.04 12.42
Pledged Shares 0.00 0.00
Source : BSE
Pledged shares as % of total shares
Naveen Trivedi
+91-22-6171-7324
Saras Singh
+91-22-6171-7336
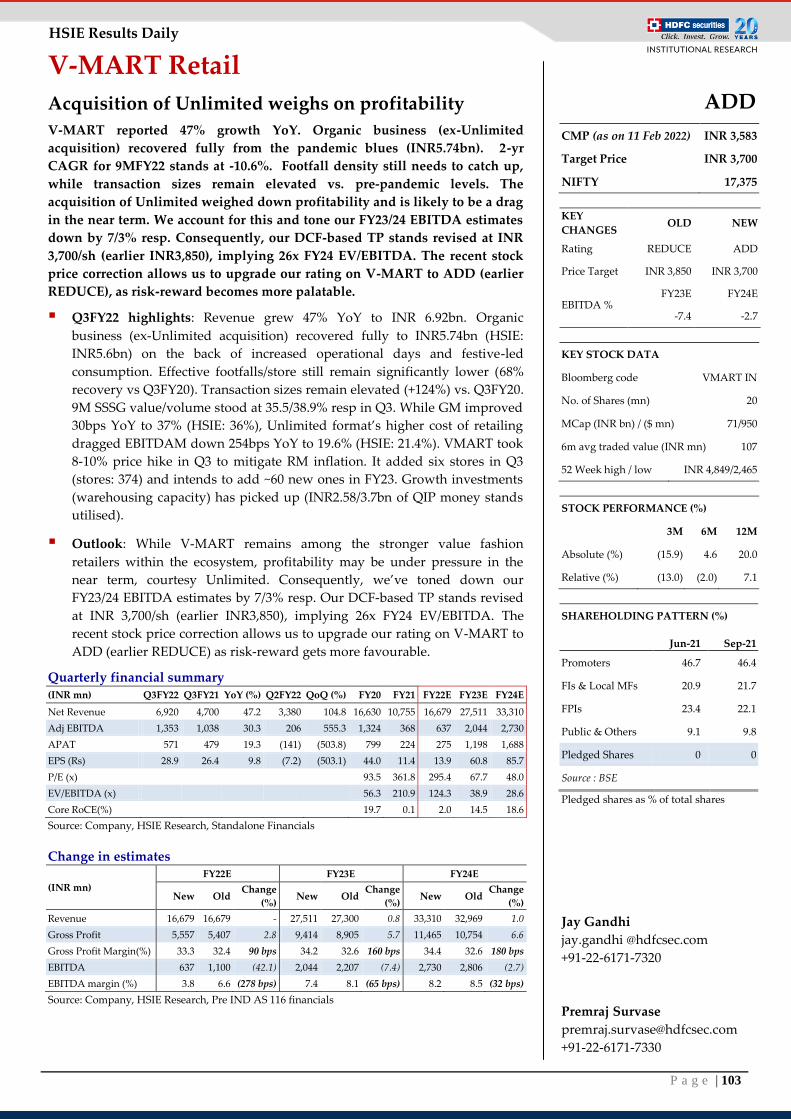
P a g e | 103
HSIE Results Daily
V-MART Retail
Acquisition of Unlimited weighs on profitability
V-MART reported 47% growth YoY. Organic business (ex-Unlimited
acquisition) recovered fully from the pandemic blues (INR5.74bn). 2-yr
CAGR for 9MFY22 stands at -10.6%. Footfall density still needs to catch up,
while transaction sizes remain elevated vs. pre-pandemic levels. The
acquisition of Unlimited weighed down profitability and is likely to be a drag
in the near term. We account for this and tone our FY23/24 EBITDA estimates
down by 7/3% resp. Consequently, our DCF-based TP stands revised at INR
3,700/sh (earlier INR3,850), implying 26x FY24 EV/EBITDA. The recent stock
price correction allows us to upgrade our rating on V-MART to ADD (earlier
REDUCE), as risk-reward becomes more palatable.
Q3FY22 highlights: Revenue grew 47% YoY to INR 6.92bn. Organic
business (ex-Unlimited acquisition) recovered fully to INR5.74bn (HSIE:
INR5.6bn) on the back of increased operational days and festive-led
consumption. Effective footfalls/store still remain significantly lower (68%
recovery vs Q3FY20). Transaction sizes remain elevated (+124%) vs. Q3FY20.
9M SSSG value/volume stood at 35.5/38.9% resp in Q3. While GM improved
30bps YoY to 37% (HSIE: 36%), Unlimited format’s higher cost of retailing
dragged EBITDAM down 254bps YoY to 19.6% (HSIE: 21.4%). VMART took
8-10% price hike in Q3 to mitigate RM inflation. It added six stores in Q3
(stores: 374) and intends to add ~60 new ones in FY23. Growth investments
(warehousing capacity) has picked up (INR2.58/3.7bn of QIP money stands
utilised).
Outlook: While V-MART remains among the stronger value fashion
retailers within the ecosystem, profitability may be under pressure in the
near term, courtesy Unlimited. Consequently, we’ve toned down our
FY23/24 EBITDA estimates by 7/3% resp. Our DCF-based TP stands revised
at INR 3,700/sh (earlier INR3,850), implying 26x FY24 EV/EBITDA. The
recent stock price correction allows us to upgrade our rating on V-MART to
ADD (earlier REDUCE) as risk-reward gets more favourable.
Quarterly financial summary (INR mn) Q3FY22 Q3FY21 YoY (%) Q2FY22 QoQ (%) FY20 FY21 FY22E FY23E FY24E
Net Revenue 6,920 4,700 47.2 3,380 104.8 16,630 10,755 16,679 27,511 33,310
Adj EBITDA 1,353 1,038 30.3 206 555.3 1,324 368 637 2,044 2,730
APAT 571 479 19.3 (141) (503.8) 799 224 275 1,198 1,688
EPS (Rs) 28.9 26.4 9.8 (7.2) (503.1) 44.0 11.4 13.9 60.8 85.7
P/E (x)
93.5 361.8 295.4 67.7 48.0
EV/EBITDA (x)
56.3 210.9 124.3 38.9 28.6
Core RoCE(%)
19.7 0.1 2.0 14.5 18.6
Source: Company, HSIE Research, Standalone Financials
Change in estimates
(INR mn)
FY22E FY23E FY24E
New Old Change
(%) New Old
Change
(%) New Old
Change
(%)
Revenue 16,679 16,679 - 27,511 27,300 0.8 33,310 32,969 1.0
Gross Profit 5,557 5,407 2.8 9,414 8,905 5.7 11,465 10,754 6.6
Gross Profit Margin(%) 33.3 32.4 90 bps 34.2 32.6 160 bps 34.4 32.6 180 bps
EBITDA 637 1,100 (42.1) 2,044 2,207 (7.4) 2,730 2,806 (2.7)
EBITDA margin (%) 3.8 6.6 (278 bps) 7.4 8.1 (65 bps) 8.2 8.5 (32 bps)
Source: Company, HSIE Research, Pre IND AS 116 financials
ADD
CMP (as on 11 Feb 2022) INR 3,583
Target Price INR 3,700
NIFTY 17,375
KEY
CHANGES OLD NEW
Rating REDUCE ADD
Price Target INR 3,850 INR 3,700
EBITDA % FY23E FY24E
-7.4 -2.7
KEY STOCK DATA
Bloomberg code VMART IN
No. of Shares (mn) 20
MCap (INR bn) / ($ mn) 71/950
6m avg traded value (INR mn) 107
52 Week high / low INR 4,849/2,465
STOCK PERFORMANCE (%)
3M 6M 12M
Absolute (%) (15.9) 4.6 20.0
Relative (%) (13.0) (2.0) 7.1
SHAREHOLDING PATTERN (%)
Jun-21 Sep-21
Promoters 46.7 46.4
FIs & Local MFs 20.9 21.7
FPIs 23.4 22.1
Public & Others 9.1 9.8
Pledged Shares 0 0
Source : BSE
Pledged shares as % of total shares
Jay Gandhi
jay.gandhi @hdfcsec.com
+91-22-6171-7320
Premraj Survase
+91-22-6171-7330
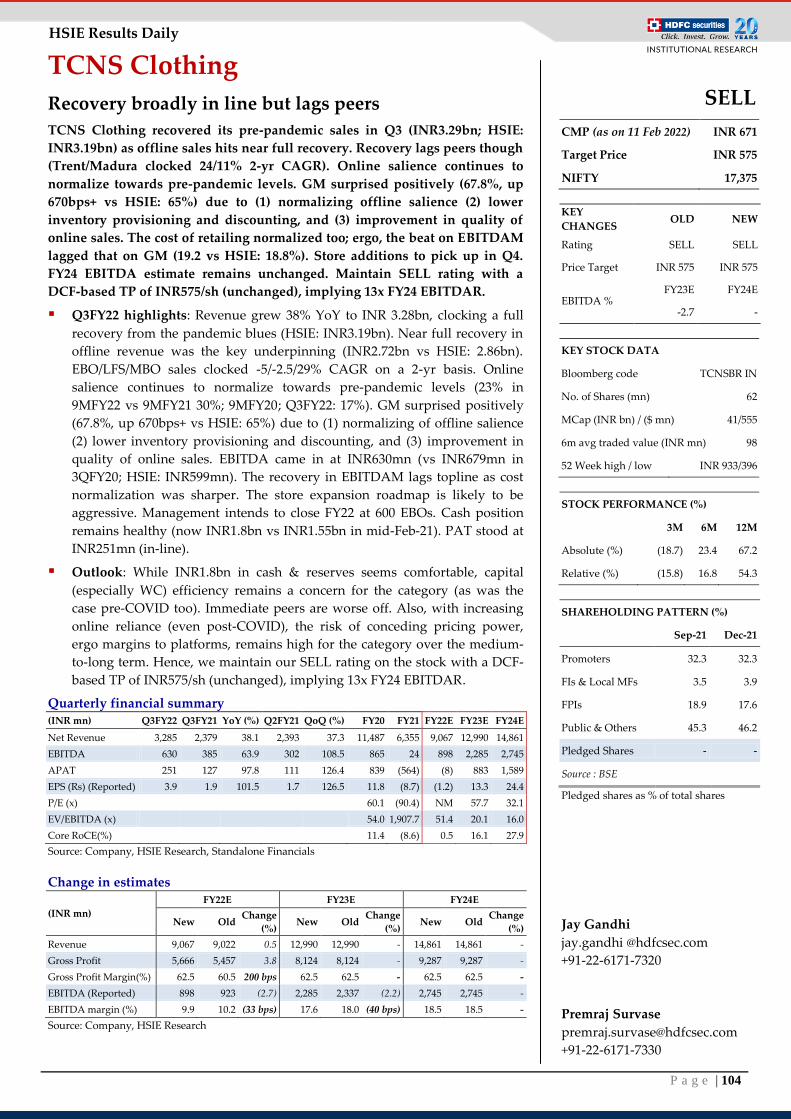
P a g e | 104
HSIE Results Daily
TCNS Clothing
Recovery broadly in line but lags peers
TCNS Clothing recovered its pre-pandemic sales in Q3 (INR3.29bn; HSIE:
INR3.19bn) as offline sales hits near full recovery. Recovery lags peers though
(Trent/Madura clocked 24/11% 2-yr CAGR). Online salience continues to
normalize towards pre-pandemic levels. GM surprised positively (67.8%, up
670bps+ vs HSIE: 65%) due to (1) normalizing offline salience (2) lower
inventory provisioning and discounting, and (3) improvement in quality of
online sales. The cost of retailing normalized too; ergo, the beat on EBITDAM
lagged that on GM (19.2 vs HSIE: 18.8%). Store additions to pick up in Q4.
FY24 EBITDA estimate remains unchanged. Maintain SELL rating with a
DCF-based TP of INR575/sh (unchanged), implying 13x FY24 EBITDAR.
Q3FY22 highlights: Revenue grew 38% YoY to INR 3.28bn, clocking a full
recovery from the pandemic blues (HSIE: INR3.19bn). Near full recovery in
offline revenue was the key underpinning (INR2.72bn vs HSIE: 2.86bn).
EBO/LFS/MBO sales clocked -5/-2.5/29% CAGR on a 2-yr basis. Online
salience continues to normalize towards pre-pandemic levels (23% in
9MFY22 vs 9MFY21 30%; 9MFY20; Q3FY22: 17%). GM surprised positively
(67.8%, up 670bps+ vs HSIE: 65%) due to (1) normalizing of offline salience
(2) lower inventory provisioning and discounting, and (3) improvement in
quality of online sales. EBITDA came in at INR630mn (vs INR679mn in
3QFY20; HSIE: INR599mn). The recovery in EBITDAM lags topline as cost
normalization was sharper. The store expansion roadmap is likely to be
aggressive. Management intends to close FY22 at 600 EBOs. Cash position
remains healthy (now INR1.8bn vs INR1.55bn in mid-Feb-21). PAT stood at
INR251mn (in-line).
Outlook: While INR1.8bn in cash & reserves seems comfortable, capital
(especially WC) efficiency remains a concern for the category (as was the
case pre-COVID too). Immediate peers are worse off. Also, with increasing
online reliance (even post-COVID), the risk of conceding pricing power,
ergo margins to platforms, remains high for the category over the medium-
to-long term. Hence, we maintain our SELL rating on the stock with a DCF-
based TP of INR575/sh (unchanged), implying 13x FY24 EBITDAR.
Quarterly financial summary (INR mn) Q3FY22 Q3FY21 YoY (%) Q2FY21 QoQ (%) FY20 FY21 FY22E FY23E FY24E
Net Revenue 3,285 2,379 38.1 2,393 37.3 11,487 6,355 9,067 12,990 14,861
EBITDA 630 385 63.9 302 108.5 865 24 898 2,285 2,745
APAT 251 127 97.8 111 126.4 839 (564) (8) 883 1,589
EPS (Rs) (Reported) 3.9 1.9 101.5 1.7 126.5 11.8 (8.7) (1.2) 13.3 24.4
P/E (x)
60.1 (90.4) NM 57.7 32.1
EV/EBITDA (x)
54.0 1,907.7 51.4 20.1 16.0
Core RoCE(%)
11.4 (8.6) 0.5 16.1 27.9
Source: Company, HSIE Research, Standalone Financials
Change in estimates
(INR mn)
FY22E FY23E FY24E
New Old Change
(%) New Old
Change
(%) New Old
Change
(%)
Revenue 9,067 9,022 0.5 12,990 12,990 - 14,861 14,861 -
Gross Profit 5,666 5,457 3.8 8,124 8,124 - 9,287 9,287 -
Gross Profit Margin(%) 62.5 60.5 200 bps 62.5 62.5 - 62.5 62.5 -
EBITDA (Reported) 898 923 (2.7) 2,285 2,337 (2.2) 2,745 2,745 -
EBITDA margin (%) 9.9 10.2 (33 bps) 17.6 18.0 (40 bps) 18.5 18.5 -
Source: Company, HSIE Research
SELL
CMP (as on 11 Feb 2022) INR 671
Target Price INR 575
NIFTY 17,375
KEY
CHANGES OLD NEW
Rating SELL SELL
Price Target INR 575 INR 575
EBITDA % FY23E FY24E
-2.7 -
KEY STOCK DATA
Bloomberg code TCNSBR IN
No. of Shares (mn) 62
MCap (INR bn) / ($ mn) 41/555
6m avg traded value (INR mn) 98
52 Week high / low INR 933/396
STOCK PERFORMANCE (%)
3M 6M 12M
Absolute (%) (18.7) 23.4 67.2
Relative (%) (15.8) 16.8 54.3
SHAREHOLDING PATTERN (%)
Sep-21 Dec-21
Promoters 32.3 32.3
FIs & Local MFs 3.5 3.9
FPIs 18.9 17.6
Public & Others 45.3 46.2
Pledged Shares - -
Source : BSE
Pledged shares as % of total shares
Jay Gandhi
jay.gandhi @hdfcsec.com
+91-22-6171-7320
Premraj Survase
+91-22-6171-7330

P a g e | 105
HSIE Results Daily
Consumer Staples
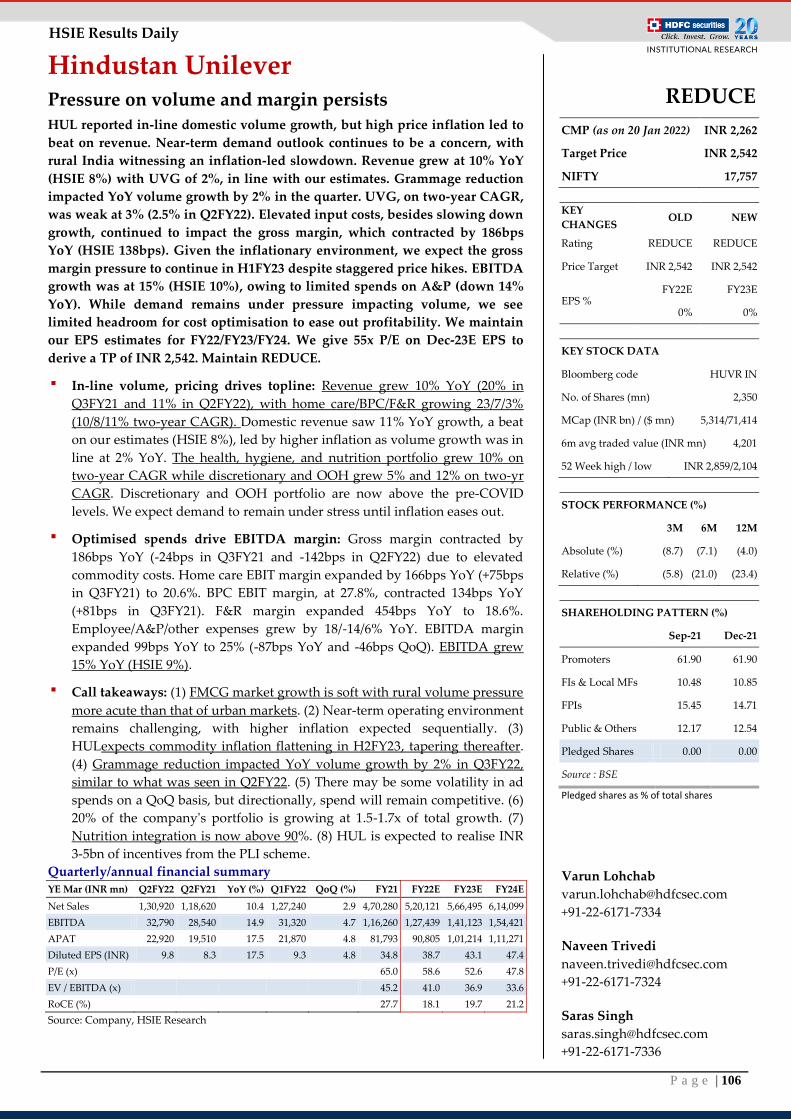
P a g e | 106
HSIE Results Daily
Hindustan Unilever Pressure on volume and margin persists HUL reported in-line domestic volume growth, but high price inflation led to
beat on revenue. Near-term demand outlook continues to be a concern, with
rural India witnessing an inflation-led slowdown. Revenue grew at 10% YoY
(HSIE 8%) with UVG of 2%, in line with our estimates. Grammage reduction
impacted YoY volume growth by 2% in the quarter. UVG, on two-year CAGR,
was weak at 3% (2.5% in Q2FY22). Elevated input costs, besides slowing down
growth, continued to impact the gross margin, which contracted by 186bps
YoY (HSIE 138bps). Given the inflationary environment, we expect the gross
margin pressure to continue in H1FY23 despite staggered price hikes. EBITDA
growth was at 15% (HSIE 10%), owing to limited spends on A&P (down 14%
YoY). While demand remains under pressure impacting volume, we see
limited headroom for cost optimisation to ease out profitability. We maintain
our EPS estimates for FY22/FY23/FY24. We give 55x P/E on Dec-23E EPS to
derive a TP of INR 2,542. Maintain REDUCE.
▪ In-line volume, pricing drives topline: Revenue grew 10% YoY (20% in
Q3FY21 and 11% in Q2FY22), with home care/BPC/F&R growing 23/7/3%
(10/8/11% two-year CAGR). Domestic revenue saw 11% YoY growth, a beat
on our estimates (HSIE 8%), led by higher inflation as volume growth was in
line at 2% YoY. The health, hygiene, and nutrition portfolio grew 10% on
two-year CAGR while discretionary and OOH grew 5% and 12% on two-yr
CAGR. Discretionary and OOH portfolio are now above the pre-COVID
levels. We expect demand to remain under stress until inflation eases out.
▪ Optimised spends drive EBITDA margin: Gross margin contracted by
186bps YoY (-24bps in Q3FY21 and -142bps in Q2FY22) due to elevated
commodity costs. Home care EBIT margin expanded by 166bps YoY (+75bps
in Q3FY21) to 20.6%. BPC EBIT margin, at 27.8%, contracted 134bps YoY
(+81bps in Q3FY21). F&R margin expanded 454bps YoY to 18.6%.
Employee/A&P/other expenses grew by 18/-14/6% YoY. EBITDA margin
expanded 99bps YoY to 25% (-87bps YoY and -46bps QoQ). EBITDA grew
15% YoY (HSIE 9%).
▪ Call takeaways: (1) FMCG market growth is soft with rural volume pressure
more acute than that of urban markets. (2) Near-term operating environment
remains challenging, with higher inflation expected sequentially. (3)
HULexpects commodity inflation flattening in H2FY23, tapering thereafter.
(4) Grammage reduction impacted YoY volume growth by 2% in Q3FY22,
similar to what was seen in Q2FY22. (5) There may be some volatility in ad
spends on a QoQ basis, but directionally, spend will remain competitive. (6)
20% of the company's portfolio is growing at 1.5-1.7x of total growth. (7)
Nutrition integration is now above 90%. (8) HUL is expected to realise INR
3-5bn of incentives from the PLI scheme.
Quarterly/annual financial summary YE Mar (INR mn) Q2FY22 Q2FY21 YoY (%) Q1FY22 QoQ (%) FY21 FY22E FY23E FY24E
Net Sales 1,30,920 1,18,620 10.4 1,27,240 2.9 4,70,280 5,20,121 5,66,495 6,14,099
EBITDA 32,790 28,540 14.9 31,320 4.7 1,16,260 1,27,439 1,41,123 1,54,421
APAT 22,920 19,510 17.5 21,870 4.8 81,793 90,805 1,01,214 1,11,271
Diluted EPS (INR) 9.8 8.3 17.5 9.3 4.8 34.8 38.7 43.1 47.4
P/E (x) 65.0 58.6 52.6 47.8
EV / EBITDA (x)
45.2 41.0 36.9 33.6
RoCE (%)
27.7 18.1 19.7 21.2
Source: Company, HSIE Research
REDUCE
CMP (as on 20 Jan 2022) INR 2,262
Target Price INR 2,542
NIFTY 17,757
KEY
CHANGES OLD NEW
Rating REDUCE REDUCE
Price Target INR 2,542 INR 2,542
EPS % FY22E FY23E
0% 0%
KEY STOCK DATA
Bloomberg code HUVR IN
No. of Shares (mn) 2,350
MCap (INR bn) / ($ mn) 5,314/71,414
6m avg traded value (INR mn) 4,201
52 Week high / low INR 2,859/2,104
STOCK PERFORMANCE (%)
3M 6M 12M
Absolute (%) (8.7) (7.1) (4.0)
Relative (%) (5.8) (21.0) (23.4)
SHAREHOLDING PATTERN (%)
Sep-21 Dec-21
Promoters 61.90 61.90
FIs & Local MFs 10.48 10.85
FPIs 15.45 14.71
Public & Others 12.17 12.54
Pledged Shares 0.00 0.00
Source : BSE
Pledged shares as % of total shares
Varun Lohchab
+91-22-6171-7334
Naveen Trivedi
+91-22-6171-7324
Saras Singh
+91-22-6171-7336
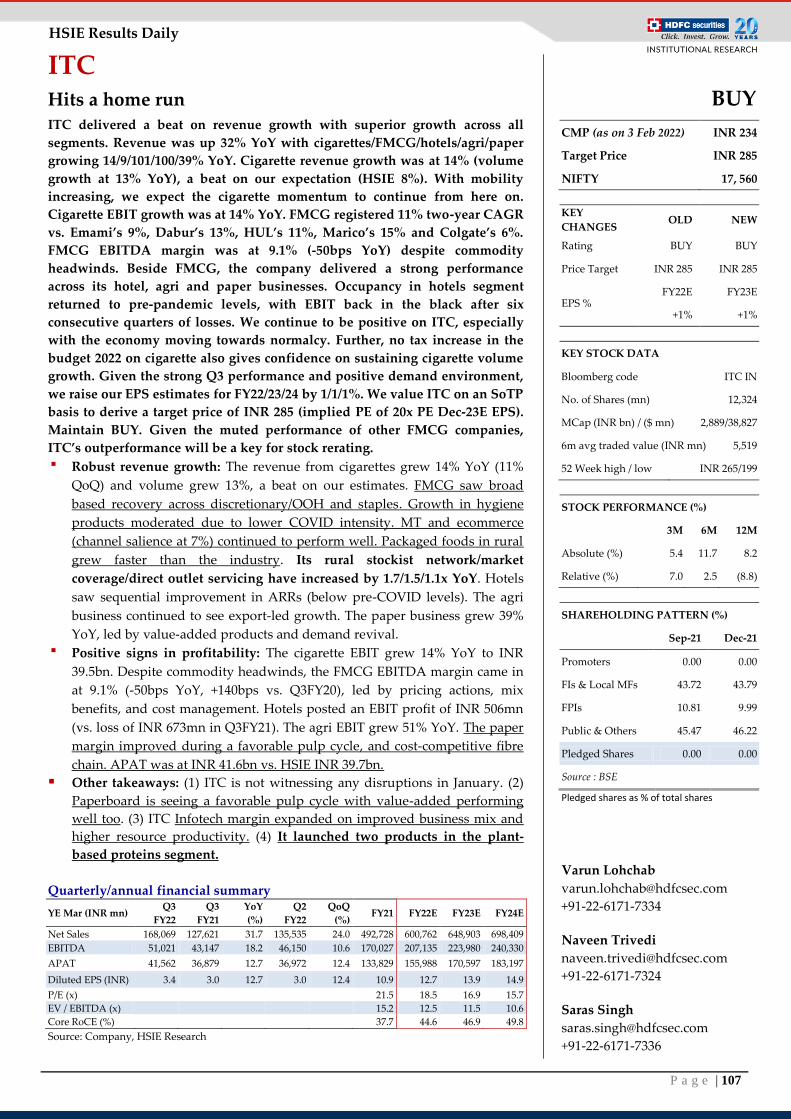
P a g e | 107
HSIE Results Daily
ITC Hits a home run ITC delivered a beat on revenue growth with superior growth across all
segments. Revenue was up 32% YoY with cigarettes/FMCG/hotels/agri/paper
growing 14/9/101/100/39% YoY. Cigarette revenue growth was at 14% (volume
growth at 13% YoY), a beat on our expectation (HSIE 8%). With mobility
increasing, we expect the cigarette momentum to continue from here on.
Cigarette EBIT growth was at 14% YoY. FMCG registered 11% two-year CAGR
vs. Emami’s 9%, Dabur’s 13%, HUL’s 11%, Marico’s 15% and Colgate’s 6%.
FMCG EBITDA margin was at 9.1% (-50bps YoY) despite commodity
headwinds. Beside FMCG, the company delivered a strong performance
across its hotel, agri and paper businesses. Occupancy in hotels segment
returned to pre-pandemic levels, with EBIT back in the black after six
consecutive quarters of losses. We continue to be positive on ITC, especially
with the economy moving towards normalcy. Further, no tax increase in the
budget 2022 on cigarette also gives confidence on sustaining cigarette volume
growth. Given the strong Q3 performance and positive demand environment,
we raise our EPS estimates for FY22/23/24 by 1/1/1%. We value ITC on an SoTP
basis to derive a target price of INR 285 (implied PE of 20x PE Dec-23E EPS).
Maintain BUY. Given the muted performance of other FMCG companies,
ITC’s outperformance will be a key for stock rerating.
▪ Robust revenue growth: The revenue from cigarettes grew 14% YoY (11%
QoQ) and volume grew 13%, a beat on our estimates. FMCG saw broad
based recovery across discretionary/OOH and staples. Growth in hygiene
products moderated due to lower COVID intensity. MT and ecommerce
(channel salience at 7%) continued to perform well. Packaged foods in rural
grew faster than the industry. Its rural stockist network/market
coverage/direct outlet servicing have increased by 1.7/1.5/1.1x YoY. Hotels
saw sequential improvement in ARRs (below pre-COVID levels). The agri
business continued to see export-led growth. The paper business grew 39%
YoY, led by value-added products and demand revival.
▪ Positive signs in profitability: The cigarette EBIT grew 14% YoY to INR
39.5bn. Despite commodity headwinds, the FMCG EBITDA margin came in
at 9.1% (-50bps YoY, +140bps vs. Q3FY20), led by pricing actions, mix
benefits, and cost management. Hotels posted an EBIT profit of INR 506mn
(vs. loss of INR 673mn in Q3FY21). The agri EBIT grew 51% YoY. The paper
margin improved during a favorable pulp cycle, and cost-competitive fibre
chain. APAT was at INR 41.6bn vs. HSIE INR 39.7bn.
Other takeaways: (1) ITC is not witnessing any disruptions in January. (2)
Paperboard is seeing a favorable pulp cycle with value-added performing
well too. (3) ITC Infotech margin expanded on improved business mix and
higher resource productivity. (4) It launched two products in the plant-
based proteins segment.
Quarterly/annual financial summary
YE Mar (INR mn) Q3
FY22
Q3
FY21
YoY
(%)
Q2
FY22
QoQ
(%) FY21 FY22E FY23E FY24E
Net Sales 168,069 127,621 31.7 135,535 24.0 492,728 600,762 648,903 698,409
EBITDA 51,021 43,147 18.2 46,150 10.6 170,027 207,135 223,980 240,330
APAT 41,562 36,879 12.7 36,972 12.4 133,829 155,988 170,597 183,197
Diluted EPS (INR) 3.4 3.0 12.7 3.0 12.4 10.9 12.7 13.9 14.9
P/E (x) 21.5 18.5 16.9 15.7
EV / EBITDA (x)
15.2 12.5 11.5 10.6
Core RoCE (%)
37.7 44.6 46.9 49.8
Source: Company, HSIE Research
BUY
CMP (as on 3 Feb 2022) INR 234
Target Price INR 285
NIFTY 17, 560
KEY
CHANGES OLD NEW
Rating BUY BUY
Price Target INR 285 INR 285
EPS % FY22E FY23E
+1% +1%
KEY STOCK DATA
Bloomberg code ITC IN
No. of Shares (mn) 12,324
MCap (INR bn) / ($ mn) 2,889/38,827
6m avg traded value (INR mn) 5,519
52 Week high / low INR 265/199
STOCK PERFORMANCE (%)
3M 6M 12M
Absolute (%) 5.4 11.7 8.2
Relative (%) 7.0 2.5 (8.8)
SHAREHOLDING PATTERN (%)
Sep-21 Dec-21
Promoters 0.00 0.00
FIs & Local MFs 43.72 43.79
FPIs 10.81 9.99
Public & Others 45.47 46.22
Pledged Shares 0.00 0.00
Source : BSE
Pledged shares as % of total shares
Varun Lohchab
+91-22-6171-7334
Naveen Trivedi
+91-22-6171-7324
Saras Singh
+91-22-6171-7336
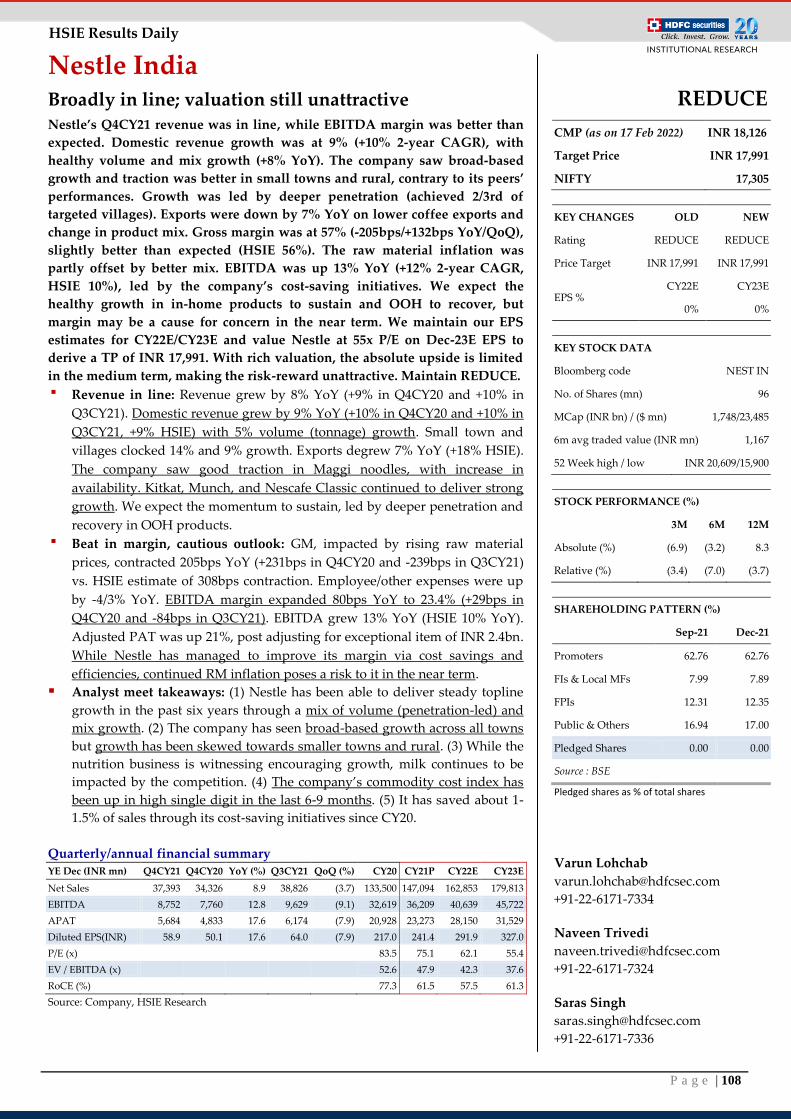
P a g e | 108
HSIE Results Daily
Nestle India Broadly in line; valuation still unattractive Nestle’s Q4CY21 revenue was in line, while EBITDA margin was better than
expected. Domestic revenue growth was at 9% (+10% 2-year CAGR), with
healthy volume and mix growth (+8% YoY). The company saw broad-based
growth and traction was better in small towns and rural, contrary to its peers’
performances. Growth was led by deeper penetration (achieved 2/3rd of
targeted villages). Exports were down by 7% YoY on lower coffee exports and
change in product mix. Gross margin was at 57% (-205bps/+132bps YoY/QoQ),
slightly better than expected (HSIE 56%). The raw material inflation was
partly offset by better mix. EBITDA was up 13% YoY (+12% 2-year CAGR,
HSIE 10%), led by the company’s cost-saving initiatives. We expect the
healthy growth in in-home products to sustain and OOH to recover, but
margin may be a cause for concern in the near term. We maintain our EPS
estimates for CY22E/CY23E and value Nestle at 55x P/E on Dec-23E EPS to
derive a TP of INR 17,991. With rich valuation, the absolute upside is limited
in the medium term, making the risk-reward unattractive. Maintain REDUCE.
▪ Revenue in line: Revenue grew by 8% YoY (+9% in Q4CY20 and +10% in
Q3CY21). Domestic revenue grew by 9% YoY (+10% in Q4CY20 and +10% in
Q3CY21, +9% HSIE) with 5% volume (tonnage) growth. Small town and
villages clocked 14% and 9% growth. Exports degrew 7% YoY (+18% HSIE).
The company saw good traction in Maggi noodles, with increase in
availability. Kitkat, Munch, and Nescafe Classic continued to deliver strong
growth. We expect the momentum to sustain, led by deeper penetration and
recovery in OOH products.
▪ Beat in margin, cautious outlook: GM, impacted by rising raw material
prices, contracted 205bps YoY (+231bps in Q4CY20 and -239bps in Q3CY21)
vs. HSIE estimate of 308bps contraction. Employee/other expenses were up
by -4/3% YoY. EBITDA margin expanded 80bps YoY to 23.4% (+29bps in
Q4CY20 and -84bps in Q3CY21). EBITDA grew 13% YoY (HSIE 10% YoY).
Adjusted PAT was up 21%, post adjusting for exceptional item of INR 2.4bn.
While Nestle has managed to improve its margin via cost savings and
efficiencies, continued RM inflation poses a risk to it in the near term.
Analyst meet takeaways: (1) Nestle has been able to deliver steady topline
growth in the past six years through a mix of volume (penetration-led) and
mix growth. (2) The company has seen broad-based growth across all towns
but growth has been skewed towards smaller towns and rural. (3) While the
nutrition business is witnessing encouraging growth, milk continues to be
impacted by the competition. (4) The company’s commodity cost index has
been up in high single digit in the last 6-9 months. (5) It has saved about 1-
1.5% of sales through its cost-saving initiatives since CY20.
Quarterly/annual financial summary YE Dec (INR mn) Q4CY21 Q4CY20 YoY (%) Q3CY21 QoQ (%) CY20 CY21P CY22E CY23E
Net Sales 37,393 34,326 8.9 38,826 (3.7) 133,500 147,094 162,853 179,813
EBITDA 8,752 7,760 12.8 9,629 (9.1) 32,619 36,209 40,639 45,722
APAT 5,684 4,833 17.6 6,174 (7.9) 20,928 23,273 28,150 31,529
Diluted EPS(INR) 58.9 50.1 17.6 64.0 (7.9) 217.0 241.4 291.9 327.0
P/E (x) 83.5 75.1 62.1 55.4
EV / EBITDA (x)
52.6 47.9 42.3 37.6
RoCE (%)
77.3 61.5 57.5 61.3
Source: Company, HSIE Research
REDUCE
CMP (as on 17 Feb 2022) INR 18,126
Target Price INR 17,991
NIFTY 17,305
KEY CHANGES OLD NEW
Rating REDUCE REDUCE
Price Target INR 17,991 INR 17,991
EPS % CY22E CY23E
0% 0%
KEY STOCK DATA
Bloomberg code NEST IN
No. of Shares (mn) 96
MCap (INR bn) / ($ mn) 1,748/23,485
6m avg traded value (INR mn) 1,167
52 Week high / low INR 20,609/15,900
STOCK PERFORMANCE (%)
3M 6M 12M
Absolute (%) (6.9) (3.2) 8.3
Relative (%) (3.4) (7.0) (3.7)
SHAREHOLDING PATTERN (%)
Sep-21 Dec-21
Promoters 62.76 62.76
FIs & Local MFs 7.99 7.89
FPIs 12.31 12.35
Public & Others 16.94 17.00
Pledged Shares 0.00 0.00
Source : BSE
Pledged shares as % of total shares
Varun Lohchab
+91-22-6171-7334
Naveen Trivedi
+91-22-6171-7324
Saras Singh
+91-22-6171-7336
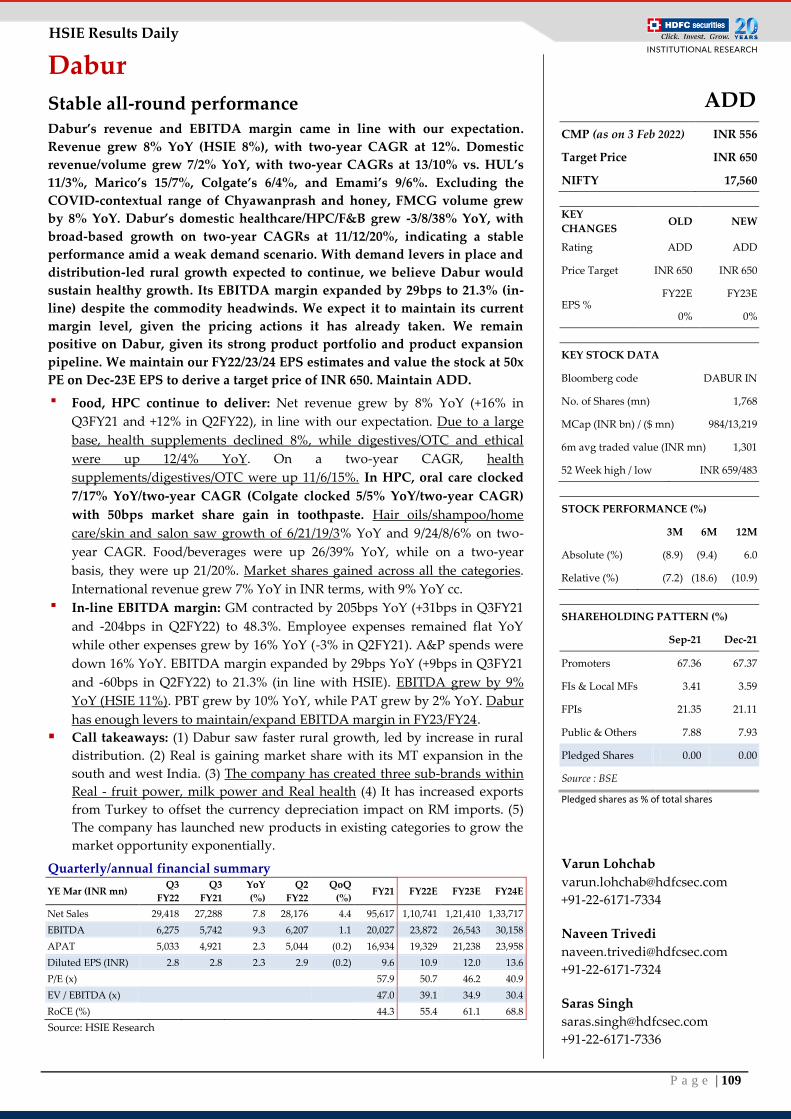
P a g e | 109
HSIE Results Daily
Dabur
Stable all-round performance Dabur’s revenue and EBITDA margin came in line with our expectation.
Revenue grew 8% YoY (HSIE 8%), with two-year CAGR at 12%. Domestic
revenue/volume grew 7/2% YoY, with two-year CAGRs at 13/10% vs. HUL’s
11/3%, Marico’s 15/7%, Colgate’s 6/4%, and Emami’s 9/6%. Excluding the
COVID-contextual range of Chyawanprash and honey, FMCG volume grew
by 8% YoY. Dabur’s domestic healthcare/HPC/F&B grew -3/8/38% YoY, with
broad-based growth on two-year CAGRs at 11/12/20%, indicating a stable
performance amid a weak demand scenario. With demand levers in place and
distribution-led rural growth expected to continue, we believe Dabur would
sustain healthy growth. Its EBITDA margin expanded by 29bps to 21.3% (in-
line) despite the commodity headwinds. We expect it to maintain its current
margin level, given the pricing actions it has already taken. We remain
positive on Dabur, given its strong product portfolio and product expansion
pipeline. We maintain our FY22/23/24 EPS estimates and value the stock at 50x
PE on Dec-23E EPS to derive a target price of INR 650. Maintain ADD.
▪ Food, HPC continue to deliver: Net revenue grew by 8% YoY (+16% in
Q3FY21 and +12% in Q2FY22), in line with our expectation. Due to a large
base, health supplements declined 8%, while digestives/OTC and ethical
were up 12/4% YoY. On a two-year CAGR, health
supplements/digestives/OTC were up 11/6/15%. In HPC, oral care clocked
7/17% YoY/two-year CAGR (Colgate clocked 5/5% YoY/two-year CAGR)
with 50bps market share gain in toothpaste. Hair oils/shampoo/home
care/skin and salon saw growth of 6/21/19/3% YoY and 9/24/8/6% on two-
year CAGR. Food/beverages were up 26/39% YoY, while on a two-year
basis, they were up 21/20%. Market shares gained across all the categories.
International revenue grew 7% YoY in INR terms, with 9% YoY cc.
▪ In-line EBITDA margin: GM contracted by 205bps YoY (+31bps in Q3FY21
and -204bps in Q2FY22) to 48.3%. Employee expenses remained flat YoY
while other expenses grew by 16% YoY (-3% in Q2FY21). A&P spends were
down 16% YoY. EBITDA margin expanded by 29bps YoY (+9bps in Q3FY21
and -60bps in Q2FY22) to 21.3% (in line with HSIE). EBITDA grew by 9%
YoY (HSIE 11%). PBT grew by 10% YoY, while PAT grew by 2% YoY. Dabur
has enough levers to maintain/expand EBITDA margin in FY23/FY24.
Call takeaways: (1) Dabur saw faster rural growth, led by increase in rural
distribution. (2) Real is gaining market share with its MT expansion in the
south and west India. (3) The company has created three sub-brands within
Real - fruit power, milk power and Real health (4) It has increased exports
from Turkey to offset the currency depreciation impact on RM imports. (5)
The company has launched new products in existing categories to grow the
market opportunity exponentially.
Quarterly/annual financial summary
YE Mar (INR mn) Q3
FY22
Q3
FY21
YoY
(%)
Q2
FY22
QoQ
(%) FY21 FY22E FY23E FY24E
Net Sales 29,418 27,288 7.8 28,176 4.4 95,617 1,10,741 1,21,410 1,33,717
EBITDA 6,275 5,742 9.3 6,207 1.1 20,027 23,872 26,543 30,158
APAT 5,033 4,921 2.3 5,044 (0.2) 16,934 19,329 21,238 23,958
Diluted EPS (INR) 2.8 2.8 2.3 2.9 (0.2) 9.6 10.9 12.0 13.6
P/E (x) 57.9 50.7 46.2 40.9
EV / EBITDA (x)
47.0 39.1 34.9 30.4
RoCE (%)
44.3 55.4 61.1 68.8
Source: HSIE Research
ADD
CMP (as on 3 Feb 2022) INR 556
Target Price INR 650
NIFTY 17,560
KEY
CHANGES OLD NEW
Rating ADD ADD
Price Target INR 650 INR 650
EPS % FY22E FY23E
0% 0%
KEY STOCK DATA
Bloomberg code DABUR IN
No. of Shares (mn) 1,768
MCap (INR bn) / ($ mn) 984/13,219
6m avg traded value (INR mn) 1,301
52 Week high / low INR 659/483
STOCK PERFORMANCE (%)
3M 6M 12M
Absolute (%) (8.9) (9.4) 6.0
Relative (%) (7.2) (18.6) (10.9)
SHAREHOLDING PATTERN (%)
Sep-21 Dec-21
Promoters 67.36 67.37
FIs & Local MFs 3.41 3.59
FPIs 21.35 21.11
Public & Others 7.88 7.93
Pledged Shares 0.00 0.00
Source : BSE
Pledged shares as % of total shares
Varun Lohchab
+91-22-6171-7334
Naveen Trivedi
+91-22-6171-7324
Saras Singh
+91-22-6171-7336
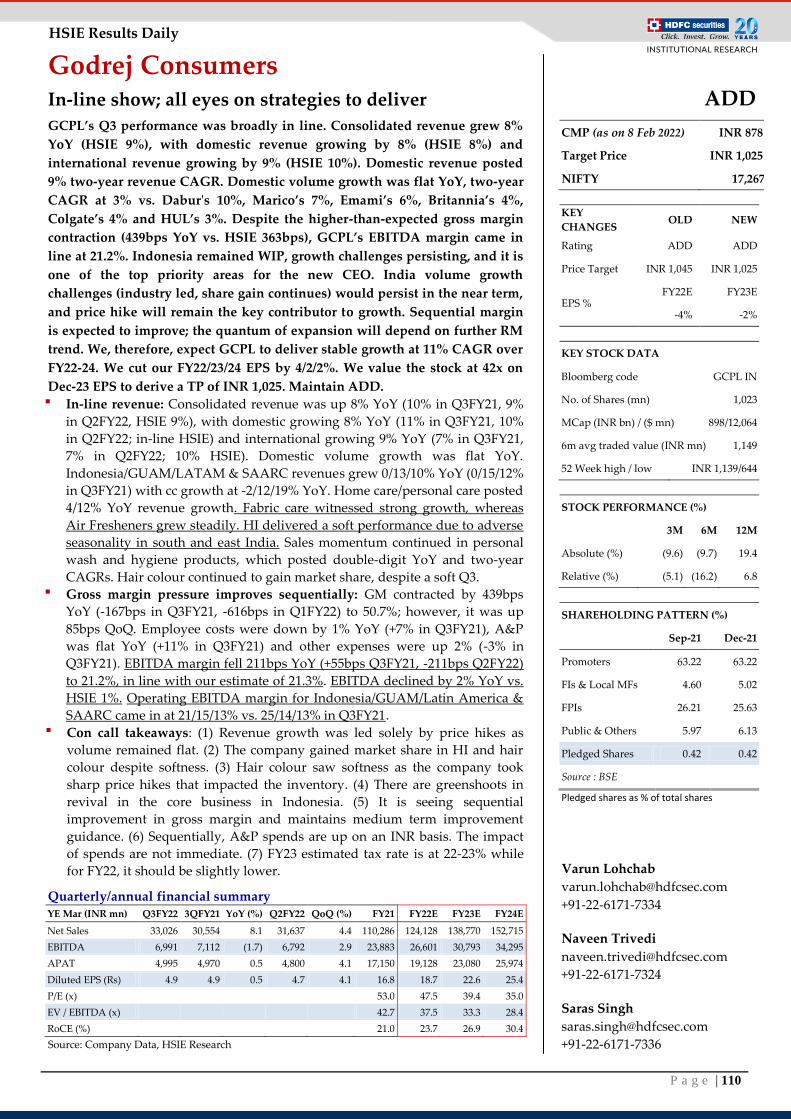
P a g e | 110
HSIE Results Daily
Godrej Consumers In-line show; all eyes on strategies to deliver
GCPL’s Q3 performance was broadly in line. Consolidated revenue grew 8%
YoY (HSIE 9%), with domestic revenue growing by 8% (HSIE 8%) and
international revenue growing by 9% (HSIE 10%). Domestic revenue posted
9% two-year revenue CAGR. Domestic volume growth was flat YoY, two-year
CAGR at 3% vs. Dabur's 10%, Marico’s 7%, Emami’s 6%, Britannia’s 4%,
Colgate’s 4% and HUL’s 3%. Despite the higher-than-expected gross margin
contraction (439bps YoY vs. HSIE 363bps), GCPL’s EBITDA margin came in
line at 21.2%. Indonesia remained WIP, growth challenges persisting, and it is
one of the top priority areas for the new CEO. India volume growth
challenges (industry led, share gain continues) would persist in the near term,
and price hike will remain the key contributor to growth. Sequential margin
is expected to improve; the quantum of expansion will depend on further RM
trend. We, therefore, expect GCPL to deliver stable growth at 11% CAGR over
FY22-24. We cut our FY22/23/24 EPS by 4/2/2%. We value the stock at 42x on
Dec-23 EPS to derive a TP of INR 1,025. Maintain ADD.
▪ In-line revenue: Consolidated revenue was up 8% YoY (10% in Q3FY21, 9%
in Q2FY22, HSIE 9%), with domestic growing 8% YoY (11% in Q3FY21, 10%
in Q2FY22; in-line HSIE) and international growing 9% YoY (7% in Q3FY21,
7% in Q2FY22; 10% HSIE). Domestic volume growth was flat YoY.
Indonesia/GUAM/LATAM & SAARC revenues grew 0/13/10% YoY (0/15/12%
in Q3FY21) with cc growth at -2/12/19% YoY. Home care/personal care posted
4/12% YoY revenue growth. Fabric care witnessed strong growth, whereas
Air Fresheners grew steadily. HI delivered a soft performance due to adverse
seasonality in south and east India. Sales momentum continued in personal
wash and hygiene products, which posted double-digit YoY and two-year
CAGRs. Hair colour continued to gain market share, despite a soft Q3.
▪ Gross margin pressure improves sequentially: GM contracted by 439bps
YoY (-167bps in Q3FY21, -616bps in Q1FY22) to 50.7%; however, it was up
85bps QoQ. Employee costs were down by 1% YoY (+7% in Q3FY21), A&P
was flat YoY (+11% in Q3FY21) and other expenses were up 2% (-3% in
Q3FY21). EBITDA margin fell 211bps YoY (+55bps Q3FY21, -211bps Q2FY22)
to 21.2%, in line with our estimate of 21.3%. EBITDA declined by 2% YoY vs.
HSIE 1%. Operating EBITDA margin for Indonesia/GUAM/Latin America &
SAARC came in at 21/15/13% vs. 25/14/13% in Q3FY21.
▪ Con call takeaways: (1) Revenue growth was led solely by price hikes as
volume remained flat. (2) The company gained market share in HI and hair
colour despite softness. (3) Hair colour saw softness as the company took
sharp price hikes that impacted the inventory. (4) There are greenshoots in
revival in the core business in Indonesia. (5) It is seeing sequential
improvement in gross margin and maintains medium term improvement
guidance. (6) Sequentially, A&P spends are up on an INR basis. The impact
of spends are not immediate. (7) FY23 estimated tax rate is at 22-23% while
for FY22, it should be slightly lower.
Quarterly/annual financial summary YE Mar (INR mn) Q3FY22 3QFY21 YoY (%) Q2FY22 QoQ (%) FY21 FY22E FY23E FY24E
Net Sales 33,026 30,554 8.1 31,637 4.4 110,286 124,128 138,770 152,715
EBITDA 6,991 7,112 (1.7) 6,792 2.9 23,883 26,601 30,793 34,295
APAT 4,995 4,970 0.5 4,800 4.1 17,150 19,128 23,080 25,974
Diluted EPS (Rs) 4.9 4.9 0.5 4.7 4.1 16.8 18.7 22.6 25.4
P/E (x) 53.0 47.5 39.4 35.0
EV / EBITDA (x)
42.7 37.5 33.3 28.4
RoCE (%)
21.0 23.7 26.9 30.4
Source: Company Data, HSIE Research
ADD
CMP (as on 8 Feb 2022) INR 878
Target Price INR 1,025
NIFTY 17,267
KEY
CHANGES OLD NEW
Rating ADD ADD
Price Target INR 1,045 INR 1,025
EPS % FY22E FY23E
-4% -2%
KEY STOCK DATA
Bloomberg code GCPL IN
No. of Shares (mn) 1,023
MCap (INR bn) / ($ mn) 898/12,064
6m avg traded value (INR mn) 1,149
52 Week high / low INR 1,139/644
STOCK PERFORMANCE (%)
3M 6M 12M
Absolute (%) (9.6) (9.7) 19.4
Relative (%) (5.1) (16.2) 6.8
SHAREHOLDING PATTERN (%)
Sep-21 Dec-21
Promoters 63.22 63.22
FIs & Local MFs 4.60 5.02
FPIs 26.21 25.63
Public & Others 5.97 6.13
Pledged Shares 0.42 0.42
Source : BSE
Pledged shares as % of total shares
Varun Lohchab
+91-22-6171-7334
Naveen Trivedi
+91-22-6171-7324
Saras Singh
+91-22-6171-7336
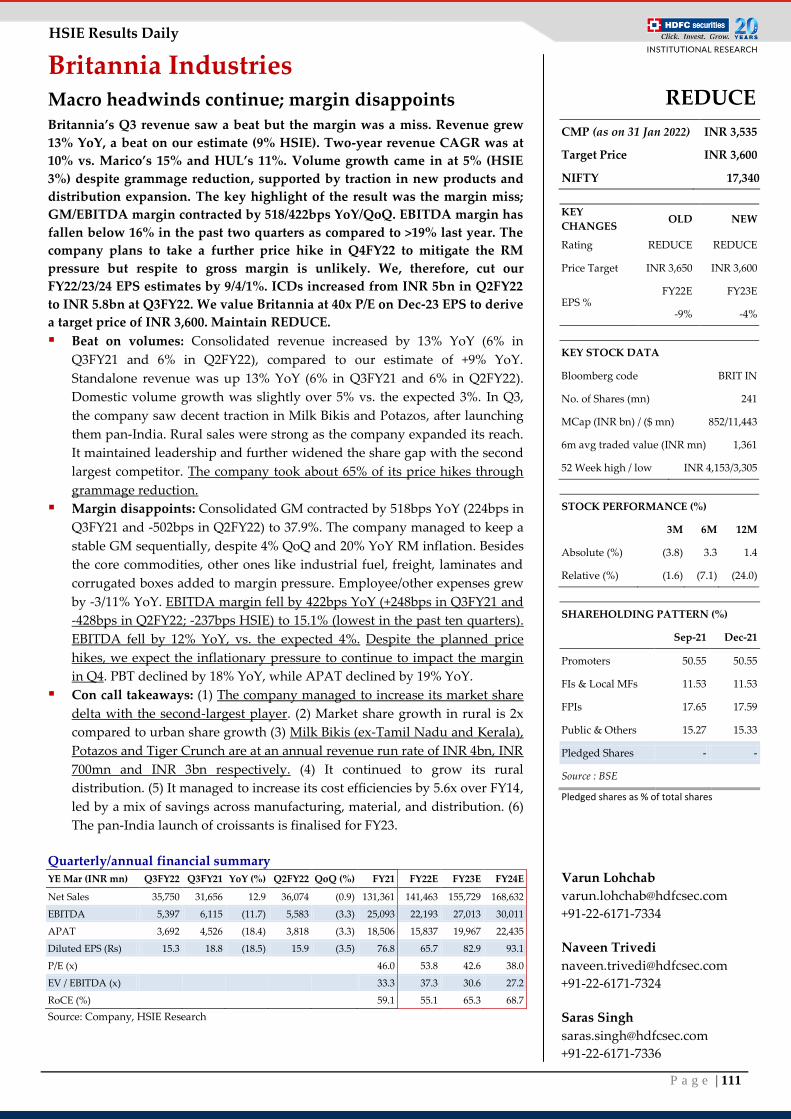
P a g e | 111
HSIE Results Daily
Britannia Industries Macro headwinds continue; margin disappoints Britannia’s Q3 revenue saw a beat but the margin was a miss. Revenue grew
13% YoY, a beat on our estimate (9% HSIE). Two-year revenue CAGR was at
10% vs. Marico’s 15% and HUL’s 11%. Volume growth came in at 5% (HSIE
3%) despite grammage reduction, supported by traction in new products and
distribution expansion. The key highlight of the result was the margin miss;
GM/EBITDA margin contracted by 518/422bps YoY/QoQ. EBITDA margin has
fallen below 16% in the past two quarters as compared to >19% last year. The
company plans to take a further price hike in Q4FY22 to mitigate the RM
pressure but respite to gross margin is unlikely. We, therefore, cut our
FY22/23/24 EPS estimates by 9/4/1%. ICDs increased from INR 5bn in Q2FY22
to INR 5.8bn at Q3FY22. We value Britannia at 40x P/E on Dec-23 EPS to derive
a target price of INR 3,600. Maintain REDUCE.
Beat on volumes: Consolidated revenue increased by 13% YoY (6% in
Q3FY21 and 6% in Q2FY22), compared to our estimate of +9% YoY.
Standalone revenue was up 13% YoY (6% in Q3FY21 and 6% in Q2FY22).
Domestic volume growth was slightly over 5% vs. the expected 3%. In Q3,
the company saw decent traction in Milk Bikis and Potazos, after launching
them pan-India. Rural sales were strong as the company expanded its reach.
It maintained leadership and further widened the share gap with the second
largest competitor. The company took about 65% of its price hikes through
grammage reduction.
Margin disappoints: Consolidated GM contracted by 518bps YoY (224bps in
Q3FY21 and -502bps in Q2FY22) to 37.9%. The company managed to keep a
stable GM sequentially, despite 4% QoQ and 20% YoY RM inflation. Besides
the core commodities, other ones like industrial fuel, freight, laminates and
corrugated boxes added to margin pressure. Employee/other expenses grew
by -3/11% YoY. EBITDA margin fell by 422bps YoY (+248bps in Q3FY21 and
-428bps in Q2FY22; -237bps HSIE) to 15.1% (lowest in the past ten quarters).
EBITDA fell by 12% YoY, vs. the expected 4%. Despite the planned price
hikes, we expect the inflationary pressure to continue to impact the margin
in Q4. PBT declined by 18% YoY, while APAT declined by 19% YoY.
Con call takeaways: (1) The company managed to increase its market share
delta with the second-largest player. (2) Market share growth in rural is 2x
compared to urban share growth (3) Milk Bikis (ex-Tamil Nadu and Kerala),
Potazos and Tiger Crunch are at an annual revenue run rate of INR 4bn, INR
700mn and INR 3bn respectively. (4) It continued to grow its rural
distribution. (5) It managed to increase its cost efficiencies by 5.6x over FY14,
led by a mix of savings across manufacturing, material, and distribution. (6)
The pan-India launch of croissants is finalised for FY23.
Quarterly/annual financial summary
YE Mar (INR mn) Q3FY22 Q3FY21 YoY (%) Q2FY22 QoQ (%) FY21 FY22E FY23E FY24E
Net Sales 35,750 31,656 12.9 36,074 (0.9) 131,361 141,463 155,729 168,632
EBITDA 5,397 6,115 (11.7) 5,583 (3.3) 25,093 22,193 27,013 30,011
APAT 3,692 4,526 (18.4) 3,818 (3.3) 18,506 15,837 19,967 22,435
Diluted EPS (Rs) 15.3 18.8 (18.5) 15.9 (3.5) 76.8 65.7 82.9 93.1
P/E (x)
46.0 53.8 42.6 38.0
EV / EBITDA (x)
33.3 37.3 30.6 27.2
RoCE (%)
59.1 55.1 65.3 68.7
Source: Company, HSIE Research
REDUCE
CMP (as on 31 Jan 2022) INR 3,535
Target Price INR 3,600
NIFTY 17,340
KEY
CHANGES OLD NEW
Rating REDUCE REDUCE
Price Target INR 3,650 INR 3,600
EPS % FY22E FY23E
-9% -4%
KEY STOCK DATA
Bloomberg code BRIT IN
No. of Shares (mn) 241
MCap (INR bn) / ($ mn) 852/11,443
6m avg traded value (INR mn) 1,361
52 Week high / low INR 4,153/3,305
STOCK PERFORMANCE (%)
3M 6M 12M
Absolute (%) (3.8) 3.3 1.4
Relative (%) (1.6) (7.1) (24.0)
SHAREHOLDING PATTERN (%)
Sep-21 Dec-21
Promoters 50.55 50.55
FIs & Local MFs 11.53 11.53
FPIs 17.65 17.59
Public & Others 15.27 15.33
Pledged Shares - -
Source : BSE
Pledged shares as % of total shares
Varun Lohchab
+91-22-6171-7334
Naveen Trivedi
+91-22-6171-7324
Saras Singh
+91-22-6171-7336
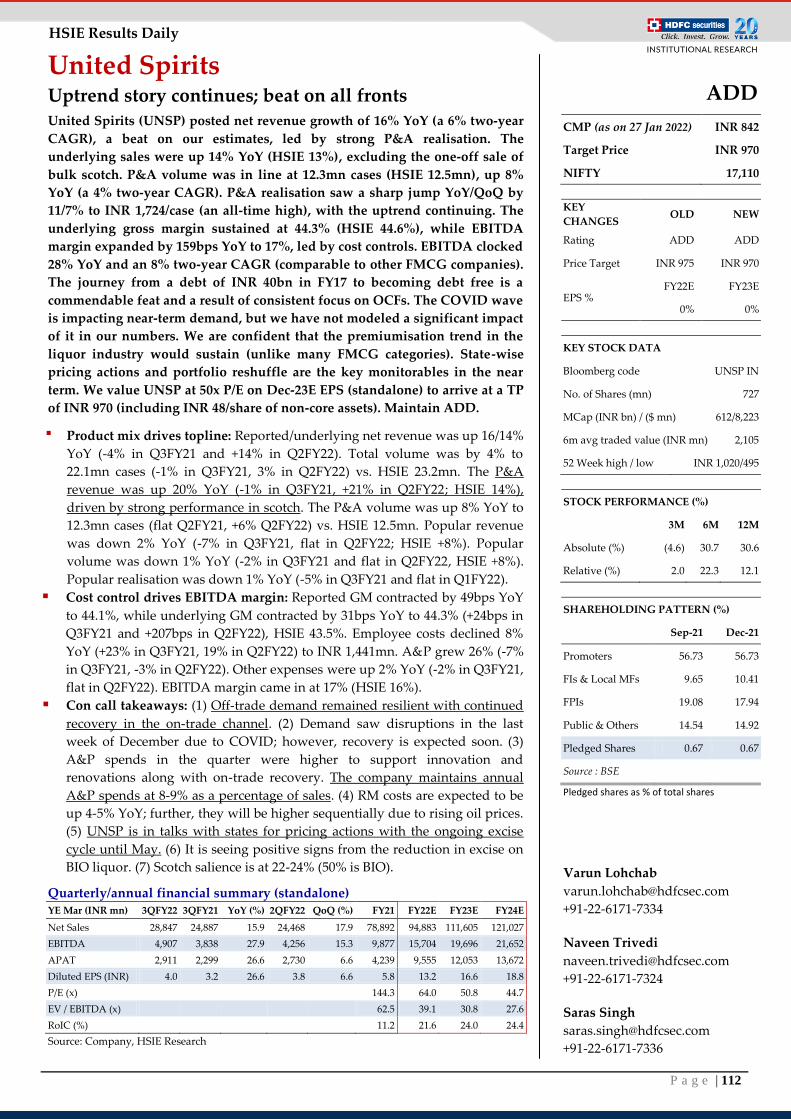
P a g e | 112
HSIE Results Daily
United Spirits Uptrend story continues; beat on all fronts United Spirits (UNSP) posted net revenue growth of 16% YoY (a 6% two-year
CAGR), a beat on our estimates, led by strong P&A realisation. The
underlying sales were up 14% YoY (HSIE 13%), excluding the one-off sale of
bulk scotch. P&A volume was in line at 12.3mn cases (HSIE 12.5mn), up 8%
YoY (a 4% two-year CAGR). P&A realisation saw a sharp jump YoY/QoQ by
11/7% to INR 1,724/case (an all-time high), with the uptrend continuing. The
underlying gross margin sustained at 44.3% (HSIE 44.6%), while EBITDA
margin expanded by 159bps YoY to 17%, led by cost controls. EBITDA clocked
28% YoY and an 8% two-year CAGR (comparable to other FMCG companies).
The journey from a debt of INR 40bn in FY17 to becoming debt free is a
commendable feat and a result of consistent focus on OCFs. The COVID wave
is impacting near-term demand, but we have not modeled a significant impact
of it in our numbers. We are confident that the premiumisation trend in the
liquor industry would sustain (unlike many FMCG categories). State-wise
pricing actions and portfolio reshuffle are the key monitorables in the near
term. We value UNSP at 50x P/E on Dec-23E EPS (standalone) to arrive at a TP
of INR 970 (including INR 48/share of non-core assets). Maintain ADD.
▪ Product mix drives topline: Reported/underlying net revenue was up 16/14%
YoY (-4% in Q3FY21 and +14% in Q2FY22). Total volume was by 4% to
22.1mn cases (-1% in Q3FY21, 3% in Q2FY22) vs. HSIE 23.2mn. The P&A
revenue was up 20% YoY (-1% in Q3FY21, +21% in Q2FY22; HSIE 14%),
driven by strong performance in scotch. The P&A volume was up 8% YoY to
12.3mn cases (flat Q2FY21, +6% Q2FY22) vs. HSIE 12.5mn. Popular revenue
was down 2% YoY (-7% in Q3FY21, flat in Q2FY22; HSIE +8%). Popular
volume was down 1% YoY (-2% in Q3FY21 and flat in Q2FY22, HSIE +8%).
Popular realisation was down 1% YoY (-5% in Q3FY21 and flat in Q1FY22).
Cost control drives EBITDA margin: Reported GM contracted by 49bps YoY
to 44.1%, while underlying GM contracted by 31bps YoY to 44.3% (+24bps in
Q3FY21 and +207bps in Q2FY22), HSIE 43.5%. Employee costs declined 8%
YoY (+23% in Q3FY21, 19% in Q2FY22) to INR 1,441mn. A&P grew 26% (-7%
in Q3FY21, -3% in Q2FY22). Other expenses were up 2% YoY (-2% in Q3FY21,
flat in Q2FY22). EBITDA margin came in at 17% (HSIE 16%).
Con call takeaways: (1) Off-trade demand remained resilient with continued
recovery in the on-trade channel. (2) Demand saw disruptions in the last
week of December due to COVID; however, recovery is expected soon. (3)
A&P spends in the quarter were higher to support innovation and
renovations along with on-trade recovery. The company maintains annual
A&P spends at 8-9% as a percentage of sales. (4) RM costs are expected to be
up 4-5% YoY; further, they will be higher sequentially due to rising oil prices.
(5) UNSP is in talks with states for pricing actions with the ongoing excise
cycle until May. (6) It is seeing positive signs from the reduction in excise on
BIO liquor. (7) Scotch salience is at 22-24% (50% is BIO).
Quarterly/annual financial summary (standalone) YE Mar (INR mn) 3QFY22 3QFY21 YoY (%) 2QFY22 QoQ (%) FY21 FY22E FY23E FY24E
Net Sales 28,847 24,887 15.9 24,468 17.9 78,892 94,883 111,605 121,027
EBITDA 4,907 3,838 27.9 4,256 15.3 9,877 15,704 19,696 21,652
APAT 2,911 2,299 26.6 2,730 6.6 4,239 9,555 12,053 13,672
Diluted EPS (INR) 4.0 3.2 26.6 3.8 6.6 5.8 13.2 16.6 18.8
P/E (x) 144.3 64.0 50.8 44.7
EV / EBITDA (x)
62.5 39.1 30.8 27.6
RoIC (%)
11.2 21.6 24.0 24.4
Source: Company, HSIE Research
ADD
CMP (as on 27 Jan 2022) INR 842
Target Price INR 970
NIFTY 17,110
KEY
CHANGES OLD NEW
Rating ADD ADD
Price Target INR 975 INR 970
EPS % FY22E FY23E
0% 0%
KEY STOCK DATA
Bloomberg code UNSP IN
No. of Shares (mn) 727
MCap (INR bn) / ($ mn) 612/8,223
6m avg traded value (INR mn) 2,105
52 Week high / low INR 1,020/495
STOCK PERFORMANCE (%)
3M 6M 12M
Absolute (%) (4.6) 30.7 30.6
Relative (%) 2.0 22.3 12.1
SHAREHOLDING PATTERN (%)
Sep-21 Dec-21
Promoters 56.73 56.73
FIs & Local MFs 9.65 10.41
FPIs 19.08 17.94
Public & Others 14.54 14.92
Pledged Shares 0.67 0.67
Source : BSE
Pledged shares as % of total shares
Varun Lohchab
+91-22-6171-7334
Naveen Trivedi
+91-22-6171-7324
Saras Singh
+91-22-6171-7336
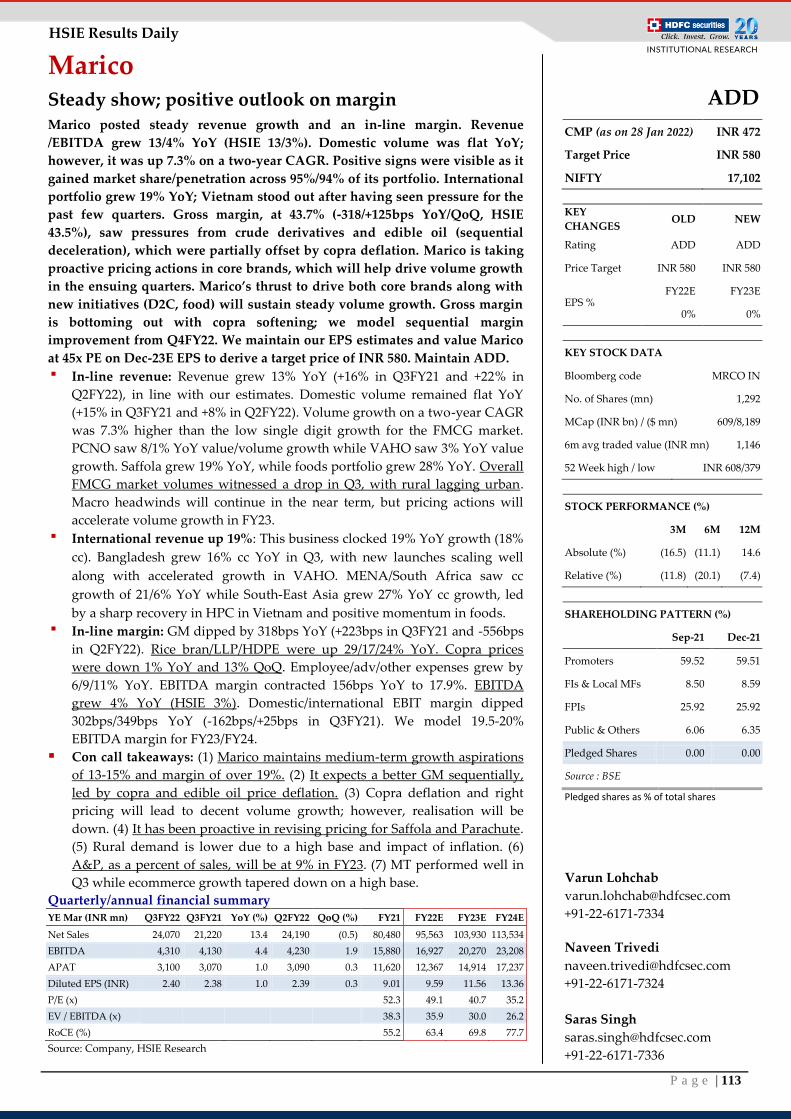
P a g e | 113
HSIE Results Daily
Marico Steady show; positive outlook on margin Marico posted steady revenue growth and an in-line margin. Revenue
/EBITDA grew 13/4% YoY (HSIE 13/3%). Domestic volume was flat YoY;
however, it was up 7.3% on a two-year CAGR. Positive signs were visible as it
gained market share/penetration across 95%/94% of its portfolio. International
portfolio grew 19% YoY; Vietnam stood out after having seen pressure for the
past few quarters. Gross margin, at 43.7% (-318/+125bps YoY/QoQ, HSIE
43.5%), saw pressures from crude derivatives and edible oil (sequential
deceleration), which were partially offset by copra deflation. Marico is taking
proactive pricing actions in core brands, which will help drive volume growth
in the ensuing quarters. Marico’s thrust to drive both core brands along with
new initiatives (D2C, food) will sustain steady volume growth. Gross margin
is bottoming out with copra softening; we model sequential margin
improvement from Q4FY22. We maintain our EPS estimates and value Marico
at 45x PE on Dec-23E EPS to derive a target price of INR 580. Maintain ADD.
▪ In-line revenue: Revenue grew 13% YoY (+16% in Q3FY21 and +22% in
Q2FY22), in line with our estimates. Domestic volume remained flat YoY
(+15% in Q3FY21 and +8% in Q2FY22). Volume growth on a two-year CAGR
was 7.3% higher than the low single digit growth for the FMCG market.
PCNO saw 8/1% YoY value/volume growth while VAHO saw 3% YoY value
growth. Saffola grew 19% YoY, while foods portfolio grew 28% YoY. Overall
FMCG market volumes witnessed a drop in Q3, with rural lagging urban.
Macro headwinds will continue in the near term, but pricing actions will
accelerate volume growth in FY23.
▪ International revenue up 19%: This business clocked 19% YoY growth (18%
cc). Bangladesh grew 16% cc YoY in Q3, with new launches scaling well
along with accelerated growth in VAHO. MENA/South Africa saw cc
growth of 21/6% YoY while South-East Asia grew 27% YoY cc growth, led
by a sharp recovery in HPC in Vietnam and positive momentum in foods.
▪ In-line margin: GM dipped by 318bps YoY (+223bps in Q3FY21 and -556bps
in Q2FY22). Rice bran/LLP/HDPE were up 29/17/24% YoY. Copra prices
were down 1% YoY and 13% QoQ. Employee/adv/other expenses grew by
6/9/11% YoY. EBITDA margin contracted 156bps YoY to 17.9%. EBITDA
grew 4% YoY (HSIE 3%). Domestic/international EBIT margin dipped
302bps/349bps YoY (-162bps/+25bps in Q3FY21). We model 19.5-20%
EBITDA margin for FY23/FY24.
Con call takeaways: (1) Marico maintains medium-term growth aspirations
of 13-15% and margin of over 19%. (2) It expects a better GM sequentially,
led by copra and edible oil price deflation. (3) Copra deflation and right
pricing will lead to decent volume growth; however, realisation will be
down. (4) It has been proactive in revising pricing for Saffola and Parachute.
(5) Rural demand is lower due to a high base and impact of inflation. (6)
A&P, as a percent of sales, will be at 9% in FY23. (7) MT performed well in
Q3 while ecommerce growth tapered down on a high base.
Quarterly/annual financial summary YE Mar (INR mn) Q3FY22 Q3FY21 YoY (%) Q2FY22 QoQ (%) FY21 FY22E FY23E FY24E
Net Sales 24,070 21,220 13.4 24,190 (0.5) 80,480 95,563 103,930 113,534
EBITDA 4,310 4,130 4.4 4,230 1.9 15,880 16,927 20,270 23,208
APAT 3,100 3,070 1.0 3,090 0.3 11,620 12,367 14,914 17,237
Diluted EPS (INR) 2.40 2.38 1.0 2.39 0.3 9.01 9.59 11.56 13.36
P/E (x) 52.3 49.1 40.7 35.2
EV / EBITDA (x)
38.3 35.9 30.0 26.2
RoCE (%)
55.2 63.4 69.8 77.7
Source: Company, HSIE Research
ADD
CMP (as on 28 Jan 2022) INR 472
Target Price INR 580
NIFTY 17,102
KEY
CHANGES OLD NEW
Rating ADD ADD
Price Target INR 580 INR 580
EPS % FY22E FY23E
0% 0%
KEY STOCK DATA
Bloomberg code MRCO IN
No. of Shares (mn) 1,292
MCap (INR bn) / ($ mn) 609/8,189
6m avg traded value (INR mn) 1,146
52 Week high / low INR 608/379
STOCK PERFORMANCE (%)
3M 6M 12M
Absolute (%) (16.5) (11.1) 14.6
Relative (%) (11.8) (20.1) (7.4)
SHAREHOLDING PATTERN (%)
Sep-21 Dec-21
Promoters 59.52 59.51
FIs & Local MFs 8.50 8.59
FPIs 25.92 25.92
Public & Others 6.06 6.35
Pledged Shares 0.00 0.00
Source : BSE
Pledged shares as % of total shares
Varun Lohchab
+91-22-6171-7334
Naveen Trivedi
+91-22-6171-7324
Saras Singh
+91-22-6171-7336
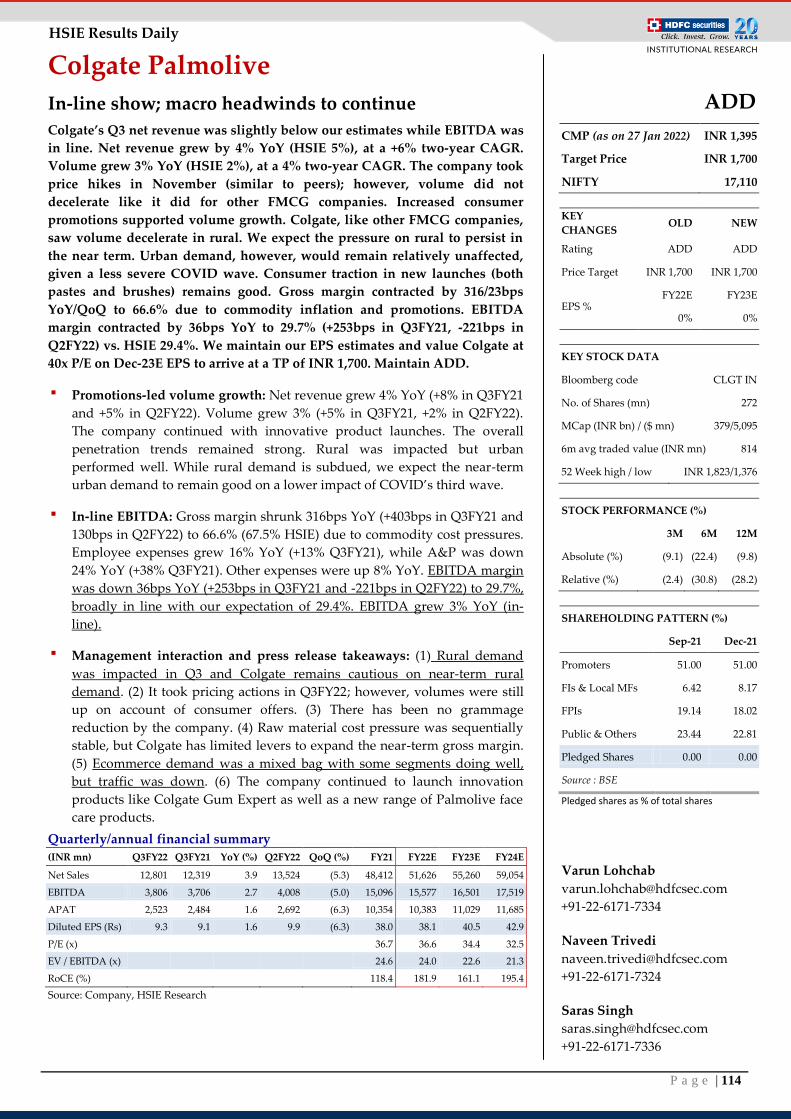
P a g e | 114
HSIE Results Daily
Colgate Palmolive
In-line show; macro headwinds to continue
Colgate’s Q3 net revenue was slightly below our estimates while EBITDA was
in line. Net revenue grew by 4% YoY (HSIE 5%), at a +6% two-year CAGR.
Volume grew 3% YoY (HSIE 2%), at a 4% two-year CAGR. The company took
price hikes in November (similar to peers); however, volume did not
decelerate like it did for other FMCG companies. Increased consumer
promotions supported volume growth. Colgate, like other FMCG companies,
saw volume decelerate in rural. We expect the pressure on rural to persist in
the near term. Urban demand, however, would remain relatively unaffected,
given a less severe COVID wave. Consumer traction in new launches (both
pastes and brushes) remains good. Gross margin contracted by 316/23bps
YoY/QoQ to 66.6% due to commodity inflation and promotions. EBITDA
margin contracted by 36bps YoY to 29.7% (+253bps in Q3FY21, -221bps in
Q2FY22) vs. HSIE 29.4%. We maintain our EPS estimates and value Colgate at
40x P/E on Dec-23E EPS to arrive at a TP of INR 1,700. Maintain ADD.
▪ Promotions-led volume growth: Net revenue grew 4% YoY (+8% in Q3FY21
and +5% in Q2FY22). Volume grew 3% (+5% in Q3FY21, +2% in Q2FY22).
The company continued with innovative product launches. The overall
penetration trends remained strong. Rural was impacted but urban
performed well. While rural demand is subdued, we expect the near-term
urban demand to remain good on a lower impact of COVID’s third wave.
▪ In-line EBITDA: Gross margin shrunk 316bps YoY (+403bps in Q3FY21 and
130bps in Q2FY22) to 66.6% (67.5% HSIE) due to commodity cost pressures.
Employee expenses grew 16% YoY (+13% Q3FY21), while A&P was down
24% YoY (+38% Q3FY21). Other expenses were up 8% YoY. EBITDA margin
was down 36bps YoY (+253bps in Q3FY21 and -221bps in Q2FY22) to 29.7%,
broadly in line with our expectation of 29.4%. EBITDA grew 3% YoY (in-
line).
▪ Management interaction and press release takeaways: (1) Rural demand
was impacted in Q3 and Colgate remains cautious on near-term rural
demand. (2) It took pricing actions in Q3FY22; however, volumes were still
up on account of consumer offers. (3) There has been no grammage
reduction by the company. (4) Raw material cost pressure was sequentially
stable, but Colgate has limited levers to expand the near-term gross margin.
(5) Ecommerce demand was a mixed bag with some segments doing well,
but traffic was down. (6) The company continued to launch innovation
products like Colgate Gum Expert as well as a new range of Palmolive face
care products.
Quarterly/annual financial summary
(INR mn) Q3FY22 Q3FY21 YoY (%) Q2FY22 QoQ (%) FY21 FY22E FY23E FY24E
Net Sales 12,801 12,319 3.9 13,524 (5.3) 48,412 51,626 55,260 59,054
EBITDA 3,806 3,706 2.7 4,008 (5.0) 15,096 15,577 16,501 17,519
APAT 2,523 2,484 1.6 2,692 (6.3) 10,354 10,383 11,029 11,685
Diluted EPS (Rs) 9.3 9.1 1.6 9.9 (6.3) 38.0 38.1 40.5 42.9
P/E (x) 36.7 36.6 34.4 32.5
EV / EBITDA (x)
24.6 24.0 22.6 21.3
RoCE (%)
118.4 181.9 161.1 195.4
Source: Company, HSIE Research
ADD
CMP (as on 27 Jan 2022) INR 1,395
Target Price INR 1,700
NIFTY 17,110
KEY
CHANGES OLD NEW
Rating ADD ADD
Price Target INR 1,700 INR 1,700
EPS % FY22E FY23E
0% 0%
KEY STOCK DATA
Bloomberg code CLGT IN
No. of Shares (mn) 272
MCap (INR bn) / ($ mn) 379/5,095
6m avg traded value (INR mn) 814
52 Week high / low INR 1,823/1,376
STOCK PERFORMANCE (%)
3M 6M 12M
Absolute (%) (9.1) (22.4) (9.8)
Relative (%) (2.4) (30.8) (28.2)
SHAREHOLDING PATTERN (%)
Sep-21 Dec-21
Promoters 51.00 51.00
FIs & Local MFs 6.42 8.17
FPIs 19.14 18.02
Public & Others 23.44 22.81
Pledged Shares 0.00 0.00
Source : BSE
Pledged shares as % of total shares
Varun Lohchab
+91-22-6171-7334
Naveen Trivedi
+91-22-6171-7324
Saras Singh
+91-22-6171-7336
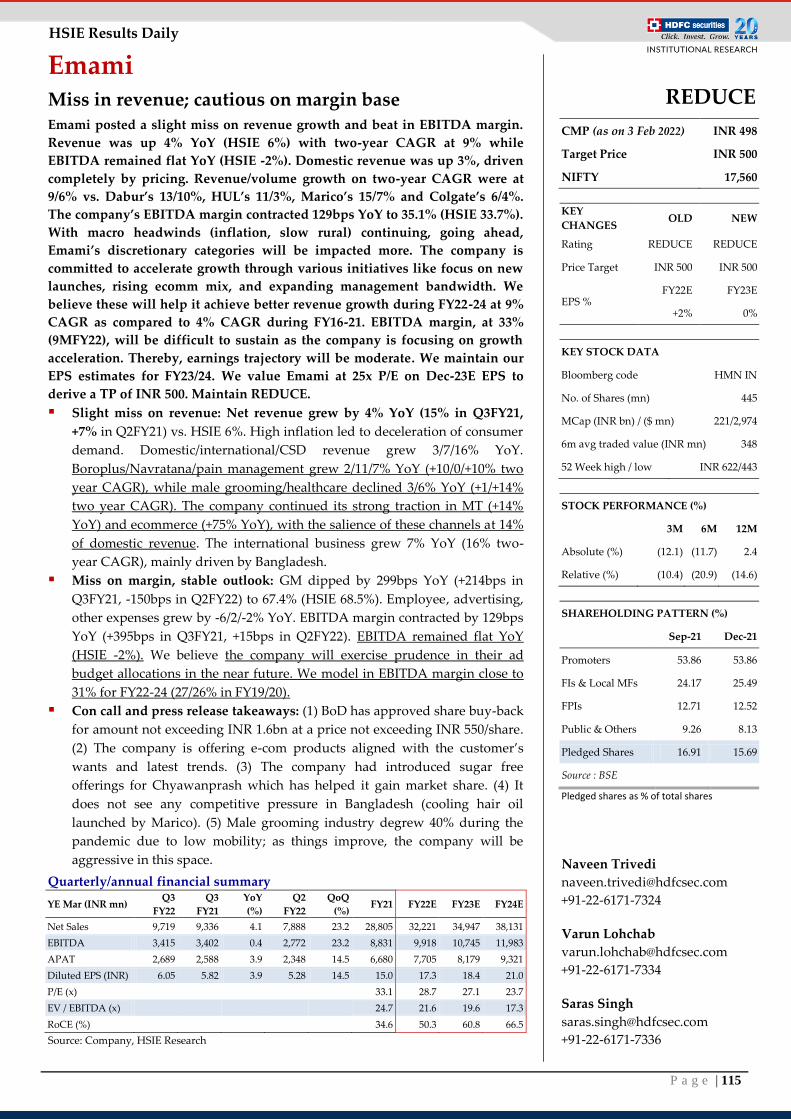
P a g e | 115
HSIE Results Daily
Emami Miss in revenue; cautious on margin base Emami posted a slight miss on revenue growth and beat in EBITDA margin.
Revenue was up 4% YoY (HSIE 6%) with two-year CAGR at 9% while
EBITDA remained flat YoY (HSIE -2%). Domestic revenue was up 3%, driven
completely by pricing. Revenue/volume growth on two-year CAGR were at
9/6% vs. Dabur’s 13/10%, HUL’s 11/3%, Marico’s 15/7% and Colgate’s 6/4%.
The company’s EBITDA margin contracted 129bps YoY to 35.1% (HSIE 33.7%).
With macro headwinds (inflation, slow rural) continuing, going ahead,
Emami’s discretionary categories will be impacted more. The company is
committed to accelerate growth through various initiatives like focus on new
launches, rising ecomm mix, and expanding management bandwidth. We
believe these will help it achieve better revenue growth during FY22-24 at 9%
CAGR as compared to 4% CAGR during FY16-21. EBITDA margin, at 33%
(9MFY22), will be difficult to sustain as the company is focusing on growth
acceleration. Thereby, earnings trajectory will be moderate. We maintain our
EPS estimates for FY23/24. We value Emami at 25x P/E on Dec-23E EPS to
derive a TP of INR 500. Maintain REDUCE.
Slight miss on revenue: Net revenue grew by 4% YoY (15% in Q3FY21,
+7% in Q2FY21) vs. HSIE 6%. High inflation led to deceleration of consumer
demand. Domestic/international/CSD revenue grew 3/7/16% YoY.
Boroplus/Navratana/pain management grew 2/11/7% YoY (+10/0/+10% two
year CAGR), while male grooming/healthcare declined 3/6% YoY (+1/+14%
two year CAGR). The company continued its strong traction in MT (+14%
YoY) and ecommerce (+75% YoY), with the salience of these channels at 14%
of domestic revenue. The international business grew 7% YoY (16% two-
year CAGR), mainly driven by Bangladesh.
Miss on margin, stable outlook: GM dipped by 299bps YoY (+214bps in
Q3FY21, -150bps in Q2FY22) to 67.4% (HSIE 68.5%). Employee, advertising,
other expenses grew by -6/2/-2% YoY. EBITDA margin contracted by 129bps
YoY (+395bps in Q3FY21, +15bps in Q2FY22). EBITDA remained flat YoY
(HSIE -2%). We believe the company will exercise prudence in their ad
budget allocations in the near future. We model in EBITDA margin close to
31% for FY22-24 (27/26% in FY19/20).
Con call and press release takeaways: (1) BoD has approved share buy-back
for amount not exceeding INR 1.6bn at a price not exceeding INR 550/share.
(2) The company is offering e-com products aligned with the customer’s
wants and latest trends. (3) The company had introduced sugar free
offerings for Chyawanprash which has helped it gain market share. (4) It
does not see any competitive pressure in Bangladesh (cooling hair oil
launched by Marico). (5) Male grooming industry degrew 40% during the
pandemic due to low mobility; as things improve, the company will be
aggressive in this space.
Quarterly/annual financial summary
YE Mar (INR mn) Q3
FY22
Q3
FY21
YoY
(%)
Q2
FY22
QoQ
(%) FY21 FY22E FY23E FY24E
Net Sales 9,719 9,336 4.1 7,888 23.2 28,805 32,221 34,947 38,131
EBITDA 3,415 3,402 0.4 2,772 23.2 8,831 9,918 10,745 11,983
APAT 2,689 2,588 3.9 2,348 14.5 6,680 7,705 8,179 9,321
Diluted EPS (INR) 6.05 5.82 3.9 5.28 14.5 15.0 17.3 18.4 21.0
P/E (x) 33.1 28.7 27.1 23.7
EV / EBITDA (x)
24.7 21.6 19.6 17.3
RoCE (%)
34.6 50.3 60.8 66.5
Source: Company, HSIE Research
REDUCE
CMP (as on 3 Feb 2022) INR 498
Target Price INR 500
NIFTY 17,560
KEY
CHANGES OLD NEW
Rating REDUCE REDUCE
Price Target INR 500 INR 500
EPS % FY22E FY23E
+2% 0%
KEY STOCK DATA
Bloomberg code HMN IN
No. of Shares (mn) 445
MCap (INR bn) / ($ mn) 221/2,974
6m avg traded value (INR mn) 348
52 Week high / low INR 622/443
STOCK PERFORMANCE (%)
3M 6M 12M
Absolute (%) (12.1) (11.7) 2.4
Relative (%) (10.4) (20.9) (14.6)
SHAREHOLDING PATTERN (%)
Sep-21 Dec-21
Promoters 53.86 53.86
FIs & Local MFs 24.17 25.49
FPIs 12.71 12.52
Public & Others 9.26 8.13
Pledged Shares 16.91 15.69
Source : BSE
Pledged shares as % of total shares
Naveen Trivedi
+91-22-6171-7324
Varun Lohchab
+91-22-6171-7334
Saras Singh
+91-22-6171-7336
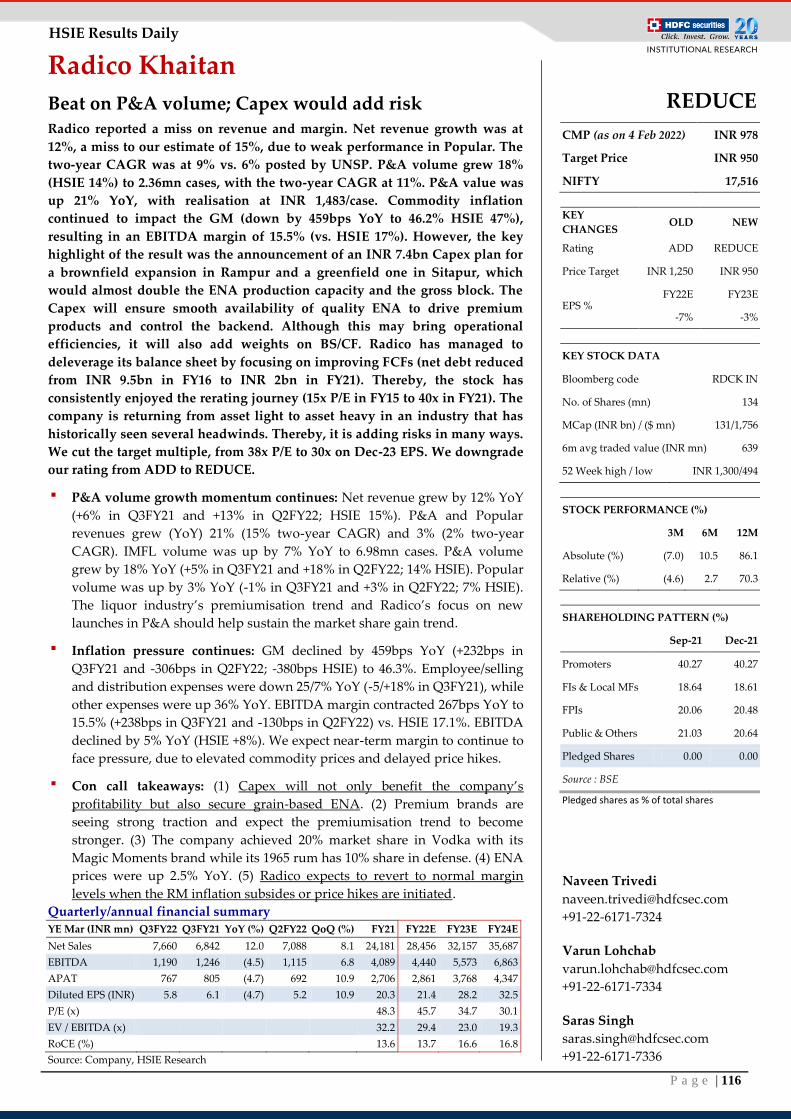
P a g e | 116
HSIE Results Daily
Radico Khaitan
Beat on P&A volume; Capex would add risk Radico reported a miss on revenue and margin. Net revenue growth was at
12%, a miss to our estimate of 15%, due to weak performance in Popular. The
two-year CAGR was at 9% vs. 6% posted by UNSP. P&A volume grew 18%
(HSIE 14%) to 2.36mn cases, with the two-year CAGR at 11%. P&A value was
up 21% YoY, with realisation at INR 1,483/case. Commodity inflation
continued to impact the GM (down by 459bps YoY to 46.2% HSIE 47%),
resulting in an EBITDA margin of 15.5% (vs. HSIE 17%). However, the key
highlight of the result was the announcement of an INR 7.4bn Capex plan for
a brownfield expansion in Rampur and a greenfield one in Sitapur, which
would almost double the ENA production capacity and the gross block. The
Capex will ensure smooth availability of quality ENA to drive premium
products and control the backend. Although this may bring operational
efficiencies, it will also add weights on BS/CF. Radico has managed to
deleverage its balance sheet by focusing on improving FCFs (net debt reduced
from INR 9.5bn in FY16 to INR 2bn in FY21). Thereby, the stock has
consistently enjoyed the rerating journey (15x P/E in FY15 to 40x in FY21). The
company is returning from asset light to asset heavy in an industry that has
historically seen several headwinds. Thereby, it is adding risks in many ways.
We cut the target multiple, from 38x P/E to 30x on Dec-23 EPS. We downgrade
our rating from ADD to REDUCE.
▪ P&A volume growth momentum continues: Net revenue grew by 12% YoY
(+6% in Q3FY21 and +13% in Q2FY22; HSIE 15%). P&A and Popular
revenues grew (YoY) 21% (15% two-year CAGR) and 3% (2% two-year
CAGR). IMFL volume was up by 7% YoY to 6.98mn cases. P&A volume
grew by 18% YoY (+5% in Q3FY21 and +18% in Q2FY22; 14% HSIE). Popular
volume was up by 3% YoY (-1% in Q3FY21 and +3% in Q2FY22; 7% HSIE).
The liquor industry’s premiumisation trend and Radico’s focus on new
launches in P&A should help sustain the market share gain trend.
▪ Inflation pressure continues: GM declined by 459bps YoY (+232bps in
Q3FY21 and -306bps in Q2FY22; -380bps HSIE) to 46.3%. Employee/selling
and distribution expenses were down 25/7% YoY (-5/+18% in Q3FY21), while
other expenses were up 36% YoY. EBITDA margin contracted 267bps YoY to
15.5% (+238bps in Q3FY21 and -130bps in Q2FY22) vs. HSIE 17.1%. EBITDA
declined by 5% YoY (HSIE +8%). We expect near-term margin to continue to
face pressure, due to elevated commodity prices and delayed price hikes.
▪ Con call takeaways: (1) Capex will not only benefit the company’s
profitability but also secure grain-based ENA. (2) Premium brands are
seeing strong traction and expect the premiumisation trend to become
stronger. (3) The company achieved 20% market share in Vodka with its
Magic Moments brand while its 1965 rum has 10% share in defense. (4) ENA
prices were up 2.5% YoY. (5) Radico expects to revert to normal margin
levels when the RM inflation subsides or price hikes are initiated.
Quarterly/annual financial summary YE Mar (INR mn) Q3FY22 Q3FY21 YoY (%) Q2FY22 QoQ (%) FY21 FY22E FY23E FY24E
Net Sales 7,660 6,842 12.0 7,088 8.1 24,181 28,456 32,157 35,687
EBITDA 1,190 1,246 (4.5) 1,115 6.8 4,089 4,440 5,573 6,863
APAT 767 805 (4.7) 692 10.9 2,706 2,861 3,768 4,347
Diluted EPS (INR) 5.8 6.1 (4.7) 5.2 10.9 20.3 21.4 28.2 32.5
P/E (x) 48.3 45.7 34.7 30.1
EV / EBITDA (x)
32.2 29.4 23.0 19.3
RoCE (%)
13.6 13.7 16.6 16.8
Source: Company, HSIE Research
REDUCE
CMP (as on 4 Feb 2022) INR 978
Target Price INR 950
NIFTY 17,516
KEY
CHANGES OLD NEW
Rating ADD REDUCE
Price Target INR 1,250 INR 950
EPS % FY22E FY23E
-7% -3%
KEY STOCK DATA
Bloomberg code RDCK IN
No. of Shares (mn) 134
MCap (INR bn) / ($ mn) 131/1,756
6m avg traded value (INR mn) 639
52 Week high / low INR 1,300/494
STOCK PERFORMANCE (%)
3M 6M 12M
Absolute (%) (7.0) 10.5 86.1
Relative (%) (4.6) 2.7 70.3
SHAREHOLDING PATTERN (%)
Sep-21 Dec-21
Promoters 40.27 40.27
FIs & Local MFs 18.64 18.61
FPIs 20.06 20.48
Public & Others 21.03 20.64
Pledged Shares 0.00 0.00
Source : BSE
Pledged shares as % of total shares
Naveen Trivedi
+91-22-6171-7324
Varun Lohchab
+91-22-6171-7334
Saras Singh
+91-22-6171-7336
P a g e | 117
HSIE Results Daily
Infra, Construction
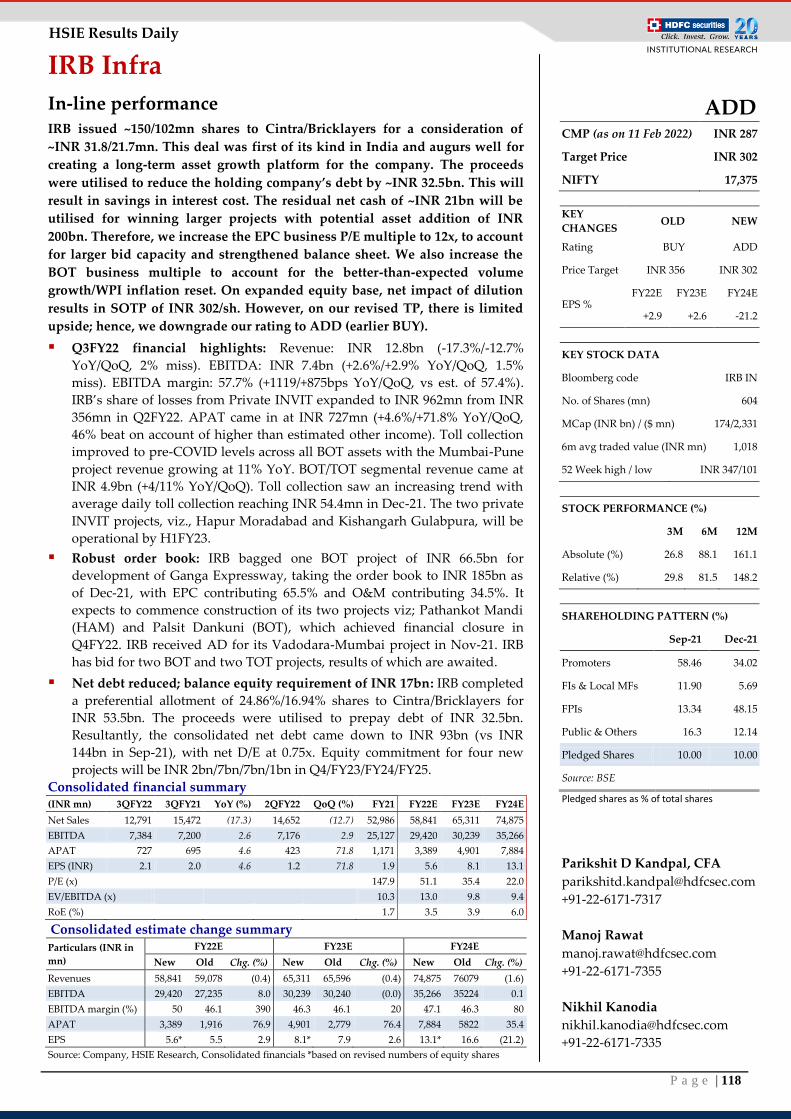
P a g e | 118
HSIE Results Daily
IRB Infra
In-line performance IRB issued ~150/102mn shares to Cintra/Bricklayers for a consideration of
~INR 31.8/21.7mn. This deal was first of its kind in India and augurs well for
creating a long-term asset growth platform for the company. The proceeds
were utilised to reduce the holding company’s debt by ~INR 32.5bn. This will
result in savings in interest cost. The residual net cash of ~INR 21bn will be
utilised for winning larger projects with potential asset addition of INR
200bn. Therefore, we increase the EPC business P/E multiple to 12x, to account
for larger bid capacity and strengthened balance sheet. We also increase the
BOT business multiple to account for the better-than-expected volume
growth/WPI inflation reset. On expanded equity base, net impact of dilution
results in SOTP of INR 302/sh. However, on our revised TP, there is limited
upside; hence, we downgrade our rating to ADD (earlier BUY).
Q3FY22 financial highlights: Revenue: INR 12.8bn (-17.3%/-12.7%
YoY/QoQ, 2% miss). EBITDA: INR 7.4bn (+2.6%/+2.9% YoY/QoQ, 1.5%
miss). EBITDA margin: 57.7% (+1119/+875bps YoY/QoQ, vs est. of 57.4%).
IRB’s share of losses from Private INVIT expanded to INR 962mn from INR
356mn in Q2FY22. APAT came in at INR 727mn (+4.6%/+71.8% YoY/QoQ,
46% beat on account of higher than estimated other income). Toll collection
improved to pre-COVID levels across all BOT assets with the Mumbai-Pune
project revenue growing at 11% YoY. BOT/TOT segmental revenue came at
INR 4.9bn (+4/11% YoY/QoQ). Toll collection saw an increasing trend with
average daily toll collection reaching INR 54.4mn in Dec-21. The two private
INVIT projects, viz., Hapur Moradabad and Kishangarh Gulabpura, will be
operational by H1FY23.
Robust order book: IRB bagged one BOT project of INR 66.5bn for
development of Ganga Expressway, taking the order book to INR 185bn as
of Dec-21, with EPC contributing 65.5% and O&M contributing 34.5%. It
expects to commence construction of its two projects viz; Pathankot Mandi
(HAM) and Palsit Dankuni (BOT), which achieved financial closure in
Q4FY22. IRB received AD for its Vadodara-Mumbai project in Nov-21. IRB
has bid for two BOT and two TOT projects, results of which are awaited.
Net debt reduced; balance equity requirement of INR 17bn: IRB completed
a preferential allotment of 24.86%/16.94% shares to Cintra/Bricklayers for
INR 53.5bn. The proceeds were utilised to prepay debt of INR 32.5bn.
Resultantly, the consolidated net debt came down to INR 93bn (vs INR
144bn in Sep-21), with net D/E at 0.75x. Equity commitment for four new
projects will be INR 2bn/7bn/7bn/1bn in Q4/FY23/FY24/FY25.
Consolidated financial summary (INR mn) 3QFY22 3QFY21 YoY (%) 2QFY22 QoQ (%) FY21 FY22E FY23E FY24E
Net Sales 12,791 15,472 (17.3) 14,652 (12.7) 52,986 58,841 65,311 74,875
EBITDA 7,384 7,200 2.6 7,176 2.9 25,127 29,420 30,239 35,266
APAT 727 695 4.6 423 71.8 1,171 3,389 4,901 7,884
EPS (INR) 2.1 2.0 4.6 1.2 71.8 1.9 5.6 8.1 13.1
P/E (x)
147.9 51.1 35.4 22.0
EV/EBITDA (x)
10.3 13.0 9.8 9.4
RoE (%)
1.7 3.5 3.9 6.0
Consolidated estimate change summary
Particulars (INR in
mn)
FY22E FY23E FY24E
New Old Chg. (%) New Old Chg. (%) New Old Chg. (%)
Revenues 58,841 59,078 (0.4) 65,311 65,596 (0.4) 74,875 76079 (1.6)
EBITDA 29,420 27,235 8.0 30,239 30,240 (0.0) 35,266 35224 0.1
EBITDA margin (%) 50 46.1 390 46.3 46.1 20 47.1 46.3 80
APAT 3,389 1,916 76.9 4,901 2,779 76.4 7,884 5822 35.4
EPS 5.6* 5.5 2.9 8.1* 7.9 2.6 13.1* 16.6 (21.2)
Source: Company, HSIE Research, Consolidated financials *based on revised numbers of equity shares
ADD CMP (as on 11 Feb 2022) INR 287
Target Price INR 302
NIFTY 17,375
KEY
CHANGES OLD NEW
Rating BUY ADD
Price Target INR 356 INR 302
EPS % FY22E FY23E FY24E
+2.9 +2.6 -21.2
KEY STOCK DATA
Bloomberg code IRB IN
No. of Shares (mn) 604
MCap (INR bn) / ($ mn) 174/2,331
6m avg traded value (INR mn) 1,018
52 Week high / low INR 347/101
STOCK PERFORMANCE (%)
3M 6M 12M
Absolute (%) 26.8 88.1 161.1
Relative (%) 29.8 81.5 148.2
SHAREHOLDING PATTERN (%)
Sep-21 Dec-21
Promoters 58.46 34.02
FIs & Local MFs 11.90 5.69
FPIs 13.34 48.15
Public & Others 16.3 12.14
Pledged Shares 10.00 10.00
Source: BSE
Pledged shares as % of total shares
Parikshit D Kandpal, CFA
+91-22-6171-7317
Manoj Rawat
+91-22-6171-7355
Nikhil Kanodia
+91-22-6171-7335
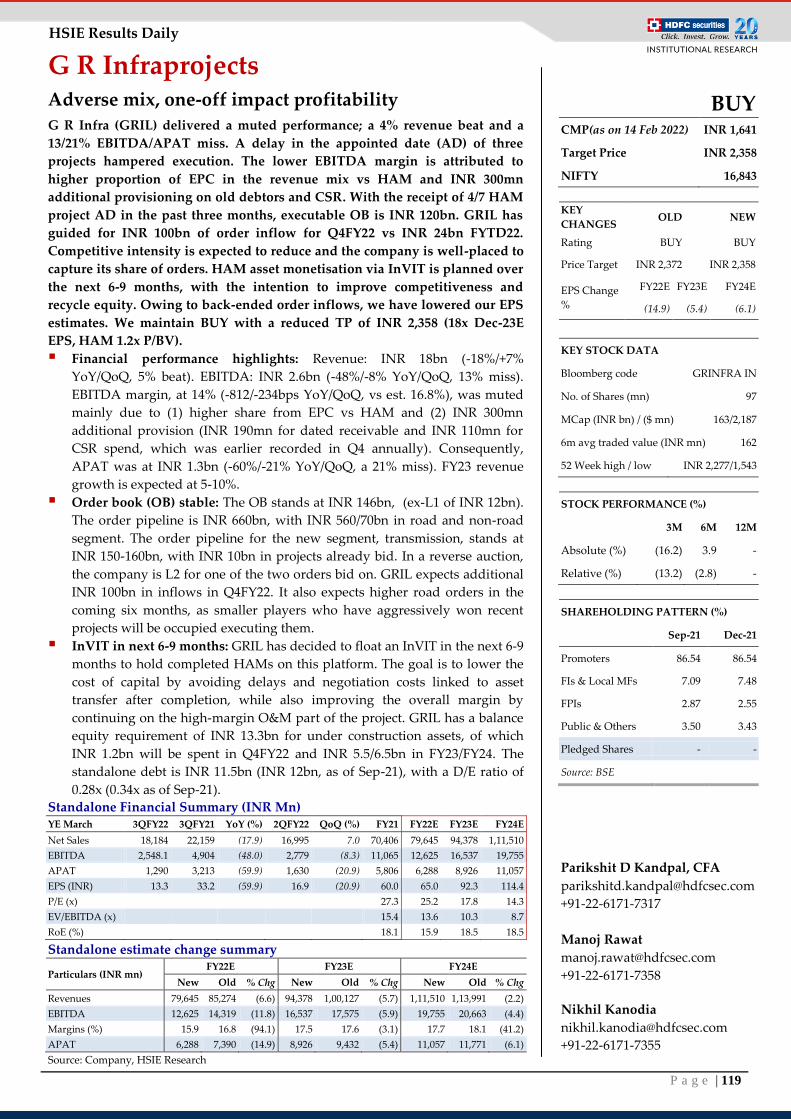
P a g e | 119
HSIE Results Daily
G R Infraprojects Adverse mix, one-off impact profitability
G R Infra (GRIL) delivered a muted performance; a 4% revenue beat and a
13/21% EBITDA/APAT miss. A delay in the appointed date (AD) of three
projects hampered execution. The lower EBITDA margin is attributed to
higher proportion of EPC in the revenue mix vs HAM and INR 300mn
additional provisioning on old debtors and CSR. With the receipt of 4/7 HAM
project AD in the past three months, executable OB is INR 120bn. GRIL has
guided for INR 100bn of order inflow for Q4FY22 vs INR 24bn FYTD22.
Competitive intensity is expected to reduce and the company is well-placed to
capture its share of orders. HAM asset monetisation via InVIT is planned over
the next 6-9 months, with the intention to improve competitiveness and
recycle equity. Owing to back-ended order inflows, we have lowered our EPS
estimates. We maintain BUY with a reduced TP of INR 2,358 (18x Dec-23E
EPS, HAM 1.2x P/BV).
Financial performance highlights: Revenue: INR 18bn (-18%/+7%
YoY/QoQ, 5% beat). EBITDA: INR 2.6bn (-48%/-8% YoY/QoQ, 13% miss).
EBITDA margin, at 14% (-812/-234bps YoY/QoQ, vs est. 16.8%), was muted
mainly due to (1) higher share from EPC vs HAM and (2) INR 300mn
additional provision (INR 190mn for dated receivable and INR 110mn for
CSR spend, which was earlier recorded in Q4 annually). Consequently,
APAT was at INR 1.3bn (-60%/-21% YoY/QoQ, a 21% miss). FY23 revenue
growth is expected at 5-10%.
Order book (OB) stable: The OB stands at INR 146bn, (ex-L1 of INR 12bn).
The order pipeline is INR 660bn, with INR 560/70bn in road and non-road
segment. The order pipeline for the new segment, transmission, stands at
INR 150-160bn, with INR 10bn in projects already bid. In a reverse auction,
the company is L2 for one of the two orders bid on. GRIL expects additional
INR 100bn in inflows in Q4FY22. It also expects higher road orders in the
coming six months, as smaller players who have aggressively won recent
projects will be occupied executing them.
InVIT in next 6-9 months: GRIL has decided to float an InVIT in the next 6-9
months to hold completed HAMs on this platform. The goal is to lower the
cost of capital by avoiding delays and negotiation costs linked to asset
transfer after completion, while also improving the overall margin by
continuing on the high-margin O&M part of the project. GRIL has a balance
equity requirement of INR 13.3bn for under construction assets, of which
INR 1.2bn will be spent in Q4FY22 and INR 5.5/6.5bn in FY23/FY24. The
standalone debt is INR 11.5bn (INR 12bn, as of Sep-21), with a D/E ratio of
0.28x (0.34x as of Sep-21).
Standalone Financial Summary (INR Mn) YE March 3QFY22 3QFY21 YoY (%) 2QFY22 QoQ (%) FY21 FY22E FY23E FY24E
Net Sales 18,184 22,159 (17.9) 16,995 7.0 70,406 79,645 94,378 1,11,510
EBITDA 2,548.1 4,904 (48.0) 2,779 (8.3) 11,065 12,625 16,537 19,755
APAT 1,290 3,213 (59.9) 1,630 (20.9) 5,806 6,288 8,926 11,057
EPS (INR) 13.3 33.2 (59.9) 16.9 (20.9) 60.0 65.0 92.3 114.4
P/E (x)
27.3 25.2 17.8 14.3
EV/EBITDA (x)
15.4 13.6 10.3 8.7
RoE (%)
18.1 15.9 18.5 18.5
Standalone estimate change summary
Particulars (INR mn) FY22E FY23E FY24E
New Old % Chg New Old % Chg New Old % Chg
Revenues 79,645 85,274 (6.6) 94,378 1,00,127 (5.7) 1,11,510 1,13,991 (2.2)
EBITDA 12,625 14,319 (11.8) 16,537 17,575 (5.9) 19,755 20,663 (4.4)
Margins (%) 15.9 16.8 (94.1) 17.5 17.6 (3.1) 17.7 18.1 (41.2)
APAT 6,288 7,390 (14.9) 8,926 9,432 (5.4) 11,057 11,771 (6.1)
Source: Company, HSIE Research
BUY CMP(as on 14 Feb 2022) INR 1,641
Target Price INR 2,358
NIFTY 16,843
KEY
CHANGES OLD NEW
Rating BUY BUY
Price Target INR 2,372 INR 2,358
EPS Change
%
FY22E FY23E FY24E
(14.9) (5.4) (6.1)
KEY STOCK DATA
Bloomberg code GRINFRA IN
No. of Shares (mn) 97
MCap (INR bn) / ($ mn) 163/2,187
6m avg traded value (INR mn) 162
52 Week high / low INR 2,277/1,543
STOCK PERFORMANCE (%)
3M 6M 12M
Absolute (%) (16.2) 3.9 -
Relative (%) (13.2) (2.8) -
SHAREHOLDING PATTERN (%)
Sep-21 Dec-21
Promoters 86.54 86.54
FIs & Local MFs 7.09 7.48
FPIs 2.87 2.55
Public & Others 3.50 3.43
Pledged Shares - -
Source: BSE
Parikshit D Kandpal, CFA
+91-22-6171-7317
Manoj Rawat
+91-22-6171-7358
Nikhil Kanodia
+91-22-6171-7355
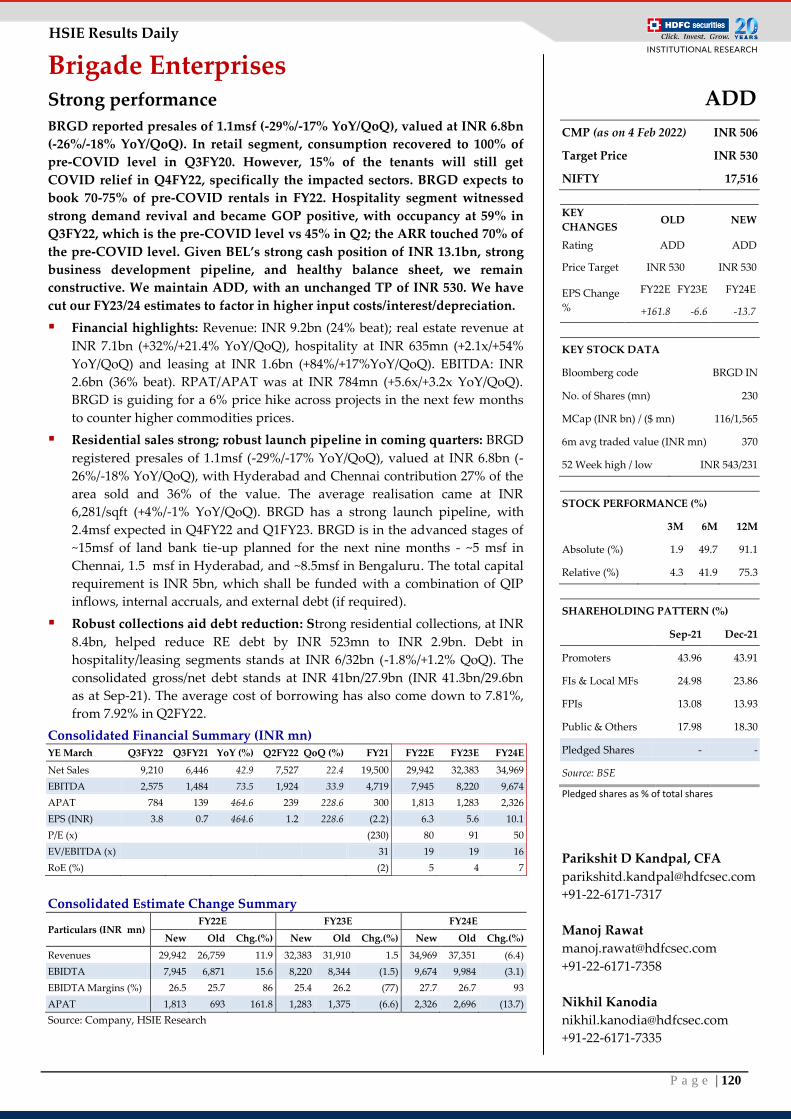
P a g e | 120
HSIE Results Daily
Brigade Enterprises Strong performance
BRGD reported presales of 1.1msf (-29%/-17% YoY/QoQ), valued at INR 6.8bn
(-26%/-18% YoY/QoQ). In retail segment, consumption recovered to 100% of
pre-COVID level in Q3FY20. However, 15% of the tenants will still get
COVID relief in Q4FY22, specifically the impacted sectors. BRGD expects to
book 70-75% of pre-COVID rentals in FY22. Hospitality segment witnessed
strong demand revival and became GOP positive, with occupancy at 59% in
Q3FY22, which is the pre-COVID level vs 45% in Q2; the ARR touched 70% of
the pre-COVID level. Given BEL’s strong cash position of INR 13.1bn, strong
business development pipeline, and healthy balance sheet, we remain
constructive. We maintain ADD, with an unchanged TP of INR 530. We have
cut our FY23/24 estimates to factor in higher input costs/interest/depreciation.
Financial highlights: Revenue: INR 9.2bn (24% beat); real estate revenue at
INR 7.1bn (+32%/+21.4% YoY/QoQ), hospitality at INR 635mn (+2.1x/+54%
YoY/QoQ) and leasing at INR 1.6bn (+84%/+17%YoY/QoQ). EBITDA: INR
2.6bn (36% beat). RPAT/APAT was at INR 784mn (+5.6x/+3.2x YoY/QoQ).
BRGD is guiding for a 6% price hike across projects in the next few months
to counter higher commodities prices.
Residential sales strong; robust launch pipeline in coming quarters: BRGD
registered presales of 1.1msf (-29%/-17% YoY/QoQ), valued at INR 6.8bn (-
26%/-18% YoY/QoQ), with Hyderabad and Chennai contribution 27% of the
area sold and 36% of the value. The average realisation came at INR
6,281/sqft (+4%/-1% YoY/QoQ). BRGD has a strong launch pipeline, with
2.4msf expected in Q4FY22 and Q1FY23. BRGD is in the advanced stages of
~15msf of land bank tie-up planned for the next nine months - ~5 msf in
Chennai, 1.5 msf in Hyderabad, and ~8.5msf in Bengaluru. The total capital
requirement is INR 5bn, which shall be funded with a combination of QIP
inflows, internal accruals, and external debt (if required).
Robust collections aid debt reduction: Strong residential collections, at INR
8.4bn, helped reduce RE debt by INR 523mn to INR 2.9bn. Debt in
hospitality/leasing segments stands at INR 6/32bn (-1.8%/+1.2% QoQ). The
consolidated gross/net debt stands at INR 41bn/27.9bn (INR 41.3bn/29.6bn
as at Sep-21). The average cost of borrowing has also come down to 7.81%,
from 7.92% in Q2FY22.
Consolidated Financial Summary (INR mn) YE March Q3FY22 Q3FY21 YoY (%) Q2FY22 QoQ (%) FY21 FY22E FY23E FY24E
Net Sales 9,210 6,446 42.9 7,527 22.4 19,500 29,942 32,383 34,969
EBITDA 2,575 1,484 73.5 1,924 33.9 4,719 7,945 8,220 9,674
APAT 784 139 464.6 239 228.6 300 1,813 1,283 2,326
EPS (INR) 3.8 0.7 464.6 1.2 228.6 (2.2) 6.3 5.6 10.1
P/E (x)
(230) 80 91 50
EV/EBITDA (x)
31 19 19 16
RoE (%)
(2) 5 4 7
Consolidated Estimate Change Summary
Particulars (INR mn) FY22E FY23E FY24E
New Old Chg.(%) New Old Chg.(%) New Old Chg.(%)
Revenues 29,942 26,759 11.9 32,383 31,910 1.5 34,969 37,351 (6.4)
EBIDTA 7,945 6,871 15.6 8,220 8,344 (1.5) 9,674 9,984 (3.1)
EBIDTA Margins (%) 26.5 25.7 86 25.4 26.2 (77) 27.7 26.7 93
APAT 1,813 693 161.8 1,283 1,375 (6.6) 2,326 2,696 (13.7)
Source: Company, HSIE Research
ADD
CMP (as on 4 Feb 2022) INR 506
Target Price INR 530
NIFTY 17,516
KEY
CHANGES OLD NEW
Rating ADD ADD
Price Target INR 530 INR 530
EPS Change
%
FY22E FY23E FY24E
+161.8 -6.6 -13.7
KEY STOCK DATA
Bloomberg code BRGD IN
No. of Shares (mn) 230
MCap (INR bn) / ($ mn) 116/1,565
6m avg traded value (INR mn) 370
52 Week high / low INR 543/231
STOCK PERFORMANCE (%)
3M 6M 12M
Absolute (%) 1.9 49.7 91.1
Relative (%) 4.3 41.9 75.3
SHAREHOLDING PATTERN (%)
Sep-21 Dec-21
Promoters 43.96 43.91
FIs & Local MFs 24.98 23.86
FPIs 13.08 13.93
Public & Others 17.98 18.30
Pledged Shares - -
Source: BSE
Pledged shares as % of total shares
Parikshit D Kandpal, CFA
+91-22-6171-7317
Manoj Rawat
+91-22-6171-7358
Nikhil Kanodia
+91-22-6171-7335
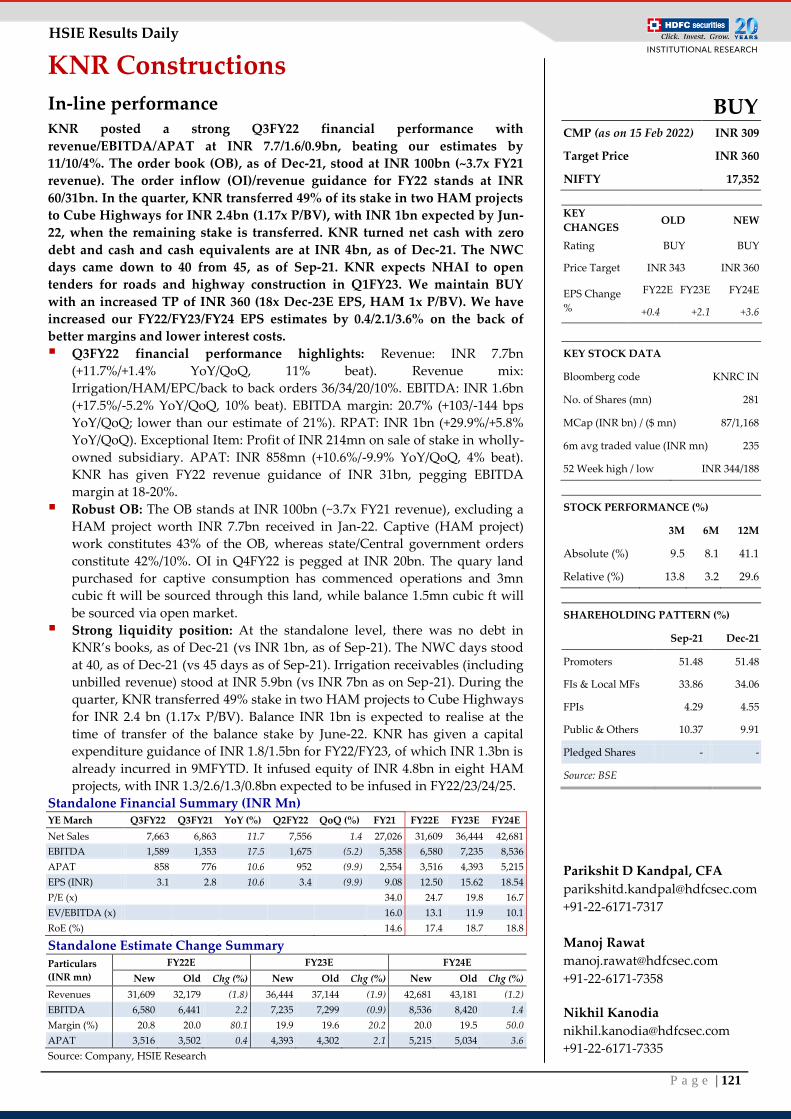
P a g e | 121
HSIE Results Daily
KNR Constructions
In-line performance KNR posted a strong Q3FY22 financial performance with
revenue/EBITDA/APAT at INR 7.7/1.6/0.9bn, beating our estimates by
11/10/4%. The order book (OB), as of Dec-21, stood at INR 100bn (~3.7x FY21
revenue). The order inflow (OI)/revenue guidance for FY22 stands at INR
60/31bn. In the quarter, KNR transferred 49% of its stake in two HAM projects
to Cube Highways for INR 2.4bn (1.17x P/BV), with INR 1bn expected by Jun-
22, when the remaining stake is transferred. KNR turned net cash with zero
debt and cash and cash equivalents are at INR 4bn, as of Dec-21. The NWC
days came down to 40 from 45, as of Sep-21. KNR expects NHAI to open
tenders for roads and highway construction in Q1FY23. We maintain BUY
with an increased TP of INR 360 (18x Dec-23E EPS, HAM 1x P/BV). We have
increased our FY22/FY23/FY24 EPS estimates by 0.4/2.1/3.6% on the back of
better margins and lower interest costs.
Q3FY22 financial performance highlights: Revenue: INR 7.7bn
(+11.7%/+1.4% YoY/QoQ, 11% beat). Revenue mix:
Irrigation/HAM/EPC/back to back orders 36/34/20/10%. EBITDA: INR 1.6bn
(+17.5%/-5.2% YoY/QoQ, 10% beat). EBITDA margin: 20.7% (+103/-144 bps
YoY/QoQ; lower than our estimate of 21%). RPAT: INR 1bn (+29.9%/+5.8%
YoY/QoQ). Exceptional Item: Profit of INR 214mn on sale of stake in wholly-
owned subsidiary. APAT: INR 858mn (+10.6%/-9.9% YoY/QoQ, 4% beat).
KNR has given FY22 revenue guidance of INR 31bn, pegging EBITDA
margin at 18-20%.
Robust OB: The OB stands at INR 100bn (~3.7x FY21 revenue), excluding a
HAM project worth INR 7.7bn received in Jan-22. Captive (HAM project)
work constitutes 43% of the OB, whereas state/Central government orders
constitute 42%/10%. OI in Q4FY22 is pegged at INR 20bn. The quary land
purchased for captive consumption has commenced operations and 3mn
cubic ft will be sourced through this land, while balance 1.5mn cubic ft will
be sourced via open market.
Strong liquidity position: At the standalone level, there was no debt in
KNR’s books, as of Dec-21 (vs INR 1bn, as of Sep-21). The NWC days stood
at 40, as of Dec-21 (vs 45 days as of Sep-21). Irrigation receivables (including
unbilled revenue) stood at INR 5.9bn (vs INR 7bn as on Sep-21). During the
quarter, KNR transferred 49% stake in two HAM projects to Cube Highways
for INR 2.4 bn (1.17x P/BV). Balance INR 1bn is expected to realise at the
time of transfer of the balance stake by June-22. KNR has given a capital
expenditure guidance of INR 1.8/1.5bn for FY22/FY23, of which INR 1.3bn is
already incurred in 9MFYTD. It infused equity of INR 4.8bn in eight HAM
projects, with INR 1.3/2.6/1.3/0.8bn expected to be infused in FY22/23/24/25.
Standalone Financial Summary (INR Mn) YE March Q3FY22 Q3FY21 YoY (%) Q2FY22 QoQ (%) FY21 FY22E FY23E FY24E
Net Sales 7,663 6,863 11.7 7,556 1.4 27,026 31,609 36,444 42,681
EBITDA 1,589 1,353 17.5 1,675 (5.2) 5,358 6,580 7,235 8,536
APAT 858 776 10.6 952 (9.9) 2,554 3,516 4,393 5,215
EPS (INR) 3.1 2.8 10.6 3.4 (9.9) 9.08 12.50 15.62 18.54
P/E (x)
34.0 24.7 19.8 16.7
EV/EBITDA (x)
16.0 13.1 11.9 10.1
RoE (%)
14.6 17.4 18.7 18.8
Standalone Estimate Change Summary
Particulars
(INR mn)
FY22E FY23E FY24E
New Old Chg (%) New Old Chg (%) New Old Chg (%)
Revenues 31,609 32,179 (1.8) 36,444 37,144 (1.9) 42,681 43,181 (1.2)
EBITDA 6,580 6,441 2.2 7,235 7,299 (0.9) 8,536 8,420 1.4
Margin (%) 20.8 20.0 80.1 19.9 19.6 20.2 20.0 19.5 50.0
APAT 3,516 3,502 0.4 4,393 4,302 2.1 5,215 5,034 3.6
Source: Company, HSIE Research
BUY CMP (as on 15 Feb 2022) INR 309
Target Price INR 360
NIFTY 17,352
KEY
CHANGES OLD NEW
Rating BUY BUY
Price Target INR 343 INR 360
EPS Change
%
FY22E FY23E FY24E
+0.4 +2.1 +3.6
KEY STOCK DATA
Bloomberg code KNRC IN
No. of Shares (mn) 281
MCap (INR bn) / ($ mn) 87/1,168
6m avg traded value (INR mn) 235
52 Week high / low INR 344/188
STOCK PERFORMANCE (%)
3M 6M 12M
Absolute (%) 9.5 8.1 41.1
Relative (%) 13.8 3.2 29.6
SHAREHOLDING PATTERN (%)
Sep-21 Dec-21
Promoters 51.48 51.48
FIs & Local MFs 33.86 34.06
FPIs 4.29 4.55
Public & Others 10.37 9.91
Pledged Shares - -
Source: BSE
Parikshit D Kandpal, CFA
+91-22-6171-7317
Manoj Rawat
+91-22-6171-7358
Nikhil Kanodia
+91-22-6171-7335
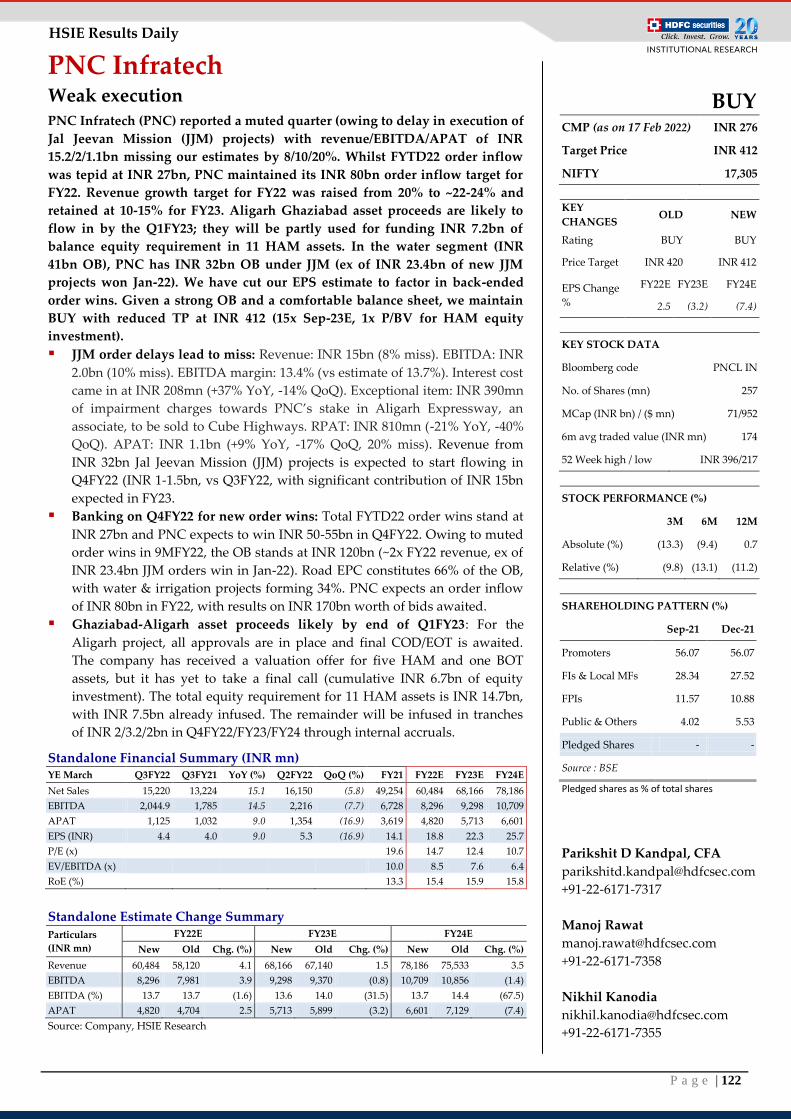
P a g e | 122
HSIE Results Daily
PNC Infratech Weak execution PNC Infratech (PNC) reported a muted quarter (owing to delay in execution of
Jal Jeevan Mission (JJM) projects) with revenue/EBITDA/APAT of INR
15.2/2/1.1bn missing our estimates by 8/10/20%. Whilst FYTD22 order inflow
was tepid at INR 27bn, PNC maintained its INR 80bn order inflow target for
FY22. Revenue growth target for FY22 was raised from 20% to ~22-24% and
retained at 10-15% for FY23. Aligarh Ghaziabad asset proceeds are likely to
flow in by the Q1FY23; they will be partly used for funding INR 7.2bn of
balance equity requirement in 11 HAM assets. In the water segment (INR
41bn OB), PNC has INR 32bn OB under JJM (ex of INR 23.4bn of new JJM
projects won Jan-22). We have cut our EPS estimate to factor in back-ended
order wins. Given a strong OB and a comfortable balance sheet, we maintain
BUY with reduced TP at INR 412 (15x Sep-23E, 1x P/BV for HAM equity
investment).
JJM order delays lead to miss: Revenue: INR 15bn (8% miss). EBITDA: INR
2.0bn (10% miss). EBITDA margin: 13.4% (vs estimate of 13.7%). Interest cost
came in at INR 208mn (+37% YoY, -14% QoQ). Exceptional item: INR 390mn
of impairment charges towards PNC’s stake in Aligarh Expressway, an
associate, to be sold to Cube Highways. RPAT: INR 810mn (-21% YoY, -40%
QoQ). APAT: INR 1.1bn (+9% YoY, -17% QoQ, 20% miss). Revenue from
INR 32bn Jal Jeevan Mission (JJM) projects is expected to start flowing in
Q4FY22 (INR 1-1.5bn, vs Q3FY22, with significant contribution of INR 15bn
expected in FY23.
Banking on Q4FY22 for new order wins: Total FYTD22 order wins stand at
INR 27bn and PNC expects to win INR 50-55bn in Q4FY22. Owing to muted
order wins in 9MFY22, the OB stands at INR 120bn (~2x FY22 revenue, ex of
INR 23.4bn JJM orders win in Jan-22). Road EPC constitutes 66% of the OB,
with water & irrigation projects forming 34%. PNC expects an order inflow
of INR 80bn in FY22, with results on INR 170bn worth of bids awaited.
Ghaziabad-Aligarh asset proceeds likely by end of Q1FY23: For the
Aligarh project, all approvals are in place and final COD/EOT is awaited.
The company has received a valuation offer for five HAM and one BOT
assets, but it has yet to take a final call (cumulative INR 6.7bn of equity
investment). The total equity requirement for 11 HAM assets is INR 14.7bn,
with INR 7.5bn already infused. The remainder will be infused in tranches
of INR 2/3.2/2bn in Q4FY22/FY23/FY24 through internal accruals.
Standalone Financial Summary (INR mn) YE March Q3FY22 Q3FY21 YoY (%) Q2FY22 QoQ (%) FY21 FY22E FY23E FY24E
Net Sales 15,220 13,224 15.1 16,150 (5.8) 49,254 60,484 68,166 78,186
EBITDA 2,044.9 1,785 14.5 2,216 (7.7) 6,728 8,296 9,298 10,709
APAT 1,125 1,032 9.0 1,354 (16.9) 3,619 4,820 5,713 6,601
EPS (INR) 4.4 4.0 9.0 5.3 (16.9) 14.1 18.8 22.3 25.7
P/E (x)
19.6 14.7 12.4 10.7
EV/EBITDA (x)
10.0 8.5 7.6 6.4
RoE (%)
13.3 15.4 15.9 15.8
Standalone Estimate Change Summary
Particulars
(INR mn)
FY22E FY23E FY24E
New Old Chg. (%) New Old Chg. (%) New Old Chg. (%)
Revenue 60,484 58,120 4.1 68,166 67,140 1.5 78,186 75,533 3.5
EBITDA 8,296 7,981 3.9 9,298 9,370 (0.8) 10,709 10,856 (1.4)
EBITDA (%) 13.7 13.7 (1.6) 13.6 14.0 (31.5) 13.7 14.4 (67.5)
APAT 4,820 4,704 2.5 5,713 5,899 (3.2) 6,601 7,129 (7.4)
Source: Company, HSIE Research
BUY CMP (as on 17 Feb 2022) INR 276
Target Price INR 412
NIFTY 17,305
KEY
CHANGES OLD NEW
Rating BUY BUY
Price Target INR 420 INR 412
EPS Change
%
FY22E FY23E FY24E
2.5 (3.2) (7.4)
KEY STOCK DATA
Bloomberg code PNCL IN
No. of Shares (mn) 257
MCap (INR bn) / ($ mn) 71/952
6m avg traded value (INR mn) 174
52 Week high / low INR 396/217
STOCK PERFORMANCE (%)
3M 6M 12M
Absolute (%) (13.3) (9.4) 0.7
Relative (%) (9.8) (13.1) (11.2)
SHAREHOLDING PATTERN (%)
Sep-21 Dec-21
Promoters 56.07 56.07
FIs & Local MFs 28.34 27.52
FPIs 11.57 10.88
Public & Others 4.02 5.53
Pledged Shares - -
Source : BSE
Pledged shares as % of total shares
Parikshit D Kandpal, CFA
+91-22-6171-7317
Manoj Rawat
+91-22-6171-7358
Nikhil Kanodia
+91-22-6171-7355
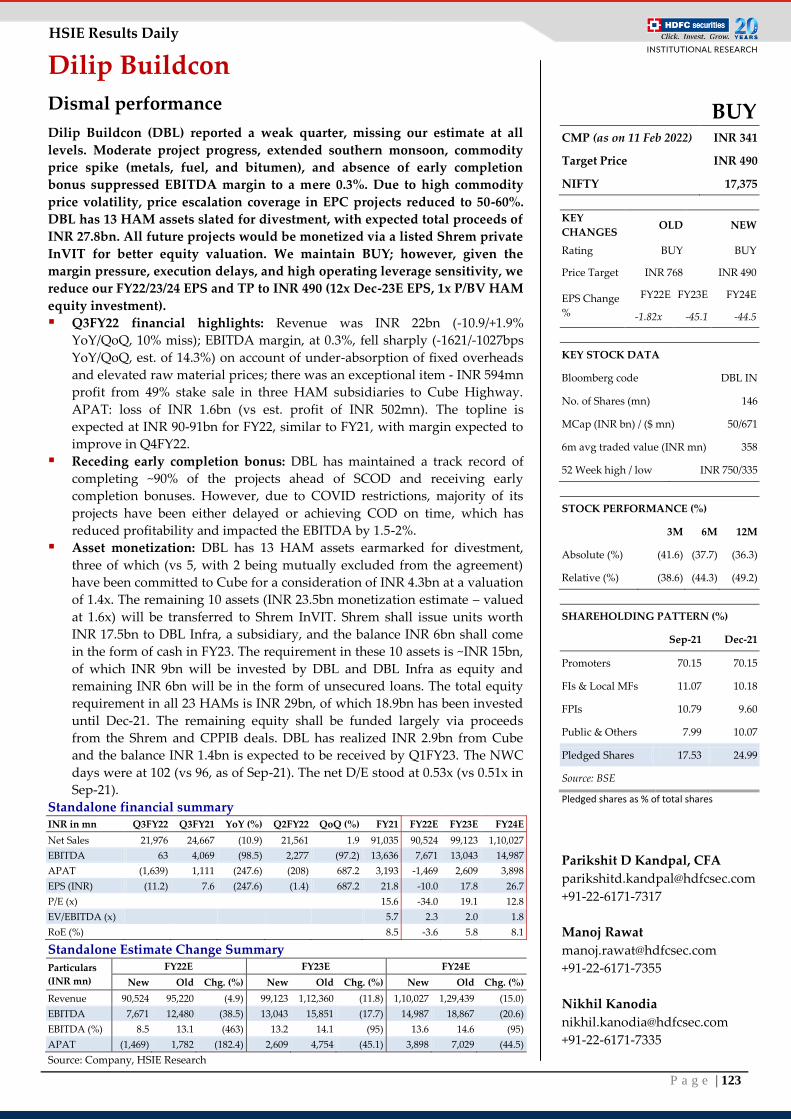
P a g e | 123
HSIE Results Daily
Dilip Buildcon
Dismal performance
Dilip Buildcon (DBL) reported a weak quarter, missing our estimate at all
levels. Moderate project progress, extended southern monsoon, commodity
price spike (metals, fuel, and bitumen), and absence of early completion
bonus suppressed EBITDA margin to a mere 0.3%. Due to high commodity
price volatility, price escalation coverage in EPC projects reduced to 50-60%.
DBL has 13 HAM assets slated for divestment, with expected total proceeds of
INR 27.8bn. All future projects would be monetized via a listed Shrem private
InVIT for better equity valuation. We maintain BUY; however, given the
margin pressure, execution delays, and high operating leverage sensitivity, we
reduce our FY22/23/24 EPS and TP to INR 490 (12x Dec-23E EPS, 1x P/BV HAM
equity investment).
Q3FY22 financial highlights: Revenue was INR 22bn (-10.9/+1.9%
YoY/QoQ, 10% miss); EBITDA margin, at 0.3%, fell sharply (-1621/-1027bps
YoY/QoQ, est. of 14.3%) on account of under-absorption of fixed overheads
and elevated raw material prices; there was an exceptional item - INR 594mn
profit from 49% stake sale in three HAM subsidiaries to Cube Highway.
APAT: loss of INR 1.6bn (vs est. profit of INR 502mn). The topline is
expected at INR 90-91bn for FY22, similar to FY21, with margin expected to
improve in Q4FY22.
Receding early completion bonus: DBL has maintained a track record of
completing ~90% of the projects ahead of SCOD and receiving early
completion bonuses. However, due to COVID restrictions, majority of its
projects have been either delayed or achieving COD on time, which has
reduced profitability and impacted the EBITDA by 1.5-2%.
Asset monetization: DBL has 13 HAM assets earmarked for divestment,
three of which (vs 5, with 2 being mutually excluded from the agreement)
have been committed to Cube for a consideration of INR 4.3bn at a valuation
of 1.4x. The remaining 10 assets (INR 23.5bn monetization estimate – valued
at 1.6x) will be transferred to Shrem InVIT. Shrem shall issue units worth
INR 17.5bn to DBL Infra, a subsidiary, and the balance INR 6bn shall come
in the form of cash in FY23. The requirement in these 10 assets is ~INR 15bn,
of which INR 9bn will be invested by DBL and DBL Infra as equity and
remaining INR 6bn will be in the form of unsecured loans. The total equity
requirement in all 23 HAMs is INR 29bn, of which 18.9bn has been invested
until Dec-21. The remaining equity shall be funded largely via proceeds
from the Shrem and CPPIB deals. DBL has realized INR 2.9bn from Cube
and the balance INR 1.4bn is expected to be received by Q1FY23. The NWC
days were at 102 (vs 96, as of Sep-21). The net D/E stood at 0.53x (vs 0.51x in
Sep-21).
Standalone financial summary INR in mn Q3FY22 Q3FY21 YoY (%) Q2FY22 QoQ (%) FY21 FY22E FY23E FY24E
Net Sales 21,976 24,667 (10.9) 21,561 1.9 91,035 90,524 99,123 1,10,027
EBITDA 63 4,069 (98.5) 2,277 (97.2) 13,636 7,671 13,043 14,987
APAT (1,639) 1,111 (247.6) (208) 687.2 3,193 -1,469 2,609 3,898
EPS (INR) (11.2) 7.6 (247.6) (1.4) 687.2 21.8 -10.0 17.8 26.7
P/E (x)
15.6 -34.0 19.1 12.8
EV/EBITDA (x)
5.7 2.3 2.0 1.8
RoE (%)
8.5 -3.6 5.8 8.1
Standalone Estimate Change Summary
Particulars
(INR mn)
FY22E FY23E FY24E
New Old Chg. (%) New Old Chg. (%) New Old Chg. (%)
Revenue 90,524 95,220 (4.9) 99,123 1,12,360 (11.8) 1,10,027 1,29,439 (15.0)
EBITDA 7,671 12,480 (38.5) 13,043 15,851 (17.7) 14,987 18,867 (20.6)
EBITDA (%) 8.5 13.1 (463) 13.2 14.1 (95) 13.6 14.6 (95)
APAT (1,469) 1,782 (182.4) 2,609 4,754 (45.1) 3,898 7,029 (44.5)
Source: Company, HSIE Research
BUY CMP (as on 11 Feb 2022) INR 341
Target Price INR 490
NIFTY 17,375
KEY
CHANGES OLD NEW
Rating BUY BUY
Price Target INR 768 INR 490
EPS Change
%
FY22E FY23E FY24E
-1.82x -45.1 -44.5
KEY STOCK DATA
Bloomberg code DBL IN
No. of Shares (mn) 146
MCap (INR bn) / ($ mn) 50/671
6m avg traded value (INR mn) 358
52 Week high / low INR 750/335
STOCK PERFORMANCE (%)
3M 6M 12M
Absolute (%) (41.6) (37.7) (36.3)
Relative (%) (38.6) (44.3) (49.2)
SHAREHOLDING PATTERN (%)
Sep-21 Dec-21
Promoters 70.15 70.15
FIs & Local MFs 11.07 10.18
FPIs 10.79 9.60
Public & Others 7.99 10.07
Pledged Shares 17.53 24.99
Source: BSE
Pledged shares as % of total shares
Parikshit D Kandpal, CFA
+91-22-6171-7317
Manoj Rawat
+91-22-6171-7355
Nikhil Kanodia
+91-22-6171-7335
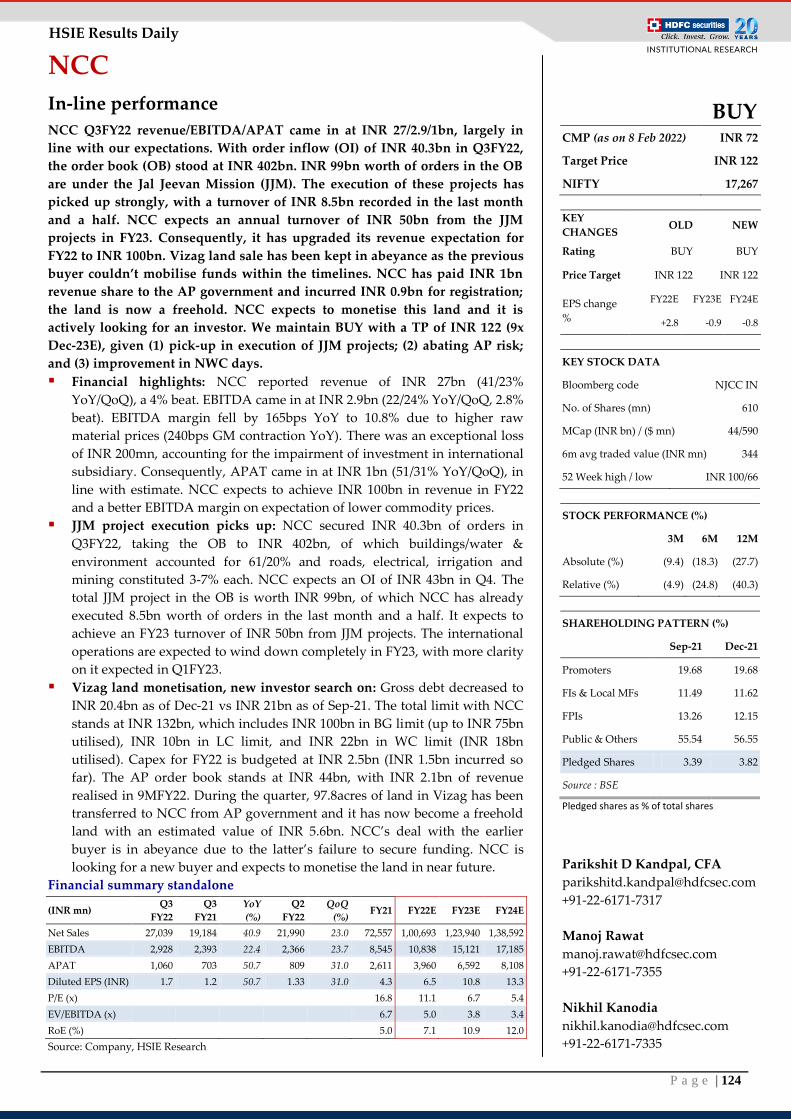
P a g e | 124
HSIE Results Daily
NCC
In-line performance
NCC Q3FY22 revenue/EBITDA/APAT came in at INR 27/2.9/1bn, largely in
line with our expectations. With order inflow (OI) of INR 40.3bn in Q3FY22,
the order book (OB) stood at INR 402bn. INR 99bn worth of orders in the OB
are under the Jal Jeevan Mission (JJM). The execution of these projects has
picked up strongly, with a turnover of INR 8.5bn recorded in the last month
and a half. NCC expects an annual turnover of INR 50bn from the JJM
projects in FY23. Consequently, it has upgraded its revenue expectation for
FY22 to INR 100bn. Vizag land sale has been kept in abeyance as the previous
buyer couldn’t mobilise funds within the timelines. NCC has paid INR 1bn
revenue share to the AP government and incurred INR 0.9bn for registration;
the land is now a freehold. NCC expects to monetise this land and it is
actively looking for an investor. We maintain BUY with a TP of INR 122 (9x
Dec-23E), given (1) pick-up in execution of JJM projects; (2) abating AP risk;
and (3) improvement in NWC days.
Financial highlights: NCC reported revenue of INR 27bn (41/23%
YoY/QoQ), a 4% beat. EBITDA came in at INR 2.9bn (22/24% YoY/QoQ, 2.8%
beat). EBITDA margin fell by 165bps YoY to 10.8% due to higher raw
material prices (240bps GM contraction YoY). There was an exceptional loss
of INR 200mn, accounting for the impairment of investment in international
subsidiary. Consequently, APAT came in at INR 1bn (51/31% YoY/QoQ), in
line with estimate. NCC expects to achieve INR 100bn in revenue in FY22
and a better EBITDA margin on expectation of lower commodity prices.
JJM project execution picks up: NCC secured INR 40.3bn of orders in
Q3FY22, taking the OB to INR 402bn, of which buildings/water &
environment accounted for 61/20% and roads, electrical, irrigation and
mining constituted 3-7% each. NCC expects an OI of INR 43bn in Q4. The
total JJM project in the OB is worth INR 99bn, of which NCC has already
executed 8.5bn worth of orders in the last month and a half. It expects to
achieve an FY23 turnover of INR 50bn from JJM projects. The international
operations are expected to wind down completely in FY23, with more clarity
on it expected in Q1FY23.
Vizag land monetisation, new investor search on: Gross debt decreased to
INR 20.4bn as of Dec-21 vs INR 21bn as of Sep-21. The total limit with NCC
stands at INR 132bn, which includes INR 100bn in BG limit (up to INR 75bn
utilised), INR 10bn in LC limit, and INR 22bn in WC limit (INR 18bn
utilised). Capex for FY22 is budgeted at INR 2.5bn (INR 1.5bn incurred so
far). The AP order book stands at INR 44bn, with INR 2.1bn of revenue
realised in 9MFY22. During the quarter, 97.8acres of land in Vizag has been
transferred to NCC from AP government and it has now become a freehold
land with an estimated value of INR 5.6bn. NCC’s deal with the earlier
buyer is in abeyance due to the latter’s failure to secure funding. NCC is
looking for a new buyer and expects to monetise the land in near future.
Financial summary standalone
(INR mn) Q3
FY22
Q3
FY21
YoY
(%)
Q2
FY22
QoQ
(%) FY21 FY22E FY23E FY24E
Net Sales 27,039 19,184 40.9 21,990 23.0 72,557 1,00,693 1,23,940 1,38,592
EBITDA 2,928 2,393 22.4 2,366 23.7 8,545 10,838 15,121 17,185
APAT 1,060 703 50.7 809 31.0 2,611 3,960 6,592 8,108
Diluted EPS (INR) 1.7 1.2 50.7 1.33 31.0 4.3 6.5 10.8 13.3
P/E (x)
16.8 11.1 6.7 5.4
EV/EBITDA (x)
6.7 5.0 3.8 3.4
RoE (%)
5.0 7.1 10.9 12.0
Source: Company, HSIE Research
BUY CMP (as on 8 Feb 2022) INR 72
Target Price INR 122
NIFTY 17,267
KEY
CHANGES OLD NEW
Rating BUY BUY
Price Target INR 122 INR 122
EPS change
%
FY22E FY23E FY24E
+2.8 -0.9 -0.8
KEY STOCK DATA
Bloomberg code NJCC IN
No. of Shares (mn) 610
MCap (INR bn) / ($ mn) 44/590
6m avg traded value (INR mn) 344
52 Week high / low INR 100/66
STOCK PERFORMANCE (%)
3M 6M 12M
Absolute (%) (9.4) (18.3) (27.7)
Relative (%) (4.9) (24.8) (40.3)
SHAREHOLDING PATTERN (%)
Sep-21 Dec-21
Promoters 19.68 19.68
FIs & Local MFs 11.49 11.62
FPIs 13.26 12.15
Public & Others 55.54 56.55
Pledged Shares 3.39 3.82
Source : BSE
Pledged shares as % of total shares
Parikshit D Kandpal, CFA
+91-22-6171-7317
Manoj Rawat
+91-22-6171-7355
Nikhil Kanodia
+91-22-6171-7335
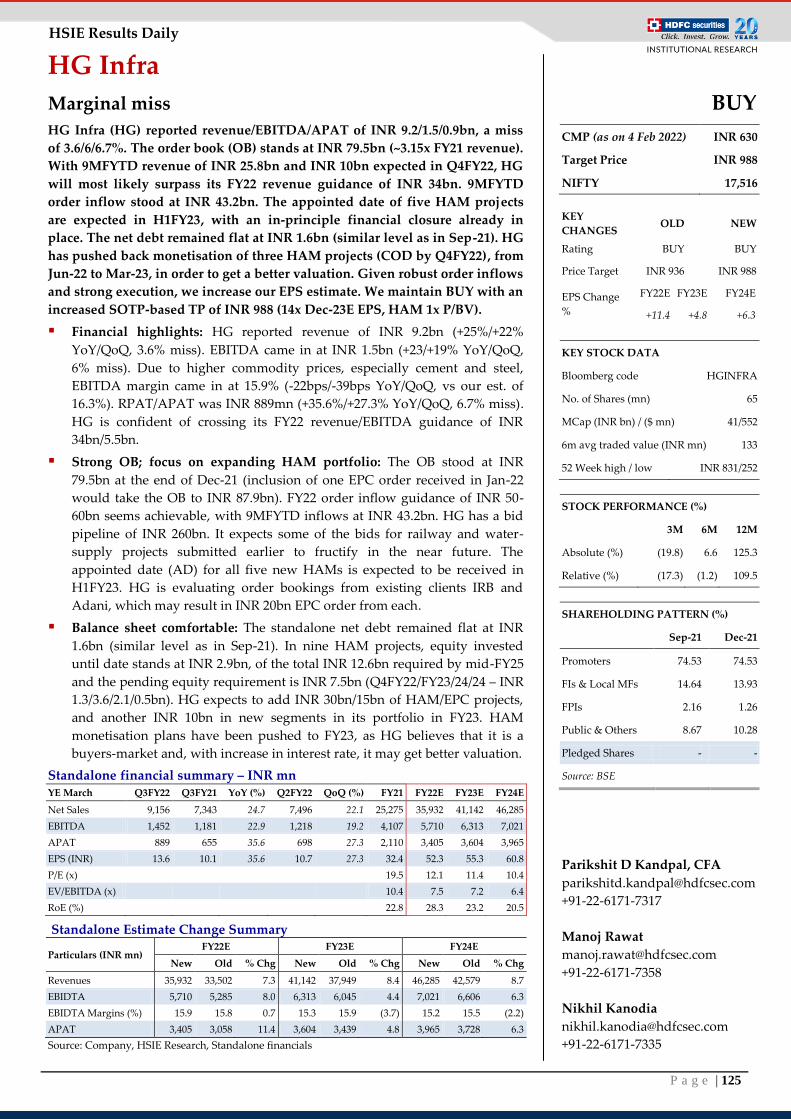
P a g e | 125
HSIE Results Daily
HG Infra
Marginal miss
HG Infra (HG) reported revenue/EBITDA/APAT of INR 9.2/1.5/0.9bn, a miss
of 3.6/6/6.7%. The order book (OB) stands at INR 79.5bn (~3.15x FY21 revenue).
With 9MFYTD revenue of INR 25.8bn and INR 10bn expected in Q4FY22, HG
will most likely surpass its FY22 revenue guidance of INR 34bn. 9MFYTD
order inflow stood at INR 43.2bn. The appointed date of five HAM projects
are expected in H1FY23, with an in-principle financial closure already in
place. The net debt remained flat at INR 1.6bn (similar level as in Sep-21). HG
has pushed back monetisation of three HAM projects (COD by Q4FY22), from
Jun-22 to Mar-23, in order to get a better valuation. Given robust order inflows
and strong execution, we increase our EPS estimate. We maintain BUY with an
increased SOTP-based TP of INR 988 (14x Dec-23E EPS, HAM 1x P/BV).
Financial highlights: HG reported revenue of INR 9.2bn (+25%/+22%
YoY/QoQ, 3.6% miss). EBITDA came in at INR 1.5bn (+23/+19% YoY/QoQ,
6% miss). Due to higher commodity prices, especially cement and steel,
EBITDA margin came in at 15.9% (-22bps/-39bps YoY/QoQ, vs our est. of
16.3%). RPAT/APAT was INR 889mn (+35.6%/+27.3% YoY/QoQ, 6.7% miss).
HG is confident of crossing its FY22 revenue/EBITDA guidance of INR
34bn/5.5bn.
Strong OB; focus on expanding HAM portfolio: The OB stood at INR
79.5bn at the end of Dec-21 (inclusion of one EPC order received in Jan-22
would take the OB to INR 87.9bn). FY22 order inflow guidance of INR 50-
60bn seems achievable, with 9MFYTD inflows at INR 43.2bn. HG has a bid
pipeline of INR 260bn. It expects some of the bids for railway and water-
supply projects submitted earlier to fructify in the near future. The
appointed date (AD) for all five new HAMs is expected to be received in
H1FY23. HG is evaluating order bookings from existing clients IRB and
Adani, which may result in INR 20bn EPC order from each.
Balance sheet comfortable: The standalone net debt remained flat at INR
1.6bn (similar level as in Sep-21). In nine HAM projects, equity invested
until date stands at INR 2.9bn, of the total INR 12.6bn required by mid-FY25
and the pending equity requirement is INR 7.5bn (Q4FY22/FY23/24/24 – INR
1.3/3.6/2.1/0.5bn). HG expects to add INR 30bn/15bn of HAM/EPC projects,
and another INR 10bn in new segments in its portfolio in FY23. HAM
monetisation plans have been pushed to FY23, as HG believes that it is a
buyers-market and, with increase in interest rate, it may get better valuation.
Standalone financial summary – INR mn YE March Q3FY22 Q3FY21 YoY (%) Q2FY22 QoQ (%) FY21 FY22E FY23E FY24E
Net Sales 9,156 7,343 24.7 7,496 22.1 25,275 35,932 41,142 46,285
EBITDA 1,452 1,181 22.9 1,218 19.2 4,107 5,710 6,313 7,021
APAT 889 655 35.6 698 27.3 2,110 3,405 3,604 3,965
EPS (INR) 13.6 10.1 35.6 10.7 27.3 32.4 52.3 55.3 60.8
P/E (x)
19.5 12.1 11.4 10.4
EV/EBITDA (x)
10.4 7.5 7.2 6.4
RoE (%)
22.8 28.3 23.2 20.5
Standalone Estimate Change Summary
Particulars (INR mn) FY22E FY23E FY24E
New Old % Chg New Old % Chg New Old % Chg
Revenues 35,932 33,502 7.3 41,142 37,949 8.4 46,285 42,579 8.7
EBIDTA 5,710 5,285 8.0 6,313 6,045 4.4 7,021 6,606 6.3
EBIDTA Margins (%) 15.9 15.8 0.7 15.3 15.9 (3.7) 15.2 15.5 (2.2)
APAT 3,405 3,058 11.4 3,604 3,439 4.8 3,965 3,728 6.3
Source: Company, HSIE Research, Standalone financials
BUY
CMP (as on 4 Feb 2022) INR 630
Target Price INR 988
NIFTY 17,516
KEY
CHANGES OLD NEW
Rating BUY BUY
Price Target INR 936 INR 988
EPS Change
%
FY22E FY23E FY24E
+11.4 +4.8 +6.3
KEY STOCK DATA
Bloomberg code HGINFRA
No. of Shares (mn) 65
MCap (INR bn) / ($ mn) 41/552
6m avg traded value (INR mn) 133
52 Week high / low INR 831/252
STOCK PERFORMANCE (%)
3M 6M 12M
Absolute (%) (19.8) 6.6 125.3
Relative (%) (17.3) (1.2) 109.5
SHAREHOLDING PATTERN (%)
Sep-21 Dec-21
Promoters 74.53 74.53
FIs & Local MFs 14.64 13.93
FPIs 2.16 1.26
Public & Others 8.67 10.28
Pledged Shares - -
Source: BSE
Parikshit D Kandpal, CFA
+91-22-6171-7317
Manoj Rawat
+91-22-6171-7358
Nikhil Kanodia
+91-22-6171-7335
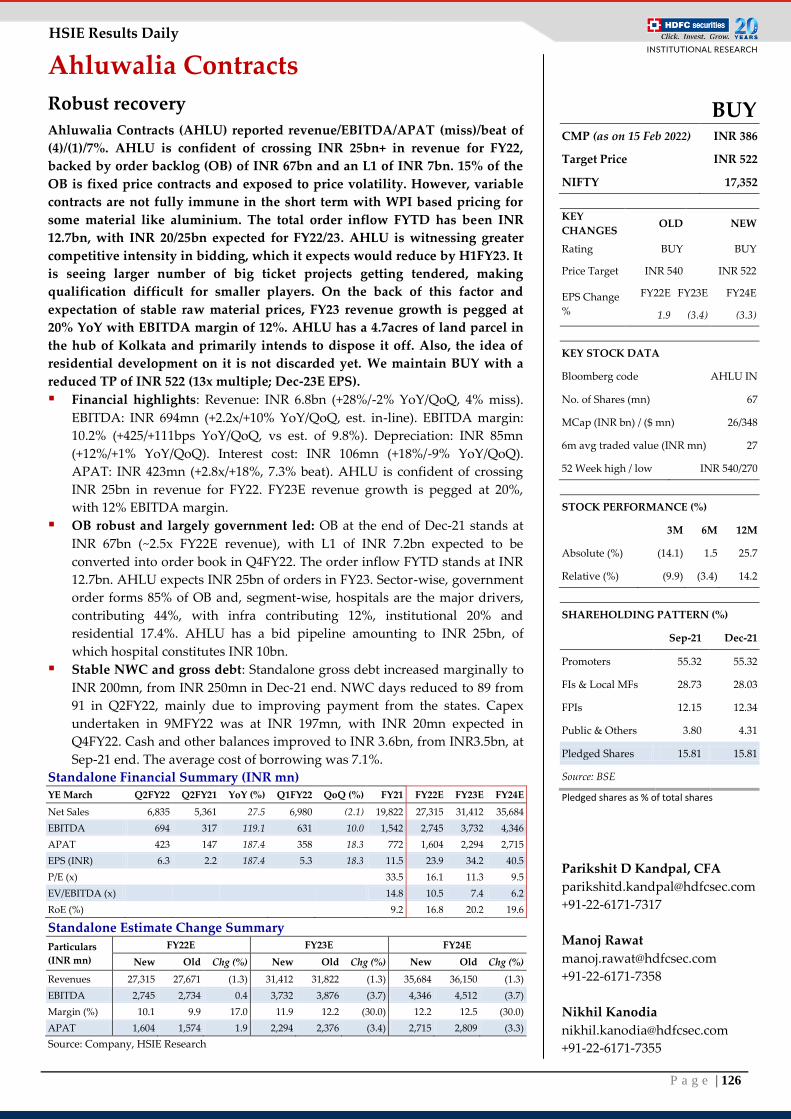
P a g e | 126
HSIE Results Daily
Ahluwalia Contracts
Robust recovery
Ahluwalia Contracts (AHLU) reported revenue/EBITDA/APAT (miss)/beat of
(4)/(1)/7%. AHLU is confident of crossing INR 25bn+ in revenue for FY22,
backed by order backlog (OB) of INR 67bn and an L1 of INR 7bn. 15% of the
OB is fixed price contracts and exposed to price volatility. However, variable
contracts are not fully immune in the short term with WPI based pricing for
some material like aluminium. The total order inflow FYTD has been INR
12.7bn, with INR 20/25bn expected for FY22/23. AHLU is witnessing greater
competitive intensity in bidding, which it expects would reduce by H1FY23. It
is seeing larger number of big ticket projects getting tendered, making
qualification difficult for smaller players. On the back of this factor and
expectation of stable raw material prices, FY23 revenue growth is pegged at
20% YoY with EBITDA margin of 12%. AHLU has a 4.7acres of land parcel in
the hub of Kolkata and primarily intends to dispose it off. Also, the idea of
residential development on it is not discarded yet. We maintain BUY with a
reduced TP of INR 522 (13x multiple; Dec-23E EPS).
Financial highlights: Revenue: INR 6.8bn (+28%/-2% YoY/QoQ, 4% miss).
EBITDA: INR 694mn (+2.2x/+10% YoY/QoQ, est. in-line). EBITDA margin:
10.2% (+425/+111bps YoY/QoQ, vs est. of 9.8%). Depreciation: INR 85mn
(+12%/+1% YoY/QoQ). Interest cost: INR 106mn (+18%/-9% YoY/QoQ).
APAT: INR 423mn (+2.8x/+18%, 7.3% beat). AHLU is confident of crossing
INR 25bn in revenue for FY22. FY23E revenue growth is pegged at 20%,
with 12% EBITDA margin.
OB robust and largely government led: OB at the end of Dec-21 stands at
INR 67bn (~2.5x FY22E revenue), with L1 of INR 7.2bn expected to be
converted into order book in Q4FY22. The order inflow FYTD stands at INR
12.7bn. AHLU expects INR 25bn of orders in FY23. Sector-wise, government
order forms 85% of OB and, segment-wise, hospitals are the major drivers,
contributing 44%, with infra contributing 12%, institutional 20% and
residential 17.4%. AHLU has a bid pipeline amounting to INR 25bn, of
which hospital constitutes INR 10bn.
Stable NWC and gross debt: Standalone gross debt increased marginally to
INR 200mn, from INR 250mn in Dec-21 end. NWC days reduced to 89 from
91 in Q2FY22, mainly due to improving payment from the states. Capex
undertaken in 9MFY22 was at INR 197mn, with INR 20mn expected in
Q4FY22. Cash and other balances improved to INR 3.6bn, from INR3.5bn, at
Sep-21 end. The average cost of borrowing was 7.1%.
Standalone Financial Summary (INR mn) YE March Q2FY22 Q2FY21 YoY (%) Q1FY22 QoQ (%) FY21 FY22E FY23E FY24E
Net Sales 6,835 5,361 27.5 6,980 (2.1) 19,822 27,315 31,412 35,684
EBITDA 694 317 119.1 631 10.0 1,542 2,745 3,732 4,346
APAT 423 147 187.4 358 18.3 772 1,604 2,294 2,715
EPS (INR) 6.3 2.2 187.4 5.3 18.3 11.5 23.9 34.2 40.5
P/E (x)
33.5 16.1 11.3 9.5
EV/EBITDA (x)
14.8 10.5 7.4 6.2
RoE (%)
9.2 16.8 20.2 19.6
Standalone Estimate Change Summary
Particulars
(INR mn)
FY22E FY23E FY24E
New Old Chg (%) New Old Chg (%) New Old Chg (%)
Revenues 27,315 27,671 (1.3) 31,412 31,822 (1.3) 35,684 36,150 (1.3)
EBITDA 2,745 2,734 0.4 3,732 3,876 (3.7) 4,346 4,512 (3.7)
Margin (%) 10.1 9.9 17.0 11.9 12.2 (30.0) 12.2 12.5 (30.0)
APAT 1,604 1,574 1.9 2,294 2,376 (3.4) 2,715 2,809 (3.3)
Source: Company, HSIE Research
BUY CMP (as on 15 Feb 2022) INR 386
Target Price INR 522
NIFTY 17,352
KEY
CHANGES OLD NEW
Rating BUY BUY
Price Target INR 540 INR 522
EPS Change
%
FY22E FY23E FY24E
1.9 (3.4) (3.3)
KEY STOCK DATA
Bloomberg code AHLU IN
No. of Shares (mn) 67
MCap (INR bn) / ($ mn) 26/348
6m avg traded value (INR mn) 27
52 Week high / low INR 540/270
STOCK PERFORMANCE (%)
3M 6M 12M
Absolute (%) (14.1) 1.5 25.7
Relative (%) (9.9) (3.4) 14.2
SHAREHOLDING PATTERN (%)
Sep-21 Dec-21
Promoters 55.32 55.32
FIs & Local MFs 28.73 28.03
FPIs 12.15 12.34
Public & Others 3.80 4.31
Pledged Shares 15.81 15.81
Source: BSE
Pledged shares as % of total shares
Parikshit D Kandpal, CFA
+91-22-6171-7317
Manoj Rawat
+91-22-6171-7358
Nikhil Kanodia
+91-22-6171-7355
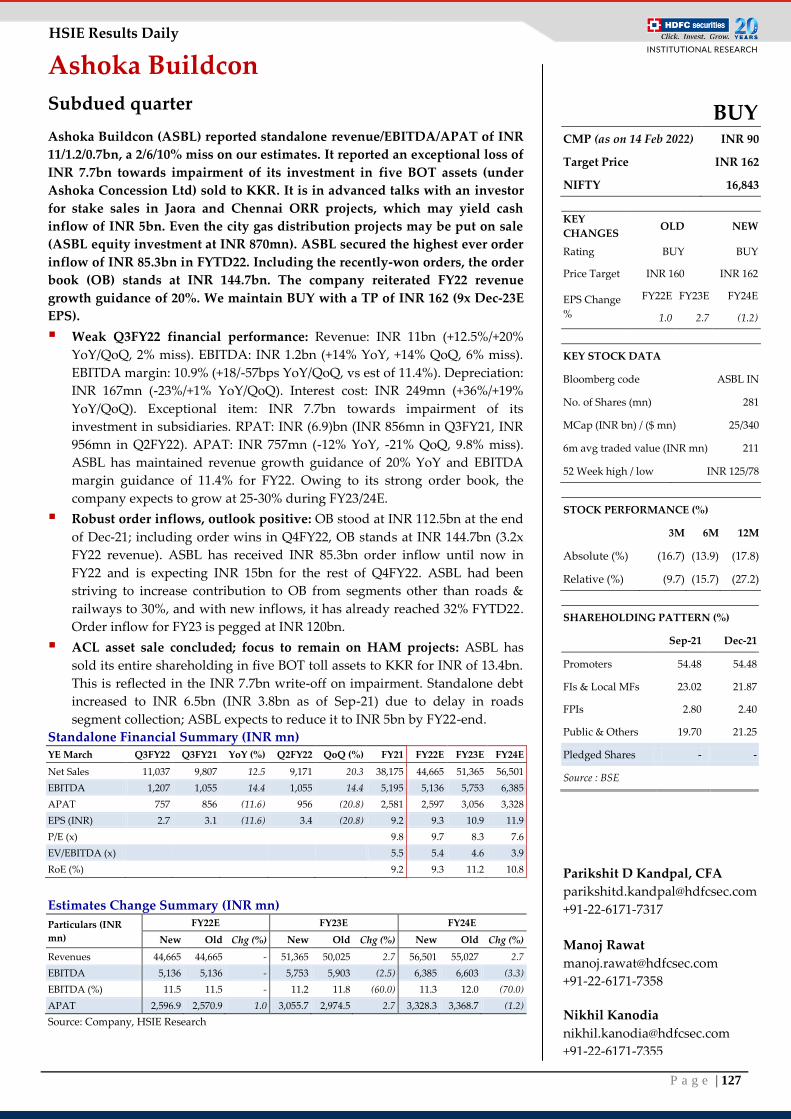
P a g e | 127
HSIE Results Daily
Ashoka Buildcon
Subdued quarter
Ashoka Buildcon (ASBL) reported standalone revenue/EBITDA/APAT of INR
11/1.2/0.7bn, a 2/6/10% miss on our estimates. It reported an exceptional loss of
INR 7.7bn towards impairment of its investment in five BOT assets (under
Ashoka Concession Ltd) sold to KKR. It is in advanced talks with an investor
for stake sales in Jaora and Chennai ORR projects, which may yield cash
inflow of INR 5bn. Even the city gas distribution projects may be put on sale
(ASBL equity investment at INR 870mn). ASBL secured the highest ever order
inflow of INR 85.3bn in FYTD22. Including the recently-won orders, the order
book (OB) stands at INR 144.7bn. The company reiterated FY22 revenue
growth guidance of 20%. We maintain BUY with a TP of INR 162 (9x Dec-23E
EPS).
Weak Q3FY22 financial performance: Revenue: INR 11bn (+12.5%/+20%
YoY/QoQ, 2% miss). EBITDA: INR 1.2bn (+14% YoY, +14% QoQ, 6% miss).
EBITDA margin: 10.9% (+18/-57bps YoY/QoQ, vs est of 11.4%). Depreciation:
INR 167mn (-23%/+1% YoY/QoQ). Interest cost: INR 249mn (+36%/+19%
YoY/QoQ). Exceptional item: INR 7.7bn towards impairment of its
investment in subsidiaries. RPAT: INR (6.9)bn (INR 856mn in Q3FY21, INR
956mn in Q2FY22). APAT: INR 757mn (-12% YoY, -21% QoQ, 9.8% miss).
ASBL has maintained revenue growth guidance of 20% YoY and EBITDA
margin guidance of 11.4% for FY22. Owing to its strong order book, the
company expects to grow at 25-30% during FY23/24E.
Robust order inflows, outlook positive: OB stood at INR 112.5bn at the end
of Dec-21; including order wins in Q4FY22, OB stands at INR 144.7bn (3.2x
FY22 revenue). ASBL has received INR 85.3bn order inflow until now in
FY22 and is expecting INR 15bn for the rest of Q4FY22. ASBL had been
striving to increase contribution to OB from segments other than roads &
railways to 30%, and with new inflows, it has already reached 32% FYTD22.
Order inflow for FY23 is pegged at INR 120bn.
ACL asset sale concluded; focus to remain on HAM projects: ASBL has
sold its entire shareholding in five BOT toll assets to KKR for INR of 13.4bn.
This is reflected in the INR 7.7bn write-off on impairment. Standalone debt
increased to INR 6.5bn (INR 3.8bn as of Sep-21) due to delay in roads
segment collection; ASBL expects to reduce it to INR 5bn by FY22-end.
Standalone Financial Summary (INR mn) YE March Q3FY22 Q3FY21 YoY (%) Q2FY22 QoQ (%) FY21 FY22E FY23E FY24E
Net Sales 11,037 9,807 12.5 9,171 20.3 38,175 44,665 51,365 56,501
EBITDA 1,207 1,055 14.4 1,055 14.4 5,195 5,136 5,753 6,385
APAT 757 856 (11.6) 956 (20.8) 2,581 2,597 3,056 3,328
EPS (INR) 2.7 3.1 (11.6) 3.4 (20.8) 9.2 9.3 10.9 11.9
P/E (x)
9.8 9.7 8.3 7.6
EV/EBITDA (x)
5.5 5.4 4.6 3.9
RoE (%)
9.2 9.3 11.2 10.8
Estimates Change Summary (INR mn)
Particulars (INR
mn)
FY22E FY23E FY24E
New Old Chg (%) New Old Chg (%) New Old Chg (%)
Revenues 44,665 44,665 - 51,365 50,025 2.7 56,501 55,027 2.7
EBITDA 5,136 5,136 - 5,753 5,903 (2.5) 6,385 6,603 (3.3)
EBITDA (%) 11.5 11.5 - 11.2 11.8 (60.0) 11.3 12.0 (70.0)
APAT 2,596.9 2,570.9 1.0 3,055.7 2,974.5 2.7 3,328.3 3,368.7 (1.2)
Source: Company, HSIE Research
BUY CMP (as on 14 Feb 2022) INR 90
Target Price INR 162
NIFTY 16,843
KEY
CHANGES OLD NEW
Rating BUY BUY
Price Target INR 160 INR 162
EPS Change
%
FY22E FY23E FY24E
1.0 2.7 (1.2)
KEY STOCK DATA
Bloomberg code ASBL IN
No. of Shares (mn) 281
MCap (INR bn) / ($ mn) 25/340
6m avg traded value (INR mn) 211
52 Week high / low INR 125/78
STOCK PERFORMANCE (%)
3M 6M 12M
Absolute (%) (16.7) (13.9) (17.8)
Relative (%) (9.7) (15.7) (27.2)
SHAREHOLDING PATTERN (%)
Sep-21 Dec-21
Promoters 54.48 54.48
FIs & Local MFs 23.02 21.87
FPIs 2.80 2.40
Public & Others 19.70 21.25
Pledged Shares - -
Source : BSE
Parikshit D Kandpal, CFA
+91-22-6171-7317
Manoj Rawat
+91-22-6171-7358
Nikhil Kanodia
+91-22-6171-7355
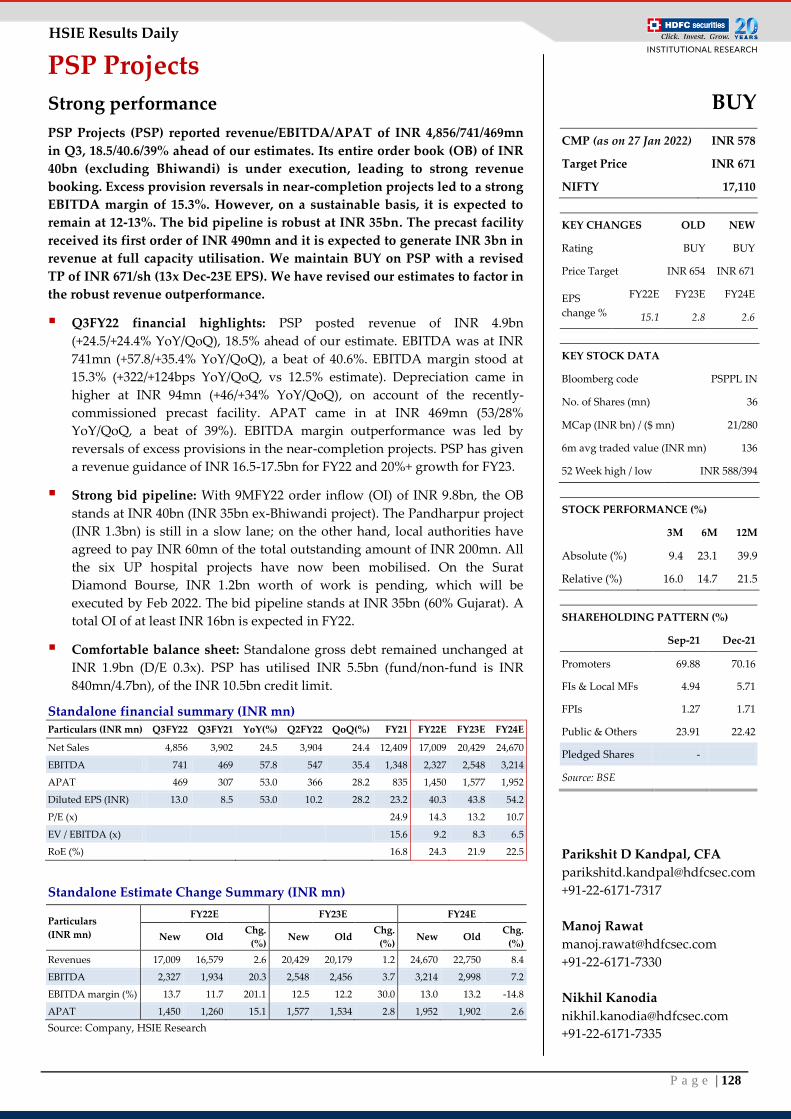
P a g e | 128
HSIE Results Daily
PSP Projects
Strong performance
PSP Projects (PSP) reported revenue/EBITDA/APAT of INR 4,856/741/469mn
in Q3, 18.5/40.6/39% ahead of our estimates. Its entire order book (OB) of INR
40bn (excluding Bhiwandi) is under execution, leading to strong revenue
booking. Excess provision reversals in near-completion projects led to a strong
EBITDA margin of 15.3%. However, on a sustainable basis, it is expected to
remain at 12-13%. The bid pipeline is robust at INR 35bn. The precast facility
received its first order of INR 490mn and it is expected to generate INR 3bn in
revenue at full capacity utilisation. We maintain BUY on PSP with a revised
TP of INR 671/sh (13x Dec-23E EPS). We have revised our estimates to factor in
the robust revenue outperformance.
Q3FY22 financial highlights: PSP posted revenue of INR 4.9bn
(+24.5/+24.4% YoY/QoQ), 18.5% ahead of our estimate. EBITDA was at INR
741mn (+57.8/+35.4% YoY/QoQ), a beat of 40.6%. EBITDA margin stood at
15.3% (+322/+124bps YoY/QoQ, vs 12.5% estimate). Depreciation came in
higher at INR 94mn (+46/+34% YoY/QoQ), on account of the recently-
commissioned precast facility. APAT came in at INR 469mn (53/28%
YoY/QoQ, a beat of 39%). EBITDA margin outperformance was led by
reversals of excess provisions in the near-completion projects. PSP has given
a revenue guidance of INR 16.5-17.5bn for FY22 and 20%+ growth for FY23.
Strong bid pipeline: With 9MFY22 order inflow (OI) of INR 9.8bn, the OB
stands at INR 40bn (INR 35bn ex-Bhiwandi project). The Pandharpur project
(INR 1.3bn) is still in a slow lane; on the other hand, local authorities have
agreed to pay INR 60mn of the total outstanding amount of INR 200mn. All
the six UP hospital projects have now been mobilised. On the Surat
Diamond Bourse, INR 1.2bn worth of work is pending, which will be
executed by Feb 2022. The bid pipeline stands at INR 35bn (60% Gujarat). A
total OI of at least INR 16bn is expected in FY22.
Comfortable balance sheet: Standalone gross debt remained unchanged at
INR 1.9bn (D/E 0.3x). PSP has utilised INR 5.5bn (fund/non-fund is INR
840mn/4.7bn), of the INR 10.5bn credit limit.
Standalone financial summary (INR mn)
Particulars (INR mn) Q3FY22 Q3FY21 YoY(%) Q2FY22 QoQ(%) FY21 FY22E FY23E FY24E
Net Sales 4,856 3,902 24.5 3,904 24.4 12,409 17,009 20,429 24,670
EBITDA 741 469 57.8 547 35.4 1,348 2,327 2,548 3,214
APAT 469 307 53.0 366 28.2 835 1,450 1,577 1,952
Diluted EPS (INR) 13.0 8.5 53.0 10.2 28.2 23.2 40.3 43.8 54.2
P/E (x)
24.9 14.3 13.2 10.7
EV / EBITDA (x)
15.6 9.2 8.3 6.5
RoE (%)
16.8 24.3 21.9 22.5
Standalone Estimate Change Summary (INR mn)
Particulars
(INR mn)
FY22E FY23E FY24E
New Old Chg.
(%) New Old
Chg.
(%) New Old
Chg.
(%)
Revenues 17,009 16,579 2.6 20,429 20,179 1.2 24,670 22,750 8.4
EBITDA 2,327 1,934 20.3 2,548 2,456 3.7 3,214 2,998 7.2
EBITDA margin (%) 13.7 11.7 201.1 12.5 12.2 30.0 13.0 13.2 -14.8
APAT 1,450 1,260 15.1 1,577 1,534 2.8 1,952 1,902 2.6
Source: Company, HSIE Research
BUY
CMP (as on 27 Jan 2022) INR 578
Target Price INR 671
NIFTY 17,110
KEY CHANGES OLD NEW
Rating BUY BUY
Price Target INR 654 INR 671
EPS
change %
FY22E FY23E FY24E
15.1 2.8 2.6
KEY STOCK DATA
Bloomberg code PSPPL IN
No. of Shares (mn) 36
MCap (INR bn) / ($ mn) 21/280
6m avg traded value (INR mn) 136
52 Week high / low INR 588/394
STOCK PERFORMANCE (%)
3M 6M 12M
Absolute (%) 9.4 23.1 39.9
Relative (%) 16.0 14.7 21.5
SHAREHOLDING PATTERN (%)
Sep-21 Dec-21
Promoters 69.88 70.16
FIs & Local MFs 4.94 5.71
FPIs 1.27 1.71
Public & Others 23.91 22.42
Pledged Shares -
Source: BSE
Parikshit D Kandpal, CFA
+91-22-6171-7317
Manoj Rawat
+91-22-6171-7330
Nikhil Kanodia
+91-22-6171-7335
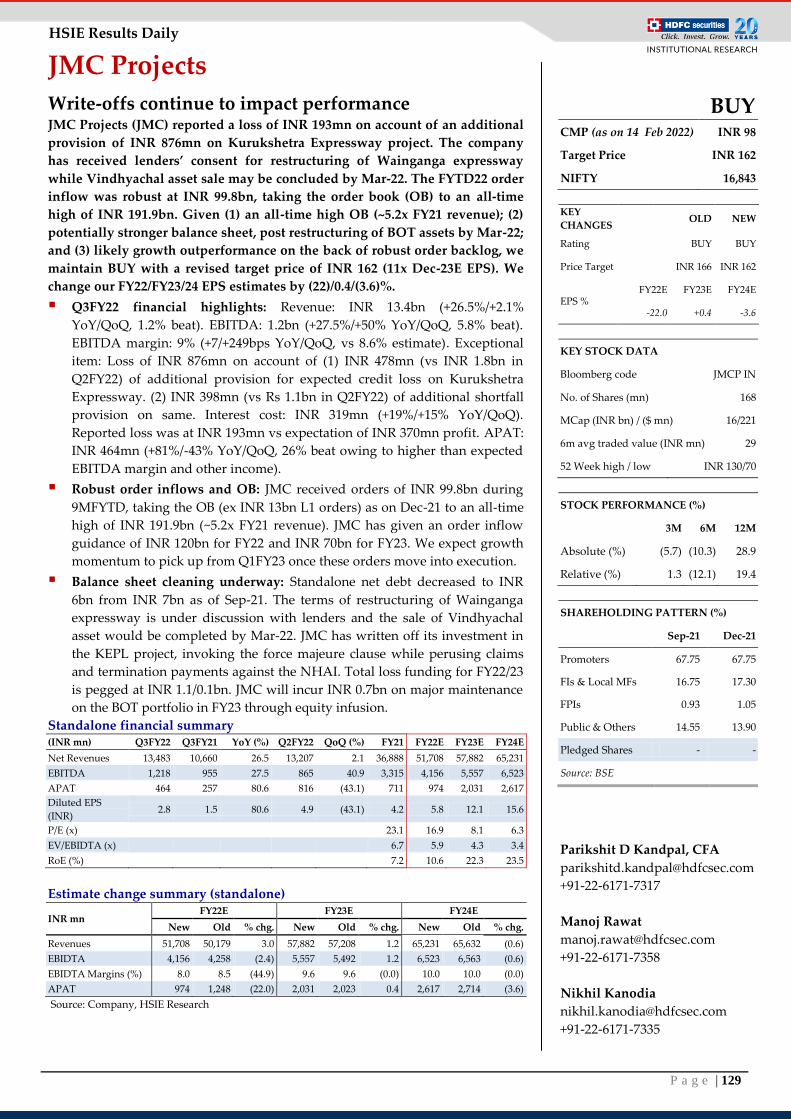
P a g e | 129
HSIE Results Daily
JMC Projects
Write-offs continue to impact performance JMC Projects (JMC) reported a loss of INR 193mn on account of an additional
provision of INR 876mn on Kurukshetra Expressway project. The company
has received lenders’ consent for restructuring of Wainganga expressway
while Vindhyachal asset sale may be concluded by Mar-22. The FYTD22 order
inflow was robust at INR 99.8bn, taking the order book (OB) to an all-time
high of INR 191.9bn. Given (1) an all-time high OB (~5.2x FY21 revenue); (2)
potentially stronger balance sheet, post restructuring of BOT assets by Mar-22;
and (3) likely growth outperformance on the back of robust order backlog, we
maintain BUY with a revised target price of INR 162 (11x Dec-23E EPS). We
change our FY22/FY23/24 EPS estimates by (22)/0.4/(3.6)%.
Q3FY22 financial highlights: Revenue: INR 13.4bn (+26.5%/+2.1%
YoY/QoQ, 1.2% beat). EBITDA: 1.2bn (+27.5%/+50% YoY/QoQ, 5.8% beat).
EBITDA margin: 9% (+7/+249bps YoY/QoQ, vs 8.6% estimate). Exceptional
item: Loss of INR 876mn on account of (1) INR 478mn (vs INR 1.8bn in
Q2FY22) of additional provision for expected credit loss on Kurukshetra
Expressway. (2) INR 398mn (vs Rs 1.1bn in Q2FY22) of additional shortfall
provision on same. Interest cost: INR 319mn (+19%/+15% YoY/QoQ).
Reported loss was at INR 193mn vs expectation of INR 370mn profit. APAT:
INR 464mn (+81%/-43% YoY/QoQ, 26% beat owing to higher than expected
EBITDA margin and other income).
Robust order inflows and OB: JMC received orders of INR 99.8bn during
9MFYTD, taking the OB (ex INR 13bn L1 orders) as on Dec-21 to an all-time
high of INR 191.9bn (~5.2x FY21 revenue). JMC has given an order inflow
guidance of INR 120bn for FY22 and INR 70bn for FY23. We expect growth
momentum to pick up from Q1FY23 once these orders move into execution.
Balance sheet cleaning underway: Standalone net debt decreased to INR
6bn from INR 7bn as of Sep-21. The terms of restructuring of Wainganga
expressway is under discussion with lenders and the sale of Vindhyachal
asset would be completed by Mar-22. JMC has written off its investment in
the KEPL project, invoking the force majeure clause while perusing claims
and termination payments against the NHAI. Total loss funding for FY22/23
is pegged at INR 1.1/0.1bn. JMC will incur INR 0.7bn on major maintenance
on the BOT portfolio in FY23 through equity infusion.
Standalone financial summary (INR mn) Q3FY22 Q3FY21 YoY (%) Q2FY22 QoQ (%) FY21 FY22E FY23E FY24E
Net Revenues 13,483 10,660 26.5 13,207 2.1 36,888 51,708 57,882 65,231
EBITDA 1,218 955 27.5 865 40.9 3,315 4,156 5,557 6,523
APAT 464 257 80.6 816 (43.1) 711 974 2,031 2,617
Diluted EPS
(INR) 2.8 1.5 80.6 4.9 (43.1) 4.2 5.8 12.1 15.6
P/E (x)
23.1 16.9 8.1 6.3
EV/EBIDTA (x)
6.7 5.9 4.3 3.4
RoE (%)
7.2 10.6 22.3 23.5
Estimate change summary (standalone)
INR mn FY22E FY23E FY24E
New Old % chg. New Old % chg. New Old % chg.
Revenues 51,708 50,179 3.0 57,882 57,208 1.2 65,231 65,632 (0.6)
EBIDTA 4,156 4,258 (2.4) 5,557 5,492 1.2 6,523 6,563 (0.6)
EBIDTA Margins (%) 8.0 8.5 (44.9) 9.6 9.6 (0.0) 10.0 10.0 (0.0)
APAT 974 1,248 (22.0) 2,031 2,023 0.4 2,617 2,714 (3.6)
Source: Company, HSIE Research
BUY CMP (as on 14 Feb 2022) INR 98
Target Price INR 162
NIFTY 16,843
KEY
CHANGES OLD NEW
Rating BUY BUY
Price Target INR 166 INR 162
EPS % FY22E FY23E FY24E
-22.0 +0.4 -3.6
KEY STOCK DATA
Bloomberg code JMCP IN
No. of Shares (mn) 168
MCap (INR bn) / ($ mn) 16/221
6m avg traded value (INR mn) 29
52 Week high / low INR 130/70
STOCK PERFORMANCE (%)
3M 6M 12M
Absolute (%) (5.7) (10.3) 28.9
Relative (%) 1.3 (12.1) 19.4
SHAREHOLDING PATTERN (%)
Sep-21 Dec-21
Promoters 67.75 67.75
FIs & Local MFs 16.75 17.30
FPIs 0.93 1.05
Public & Others 14.55 13.90
Pledged Shares - -
Source: BSE
Parikshit D Kandpal, CFA
+91-22-6171-7317
Manoj Rawat
+91-22-6171-7358
Nikhil Kanodia
+91-22-6171-7335
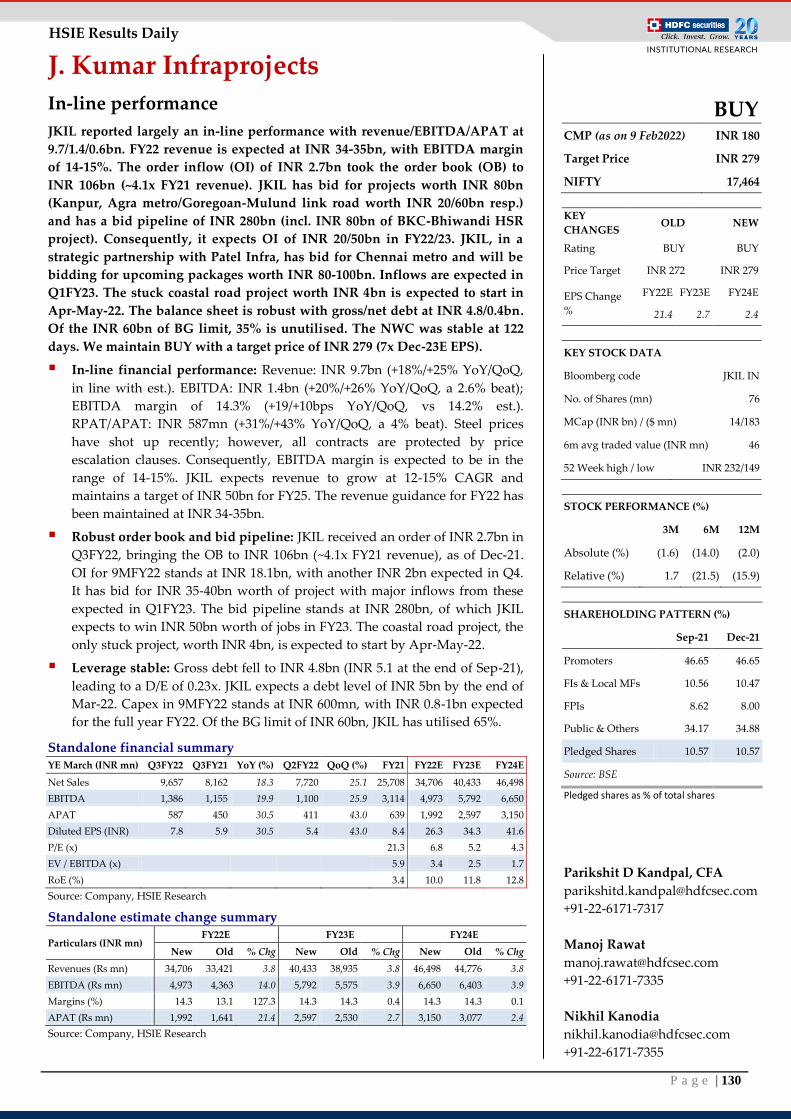
P a g e | 130
HSIE Results Daily
J. Kumar Infraprojects
In-line performance
JKIL reported largely an in-line performance with revenue/EBITDA/APAT at
9.7/1.4/0.6bn. FY22 revenue is expected at INR 34-35bn, with EBITDA margin
of 14-15%. The order inflow (OI) of INR 2.7bn took the order book (OB) to
INR 106bn (~4.1x FY21 revenue). JKIL has bid for projects worth INR 80bn
(Kanpur, Agra metro/Goregoan-Mulund link road worth INR 20/60bn resp.)
and has a bid pipeline of INR 280bn (incl. INR 80bn of BKC-Bhiwandi HSR
project). Consequently, it expects OI of INR 20/50bn in FY22/23. JKIL, in a
strategic partnership with Patel Infra, has bid for Chennai metro and will be
bidding for upcoming packages worth INR 80-100bn. Inflows are expected in
Q1FY23. The stuck coastal road project worth INR 4bn is expected to start in
Apr-May-22. The balance sheet is robust with gross/net debt at INR 4.8/0.4bn.
Of the INR 60bn of BG limit, 35% is unutilised. The NWC was stable at 122
days. We maintain BUY with a target price of INR 279 (7x Dec-23E EPS).
In-line financial performance: Revenue: INR 9.7bn (+18%/+25% YoY/QoQ,
in line with est.). EBITDA: INR 1.4bn (+20%/+26% YoY/QoQ, a 2.6% beat);
EBITDA margin of 14.3% (+19/+10bps YoY/QoQ, vs 14.2% est.).
RPAT/APAT: INR 587mn (+31%/+43% YoY/QoQ, a 4% beat). Steel prices
have shot up recently; however, all contracts are protected by price
escalation clauses. Consequently, EBITDA margin is expected to be in the
range of 14-15%. JKIL expects revenue to grow at 12-15% CAGR and
maintains a target of INR 50bn for FY25. The revenue guidance for FY22 has
been maintained at INR 34-35bn.
Robust order book and bid pipeline: JKIL received an order of INR 2.7bn in
Q3FY22, bringing the OB to INR 106bn (~4.1x FY21 revenue), as of Dec-21.
OI for 9MFY22 stands at INR 18.1bn, with another INR 2bn expected in Q4.
It has bid for INR 35-40bn worth of project with major inflows from these
expected in Q1FY23. The bid pipeline stands at INR 280bn, of which JKIL
expects to win INR 50bn worth of jobs in FY23. The coastal road project, the
only stuck project, worth INR 4bn, is expected to start by Apr-May-22.
Leverage stable: Gross debt fell to INR 4.8bn (INR 5.1 at the end of Sep-21),
leading to a D/E of 0.23x. JKIL expects a debt level of INR 5bn by the end of
Mar-22. Capex in 9MFY22 stands at INR 600mn, with INR 0.8-1bn expected
for the full year FY22. Of the BG limit of INR 60bn, JKIL has utilised 65%.
Standalone financial summary YE March (INR mn) Q3FY22 Q3FY21 YoY (%) Q2FY22 QoQ (%) FY21 FY22E FY23E FY24E
Net Sales 9,657 8,162 18.3 7,720 25.1 25,708 34,706 40,433 46,498
EBITDA 1,386 1,155 19.9 1,100 25.9 3,114 4,973 5,792 6,650
APAT 587 450 30.5 411 43.0 639 1,992 2,597 3,150
Diluted EPS (INR) 7.8 5.9 30.5 5.4 43.0 8.4 26.3 34.3 41.6
P/E (x)
21.3 6.8 5.2 4.3
EV / EBITDA (x)
5.9 3.4 2.5 1.7
RoE (%)
3.4 10.0 11.8 12.8
Source: Company, HSIE Research
Standalone estimate change summary
Particulars (INR mn) FY22E FY23E FY24E
New Old % Chg New Old % Chg New Old % Chg
Revenues (Rs mn) 34,706 33,421 3.8 40,433 38,935 3.8 46,498 44,776 3.8
EBITDA (Rs mn) 4,973 4,363 14.0 5,792 5,575 3.9 6,650 6,403 3.9
Margins (%) 14.3 13.1 127.3 14.3 14.3 0.4 14.3 14.3 0.1
APAT (Rs mn) 1,992 1,641 21.4 2,597 2,530 2.7 3,150 3,077 2.4
Source: Company, HSIE Research
BUY CMP (as on 9 Feb2022) INR 180
Target Price INR 279
NIFTY 17,464
KEY
CHANGES OLD NEW
Rating BUY BUY
Price Target INR 272 INR 279
EPS Change
%
FY22E FY23E FY24E
21.4 2.7 2.4
KEY STOCK DATA
Bloomberg code JKIL IN
No. of Shares (mn) 76
MCap (INR bn) / ($ mn) 14/183
6m avg traded value (INR mn) 46
52 Week high / low INR 232/149
STOCK PERFORMANCE (%)
3M 6M 12M
Absolute (%) (1.6) (14.0) (2.0)
Relative (%) 1.7 (21.5) (15.9)
SHAREHOLDING PATTERN (%)
Sep-21 Dec-21
Promoters 46.65 46.65
FIs & Local MFs 10.56 10.47
FPIs 8.62 8.00
Public & Others 34.17 34.88
Pledged Shares 10.57 10.57
Source: BSE
Pledged shares as % of total shares
Parikshit D Kandpal, CFA
+91-22-6171-7317
Manoj Rawat
+91-22-6171-7335
Nikhil Kanodia
+91-22-6171-7355
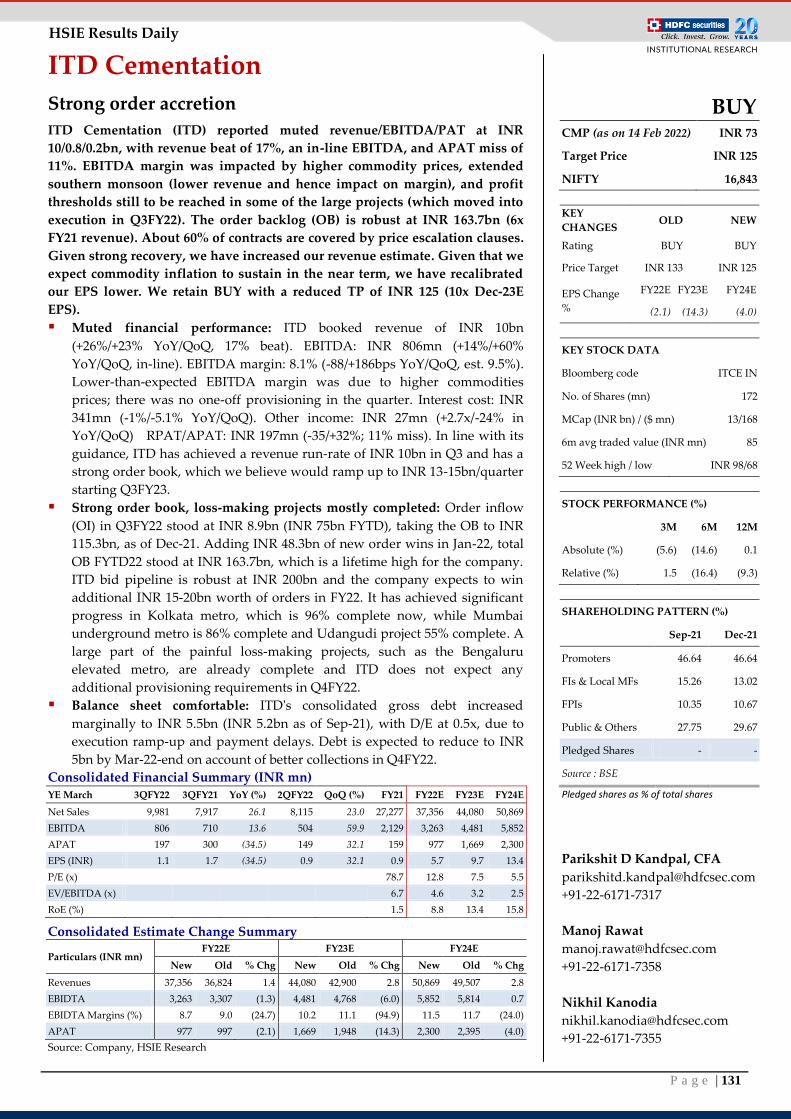
P a g e | 131
HSIE Results Daily
ITD Cementation
Strong order accretion
ITD Cementation (ITD) reported muted revenue/EBITDA/PAT at INR
10/0.8/0.2bn, with revenue beat of 17%, an in-line EBITDA, and APAT miss of
11%. EBITDA margin was impacted by higher commodity prices, extended
southern monsoon (lower revenue and hence impact on margin), and profit
thresholds still to be reached in some of the large projects (which moved into
execution in Q3FY22). The order backlog (OB) is robust at INR 163.7bn (6x
FY21 revenue). About 60% of contracts are covered by price escalation clauses.
Given strong recovery, we have increased our revenue estimate. Given that we
expect commodity inflation to sustain in the near term, we have recalibrated
our EPS lower. We retain BUY with a reduced TP of INR 125 (10x Dec-23E
EPS).
Muted financial performance: ITD booked revenue of INR 10bn
(+26%/+23% YoY/QoQ, 17% beat). EBITDA: INR 806mn (+14%/+60%
YoY/QoQ, in-line). EBITDA margin: 8.1% (-88/+186bps YoY/QoQ, est. 9.5%).
Lower-than-expected EBITDA margin was due to higher commodities
prices; there was no one-off provisioning in the quarter. Interest cost: INR
341mn (-1%/-5.1% YoY/QoQ). Other income: INR 27mn (+2.7x/-24% in
YoY/QoQ) RPAT/APAT: INR 197mn (-35/+32%; 11% miss). In line with its
guidance, ITD has achieved a revenue run-rate of INR 10bn in Q3 and has a
strong order book, which we believe would ramp up to INR 13-15bn/quarter
starting Q3FY23.
Strong order book, loss-making projects mostly completed: Order inflow
(OI) in Q3FY22 stood at INR 8.9bn (INR 75bn FYTD), taking the OB to INR
115.3bn, as of Dec-21. Adding INR 48.3bn of new order wins in Jan-22, total
OB FYTD22 stood at INR 163.7bn, which is a lifetime high for the company.
ITD bid pipeline is robust at INR 200bn and the company expects to win
additional INR 15-20bn worth of orders in FY22. It has achieved significant
progress in Kolkata metro, which is 96% complete now, while Mumbai
underground metro is 86% complete and Udangudi project 55% complete. A
large part of the painful loss-making projects, such as the Bengaluru
elevated metro, are already complete and ITD does not expect any
additional provisioning requirements in Q4FY22.
Balance sheet comfortable: ITD's consolidated gross debt increased
marginally to INR 5.5bn (INR 5.2bn as of Sep-21), with D/E at 0.5x, due to
execution ramp-up and payment delays. Debt is expected to reduce to INR
5bn by Mar-22-end on account of better collections in Q4FY22.
Consolidated Financial Summary (INR mn) YE March 3QFY22 3QFY21 YoY (%) 2QFY22 QoQ (%) FY21 FY22E FY23E FY24E
Net Sales 9,981 7,917 26.1 8,115 23.0 27,277 37,356 44,080 50,869
EBITDA 806 710 13.6 504 59.9 2,129 3,263 4,481 5,852
APAT 197 300 (34.5) 149 32.1 159 977 1,669 2,300
EPS (INR) 1.1 1.7 (34.5) 0.9 32.1 0.9 5.7 9.7 13.4
P/E (x)
78.7 12.8 7.5 5.5
EV/EBITDA (x)
6.7 4.6 3.2 2.5
RoE (%)
1.5 8.8 13.4 15.8
Consolidated Estimate Change Summary
Particulars (INR mn) FY22E FY23E FY24E
New Old % Chg New Old % Chg New Old % Chg
Revenues 37,356 36,824 1.4 44,080 42,900 2.8 50,869 49,507 2.8
EBIDTA 3,263 3,307 (1.3) 4,481 4,768 (6.0) 5,852 5,814 0.7
EBIDTA Margins (%) 8.7 9.0 (24.7) 10.2 11.1 (94.9) 11.5 11.7 (24.0)
APAT 977 997 (2.1) 1,669 1,948 (14.3) 2,300 2,395 (4.0)
Source: Company, HSIE Research
BUY CMP (as on 14 Feb 2022) INR 73
Target Price INR 125
NIFTY 16,843
KEY
CHANGES OLD NEW
Rating BUY BUY
Price Target INR 133 INR 125
EPS Change
%
FY22E FY23E FY24E
(2.1) (14.3) (4.0)
KEY STOCK DATA
Bloomberg code ITCE IN
No. of Shares (mn) 172
MCap (INR bn) / ($ mn) 13/168
6m avg traded value (INR mn) 85
52 Week high / low INR 98/68
STOCK PERFORMANCE (%)
3M 6M 12M
Absolute (%) (5.6) (14.6) 0.1
Relative (%) 1.5 (16.4) (9.3)
SHAREHOLDING PATTERN (%)
Sep-21 Dec-21
Promoters 46.64 46.64
FIs & Local MFs 15.26 13.02
FPIs 10.35 10.67
Public & Others 27.75 29.67
Pledged Shares - -
Source : BSE
Pledged shares as % of total shares
Parikshit D Kandpal, CFA
+91-22-6171-7317
Manoj Rawat
+91-22-6171-7358
Nikhil Kanodia
+91-22-6171-7355
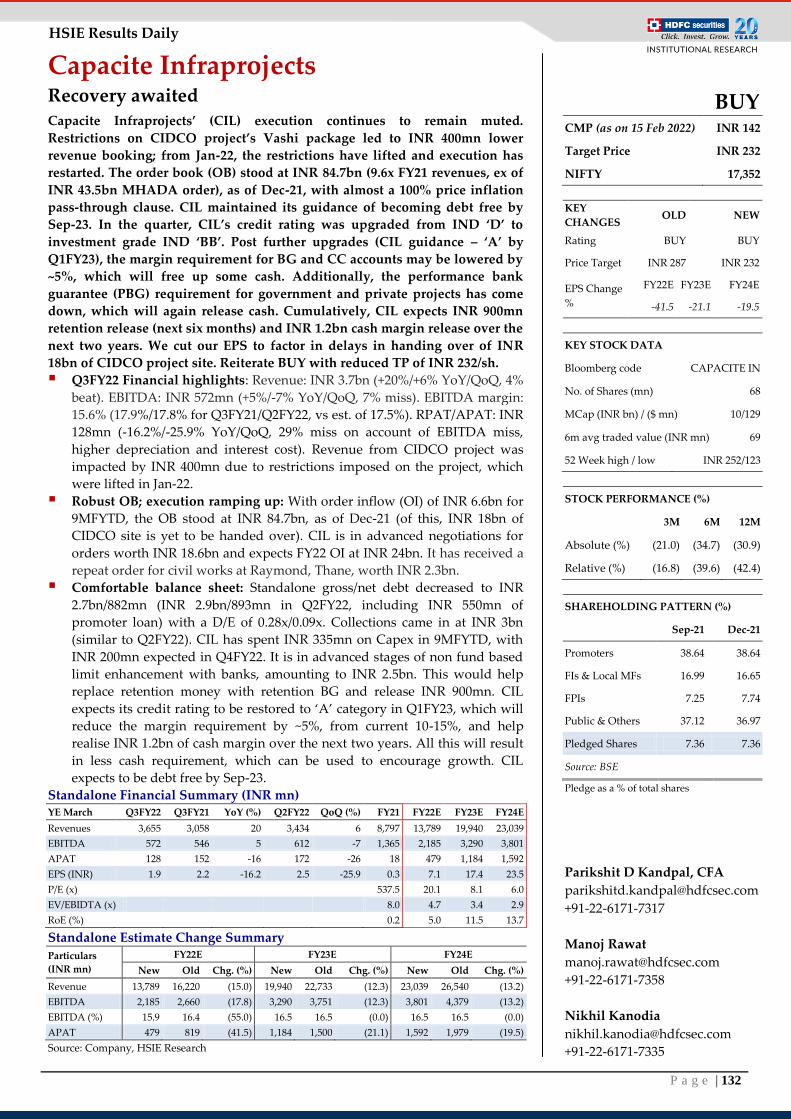
P a g e | 132
HSIE Results Daily
Capacite Infraprojects Recovery awaited Capacite Infraprojects’ (CIL) execution continues to remain muted.
Restrictions on CIDCO project’s Vashi package led to INR 400mn lower
revenue booking; from Jan-22, the restrictions have lifted and execution has
restarted. The order book (OB) stood at INR 84.7bn (9.6x FY21 revenues, ex of
INR 43.5bn MHADA order), as of Dec-21, with almost a 100% price inflation
pass-through clause. CIL maintained its guidance of becoming debt free by
Sep-23. In the quarter, CIL’s credit rating was upgraded from IND ‘D’ to
investment grade IND ‘BB’. Post further upgrades (CIL guidance – ‘A’ by
Q1FY23), the margin requirement for BG and CC accounts may be lowered by
~5%, which will free up some cash. Additionally, the performance bank
guarantee (PBG) requirement for government and private projects has come
down, which will again release cash. Cumulatively, CIL expects INR 900mn
retention release (next six months) and INR 1.2bn cash margin release over the
next two years. We cut our EPS to factor in delays in handing over of INR
18bn of CIDCO project site. Reiterate BUY with reduced TP of INR 232/sh.
Q3FY22 Financial highlights: Revenue: INR 3.7bn (+20%/+6% YoY/QoQ, 4%
beat). EBITDA: INR 572mn (+5%/-7% YoY/QoQ, 7% miss). EBITDA margin:
15.6% (17.9%/17.8% for Q3FY21/Q2FY22, vs est. of 17.5%). RPAT/APAT: INR
128mn (-16.2%/-25.9% YoY/QoQ, 29% miss on account of EBITDA miss,
higher depreciation and interest cost). Revenue from CIDCO project was
impacted by INR 400mn due to restrictions imposed on the project, which
were lifted in Jan-22.
Robust OB; execution ramping up: With order inflow (OI) of INR 6.6bn for
9MFYTD, the OB stood at INR 84.7bn, as of Dec-21 (of this, INR 18bn of
CIDCO site is yet to be handed over). CIL is in advanced negotiations for
orders worth INR 18.6bn and expects FY22 OI at INR 24bn. It has received a
repeat order for civil works at Raymond, Thane, worth INR 2.3bn.
Comfortable balance sheet: Standalone gross/net debt decreased to INR
2.7bn/882mn (INR 2.9bn/893mn in Q2FY22, including INR 550mn of
promoter loan) with a D/E of 0.28x/0.09x. Collections came in at INR 3bn
(similar to Q2FY22). CIL has spent INR 335mn on Capex in 9MFYTD, with
INR 200mn expected in Q4FY22. It is in advanced stages of non fund based
limit enhancement with banks, amounting to INR 2.5bn. This would help
replace retention money with retention BG and release INR 900mn. CIL
expects its credit rating to be restored to ‘A’ category in Q1FY23, which will
reduce the margin requirement by ~5%, from current 10-15%, and help
realise INR 1.2bn of cash margin over the next two years. All this will result
in less cash requirement, which can be used to encourage growth. CIL
expects to be debt free by Sep-23.
Standalone Financial Summary (INR mn) YE March Q3FY22 Q3FY21 YoY (%) Q2FY22 QoQ (%) FY21 FY22E FY23E FY24E
Revenues 3,655 3,058 20 3,434 6 8,797 13,789 19,940 23,039
EBITDA 572 546 5 612 -7 1,365 2,185 3,290 3,801
APAT 128 152 -16 172 -26 18 479 1,184 1,592
EPS (INR) 1.9 2.2 -16.2 2.5 -25.9 0.3 7.1 17.4 23.5
P/E (x)
537.5 20.1 8.1 6.0
EV/EBIDTA (x)
8.0 4.7 3.4 2.9
RoE (%)
0.2 5.0 11.5 13.7
Standalone Estimate Change Summary
Particulars
(INR mn)
FY22E FY23E FY24E
New Old Chg. (%) New Old Chg. (%) New Old Chg. (%)
Revenue 13,789 16,220 (15.0) 19,940 22,733 (12.3) 23,039 26,540 (13.2)
EBITDA 2,185 2,660 (17.8) 3,290 3,751 (12.3) 3,801 4,379 (13.2)
EBITDA (%) 15.9 16.4 (55.0) 16.5 16.5 (0.0) 16.5 16.5 (0.0)
APAT 479 819 (41.5) 1,184 1,500 (21.1) 1,592 1,979 (19.5)
Source: Company, HSIE Research
BUY CMP (as on 15 Feb 2022) INR 142
Target Price INR 232
NIFTY 17,352
KEY
CHANGES OLD NEW
Rating BUY BUY
Price Target INR 287 INR 232
EPS Change
%
FY22E FY23E FY24E
-41.5 -21.1 -19.5
KEY STOCK DATA
Bloomberg code CAPACITE IN
No. of Shares (mn) 68
MCap (INR bn) / ($ mn) 10/129
6m avg traded value (INR mn) 69
52 Week high / low INR 252/123
STOCK PERFORMANCE (%)
3M 6M 12M
Absolute (%) (21.0) (34.7) (30.9)
Relative (%) (16.8) (39.6) (42.4)
SHAREHOLDING PATTERN (%)
Sep-21 Dec-21
Promoters 38.64 38.64
FIs & Local MFs 16.99 16.65
FPIs 7.25 7.74
Public & Others 37.12 36.97
Pledged Shares 7.36 7.36
Source: BSE
Pledge as a % of total shares
Parikshit D Kandpal, CFA
+91-22-6171-7317
Manoj Rawat
+91-22-6171-7358
Nikhil Kanodia
+91-22-6171-7335
P a g e | 133
HSIE Results Daily
IT, Exchanges
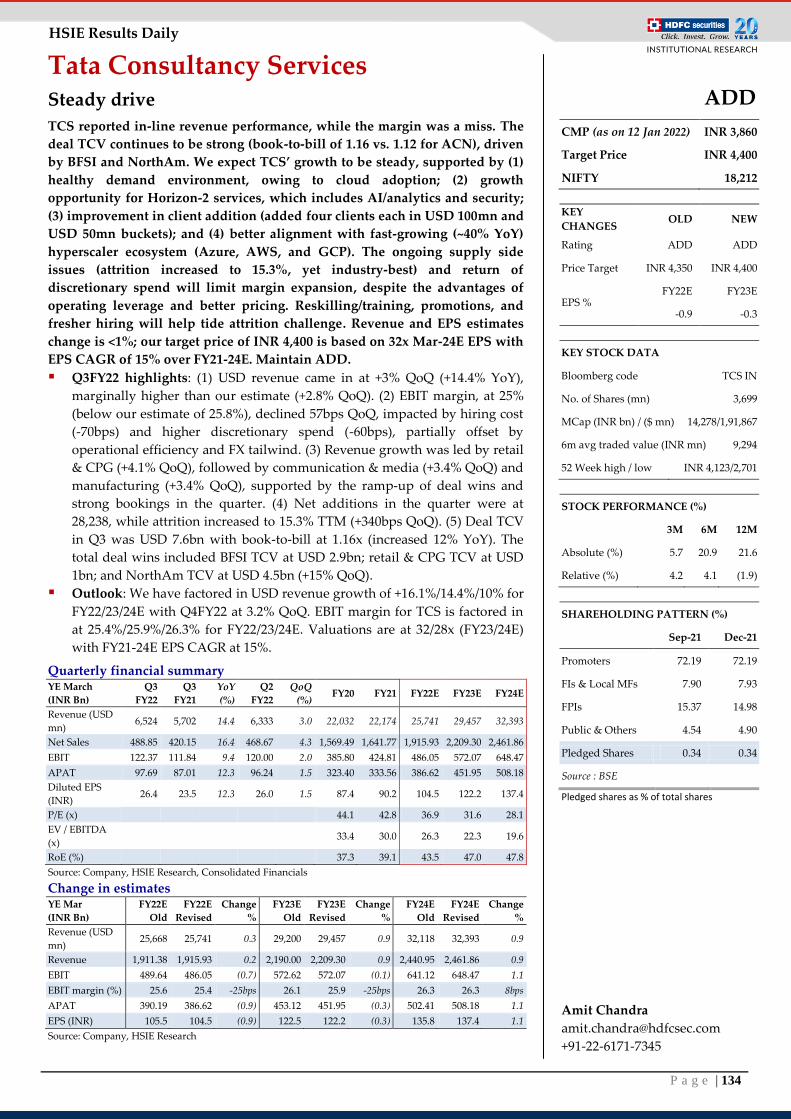
P a g e | 134
HSIE Results Daily
Tata Consultancy Services Steady drive
TCS reported in-line revenue performance, while the margin was a miss. The
deal TCV continues to be strong (book-to-bill of 1.16 vs. 1.12 for ACN), driven
by BFSI and NorthAm. We expect TCS’ growth to be steady, supported by (1)
healthy demand environment, owing to cloud adoption; (2) growth
opportunity for Horizon-2 services, which includes AI/analytics and security;
(3) improvement in client addition (added four clients each in USD 100mn and
USD 50mn buckets); and (4) better alignment with fast-growing (~40% YoY)
hyperscaler ecosystem (Azure, AWS, and GCP). The ongoing supply side
issues (attrition increased to 15.3%, yet industry-best) and return of
discretionary spend will limit margin expansion, despite the advantages of
operating leverage and better pricing. Reskilling/training, promotions, and
fresher hiring will help tide attrition challenge. Revenue and EPS estimates
change is <1%; our target price of INR 4,400 is based on 32x Mar-24E EPS with
EPS CAGR of 15% over FY21-24E. Maintain ADD.
Q3FY22 highlights: (1) USD revenue came in at +3% QoQ (+14.4% YoY),
marginally higher than our estimate (+2.8% QoQ). (2) EBIT margin, at 25%
(below our estimate of 25.8%), declined 57bps QoQ, impacted by hiring cost
(-70bps) and higher discretionary spend (-60bps), partially offset by
operational efficiency and FX tailwind. (3) Revenue growth was led by retail
& CPG (+4.1% QoQ), followed by communication & media (+3.4% QoQ) and
manufacturing (+3.4% QoQ), supported by the ramp-up of deal wins and
strong bookings in the quarter. (4) Net additions in the quarter were at
28,238, while attrition increased to 15.3% TTM (+340bps QoQ). (5) Deal TCV
in Q3 was USD 7.6bn with book-to-bill at 1.16x (increased 12% YoY). The
total deal wins included BFSI TCV at USD 2.9bn; retail & CPG TCV at USD
1bn; and NorthAm TCV at USD 4.5bn (+15% QoQ).
Outlook: We have factored in USD revenue growth of +16.1%/14.4%/10% for
FY22/23/24E with Q4FY22 at 3.2% QoQ. EBIT margin for TCS is factored in
at 25.4%/25.9%/26.3% for FY22/23/24E. Valuations are at 32/28x (FY23/24E)
with FY21-24E EPS CAGR at 15%.
Quarterly financial summary YE March
(INR Bn)
Q3
FY22
Q3
FY21
YoY
(%)
Q2
FY22
QoQ
(%) FY20 FY21 FY22E FY23E FY24E
Revenue (USD
mn) 6,524 5,702 14.4 6,333 3.0 22,032 22,174 25,741 29,457 32,393
Net Sales 488.85 420.15 16.4 468.67 4.3 1,569.49 1,641.77 1,915.93 2,209.30 2,461.86
EBIT 122.37 111.84 9.4 120.00 2.0 385.80 424.81 486.05 572.07 648.47
APAT 97.69 87.01 12.3 96.24 1.5 323.40 333.56 386.62 451.95 508.18
Diluted EPS
(INR) 26.4 23.5 12.3 26.0 1.5 87.4 90.2 104.5 122.2 137.4
P/E (x)
44.1 42.8 36.9 31.6 28.1
EV / EBITDA
(x) 33.4 30.0 26.3 22.3 19.6
RoE (%)
37.3 39.1 43.5 47.0 47.8
Source: Company, HSIE Research, Consolidated Financials
Change in estimates YE Mar
(INR Bn)
FY22E
Old
FY22E
Revised
Change
%
FY23E
Old
FY23E
Revised
Change
%
FY24E
Old
FY24E
Revised
Change
%
Revenue (USD
mn) 25,668 25,741 0.3 29,200 29,457 0.9 32,118 32,393 0.9
Revenue 1,911.38 1,915.93 0.2 2,190.00 2,209.30 0.9 2,440.95 2,461.86 0.9
EBIT 489.64 486.05 (0.7) 572.62 572.07 (0.1) 641.12 648.47 1.1
EBIT margin (%) 25.6 25.4 -25bps 26.1 25.9 -25bps 26.3 26.3 8bps
APAT 390.19 386.62 (0.9) 453.12 451.95 (0.3) 502.41 508.18 1.1
EPS (INR) 105.5 104.5 (0.9) 122.5 122.2 (0.3) 135.8 137.4 1.1
Source: Company, HSIE Research
ADD
CMP (as on 12 Jan 2022) INR 3,860
Target Price INR 4,400
NIFTY 18,212
KEY
CHANGES OLD NEW
Rating ADD ADD
Price Target INR 4,350 INR 4,400
EPS % FY22E FY23E
-0.9 -0.3
KEY STOCK DATA
Bloomberg code TCS IN
No. of Shares (mn) 3,699
MCap (INR bn) / ($ mn) 14,278/1,91,867
6m avg traded value (INR mn) 9,294
52 Week high / low INR 4,123/2,701
STOCK PERFORMANCE (%)
3M 6M 12M
Absolute (%) 5.7 20.9 21.6
Relative (%) 4.2 4.1 (1.9)
SHAREHOLDING PATTERN (%)
Sep-21 Dec-21
Promoters 72.19 72.19
FIs & Local MFs 7.90 7.93
FPIs 15.37 14.98
Public & Others 4.54 4.90
Pledged Shares 0.34 0.34
Source : BSE
Pledged shares as % of total shares
Amit Chandra
+91-22-6171-7345
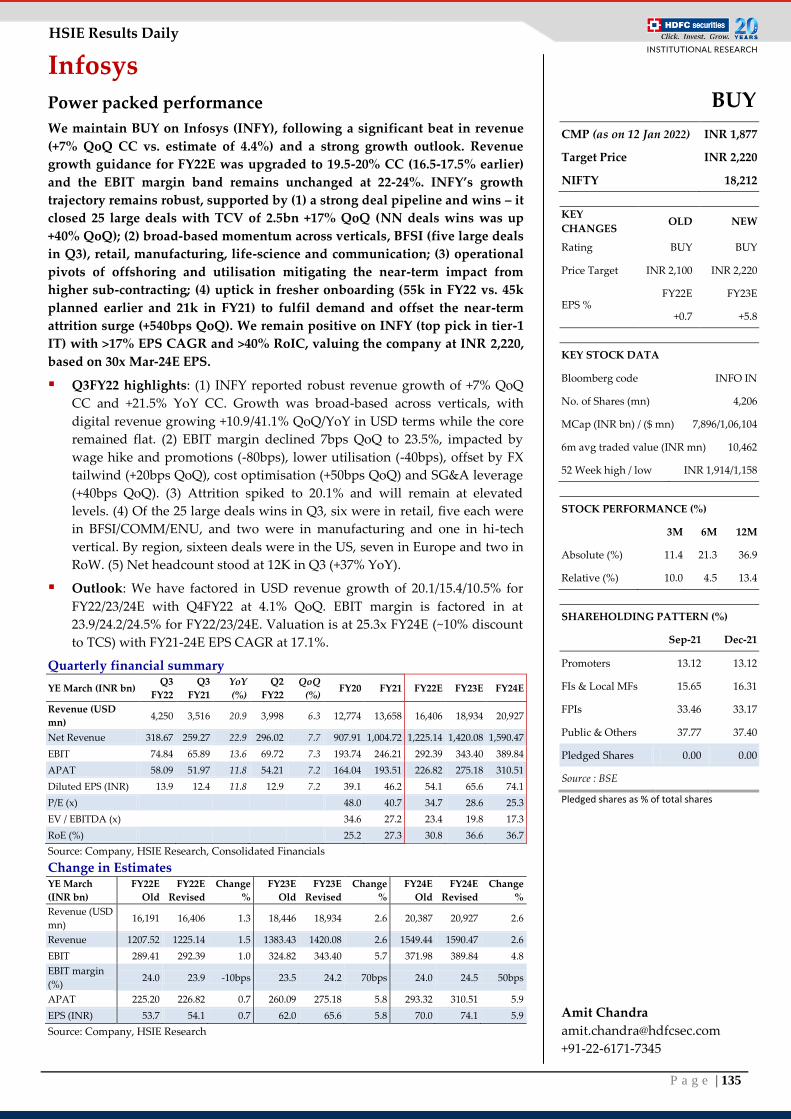
P a g e | 135
HSIE Results Daily
Infosys
Power packed performance
We maintain BUY on Infosys (INFY), following a significant beat in revenue
(+7% QoQ CC vs. estimate of 4.4%) and a strong growth outlook. Revenue
growth guidance for FY22E was upgraded to 19.5-20% CC (16.5-17.5% earlier)
and the EBIT margin band remains unchanged at 22-24%. INFY’s growth
trajectory remains robust, supported by (1) a strong deal pipeline and wins – it
closed 25 large deals with TCV of 2.5bn +17% QoQ (NN deals wins was up
+40% QoQ); (2) broad-based momentum across verticals, BFSI (five large deals
in Q3), retail, manufacturing, life-science and communication; (3) operational
pivots of offshoring and utilisation mitigating the near-term impact from
higher sub-contracting; (4) uptick in fresher onboarding (55k in FY22 vs. 45k
planned earlier and 21k in FY21) to fulfil demand and offset the near-term
attrition surge (+540bps QoQ). We remain positive on INFY (top pick in tier-1
IT) with >17% EPS CAGR and >40% RoIC, valuing the company at INR 2,220,
based on 30x Mar-24E EPS.
Q3FY22 highlights: (1) INFY reported robust revenue growth of +7% QoQ
CC and +21.5% YoY CC. Growth was broad-based across verticals, with
digital revenue growing +10.9/41.1% QoQ/YoY in USD terms while the core
remained flat. (2) EBIT margin declined 7bps QoQ to 23.5%, impacted by
wage hike and promotions (-80bps), lower utilisation (-40bps), offset by FX
tailwind (+20bps QoQ), cost optimisation (+50bps QoQ) and SG&A leverage
(+40bps QoQ). (3) Attrition spiked to 20.1% and will remain at elevated
levels. (4) Of the 25 large deals wins in Q3, six were in retail, five each were
in BFSI/COMM/ENU, and two were in manufacturing and one in hi-tech
vertical. By region, sixteen deals were in the US, seven in Europe and two in
RoW. (5) Net headcount stood at 12K in Q3 (+37% YoY).
Outlook: We have factored in USD revenue growth of 20.1/15.4/10.5% for
FY22/23/24E with Q4FY22 at 4.1% QoQ. EBIT margin is factored in at
23.9/24.2/24.5% for FY22/23/24E. Valuation is at 25.3x FY24E (~10% discount
to TCS) with FY21-24E EPS CAGR at 17.1%.
Quarterly financial summary
YE March (INR bn) Q3
FY22
Q3
FY21
YoY
(%)
Q2
FY22
QoQ
(%) FY20 FY21 FY22E FY23E FY24E
Revenue (USD
mn) 4,250 3,516 20.9 3,998 6.3 12,774 13,658 16,406 18,934 20,927
Net Revenue 318.67 259.27 22.9 296.02 7.7 907.91 1,004.72 1,225.14 1,420.08 1,590.47
EBIT 74.84 65.89 13.6 69.72 7.3 193.74 246.21 292.39 343.40 389.84
APAT 58.09 51.97 11.8 54.21 7.2 164.04 193.51 226.82 275.18 310.51
Diluted EPS (INR) 13.9 12.4 11.8 12.9 7.2 39.1 46.2 54.1 65.6 74.1
P/E (x)
48.0 40.7 34.7 28.6 25.3
EV / EBITDA (x)
34.6 27.2 23.4 19.8 17.3
RoE (%)
25.2 27.3 30.8 36.6 36.7
Source: Company, HSIE Research, Consolidated Financials
Change in Estimates YE March
(INR bn)
FY22E
Old
FY22E
Revised
Change
%
FY23E
Old
FY23E
Revised
Change
%
FY24E
Old
FY24E
Revised
Change
%
Revenue (USD
mn) 16,191 16,406 1.3 18,446 18,934 2.6 20,387 20,927 2.6
Revenue 1207.52 1225.14 1.5 1383.43 1420.08 2.6 1549.44 1590.47 2.6
EBIT 289.41 292.39 1.0 324.82 343.40 5.7 371.98 389.84 4.8
EBIT margin
(%) 24.0 23.9 -10bps 23.5 24.2 70bps 24.0 24.5 50bps
APAT 225.20 226.82 0.7 260.09 275.18 5.8 293.32 310.51 5.9
EPS (INR) 53.7 54.1 0.7 62.0 65.6 5.8 70.0 74.1 5.9
Source: Company, HSIE Research
BUY
CMP (as on 12 Jan 2022) INR 1,877
Target Price INR 2,220
NIFTY 18,212
KEY
CHANGES OLD NEW
Rating BUY BUY
Price Target INR 2,100 INR 2,220
EPS % FY22E FY23E
+0.7 +5.8
KEY STOCK DATA
Bloomberg code INFO IN
No. of Shares (mn) 4,206
MCap (INR bn) / ($ mn) 7,896/1,06,104
6m avg traded value (INR mn) 10,462
52 Week high / low INR 1,914/1,158
STOCK PERFORMANCE (%)
3M 6M 12M
Absolute (%) 11.4 21.3 36.9
Relative (%) 10.0 4.5 13.4
SHAREHOLDING PATTERN (%)
Sep-21 Dec-21
Promoters 13.12 13.12
FIs & Local MFs 15.65 16.31
FPIs 33.46 33.17
Public & Others 37.77 37.40
Pledged Shares 0.00 0.00
Source : BSE
Pledged shares as % of total shares
Amit Chandra
+91-22-6171-7345
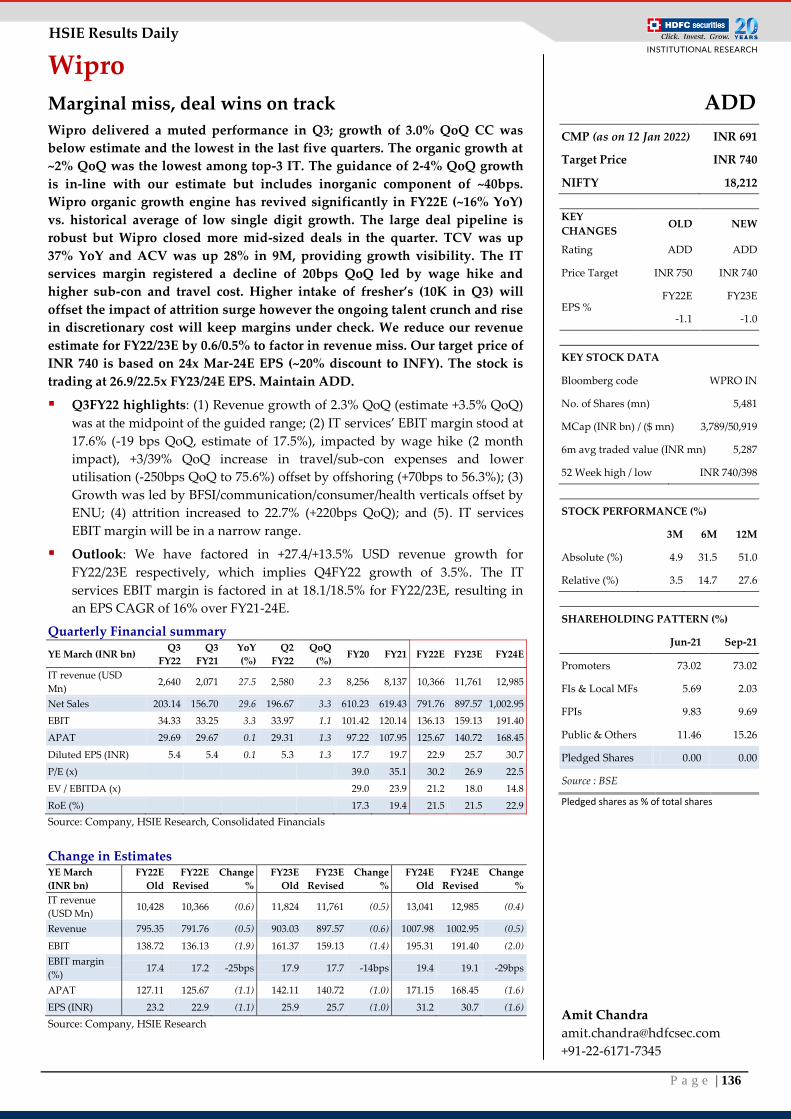
P a g e | 136
HSIE Results Daily
Wipro
Marginal miss, deal wins on track
Wipro delivered a muted performance in Q3; growth of 3.0% QoQ CC was
below estimate and the lowest in the last five quarters. The organic growth at
~2% QoQ was the lowest among top-3 IT. The guidance of 2-4% QoQ growth
is in-line with our estimate but includes inorganic component of ~40bps.
Wipro organic growth engine has revived significantly in FY22E (~16% YoY)
vs. historical average of low single digit growth. The large deal pipeline is
robust but Wipro closed more mid-sized deals in the quarter. TCV was up
37% YoY and ACV was up 28% in 9M, providing growth visibility. The IT
services margin registered a decline of 20bps QoQ led by wage hike and
higher sub-con and travel cost. Higher intake of fresher’s (10K in Q3) will
offset the impact of attrition surge however the ongoing talent crunch and rise
in discretionary cost will keep margins under check. We reduce our revenue
estimate for FY22/23E by 0.6/0.5% to factor in revenue miss. Our target price of
INR 740 is based on 24x Mar-24E EPS (~20% discount to INFY). The stock is
trading at 26.9/22.5x FY23/24E EPS. Maintain ADD.
Q3FY22 highlights: (1) Revenue growth of 2.3% QoQ (estimate +3.5% QoQ)
was at the midpoint of the guided range; (2) IT services’ EBIT margin stood at
17.6% (-19 bps QoQ, estimate of 17.5%), impacted by wage hike (2 month
impact), +3/39% QoQ increase in travel/sub-con expenses and lower
utilisation (-250bps QoQ to 75.6%) offset by offshoring (+70bps to 56.3%); (3)
Growth was led by BFSI/communication/consumer/health verticals offset by
ENU; (4) attrition increased to 22.7% (+220bps QoQ); and (5). IT services
EBIT margin will be in a narrow range.
Outlook: We have factored in +27.4/+13.5% USD revenue growth for
FY22/23E respectively, which implies Q4FY22 growth of 3.5%. The IT
services EBIT margin is factored in at 18.1/18.5% for FY22/23E, resulting in
an EPS CAGR of 16% over FY21-24E.
Quarterly Financial summary
YE March (INR bn) Q3
FY22
Q3
FY21
YoY
(%)
Q2
FY22
QoQ
(%) FY20 FY21 FY22E FY23E FY24E
IT revenue (USD
Mn) 2,640 2,071 27.5 2,580 2.3 8,256 8,137 10,366 11,761 12,985
Net Sales 203.14 156.70 29.6 196.67 3.3 610.23 619.43 791.76 897.57 1,002.95
EBIT 34.33 33.25 3.3 33.97 1.1 101.42 120.14 136.13 159.13 191.40
APAT 29.69 29.67 0.1 29.31 1.3 97.22 107.95 125.67 140.72 168.45
Diluted EPS (INR) 5.4 5.4 0.1 5.3 1.3 17.7 19.7 22.9 25.7 30.7
P/E (x)
39.0 35.1 30.2 26.9 22.5
EV / EBITDA (x)
29.0 23.9 21.2 18.0 14.8
RoE (%)
17.3 19.4 21.5 21.5 22.9
Source: Company, HSIE Research, Consolidated Financials
Change in Estimates YE March
(INR bn)
FY22E
Old
FY22E
Revised
Change
%
FY23E
Old
FY23E
Revised
Change
%
FY24E
Old
FY24E
Revised
Change
%
IT revenue
(USD Mn) 10,428 10,366 (0.6) 11,824 11,761 (0.5) 13,041 12,985 (0.4)
Revenue 795.35 791.76 (0.5) 903.03 897.57 (0.6) 1007.98 1002.95 (0.5)
EBIT 138.72 136.13 (1.9) 161.37 159.13 (1.4) 195.31 191.40 (2.0)
EBIT margin
(%) 17.4 17.2 -25bps 17.9 17.7 -14bps 19.4 19.1 -29bps
APAT 127.11 125.67 (1.1) 142.11 140.72 (1.0) 171.15 168.45 (1.6)
EPS (INR) 23.2 22.9 (1.1) 25.9 25.7 (1.0) 31.2 30.7 (1.6)
Source: Company, HSIE Research
ADD
CMP (as on 12 Jan 2022) INR 691
Target Price INR 740
NIFTY 18,212
KEY
CHANGES OLD NEW
Rating ADD ADD
Price Target INR 750 INR 740
EPS % FY22E FY23E
-1.1 -1.0
KEY STOCK DATA
Bloomberg code WPRO IN
No. of Shares (mn) 5,481
MCap (INR bn) / ($ mn) 3,789/50,919
6m avg traded value (INR mn) 5,287
52 Week high / low INR 740/398
STOCK PERFORMANCE (%)
3M 6M 12M
Absolute (%) 4.9 31.5 51.0
Relative (%) 3.5 14.7 27.6
SHAREHOLDING PATTERN (%)
Jun-21 Sep-21
Promoters 73.02 73.02
FIs & Local MFs 5.69 2.03
FPIs 9.83 9.69
Public & Others 11.46 15.26
Pledged Shares 0.00 0.00
Source : BSE
Pledged shares as % of total shares
Amit Chandra
+91-22-6171-7345
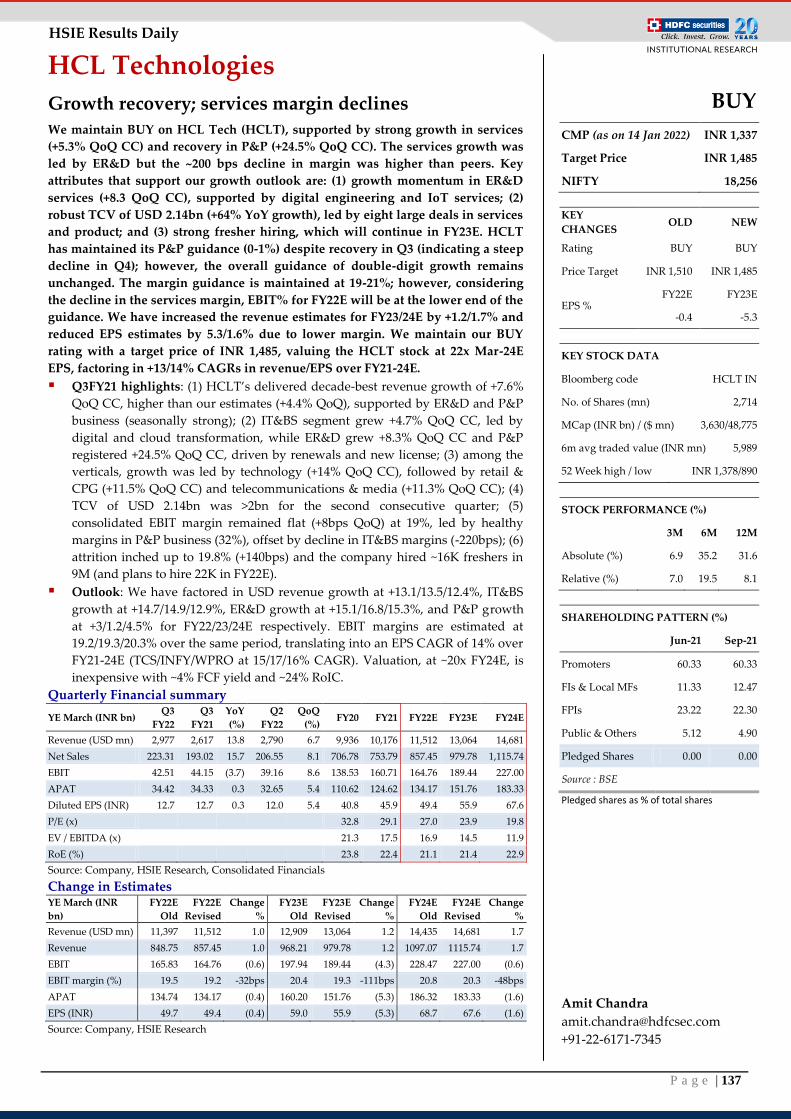
P a g e | 137
HSIE Results Daily
HCL Technologies
Growth recovery; services margin declines
We maintain BUY on HCL Tech (HCLT), supported by strong growth in services
(+5.3% QoQ CC) and recovery in P&P (+24.5% QoQ CC). The services growth was
led by ER&D but the ~200 bps decline in margin was higher than peers. Key
attributes that support our growth outlook are: (1) growth momentum in ER&D
services (+8.3 QoQ CC), supported by digital engineering and IoT services; (2)
robust TCV of USD 2.14bn (+64% YoY growth), led by eight large deals in services
and product; and (3) strong fresher hiring, which will continue in FY23E. HCLT
has maintained its P&P guidance (0-1%) despite recovery in Q3 (indicating a steep
decline in Q4); however, the overall guidance of double-digit growth remains
unchanged. The margin guidance is maintained at 19-21%; however, considering
the decline in the services margin, EBIT% for FY22E will be at the lower end of the
guidance. We have increased the revenue estimates for FY23/24E by +1.2/1.7% and
reduced EPS estimates by 5.3/1.6% due to lower margin. We maintain our BUY
rating with a target price of INR 1,485, valuing the HCLT stock at 22x Mar-24E
EPS, factoring in +13/14% CAGRs in revenue/EPS over FY21-24E.
Q3FY21 highlights: (1) HCLT’s delivered decade-best revenue growth of +7.6%
QoQ CC, higher than our estimates (+4.4% QoQ), supported by ER&D and P&P
business (seasonally strong); (2) IT&BS segment grew +4.7% QoQ CC, led by
digital and cloud transformation, while ER&D grew +8.3% QoQ CC and P&P
registered +24.5% QoQ CC, driven by renewals and new license; (3) among the
verticals, growth was led by technology (+14% QoQ CC), followed by retail &
CPG (+11.5% QoQ CC) and telecommunications & media (+11.3% QoQ CC); (4)
TCV of USD 2.14bn was >2bn for the second consecutive quarter; (5)
consolidated EBIT margin remained flat (+8bps QoQ) at 19%, led by healthy
margins in P&P business (32%), offset by decline in IT&BS margins (-220bps); (6)
attrition inched up to 19.8% (+140bps) and the company hired ~16K freshers in
9M (and plans to hire 22K in FY22E).
Outlook: We have factored in USD revenue growth at +13.1/13.5/12.4%, IT&BS
growth at +14.7/14.9/12.9%, ER&D growth at +15.1/16.8/15.3%, and P&P growth
at +3/1.2/4.5% for FY22/23/24E respectively. EBIT margins are estimated at
19.2/19.3/20.3% over the same period, translating into an EPS CAGR of 14% over
FY21-24E (TCS/INFY/WPRO at 15/17/16% CAGR). Valuation, at ~20x FY24E, is
inexpensive with ~4% FCF yield and ~24% RoIC.
Quarterly Financial summary
YE March (INR bn) Q3
FY22
Q3
FY21
YoY
(%)
Q2
FY22
QoQ
(%) FY20 FY21 FY22E FY23E FY24E
Revenue (USD mn) 2,977 2,617 13.8 2,790 6.7 9,936 10,176 11,512 13,064 14,681
Net Sales 223.31 193.02 15.7 206.55 8.1 706.78 753.79 857.45 979.78 1,115.74
EBIT 42.51 44.15 (3.7) 39.16 8.6 138.53 160.71 164.76 189.44 227.00
APAT 34.42 34.33 0.3 32.65 5.4 110.62 124.62 134.17 151.76 183.33
Diluted EPS (INR) 12.7 12.7 0.3 12.0 5.4 40.8 45.9 49.4 55.9 67.6
P/E (x)
32.8 29.1 27.0 23.9 19.8
EV / EBITDA (x)
21.3 17.5 16.9 14.5 11.9
RoE (%)
23.8 22.4 21.1 21.4 22.9
Source: Company, HSIE Research, Consolidated Financials
Change in Estimates YE March (INR
bn)
FY22E
Old
FY22E
Revised
Change
%
FY23E
Old
FY23E
Revised
Change
%
FY24E
Old
FY24E
Revised
Change
%
Revenue (USD mn) 11,397 11,512 1.0 12,909 13,064 1.2 14,435 14,681 1.7
Revenue 848.75 857.45 1.0 968.21 979.78 1.2 1097.07 1115.74 1.7
EBIT 165.83 164.76 (0.6) 197.94 189.44 (4.3) 228.47 227.00 (0.6)
EBIT margin (%) 19.5 19.2 -32bps 20.4 19.3 -111bps 20.8 20.3 -48bps
APAT 134.74 134.17 (0.4) 160.20 151.76 (5.3) 186.32 183.33 (1.6)
EPS (INR) 49.7 49.4 (0.4) 59.0 55.9 (5.3) 68.7 67.6 (1.6)
Source: Company, HSIE Research
BUY
CMP (as on 14 Jan 2022) INR 1,337
Target Price INR 1,485
NIFTY 18,256
KEY
CHANGES OLD NEW
Rating BUY BUY
Price Target INR 1,510 INR 1,485
EPS % FY22E FY23E
-0.4 -5.3
KEY STOCK DATA
Bloomberg code HCLT IN
No. of Shares (mn) 2,714
MCap (INR bn) / ($ mn) 3,630/48,775
6m avg traded value (INR mn) 5,989
52 Week high / low INR 1,378/890
STOCK PERFORMANCE (%)
3M 6M 12M
Absolute (%) 6.9 35.2 31.6
Relative (%) 7.0 19.5 8.1
SHAREHOLDING PATTERN (%)
Jun-21 Sep-21
Promoters 60.33 60.33
FIs & Local MFs 11.33 12.47
FPIs 23.22 22.30
Public & Others 5.12 4.90
Pledged Shares 0.00 0.00
Source : BSE
Pledged shares as % of total shares
Amit Chandra
+91-22-6171-7345
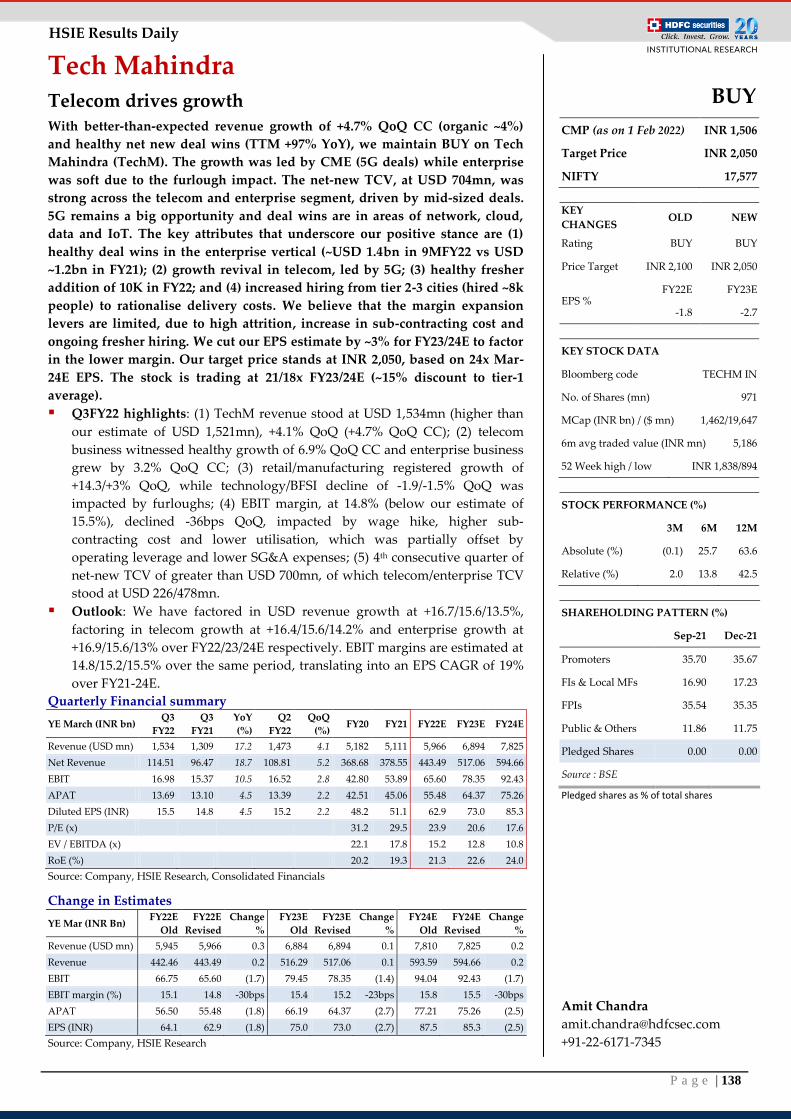
P a g e | 138
HSIE Results Daily
Tech Mahindra Telecom drives growth With better-than-expected revenue growth of +4.7% QoQ CC (organic ~4%)
and healthy net new deal wins (TTM +97% YoY), we maintain BUY on Tech
Mahindra (TechM). The growth was led by CME (5G deals) while enterprise
was soft due to the furlough impact. The net-new TCV, at USD 704mn, was
strong across the telecom and enterprise segment, driven by mid-sized deals.
5G remains a big opportunity and deal wins are in areas of network, cloud,
data and IoT. The key attributes that underscore our positive stance are (1)
healthy deal wins in the enterprise vertical (~USD 1.4bn in 9MFY22 vs USD
~1.2bn in FY21); (2) growth revival in telecom, led by 5G; (3) healthy fresher
addition of 10K in FY22; and (4) increased hiring from tier 2-3 cities (hired ~8k
people) to rationalise delivery costs. We believe that the margin expansion
levers are limited, due to high attrition, increase in sub-contracting cost and
ongoing fresher hiring. We cut our EPS estimate by ~3% for FY23/24E to factor
in the lower margin. Our target price stands at INR 2,050, based on 24x Mar-
24E EPS. The stock is trading at 21/18x FY23/24E (~15% discount to tier-1
average).
Q3FY22 highlights: (1) TechM revenue stood at USD 1,534mn (higher than
our estimate of USD 1,521mn), +4.1% QoQ (+4.7% QoQ CC); (2) telecom
business witnessed healthy growth of 6.9% QoQ CC and enterprise business
grew by 3.2% QoQ CC; (3) retail/manufacturing registered growth of
+14.3/+3% QoQ, while technology/BFSI decline of -1.9/-1.5% QoQ was
impacted by furloughs; (4) EBIT margin, at 14.8% (below our estimate of
15.5%), declined -36bps QoQ, impacted by wage hike, higher sub-
contracting cost and lower utilisation, which was partially offset by
operating leverage and lower SG&A expenses; (5) 4th consecutive quarter of
net-new TCV of greater than USD 700mn, of which telecom/enterprise TCV
stood at USD 226/478mn.
Outlook: We have factored in USD revenue growth at +16.7/15.6/13.5%,
factoring in telecom growth at +16.4/15.6/14.2% and enterprise growth at
+16.9/15.6/13% over FY22/23/24E respectively. EBIT margins are estimated at
14.8/15.2/15.5% over the same period, translating into an EPS CAGR of 19%
over FY21-24E.
Quarterly Financial summary
YE March (INR bn) Q3
FY22
Q3
FY21
YoY
(%)
Q2
FY22
QoQ
(%) FY20 FY21 FY22E FY23E FY24E
Revenue (USD mn) 1,534 1,309 17.2 1,473 4.1 5,182 5,111 5,966 6,894 7,825
Net Revenue 114.51 96.47 18.7 108.81 5.2 368.68 378.55 443.49 517.06 594.66
EBIT 16.98 15.37 10.5 16.52 2.8 42.80 53.89 65.60 78.35 92.43
APAT 13.69 13.10 4.5 13.39 2.2 42.51 45.06 55.48 64.37 75.26
Diluted EPS (INR) 15.5 14.8 4.5 15.2 2.2 48.2 51.1 62.9 73.0 85.3
P/E (x)
31.2 29.5 23.9 20.6 17.6
EV / EBITDA (x) 22.1 17.8 15.2 12.8 10.8
RoE (%) 20.2 19.3 21.3 22.6 24.0
Source: Company, HSIE Research, Consolidated Financials
Change in Estimates
YE Mar (INR Bn) FY22E
Old
FY22E
Revised
Change
%
FY23E
Old
FY23E
Revised
Change
%
FY24E
Old
FY24E
Revised
Change
%
Revenue (USD mn) 5,945 5,966 0.3 6,884 6,894 0.1 7,810 7,825 0.2
Revenue 442.46 443.49 0.2 516.29 517.06 0.1 593.59 594.66 0.2
EBIT 66.75 65.60 (1.7) 79.45 78.35 (1.4) 94.04 92.43 (1.7)
EBIT margin (%) 15.1 14.8 -30bps 15.4 15.2 -23bps 15.8 15.5 -30bps
APAT 56.50 55.48 (1.8) 66.19 64.37 (2.7) 77.21 75.26 (2.5)
EPS (INR) 64.1 62.9 (1.8) 75.0 73.0 (2.7) 87.5 85.3 (2.5)
Source: Company, HSIE Research
BUY
CMP (as on 1 Feb 2022) INR 1,506
Target Price INR 2,050
NIFTY 17,577
KEY
CHANGES OLD NEW
Rating BUY BUY
Price Target INR 2,100 INR 2,050
EPS % FY22E FY23E
-1.8 -2.7
KEY STOCK DATA
Bloomberg code TECHM IN
No. of Shares (mn) 971
MCap (INR bn) / ($ mn) 1,462/19,647
6m avg traded value (INR mn) 5,186
52 Week high / low INR 1,838/894
STOCK PERFORMANCE (%)
3M 6M 12M
Absolute (%) (0.1) 25.7 63.6
Relative (%) 2.0 13.8 42.5
SHAREHOLDING PATTERN (%)
Sep-21 Dec-21
Promoters 35.70 35.67
FIs & Local MFs 16.90 17.23
FPIs 35.54 35.35
Public & Others 11.86 11.75
Pledged Shares 0.00 0.00
Source : BSE
Pledged shares as % of total shares
Amit Chandra
+91-22-6171-7345
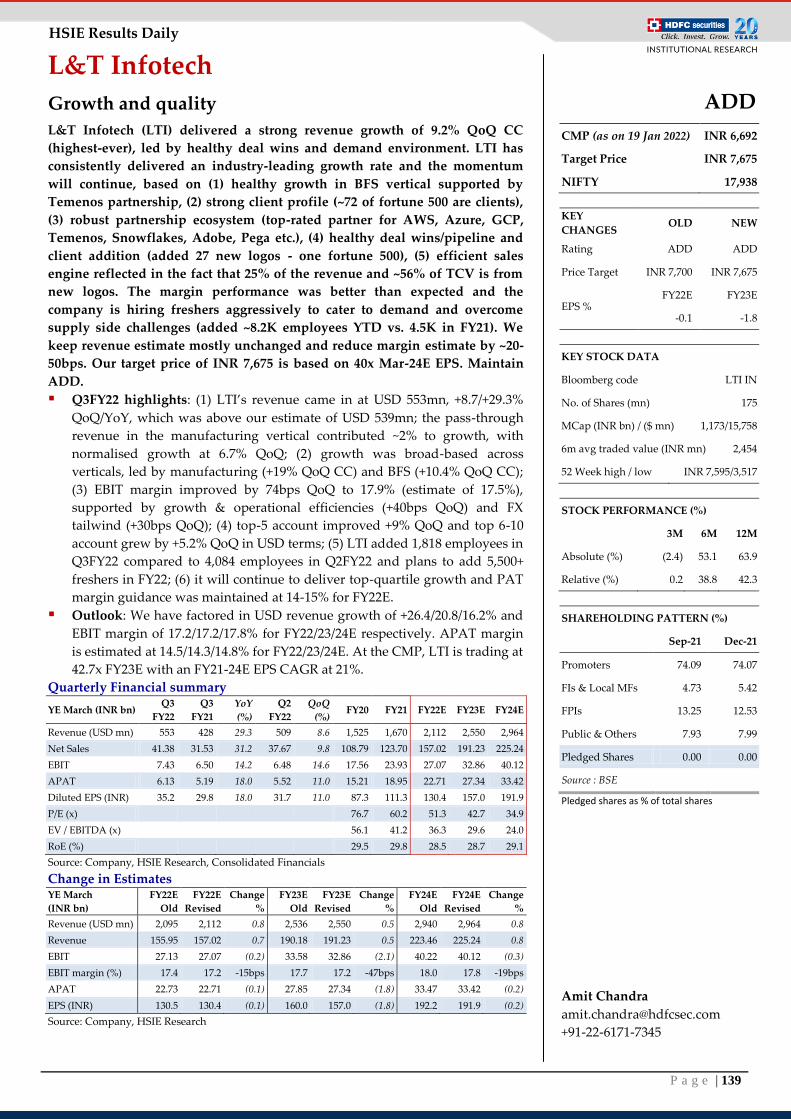
P a g e | 139
HSIE Results Daily
L&T Infotech
Growth and quality
L&T Infotech (LTI) delivered a strong revenue growth of 9.2% QoQ CC
(highest-ever), led by healthy deal wins and demand environment. LTI has
consistently delivered an industry-leading growth rate and the momentum
will continue, based on (1) healthy growth in BFS vertical supported by
Temenos partnership, (2) strong client profile (~72 of fortune 500 are clients),
(3) robust partnership ecosystem (top-rated partner for AWS, Azure, GCP,
Temenos, Snowflakes, Adobe, Pega etc.), (4) healthy deal wins/pipeline and
client addition (added 27 new logos - one fortune 500), (5) efficient sales
engine reflected in the fact that 25% of the revenue and ~56% of TCV is from
new logos. The margin performance was better than expected and the
company is hiring freshers aggressively to cater to demand and overcome
supply side challenges (added ~8.2K employees YTD vs. 4.5K in FY21). We
keep revenue estimate mostly unchanged and reduce margin estimate by ~20-
50bps. Our target price of INR 7,675 is based on 40x Mar-24E EPS. Maintain
ADD.
Q3FY22 highlights: (1) LTI’s revenue came in at USD 553mn, +8.7/+29.3%
QoQ/YoY, which was above our estimate of USD 539mn; the pass-through
revenue in the manufacturing vertical contributed ~2% to growth, with
normalised growth at 6.7% QoQ; (2) growth was broad-based across
verticals, led by manufacturing (+19% QoQ CC) and BFS (+10.4% QoQ CC);
(3) EBIT margin improved by 74bps QoQ to 17.9% (estimate of 17.5%),
supported by growth & operational efficiencies (+40bps QoQ) and FX
tailwind (+30bps QoQ); (4) top-5 account improved +9% QoQ and top 6-10
account grew by +5.2% QoQ in USD terms; (5) LTI added 1,818 employees in
Q3FY22 compared to 4,084 employees in Q2FY22 and plans to add 5,500+
freshers in FY22; (6) it will continue to deliver top-quartile growth and PAT
margin guidance was maintained at 14-15% for FY22E.
Outlook: We have factored in USD revenue growth of +26.4/20.8/16.2% and
EBIT margin of 17.2/17.2/17.8% for FY22/23/24E respectively. APAT margin
is estimated at 14.5/14.3/14.8% for FY22/23/24E. At the CMP, LTI is trading at
42.7x FY23E with an FY21-24E EPS CAGR at 21%.
Quarterly Financial summary
YE March (INR bn) Q3
FY22
Q3
FY21
YoY
(%)
Q2
FY22
QoQ
(%) FY20 FY21 FY22E FY23E FY24E
Revenue (USD mn) 553 428 29.3 509 8.6 1,525 1,670 2,112 2,550 2,964
Net Sales 41.38 31.53 31.2 37.67 9.8 108.79 123.70 157.02 191.23 225.24
EBIT 7.43 6.50 14.2 6.48 14.6 17.56 23.93 27.07 32.86 40.12
APAT 6.13 5.19 18.0 5.52 11.0 15.21 18.95 22.71 27.34 33.42
Diluted EPS (INR) 35.2 29.8 18.0 31.7 11.0 87.3 111.3 130.4 157.0 191.9
P/E (x)
76.7 60.2 51.3 42.7 34.9
EV / EBITDA (x)
56.1 41.2 36.3 29.6 24.0
RoE (%)
29.5 29.8 28.5 28.7 29.1
Source: Company, HSIE Research, Consolidated Financials
Change in Estimates YE March
(INR bn)
FY22E
Old
FY22E
Revised
Change
%
FY23E
Old
FY23E
Revised
Change
%
FY24E
Old
FY24E
Revised
Change
%
Revenue (USD mn) 2,095 2,112 0.8 2,536 2,550 0.5 2,940 2,964 0.8
Revenue 155.95 157.02 0.7 190.18 191.23 0.5 223.46 225.24 0.8
EBIT 27.13 27.07 (0.2) 33.58 32.86 (2.1) 40.22 40.12 (0.3)
EBIT margin (%) 17.4 17.2 -15bps 17.7 17.2 -47bps 18.0 17.8 -19bps
APAT 22.73 22.71 (0.1) 27.85 27.34 (1.8) 33.47 33.42 (0.2)
EPS (INR) 130.5 130.4 (0.1) 160.0 157.0 (1.8) 192.2 191.9 (0.2)
Source: Company, HSIE Research
ADD
CMP (as on 19 Jan 2022) INR 6,692
Target Price INR 7,675
NIFTY 17,938
KEY
CHANGES OLD NEW
Rating ADD ADD
Price Target INR 7,700 INR 7,675
EPS % FY22E FY23E
-0.1 -1.8
KEY STOCK DATA
Bloomberg code LTI IN
No. of Shares (mn) 175
MCap (INR bn) / ($ mn) 1,173/15,758
6m avg traded value (INR mn) 2,454
52 Week high / low INR 7,595/3,517
STOCK PERFORMANCE (%)
3M 6M 12M
Absolute (%) (2.4) 53.1 63.9
Relative (%) 0.2 38.8 42.3
SHAREHOLDING PATTERN (%)
Sep-21 Dec-21
Promoters 74.09 74.07
FIs & Local MFs 4.73 5.42
FPIs 13.25 12.53
Public & Others 7.93 7.99
Pledged Shares 0.00 0.00
Source : BSE
Pledged shares as % of total shares
Amit Chandra
+91-22-6171-7345
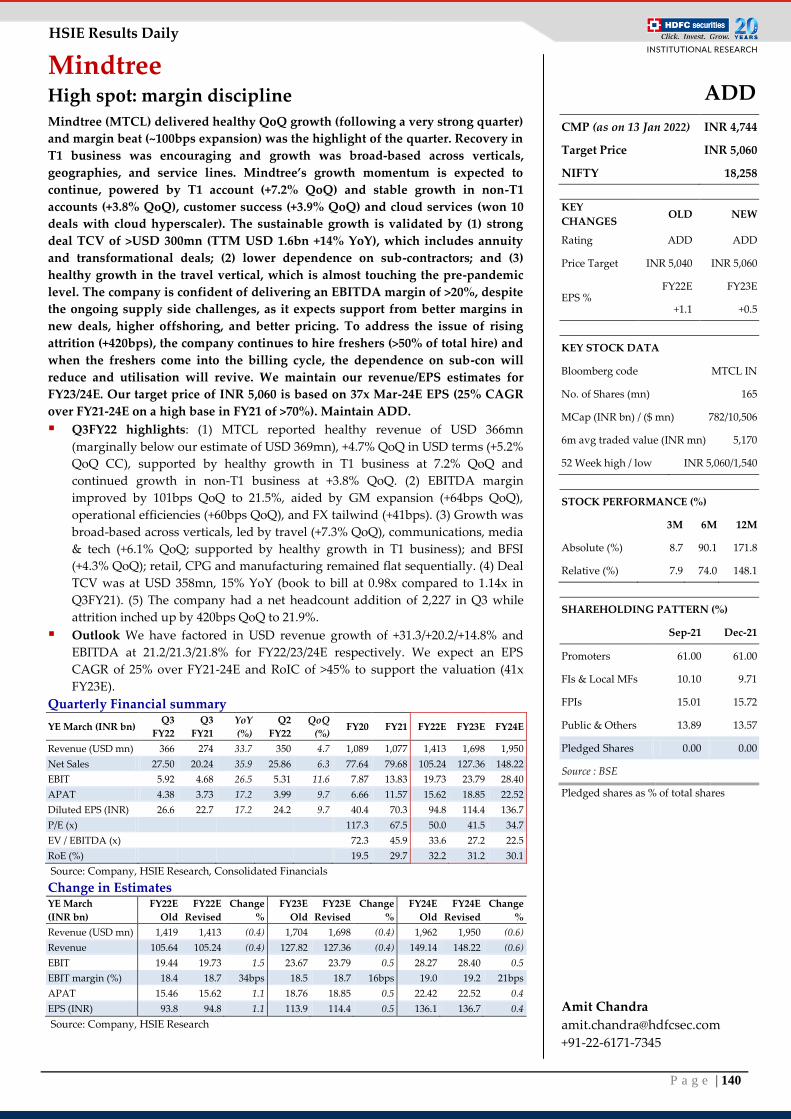
P a g e | 140
HSIE Results Daily
Mindtree High spot: margin discipline
Mindtree (MTCL) delivered healthy QoQ growth (following a very strong quarter)
and margin beat (~100bps expansion) was the highlight of the quarter. Recovery in
T1 business was encouraging and growth was broad-based across verticals,
geographies, and service lines. Mindtree’s growth momentum is expected to
continue, powered by T1 account (+7.2% QoQ) and stable growth in non-T1
accounts (+3.8% QoQ), customer success (+3.9% QoQ) and cloud services (won 10
deals with cloud hyperscaler). The sustainable growth is validated by (1) strong
deal TCV of >USD 300mn (TTM USD 1.6bn +14% YoY), which includes annuity
and transformational deals; (2) lower dependence on sub-contractors; and (3)
healthy growth in the travel vertical, which is almost touching the pre-pandemic
level. The company is confident of delivering an EBITDA margin of >20%, despite
the ongoing supply side challenges, as it expects support from better margins in
new deals, higher offshoring, and better pricing. To address the issue of rising
attrition (+420bps), the company continues to hire freshers (>50% of total hire) and
when the freshers come into the billing cycle, the dependence on sub-con will
reduce and utilisation will revive. We maintain our revenue/EPS estimates for
FY23/24E. Our target price of INR 5,060 is based on 37x Mar-24E EPS (25% CAGR
over FY21-24E on a high base in FY21 of >70%). Maintain ADD.
Q3FY22 highlights: (1) MTCL reported healthy revenue of USD 366mn
(marginally below our estimate of USD 369mn), +4.7% QoQ in USD terms (+5.2%
QoQ CC), supported by healthy growth in T1 business at 7.2% QoQ and
continued growth in non-T1 business at +3.8% QoQ. (2) EBITDA margin
improved by 101bps QoQ to 21.5%, aided by GM expansion (+64bps QoQ),
operational efficiencies (+60bps QoQ), and FX tailwind (+41bps). (3) Growth was
broad-based across verticals, led by travel (+7.3% QoQ), communications, media
& tech (+6.1% QoQ; supported by healthy growth in T1 business); and BFSI
(+4.3% QoQ); retail, CPG and manufacturing remained flat sequentially. (4) Deal
TCV was at USD 358mn, 15% YoY (book to bill at 0.98x compared to 1.14x in
Q3FY21). (5) The company had a net headcount addition of 2,227 in Q3 while
attrition inched up by 420bps QoQ to 21.9%.
Outlook We have factored in USD revenue growth of +31.3/+20.2/+14.8% and
EBITDA at 21.2/21.3/21.8% for FY22/23/24E respectively. We expect an EPS
CAGR of 25% over FY21-24E and RoIC of >45% to support the valuation (41x
FY23E).
Quarterly Financial summary
YE March (INR bn) Q3
FY22
Q3
FY21
YoY
(%)
Q2
FY22
QoQ
(%) FY20 FY21 FY22E FY23E FY24E
Revenue (USD mn) 366 274 33.7 350 4.7 1,089 1,077 1,413 1,698 1,950
Net Sales 27.50 20.24 35.9 25.86 6.3 77.64 79.68 105.24 127.36 148.22
EBIT 5.92 4.68 26.5 5.31 11.6 7.87 13.83 19.73 23.79 28.40
APAT 4.38 3.73 17.2 3.99 9.7 6.66 11.57 15.62 18.85 22.52
Diluted EPS (INR) 26.6 22.7 17.2 24.2 9.7 40.4 70.3 94.8 114.4 136.7
P/E (x)
117.3 67.5 50.0 41.5 34.7
EV / EBITDA (x)
72.3 45.9 33.6 27.2 22.5
RoE (%)
19.5 29.7 32.2 31.2 30.1
Source: Company, HSIE Research, Consolidated Financials
Change in Estimates YE March
(INR bn)
FY22E
Old
FY22E
Revised
Change
%
FY23E
Old
FY23E
Revised
Change
%
FY24E
Old
FY24E
Revised
Change
%
Revenue (USD mn) 1,419 1,413 (0.4) 1,704 1,698 (0.4) 1,962 1,950 (0.6)
Revenue 105.64 105.24 (0.4) 127.82 127.36 (0.4) 149.14 148.22 (0.6)
EBIT 19.44 19.73 1.5 23.67 23.79 0.5 28.27 28.40 0.5
EBIT margin (%) 18.4 18.7 34bps 18.5 18.7 16bps 19.0 19.2 21bps
APAT 15.46 15.62 1.1 18.76 18.85 0.5 22.42 22.52 0.4
EPS (INR) 93.8 94.8 1.1 113.9 114.4 0.5 136.1 136.7 0.4
Source: Company, HSIE Research
ADD
CMP (as on 13 Jan 2022) INR 4,744
Target Price INR 5,060
NIFTY 18,258
KEY
CHANGES OLD NEW
Rating ADD ADD
Price Target INR 5,040 INR 5,060
EPS % FY22E FY23E
+1.1 +0.5
KEY STOCK DATA
Bloomberg code MTCL IN
No. of Shares (mn) 165
MCap (INR bn) / ($ mn) 782/10,506
6m avg traded value (INR mn) 5,170
52 Week high / low INR 5,060/1,540
STOCK PERFORMANCE (%)
3M 6M 12M
Absolute (%) 8.7 90.1 171.8
Relative (%) 7.9 74.0 148.1
SHAREHOLDING PATTERN (%)
Sep-21 Dec-21
Promoters 61.00 61.00
FIs & Local MFs 10.10 9.71
FPIs 15.01 15.72
Public & Others 13.89 13.57
Pledged Shares 0.00 0.00
Source : BSE
Pledged shares as % of total shares
Amit Chandra
+91-22-6171-7345
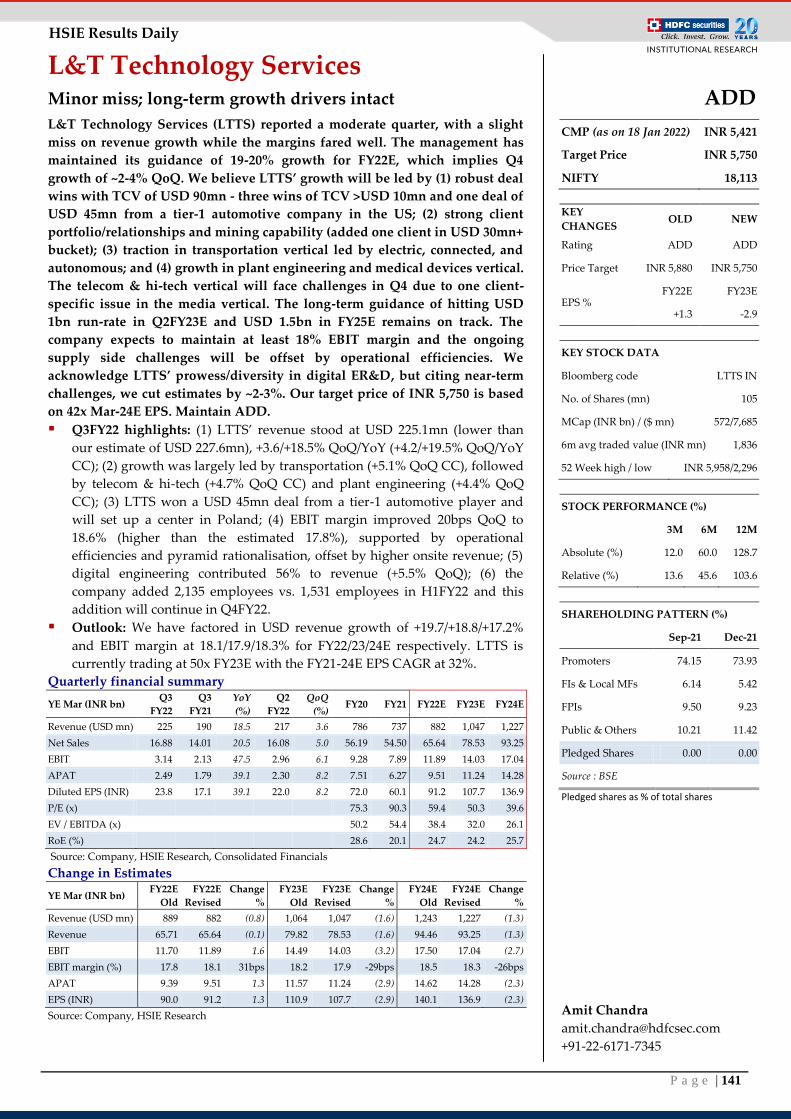
P a g e | 141
HSIE Results Daily
L&T Technology Services Minor miss; long-term growth drivers intact
L&T Technology Services (LTTS) reported a moderate quarter, with a slight
miss on revenue growth while the margins fared well. The management has
maintained its guidance of 19-20% growth for FY22E, which implies Q4
growth of ~2-4% QoQ. We believe LTTS’ growth will be led by (1) robust deal
wins with TCV of USD 90mn - three wins of TCV >USD 10mn and one deal of
USD 45mn from a tier-1 automotive company in the US; (2) strong client
portfolio/relationships and mining capability (added one client in USD 30mn+
bucket); (3) traction in transportation vertical led by electric, connected, and
autonomous; and (4) growth in plant engineering and medical devices vertical.
The telecom & hi-tech vertical will face challenges in Q4 due to one client-
specific issue in the media vertical. The long-term guidance of hitting USD
1bn run-rate in Q2FY23E and USD 1.5bn in FY25E remains on track. The
company expects to maintain at least 18% EBIT margin and the ongoing
supply side challenges will be offset by operational efficiencies. We
acknowledge LTTS’ prowess/diversity in digital ER&D, but citing near-term
challenges, we cut estimates by ~2-3%. Our target price of INR 5,750 is based
on 42x Mar-24E EPS. Maintain ADD.
Q3FY22 highlights: (1) LTTS’ revenue stood at USD 225.1mn (lower than
our estimate of USD 227.6mn), +3.6/+18.5% QoQ/YoY (+4.2/+19.5% QoQ/YoY
CC); (2) growth was largely led by transportation (+5.1% QoQ CC), followed
by telecom & hi-tech (+4.7% QoQ CC) and plant engineering (+4.4% QoQ
CC); (3) LTTS won a USD 45mn deal from a tier-1 automotive player and
will set up a center in Poland; (4) EBIT margin improved 20bps QoQ to
18.6% (higher than the estimated 17.8%), supported by operational
efficiencies and pyramid rationalisation, offset by higher onsite revenue; (5)
digital engineering contributed 56% to revenue (+5.5% QoQ); (6) the
company added 2,135 employees vs. 1,531 employees in H1FY22 and this
addition will continue in Q4FY22.
Outlook: We have factored in USD revenue growth of +19.7/+18.8/+17.2%
and EBIT margin at 18.1/17.9/18.3% for FY22/23/24E respectively. LTTS is
currently trading at 50x FY23E with the FY21-24E EPS CAGR at 32%.
Quarterly financial summary
YE Mar (INR bn) Q3
FY22
Q3
FY21
YoY
(%)
Q2
FY22
QoQ
(%) FY20 FY21 FY22E FY23E FY24E
Revenue (USD mn) 225 190 18.5 217 3.6 786 737 882 1,047 1,227
Net Sales 16.88 14.01 20.5 16.08 5.0 56.19 54.50 65.64 78.53 93.25
EBIT 3.14 2.13 47.5 2.96 6.1 9.28 7.89 11.89 14.03 17.04
APAT 2.49 1.79 39.1 2.30 8.2 7.51 6.27 9.51 11.24 14.28
Diluted EPS (INR) 23.8 17.1 39.1 22.0 8.2 72.0 60.1 91.2 107.7 136.9
P/E (x)
75.3 90.3 59.4 50.3 39.6
EV / EBITDA (x)
50.2 54.4 38.4 32.0 26.1
RoE (%)
28.6 20.1 24.7 24.2 25.7
Source: Company, HSIE Research, Consolidated Financials
Change in Estimates
YE Mar (INR bn) FY22E
Old
FY22E
Revised
Change
%
FY23E
Old
FY23E
Revised
Change
%
FY24E
Old
FY24E
Revised
Change
%
Revenue (USD mn) 889 882 (0.8) 1,064 1,047 (1.6) 1,243 1,227 (1.3)
Revenue 65.71 65.64 (0.1) 79.82 78.53 (1.6) 94.46 93.25 (1.3)
EBIT 11.70 11.89 1.6 14.49 14.03 (3.2) 17.50 17.04 (2.7)
EBIT margin (%) 17.8 18.1 31bps 18.2 17.9 -29bps 18.5 18.3 -26bps
APAT 9.39 9.51 1.3 11.57 11.24 (2.9) 14.62 14.28 (2.3)
EPS (INR) 90.0 91.2 1.3 110.9 107.7 (2.9) 140.1 136.9 (2.3)
Source: Company, HSIE Research
ADD
CMP (as on 18 Jan 2022) INR 5,421
Target Price INR 5,750
NIFTY 18,113
KEY
CHANGES OLD NEW
Rating ADD ADD
Price Target INR 5,880 INR 5,750
EPS % FY22E FY23E
+1.3 -2.9
KEY STOCK DATA
Bloomberg code LTTS IN
No. of Shares (mn) 105
MCap (INR bn) / ($ mn) 572/7,685
6m avg traded value (INR mn) 1,836
52 Week high / low INR 5,958/2,296
STOCK PERFORMANCE (%)
3M 6M 12M
Absolute (%) 12.0 60.0 128.7
Relative (%) 13.6 45.6 103.6
SHAREHOLDING PATTERN (%)
Sep-21 Dec-21
Promoters 74.15 73.93
FIs & Local MFs 6.14 5.42
FPIs 9.50 9.23
Public & Others 10.21 11.42
Pledged Shares 0.00 0.00
Source : BSE
Pledged shares as % of total shares
Amit Chandra
+91-22-6171-7345
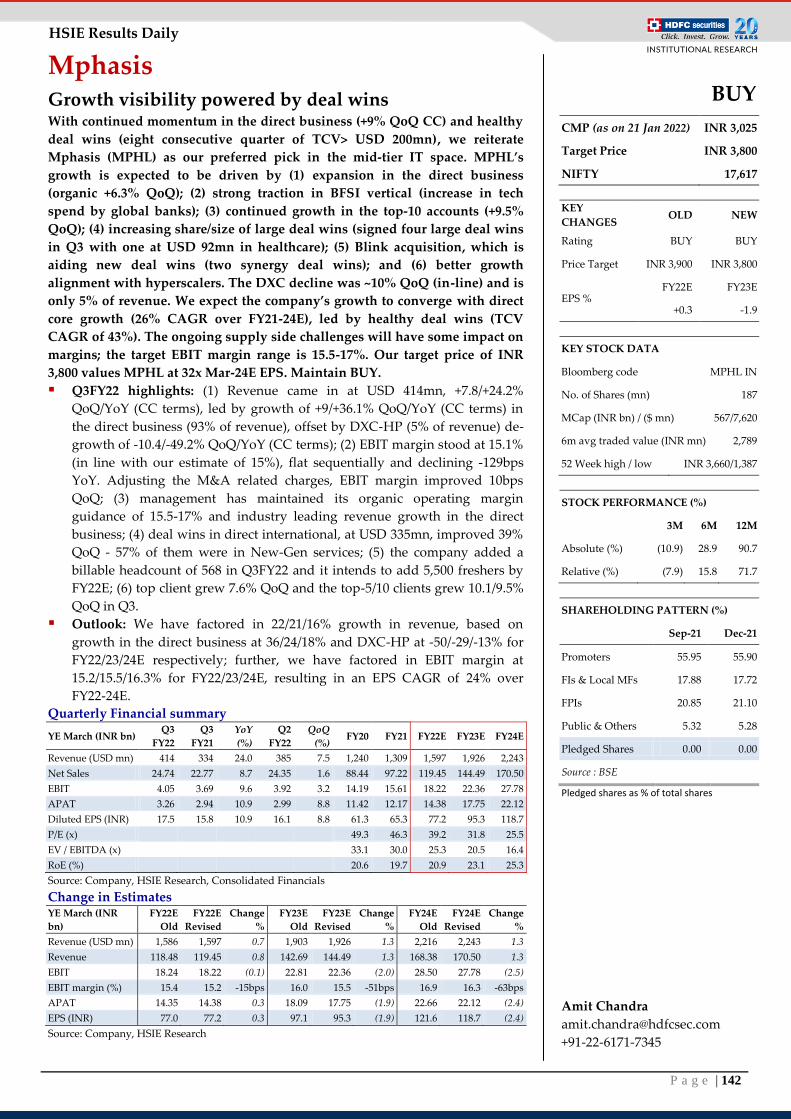
P a g e | 142
HSIE Results Daily
Mphasis Growth visibility powered by deal wins With continued momentum in the direct business (+9% QoQ CC) and healthy
deal wins (eight consecutive quarter of TCV> USD 200mn), we reiterate
Mphasis (MPHL) as our preferred pick in the mid-tier IT space. MPHL’s
growth is expected to be driven by (1) expansion in the direct business
(organic +6.3% QoQ); (2) strong traction in BFSI vertical (increase in tech
spend by global banks); (3) continued growth in the top-10 accounts (+9.5%
QoQ); (4) increasing share/size of large deal wins (signed four large deal wins
in Q3 with one at USD 92mn in healthcare); (5) Blink acquisition, which is
aiding new deal wins (two synergy deal wins); and (6) better growth
alignment with hyperscalers. The DXC decline was ~10% QoQ (in-line) and is
only 5% of revenue. We expect the company’s growth to converge with direct
core growth (26% CAGR over FY21-24E), led by healthy deal wins (TCV
CAGR of 43%). The ongoing supply side challenges will have some impact on
margins; the target EBIT margin range is 15.5-17%. Our target price of INR
3,800 values MPHL at 32x Mar-24E EPS. Maintain BUY.
Q3FY22 highlights: (1) Revenue came in at USD 414mn, +7.8/+24.2%
QoQ/YoY (CC terms), led by growth of +9/+36.1% QoQ/YoY (CC terms) in
the direct business (93% of revenue), offset by DXC-HP (5% of revenue) de-
growth of -10.4/-49.2% QoQ/YoY (CC terms); (2) EBIT margin stood at 15.1%
(in line with our estimate of 15%), flat sequentially and declining -129bps
YoY. Adjusting the M&A related charges, EBIT margin improved 10bps
QoQ; (3) management has maintained its organic operating margin
guidance of 15.5-17% and industry leading revenue growth in the direct
business; (4) deal wins in direct international, at USD 335mn, improved 39%
QoQ - 57% of them were in New-Gen services; (5) the company added a
billable headcount of 568 in Q3FY22 and it intends to add 5,500 freshers by
FY22E; (6) top client grew 7.6% QoQ and the top-5/10 clients grew 10.1/9.5%
QoQ in Q3.
Outlook: We have factored in 22/21/16% growth in revenue, based on
growth in the direct business at 36/24/18% and DXC-HP at -50/-29/-13% for
FY22/23/24E respectively; further, we have factored in EBIT margin at
15.2/15.5/16.3% for FY22/23/24E, resulting in an EPS CAGR of 24% over
FY22-24E.
Quarterly Financial summary
YE March (INR bn) Q3
FY22
Q3
FY21
YoY
(%)
Q2
FY22
QoQ
(%) FY20 FY21 FY22E FY23E FY24E
Revenue (USD mn) 414 334 24.0 385 7.5 1,240 1,309 1,597 1,926 2,243
Net Sales 24.74 22.77 8.7 24.35 1.6 88.44 97.22 119.45 144.49 170.50
EBIT 4.05 3.69 9.6 3.92 3.2 14.19 15.61 18.22 22.36 27.78
APAT 3.26 2.94 10.9 2.99 8.8 11.42 12.17 14.38 17.75 22.12
Diluted EPS (INR) 17.5 15.8 10.9 16.1 8.8 61.3 65.3 77.2 95.3 118.7
P/E (x)
49.3 46.3 39.2 31.8 25.5
EV / EBITDA (x)
33.1 30.0 25.3 20.5 16.4
RoE (%)
20.6 19.7 20.9 23.1 25.3
Source: Company, HSIE Research, Consolidated Financials
Change in Estimates YE March (INR
bn)
FY22E
Old
FY22E
Revised
Change
%
FY23E
Old
FY23E
Revised
Change
%
FY24E
Old
FY24E
Revised
Change
%
Revenue (USD mn) 1,586 1,597 0.7 1,903 1,926 1.3 2,216 2,243 1.3
Revenue 118.48 119.45 0.8 142.69 144.49 1.3 168.38 170.50 1.3
EBIT 18.24 18.22 (0.1) 22.81 22.36 (2.0) 28.50 27.78 (2.5)
EBIT margin (%) 15.4 15.2 -15bps 16.0 15.5 -51bps 16.9 16.3 -63bps
APAT 14.35 14.38 0.3 18.09 17.75 (1.9) 22.66 22.12 (2.4)
EPS (INR) 77.0 77.2 0.3 97.1 95.3 (1.9) 121.6 118.7 (2.4)
Source: Company, HSIE Research
BUY
CMP (as on 21 Jan 2022) INR 3,025
Target Price INR 3,800
NIFTY 17,617
KEY
CHANGES OLD NEW
Rating BUY BUY
Price Target INR 3,900 INR 3,800
EPS % FY22E FY23E
+0.3 -1.9
KEY STOCK DATA
Bloomberg code MPHL IN
No. of Shares (mn) 187
MCap (INR bn) / ($ mn) 567/7,620
6m avg traded value (INR mn) 2,789
52 Week high / low INR 3,660/1,387
STOCK PERFORMANCE (%)
3M 6M 12M
Absolute (%) (10.9) 28.9 90.7
Relative (%) (7.9) 15.8 71.7
SHAREHOLDING PATTERN (%)
Sep-21 Dec-21
Promoters 55.95 55.90
FIs & Local MFs 17.88 17.72
FPIs 20.85 21.10
Public & Others 5.32 5.28
Pledged Shares 0.00 0.00
Source : BSE
Pledged shares as % of total shares
Amit Chandra
+91-22-6171-7345
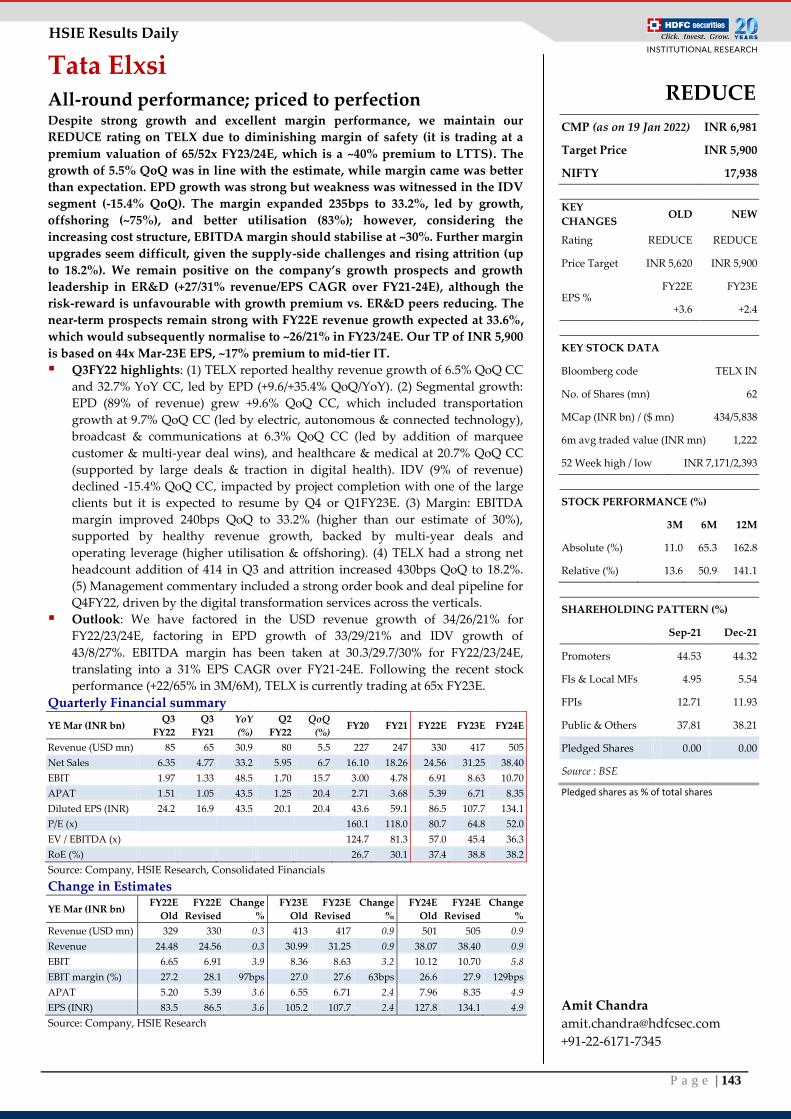
P a g e | 143
HSIE Results Daily
Tata Elxsi All-round performance; priced to perfection Despite strong growth and excellent margin performance, we maintain our
REDUCE rating on TELX due to diminishing margin of safety (it is trading at a
premium valuation of 65/52x FY23/24E, which is a ~40% premium to LTTS). The
growth of 5.5% QoQ was in line with the estimate, while margin came was better
than expectation. EPD growth was strong but weakness was witnessed in the IDV
segment (-15.4% QoQ). The margin expanded 235bps to 33.2%, led by growth,
offshoring (~75%), and better utilisation (83%); however, considering the
increasing cost structure, EBITDA margin should stabilise at ~30%. Further margin
upgrades seem difficult, given the supply-side challenges and rising attrition (up
to 18.2%). We remain positive on the company’s growth prospects and growth
leadership in ER&D (+27/31% revenue/EPS CAGR over FY21-24E), although the
risk-reward is unfavourable with growth premium vs. ER&D peers reducing. The
near-term prospects remain strong with FY22E revenue growth expected at 33.6%,
which would subsequently normalise to ~26/21% in FY23/24E. Our TP of INR 5,900
is based on 44x Mar-23E EPS, ~17% premium to mid-tier IT.
Q3FY22 highlights: (1) TELX reported healthy revenue growth of 6.5% QoQ CC
and 32.7% YoY CC, led by EPD (+9.6/+35.4% QoQ/YoY). (2) Segmental growth:
EPD (89% of revenue) grew +9.6% QoQ CC, which included transportation
growth at 9.7% QoQ CC (led by electric, autonomous & connected technology),
broadcast & communications at 6.3% QoQ CC (led by addition of marquee
customer & multi-year deal wins), and healthcare & medical at 20.7% QoQ CC
(supported by large deals & traction in digital health). IDV (9% of revenue)
declined -15.4% QoQ CC, impacted by project completion with one of the large
clients but it is expected to resume by Q4 or Q1FY23E. (3) Margin: EBITDA
margin improved 240bps QoQ to 33.2% (higher than our estimate of 30%),
supported by healthy revenue growth, backed by multi-year deals and
operating leverage (higher utilisation & offshoring). (4) TELX had a strong net
headcount addition of 414 in Q3 and attrition increased 430bps QoQ to 18.2%.
(5) Management commentary included a strong order book and deal pipeline for
Q4FY22, driven by the digital transformation services across the verticals.
Outlook: We have factored in the USD revenue growth of 34/26/21% for
FY22/23/24E, factoring in EPD growth of 33/29/21% and IDV growth of
43/8/27%. EBITDA margin has been taken at 30.3/29.7/30% for FY22/23/24E,
translating into a 31% EPS CAGR over FY21-24E. Following the recent stock
performance (+22/65% in 3M/6M), TELX is currently trading at 65x FY23E.
Quarterly Financial summary
YE Mar (INR bn) Q3
FY22
Q3
FY21
YoY
(%)
Q2
FY22
QoQ
(%) FY20 FY21 FY22E FY23E FY24E
Revenue (USD mn) 85 65 30.9 80 5.5 227 247 330 417 505
Net Sales 6.35 4.77 33.2 5.95 6.7 16.10 18.26 24.56 31.25 38.40
EBIT 1.97 1.33 48.5 1.70 15.7 3.00 4.78 6.91 8.63 10.70
APAT 1.51 1.05 43.5 1.25 20.4 2.71 3.68 5.39 6.71 8.35
Diluted EPS (INR) 24.2 16.9 43.5 20.1 20.4 43.6 59.1 86.5 107.7 134.1
P/E (x)
160.1 118.0 80.7 64.8 52.0
EV / EBITDA (x) 124.7 81.3 57.0 45.4 36.3
RoE (%) 26.7 30.1 37.4 38.8 38.2
Source: Company, HSIE Research, Consolidated Financials
Change in Estimates
YE Mar (INR bn) FY22E
Old
FY22E
Revised
Change
%
FY23E
Old
FY23E
Revised
Change
%
FY24E
Old
FY24E
Revised
Change
%
Revenue (USD mn) 329 330 0.3 413 417 0.9 501 505 0.9
Revenue 24.48 24.56 0.3 30.99 31.25 0.9 38.07 38.40 0.9
EBIT 6.65 6.91 3.9 8.36 8.63 3.2 10.12 10.70 5.8
EBIT margin (%) 27.2 28.1 97bps 27.0 27.6 63bps 26.6 27.9 129bps
APAT 5.20 5.39 3.6 6.55 6.71 2.4 7.96 8.35 4.9
EPS (INR) 83.5 86.5 3.6 105.2 107.7 2.4 127.8 134.1 4.9
Source: Company, HSIE Research
REDUCE
CMP (as on 19 Jan 2022) INR 6,981
Target Price INR 5,900
NIFTY 17,938
KEY
CHANGES OLD NEW
Rating REDUCE REDUCE
Price Target INR 5,620 INR 5,900
EPS % FY22E FY23E
+3.6 +2.4
KEY STOCK DATA
Bloomberg code TELX IN
No. of Shares (mn) 62
MCap (INR bn) / ($ mn) 434/5,838
6m avg traded value (INR mn) 1,222
52 Week high / low INR 7,171/2,393
STOCK PERFORMANCE (%)
3M 6M 12M
Absolute (%) 11.0 65.3 162.8
Relative (%) 13.6 50.9 141.1
SHAREHOLDING PATTERN (%)
Sep-21 Dec-21
Promoters 44.53 44.32
FIs & Local MFs 4.95 5.54
FPIs 12.71 11.93
Public & Others 37.81 38.21
Pledged Shares 0.00 0.00
Source : BSE
Pledged shares as % of total shares
Amit Chandra
+91-22-6171-7345
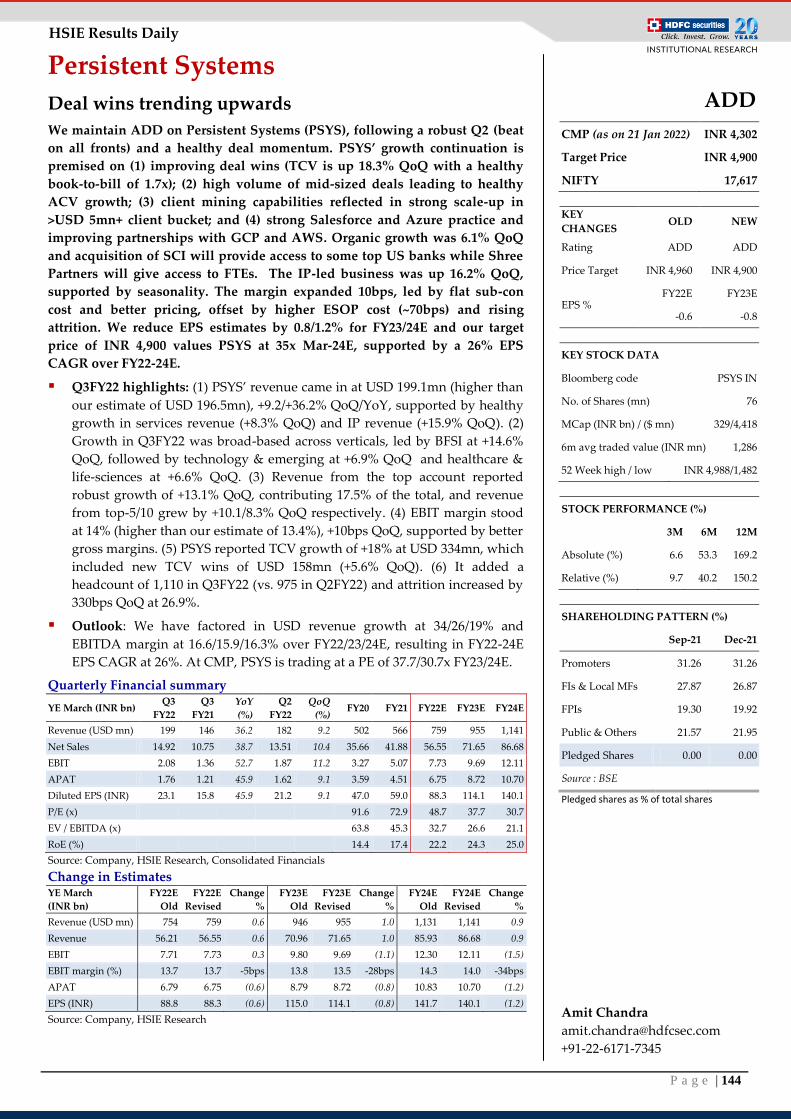
P a g e | 144
HSIE Results Daily
Persistent Systems
Deal wins trending upwards We maintain ADD on Persistent Systems (PSYS), following a robust Q2 (beat
on all fronts) and a healthy deal momentum. PSYS’ growth continuation is
premised on (1) improving deal wins (TCV is up 18.3% QoQ with a healthy
book-to-bill of 1.7x); (2) high volume of mid-sized deals leading to healthy
ACV growth; (3) client mining capabilities reflected in strong scale-up in
>USD 5mn+ client bucket; and (4) strong Salesforce and Azure practice and
improving partnerships with GCP and AWS. Organic growth was 6.1% QoQ
and acquisition of SCI will provide access to some top US banks while Shree
Partners will give access to FTEs. The IP-led business was up 16.2% QoQ,
supported by seasonality. The margin expanded 10bps, led by flat sub-con
cost and better pricing, offset by higher ESOP cost (~70bps) and rising
attrition. We reduce EPS estimates by 0.8/1.2% for FY23/24E and our target
price of INR 4,900 values PSYS at 35x Mar-24E, supported by a 26% EPS
CAGR over FY22-24E.
Q3FY22 highlights: (1) PSYS’ revenue came in at USD 199.1mn (higher than
our estimate of USD 196.5mn), +9.2/+36.2% QoQ/YoY, supported by healthy
growth in services revenue (+8.3% QoQ) and IP revenue (+15.9% QoQ). (2)
Growth in Q3FY22 was broad-based across verticals, led by BFSI at +14.6%
QoQ, followed by technology & emerging at +6.9% QoQ and healthcare &
life-sciences at +6.6% QoQ. (3) Revenue from the top account reported
robust growth of +13.1% QoQ, contributing 17.5% of the total, and revenue
from top-5/10 grew by +10.1/8.3% QoQ respectively. (4) EBIT margin stood
at 14% (higher than our estimate of 13.4%), +10bps QoQ, supported by better
gross margins. (5) PSYS reported TCV growth of +18% at USD 334mn, which
included new TCV wins of USD 158mn (+5.6% QoQ). (6) It added a
headcount of 1,110 in Q3FY22 (vs. 975 in Q2FY22) and attrition increased by
330bps QoQ at 26.9%.
Outlook: We have factored in USD revenue growth at 34/26/19% and
EBITDA margin at 16.6/15.9/16.3% over FY22/23/24E, resulting in FY22-24E
EPS CAGR at 26%. At CMP, PSYS is trading at a PE of 37.7/30.7x FY23/24E.
Quarterly Financial summary
YE March (INR bn) Q3
FY22
Q3
FY21
YoY
(%)
Q2
FY22
QoQ
(%) FY20 FY21 FY22E FY23E FY24E
Revenue (USD mn) 199 146 36.2 182 9.2 502 566 759 955 1,141
Net Sales 14.92 10.75 38.7 13.51 10.4 35.66 41.88 56.55 71.65 86.68
EBIT 2.08 1.36 52.7 1.87 11.2 3.27 5.07 7.73 9.69 12.11
APAT 1.76 1.21 45.9 1.62 9.1 3.59 4.51 6.75 8.72 10.70
Diluted EPS (INR) 23.1 15.8 45.9 21.2 9.1 47.0 59.0 88.3 114.1 140.1
P/E (x)
91.6 72.9 48.7 37.7 30.7
EV / EBITDA (x)
63.8 45.3 32.7 26.6 21.1
RoE (%)
14.4 17.4 22.2 24.3 25.0
Source: Company, HSIE Research, Consolidated Financials
Change in Estimates YE March
(INR bn)
FY22E
Old
FY22E
Revised
Change
%
FY23E
Old
FY23E
Revised
Change
%
FY24E
Old
FY24E
Revised
Change
%
Revenue (USD mn) 754 759 0.6 946 955 1.0 1,131 1,141 0.9
Revenue 56.21 56.55 0.6 70.96 71.65 1.0 85.93 86.68 0.9
EBIT 7.71 7.73 0.3 9.80 9.69 (1.1) 12.30 12.11 (1.5)
EBIT margin (%) 13.7 13.7 -5bps 13.8 13.5 -28bps 14.3 14.0 -34bps
APAT 6.79 6.75 (0.6) 8.79 8.72 (0.8) 10.83 10.70 (1.2)
EPS (INR) 88.8 88.3 (0.6) 115.0 114.1 (0.8) 141.7 140.1 (1.2)
Source: Company, HSIE Research
ADD
CMP (as on 21 Jan 2022) INR 4,302
Target Price INR 4,900
NIFTY 17,617
KEY
CHANGES OLD NEW
Rating ADD ADD
Price Target INR 4,960 INR 4,900
EPS % FY22E FY23E
-0.6 -0.8
KEY STOCK DATA
Bloomberg code PSYS IN
No. of Shares (mn) 76
MCap (INR bn) / ($ mn) 329/4,418
6m avg traded value (INR mn) 1,286
52 Week high / low INR 4,988/1,482
STOCK PERFORMANCE (%)
3M 6M 12M
Absolute (%) 6.6 53.3 169.2
Relative (%) 9.7 40.2 150.2
SHAREHOLDING PATTERN (%)
Sep-21 Dec-21
Promoters 31.26 31.26
FIs & Local MFs 27.87 26.87
FPIs 19.30 19.92
Public & Others 21.57 21.95
Pledged Shares 0.00 0.00
Source : BSE
Pledged shares as % of total shares
Amit Chandra
+91-22-6171-7345
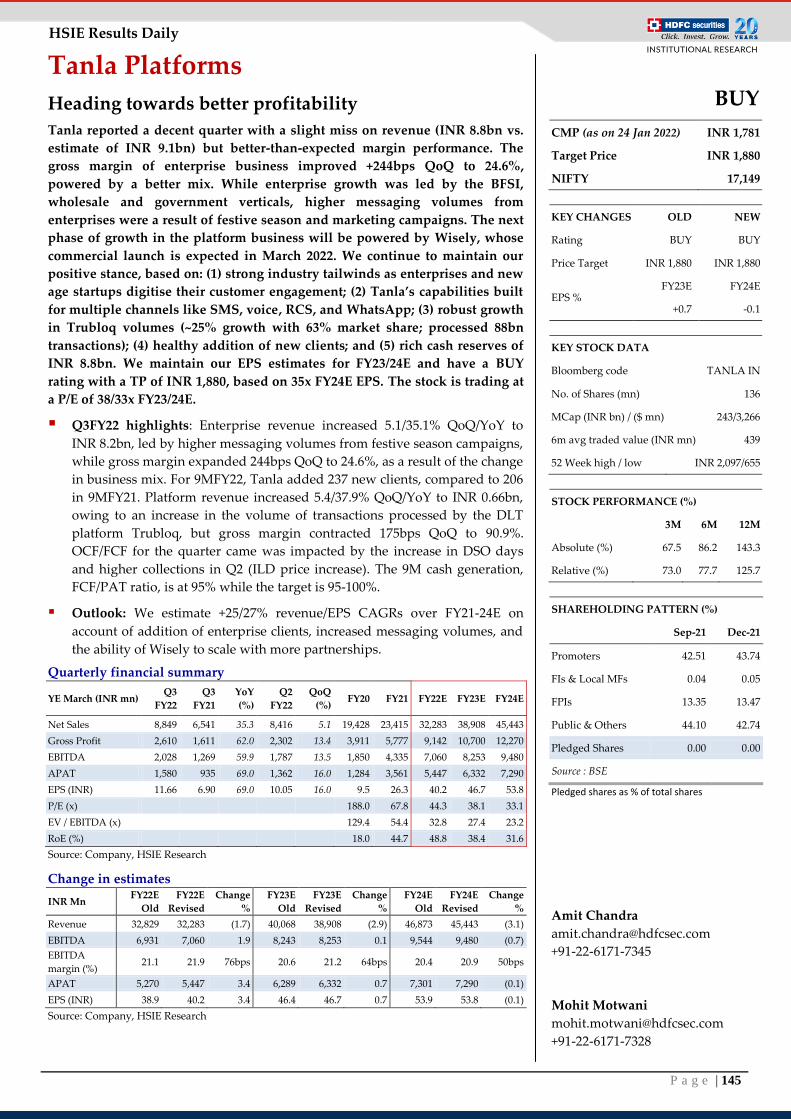
P a g e | 145
HSIE Results Daily
Tanla Platforms
Heading towards better profitability
Tanla reported a decent quarter with a slight miss on revenue (INR 8.8bn vs.
estimate of INR 9.1bn) but better-than-expected margin performance. The
gross margin of enterprise business improved +244bps QoQ to 24.6%,
powered by a better mix. While enterprise growth was led by the BFSI,
wholesale and government verticals, higher messaging volumes from
enterprises were a result of festive season and marketing campaigns. The next
phase of growth in the platform business will be powered by Wisely, whose
commercial launch is expected in March 2022. We continue to maintain our
positive stance, based on: (1) strong industry tailwinds as enterprises and new
age startups digitise their customer engagement; (2) Tanla’s capabilities built
for multiple channels like SMS, voice, RCS, and WhatsApp; (3) robust growth
in Trubloq volumes (~25% growth with 63% market share; processed 88bn
transactions); (4) healthy addition of new clients; and (5) rich cash reserves of
INR 8.8bn. We maintain our EPS estimates for FY23/24E and have a BUY
rating with a TP of INR 1,880, based on 35x FY24E EPS. The stock is trading at
a P/E of 38/33x FY23/24E.
Q3FY22 highlights: Enterprise revenue increased 5.1/35.1% QoQ/YoY to
INR 8.2bn, led by higher messaging volumes from festive season campaigns,
while gross margin expanded 244bps QoQ to 24.6%, as a result of the change
in business mix. For 9MFY22, Tanla added 237 new clients, compared to 206
in 9MFY21. Platform revenue increased 5.4/37.9% QoQ/YoY to INR 0.66bn,
owing to an increase in the volume of transactions processed by the DLT
platform Trubloq, but gross margin contracted 175bps QoQ to 90.9%.
OCF/FCF for the quarter came was impacted by the increase in DSO days
and higher collections in Q2 (ILD price increase). The 9M cash generation,
FCF/PAT ratio, is at 95% while the target is 95-100%.
Outlook: We estimate +25/27% revenue/EPS CAGRs over FY21-24E on
account of addition of enterprise clients, increased messaging volumes, and
the ability of Wisely to scale with more partnerships.
Quarterly financial summary
YE March (INR mn) Q3
FY22
Q3
FY21
YoY
(%)
Q2
FY22
QoQ
(%) FY20 FY21 FY22E FY23E FY24E
Net Sales 8,849 6,541 35.3 8,416 5.1 19,428 23,415 32,283 38,908 45,443
Gross Profit 2,610 1,611 62.0 2,302 13.4 3,911 5,777 9,142 10,700 12,270
EBITDA 2,028 1,269 59.9 1,787 13.5 1,850 4,335 7,060 8,253 9,480
APAT 1,580 935 69.0 1,362 16.0 1,284 3,561 5,447 6,332 7,290
EPS (INR) 11.66 6.90 69.0 10.05 16.0 9.5 26.3 40.2 46.7 53.8
P/E (x)
188.0 67.8 44.3 38.1 33.1
EV / EBITDA (x)
129.4 54.4 32.8 27.4 23.2
RoE (%)
18.0 44.7 48.8 38.4 31.6
Source: Company, HSIE Research
Change in estimates
INR Mn FY22E
Old
FY22E
Revised
Change
%
FY23E
Old
FY23E
Revised
Change
%
FY24E
Old
FY24E
Revised
Change
%
Revenue 32,829 32,283 (1.7) 40,068 38,908 (2.9) 46,873 45,443 (3.1)
EBITDA 6,931 7,060 1.9 8,243 8,253 0.1 9,544 9,480 (0.7)
EBITDA
margin (%) 21.1 21.9 76bps 20.6 21.2 64bps 20.4 20.9 50bps
APAT 5,270 5,447 3.4 6,289 6,332 0.7 7,301 7,290 (0.1)
EPS (INR) 38.9 40.2 3.4 46.4 46.7 0.7 53.9 53.8 (0.1)
Source: Company, HSIE Research
BUY
CMP (as on 24 Jan 2022) INR 1,781
Target Price INR 1,880
NIFTY 17,149
KEY CHANGES OLD NEW
Rating BUY BUY
Price Target INR 1,880 INR 1,880
EPS % FY23E FY24E
+0.7 -0.1
KEY STOCK DATA
Bloomberg code TANLA IN
No. of Shares (mn) 136
MCap (INR bn) / ($ mn) 243/3,266
6m avg traded value (INR mn) 439
52 Week high / low INR 2,097/655
STOCK PERFORMANCE (%)
3M 6M 12M
Absolute (%) 67.5 86.2 143.3
Relative (%) 73.0 77.7 125.7
SHAREHOLDING PATTERN (%)
Sep-21 Dec-21
Promoters 42.51 43.74
FIs & Local MFs 0.04 0.05
FPIs 13.35 13.47
Public & Others 44.10 42.74
Pledged Shares 0.00 0.00
Source : BSE
Pledged shares as % of total shares
Amit Chandra
+91-22-6171-7345
Mohit Motwani
+91-22-6171-7328
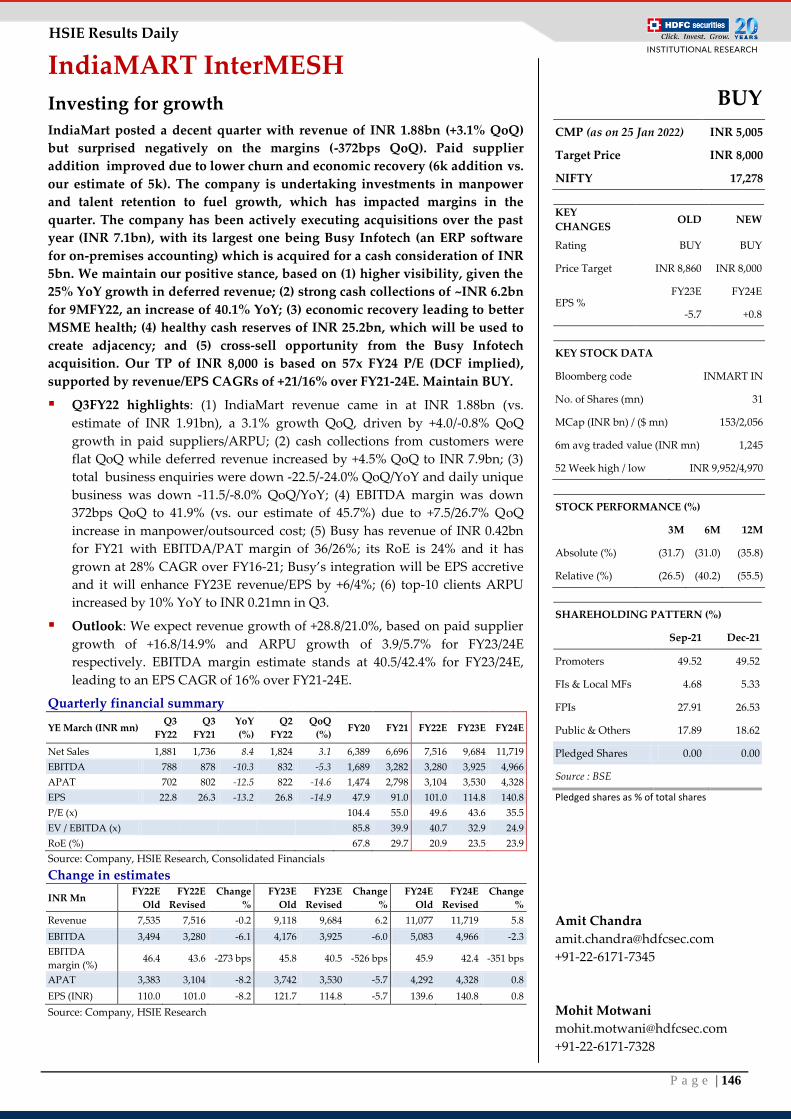
P a g e | 146
HSIE Results Daily
IndiaMART InterMESH
Investing for growth
IndiaMart posted a decent quarter with revenue of INR 1.88bn (+3.1% QoQ)
but surprised negatively on the margins (-372bps QoQ). Paid supplier
addition improved due to lower churn and economic recovery (6k addition vs.
our estimate of 5k). The company is undertaking investments in manpower
and talent retention to fuel growth, which has impacted margins in the
quarter. The company has been actively executing acquisitions over the past
year (INR 7.1bn), with its largest one being Busy Infotech (an ERP software
for on-premises accounting) which is acquired for a cash consideration of INR
5bn. We maintain our positive stance, based on (1) higher visibility, given the
25% YoY growth in deferred revenue; (2) strong cash collections of ~INR 6.2bn
for 9MFY22, an increase of 40.1% YoY; (3) economic recovery leading to better
MSME health; (4) healthy cash reserves of INR 25.2bn, which will be used to
create adjacency; and (5) cross-sell opportunity from the Busy Infotech
acquisition. Our TP of INR 8,000 is based on 57x FY24 P/E (DCF implied),
supported by revenue/EPS CAGRs of +21/16% over FY21-24E. Maintain BUY.
Q3FY22 highlights: (1) IndiaMart revenue came in at INR 1.88bn (vs.
estimate of INR 1.91bn), a 3.1% growth QoQ, driven by +4.0/-0.8% QoQ
growth in paid suppliers/ARPU; (2) cash collections from customers were
flat QoQ while deferred revenue increased by +4.5% QoQ to INR 7.9bn; (3)
total business enquiries were down -22.5/-24.0% QoQ/YoY and daily unique
business was down -11.5/-8.0% QoQ/YoY; (4) EBITDA margin was down
372bps QoQ to 41.9% (vs. our estimate of 45.7%) due to +7.5/26.7% QoQ
increase in manpower/outsourced cost; (5) Busy has revenue of INR 0.42bn
for FY21 with EBITDA/PAT margin of 36/26%; its RoE is 24% and it has
grown at 28% CAGR over FY16-21; Busy’s integration will be EPS accretive
and it will enhance FY23E revenue/EPS by +6/4%; (6) top-10 clients ARPU
increased by 10% YoY to INR 0.21mn in Q3.
Outlook: We expect revenue growth of +28.8/21.0%, based on paid supplier
growth of +16.8/14.9% and ARPU growth of 3.9/5.7% for FY23/24E
respectively. EBITDA margin estimate stands at 40.5/42.4% for FY23/24E,
leading to an EPS CAGR of 16% over FY21-24E.
Quarterly financial summary
YE March (INR mn) Q3
FY22
Q3
FY21
YoY
(%)
Q2
FY22
QoQ
(%) FY20 FY21 FY22E FY23E FY24E
Net Sales 1,881 1,736 8.4 1,824 3.1 6,389 6,696 7,516 9,684 11,719
EBITDA 788 878 -10.3 832 -5.3 1,689 3,282 3,280 3,925 4,966
APAT 702 802 -12.5 822 -14.6 1,474 2,798 3,104 3,530 4,328
EPS 22.8 26.3 -13.2 26.8 -14.9 47.9 91.0 101.0 114.8 140.8
P/E (x)
104.4 55.0 49.6 43.6 35.5
EV / EBITDA (x)
85.8 39.9 40.7 32.9 24.9
RoE (%)
67.8 29.7 20.9 23.5 23.9
Source: Company, HSIE Research, Consolidated Financials
Change in estimates
INR Mn FY22E
Old
FY22E
Revised
Change
%
FY23E
Old
FY23E
Revised
Change
%
FY24E
Old
FY24E
Revised
Change
%
Revenue 7,535 7,516 -0.2 9,118 9,684 6.2 11,077 11,719 5.8
EBITDA 3,494 3,280 -6.1 4,176 3,925 -6.0 5,083 4,966 -2.3
EBITDA
margin (%) 46.4 43.6 -273 bps 45.8 40.5 -526 bps 45.9 42.4 -351 bps
APAT 3,383 3,104 -8.2 3,742 3,530 -5.7 4,292 4,328 0.8
EPS (INR) 110.0 101.0 -8.2 121.7 114.8 -5.7 139.6 140.8 0.8
Source: Company, HSIE Research
BUY
CMP (as on 25 Jan 2022) INR 5,005
Target Price INR 8,000
NIFTY 17,278
KEY
CHANGES OLD NEW
Rating BUY BUY
Price Target INR 8,860 INR 8,000
EPS % FY23E FY24E
-5.7 +0.8
KEY STOCK DATA
Bloomberg code INMART IN
No. of Shares (mn) 31
MCap (INR bn) / ($ mn) 153/2,056
6m avg traded value (INR mn) 1,245
52 Week high / low INR 9,952/4,970
STOCK PERFORMANCE (%)
3M 6M 12M
Absolute (%) (31.7) (31.0) (35.8)
Relative (%) (26.5) (40.2) (55.5)
SHAREHOLDING PATTERN (%)
Sep-21 Dec-21
Promoters 49.52 49.52
FIs & Local MFs 4.68 5.33
FPIs 27.91 26.53
Public & Others 17.89 18.62
Pledged Shares 0.00 0.00
Source : BSE
Pledged shares as % of total shares
Amit Chandra
+91-22-6171-7345
Mohit Motwani
+91-22-6171-7328
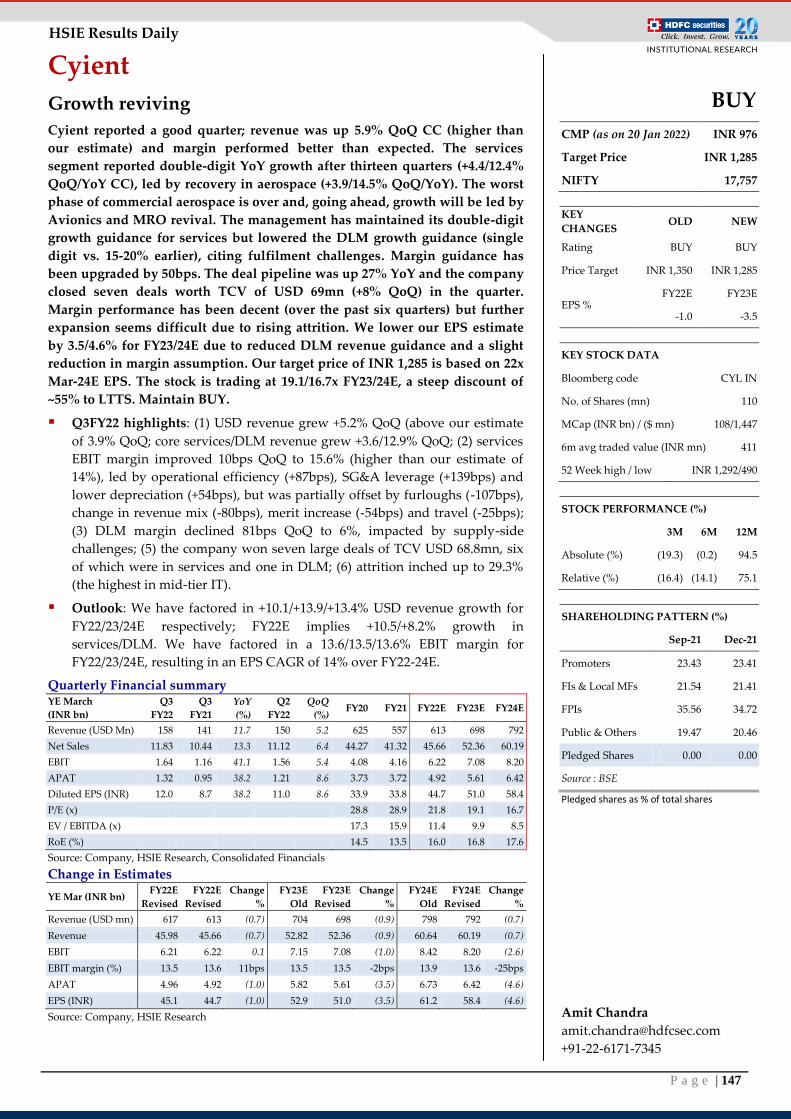
P a g e | 147
HSIE Results Daily
Cyient
Growth reviving
Cyient reported a good quarter; revenue was up 5.9% QoQ CC (higher than
our estimate) and margin performed better than expected. The services
segment reported double-digit YoY growth after thirteen quarters (+4.4/12.4%
QoQ/YoY CC), led by recovery in aerospace (+3.9/14.5% QoQ/YoY). The worst
phase of commercial aerospace is over and, going ahead, growth will be led by
Avionics and MRO revival. The management has maintained its double-digit
growth guidance for services but lowered the DLM growth guidance (single
digit vs. 15-20% earlier), citing fulfilment challenges. Margin guidance has
been upgraded by 50bps. The deal pipeline was up 27% YoY and the company
closed seven deals worth TCV of USD 69mn (+8% QoQ) in the quarter.
Margin performance has been decent (over the past six quarters) but further
expansion seems difficult due to rising attrition. We lower our EPS estimate
by 3.5/4.6% for FY23/24E due to reduced DLM revenue guidance and a slight
reduction in margin assumption. Our target price of INR 1,285 is based on 22x
Mar-24E EPS. The stock is trading at 19.1/16.7x FY23/24E, a steep discount of
~55% to LTTS. Maintain BUY.
Q3FY22 highlights: (1) USD revenue grew +5.2% QoQ (above our estimate
of 3.9% QoQ; core services/DLM revenue grew +3.6/12.9% QoQ; (2) services
EBIT margin improved 10bps QoQ to 15.6% (higher than our estimate of
14%), led by operational efficiency (+87bps), SG&A leverage (+139bps) and
lower depreciation (+54bps), but was partially offset by furloughs (-107bps),
change in revenue mix (-80bps), merit increase (-54bps) and travel (-25bps);
(3) DLM margin declined 81bps QoQ to 6%, impacted by supply-side
challenges; (5) the company won seven large deals of TCV USD 68.8mn, six
of which were in services and one in DLM; (6) attrition inched up to 29.3%
(the highest in mid-tier IT).
Outlook: We have factored in +10.1/+13.9/+13.4% USD revenue growth for
FY22/23/24E respectively; FY22E implies +10.5/+8.2% growth in
services/DLM. We have factored in a 13.6/13.5/13.6% EBIT margin for
FY22/23/24E, resulting in an EPS CAGR of 14% over FY22-24E.
Quarterly Financial summary YE March
(INR bn)
Q3
FY22
Q3
FY21
YoY
(%)
Q2
FY22
QoQ
(%) FY20 FY21 FY22E FY23E FY24E
Revenue (USD Mn) 158 141 11.7 150 5.2 625 557 613 698 792
Net Sales 11.83 10.44 13.3 11.12 6.4 44.27 41.32 45.66 52.36 60.19
EBIT 1.64 1.16 41.1 1.56 5.4 4.08 4.16 6.22 7.08 8.20
APAT 1.32 0.95 38.2 1.21 8.6 3.73 3.72 4.92 5.61 6.42
Diluted EPS (INR) 12.0 8.7 38.2 11.0 8.6 33.9 33.8 44.7 51.0 58.4
P/E (x)
28.8 28.9 21.8 19.1 16.7
EV / EBITDA (x)
17.3 15.9 11.4 9.9 8.5
RoE (%) 14.5 13.5 16.0 16.8 17.6
Source: Company, HSIE Research, Consolidated Financials
Change in Estimates
YE Mar (INR bn) FY22E
Revised
FY22E
Revised
Change
%
FY23E
Old
FY23E
Revised
Change
%
FY24E
Old
FY24E
Revised
Change
%
Revenue (USD mn) 617 613 (0.7) 704 698 (0.9) 798 792 (0.7)
Revenue 45.98 45.66 (0.7) 52.82 52.36 (0.9) 60.64 60.19 (0.7)
EBIT 6.21 6.22 0.1 7.15 7.08 (1.0) 8.42 8.20 (2.6)
EBIT margin (%) 13.5 13.6 11bps 13.5 13.5 -2bps 13.9 13.6 -25bps
APAT 4.96 4.92 (1.0) 5.82 5.61 (3.5) 6.73 6.42 (4.6)
EPS (INR) 45.1 44.7 (1.0) 52.9 51.0 (3.5) 61.2 58.4 (4.6)
Source: Company, HSIE Research
BUY
CMP (as on 20 Jan 2022) INR 976
Target Price INR 1,285
NIFTY 17,757
KEY
CHANGES OLD NEW
Rating BUY BUY
Price Target INR 1,350 INR 1,285
EPS % FY22E FY23E
-1.0 -3.5
KEY STOCK DATA
Bloomberg code CYL IN
No. of Shares (mn) 110
MCap (INR bn) / ($ mn) 108/1,447
6m avg traded value (INR mn) 411
52 Week high / low INR 1,292/490
STOCK PERFORMANCE (%)
3M 6M 12M
Absolute (%) (19.3) (0.2) 94.5
Relative (%) (16.4) (14.1) 75.1
SHAREHOLDING PATTERN (%)
Sep-21 Dec-21
Promoters 23.43 23.41
FIs & Local MFs 21.54 21.41
FPIs 35.56 34.72
Public & Others 19.47 20.46
Pledged Shares 0.00 0.00
Source : BSE
Pledged shares as % of total shares
Amit Chandra
+91-22-6171-7345
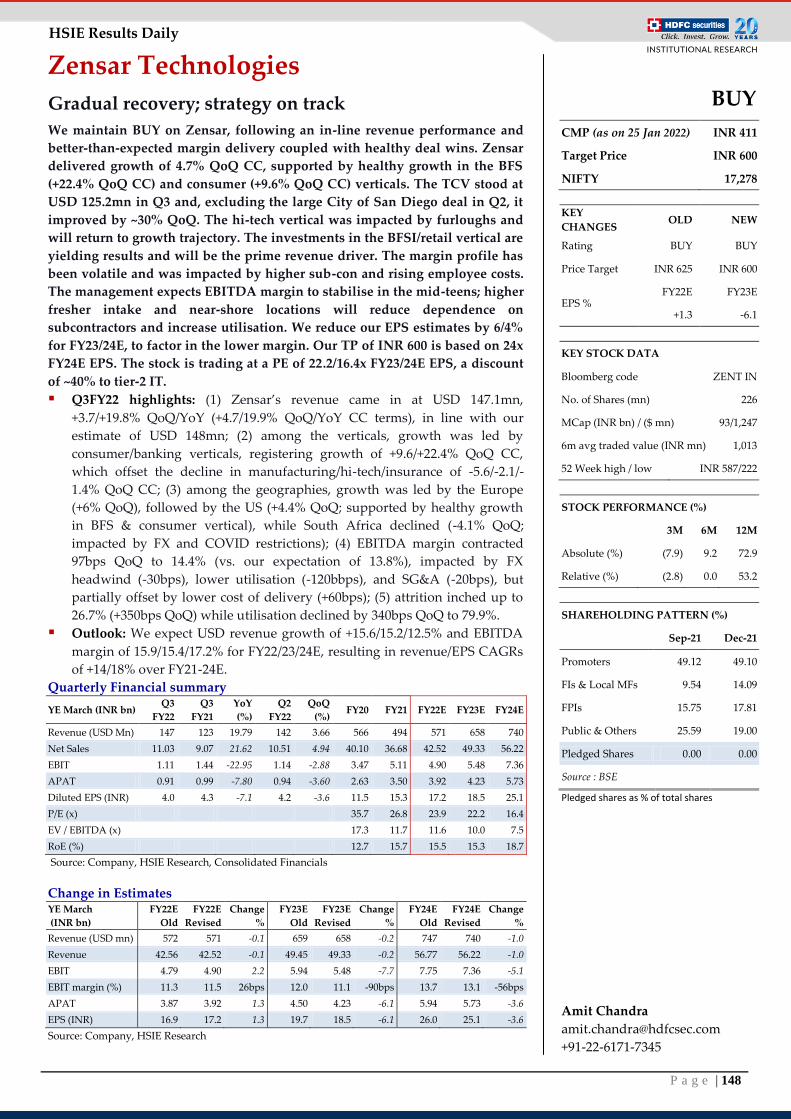
P a g e | 148
HSIE Results Daily
Zensar Technologies
Gradual recovery; strategy on track
We maintain BUY on Zensar, following an in-line revenue performance and
better-than-expected margin delivery coupled with healthy deal wins. Zensar
delivered growth of 4.7% QoQ CC, supported by healthy growth in the BFS
(+22.4% QoQ CC) and consumer (+9.6% QoQ CC) verticals. The TCV stood at
USD 125.2mn in Q3 and, excluding the large City of San Diego deal in Q2, it
improved by ~30% QoQ. The hi-tech vertical was impacted by furloughs and
will return to growth trajectory. The investments in the BFSI/retail vertical are
yielding results and will be the prime revenue driver. The margin profile has
been volatile and was impacted by higher sub-con and rising employee costs.
The management expects EBITDA margin to stabilise in the mid-teens; higher
fresher intake and near-shore locations will reduce dependence on
subcontractors and increase utilisation. We reduce our EPS estimates by 6/4%
for FY23/24E, to factor in the lower margin. Our TP of INR 600 is based on 24x
FY24E EPS. The stock is trading at a PE of 22.2/16.4x FY23/24E EPS, a discount
of ~40% to tier-2 IT.
Q3FY22 highlights: (1) Zensar’s revenue came in at USD 147.1mn,
+3.7/+19.8% QoQ/YoY (+4.7/19.9% QoQ/YoY CC terms), in line with our
estimate of USD 148mn; (2) among the verticals, growth was led by
consumer/banking verticals, registering growth of +9.6/+22.4% QoQ CC,
which offset the decline in manufacturing/hi-tech/insurance of -5.6/-2.1/-
1.4% QoQ CC; (3) among the geographies, growth was led by the Europe
(+6% QoQ), followed by the US (+4.4% QoQ; supported by healthy growth
in BFS & consumer vertical), while South Africa declined (-4.1% QoQ;
impacted by FX and COVID restrictions); (4) EBITDA margin contracted
97bps QoQ to 14.4% (vs. our expectation of 13.8%), impacted by FX
headwind (-30bps), lower utilisation (-120bbps), and SG&A (-20bps), but
partially offset by lower cost of delivery (+60bps); (5) attrition inched up to
26.7% (+350bps QoQ) while utilisation declined by 340bps QoQ to 79.9%.
Outlook: We expect USD revenue growth of +15.6/15.2/12.5% and EBITDA
margin of 15.9/15.4/17.2% for FY22/23/24E, resulting in revenue/EPS CAGRs
of +14/18% over FY21-24E.
Quarterly Financial summary
YE March (INR bn) Q3
FY22
Q3
FY21
YoY
(%)
Q2
FY22
QoQ
(%) FY20 FY21 FY22E FY23E FY24E
Revenue (USD Mn) 147 123 19.79 142 3.66 566 494 571 658 740
Net Sales 11.03 9.07 21.62 10.51 4.94 40.10 36.68 42.52 49.33 56.22
EBIT 1.11 1.44 -22.95 1.14 -2.88 3.47 5.11 4.90 5.48 7.36
APAT 0.91 0.99 -7.80 0.94 -3.60 2.63 3.50 3.92 4.23 5.73
Diluted EPS (INR) 4.0 4.3 -7.1 4.2 -3.6 11.5 15.3 17.2 18.5 25.1
P/E (x) 35.7 26.8 23.9 22.2 16.4
EV / EBITDA (x)
17.3 11.7 11.6 10.0 7.5
RoE (%) 12.7 15.7 15.5 15.3 18.7
Source: Company, HSIE Research, Consolidated Financials
Change in Estimates YE March
(INR bn)
FY22E
Old
FY22E
Revised
Change
%
FY23E
Old
FY23E
Revised
Change
%
FY24E
Old
FY24E
Revised
Change
%
Revenue (USD mn) 572 571 -0.1 659 658 -0.2 747 740 -1.0
Revenue 42.56 42.52 -0.1 49.45 49.33 -0.2 56.77 56.22 -1.0
EBIT 4.79 4.90 2.2 5.94 5.48 -7.7 7.75 7.36 -5.1
EBIT margin (%) 11.3 11.5 26bps 12.0 11.1 -90bps 13.7 13.1 -56bps
APAT 3.87 3.92 1.3 4.50 4.23 -6.1 5.94 5.73 -3.6
EPS (INR) 16.9 17.2 1.3 19.7 18.5 -6.1 26.0 25.1 -3.6
Source: Company, HSIE Research
BUY
CMP (as on 25 Jan 2022) INR 411
Target Price INR 600
NIFTY 17,278
KEY
CHANGES OLD NEW
Rating BUY BUY
Price Target INR 625 INR 600
EPS % FY22E FY23E
+1.3 -6.1
KEY STOCK DATA
Bloomberg code ZENT IN
No. of Shares (mn) 226
MCap (INR bn) / ($ mn) 93/1,247
6m avg traded value (INR mn) 1,013
52 Week high / low INR 587/222
STOCK PERFORMANCE (%)
3M 6M 12M
Absolute (%) (7.9) 9.2 72.9
Relative (%) (2.8) 0.0 53.2
SHAREHOLDING PATTERN (%)
Sep-21 Dec-21
Promoters 49.12 49.10
FIs & Local MFs 9.54 14.09
FPIs 15.75 17.81
Public & Others 25.59 19.00
Pledged Shares 0.00 0.00
Source : BSE
Pledged shares as % of total shares
Amit Chandra
+91-22-6171-7345
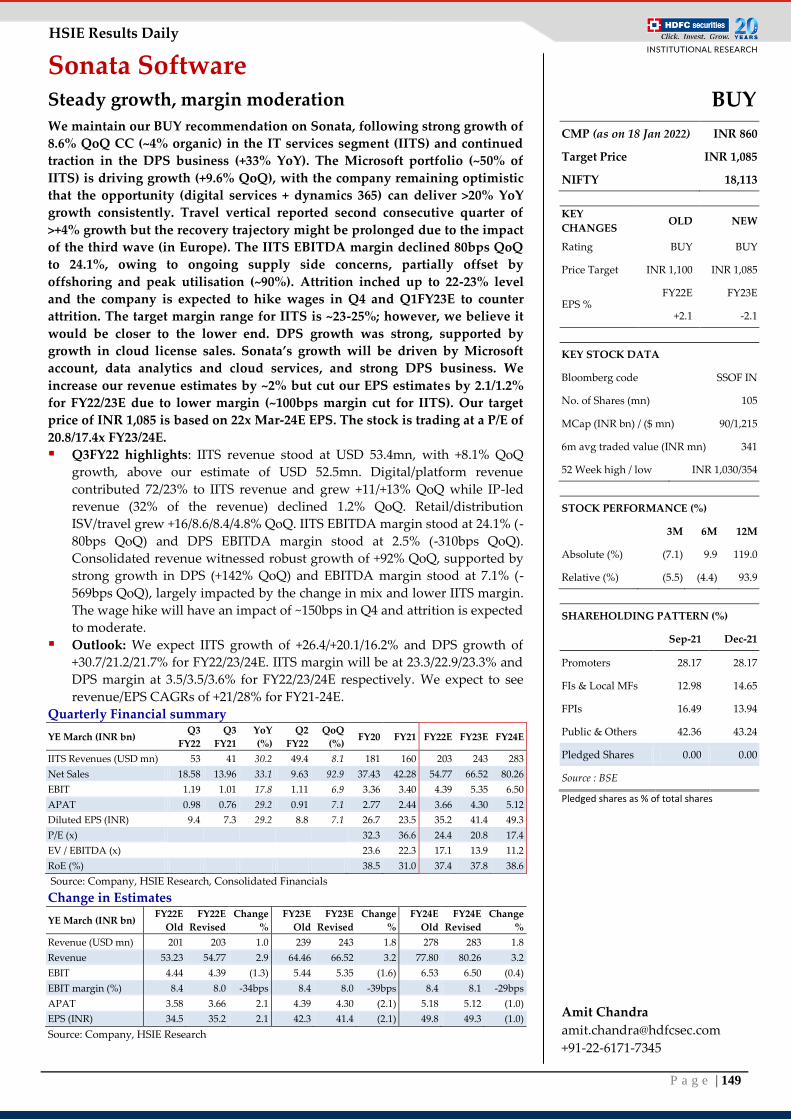
P a g e | 149
HSIE Results Daily
Sonata Software Steady growth, margin moderation
We maintain our BUY recommendation on Sonata, following strong growth of
8.6% QoQ CC (~4% organic) in the IT services segment (IITS) and continued
traction in the DPS business (+33% YoY). The Microsoft portfolio (~50% of
IITS) is driving growth (+9.6% QoQ), with the company remaining optimistic
that the opportunity (digital services + dynamics 365) can deliver >20% YoY
growth consistently. Travel vertical reported second consecutive quarter of
>+4% growth but the recovery trajectory might be prolonged due to the impact
of the third wave (in Europe). The IITS EBITDA margin declined 80bps QoQ
to 24.1%, owing to ongoing supply side concerns, partially offset by
offshoring and peak utilisation (~90%). Attrition inched up to 22-23% level
and the company is expected to hike wages in Q4 and Q1FY23E to counter
attrition. The target margin range for IITS is ~23-25%; however, we believe it
would be closer to the lower end. DPS growth was strong, supported by
growth in cloud license sales. Sonata’s growth will be driven by Microsoft
account, data analytics and cloud services, and strong DPS business. We
increase our revenue estimates by ~2% but cut our EPS estimates by 2.1/1.2%
for FY22/23E due to lower margin (~100bps margin cut for IITS). Our target
price of INR 1,085 is based on 22x Mar-24E EPS. The stock is trading at a P/E of
20.8/17.4x FY23/24E.
Q3FY22 highlights: IITS revenue stood at USD 53.4mn, with +8.1% QoQ
growth, above our estimate of USD 52.5mn. Digital/platform revenue
contributed 72/23% to IITS revenue and grew +11/+13% QoQ while IP-led
revenue (32% of the revenue) declined 1.2% QoQ. Retail/distribution
ISV/travel grew +16/8.6/8.4/4.8% QoQ. IITS EBITDA margin stood at 24.1% (-
80bps QoQ) and DPS EBITDA margin stood at 2.5% (-310bps QoQ).
Consolidated revenue witnessed robust growth of +92% QoQ, supported by
strong growth in DPS (+142% QoQ) and EBITDA margin stood at 7.1% (-
569bps QoQ), largely impacted by the change in mix and lower IITS margin.
The wage hike will have an impact of ~150bps in Q4 and attrition is expected
to moderate.
Outlook: We expect IITS growth of +26.4/+20.1/16.2% and DPS growth of
+30.7/21.2/21.7% for FY22/23/24E. IITS margin will be at 23.3/22.9/23.3% and
DPS margin at 3.5/3.5/3.6% for FY22/23/24E respectively. We expect to see
revenue/EPS CAGRs of +21/28% for FY21-24E.
Quarterly Financial summary
YE March (INR bn) Q3
FY22
Q3
FY21
YoY
(%)
Q2
FY22
QoQ
(%) FY20 FY21 FY22E FY23E FY24E
IITS Revenues (USD mn) 53 41 30.2 49.4 8.1 181 160 203 243 283
Net Sales 18.58 13.96 33.1 9.63 92.9 37.43 42.28 54.77 66.52 80.26
EBIT 1.19 1.01 17.8 1.11 6.9 3.36 3.40 4.39 5.35 6.50
APAT 0.98 0.76 29.2 0.91 7.1 2.77 2.44 3.66 4.30 5.12
Diluted EPS (INR) 9.4 7.3 29.2 8.8 7.1 26.7 23.5 35.2 41.4 49.3
P/E (x)
32.3 36.6 24.4 20.8 17.4
EV / EBITDA (x) 23.6 22.3 17.1 13.9 11.2
RoE (%) 38.5 31.0 37.4 37.8 38.6
Source: Company, HSIE Research, Consolidated Financials
Change in Estimates
YE March (INR bn) FY22E
Old
FY22E
Revised
Change
%
FY23E
Old
FY23E
Revised
Change
%
FY24E
Old
FY24E
Revised
Change
%
Revenue (USD mn) 201 203 1.0 239 243 1.8 278 283 1.8
Revenue 53.23 54.77 2.9 64.46 66.52 3.2 77.80 80.26 3.2
EBIT 4.44 4.39 (1.3) 5.44 5.35 (1.6) 6.53 6.50 (0.4)
EBIT margin (%) 8.4 8.0 -34bps 8.4 8.0 -39bps 8.4 8.1 -29bps
APAT 3.58 3.66 2.1 4.39 4.30 (2.1) 5.18 5.12 (1.0)
EPS (INR) 34.5 35.2 2.1 42.3 41.4 (2.1) 49.8 49.3 (1.0)
Source: Company, HSIE Research
BUY
CMP (as on 18 Jan 2022) INR 860
Target Price INR 1,085
NIFTY 18,113
KEY
CHANGES OLD NEW
Rating BUY BUY
Price Target INR 1,100 INR 1,085
EPS % FY22E FY23E
+2.1 -2.1
KEY STOCK DATA
Bloomberg code SSOF IN
No. of Shares (mn) 105
MCap (INR bn) / ($ mn) 90/1,215
6m avg traded value (INR mn) 341
52 Week high / low INR 1,030/354
STOCK PERFORMANCE (%)
3M 6M 12M
Absolute (%) (7.1) 9.9 119.0
Relative (%) (5.5) (4.4) 93.9
SHAREHOLDING PATTERN (%)
Sep-21 Dec-21
Promoters 28.17 28.17
FIs & Local MFs 12.98 14.65
FPIs 16.49 13.94
Public & Others 42.36 43.24
Pledged Shares 0.00 0.00
Source : BSE
Pledged shares as % of total shares
Amit Chandra
+91-22-6171-7345
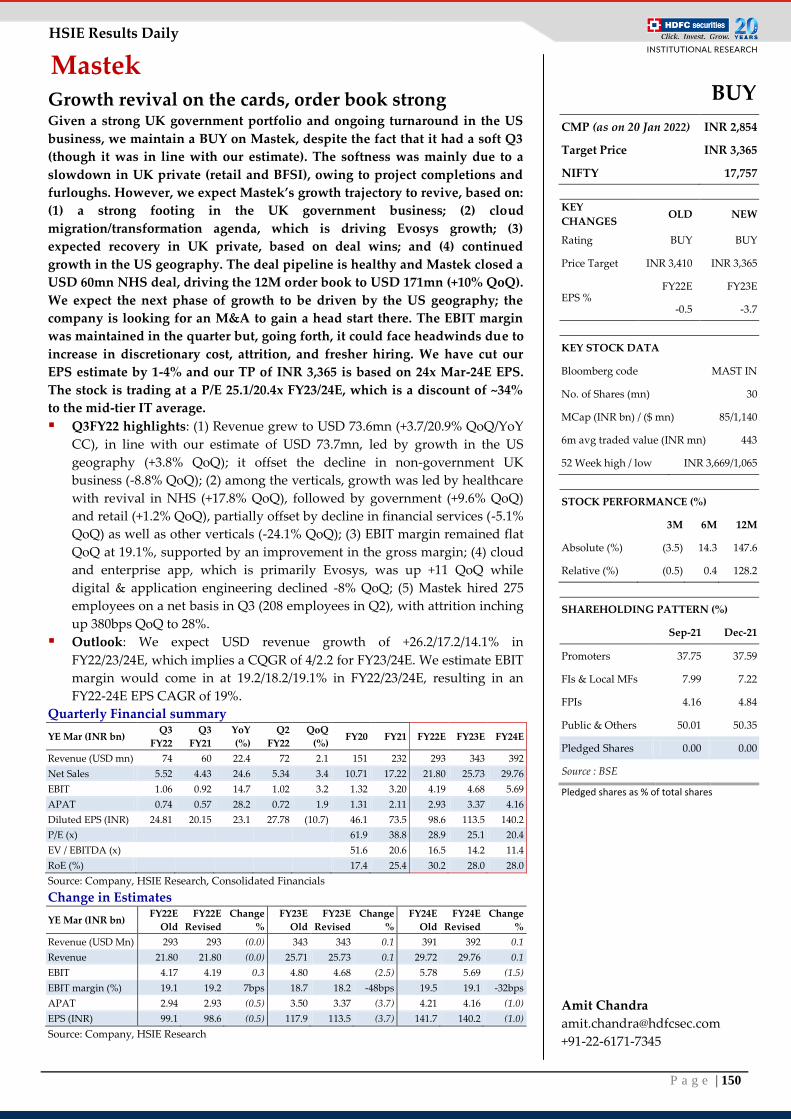
P a g e | 150
HSIE Results Daily
Mastek Growth revival on the cards, order book strong Given a strong UK government portfolio and ongoing turnaround in the US
business, we maintain a BUY on Mastek, despite the fact that it had a soft Q3
(though it was in line with our estimate). The softness was mainly due to a
slowdown in UK private (retail and BFSI), owing to project completions and
furloughs. However, we expect Mastek’s growth trajectory to revive, based on:
(1) a strong footing in the UK government business; (2) cloud
migration/transformation agenda, which is driving Evosys growth; (3)
expected recovery in UK private, based on deal wins; and (4) continued
growth in the US geography. The deal pipeline is healthy and Mastek closed a
USD 60mn NHS deal, driving the 12M order book to USD 171mn (+10% QoQ).
We expect the next phase of growth to be driven by the US geography; the
company is looking for an M&A to gain a head start there. The EBIT margin
was maintained in the quarter but, going forth, it could face headwinds due to
increase in discretionary cost, attrition, and fresher hiring. We have cut our
EPS estimate by 1-4% and our TP of INR 3,365 is based on 24x Mar-24E EPS.
The stock is trading at a P/E 25.1/20.4x FY23/24E, which is a discount of ~34%
to the mid-tier IT average.
Q3FY22 highlights: (1) Revenue grew to USD 73.6mn (+3.7/20.9% QoQ/YoY
CC), in line with our estimate of USD 73.7mn, led by growth in the US
geography (+3.8% QoQ); it offset the decline in non-government UK
business (-8.8% QoQ); (2) among the verticals, growth was led by healthcare
with revival in NHS (+17.8% QoQ), followed by government (+9.6% QoQ)
and retail (+1.2% QoQ), partially offset by decline in financial services (-5.1%
QoQ) as well as other verticals (-24.1% QoQ); (3) EBIT margin remained flat
QoQ at 19.1%, supported by an improvement in the gross margin; (4) cloud
and enterprise app, which is primarily Evosys, was up +11 QoQ while
digital & application engineering declined -8% QoQ; (5) Mastek hired 275
employees on a net basis in Q3 (208 employees in Q2), with attrition inching
up 380bps QoQ to 28%.
Outlook: We expect USD revenue growth of +26.2/17.2/14.1% in
FY22/23/24E, which implies a CQGR of 4/2.2 for FY23/24E. We estimate EBIT
margin would come in at 19.2/18.2/19.1% in FY22/23/24E, resulting in an
FY22-24E EPS CAGR of 19%.
Quarterly Financial summary
YE Mar (INR bn) Q3
FY22
Q3
FY21
YoY
(%)
Q2
FY22
QoQ
(%) FY20 FY21 FY22E FY23E FY24E
Revenue (USD mn) 74 60 22.4 72 2.1 151 232 293 343 392
Net Sales 5.52 4.43 24.6 5.34 3.4 10.71 17.22 21.80 25.73 29.76
EBIT 1.06 0.92 14.7 1.02 3.2 1.32 3.20 4.19 4.68 5.69
APAT 0.74 0.57 28.2 0.72 1.9 1.31 2.11 2.93 3.37 4.16
Diluted EPS (INR) 24.81 20.15 23.1 27.78 (10.7) 46.1 73.5 98.6 113.5 140.2
P/E (x)
61.9 38.8 28.9 25.1 20.4
EV / EBITDA (x)
51.6 20.6 16.5 14.2 11.4
RoE (%)
17.4 25.4 30.2 28.0 28.0
Source: Company, HSIE Research, Consolidated Financials
Change in Estimates
YE Mar (INR bn) FY22E
Old
FY22E
Revised
Change
%
FY23E
Old
FY23E
Revised
Change
%
FY24E
Old
FY24E
Revised
Change
%
Revenue (USD Mn) 293 293 (0.0) 343 343 0.1 391 392 0.1
Revenue 21.80 21.80 (0.0) 25.71 25.73 0.1 29.72 29.76 0.1
EBIT 4.17 4.19 0.3 4.80 4.68 (2.5) 5.78 5.69 (1.5)
EBIT margin (%) 19.1 19.2 7bps 18.7 18.2 -48bps 19.5 19.1 -32bps
APAT 2.94 2.93 (0.5) 3.50 3.37 (3.7) 4.21 4.16 (1.0)
EPS (INR) 99.1 98.6 (0.5) 117.9 113.5 (3.7) 141.7 140.2 (1.0)
Source: Company, HSIE Research
BUY
CMP (as on 20 Jan 2022) INR 2,854
Target Price INR 3,365
NIFTY 17,757
KEY
CHANGES OLD NEW
Rating BUY BUY
Price Target INR 3,410 INR 3,365
EPS % FY22E FY23E
-0.5 -3.7
KEY STOCK DATA
Bloomberg code MAST IN
No. of Shares (mn) 30
MCap (INR bn) / ($ mn) 85/1,140
6m avg traded value (INR mn) 443
52 Week high / low INR 3,669/1,065
STOCK PERFORMANCE (%)
3M 6M 12M
Absolute (%) (3.5) 14.3 147.6
Relative (%) (0.5) 0.4 128.2
SHAREHOLDING PATTERN (%)
Sep-21 Dec-21
Promoters 37.75 37.59
FIs & Local MFs 7.99 7.22
FPIs 4.16 4.84
Public & Others 50.01 50.35
Pledged Shares 0.00 0.00
Source : BSE
Pledged shares as % of total shares
Amit Chandra
+91-22-6171-7345
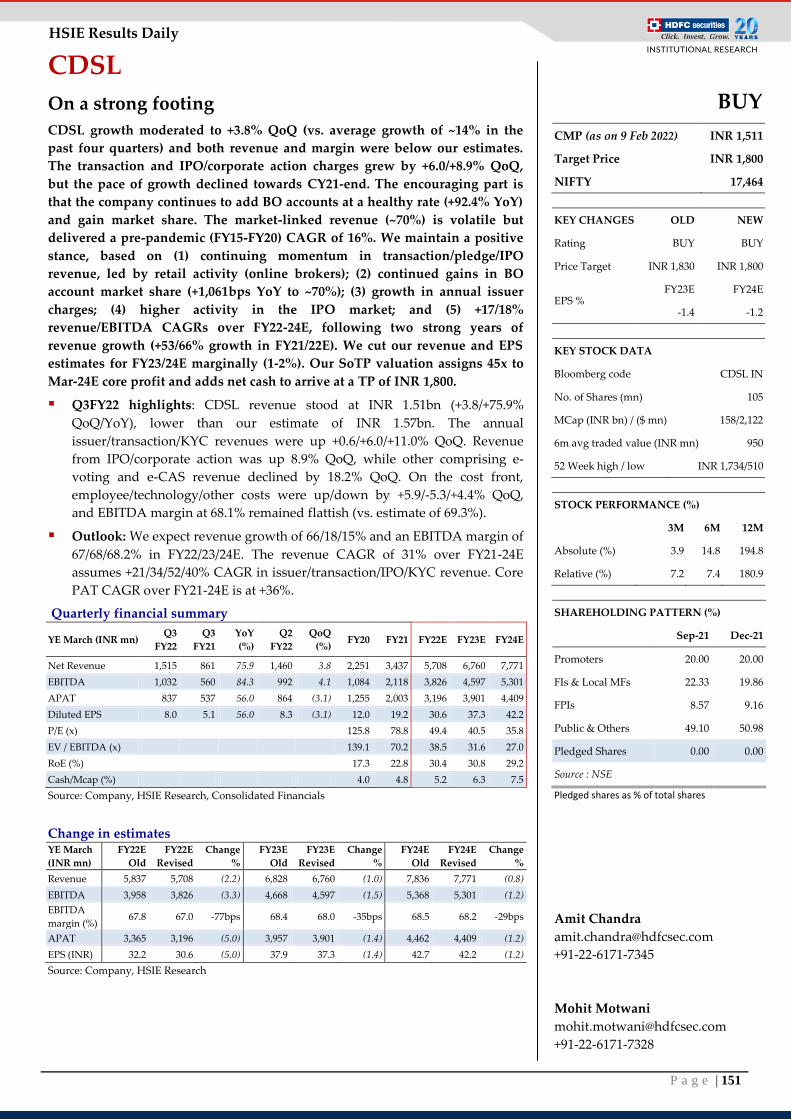
P a g e | 151
HSIE Results Daily
CDSL
On a strong footing
CDSL growth moderated to +3.8% QoQ (vs. average growth of ~14% in the
past four quarters) and both revenue and margin were below our estimates.
The transaction and IPO/corporate action charges grew by +6.0/+8.9% QoQ,
but the pace of growth declined towards CY21-end. The encouraging part is
that the company continues to add BO accounts at a healthy rate (+92.4% YoY)
and gain market share. The market-linked revenue (~70%) is volatile but
delivered a pre-pandemic (FY15-FY20) CAGR of 16%. We maintain a positive
stance, based on (1) continuing momentum in transaction/pledge/IPO
revenue, led by retail activity (online brokers); (2) continued gains in BO
account market share (+1,061bps YoY to ~70%); (3) growth in annual issuer
charges; (4) higher activity in the IPO market; and (5) +17/18%
revenue/EBITDA CAGRs over FY22-24E, following two strong years of
revenue growth (+53/66% growth in FY21/22E). We cut our revenue and EPS
estimates for FY23/24E marginally (1-2%). Our SoTP valuation assigns 45x to
Mar-24E core profit and adds net cash to arrive at a TP of INR 1,800.
Q3FY22 highlights: CDSL revenue stood at INR 1.51bn (+3.8/+75.9%
QoQ/YoY), lower than our estimate of INR 1.57bn. The annual
issuer/transaction/KYC revenues were up +0.6/+6.0/+11.0% QoQ. Revenue
from IPO/corporate action was up 8.9% QoQ, while other comprising e-
voting and e-CAS revenue declined by 18.2% QoQ. On the cost front,
employee/technology/other costs were up/down by +5.9/-5.3/+4.4% QoQ,
and EBITDA margin at 68.1% remained flattish (vs. estimate of 69.3%).
Outlook: We expect revenue growth of 66/18/15% and an EBITDA margin of
67/68/68.2% in FY22/23/24E. The revenue CAGR of 31% over FY21-24E
assumes +21/34/52/40% CAGR in issuer/transaction/IPO/KYC revenue. Core
PAT CAGR over FY21-24E is at +36%.
Quarterly financial summary
YE March (INR mn) Q3
FY22
Q3
FY21
YoY
(%)
Q2
FY22
QoQ
(%) FY20 FY21 FY22E FY23E FY24E
Net Revenue 1,515 861 75.9 1,460 3.8 2,251 3,437 5,708 6,760 7,771
EBITDA 1,032 560 84.3 992 4.1 1,084 2,118 3,826 4,597 5,301
APAT 837 537 56.0 864 (3.1) 1,255 2,003 3,196 3,901 4,409
Diluted EPS 8.0 5.1 56.0 8.3 (3.1) 12.0 19.2 30.6 37.3 42.2
P/E (x)
125.8 78.8 49.4 40.5 35.8
EV / EBITDA (x)
139.1 70.2 38.5 31.6 27.0
RoE (%)
17.3 22.8 30.4 30.8 29.2
Cash/Mcap (%) 4.0 4.8 5.2 6.3 7.5
Source: Company, HSIE Research, Consolidated Financials
Change in estimates YE March
(INR mn)
FY22E
Old
FY22E
Revised
Change
%
FY23E
Old
FY23E
Revised
Change
%
FY24E
Old
FY24E
Revised
Change
%
Revenue 5,837 5,708 (2.2) 6,828 6,760 (1.0) 7,836 7,771 (0.8)
EBITDA 3,958 3,826 (3.3) 4,668 4,597 (1.5) 5,368 5,301 (1.2)
EBITDA
margin (%) 67.8 67.0 -77bps 68.4 68.0 -35bps 68.5 68.2 -29bps
APAT 3,365 3,196 (5.0) 3,957 3,901 (1.4) 4,462 4,409 (1.2)
EPS (INR) 32.2 30.6 (5.0) 37.9 37.3 (1.4) 42.7 42.2 (1.2)
Source: Company, HSIE Research
BUY
CMP (as on 9 Feb 2022) INR 1,511
Target Price INR 1,800
NIFTY 17,464
KEY CHANGES OLD NEW
Rating BUY BUY
Price Target INR 1,830 INR 1,800
EPS % FY23E FY24E
-1.4 -1.2
KEY STOCK DATA
Bloomberg code CDSL IN
No. of Shares (mn) 105
MCap (INR bn) / ($ mn) 158/2,122
6m avg traded value (INR mn) 950
52 Week high / low INR 1,734/510
STOCK PERFORMANCE (%)
3M 6M 12M
Absolute (%) 3.9 14.8 194.8
Relative (%) 7.2 7.4 180.9
SHAREHOLDING PATTERN (%)
Sep-21 Dec-21
Promoters 20.00 20.00
FIs & Local MFs 22.33 19.86
FPIs 8.57 9.16
Public & Others 49.10 50.98
Pledged Shares 0.00 0.00
Source : NSE
Pledged shares as % of total shares
Amit Chandra
+91-22-6171-7345
Mohit Motwani
+91-22-6171-7328
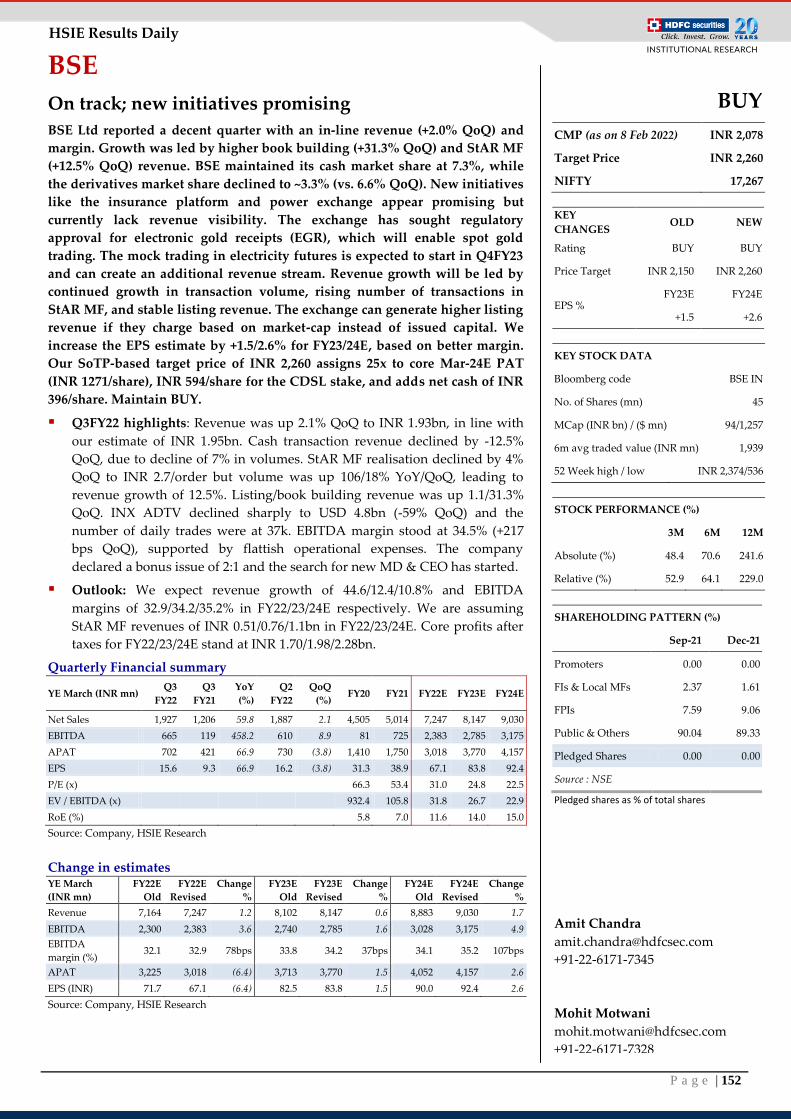
P a g e | 152
HSIE Results Daily
BSE
On track; new initiatives promising
BSE Ltd reported a decent quarter with an in-line revenue (+2.0% QoQ) and
margin. Growth was led by higher book building (+31.3% QoQ) and StAR MF
(+12.5% QoQ) revenue. BSE maintained its cash market share at 7.3%, while
the derivatives market share declined to ~3.3% (vs. 6.6% QoQ). New initiatives
like the insurance platform and power exchange appear promising but
currently lack revenue visibility. The exchange has sought regulatory
approval for electronic gold receipts (EGR), which will enable spot gold
trading. The mock trading in electricity futures is expected to start in Q4FY23
and can create an additional revenue stream. Revenue growth will be led by
continued growth in transaction volume, rising number of transactions in
StAR MF, and stable listing revenue. The exchange can generate higher listing
revenue if they charge based on market-cap instead of issued capital. We
increase the EPS estimate by +1.5/2.6% for FY23/24E, based on better margin.
Our SoTP-based target price of INR 2,260 assigns 25x to core Mar-24E PAT
(INR 1271/share), INR 594/share for the CDSL stake, and adds net cash of INR
396/share. Maintain BUY.
Q3FY22 highlights: Revenue was up 2.1% QoQ to INR 1.93bn, in line with
our estimate of INR 1.95bn. Cash transaction revenue declined by -12.5%
QoQ, due to decline of 7% in volumes. StAR MF realisation declined by 4%
QoQ to INR 2.7/order but volume was up 106/18% YoY/QoQ, leading to
revenue growth of 12.5%. Listing/book building revenue was up 1.1/31.3%
QoQ. INX ADTV declined sharply to USD 4.8bn (-59% QoQ) and the
number of daily trades were at 37k. EBITDA margin stood at 34.5% (+217
bps QoQ), supported by flattish operational expenses. The company
declared a bonus issue of 2:1 and the search for new MD & CEO has started.
Outlook: We expect revenue growth of 44.6/12.4/10.8% and EBITDA
margins of 32.9/34.2/35.2% in FY22/23/24E respectively. We are assuming
StAR MF revenues of INR 0.51/0.76/1.1bn in FY22/23/24E. Core profits after
taxes for FY22/23/24E stand at INR 1.70/1.98/2.28bn.
Quarterly Financial summary
YE March (INR mn) Q3
FY22
Q3
FY21
YoY
(%)
Q2
FY22
QoQ
(%) FY20 FY21 FY22E FY23E FY24E
Net Sales 1,927 1,206 59.8 1,887 2.1 4,505 5,014 7,247 8,147 9,030
EBITDA 665 119 458.2 610 8.9 81 725 2,383 2,785 3,175
APAT 702 421 66.9 730 (3.8) 1,410 1,750 3,018 3,770 4,157
EPS 15.6 9.3 66.9 16.2 (3.8) 31.3 38.9 67.1 83.8 92.4
P/E (x)
66.3 53.4 31.0 24.8 22.5
EV / EBITDA (x)
932.4 105.8 31.8 26.7 22.9
RoE (%)
5.8 7.0 11.6 14.0 15.0
Source: Company, HSIE Research
Change in estimates YE March
(INR mn)
FY22E
Old
FY22E
Revised
Change
%
FY23E
Old
FY23E
Revised
Change
%
FY24E
Old
FY24E
Revised
Change
%
Revenue 7,164 7,247 1.2 8,102 8,147 0.6 8,883 9,030 1.7
EBITDA 2,300 2,383 3.6 2,740 2,785 1.6 3,028 3,175 4.9
EBITDA
margin (%) 32.1 32.9 78bps 33.8 34.2 37bps 34.1 35.2 107bps
APAT 3,225 3,018 (6.4) 3,713 3,770 1.5 4,052 4,157 2.6
EPS (INR) 71.7 67.1 (6.4) 82.5 83.8 1.5 90.0 92.4 2.6
Source: Company, HSIE Research
BUY
CMP (as on 8 Feb 2022) INR 2,078
Target Price INR 2,260
NIFTY 17,267
KEY
CHANGES OLD NEW
Rating BUY BUY
Price Target INR 2,150 INR 2,260
EPS % FY23E FY24E
+1.5 +2.6
KEY STOCK DATA
Bloomberg code BSE IN
No. of Shares (mn) 45
MCap (INR bn) / ($ mn) 94/1,257
6m avg traded value (INR mn) 1,939
52 Week high / low INR 2,374/536
STOCK PERFORMANCE (%)
3M 6M 12M
Absolute (%) 48.4 70.6 241.6
Relative (%) 52.9 64.1 229.0
SHAREHOLDING PATTERN (%)
Sep-21 Dec-21
Promoters 0.00 0.00
FIs & Local MFs 2.37 1.61
FPIs 7.59 9.06
Public & Others 90.04 89.33
Pledged Shares 0.00 0.00
Source : NSE
Pledged shares as % of total shares
Amit Chandra
+91-22-6171-7345
Mohit Motwani
+91-22-6171-7328
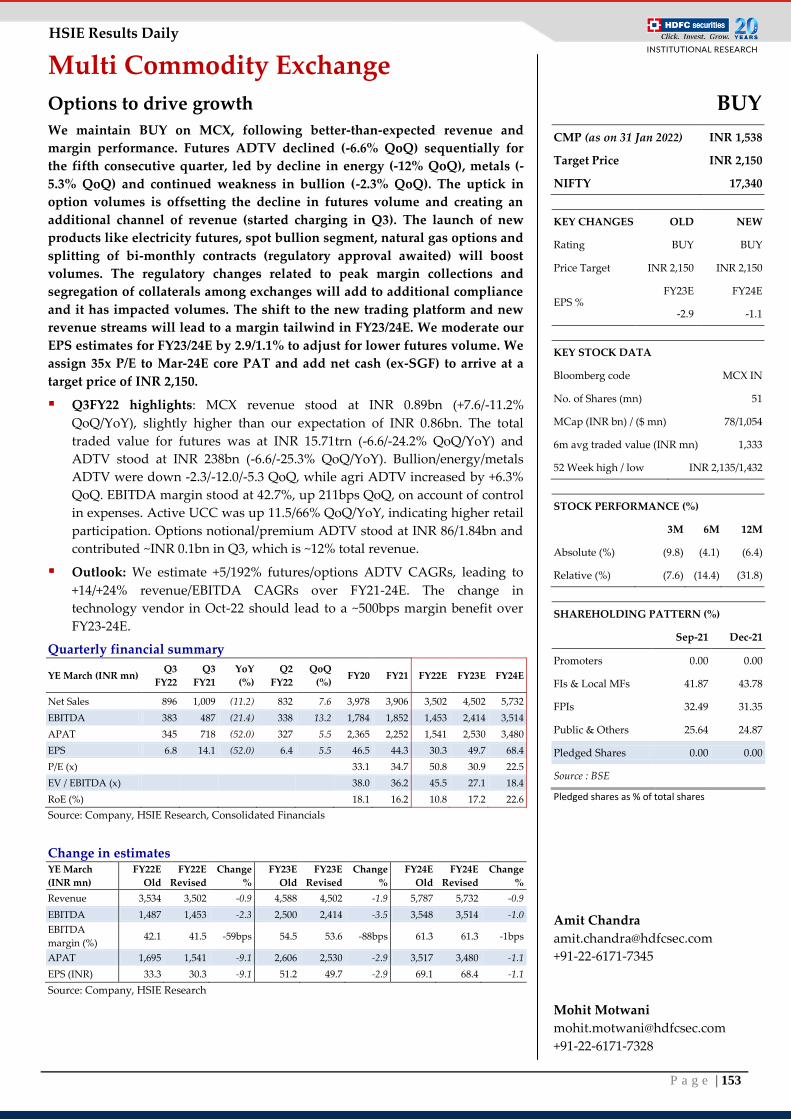
P a g e | 153
HSIE Results Daily
Multi Commodity Exchange
Options to drive growth
We maintain BUY on MCX, following better-than-expected revenue and
margin performance. Futures ADTV declined (-6.6% QoQ) sequentially for
the fifth consecutive quarter, led by decline in energy (-12% QoQ), metals (-
5.3% QoQ) and continued weakness in bullion (-2.3% QoQ). The uptick in
option volumes is offsetting the decline in futures volume and creating an
additional channel of revenue (started charging in Q3). The launch of new
products like electricity futures, spot bullion segment, natural gas options and
splitting of bi-monthly contracts (regulatory approval awaited) will boost
volumes. The regulatory changes related to peak margin collections and
segregation of collaterals among exchanges will add to additional compliance
and it has impacted volumes. The shift to the new trading platform and new
revenue streams will lead to a margin tailwind in FY23/24E. We moderate our
EPS estimates for FY23/24E by 2.9/1.1% to adjust for lower futures volume. We
assign 35x P/E to Mar-24E core PAT and add net cash (ex-SGF) to arrive at a
target price of INR 2,150.
Q3FY22 highlights: MCX revenue stood at INR 0.89bn (+7.6/-11.2%
QoQ/YoY), slightly higher than our expectation of INR 0.86bn. The total
traded value for futures was at INR 15.71trn (-6.6/-24.2% QoQ/YoY) and
ADTV stood at INR 238bn (-6.6/-25.3% QoQ/YoY). Bullion/energy/metals
ADTV were down -2.3/-12.0/-5.3 QoQ, while agri ADTV increased by +6.3%
QoQ. EBITDA margin stood at 42.7%, up 211bps QoQ, on account of control
in expenses. Active UCC was up 11.5/66% QoQ/YoY, indicating higher retail
participation. Options notional/premium ADTV stood at INR 86/1.84bn and
contributed ~INR 0.1bn in Q3, which is ~12% total revenue.
Outlook: We estimate +5/192% futures/options ADTV CAGRs, leading to
+14/+24% revenue/EBITDA CAGRs over FY21-24E. The change in
technology vendor in Oct-22 should lead to a ~500bps margin benefit over
FY23-24E.
Quarterly financial summary
YE March (INR mn) Q3
FY22
Q3
FY21
YoY
(%)
Q2
FY22
QoQ
(%) FY20 FY21 FY22E FY23E FY24E
Net Sales 896 1,009 (11.2) 832 7.6 3,978 3,906 3,502 4,502 5,732
EBITDA 383 487 (21.4) 338 13.2 1,784 1,852 1,453 2,414 3,514
APAT 345 718 (52.0) 327 5.5 2,365 2,252 1,541 2,530 3,480
EPS 6.8 14.1 (52.0) 6.4 5.5 46.5 44.3 30.3 49.7 68.4
P/E (x)
33.1 34.7 50.8 30.9 22.5
EV / EBITDA (x)
38.0 36.2 45.5 27.1 18.4
RoE (%)
18.1 16.2 10.8 17.2 22.6
Source: Company, HSIE Research, Consolidated Financials
Change in estimates YE March
(INR mn)
FY22E
Old
FY22E
Revised
Change
%
FY23E
Old
FY23E
Revised
Change
%
FY24E
Old
FY24E
Revised
Change
%
Revenue 3,534 3,502 -0.9 4,588 4,502 -1.9 5,787 5,732 -0.9
EBITDA 1,487 1,453 -2.3 2,500 2,414 -3.5 3,548 3,514 -1.0
EBITDA
margin (%) 42.1 41.5 -59bps 54.5 53.6 -88bps 61.3 61.3 -1bps
APAT 1,695 1,541 -9.1 2,606 2,530 -2.9 3,517 3,480 -1.1
EPS (INR) 33.3 30.3 -9.1 51.2 49.7 -2.9 69.1 68.4 -1.1
Source: Company, HSIE Research
BUY
CMP (as on 31 Jan 2022) INR 1,538
Target Price INR 2,150
NIFTY 17,340
KEY CHANGES OLD NEW
Rating BUY BUY
Price Target INR 2,150 INR 2,150
EPS % FY23E FY24E
-2.9 -1.1
KEY STOCK DATA
Bloomberg code MCX IN
No. of Shares (mn) 51
MCap (INR bn) / ($ mn) 78/1,054
6m avg traded value (INR mn) 1,333
52 Week high / low INR 2,135/1,432
STOCK PERFORMANCE (%)
3M 6M 12M
Absolute (%) (9.8) (4.1) (6.4)
Relative (%) (7.6) (14.4) (31.8)
SHAREHOLDING PATTERN (%)
Sep-21 Dec-21
Promoters 0.00 0.00
FIs & Local MFs 41.87 43.78
FPIs 32.49 31.35
Public & Others 25.64 24.87
Pledged Shares 0.00 0.00
Source : BSE
Pledged shares as % of total shares
Amit Chandra
+91-22-6171-7345
Mohit Motwani
+91-22-6171-7328
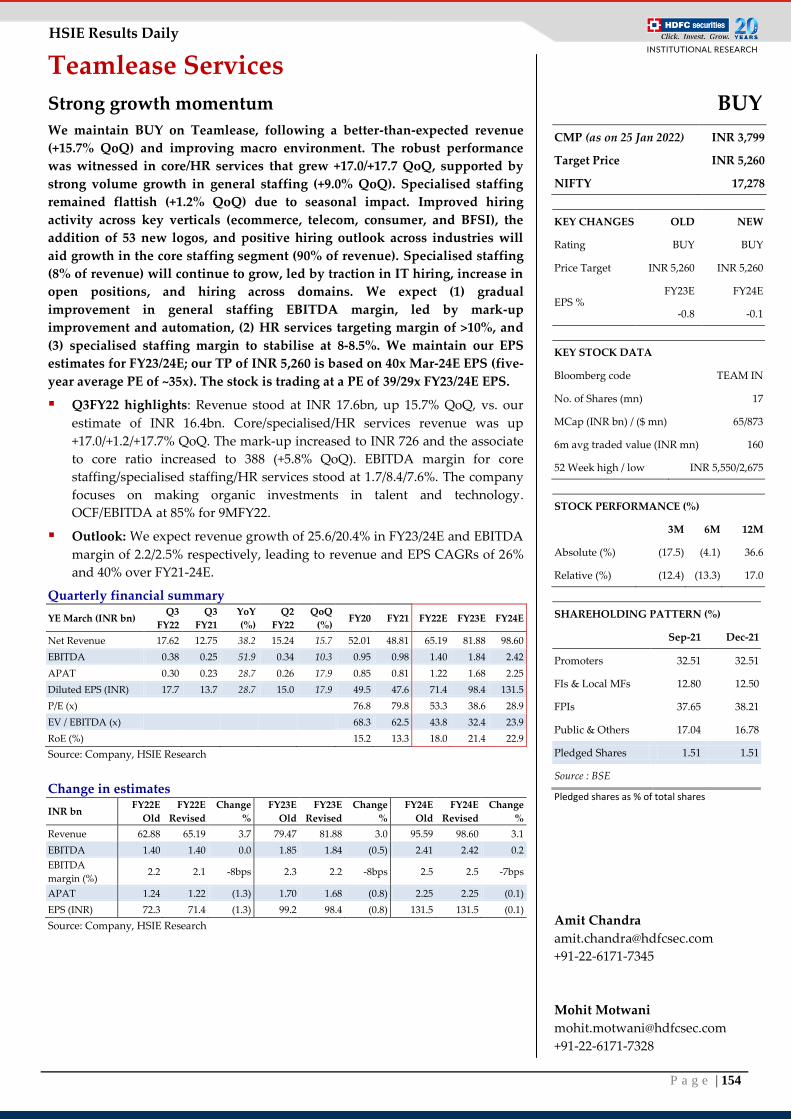
P a g e | 154
HSIE Results Daily
Teamlease Services
Strong growth momentum
We maintain BUY on Teamlease, following a better-than-expected revenue
(+15.7% QoQ) and improving macro environment. The robust performance
was witnessed in core/HR services that grew +17.0/+17.7 QoQ, supported by
strong volume growth in general staffing (+9.0% QoQ). Specialised staffing
remained flattish (+1.2% QoQ) due to seasonal impact. Improved hiring
activity across key verticals (ecommerce, telecom, consumer, and BFSI), the
addition of 53 new logos, and positive hiring outlook across industries will
aid growth in the core staffing segment (90% of revenue). Specialised staffing
(8% of revenue) will continue to grow, led by traction in IT hiring, increase in
open positions, and hiring across domains. We expect (1) gradual
improvement in general staffing EBITDA margin, led by mark-up
improvement and automation, (2) HR services targeting margin of >10%, and
(3) specialised staffing margin to stabilise at 8-8.5%. We maintain our EPS
estimates for FY23/24E; our TP of INR 5,260 is based on 40x Mar-24E EPS (five-
year average PE of ~35x). The stock is trading at a PE of 39/29x FY23/24E EPS.
Q3FY22 highlights: Revenue stood at INR 17.6bn, up 15.7% QoQ, vs. our
estimate of INR 16.4bn. Core/specialised/HR services revenue was up
+17.0/+1.2/+17.7% QoQ. The mark-up increased to INR 726 and the associate
to core ratio increased to 388 (+5.8% QoQ). EBITDA margin for core
staffing/specialised staffing/HR services stood at 1.7/8.4/7.6%. The company
focuses on making organic investments in talent and technology.
OCF/EBITDA at 85% for 9MFY22.
Outlook: We expect revenue growth of 25.6/20.4% in FY23/24E and EBITDA
margin of 2.2/2.5% respectively, leading to revenue and EPS CAGRs of 26%
and 40% over FY21-24E.
Quarterly financial summary
YE March (INR bn) Q3
FY22
Q3
FY21
YoY
(%)
Q2
FY22
QoQ
(%) FY20 FY21 FY22E FY23E FY24E
Net Revenue 17.62 12.75 38.2 15.24 15.7 52.01 48.81 65.19 81.88 98.60
EBITDA 0.38 0.25 51.9 0.34 10.3 0.95 0.98 1.40 1.84 2.42
APAT 0.30 0.23 28.7 0.26 17.9 0.85 0.81 1.22 1.68 2.25
Diluted EPS (INR) 17.7 13.7 28.7 15.0 17.9 49.5 47.6 71.4 98.4 131.5
P/E (x)
76.8 79.8 53.3 38.6 28.9
EV / EBITDA (x)
68.3 62.5 43.8 32.4 23.9
RoE (%)
15.2 13.3 18.0 21.4 22.9
Source: Company, HSIE Research
Change in estimates
INR bn FY22E
Old
FY22E
Revised
Change
%
FY23E
Old
FY23E
Revised
Change
%
FY24E
Old
FY24E
Revised
Change
%
Revenue 62.88 65.19 3.7 79.47 81.88 3.0 95.59 98.60 3.1
EBITDA 1.40 1.40 0.0 1.85 1.84 (0.5) 2.41 2.42 0.2
EBITDA
margin (%) 2.2 2.1 -8bps 2.3 2.2 -8bps 2.5 2.5 -7bps
APAT 1.24 1.22 (1.3) 1.70 1.68 (0.8) 2.25 2.25 (0.1)
EPS (INR) 72.3 71.4 (1.3) 99.2 98.4 (0.8) 131.5 131.5 (0.1)
Source: Company, HSIE Research
BUY
CMP (as on 25 Jan 2022) INR 3,799
Target Price INR 5,260
NIFTY 17,278
KEY CHANGES OLD NEW
Rating BUY BUY
Price Target INR 5,260 INR 5,260
EPS % FY23E FY24E
-0.8 -0.1
KEY STOCK DATA
Bloomberg code TEAM IN
No. of Shares (mn) 17
MCap (INR bn) / ($ mn) 65/873
6m avg traded value (INR mn) 160
52 Week high / low INR 5,550/2,675
STOCK PERFORMANCE (%)
3M 6M 12M
Absolute (%) (17.5) (4.1) 36.6
Relative (%) (12.4) (13.3) 17.0
SHAREHOLDING PATTERN (%)
Sep-21 Dec-21
Promoters 32.51 32.51
FIs & Local MFs 12.80 12.50
FPIs 37.65 38.21
Public & Others 17.04 16.78
Pledged Shares 1.51 1.51
Source : BSE
Pledged shares as % of total shares
Amit Chandra
+91-22-6171-7345
Mohit Motwani
+91-22-6171-7328

P a g e | 155
HSIE Results Daily
Oil & Gas
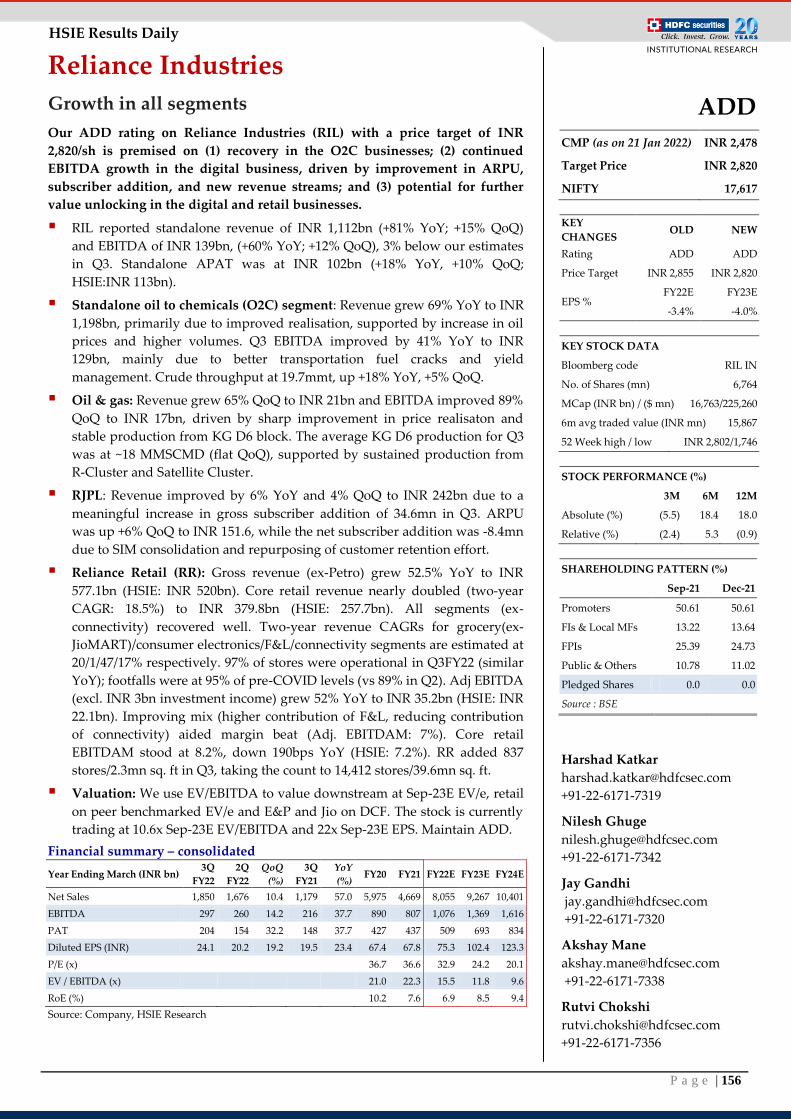
P a g e | 156
HSIE Results Daily
Reliance Industries
Growth in all segments
Our ADD rating on Reliance Industries (RIL) with a price target of INR
2,820/sh is premised on (1) recovery in the O2C businesses; (2) continued
EBITDA growth in the digital business, driven by improvement in ARPU,
subscriber addition, and new revenue streams; and (3) potential for further
value unlocking in the digital and retail businesses.
RIL reported standalone revenue of INR 1,112bn (+81% YoY; +15% QoQ)
and EBITDA of INR 139bn, (+60% YoY; +12% QoQ), 3% below our estimates
in Q3. Standalone APAT was at INR 102bn (+18% YoY, +10% QoQ;
HSIE:INR 113bn).
Standalone oil to chemicals (O2C) segment: Revenue grew 69% YoY to INR
1,198bn, primarily due to improved realisation, supported by increase in oil
prices and higher volumes. Q3 EBITDA improved by 41% YoY to INR
129bn, mainly due to better transportation fuel cracks and yield
management. Crude throughput at 19.7mmt, up +18% YoY, +5% QoQ.
Oil & gas: Revenue grew 65% QoQ to INR 21bn and EBITDA improved 89%
QoQ to INR 17bn, driven by sharp improvement in price realisaton and
stable production from KG D6 block. The average KG D6 production for Q3
was at ~18 MMSCMD (flat QoQ), supported by sustained production from
R-Cluster and Satellite Cluster.
RJPL: Revenue improved by 6% YoY and 4% QoQ to INR 242bn due to a
meaningful increase in gross subscriber addition of 34.6mn in Q3. ARPU
was up +6% QoQ to INR 151.6, while the net subscriber addition was -8.4mn
due to SIM consolidation and repurposing of customer retention effort.
Reliance Retail (RR): Gross revenue (ex-Petro) grew 52.5% YoY to INR
577.1bn (HSIE: INR 520bn). Core retail revenue nearly doubled (two-year
CAGR: 18.5%) to INR 379.8bn (HSIE: 257.7bn). All segments (ex-
connectivity) recovered well. Two-year revenue CAGRs for grocery(ex-
JioMART)/consumer electronics/F&L/connectivity segments are estimated at
20/1/47/17% respectively. 97% of stores were operational in Q3FY22 (similar
YoY); footfalls were at 95% of pre-COVID levels (vs 89% in Q2). Adj EBITDA
(excl. INR 3bn investment income) grew 52% YoY to INR 35.2bn (HSIE: INR
22.1bn). Improving mix (higher contribution of F&L, reducing contribution
of connectivity) aided margin beat (Adj. EBITDAM: 7%). Core retail
EBITDAM stood at 8.2%, down 190bps YoY (HSIE: 7.2%). RR added 837
stores/2.3mn sq. ft in Q3, taking the count to 14,412 stores/39.6mn sq. ft.
Valuation: We use EV/EBITDA to value downstream at Sep-23E EV/e, retail
on peer benchmarked EV/e and E&P and Jio on DCF. The stock is currently
trading at 10.6x Sep-23E EV/EBITDA and 22x Sep-23E EPS. Maintain ADD.
Financial summary – consolidated
Year Ending March (INR bn) 3Q
FY22
2Q
FY22
QoQ
(%)
3Q
FY21
YoY
(%) FY20 FY21 FY22E FY23E FY24E
Net Sales 1,850 1,676 10.4 1,179 57.0 5,975 4,669 8,055 9,267 10,401
EBITDA 297 260 14.2 216 37.7 890 807 1,076 1,369 1,616
PAT 204 154 32.2 148 37.7 427 437 509 693 834
Diluted EPS (INR) 24.1 20.2 19.2 19.5 23.4 67.4 67.8 75.3 102.4 123.3
P/E (x)
36.7 36.6 32.9 24.2 20.1
EV / EBITDA (x)
21.0 22.3 15.5 11.8 9.6
RoE (%)
10.2 7.6 6.9 8.5 9.4
Source: Company, HSIE Research
ADD
CMP (as on 21 Jan 2022) INR 2,478
Target Price INR 2,820
NIFTY 17,617
KEY
CHANGES OLD NEW
Rating ADD ADD
Price Target INR 2,855 INR 2,820
EPS % FY22E FY23E
-3.4% -4.0%
KEY STOCK DATA
Bloomberg code RIL IN
No. of Shares (mn) 6,764
MCap (INR bn) / ($ mn) 16,763/225,260
6m avg traded value (INR mn) 15,867
52 Week high / low INR 2,802/1,746
STOCK PERFORMANCE (%)
3M 6M 12M
Absolute (%) (5.5) 18.4 18.0
Relative (%) (2.4) 5.3 (0.9)
SHAREHOLDING PATTERN (%)
Sep-21 Dec-21
Promoters 50.61 50.61
FIs & Local MFs 13.22 13.64
FPIs 25.39 24.73
Public & Others 10.78 11.02
Pledged Shares 0.0 0.0
Source : BSE
Harshad Katkar
+91-22-6171-7319
Nilesh Ghuge
+91-22-6171-7342
Jay Gandhi
+91-22-6171-7320
Akshay Mane
+91-22-6171-7338
Rutvi Chokshi
+91-22-6171-7356
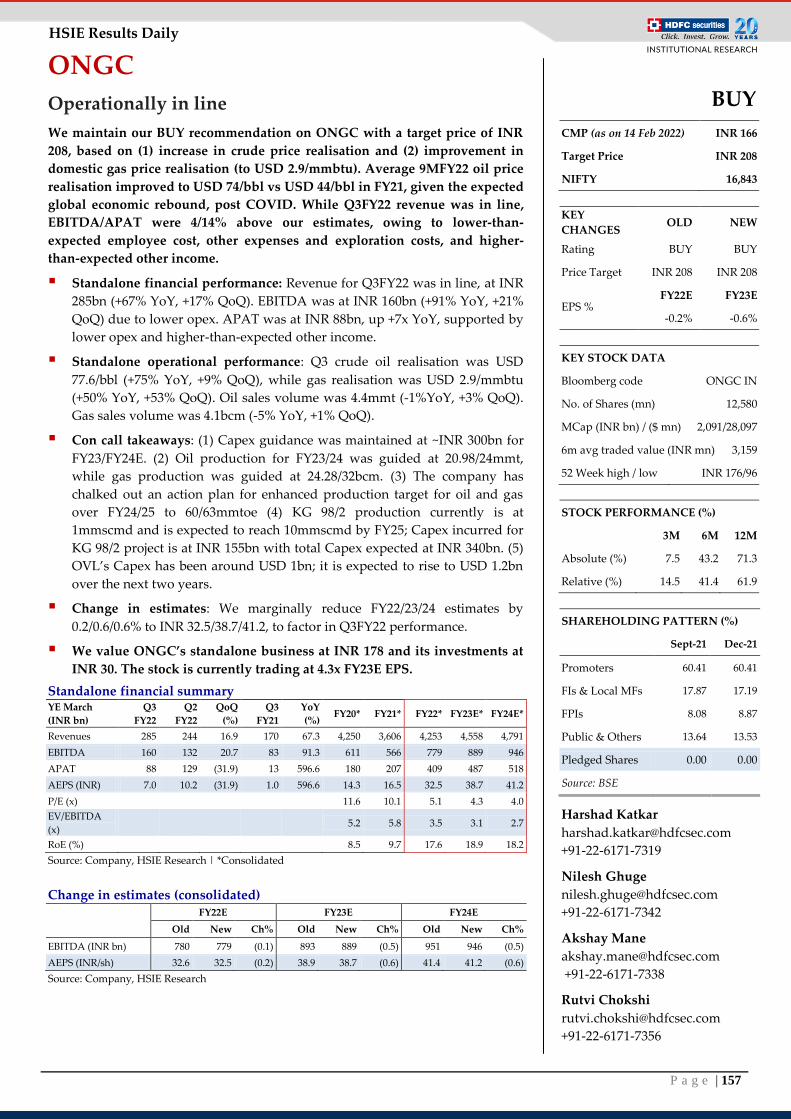
P a g e | 157
HSIE Results Daily
ONGC
Operationally in line
We maintain our BUY recommendation on ONGC with a target price of INR
208, based on (1) increase in crude price realisation and (2) improvement in
domestic gas price realisation (to USD 2.9/mmbtu). Average 9MFY22 oil price
realisation improved to USD 74/bbl vs USD 44/bbl in FY21, given the expected
global economic rebound, post COVID. While Q3FY22 revenue was in line,
EBITDA/APAT were 4/14% above our estimates, owing to lower-than-
expected employee cost, other expenses and exploration costs, and higher-
than-expected other income.
Standalone financial performance: Revenue for Q3FY22 was in line, at INR
285bn (+67% YoY, +17% QoQ). EBITDA was at INR 160bn (+91% YoY, +21%
QoQ) due to lower opex. APAT was at INR 88bn, up +7x YoY, supported by
lower opex and higher-than-expected other income.
Standalone operational performance: Q3 crude oil realisation was USD
77.6/bbl (+75% YoY, +9% QoQ), while gas realisation was USD 2.9/mmbtu
(+50% YoY, +53% QoQ). Oil sales volume was 4.4mmt (-1%YoY, +3% QoQ).
Gas sales volume was 4.1bcm (-5% YoY, +1% QoQ).
Con call takeaways: (1) Capex guidance was maintained at ~INR 300bn for
FY23/FY24E. (2) Oil production for FY23/24 was guided at 20.98/24mmt,
while gas production was guided at 24.28/32bcm. (3) The company has
chalked out an action plan for enhanced production target for oil and gas
over FY24/25 to 60/63mmtoe (4) KG 98/2 production currently is at
1mmscmd and is expected to reach 10mmscmd by FY25; Capex incurred for
KG 98/2 project is at INR 155bn with total Capex expected at INR 340bn. (5)
OVL’s Capex has been around USD 1bn; it is expected to rise to USD 1.2bn
over the next two years.
Change in estimates: We marginally reduce FY22/23/24 estimates by
0.2/0.6/0.6% to INR 32.5/38.7/41.2, to factor in Q3FY22 performance.
We value ONGC’s standalone business at INR 178 and its investments at
INR 30. The stock is currently trading at 4.3x FY23E EPS.
Standalone financial summary YE March
(INR bn)
Q3
FY22
Q2
FY22
QoQ
(%)
Q3
FY21
YoY
(%) FY20* FY21* FY22* FY23E* FY24E*
Revenues 285 244 16.9 170 67.3 4,250 3,606 4,253 4,558 4,791
EBITDA 160 132 20.7 83 91.3 611 566 779 889 946
APAT 88 129 (31.9) 13 596.6 180 207 409 487 518
AEPS (INR) 7.0 10.2 (31.9) 1.0 596.6 14.3 16.5 32.5 38.7 41.2
P/E (x)
11.6 10.1 5.1 4.3 4.0
EV/EBITDA
(x) 5.2 5.8 3.5 3.1 2.7
RoE (%)
8.5 9.7 17.6 18.9 18.2
Source: Company, HSIE Research | *Consolidated
Change in estimates (consolidated)
FY22E FY23E FY24E
Old New Ch% Old New Ch% Old New Ch%
EBITDA (INR bn) 780 779 (0.1) 893 889 (0.5) 951 946 (0.5)
AEPS (INR/sh) 32.6 32.5 (0.2) 38.9 38.7 (0.6) 41.4 41.2 (0.6)
Source: Company, HSIE Research
BUY
CMP (as on 14 Feb 2022) INR 166
Target Price INR 208
NIFTY 16,843
KEY
CHANGES OLD NEW
Rating BUY BUY
Price Target INR 208 INR 208
EPS % FY22E FY23E
-0.2% -0.6%
KEY STOCK DATA
Bloomberg code ONGC IN
No. of Shares (mn) 12,580
MCap (INR bn) / ($ mn) 2,091/28,097
6m avg traded value (INR mn) 3,159
52 Week high / low INR 176/96
STOCK PERFORMANCE (%)
3M 6M 12M
Absolute (%) 7.5 43.2 71.3
Relative (%) 14.5 41.4 61.9
SHAREHOLDING PATTERN (%)
Sept-21 Dec-21
Promoters 60.41 60.41
FIs & Local MFs 17.87 17.19
FPIs 8.08 8.87
Public & Others 13.64 13.53
Pledged Shares 0.00 0.00
Source: BSE
Harshad Katkar
+91-22-6171-7319
Nilesh Ghuge
+91-22-6171-7342
Akshay Mane
+91-22-6171-7338
Rutvi Chokshi
+91-22-6171-7356
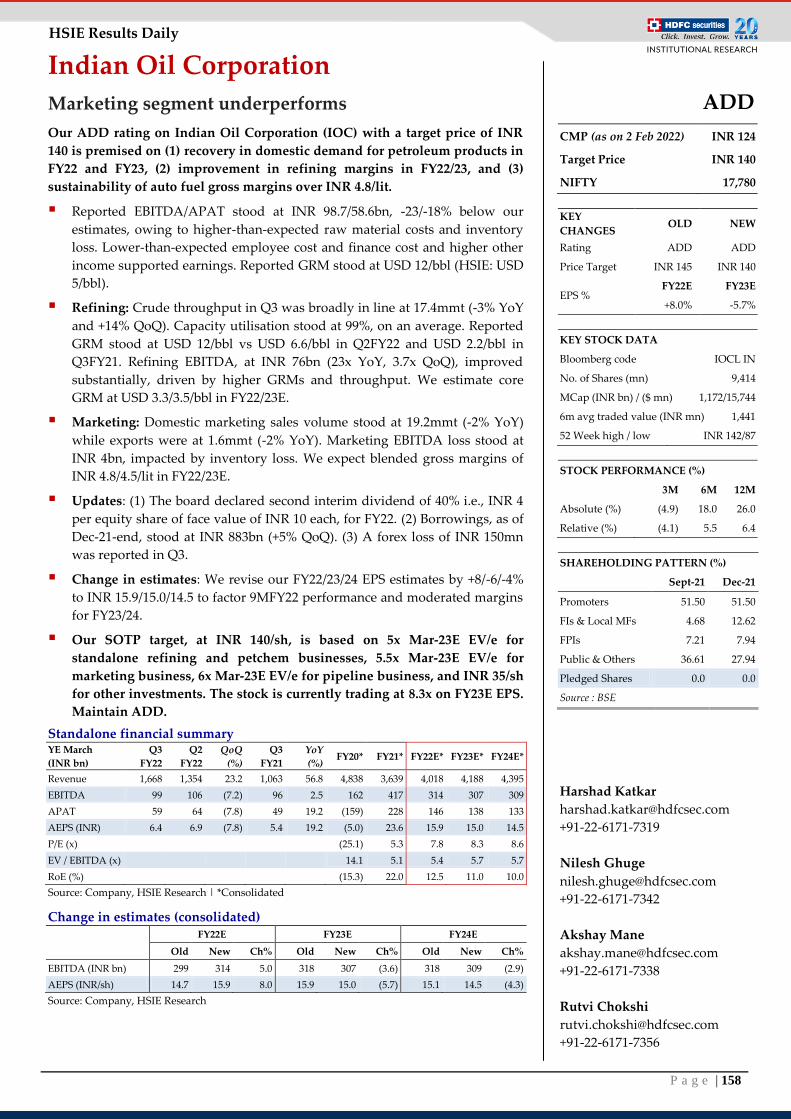
P a g e | 158
HSIE Results Daily
Indian Oil Corporation
Marketing segment underperforms
Our ADD rating on Indian Oil Corporation (IOC) with a target price of INR
140 is premised on (1) recovery in domestic demand for petroleum products in
FY22 and FY23, (2) improvement in refining margins in FY22/23, and (3)
sustainability of auto fuel gross margins over INR 4.8/lit.
Reported EBITDA/APAT stood at INR 98.7/58.6bn, -23/-18% below our
estimates, owing to higher-than-expected raw material costs and inventory
loss. Lower-than-expected employee cost and finance cost and higher other
income supported earnings. Reported GRM stood at USD 12/bbl (HSIE: USD
5/bbl).
Refining: Crude throughput in Q3 was broadly in line at 17.4mmt (-3% YoY
and +14% QoQ). Capacity utilisation stood at 99%, on an average. Reported
GRM stood at USD 12/bbl vs USD 6.6/bbl in Q2FY22 and USD 2.2/bbl in
Q3FY21. Refining EBITDA, at INR 76bn (23x YoY, 3.7x QoQ), improved
substantially, driven by higher GRMs and throughput. We estimate core
GRM at USD 3.3/3.5/bbl in FY22/23E.
Marketing: Domestic marketing sales volume stood at 19.2mmt (-2% YoY)
while exports were at 1.6mmt (-2% YoY). Marketing EBITDA loss stood at
INR 4bn, impacted by inventory loss. We expect blended gross margins of
INR 4.8/4.5/lit in FY22/23E.
Updates: (1) The board declared second interim dividend of 40% i.e., INR 4
per equity share of face value of INR 10 each, for FY22. (2) Borrowings, as of
Dec-21-end, stood at INR 883bn (+5% QoQ). (3) A forex loss of INR 150mn
was reported in Q3.
Change in estimates: We revise our FY22/23/24 EPS estimates by +8/-6/-4%
to INR 15.9/15.0/14.5 to factor 9MFY22 performance and moderated margins
for FY23/24.
Our SOTP target, at INR 140/sh, is based on 5x Mar-23E EV/e for
standalone refining and petchem businesses, 5.5x Mar-23E EV/e for
marketing business, 6x Mar-23E EV/e for pipeline business, and INR 35/sh
for other investments. The stock is currently trading at 8.3x on FY23E EPS.
Maintain ADD.
Standalone financial summary YE March
(INR bn)
Q3
FY22
Q2
FY22
QoQ
(%)
Q3
FY21
YoY
(%) FY20* FY21* FY22E* FY23E* FY24E*
Revenue 1,668 1,354 23.2 1,063 56.8 4,838 3,639 4,018 4,188 4,395
EBITDA 99 106 (7.2) 96 2.5 162 417 314 307 309
APAT 59 64 (7.8) 49 19.2 (159) 228 146 138 133
AEPS (INR) 6.4 6.9 (7.8) 5.4 19.2 (5.0) 23.6 15.9 15.0 14.5
P/E (x)
(25.1) 5.3 7.8 8.3 8.6
EV / EBITDA (x)
14.1 5.1 5.4 5.7 5.7
RoE (%)
(15.3) 22.0 12.5 11.0 10.0
Source: Company, HSIE Research | *Consolidated
Change in estimates (consolidated)
FY22E FY23E FY24E
Old New Ch% Old New Ch% Old New Ch%
EBITDA (INR bn) 299 314 5.0 318 307 (3.6) 318 309 (2.9)
AEPS (INR/sh) 14.7 15.9 8.0 15.9 15.0 (5.7) 15.1 14.5 (4.3)
Source: Company, HSIE Research
ADD
CMP (as on 2 Feb 2022) INR 124
Target Price INR 140
NIFTY 17,780
KEY
CHANGES OLD NEW
Rating ADD ADD
Price Target INR 145 INR 140
EPS % FY22E FY23E
+8.0% -5.7%
KEY STOCK DATA
Bloomberg code IOCL IN
No. of Shares (mn) 9,414
MCap (INR bn) / ($ mn) 1,172/15,744
6m avg traded value (INR mn) 1,441
52 Week high / low INR 142/87
STOCK PERFORMANCE (%)
3M 6M 12M
Absolute (%) (4.9) 18.0 26.0
Relative (%) (4.1) 5.5 6.4
SHAREHOLDING PATTERN (%)
Sept-21 Dec-21
Promoters 51.50 51.50
FIs & Local MFs 4.68 12.62
FPIs 7.21 7.94
Public & Others 36.61 27.94
Pledged Shares 0.0 0.0
Source : BSE
Harshad Katkar
+91-22-6171-7319
Nilesh Ghuge
+91-22-6171-7342
Akshay Mane
+91-22-6171-7338
Rutvi Chokshi
+91-22-6171-7356
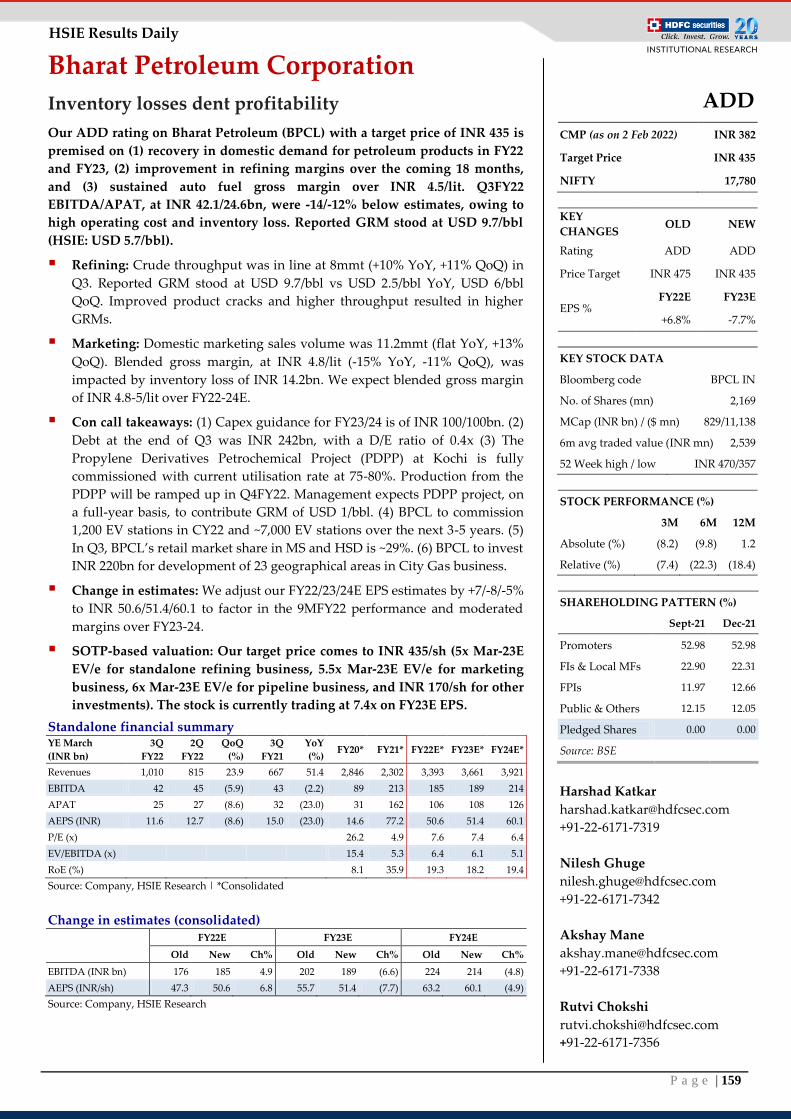
P a g e | 159
HSIE Results Daily
Bharat Petroleum Corporation
Inventory losses dent profitability
Our ADD rating on Bharat Petroleum (BPCL) with a target price of INR 435 is
premised on (1) recovery in domestic demand for petroleum products in FY22
and FY23, (2) improvement in refining margins over the coming 18 months,
and (3) sustained auto fuel gross margin over INR 4.5/lit. Q3FY22
EBITDA/APAT, at INR 42.1/24.6bn, were -14/-12% below estimates, owing to
high operating cost and inventory loss. Reported GRM stood at USD 9.7/bbl
(HSIE: USD 5.7/bbl).
Refining: Crude throughput was in line at 8mmt (+10% YoY, +11% QoQ) in
Q3. Reported GRM stood at USD 9.7/bbl vs USD 2.5/bbl YoY, USD 6/bbl
QoQ. Improved product cracks and higher throughput resulted in higher
GRMs.
Marketing: Domestic marketing sales volume was 11.2mmt (flat YoY, +13%
QoQ). Blended gross margin, at INR 4.8/lit (-15% YoY, -11% QoQ), was
impacted by inventory loss of INR 14.2bn. We expect blended gross margin
of INR 4.8-5/lit over FY22-24E.
Con call takeaways: (1) Capex guidance for FY23/24 is of INR 100/100bn. (2)
Debt at the end of Q3 was INR 242bn, with a D/E ratio of 0.4x (3) The
Propylene Derivatives Petrochemical Project (PDPP) at Kochi is fully
commissioned with current utilisation rate at 75-80%. Production from the
PDPP will be ramped up in Q4FY22. Management expects PDPP project, on
a full-year basis, to contribute GRM of USD 1/bbl. (4) BPCL to commission
1,200 EV stations in CY22 and ~7,000 EV stations over the next 3-5 years. (5)
In Q3, BPCL’s retail market share in MS and HSD is ~29%. (6) BPCL to invest
INR 220bn for development of 23 geographical areas in City Gas business.
Change in estimates: We adjust our FY22/23/24E EPS estimates by +7/-8/-5%
to INR 50.6/51.4/60.1 to factor in the 9MFY22 performance and moderated
margins over FY23-24.
SOTP-based valuation: Our target price comes to INR 435/sh (5x Mar-23E
EV/e for standalone refining business, 5.5x Mar-23E EV/e for marketing
business, 6x Mar-23E EV/e for pipeline business, and INR 170/sh for other
investments). The stock is currently trading at 7.4x on FY23E EPS.
Standalone financial summary YE March
(INR bn)
3Q
FY22
2Q
FY22
QoQ
(%)
3Q
FY21
YoY
(%) FY20* FY21* FY22E* FY23E* FY24E*
Revenues 1,010 815 23.9 667 51.4 2,846 2,302 3,393 3,661 3,921
EBITDA 42 45 (5.9) 43 (2.2) 89 213 185 189 214
APAT 25 27 (8.6) 32 (23.0) 31 162 106 108 126
AEPS (INR) 11.6 12.7 (8.6) 15.0 (23.0) 14.6 77.2 50.6 51.4 60.1
P/E (x)
26.2 4.9 7.6 7.4 6.4
EV/EBITDA (x)
15.4 5.3 6.4 6.1 5.1
RoE (%)
8.1 35.9 19.3 18.2 19.4
Source: Company, HSIE Research | *Consolidated
Change in estimates (consolidated)
FY22E FY23E FY24E
Old New Ch% Old New Ch% Old New Ch%
EBITDA (INR bn) 176 185 4.9 202 189 (6.6) 224 214 (4.8)
AEPS (INR/sh) 47.3 50.6 6.8 55.7 51.4 (7.7) 63.2 60.1 (4.9)
Source: Company, HSIE Research
ADD
CMP (as on 2 Feb 2022) INR 382
Target Price INR 435
NIFTY 17,780
KEY
CHANGES OLD NEW
Rating ADD ADD
Price Target INR 475 INR 435
EPS % FY22E FY23E
+6.8% -7.7%
KEY STOCK DATA
Bloomberg code BPCL IN
No. of Shares (mn) 2,169
MCap (INR bn) / ($ mn) 829/11,138
6m avg traded value (INR mn) 2,539
52 Week high / low INR 470/357
STOCK PERFORMANCE (%)
3M 6M 12M
Absolute (%) (8.2) (9.8) 1.2
Relative (%) (7.4) (22.3) (18.4)
SHAREHOLDING PATTERN (%)
Sept-21 Dec-21
Promoters 52.98 52.98
FIs & Local MFs 22.90 22.31
FPIs 11.97 12.66
Public & Others 12.15 12.05
Pledged Shares 0.00 0.00
Source: BSE
Harshad Katkar
+91-22-6171-7319
Nilesh Ghuge
+91-22-6171-7342
Akshay Mane
+91-22-6171-7338
Rutvi Chokshi
+91-22-6171-7356
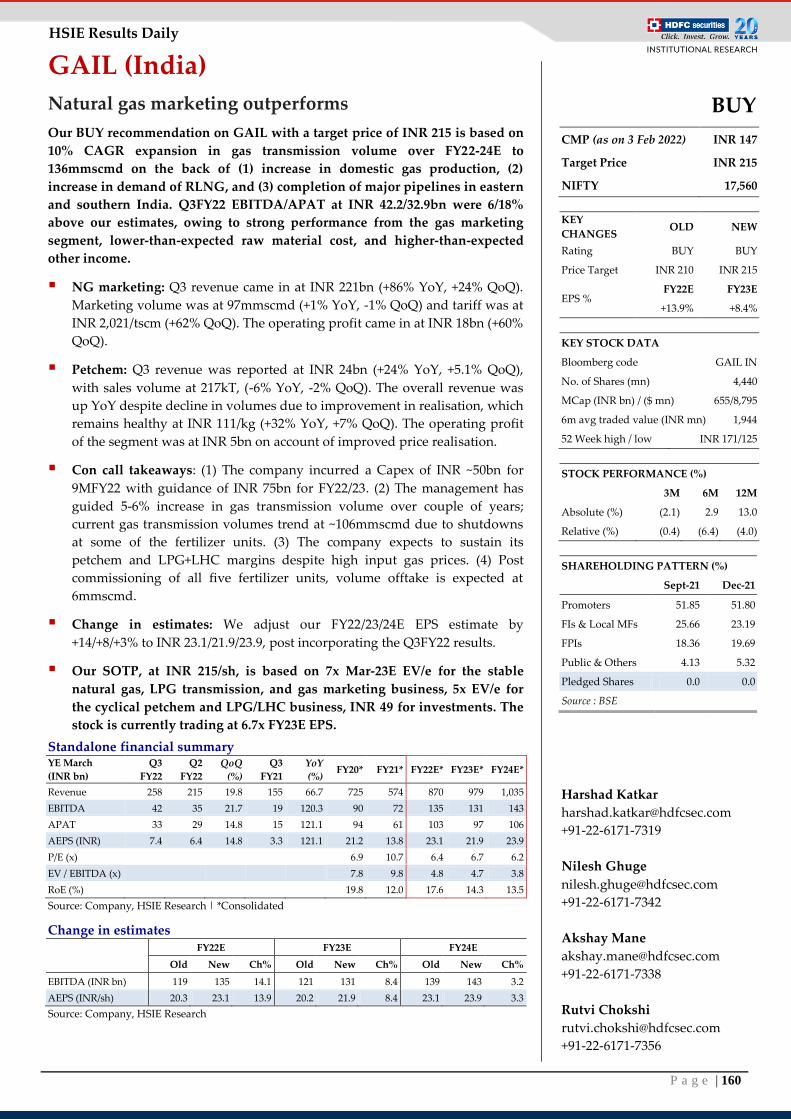
P a g e | 160
HSIE Results Daily
GAIL (India)
Natural gas marketing outperforms
Our BUY recommendation on GAIL with a target price of INR 215 is based on
10% CAGR expansion in gas transmission volume over FY22-24E to
136mmscmd on the back of (1) increase in domestic gas production, (2)
increase in demand of RLNG, and (3) completion of major pipelines in eastern
and southern India. Q3FY22 EBITDA/APAT at INR 42.2/32.9bn were 6/18%
above our estimates, owing to strong performance from the gas marketing
segment, lower-than-expected raw material cost, and higher-than-expected
other income.
NG marketing: Q3 revenue came in at INR 221bn (+86% YoY, +24% QoQ).
Marketing volume was at 97mmscmd (+1% YoY, -1% QoQ) and tariff was at
INR 2,021/tscm (+62% QoQ). The operating profit came in at INR 18bn (+60%
QoQ).
Petchem: Q3 revenue was reported at INR 24bn (+24% YoY, +5.1% QoQ),
with sales volume at 217kT, (-6% YoY, -2% QoQ). The overall revenue was
up YoY despite decline in volumes due to improvement in realisation, which
remains healthy at INR 111/kg (+32% YoY, +7% QoQ). The operating profit
of the segment was at INR 5bn on account of improved price realisation.
Con call takeaways: (1) The company incurred a Capex of INR ~50bn for
9MFY22 with guidance of INR 75bn for FY22/23. (2) The management has
guided 5-6% increase in gas transmission volume over couple of years;
current gas transmission volumes trend at ~106mmscmd due to shutdowns
at some of the fertilizer units. (3) The company expects to sustain its
petchem and LPG+LHC margins despite high input gas prices. (4) Post
commissioning of all five fertilizer units, volume offtake is expected at
6mmscmd.
Change in estimates: We adjust our FY22/23/24E EPS estimate by
+14/+8/+3% to INR 23.1/21.9/23.9, post incorporating the Q3FY22 results.
Our SOTP, at INR 215/sh, is based on 7x Mar-23E EV/e for the stable
natural gas, LPG transmission, and gas marketing business, 5x EV/e for
the cyclical petchem and LPG/LHC business, INR 49 for investments. The
stock is currently trading at 6.7x FY23E EPS.
Standalone financial summary YE March
(INR bn)
Q3
FY22
Q2
FY22
QoQ
(%)
Q3
FY21
YoY
(%) FY20* FY21* FY22E* FY23E* FY24E*
Revenue 258 215 19.8 155 66.7 725 574 870 979 1,035
EBITDA 42 35 21.7 19 120.3 90 72 135 131 143
APAT 33 29 14.8 15 121.1 94 61 103 97 106
AEPS (INR) 7.4 6.4 14.8 3.3 121.1 21.2 13.8 23.1 21.9 23.9
P/E (x)
6.9 10.7 6.4 6.7 6.2
EV / EBITDA (x)
7.8 9.8 4.8 4.7 3.8
RoE (%)
19.8 12.0 17.6 14.3 13.5
Source: Company, HSIE Research | *Consolidated
Change in estimates
FY22E FY23E FY24E
Old New Ch% Old New Ch% Old New Ch%
EBITDA (INR bn) 119 135 14.1 121 131 8.4 139 143 3.2
AEPS (INR/sh) 20.3 23.1 13.9 20.2 21.9 8.4 23.1 23.9 3.3
Source: Company, HSIE Research
BUY
CMP (as on 3 Feb 2022) INR 147
Target Price INR 215
NIFTY 17,560
KEY
CHANGES OLD NEW
Rating BUY BUY
Price Target INR 210 INR 215
EPS % FY22E FY23E
+13.9% +8.4%
KEY STOCK DATA
Bloomberg code GAIL IN
No. of Shares (mn) 4,440
MCap (INR bn) / ($ mn) 655/8,795
6m avg traded value (INR mn) 1,944
52 Week high / low INR 171/125
STOCK PERFORMANCE (%)
3M 6M 12M
Absolute (%) (2.1) 2.9 13.0
Relative (%) (0.4) (6.4) (4.0)
SHAREHOLDING PATTERN (%)
Sept-21 Dec-21
Promoters 51.85 51.80
FIs & Local MFs 25.66 23.19
FPIs 18.36 19.69
Public & Others 4.13 5.32
Pledged Shares 0.0 0.0
Source : BSE
Harshad Katkar
+91-22-6171-7319
Nilesh Ghuge
+91-22-6171-7342
Akshay Mane
+91-22-6171-7338
Rutvi Chokshi
+91-22-6171-7356
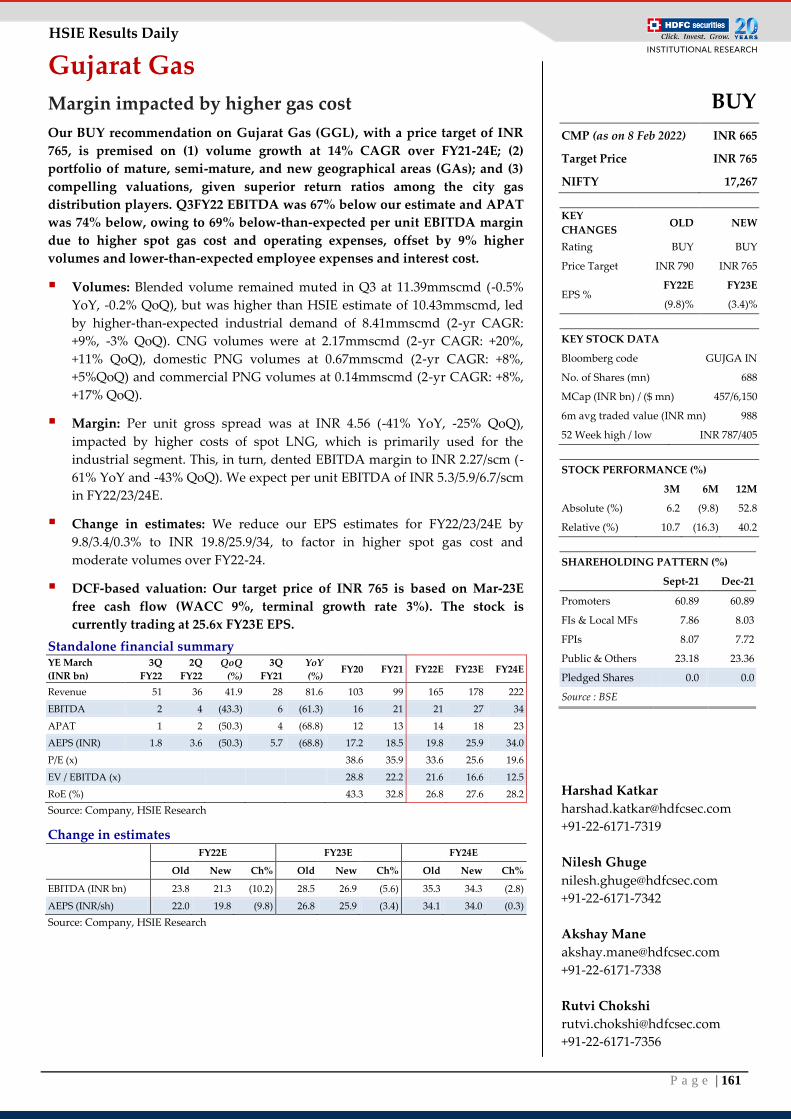
P a g e | 161
HSIE Results Daily
Gujarat Gas
Margin impacted by higher gas cost
Our BUY recommendation on Gujarat Gas (GGL), with a price target of INR
765, is premised on (1) volume growth at 14% CAGR over FY21-24E; (2)
portfolio of mature, semi-mature, and new geographical areas (GAs); and (3)
compelling valuations, given superior return ratios among the city gas
distribution players. Q3FY22 EBITDA was 67% below our estimate and APAT
was 74% below, owing to 69% below-than-expected per unit EBITDA margin
due to higher spot gas cost and operating expenses, offset by 9% higher
volumes and lower-than-expected employee expenses and interest cost.
Volumes: Blended volume remained muted in Q3 at 11.39mmscmd (-0.5%
YoY, -0.2% QoQ), but was higher than HSIE estimate of 10.43mmscmd, led
by higher-than-expected industrial demand of 8.41mmscmd (2-yr CAGR:
+9%, -3% QoQ). CNG volumes were at 2.17mmscmd (2-yr CAGR: +20%,
+11% QoQ), domestic PNG volumes at 0.67mmscmd (2-yr CAGR: +8%,
+5%QoQ) and commercial PNG volumes at 0.14mmscmd (2-yr CAGR: +8%,
+17% QoQ).
Margin: Per unit gross spread was at INR 4.56 (-41% YoY, -25% QoQ),
impacted by higher costs of spot LNG, which is primarily used for the
industrial segment. This, in turn, dented EBITDA margin to INR 2.27/scm (-
61% YoY and -43% QoQ). We expect per unit EBITDA of INR 5.3/5.9/6.7/scm
in FY22/23/24E.
Change in estimates: We reduce our EPS estimates for FY22/23/24E by
9.8/3.4/0.3% to INR 19.8/25.9/34, to factor in higher spot gas cost and
moderate volumes over FY22-24.
DCF-based valuation: Our target price of INR 765 is based on Mar-23E
free cash flow (WACC 9%, terminal growth rate 3%). The stock is
currently trading at 25.6x FY23E EPS.
Standalone financial summary YE March
(INR bn)
3Q
FY22
2Q
FY22
QoQ
(%)
3Q
FY21
YoY
(%) FY20 FY21 FY22E FY23E FY24E
Revenue 51 36 41.9 28 81.6 103 99 165 178 222
EBITDA 2 4 (43.3) 6 (61.3) 16 21 21 27 34
APAT 1 2 (50.3) 4 (68.8) 12 13 14 18 23
AEPS (INR) 1.8 3.6 (50.3) 5.7 (68.8) 17.2 18.5 19.8 25.9 34.0
P/E (x)
38.6 35.9 33.6 25.6 19.6
EV / EBITDA (x)
28.8 22.2 21.6 16.6 12.5
RoE (%)
43.3 32.8 26.8 27.6 28.2
Source: Company, HSIE Research
Change in estimates
FY22E FY23E FY24E
Old New Ch% Old New Ch% Old New Ch%
EBITDA (INR bn) 23.8 21.3 (10.2) 28.5 26.9 (5.6) 35.3 34.3 (2.8)
AEPS (INR/sh) 22.0 19.8 (9.8) 26.8 25.9 (3.4) 34.1 34.0 (0.3)
Source: Company, HSIE Research
BUY
CMP (as on 8 Feb 2022) INR 665
Target Price INR 765
NIFTY 17,267
KEY
CHANGES OLD NEW
Rating BUY BUY
Price Target INR 790 INR 765
EPS % FY22E FY23E
(9.8)% (3.4)%
KEY STOCK DATA
Bloomberg code GUJGA IN
No. of Shares (mn) 688
MCap (INR bn) / ($ mn) 457/6,150
6m avg traded value (INR mn) 988
52 Week high / low INR 787/405
STOCK PERFORMANCE (%)
3M 6M 12M
Absolute (%) 6.2 (9.8) 52.8
Relative (%) 10.7 (16.3) 40.2
SHAREHOLDING PATTERN (%)
Sept-21 Dec-21
Promoters 60.89 60.89
FIs & Local MFs 7.86 8.03
FPIs 8.07 7.72
Public & Others 23.18 23.36
Pledged Shares 0.0 0.0
Source : BSE
Harshad Katkar
+91-22-6171-7319
Nilesh Ghuge
+91-22-6171-7342
Akshay Mane
+91-22-6171-7338
Rutvi Chokshi
+91-22-6171-7356
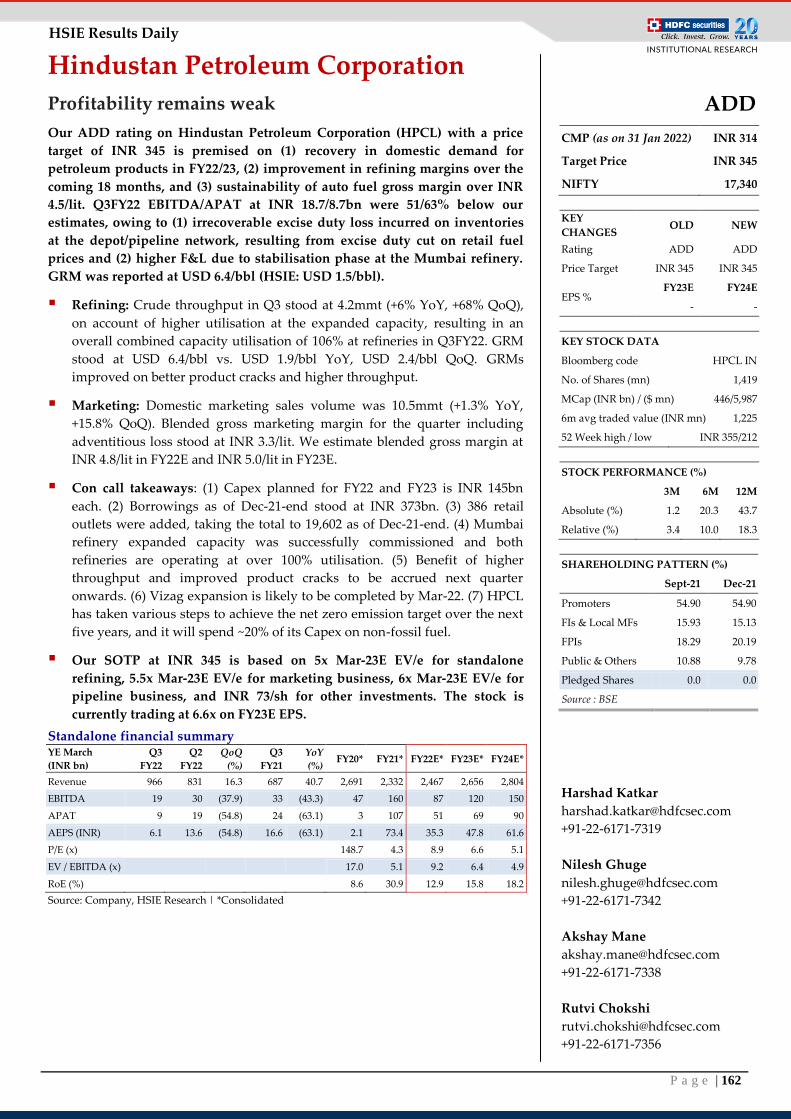
P a g e | 162
HSIE Results Daily
Hindustan Petroleum Corporation
Profitability remains weak
Our ADD rating on Hindustan Petroleum Corporation (HPCL) with a price
target of INR 345 is premised on (1) recovery in domestic demand for
petroleum products in FY22/23, (2) improvement in refining margins over the
coming 18 months, and (3) sustainability of auto fuel gross margin over INR
4.5/lit. Q3FY22 EBITDA/APAT at INR 18.7/8.7bn were 51/63% below our
estimates, owing to (1) irrecoverable excise duty loss incurred on inventories
at the depot/pipeline network, resulting from excise duty cut on retail fuel
prices and (2) higher F&L due to stabilisation phase at the Mumbai refinery.
GRM was reported at USD 6.4/bbl (HSIE: USD 1.5/bbl).
Refining: Crude throughput in Q3 stood at 4.2mmt (+6% YoY, +68% QoQ),
on account of higher utilisation at the expanded capacity, resulting in an
overall combined capacity utilisation of 106% at refineries in Q3FY22. GRM
stood at USD 6.4/bbl vs. USD 1.9/bbl YoY, USD 2.4/bbl QoQ. GRMs
improved on better product cracks and higher throughput.
Marketing: Domestic marketing sales volume was 10.5mmt (+1.3% YoY,
+15.8% QoQ). Blended gross marketing margin for the quarter including
adventitious loss stood at INR 3.3/lit. We estimate blended gross margin at
INR 4.8/lit in FY22E and INR 5.0/lit in FY23E.
Con call takeaways: (1) Capex planned for FY22 and FY23 is INR 145bn
each. (2) Borrowings as of Dec-21-end stood at INR 373bn. (3) 386 retail
outlets were added, taking the total to 19,602 as of Dec-21-end. (4) Mumbai
refinery expanded capacity was successfully commissioned and both
refineries are operating at over 100% utilisation. (5) Benefit of higher
throughput and improved product cracks to be accrued next quarter
onwards. (6) Vizag expansion is likely to be completed by Mar-22. (7) HPCL
has taken various steps to achieve the net zero emission target over the next
five years, and it will spend ~20% of its Capex on non-fossil fuel.
Our SOTP at INR 345 is based on 5x Mar-23E EV/e for standalone
refining, 5.5x Mar-23E EV/e for marketing business, 6x Mar-23E EV/e for
pipeline business, and INR 73/sh for other investments. The stock is
currently trading at 6.6x on FY23E EPS.
Standalone financial summary YE March
(INR bn)
Q3
FY22
Q2
FY22
QoQ
(%)
Q3
FY21
YoY
(%) FY20* FY21* FY22E* FY23E* FY24E*
Revenue 966 831 16.3 687 40.7 2,691 2,332 2,467 2,656 2,804
EBITDA 19 30 (37.9) 33 (43.3) 47 160 87 120 150
APAT 9 19 (54.8) 24 (63.1) 3 107 51 69 90
AEPS (INR) 6.1 13.6 (54.8) 16.6 (63.1) 2.1 73.4 35.3 47.8 61.6
P/E (x)
148.7 4.3 8.9 6.6 5.1
EV / EBITDA (x)
17.0 5.1 9.2 6.4 4.9
RoE (%)
8.6 30.9 12.9 15.8 18.2
Source: Company, HSIE Research | *Consolidated
ADD
CMP (as on 31 Jan 2022) INR 314
Target Price INR 345
NIFTY 17,340
KEY
CHANGES OLD NEW
Rating ADD ADD
Price Target INR 345 INR 345
EPS % FY23E FY24E
- -
KEY STOCK DATA
Bloomberg code HPCL IN
No. of Shares (mn) 1,419
MCap (INR bn) / ($ mn) 446/5,987
6m avg traded value (INR mn) 1,225
52 Week high / low INR 355/212
STOCK PERFORMANCE (%)
3M 6M 12M
Absolute (%) 1.2 20.3 43.7
Relative (%) 3.4 10.0 18.3
SHAREHOLDING PATTERN (%)
Sept-21 Dec-21
Promoters 54.90 54.90
FIs & Local MFs 15.93 15.13
FPIs 18.29 20.19
Public & Others 10.88 9.78
Pledged Shares 0.0 0.0
Source : BSE
Harshad Katkar
+91-22-6171-7319
Nilesh Ghuge
+91-22-6171-7342
Akshay Mane
+91-22-6171-7338
Rutvi Chokshi
+91-22-6171-7356
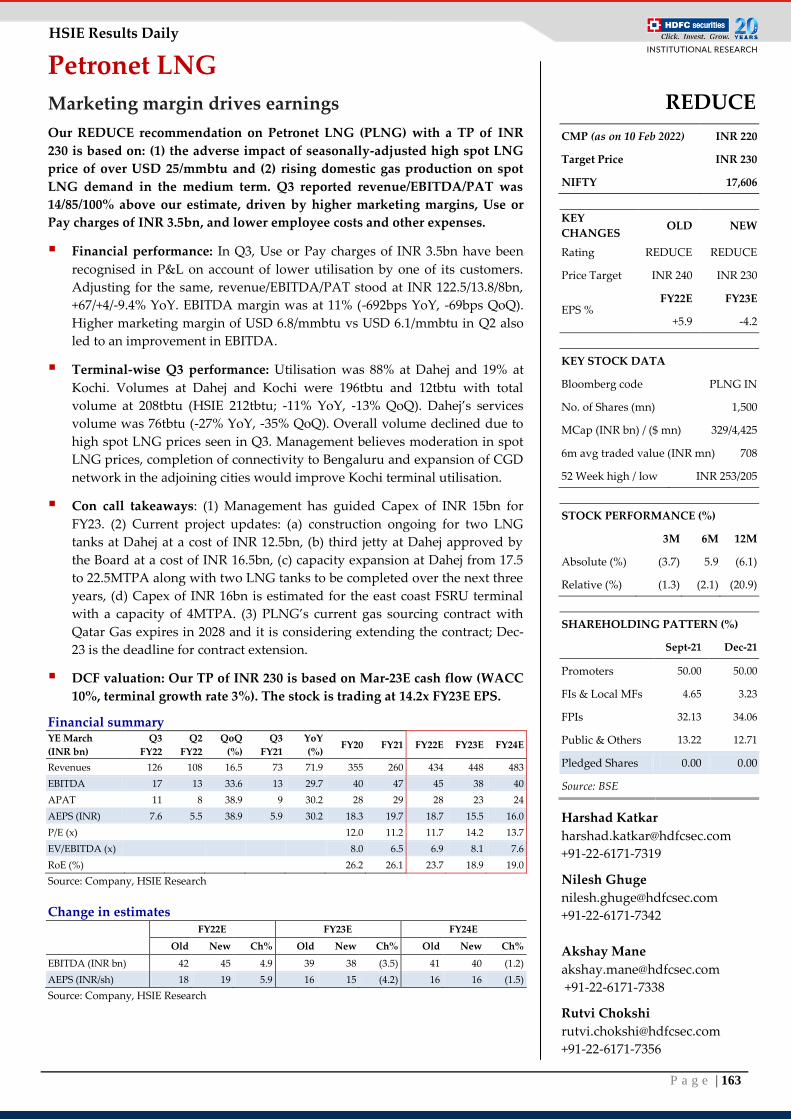
P a g e | 163
HSIE Results Daily
Petronet LNG
Marketing margin drives earnings
Our REDUCE recommendation on Petronet LNG (PLNG) with a TP of INR
230 is based on: (1) the adverse impact of seasonally-adjusted high spot LNG
price of over USD 25/mmbtu and (2) rising domestic gas production on spot
LNG demand in the medium term. Q3 reported revenue/EBITDA/PAT was
14/85/100% above our estimate, driven by higher marketing margins, Use or
Pay charges of INR 3.5bn, and lower employee costs and other expenses.
Financial performance: In Q3, Use or Pay charges of INR 3.5bn have been
recognised in P&L on account of lower utilisation by one of its customers.
Adjusting for the same, revenue/EBITDA/PAT stood at INR 122.5/13.8/8bn,
+67/+4/-9.4% YoY. EBITDA margin was at 11% (-692bps YoY, -69bps QoQ).
Higher marketing margin of USD 6.8/mmbtu vs USD 6.1/mmbtu in Q2 also
led to an improvement in EBITDA.
Terminal-wise Q3 performance: Utilisation was 88% at Dahej and 19% at
Kochi. Volumes at Dahej and Kochi were 196tbtu and 12tbtu with total
volume at 208tbtu (HSIE 212tbtu; -11% YoY, -13% QoQ). Dahej’s services
volume was 76tbtu (-27% YoY, -35% QoQ). Overall volume declined due to
high spot LNG prices seen in Q3. Management believes moderation in spot
LNG prices, completion of connectivity to Bengaluru and expansion of CGD
network in the adjoining cities would improve Kochi terminal utilisation.
Con call takeaways: (1) Management has guided Capex of INR 15bn for
FY23. (2) Current project updates: (a) construction ongoing for two LNG
tanks at Dahej at a cost of INR 12.5bn, (b) third jetty at Dahej approved by
the Board at a cost of INR 16.5bn, (c) capacity expansion at Dahej from 17.5
to 22.5MTPA along with two LNG tanks to be completed over the next three
years, (d) Capex of INR 16bn is estimated for the east coast FSRU terminal
with a capacity of 4MTPA. (3) PLNG’s current gas sourcing contract with
Qatar Gas expires in 2028 and it is considering extending the contract; Dec-
23 is the deadline for contract extension.
DCF valuation: Our TP of INR 230 is based on Mar-23E cash flow (WACC
10%, terminal growth rate 3%). The stock is trading at 14.2x FY23E EPS.
Financial summary YE March
(INR bn)
Q3
FY22
Q2
FY22
QoQ
(%)
Q3
FY21
YoY
(%) FY20 FY21 FY22E FY23E FY24E
Revenues 126 108 16.5 73 71.9 355 260 434 448 483
EBITDA 17 13 33.6 13 29.7 40 47 45 38 40
APAT 11 8 38.9 9 30.2 28 29 28 23 24
AEPS (INR) 7.6 5.5 38.9 5.9 30.2 18.3 19.7 18.7 15.5 16.0
P/E (x)
12.0 11.2 11.7 14.2 13.7
EV/EBITDA (x)
8.0 6.5 6.9 8.1 7.6
RoE (%)
26.2 26.1 23.7 18.9 19.0
Source: Company, HSIE Research
Change in estimates
FY22E FY23E FY24E
Old New Ch% Old New Ch% Old New Ch%
EBITDA (INR bn) 42 45 4.9 39 38 (3.5) 41 40 (1.2)
AEPS (INR/sh) 18 19 5.9 16 15 (4.2) 16 16 (1.5)
Source: Company, HSIE Research
REDUCE
CMP (as on 10 Feb 2022) INR 220
Target Price INR 230
NIFTY 17,606
KEY
CHANGES OLD NEW
Rating REDUCE REDUCE
Price Target INR 240 INR 230
EPS % FY22E FY23E
+5.9 -4.2
KEY STOCK DATA
Bloomberg code PLNG IN
No. of Shares (mn) 1,500
MCap (INR bn) / ($ mn) 329/4,425
6m avg traded value (INR mn) 708
52 Week high / low INR 253/205
STOCK PERFORMANCE (%)
3M 6M 12M
Absolute (%) (3.7) 5.9 (6.1)
Relative (%) (1.3) (2.1) (20.9)
SHAREHOLDING PATTERN (%)
Sept-21 Dec-21
Promoters 50.00 50.00
FIs & Local MFs 4.65 3.23
FPIs 32.13 34.06
Public & Others 13.22 12.71
Pledged Shares 0.00 0.00
Source: BSE
Harshad Katkar
+91-22-6171-7319
Nilesh Ghuge
+91-22-6171-7342
Akshay Mane
+91-22-6171-7338
Rutvi Chokshi
+91-22-6171-7356
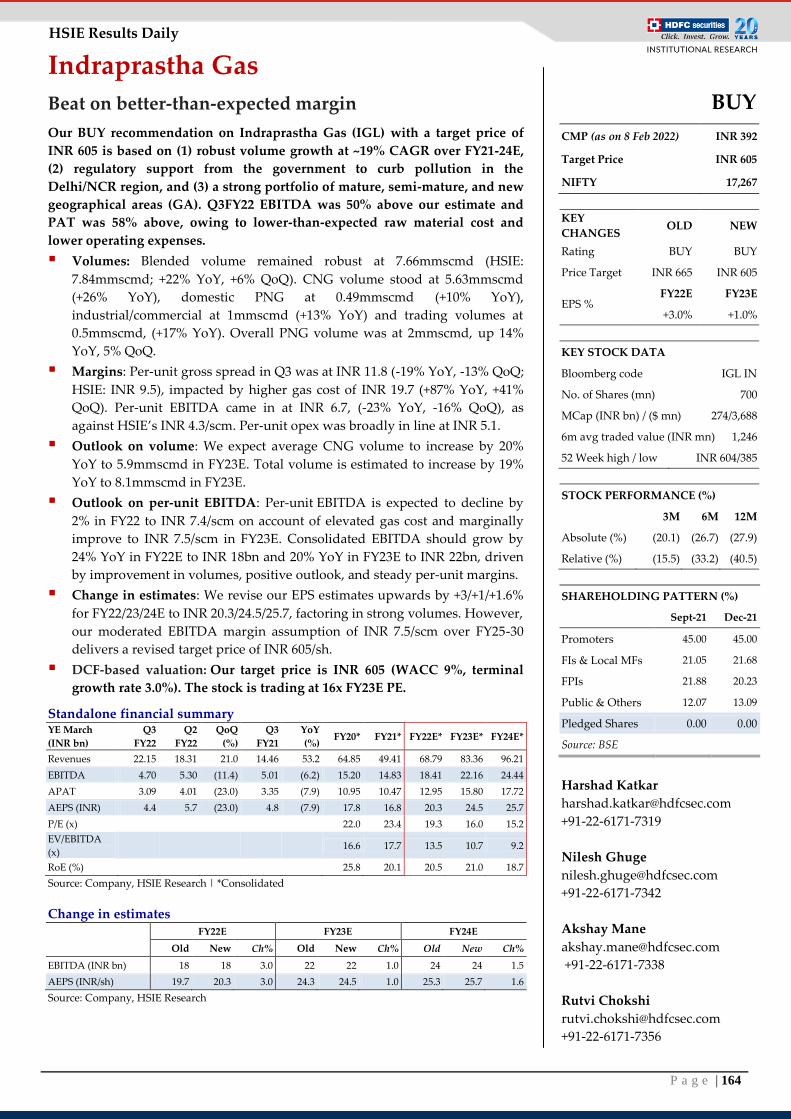
P a g e | 164
HSIE Results Daily
Indraprastha Gas
Beat on better-than-expected margin
Our BUY recommendation on Indraprastha Gas (IGL) with a target price of
INR 605 is based on (1) robust volume growth at ~19% CAGR over FY21-24E,
(2) regulatory support from the government to curb pollution in the
Delhi/NCR region, and (3) a strong portfolio of mature, semi-mature, and new
geographical areas (GA). Q3FY22 EBITDA was 50% above our estimate and
PAT was 58% above, owing to lower-than-expected raw material cost and
lower operating expenses.
Volumes: Blended volume remained robust at 7.66mmscmd (HSIE:
7.84mmscmd; +22% YoY, +6% QoQ). CNG volume stood at 5.63mmscmd
(+26% YoY), domestic PNG at 0.49mmscmd (+10% YoY),
industrial/commercial at 1mmscmd (+13% YoY) and trading volumes at
0.5mmscmd, (+17% YoY). Overall PNG volume was at 2mmscmd, up 14%
YoY, 5% QoQ.
Margins: Per-unit gross spread in Q3 was at INR 11.8 (-19% YoY, -13% QoQ;
HSIE: INR 9.5), impacted by higher gas cost of INR 19.7 (+87% YoY, +41%
QoQ). Per-unit EBITDA came in at INR 6.7, (-23% YoY, -16% QoQ), as
against HSIE’s INR 4.3/scm. Per-unit opex was broadly in line at INR 5.1.
Outlook on volume: We expect average CNG volume to increase by 20%
YoY to 5.9mmscmd in FY23E. Total volume is estimated to increase by 19%
YoY to 8.1mmscmd in FY23E.
Outlook on per-unit EBITDA: Per-unit EBITDA is expected to decline by
2% in FY22 to INR 7.4/scm on account of elevated gas cost and marginally
improve to INR 7.5/scm in FY23E. Consolidated EBITDA should grow by
24% YoY in FY22E to INR 18bn and 20% YoY in FY23E to INR 22bn, driven
by improvement in volumes, positive outlook, and steady per-unit margins.
Change in estimates: We revise our EPS estimates upwards by +3/+1/+1.6%
for FY22/23/24E to INR 20.3/24.5/25.7, factoring in strong volumes. However,
our moderated EBITDA margin assumption of INR 7.5/scm over FY25-30
delivers a revised target price of INR 605/sh.
DCF-based valuation: Our target price is INR 605 (WACC 9%, terminal
growth rate 3.0%). The stock is trading at 16x FY23E PE.
Standalone financial summary YE March
(INR bn)
Q3
FY22
Q2
FY22
QoQ
(%)
Q3
FY21
YoY
(%) FY20* FY21* FY22E* FY23E* FY24E*
Revenues 22.15 18.31 21.0 14.46 53.2 64.85 49.41 68.79 83.36 96.21
EBITDA 4.70 5.30 (11.4) 5.01 (6.2) 15.20 14.83 18.41 22.16 24.44
APAT 3.09 4.01 (23.0) 3.35 (7.9) 10.95 10.47 12.95 15.80 17.72
AEPS (INR) 4.4 5.7 (23.0) 4.8 (7.9) 17.8 16.8 20.3 24.5 25.7
P/E (x)
22.0 23.4 19.3 16.0 15.2
EV/EBITDA
(x) 16.6 17.7 13.5 10.7 9.2
RoE (%)
25.8 20.1 20.5 21.0 18.7
Source: Company, HSIE Research | *Consolidated
Change in estimates
FY22E FY23E FY24E
Old New Ch% Old New Ch% Old New Ch%
EBITDA (INR bn) 18 18 3.0 22 22 1.0 24 24 1.5
AEPS (INR/sh) 19.7 20.3 3.0 24.3 24.5 1.0 25.3 25.7 1.6
Source: Company, HSIE Research
BUY
CMP (as on 8 Feb 2022) INR 392
Target Price INR 605
NIFTY 17,267
KEY
CHANGES OLD NEW
Rating BUY BUY
Price Target INR 665 INR 605
EPS % FY22E FY23E
+3.0% +1.0%
KEY STOCK DATA
Bloomberg code IGL IN
No. of Shares (mn) 700
MCap (INR bn) / ($ mn) 274/3,688
6m avg traded value (INR mn) 1,246
52 Week high / low INR 604/385
STOCK PERFORMANCE (%)
3M 6M 12M
Absolute (%) (20.1) (26.7) (27.9)
Relative (%) (15.5) (33.2) (40.5)
SHAREHOLDING PATTERN (%)
Sept-21 Dec-21
Promoters 45.00 45.00
FIs & Local MFs 21.05 21.68
FPIs 21.88 20.23
Public & Others 12.07 13.09
Pledged Shares 0.00 0.00
Source: BSE
Harshad Katkar
+91-22-6171-7319
Nilesh Ghuge
+91-22-6171-7342
Akshay Mane
+91-22-6171-7338
Rutvi Chokshi
+91-22-6171-7356
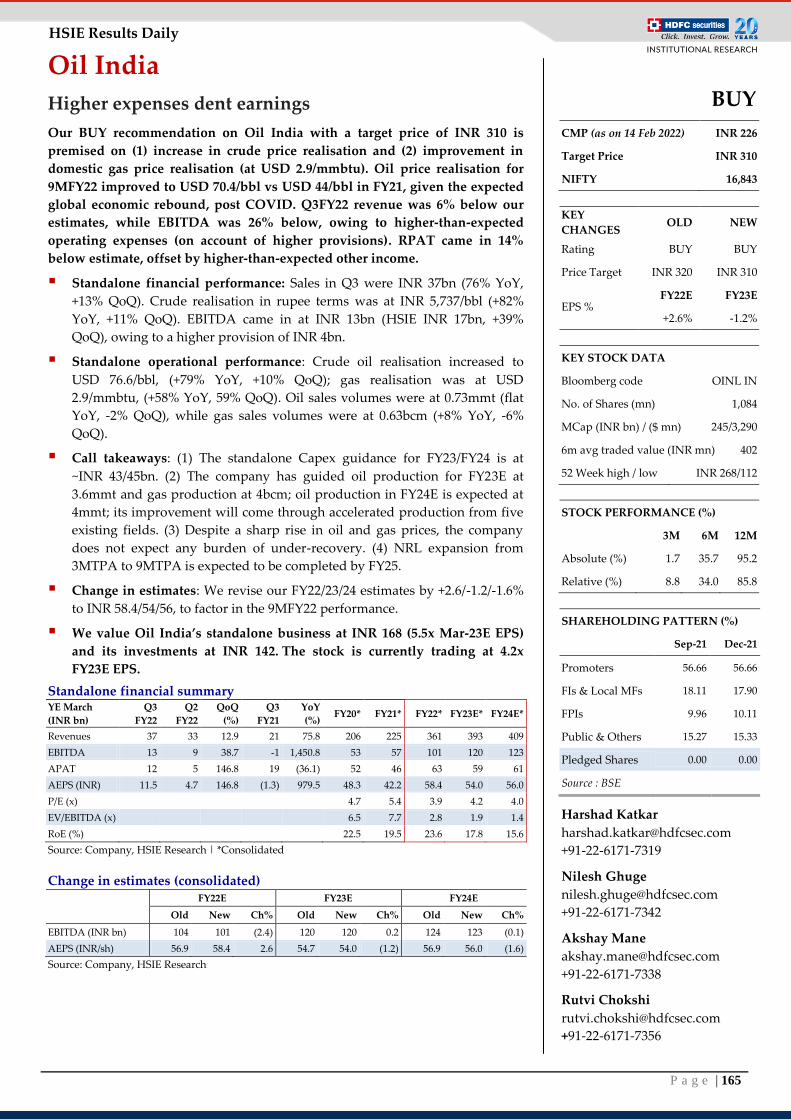
P a g e | 165
HSIE Results Daily
Oil India
Higher expenses dent earnings
Our BUY recommendation on Oil India with a target price of INR 310 is
premised on (1) increase in crude price realisation and (2) improvement in
domestic gas price realisation (at USD 2.9/mmbtu). Oil price realisation for
9MFY22 improved to USD 70.4/bbl vs USD 44/bbl in FY21, given the expected
global economic rebound, post COVID. Q3FY22 revenue was 6% below our
estimates, while EBITDA was 26% below, owing to higher-than-expected
operating expenses (on account of higher provisions). RPAT came in 14%
below estimate, offset by higher-than-expected other income.
Standalone financial performance: Sales in Q3 were INR 37bn (76% YoY,
+13% QoQ). Crude realisation in rupee terms was at INR 5,737/bbl (+82%
YoY, +11% QoQ). EBITDA came in at INR 13bn (HSIE INR 17bn, +39%
QoQ), owing to a higher provision of INR 4bn.
Standalone operational performance: Crude oil realisation increased to
USD 76.6/bbl, (+79% YoY, +10% QoQ); gas realisation was at USD
2.9/mmbtu, (+58% YoY, 59% QoQ). Oil sales volumes were at 0.73mmt (flat
YoY, -2% QoQ), while gas sales volumes were at 0.63bcm (+8% YoY, -6%
QoQ).
Call takeaways: (1) The standalone Capex guidance for FY23/FY24 is at
~INR 43/45bn. (2) The company has guided oil production for FY23E at
3.6mmt and gas production at 4bcm; oil production in FY24E is expected at
4mmt; its improvement will come through accelerated production from five
existing fields. (3) Despite a sharp rise in oil and gas prices, the company
does not expect any burden of under-recovery. (4) NRL expansion from
3MTPA to 9MTPA is expected to be completed by FY25.
Change in estimates: We revise our FY22/23/24 estimates by +2.6/-1.2/-1.6%
to INR 58.4/54/56, to factor in the 9MFY22 performance.
We value Oil India’s standalone business at INR 168 (5.5x Mar-23E EPS)
and its investments at INR 142. The stock is currently trading at 4.2x
FY23E EPS.
Standalone financial summary YE March
(INR bn)
Q3
FY22
Q2
FY22
QoQ
(%)
Q3
FY21
YoY
(%) FY20* FY21* FY22* FY23E* FY24E*
Revenues 37 33 12.9 21 75.8 206 225 361 393 409
EBITDA 13 9 38.7 -1 1,450.8 53 57 101 120 123
APAT 12 5 146.8 19 (36.1) 52 46 63 59 61
AEPS (INR) 11.5 4.7 146.8 (1.3) 979.5 48.3 42.2 58.4 54.0 56.0
P/E (x)
4.7 5.4 3.9 4.2 4.0
EV/EBITDA (x)
6.5 7.7 2.8 1.9 1.4
RoE (%)
22.5 19.5 23.6 17.8 15.6
Source: Company, HSIE Research | *Consolidated
Change in estimates (consolidated)
FY22E FY23E FY24E
Old New Ch% Old New Ch% Old New Ch%
EBITDA (INR bn) 104 101 (2.4) 120 120 0.2 124 123 (0.1)
AEPS (INR/sh) 56.9 58.4 2.6 54.7 54.0 (1.2) 56.9 56.0 (1.6)
Source: Company, HSIE Research
BUY
CMP (as on 14 Feb 2022) INR 226
Target Price INR 310
NIFTY 16,843
KEY
CHANGES OLD NEW
Rating BUY BUY
Price Target INR 320 INR 310
EPS % FY22E FY23E
+2.6% -1.2%
KEY STOCK DATA
Bloomberg code OINL IN
No. of Shares (mn) 1,084
MCap (INR bn) / ($ mn) 245/3,290
6m avg traded value (INR mn) 402
52 Week high / low INR 268/112
STOCK PERFORMANCE (%)
3M 6M 12M
Absolute (%) 1.7 35.7 95.2
Relative (%) 8.8 34.0 85.8
SHAREHOLDING PATTERN (%)
Sep-21 Dec-21
Promoters 56.66 56.66
FIs & Local MFs 18.11 17.90
FPIs 9.96 10.11
Public & Others 15.27 15.33
Pledged Shares 0.00 0.00
Source : BSE
Harshad Katkar
+91-22-6171-7319
Nilesh Ghuge
+91-22-6171-7342
Akshay Mane
+91-22-6171-7338
Rutvi Chokshi
+91-22-6171-7356
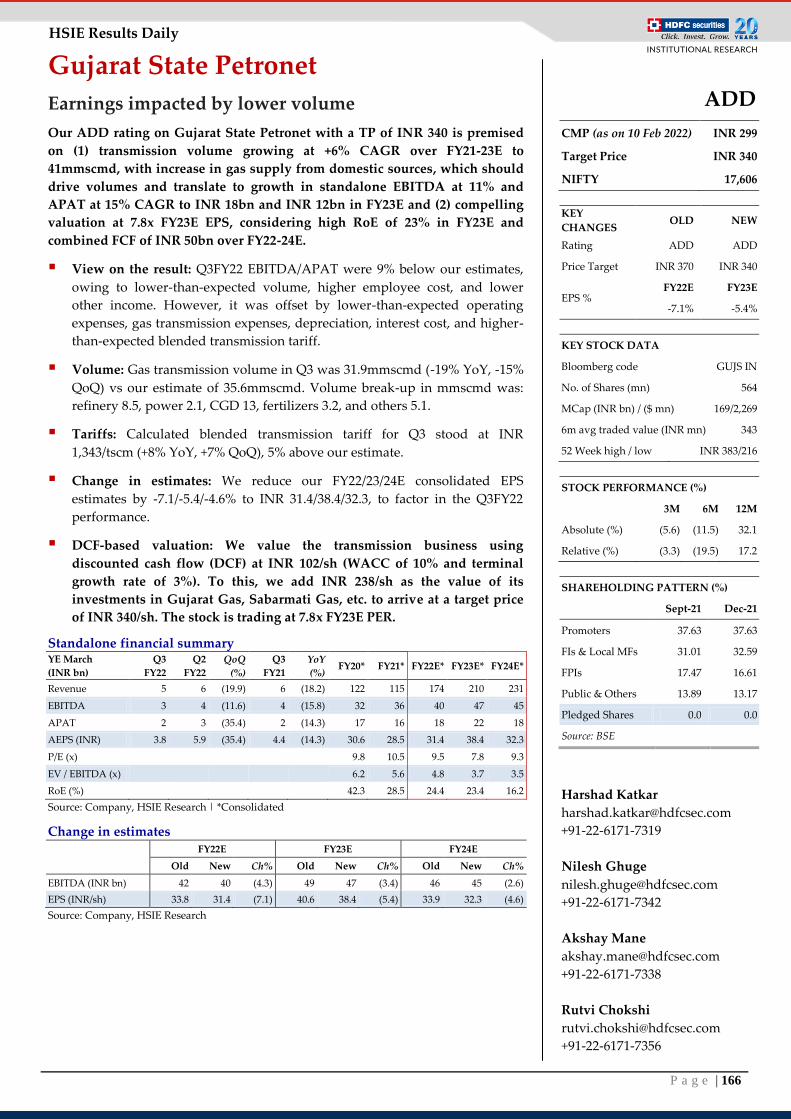
P a g e | 166
HSIE Results Daily
Gujarat State Petronet
Earnings impacted by lower volume
Our ADD rating on Gujarat State Petronet with a TP of INR 340 is premised
on (1) transmission volume growing at +6% CAGR over FY21-23E to
41mmscmd, with increase in gas supply from domestic sources, which should
drive volumes and translate to growth in standalone EBITDA at 11% and
APAT at 15% CAGR to INR 18bn and INR 12bn in FY23E and (2) compelling
valuation at 7.8x FY23E EPS, considering high RoE of 23% in FY23E and
combined FCF of INR 50bn over FY22-24E.
View on the result: Q3FY22 EBITDA/APAT were 9% below our estimates,
owing to lower-than-expected volume, higher employee cost, and lower
other income. However, it was offset by lower-than-expected operating
expenses, gas transmission expenses, depreciation, interest cost, and higher-
than-expected blended transmission tariff.
Volume: Gas transmission volume in Q3 was 31.9mmscmd (-19% YoY, -15%
QoQ) vs our estimate of 35.6mmscmd. Volume break-up in mmscmd was:
refinery 8.5, power 2.1, CGD 13, fertilizers 3.2, and others 5.1.
Tariffs: Calculated blended transmission tariff for Q3 stood at INR
1,343/tscm (+8% YoY, +7% QoQ), 5% above our estimate.
Change in estimates: We reduce our FY22/23/24E consolidated EPS
estimates by -7.1/-5.4/-4.6% to INR 31.4/38.4/32.3, to factor in the Q3FY22
performance.
DCF-based valuation: We value the transmission business using
discounted cash flow (DCF) at INR 102/sh (WACC of 10% and terminal
growth rate of 3%). To this, we add INR 238/sh as the value of its
investments in Gujarat Gas, Sabarmati Gas, etc. to arrive at a target price
of INR 340/sh. The stock is trading at 7.8x FY23E PER.
Standalone financial summary YE March
(INR bn)
Q3
FY22
Q2
FY22
QoQ
(%)
Q3
FY21
YoY
(%) FY20* FY21* FY22E* FY23E* FY24E*
Revenue 5 6 (19.9) 6 (18.2) 122 115 174 210 231
EBITDA 3 4 (11.6) 4 (15.8) 32 36 40 47 45
APAT 2 3 (35.4) 2 (14.3) 17 16 18 22 18
AEPS (INR) 3.8 5.9 (35.4) 4.4 (14.3) 30.6 28.5 31.4 38.4 32.3
P/E (x)
9.8 10.5 9.5 7.8 9.3
EV / EBITDA (x)
6.2 5.6 4.8 3.7 3.5
RoE (%)
42.3 28.5 24.4 23.4 16.2
Source: Company, HSIE Research | *Consolidated
Change in estimates
FY22E FY23E FY24E
Old New Ch% Old New Ch% Old New Ch%
EBITDA (INR bn) 42 40 (4.3) 49 47 (3.4) 46 45 (2.6)
EPS (INR/sh) 33.8 31.4 (7.1) 40.6 38.4 (5.4) 33.9 32.3 (4.6)
Source: Company, HSIE Research
ADD
CMP (as on 10 Feb 2022) INR 299
Target Price INR 340
NIFTY 17,606
KEY
CHANGES OLD NEW
Rating ADD ADD
Price Target INR 370 INR 340
EPS % FY22E FY23E
-7.1% -5.4%
KEY STOCK DATA
Bloomberg code GUJS IN
No. of Shares (mn) 564
MCap (INR bn) / ($ mn) 169/2,269
6m avg traded value (INR mn) 343
52 Week high / low INR 383/216
STOCK PERFORMANCE (%)
3M 6M 12M
Absolute (%) (5.6) (11.5) 32.1
Relative (%) (3.3) (19.5) 17.2
SHAREHOLDING PATTERN (%)
Sept-21 Dec-21
Promoters 37.63 37.63
FIs & Local MFs 31.01 32.59
FPIs 17.47 16.61
Public & Others 13.89 13.17
Pledged Shares 0.0 0.0
Source: BSE
Harshad Katkar
+91-22-6171-7319
Nilesh Ghuge
+91-22-6171-7342
Akshay Mane
+91-22-6171-7338
Rutvi Chokshi
+91-22-6171-7356
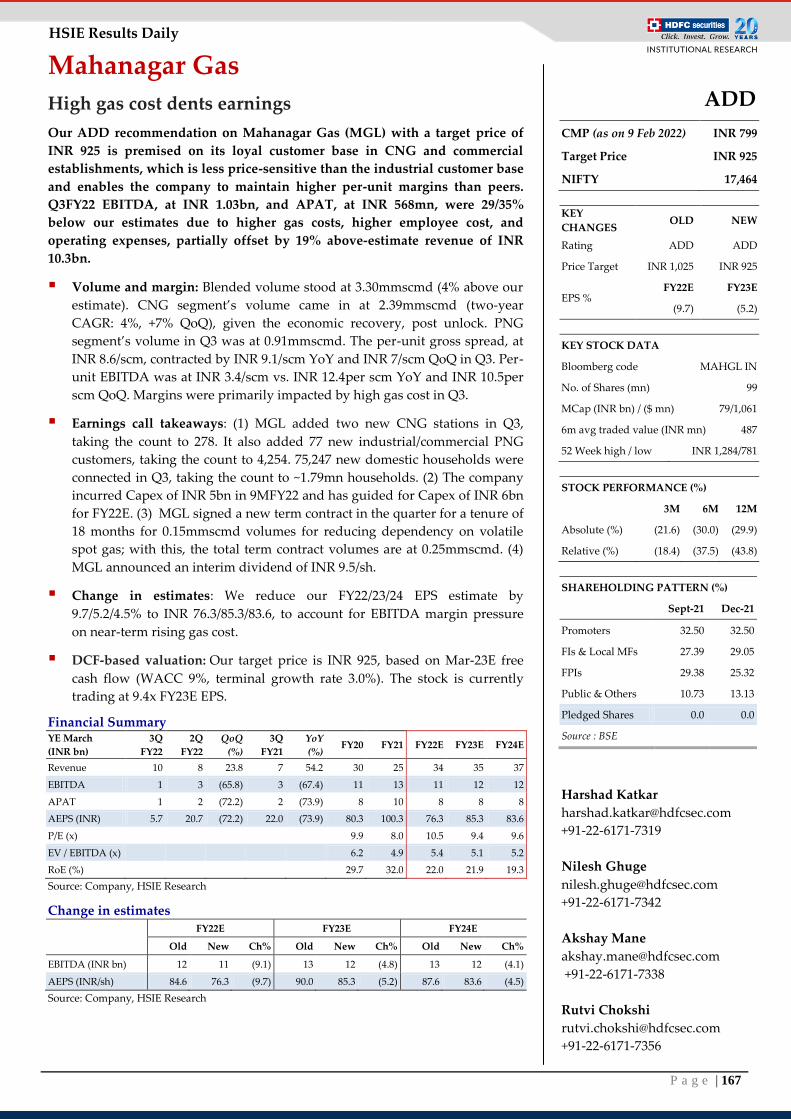
P a g e | 167
HSIE Results Daily
Mahanagar Gas
High gas cost dents earnings
Our ADD recommendation on Mahanagar Gas (MGL) with a target price of
INR 925 is premised on its loyal customer base in CNG and commercial
establishments, which is less price-sensitive than the industrial customer base
and enables the company to maintain higher per-unit margins than peers.
Q3FY22 EBITDA, at INR 1.03bn, and APAT, at INR 568mn, were 29/35%
below our estimates due to higher gas costs, higher employee cost, and
operating expenses, partially offset by 19% above-estimate revenue of INR
10.3bn.
Volume and margin: Blended volume stood at 3.30mmscmd (4% above our
estimate). CNG segment’s volume came in at 2.39mmscmd (two-year
CAGR: 4%, +7% QoQ), given the economic recovery, post unlock. PNG
segment’s volume in Q3 was at 0.91mmscmd. The per-unit gross spread, at
INR 8.6/scm, contracted by INR 9.1/scm YoY and INR 7/scm QoQ in Q3. Per-
unit EBITDA was at INR 3.4/scm vs. INR 12.4per scm YoY and INR 10.5per
scm QoQ. Margins were primarily impacted by high gas cost in Q3.
Earnings call takeaways: (1) MGL added two new CNG stations in Q3,
taking the count to 278. It also added 77 new industrial/commercial PNG
customers, taking the count to 4,254. 75,247 new domestic households were
connected in Q3, taking the count to ~1.79mn households. (2) The company
incurred Capex of INR 5bn in 9MFY22 and has guided for Capex of INR 6bn
for FY22E. (3) MGL signed a new term contract in the quarter for a tenure of
18 months for 0.15mmscmd volumes for reducing dependency on volatile
spot gas; with this, the total term contract volumes are at 0.25mmscmd. (4)
MGL announced an interim dividend of INR 9.5/sh.
Change in estimates: We reduce our FY22/23/24 EPS estimate by
9.7/5.2/4.5% to INR 76.3/85.3/83.6, to account for EBITDA margin pressure
on near-term rising gas cost.
DCF-based valuation: Our target price is INR 925, based on Mar-23E free
cash flow (WACC 9%, terminal growth rate 3.0%). The stock is currently
trading at 9.4x FY23E EPS.
Financial Summary YE March
(INR bn)
3Q
FY22
2Q
FY22
QoQ
(%)
3Q
FY21
YoY
(%) FY20 FY21 FY22E FY23E FY24E
Revenue 10 8 23.8 7 54.2 30 25 34 35 37
EBITDA 1 3 (65.8) 3 (67.4) 11 13 11 12 12
APAT 1 2 (72.2) 2 (73.9) 8 10 8 8 8
AEPS (INR) 5.7 20.7 (72.2) 22.0 (73.9) 80.3 100.3 76.3 85.3 83.6
P/E (x)
9.9 8.0 10.5 9.4 9.6
EV / EBITDA (x)
6.2 4.9 5.4 5.1 5.2
RoE (%)
29.7 32.0 22.0 21.9 19.3
Source: Company, HSIE Research
Change in estimates
FY22E FY23E FY24E
Old New Ch% Old New Ch% Old New Ch%
EBITDA (INR bn) 12 11 (9.1) 13 12 (4.8) 13 12 (4.1)
AEPS (INR/sh) 84.6 76.3 (9.7) 90.0 85.3 (5.2) 87.6 83.6 (4.5)
Source: Company, HSIE Research
ADD
CMP (as on 9 Feb 2022) INR 799
Target Price INR 925
NIFTY 17,464
KEY
CHANGES OLD NEW
Rating ADD ADD
Price Target INR 1,025 INR 925
EPS % FY22E FY23E
(9.7) (5.2)
KEY STOCK DATA
Bloomberg code MAHGL IN
No. of Shares (mn) 99
MCap (INR bn) / ($ mn) 79/1,061
6m avg traded value (INR mn) 487
52 Week high / low INR 1,284/781
STOCK PERFORMANCE (%)
3M 6M 12M
Absolute (%) (21.6) (30.0) (29.9)
Relative (%) (18.4) (37.5) (43.8)
SHAREHOLDING PATTERN (%)
Sept-21 Dec-21
Promoters 32.50 32.50
FIs & Local MFs 27.39 29.05
FPIs 29.38 25.32
Public & Others 10.73 13.13
Pledged Shares 0.0 0.0
Source : BSE
Harshad Katkar
+91-22-6171-7319
Nilesh Ghuge
+91-22-6171-7342
Akshay Mane
+91-22-6171-7338
Rutvi Chokshi
+91-22-6171-7356
P a g e | 168
HSIE Results Daily
Pharma
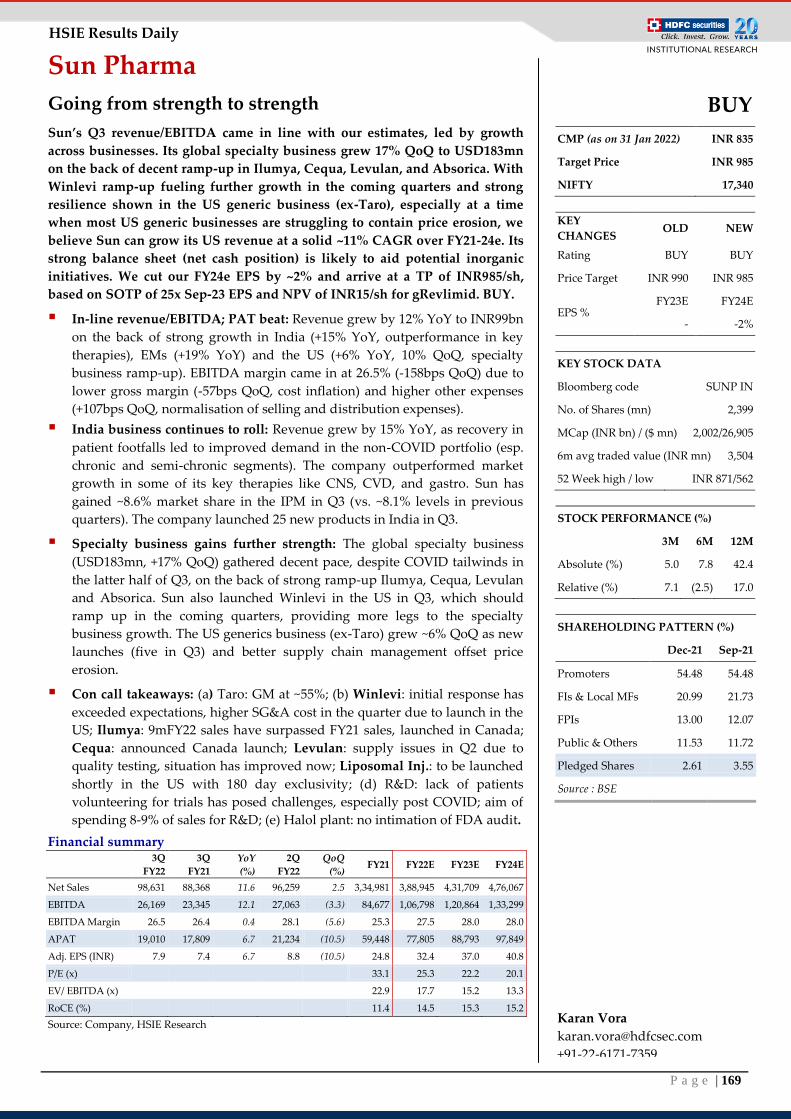
P a g e | 169
HSIE Results Daily
Sun Pharma
Going from strength to strength
Sun’s Q3 revenue/EBITDA came in line with our estimates, led by growth
across businesses. Its global specialty business grew 17% QoQ to USD183mn
on the back of decent ramp-up in Ilumya, Cequa, Levulan, and Absorica. With
Winlevi ramp-up fueling further growth in the coming quarters and strong
resilience shown in the US generic business (ex-Taro), especially at a time
when most US generic businesses are struggling to contain price erosion, we
believe Sun can grow its US revenue at a solid ~11% CAGR over FY21-24e. Its
strong balance sheet (net cash position) is likely to aid potential inorganic
initiatives. We cut our FY24e EPS by ~2% and arrive at a TP of INR985/sh,
based on SOTP of 25x Sep-23 EPS and NPV of INR15/sh for gRevlimid. BUY.
In-line revenue/EBITDA; PAT beat: Revenue grew by 12% YoY to INR99bn
on the back of strong growth in India (+15% YoY, outperformance in key
therapies), EMs (+19% YoY) and the US (+6% YoY, 10% QoQ, specialty
business ramp-up). EBITDA margin came in at 26.5% (-158bps QoQ) due to
lower gross margin (-57bps QoQ, cost inflation) and higher other expenses
(+107bps QoQ, normalisation of selling and distribution expenses).
India business continues to roll: Revenue grew by 15% YoY, as recovery in
patient footfalls led to improved demand in the non-COVID portfolio (esp.
chronic and semi-chronic segments). The company outperformed market
growth in some of its key therapies like CNS, CVD, and gastro. Sun has
gained ~8.6% market share in the IPM in Q3 (vs. ~8.1% levels in previous
quarters). The company launched 25 new products in India in Q3.
Specialty business gains further strength: The global specialty business
(USD183mn, +17% QoQ) gathered decent pace, despite COVID tailwinds in
the latter half of Q3, on the back of strong ramp-up Ilumya, Cequa, Levulan
and Absorica. Sun also launched Winlevi in the US in Q3, which should
ramp up in the coming quarters, providing more legs to the specialty
business growth. The US generics business (ex-Taro) grew ~6% QoQ as new
launches (five in Q3) and better supply chain management offset price
erosion.
Con call takeaways: (a) Taro: GM at ~55%; (b) Winlevi: initial response has
exceeded expectations, higher SG&A cost in the quarter due to launch in the
US; Ilumya: 9mFY22 sales have surpassed FY21 sales, launched in Canada;
Cequa: announced Canada launch; Levulan: supply issues in Q2 due to
quality testing, situation has improved now; Liposomal Inj.: to be launched
shortly in the US with 180 day exclusivity; (d) R&D: lack of patients
volunteering for trials has posed challenges, especially post COVID; aim of
spending 8-9% of sales for R&D; (e) Halol plant: no intimation of FDA audit.
Financial summary
3Q
FY22
3Q
FY21
YoY
(%)
2Q
FY22
QoQ
(%) FY21 FY22E FY23E FY24E
Net Sales 98,631 88,368 11.6 96,259 2.5 3,34,981 3,88,945 4,31,709 4,76,067
EBITDA 26,169 23,345 12.1 27,063 (3.3) 84,677 1,06,798 1,20,864 1,33,299
EBITDA Margin 26.5 26.4 0.4 28.1 (5.6) 25.3 27.5 28.0 28.0
APAT 19,010 17,809 6.7 21,234 (10.5) 59,448 77,805 88,793 97,849
Adj. EPS (INR) 7.9 7.4 6.7 8.8 (10.5) 24.8 32.4 37.0 40.8
P/E (x)
33.1 25.3 22.2 20.1
EV/ EBITDA (x)
22.9 17.7 15.2 13.3
RoCE (%)
11.4 14.5 15.3 15.2
Source: Company, HSIE Research
BUY
CMP (as on 31 Jan 2022) INR 835
Target Price INR 985
NIFTY 17,340
KEY
CHANGES OLD NEW
Rating BUY BUY
Price Target INR 990 INR 985
EPS % FY23E FY24E
- -2%
KEY STOCK DATA
Bloomberg code SUNP IN
No. of Shares (mn) 2,399
MCap (INR bn) / ($ mn) 2,002/26,905
6m avg traded value (INR mn) 3,504
52 Week high / low INR 871/562
STOCK PERFORMANCE (%)
3M 6M 12M
Absolute (%) 5.0 7.8 42.4
Relative (%) 7.1 (2.5) 17.0
SHAREHOLDING PATTERN (%)
Dec-21 Sep-21
Promoters 54.48 54.48
FIs & Local MFs 20.99 21.73
FPIs 13.00 12.07
Public & Others 11.53 11.72
Pledged Shares 2.61 3.55
Source : BSE
Karan Vora
+91-22-6171-7359
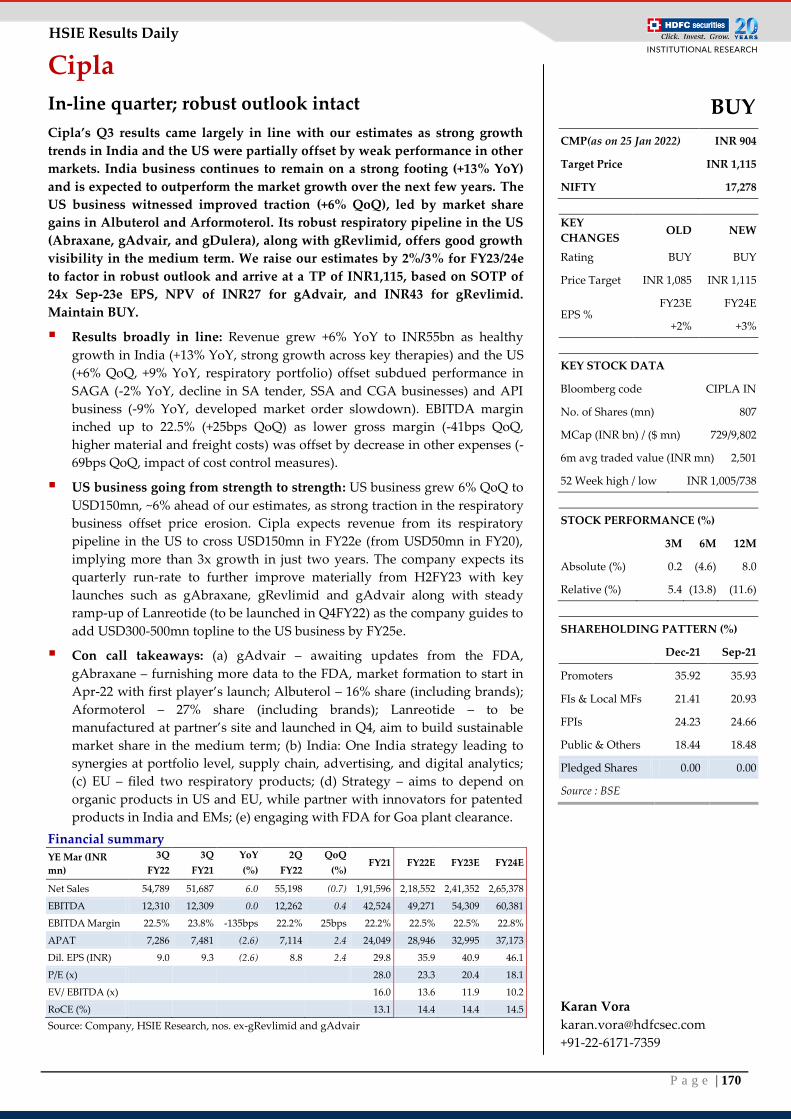
P a g e | 170
HSIE Results Daily
Cipla
In-line quarter; robust outlook intact
Cipla’s Q3 results came largely in line with our estimates as strong growth
trends in India and the US were partially offset by weak performance in other
markets. India business continues to remain on a strong footing (+13% YoY)
and is expected to outperform the market growth over the next few years. The
US business witnessed improved traction (+6% QoQ), led by market share
gains in Albuterol and Arformoterol. Its robust respiratory pipeline in the US
(Abraxane, gAdvair, and gDulera), along with gRevlimid, offers good growth
visibility in the medium term. We raise our estimates by 2%/3% for FY23/24e
to factor in robust outlook and arrive at a TP of INR1,115, based on SOTP of
24x Sep-23e EPS, NPV of INR27 for gAdvair, and INR43 for gRevlimid.
Maintain BUY.
Results broadly in line: Revenue grew +6% YoY to INR55bn as healthy
growth in India (+13% YoY, strong growth across key therapies) and the US
(+6% QoQ, +9% YoY, respiratory portfolio) offset subdued performance in
SAGA (-2% YoY, decline in SA tender, SSA and CGA businesses) and API
business (-9% YoY, developed market order slowdown). EBITDA margin
inched up to 22.5% (+25bps QoQ) as lower gross margin (-41bps QoQ,
higher material and freight costs) was offset by decrease in other expenses (-
69bps QoQ, impact of cost control measures).
US business going from strength to strength: US business grew 6% QoQ to
USD150mn, ~6% ahead of our estimates, as strong traction in the respiratory
business offset price erosion. Cipla expects revenue from its respiratory
pipeline in the US to cross USD150mn in FY22e (from USD50mn in FY20),
implying more than 3x growth in just two years. The company expects its
quarterly run-rate to further improve materially from H2FY23 with key
launches such as gAbraxane, gRevlimid and gAdvair along with steady
ramp-up of Lanreotide (to be launched in Q4FY22) as the company guides to
add USD300-500mn topline to the US business by FY25e.
Con call takeaways: (a) gAdvair – awaiting updates from the FDA,
gAbraxane – furnishing more data to the FDA, market formation to start in
Apr-22 with first player’s launch; Albuterol – 16% share (including brands);
Aformoterol – 27% share (including brands); Lanreotide – to be
manufactured at partner’s site and launched in Q4, aim to build sustainable
market share in the medium term; (b) India: One India strategy leading to
synergies at portfolio level, supply chain, advertising, and digital analytics;
(c) EU – filed two respiratory products; (d) Strategy – aims to depend on
organic products in US and EU, while partner with innovators for patented
products in India and EMs; (e) engaging with FDA for Goa plant clearance.
Financial summary
YE Mar (INR
mn)
3Q
FY22
3Q
FY21
YoY
(%)
2Q
FY22
QoQ
(%) FY21 FY22E FY23E FY24E
Net Sales 54,789 51,687 6.0 55,198 (0.7) 1,91,596 2,18,552 2,41,352 2,65,378
EBITDA 12,310 12,309 0.0 12,262 0.4 42,524 49,271 54,309 60,381
EBITDA Margin 22.5% 23.8% -135bps 22.2% 25bps 22.2% 22.5% 22.5% 22.8%
APAT 7,286 7,481 (2.6) 7,114 2.4 24,049 28,946 32,995 37,173
Dil. EPS (INR) 9.0 9.3 (2.6) 8.8 2.4 29.8 35.9 40.9 46.1
P/E (x)
28.0 23.3 20.4 18.1
EV/ EBITDA (x)
16.0 13.6 11.9 10.2
RoCE (%)
13.1 14.4 14.4 14.5
Source: Company, HSIE Research, nos. ex-gRevlimid and gAdvair
BUY
CMP(as on 25 Jan 2022) INR 904
Target Price INR 1,115
NIFTY 17,278
KEY
CHANGES OLD NEW
Rating BUY BUY
Price Target INR 1,085 INR 1,115
EPS % FY23E FY24E
+2% +3%
KEY STOCK DATA
Bloomberg code CIPLA IN
No. of Shares (mn) 807
MCap (INR bn) / ($ mn) 729/9,802
6m avg traded value (INR mn) 2,501
52 Week high / low INR 1,005/738
STOCK PERFORMANCE (%)
3M 6M 12M
Absolute (%) 0.2 (4.6) 8.0
Relative (%) 5.4 (13.8) (11.6)
SHAREHOLDING PATTERN (%)
Dec-21 Sep-21
Promoters 35.92 35.93
FIs & Local MFs 21.41 20.93
FPIs 24.23 24.66
Public & Others 18.44 18.48
Pledged Shares 0.00 0.00
Source : BSE
Karan Vora
+91-22-6171-7359
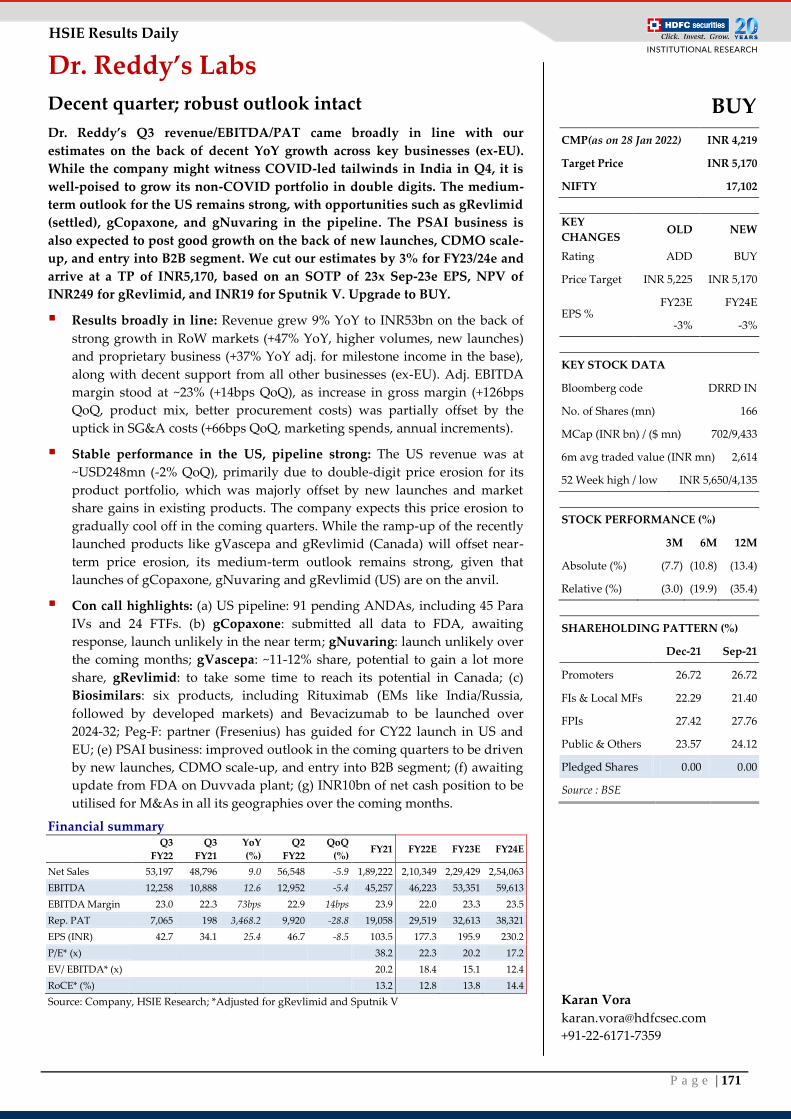
P a g e | 171
HSIE Results Daily
Dr. Reddy’s Labs
Decent quarter; robust outlook intact
Dr. Reddy’s Q3 revenue/EBITDA/PAT came broadly in line with our
estimates on the back of decent YoY growth across key businesses (ex-EU).
While the company might witness COVID-led tailwinds in India in Q4, it is
well-poised to grow its non-COVID portfolio in double digits. The medium-
term outlook for the US remains strong, with opportunities such as gRevlimid
(settled), gCopaxone, and gNuvaring in the pipeline. The PSAI business is
also expected to post good growth on the back of new launches, CDMO scale-
up, and entry into B2B segment. We cut our estimates by 3% for FY23/24e and
arrive at a TP of INR5,170, based on an SOTP of 23x Sep-23e EPS, NPV of
INR249 for gRevlimid, and INR19 for Sputnik V. Upgrade to BUY.
Results broadly in line: Revenue grew 9% YoY to INR53bn on the back of
strong growth in RoW markets (+47% YoY, higher volumes, new launches)
and proprietary business (+37% YoY adj. for milestone income in the base),
along with decent support from all other businesses (ex-EU). Adj. EBITDA
margin stood at ~23% (+14bps QoQ), as increase in gross margin (+126bps
QoQ, product mix, better procurement costs) was partially offset by the
uptick in SG&A costs (+66bps QoQ, marketing spends, annual increments).
Stable performance in the US, pipeline strong: The US revenue was at
~USD248mn (-2% QoQ), primarily due to double-digit price erosion for its
product portfolio, which was majorly offset by new launches and market
share gains in existing products. The company expects this price erosion to
gradually cool off in the coming quarters. While the ramp-up of the recently
launched products like gVascepa and gRevlimid (Canada) will offset near-
term price erosion, its medium-term outlook remains strong, given that
launches of gCopaxone, gNuvaring and gRevlimid (US) are on the anvil.
Con call highlights: (a) US pipeline: 91 pending ANDAs, including 45 Para
IVs and 24 FTFs. (b) gCopaxone: submitted all data to FDA, awaiting
response, launch unlikely in the near term; gNuvaring: launch unlikely over
the coming months; gVascepa: ~11-12% share, potential to gain a lot more
share, gRevlimid: to take some time to reach its potential in Canada; (c)
Biosimilars: six products, including Rituximab (EMs like India/Russia,
followed by developed markets) and Bevacizumab to be launched over
2024-32; Peg-F: partner (Fresenius) has guided for CY22 launch in US and
EU; (e) PSAI business: improved outlook in the coming quarters to be driven
by new launches, CDMO scale-up, and entry into B2B segment; (f) awaiting
update from FDA on Duvvada plant; (g) INR10bn of net cash position to be
utilised for M&As in all its geographies over the coming months.
Financial summary
Q3
FY22
Q3
FY21
YoY
(%)
Q2
FY22
QoQ
(%) FY21 FY22E FY23E FY24E
Net Sales 53,197 48,796 9.0 56,548 -5.9 1,89,222 2,10,349 2,29,429 2,54,063
EBITDA 12,258 10,888 12.6 12,952 -5.4 45,257 46,223 53,351 59,613
EBITDA Margin 23.0 22.3 73bps 22.9 14bps 23.9 22.0 23.3 23.5
Rep. PAT 7,065 198 3,468.2 9,920 -28.8 19,058 29,519 32,613 38,321
EPS (INR) 42.7 34.1 25.4 46.7 -8.5 103.5 177.3 195.9 230.2
P/E* (x)
38.2 22.3 20.2 17.2
EV/ EBITDA* (x)
20.2 18.4 15.1 12.4
RoCE* (%)
13.2 12.8 13.8 14.4
Source: Company, HSIE Research; *Adjusted for gRevlimid and Sputnik V
BUY
CMP(as on 28 Jan 2022) INR 4,219
Target Price INR 5,170
NIFTY 17,102
KEY
CHANGES OLD NEW
Rating ADD BUY
Price Target INR 5,225 INR 5,170
EPS % FY23E FY24E
-3% -3%
KEY STOCK DATA
Bloomberg code DRRD IN
No. of Shares (mn) 166
MCap (INR bn) / ($ mn) 702/9,433
6m avg traded value (INR mn) 2,614
52 Week high / low INR 5,650/4,135
STOCK PERFORMANCE (%)
3M 6M 12M
Absolute (%) (7.7) (10.8) (13.4)
Relative (%) (3.0) (19.9) (35.4)
SHAREHOLDING PATTERN (%)
Dec-21 Sep-21
Promoters 26.72 26.72
FIs & Local MFs 22.29 21.40
FPIs 27.42 27.76
Public & Others 23.57 24.12
Pledged Shares 0.00 0.00
Source : BSE
Karan Vora
+91-22-6171-7359
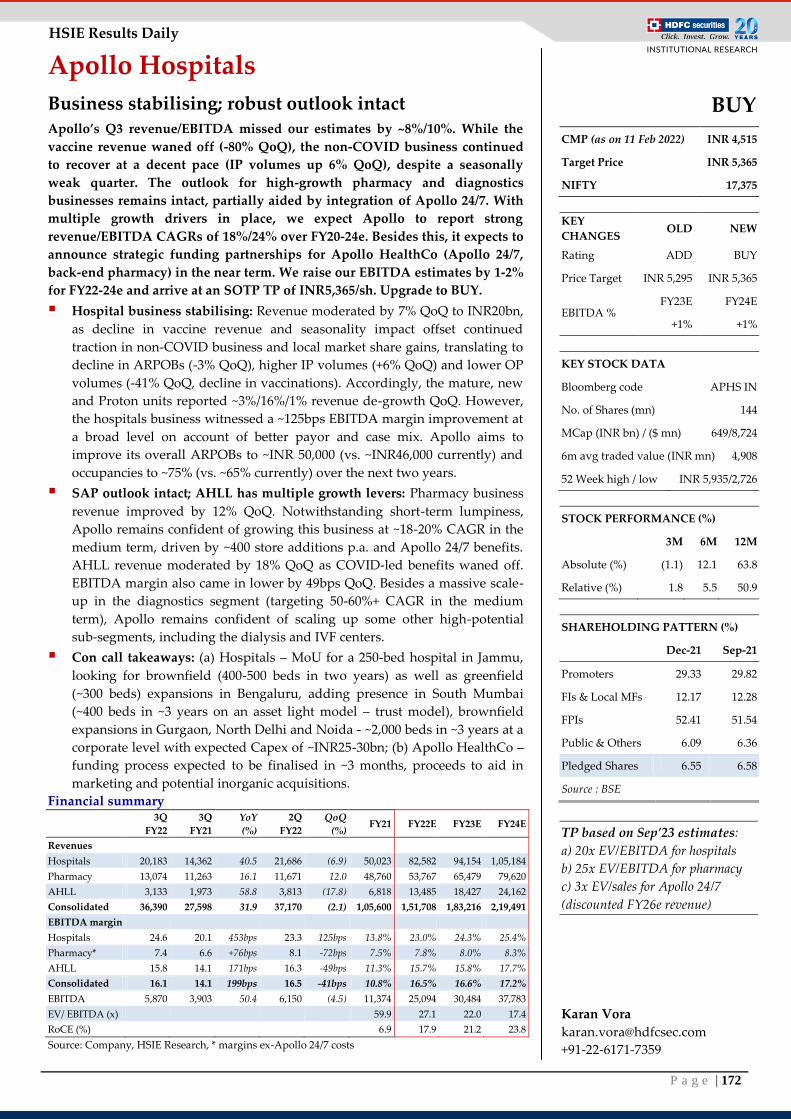
P a g e | 172
HSIE Results Daily
Apollo Hospitals
Business stabilising; robust outlook intact Apollo’s Q3 revenue/EBITDA missed our estimates by ~8%/10%. While the
vaccine revenue waned off (-80% QoQ), the non-COVID business continued
to recover at a decent pace (IP volumes up 6% QoQ), despite a seasonally
weak quarter. The outlook for high-growth pharmacy and diagnostics
businesses remains intact, partially aided by integration of Apollo 24/7. With
multiple growth drivers in place, we expect Apollo to report strong
revenue/EBITDA CAGRs of 18%/24% over FY20-24e. Besides this, it expects to
announce strategic funding partnerships for Apollo HealthCo (Apollo 24/7,
back-end pharmacy) in the near term. We raise our EBITDA estimates by 1-2%
for FY22-24e and arrive at an SOTP TP of INR5,365/sh. Upgrade to BUY.
Hospital business stabilising: Revenue moderated by 7% QoQ to INR20bn,
as decline in vaccine revenue and seasonality impact offset continued
traction in non-COVID business and local market share gains, translating to
decline in ARPOBs (-3% QoQ), higher IP volumes (+6% QoQ) and lower OP
volumes (-41% QoQ, decline in vaccinations). Accordingly, the mature, new
and Proton units reported ~3%/16%/1% revenue de-growth QoQ. However,
the hospitals business witnessed a ~125bps EBITDA margin improvement at
a broad level on account of better payor and case mix. Apollo aims to
improve its overall ARPOBs to ~INR 50,000 (vs. ~INR46,000 currently) and
occupancies to ~75% (vs. ~65% currently) over the next two years.
SAP outlook intact; AHLL has multiple growth levers: Pharmacy business
revenue improved by 12% QoQ. Notwithstanding short-term lumpiness,
Apollo remains confident of growing this business at ~18-20% CAGR in the
medium term, driven by ~400 store additions p.a. and Apollo 24/7 benefits.
AHLL revenue moderated by 18% QoQ as COVID-led benefits waned off.
EBITDA margin also came in lower by 49bps QoQ. Besides a massive scale-
up in the diagnostics segment (targeting 50-60%+ CAGR in the medium
term), Apollo remains confident of scaling up some other high-potential
sub-segments, including the dialysis and IVF centers.
Con call takeaways: (a) Hospitals – MoU for a 250-bed hospital in Jammu,
looking for brownfield (400-500 beds in two years) as well as greenfield
(~300 beds) expansions in Bengaluru, adding presence in South Mumbai
(~400 beds in ~3 years on an asset light model – trust model), brownfield
expansions in Gurgaon, North Delhi and Noida - ~2,000 beds in ~3 years at a
corporate level with expected Capex of ~INR25-30bn; (b) Apollo HealthCo –
funding process expected to be finalised in ~3 months, proceeds to aid in
marketing and potential inorganic acquisitions.
Financial summary
3Q
FY22
3Q
FY21
YoY
(%)
2Q
FY22
QoQ
(%) FY21 FY22E FY23E FY24E
Revenues
Hospitals 20,183 14,362 40.5 21,686 (6.9) 50,023 82,582 94,154 1,05,184
Pharmacy 13,074 11,263 16.1 11,671 12.0 48,760 53,767 65,479 79,620
AHLL 3,133 1,973 58.8 3,813 (17.8) 6,818 13,485 18,427 24,162
Consolidated 36,390 27,598 31.9 37,170 (2.1) 1,05,600 1,51,708 1,83,216 2,19,491
EBITDA margin
Hospitals 24.6 20.1 453bps 23.3 125bps 13.8% 23.0% 24.3% 25.4%
Pharmacy* 7.4 6.6 +76bps 8.1 -72bps 7.5% 7.8% 8.0% 8.3%
AHLL 15.8 14.1 171bps 16.3 -49bps 11.3% 15.7% 15.8% 17.7%
Consolidated 16.1 14.1 199bps 16.5 -41bps 10.8% 16.5% 16.6% 17.2%
EBITDA 5,870 3,903 50.4 6,150 (4.5) 11,374 25,094 30,484 37,783
EV/ EBITDA (x)
59.9 27.1 22.0 17.4
RoCE (%)
6.9 17.9 21.2 23.8
Source: Company, HSIE Research, * margins ex-Apollo 24/7 costs
BUY
CMP (as on 11 Feb 2022) INR 4,515
Target Price INR 5,365
NIFTY 17,375
KEY
CHANGES OLD NEW
Rating ADD BUY
Price Target INR 5,295 INR 5,365
EBITDA % FY23E FY24E
+1% +1%
KEY STOCK DATA
Bloomberg code APHS IN
No. of Shares (mn) 144
MCap (INR bn) / ($ mn) 649/8,724
6m avg traded value (INR mn) 4,908
52 Week high / low INR 5,935/2,726
STOCK PERFORMANCE (%)
3M 6M 12M
Absolute (%) (1.1) 12.1 63.8
Relative (%) 1.8 5.5 50.9
SHAREHOLDING PATTERN (%)
Dec-21 Sep-21
Promoters 29.33 29.82
FIs & Local MFs 12.17 12.28
FPIs 52.41 51.54
Public & Others 6.09 6.36
Pledged Shares 6.55 6.58
Source : BSE
TP based on Sep’23 estimates:
a) 20x EV/EBITDA for hospitals
b) 25x EV/EBITDA for pharmacy
c) 3x EV/sales for Apollo 24/7
(discounted FY26e revenue)
Karan Vora
+91-22-6171-7359
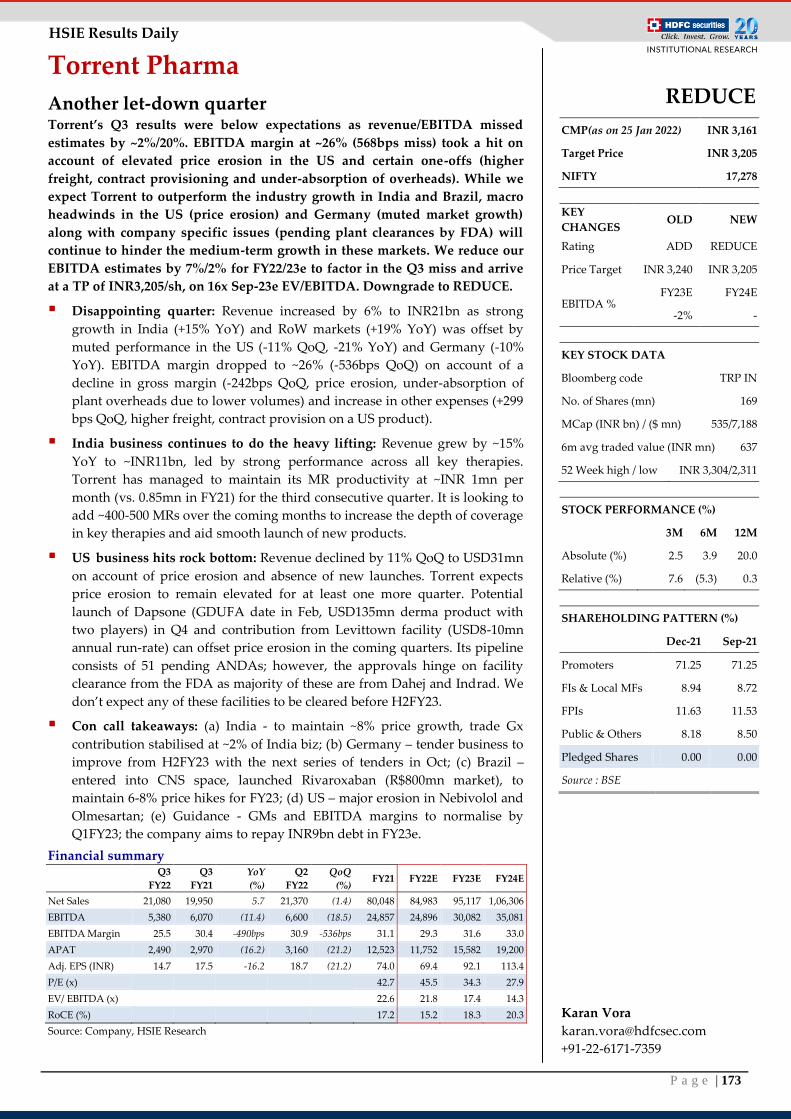
P a g e | 173
HSIE Results Daily
Torrent Pharma
Another let-down quarter Torrent’s Q3 results were below expectations as revenue/EBITDA missed
estimates by ~2%/20%. EBITDA margin at ~26% (568bps miss) took a hit on
account of elevated price erosion in the US and certain one-offs (higher
freight, contract provisioning and under-absorption of overheads). While we
expect Torrent to outperform the industry growth in India and Brazil, macro
headwinds in the US (price erosion) and Germany (muted market growth)
along with company specific issues (pending plant clearances by FDA) will
continue to hinder the medium-term growth in these markets. We reduce our
EBITDA estimates by 7%/2% for FY22/23e to factor in the Q3 miss and arrive
at a TP of INR3,205/sh, on 16x Sep-23e EV/EBITDA. Downgrade to REDUCE.
Disappointing quarter: Revenue increased by 6% to INR21bn as strong
growth in India (+15% YoY) and RoW markets (+19% YoY) was offset by
muted performance in the US (-11% QoQ, -21% YoY) and Germany (-10%
YoY). EBITDA margin dropped to ~26% (-536bps QoQ) on account of a
decline in gross margin (-242bps QoQ, price erosion, under-absorption of
plant overheads due to lower volumes) and increase in other expenses (+299
bps QoQ, higher freight, contract provision on a US product).
India business continues to do the heavy lifting: Revenue grew by ~15%
YoY to ~INR11bn, led by strong performance across all key therapies.
Torrent has managed to maintain its MR productivity at ~INR 1mn per
month (vs. 0.85mn in FY21) for the third consecutive quarter. It is looking to
add ~400-500 MRs over the coming months to increase the depth of coverage
in key therapies and aid smooth launch of new products.
US business hits rock bottom: Revenue declined by 11% QoQ to USD31mn
on account of price erosion and absence of new launches. Torrent expects
price erosion to remain elevated for at least one more quarter. Potential
launch of Dapsone (GDUFA date in Feb, USD135mn derma product with
two players) in Q4 and contribution from Levittown facility (USD8-10mn
annual run-rate) can offset price erosion in the coming quarters. Its pipeline
consists of 51 pending ANDAs; however, the approvals hinge on facility
clearance from the FDA as majority of these are from Dahej and Indrad. We
don’t expect any of these facilities to be cleared before H2FY23.
Con call takeaways: (a) India - to maintain ~8% price growth, trade Gx
contribution stabilised at ~2% of India biz; (b) Germany – tender business to
improve from H2FY23 with the next series of tenders in Oct; (c) Brazil –
entered into CNS space, launched Rivaroxaban (R$800mn market), to
maintain 6-8% price hikes for FY23; (d) US – major erosion in Nebivolol and
Olmesartan; (e) Guidance - GMs and EBITDA margins to normalise by
Q1FY23; the company aims to repay INR9bn debt in FY23e.
Financial summary
Q3
FY22
Q3
FY21
YoY
(%)
Q2
FY22
QoQ
(%) FY21 FY22E FY23E FY24E
Net Sales 21,080 19,950 5.7 21,370 (1.4) 80,048 84,983 95,117 1,06,306
EBITDA 5,380 6,070 (11.4) 6,600 (18.5) 24,857 24,896 30,082 35,081
EBITDA Margin 25.5 30.4 -490bps 30.9 -536bps 31.1 29.3 31.6 33.0
APAT 2,490 2,970 (16.2) 3,160 (21.2) 12,523 11,752 15,582 19,200
Adj. EPS (INR) 14.7 17.5 -16.2 18.7 (21.2) 74.0 69.4 92.1 113.4
P/E (x)
42.7 45.5 34.3 27.9
EV/ EBITDA (x)
22.6 21.8 17.4 14.3
RoCE (%)
17.2 15.2 18.3 20.3
Source: Company, HSIE Research
REDUCE
CMP(as on 25 Jan 2022) INR 3,161
Target Price INR 3,205
NIFTY 17,278
KEY
CHANGES OLD NEW
Rating ADD REDUCE
Price Target INR 3,240 INR 3,205
EBITDA % FY23E FY24E
-2% -
KEY STOCK DATA
Bloomberg code TRP IN
No. of Shares (mn) 169
MCap (INR bn) / ($ mn) 535/7,188
6m avg traded value (INR mn) 637
52 Week high / low INR 3,304/2,311
STOCK PERFORMANCE (%)
3M 6M 12M
Absolute (%) 2.5 3.9 20.0
Relative (%) 7.6 (5.3) 0.3
SHAREHOLDING PATTERN (%)
Dec-21 Sep-21
Promoters 71.25 71.25
FIs & Local MFs 8.94 8.72
FPIs 11.63 11.53
Public & Others 8.18 8.50
Pledged Shares 0.00 0.00
Source : BSE
Karan Vora
+91-22-6171-7359
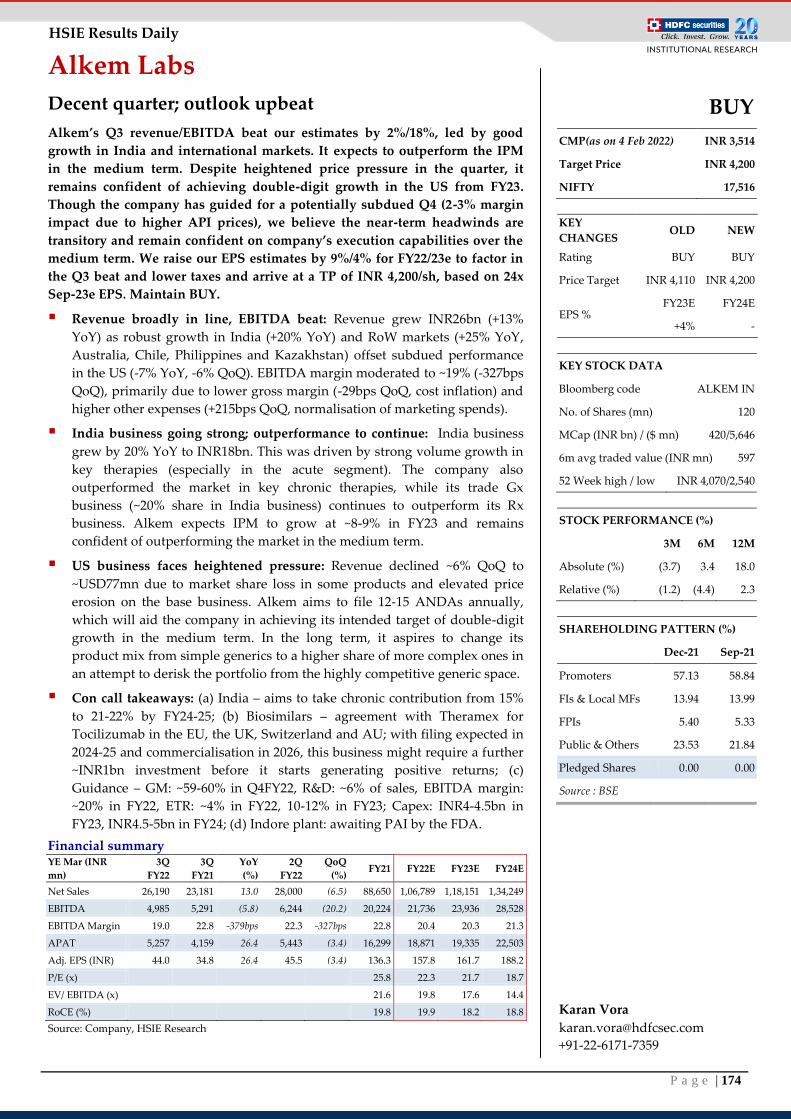
P a g e | 174
HSIE Results Daily
Alkem Labs
Decent quarter; outlook upbeat
Alkem’s Q3 revenue/EBITDA beat our estimates by 2%/18%, led by good
growth in India and international markets. It expects to outperform the IPM
in the medium term. Despite heightened price pressure in the quarter, it
remains confident of achieving double-digit growth in the US from FY23.
Though the company has guided for a potentially subdued Q4 (2-3% margin
impact due to higher API prices), we believe the near-term headwinds are
transitory and remain confident on company’s execution capabilities over the
medium term. We raise our EPS estimates by 9%/4% for FY22/23e to factor in
the Q3 beat and lower taxes and arrive at a TP of INR 4,200/sh, based on 24x
Sep-23e EPS. Maintain BUY.
Revenue broadly in line, EBITDA beat: Revenue grew INR26bn (+13%
YoY) as robust growth in India (+20% YoY) and RoW markets (+25% YoY,
Australia, Chile, Philippines and Kazakhstan) offset subdued performance
in the US (-7% YoY, -6% QoQ). EBITDA margin moderated to ~19% (-327bps
QoQ), primarily due to lower gross margin (-29bps QoQ, cost inflation) and
higher other expenses (+215bps QoQ, normalisation of marketing spends).
India business going strong; outperformance to continue: India business
grew by 20% YoY to INR18bn. This was driven by strong volume growth in
key therapies (especially in the acute segment). The company also
outperformed the market in key chronic therapies, while its trade Gx
business (~20% share in India business) continues to outperform its Rx
business. Alkem expects IPM to grow at ~8-9% in FY23 and remains
confident of outperforming the market in the medium term.
US business faces heightened pressure: Revenue declined ~6% QoQ to
~USD77mn due to market share loss in some products and elevated price
erosion on the base business. Alkem aims to file 12-15 ANDAs annually,
which will aid the company in achieving its intended target of double-digit
growth in the medium term. In the long term, it aspires to change its
product mix from simple generics to a higher share of more complex ones in
an attempt to derisk the portfolio from the highly competitive generic space.
Con call takeaways: (a) India – aims to take chronic contribution from 15%
to 21-22% by FY24-25; (b) Biosimilars – agreement with Theramex for
Tocilizumab in the EU, the UK, Switzerland and AU; with filing expected in
2024-25 and commercialisation in 2026, this business might require a further
~INR1bn investment before it starts generating positive returns; (c)
Guidance – GM: ~59-60% in Q4FY22, R&D: ~6% of sales, EBITDA margin:
~20% in FY22, ETR: ~4% in FY22, 10-12% in FY23; Capex: INR4-4.5bn in
FY23, INR4.5-5bn in FY24; (d) Indore plant: awaiting PAI by the FDA.
Financial summary YE Mar (INR
mn)
3Q
FY22
3Q
FY21
YoY
(%)
2Q
FY22
QoQ
(%) FY21 FY22E FY23E FY24E
Net Sales 26,190 23,181 13.0 28,000 (6.5) 88,650 1,06,789 1,18,151 1,34,249
EBITDA 4,985 5,291 (5.8) 6,244 (20.2) 20,224 21,736 23,936 28,528
EBITDA Margin 19.0 22.8 -379bps 22.3 -327bps 22.8 20.4 20.3 21.3
APAT 5,257 4,159 26.4 5,443 (3.4) 16,299 18,871 19,335 22,503
Adj. EPS (INR) 44.0 34.8 26.4 45.5 (3.4) 136.3 157.8 161.7 188.2
P/E (x)
25.8 22.3 21.7 18.7
EV/ EBITDA (x)
21.6 19.8 17.6 14.4
RoCE (%)
19.8 19.9 18.2 18.8
Source: Company, HSIE Research
BUY
CMP(as on 4 Feb 2022) INR 3,514
Target Price INR 4,200
NIFTY 17,516
KEY
CHANGES OLD NEW
Rating BUY BUY
Price Target INR 4,110 INR 4,200
EPS % FY23E FY24E
+4% -
KEY STOCK DATA
Bloomberg code ALKEM IN
No. of Shares (mn) 120
MCap (INR bn) / ($ mn) 420/5,646
6m avg traded value (INR mn) 597
52 Week high / low INR 4,070/2,540
STOCK PERFORMANCE (%)
3M 6M 12M
Absolute (%) (3.7) 3.4 18.0
Relative (%) (1.2) (4.4) 2.3
SHAREHOLDING PATTERN (%)
Dec-21 Sep-21
Promoters 57.13 58.84
FIs & Local MFs 13.94 13.99
FPIs 5.40 5.33
Public & Others 23.53 21.84
Pledged Shares 0.00 0.00
Source : BSE
Karan Vora
+91-22-6171-7359
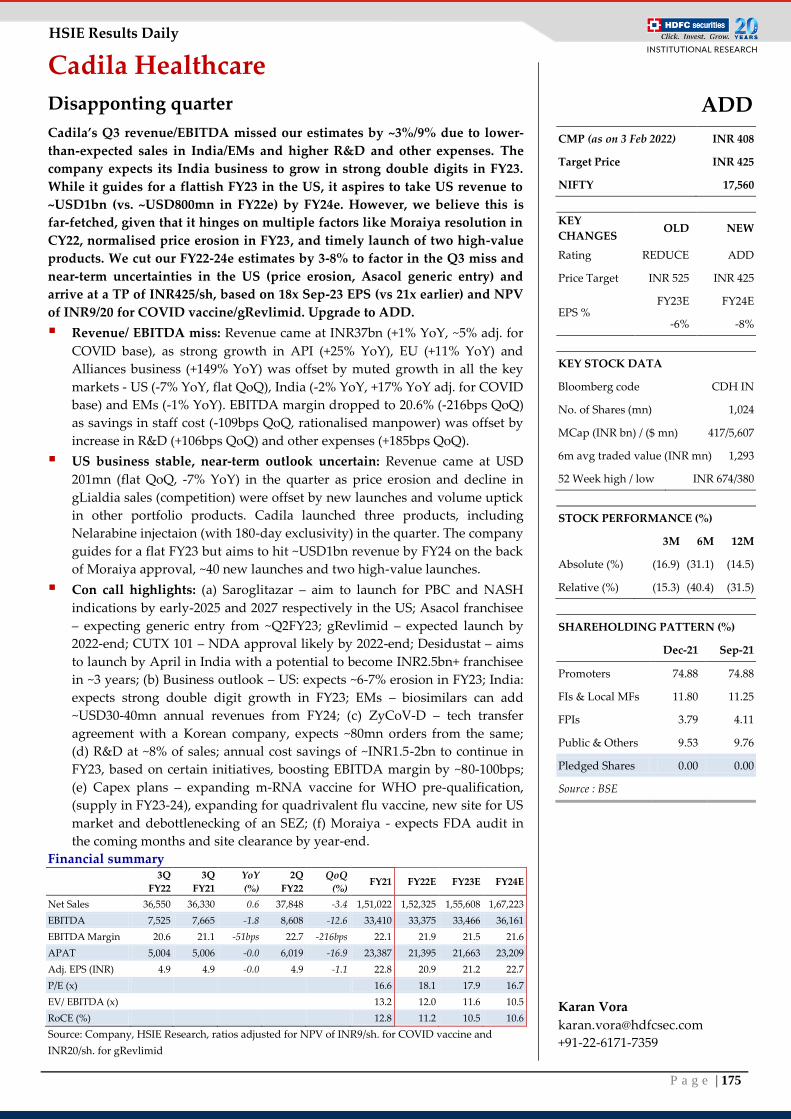
P a g e | 175
HSIE Results Daily
Cadila Healthcare
Disapponting quarter
Cadila’s Q3 revenue/EBITDA missed our estimates by ~3%/9% due to lower-
than-expected sales in India/EMs and higher R&D and other expenses. The
company expects its India business to grow in strong double digits in FY23.
While it guides for a flattish FY23 in the US, it aspires to take US revenue to
~USD1bn (vs. ~USD800mn in FY22e) by FY24e. However, we believe this is
far-fetched, given that it hinges on multiple factors like Moraiya resolution in
CY22, normalised price erosion in FY23, and timely launch of two high-value
products. We cut our FY22-24e estimates by 3-8% to factor in the Q3 miss and
near-term uncertainties in the US (price erosion, Asacol generic entry) and
arrive at a TP of INR425/sh, based on 18x Sep-23 EPS (vs 21x earlier) and NPV
of INR9/20 for COVID vaccine/gRevlimid. Upgrade to ADD.
Revenue/ EBITDA miss: Revenue came at INR37bn (+1% YoY, ~5% adj. for
COVID base), as strong growth in API (+25% YoY), EU (+11% YoY) and
Alliances business (+149% YoY) was offset by muted growth in all the key
markets - US (-7% YoY, flat QoQ), India (-2% YoY, +17% YoY adj. for COVID
base) and EMs (-1% YoY). EBITDA margin dropped to 20.6% (-216bps QoQ)
as savings in staff cost (-109bps QoQ, rationalised manpower) was offset by
increase in R&D (+106bps QoQ) and other expenses (+185bps QoQ).
US business stable, near-term outlook uncertain: Revenue came at USD
201mn (flat QoQ, -7% YoY) in the quarter as price erosion and decline in
gLialdia sales (competition) were offset by new launches and volume uptick
in other portfolio products. Cadila launched three products, including
Nelarabine injectaion (with 180-day exclusivity) in the quarter. The company
guides for a flat FY23 but aims to hit ~USD1bn revenue by FY24 on the back
of Moraiya approval, ~40 new launches and two high-value launches.
Con call highlights: (a) Saroglitazar – aim to launch for PBC and NASH
indications by early-2025 and 2027 respectively in the US; Asacol franchisee
– expecting generic entry from ~Q2FY23; gRevlimid – expected launch by
2022-end; CUTX 101 – NDA approval likely by 2022-end; Desidustat – aims
to launch by April in India with a potential to become INR2.5bn+ franchisee
in ~3 years; (b) Business outlook – US: expects ~6-7% erosion in FY23; India:
expects strong double digit growth in FY23; EMs – biosimilars can add
~USD30-40mn annual revenues from FY24; (c) ZyCoV-D – tech transfer
agreement with a Korean company, expects ~80mn orders from the same;
(d) R&D at ~8% of sales; annual cost savings of ~INR1.5-2bn to continue in
FY23, based on certain initiatives, boosting EBITDA margin by ~80-100bps;
(e) Capex plans – expanding m-RNA vaccine for WHO pre-qualification,
(supply in FY23-24), expanding for quadrivalent flu vaccine, new site for US
market and debottlenecking of an SEZ; (f) Moraiya - expects FDA audit in
the coming months and site clearance by year-end.
Financial summary
3Q
FY22
3Q
FY21
YoY
(%)
2Q
FY22
QoQ
(%) FY21 FY22E FY23E FY24E
Net Sales 36,550 36,330 0.6 37,848 -3.4 1,51,022 1,52,325 1,55,608 1,67,223
EBITDA 7,525 7,665 -1.8 8,608 -12.6 33,410 33,375 33,466 36,161
EBITDA Margin 20.6 21.1 -51bps 22.7 -216bps 22.1 21.9 21.5 21.6
APAT 5,004 5,006 -0.0 6,019 -16.9 23,387 21,395 21,663 23,209
Adj. EPS (INR) 4.9 4.9 -0.0 4.9 -1.1 22.8 20.9 21.2 22.7
P/E (x)
16.6 18.1 17.9 16.7
EV/ EBITDA (x)
13.2 12.0 11.6 10.5
RoCE (%)
12.8 11.2 10.5 10.6
Source: Company, HSIE Research, ratios adjusted for NPV of INR9/sh. for COVID vaccine and
INR20/sh. for gRevlimid
ADD
CMP (as on 3 Feb 2022) INR 408
Target Price INR 425
NIFTY 17,560
KEY
CHANGES OLD NEW
Rating REDUCE ADD
Price Target INR 525 INR 425
EPS % FY23E FY24E
-6% -8%
KEY STOCK DATA
Bloomberg code CDH IN
No. of Shares (mn) 1,024
MCap (INR bn) / ($ mn) 417/5,607
6m avg traded value (INR mn) 1,293
52 Week high / low INR 674/380
STOCK PERFORMANCE (%)
3M 6M 12M
Absolute (%) (16.9) (31.1) (14.5)
Relative (%) (15.3) (40.4) (31.5)
SHAREHOLDING PATTERN (%)
Dec-21 Sep-21
Promoters 74.88 74.88
FIs & Local MFs 11.80 11.25
FPIs 3.79 4.11
Public & Others 9.53 9.76
Pledged Shares 0.00 0.00
Source : BSE
Karan Vora
+91-22-6171-7359
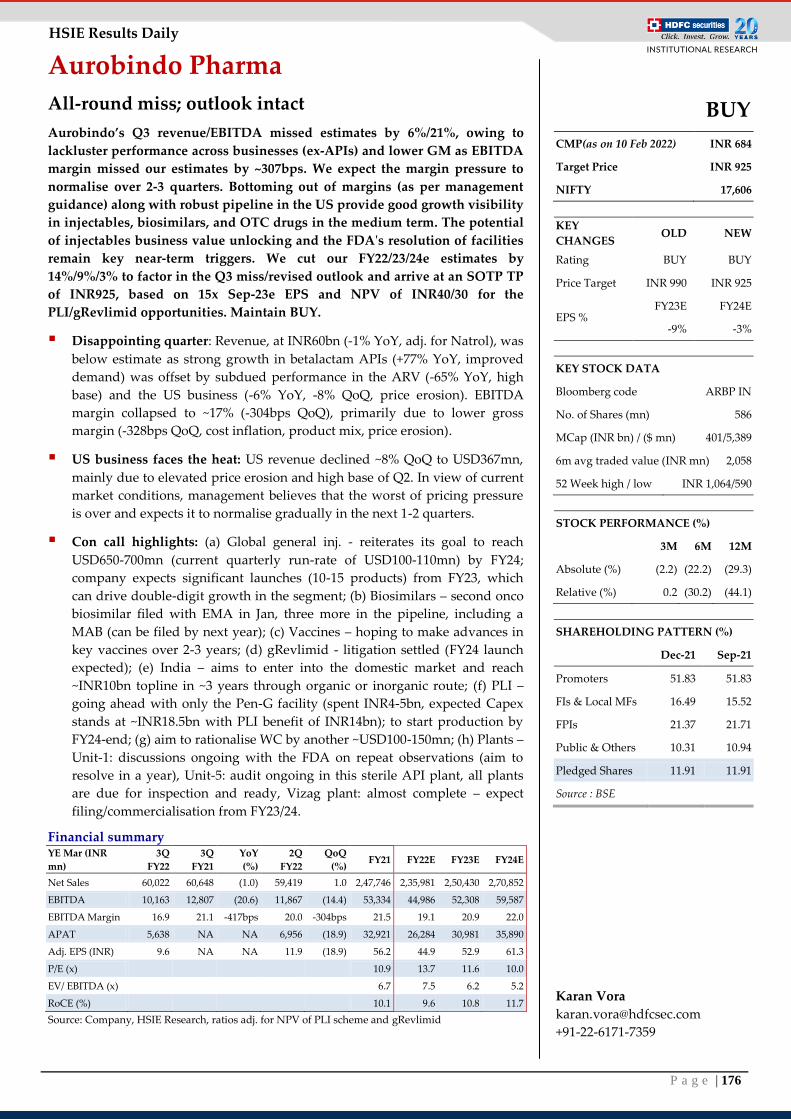
P a g e | 176
HSIE Results Daily
Aurobindo Pharma
All-round miss; outlook intact
Aurobindo’s Q3 revenue/EBITDA missed estimates by 6%/21%, owing to
lackluster performance across businesses (ex-APIs) and lower GM as EBITDA
margin missed our estimates by ~307bps. We expect the margin pressure to
normalise over 2-3 quarters. Bottoming out of margins (as per management
guidance) along with robust pipeline in the US provide good growth visibility
in injectables, biosimilars, and OTC drugs in the medium term. The potential
of injectables business value unlocking and the FDA's resolution of facilities
remain key near-term triggers. We cut our FY22/23/24e estimates by
14%/9%/3% to factor in the Q3 miss/revised outlook and arrive at an SOTP TP
of INR925, based on 15x Sep-23e EPS and NPV of INR40/30 for the
PLI/gRevlimid opportunities. Maintain BUY.
Disappointing quarter: Revenue, at INR60bn (-1% YoY, adj. for Natrol), was
below estimate as strong growth in betalactam APIs (+77% YoY, improved
demand) was offset by subdued performance in the ARV (-65% YoY, high
base) and the US business (-6% YoY, -8% QoQ, price erosion). EBITDA
margin collapsed to ~17% (-304bps QoQ), primarily due to lower gross
margin (-328bps QoQ, cost inflation, product mix, price erosion).
US business faces the heat: US revenue declined ~8% QoQ to USD367mn,
mainly due to elevated price erosion and high base of Q2. In view of current
market conditions, management believes that the worst of pricing pressure
is over and expects it to normalise gradually in the next 1-2 quarters.
Con call highlights: (a) Global general inj. - reiterates its goal to reach
USD650-700mn (current quarterly run-rate of USD100-110mn) by FY24;
company expects significant launches (10-15 products) from FY23, which
can drive double-digit growth in the segment; (b) Biosimilars – second onco
biosimilar filed with EMA in Jan, three more in the pipeline, including a
MAB (can be filed by next year); (c) Vaccines – hoping to make advances in
key vaccines over 2-3 years; (d) gRevlimid - litigation settled (FY24 launch
expected); (e) India – aims to enter into the domestic market and reach
~INR10bn topline in ~3 years through organic or inorganic route; (f) PLI –
going ahead with only the Pen-G facility (spent INR4-5bn, expected Capex
stands at ~INR18.5bn with PLI benefit of INR14bn); to start production by
FY24-end; (g) aim to rationalise WC by another ~USD100-150mn; (h) Plants –
Unit-1: discussions ongoing with the FDA on repeat observations (aim to
resolve in a year), Unit-5: audit ongoing in this sterile API plant, all plants
are due for inspection and ready, Vizag plant: almost complete – expect
filing/commercialisation from FY23/24.
Financial summary YE Mar (INR
mn)
3Q
FY22
3Q
FY21
YoY
(%)
2Q
FY22
QoQ
(%) FY21 FY22E FY23E FY24E
Net Sales 60,022 60,648 (1.0) 59,419 1.0 2,47,746 2,35,981 2,50,430 2,70,852
EBITDA 10,163 12,807 (20.6) 11,867 (14.4) 53,334 44,986 52,308 59,587
EBITDA Margin 16.9 21.1 -417bps 20.0 -304bps 21.5 19.1 20.9 22.0
APAT 5,638 NA NA 6,956 (18.9) 32,921 26,284 30,981 35,890
Adj. EPS (INR) 9.6 NA NA 11.9 (18.9) 56.2 44.9 52.9 61.3
P/E (x)
10.9 13.7 11.6 10.0
EV/ EBITDA (x)
6.7 7.5 6.2 5.2
RoCE (%)
10.1 9.6 10.8 11.7
Source: Company, HSIE Research, ratios adj. for NPV of PLI scheme and gRevlimid
BUY
CMP(as on 10 Feb 2022) INR 684
Target Price INR 925
NIFTY 17,606
KEY
CHANGES OLD NEW
Rating BUY BUY
Price Target INR 990 INR 925
EPS % FY23E FY24E
-9% -3%
KEY STOCK DATA
Bloomberg code ARBP IN
No. of Shares (mn) 586
MCap (INR bn) / ($ mn) 401/5,389
6m avg traded value (INR mn) 2,058
52 Week high / low INR 1,064/590
STOCK PERFORMANCE (%)
3M 6M 12M
Absolute (%) (2.2) (22.2) (29.3)
Relative (%) 0.2 (30.2) (44.1)
SHAREHOLDING PATTERN (%)
Dec-21 Sep-21
Promoters 51.83 51.83
FIs & Local MFs 16.49 15.52
FPIs 21.37 21.71
Public & Others 10.31 10.94
Pledged Shares 11.91 11.91
Source : BSE
Karan Vora
+91-22-6171-7359
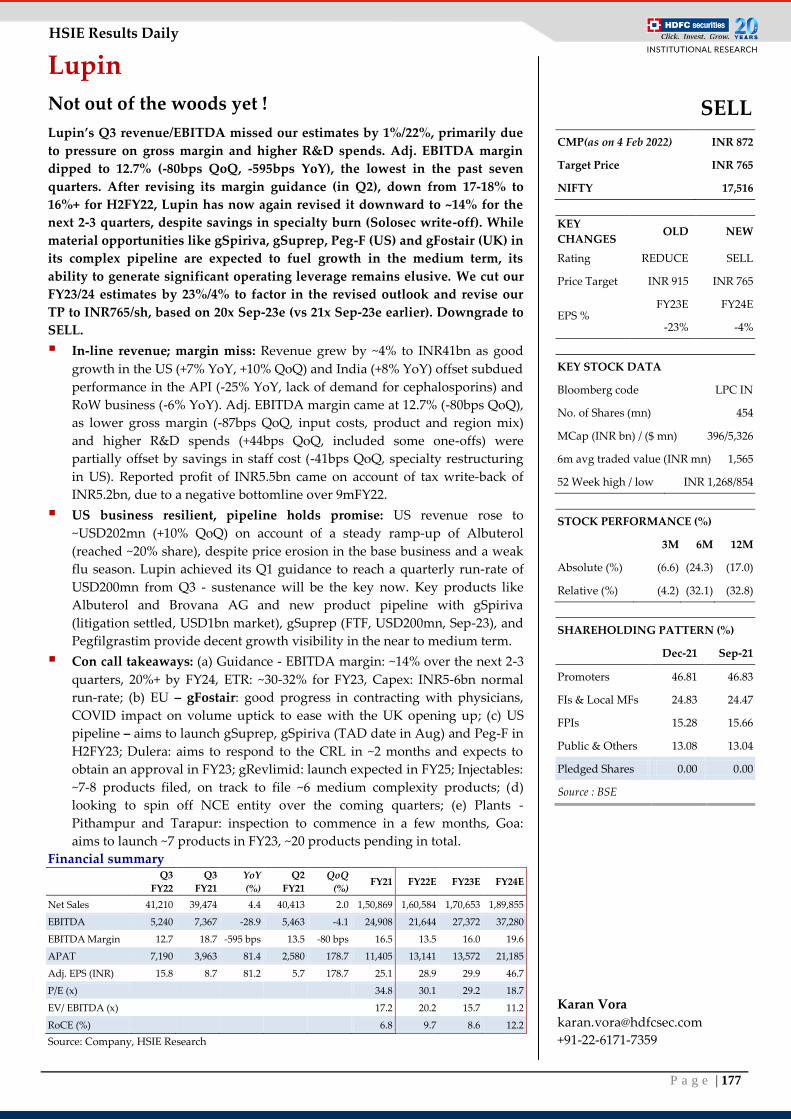
P a g e | 177
HSIE Results Daily
Lupin
Not out of the woods yet !
Lupin’s Q3 revenue/EBITDA missed our estimates by 1%/22%, primarily due
to pressure on gross margin and higher R&D spends. Adj. EBITDA margin
dipped to 12.7% (-80bps QoQ, -595bps YoY), the lowest in the past seven
quarters. After revising its margin guidance (in Q2), down from 17-18% to
16%+ for H2FY22, Lupin has now again revised it downward to ~14% for the
next 2-3 quarters, despite savings in specialty burn (Solosec write-off). While
material opportunities like gSpiriva, gSuprep, Peg-F (US) and gFostair (UK) in
its complex pipeline are expected to fuel growth in the medium term, its
ability to generate significant operating leverage remains elusive. We cut our
FY23/24 estimates by 23%/4% to factor in the revised outlook and revise our
TP to INR765/sh, based on 20x Sep-23e (vs 21x Sep-23e earlier). Downgrade to
SELL.
In-line revenue; margin miss: Revenue grew by ~4% to INR41bn as good
growth in the US (+7% YoY, +10% QoQ) and India (+8% YoY) offset subdued
performance in the API (-25% YoY, lack of demand for cephalosporins) and
RoW business (-6% YoY). Adj. EBITDA margin came at 12.7% (-80bps QoQ),
as lower gross margin (-87bps QoQ, input costs, product and region mix)
and higher R&D spends (+44bps QoQ, included some one-offs) were
partially offset by savings in staff cost (-41bps QoQ, specialty restructuring
in US). Reported profit of INR5.5bn came on account of tax write-back of
INR5.2bn, due to a negative bottomline over 9mFY22.
US business resilient, pipeline holds promise: US revenue rose to
~USD202mn (+10% QoQ) on account of a steady ramp-up of Albuterol
(reached ~20% share), despite price erosion in the base business and a weak
flu season. Lupin achieved its Q1 guidance to reach a quarterly run-rate of
USD200mn from Q3 - sustenance will be the key now. Key products like
Albuterol and Brovana AG and new product pipeline with gSpiriva
(litigation settled, USD1bn market), gSuprep (FTF, USD200mn, Sep-23), and
Pegfilgrastim provide decent growth visibility in the near to medium term.
Con call takeaways: (a) Guidance - EBITDA margin: ~14% over the next 2-3
quarters, 20%+ by FY24, ETR: ~30-32% for FY23, Capex: INR5-6bn normal
run-rate; (b) EU – gFostair: good progress in contracting with physicians,
COVID impact on volume uptick to ease with the UK opening up; (c) US
pipeline – aims to launch gSuprep, gSpiriva (TAD date in Aug) and Peg-F in
H2FY23; Dulera: aims to respond to the CRL in ~2 months and expects to
obtain an approval in FY23; gRevlimid: launch expected in FY25; Injectables:
~7-8 products filed, on track to file ~6 medium complexity products; (d)
looking to spin off NCE entity over the coming quarters; (e) Plants -
Pithampur and Tarapur: inspection to commence in a few months, Goa:
aims to launch ~7 products in FY23, ~20 products pending in total.
Financial summary
Q3
FY22
Q3
FY21
YoY
(%)
Q2
FY21
QoQ
(%) FY21 FY22E FY23E FY24E
Net Sales 41,210 39,474 4.4 40,413 2.0 1,50,869 1,60,584 1,70,653 1,89,855
EBITDA 5,240 7,367 -28.9 5,463 -4.1 24,908 21,644 27,372 37,280
EBITDA Margin 12.7 18.7 -595 bps 13.5 -80 bps 16.5 13.5 16.0 19.6
APAT 7,190 3,963 81.4 2,580 178.7 11,405 13,141 13,572 21,185
Adj. EPS (INR) 15.8 8.7 81.2 5.7 178.7 25.1 28.9 29.9 46.7
P/E (x)
34.8 30.1 29.2 18.7
EV/ EBITDA (x)
17.2 20.2 15.7 11.2
RoCE (%)
6.8 9.7 8.6 12.2
Source: Company, HSIE Research
SELL
CMP(as on 4 Feb 2022) INR 872
Target Price INR 765
NIFTY 17,516
KEY
CHANGES OLD NEW
Rating REDUCE SELL
Price Target INR 915 INR 765
EPS % FY23E FY24E
-23% -4%
KEY STOCK DATA
Bloomberg code LPC IN
No. of Shares (mn) 454
MCap (INR bn) / ($ mn) 396/5,326
6m avg traded value (INR mn) 1,565
52 Week high / low INR 1,268/854
STOCK PERFORMANCE (%)
3M 6M 12M
Absolute (%) (6.6) (24.3) (17.0)
Relative (%) (4.2) (32.1) (32.8)
SHAREHOLDING PATTERN (%)
Dec-21 Sep-21
Promoters 46.81 46.83
FIs & Local MFs 24.83 24.47
FPIs 15.28 15.66
Public & Others 13.08 13.04
Pledged Shares 0.00 0.00
Source : BSE
Karan Vora
+91-22-6171-7359
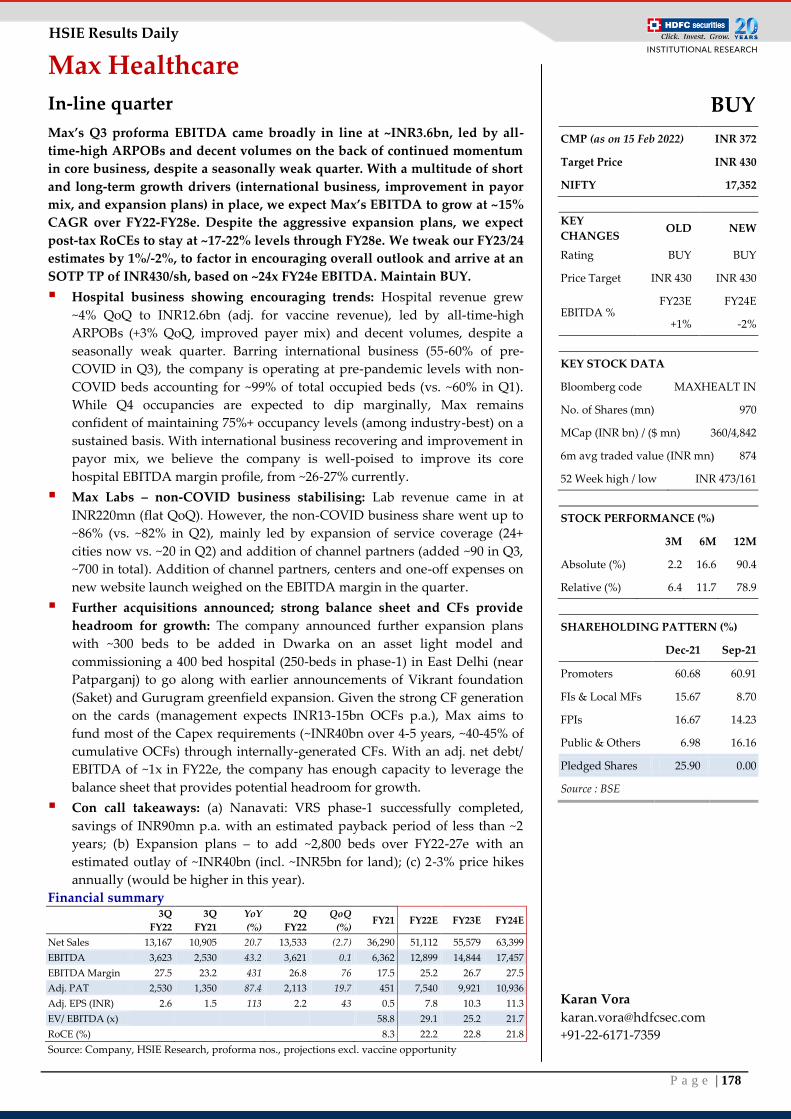
P a g e | 178
HSIE Results Daily
Max Healthcare
In-line quarter
Max’s Q3 proforma EBITDA came broadly in line at ~INR3.6bn, led by all-
time-high ARPOBs and decent volumes on the back of continued momentum
in core business, despite a seasonally weak quarter. With a multitude of short
and long-term growth drivers (international business, improvement in payor
mix, and expansion plans) in place, we expect Max’s EBITDA to grow at ~15%
CAGR over FY22-FY28e. Despite the aggressive expansion plans, we expect
post-tax RoCEs to stay at ~17-22% levels through FY28e. We tweak our FY23/24
estimates by 1%/-2%, to factor in encouraging overall outlook and arrive at an
SOTP TP of INR430/sh, based on ~24x FY24e EBITDA. Maintain BUY.
Hospital business showing encouraging trends: Hospital revenue grew
~4% QoQ to INR12.6bn (adj. for vaccine revenue), led by all-time-high
ARPOBs (+3% QoQ, improved payer mix) and decent volumes, despite a
seasonally weak quarter. Barring international business (55-60% of pre-
COVID in Q3), the company is operating at pre-pandemic levels with non-
COVID beds accounting for ~99% of total occupied beds (vs. ~60% in Q1).
While Q4 occupancies are expected to dip marginally, Max remains
confident of maintaining 75%+ occupancy levels (among industry-best) on a
sustained basis. With international business recovering and improvement in
payor mix, we believe the company is well-poised to improve its core
hospital EBITDA margin profile, from ~26-27% currently.
Max Labs – non-COVID business stabilising: Lab revenue came in at
INR220mn (flat QoQ). However, the non-COVID business share went up to
~86% (vs. ~82% in Q2), mainly led by expansion of service coverage (24+
cities now vs. ~20 in Q2) and addition of channel partners (added ~90 in Q3,
~700 in total). Addition of channel partners, centers and one-off expenses on
new website launch weighed on the EBITDA margin in the quarter.
Further acquisitions announced; strong balance sheet and CFs provide
headroom for growth: The company announced further expansion plans
with ~300 beds to be added in Dwarka on an asset light model and
commissioning a 400 bed hospital (250-beds in phase-1) in East Delhi (near
Patparganj) to go along with earlier announcements of Vikrant foundation
(Saket) and Gurugram greenfield expansion. Given the strong CF generation
on the cards (management expects INR13-15bn OCFs p.a.), Max aims to
fund most of the Capex requirements (~INR40bn over 4-5 years, ~40-45% of
cumulative OCFs) through internally-generated CFs. With an adj. net debt/
EBITDA of ~1x in FY22e, the company has enough capacity to leverage the
balance sheet that provides potential headroom for growth.
Con call takeaways: (a) Nanavati: VRS phase-1 successfully completed,
savings of INR90mn p.a. with an estimated payback period of less than ~2
years; (b) Expansion plans – to add ~2,800 beds over FY22-27e with an
estimated outlay of ~INR40bn (incl. ~INR5bn for land); (c) 2-3% price hikes
annually (would be higher in this year).
Financial summary
3Q
FY22
3Q
FY21
YoY
(%)
2Q
FY22
QoQ
(%) FY21 FY22E FY23E FY24E
Net Sales 13,167 10,905 20.7 13,533 (2.7) 36,290 51,112 55,579 63,399
EBITDA 3,623 2,530 43.2 3,621 0.1 6,362 12,899 14,844 17,457
EBITDA Margin 27.5 23.2 431 26.8 76 17.5 25.2 26.7 27.5
Adj. PAT 2,530 1,350 87.4 2,113 19.7 451 7,540 9,921 10,936
Adj. EPS (INR) 2.6 1.5 113 2.2 43 0.5 7.8 10.3 11.3
EV/ EBITDA (x)
58.8 29.1 25.2 21.7
RoCE (%)
8.3 22.2 22.8 21.8
Source: Company, HSIE Research, proforma nos., projections excl. vaccine opportunity
BUY
CMP (as on 15 Feb 2022) INR 372
Target Price INR 430
NIFTY 17,352
KEY
CHANGES OLD NEW
Rating BUY BUY
Price Target INR 430 INR 430
EBITDA % FY23E FY24E
+1% -2%
KEY STOCK DATA
Bloomberg code MAXHEALT IN
No. of Shares (mn) 970
MCap (INR bn) / ($ mn) 360/4,842
6m avg traded value (INR mn) 874
52 Week high / low INR 473/161
STOCK PERFORMANCE (%)
3M 6M 12M
Absolute (%) 2.2 16.6 90.4
Relative (%) 6.4 11.7 78.9
SHAREHOLDING PATTERN (%)
Dec-21 Sep-21
Promoters 60.68 60.91
FIs & Local MFs 15.67 8.70
FPIs 16.67 14.23
Public & Others 6.98 16.16
Pledged Shares 25.90 0.00
Source : BSE
Karan Vora
+91-22-6171-7359
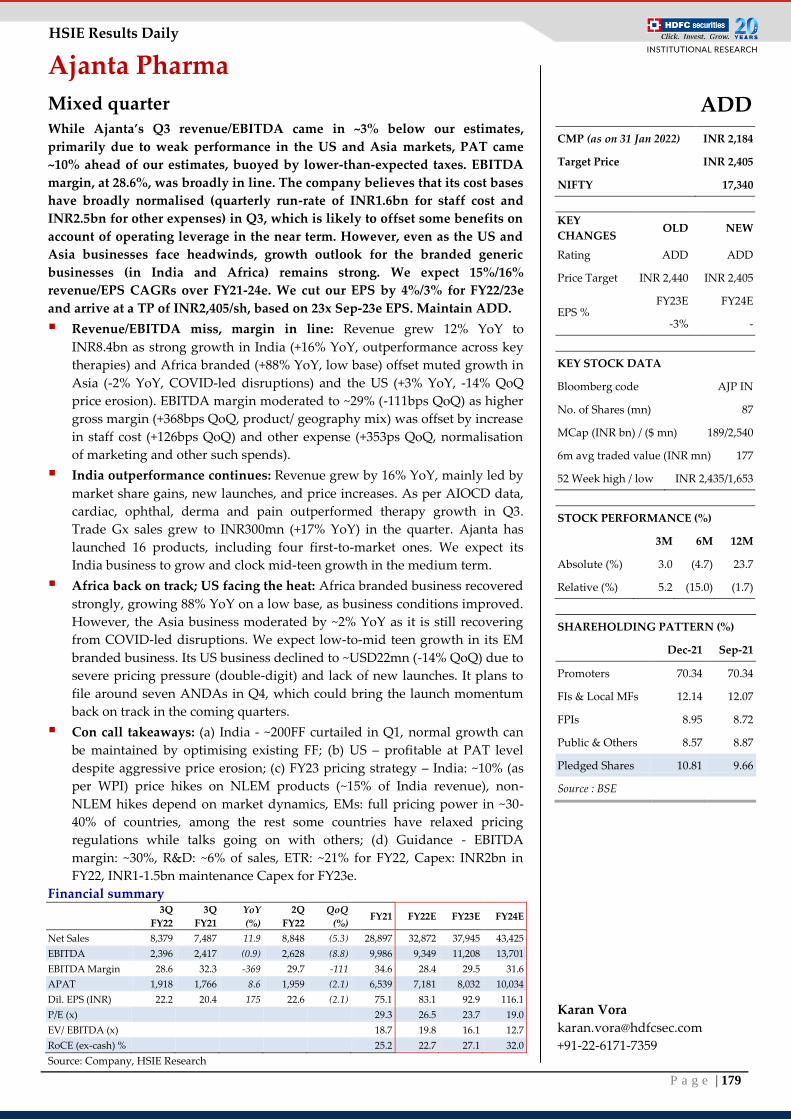
P a g e | 179
HSIE Results Daily
Ajanta Pharma
Mixed quarter
While Ajanta’s Q3 revenue/EBITDA came in ~3% below our estimates,
primarily due to weak performance in the US and Asia markets, PAT came
~10% ahead of our estimates, buoyed by lower-than-expected taxes. EBITDA
margin, at 28.6%, was broadly in line. The company believes that its cost bases
have broadly normalised (quarterly run-rate of INR1.6bn for staff cost and
INR2.5bn for other expenses) in Q3, which is likely to offset some benefits on
account of operating leverage in the near term. However, even as the US and
Asia businesses face headwinds, growth outlook for the branded generic
businesses (in India and Africa) remains strong. We expect 15%/16%
revenue/EPS CAGRs over FY21-24e. We cut our EPS by 4%/3% for FY22/23e
and arrive at a TP of INR2,405/sh, based on 23x Sep-23e EPS. Maintain ADD.
Revenue/EBITDA miss, margin in line: Revenue grew 12% YoY to
INR8.4bn as strong growth in India (+16% YoY, outperformance across key
therapies) and Africa branded (+88% YoY, low base) offset muted growth in
Asia (-2% YoY, COVID-led disruptions) and the US (+3% YoY, -14% QoQ
price erosion). EBITDA margin moderated to ~29% (-111bps QoQ) as higher
gross margin (+368bps QoQ, product/ geography mix) was offset by increase
in staff cost (+126bps QoQ) and other expense (+353ps QoQ, normalisation
of marketing and other such spends).
India outperformance continues: Revenue grew by 16% YoY, mainly led by
market share gains, new launches, and price increases. As per AIOCD data,
cardiac, ophthal, derma and pain outperformed therapy growth in Q3.
Trade Gx sales grew to INR300mn (+17% YoY) in the quarter. Ajanta has
launched 16 products, including four first-to-market ones. We expect its
India business to grow and clock mid-teen growth in the medium term.
Africa back on track; US facing the heat: Africa branded business recovered
strongly, growing 88% YoY on a low base, as business conditions improved.
However, the Asia business moderated by ~2% YoY as it is still recovering
from COVID-led disruptions. We expect low-to-mid teen growth in its EM
branded business. Its US business declined to ~USD22mn (-14% QoQ) due to
severe pricing pressure (double-digit) and lack of new launches. It plans to
file around seven ANDAs in Q4, which could bring the launch momentum
back on track in the coming quarters.
Con call takeaways: (a) India - ~200FF curtailed in Q1, normal growth can
be maintained by optimising existing FF; (b) US – profitable at PAT level
despite aggressive price erosion; (c) FY23 pricing strategy – India: ~10% (as
per WPI) price hikes on NLEM products (~15% of India revenue), non-
NLEM hikes depend on market dynamics, EMs: full pricing power in ~30-
40% of countries, among the rest some countries have relaxed pricing
regulations while talks going on with others; (d) Guidance - EBITDA
margin: ~30%, R&D: ~6% of sales, ETR: ~21% for FY22, Capex: INR2bn in
FY22, INR1-1.5bn maintenance Capex for FY23e.
Financial summary
3Q
FY22
3Q
FY21
YoY
(%)
2Q
FY22
QoQ
(%) FY21 FY22E FY23E FY24E
Net Sales 8,379 7,487 11.9 8,848 (5.3) 28,897 32,872 37,945 43,425
EBITDA 2,396 2,417 (0.9) 2,628 (8.8) 9,986 9,349 11,208 13,701
EBITDA Margin 28.6 32.3 -369 29.7 -111 34.6 28.4 29.5 31.6
APAT 1,918 1,766 8.6 1,959 (2.1) 6,539 7,181 8,032 10,034
Dil. EPS (INR) 22.2 20.4 175 22.6 (2.1) 75.1 83.1 92.9 116.1
P/E (x)
29.3 26.5 23.7 19.0
EV/ EBITDA (x)
18.7 19.8 16.1 12.7
RoCE (ex-cash) %
25.2 22.7 27.1 32.0
Source: Company, HSIE Research
ADD
CMP (as on 31 Jan 2022) INR 2,184
Target Price INR 2,405
NIFTY 17,340
KEY
CHANGES OLD NEW
Rating ADD ADD
Price Target INR 2,440 INR 2,405
EPS % FY23E FY24E
-3% -
KEY STOCK DATA
Bloomberg code AJP IN
No. of Shares (mn) 87
MCap (INR bn) / ($ mn) 189/2,540
6m avg traded value (INR mn) 177
52 Week high / low INR 2,435/1,653
STOCK PERFORMANCE (%)
3M 6M 12M
Absolute (%) 3.0 (4.7) 23.7
Relative (%) 5.2 (15.0) (1.7)
SHAREHOLDING PATTERN (%)
Dec-21 Sep-21
Promoters 70.34 70.34
FIs & Local MFs 12.14 12.07
FPIs 8.95 8.72
Public & Others 8.57 8.87
Pledged Shares 10.81 9.66
Source : BSE
Karan Vora
+91-22-6171-7359
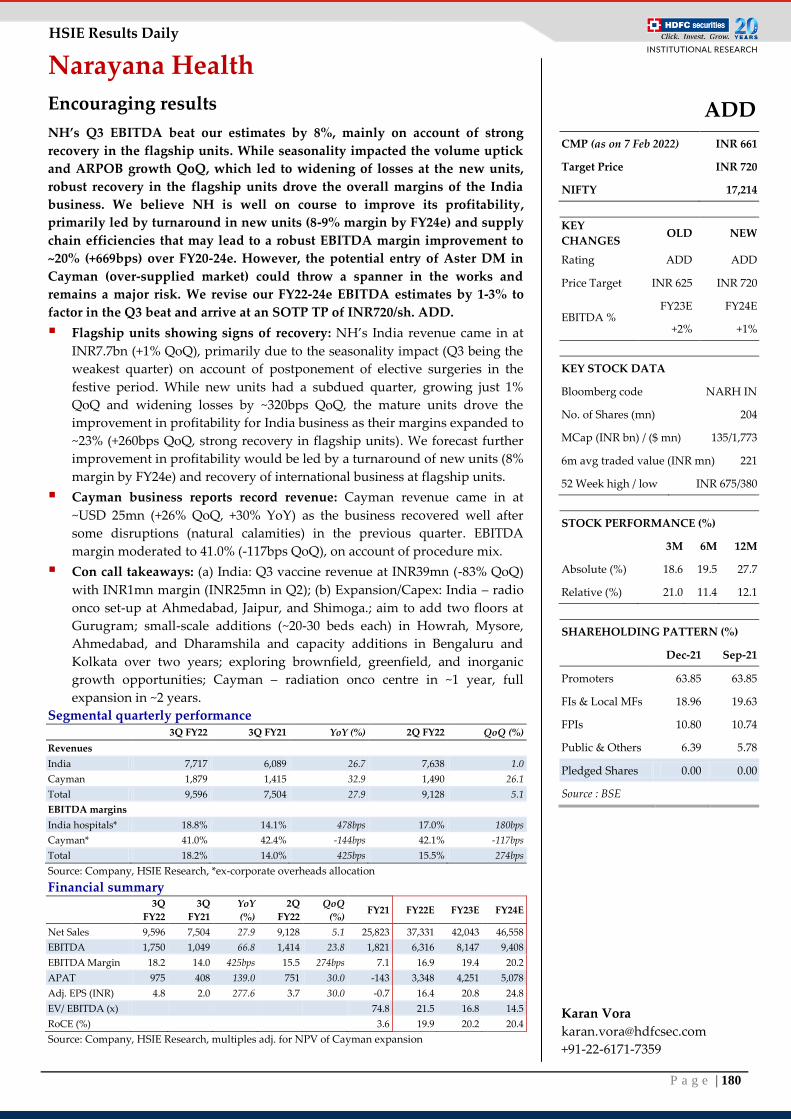
P a g e | 180
HSIE Results Daily
Narayana Health
Encouraging results
NH’s Q3 EBITDA beat our estimates by 8%, mainly on account of strong
recovery in the flagship units. While seasonality impacted the volume uptick
and ARPOB growth QoQ, which led to widening of losses at the new units,
robust recovery in the flagship units drove the overall margins of the India
business. We believe NH is well on course to improve its profitability,
primarily led by turnaround in new units (8-9% margin by FY24e) and supply
chain efficiencies that may lead to a robust EBITDA margin improvement to
~20% (+669bps) over FY20-24e. However, the potential entry of Aster DM in
Cayman (over-supplied market) could throw a spanner in the works and
remains a major risk. We revise our FY22-24e EBITDA estimates by 1-3% to
factor in the Q3 beat and arrive at an SOTP TP of INR720/sh. ADD.
Flagship units showing signs of recovery: NH’s India revenue came in at
INR7.7bn (+1% QoQ), primarily due to the seasonality impact (Q3 being the
weakest quarter) on account of postponement of elective surgeries in the
festive period. While new units had a subdued quarter, growing just 1%
QoQ and widening losses by ~320bps QoQ, the mature units drove the
improvement in profitability for India business as their margins expanded to
~23% (+260bps QoQ, strong recovery in flagship units). We forecast further
improvement in profitability would be led by a turnaround of new units (8%
margin by FY24e) and recovery of international business at flagship units.
Cayman business reports record revenue: Cayman revenue came in at
~USD 25mn (+26% QoQ, +30% YoY) as the business recovered well after
some disruptions (natural calamities) in the previous quarter. EBITDA
margin moderated to 41.0% (-117bps QoQ), on account of procedure mix.
Con call takeaways: (a) India: Q3 vaccine revenue at INR39mn (-83% QoQ)
with INR1mn margin (INR25mn in Q2); (b) Expansion/Capex: India – radio
onco set-up at Ahmedabad, Jaipur, and Shimoga.; aim to add two floors at
Gurugram; small-scale additions (~20-30 beds each) in Howrah, Mysore,
Ahmedabad, and Dharamshila and capacity additions in Bengaluru and
Kolkata over two years; exploring brownfield, greenfield, and inorganic
growth opportunities; Cayman – radiation onco centre in ~1 year, full
expansion in ~2 years.
Segmental quarterly performance
3Q FY22 3Q FY21 YoY (%) 2Q FY22 QoQ (%)
Revenues
India 7,717 6,089 26.7 7,638 1.0
Cayman 1,879 1,415 32.9 1,490 26.1
Total 9,596 7,504 27.9 9,128 5.1
EBITDA margins
India hospitals* 18.8% 14.1% 478bps 17.0% 180bps
Cayman* 41.0% 42.4% -144bps 42.1% -117bps
Total 18.2% 14.0% 425bps 15.5% 274bps
Source: Company, HSIE Research, *ex-corporate overheads allocation
Financial summary
3Q
FY22
3Q
FY21
YoY
(%)
2Q
FY22
QoQ
(%) FY21 FY22E FY23E FY24E
Net Sales 9,596 7,504 27.9 9,128 5.1 25,823 37,331 42,043 46,558
EBITDA 1,750 1,049 66.8 1,414 23.8 1,821 6,316 8,147 9,408
EBITDA Margin 18.2 14.0 425bps 15.5 274bps 7.1 16.9 19.4 20.2
APAT 975 408 139.0 751 30.0 -143 3,348 4,251 5,078
Adj. EPS (INR) 4.8 2.0 277.6 3.7 30.0 -0.7 16.4 20.8 24.8
EV/ EBITDA (x)
74.8 21.5 16.8 14.5
RoCE (%)
3.6 19.9 20.2 20.4
Source: Company, HSIE Research, multiples adj. for NPV of Cayman expansion
ADD
CMP (as on 7 Feb 2022) INR 661
Target Price INR 720
NIFTY 17,214
KEY
CHANGES OLD NEW
Rating ADD ADD
Price Target INR 625 INR 720
EBITDA % FY23E FY24E
+2% +1%
KEY STOCK DATA
Bloomberg code NARH IN
No. of Shares (mn) 204
MCap (INR bn) / ($ mn) 135/1,773
6m avg traded value (INR mn) 221
52 Week high / low INR 675/380
STOCK PERFORMANCE (%)
3M 6M 12M
Absolute (%) 18.6 19.5 27.7
Relative (%) 21.0 11.4 12.1
SHAREHOLDING PATTERN (%)
Dec-21 Sep-21
Promoters 63.85 63.85
FIs & Local MFs 18.96 19.63
FPIs 10.80 10.74
Public & Others 6.39 5.78
Pledged Shares 0.00 0.00
Source : BSE
Karan Vora
+91-22-6171-7359

P a g e | 181
HSIE Results Daily
Real Estate
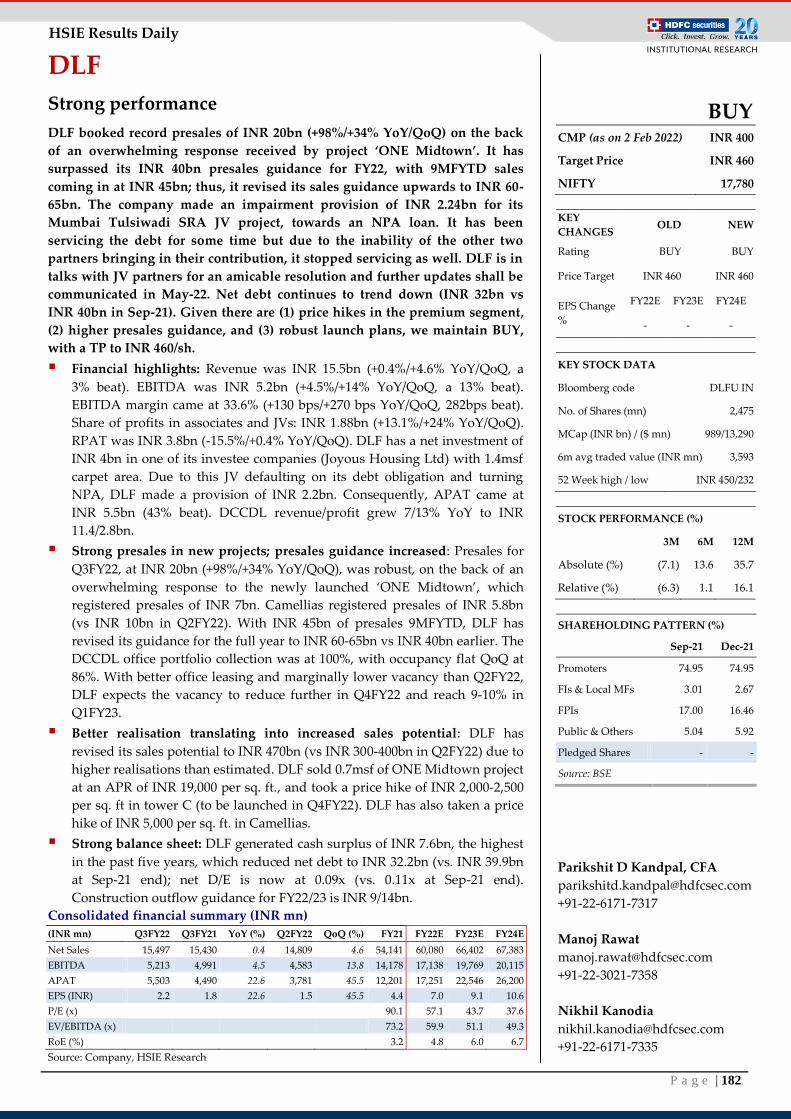
P a g e | 182
HSIE Results Daily
DLF
Strong performance
DLF booked record presales of INR 20bn (+98%/+34% YoY/QoQ) on the back
of an overwhelming response received by project ‘ONE Midtown’. It has
surpassed its INR 40bn presales guidance for FY22, with 9MFYTD sales
coming in at INR 45bn; thus, it revised its sales guidance upwards to INR 60-
65bn. The company made an impairment provision of INR 2.24bn for its
Mumbai Tulsiwadi SRA JV project, towards an NPA loan. It has been
servicing the debt for some time but due to the inability of the other two
partners bringing in their contribution, it stopped servicing as well. DLF is in
talks with JV partners for an amicable resolution and further updates shall be
communicated in May-22. Net debt continues to trend down (INR 32bn vs
INR 40bn in Sep-21). Given there are (1) price hikes in the premium segment,
(2) higher presales guidance, and (3) robust launch plans, we maintain BUY,
with a TP to INR 460/sh.
Financial highlights: Revenue was INR 15.5bn (+0.4%/+4.6% YoY/QoQ, a
3% beat). EBITDA was INR 5.2bn (+4.5%/+14% YoY/QoQ, a 13% beat).
EBITDA margin came at 33.6% (+130 bps/+270 bps YoY/QoQ, 282bps beat).
Share of profits in associates and JVs: INR 1.88bn (+13.1%/+24% YoY/QoQ).
RPAT was INR 3.8bn (-15.5%/+0.4% YoY/QoQ). DLF has a net investment of
INR 4bn in one of its investee companies (Joyous Housing Ltd) with 1.4msf
carpet area. Due to this JV defaulting on its debt obligation and turning
NPA, DLF made a provision of INR 2.2bn. Consequently, APAT came at
INR 5.5bn (43% beat). DCCDL revenue/profit grew 7/13% YoY to INR
11.4/2.8bn.
Strong presales in new projects; presales guidance increased: Presales for
Q3FY22, at INR 20bn (+98%/+34% YoY/QoQ), was robust, on the back of an
overwhelming response to the newly launched ‘ONE Midtown’, which
registered presales of INR 7bn. Camellias registered presales of INR 5.8bn
(vs INR 10bn in Q2FY22). With INR 45bn of presales 9MFYTD, DLF has
revised its guidance for the full year to INR 60-65bn vs INR 40bn earlier. The
DCCDL office portfolio collection was at 100%, with occupancy flat QoQ at
86%. With better office leasing and marginally lower vacancy than Q2FY22,
DLF expects the vacancy to reduce further in Q4FY22 and reach 9-10% in
Q1FY23.
Better realisation translating into increased sales potential: DLF has
revised its sales potential to INR 470bn (vs INR 300-400bn in Q2FY22) due to
higher realisations than estimated. DLF sold 0.7msf of ONE Midtown project
at an APR of INR 19,000 per sq. ft., and took a price hike of INR 2,000-2,500
per sq. ft in tower C (to be launched in Q4FY22). DLF has also taken a price
hike of INR 5,000 per sq. ft. in Camellias.
Strong balance sheet: DLF generated cash surplus of INR 7.6bn, the highest
in the past five years, which reduced net debt to INR 32.2bn (vs. INR 39.9bn
at Sep-21 end); net D/E is now at 0.09x (vs. 0.11x at Sep-21 end).
Construction outflow guidance for FY22/23 is INR 9/14bn.
Consolidated financial summary (INR mn)
(INR mn) Q3FY22 Q3FY21 YoY (%) Q2FY22 QoQ (%) FY21 FY22E FY23E FY24E
Net Sales 15,497 15,430 0.4 14,809 4.6 54,141 60,080 66,402 67,383
EBITDA 5,213 4,991 4.5 4,583 13.8 14,178 17,138 19,769 20,115
APAT 5,503 4,490 22.6 3,781 45.5 12,201 17,251 22,546 26,200
EPS (INR) 2.2 1.8 22.6 1.5 45.5 4.4 7.0 9.1 10.6
P/E (x)
90.1 57.1 43.7 37.6
EV/EBITDA (x)
73.2 59.9 51.1 49.3
RoE (%)
3.2 4.8 6.0 6.7
Source: Company, HSIE Research
BUY CMP (as on 2 Feb 2022) INR 400
Target Price INR 460
NIFTY 17,780
KEY
CHANGES OLD NEW
Rating BUY BUY
Price Target INR 460 INR 460
EPS Change
%
FY22E FY23E FY24E
- - -
KEY STOCK DATA
Bloomberg code DLFU IN
No. of Shares (mn) 2,475
MCap (INR bn) / ($ mn) 989/13,290
6m avg traded value (INR mn) 3,593
52 Week high / low INR 450/232
STOCK PERFORMANCE (%)
3M 6M 12M
Absolute (%) (7.1) 13.6 35.7
Relative (%) (6.3) 1.1 16.1
SHAREHOLDING PATTERN (%)
Sep-21 Dec-21
Promoters 74.95 74.95
FIs & Local MFs 3.01 2.67
FPIs 17.00 16.46
Public & Others 5.04 5.92
Pledged Shares - -
Source: BSE
Parikshit D Kandpal, CFA
+91-22-6171-7317
Manoj Rawat
+91-22-3021-7358
Nikhil Kanodia
+91-22-6171-7335
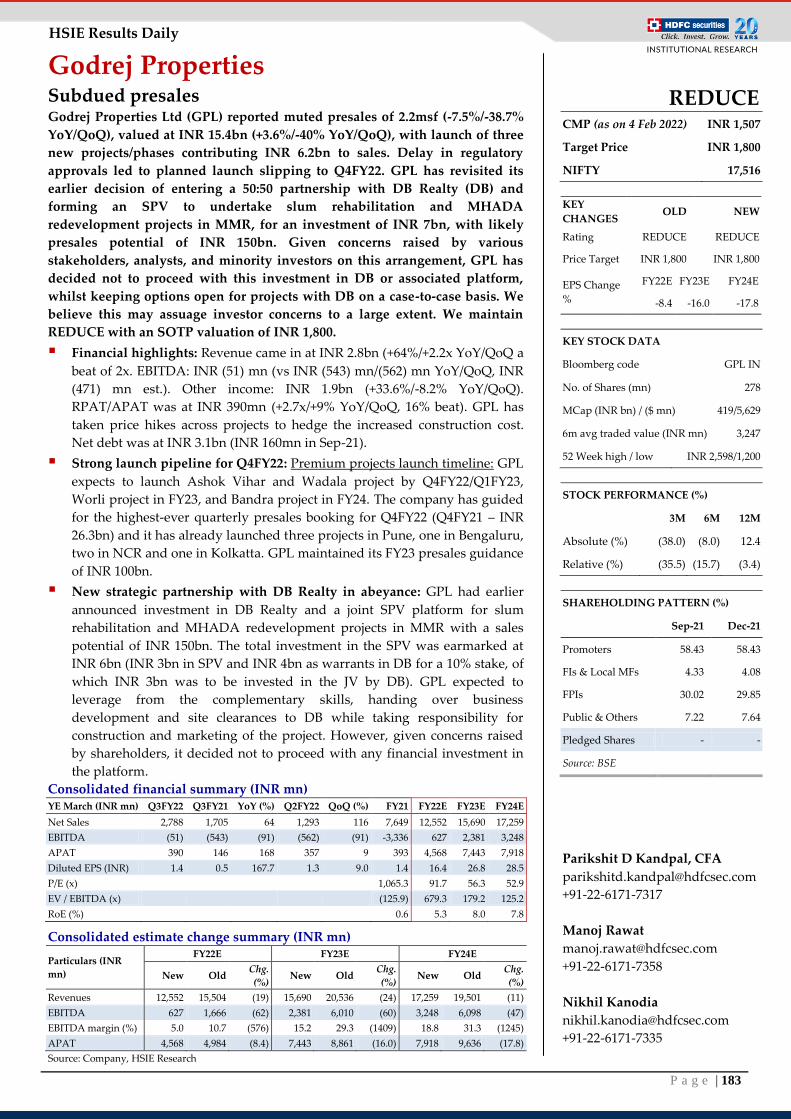
P a g e | 183
HSIE Results Daily
Godrej Properties Subdued presales Godrej Properties Ltd (GPL) reported muted presales of 2.2msf (-7.5%/-38.7%
YoY/QoQ), valued at INR 15.4bn (+3.6%/-40% YoY/QoQ), with launch of three
new projects/phases contributing INR 6.2bn to sales. Delay in regulatory
approvals led to planned launch slipping to Q4FY22. GPL has revisited its
earlier decision of entering a 50:50 partnership with DB Realty (DB) and
forming an SPV to undertake slum rehabilitation and MHADA
redevelopment projects in MMR, for an investment of INR 7bn, with likely
presales potential of INR 150bn. Given concerns raised by various
stakeholders, analysts, and minority investors on this arrangement, GPL has
decided not to proceed with this investment in DB or associated platform,
whilst keeping options open for projects with DB on a case-to-case basis. We
believe this may assuage investor concerns to a large extent. We maintain
REDUCE with an SOTP valuation of INR 1,800.
Financial highlights: Revenue came in at INR 2.8bn (+64%/+2.2x YoY/QoQ a
beat of 2x. EBITDA: INR (51) mn (vs INR (543) mn/(562) mn YoY/QoQ, INR
(471) mn est.). Other income: INR 1.9bn (+33.6%/-8.2% YoY/QoQ).
RPAT/APAT was at INR 390mn (+2.7x/+9% YoY/QoQ, 16% beat). GPL has
taken price hikes across projects to hedge the increased construction cost.
Net debt was at INR 3.1bn (INR 160mn in Sep-21).
Strong launch pipeline for Q4FY22: Premium projects launch timeline: GPL
expects to launch Ashok Vihar and Wadala project by Q4FY22/Q1FY23,
Worli project in FY23, and Bandra project in FY24. The company has guided
for the highest-ever quarterly presales booking for Q4FY22 (Q4FY21 – INR
26.3bn) and it has already launched three projects in Pune, one in Bengaluru,
two in NCR and one in Kolkatta. GPL maintained its FY23 presales guidance
of INR 100bn.
New strategic partnership with DB Realty in abeyance: GPL had earlier
announced investment in DB Realty and a joint SPV platform for slum
rehabilitation and MHADA redevelopment projects in MMR with a sales
potential of INR 150bn. The total investment in the SPV was earmarked at
INR 6bn (INR 3bn in SPV and INR 4bn as warrants in DB for a 10% stake, of
which INR 3bn was to be invested in the JV by DB). GPL expected to
leverage from the complementary skills, handing over business
development and site clearances to DB while taking responsibility for
construction and marketing of the project. However, given concerns raised
by shareholders, it decided not to proceed with any financial investment in
the platform.
Consolidated financial summary (INR mn) YE March (INR mn) Q3FY22 Q3FY21 YoY (%) Q2FY22 QoQ (%) FY21 FY22E FY23E FY24E
Net Sales 2,788 1,705 64 1,293 116 7,649 12,552 15,690 17,259
EBITDA (51) (543) (91) (562) (91) -3,336 627 2,381 3,248
APAT 390 146 168 357 9 393 4,568 7,443 7,918
Diluted EPS (INR) 1.4 0.5 167.7 1.3 9.0 1.4 16.4 26.8 28.5
P/E (x)
1,065.3 91.7 56.3 52.9
EV / EBITDA (x)
(125.9) 679.3 179.2 125.2
RoE (%)
0.6 5.3 8.0 7.8
Consolidated estimate change summary (INR mn)
Particulars (INR
mn)
FY22E FY23E FY24E
New Old Chg.
(%) New Old
Chg.
(%) New Old
Chg.
(%)
Revenues 12,552 15,504 (19) 15,690 20,536 (24) 17,259 19,501 (11)
EBITDA 627 1,666 (62) 2,381 6,010 (60) 3,248 6,098 (47)
EBITDA margin (%) 5.0 10.7 (576) 15.2 29.3 (1409) 18.8 31.3 (1245)
APAT 4,568 4,984 (8.4) 7,443 8,861 (16.0) 7,918 9,636 (17.8)
Source: Company, HSIE Research
REDUCE CMP (as on 4 Feb 2022) INR 1,507
Target Price INR 1,800
NIFTY 17,516
KEY
CHANGES OLD NEW
Rating REDUCE REDUCE
Price Target INR 1,800 INR 1,800
EPS Change
%
FY22E FY23E FY24E
-8.4 -16.0 -17.8
KEY STOCK DATA
Bloomberg code GPL IN
No. of Shares (mn) 278
MCap (INR bn) / ($ mn) 419/5,629
6m avg traded value (INR mn) 3,247
52 Week high / low INR 2,598/1,200
STOCK PERFORMANCE (%)
3M 6M 12M
Absolute (%) (38.0) (8.0) 12.4
Relative (%) (35.5) (15.7) (3.4)
SHAREHOLDING PATTERN (%)
Sep-21 Dec-21
Promoters 58.43 58.43
FIs & Local MFs 4.33 4.08
FPIs 30.02 29.85
Public & Others 7.22 7.64
Pledged Shares - -
Source: BSE
Parikshit D Kandpal, CFA
+91-22-6171-7317
Manoj Rawat
+91-22-6171-7358
Nikhil Kanodia
+91-22-6171-7335
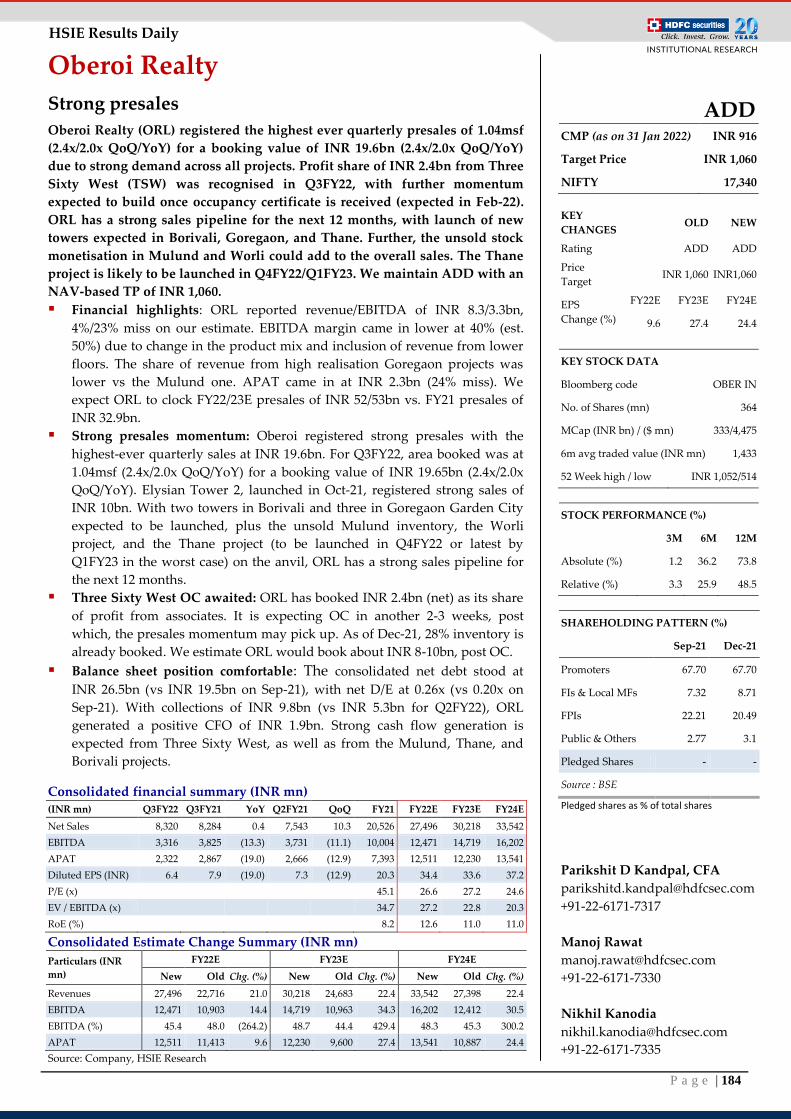
P a g e | 184
HSIE Results Daily
Oberoi Realty
Strong presales
Oberoi Realty (ORL) registered the highest ever quarterly presales of 1.04msf
(2.4x/2.0x QoQ/YoY) for a booking value of INR 19.6bn (2.4x/2.0x QoQ/YoY)
due to strong demand across all projects. Profit share of INR 2.4bn from Three
Sixty West (TSW) was recognised in Q3FY22, with further momentum
expected to build once occupancy certificate is received (expected in Feb-22).
ORL has a strong sales pipeline for the next 12 months, with launch of new
towers expected in Borivali, Goregaon, and Thane. Further, the unsold stock
monetisation in Mulund and Worli could add to the overall sales. The Thane
project is likely to be launched in Q4FY22/Q1FY23. We maintain ADD with an
NAV-based TP of INR 1,060.
Financial highlights: ORL reported revenue/EBITDA of INR 8.3/3.3bn,
4%/23% miss on our estimate. EBITDA margin came in lower at 40% (est.
50%) due to change in the product mix and inclusion of revenue from lower
floors. The share of revenue from high realisation Goregaon projects was
lower vs the Mulund one. APAT came in at INR 2.3bn (24% miss). We
expect ORL to clock FY22/23E presales of INR 52/53bn vs. FY21 presales of
INR 32.9bn.
Strong presales momentum: Oberoi registered strong presales with the
highest-ever quarterly sales at INR 19.6bn. For Q3FY22, area booked was at
1.04msf (2.4x/2.0x QoQ/YoY) for a booking value of INR 19.65bn (2.4x/2.0x
QoQ/YoY). Elysian Tower 2, launched in Oct-21, registered strong sales of
INR 10bn. With two towers in Borivali and three in Goregaon Garden City
expected to be launched, plus the unsold Mulund inventory, the Worli
project, and the Thane project (to be launched in Q4FY22 or latest by
Q1FY23 in the worst case) on the anvil, ORL has a strong sales pipeline for
the next 12 months.
Three Sixty West OC awaited: ORL has booked INR 2.4bn (net) as its share
of profit from associates. It is expecting OC in another 2-3 weeks, post
which, the presales momentum may pick up. As of Dec-21, 28% inventory is
already booked. We estimate ORL would book about INR 8-10bn, post OC.
Balance sheet position comfortable: The consolidated net debt stood at
INR 26.5bn (vs INR 19.5bn on Sep-21), with net D/E at 0.26x (vs 0.20x on
Sep-21). With collections of INR 9.8bn (vs INR 5.3bn for Q2FY22), ORL
generated a positive CFO of INR 1.9bn. Strong cash flow generation is
expected from Three Sixty West, as well as from the Mulund, Thane, and
Borivali projects.
Consolidated financial summary (INR mn) (INR mn) Q3FY22 Q3FY21 YoY Q2FY21 QoQ FY21 FY22E FY23E FY24E
Net Sales 8,320 8,284 0.4 7,543 10.3 20,526 27,496 30,218 33,542
EBITDA 3,316 3,825 (13.3) 3,731 (11.1) 10,004 12,471 14,719 16,202
APAT 2,322 2,867 (19.0) 2,666 (12.9) 7,393 12,511 12,230 13,541
Diluted EPS (INR) 6.4 7.9 (19.0) 7.3 (12.9) 20.3 34.4 33.6 37.2
P/E (x)
45.1 26.6 27.2 24.6
EV / EBITDA (x)
34.7 27.2 22.8 20.3
RoE (%)
8.2 12.6 11.0 11.0
Consolidated Estimate Change Summary (INR mn)
Particulars (INR
mn)
FY22E FY23E FY24E
New Old Chg. (%) New Old Chg. (%) New Old Chg. (%)
Revenues 27,496 22,716 21.0 30,218 24,683 22.4 33,542 27,398 22.4
EBITDA 12,471 10,903 14.4 14,719 10,963 34.3 16,202 12,412 30.5
EBITDA (%) 45.4 48.0 (264.2) 48.7 44.4 429.4 48.3 45.3 300.2
APAT 12,511 11,413 9.6 12,230 9,600 27.4 13,541 10,887 24.4
Source: Company, HSIE Research
ADD CMP (as on 31 Jan 2022) INR 916
Target Price INR 1,060
NIFTY 17,340
KEY
CHANGES OLD NEW
Rating ADD ADD
Price
Target INR 1,060 INR1,060
EPS
Change (%)
FY22E FY23E FY24E
9.6 27.4 24.4
KEY STOCK DATA
Bloomberg code OBER IN
No. of Shares (mn) 364
MCap (INR bn) / ($ mn) 333/4,475
6m avg traded value (INR mn) 1,433
52 Week high / low INR 1,052/514
STOCK PERFORMANCE (%)
3M 6M 12M
Absolute (%) 1.2 36.2 73.8
Relative (%) 3.3 25.9 48.5
SHAREHOLDING PATTERN (%)
Sep-21 Dec-21
Promoters 67.70 67.70
FIs & Local MFs 7.32 8.71
FPIs 22.21 20.49
Public & Others 2.77 3.1
Pledged Shares - -
Source : BSE
Pledged shares as % of total shares
Parikshit D Kandpal, CFA
+91-22-6171-7317
Manoj Rawat
+91-22-6171-7330
Nikhil Kanodia
+91-22-6171-7335
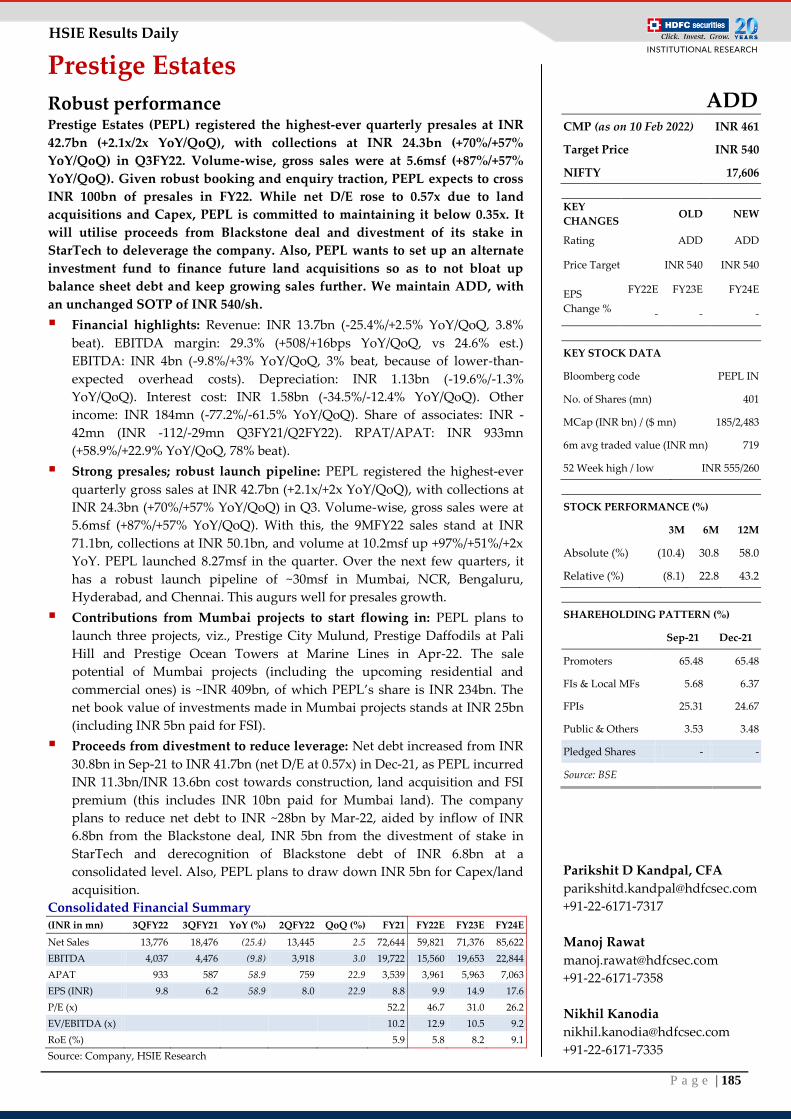
P a g e | 185
HSIE Results Daily
Prestige Estates
Robust performance Prestige Estates (PEPL) registered the highest-ever quarterly presales at INR
42.7bn (+2.1x/2x YoY/QoQ), with collections at INR 24.3bn (+70%/+57%
YoY/QoQ) in Q3FY22. Volume-wise, gross sales were at 5.6msf (+87%/+57%
YoY/QoQ). Given robust booking and enquiry traction, PEPL expects to cross
INR 100bn of presales in FY22. While net D/E rose to 0.57x due to land
acquisitions and Capex, PEPL is committed to maintaining it below 0.35x. It
will utilise proceeds from Blackstone deal and divestment of its stake in
StarTech to deleverage the company. Also, PEPL wants to set up an alternate
investment fund to finance future land acquisitions so as to not bloat up
balance sheet debt and keep growing sales further. We maintain ADD, with
an unchanged SOTP of INR 540/sh.
Financial highlights: Revenue: INR 13.7bn (-25.4%/+2.5% YoY/QoQ, 3.8%
beat). EBITDA margin: 29.3% (+508/+16bps YoY/QoQ, vs 24.6% est.)
EBITDA: INR 4bn (-9.8%/+3% YoY/QoQ, 3% beat, because of lower-than-
expected overhead costs). Depreciation: INR 1.13bn (-19.6%/-1.3%
YoY/QoQ). Interest cost: INR 1.58bn (-34.5%/-12.4% YoY/QoQ). Other
income: INR 184mn (-77.2%/-61.5% YoY/QoQ). Share of associates: INR -
42mn (INR -112/-29mn Q3FY21/Q2FY22). RPAT/APAT: INR 933mn
(+58.9%/+22.9% YoY/QoQ, 78% beat).
Strong presales; robust launch pipeline: PEPL registered the highest-ever
quarterly gross sales at INR 42.7bn (+2.1x/+2x YoY/QoQ), with collections at
INR 24.3bn (+70%/+57% YoY/QoQ) in Q3. Volume-wise, gross sales were at
5.6msf (+87%/+57% YoY/QoQ). With this, the 9MFY22 sales stand at INR
71.1bn, collections at INR 50.1bn, and volume at 10.2msf up +97%/+51%/+2x
YoY. PEPL launched 8.27msf in the quarter. Over the next few quarters, it
has a robust launch pipeline of ~30msf in Mumbai, NCR, Bengaluru,
Hyderabad, and Chennai. This augurs well for presales growth.
Contributions from Mumbai projects to start flowing in: PEPL plans to
launch three projects, viz., Prestige City Mulund, Prestige Daffodils at Pali
Hill and Prestige Ocean Towers at Marine Lines in Apr-22. The sale
potential of Mumbai projects (including the upcoming residential and
commercial ones) is ~INR 409bn, of which PEPL’s share is INR 234bn. The
net book value of investments made in Mumbai projects stands at INR 25bn
(including INR 5bn paid for FSI).
Proceeds from divestment to reduce leverage: Net debt increased from INR
30.8bn in Sep-21 to INR 41.7bn (net D/E at 0.57x) in Dec-21, as PEPL incurred
INR 11.3bn/INR 13.6bn cost towards construction, land acquisition and FSI
premium (this includes INR 10bn paid for Mumbai land). The company
plans to reduce net debt to INR ~28bn by Mar-22, aided by inflow of INR
6.8bn from the Blackstone deal, INR 5bn from the divestment of stake in
StarTech and derecognition of Blackstone debt of INR 6.8bn at a
consolidated level. Also, PEPL plans to draw down INR 5bn for Capex/land
acquisition.
Consolidated Financial Summary (INR in mn) 3QFY22 3QFY21 YoY (%) 2QFY22 QoQ (%) FY21 FY22E FY23E FY24E
Net Sales 13,776 18,476 (25.4) 13,445 2.5 72,644 59,821 71,376 85,622
EBITDA 4,037 4,476 (9.8) 3,918 3.0 19,722 15,560 19,653 22,844
APAT 933 587 58.9 759 22.9 3,539 3,961 5,963 7,063
EPS (INR) 9.8 6.2 58.9 8.0 22.9 8.8 9.9 14.9 17.6
P/E (x)
52.2 46.7 31.0 26.2
EV/EBITDA (x)
10.2 12.9 10.5 9.2
RoE (%)
5.9 5.8 8.2 9.1
Source: Company, HSIE Research
ADD CMP (as on 10 Feb 2022) INR 461
Target Price INR 540
NIFTY 17,606
KEY
CHANGES OLD NEW
Rating ADD ADD
Price Target INR 540 INR 540
EPS
Change %
FY22E FY23E FY24E
- - -
KEY STOCK DATA
Bloomberg code PEPL IN
No. of Shares (mn) 401
MCap (INR bn) / ($ mn) 185/2,483
6m avg traded value (INR mn) 719
52 Week high / low INR 555/260
STOCK PERFORMANCE (%)
3M 6M 12M
Absolute (%) (10.4) 30.8 58.0
Relative (%) (8.1) 22.8 43.2
SHAREHOLDING PATTERN (%)
Sep-21 Dec-21
Promoters 65.48 65.48
FIs & Local MFs 5.68 6.37
FPIs 25.31 24.67
Public & Others 3.53 3.48
Pledged Shares - -
Source: BSE
Parikshit D Kandpal, CFA
+91-22-6171-7317
Manoj Rawat
+91-22-6171-7358
Nikhil Kanodia
+91-22-6171-7335
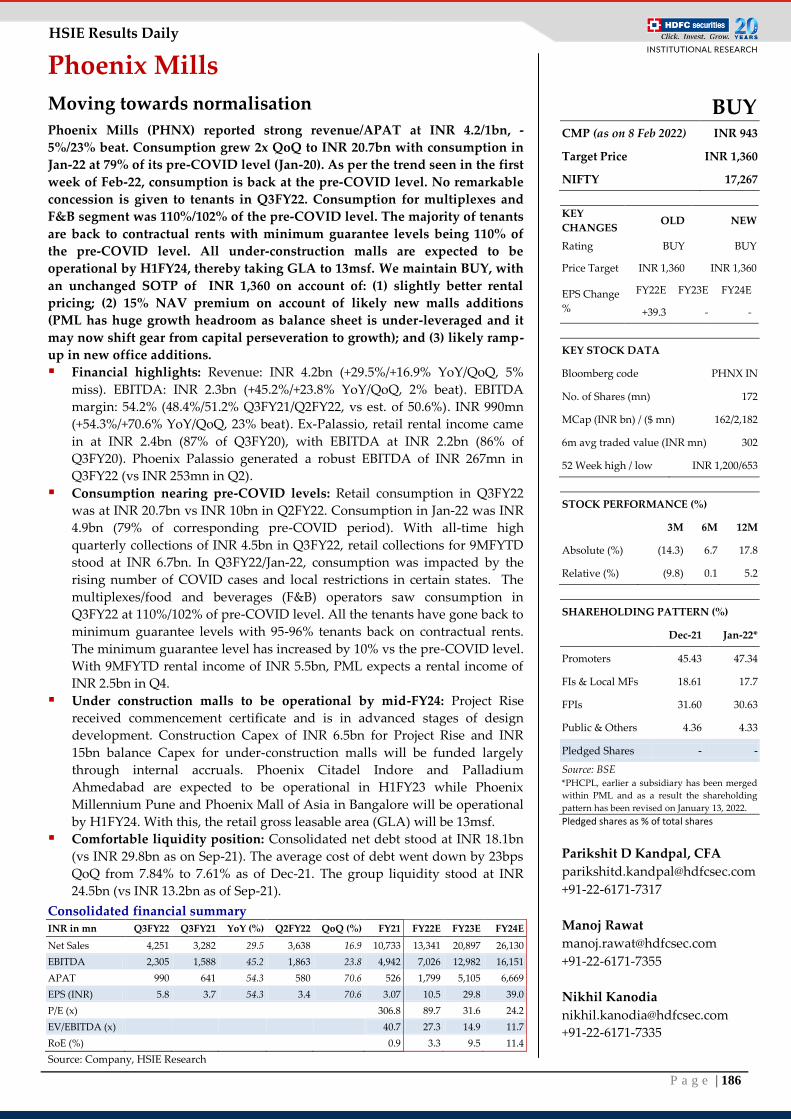
P a g e | 186
HSIE Results Daily
Phoenix Mills
Moving towards normalisation
Phoenix Mills (PHNX) reported strong revenue/APAT at INR 4.2/1bn, -
5%/23% beat. Consumption grew 2x QoQ to INR 20.7bn with consumption in
Jan-22 at 79% of its pre-COVID level (Jan-20). As per the trend seen in the first
week of Feb-22, consumption is back at the pre-COVID level. No remarkable
concession is given to tenants in Q3FY22. Consumption for multiplexes and
F&B segment was 110%/102% of the pre-COVID level. The majority of tenants
are back to contractual rents with minimum guarantee levels being 110% of
the pre-COVID level. All under-construction malls are expected to be
operational by H1FY24, thereby taking GLA to 13msf. We maintain BUY, with
an unchanged SOTP of INR 1,360 on account of: (1) slightly better rental
pricing; (2) 15% NAV premium on account of likely new malls additions
(PML has huge growth headroom as balance sheet is under-leveraged and it
may now shift gear from capital perseveration to growth); and (3) likely ramp-
up in new office additions.
Financial highlights: Revenue: INR 4.2bn (+29.5%/+16.9% YoY/QoQ, 5%
miss). EBITDA: INR 2.3bn (+45.2%/+23.8% YoY/QoQ, 2% beat). EBITDA
margin: 54.2% (48.4%/51.2% Q3FY21/Q2FY22, vs est. of 50.6%). INR 990mn
(+54.3%/+70.6% YoY/QoQ, 23% beat). Ex-Palassio, retail rental income came
in at INR 2.4bn (87% of Q3FY20), with EBITDA at INR 2.2bn (86% of
Q3FY20). Phoenix Palassio generated a robust EBITDA of INR 267mn in
Q3FY22 (vs INR 253mn in Q2).
Consumption nearing pre-COVID levels: Retail consumption in Q3FY22
was at INR 20.7bn vs INR 10bn in Q2FY22. Consumption in Jan-22 was INR
4.9bn (79% of corresponding pre-COVID period). With all-time high
quarterly collections of INR 4.5bn in Q3FY22, retail collections for 9MFYTD
stood at INR 6.7bn. In Q3FY22/Jan-22, consumption was impacted by the
rising number of COVID cases and local restrictions in certain states. The
multiplexes/food and beverages (F&B) operators saw consumption in
Q3FY22 at 110%/102% of pre-COVID level. All the tenants have gone back to
minimum guarantee levels with 95-96% tenants back on contractual rents.
The minimum guarantee level has increased by 10% vs the pre-COVID level.
With 9MFYTD rental income of INR 5.5bn, PML expects a rental income of
INR 2.5bn in Q4.
Under construction malls to be operational by mid-FY24: Project Rise
received commencement certificate and is in advanced stages of design
development. Construction Capex of INR 6.5bn for Project Rise and INR
15bn balance Capex for under-construction malls will be funded largely
through internal accruals. Phoenix Citadel Indore and Palladium
Ahmedabad are expected to be operational in H1FY23 while Phoenix
Millennium Pune and Phoenix Mall of Asia in Bangalore will be operational
by H1FY24. With this, the retail gross leasable area (GLA) will be 13msf.
Comfortable liquidity position: Consolidated net debt stood at INR 18.1bn
(vs INR 29.8bn as on Sep-21). The average cost of debt went down by 23bps
QoQ from 7.84% to 7.61% as of Dec-21. The group liquidity stood at INR
24.5bn (vs INR 13.2bn as of Sep-21).
Consolidated financial summary INR in mn Q3FY22 Q3FY21 YoY (%) Q2FY22 QoQ (%) FY21 FY22E FY23E FY24E
Net Sales 4,251 3,282 29.5 3,638 16.9 10,733 13,341 20,897 26,130
EBITDA 2,305 1,588 45.2 1,863 23.8 4,942 7,026 12,982 16,151
APAT 990 641 54.3 580 70.6 526 1,799 5,105 6,669
EPS (INR) 5.8 3.7 54.3 3.4 70.6 3.07 10.5 29.8 39.0
P/E (x)
306.8 89.7 31.6 24.2
EV/EBITDA (x)
40.7 27.3 14.9 11.7
RoE (%)
0.9 3.3 9.5 11.4
Source: Company, HSIE Research
BUY CMP (as on 8 Feb 2022) INR 943
Target Price INR 1,360
NIFTY 17,267
KEY
CHANGES OLD NEW
Rating BUY BUY
Price Target INR 1,360 INR 1,360
EPS Change
%
FY22E FY23E FY24E
+39.3 - -
KEY STOCK DATA
Bloomberg code PHNX IN
No. of Shares (mn) 172
MCap (INR bn) / ($ mn) 162/2,182
6m avg traded value (INR mn) 302
52 Week high / low INR 1,200/653
STOCK PERFORMANCE (%)
3M 6M 12M
Absolute (%) (14.3) 6.7 17.8
Relative (%) (9.8) 0.1 5.2
SHAREHOLDING PATTERN (%)
Dec-21 Jan-22*
Promoters 45.43 47.34
FIs & Local MFs 18.61 17.7
FPIs 31.60 30.63
Public & Others 4.36 4.33
Pledged Shares - -
Source: BSE *PHCPL, earlier a subsidiary has been merged
within PML and as a result the shareholding
pattern has been revised on January 13, 2022.
Pledged shares as % of total shares
Parikshit D Kandpal, CFA
+91-22-6171-7317
Manoj Rawat
+91-22-6171-7355
Nikhil Kanodia
+91-22-6171-7335
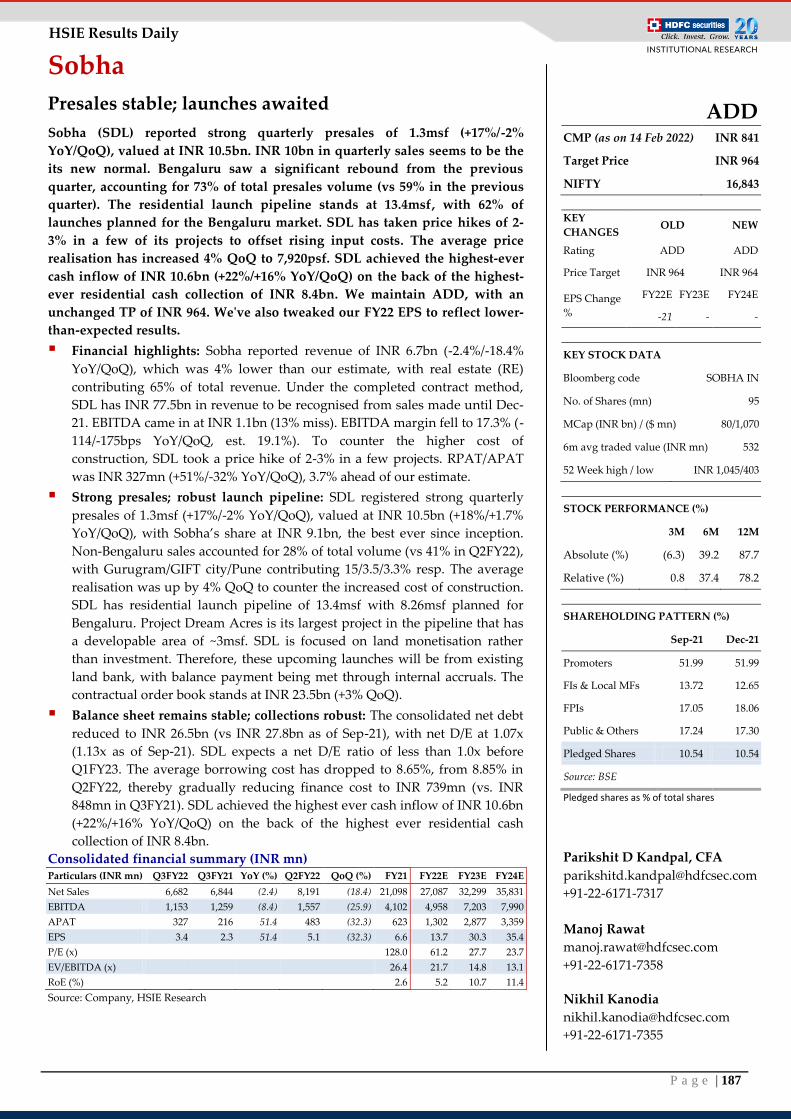
P a g e | 187
HSIE Results Daily
Sobha
Presales stable; launches awaited
Sobha (SDL) reported strong quarterly presales of 1.3msf (+17%/-2%
YoY/QoQ), valued at INR 10.5bn. INR 10bn in quarterly sales seems to be the
its new normal. Bengaluru saw a significant rebound from the previous
quarter, accounting for 73% of total presales volume (vs 59% in the previous
quarter). The residential launch pipeline stands at 13.4msf, with 62% of
launches planned for the Bengaluru market. SDL has taken price hikes of 2-
3% in a few of its projects to offset rising input costs. The average price
realisation has increased 4% QoQ to 7,920psf. SDL achieved the highest-ever
cash inflow of INR 10.6bn (+22%/+16% YoY/QoQ) on the back of the highest-
ever residential cash collection of INR 8.4bn. We maintain ADD, with an
unchanged TP of INR 964. We've also tweaked our FY22 EPS to reflect lower-
than-expected results.
Financial highlights: Sobha reported revenue of INR 6.7bn (-2.4%/-18.4%
YoY/QoQ), which was 4% lower than our estimate, with real estate (RE)
contributing 65% of total revenue. Under the completed contract method,
SDL has INR 77.5bn in revenue to be recognised from sales made until Dec-
21. EBITDA came in at INR 1.1bn (13% miss). EBITDA margin fell to 17.3% (-
114/-175bps YoY/QoQ, est. 19.1%). To counter the higher cost of
construction, SDL took a price hike of 2-3% in a few projects. RPAT/APAT
was INR 327mn (+51%/-32% YoY/QoQ), 3.7% ahead of our estimate.
Strong presales; robust launch pipeline: SDL registered strong quarterly
presales of 1.3msf (+17%/-2% YoY/QoQ), valued at INR 10.5bn (+18%/+1.7%
YoY/QoQ), with Sobha’s share at INR 9.1bn, the best ever since inception.
Non-Bengaluru sales accounted for 28% of total volume (vs 41% in Q2FY22),
with Gurugram/GIFT city/Pune contributing 15/3.5/3.3% resp. The average
realisation was up by 4% QoQ to counter the increased cost of construction.
SDL has residential launch pipeline of 13.4msf with 8.26msf planned for
Bengaluru. Project Dream Acres is its largest project in the pipeline that has
a developable area of ~3msf. SDL is focused on land monetisation rather
than investment. Therefore, these upcoming launches will be from existing
land bank, with balance payment being met through internal accruals. The
contractual order book stands at INR 23.5bn (+3% QoQ).
Balance sheet remains stable; collections robust: The consolidated net debt
reduced to INR 26.5bn (vs INR 27.8bn as of Sep-21), with net D/E at 1.07x
(1.13x as of Sep-21). SDL expects a net D/E ratio of less than 1.0x before
Q1FY23. The average borrowing cost has dropped to 8.65%, from 8.85% in
Q2FY22, thereby gradually reducing finance cost to INR 739mn (vs. INR
848mn in Q3FY21). SDL achieved the highest ever cash inflow of INR 10.6bn
(+22%/+16% YoY/QoQ) on the back of the highest ever residential cash
collection of INR 8.4bn.
Consolidated financial summary (INR mn) Particulars (INR mn) Q3FY22 Q3FY21 YoY (%) Q2FY22 QoQ (%) FY21 FY22E FY23E FY24E
Net Sales 6,682 6,844 (2.4) 8,191 (18.4) 21,098 27,087 32,299 35,831
EBITDA 1,153 1,259 (8.4) 1,557 (25.9) 4,102 4,958 7,203 7,990
APAT 327 216 51.4 483 (32.3) 623 1,302 2,877 3,359
EPS 3.4 2.3 51.4 5.1 (32.3) 6.6 13.7 30.3 35.4
P/E (x)
128.0 61.2 27.7 23.7
EV/EBITDA (x)
26.4 21.7 14.8 13.1
RoE (%)
2.6 5.2 10.7 11.4
Source: Company, HSIE Research
ADD CMP (as on 14 Feb 2022) INR 841
Target Price INR 964
NIFTY 16,843
KEY
CHANGES OLD NEW
Rating ADD ADD
Price Target INR 964 INR 964
EPS Change
%
FY22E FY23E FY24E
-21 - -
KEY STOCK DATA
Bloomberg code SOBHA IN
No. of Shares (mn) 95
MCap (INR bn) / ($ mn) 80/1,070
6m avg traded value (INR mn) 532
52 Week high / low INR 1,045/403
STOCK PERFORMANCE (%)
3M 6M 12M
Absolute (%) (6.3) 39.2 87.7
Relative (%) 0.8 37.4 78.2
SHAREHOLDING PATTERN (%)
Sep-21 Dec-21
Promoters 51.99 51.99
FIs & Local MFs 13.72 12.65
FPIs 17.05 18.06
Public & Others 17.24 17.30
Pledged Shares 10.54 10.54
Source: BSE
Pledged shares as % of total shares
Parikshit D Kandpal, CFA
+91-22-6171-7317
Manoj Rawat
+91-22-6171-7358
Nikhil Kanodia
+91-22-6171-7355
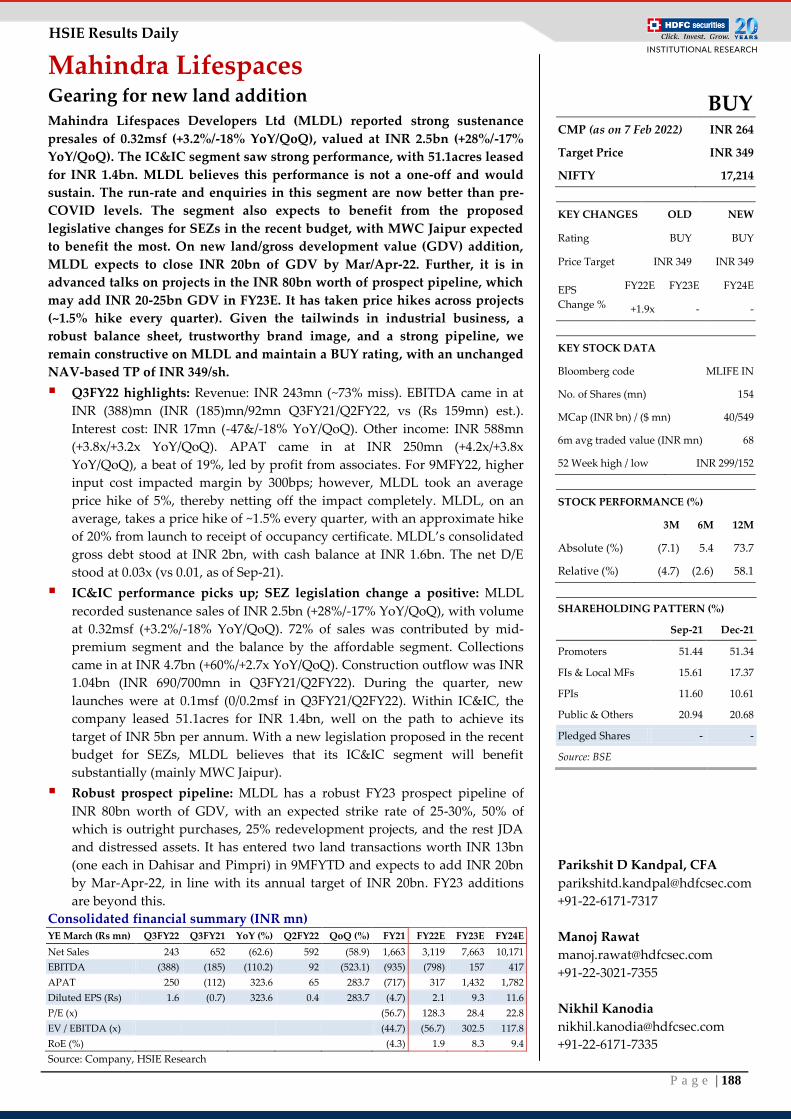
P a g e | 188
HSIE Results Daily
Mahindra Lifespaces Gearing for new land addition Mahindra Lifespaces Developers Ltd (MLDL) reported strong sustenance
presales of 0.32msf (+3.2%/-18% YoY/QoQ), valued at INR 2.5bn (+28%/-17%
YoY/QoQ). The IC&IC segment saw strong performance, with 51.1acres leased
for INR 1.4bn. MLDL believes this performance is not a one-off and would
sustain. The run-rate and enquiries in this segment are now better than pre-
COVID levels. The segment also expects to benefit from the proposed
legislative changes for SEZs in the recent budget, with MWC Jaipur expected
to benefit the most. On new land/gross development value (GDV) addition,
MLDL expects to close INR 20bn of GDV by Mar/Apr-22. Further, it is in
advanced talks on projects in the INR 80bn worth of prospect pipeline, which
may add INR 20-25bn GDV in FY23E. It has taken price hikes across projects
(~1.5% hike every quarter). Given the tailwinds in industrial business, a
robust balance sheet, trustworthy brand image, and a strong pipeline, we
remain constructive on MLDL and maintain a BUY rating, with an unchanged
NAV-based TP of INR 349/sh.
Q3FY22 highlights: Revenue: INR 243mn (~73% miss). EBITDA came in at
INR (388)mn (INR (185)mn/92mn Q3FY21/Q2FY22, vs (Rs 159mn) est.).
Interest cost: INR 17mn (-47&/-18% YoY/QoQ). Other income: INR 588mn
(+3.8x/+3.2x YoY/QoQ). APAT came in at INR 250mn (+4.2x/+3.8x
YoY/QoQ), a beat of 19%, led by profit from associates. For 9MFY22, higher
input cost impacted margin by 300bps; however, MLDL took an average
price hike of 5%, thereby netting off the impact completely. MLDL, on an
average, takes a price hike of ~1.5% every quarter, with an approximate hike
of 20% from launch to receipt of occupancy certificate. MLDL’s consolidated
gross debt stood at INR 2bn, with cash balance at INR 1.6bn. The net D/E
stood at 0.03x (vs 0.01, as of Sep-21).
IC&IC performance picks up; SEZ legislation change a positive: MLDL
recorded sustenance sales of INR 2.5bn (+28%/-17% YoY/QoQ), with volume
at 0.32msf (+3.2%/-18% YoY/QoQ). 72% of sales was contributed by mid-
premium segment and the balance by the affordable segment. Collections
came in at INR 4.7bn (+60%/+2.7x YoY/QoQ). Construction outflow was INR
1.04bn (INR 690/700mn in Q3FY21/Q2FY22). During the quarter, new
launches were at 0.1msf (0/0.2msf in Q3FY21/Q2FY22). Within IC&IC, the
company leased 51.1acres for INR 1.4bn, well on the path to achieve its
target of INR 5bn per annum. With a new legislation proposed in the recent
budget for SEZs, MLDL believes that its IC&IC segment will benefit
substantially (mainly MWC Jaipur).
Robust prospect pipeline: MLDL has a robust FY23 prospect pipeline of
INR 80bn worth of GDV, with an expected strike rate of 25-30%, 50% of
which is outright purchases, 25% redevelopment projects, and the rest JDA
and distressed assets. It has entered two land transactions worth INR 13bn
(one each in Dahisar and Pimpri) in 9MFYTD and expects to add INR 20bn
by Mar-Apr-22, in line with its annual target of INR 20bn. FY23 additions
are beyond this.
Consolidated financial summary (INR mn) YE March (Rs mn) Q3FY22 Q3FY21 YoY (%) Q2FY22 QoQ (%) FY21 FY22E FY23E FY24E
Net Sales 243 652 (62.6) 592 (58.9) 1,663 3,119 7,663 10,171
EBITDA (388) (185) (110.2) 92 (523.1) (935) (798) 157 417
APAT 250 (112) 323.6 65 283.7 (717) 317 1,432 1,782
Diluted EPS (Rs) 1.6 (0.7) 323.6 0.4 283.7 (4.7) 2.1 9.3 11.6
P/E (x)
(56.7) 128.3 28.4 22.8
EV / EBITDA (x)
(44.7) (56.7) 302.5 117.8
RoE (%)
(4.3) 1.9 8.3 9.4
Source: Company, HSIE Research
BUY CMP (as on 7 Feb 2022) INR 264
Target Price INR 349
NIFTY 17,214
KEY CHANGES OLD NEW
Rating BUY BUY
Price Target INR 349 INR 349
EPS
Change %
FY22E FY23E FY24E
+1.9x - -
KEY STOCK DATA
Bloomberg code MLIFE IN
No. of Shares (mn) 154
MCap (INR bn) / ($ mn) 40/549
6m avg traded value (INR mn) 68
52 Week high / low INR 299/152
STOCK PERFORMANCE (%)
3M 6M 12M
Absolute (%) (7.1) 5.4 73.7
Relative (%) (4.7) (2.6) 58.1
SHAREHOLDING PATTERN (%)
Sep-21 Dec-21
Promoters 51.44 51.34
FIs & Local MFs 15.61 17.37
FPIs 11.60 10.61
Public & Others 20.94 20.68
Pledged Shares - -
Source: BSE
Parikshit D Kandpal, CFA
+91-22-6171-7317
Manoj Rawat
+91-22-3021-7355
Nikhil Kanodia
+91-22-6171-7335
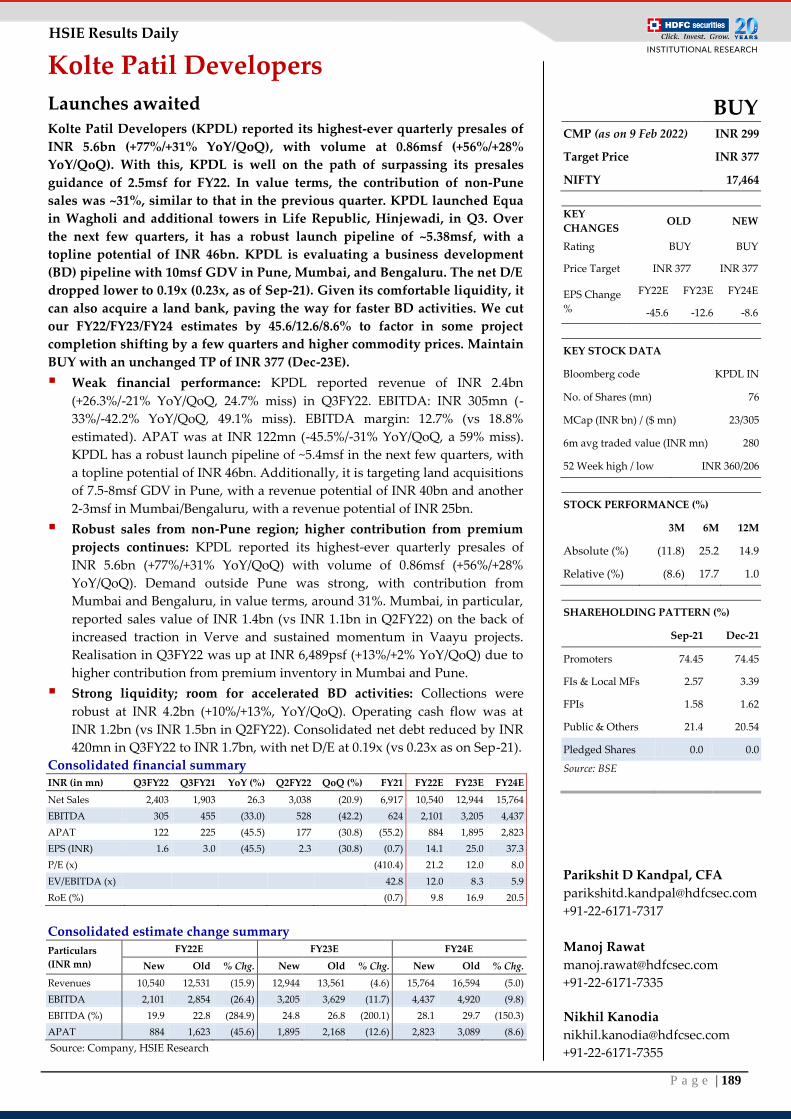
P a g e | 189
HSIE Results Daily
Kolte Patil Developers
Launches awaited Kolte Patil Developers (KPDL) reported its highest-ever quarterly presales of
INR 5.6bn (+77%/+31% YoY/QoQ), with volume at 0.86msf (+56%/+28%
YoY/QoQ). With this, KPDL is well on the path of surpassing its presales
guidance of 2.5msf for FY22. In value terms, the contribution of non-Pune
sales was ~31%, similar to that in the previous quarter. KPDL launched Equa
in Wagholi and additional towers in Life Republic, Hinjewadi, in Q3. Over
the next few quarters, it has a robust launch pipeline of ~5.38msf, with a
topline potential of INR 46bn. KPDL is evaluating a business development
(BD) pipeline with 10msf GDV in Pune, Mumbai, and Bengaluru. The net D/E
dropped lower to 0.19x (0.23x, as of Sep-21). Given its comfortable liquidity, it
can also acquire a land bank, paving the way for faster BD activities. We cut
our FY22/FY23/FY24 estimates by 45.6/12.6/8.6% to factor in some project
completion shifting by a few quarters and higher commodity prices. Maintain
BUY with an unchanged TP of INR 377 (Dec-23E).
Weak financial performance: KPDL reported revenue of INR 2.4bn
(+26.3%/-21% YoY/QoQ, 24.7% miss) in Q3FY22. EBITDA: INR 305mn (-
33%/-42.2% YoY/QoQ, 49.1% miss). EBITDA margin: 12.7% (vs 18.8%
estimated). APAT was at INR 122mn (-45.5%/-31% YoY/QoQ, a 59% miss).
KPDL has a robust launch pipeline of ~5.4msf in the next few quarters, with
a topline potential of INR 46bn. Additionally, it is targeting land acquisitions
of 7.5-8msf GDV in Pune, with a revenue potential of INR 40bn and another
2-3msf in Mumbai/Bengaluru, with a revenue potential of INR 25bn.
Robust sales from non-Pune region; higher contribution from premium
projects continues: KPDL reported its highest-ever quarterly presales of
INR 5.6bn (+77%/+31% YoY/QoQ) with volume of 0.86msf (+56%/+28%
YoY/QoQ). Demand outside Pune was strong, with contribution from
Mumbai and Bengaluru, in value terms, around 31%. Mumbai, in particular,
reported sales value of INR 1.4bn (vs INR 1.1bn in Q2FY22) on the back of
increased traction in Verve and sustained momentum in Vaayu projects.
Realisation in Q3FY22 was up at INR 6,489psf (+13%/+2% YoY/QoQ) due to
higher contribution from premium inventory in Mumbai and Pune.
Strong liquidity; room for accelerated BD activities: Collections were
robust at INR 4.2bn (+10%/+13%, YoY/QoQ). Operating cash flow was at
INR 1.2bn (vs INR 1.5bn in Q2FY22). Consolidated net debt reduced by INR
420mn in Q3FY22 to INR 1.7bn, with net D/E at 0.19x (vs 0.23x as on Sep-21).
Consolidated financial summary INR (in mn) Q3FY22 Q3FY21 YoY (%) Q2FY22 QoQ (%) FY21 FY22E FY23E FY24E
Net Sales 2,403 1,903 26.3 3,038 (20.9) 6,917 10,540 12,944 15,764
EBITDA 305 455 (33.0) 528 (42.2) 624 2,101 3,205 4,437
APAT 122 225 (45.5) 177 (30.8) (55.2) 884 1,895 2,823
EPS (INR) 1.6 3.0 (45.5) 2.3 (30.8) (0.7) 14.1 25.0 37.3
P/E (x)
(410.4) 21.2 12.0 8.0
EV/EBITDA (x)
42.8 12.0 8.3 5.9
RoE (%)
(0.7) 9.8 16.9 20.5
Consolidated estimate change summary
Particulars
(INR mn)
FY22E FY23E FY24E
New Old % Chg. New Old % Chg. New Old % Chg.
Revenues 10,540 12,531 (15.9) 12,944 13,561 (4.6) 15,764 16,594 (5.0)
EBITDA 2,101 2,854 (26.4) 3,205 3,629 (11.7) 4,437 4,920 (9.8)
EBITDA (%) 19.9 22.8 (284.9) 24.8 26.8 (200.1) 28.1 29.7 (150.3)
APAT 884 1,623 (45.6) 1,895 2,168 (12.6) 2,823 3,089 (8.6)
Source: Company, HSIE Research
BUY CMP (as on 9 Feb 2022) INR 299
Target Price INR 377
NIFTY 17,464
KEY
CHANGES OLD NEW
Rating BUY BUY
Price Target INR 377 INR 377
EPS Change
%
FY22E FY23E FY24E
-45.6 -12.6 -8.6
KEY STOCK DATA
Bloomberg code KPDL IN
No. of Shares (mn) 76
MCap (INR bn) / ($ mn) 23/305
6m avg traded value (INR mn) 280
52 Week high / low INR 360/206
STOCK PERFORMANCE (%)
3M 6M 12M
Absolute (%) (11.8) 25.2 14.9
Relative (%) (8.6) 17.7 1.0
SHAREHOLDING PATTERN (%)
Sep-21 Dec-21
Promoters 74.45 74.45
FIs & Local MFs 2.57 3.39
FPIs 1.58 1.62
Public & Others 21.4 20.54
Pledged Shares 0.0 0.0
Source: BSE
Parikshit D Kandpal, CFA
+91-22-6171-7317
Manoj Rawat
+91-22-6171-7335
Nikhil Kanodia
+91-22-6171-7355
P a g e | 190
HSIE Results Daily
Utilities
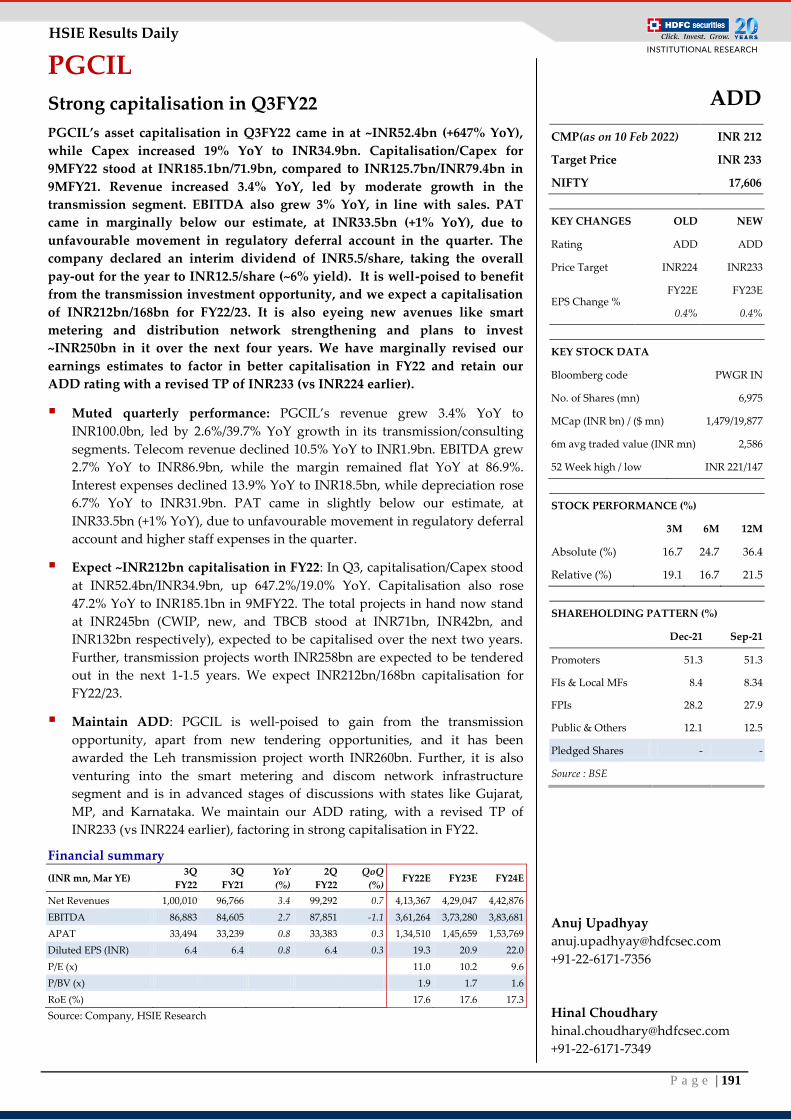
P a g e | 191
HSIE Results Daily
PGCIL
Strong capitalisation in Q3FY22
PGCIL’s asset capitalisation in Q3FY22 came in at ~INR52.4bn (+647% YoY),
while Capex increased 19% YoY to INR34.9bn. Capitalisation/Capex for
9MFY22 stood at INR185.1bn/71.9bn, compared to INR125.7bn/INR79.4bn in
9MFY21. Revenue increased 3.4% YoY, led by moderate growth in the
transmission segment. EBITDA also grew 3% YoY, in line with sales. PAT
came in marginally below our estimate, at INR33.5bn (+1% YoY), due to
unfavourable movement in regulatory deferral account in the quarter. The
company declared an interim dividend of INR5.5/share, taking the overall
pay-out for the year to INR12.5/share (~6% yield). It is well-poised to benefit
from the transmission investment opportunity, and we expect a capitalisation
of INR212bn/168bn for FY22/23. It is also eyeing new avenues like smart
metering and distribution network strengthening and plans to invest
~INR250bn in it over the next four years. We have marginally revised our
earnings estimates to factor in better capitalisation in FY22 and retain our
ADD rating with a revised TP of INR233 (vs INR224 earlier).
Muted quarterly performance: PGCIL’s revenue grew 3.4% YoY to
INR100.0bn, led by 2.6%/39.7% YoY growth in its transmission/consulting
segments. Telecom revenue declined 10.5% YoY to INR1.9bn. EBITDA grew
2.7% YoY to INR86.9bn, while the margin remained flat YoY at 86.9%.
Interest expenses declined 13.9% YoY to INR18.5bn, while depreciation rose
6.7% YoY to INR31.9bn. PAT came in slightly below our estimate, at
INR33.5bn (+1% YoY), due to unfavourable movement in regulatory deferral
account and higher staff expenses in the quarter.
Expect ~INR212bn capitalisation in FY22: In Q3, capitalisation/Capex stood
at INR52.4bn/INR34.9bn, up 647.2%/19.0% YoY. Capitalisation also rose
47.2% YoY to INR185.1bn in 9MFY22. The total projects in hand now stand
at INR245bn (CWIP, new, and TBCB stood at INR71bn, INR42bn, and
INR132bn respectively), expected to be capitalised over the next two years.
Further, transmission projects worth INR258bn are expected to be tendered
out in the next 1-1.5 years. We expect INR212bn/168bn capitalisation for
FY22/23.
Maintain ADD: PGCIL is well-poised to gain from the transmission
opportunity, apart from new tendering opportunities, and it has been
awarded the Leh transmission project worth INR260bn. Further, it is also
venturing into the smart metering and discom network infrastructure
segment and is in advanced stages of discussions with states like Gujarat,
MP, and Karnataka. We maintain our ADD rating, with a revised TP of
INR233 (vs INR224 earlier), factoring in strong capitalisation in FY22.
Financial summary
(INR mn, Mar YE) 3Q
FY22
3Q
FY21
YoY
(%)
2Q
FY22
QoQ
(%) FY22E FY23E FY24E
Net Revenues 1,00,010 96,766 3.4 99,292 0.7 4,13,367 4,29,047 4,42,876
EBITDA 86,883 84,605 2.7 87,851 -1.1 3,61,264 3,73,280 3,83,681
APAT 33,494 33,239 0.8 33,383 0.3 1,34,510 1,45,659 1,53,769
Diluted EPS (INR) 6.4 6.4 0.8 6.4 0.3 19.3 20.9 22.0
P/E (x)
11.0 10.2 9.6
P/BV (x) 1.9 1.7 1.6
RoE (%) 17.6 17.6 17.3
Source: Company, HSIE Research
ADD
CMP(as on 10 Feb 2022) INR 212
Target Price INR 233
NIFTY 17,606
KEY CHANGES OLD NEW
Rating ADD ADD
Price Target INR224 INR233
EPS Change % FY22E FY23E
0.4% 0.4%
KEY STOCK DATA
Bloomberg code PWGR IN
No. of Shares (mn) 6,975
MCap (INR bn) / ($ mn) 1,479/19,877
6m avg traded value (INR mn) 2,586
52 Week high / low INR 221/147
STOCK PERFORMANCE (%)
3M 6M 12M
Absolute (%) 16.7 24.7 36.4
Relative (%) 19.1 16.7 21.5
SHAREHOLDING PATTERN (%)
Dec-21 Sep-21
Promoters 51.3 51.3
FIs & Local MFs 8.4 8.34
FPIs 28.2 27.9
Public & Others 12.1 12.5
Pledged Shares - -
Source : BSE
Anuj Upadhyay
+91-22-6171-7356
Hinal Choudhary
+91-22-6171-7349
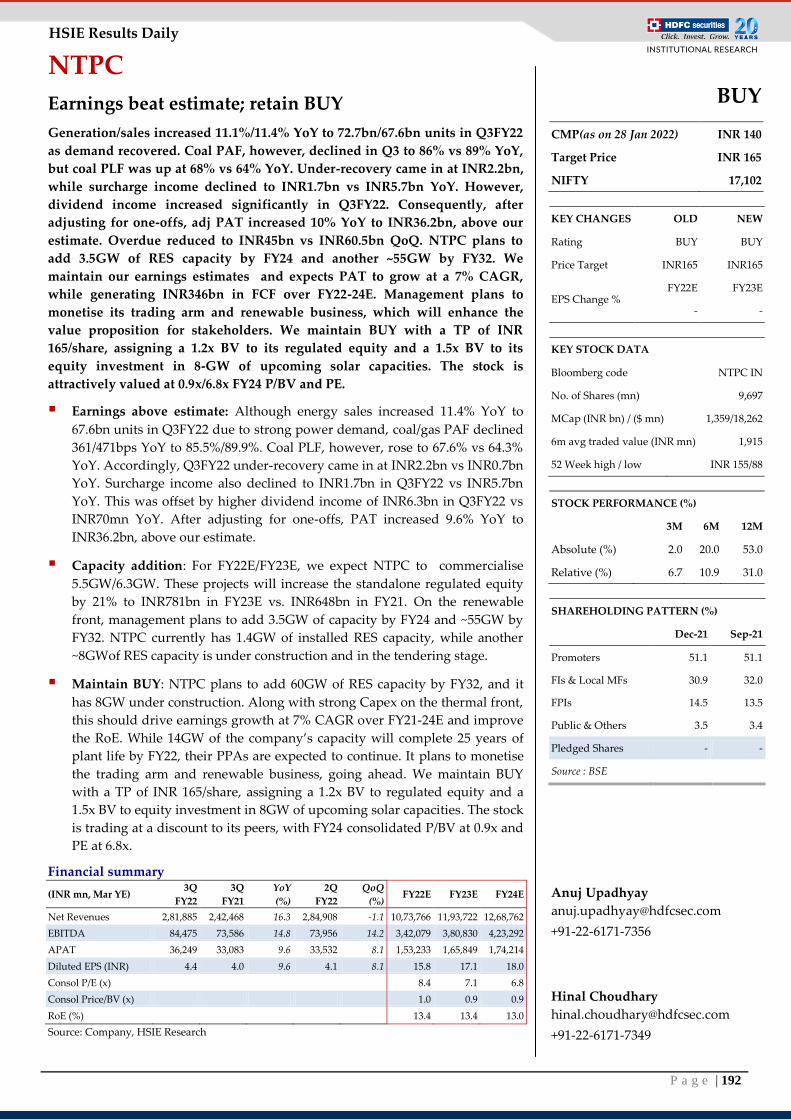
P a g e | 192
HSIE Results Daily
NTPC
Earnings beat estimate; retain BUY
Generation/sales increased 11.1%/11.4% YoY to 72.7bn/67.6bn units in Q3FY22
as demand recovered. Coal PAF, however, declined in Q3 to 86% vs 89% YoY,
but coal PLF was up at 68% vs 64% YoY. Under-recovery came in at INR2.2bn,
while surcharge income declined to INR1.7bn vs INR5.7bn YoY. However,
dividend income increased significantly in Q3FY22. Consequently, after
adjusting for one-offs, adj PAT increased 10% YoY to INR36.2bn, above our
estimate. Overdue reduced to INR45bn vs INR60.5bn QoQ. NTPC plans to
add 3.5GW of RES capacity by FY24 and another ~55GW by FY32. We
maintain our earnings estimates and expects PAT to grow at a 7% CAGR,
while generating INR346bn in FCF over FY22-24E. Management plans to
monetise its trading arm and renewable business, which will enhance the
value proposition for stakeholders. We maintain BUY with a TP of INR
165/share, assigning a 1.2x BV to its regulated equity and a 1.5x BV to its
equity investment in 8-GW of upcoming solar capacities. The stock is
attractively valued at 0.9x/6.8x FY24 P/BV and PE.
Earnings above estimate: Although energy sales increased 11.4% YoY to
67.6bn units in Q3FY22 due to strong power demand, coal/gas PAF declined
361/471bps YoY to 85.5%/89.9%. Coal PLF, however, rose to 67.6% vs 64.3%
YoY. Accordingly, Q3FY22 under-recovery came in at INR2.2bn vs INR0.7bn
YoY. Surcharge income also declined to INR1.7bn in Q3FY22 vs INR5.7bn
YoY. This was offset by higher dividend income of INR6.3bn in Q3FY22 vs
INR70mn YoY. After adjusting for one-offs, PAT increased 9.6% YoY to
INR36.2bn, above our estimate.
Capacity addition: For FY22E/FY23E, we expect NTPC to commercialise
5.5GW/6.3GW. These projects will increase the standalone regulated equity
by 21% to INR781bn in FY23E vs. INR648bn in FY21. On the renewable
front, management plans to add 3.5GW of capacity by FY24 and ~55GW by
FY32. NTPC currently has 1.4GW of installed RES capacity, while another
~8GWof RES capacity is under construction and in the tendering stage.
Maintain BUY: NTPC plans to add 60GW of RES capacity by FY32, and it
has 8GW under construction. Along with strong Capex on the thermal front,
this should drive earnings growth at 7% CAGR over FY21-24E and improve
the RoE. While 14GW of the company’s capacity will complete 25 years of
plant life by FY22, their PPAs are expected to continue. It plans to monetise
the trading arm and renewable business, going ahead. We maintain BUY
with a TP of INR 165/share, assigning a 1.2x BV to regulated equity and a
1.5x BV to equity investment in 8GW of upcoming solar capacities. The stock
is trading at a discount to its peers, with FY24 consolidated P/BV at 0.9x and
PE at 6.8x.
Financial summary
(INR mn, Mar YE) 3Q
FY22
3Q
FY21
YoY
(%)
2Q
FY22
QoQ
(%) FY22E FY23E FY24E
Net Revenues 2,81,885 2,42,468 16.3 2,84,908 -1.1 10,73,766 11,93,722 12,68,762
EBITDA 84,475 73,586 14.8 73,956 14.2 3,42,079 3,80,830 4,23,292
APAT 36,249 33,083 9.6 33,532 8.1 1,53,233 1,65,849 1,74,214
Diluted EPS (INR) 4.4 4.0 9.6 4.1 8.1 15.8 17.1 18.0
Consol P/E (x)
8.4 7.1 6.8
Consol Price/BV (x) 1.0 0.9 0.9
RoE (%) 13.4 13.4 13.0
Source: Company, HSIE Research
BUY
CMP(as on 28 Jan 2022) INR 140
Target Price INR 165
NIFTY 17,102
KEY CHANGES OLD NEW
Rating BUY BUY
Price Target INR165 INR165
EPS Change % FY22E FY23E
- -
KEY STOCK DATA
Bloomberg code NTPC IN
No. of Shares (mn) 9,697
MCap (INR bn) / ($ mn) 1,359/18,262
6m avg traded value (INR mn) 1,915
52 Week high / low INR 155/88
STOCK PERFORMANCE (%)
3M 6M 12M
Absolute (%) 2.0 20.0 53.0
Relative (%) 6.7 10.9 31.0
SHAREHOLDING PATTERN (%)
Dec-21 Sep-21
Promoters 51.1 51.1
FIs & Local MFs 30.9 32.0
FPIs 14.5 13.5
Public & Others 3.5 3.4
Pledged Shares - -
Source : BSE
Anuj Upadhyay
+91-22-6171-7356
Hinal Choudhary
+91-22-6171-7349
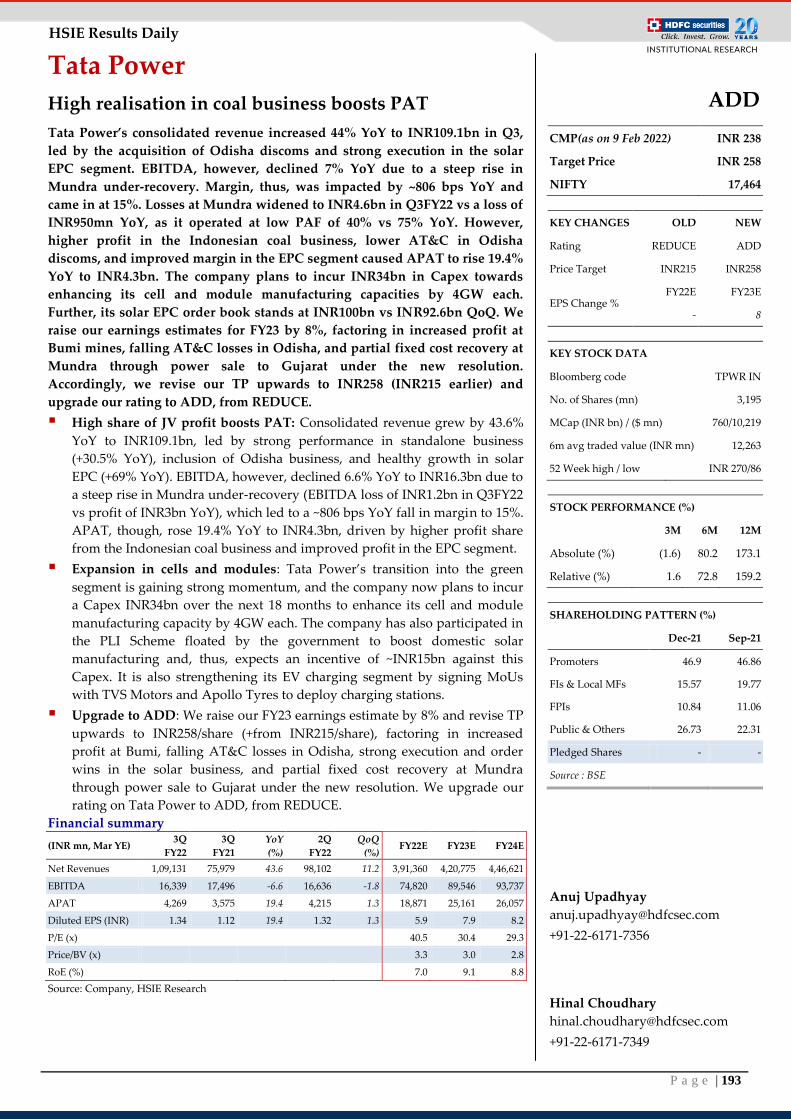
P a g e | 193
HSIE Results Daily
Tata Power
High realisation in coal business boosts PAT
Tata Power’s consolidated revenue increased 44% YoY to INR109.1bn in Q3,
led by the acquisition of Odisha discoms and strong execution in the solar
EPC segment. EBITDA, however, declined 7% YoY due to a steep rise in
Mundra under-recovery. Margin, thus, was impacted by ~806 bps YoY and
came in at 15%. Losses at Mundra widened to INR4.6bn in Q3FY22 vs a loss of
INR950mn YoY, as it operated at low PAF of 40% vs 75% YoY. However,
higher profit in the Indonesian coal business, lower AT&C in Odisha
discoms, and improved margin in the EPC segment caused APAT to rise 19.4%
YoY to INR4.3bn. The company plans to incur INR34bn in Capex towards
enhancing its cell and module manufacturing capacities by 4GW each.
Further, its solar EPC order book stands at INR100bn vs INR92.6bn QoQ. We
raise our earnings estimates for FY23 by 8%, factoring in increased profit at
Bumi mines, falling AT&C losses in Odisha, and partial fixed cost recovery at
Mundra through power sale to Gujarat under the new resolution.
Accordingly, we revise our TP upwards to INR258 (INR215 earlier) and
upgrade our rating to ADD, from REDUCE.
High share of JV profit boosts PAT: Consolidated revenue grew by 43.6%
YoY to INR109.1bn, led by strong performance in standalone business
(+30.5% YoY), inclusion of Odisha business, and healthy growth in solar
EPC (+69% YoY). EBITDA, however, declined 6.6% YoY to INR16.3bn due to
a steep rise in Mundra under-recovery (EBITDA loss of INR1.2bn in Q3FY22
vs profit of INR3bn YoY), which led to a ~806 bps YoY fall in margin to 15%.
APAT, though, rose 19.4% YoY to INR4.3bn, driven by higher profit share
from the Indonesian coal business and improved profit in the EPC segment.
Expansion in cells and modules: Tata Power’s transition into the green
segment is gaining strong momentum, and the company now plans to incur
a Capex INR34bn over the next 18 months to enhance its cell and module
manufacturing capacity by 4GW each. The company has also participated in
the PLI Scheme floated by the government to boost domestic solar
manufacturing and, thus, expects an incentive of ~INR15bn against this
Capex. It is also strengthening its EV charging segment by signing MoUs
with TVS Motors and Apollo Tyres to deploy charging stations.
Upgrade to ADD: We raise our FY23 earnings estimate by 8% and revise TP
upwards to INR258/share (+from INR215/share), factoring in increased
profit at Bumi, falling AT&C losses in Odisha, strong execution and order
wins in the solar business, and partial fixed cost recovery at Mundra
through power sale to Gujarat under the new resolution. We upgrade our
rating on Tata Power to ADD, from REDUCE.
Financial summary
(INR mn, Mar YE) 3Q
FY22
3Q
FY21
YoY
(%)
2Q
FY22
QoQ
(%) FY22E FY23E FY24E
Net Revenues 1,09,131 75,979 43.6 98,102 11.2 3,91,360 4,20,775 4,46,621
EBITDA 16,339 17,496 -6.6 16,636 -1.8 74,820 89,546 93,737
APAT 4,269 3,575 19.4 4,215 1.3 18,871 25,161 26,057
Diluted EPS (INR) 1.34 1.12 19.4 1.32 1.3 5.9 7.9 8.2
P/E (x)
40.5 30.4 29.3
Price/BV (x)
3.3 3.0 2.8
RoE (%)
7.0 9.1 8.8
Source: Company, HSIE Research
ADD
CMP(as on 9 Feb 2022) INR 238
Target Price INR 258
NIFTY 17,464
KEY CHANGES OLD NEW
Rating REDUCE ADD
Price Target INR215 INR258
EPS Change % FY22E FY23E
- 8
KEY STOCK DATA
Bloomberg code TPWR IN
No. of Shares (mn) 3,195
MCap (INR bn) / ($ mn) 760/10,219
6m avg traded value (INR mn) 12,263
52 Week high / low INR 270/86
STOCK PERFORMANCE (%)
3M 6M 12M
Absolute (%) (1.6) 80.2 173.1
Relative (%) 1.6 72.8 159.2
SHAREHOLDING PATTERN (%)
Dec-21 Sep-21
Promoters 46.9 46.86
FIs & Local MFs 15.57 19.77
FPIs 10.84 11.06
Public & Others 26.73 22.31
Pledged Shares - -
Source : BSE
Anuj Upadhyay
+91-22-6171-7356
Hinal Choudhary
+91-22-6171-7349
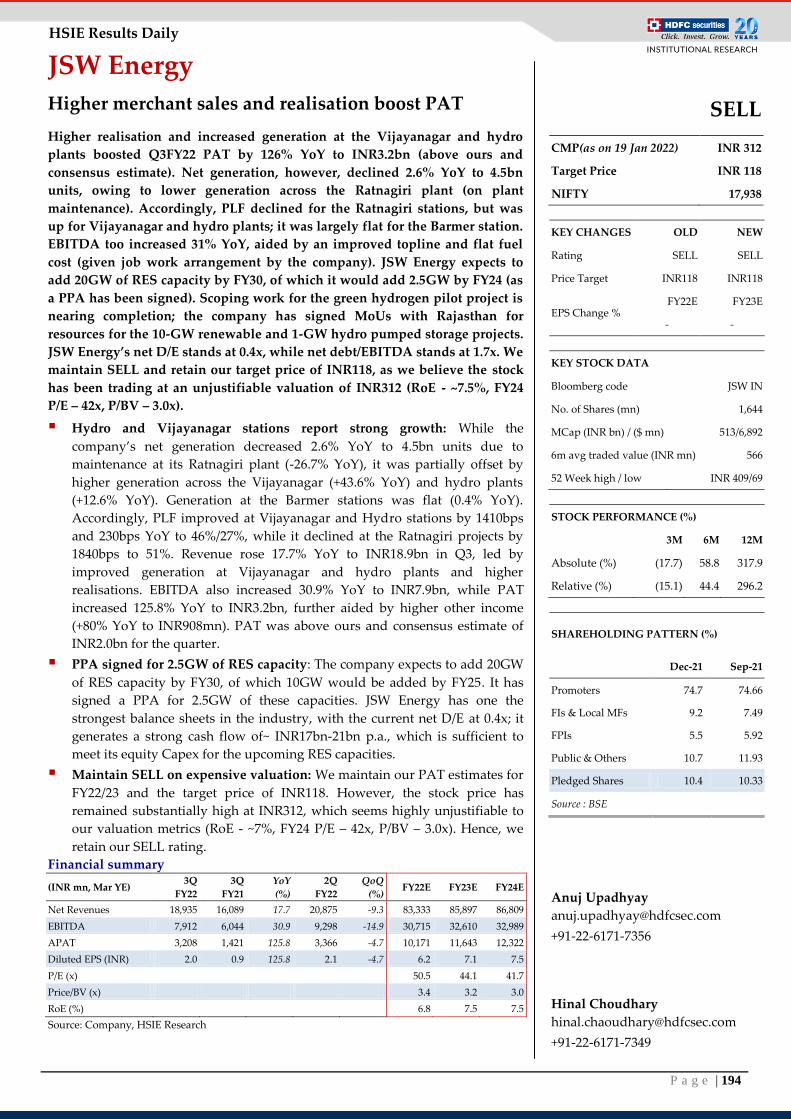
P a g e | 194
HSIE Results Daily
JSW Energy
Higher merchant sales and realisation boost PAT
Higher realisation and increased generation at the Vijayanagar and hydro
plants boosted Q3FY22 PAT by 126% YoY to INR3.2bn (above ours and
consensus estimate). Net generation, however, declined 2.6% YoY to 4.5bn
units, owing to lower generation across the Ratnagiri plant (on plant
maintenance). Accordingly, PLF declined for the Ratnagiri stations, but was
up for Vijayanagar and hydro plants; it was largely flat for the Barmer station.
EBITDA too increased 31% YoY, aided by an improved topline and flat fuel
cost (given job work arrangement by the company). JSW Energy expects to
add 20GW of RES capacity by FY30, of which it would add 2.5GW by FY24 (as
a PPA has been signed). Scoping work for the green hydrogen pilot project is
nearing completion; the company has signed MoUs with Rajasthan for
resources for the 10-GW renewable and 1-GW hydro pumped storage projects.
JSW Energy’s net D/E stands at 0.4x, while net debt/EBITDA stands at 1.7x. We
maintain SELL and retain our target price of INR118, as we believe the stock
has been trading at an unjustifiable valuation of INR312 (RoE - ~7.5%, FY24
P/E – 42x, P/BV – 3.0x).
Hydro and Vijayanagar stations report strong growth: While the
company’s net generation decreased 2.6% YoY to 4.5bn units due to
maintenance at its Ratnagiri plant (-26.7% YoY), it was partially offset by
higher generation across the Vijayanagar (+43.6% YoY) and hydro plants
(+12.6% YoY). Generation at the Barmer stations was flat (0.4% YoY).
Accordingly, PLF improved at Vijayanagar and Hydro stations by 1410bps
and 230bps YoY to 46%/27%, while it declined at the Ratnagiri projects by
1840bps to 51%. Revenue rose 17.7% YoY to INR18.9bn in Q3, led by
improved generation at Vijayanagar and hydro plants and higher
realisations. EBITDA also increased 30.9% YoY to INR7.9bn, while PAT
increased 125.8% YoY to INR3.2bn, further aided by higher other income
(+80% YoY to INR908mn). PAT was above ours and consensus estimate of
INR2.0bn for the quarter.
PPA signed for 2.5GW of RES capacity: The company expects to add 20GW
of RES capacity by FY30, of which 10GW would be added by FY25. It has
signed a PPA for 2.5GW of these capacities. JSW Energy has one the
strongest balance sheets in the industry, with the current net D/E at 0.4x; it
generates a strong cash flow of~ INR17bn-21bn p.a., which is sufficient to
meet its equity Capex for the upcoming RES capacities.
Maintain SELL on expensive valuation: We maintain our PAT estimates for
FY22/23 and the target price of INR118. However, the stock price has
remained substantially high at INR312, which seems highly unjustifiable to
our valuation metrics (RoE - ~7%, FY24 P/E – 42x, P/BV – 3.0x). Hence, we
retain our SELL rating.
Financial summary
(INR mn, Mar YE) 3Q
FY22
3Q
FY21
YoY
(%)
2Q
FY22
QoQ
(%) FY22E FY23E FY24E
Net Revenues 18,935 16,089 17.7 20,875 -9.3 83,333 85,897 86,809
EBITDA 7,912 6,044 30.9 9,298 -14.9 30,715 32,610 32,989
APAT 3,208 1,421 125.8 3,366 -4.7 10,171 11,643 12,322
Diluted EPS (INR) 2.0 0.9 125.8 2.1 -4.7 6.2 7.1 7.5
P/E (x)
50.5 44.1 41.7
Price/BV (x) 3.4 3.2 3.0
RoE (%) 6.8 7.5 7.5
Source: Company, HSIE Research
SELL
CMP(as on 19 Jan 2022) INR 312
Target Price INR 118
NIFTY 17,938
KEY CHANGES OLD NEW
Rating SELL SELL
Price Target INR118 INR118
EPS Change % FY22E FY23E
- -
KEY STOCK DATA
Bloomberg code JSW IN
No. of Shares (mn) 1,644
MCap (INR bn) / ($ mn) 513/6,892
6m avg traded value (INR mn) 566
52 Week high / low INR 409/69
STOCK PERFORMANCE (%)
3M 6M 12M
Absolute (%) (17.7) 58.8 317.9
Relative (%) (15.1) 44.4 296.2
SHAREHOLDING PATTERN (%)
Dec-21 Sep-21
Promoters 74.7 74.66
FIs & Local MFs 9.2 7.49
FPIs 5.5 5.92
Public & Others 10.7 11.93
Pledged Shares 10.4 10.33
Source : BSE
Anuj Upadhyay
+91-22-6171-7356
Hinal Choudhary
+91-22-6171-7349
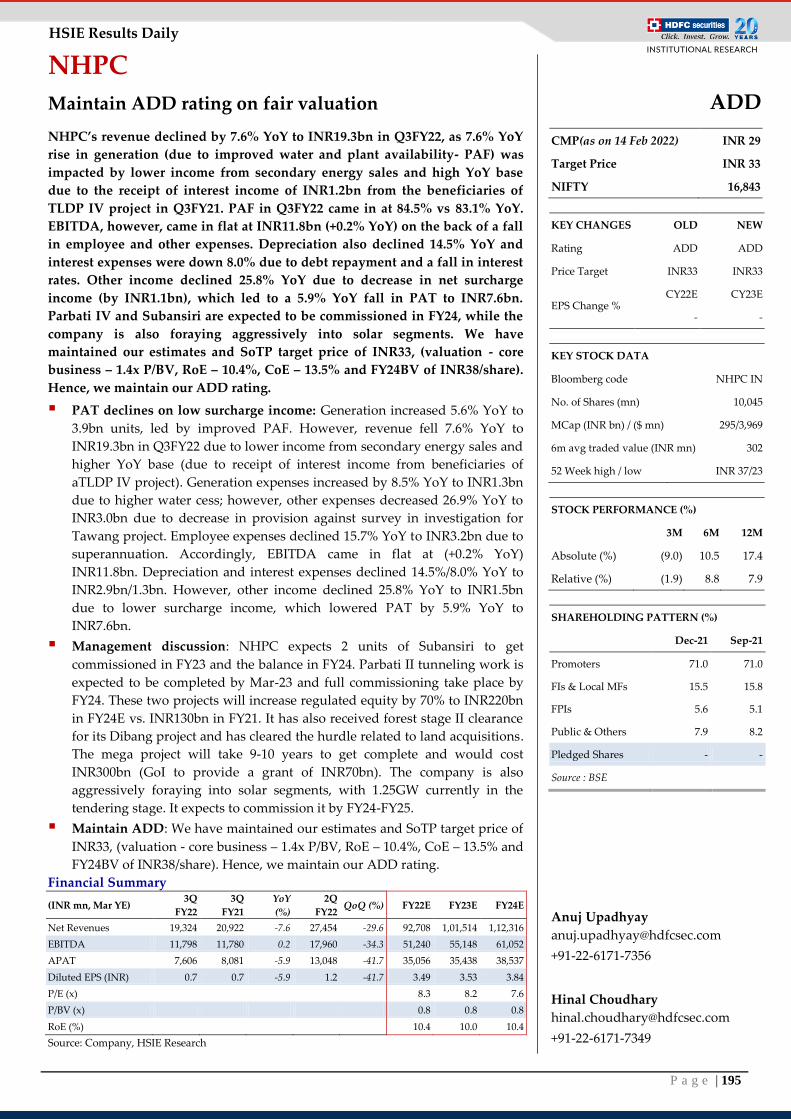
P a g e | 195
HSIE Results Daily
NHPC
Maintain ADD rating on fair valuation
NHPC’s revenue declined by 7.6% YoY to INR19.3bn in Q3FY22, as 7.6% YoY
rise in generation (due to improved water and plant availability- PAF) was
impacted by lower income from secondary energy sales and high YoY base
due to the receipt of interest income of INR1.2bn from the beneficiaries of
TLDP IV project in Q3FY21. PAF in Q3FY22 came in at 84.5% vs 83.1% YoY.
EBITDA, however, came in flat at INR11.8bn (+0.2% YoY) on the back of a fall
in employee and other expenses. Depreciation also declined 14.5% YoY and
interest expenses were down 8.0% due to debt repayment and a fall in interest
rates. Other income declined 25.8% YoY due to decrease in net surcharge
income (by INR1.1bn), which led to a 5.9% YoY fall in PAT to INR7.6bn.
Parbati IV and Subansiri are expected to be commissioned in FY24, while the
company is also foraying aggressively into solar segments. We have
maintained our estimates and SoTP target price of INR33, (valuation - core
business – 1.4x P/BV, RoE – 10.4%, CoE – 13.5% and FY24BV of INR38/share).
Hence, we maintain our ADD rating.
PAT declines on low surcharge income: Generation increased 5.6% YoY to
3.9bn units, led by improved PAF. However, revenue fell 7.6% YoY to
INR19.3bn in Q3FY22 due to lower income from secondary energy sales and
higher YoY base (due to receipt of interest income from beneficiaries of
aTLDP IV project). Generation expenses increased by 8.5% YoY to INR1.3bn
due to higher water cess; however, other expenses decreased 26.9% YoY to
INR3.0bn due to decrease in provision against survey in investigation for
Tawang project. Employee expenses declined 15.7% YoY to INR3.2bn due to
superannuation. Accordingly, EBITDA came in flat at (+0.2% YoY)
INR11.8bn. Depreciation and interest expenses declined 14.5%/8.0% YoY to
INR2.9bn/1.3bn. However, other income declined 25.8% YoY to INR1.5bn
due to lower surcharge income, which lowered PAT by 5.9% YoY to
INR7.6bn.
Management discussion: NHPC expects 2 units of Subansiri to get
commissioned in FY23 and the balance in FY24. Parbati II tunneling work is
expected to be completed by Mar-23 and full commissioning take place by
FY24. These two projects will increase regulated equity by 70% to INR220bn
in FY24E vs. INR130bn in FY21. It has also received forest stage II clearance
for its Dibang project and has cleared the hurdle related to land acquisitions.
The mega project will take 9-10 years to get complete and would cost
INR300bn (GoI to provide a grant of INR70bn). The company is also
aggressively foraying into solar segments, with 1.25GW currently in the
tendering stage. It expects to commission it by FY24-FY25.
Maintain ADD: We have maintained our estimates and SoTP target price of
INR33, (valuation - core business – 1.4x P/BV, RoE – 10.4%, CoE – 13.5% and
FY24BV of INR38/share). Hence, we maintain our ADD rating.
Financial Summary
(INR mn, Mar YE) 3Q
FY22
3Q
FY21
YoY
(%)
2Q
FY22 QoQ (%) FY22E FY23E FY24E
Net Revenues 19,324 20,922 -7.6 27,454 -29.6 92,708 1,01,514 1,12,316
EBITDA 11,798 11,780 0.2 17,960 -34.3 51,240 55,148 61,052
APAT 7,606 8,081 -5.9 13,048 -41.7 35,056 35,438 38,537
Diluted EPS (INR) 0.7 0.7 -5.9 1.2 -41.7 3.49 3.53 3.84
P/E (x)
8.3 8.2 7.6
P/BV (x) 0.8 0.8 0.8
RoE (%) 10.4 10.0 10.4
Source: Company, HSIE Research
ADD
CMP(as on 14 Feb 2022) INR 29
Target Price INR 33
NIFTY 16,843
KEY CHANGES OLD NEW
Rating ADD ADD
Price Target INR33 INR33
EPS Change % CY22E CY23E
- -
KEY STOCK DATA
Bloomberg code NHPC IN
No. of Shares (mn) 10,045
MCap (INR bn) / ($ mn) 295/3,969
6m avg traded value (INR mn) 302
52 Week high / low INR 37/23
STOCK PERFORMANCE (%)
3M 6M 12M
Absolute (%) (9.0) 10.5 17.4
Relative (%) (1.9) 8.8 7.9
SHAREHOLDING PATTERN (%)
Dec-21 Sep-21
Promoters 71.0 71.0
FIs & Local MFs 15.5 15.8
FPIs 5.6 5.1
Public & Others 7.9 8.2
Pledged Shares - -
Source : BSE
Anuj Upadhyay
+91-22-6171-7356
Hinal Choudhary
+91-22-6171-7349
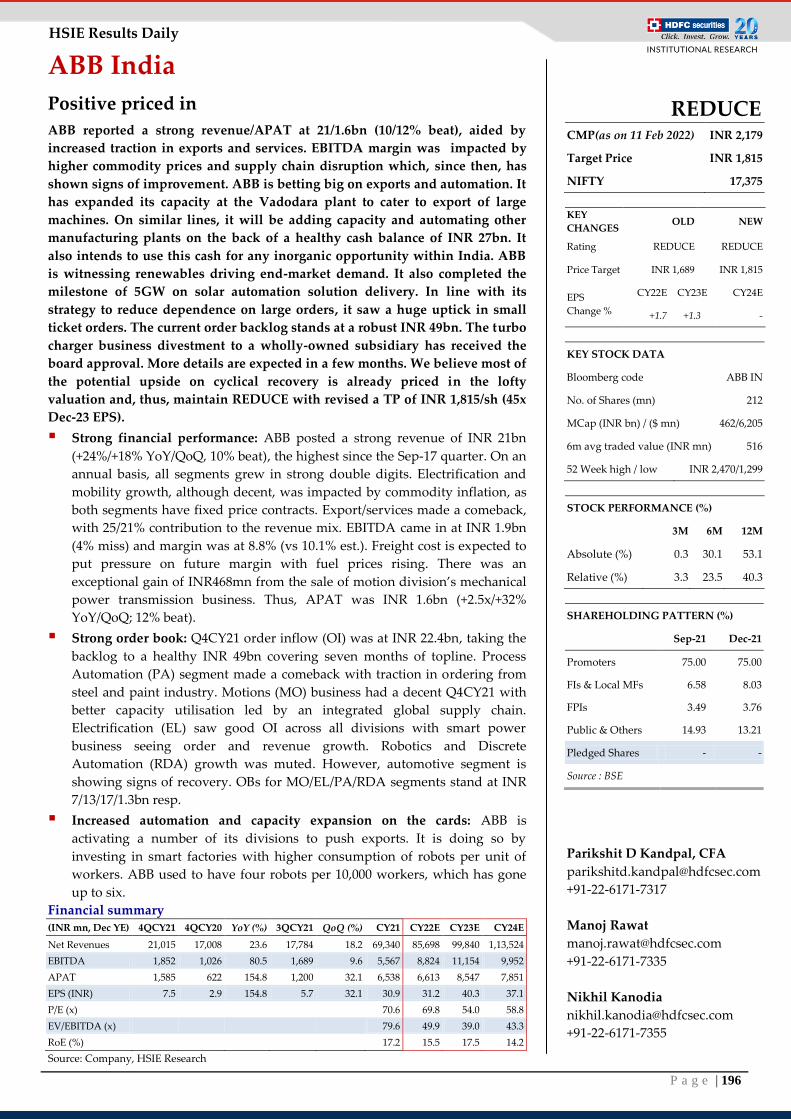
P a g e | 196
HSIE Results Daily
ABB India
Positive priced in
ABB reported a strong revenue/APAT at 21/1.6bn (10/12% beat), aided by
increased traction in exports and services. EBITDA margin was impacted by
higher commodity prices and supply chain disruption which, since then, has
shown signs of improvement. ABB is betting big on exports and automation. It
has expanded its capacity at the Vadodara plant to cater to export of large
machines. On similar lines, it will be adding capacity and automating other
manufacturing plants on the back of a healthy cash balance of INR 27bn. It
also intends to use this cash for any inorganic opportunity within India. ABB
is witnessing renewables driving end-market demand. It also completed the
milestone of 5GW on solar automation solution delivery. In line with its
strategy to reduce dependence on large orders, it saw a huge uptick in small
ticket orders. The current order backlog stands at a robust INR 49bn. The turbo
charger business divestment to a wholly-owned subsidiary has received the
board approval. More details are expected in a few months. We believe most of
the potential upside on cyclical recovery is already priced in the lofty
valuation and, thus, maintain REDUCE with revised a TP of INR 1,815/sh (45x
Dec-23 EPS).
Strong financial performance: ABB posted a strong revenue of INR 21bn
(+24%/+18% YoY/QoQ, 10% beat), the highest since the Sep-17 quarter. On an
annual basis, all segments grew in strong double digits. Electrification and
mobility growth, although decent, was impacted by commodity inflation, as
both segments have fixed price contracts. Export/services made a comeback,
with 25/21% contribution to the revenue mix. EBITDA came in at INR 1.9bn
(4% miss) and margin was at 8.8% (vs 10.1% est.). Freight cost is expected to
put pressure on future margin with fuel prices rising. There was an
exceptional gain of INR468mn from the sale of motion division’s mechanical
power transmission business. Thus, APAT was INR 1.6bn (+2.5x/+32%
YoY/QoQ; 12% beat).
Strong order book: Q4CY21 order inflow (OI) was at INR 22.4bn, taking the
backlog to a healthy INR 49bn covering seven months of topline. Process
Automation (PA) segment made a comeback with traction in ordering from
steel and paint industry. Motions (MO) business had a decent Q4CY21 with
better capacity utilisation led by an integrated global supply chain.
Electrification (EL) saw good OI across all divisions with smart power
business seeing order and revenue growth. Robotics and Discrete
Automation (RDA) growth was muted. However, automotive segment is
showing signs of recovery. OBs for MO/EL/PA/RDA segments stand at INR
7/13/17/1.3bn resp.
Increased automation and capacity expansion on the cards: ABB is
activating a number of its divisions to push exports. It is doing so by
investing in smart factories with higher consumption of robots per unit of
workers. ABB used to have four robots per 10,000 workers, which has gone
up to six.
Financial summary (INR mn, Dec YE) 4QCY21 4QCY20 YoY (%) 3QCY21 QoQ (%) CY21 CY22E CY23E CY24E
Net Revenues 21,015 17,008 23.6 17,784 18.2 69,340 85,698 99,840 1,13,524
EBITDA 1,852 1,026 80.5 1,689 9.6 5,567 8,824 11,154 9,952
APAT 1,585 622 154.8 1,200 32.1 6,538 6,613 8,547 7,851
EPS (INR) 7.5 2.9 154.8 5.7 32.1 30.9 31.2 40.3 37.1
P/E (x)
70.6 69.8 54.0 58.8
EV/EBITDA (x)
79.6 49.9 39.0 43.3
RoE (%)
17.2 15.5 17.5 14.2
Source: Company, HSIE Research
REDUCE CMP(as on 11 Feb 2022) INR 2,179
Target Price INR 1,815
NIFTY 17,375
KEY
CHANGES OLD NEW
Rating REDUCE REDUCE
Price Target INR 1,689 INR 1,815
EPS
Change %
CY22E CY23E CY24E
+1.7 +1.3 -
KEY STOCK DATA
Bloomberg code ABB IN
No. of Shares (mn) 212
MCap (INR bn) / ($ mn) 462/6,205
6m avg traded value (INR mn) 516
52 Week high / low INR 2,470/1,299
STOCK PERFORMANCE (%)
3M 6M 12M
Absolute (%) 0.3 30.1 53.1
Relative (%) 3.3 23.5 40.3
SHAREHOLDING PATTERN (%)
Sep-21 Dec-21
Promoters 75.00 75.00
FIs & Local MFs 6.58 8.03
FPIs 3.49 3.76
Public & Others 14.93 13.21
Pledged Shares - -
Source : BSE
Parikshit D Kandpal, CFA
+91-22-6171-7317
Manoj Rawat
+91-22-6171-7335
Nikhil Kanodia
+91-22-6171-7355
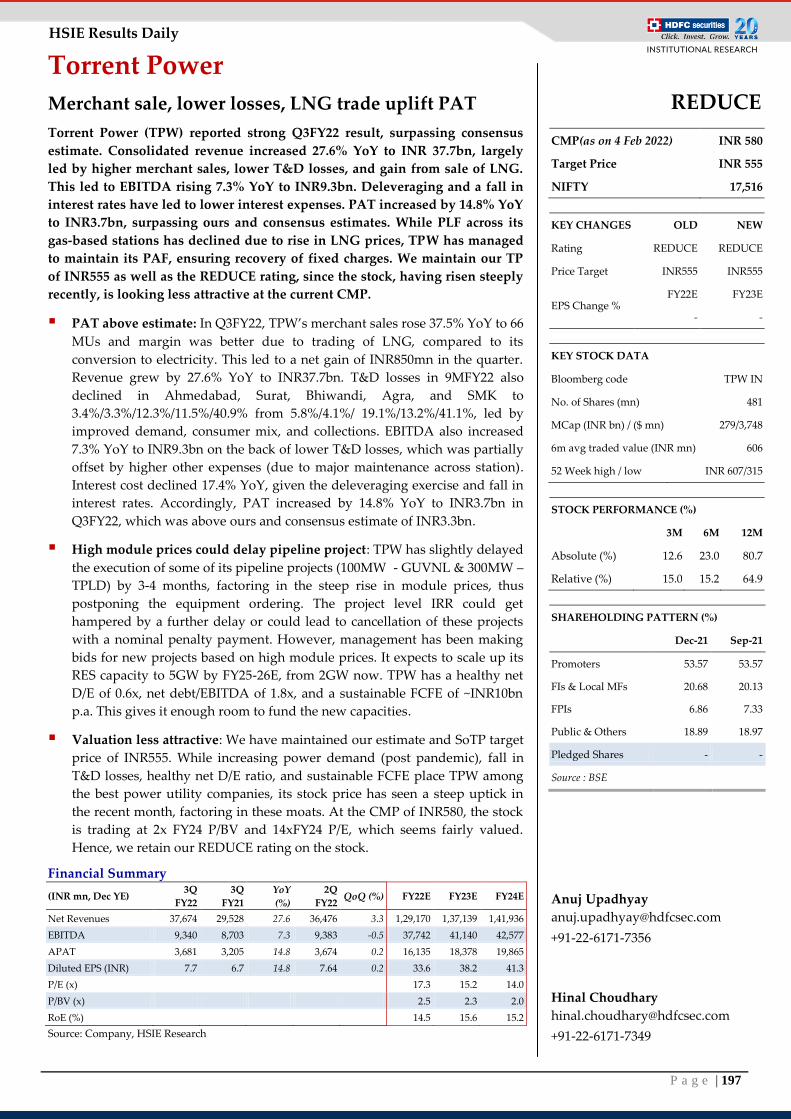
P a g e | 197
HSIE Results Daily
Torrent Power
Merchant sale, lower losses, LNG trade uplift PAT
Torrent Power (TPW) reported strong Q3FY22 result, surpassing consensus
estimate. Consolidated revenue increased 27.6% YoY to INR 37.7bn, largely
led by higher merchant sales, lower T&D losses, and gain from sale of LNG.
This led to EBITDA rising 7.3% YoY to INR9.3bn. Deleveraging and a fall in
interest rates have led to lower interest expenses. PAT increased by 14.8% YoY
to INR3.7bn, surpassing ours and consensus estimates. While PLF across its
gas-based stations has declined due to rise in LNG prices, TPW has managed
to maintain its PAF, ensuring recovery of fixed charges. We maintain our TP
of INR555 as well as the REDUCE rating, since the stock, having risen steeply
recently, is looking less attractive at the current CMP.
PAT above estimate: In Q3FY22, TPW’s merchant sales rose 37.5% YoY to 66
MUs and margin was better due to trading of LNG, compared to its
conversion to electricity. This led to a net gain of INR850mn in the quarter.
Revenue grew by 27.6% YoY to INR37.7bn. T&D losses in 9MFY22 also
declined in Ahmedabad, Surat, Bhiwandi, Agra, and SMK to
3.4%/3.3%/12.3%/11.5%/40.9% from 5.8%/4.1%/ 19.1%/13.2%/41.1%, led by
improved demand, consumer mix, and collections. EBITDA also increased
7.3% YoY to INR9.3bn on the back of lower T&D losses, which was partially
offset by higher other expenses (due to major maintenance across station).
Interest cost declined 17.4% YoY, given the deleveraging exercise and fall in
interest rates. Accordingly, PAT increased by 14.8% YoY to INR3.7bn in
Q3FY22, which was above ours and consensus estimate of INR3.3bn.
High module prices could delay pipeline project: TPW has slightly delayed
the execution of some of its pipeline projects (100MW - GUVNL & 300MW –
TPLD) by 3-4 months, factoring in the steep rise in module prices, thus
postponing the equipment ordering. The project level IRR could get
hampered by a further delay or could lead to cancellation of these projects
with a nominal penalty payment. However, management has been making
bids for new projects based on high module prices. It expects to scale up its
RES capacity to 5GW by FY25-26E, from 2GW now. TPW has a healthy net
D/E of 0.6x, net debt/EBITDA of 1.8x, and a sustainable FCFE of ~INR10bn
p.a. This gives it enough room to fund the new capacities.
Valuation less attractive: We have maintained our estimate and SoTP target
price of INR555. While increasing power demand (post pandemic), fall in
T&D losses, healthy net D/E ratio, and sustainable FCFE place TPW among
the best power utility companies, its stock price has seen a steep uptick in
the recent month, factoring in these moats. At the CMP of INR580, the stock
is trading at 2x FY24 P/BV and 14xFY24 P/E, which seems fairly valued.
Hence, we retain our REDUCE rating on the stock.
Financial Summary
(INR mn, Dec YE) 3Q
FY22
3Q
FY21
YoY
(%)
2Q
FY22 QoQ (%) FY22E FY23E FY24E
Net Revenues 37,674 29,528 27.6 36,476 3.3 1,29,170 1,37,139 1,41,936
EBITDA 9,340 8,703 7.3 9,383 -0.5 37,742 41,140 42,577
APAT 3,681 3,205 14.8 3,674 0.2 16,135 18,378 19,865
Diluted EPS (INR) 7.7 6.7 14.8 7.64 0.2 33.6 38.2 41.3
P/E (x)
17.3 15.2 14.0
P/BV (x) 2.5 2.3 2.0
RoE (%) 14.5 15.6 15.2
Source: Company, HSIE Research
REDUCE
CMP(as on 4 Feb 2022) INR 580
Target Price INR 555
NIFTY 17,516
KEY CHANGES OLD NEW
Rating REDUCE REDUCE
Price Target INR555 INR555
EPS Change % FY22E FY23E
- -
KEY STOCK DATA
Bloomberg code TPW IN
No. of Shares (mn) 481
MCap (INR bn) / ($ mn) 279/3,748
6m avg traded value (INR mn) 606
52 Week high / low INR 607/315
STOCK PERFORMANCE (%)
3M 6M 12M
Absolute (%) 12.6 23.0 80.7
Relative (%) 15.0 15.2 64.9
SHAREHOLDING PATTERN (%)
Dec-21 Sep-21
Promoters 53.57 53.57
FIs & Local MFs 20.68 20.13
FPIs 6.86 7.33
Public & Others 18.89 18.97
Pledged Shares - -
Source : BSE
Anuj Upadhyay
+91-22-6171-7356
Hinal Choudhary
+91-22-6171-7349
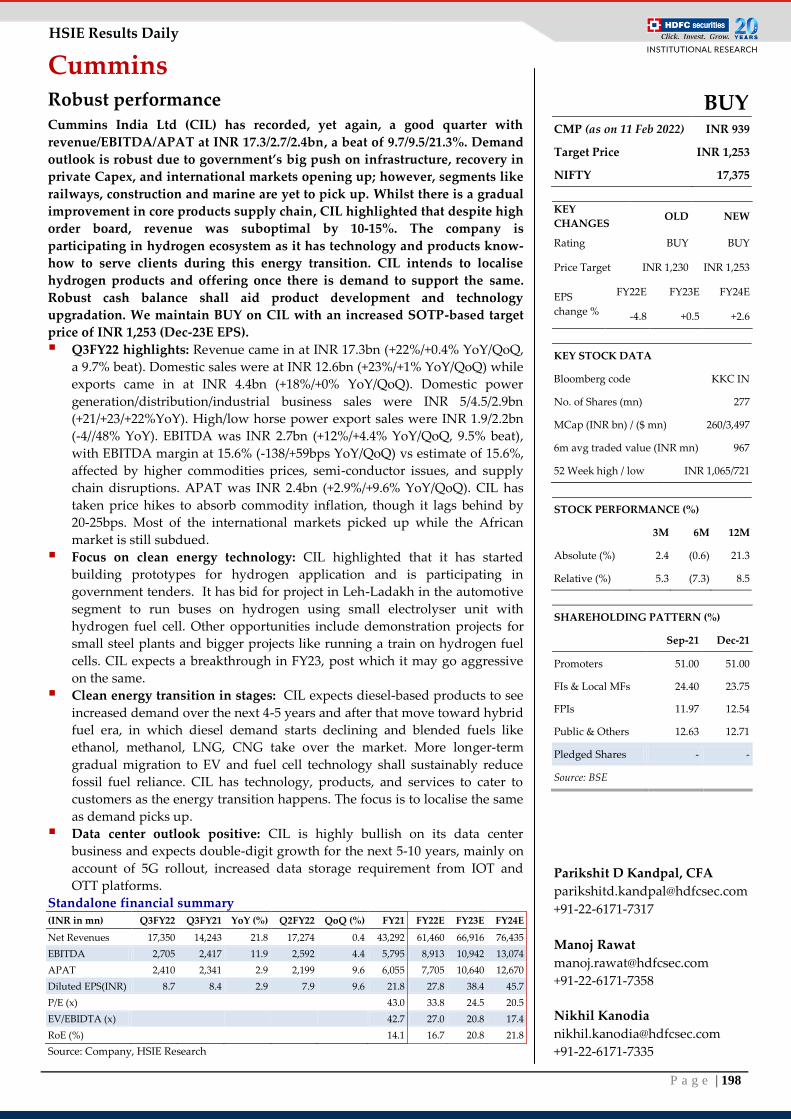
P a g e | 198
HSIE Results Daily
Cummins Robust performance Cummins India Ltd (CIL) has recorded, yet again, a good quarter with
revenue/EBITDA/APAT at INR 17.3/2.7/2.4bn, a beat of 9.7/9.5/21.3%. Demand
outlook is robust due to government’s big push on infrastructure, recovery in
private Capex, and international markets opening up; however, segments like
railways, construction and marine are yet to pick up. Whilst there is a gradual
improvement in core products supply chain, CIL highlighted that despite high
order board, revenue was suboptimal by 10-15%. The company is
participating in hydrogen ecosystem as it has technology and products know-
how to serve clients during this energy transition. CIL intends to localise
hydrogen products and offering once there is demand to support the same.
Robust cash balance shall aid product development and technology
upgradation. We maintain BUY on CIL with an increased SOTP-based target
price of INR 1,253 (Dec-23E EPS).
Q3FY22 highlights: Revenue came in at INR 17.3bn (+22%/+0.4% YoY/QoQ,
a 9.7% beat). Domestic sales were at INR 12.6bn (+23%/+1% YoY/QoQ) while
exports came in at INR 4.4bn (+18%/+0% YoY/QoQ). Domestic power
generation/distribution/industrial business sales were INR 5/4.5/2.9bn
(+21/+23/+22%YoY). High/low horse power export sales were INR 1.9/2.2bn
(-4//48% YoY). EBITDA was INR 2.7bn (+12%/+4.4% YoY/QoQ, 9.5% beat),
with EBITDA margin at 15.6% (-138/+59bps YoY/QoQ) vs estimate of 15.6%,
affected by higher commodities prices, semi-conductor issues, and supply
chain disruptions. APAT was INR 2.4bn (+2.9%/+9.6% YoY/QoQ). CIL has
taken price hikes to absorb commodity inflation, though it lags behind by
20-25bps. Most of the international markets picked up while the African
market is still subdued.
Focus on clean energy technology: CIL highlighted that it has started
building prototypes for hydrogen application and is participating in
government tenders. It has bid for project in Leh-Ladakh in the automotive
segment to run buses on hydrogen using small electrolyser unit with
hydrogen fuel cell. Other opportunities include demonstration projects for
small steel plants and bigger projects like running a train on hydrogen fuel
cells. CIL expects a breakthrough in FY23, post which it may go aggressive
on the same.
Clean energy transition in stages: CIL expects diesel-based products to see
increased demand over the next 4-5 years and after that move toward hybrid
fuel era, in which diesel demand starts declining and blended fuels like
ethanol, methanol, LNG, CNG take over the market. More longer-term
gradual migration to EV and fuel cell technology shall sustainably reduce
fossil fuel reliance. CIL has technology, products, and services to cater to
customers as the energy transition happens. The focus is to localise the same
as demand picks up.
Data center outlook positive: CIL is highly bullish on its data center
business and expects double-digit growth for the next 5-10 years, mainly on
account of 5G rollout, increased data storage requirement from IOT and
OTT platforms.
Standalone financial summary (INR in mn) Q3FY22 Q3FY21 YoY (%) Q2FY22 QoQ (%) FY21 FY22E FY23E FY24E
Net Revenues 17,350 14,243 21.8 17,274 0.4 43,292 61,460 66,916 76,435
EBITDA 2,705 2,417 11.9 2,592 4.4 5,795 8,913 10,942 13,074
APAT 2,410 2,341 2.9 2,199 9.6 6,055 7,705 10,640 12,670
Diluted EPS(INR) 8.7 8.4 2.9 7.9 9.6 21.8 27.8 38.4 45.7
P/E (x)
43.0 33.8 24.5 20.5
EV/EBIDTA (x)
42.7 27.0 20.8 17.4
RoE (%)
14.1 16.7 20.8 21.8
Source: Company, HSIE Research
BUY CMP (as on 11 Feb 2022) INR 939
Target Price INR 1,253
NIFTY 17,375
KEY
CHANGES OLD NEW
Rating BUY BUY
Price Target INR 1,230 INR 1,253
EPS
change %
FY22E FY23E FY24E
-4.8 +0.5 +2.6
KEY STOCK DATA
Bloomberg code KKC IN
No. of Shares (mn) 277
MCap (INR bn) / ($ mn) 260/3,497
6m avg traded value (INR mn) 967
52 Week high / low INR 1,065/721
STOCK PERFORMANCE (%)
3M 6M 12M
Absolute (%) 2.4 (0.6) 21.3
Relative (%) 5.3 (7.3) 8.5
SHAREHOLDING PATTERN (%)
Sep-21 Dec-21
Promoters 51.00 51.00
FIs & Local MFs 24.40 23.75
FPIs 11.97 12.54
Public & Others 12.63 12.71
Pledged Shares - -
Source: BSE
Parikshit D Kandpal, CFA
+91-22-6171-7317
Manoj Rawat
+91-22-6171-7358
Nikhil Kanodia
+91-22-6171-7335
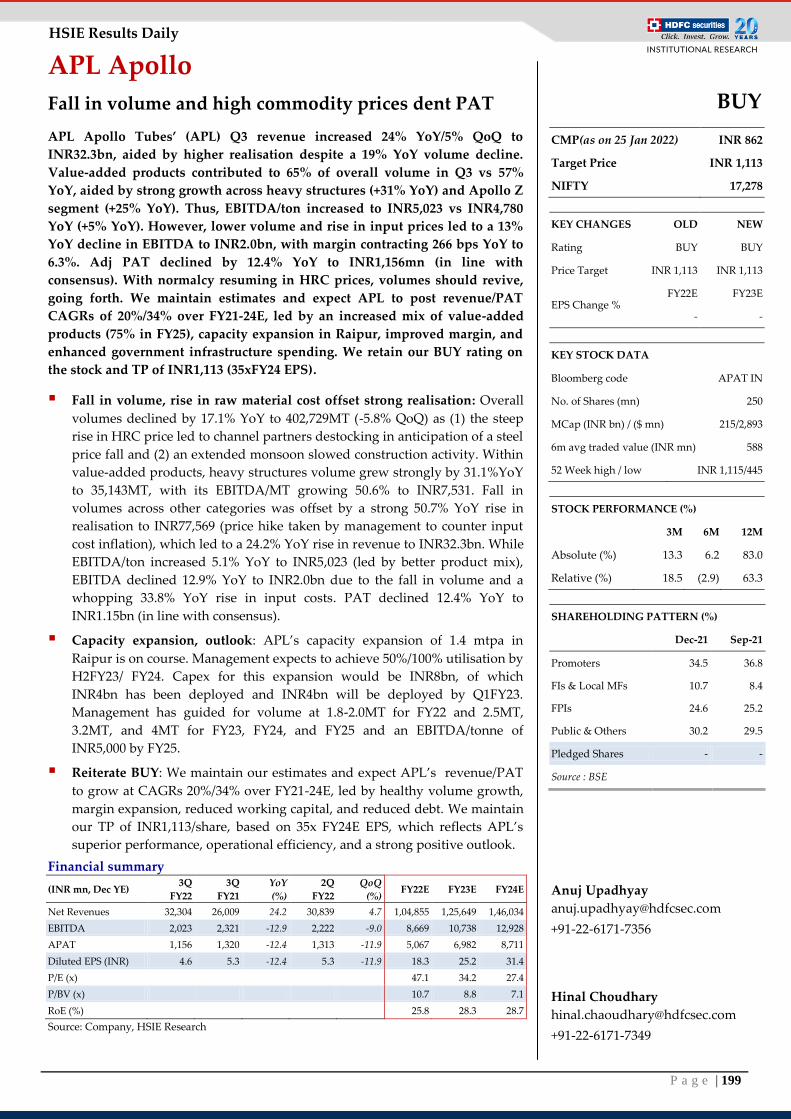
P a g e | 199
HSIE Results Daily
APL Apollo
Fall in volume and high commodity prices dent PAT
APL Apollo Tubes’ (APL) Q3 revenue increased 24% YoY/5% QoQ to
INR32.3bn, aided by higher realisation despite a 19% YoY volume decline.
Value-added products contributed to 65% of overall volume in Q3 vs 57%
YoY, aided by strong growth across heavy structures (+31% YoY) and Apollo Z
segment (+25% YoY). Thus, EBITDA/ton increased to INR5,023 vs INR4,780
YoY (+5% YoY). However, lower volume and rise in input prices led to a 13%
YoY decline in EBITDA to INR2.0bn, with margin contracting 266 bps YoY to
6.3%. Adj PAT declined by 12.4% YoY to INR1,156mn (in line with
consensus). With normalcy resuming in HRC prices, volumes should revive,
going forth. We maintain estimates and expect APL to post revenue/PAT
CAGRs of 20%/34% over FY21-24E, led by an increased mix of value-added
products (75% in FY25), capacity expansion in Raipur, improved margin, and
enhanced government infrastructure spending. We retain our BUY rating on
the stock and TP of INR1,113 (35xFY24 EPS).
Fall in volume, rise in raw material cost offset strong realisation: Overall
volumes declined by 17.1% YoY to 402,729MT (-5.8% QoQ) as (1) the steep
rise in HRC price led to channel partners destocking in anticipation of a steel
price fall and (2) an extended monsoon slowed construction activity. Within
value-added products, heavy structures volume grew strongly by 31.1%YoY
to 35,143MT, with its EBITDA/MT growing 50.6% to INR7,531. Fall in
volumes across other categories was offset by a strong 50.7% YoY rise in
realisation to INR77,569 (price hike taken by management to counter input
cost inflation), which led to a 24.2% YoY rise in revenue to INR32.3bn. While
EBITDA/ton increased 5.1% YoY to INR5,023 (led by better product mix),
EBITDA declined 12.9% YoY to INR2.0bn due to the fall in volume and a
whopping 33.8% YoY rise in input costs. PAT declined 12.4% YoY to
INR1.15bn (in line with consensus).
Capacity expansion, outlook: APL’s capacity expansion of 1.4 mtpa in
Raipur is on course. Management expects to achieve 50%/100% utilisation by
H2FY23/ FY24. Capex for this expansion would be INR8bn, of which
INR4bn has been deployed and INR4bn will be deployed by Q1FY23.
Management has guided for volume at 1.8-2.0MT for FY22 and 2.5MT,
3.2MT, and 4MT for FY23, FY24, and FY25 and an EBITDA/tonne of
INR5,000 by FY25.
Reiterate BUY: We maintain our estimates and expect APL’s revenue/PAT
to grow at CAGRs 20%/34% over FY21-24E, led by healthy volume growth,
margin expansion, reduced working capital, and reduced debt. We maintain
our TP of INR1,113/share, based on 35x FY24E EPS, which reflects APL’s
superior performance, operational efficiency, and a strong positive outlook.
Financial summary
(INR mn, Dec YE) 3Q
FY22
3Q
FY21
YoY
(%)
2Q
FY22
QoQ
(%) FY22E FY23E FY24E
Net Revenues 32,304 26,009 24.2 30,839 4.7 1,04,855 1,25,649 1,46,034
EBITDA 2,023 2,321 -12.9 2,222 -9.0 8,669 10,738 12,928
APAT 1,156 1,320 -12.4 1,313 -11.9 5,067 6,982 8,711
Diluted EPS (INR) 4.6 5.3 -12.4 5.3 -11.9 18.3 25.2 31.4
P/E (x)
47.1 34.2 27.4
P/BV (x) 10.7 8.8 7.1
RoE (%) 25.8 28.3 28.7
Source: Company, HSIE Research
BUY
CMP(as on 25 Jan 2022) INR 862
Target Price INR 1,113
NIFTY 17,278
KEY CHANGES OLD NEW
Rating BUY BUY
Price Target INR 1,113 INR 1,113
EPS Change % FY22E FY23E
- -
KEY STOCK DATA
Bloomberg code APAT IN
No. of Shares (mn) 250
MCap (INR bn) / ($ mn) 215/2,893
6m avg traded value (INR mn) 588
52 Week high / low INR 1,115/445
STOCK PERFORMANCE (%)
3M 6M 12M
Absolute (%) 13.3 6.2 83.0
Relative (%) 18.5 (2.9) 63.3
SHAREHOLDING PATTERN (%)
Dec-21 Sep-21
Promoters 34.5 36.8
FIs & Local MFs 10.7 8.4
FPIs 24.6 25.2
Public & Others 30.2 29.5
Pledged Shares - -
Source : BSE
Anuj Upadhyay
+91-22-6171-7356
Hinal Choudhary
+91-22-6171-7349
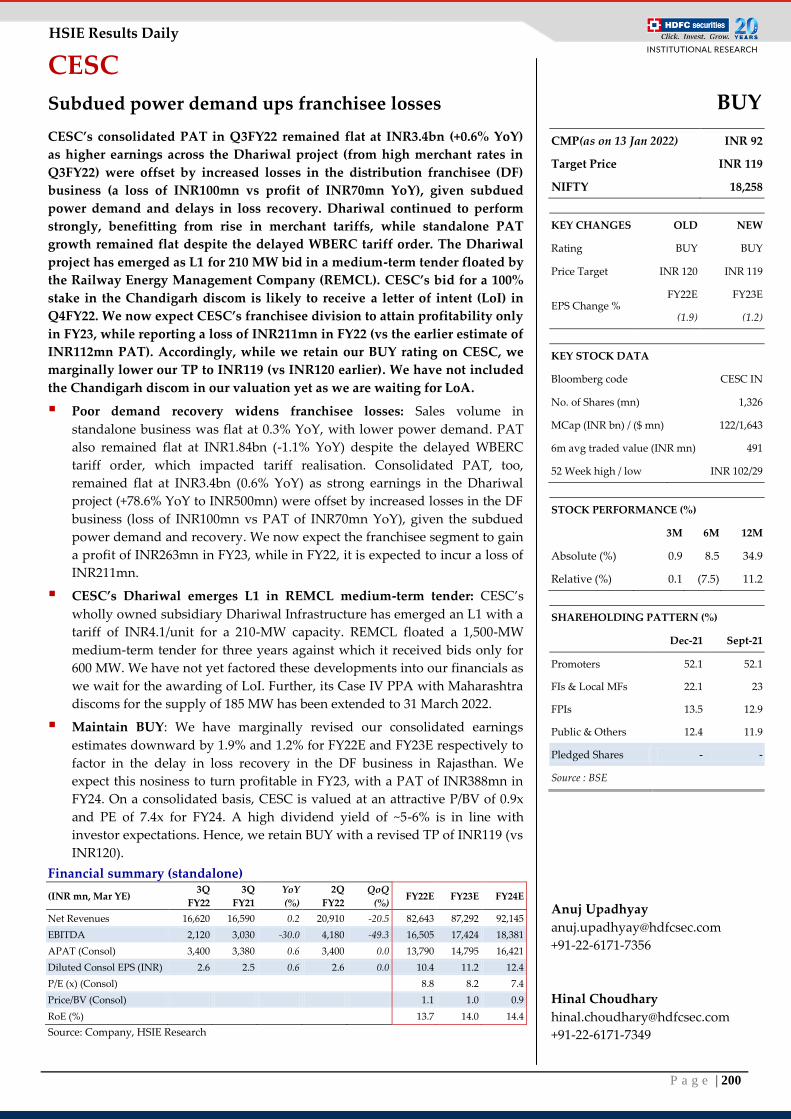
P a g e | 200
HSIE Results Daily
CESC
Subdued power demand ups franchisee losses
CESC’s consolidated PAT in Q3FY22 remained flat at INR3.4bn (+0.6% YoY)
as higher earnings across the Dhariwal project (from high merchant rates in
Q3FY22) were offset by increased losses in the distribution franchisee (DF)
business (a loss of INR100mn vs profit of INR70mn YoY), given subdued
power demand and delays in loss recovery. Dhariwal continued to perform
strongly, benefitting from rise in merchant tariffs, while standalone PAT
growth remained flat despite the delayed WBERC tariff order. The Dhariwal
project has emerged as L1 for 210 MW bid in a medium-term tender floated by
the Railway Energy Management Company (REMCL). CESC’s bid for a 100%
stake in the Chandigarh discom is likely to receive a letter of intent (LoI) in
Q4FY22. We now expect CESC’s franchisee division to attain profitability only
in FY23, while reporting a loss of INR211mn in FY22 (vs the earlier estimate of
INR112mn PAT). Accordingly, while we retain our BUY rating on CESC, we
marginally lower our TP to INR119 (vs INR120 earlier). We have not included
the Chandigarh discom in our valuation yet as we are waiting for LoA.
Poor demand recovery widens franchisee losses: Sales volume in
standalone business was flat at 0.3% YoY, with lower power demand. PAT
also remained flat at INR1.84bn (-1.1% YoY) despite the delayed WBERC
tariff order, which impacted tariff realisation. Consolidated PAT, too,
remained flat at INR3.4bn (0.6% YoY) as strong earnings in the Dhariwal
project (+78.6% YoY to INR500mn) were offset by increased losses in the DF
business (loss of INR100mn vs PAT of INR70mn YoY), given the subdued
power demand and recovery. We now expect the franchisee segment to gain
a profit of INR263mn in FY23, while in FY22, it is expected to incur a loss of
INR211mn.
CESC’s Dhariwal emerges L1 in REMCL medium-term tender: CESC’s
wholly owned subsidiary Dhariwal Infrastructure has emerged an L1 with a
tariff of INR4.1/unit for a 210-MW capacity. REMCL floated a 1,500-MW
medium-term tender for three years against which it received bids only for
600 MW. We have not yet factored these developments into our financials as
we wait for the awarding of LoI. Further, its Case IV PPA with Maharashtra
discoms for the supply of 185 MW has been extended to 31 March 2022.
Maintain BUY: We have marginally revised our consolidated earnings
estimates downward by 1.9% and 1.2% for FY22E and FY23E respectively to
factor in the delay in loss recovery in the DF business in Rajasthan. We
expect this nosiness to turn profitable in FY23, with a PAT of INR388mn in
FY24. On a consolidated basis, CESC is valued at an attractive P/BV of 0.9x
and PE of 7.4x for FY24. A high dividend yield of ~5-6% is in line with
investor expectations. Hence, we retain BUY with a revised TP of INR119 (vs
INR120).
Financial summary (standalone)
(INR mn, Mar YE) 3Q
FY22
3Q
FY21
YoY
(%)
2Q
FY22
QoQ
(%) FY22E FY23E FY24E
Net Revenues 16,620 16,590 0.2 20,910 -20.5 82,643 87,292 92,145
EBITDA 2,120 3,030 -30.0 4,180 -49.3 16,505 17,424 18,381
APAT (Consol) 3,400 3,380 0.6 3,400 0.0 13,790 14,795 16,421
Diluted Consol EPS (INR) 2.6 2.5 0.6 2.6 0.0 10.4 11.2 12.4
P/E (x) (Consol)
8.8 8.2 7.4
Price/BV (Consol) 1.1 1.0 0.9
RoE (%) 13.7 14.0 14.4
Source: Company, HSIE Research
BUY
CMP(as on 13 Jan 2022) INR 92
Target Price INR 119
NIFTY 18,258
KEY CHANGES OLD NEW
Rating BUY BUY
Price Target INR 120 INR 119
EPS Change % FY22E FY23E
(1.9) (1.2)
KEY STOCK DATA
Bloomberg code CESC IN
No. of Shares (mn) 1,326
MCap (INR bn) / ($ mn) 122/1,643
6m avg traded value (INR mn) 491
52 Week high / low INR 102/29
STOCK PERFORMANCE (%)
3M 6M 12M
Absolute (%) 0.9 8.5 34.9
Relative (%) 0.1 (7.5) 11.2
SHAREHOLDING PATTERN (%)
Dec-21 Sept-21
Promoters 52.1 52.1
FIs & Local MFs 22.1 23
FPIs 13.5 12.9
Public & Others 12.4 11.9
Pledged Shares - -
Source : BSE
Anuj Upadhyay
+91-22-6171-7356
Hinal Choudhary
+91-22-6171-7349
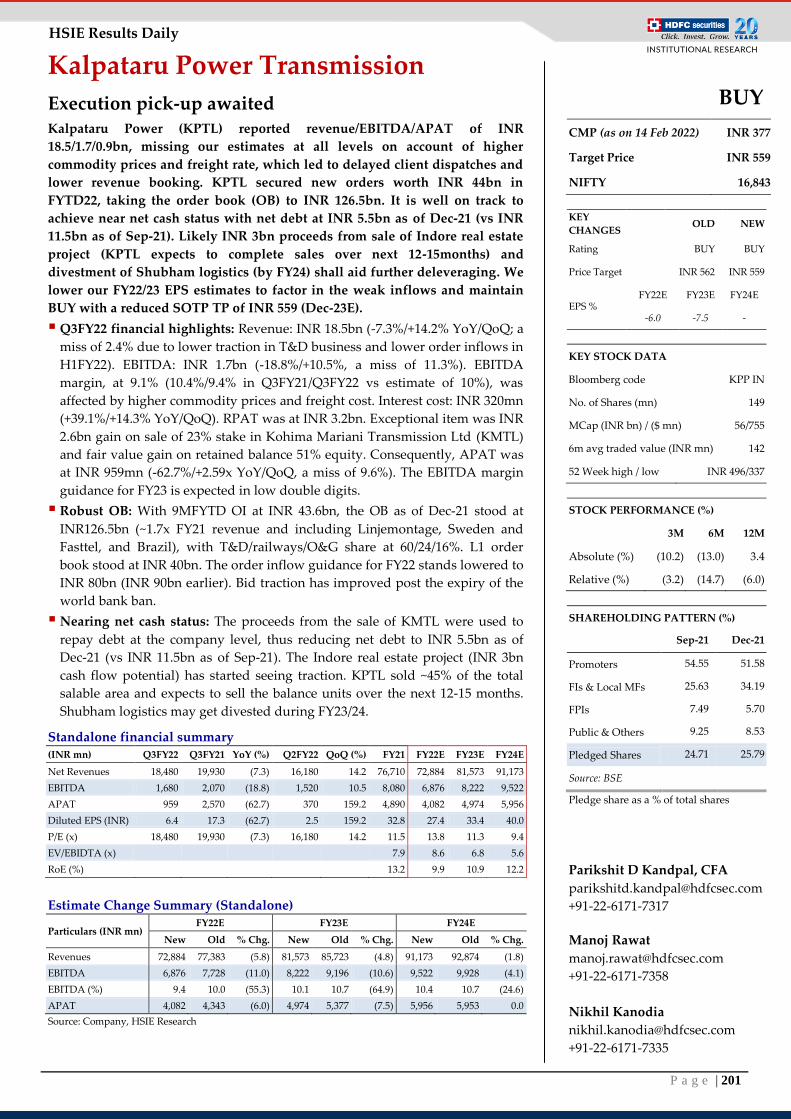
P a g e | 201
HSIE Results Daily
Kalpataru Power Transmission
Execution pick-up awaited Kalpataru Power (KPTL) reported revenue/EBITDA/APAT of INR
18.5/1.7/0.9bn, missing our estimates at all levels on account of higher
commodity prices and freight rate, which led to delayed client dispatches and
lower revenue booking. KPTL secured new orders worth INR 44bn in
FYTD22, taking the order book (OB) to INR 126.5bn. It is well on track to
achieve near net cash status with net debt at INR 5.5bn as of Dec-21 (vs INR
11.5bn as of Sep-21). Likely INR 3bn proceeds from sale of Indore real estate
project (KPTL expects to complete sales over next 12-15months) and
divestment of Shubham logistics (by FY24) shall aid further deleveraging. We
lower our FY22/23 EPS estimates to factor in the weak inflows and maintain
BUY with a reduced SOTP TP of INR 559 (Dec-23E).
Q3FY22 financial highlights: Revenue: INR 18.5bn (-7.3%/+14.2% YoY/QoQ; a
miss of 2.4% due to lower traction in T&D business and lower order inflows in
H1FY22). EBITDA: INR 1.7bn (-18.8%/+10.5%, a miss of 11.3%). EBITDA
margin, at 9.1% (10.4%/9.4% in Q3FY21/Q3FY22 vs estimate of 10%), was
affected by higher commodity prices and freight cost. Interest cost: INR 320mn
(+39.1%/+14.3% YoY/QoQ). RPAT was at INR 3.2bn. Exceptional item was INR
2.6bn gain on sale of 23% stake in Kohima Mariani Transmission Ltd (KMTL)
and fair value gain on retained balance 51% equity. Consequently, APAT was
at INR 959mn (-62.7%/+2.59x YoY/QoQ, a miss of 9.6%). The EBITDA margin
guidance for FY23 is expected in low double digits.
Robust OB: With 9MFYTD OI at INR 43.6bn, the OB as of Dec-21 stood at
INR126.5bn (~1.7x FY21 revenue and including Linjemontage, Sweden and
Fasttel, and Brazil), with T&D/railways/O&G share at 60/24/16%. L1 order
book stood at INR 40bn. The order inflow guidance for FY22 stands lowered to
INR 80bn (INR 90bn earlier). Bid traction has improved post the expiry of the
world bank ban.
Nearing net cash status: The proceeds from the sale of KMTL were used to
repay debt at the company level, thus reducing net debt to INR 5.5bn as of
Dec-21 (vs INR 11.5bn as of Sep-21). The Indore real estate project (INR 3bn
cash flow potential) has started seeing traction. KPTL sold ~45% of the total
salable area and expects to sell the balance units over the next 12-15 months.
Shubham logistics may get divested during FY23/24.
Standalone financial summary (INR mn) Q3FY22 Q3FY21 YoY (%) Q2FY22 QoQ (%) FY21 FY22E FY23E FY24E
Net Revenues 18,480 19,930 (7.3) 16,180 14.2 76,710 72,884 81,573 91,173
EBITDA 1,680 2,070 (18.8) 1,520 10.5 8,080 6,876 8,222 9,522
APAT 959 2,570 (62.7) 370 159.2 4,890 4,082 4,974 5,956
Diluted EPS (INR) 6.4 17.3 (62.7) 2.5 159.2 32.8 27.4 33.4 40.0
P/E (x) 18,480 19,930 (7.3) 16,180 14.2 11.5 13.8 11.3 9.4
EV/EBIDTA (x)
7.9 8.6 6.8 5.6
RoE (%)
13.2 9.9 10.9 12.2
Estimate Change Summary (Standalone)
Particulars (INR mn) FY22E FY23E FY24E
New Old % Chg. New Old % Chg. New Old % Chg.
Revenues 72,884 77,383 (5.8) 81,573 85,723 (4.8) 91,173 92,874 (1.8)
EBITDA 6,876 7,728 (11.0) 8,222 9,196 (10.6) 9,522 9,928 (4.1)
EBITDA (%) 9.4 10.0 (55.3) 10.1 10.7 (64.9) 10.4 10.7 (24.6)
APAT 4,082 4,343 (6.0) 4,974 5,377 (7.5) 5,956 5,953 0.0
Source: Company, HSIE Research
BUY
CMP (as on 14 Feb 2022) INR 377
Target Price INR 559
NIFTY 16,843
KEY
CHANGES OLD NEW
Rating BUY BUY
Price Target INR 562 INR 559
EPS % FY22E FY23E FY24E
-6.0 -7.5 -
KEY STOCK DATA
Bloomberg code KPP IN
No. of Shares (mn) 149
MCap (INR bn) / ($ mn) 56/755
6m avg traded value (INR mn) 142
52 Week high / low INR 496/337
STOCK PERFORMANCE (%)
3M 6M 12M
Absolute (%) (10.2) (13.0) 3.4
Relative (%) (3.2) (14.7) (6.0)
SHAREHOLDING PATTERN (%)
Sep-21 Dec-21
Promoters 54.55 51.58
FIs & Local MFs 25.63 34.19
FPIs 7.49 5.70
Public & Others 9.25 8.53
Pledged Shares 24.71 25.79
Source: BSE
Pledge share as a % of total shares
Parikshit D Kandpal, CFA
+91-22-6171-7317
Manoj Rawat
+91-22-6171-7358
Nikhil Kanodia
+91-22-6171-7335
P a g e | 202
HSIE Results Daily
Contributing analysts
INDUSTRY ANALYST EMAIL ID PHONE NO.
Head - Research (Consumer, Strategy) Varun Lohchab [email protected] +91-22-6171-7334
Strategy Amit Kumar,CFA
Atishray Malhan
+91-22-6171-7354
+91-22-6171-7363
AMCs, Brokerages, Insurance Krishnan ASV
Sahej Mittal
+91-22-6171-7314
+91-22-6171-7325
Banks, NBFCs
Krishnan ASV
Deepak Shinde
Neelam Bhatia
+91-22-6171-7314
+91-22-6171-7323
+91-22-6171-7341
Cement & Building Materials Rajesh Ravi
Keshav Lahoti
+91-22-6171-7352
+91-22-6171-7353
Construction & Infrastructure, Capital Goods,
Real Estate
Parikshit Kandpal, CFA
Manoj Rawat
Nikhil Kanodia
+91-22-6171-7317
+91-22-6171-7330
+91-22-6171-7335
Consumer Durables, FMCG Naveen Trivedi
Saras Singh
+91-22-6171-7324
+91-22-6171-7336
IT Services & Exchanges
Amit Chandra
Vinesh Vala
Mohit Motwani
+91-22-6171-7345
+91-22-6171-7332
+91-22-6171-7328
Oil & Gas, Chemicals
Harshad Katkar
Nilesh Ghuge
Rutvi Chokshi
Akshay Mane
+91-22-6171-7319
+91-22-6171-7342
+91-22-6171-7356
+91-22-6171-7338
Pharma Karan Vora [email protected] +91-22-6171-7359
Retail & Fashion, Paints Jay Gandhi
Premraj Survase
+91-22-6171-7320
+91-22-6171-7348
Utilities Anuj Upadhyay
Hinal Chaoudhary
+91-22-6171-7356
+91-22-6171-7349
P a g e | 203
HSIE Results Daily
Rating Criteria
BUY: >+15% return potential
ADD: +5% to +15% return potential
REDUCE: -10% to +5% return potential
SELL: > 10% Downside return potential
Disclosure:
Authors and the names subscribed to this report, hereby certify that all of the views expressed in this research report accurately reflect our views about the
subject issuer(s) or securities. HSL has no material adverse disciplinary history as on the date of publication of this report. We also certify that no part of our
compensation was, is, or will be directly or indirectly related to the specific recommendation(s) or view(s) in this report.
Research Analyst or his/her relative or HDFC Securities Ltd. does not have any financial interest in the subject company. Also Research Analyst or his relative
or HDFC Securities Ltd. or its Associate may have beneficial ownership of 1% or more in the subject company at the end of the month immediately preceding
the date of publication of the Research Report. Further Research Analyst or his relative or HDFC Securities Ltd. or its associate does not have any material
conflict of interest.
HDFC Securities Limited (HSL) is a SEBI Registered Research Analyst having registration no. INH000002475.
Disclaimer:
This report has been prepared by HDFC Securities Ltd and is solely for information of the recipient only. The report must not be used as a singular basis of any
investment decision. The views herein are of a general nature and do not consider the risk appetite or the particular circumstances of an individual investor;
readers are requested to take professional advice before investing. Nothing in this document should be construed as investment advice. Each recipient of this
document should make such investigations as they deem necessary to arrive at an independent evaluation of an investment in securities of the companies
referred to in this document (including merits and risks) and should consult their own advisors to determine merits and risks of such investment. The
information and opinions contained herein have been compiled or arrived at, based upon information obtained in good faith from sources believed to be
reliable. Such information has not been independently verified and no guaranty, representation of warranty, express or implied, is made as to its accuracy,
completeness or correctness. All such information and opinions are subject to change without notice. Descriptions of any company or companies or their
securities mentioned herein are not intended to be complete. HSL is not obliged to update this report for such changes. HSL has the right to make changes and
modifications at any time.
This report is not directed to, or intended for display, downloading, printing, reproducing or for distribution to or use by, any person or entity who is a citizen
or resident or located in any locality, state, country or other jurisdiction where such distribution, publication, reproduction, availability or use would be
contrary to law or regulation or what would subject HSL or its affiliates to any registration or licensing requirement within such jurisdiction.
If this report is inadvertently sent or has reached any person in such country, especially, United States of America, the same should be ignored and brought to
the attention of the sender. This document may not be reproduced, distributed or published in whole or in part, directly or indirectly, for any purposes or in
any manner.
Foreign currencies denominated securities, wherever mentioned, are subject to exchange rate fluctuations, which could have an adverse effect on their value or
price, or the income derived from them. In addition, investors in securities such as ADRs, the values of which are influenced by foreign currencies effectively
assume currency risk. It should not be considered to be taken as an offer to sell or a solicitation to buy any security.
This document is not, and should not, be construed as an offer or solicitation of an offer, to buy or sell any securities or other financial instruments. This report
should not be construed as an invitation or solicitation to do business with HSL. HSL may from time to time solicit from, or perform broking, or other services
for, any company mentioned in this mail and/or its attachments.
HSL and its affiliated company(ies), their directors and employees may; (a) from time to time, have a long or short position in, and buy or sell the securities of
the company(ies) mentioned herein or (b) be engaged in any other transaction involving such securities and earn brokerage or other compensation or act as a
market maker in the financial instruments of the company(ies) discussed herein or act as an advisor or lender/borrower to such company(ies) or may have any
other potential conflict of interests with respect to any recommendation and other related information and opinions.
HSL, its directors, analysts or employees do not take any responsibility, financial or otherwise, of the losses or the damages sustained due to the investments
made or any action taken on basis of this report, including but not restricted to, fluctuation in the prices of shares and bonds, changes in the currency rates,
diminution in the NAVs, reduction in the dividend or income, etc.
HSL and other group companies, its directors, associates, employees may have various positions in any of the stocks, securities and financial instruments dealt
in the report, or may make sell or purchase or other deals in these securities from time to time or may deal in other securities of the companies / organizations
described in this report.
HSL or its associates might have managed or co-managed public offering of securities for the subject company or might have been mandated by the subject
company for any other assignment in the past twelve months.
HSL or its associates might have received any compensation from the companies mentioned in the report during the period preceding twelve months from the
date of this report for services in respect of managing or co-managing public offerings, corporate finance, investment banking or merchant banking, brokerage
services or other advisory service in a merger or specific transaction in the normal course of business.
HSL or its analysts did not receive any compensation or other benefits from the companies mentioned in the report or third party in connection with
preparation of the research report. Accordingly, neither HSL nor Research Analysts have any material conflict of interest at the time of publication of this
report. Compensation of our Research Analysts is not based on any specific merchant banking, investment banking or brokerage service transactions. HSL may
have issued other reports that are inconsistent with and reach different conclusion from the information presented in this report.
Research entity has not been engaged in market making activity for the subject company. Research analyst has not served as an officer, director or employee of
the subject company. We have not received any compensation/benefits from the subject company or third party in connection with the Research Report.
HDFC securities Limited, I Think Techno Campus, Building - B, "Alpha", Office Floor 8, Near Kanjurmarg Station, Opp. Crompton Greaves, Kanjurmarg
(East), Mumbai 400 042 Phone: (022) 3075 3400 Fax: (022) 2496 5066 Compliance Officer: Binkle R. Oza Email: [email protected] Phone: (022)
3045 3600
HDFC Securities Limited, SEBI Reg. No.: NSE, BSE, MSEI, MCX: INZ000186937; AMFI Reg. No. ARN: 13549; PFRDA Reg. No. POP: 11092018; IRDA
Corporate Agent License No.: CA0062; SEBI Research Analyst Reg. No.: INH000002475; SEBI Investment Adviser Reg. No.: INA000011538; CIN -
U67120MH2000PLC152193

P a g e | 204
HSIE Results Daily
HDFC securities
Institutional Equities
Unit No. 1602, 16th Floor, Tower A, Peninsula Business Park,
Senapati Bapat Marg, Lower Parel, Mumbai - 400 013
Board: +91-22-6171-7330 www.hdfcsec.com