Glenmark Pharmaceuticals Ltd. - HDFC securities
15
Glenmark Pharmaceuticals Ltd. 1 Loremipsumdolor sitamet, consectetueradipiscingelit, seddiamnonummynibheuismodtinciduntutlaoreetdolore magna aliquameratvolutpat. Utwisienim ad minim veniam, quisnostrudexercitationullamcorpersuscipitlobortisnislutaliquip ex eacommodoconsequat.Duisautemveleumiriure dolor in hendrerit in vulputatevelitessemolestieconsequat, velillumdoloreeufeugiatnulla Loremipsumdolor sitamet, consectetueradipiscingelit, seddiamnonummynibheuismodtinciduntutlaoreetdolore magna aliquameratvolutpat. Utwisienim ad minim veniam, quisnostrudexercitationullamcorpersuscipitlobortisnislutaliquip ex eacommodoconsequat. Duisautemveleumiriure dolor in hendrerit in vulputatevelitessemolestieconsequat, velillumdoloreeufeugiatnullafacilisis at veroeros et accumsan et iustoodiodignissim qui blanditpraesentluptatumzzrildelenitaugueduisdoloretefeugaitnullafacilisi. et iustoodiodignissim qui Initiating Coverage Glenmark Pharmaceuticals 23-October-2020
-
Upload
khangminh22 -
Category
Documents
-
view
0 -
download
0
Transcript of Glenmark Pharmaceuticals Ltd. - HDFC securities

Glenmark Pharmaceuticals Ltd.
1
Loremipsumdolor sitamet, consectetueradipiscingelit, seddiamnonummynibheuismodtinciduntutlaoreetdolore magna aliquameratvolutpat. Utwisienim ad minim veniam, quisnostrudexercitationullamcorpersuscipitlobortisnislutaliquip ex eacommodoconsequat.Duisautemveleumiriure dolor in hendrerit in vulputatevelitessemolestieconsequat, velillumdoloreeufeugiatnulla
Loremipsumdolor sitamet, consectetueradipiscingelit,
seddiamnonummynibheuismodtinciduntutlaoreetdolore magna aliquameratvolutpat. Utwisienim ad minim veniam,
quisnostrudexercitationullamcorpersuscipitlobortisnislutaliquip ex eacommodoconsequat. Duisautemveleumiriure dolor in hendrerit in vulputatevelitessemolestieconsequat,
velillumdoloreeufeugiatnullafacilisis at veroeros et accumsan et iustoodiodignissim qui blanditpraesentluptatumzzrildelenitaugueduisdoloretefeugaitnullafacilisi. et iustoodiodignissim qui
Initiating Coverage
Glenmark Pharmaceuticals 23-October-2020

Glenmark Pharmaceuticals Ltd.
2
Industry LTP Recommendation Base Case Fair Value Bull Case Fair Value Time Horizon
Pharmaceuticals Rs 486.8 Buy in the band of Rs 436-440 and add further on dips to Rs 399-403 Rs 474 Rs 528 2 quarters
Our Take Glenmark has outpaced IPM (Indian Pharmaceuticals Market) with the launch of differentiated products and successful brand building efforts. Company is ranked no.2 in Dermatology, 4th in Respiratory and 6th in Cardiac. Its nine brands appear in Top-300 and one in Top-50 in the Indian Pharma Market. In April 2019, Glenmark became the first company globally to launch the novel patent-protected and globally researched SGLT2 inhibitor remogliflozin for Type 2 diabetes. In 2015, the company had launched an affordable version of teneligliptin for Type 2 diabetes. Going forward, company intends to keep scouting for ways to make drugs more accessible and affordable in the domestic market. Company has built upon a strong portfolio in OTC segment as well with few key products such as Candid dusting powder and Scalpe. Domestic sales for Sep-20 rose 34 percent, led by Covid anti-viral drug Fabiflu. Also, other brands such as Telma, Candid, and Candid B supported growth. For the Sep-2020 quarter, the company registered strong 32% growth led by robust numbers from anti-viral drug sales and strong traction from cardiac and anti-diabetic therapeutic areas. Glenmark is the 14th largest generics manufacturer by prescription volume in the US. However, in the recent years, company’s performance in the US market has remained weak on the back of competitive environment and price erosion. Also its Baddi facility continues to be under US FDA scanner since May 2019 where it had received a warning letter with key issues. Company guides for better growth in the next two years for US business vs. 5% decline in the last three years. Glenmark has approval for 164 products in the US while 44 applications pending in various stages of approval with US FDA, of which 24 are Para IV filings. LatAm and Europe business has been growing at steady pace. On the back of lower base and new launches LatAm could see better growth in the coming quarters. Company has been one of the highest spenders on R&D; it has spent ~Rs 4800cr or ~12% of its revenues over FY17-20. Management has guided for lower R&D as compared to last three years and commercialization of Monroe facility would drive margins over the next two years; we have factored in 160bps margin expansion over FY20-22E. API business is expected to do well on the back of better utilisation and due to tighter pollution control norms in China over the next two years. Company derives > 75% of API revenues Internationally from Europe, US and Japan etc. The re-rating of the stock depends upon the company’s achievement in containing R&D spend and reduction in debt. Currently, the combination of financial risk and business risk (NCE development) is suppressing valuation multiples.
HDFC Scrip Code GLEPHAEQNR
BSE Code 532296
NSE Code GLENMARK
Bloomberg Code GNP: IN
CMP Oct 22, 2020 486.85
Equity Capital (Rs cr) 28.22
Face Value (Rs) 1
Equity Share O/S (cr) 28.22
Market Cap (Rs cr) 13737
Book Value (Rs) 215
Avg. 52 Wk Volumes 3521453
52 Week High 572.7
52 Week Low 168
Share holding Pattern % (Sep, 2020)
Promoters 46.6
Institutions 34.7
Non Institutions 18.7
Total 100.0
Fundamental Research Analyst Kushal Rughani [email protected]
Glenmark Pharmaceuticals Ltd.
3
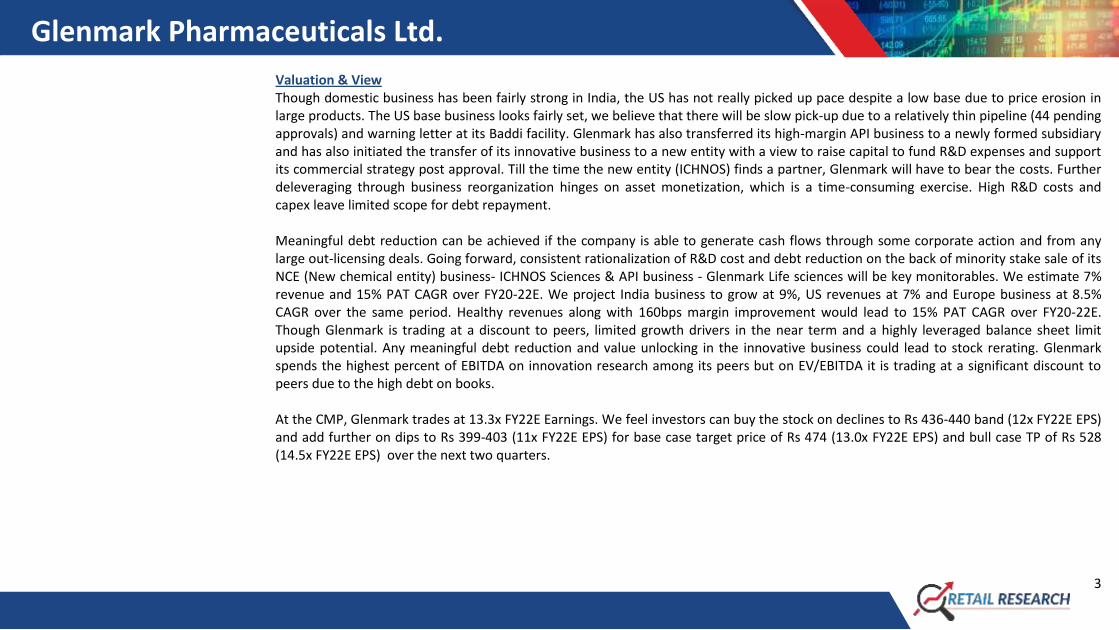
Valuation & View Though domestic business has been fairly strong in India, the US has not really picked up pace despite a low base due to price erosion in large products. The US base business looks fairly set, we believe that there will be slow pick-up due to a relatively thin pipeline (44 pending approvals) and warning letter at its Baddi facility. Glenmark has also transferred its high-margin API business to a newly formed subsidiary and has also initiated the transfer of its innovative business to a new entity with a view to raise capital to fund R&D expenses and support its commercial strategy post approval. Till the time the new entity (ICHNOS) finds a partner, Glenmark will have to bear the costs. Further deleveraging through business reorganization hinges on asset monetization, which is a time-consuming exercise. High R&D costs and capex leave limited scope for debt repayment. Meaningful debt reduction can be achieved if the company is able to generate cash flows through some corporate action and from any large out-licensing deals. Going forward, consistent rationalization of R&D cost and debt reduction on the back of minority stake sale of its NCE (New chemical entity) business- ICHNOS Sciences & API business - Glenmark Life sciences will be key monitorables. We estimate 7% revenue and 15% PAT CAGR over FY20-22E. We project India business to grow at 9%, US revenues at 7% and Europe business at 8.5% CAGR over the same period. Healthy revenues along with 160bps margin improvement would lead to 15% PAT CAGR over FY20-22E. Though Glenmark is trading at a discount to peers, limited growth drivers in the near term and a highly leveraged balance sheet limit upside potential. Any meaningful debt reduction and value unlocking in the innovative business could lead to stock rerating. Glenmark spends the highest percent of EBITDA on innovation research among its peers but on EV/EBITDA it is trading at a significant discount to peers due to the high debt on books. At the CMP, Glenmark trades at 13.3x FY22E Earnings. We feel investors can buy the stock on declines to Rs 436-440 band (12x FY22E EPS) and add further on dips to Rs 399-403 (11x FY22E EPS) for base case target price of Rs 474 (13.0x FY22E EPS) and bull case TP of Rs 528 (14.5x FY22E EPS) over the next two quarters.

Glenmark Pharmaceuticals Ltd.
4
Financial Summary Particulars (Rs cr) Q1 FY21 Q1 FY20 YoY (%) Q4 FY20 QoQ (%) FY19 FY20 FY21E FY22E
Total Revenues 2345 2323 0.9 2768 -15.3 9,865 10,641 11,120 12,158
EBITDA 478 342 39.8 466 2.6 1586 1699 1991 2127
Depreciation 113 91 24.4 126 -10.4 326 417 474 509
Other Income 59 2 - 44 33.0 208 160 136 149
Interest Cost 94 93 1.1 99 -4.6 335 377 375 338
Tax 104 51 103.7 98 5.6 376 320 355 400
APAT 254 109 133.0 220 15.3 925 776 921 1027
EPS (Rs) 32.8 27.5 32.7 36.4
RoE (%) 17.2 13.3 14.2 14.0
P/E (x) 14.8 17.6 14.9 13.3
EV/EBITDA 10.1 9.4 8.1 7.5 (Source: Company, HDFC sec)
Q1 FY21 result highlights Revenues grew 2.7% yoy to Rs 2345cr. It was driven by Europe and Domestic Formulation, partially offset by decline in RoW markets
and LatAm sales. Domestic Formulations (34% of sales) revenue grew 3.7% yoy to Rs 780cr. Europe revenue (12% of sales) increased 13% yoy to Rs 273cr. US revenues grew 1.6% to Rs 743cr. API sales also saw muted growth of 1.8% to Rs 235cr. RoW sales declined 18% YoY to Rs 212cr, LatAm sales declined 19% yoy to Rs 66cr.
Gross Margin expanded 100bps yoy to 65.5% due to superior product mix. EBITDA margin surged 610bps YoY to 20.4%, due to lower other expenses (-550bps yoy as % of sales). EBITDA grew 46% YoY while PAT surged 51% yoy on better margins and lower taxes.
Company guides for EBITDA margin of around 19% in FY21. Management expects some benefits of lower SG&A to continue throughout the year.
Company expects Ryaltris NDA approval for the US market in H2CY21. Management commented that they are on track to resolve regulatory issues at Baddi facility.
R&D expense is expected at ~11% of sales for FY21 (~60% for innovation and 40% for generics). R&D spend in Q1FY21 stood at around Rs 254cr or 10.8% of sales.

Glenmark Pharmaceuticals Ltd.
5
Ichnos Sciences has initiated the process to raise capital in the US to fund development of its pipeline and future growth plans. It is expected to complete the process in H2FY21.
US business: Dermatology segment contributes around 30% to the US revenue as against the highs of 40-45%. Company filed 3 ANDAs in Q1FY21 and plans 3 more ANDAs in the next quarter. It launched 3 products and received 2 approvals. Company guides for 8-10 launches this year. Company is expected to close 1 out-licensing deal in the US in FY21. It expects high-single-digit growth in FY21; however, in derma portfolio, price erosion coupled with lower volume is expected to continue for next few quarters; overall generic derma market is witnessing 5-6% price erosion on QoQ basis due to lower demand.
Costs: Expects (a) R&D as % of sales to decline YoY in FY21 (FY20 R&D expenses at ~Rs 1352cr, 12.7% of sales), (b) staff cost as % of sales to decline YoY in FY21 as no major MR addition (FY20 MRs strength at ~3,800). Management guided for Rs 700-800cr capex in FY21. About 50% would be maintenance capex and the rest will be on in-licensing and asset addition.
Other highlights: (1) Ichnos Sciences (Innovation business spin-off): Glenmark has invested US$ 115mn in FY20 and US$ 23mn in Q1FY21; It expects to initiate fund raising by Q3FY21 and (2) R&D pipeline: (a) Specialty assets: Ryaltris - in Jun’19, received Complete Response Letter (CRL) from US FDA citing deficiencies in DMF and in manufacturing facilities; it is in process to resolve CRL. Additionally, it is in the process of partnering Ryaltris in US and EU, and (b) pipeline products to categorized as (i) Ichnos to focus on immunology and oncology base product pipeline and (ii) Glenmark will continue with Biologics, dermatology and respiratory projects.
US Business highlights Glenmark is the 14th largest generics manufacturer by prescription volume in the US. Over the last 8 years, the company has grown the US business at around 15% CAGR but due to recent cost pressures and competitive environment, the revenue has seen around 5% decline in the last three years. The company has shifted focus from vanilla generic oral solids to value-added niche generics in relatively high barrier-to-entry segments such as oral contraceptives and skin treatments. Company guides for better growth in the next two years for US business led by new launches and moderating price erosion. In the US, the company continues to seek approvals for new products while improving cost efficiency and defending the market share. The company has consistently gained market share in Naproxen, Mupirocin, Omeprazole, Olmesartan, Verapamil ER and Clobetasol propionate. The Baddi formulations facility remains under warning letter and the resolution of the same is critical in order for Glenmark to sustain growth in the US. As on Jun-2020, company had 164 ANDA approvals and 44 pending for approval with US FDA. It includes 24 Para-IV applications with a sizable market size and revenue visibility, though this would depend upon pricing environment and competition at

Glenmark Pharmaceuticals Ltd.
6
the time of approval/launch. Dermatology segment contributes around 30% to the US revenue as against the highs of 40-45%. Company filed 3 ANDAs in Q1FY21 and plans 3 more ANDAs in the next quarter. It launched 3 products and received 2 approvals. Company guides for 8-10 launches in FY21. Company is expected to close 1 out-licensing deal in the US in FY21. Ryaltris [Olopatadine hydrochloride and Mometasone Furoate] is a novel fixed-dose combination nasal spray of an anti-histamine and a steroid, indicated for the treatment of symptoms associated with seasonal allergic rhinitis (SAR) in patients over 12 years of age. Ryaltris is currently under review with the US FDA as a treatment for seasonal allergic rhinitis in the US. Glenmark and Hikma entered into an exclusive licensing agreement for commercializing Ryaltris Seasonal Allergic Rhinitis Nasal Spray in the US. Under the terms of the agreement, Glenmark will be responsible for continued development and regulatory approval of Ryaltris by the US FDA, while Hikma will be responsible for the commercialization of Ryaltris in the US. Domestic Business to continue strong growth trajectory Glenmark is concentrated on the core therapy areas like Cardiac, Dermatology and Respiratory in the domestic market, which are ranked 2nd, 4th and 6th respectively in IPM. Company derives around 70% of its domestic revenues from these therapeutic areas. The company has 9 products in the Top-300 products in IPM. The company is ranked 14 in the Indian Pharma Market (IPM) as on FY20. Glenmark ranks third in the respiratory segment in the Indian pharmaceutical market. In the cardiology space, the most notable brand remains Telma, which is the first brand to feature in the top-20 IPM brands. It has shown consistent growth over the last several years, growing faster than the Indian Pharmaceutical Market (IPM). Revenues have grown at 13% CAGR in FY14-20 as against market growth of low double digits over the same period. Company derives ~60% of its domestic revenues from chronic therapeutic area while the balance from acute segment. The Indian business is concentrated in few chronic therapies, making the company immune to seasonal fluctuations. In anti-diabetics segment, Glenmark became the first company to launch the novel patent-protected and globally researched SGLT2 inhibitor Remogliflozin Etabonate 100 mg for Type 2 diabetes. Glenmark, with its clinical efficacy and economical pricing through Remogliflozin has been transforming diabetes therapy in the country. SGLT2 inhibitors are the newest class of oral drugs for the management of Type 2 diabetes, combining effective glycemic control with weight loss and cardiovascular risk reduction. Since its launch, Remogliflozin continues to do well in the market and is well received in the medical community. It has achieved an impressive market penetration of 34% in the segment. Going forward, the company is expected to outperform the market with new launches. Recently, the company announced the launch of Nindanib, a branded generic version for treatment of Pulmonary Fibrosis in India. Pulmonary fibrosis (PF) is a respiratory condition characterized by thickening

Glenmark Pharmaceuticals Ltd.
7
and/or scarring of the lungs, making breathing difficult and reducing patient life spans. Glenmark is 3rd largest in the respiratory segment in India. Its Nindanib is priced at Rs 4500 (100 mg) and Rs 5400 (150 mg) per month which are available at just 5% of the cost as compared to the innovator brand in India. Consumer care business registered revenues of Rs 204cr in FY20. The company has a strong presence across OTC segments as well with Candid Dusting Powder (DP) and Scalpe+. Candid DP is a 30 year-old flagship and a prescription leader in the category of fungal skin infection. Scalpe+ is a 17-year old brand with a proven track record in dandruff treatment. Going forward, Glenmark’s OTC business will focus on its other leading brands like Candid Powder, Scalpe and introduce new Rx to OTC switches. Channel-wise modern trade channel was a key growth driver delivering 34% growth in FY20. Apart from this, company has also divested VWash brand to HUL in Mar-2020. Under this agreement, the brand and other trademarks, copyrights, know-how associated with Glenmark’s VWash brand transferred to HUL in Jun-2020. Glenmark will receive an upfront payment and royalty on sales for 3 years. Glenmark announced the sale of its gynaecology business for Rs 115cr to Integrace in Jan-2020. It includes products like Dubagest, Mumfer and Fenza; these three products had sales of around Rs 60cr with single digit EBITDA margin. Europe & RoW Business Glenmark is one of the fastest growing domestic players in Europe. Company recorded 11.4% yoy growth in revenues at Rs 1248cr in FY20. Europe business has registered 8% revenue CAGR over FY17-20. This has been achieved through a combination of portfolio expansion and geographical spread. The company’s geographical footprint covers all major markets in Western Europe and Central and Eastern Europe. The business has leveraged not just its in-house pipeline, but also added a significant component of in licensing partnerships to develop a robust portfolio, delivering strong growth over the last decade. During FY20, the Western European business continued expanding through increased penetration in the UK, Germany, Spain and the Netherlands while Nordic countries witnessed some de-growth. During the year under review, the Central Eastern European region also managed to grow well in constant currency with major markets witnessing sales growth. During the year under review, GSK concluded a settlement agreement concerning the existing litigation against Glenmark and Celon regarding the shape of their inhalation product containing salmeterol xinafoate and fluticasone propionate, named Salmex (aka Stalpex, Salflutin and Asthmex) in selected European markets.

Glenmark Pharmaceuticals Ltd.
8
Glenmark is also working to close a partnership deal for Ryaltris in various other markets including the EU. The company has already filed an application for Ryaltris approval in the European Union. We expect the company to clock 8.5% revenue CAGR over FY20-22E. In the RoW, the key markets are Russia/CIS, Asia and Africa region. For FY20, revenues grew by 1% yoy at Rs 1286cr. Company intends consolidate its position in key markets in the Middle East and African regions. Company targets to grow faster than the market in Russia through a diversified, innovative portfolio, strengthen hold on the respiratory and dermatology segments and enter the specialty and hospital channels. Launch of Momate Rhino OTC helped to further strengthen Glenmark’s respiratory franchise in the Russian market. An important growth lever will be the in-licensing of complex generics that provide first-to-file opportunities. We estimate 4% revenue growth over FY20-22E. Latin America Business update For FY20, Glenmark’s revenue from its Latin America and Caribbean operations (LatAm) increased 28% yoy at Rs 536cr (US$ 75.6mn). In Jun-2019, Glenmark announced that its Brazilian subsidiary has entered into an exclusive partnership agreement with Novartis AG, for three respiratory products indicated for treatment of Chronic Obstructive Pulmonary Disease (COPD) in Brazil. The products involved in the agreement are Seebri (Glycopyrronium bromide), Onbrize (Indacaterol) and Ultibro (combination of Indacaterol and Glycopyrronium). Under the terms of the agreement, Novartis remains the holder of the registration of these medicines and will be responsible for their manufacture and supply. Glenmark will be responsible for exclusively promoting, commercializing and distributing these products in Brazil. This deal strengthened Glenmark’s respiratory franchise and helped consolidate the company’s position in this segment in Brazil. We estimate 7.5% revenue CAGR in LatAm business over FY20-22E. Key focus areas Glenmark is concentrated on the core therapy areas like Dermatology, Respiratory and Oncology globally, and Cardio-metabolic in select markets to maximise offerings to patients. Secondly, the company has built strong partnerships and alliances with companies across markets for technology, products and commercialization. This has helped to improve offerings and enhance reach across geographies. The third driver is the launch of global brands. Company develops products bearing in mind the requirements of multiple markets across the globe. Company has been one of the highest spenders on R&D; it has spent ~Rs 4800cr or ~12% of its revenues over FY17-20.

Glenmark Pharmaceuticals Ltd.
9
Ryaltris, the innovative product for seasonal allergic rhinitis, which was developed to meet requirements of the stringent health regulators is targeted for launch in key global markets. Company is in the process of increasing its presence in Asia, Africa, Middle East and also expanding field force in India and certain Latin American countries. API Business Outlook On the API front, API manufacturing in China has got curtailed owing to tighter pollution control norms. Glenmark Life Sciences is well placed to leverage this opportunity in a cost-effective and quality-conscious manner. Company expects 10-12% growth in the API business over the next two years. Over the last two decades, Glenmark has built a robust and reliable Active Pharmaceutical Ingredients (API) business that caters to the world’s leading pharmaceutical companies. Starting with two APIs in 2003, this division has scaled up to manufacture nearly 135 APIs for over 200 customers in more than 80 countries. 60% of the API revenues come from Top-10 molecules. Company derives > 75% revenues internationally from Europe, US and Japan etc. In FY19, Glenmark spun off the API business into an independent entity called Glenmark Life Sciences (GLS). Domestic and ROW regions led the growth for Glenmark Life Sciences, with both regions recording good growth over the corresponding period last year. The US business also witnessed revival in FY20. The company also expanded its presence in the Japanese market. GLS continued to sustain its leadership position in products like Lercanidipine, Atovaquone, Perindopril, Olmesartan, and Aprepitant. Company recorded 8% yoy rise in API business and accounted for ~10% of its revenues in FY20. We estimate 7% revenue CAGR in API business over the next two years. COVID 19: Anti-viral drug Favipiravir update In May-2020, Glenmark Pharma said that it has initiated phase-III trial on anti-viral Favipiravir for COVID-19 in India. Company said that Clinical trials have commenced and over 10 leading government & private hospitals in India are being enrolled for the study. Glenmark is the first pharmaceutical company in India to be given an approval by the regulator to conduct Phase 3 clinical trials in India on Favipiravir Antiviral tablets for COVID -19 patients. Favipiravir is a generic version of Avigan of Fujifilm Toyama Chemical Co., Japan, a subsidiary of Fujifilm Corporation. Glenmark has successfully developed API and formulations for the product through its in house R&D team. Favipiravir has demonstrated activity against influenza viruses and has been approved in Japan for the treatment of novel influenza virus infections. The molecule will be marketed under the brand name ‘FabiFlu’ in India. Glenmark Pharmaceuticals on Jul 22, 2020 announced top-line results from a Phase 3 clinical trial in mild to moderate COVID-19 patients conducted across seven clinical sites in India. The Drugs Controller General of India (DCGI) granted it approval for Covid-19 treatment under emergency use authorisation, which means since

Glenmark Pharmaceuticals Ltd.
10
there is limited data available on the medicine’s performance on Covid-19 positive cases, doctors prescribing it would have to document the written consent of a patient. Glenmark Pharmaceuticals reduced the selling price of its coronavirus disease (Covid-19) drug Favipiravir from Rs 103 to Rs 75 per tablet that could significantly lessen the cost for 14-days regimen from Rs 14,000 to Rs 10,200.
Indian government’s panel of experts in September rejected Glenmark’s proposal to conduct phase 3 clinical trials of Favipiravir drug combined with steroid dexamethasone as possible treatment for Covid-19. Recently, the company said that a combination of antivirals Umifenovir and Favipiravir in the treatment of moderate hospitalised Covid-19 patients did not show significant clinical benefit.
Key Risks Regulatory compliance remains the key risk. Warning letters remain key issues to be resolved. The company has received a warning
letter for its Baddi facility. Company has not been able to scale up US business over the past three years, postponement of new launches and higher generic price
erosion in the US market may hinder growth. Lower than expected contribution from new launches in the US. Slower than expected ramp up in the EU business. Execution and commercialization capabilities for new as well as existing products are a key risk. With a large NCE pipeline, the
company faces a lot of risk in terms of successful trials and marketing. The company in the past has dropped a lot of NCEs due to failure in clinical trials.
DPCO risk – The risk of additional drugs coming under price control is a major risk to the India business of Glenmark. The value growth of India business will largely depend on the extent of price control on the drugs.
Foreign exchange Risk: Large part of revenue comes from exports and hence, the company faces risk of currency fluctuations. Company has heavy debt on books; gross D/E stood at 0.7x as on Mar-2020. Capex & R&D needs - Higher than anticipated Capex & R&D spends will affect net debt reduction. Delay in monetizing innovations and API business could hinder its plan to derisk its model and bring down debt. Balance sheet quality, high capex, weak free cash generation, limited visibility on US generic pipeline, lack of near-term catalysts in
NCE/NBE pipeline remain key concerns for Glenmark. While earnings trajectory is improving, meaningful improvement in return ratios is some time away. Inability to monetise innovation/specialty assets could postpone rerating for the stock. Adverse development and payout due to price fixing litigation in the US could be a concern going forward for the company.

Glenmark Pharmaceuticals Ltd.
11
Company Background Incorporated in 1977, Glenmark Pharmaceuticals is a leading player in India with main focus in India, US and Europe region. Apart from this the company has also presence in LatAm and RoW markets. Company derives around 10% of its revenues from API business with majority being from international markets. In the last three-four years, US business has witnessed weak performance due to pricing erosion and lack of new blockbuster launches. Company spends on innovative R&D and generic R&D remains at 65:35 ratio. Ex-US, other geographies have started showing greater traction especially Europe, LatAm and Russia. The company has undertaken a strategic step of reorganising its business into three separate entities operating independently – 1) Glenmark Pharmaceuticals (GPL) - To primarily focus on building a global generics, specialty and OTC business in the therapy areas of dermatology, respiratory and oncology. It also has a strong regional/country specific presence in other therapeutic areas like diabetes, cardiovascular and oral contraceptives, 2) Glenmark Life Sciences (GLS) - This primarily includes manufacturing and marketing of active pharmaceutical ingredient (API) products across all major markets globally. It also includes captive sales, 3) Innovation New Company (NewCo) - to focus on discovery and development of novel, first‐in‐class treatments in the therapeutic areas of immunology, oncology and pain encompassing both biologics (NBE) as well as new chemical entities (NCE). In Jun-2020, the company concluded divestment of its intimate female hygiene OTC brand, 'VWash' alongside other extensions (no employee transfer) to HUL for which it will receive an upfront payment and sales royalties for three years. The company's consumer business comprised three brands (Candid, VWash and Scalp) contributing Rs 204 crore in FY20.
Peer Comparison
Company CMP Mcap (Rs cr)
Revenues* (Rs cr)
Operating Profit* (Rs cr)
PAT* (Rs cr)
RoE* (%)
RoCE* (%)
P/E* (x)
D/E* (x)
P/B* (x)
Ajanta Pharma 1639 14305 3228 900 634 19.5 22.0 23 0.1 4.3
Alembic Pharma 1011 19884 5858 1486 1020 19.9 19.2 18.8 0.2 3.7
Glenmark Pharma 487 13737 12158 2127 1027 14.0 13.5 13.3 0.5 1.8 Source: Company, HDFC sec Research, *FY22E consolidated

Glenmark Pharmaceuticals Ltd.
12
Revenues Mix (%)
31
30
12
12
5
10
India
US
Europe
RoW
LatAm
API
Domestic Revenues Split (%)
27
2518
17
94
Cardiac
Dermatology
Anti-Infectives
Respiratory
Anti-diabetic
Others
R&D expenses to taper off
676 725 1066 1122 1298 1352 1208 1273
10.2 9.5
11.612.3
13.2 12.7
10.9 10.5
2
4
6
8
10
12
14
0
200
400
600
800
1000
1200
1400
1600
FY15 FY16 FY17 FY18 FY19 FY20 FY21E FY22E
R&D Expenses % of sales
FCF to see significant improvement
Source: Company, HDFC sec Research
-1750
-1500
-1250
-1000
-750
-500
-250
0
250
500
750
1000
FY18 FY19 FY20 FY21E FY22E
FCF Capex

Glenmark Pharmaceuticals Ltd.
13
Income Statement
Balance Sheet (Rs Cr) FY18 FY19 FY20 FY21E FY22E
As at March FY18 FY19 FY20 FY21E FY22E
Total Income 9103 9865 10641 11120 12158
SOURCE OF FUNDS
Growth (%) -0.9 8.4 7.9 4.5 9.3
Share Capital 28.2 28.2 28.2 28.2 28.2
Operating Expenses 7488 8279 8942 9129 10031
Reserves 5135 5577 6042 6875 7782
EBITDA 1615 1586 1699 1991 2127
Shareholders' Funds 5163 5605 6070 6903 7810
Growth (%) -21 -2 7 17 7
Long Term Debt 4142 3574 4043 3711 3266
EBITDA Margin (%) 17.7 16.1 15.9 17.9 17.5
Net Deferred Taxes -1320 -1383 -1440 -1440 -1440
Depreciation 302 326 417 474 509
Long Term Provisions & Others 3 89 430 486 579
EBIT 1313 1260 1280 1517 1618
Total Source of Funds 7988 7885 9104 9662 10215
Other Income 92 208 160 136 149
APPLICATION OF FUNDS
Interest expenses 286 335 377 375 338
Net Block (incl. CWIP) 3018 3497 4199 4455 4714
PBT 1119 1301 1096 1276 1427
Intangible Assets 1082 1518 1998 1998 1998
Tax 315 376 320 355 400
Long Term Loans & Advances 136 141 177 190 211
RPAT 804 925 776 921 1027
Total Non-Current Assets 4288 5211 6426 6714 6974
Growth (%) -27.5 15 -16.1 18.8 11.5
Inventories 2031 2252 2136 2376 2631
EPS 28.5 32.8 27.5 32.7 36.4
Trade Receivables 2332 2195 2409 2565 2748
Cash & Equivalents 1234 937 1111 1163 1261
Other Current Assets 1391 1313 1148 1173 1210
Total Current Assets 6990 6695 6804 7279 7854
Short-Term Borrowings 295 303 443 421 341
Trade Payables 1870 2221 2126 2266 2527
Other Current Liab & Provisions 719 1059 1042 1094 1171
Short-Term Provisions 404 438 515 551 573
Total Current Liabilities 3290 4021 4126 4332 4612
Net Current Assets 3700 2674 2678 2947 3242
Total Application of Funds 7988 7885 9104 9662 10215
Source: Company, HDFC sec Research

Glenmark Pharmaceuticals Ltd.
14
Cash Flow Statement
Key Ratios (Rs Cr) FY18 FY19 FY20 FY21E FY22E
FY18 FY19 FY20 FY21E FY22E
Reported PBT 1119 1301 1096 1276 1427
Profitability Ratios
Non-operating & EO items -92 -208 -160 -136 -149
EBITDA Margin 17.7 16.1 15.9 17.9 17.5
Interest Expenses 286 335 377 375 338
EBIT Margin 14.4 12.8 12 13.6 13.3
Depreciation 302 326 417 474 509
APAT Margin 8.8 9.4 7.3 8.3 8.5
Working Capital Change 647 727 172 -217 -196
RoE 16.7 17.2 13.3 14.2 14
Tax Paid -315 -376 -320 -355 -400
RoCE 13.7 13.2 11.6 13.2 13.5
OPERATING CASH FLOW ( a ) 1946 2105 1582 1418 1529
Solvency Ratio
Capex -1007 -1433 -1568 -750 -750
Net Debt/EBITDA (x) 2 1.9 2 1.5 1.1
Free Cash Flow 939 672 15 668 779
D/E 0.9 0.7 0.7 0.6 0.5
Investments -34 -71 -107 -13 -21
Net D/E 0.6 0.5 0.6 0.4 0.3
Non-operating income 92 208 160 136 149
PER SHARE DATA
INVESTING CASH FLOW ( b ) -949 -1296 -1514 -627 -622
EPS 28.5 32.8 27.5 32.7 36.4
Debt Issuance / (Repaid) -424 -482 826 -275 -351
CEPS 39.2 44.3 42.3 49.5 54.5
Interest Expenses -286 -335 -377 -375 -338
BV 183 198.6 215.1 244.6 276.8
FCFE 229 -145 464 17 90
Dividend 2 2 2.5 3 4
Share Capital Issuance 0 0 0 0 0
Turnover Ratios (days)
Dividend -67 -68 -73 -89 -120
Debtor days 94 81 83 84 83
FINANCING CASH FLOW ( c ) -777 -885 377 -739 -809
Inventory days 84 79 75 78 79
NET CASH FLOW (a+b+c) 220 -76 444 52 99
Creditors days 125 129 118 122 125
VALUATION
P/E 17 14.8 17.6 14.9 13.3
P/BV 2.7 2.4 2.3 2 1.8
EV/EBITDA 9.9 10.1 9.4 8.1 7.5
EV / Revenues 1.7 1.6 1.5 1.4 1.3
Dividend Payout 7 6.1 9.1 9.2 11 Source: Company, HDFC sec Research
One Year Price Chart
150
250
350
450
550
22
-Oct
-19
22
-No
v-1
9
22
-De
c-1
9
22
-Jan
-20
22
-Fe
b-2
0
22
-Mar
-20
22
-Ap
r-2
0
22
-May
-20
22
-Ju
n-2
0
22
-Ju
l-2
0
22
-Au
g-2
0
22
-Se
p-2
0
22
-Oct
-20

Glenmark Pharmaceuticals Ltd.
15
Disclosure:
I, Kushal Rughani (MBA), author and the names subscribed to this report, hereby certify that all of the views expressed in this research report accurately reflect our views about the subject issuer(s) or securities. HSL has no material adverse disciplinary history as on the date of
publication of this report. We also certify that no part of our compensation was, is, or will be directly or indirectly related to the specific recommendation(s) or view(s) in this report.
Research Analyst or his/her relative or HDFC Securities Ltd. does not have any financial interest in the subject company. Also Research Analyst or his relative or HDFC Securities Ltd. or its Associate may have beneficial ownership of 1% or more in the subject company at the end of the
month immediately preceding the date of publication of the Research Report. Further Research Analyst or his relative or HDFC Securities Ltd. or its associate does not have any material conflict of interest.
Any holding in stock - No
HDFC Securities Limited (HSL) is a SEBI Registered Research Analyst having registration no. INH000002475.
Disclaimer:
This report has been prepared by HDFC Securities Ltd and is meant for sole use by the recipient and not for circulation. The information and opinions contained herein have been compiled or arrived at, based upon information obtained in good faith from sources believed to be reliable.
Such information has not been independently verified and no guaranty, representation of warranty, express or implied, is made as to its accuracy, completeness or correctness. All such information and opinions are subject to change without notice. This document is for information
purposes only. Descriptions of any company or companies or their securities mentioned herein are not intended to be complete and this document is not, and should not be construed as an offer or solicitation of an offer, to buy or sell any securities or other financial instruments.
This report is not directed to, or intended for display, downloading, printing, reproducing or for distribution to or use by, any person or entity who is a citizen or resident or located in any locality, state, country or other jurisdiction where such distribution, publication, reproduction,
availability or use would be contrary to law or regulation or what would subject HSL or its affiliates to any registration or licensing requirement within such jurisdiction.
If this report is inadvertently sent or has reached any person in such country, especially, United States of America, the same should be ignored and brought to the attention of the sender. This document may not be reproduced, distributed or published in whole or in part, directly or
indirectly, for any purposes or in any manner.
Foreign currencies denominated securities, wherever mentioned, are subject to exchange rate fluctuations, which could have an adverse effect on their value or price, or the income derived from them. In addition, investors in securities such as ADRs, the values of which are influenced
by foreign currencies effectively assume currency risk.
It should not be considered to be taken as an offer to sell or a solicitation to buy any security. HSL may from time to time solicit from, or perform broking, or other services for, any company mentioned in this mail and/or its attachments.
HSL and its affiliated company(ies), their directors and employees may; (a) from time to time, have a long or short position in, and buy or sell the securities of the company(ies) me ntioned herein or (b) be engaged in any other transaction involving such securities and earn brokerage or
other compensation or act as a market maker in the financial instruments of the company(ies) discussed herein or act as an advisor or lender/borrower to such company(ies) or may have any other potential conflict of interests with respect to any recommendation and other related
information and opinions.
HSL, its directors, analysts or employees do not take any responsibility, financial or otherwise, of the losses or the damages sustained due to the investments made or any action taken on basis of this report, including but not restricted to, fluctuation in the prices of shares and bonds,
changes in the currency rates, diminution in the NAVs, reduction in the dividend or income, etc.
HSL and other group companies, its directors, associates, employees may have various positions in any of the stocks, securities and financial instruments dealt in the report, or may make sell or purchase or other deals in these securities from time to time or may deal in other securities
of the companies / organizations described in this report.
HSL or its associates might have managed or co-managed public offering of securities for the subject company or might have been mandated by the subject company for any other assignment in the past twelve months.
HSL or its associates might have received any compensation from the companies mentioned in the report during the period preceding twelve months from t date of this report for services in respect of managing or co-managing public offerings, corporate finance, investment banking or
merchant banking, brokerage services or other advisory service in a merger or specific transaction in the normal course of business.
HSL or its analysts did not receive any compensation or other benefits from the companies mentioned in the report or third party in connection with preparation of the research report. Accordingly, neither HSL nor Research Analysts have any material conflict of interest at the time of
publication of this report. Compensation of our Research Analysts is not based on any specific merchant banking, investment banking or brokerage service transactions. HSL may have issued other reports that are inconsistent with and reach different conclusion from the information
presented in this report.
Research entity has not been engaged in market making activity for the subject company. Research analyst has not served as an officer, director or employee of the subject company. We have not received any compensation/benefits from the subject company or third party in
connection with the Research Report.
HDFC securities Limited, I Think Techno Campus, Building - B, "Alpha", Office Floor 8, Near Kanjurmarg Station, Opp. Crompton Greaves, Kanjurmarg (East), Mumbai 400 042 Phone: (022) 3075 3400 Fax: (022) 2496 5066
Compliance Officer: Binkle R. Oza Email: [email protected] Phone: (022) 3045 3600
HDFC Securities Limited, SEBI Reg. No.: NSE, BSE, MSEI, MCX: INZ000186937; AMFI Reg. No. ARN: 13549; PFRDA Reg. No. POP: 11092018; IRDA Corporate Agent License No.: CA0062; SEBI Research Analyst Reg. No.: INH000002475; SEBI Investment Adviser Reg. No.: INA000011538; CIN -
U67120MH2000PLC152193
Mutual Funds Investments are subject to market risk. Please read the offer and scheme related documents carefully before investing.