VST Tillers & Tractors Limited - HDFC securities
14
RETAIL RESEARCH Stock Note 01 Nov 2017 VST Tillers & Tractors Limited RETAIL RESEARCH Page | 1 Industry CMP Recommendation Add on dips to Sequential Targets Time Horizon Tillers & Tractors Rs.2221 Buy at CMP and add on declines Rs.2040 – 2080 Rs.2550 & Rs.2745 3 - 4 quarters Company Description: VST Tillers & Tractors Limited (VTTL), is a company formed on account of a JV between VST group and Mitsubishi Heavy Industries in 1967. VTTL derives its major income from manufacturing and marketing two agricultural aid equipments i.e. Power tillers and Tractors. It also trades in reapers, rice transplanters and other spare components. Company is a market leader in the power tiller segment across country deriving major income from the agriculture activities in South India and is a fast growing company in the sub-30 HP tractor segment. The company has three manufacturing facilities with Bangalore plant dedicated for manufacturing power tillers, Hosur plant dedicated for manufacturing tractors and Mysore plant engaged in production of engine components for both power tiller and tractors. Investment Rationale: Good monsoon, product portfolio expansion in tractors segment & efforts of geographical expansion augur well for VTTL. Foray into higher HP tractor on the back of a JV with Korean major will grow its tractor segment presence meaningfully. Improving farm mechanization levels, suitability of tillers & leadership in tillers to help VTTL maintain its mainstay growth. Shift in manufacturing plant from Whitefield to Hosur and possibility to unlock embedded value of land. Ample cash reserves to help company pursue organic/inorganic growth opportunities without stretching its balance sheet. Fundamentally strong with debt free status, abundant cash reserves, good return ratios, good dividend payout, growing revenues etc. Concerns: Rising input prices, regulated tiller prices may lead to margin contraction for the company Highly competitive tractor & tiller market. Weak monsoon in the coming fiscal may bring down company’s revenue prospects. DBT/subsidy disbursement inefficiency may dent demand for company’s major revenue earning tiller segment. View and Valuation: VTTL being an industry major in the tiller segment and a growing company in sub-30HP tractor segment is expected to benefit from the normal monsoon witnessed in the regions of its dominance. Further, company has recently signaled signs of setting up plant for the manufacture of higher HP tractors which shall not only help it grow its revenue but also help improve its margins as higher HP tractors are more value accretive. Company has in the past fiscal launched 2 new tractor models and is expected to bring newer products in both of its major segments i.e. tractors and tillers. An allocation of ~Rs. 150 Crs (over 3-4 years) has been made towards newer product development which could boost company’s future revenues prospects. Company has huge cash reserves on its balance sheet and consequently enjoys a debt free status. Although company intends to use the available cash for organic expansions and other earmarked capex, we are confident in company’s ability to re- generate cash which can be effectively used for various value accretive purposes. HDFC Scrip Code VSTTILEQNR BSE Code 531266 NSE Code VSTTILLERS Bloomberg VSTT IN CMP Rs.2221 Equity Capital (Rs crs) 8.6 Face Value (Rs) 10.0 Equity Share o/s (crs) 0.86 Market Cap (Rs crs) 1910.1 Book Value (Rs) 566.1 Avg. 52 Wk Volumes ~2849 52 Week High 2487 52 Week Low 1670 Shareholding Pattern % (Sept 2017) Promoters 54.0 Institutions 16.9 Non Institutions 29.1 Total 100.0 Fundamental Research Analyst CA Arpit Bhatt [email protected]
-
Upload
khangminh22 -
Category
Documents
-
view
2 -
download
0
Transcript of VST Tillers & Tractors Limited - HDFC securities

RETAIL RESEARCH Stock Note 01 Nov 2017
VST Tillers & Tractors Limited
RETAIL RESEARCH P a g e | 1
Industry CMP Recommendation Add on dips to Sequential Targets Time Horizon Tillers & Tractors Rs.2221 Buy at CMP and add on declines Rs.2040 – 2080 Rs.2550 & Rs.2745 3 - 4 quarters
Company Description: VST Tillers & Tractors Limited (VTTL), is a company formed on account of a JV between VST group and Mitsubishi Heavy Industries in 1967. VTTL derives its major income from manufacturing and marketing two agricultural aid equipments i.e. Power tillers and Tractors. It also trades in reapers, rice transplanters and other spare components. Company is a market leader in the power tiller segment across country deriving major income from the agriculture activities in South India and is a fast growing company in the sub-30 HP tractor segment. The company has three manufacturing facilities with Bangalore plant dedicated for manufacturing power tillers, Hosur plant dedicated for manufacturing tractors and Mysore plant engaged in production of engine components for both power tiller and tractors.
Investment Rationale: Good monsoon, product portfolio expansion in tractors segment & efforts of geographical expansion augur well for VTTL. Foray into higher HP tractor on the back of a JV with Korean major will grow its tractor segment presence meaningfully. Improving farm mechanization levels, suitability of tillers & leadership in tillers to help VTTL maintain its mainstay growth. Shift in manufacturing plant from Whitefield to Hosur and possibility to unlock embedded value of land. Ample cash reserves to help company pursue organic/inorganic growth opportunities without stretching its balance sheet. Fundamentally strong with debt free status, abundant cash reserves, good return ratios, good dividend payout, growing
revenues etc.
Concerns: Rising input prices, regulated tiller prices may lead to margin contraction for the company Highly competitive tractor & tiller market. Weak monsoon in the coming fiscal may bring down company’s revenue prospects. DBT/subsidy disbursement inefficiency may dent demand for company’s major revenue earning tiller segment.
View and Valuation: VTTL being an industry major in the tiller segment and a growing company in sub-30HP tractor segment is expected to benefit from the normal monsoon witnessed in the regions of its dominance. Further, company has recently signaled signs of setting up plant for the manufacture of higher HP tractors which shall not only help it grow its revenue but also help improve its margins as higher HP tractors are more value accretive. Company has in the past fiscal launched 2 new tractor models and is expected to bring newer products in both of its major segments i.e. tractors and tillers. An allocation of ~Rs. 150 Crs (over 3-4 years) has been made towards newer product development which could boost company’s future revenues prospects.
Company has huge cash reserves on its balance sheet and consequently enjoys a debt free status. Although company intends to use the available cash for organic expansions and other earmarked capex, we are confident in company’s ability to re-generate cash which can be effectively used for various value accretive purposes.
HDFC Scrip Code VSTTILEQNR
BSE Code 531266
NSE Code VSTTILLERS
Bloomberg VSTT IN
CMP Rs.2221
Equity Capital (Rs crs) 8.6
Face Value (Rs) 10.0
Equity Share o/s (crs) 0.86
Market Cap (Rs crs) 1910.1
Book Value (Rs) 566.1
Avg. 52 Wk Volumes ~2849
52 Week High 2487
52 Week Low 1670
Shareholding Pattern % (Sept 2017)
Promoters 54.0
Institutions 16.9
Non Institutions 29.1
Total 100.0 Fundamental Research Analyst CA Arpit Bhatt [email protected]
RETAIL RESEARCH
RETAIL RESEARCH P a g e | 2
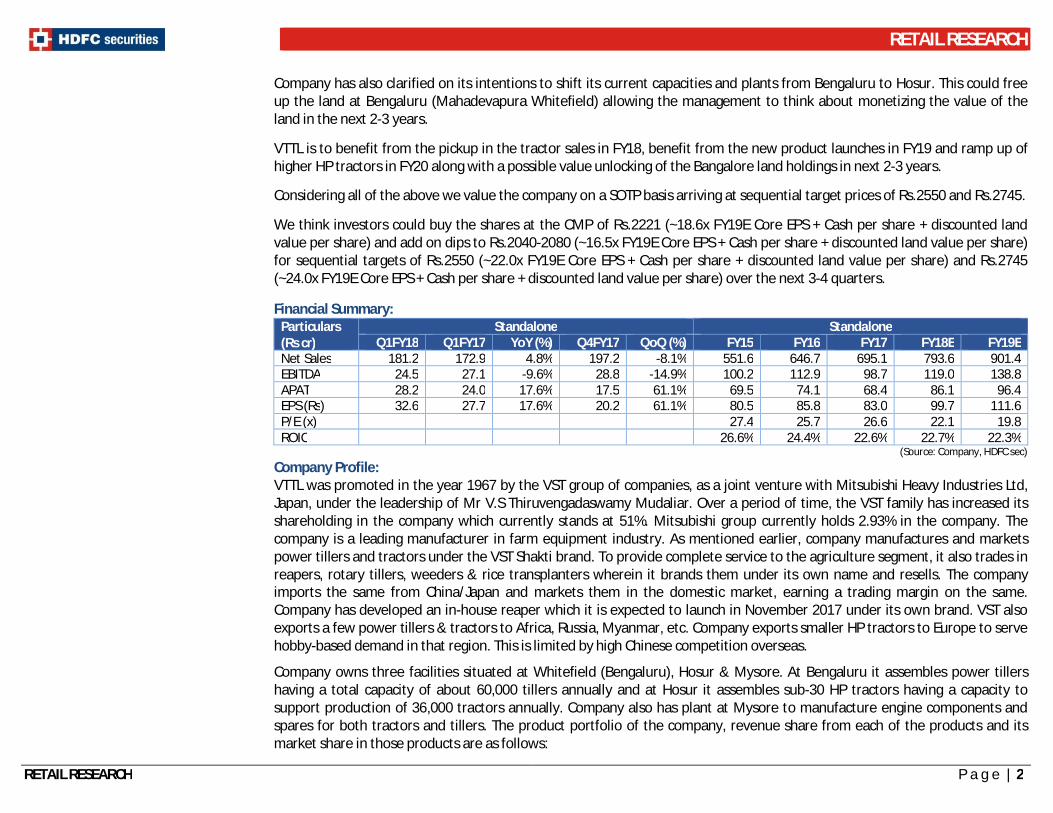
Company has also clarified on its intentions to shift its current capacities and plants from Bengaluru to Hosur. This could free up the land at Bengaluru (Mahadevapura Whitefield) allowing the management to think about monetizing the value of the land in the next 2-3 years.
VTTL is to benefit from the pickup in the tractor sales in FY18, benefit from the new product launches in FY19 and ramp up of higher HP tractors in FY20 along with a possible value unlocking of the Bangalore land holdings in next 2-3 years.
Considering all of the above we value the company on a SOTP basis arriving at sequential target prices of Rs.2550 and Rs.2745.
We think investors could buy the shares at the CMP of Rs.2221 (~18.6x FY19E Core EPS + Cash per share + discounted land value per share) and add on dips to Rs.2040-2080 (~16.5x FY19E Core EPS + Cash per share + discounted land value per share) for sequential targets of Rs.2550 (~22.0x FY19E Core EPS + Cash per share + discounted land value per share) and Rs.2745 (~24.0x FY19E Core EPS + Cash per share + discounted land value per share) over the next 3-4 quarters. Financial Summary:
Particulars (Rs cr)
Standalone Standalone Q1FY18 Q1FY17 YoY (%) Q4FY17 QoQ (%) FY15 FY16 FY17 FY18E FY19E
Net Sales 181.2 172.9 4.8% 197.2 -8.1% 551.6 646.7 695.1 793.6 901.4 EBITDA 24.5 27.1 -9.6% 28.8 -14.9% 100.2 112.9 98.7 119.0 138.8 APAT 28.2 24.0 17.6% 17.5 61.1% 69.5 74.1 68.4 86.1 96.4 EPS (Rs) 32.6 27.7 17.6% 20.2 61.1% 80.5 85.8 83.0 99.7 111.6 P/E (x) 27.4 25.7 26.6 22.1 19.8 ROIC 26.6% 24.4% 22.6% 22.7% 22.3%
(Source: Company, HDFC sec) Company Profile: VTTL was promoted in the year 1967 by the VST group of companies, as a joint venture with Mitsubishi Heavy Industries Ltd, Japan, under the leadership of Mr V.S Thiruvengadaswamy Mudaliar. Over a period of time, the VST family has increased its shareholding in the company which currently stands at 51%. Mitsubishi group currently holds 2.93% in the company. The company is a leading manufacturer in farm equipment industry. As mentioned earlier, company manufactures and markets power tillers and tractors under the VST Shakti brand. To provide complete service to the agriculture segment, it also trades in reapers, rotary tillers, weeders & rice transplanters wherein it brands them under its own name and resells. The company imports the same from China/Japan and markets them in the domestic market, earning a trading margin on the same. Company has developed an in-house reaper which it is expected to launch in November 2017 under its own brand. VST also exports a few power tillers & tractors to Africa, Russia, Myanmar, etc. Company exports smaller HP tractors to Europe to serve hobby-based demand in that region. This is limited by high Chinese competition overseas.
Company owns three facilities situated at Whitefield (Bengaluru), Hosur & Mysore. At Bengaluru it assembles power tillers having a total capacity of about 60,000 tillers annually and at Hosur it assembles sub-30 HP tractors having a capacity to support production of 36,000 tractors annually. Company also has plant at Mysore to manufacture engine components and spares for both tractors and tillers. The product portfolio of the company, revenue share from each of the products and its market share in those products are as follows:

RETAIL RESEARCH
RETAIL RESEARCH P a g e | 3

RETAIL RESEARCH
RETAIL RESEARCH P a g e | 4
(Source: Company, HDFC sec)

RETAIL RESEARCH
RETAIL RESEARCH P a g e | 5
Q1FY18 numbers were subdued due to poor rains in Karnataka and delay in Subsidy/DBT settlement: The company witnessed a de-growth in its revenues sequentially of 8.1% and growth of about 4.8% on a YoY basis. The major reason for the fall in the revenues was fall in revenues from the Tiller segment on account of weak industry sentiments. In the compact tractor segment, VTTL grew ~16% while the overall industry growth in the compact segment was adverse 3%. In case of Tillers in the quarter, the industry growth was negative 3% while the VST degrew by 2%. This has helped company tighten its grip in the tiller segment where it improved its market share to 61% from 59% in previous quarter. The decline in the industry was mainly due to weak early monsoon in Karnataka due to which there was lower pull from the farmers. There has been a fall in the EBITDA margin levels which fell to 13.5% from 14.6% in the previous quarter and 15.7% the quarter from the previous fiscal. The reason for reduction in operating profit is due to product mix in tractors as VTTL sold more of 18 HP tractors bearing lower margins as compared to the other models. Higher sales promotion expense incurred for the launch of two new tractor models Viraat Plus and Samraat tractors also had a toll on the margins. However, company grew at the PAT level wherein its PAT margin grew to 15.6% (vs 8.9% & 13.9% QoQ & YoY respectively) on account of disproportionate other income. Of the other income of Rs.14.8 Crs recorded, Rs. 12.5 Crs was on account of the adoption of IndAS as a reporting framework and is not expected to repeat in the coming quarters. Further, the company has seen a lower 6M sales for the H1FY18 on account of poor start to the monsoon which lead to lower sales in the July and August month. However, the rainfall in the latter half of the monsoon recovered and the same is to help company recover the sales lost in the ensuing half. Company had effected a price hike in its compact tractor segment and is waiting for the approval to hike its tiller prices from the relevant regulatory authorities to pass on the increasing input prices. This is to help company in H2FY18 of realizations front as well.
(Source: Company, HDFC sec)

RETAIL RESEARCH
RETAIL RESEARCH P a g e | 6
Investment Rationale: Good monsoon, product additions in sub-30 HP tractor segment & efforts of geographical expansion auger well for company: The rainfall over the country as a whole during the monsoon season (June – September) was 95% of its long period average (LPA). Out of the total 36 meteorological subdivisions, 25 subdivisions constituting 65% of the total area of the country received normal seasonal rainfall, 5 subdivisions received excess rainfall (18% of the total area), and 6 subdivisions (17% of the total area) received deficient seasonal rainfall. The highest rainfall (100% of LPA) was received by South Peninsula and lowest rainfall (90% of LPA) was received by Northwest India. Company’s major revenue is derived from south and east of India and some parts of western and central India. With good monsoon in the current year, company could witness higher demand for its products in the ensuing rabi season and the next kharif season. Also, the company understands the importance of growing its share in the tractor segment to support its growth objectives. In the sub-30 segments till 2016 company had tractors in the range of 18.5 to 22 HP. In order to capture the market further, company introduced newer HP range tractors. It in the year 2016 entered into the 27 HP tractor segment by launching the 27 HP Viraat. On the back of a successful acceptance of the Viraat in the domestic markets, company introduced two newer versions one in the 17HP segment named Samraat and other in the 27 HP segment but with enhanced technical specifications named Viraat Plus. With these new launches, company is now required to introduce a tractor in the 30 HP segment which it plans to bring in the market by end of March 2018. With this, company shall be able to cater roughly all the requirements in the lower HP tractor segment. This could lead to good volume growth expectations for the company in the coming two fiscals. Further, company also indicated the need to gear itself up for the slowly growing power tiller segment in order to maintain improve its market position. The company continues to dominate the power tiller industry and plans to improve its market share by launching a higher HP power tiller with an annual market size of ~4,000 units during FY18E. In order to develop these newer products and to upgrade the existing plant infrastructure, company has planned a capex plan to invest close to Rs.150 crs. It has also started its expending on development on a new facility at Malur, Karnataka. It will use this facility mainly towards manufacturing of any new models launched in future in the power tiller segment and launch of new product lines. The total dealer count of VST is close to 265 as on March 2017. Company intends to take this number to close to 450 dealers by end of FY21. With its present major chunk of revenues coming from the southern and north-eastern regions in the domestic market, there’s a good scope of growth for the company by extending its presence in other parts of the country. The management has indicated that although the acceptance of power tillers in northern region is difficult on account of large size of land holdings by the farmers, we believe that with growing presence in the tractor segment, company can grow its tractor sales in the northern region and derive good growth on the topline front. Hence, with a good monsoon, expanding product portfolio and higher penetration in the untouched markets, company is set to fatten its revenue stream on a consistent basis in the forthcoming fiscals.
RETAIL RESEARCH
RETAIL RESEARCH P a g e | 7
Foray in the higher HP segment of tractors to strengthen its revenue stream: In the tractor space, although VST has a share of close to 17.6% share in the sub-30 HP i.e. smaller tractors segment, the overall market share for tractors is not more than just 2% as it is present only in lower HP segment of tractors. Company realizes that for further growth in the tractor segment, it is required to foray in the higher HP tractors. To give effect to same VST Tillers Ltd. has entered into Technology transfer Agreement with Kukje Machinery Co., Ltd, Korea for Manufacture of Higher HP Tractor (Branson 5025R model) in India. The Tractor will be Co-Branded as "VST SHAKTI BRANSON". Kukje Machinery Co. is part of Tong Yang Moolsan Co., Ltd, Korea (TYM) group and it exports tractors to USA in the brand name of "BRANSON". "BRANSON" is a well-known brand in USA having good track record of quality & customer satisfaction. The said tractor will be in the midsize range of 47 HP and company shall be paying its Korean partner a lumpsome fee and royalty for a period of 6 years. The company shall start with sale of Tractors on trading basis. Once the production line is set up the company shall start with manufacture of sale of said higher HP tractor. The company estimates to start manufacturing and selling the new product by mid FY20. This being a larger ground to play on and with a lot of headroom to grow, company stands to benefit in the long term making the company a more dependable bet. Farm mechanization: VST is a strong bet in increased farm mechanization amid lower tractor penetration. India is the largest tractor market in the world, but also one of the smallest when it comes to tillers. However, India’s tractor penetration is the lowest in the world at 0.8HP/hectare versus 3.0-4.0HP/hectare in case of developed countries. The main reason behind low tractor penetration is fragmented land holdings as 43% of the farmers hold less than two hectares of land and use manual labor. Average size of agricultural land holdings in India has reduced significantly from 1.95 hectares per holding in 1976 to 1.15 hectares per holding in 2016 marking a drop of 41%. It is expected that the average size of agricultural land holdings would further drop to 1.05 hectares per holding by 2021E. Fragmentation of land holdings has led to increase in number of farmers with marginal land holdings.
Also, tiller market size in India is very small as annual tiller sales account for 55,000-60,000 units per annum in India versus 5mn/2mn tiller market size in Japan and China. Even Bangladesh registers 200,000 tiller sales per year. As per World Bank forecasts, the workforce in the rural segment is expected to drop to 25.7% by 2050 thereby giving an impetus to farm mechanization. Further, use of proper equipment can increase the productivity by up to 30% and reduce costs by ~20%, the need for farm mechanization is a top priority.
Tractors constitute a bulk of the farm mechanization industry and India’s tractor penetration being one of the lowest among major economies represents significant latent demand. With the shortage of farm labor, rising wages and focus on productivity, we expect both low-end tractor and tillers to be strong structural bets over the next few years as they are the first upgrade for a small farmer from manual labor. In a country where farm size holdings are diminishing and there is a rise in the number of marginal holdings, the cost of tractor ownership (range of ~Rs.2.5-8 lakh/unit) can be quite prohibitive, given the high cost. This, in turn, throws up a huge opportunity for the domestic power tiller sector wherein a power tiller costs ~Rs.1.25 lakh but suffices to perform most of requisite agricultural operations performed by a tractor. Also lower HP tractors can be preferred by those who can extend their budget to some extent.
RETAIL RESEARCH
RETAIL RESEARCH P a g e | 8
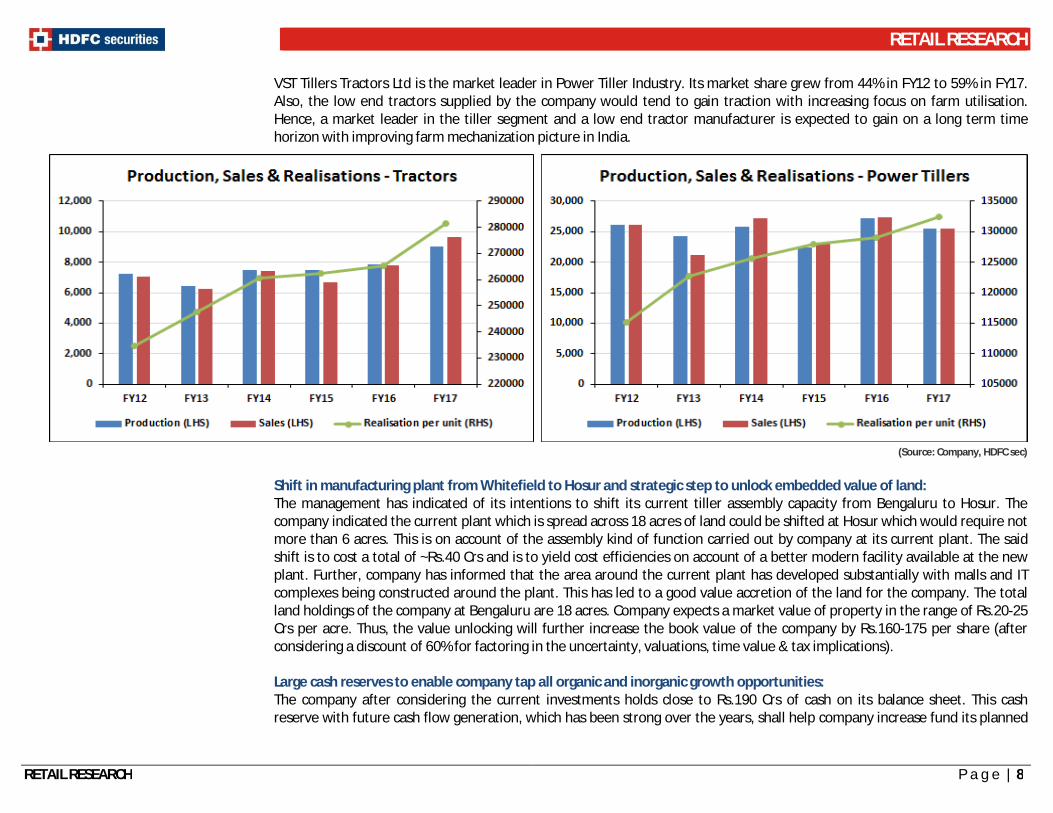
VST Tillers Tractors Ltd is the market leader in Power Tiller Industry. Its market share grew from 44% in FY12 to 59% in FY17. Also, the low end tractors supplied by the company would tend to gain traction with increasing focus on farm utilisation. Hence, a market leader in the tiller segment and a low end tractor manufacturer is expected to gain on a long term time horizon with improving farm mechanization picture in India.
(Source: Company, HDFC sec) Shift in manufacturing plant from Whitefield to Hosur and strategic step to unlock embedded value of land: The management has indicated of its intentions to shift its current tiller assembly capacity from Bengaluru to Hosur. The company indicated the current plant which is spread across 18 acres of land could be shifted at Hosur which would require not more than 6 acres. This is on account of the assembly kind of function carried out by company at its current plant. The said shift is to cost a total of ~Rs.40 Crs and is to yield cost efficiencies on account of a better modern facility available at the new plant. Further, company has informed that the area around the current plant has developed substantially with malls and IT complexes being constructed around the plant. This has led to a good value accretion of the land for the company. The total land holdings of the company at Bengaluru are 18 acres. Company expects a market value of property in the range of Rs.20-25 Crs per acre. Thus, the value unlocking will further increase the book value of the company by Rs.160-175 per share (after considering a discount of 60% for factoring in the uncertainty, valuations, time value & tax implications). Large cash reserves to enable company tap all organic and inorganic growth opportunities: The company after considering the current investments holds close to Rs.190 Crs of cash on its balance sheet. This cash reserve with future cash flow generation, which has been strong over the years, shall help company increase fund its planned

RETAIL RESEARCH
RETAIL RESEARCH P a g e | 9
capex of about Rs.300 crores over next 4 years. A large cash reserve gives a sense of safety among the investor community as it enables the company to grow organically or inorganically without stretching its balance sheet with debt. Healthy Financials: Over the years VTTL has maintained a deleveraged balance sheet with zero debt on its books. It has generated abundantc cash reserves and has been regular in paying the shareholders in the form of dividends. Company has been growing on the revenue front and has seen some downward trend in the past two years in the margins on account of certain unsystematic risks. It is expected to maintain its dividend payout and revenue growth constant and improve on its margins on the back of its efforts.
(Source: Company, HDFC sec)
Concerns: Increasing input costs and regulated tiller prices may weigh down company’s profitability: The steel and other major raw material prices have been in an uptrend for the past 3 quarters or so. To pass on the price hikes, it is easier in the tractor segment but difficult in the tillers space as it need to be approved by the government. Hence, the same may bring down the margin levels for the company despite growing volumes. Higher competition: The company operates in a highly competitive segment in which cheaper Chinese tillers pose a great threat to market share of other organized players. Kirloskar Oil is the new player in the tillers segment (apart from the existing KAMCO, Kuboto, Chinese players) who could provide some competition to VST going forward. Further, the domestic tractor market is highly competitive in nature and any price hike specially in the mid to high HP segment would lead to reduction in volumes.

RETAIL RESEARCH
RETAIL RESEARCH P a g e | 10
Weak monsoon in coming fiscal: As the company is serving the farm equipment segment, a deficit rainfall would directly impact company’s volumes and dent its profitability and valuations as well. DBT/subsidy disbursement inefficiency may dent demand for company’s major revenue earning tiller segment: Delay in disbursement of subsidy/DBT by the government to farmers on purchase of farm equipment will deter the market demand for farm machinery especially for Tillers. Loans to related party: Company has advanced loans to related concerns of promoters at 9% interest rate. Company has advanced Rs. 20 Crs to VST Motors Pvt. Ltd. and Rs.15 Crs to Gove Finance Ltd. High cash per share is pulling down the return ratios: Company needs to decide soon about efficient utilization of cash on its books to avoid dilution in return ratios. View and Valuation: VTTL being an industry major in the tiller segment and a growing company in sub-30HP tractor segment is expected to benefit from the normal monsoon witnessed in the regions of its dominance. Further, company has recently signaled signs of setting up plant for the manufacture of higher HP tractors which shall not only help it grow its revenue but also help improve its margins as higher HP tractors are more value accretive. Company has in the past fiscal launched 2 new tractor models and is expected to bring newer products in both of its major segments i.e. tractors and tillers. An allocation of ~Rs. 150 Crs (over 3-4 years) has been made towards newer product development which could boost company’s future revenues prospects.
Company has huge cash reserves on its balance sheet and consequently enjoys a debt free status. Although company intends to use the available cash for organic expansions and other earmarked capex, we are confident in company’s ability to re-generate cash which can be effectively used for various value accretive purposes. Company has also clarified on its intentions to shift its current capacities and plants from Bengaluru to Hosur. This could free up the land at Bengaluru (Mahadevapura Whitefield) allowing the management to think about monetizing the value of the land in the next 2-3 years.
VTTL is to benefit from the pickup in the tractor sales in FY18, benefit from the new product launches in FY19 and ramp up of higher HP tractors in FY20 along with a possible value unlocking of the Bangalore land holdings in next 2-3 years.
Considering all of the above we value the company on a SOTP basis arriving at sequential target prices of Rs.2550 and Rs.2745.
We think investors could buy the shares at the CMP of Rs.2221 (~18.6x FY19E Core EPS + Cash per share + discounted land value per share) and add on dips to Rs.2005 (~16.5x FY19E Core EPS + Cash per share + discounted land value per share) for

RETAIL RESEARCH
RETAIL RESEARCH P a g e | 11
sequential targets of Rs.2550 (~22.0x FY19E Core EPS + Cash per share + discounted land value per share) and Rs.2745 (~24.0x FY19E Core EPS + Cash per share + discounted land value per share) over the next 3-4 quarters.
Particulars At CMP Target 1 Target 2 Core Business Valuation Core PAT - FY19E 83.5 83.5 83.5 Core P/E 18.6 22.0 24.0 Value of Core Business - A 1,547.3 1,836.9 2,003.9
Cash & Investments (Non Core Investments) - B 223.2 223.2 223.2
Bangalore Land Value Acres of land 18.0 18.0 18.0
Value per acre (Conservative estimate between Rs.20-25 Cr per acre) 20.0 20.0 20.0 MV of Land 360.0 360.0 360.0 Discount @ 60% for for factoring in the uncertainty, valuations, time value & tax implications 216.0 216.0 216.0 Conservative Value of land - C 144.0 144.0 144.0
Total Value of the company (A+B+C) 1,914.5 2,204.2 2,371.2 No. of Shares 0.86 0.86 0.86 Share Price 2,221 2,550 2,745
Standalone Quarterly Financials-
Rs in Cr Q1FY18 Q1FY17 YoY (%) Q4FY17 QoQ (%) FY16 FY17 YoY (%) Revenue from operations 181.2 172.9 4.8% 197.2 -8.1% 646.7 695.1 -7.0% Raw Material Consumed 128.2 116.7 9.9% 90.0 42.4% 404.3 429.5 -5.9% Stock Adjustment -8.0 -4.4 79.7% 36.2 -122.0% 15.6 9.1 71.6% Purchase of Stock 0.0 2.2 -100.0% 2.2 -100.0% 1.2 7.3 -83.7% Employee Expenses 15.8 14.3 10.0% 13.4 17.8% 45.4 58.5 -22.4% Other Expenses 20.7 17.1 21.1% 26.6 -22.2% 67.3 92.0 -26.9% Total Expenditure 156.7 145.8 7.5% 168.3 -6.9% 533.8 596.4 -10.5% EBITDA 24.5 27.1 -9.6% 28.8 -14.9% 112.9 98.7 14.3% Depreciation 2.7 2.4 11.3% 3.4 -20.5% 12.5 11.8 6.2% EBIT 21.9 24.7 -11.6% 25.5 -14.2% 100.3 86.9 15.4% Interest 0.7 0.7 -6.9% 0.7 -6.9% 2.6 3.0 -14.1% Other Income 14.8 8.6 71.8% 2.5 500.0% 12.3 15.6 -21.4% Profit before Tax 36.0 32.6 10.3% 27.2 32.1% 110.0 99.5 10.5% Tax Expenses 7.8 8.6 -10.1% 9.7 -20.1% 35.9 31.1 15.4% Reported Profit After Tax 28.2 24.0 17.6% 17.5 61.1% 74.1 68.4 8.3% EPS 32.62 27.73 17.6% 20.24 61.1% 85.81 79.21 8.3%

RETAIL RESEARCH
RETAIL RESEARCH P a g e | 12
Financials- Profit & Loss - Cash Flow -
Particulars, Rs in Cr FY15 FY16 FY17 FY18E FY19E
Particulars, Rs in Cr FY15 FY16 FY17E FY18E FY19E Revenue from Ops 551.6 646.7 695.1 793.6 901.4
EBT 100.6 110.0 102.9 124.8 137.8
RMC 360.1 404.3 429.5 489.2 555.7
Depreciation 9.4 12.5 11.8 13.9 17.0 Purchase of FG 20.8 1.2 7.3 8.3 9.5
Interest /Dividend paid 2.1 2.6 3.0 2.8 2.5
Stock Adjustment -23.8 15.6 9.1 10.4 11.8
Other Adjustment -10.2 -11.2 -10.8 13.1 -35.8 Employee Benefits 40.6 45.4 58.5 65.1 73.0
(Inc)/Dec in WCap -44.3 10.4 20.3 -27.2 -27.5
Other Expenses 53.6 67.3 92.0 101.6 112.7
Tax Paid -31.6 -39.2 -37.6 -38.7 -41.3 Total Expenses 451.4 533.8 596.4 674.6 762.6
Operating CFs 26.0 85.2 89.5 88.7 52.7
EBITDA 100.2 112.9 98.7 119.0 138.8
Capex -29.6 -8.1 -35.6 -69.0 -58.0 Depreciation 9.4 12.5 11.8 13.9 17.0
Sale of FA 0.1 0.2 3.4 4.0 3.0
EBIT 90.8 100.3 86.9 105.1 121.8
(Purch)/Sale of Inves. 16.5 -41.4 -53.7 -10.6 14.4 Interest 2.1 2.6 3.0 2.8 2.5
Others 0.0 6.5 8.4 9.0 12.0
Other Income 11.9 12.3 18.9 22.5 18.5
Investing CFs -12.9 -42.8 -77.5 -66.6 -28.6 Profit before Tax 100.6 110.0 102.8 124.8 137.8
Inc/(Dec) in Share cap 0.0 0.0 0.0 0.0 0.0
Tax Expenses 31.0 35.9 31.1 38.7 41.3
Inc/(Dec) in Debt 0.0 0.0 0.0 0.0 0.0 PAT 69.5 74.1 71.7 86.1 96.4
Divi and Int Paid -17.3 -33.8 -3.0 -18.4 -19.8
EPS 80.5 85.8 83.0 99.7 111.6
Financing CFs -17.3 -33.8 -3.0 -18.4 -19.8
Net Cash Flow -4.2 8.6 9.0 3.8 4.3
Opening Balance 22.2 18.0 26.6 35.6 39.4
Closing Balance 18.0 26.6 35.6 39.4 43.7
Balance Sheet - Financial Ratios -
Particulars, Rs in Cr FY15 FY16 FY17 FY18E FY19E
Particulars FY15 FY16 FY17 FY18E FY19E LIABLITIES
No of Equity Shares-cr 0.9 0.9 0.9 0.9 0.9
Share Capital 8.6 8.6 8.6 8.6 8.6
Enterprise Value-cr 1814.6 1771.3 1728.7 1739.1 1722.4 Reserves and Surplus 354.9 411.5 480.4 551.0 630.2
Shareholders’ Funds: 363.5 420.1 489.1 559.6 638.8
EPS 80.5 85.8 83.0 99.7 111.6 Long Term Borrowings 0.0 0.0 0.0 0.0 0.0
Cash EPS 91.3 100.3 96.7 115.8 131.4
Deferred Tax Liabilities (Net) 4.7 4.6 3.7 3.5 3.3
BVPS 420.8 486.3 566.1 647.8 739.4 Other Long Term Liab 31.7 36.5 39.9 41.2 43.0
Cash Per share 113.6 164.0 247.5 239.7 258.4
Long Term Provisions 2.5 2.1 2.7 2.9 3.1
Non-Current Liabilities: 38.9 43.2 46.4 47.6 49.4
PE(x) 27.6 25.9 26.8 22.3 19.9
Short Term Borrowings 0.0 0.0 0.0 0.0 0.0
P/BV (x) 5.3 4.6 3.9 3.4 3.0 Trade Payables 16.5 32.3 36.3 39.1 46.9
Mcap/Sales(x) 3.5 2.9 2.7 2.4 2.1
Other Current Liabilities 36.2 36.7 45.3 48.2 51.3
EV/EBITDA 18.1 15.7 17.5 14.6 12.4 Short Term Provisions 17.0 1.2 1.6 1.8 2.0
Current Liabilities: 69.7 70.1 83.2 89.1 100.2
EBITDAM (%) 18.2% 17.5% 14.2% 15.0% 15.4% Total 472.1 533.4 618.6 696.4 788.4
EBITM (%) 16.5% 15.5% 12.5% 13.2% 13.5%
ASSETS:
PATM (%) 12.6% 11.5% 10.3% 10.9% 10.7% Fixed Assets 136.8 129.8 136.9 188.0 221.0
RETAIL RESEARCH
RETAIL RESEARCH P a g e | 13
Non Current Investments 9.4 16.5 57.3 60.0 62.0
ROCE (%) 30.4% 28.7% 22.6% 24.3% 23.4% Long Term Loans and 9.2 11.5 6.4 7.8 8.9
RONW (%) 20.6% 18.9% 15.8% 16.4% 16.1%
Non-Current Assets: 155.3 157.8 200.6 255.8 291.9
ROIC (%) 26.6% 24.4% 22.6% 22.7% 22.3% Current Investments 85.8 119.8 153.6 140.3 152.7
Dividend Payout % 18.6% 17.5% 18.1% 18.1% 17.9%
Inventories 100.2 80.4 70.7 82.6 96.3
Trade Receivables 93.9 123.8 132.3 147.8 170.4
Current Ratio 2.34 2.56 3.46 2.71 4.54
Cash and Bank Balances 18.4 27.7 36.6 39.4 43.7
Quick Ratio 1.65 1.89 2.24 2.02 3.11 ST Loans and Advances 18.1 23.2 23.4 28.6 31.3
Other Current Assets 0.4 0.7 1.5 1.8 2.1 Current Assets: 316.8 375.6 418.0 440.6 496.5 Total 472.1 533.4 618.6 696.4 788.4
(Source: Company, HDFC sec)
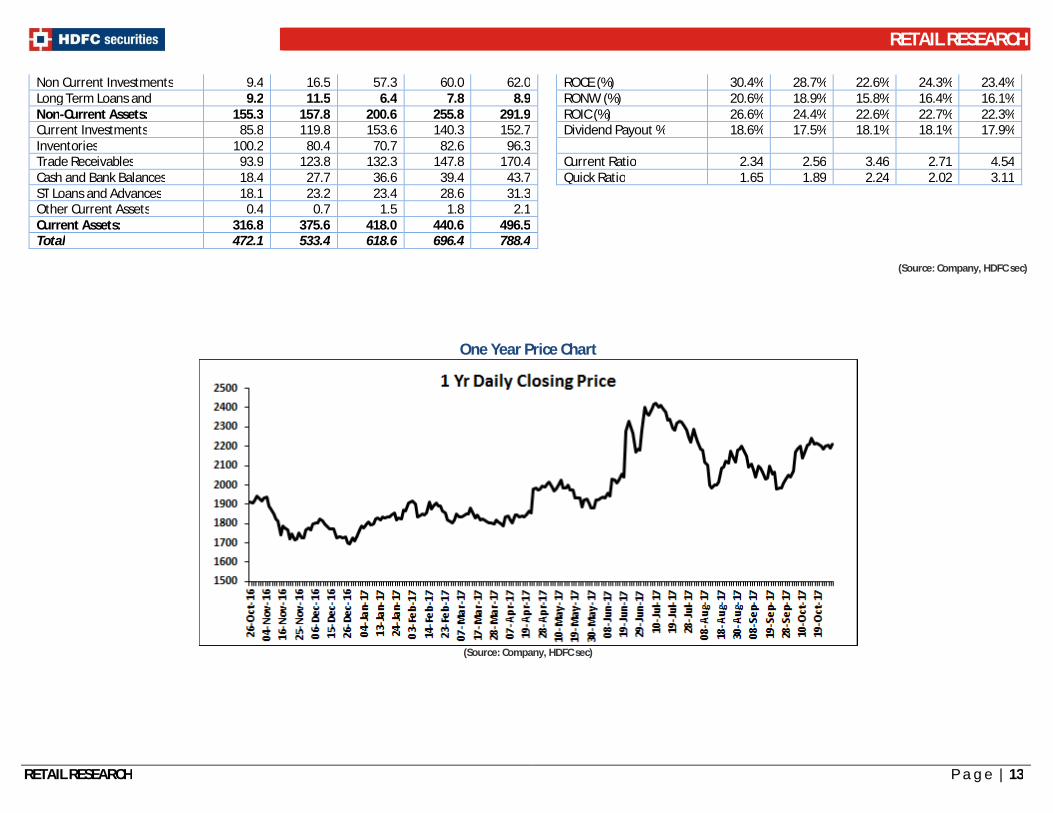
One Year Price Chart
(Source: Company, HDFC sec)

RETAIL RESEARCH
RETAIL RESEARCH P a g e | 14
Fundamental Research Analyst: CA Arpit Bhatt ([email protected]) HDFC securities Limited, I Think Techno Campus, Building - B, "Alpha", Office Floor 8, Near Kanjurmarg Station, Opp. Crompton Greaves, Kanjurmarg (East), Mumbai 400 042 Phone: (022) 3075 3400 Fax: (022) 2496 5066Website: www.hdfcsec.com Email: [email protected]. Compliance Officer: Binkle R. Oza Email: [email protected] Phone: (022) 3045 3600 __________________________________________________________________________________________________________________________________________________________________________________________ Disclosure: I, (Arpit Bhatt, CA), authors and the names subscribed to this report, hereby certify that all of the views expressed in this research report accurately reflect our views about the subject issuer(s) or securities. HSL has no material adverse disciplinary history as on the date of publication of this report. We also certify that no part of our compensation was, is, or will be directly or indirectly related to the specific recommendation(s) or view(s) in this report. Research Analyst or his/her relative or HDFC Securities Ltd. does not have any financial interest in the subject company. Also Research Analyst or his relative or HDFC Securities Ltd. or its Associate does not have beneficial ownership of 1% or more in the subject company at the end of the month immediately preceding the date of publication of the Research Report. Further Research Analyst or his relative or HDFC Securities Ltd. or its associate does not have any material conflict of interest. Any holding in stock – No HDFC Securities Limited (HSL) is a SEBI Registered Research Analyst having registration no. INH000002475. Disclaimer: This report has been prepared by HDFC Securities Ltd and is meant for sole use by the recipient and not for circulation. The information and opinions contained herein have been compiled or arrived at, based upon information obtained in good faith from sources believed to be reliable. Such information has not been independently verified and no guaranty, representation of warranty, express or implied, is made as to its accuracy, completeness or correctness. All such information and opinions are subject to change without notice. This document is for information purposes only. Descriptions of any company or companies or their securities mentioned herein are not intended to be complete and this document is not, and should not be construed as an offer or solicitation of an offer, to buy or sell any securities or other financial instruments. This report is not directed to, or intended for display, downloading, printing, reproducing or for distribution to or use by, any person or entity who is a citizen or resident or located in any locality, state, country or other jurisdiction where such distribution, publication, reproduction, availability or use would be contrary to law or regulation or what would subject HSL or its affiliates to any registration or licensing requirement within such jurisdiction. If this report is inadvertently send or has reached any individual in such country, especially, USA, the same may be ignored and brought to the attention of the sender. This document may not be reproduced, distributed or published for any purposes without prior written approval of HSL. Foreign currencies denominated securities, wherever mentioned, are subject to exchange rate fluctuations, which could have an adverse effect on their value or price, or the income derived from them. In addition, investors in securities such as ADRs, the values of which are influenced by foreign currencies effectively assume currency risk. It should not be considered to be taken as an offer to sell or a solicitation to buy any security. HSL may from time to time solicit from, or perform broking, or other services for, any company mentioned in this mail and/or its attachments. HSL and its affiliated company(ies), their directors and employees may; (a) from time to time, have a long or short position in, and buy or sell the securities of the company(ies) mentioned herein or (b) be engaged in any other transaction involving such securities and earn brokerage or other compensation or act as a market maker in the financial instruments of the company(ies) discussed herein or act as an advisor or lender/borrower to such company(ies) or may have any other potential conflict of interests with respect to any recommendation and other related information and opinions. HSL, its directors, analysts or employees do not take any responsibility, financial or otherwise, of the losses or the damages sustained due to the investments made or any action taken on basis of this report, including but not restricted to, fluctuation in the prices of shares and bonds, changes in the currency rates, diminution in the NAVs, reduction in the dividend or income, etc. HSL and other group companies, its directors, associates, employees may have various positions in any of the stocks, securities and financial instruments dealt in the report, or may make sell or purchase or other deals in these securities from time to time or may deal in other securities of the companies / organizations described in this report.
HSL or its associates might have managed or co-managed public offering of securities for the subject company or might have been mandated by the subject company for any other assignment in the past twelve months. HSL or its associates might have received any compensation from the companies mentioned in the report during the period preceding twelve months from t date of this report for services in respect of managing or co-managing public offerings, corporate finance, investment banking or merchant banking, brokerage services or other advisory service in a merger or specific transaction in the normal course of business. HSL or its analysts did not receive any compensation or other benefits from the companies mentioned in the report or third party in connection with preparation of the research report. Accordingly, neither HSL nor Research Analysts have any material conflict of interest at the time of publication of this report. Compensation of our Research Analysts is not based on any specific merchant banking, investment banking or brokerage service transactions. HSL may have issued other reports that are inconsistent with and reach different conclusion from the information presented in this report. Research entity has not been engaged in market making activity for the subject company. Research analyst has not served as an officer, director or employee of the subject company. We have not received any compensation/benefits from the subject company or third party in connection with the Research Report.
This report is intended for non-Institutional Clients only. The views and opinions expressed in this report may at times be contrary to or not in consonance with those of Institutional Research or PCG Research teams of HDFC Securities Ltd. and/or may have different time horizons
HDFC Securities Limited, SEBI Reg. No.: NSE-INB/F/E 231109431, BSE-INB/F 011109437, AMFI Reg. No. ARN: 13549, PFRDA Reg. No. POP: 04102015, IRDA Corporate Agent License No.: HDF 2806925/HDF C000222657, SEBI Research Analyst Reg. No.: INH000002475, CIN - U67120MH2000PLC152193
Mutual Funds Investments are subject to market risk. Please read the offer and scheme related documents carefully before investing.