National Aluminium Company Ltd Agro Ltd - HDFC securities
10
RETAIL RESEARCH Pick of the Week 27 Feb 2017 National Aluminium Company Ltd Agro Ltd RETAIL RESEARCH Page | 1 Industry CMP Recommendation Add on dips to Sequential Targets Time Horizon Metal- Aluminium Rs. 65.80 Buy at CMP and add on declines Rs. 57-59.5 Rs. 77 – 85.40 2-3 quarters We had issued a Pick of the Week report on Oct 10, 2016 (when its CMP was at Rs.49) with a recommendation to buy at CMP and add the stock in the price band of Rs. 42.5-44 for sequential targets of Rs 57.50 and Rs 61 in 2-3 quarters. The stock achieved both the targets on 25 th Nov and 6 th Dec 2016 respectively and later made a high of Rs.79.35 on Jan 27, 2017. Refer: http://hdfcsec.com/Share-Market-Research/Research-Details/StockReports/3019472. We now review the developments in the company and provide our updated view on the stock. Company Description: National Aluminium Company Ltd (NALCO) is a Navratna company (Government of India holds 74.6% stake) and is a fully integrated producer of Alumina and Aluminium. It has an installed capacity of 2.28MT, 0.46MT, and 1200MW for Alumina, Aluminium, and Power, respectively. Aluminum contributes ~67%, Alumina ~32% and Power 1% of its revenue for FY16. NALCO is lowest cost producer of Alumina globally, supported by captive bauxite mines at Panchpatmali in Odissa with capacity of Mines is 0.6825 MTPA (estimated reserve of 160 MT). NALCO is better placed compared to its peers owing to high sales of alumina. Investment Rationale: Aggressive capex plan for FY17E onwards including plan to set up a power plant in Odisha, Recent operating performance promises healthy growth ahead, Captive R&D centre could help to provide immense competitive benefits, Low cost advantage-Margins to remain healthy, Coal Block allocation and bridge linkage facility to benefit NALCO, Strong fundamentals and consistent dividend/buyback payouts. Concerns: Slowdown in Chinese economy and its impact on global demand for aluminium/alumina and their prices, Low Return ratios, Forex Fluctuations, Volatility in coal prices, Majority owner’s interest may not be aligned with those of minority shareholders, Elevated power & fuel costs results in aluminium segment continuously underperforming View and Valuation: Price rise in base metal could help to generate more revenue and margins for NALCO and its's profitability would remain largely intact on the back of low cost of production, improvement the prices of alumina prices. NALCO's alumina cost of production, which is one of the lowest in the world due to its high grade captive bauxite mine. With expectation of better revenue growth, higher margin on the back of lower raw material prices and consistency of dividend/buyback payout, we are optimistic on the stock. NALCO’s share price is correlated with Alumina/Aluminium prices to a large extent. NALCO will gain HDFC Scrip Code NATALUEQNR BSE Code 532234 NSE Code NATIONALUM Bloomberg NACL IN CMP Feb 23 2017 Rs. 65.80 Equity Capital (Rs crs) 966.5 Face Value (Rs) 5.0 Equity Share O/S (crs) 193.3 Market Cap (Rs crs) 12718.7 Book Value (Rs) 50.1 Avg. 52 Wk Volumes 318237 52 Week High 79.4 52 Week Low 32.6 Shareholding Pattern % (Dec 31, 2016) Promoters 74.6 Institutions 16.5 Non Institutions 8.9 Total 100.0 Fundamental Research Analyst Abdul Karim [email protected]
-
Upload
khangminh22 -
Category
Documents
-
view
1 -
download
0
Transcript of National Aluminium Company Ltd Agro Ltd - HDFC securities

RETAIL RESEARCH Pick of the Week 27 Feb 2017
National Aluminium Company Ltd
Agro Ltd
RETAIL RESEARCH P a g e | 1
Industry CMP Recommendation Add on dips to Sequential Targets Time Horizon
Metal- Aluminium Rs. 65.80 Buy at CMP and add on declines Rs. 57-59.5 Rs. 77 – 85.40 2-3 quarters
We had issued a Pick of the Week report on Oct 10, 2016 (when its CMP was at Rs.49) with a recommendation to buy at CMP and add the stock in the price band of Rs. 42.5-44 for sequential targets of Rs 57.50 and Rs 61 in 2-3 quarters. The stock achieved both the targets on 25th Nov and 6th Dec 2016 respectively and later made a high of Rs.79.35 on Jan 27, 2017. Refer: http://hdfcsec.com/Share-Market-Research/Research-Details/StockReports/3019472. We now review the developments in the company and provide our updated view on the stock.
Company Description: National Aluminium Company Ltd (NALCO) is a Navratna company (Government of India holds 74.6% stake) and is a fully integrated producer of Alumina and Aluminium. It has an installed capacity of 2.28MT, 0.46MT, and 1200MW for Alumina, Aluminium, and Power, respectively. Aluminum contributes ~67%, Alumina ~32% and Power 1% of its revenue for FY16. NALCO is lowest cost producer of Alumina globally, supported by captive bauxite mines at Panchpatmali in Odissa with capacity of Mines is 0.6825 MTPA (estimated reserve of 160 MT). NALCO is better placed compared to its peers owing to high sales of alumina.
Investment Rationale:
Aggressive capex plan for FY17E onwards including plan to set up a power plant in Odisha,
Recent operating performance promises healthy growth ahead,
Captive R&D centre could help to provide immense competitive benefits,
Low cost advantage-Margins to remain healthy,
Coal Block allocation and bridge linkage facility to benefit NALCO,
Strong fundamentals and consistent dividend/buyback payouts.
Concerns:
Slowdown in Chinese economy and its impact on global demand for aluminium/alumina and their prices,
Low Return ratios, Forex Fluctuations,
Volatility in coal prices, Majority owner’s interest may not be aligned with those of minority shareholders,
Elevated power & fuel costs results in aluminium segment continuously underperforming
View and Valuation: Price rise in base metal could help to generate more revenue and margins for NALCO and its's profitability would remain largely intact on the back of low cost of production, improvement the prices of alumina prices. NALCO's alumina cost of production, which is one of the lowest in the world due to its high grade captive bauxite mine. With expectation of better revenue growth, higher margin on the back of lower raw material prices and consistency of dividend/buyback payout, we are optimistic on the stock. NALCO’s share price is correlated with Alumina/Aluminium prices to a large extent. NALCO will gain
HDFC Scrip Code NATALUEQNR
BSE Code 532234
NSE Code NATIONALUM
Bloomberg NACL IN
CMP Feb 23 2017 Rs. 65.80
Equity Capital (Rs crs) 966.5
Face Value (Rs) 5.0
Equity Share O/S (crs) 193.3
Market Cap (Rs crs) 12718.7
Book Value (Rs) 50.1
Avg. 52 Wk Volumes 318237
52 Week High 79.4
52 Week Low 32.6
Shareholding Pattern % (Dec 31, 2016)
Promoters 74.6
Institutions 16.5
Non Institutions 8.9
Total 100.0
Fundamental Research Analyst Abdul Karim [email protected]

RETAIL RESEARCH
RETAIL RESEARCH P a g e | 2
from operating leverage in Aluminium because of high fixed costs as it expects production to increase by ~20% over FY16-FY18 on improved domestic coal supply.
We feel investors could buy the stock at the CMP and add on dips to Rs. 57-59.5 band (~4.75x FY19E EV/EBITDA) for sequential targets of Rs.77 (7x FY19E EV/EBITDA) and Rs 85.4 (8x FY19E EV/EBITDA) over the next 2-3 quarters. At the CMP of Rs 65.80 the stock trades at 5.6x FY19E EV/EBITDA.
Financial Summary:
Particulars (Rs cr) Q3FY17 Q3FY16 YoY-% Q2FY17 QoQ-% FY16 FY17E FY18E FY19E
Net Sales 1963.8 1723.8 13.9% 1813.2 8.3% 6703.3 7243.6 8276.5 8912.2
EBITDA 285.2 141.5 101.5% 172.3 65.5% 938.0 1025.0 1365.6 1622.0
APAT 181.1 94.4 91.7% 121.2 49.3% 677.6 659.1 910.2 1088.0
Diluted EPS (Rs) 0.9 0.4 155.7% 0.6 49.3% 2.8 3.4 4.7 5.6
P/E 23.2 19.3 14.0 11.7
EV / EBITDA 11.9 9.4 6.9 5.4
EV/EBITDA ( without adj- Cash) 18.1 12.4 9.3 7.8 (Source: Company, HDFC sec)
Investment Rationale:
Aggressive capex plans for FY17E onward: NALCO and NTPC have entered into agreement on Dec 16, 2016 to form a JV NTPC-Nalco Power Company (NNPC) for developing power projects. The JV plans to set up its first power plant at Gajamara (Odisha) with a capacity of 2,400 MW (3X800 MW), at an estimated investment of Rs 14,000 crore. This project requires 1500 acre land, which could be provided by OIDCO (Odisha Industrial Development Corporation). The proposed super critical power plant will supply uninterrupted 80% of the power to Nalco’s smelter at Angul and Kamakhyanagar in Dhenkanal. The proposed smelter’s capacity is pegged at 0.5 million tones and 0.6 million tonnes per annum respectively to be set up at a cost of Rs.10,000 cr and Rs.12,000 cr respectively. Kamakhya nagar smelter is expected to go on stream in four years. This state-of-the-art facility will use the latest aluminium smelting technology. The proposed expansion will help the Nalco to achieve economy of scale and substantially reduce its cost of production. This expansion will be taken up immediately by Nalco, incorporating latest technology ensuring reduced energy consumption and high productivity.
Nalco and Neelachal Ispat Nigam Limited (NINL) have on Jan 31, 2017 signed an MoU to set up a joint venture company for producing coal tar pitch in Odisha. The agreement is part of the new business plan of Nalco to ensure backward integration and sustain the plans for forward integration. Under the JV, the coal tar distillation plant that is proposed to be set up, will use the coal tar generated from NINL’s coke oven plant at its 1.1 million tonne per annum integrated iron and steel plant at Kalinga Nagar in Duburi. NINL will be preparing a techno-economic feasibility report for the JV project.
Recent operating performance promises healthy growth ahead: NALCO achieved production of 53.23 lakh tonnes of bauxite in 9MFY17, compared to 45.74 lakh tonnes over the same period of the previous fiscal, registering 16 % (YoY) growth. The company produced 15.27 lakh tonnes of alumina hydrate, against

RETAIL RESEARCH
RETAIL RESEARCH P a g e | 3
14.37 lakh tonnes achieved in the corresponding period of the previous financial year. Metal production was 2.86 lakh tonnes, against 2.76 lakh tones registered during the comparable nine months of the previous fiscal. The net power generated during the period was 4494 million units, against 4351 million units achieved in the corresponding period of the previous year. The company has generated 164 million units of wind power during the first 9 months of this fiscal.
In Q3FY17, Alumina production was up 27% QoQ/9% YoY to best-ever 566000 tons. Sales growth was lower at 7% QoQ to 311000 tons. Realization was up 1% QoQ to USD269/t as benefit of recent alumina price increase is likely to flow with a lag. Cost of production (CoP) declined USD10/t QoQ to USD211/t. Aluminum production was up 6% QoQ to 99000 tons, which is ramping up ahead of expectation. Sales were flat QoQ at 99000 tons. CoP declined ~USD100/t QoQ on operating leverage.
OPM in Q3FY17 was at a 5 quarter high. Alumina realizations could rise in Q4 and beyond from $269 per tonne as spot prices have moved up by about 25% since.
Captive R&D centre could help to provide immense competitive benefits: NALCO plans to set up a Research & Technology Centre at Bhubaneswar to boost research initiatives, including development of new products & alloys. NALCO has already set a niche in the field of R&D in the Aluminium industry. Nalco R&D centre has already registered 29 patents of which five have been commercialized and company has entered into an R&D Co-operation Agreement with Rio Tinto Alcan for development of technology which aims to reduce energy consumption at the smelter by about 5%. Waste utilization, maximizing productivity, reduction of specific consumption, development of new products & alloys are key research areas that will complement the new business plan being put together by the company.
Low cost advantage-Margins to remain healthy: NALCO’s lowest cost bauxite mines make it one of the lowest cost alumina producers globally. Company has cut alumina production cost to ~$210 a tonne compared to the global benchmark of $220-230 per ton. NALCO recently signed the allocation agreement for two coal blocks with combined capacity of over 200 million tonne. The company is investing Rs 2000 crore on development of these blocks. It could further aid margins over the medium term. It expects to begin coal production from Utkal D mine in two years. Availability of coal from this block would help to reduce production cost by about Rs 500 a tonne.
Possibility of levy of Minimum import price could help NALCO improve realizations and margins: To counter “dumping” of cheap aluminium products, the commerce ministry reportedly has given an in-principle nod for imposing Minimum Import Price (MIP) on aluminium products. The final decision will be taken in the next two weeks. As and when this happens, it will improve realizations and margins for aluminium manufacturers like NALCO.
Strong fundamentals and Consistent on dividend payouts: NALCO’s stable and efficient operations have strengthened its balance sheet and return ratios over the years. NALCO has had a healthy track record of generating free cash flow. Barring two instances (FY09 and FY13) in the last 12 years, it has generated positive FCF every year. Going forward, the FCF yield is set to decline as capex on the Damanjodi refinery expansion and other plans picks up. As on 30th Sept, 2016, NALCO has Rs. ~2800cr of cash and cash equivalent, implying Rs. ~15 per share or ~23% of the CMP. NALCO has declared 40% dividend for FY16 resulting in an attractive dividend yield of ~3%. We expect similar payouts going ahead. It has also conducted buyback in Sept 2016 buying back 64.43 cr shares @Rs.44 per share.

RETAIL RESEARCH
RETAIL RESEARCH P a g e | 4
NALCO has kept pay-out ratio in the range of 40-70%. Being a PSU, we expect dividend yields to stay high in the future as well.
Cash and Cash Equivalent/Share Dividend Payout-%
(Source: Company, HDFC sec)
Concerns:
Slowdown in Chinese economy and its impact on global demand for aluminium and prices: Global demand of Aluminium has entered a period of flux, with large variations seen in off-take in different regions. Macroeconomic indicators suggest that the Chinese economy had slowed in 2016. Slowing demand from the construction sector, which accounts for nearly one-third of total demand for Aluminium in China is likely to have a significant impact on Aluminium demand.
China which has close to 50 per cent share in both production and consumption, dominates the 57-58 million-tonne aluminium market. An additional four million tonnes of Chinese capacity is said to be coming on line. About half-a-million-tonne smelter restarts are also on the cards. While the aluminium metal recorded a 12 per cent price gain in 2016 over the previous year, in the current year it will struggle to hold on to the gain, unless demand turns more helpful. In the last quarter of 2016, investors recognised the pull of tighter fundamentals and a Chinese economy responding to stimulus. Now, the big question is whether the momentum seen in Q4 will carry into this year.
Volatility in coal prices: Coal prices internationally have started to rise in 2016 year after remaining subdued last year. Though the local coal prices trends are not the same as global prices, any large increase in coal prices could have an adverse impact on margins of the company as NALCO has a captive Thermal Power Plant with generation capacity of 1200 MW (10X120MW). The coal demand is met from a mine of 3.5 Million TPA capacity opened up for NALCO, initially at Bharatpur in Talcher by Mahanadi Coalfields Limited. Any disruptions of coal supply could impact its operation and volatility in coal prices could hit its margin.
RETAIL RESEARCH
RETAIL RESEARCH P a g e | 5
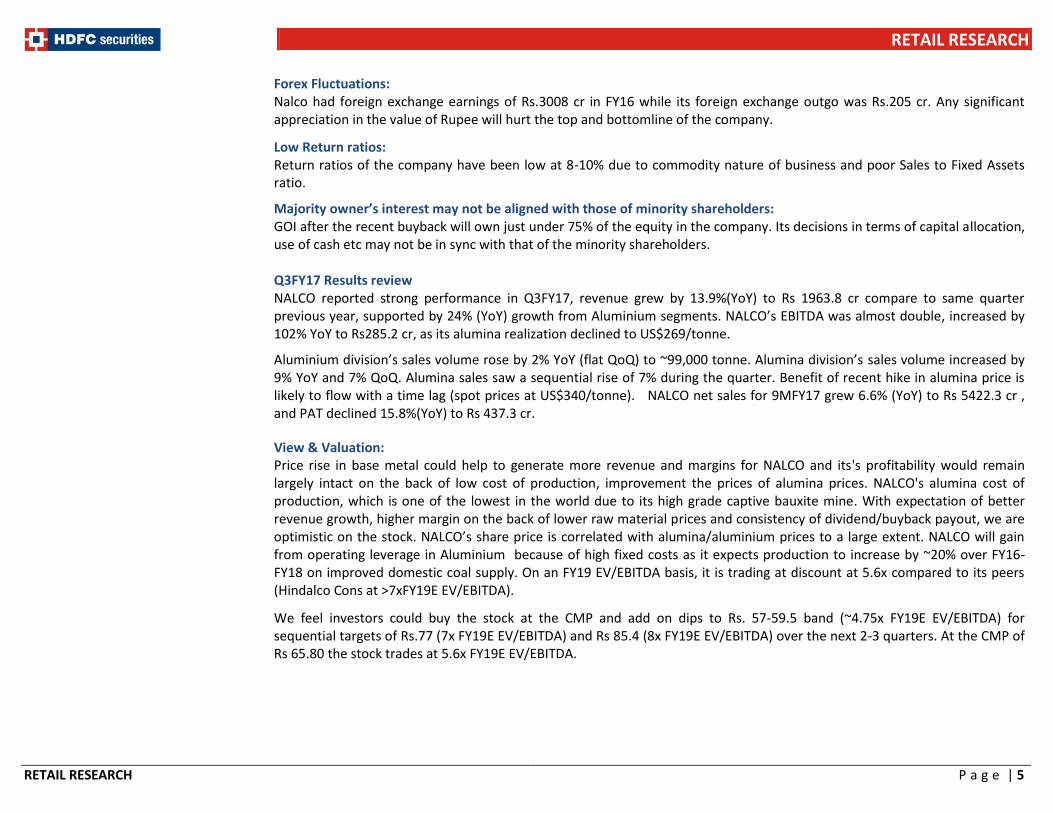
Forex Fluctuations: Nalco had foreign exchange earnings of Rs.3008 cr in FY16 while its foreign exchange outgo was Rs.205 cr. Any significant appreciation in the value of Rupee will hurt the top and bottomline of the company.
Low Return ratios: Return ratios of the company have been low at 8-10% due to commodity nature of business and poor Sales to Fixed Assets ratio.
Majority owner’s interest may not be aligned with those of minority shareholders: GOI after the recent buyback will own just under 75% of the equity in the company. Its decisions in terms of capital allocation, use of cash etc may not be in sync with that of the minority shareholders.
Q3FY17 Results review NALCO reported strong performance in Q3FY17, revenue grew by 13.9%(YoY) to Rs 1963.8 cr compare to same quarter previous year, supported by 24% (YoY) growth from Aluminium segments. NALCO’s EBITDA was almost double, increased by 102% YoY to Rs285.2 cr, as its alumina realization declined to US$269/tonne.
Aluminium division’s sales volume rose by 2% YoY (flat QoQ) to ~99,000 tonne. Alumina division’s sales volume increased by 9% YoY and 7% QoQ. Alumina sales saw a sequential rise of 7% during the quarter. Benefit of recent hike in alumina price is likely to flow with a time lag (spot prices at US$340/tonne). NALCO net sales for 9MFY17 grew 6.6% (YoY) to Rs 5422.3 cr , and PAT declined 15.8%(YoY) to Rs 437.3 cr.
View & Valuation: Price rise in base metal could help to generate more revenue and margins for NALCO and its's profitability would remain largely intact on the back of low cost of production, improvement the prices of alumina prices. NALCO's alumina cost of production, which is one of the lowest in the world due to its high grade captive bauxite mine. With expectation of better revenue growth, higher margin on the back of lower raw material prices and consistency of dividend/buyback payout, we are optimistic on the stock. NALCO’s share price is correlated with alumina/aluminium prices to a large extent. NALCO will gain from operating leverage in Aluminium because of high fixed costs as it expects production to increase by ~20% over FY16-FY18 on improved domestic coal supply. On an FY19 EV/EBITDA basis, it is trading at discount at 5.6x compared to its peers (Hindalco Cons at >7xFY19E EV/EBITDA).
We feel investors could buy the stock at the CMP and add on dips to Rs. 57-59.5 band (~4.75x FY19E EV/EBITDA) for sequential targets of Rs.77 (7x FY19E EV/EBITDA) and Rs 85.4 (8x FY19E EV/EBITDA) over the next 2-3 quarters. At the CMP of Rs 65.80 the stock trades at 5.6x FY19E EV/EBITDA.

RETAIL RESEARCH
RETAIL RESEARCH P a g e | 6
Aluminium (Domestic and LME) and Alumina Prices over the last 3 years:
Domestic Aluminium Prices, LME Aluminium Prices($) Alumina Prices
(Source: Quandl.com, HDFC sec)
Quarterly Financials- Particulars(Rs in Cr) Q3FY17 Q3FY16 YoY-% Q2FY17 QoQ-% 9MFY17 9MFY16 YoY-%
Net Sales 1963.8 1723.8 13.9% 1813.2 8.3% 5422.3 5086.8 6.6%
Other Operating Income 24.3 19.3 26.1% 32.9 -26.0% 78.0 75.2 3.8%
Total Income from Operation 1988.1 1743.1 14.1% 1846.1 7.7% 5500.3 5161.9 6.6%
Raw Material Consumed 336.2 304.4 10.5% 283.7 18.5% 866.9 817.5 6.0%
Stock Adjustment -106.1 -48.9 116.9% 36.1 -393.9% -236.8 -187.8 26.1%
Employee Expenses 355.9 355.8 0.0% 351.9 1.2% 1054.8 1057.6 -0.3%
Power, Oil & Fuel 591.3 508.4 16.3% 528.3 11.9% 1623.6 1426.6 13.8%
Other Expenses 525.6 481.9 9.1% 473.8 10.9% 1539.7 1328.8 15.9%
Total Expenditure 1702.9 1601.5 6.3% 1673.8 1.7% 4848.1 4442.6 9.1%
EBITDA 285.2 141.5 101.5% 172.3 65.5% 652.2 719.4 -9.3%
Depreciation 117.7 107.3 9.7% 135.3 -13.0% 371.8 315.3 17.9%
EBIT 167.6 34.3 389.1% 37.0 352.4% 280.4 404.1 -30.6%
Interest 0.6 0.5 15.4% 0.6 7.1% 1.7 2.7 -38.0%
Other Income 75.9 140.7 -46.1% 136.9 -44.6% 346.3 427.3 -18.9%
Profit before tax and EI 242.8 174.5 39.2% 173.3 40.1% 625.0 828.6 -24.6%
Exceptional Item(EI) 37.1 -53.5 169.5% 0.0 - 37.1 -53.5 -169.5%
Profit before tax 205.7 227.9 -9.8% 173.3 18.7% 587.9 882.0 -33.3%
Tax 61.8 80.1 -22.8% 52.1 18.5% 187.8 309.0 -39.2%
PAT 143.9 147.9 -2.7% 121.2 18.7% 400.2 573.0 -30.2%
Adjusted Profit 181.1 94.4 91.7% 121.2 49.3% 437.3 519.6 -15.8%
EPS 0.9 0.4 155.7% 0.6 49.3% 2.3 2.0 -12.2%

RETAIL RESEARCH
RETAIL RESEARCH P a g e | 7
(Source: Company, HDFC sec) Segment Overview
Particulars, Rs in Cr Q3FY17 Q2FY17 Q1FY17 Q4FY16 Q3FY16 Q2FY16 Q1FY16 Q4FY15 Q3FY15 Q2FY15 Q1FY15
Revenue
Chemicals 962.22 864.39 934.37 892.76 933.7 1034.78 769.9 871.33 985.77 1068.11 871.33
Aluminium 1394.55 1296.49 1140.17 1223.2 1122.36 1259.61 1042.26 1072.62 1272.66 1248.99 1072.62
Aunallocated Common 8.7 27.69 21.96 7.88 6.57 21.99 13.81 15.72 5.92 28.05 13.81
Less : Inter segmental 401.66 375.37 351.23 286.98 446.66 423.5 355.87 308.38 387.54 389.51 355.87
Total 1963.81 1813.2 1745.27 1836.86 1615.97 1892.88 1470.1 1651.29 1876.81 1955.64 1601.89
EBT
Chemicals 206.48 147.45 214.79 125.22 256.5 322.26 180.1 200.07 336.08 315.51 200.07
Aluminium 11.46 -99.94 -105.95 64.74 -132.37 -111.05 -9.61 31.09 149.13 95.36 31.09 (Source: Company, HDFC sec)
Financials –Consolidated Income Statement Cash Flow
Particulars, Rs in Cr FY15 FY16 FY17E FY18E FY19E
Particulars, Rs in Cr FY15 FY16 FY17E FY18E FY19E
Net Sales 7261.9 6703.3 7243.6 8276.5 8912.2
EBT 2113.5 1102.8 969.2 1338.5 1600.0
Other Operating Income 120.9 112.7 108.7 115.9 133.7
Depreciation and Amort- 413.7 424.1 485.4 499.0 511.2
Total Income from Operation 7382.8 6816.0 7352.2 8392.3 9045.9
Other Adjustment -522.7 -402.5 -365.2 -529.7 -597.1
Raw Material Consumed 1034.5 1095.4 1039.5 1200.1 1274.5
(Inc)/Dec in working Capital -992.5 81.1 -52.7 -141.5 -1.6
Employee Expenses 1377.9 1361.4 1401.6 1489.8 1559.6
Tax Paid -491.5 -361.4 -310.2 -428.3 -512.0
Power, Oil & Fuel 1802.2 1864.6 2086.1 2255.3 2361.7
CF from Operat- Activities 520.5 845.3 727.9 739.0 1001.5
Other Expenses 1462.2 1556.6 1800.0 2081.5 2228.1
Capital expenditure -303.3 -546.1 -214.6 -336.5 -187.8
Total Expenditure 5676.8 5878.0 6327.3 7026.7 7423.9
(Purchase)/Sale of Inv 294.0 74.0 401.7 97.8 57.1
EBITDA 1706.0 938.0 1025.0 1365.6 1622.0
Others 574.9 477.4 530.6 52.2 105.5
Depreciation 413.7 424.1 485.4 499.0 511.2
CF from Investing Activities 565.7 5.2 287.0 -111.9 -150.6
EBIT 1292.4 513.9 539.5 866.7 1110.9
Inc/(Dec) in Share capital 0.0 0.0 -2834.9 0.0 0.0
Other Income 672.6 536.6 431.0 473.0 490.2
Inc/(Dec) in Debt 0.0 0.0 0.0 0.0 0.0
EBT 1965.0 1049.4 969.2 1338.5 1600.0
Dividend and Interest Paid -506.5 -544.0 -523.2 -581.0 -638.9
Tax 791.6 371.8 310.2 428.3 512.0
CF from Financing Activities -506.5 -543.9 -3358.1 -581.0 -638.9
PAT 1173.4 677.6 659.1 910.2 1088.0
Net Cash Flow 579.7 306.6 -2343.2 46.1 211.9
Exceptional Items 148.4 53.5 0.0 0.0 0.0
Opening Balance 4049.2 4628.8 4944.1 2931.7 3429.6
PAT Adjusted 1321.9 731.0 659.1 910.2 1088.0
Closing Balance 4628.8 4944.1 2600.9 2977.7 3641.5
EPS 5.1 2.8 3.4 4.7 5.6 (Source: Company, HDFC sec)

RETAIL RESEARCH
RETAIL RESEARCH P a g e | 8
Balance Sheet Key Ratios Particulars, Rs in Cr FY15 FY16 FY17E FY18E FY19E
Particulars FY15 FY16 FY17E FY18E FY19E
EQUITY AND LIABILITIES
No of Equity Shares-cr 257.7 257.7 193.3 193.3 193.3
Share capital 1288.6 1288.6 966.5 966.5 966.5
Entreprise Value-cr 11379.2 11138.1 9643.5 9364.5 8757.8
Reserves and surplus 11508.7 11627.9 9252.3 9582.6 10032.8
Shareholders’ funds 12797.3 12916.5 10218.8 10549.1 10999.2
EPS 5.1 2.8 3.4 4.7 5.6
Deferred tax liabilities 1105.3 1110.1 1132.3 1188.9 1212.7
Cash EPS (PAT + Depreciation) 6.7 4.5 5.9 7.3 8.3
Other Long term liabilities 65.3 69.5 72.9 76.6 80.4
Book Value Per Share(Rs.) 49.7 50.1 52.9 54.6 56.9
Long-term provisions 242.8 223.7 212.5 201.9 191.8
Cash and cash equival- Per Share 21.6 22.6 15.9 17.4 20.5
Non-current liabilities 1413.3 1403.3 1417.8 1467.4 1484.9
Trade payables 455.5 581.4 595.4 612.2 659.3
PE(x) 12.8 23.2 19.3 14.0 11.7
Other current liabilities 1325.4 1350.8 1418.3 1489.2 1563.7
P/BV (x) 1.3 1.3 1.2 1.2 1.2
Short-term provisions 186.2 277.4 291.3 305.9 321.2
Mcap/Sales(x) 2.3 2.5 1.8 1.5 1.4
Current liabilities 1967.0 2209.6 2305.0 2407.3 2544.1
EV/EBITDA 6.7 11.9 9.4 6.9 5.4
Total 16177.7 16529.4 13941.5 14423.8 15028.2
Ev/EBITDA( without adj- Cash) 9.9 18.1 12.4 9.3 7.8
ASSETS
Fixed assets 7195.2 7129.7 7344.2 7680.7 7868.5
EBITDAM (%) 23.5% 14.0% 14.2% 16.5% 18.2%
Non-current investments 1.0 810.0 405.0 303.8 243.0
PATM (%) 18.2% 10.9% 9.1% 11.0% 12.2%
Long-term loans and adv 1221.9 1347.6 1320.6 1162.1 1022.7
Other non-current assets 47.5 49.5 52.0 54.6 57.3
ROCE (%) 15.4% 8.1% 9.5% 12.7% 14.6%
Non-current assets 8465.5 9336.7 9121.8 9201.1 9191.5
RONW (%) 10.3% 5.7% 6.4% 8.6% 9.9%
Current investments 950.0 66.0 69.3 72.8 76.4
Inventories 1165.6 1127.0 1190.7 1315.2 1367.4
Current Ratio 3.9 3.3 2.1 2.2 2.3
Trade receivables 120.8 235.2 238.1 272.1 268.6
Quick Ratio 3.3 2.7 1.6 1.6 1.8
Cash and Bank Balances 4628.0 4944.1 2600.9 2977.7 3641.5
Short-term loans and adv 607.5 586.7 498.7 374.0 280.5
Debt-Equity 0.0 0.0 0.0 0.0 0.0
Other current assets 240.3 233.7 222.0 210.9 202.5 Current assets 7712.2 7192.7 4819.7 5222.7 5836.8 Total 16177.7 16529.4 13941.5 14423.8 15028.2 (Source: Company, HDFC sec)

RETAIL RESEARCH
RETAIL RESEARCH P a g e | 9
One Year Price Chart
(Source: Company, HDFC sec)

RETAIL RESEARCH
RETAIL RESEARCH P a g e | 10
Fundamental Research Analyst: Abdul Karim ([email protected]) HDFC securities Limited, I Think Techno Campus, Building - B, "Alpha", Office Floor 8, Near Kanjurmarg Station, Opp. Crompton Greaves, Kanjurmarg (East), Mumbai 400 042 Phone: (022) 3075 3400 Fax: (022) 2496 5066 Website: www.hdfcsec.com Email: [email protected]. ___________________________________________________________________________________________________________________________________________________________________________________________
"HDFC Securities Ltd. is a SEBI Registered Research Analyst having registration no. INH000002475." Disclosure: We /I, Abdul Karim, (MBA), authors and the names subscribed to this report, hereby certify that all of the views expressed in this research report accurately reflect our views about the subject issuer(s) or securities. We also certify that no part of our compensation was, is, or will be directly or indirectly related to the specific recommendation(s) or view(s) in this report. Research Analyst or his/her relative or HDFC Securities Ltd. does not have any financial interest in the subject company. Also Research Analyst or his relative or HDFC Securities Ltd. or its Associate may have beneficial ownership of 1% or more in the subject company at the end of the month immediately preceding the date of publication of the Research Report. Further Research Analyst or his relative or HDFC Securities Ltd. or its associate does not have any material conflict of interest. Any holding in stock – No Disclaimer: This report has been prepared by HDFC Securities Ltd and is meant for sole use by the recipient and not for circulation. The information and opinions contained herein have been compiled or arrived at, based upon information obtained in good faith from sources believed to be reliable. Such information has not been independently verified and no guaranty, representation of warranty, express or implied, is made as to its accuracy, completeness or correctness. All such information and opinions are subject to change without notice. This document is for information purposes only. Descriptions of any company or companies or their securities mentioned herein are not intended to be complete and this document is not, and should not be construed as an offer or solicitation of an offer, to buy or sell any securities or other financial instruments. This report is not directed to, or intended for display, downloading, printing, reproducing or for distribution to or use by, any person or entity who is a citizen or resident or located in any locality, state, country or other jurisdiction where such distribution, publication, reproduction, availability or use would be contrary to law or regulation or what would subject HDFC Securities Ltd or its affiliates to any registration or licensing requirement within such jurisdiction. If this report is inadvertently send or has reached any individual in such country, especially, USA, the same may be ignored and brought to the attention of the sender. This document may not be reproduced, distributed or published for any purposes without prior written approval of HDFC Securities Ltd. Foreign currencies denominated securities, wherever mentioned, are subject to exchange rate fluctuations, which could have an adverse effect on their value or price, or the income derived from them. In addition, investors in securities such as ADRs, the values of which are influenced by foreign currencies effectively assume currency risk. It should not be considered to be taken as an offer to sell or a solicitation to buy any security. HDFC Securities Ltd may from time to time solicit from, or perform broking, or other services for, any company mentioned in this mail and/or its attachments. HDFC Securities and its affiliated company(ies), their directors and employees may; (a) from time to time, have a long or short position in, and buy or sell the securities of the company(ies) mentioned herein or (b) be engaged in any other transaction involving such securities and earn brokerage or other compensation or act as a market maker in the financial instruments of the company(ies) discussed herein or act as an advisor or lender/borrower to such company(ies) or may have any other potential conflict of interests with respect to any recommendation and other related information and opinions. HDFC Securities Ltd, its directors, analysts or employees do not take any responsibility, financial or otherwise, of the losses or the damages sustained due to the investments made or any action taken on basis of this report, including but not restricted to, fluctuation in the prices of shares and bonds, changes in the currency rates, diminution in the NAVs, reduction in the dividend or income, etc.
HDFC Securities Ltd and other group companies, its directors, associates, employees may have various positions in any of the stocks, securities and financial instruments dealt in the report, or may make sell or purchase or other deals in these securities from time to time or may deal in other securities of the companies / organizations described in this report. HDFC Securities or its associates might have managed or co-managed public offering of securities for the subject company or might have been mandated by the subject company for any other assignment in the past twelve months. HDFC Securities or its associates might have received any compensation from the companies mentioned in the report during the period preceding twelve months from the date of this report for services in respect of managing or co-managing public offerings, corporate finance, investment banking or merchant banking, brokerage services or other advisory service in a merger or specific transaction in the normal course of business. HDFC Securities or its analysts did not receive any compensation or other benefits from the companies mentioned in the report or third party in connection with preparation of the research report. Accordingly, neither HDFC Securities nor Research Analysts have any material conflict of interest at the time of publication of this report. Compensation of our Research Analysts is not based on any specific merchant banking, investment banking or brokerage service transactions. HDFC Securities may have issued other reports that are inconsistent with and reach different conclusion from the information presented in this report. Research entity has not been engaged in market making activity for the subject company. Research analyst has not served as an officer, director or employee of the subject company. We have not received any compensation/benefits from the subject company or third party in connection with the Research Report. This report has been prepared by the Retail Research team of HDFC Securities Ltd. The views, opinions, estimates, ratings, target price, entry prices and/or other parameters mentioned in this document may or may not match or may be contrary with those of the other Research teams (Institutional, PCG) of HDFC Securities Ltd.