INFOSYS LIMITED
33
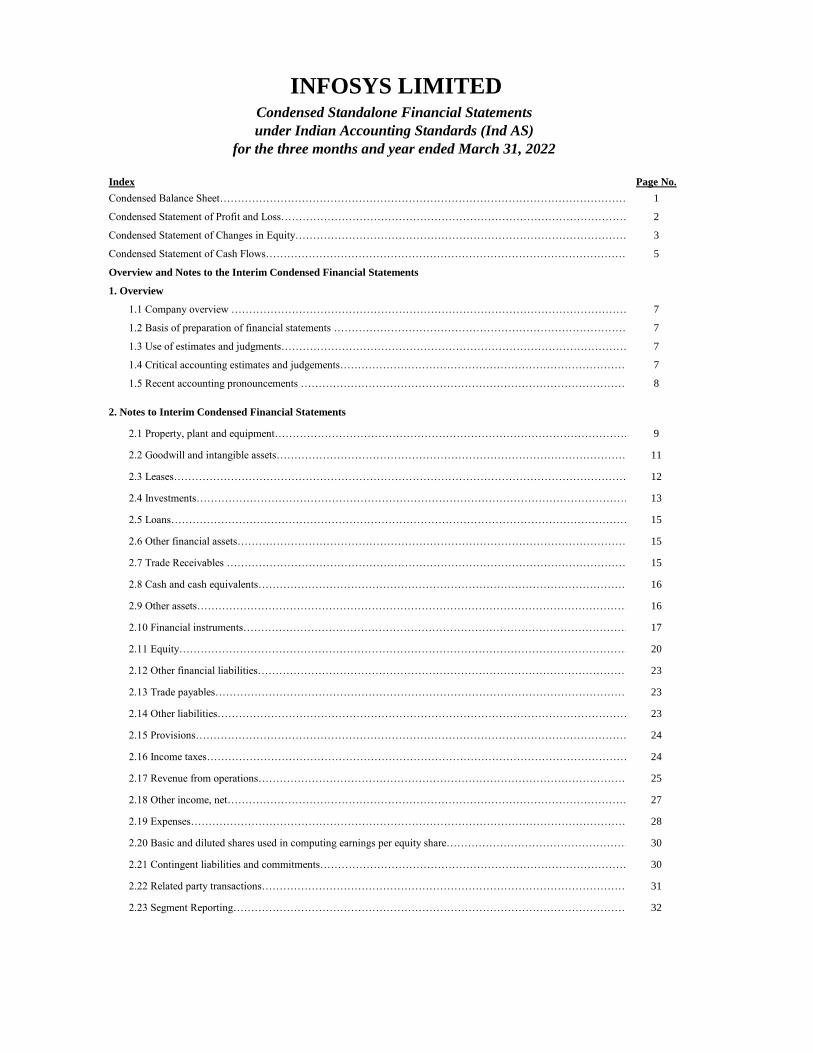
Index Page No. Condensed Balance Sheet……………………………………………………………………………………………………… 1 Condensed Statement of Profit and Loss……………………………………………………………………………………… 2 Condensed Statement of Changes in Equity………………………………………………………………………………… 3 Condensed Statement of Cash Flows………………………………………………………………………………………… 5 Overview and Notes to the Interim Condensed Financial Statements 1. Overview 1.1 Company overview ………………………………………………………………………………………………… 7 1.2 Basis of preparation of financial statements ………………………………………………………………………… 7 1.3 Use of estimates and judgments……………………………………………………………………………………… 7 1.4 Critical accounting estimates and judgements……………………………………………………………………… 7 1.5 Recent accounting pronouncements ………………………………………………………………………………… 8 2. Notes to Interim Condensed Financial Statements 2.1 Property, plant and equipment……………………………………………………………………………………… 9 2.2 Goodwill and intangible assets……………………………………………………………………………………… 11 2.3 Leases………………………………………………………………………………………………………………… 12 2.4 Investments…………………………………………………………………………………………………………… 13 2.5 Loans………………………………………………………………………………………………………………… 15 2.6 Other financial assets………………………………………………………………………………………………… 15 2.7 Trade Receivables …………………………………………………………………………………………………… 15 2.8 Cash and cash equivalents…………………………………………………………………………………………… 16 2.9 Other assets…………………………………………………………………………………………………………… 16 2.10 Financial instruments……………………………………………………………………………………………… 17 2.11 Equity……………………………………………………………………………………………………………… 20 2.12 Other financial liabilities…………………………………………………………………………………………… 23 2.13 Trade payables……………………………………………………………………………………………………… 23 2.14 Other liabilities……………………………………………………………………………………………………… 23 2.15 Provisions…………………………………………………………………………………………………………… 24 2.16 Income taxes………………………………………………………………………………………………………… 24 2.17 Revenue from operations…………………………………………………………………………………………… 25 2.18 Other income, net…………………………………………………………………………………………………… 27 2.19 Expenses…………………………………………………………………………………………………………… 28 2.20 Basic and diluted shares used in computing earnings per equity share…………………………………………… 30 2.21 Contingent liabilities and commitments…………………………………………………………………………… 30 2.22 Related party transactions…………………………………………………………………………………………… 31 2.23 Segment Reporting………………………………………………………………………………………………… 32 INFOSYS LIMITED Condensed Standalone Financial Statements under Indian Accounting Standards (Ind AS) for the three months and year ended March 31, 2022
-
Upload
khangminh22 -
Category
Documents
-
view
6 -
download
0
Transcript of INFOSYS LIMITED
Index Page No.
Condensed Balance Sheet……………………………………………………………………………………………………………1
Condensed Statement of Profit and Loss………………………………………………………………………………………….. 2
Condensed Statement of Changes in Equity………………………………………………………………………………………..3
Condensed Statement of Cash Flows…………………………………………………………………………………………………..5
Overview and Notes to the Interim Condensed Financial Statements
1. Overview
1.1 Company overview ……………………………………………………………………………………………………………7
1.2 Basis of preparation of financial statements ……………………………………………………………………………………………………………7
1.3 Use of estimates and judgments……………………………………………………………………………………………………………7
1.4 Critical accounting estimates and judgements……………………………………………………………………………………………………………7
1.5 Recent accounting pronouncements ……………………………………………………………………………………………………………8
2. Notes to Interim Condensed Financial Statements
2.1 Property, plant and equipment……………………………………………………………………………………………………………9
2.2 Goodwill and intangible assets………………………………………………………………………………………… 11
2.3 Leases……………………………………………………………………………………………………………………….12
2.4 Investments………………………………………………………………………………………………………………..13
2.5 Loans………………………………………………………………………………………………………………………...15
2.6 Other financial assets………………………………………………………………………………………………………….15
2.7 Trade Receivables ………………………………………………………………………………………………………….15
2.8 Cash and cash equivalents………………………………………………………………………………………………………….16
2.9 Other assets……………………………………………………………………………………………………………… 16
2.10 Financial instruments………………………………………………………………………………………………………….17
2.11 Equity……………………………………………………………………………………………………………………..20
2.12 Other financial liabilities………………………………………………………………………………………………………….23
2.13 Trade payables…………………………………………………………………………………………………………. 23
2.14 Other liabilities…………………………………………………………………………………………………………. 23
2.15 Provisions………………………………………………………………………………………………………………. 24
2.16 Income taxes……………………………………………………………………………………………………………. 24
2.17 Revenue from operations………………………………………………………………………………………………………….25
2.18 Other income, net………………………………………………………………………………………………………….27
2.19 Expenses……………………………………………………………………………………………………………….. 28
2.20 Basic and diluted shares used in computing earnings per equity share………………………………………………………………………………………………………….30
2.21 Contingent liabilities and commitments………………………………………………………………………………………………………….30
2.22 Related party transactions………………………………………………………………………………………………………….31
2.23 Segment Reporting………………………………………………………………………………………………………….32
INFOSYS LIMITEDCondensed Standalone Financial Statements
under Indian Accounting Standards (Ind AS)
for the three months and year ended March 31, 2022
INFOSYS LIMITED
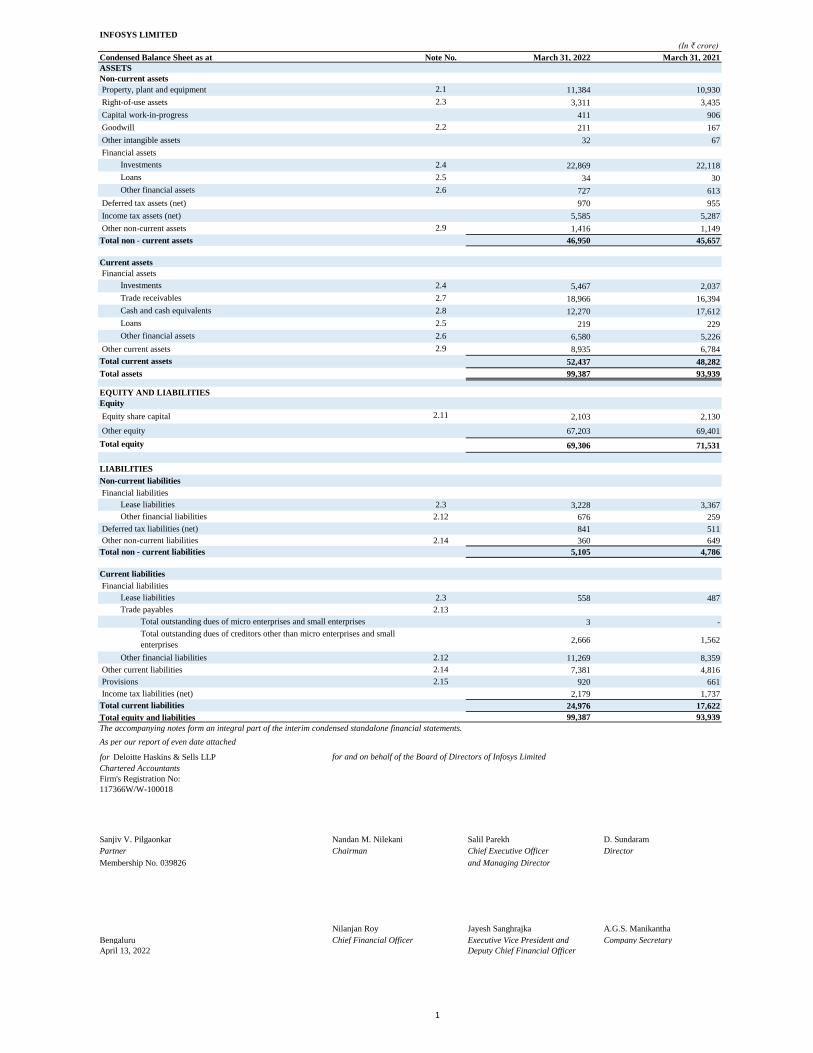
(In ₹ crore)
Note No. March 31, 2022 March 31, 2021
Property, plant and equipment 2.1 11,384 10,930
Right-of-use assets 2.3 3,311 3,435
Capital work-in-progress 411 906
Goodwill 2.2 211 167
Other intangible assets 32 67
Financial assets
Investments 2.4 22,869 22,118
Loans 2.5 34 30
Other financial assets 2.6 727 613
Deferred tax assets (net) 970 955
Income tax assets (net) 5,585 5,287
Other non-current assets 2.9 1,416 1,149
46,950 45,657
Current assets
Financial assets
Investments 2.4 5,467 2,037
Trade receivables 2.7 18,966 16,394
Cash and cash equivalents 2.8 12,270 17,612
Loans 2.5 219 229
Other financial assets 2.6 6,580 5,226
Other current assets 2.9 8,935 6,784
52,437 48,282
99,387 93,939
Equity
Equity share capital 2.11 2,103 2,130
Other equity 67,203 69,401
Total equity 69,306 71,531
LIABILITIES
Non-current liabilities
Financial liabilities
Lease liabilities 2.3 3,228 3,367
Other financial liabilities 2.12 676 259
Deferred tax liabilities (net) 841 511
Other non-current liabilities 2.14 360 649
5,105 4,786
Current liabilities
Financial liabilities
Lease liabilities 2.3 558 487
Trade payables 2.13
Total outstanding dues of micro enterprises and small enterprises 3 -
2,666 1,562
Other financial liabilities 2.12 11,269 8,359
Other current liabilities 2.14 7,381 4,816
Provisions 2.15 920 661
Income tax liabilities (net) 2,179 1,737
24,976 17,622
Total equity and liabilities 99,387 93,939
The accompanying notes form an integral part of the interim condensed standalone financial statements.
As per our report of even date attached
for Deloitte Haskins & Sells LLP for and on behalf of the Board of Directors of Infosys Limited
Chartered Accountants
Firm's Registration No:
117366W/W-100018
Sanjiv V. Pilgaonkar Nandan M. Nilekani Salil Parekh D. Sundaram
Partner Chairman Chief Executive Officer Director
Membership No. 039826 and Managing Director
Nilanjan Roy Jayesh Sanghrajka A.G.S. Manikantha
Bengaluru Chief Financial Officer Executive Vice President and Company Secretary
April 13, 2022 Deputy Chief Financial Officer
Non-current assets
Condensed Balance Sheet as at
ASSETS
Total assets
Total current liabilities
EQUITY AND LIABILITIES
Total non - current assets
Total non - current liabilities
Total current assets
Total outstanding dues of creditors other than micro enterprises and small
enterprises
1
INFOSYS LIMITED
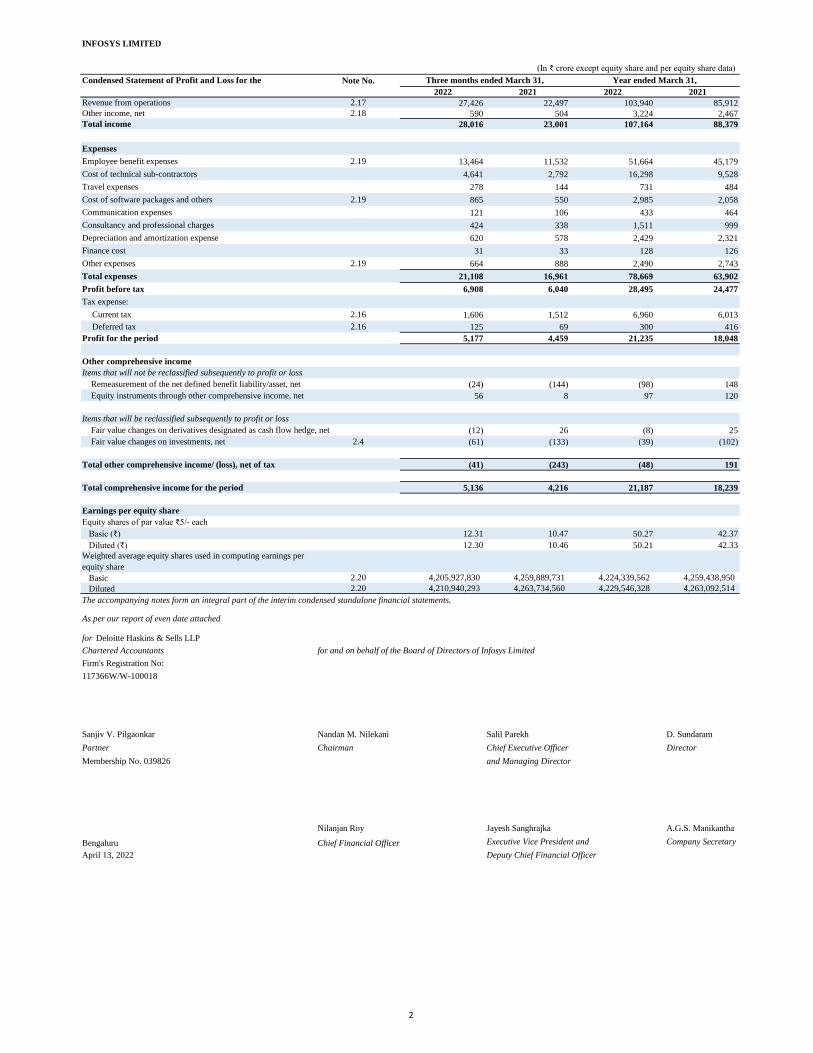
(In ₹ crore except equity share and per equity share data)
Condensed Statement of Profit and Loss for the Note No.
2022 2021 2022 2021
Revenue from operations 2.17 27,426 22,497 103,940 85,912
Other income, net 2.18 590 504 3,224 2,467
Total income 28,016 23,001 107,164 88,379
Expenses
Employee benefit expenses 2.19 13,464 11,532 51,664 45,179
Cost of technical sub-contractors 4,641 2,792 16,298 9,528
Travel expenses 278 144 731 484
Cost of software packages and others 2.19 865 550 2,985 2,058
Communication expenses 121 106 433 464
Consultancy and professional charges 424 338 1,511 999
Depreciation and amortization expense 620 578 2,429 2,321
Finance cost 31 33 128 126
Other expenses 2.19 664 888 2,490 2,743
Total expenses 21,108 16,961 78,669 63,902
Profit before tax 6,908 6,040 28,495 24,477
Tax expense:
Current tax 2.16 1,606 1,512 6,960 6,013
Deferred tax 2.16 125 69 300 416
Profit for the period 5,177 4,459 21,235 18,048
Other comprehensive income
Items that will not be reclassified subsequently to profit or loss
Remeasurement of the net defined benefit liability/asset, net (24) (144) (98) 148
Equity instruments through other comprehensive income, net 56 8 97 120
Items that will be reclassified subsequently to profit or loss
Fair value changes on derivatives designated as cash flow hedge, net (12) 26 (8) 25
Fair value changes on investments, net 2.4 (61) (133) (39) (102)
Total other comprehensive income/ (loss), net of tax (41) (243) (48) 191
Total comprehensive income for the period 5,136 4,216 21,187 18,239
Earnings per equity share
Equity shares of par value ₹5/- each
Basic (₹) 12.31 10.47 50.27 42.37
Diluted (₹) 12.30 10.46 50.21 42.33
Basic 2.20 4,205,927,830 4,259,889,731 4,224,339,562 4,259,438,950
Diluted 2.20 4,210,940,293 4,263,734,560 4,229,546,328 4,263,092,514
The accompanying notes form an integral part of the interim condensed standalone financial statements.
As per our report of even date attached
for Deloitte Haskins & Sells LLP
Chartered Accountants for and on behalf of the Board of Directors of Infosys Limited
Firm's Registration No:
117366W/W-100018
Sanjiv V. Pilgaonkar Nandan M. Nilekani Salil Parekh D. Sundaram
Partner Chairman Chief Executive Officer Director
Membership No. 039826 and Managing Director
Nilanjan Roy Jayesh Sanghrajka A.G.S. Manikantha
Bengaluru Chief Financial Officer Executive Vice President and Company Secretary
April 13, 2022 Deputy Chief Financial Officer
Year ended March 31,
Weighted average equity shares used in computing earnings per
equity share
Three months ended March 31,
2
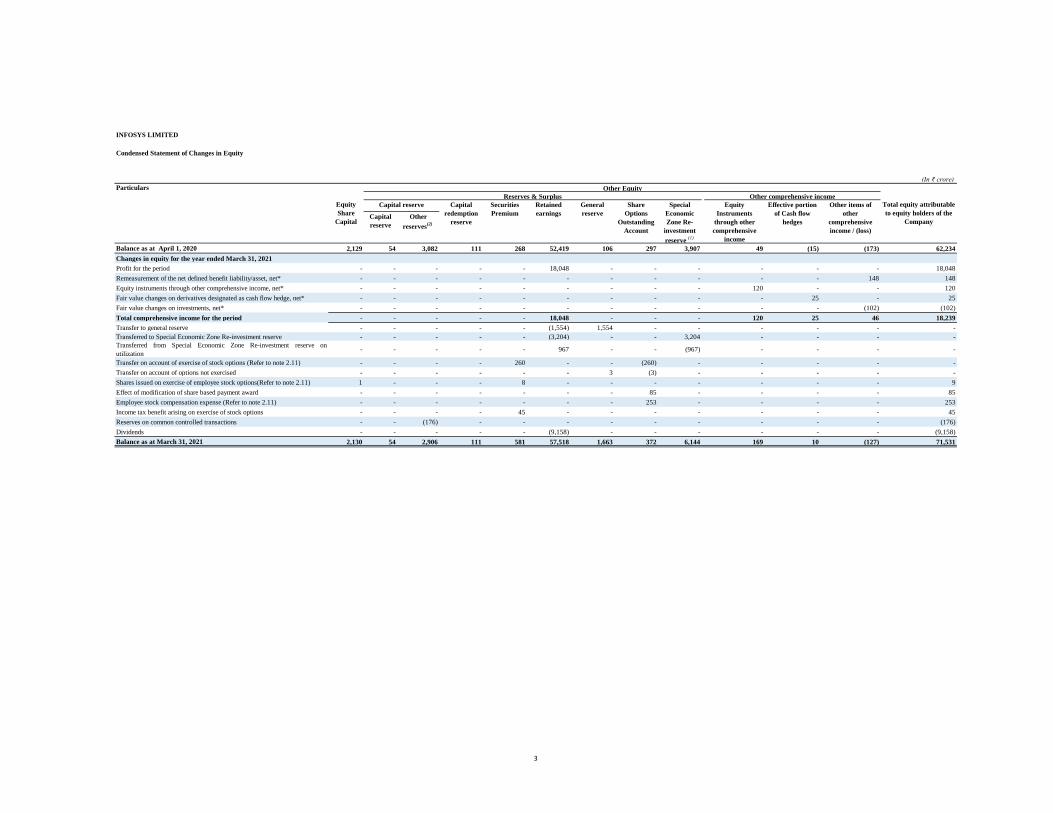
INFOSYS LIMITED
Condensed Statement of Changes in Equity
(In ₹ crore)
Particulars
Capital
reserve
Other
reserves(2)
Balance as at April 1, 2020 2,129 54 3,082 111 268 52,419 106 297 3,907 49 (15) (173) 62,234
Changes in equity for the year ended March 31, 2021
Profit for the period - - - - - 18,048 - - - - - - 18,048
Remeasurement of the net defined benefit liability/asset, net* - - - - - - - - - - - 148 148
Equity instruments through other comprehensive income, net* - - - - - - - - - 120 - - 120
Fair value changes on derivatives designated as cash flow hedge, net* - - - - - - - - - - 25 - 25
Fair value changes on investments, net* - - - - - - - - - - - (102) (102)
Total comprehensive income for the period - - - - - 18,048 - - - 120 25 46 18,239
Transfer to general reserve - - - - - (1,554) 1,554 - - - - - -
Transferred to Special Economic Zone Re-investment reserve - - - - - (3,204) - - 3,204 - - - -
Transferred from Special Economic Zone Re-investment reserve on
utilization - - - - - 967 - - (967) - - - -
Transfer on account of exercise of stock options (Refer to note 2.11) - - - - 260 - - (260) - - - - -
Transfer on account of options not exercised - - - - - - 3 (3) - - - - -
Shares issued on exercise of employee stock options(Refer to note 2.11) 1 - - - 8 - - - - - - - 9
Effect of modification of share based payment award - - - - - - - 85 - - - - 85
Employee stock compensation expense (Refer to note 2.11) - - - - - - - 253 - - - - 253
Income tax benefit arising on exercise of stock options - - - - 45 - - - - - - - 45
Reserves on common controlled transactions - - (176) - - - - - - - - - (176)
Dividends - - - - - (9,158) - - - - - - (9,158)
Balance as at March 31, 2021 2,130 54 2,906 111 581 57,518 1,663 372 6,144 169 10 (127) 71,531
Total equity attributable
to equity holders of the
Company
Effective portion
of Cash flow
hedges
Share
Options
Outstanding
Account
General
reserve
Other items of
other
comprehensive
income / (loss)
Equity
Share
Capital
Other Equity
Other comprehensive income
Capital
redemption
reserve
Retained
earnings
Equity
Instruments
through other
comprehensive
income
Special
Economic
Zone Re-
investment
reserve (1)
Capital reserve
Reserves & Surplus
Securities
Premium
3
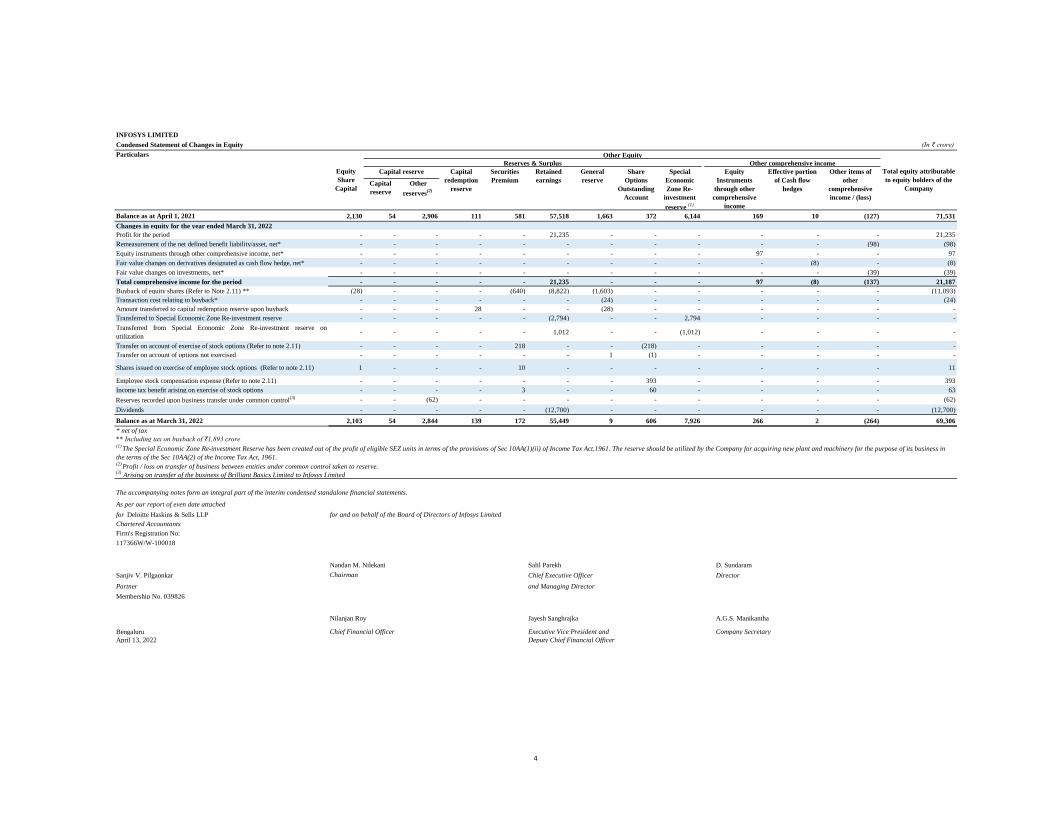
INFOSYS LIMITED
Condensed Statement of Changes in Equity (In ₹ crore)
Particulars
Capital
reserve
Other
reserves(2)
Balance as at April 1, 2021 2,130 54 2,906 111 581 57,518 1,663 372 6,144 169 10 (127) 71,531
Changes in equity for the year ended March 31, 2022
Profit for the period - - - - - 21,235 - - - - - - 21,235
Remeasurement of the net defined benefit liability/asset, net* - - - - - - - - - - - (98) (98)
Equity instruments through other comprehensive income, net* - - - - - - - - - 97 - - 97
Fair value changes on derivatives designated as cash flow hedge, net* - - - - - - - - - - (8) - (8)
Fair value changes on investments, net* - - - - - - - - - - - (39) (39)
Total comprehensive income for the period - - - - - 21,235 - - - 97 (8) (137) 21,187
Buyback of equity shares (Refer to Note 2.11) ** (28) - - - (640) (8,822) (1,603) - - - - - (11,093)
Transaction cost relating to buyback* - - - - - - (24) - - - - - (24)
Amount transferred to capital redemption reserve upon buyback - - - 28 - - (28) - - - - - -
Transferred to Special Economic Zone Re-investment reserve - - - - - (2,794) - - 2,794 - - - -
Transferred from Special Economic Zone Re-investment reserve on
utilization - - - - - 1,012 - - (1,012) - - - -
Transfer on account of exercise of stock options (Refer to note 2.11) - - - - 218 - - (218) - - - - -
Transfer on account of options not exercised - - - - - - 1 (1) - - - - -
Shares issued on exercise of employee stock options (Refer to note 2.11) 1 - - - 10 - - - - - - - 11
Employee stock compensation expense (Refer to note 2.11) - - - - - - - 393 - - - - 393
Income tax benefit arising on exercise of stock options - - - - 3 - - 60 - - - - 63
Reserves recorded upon business transfer under common control(3) - - (62) - - - - - - - - - (62)
Dividends - - - - - (12,700) - - - - - - (12,700)
Balance as at March 31, 2022 2,103 54 2,844 139 172 55,449 9 606 7,926 266 2 (264) 69,306
* net of tax
** Including tax on buyback of ₹1,893 crore
The accompanying notes form an integral part of the interim condensed standalone financial statements.
As per our report of even date attached
for Deloitte Haskins & Sells LLP for and on behalf of the Board of Directors of Infosys Limited
Chartered Accountants
Firm's Registration No:
117366W/W-100018
Nandan M. Nilekani Salil Parekh D. Sundaram
Sanjiv V. Pilgaonkar Chairman Chief Executive Officer Director
Partner and Managing Director
Membership No. 039826
Nilanjan Roy Jayesh Sanghrajka A.G.S. Manikantha
Bengaluru Chief Financial Officer Executive Vice President and Company Secretary
April 13, 2022 Deputy Chief Financial Officer
Share
Options
Outstanding
Account
(1)The Special Economic Zone Re-investment Reserve has been created out of the profit of eligible SEZ units in terms of the provisions of Sec 10AA(1)(ii) of Income Tax Act,1961. The reserve should be utilized by the Company for acquiring new plant and machinery for the purpose of its business in
the terms of the Sec 10AA(2) of the Income Tax Act, 1961.
(3) Arising on transfer of the business of Brilliant Basics Limited to Infosys Limited
Equity
Share
Capital
Special
Economic
Zone Re-
investment
reserve (1)
Capital reserve General
reserve
(2)Profit / loss on transfer of business between entities under common control taken to reserve.
Equity
Instruments
through other
comprehensive
income
Effective portion
of Cash flow
hedges
Other items of
other
comprehensive
income / (loss)
Total equity attributable
to equity holders of the
Company
Capital
redemption
reserve
Securities
Premium
Retained
earnings
Other Equity
Other comprehensive incomeReserves & Surplus
4
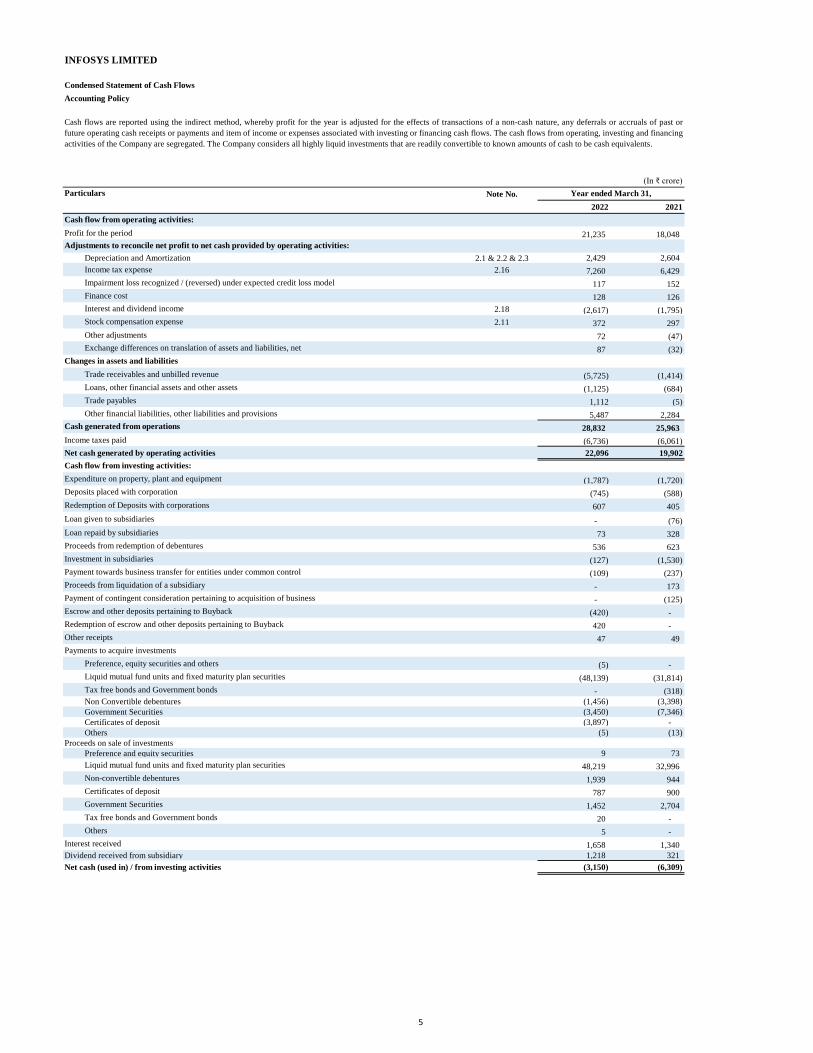
INFOSYS LIMITED
Condensed Statement of Cash Flows
(In ₹ crore)
Particulars Note No.
2022 2021
Profit for the period 21,235 18,048
Adjustments to reconcile net profit to net cash provided by operating activities:
Depreciation and Amortization 2.1 & 2.2 & 2.3 2,429 2,604
Income tax expense 2.16 7,260 6,429
Impairment loss recognized / (reversed) under expected credit loss model 117 152
Finance cost 128 126
2.18 (2,617) (1,795)
2.11 372 297
Other adjustments 72 (47)
87 (32)
Trade receivables and unbilled revenue (5,725) (1,414)
Loans, other financial assets and other assets (1,125) (684)
Trade payables 1,112 (5)
Other financial liabilities, other liabilities and provisions 5,487 2,284
28,832 25,963
Income taxes paid (6,736) (6,061)
Net cash generated by operating activities 22,096 19,902
(1,787) (1,720)
(745) (588)
Redemption of Deposits with corporations 607 405
Loan given to subsidiaries - (76)
Loan repaid by subsidiaries 73 328
Proceeds from redemption of debentures 536 623
Investment in subsidiaries (127) (1,530)
Payment towards business transfer for entities under common control (109) (237)
Proceeds from liquidation of a subsidiary - 173
Payment of contingent consideration pertaining to acquisition of business - (125)
Escrow and other deposits pertaining to Buyback (420) -
Redemption of escrow and other deposits pertaining to Buyback 420 -
Other receipts 47 49
Payments to acquire investments
Preference, equity securities and others (5) -
Liquid mutual fund units and fixed maturity plan securities (48,139) (31,814)
Tax free bonds and Government bonds - (318)
Non Convertible debentures (1,456) (3,398)
Government Securities (3,450) (7,346)
Certificates of deposit (3,897) -
Others (5) (13)
Proceeds on sale of investments
Preference and equity securities 9 73
Liquid mutual fund units and fixed maturity plan securities 48,219 32,996
Non-convertible debentures 1,939 944
Certificates of deposit 787 900
Government Securities 1,452 2,704
Tax free bonds and Government bonds 20 -
Others 5 -
Interest received 1,658 1,340
Dividend received from subsidiary 1,218 321
Net cash (used in) / from investing activities (3,150) (6,309)
Deposits placed with corporation
Accounting Policy
Cash flows are reported using the indirect method, whereby profit for the year is adjusted for the effects of transactions of a non-cash nature, any deferrals or accruals of past or
future operating cash receipts or payments and item of income or expenses associated with investing or financing cash flows. The cash flows from operating, investing and financing
activities of the Company are segregated. The Company considers all highly liquid investments that are readily convertible to known amounts of cash to be cash equivalents.
Cash flow from investing activities:
Expenditure on property, plant and equipment
Stock compensation expense
Year ended March 31,
Changes in assets and liabilities
Cash generated from operations
Exchange differences on translation of assets and liabilities, net
Cash flow from operating activities:
Interest and dividend income
5
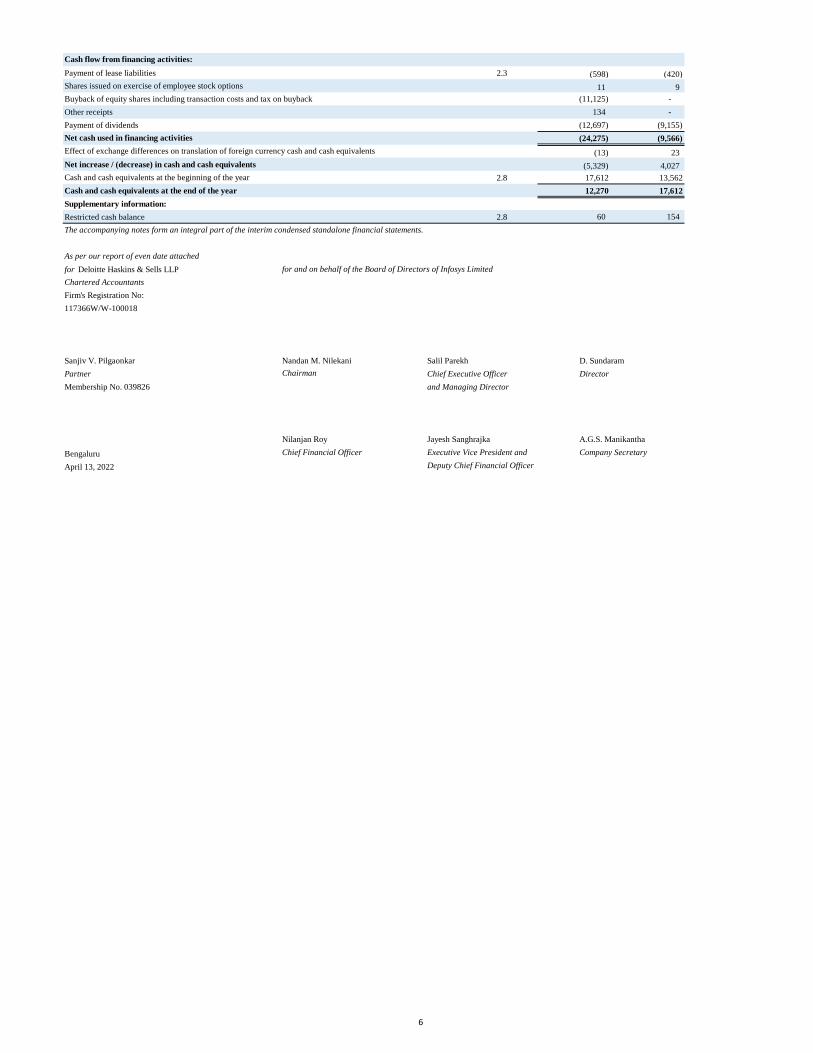
Payment of lease liabilities 2.3 (598) (420)
Shares issued on exercise of employee stock options 11 9
Buyback of equity shares including transaction costs and tax on buyback (11,125) -
Other receipts 134 -
Payment of dividends (12,697) (9,155)
(24,275) (9,566)
(13) 23
Net increase / (decrease) in cash and cash equivalents (5,329) 4,027
Cash and cash equivalents at the beginning of the year 2.8 17,612 13,562
Cash and cash equivalents at the end of the year 12,270 17,612
Supplementary information:
Restricted cash balance 2.8 60 154
The accompanying notes form an integral part of the interim condensed standalone financial statements.
As per our report of even date attached
for Deloitte Haskins & Sells LLP for and on behalf of the Board of Directors of Infosys Limited
Chartered Accountants
Firm's Registration No:
117366W/W-100018
Sanjiv V. Pilgaonkar Nandan M. Nilekani Salil Parekh D. Sundaram
Partner Chairman Chief Executive Officer Director
Membership No. 039826 and Managing Director
Nilanjan Roy Jayesh Sanghrajka A.G.S. Manikantha
Bengaluru Chief Financial Officer Executive Vice President and Company Secretary
April 13, 2022 Deputy Chief Financial Officer
Net cash used in financing activities
Effect of exchange differences on translation of foreign currency cash and cash equivalents
Cash flow from financing activities:
6

Estimation of uncertainties relating to the global health pandemic from COVID-19 (COVID-19):
Fixed price maintenance revenue is recognized ratably on a straight-line basis when services are performed through an indefinite number of repetitive acts over a specified period. Revenue
from fixed price maintenance contract is recognized ratably using a percentage of completion method when the pattern of benefits from the services rendered to the customer and
Company’s costs to fulfil the contract is not even through the period of the contract because the services are generally discrete in nature and not repetitive. The use of method to recognize
the maintenance revenues requires judgment and is based on the promises in the contract and nature of the deliverables.
Provisions for estimated losses, if any, on incomplete contracts are recorded in the period in which such losses become probable based on the estimated efforts or costs to complete the
contract.
The Company uses the percentage-of-completion method in accounting for other fixed-price contracts. Use of the percentage-of-completion method requires the Company to determine the
actual efforts or costs expended to date as a proportion of the estimated total efforts or costs to be incurred. Efforts or costs expended have been used to measure progress towards
completion as there is a direct relationship between input and productivity. The estimation of total efforts or costs involves significant judgement and is assessed throughout the period of
the contract to reflect any changes based on the latest available information.
1.3 Use of estimates and judgments
The preparation of the interim condensed standalone financial statements in conformity with Ind AS requires the management to make estimates, judgments and assumptions. These
estimates, judgments and assumptions affect the application of accounting policies and the reported amounts of assets and liabilities, the disclosures of contingent assets and liabilities at
the date of the interim condensed standalone financial statements and reported amounts of revenues and expenses during the period. The application of accounting policies that require
critical accounting estimates involving complex and subjective judgments and the use of assumptions in these financial statements have been disclosed in Note no. 1.4. Accounting
estimates could change from period to period. Actual results could differ from those estimates. Appropriate changes in estimates are made as management becomes aware of changes in
circumstances surrounding the estimates. Changes in estimates are reflected in the financial statements in the period in which changes are made and, if material, their effects are disclosed
in the notes to the interim condensed standalone financial statements.
1.4 Critical accounting estimates and judgments
a. Revenue recognition
The Company’s contracts with customers include promises to transfer multiple products and services to a customer. Revenues from customer contracts are considered for recognition and
measurement when the contract has been approved, in writing, by the parties to the contract, the parties to contract are committed to perform their respective obligations under the contract,
and the contract is legally enforceable. The Company assesses the services promised in a contract and identifies distinct performance obligations in the contract. Identification of distinct
performance obligations to determine the deliverables and the ability of the customer to benefit independently from such deliverables, and allocation of transaction price to these distinct
performance obligations involves significant judgement.
The Company has considered the possible effects that may result from COVID-19 pandemic in the preparation of these interim condensed standalone financial statements including the
recoverability of carrying amounts of financial and non financial assets. In developing the assumptions relating to the possible future uncertainties in the global economic conditions
because of the COVID-19 pandemic, the Company has, at the date of approval of these condensed financial statements, used internal and external sources of information including credit
reports and related information and economic forecasts and expects that the carrying amount of these assets will be recovered. The impact of COVID-19 on the Company's financial
statements may differ from that estimated as at the date of approval of these interim condensed standalone financial statements.
Accounting policies have been consistently applied except where a newly issued accounting standard is initially adopted or a revision to an existing accounting standard requires a change
in the accounting policy hitherto in use.
These interim condensed standalone financial statements are prepared in accordance with Indian Accounting Standard (Ind AS) 34 Interim Financial Reporting, under the historical cost
convention on accrual basis except for certain financial instruments which are measured at fair values, the provisions of the Companies Act, 2013 (''the Act'') (to the extent notified) and
guidelines issued by the Securities and Exchange Board of India (SEBI). Accordingly, these interim condensed standalone financial statements do not include all the information required
for a complete set of financial statements. These interim condensed standalone financial statements should be read in conjunction with the standalone financial statements and related notes
included in the Company’s Annual Report for the year ended March 31, 2022. The Ind AS are prescribed under Section 133 of the Act read with Rule 3 of the Companies (Indian
Accounting Standards) Rules, 2015 and relevant amendment rules issued there after.
INFOSYS LIMITED
Overview and Notes to the Interim Condensed Standalone Financial Statements
1. Overview
1.1 Company overview
Infosys Limited ('the Company' or Infosys) provides consulting, technology, outsourcing and next-generation digital services, to enable clients to execute strategies for their digital
transformation. Infosys strategic objective is to build a sustainable organization that remains relevant to the agenda of clients, while creating growth opportunities for employees and
generating profitable returns for investors. Infosys strategy is to be a navigator for our clients as they ideate, plan and execute on their journey to a digital future.
The Company is a public limited company incorporated and domiciled in India and has its registered office at Electronic city, Hosur Road, Bengaluru 560100, Karnataka, India. The
company has its primary listings on the BSE Ltd. and National Stock Exchange of India Limited. The Company’s American Depositary Shares (ADS) representing equity shares are listed
on the New York Stock Exchange (NYSE).
The interim condensed standalone financial statements are approved for issue by the Company's Board of Directors on April 13, 2022.
1.2 Basis of preparation of financial statements
As the quarter and year to date figures are taken from the source and rounded to the nearest digits, the figures reported for the previous quarters might not always add up to the year to date
figures reported in this statement.
7
Property, plant and equipment represent a significant proportion of the asset base of the Company. The charge in respect of periodic depreciation is derived after determining an estimate of
an asset’s expected useful life and the expected residual value at the end of its life. The useful lives and residual values of Company's assets are determined by the management at the time
the asset is acquired and reviewed periodically, including at each financial year end. The lives are based on historical experience with similar assets as well as anticipation of future events,
which may impact their life, such as changes in technology. Refer to note 2.1
Ministry of Corporate Affairs (“MCA”) notifies new standards or amendments to the existing standards under Companies (Indian Accounting Standards) Rules as issued from time to time.
On March 23, 2022, MCA amended the Companies (Indian Accounting Standards) Amendment Rules, 2022, as below.
Ind AS 16 – Property Plant and equipment - The amendment clarifies that excess of net sale proceeds of items produced over the cost of testing, if any, shall not be recognized in the profit
or loss but deducted from the directly attributable costs considered as part of cost of an item of property, plant, and equipment. The effective date for adoption of this amendment is annual
periods beginning on or after April 1, 2022. The Company has evaluated the amendment and there is no impact on its standalone financial statements.
Ind AS 37 – Provisions, Contingent Liabilities and Contingent Assets – The amendment specifies that the ‘cost of fulfilling’ a contract comprises the ‘costs that relate directly to the
contract’. Costs that relate directly to a contract can either be incremental costs of fulfilling that contract (examples would be direct labor, materials) or an allocation of other costs that
relate directly to fulfilling contracts (an example would be the allocation of the depreciation charge for an item of property, plant and equipment used in fulfilling the contract). The
effective date for adoption of this amendment is annual periods beginning on or after April 1, 2022, although early adoption is permitted. The Company has evaluated the amendment and
the impact is not expected to be material.
1.5 Recent accounting pronouncements
b. Income taxes
The Company's two major tax jurisdictions are India and the U.S., though the Company also files tax returns in other overseas jurisdictions.
Significant judgments are involved in determining the provision for income taxes, including amount expected to be paid/recovered for uncertain tax positions.
c. Property, plant and equipment
In assessing the realizability of deferred income tax assets, management considers whether some portion or all of the deferred income tax assets will not be realized. The ultimate
realization of deferred income tax assets is dependent upon the generation of future taxable income during the periods in which the temporary differences become deductible. Management
considers the scheduled reversals of deferred income tax liabilities, projected future taxable income and tax planning strategies in making this assessment. Based on the level of historical
taxable income and projections for future taxable income over the periods in which the deferred income tax assets are deductible, management believes that the company will realize the
benefits of those deductible differences. The amount of the deferred income tax assets considered realizable, however, could be reduced in the near term if estimates of future taxable
income during the carry forward period are reduced.(Refer to note 2.16 and note 2.21)
8
2. Notes to the Interim Condensed Standalone Financial Statements
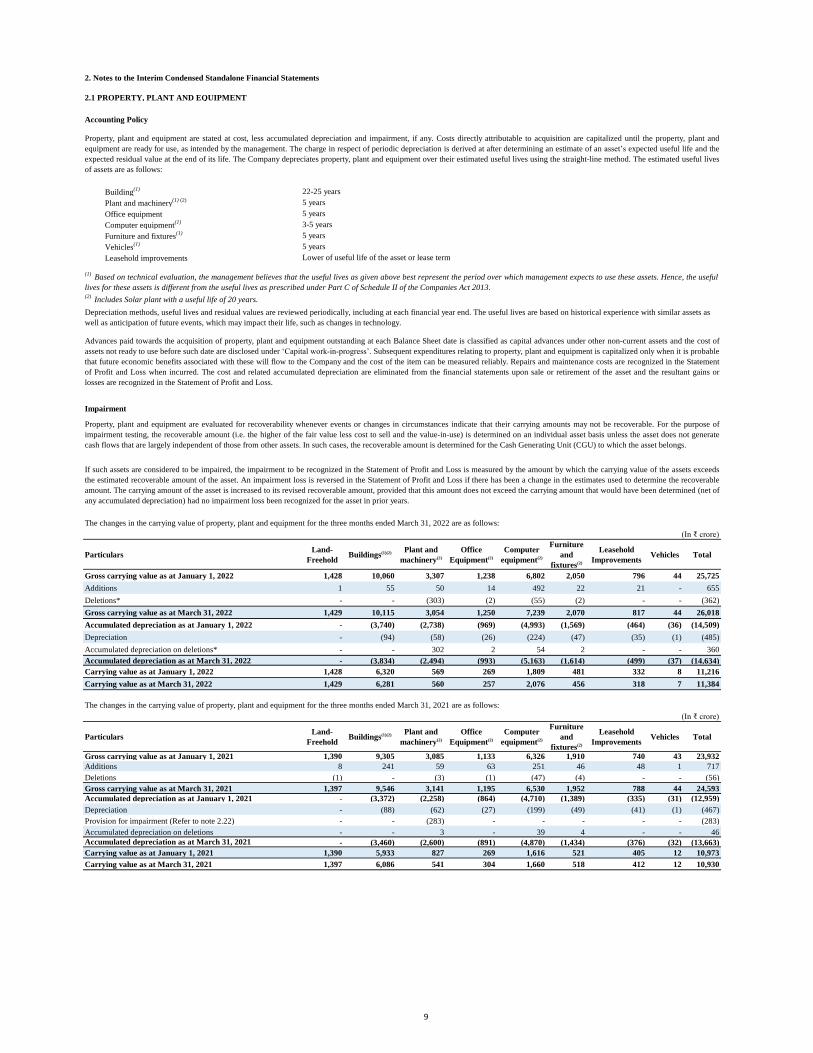
2.1 PROPERTY, PLANT AND EQUIPMENT
Building(1) 22-25 years
Plant and machinery(1) (2) 5 years
Office equipment 5 years
Computer equipment(1) 3-5 years
Furniture and fixtures(1) 5 years
Vehicles(1) 5 years
Leasehold improvements Lower of useful life of the asset or lease term
The changes in the carrying value of property, plant and equipment for the three months ended March 31, 2022 are as follows:
(In ₹ crore)
ParticularsLand-
FreeholdBuildings(1)(2) Plant and
machinery(2)
Office
Equipment(2)
Computer
equipment(2)
Furniture
and
fixtures(2)
Leasehold
ImprovementsVehicles Total
Gross carrying value as at January 1, 2022 1,428 10,060 3,307 1,238 6,802 2,050 796 44 25,725
Additions 1 55 50 14 492 22 21 - 655
Deletions* - - (303) (2) (55) (2) - - (362)
Gross carrying value as at March 31, 2022 1,429 10,115 3,054 1,250 7,239 2,070 817 44 26,018
Accumulated depreciation as at January 1, 2022 - (3,740) (2,738) (969) (4,993) (1,569) (464) (36) (14,509)
Depreciation - (94) (58) (26) (224) (47) (35) (1) (485)
Accumulated depreciation on deletions* - - 302 2 54 2 - - 360
Accumulated depreciation as at March 31, 2022 - (3,834) (2,494) (993) (5,163) (1,614) (499) (37) (14,634)
Carrying value as at January 1, 2022 1,428 6,320 569 269 1,809 481 332 8 11,216
Carrying value as at March 31, 2022 1,429 6,281 560 257 2,076 456 318 7 11,384
The changes in the carrying value of property, plant and equipment for the three months ended March 31, 2021 are as follows:
(In ₹ crore)
ParticularsLand-
FreeholdBuildings(1)(2) Plant and
machinery(2)
Office
Equipment(2)
Computer
equipment(2)
Furniture
and
fixtures(2)
Leasehold
ImprovementsVehicles Total
Gross carrying value as at January 1, 2021 1,390 9,305 3,085 1,133 6,326 1,910 740 43 23,932
Additions 8 241 59 63 251 46 48 1 717
Deletions (1) - (3) (1) (47) (4) - - (56)
Gross carrying value as at March 31, 2021 1,397 9,546 3,141 1,195 6,530 1,952 788 44 24,593
Accumulated depreciation as at January 1, 2021 - (3,372) (2,258) (864) (4,710) (1,389) (335) (31) (12,959)
Depreciation - (88) (62) (27) (199) (49) (41) (1) (467)
Provision for impairment (Refer to note 2.22) - - (283) - - - - - (283)
Accumulated depreciation on deletions - - 3 - 39 4 - - 46
Accumulated depreciation as at March 31, 2021 - (3,460) (2,600) (891) (4,870) (1,434) (376) (32) (13,663)
Carrying value as at January 1, 2021 1,390 5,933 827 269 1,616 521 405 12 10,973
Carrying value as at March 31, 2021 1,397 6,086 541 304 1,660 518 412 12 10,930
Accounting Policy
Impairment
Property, plant and equipment are evaluated for recoverability whenever events or changes in circumstances indicate that their carrying amounts may not be recoverable. For the purpose of
impairment testing, the recoverable amount (i.e. the higher of the fair value less cost to sell and the value-in-use) is determined on an individual asset basis unless the asset does not generate
cash flows that are largely independent of those from other assets. In such cases, the recoverable amount is determined for the Cash Generating Unit (CGU) to which the asset belongs.
If such assets are considered to be impaired, the impairment to be recognized in the Statement of Profit and Loss is measured by the amount by which the carrying value of the assets exceeds
the estimated recoverable amount of the asset. An impairment loss is reversed in the Statement of Profit and Loss if there has been a change in the estimates used to determine the recoverable
amount. The carrying amount of the asset is increased to its revised recoverable amount, provided that this amount does not exceed the carrying amount that would have been determined (net of
any accumulated depreciation) had no impairment loss been recognized for the asset in prior years.
Property, plant and equipment are stated at cost, less accumulated depreciation and impairment, if any. Costs directly attributable to acquisition are capitalized until the property, plant and
equipment are ready for use, as intended by the management. The charge in respect of periodic depreciation is derived at after determining an estimate of an asset’s expected useful life and the
expected residual value at the end of its life. The Company depreciates property, plant and equipment over their estimated useful lives using the straight-line method. The estimated useful lives
of assets are as follows:
(1)Based on technical evaluation, the management believes that the useful lives as given above best represent the period over which management expects to use these assets. Hence, the useful
lives for these assets is different from the useful lives as prescribed under Part C of Schedule II of the Companies Act 2013.
Depreciation methods, useful lives and residual values are reviewed periodically, including at each financial year end. The useful lives are based on historical experience with similar assets as
well as anticipation of future events, which may impact their life, such as changes in technology.
Advances paid towards the acquisition of property, plant and equipment outstanding at each Balance Sheet date is classified as capital advances under other non-current assets and the cost of
assets not ready to use before such date are disclosed under ‘Capital work-in-progress’. Subsequent expenditures relating to property, plant and equipment is capitalized only when it is probable
that future economic benefits associated with these will flow to the Company and the cost of the item can be measured reliably. Repairs and maintenance costs are recognized in the Statement
of Profit and Loss when incurred. The cost and related accumulated depreciation are eliminated from the financial statements upon sale or retirement of the asset and the resultant gains or
losses are recognized in the Statement of Profit and Loss.
(2) Includes Solar plant with a useful life of 20 years.
9
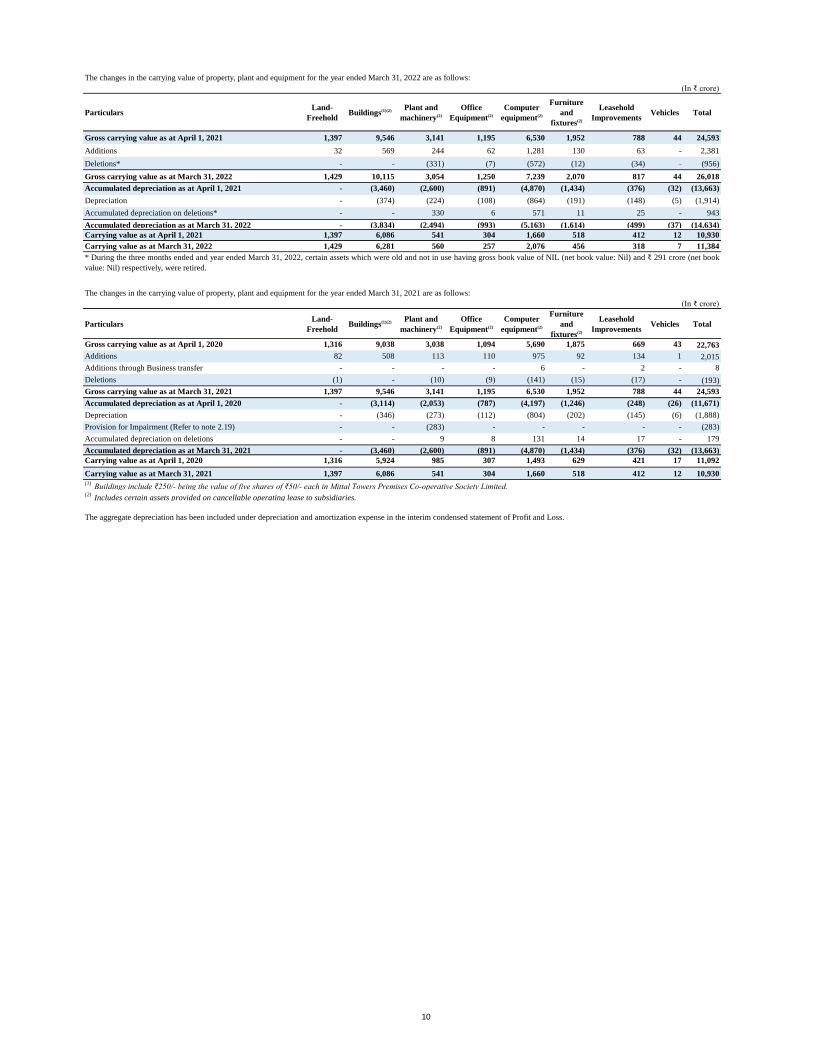
The changes in the carrying value of property, plant and equipment for the year ended March 31, 2022 are as follows:
(In ₹ crore)
ParticularsLand-
FreeholdBuildings(1)(2) Plant and
machinery(2)
Office
Equipment(2)
Computer
equipment(2)
Furniture
and
fixtures(2)
Leasehold
ImprovementsVehicles Total
Gross carrying value as at April 1, 2021 1,397 9,546 3,141 1,195 6,530 1,952 788 44 24,593
Additions 32 569 244 62 1,281 130 63 - 2,381
Deletions* - - (331) (7) (572) (12) (34) - (956)
Gross carrying value as at March 31, 2022 1,429 10,115 3,054 1,250 7,239 2,070 817 44 26,018
Accumulated depreciation as at April 1, 2021 - (3,460) (2,600) (891) (4,870) (1,434) (376) (32) (13,663)
Depreciation - (374) (224) (108) (864) (191) (148) (5) (1,914)
Accumulated depreciation on deletions* - - 330 6 571 11 25 - 943
Accumulated depreciation as at March 31, 2022 - (3,834) (2,494) (993) (5,163) (1,614) (499) (37) (14,634)
Carrying value as at April 1, 2021 1,397 6,086 541 304 1,660 518 412 12 10,930
Carrying value as at March 31, 2022 1,429 6,281 560 257 2,076 456 318 7 11,384
The changes in the carrying value of property, plant and equipment for the year ended March 31, 2021 are as follows:
(In ₹ crore)
ParticularsLand-
FreeholdBuildings(1)(2) Plant and
machinery(2)
Office
Equipment(2)
Computer
equipment(2)
Furniture
and
fixtures(2)
Leasehold
ImprovementsVehicles Total
Gross carrying value as at April 1, 2020 1,316 9,038 3,038 1,094 5,690 1,875 669 43 22,763
Additions 82 508 113 110 975 92 134 1 2,015
Additions through Business transfer - - - - 6 - 2 - 8
Deletions (1) - (10) (9) (141) (15) (17) - (193)
Gross carrying value as at March 31, 2021 1,397 9,546 3,141 1,195 6,530 1,952 788 44 24,593
Accumulated depreciation as at April 1, 2020 - (3,114) (2,053) (787) (4,197) (1,246) (248) (26) (11,671)
Depreciation - (346) (273) (112) (804) (202) (145) (6) (1,888)
Provision for Impairment (Refer to note 2.19) - - (283) - - - - - (283)
Accumulated depreciation on deletions - - 9 8 131 14 17 - 179
Accumulated depreciation as at March 31, 2021 - (3,460) (2,600) (891) (4,870) (1,434) (376) (32) (13,663)
Carrying value as at April 1, 2020 1,316 5,924 985 307 1,493 629 421 17 11,092
Carrying value as at March 31, 2021 1,397 6,086 541 304 1,660 518 412 12 10,930 (1)
Buildings include ₹250/- being the value of five shares of ₹50/- each in Mittal Towers Premises Co-operative Society Limited.(2)
Includes certain assets provided on cancellable operating lease to subsidiaries.
The aggregate depreciation has been included under depreciation and amortization expense in the interim condensed statement of Profit and Loss.
* During the three months ended and year ended March 31, 2022, certain assets which were old and not in use having gross book value of NIL (net book value: Nil) and ₹ 291 crore (net book
value: Nil) respectively, were retired.
10
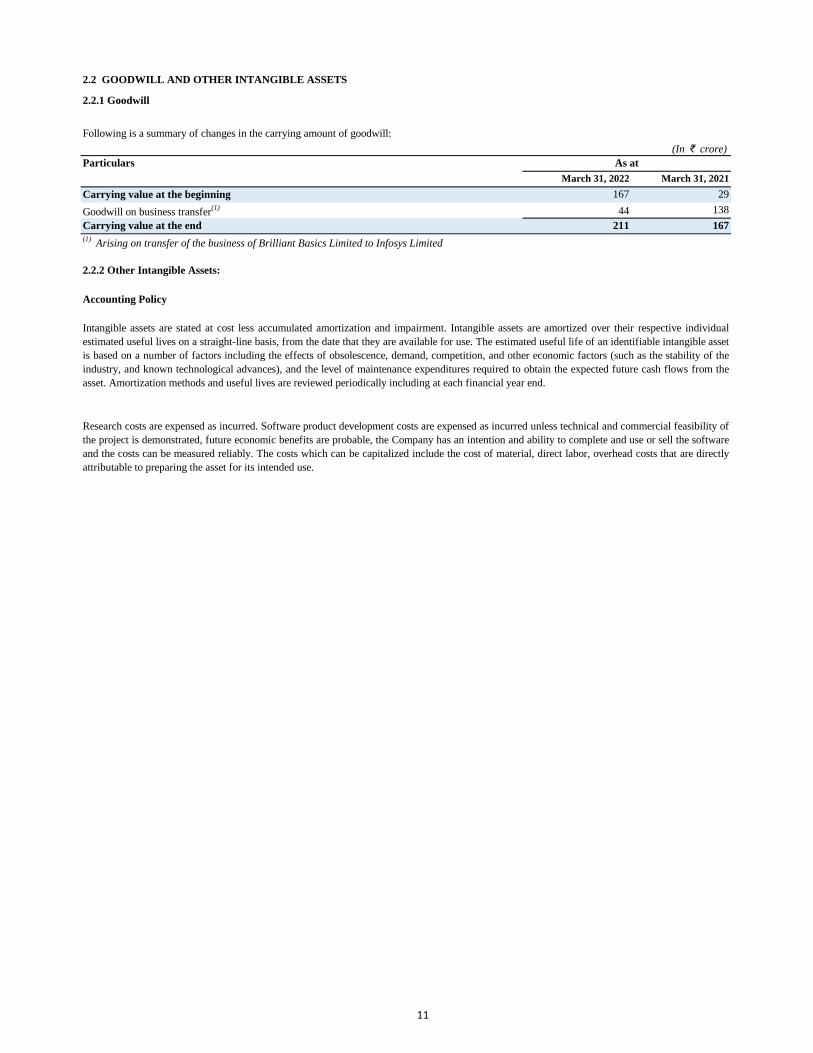
2.2 GOODWILL AND OTHER INTANGIBLE ASSETS
2.2.1 Goodwill
Following is a summary of changes in the carrying amount of goodwill:
(In ₹ crore)
Particulars
March 31, 2022 March 31, 2021
Carrying value at the beginning 167 29
Goodwill on business transfer(1) 44 138
Carrying value at the end 211 167
(1) Arising on transfer of the business of Brilliant Basics Limited to Infosys Limited
2.2.2 Other Intangible Assets:
Research costs are expensed as incurred. Software product development costs are expensed as incurred unless technical and commercial feasibility of
the project is demonstrated, future economic benefits are probable, the Company has an intention and ability to complete and use or sell the software
and the costs can be measured reliably. The costs which can be capitalized include the cost of material, direct labor, overhead costs that are directly
attributable to preparing the asset for its intended use.
As at
Accounting Policy
Intangible assets are stated at cost less accumulated amortization and impairment. Intangible assets are amortized over their respective individual
estimated useful lives on a straight-line basis, from the date that they are available for use. The estimated useful life of an identifiable intangible asset
is based on a number of factors including the effects of obsolescence, demand, competition, and other economic factors (such as the stability of the
industry, and known technological advances), and the level of maintenance expenditures required to obtain the expected future cash flows from the
asset. Amortization methods and useful lives are reviewed periodically including at each financial year end.
11
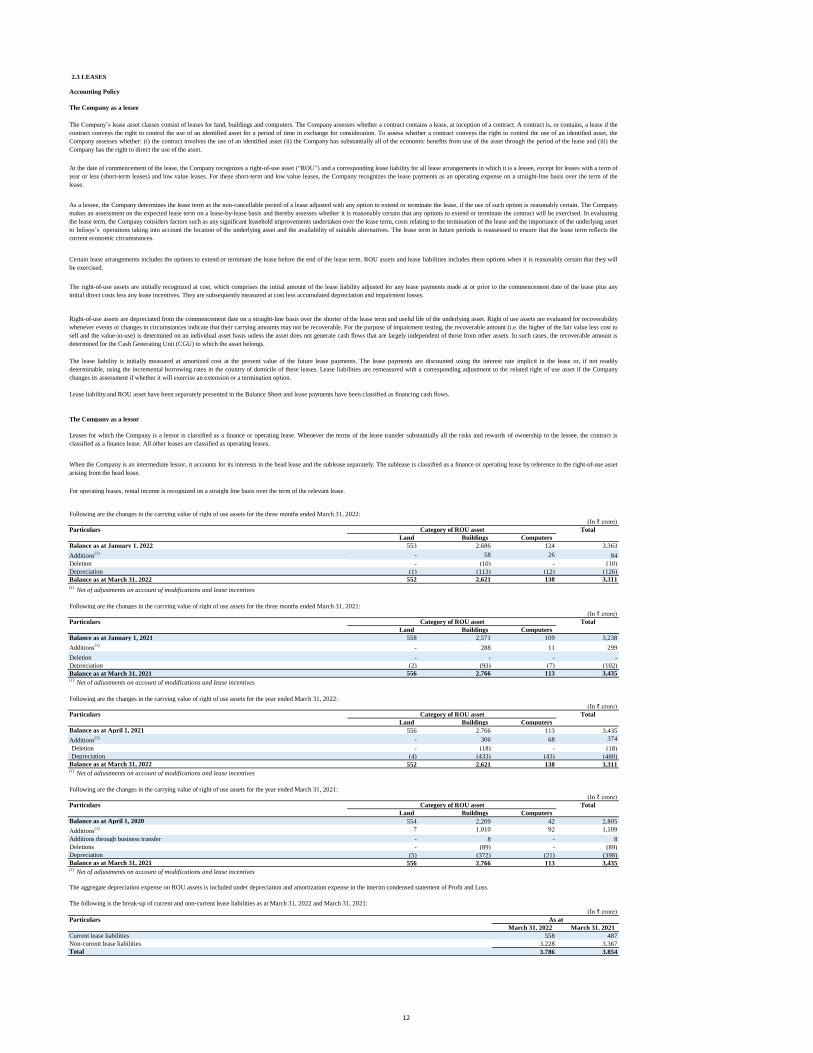
2.3 LEASES
(In ₹ crore)
Particulars Total
Land Buildings Computers
Balance as at January 1, 2022 553 2,686 124 3,363
Additions(1) - 58 26 84
Deletion - (10) - (10)
Depreciation (1) (113) (12) (126)
Balance as at March 31, 2022 552 2,621 138 3,311
(1) Net of adjustments on account of modifications and lease incentives
(In ₹ crore)
Particulars Total
Land Buildings Computers
Balance as at January 1, 2021 558 2,571 109 3,238
Additions(1)
- 288 11 299
Deletion - - - -
Depreciation (2) (93) (7) (102)
Balance as at March 31, 2021 556 2,766 113 3,435 (1)
Net of adjustments on account of modifications and lease incentives
(In ₹ crore)
Particulars Total
Land Buildings Computers
Balance as at April 1, 2021 556 2,766 113 3,435
Additions(1) - 306 68 374
Deletion - (18) - (18)
Depreciation (4) (433) (43) (480)
Balance as at March 31, 2022 552 2,621 138 3,311 (1)
Net of adjustments on account of modifications and lease incentives
(In ₹ crore)
Particulars Total
Land Buildings Computers
Balance as at April 1, 2020 554 2,209 42 2,805
Additions(1) 7 1,010 92 1,109
Additions through business transfer - 8 - 8
Deletions - (89) - (89)
Depreciation (5) (372) (21) (398)
Balance as at March 31, 2021 556 2,766 113 3,435 (1)
Net of adjustments on account of modifications and lease incentives
(In ₹ crore)
Particulars
March 31, 2022 March 31, 2021
Current lease liabilities 558 487
Non-current lease liabilities 3,228 3,367
Total 3,786 3,854
As at
Accounting Policy
The Company as a lessee
The Company’s lease asset classes consist of leases for land, buildings and computers. The Company assesses whether a contract contains a lease, at inception of a contract. A contract is, or contains, a lease if the
contract conveys the right to control the use of an identified asset for a period of time in exchange for consideration. To assess whether a contract conveys the right to control the use of an identified asset, the
Company assesses whether: (i) the contract involves the use of an identified asset (ii) the Company has substantially all of the economic benefits from use of the asset through the period of the lease and (iii) the
Company has the right to direct the use of the asset.
At the date of commencement of the lease, the Company recognizes a right-of-use asset (“ROU”) and a corresponding lease liability for all lease arrangements in which it is a lessee, except for leases with a term of
year or less (short-term leases) and low value leases. For these short-term and low value leases, the Company recognizes the lease payments as an operating expense on a straight-line basis over the term of the
lease.
Certain lease arrangements includes the options to extend or terminate the lease before the end of the lease term. ROU assets and lease liabilities includes these options when it is reasonably certain that they will
be exercised.
The right-of-use assets are initially recognized at cost, which comprises the initial amount of the lease liability adjusted for any lease payments made at or prior to the commencement date of the lease plus any
initial direct costs less any lease incentives. They are subsequently measured at cost less accumulated depreciation and impairment losses.
Right-of-use assets are depreciated from the commencement date on a straight-line basis over the shorter of the lease term and useful life of the underlying asset. Right of use assets are evaluated for recoverability
whenever events or changes in circumstances indicate that their carrying amounts may not be recoverable. For the purpose of impairment testing, the recoverable amount (i.e. the higher of the fair value less cost to
sell and the value-in-use) is determined on an individual asset basis unless the asset does not generate cash flows that are largely independent of those from other assets. In such cases, the recoverable amount is
determined for the Cash Generating Unit (CGU) to which the asset belongs.
The lease liability is initially measured at amortized cost at the present value of the future lease payments. The lease payments are discounted using the interest rate implicit in the lease or, if not readily
determinable, using the incremental borrowing rates in the country of domicile of these leases. Lease liabilities are remeasured with a corresponding adjustment to the related right of use asset if the Company
changes its assessment if whether it will exercise an extension or a termination option.
Lease liability and ROU asset have been separately presented in the Balance Sheet and lease payments have been classified as financing cash flows.
The Company as a lessor
Leases for which the Company is a lessor is classified as a finance or operating lease. Whenever the terms of the lease transfer substantially all the risks and rewards of ownership to the lessee, the contract is
classified as a finance lease. All other leases are classified as operating leases.
When the Company is an intermediate lessor, it accounts for its interests in the head lease and the sublease separately. The sublease is classified as a finance or operating lease by reference to the right-of-use asset
arising from the head lease.
For operating leases, rental income is recognized on a straight line basis over the term of the relevant lease.
Category of ROU asset
The aggregate depreciation expense on ROU assets is included under depreciation and amortization expense in the interim condensed statement of Profit and Loss.
The following is the break-up of current and non-current lease liabilities as at March 31, 2022 and March 31, 2021:
As a lessee, the Company determines the lease term as the non-cancellable period of a lease adjusted with any option to extend or terminate the lease, if the use of such option is reasonably certain. The Company
makes an assessment on the expected lease term on a lease-by-lease basis and thereby assesses whether it is reasonably certain that any options to extend or terminate the contract will be exercised. In evaluating
the lease term, the Company considers factors such as any significant leasehold improvements undertaken over the lease term, costs relating to the termination of the lease and the importance of the underlying asset
to Infosys’s operations taking into account the location of the underlying asset and the availability of suitable alternatives. The lease term in future periods is reassessed to ensure that the lease term reflects the
current economic circumstances.
Following are the changes in the carrying value of right of use assets for the year ended March 31, 2021:
Category of ROU asset
Category of ROU asset
Category of ROU asset
Following are the changes in the carrying value of right of use assets for the three months ended March 31, 2022:
Following are the changes in the carrying value of right of use assets for the year ended March 31, 2022:
Following are the changes in the carrying value of right of use assets for the three months ended March 31, 2021:
12
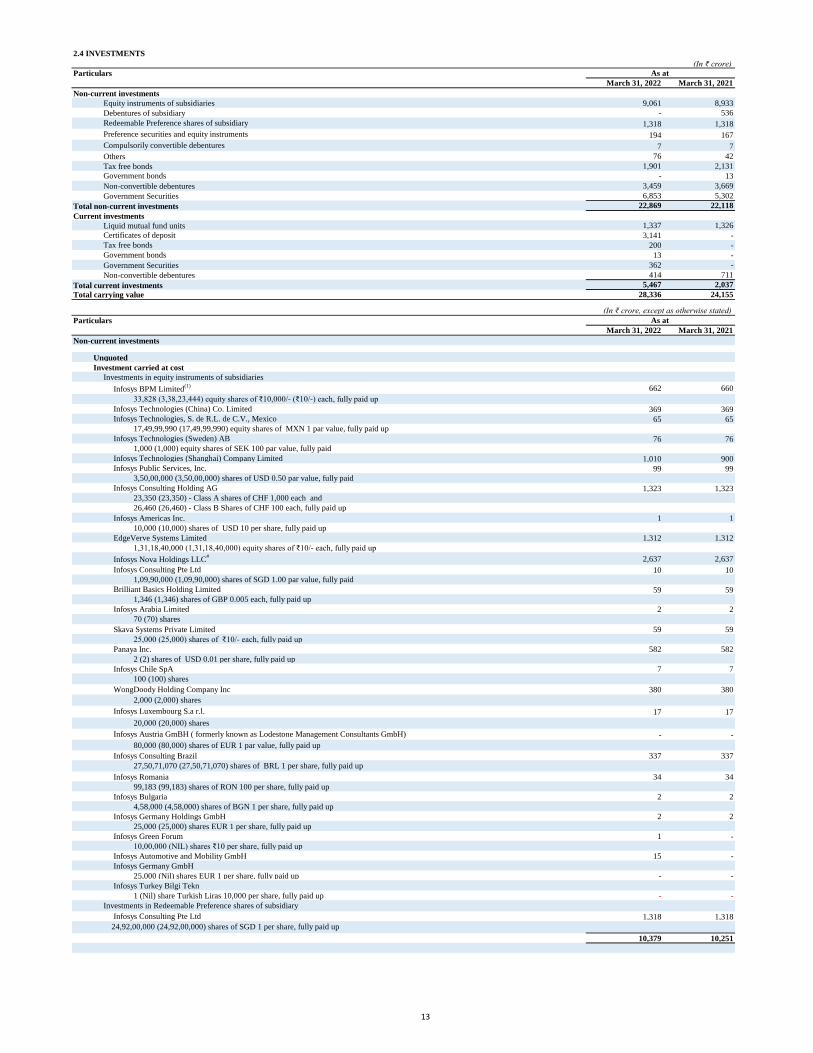
2.4 INVESTMENTS
(In ₹ crore)
Particulars
March 31, 2022 March 31, 2021
Non-current investments
Equity instruments of subsidiaries 9,061 8,933
Debentures of subsidiary - 536
Redeemable Preference shares of subsidiary 1,318 1,318
Preference securities and equity instruments 194 167
Compulsorily convertible debentures 7 7
Others 76 42
Tax free bonds 1,901 2,131
Government bonds - 13
Non-convertible debentures 3,459 3,669
Government Securities 6,853 5,302
Total non-current investments 22,869 22,118
Current investments
Liquid mutual fund units 1,337 1,326
Certificates of deposit 3,141 -
Tax free bonds 200 -
Government bonds 13 -
Government Securities 362 -
Non-convertible debentures 414 711
Total current investments 5,467 2,037
Total carrying value 28,336 24,155
(In ₹ crore, except as otherwise stated)
Particulars
March 31, 2022 March 31, 2021
Non-current investments
Unquoted
Investment carried at cost
Investments in equity instruments of subsidiaries
Infosys BPM Limited(1) 662 660
33,828 (3,38,23,444) equity shares of ₹10,000/- (₹10/-) each, fully paid up
Infosys Technologies (China) Co. Limited 369 369
Infosys Technologies, S. de R.L. de C.V., Mexico 65 65
17,49,99,990 (17,49,99,990) equity shares of MXN 1 par value, fully paid up
Infosys Technologies (Sweden) AB 76 76
1,000 (1,000) equity shares of SEK 100 par value, fully paid
Infosys Technologies (Shanghai) Company Limited 1,010 900
Infosys Public Services, Inc. 99 99
3,50,00,000 (3,50,00,000) shares of USD 0.50 par value, fully paid
Infosys Consulting Holding AG 1,323 1,323
23,350 (23,350) - Class A shares of CHF 1,000 each and
26,460 (26,460) - Class B Shares of CHF 100 each, fully paid up
Infosys Americas Inc. 1 1
10,000 (10,000) shares of USD 10 per share, fully paid up
EdgeVerve Systems Limited 1,312 1,312
1,31,18,40,000 (1,31,18,40,000) equity shares of ₹10/- each, fully paid up
Infosys Nova Holdings LLC# 2,637 2,637
Infosys Consulting Pte Ltd 10 10
1,09,90,000 (1,09,90,000) shares of SGD 1.00 par value, fully paid
Brilliant Basics Holding Limited 59 59
1,346 (1,346) shares of GBP 0.005 each, fully paid up
Infosys Arabia Limited 2 2
70 (70) shares
Skava Systems Private Limited 59 59
25,000 (25,000) shares of ₹10/- each, fully paid up
Panaya Inc. 582 582
2 (2) shares of USD 0.01 per share, fully paid up
Infosys Chile SpA 7 7
100 (100) shares
WongDoody Holding Company Inc 380 380
2,000 (2,000) shares
Infosys Luxembourg S.a r.l. 17 17
20,000 (20,000) shares
Infosys Austria GmBH ( formerly known as Lodestone Management Consultants GmbH) - -
80,000 (80,000) shares of EUR 1 par value, fully paid up
Infosys Consulting Brazil 337 337
27,50,71,070 (27,50,71,070) shares of BRL 1 per share, fully paid up
Infosys Romania 34 34
99,183 (99,183) shares of RON 100 per share, fully paid up
Infosys Bulgaria 2 2
4,58,000 (4,58,000) shares of BGN 1 per share, fully paid up
Infosys Germany Holdings GmbH 2 2
25,000 (25,000) shares EUR 1 per share, fully paid up
Infosys Green Forum 1 -
10,00,000 (NIL) shares ₹10 per share, fully paid up
Infosys Automotive and Mobility GmbH 15 -
Infosys Germany GmbH
25,000 (Nil) shares EUR 1 per share, fully paid up - -
Infosys Turkey Bilgi Tekn
1 (Nil) share Turkish Liras 10,000 per share, fully paid up - -
Investments in Redeemable Preference shares of subsidiary
Infosys Consulting Pte Ltd 1,318 1,318
24,92,00,000 (24,92,00,000) shares of SGD 1 per share, fully paid up
10,379 10,251
As at
As at
13
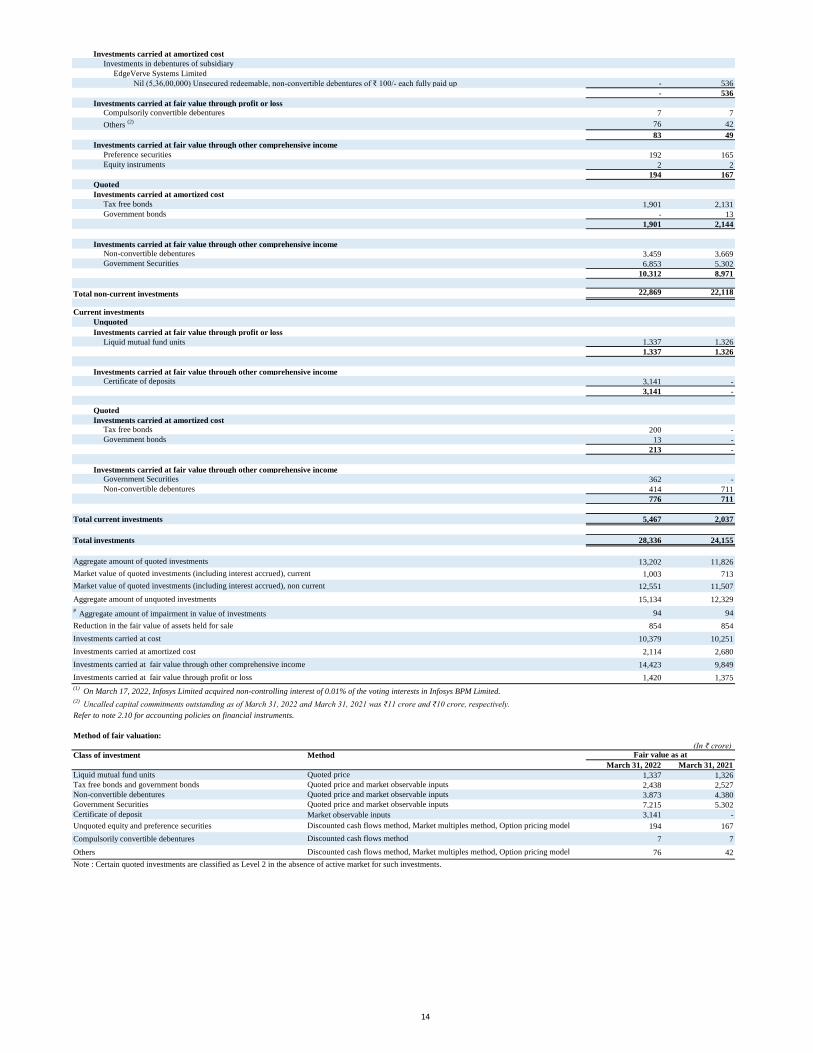
Investments carried at amortized cost
Investments in debentures of subsidiary
EdgeVerve Systems Limited
Nil (5,36,00,000) Unsecured redeemable, non-convertible debentures of ₹ 100/- each fully paid up - 536
- 536
Investments carried at fair value through profit or loss
Compulsorily convertible debentures 7 7
Others (2) 76 42
83 49
Investments carried at fair value through other comprehensive income
Preference securities 192 165
Equity instruments 2 2
194 167
Quoted
Investments carried at amortized cost
Tax free bonds 1,901 2,131
Government bonds - 13
1,901 2,144
Investments carried at fair value through other comprehensive income
Non-convertible debentures 3,459 3,669
Government Securities 6,853 5,302
10,312 8,971
Total non-current investments 22,869 22,118
Current investments
Unquoted
Investments carried at fair value through profit or loss
Liquid mutual fund units 1,337 1,326
1,337 1,326
Investments carried at fair value through other comprehensive income
Certificate of deposits 3,141 -
3,141 -
Quoted
Investments carried at amortized cost
Tax free bonds 200 -
Government bonds 13 -
213 -
Investments carried at fair value through other comprehensive income
Government Securities 362 -
Non-convertible debentures 414 711
776 711
Total current investments 5,467 2,037
Total investments 28,336 24,155
13,202 11,826
1,003 713
12,551 11,507
Aggregate amount of unquoted investments 15,134 12,329
# Aggregate amount of impairment in value of investments 94 94
Reduction in the fair value of assets held for sale 854 854
Investments carried at cost 10,379 10,251
Investments carried at amortized cost 2,114 2,680
Investments carried at fair value through other comprehensive income 14,423 9,849
Investments carried at fair value through profit or loss 1,420 1,375
(1) On March 17, 2022, Infosys Limited acquired non-controlling interest of 0.01% of the voting interests in Infosys BPM Limited.
(2) Uncalled capital commitments outstanding as of March 31, 2022 and March 31, 2021 was ₹11 crore and ₹10 crore, respectively.
Refer to note 2.10 for accounting policies on financial instruments.
Method of fair valuation:
(In ₹ crore)
Class of investment Method
March 31, 2022 March 31, 2021
Liquid mutual fund units 1,337 1,326
Tax free bonds and government bonds 2,438 2,527
Non-convertible debentures 3,873 4,380
Government Securities 7,215 5,302
Certificate of deposit Market observable inputs 3,141 -
Unquoted equity and preference securities 194 167
Compulsorily convertible debentures 7 7
Others 76 42
Note : Certain quoted investments are classified as Level 2 in the absence of active market for such investments.
Quoted price and market observable inputs
Quoted price and market observable inputs
Discounted cash flows method, Market multiples method, Option pricing model
Discounted cash flows method, Market multiples method, Option pricing model
Quoted price and market observable inputs
Discounted cash flows method
Quoted price
Aggregate amount of quoted investments
Fair value as at
Market value of quoted investments (including interest accrued), current
Market value of quoted investments (including interest accrued), non current
14
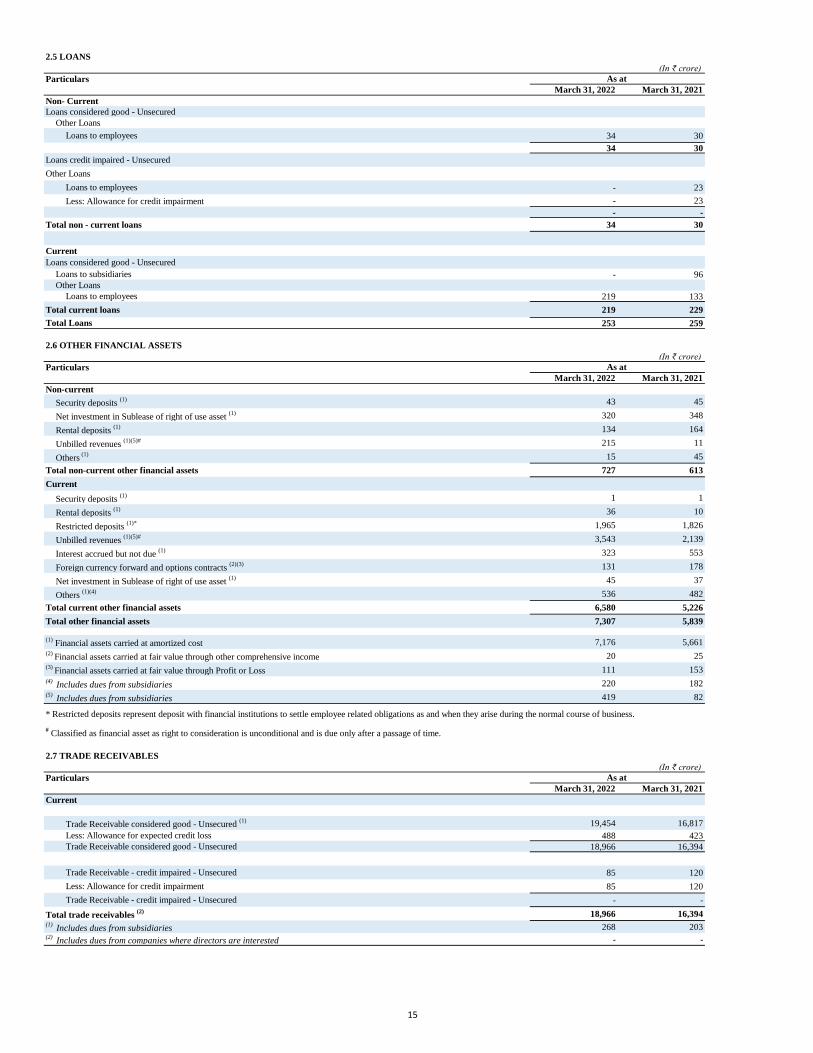
2.5 LOANS
(In ₹ crore)
Particulars
March 31, 2022 March 31, 2021
Non- Current
Loans considered good - Unsecured
Other Loans
Loans to employees 34 30
34 30
Loans credit impaired - Unsecured
Other Loans
Loans to employees - 23
Less: Allowance for credit impairment - 23
- -
Total non - current loans 34 30
Current
Loans considered good - Unsecured
Loans to subsidiaries - 96
Other Loans
Loans to employees 219 133
Total current loans 219 229
Total Loans 253 259
2.6 OTHER FINANCIAL ASSETS
(In ₹ crore)
Particulars
March 31, 2022 March 31, 2021
Non-current
Security deposits (1) 43 45
Net investment in Sublease of right of use asset (1) 320 348
Rental deposits (1) 134 164
Unbilled revenues (1)(5)# 215 11
Others (1) 15 45
Total non-current other financial assets 727 613
Current
Security deposits (1) 1 1
Rental deposits (1) 36 10
Restricted deposits (1)* 1,965 1,826
Unbilled revenues (1)(5)# 3,543 2,139
Interest accrued but not due (1) 323 553
Foreign currency forward and options contracts (2)(3) 131 178
Net investment in Sublease of right of use asset (1) 45 37
Others (1)(4) 536 482
Total current other financial assets 6,580 5,226
Total other financial assets 7,307 5,839
(1) Financial assets carried at amortized cost 7,176 5,661
(2) Financial assets carried at fair value through other comprehensive income 20 25
(3) Financial assets carried at fair value through Profit or Loss 111 153
(4) Includes dues from subsidiaries 220 182
(5) Includes dues from subsidiaries 419 82
# Classified as financial asset as right to consideration is unconditional and is due only after a passage of time.
2.7 TRADE RECEIVABLES
(In ₹ crore)
Particulars
March 31, 2022 March 31, 2021
Current
Trade Receivable considered good - Unsecured (1) 19,454 16,817
Less: Allowance for expected credit loss 488 423
Trade Receivable considered good - Unsecured 18,966 16,394
Trade Receivable - credit impaired - Unsecured 85 120
Less: Allowance for credit impairment 85 120
Trade Receivable - credit impaired - Unsecured - -
Total trade receivables (2) 18,966 16,394
(1) Includes dues from subsidiaries 268 203
(2) Includes dues from companies where directors are interested - -
As at
As at
As at
* Restricted deposits represent deposit with financial institutions to settle employee related obligations as and when they arise during the normal course of business.
15
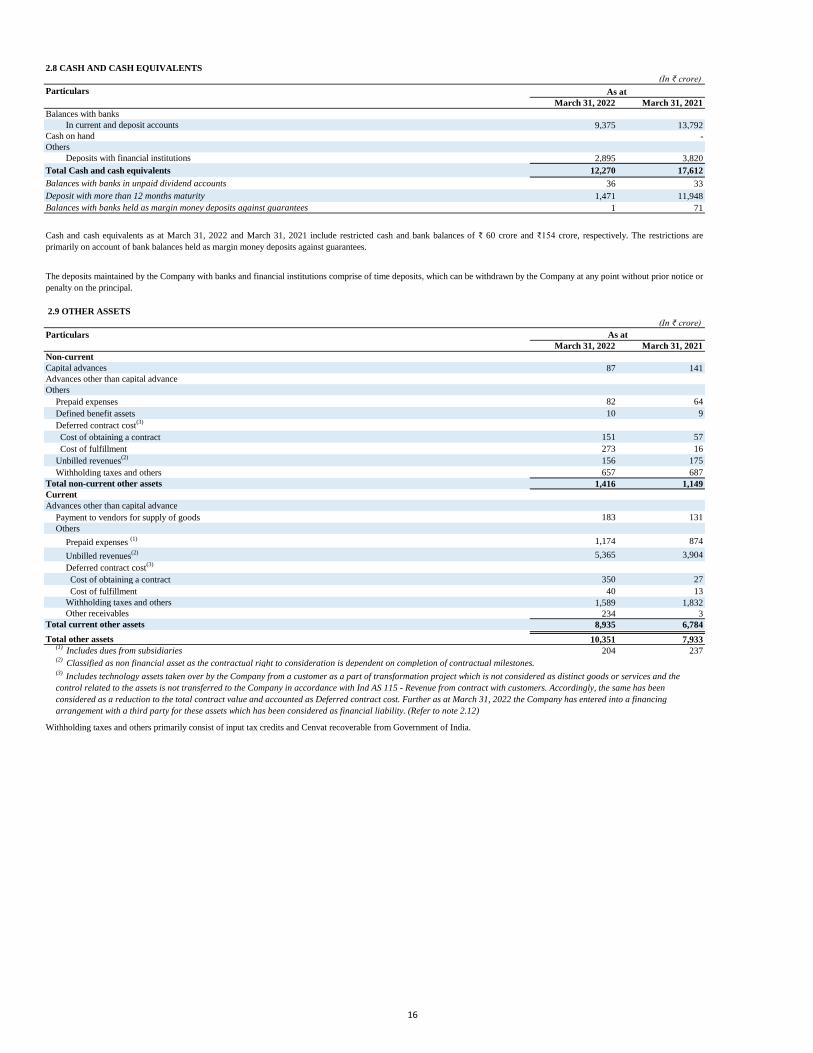
2.8 CASH AND CASH EQUIVALENTS
(In ₹ crore)
Particulars
March 31, 2022 March 31, 2021
Balances with banks
In current and deposit accounts 9,375 13,792
Cash on hand -
Others
Deposits with financial institutions 2,895 3,820
Total Cash and cash equivalents 12,270 17,612
Balances with banks in unpaid dividend accounts 36 33
Deposit with more than 12 months maturity 1,471 11,948
Balances with banks held as margin money deposits against guarantees 1 71
2.9 OTHER ASSETS
(In ₹ crore)
Particulars
March 31, 2022 March 31, 2021
Non-current
Capital advances 87 141
Advances other than capital advance
Others
Prepaid expenses 82 64
Defined benefit assets 10 9
Deferred contract cost(3)
Cost of obtaining a contract 151 57
Cost of fulfillment 273 16
Unbilled revenues(2)
156 175
Withholding taxes and others 657 687
Total non-current other assets 1,416 1,149
Current
Advances other than capital advance
Payment to vendors for supply of goods 183 131
Others
Prepaid expenses (1) 1,174 874
Unbilled revenues(2) 5,365 3,904
Deferred contract cost(3)
Cost of obtaining a contract 350 27
Cost of fulfillment 40 13
Withholding taxes and others 1,589 1,832
Other receivables 234 3
Total current other assets 8,935 6,784
Total other assets 10,351 7,933 (1)
Includes dues from subsidiaries 204 237 (2)
Classified as non financial asset as the contractual right to consideration is dependent on completion of contractual milestones.
As at
As at
Withholding taxes and others primarily consist of input tax credits and Cenvat recoverable from Government of India.
Cash and cash equivalents as at March 31, 2022 and March 31, 2021 include restricted cash and bank balances of ₹ 60 crore and ₹154 crore, respectively. The restrictions are
primarily on account of bank balances held as margin money deposits against guarantees.
The deposits maintained by the Company with banks and financial institutions comprise of time deposits, which can be withdrawn by the Company at any point without prior notice or
penalty on the principal.
(3) Includes technology assets taken over by the Company from a customer as a part of transformation project which is not considered as distinct goods or services and the
control related to the assets is not transferred to the Company in accordance with Ind AS 115 - Revenue from contract with customers. Accordingly, the same has been
considered as a reduction to the total contract value and accounted as Deferred contract cost. Further as at March 31, 2022 the Company has entered into a financing
arrangement with a third party for these assets which has been considered as financial liability. (Refer to note 2.12)
16
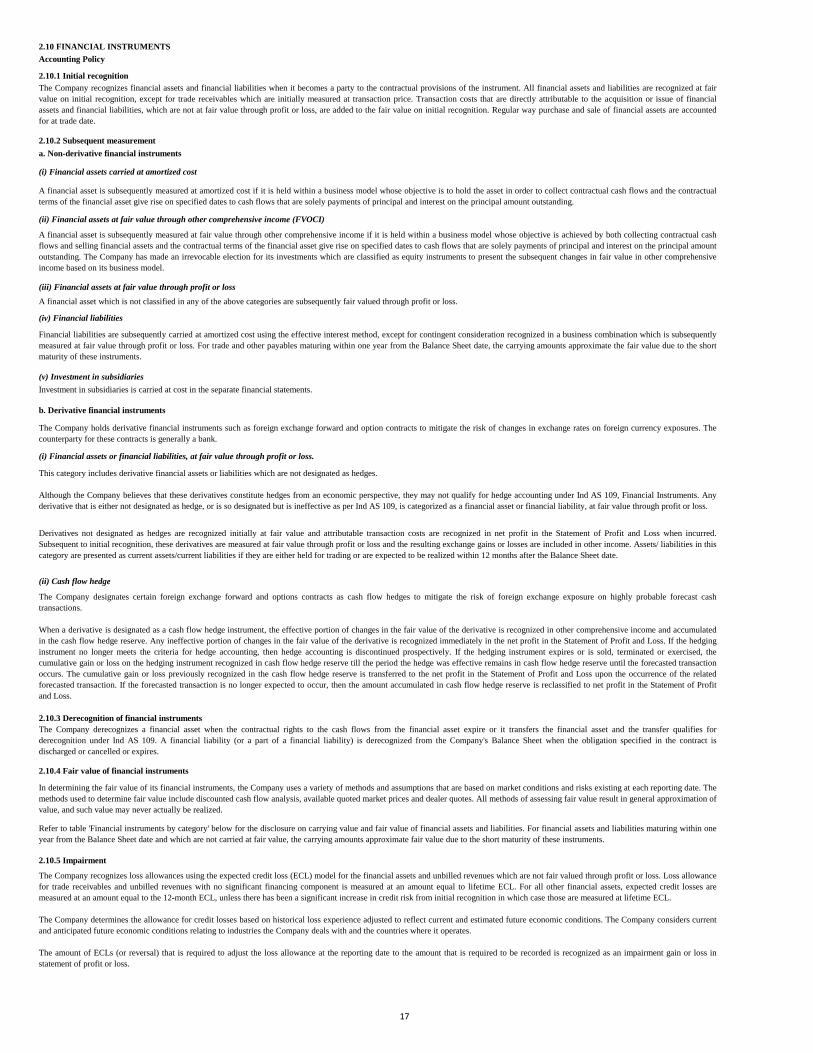
2.10 FINANCIAL INSTRUMENTS
In determining the fair value of its financial instruments, the Company uses a variety of methods and assumptions that are based on market conditions and risks existing at each reporting date. The
methods used to determine fair value include discounted cash flow analysis, available quoted market prices and dealer quotes. All methods of assessing fair value result in general approximation of
value, and such value may never actually be realized.
Refer to table 'Financial instruments by category' below for the disclosure on carrying value and fair value of financial assets and liabilities. For financial assets and liabilities maturing within one
year from the Balance Sheet date and which are not carried at fair value, the carrying amounts approximate fair value due to the short maturity of these instruments.
The Company designates certain foreign exchange forward and options contracts as cash flow hedges to mitigate the risk of foreign exchange exposure on highly probable forecast cash
transactions.
When a derivative is designated as a cash flow hedge instrument, the effective portion of changes in the fair value of the derivative is recognized in other comprehensive income and accumulated
in the cash flow hedge reserve. Any ineffective portion of changes in the fair value of the derivative is recognized immediately in the net profit in the Statement of Profit and Loss. If the hedging
instrument no longer meets the criteria for hedge accounting, then hedge accounting is discontinued prospectively. If the hedging instrument expires or is sold, terminated or exercised, the
cumulative gain or loss on the hedging instrument recognized in cash flow hedge reserve till the period the hedge was effective remains in cash flow hedge reserve until the forecasted transaction
occurs. The cumulative gain or loss previously recognized in the cash flow hedge reserve is transferred to the net profit in the Statement of Profit and Loss upon the occurrence of the related
forecasted transaction. If the forecasted transaction is no longer expected to occur, then the amount accumulated in cash flow hedge reserve is reclassified to net profit in the Statement of Profit
and Loss.
Although the Company believes that these derivatives constitute hedges from an economic perspective, they may not qualify for hedge accounting under Ind AS 109, Financial Instruments. Any
derivative that is either not designated as hedge, or is so designated but is ineffective as per Ind AS 109, is categorized as a financial asset or financial liability, at fair value through profit or loss.
Derivatives not designated as hedges are recognized initially at fair value and attributable transaction costs are recognized in net profit in the Statement of Profit and Loss when incurred.
Subsequent to initial recognition, these derivatives are measured at fair value through profit or loss and the resulting exchange gains or losses are included in other income. Assets/ liabilities in this
category are presented as current assets/current liabilities if they are either held for trading or are expected to be realized within 12 months after the Balance Sheet date.
(i) Financial assets or financial liabilities, at fair value through profit or loss.
The Company recognizes loss allowances using the expected credit loss (ECL) model for the financial assets and unbilled revenues which are not fair valued through profit or loss. Loss allowance
for trade receivables and unbilled revenues with no significant financing component is measured at an amount equal to lifetime ECL. For all other financial assets, expected credit losses are
measured at an amount equal to the 12-month ECL, unless there has been a significant increase in credit risk from initial recognition in which case those are measured at lifetime ECL.
The Company determines the allowance for credit losses based on historical loss experience adjusted to reflect current and estimated future economic conditions. The Company considers current
and anticipated future economic conditions relating to industries the Company deals with and the countries where it operates.
The amount of ECLs (or reversal) that is required to adjust the loss allowance at the reporting date to the amount that is required to be recorded is recognized as an impairment gain or loss in
statement of profit or loss.
2.10.5 Impairment
2.10.3 Derecognition of financial instruments
2.10.4 Fair value of financial instruments
The Company derecognizes a financial asset when the contractual rights to the cash flows from the financial asset expire or it transfers the financial asset and the transfer qualifies for
derecognition under Ind AS 109. A financial liability (or a part of a financial liability) is derecognized from the Company's Balance Sheet when the obligation specified in the contract is
discharged or cancelled or expires.
This category includes derivative financial assets or liabilities which are not designated as hedges.
(iv) Financial liabilities
(v) Investment in subsidiaries
Financial liabilities are subsequently carried at amortized cost using the effective interest method, except for contingent consideration recognized in a business combination which is subsequently
measured at fair value through profit or loss. For trade and other payables maturing within one year from the Balance Sheet date, the carrying amounts approximate the fair value due to the short
maturity of these instruments.
The Company holds derivative financial instruments such as foreign exchange forward and option contracts to mitigate the risk of changes in exchange rates on foreign currency exposures. The
counterparty for these contracts is generally a bank.
Investment in subsidiaries is carried at cost in the separate financial statements.
(ii) Cash flow hedge
Accounting Policy
2.10.1 Initial recognition
(ii) Financial assets at fair value through other comprehensive income (FVOCI)
The Company recognizes financial assets and financial liabilities when it becomes a party to the contractual provisions of the instrument. All financial assets and liabilities are recognized at fair
value on initial recognition, except for trade receivables which are initially measured at transaction price. Transaction costs that are directly attributable to the acquisition or issue of financial
assets and financial liabilities, which are not at fair value through profit or loss, are added to the fair value on initial recognition. Regular way purchase and sale of financial assets are accounted
for at trade date.
(i) Financial assets carried at amortized cost
A financial asset is subsequently measured at amortized cost if it is held within a business model whose objective is to hold the asset in order to collect contractual cash flows and the contractual
terms of the financial asset give rise on specified dates to cash flows that are solely payments of principal and interest on the principal amount outstanding.
(iii) Financial assets at fair value through profit or loss
2.10.2 Subsequent measurement
a. Non-derivative financial instruments
b. Derivative financial instruments
A financial asset is subsequently measured at fair value through other comprehensive income if it is held within a business model whose objective is achieved by both collecting contractual cash
flows and selling financial assets and the contractual terms of the financial asset give rise on specified dates to cash flows that are solely payments of principal and interest on the principal amount
outstanding. The Company has made an irrevocable election for its investments which are classified as equity instruments to present the subsequent changes in fair value in other comprehensive
income based on its business model.
A financial asset which is not classified in any of the above categories are subsequently fair valued through profit or loss.
17
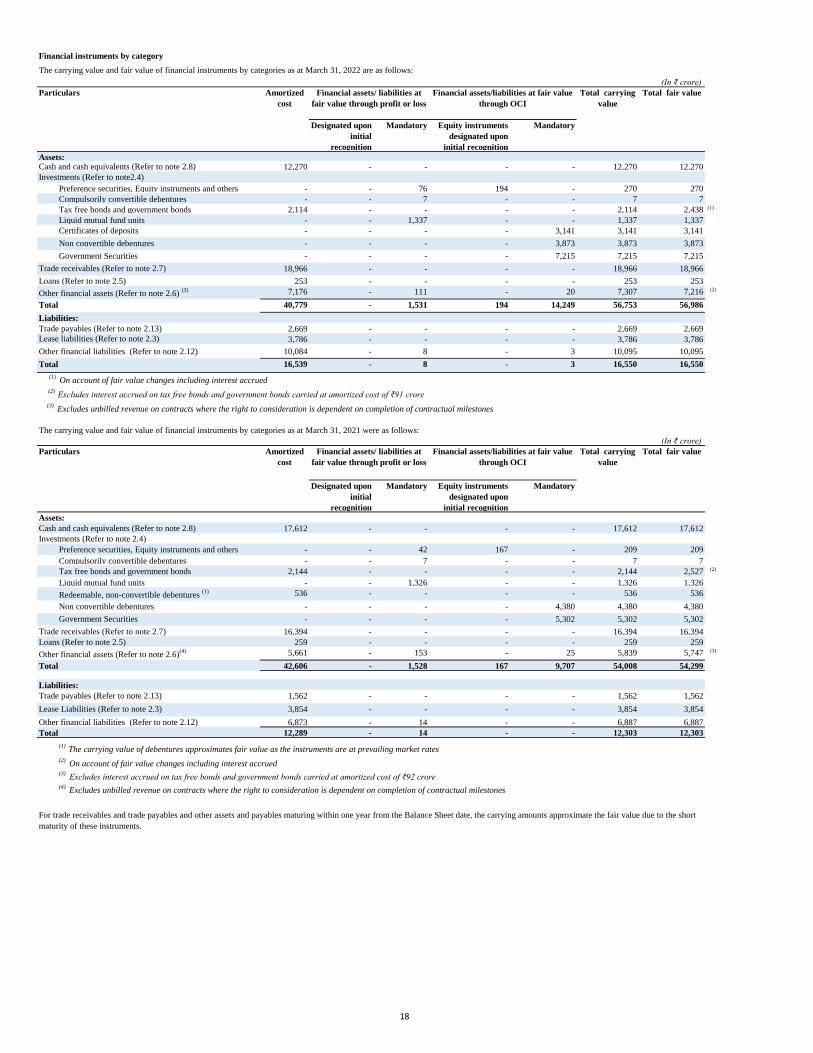
Financial instruments by category
The carrying value and fair value of financial instruments by categories as at March 31, 2022 are as follows:
(In ₹ crore)
Particulars
Designated upon
initial
recognition
Mandatory Equity instruments
designated upon
initial recognition
Mandatory
Assets: Cash and cash equivalents (Refer to note 2.8) 12,270 - - - - 12,270 12,270
Investments (Refer to note2.4)
Preference securities, Equity instruments and others - - 76 194 - 270 270
Compulsorily convertible debentures - - 7 - - 7 7
Tax free bonds and government bonds 2,114 - - - - 2,114 2,438 (1)
Liquid mutual fund units - - 1,337 - - 1,337 1,337
Certificates of deposits - - - - 3,141 3,141 3,141
Non convertible debentures - - - - 3,873 3,873 3,873
Government Securities - - - - 7,215 7,215 7,215
Trade receivables (Refer to note 2.7) 18,966 - - - - 18,966 18,966
Loans (Refer to note 2.5) 253 - - - - 253 253
Other financial assets (Refer to note 2.6) (3) 7,176 - 111 - 20 7,307 7,216 (2)
Total 40,779 - 1,531 194 14,249 56,753 56,986
Liabilities:
Trade payables (Refer to note 2.13) 2,669 - - - - 2,669 2,669
Lease liabilities (Refer to note 2.3) 3,786 - - - - 3,786 3,786
Other financial liabilities (Refer to note 2.12) 10,084 - 8 - 3 10,095 10,095
Total 16,539 - 8 - 3 16,550 16,550
(1)
On account of fair value changes including interest accrued
(2)
Excludes interest accrued on tax free bonds and government bonds carried at amortized cost of ₹91 crore
(3)
Excludes unbilled revenue on contracts where the right to consideration is dependent on completion of contractual milestones
The carrying value and fair value of financial instruments by categories as at March 31, 2021 were as follows:
(In ₹ crore)
Particulars
Designated upon
initial
recognition
Mandatory Equity instruments
designated upon
initial recognition
Mandatory
Assets:
Cash and cash equivalents (Refer to note 2.8) 17,612 - - - - 17,612 17,612
Investments (Refer to note 2.4)
Preference securities, Equity instruments and others - - 42 167 - 209 209
Compulsorily convertible debentures - - 7 - - 7 7
Tax free bonds and government bonds 2,144 - - - - 2,144 2,527 (2)
Liquid mutual fund units - - 1,326 - - 1,326 1,326
Redeemable, non-convertible debentures (1) 536 - - - - 536 536
Non convertible debentures - - - - 4,380 4,380 4,380
Government Securities - - - - 5,302 5,302 5,302
Trade receivables (Refer to note 2.7) 16,394 - - - - 16,394 16,394
Loans (Refer to note 2.5) 259 - - - - 259 259
Other financial assets (Refer to note 2.6)(4) 5,661 - 153 - 25 5,839 5,747 (3)
Total 42,606 - 1,528 167 9,707 54,008 54,299
Liabilities:
Trade payables (Refer to note 2.13) 1,562 - - - - 1,562 1,562
Lease Liabilities (Refer to note 2.3) 3,854 - - - - 3,854 3,854
Other financial liabilities (Refer to note 2.12) 6,873 - 14 - - 6,887 6,887
Total 12,289 - 14 - - 12,303 12,303
(1) The carrying value of debentures approximates fair value as the instruments are at prevailing market rates
(2) On account of fair value changes including interest accrued
(3) Excludes interest accrued on tax free bonds and government bonds carried at amortized cost of ₹92 crore
(4) Excludes unbilled revenue on contracts where the right to consideration is dependent on completion of contractual milestones
Financial assets/ liabilities at
fair value through profit or loss
Financial assets/liabilities at fair value
through OCI
Total fair valueTotal carrying
value
Amortized
cost
Financial assets/ liabilities at
fair value through profit or loss
Financial assets/liabilities at fair value
through OCI
Total fair valueAmortized
cost
Total carrying
value
For trade receivables and trade payables and other assets and payables maturing within one year from the Balance Sheet date, the carrying amounts approximate the fair value due to the short
maturity of these instruments.
18
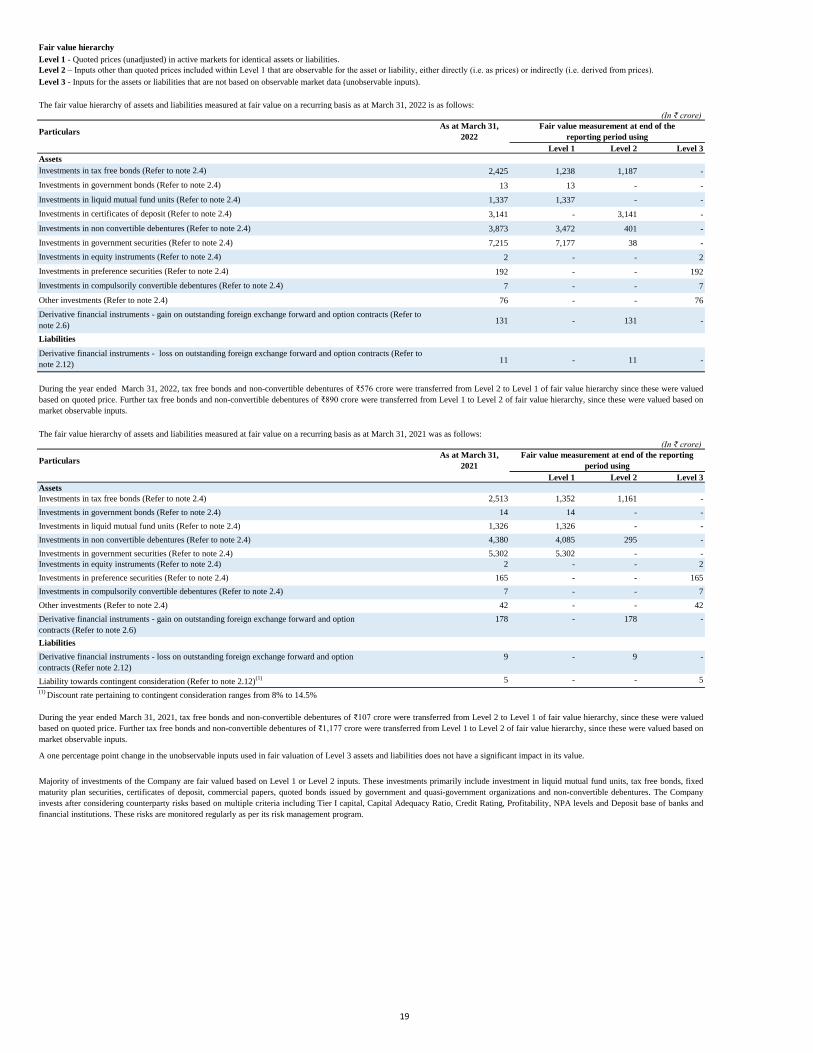
Fair value hierarchy
Level 1 - Quoted prices (unadjusted) in active markets for identical assets or liabilities.
Level 3 - Inputs for the assets or liabilities that are not based on observable market data (unobservable inputs).
(In ₹ crore)
Particulars
Level 1 Level 2 Level 3
Assets
2,425 1,238 1,187 -
13 13 - -
Investments in liquid mutual fund units (Refer to note 2.4) 1,337 1,337 - -
3,141 - 3,141 -
Investments in non convertible debentures (Refer to note 2.4) 3,873 3,472 401 -
Investments in government securities (Refer to note 2.4) 7,215 7,177 38 -
2 - - 2
192 - - 192
7 - - 7
Other investments (Refer to note 2.4) 76 - - 76
131 - 131 -
Liabilities
11 - 11 -
(In ₹ crore)
Particulars
Level 1 Level 2 Level 3
Assets
2,513 1,352 1,161 -
14 14 - -
Investments in liquid mutual fund units (Refer to note 2.4) 1,326 1,326 - -
4,380 4,085 295 -
5,302 5,302 - -
2 - - 2
165 - - 165
Investments in compulsorily convertible debentures (Refer to note 2.4) 7 - - 7
42 - - 42
178 - 178 -
Liabilities
9 - 9 -
Liability towards contingent consideration (Refer to note 2.12)(1) 5 - - 5
(1) Discount rate pertaining to contingent consideration ranges from 8% to 14.5%
Investments in compulsorily convertible debentures (Refer to note 2.4)
During the year ended March 31, 2022, tax free bonds and non-convertible debentures of ₹576 crore were transferred from Level 2 to Level 1 of fair value hierarchy since these were valued
based on quoted price. Further tax free bonds and non-convertible debentures of ₹890 crore were transferred from Level 1 to Level 2 of fair value hierarchy, since these were valued based on
market observable inputs.
Level 2 – Inputs other than quoted prices included within Level 1 that are observable for the asset or liability, either directly (i.e. as prices) or indirectly (i.e. derived from prices).
Investments in equity instruments (Refer to note 2.4)
Investments in preference securities (Refer to note 2.4)
Derivative financial instruments - loss on outstanding foreign exchange forward and option contracts (Refer to
note 2.12)
Derivative financial instruments - gain on outstanding foreign exchange forward and option contracts (Refer to
note 2.6)
Investments in certificates of deposit (Refer to note 2.4)
Fair value measurement at end of the
reporting period using
Investments in tax free bonds (Refer to note 2.4)
Investments in government bonds (Refer to note 2.4)
Investments in government bonds (Refer to note 2.4)
Investments in tax free bonds (Refer to note 2.4)
The fair value hierarchy of assets and liabilities measured at fair value on a recurring basis as at March 31, 2022 is as follows:
As at March 31,
2022
Majority of investments of the Company are fair valued based on Level 1 or Level 2 inputs. These investments primarily include investment in liquid mutual fund units, tax free bonds, fixed
maturity plan securities, certificates of deposit, commercial papers, quoted bonds issued by government and quasi-government organizations and non-convertible debentures. The Company
invests after considering counterparty risks based on multiple criteria including Tier I capital, Capital Adequacy Ratio, Credit Rating, Profitability, NPA levels and Deposit base of banks and
financial institutions. These risks are monitored regularly as per its risk management program.
During the year ended March 31, 2021, tax free bonds and non-convertible debentures of ₹107 crore were transferred from Level 2 to Level 1 of fair value hierarchy, since these were valued
based on quoted price. Further tax free bonds and non-convertible debentures of ₹1,177 crore were transferred from Level 1 to Level 2 of fair value hierarchy, since these were valued based on
market observable inputs.
The fair value hierarchy of assets and liabilities measured at fair value on a recurring basis as at March 31, 2021 was as follows:
Derivative financial instruments - loss on outstanding foreign exchange forward and option
contracts (Refer note 2.12)
A one percentage point change in the unobservable inputs used in fair valuation of Level 3 assets and liabilities does not have a significant impact in its value.
Other investments (Refer to note 2.4)
Derivative financial instruments - gain on outstanding foreign exchange forward and option
contracts (Refer to note 2.6)
Fair value measurement at end of the reporting
period using
As at March 31,
2021
Investments in non convertible debentures (Refer to note 2.4)
Investments in equity instruments (Refer to note 2.4)
Investments in preference securities (Refer to note 2.4)
Investments in government securities (Refer to note 2.4)
19
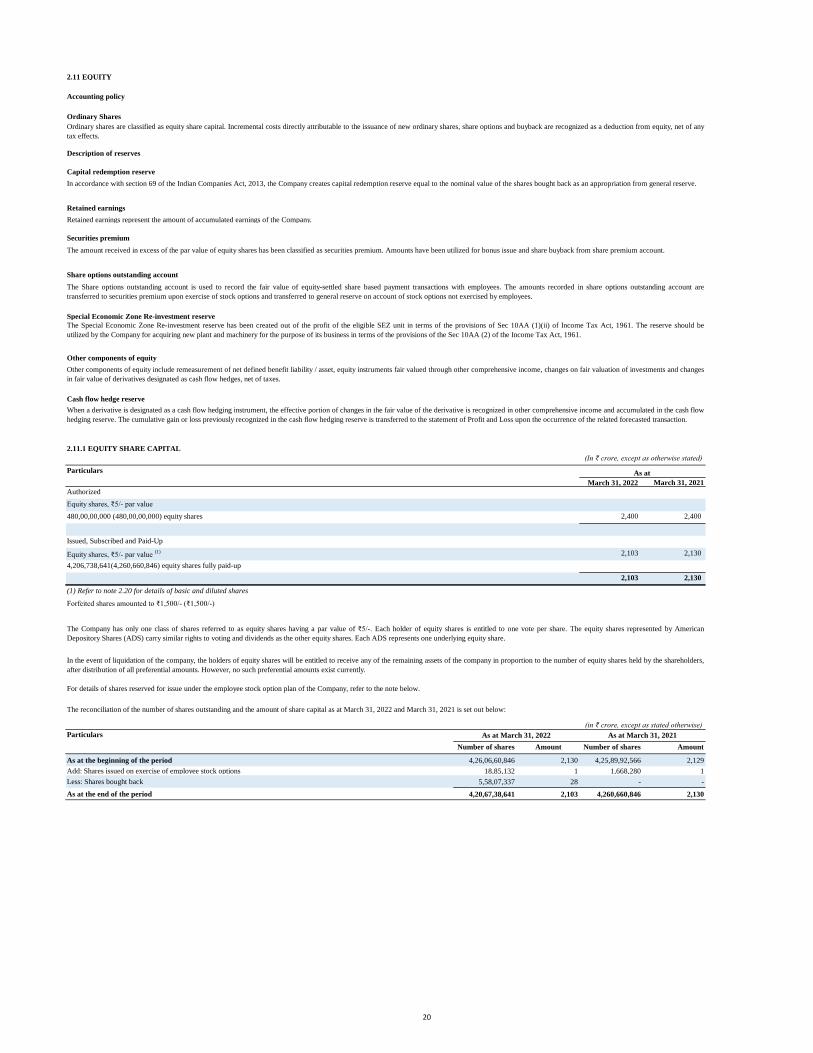
2.11 EQUITY
Accounting policy
Ordinary Shares
Description of reserves
Retained earnings
Retained earnings represent the amount of accumulated earnings of the Company.
Securities premium
Share options outstanding account
Other components of equity
Cash flow hedge reserve
2.11.1 EQUITY SHARE CAPITAL
(In ₹ crore, except as otherwise stated)
Particulars
March 31, 2022 March 31, 2021
Authorized
Equity shares, ₹5/- par value
480,00,00,000 (480,00,00,000) equity shares 2,400 2,400
Issued, Subscribed and Paid-Up
Equity shares, ₹5/- par value (1) 2,103 2,130
4,206,738,641(4,260,660,846) equity shares fully paid-up
2,103 2,130
Forfeited shares amounted to ₹1,500/- (₹1,500/-)
(in ₹ crore, except as stated otherwise)
Particulars
Number of shares Amount Number of shares Amount
As at the beginning of the period 4,26,06,60,846 2,130 4,25,89,92,566 2,129
Add: Shares issued on exercise of employee stock options 18,85,132 1 1,668,280 1
Less: Shares bought back 5,58,07,337 28 - -
As at the end of the period 4,20,67,38,641 2,103 4,260,660,846 2,130
Special Economic Zone Re-investment reserve
The Special Economic Zone Re-investment reserve has been created out of the profit of the eligible SEZ unit in terms of the provisions of Sec 10AA (1)(ii) of Income Tax Act, 1961. The reserve should be
utilized by the Company for acquiring new plant and machinery for the purpose of its business in terms of the provisions of the Sec 10AA (2) of the Income Tax Act, 1961.
(1) Refer to note 2.20 for details of basic and diluted shares
The Company has only one class of shares referred to as equity shares having a par value of ₹5/-. Each holder of equity shares is entitled to one vote per share. The equity shares represented by American
Depository Shares (ADS) carry similar rights to voting and dividends as the other equity shares. Each ADS represents one underlying equity share.
In the event of liquidation of the company, the holders of equity shares will be entitled to receive any of the remaining assets of the company in proportion to the number of equity shares held by the shareholders,
after distribution of all preferential amounts. However, no such preferential amounts exist currently.
For details of shares reserved for issue under the employee stock option plan of the Company, refer to the note below.
The reconciliation of the number of shares outstanding and the amount of share capital as at March 31, 2022 and March 31, 2021 is set out below:
As at March 31, 2022 As at March 31, 2021
Ordinary shares are classified as equity share capital. Incremental costs directly attributable to the issuance of new ordinary shares, share options and buyback are recognized as a deduction from equity, net of any
tax effects.
The amount received in excess of the par value of equity shares has been classified as securities premium. Amounts have been utilized for bonus issue and share buyback from share premium account.
In accordance with section 69 of the Indian Companies Act, 2013, the Company creates capital redemption reserve equal to the nominal value of the shares bought back as an appropriation from general reserve.
Other components of equity include remeasurement of net defined benefit liability / asset, equity instruments fair valued through other comprehensive income, changes on fair valuation of investments and changes
in fair value of derivatives designated as cash flow hedges, net of taxes.
As at
The Share options outstanding account is used to record the fair value of equity-settled share based payment transactions with employees. The amounts recorded in share options outstanding account are
transferred to securities premium upon exercise of stock options and transferred to general reserve on account of stock options not exercised by employees.
When a derivative is designated as a cash flow hedging instrument, the effective portion of changes in the fair value of the derivative is recognized in other comprehensive income and accumulated in the cash flow
hedging reserve. The cumulative gain or loss previously recognized in the cash flow hedging reserve is transferred to the statement of Profit and Loss upon the occurrence of the related forecasted transaction.
Capital redemption reserve
20
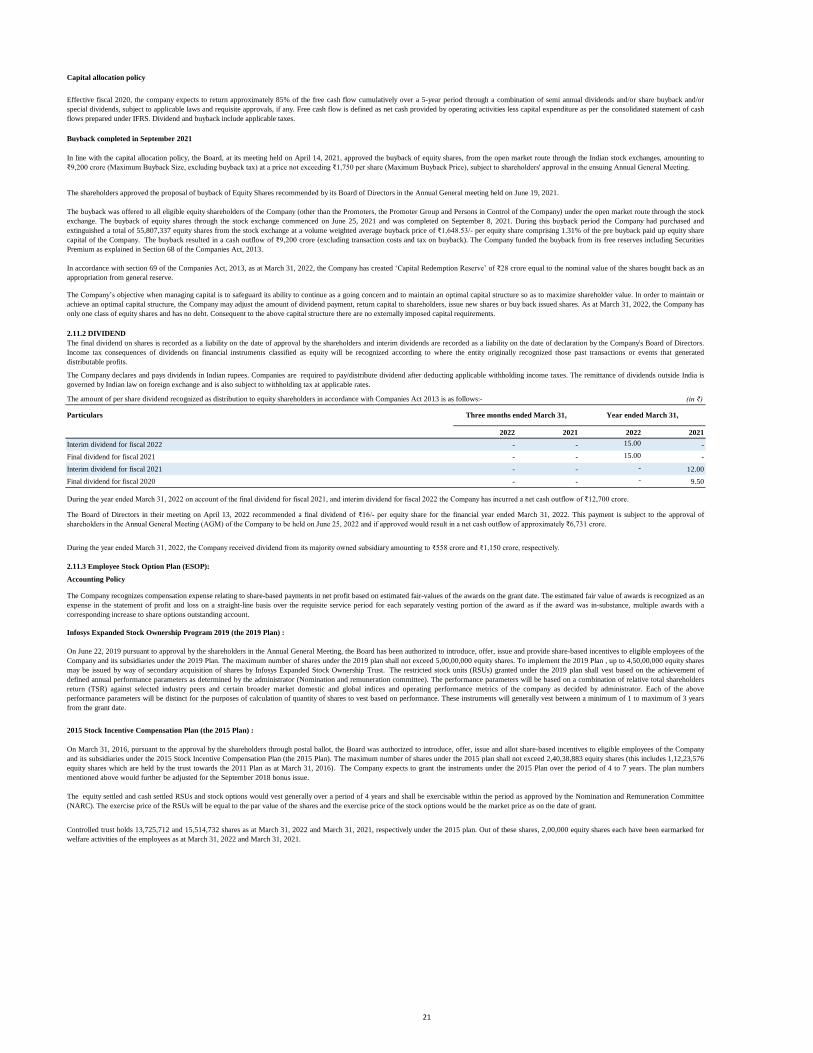
Capital allocation policy
2.11.2 DIVIDEND
The amount of per share dividend recognized as distribution to equity shareholders in accordance with Companies Act 2013 is as follows:- (in ₹)
2022 2021 2022 2021
Interim dividend for fiscal 2022 - - 15.00 -
Final dividend for fiscal 2021 - - 15.00 -
Interim dividend for fiscal 2021 - - - 12.00
Final dividend for fiscal 2020 - - - 9.50
Year ended March 31,
2.11.3 Employee Stock Option Plan (ESOP):
During the year ended March 31, 2022, the Company received dividend from its majority owned subsidiary amounting to ₹558 crore and ₹1,150 crore, respectively.
During the year ended March 31, 2022 on account of the final dividend for fiscal 2021, and interim dividend for fiscal 2022 the Company has incurred a net cash outflow of ₹12,700 crore.
The Board of Directors in their meeting on April 13, 2022 recommended a final dividend of ₹16/- per equity share for the financial year ended March 31, 2022. This payment is subject to the approval of
shareholders in the Annual General Meeting (AGM) of the Company to be held on June 25, 2022 and if approved would result in a net cash outflow of approximately ₹6,731 crore.
Effective fiscal 2020, the company expects to return approximately 85% of the free cash flow cumulatively over a 5-year period through a combination of semi annual dividends and/or share buyback and/or
special dividends, subject to applicable laws and requisite approvals, if any. Free cash flow is defined as net cash provided by operating activities less capital expenditure as per the consolidated statement of cash
flows prepared under IFRS. Dividend and buyback include applicable taxes.
Particulars
The Company declares and pays dividends in Indian rupees. Companies are required to pay/distribute dividend after deducting applicable withholding income taxes. The remittance of dividends outside India is
governed by Indian law on foreign exchange and is also subject to withholding tax at applicable rates.
Three months ended March 31,
The final dividend on shares is recorded as a liability on the date of approval by the shareholders and interim dividends are recorded as a liability on the date of declaration by the Company's Board of Directors.
Income tax consequences of dividends on financial instruments classified as equity will be recognized according to where the entity originally recognized those past transactions or events that generated
distributable profits.
Buyback completed in September 2021
In line with the capital allocation policy, the Board, at its meeting held on April 14, 2021, approved the buyback of equity shares, from the open market route through the Indian stock exchanges, amounting to
₹9,200 crore (Maximum Buyback Size, excluding buyback tax) at a price not exceeding ₹1,750 per share (Maximum Buyback Price), subject to shareholders' approval in the ensuing Annual General Meeting.
The shareholders approved the proposal of buyback of Equity Shares recommended by its Board of Directors in the Annual General meeting held on June 19, 2021.
The buyback was offered to all eligible equity shareholders of the Company (other than the Promoters, the Promoter Group and Persons in Control of the Company) under the open market route through the stock
exchange. The buyback of equity shares through the stock exchange commenced on June 25, 2021 and was completed on September 8, 2021. During this buyback period the Company had purchased and
extinguished a total of 55,807,337 equity shares from the stock exchange at a volume weighted average buyback price of ₹1,648.53/- per equity share comprising 1.31% of the pre buyback paid up equity share
capital of the Company. The buyback resulted in a cash outflow of ₹9,200 crore (excluding transaction costs and tax on buyback). The Company funded the buyback from its free reserves including Securities
Premium as explained in Section 68 of the Companies Act, 2013.
In accordance with section 69 of the Companies Act, 2013, as at March 31, 2022, the Company has created ‘Capital Redemption Reserve’ of ₹28 crore equal to the nominal value of the shares bought back as an
appropriation from general reserve.
The Company’s objective when managing capital is to safeguard its ability to continue as a going concern and to maintain an optimal capital structure so as to maximize shareholder value. In order to maintain or
achieve an optimal capital structure, the Company may adjust the amount of dividend payment, return capital to shareholders, issue new shares or buy back issued shares. As at March 31, 2022, the Company has
only one class of equity shares and has no debt. Consequent to the above capital structure there are no externally imposed capital requirements.
The Company recognizes compensation expense relating to share-based payments in net profit based on estimated fair-values of the awards on the grant date. The estimated fair value of awards is recognized as an
expense in the statement of profit and loss on a straight-line basis over the requisite service period for each separately vesting portion of the award as if the award was in-substance, multiple awards with a
corresponding increase to share options outstanding account.
Accounting Policy
Controlled trust holds 13,725,712 and 15,514,732 shares as at March 31, 2022 and March 31, 2021, respectively under the 2015 plan. Out of these shares, 2,00,000 equity shares each have been earmarked for
welfare activities of the employees as at March 31, 2022 and March 31, 2021.
2015 Stock Incentive Compensation Plan (the 2015 Plan) :
On March 31, 2016, pursuant to the approval by the shareholders through postal ballot, the Board was authorized to introduce, offer, issue and allot share-based incentives to eligible employees of the Company
and its subsidiaries under the 2015 Stock Incentive Compensation Plan (the 2015 Plan). The maximum number of shares under the 2015 plan shall not exceed 2,40,38,883 equity shares (this includes 1,12,23,576
equity shares which are held by the trust towards the 2011 Plan as at March 31, 2016). The Company expects to grant the instruments under the 2015 Plan over the period of 4 to 7 years. The plan numbers
mentioned above would further be adjusted for the September 2018 bonus issue.
The equity settled and cash settled RSUs and stock options would vest generally over a period of 4 years and shall be exercisable within the period as approved by the Nomination and Remuneration Committee
(NARC). The exercise price of the RSUs will be equal to the par value of the shares and the exercise price of the stock options would be the market price as on the date of grant.
Infosys Expanded Stock Ownership Program 2019 (the 2019 Plan) :
On June 22, 2019 pursuant to approval by the shareholders in the Annual General Meeting, the Board has been authorized to introduce, offer, issue and provide share-based incentives to eligible employees of the
Company and its subsidiaries under the 2019 Plan. The maximum number of shares under the 2019 plan shall not exceed 5,00,00,000 equity shares. To implement the 2019 Plan , up to 4,50,00,000 equity shares
may be issued by way of secondary acquisition of shares by Infosys Expanded Stock Ownership Trust. The restricted stock units (RSUs) granted under the 2019 plan shall vest based on the achievement of
defined annual performance parameters as determined by the administrator (Nomination and remuneration committee). The performance parameters will be based on a combination of relative total shareholders
return (TSR) against selected industry peers and certain broader market domestic and global indices and operating performance metrics of the company as decided by administrator. Each of the above
performance parameters will be distinct for the purposes of calculation of quantity of shares to vest based on performance. These instruments will generally vest between a minimum of 1 to maximum of 3 years
from the grant date.
21
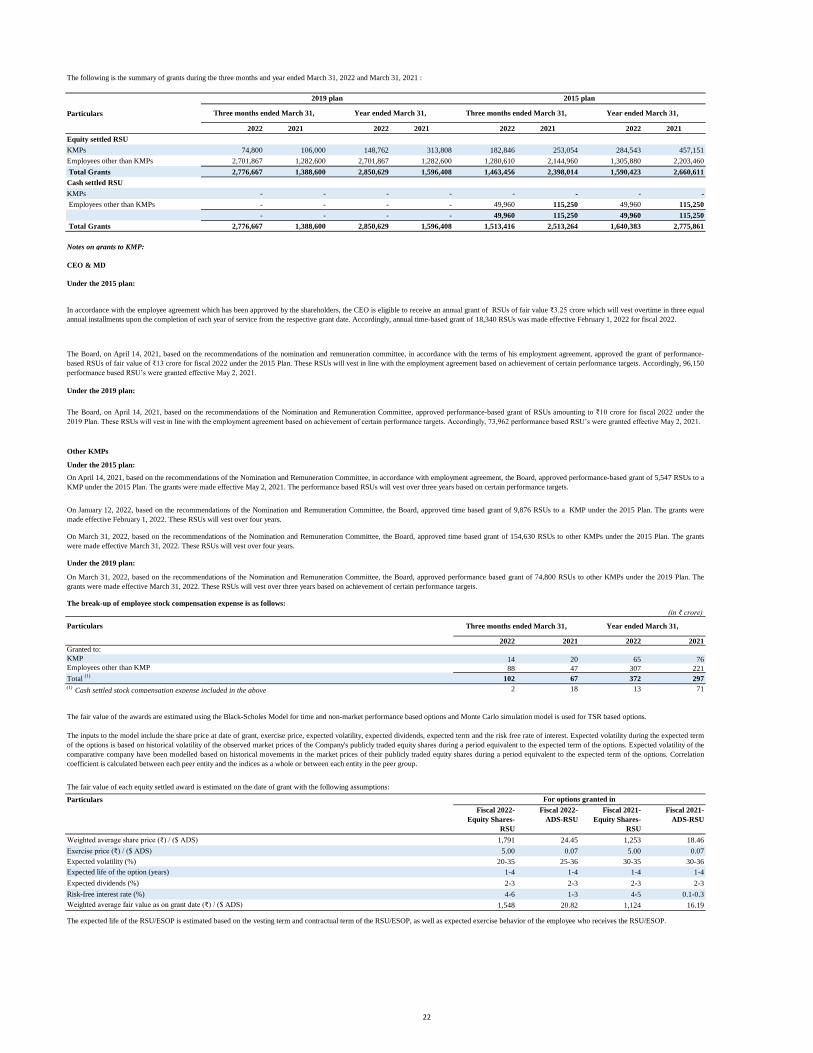
Particulars
2022 2021 2022 2021 2022 2021 2022 2021
Equity settled RSU
KMPs 74,800 106,000 148,762 313,808 182,846 253,054 284,543 457,151
Employees other than KMPs 2,701,867 1,282,600 2,701,867 1,282,600 1,280,610 2,144,960 1,305,880 2,203,460
Total Grants 2,776,667 1,388,600 2,850,629 1,596,408 1,463,456 2,398,014 1,590,423 2,660,611
Cash settled RSU
KMPs - - - - - - - -
Employees other than KMPs - - - - 49,960 115,250 49,960 115,250
- - - - 49,960 115,250 49,960 115,250
Total Grants 2,776,667 1,388,600 2,850,629 1,596,408 1,513,416 2,513,264 1,640,383 2,775,861
Notes on grants to KMP:
CEO & MD
Under the 2015 plan:
Under the 2015 plan:
The break-up of employee stock compensation expense is as follows:
(in ₹ crore)
2022 2021 2022 2021
14 20 65 76
88 47 307 221
102 67 372 297 (1)
Cash settled stock compensation expense included in the above 2 18 13 71
The fair value of each equity settled award is estimated on the date of grant with the following assumptions:
Particulars
Fiscal 2022-
Equity Shares-
RSU
Fiscal 2022-
ADS-RSU
Fiscal 2021-
Equity Shares-
RSU
Fiscal 2021-
ADS-RSU
Weighted average share price (₹) / ($ ADS) 1,791 24.45 1,253 18.46
Exercise price (₹) / ($ ADS) 5.00 0.07 5.00 0.07
Expected volatility (%) 20-35 25-36 30-35 30-36
Expected life of the option (years) 1-4 1-4 1-4 1-4
Expected dividends (%) 2-3 2-3 2-3 2-3
Risk-free interest rate (%) 4-6 1-3 4-5 0.1-0.3
1,548 20.82 1,124 16.19
On January 12, 2022, based on the recommendations of the Nomination and Remuneration Committee, the Board, approved time based grant of 9,876 RSUs to a KMP under the 2015 Plan. The grants were
made effective February 1, 2022. These RSUs will vest over four years.
Under the 2019 plan:
On March 31, 2022, based on the recommendations of the Nomination and Remuneration Committee, the Board, approved time based grant of 154,630 RSUs to other KMPs under the 2015 Plan. The grants
were made effective March 31, 2022. These RSUs will vest over four years.
On April 14, 2021, based on the recommendations of the Nomination and Remuneration Committee, in accordance with employment agreement, the Board, approved performance-based grant of 5,547 RSUs to a
KMP under the 2015 Plan. The grants were made effective May 2, 2021. The performance based RSUs will vest over three years based on certain performance targets.
Three months ended March 31,Three months ended March 31,
The following is the summary of grants during the three months and year ended March 31, 2022 and March 31, 2021 :
2019 plan 2015 plan
The expected life of the RSU/ESOP is estimated based on the vesting term and contractual term of the RSU/ESOP, as well as expected exercise behavior of the employee who receives the RSU/ESOP.
Total (1)
Employees other than KMP
Granted to:
Particulars
Other KMPs
KMP
Year ended March 31,
The Board, on April 14, 2021, based on the recommendations of the nomination and remuneration committee, in accordance with the terms of his employment agreement, approved the grant of performance-
based RSUs of fair value of ₹13 crore for fiscal 2022 under the 2015 Plan. These RSUs will vest in line with the employment agreement based on achievement of certain performance targets. Accordingly, 96,150
performance based RSU’s were granted effective May 2, 2021.
On March 31, 2022, based on the recommendations of the Nomination and Remuneration Committee, the Board, approved performance based grant of 74,800 RSUs to other KMPs under the 2019 Plan. The
grants were made effective March 31, 2022. These RSUs will vest over three years based on achievement of certain performance targets.
Year ended March 31,
The Board, on April 14, 2021, based on the recommendations of the Nomination and Remuneration Committee, approved performance-based grant of RSUs amounting to ₹10 crore for fiscal 2022 under the
2019 Plan. These RSUs will vest in line with the employment agreement based on achievement of certain performance targets. Accordingly, 73,962 performance based RSU’s were granted effective May 2, 2021.
Year ended March 31,
Three months ended March 31,
In accordance with the employee agreement which has been approved by the shareholders, the CEO is eligible to receive an annual grant of RSUs of fair value ₹3.25 crore which will vest overtime in three equal
annual installments upon the completion of each year of service from the respective grant date. Accordingly, annual time-based grant of 18,340 RSUs was made effective February 1, 2022 for fiscal 2022.
Under the 2019 plan:
Weighted average fair value as on grant date (₹) / ($ ADS)
The fair value of the awards are estimated using the Black-Scholes Model for time and non-market performance based options and Monte Carlo simulation model is used for TSR based options.
The inputs to the model include the share price at date of grant, exercise price, expected volatility, expected dividends, expected term and the risk free rate of interest. Expected volatility during the expected term
of the options is based on historical volatility of the observed market prices of the Company's publicly traded equity shares during a period equivalent to the expected term of the options. Expected volatility of the
comparative company have been modelled based on historical movements in the market prices of their publicly traded equity shares during a period equivalent to the expected term of the options. Correlation
coefficient is calculated between each peer entity and the indices as a whole or between each entity in the peer group.
For options granted in
22
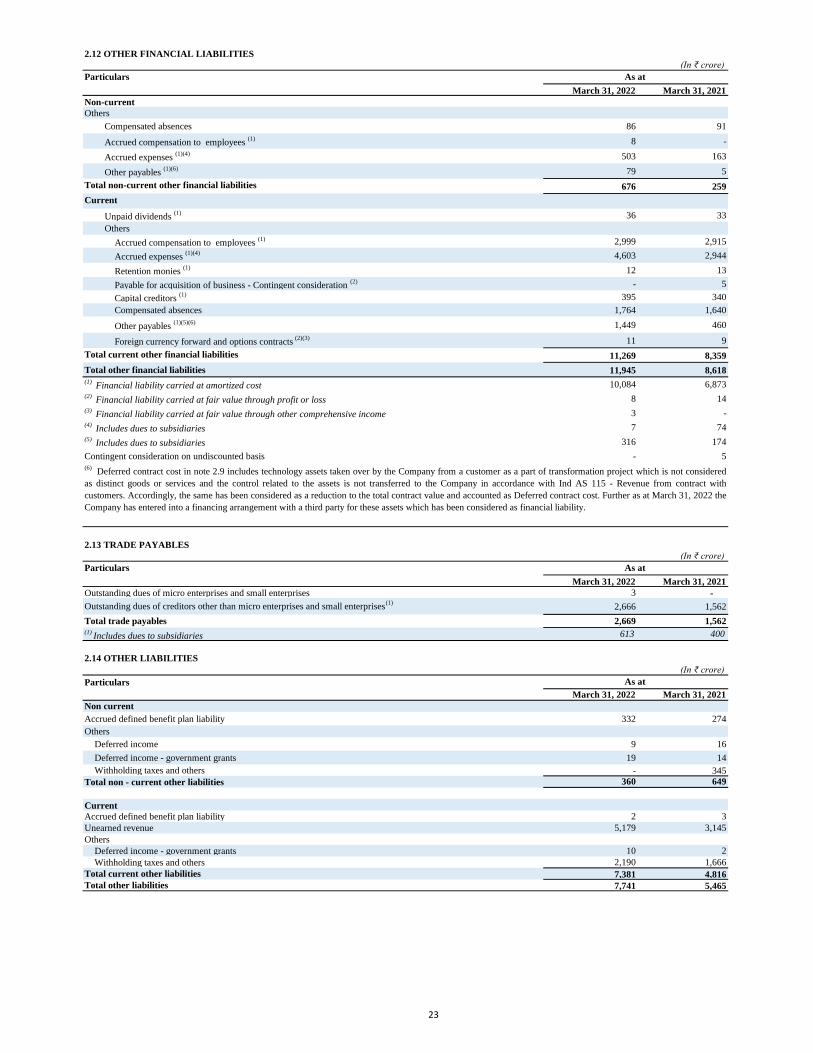
2.12 OTHER FINANCIAL LIABILITIES
(In ₹ crore)
Particulars
March 31, 2022 March 31, 2021
Non-current
Others
Compensated absences 86 91
Accrued compensation to employees (1) 8 -
Accrued expenses (1)(4) 503 163
Other payables (1)(6) 79 5
Total non-current other financial liabilities 676 259
Current
Unpaid dividends (1) 36 33
Others
Accrued compensation to employees (1) 2,999 2,915
Accrued expenses (1)(4) 4,603 2,944
Retention monies (1) 12 13
Payable for acquisition of business - Contingent consideration (2) - 5
Capital creditors (1) 395 340
Compensated absences 1,764 1,640
Other payables (1)(5)(6) 1,449 460
Foreign currency forward and options contracts (2)(3) 11 9
Total current other financial liabilities 11,269 8,359
Total other financial liabilities 11,945 8,618 (1)
Financial liability carried at amortized cost 10,084 6,873 (2)
Financial liability carried at fair value through profit or loss 8 14 (3)
Financial liability carried at fair value through other comprehensive income 3 - (4)
Includes dues to subsidiaries 7 74 (5)
Includes dues to subsidiaries 316 174
Contingent consideration on undiscounted basis - 5
2.13 TRADE PAYABLES
(In ₹ crore)
Particulars
March 31, 2022 March 31, 2021
Outstanding dues of micro enterprises and small enterprises 3 -
Outstanding dues of creditors other than micro enterprises and small enterprises(1)
2,666 1,562
Total trade payables 2,669 1,562 (1)
Includes dues to subsidiaries 613 400
2.14 OTHER LIABILITIES
(In ₹ crore)
Particulars
March 31, 2022 March 31, 2021
Non current
Accrued defined benefit plan liability 332 274
Others
Deferred income 9 16
Deferred income - government grants 19 14
Withholding taxes and others - 345
Total non - current other liabilities 360 649
Current
Accrued defined benefit plan liability 2 3
Unearned revenue 5,179 3,145
Others
Deferred income - government grants 10 2
Withholding taxes and others 2,190 1,666
Total current other liabilities 7,381 4,816
Total other liabilities 7,741 5,465
As at
As at
As at
(6)Deferred contract cost in note 2.9 includes technology assets taken over by the Company from a customer as a part of transformation project which is not considered
as distinct goods or services and the control related to the assets is not transferred to the Company in accordance with Ind AS 115 - Revenue from contract with
customers. Accordingly, the same has been considered as a reduction to the total contract value and accounted as Deferred contract cost. Further as at March 31, 2022 the
Company has entered into a financing arrangement with a third party for these assets which has been considered as financial liability.
23
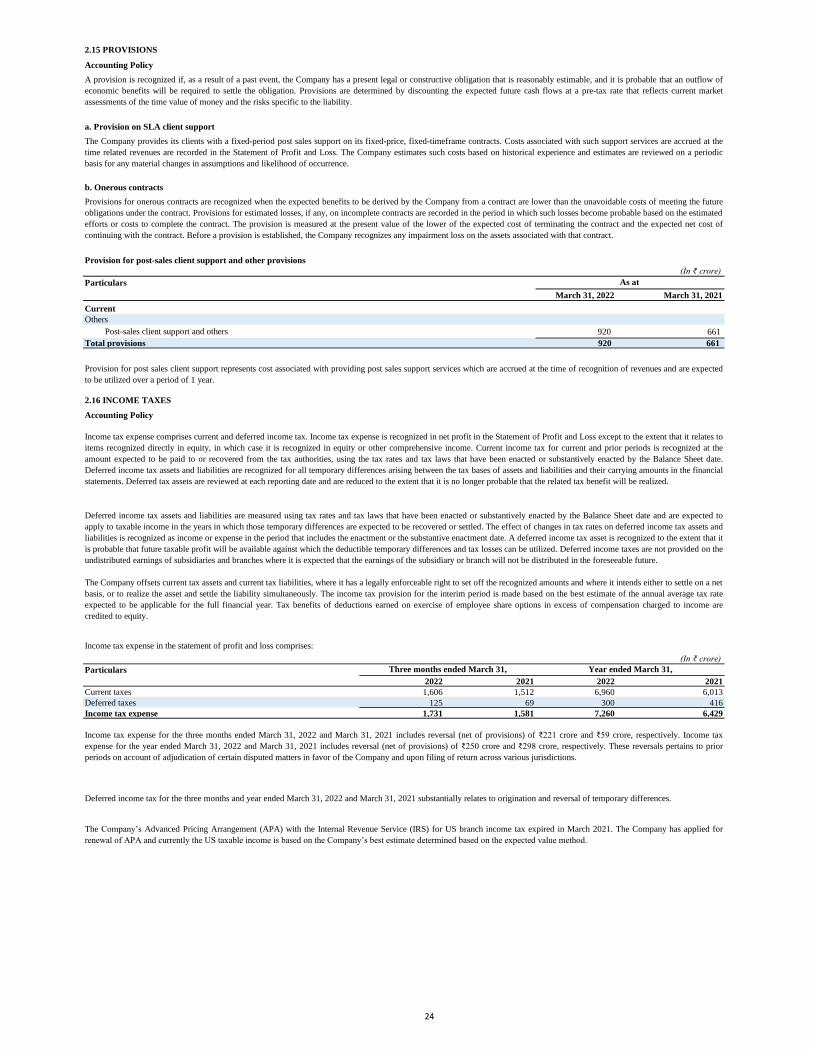
2.15 PROVISIONS
Provision for post-sales client support and other provisions
(In ₹ crore)
Particulars
March 31, 2022 March 31, 2021
Current
Others
Post-sales client support and others 920 661
Total provisions 920 661
2.16 INCOME TAXES
Income tax expense in the statement of profit and loss comprises:
(In ₹ crore)
Particulars
2022 2021 2022 2021
Current taxes 1,606 1,512 6,960 6,013
Deferred taxes 125 69 300 416
Income tax expense 1,731 1,581 7,260 6,429
Accounting Policy
a. Provision on SLA client support
b. Onerous contracts
Deferred income tax for the three months and year ended March 31, 2022 and March 31, 2021 substantially relates to origination and reversal of temporary differences.
Provision for post sales client support represents cost associated with providing post sales support services which are accrued at the time of recognition of revenues and are expected
to be utilized over a period of 1 year.
Provisions for onerous contracts are recognized when the expected benefits to be derived by the Company from a contract are lower than the unavoidable costs of meeting the future
obligations under the contract. Provisions for estimated losses, if any, on incomplete contracts are recorded in the period in which such losses become probable based on the estimated
efforts or costs to complete the contract. The provision is measured at the present value of the lower of the expected cost of terminating the contract and the expected net cost of
continuing with the contract. Before a provision is established, the Company recognizes any impairment loss on the assets associated with that contract.
The Company provides its clients with a fixed-period post sales support on its fixed-price, fixed-timeframe contracts. Costs associated with such support services are accrued at the
time related revenues are recorded in the Statement of Profit and Loss. The Company estimates such costs based on historical experience and estimates are reviewed on a periodic
basis for any material changes in assumptions and likelihood of occurrence.
A provision is recognized if, as a result of a past event, the Company has a present legal or constructive obligation that is reasonably estimable, and it is probable that an outflow of
economic benefits will be required to settle the obligation. Provisions are determined by discounting the expected future cash flows at a pre-tax rate that reflects current market
assessments of the time value of money and the risks specific to the liability.
Accounting Policy
As at
Three months ended March 31,
The Company’s Advanced Pricing Arrangement (APA) with the Internal Revenue Service (IRS) for US branch income tax expired in March 2021. The Company has applied for
renewal of APA and currently the US taxable income is based on the Company’s best estimate determined based on the expected value method.
Income tax expense for the three months ended March 31, 2022 and March 31, 2021 includes reversal (net of provisions) of ₹221 crore and ₹59 crore, respectively. Income tax
expense for the year ended March 31, 2022 and March 31, 2021 includes reversal (net of provisions) of ₹250 crore and ₹298 crore, respectively. These reversals pertains to prior
periods on account of adjudication of certain disputed matters in favor of the Company and upon filing of return across various jurisdictions.
Income tax expense comprises current and deferred income tax. Income tax expense is recognized in net profit in the Statement of Profit and Loss except to the extent that it relates to
items recognized directly in equity, in which case it is recognized in equity or other comprehensive income. Current income tax for current and prior periods is recognized at the
amount expected to be paid to or recovered from the tax authorities, using the tax rates and tax laws that have been enacted or substantively enacted by the Balance Sheet date.
Deferred income tax assets and liabilities are recognized for all temporary differences arising between the tax bases of assets and liabilities and their carrying amounts in the financial
statements. Deferred tax assets are reviewed at each reporting date and are reduced to the extent that it is no longer probable that the related tax benefit will be realized.
Deferred income tax assets and liabilities are measured using tax rates and tax laws that have been enacted or substantively enacted by the Balance Sheet date and are expected to
apply to taxable income in the years in which those temporary differences are expected to be recovered or settled. The effect of changes in tax rates on deferred income tax assets and
liabilities is recognized as income or expense in the period that includes the enactment or the substantive enactment date. A deferred income tax asset is recognized to the extent that it
is probable that future taxable profit will be available against which the deductible temporary differences and tax losses can be utilized. Deferred income taxes are not provided on the
undistributed earnings of subsidiaries and branches where it is expected that the earnings of the subsidiary or branch will not be distributed in the foreseeable future.
The Company offsets current tax assets and current tax liabilities, where it has a legally enforceable right to set off the recognized amounts and where it intends either to settle on a net
basis, or to realize the asset and settle the liability simultaneously. The income tax provision for the interim period is made based on the best estimate of the annual average tax rate
expected to be applicable for the full financial year. Tax benefits of deductions earned on exercise of employee share options in excess of compensation charged to income are
credited to equity.
Year ended March 31,
24
2.17 REVENUE FROM OPERATIONS
Accounting Policy
Revenues from customer contracts are considered for recognition and measurement when the contract has been approved by the parties, in writing, to the contract, the
parties to contract are committed to perform their respective obligations under the contract, and the contract is legally enforceable. Revenue is recognized upon transfer of
control of promised products or services (“performance obligations”) to customers in an amount that reflects the consideration the Company has received or expects to
receive in exchange for these products or services (“transaction price”). When there is uncertainty as to collectability, revenue recognition is postponed until such
uncertainty is resolved.
In arrangements for software development and related services and maintenance services, by applying the revenue recognition criteria for each distinct performance
obligation, the arrangements with customers generally meet the criteria for considering software development and related services as distinct performance obligations. For
allocating the transaction price, the Company measures the revenue in respect of each performance obligation of a contract at its relative standalone selling price. The
price that is regularly charged for an item when sold separately is the best evidence of its standalone selling price. In cases where the Company is unable to determine the
standalone selling price, the Company uses the expected cost plus margin approach in estimating the standalone selling price. For software development and related
services, the performance obligations are satisfied as and when the services are rendered since the customer generally obtains control of the work as it progresses.
The Company presents revenues net of indirect taxes in its statement of profit and loss.
The Company derives revenues primarily from IT services comprising software development and related services, cloud and infrastructure services, maintenance,
consulting and package implementation, licensing of software products and platforms across the Company’s core and digital offerings (together called as “software
related services”). Contracts with customers are either on a time-and-material, unit of work, fixed-price or on a fixed-timeframe basis.
The Company assesses the services promised in a contract and identifies distinct performance obligations in the contract. The Company allocates the transaction price to
each distinct performance obligation based on the relative standalone selling price. The price that is regularly charged for an item when sold separately is the best
evidence of its standalone selling price. In the absence of such evidence, the primary method used to estimate standalone selling price is the expected cost plus a margin,
under which the Company estimates the cost of satisfying the performance obligation and then adds an appropriate margin based on similar services
Revenue on time-and-material and unit of work based contracts, are recognized as the related services are performed. Fixed price maintenance revenue is recognized
ratably either on a straight-line basis when services are performed through an indefinite number of repetitive acts over a specified period or ratably using a percentage of
completion method when the pattern of benefits from the services rendered to the customer and Company’s costs to fulfil the contract is not even through the period of
contract because the services are generally discrete in nature and not repetitive. Revenue from other fixed-price, fixed-timeframe contracts, where the performance
obligations are satisfied over time is recognized using the percentage-of-completion method. Efforts or costs expended are used to determine progress towards completion
as there is a direct relationship between input and productivity. Progress towards completion is measured as the ratio of costs or efforts incurred to date (representing
work performed) to the estimated total costs or efforts. Estimates of transaction price and total costs or efforts are continuously monitored over the term of the contracts
and are recognized in net profit in the period when these estimates change or when the estimates are revised. Revenues and the estimated total costs or efforts are subject
to revision as the contract progresses. Provisions for estimated losses, if any, on incomplete contracts are recorded in the period in which such losses become probable
based on the estimated efforts or costs to complete the contract.
The billing schedules agreed with customers include periodic performance based billing and / or milestone based progress billings. Revenues in excess of billing are
classified as unbilled revenue while billing in excess of revenues are classified as contract liabilities (which we refer to as "unearned revenues").
Arrangements to deliver software products generally have three elements: license, implementation and Annual Technical Services (ATS). When implementation services
are provided in conjunction with the licensing arrangement and the license and implementation have been identified as two distinct separate performance obligations, the
transaction price for such contracts are allocated to each performance obligation of the contract based on their relative standalone selling prices. In the absence of
standalone selling price for implementation, the Company uses the expected cost plus margin approach in estimating the standalone selling price. Where the license is
required to be substantially customized as part of the implementation service the entire arrangement fee for license and implementation is considered to be a single
performance obligation and the revenue is recognized using the percentage-of-completion method as the implementation is performed. Revenue from client training,
support and other services arising due to the sale of software products is recognized as the performance obligations are satisfied. ATS revenue is recognized ratably on a
straight line basis over the period in which the services are rendered.
Contracts with customers includes subcontractor services or third-party vendor equipment or software in certain integrated services arrangements. In these types of
arrangements, revenue from sales of third-party vendor products or services is recorded net of costs when the Company is acting as an agent between the customer and the
vendor, and gross when the Company is the principal for the transaction. In doing so, the Company first evaluates whether it controls the good or service before it is
transferred to the customer. The Company considers whether it has the primary obligation to fulfil the contract, inventory risk, pricing discretion and other factors to
determine whether it controls the goods or service and therefore is acting as a principal or an agent.
The incremental costs of obtaining a contract (i.e., costs that would not have been incurred if the contract had not been obtained) are recognized as an asset if the
Company expects to recover them.
Certain eligible, nonrecurring costs (e.g. set-up or transition or transformation costs) that do not represent a separate performance obligation are recognized as an asset
when such costs (a) relate directly to the contract; (b) generate or enhance resources of the Company that will be used in satisfying the performance obligation in the
future; and (c) are expected to be recovered.
Such Capitalized contract costs relating to upfront payments to customers are amortized to revenue and other capitalized costs are amortized to expenses over the
respective contract life on a systematic basis consistent with the transfer of goods or services to customer to which the asset relates. Capitalized costs are monitored
regularly for impairment. Impairment losses are recorded when present value of projected remaining operating cash flows is not sufficient to recover the carrying amount
of the capitalized costs.
The Company’s contracts may include variable consideration including rebates, volume discounts and penalties. The Company includes variable consideration as part of
transaction price when there is a basis to reasonably estimate the amount of the variable consideration and when it is probable that a significant reversal of cumulative
revenue recognized will not occur when the uncertainty associated with the variable consideration is resolved.
Revenue from licenses where the customer obtains a “right to use” the licenses is recognized at the time the license is made available to the customer. Revenue from
licenses where the customer obtains a “right to access” is recognized over the access period.
Certain cloud and infrastructure services contracts include multiple elements which may be subject to other specific accounting guidance, such as leasing guidance. These
contracts are accounted in accordance with such specific accounting guidance. In such arrangements where the Company is able to determine that hardware and services
are distinct performance obligations, it allocates the consideration to these performance obligations on a relative standalone selling price basis. In the absence of
standalone selling price, the Company uses the expected cost-plus margin approach in estimating the standalone selling price. When such arrangements are considered as
a single performance obligation, revenue is recognized over the period and measure of progress is determined based on promise in the contract
25
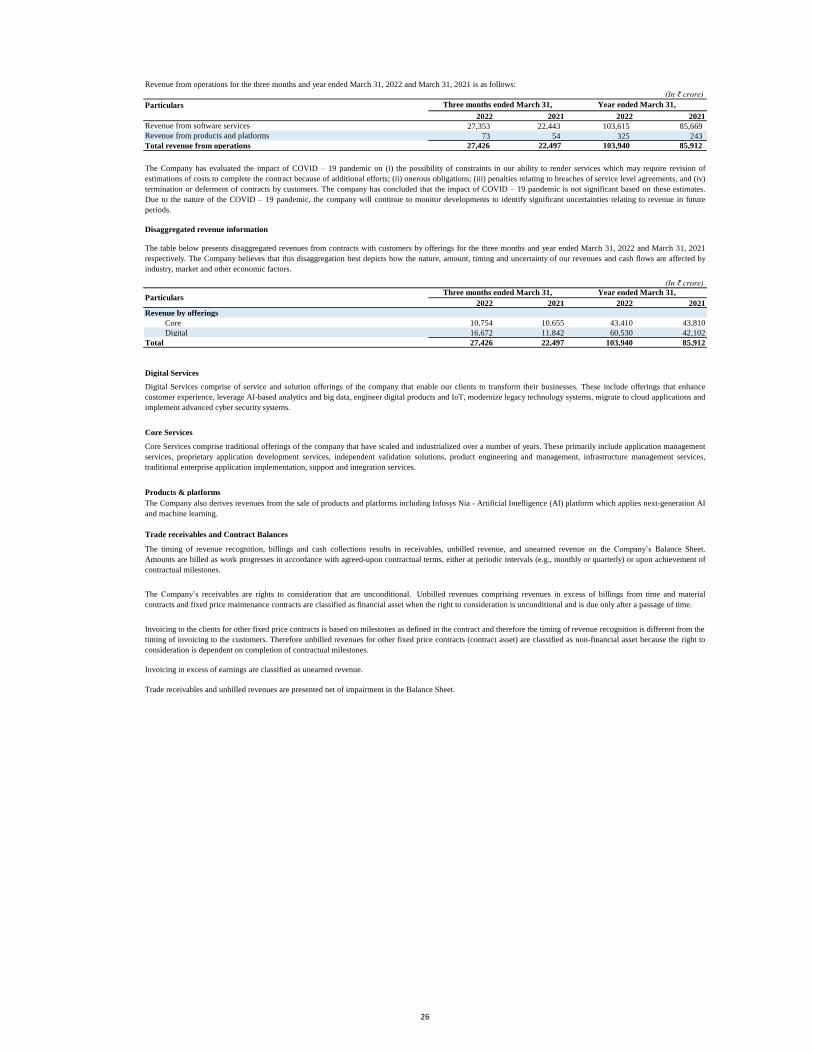
Revenue from operations for the three months and year ended March 31, 2022 and March 31, 2021 is as follows:
(In ₹ crore)
Particulars
2022 2021 2022 2021
Revenue from software services 27,353 22,443 103,615 85,669
Revenue from products and platforms 73 54 325 243
Total revenue from operations 27,426 22,497 103,940 85,912
(In ₹ crore)
2022 2021 2022 2021
Revenue by offerings
Core 10,754 10,655 43,410 43,810
Digital 16,672 11,842 60,530 42,102
Total 27,426 22,497 103,940 85,912
Digital Services
Core Services
Products & platforms
Three months ended March 31, Year ended March 31,
ParticularsYear ended March 31,
The Company has evaluated the impact of COVID – 19 pandemic on (i) the possibility of constraints in our ability to render services which may require revision of
estimations of costs to complete the contract because of additional efforts; (ii) onerous obligations; (iii) penalties relating to breaches of service level agreements, and (iv)
termination or deferment of contracts by customers. The company has concluded that the impact of COVID – 19 pandemic is not significant based on these estimates.
Due to the nature of the COVID – 19 pandemic, the company will continue to monitor developments to identify significant uncertainties relating to revenue in future
periods.
The table below presents disaggregated revenues from contracts with customers by offerings for the three months and year ended March 31, 2022 and March 31, 2021
respectively. The Company believes that this disaggregation best depicts how the nature, amount, timing and uncertainty of our revenues and cash flows are affected by
industry, market and other economic factors.
The Company’s receivables are rights to consideration that are unconditional. Unbilled revenues comprising revenues in excess of billings from time and material
contracts and fixed price maintenance contracts are classified as financial asset when the right to consideration is unconditional and is due only after a passage of time.
Invoicing to the clients for other fixed price contracts is based on milestones as defined in the contract and therefore the timing of revenue recognition is different from the
timing of invoicing to the customers. Therefore unbilled revenues for other fixed price contracts (contract asset) are classified as non-financial asset because the right to
consideration is dependent on completion of contractual milestones.
Invoicing in excess of earnings are classified as unearned revenue.
Trade receivables and unbilled revenues are presented net of impairment in the Balance Sheet.
The Company also derives revenues from the sale of products and platforms including Infosys Nia - Artificial Intelligence (AI) platform which applies next-generation AI
and machine learning.
Trade receivables and Contract Balances
The timing of revenue recognition, billings and cash collections results in receivables, unbilled revenue, and unearned revenue on the Company’s Balance Sheet.
Amounts are billed as work progresses in accordance with agreed-upon contractual terms, either at periodic intervals (e.g., monthly or quarterly) or upon achievement of
contractual milestones.
Digital Services comprise of service and solution offerings of the company that enable our clients to transform their businesses. These include offerings that enhance
customer experience, leverage AI-based analytics and big data, engineer digital products and IoT, modernize legacy technology systems, migrate to cloud applications and
implement advanced cyber security systems.
Core Services comprise traditional offerings of the company that have scaled and industrialized over a number of years. These primarily include application management
services, proprietary application development services, independent validation solutions, product engineering and management, infrastructure management services,
traditional enterprise application implementation, support and integration services.
Disaggregated revenue information
Three months ended March 31,
26
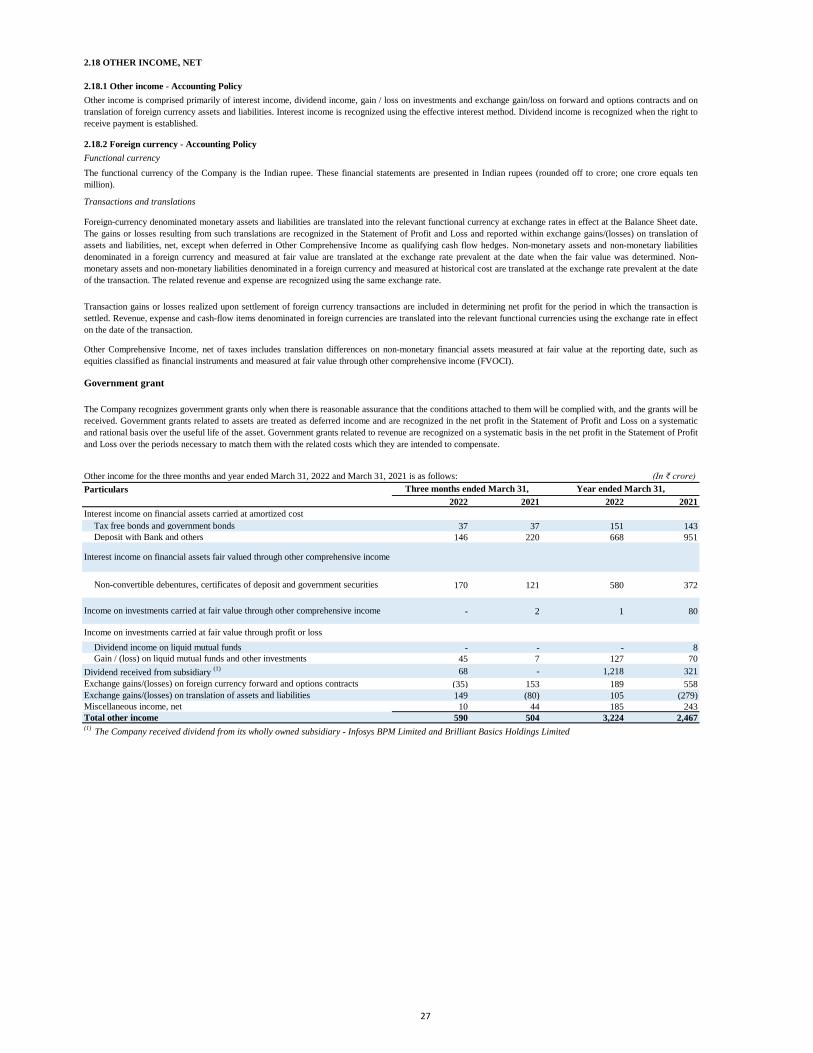
2.18 OTHER INCOME, NET
2.18.1 Other income - Accounting Policy
Government grant
Other income for the three months and year ended March 31, 2022 and March 31, 2021 is as follows: (In ₹ crore)
Particulars
2022 2021 2022 2021
Interest income on financial assets carried at amortized cost
Tax free bonds and government bonds 37 37 151 143
Deposit with Bank and others 146 220 668 951
170 121 580 372
- 2 1 80
Dividend income on liquid mutual funds - - - 8
Gain / (loss) on liquid mutual funds and other investments 45 7 127 70
Dividend received from subsidiary (1) 68 - 1,218 321
(35) 153 189 558
Exchange gains/(losses) on translation of assets and liabilities 149 (80) 105 (279)
Miscellaneous income, net 10 44 185 243
Total other income 590 504 3,224 2,467
Other Comprehensive Income, net of taxes includes translation differences on non-monetary financial assets measured at fair value at the reporting date, such as
equities classified as financial instruments and measured at fair value through other comprehensive income (FVOCI).
Exchange gains/(losses) on foreign currency forward and options contracts
The Company recognizes government grants only when there is reasonable assurance that the conditions attached to them will be complied with, and the grants will be
received. Government grants related to assets are treated as deferred income and are recognized in the net profit in the Statement of Profit and Loss on a systematic
and rational basis over the useful life of the asset. Government grants related to revenue are recognized on a systematic basis in the net profit in the Statement of Profit
and Loss over the periods necessary to match them with the related costs which they are intended to compensate.
Income on investments carried at fair value through profit or loss
(1) The Company received dividend from its wholly owned subsidiary - Infosys BPM Limited and Brilliant Basics Holdings Limited
Other income is comprised primarily of interest income, dividend income, gain / loss on investments and exchange gain/loss on forward and options contracts and on
translation of foreign currency assets and liabilities. Interest income is recognized using the effective interest method. Dividend income is recognized when the right to
receive payment is established.
Foreign-currency denominated monetary assets and liabilities are translated into the relevant functional currency at exchange rates in effect at the Balance Sheet date.
The gains or losses resulting from such translations are recognized in the Statement of Profit and Loss and reported within exchange gains/(losses) on translation of
assets and liabilities, net, except when deferred in Other Comprehensive Income as qualifying cash flow hedges. Non-monetary assets and non-monetary liabilities
denominated in a foreign currency and measured at fair value are translated at the exchange rate prevalent at the date when the fair value was determined. Non-
monetary assets and non-monetary liabilities denominated in a foreign currency and measured at historical cost are translated at the exchange rate prevalent at the date
of the transaction. The related revenue and expense are recognized using the same exchange rate.
Transactions and translations
The functional currency of the Company is the Indian rupee. These financial statements are presented in Indian rupees (rounded off to crore; one crore equals ten
million).
Transaction gains or losses realized upon settlement of foreign currency transactions are included in determining net profit for the period in which the transaction is
settled. Revenue, expense and cash-flow items denominated in foreign currencies are translated into the relevant functional currencies using the exchange rate in effect
on the date of the transaction.
2.18.2 Foreign currency - Accounting Policy
Functional currency
Year ended March 31,
Interest income on financial assets fair valued through other comprehensive income
Three months ended March 31,
Income on investments carried at fair value through other comprehensive income
Non-convertible debentures, certificates of deposit and government securities
27
2.19 EXPENSES
Accounting Policy
2.19.3 Superannuation
The Company operates defined benefit pension plan in certain overseas jurisdictions, in accordance with the local laws. These plans are managed by third party fund
managers. The plans provide for periodic payouts after retirement or for a lumpsum payment as set out in rules of each fund and includes death and disability benefits.
The Company recognizes the net obligation of a defined benefit plan in its Balance Sheet as an asset or liability. Gains and losses through re-measurements of the net
defined benefit liability/(asset) are recognized in other comprehensive income and are not reclassified to profit or loss in subsequent periods. The actual return of the
portfolio of plan assets, in excess of the yields computed by applying the discount rate used to measure the defined benefit obligation is recognized in other
comprehensive income. The effect of any plan amendments is recognized in net profit in the Statement of Profit and Loss.
Infosys has an obligation to fund any shortfall on the yield of the trust’s investments over the administered interest rates on an annual basis. These administered rates
are determined annually predominantly considering the social rather than economic factors. The actuary has provided a valuation for provident fund liabilities on the
basis of guidance issued by Actuarial Society of India.
The Company has a policy on compensated absences which are both accumulating and non-accumulating in nature. The expected cost of accumulating compensated
absences is determined by actuarial valuation performed by an independent actuary at each Balance Sheet date using projected unit credit method on the additional
amount expected to be paid/availed as a result of the unused entitlement that has accumulated at the Balance Sheet date. Expense on non-accumulating compensated
absences is recognized in the period in which the absences occur.
2.19.4 Compensated absences
Eligible employees of Infosys receive benefits from a provident fund, which is a defined benefit plan. Both the eligible employee and the Company make monthly
contributions to the provident fund plan equal to a specified percentage of the covered employee's salary. The Company contributes a portion to the Infosys Limited
Employees' Provident Fund Trust. The trust invests in specific designated instruments as permitted by Indian law. The remaining portion is contributed to the
government administered pension fund. The rate at which the annual interest is payable to the beneficiaries by the trust is being administered by the Government. The
Company has an obligation to make good the shortfall, if any, between the return from the investments of the Trust and the notified interest rate.
2.19.2 Provident fund
The Code on Social Security,2020 (‘Code’) relating to employee benefits during employment and post employment benefits received Presidential assent in September
2020. The Code has been published in the Gazette of India. However, the date on which the Code will come into effect has not been notified. The Company will
assess the impact of the Code when it comes into effect and will record any related impact in the period the Code becomes effective.
Certain employees of Infosys are participants in a defined contribution plan. The Company has no further obligations to the Plan beyond its monthly contributions
which are periodically contributed to a trust fund, the corpus of which is invested with the Life Insurance Corporation of India.
2.19.1 Gratuity and Pension
The Company provides for gratuity, a defined benefit retirement plan ('the Gratuity Plan') covering eligible Indian employees of Infosys. The Gratuity Plan provides a
lump-sum payment to vested employees at retirement, death, incapacitation or termination of employment, of an amount based on the respective employee's salary and
the tenure of employment with the Company. The Company contributes Gratuity liabilities to the Infosys Limited Employees' Gratuity Fund Trust (the Trust). Trustees
administer contributions made to the Trusts and contributions are invested in a scheme with the Life Insurance Corporation of India as permitted by Indian law.
Liabilities with regard to these defined benefit plans are determined by actuarial valuation, performed by an independent actuary, at each Balance Sheet date using the
projected unit credit method. These defined benefit plans expose the Company to actuarial risks, such as longevity risk, currency risk, interest rate risk and market
risk.
28
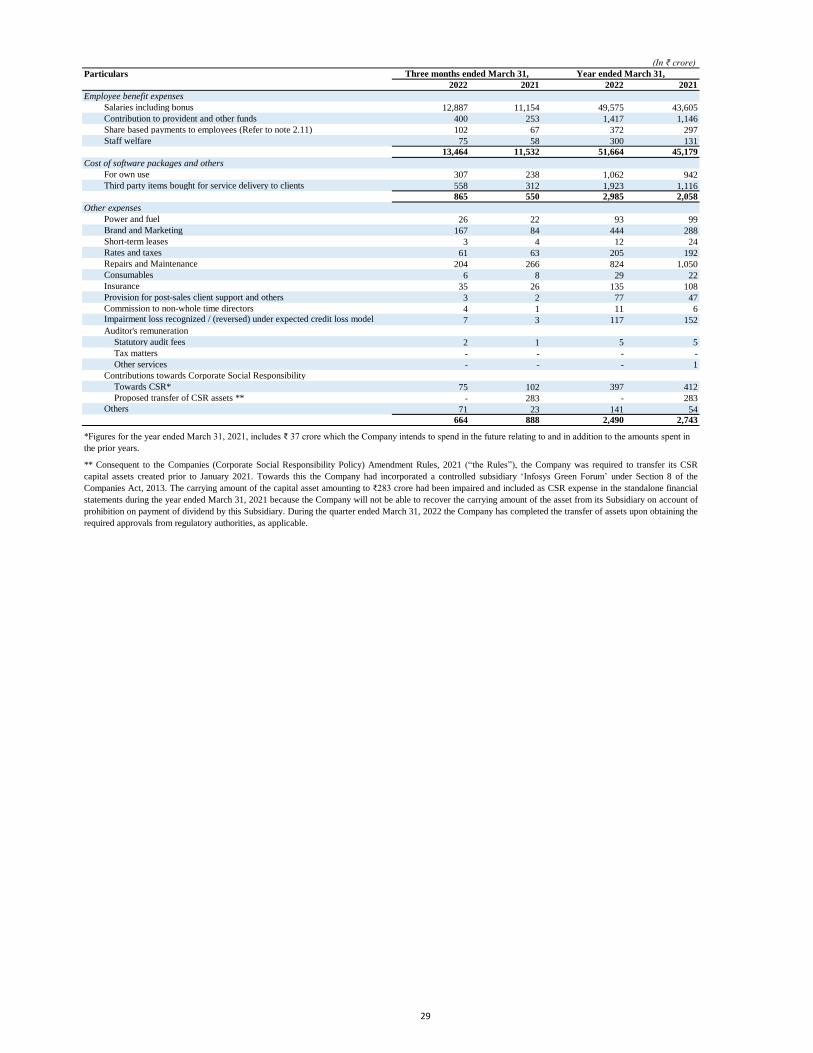
(In ₹ crore)
Particulars
2022 2021 2022 2021
Employee benefit expenses
Salaries including bonus 12,887 11,154 49,575 43,605
Contribution to provident and other funds 400 253 1,417 1,146
Share based payments to employees (Refer to note 2.11) 102 67 372 297
Staff welfare 75 58 300 131
13,464 11,532 51,664 45,179
Cost of software packages and others
For own use 307 238 1,062 942
Third party items bought for service delivery to clients 558 312 1,923 1,116
865 550 2,985 2,058
Other expenses
Power and fuel 26 22 93 99
Brand and Marketing 167 84 444 288
Short-term leases 3 4 12 24
Rates and taxes 61 63 205 192
Repairs and Maintenance 204 266 824 1,050
Consumables 6 8 29 22
Insurance 35 26 135 108
Provision for post-sales client support and others 3 2 77 47
Commission to non-whole time directors 4 1 11 6
7 3 117 152
Auditor's remuneration
Statutory audit fees 2 1 5 5
Tax matters - - - -
Other services - - - 1
Contributions towards Corporate Social Responsibility
Towards CSR* 75 102 397 412
Proposed transfer of CSR assets ** - 283 - 283
71 23 141 54
664 888 2,490 2,743
** Consequent to the Companies (Corporate Social Responsibility Policy) Amendment Rules, 2021 (“the Rules”), the Company was required to transfer its CSR
capital assets created prior to January 2021. Towards this the Company had incorporated a controlled subsidiary ‘Infosys Green Forum’ under Section 8 of the
Companies Act, 2013. The carrying amount of the capital asset amounting to ₹283 crore had been impaired and included as CSR expense in the standalone financial
statements during the year ended March 31, 2021 because the Company will not be able to recover the carrying amount of the asset from its Subsidiary on account of
prohibition on payment of dividend by this Subsidiary. During the quarter ended March 31, 2022 the Company has completed the transfer of assets upon obtaining the
required approvals from regulatory authorities, as applicable.
Others
Year ended March 31,Three months ended March 31,
Impairment loss recognized / (reversed) under expected credit loss model
*Figures for the year ended March 31, 2021, includes ₹ 37 crore which the Company intends to spend in the future relating to and in addition to the amounts spent in
the prior years.
29
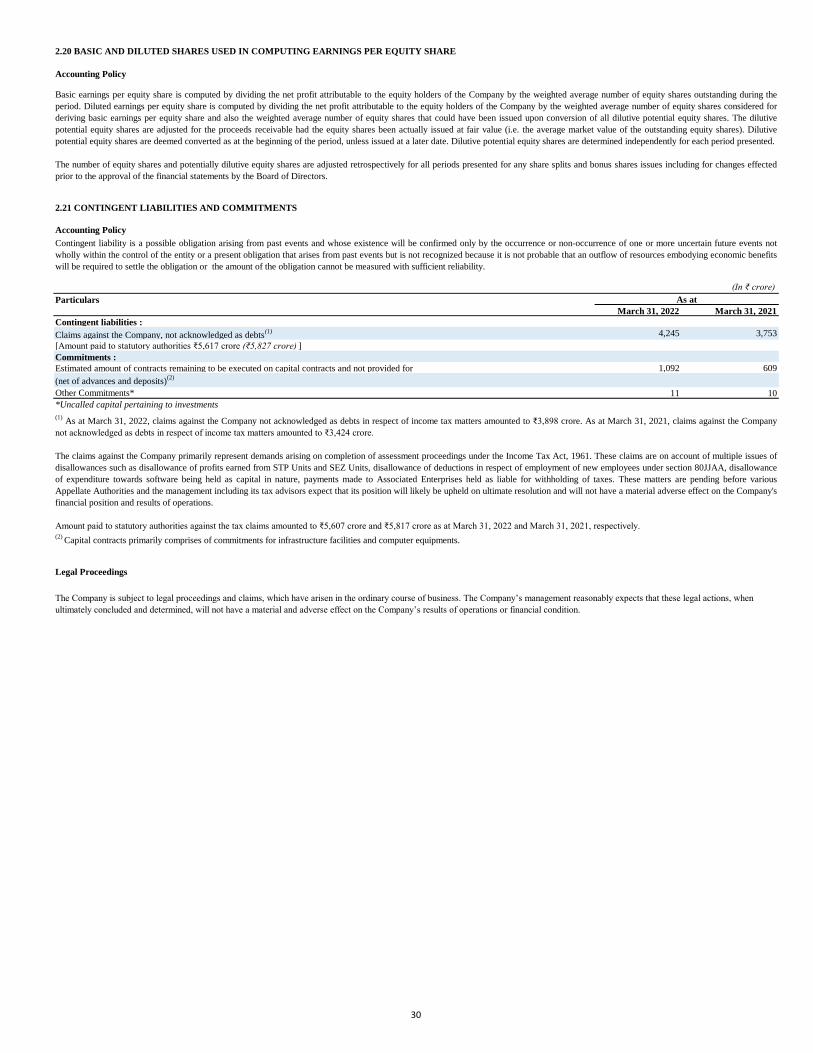
2.20 BASIC AND DILUTED SHARES USED IN COMPUTING EARNINGS PER EQUITY SHARE
2.21 CONTINGENT LIABILITIES AND COMMITMENTS
(In ₹ crore)
Particulars
March 31, 2022 March 31, 2021
Contingent liabilities :
Claims against the Company, not acknowledged as debts(1) 4,245 3,753
[Amount paid to statutory authorities ₹5,617 crore (₹5,827 crore) ]
Commitments :
Estimated amount of contracts remaining to be executed on capital contracts and not provided for 1,092 609
(net of advances and deposits)(2)
Other Commitments* 11 10
*Uncalled capital pertaining to investments
(2) Capital contracts primarily comprises of commitments for infrastructure facilities and computer equipments.
The Company is subject to legal proceedings and claims, which have arisen in the ordinary course of business. The Company’s management reasonably expects that these legal actions, when
ultimately concluded and determined, will not have a material and adverse effect on the Company’s results of operations or financial condition.
Legal Proceedings
Accounting Policy
Basic earnings per equity share is computed by dividing the net profit attributable to the equity holders of the Company by the weighted average number of equity shares outstanding during the
period. Diluted earnings per equity share is computed by dividing the net profit attributable to the equity holders of the Company by the weighted average number of equity shares considered for
deriving basic earnings per equity share and also the weighted average number of equity shares that could have been issued upon conversion of all dilutive potential equity shares. The dilutive
potential equity shares are adjusted for the proceeds receivable had the equity shares been actually issued at fair value (i.e. the average market value of the outstanding equity shares). Dilutive
potential equity shares are deemed converted as at the beginning of the period, unless issued at a later date. Dilutive potential equity shares are determined independently for each period presented.
The number of equity shares and potentially dilutive equity shares are adjusted retrospectively for all periods presented for any share splits and bonus shares issues including for changes effected
prior to the approval of the financial statements by the Board of Directors.
As at
(1)As at March 31, 2022, claims against the Company not acknowledged as debts in respect of income tax matters amounted to ₹3,898 crore. As at March 31, 2021, claims against the Company
not acknowledged as debts in respect of income tax matters amounted to ₹3,424 crore.
The claims against the Company primarily represent demands arising on completion of assessment proceedings under the Income Tax Act, 1961. These claims are on account of multiple issues of
disallowances such as disallowance of profits earned from STP Units and SEZ Units, disallowance of deductions in respect of employment of new employees under section 80JJAA, disallowance
of expenditure towards software being held as capital in nature, payments made to Associated Enterprises held as liable for withholding of taxes. These matters are pending before various
Appellate Authorities and the management including its tax advisors expect that its position will likely be upheld on ultimate resolution and will not have a material adverse effect on the Company's
financial position and results of operations.
Amount paid to statutory authorities against the tax claims amounted to ₹5,607 crore and ₹5,817 crore as at March 31, 2022 and March 31, 2021, respectively.
Accounting Policy
Contingent liability is a possible obligation arising from past events and whose existence will be confirmed only by the occurrence or non-occurrence of one or more uncertain future events not
wholly within the control of the entity or a present obligation that arises from past events but is not recognized because it is not probable that an outflow of resources embodying economic benefits
will be required to settle the obligation or the amount of the obligation cannot be measured with sufficient reliability.
30
2.22 RELATED PARTY TRANSACTIONS
Changes in Subsidiaries
During the year ended March 31, 2022, the following are the changes in the subsidiaries:
-
- Simplus Europe, Ltd., a wholly-owned subsidiary of Outbox Systems Inc., has been liquidated effective July 20, 2021.
- Stater GmbH, a wholly-owned subsidiary of Stater N.V., was incorporated on August 4, 2021.
- Infosys Green Forum, a wholly-owned subsidiary of Infosys Limited, was incorporated on August 31, 2021.
- Infosys Consulting (Shanghai) Co., Ltd., a wholly-owned subsidiary of Infosys Consulting Holding AG, has been liquidated effective September 01, 2021.
- Sqware Peg Digital Pty Ltd, a wholly-owned subsidiary of Simplus Australia Pty Ltd, has been liquidated effective September 02, 2021.
- Beringer Commerce Inc. renamed as Blue Acorn iCi Inc.
- Infosys Canada Public Services, Inc., a wholly-owned subsidiary of Infosys Public Services, Inc. has been liquidated effective November 23, 2021.
-
-
- WongDoody Holding Company Inc. (WongDoody) merged into WongDoody, Inc effective December 31, 2021.
- WDW Communications, Inc merged into WongDoody, Inc effective December 31, 2021.
- SureSource LLC , Blue Acorn LLC and Simply Commerce LLC , merged into Beringer Commerce Holdings LLC effective January 1, 2022.
- iCiDIGITAL LLC, merged into Beringer Capital Digital Group Inc effective January 1, 2022.
- Beringer Capital Digital Group Inc, Mediotype LLC and Beringer Commerce Holdings LLC, merged into Blue Acorn iCi Inc effective January 1, 2022.
- Infosys Business Solutions LLC, a wholly-owned subsidiary of Infosys Limited, was incorporated on February 20, 2022.
- On March 17, 2022, Infosys Limited acquired non-controlling interest of 0.01% of the voting interests in Infosys BPM Limited.
-
- Brilliant Basics Holdings Limited (Brilliant Basics), a wholly-owned subsidiary of Infosys Limited, is under liquidation.
- Brilliant Basics Limited, a wholly-owned subsidiary of Brilliant Basics Holdings Limited (Brilliant Basics), is under liquidation.
- Infosys Foundation , a trust jointly controlled by KMPs effective January 1, 2022
Change in key management personnel
The following are the changes in the Key management personnel:
- U.B. Pravin Rao (retired as a Chief Operating Officer and Whole-time director effective December 12, 2021).
Transactions with key management personnel
The table below describes the compensation to key managerial personnel which comprise directors and executive officers:
(In ₹ crore)
Particulars
2022 2021 2022 2021
29 37 134 144
Commission and other benefits to non-executive / independent directors 4 1 11 6
Total 33 38 145 150
(2)Does not include post-employment benefit based on actuarial valuation as this is done for the Company as a whole.
On March 22, 2022, Infosys Consulting Pte. Ltd., a wholly-owned subsidiary of Infosys Limited acquired 100% of voting interests in Infosys Germany GmbH (formerly Kristall 247.
GmbH (“Kristall”) )
Refer to the Company's Annual Report for the year ended March 31, 2021 for the full names and other details of the Company's subsidiaries and controlled trusts.
Simplus North America Inc., a wholly-owned subsidiary of Outbox Systems Inc., has been liquidated effective April 27, 2021.
Year ended March 31,
The Company’s related party transactions during the three months and year ended March 31, 2022 and March 31, 2021 and outstanding balances as at March 31, 2022 and March 31, 2021 are
with its subsidiaries with whom the Company generally enters into transactions which are at arms length and in the ordinary course of business.
Three months ended March 31,
On December 14, 2021, Infosys Consulting Pte. Ltd., a wholly-owned subsidiary of Infosys Limited acquired 100% of voting interests in Global Enterprise International (Malaysia)
Sdn. Bhd., renamed as Infosys (Malaysia) SDN. BHD.
Infosys Consulting s.r.o. v likvidaci (formerly Infosys Consulting s.r.o.), a wholly-owned subsidiary of Infosys Consulting Holding AG, has been liquidated effective December 16,
2021.
(1)Total employee stock compensation expense for the three months ended March 31, 2022 and March 31, 2021 includes a charge of ₹14 crore and ₹20 crore, respectively, towards key
managerial personnel. For the year ended March 31, 2022 and March 31, 2021, includes a charge of ₹65 crore and ₹76 crore respectively, towards key managerial personnel. (Refer to note
2.11)
Salaries and other employee benefits to whole-time directors and executive officers (1)(2)
31
for and on behalf of the Board of Directors of Infosys Limited
Nandan M. Nilekani Salil Parekh D. Sundaram
Chairman Chief Executive Officer Director
and Managing Director
Nilanjan Roy Jayesh Sanghrajka A.G.S. Manikantha
Chief Financial Officer Executive Vice President and Company Secretary
Deputy Chief Financial Officer
Bengaluru
April 13, 2022
2.23 SEGMENT REPORTING
The Company publishes this financial statement along with the interim condensed consolidated financial statements. In accordance with Ind AS 108, Operating Segments, the Company has
disclosed the segment information in the interim condensed consolidated financial statements.
32