An Analysis of Financial Performance of Infosys Limited
11
© 2019 JETIR February 2019, Volume 6, Issue 2 www.jetir.org (ISSN-2349-5162) JETIR1902639 Journal of Emerging Technologies and Innovative Research (JETIR) www.jetir.org 294 An Analysis of Financial Performance of Infosys Limited Dr. B Navaneetha 1 , K Elakkia 2 , R Keerthi sowndarya 3 , P Nigetha 4 ABSTRACT Infosys was established in the year 1981. Infosys is a global leader in next generation digital services and consulting. Information technology is a use of computer and software for the purpose of managing the information’s. This study is based upon the secondary data extracted from the annual report of the INFOSYS Limited. The financial statements of INFOSYS limited have been collected over a period of 5 years from 2013- 2018. Financial performance analysis identifies the financial strength and weakness of the company and facilitates management in decision making. Financial performance helps in forecasting the short term and long term financial position and growth of the company. Common size statement and trend analysis have been used to analyse the financial performance of the INFOSYS Limited. The overall financial position of the company was satisfactory. Key words: Financial performance, Balance sheet, Financial position. INTRODUCTION Infosys Limited (formerly Infosys Technologies Limited) is an Indian multinational corporation that provides business consulting, information technology and outsourcing services. It provides software development, maintenance and independent validation services to companies in finance, insurance, manufacturing and other domains. One of its known products is Finance which is a universal banking solution with various modules for retail & corporate banking. Common size of financial statement is the comparison of the financial statement of the business with the previous year’s financial statements and with the performance of other competitors, so that weaknesses can be identified. The common size balance sheet shows the effect of operations on the assets and liabilities 1 Assistant professor, Department of B.Com (PA), PSGR Krishnammal College for Women, Coimbatore, Tamil Nadu, India. 234 III B.Com (PA), Department of B.Com (PA), PSGR Krishnammal College for Women, Coimbatore, Tamil Nadu, India.
-
Upload
khangminh22 -
Category
Documents
-
view
7 -
download
0
Transcript of An Analysis of Financial Performance of Infosys Limited

© 2019 JETIR February 2019, Volume 6, Issue 2 www.jetir.org (ISSN-2349-5162)
JETIR1902639 Journal of Emerging Technologies and Innovative Research (JETIR) www.jetir.org 294
An Analysis of Financial Performance of Infosys
Limited
Dr. B Navaneetha1, K Elakkia2, R Keerthi sowndarya3, P Nigetha4
ABSTRACT
Infosys was established in the year 1981. Infosys is a global leader in next generation digital services and
consulting. Information technology is a use of computer and software for the purpose of managing the
information’s. This study is based upon the secondary data extracted from the annual report of the
INFOSYS Limited. The financial statements of INFOSYS limited have been collected over a period of 5
years from 2013- 2018. Financial performance analysis identifies the financial strength and weakness of the
company and facilitates management in decision making. Financial performance helps in forecasting the
short term and long term financial position and growth of the company. Common size statement and trend
analysis have been used to analyse the financial performance of the INFOSYS Limited. The overall financial
position of the company was satisfactory.
Key words: Financial performance, Balance sheet, Financial position.
INTRODUCTION
Infosys Limited (formerly Infosys Technologies Limited) is an Indian multinational corporation that
provides business consulting, information technology and outsourcing services. It provides software
development, maintenance and independent validation services to companies in finance, insurance,
manufacturing and other domains. One of its known products is Finance which is a universal banking
solution with various modules for retail & corporate banking.
Common size of financial statement is the comparison of the financial statement of the business with
the previous year’s financial statements and with the performance of other competitors, so that weaknesses
can be identified. The common size balance sheet shows the effect of operations on the assets and liabilities
1 Assistant professor, Department of B.Com (PA), PSGR Krishnammal College for Women, Coimbatore,
Tamil Nadu, India.
234 III B.Com (PA), Department of B.Com (PA), PSGR Krishnammal College for Women, Coimbatore,
Tamil Nadu, India.
© 2019 JETIR February 2019, Volume 6, Issue 2 www.jetir.org (ISSN-2349-5162)
JETIR1902639 Journal of Emerging Technologies and Innovative Research (JETIR) www.jetir.org 295
that change in the financial position during the period under consideration. The presentation of common size
statements, in annual reports, enhances the usefulness of such reports and brings out more clearly the nature
and trends of current changes affecting the enterprise. The common size balance sheet represents not nearly
the balance of accounts drawn on different dates, but also the extent of their increase or decrease between
two dates. Common size balance sheet focuses on the changes that have taken place in one accounting
period. The changes are the outcome of operational activities, conversion of assets, liability and capital form
into others as well as various interactions among assets, liability and capital.
OBJECTIVES OF THE STUDY
To predict the sales and profit of Infosys Ltd.,
To analyse the financial performance of Infosys Ltd.,
RESEARCH METHODOLGY
The following methodology have been used in this study,
Period of Study
The study period of Infosys Ltd. consists of 5 years from 2013-14 to 2017-18
Source of Study
This study is based on secondary data which have been obtained from the annual reports of the
company, books, journals and websites.
Tools and Techniques Used
Common size statement and Trend analysis are the tools used in this study for analysing the financial
statement of Infosys.
LIMITATION OF THE STUDY
1. The secondary data was collected through audited financial reports, websites, etc. So the inherent
limitations of the secondary data apply to the study.
2. The study is based on secondary data so it may not be accurate.
REVIEW LITERATURE
A review literature is collected through secondary sources. We collected different reviews
from many authors.

© 2019 JETIR February 2019, Volume 6, Issue 2 www.jetir.org (ISSN-2349-5162)
JETIR1902639 Journal of Emerging Technologies and Innovative Research (JETIR) www.jetir.org 296
Donthi Ravinder and Muskula Anitha (2013) have made “A study on financial analysis”
with the objective to find out the financial stability and soundness of the Bambino Agro Industries
Limited by using Comparative statement, common size statement, trend, fund flow and cash flow
analysis for the period 2006-2011. It has been found that there is an increase in inventories, sundry
debtors, current assets, secured loans and current liabilities for the year 2006-07. For the year 2007-
08 there is an increase in inventories, debtors, current assets and current liabilities. For the year
2008-2009 there is an increase in inventories, cash and bank balance, current assets and liabilities
and decrease in debtors. For the year 2009-10 there is an increase in inventories, sundry debtors,
cash and bank balances current assets and liabilities. For the year 2010-2011 there is a decrease in
inventory, sundry debtors, cash and bank balances, current assets and current liabilities. The study
concludes that the overall financial performance of the Bambino Agro Industries Limited is not
satisfactory.
Ravichandran and Venkata subramaniyan (2016) have made” A study on financial
performance analysis of Force Motors limited” for the period 2010 - 2015. The main objectives of
the study are to compare the financial performance and to analyse the financial changes over a
period of time. The comparative financial statement analysis has been used and the major findings of
the study highlighted that there has been increase in reserves & surplus and also shows deferred tax
liabilities, trade payables and decrease in long term borrowings. The study interpreted that the
company has maintaining good financial position. The study suggested that the Force Motors has to
concentrates on its operating, administrative and selling expenses and by reducing expenses.
To analyse the strength and weakness of the Tata Steel Ashok Kumar Rath (2016) has
made” A study on Financial Statement Analysis of Tata Steel Odisha project, Kalinga Nagar”. The
study uses secondary data and comparative, trend and ratio analysis is used to analyse the financial
statement of Tata Steels for the period 2010 -2015. It has been observed that there is an increase in
fixed assets, investments, shareholders fund, loan funds and decrease in the working capital. The
study concluded that the overall financial position of the Tata Steels is not satisfactory.
To examine the financial statement of Das Limited Poongavanam (2017) has conducted “A
study on comparative financial statement analysis. Secondary data is used for analysing the
comparative study for the period from 2011 – 2016. The study identified that the working capital
management of the Das Limited is satisfactory. The study concluded that the financial position of the
Das Limited is good and it is helpful in evaluating the efficiency of performance in Das Limited.
© 2019 JETIR February 2019, Volume 6, Issue 2 www.jetir.org (ISSN-2349-5162)
JETIR1902639 Journal of Emerging Technologies and Innovative Research (JETIR) www.jetir.org 297
ANALYSIS AND INTERPRETATION OF INFOSYS
Analysis means a detailed examination of the elements. It is a process of applying statistical or
logical techniques for the purpose of evaluating data. Interpretation refers to the task of drawing inferences
from the collected facts.
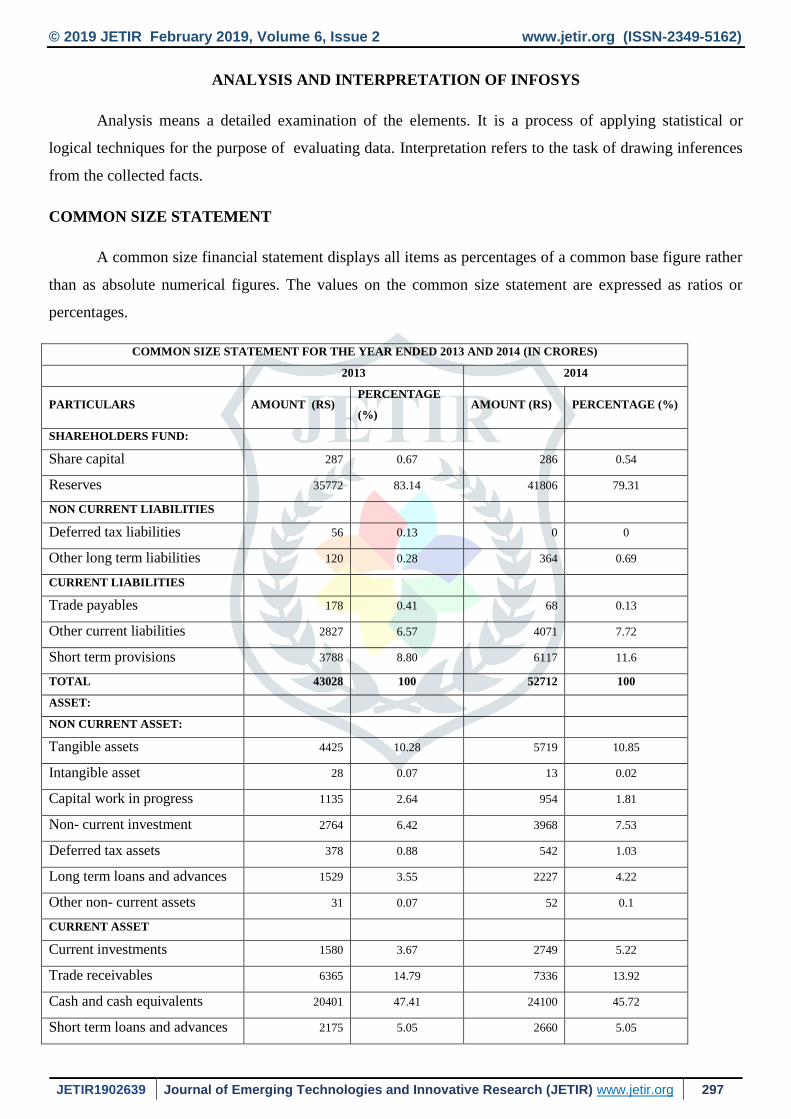
COMMON SIZE STATEMENT
A common size financial statement displays all items as percentages of a common base figure rather
than as absolute numerical figures. The values on the common size statement are expressed as ratios or
percentages.
COMMON SIZE STATEMENT FOR THE YEAR ENDED 2013 AND 2014 (IN CRORES)
2013 2014
PARTICULARS AMOUNT (RS) PERCENTAGE
(%) AMOUNT (RS) PERCENTAGE (%)
SHAREHOLDERS FUND:
Share capital 287 0.67 286 0.54
Reserves 35772 83.14 41806 79.31
NON CURRENT LIABILITIES
Deferred tax liabilities 56 0.13 0 0
Other long term liabilities 120 0.28 364 0.69
CURRENT LIABILITIES
Trade payables 178 0.41 68 0.13
Other current liabilities 2827 6.57 4071 7.72
Short term provisions 3788 8.80 6117 11.6
TOTAL 43028 100 52712 100
ASSET:
NON CURRENT ASSET:
Tangible assets 4425 10.28 5719 10.85
Intangible asset 28 0.07 13 0.02
Capital work in progress 1135 2.64 954 1.81
Non- current investment 2764 6.42 3968 7.53
Deferred tax assets 378 0.88 542 1.03
Long term loans and advances 1529 3.55 2227 4.22
Other non- current assets 31 0.07 52 0.1
CURRENT ASSET
Current investments 1580 3.67 2749 5.22
Trade receivables 6365 14.79 7336 13.92
Cash and cash equivalents 20401 47.41 24100 45.72
Short term loans and advances 2175 5.05 2660 5.05
© 2019 JETIR February 2019, Volume 6, Issue 2 www.jetir.org (ISSN-2349-5162)
JETIR1902639 Journal of Emerging Technologies and Innovative Research (JETIR) www.jetir.org 298
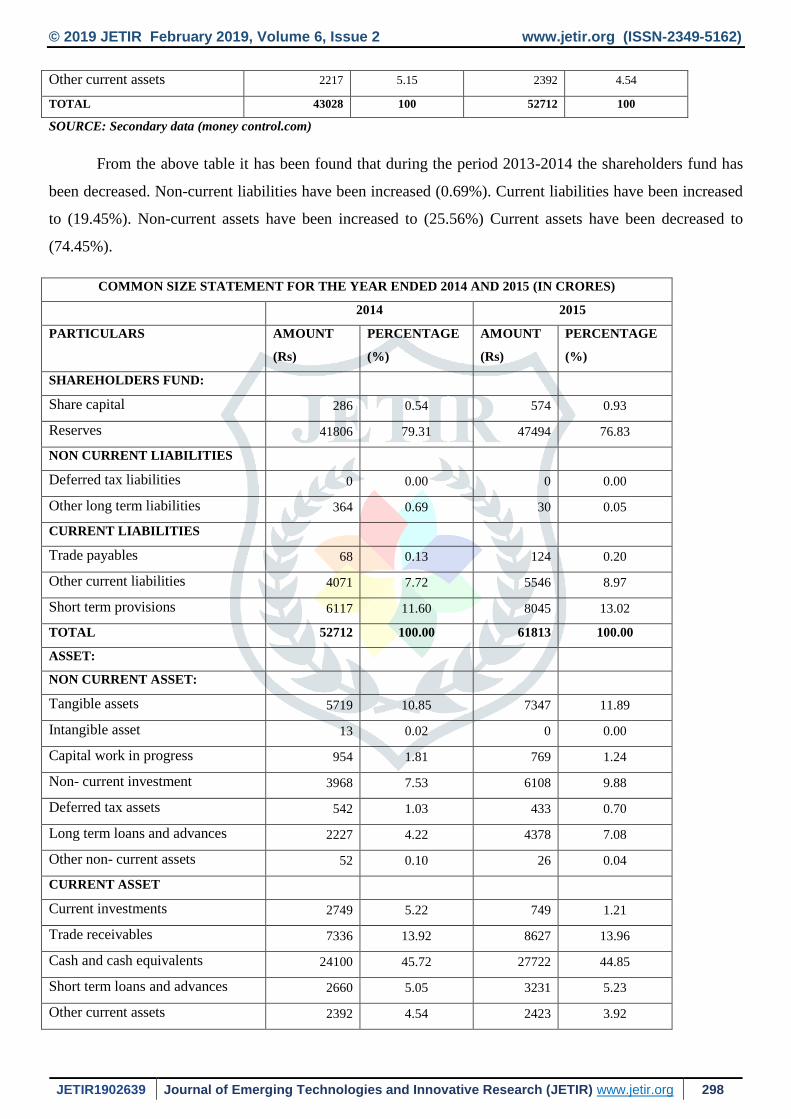
Other current assets 2217 5.15 2392 4.54
TOTAL 43028 100 52712 100
SOURCE: Secondary data (money control.com)
From the above table it has been found that during the period 2013-2014 the shareholders fund has
been decreased. Non-current liabilities have been increased (0.69%). Current liabilities have been increased
to (19.45%). Non-current assets have been increased to (25.56%) Current assets have been decreased to
(74.45%).
COMMON SIZE STATEMENT FOR THE YEAR ENDED 2014 AND 2015 (IN CRORES)
2014 2015
PARTICULARS AMOUNT
(Rs)
PERCENTAGE
(%)
AMOUNT
(Rs)
PERCENTAGE
(%)
SHAREHOLDERS FUND:
Share capital 286 0.54 574 0.93
Reserves 41806 79.31 47494 76.83
NON CURRENT LIABILITIES
Deferred tax liabilities 0 0.00 0 0.00
Other long term liabilities 364 0.69 30 0.05
CURRENT LIABILITIES
Trade payables 68 0.13 124 0.20
Other current liabilities 4071 7.72 5546 8.97
Short term provisions 6117 11.60 8045 13.02
TOTAL 52712 100.00 61813 100.00
ASSET:
NON CURRENT ASSET:
Tangible assets 5719 10.85 7347 11.89
Intangible asset 13 0.02 0 0.00
Capital work in progress 954 1.81 769 1.24
Non- current investment 3968 7.53 6108 9.88
Deferred tax assets 542 1.03 433 0.70
Long term loans and advances 2227 4.22 4378 7.08
Other non- current assets 52 0.10 26 0.04
CURRENT ASSET
Current investments 2749 5.22 749 1.21
Trade receivables 7336 13.92 8627 13.96
Cash and cash equivalents 24100 45.72 27722 44.85
Short term loans and advances 2660 5.05 3231 5.23
Other current assets 2392 4.54 2423 3.92
© 2019 JETIR February 2019, Volume 6, Issue 2 www.jetir.org (ISSN-2349-5162)
JETIR1902639 Journal of Emerging Technologies and Innovative Research (JETIR) www.jetir.org 299
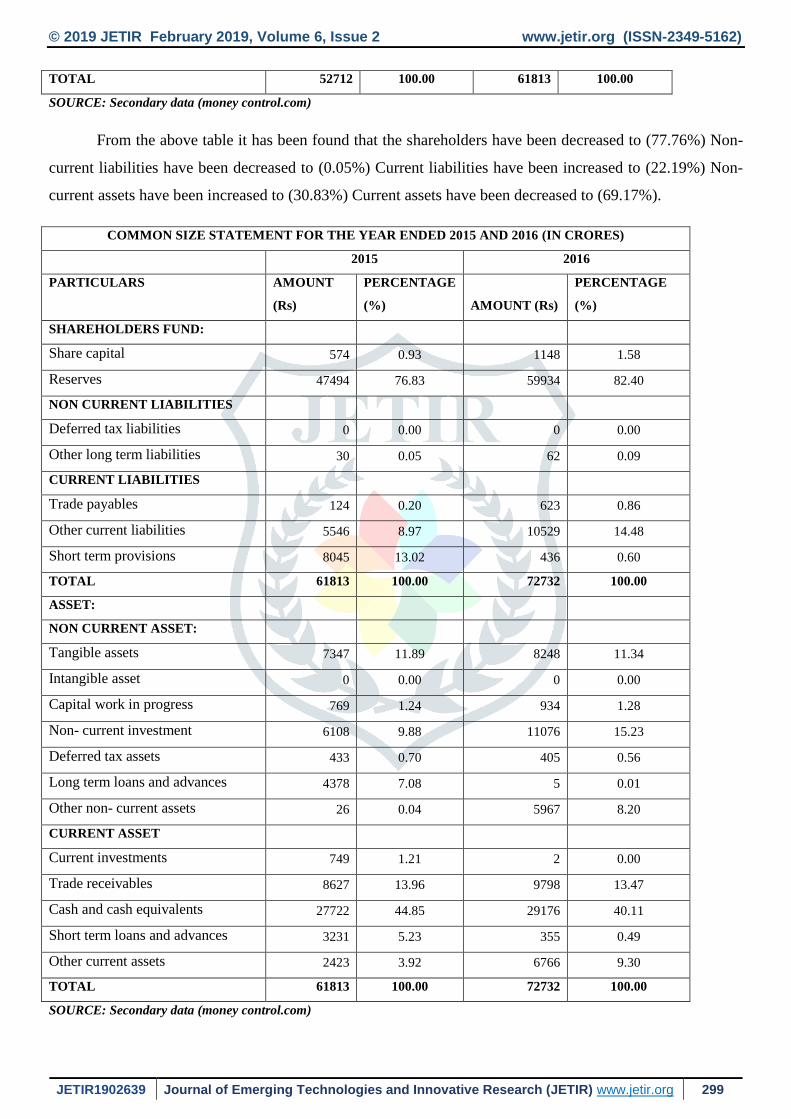
TOTAL 52712 100.00 61813 100.00
SOURCE: Secondary data (money control.com)
From the above table it has been found that the shareholders have been decreased to (77.76%) Non-
current liabilities have been decreased to (0.05%) Current liabilities have been increased to (22.19%) Non-
current assets have been increased to (30.83%) Current assets have been decreased to (69.17%).
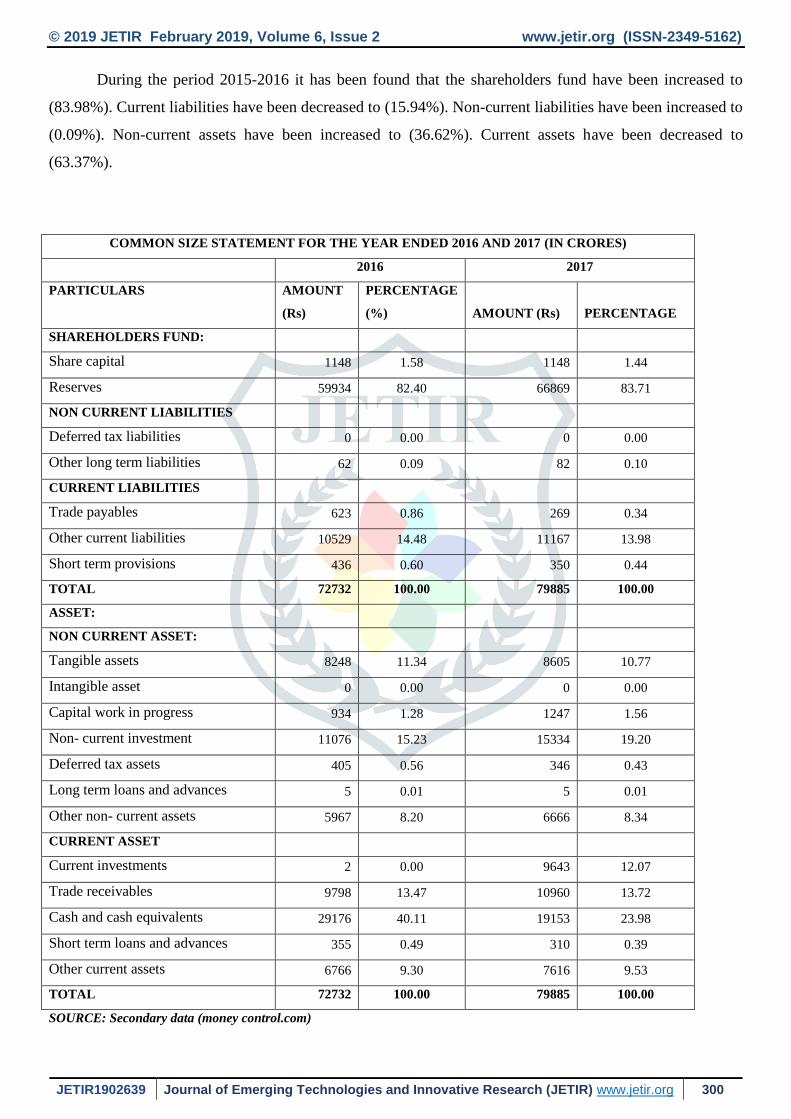
COMMON SIZE STATEMENT FOR THE YEAR ENDED 2015 AND 2016 (IN CRORES)
2015 2016
PARTICULARS AMOUNT
(Rs)
PERCENTAGE
(%) AMOUNT (Rs)
PERCENTAGE
(%)
SHAREHOLDERS FUND:
Share capital 574 0.93 1148 1.58
Reserves 47494 76.83 59934 82.40
NON CURRENT LIABILITIES
Deferred tax liabilities 0 0.00 0 0.00
Other long term liabilities 30 0.05 62 0.09
CURRENT LIABILITIES
Trade payables 124 0.20 623 0.86
Other current liabilities 5546 8.97 10529 14.48
Short term provisions 8045 13.02 436 0.60
TOTAL 61813 100.00 72732 100.00
ASSET:
NON CURRENT ASSET:
Tangible assets 7347 11.89 8248 11.34
Intangible asset 0 0.00 0 0.00
Capital work in progress 769 1.24 934 1.28
Non- current investment 6108 9.88 11076 15.23
Deferred tax assets 433 0.70 405 0.56
Long term loans and advances 4378 7.08 5 0.01
Other non- current assets 26 0.04 5967 8.20
CURRENT ASSET
Current investments 749 1.21 2 0.00
Trade receivables 8627 13.96 9798 13.47
Cash and cash equivalents 27722 44.85 29176 40.11
Short term loans and advances 3231 5.23 355 0.49
Other current assets 2423 3.92 6766 9.30
TOTAL 61813 100.00 72732 100.00
SOURCE: Secondary data (money control.com)
© 2019 JETIR February 2019, Volume 6, Issue 2 www.jetir.org (ISSN-2349-5162)
JETIR1902639 Journal of Emerging Technologies and Innovative Research (JETIR) www.jetir.org 300
During the period 2015-2016 it has been found that the shareholders fund have been increased to
(83.98%). Current liabilities have been decreased to (15.94%). Non-current liabilities have been increased to
(0.09%). Non-current assets have been increased to (36.62%). Current assets have been decreased to
(63.37%).
COMMON SIZE STATEMENT FOR THE YEAR ENDED 2016 AND 2017 (IN CRORES)
2016 2017
PARTICULARS AMOUNT
(Rs)
PERCENTAGE
(%) AMOUNT (Rs) PERCENTAGE
SHAREHOLDERS FUND:
Share capital 1148 1.58 1148 1.44
Reserves 59934 82.40 66869 83.71
NON CURRENT LIABILITIES
Deferred tax liabilities 0 0.00 0 0.00
Other long term liabilities 62 0.09 82 0.10
CURRENT LIABILITIES
Trade payables 623 0.86 269 0.34
Other current liabilities 10529 14.48 11167 13.98
Short term provisions 436 0.60 350 0.44
TOTAL 72732 100.00 79885 100.00
ASSET:
NON CURRENT ASSET:
Tangible assets 8248 11.34 8605 10.77
Intangible asset 0 0.00 0 0.00
Capital work in progress 934 1.28 1247 1.56
Non- current investment 11076 15.23 15334 19.20
Deferred tax assets 405 0.56 346 0.43
Long term loans and advances 5 0.01 5 0.01
Other non- current assets 5967 8.20 6666 8.34
CURRENT ASSET
Current investments 2 0.00 9643 12.07
Trade receivables 9798 13.47 10960 13.72
Cash and cash equivalents 29176 40.11 19153 23.98
Short term loans and advances 355 0.49 310 0.39
Other current assets 6766 9.30 7616 9.53
TOTAL 72732 100.00 79885 100.00
SOURCE: Secondary data (money control.com)
© 2019 JETIR February 2019, Volume 6, Issue 2 www.jetir.org (ISSN-2349-5162)
JETIR1902639 Journal of Emerging Technologies and Innovative Research (JETIR) www.jetir.org 301
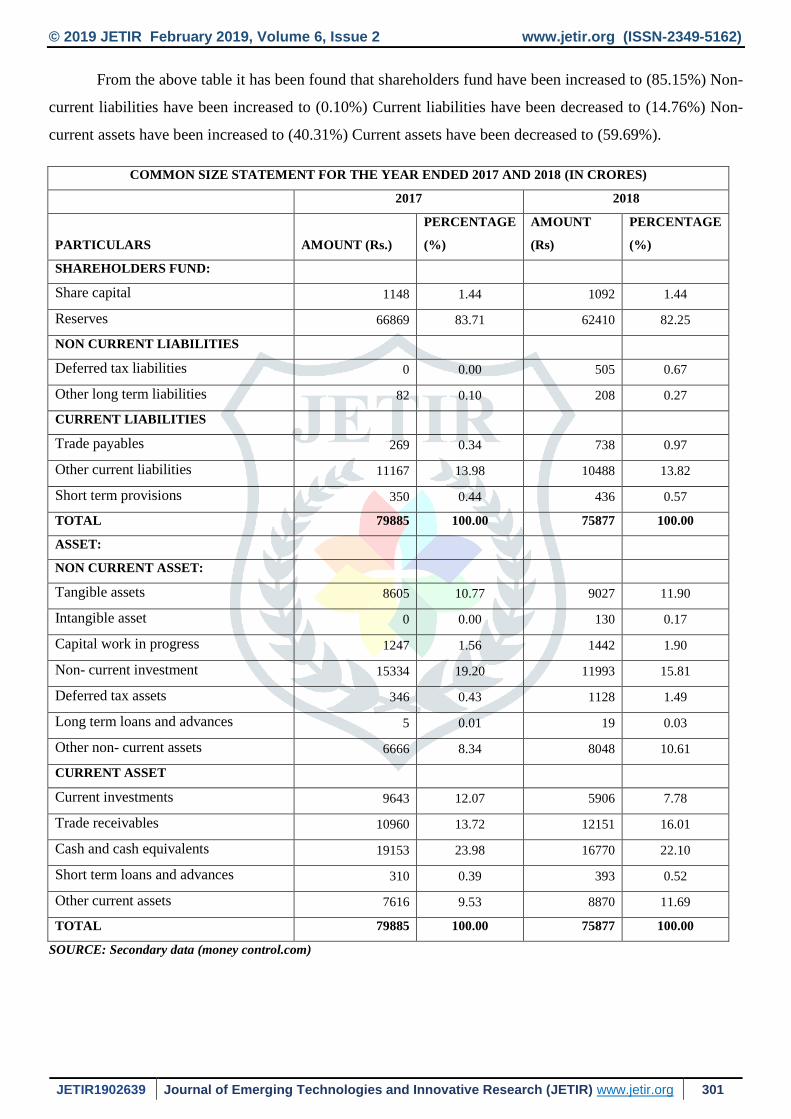
From the above table it has been found that shareholders fund have been increased to (85.15%) Non-
current liabilities have been increased to (0.10%) Current liabilities have been decreased to (14.76%) Non-
current assets have been increased to (40.31%) Current assets have been decreased to (59.69%).
COMMON SIZE STATEMENT FOR THE YEAR ENDED 2017 AND 2018 (IN CRORES)
2017 2018
PARTICULARS AMOUNT (Rs.)
PERCENTAGE
(%)
AMOUNT
(Rs)
PERCENTAGE
(%)
SHAREHOLDERS FUND:
Share capital 1148 1.44 1092 1.44
Reserves 66869 83.71 62410 82.25
NON CURRENT LIABILITIES
Deferred tax liabilities 0 0.00 505 0.67
Other long term liabilities 82 0.10 208 0.27
CURRENT LIABILITIES
Trade payables 269 0.34 738 0.97
Other current liabilities 11167 13.98 10488 13.82
Short term provisions 350 0.44 436 0.57
TOTAL 79885 100.00 75877 100.00
ASSET:
NON CURRENT ASSET:
Tangible assets 8605 10.77 9027 11.90
Intangible asset 0 0.00 130 0.17
Capital work in progress 1247 1.56 1442 1.90
Non- current investment 15334 19.20 11993 15.81
Deferred tax assets 346 0.43 1128 1.49
Long term loans and advances 5 0.01 19 0.03
Other non- current assets 6666 8.34 8048 10.61
CURRENT ASSET
Current investments 9643 12.07 5906 7.78
Trade receivables 10960 13.72 12151 16.01
Cash and cash equivalents 19153 23.98 16770 22.10
Short term loans and advances 310 0.39 393 0.52
Other current assets 7616 9.53 8870 11.69
TOTAL 79885 100.00 75877 100.00
SOURCE: Secondary data (money control.com)
© 2019 JETIR February 2019, Volume 6, Issue 2 www.jetir.org (ISSN-2349-5162)
JETIR1902639 Journal of Emerging Technologies and Innovative Research (JETIR) www.jetir.org 302
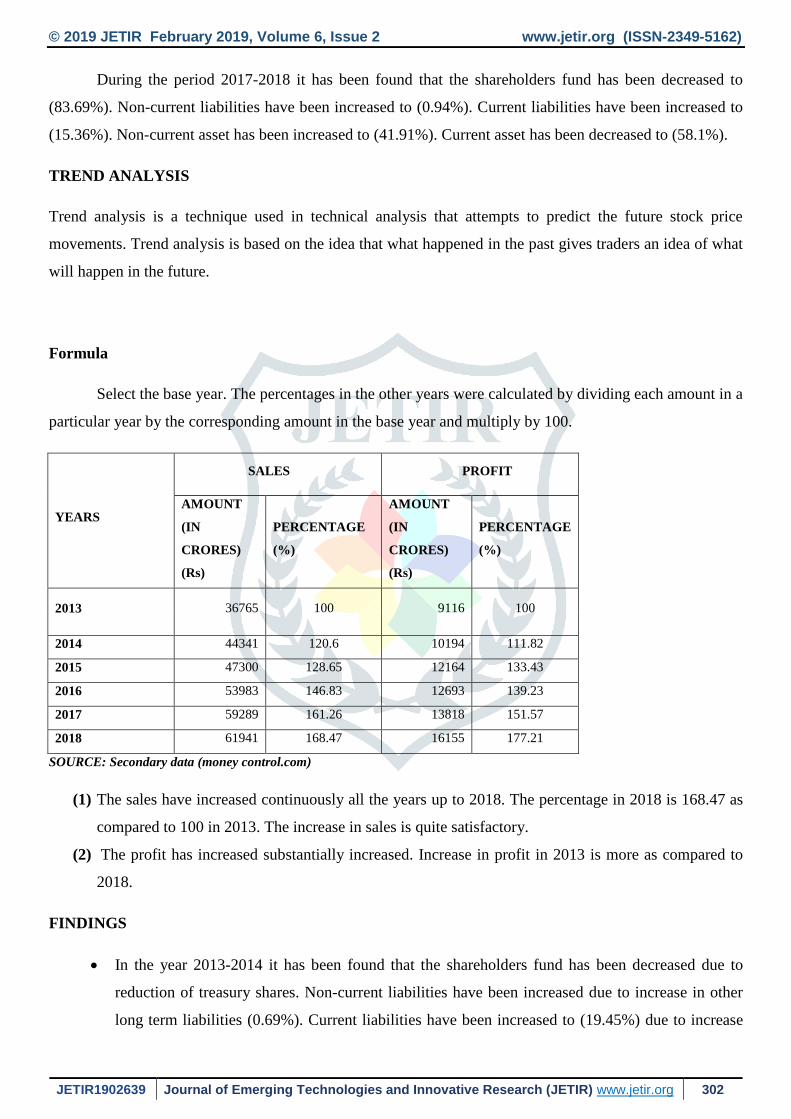
During the period 2017-2018 it has been found that the shareholders fund has been decreased to
(83.69%). Non-current liabilities have been increased to (0.94%). Current liabilities have been increased to
(15.36%). Non-current asset has been increased to (41.91%). Current asset has been decreased to (58.1%).
TREND ANALYSIS
Trend analysis is a technique used in technical analysis that attempts to predict the future stock price
movements. Trend analysis is based on the idea that what happened in the past gives traders an idea of what
will happen in the future.
Formula
Select the base year. The percentages in the other years were calculated by dividing each amount in a
particular year by the corresponding amount in the base year and multiply by 100.
YEARS
SALES PROFIT
AMOUNT
(IN
CRORES)
(Rs)
PERCENTAGE
(%)
AMOUNT
(IN
CRORES)
(Rs)
PERCENTAGE
(%)
2013 36765 100 9116 100
2014 44341 120.6 10194 111.82
2015 47300 128.65 12164 133.43
2016 53983 146.83 12693 139.23
2017 59289 161.26 13818 151.57
2018 61941 168.47 16155 177.21
SOURCE: Secondary data (money control.com)
(1) The sales have increased continuously all the years up to 2018. The percentage in 2018 is 168.47 as
compared to 100 in 2013. The increase in sales is quite satisfactory.
(2) The profit has increased substantially increased. Increase in profit in 2013 is more as compared to
2018.
FINDINGS
In the year 2013-2014 it has been found that the shareholders fund has been decreased due to
reduction of treasury shares. Non-current liabilities have been increased due to increase in other
long term liabilities (0.69%). Current liabilities have been increased to (19.45%) due to increase
© 2019 JETIR February 2019, Volume 6, Issue 2 www.jetir.org (ISSN-2349-5162)
JETIR1902639 Journal of Emerging Technologies and Innovative Research (JETIR) www.jetir.org 303
in other current liabilities and short term provisions. Non-current assets have been increased to
(25.56%) due to increase in tangible asset, non- current investment, deferred tax assets, long term
loans and advances and other non-current assets. Current assets have been decreased to (74.45%)
due to decrease in trade receivables, cash and cash equivalents and other current assets.
In the year 2014-2015 there will be decrease in shareholders fund to (77.76%) due to reduction
of treasury shares. Non-current liabilities have been decreased to (0.05%) due to decrease in other
long term liabilities. Current liabilities have been increased to (22.19%) due to increase in trade
payables, other current liabilities and short term provisions. Non-current assets have been
increased to (30.83%) due to increase in tangible asset, non- current investment and long term
loans and advances. Current assets have been decreased to (69.17%) due to increase in trade
receivables, cash and cash equivalents, short term loans and advances and other current assets.
In the year 2015-2016 it has been found that the shareholders fund have been increased to
(83.98%) due to issue of bonus shares. Current liabilities have been decreased to (15.94%) due to
decrease in short term provisions. Non-current liabilities have been increased to (0.09%) due to
increase in other long term liabilities. Non-current assets have been increased to (36.62%) due to
increase in capital work in progress, non-current investment and other non-current assets. Current
assets have been decreased to (63.37%) because of decrease in trade receivables, cash and cash
equivalents and short term loans and advances.
In the year 2016-2017 there will be increase in shareholders fund by (85.15%) due to increase in
issuing of bonus shares. Non-current liabilities have been increased to (0.10%) due to increase in
other long term liabilities. Current liabilities have been decreased to (14.76%) due to decrease in
trade payables, short term provisions and other current liabilities. Non-current assets have been
increased to (40.31%) due to increase in capital work in progress, non-current investment, and
other non-current asset. Current assets have been decreased to (59.69%) due to decreasing in cash
and cash equivalents and short term loans and advances
In the year 2017-2018 it has been found that the shareholders fund has been decreased to
(83.69%) due to reduction of treasury shares. Non-current liabilities have been increased to
(0.94%) due to increase in deferred tax liabilities and other long term liabilities. Current liabilities
have been increased to (15.36%) due to decrease in other current liabilities. Non-current asset has
been increased to (41.91%) due to increase in tangible asset, intangible asset, capital work in
progress, deferred tax assets, long term loans and advances and other non-current assets. Current
asset has been decreased to (58.1%) due to decrease in current investment and cash and cash
equivalent.
The average sales of the company is 137.63% and the average profit of the company is 135.54%
from 2013 to 2018.
© 2019 JETIR February 2019, Volume 6, Issue 2 www.jetir.org (ISSN-2349-5162)
JETIR1902639 Journal of Emerging Technologies and Innovative Research (JETIR) www.jetir.org 304
CONCLUSION
The study entitled “An Analysis of Financial Performance of INFOSYS Limited” highlighted that
the financial position of the INFOSYS Limited is good. During the period 2013-2018 by using trend
analysis sales and profit of the INFOSYS Limited has been increased gradually. This indicates the
performance of the INFOSYS Limited is good.
REFRENCES
BOOKS
MANAGEMENT ACCOUNTING- JAIN & NARANG
MANAGEMENT ACCOUNTING- R.J. REDDY
MANAGEMENT ACCOUNTING- S.CHAND
JOURNALS
Donith Ravinder, Muskula Anitha “Financial Analysis – A Study” IOSR Journal of
economics and finance ISSN NO 2321-5925, VOL 2, pp 10-22 Dec(2013).
Ravichandran and Venkata Subramanian “A Study On Financial Performance Analysis
Of Force Motors Limited” IJIRST –International Journal for innovative research in
science & technology ISSN NO 2349-6010, VOL 2, April 2016.
Ashok kumar rath “ A Study On Financial Statement Analysis Of Tata Steel Odisha
Project , Kalinga Nagar” Journnal Of Research In Business And Management ISSN NO
2347-3002, VOL 4 , PP 49-60 , Dec 2016.
Poongavanam “ A Study On Comparative Financial Statement Analysis With Reference
To Das Limited” IOSR Journal Of Humanities And Social Science ISSN NO 2279 -0845,
VOL 22 , PP 09-14 Oct (2017).
WEBSITE
www.money control.com
www.ijsrp.org
www.google.com
http://www.ijmdr.in