Financial Inclusion Status of Bangladesh: An Empirical Study
Upload
khangminh22Category
view
1download
0
Report On
Financial performance analysis of
Linde Bangladesh Limited
By
Md. Ziad Hassan
ID: 18264042
An internship report submitted to the BRAC Business School in partial fulfillment of the
requirements for the degree of
Master of Business Administration
BRAC business School
BRAC University
June, 2021
© 2021. Brac University
All rights reserved.

ii
Declaration
It is hereby declared that
1. The internship report submitted is my/our own original work while completing degree at
Brac University.
2. The report does not contain material previously published or written by a third party, except
where this is appropriately cited through full and accurate referencing.
3. The report does not contain material which has been accepted, or submitted, for any other
degree or diploma at a university or other institution.
4. I/We have acknowledged all main sources of help.
Student’s Full Name & Signature:
___________________________________________
Md. Ziad Hassan
Student ID: 18264042
Supervisor’s Full Name & Signature:
___________________________________________
Meer Sajed-Ul-Basher
Adjunct Professor, BRAC Business School
BRAC University

iii
Letter of Transmittal
Meer Sajed-Ul-Basher
Adjunct Professor,
BRAC Business School
BRAC University
66 Mohakhali, Dhaka-1212
Subject: Submission of report on Financial performance analysis of Linde Bangladesh Limited
Dear Sir,
I am very pleased to submitting my internship report on Financial performance analysis of
Linde Bangladesh Limited. As it is an important part of MBA degree requirement, I have
included all the knowledge I gained from my academic knowledge. I tried my best to prepare
this internship report though I have to face various challenges and obstacles while making this
internship report.
I would like to thank my supervisor for guiding me to prepare the report. Hence, I hope you
will appreciate the information that I have provided in the report. However, this report shows
some limitation because of lack of my knowledge and shortage of time duration. Please inform
me if you have any inquiries about the report, I am glad to provide you any help to clarify on
my report.
Sincerely yours,
__________________
Md. Ziad Hassan
Student ID: 18264042
BRAC Business School
BRAC University
Date: June, 2021

iv
Non-Disclosure Agreement
[This page is for Non-Disclosure Agreement between the Company and The Student]
This agreement is made and entered into by and between [Name of Company] and the
undersigned student at BRAC University Student …………………………………….

v
Acknowledgement
First of all, I would like to thank Almighty Allah for giving me the strength, opportunity and
will power for the completion this internship report successfully.
I am also grateful to all who have motivated me and support me during the internship period.
I am very much thankful to my Supervisor Meer Sajed-Ul-Basher who guided me while
preparing my report.
Lastly, I would like to thank my friends Farhan Chowdhury, Khalid Saif and Naushin Mahmud
Sarna for helping me with different matters while creating this report.

vi
Executive Summary
Financial Performance analysis is essential for an organization or business or an individual.
Because every company needs to know about its performance whether they are doing well,
whether it is going with international standards. There are a few tools or formulas out there to
calculate or know the effectiveness of a corporation. It is possible to analyze the performance
of an organization using these tools. By doing this analysis it can understand how an
organization earns its assets, equity, or income, how debt or liability is managed, what is the
ratio of debt to assets, etc. My supervisor assigned me to do Linde Bangladesh Limited
Performance analysis. For this performance analysis of Linde, I have tried to gather as much
achievable information as possible through online or secondary data. So, for performance
analysis, I have selected five years which are 2016 to 2020. I have collected Linde's annual
report and Financial statements of Linde Bangladesh Limited from 2016 to 2020 and other
related information. Then I have listed some ratios formulas and calculate with Linde’s worth
and lastly, I have interpreted ratios with graph and table.
Linde is a multinational company; therefore, this company has large data and complexity. I
have analysis with limited data. Though having limited resources, I have done this report and
tried to make it as much correct as possible. Overall, I can see that almost all results are
preferable for the company and business.
Keywords: Financial performance analysis; Linde’s Annual report; Financial statements;
Ratio analysis; interpreted ratios.

vii
Table of Contents Declaration................................................................................................................................ ii
Letter of Transmittal ............................................................................................................. iii
Non-Disclosure Agreement .................................................................................................... iv
Acknowledgement .................................................................................................................... v
Executive Summary ................................................................................................................ vi
List of Tables ........................................................................................................................... ix
List of Figures .......................................................................................................................... ix
List of Acronyms ...................................................................................................................... x
Chapter 1 Overview of Internship.......................................................................................... 1
1.1 Student Information .................................................................................................... 1
1.2 Problem/ Difficulties .................................................................................................... 1
Chapter 2 Organization Part .................................................................................................. 2
2.1 Overview of the Company ........................................................................................... 2
2.1.1 LBL Mission: ................................................................................................................... 2
2.1.2 LBL Vision: ..................................................................................................................... 2
2.1.3 LBL Strategic Direction: ................................................................................................ 3
2.1.4 Company Core Values .................................................................................................... 3
2.1.5 LBL milestones at a glance............................................................................................. 3
Linde Operates countries ........................................................................................................ 4
2.3 Marketing Practices ........................................................................................................... 5
2.4 Industry and Competitive Analysis .................................................................................. 5

viii
Chapter 3 Financial performance analysis of Linde Bangladesh Limited ......................... 6
3.1 Introduction ............................................................................................................ 6
3.1.1 Objective(s) .............................................................................................................. 6
3.2 Methodology ........................................................................................................... 6
3.3 Findings and Analysis ............................................................................................ 7
3.3.1 Assess Working Capital Policy: ......................................................................... 8
(1) Working Capital Investment Policy: ................................................................... 8
Examples of Liquidity Ratios ...................................................................................... 8
(2) Working Capital Financing Policy: ........................................................................ 10
3.3.2Assess Capital Structure Policy: ....................................................................... 11
3.3.3 Assess Dividend Policy: .................................................................................... 13
3.3.4 DU Pont Analysis: ............................................................................................. 14
3.3.5 Analyze Price Multiple: .................................................................................... 15
3.4 Required Rate of Return and Share Price ......................................................... 17
3.5 Conclusions and Recommendations ................................................................. 178
References ................................................................................. Error! Bookmark not defined.9

ix
List of Tables
Table 1: WCFP ........................................................................................................................ 11
Table 2: Assess dividend policy………………………………………………………………13
Table 3: Analyze Price Multiple……………………………………………………………...16
List of Figures
Figure 1: Balance Sheet ……………………………………………………………………….7
Figure 2: Income Statement ....................................................................................................... 8
Figure 3: Working Capital Investment Policy………………………………………………9
Figure 4: Assess Capital Structure Policy……………………………………………….….13
Figure 5: Du Pont Analysis…………………………………………………………………...14

x
List of Acronyms
LBL Linde Bangladesh Limited
BOL Bangladesh Oxygen Limited
WCFP Working Capital Financing Policy
RRR Required Rate of Return
CAPM Capital Asset Pricing Model

Chapter 1
Overview of Internship
1.1 Student Information
I am Md. Ziad Hassan student of BRAC University. My Id is 18264042 and my major is in
Finance. I am doing MBA in BRAC University. For completing this program, I need submit
an internship report on “Financial Performance analysis of Linde Bangladesh Limited”. I will
submit this report to Meer Sajed-Ul-Basher sir, who is my supervisor.
1.2 Problem/ Difficulties
The report is prepared in a very detailed and integrated format. Still, there may have some
information gap because of some limitations. The limitations what I face are given below:
Firstly, I cannot visit of Linde office employee. As a result, I cannot get to know the corporate
culture and proper information for my report.
Secondly, there is a shortage of availability of articles and research on Linde Bangladesh
Limited. They keep their operations information hide from online and also forbade to share
their confidential files.
Thirdly, they have limited customer and spread all over the country. So, it was not possible to
get more details from customer and not to reach them.
Finally, I had not enough experience to make this report professionally which may also a cause
of missing company information.

2
Chapter 2
Organization Part
2.1 Overview of the Company
Linde Bangladesh Limited
Linde Bangladesh Limited is a member of the Linde group. Linde Bangladesh Limited started
its journey in 1958 as Pakistan oxygen Limited. After the Liberation war in 1971, Pakistan
oxygen Limited renamed as Bangladesh oxygen Limited. In 1973 Bangladesh oxygen Limited
received government approval for the first full-fledged company of the newly formed country.
The first CO2 Plant was introduced in 1976. In 1979 welding Training Centre is started its
journey. The company changed its name from "Bangladesh oxygen Limited" to "BOC
Bangladesh Limited" in 1995. Rupganj Plant was commissioned in 1997. And in 2006 the
company was acquired by the Linde group. After that, the company achieved a total profit of
hundred crores in 2010.
Linda Bangladesh Limited is a Pioneer multinational company in gas businesses. The
company's factory is situated in three major locations. Tejgaon, Rupganj, Shitalpur. It has also
18th sales centers spread throughout the country. The sales centers provide service to over
35,000 people. The Company can produce 80 tons of liquid ESU gases and 23100 MT of
welding electrodes per year per day.
2.1.1 LBL Mission:
Linda Bangladesh Limited as a forerunner is not only a Gas Manufacturer however also a
Welding Training Centre. Hence, the motto is straightforward, “Ensure optimum conditions in
health, safety and the environment for its employees, customers and stakeholders”.
2.1.2 LBL Vision:
Linde Bangladesh Limited is committed to fulfilling our vision to be the best performing global
industrial gases and engineering company, where their people deliver innovative and
sustainable solutions for our customers in a connected world.

3
2.1.3 LBL Strategic Direction: LBL will work as One Linde to build on our individual
and collective strengths across a larger global footprint. They will increase network density in
core industrial gas geographies and will execute our robust backlog. They are fully committed
to capturing the full value of the merger.
2.1.4 Company Core Values
• Safety: Company put safety first. They believe all incidents are preventable, and their
goal is no harm to people, communities or the environment. They continuously work to
improve their safety culture and performance worldwide.
• Integrity: Company always strive to achieve their goals ethically, and with the highest
integrity. They expect transparent and respectful interactions between management,
employees and their business partners, consistent with our Code of Business Integrity.
• Community: They are committed to improving the communities where they live and
work. Their charitable contributions, along with employee volunteerism, support
initiatives that make important and sustainable contributions to the world.
• Inclusion: They embrace diversity and inclusion in order to attract, develop and retain
the best talent and build high-performing teams. By hearing all voices and benefiting
from diverse opinions, thoughts and perspectives, they achieve their full promise and
potential.
• Accountability: Company hold themselves accountable for our performance,
individually and collectively. They focus both on what we accomplish and how they
accomplish it, and are committed to delivering on individual and company goals.
2.1.5 LBL milestones at a glance
1953 Chittagong Oxygen plant was commissioned.
1973 Bangladesh Oxygen Limited (BOL) Incorporated in the joint stock
companies and received government approval as the first full–fledged
“Company” of the newly formed country.
1976 First CO2 plant was introduced.
1979 Welding Training Centre started its journey.
1995 The Company changed its name from “Bangladesh Oxygen

4
Limited” to “BOC Bangladesh Limited.”
1995 The Company has commissioned a 30TPD ASU Plant and 1st
Welding Production line at Rupganj.
1998 2nd Welding production line at Rupganj was commissioned.
1999 20 TPD Shitalpur plant was acquired.
2000 ASPEN at shitalpur and LPG Bottling plant at Bogra commissioned.
2004 Moved into newly built Corporate Office.
2006 The BOC Bangladesh Limited acquired by the Linde Group, Germany.
2010 Achieved BDT 100 Crore EBITDA.
2011 3rd Welding production line at Rupganj was commissioned.
2011 The Company changed its name from “BOC Bangladesh Limited”
to “Linde Bangladesh Limited.”
2012 4th Welding production line at Rupganj was commissioned.
2013 LPG Plant at Bogra decommissioned.
2017 Rupganj 100 TPD ASU plant was commissioned.
2019 36 TPD CO2 plant was commissioned at Rupganj
Linde Operates countries
5
2.3 Marketing Practices
Linde Bangladesh Limited has a dedicated marketing team who mainly handle the marketing
sector. Since Linde Bangladesh limited has two customer segment one is Government sector
and another is Private sector but marketing team only works for the private customers
because in the government sector marketing is not working that way. Each depo has their
marketing officer for the sale of private hospital, clinic etc. on the other hand Government
project comes through win the Central Tender.
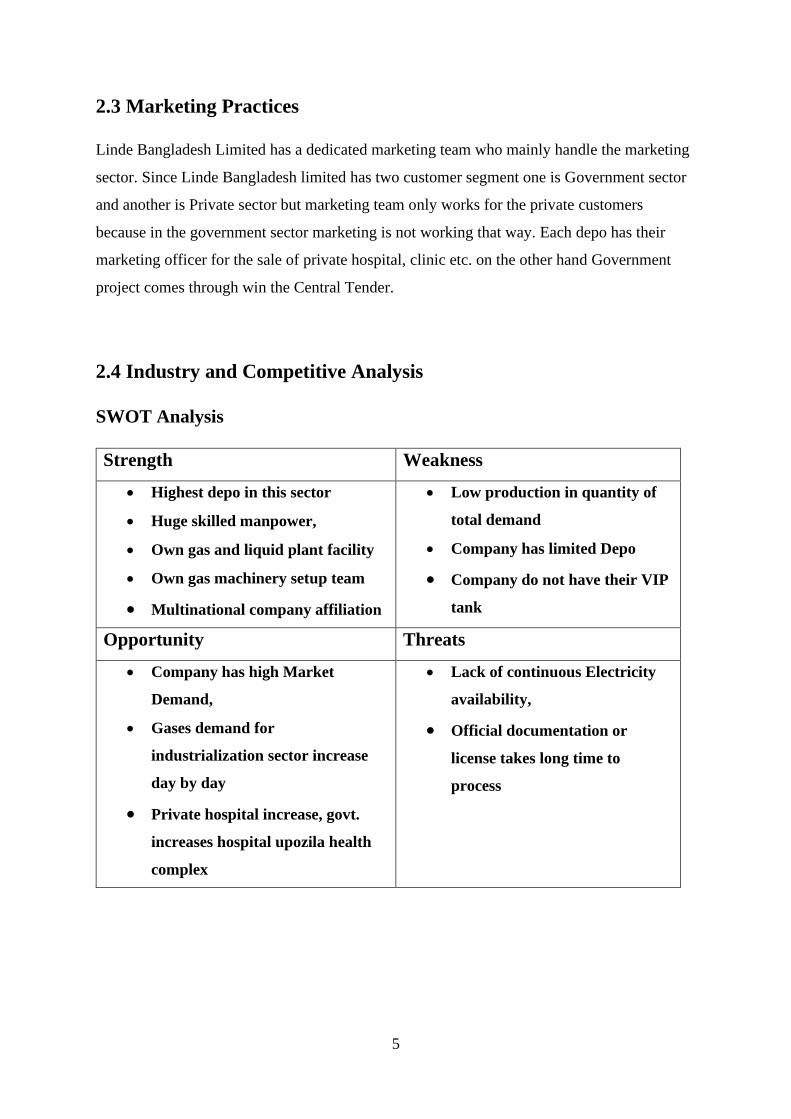
2.4 Industry and Competitive Analysis
SWOT Analysis
Strength Weakness
• Highest depo in this sector
• Huge skilled manpower,
• Own gas and liquid plant facility
• Own gas machinery setup team
• Multinational company affiliation
• Low production in quantity of
total demand
• Company has limited Depo
• Company do not have their VIP
tank
Opportunity Threats
• Company has high Market
Demand,
• Gases demand for
industrialization sector increase
day by day
• Private hospital increase, govt.
increases hospital upozila health
complex
• Lack of continuous Electricity
availability,
• Official documentation or
license takes long time to
process

6
Chapter 3 Financial performance analysis of Linde Bangladesh
Limited
3.1 Introduction
This report is based on different financial ratios and performance measurement of Linde
Bangladesh Limited which is listed in Dhaka Stock Exchange. Main motive to gather practical
knowledge and the theoretical knowledge and their differences for the completion of
‘Internship’ of MBA program in BRAC University.
3.1.1 Objective(s)
There are mainly two objectives behind the preparation of this report. They are primary and
secondary objective.
Primary objective
The primary objective of preparing this report is to fulfill the practical requirement of internship
of MBA program and to gain knowledge on “Financial Performance Assessment”.
Secondary objective
The secondary objective of the report is as below: -
➢ To co-ordinate between theory and practice and to gain theoretical and practical
knowledge on ratio analysis.
➢ To know about the financial performance of selected company’s registered in the
‘Dhaka Stock Exchange’ by analyzing ratios.
➢ To apply theoretical knowledge and compare their financial status between year 2016,
2017, 2018, 2019 & 2020.
3.2 Methodology
In this report the topic is suggested by my supervisor Meer Sajed-Ul-Basher. The report is
designed in a way so that it can meet the objects of this report. The study is descriptive in
nature. The data for this paper has been collected from secondary sources of information. Data
were derived from various sources including the website of DSE, journals & articles of related
topics, different books and materials from libraries to prepare this report.

7
3.3 Findings and Analysis
Fig 1: Balance Sheet

8
Fig 2: Income statement
The analysis and interpretation of financial statement is used to determine the financial position
and result of operation as well. In this report we have use the following ratios that are used for
analyzing the financial position of the Linde Bangladesh Limited:
3.3.1 Assess Working Capital Policy:
(1) Working Capital Investment Policy: The working capital policy of a company refers
to the level of investment in current assets for attaining their targeted sales. It can be of
three types viz. restricted, relaxed, and moderate. The relaxed policy has higher and
restricted has lower levels of current assets whereas moderate places itself between
relaxed and restricted. Commonly, these policies are also named as aggressive,
conservative and hedging policy.
➢ Current Asset to Total Asset= 𝐂𝐮𝐫𝐫𝐞𝐧𝐭 𝐀𝐬𝐬𝐞𝐭
𝐓𝐨𝐭𝐚𝐥 𝐀𝐬𝐬𝐞𝐭
➢ Sales to Current Asset= 𝐒𝐚𝐥𝐞𝐬
𝐂𝐮𝐫𝐫𝐞𝐧𝐭 𝐚𝐬𝐬𝐞𝐭
Liquidity Ratio: A liquidity ratio is a financial ratio that indicates whether a company's current
assets will be sufficient to meet the company's obligations when they become due.
Examples of Liquidity Ratios
Typically, the following financial ratios are considered to be liquidity ratios:
• Current ratio
• Quick ratio or acid test ratio

9
The amount of a company's working capital is also cited as an indicator of liquidity.
Current ratio: The current ratio is a liquidity and efficiency ratio that measures a firm's ability
to pay off its short-term liabilities with its current assets. The current ratio is an important
measure of liquidity because short-term liabilities are due within the next year. This means that
a company has a limited amount of time in order to raise the funds to pay for these liabilities.
Calculated as:
Current ratio = 𝐂𝐮𝐫𝐫𝐞𝐧𝐭 𝐚𝐬𝐬𝐞𝐭
𝐂𝐮𝐫𝐫𝐞𝐧𝐭 𝐥𝐢𝐛𝐢𝐥𝐢𝐭𝐢𝐞𝐬
Quick Ratio: The quick ratio is a financial ratio used to gauge a company's liquidity. The quick
ratio is also known as the acid test ratio. The quick ratio differs from the current ratio in that
some current assets are excluded from the quick ratio. The most significant current asset that
is excluded is inventory. The reason is that inventory might not be "quick" to turn to cash.
Calculated as:
Current ratio = 𝐂𝐮𝐫𝐫𝐞𝐧𝐭 𝐚𝐬𝐬𝐞𝐭−𝐈𝐧𝐯𝐞𝐧𝐭𝐨𝐫𝐢𝐞𝐬
𝐂𝐮𝐫𝐫𝐞𝐧𝐭 𝐥𝐢𝐛𝐢𝐥𝐢𝐭𝐢𝐞𝐬
Trend Analysis:
Fig 3: Working capital investment policy
2020 2019 2018 2017 2016
CA/TA 0.56 0.51 0.48 0.44 0.52
TS/CA 1.06 1.45 1.65 1.89 1.51
Current ratio 2.58 2.25 2.01 1.66 1.77
Acid Test 2.07 1.77 1.49 1.23 1.31
0.56 0.51 0.48 0.44 0.52
1.06
1.451.65
1.89
1.51
2.58
2.25
2.01
1.661.77
2.07
1.77
1.49
1.23 1.31
0
0.5
1
1.5
2
2.5
3
CA/TA TS/CA Current ratio Acid Test

10
Interpretation: In case of CA/TA. Linde Bangladesh Limited shows that its ratio has been
decreases 2016 to 2017, The company had more current asset in 2016 is 0.52. Then it starts to
goes up continuously in 2018, 2019 and 2020. That means it lose its current asset in 2017 and
again gain good grip in current asset simultaneously. In 2020 its CA/TA ratio is 0.56. The
current assets actually account for half of its total assets and firm can easily realize return on
investment.
In sales to current asset ratio is a financial calculation how efficiently a company is making to
use of its current assets to generate revenue. For LBL, the ratio is higher in 2017 is 1.89. That
means company has make more sales in 2017 by using their current asset like marketable
securities, inventories etc.
In Current ratio, LBL has growing from 2017 to 2020. The highest ratio is 2.58 in 2020 that
indicates that company has more ability to cover its current liabilities by paying utility bills,
accounts payable etc.
In Quick or Acid test ratio, LBL ratio is increasing from 2017 to 2020, that provides the ability
to make payments on current obligations is growing. A higher ratio gained in 2020 is 2.07
indicates that, company is making more assets by convert their inventories in cash.
(2) Working Capital Financing Policy: WCFP basically deals with the sources and the
amount of working capital that a company should maintain. A firm is not only concerned about
the amount of current assets but also about the proportions of short-term and long-term sources
for financing the current assets. There are several working capital investment policies a firm
may adopt after taking into account the variability of its cash inflows and outflows and the
level of risk.
➢ Current Liability to Total Asset: = 𝐂𝐮𝐫𝐫𝐞𝐧𝐭 𝐋𝐢𝐚𝐛𝐢𝐥𝐢𝐭𝐲
𝐓𝐨𝐭𝐚𝐥 𝐀𝐬𝐬𝐞𝐭

11
Trend Analysis:
Company Linde Bangladesh Limited
CL/TA 2020 2019 2018 2017 2016
0.22 0.23 0.24 0.27 0.29
Table 1: WCFP
Interpretation: The Current liabilities to Total asset ratio is a solvency ratio that shows how
much of a company’s assets are made of liabilities. In case of LBL Ratio is continuously
decrease on 2016 to 2020. The company has more profit and return on 2016 than 2017, 2018,
2019 and 2020. As in 2017, 2018, 2019 and 2020, interest expense more because of long term
debt.
3.3.2Assess Capital Structure Policy: The capital structure is the particular
combination of debt and equity used by a company to finance its overall operations and growth.
Debt comes in the form of bond issues or loans, while equity may come in the form of common
stock, preferred stock, or retained earnings. Short-term debt such as working capital
requirements is also considered to be part of the capital structure.
➢ Financial Leverage Ratio: Financial leverage is the use of debt to buy more assets.
Leverage is employed to increase the return on equity. However, an excessive amount
of financial leverage increases the risk of failure, since it becomes more difficult to
repay debt.
➢ Debt to Equity: The debt-to-equity (D/E) ratio is calculated by dividing a company’s
total liabilities by its shareholder equity. The ratio is used to evaluate a company's
financial leverage. The D/E ratio is an important metric used in corporate finance. It is
a measure of the degree to which a company is financing its operations through debt
versus wholly-owned funds.
Calculated as:
Debt to Equity ratio = 𝐓𝐨𝐭𝐚𝐥 𝐃𝐞𝐛𝐭
𝐓𝐨𝐭𝐚𝐥 𝐬𝐡𝐚𝐫𝐞𝐡𝐨𝐥𝐝𝐞𝐫𝐬 𝐞𝐪𝐮𝐢𝐭𝐲
➢ Debt to Total Asset: The debt to total assets ratio is an indicator of a company's
financial leverage. It tells you the percentage of a company's total assets that were
financed by creditors.

12
Calculated as:
Debt to Total Asset ratio = 𝐓𝐨𝐭𝐚𝐥 𝐃𝐞𝐛𝐭
𝐓𝐨𝐭𝐚𝐥 𝐀𝐬𝐬𝐞𝐭
➢ Interest coverage ratio: The interest coverage ratio (ICR) is a measure of a company’s
ability to meet its interest payments. Interest coverage ratio is equal to earnings before
interest and taxes (EBIT) for a time period, often one year, divided by interest expenses
for the same time period. The interest coverage ratio is a measure of the number of
times a company could make the interest payments on its debt with its EBIT. It
determines how easily a company can pay interest expenses on outstanding debt.
Calculated as:
Interest coverage ratio = 𝐄𝐁𝐈𝐓
𝐃𝐞𝐛𝐭 𝐢𝐧𝐭𝐞𝐫𝐞𝐬𝐭 𝐜𝐡𝐚𝐫𝐠𝐞
Trend Analysis:
Fig 4: Assess Capital Structure Policy
Interpretation: In debt to equity ratio, Linde Bangladesh Limited ratio is decreasing from
2016 to 2020. It showed that company is doing good in this ratio. Its lowest debt from five
years is 0.48 in 2020 than other four years. So, the company position is getting better and better
in each year because low ratio indication is good. In 2020 it done better than other years.
2020 2019 2018 2017 2016
Debt to Equity 0.48 0.5 0.53 0.62 0.65
Debt to Asset2 Interest xa 0.32 0.33 0.35 0.38 0.38
Series 3 3.89 3.87 3.87 3.66 3.84
0.48 0.5 0.53 0.62 0.65
0.32 0.33 0.35 0.38 0.38
3.89 3.87 3.873.66
3.84
0
0.5
1
1.5
2
2.5
3
3.5
4
4.5
Debt to Equity Debt to Asset2 Interest xa Series 3

13
In debt to asset ratio, LBL ratio is stable in 2016 to 2017 and after that it goes down
simultaneously in 2018, 2019 and 2020. So, company had more financial risk in 2017 and 2016.
From 2018 it starts covering some risk then previous risk.
In Interest Coverage ratio, LBL ratio is highest in 2020 is 3.89. So, company has high earnings
to cover its interest charges. In 2016 company’s ability was lowest to cover it charges then rest
of four years.
3.3.3 Assess Dividend Policy:
Dividend Payout ratio: The dividend payout ratio is the ratio of the total amount of dividends
paid out to shareholders relative to the net income of the company. It is the percentage of
earnings paid to shareholders in dividends. The amount that is not paid to shareholders is
retained by the company to pay off debt or to reinvest in core operations. It is sometimes simply
referred to as the 'payout ratio.'
Dividend Payout Ratio = 𝐃𝐢𝐯𝐢𝐝𝐞𝐧𝐝
𝐍𝐞𝐭 𝐢𝐧𝐜𝐨𝐦𝐞
Dividend Yield Ratio: The dividend yield is the ratio of a company's annual dividend
compared to its share price. The dividend yield is represented as a percentage and is calculated
Dividend Yield Ratio = 𝐃𝐢𝐯𝐢𝐝𝐞𝐧𝐝 𝐏𝐞𝐫 𝐒𝐡𝐚𝐫𝐞
𝐏𝐫𝐢𝐜𝐞 𝐏𝐞𝐫 𝐒𝐡𝐚𝐫𝐞
Company Linde Bangladesh Limited
Year 2020 2019 2018 2017 2016
Dividend
Payout
70.028% 45.834% 21.026% 48.939% 52.996%
Dividend
Yield
3.56% 2.77% 1.10% 2.48% 2.43%
Table 2: Assess Dividend Policy
Interpretation: In Dividend Payout ratio is decrease in 2017 compare to 2016 and then
decrease in 2018 and then it starts goes up in 2019 and 2020 it achieves its best compare to the
rest. Company was paying highest dividends in 2020, 2nd highest was 2016 and paying lowest

14
in 2018. A high ratio shows, they had more shares and investors as they paid more dividends
and then it decreases by paying low dividend in 2018.
Dividend Yield Ratio is increases from 2016 to 2017 and then decrease in 2018. The high ratio
indicates, the asset value is increases by stock appreciation. So, company position was good in
2020,2019,2017 and 2016 and worst in 2018 by asset value decreased. Though in 2019, they
cover up asset value and start going upward.
3.3.4 DU Pont Analysis: DuPont Analysis is an extended examination of Return on
Equity (ROE) of a company which analyses Net Profit Margin, Asset Turnover, and Financial
Leverage. This analysis was developed by the DuPont Corporation in the year 1920.In simple
words, it breaks down the ROE to analyze how corporate can increase the return for their
shareholders.
Return on Equity= Net Profit Margin x Asset Turnover Ratio
Financial Leverage= (Net Income / Sales) x (Sales / Total Assets) x (Total Assets / Total
Equity).
Fig 5: Du Pont Analysis
2020 2019 2018 2017 2016
Net profit Margine 0.23 0.22 0.19 0.19 0.21
Total Asset Turnover 0.59 0.74 0.8 0.83 0.78
Equity Multiplier 1.48 1.5 1.53 1.61 1.72
0.23 0.22 0.19 0.19 0.21
0.59
0.740.8 0.83 0.78
1.48 1.5 1.531.61
1.72
0
0.2
0.4
0.6
0.8
1
1.2
1.4
1.6
1.8
2
Net profit Margine Total Asset Turnover Equity Multiplier

15
Net profit margin ratio increases from 2016 to 2020 and being stable in 2018 and 2017. High
ratio measures profitability with respect sales generated, net income per taka of sales. So, in
2020, industry was more profitable than past years.
Total asset turnover ratio is fluctuating. In 2016 to 2017 it increases by 0.05 and then start
decrease in simultaneously 2018, 2019 and 2020 by 0.80, 0.74 and 0.59. High ratio indicates
the good efficiency of total assets to generate sales. In 2017, they make good sales by their
asset. However, we see opposite scenario in 2018-2020. They continuously lose their efficiency
of total assets to generate sales.
Equity multiplier ratio was decreasing continuously each year from 2016 to 2020. In 2016 it
was 1.72 and in 2020 it was 1.48. We know A higher ratio indicates the more leveraged and
therefore must generate higher revenue to meet the debt expenses but here we could assume
that company may reduce their use of leveraged.
3.3.5 Analyze Price Multiple:
Price Multiple: A price multiple is any ratio that uses the share price of a company in
conjunction with some specific per-share financial metric for a snapshot on valuation. The
share price is typically divided by a chosen per-share metric to form a ratio.
Price Earnings ratio: The price to earnings ratio (PE Ratio) is the measure of the share price
relative to the annual net income earned by the firm per share. PE ratio shows current investor
demand for a company share. A high PE ratio generally indicates increased demand because
investors anticipate earnings growth in the future. The PE ratio has units of years, which can
be interpreted as the number of years of earnings to pay back purchase price.
Calculated as:
• Price earnings ratio= Market Price per share/ Earning per share
Price Sales ratio: The price-to-sales (P/S) ratio is a valuation ratio that compares a company’s
stock price to its revenues. It is an indicator of the value placed on each dollar of a company’s
sales or revenues.
The P/S ratio can be calculated either by dividing the company’s market capitalization by its
total sales over a designated period – usually twelve months, or on a per-share basis by dividing

16
the stock price by sales per share. The P/S ratio is also known as a "sales multiple" or "revenue
multiple."
Calculated as:
• Price Sales ratio= Price per share / sales per share
Price Net Cash Flow ratio: The price-to-cash flow (P/CF) ratio is a stock valuation indicator or
multiple that measures the value of a stock’s price relative to its operating cash flow per share.
The ratio uses operating cash flow which adds back non-cash expenses such as depreciation
and amortization to net income. It is especially useful for valuing stocks that have positive cash
flow but are not profitable because of large non-cash charges.
Calculated as:
• Price Net Cash Flow Per ratio= Price per share / cash flow per share
Company Linde Bangladesh Limited
Year 2020 2019 2018 2017 2016
Price Earnings 19.670 16.560 19.196 19.704 21.822
Price Sales 4.48 3.59 3.53 3.80 4.50
Price Net Cash
Flow
15.34 13.45 14.66 16.27 18.48
Table 3: Analyze Price Multiple
Price earnings ratio is higher in 2016 and lowest in 2019. The Company Earn more money in
2016 and then falling down in 2017, 2018 and 2019 from 21.822 to 16.560. After 2018 price
earnings ratio increase. A higher ratio indicates that investor expect higher earnings. The
company Position is better.
In year 2016, investors are paying 4.50times more for per share, that is highest value over five
years. A higher ratio means that the market is willing to pay for each taka of annual sales. The
value was decrease in 2017 and 2018. After 2018 it starts increase and 2020 again it cross four
times. We assume that it’s the effect of Covid-19.
Price Net Cash Flow is higher in 2016 is 18.48taka for one taka cash flow. Higher ratio
indicates that company in the stages of development when the share price is mostly valued
based on their future growth prospects.

17
3.4 Required Rate of Return and Share Price
CAPM full form is Capital Asset Pricing Model. It is used to calculate the Required rate of
Return of a stock based on risk free rate, expected return of the market and Beta.
CAPM formula
𝑅𝑓= Risk free rate; 𝑅𝑚= Return of a market; 𝛽 = Beta (Investment Risk)
Here,
𝑅𝑓= 0.0568;
[Bangladesh Government Treasury Bond Rate is the best source to get the risk free rate. 10
Years data was reported at 5.680 % pa in May 2021.]
𝑅𝑚= 0.10;
[In last 100 years, the average stock market return is about 10% per year. The S&P 500 is often
considered the benchmark measure for annual stock market returns.]
𝛽 = 0.22
[I use Linde Bangladesh price and DSEX value’s historical data of August,2016 to July, 2021
to calculate beta]
𝑅𝑅𝑅 = 𝑅𝑓 + 𝛽(𝑅𝑚 − 𝑅𝑓) = 6.6%
Since, its beta is low it is obvious that its expected return also be low. We know that return has
a positive relation with risk of a share. If risk is high of a share, then expected return will also
high. However, share price will decrease if risk increase.
So, based on my opinion if I buy Linde bd share in June at a price of 1,324.70tk then my
expected return for July will be 1,324.70 * (100+6.6)% = 1412.13tk. However, in July the share
price is 1,338.30 which is 73.83tk less than my expectation.

18
3.5 Conclusions and Recommendations
I completely did my report. I am trying to analyze Bangladesh one of the leading company’s
financial performance perfectly. There I finding company’s overall position. The financial
analysis helps me to find out the actual scenario of that company. Performance analysis is a
huge term, performance analysis consists so many calculations, observations, knowledge and
skill. For company like Linde Bangladesh doing performance analysis is a very tough and
complex task. Linde’s most of the performance is up to the mark. In 2016 to 2020 Linde’s
performance was good enough but company should try to cover up their drawbacks. As their
key concern to serve customer so they can improve their service more and they can keep
exploring more new ideas.

19
References
ceicdata. (2021, July 7). ceicdata. Retrieved from www.ceicdata.com:
https://www.ceicdata.com/en/bangladesh/government-treasury-bills/bangladesh-
government-treasury-bond-rate-10-years
Finance Management. (2017, July 31). Finance Management. Retrieved from
efinancemanagement.com: https://efinancemanagement.com/financial-
management/financing-strategies
investing.com. (2021, July 18). investing.com. Retrieved from www.investing.com:
https://www.investing.com/equities/linde-bangladesh-ltd-historical-data
kurt, D. (2021, May 28). Investopedia. Retrieved from Investopedia.com:
https://www.investopedia.com/articles/investing/080113/understanding-leverage-
ratios.asp
Linde Bangladesh Limited. (2017). Linde Bangladesh Limited Annual report 2017. Dhaka:
lindebd.
Linde Bangladesh limited. (2018). Linde Bangladesh Limited Annual report 2018. Dhaka:
Lindebd.
Linde bangladesh limited. (2019). Linde Bangladesh Limited Annual report 2019. Dhaka:
Lindebd.
Linde Bangladesh Limited. (2020). Linde Bangladesh Limited Annual Report 2020. Dhaka:
Lindebd.
Linde Bangladesh. (n.d.). Linde Bangladesh. (Linde Bangladesh Limited) Retrieved June 12,
2021, from http://www.linde.com.bd/en/index.html

20
little, K. (2021, February 26). The Balance. Retrieved from thebalanc.com:
https://www.thebalance.com/understanding-dividend-payout-ratio-3140781
Royal, J., & O'Shea, A. (2021, May 25). nerdwallet. Retrieved from www.nerdwallet.com:
https://www.nerdwallet.com/article/investing/average-stock-market-return
Copyright © 2022 FDOKUMEN