GRINDROD BANK LIMITED ANNUAL FINANCIAL ...
76
GRINDROD BANK LIMITED ANNUAL FINANCIAL STATEMENTS for the year ended 31 December 2019
-
Upload
khangminh22 -
Category
Documents
-
view
4 -
download
0
Transcript of GRINDROD BANK LIMITED ANNUAL FINANCIAL ...
GRINDROD BANK LIMITED ANNUAL FINANCIAL STATEMENTS
for the year ended 31 December 2019


1GRINDROD BANK LIMITEDAnnual financial statements
CONTENTS
CERTIFICATE BY THE COMPANY SECRETARY
The company secretary hereby certifies that in terms of section 88(2) of the Companies Act No.71 of 2008, as amended (the Companies Act), the Company has lodged with the Companies and Intellectual Property Commission of South Africa all such returns and notices as are required of a public company in terms of the Companies Act and that all such returns are true, correct and up to date in respect of the financial year ended 31 December 2019.
Shana AshokumarCompany secretary
29 April 2020
Certificate by the company secretary 1
Directors’ responsibility and approval of annual financial statements 2
Independent auditor’s report 3
Audit and compliance committee report 8
Directors’ report 11
Statement of financial position 14
Statement of comprehensive income 15
Statement of changes in equity 16
Statement of cash flows 17
Accounting policies 18
Notes to the annual financial statements 28
Corporate details 70
2 GRINDROD BANK LIMITEDAnnual financial statements
* Copyright and trademarks are owned by the Institute of Directors in South Africa NPC and all of its rights are reserved.
DIRECTORS’ RESPONSIBILITY AND APPROVAL OF ANNUAL FINANCIAL STATEMENTSThe directors are required by the Companies Act to maintain adequate accounting records and are responsible for the content and integrity of the annual financial statements and related financial information included in this report. It is their responsibility to ensure that the annual financial statements fairly present the affairs of the Group and Company as at the end of the financial year and the results of its operations and cash flows for the period then ended, in conformity with International Financial Reporting Standards (IFRS), the SAICA Financial Reporting Guides as issued by the Accounting Practices Committee and Financial Pronouncements as issued by the Financial Reporting Standards Council, the JSE Debt Listings Requirements and the Companies Act. The external auditor is engaged to express an independent opinion on the annual financial statements.
The directors acknowledge that they are ultimately responsible for the system of internal financial control established by the Group and Company and place considerable importance on maintaining a strong control environment. To enable the directors to meet these responsibilities, the board of directors (the board) sets standards for internal control aimed at reducing the risk of error or loss in a cost‑effective manner. The standards include the proper delegation of responsibilities within a clearly defined framework, effective accounting procedures and adequate segregation of duties to ensure an acceptable level of risk. These controls are monitored throughout the Group and Company and all employees are required to maintain the highest ethical standards in ensuring the Group and Company’s business is conducted in a manner that in all reasonable circumstances is above reproach. The focus of risk management in the Group and Company is on identifying, assessing, managing and monitoring all known forms of risk across the Group and Company. While operating risks cannot be fully eliminated, the Group and Company endeavours to minimise them by ensuring that appropriate infrastructure, controls, systems and ethical behaviour are applied and managed within predetermined procedures and constraints.
The directors are of the opinion that the system of internal control provides reasonable assurance that the financial records may be relied on for the preparation of the annual financial statements. However, any system of internal control can provide only reasonable, and not absolute, assurance against material misstatement or loss.
The directors have reviewed the Group and Company’s financial forecast for the year to 31 December 2020 and, in light of this review and the current financial position, they are satisfied that the Group and Company has or has access to adequate resources to continue in operational existence for the foreseeable future.
A sound corporate governance framework commits the Group and Company to high standards of business ethics. The framework guides the board, as the custodian of responsible corporate governance, in the formulation and implementation of the Group and Company strategy to achieve targeted performance and create sustainable value to the benefit of all stakeholders. The framework comprises appropriate policies, procedures and power of execution to ensure that governance objectives are properly implemented, managed, reviewed and adjusted. This ensures responsible corporate citizenship through regulatory and best practice adherence, effective and ethical leadership and sustainable value creation. Additional disclosure in this regard, including disclosures relating to the King Report on Corporate Governance™ for South Africa, 2016 (King IV)*, can be found in the Grindrod Financial Holdings Limited integrated annual report, published on the Bank’s website at www.grindrodbank.co.za.
The annual financial statements set out on pages 14 to 69, which have been prepared on the going concern basis, were approved by the board on 29 April 2020, and are signed on its behalf by:
Amanda Dambuza David Polkinghorne Rakesh GarachChairman Chiefexecutiveofficer Chieffinancialofficer
SNG Grant Thornton is a member firm of Grant Thornton International Ltd (GTIL). GTIL and the member firms are not a worldwide partnership. Services are delivered independently by the member firms. GTIL and its member firms are not agents of, and do not obligate, one another and are not liable for one another’s acts or omissions. SizweNtsalubaGobodo Grant Thornton Incorporated Registration Number: 2005/034639/21
sng-grantthornton.co.za
1
Victor Sekese [Chief Executive]
A comprehensive list of all Directors is available at the company offices or registered office
Independent Auditor’s Report to the shareholders of Grindrod Bank Limited Report on the audit of the financial statements Opinion We have audited the consolidated and separate financial statements of Grindrod Bank Limited and its subsidiaries (the Group) set out on pages 14 to 69, which comprise the consolidated and separate statement of financial position as at 31 December 2019, and the consolidated and separate statement of comprehensive income, consolidated and separate statement of changes in equity and consolidated and separate statement of cash flows for the year then ended, and notes to the consolidated annual financial statements, including a summary of significant accounting policies. In our opinion, the consolidated and separate financial statements present fairly, in all material respects, the financial position of the Group as at 31 December 2019, and its financial performance and cash flows for the year then ended in accordance with the International Financial Reporting Standards and the requirements of the Companies Act of South Africa. Basis for opinion We conducted our audit in accordance with International Standards on Auditing (ISAs). Our responsibilities under those standards are further described in the Auditor’s Responsibilities for the Audit of the Consolidated and Separate Financial Statements section of our report. We are independent of the Group in accordance with the sections 290 and 291 of the Independent Regulatory Board for Auditors’ Code of Professional Conduct for Registered Auditors (Revised January 2018), parts 1 and 3 of the Independent Regulatory Board for Auditors’ Code of Professional Conduct for Registered Auditors (Revised November 2018) (together the IRBA Codes) and other independence requirements applicable to performing audits of financial statements in South Africa. We have fulfilled our other ethical responsibilities, as applicable, in accordance with the IRBA Codes and in accordance with other ethical requirements applicable to performing audits in South Africa. The IRBA Codes are consistent with the corresponding sections of the International Ethics Standards Board for Accountants’ Code of Ethics for Professional Accountants and the International Ethics Standards Board for Accountants’ International Code of Ethics for Professional Accountants (including International Independence Standards) respectively. We believe that the audit evidence we have obtained is sufficient and appropriate to provide a basis for our opinion. Key Audit Matters Key audit matters are those matters that, in our professional judgement, were of most significance in our audit of the consolidated and separate financial statements of the current period. These matters were addressed in the context of our audit of the consolidated and separate financial statements as a whole, and in forming our opinion thereon, and we do not provide a separate opinion on these matters.
SNG Grant Thornton 20 Morris Street East Woodmead, 2191 P.O. Box 2939 Saxonwold, 2132 T: 011 231 0600
3GRINDROD BANK LIMITEDAnnual financial statements
INDEPENDENT AUDITOR’S REPORT
To the shareholders of Grindrod Bank LimitedReport on the audit of the financial statements
Opinion We have audited the consolidated and separate financial statements of Grindrod Bank Limited and its subsidiaries (the Group) set out on pages 14 to 69, which comprise the consolidated and separate statement of financial position as at 31 December 2019, and the consolidated and separate statement of comprehensive income, consolidated and separate statement of changes in equity and consolidated and separate statement of cash flows for the year then ended, and notes to the consolidated annual financial statements, including a summary of significant accounting policies.
In our opinion, the consolidated and separate financial statements present fairly, in all material respects, the financial position of the Group as at 31 December 2019, and its financial performance and cash flows for the year then ended in accordance with the International Financial Reporting Standards and the requirements of the Companies Act of South Africa.
Basis for opinionWe conducted our audit in accordance with International Standards on Auditing (ISAs). Our responsibilities under those standards are further described in the Auditor’s Responsibilities for the Audit of the Consolidated and Separate Financial Statements section of our report. We are independent of the Group in accordance with the sections 290 and 291 of the Independent Regulatory Board for Auditors’ Code of Professional Conduct for Registered Auditors (Revised January 2018), parts 1 and 3 of the Independent Regulatory Board for Auditors’ Code of Professional Conduct for Registered Auditors (Revised November 2018) (together the IRBA Codes) and other independence requirements applicable to performing audits of financial statements in South Africa. We have fulfilled our other ethical responsibilities, as applicable, in accordance with the IRBA Codes and in accordance with other ethical requirements applicable to performing audits in South Africa. The IRBA Codes are consistent with the corresponding sections of the International Ethics Standards Board for Accountants’ Code of Ethics for Professional Accountants and the International Ethics Standards Board for Accountants’ International Code of Ethics for Professional Accountants (including International Independence Standards) respectively. We believe that the audit evidence we have obtained is sufficient and appropriate to provide a basis for our opinion.
Key Audit Matters Key audit matters are those matters that, in our professional judgement, were of most significance in our audit of the consolidated and separate financial statements of the current period. These matters were addressed in the context of our audit of the consolidated and separate financial statements as a whole, and in forming our opinion thereon, and we do not provide a separate opinion on these matters.
SNG Grant Thornton is a member firm of Grant Thornton International Ltd (GTIL). GTIL and the member firms are not a worldwide partnership. Services are delivered independently by the member firms. GTIL and its member firms are not agents of, and do not obligate, one another and are not liable for one another’s acts or omissions. SizweNtsalubaGobodo Grant Thornton Incorporated Registration Number: 2005/034639/21
sng-grantthornton.co.za
1
Victor Sekese [Chief Executive]
A comprehensive list of all Directors is available at the company offices or registered office
Independent Auditor’s Report to the shareholders of Grindrod Bank Limited Report on the audit of the financial statements Opinion We have audited the consolidated and separate financial statements of Grindrod Bank Limited and its subsidiaries (the Group) set out on pages 14 to 69, which comprise the consolidated and separate statement of financial position as at 31 December 2019, and the consolidated and separate statement of comprehensive income, consolidated and separate statement of changes in equity and consolidated and separate statement of cash flows for the year then ended, and notes to the consolidated annual financial statements, including a summary of significant accounting policies. In our opinion, the consolidated and separate financial statements present fairly, in all material respects, the financial position of the Group as at 31 December 2019, and its financial performance and cash flows for the year then ended in accordance with the International Financial Reporting Standards and the requirements of the Companies Act of South Africa. Basis for opinion We conducted our audit in accordance with International Standards on Auditing (ISAs). Our responsibilities under those standards are further described in the Auditor’s Responsibilities for the Audit of the Consolidated and Separate Financial Statements section of our report. We are independent of the Group in accordance with the sections 290 and 291 of the Independent Regulatory Board for Auditors’ Code of Professional Conduct for Registered Auditors (Revised January 2018), parts 1 and 3 of the Independent Regulatory Board for Auditors’ Code of Professional Conduct for Registered Auditors (Revised November 2018) (together the IRBA Codes) and other independence requirements applicable to performing audits of financial statements in South Africa. We have fulfilled our other ethical responsibilities, as applicable, in accordance with the IRBA Codes and in accordance with other ethical requirements applicable to performing audits in South Africa. The IRBA Codes are consistent with the corresponding sections of the International Ethics Standards Board for Accountants’ Code of Ethics for Professional Accountants and the International Ethics Standards Board for Accountants’ International Code of Ethics for Professional Accountants (including International Independence Standards) respectively. We believe that the audit evidence we have obtained is sufficient and appropriate to provide a basis for our opinion. Key Audit Matters Key audit matters are those matters that, in our professional judgement, were of most significance in our audit of the consolidated and separate financial statements of the current period. These matters were addressed in the context of our audit of the consolidated and separate financial statements as a whole, and in forming our opinion thereon, and we do not provide a separate opinion on these matters.
SNG Grant Thornton 20 Morris Street East Woodmead, 2191 P.O. Box 2939 Saxonwold, 2132 T: 011 231 0600

4 GRINDROD BANK LIMITEDAnnual financial statements
INDEPENDENT AUDITOR’S REPORT CONTINUED
Key audit matter How the matter was addressed in the audit
Expected Credit Losses (ECLs)
Significant judgement is required by the directors in assessing the impairment against advances.
Impairment amounting to R89.9 million against an advances balance of R5.4 billion disclosed in note 10 to the consolidated annual financial statements, represents the ECL based on the requirements of IFRS 9: Financial Instruments (IFRS 9). The ECL is calculated by multiplying the loss given default (LGD), probability of default (PD) and applicable discount factors.
The significant judgements applied in determining the impairment included:
о The probability that an advance will default (PD); о Credit risk changes (significant increase in credit risk
(SICR)); о The size of credit exposures (“exposures at default (EAD)); о The loss on default (LGD); and о The expected realisable value of collateral securing the
advance: There is significant judgement used by the directors in the valuation of collateral relating to loans held at amortised cost, specifically around the use of unobservable inputs in the fair value models of those collateral securities. The fair value of collateral reduces the amount of ECL directly and is therefore a key input into the ECL amounts calculated.
In evaluating the impairment against advances, we performed the following procedures:
о Assessed the design and implementation of key controls relating to the ECL model;
о Assessed the reasonableness of assumptions and variables used in determining the specific credit impairment in relation to current market conditions;
о Assessed the completeness, accuracy and validity of data inputs used during the development and application of the credit impairment model;
о Assessed the methodologies and assumptions applied to ensure compliance with IFRS 9 including the determination of the probability that an advance will default (PD), size of credit exposures (exposure at default (EAD)) and the loss on default (LGD);
о Reperformed management’s calculation of the stage allocation;
о Evaluated the methodology used to incorporate forward looking information in the calculation of ECLs;
о Assessed the adequacy of the impairment raised based on the realisable value of collateral and the qualitative factors described above;
о Considered the qualitative factors that indicate impairment including the amount in arrears, period in arrears and the financial strength of the borrower; and
о Performed substantive tests of detail on a sample basis, the appraised fair value of the collateral securing impaired advances and advances included in the ECL model.

5GRINDROD BANK LIMITEDAnnual financial statements
Key audit matter How the matter was addressed in the audit
Control assessment of underlying investment structures under IFRS 10: Consolidated Financial Statements (IFRS 10)
Significant judgement is applied by management in the determination of whether control is achieved, of certain entities under IFRS 10.
In evaluating the control assessment of underlying investment structures under IFRS 10, we performed the following procedures:
о Obtained an understanding of the structured entity and its purpose;
о Obtained an understanding of the terms of the related agreements, and where applicable, the nature and terms of the preference share issuing vehicle;
о Reviewed and assessed management’s assessment of the underlying investee entities in terms of IFRS 10;
о Reviewed the Memorandums of Incorporation of preference share issuing vehicles as well as preference share subscription agreements; and
о Engaged internal technical experts to assist where significant judgement has been applied in the determination of whether control has been achieved.
Assessment of the application of the principles of IFRS 13: Fair Value Measurement (IFRS 13)
Under IFRS 13, fair value is determined as an exit price, maximising the use of relevant observable inputs and minimising the use of unobservable inputs. Significant judgement is applied in the determination of the inputs to be used in the models, especially in those models whose fair values are classified as Level 3 in the fair value hierarchy under IFRS 13.
The determination of the fair value of certain financial instruments are subject to significant observable and unobservable inputs.
In assessing the application of IFRS 13, we performed the following procedures:
о Where management used specialists to perform the valuations, we evaluated their competence, capabilities and objectivity in performing these valuations;
о Where new valuation methodologies have been applied, we evaluated whether the model valuation methodologies used for material valuation risks are appropriate, with the assistance of our valuation specialists;
о We evaluated the appropriateness of key assumptions and observable input sources and, where adjustments were made to observable inputs, we evaluated the appropriateness of the adjustments; and
о The key valuation inputs assessed included prime and swap curves and adjustments for credit risk and liquidity risk.
6 GRINDROD BANK LIMITEDAnnual financial statements
INDEPENDENT AUDITOR’S REPORT CONTINUED
Other InformationThe directors are responsible for the other information. The other information comprises the information included in the document titled “Grindrod Bank Limited Annual Financial Statements for the year ended 31 December 2019”, which includes the Directors’ Report, the Audit and Compliance Committee’s Report and the Certificate by the Company Secretary as required by the Companies Act of South Africa. The other information does not include the consolidated separate financial statements and our auditor’s reports thereon.
Our opinion on the consolidated and separate financial statements does not cover the other information and we do not express an audit opinion or any form of assurance conclusion thereon.
In connection with our audit of the consolidated and separate financial statements, our responsibility is to read the other information and, in doing so, consider whether the other information is materially inconsistent with the consolidated financial statements or our knowledge obtained in the audit, or otherwise appears to be materially misstated. If, based on the work we have performed, we conclude that there is a material misstatement of this other information, we are required to report that fact. We have nothing to report in this regard.
Responsibilities of the directors for the Financial StatementsThe directors are responsible for the preparation and fair presentation of the consolidated and separate annual financial statements in accordance with the International Financial Reporting Standards and the requirements of the Companies Act of South Africa, and for such internal control as the directors determine is necessary to enable the preparation of financial statements that are free from material misstatement, whether due to fraud or error.
In preparing the consolidated and separate annual financial statements, the directors are responsible for assessing the company’s ability to continue as a going concern, disclosing, as applicable, matters related to going concern and using the going concern basis of accounting unless the directors either intend to liquidate the company or to cease operations, or have no realistic alternative but to do so.
Auditor’s Responsibilities for the Audit of the Financial StatementsOur objectives are to obtain reasonable assurance about whether the consolidated and separate annual financial statements as a whole are free from material misstatement, whether due to fraud or error, and to issue an auditor’s report that includes our opinion. Reasonable assurance is a high level of assurance but is not a guarantee that an audit conducted in accordance with ISAs will always detect a material misstatement when it exists. Misstatements can arise from fraud or error and are considered material if, individually or in the aggregate, they could reasonably be expected to influence the economic decisions of users taken on the basis of these consolidated and separate annual financial statements.
As part of an audit in accordance with ISAs, we exercise professional judgement and maintain professional scepticism throughout the audit. We also:
о Identify and assess the risks of material misstatement of the financial statements, whether due to fraud or error, design and perform audit procedures responsive to those risks, and obtain audit evidence that is sufficient and appropriate to provide a basis for our opinion. The risk of not detecting a material misstatement resulting from fraud is higher than for one resulting from error, as fraud may involve collusion, forgery, intentional omissions, misrepresentations, or the override of internal control.
о Obtain an understanding of internal control relevant to the audit in order to design audit procedures that are appropriate in the circumstances, but not for the purpose of expressing an opinion on the effectiveness of the company’s internal control.
о Evaluate the appropriateness of accounting policies used and the reasonableness of accounting estimates and related disclosures made by the directors
о Conclude on the appropriateness of the directors’ use of the going concern basis of accounting and based on the audit evidence obtained, whether a material uncertainty exists related to events or conditions that may cast significant doubt on the company’s ability to continue as a going concern. If we conclude that a material uncertainty exists, we are required to draw attention in our auditor’s report to the related disclosures in the financial statements or, if such disclosures are inadequate, to modify our opinion. Our conclusions are based on the audit evidence obtained up to the date of our auditor’s report. However, future events or conditions may cause the company to cease to continue as a going concern.

7GRINDROD BANK LIMITEDAnnual financial statements
о Evaluate the overall presentation, structure and content of the consolidated and separate annual financial statements, including the disclosures, and whether the consolidated and separate financial statements represent the underlying transactions and events in a manner that achieves fair presentation.
о Obtain sufficient appropriate audit evidence regarding the financial information of the entities or business activities within the Group to express an opinion on the consolidated and separate financial statements. We are responsible for the direction, supervision and performance of the Group audit. We remain solely responsible for our audit opinion.
We communicate with the directors regarding, among other matters, the planned scope and timing of the audit and significant audit findings, including any significant deficiencies in internal control that we identify during our audit.
We also provide the directors with a statement that we have complied with relevant ethical requirements regarding independence, and to communicate with them all relationships and other matters that may reasonably be thought to bear on our independence, and where applicable, related safeguards.
From the matters communicated with the directors, we determine those matters that were of most significance in the audit of the consolidated financial statements of the current period and are therefore the key audit matters. We describe these matters in our auditor’s report unless law or regulation precludes public disclosure about the matter or when, in extremely rare circumstances, we determine that a matter should not be communicated in our report because the adverse consequences of doing so would reasonably be expected to outweigh the public interest benefits of such communication.
Report on Other Legal and Regulatory RequirementsCapital adequacy requirementsAs at the years ended 31 December 2018 and December 2019, the Group had breached its minimum capital adequacy requirements, as per Section 70 of the Banks Act, No. 94 of 1990. Refer to Note 30 of the consolidated financial statements for disclosures applicable to this matter.
Audit tenureIn terms of the IRBA Rule published in Government Gazette Number 39475 dated 4 December 2015, we report that SizweNtsalubaGobodo Grant Thornton Inc. has been the auditor of the Group for one year.
SizweNtsalubaGobodo Grant Thornton Inc.Director: Alethia ChettyRegistered AuditorChartered Accountant (SA)
29 April 2020
20 Morris Street EastWoodmead
8 GRINDROD BANK LIMITEDAnnual financial statements
AUDIT AND COMPLIANCE COMMITTEE REPORTFor the year ended 31 December 2019
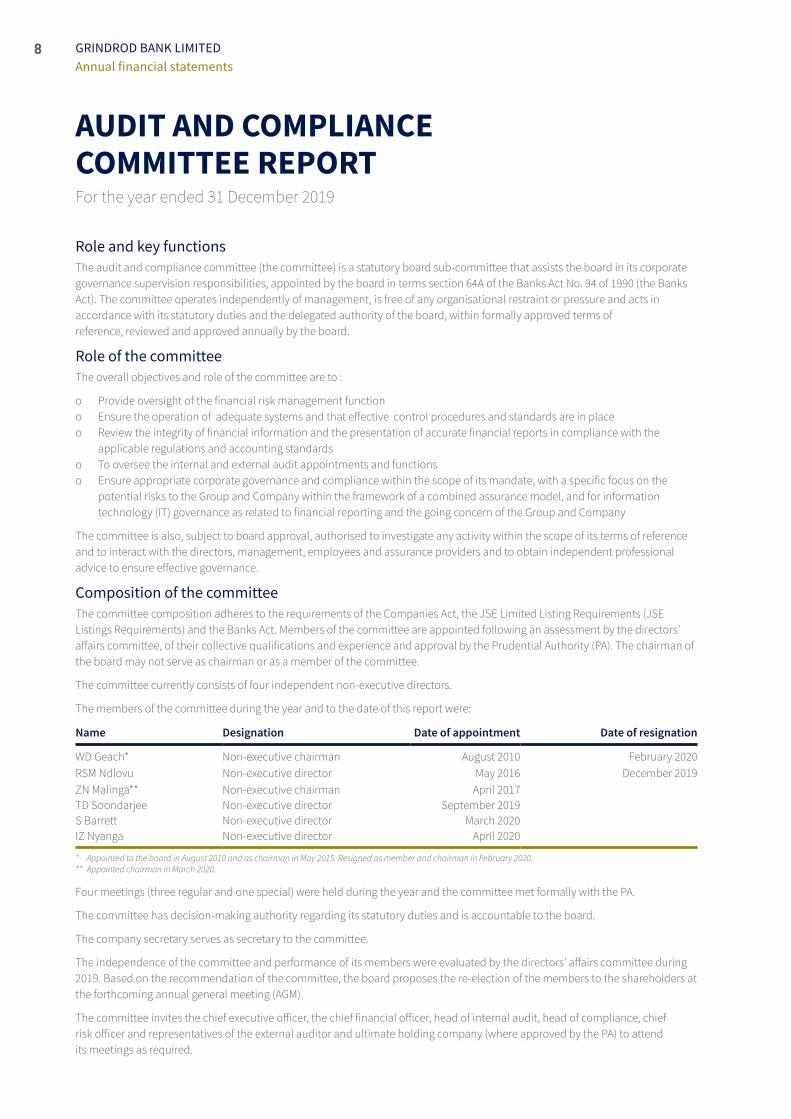
Role and key functionsThe audit and compliance committee (the committee) is a statutory board sub‑committee that assists the board in its corporate governance supervision responsibilities, appointed by the board in terms section 64A of the Banks Act No. 94 of 1990 (the Banks Act). The committee operates independently of management, is free of any organisational restraint or pressure and acts in accordance with its statutory duties and the delegated authority of the board, within formally approved terms of reference, reviewed and approved annually by the board.
Role of the committeeThe overall objectives and role of the committee are to :
о Provide oversight of the financial risk management function о Ensure the operation of adequate systems and that effective control procedures and standards are in place о Review the integrity of financial information and the presentation of accurate financial reports in compliance with the
applicable regulations and accounting standards о To oversee the internal and external audit appointments and functions о Ensure appropriate corporate governance and compliance within the scope of its mandate, with a specific focus on the
potential risks to the Group and Company within the framework of a combined assurance model, and for information technology (IT) governance as related to financial reporting and the going concern of the Group and Company
The committee is also, subject to board approval, authorised to investigate any activity within the scope of its terms of reference and to interact with the directors, management, employees and assurance providers and to obtain independent professional advice to ensure effective governance.
Composition of the committeeThe committee composition adheres to the requirements of the Companies Act, the JSE Limited Listing Requirements (JSE Listings Requirements) and the Banks Act. Members of the committee are appointed following an assessment by the directors’ affairs committee, of their collective qualifications and experience and approval by the Prudential Authority (PA). The chairman of the board may not serve as chairman or as a member of the committee.
The committee currently consists of four independent non‑executive directors.
The members of the committee during the year and to the date of this report were:
Name Designation Date of appointment Date of resignation
WD Geach* Non‑executive chairman August 2010 February 2020RSM Ndlovu Non‑executive director May 2016 December 2019ZN Malinga** Non‑executive chairman April 2017TD Soondarjee Non‑executive director September 2019S Barrett Non‑executive director March 2020IZ Nyanga Non‑executive director April 2020
* Appointed to the board in August 2010 and as chairman in May 2015. Resigned as member and chairman in February 2020.** Appointed chairman in March 2020.
Four meetings (three regular and one special) were held during the year and the committee met formally with the PA.
The committee has decision‑making authority regarding its statutory duties and is accountable to the board.
The company secretary serves as secretary to the committee.
The independence of the committee and performance of its members were evaluated by the directors’ affairs committee during 2019. Based on the recommendation of the committee, the board proposes the re‑election of the members to the shareholders at the forthcoming annual general meeting (AGM).
The committee invites the chief executive officer, the chief financial officer, head of internal audit, head of compliance, chief risk officer and representatives of the external auditor and ultimate holding company (where approved by the PA) to attend its meetings as required.
9GRINDROD BANK LIMITEDAnnual financial statements
The internal and external auditors have unrestricted access to the chairman and members of the committee. In 2019, the committee met with the internal and external auditors without management being present.
During the year, a new chief financial officer was appointed and the finance team was strengthened with the appointment of a head of finance. The committee has satisfied itself that the chief financial officer has the appropriate expertise and experience and that the finance function is effective. Plans are in place to further strengthen the regulatory function.
Key activitiesIn terms of its mandate, matters considered by the committee based on its annual work plan for 2019 included:
о Reviewing and recommending to the board publicly disclosed financial information о Reviewing the annual financial statements and results for the year ended 31 December 2019 in line with applicable legislative
and regulatory compliance and recommendation thereof for approval by the board о Reviewing the combined assurance model and the effectiveness of the process for identifying, assessing and reporting on
significant internal financial control and tax and fraud risks as related to financial reporting о Assessing the suitability, expertise and experience of the chief financial officer and the expertise, experience and resources of
the Group and Company’s finance function о Evaluation of the independence, effectiveness and performance of the internal audit function о Reviewing and approving the internal audit plan о Recommending the independent external auditor and designated audit partner and the approval of their terms of
engagement and fees for audit services, for approval by shareholders at the AGM о Reviewing the extent of non‑audit services provided by the independent external auditor and other auditors and the
approval of the related terms of engagement and fees о Reviewing the external auditor’s work plan, staffing, independence, effectiveness, audit findings, key audit risks and external
audit report о Reviewing legislative and statutory compliance within the scope of its mandate о Reviewing compliance with the Group and Company’s code of ethics and conduct о Reviewing IT risks and evaluation of audit assessments of IT‑related controls performed by the internal and external auditors
together with the appropriateness of actions taken by management to address key issues identified, and reporting on its findings to the risk and capital management committee
о Reviewing and confirming the going concern status о Approving its annual work plan for 2020 о Approving this committee report for presentation to the shareholders
External auditSNG Grant Thornton served as the Group and Company’s registered external auditor for the 2019 financial year following approval by the PA and replaced Deloitte in the 2019 financial year. The change to SNG Grant Thornton is due to early adoption of the mandatory audit firm rotation rule issued by the IRBA and is made in the interest of promoting transformation of the sector. The terms of engagement, independence, expertise, audit quality, objectivity and the appropriateness of key partners at SNG Grant Thornton as the external auditor are appraised by the committee, which includes an annual evaluation. The SNG Grant Thornton audit team includes relevant financial services experts.
In assessing the auditor’s independence, the committee considered guidance contained in King IV as well as IRBA publications and the JSE Listings Requirements and the related commentary thereon.
The committee is satisfied that the auditor does not, except as external auditor or in rendering permitted non‑audit services, receive any remuneration or other benefits from the Group and Company. External audit fees approved for the 2019 financial year to SNG Grant Thornton amounted to R3.3 million (2018: Rnil). No non‑audit services were performed.
Following review, the committee satisfied itself that the auditor’s independence was not prejudiced by any consultancy, advisory or other work undertaken or as a result of any previous appointment as auditor.
Key audit matters (KAM)The committee considered the key audit matters as reported by the external auditor as part of the SNG Grant Thornton audit report.
These matters are also key aspects considered by the committee as part of the year‑end reporting process in recommending the annual financial statements as well as the adequacy and effectiveness of internal controls to the board for approval and disclosure.
10 GRINDROD BANK LIMITEDAnnual financial statements
AUDIT AND COMPLIANCE COMMITTEE REPORT CONTINUEDFor the year ended 31 December 2019
KAM: credit impairment against advances and related IFRS 9 ECLThis is an area that is also reviewed by the credit risk committee. The committee considered whether the levels of provisioning and credit impairment were appropriate, noting a material increase in Stage 3 impairments year on year. Discussions were held with management and the credit risk committee to obtain comfort over the adequacy of Stage 1, 2 and 3 provisioning. The committee also had a specific discussion with the external auditors in order to satisfy itself in this regard.
KAM: control assessment of underlying investment structures under IFRS 10 The committee obtained an understanding of the underlying investment structure, including its nature and purpose. The committee also reviewed and assessed management’s assessment of the investment structures in terms of IFRS 10. The judgements applied by management were discussed at great length in order for the committee to satisfy itself as to the reasonableness of management’s assessment. The committee also had a specific discussion with the external auditor in order to satisfy itself in this regard.
KAM: assessment of the application of the principles of IFRS 13The Group engaged the services of an external expert to assist in the valuation of its loans and advances portfolio to ensure compliance with IFRS 13. The committee satisfied itself as to the appropriateness of the skills and experience of the expert engaged. The committee is satisfied with the outcome of the resulting valuation. The committee also had a specific discussion with the external auditors in order to satisfy itself in this regard.
Prior period errorsThe committee notes the restatement of comparative information which arose mainly due to the incorrect application of IFRS 9, IFRS 10 and IFRS 13 in prior years. Refer to note 40 for further detail.
Key focus areas for the 2020 financial yearIn addition to the standard audit committee workplan, the committee has identified the following as key focus areas for the 2020 financial year:
о Further strengthen the finance function with a focus on regulatory reporting and accounting technical skills о Improve audit committee supervision on the Group’s regulatory reporting о Review development and implementation of the Group’s tax strategy о Enhance the combined assurance model
Annual financial statementsFollowing the committee’s review of the annual financial statements for the year ended 31 December 2019, it is of the opinion that, in all material respects, they comply with the relevant provisions of the Companies Act, Banks Act, JSE Listings Requirements and IFRS as issued by the International Accounting Standards Board (IASB), and fairly present the results of operations, cash flows and the financial position of the Group and Company.
Based on the results of the internal audit review of the Group’s internal controls, no material weaknesses were identified to indicate that the internal financial controls were not operating effectively.
On this basis, the committee recommended that the board approves the annual financial statements of the Group and Company for the year ended 31 December 2019.
Zola MalingaAudit and compliance committee chairman
29 April 2020
11GRINDROD BANK LIMITEDAnnual financial statements
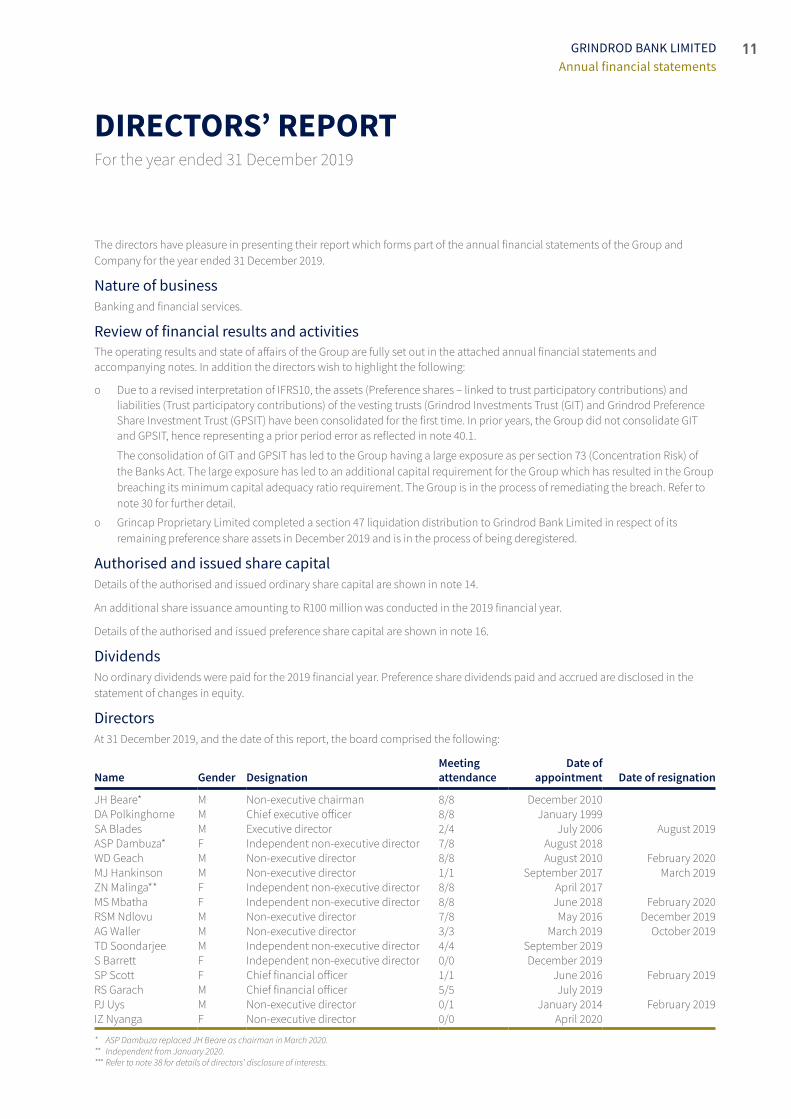
DIRECTORS’ REPORTFor the year ended 31 December 2019
The directors have pleasure in presenting their report which forms part of the annual financial statements of the Group and Company for the year ended 31 December 2019.
Nature of businessBanking and financial services.
Review of financial results and activitiesThe operating results and state of affairs of the Group are fully set out in the attached annual financial statements and accompanying notes. In addition the directors wish to highlight the following:
о Due to a revised interpretation of IFRS10, the assets (Preference shares – linked to trust participatory contributions) and liabilities (Trust participatory contributions) of the vesting trusts (Grindrod Investments Trust (GIT) and Grindrod Preference Share Investment Trust (GPSIT) have been consolidated for the first time. In prior years, the Group did not consolidate GIT and GPSIT, hence representing a prior period error as reflected in note 40.1.
The consolidation of GIT and GPSIT has led to the Group having a large exposure as per section 73 (Concentration Risk) of the Banks Act. The large exposure has led to an additional capital requirement for the Group which has resulted in the Group breaching its minimum capital adequacy ratio requirement. The Group is in the process of remediating the breach. Refer to note 30 for further detail.
о Grincap Proprietary Limited completed a section 47 liquidation distribution to Grindrod Bank Limited in respect of its remaining preference share assets in December 2019 and is in the process of being deregistered.
Authorised and issued share capitalDetails of the authorised and issued ordinary share capital are shown in note 14.
An additional share issuance amounting to R100 million was conducted in the 2019 financial year.
Details of the authorised and issued preference share capital are shown in note 16.
DividendsNo ordinary dividends were paid for the 2019 financial year. Preference share dividends paid and accrued are disclosed in the statement of changes in equity.
DirectorsAt 31 December 2019, and the date of this report, the board comprised the following:
Name Gender DesignationMeeting attendance
Date of appointment Date of resignation
JH Beare* M Non‑executive chairman 8/8 December 2010DA Polkinghorne M Chief executive officer 8/8 January 1999SA Blades M Executive director 2/4 July 2006 August 2019ASP Dambuza* F Independent non‑executive director 7/8 August 2018WD Geach M Non‑executive director 8/8 August 2010 February 2020MJ Hankinson M Non‑executive director 1/1 September 2017 March 2019ZN Malinga** F Independent non‑executive director 8/8 April 2017MS Mbatha F Independent non‑executive director 8/8 June 2018 February 2020RSM Ndlovu M Non‑executive director 7/8 May 2016 December 2019AG Waller M Non‑executive director 3/3 March 2019 October 2019TD Soondarjee M Independent non‑executive director 4/4 September 2019S Barrett F Independent non‑executive director 0/0 December 2019SP Scott F Chief financial officer 1/1 June 2016 February 2019RS Garach M Chief financial officer 5/5 July 2019PJ Uys M Non‑executive director 0/1 January 2014 February 2019IZ Nyanga F Non‑executive director 0/0 April 2020
* ASP Dambuza replaced JH Beare as chairman in March 2020.** Independent from January 2020.*** Refer to note 38 for details of directors’ disclosure of interests.
12 GRINDROD BANK LIMITEDAnnual financial statements
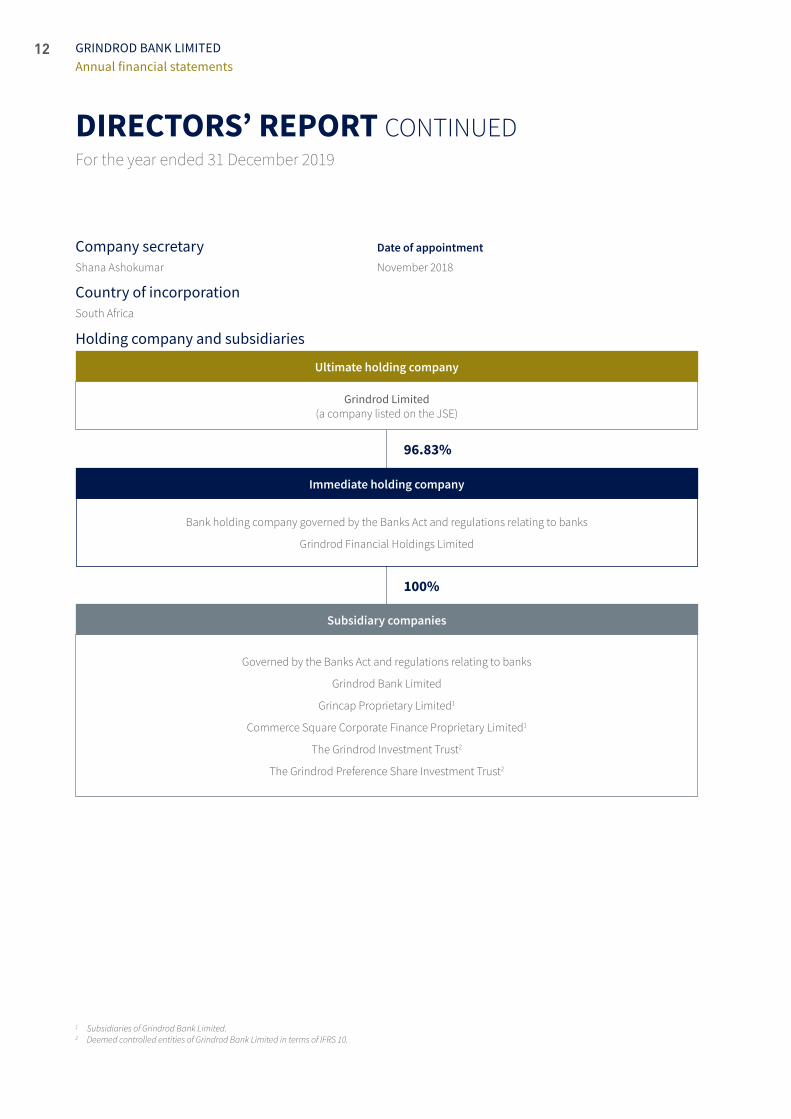
Company secretary Date of appointment
Shana Ashokumar November 2018
Country of incorporationSouth Africa
Holding company and subsidiaries
Ultimate holding company
Grindrod Limited(a company listed on the JSE)
Subsidiary companies
Governed by the Banks Act and regulations relating to banks
Grindrod Bank Limited
Grincap Proprietary Limited1
Commerce Square Corporate Finance Proprietary Limited1
The Grindrod Investment Trust2
The Grindrod Preference Share Investment Trust2
Immediate holding company
Bank holding company governed by the Banks Act and regulations relating to banks
Grindrod Financial Holdings Limited
96.83%
100%
DIRECTORS’ REPORT CONTINUEDFor the year ended 31 December 2019
1 Subsidiaries of Grindrod Bank Limited.2 Deemed controlled entities of Grindrod Bank Limited in terms of IFRS 10.

13GRINDROD BANK LIMITEDAnnual financial statements
Going concernIt is anticipated that the COVID‑19 pandemic may impact the Group’s/Company’s profitability for the year ending 31 December 2020. It is, however, not possible to make an accurate estimate of its full financial effect for the year ahead as the virus’s infection rate and impact on macro‑economic conditions are fluid.
The directors have assessed the business risks and financial forecasts of the Group and Company and have no reason to believe the business will not continue as a going concern in the year ahead.
Subsequent eventsThe directors are not aware of any matter or circumstance, other than as disclosed in note 39, arising since the end of the financial year that has a material impact on the annual financial statements.
Committee meetingsThe financial director of the Grindrod Limited, Xolani Mbambo, has been given approval by the PA to attend the committee meetings listed below:
о Credit risk committee о Asset and liability committee о Audit and compliance committee о Risk and capital management committee о Social and ethics committee
AuditorSNG Grant Thornton.
Preparer of annual financial statementsBrendon James, head of finance, under the supervision of Rakesh Garach (chief financial officer).
Registered office5 Arundel Close, Kingsmead Office Park, Durban, 4001.

14 GRINDROD BANK LIMITEDAnnual financial statements
STATEMENT OF FINANCIAL POSITIONAt 31 December 2019
Consolidated Company
Notes
31 December2019 R000
31 December2018
RestatedR000*
1 January 2018
Restated R000*
31 December2019 R000
31 December2018
Restated* R000
1 January2018
Restated*R000
AssetsIntangible assets 7 – – 12 – – 12Property and equipment 8 18 031 6 513 10 138 18 031 6 513 10 138Investment securities 9 9 177 – – 9 177 – –Deferred taxation 17 24 947 – – 24 947 – –Loans and advances 10 7 416 453 7 666 062 7 129 002 7 416 453 7 220 113 6 823 172Preference shares – linked to trust participatory contributions 21 1 727 444 1 391 000 1 691 000 – – –Other assets 11 94 071 154 371 117 264 79 853 175 058 119 276Liquid assets and short‑term negotiable securities 12 2 478 941 2 825 285 1 730 384 2 482 109 2 903 491 1 830 228Cash and short‑term funds 13 3 572 496 2 238 791 7 653 107 3 572 496 2 238 791 7 653 107
Total assets 15 341 560 14 282 022 18 330 907 13 603 066 12 543 966 16 435 933
Equity and liabilitiesOrdinary share capital 14 650 650 650 650 650 650Ordinary share premium 15 347 929 247 929 247 929 347 929 247 929 247 929Preference share capital 16 285 000 285 000 285 000 285 000 285 000 285 000Distributable reserves 921 631 847 832 685 540 921 631 847 832 685 540
Total equity 1 555 210 1 381 411 1 219 119 1 555 210 1 381 411 1 219 119
Deposits and funding instruments 18 11 957 109 11 020 486 15 071 965 11 965 170 11 027 182 15 079 824Derivative instruments 19 22 249 7 911 18 939 22 249 7 911 18 939Provisions 20.1 28 201 71 130 65 443 28 201 71 130 65 443Other liabilities 20.2 54 309 82 022 53 225 32 030 51 394 41 851Trust participatory contributions 21 1 724 276 1 714 124 1 891 459 – – –Taxation 206 – 3 952 206 – 3 952Deferred taxation 17 – 4 938 6 805 – 4 938 6 805
Total equity and liabilities 15 341 560 14 282 022 18 330 907 13 603 066 12 543 966 16 435 933
* Refer to note 40.
15GRINDROD BANK LIMITEDAnnual financial statements
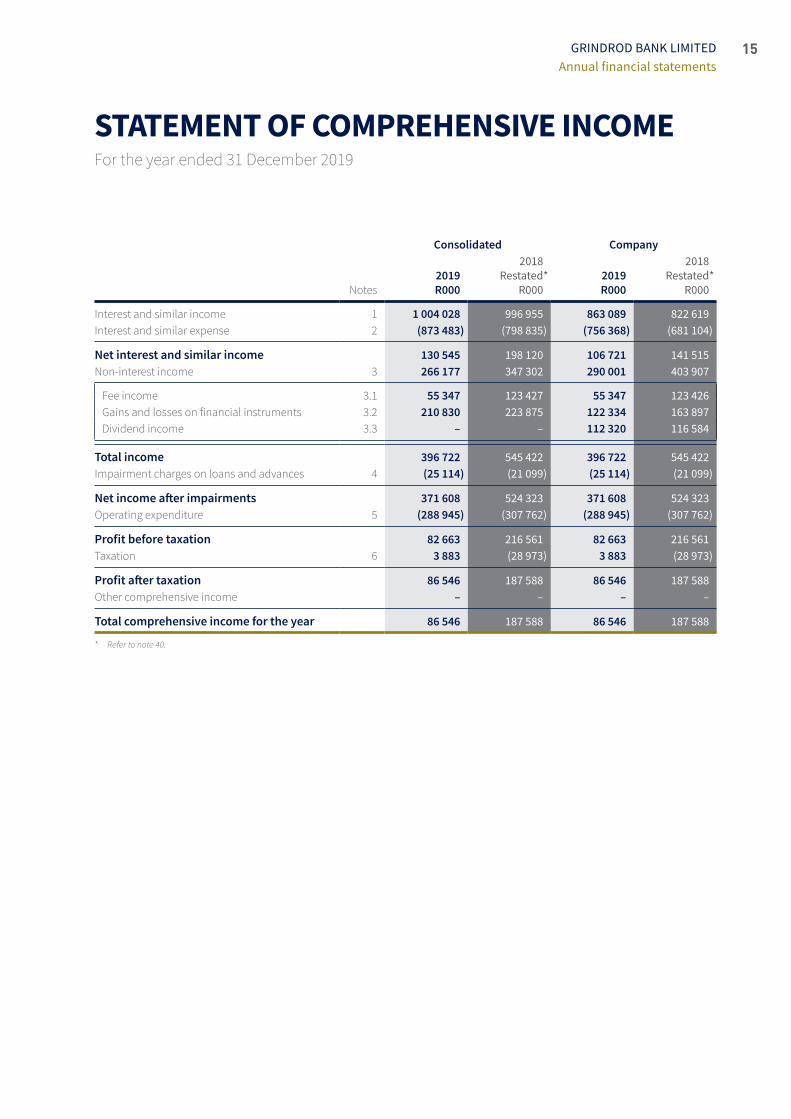
STATEMENT OF COMPREHENSIVE INCOMEFor the year ended 31 December 2019
Consolidated Company
Notes 2019 R000
2018Restated*
R000 2019 R000
2018Restated*
R000
Interest and similar income 1 1 004 028 996 955 863 089 822 619 Interest and similar expense 2 (873 483) (798 835) (756 368) (681 104)
Net interest and similar income 130 545 198 120 106 721 141 515 Non‑interest income 3 266 177 347 302 290 001 403 907
Fee income 3.1 55 347 123 427 55 347 123 426Gains and losses on financial instruments 3.2 210 830 223 875 122 334 163 897Dividend income 3.3 – – 112 320 116 584
Total income 396 722 545 422 396 722 545 422Impairment charges on loans and advances 4 (25 114) (21 099) (25 114) (21 099)
Net income after impairments 371 608 524 323 371 608 524 323 Operating expenditure 5 (288 945) (307 762) (288 945) (307 762)
Profit before taxation 82 663 216 561 82 663 216 561 Taxation 6 3 883 (28 973) 3 883 (28 973)
Profit after taxation 86 546 187 588 86 546 187 588 Other comprehensive income – – – –
Total comprehensive income for the year 86 546 187 588 86 546 187 588
* Refer to note 40.
16 GRINDROD BANK LIMITEDAnnual financial statements
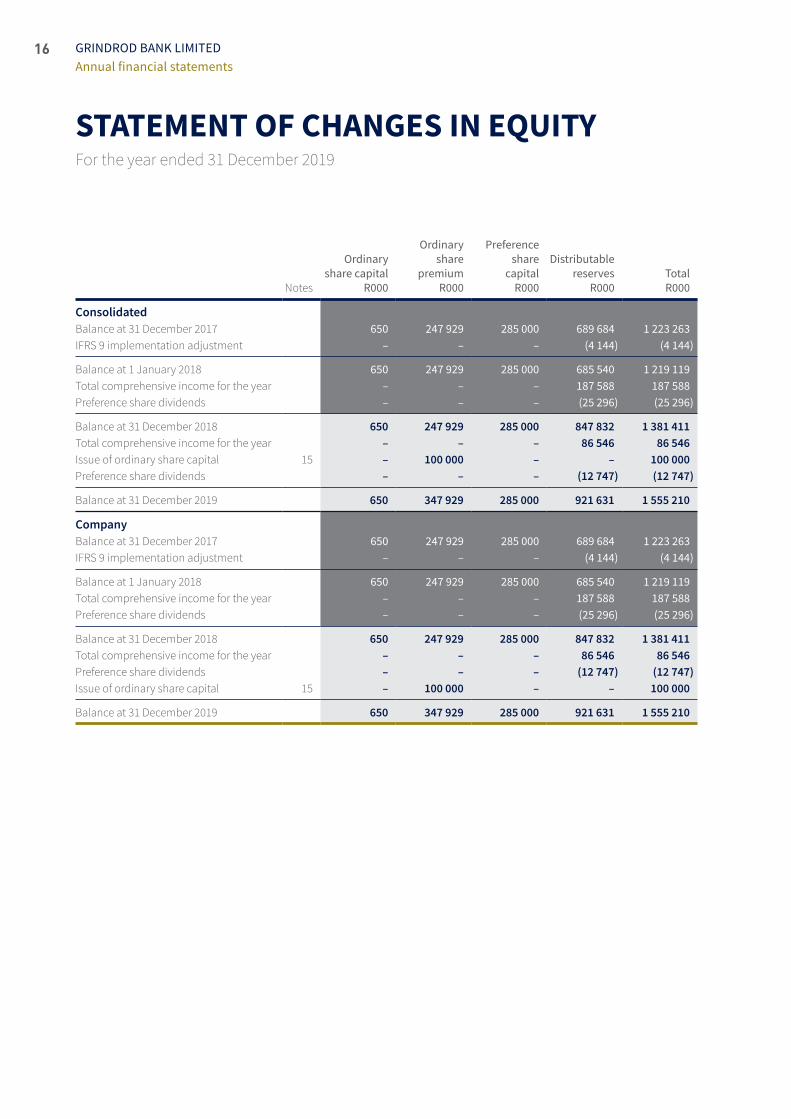
STATEMENT OF CHANGES IN EQUITYFor the year ended 31 December 2019
Notes
Ordinary share capital
R000
Ordinary share
premium R000
Preference share
capital R000
Distributable reserves
R000 Total R000
ConsolidatedBalance at 31 December 2017 650 247 929 285 000 689 684 1 223 263 IFRS 9 implementation adjustment – – – (4 144) (4 144)
Balance at 1 January 2018 650 247 929 285 000 685 540 1 219 119 Total comprehensive income for the year – – – 187 588 187 588 Preference share dividends – – – (25 296) (25 296)
Balance at 31 December 2018 650 247 929 285 000 847 832 1 381 411 Total comprehensive income for the year – – – 86 546 86 546Issue of ordinary share capital 15 – 100 000 – – 100 000 Preference share dividends – – – (12 747) (12 747)
Balance at 31 December 2019 650 347 929 285 000 921 631 1 555 210
Company Balance at 31 December 2017 650 247 929 285 000 689 684 1 223 263 IFRS 9 implementation adjustment – – – (4 144) (4 144)
Balance at 1 January 2018 650 247 929 285 000 685 540 1 219 119 Total comprehensive income for the year – – – 187 588 187 588 Preference share dividends – – – (25 296) (25 296)
Balance at 31 December 2018 650 247 929 285 000 847 832 1 381 411 Total comprehensive income for the year – – – 86 546 86 546Preference share dividends – – – (12 747) (12 747)Issue of ordinary share capital 15 – 100 000 – – 100 000
Balance at 31 December 2019 650 347 929 285 000 921 631 1 555 210

17GRINDROD BANK LIMITEDAnnual financial statements
STATEMENT OF CASH FLOWSFor the year ended 31 December 2019
Consolidated Company
Notes 2019 R000
2018Restated*
R000 2019R000
2018Restated*
R000
Cash flows from operating activitiesCash receipts from customers 1 323 643 1 448 904 1 307 642 1 390 109Cash paid to customers, employees and suppliers (1 172 509) (991 000) (1 113 255) (970 133)
Cash generated from operations 35 151 134 457 904 194 387 419 976(Increase)/decrease in operating assets:Loans and advances to customers 176 103 (786 580) (269 845) (646 461)(Purchase)/sale of preference shares linked to trust participatory contributions (336 444) 300 000 – –Deposits held for regulatory purposes 55 562 (224 199) 55 562 (224 199)Other short‑term negotiable securities 346 344 (893 969) 421 382 (872 331)Increase/(decrease) in operating liabilities:Deposits from customers 936 623 (4 051 479) 937 988 (4 052 642)Raising/(redemption) of trust participatory contributions 10 152 (177 335) – –Dividends paid – preference shares (12 747) (23 436) (12 747) (23 436)Normal tax paid (22 213) (36 764) (22 213) (36 764)
Net cash inflow/(outflow) from operating activities 1 304 514 (5 435 858) 1 304 514 (5 435 857)Cash flows from investing activitiesPurchase of property and equipment (2 042) (1 725) (2 042) (1 726)Acquisition of investment securities (524) – (524) –Cash flows from financing activitiesIssue of ordinary share capital 100 000 – 100 000 –Lease instalments 36.2 (12 681) – (12 681) –
Net increase/(decrease) in cash and cash equivalents 1 389 267 (5 437 583) 1 389 267 (5 437 583)Cash and cash equivalents at the beginning of the year 1 974 431 7 412 014 1 974 431 7 412 014
Cash and cash equivalents at the end of the year 36.1 3 363 698 1 974 431 3 363 698 1 974 431
* Refer to note 40.
18 GRINDROD BANK LIMITEDAnnual financial statements
ACCOUNTING POLICIES For the year ended 31 December 2019
Basis of preparationThe separate/consolidated annual financial statements of the Company/Group are prepared in accordance with IFRS, the SAICA Financial Reporting Guides as issued by the Accounting Practices Committee and Financial Pronouncements as issued by the Financial Reporting Standards Council, the JSE Debt Listings Requirements and the Companies Act and have been prepared using the going concern principle and on the historical cost basis except for the revaluation of certain financial instruments. All monetary information and figures in the annual financial statements are presented in R000s.
Recent accounting developmentsAt the date of authorisation of these financial statements, several new, but not yet effective standards and amendments to existing standards and Interpretations have been published by the IASB. None of these standards or amendments to existing standards have been early adopted by the Group/Company.
Management anticipates that all relevant pronouncements will be adopted for the first period beginning on or after the effective date of the pronouncements. New standards, amendments and interpretations not adopted in the current year have not been disclosed as they are not expected to have a material impact on the Group’s financial statements.
Application of new IFRSIn the current year, the Group/Company has applied IFRS 16 issued by the IASB that are mandatorily effective for an accounting period that begins on or after 1 January 2019. The impact of the application of the new standard is detailed below.
IFRS 16 LeasesIFRS 16 introduces new or amended requirements with respect to lease accounting. It introduces significant changes to lessee accounting by removing the distinction between operating and finance leases and requiring the recognition of a right‑of‑use asset and lease liability at commencement for all leases, except for short‑term leases and leases of low‑value assets. The Group has applied IFRS 16 using the modified retrospective approach. For contracts in place at the date of initial application, the Company/Group has elected to apply the definition of a lease from IAS 17 and has not applied IFRS 16 to arrangements that were previously not identified as a lease under IAS 17. The Company/Group has elected not to include initial direct costs in the measurement of the right‑of‑use asset for operating leases in existence at the date of initial application of IFRS 16, being 1 January 2019. Applying IFRS 16 for all leases, the Company/Group:
о Recognises right‑of‑use assets and lease liabilities in the separate/consolidated statement of financial position, initially measured at the present value of the future lease payments
о Recognises depreciation of right‑of‑use assets and interest on lease liabilities in profit and loss.
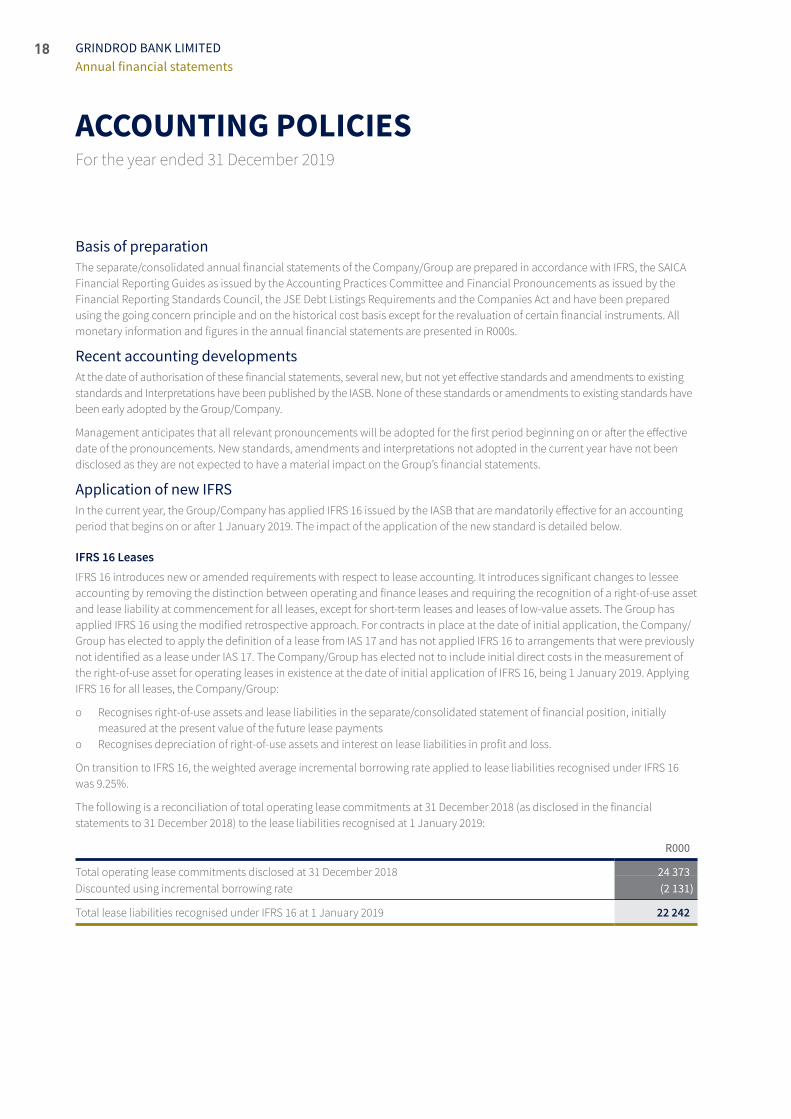
On transition to IFRS 16, the weighted average incremental borrowing rate applied to lease liabilities recognised under IFRS 16 was 9.25%.
The following is a reconciliation of total operating lease commitments at 31 December 2018 (as disclosed in the financial statements to 31 December 2018) to the lease liabilities recognised at 1 January 2019:
R000
Total operating lease commitments disclosed at 31 December 2018 24 373Discounted using incremental borrowing rate (2 131)
Total lease liabilities recognised under IFRS 16 at 1 January 2019 22 242
19GRINDROD BANK LIMITEDAnnual financial statements
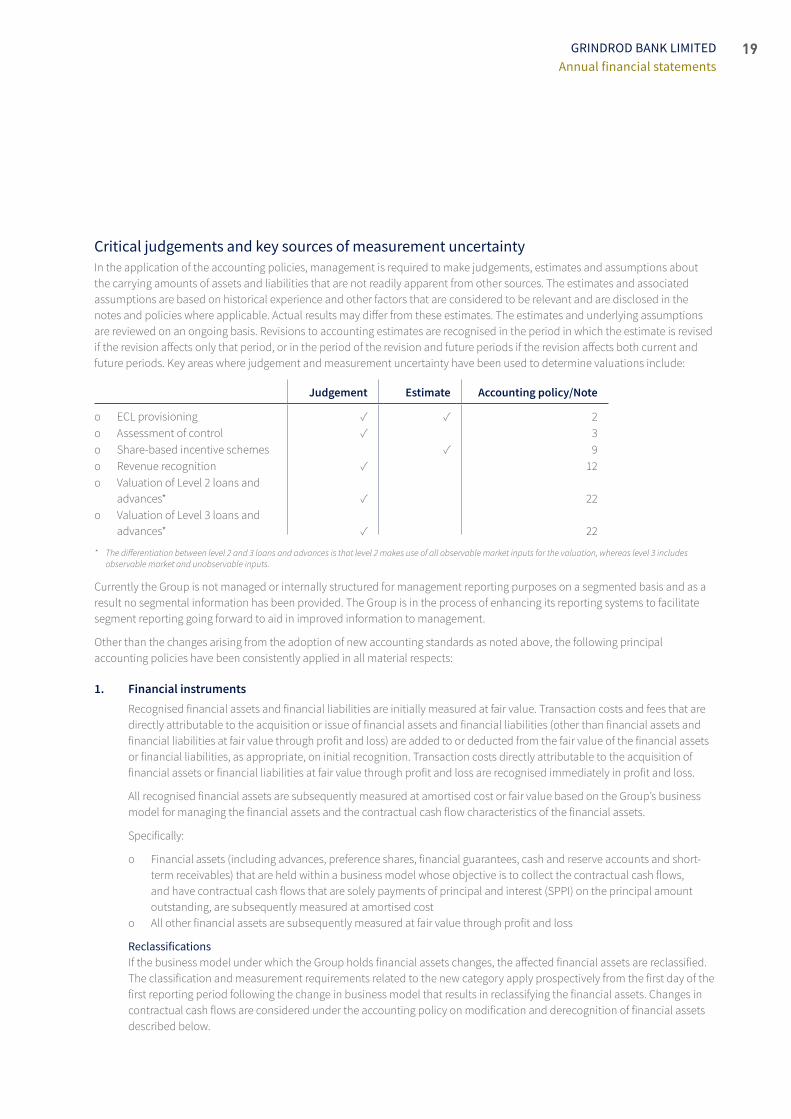
Critical judgements and key sources of measurement uncertaintyIn the application of the accounting policies, management is required to make judgements, estimates and assumptions about the carrying amounts of assets and liabilities that are not readily apparent from other sources. The estimates and associated assumptions are based on historical experience and other factors that are considered to be relevant and are disclosed in the notes and policies where applicable. Actual results may differ from these estimates. The estimates and underlying assumptions are reviewed on an ongoing basis. Revisions to accounting estimates are recognised in the period in which the estimate is revised if the revision affects only that period, or in the period of the revision and future periods if the revision affects both current and future periods. Key areas where judgement and measurement uncertainty have been used to determine valuations include:
Judgement Estimate Accounting policy/Note
о ECL provisioning ✓ ✓ 2 о Assessment of control ✓ 3 о Share‑based incentive schemes ✓ 9 о Revenue recognition ✓ 12 о Valuation of Level 2 loans and
advances* ✓ 22 о Valuation of Level 3 loans and
advances* ✓ 22
* The differentiation between level 2 and 3 loans and advances is that level 2 makes use of all observable market inputs for the valuation, whereas level 3 includes observable market and unobservable inputs.
Currently the Group is not managed or internally structured for management reporting purposes on a segmented basis and as a result no segmental information has been provided. The Group is in the process of enhancing its reporting systems to facilitate segment reporting going forward to aid in improved information to management.
Other than the changes arising from the adoption of new accounting standards as noted above, the following principal accounting policies have been consistently applied in all material respects:
1. Financial instrumentsRecognised financial assets and financial liabilities are initially measured at fair value. Transaction costs and fees that are directly attributable to the acquisition or issue of financial assets and financial liabilities (other than financial assets and financial liabilities at fair value through profit and loss) are added to or deducted from the fair value of the financial assets or financial liabilities, as appropriate, on initial recognition. Transaction costs directly attributable to the acquisition of financial assets or financial liabilities at fair value through profit and loss are recognised immediately in profit and loss.
All recognised financial assets are subsequently measured at amortised cost or fair value based on the Group’s business model for managing the financial assets and the contractual cash flow characteristics of the financial assets.
Specifically:
о Financial assets (including advances, preference shares, financial guarantees, cash and reserve accounts and short‑term receivables) that are held within a business model whose objective is to collect the contractual cash flows, and have contractual cash flows that are solely payments of principal and interest (SPPI) on the principal amount outstanding, are subsequently measured at amortised cost
о All other financial assets are subsequently measured at fair value through profit and loss
ReclassificationsIf the business model under which the Group holds financial assets changes, the affected financial assets are reclassified. The classification and measurement requirements related to the new category apply prospectively from the first day of the first reporting period following the change in business model that results in reclassifying the financial assets. Changes in contractual cash flows are considered under the accounting policy on modification and derecognition of financial assets described below.
20
ACCOUNTING POLICIES CONTINUEDFor the year ended 31 December 2019
GRINDROD BANK LIMITEDAnnual financial statements
1. Financial instruments continued Loans and advances Initial measurement
Trade receivables, loans and other receivables that have fixed or determinable payments which are not quoted in an active market are classified as loans and advances. Loans and advances are recognised at fair value at origination of the loan.
Loan origination fees that form an integral part of the loan are capitalised and recognised as an adjustment to the effective interest rate over the life of the loan.
Subsequent measurementFixed rate advances: the Group has irrevocably decided to hold fixed rate loans at fair value through profit and loss. The Group enters into interest rate swap agreements to economically hedge its fixed rate loans. Therefore, as the Group has used these instruments as hedging tools, it has chosen to recognise fixed rate loans at their fair value. The Group does not apply hedge accounting.
Variable rate advances are held at amortised cost as the business model is to hold the assets for the collection of contractual cash flows. These advances’ contractual cash flows represent SPPI.
Special revenue arrangements: there are certain advances that have additional revenue arrangements attached to them in terms of which the Group is entitled to a fee or dividend derived from specified asset values upon facility expiry or upon early settlement due to realisation of the specified asset. Where such loans meet the SPPI test they are classified as held at amortised cost and where they fail the SPPI test they are classified as held at fair value through profit and loss.
ModificationThe Group is sometimes required to modify the terms of advances provided to customers. When the modification is not substantial it does not result in derecognition of the original asset. Gains/losses on modifications are recognised in profit and loss. The risk of default of such advances after modification is assessed at the reporting date and compared with the risk under the original terms at initial recognition.
Renegotiated termsChanges to credit risk of a borrower resulting in renegotiation of key terms of the advance (interest rate, repayment terms or expiry date) are treated as a derecognition of the advance, and a recognition of a new advance, as any changes to existing advances are subject to a new credit assessment, scoring and approval.
DerecognitionLoans and advances are only derecognised when the balance is repaid or renegotiated, as there is no longer a right to contractual cash flows, or if an advance is written off.
Other receivables Initial measurement
Sundry debtors: These are recognised at transaction price as this represents the fair value. There is no significant financing component, given the receivables are short term in nature.
Fees from the other business units (Retail, Treasury, Corporate Finance and General Bank) are recognised at their transaction price. These fees are not integral to a loan as they are for compensation for services performed and are recognised as the service is performed in accordance with the requirements of IFRS 15. Refer accounting policy 12 for further detail.
Subsequent measurementSundry debtors are subsequently measured at amortised cost using the effective interest rate method.
Cash and cash equivalentsCash and cash equivalents consist of money held with the South African Reserve Bank (SARB) and funds held with other South African banks and financial institutions.
Initial measurementCash and cash equivalents at fair value.
Subsequent measurementCash and cash equivalents are subsequently measured at amortised cost using the effective interest rate method.

21GRINDROD BANK LIMITEDAnnual financial statements
Preference share investmentsPreference share investments consist of investments held in various preference shares that accrue dividends. The Group primarily holds these investments in order to collect the contractual cash flows in the form of dividends and the principal amount initially invested. In certain instances, the preference share investments include an embedded profit share.
Initial measurementPreference share investments are recognised at fair value on the date of the investment.
Subsequent measurementPreference share investments are held at amortised cost using the effective interest rate method as these assets are held to collect contractual cash flows in the form of dividends receivable and the contractual principal originally invested. If there is an embedded profit share within the preference share, this is held at fair value through profit and loss.
DerecognitionPreference share investments are derecognised once the investment has matured and the capital repaid.
Financial liabilitiesFinancial liabilities include deposits and funding instruments, interest rate swaps, trust participatory contributions, accounts payable and sundry creditors.
Initial measurementAll financial liabilities are recognised at fair value of the financial liability.
Subsequent measurementAll financial liabilities, with the exception of interest rate swaps, are classified and measured at amortised cost.
The Group measures the interest rate swaps at their fair value as the interest rate swap agreements are linked to a market‑related reference rate.
DerecognitionFinancial liabilities are derecognised only when the obligation specified in the contract is discharged, cancelled or expires.
Derivative instrumentsIt is not the policy of the Group to trade in derivative instruments. Derivative instruments are held either in terms of asset and liability management strategies, defined as economic hedging activities, or on a back to back basis. Derivative instruments are originally recorded at fair value and remeasured to fair value through profit and loss using market prices at each subsequent reporting date. Typically derivative instruments include interest rate swaps.
2. Loans and advances – ECLA financial asset that is not credit impaired on initial recognition is classified in Stage 1 and has its credit risk continuously monitored by the Group. If a SICR since initial recognition is identified, the financial instrument is moved to Stage 2 but is not yet deemed to be credit impaired (unless an event of default has occurred). Refer below for key considerations by the Group in determining when a significant increase in credit risk has occurred.
If the financial instrument is credit impaired, the financial instrument is then moved to Stage 3. An advance is credit impaired when one or more events that have a detrimental impact on the estimated future cash flows have occurred. Evidence of credit impairment includes observable data that typically indicates one or more of the following:
о Acts of insolvency (liquidation/business rescue proceedings) о Significant financial difficulty of the borrower о A default event, which typically includes non‑repayment according to contractual terms
Financial assets in Stage 1 have their ECL measured at an amount equal to the portion of lifetime ECLs that result from default events possible within the next 12 months. Financial assets in Stages 2 or 3 have their ECL measured based on ECLs that result from default events that may arise on a remaining lifetime basis.
22
ACCOUNTING POLICIES CONTINUEDFor the year ended 31 December 2019
GRINDROD BANK LIMITEDAnnual financial statements
2. Loans and advances – ECL continued
Financial guarantee contracts have their ECL measured based on the same basis as loans and advances and are disclosed in note 10 of the annual financial statements.
The Group measures credit risk of advances using assumptions with regards to PD, LGD and EAD on an individual loan by loan basis. Refer below for more information regarding inputs, assumptions and estimation techniques, which have been applied consistently throughout the reporting period.
Collateral valuationCollateral is measured at fair value at inception of the loan or advance and the valuation is reviewed periodically depending on the collateral type. Collateral held against Stage 2 loans and advances is reviewed when a SICR since initial recognition is identified and collateral held against Stage 3 loans and advances is monitored on an ongoing basis.
SICR Qualitativeconsiderations
о Facility is in arrears о Classification and appearance on watch list о Significant changes in value of collateral
CuringDue to the nature of the Group’s clients and composition of the loan book, clients are placed under managed accounts once default occurs or if any evidence comes to light affecting the recovery of the loan. When a loan cures it ceases to be classified as a managed account once the relevant period passes, being three consecutive payments paid on or before the due date. If a redefault happens to occur, the above process is once again followed.
Period of exposureThe period of exposure used in this model for all types of facilities is the expiry date of the facility granted. This is deemed appropriate for the Group’s loan book since behavioural patterns of individual facilities cannot consistently reflect the average behavioural patterns across products. For example, overdrafts can be used for various purposes which include bridging facilities, working capital, purchase of share portfolios, etc. As such, the probability that the facility will be renewed varies significantly across the loan book. Furthermore, no open‑ended rolling facilities are granted. All facilities are granted with a defined expiry date and with no guarantee of renewal. Renewals are subject to the normal credit evaluation process.
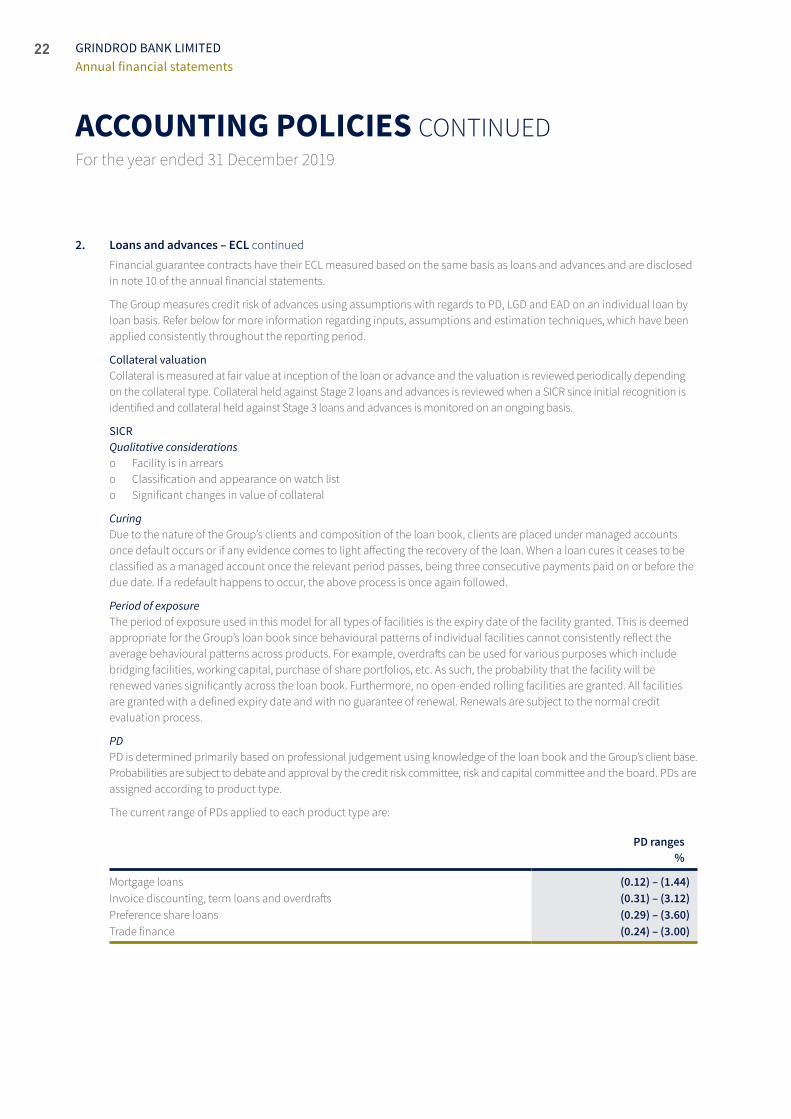
PDPD is determined primarily based on professional judgement using knowledge of the loan book and the Group’s client base. Probabilities are subject to debate and approval by the credit risk committee, risk and capital committee and the board. PDs are assigned according to product type.
The current range of PDs applied to each product type are:
PD ranges %
Mortgage loans (0.12) – (1.44)Invoice discounting, term loans and overdrafts (0.31) – (3.12)Preference share loans (0.29) – (3.60)Trade finance (0.24) – (3.00)
23GRINDROD BANK LIMITEDAnnual financial statements
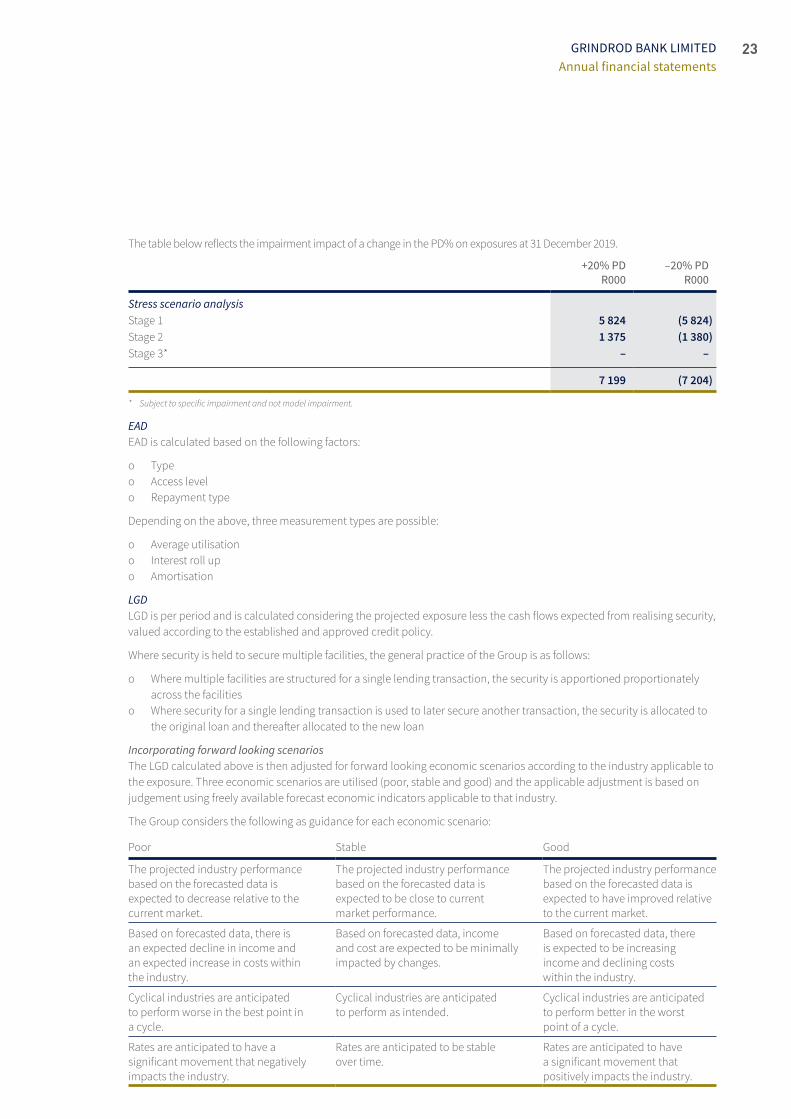
The table below reflects the impairment impact of a change in the PD% on exposures at 31 December 2019.
+20% PDR000
–20% PDR000
StressscenarioanalysisStage 1 5 824 (5 824)Stage 2 1 375 (1 380)Stage 3* – –
7 199 (7 204)
* Subject to specific impairment and not model impairment.
EADEAD is calculated based on the following factors:
о Type о Access level о Repayment type
Depending on the above, three measurement types are possible:
о Average utilisation о Interest roll up о Amortisation
LGDLGD is per period and is calculated considering the projected exposure less the cash flows expected from realising security, valued according to the established and approved credit policy.
Where security is held to secure multiple facilities, the general practice of the Group is as follows:
о Where multiple facilities are structured for a single lending transaction, the security is apportioned proportionately across the facilities
о Where security for a single lending transaction is used to later secure another transaction, the security is allocated to the original loan and thereafter allocated to the new loan
IncorporatingforwardlookingscenariosThe LGD calculated above is then adjusted for forward looking economic scenarios according to the industry applicable to the exposure. Three economic scenarios are utilised (poor, stable and good) and the applicable adjustment is based on judgement using freely available forecast economic indicators applicable to that industry.
The Group considers the following as guidance for each economic scenario:
Poor Stable Good
The projected industry performance based on the forecasted data is expected to decrease relative to the current market.
The projected industry performance based on the forecasted data is expected to be close to current market performance.
The projected industry performance based on the forecasted data is expected to have improved relative to the current market.
Based on forecasted data, there is an expected decline in income and an expected increase in costs within the industry.
Based on forecasted data, income and cost are expected to be minimally impacted by changes.
Based on forecasted data, there is expected to be increasing income and declining costs within the industry.
Cyclical industries are anticipated to perform worse in the best point in a cycle.
Cyclical industries are anticipated to perform as intended.
Cyclical industries are anticipated to perform better in the worst point of a cycle.
Rates are anticipated to have a significant movement that negatively impacts the industry.
Rates are anticipated to be stable over time.
Rates are anticipated to have a significant movement that positively impacts the industry.

24
ACCOUNTING POLICIES CONTINUEDFor the year ended 31 December 2019
GRINDROD BANK LIMITEDAnnual financial statements
2. Loans and advances – ECL continued
SICR continuedLGD continuedUtilising the factors above, the overall probabilities and LGD adjustments are assigned to the applicable industries. Both the impact on exposure as well as security are considered.
The table below reflects the impairment impact of a change in the LGD% on exposures at 31 December 2019:
+20% LGD R000
–20% LGDR000
StressscenarioanalysisStage 1 5 824 (5 824)Stage 2 1 390 (1 390)Stage 3* – –
7 214 (7 214)
* Subject to specific impairment and not model impairment.
ExpectedlossExpected loss is calculated by multiplying the LGD by the relevant PD and thereafter discounting the result by the relevant interest rate.
SignificantareasofjudgementandkeyassumptionsDue to the Group’s history of low credit default, limited numeric data is available to make reasonable assumptions regarding the various aspects required to determine forward looking information (FLI) and ECLs. Consequently, various elements of the model (key elements detailed below) require the use of experience and professional judgement.
о Determining PD across all product types including when PDs are different о Quantitative triggers for SICR which include significant changes in value of collateral and a decline in credit risk scores о Qualitative triggers for SICR and credit impairment include:
• Facility is in arrears• Facility is in default• Classification and appearance on watch list• Acts of insolvency• Change in business and economic conditions• 30 days rebuttable presumption unless it can be appropriately justified that no significant increase in PD
has occurred о Security valuation methodology о FLI impact on LGD
One-year range
%
Three-year range
%
KeyeconomicvariablesGross domestic product (GDP) 0.9 – 1.7 1.3 – 2.4Inflation rate 4 – 7 4 – 7Prime lending rate 9.5 – 10.5 9.5 – 11.25Unemployment rate 26 – 30 26 – 31
Key economic variables beyond the three‑year forecast period equate to a long‑run average expectation.
Of the key economic variables, GDP and the inflation rate were used. In addition, four other factors, namely producer price index, inflation rate, overall economic risk and construction output levels were used. Economic risk constitutes a weighted average of exchange risk, demand risk, cost risk, sovereign credit risk and trade credit risk resulting in a measurable figure
25GRINDROD BANK LIMITEDAnnual financial statements
of economic risk for a given country. The historical indicators and book performance as well as the current economic state were used to determine an acceptable range looking forward. Should the 12‑month or lifetime values fall outside the threshold, the PDs are adjusted accordingly.
3. Assessment of controlA subsidiary is a company or entity controlled by the Group.
Control is achieved when the Group meets all three of the below criteria:
о Has power over the investee о Is exposed, or has rights, to variable returns from its involvement with the investee о Has the ability to use its power to affect its returns
Significant areas of judgement and key assumptionsThe Group currently holds preference shares in various entities outside the Group as a result of lending activities. Some of the entities financed have defined investment‑related activities including holding shares in either listed or unlisted entities. The Group does not have any voting rights in these entities on a business as usual basis. In some instances the preference share agreements in place with the issuers of the preference shares are structured to ensure the Group, as the preference share holder, has protective rights in the event of the preference share issuer defaulting. In accordance with IFRS 10, an assessment of the facts, circumstances, significant judgements and assumptions has been performed to ensure that there is no control over these entities.
Judgement is applied by management when determining whether the requirements of control as defined by IFRS 10 are met. These judgements include:
о The determination of relevant activities of the entity. Relevant activities have been identified as decisions surrounding early redemption and/or repayment of funding.
о How decisions surrounding relevant activities are made. о Assessment of the ability to direct these activities. о Whether rights defined in funding agreements are protective or substantive in nature. о The right of the Group to any residual interest.
As the Group does not control the relevant activities referred to above or right to any residual interest, the Group does not have power over the investees and hence does not control the investees in terms of IFRS 10. Refer to note 37 for further detail.
In addition, step‑in rights at the time of default are a relevant activity which is substantive in nature. When step‑in rights become effective, the assessment of control is reassessed.
4. Property and equipmentFixed assets are stated at cost less accumulated depreciation and any accumulated impairment losses. Depreciation is accounted for through profit and loss and is calculated using the straight‑line method, at rates estimated to write off each asset over the term of its useful life. The estimated useful lives, residual values and depreciation methods are reviewed each year‑end, with the effect of any changes in estimate accounted for on a prospective basis.
The following useful lives are used in the calculation of depreciation:
YearsOffice equipment 5Furniture and fittings 6Motor vehicles 4Computers and computer hardware 3
26
ACCOUNTING POLICIES CONTINUEDFor the year ended 31 December 2019
GRINDROD BANK LIMITEDAnnual financial statements
5. Intangible assetsIntangible assets are recognised at cost less accumulated amortisation and any impairment. Amortisation is accounted for through profit and loss and the estimated useful life and amortisation method are reviewed at each year‑end, with the effect of changes in estimate being accounted for on a prospective basis.
Computer software is amortised over a three‑year period.
6. Deferred taxDeferred tax is provided on the comprehensive basis at current tax rates using the statement of financial position liability method in respect of tax on temporary differences between the carrying value and tax base of items on the statement of financial position. Where the effect of temporary differences results in a deferred tax asset, the amount of such asset is brought to account where it is probable that future taxable profit will be available against which the deductible temporary differences can be utilised.
7. Foreign currenciesForeign currency transactions are recorded at the exchange rate ruling on the transaction date.
8. ProvisionsProvisions are recognised when the Group has a present obligation as a result of a past event which results in a probable outflow of economic benefits which can be reliably measured.
9. Incentive schemes – medium-term share-basedMedium‑term share‑based incentives payable are raised as a liability and recognised in profit and loss immediately or, if vesting requirements are applicable, over the vesting period. The liability is remeasured at least annually until settled and any changes in value are recognised in profit and loss. Estimations in relation to exits from the schemes are used in the valuations.
10. Retirement benefitsCurrent contributions to the defined contribution retirement benefit plans are the current service costs and are charged in profit and loss as incurred.
11. Leases (as lessee)The Group recognises right‑of‑use assets and lease liabilities in the statement of financial position, initially measured at the present value of future lease payments. Depreciation on the right‑of‑use asset and interest on lease liabilities are recognised in profit and loss. The right‑of‑use assets are depreciated over the term of the lease and are tested annually for impairment. For short‑term leases (lease term of 12 months or less) and leases of low‑value assets (such as tablets and personal computers, small items of office furniture and telephones), the Group recognises a lease expense on a straight‑line basis.
12. Revenue recognitionRevenue from financial instruments is recognised in terms of IFRS 9 and revenue from other service contracts is recognised in terms of IFRS 15.
The description of fees charged by the Group to its customers is not necessarily indicative of the nature of the services provided, or of whether or not they form part of the effective interest rate. Accordingly, judgement is applied in categorising fees between those forming part of the effective interest rate to be accounted for in accordance with IFRS 9 and those to be accounted for in accordance with IFRS 15.
27GRINDROD BANK LIMITEDAnnual financial statements
The following significant judgements are applied by management to distinguish whether fees are earned in accordance with IFRS 9 or IFRS 15:
о Whether the fee directly relates to origination of a loan recognised on the statement of financial position. These fees are compensation for the loan origination process
о Whether the fee is compensation for the time value of money, such as when a lower rate of interest is charged together with an upfront or periodic fee to compensate for that lower interest rate
о Whether the fee is compensation for credit risk, such as when an additional fee is charged for credit risk not fully priced into the quoted interest rate. Such fees may be charged in advance, periodically or upon exit of the facility
о Whether the fee relates to basic lending risks and whether the fee forms part of the normal profit margin associated with basic lending
The above fees are recognised as an adjustment to the effective interest rate and recognised in accordance with IFRS 9. The effective interest rate method discounts the future cash flows over the expected life of the financial instrument to the carrying amount of the instrument. The effective interest rate is determined on initial recognition of the financial instrument and is not subsequently remeasured.
The Company/Group also earns fees from certain services it provides to clients which are recognised over time as the performance obligation is fulfilled. These fees typically include administration and service fees for Retail Banking‑related services and advisory fees from Corporate Finance activities. In certain instances, the advisory contracts may include distinct performance obligations. Income earned on the execution of a distinct performance obligation is recognised when the distinct performance obligation has been performed. Revenue is recognised at a point in time.
Dividend revenue from investments is recognised when the shareholder has a right to receive payment.
13. ImpairmentThe carrying amounts of tangible and intangible assets are assessed at each reporting date to determine whether any assets are impaired. Where there is evidence of impairment the asset value is written down to the recoverable amount and the loss is recognised in profit and loss for the period. If in subsequent periods the impairment loss reverses, the carrying value of the asset is increased but limited to the original carrying value prior to impairment. The reversal is recognised in profit and loss for the period.
14. TaxationThe charge for current tax is based on the results for the year as adjusted for income that is exempt and expenses that are not deductible using tax rates that are applicable to taxable income.
Deferred tax is recognised in profit and loss except when it relates to items credited or charged directly to equity, in which case it is also recognised in equity.
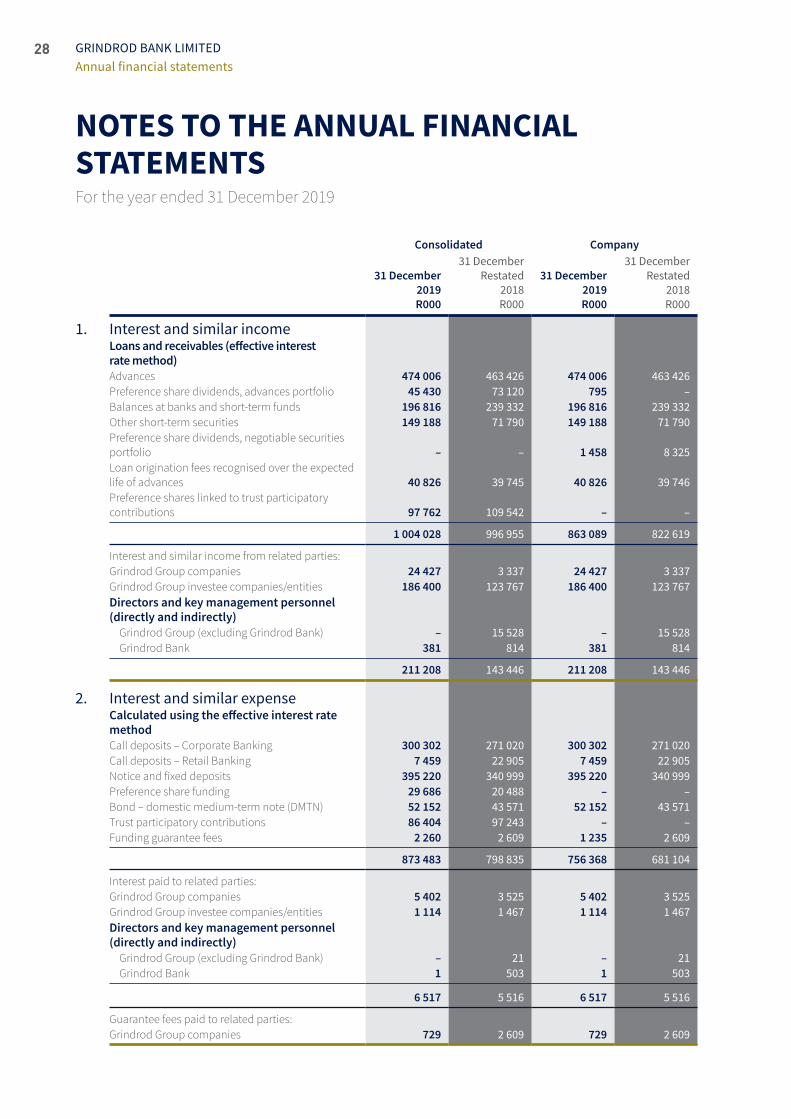
28 GRINDROD BANK LIMITEDAnnual financial statements
NOTES TO THE ANNUAL FINANCIAL STATEMENTS For the year ended 31 December 2019
Consolidated Company
31 December 2019R000
31 DecemberRestated
2018R000
31 December 2019R000
31 DecemberRestated
2018R000
1. Interest and similar incomeLoans and receivables (effective interest rate method)Advances 474 006 463 426 474 006 463 426 Preference share dividends, advances portfolio 45 430 73 120 795 –Balances at banks and short‑term funds 196 816 239 332 196 816 239 332 Other short‑term securities 149 188 71 790 149 188 71 790 Preference share dividends, negotiable securities portfolio – – 1 458 8 325 Loan origination fees recognised over the expected life of advances 40 826 39 745 40 826 39 746Preference shares linked to trust participatory contributions 97 762 109 542 – –
1 004 028 996 955 863 089 822 619
Interest and similar income from related parties:Grindrod Group companies 24 427 3 337 24 427 3 337 Grindrod Group investee companies/entities 186 400 123 767 186 400 123 767 Directors and key management personnel (directly and indirectly)
Grindrod Group (excluding Grindrod Bank) – 15 528 – 15 528 Grindrod Bank 381 814 381 814
211 208 143 446 211 208 143 446
2. Interest and similar expenseCalculated using the effective interest rate methodCall deposits – Corporate Banking 300 302 271 020 300 302 271 020 Call deposits – Retail Banking 7 459 22 905 7 459 22 905 Notice and fixed deposits 395 220 340 999 395 220 340 999 Preference share funding 29 686 20 488 – – Bond – domestic medium‑term note (DMTN) 52 152 43 571 52 152 43 571 Trust participatory contributions 86 404 97 243 – – Funding guarantee fees 2 260 2 609 1 235 2 609
873 483 798 835 756 368 681 104
Interest paid to related parties:Grindrod Group companies 5 402 3 525 5 402 3 525 Grindrod Group investee companies/entities 1 114 1 467 1 114 1 467 Directors and key management personnel (directly and indirectly)
Grindrod Group (excluding Grindrod Bank) – 21 – 21 Grindrod Bank 1 503 1 503
6 517 5 516 6 517 5 516
Guarantee fees paid to related parties:Grindrod Group companies 729 2 609 729 2 609
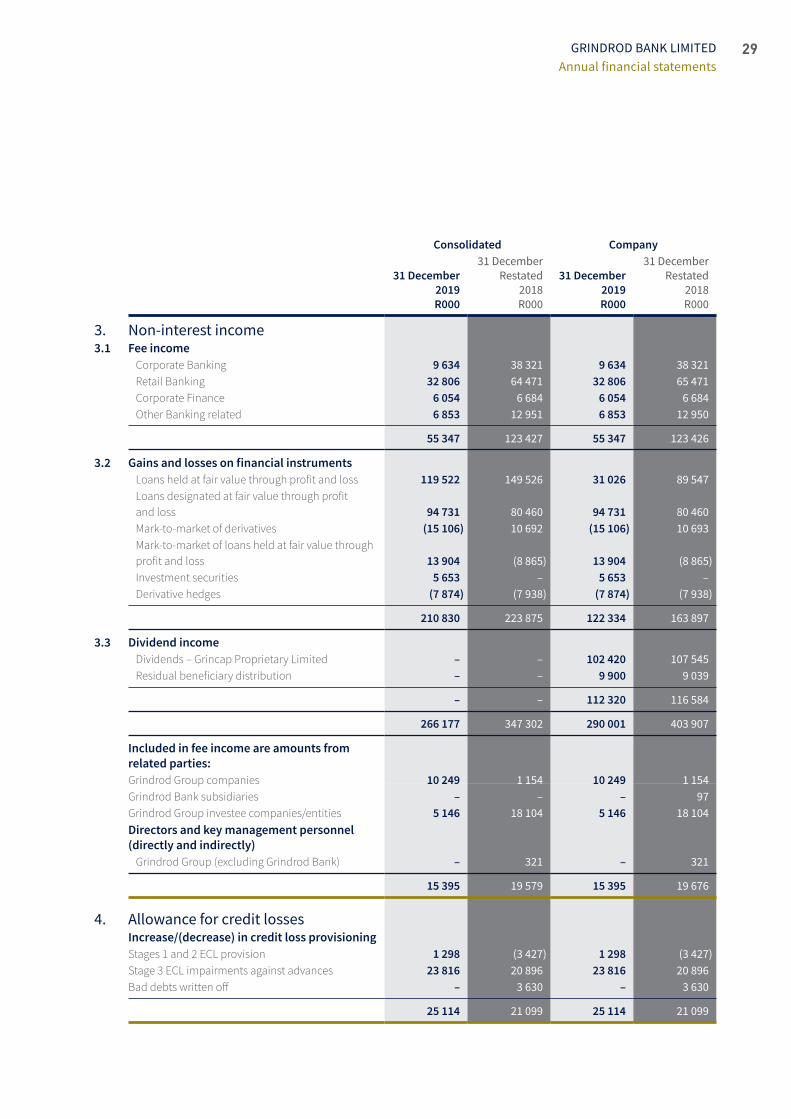
29GRINDROD BANK LIMITEDAnnual financial statements
Consolidated Company
31 December 2019R000
31 DecemberRestated
2018R000
31 December 2019R000
31 DecemberRestated
2018R000
3. Non-interest income3.1 Fee income
Corporate Banking 9 634 38 321 9 634 38 321Retail Banking 32 806 64 471 32 806 65 471Corporate Finance 6 054 6 684 6 054 6 684Other Banking related 6 853 12 951 6 853 12 950
55 347 123 427 55 347 123 426
3.2 Gains and losses on financial instrumentsLoans held at fair value through profit and loss 119 522 149 526 31 026 89 547Loans designated at fair value through profit and loss 94 731 80 460 94 731 80 460Mark‑to‑market of derivatives (15 106) 10 692 (15 106) 10 693Mark‑to‑market of loans held at fair value through profit and loss 13 904 (8 865) 13 904 (8 865)Investment securities 5 653 – 5 653 –Derivative hedges (7 874) (7 938) (7 874) (7 938)
210 830 223 875 122 334 163 897
3.3 Dividend incomeDividends – Grincap Proprietary Limited – – 102 420 107 545Residual beneficiary distribution – – 9 900 9 039
– – 112 320 116 584
266 177 347 302 290 001 403 907
Included in fee income are amounts from related parties:Grindrod Group companies 10 249 1 154 10 249 1 154 Grindrod Bank subsidiaries – – – 97 Grindrod Group investee companies/entities 5 146 18 104 5 146 18 104 Directors and key management personnel (directly and indirectly)
Grindrod Group (excluding Grindrod Bank) – 321 – 321
15 395 19 579 15 395 19 676
4. Allowance for credit lossesIncrease/(decrease) in credit loss provisioningStages 1 and 2 ECL provision 1 298 (3 427) 1 298 (3 427)Stage 3 ECL impairments against advances 23 816 20 896 23 816 20 896 Bad debts written off – 3 630 – 3 630
25 114 21 099 25 114 21 099
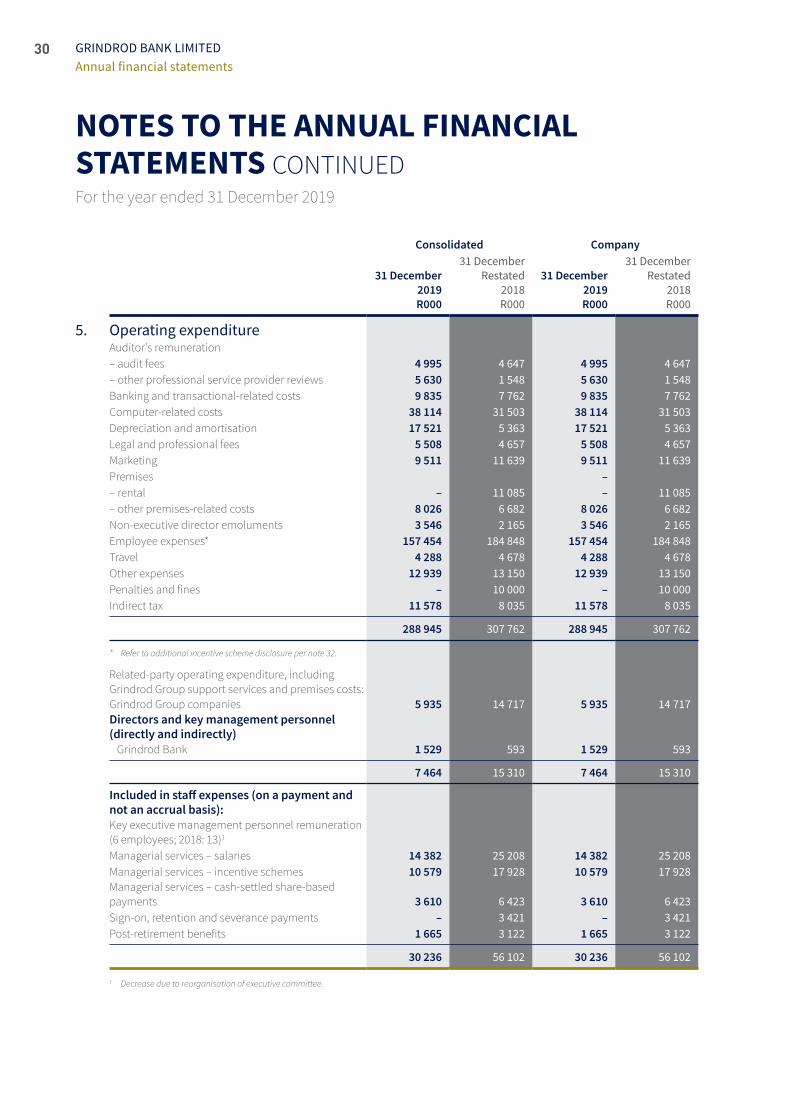
30
NOTES TO THE ANNUAL FINANCIAL STATEMENTS CONTINUEDFor the year ended 31 December 2019
GRINDROD BANK LIMITEDAnnual financial statements
Consolidated Company
31 December 2019R000
31 DecemberRestated
2018R000
31 December 2019R000
31 DecemberRestated
2018R000
5. Operating expenditureAuditor’s remuneration– audit fees 4 995 4 647 4 995 4 647– other professional service provider reviews 5 630 1 548 5 630 1 548Banking and transactional‑related costs 9 835 7 762 9 835 7 762Computer‑related costs 38 114 31 503 38 114 31 503Depreciation and amortisation 17 521 5 363 17 521 5 363Legal and professional fees 5 508 4 657 5 508 4 657Marketing 9 511 11 639 9 511 11 639Premises –– rental – 11 085 – 11 085– other premises‑related costs 8 026 6 682 8 026 6 682Non‑executive director emoluments 3 546 2 165 3 546 2 165Employee expenses* 157 454 184 848 157 454 184 848Travel 4 288 4 678 4 288 4 678Other expenses 12 939 13 150 12 939 13 150Penalties and fines – 10 000 – 10 000Indirect tax 11 578 8 035 11 578 8 035
288 945 307 762 288 945 307 762
* Refer to additional incentive scheme disclosure per note 32.
Related‑party operating expenditure, including Grindrod Group support services and premises costs:Grindrod Group companies 5 935 14 717 5 935 14 717Directors and key management personnel (directly and indirectly)
Grindrod Bank 1 529 593 1 529 593
7 464 15 310 7 464 15 310
Included in staff expenses (on a payment and not an accrual basis):Key executive management personnel remuneration (6 employees; 2018: 13)1
Managerial services – salaries 14 382 25 208 14 382 25 208Managerial services – incentive schemes 10 579 17 928 10 579 17 928Managerial services – cash‑settled share‑based payments 3 610 6 423 3 610 6 423Sign‑on, retention and severance payments – 3 421 – 3 421Post‑retirement benefits 1 665 3 122 1 665 3 122
30 236 56 102 30 236 56 102
1 Decrease due to reorganisation of executive committee.

31GRINDROD BANK LIMITEDAnnual financial statements
Services as directors
R000
Cash package
R000
Post- retirement
benefits R000
Sign-on, retention
and severance payments
R000
Incentive schemes
R000 TotalR000
5. Operating expenditure continued Directors’ remunerationConsolidated and Company2019Executive directorsDA Polkinghorne – 5 275 290 – 4 856*** 10 421SA Blades – 1 851 182 – 3 772*** 5 805RS Garach – 1 267 191 – – 1 458Non-executive directorsJH Beare 797 – – – – 797ASP Dambuza 454 – – – – 454WD Geach 443 – – – – 443ZN Malinga 551 – – – – 551MS Mbatha 282 – – – – 282RSM Ndlovu* 780 – – – – 780PJ Uys* 54 – – – – 54M Hankinson 83 – – – – 83T Soondarjee 94 – – – – 94S Barrett 8 – – – – 8
3 546 8 393 663 – 8 628 21 230
2018Executive directorsDA Polkinghorne – 4 953 297 2 703 4 815 12 768SA Blades – 3 015 316 3 527 6 858SP Scott – 2 064 247 2 298 4 609Non-executive directorsJH Beare 532 – – – – 532ASP Dambuza 96 – – – – 96WD Geach 350 – – – – 350ZN Malinga 364 – – – – 364MS Mbatha 113 – – – – 113RSM Ndlovu* 485 – – – – 485PJ Uys* 225 – – – – 225
2 165 10 033 860 2 703 10 640 26 400
* Fees ceded to Remgro Limited.
*** Relates to the 2018 financial year but paid in the 2019 financial year. No incentives were awarded for the 2019 financial year.
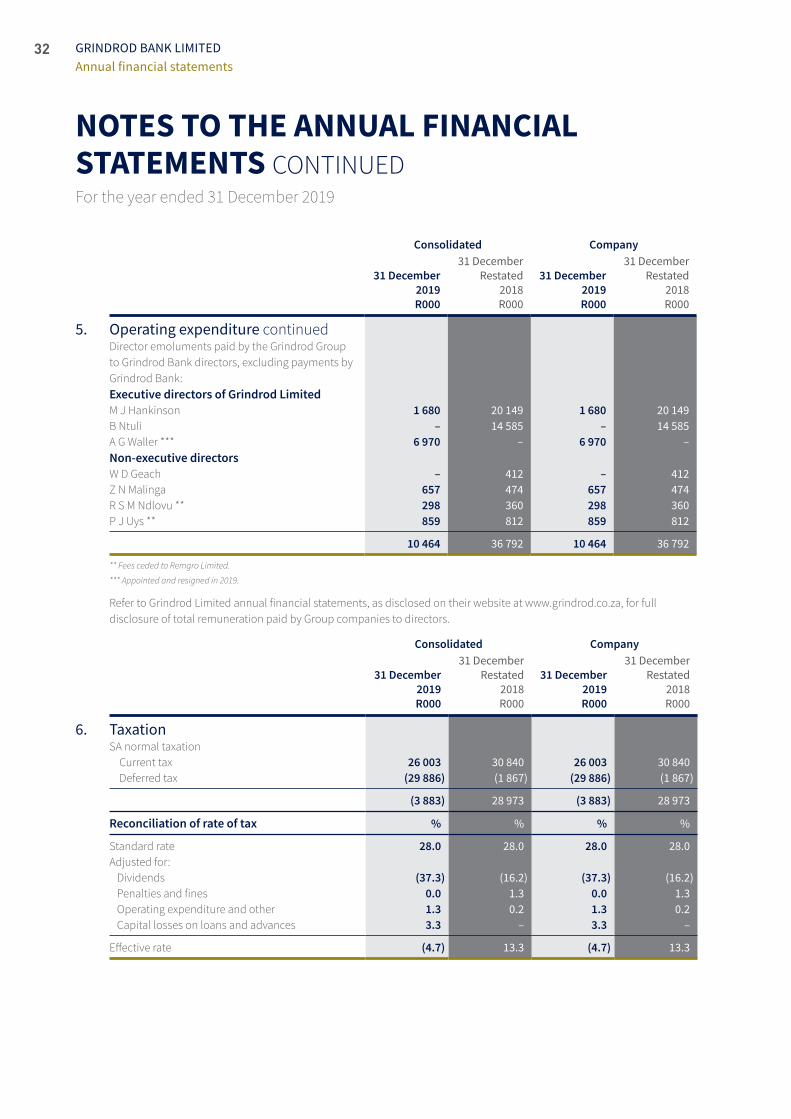
32
NOTES TO THE ANNUAL FINANCIAL STATEMENTS CONTINUEDFor the year ended 31 December 2019
GRINDROD BANK LIMITEDAnnual financial statements
Consolidated Company
31 December 2019R000
31 DecemberRestated
2018R000
31 December 2019R000
31 DecemberRestated
2018R000
5. Operating expenditure continuedDirector emoluments paid by the Grindrod Group to Grindrod Bank directors, excluding payments by Grindrod Bank:Executive directors of Grindrod LimitedM J Hankinson 1 680 20 149 1 680 20 149 B Ntuli – 14 585 – 14 585 A G Waller *** 6 970 – 6 970 – Non-executive directorsW D Geach – 412 – 412 Z N Malinga 657 474 657 474 R S M Ndlovu ** 298 360 298 360 P J Uys ** 859 812 859 812
10 464 36 792 10 464 36 792
** Fees ceded to Remgro Limited.
*** Appointed and resigned in 2019.
Refer to Grindrod Limited annual financial statements, as disclosed on their website at www.grindrod.co.za, for full disclosure of total remuneration paid by Group companies to directors.
Consolidated Company
31 December 2019R000
31 DecemberRestated
2018R000
31 December 2019R000
31 DecemberRestated
2018R000
6. TaxationSA normal taxation
Current tax 26 003 30 840 26 003 30 840 Deferred tax (29 886) (1 867) (29 886) (1 867)
(3 883) 28 973 (3 883) 28 973
Reconciliation of rate of tax % % % %
Standard rate 28.0 28.0 28.0 28.0 Adjusted for:
Dividends (37.3) (16.2) (37.3) (16.2)Penalties and fines 0.0 1.3 0.0 1.3 Operating expenditure and other 1.3 0.2 1.3 0.2 Capital losses on loans and advances 3.3 – 3.3 –
Effective rate (4.7) 13.3 (4.7) 13.3

33GRINDROD BANK LIMITEDAnnual financial statements
Consolidated Company
31 December 2019R000
31 DecemberRestated
2018R000
31 December 2019R000
31 DecemberRestated
2018R000
7. Intangible assetsConsolidated and CompanyComputer softwareCarrying amount at the beginning of the year – 12 – 12Amortisation – (12) – (12)
– – – –
Furniture, fittings, office
equipment and motor
vehiclesR000
Computers and computer hardware
R000
Right-of-use assetR000*
TotalR000
8. Property and equipmentConsolidated and Company2019Cost at the beginning of the year 12 895 22 066 – 34 961Additions/IFRS 16 implementation – 2 042 26 997 29 039Disposals – (2 656) – (2 656)
Cost at the end of the year 12 895 21 452 26 997 61 344
Accumulated depreciation at the beginning of the year 9 077 19 371 – 28 448Depreciation charge for the year 1 750 2 147 13 624 17 521Disposals – (2 656) – (2 656)
Accumulated depreciation at the end of the year 10 827 18 862 13 624 43 313
Carrying amount at the beginning of the year 3 818 2 695 – 6 513
Carrying amount at the end of the year 2 068 2 590 13 373 18 031
Consolidated and Company2018Cost at the beginning of the year 12 349 20 886 – 33 235Additions 546 1 180 – 1 726
Cost at the end of the year 12 895 22 066 – 34 961
Accumulated depreciation at the beginning of the year 7 308 15 789 – 23 097Depreciation charge for the year 1 769 3 582 – 5 351
Accumulated depreciation at the end of the year 9 077 19 371 – 28 448
Carrying amount at the beginning of the year 5 042 5 097 – 10 138
Carrying amount at the end of the year 3 818 2 695 – 6 513
* Right-of-use asset relates to property rentals for business purposes.
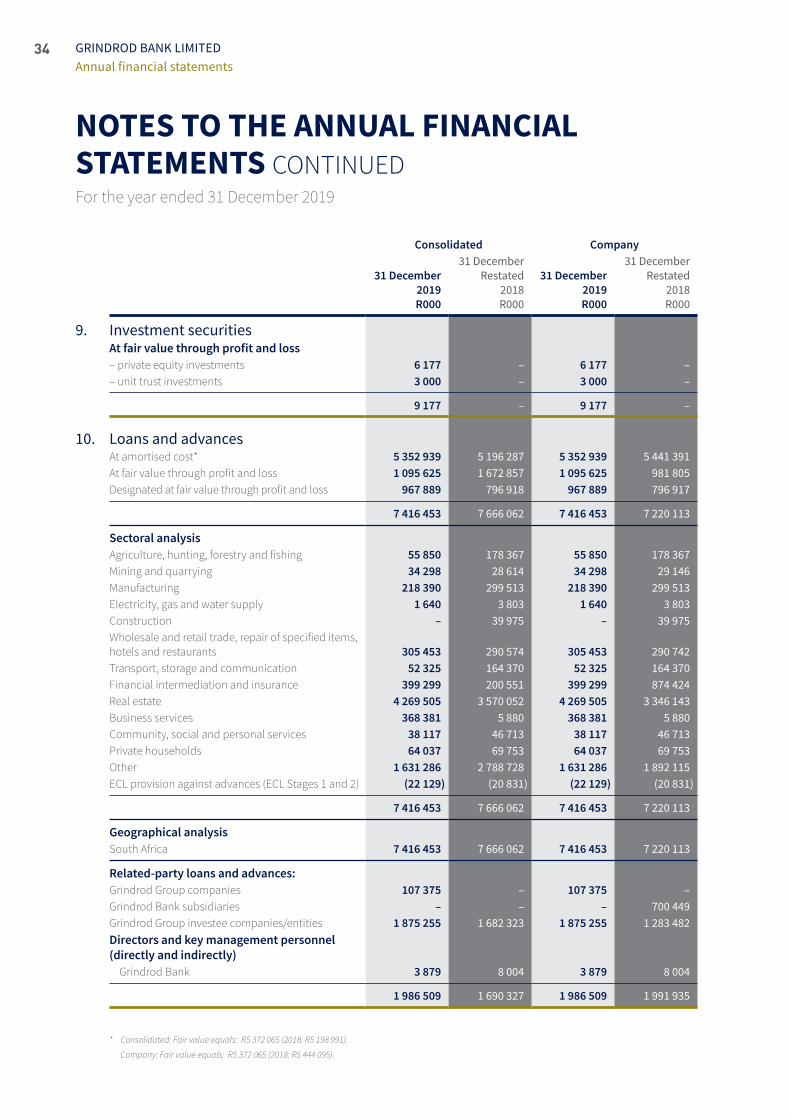
34
NOTES TO THE ANNUAL FINANCIAL STATEMENTS CONTINUEDFor the year ended 31 December 2019
GRINDROD BANK LIMITEDAnnual financial statements
Consolidated Company
31 December 2019R000
31 DecemberRestated
2018R000
31 December 2019R000
31 DecemberRestated
2018R000
9. Investment securitiesAt fair value through profit and loss– private equity investments 6 177 – 6 177 – – unit trust investments 3 000 – 3 000 –
9 177 – 9 177 –
10. Loans and advancesAt amortised cost* 5 352 939 5 196 287 5 352 939 5 441 391 At fair value through profit and loss 1 095 625 1 672 857 1 095 625 981 805 Designated at fair value through profit and loss 967 889 796 918 967 889 796 917
7 416 453 7 666 062 7 416 453 7 220 113
Sectoral analysisAgriculture, hunting, forestry and fishing 55 850 178 367 55 850 178 367 Mining and quarrying 34 298 28 614 34 298 29 146 Manufacturing 218 390 299 513 218 390 299 513 Electricity, gas and water supply 1 640 3 803 1 640 3 803 Construction – 39 975 – 39 975 Wholesale and retail trade, repair of specified items, hotels and restaurants 305 453 290 574 305 453 290 742 Transport, storage and communication 52 325 164 370 52 325 164 370 Financial intermediation and insurance 399 299 200 551 399 299 874 424Real estate 4 269 505 3 570 052 4 269 505 3 346 143Business services 368 381 5 880 368 381 5 880 Community, social and personal services 38 117 46 713 38 117 46 713 Private households 64 037 69 753 64 037 69 753 Other 1 631 286 2 788 728 1 631 286 1 892 115 ECL provision against advances (ECL Stages 1 and 2) (22 129) (20 831) (22 129) (20 831)
7 416 453 7 666 062 7 416 453 7 220 113
Geographical analysisSouth Africa 7 416 453 7 666 062 7 416 453 7 220 113
Related-party loans and advances:Grindrod Group companies 107 375 – 107 375 –Grindrod Bank subsidiaries – – – 700 449 Grindrod Group investee companies/entities 1 875 255 1 682 323 1 875 255 1 283 482 Directors and key management personnel (directly and indirectly)
Grindrod Bank 3 879 8 004 3 879 8 004
1 986 509 1 690 327 1 986 509 1 991 935
* Consolidated: Fair value equals: R5 372 065 (2018: R5 198 991).
Company: Fair value equals: R5 372 065 (2018: R5 444 095).
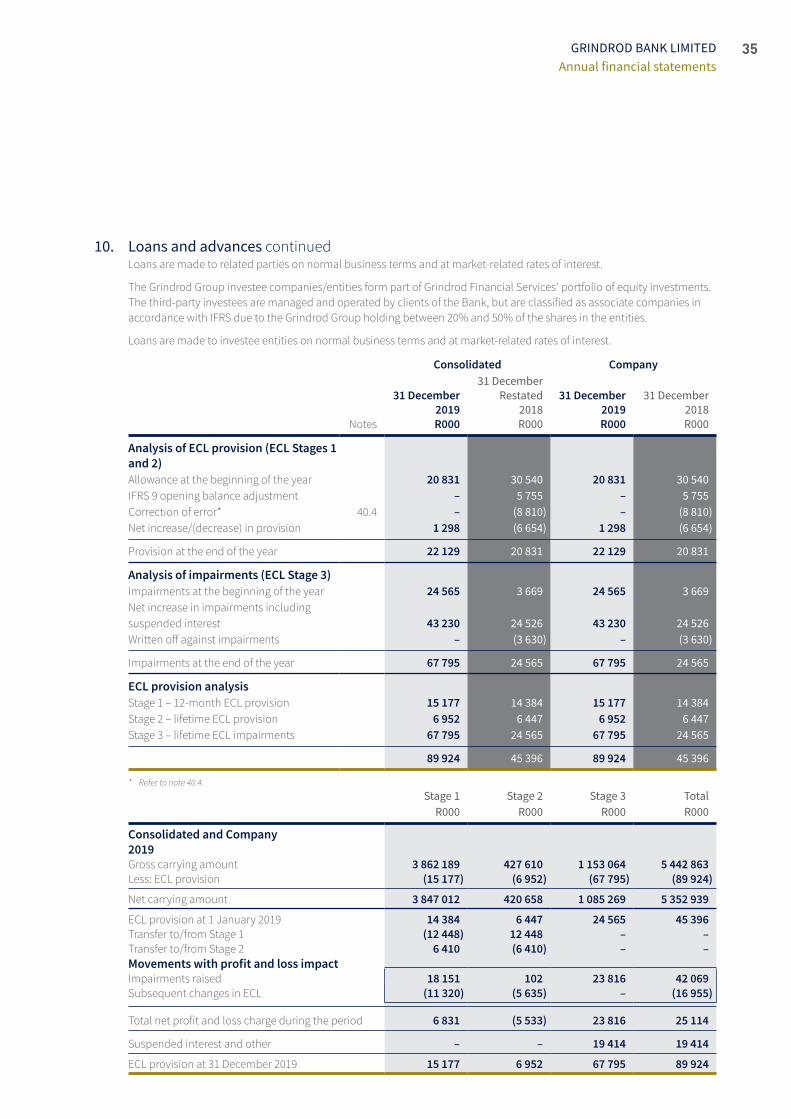
35GRINDROD BANK LIMITEDAnnual financial statements
10. Loans and advances continuedLoans are made to related parties on normal business terms and at market‑related rates of interest.
The Grindrod Group investee companies/entities form part of Grindrod Financial Services’ portfolio of equity investments. The third‑party investees are managed and operated by clients of the Bank, but are classified as associate companies in accordance with IFRS due to the Grindrod Group holding between 20% and 50% of the shares in the entities.
Loans are made to investee entities on normal business terms and at market‑related rates of interest.
Consolidated Company
Notes
31 December 2019R000
31 DecemberRestated
2018R000
31 December 2019R000
31 December 2018R000
Analysis of ECL provision (ECL Stages 1 and 2)Allowance at the beginning of the year 20 831 30 540 20 831 30 540 IFRS 9 opening balance adjustment – 5 755 – 5 755 Correction of error* 40.4 – (8 810) – (8 810)Net increase/(decrease) in provision 1 298 (6 654) 1 298 (6 654)
Provision at the end of the year 22 129 20 831 22 129 20 831
Analysis of impairments (ECL Stage 3)Impairments at the beginning of the year 24 565 3 669 24 565 3 669 Net increase in impairments including suspended interest 43 230 24 526 43 230 24 526 Written off against impairments – (3 630) – (3 630)
Impairments at the end of the year 67 795 24 565 67 795 24 565
ECL provision analysisStage 1 – 12‑month ECL provision 15 177 14 384 15 177 14 384Stage 2 – lifetime ECL provision 6 952 6 447 6 952 6 447 Stage 3 – lifetime ECL impairments 67 795 24 565 67 795 24 565
89 924 45 396 89 924 45 396
* Refer to note 40.4.
Stage 1R000
Stage 2R000
Stage 3R000
TotalR000
Consolidated and Company2019Gross carrying amount 3 862 189 427 610 1 153 064 5 442 863Less: ECL provision (15 177) (6 952) (67 795) (89 924)
Net carrying amount 3 847 012 420 658 1 085 269 5 352 939
ECL provision at 1 January 2019 14 384 6 447 24 565 45 396Transfer to/from Stage 1 (12 448) 12 448 – –Transfer to/from Stage 2 6 410 (6 410) – –Movements with profit and loss impactImpairments raised 18 151 102 23 816 42 069Subsequent changes in ECL (11 320) (5 635) – (16 955)
Total net profit and loss charge during the period 6 831 (5 533) 23 816 25 114
Suspended interest and other – – 19 414 19 414
ECL provision at 31 December 2019 15 177 6 952 67 795 89 924
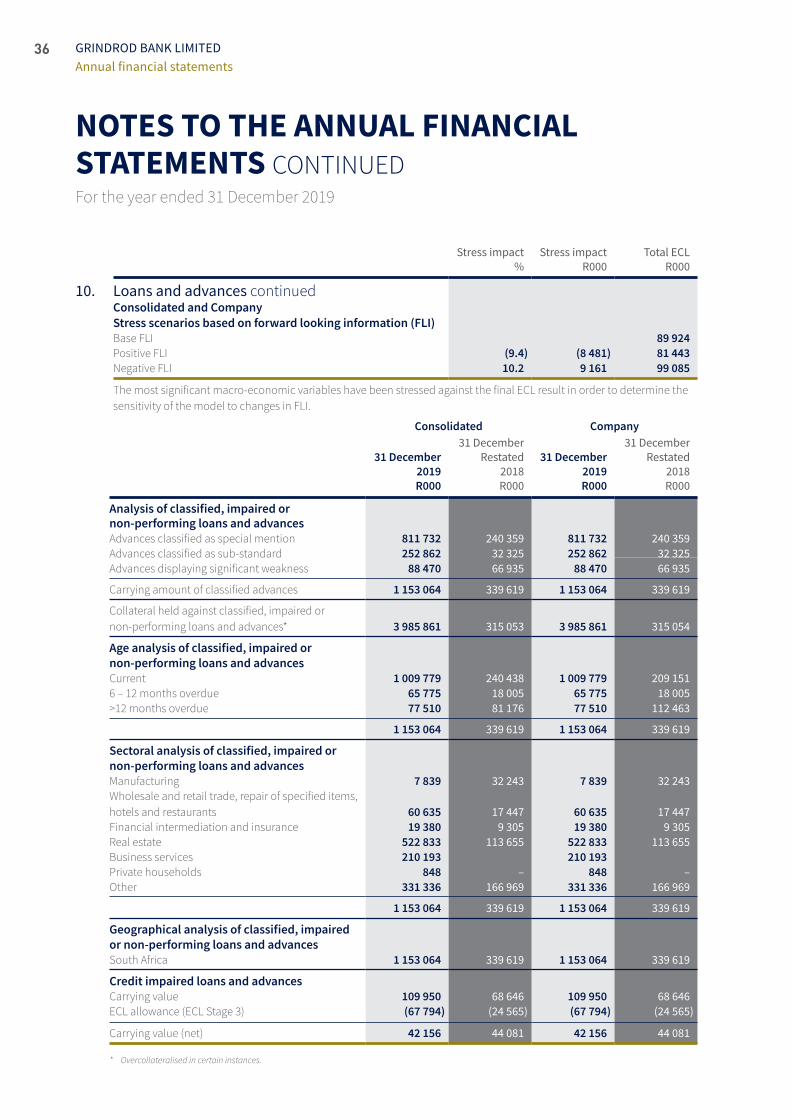
36
NOTES TO THE ANNUAL FINANCIAL STATEMENTS CONTINUEDFor the year ended 31 December 2019
GRINDROD BANK LIMITEDAnnual financial statements
Stress impact %
Stress impact R000
Total ECL R000
10. Loans and advances continuedConsolidated and CompanyStress scenarios based on forward looking information (FLI)Base FLI 89 924Positive FLI (9.4) (8 481) 81 443Negative FLI 10.2 9 161 99 085
The most significant macro‑economic variables have been stressed against the final ECL result in order to determine the sensitivity of the model to changes in FLI.
Consolidated Company
31 December 2019R000
31 DecemberRestated
2018R000
31 December 2019R000
31 DecemberRestated
2018R000
Analysis of classified, impaired or non-performing loans and advances Advances classified as special mention 811 732 240 359 811 732 240 359Advances classified as sub‑standard 252 862 32 325 252 862 32 325Advances displaying significant weakness 88 470 66 935 88 470 66 935
Carrying amount of classified advances 1 153 064 339 619 1 153 064 339 619
Collateral held against classified, impaired or non‑performing loans and advances* 3 985 861 315 053 3 985 861 315 054
Age analysis of classified, impaired or non-performing loans and advancesCurrent 1 009 779 240 438 1 009 779 209 1516 – 12 months overdue 65 775 18 005 65 775 18 005>12 months overdue 77 510 81 176 77 510 112 463
1 153 064 339 619 1 153 064 339 619
Sectoral analysis of classified, impaired or non-performing loans and advancesManufacturing 7 839 32 243 7 839 32 243Wholesale and retail trade, repair of specified items, hotels and restaurants 60 635 17 447 60 635 17 447Financial intermediation and insurance 19 380 9 305 19 380 9 305Real estate 522 833 113 655 522 833 113 655Business services 210 193 210 193Private households 848 – 848 –Other 331 336 166 969 331 336 166 969
1 153 064 339 619 1 153 064 339 619
Geographical analysis of classified, impaired or non-performing loans and advancesSouth Africa 1 153 064 339 619 1 153 064 339 619
Credit impaired loans and advancesCarrying value 109 950 68 646 109 950 68 646ECL allowance (ECL Stage 3) (67 794) (24 565) (67 794) (24 565)
Carrying value (net) 42 156 44 081 42 156 44 081
* Overcollateralised in certain instances.
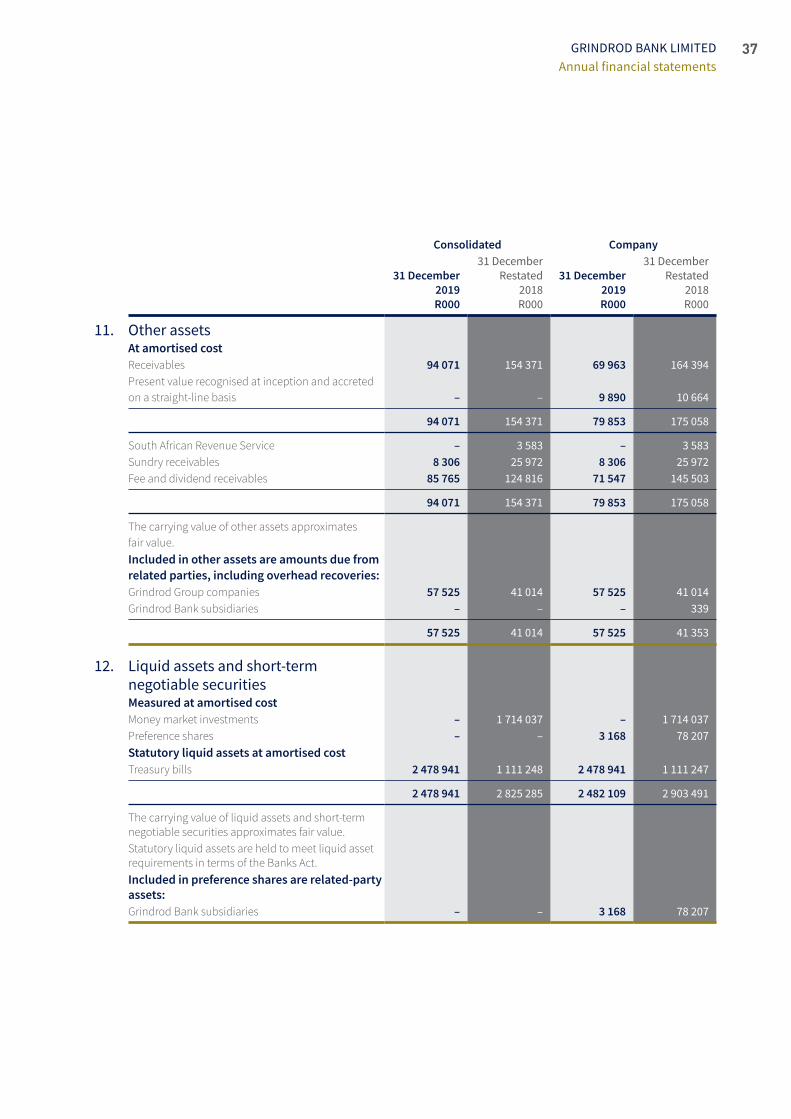
37GRINDROD BANK LIMITEDAnnual financial statements
Consolidated Company
31 December 2019R000
31 DecemberRestated
2018R000
31 December 2019R000
31 DecemberRestated
2018R000
11. Other assetsAt amortised costReceivables 94 071 154 371 69 963 164 394 Present value recognised at inception and accreted on a straight‑line basis – – 9 890 10 664
94 071 154 371 79 853 175 058
South African Revenue Service – 3 583 – 3 583 Sundry receivables 8 306 25 972 8 306 25 972 Fee and dividend receivables 85 765 124 816 71 547 145 503
94 071 154 371 79 853 175 058
The carrying value of other assets approximates fair value.Included in other assets are amounts due from related parties, including overhead recoveries:Grindrod Group companies 57 525 41 014 57 525 41 014 Grindrod Bank subsidiaries – – – 339
57 525 41 014 57 525 41 353
12. Liquid assets and short-term negotiable securitiesMeasured at amortised costMoney market investments – 1 714 037 – 1 714 037 Preference shares – – 3 168 78 207 Statutory liquid assets at amortised costTreasury bills 2 478 941 1 111 248 2 478 941 1 111 247
2 478 941 2 825 285 2 482 109 2 903 491
The carrying value of liquid assets and short‑term negotiable securities approximates fair value.
Statutory liquid assets are held to meet liquid asset requirements in terms of the Banks Act. Included in preference shares are related-party assets:Grindrod Bank subsidiaries – – 3 168 78 207
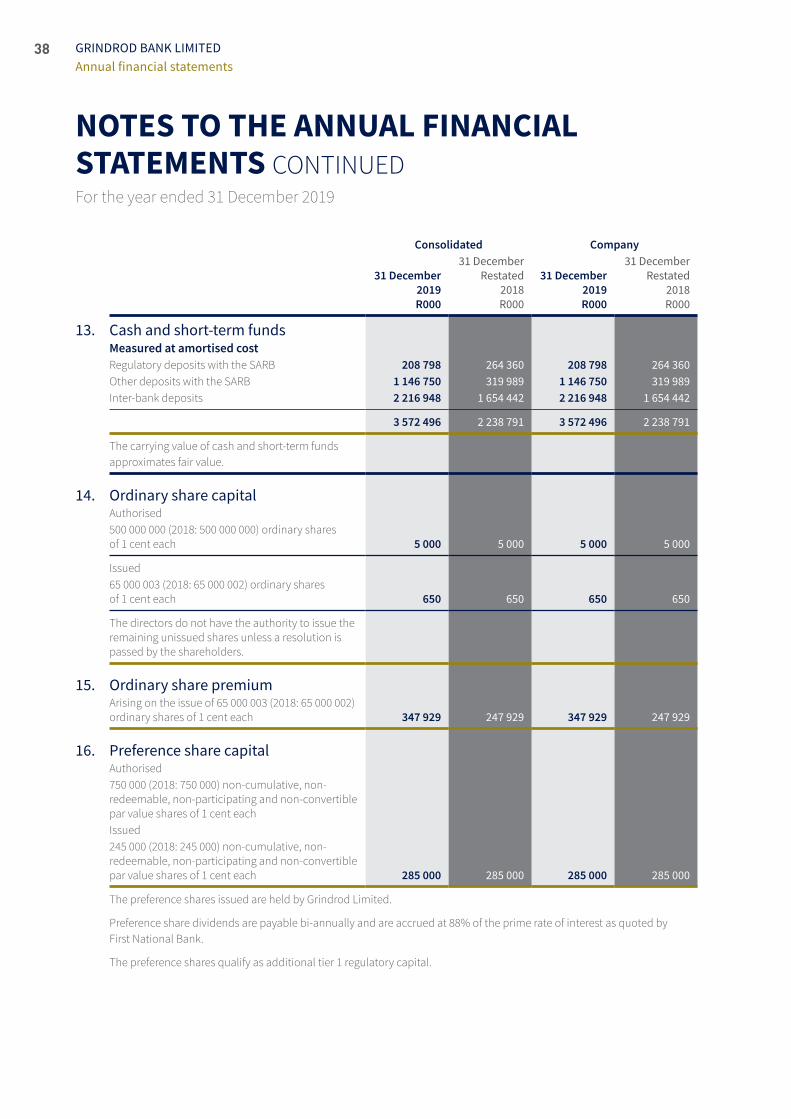
38
NOTES TO THE ANNUAL FINANCIAL STATEMENTS CONTINUEDFor the year ended 31 December 2019
GRINDROD BANK LIMITEDAnnual financial statements
Consolidated Company
31 December 2019R000
31 DecemberRestated
2018R000
31 December 2019R000
31 DecemberRestated
2018R000
13. Cash and short-term fundsMeasured at amortised costRegulatory deposits with the SARB 208 798 264 360 208 798 264 360Other deposits with the SARB 1 146 750 319 989 1 146 750 319 989Inter‑bank deposits 2 216 948 1 654 442 2 216 948 1 654 442
3 572 496 2 238 791 3 572 496 2 238 791
The carrying value of cash and short‑term funds approximates fair value.
14. Ordinary share capital Authorised
500 000 000 (2018: 500 000 000) ordinary shares of 1 cent each 5 000 5 000 5 000 5 000
Issued
65 000 003 (2018: 65 000 002) ordinary shares of 1 cent each 650 650 650 650
The directors do not have the authority to issue the remaining unissued shares unless a resolution is passed by the shareholders.
15. Ordinary share premiumArising on the issue of 65 000 003 (2018: 65 000 002) ordinary shares of 1 cent each 347 929 247 929 347 929 247 929
16. Preference share capitalAuthorised750 000 (2018: 750 000) non‑cumulative, non‑redeemable, non‑participating and non‑convertible par value shares of 1 cent eachIssued245 000 (2018: 245 000) non‑cumulative, non‑redeemable, non‑participating and non‑convertible par value shares of 1 cent each 285 000 285 000 285 000 285 000
The preference shares issued are held by Grindrod Limited.
Preference share dividends are payable bi‑annually and are accrued at 88% of the prime rate of interest as quoted by First National Bank.
The preference shares qualify as additional tier 1 regulatory capital.
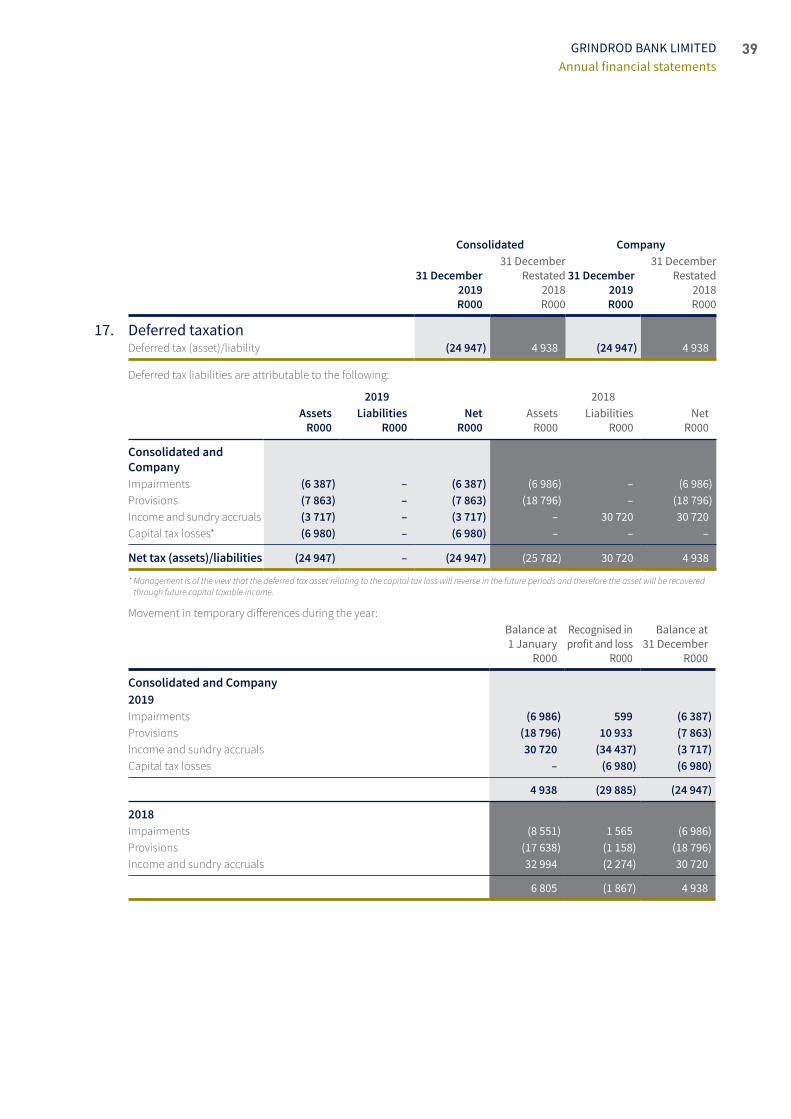
39GRINDROD BANK LIMITEDAnnual financial statements
Consolidated Company
31 December 2019R000
31 DecemberRestated
2018R000
31 December 2019R000
31 DecemberRestated
2018R000
17. Deferred taxation Deferred tax (asset)/liability (24 947) 4 938 (24 947) 4 938
Deferred tax liabilities are attributable to the following:
2019 2018Assets
R000Liabilities
R000 Net
R000Assets
R000Liabilities
R000 Net
R000
Consolidated and CompanyImpairments (6 387) – (6 387) (6 986) – (6 986)Provisions (7 863) – (7 863) (18 796) – (18 796)Income and sundry accruals (3 717) – (3 717) – 30 720 30 720 Capital tax losses* (6 980) – (6 980) – – –
Net tax (assets)/liabilities (24 947) – (24 947) (25 782) 30 720 4 938
* Management is of the view that the deferred tax asset relating to the capital tax loss will reverse in the future periods and therefore the asset will be recovered through future capital taxable income.
Movement in temporary differences during the year: Balance at
1 January R000
Recognised in profit and loss
R000
Balance at 31 December
R000
Consolidated and Company2019Impairments (6 986) 599 (6 387)Provisions (18 796) 10 933 (7 863)Income and sundry accruals 30 720 (34 437) (3 717)Capital tax losses – (6 980) (6 980)
4 938 (29 885) (24 947)
2018Impairments (8 551) 1 565 (6 986)Provisions (17 638) (1 158) (18 796)Income and sundry accruals 32 994 (2 274) 30 720
6 805 (1 867) 4 938
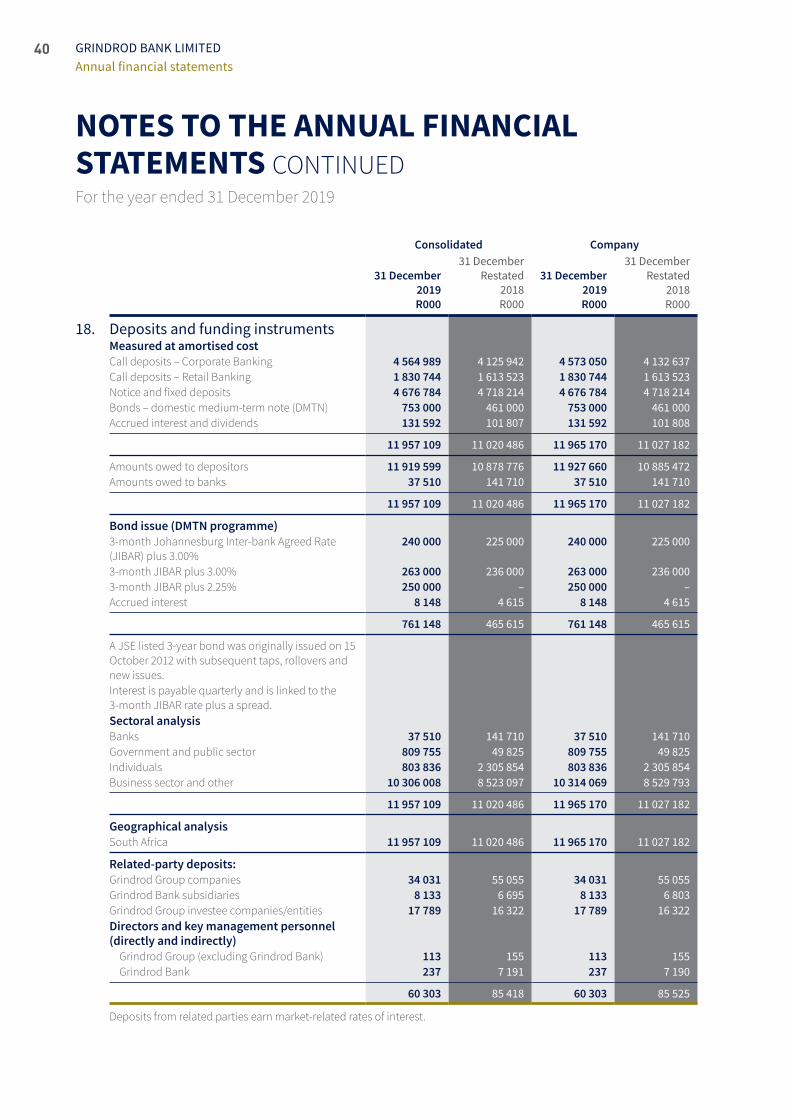
40
NOTES TO THE ANNUAL FINANCIAL STATEMENTS CONTINUEDFor the year ended 31 December 2019
GRINDROD BANK LIMITEDAnnual financial statements
Consolidated Company
31 December 2019R000
31 DecemberRestated
2018R000
31 December 2019R000
31 DecemberRestated
2018R000
18. Deposits and funding instrumentsMeasured at amortised costCall deposits – Corporate Banking 4 564 989 4 125 942 4 573 050 4 132 637 Call deposits – Retail Banking 1 830 744 1 613 523 1 830 744 1 613 523 Notice and fixed deposits 4 676 784 4 718 214 4 676 784 4 718 214 Bonds – domestic medium‑term note (DMTN) 753 000 461 000 753 000 461 000 Accrued interest and dividends 131 592 101 807 131 592 101 808
11 957 109 11 020 486 11 965 170 11 027 182
Amounts owed to depositors 11 919 599 10 878 776 11 927 660 10 885 472 Amounts owed to banks 37 510 141 710 37 510 141 710
11 957 109 11 020 486 11 965 170 11 027 182
Bond issue (DMTN programme)3‑month Johannesburg Inter‑bank Agreed Rate (JIBAR) plus 3.00%
240 000 225 000 240 000 225 000
3‑month JIBAR plus 3.00% 263 000 236 000 263 000 236 000 3‑month JIBAR plus 2.25% 250 000 – 250 000 –Accrued interest 8 148 4 615 8 148 4 615
761 148 465 615 761 148 465 615
A JSE listed 3‑year bond was originally issued on 15 October 2012 with subsequent taps, rollovers and new issues. Interest is payable quarterly and is linked to the 3‑month JIBAR rate plus a spread. Sectoral analysisBanks 37 510 141 710 37 510 141 710 Government and public sector 809 755 49 825 809 755 49 825 Individuals 803 836 2 305 854 803 836 2 305 854 Business sector and other 10 306 008 8 523 097 10 314 069 8 529 793
11 957 109 11 020 486 11 965 170 11 027 182
Geographical analysisSouth Africa 11 957 109 11 020 486 11 965 170 11 027 182
Related-party deposits:Grindrod Group companies 34 031 55 055 34 031 55 055 Grindrod Bank subsidiaries 8 133 6 695 8 133 6 803 Grindrod Group investee companies/entities 17 789 16 322 17 789 16 322 Directors and key management personnel (directly and indirectly)
Grindrod Group (excluding Grindrod Bank) 113 155 113 155 Grindrod Bank 237 7 191 237 7 190
60 303 85 418 60 303 85 525
Deposits from related parties earn market‑related rates of interest.
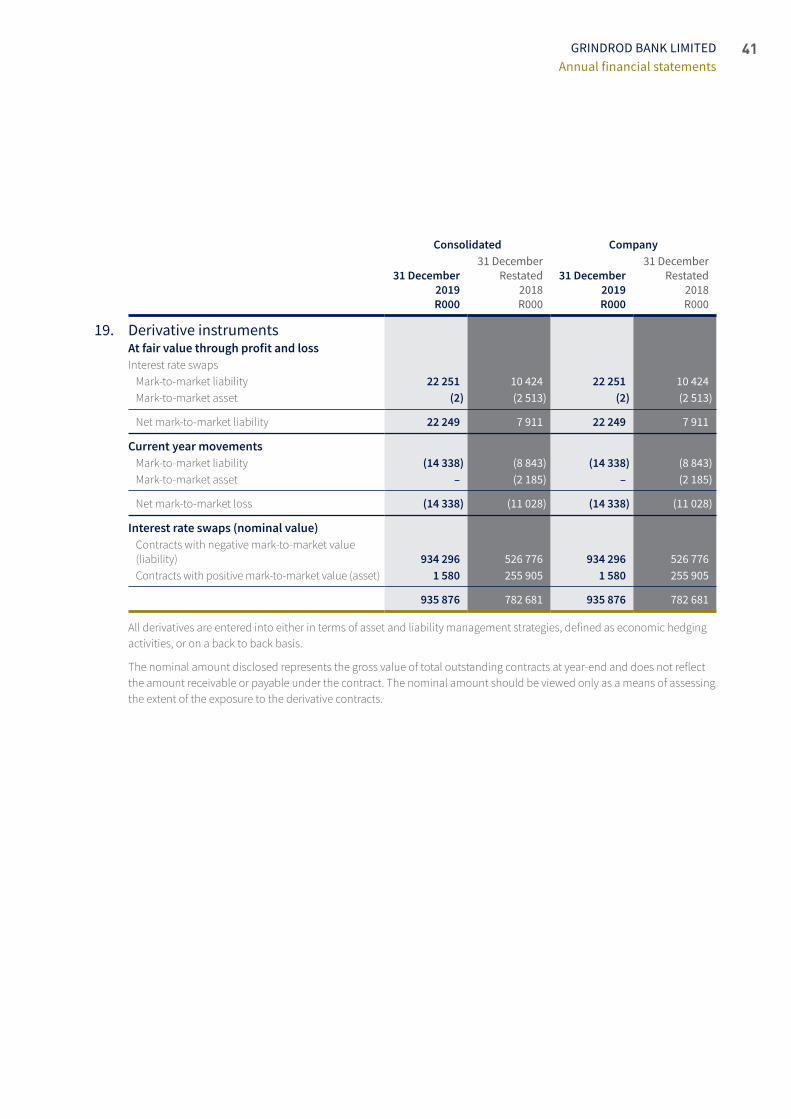
41GRINDROD BANK LIMITEDAnnual financial statements
Consolidated Company
31 December 2019R000
31 DecemberRestated
2018R000
31 December 2019R000
31 DecemberRestated
2018R000
19. Derivative instrumentsAt fair value through profit and loss Interest rate swaps
Mark‑to‑market liability 22 251 10 424 22 251 10 424Mark‑to‑market asset (2) (2 513) (2) (2 513)
Net mark‑to‑market liability 22 249 7 911 22 249 7 911
Current year movementsMark‑to‑market liability (14 338) (8 843) (14 338) (8 843)Mark‑to‑market asset – (2 185) – (2 185)
Net mark‑to‑market loss (14 338) (11 028) (14 338) (11 028)
Interest rate swaps (nominal value)Contracts with negative mark‑to‑market value (liability) 934 296 526 776 934 296 526 776Contracts with positive mark‑to‑market value (asset) 1 580 255 905 1 580 255 905
935 876 782 681 935 876 782 681
All derivatives are entered into either in terms of asset and liability management strategies, defined as economic hedging activities, or on a back to back basis.
The nominal amount disclosed represents the gross value of total outstanding contracts at year‑end and does not reflect the amount receivable or payable under the contract. The nominal amount should be viewed only as a means of assessing the extent of the exposure to the derivative contracts.
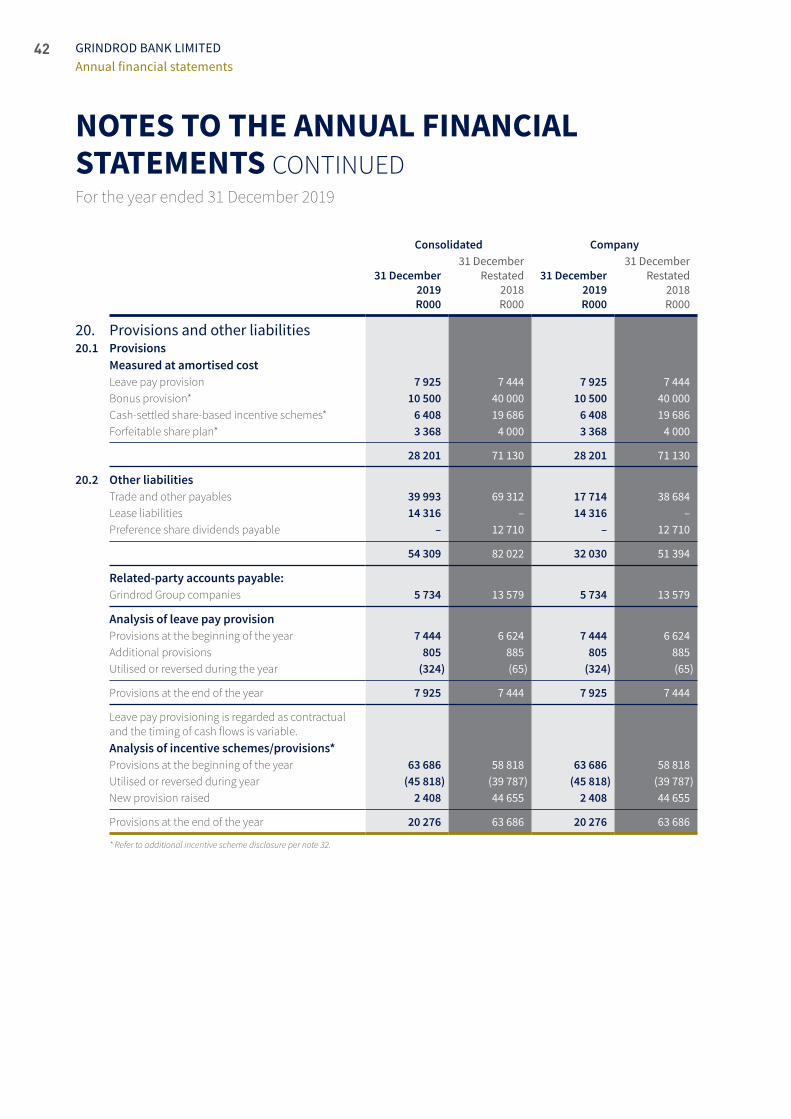
42
NOTES TO THE ANNUAL FINANCIAL STATEMENTS CONTINUEDFor the year ended 31 December 2019
GRINDROD BANK LIMITEDAnnual financial statements
Consolidated Company
31 December 2019R000
31 DecemberRestated
2018R000
31 December 2019R000
31 DecemberRestated
2018R000
20. Provisions and other liabilities20.1 Provisions
Measured at amortised costLeave pay provision 7 925 7 444 7 925 7 444Bonus provision* 10 500 40 000 10 500 40 000Cash‑settled share‑based incentive schemes* 6 408 19 686 6 408 19 686Forfeitable share plan* 3 368 4 000 3 368 4 000
28 201 71 130 28 201 71 130
20.2 Other liabilitiesTrade and other payables 39 993 69 312 17 714 38 684Lease liabilities 14 316 – 14 316 –Preference share dividends payable – 12 710 – 12 710
54 309 82 022 32 030 51 394
Related-party accounts payable:Grindrod Group companies 5 734 13 579 5 734 13 579
Analysis of leave pay provisionProvisions at the beginning of the year 7 444 6 624 7 444 6 624 Additional provisions 805 885 805 885Utilised or reversed during the year (324) (65) (324) (65)
Provisions at the end of the year 7 925 7 444 7 925 7 444
Leave pay provisioning is regarded as contractual and the timing of cash flows is variable.Analysis of incentive schemes/provisions*Provisions at the beginning of the year 63 686 58 818 63 686 58 818 Utilised or reversed during year (45 818) (39 787) (45 818) (39 787)New provision raised 2 408 44 655 2 408 44 655
Provisions at the end of the year 20 276 63 686 20 276 63 686
* Refer to additional incentive scheme disclosure per note 32.
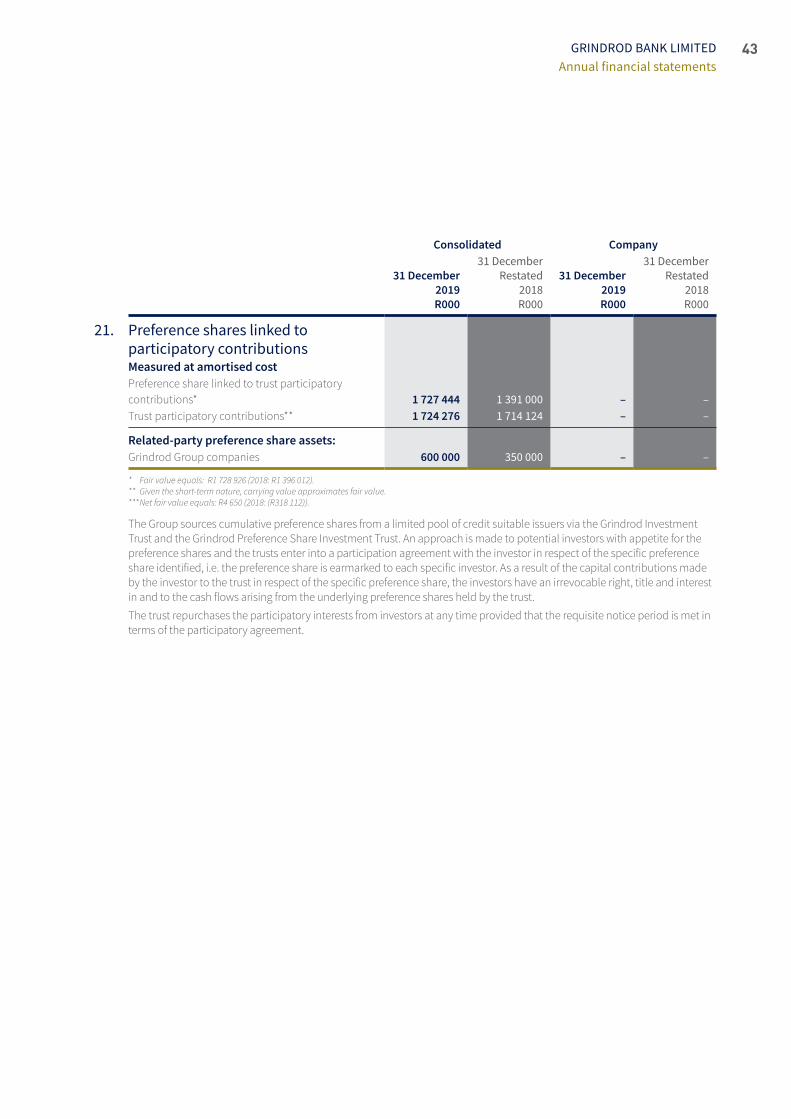
43GRINDROD BANK LIMITEDAnnual financial statements
Consolidated Company
31 December 2019R000
31 DecemberRestated
2018R000
31 December 2019R000
31 DecemberRestated
2018R000
21. Preference shares linked to participatory contributionsMeasured at amortised costPreference share linked to trust participatory contributions* 1 727 444 1 391 000 – –Trust participatory contributions** 1 724 276 1 714 124 – –
Related-party preference share assets:Grindrod Group companies 600 000 350 000 – –
* Fair value equals: R1 728 926 (2018: R1 396 012).** Given the short-term nature, carrying value approximates fair value.*** Net fair value equals: R4 650 (2018: (R318 112)).
The Group sources cumulative preference shares from a limited pool of credit suitable issuers via the Grindrod Investment Trust and the Grindrod Preference Share Investment Trust. An approach is made to potential investors with appetite for the preference shares and the trusts enter into a participation agreement with the investor in respect of the specific preference share identified, i.e. the preference share is earmarked to each specific investor. As a result of the capital contributions made by the investor to the trust in respect of the specific preference share, the investors have an irrevocable right, title and interest in and to the cash flows arising from the underlying preference shares held by the trust.
The trust repurchases the participatory interests from investors at any time provided that the requisite notice period is met in terms of the participatory agreement.
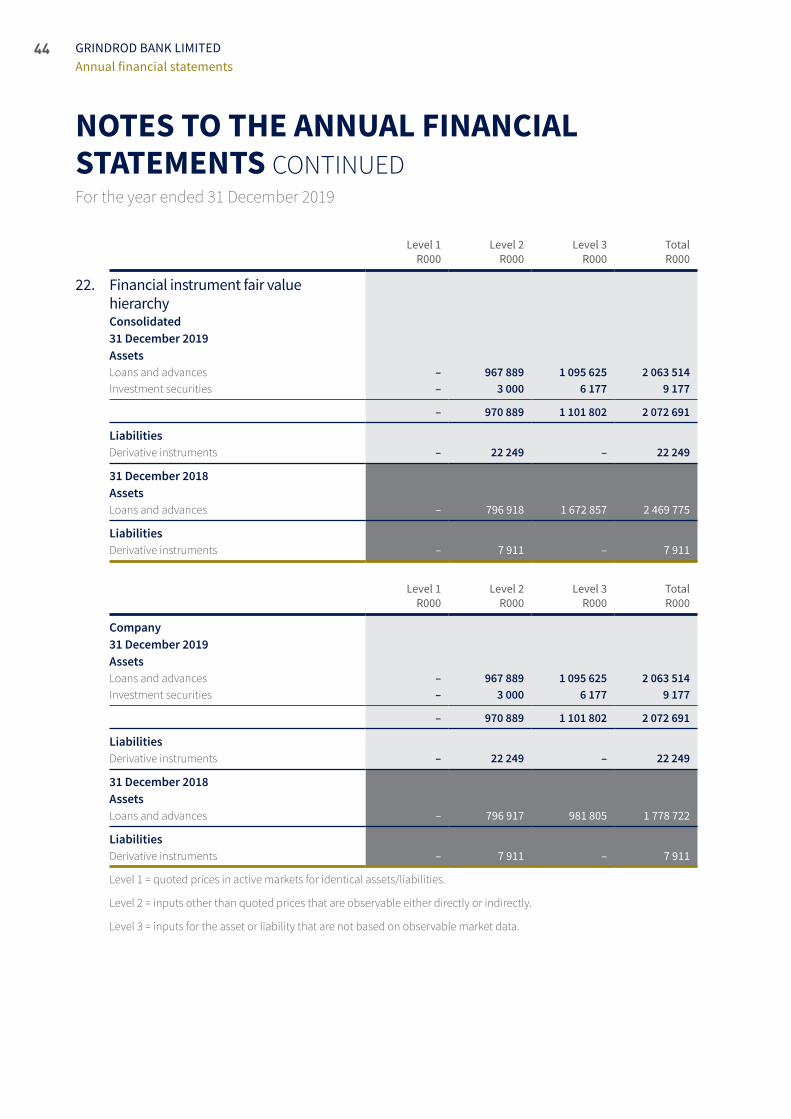
44
NOTES TO THE ANNUAL FINANCIAL STATEMENTS CONTINUEDFor the year ended 31 December 2019
GRINDROD BANK LIMITEDAnnual financial statements
Level 1R000
Level 2R000
Level 3R000
TotalR000
22. Financial instrument fair value hierarchyConsolidated31 December 2019AssetsLoans and advances – 967 889 1 095 625 2 063 514Investment securities – 3 000 6 177 9 177
– 970 889 1 101 802 2 072 691
LiabilitiesDerivative instruments – 22 249 – 22 249
31 December 2018AssetsLoans and advances – 796 918 1 672 857 2 469 775
LiabilitiesDerivative instruments – 7 911 – 7 911
Level 1R000
Level 2R000
Level 3R000
TotalR000
Company31 December 2019AssetsLoans and advances – 967 889 1 095 625 2 063 514Investment securities – 3 000 6 177 9 177
– 970 889 1 101 802 2 072 691
LiabilitiesDerivative instruments – 22 249 – 22 249
31 December 2018AssetsLoans and advances – 796 917 981 805 1 778 722
LiabilitiesDerivative instruments – 7 911 – 7 911
Level 1 = quoted prices in active markets for identical assets/liabilities.
Level 2 = inputs other than quoted prices that are observable either directly or indirectly.
Level 3 = inputs for the asset or liability that are not based on observable market data.
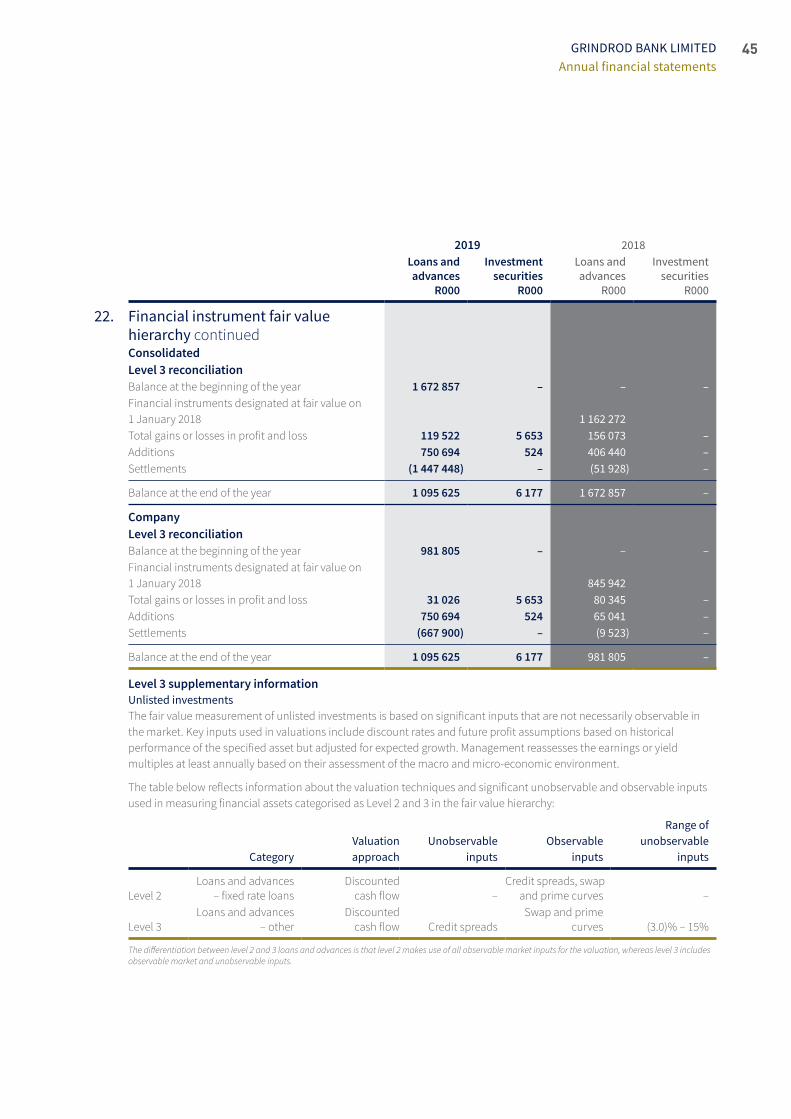
45GRINDROD BANK LIMITEDAnnual financial statements
2019 2018Loans and advances
R000
Investment securities
R000
Loans and advances
R000
Investment securities
R000
22. Financial instrument fair value hierarchy continuedConsolidatedLevel 3 reconciliationBalance at the beginning of the year 1 672 857 – – –Financial instruments designated at fair value on 1 January 2018 1 162 272 Total gains or losses in profit and loss 119 522 5 653 156 073 –Additions 750 694 524 406 440 –Settlements (1 447 448) – (51 928) –
Balance at the end of the year 1 095 625 6 177 1 672 857 –
CompanyLevel 3 reconciliationBalance at the beginning of the year 981 805 – – –Financial instruments designated at fair value on 1 January 2018 845 942 Total gains or losses in profit and loss 31 026 5 653 80 345 –Additions 750 694 524 65 041 –Settlements (667 900) – (9 523) –
Balance at the end of the year 1 095 625 6 177 981 805 –
Level 3 supplementary informationUnlisted investmentsThe fair value measurement of unlisted investments is based on significant inputs that are not necessarily observable in the market. Key inputs used in valuations include discount rates and future profit assumptions based on historical performance of the specified asset but adjusted for expected growth. Management reassesses the earnings or yield multiples at least annually based on their assessment of the macro and micro‑economic environment.
The table below reflects information about the valuation techniques and significant unobservable and observable inputs used in measuring financial assets categorised as Level 2 and 3 in the fair value hierarchy:
CategoryValuation approach
Unobservable inputs
Observable inputs
Range of unobservable
inputs
Level 2Loans and advances
– fixed rate loansDiscounted
cash flow –Credit spreads, swap
and prime curves –
Level 3Loans and advances
– otherDiscounted
cash flow Credit spreadsSwap and prime
curves (3.0)% – 15%
The differentiation between level 2 and 3 loans and advances is that level 2 makes use of all observable market inputs for the valuation, whereas level 3 includes observable market and unobservable inputs.
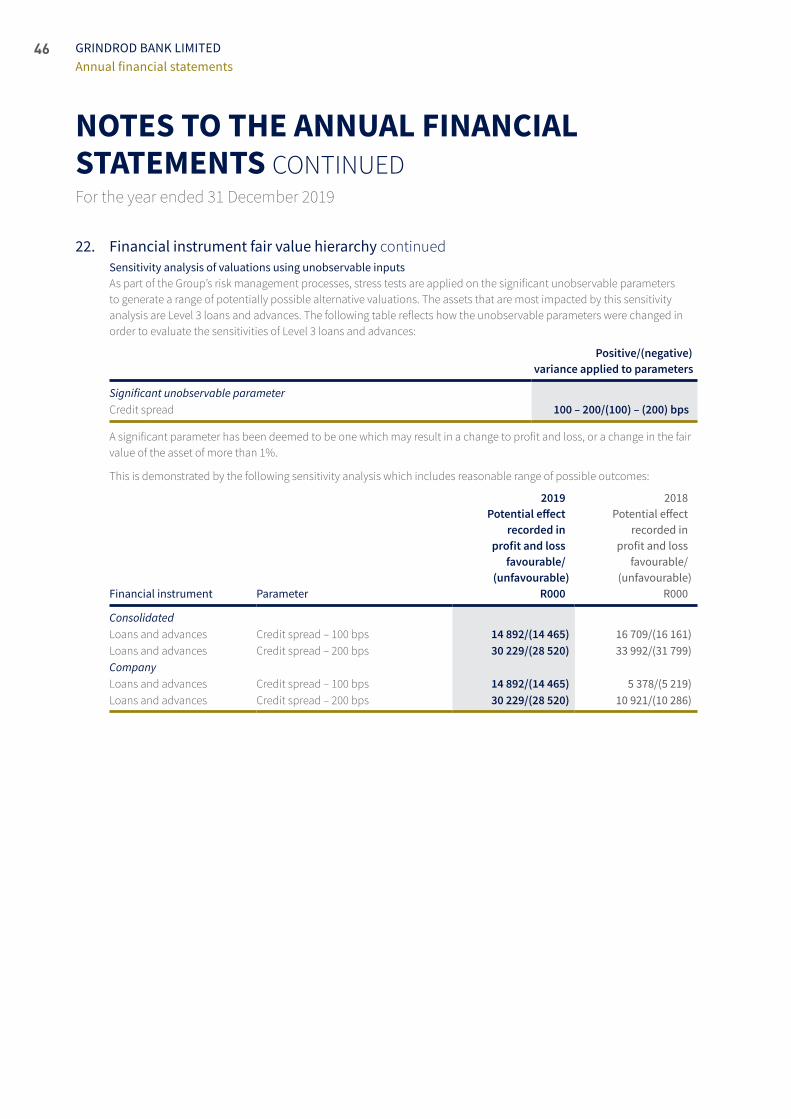
46
NOTES TO THE ANNUAL FINANCIAL STATEMENTS CONTINUEDFor the year ended 31 December 2019
GRINDROD BANK LIMITEDAnnual financial statements
22. Financial instrument fair value hierarchy continuedSensitivity analysis of valuations using unobservable inputs As part of the Group’s risk management processes, stress tests are applied on the significant unobservable parameters to generate a range of potentially possible alternative valuations. The assets that are most impacted by this sensitivity analysis are Level 3 loans and advances. The following table reflects how the unobservable parameters were changed in order to evaluate the sensitivities of Level 3 loans and advances:
Positive/(negative) variance applied to parameters
SignificantunobservableparameterCredit spread 100 – 200/(100) – (200) bps
A significant parameter has been deemed to be one which may result in a change to profit and loss, or a change in the fair value of the asset of more than 1%.
This is demonstrated by the following sensitivity analysis which includes reasonable range of possible outcomes:
Financial instrument Parameter
2019Potential effect
recorded inprofit and loss
favourable/(unfavourable)
R000
2018 Potential effect
recorded in profit and loss
favourable/(unfavourable)
R000
ConsolidatedLoans and advances Credit spread – 100 bps 14 892/(14 465) 16 709/(16 161) Loans and advances Credit spread – 200 bps 30 229/(28 520) 33 992/(31 799)CompanyLoans and advances Credit spread – 100 bps 14 892/(14 465) 5 378/(5 219)Loans and advances Credit spread – 200 bps 30 229/(28 520) 10 921/(10 286)
47GRINDROD BANK LIMITEDAnnual financial statements
23. Financial instruments risk management: credit riskThe risk of financial loss resulting from failure of a counterparty to an asset, for any reason, to fully honour its financial and contractual obligations.
Credit risk managementSound credit risk management involves prudently managing the risk and reward relationship and controlling and minimising credit risks across a variety of dimensions, such as quality, concentration, maturity and security. The credit committee is responsible for ensuring that the credit approval processes are stringent and for monitoring large exposures, associated exposures, sectoral exposure and any irregular or problem loans. Credit risk is monitored at an individual and at an aggregated exposure level. Our target market typically includes SME businesses with a focused client‑centric approach. New deal approval is subject to specified limits of authority which are aggregated at a client group level, i.e. credit (R10 million), credit exco (R30 million), credit risk committee (R50 million) and the board (above R50 million).
Maximum exposure to credit riskMaximum exposure to credit risk at year‑end is stated before taking into account any collateral or other credit enhancement and after taking into account impairments and netting where applicable. For financial assets recognised on the statement of financial position, the maximum exposure to credit risk equals the carrying amount. For financial commitments and guarantees, the maximum exposure to credit risk is the maximum amount the Group would have to pay to perform in terms of the commitment.
Definitions Past due
Exposures are considered past due where the facility has expired and the Group is not considering renewal of the facility or where expected cash flows on the facility are more than two months in arrears. Past due exposures are considered impaired and a specific impairment is raised based on the carrying amount less the expected realisable value of the security held, but as a minimum, the impairment is equivalent to any regulatory requirement.
The Group has had a low default and bad debt history and as a result has limited internal statistics for the calculation of ECLs. The Group’s ECL model includes various factors and key areas of professional judgement which are reviewed and approved by both the credit committee and risk and capital management committee.
Credit risk mitigationThe Group does not have material netting arrangements and it does not currently use credit derivatives to mitigate credit risk.
The Group values property assets on a cyclical basis using a desktop approach and physical valuations are performed where appropriate or necessary. The value of listed assets is tracked on an ongoing basis and unlisted investments and other security assets are valued periodically where significant reliance is placed on the security.
The Group actively manages and monitors risk concentrations resulting from credit mitigation activities and these tend to arise where guarantees have been taken in addition to other classes of security. The Group tends to deal with small to medium‑sized corporates and guarantees and suretyships tend to be provided by similar types of entities.
48
NOTES TO THE ANNUAL FINANCIAL STATEMENTS CONTINUEDFor the year ended 31 December 2019
GRINDROD BANK LIMITEDAnnual financial statements
23. Financial instruments risk management: credit risk continued Credit risk mitigation continued
CounterpartyriskThe risk that a counterparty to a transaction fails to perform in terms of the contract resulting in a potential cost to replace the cash flow or the risk that a counterparty fails to honour an undertaking for payment or delivery in terms of unsettled transactions.
The Group is extremely cautious when selecting counterparties to transactions and formal limits are established for counterparties to asset or hedging transactions.
The Group does not hold collateral for interest rate swaps, all which have been entered into with the major South African banks.
The Group has adopted the Basel III standardised approach for the measurement of its exposure to credit risk.
ConcentrationriskThe risk of an uneven distribution of loans and advances to individual borrowers, industries or services sectors and geographical regions which could result in significant credit losses.
The Group monitors concentration risk on an ongoing basis and ensures adequate diversification of exposure at account and underlying security level. Sufficient regard is also given to section 73 (Concentration Risk) of the Banks Act.
24. Financial instruments risk management: liquidity riskIn the banking environment liquidity risk may be defined as the risk of a bank not being able to repay its maturing deposits or meet its obligations under a loan agreement. Liquidity risk in a bank includes the risk of incurring excessively high interest costs or being forced to sell assets at a loss in order to meet obligations.
Liquidity risk managementThe Group has a prudent liquidity management policy and the asset and liability committee (ALCO) is responsible for monitoring the stability of funding, surplus cash or near cash assets, anticipated cash outflows, exposure to large depositors and exposure to connected parties. The Group is exposed to a maturity mismatch due to the duration of the lending book compared against the duration of the funding book. The Group has been well served by its prudent liquidity management policy, strong liquidity ratios, the stability of its deposit base and the high quality of the advances book and intends to continue to adopt a conservative liquidity policy in the future. In addition, the Group maintains a healthy level of easily liquifiable assets to adequately manage short‑term liquidity requirements.

49GRINDROD BANK LIMITEDAnnual financial statements
<3 monthsR000
>3 months <6 months
R000
>6 months <1 year
R000
>1 year <5 years
R000>5 years
R000
Non-contrac-
tualR000
TotalR000
24. Financial instruments risk management: liquidity risk continuedConsolidatedContractual maturity analysis31 December 2019Assets (discounted maturity)Property and equipment – – – – – 18 031 18 031 Investment securities – – – – – 9 177 9 177 Loans and advances 1 656 702 973 867 487 994 2 936 149 1 500 485 (138 744) 7 416 453Liquid assets and short‑term negotiable securities 549 212 1 929 729 – – – – 2 478 941 Cash and short–term funds 3 572 496 – – – – – 3 572 496 Deferred taxation – – – – – 24 947 24 947Preference shares – linked to trust participatory contributions 359 544 75 000 373 000 919 900 – – 1 727 444 Other assets 94 071 – – – – – 94 071
6 232 025 2 978 596 860 994 3 856 049 1 500 485 (86 589) 15 341 560
31 December 2019Liabilities (undiscounted maturity)Derivative instruments – 303 2 317 4 629 15 000 – 22 249 Deposits and funding instruments 9 763 279 827 061 598 801 953 383 – – 12 142 524 Other liabilities and provisions 68 195 – – – – – 68 195 Lease liabilities 3 787 3 788 4 920 2 635 – – 15 130 Trust participatory contributions 1 295 555 277 448 170 172 – – – 1 743 175 Taxation (normal and deferred) 206 – – – – – 206
11 131 022 1 108 600 776 210 960 648 15 000 – 13 991 480
Financing guarantees 538 231 – – – – – 538 231 Irrevocable unutilised facilities 204 553 – – – – – 204 553
11 873 806 1 108 600 776 210 960 648 15 000 – 14 734 264
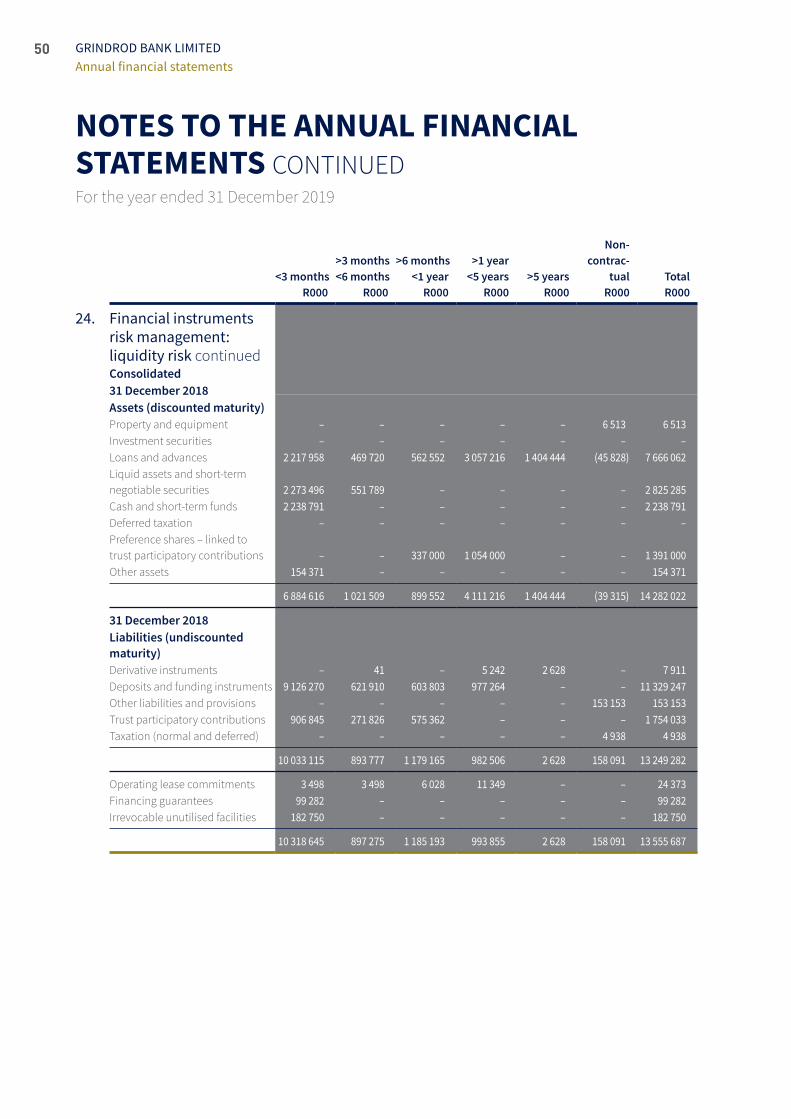
50
NOTES TO THE ANNUAL FINANCIAL STATEMENTS CONTINUEDFor the year ended 31 December 2019
GRINDROD BANK LIMITEDAnnual financial statements
<3 monthsR000
>3 months <6 months
R000
>6 months <1 year
R000
>1 year <5 years
R000>5 years
R000
Non-contrac-
tualR000
TotalR000
24. Financial instruments risk management: liquidity risk continuedConsolidated31 December 2018Assets (discounted maturity)Property and equipment – – – – – 6 513 6 513 Investment securities – – – – – – – Loans and advances 2 217 958 469 720 562 552 3 057 216 1 404 444 (45 828) 7 666 062 Liquid assets and short‑term negotiable securities 2 273 496 551 789 – – – – 2 825 285 Cash and short‑term funds 2 238 791 – – – – – 2 238 791 Deferred taxation – – – – – – – Preference shares – linked to trust participatory contributions – – 337 000 1 054 000 – – 1 391 000 Other assets 154 371 – – – – – 154 371
6 884 616 1 021 509 899 552 4 111 216 1 404 444 (39 315) 14 282 022
31 December 2018Liabilities (undiscounted maturity)Derivative instruments – 41 – 5 242 2 628 – 7 911 Deposits and funding instruments 9 126 270 621 910 603 803 977 264 – – 11 329 247 Other liabilities and provisions – – – – – 153 153 153 153 Trust participatory contributions 906 845 271 826 575 362 – – – 1 754 033 Taxation (normal and deferred) – – – – – 4 938 4 938
10 033 115 893 777 1 179 165 982 506 2 628 158 091 13 249 282
Operating lease commitments 3 498 3 498 6 028 11 349 – – 24 373 Financing guarantees 99 282 – – – – – 99 282 Irrevocable unutilised facilities 182 750 – – – – – 182 750
10 318 645 897 275 1 185 193 993 855 2 628 158 091 13 555 687
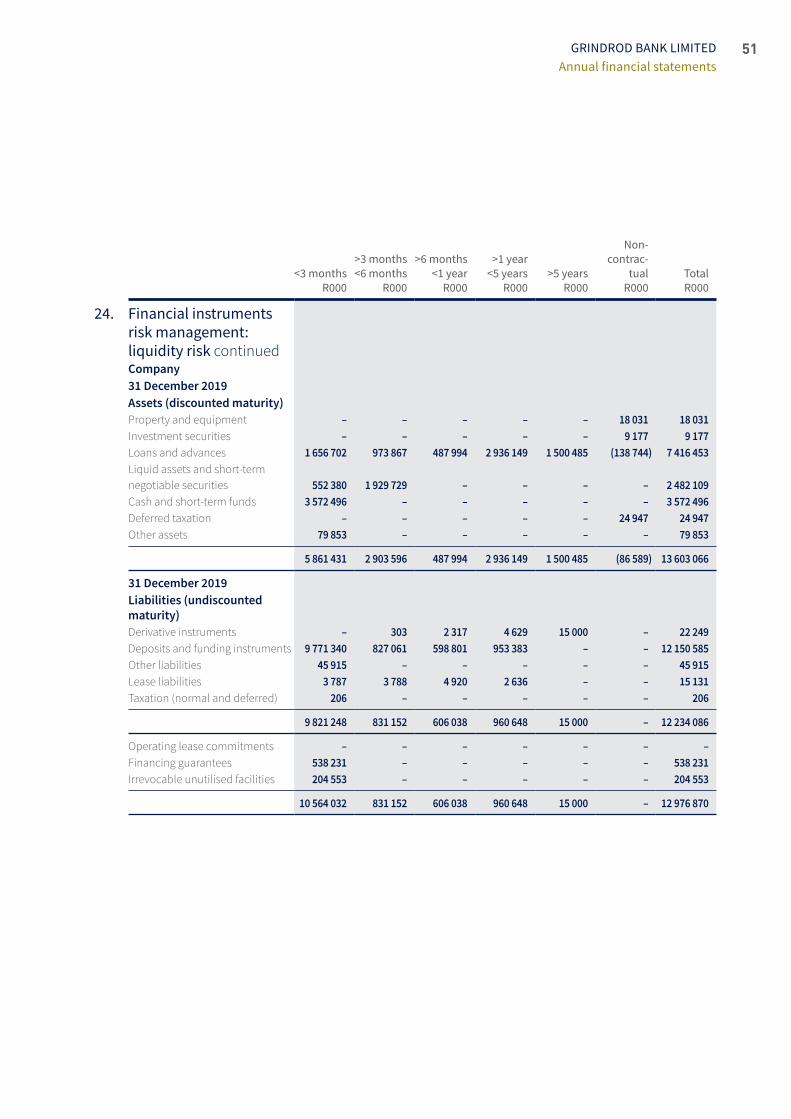
51GRINDROD BANK LIMITEDAnnual financial statements
<3 monthsR000
>3 months<6 months
R000
>6 months<1 year
R000
>1 year <5 years
R000>5 years
R000
Non-contrac-
tualR000
Total R000
24. Financial instruments risk management: liquidity risk continuedCompany31 December 2019Assets (discounted maturity)Property and equipment – – – – – 18 031 18 031 Investment securities – – – – – 9 177 9 177 Loans and advances 1 656 702 973 867 487 994 2 936 149 1 500 485 (138 744) 7 416 453Liquid assets and short‑term negotiable securities 552 380 1 929 729 – – – – 2 482 109 Cash and short‑term funds 3 572 496 – – – – – 3 572 496 Deferred taxation – – – – – 24 947 24 947Other assets 79 853 – – – – – 79 853
5 861 431 2 903 596 487 994 2 936 149 1 500 485 (86 589) 13 603 066
31 December 2019Liabilities (undiscounted maturity)Derivative instruments – 303 2 317 4 629 15 000 – 22 249 Deposits and funding instruments 9 771 340 827 061 598 801 953 383 – – 12 150 585 Other liabilities 45 915 – – – – – 45 915 Lease liabilities 3 787 3 788 4 920 2 636 – – 15 131Taxation (normal and deferred) 206 – – – – – 206
9 821 248 831 152 606 038 960 648 15 000 – 12 234 086
Operating lease commitments – – – – – – – Financing guarantees 538 231 – – – – – 538 231 Irrevocable unutilised facilities 204 553 – – – – – 204 553
10 564 032 831 152 606 038 960 648 15 000 – 12 976 870
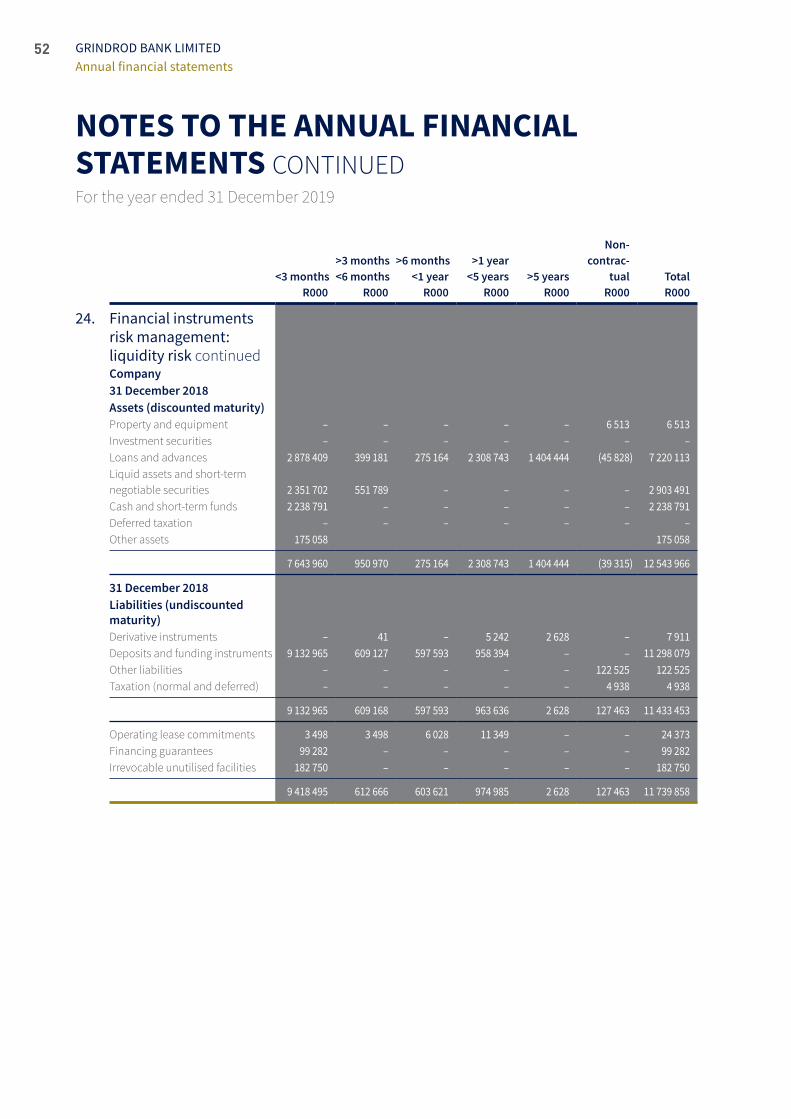
52
NOTES TO THE ANNUAL FINANCIAL STATEMENTS CONTINUEDFor the year ended 31 December 2019
GRINDROD BANK LIMITEDAnnual financial statements
<3 monthsR000
>3 months<6 months
R000
>6 months<1 year
R000
>1 year <5 years
R000>5 years
R000
Non-contrac-
tualR000
Total R000
24. Financial instruments risk management: liquidity risk continuedCompany31 December 2018Assets (discounted maturity)Property and equipment – – – – – 6 513 6 513 Investment securities – – – – – – – Loans and advances 2 878 409 399 181 275 164 2 308 743 1 404 444 (45 828) 7 220 113 Liquid assets and short‑term negotiable securities 2 351 702 551 789 – – – – 2 903 491 Cash and short‑term funds 2 238 791 – – – – – 2 238 791 Deferred taxation – – – – – – – Other assets 175 058 175 058
7 643 960 950 970 275 164 2 308 743 1 404 444 (39 315) 12 543 966
31 December 2018Liabilities (undiscounted maturity)Derivative instruments – 41 – 5 242 2 628 – 7 911 Deposits and funding instruments 9 132 965 609 127 597 593 958 394 – – 11 298 079 Other liabilities – – – – – 122 525 122 525 Taxation (normal and deferred) – – – – – 4 938 4 938
9 132 965 609 168 597 593 963 636 2 628 127 463 11 433 453
Operating lease commitments 3 498 3 498 6 028 11 349 – – 24 373 Financing guarantees 99 282 – – – – – 99 282 Irrevocable unutilised facilities 182 750 – – – – – 182 750
9 418 495 612 666 603 621 974 985 2 628 127 463 11 739 858
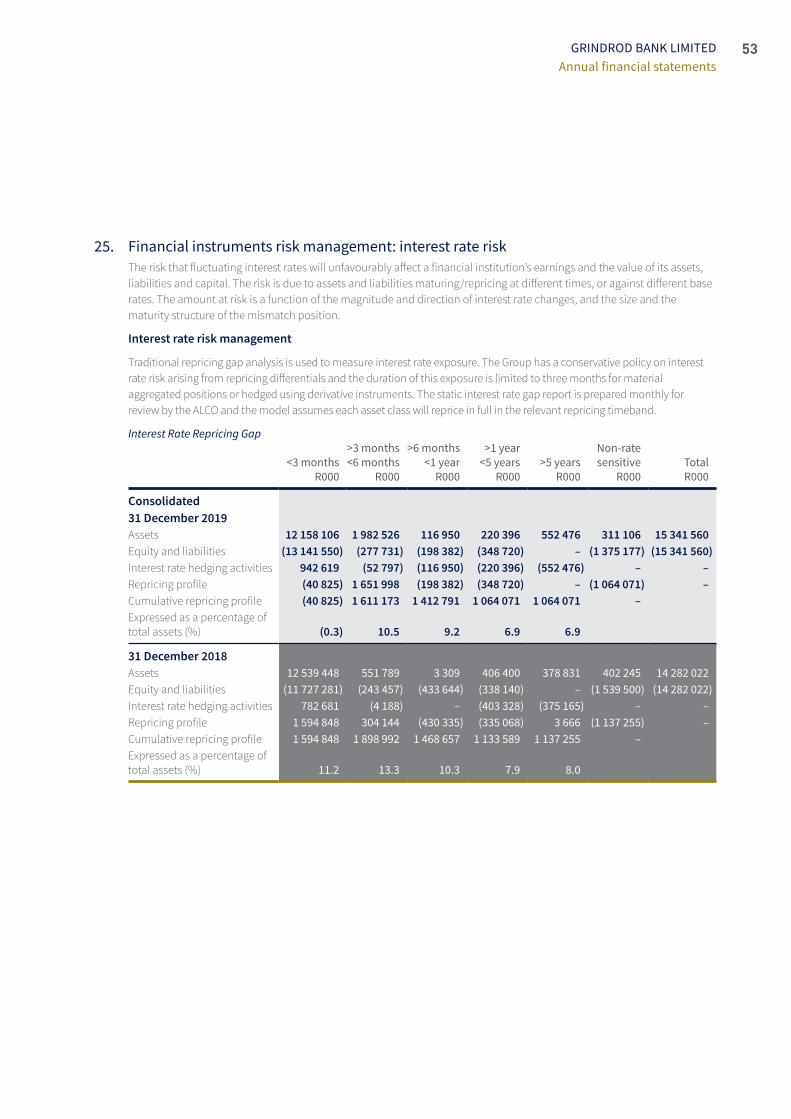
53GRINDROD BANK LIMITEDAnnual financial statements
25. Financial instruments risk management: interest rate riskThe risk that fluctuating interest rates will unfavourably affect a financial institution’s earnings and the value of its assets, liabilities and capital. The risk is due to assets and liabilities maturing/repricing at different times, or against different base rates. The amount at risk is a function of the magnitude and direction of interest rate changes, and the size and the maturity structure of the mismatch position.
Interest rate risk management
Traditional repricing gap analysis is used to measure interest rate exposure. The Group has a conservative policy on interest rate risk arising from repricing differentials and the duration of this exposure is limited to three months for material aggregated positions or hedged using derivative instruments. The static interest rate gap report is prepared monthly for review by the ALCO and the model assumes each asset class will reprice in full in the relevant repricing timeband.
InterestRateRepricingGap
<3 months R000
>3 months<6 months
R000
>6 months<1 year
R000
>1 year<5 years
R000>5 years
R000
Non-rate sensitive
R000Total R000
Consolidated31 December 2019Assets 12 158 106 1 982 526 116 950 220 396 552 476 311 106 15 341 560Equity and liabilities (13 141 550) (277 731) (198 382) (348 720) – (1 375 177) (15 341 560)Interest rate hedging activities 942 619 (52 797) (116 950) (220 396) (552 476) – –Repricing profile (40 825) 1 651 998 (198 382) (348 720) – (1 064 071) –Cumulative repricing profile (40 825) 1 611 173 1 412 791 1 064 071 1 064 071 –Expressed as a percentage of total assets (%) (0.3) 10.5 9.2 6.9 6.9
31 December 2018Assets 12 539 448 551 789 3 309 406 400 378 831 402 245 14 282 022 Equity and liabilities (11 727 281) (243 457) (433 644) (338 140) – (1 539 500) (14 282 022)Interest rate hedging activities 782 681 (4 188) – (403 328) (375 165) – –Repricing profile 1 594 848 304 144 (430 335) (335 068) 3 666 (1 137 255) –Cumulative repricing profile 1 594 848 1 898 992 1 468 657 1 133 589 1 137 255 –Expressed as a percentage of total assets (%) 11.2 13.3 10.3 7.9 8.0
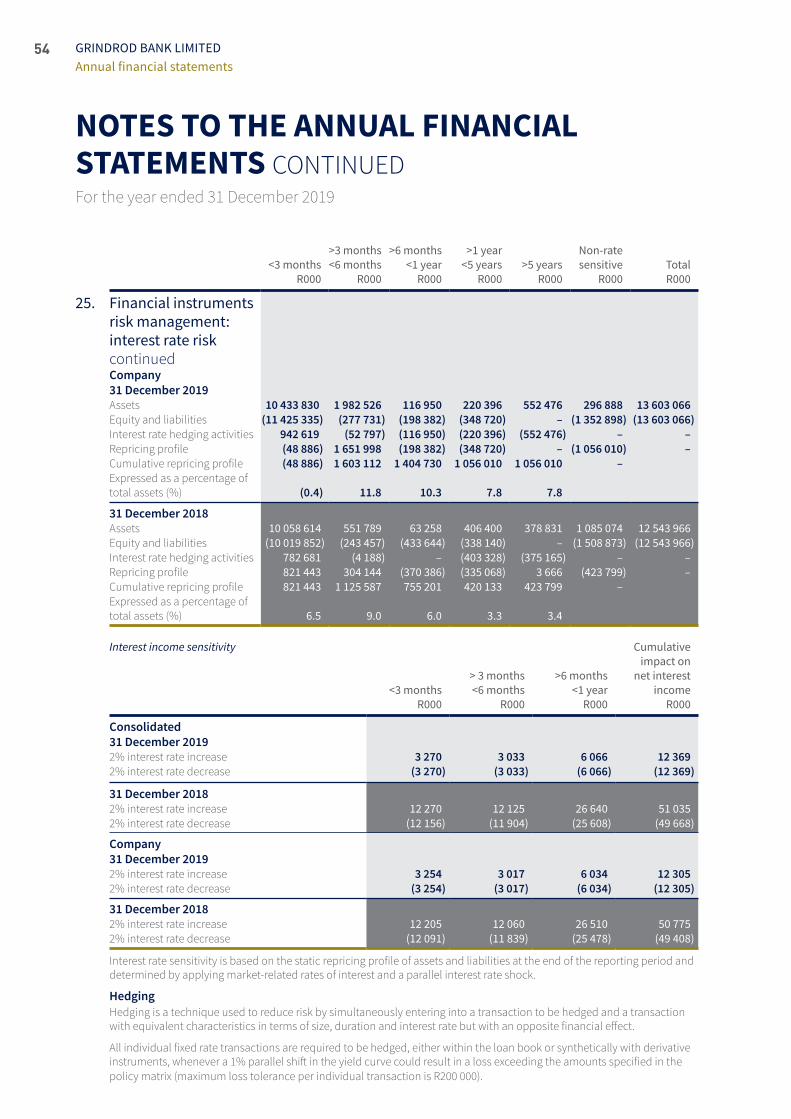
54
NOTES TO THE ANNUAL FINANCIAL STATEMENTS CONTINUEDFor the year ended 31 December 2019
GRINDROD BANK LIMITEDAnnual financial statements
<3 monthsR000
>3 months<6 months
R000
>6 months<1 year
R000
>1 year<5 years
R000>5 years
R000
Non-ratesensitive
R000Total R000
25. Financial instruments risk management: interest rate risk continuedCompany31 December 2019Assets 10 433 830 1 982 526 116 950 220 396 552 476 296 888 13 603 066Equity and liabilities (11 425 335) (277 731) (198 382) (348 720) – (1 352 898) (13 603 066)Interest rate hedging activities 942 619 (52 797) (116 950) (220 396) (552 476) – –Repricing profile (48 886) 1 651 998 (198 382) (348 720) – (1 056 010) –Cumulative repricing profile (48 886) 1 603 112 1 404 730 1 056 010 1 056 010 –Expressed as a percentage of total assets (%) (0.4) 11.8 10.3 7.8 7.8
31 December 2018Assets 10 058 614 551 789 63 258 406 400 378 831 1 085 074 12 543 966 Equity and liabilities (10 019 852) (243 457) (433 644) (338 140) – (1 508 873) (12 543 966)Interest rate hedging activities 782 681 (4 188) – (403 328) (375 165) – –Repricing profile 821 443 304 144 (370 386) (335 068) 3 666 (423 799) –Cumulative repricing profile 821 443 1 125 587 755 201 420 133 423 799 –Expressed as a percentage of total assets (%) 6.5 9.0 6.0 3.3 3.4
Interestincomesensitivity
<3 monthsR000
> 3 months<6 months
R000
>6 months<1 year
R000
Cumulative impact on
net interest income
R000
Consolidated 31 December 20192% interest rate increase 3 270 3 033 6 066 12 3692% interest rate decrease (3 270) (3 033) (6 066) (12 369)
31 December 20182% interest rate increase 12 270 12 125 26 640 51 035 2% interest rate decrease (12 156) (11 904) (25 608) (49 668)
Company31 December 20192% interest rate increase 3 254 3 017 6 034 12 3052% interest rate decrease (3 254) (3 017) (6 034) (12 305)
31 December 20182% interest rate increase 12 205 12 060 26 510 50 775 2% interest rate decrease (12 091) (11 839) (25 478) (49 408)
Interest rate sensitivity is based on the static repricing profile of assets and liabilities at the end of the reporting period and determined by applying market‑related rates of interest and a parallel interest rate shock.
HedgingHedging is a technique used to reduce risk by simultaneously entering into a transaction to be hedged and a transaction with equivalent characteristics in terms of size, duration and interest rate but with an opposite financial effect.
All individual fixed rate transactions are required to be hedged, either within the loan book or synthetically with derivative instruments, whenever a 1% parallel shift in the yield curve could result in a loss exceeding the amounts specified in the policy matrix (maximum loss tolerance per individual transaction is R200 000).
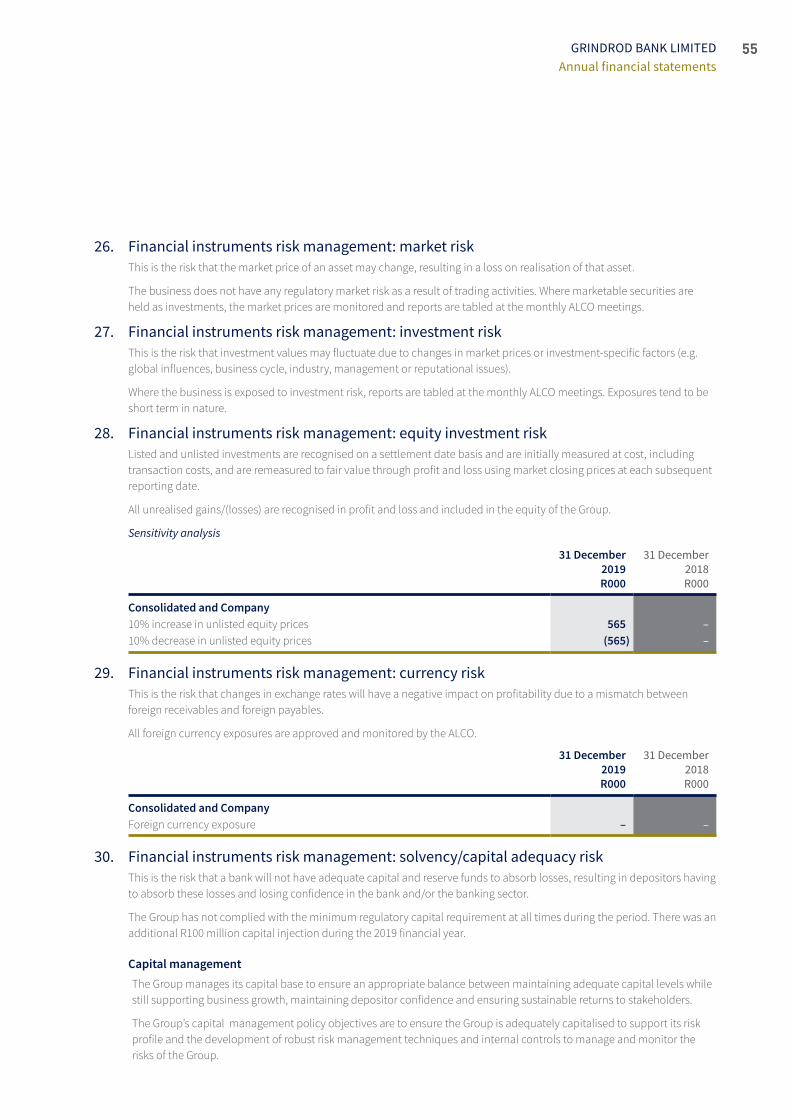
55GRINDROD BANK LIMITEDAnnual financial statements
26. Financial instruments risk management: market riskThis is the risk that the market price of an asset may change, resulting in a loss on realisation of that asset.
The business does not have any regulatory market risk as a result of trading activities. Where marketable securities are held as investments, the market prices are monitored and reports are tabled at the monthly ALCO meetings.
27. Financial instruments risk management: investment riskThis is the risk that investment values may fluctuate due to changes in market prices or investment‑specific factors (e.g. global influences, business cycle, industry, management or reputational issues).
Where the business is exposed to investment risk, reports are tabled at the monthly ALCO meetings. Exposures tend to be short term in nature.
28. Financial instruments risk management: equity investment riskListed and unlisted investments are recognised on a settlement date basis and are initially measured at cost, including transaction costs, and are remeasured to fair value through profit and loss using market closing prices at each subsequent reporting date.
All unrealised gains/(losses) are recognised in profit and loss and included in the equity of the Group.
Sensitivityanalysis
31 December 2019R000
31 December 2018R000
Consolidated and Company10% increase in unlisted equity prices 565 –10% decrease in unlisted equity prices (565) –
29. Financial instruments risk management: currency riskThis is the risk that changes in exchange rates will have a negative impact on profitability due to a mismatch between foreign receivables and foreign payables.
All foreign currency exposures are approved and monitored by the ALCO.
31 December 2019 R000
31 December 2018
R000
Consolidated and CompanyForeign currency exposure – –
30. Financial instruments risk management: solvency/capital adequacy riskThis is the risk that a bank will not have adequate capital and reserve funds to absorb losses, resulting in depositors having to absorb these losses and losing confidence in the bank and/or the banking sector.
The Group has not complied with the minimum regulatory capital requirement at all times during the period. There was an additional R100 million capital injection during the 2019 financial year.
Capital managementThe Group manages its capital base to ensure an appropriate balance between maintaining adequate capital levels while still supporting business growth, maintaining depositor confidence and ensuring sustainable returns to stakeholders.
The Group’s capital management policy objectives are to ensure the Group is adequately capitalised to support its risk profile and the development of robust risk management techniques and internal controls to manage and monitor the risks of the Group.
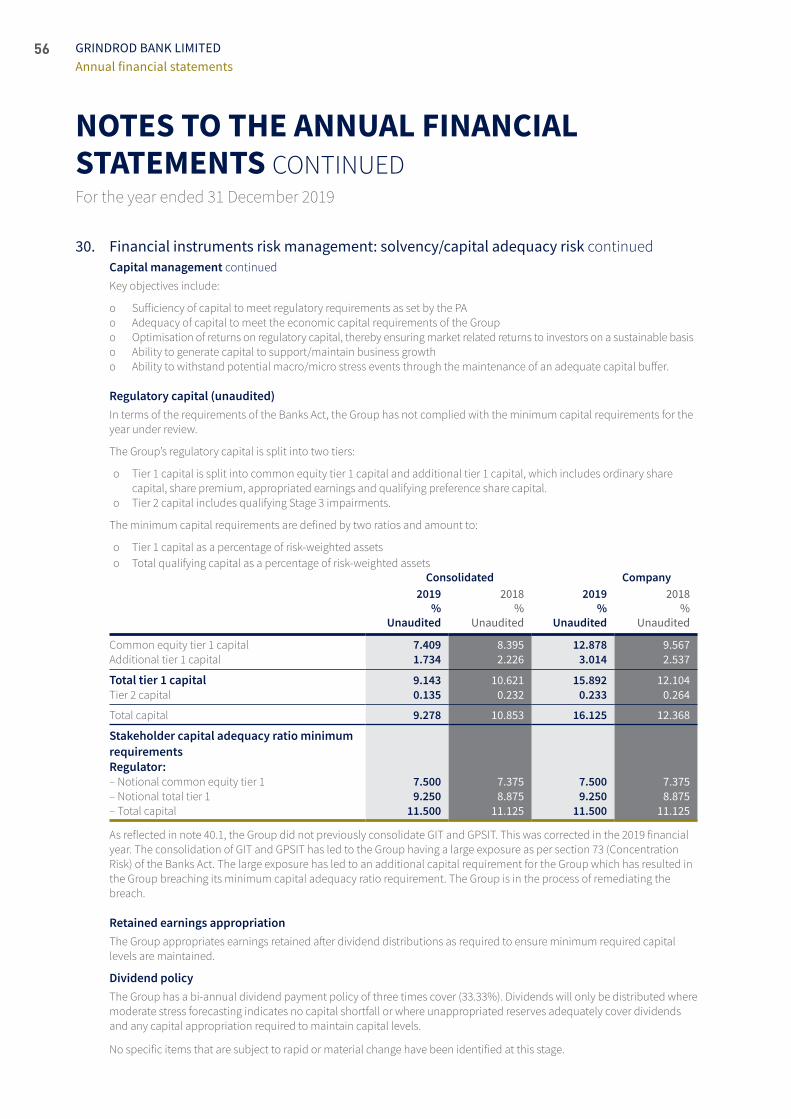
56
NOTES TO THE ANNUAL FINANCIAL STATEMENTS CONTINUEDFor the year ended 31 December 2019
GRINDROD BANK LIMITEDAnnual financial statements
30. Financial instruments risk management: solvency/capital adequacy risk continuedCapital management continuedKey objectives include:
о Sufficiency of capital to meet regulatory requirements as set by the PA о Adequacy of capital to meet the economic capital requirements of the Group о Optimisation of returns on regulatory capital, thereby ensuring market related returns to investors on a sustainable basis о Ability to generate capital to support/maintain business growth о Ability to withstand potential macro/micro stress events through the maintenance of an adequate capital buffer.
Regulatory capital (unaudited)In terms of the requirements of the Banks Act, the Group has not complied with the minimum capital requirements for the year under review.
The Group’s regulatory capital is split into two tiers:
о Tier 1 capital is split into common equity tier 1 capital and additional tier 1 capital, which includes ordinary share capital, share premium, appropriated earnings and qualifying preference share capital.
о Tier 2 capital includes qualifying Stage 3 impairments.
The minimum capital requirements are defined by two ratios and amount to:
о Tier 1 capital as a percentage of risk‑weighted assets о Total qualifying capital as a percentage of risk‑weighted assets
Consolidated Company2019
%Unaudited
2018%
Unaudited
2019%
Unaudited
2018%
Unaudited
Common equity tier 1 capital 7.409 8.395 12.878 9.567Additional tier 1 capital 1.734 2.226 3.014 2.537
Total tier 1 capital 9.143 10.621 15.892 12.104Tier 2 capital 0.135 0.232 0.233 0.264
Total capital 9.278 10.853 16.125 12.368
Stakeholder capital adequacy ratio minimum requirementsRegulator:– Notional common equity tier 1 7.500 7.375 7.500 7.375– Notional total tier 1 9.250 8.875 9.250 8.875– Total capital 11.500 11.125 11.500 11.125
As reflected in note 40.1, the Group did not previously consolidate GIT and GPSIT. This was corrected in the 2019 financial year. The consolidation of GIT and GPSIT has led to the Group having a large exposure as per section 73 (Concentration Risk) of the Banks Act. The large exposure has led to an additional capital requirement for the Group which has resulted in the Group breaching its minimum capital adequacy ratio requirement. The Group is in the process of remediating the breach.
Retained earnings appropriationThe Group appropriates earnings retained after dividend distributions as required to ensure minimum required capital levels are maintained.
Dividend policyThe Group has a bi‑annual dividend payment policy of three times cover (33.33%). Dividends will only be distributed where moderate stress forecasting indicates no capital shortfall or where unappropriated reserves adequately cover dividends and any capital appropriation required to maintain capital levels.
No specific items that are subject to rapid or material change have been identified at this stage.
57GRINDROD BANK LIMITEDAnnual financial statements
30. Financial instruments risk management: solvency/capital adequacy risk continuedDividend policy continuedRestrictions or other major impediments on the transfer of funds or qualifying capital within the banking entities:
о The only restriction on the transfer of funds or qualifying capital is in terms of the Banks Act
Additional public disclosure as required in terms of the Banks Act can be found on the Group’s website at https://www.grindrodbank.co.za.
31. Financial instruments risk management: operational riskThis is the risk that internal practices, policies and systems are not rigorous or sophisticated enough to cope with adverse market conditions or human or technological errors, including:
о Error, negligence or fraud о Failure to correctly measure or report risk о Lack of controls to prevent unauthorised or inappropriate transactions being made о Lack of understanding by key employees
It is the responsibility of management and ultimately the risk and capital management committee to assess operational procedures and controls and to ensure the adequacy thereof. Management is assisted by internal audit in this regard.
The Group has adopted the Basel III basic indicator approach for the measurement of operational risk.
32. Incentive schemesAt this stage no clawbacks or long‑term performance measures exist. The share option schemes have a deferral mechanism as a result of the vesting periods and are forfeited on resignation or dismissal from the Group.
Risk and compliance employees do not have specific incentive schemes linked to the performance of the business. However, they do share in the general short‑term incentive/bonus pool should there be one, and they may be granted share options.
No employees of the Group are considered to be material risk takers. The main business areas of the Group are:
о Corporate Banking о Treasury (activities limited to deposit taking and investment of surplus liquidity) о Corporate Finance о Retail Banking
Incentive schemes – variable short-termPerformance bonuses for key executives are based on the achievement of stretch profit targets and specified strategic and non‑specified value‑added objectives approved by the remuneration committee annually. Short‑term performance incentives for executives are capped at 100% of total cost of employment. All other employees who have performed according to predetermined criteria are incentivised where an incentive pool is justified and created.
Material key performance areas and risks accounted for when implementing remuneration measures are:
о Business profitability о Divisional profitability о Credit risk and bad debts о Adequacy of liquidity о New business generation and alignment with medium‑term strategy о Broad‑based black economic empowerment (B‑BBEE) criteria о Transformation о Safety, health, environment, risk and quality (SHERQ) о Compliance with the Financial Intelligence Centre Act (FICA) and other applicable regulations о Risk management о Implementation and maintenance of internal controls
Not all of the measures are quantifiable and variable incentive payments have a subjective element. There has been no significant change to the approach over the past year.
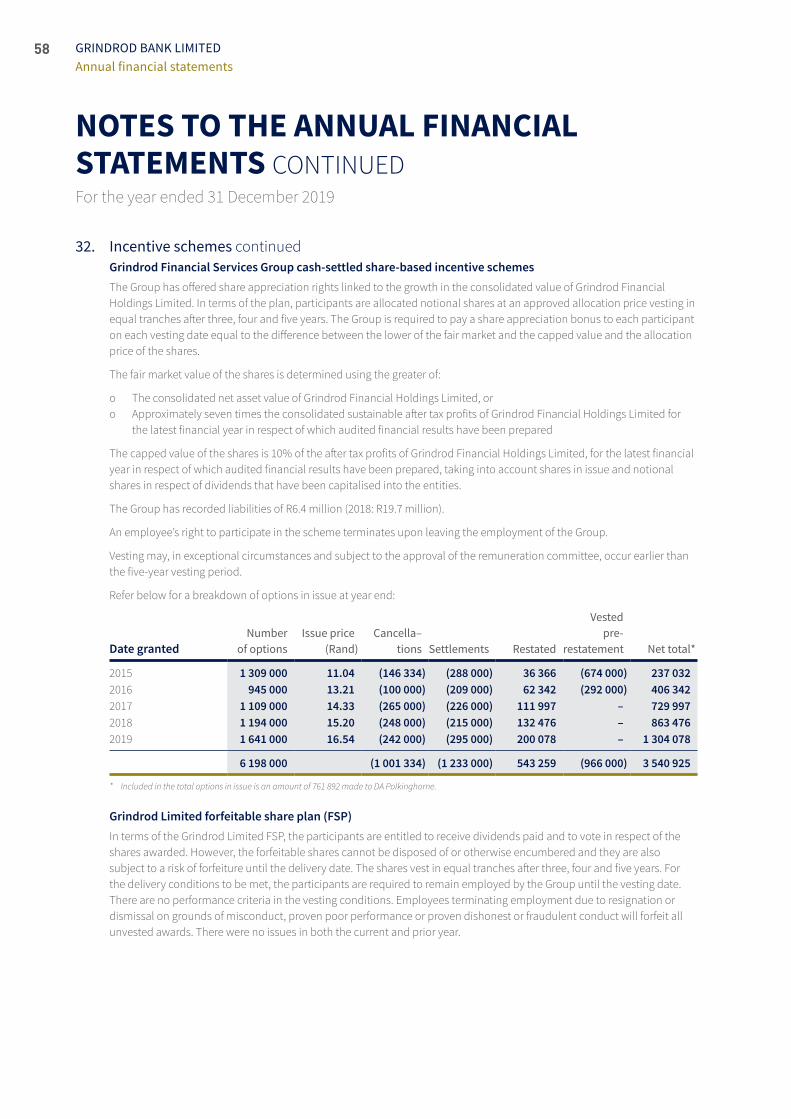
58
NOTES TO THE ANNUAL FINANCIAL STATEMENTS CONTINUEDFor the year ended 31 December 2019
GRINDROD BANK LIMITEDAnnual financial statements
32. Incentive schemes continuedGrindrod Financial Services Group cash-settled share-based incentive schemes The Group has offered share appreciation rights linked to the growth in the consolidated value of Grindrod Financial Holdings Limited. In terms of the plan, participants are allocated notional shares at an approved allocation price vesting in equal tranches after three, four and five years. The Group is required to pay a share appreciation bonus to each participant on each vesting date equal to the difference between the lower of the fair market and the capped value and the allocation price of the shares.
The fair market value of the shares is determined using the greater of:
о The consolidated net asset value of Grindrod Financial Holdings Limited, or о Approximately seven times the consolidated sustainable after tax profits of Grindrod Financial Holdings Limited for
the latest financial year in respect of which audited financial results have been prepared
The capped value of the shares is 10% of the after tax profits of Grindrod Financial Holdings Limited, for the latest financial year in respect of which audited financial results have been prepared, taking into account shares in issue and notional shares in respect of dividends that have been capitalised into the entities.
The Group has recorded liabilities of R6.4 million (2018: R19.7 million).
An employee’s right to participate in the scheme terminates upon leaving the employment of the Group.
Vesting may, in exceptional circumstances and subject to the approval of the remuneration committee, occur earlier than the five‑year vesting period.
Refer below for a breakdown of options in issue at year end:
Date grantedNumber
of optionsIssue price
(Rand)Cancella–
tions Settlements Restated
Vested pre-
restatement Net total*
2015 1 309 000 11.04 (146 334) (288 000) 36 366 (674 000) 237 0322016 945 000 13.21 (100 000) (209 000) 62 342 (292 000) 406 3422017 1 109 000 14.33 (265 000) (226 000) 111 997 – 729 9972018 1 194 000 15.20 (248 000) (215 000) 132 476 – 863 4762019 1 641 000 16.54 (242 000) (295 000) 200 078 – 1 304 078
6 198 000 (1 001 334) (1 233 000) 543 259 (966 000) 3 540 925
* Included in the total options in issue is an amount of 761 892 made to DA Polkinghorne.
Grindrod Limited forfeitable share plan (FSP)In terms of the Grindrod Limited FSP, the participants are entitled to receive dividends paid and to vote in respect of the shares awarded. However, the forfeitable shares cannot be disposed of or otherwise encumbered and they are also subject to a risk of forfeiture until the delivery date. The shares vest in equal tranches after three, four and five years. For the delivery conditions to be met, the participants are required to remain employed by the Group until the vesting date. There are no performance criteria in the vesting conditions. Employees terminating employment due to resignation or dismissal on grounds of misconduct, proven poor performance or proven dishonest or fraudulent conduct will forfeit all unvested awards. There were no issues in both the current and prior year.
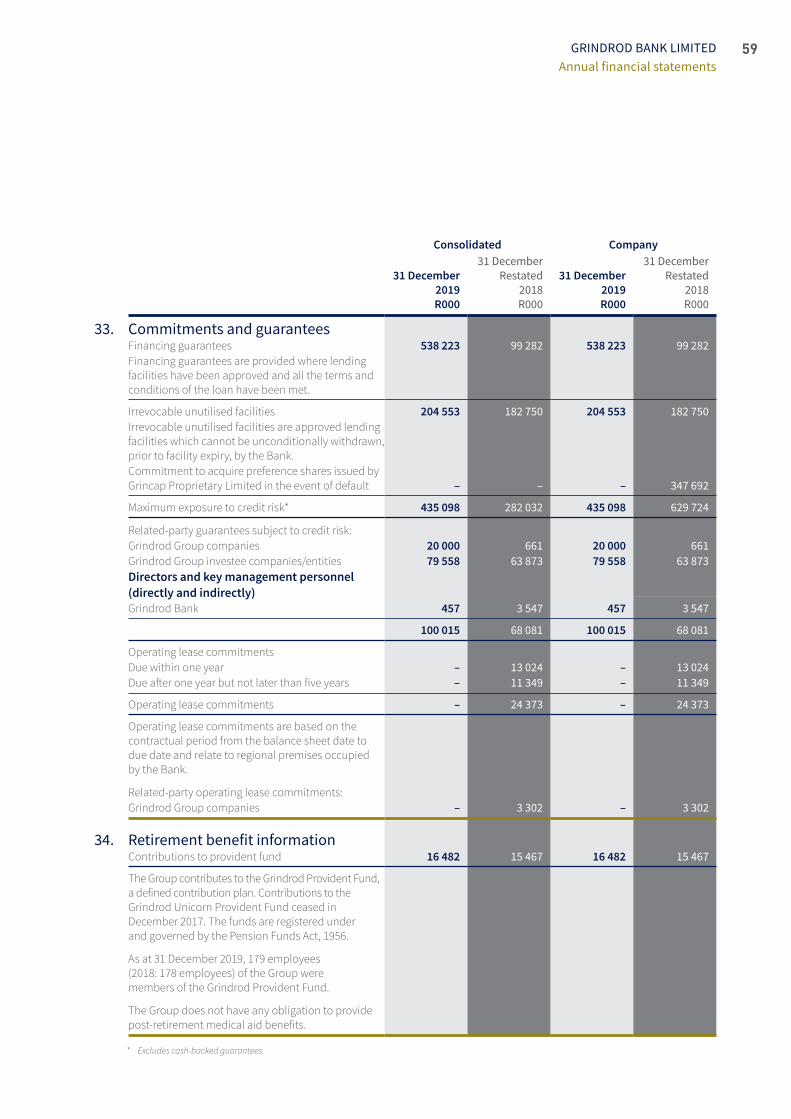
59GRINDROD BANK LIMITEDAnnual financial statements
Consolidated Company
31 December 2019R000
31 DecemberRestated
2018R000
31 December 2019R000
31 DecemberRestated
2018R000
33. Commitments and guarantees Financing guarantees 538 223 99 282 538 223 99 282
Financing guarantees are provided where lending facilities have been approved and all the terms and conditions of the loan have been met.
Irrevocable unutilised facilities 204 553 182 750 204 553 182 750 Irrevocable unutilised facilities are approved lending facilities which cannot be unconditionally withdrawn, prior to facility expiry, by the Bank.Commitment to acquire preference shares issued by Grincap Proprietary Limited in the event of default – – – 347 692
Maximum exposure to credit risk* 435 098 282 032 435 098 629 724
Related‑party guarantees subject to credit risk:Grindrod Group companies 20 000 661 20 000 661 Grindrod Group investee companies/entities 79 558 63 873 79 558 63 873 Directors and key management personnel (directly and indirectly)Grindrod Bank 457 3 547 457 3 547
100 015 68 081 100 015 68 081
Operating lease commitmentsDue within one year – 13 024 – 13 024 Due after one year but not later than five years – 11 349 – 11 349
Operating lease commitments – 24 373 – 24 373
Operating lease commitments are based on the contractual period from the balance sheet date to due date and relate to regional premises occupied by the Bank.
Related‑party operating lease commitments:Grindrod Group companies – 3 302 – 3 302
34. Retirement benefit informationContributions to provident fund 16 482 15 467 16 482 15 467
The Group contributes to the Grindrod Provident Fund, a defined contribution plan. Contributions to the Grindrod Unicorn Provident Fund ceased in December 2017. The funds are registered under and governed by the Pension Funds Act, 1956.
As at 31 December 2019, 179 employees (2018: 178 employees) of the Group were members of the Grindrod Provident Fund.
The Group does not have any obligation to provide post‑retirement medical aid benefits.
* Excludes cash-backed guarantees.

60
NOTES TO THE ANNUAL FINANCIAL STATEMENTS CONTINUEDFor the year ended 31 December 2019
GRINDROD BANK LIMITEDAnnual financial statements
Consolidated Company
31 December 2019R000
31 DecemberRestated
2018R000
31 December 2019R000
31 DecemberRestated
2018R000
35. Reconciliation of net profit before taxation to cash generated from operationsProfit before tax 82 663 216 561 82 663 216 561Adjusted for:Unrealised loss/(profit) on derivatives 14 338 (11 028) 14 338 (11 028)Unrealised (profit)/loss on loans at fair value 42 738 8 865 42 738 8 865 Depreciation and amortisation 17 521 5 363 17 521 5 363 Bad debts written off – 3 630 – 3 630 Increase in stage 3 ECL impairments against advances 23 816 20 896 23 816 20 896 (Decrease)/Increase in Stages 1 and 2 ECL provisions 1 298 (6 655) 1 298 (6 655)
Operating profit before working capital changes 182 374 237 632 182 374 237 632 Working capital changesDecrease in sundry receivables 14 666 3 759 14 666 206 813(Increase)/decrease in fee and dividend receivables 39 051 183 889 73 956 (37 840)Decrease/(increase) in accounts payable/lease liabilities (84 957) 32 624 (76 609) 13 371
Cash generated from operations 151 134 457 904 194 387 419 976
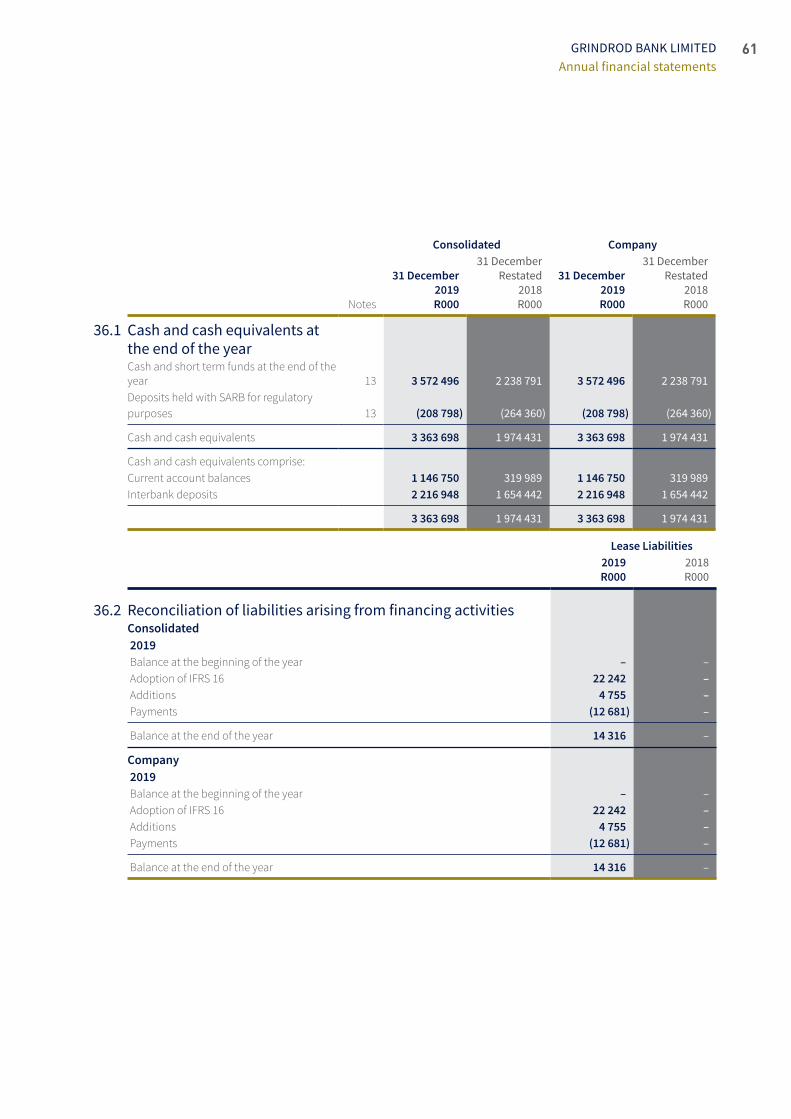
61GRINDROD BANK LIMITEDAnnual financial statements
Consolidated Company
Notes
31 December 2019R000
31 DecemberRestated
2018R000
31 December 2019R000
31 DecemberRestated
2018R000
36.1 Cash and cash equivalents at the end of the yearCash and short term funds at the end of the year 13 3 572 496 2 238 791 3 572 496 2 238 791 Deposits held with SARB for regulatory purposes 13 (208 798) (264 360) (208 798) (264 360)
Cash and cash equivalents 3 363 698 1 974 431 3 363 698 1 974 431
Cash and cash equivalents comprise:Current account balances 1 146 750 319 989 1 146 750 319 989 Interbank deposits 2 216 948 1 654 442 2 216 948 1 654 442
3 363 698 1 974 431 3 363 698 1 974 431
Lease Liabilities2019R000
2018R000
36.2 Reconciliation of liabilities arising from financing activitiesConsolidated 2019 Balance at the beginning of the year – – Adoption of IFRS 16 22 242 – Additions 4 755 – Payments (12 681) –
Balance at the end of the year 14 316 –
Company 2019 Balance at the beginning of the year – – Adoption of IFRS 16 22 242 – Additions 4 755 – Payments (12 681) –
Balance at the end of the year 14 316 –
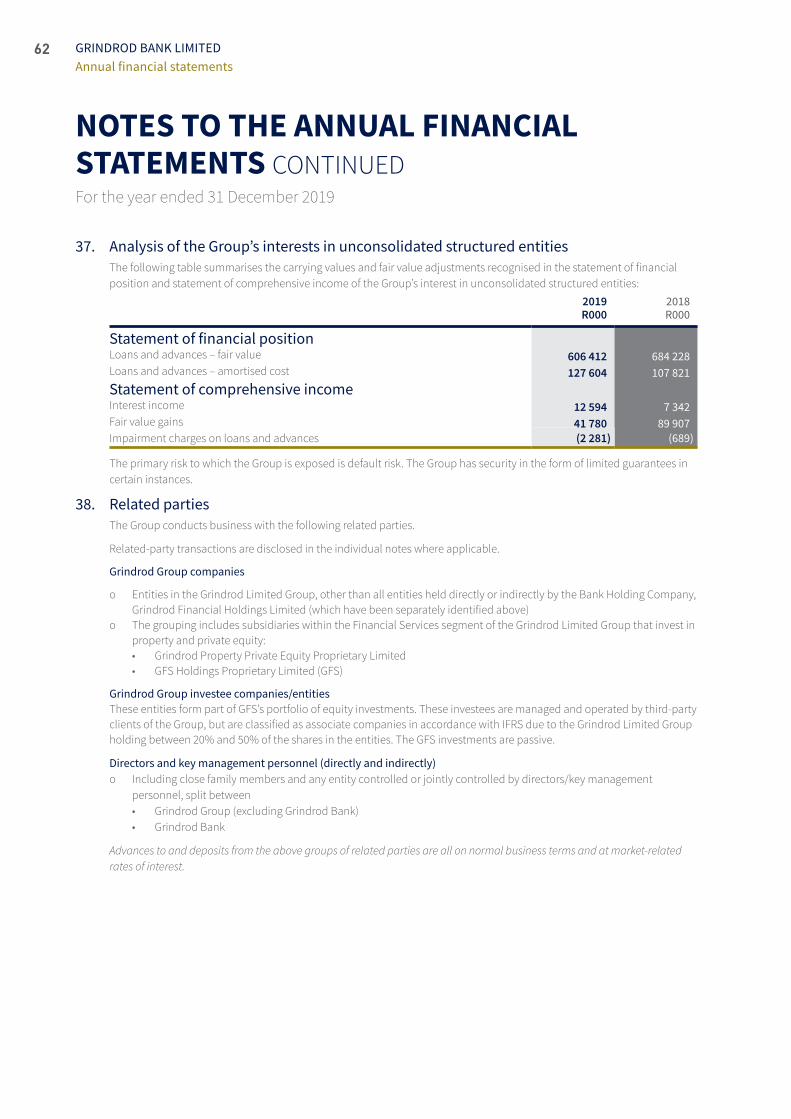
62 GRINDROD BANK LIMITEDAnnual financial statements
37. Analysis of the Group’s interests in unconsolidated structured entitiesThe following table summarises the carrying values and fair value adjustments recognised in the statement of financial position and statement of comprehensive income of the Group’s interest in unconsolidated structured entities:
2019R000
2018R000
Statement of financial positionLoans and advances – fair value 606 412 684 228Loans and advances – amortised cost 127 604 107 821Statement of comprehensive incomeInterest income 12 594 7 342 Fair value gains 41 780 89 907Impairment charges on loans and advances (2 281) (689)
The primary risk to which the Group is exposed is default risk. The Group has security in the form of limited guarantees in certain instances.
38. Related partiesThe Group conducts business with the following related parties.
Related‑party transactions are disclosed in the individual notes where applicable.
Grindrod Group companies
о Entities in the Grindrod Limited Group, other than all entities held directly or indirectly by the Bank Holding Company, Grindrod Financial Holdings Limited (which have been separately identified above)
о The grouping includes subsidiaries within the Financial Services segment of the Grindrod Limited Group that invest in property and private equity:• Grindrod Property Private Equity Proprietary Limited• GFS Holdings Proprietary Limited (GFS)
Grindrod Group investee companies/entitiesThese entities form part of GFS’s portfolio of equity investments. These investees are managed and operated by third‑party clients of the Group, but are classified as associate companies in accordance with IFRS due to the Grindrod Limited Group holding between 20% and 50% of the shares in the entities. The GFS investments are passive.
Directors and key management personnel (directly and indirectly) о Including close family members and any entity controlled or jointly controlled by directors/key management
personnel, split between• Grindrod Group (excluding Grindrod Bank)• Grindrod Bank
Advances to and deposits from the above groups of related parties are all on normal business terms and at market-related rates of interest.
NOTES TO THE ANNUAL FINANCIAL STATEMENTS CONTINUEDFor the year ended 31 December 2019

63GRINDROD BANK LIMITEDAnnual financial statements
38. Related parties continuedSummary of related-party transactions
Consolidated Company
Asdisclosedintheannualfinancialstatements:2019R000
2018R000
2019R000
2018R000
1. Interest and similar incomeGrindrod Group companies 24 427 3 337 24 427 3 337 Grindrod Group investee companies/entities 186 400 123 767 186 400 123 767 Directors and key management personnel (directly and indirectly)Grindrod Group (excluding Grindrod Bank) – 15 528 – 15 528 Grindrod Bank 381 814 381 814
211 208 143 446 211 208 143 446
2. Interest and similar expenseGrindrod Group companies 6 131 6 134 6 131 6 134 Grindrod Group investee companies/entities 1 114 1 467 1 114 1 467 Directors and key management personnel (directly and indirectly)Grindrod Group (excluding Grindrod Bank) – 21 – 21 Grindrod Bank 1 503 1 503
7 246 8 125 7 246 8 125
3. Fee incomeGrindrod Group companies 10 249 1 154 10 249 1 154 Grindrod Bank subsidiaries – – – 97 Grindrod Group investee companies/entities 5 146 18 104 5 146 18 104 Directors and key management personnel (directly and indirectly)Grindrod Group (excluding Grindrod Bank) – 321 – 321
15 395 19 579 15 395 19 676
4. Operating expenditureGrindrod Group companies 5 935 14 717 5 935 14 717 Directors and key management personnel (directly and indirectly)Grindrod Bank* 1 529 593 1 529 593
7 464 15 310 7 464 15 310
* Paid to Uyandiswa Project Management Services, of which ASP Dambuza is a 100% shareholder.
5. Loans and advancesGrindrod Group companies 107 375 – 107 375 – Grindrod Bank subsidiaries – – – 700 449 Grindrod Group investee companies/entities 1 875 255 1 682 323 1 875 255 1 283 482 Directors and key management personnel (directly and indirectly)Grindrod Bank 3 879 8 004 3 879 8 004
1 986 509 1 690 327 1 986 509 1 991 935

64
NOTES TO THE ANNUAL FINANCIAL STATEMENTS CONTINUEDFor the year ended 31 December 2019
GRINDROD BANK LIMITEDAnnual financial statements
38. Related parties continuedSummary of related-party transactions continued
Consolidated Company
Asdisclosedintheannualfinancialstatements:2019R000
2018R000
2019R000
2018R000
6. Other assetsGrindrod Group companies 57 525 41 014 57 525 41 014 Grindrod Bank subsidiaries – – – 339
57 525 41 014 57 525 41 353
7. Deposits and funding instrumentsGrindrod Group companies 34 031 55 055 34 031 55 055 Grindrod Group investee companies/entities 17 789 16 322 17 789 16 322 Grindrod Bank subsidiaries 8 133 6 695 8 133 6 803 Directors and key management personnel (directly and indirectly)Grindrod Group (excluding Grindrod Bank) 113 155 113 155 Grindrod Bank 237 7 191 237 7 190
60 303 85 418 60 303 85 525
8. Preference shares linked to trust participatory contributions
Grindrod Group companies 600 000 350 000 – –
9. Other liabilities
Grindrod Group companies 5 734 13 579 5 734 13 579
10. Liquid assets and short-term negotiable securities
Grindrod Bank subsidiaries – – 3 168 78 207
11. Commitments and guaranteesGrindrod Group companies 20 000 661 20 000 661 Grindrod Group investee companies/entities 79 558 63 873 79 558 63 873 Directors and key management personnel (directly and indirectly)Grindrod Bank 457 3 547 457 3 547
100 015 68 081 100 015 68 081
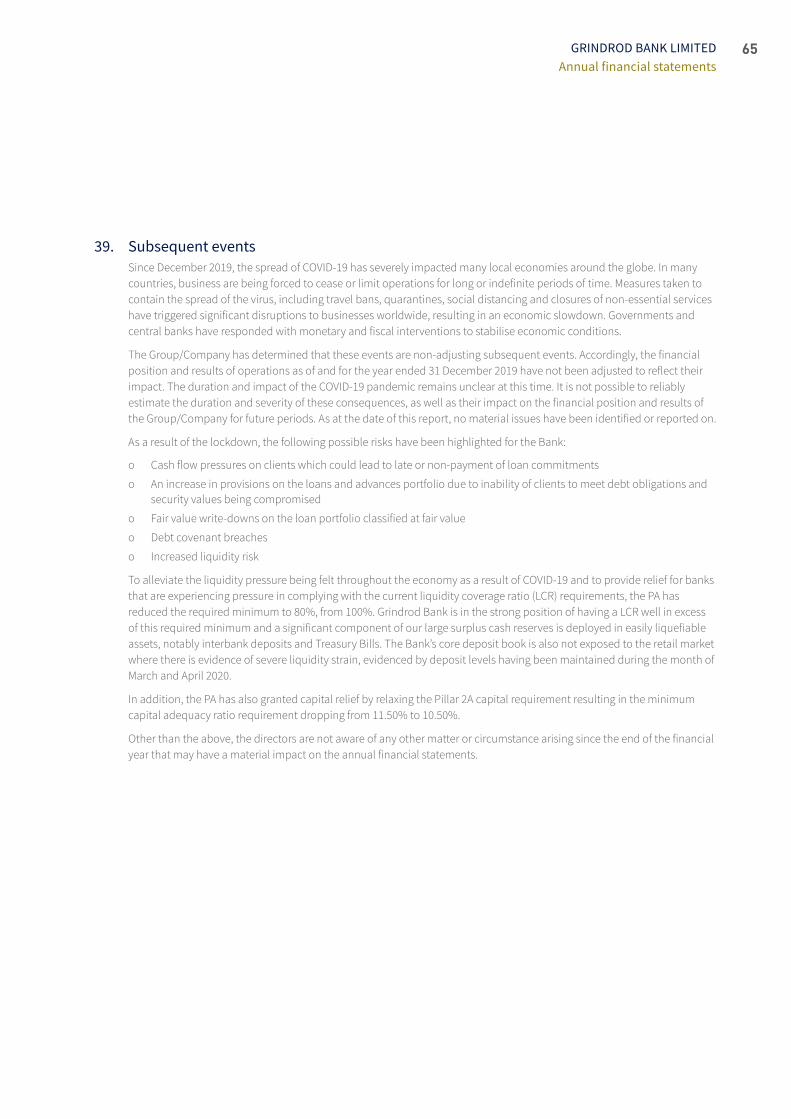
65GRINDROD BANK LIMITEDAnnual financial statements
39. Subsequent eventsSince December 2019, the spread of COVID‑19 has severely impacted many local economies around the globe. In many countries, business are being forced to cease or limit operations for long or indefinite periods of time. Measures taken to contain the spread of the virus, including travel bans, quarantines, social distancing and closures of non‑essential services have triggered significant disruptions to businesses worldwide, resulting in an economic slowdown. Governments and central banks have responded with monetary and fiscal interventions to stabilise economic conditions.
The Group/Company has determined that these events are non‑adjusting subsequent events. Accordingly, the financial position and results of operations as of and for the year ended 31 December 2019 have not been adjusted to reflect their impact. The duration and impact of the COVID‑19 pandemic remains unclear at this time. It is not possible to reliably estimate the duration and severity of these consequences, as well as their impact on the financial position and results of the Group/Company for future periods. As at the date of this report, no material issues have been identified or reported on.
As a result of the lockdown, the following possible risks have been highlighted for the Bank:
о Cash flow pressures on clients which could lead to late or non‑payment of loan commitments
о An increase in provisions on the loans and advances portfolio due to inability of clients to meet debt obligations and security values being compromised
о Fair value write‑downs on the loan portfolio classified at fair value
о Debt covenant breaches
о Increased liquidity risk
To alleviate the liquidity pressure being felt throughout the economy as a result of COVID‑19 and to provide relief for banks that are experiencing pressure in complying with the current liquidity coverage ratio (LCR) requirements, the PA has reduced the required minimum to 80%, from 100%. Grindrod Bank is in the strong position of having a LCR well in excess of this required minimum and a significant component of our large surplus cash reserves is deployed in easily liquefiable assets, notably interbank deposits and Treasury Bills. The Bank’s core deposit book is also not exposed to the retail market where there is evidence of severe liquidity strain, evidenced by deposit levels having been maintained during the month of March and April 2020.
In addition, the PA has also granted capital relief by relaxing the Pillar 2A capital requirement resulting in the minimum capital adequacy ratio requirement dropping from 11.50% to 10.50%.
Other than the above, the directors are not aware of any other matter or circumstance arising since the end of the financial year that may have a material impact on the annual financial statements.
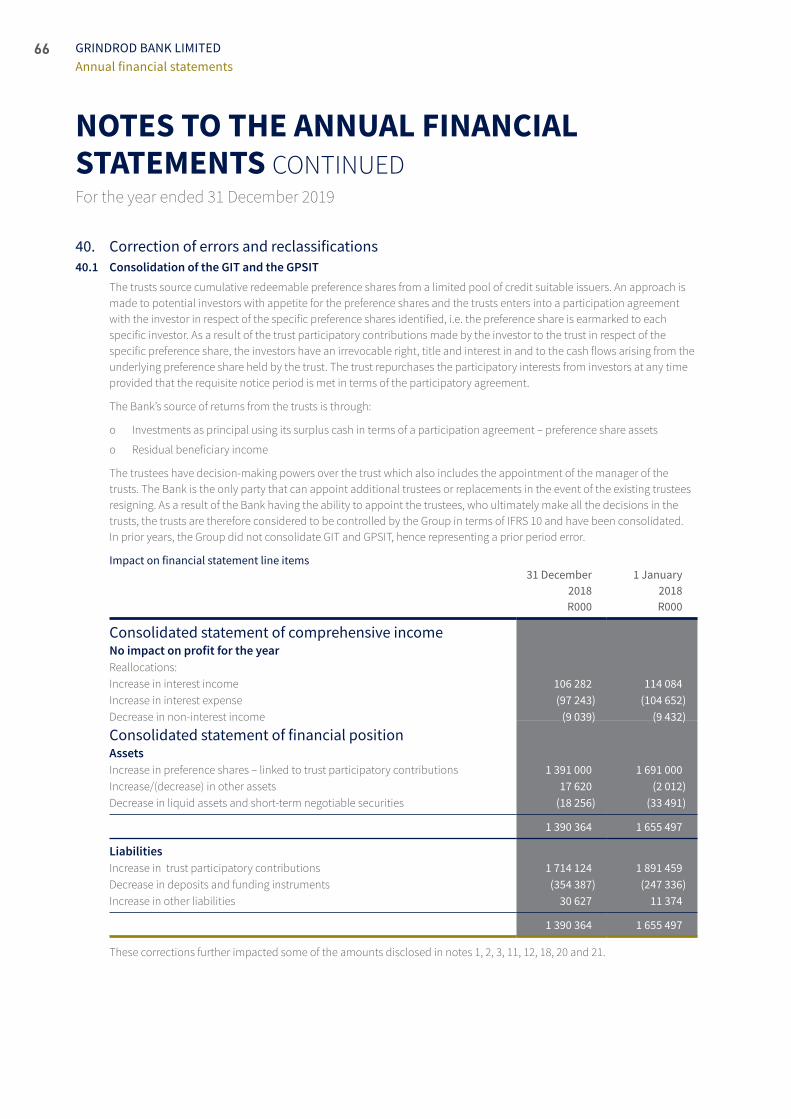
66
NOTES TO THE ANNUAL FINANCIAL STATEMENTS CONTINUEDFor the year ended 31 December 2019
GRINDROD BANK LIMITEDAnnual financial statements
40. Correction of errors and reclassifications40.1 Consolidation of the GIT and the GPSIT
The trusts source cumulative redeemable preference shares from a limited pool of credit suitable issuers. An approach is made to potential investors with appetite for the preference shares and the trusts enters into a participation agreement with the investor in respect of the specific preference shares identified, i.e. the preference share is earmarked to each specific investor. As a result of the trust participatory contributions made by the investor to the trust in respect of the specific preference share, the investors have an irrevocable right, title and interest in and to the cash flows arising from the underlying preference share held by the trust. The trust repurchases the participatory interests from investors at any time provided that the requisite notice period is met in terms of the participatory agreement.
The Bank’s source of returns from the trusts is through:
о Investments as principal using its surplus cash in terms of a participation agreement – preference share assets
о Residual beneficiary income
The trustees have decision‑making powers over the trust which also includes the appointment of the manager of the trusts. The Bank is the only party that can appoint additional trustees or replacements in the event of the existing trustees resigning. As a result of the Bank having the ability to appoint the trustees, who ultimately make all the decisions in the trusts, the trusts are therefore considered to be controlled by the Group in terms of IFRS 10 and have been consolidated. In prior years, the Group did not consolidate GIT and GPSIT, hence representing a prior period error.
Impact on financial statement line items 31 December
2018 R000
1 January2018
R000
Consolidated statement of comprehensive incomeNo impact on profit for the yearReallocations:Increase in interest income 106 282 114 084 Increase in interest expense (97 243) (104 652)Decrease in non‑interest income (9 039) (9 432)
Consolidated statement of financial positionAssetsIncrease in preference shares – linked to trust participatory contributions 1 391 000 1 691 000 Increase/(decrease) in other assets 17 620 (2 012)Decrease in liquid assets and short‑term negotiable securities (18 256) (33 491)
1 390 364 1 655 497
LiabilitiesIncrease in trust participatory contributions 1 714 124 1 891 459 Decrease in deposits and funding instruments (354 387) (247 336)Increase in other liabilities 30 627 11 374
1 390 364 1 655 497
These corrections further impacted some of the amounts disclosed in notes 1, 2, 3, 11, 12, 18, 20 and 21.
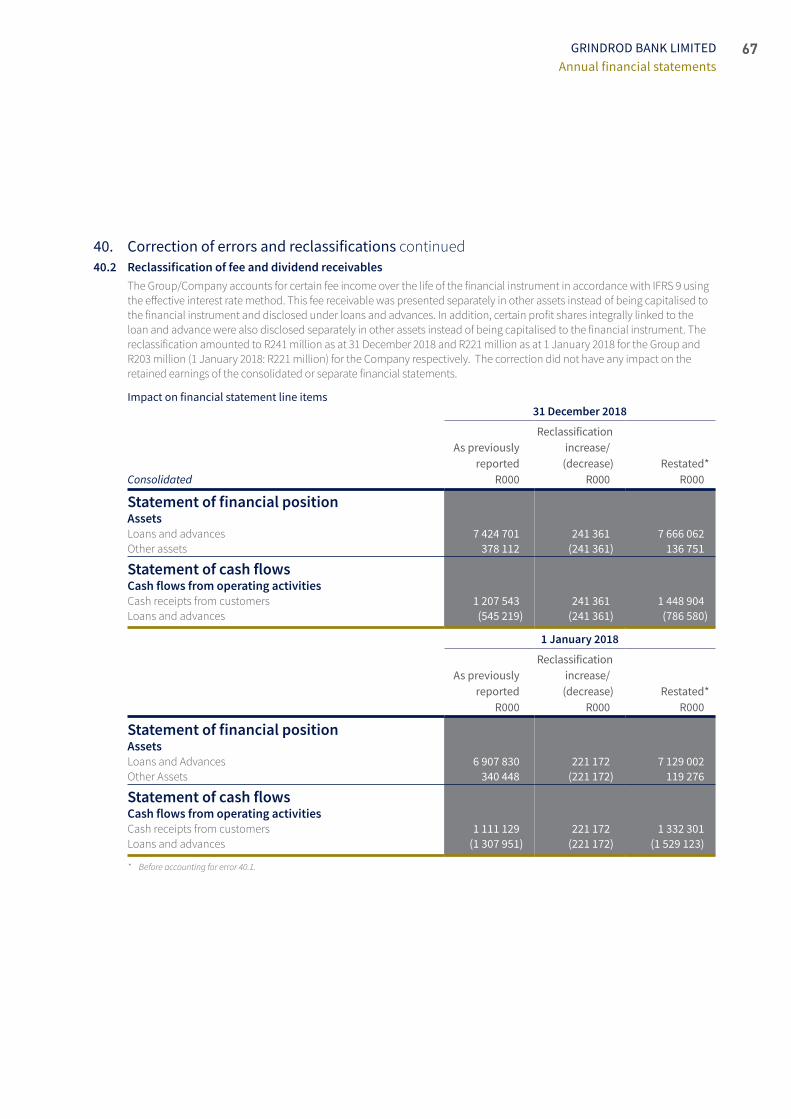
67GRINDROD BANK LIMITEDAnnual financial statements
40. Correction of errors and reclassifications continued40.2 Reclassification of fee and dividend receivables
The Group/Company accounts for certain fee income over the life of the financial instrument in accordance with IFRS 9 using the effective interest rate method. This fee receivable was presented separately in other assets instead of being capitalised to the financial instrument and disclosed under loans and advances. In addition, certain profit shares integrally linked to the loan and advance were also disclosed separately in other assets instead of being capitalised to the financial instrument. The reclassification amounted to R241 million as at 31 December 2018 and R221 million as at 1 January 2018 for the Group and R203 million (1 January 2018: R221 million) for the Company respectively. The correction did not have any impact on the retained earnings of the consolidated or separate financial statements.
Impact on financial statement line items31 December 2018
Consolidated
As previously reported
R000
Reclassification increase/(decrease)
R000 Restated*
R000
Statement of financial positionAssetsLoans and advances 7 424 701 241 361 7 666 062 Other assets 378 112 (241 361) 136 751
Statement of cash flowsCash flows from operating activitiesCash receipts from customers 1 207 543 241 361 1 448 904 Loans and advances (545 219) (241 361) (786 580)
1 January 2018
As previously reported
R000
Reclassification increase/(decrease)
R000 Restated*
R000
Statement of financial positionAssetsLoans and Advances 6 907 830 221 172 7 129 002 Other Assets 340 448 (221 172) 119 276
Statement of cash flowsCash flows from operating activitiesCash receipts from customers 1 111 129 221 172 1 332 301Loans and advances (1 307 951) (221 172) (1 529 123)
* Before accounting for error 40.1.
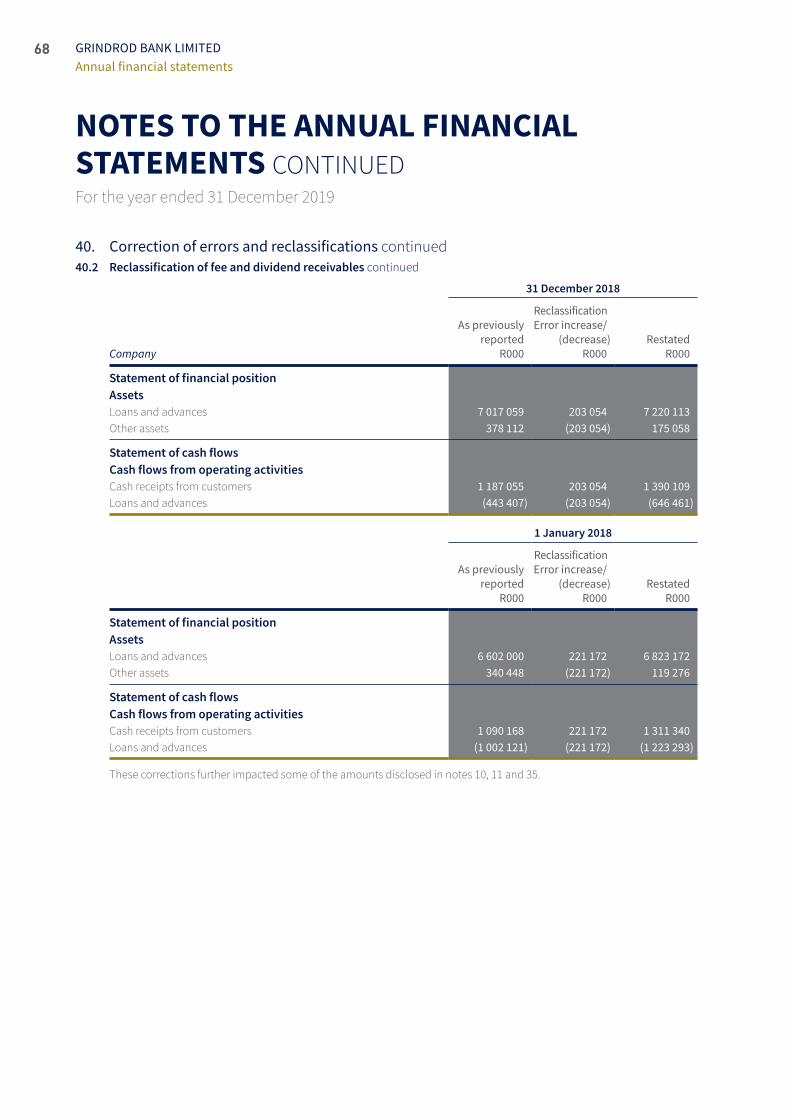
68
NOTES TO THE ANNUAL FINANCIAL STATEMENTS CONTINUEDFor the year ended 31 December 2019
GRINDROD BANK LIMITEDAnnual financial statements
40. Correction of errors and reclassifications continued40.2 Reclassification of fee and dividend receivables continued
31 December 2018
Company
As previously reported
R000
Reclassification Error increase/
(decrease) R000
RestatedR000
Statement of financial positionAssetsLoans and advances 7 017 059 203 054 7 220 113 Other assets 378 112 (203 054) 175 058
Statement of cash flowsCash flows from operating activitiesCash receipts from customers 1 187 055 203 054 1 390 109 Loans and advances (443 407) (203 054) (646 461)
1 January 2018
As previously reported
R000
ReclassificationError increase/
(decrease) R000
RestatedR000
Statement of financial positionAssetsLoans and advances 6 602 000 221 172 6 823 172 Other assets 340 448 (221 172) 119 276
Statement of cash flowsCash flows from operating activitiesCash receipts from customers 1 090 168 221 172 1 311 340 Loans and advances (1 002 121) (221 172) (1 223 293)
These corrections further impacted some of the amounts disclosed in notes 10, 11 and 35.
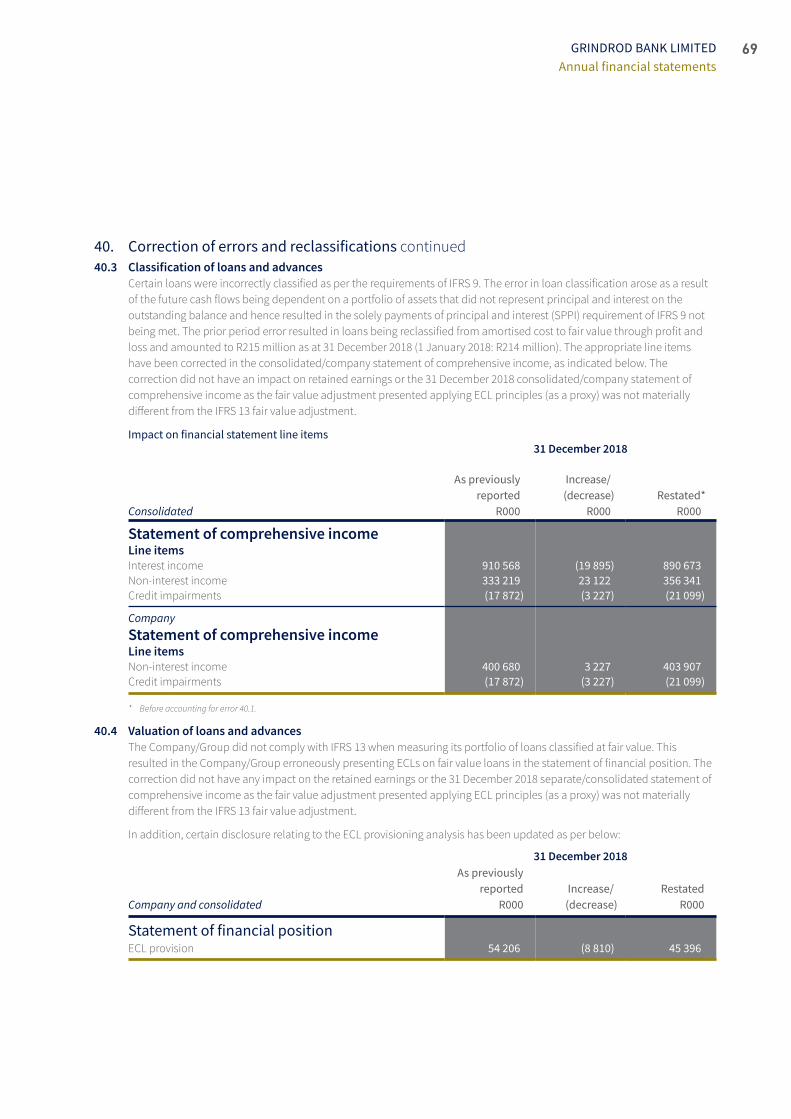
69GRINDROD BANK LIMITEDAnnual financial statements
40. Correction of errors and reclassifications continued40.3 Classification of loans and advances
Certain loans were incorrectly classified as per the requirements of IFRS 9. The error in loan classification arose as a result of the future cash flows being dependent on a portfolio of assets that did not represent principal and interest on the outstanding balance and hence resulted in the solely payments of principal and interest (SPPI) requirement of IFRS 9 not being met. The prior period error resulted in loans being reclassified from amortised cost to fair value through profit and loss and amounted to R215 million as at 31 December 2018 (1 January 2018: R214 million). The appropriate line items have been corrected in the consolidated/company statement of comprehensive income, as indicated below. The correction did not have an impact on retained earnings or the 31 December 2018 consolidated/company statement of comprehensive income as the fair value adjustment presented applying ECL principles (as a proxy) was not materially different from the IFRS 13 fair value adjustment.
Impact on financial statement line items31 December 2018
Consolidated
As previously reported
R000
Increase/(decrease)
R000 Restated*
R000
Statement of comprehensive incomeLine itemsInterest income 910 568 (19 895) 890 673 Non‑interest income 333 219 23 122 356 341 Credit impairments (17 872) (3 227) (21 099)
CompanyStatement of comprehensive incomeLine itemsNon‑interest income 400 680 3 227 403 907Credit impairments (17 872) (3 227) (21 099)
* Before accounting for error 40.1.
40.4 Valuation of loans and advancesThe Company/Group did not comply with IFRS 13 when measuring its portfolio of loans classified at fair value. This resulted in the Company/Group erroneously presenting ECLs on fair value loans in the statement of financial position. The correction did not have any impact on the retained earnings or the 31 December 2018 separate/consolidated statement of comprehensive income as the fair value adjustment presented applying ECL principles (as a proxy) was not materially different from the IFRS 13 fair value adjustment.
In addition, certain disclosure relating to the ECL provisioning analysis has been updated as per below:
31 December 2018
Companyandconsolidated
As previously reported
R000 Increase/(decrease)
RestatedR000
Statement of financial positionECL provision 54 206 (8 810) 45 396
70 GRINDROD BANK LIMITEDAnnual financial statements
CORPORATE DETAILS
Country of incorporation: South Africa
Independent non-executive chairperson: Amanda Dambuza
Lead independent non-executive director: Tyrone Soondarjee
Executive directors: David Polkinghorne (chief executive officer)Rakesh Garach (chief financial officer)
Independent non-executive directors: Sherry BarrettZola MalingaZizipho Nyanga
Non-executive director: Julian Beare
Company secretary: Shana Ashokumar
Debt sponsor: Nedbank Limited, acting through its Corporate and Investment Banking Division135 Rivonia RoadFourth Floor, Block F135 Rivonia CampusSandown, Sandton, 2196
Transfer agent: Nedbank Limited, acting through its Corporate and Investment Banking Division135 Rivonia RoadFourth Floor, Block F135 Rivonia CampusSandown, Sandton, 2196
Auditor: SizweNtsalubaGobodo Grant Thornton Incorporated
Registered office: 5 Arundel Close, Kingsmead Office Park, Durban, 4001
Postal address: P O Box 3211, Durban, 4000
Website: www.grindrodbank.co.za
Email: [email protected]

71GRINDROD BANK LIMITEDAnnual financial statements
NOTES

72 GRINDROD BANK LIMITEDAnnual financial statements
NOTES

GREYMATTERFINCH # 14137

www.grindrodbank.co.za