
Supplier Logistics Manual | Release 3.0 Supplier Logistics Manual Contents
Upload
khangminh22Category
view
1download
0
2020 THIRD-PARTY LOGISTICS STUDY
The State of Logistics OutsourcingResults and Findings of the 24th Annual Study
2 2020 24th ANNUAL THIRD-PARTY LOGISTICS STUDY
CONTENTS
©2020 C. John Langley, Jr., Ph.D., and Infosys. All Rights Reserved. No part of this document may be reproduced, displayed, modified or distributed by any process or means without prior written permission from Infosys.
Contents 2
Executive Summary 4
Current State of the 3PL Market 6
Analytics in Shipper-3PL Relationships 13
Supply Chain Finance 21
The Greening of the Supply Chain 26
Contemporary Issues 33
Continuing the Conversation 36
About the Study 39
The Annual 3PL Study Process 40
About the Respondents 42
About the Sponsors 43

3
4 2020 24th ANNUAL THIRD-PARTY LOGISTICS STUDY
EXECUTIVE SUMMARY
Analytics in Shipper-3PL Relationships
Shippers and 3PLs have been using data and information for many years to support decisions that are relevant to their relationships. However recent history suggests that the use of analytics—the scientific process of transforming data into insight for making better decisions—is gaining significantly in terms of frequency of use, levels of sophistication and utilization of available computational capabilities.
Broader types of capabilities that support this trend include the availability and utilization of cloud-based technologies, growth of software and approaches to manage and analyze data, and the successful
Current State of the 3PL Market
The 2020 24th Annual Third-Party Logistics Study shows that shippers and their third-party logistics providers continue to enhance their relationships and work together to accomplish supply chain goals and objectives. Both parties seem to focus on doing what it takes to achieve supply chain success and to meet their business objectives. As suggested throughout the content of this report, the availability of data and the utilization of appropriate technologies are responsible for much of the improvement that is taking place.
The study shows that the vast majority of shippers—93%—report that the relationships they have with their 3PLs generally have been successful. A higher number—99%—of 3PLs agree that their customer relationships generally have been successful.
Among respondents of the 2020 study, 83% of shippers and 98% of 3PL providers agree that the use of 3PLs has contributed to improving services to the ultimate customers. Additionally, 66% of 3PL users and 93% of 3PL providers agree that 3PLs provide new and innovative ways to improve logistics effectiveness.
Shippers are increasingly aware that if they do not have the technological capabilities to accomplish their goals, they should partner with those that do. As the amount of available data increases, shippers and their logistics partners will need to be able to take the available information and make it relevant. Many 3PLs are already making significant investments in technology that allow them to analyze shippers’ operations. The majority of shippers—94%—agree that IT capabilities are a necessary element of 3PL expertise, and 56% of shippers agree they are satisfied with 3PL IT capabilities.
Again this year, there has been a continuation of the most frequently outsourced activities, which tend to be those that are more transactional, operational and repetitive. The most prevalent activities shippers outsource are domestic transportation (73%), warehousing (73%), international transportation (65%), customs brokerage (54%), and freight forwarding (52%).
adoption and use of Internet of Things (IoT) capabilities.
Both 3PLs and shippers are involved with analytics. Among shippers, 39% indicated their involvement with 3PLs was significant, 36% somewhat, and 25% not at all. From the 3PL perspective, 43% indicated they had significant involvement, 43% somewhat, and 14% not at all.
There are five frequently referenced types of analytics: descriptive, diagnostic, predictive, prescriptive and cognitive/AI/machine learning. The more frequently used types of analytics (e.g. descriptive and diagnostic) are more “backward-looking,” while those that are higher-placed on the maturity scale are more “forward-looking.”
There are several areas that may be in need of improvement and for which the use of analytics may be useful in achieving a greater understanding. Those include on-time and complete order fulfillment, shipment visibility, freight costs per shipment, transit time, cost-to-serve and order-to-delivery cycle time.
Encouragingly, 66% of shippers and 74% of 3PLs are in agreement that the use of analytics is a key to successful working relationships. These results were consistent over the range of sales categories. What’s more, both parties generally agree upon the problems that may arise when implementing analytics. Among respondents, 41% of shippers and 40% of 3PLs recognize the need for additional expertise and talent; 34% of shippers and 42% of 3PLs feel they do not have the needed analytics capabilities.
There are several common types of problems with data and the frequency that they are recognized by shippers and 3PLs. These problems include the availability of clean data as well as insufficient analytics resources and the need for additional expertise and talent.
Shippers and 3PLs strongly agreed that analytics capabilities are a necessary element of 3PL expertise, but they also agreed that they were only minimally satisfied with those capabilities. As this study has focused attention over a lengthy period of time on the “IT Gap,” this year’s study has identified the existence of an “Analytics Gap.”
This report delves into the key steps that should be included in an analytics strategy that can be of value to shippers and 3PLs as they strive to improve planning and operations when working with each other.
Supply Chain Finance: A Growing Industry
The role of supply chain finance—the practices used by banks and financial institutions to manage capital invested in the supply chain—is taking on more significance as global trade volumes rise. Supply chain finance enables those within the supply
5
chain to access funds that would otherwise be tied up while goods are in transit.
For shipper respondents in the 24th Annual Third Party Logistics Study, 31% said the senior most supply chain finance executive in their supply chain/logistics organization held the title of finance director, 26% said their senior-most finance person held the title of finance vice president; 26% held the title of finance manager; 17%, held the title of financial analyst.
Among 3PLs, the majority, 45% said the senior most supply chain finance executive in the organization had the title of finance vice president; 23% were referred to as finance director; 23% had the title of finance manager; just 9% held the title of financial analyst.
Supply chain costs are one of the top factors in shippers’ operations decisions, with 91%, reporting that they consider shipping expenses, which include costs associated with crating, packing, handling and freight. More than half, 60%, consider product cost; 59% consider customs, including duties, taxes, tariffs, VAT, broker fees and harbor fees; 52%, of shippers consider overhead costs, such as purchasing staff, due diligence cost, travel and exchange rates. In addition, 42% considered the cost of risk, such as insurance, compliance, quality and safety stock cost, in their operations decisions.
Among 3PLs, 92%, reported that they consider shipping costs; 61% consider overhead costs; 55% consider the cost of risk, such as insurance, compliance, quality and safety stock cost, in their operations decisions; 47% consider product cost; and 44% consider customs.
Shippers are utilizing several supply chain finance practices, with 72%, reporting using freight payment and audit; 57% are using total landed cost; 37% are using letters of credit. A smaller number, 30%, also reported using factoring accounts receivable; 20%, are using open accounts; 20% are using preferential or free trade agreements.
Among 3PLs, 71% reported using freight payment and audit; 39% are using letters of credit; 36% are using open accounts; 20% are using factoring accounts receivable; 15% reported using preferential or free trade agreements.
Tariff changes and concerns over potential changes are prompting organizations to become more prepared for, and many companies are actively hedging against, a trade war. The threat of tariffs can disrupt the supply chain, causing companies to bring imports in early ahead of tariff deadlines or hold more inventory.
The Greening of the Supply Chain
Environmental sustainability is taking on greater importance globally, and those within the supply chain are no different. More and more shippers are embracing sustainability programs, and carriers and 3PLs are focusing on greening efforts to attract shippers. In addition, those within the supply chain are becoming more sophisticated in how they demonstrate and document their carbon emissions, miles per gallon, data and efficiency metrics.
Public perception and cost savings are driving sustainability within logistics for shippers as well as their third-party logistics providers. At the same time, there are multiple ways shippers and 3PLs are integrating sustainable environmental processes into the traditional supply chain.
The majority of shippers, 76%, said they are participating in optimization, such as route planning and load consolidation; 42% said they are involved in tracking and reporting emissions; 38% said they are taking part in voluntary programs, such as the Environmental Protection Agency’s SmartWay program; 16% said they are piloting alternative fuels.
Among 3PLs, 78% said they are participating in optimization; 63% said they are taking part in voluntary programs; 39% are involved in
tracking and reporting emissions; 19% said they are piloting alternative fuels.
When asked to measure current and future greening initiatives, 82% of shippers cited optimization, such as route optimization and load consolidation; 28% cited alternative fuels, including electric vehicles and natural gas; 10% cited autonomous vehicles or platooning technology.
A slightly higher number of 3PLs, 88%, cited optimization; 36% listed alternative fuels; 9% cited autonomous vehicles or platooning technology.
Within the next five years, 79% of shippers expect to launch optimization initiatives; 43% said they plan to invest in alternative fuels; and 20% reported that they would launch initiatives related to autonomous vehicles or platooning technologies.
Among 3PLs, 77% cited optimization initiatives (route optimization and load consolidation); 40% noted alternative fuels; 27% listed initiatives related to autonomous vehicles or platooning technologies.
Evaluating the entire network, including sourcing locations and product demand, can drive the overall efficiency within the supply chain, resulting in emissions reductions. Shippers are becoming more and more flexible with their networks, but oftentimes business rules can inhibit network optimization.
Shippers are also becoming more interested in alternative fuel options and sustainable technologies. Manufacturers are continuing to move forward with alternative fuel options as well as advanced technologies, such as automated vehicles or platooning vehicles.
6 2020 24th ANNUAL THIRD-PARTY LOGISTICS STUDY
CURRENT STATE OF THE 3PL MARKETAt the time of this writing, both shippers and third-party providers have benefited from generally favorable economic conditions, both domestic and abroad. Although there have been pressures on the availability of capacity in the supply chain, notably transportation and facility-based resources, shippers and 3PLs have worked together to meet increasingly stringent delivery deadlines and boost customer and consumer satisfaction.
While shippers have greater expectations of what they need from logistics and supply chain service providers, the logistics service provider (LSP) sector has responded with levels of service and innovation that have met these challenges. Essentially, transportation and logistics companies have found it necessary to focus on digital capabilities, cost and asset efficiencies, and an expanding range of services to satisfy their customers.
More recently, evidence of soft spots in various global economies has surfaced, and so both shippers and 3PLs find themselves focusing on defensive as well as offensive strategies. With the slowing of some gross domestic product (GDP) figures, it becomes obvious that tight capacities begin to lessen, supply and demand for 3PL services begin to change, and shippers and 3PLs focus on evaluating the currency, effectiveness and robustness of their supply chain practices and priorities. Only time will tell how this plays out over the long term but dealing with economic uncertainty has become an area of concern for supply chain participants.
The 2020 24th Annual Third-Party Logistics Study provides the latest perspectives on the nature of shipper and 3PL relationships, why they are generally successful, some of the ways in which they could be improved, and how they can better meet the supply chain demands of the future.
When reviewing the report, it is important to consider that the individuals who respond to the survey may differ from year to year. Thus, some of the results may be impacted by the composition of respondents.
One widely-recognized necessity for supply chain success is the ability to have access to data in real-time or near real-time, and also to mine and analyze that data to provide insight that can help to improve supply chain practices. Issues relating to this topic are highlighted in this year’s special topic Analytics in Shipper-3PL Relationships.
This year’s study once again proves that shippers and their 3PL providers are strengthening their relationships and continually moving toward meaningful partnerships. They are collaborating to accomplish their supply chain goals and improve efficiencies. The available evidence confirms that both parties are creating reliable solutions and improving the end-user experience for the customer, which is allowing shippers to use the supply chain as a strategic, competitive advantage.
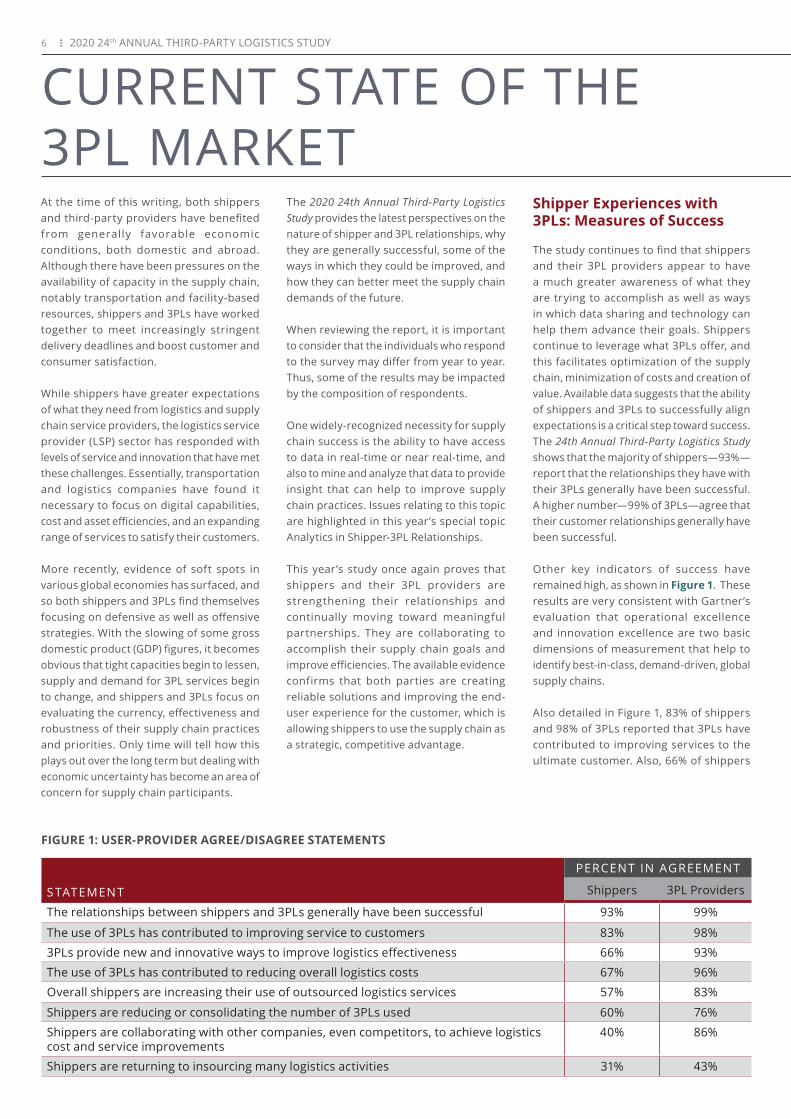
FIGURE 1: USER-PROVIDER AGREE/DISAGREE STATEMENTS
S TATEMENT
PERCENT IN AGREEMENT
Shippers 3PL Providers
The relationships between shippers and 3PLs generally have been successful 93% 99%
The use of 3PLs has contributed to improving service to customers 83% 98%
3PLs provide new and innovative ways to improve logistics effectiveness 66% 93%
The use of 3PLs has contributed to reducing overall logistics costs 67% 96%
Overall shippers are increasing their use of outsourced logistics services 57% 83%
Shippers are reducing or consolidating the number of 3PLs used 60% 76%
Shippers are collaborating with other companies, even competitors, to achieve logistics cost and service improvements
40% 86%
Shippers are returning to insourcing many logistics activities 31% 43%
Shipper Experiences with 3PLs: Measures of Success
The study continues to find that shippers and their 3PL providers appear to have a much greater awareness of what they are trying to accomplish as well as ways in which data sharing and technology can help them advance their goals. Shippers continue to leverage what 3PLs offer, and this facilitates optimization of the supply chain, minimization of costs and creation of value. Available data suggests that the ability of shippers and 3PLs to successfully align expectations is a critical step toward success. The 24th Annual Third-Party Logistics Study shows that the majority of shippers—93%—report that the relationships they have with their 3PLs generally have been successful. A higher number—99% of 3PLs—agree that their customer relationships generally have been successful.
Other key indicators of success have remained high, as shown in Figure 1. These results are very consistent with Gartner’s evaluation that operational excellence and innovation excellence are two basic dimensions of measurement that help to identify best-in-class, demand-driven, global supply chains.
Also detailed in Figure 1, 83% of shippers and 98% of 3PLs reported that 3PLs have contributed to improving services to the ultimate customer. Also, 66% of shippers
7
and 93% of 3PL providers agree that 3PLs provide new and innovative ways to improve logistics effectiveness; 67% of 3PL users and 96% of 3PL providers agree that the use of 3PLs has contributed to reducing overall logistics costs.
Similar to results from previous years’ annual 3PL studies, the percentage figures from 3PL respondents typically run somewhat higher than those from shipper respondents.
Current Challenges
As with most topics in today’s business world, supply chains are being impacted regularly by changes and advances in a number of critical areas. Some of these include:
• Growth of e-commerce. Closely related to the “Amazon effect,” the introduction and expansion of multi-channels for distribution has been a game-changing factor in the planning and operations of many supply chains. This phenomenon has challenged the ability of traditional brick-and-mortar retailers to adapt their supply chain practices to respond to what seems to be a continually-increasing number of customer and consumer needs.
• Economic uncertainty. Domestic and global economic changes have resulted in heavy pressure on supply chains to adapt to new economic circumstances. Some of these changes include cross-border relations with trading partners,
Brexit, changing tariff structures, and the execution of nimble strategic sourcing, manufacturing and distribution practices in today’s supply chains. Also magnifying some of these impacts is that some of the major global economies are exhibiting some degree of slowdown in growth rates.
• Driver availability. Of great concern, but not unique to the U.S., is the lack of trained and capable truck drivers. Within the U.S., American Trucking Associations estimates a current shortage of 60,000 qualified drivers, and Bob Costello, ATA’s chief economist, estimates it could reach 160,000 by 2028. Although the shortage of drivers tends to be less critical when economies are less robust, this factor will continue to be a concern in many countries around the world. Similarly, the trucking industry in the U.S. is experiencing a severe shortage of diesel technicians, with the Tech Force Foundation estimating demand for more than 29,000 new technicians in 2019 and more than 25,000 annually from 2020 to 2022. A shortage could cause transportation delays if preventive maintenance and repairs can’t be conducted in a timely manner.
• Disruptive technologies. Some of the disruptive technologies impacting supply chains include use of drones, autonomous vehicles, cloud-based capabilities, artificial intelligence (AI), internet-of-things (IOT), etc. In addition, there are new generations of hardware,
software and middleware that are enabling the continually-improving performance of supply chains.
• Relationship necessities. While this area of challenge involves some relatively traditional areas for improvement, it is becoming very obvious that these are also some of the primary areas in which improvement is needed. Examples would include: effective collaboration of people, processes and technologies in shipper-3PL relationships; structured approaches to achieving alignment between these organizations; effective use of techniques such as gainsharing; and the development of joint strategies that can be of value to both parties and also to the overall supply chain.
• Competitive challenges. In addition to the factors included above, shipper and 3PL organizations recognize the need to deal with new entrants into their lines of business. In the logistics service provider sector, many participants are expanding their range of capabilities and thus represent a new form of competition. While this involves an increase in the number of providers of certain types of services, shippers have a growing list of service needs that represent new and innovative opportunities for new entrants to the LSP sector. A convenient example of the latter is the greatly expanded range of delivery options that are related to advances in the areas of e-commerce and omni-channel fulfillment.
8 2020 24th ANNUAL THIRD-PARTY LOGISTICS STUDY
3PL User Spending Patterns on Logistics and 3PL Services
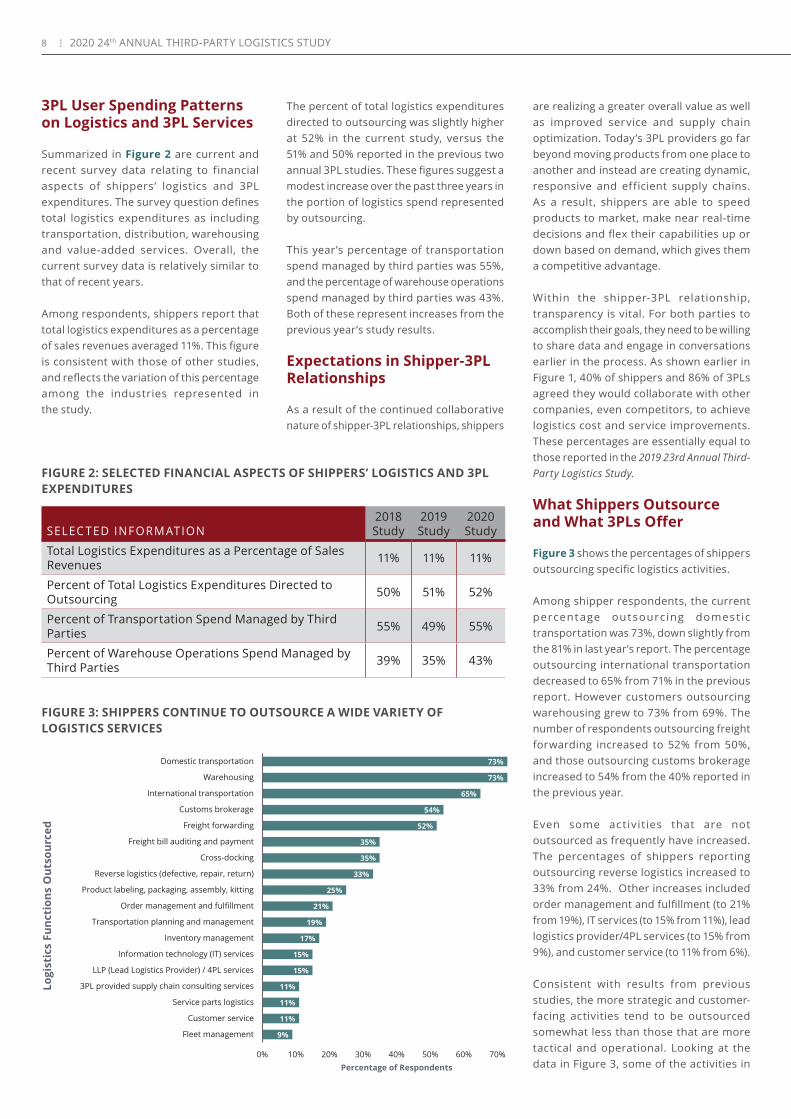
Summarized in Figure 2 are current and recent survey data relating to financial aspects of shippers’ logistics and 3PL expenditures. The survey question defines total logistics expenditures as including transportation, distribution, warehousing and value-added services. Overall, the current survey data is relatively similar to that of recent years.
Among respondents, shippers report that total logistics expenditures as a percentage of sales revenues averaged 11%. This figure is consistent with those of other studies, and reflects the variation of this percentage among the industries represented in the study.
SELEC TED INFORMATION2018 Study
2019 Study
2020 Study
Total Logistics Expenditures as a Percentage of Sales Revenues 11% 11% 11%
Percent of Total Logistics Expenditures Directed to Outsourcing 50% 51% 52%
Percent of Transportation Spend Managed by Third Parties 55% 49% 55%
Percent of Warehouse Operations Spend Managed by Third Parties 39% 35% 43%
FIGURE 2: SELECTED FINANCIAL ASPECTS OF SHIPPERS’ LOGISTICS AND 3PL EXPENDITURES
The percent of total logistics expenditures directed to outsourcing was slightly higher at 52% in the current study, versus the 51% and 50% reported in the previous two annual 3PL studies. These figures suggest a modest increase over the past three years in the portion of logistics spend represented by outsourcing.
This year’s percentage of transportation spend managed by third parties was 55%, and the percentage of warehouse operations spend managed by third parties was 43%. Both of these represent increases from the previous year’s study results.
Expectations in Shipper-3PL Relationships
As a result of the continued collaborative nature of shipper-3PL relationships, shippers
are realizing a greater overall value as well as improved service and supply chain optimization. Today’s 3PL providers go far beyond moving products from one place to another and instead are creating dynamic, responsive and efficient supply chains. As a result, shippers are able to speed products to market, make near real-time decisions and flex their capabilities up or down based on demand, which gives them a competitive advantage.
Within the shipper-3PL relationship, transparency is vital. For both parties to accomplish their goals, they need to be willing to share data and engage in conversations earlier in the process. As shown earlier in Figure 1, 40% of shippers and 86% of 3PLs agreed they would collaborate with other companies, even competitors, to achieve logistics cost and service improvements. These percentages are essentially equal to those reported in the 2019 23rd Annual Third-Party Logistics Study.
What Shippers Outsource and What 3PLs Offer
Figure 3 shows the percentages of shippers outsourcing specific logistics activities.
Among shipper respondents, the current percentage outsourcing domest ic transportation was 73%, down slightly from the 81% in last year’s report. The percentage outsourcing international transportation decreased to 65% from 71% in the previous report. However customers outsourcing warehousing grew to 73% from 69%. The number of respondents outsourcing freight forwarding increased to 52% from 50%, and those outsourcing customs brokerage increased to 54% from the 40% reported in the previous year.
Even some activities that are not outsourced as frequently have increased. The percentages of shippers reporting outsourcing reverse logistics increased to 33% from 24%. Other increases included order management and fulfillment (to 21% from 19%), IT services (to 15% from 11%), lead logistics provider/4PL services (to 15% from 9%), and customer service (to 11% from 6%).
Consistent with results from previous studies, the more strategic and customer-facing activities tend to be outsourced somewhat less than those that are more tactical and operational. Looking at the data in Figure 3, some of the activities in
FIGURE 3: SHIPPERS CONTINUE TO OUTSOURCE A WIDE VARIETY OF LOGISTICS SERVICES
9%
11%
11%
11%
15%
15%
17%
19%
21%
25%
33%
35%
35%
52%
54%
65%
73%
73%
0% 10% 20% 30% 40% 50% 60% 70% 80%
Fleet management
Customer service
Service parts logistics
3PL provided supply chain consulting services
LLP (Lead Logistics Provider) / 4PL services
Information technology (IT) services
Inventory management
Transportation planning and management
Order management and fulfillment
Product labeling, packaging, assembly, kitting
Reverse logistics (defective, repair, return)
Cross-docking
Freight bill auditing and payment
Freight forwarding
Customs brokerage
International transportation
Warehousing
Domestic transportation
Percentage of Respondents
Logi
stic
s Fu
ncti
ons
Out
sour
ced
9
this category are cross-docking (35%), order management and fulfillment (21%), information technology services (15%), lead logistics provider/4PL services (15%), and customer service (11%).
3PL’s IT Capabilities: A Consistent Differentiator Among 3PLs
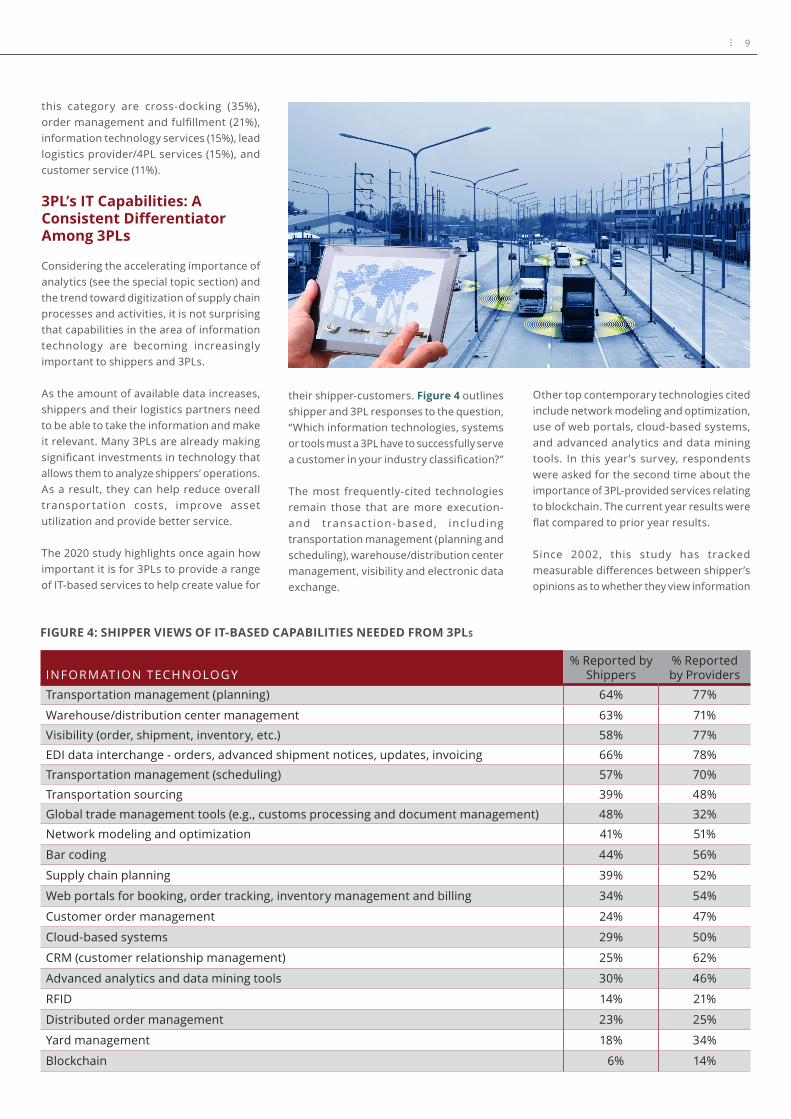
Considering the accelerating importance of analytics (see the special topic section) and the trend toward digitization of supply chain processes and activities, it is not surprising that capabilities in the area of information technology are becoming increasingly important to shippers and 3PLs.
As the amount of available data increases, shippers and their logistics partners need to be able to take the information and make it relevant. Many 3PLs are already making significant investments in technology that allows them to analyze shippers’ operations. As a result, they can help reduce overall transportation costs, improve asset utilization and provide better service.
The 2020 study highlights once again how important it is for 3PLs to provide a range of IT-based services to help create value for
their shipper-customers. Figure 4 outlines shipper and 3PL responses to the question, “Which information technologies, systems or tools must a 3PL have to successfully serve a customer in your industry classification?”
The most frequently-cited technologies remain those that are more execution- and transac t ion-based, including transportation management (planning and scheduling), warehouse/distribution center management, visibility and electronic data exchange.
Other top contemporary technologies cited include network modeling and optimization, use of web portals, cloud-based systems, and advanced analytics and data mining tools. In this year’s survey, respondents were asked for the second time about the importance of 3PL-provided services relating to blockchain. The current year results were flat compared to prior year results.
Since 2002, this study has tracked measurable differences between shipper’s opinions as to whether they view information
FIGURE 4: SHIPPER VIEWS OF IT-BASED CAPABILITIES NEEDED FROM 3PLs
INFORMATION TECHNOLOGY% Reported by
Shippers% Reported by Providers
Transportation management (planning) 64% 77%
Warehouse/distribution center management 63% 71%
Visibility (order, shipment, inventory, etc.) 58% 77%
EDI data interchange - orders, advanced shipment notices, updates, invoicing 66% 78%
Transportation management (scheduling) 57% 70%
Transportation sourcing 39% 48%
Global trade management tools (e.g., customs processing and document management) 48% 32%
Network modeling and optimization 41% 51%
Bar coding 44% 56%
Supply chain planning 39% 52%
Web portals for booking, order tracking, inventory management and billing 34% 54%
Customer order management 24% 47%
Cloud-based systems 29% 50%
CRM (customer relationship management) 25% 62%
Advanced analytics and data mining tools 30% 46%
RFID 14% 21%
Distributed order management 23% 25%
Yard management 18% 34%
Blockchain 6% 14%
10 2020 24th ANNUAL THIRD-PARTY LOGISTICS STUDY
89%85%
91% 90%92% 92% 92%
88%
94% 93% 94%98% 96%
93%91% 91%
93% 94%
27%
33%
42%40%
35%
42%
37%
42%
54% 54% 53%55%
60% 59%
65%
56% 55% 56%
2002 2003 2004 2005 2006 2007 2008 2009 2010 2011 2012 2013 2014 2015 2016 2017 2018 20190%
10%
20%
30%
40%
50%
60%
70%
80%
90%
100%
IT Capabilities Necessary Element of 3PL Expertise Shippers Satisfied with 3PL IT Capabilities IT "Gap"
FIGURE 5: THE “IT GAP”: SHOWING POTENTIAL STABILITY
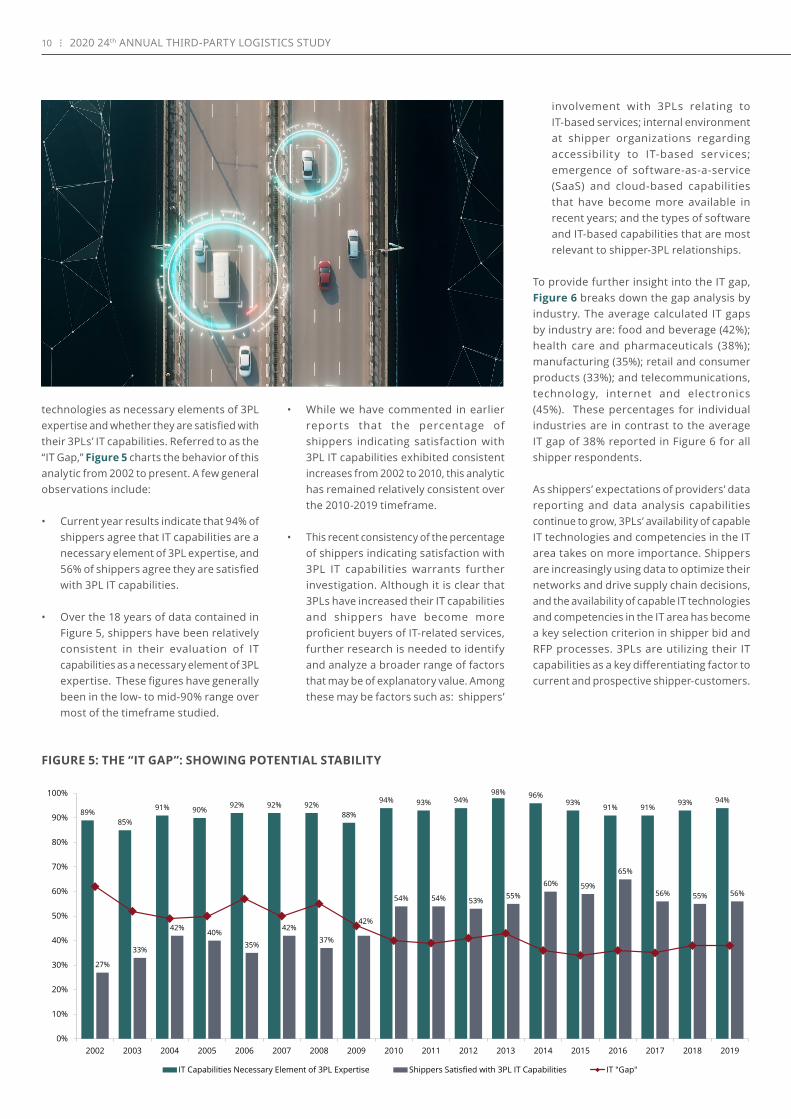
technologies as necessary elements of 3PL expertise and whether they are satisfied with their 3PLs’ IT capabilities. Referred to as the “IT Gap,” Figure 5 charts the behavior of this analytic from 2002 to present. A few general observations include:
• Current year results indicate that 94% of shippers agree that IT capabilities are a necessary element of 3PL expertise, and 56% of shippers agree they are satisfied with 3PL IT capabilities.
• Over the 18 years of data contained in Figure 5, shippers have been relatively consistent in their evaluation of IT capabilities as a necessary element of 3PL expertise. These figures have generally been in the low- to mid-90% range over most of the timeframe studied.
• While we have commented in earlier reports that the percentage of shippers indicating satisfaction with 3PL IT capabilities exhibited consistent increases from 2002 to 2010, this analytic has remained relatively consistent over the 2010-2019 timeframe.
• This recent consistency of the percentage of shippers indicating satisfaction with 3PL IT capabilities warrants further investigation. Although it is clear that 3PLs have increased their IT capabilities and shippers have become more proficient buyers of IT-related services, further research is needed to identify and analyze a broader range of factors that may be of explanatory value. Among these may be factors such as: shippers’
involvement with 3PLs relating to IT-based services; internal environment at shipper organizations regarding accessibility to IT-based services; emergence of software-as-a-service (SaaS) and cloud-based capabilities that have become more available in recent years; and the types of software and IT-based capabilities that are most relevant to shipper-3PL relationships.
To provide further insight into the IT gap, Figure 6 breaks down the gap analysis by industry. The average calculated IT gaps by industry are: food and beverage (42%); health care and pharmaceuticals (38%); manufacturing (35%); retail and consumer products (33%); and telecommunications, technology, internet and electronics (45%). These percentages for individual industries are in contrast to the average IT gap of 38% reported in Figure 6 for all shipper respondents.
As shippers’ expectations of providers’ data reporting and data analysis capabilities continue to grow, 3PLs’ availability of capable IT technologies and competencies in the IT area takes on more importance. Shippers are increasingly using data to optimize their networks and drive supply chain decisions, and the availability of capable IT technologies and competencies in the IT area has become a key selection criterion in shipper bid and RFP processes. 3PLs are utilizing their IT capabilities as a key differentiating factor to current and prospective shipper-customers.

11
Increased Use of Outsourcing Versus Moves to Insourcing
Throughout the 24 years of the Annual Third-Party Logistics Study, researchers have observed changes in the percentages of shippers indicating increases in their use of outsourced logistics services and those indicating a return to insourcing many of their logistics activities. While some shippers may exhibit a consistent use or non-use of outsourced logistics services, there are others that may modify their use of outsourcing from time to time.
Outsourcing: Among respondents, 57% of shippers indicate they are increasing their use of outsourced logistics services this year, which compares to a figure of 63% reported last year. In comparison, 83% of 3PL providers agreed their customers experienced an increase this year in their use of outsourced logistics services, which compares to 86% last year. These figures are consistent with the generally positive growth rates for 3PL services that have been referenced earlier in this report. Differences between the year-over-year figures tend to vary somewhat based on the composition of survey respondents for each individual year.
Insourcing: This year, 31% of shippers indicate they are returning to insourcing many of their logistics activities, which is modestly higher than the 28% reported last year, but still lower than the 35% reported three years ago. Also, 43% of 3PL providers agree that some of their customers are returning to insourcing, an increase from the 36% reported last year. While these percentages may seem to conflict, individual shipper responses
pertain only to their organization’s directions, while the 3PL responses reflect the providers’ thoughts about their overall group of customers.
Reducing or Consolidating 3PLs: This year, 60% of 3PL users report reducing or consolidating the number of 3PLs they use, compared to the 61% reported in the previous year.
45%
33%35%
38%
42%
0%
5%
10%
15%
20%
25%
30%
35%
40%
45%
50%
Telecommunications,Technology, Internet &
Electronics
Retail & Consumer ProductsManufacturingHealth Care &Pharmaceuticals
Food & Beverage
All Shipper RespondentsAverage = 38%
FIGURE 6: THE “IT GAP” BY INDUSTRY

12 2020 24th ANNUAL THIRD-PARTY LOGISTICS STUDY
Responses from Non-Users of 3PL Services
Since some of the respondents to our annual survey classify themselves as non-users of 3PL services at present, it is always interesting to ask them about the reasons why this may be the case. Among this year’s findings are: 32% feel that control over the outsourced functions would diminish; 21% are concerned that cost reductions would not be realized; 15% feel they have more logistics expertise than most 3PL providers; and 13% think it would be too difficult to integrate their IT systems with those of a 3PL.
As noted in previous years’ studies, results from the annual 3PL study workshops have confirmed that some of the stated reasons as to why some shippers elect not to outsource their logistics services are some of the very same reasons why others choose to use the services of 3PLs. The conclusion to be drawn is that each shipper organization needs to diligently assess the need for all of its supply chain services and determine which strategies relating to outsourcing best fit their needs.
Key Takeaways
Key findings about the Current State of the Market for the 2020 24th Annual 3PL Study include:
• The majority of shippers—93%—report that the relationships they have with their 3PLs generally have been successful. A higher number of 3PLs—99%—agree that relationships have generally been successful.
• Total logistics expenditures as a percentage of sales revenues are a reported 11% in the current year, which is equal to the results reported in the previous two years’ studies. The percentage of transportation spend managed by third parties was 55%, and the percentage of warehouse operations spend managed by third parties was 43%. Both of these represent increases from the previous year’s study results.
• Users of 3PL services report an average of 52% of their total logistics expenditures are related to outsourcing, which is up slightly from the previous year’s figure of 51%.
• The 2020 Annual 3PL Study reported that 57% of shippers are increasing their use of outsourced logistics services, compared to 63% reported last year. However, 83% of 3PL providers agreed their customers increased their use of outsourced logistics services, compared to 86% last year.
• Shippers outsource a wide range of logistics services, with the most prevalent being domestic transportation (73%), warehousing (73%), international transportation (65%), customs brokerage (54%) and freight forwarding (52%).
• Activities that are more strategic, IT-intensive and customer-facing tend to be outsourced to a lesser extent. Current study results document the percentages of shippers outsourcing the following activities: order management and fulfillment (21%), information technology services (15%), LLP (lead logistics provider)/4PL services (15%) and customer service (11%).
• The IT Gap appears to be fairly static in recent years, with 94% of shippers currently agreeing that IT capabilities are a necessary element of 3PL expertise, and 56% of shippers indicating they are satisfied with their 3PLs’ IT capabilities. Further research is needed to better understand the apparent stability in the percentages of shippers indicating satisfaction in recent years with 3PL IT-based services.
13
“The Purpose of Computing is Insight, Not Numbers” – Dr. Richard Hamming
Analytics, as defined by the Institute for Operations Research and the Management Science, is “the scientific process of transforming data into insight for making better decisions.” While shippers and 3PLs have been using data and information for many years to support decisions that are relevant to their relationships, recent history suggests that the use of analytics is gaining significantly in terms of frequency of use, levels of sophistication and utilization of available computational capabilities.
Some of the broader types of capabilities that support this trend include:
• Availability and utilization of cloud-based technologies• Growth of software and approaches to manage and analyze data• 90% of the data in the world today has been created in the last two years (IBM)• Utilization of mobile devices and the rapid growth of sensing devices, particularly with use in supply chain processes and activities• Successful adoption and use of internet of things (IoT) capabilities• IT innovation and the growth trajectories of computing power, storage capabilities and internet data transmission speeds• Development and use of artificial intelligence (AI) capabilities• Use of augmented and virtual reality
As another relevant perspective, Gartner has included “advanced analytics” among its top eight technology trends in 2019. Citing particular emphasis on predictive and prescriptive analytics, these advanced technologies facilitate supply chain planning, scenario planning and a better understanding of how supply chains operate on a day-to-day basis. While in many instances the analytics themselves may not be new, their applications in the supply chain area innovate in terms of first use in a particular organization. On the leading edge of “new-to-the world” innovation, however, are the development of unique approaches in areas such as machine learning (ML), artificial intelligence and data science approaches to deal with structured and unstructured data.
Framing the Objective of Analytics in Shipper-3PL Relationships
A major purpose of this special topic is to better understand the role of analytics in shipper-3PL relationships and to identify some of the opportunities and challenges to the effective implementation and use of analytics capabilities. In addition, the research results should help to suggest a going-forward strategy for the effective use of analytics in shipper-3PL relationships.
Various studies have documented the need for analytics to improve business planning and operations, and a number of these have focused specifically on applications and implications for supply chains and the key processes implied therein. Some of these having content relevant to shipper-3PL relationships include:
• B i g Dat a in 3 PL - Cu s to m e r Relationships: Included as a special topic in the 2014 18th Annual 3PL Study,
this research focused on developing an initial understanding of how big data was or was not used in shipper-3PL relationships. Although analysts at the time declared the year 2013 to be the start of the big data era in the supply chain, 97% of shippers and 93% of 3PLs agreed that improved, data-driven decision-making was essential to the future success of their supply chain activities. As may have been expected when the 2014 study was conducted, only 22% of shippers and 23% of 3PLs indicated they were planning or currently using big data initiatives.
• Utilizing Big Data and Analytics: Research into this topic was conducted as part of the 2017 21st Annual 3PL Study and basically was included as a follow-up to the earlier coverage of this topic in the 2014 study. Both shippers and 3PLs continued to agree that improved, data-driven decision-making was essential to the future success of supply chain activities and processes, as evidenced
by 93% agreement among shippers and 98% among 3PLs. Additionally, this research provided an understanding of what shippers and 3PLs thought to be most important as they considered the use of big data techniques in their relationships.
• Shipper-3PL Data Sharing: This topic received attention in last year’s 2019 23rd Annual 3PL Study and examined the challenge of shipper-3PL data sharing through the lens of the request for proposal (RFP) process that involves shippers and 3PLs. The study highlighted four crucial elements for an effective RFP process: a problem that needs to be solved, complete data, true assumptions and operational insight. Faulty hand-offs of data may affect the extent to which overall shipper-3PL relationships accomplish their objectives. Continued progress is needed regarding effective management of people, processes and technologies.
ANALYTICS IN SHIPPER-3PL RELATIONSHIPS
14 2020 24th ANNUAL THIRD-PARTY LOGISTICS STUDY
Definitions
At the outset of the survey questions relating to analytics, three definitions were provided for respondents to keep in mind as they completed the survey questions.
• Metrics: Quantifiable measures related to specific supply chain operations.
• Key Performance Indicators (KPIs): Mutually agreed upon metrics that focus most on what it takes to achieve success.
• Analytics: Information resulting from the use of mathematical and statistical methods to transform data into insight.
Current Involvement with Analytics
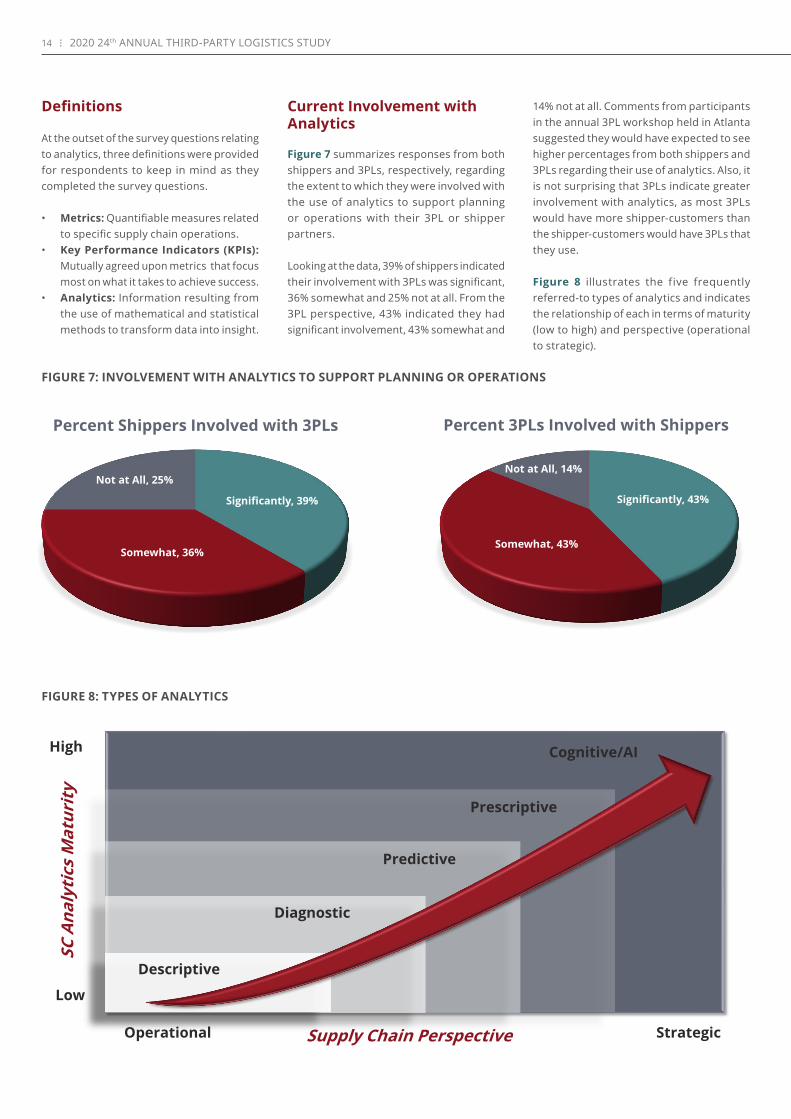
Figure 7 summarizes responses from both shippers and 3PLs, respectively, regarding the extent to which they were involved with the use of analytics to support planning or operations with their 3PL or shipper partners.
Looking at the data, 39% of shippers indicated their involvement with 3PLs was significant, 36% somewhat and 25% not at all. From the 3PL perspective, 43% indicated they had significant involvement, 43% somewhat and
14% not at all. Comments from participants in the annual 3PL workshop held in Atlanta suggested they would have expected to see higher percentages from both shippers and 3PLs regarding their use of analytics. Also, it is not surprising that 3PLs indicate greater involvement with analytics, as most 3PLs would have more shipper-customers than the shipper-customers would have 3PLs that they use.
Figure 8 illustrates the five frequently referred-to types of analytics and indicates the relationship of each in terms of maturity (low to high) and perspective (operational to strategic).
Significantly, 39%
Somewhat, 36%
Not at All, 25%
Percent Shippers Involved with 3PLs
Significantly, 43%
Somewhat, 43%
Not at All, 14%
Percent 3PLs Involved with Shippers
Supply Chain Perspective
SC A
naly
tics
Mat
urit
y
High
Low
Operational Strategic
Diagnostic
Predictive
Prescriptive
Cognitive/AI
Descriptive
FIGURE 7: INVOLVEMENT WITH ANALYTICS TO SUPPORT PLANNING OR OPERATIONS
FIGURE 8: TYPES OF ANALYTICS

15
Also, the survey provides the following brief explanations of what is meant by each of these types of analytics:
• Descriptive: Explain what is happening.• Diagnostic: Understand why it
is happening.• Predictive: Forecast what may happen.• Prescriptive: Suggest what should
be done.• Cognitive/AI/machine learning:
Identify patterns of activity.
Each shipper respondent was asked about the types of analytics used to support planning or operations with 3PLs, and 3PL respondents were similarly asked about the
78%
69%
49% 46%
16%
81% 79%
62%56%
21%
Descriptive Diagnostic Predictive Prescriptive Cognitive/AI
Shippers 3PLs
FIGURE 9: TYPES OF ANALYTICS TO SUPPORT PLANNING OR OPERATIONS
types of analytics used with their customers. The results are shown in Figure 9, and generally suggest similar experiences by both shippers and 3PLs. Another observation is that the most frequently-used are descriptive and diagnostic analytics, which also are located in the lower-left portion of Figure 8, suggesting that in general they are of lower maturity and are more operational than the other types of analytics.
The predictive, prescriptive and cognitive/AI types of analytics are higher on the scale of maturity and strategic. Also of note is that the 3PL percentages in Figure 9 for each type of analytic are slightly higher than the percentages that relate to shippers. Once
again, this may be explained by the greater number of individual customers typically served by individual 3PLs.
Another observation from Figure 9, and not surprising is that the more frequently used types of analytics (e.g., descriptive and diagnostic) are more “backward-looking,” while those that are higher-placed on the maturity scale in Figure 8 are more “forward-looking.” As indicated by one of our workshop attendees, this is consistent with the current focus on the utilization of more meaningful metrics and analytics to provide operational intelligence that can be of value to both shippers and 3PLs.

16 2020 24th ANNUAL THIRD-PARTY LOGISTICS STUDY
When asked about areas in which the use of analytics is most helpful for improvement of shipper-3PL relationships, there was a very high level of agreement among shipper and 3PL respondents. Figure 10 suggests several areas that may be in need of improvement and for which the use of analytics may be useful to achieving a greater understanding.
The table lists the types of problem areas in order of the percentages of shipper and 3PL respondents rating them as relevant to the use of analytics. One interesting observation is there was a high level of agreement among shippers and 3PL respondents as to the critical nature of each of these areas.
As may have been expected, the higher-rated types of problems included on-time and complete order fulfillment, shipment visibility, freight costs per shipment, transit time, cost-to-serve and order-to-delivery cycle time. These are all critical to achieving transactional KPIs (key performance indicators) that are designed to focus attention on what it takes to achieve success. Progress in seeing improvement in these areas is dependent on the availability of accurate, reliable and complete data that
FIGURE 10: AREAS IN WHICH USE OF ANALYTICS IS MOST HELPFUL FOR IMPROVEMENT
T YPES OF PROBLEMS % Shippers % 3PLS
On-time and complete order fulfillment 69% 66%
Shipment visibility 63% 65%
Freight costs per shipment 60% 65%
Transit time 59% 55%
Cost to serve 58% 65%
Order-to-delivery cycle time 58% 63%
Flexibility and adaptability 47% 54%
Inquiry response time to shippers 28% 40%
Sustainability - use of approved carriers 24% 29%
Damage-free shipments 23% 22%
can be better understood through the use of appropriate analytical approaches and techniques.
The other four types of problems identified in Figure 10 are no less relevant, but were rated as being of lesser concern than the others included in the question. Discussion in the Atlanta workshop suggested that safety and compliance concerns also would be areas in which the use of analytics could be very helpful.
To more fully appreciate the various types of analytics being discussed, it is important to understand that the level of mathematical and statistical sophistication will increase significantly as the type of analytic moves from descriptive to cognitive/AI/machine learning.
For example, and even if very large amounts of data are involved, descriptive and diagnostic analytics may be created through relatively straightforward, but easily understandable analytical approaches. Included may be data summaries, cross-tabulations, and cause and effect analyses.
Moving into the arena of predictive analytics, the objective is to utilize historical data for the purposes of establishing patterns and then to make predictions for the future based on these past experiences. Central to the success of developing high-quality predictive analytics is the ability to isolate, quantify and digitize key factors that are central to satisfactorily predicting future events/outcomes.
To some extent, the use of prescriptive analytics involves extensions of descriptive and predictive analytics, but it focuses on finding the best course of action for a given situation. An example of prescriptive analytics that would be familiar to many online shoppers is Amazon’s use of previous purchase data to suggest/predict other items that may be of interest to individual shoppers.
Another example is the current availability of software that provides powerful analytics to transportation and 3PL pricing teams. With the benefit of historical shipment and rate/price information and data relating to cost, margins and profitability, prescriptive analytics may be developed that can help pricing discussions to quickly focus on a range of proposals that would be profitable for suppliers and acceptable to prospective customers.
Data relating to lane guidance, external rate index information, internal historical information, and cost and margin data help to better understand alternative approaches to the pricing of services. Both of these examples effectively use the power of prescriptive analytics to help improve organizational revenues.
The use of cognitive, AI and machine learning approaches typify the high-end of the maturity scale relating to analytics. These represent fields of analytics that apply human-like intelligence to base future decisions on inferences from existing data and patterns and then inserts this back into the knowledge base for future inferences. Essentially, these approaches include self-learning feedback loops, where the resulting cognitive applications may become smarter over time through continuing interactions with data and humans. This category of analytics typically requires significant mathematical and statistical expertise and sometimes exceptional amounts of computational capability.
17
Shipper-3PL Assessment of Analytics
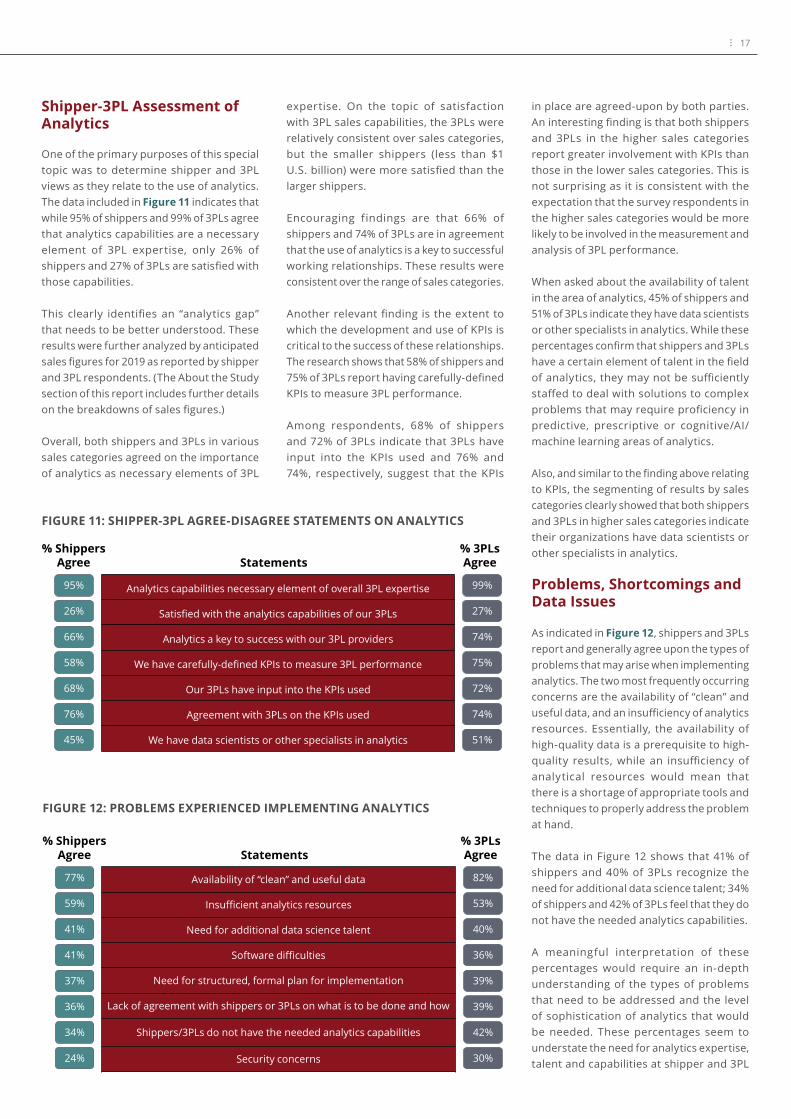
One of the primary purposes of this special topic was to determine shipper and 3PL views as they relate to the use of analytics. The data included in Figure 11 indicates that while 95% of shippers and 99% of 3PLs agree that analytics capabilities are a necessary element of 3PL expertise, only 26% of shippers and 27% of 3PLs are satisfied with those capabilities.
This clearly identifies an “analytics gap” that needs to be better understood. These results were further analyzed by anticipated sales figures for 2019 as reported by shipper and 3PL respondents. (The About the Study section of this report includes further details on the breakdowns of sales figures.)
Overall, both shippers and 3PLs in various sales categories agreed on the importance of analytics as necessary elements of 3PL
expertise. On the topic of satisfaction with 3PL sales capabilities, the 3PLs were relatively consistent over sales categories, but the smaller shippers (less than $1 U.S. billion) were more satisfied than the larger shippers.
Encouraging findings are that 66% of shippers and 74% of 3PLs are in agreement that the use of analytics is a key to successful working relationships. These results were consistent over the range of sales categories.
Another relevant finding is the extent to which the development and use of KPIs is critical to the success of these relationships. The research shows that 58% of shippers and 75% of 3PLs report having carefully-defined KPIs to measure 3PL performance.
Among respondents, 68% of shippers and 72% of 3PLs indicate that 3PLs have input into the KPIs used and 76% and 74%, respectively, suggest that the KPIs
in place are agreed-upon by both parties. An interesting finding is that both shippers and 3PLs in the higher sales categories report greater involvement with KPIs than those in the lower sales categories. This is not surprising as it is consistent with the expectation that the survey respondents in the higher sales categories would be more likely to be involved in the measurement and analysis of 3PL performance.
When asked about the availability of talent in the area of analytics, 45% of shippers and 51% of 3PLs indicate they have data scientists or other specialists in analytics. While these percentages confirm that shippers and 3PLs have a certain element of talent in the field of analytics, they may not be sufficiently staffed to deal with solutions to complex problems that may require proficiency in predictive, prescriptive or cognitive/AI/machine learning areas of analytics.
Also, and similar to the finding above relating to KPIs, the segmenting of results by sales categories clearly showed that both shippers and 3PLs in higher sales categories indicate their organizations have data scientists or other specialists in analytics.
Problems, Shortcomings and Data Issues
As indicated in Figure 12, shippers and 3PLs report and generally agree upon the types of problems that may arise when implementing analytics. The two most frequently occurring concerns are the availability of “clean” and useful data, and an insufficiency of analytics resources. Essentially, the availability of high-quality data is a prerequisite to high-quality results, while an insufficiency of analytical resources would mean that there is a shortage of appropriate tools and techniques to properly address the problem at hand.
The data in Figure 12 shows that 41% of shippers and 40% of 3PLs recognize the need for additional data science talent; 34% of shippers and 42% of 3PLs feel that they do not have the needed analytics capabilities.
A meaningful interpretation of these percentages would require an in-depth understanding of the types of problems that need to be addressed and the level of sophistication of analytics that would be needed. These percentages seem to understate the need for analytics expertise, talent and capabilities at shipper and 3PL
Analytics capabilities necessary element of overall 3PL expertise
Satisfied with the analytics capabilities of our 3PLs
Analytics a key to success with our 3PL providers
We have carefully-defined KPIs to measure 3PL performance
Our 3PLs have input into the KPIs used
Agreement with 3PLs on the KPIs used
We have data scientists or other specialists in analytics
95%
26%
66%
58%
68%
76%
45%
99%
27%
74%
75%
72%
74%
51%
% 3PLsAgree
% ShippersAgree Statements
FIGURE 11: SHIPPER-3PL AGREE-DISAGREE STATEMENTS ON ANALYTICS
Availability of “clean” and useful data
Insufficient analytics resources
Need for additional data science talent
Software difficulties
Need for structured, formal plan for implementation
Lack of agreement with shippers or 3PLs on what is to be done and how
Shippers/3PLs do not have the needed analytics capabilities
Security concerns
77%
59%
41%
41%
37%
36%
34%
24%
82%
53%
40%
36%
39%
39%
42%
30%
% 3PLsAgree
% ShippersAgree Statements
FIGURE 12: PROBLEMS EXPERIENCED IMPLEMENTING ANALYTICS

18 2020 24th ANNUAL THIRD-PARTY LOGISTICS STUDY
organizations. As discussed at the Atlanta workshop, significant attention needs to be directed to developing effective strategies for mitigation or elimination of these types of problems.
Among the other problems identified in Figure 12 are the need for a structured, formal plan for implementation and a lack of agreement with shippers or 3PLs on what is to be done and how.
Figure 13 identifies several common types of problems with data and the frequency with which they are recognized by shippers and 3PLs. Clearly, there are concerns with accuracy, completeness and availability of needed data. These concerns are compounded by the likelihood that there are differences between shipper and 3PL data, for example parties may maintain different metrics relating to the percent of shipments delivered on-time, and that KPIs may not be fully aligned with the objectives to be met.
Developing an Analytics Strategy for Shippers and 3PLs
Essentially, development of an analytics strategy is the equivalent of a transformation strategy to effectively incorporate the use of analytics into the planning and operations of shipper-3PL relationships.
Some of the key elements of this transformation as shippers and 3PLs work together to resolve a problem of mutual interest include:
Shipper-3PL Joint Commitment for Improvement. This requires 100% agreement between shippers and their 3PLs. This should take the form of a strategic plan to understand and leverage the power of analytics to strengthen and improve shipper-3PL relationships. Ideally it should involve representatives of involved firms at the executive, management and operating
levels. Essentially, the commitment for improvement should involve development of a robust business intelligence program that can support the need for analytics in shipper-3PL relationships.
Overall Agreement and Alignment on Purpose and Objectives of the Relationship. Agreement and alignment will be most impactful when the involved parties have taken the time and effort to understand exactly what the relationship is trying to accomplish. While it is a given that contracts should identify responsibilities, shippers and 3PLs need to institute dialogue and understanding to meaningfully achieve agreement and alignment.
Problem Identification. Sometimes referred to as the “as-is” situation, this establishes a baseline description of the current situation for involved parties. It must include a clear, agreed-upon understanding of the problem(s) to be solved. Care should be taken to properly identify problems rather than just respond to symptoms.
Improvement Objective. This would represent the “to-be” situation, and it should reflect the goals and objectives that are to be met by the transformation.
Structured Approach to Analysis. Included within this step is the development of an understandable and realistic plan to approach the problem under investigation.
FIGURE 13: ANALYTICS DATA PROBLEMS
T YPES OF PROBLEMS % Shippers % 3PLS
Accuracy and completeness 79% 83%
Availability of needed data 66% 72%
Differences between your data and shipper/3PL data 50% 44%
Lack of alignment with KPIs 40% 50%
Measurability 39% 33%
Complexity of data 38% 36%
Issues relating to use of sensitive or proprietary data 17% 27%
Too much data 15% 13%
19
Use of Appropriate Analytical Tools. This step will depend on the need for descriptive, diagnostic, predictive, prescriptive or cognitive/AI approaches.
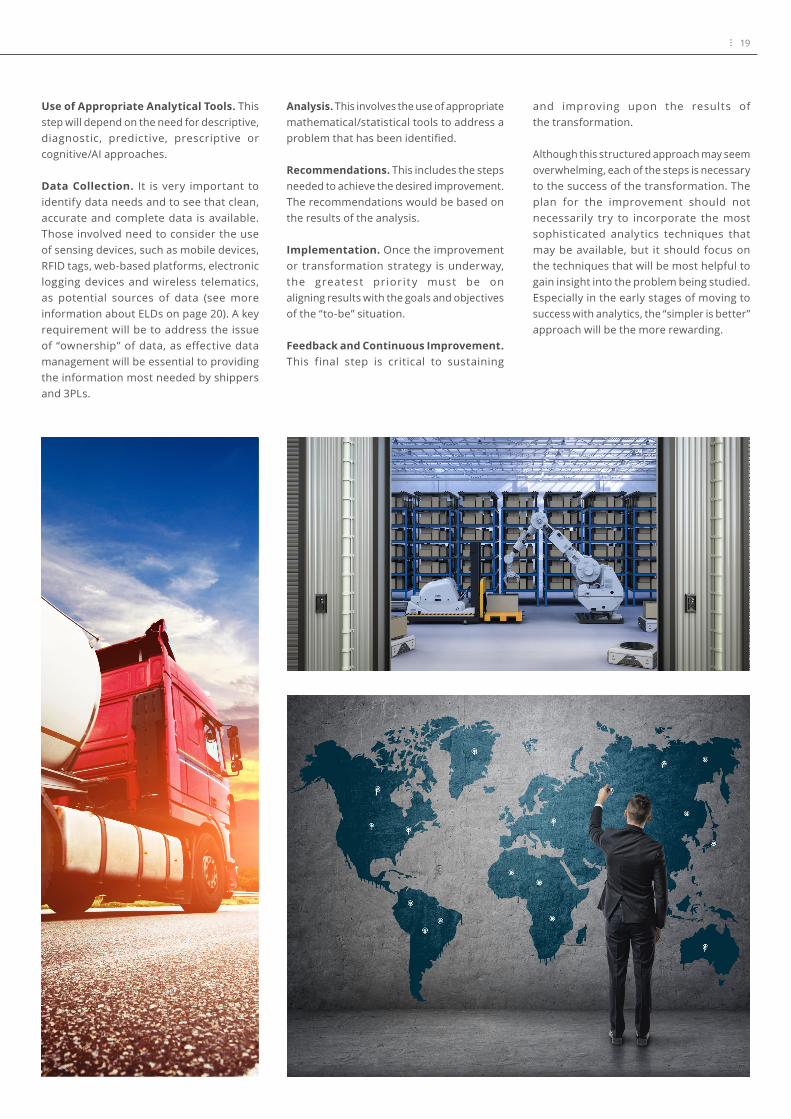
Data Collection. It is very important to identify data needs and to see that clean, accurate and complete data is available. Those involved need to consider the use of sensing devices, such as mobile devices, RFID tags, web-based platforms, electronic logging devices and wireless telematics, as potential sources of data (see more information about ELDs on page 20). A key requirement will be to address the issue of “ownership” of data, as effective data management will be essential to providing the information most needed by shippers and 3PLs.
Analysis. This involves the use of appropriate mathematical/statistical tools to address a problem that has been identified.
Recommendations. This includes the steps needed to achieve the desired improvement. The recommendations would be based on the results of the analysis.
Implementation. Once the improvement or transformation strategy is underway, the greatest priorit y must be on aligning results with the goals and objectives of the “to-be” situation.
Feedback and Continuous Improvement. This final step is critical to sustaining
and improving upon the results of the transformation.
Although this structured approach may seem overwhelming, each of the steps is necessary to the success of the transformation. The plan for the improvement should not necessarily try to incorporate the most sophisticated analytics techniques that may be available, but it should focus on the techniques that will be most helpful to gain insight into the problem being studied. Especially in the early stages of moving to success with analytics, the “simpler is better” approach will be the more rewarding.
20 2020 24th ANNUAL THIRD-PARTY LOGISTICS STUDY
Key Takeaways
• The use of analytics in the supply chain is gaining in terms of frequency of use, levels of sophistication and utilization of available computational capabilities. There is a great interest by shippers and 3PLs on using analytics to improve their relationships and achieve more focused results.
• Based on results from the 2020 24th Annual 3PL Study, most shippers and 3PLs surveyed indicated that they were involved to some extent with analytics to support planning or operations.
• Shippers and 3PLs report similar frequency of use of the five major types of analytics, which are descriptive, diagnostic, predictive, prescriptive and cognitive/AI/machine learning. The available data suggests more frequent use of those in the descriptive and diagnostic categories.
Electronic Logging Devices Give Carriers, 3PLs and Shippers Vast Amounts of Useful Data
The electronic logging device mandate, which took effect Dec. 18, 2017, required the majority of long-haul motor carriers within the trucking industry to install devices that automatically record a driver’s hours-of-service. The primary focus of ELDs is to ensure drivers are complying with federal drive-time regulations, but carriers, 3PLs and shippers can tap into the rich data the devices collect for other uses.
In addition to recording drivers’ time behind the wheel, ELDs monitor engine hours, vehicle movement, miles driven and location information. They transmit data via satellite or cellular technology as frequently as the customer desires, such as every five minutes. That information can help companies proactively manage delays, provide customers with a load’s estimated time of arrival, schedule labor and update dispatchers. The devices can also show customer delivery information.
The vast amount of tracking data from a device can benefit carriers, 3PLs and shippers in multiple ways. The information creates transparency and enables those within the supply chain to see the same thing at the same time. The data can also be used to drive collaboration as shippers and their transportation and logistics providers work to identify inefficiencies, minimize idle time and keep shipments moving. The recorded information provides factual examples of inefficiencies, which can drive deeper conversations than those based on observations.
The ELD mandate provided a two-stage compliance timeline to switch to an ELD and gave vehicles that were using automatic on-board recording devices (AOBRDs) prior to Dec. 16, 2017, more time to comply. AOBRDs function much like an ELD but record and display less data. AOBRD users have until Dec. 16, 2019, to switch to an ELD. Therefore, 2020 will mark the first year that the majority fleets will be gathering the robust, useful data ELDs capture.
As carriers’ use of ELDs evolves, the industry will likely see more ways in which carriers, as well as the 3PLs and shippers they work with, can utilize the rich data the devices capture.
• There were high levels of agreement among shippers and 3PLs regarding the types of problems that were good candidates for improvement through the use of analytics. The higher-rated problems include on-time and complete order fulfillment, shipment visibility, freight costs per shipment, transit time, cost-to-serve and order-to-delivery cycle time. These are all critical to achieving transactional KPIs (key performance indicators) that are designed to focus attention on what it takes to achieve success.
• Another topic of interest was the assessment by shippers and 3PLs of their use of analytics. An interesting finding is that while both shippers and 3PLs strongly agreed that analytics capabilities are a necessary element of 3PL expertise, they also agreed that they were only minimally satisfied with those capabilities. As this study has focused
attention over a lengthy period of time on the “IT Gap,” this year’s study has identified the existence of an “Analytics Gap.”
• The use of analytics is not without its problems, shortcomings and data issues. One area of concern is the need for clean and useful data and sufficient analytics resources. Other areas of concern include the need for appropriate talent, whether it is at the level of a data analyst or a data scientist, and a structured, formal planning effort by shippers and 3PLs on how to make progress while prioritizing the use of analytics.

21
SUPPLY CHAIN FINANCE
For more than 20 years, globalization has increased, and global trade volumes have continued to rise. This has presented new opportunities, and the supply chain is now an instrumental part of how companies are building, scaling and managing their operations.
However, it has also increased the exposure businesses face due to instabilities from political and economic disruption. Geopolitical strife across the globe, ongoing trade wars and the risk of natural disasters has made the supply chain more complex, and today’s shippers must be prepared, flexible and innovative.
As a result, supply chain finance—the ability to model and manage the financial impacts of operations decisions, within and outside of a company’s control—is emerging as a must have capability. Supply chain financing allows those within the supply chain to manage the increasing complexity of global operations.
In earlier times, companies focused on transportation rates by mode, analyzing the tradeoff between those costs and shipment frequency. Then came globalization, low-cost country sourcing and the pursuit of labor arbitrage, resulting in significantly
more complicated operations. Seemingly overnight, duties, value added tax and shipping delays changed budgets dramatically. Companies had to understand trade agreements and the impact of product classifications and politicians introduced new instability that led to huge impacts on profitability.
In 2016, Jeffrey Immelt, then CEO of GE, gave a commencement speech that highlighted some of these complexities and their impact. As reported in Forbes magazine, he stated that, “In the face of a protectionist global environment, companies must navigate the world on their own.” He believed that the
FIGURE 14: TITLES OF THE MOST SENIOR FINANCE PERSON IN THE SUPPLY CHAIN/LOGISTICS ORGANIZATION
A Critical Capability
19
Shippers 3PL/4PL (Provider/manager of outsourced logistics services)0%
5%
10%
15%
20%
25%
30%
35%
40%
45%
50%
Financial Analyst
Finance Manager
Finance Director
Finance VP
political environment led to a fracturing of the global economy that made it difficult for companies to efficiently operate globally.
Now supply chain leaders need their own finance capability to manage the growing number of factors that impact supply chain costs.
Figure 14 shows that 31% of shippers said their senior-most finance person in their supply chain/logistics organization held the title of finance director; 26% were referred to as finance manager; 26% held the title of finance vice president. A smaller number, 17%, held the title of financial analyst.
22 2020 24th ANNUAL THIRD-PARTY LOGISTICS STUDY
Among 3PLs respondents, 45% had the title of finance vice president; 23% were referred to as finance director; 23% had the title of finance manager; just 9% held the title of financial analyst.
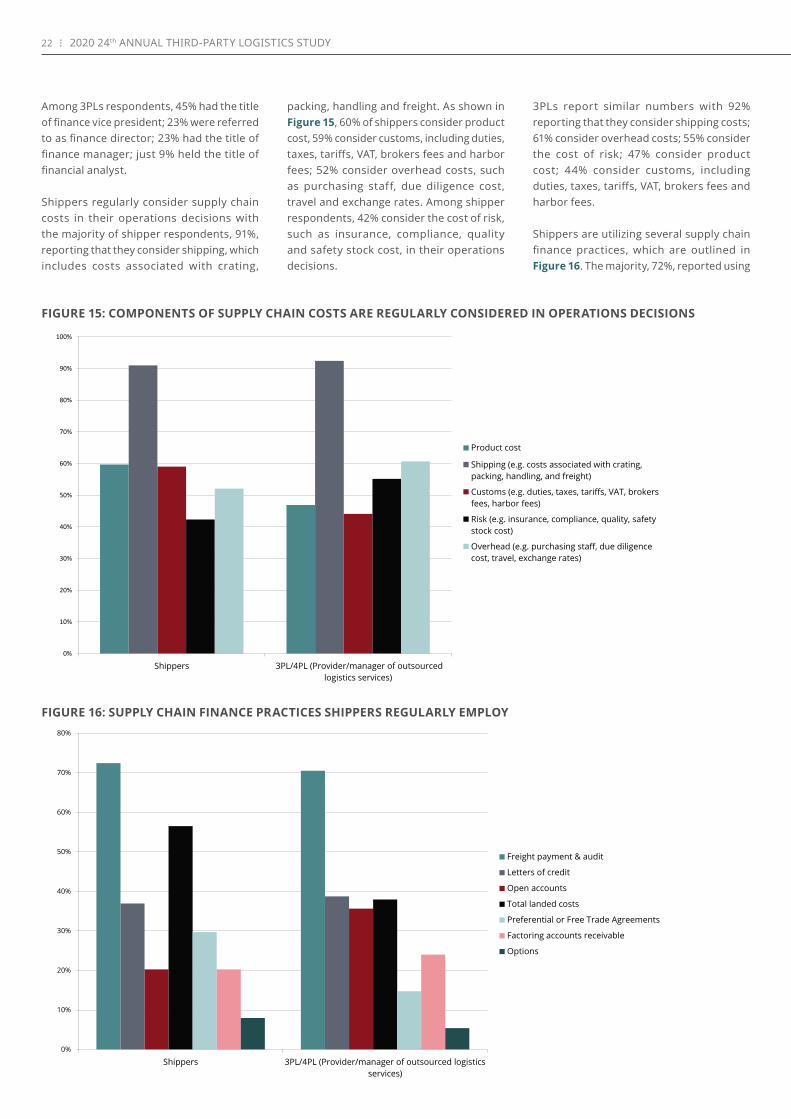
Shippers regularly consider supply chain costs in their operations decisions with the majority of shipper respondents, 91%, reporting that they consider shipping, which includes costs associated with crating,
packing, handling and freight. As shown in Figure 15, 60% of shippers consider product cost, 59% consider customs, including duties, taxes, tariffs, VAT, brokers fees and harbor fees; 52% consider overhead costs, such as purchasing staff, due diligence cost, travel and exchange rates. Among shipper respondents, 42% consider the cost of risk, such as insurance, compliance, quality and safety stock cost, in their operations decisions.
3PLs report similar numbers with 92% reporting that they consider shipping costs; 61% consider overhead costs; 55% consider the cost of risk; 47% consider product cost; 44% consider customs, including duties, taxes, tariffs, VAT, brokers fees and harbor fees.
Shippers are utilizing several supply chain finance practices, which are outlined in Figure 16. The majority, 72%, reported using
FIGURE 15: COMPONENTS OF SUPPLY CHAIN COSTS ARE REGULARLY CONSIDERED IN OPERATIONS DECISIONS
FIGURE 16: SUPPLY CHAIN FINANCE PRACTICES SHIPPERS REGULARLY EMPLOY
Shippers 3PL/4PL (Provider/manager of outsourced logistics services)
0%
10%
20%
30%
40%
50%
60%
70%
80%
90%
100%
Product cost
Shipping (e.g. costs associated with crating,packing, handling, and freight)
Customs (e.g. duties, taxes, tariffs, VAT, brokersfees, harbor fees)
Risk (e.g. insurance, compliance, quality, safetystock cost)
Overhead (e.g. purchasing staff, due diligencecost, travel, exchange rates)
Shippers 3PL/4PL (Provider/manager of outsourced logisticsservices)
0%
10%
20%
30%
40%
50%
60%
70%
80%
Freight payment & audit
Letters of credit
Open accounts
Total landed costs
Preferential or Free Trade Agreements
Factoring accounts receivable
Options
23
freight payment and audit; 57% are using total landed cost; 37% are using letters of credit; 30% are using preferential or free trade agreements. A smaller number, 20%, are using open accounts, and 20% reported using factoring accounts receivable.
Among 3PLs, 71% reported using freight payment and audit; 39% are using letters of credit; 36% are using open accounts; 20% are using factoring accounts receivable; 15% reported using preferential or free trade agreements.
Today the industry is seeing embedded cost models. While nearly half of shippers continue to use total landed costs, companies are also embracing a dynamic model and strategically thinking about how changing suppliers will affect the supply chain. They are hiring teams of people to provide real-time analysis so they can make timely adjustments to their supply chain, and there is a series of levers companies can pull in real time to decrease volume, if needed, or add product based on their projected total costs.
Toyota Motor Corp., for example, has created a “virtual war room” of about 150 employees mapping out the impact of various U.S. trade policy scenarios, according to a person familiar with its strategic planning, Bloomberg reported. The news agency said about 50 of those employees, mostly supply chain and logistics experts, are based in North America.
Technology is impacting supply chain finance. As was reported in the 22nd Annual Third-Party Logistics Study, interest in applying blockchain technology to the supply chain is gaining traction. Blockchain has significant implications for supply chain finance. It will provide information on supplier inventory levels, purchase order data and invoice approval. Because it will result in a single source of information that documents each movement within the supply chain, it will enable increased settlement speeds at lower costs.
In addition, real-time tracking allows those within the supply chain to see what is happening to the product and enables them to make decisions about how a product should progress.
It is likely that as the adoption of new technologies increases, supply chain finance will become more available to smaller and more diverse suppliers within the supply chain.
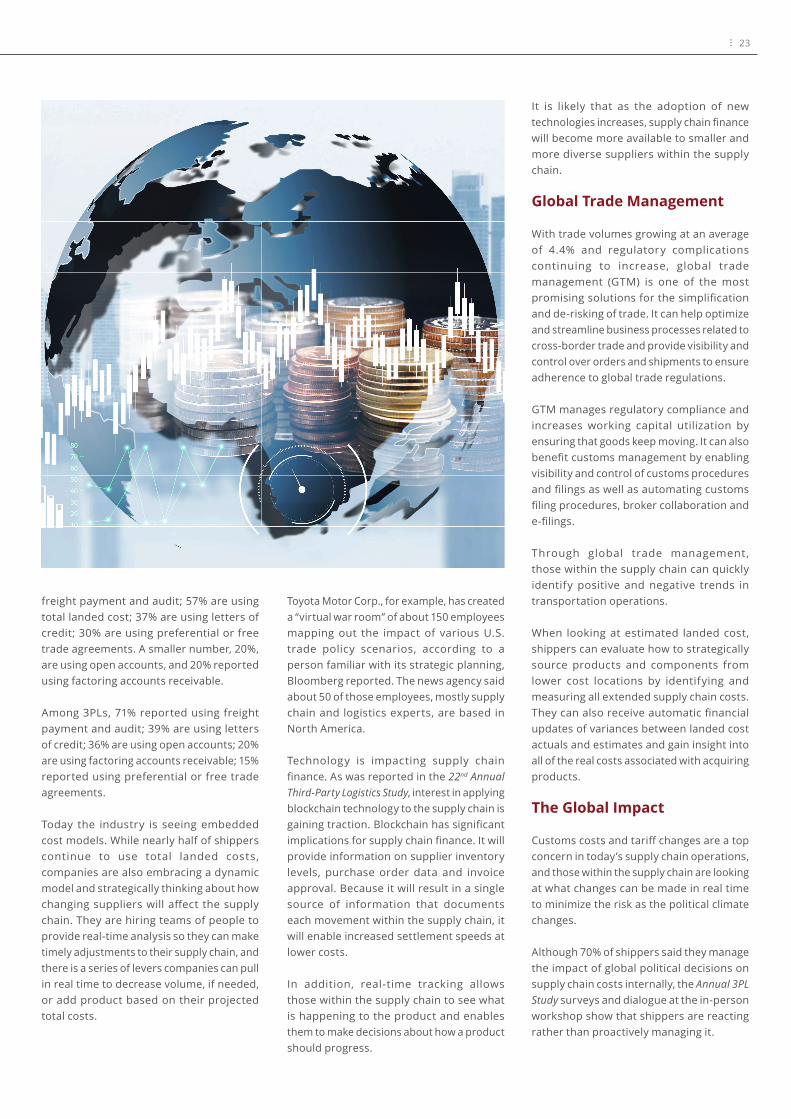
Global Trade Management
With trade volumes growing at an average of 4.4% and regulatory complications continuing to increase, global trade management (GTM) is one of the most promising solutions for the simplification and de-risking of trade. It can help optimize and streamline business processes related to cross-border trade and provide visibility and control over orders and shipments to ensure adherence to global trade regulations.
GTM manages regulatory compliance and increases working capital utilization by ensuring that goods keep moving. It can also benefit customs management by enabling visibility and control of customs procedures and filings as well as automating customs filing procedures, broker collaboration and e-filings.
Through global trade management, those within the supply chain can quickly identify positive and negative trends in transportation operations.
When looking at estimated landed cost, shippers can evaluate how to strategically source products and components from lower cost locations by identifying and measuring all extended supply chain costs. They can also receive automatic financial updates of variances between landed cost actuals and estimates and gain insight into all of the real costs associated with acquiring products.
The Global Impact
Customs costs and tariff changes are a top concern in today’s supply chain operations, and those within the supply chain are looking at what changes can be made in real time to minimize the risk as the political climate changes.
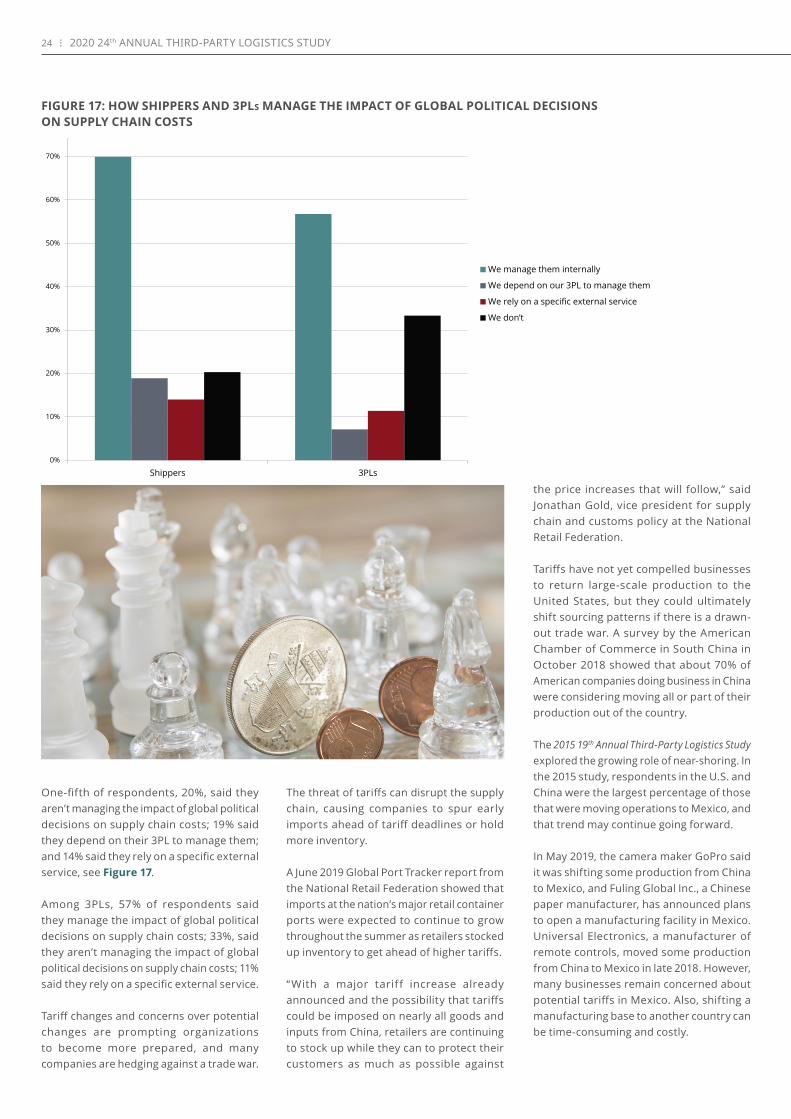
Although 70% of shippers said they manage the impact of global political decisions on supply chain costs internally, the Annual 3PL Study surveys and dialogue at the in-person workshop show that shippers are reacting rather than proactively managing it.
24 2020 24th ANNUAL THIRD-PARTY LOGISTICS STUDY
One-fifth of respondents, 20%, said they aren’t managing the impact of global political decisions on supply chain costs; 19% said they depend on their 3PL to manage them; and 14% said they rely on a specific external service, see Figure 17.
Among 3PLs, 57% of respondents said they manage the impact of global political decisions on supply chain costs; 33%, said they aren’t managing the impact of global political decisions on supply chain costs; 11% said they rely on a specific external service.
Tariff changes and concerns over potential changes are prompting organizations to become more prepared, and many companies are hedging against a trade war.
The threat of tariffs can disrupt the supply chain, causing companies to spur early imports ahead of tariff deadlines or hold more inventory.
A June 2019 Global Port Tracker report from the National Retail Federation showed that imports at the nation’s major retail container ports were expected to continue to grow throughout the summer as retailers stocked up inventory to get ahead of higher tariffs.
“With a major tariff increase already announced and the possibility that tariffs could be imposed on nearly all goods and inputs from China, retailers are continuing to stock up while they can to protect their customers as much as possible against
the price increases that will follow,” said Jonathan Gold, vice president for supply chain and customs policy at the National Retail Federation.
Tariffs have not yet compelled businesses to return large-scale production to the United States, but they could ultimately shift sourcing patterns if there is a drawn-out trade war. A survey by the American Chamber of Commerce in South China in October 2018 showed that about 70% of American companies doing business in China were considering moving all or part of their production out of the country.
The 2015 19th Annual Third-Party Logistics Study explored the growing role of near-shoring. In the 2015 study, respondents in the U.S. and China were the largest percentage of those that were moving operations to Mexico, and that trend may continue going forward.
In May 2019, the camera maker GoPro said it was shifting some production from China to Mexico, and Fuling Global Inc., a Chinese paper manufacturer, has announced plans to open a manufacturing facility in Mexico. Universal Electronics, a manufacturer of remote controls, moved some production from China to Mexico in late 2018. However, many businesses remain concerned about potential tariffs in Mexico. Also, shifting a manufacturing base to another country can be time-consuming and costly.
Shippers 3PLs0%
10%
20%
30%
40%
50%
60%
70%
80%
We manage them internally
We depend on our 3PL to manage them
We rely on a specific external service
We don’t
FIGURE 17: HOW SHIPPERS AND 3PLs MANAGE THE IMPACT OF GLOBAL POLITICAL DECISIONS ON SUPPLY CHAIN COSTS

25
As companies continuously look for opportunities to grow revenue and lower costs in an increasingly complicated operating environment, supply chain finance is emerging as a must-have capability. Multiple logistics services, several border crossings and information gaps make it harder to be proactive. And finally, the global political environment continues to drive instability into operations decisions, creating what some fear is the new normal for those companies with global supply chains.
Key Takeaways
• Supply chain finance is a growing industry, and supply chain financing allows those within the supply chain to access capital that would otherwise be tied up while goods are in transit.
• Companies are starting to turn to their logistics and supply chain teams for direction and input, and supply chain is an instrumental part of how companies are building, scaling and managing their overall operations.
• Among shippers, 31% said their senior-most finance person in their supply chain/logistics organization held the title of finance director; 26% were referred to as finance manager; 26% were categorized as finance vice president. A smaller number, 17%, held the title of financial analyst.
• Among 3PLs respondents, 45% had the title of finance vice president; 23% were referred to as finance director; 23% had the title of finance manager; just 9% held the title of financial analyst.
• Shippers consider supply chain costs in their operations decisions with 91% reporting that they consider shipping, which includes costs associated with crating, packing, handling and freight.
• More than half, 60%, consider product cost, and 59% consider customs, including duties, taxes, tariffs, VAT, broker fees and harbor fees; 52% of shippers consider overhead costs, such as purchasing staff, due diligence cost, travel and exchange rates; 42% consider the cost of risk, such as insurance, compliance, quality and safety stock cost, in their operations decisions.
• 3PLs report similar numbers with 92% reporting that they consider shipping costs; 61% consider overhead costs; 55% consider the cost of risk; 47% consider product cost; 44% consider customs, including duties, taxes, tariffs, VAT, brokers’ fees and harbor fees.
• Shippers are utilizing several supply chain f inance practices with 72% reporting using freight payment and audit; 57% are using total landed cost; 37% are using letters of credit; 30%
are using preferential or free trade agreements. A smaller number, 20%, are using open accounts; 20% also reported using factoring accounts receivable.
• More than half of shippers, 70%, said they manage the impact of global political decisions on supply chain costs internally; 20% said they aren’t managing the impact of global political decisions on supply chain costs; 19% said they depend on their 3PL to manage them; and 14% said they rely on a specific external service.
• Among 3PLs, 57% of respondents said they manage the impact of global political decisions on supply chain costs; 33%, said they aren’t managing the impact of global political decisions on supply chain costs; 11% said they rely on a specific external service and 7% said they depend on a 3PL.
• Tariff changes and concerns over potential changes are prompting organizations to become more prepared for, and many companies are actively hedging against, a trade war. The threat of tariffs can disrupt the supply chain, causing companies to schedule early imports ahead of tariff deadlines or hold more inventory.
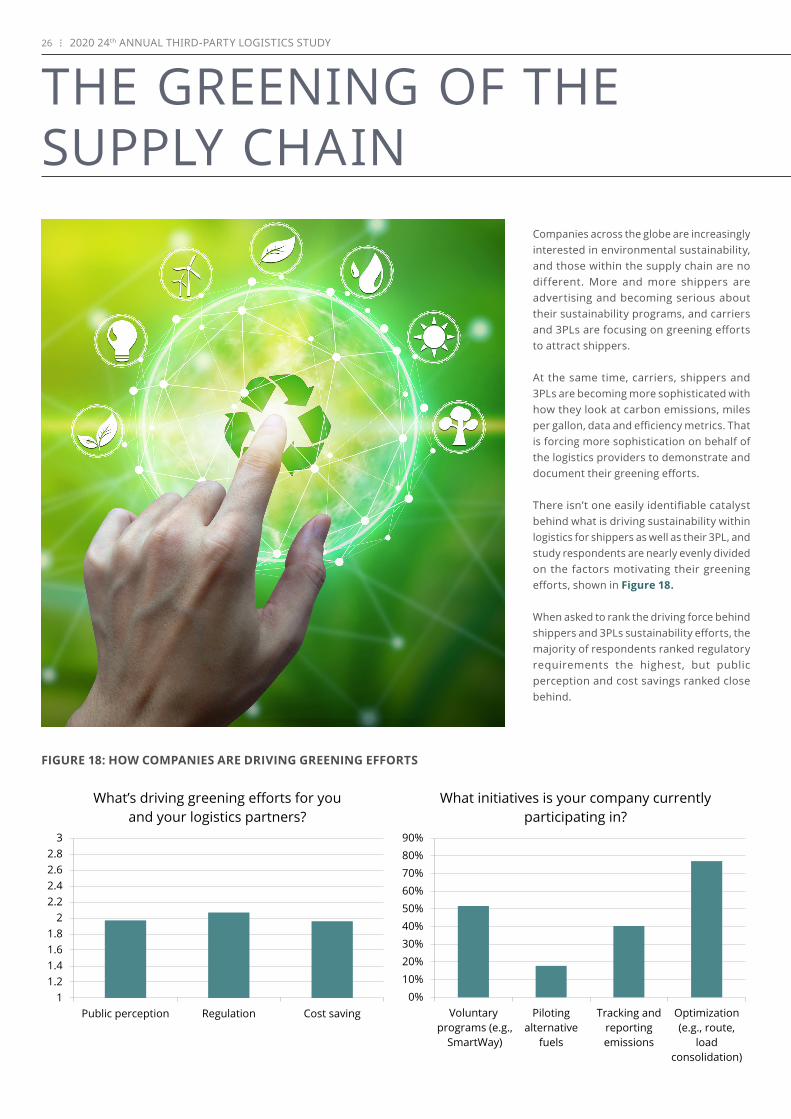
26 2020 24th ANNUAL THIRD-PARTY LOGISTICS STUDY
THE GREENING OF THE SUPPLY CHAIN
Companies across the globe are increasingly interested in environmental sustainability, and those within the supply chain are no different. More and more shippers are advertising and becoming serious about their sustainability programs, and carriers and 3PLs are focusing on greening efforts to attract shippers.
At the same time, carriers, shippers and 3PLs are becoming more sophisticated with how they look at carbon emissions, miles per gallon, data and efficiency metrics. That is forcing more sophistication on behalf of the logistics providers to demonstrate and document their greening efforts.
There isn’t one easily identifiable catalyst behind what is driving sustainability within logistics for shippers as well as their 3PL, and study respondents are nearly evenly divided on the factors motivating their greening efforts, shown in Figure 18.
When asked to rank the driving force behind shippers and 3PLs sustainability efforts, the majority of respondents ranked regulatory requirements the highest, but public perception and cost savings ranked close behind.
Public perception Regulation Cost saving1
1.21.41.61.8
22.22.42.62.8
3
What’s driving greening efforts for you and your logistics partners?
Voluntary programs (e.g.,
SmartWay)
Pilotingalternative
fuels
Tracking andreportingemissions
Optimization(e.g., route,
loadconsolidation)
0%10%20%30%40%50%60%70%80%90%
What initiatives is your company currently participating in?
FIGURE 18: HOW COMPANIES ARE DRIVING GREENING EFFORTS

27
There are multiple ways shippers and 3PLs are integrating sustainable environmental processes into the traditional supply chain.
The majority of shippers, 76%, said they are participating in optimization, such as route planning and load consolidation, shown in Figure 19. Another 42% said they are involved in tracking and reporting emissions; 38% said they are taking part in voluntary programs, such as the Environmental Protection Agency’s SmartWay program; 16% said they are piloting alternative fuels.
Several greening technologies are part of shippers’ logistics operations current and future plans, shown in Figure 20. A large number of shippers, 82%, cited optimization, such as route optimization and load consolidation; 28% cited alternative fuels, including electric vehicles and natural gas. A smaller number, 10%, cited autonomous vehicles or platooning technology. The term autonomous, rather than automated, was used within the study (see page 30 for more information on the two terms).
Among 3PLs, 88% cite optimization; 36% cite alternative fuels; 9% cite autonomous vehicles or platooning technology.
Within the next five years, 79% of shippers expect to launch optimization initiatives, such as route optimization and load consolidation; 43% said they plan to invest in alternative fuels and 20% report that they would launch
FIGURE 19: INITIATIVES SHIPPERS PARTICIPATE IN CURRENTLY
Shippers 3PLs0%
10%
20%
30%
40%
50%
60%
70%
80%
90%
Voluntary programs (e.g., SmartWay)
Piloting alternative fuels
Tracking and reporting emissions
Optimization (e.g., route, load consolidation)
FIGURE 20: CURRENT AND FUTURE GREENING INITIATIVES
Shippers 3PLs0%
10%
20%
30%
40%
50%
60%
70%
80%
90%
100%
What greening technologies are part of your logistics operations today?
Alternative fuels (e.g., electric, CNG,hydrogen)
Autonomous vehicles or platooningtechnologies
Optimization (e.g., route, loadconsolidation)
Other
Shippers 3PLs0%
10%
20%
30%
40%
50%
60%
70%
80%
90%
100%
What initiatives will you be launching in the next five years?
Alternative fuels (e.g., electric, CNG,hydrogen)
Autonomous vehicles or platooningtechnologies
Optimization (e.g., route, loadconsolidation)
Other (please specify)
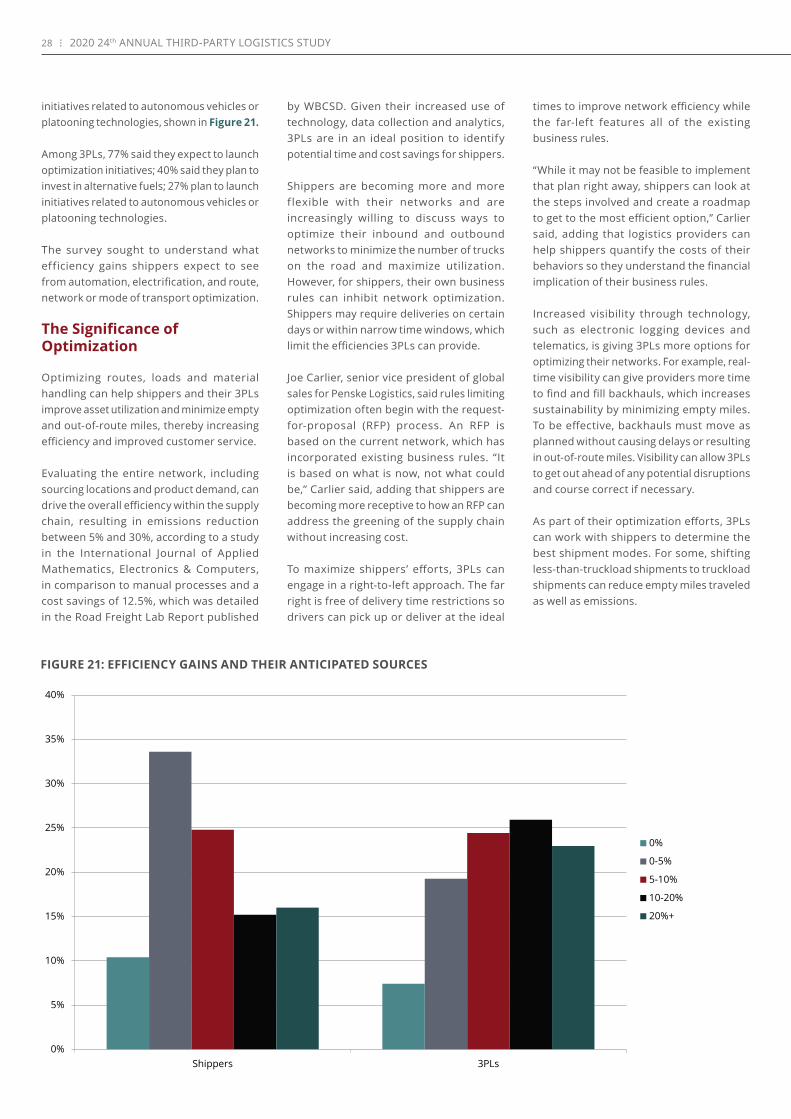
28 2020 24th ANNUAL THIRD-PARTY LOGISTICS STUDY
initiatives related to autonomous vehicles or platooning technologies, shown in Figure 21.
Among 3PLs, 77% said they expect to launch optimization initiatives; 40% said they plan to invest in alternative fuels; 27% plan to launch initiatives related to autonomous vehicles or platooning technologies.
The survey sought to understand what efficiency gains shippers expect to see from automation, electrification, and route, network or mode of transport optimization.
The Significance of Optimization
Optimizing routes, loads and material handling can help shippers and their 3PLs improve asset utilization and minimize empty and out-of-route miles, thereby increasing efficiency and improved customer service.
Evaluating the entire network, including sourcing locations and product demand, can drive the overall efficiency within the supply chain, resulting in emissions reduction between 5% and 30%, according to a study in the International Journal of Applied Mathematics, Electronics & Computers, in comparison to manual processes and a cost savings of 12.5%, which was detailed in the Road Freight Lab Report published
by WBCSD. Given their increased use of technology, data collection and analytics, 3PLs are in an ideal position to identify potential time and cost savings for shippers.
Shippers are becoming more and more flexible with their networks and are increasingly willing to discuss ways to optimize their inbound and outbound networks to minimize the number of trucks on the road and maximize utilization. However, for shippers, their own business rules can inhibit network optimization. Shippers may require deliveries on certain days or within narrow time windows, which limit the efficiencies 3PLs can provide.
Joe Carlier, senior vice president of global sales for Penske Logistics, said rules limiting optimization often begin with the request-for-proposal (RFP) process. An RFP is based on the current network, which has incorporated existing business rules. “It is based on what is now, not what could be,” Carlier said, adding that shippers are becoming more receptive to how an RFP can address the greening of the supply chain without increasing cost.
To maximize shippers’ efforts, 3PLs can engage in a right-to-left approach. The far right is free of delivery time restrictions so drivers can pick up or deliver at the ideal
times to improve network efficiency while the far-left features all of the existing business rules.
“While it may not be feasible to implement that plan right away, shippers can look at the steps involved and create a roadmap to get to the most efficient option,” Carlier said, adding that logistics providers can help shippers quantify the costs of their behaviors so they understand the financial implication of their business rules.
Increased visibility through technology, such as electronic logging devices and telematics, is giving 3PLs more options for optimizing their networks. For example, real-time visibility can give providers more time to find and fill backhauls, which increases sustainability by minimizing empty miles. To be effective, backhauls must move as planned without causing delays or resulting in out-of-route miles. Visibility can allow 3PLs to get out ahead of any potential disruptions and course correct if necessary.
As part of their optimization efforts, 3PLs can work with shippers to determine the best shipment modes. For some, shifting less-than-truckload shipments to truckload shipments can reduce empty miles traveled as well as emissions.
Shippers 3PLs0%
5%
10%
15%
20%
25%
30%
35%
40%
0%
0-5%
5-10%
10-20%
20%+
FIGURE 21: EFFICIENCY GAINS AND THEIR ANTICIPATED SOURCES

29
Converting truckload shipments to rail can also reduce emissions by eliminating on-road miles. For example, increased rail freight model shares in the European Union could reduce land freight emissions by 4% by 2050, according to a report by CE Delft. The conversion could also result in about a 15% to 35% reduction in costs.
Innovations in fleet technology, such as improved aerodynamics and reduced rolling friction tires leading to increased mileage, can improve fuel efficiency (which is discussed in more detail on page 30).
Optimization is also occurring within the warehouse, which plays a crucial role in speeding deliveries, managing inventories and cutting costs. Logistics providers can track the flow of inventory through and around the warehouse, monitor product velocity, and provide advanced notice of arrivals, which drive reduced dwell time and engine idling and increased efficiency. Data on incoming and outbound loads can be transmitted electronically between supply chain partners to reduce downtime.
The Role of Alternative Fuels
Shippers are becoming more interested in alternative fuel options and sustainable technologies even as oil has remained modestly priced. This is largely because customers are demanding it.
“They want a cleaner and more sustainable product and technology,” said Erik Neandross, chief executive officer of Gladstein, Neandross & Associates, a consulting firm for the development of the advanced transportation fuels and technology market. “There is a groundswell of recognition, activity and commitment to improved environmental performance.”
Major truck manufacturers and Tier 1 component suppliers are investing in electric vehicle technology, and Roger Nielsen, chief executive officer of Daimler Trucks North America, has said he believes the beginning of the end is here for the internal-combustion truck engine. In 2019, Nielsen predicted that electric vehicles will replace their diesel-powered equivalent and said Daimler is planning for a future that includes totally electric trucks and buses.
However, several challenges, including the cost of equipment and shippers’ willingness
to pay higher incremental costs to lower the environmental impact of supply chain operations, remain.
Alternative fuel vehicles typically cost more than their diesel equivalent. The shippers that are really committed to green are recognizing that there is a cost difference and that the available fueling infrastructure in many cases isn’t the most optimal network. However, they are willing to absorb the cost because it is important to them, Carlier said.
For many shippers, logistics remains a cost center. Procurement managers of transportation services are unlikely to say they want to increase expenses, but those that are genuinely committed would be willing to invest more to utilize a carrier who is investing in clean fuel or clean technology. “I think there is a lot of opportunity for that to be a shared experience, but we haven’t seen that in practice yet,” Neandross said.
Some companies, such as Lowe’s, Proctor and Gamble and Anheuser Busch, have shown they can make environmental sustainability within the supply chain work on a contract basis.
What’s more, asset-based 3PLs are more effective at developing and implementing programs to improve their environmental performance because they have more control and generally have, longer asset lives to justify the investment, Neandross explained.
Penske Truck Leasing is investing in electric vehicles, and in late 2018, Daimler Trucks North America delivered the first vehicle in
its Freightliner Electric Innovation Fleet – a medium-duty Freightliner eM2 – to Penske. The eM2 electrified solution is designed for local distribution, pickup and delivery, food and beverage delivery, and last-mile logistics applications. Penske planned to put an additional 10 medium-duty electric eM2 trucks and 10 heavy-duty eCascadia electric trucks into targeted service in California and the Pacific Northwest throughout 2019.
To support the electric vehicles, Penske Truck Leasing opened commercial heavy-duty electric vehicle charging stations with 14 high-speed chargers at four of its existing facilities in Southern California. The company plans to add at least six more chargers, bringing the total number to 20.
The charging infrastructure allows Penske to power an all-electric class 8 tractor from zero to a 100% charge in less than half a shift.
Electric trucks are expected to improve the total cost of ownership. Electricity costs less than diesel, and an electric truck has 80% fewer moving parts than its diesel equivalent, which means there are fewer parts to replace and less maintenance.
A report from the North American Council for Freight Efficiency said early adopters of electric vehicle technology are expected to be in the Class 3 through Class 6 segments. The report also found that longer ranges and heavier weights in Classes 7 and 8 are possible in specific operations, but will not be viable in all roles. It is essential for electric trucks to be placed in the right duty cycle to be successful, the report said.
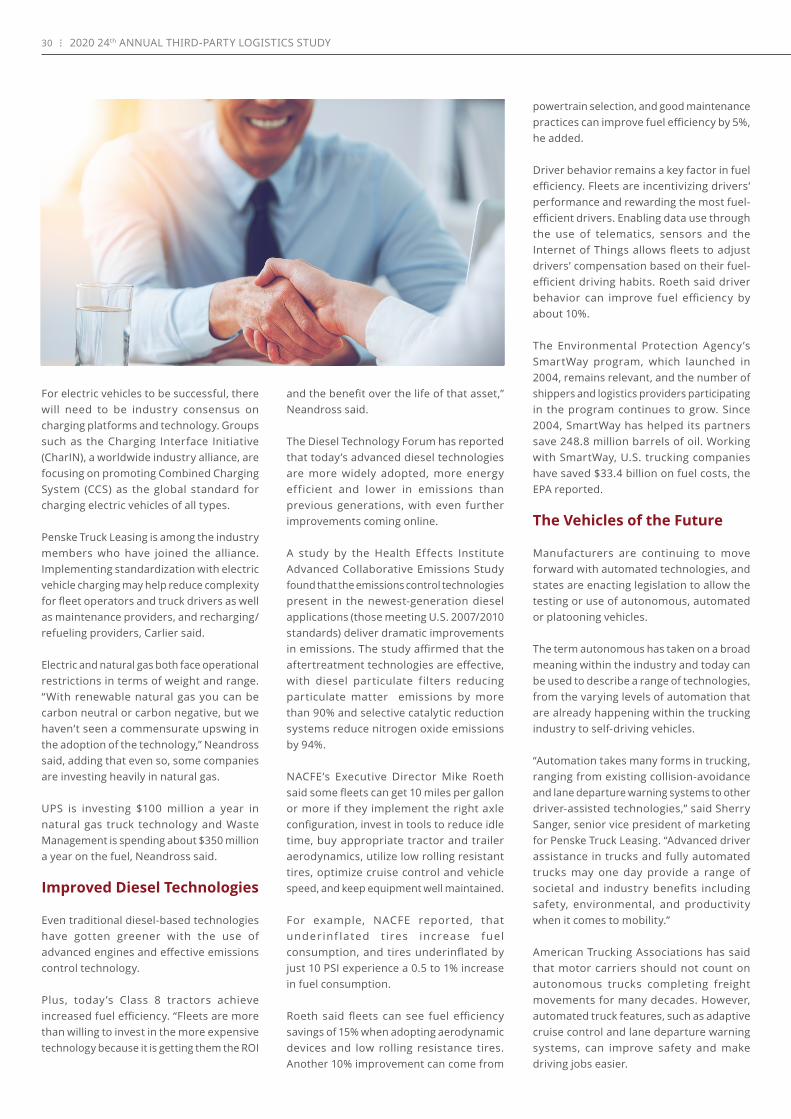
30 2020 24th ANNUAL THIRD-PARTY LOGISTICS STUDY
For electric vehicles to be successful, there will need to be industry consensus on charging platforms and technology. Groups such as the Charging Interface Initiative (CharIN), a worldwide industry alliance, are focusing on promoting Combined Charging System (CCS) as the global standard for charging electric vehicles of all types.
Penske Truck Leasing is among the industry members who have joined the alliance. Implementing standardization with electric vehicle charging may help reduce complexity for fleet operators and truck drivers as well as maintenance providers, and recharging/refueling providers, Carlier said.
Electric and natural gas both face operational restrictions in terms of weight and range. “With renewable natural gas you can be carbon neutral or carbon negative, but we haven’t seen a commensurate upswing in the adoption of the technology,” Neandross said, adding that even so, some companies are investing heavily in natural gas.
UPS is investing $100 million a year in natural gas truck technology and Waste Management is spending about $350 million a year on the fuel, Neandross said.
Improved Diesel Technologies
Even traditional diesel-based technologies have gotten greener with the use of advanced engines and effective emissions control technology.
Plus, today’s Class 8 tractors achieve increased fuel efficiency. “Fleets are more than willing to invest in the more expensive technology because it is getting them the ROI
and the benefit over the life of that asset,” Neandross said.
The Diesel Technology Forum has reported that today’s advanced diesel technologies are more widely adopted, more energy efficient and lower in emissions than previous generations, with even further improvements coming online.
A study by the Health Effects Institute Advanced Collaborative Emissions Study found that the emissions control technologies present in the newest-generation diesel applications (those meeting U.S. 2007/2010 standards) deliver dramatic improvements in emissions. The study affirmed that the aftertreatment technologies are effective, with diesel particulate filters reducing particulate matter emissions by more than 90% and selective catalytic reduction systems reduce nitrogen oxide emissions by 94%.
NACFE’s Executive Director Mike Roeth said some fleets can get 10 miles per gallon or more if they implement the right axle configuration, invest in tools to reduce idle time, buy appropriate tractor and trailer aerodynamics, utilize low rolling resistant tires, optimize cruise control and vehicle speed, and keep equipment well maintained.
For example, NACFE reported, that under inf lated t ires increase fuel consumption, and tires underinflated by just 10 PSI experience a 0.5 to 1% increase in fuel consumption.
Roeth said fleets can see fuel efficiency savings of 15% when adopting aerodynamic devices and low rolling resistance tires. Another 10% improvement can come from
powertrain selection, and good maintenance practices can improve fuel efficiency by 5%, he added.
Driver behavior remains a key factor in fuel efficiency. Fleets are incentivizing drivers’ performance and rewarding the most fuel-efficient drivers. Enabling data use through the use of telematics, sensors and the Internet of Things allows fleets to adjust drivers’ compensation based on their fuel-efficient driving habits. Roeth said driver behavior can improve fuel efficiency by about 10%.
The Environmental Protection Agency’s SmartWay program, which launched in 2004, remains relevant, and the number of shippers and logistics providers participating in the program continues to grow. Since 2004, SmartWay has helped its partners save 248.8 million barrels of oil. Working with SmartWay, U.S. trucking companies have saved $33.4 billion on fuel costs, the EPA reported.
The Vehicles of the Future
Manufacturers are continuing to move forward with automated technologies, and states are enacting legislation to allow the testing or use of autonomous, automated or platooning vehicles.
The term autonomous has taken on a broad meaning within the industry and today can be used to describe a range of technologies, from the varying levels of automation that are already happening within the trucking industry to self-driving vehicles.
“Automation takes many forms in trucking, ranging from existing collision-avoidance and lane departure warning systems to other driver-assisted technologies,” said Sherry Sanger, senior vice president of marketing for Penske Truck Leasing. “Advanced driver assistance in trucks and fully automated trucks may one day provide a range of societal and industry benefits including safety, environmental, and productivity when it comes to mobility.”
American Trucking Associations has said that motor carriers should not count on autonomous trucks completing freight movements for many decades. However, automated truck features, such as adaptive cruise control and lane departure warning systems, can improve safety and make driving jobs easier.
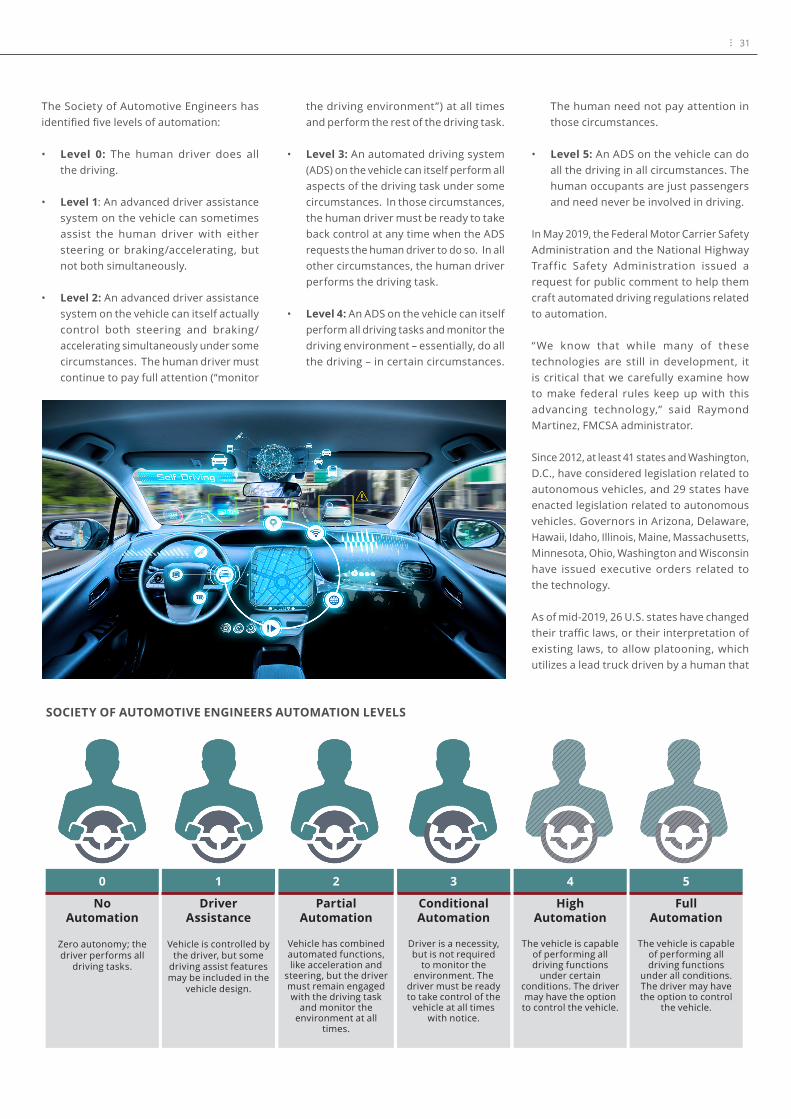
31
The Society of Automotive Engineers has identified five levels of automation:
• Level 0: The human driver does all the driving.
• Level 1: An advanced driver assistance system on the vehicle can sometimes assist the human driver with either steering or braking/accelerating, but not both simultaneously.
• Level 2: An advanced driver assistance system on the vehicle can itself actually control both steering and braking/accelerating simultaneously under some circumstances. The human driver must continue to pay full attention (“monitor
the driving environment”) at all times and perform the rest of the driving task.
• Level 3: An automated driving system (ADS) on the vehicle can itself perform all aspects of the driving task under some circumstances. In those circumstances, the human driver must be ready to take back control at any time when the ADS requests the human driver to do so. In all other circumstances, the human driver performs the driving task.
• Level 4: An ADS on the vehicle can itself perform all driving tasks and monitor the driving environment – essentially, do all the driving – in certain circumstances.
The human need not pay attention in those circumstances.
• Level 5: An ADS on the vehicle can do all the driving in all circumstances. The human occupants are just passengers and need never be involved in driving.
In May 2019, the Federal Motor Carrier Safety Administration and the National Highway Traffic Safety Administration issued a request for public comment to help them craft automated driving regulations related to automation.
“We know that while many of these technologies are still in development, it is critical that we carefully examine how to make federal rules keep up with this advancing technology,” said Raymond Martinez, FMCSA administrator.
Since 2012, at least 41 states and Washington, D.C., have considered legislation related to autonomous vehicles, and 29 states have enacted legislation related to autonomous vehicles. Governors in Arizona, Delaware, Hawaii, Idaho, Illinois, Maine, Massachusetts, Minnesota, Ohio, Washington and Wisconsin have issued executive orders related to the technology.
As of mid-2019, 26 U.S. states have changed their traffic laws, or their interpretation of existing laws, to allow platooning, which utilizes a lead truck driven by a human that
1
Driver Assistance
Vehicle is controlled by the driver, but some
driving assist features may be included in the
vehicle design.
2
Partial Automation
Vehicle has combined automated functions, like acceleration and
steering, but the driver must remain engaged with the driving task
and monitor the environment at all
times.
3
Conditional Automation
Driver is a necessity, but is not required
to monitor the environment. The
driver must be ready to take control of the
vehicle at all times with notice.
4
High Automation
The vehicle is capable of performing all driving functions
under certain conditions. The driver may have the option
to control the vehicle.
5
FullAutomation
The vehicle is capable of performing all driving functions
under all conditions. The driver may have the option to control
the vehicle.
0
No Automation
Zero autonomy; the driver performs all
driving tasks.
SOCIETY OF AUTOMOTIVE ENGINEERS AUTOMATION LEVELS

32 2020 24th ANNUAL THIRD-PARTY LOGISTICS STUDY
is then linked to two or more vehicles and is expected to be the most widely used autonomous technology.
Currently, 18 U.S. states fully authorize platooning, and eight U.S. states allow testing or limited deployments. Collectively, those 26 states represent more than 75% of U.S. freight movement, according to Ross Froat, director of engineering and information technology at American Trucking Associations.
Partners for Automated Vehicle Education (PAVE), a coalition of industry leaders, non-profits and academic institutions, is working to create a fact-based campaign to inform the public and policymakers about the potential and the reality of advanced vehicle technologies.
The Need for Continued Improvement
The Environmental Protection Agency has said that U.S. trends point to rapid growth in freight activity, which is making sustainability within the supply chain even more critical. Between 1990 and 2013, freight activity grew by over 50% and is projected to
nearly double again by 2040, the EPA said. Experts expect that by 2050, global freight transport emissions will surpass those from passenger vehicles.
Key Takeaways
• Those within the supply chain are becoming more sophisticated with how they look at carbon emissions, miles per gallon, data and efficiency metrics. That is forcing more sophistication on behalf of the logistics providers to demonstrate and document their greening efforts.
• Shippers and 3PLs, when combined, are nearly split on the factors driving their sustainability efforts. The majority ranked regulatory requirements the highest, but public perception and cost savings ranked close behind.
• The majority of shippers, 76%, said they are participating in optimization, such as route planning and load consolidation. Another 38% said they are taking part in voluntary programs, such as the Environmental Protection Agency’s SmartWay program.
• Among shipper respondents, 42% said they are involved in tracking and reporting emissions, and 16% said they are piloting alternative fuels.
• The majority of 3PLs, 78%, said they are participating in optimization; 63% said they are taking part in voluntary programs; 39% are involved in tracking and reporting emissions; 19% said they are piloting alternative fuels.
• Within the next five years, 79% of shippers expect to launch optimization initiatives; 43% said they plan to invest in alternative fuels and 20% reported that they would launch initiatives related to autonomous vehicles or platooning technologies.
• Among 3PLs, 77% said they expect to launch optimization initiatives; 40% said they plan to invest in alternative fuels; 27% plan to launch initiatives related to autonomous vehicles or platooning technologies.
• Continued growth in freight activity is making sustainability within the supply chain even more critical.

33
3PLs, 4PLs AND BEYOND: CRITICAL ISSUES TO CONSIDERThe supply chain and logistics sectors have relied significantly on logistics service providers (LSPs) to create and deliver value to end-user customers and consumers. As markets for these services become more competitive, users and providers have been on a relentless search for innovation and expansion of available logistics capabilities. As a result, the growth and development of third-party logistics (3PL) and fourth-party logistics (4PL) capabilities have added significantly to the range of service offerings available to shippers and other customers.
It is important to acknowledge that there is a very extensive and robust supply of information, reports, blogs, etc., on the background and current/future directions of the LSP sector. The information below is not intended to represent a comprehensive summary of what has been previously discussed, but, rather, to suggest logical and relevant issues and questions that may be insightful to pursue.
Considering there are numerous alternative ways to define 3PLs and 4PLs, clarity of terminology is one of the issues that may need to be addressed more comprehensively in the future.
The 2020 24th Annual Third Party Logistics Study and earlier versions of this annual study have described them as:
• 3PL – provides or manages one or more logistics services for its customers.
• 4PL – manages multiple logistics providers or orchestrates broader aspects of a customer’s supply chain.
The Evolving Roles of Logistics Service Providers
As use of the term “supply chain” continues to advance, there have been noticeable changes in many of the terminologies that are used to define various types of logistics service providers. Some of the most widely-recognized of these changes include the following:
• “Blurring” of definitions. Over time, the distinctions between terms, such as LTL (less-than-truckload), TL (truckload) and parcel, have blurred or, in some instances, disappeared. While there were earlier points in time when these terms were suitable descriptors of specific types of transportation/logistics services, today there are far fewer “pure-play” providers in any of these individual categories. This is due largely to the broadening range of services that are available from most LSPs.
• Asset vs. non-asset-based services. Historically, the predominant model was the “asset-based” model where most LSPs served customers through use of their own assets and services. In more recent decades/years, however, there has been significant growth and development of “non-asset based” LSPs that rely on relationships with various asset-based providers to serve their customers. While there are a growing number of examples of products that have become digitized or otherwise electronically transformed (e.g. books, music, software, 3-D printing, etc.), most supply chains require the use of capable asset-based services to manage the logistical flows of physical products.
• Provision vs. management of logistics services. Essentially this is an extension of the non-asset model, and the industry has seen the growth and development of
many organizations that do not actually provide logistics services themselves. Instead the providers serve their clients and customers by using the asset-based services available from other organizations. While many of these non-asset managers of logistics services have evolved from asset-based predecessor organizations, there are others that originated specifically to compete in the non-asset-based sector.
• Availability of greatly enhanced supply chain technologies. Although they are proving to be of benefit to a wide variety of industries, supply chain practices have been greatly impacted by newer capabilities, such as cloud-based technologies, SaaS (software-as-a-service) platforms and 5G broadband networks. As indicated in the Current State section of this report, shippers overwhelmingly indicate their agreement that information technologies are necessary elements of 3PL expertise.
• The “Amazon effect.” While there are many ways to define this term, it is clear that the presence of Amazon and the overall growth of the omni-channel phenomenon have had disruptive impacts on more traditional supply chains. In turn, this has created a need for individual LSPs to reconsider their operating strategies and to make changes as deemed to be appropriate.
CONTEMPORARY ISSUES
34 2020 24th ANNUAL THIRD-PARTY LOGISTICS STUDY
Impacts on Growth and Development of 3PLs and 4PLs
3PLs and more recently 4PLs have become recognized as important providers and managers of broad ranges of logistics and supply chain services. While there are various reports as to when the term 3PL came into use, it is generally accepted that the move to 3PLs began in the 1970s and 1980s.
It is not just coincidental that these timeframes also included the legislated deregulation of several transportation sectors in the U.S. Included were trucking (LTL and TL), rail, air, etc. While these created opportunities for LSPs to become more market- and customer-focused, they provided motivation for these providers to craft service offerings that would better fit the logistics and supply chain needs of their customers.
Growth and development of 3PLs. In response to customer requests and in pursuit of new market opportunities, most 3PL organizations represent an expansion of business models beyond what may have been limited to the provision of asset-based services. While example 3PL organizations may include XPO Logistics, UPS Supply Chain Solutions, Ryder Supply Chain Solutions, FedEx Supply Chain Solutions, Amazon and Penske Logistics, a quick internet search can easily identify a much larger number of 3PL organizations and measures of their market presence.
Although there are “pure-play” 3PLs, most 3PL organizations represent an outgrowth and expansion of logistics services from more traditional providers of asset-based logistics services.
Emergence of 4PL capabilities. In 1996, Accenture invented and trademarked the term fourth-party logistics (4PL) provider to describe “a supply chain integrator that assembles and manages the resources, capabilities and technology of its own organization with those of complementary service providers to deliver a comprehensive supply chain solution.”
Although the 4PL designation is no longer registered, there has been significant expansion of 4PL organizations, and they play a valuable role in the pursuit of supply chain success. Some examples of traditional
LSP organizations that offer various types of 4PL services include UPS, DHL, FedEx and Penske Logistics. Additionally, there are a number of other types of 4PLs that have not evolved from the traditional LSP sector, and examples include Accenture, Deloitte, IBM, Chainalytics and SAP.
In comparison with 3PLs, it is interesting to note that an internet search for 4PL organizations does not turn up any organized listings of primary competitors. This most likely results from the significant breadth and diversity of the types of services available in general from 4PLs. Examples of these services include lead logistics provider, consulting/advisory, advanced IT services, risk management and “control tower” services.
LLP responsibilities are particularly interesting as they require 4PLs to use their high levels of visibility, real-time information, communication abilities, and broad knowledge to align 3PLs, customers and service providers. Not only does a 4PL draw on the data it collects, but it also can gather, store and manage data from other supply chain partners. The accompanying visibility plays a crucial role in allowing the customer and 4PL to provide seamless supply chain services, manage exceptions, and remove costs and inefficiencies from the supply chain.
What is (or is not) a 5PL? Innovation and change is frequently accompanied by the introduction of new terminology to describe what may be new and different. Use of the term “5PL” is no exception. Some example phrases used by organizations to describe their 5PL capabilities include:
• Develop and implement best possible supply chains or networks.
• Plan, design and implement complete logistics solutions.
• Manage networks of supply chains.• Apply expertise when customers
are switching from supply chains to supply networks.
• Provide linkages to e-business.• Manage networks of supply chains.• Implement log is t ics so lut ions
and technologies.• Aggregate demand from 3PLs into more
efficient volumes for lower rates.
At face value, these are interestingly similar to capabilities that may be ascribed to some 4PLs. This observation leads specifically to the question of exactly what is a 5PL, and how does it differ from a 3PL and 4PL. More generally, the issue is where in the lexicon of LSPs does the 5PL exist, and is it unique and different from other types of LSPs?

35
Supply Chain as an Ecosystem. The future development of LSPs will be impacted by the current trend toward thinking of supply chains as “ecosystems” instead of linear systems or processes. Essentially, supply chains are evolving into complex international networks that include interlinked companies that interact and collaborate with each other to ultimately create value for their end-user customers or consumers.
In addition to including traditional supply chain participants, such as suppliers, manufacturers, distributors, etc., they are characterized by the alignment and convergence of digital and physical flows. Examples would include IoT, sensing devices, blockchain and overall digitization of the supply chain. As this new and innovative context for supply chain continues to gain acceptance, there will be significant opportunities for LSPs to respond and participate accordingly.
Discussions in this section are not intended to provide a comprehensive summary of what has been previously discussed, but rather, to identify what may be some logical and relevant issues and questions for the future.
FLEETS PREDICT DRIVER ARRIVALS WITH GREATER ACCURACY Within the supply chain, good customer service is often defined by on-time, accurate deliveries. Today’s shippers and receivers are demanding tighter delivery windows, and fleets are using various technologies to accurately predict when drivers will arrive. Fleets are drawing on technology and the information it provides to combine information, such as drivers’ locations, available hours, and anticipated traffic and weather delays, to predict delivery times.
Technology is becoming a differentiator for businesses, and some fleets that are using it combine real-time information with historical delivery data, such as the typical amount of time needed to complete a route and specific customer needs on the route or at a stop. That creates greater transparency surrounding delivery times and offers fleets as well as shippers insight surrounding weather or traffic delays or even delays drivers face at shippers’ loading docks. The specific insight can increase collaboration between fleets, shippers and receivers, enable better dock appointment scheduling and improve routing.
Currently, some shippers are dictating narrow delivery windows with the specificity shippers demand varying by the industry. Some locations specify as little as a 15-minute window and some shippers want to know within a minute of a load’s arrival to improve yard and dock management. What’s more, some locations have penalties if drivers are late, and chargebacks for late appointments can be as high as $500 or more.
Increased visibility and the use of geofencing can allow carriers to notify shippers when drivers have picked up or delivered a load.
Some carriers are using data to determine, on average, how long it takes to deliver a shipment based on the contents of the load or the specific customer location, including how long it takes to complete the paperwork associated with each load. That helps transportation providers accurately schedule future routes.
Increased visibility ensures drivers follow the most optimal route and increases productivity, leading to a greater percentage of on-time deliveries and greater service. Not only does that strengthen the shippers’ relationships with its final customers, it can cut costs and streamline operations.
When a production line is down at a manufacturing facility, for example, every minute counts. Tens of thousands of dollars can be lost if workers stand idle, and time lost equates to revenue manufacturers will never recoup. Manufacturers need to know the parts needed for production will arrive on time and in the quantities needed.
Visibility is the key to minimizing supply chain disruptions that can disrupt labor planning at loading docks or shut down or slow a production line.
How will the roles of 3PLs and 4PLs continue to evolve? How will technology, data collection and analysis shape the ways in which shippers and their logistics providers collaborate? Will shippers find new ways to partner with 3PLs and 4PLs as logistics providers capabilities and responsibilities increase? Are there better ways to distinguish between the various types of LSPs? Do our current thoughts and interpretations of 3PL, 4PL and 5PL capabilities need to be more focused and specific as to what types of service offerings may be involved? Has the time arrived to consider a new template for categorizing these types of services? How can we better understand the concept of viewing a supply chain as an “ecosystem?” What are some of the likely future scenarios that may emerge?
How can increased visibility drive collaboration between shippers and their transportation providers? Can accurately predicting drivers’ delivery schedules become a business differentiator? How can better driver data enable contingency planning and minimize incremental supply chain costs? How will accuracy of driver ETAs improve as data collection increases? What cost savings can fleets and shippers save by uncovering and avoiding disruptions?
36 2020 24th ANNUAL THIRD-PARTY LOGISTICS STUDY
CONTINUING THE CONVERSATIONThe 2019 23rd Annual Third-Party Logistics Study covered several issues that remain relevant today. As part of this year’s study, researchers provided an update on shipper-3PL management of RFPs and the continued growth of e-commerce.
Shipper-3PL Management of RFPs
Featured as one of the special topics in the 2019 23rd Annual 3PL Study, “Shipper-3PL Data Sharing” reflected on the importance of issuing and responding to requests for proposals (RFPs). This topic outlined key responsibilities that require significant involvement for both shippers and 3PLs, and focused on the types of data, workflows, and process steps at both shipper and 3PL organizations that were relevant to having an effective RFP process.
More specifically, this research involved:
• Identifying key players at both types of firms and their roles and responsibilities.
• Understanding the types of information and data that are essential to an efficient and effective RFP process.
• Isolating potential sources of inefficiency in the RFP process and specifically the hand-offs of key information that are needed by both shippers and 3PLs.
• Suggested areas of priority to see that both parties are as well-aligned as possible in the pursuit of a high-quality RFP process and subsequently a successful relationship between the parties involved in the relationship.
Since the original research was conducted, the 3PL study team has expanded its efforts to better understand some of the further details and nuances of what may be done to help produce more successful relationships vis-à-vis the RFP process. To “continue the conversation,” a sample of 3PLs participated in a survey effort to learn more about their experiences and points of view.
Primary areas of interest were the organizational time and effort of 3PLs that was directed toward the RFP process and the associated types of cost that were recognized as being included in this process. Organizations that participated in the study included domestic and international 3PL/4PL and freight forwarding operations, providers of warehousing/supply chain services and asset-based transportation companies. While findings from this preliminary study were based on results from a small sample of 3PLs, they do provide some useful insights into how elements of the RFP process are managed and appear to be directionally informative.
Tracking the cost of qualif ying and responding to RFPs. When 3PL respondents were asked whether their organizations tracked the cost of qualifying and responding to RFPs, 43% said yes, 21% replied sometimes, and 36% said no. This is an interesting observation, as it might have been expected that a higher percentage of 3PLs would make some assessment of the cost of responding to RFP opportunities in relation to the potential business value that could result.
When asked about the number of people involved in qualifying and responding to RFPs, results ranged from a low of four to a high of 100. The average number of people who spent more than 40% of the time working on RFPs was 10, while the average who spent less than 40% of their time was 14.
Tasks included in costs of qualifying and responding to RFPs. As part of the survey, 3PL respondents indicating their organization tracks the cost of qualifying and responding to RFPs were asked what tasks were included in this calculation. The majority, 79%, said they factored in analysis/modeling of proposed solutions. The same amount, 79%, said they included pricing.
While 64% included the cost of qualifying RFPs, the same number included the cost of writing the response to the document. Also, 57% factored in the cost of collaborating with subject matter experts. There was an “other” category, and those tasks included gathering additional data from the client, analyzing a lease agreement, and validating the accuracy and quality of submission.
37
Cost of RFP process. An additional topic of interest included how much time and money companies spent on a typical RFP process. Respondents were asked to estimate how much they spent in terms of the number of person-hours required, the average cost per response, and the average cost per response as percent of potential contract sales revenue. As would be expected, there was considerable variation in these estimates, as they vary depending on the size of the project. The number of person-hours required varied from less than 10 hours per RFP to hundreds of hours. Most responses were in the range of 40 to 80 hours.
Estimates of average cost per RFP ranged from $1,000 to $25,000. In addition, the average cost per response as percent of potential contract sales revenue ranged from 1.0% to 1.5% of potential contract value. The research team asked this question to see if there appeared to be any relationship between how much a 3PL was willing to spend on an RFP process vs. the revenue potential of the contract if awarded.
The study also provided insight into factors that were reported as having significant impacts on the magnitude of the types of cost indicated above. The majority, 86%, cited potential sales revenue from new business; 71% noted current or previous experience with individual customers; 50% assessed the likelihood of winning the bid; and 21%
considered how many other providers were estimated to be in the bid process.
Other suggestions from respondents included potential gross margin and the complexity of the bid and of the solution needed, such as automation vs. manual. One respondent suggested that his company was not interested in responding to RFPs that are sent to a large number of providers, that include price as the only bid criterion, and where it appears that the chances of success are very low.
Overall, the results of this convenience study provide some interesting perspectives into how the 3PL participants manage activities and tasks that are related to responding to RFPs from shippers. One observation was that the reported structure of RFP-related processes differed somewhat among the 3PLs that responded to the survey. While there was consensus among respondents as to the actual steps that are included in these processes, there was wide variation in the extent to which the costs of performing these tasks are calculated and considered.
One key takeaway from this preliminary study is that there needs to be better alignment at 3PL organizations between the time and effort directed to responding to RFPs and the potential business value of a winning bid. Also, it appears there are opportunities for improvement in decisions made by 3PLs as
to whether or not to participate in individual bid opportunities.
Parcel Delivery, E-commerce Growth Shapes Transportation Offerings
In the 2019 Third-Party Logistics Study, researchers delved into the growth in omni-channel as well as the work done in the final segment of a delivery process. As noted in last year’s study, retailers are emphasizing an always-on, always-open shopping experience that provides seamless interaction across all retail sales channels, which is forcing shippers and their logistics partners to be fluid and move quickly.
According to the U.S. Census Bureau, on an adjusted basis, the estimate of 2017 U.S. total retail sales was $5.1 trillion of which $448.3 billion was e-commerce. One of the primary challenges is that increased residential deliveries create routes that are longer and less efficient.
E-commerce and the demand for rapid, free shipping has continued to grow, and the time compression of when a retailer receives an order to when a parcel goes out the door continues to tighten. Not surprisingly, shippers expect their logistics providers to meet their customers’ expectations, which means those within the supply chain are working to improve their speed and agility.
38 2020 24th ANNUAL THIRD-PARTY LOGISTICS STUDY
FedEx, for example, has said it is making ongoing investments in network capacity, automation and technology, which is creating a flexible and responsive network to help it meet the long-term changes the supply chain is experiencing. Earlier this year, Jonathan Lyons, a spokesman for FedEx, said the company has expanded its e-commerce delivery options for retailers with FedEx Extra Hours so retailers could receive late pickups by FedEx Express with next-day local delivery and two-day shipping to any address in the continental U.S.
DHL has invested in artificial intelligence and machine learning to enhance its route planning and optimization and warehouse fulfillment, said Lee Spratt, CEO of the DHL eCommerce division in the Americas.
E-commerce transactions require greater flexibility than brick-and-mortar purchases, and supply chain partners are examining their order management process to ensure they can deliver products on time and at a low cost. That is having an effect on the trucking industry.
The American Transportation Research Institute has reported that from 1999 to 2017, e-commerce sales increased from less than 1% of total U.S. retail sales to more than 9%, reflecting a 3,000 percent increase in e-commerce sales.
ATRI also estimates that the overall average trip length for a truck has dropped by 37% since 2000, which the group attributes the decrease to the dramatic growth of e-commerce sales. ATRI added that the shift in the length of haul is changing the types of equipment fleets are investing in for their operations, spurring an increase in the use of single-unit trucks.
“Registrations for single-unit trucks, a proxy for straight trucks used for local deliveries, are growing at a faster rate than registrations of more traditional combination trucks,” ATRI said, reporting that single-unit truck registrations increased by 7.8% between 2007 and 2016 compared to 4.4% growth in combination truck registrations. Much of this growth has occurred in recent years with the majority of the new straight truck registrations, 66.3%, occurring between 2014 and 2016.
With continued e-commerce growth, there has been a re-emergence of decentralized
hub-and-spoke distribution/fulfillment networks, ATRI said. Last-mile fulfillment centers represented 73% of the industrial real estate market in 2017, a 15-percentage point increase from the previous year.
The intra-regional and local hauls associated with e-commerce could create several benefits for professional Class 8, truck drivers, including more home time, which could improve health, the survey reported. “This makes it easier for truck drivers to seek out healthier food options and provides more time for exercise. From a health and wellness perspective, these are improvements over the food and exercise options available at rest stops and parking locations,” ATRI reported.
Intra-regional and local hauls associated with parcel delivery could also be leveraged as a training opportunity to train younger drivers. Driver candidates between the ages of 18 and 21 could acquire training and build experience for safe and efficient driving by completing intra-state hauls and local pickups and deliveries, according to the report.
“In this ‘graduated CDL’ concept, these now experienced drivers could transition to interstate operations when they turn 21,” ATRI said. “As one strategy in a suite of driver recruitment strategies, this could alleviate some pressure on motor carriers by expanding the supply of qualified truck drivers over time.”

39
ABOUT THE STUDY
In 1996, Dr. C. John Langley, clinical professor of supply chain and information systems and director of development at the Center for Supply Chain Research® at Smeal College of Business at The Pennsylvania State University, initiated the Annual Third-Party Logistics Study to evaluate and document the ways in which the global 3PL industry was evolving.
Today, the study investigates leading trends in logistics and the supply chain and takes a deep dive into the ways in which shippers and 3PLs can collaborate to drive value. It looks at 3PL industry growth and development, what shippers outsource and what 3PLs offer, as well as why customers outsource to 3PLs and how well 3PLs respond. As part of the study, researchers investigate trends and issues that likely will be impactful for the future state of logistics outsourcing.
Throughout the year, the study team establishes topics of interest, develops the survey tool, conducts the research, analyzes the results, writes this report, and presents and shares the findings. As part of this year’s research, the team engaged shippers and 3PLs/4PLs with an email survey, workshops, roundtables and focus interviews.
Industry representatives, supporting organizations and sponsor firms have contributed to the study, which has helped maintain and sustain the report for more than 20 years. Shippers and 3PLs have generously participated in the surveys and interviews needed to produce the Annual 3PL Study, and, once again, the 24th Annual Third-Party Logistics Study is dedicated to those who have made this possible.
The Annual Third-Party Logistics Study has been designed to serve as a resource and tool for shippers and 3PLs, and it has become a widely anticipated, heavily referenced index on the state of the 3PL industry.
Throughout the past 24 years, the primary issues of interest have shifted, with past reports delving into everything from labor issues to ever-changing consumer trends and how they alter the expectations of the outsourced logistics sector. At its core, the
report continues to focus on people, processes and technology, relationship management and the end-to-end supply chain.
Each year, the research methodology has evolved in both reach and scope, as has the participation rate fluctuation among members and affiliates of the Annual Third-Party Logistics Study’s partner organizations.
As part of this year’s survey process, the study attracted 558 respondents.
Results included in the “Current State of the 3PL Market” chapter from current users of 3PL and 4PL services rely primarily on data gathered from respondents in North America (65%), Asia (8%) and Europe (15%).
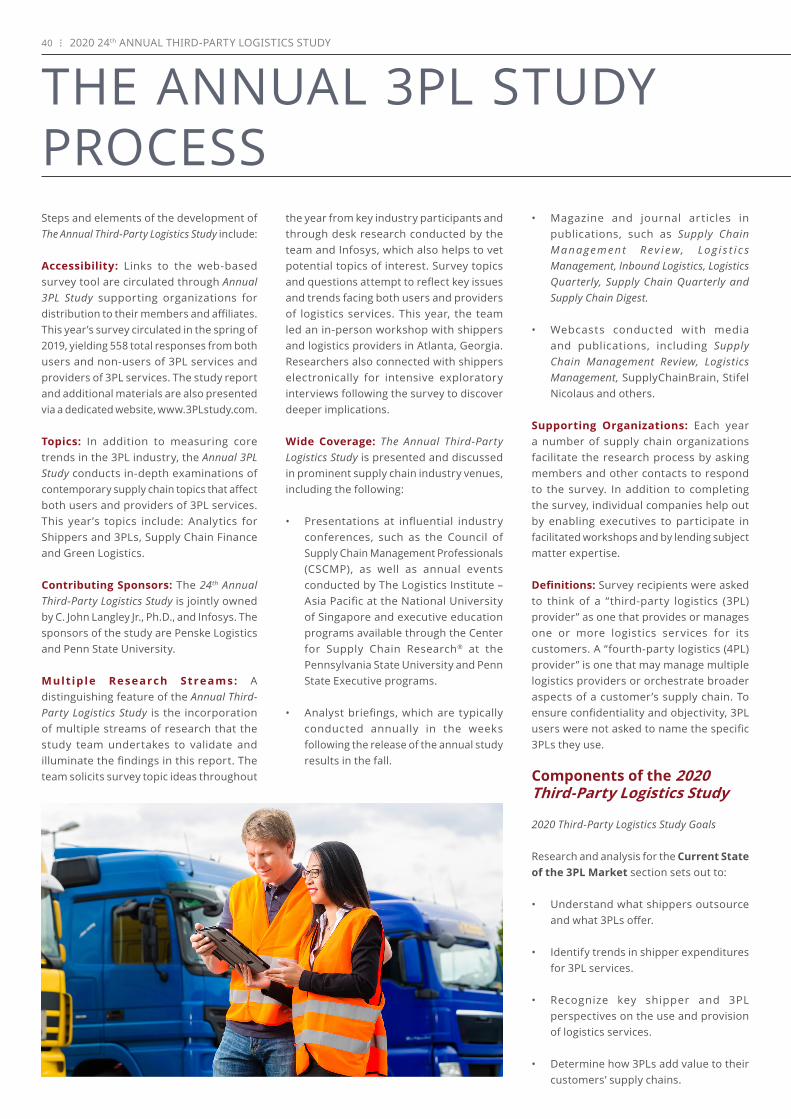
40 2020 24th ANNUAL THIRD-PARTY LOGISTICS STUDY
THE ANNUAL 3PL STUDY PROCESSSteps and elements of the development of The Annual Third-Party Logistics Study include:
Accessibility: Links to the web-based survey tool are circulated through Annual 3PL Study supporting organizations for distribution to their members and affiliates. This year’s survey circulated in the spring of 2019, yielding 558 total responses from both users and non-users of 3PL services and providers of 3PL services. The study report and additional materials are also presented via a dedicated website, www.3PLstudy.com.
Topics: In addition to measuring core trends in the 3PL industry, the Annual 3PL Study conducts in-depth examinations of contemporary supply chain topics that affect both users and providers of 3PL services. This year’s topics include: Analytics for Shippers and 3PLs, Supply Chain Finance and Green Logistics.
Contributing Sponsors: The 24th Annual Third-Party Logistics Study is jointly owned by C. John Langley Jr., Ph.D., and Infosys. The sponsors of the study are Penske Logistics and Penn State University.
Multiple Research Streams: A distinguishing feature of the Annual Third-Party Logistics Study is the incorporation of multiple streams of research that the study team undertakes to validate and illuminate the findings in this report. The team solicits survey topic ideas throughout
the year from key industry participants and through desk research conducted by the team and Infosys, which also helps to vet potential topics of interest. Survey topics and questions attempt to reflect key issues and trends facing both users and providers of logistics services. This year, the team led an in-person workshop with shippers and logistics providers in Atlanta, Georgia. Researchers also connected with shippers electronically for intensive exploratory interviews following the survey to discover deeper implications.
Wide Coverage: The Annual Third-Party Logistics Study is presented and discussed in prominent supply chain industry venues, including the following:
• Presentations at influential industry conferences, such as the Council of Supply Chain Management Professionals (CSCMP), as well as annual events conducted by The Logistics Institute – Asia Pacific at the National University of Singapore and executive education programs available through the Center for Supply Chain Research® at the Pennsylvania State University and Penn State Executive programs.
• Analyst briefings, which are typically conducted annually in the weeks following the release of the annual study results in the fall.
• Magazine and journal articles in publications, such as Supply Chain Mana gement R e v ie w, Log i s t i c s Management, Inbound Logistics, Logistics Quarterly, Supply Chain Quarterly and Supply Chain Digest.
• Webcasts conducted with media and publications, including Supply Chain Management Review, Logistics Management, SupplyChainBrain, Stifel Nicolaus and others.
Supporting Organizations: Each year a number of supply chain organizations facilitate the research process by asking members and other contacts to respond to the survey. In addition to completing the survey, individual companies help out by enabling executives to participate in facilitated workshops and by lending subject matter expertise.
Definitions: Survey recipients were asked to think of a “third-party logistics (3PL) provider” as one that provides or manages one or more logistics services for its customers. A “fourth-party logistics (4PL) provider” is one that may manage multiple logistics providers or orchestrate broader aspects of a customer’s supply chain. To ensure confidentiality and objectivity, 3PL users were not asked to name the specific 3PLs they use.
Components of the 2020 Third-Party Logistics Study
2020 Third-Party Logistics Study Goals
Research and analysis for the Current State of the 3PL Market section sets out to:
• Understand what shippers outsource and what 3PLs offer.
• Identify trends in shipper expenditures for 3PL services.
• Recognize key shipper and 3PL perspectives on the use and provision of logistics services.
• Determine how 3PLs add value to their customers’ supply chains.
41
• Update researchers’ knowledge of 3PL-shipper relationships and to learn how both types of organizations are using these relationships to improve and enhance their businesses and supply chains.
• Understand the benefits reported by shippers that are attributed to the use of 3PLs.
• Assess the impor tance of 3PL capabilities relating to people, process, technology, and planning/execution/implementation.
• Document what types of information technologies and systems are needed for 3PLs to successfully serve customers, and to assess the extent to which this success is being achieved.
• Examine why customers outsource or elect not to outsource to 3PLs.
The Special Topic section is crafted to provide an introspective view of the future of the 3PL industry and shipper-3PL relationships. Topics are chosen based on what was learned from the study process and current trends in the industry.
This year’s sections include:
• Analytics for Shippers and 3PLs: This year’s study looked at how shippers and 3PLs use data and information and the growing role of analytics in terms of frequency of use, levels of sophistication and utilization of available computational capabilities.
• Supply Chain Finance: The supply chain is an instrumental part of how companies are building, scaling and managing their operations, and this year’s study evaluated the logistics costs that influence shippers’ decisions and
the supply chain finance practices they regularly employ.
• Green Logistics: The study sought to understand how shippers and logistics providers demonstrate, achieve and document their greening efforts as well as what drives a mutual pursuit of sustainability as a key element of their relationships.
The Contemporary Issues section is crafted to take an introspective view of the future of the 3PL industry and shipper-3PL relationships. Topics this year included: “3PLs, 4PLs and Beyond” and “Fleets Predict Driver Arrivals with Greater Accuracy.”
The Continuing the Conversation section was a new addition beginning with the 2019 study. It has been designed to provide a brief update on still-relevant topics covered in previous versions of the report.
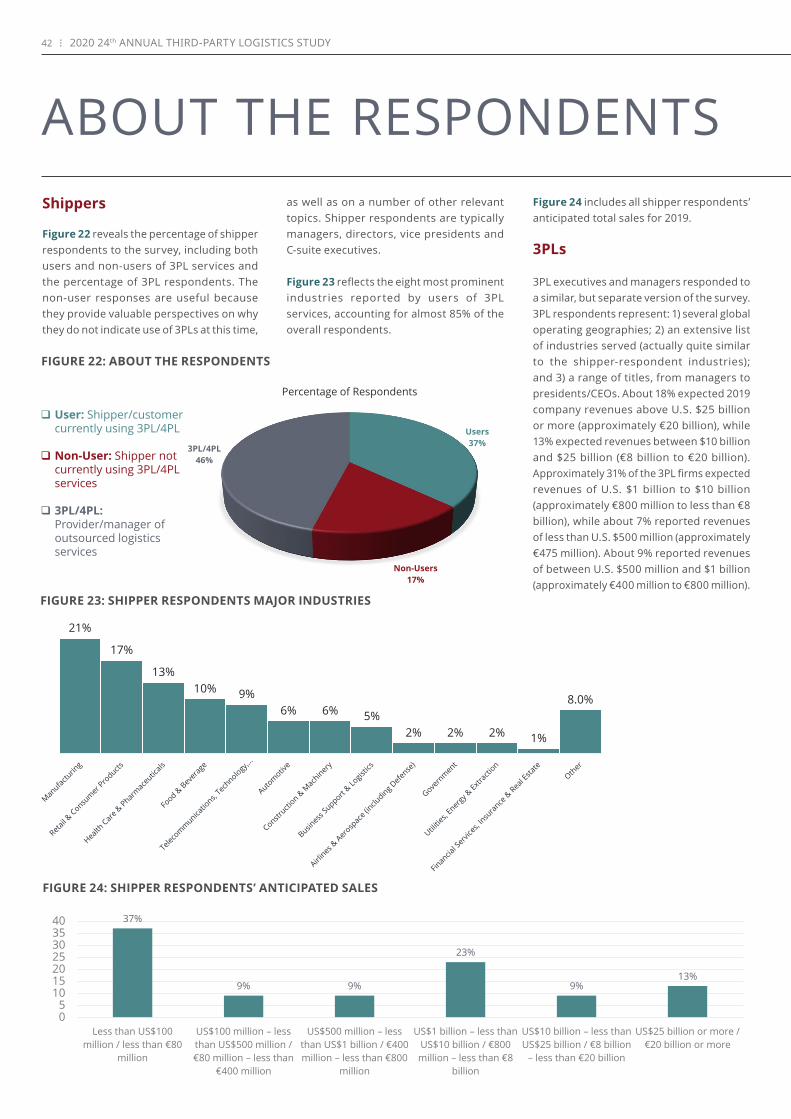
42 2020 24th ANNUAL THIRD-PARTY LOGISTICS STUDY
ABOUT THE RESPONDENTSShippers
Figure 22 reveals the percentage of shipper respondents to the survey, including both users and non-users of 3PL services and the percentage of 3PL respondents. The non-user responses are useful because they provide valuable perspectives on why they do not indicate use of 3PLs at this time,
FIGURE 24: SHIPPER RESPONDENTS’ ANTICIPATED SALES
❑ User: Shipper/customer currently using 3PL/4PL
❑ Non-User: Shipper not currently using 3PL/4PL services
❑ 3PL/4PL: Provider/manager of outsourced logistics services
Users37%
Non-Users17%
3PL/4PL46%
Percentage of Respondents
FIGURE 22: ABOUT THE RESPONDENTS
21%
17%
13%10% 9%
6% 6% 5%2% 2% 2% 1%
8.0%
FIGURE 23: SHIPPER RESPONDENTS MAJOR INDUSTRIES
as well as on a number of other relevant topics. Shipper respondents are typically managers, directors, vice presidents and C-suite executives.
Figure 23 reflects the eight most prominent industries reported by users of 3PL services, accounting for almost 85% of the overall respondents.
Figure 24 includes all shipper respondents’ anticipated total sales for 2019.
3PLs
3PL executives and managers responded to a similar, but separate version of the survey. 3PL respondents represent: 1) several global operating geographies; 2) an extensive list of industries served (actually quite similar to the shipper-respondent industries); and 3) a range of titles, from managers to presidents/CEOs. About 18% expected 2019 company revenues above U.S. $25 billion or more (approximately €20 billion), while 13% expected revenues between $10 billion and $25 billion (€8 billion to €20 billion). Approximately 31% of the 3PL firms expected revenues of U.S. $1 billion to $10 billion (approximately €800 million to less than €8 billion), while about 7% reported revenues of less than U.S. $500 million (approximately €475 million). About 9% reported revenues of between U.S. $500 million and $1 billion (approximately €400 million to €800 million).
13%9%
23%
9%9%
37%
05
10152025303540
US$25 billion or more / €20 billion or more
US$10 billion – less than US$25 billion / €8 billion
– less than €20 billion
US$1 billion – less than US$10 billion / €800 million – less than €8
billion
US$500 million – less than US$1 billion / €400 million – less than €800
million
US$100 million – less than US$500 million / €80 million – less than
€400 million
Less than US$100 million / less than €80
million
43
ABOUT THE SPONSORS
Infosys ConsultingInfosys is a global advisor enabling organizations to reimagine their future and create sustainable value leveraging disruptive technologies. As part of technology leader Infosys, the firm has access to a global network and delivery capability of 200,000 professionals that help its consultants implement at scale. To see Infosys’s ideas in action, please visit InfosysConsultingInsights.com.
Penn State University Penn State is designated as the sole land grant institution of the Commonwealth of Pennsylvania. The University’s main campus is located in University Park, Pennsylvania. Penn State’s Smeal College of Business is one of the largest business schools in the United States and is home to the Supply Chain & Information Systems (SC&IS) academic department, Center for Supply Chain Research (CSCR®), and Penn State Executive Programs. With more than 30 faculty members and over 800 students, SC&IS is one of the largest and most respected academic concentrations of supply chain education and research in the world. SC&IS offers supply chain programs for every educational level, including undergraduate, graduate and doctorate degrees, in addition to a very popular online, 30-credit professional master’s degree program in supply chain management. The supply chain educational portfolio also includes open enrollment, custom and certificate programs developed by Smeal’s Penn State Executive Programs and CSCR®, which helps to integrate Smeal into the broader business community. Along with executive education, CSCR® focuses its efforts in research, benchmarking and corporate sponsorship. CSCR® corporate sponsors direct the center’s research initiatives by identifying relevant supply chain issues that their organizations are experiencing in today’s business environment. This process also helps to encourage Penn State researchers to advance the state of scholarship in the supply chain management field. Penn State’s Smeal College of Business has the No. 1 undergraduate and graduate programs in supply chain management, according to the most current reports from Gartner. For more information, please visit www.smeal.psu.edu/scis and www.smeal.psu.edu/cscr.
Disclaimer
The information contained herein is general
in nature and is not intended as, and should
not be construed as, professional advice or
opinion provided by the sponsors (Infosys,
Penn State and Penske Logistics) to the
reader. While every effort has been made to
offer current and accurate information, errors
can occur. This information is provided as is,
with no guaranty of completeness, accuracy or
timeliness, and without warranty of any kind,
expressed or implied, including any warranty
of performance, merchantability or fitness for
a particular purpose. In addition, changes
may be made in this information from time
to time without notice to the user. The reader
also is cautioned that this material may not
be applicable to, or suitable for, the reader’s
specific circumstances or needs, and may
require consideration of additional factors if
any action is to be contemplated. The reader
should contact a professional prior to taking
any action based upon this information. The
sponsors assume no obligation to inform
the reader of any changes in law, business
environment or other factors that could affect
the information contained herein.
Lead Writer: Mindy Long
Citation Guidelines: “2020 24th Annual Third-Party Logistics Study: The State of Logistics Outsourcing,” C. John Langley Jr., Ph.D., and Infosys, 2020.
Penske Logistics Penske Logistics is a wholly owned subsidiary of Penske Truck Leasing. With operations in North America, South America, Europe and Asia, Penske Logistics provides supply chain management and logistics services to leading companies around the world. Penske Logistics delivers value through its design, planning and execution in transportation, warehousing and freight management. To learn more visit: www.penskelogistics.com.
CONTACTS
C. John Langley Jr., Ph.D.Clinical Professor of Supply Chain Management Director of Development, Center for Supply Chain Research (CSCR) Penn State University University Park, PA, USA T: +1 814 865 1866 [email protected]
Shanton Wilcox PartnerInfosys Consulting Atlanta, GA, USA T: +1 404 431 8895 [email protected] Melissa HadhazyAssociate PartnerInfosys Consulting Newport Beach, CA, USA T: +1 708 297 4564 [email protected]
Jack JohnsonSenior ConsultantInfosys Consulting Atlanta, GA, USA T: +1 269 209 8769 [email protected]
Drew AndrewsSenior ConsultantInfosys ConsultngAtlanta, GA, USAT: +1 615 260 [email protected]
Randolph P. Ryerson Director of Communications Penske Truck Leasing & Penske Logistics Reading, PA, USA T: +1 610 775 6408 [email protected]
Alen BeljinPublic Relations Manager Penske Truck Leasing & Penske LogisticsReading, PA, USAT: +1 610 775 [email protected]
Copyright © 2022 FDOKUMEN


![King of Heaven [G, 112 bpm]](https://static.fdokumen.com/doc/165x107/631e53305ff22fc74506a431/king-of-heaven-g-112-bpm.jpg)