DETERMINANTS OF PROFITABILITY FOR THE BANKING ...
101
DETERMINANTS OF PROFITABILITY FOR THE BANKING SECTOR AT BORSA ISTANBUL CHAWAN AWL MASTER’S THESIS NICOSIA 2020 NEAR EAST UNIVERSITY GRADUATE SCHOOL OF SOCIAL SCIENCES BUSINESS ADMINISTRATION PROGRAM
-
Upload
khangminh22 -
Category
Documents
-
view
1 -
download
0
Transcript of DETERMINANTS OF PROFITABILITY FOR THE BANKING ...
DETERMINANTS OF PROFITABILITY FOR THE BANKING SECTOR AT
BORSA ISTANBUL
CHAWAN AWL
MASTER’S THESIS
NICOSIA 2020
NEAR EAST UNIVERSITY
GRADUATE SCHOOL OF SOCIAL SCIENCES
BUSINESS ADMINISTRATION PROGRAM
CHAWAN AWL
SUPERVISOR:
ASSOC. PROF. DR.TURGUT TÜRSOY
MASTER’S THESIS
NICOSIA 2020
NEAR EAST UNIVERSITY
GRADUATE SCHOOL OF SOCIAL SCIENCES
DEPARTMENT OF BANKING AND FINANCE
BANKING AND ACCOUNTING PROGRAM
DETERMINANTS OF PROFITABILITY FOR THE BANKING SECTOR AT
BORSA ISTANBUL

We as the jury members certify the ‘DETERMINANTS OF PROFITABILITY FOR THE BANKING SECTOR AT BORSA ISTANBUL Chawan Awl the defended on /2020 has been found satisfactory for the award degree of Master.
ACCEPTANCE/APPROVAL
JURY MEMBERS
.........................................................
ASSOC. PROF. DR. TURGUT TÜRSOY (Supervisor)
Near East University Graduate school of Social Sciences
Department of Banking and Finance
.........................................................
Assist. Prof. Dr.dervis kirikkaleli (Head of Jury)
European University of Lefka Faculty of Economics and Administrative Sciences
Department of Banking and Finance
.........................................................
Dr. Ahmed somour
Near East University Graduate school of Social Sciences Department of Banking and Finance
.........................................................
Prof. Dr. Mustafa SAĞSAN Graduate School of Social Sciences
Director

DECLARATION
I CHAWAN AWL hereby declare that this dissertation entitled ‘DETERMINANTS OF
PROFITABILITY FOR THE BANKING SECTOR AT BORSA ISTANBUL’ has been prepared
myself under the guidance and supervision of ASSOC. PROF. DR.TURGUT TÜRSOY in partial
fulfilment of the Near East University, Graduate School of Social Sciences regulations and does
not to the best of my knowledge breach and Law of Copyrights and has been tested for
plagiarism and a copy of the result can be found in the Thesis.
o The full extent of my Thesis can be accessible from anywhere.
o My Thesis can only be accessible from Near East University.
o My Thesis cannot be accessible for two (2) years. If I do not apply for
extension at the end of this period, the full extent of my Thesis will be
accessible from anywhere.
Date:
Signature:
Name Surname: CHAWAN AWL

iii
ACKNOWLEDGEMENTS
Firstly, I would like to express my sincere gratitude to my supervisor PROF.
DR.TURGUT TÜRSOY for the continuous support of my master study and
related research, for his patience, motivation, and immense knowledge. His
guidance helped me in all the time of research and writing of this thesis. I
could not have imagined having a better supervisor and mentor for my thesis.
Also I want to acknowledge my course advisor Prof. Dr. Aliya IŞIKSALfor
her presence and support that has led me this far.
Last but not the least, I would like to thank my parents and to my sister for
supporting me spiritually throughout writing this thesis and my life in general.

iv
DEDICATION
I dedicate this thesis to my family for nursing me with affections and love and
their dedicated partnership for success in my life.

v
ABSTRACT
DETERMINANTS OF PROFITABILITY FOR THE BANKING SECTOR AT BORSA ISTANBUL
One of the major priority of banks and other firms is to maximize their
profitability. Achieving such profits enables them to maintain and sustain their
financial position, increase their equity, and enhance their solvency and
liquidity, thereby increasing their ability to face the risks and obligations they
face. This study is designed as an explanatory research aiming to study
bank-specific factors which have potential to determine profitability ratios for
banks in Turkey. In addition to determine factors affecting profitability, this
study also aims at shedding light on the situation of banks in Turkey and the
indicators used in measuring their performance. The research sample
included several banks operating in Turkey and listed on Borsa Istanbul.
Those banks included that their annual financial data is available for the
period 1999 to 2018. Therefore, the sample of this study is categorised as
panel data, including a number of banks over a series of time.
On the basis of some ground theories that can explain the determinants of
profitability, three models are specified for investigation. Those ground
theories are the signalling theory, agency theory, relative efficiency
hypothesis, and trade-off theory.
Using multiple linear regressions of pooled OLS, FE and RE to examine the
influence of the selected firm-specific factors on the profitability, the results
show that financial leverage, asset structure and asset quality could
negatively determine the profitability of banks listed on BIST over the studied
period whereas capital adequacy and dividend per share have positive
impacts. These results are likely to provide valuable insights to managers of
the banks in Turkey and assist them in planning for profit maximization. With
regard to recommendation for future studies, someone may consider some
macro factors along with firm specific factors to further explain the variations
in profitability.
Key words: profitability determinants, banking sector, Borsa Istanbul
vi
ÖZ
BORSA İSTANBUL'DA BANKACILIK SEKTÖRÜNE
KARLILIĞIN BELİRLENMESİ
Bankaların ve diğer firmaların en büyük önceliğinden biri karlılıklarını en üst
düzeye çıkarmaktır. Bu tür kazançlar elde etmeleri, finansal konumlarını
korumalarına ve sürdürmelerine, özkaynaklarını artırmalarına ve ödeme gücü
ve likiditelerini artırmalarına olanak tanıyarak, karşılaştıkları risk ve
yükümlülüklerle yüzleşme yeteneklerini artırır. Bu çalışma, Türkiye'deki
bankalar için karlılık oranlarını belirleme potansiyeline sahip bankaya özgü
faktörleri araştırmayı amaçlayan açıklayıcı bir araştırma olarak tasarlanmıştır.
Kârlılığı etkileyen faktörleri belirlemeye ek olarak, bu çalışma Türkiye'deki
bankaların durumuna ve performanslarının ölçülmesinde kullanılan
göstergelere de ışık tutmayı amaçlamaktadır. Araştırma örneklemi Türkiye'de
faaliyet gösteren ve Borsa İstanbul'da listelenen çeşitli bankaları
içermektedir. Bu bankalar, yıllık finansal verilerinin 1999-2018 dönemi için
mevcut olduğunu içermiştir. Bu nedenle, bu çalışmanın örneği, bir dizi zaman
içinde bir dizi banka dahil olmak üzere panel verileri olarak kategorize
edilmiştir.
Kârlılığın belirleyicilerini açıklayabilecek bazı temel teoriler temelinde,
araştırma için üç model belirlenmiştir. Bu temel teoriler sinyal teorisi, ajans
teorisi, nispi verimlilik hipotezi ve değiş tokuş teorisidir.
Seçilen firmaya özgü faktörlerin karlılık üzerindeki etkisini incelemek için
toplanmış OLS, FE ve RE'nin birden fazla doğrusal regresyonu kullanılarak,
sonuçlar finansal kaldıraç, varlık yapısı ve varlık kalitesinin BIST'te listelenen
bankaların incelenen karlılığını olumsuz yönde belirleyebileceğini
göstermektedir. sermaye yeterliliği ve hisse başına temettü tutarının olumlu
etkileri bulunmaktadır. Bu sonuçların Türkiye'deki bankaların yöneticilerine
değerli bilgiler vermesi ve kâr maksimizasyonu planlamasına yardımcı olması
muhtemeldir. Gelecekteki çalışmalar için tavsiye ile ilgili olarak, birileri
karlılıktaki varyasyonları daha fazla açıklamak için firmaya özgü faktörlerle
birlikte bazı makro faktörleri düşünebilir.
Anahtar kelimeler: karlılık belirleyicileri, bankacılık sektörü, Borsa İstanbul

vii
TABLE OF CONTENTS
ACKNOWLEDGEMENTS ............................................................................ iii
DEDICATION ................................................................................................ iv
ABSTRACT ................................................................................................... v
ÖZ ................................................................................................................. vi
LISTOF TABLES .......................................................................................... ix
LIST OF FIGURES ........................................................................................ x
CHAPTER 1................................................................................................... 1
INTRODUCTION ........................................................................................... 1
1.1. General background ............................................................................................. 1
1.2. Problem statement ................................................................................................ 4
1.3. Research objectives .............................................................................................. 5
1.4. Research significance .......................................................................................... 6
1.5. Research hypotheses ........................................................................................... 6
1.6. Research limitations .............................................................................................. 7
1.7. Conclusion .............................................................................................................. 7
CHAPTER 2................................................................................................... 9
THEORETICAL BACKGROUND .................................................................. 9
2.1. Banks and their services .................................................................................... 10
2.1.1. Definition of banks ....................................................................................... 10
2.1.2. Objectives of banks ..................................................................................... 11
2.1.3. Importance of banks ................................................................................... 13
2.1.4. Economic roles of banks ............................................................................ 15
2.2. Assets and liabilities structure ........................................................................... 16
2.2.1. Short-term funding sources: ...................................................................... 17
2.2.2. Medium-term sources of funding: ............................................................. 17
2.2.3. Long-term sources of finance: ................................................................... 18
2.3. Profitability of banks ............................................................................................ 19
2.3.1. The concept of profitability ......................................................................... 20
2.3.2. Sources of profits for banks ....................................................................... 21
2.3.3. Measurement standards forbanks’ profitability ....................................... 23
2.3.4. Factors affecting bank’s profitability ......................................................... 25
viii
2.4. Ground theories ................................................................................................... 28
2.5. Empirical review .................................................................................................. 31
2.6. Conclusion ............................................................................................................ 35
CHAPTER 3................................................................................................. 36
METHODOLOGY ........................................................................................ 36
3.1. Sample and data ................................................................................................. 36
3.2. Turkey economy and financial market ............................................................. 37
3.2.1. An overview of the economy ..................................................................... 37
3.2.2. An overview of the financial market .......................................................... 39
3.2.3 Turkish banking sector ............................................................................... 41
3.3. Variable construction and Research model .................................................... 47
3.3.1 Dependent variables ................................................................................... 47
3.3.2 Independent variables ................................................................................ 49
3.4. Research model .................................................................................................. 55
3.5. Research design .................................................................................................. 57
3.6. Conclusion ............................................................................................................ 57
CHAPTER 4................................................................................................. 58
DATA ANALYSIS ........................................................................................ 58
4.1. Descriptive statistics ........................................................................................... 58
4.2. Correlation coefficients ....................................................................................... 60
4.3. Panel unit root test .............................................................................................. 62
4.4. Regression analysis ............................................................................................ 64
4.4.1. Pooled OLS regression .............................................................................. 64
4.4.2. FE and RE regression analyses ............................................................... 68
4.5. Conclusion ............................................................................................................ 72
CHAPTER 5................................................................................................. 73
CONCLUSION ............................................................................................. 73
5.1. Discussion of the results .................................................................................... 73
5.2. Summary of the thesis ........................................................................................ 75
5.3. Policy implication and suggestions ................................................................... 76
5.4. Limitations and recommendations .................................................................... 77
REFERENCES ............................................................................................ 79
PLAGIARISM REPORT…………………………………………………….. ..... 87

ix
LIST OF TABLES
TABLE 3.1: List of banks operating in turkey ........................... 43
TABLE 3.2: Research variables and their measures ............... 53
TABLE 4.1: Descriptive statistics of the variables ................... 58
TABLE 4.2: Correlation coefficients between the variables .... 61
TABLE 4.4: Panel unit root tests ............................................. 63
TABLE 4.5: Results of pooled OLS regression analysis ......... 65
TABLE 4.6: Hausman test ....................................................... 68
TABLE 4.7: Results of fixed effect regression analysis ........... 69
x
LIST OF FIGURES
Figure 3.1: GDP (in billions of current US dollar) ....................................... 38
Figure 3.2: Asset size of Turkeys financial industry.................................... 40
Figure 3.3: Regulation changes in Turkish financial sector ....................... 42
Figure 3.4: Turkish banking sector distribution........................................... 43
Figure 3.5: Total assets size of banking sector in turkey ........................... 43
Figure 3.6: Conceptual framework Created by the author.......................... 54

xi
ABBREVATIONS
ROA ..................................................Return on assets
ROE ..................................................Return on equity
EPS ..................................................Earnings per share
NIM ...................................................Net interest margin
GMM ................................................Generalized method of moments
BIST..................................................Borsaistanbul
ISE ...................................................Istanbul stock exchange
IMF...................................................International monetary fund
IFRS.................................................International financial reporting standards
ISE...................................................Istanbul stock exchange
OLS .................................................Ordinary least square
RE ...................................................Random effect
FE ...................................................Fixed effect

1
CHAPTER 1
INTRODUCTION
In this chapter, an overall background is presented about the banking sector
in general and banks in Turkey in particular. It shows that commercial banks
commonly prioritize their profit maximization and therefore the factors that
determine profitability are considered by the management of bank as well.
Moreover, the problem statement of this study arouses around the increase
of Turkish banks’ branches whereas their profitability had declined over time.
The key objective of our study is also shown to examine the factors
determining profitability of Turkish banking sector. The hypotheses of this
study are set in accordance with the selected internal factors that probably
influence profitability of this sector. The contributions that the study possibly
makes through a number of aspects are also presented in this chapter.
Finally, the limitations are shown in the last section of the chapter.
1.1. General background
The achievement and maximization of profits is considered as one of the top
goals of commercial banks, if it is not the primary objective. Obtaining such
profits empowers the banks to sustain and maintain the financial position of
them, enhance their equity size, and increase their solvency and liquidity
ratios, thus increasing capability of the banks to bear the risks and
obligations that might occur in the business. Contrary to the losses which
cause the deterioration of the financial situations of banks, the destruction of

2
their owners’ equity and exposure to financial adversity and default, that may
eventually bring about liquidation.
However, profit maximization in commercial banks is constrained by many
considerations. Since banks have to manage different aspects of finance its
sources and investments such as maintaining sufficient liquidity, seeking
safe use of funds, guaranteeing depositors' rights, and avoiding the different
types of risks, their ability of the commercial bank to maximize profits are
limited accordingly (Sufian andHabibullah, 2009; Alshatti, 2015). On the
other hand, in order for the bank to make the appropriate profits that increase
the value of the shareholders' wealth, it must use the funds obtained from
various sources as efficiently as possible (Bodla andVerma, 2006). It should
also maximize revenues and rationalize expenditures. To achieve this, they
must seek to obtain a certain amount of deposits at the lowest possible cost.
These deposits are then utilized in the form of credit facilities, financial
investments that generate the maximum profit possible within an acceptable
liquidity and relatively low risk, aiming to maximize net profit. Consequently,
this will increase the fair value of stock of the bank (Barth, Beaver and
Landsman, 1996).
Profitability is the association between the earnings of the projects and the
investments they have contributed to. It is the objective that bank
administrations aspire to achieve as a measure of judging their efficiency and
effectiveness in using their resources (Olweny and Shipho, 2011). They
represent the net outcome of a great number of decisions and policies.
Therefore, it is an indicator of the performance of the management of the
commercial banks (Pasiouras and Kosmidou, 2007).
The relationship between profits, on the one hand, and assets or equity on
the other hand is direct. The main objective of capital formation and asset
acquisition is to achieve an adequate volume of business operations,
ultimately with satisfactory profits, when compared with similar institutions in
the sector rate, or with popular rates in financial markets (Balasubramaniam,
2012).
3
On the other hand, profitability not only contributes to the satisfaction of
shareholders, but is also an indication for depositors, creditors, current
shareholders and prospective bankers. Profitability indicators are important
compounds for investors and the owners to establish a banking organization
when taking risks and putting capital in a business.
This profitability in commercial banks may be influenced by many factors,
whether related to the management of the bank or its financial conditions
such as the size of equity and assets, liquidity rates, solvency, spread of the
bank, number of branches, performance of banking services, interest and
debit interest rates (Guru, Staunton and Balashanmugam, 2002; Islam,
Sarker, Rahman, Sultana andProdhan,2017; Öhman and Yazdanfar, 2018;
Batten and Vo, 2019). The relative importance of these factors varies in the
degree and severity of their impact on profits. These factors need to be
examined and determined to be important in influencing profits in order to
develop appropriate policies to improve profitability, activate banking activity,
maintain liquidity and cash flows.
The banking sector of Turkey is one of the most developed economic
segments in the past couple decades. This sector has witnessed a rapid
growth in the number of banks and number of their branches. The number of
banks in Turkey increased from 48banks and 5,987 branches and offices at
the end of 2004(Kafali, 2005) to 53 banks with 11,576 branches and offices
at the end of 2018 (The European Banking Federation, 2018). These banks
have employed 208,000 people, according to the data for 2018. The total
assets of the Turkish banking sector reached $743.7 billion as of 2018. They
have contributed to the economy by providing loan volume of $461.8 billion
in 2018 (Hurriyet daily news, 2019). Net profit of banking sector in Turkey
reached $9.405 billion. Moreover, domestic credit as a percentage to GDP
which is provided to private sectors by banks dramatically rose from 17.3 in
2000 to 64.2 in 2018 (World Bank data, 2019).
The Turkish banking sector is considered as unique with regard to their long
history of operating in a developing country and continues to provide their
services under different economic conditions. Firm characteristics have
4
dramatically changed over that history of operation. These all influences firm
performance of this sector. Therefore, the study to investigate the factors
influencing banks profitability is important and useful to reveal the extent and
degree of impact on banking performance. Moreover, understanding the
determinants of profitability is vital in guiding banking policies and
management because it could assist them to create the right climate to
enhance their profitability to ensure their continuity and success in achieving
their objectives.
1.2. Problem statement
The profitability index is one of the most important indicators of financial
performance of commercial banks. Commercial banks always seek to
maximize their profits. In order to achieve this, it is necessary to identify the
firm-specific factors that might influence the profitability of banking sector.
The importance and role of the banking sector has been increasing in
Turkey. The remarkable development in the number of banks and their
branches operating in Turkey over the past few years is a clear evidence for
that. Despite all these, it is noticeable that the profitability of Turkish banking
sector has dropped over the past year (BRSA, 2019). Thus, the main
problem statement of this study is raised from this perspective and it is worth
investigating the factors that affect the financial performance indicators of the
banking sector in Turkey. Moreover, the research problem of the study can
be formulated in the question of; what are the most important variables and
factors that influence the banks’ profitability in Turkey?
Then, the following sub-questions are raised to answer the main research
question in detail:
1. What is the nature of the association between total assets and the
ratios of banks’ profitability?
2. What is the nature of the relationship between the ratio of capital funds
to risk weighted assets and the ratios of profitability?

5
3. What is the nature of the relationship between the ratio of total
liabilities to total assets and the ratios of profitability?
4. What is the nature of the association between the ratio of total loans to
total assets and the ratios of profitability?
5. What is the nature of the association between the loan loss provisions
to net loans and profitability ratios?
6. What is the nature of the association between the ratio of customer
deposits to total liabilities and the ratios of profitability?
7. What is the nature of the association between cash dividend per share
and the ratios of profitability?
1.3. Research objectives
According to the problem statement, this research aims to attain a number of
objectives, including:
1. Identify the elements influencing the profitability of banks which are
operating in Turkey.
2. Shedding light on the situation of banks in Turkey and the indicators
used in measuring their performance.
3. Identify the sources of fund of those banks and their uses.
4. Investigate the impact of fund sources and their methods of use on the
performance of the banking sector.
5. Making recommendations that would preserve and improve the profits of
banks.
6. Address the possible reasons that lead to loss or decrease banks
profitability.
6
1.4. Research significance
This study can contribute to the literature through the following aspects:
1. It contributes through highlighting one of the significant issues related to
factors influencing the banks’ profitability ratios.
2. It attempts to identify factors will probably enhance banks profitability.
This will provide a source of guarantee to investors, a trustworthiness of
the official authorities, and an enhanced speculation environment.
3. It also contributes to providing useful information that helps decision
makers in the Turkish Monetary Authority and other relevant parties to
help to develop banking policies that support the profitability
requirements of the Turkish banking system and to achieve growth and
progress of this body.
4. This research will be of great interest to scholars and specialists in the
field of banking. Moreover, it opens the path for future studies to
investigate the external aspects influencing the banks’ profitability.
1.5. Research hypotheses
According to the objectives and questions raised by this study, the following
research hypotheses are set to be tested:
H 1: There is an association between the total assets and profitability, and
this relationship is statistically significant.
H 2: There is an association between the ratio of capital funds to risk
weighted assets and profitability, and this relationship is statistically
significant.
H 3: There is an association between the ratio of total liabilities to total
assets and profitability, and this relationship is statistically significant.
H 4: There is an association between the ratio of total loans to total assets
and profitability, and this relationship is statistically significant.
7
H 5: There is an association between the ratio of loan loss provisions to net
loans and profitability, and this relationship is statistically significant.
H 6: There is an association between the ratio of customer deposits to total
liabilities and profitability, and this relationship is statistically significant.
H 7: There is an association between cash dividend per share and
profitability, and this relationship is statistically significant.
1.6. Research limitations
There is missing and inconsistency of the data of banks, where the
researcher to make models to unify the budgets of banks in order to access
to statistical data can be used. This is because the banks:
1. Banks differ in the classification of financial statements published in the
financial statements from one bank to another.
2. Different methods of banks in the classification of financial statements
published in the financial statements from one fiscal year to another for
one bank. In a way that some banks make adjustments to the
classification of some items of financial statements from one fiscal year
to another year.
3. Additionally, there were some missing data for some banks related to
some financial year which made us to exclude those banks in our
sample study.
1.7. Conclusion
This chapter presented a general background about the banking sector in
general and banks in Turkey in particular. It showed that commercial banks
commonly prioritize their profit maximization and therefore the factors that
determine profitability are considered by the management of bank as well.
In addition to the general background on the topic, the problem statement of
this study stimulated around the increase of Turkish banks’ branches
whereas their profitability had declined over time. Accordingly, the main goal

8
of this research was also shown to investigate the factors influencing the
profitability of Turkish banking sector. The hypotheses of this study were set
in accordance with the selected internal factors that probably influence
profitability of this sector. The contributions that the study possibly makes
through a number of aspects were also presented in this chapter. Finally, the
limitations were shown in the last section of the chapter.

9
CHAPTER 2
THEORETICAL BACKGROUND
Banks are intermediary financial institutions that provide services to both
depositors and borrowers (investors) in the community. They play a key role
in the growth of economic activity by providing important banking services to
the community, whether individuals, institutions or governments. Commercial
banks have evolved with the development of economic activity, the spread of
prosperity and economic prosperity, as well as the increasing need to use
money in daily transactions.
The success of the bank's management in achieving its objectives is
connected to its ability to provide the bank with a strong financial structure
.Financial structure consists of the liabilities structure, which are considered
as sources of finance, and the asset structure, which are seen as uses of
funds .Accordingly, they are able to accommodate changes in its current and
future liabilities and consequent losses if its assets cannot fulfil these
obligations .In light of the political, financial and economic fluctuations in the
Turkish territory, which cast a shadow over the economic and financial
situation in Turkey, the success of the commercial banks departments in
Turkey in achieving their objectives has been linked to their ability to
reconcile the structure of liabilities (sources of financing) and the structure of
assets (uses of funds). They are exposed to economic shocks that may
threaten their profitability, liquidity and sustainability.
Banks in Turkey play a key role in the Turkish national economy, through
their character in the procedure of financial intermediation between
depositors and borrowers.

10
In this chapter we will discuss three main topics: The first section discusses
the general framework of commercial banks –concepts and definitions, their
importance and their functions. The second section deals with the structure
of assets and liabilities in banks and their determinants. The third section
discusses the sources and uses of funds for commercial banks operating in
Turkey.
2.1. Banks and their services
2.1.1. Definition of banks
A bank is a financial organization that accepts deposits from the public and
loans credit. The exercise of lending could be accomplished either
straightforwardly or in a circulation method by the capital markets. As a result
of their significant role in the financial security of an economy, banks are
differently managed in several countries. Most economies have
homogeneous a framework recognised as fragmentary save banking under
which these forms of financial institutions hold liquidity resources
correspondent to only a portion of their current liabilities. Although different
guidelines planned to guarantee liquidity ratios, banks are yet commonly
dependent upon least capital prerequisites on the basis of a world
widepreparation of capital measures, which are known as the Basel Accords
(Heid, 2007).
The concepts related to commercial banks are varied according to the
perspectives from which they were viewed. In this sense, the bank is an
intermediary between those who have surplus funds and those who need
those funds. Commercial banks can also be defined by the functions they
perform and the services they provide to their clients. Thus, they are financial
intermediaries providing financial services to surplus and deficit units
(Cornett and Saunders, 2003).
Others have defined bank as financial institutions dealing with money and
securities, taking and giving, buying and selling, savings and investment,
11
which may be owened by private sector, government or both together at the
same time (La Porta, Lopez‐de‐Silanes and Shleifer, 2002).
Commercial banks, also known as deposit banks, perform a basic task that is
limited to other banking and financial institutions. This task is to accept
current deposits, that is, demand deposits that can be withdrawn by checks
by depositors at any time after they are deposited (Berger and Bouwman,
2015).
2.1.2. Objectives of banks
- Protecting cash for customers
- Provide customers with interest on deposits, securing against losing
cash value because of inflation.
- Providing cash loans to companies, individuals and householders.
- Providing financial counsel and alike financial facilities, for example,
insurance (Pettinger, 2017).
Protect deposits:
Banks are considered as a securitised place to deposit money. It is likely to
be unfeasible and risky to keep all of your retained income sat home or at
your business office. In medieval occasions, individuals would often ask
banks to protect their money and resources. Therefore, individuals could in
turn avoid the stress and worrying about their additional cash. Typically, the
central bank of a related country guarantees the banks as a loan specialist
after their compliance to the accepted regulations and policies have been
investigated and approved. In this way, savers consider the banks to be
sheltered spots to deposit their saved cash.
Interest on deposits:
In general, banks pay interest to customers on their deposits. Currently, this
might be fairly low. However, the loan fee can be noteworthy for cautious
records. In the time of growth, debt costs on deposits are important for
synchronising the genuine estimation of the savers’ funds. For example, in
the evsent that growth is 4%, saving income will cause decline in the worth of

12
the estimation of investment funds at that point. Nonetheless, in the case if
the bank bears a 6% debt cost, the estimation of the customers’ investment
funds is more likely to increase. For specific customers such as beneficiaries,
premium instalments on their bank deposited funds can be an important
source of income.
Banks are financial intermediary in which they invest the deposits in
investments such as loans to different customers and this could bring bout
profit to the bank. For instance, a bank has willing to pay 2% on bank
deposits yet provides loans to businesses and companies at a higher rate,
6% for example. Consequently, the bank could generate profit through the
difference between interest payable and interest receivable. Moreover, a
bank basically needs to maintain adequate liquidity to fulfil the needs of
customers in the case of cash withdraw requirement.
The process of loaning in banks is possible change unguaranteed individual
early payment to guaranteed household loan, is also known as mortgages.
Unguaranteed loan is associated with a higher financing cost due to the high
level of risk. In addition, guaranteed household loan is at a lower interest
rate, but for longer terms in which it can last fora 30-year period and beyond.
Individual loan is one of the most common types of loans that banks provide
to normal persons. In such a case, the bank might provide a credit to be paid
back over a short period of time, a couple of years. This credit might be
unguaranteed and make not lien to a valuable property such as a house.
This kind of debt could be borrowed by individuals for the purposes of
purchasing personal assets like a car.
Another common type of bank credit is business loan which is provided by
banks to companies and businesses. The purpose of this credit could be to
start a business or to grow an existing company.
Moreover, mortgage loan is an exceptional kind of credit, where the bank
pays an advance to purchase a house. Normally, the customer needs to pay
a deposit on the house in advance, which is a percentage of the price
.Legitimately, the bank claims the ownership of the house until the full

13
amount of the loan is paid back by the borrower through several instalments
over a long period of time. Generally, financing costs on mortgage loans is
moderately low since the credit is guaranteed by lien.
Finally, overdraft is also provided by banks as another kind of credit. Here, a
bank can concede to an overdraft with the existing customers. As a result,
customers could generate liquidity to pass some emergency situations.
However, the amount of overdraft is generally limited by the regulations of
the bank.
In addition to loan, banks can provide different facilities to customers, for
example; guidance on financial matters, offering extraordinary ideas to
clients, including organizing travel protection, rapid access to cash, and
strategies to make worldwide payments. Increasingly, banks offer electronic
exchange of cash through frameworks such as Payment Schemes Limited.
2.1.3. Importance of banks
The process of banking is widely assumes and proved as a significant job in
the economy since it provides and circulates cash in the market among
savers, investors and households. The significance of banks could be
considered through the notion of the present life-blood of the economy. Albeit
no wealth is made by Bank, however their fundamental exercises
encourages the procedure of creation, trade and circulation of fortune. Along
these lines they become the successful assistantsin the financial
improvement and development. Saini and Sindhu (2014) define Banks as the
overseers and dispersion of liquid capital that is the life-blood of business
and contemporary exercises and the judiciousness of their organization
depends on the monetary prosperity. Based on the important functions of
Banks, we may effortlessly portray the significance of banks in the present
global life (Kalpana and Rao, 2017), as follow:
Accumulations of Savings and Advancing Loans: the acceptance of deposit
and propelling the credits is the essential capability of commercial banks.
There are number of records that banks keep for their customers.

14
Cash Transfer :banks have stimulated the creation of instalments beginning
with one place or people into the next through checks, trade bills and drafts,
instead of cash. However, instalment check draft is increasingly protected
and valuable. This office is an extraordinary assistance for traders and
representatives. Actually, it upgrades the role of banks for business network.
Inspires savings: banks play out a priceless administration by empowering
investment funds among the individuals. They initiate them to put something
aside for gainful speculation for themselves and for national intrigue. These
investment funds help in capital development.
Allocation Savings into Investment: banks transfer the reserve funds
gathered from the individuals into speculation and along these lines
increment the measure of viable capital, which helps the procedure of
monetary development.
Overdraft Services: the banks enable the overdraft offices to their believed
clients and hence help them in defeating of impermanent money related
troubles.
Discount Bill of Exchange: the significance of banks could be considered by
the office of trade bills limitation. Banks refund their trade bills of customers
and assist them in the money related issues. Through limiting bill of trade,
the banks are likely to obtain whole speculation they need.
Finance External and Internal Trade: banks help dealers and brokers in
financing inside and outside exchange by limiting remote bill of trade, issuing
of letter of credit and different certifications for their clients.
Performance as an Agent :the bank act as a specialist and help their clients
in the buy and offers of offers, arrangement of storage spaces instalment of
month to month and profits on stock.
Issue of Traveler's Checks :for the suitability and safety of cash for voyagers
and vacationers, bank gives the office of explorer's checks. These checks
empower the explorers and vacationers to meet their costs during their
adventure, as these are acknowledged by issuing investors, cafés, and other
15
agents both at home and abroad. Almost certainly, this is additionally one of
the extraordinary elements of banks and demonstrates the significance of
banks for us in progressively exact ways.
General Utility Facilities: presence of commercial banks is fundamental for
commitment to general thriving. Banks are the principle factors in raising the
degree of monetary improvement of the world. Notwithstanding, banks
likewise give numerous administrations of general utilities to the clients and
the overall population.
2.1.4. Economic roles of banks
As we realize that key objectives of a commercial bank is to procure benefit
through tolerating of deposits and propelling advances through numerous
strategies. In spite of the fact that these capacities are the fundamental
capability of commercial banks, nevertheless there are meaning fully greater
capacities which improve the significance of today’s banks (Disyatat, 2004).
- Receiving deposits, by opening various types of bank accounts such as
saving deposits, time deposits and current deposits.
- Advancing of credits to people who need cash through various
strategies and necessities.
- Arrangements of assistance and general utility facilities to the clients.
- Creating original investments in various associations and expanding the
economy.
- Advance capital arrangement in the economy by preparing and
accretion of reserve funds with the goal of speculations.
- Improvement of enterprises in the economy as specified by the
prerequisites of the economy.
- A fair economic development is obtained in various segments through
the bank reserves.
- Advancement in agricultural creation is made conceivable by giving
several kinds of credits
- Banks assist in decreasing dependence in remote help by their
endeavours in the activation of household investment funds

16
- Banks help in the usage of a powerful fiscal strategy as per the target to
national bank.
- Commercial banks help in the creation and conveyance of cash through
the deals and acquisition of protections.
- Commercial banks are the custodian and wholesaler of liquid capital of
the economy, which is the initial need of all business and financial
activities of an economy.
2.2. Assets and liabilities structure
The success of banks in achieving their objectives, like any other commercial
enterprises, depends on the ability of its management to manage the assets
of these banks and their use ,as well as their ability to develop financial
resources of these banks, whether self-directed or external resources and
directed these resources towards investments that enable them to enhance
their profitability and maximize them.
With regard to the concept of financial structure, there are several definitions
of the financial structure. It is defined in the literature to represent all forms
and types of financing, whether ownership or borrowing, as well as short-
term or long-term sources. Moreover, financial structure is also defined as
the variety of sources from which an entity has received funds to finance its
application. It includes all the elements that make up the liabilities side,
whether long-term or short-term. The financial structure can be said to be a
combination of long-term, medium-term and short-term funding sources.
The leverage is defined as the ratio of debt to private funds and called lift
because it raises the profits of the institution with all its assets if they
continue.
The term financial structure is linked to the left side of an organization's
balance sheet, which means a detailed description of the sources of funding
in terms of the percentage of each source element for the total.
17
2.2.1. Short-term funding sources:
These are those types of financing in which the term of the loan or financing
is one year or less. It is usually for the purpose of investing in current assets
and short-term financing consists of bank credit, commercial credit and
commercial paper.
- Bank credit:
Commercial and industrial institutions are very dependent on banks for their
activities. In many areas, such as facilitating payment, import and export
operations, in addition to providing the necessary credit to finance its growth
and development needs.
- Commercial Credit:
The business in general buys the supplies it needs in its operations and
operational activities from other establishments. The value of such inputs is
shown in the entity's records under Accounts or Accounts Payable. This type
of financing is called commercial credit earned. This source accounts for the
largest proportion of total short-term indebtedness.
- Commercial papers:
They are instruments written in line with the formal conditions recognised by
the law representing money worth paying in a certain place and accept
trading by commercial methods. Commercial papers have several
characteristics that distinguish them from other commercial papers. It
represents a cash right, accepts trading by trading methods, which are short-
term securities and have traditionally been accepted as a loyalty instrument
that replaces cash.
2.2.2. Medium-term sources of funding:
- Direct medium-term loans:
These loans are a type of loan that the entity is obliged upon obtaining to
repay both the principal and the interest due on a certain date. In this case,
the borrowing process is subject to the terms of the agreement between the

18
entity and the lender regarding the interest rate, maturity date and method of
repayment. The borrowing period usually ranges from three to fifteen years.
- Leasing:
A contract whereby the lessee is obliged to pay certain amounts at agreed
dates to the lessor of an asset for the first use of the services provided by the
leased asset for a certain period.
2.2.3. Long-term sources of finance:
This is the complementary component of the financial structure. Private
funds include:
- Ordinary shares:
A common stock represents a proprietary document with a nominal, book
and market value. The face value is the value on the share document. The
book value represents the value of shares. The market value of a stock is the
price at which the stock trades. This means that ordinary equity holders are
more likely to receive returns than bondholders and are associated with risk
to owners.
- Preferred Shares:
The ones that are held according to the company’s system that issues them.
These are the shares that the bearer decides more than what is prescribed
for ordinary shareholders, such as the priority in obtaining profits, even if the
ordinary shareholders do not have any share of the profits to be distributed,
and among its characteristics are the right to priority in obtaining profits at a
specified percentage.
- Retained earnings:
The undistributed portion of dividends to shareholders during the previous
financial year.
19
- Long-term borrowing:
Indebtedness represents what the institution should meet its value at a later
date. Long-term borrowing takes two basic forms: long-term loans and
bonds. Here are the main features of each:
- Long-term loans:
These are loans obtained by the institution from financial institutions such as
banks and insurance companies, and the maturity date may reach thirty
years. One of the most important characteristics of the loans is that the terms
(interest rate, maturity, mortgages, etc.) are agreed upon by negotiation
between the lender and the borrower.
- Bonds:
A debt document issued by the company or any other entity, which is an
expenditure or contract between the investor or the savings (the lender) and
the company (the borrower). A predetermined bond maturity usually lasts
from 20 to 30 years.
2.3. Profitability of banks
The achievement of profits is one of the most important goals pursued by
commercial banks, like other economic units. It is necessary for its survival
and continuity, as it is considered the main requirement for shareholders,
depositors, lenders, management and supervisory authorities. It is the goal
that shareholders aspire to increase the value of their wealth. It is the source
of confidence for both the bank's depositors and lenders. It is also the goal
that the bank’s management aspires to be an important indicator to measure
its efficiency in using the resources available to it. It is the subject of attention
of the regulatory authorities because of the success of the bank and its ability
to improve the adequacy of its capital (Kajola et al., 2018).

20
2.3.1. The concept of profitability
Profitability can be defined as the relationship between profits achieved by
the firm and the investment activities which contributed to the profit
generation. Profitability is a goal for the firm and an adequate measure of its
efficiency (Petria et al., 2015).
Profitability is measured either by the use of the association between profits
and sales, or by the use of the association between profits and investments
that it contributed to achieving, knowing that what is meant by investments is
the value of assets or equity (Kajola et al., 2018).Commercial banks effort to
attain their goal of targeted profitability through making two major types of
decisions which are investment decision and financial decision (Hzwry,
2018).
Investment decision it is the set of decisions regarding how commercial
banks use the resources available to them to acquire several kinds of their
assets. The effect of the investment decision on profitability is shown through
the optimal distribution of the resources available to the institution on the
various types of assets in a way that balances between the appropriate
investment in each item of assets without an increase leading to the
disruption of resources, and without a decrease leading to missed
opportunities in order to enable commercial banks to achieve the best
possible return with the minimum loss of liquidity.
Financing decision it is related to how to show the sources from which the
funds needed for commercial banks will be obtained to finance investment in
their assets. The impact of the financing decision is reflected on profitability
by arranging sources of funds from deposits, rights of owners and debts in a
way that enables the project to obtain the largest possible return. It can be
considered that profitability is a strategic goal that enables banks to grow and
continue, because losses and the inability to achieve profit will ultimately
erode the rights of owners and thus liquidate.

21
2.3.2. Sources of profits for banks
Sources of profits consist of the benefits derived from loans and interest
(capital gains) obtained from investments and the wages of different
services, and we will address these sources in detail as follows:
2.3.2.1. Interest on loans
Loans and advances are among the most important elements of revenue for
commercial banks. The process of granting banking is affected by the
increased demand for them and the policy of promoting loans. The more
demand for loans, the more the bank will be able to repay it, the higher its
profits. The diversity of banking services for clients contributes to increasing
the volume of loans. The size of bank revenues is estimated at the interest
rates on lending which is affected in turn by a combination of some factors,
as follows (Nabila, 2016):
The bank's default susceptibility: there is a strong relationship between
interest rates and investable cash reserves. The higher these reserves, the
lower the interest rate, and vice versa, assuming other things are constant.
The degree of default risks: where there is a clear inverse relationship
between the degree of risk, the greater the risk to loans provided to clients
and the interest rates on them, the higher the risk, the greater the interest
rates imposed on loans in order to cover the expected losses due to that on
the one hand and cover the collection expenses of loans on the one hand
Other.
Documentation :the more guarantees that document the loans, the more the
bank will tolerate the conditions it imposes on the loans, including the interest
rate, and vice versa.
Forwards: there is a direct relationship between the maturity of the loans and
the interest rate on them, the higher the maturity of the loans, the greater the
interest rate charged on them.
Borrower size and loan size :the higher the size of the loan or the borrower,
the lower the interest rate, because of the availability of financial resources
for these borrowers to cover the size of their loans.
22
Assumption cost :there is an inverse relationship between the borrowing
costs represented various costs, including expenses of identifying the
customer’s financial position and learning about his ability to pay, between
the interest rates on them, the higher the costs, the higher the interest rates
in order to cover those costs.
Competition :the more competition among commercial banks, the lower
interest rates on loans.
2.3.2.2. Capital gains from investments
Banking policies for investing in commercial paper differ from those used to
provide loans to individuals and institutions. Banks take stock investments as
an alternative to money. Instead of banks maintaining large cash balances in
their coffers to meet liquidity requirements, they depend on investing them in
securities that achieve returns. This can be converted to cash quickly when
required. Thus, investment is targeted for profitability and liquidity (Stowell,
2017).
2.3.2.3. Other banking services fees
Commercial banks provide many services to their clients, which receive
different types of commissions on the services they provide, including
(Nabila, 2016):
Trust and custody services: such as investing funds for the benefit of others,
executing the deceased's wills, collecting rental properties for the benefit of
others, and disbursing the funds concerned for the benefit of others.
Lending services: such as wages for inquiring about the credit, statements of
property and real estate, mortgage wages, fees for renewing or extending
loans, and fees for deducting securities.
Issuing letters of guarantee :this is what banks receive in exchange for
issuing local and foreign letters for natural and regular persons.
23
Collecting public revenue: such as the phone, water and electricity, selling
insurance documents to the interests of insurance facilities, and collecting
government housing projects rents.
Transfer of money: in exchange for receiving its money in cash or
transferring it from deposit accounts to customers.
Depositing and withdrawal services: such as the fees of the instrument,
drawn in favour of the customer and deposited in the bank, but bank deposits
do not achieve any revenue for the bank. This may not cover the costs
incurred by the bank such as commercial deposits as a result of repeated
deposits and withdrawals on them.
2.3.3. Measurements for banks’ profitability
There are several criteria for measuring profitability (Albertazzi and
Gambacorta, 2009), and we find that there are a number of criteria utilised to
measure profitability:
- Return on Assets (ROA)
This criterion for measuring profitability is based on the relationship between
profit from operations and the assets that contributed to its achievement.
Revenue power or return on assets is defined as the ability of a particular
investment to achieve a return as a result of its use. Or is the institution's
ability to achieve profits as a result of using its assets in its primary activity
and in a simpler way it is the ratio of operations profit to the Foundation's
assets. Revenue is a better measure of profit than judgment to judge an
organization's efficiency. Because the profit is an absolute number that does
not refer to investments made. While voluntary power creates such a
relationship, which facilitates comparisons with returns for other periods, as
well as other institutions, it also helps in identifying the direction that the
institution's performance takes. The voluntary strength is a measure of the
organization's operational performance. Therefore, when calculating it, it is
necessary to limit the assets actually participating in the normal operations of
the corporation, and the net operating profit must be used. In other words, it

24
is limited to the profits that are generated as a result of operating these
assets before taxes, expenses and other revenues.
- Return on equity (ROE)
It refers to the amount of return that owners receive as a result of investing
their money in the facility and bearing it for risk. It is based on the concept of
profit, as equity is the paid-up capital plus various legal and optional reserves
as well as undistributed profits. These rights are equal to the total assets
minus all liabilities, whether long or short term. As for the net income, it
means the profit realized from the operations of the institution or any other
sources after the tax is offered. That is, the net comprehensive profit, and
there are those who see the necessity of having this proportion calculated
before the tax, given that the tax is an element that the corporation has no
control over.
The return on equity reflects the efficiency of the institution’s management in
managing both sides of the budget or the skill in using the assets (operating
efficiency), as well as the skill in installing the left side (financial efficiency) to
achieve the best possible return for project singles. It is noted that the return
on equity index measures every pound invested by common stock equity.
This measure could controls for the influence of operating and financing
activities. In the case when there is zero amount of debt in the company's
capital structure, the ROE equals the ROA.
- Earnings per share (EPS)
Another commonly used measure of profitability is earnings per share,
denoted as EPS. This ratio is considered as one of the best measures of the
real price of a share because it demonstrations the portion of each
shareholder in the profit after tax for the company. EPS is calculated by
subtracting dividends of preference shares from the net income of the firm in
a particular year, then dividing this number by the average number of
outstanding shares in the same period of time.

25
EPS comes in two major methods, diluted earnings per share and basic
earnings per share. These kinds are similar from some aspects and different
from some other aspects. The diluted ratio of earnings per share also
includes the number of tradable and convertible shares whereas the basic
earnings per share do not. In general, the diluted method of earnings per
share has greater accuracy and it is more commonly used. Although there is
no general understanding about a good or bad method, it is obvious that the
higher the value of earnings per share, the better is.
Returns are considered one of the most important elements for the
continuation of companies. The possibility of achieving goals and the survival
of companies depends on achieving returns. On the other hand, the
continuous losses lead to the depletion of assets and amortization of equity,
and then the creditors' control of the company. And when desiring the
success and continuation of the company, he should be concerned with the
issue of returns as a percentage of sales, from total assets and from equity,
not just the amount of returns. The most important thing is to look at the
stability, returns and regularity of returns. This is more acceptable than
obtaining sudden profits for a certain period (Kumar and Venoor, 2018).
2.3.4. Factors affecting bank’s profitability
In order to achieve their goal of profit maximization, banks face many
challenges in managing the factors whose influence on their profitability
varies.These factors can beinternal to the banks themselves or external to
the surrounding environment. Internal factors include assets size, structure
and quality, leverage, financial structure and some other firm-specific
characters whereas external factors include political, economic, legislative,
and several other factors.In this research, we focus on the internal factors
that are used in testing hypotheses and analysing results (Afolabi et al.,
2019; Kadioglu et al., 2017; Molinari et al., 2017; Petria et al., 2015; Yusuf,
2018).

26
2.3.4.1. Bank size
The size of the bank is usually measured by the amount of assets the bank
owns or the amount of ownership it owns. The larger the size of the bank
measured by the assets leads to a decrease in the rate of return on the
assets. This rate is large in small banks, compared to large banks. However,
it is noted that the volume of deposits in large banks is greater than in small
banks. This means that if the degree of leverage is high, it would lead to
increase the rate of return on equity. The increase in the assets of
commercial banks increases their ability to invest. It is always expected that
an increase in the bank's assets will lead to an increase in its profitability. In
the event that the size of the bank is measured by its ownership rights (paid-
up capital, reserves, and profits not distributed), we find that the banks have
large ownership rights, the funds available to them are greater, and their
ability to invest these funds is wider, and the increase in property rights
increases the confidence of the public dealing with them. This may be
reflected in the size of customer deposits with it and thus increase in
leverage, which in turn maximizes the rate of return on equity.
2.3.4.2. Capital adequacy
Capital adequacy indicators determine the financial institutions' solidity
throughthe shocks to budget lines. The significance of the indicators of
capital adequacy is that they take into consideration the initial financial risks
facing financial institutions such as risk of exchange rate, credit risks and
interest rate risks. Capital adequacy indicators go beyond calculating risk
within budget lines to off balance sheet items such as dealing in derivatives.
The benchmark used is aggregate capital ratios adjusted for risk. This
indicator is measured by the ratio of the capital to the group of risk weighted
assets. A decrease in this ratio means an increase in the exposure of budget
lines to risks and the possibility of a capital adequacy to face these risks.
2.3.4.3. Leverage
It is the dependence of banks on external sources such as loans. This
obliges the borrowing bank to pay a fixed financial cost. Leverage relates to
27
the use of debt to purchase assets. This is done to avoid using too much
capital. The debt-to-asset ratio is the formula for calculating leverage. The
greater the debt ratio, the greater the leverage is. If a bank is classified as
having a high leverage, this means that the debt ratio is greater than
ownership. When debts are used in such a way that the resulting return on
investment is greater than the interest associated with it, the investor’s
position is in the proper. However, an excessive amount of leverage is
always risky, given that it is possible to fail to use it.
2.3.4.4. Asset structure
Commercial banks direct most of their financial resources to invest in loans
and securities, as they are considered the most important areas of
investment for the commercial bank. It is by increasing the proportion of
resources invested in these assets increases the profitability of the
Commercial Bank. The income generated by it is the main source of the
bank's revenue, particularly the income generated from the loan. The
proportion of resources invested in income generating assets affects the
profitability of banks, where profitability increases with increasing this
percentage. The bank’s decision to invest its resources in loans and financial
investments is one of the decisions that depend on several factors, the most
important of which is the bank’s need for liquidity and the availability of good
income-generating investment opportunities.
2.3.4.5. Asset quality
The degree of reliability of capital ratios generally depends on the degree of
reliability of asset quality and quality indicators, and insolvency risks in
financial institutions mostly come from the quality of assets and the difficulty
of their liquidation. Hence, the importance of monitoring the instruments
appears that indicate the quality of assets. Asset quality indicators must take
into account credit risk involved in budgetary operations such as agencies,
mortgages and derivative trading.

28
2.3.4.6. Financial structure
Deposits are generally considered the main source of commercial bank
money. The idea of banks arose based on deposits as a basis for all banking
activities. Accordingly, the idea of financial leverage in commercial banks is
mainly and substantially based. The deposit system is based mainly on the
public’s confidence in the banking system, as it provides control systems that
attract depositors from the risk of losing their money or being exposed to
theft or fire and ensure that they get their money or a reward from them upon
request or upon maturity. . Deposits are the only component of the bank’s
budget that clearly differentiates other types of businesses. Therefore, the
ability of the bank’s management and its employees to obtain current
accounts from business organizations and individuals is an important
measure of the extent of customer loyalty to the bank. Deposits represent the
raw material for bank loans and investments that aim to achieve profitability.
2.3.4.7. Dividend policy
Earned profits are distributed to the owners of the bank in specific
proportions. For the purpose of measuring the efficiency of achieving profits,
a comparison has been made between the ratios distributed to the owners
and the amounts they invested as equity. Dividend policy is a vital strategic
financial decision for a firm and is dependent on a number of considerations
in its determination. A number of grounded theories has potential to explain
the behaviour of investors towards the dividend policy that a company follow.
These theories diverged between supportive and neutral towards the effect
of the dividend policy on the value of the company.
2.4. Ground theories
This research attempts to examine several potential determinants of
profitability for banks listed in Turkey. There are some ground theories that
can theoretically explain the determinants of profitability, including the

29
signaling theory, agency theory, relative efficiency hypothesis, and trade-off
theory.
2.4.1. The Signaling Theory
This theory focuses on increasing the firm's opportunity to obtain capital
financing from the market. This is based on the confidence gained by the
enterprise from the publication of its financial statements, which appear in a
manner that supports the reputation of the enterprise. This creates an
impression of confidence among investors and a low level of sense of risk
towards the financing of the operations. Moreover, the presence of strong
incentives for successful firms to announce the results of their activities
increases the competitive pressures between firms. Even firms that do not
achieve good results are forced to announce the results of their activities
because failure to disclose completely loses confidence in the investors.
Signaling theory claims that firm management increases capital of their firms
aiming to delivertypical signals about the future expectations to befavourable
(Connelly et al., 2011). So that it is indicated that a reduction in the ratios of
financial leverage confirms that performance of the firm is healthiercompare
to their competitors who are unable to improve their equity unless they
further reduce their profits.
2.4.2. Agency theory
This theory depends on explaining the association between the managers of
a business and its shareholders. It helps in identifying the finest private
incentives in individuals that emerge as a result of successful business
operation and activities. It contributes to reducing costs that might arise due
to conflicts of interests between principals and agents (Hoffmann and
Rodrigo, 2011). According to this theory, this conflict of interest involves cost
which can in turn negatively affects profitability. The agency theory can be
identifies as a hypothesis that contributes to the interpretation of relation
between agents and principals in a business. The agency theory seeks to
30
resolve issues that could affect the objectives of a business. Moreover, it
aims to solve those issues that could lead to increased level of risk.
The agency's theory is concerned with following the nature of the disputes
arising because of the special desires or goals of the agent and the principal.
These disputes may be caused by the client not knowing the actions or
decisions of the agent. For example, if the CEO of the company sees that it
is necessary to participate in commercial activities in various markets by
increasing production dependent on raising the costs of production, in order
to contribute to obtaining greater profits in the future, whereas shareholders
want to grow the current capital rather than paying additional production
costs.
2.4.3. Relative efficiency hypothesis
This theory tries to explain the profitability through looking at the size of the
firms. Accordingly, it indicates that the larger firms, on the basis of their total
assets, are more profitable in comparison with those who are smaller in size.
The reason for this claim is that the larger firms tend to have better
management and they are more efficient. This greater efficiency is
considered rather than of any conspiracy (Clarke, 1986). Moreover, this
influence of bank size restricts the perception that great banks can take
benefits from economies of scale.
2.4.4. Trade-off theory
The trade-off theory can explain the relationship capital structure firm
profitability. Additionally, it presents the idea that a firm selects amount of
debt finance and amount of equity finance to invest in the firm through
balancing the benefits and costs of debt (Ketyenya and Mwaura, 2017).
Accordingly, a firm choose to finance its operations mainly through debt
aiming to take advantage of the tax saving benefits of debt.
A significant purpose of the theory is to clarify that firms generally are
financed partially with equity and partially with debt. The theory confirms that

31
there exists a benefit from debt financing which is the tax shield advantage of
debt. However, there exists a cost of debt financing which are financial
distress costs. The financial distress costs include bankruptcy costs and non-
bankruptcy costs of debt. Non-bankruptcy costs are such as
bondholder/stockholder infighting, suppliers demanding disadvantageous
payment terms, staff leaving, and some other factors .The marginal benefit of
more increases in debt reduces with the increase of debt, whereas the
marginal cost rises. There fore, a firm that is optimizing its general value is
more likely to emphasis on this trade-off when selecting the combination mix
of debt and equity to use for the purpose of financing.
2.5. Empirical review
The empirical review of the study was illustrated by detecting differences and
similarities of the studies across the various economies. We illustrate and
compare several studies from both developing and developed countries.
There are some empirical studies conducted in developing countries
examining the factors influencing profitability of banking sector in different
countries. Ebenezeret al. (2017) investigates the impact of a number of
bank-specific factors on the profitability of 16 commercial banks in Nigeria
during the period 2010-2015. Using the annual financial statements, the
study collects and analyses a balanced panel data. The results of this
empirical investigation show that profitability of banks measured by ROA and
ROE is affected by bank-specific factors including liquidity, capital adequacy
and efficiency ratio. The authors suggest that banks in Nigeria could expand
their profitability by decreasing operating cost, increasing liquidity and capital
with conscious work to sustain operational transparency.
Moreover, Obamuyi (2013) investigates the performance of 20 banks in
Nigeria 20 over the period 2006 to 2012. Using Fe and RE regression model
for a panel data set, the results confirm that bank size, bank capital, interest
income, expense management, and the economic condition can positively
influence bank performance in Nigeria. The study recommends the

32
authorities of the banking system to more encourage banks to increase their
capital and assets.
Garcia and Guerreiro(2016) examine the profitability of 27 banks in Portugal
over the period 2002- 2011. This study uses the regression methods of
ordinary least square and fixed effect to analyse the data. The authors
measure profitability using the proxies of ROA, ROE and NIM. The results
claim that the selected variables such as financial crisis and corporate
governance significantly influence profitability.
Anbar and Alper (2011) examine the profitability of banks in Turkey during
2002-2010 using several bank-specific and macroeconomic factors. The
study measures banks profitability according to the ratios of ROA and ROE.
With regard to the bank-specific factors, the results of regression analysis
state that banks size, non-interest income, loans under follow-up, credit
portfolio size can significantly influence the profitability of banks in Turkey.
Regarding the macroeconomic factors, real interest rate could also have
impact on profitability. The study recommends the banks in Turkey to
increase their total assets invested in their financial operations and decrease
their credit to assets ratio in order to enhance their profitability.
Considering the commercial banks in Jordan, Khrawish (2011) accessed the
profitability determinants for the period 2000-2010. Both internal and external
factors are studies in this research. The results of data analysis in this study
claim that bank size at total assets, the ratio of total equity to total assets and
the ratio total liabilities to total assets could significantly affect the profitability
ratio on Jordanian banks measured as return on assets. The results show
that the impact of all these variables on ROA is positive.
Olweny and Shipho (2011) assessed the impacts of several bank-specific
factors on the profitability. The sample of this study consists of 38
commercial banks in in Kenya and their financial data was collected over the
period 2002- 2008. The results of multiple regression analysis suggest that
capital size, operational cost, asset quality, employs revenue diversification
strategies, the amount of liquid assets and the rate of nonperforming loans
33
are the key factors that could influence the profitability of commercial banks
in Kenya.
Rahman et al. (2015) investigate the determinate of banks profitability for25
commercial banks in Bangladesh during 2006- 2013. Considering ROA, ROE
and NIM as measures of profitability, the results claim capital strength, cost
efficiency, loan intensity and off-balance sheet activities can significantly
affect the three different measure of profitability.
Moreover, the factors affecting the profitability of banks have been
empirically investigated previously by many studies, particularly in the
developed countries.
Petria et al. (2015) investigate some potential determinants of profitability for
banks in EU27 during the financial periods 2004-2011. This study considers
two groups of factors that can drive bank profitability: external factors of
industry-specific and macroeconomic variables and internal factors of bank-
specific variables. The authors measure banks profitability on the basis of
proxies such as the return on average equity (ROAE) and the return on
average assets (ROAA). The results for the empirical results from this
research confirm that there are several factors could determine the banks’
profitability including liquidity and credit risk, the diversification of business,
the market competition/ concentration, management efficiency and the
economic growth. These factors can influence both used measures of
profitability ;ROAE and ROAA. They additionally add that the impact of
competition on bank profitability in EU27 is positive.
Similarly, Capraru and Ihnatov(2015) examine determinants of profitability
bank in EU15 during 2001-2011. In addition to the proxies of ROAA and
ROAE, this study uses net interest margin (NIM) to measure banks
profitability .Using a dummy variable, the study examines the impact of the
first and the major movement of expansion on EU15 bank profitability.
Consistent with the study conducted by Petria et al. (2015), this study splits
the factors affecting banks profitability into internal and external variables.
The results of the study claim that credit risk, market concentration cost to
income ratio, bank liquidity and banks size could influence the profitability of

34
banks in EU15. This study recommends the authorities to better control
liquidity and credit risk with a competitive banking environment needs to be
maintained.
Menicucci and Paolucci(2016) aim at examining the association between
profitability of banks and some bank-specific factors in European banking
sector. Using a regression analysis for an unbalanced panel data set for 35
largest banks in Europe, the study investigates the relationship for the period
2009-2013. The results of this study state banks size, deposit ratio, loan
ratio, capital ratio, loan loss provisions are among the significant factors
which could determine banks profitability in Europe. Since the performance
of those European banks relies on efficiency, competitiveness and
profitability, the study suggests banks regulatory authorities to sustain and
intensify robustness and constancy of the banking sector.
Using data of commercial banks in seven countries in Latin American, Saona
(2016) conducted an empirical study examining the bank-specific factors
affecting profitability ratios. This study uses the generalized method of
moments (GMM) to analyse the data collected for the period 1995-2012. The
regression results suggest that factors such as capital ratio, asset
diversification, revenue diversification, improvements in the legal and
regulatory system and market concentration can affect profitability but with
different type of effect.
At hanasoglou et al., (2005) examines the profitability of banks using bank-
specific, industry-related and macroeconomic determinants. The study
sample is an unbalanced panel data set which is taken from credit firms in
South Eastern European over the period 1998-2002. Using FE and RE
models, the results of this study emphasise that banks size could not
influence banks profitability. However, some other bank-specific factors have
significant influence.
The above literature review revealed the uniformity of some of the bank-
specific variables such as bank size, capital adequacy, leverage, in
determining the profitability of banks through different countries world wide.
35
Moreover, we observed that ROA and ROE were the most common criteria
used by authors in the literature to measure profitability.
2.6. Conclusion
In this chapter, the theoretical literature is highlighted in the section 1 to 3.
The concepts related to profitability and its sources were discussed in
addition to the most important factors affecting it. From it we can say that
profitability is the policy of reaching goals. In spite of the different types, we
find that they flow into one concept, measuring the bank’s effectiveness and
efficiency. Likewise, profitability ratios are linked to the bank and everyone
who has a relationship with the bank. It is the duty of bank to control all
factors that could affect its profitability. Section 4 shows and discusses the
ground theories about the factors affecting profitability. Section 5 was
centred on the most important previous studies that are related to the subject
of the study. And through which a review of the most important aspects of
these studies represented in the aim of the study as well as mentioning the
most important results reached. Finally, a literature gap was identified based
on the review of the previous empirical studies.
36
CHAPTER 3
METHODOLOGY
The content of this chapter is divided to several sections. Section 3.1 defines
the study sample and the method of data collection. Section 3.2 provides an
overview on the sample study. Section 3.3 identifies the research variables
and defines them and accordingly develops their proposed relationships with
regard to the variables determining profitability easements. Section
3.4specifies the research models of the study. Lastly, the research method
used to investigate the proposed relationships of the study is described and
explains in section 3.5.
3.1. Sample and data
In order to achieve the objectives of this research in investigating the
profitability determinants of banks in Turkey during the period 1999-2018 by
using some statistical techniques, the study is based on the annual financial
reports about banks in Turkey, published by the banks themselves, central
bank of Turkey and Borsa Istanbul (BIST).
Using the Public Disclosure Platform for Borsa Istanbul (CEIC, 2019), we
drew the sample of this study. This study firstly considered the entire banks
listed on the stock market of Borsa Istanbul and then the research sample
was drawn in regard with a number of criteria. First, banks that are not yet
listed on Borsa Istanbul are excluded from our selected sample. Second, this
study aims to investigate the determinates of profitability over a long time
span of twenty years from 1999 to 2018, and for that reason only those
banks are selected whose their financial data and information are available

37
over the selected period. Third, the central banks of Turkey is eliminated
form our sample since the central banks plays more the role of governing the
monetary system in the country and it controls and governs the financial
rules and regulations for the other banks. The reason for selecting that
period is to provide valuable and more reliable results about the factors
determining of profitability by investigating a long period of time since
previous studies cover relatively shorter periods (see for instance, Alshatti,
2016; Petria et al., 2015).
Out of 53 banks listed on Borsa Istanbul in 2019, the final research sample of
this study consists of 19 banks including commercial banks and investment
banks. As a result, a balanced longitudinal data is generated for this
investigation, consistent with Anbar and Alper (2011) and Obamuyi (2013).
Annual data was collected form DataStream database and Borsa Istanbul
data store (CEIC).As a result, these selection criteria resulted in providing
380bank-year observations of the banks listed on BIST.
3.2. Turkey economy and financial market
3.2.1. An overview of the economy
The economy of Turkey is characterized by growth and development. Until
1920s, Turkey was nearly entirely an agricultural country. Under the
guidance and supervision of the Turkish government, the number of factories
increased from 118 in 1923 to more than a thousand in 1941. Currently,
there are more than 30 thous and manufacturing companies in Turkey.
Nevertheless, agriculture sector remained as one of the central economic
activities, as it provides employment opportunities for 58 per cent of the total
labour force in the country. Nonetheless, the size of agricultural production
represents only approximately 20 per cent of the value of all services and
goods produced in Turkey. The industry absorbs approximately 11 per cent
of the total labour force in the country. However, the returns value of
industrial production goes beyond that of agricultural production.
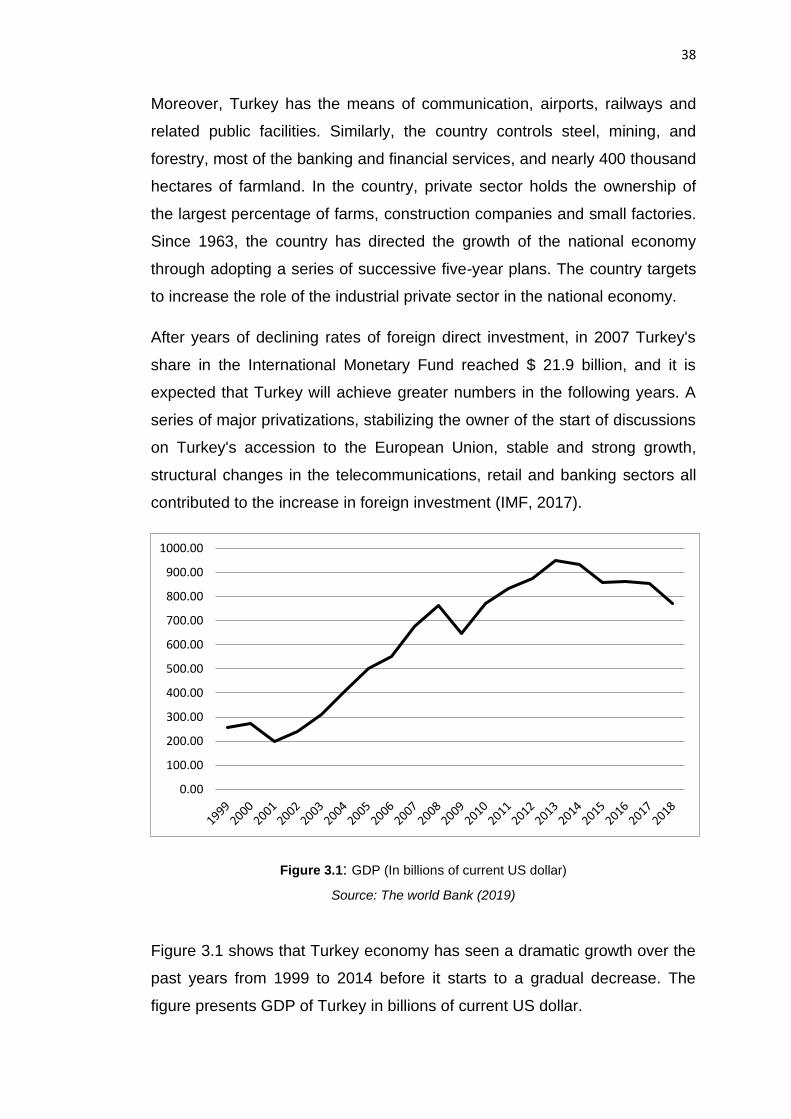
38
Moreover, Turkey has the means of communication, airports, railways and
related public facilities. Similarly, the country controls steel, mining, and
forestry, most of the banking and financial services, and nearly 400 thousand
hectares of farmland. In the country, private sector holds the ownership of
the largest percentage of farms, construction companies and small factories.
Since 1963, the country has directed the growth of the national economy
through adopting a series of successive five-year plans. The country targets
to increase the role of the industrial private sector in the national economy.
After years of declining rates of foreign direct investment, in 2007 Turkey's
share in the International Monetary Fund reached $ 21.9 billion, and it is
expected that Turkey will achieve greater numbers in the following years. A
series of major privatizations, stabilizing the owner of the start of discussions
on Turkey's accession to the European Union, stable and strong growth,
structural changes in the telecommunications, retail and banking sectors all
contributed to the increase in foreign investment (IMF, 2017).
Figure 3.1: GDP (In billions of current US dollar)
Source: The world Bank (2019)
Figure 3.1 shows that Turkey economy has seen a dramatic growth over the
past years from 1999 to 2014 before it starts to a gradual decrease. The
figure presents GDP of Turkey in billions of current US dollar.
0.00
100.00
200.00
300.00
400.00
500.00
600.00
700.00
800.00
900.00
1000.00

39
3.2.2. An overview of the financial market
Turkish stock market was originally founded in the name of the Ottoman
Stock Exchange in 1866. It was reorganized into its current structure at the
beginning of 1986. Currently, Istanbul Stock Exchange (ISE) is the only stock
market in Turkey. During the 19th and early 20th centuries, Bank Street in
Istanbul was the centre of the Ottoman Empire, where it was the main centre
of the Ottoman Central Bank (it was established in the name of the Ottoman
Bank in 1856, and later it was restructured to become an Ottoman Shahani
Bank in 1863) and the Ottoman Stock Exchange (1866). Bank Street
continued to be Istanbul's core financial area until the 1990s,by the time
banks in Turkey started to settle their headquarters in the central business
districts of Levant and Maslak. Istanbul Stock Exchange moved to its current
building in it stiny neighbourhood in 1995. Moreover, Istanbul Gold Exchange
was established in 1995. The capital market exchange, on which Turkish
companies are listed, was worth $ 171,765,000,000 in 2016, according to the
CEIC (2018). The ISE is today called Borsa Istanbul.
Since 2003, the rate of inflation has decreased to single digits, and the
economy showed an average growth of 7.8 per cent between 2002 and
2005. The fiscal deficit (albeit in small amounts) is settled from the
privatization of major industries. Exchange became under pressure that
started in October 2008 after Turkish exchange authorities warned state
banks against withdrawing loans from the greater institutions of financial
sectors.
In recent years, chronic high rate of inflation has been taken into control and
this has resulted in the introduction of a new currency, the “New Turkish
Lira”, on January 1, 2005, to support economic reforms and erase scenes of
the unstable economy. On January 1, 2009, the name "New Turkish Lira"
was changed to "Turkish Lira", with the launch of new banknotes and
currencies (Trading Economics, 2018).
On June 28, 2019, Qatar withdrew investments of $ 4.6 billion from the
Istanbul Stock Exchange, in the first five months of this year, according to the

40
Turkish Central Depository of Securities. On the other hand, the Turkish
banking authorities agreed today that Emirates Bank would acquire Turkish
Deniz Bank for approximately $ 3.2 billion, which it had bought from Sber
bank, the largest Russian bank.
In the middle of 1980s, ISE began to emerge in Turkey. In spite of all the
developments in the country and the market, the listed companies worked
under a remarkably different regulatory setting till early 2000s. Then, the
stock market is united with the Istanbul Gold Exchange and the Turkish
Derivatives Exchange. They, then, together formed Borsa Istanbul, which is
denoted by BIST. The shares of this market are owned by the local
government by 49 per cent. Borsa Istanbul is currently the lone exchange
market throughout the country. Consequently, it characterizes the complete
financial market size for Turkey. The financial industry in Turkey has rapidly
grown with regard to asset size over the last decade, according to the Turkey
financial services report (2019). Figure 3.2 presents assets size of financial
sector in Turkey in billions of Turkish Lira.
Figure 3.2: Asset size of Turkey’s financial industry
Source: Turkey Financial Services (2019)
41
It seems that financial services in Turkey deliver significant opportunities to
boost growth in Turkey. The regulatory changes and structural renewal
applied by the government of Turkey over the past two decades brought
about enhancement to financial sector which supported the country during
global financial and economic crisis in 2009.These modification sled to
development of investor confidence. As a result, it caused the investment in
the country to increase in the financial sector by more than $50 billion over
the past fifteen years. The Turkish financial industry is largely (around 70 per
cent) is dominated by services of banking, as it is clearly observed from
figure 3.2. Nevertheless, there are significant developments of insurance
services and other financial activities over the same period alongside the
banking services. Currently, there are fifty three (53) banks operating in
Turkey with $550 billion in 2018 (see table 3.1 for more details).
3.2.3 Turkish banking sector
The Central Bank of the Republic of Turkey
(TürkiyeCumhuriyetMerkezBankası) was established in 1930, as a private
joint stock firm. The bank has the only right to issue banknotes. Moreover, it
has there sponsibility to supply the monetary necessities of the commercial
and agricultural bodies of the state. The total foreign exchange transfers are
monopolized by the Central Bank of Turkey.
In the late of 1990s, there were 72 banks operating in Turkey. In late 2000
and early 2001, the increasing trade deficit and the growing weakness of the
banking sector leaped the economy of the country into crisis. Furthermore,
there was a depression followed by a pound float. This financial breakdown
has reduced the number of banks in the country to only 31 banks, have of
the size in late of 1990s. Presently, more than 34 per cent of the assets are
concentrated in Ziraat Bank, YapiKredi Bank, Garanti Bank, Turkey IS Bank
and AK Bank and Halk Bank. The five major government-owned banks were
restructured in 2001. Political participation was reduced and lending policies
changed. There are also branches in Turkey for many foreign banks. There
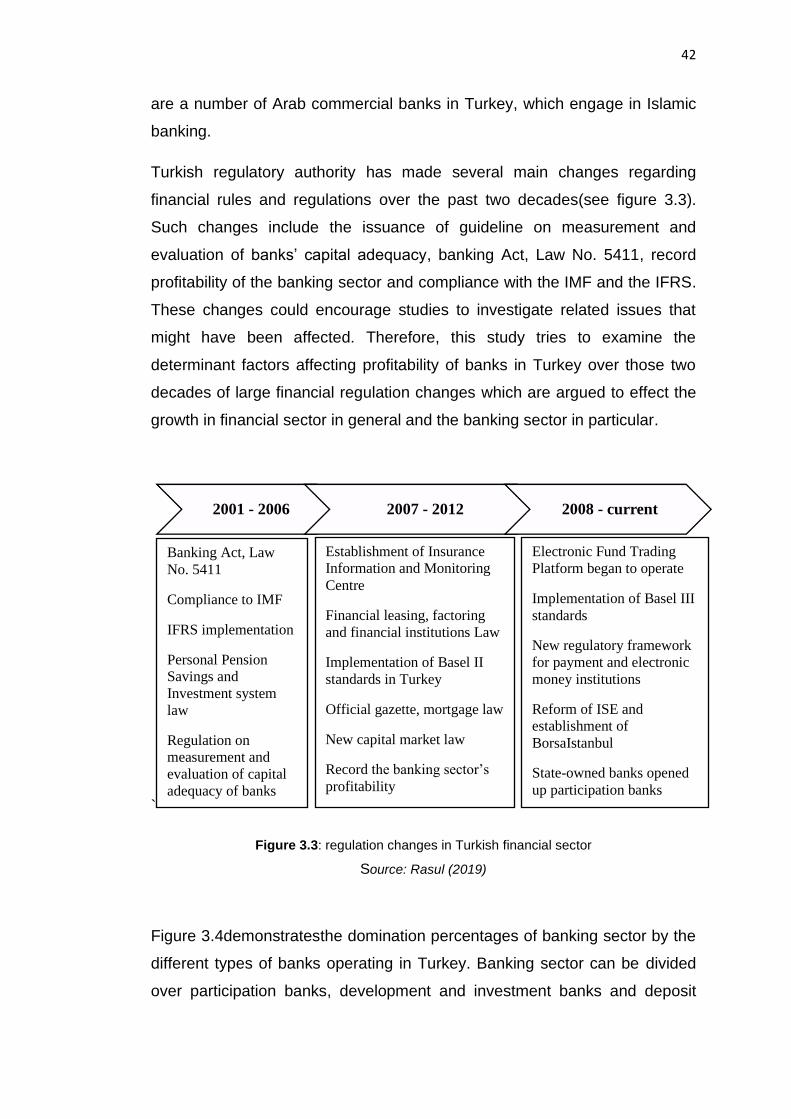
42
are a number of Arab commercial banks in Turkey, which engage in Islamic
banking.
Turkish regulatory authority has made several main changes regarding
financial rules and regulations over the past two decades(see figure 3.3).
Such changes include the issuance of guideline on measurement and
evaluation of banks’ capital adequacy, banking Act, Law No. 5411, record
profitability of the banking sector and compliance with the IMF and the IFRS.
These changes could encourage studies to investigate related issues that
might have been affected. Therefore, this study tries to examine the
determinant factors affecting profitability of banks in Turkey over those two
decades of large financial regulation changes which are argued to effect the
growth in financial sector in general and the banking sector in particular.
`
Figure 3.3: regulation changes in Turkish financial sector
Source: Rasul (2019)
Figure 3.4demonstratesthe domination percentages of banking sector by the
different types of banks operating in Turkey. Banking sector can be divided
over participation banks, development and investment banks and deposit
2001 - 2006 2007 - 2012 2008 - current
Electronic Fund Trading
Platform began to operate
Implementation of Basel III
standards
New regulatory framework
for payment and electronic
money institutions
Reform of ISE and
establishment of
BorsaIstanbul
State-owned banks opened
up participation banks
Establishment of Insurance
Information and Monitoring
Centre
Financial leasing, factoring
and financial institutions Law
Implementation of Basel II
standards in Turkey
Official gazette, mortgage law
New capital market law
Record the banking sector’s
profitability
Banking Act, Law
No. 5411
Compliance to IMF
IFRS implementation
Personal Pension
Savings and
Investment system
law
Regulation on
measurement and
evaluation of capital
adequacy of banks

43
banks. As the information from figure 3.4 shows, deposit bank controls 65%
of the whole banking sector services in Turkey.
Figure 3.4:Turkish banking sector distribution
Source: Turkey Financial Services (2019)
Out of the 53 banks in Turkey, 21 of them considerably hold foreign
investment by around 30 per cent. This factor can identify some aspects
such as profitability very important to both management and shareholders.
Since shareholders and investors of different financial experiences have a
tendency to possess dissimilar standpoints with regard to financial policies
and analysis. The largest banks operating in Turkey in accordance to their
book value of total assets are the banks ofZirrat, Turkiye IS, Garanti, Ak and
Halk. Together, these largest five banks capitali zearound 50% of the entire
assets of the whole Turkish banking sector (see figure 3.5).
Figure 3.5:Total assets size of banking sector in Turkey
Source: Turkey Financial Services (2019)
65%
25%
10%Deposit Banks
Investment and Development
Banks
Participation Banks
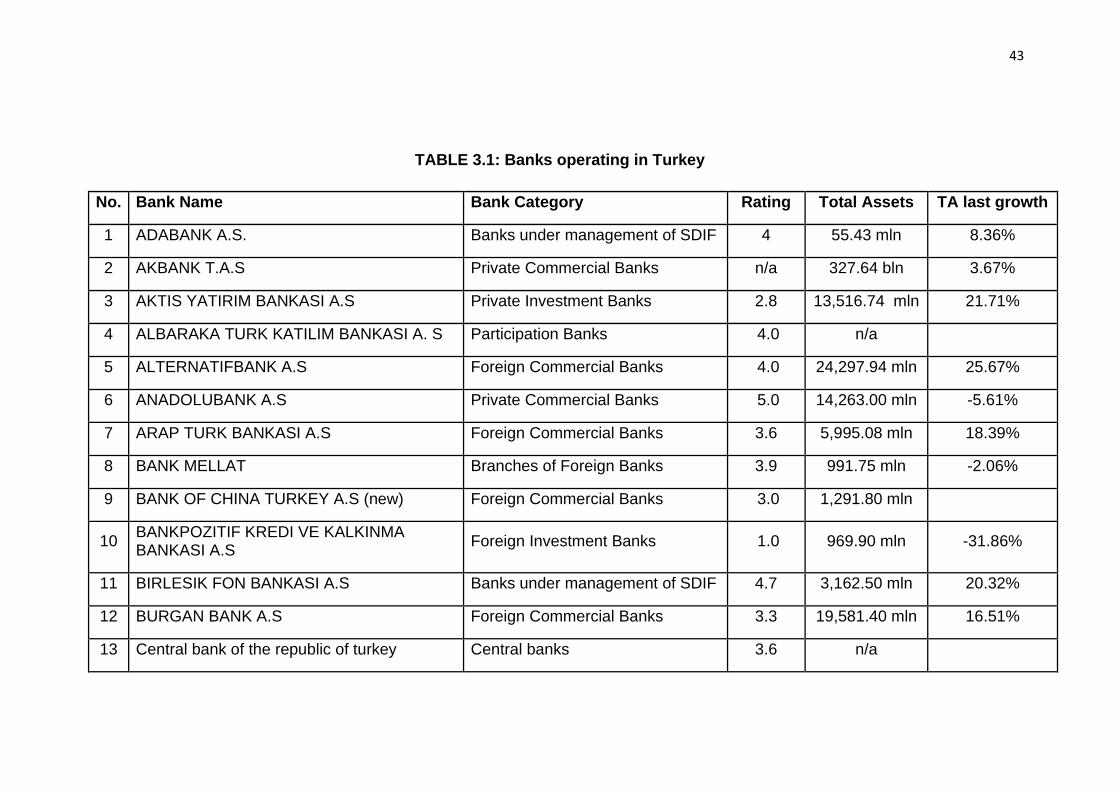
43
TABLE 3.1: Banks operating in Turkey
No. Bank Name Bank Category Rating Total Assets TA last growth
1 ADABANK A.S. Banks under management of SDIF 4 55.43 mln 8.36%
2 AKBANK T.A.S Private Commercial Banks n/a 327.64 bln 3.67%
3 AKTIS YATIRIM BANKASI A.S Private Investment Banks 2.8 13,516.74 mln 21.71%
4 ALBARAKA TURK KATILIM BANKASI A. S Participation Banks 4.0 n/a
5 ALTERNATIFBANK A.S Foreign Commercial Banks 4.0 24,297.94 mln 25.67%
6 ANADOLUBANK A.S Private Commercial Banks 5.0 14,263.00 mln -5.61%
7 ARAP TURK BANKASI A.S Foreign Commercial Banks 3.6 5,995.08 mln 18.39%
8 BANK MELLAT Branches of Foreign Banks 3.9 991.75 mln -2.06%
9 BANK OF CHINA TURKEY A.S (new) Foreign Commercial Banks 3.0 1,291.80 mln
10 BANKPOZITIF KREDI VE KALKINMA BANKASI A.S
Foreign Investment Banks 1.0 969.90 mln -31.86%
11 BIRLESIK FON BANKASI A.S Banks under management of SDIF 4.7 3,162.50 mln 20.32%
12 BURGAN BANK A.S Foreign Commercial Banks 3.3 19,581.40 mln 16.51%
13 Central bank of the republic of turkey Central banks 3.6 n/a
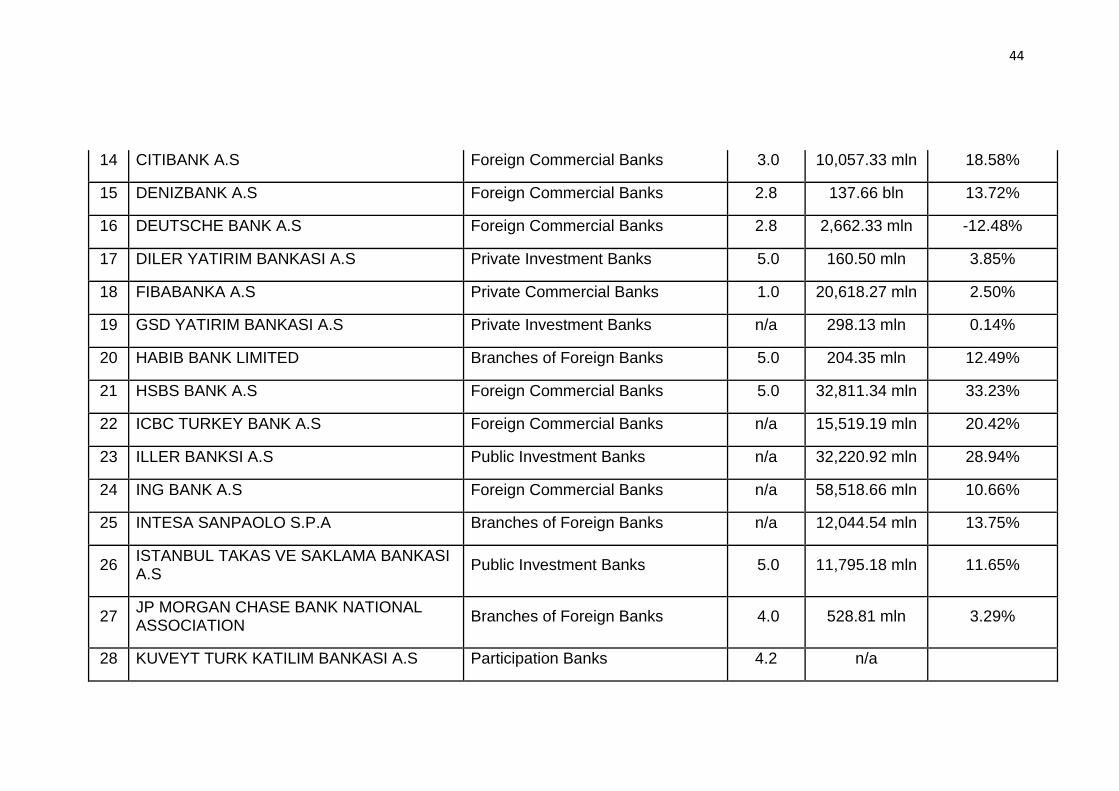
44
14 CITIBANK A.S Foreign Commercial Banks 3.0 10,057.33 mln 18.58%
15 DENIZBANK A.S Foreign Commercial Banks 2.8 137.66 bln 13.72%
16 DEUTSCHE BANK A.S Foreign Commercial Banks 2.8 2,662.33 mln -12.48%
17 DILER YATIRIM BANKASI A.S Private Investment Banks 5.0 160.50 mln 3.85%
18 FIBABANKA A.S Private Commercial Banks 1.0 20,618.27 mln 2.50%
19 GSD YATIRIM BANKASI A.S Private Investment Banks n/a 298.13 mln 0.14%
20 HABIB BANK LIMITED Branches of Foreign Banks 5.0 204.35 mln 12.49%
21 HSBS BANK A.S Foreign Commercial Banks 5.0 32,811.34 mln 33.23%
22 ICBC TURKEY BANK A.S Foreign Commercial Banks n/a 15,519.19 mln 20.42%
23 ILLER BANKSI A.S Public Investment Banks n/a 32,220.92 mln 28.94%
24 ING BANK A.S Foreign Commercial Banks n/a 58,518.66 mln 10.66%
25 INTESA SANPAOLO S.P.A Branches of Foreign Banks n/a 12,044.54 mln 13.75%
26 ISTANBUL TAKAS VE SAKLAMA BANKASI A.S
Public Investment Banks 5.0 11,795.18 mln 11.65%
27 JP MORGAN CHASE BANK NATIONAL ASSOCIATION
Branches of Foreign Banks 4.0 528.81 mln 3.29%
28 KUVEYT TURK KATILIM BANKASI A.S Participation Banks 4.2 n/a
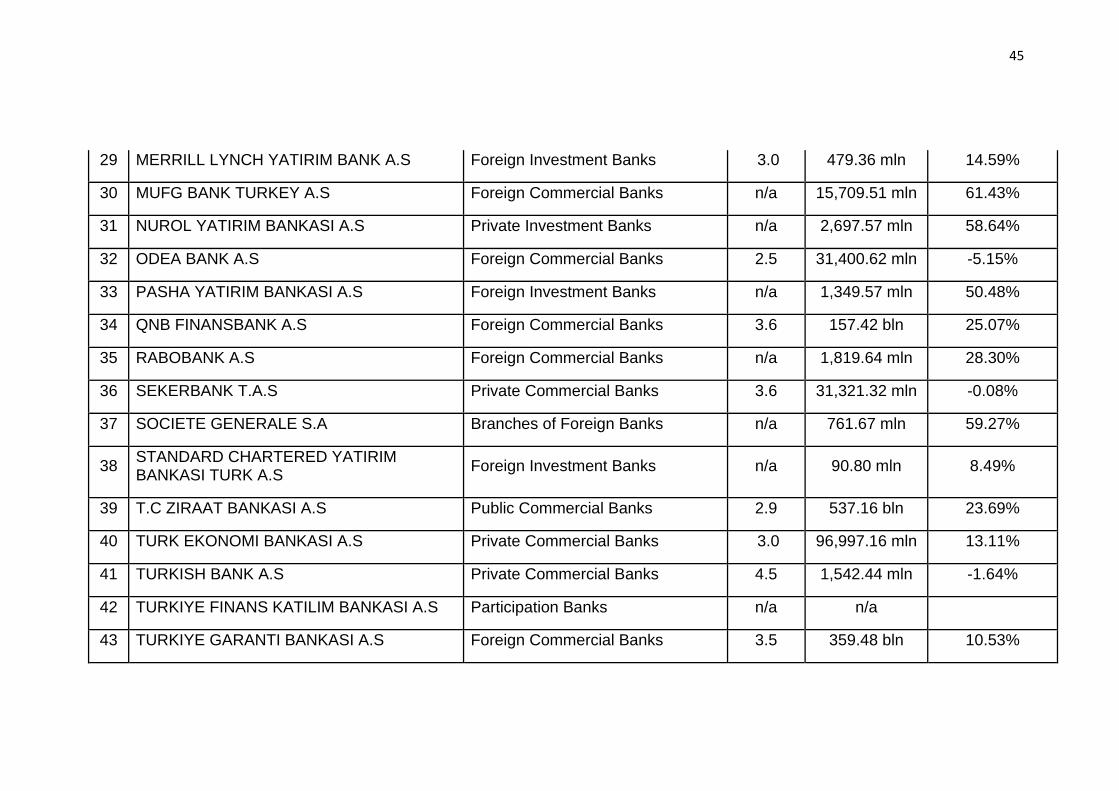
45
29 MERRILL LYNCH YATIRIM BANK A.S Foreign Investment Banks 3.0 479.36 mln 14.59%
30 MUFG BANK TURKEY A.S Foreign Commercial Banks n/a 15,709.51 mln 61.43%
31 NUROL YATIRIM BANKASI A.S Private Investment Banks n/a 2,697.57 mln 58.64%
32 ODEA BANK A.S Foreign Commercial Banks 2.5 31,400.62 mln -5.15%
33 PASHA YATIRIM BANKASI A.S Foreign Investment Banks n/a 1,349.57 mln 50.48%
34 QNB FINANSBANK A.S Foreign Commercial Banks 3.6 157.42 bln 25.07%
35 RABOBANK A.S Foreign Commercial Banks n/a 1,819.64 mln 28.30%
36 SEKERBANK T.A.S Private Commercial Banks 3.6 31,321.32 mln -0.08%
37 SOCIETE GENERALE S.A Branches of Foreign Banks n/a 761.67 mln 59.27%
38 STANDARD CHARTERED YATIRIM BANKASI TURK A.S
Foreign Investment Banks n/a 90.80 mln 8.49%
39 T.C ZIRAAT BANKASI A.S Public Commercial Banks 2.9 537.16 bln 23.69%
40 TURK EKONOMI BANKASI A.S Private Commercial Banks 3.0 96,997.16 mln 13.11%
41 TURKISH BANK A.S Private Commercial Banks 4.5 1,542.44 mln -1.64%
42 TURKIYE FINANS KATILIM BANKASI A.S Participation Banks n/a n/a
43 TURKIYE GARANTI BANKASI A.S Foreign Commercial Banks 3.5 359.48 bln 10.53%

46
44 TURKIYE HALK BANKASI Public Commercial Banks 5.0 378.42 bln 23.93%
45 TURKIYE IHRACAT KREDI BANKASI Public Investment Banks 4.7 139.43 bln 63.31%
46 TURKIYE IS BANKASI Private Commercial Banks 3.2 416.39 bln 14.91%
47 TURKIYE KALKINMA BANKASI Public Investment Banks 4.5 15,714.81 mln 74.94%
48 TURKIYE SINAI KALKINMA BANKASI Private Investment Banks 4.0 38,298.11 mln 32.47%
49 TURKIYE VAKIFLAR BANKASI T.A.O Public Commercial Banks n/a 331.36 bln 22.46%
50 TURKLAND BANK A.S Foreign Commercial Banks 3.0 3,624.39 mln -25.66%
51 VAKIF KATILIM BANKASI A.S Public Participation Banks 1.0 n/a
52 YAPI VE KREDI BANKASI A.S Private Commercial Banks 2.9 348.04 bln 16.87%
53 ZIRAAT KATILIM BANKASI A.S Public Participation Banks 3.9 n/a
47
3.3. Variable construction and Research model
3.3.1 Dependent variables
Profitability ratios are the dependent variable of this study. The profitability
index is an essential goal for all banks and is essential for its survival and
sustainability and an objective that investors aspire to. The index is of
interest to creditors when dealing with the bank, and it is also an important
tool for measuring management efficiency in using available resources.
Garcia and Guerreiro (2016) define them as ratios that give indicators of the
bank's ability to generate income from the resources available to it. The
profitability index is the measure of a company's investment, operating, and
financing management policies and decisions. It reflects the overall
performance of the company, unifies the effect of most management
decisions and it examines the firm’s capability to generate profits from sales,
assets and equity (Li, 2007). Therefore, the profitability ratios are one of the
most difficult directions for the bank as a concept and measurement,
because there is no integrated method that determines when the bank is in a
profitable position, as many investment opportunities include sacrificing the
current profit in order to obtain greater profit in the future. For example, the
new service requires high administrative costs, which initially creates a low
profit, so the current profit becomes weak, but this may mean higher levels of
profitability in the future. The most commonly use dratios of profitability in the
literature are ROA and ROE.
- Return on assets (ROA):
It is a financial indicator that reveals the bank’s ability to achieve profits by
investing in its assets. It depends to a large extent on the amount of profits
realized from these assets and is also called return on investment because it
is a measure of the profitability of all the bank's short and long-term
investments (Jabbar, 2014). It also reflects the efficiency and effectiveness of
management in operating the assets and gives confidence in managing the
funds and the integrity of investment and operational decisions

48
taken(Kosmidou, 2008). This indicator is calculated by dividing the net profit
into total assets. ROA is calculated through the following equation:
Return on Aseets =𝑁𝑒𝑡 𝐼𝑛𝑐𝑜𝑚𝑒
𝑇𝑜𝑡𝑎𝑙 𝐴𝑠𝑠𝑒𝑡𝑠∗ 100
- Return on Equity (ROE):
This indicator receives a lot of interest from the bank’s management, as it
measures the extent to which the banks seek to achieve the rate of return on
the funds invested by the owners, which is the criterion for maximizing their
wealth. Moreover, it is a specific indicator of growth and development. On the
other hand, this high percentage indicates the efficiency of the bank's
management (Lombardo and Pagano, 2006; Obamuyi, 2013). At the same
time, it indicates the high risk resulting from the increase in the leverage (the
bank’s degree of borrowing dependence), and its decline indicates the
bank’s conservative financing of loans, measured by applying the following
formula:
Return on Equity =𝑁𝑒𝑡 𝐼𝑛𝑐𝑜𝑚𝑒
𝑇𝑜𝑡𝑎𝑙 𝐸𝑞𝑢𝑖𝑡𝑦∗ 100
- Earnings per Share (EPS):
EPS is a common measure used to analyse a firm’s profitability and evaluate
its performance, as it is employed to compare that with the firm itself over
sequential periods of time. Furthermore, analysts utilise the ratio of earnings
per share to compare the firm's profitability and performance with
comparable firms operating in the same sector during the same fiscal period.
The earnings per share are calculated and displayed for companies whose
shares are offered for public subscription and trading in the financial market
or that are planning to offer shares for public subscription. Earnings per

49
share generally represent the average common share of a company’s net
profit from continuing activity after interest and taxes. Earnings per share is
extracted by dividing the company's net profits from the continuing activity
after subtracting all expenses, including interest, taxes, minority share of the
profits, and preference shares from the profits by the number of ordinary
shares issued and traded by the company (Kumar and Venoor, 2018). EPS
is calculated through the following equation:
Earnings per share =𝑁𝑒𝑡 𝐼𝑛𝑐𝑜𝑚𝑒 − 𝑃𝑟𝑒𝑓𝑒𝑟𝑟𝑒𝑑 𝐷𝑖𝑣𝑖𝑑𝑒𝑛𝑑𝑠
𝐶𝑜𝑚𝑚𝑜𝑛 𝑠ℎ𝑎𝑟𝑒𝑠 𝑜𝑢𝑡𝑠𝑡𝑎𝑛𝑑𝑖𝑛𝑔
3.3.2 Independent variables
Through reviewing a number of literatures, it was observed that researchers
identified several common determinants which could affect banks’
profitability. There are internal factors that the bank can control them since
they have potential to influence its profitability. Summarizing the outcomes
from several empirical studies, bank specific financial ratios representing
financial leverage, capital adequacy, cost efficiency, asset structure, asset
quality, and bank size are commonly studied internal variables. There fore,
this current study included the following bank-specific factors in order to
capture the determinants of profitability of banks listed in Turkey:
- Bank size
The size of the bank is usually measured by the amount of assets the bank
owns or the amount of ownership it owns (Kumar andKaur, 2016). The larger
the size of the bank measured by the assets leads to a decrease in the rate
of return on the assets. This rate is large in small banks, compared to large
banks, but it is noted that the volume of deposits in large banks is greater
than small banks. This means that the degree of leverage is greater which
can increase the rate of return on shareholders’ equity. Then, that increasing

50
the size of the assets of commercial banks increases their ability to invest, it
is always expected that increasing the assets of the bank will lead to an
increase in their profitability, according to the relative efficiency hypothesis.
In the case of measuring the size of the bank with its ownership rights (paid
up capital, reserves, and profits not distributed), we find that the banks have
significant ownership rights. The funds available to it are greater and its
ability to invest these funds is wider, and increasing ownership rights
increases the confidence of its customers, which may be reflected in the size
of customer deposits with them and thus increase the leverage that in turn
maximizes the rate of return on equity (Dogan, 2013; Petria et al., 2015).
- Capital adequacy
The ratio of equity to total assets is commonly used in the literature to
measure capital strength. This ratio is likely to have a negative relationship
with the need for external fun and therefore it results in increase profitability
of the banks (Gueyie et al., 2019). The concept of capital adequacy
describes the association between the sources of funds in a bank and the
risks associated to them. Capital adequacy is considered as one of the most
vital tools used to identify the solvency of a bank and the ability to withstand
possible losses or liquidation. Where the lower the probability of the bank's
insolvency, the higher its financial solvency accordingly, and vice versa from
that is true. The higher the probability of the bank's insolvency, the lower is
its solvency (Posner, 2015).
- Leverage
There are several common ratios used in the literature to present financial
leverage including total liabilities to total debt ratio, long-term debt ratio,
short-term debt ratio, equity multiplier. Following Abubakar (2015), this study
uses total debt ratio which is calculated through total liabilities to total assets.
This ratio is likely to have positive impact on profitability because banks
avoid high taxation through high borrowing (Afolabi et al., 2019). In other

51
words, banks tend to rely on external fund particularly on debt to fund their
sources in order to take advantage of tax shield. Thus, the higher the total
debt ratio, the higher is the profitability of the banks.
- Asset structure
This study investigates the impact of asset structure on the profitability of
banks. We measure asset structure by total loans to total assets, following
Umbarwati and Fachrurrozie (2018). Firm asset structure plays an important
role in determining the financial structure of the company. The high value of
tangible assets gives a signal for a high value of assets of the firm as price of
filtering. Firms with large investment in tangible assets have a higher debt
ratio than firms that do not use tangible assets. Moreover, firms with high
level of tangible assets would have higher opportunity to borrow with lower
rate of interest because the tangible assets are seen as guarantee for repay
the debt.
- Asset Quality
Total loans to total assets ratio is used in this study to present the asset
quality, following Sunet al. (2017). The ratio of asset quality is likely to
positively influence the profitability of the bank because loan isconsidered
asone of the key source of banks’ income. This is true unless a bank
burdens an intolerable amount of risk. In general, the degree of reliability of
capital ratios depends on the degree of reliability of asset quality and quality
indicators. The insolvency risks in financial institutions mostly come from the
quality of assets and the difficulty in liquidating them, hence the importance
of monitoring indicators that indicate the quality of assets. Asset quality
indicators must take into account credit risk involved in budgetary operations
such as agencies, mortgages and derivative trading (Kadioglu et al., 2017).
52
- Financial structure
To capture the influence of financial structure on profitability of banks, this
study used the ratio of total deposits to total liabilities, consistent with
Molinari et al. (2017).The issue of financing structure is one of the important
topics in the field of financial management, which has gained importance
through its impact and its link with the objectives of financial management
related to maximizing profit and maximizing the wealth of owners, which is
the goal that most companies seek to achieve. Any increase in the level of
debt causes an increase in bankruptcy, financial problems, and agency
costs. Thus, profitability and the value of the company decrease. Therefore,
it is possible to determine an optimal capital structure through a balance
between tax benefits, bankruptcy costs and financial crises.
Safe companies with tangible assets and tax savings have high target ratios
to a certain extent. As for the companies that are exposed to risk, and their
assets are intangible, their initial financing is from the right of ownership.
There are a lot of profitable companies that prefer little debt. However,
according to the expectations of the trade-off theory as companies with high
profits, their borrowing capacity is high, and they have large tax savings, so
the debt ratio should be high(KetyenyaandMwaura, 2017).
- Dividend policy
Dividend payout ratio is also one of the factors studied in the literature to
have influence on profitability (Sattar et al., 2017). Based on the agency
theory dividend payout ratio can affect profitability since less cash available
for managers would pressure them to invest in high profitable investment and
projects. On the other hand, when there is excess cash in the firm, agents
invest in low and negative net present value projects. Thus, profitability of
those firms would decline. This all can be explicated through the agency
theory which explains the conflict of interest between shareholders and
managers (Yusuf, 2018).
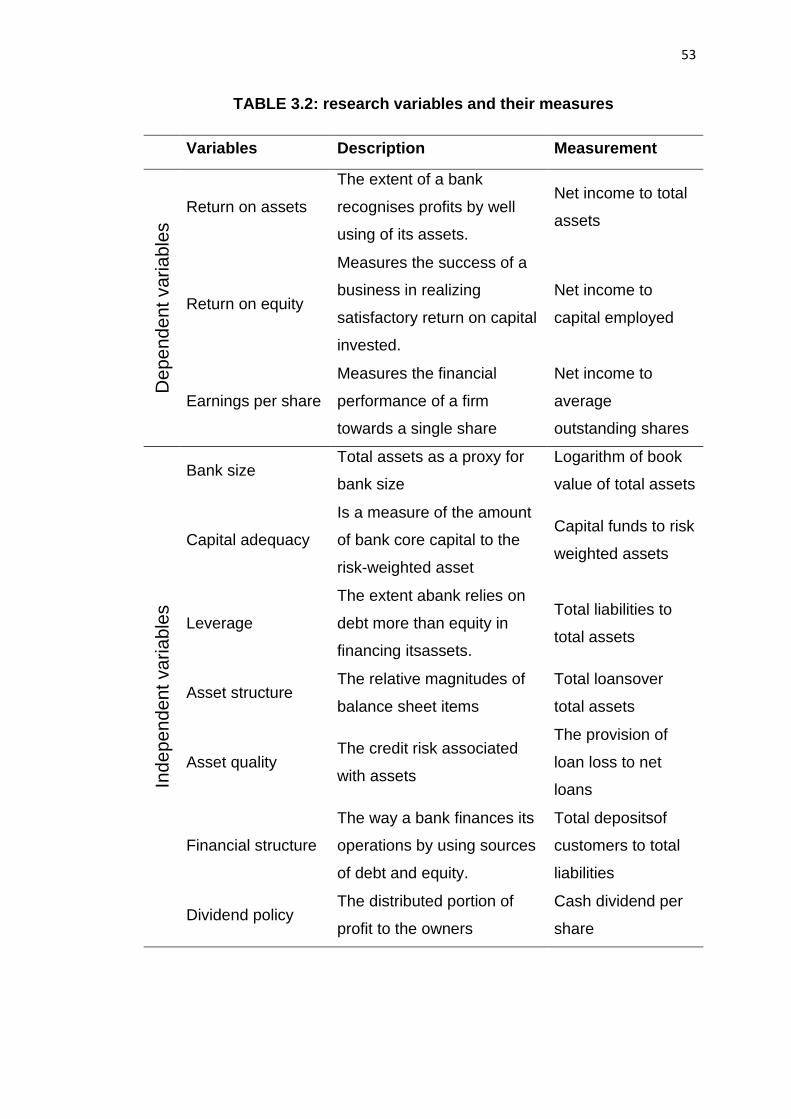
53
TABLE 3.2: research variables and their measures
Variables Description Measurement D
ep
en
de
nt varia
ble
s
Return on assets
The extent of a bank
recognises profits by well
using of its assets.
Net income to total
assets
Return on equity
Measures the success of a
business in realizing
satisfactory return on capital
invested.
Net income to
capital employed
Earnings per share
Measures the financial
performance of a firm
towards a single share
Net income to
average
outstanding shares
Ind
ep
en
den
t va
ria
ble
s
Bank size Total assets as a proxy for
bank size
Logarithm of book
value of total assets
Capital adequacy
Is a measure of the amount
of bank core capital to the
risk-weighted asset
Capital funds to risk
weighted assets
Leverage
The extent abank relies on
debt more than equity in
financing itsassets.
Total liabilities to
total assets
Asset structure The relative magnitudes of
balance sheet items
Total loansover
total assets
Asset quality The credit risk associated
with assets
The provision of
loan loss to net
loans
Financial structure
The way a bank finances its
operations by using sources
of debt and equity.
Total depositsof
customers to total
liabilities
Dividend policy The distributed portion of
profit to the owners
Cash dividend per
share
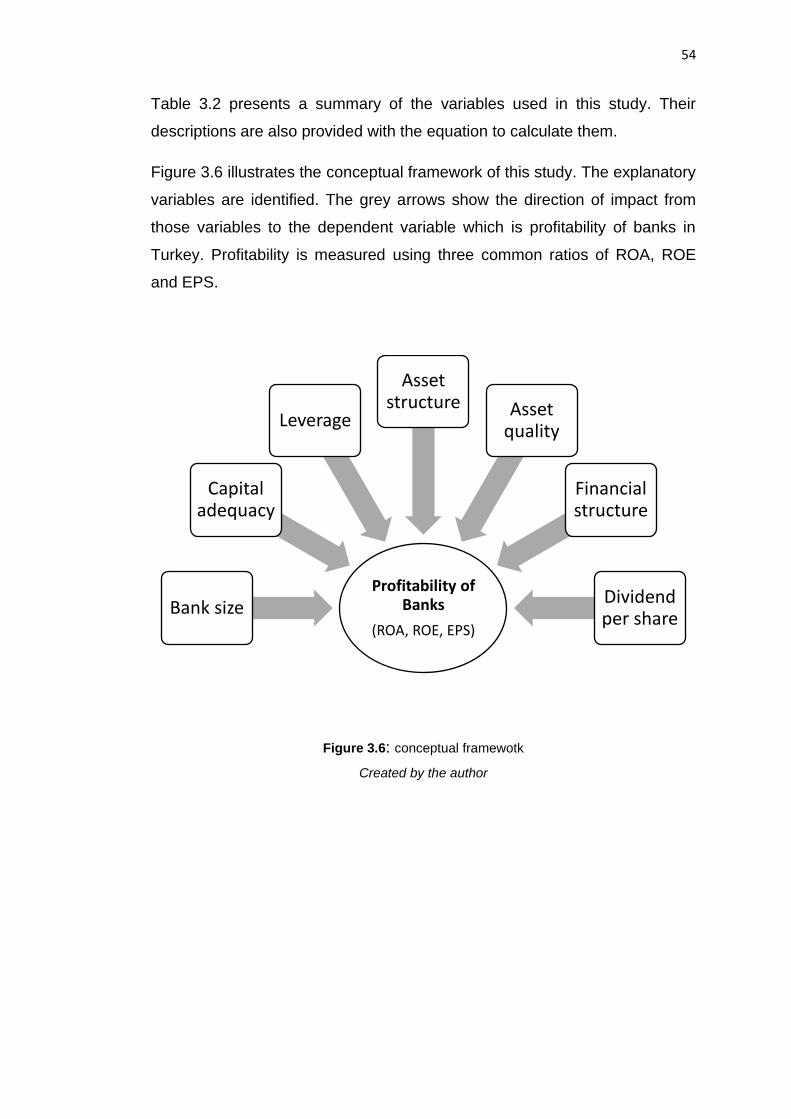
54
Table 3.2 presents a summary of the variables used in this study. Their
descriptions are also provided with the equation to calculate them.
Figure 3.6 illustrates the conceptual framework of this study. The explanatory
variables are identified. The grey arrows show the direction of impact from
those variables to the dependent variable which is profitability of banks in
Turkey. Profitability is measured using three common ratios of ROA, ROE
and EPS.
Figure 3.6: conceptual framewotk
Created by the author
Profitability of Banks
(ROA, ROE, EPS)
Bank size
Capital adequacy
Leverage
Asset structure Asset
quality
Financial structure
Dividend per share

55
3.4. Research model
To examine the determinants of the profitability of the listed banks in Turkey,
the above variables (table 3.2) included in this study, three of them were the
dependent and the others were as independent variables. Based on the
defined variables, we can build and specify our research model according to
the following models:
𝑷𝑹𝑶𝑭 = 𝒇(𝑿𝒔) (3.1)
PROF is the profitability of the banks listed on Borsa Istanbul;we measure
profitability by return on assets (ROA), return on equity (ROE) and earnings
per share (EPS); these variables are seperately the function of a number of
variables (denoted as Xs);Xs are several firm-specific variables including
bank size, capital adequacy, leverage, asset structure, asset quality, financial
structure and dividend payout ratio. Thus, equation 3.1 can be written as
follow:
𝑷𝑹𝑶𝑭 = 𝒇(𝑺𝑰𝒁, 𝑪𝑨, 𝑳𝑬𝑽, 𝑨𝑺, 𝑨𝑸 , 𝑭𝑺, 𝑫𝑰𝑽) (3.2)
SIZ is bank size measured by the logarithm of total assets, CA is capital
adequacy measured by capital funds to risk weighted assets, LEV is financial
leverage measured by the ratio of total liabilities to total assets, AS is asset
structure measured by total loans to total assets ratio, AQ is asset quality
measured by the ratio of loan loss provisions to net loans, FS is financial
structure measured by customer deposits to total liabilities ratio, and DIV is
dividend payout ratio to measure dividend policy of banks measured by cash
dividend per share.
The model, then, can be presented in an econometrics form in order to
control for the coefficients of each explanatory variables used in the study. In
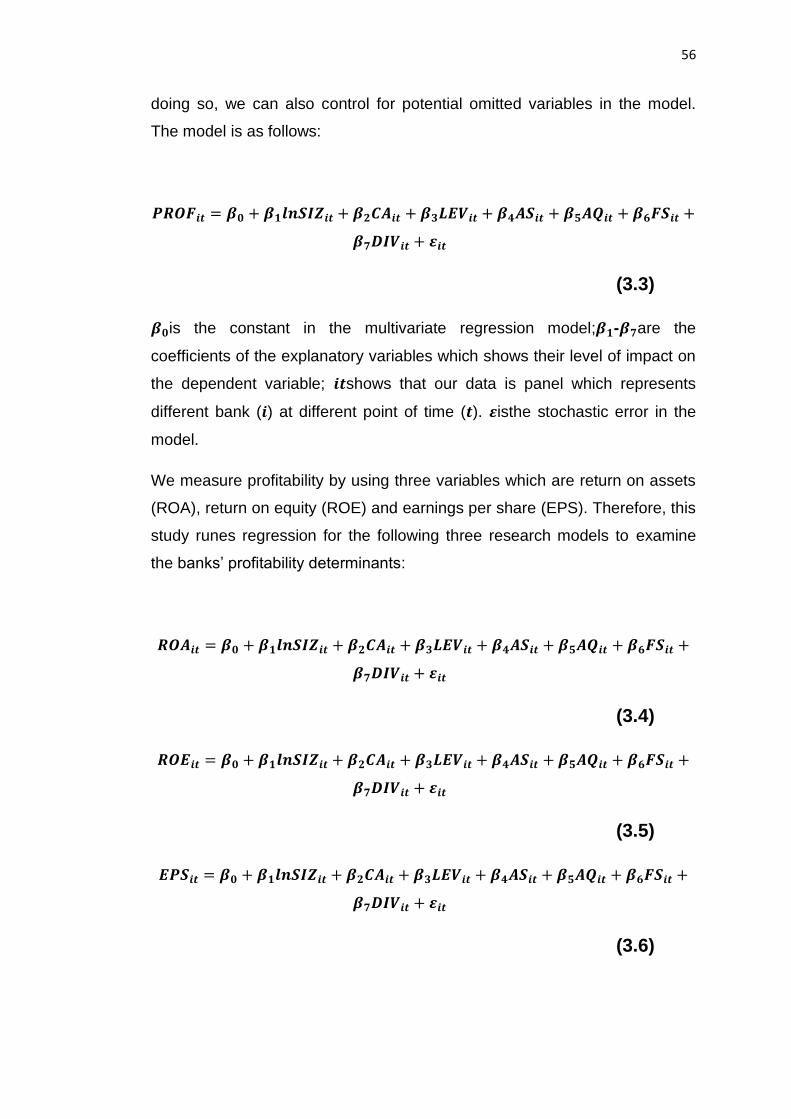
56
doing so, we can also control for potential omitted variables in the model.
The model is as follows:
𝑷𝑹𝑶𝑭𝒊𝒕 = 𝜷𝟎 + 𝜷𝟏𝒍𝒏𝑺𝑰𝒁𝒊𝒕 + 𝜷𝟐𝑪𝑨𝒊𝒕 + 𝜷𝟑𝑳𝑬𝑽𝒊𝒕 + 𝜷𝟒𝑨𝑺𝒊𝒕 + 𝜷𝟓𝑨𝑸𝒊𝒕 + 𝜷𝟔𝑭𝑺𝒊𝒕 +
𝜷𝟕𝑫𝑰𝑽𝒊𝒕 + 𝜺𝒊𝒕
(3.3)
𝜷𝟎is the constant in the multivariate regression model;𝜷𝟏-𝜷𝟕are the
coefficients of the explanatory variables which shows their level of impact on
the dependent variable; 𝒊𝒕shows that our data is panel which represents
different bank (𝒊) at different point of time (𝒕). 𝜺isthe stochastic error in the
model.
We measure profitability by using three variables which are return on assets
(ROA), return on equity (ROE) and earnings per share (EPS). Therefore, this
study runes regression for the following three research models to examine
the banks’ profitability determinants:
𝑹𝑶𝑨𝒊𝒕 = 𝜷𝟎 + 𝜷𝟏𝒍𝒏𝑺𝑰𝒁𝒊𝒕 + 𝜷𝟐𝑪𝑨𝒊𝒕 + 𝜷𝟑𝑳𝑬𝑽𝒊𝒕 + 𝜷𝟒𝑨𝑺𝒊𝒕 + 𝜷𝟓𝑨𝑸𝒊𝒕 + 𝜷𝟔𝑭𝑺𝒊𝒕 +
𝜷𝟕𝑫𝑰𝑽𝒊𝒕 + 𝜺𝒊𝒕
(3.4)
𝑹𝑶𝑬𝒊𝒕 = 𝜷𝟎 + 𝜷𝟏𝒍𝒏𝑺𝑰𝒁𝒊𝒕 + 𝜷𝟐𝑪𝑨𝒊𝒕 + 𝜷𝟑𝑳𝑬𝑽𝒊𝒕 + 𝜷𝟒𝑨𝑺𝒊𝒕 + 𝜷𝟓𝑨𝑸𝒊𝒕 + 𝜷𝟔𝑭𝑺𝒊𝒕 +
𝜷𝟕𝑫𝑰𝑽𝒊𝒕 + 𝜺𝒊𝒕
(3.5)
𝑬𝑷𝑺𝒊𝒕 = 𝜷𝟎 + 𝜷𝟏𝒍𝒏𝑺𝑰𝒁𝒊𝒕 + 𝜷𝟐𝑪𝑨𝒊𝒕 + 𝜷𝟑𝑳𝑬𝑽𝒊𝒕 + 𝜷𝟒𝑨𝑺𝒊𝒕 + 𝜷𝟓𝑨𝑸𝒊𝒕 + 𝜷𝟔𝑭𝑺𝒊𝒕 +
𝜷𝟕𝑫𝑰𝑽𝒊𝒕 + 𝜺𝒊𝒕
(3.6)

57
Equation 3.4 examines the determinants of the profitability by using ROA
whereas equation 3.5 examines the determinants of the banks’ profitability
by using ROE. Furthermore, equation 3.6 examines the determinants of the
banks’ profitability by using EPS. The three measure of ROA, ROE and EPS
measure profitability of banks in Turkey from different perspectives.
3.5. Research design
This study uses an explanatory research design to investigate the variables
that can determine profitability of banks listed on Borsa Istanbul.Explanatory
approach of research is suitable to examine the relationships that involve a
number of variables (Brymanand Bell, 2015). In addition, this technique could
be employed for issues that have not been clearly defined (Saunders et al.,
2009). With regard to data, panel research design is implemented and with a
use of a number of practical variables simultaneously. Descriptive statistics
are used to show the patterns in the variables. Correlation coefficient is
utilised to show the associations between the pairs of the variables and to
check for the multi collinearity issue.Multiple linear regressions of pooled
ordinary least square (OLS), Random-Effect (RE) and Fixed-Effect (FE) are
performed to examine the influence of the independent variables on the three
dependent measures of profitability. Furthermore, related diagnostic tests will
be used.
3.6. Conclusion
This chapter was divided to six sections. Section 3.1 defined the study
sample and the method of data collection. Section 3.2 provided an overview
on the sample study. Section 3.3 described the research variables and
accordingly develops their proposed relationships with regard to the
variables determining profitability easements. Section 3.4 specified the
research models. Section 3.5 described and explained the research method
used to examine the suggested relationships of the research.
58
CHAPTER 4
DATA ANALYSIS
This chapter presents the analysis of the sample data of this study according
to different used tests in order to identify the nature and pattern of the data
and variables separately, to examine the potential relationships among the
employed variables and to recognize the directions of relationships and level
of impacts form the selected bank-specific characteristics to the profitability
ratios of those banks. Section 1 demonstrates an overview to the measures
of bank profitability and several chosen explanatory variables at the level of
bank via descriptive statistics and related diagram figures. Section 2
presents correlation coefficient to deliver an initial understanding about the
bivariate association of the variables. Section 3 shows and discusses the
results of used panel unit root test. Section4 illustrates the results of
regression models and interpretations of those results regarding the
determinant factors of banks profitability in Turkey during 1999-2018.
4.1. Descriptive statistics
It is worthy to check for the descriptive statistics which is used in our
research to understand the nature and the pattern in them. Table 4.1
provides some information with regard to descriptive statistics such as mean
value for the all used variables, standard deviations, range of the values by
minimum and maximum, and the probability of normality test of Jarque-Bera.
Mean values provide the average which is used to originate the central
tendency of the data in the variables individually.

59
TABLE 4.1: descriptive statistics
Variables Mean Maximum Minimum Std. Dev. Jarque-Bera p-value
ROA 2.653 12.480 -11.43 2.353 0.000
ROE 15.680 109.060 -181.12 23.667 0.000
EPS 0.353 2.4100 0.000 0.468 0.000
SIZ 17.164 20.027 12.477 1.687 0.000
CA 17.412 43.300 11.800 5.289 0.000
LEV 0.882 0.992 0.760 0.034 0.000
AS 0.624 0.986 0.252 0.137 0.000
AQ 0.013 0.132 -0.035 0.016 0.000
FS 0.600 0.929 0.000 0.231 0.000
DIV 7.066 95.420 0.000 13.403 0.000
The information presented in the above table provides information
concerning descriptive statistics. It is clearly observed that the mean values
of the three used measures of profitability are positive. Mean value of return
on assets is 2.65 with a range between -11 and +12. Mean value of return on
equity is 15.68 with a wide range of disperse and slightly high standard
deviation. Moreover, the mean value of earnings per share is 0.35 with a
relatively small standard deviation. As we can see the minimum value of EPS
is 0 which can claim the fact that none of the banks of our sample study
generated negative earnings per share during the studies period. These
positive mean values of profitability measures could indicate that the
profitability of banking sector in Turkey was, in general, positive.
The mean value of total assets is given in logarithm which is 17.16 with a law
standard deviation 1.69. There are both small and large banks included in
our sample, according to their total assets. The mean value of the ratio
60
capital funds to risk weighted assets (denote as CA) is 17.14, ranging
between 11.8 and 43.3. According to the employed ratio of financial
leverage, total liabilities to total assets, banks are highly levered with an
average of 88.16% of their operations are financed through debt. There are
banks in our sample that almost all of its assets are financed through debt,
99.2%. The minimum value of leverage in our sample observed is 0.76,
meaning that 76 per cent of the assets come from debt. The mean values of
asset structure and asset quality are 0.6 and 0.01 respectively. Asset
structure also confirms that debt contributes highly in assets generating of
the banks in Turkey. The mean value of asset quality states that the quality
of loans seems to be high in general. Financial structure ratio provides the
proportion of customer deposits in the total liability of a bank. The mean
value of this ratio is 59.98 which gives a signal that 60% of the total liabilities
of our sample bank is provided through the different types of deposits made
by customers. However, there are banks with zero per cent of this ratio.
Finally, the mean value of cash payout dividend per share is 7.07, ranging
from 0 minimum to 95.4 maximum.
4.2. Correlation coefficients
The bivariate correlation measures the relation between each pair of the
selected variables in this study. Using Pearson correlations coefficient, the
relationships between the variables and their levels of significance are given
in table 4.2. This test is performed for all the selected variables of our
research including dependent and explanatory variables. The importance of
this correlation analysis can be seen as to understand the relationship
between the pairs of the variables and to test for multi collinearity issue
among the explanatory variables. Correlation matrix is commonly used in the
literature to examine the nature of the association between two variables.
However, the direction of the impact cannot be identified by this analysis.
The values of the correlation matrix tend to be between +1 for perfect
positive association and -1 for perfect negative association.

61
TABLE 4.2: correlation coefficients between the variables
ROA ROE EPS SIZ CA LEV AS AQ FS DIV
ROA 1.00
ROE 0.76 1.00
0.00
EPS -0.05 0.06 1.00
0.37 0.25
SIZ -0.19 -0.05 0.58 1.00
0.00 0.29 0.00
CA 0.49 0.15 -0.25 -0.44 1.00
0.00 0.00 0.00 0.00
LEV -0.24 -0.09 0.12 0.13 -0.27 1.00
0.00 0.08 0.02 0.01 0.00
AS -0.03 -0.06 0.05 0.13 0.01 0.07 1.00
0.59 0.25 0.37 0.01 0.80 0.18
AQ -0.42 -0.38 -0.13 -0.05 -0.09 0.02 -0.15 1.00
0.00 0.00 0.01 0.34 0.09 0.70 0.00
FS -0.47 -0.06 0.19 0.17 -0.48 0.25 -0.23 0.20 1.00
0.00 0.23 0.00 0.00 0.00 0.00 0.00 0.00
DIV 0.06 0.09 0.37 0.30 -0.08 -0.26 -0.25 -0.03 0.15 1.00
0.21 0.08 0.00 0.00 0.13 0.00 0.00 0.58 0.00
The results of correlation coefficients, bold values, are shown in table
4.2.The italic values show the probability of the associations. The results
confirm that the relationships are moderate between the pairs of the
variables. However, the association between return on assets and return on
equity is strong and positive because the two measures provide the same
information, but from different perspective.
The correlation of size with both return on assets and return on equity are
negative, -0.19 and -0.05. These could indicate that smaller banks in size
can be more profitable or highly profitable banks prefer to hold fewer assets
62
but invest in highly profitable investment and projects. However, bank size
based on total assets is positively correlated to profitability measured by
earnings per share 0.58.
The explanatory variables of leverage, asset structure, assets quality and
financial structure tend to have negative correlations with the two measures
of ROA and ROE, but with different level of associations. Dividend per share
is weakly and positively correlated to all the three measures of profitability,
0.06, 0.09 and 0.37 respectively. Capital adequacy is also positively
correlated to return on assets and return on equity, 0.49 and 0.15
respectively, whereas it is negatively correlated with earnings per share
(EPS) -0.25.
The correlation between financial structure and asset quality, -0.48, is
negative and statistically significant at the level of 1%. Nevertheless, financial
structure is positively correlated with assets structure with 0.25 and it is also
statistically significant at the 1% level of significance. Dividend per share is
negatively correlated to capital adequacy, financial leverage, asset structure,
and asset quality while it is positively correlated to financial structure.
4.3. Panel unit root test
Since the variables used in this study possess panel characteristic, we shall
check for unit root of the variables we employ in this research. Having unit
root condition in the mean of variable is commonly observable for financial
panel data (Rasul, 2019). The condition of having unit root in data could
bring about bias to the results of the study. Therefore, it is recommended to
conduct some panel unit root tests before selecting and performing any
regression models. Otherwise, the results are misled and biased. Non-
stationary data can be converted into stationary data through methods such
as differencing. Additionally, the tests of unit root can help with the selection
of an appropriate regression method that suits the data.
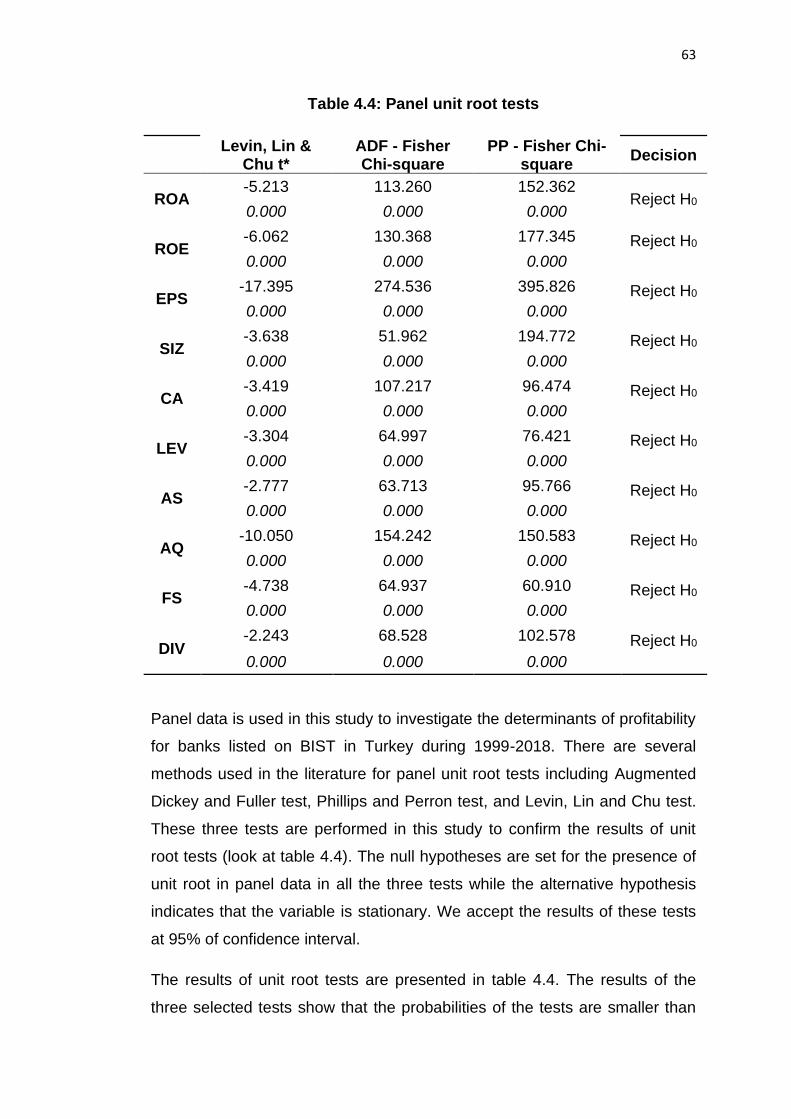
63
Table 4.4: Panel unit root tests
Levin, Lin &
Chu t* ADF - Fisher Chi-square
PP - Fisher Chi-square
Decision
ROA -5.213 113.260 152.362
Reject H0 0.000 0.000 0.000
ROE -6.062 130.368 177.345 Reject H0
0.000 0.000 0.000
EPS -17.395 274.536 395.826 Reject H0
0.000 0.000 0.000
SIZ -3.638 51.962 194.772 Reject H0
0.000 0.000 0.000
CA -3.419 107.217 96.474 Reject H0
0.000 0.000 0.000
LEV -3.304 64.997 76.421 Reject H0
0.000 0.000 0.000
AS -2.777 63.713 95.766 Reject H0
0.000 0.000 0.000
AQ -10.050 154.242 150.583 Reject H0
0.000 0.000 0.000
FS -4.738 64.937 60.910 Reject H0
0.000 0.000 0.000
DIV -2.243 68.528 102.578 Reject H0
0.000 0.000 0.000
Panel data is used in this study to investigate the determinants of profitability
for banks listed on BIST in Turkey during 1999-2018. There are several
methods used in the literature for panel unit root tests including Augmented
Dickey and Fuller test, Phillips and Perron test, and Levin, Lin and Chu test.
These three tests are performed in this study to confirm the results of unit
root tests (look at table 4.4). The null hypotheses are set for the presence of
unit root in panel data in all the three tests while the alternative hypothesis
indicates that the variable is stationary. We accept the results of these tests
at 95% of confidence interval.
The results of unit root tests are presented in table 4.4. The results of the
three selected tests show that the probabilities of the tests are smaller than

64
0.05 for all the variables and in all the tests. Thus, we can reject the null
hypotheses claiming that the panel variables have unit roots in favour for the
alternative hypotheses. Therefore, we claim that the variables we use in this
study are all stationary at their level, meaning that they are all I(0). We can
perform regressions such as pooled Ordinary Least Square (OLS) and
Random and Fixed effect to investigate the impacts of the selected
explanatory variables on profitability ratios of Banks listed on BIST.
4.4. Regression analysis
In order to investigate the direction and level of impact form the explanatory
variables to the dependent variables, we must run some regression models
for the three study models we specified previously. Consequently, we can
identify the factors that determine bank’s profitability in Turkey. First, we
perform pooled OLS regression. Second, we run FE and RE regression
models for robustness. FE and RE models are considered to work better
compare to polled ordinary least square because they can control for firm-
specific effects which can be commonly found in non-experimental studies
(Rasul, 2019).
4.4.1. Pooled OLS regression
Table 4.5 presents the results of pooled OLS in three models. In model 1,
ROA is the dependent variable and ROE is the dependent in model 2
whereas EPS is the dependent variable in model 3.

65
Table 4.5: results of pooled OLS regression analysis
Model 1 Dependent Variable: ROA
Model 2 Dependent Variable: ROE
Dependent Variable: EPS
Variable Coefficient Std. Error t* and
probability Coefficient
Std. Error
t* and probability
Coefficient Std. Error t* and
probability
C 7.648 2.832 2.701*** 47.673 34.741 1.372 -3.638 0.584 -6.230***
SIZ -0.043 0.065 -0.664 -0.393 0.794 -0.495 0.134 0.013 10.047***
CA 0.135 0.022 6.226*** 0.599 0.267 2.244** 0.004 0.004 0.93
LEV -3.501 2.942 -1.19 -26.972 36.1 -0.747 1.58 0.607 2.603**
AS -2.016 0.724 -2.785*** -14.42 8.881 -1.624 0.15 0.149 1.002
AQ -52.766 5.986 -8.815*** -604.363 73.441 -8.229*** -3.203 1.235 -2.594**
FS -2.81 0.479 -5.864*** 7.211 5.879 1.227 0.179 0.099 1.816*
DIV 0.015 0.008 1.918** 0.099 0.097 1.024 0.009 0.002 5.495***
R-squared 0.451 0.184 0.41
Adj. R-squared 0.441 0.169 0.399
F-statistic 43.7*** 11.97*** 36.994***
Durbin-Watson stat
1.603 1.841 0.329
Observations 380 380 380
66
The results of model 1 show that the impact on profitability measured by
ROA from the independent variables of capital adequacy, asset structure,
asset quality and financial structure are statistically significant at the level
1%. Additionally, the effect of dividend per share is statistically significant at
5% level of significance. However, the effects from size and leverage do not
seem to be significant. The impacts from asset structure, asset quality and
financial structure on ROA are negative while the impacts of capital
adequacy and dividend per share seem to be positive.
Precisely, capital adequacy could positively influence ROA in a way that
every percentage increase in capital adequacy can result an increase in
ROA by 0.13%. Moreover, one percentage increase in dividend per share
can lead to an increase in ROA by 0.015%. However, one percentage
increase in each of asset structure and financial structure separately can
bring about a reduction in ROA by 2% and 2.8%. In addition, asset quality
can have a greater negative impact on ROA, according to its coefficient is -
52.8.
The adjusted R-squared show in model 1 that the variables together can
explain 44.1% of the variations in return on assets. The probability of F-
statistics is smaller than 0.01, showing that the variables could fit in the
model.
The outcomes of model 2 show that the effect on profitability measured by
ROE from the independent variables of size, leverage, asset structure,
financial structure and dividend per share are statistically insignificant at the
level 5%. However, the effect of capital adequacy and asset quality are
statistically significant at 5% level of significance. The impact from capital
adequacy on ROE is positive while the impact of asset quality looks to be
negative.
Precisely, capital adequacy could positively influence bank’s profitability
measured by ROE in a way that every percentage increase in capital
adequacy can result an increase in ROE by 0.6% and this result is
statistically significant at the level 5%. Nonetheless, one percentage increase

67
in asset quality could bring about a reduction in ROE by 604% and it is
statistically significant at the level 1%.
The adjusted R-squared in model 2 is 16.9%, relatively lower compare to the
results in model 1, showing that the included variables in model 2 have
power to jointly explain 16.9% of the variations in profitability of banks
measured by return on equity. The probability of F-statistics is smaller than
0.01, showing the goodness of fit for model 2.
The results of model 3 show that the impact on profitability measured by EPS
from the independent variables of size, leverage, asset quality, financial
structure and dividend per share are statistically significant at the levels 1%,
5% and 10%. However, the effect of capital adequacy and asset structure
are statistically insignificant even at 10% level of significance. The impact
from bank size, financial leverage, financial structure and dividend per share
on EPS are positive whereas the impact from asset quality is negative.
Banks size measured by total assets at book value could positively influence
bank’s profitability measured by EPS in a way that every percentage
increase in total assets can result an increase in EPS by 0.13%. Likewise,
one percentage increase in leverage ratio, dividend per share and financial
structure separately can result an increase in EPS by 1.58%, 0.009% and
0.18% respectively. The impact of dividend per share is statistically
significant at 1% level but the impact of financial structure is only significant
at the level of 10%.Nevertheless, asset quality tends to negatively influence
EPS. Precisely, one percentage increase in AQ brings about a decrease in
EPS by 3.2% and it is statistically significant at 5% level.
The adjusted R-squared in model 3 is 39.9%, relatively higher compare to
the outcomes in model 2, showing that the studied variables in model 3 have
power to jointly explain 39.9% of the variations in profitability of banks
measured by earnings per share. The probability of F-statistics is smaller
than 0.01, showing the goodness of fit for the model.
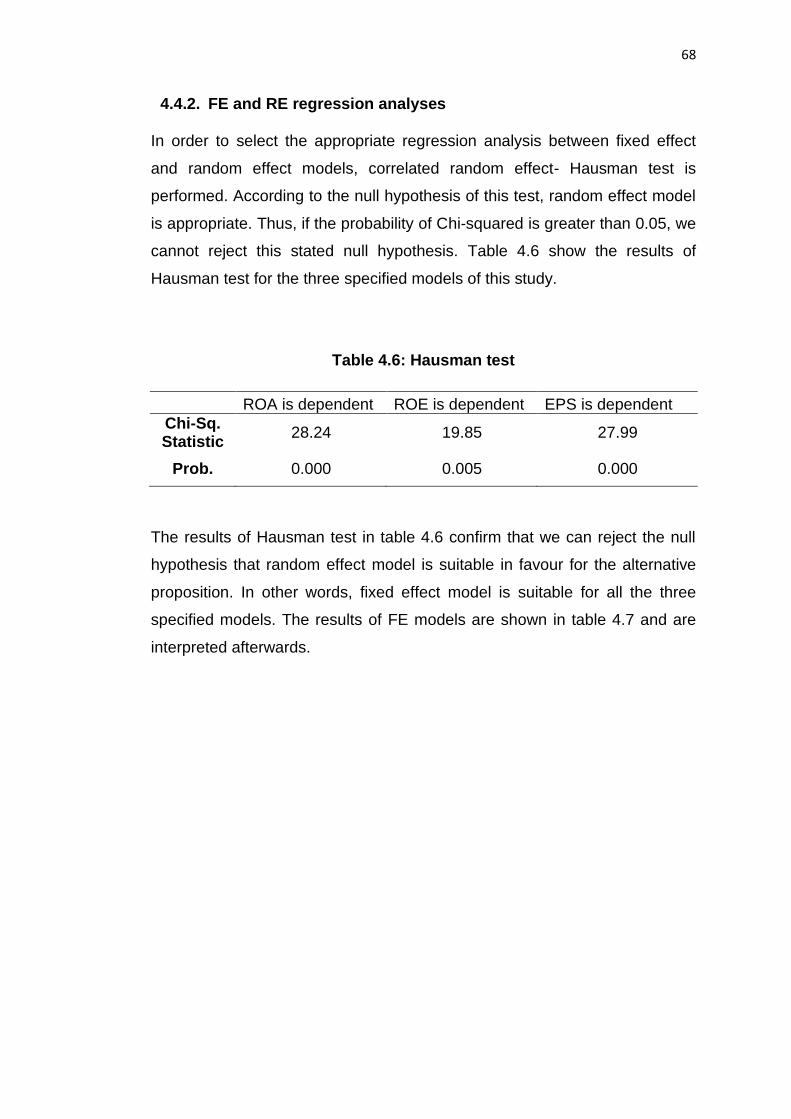
68
4.4.2. FE and RE regression analyses
In order to select the appropriate regression analysis between fixed effect
and random effect models, correlated random effect- Hausman test is
performed. According to the null hypothesis of this test, random effect model
is appropriate. Thus, if the probability of Chi-squared is greater than 0.05, we
cannot reject this stated null hypothesis. Table 4.6 show the results of
Hausman test for the three specified models of this study.
Table 4.6: Hausman test
ROA is dependent ROE is dependent EPS is dependent
Chi-Sq. Statistic
28.24 19.85 27.99
Prob. 0.000 0.005 0.000
The results of Hausman test in table 4.6 confirm that we can reject the null
hypothesis that random effect model is suitable in favour for the alternative
proposition. In other words, fixed effect model is suitable for all the three
specified models. The results of FE models are shown in table 4.7 and are
interpreted afterwards.
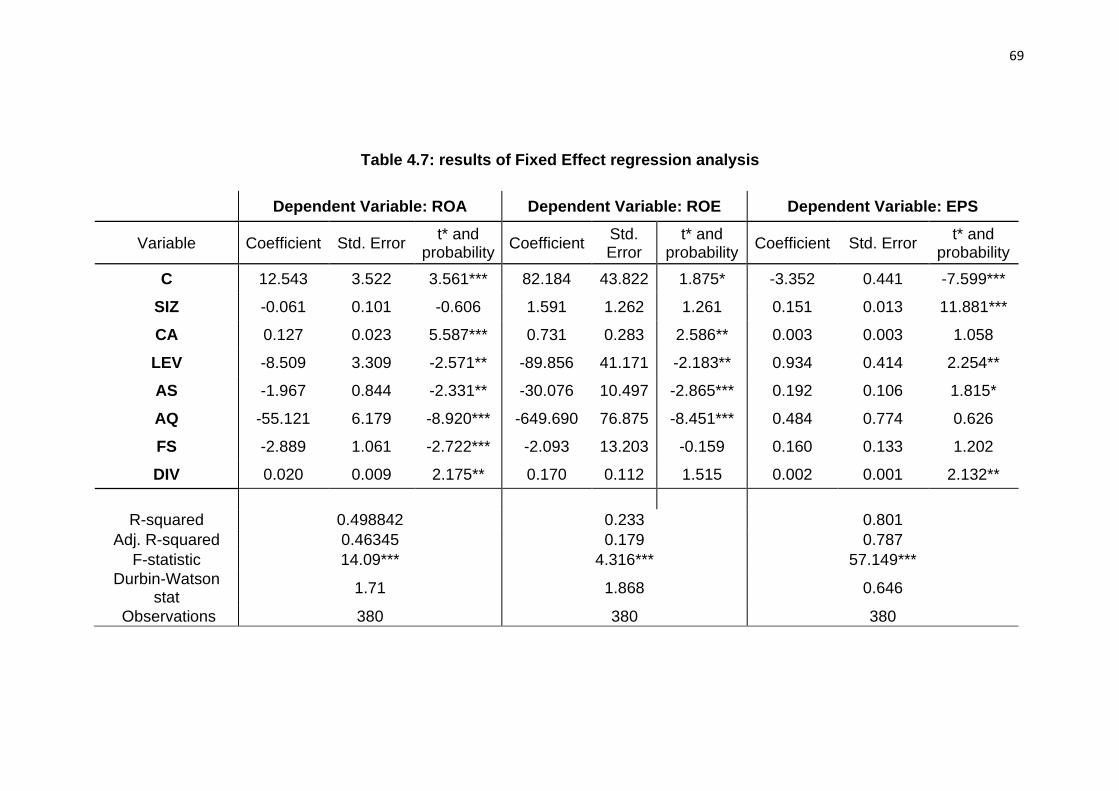
69
Table 4.7: results of Fixed Effect regression analysis
Dependent Variable: ROA Dependent Variable: ROE Dependent Variable: EPS
Variable Coefficient Std. Error t* and
probability Coefficient
Std. Error
t* and probability
Coefficient Std. Error t* and
probability
C 12.543 3.522 3.561*** 82.184 43.822 1.875* -3.352 0.441 -7.599***
SIZ -0.061 0.101 -0.606 1.591 1.262 1.261 0.151 0.013 11.881***
CA 0.127 0.023 5.587*** 0.731 0.283 2.586** 0.003 0.003 1.058
LEV -8.509 3.309 -2.571** -89.856 41.171 -2.183** 0.934 0.414 2.254**
AS -1.967 0.844 -2.331** -30.076 10.497 -2.865*** 0.192 0.106 1.815*
AQ -55.121 6.179 -8.920*** -649.690 76.875 -8.451*** 0.484 0.774 0.626
FS -2.889 1.061 -2.722*** -2.093 13.203 -0.159 0.160 0.133 1.202
DIV 0.020 0.009 2.175** 0.170 0.112 1.515 0.002 0.001 2.132**
R-squared 0.498842 0.233 0.801
Adj. R-squared 0.46345 0.179 0.787
F-statistic 14.09*** 4.316*** 57.149***
Durbin-Watson stat
1.71 1.868 0.646
Observations 380 380 380

70
Table 4.7 shows the results of Fixed Effect model of regression analysis in
three models. In model 1, ROA is the dependent variable and ROE is the
dependent in model 2 whereas EPS is the dependent variable in model 3.
The results of model 1 show that the impact on profitability measured by
ROA from the explanatory variables of capital adequacy, asset quality and
financial structure are statistically significant at the level 1%. Additionally, the
effect of financial leverage, asset structure and dividend per share are
statistically significant at 5% level of significance. However, the effect from
size does not seem to be statistically significant. The impacts from leverage,
asset structure, asset quality and financial structure on ROA are negative
while the impacts of capital adequacy and dividend per share are positive.
With regard to the coefficients of the explanatory variables, capital adequacy
could positively influence ROA in a way that every percentage increase in
capital adequacy can result an increase in ROA by 0.127%. Furthermore,
one percentage increase in dividend per share can lead to an increase in
ROA by 0.020%. However, one percentage increase in each of asset
structure and financial structure separately can bring about a reduction in
ROA by 1.97% and 2.9%. In addition, asset quality and leverage can have
greater negative impacts on ROA, as stated by the values of their
coefficients, -55.12 and 8.51 respectively.
The adjusted R-squared show in model 1 that the variables jointly can
explain 46.3% of the variations in profitability measured by ROA. The
probability of F-statistics is smaller than 0.01, indicating the goodness of fit
for the model.
The results of model 2 show that the impact on profitability measured by
ROE from the explanatory variables of Capital adequacy, financial leverage,
asset structure, asset quality are statistically significant at the levels 1% and
5%. However, the effect of total assets and financial structure and dividend
per share are statistically insignificant at 5% level of significance. The
impacts leverage ratio, asset structure, asset quality are negative whereas
the impact from capital adequacy on ROE is positive.

71
Precisely, capital adequacy could positively influence bank’s profitability
measured by ROE in a way that every percentage increase in capital
adequacy can lead to an increase in ROE by 0.73% and this result is
statistically significant at the level 5%. Nonetheless, one percentage increase
in total liabilities to total assets ratio, asset structure and asset quality
separately could cause ROE to reduce by 2.18%, 2.87% and 8.45%
respectively. The coefficient value of asset structure and asset quality are
significant at 1% level of significance while the results of t-statistics show that
the impact of leverage ratio on ROE is statistically significant only at the level
of 5%.
The adjusted R-squared in model 2 is 17.9%, reasonably lower than the
adjusted R-squared in model 1, showing that the included variables in model
2 have power to jointly explain 17.9% of the variations in profitability of banks
measured by ROE. The probability of F-statistics is smaller than 0.01,
showing the goodness of fit for the specified model.
The results of model 3 show that the impacts on profitability measured by
EPS from the independent variables of total assets at book value, leverage
ratio, asset quality and dividend per share are statistically significant at
different levels of 1%, 5% and 10%. However, the effect of capital adequacy,
asset quality and financial structure are statistically insignificant even at 10%
level of significance. The results also demonstrate that effect of the
independent variables, which are statistically significant, tend to be positive
on EPS.
Banks size could positively influence bank’s profitability measured by EPS in
a way that every percentage increase in total assets leads toan increase in
EPS by 0.15% with a low standard error 0.01. Likewise, one percentage
increase in leverage ratio and dividend per share separately could increase
EPS by 0.93% and 0.002% respectively, at the 5% level. The impact of asset
structureis 0.19 and it is only statistically significant at 10%.
The adjusted R-squared in model 3 is 0.787, relatively higher compare to the
outcomes of the same test in model1 and model 2, showing that the included
variables in model 3 could jointly explain 78.7% of the variations in

72
profitability of banks measured by earnings per share. The probability of F-
statistics is smaller than 0.01, showing the goodness of fit for the model.
4.5. Conclusion
In this chapter, data analysis and the interpretation of their results were
shown. The aim of this chapter is to illustrate the analysis of the sample data
of this study according to different used tests to identify the nature and
pattern of the data and variables separately, to examine the
possibleassociation among the employed variables and to recognize the
directions of relationships and level of impacts form the selected bank-
specific characteristics to the profitability ratios of those banks. The chapter
is divided into five sections. Section 1 demonstrates an overview to the
measures of bank profitability and several chosen explanatory variables at
the level of bank via descriptive statistics. Section 2 presents correlation
coefficient to deliver an initial understanding about the bivariate association
of the variables. Section 3 shows and discusses the results of employed
panel unit root tests. Section 4 illustrates the results of regression analyses
and interpretations of those results regarding the determinant factors of
banks profitability in Turkey during 1999-2018.

73
CHAPTER 5
CONCLUSION
The purposes of this chapter are several. First aim is to discuss the results of
data analysis in chapter 4 and compare the results to previous empirical
literature. Second purpose is to briefly present the previous chapters of the
thesis. Finally, it aims at presenting implication policy, suggestion and some
recommendation for future studies.
5.1. Discussion of the results
The empirical results of this study suggest that there are several bank-
specific variables that could determine the profitability if banking sector in
Turkey. We conclude our results based on the results of fixed effect
regression analysis because this technique of data analysis is more accurate
based on the control for cross-section aspect in panel data and it is widely
recommended and used in the literature.
We found that bank size measured as total assets at book value has positive
and significant impact on EPS only, but no significant impact on ROA and
ROE. These results are consistent with the findings of Athanasoglou et al.
(2005) but contrary with Obamuyi (2013) and Anbar and Alper (2011).
The results of regression analysis show that capital adequacy has a positive
impact on both return on assets and return on equity. Ebenezer et al. (2017)
found similar results in the case of Nigeria when capital adequacy had a
positive and significant impact on bank profitability. Rahman et al. (2015)
claim similar results in Bangladesh. Similarly, dividend per share has a
74
positive and significant impact on the two measures of profitability; return on
assets and earnings per share. This is supported by the argument that
managers are forced to payout dividend to the shareholders in order to
minimise cash available in the banks, because excess cash may mislead
managers to invest in low profitable and negative net present value projects
and investments.
The results show that the impact of leverage is not uniform on the different
measures of profitability. Leverage has a negative and significant impact on
ROA and ROE, indicating that the higher the ratio of total liabilities to total
assets, the lower the profitability of banks in Turkey is. Contrary to our result,
Khrawish (2011) found that the ratio total liabilities to total assets could
positively affect ROA in Jordan.
The results of asset structure and asset quality tend to be negative and
significant on return on assets and return on equity. This means high ratio of
total loans to total assets and high ratio loan loss provisions to net loans are
associated with low profitability of banks and vice versa. Anbar and Alper
(2011) also found that loan to asset ratio can have negative impact on
profitability because banks also need to invest in other activities for the
purpose of risk diversification. However, Olweny and Shipho (2011)found
contrary results in Kenya. With regard to asset structure ratio, Menicucci and
Paolucci (2016) found similar result that higher loan loss provisions result in
lower profitability levels. This suggests that banks with high provisions of
loan losses have lent high level of doubtful loans which can result in
decreasing profitability.
Additionally, the results of our study claim that financial structure measures
as ratio customer deposits to total liabilities have a negative effect on
profitability of banks in Turkey. These findings are contrary to the results
found by Menicucci and Paolucci (2016)
75
5.2. Summary of the thesis
Chapter 1 presented a general background about the banking sector in
general and banks in Turkey in particular. It showed that commercial banks
commonly prioritize their profit maximization and therefore the factors that
determine profitability are considered by the management of bank as well.In
addition to the general background on the topic, the problem statement of
this study stimulated around the increase of Turkish banks’ branches
whereas their profitability had declined over time. Accordingly, the main
objective of this study was also shown to investigate the factors affecting
profitability of Turkish banking sector. The hypotheses of this study were set
in accordance with the selected internal factors that probably influence
profitability of this sector. The contributions that the study possibly makes
through a number of aspects were also presented in this chapter. Finally, the
limitations were shown in the last section of the chapter.
In chapter 2, the theoretical literature is highlighted in the sections 1 to 3. The
concepts related to profitability and its sources were discussed in addition to
the most important factors affecting it. From it we can say that profitability is
the policy of reaching goals. In spite of the different types, we find that they
flow into one concept, measuring the bank’s effectiveness and efficiency.
Likewise, profitability ratios are linked to the bank and everyone who has a
relationship with the bank. It is the duty of bank to control all factors that
could affect its profitability. Section 4 shows and discusses the ground
theories about the factors affecting profitability. Section 5 was centred on the
most important previous studies that are similar to the purposes of
thisreserach. And through which a review of the most important aspects of
these studies represented in the aim of the study as well as mentioning the
most important results reached. Finally, a literature gap was identified based
on the review of the previous empirical studies.
Chapter 3is methodology and was divided to six sections. Section 3.1
defined the study sample and the method of data collection. Section 3.2
provided an overview on the sample study. Section 3.3 described the

76
research variables and accordingly develops their proposed relationships
with regard to the variables determining profitability easements. Section 3.4
specified the research models. Section 3.5 described and explained the
research method used to investigate the proposed relationships of the study.
In chapter 4, data analysis and the interpretation of their results were shown.
The aim of this chapter is to illustrate the analysis of the sample data of this
study according to different used tests in to identify the nature and pattern of
the data and variables separately, to examine the possible associations
among the employed variables and to recognize the directions of
relationships and level of impacts form the selected bank-specific
characteristics to the profitability ratios of those banks. The chapter is divided
into five sections. Section 1 demonstrates an overview to the measures of
bank profitability and several chosen explanatory variables at the level of
bank via descriptive statistics. Section 2 presents correlation coefficient to
deliver an initial understanding about the bivariate association of the
variables. Section 3 shows and discusses the results of employed panel unit
root tests. Section 4 illustrates the results of regression analyses and
interpretations of those results regarding the determinant factors of banks
profitability in Turkey during 1999-2018.
5.3. Policy implication and suggestions
According to the results of this empirical study, profitable banks in Turkey
were those that strive to improve their capital adequacy, payout high and
more regular dividend to common shareholders, reduce level of leverage,
asset structure, asset quality and financial structure. However, the impact of
the studied factors is not uniform with regard to different proxies of
profitability.
In general, we can claim the following implications and make some
suggestions:

77
1. Regulatory authorities of banking sector in Turkey need to encourage
banks to increase capital funds to risk weighted assetsin order ot
increase their profitability.
2. Directors of the banks’ board need to support high dividend payment
policy since more frequent and potentially high dividend payout to
shareholders is associated with high profitability of banks.
3. Banks listed on BIST are highly levered. Managers of those banks
needs to minimise the ratio of financial leverage in their banks to
further improve profitability.
4. Loan rating procedure needed to be appreciated as an important task
to avoid low quality loans and further improve profitability.
5. It is necessary to work to decrease total loans to total assets ratio as of
this ratio has a negative relationship with profitability.
5.4. Limitations and recommendations
There ismissing and inconsistency of the data of banks, where the
researcher to make models to unify the budgets of banks in order to access
to statistical data can be used. This is because of some reasons. First, banks
differ in the classification of financial statements published in the financial
statements from one bank to another. Second, different methods of banks in
the classification of financial statements published in the financial statements
from one fiscal year to another for one bank. Some banks make adjustments
to the classification of some items of financial statements from one fiscal
year to another year. Lastly, there were some missing data for some banks
related to some financial year which made us to exclude those banks in our
sample study.
Future studies can examine profitability determinants over different period of
time include other banks in their research sample. Moreover, it is stated in
the literature that macro factors can also determine profitability ratios.
Therefore, future studies may consider some macro factors along with firm
specific factors to further explain the variations in profitability. Additionally,
someone can also consider the whole financial sector including insurance

78
firms, real estate and others to expand the generalizability of the results
around this issue.
79
REFERENCES
Abubakar, A. (2015). Relationship between financial leverage and financial
performance of deposit money banks in Nigeria. International Journal of
Economics, Commerce and Management, 3(10), 759-778.
Afolabi, A., Olabisi, J., Kajola, S. O., &Asaolu, T. O. (2019). Does leverage
affect the financial performance of Nigerian firms?. Journal of
Economics & Management, 37, 5-22.
Albertazzi, U., &Gambacorta, L. (2009).Bank profitability and the business
cycle. Journal of Financial Stability, 5(4), 393-409.
Alshatti, A. S. (2015). The effect of the liquidity management on profitability
in the Jordanian commercial banks. International Journal of Business
and Management, 10(1), 62.
Alshatti, A. S. (2016). Determinants of banks’ profitability− the case of
Jordan. Investment Management and Financial Innovations, 13(1), 84-
91.
Anbar, A., &Alper, D. (2011). Bank specific and macroeconomic
determinants of commercial bank profitability: Empirical evidence from
Turkey. Business and economics research journal, 2(2), 139-152.
Athanasoglou, P., Delis, M., &Staikouras, C. (2005).Determinants of bank
profitability in the South Eastern European region.Munich Personal
RePEc Archive. Available at: https://mpra.ub.uni-
muenchen.de/10274/1/MPRA_paper_10274.pdf
Balasubramaniam, C. S. (2012). Non-performing assets and profitability of
commercial banks in India: assessment and emerging issues. Abhinav,
National Monthly Refereed Journal of Research in Commerce &
Management, 1(7), 41-52.
Barth, M. E., Beaver, W. H., & Landsman, W. R. (1996). Value-relevance of
banks' fair value disclosures under SFAS No. 107. Accounting Review,
513-537.

80
Batten, J., &Vo, X. V. (2019). Determinants of bank profitability—Evidence
from Vietnam. Emerging Markets Finance and Trade, 55(6), 1417-1428.
Berger, A. N., &Bouwman, C. (2015). Bank liquidity creation and financial
crises.Academic Press.
Bodla, B. S., &Verma, R. (2006). Determinants of profitability of banks in
India: A multivariate analysis. Journal of Services Research, 6(2), 75-
89.
BRSA (2019).Financial statements of listed banks on BIST in Turkey.
Available at: https://www.turkiyefinans.com.tr/en-us/investor-
relations/financial-data-and-reports/pages/brsa.aspx
Bryman, A., & Bell, E. (2015).Business Research Methods (Vol. fourth).
Glasgow: Bell & Bain Ltd.
Capraru, B., &Ihnatov, I. (2015).Determinants of Bank’s Profitability in EU15.
Annals of the AlexandruIoanCuza University-Economics, 62(1), 93-101.
CEIC (2018).Borsa Istanbul data store, available
at:https://www.ceicdata.com/en/turkey/borsa-istanbul-number-of-listed-
companies-and-nominal-value/listed-company-borsa-istanbul-number-
of-companies.
CEIC (2018). Turkey Market Cap: Borsa Istanbul, available at:
https://www.ceicdata.com/en/turkey/borsa-istanbul-market-
capitalization/market-cap-borsa-istanbul
Clark, J. A. (1986). Single-equation, multiple-regression methodology: Is it an
appropriate methodology for the estimation of the structure-
performance relationship in banking? Journal of Monetary Economics,
18(3), 295-312.
Connelly, B. L., Certo, S. T., Ireland, R. D., &Reutzel, C. R. (2011).Signaling
theory: A review and assessment.Journal of management, 37(1), 39-67.
Cornett, M. M., & Saunders, A. (2003). Financial institutions management: A
risk management approach. McGraw-Hill/Irwin.
https://www.turkiyefinans.com.tr/en-us/investor-relations/financial-data-and-reports/pages/brsa.aspx

81
Disyatat, P. (2004). Currency crises and the real economy: The role of
banks. European Economic Review, 48(1), 75-90.
Dogan, M. (2013). Does firm size affect the firm profitability? Evidence from
Turkey. Research Journal of Finance and Accounting, 4(4), 53-59.
Ebenezer, O. O., Omar, W. A. W. B., &Kamil, S. (2017). Bank specific and
macroeconomic determinants of commercial bank profitability: Empirical
evidence from Nigeria. International Journal of Finance & Banking
Studies, 6(1), 25-38.
Garcia, M. T. M., &Guerreiro, J. P. S. M. (2016). Internal and external
determinants of banks’ profitability: The Portuguese case. Journal of
Economic Studies, 43(1), 90-107.
Gueyie, J. P., Guidara, A., & Lai, V. S. (2019). Banks’ non-traditional
activities under regulatory changes: impact on risk, performance and
capital adequacy. Applied Economics, 51(29), 3184-3197.
Guru, B. K., Staunton, J., &Balashanmugam, B. (2002).Determinants of
commercial bank profitability in Malaysia. Journal of Money, Credit, and
Banking, 17(1), 69-82.
Heid, F. (2007).The cyclical effects of the Basel II capital
requirements. Journal of Banking & Finance, 31(12), 3885-3900.
Hoffmann, S., & Rodrigo, P. (2011).Determinants of the Profitability of the US
Banking Industry.
Hurriyet daily news (2019). Turkish banking sector’s net profit rises 12
percent in January-November. Available at:
http://www.hurriyetdailynews.com/turkish-banking-sectors-net-profit-
rises-12-percent-in-january-november-140163
Hzwry, H. (2018). Factors affecting bank’s profitability; an analytical study on
a sample of private banks in Syria.Journal of Firat University, 73-92.
IMF (2017).International Monetary Fund, Turkey. Available at:
https://www.imf.org/en/Countries/TUR
82
Islam, M. A., Sarker, M. N. I., Rahman, M., Sultana, A., &Prodhan, A. S.
(2017).Determinants of Profitability of Commercial Banks in
Bangladesh. International Journal of Banking and Financial Law, 1(1),
1-11.
Jabbar, H. (2014). Determinants of banks profitability. IOSR Journal of
Business and Management, 16(1), 109-111.
Kadioglu, E., Telceken, N., &Ocal, N. (2017). Effect of the asset quality on
the bank profitability.International Journal of Economics and Finance,
9(7), 60.
Kafali, S. (2005).The structure of the Turkish banking sector after the 1994-
2000 and 2001 financial crises.Master thesis, Bilkent University,
Ankara.
Kajola, S. O., Olabisi, J., Ajayi, J. A., &Agbatogun, T. O. (2018).Determinants
of Profitability in Nigerian Listed Deposit Money Banks.Journal of
Economics & Business Research, 24(1).
Kalpana, B., &Rao, T. V. (2017). Role of Commercial banks in the Economic
Development of India. International Journal of Management and
Applied Science, 4(3).
Ketyenya, R. P., &Mwaura, M. F. (2017).THE INFLUENCE OF FINANCIAL
STRUCTURE ON BANK PERFORMANCE IN COMMERCIAL BANKS
IN EAC COUNTRIES. International Journal of Finance and Accounting,
2(5), 15-28.
Khrawish, H. A. (2011). Determinants of commercial banks performance:
Evidence from Jordan. International Research Journal of Finance and
Economics, 81, 148-159.
Kosmidou, K. (2008). The determinants of banks' profits in Greece during the
period of EU financial integration.Managerial finance, 34(3), 146-159.

83
Kumar, N., &Kaur, K. (2016). Firm size and profitability in indian automobile
industry: An analysis. Pacific Business Review International, 8(7), 69-
78.
Kumar, S., &Venoor, M. A. (2018).Analysis of impact of earning per share,
dividend per share and price earnings ratio on stock
performance.International Journal of Research in Economics and Social
Sciences (IJRESS), 8(3).
La Porta, R., Lopez‐de‐Silanes, F., &Shleifer, A. (2002). Government
ownership of banks. The Journal of Finance, 57(1), 265-301.
Li, Y. (2007). Determinants of banks' profitability and its implication on risk
management practices: Panel evidence from the UK in the period 1999-
2006.
Lombardo, D., & Pagano, M. (2006).Legal determinants of the return on
equity.Corporate and institutional transparency for economic growth in
Europe, 235-270.
Menicucci, E., &Paolucci, G. (2016). The determinants of bank profitability:
empirical evidence from European banking sector. Journal of Financial
Reporting and Accounting, 14(1), 86-115.
Molinari, M., Giannangeli, S., &Fagiolo, G. (2016). Financial structure and
corporate growth: evidence from Italian panel data. Economic Notes:
Review of Banking, Finance and Monetary Economics, 45(3), 303-325.
Nabila, R. (2016). A study of the factors affecting the profitability of
commercial banks; the case of SociétéGénéraleAlgeria.Master thesis,
University of Ouargla.
Obamuyi, T. M. (2013). Determinants of banks’profitability in a developing
economy: evidence from Nigeria. Organizations and markets in
emerging economies, 4(08), 97-111.

84
Öhman, P., &Yazdanfar, D. (2018). Organizational-level profitability
determinants in commercial banks: Swedish evidence. Journal of
Economic Studies, 45(6), 1175-1191.
Olweny, T., &Shipho, T. M. (2011).Effects of banking sectoral factors on the
profitability of commercial banks in Kenya. Economics and Finance
Review, 1(5), 1-30.
Pasiouras, F., &Kosmidou, K. (2007).Factors influencing the profitability of
domestic and foreign commercial banks in the European
Union. Research in International Business and Finance, 21(2), 222-
237.
Petria, N., Capraru, B., &Ihnatov, I. (2015). Determinants of banks’
profitability: evidence from EU 27 banking systems. Procedia
Economics and Finance, 20, 518-524.
Pettinger.T. (2017).Purposes of Banks. Economics help blog. Available at:
https://www.economicshelp.org/blog/glossary/banks/
Posner, E. A. (2015). How do bank regulators determine capital-adequacy
requirements. U. Chi. L. Rev., 82, 1853.
Rahman, M. M., Hamid, M. K., & Khan, M. A. M. (2015). Determinants of
bank profitability: Empirical evidence from Bangladesh. International
journal of business and management, 10(8), 135.
Rasul, R. (2019). The relationship between dividend policy and firm value in
the IFRS adoption era: a case of Borsa Istanbul, Master thesis, NEU.
Saini, P., &Sindhu, J. (2014).Role of commercial bank in the economic
development of India. International Journal of Engineering and
Management Research (IJEMR), 4(1), 27-31.
Saona, P. (2016). Intra-and extra-bank determinants of Latin American
Banks' profitability. International Review of Economics & Finance, 45,
197-214.
85
Sattar, A., Leifu, G., Ahmad, M. I., Hassan, M., & Ali, R. (2017). Do Dividend
Payout Ratio Drive the Profitability of a Firm: A Case of Energy and
Textile Sector of Pakistan?.In Advances in Applied Economic Research
(pp. 591-597).Springer, Cham.
Saunders, M., Lewis, P., &Thornhill, A. (2009).Research methods for
business students.Pearson education.
Stowell, D. P. (2017). Investment banks, hedge funds, and private equity.
Academic Press.
Sufian, F., &Habibullah, M. S. (2009). Determinants of bank profitability in a
developing economy: Empirical evidence from Bangladesh. Journal of
business economics and management, 10(3), 207-217.
Sun, P. H., Mohamad, S., &Ariff, M. (2017). Determinants driving bank
performance: A comparison of two types of banks in the OIC. Pacific-
Basin Finance Journal, 42, 193-203.
The European Banking Federation (2018). Turkey’s banking sector: Facts &
Figures. Available at: https://www.ebf.eu/turkey/
The World Bank (2019.GDP (current US$) – Turkey. Available at:
https://data.worldbank.org/indicator/NY.GDP.MKTP.CD?contextual=def
ault&end=2018&locations=TR&start=1999
Trading Economics (2018).The history of Turkish Lira. Available at:
https://tradingeconomics.com/turkey/currency
Turkey Financial Services (2019). Report of financial services in Turkey,
Available at:
https://www.invest.gov.tr/en/publications/lists/investpublications/financia
l-services-industry.pdf
Umbarwati, U., &Fachrurrozie, F. (2018).Profitability as the Moderator of the
Effects of Dividend Policy, Firm Size, and Asset Structure on Debt
Policy.Accounting Analysis Journal, 7(3), 192-199.

86
World Bank data (2019). World Development Indicators, Turkish banking
sector. Available at: https://databank.worldbank.org/home
Yusuf, B. R. (2018). Dividend payout ratio and performance of deposit
money banks in Nigeria.IJAME. 4(6), 95-108.
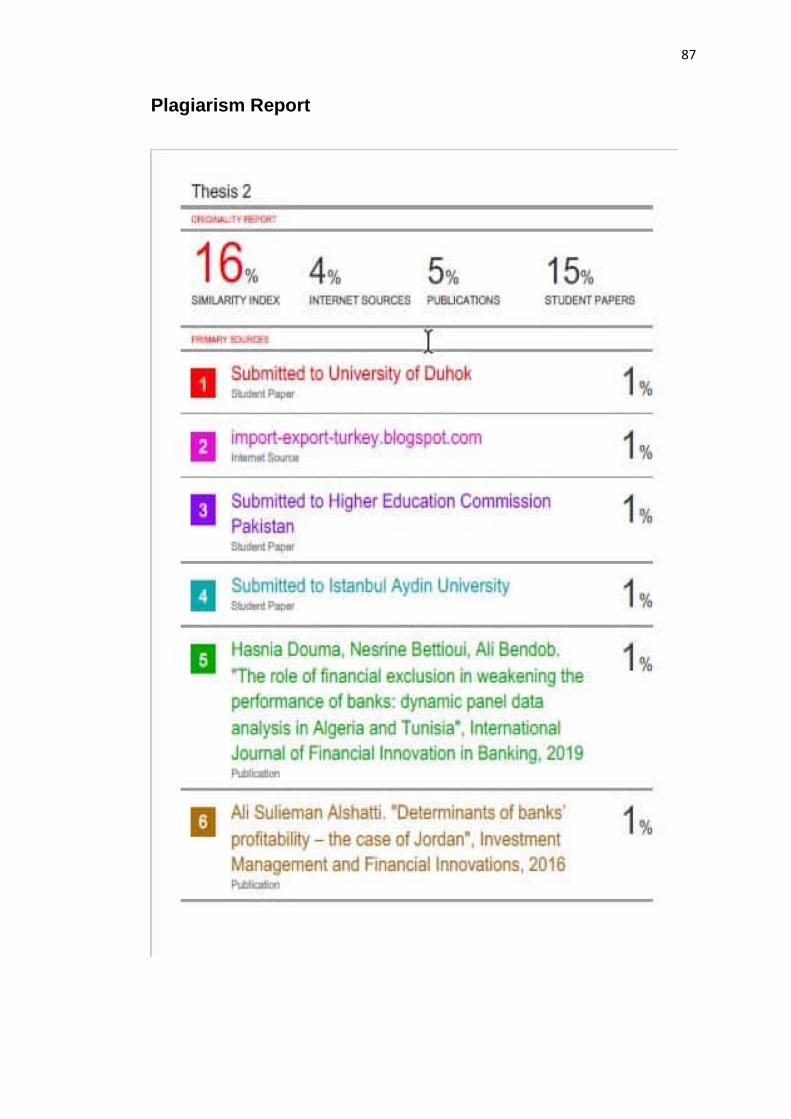
87
Plagiarism Report