Determinants of interest rate exposure of Spanish banking industry
38
Working papers Working papers ng papers e c serie Laura Ballester, Román Ferrer, Cristóbal González and Gloria M. Soto WP-EC 2009-07 Determinants of interest rate exposure of Spanish banking industry
-
Upload
independent -
Category
Documents
-
view
4 -
download
0
Transcript of Determinants of interest rate exposure of Spanish banking industry
Wo
rkin
g p
aper
sW
ork
ing
pap
ers
ng
pap
ers
ecserie
Laura Ballester, Román Ferrer, Cristóbal González and Gloria M. SotoWP-EC 2009-07
Determinants of interest rate exposure of Spanish banking industry
Los documentos de trabajo del Ivie ofrecen un avance de los resultados de las investigaciones económicas en curso, con objeto de generar un proceso de discusión previo a su remisión a las revistas científicas. Al publicar este documento de trabajo, el Ivie no asume responsabilidad sobre su contenido. Ivie working papers offer in advance the results of economic research under way in order to encourage a discussion process before sending them to scientific journals for their final publication. Ivie’s decision to publish this working paper does not imply any responsibility for its content. La Serie EC, coordinada por Matilde Mas, está orientada a la aplicación de distintos instrumentos de análisis al estudio de problemas económicos concretos. Coordinated by Matilde Mas, the EC Series mainly includes applications of different analytical tools to the study of specific economic problems. Todos los documentos de trabajo están disponibles de forma gratuita en la web del Ivie http://www.ivie.es, así como las instrucciones para los autores que desean publicar en nuestras series. Working papers can be downloaded free of charge from the Ivie website http://www.ivie.es, as well as the instructions for authors who are interested in publishing in our series. Edita / Published by: Instituto Valenciano de Investigaciones Económicas, S.A. Depósito Legal / Legal Deposit no.: V-2119-2009 Impreso en España (mayo 2009) / Printed in Spain (May 2009)
3
WP-EC 2009-07
Determinants of interest rate exposure of Spanish banking industry*
Laura Ballester, Román Ferrer, Cristóbal González
and Gloria M. Soto**
Abstract
Interest rate risk represents one of the key forms of financial risk faced by banks. It has given rise to an extensive body of research, mainly focused on the estimation of sensitivity of bank stock returns to changes in interest rates. However, the analysis of the sources of bank interest rate risk has received much less attention in the literature. The aim of this paper is to empirically investigate the main determinants of the interest rate exposure of Spanish commercial banks by using panel data methodology. The results indicate that interest rate exposure is systematically related to some bank-specific characteristics. In particular, a significant positive association is found between bank size, derivative activities, and proportion of loans to total assets and banks’ interest rate exposure. In contrast, the proportion of deposits to total assets is significantly and negatively related to the level of bank’s interest rate risk.
JEL Classification: G12, G21, C52 Keywords: interest rate risk, banking firms, stocks, balance sheet characteristics.
Resumen
El riesgo de interés representa una de las principales fuentes de riesgo financiero a las que se enfrentan las entidades bancarias. Este riesgo ha dado lugar a un extenso cuerpo de investigación, centrado básicamente en la estimación de la sensibilidad del rendimiento de las acciones bancarias ante las variaciones de los tipos de interés. Sin embargo, el análisis de los determinantes del riesgo de interés ha recibido mucha menos atención en la literatura. El objetivo de este trabajo es investigar empíricamente los principales determinantes de la exposición al riesgo de interés de las entidades bancarias españolas utilizando metodología de datos de panel. Los resultados obtenidos indican que la exposición al riesgo de interés se encuentra sistemáticamente relacionada con varias características bancarias. En particular, se ha constatado una significativa asociación positiva entre el tamaño de la entidad, el volumen de operaciones con activos derivados y el ratio de préstamos sobre activos bancarios totales y el grado de exposición al riesgo de interés. Por el contrario, se ha observado una relación negativa significativa entre el ratio de depósitos sobre activos bancarios totales y el nivel del riesgo de interés de las entidades bancarias.
Palabras Clave: riesgo de interés, entidades bancarias, acciones, características bancarias.
* The authors are grateful to Dr. Joaquin Maudos (University of Valencia and Ivie) and Dr. Juan Fernández de Guevara (University of Valencia and Ivie) for providing us with the database used in this paper. ** L. Ballester: University of Castilla-La Mancha; corresponding author: [email protected]; R. Ferrer and C. González: University of Valencia; G.M. Soto: University of Murcia.
1. Introduction
Interest rate risk (IRR) represents one of the key forms of financial risk that banks face in their role as financial intermediaries. For a bank, IRR can be defined as the risk that its income and/or market value will be adversely affected by interest rate movements. This risk stems from the peculiar nature of the banking business and it can be predominantly attributed to the following reasons. On the one hand, banking institutions hold primarily in their balance sheets financial assets and liabilities fixed in nominal (non-inflation adjusted) terms, hence especially sensitive to interest rate fluctuations. On the other hand, banks traditionally perform a maturity transformation function using short-term deposits to finance long-term loans. The resulting mismatch between the maturity (or time to repricing) of the assets and liabilities exposes banks to repricing risk, which is often seen as the major source of the interest rate sensitivity of the banking system. Apart from repricing risk, banking firms are also subject to other types of sources of IRR. Basis risk arises from imperfect correlation in the adjustment of the rates earned and paid due to the use of different base rates; yield curve risk is associated to changes in the shape of the yield curve with an adverse impact on a bank’s value; and optionality risk has its origin in the presence of option features within certain assets, liabilities, and off-balance sheet items. Additionally, IRR may also influence banks indirectly by altering the expected future cash flows from loan and credits. As a consequence, the banking sector has been typically viewed as one of the industries with greater interest rate sensitivity and a large part of the literature on interest rate exposure has focused on banks in detriment of nonfinancial firms.
In recent years, IRR management has gained prominence in the banking sector due to several reasons. First, the increasing volatility of interest rates and financial market conditions is having a significant impact on the income streams and the cost of funds of banks. Second, the growing international emphasis on the supervision and control of banks’ market risks, including IRR, under the new Basel Capital Accord (Basel II) has also contributed to increase the concern about this topic.1 Third, net interest income, which directly depends on interest rate fluctuations, still remains as the most important source of bank revenue in spite of the rising relevance of fee-based income.
The exposure of financial institutions to IRR has been the focus of an extensive body of research since the late 1970s. The literature has undertaken this topic by
1 Although the new Basel Capital Accord (Basel II) does not establish mandatory capital requirements for IRR, it is supervised under pillar 2.
4
examining the relationship between interest rate changes and firm value, proxied by the firm’s stock return, in a regression framework. In particular, the approach most commonly used has consisted of estimating the sensitivity of bank stock returns to movements in interest rates (e.g., Lynge and Zumwalt, 1980; Madura and Zarruk, 1995; Elyasiani and Mansur, 1998; Faff and Howard, 1999; Faff et al., 2005). In contrast, there exists a substantially lower amount of empirical evidence regarding the factors that explain the variation in interest rate exposure across banks and over time (e.g., Flannery and James, 1984; Kwan, 1991; Hirtle, 1997; Fraser et al., 2002; Au Yong et al., 2007).
Studies that empirically investigate the determinants of bank IRR have traditionally used asset-liability maturity or duration gap as the key factor explaining banks’ interest rate exposure. However, this approach presents serious drawbacks given the well-known limitations of static gap indicators, together with the difficulties to obtain precise year-by-year gap measures for most of banks. For this reason, an interesting alternative, which however has received sparse attention in the literature, is to examine the association between each bank’s estimated interest rate exposure and a set of readily observable specific characteristics that might have a potentially relevant role in explaining that exposure, such as bank size, equity capital, balance sheet composition, or off-balance sheet activities.
This paper attempts to fill this gap in the Spanish case by undertaking a comprehensive study addressed to identify the most important sources of interest rate exposure of commercial banks. This paper differs from previous studies in three ways. First, to the authors’ knowledge, this is the first work to specifically tackle this issue for the Spanish banking sector. Second, a panel data approach has been used in order to analyze whether some bank characteristics can contribute significantly to explain bank IRR. Third, the present study considers a group of bank variables larger than those usually employed in the extant studies about this topic, taking into account both traditional on-balance and off-balance sheet activities.
The empirical evidence in this paper can be summarized as follows. The results show that the sensitivity of bank stock returns to changes in interest rates is significantly linked with some financial indicators. In particular, interest rate exposure increases with bank size, and banks with larger proportion of loans are more exposed to interest rate movements. Moreover, off-balance sheet activities are also positively related to the level of bank interest rate risk, indicating that Spanish banks typically use financial
5

derivatives to take speculative positions. However, banks that finance a large portion of their assets with deposits have less interest rate exposure.
The characterization of the interest rate exposure profile of banks in terms of a reduced group of financial indicators, which can be easily obtained from their publicly available balance sheets and income statements, can be of great significance for a wide audience. It includes bank managers, investors, bank regulators, and even academicians, especially interested in how to measure, manage, and hedge interest rate risk exposure.
The remainder of the paper is organized as follows. Section 2 provides a brief review of related studies. Section 3 describes the data and methodology used in this study. The empirical results are presented in Section 4. Finally, Section 5 draws the concluding remarks.
2. Literature review
The incidence of IRR on bank stocks has been the focus of a considerable amount of literature over the last three decades. The vast majority of the empirical studies have adopted a capital market approach based on the estimation of the sensitivity of bank stock returns to changes in interest rates within the framework of the two-factor regression model proposed by Stone (1974). This formulation is, in essence, an augmented version of the standard market model, where an interest rate change factor is added as an additional explanatory variable to the market portfolio return in order to better explain the variability of bank stock returns.
The bulk of this research, mostly based on US banks, has documented a significant and negative effect of interest rate fluctuations on the stock returns of banking institutions (e.g., Lynge and Zumwalt, 1980; Bae, 1990; Kwan, 1991; Dinenis and Staikouras, 1998; Fraser et al., 2002; Czaja and Scholz, 2007), which has been primarily attributed to the typical maturity mismatch between bank’s assets and liabilities. In particular, banks have been generally exposed to a positive duration gap, i.e. the average duration of their assets exceeds the average duration of their liabilities.
In comparison, the attention paid to the identification of the determinants of banks’ interest rate exposure has been much less, although it is possible to distinguish two alternative groups of contributions.
The first approach investigates the relationship between the interest rate sensitivity of bank stock returns and the maturity composition of banks’ assets and
6
liabilities. Specifically, the one-year maturity gap (the difference between assets and liabilities that mature or reprice within one year) is the variable most commonly used in this strand of literature to measure balance sheet maturity composition.2 The pioneering study of Flannery and James (1984) provided empirical evidence that maturity mismatch between banks’ nominal assets and liabilities may be used to explain cross-sectional variation in bank interest rate sensitivity (maturity mismatch hypothesis). This finding has been supported by subsequent work by Yourougou (1990), Kwan (1991), and Akella and Greenbaum (1992).
This procedure is based on the nominal contracting hypothesis introduced by Kessel (1956) and French et al. (1983). This hypothesis postulates that a firm’s holdings of nominal assets and nominal liabilities can affect stock returns through the wealth redistribution effects from creditors to debtors caused by unexpected inflation. Hence, stockholders of firms with more nominal liabilities than nominal assets should benefit from unexpected inflation. Therefore, the effect of unanticipated changes in inflation on the value of the equity will be directly related to the difference between the durations of nominal assets and liabilities.
The link between stock returns and unexpected inflation is given by interest rates. Specifically, it is assumed that movements in interest rates result primarily from changes in inflationary expectations (e.g., Fama, 1975 and 1976; Fama and Gibbons, 1982). According to this assumption, the nominal contracting hypothesis implies a relationship between stock returns and interest rate fluctuations. The greater the discrepancy between the duration of assets and liabilities, the more sensitive stock returns are to interest rate changes. This hypothesis may be especially relevant in the banking industry because most of the banks’ assets and liabilities are contracted in nominal terms and moreover there generally exists a significant maturity mismatch between them. Therefore, the maturity mismatch hypothesis can be seen as a testable implication of the nominal contracting hypothesis in the banking context (Staikouras, 2003).
Subsequently, several empirical papers have extended the analysis of Flannery and James (1984) by incorporating the effect of derivatives usage on banks’ IRR. The primary focus of this line of research is to examine the association between banks’ derivative activities and their interest rate exposure after controlling for the influence of maturity composition (e.g., Hirtle, 1997; Schrand, 1997; Zhao and Moser, 2006).
2 Maturity gap constitutes a method to quantify IRR by comparing the potential changes in value to assets and liabilities that are affected by interest rate fluctuations over some predefined relevant intervals.
7
The second approach focuses on the role played by a set of bank-specific characteristics, including both traditional on-balance sheet banking activities and off-balance sheet activities. In particular, it seeks to characterize the main determinants of bank’s IRR by investigating whether the level of interest rate exposure is systematically related to a set of different financial variables such as bank size, non-interest income, equity capital, off-balance sheet activities, deposits on total assets, or loans to total assets ratios; all of them extracted from basic financial statement information. Thus, this methodology overcomes the usual difficulties to obtain reliable and noise-free maturity gap measures which prevent to test the maturity mismatch hypothesis accurately. Relevant papers in this area are Drakos (2001), Fraser et al. (2002), Saporoschenko (2002), Reichert and Shyu (2003), and Au Yong et al. (2007), and their basic features are described below.
The study of Drakos (2001) examines the determinants of IRR heterogeneity in the Greek banking sector by using a group of financial indicators. The results are consistent with the nominal contracting hypothesis, showing that working capital, defined as the difference between current assets and current liabilities, is the main source of interest rate sensitivity. Hence, the greater the working capital (high level of assets relatively to liabilities), the greater the potential loss derived from wealth redistribution from unexpected increases in inflation, and thus the greater the bank’s interest rate exposure. Moreover, equity capital and total debt ratios also explain a significant proportion of the variation in the interest rate sensitivity across Greek banks. However, the results suggest that the market-to-book and the leverage ratios do not play a significant role.
In a comprehensive study of the sensitivity of US bank stock returns to interest rate changes, Fraser et al. (2002) document that individual bank IRR is significantly affected by several bank-specific characteristics. In particular, it is shown that interest rate exposure is negatively related to the equity capital ratio, the ratio of demand deposits to total deposits, and the proportion of loans granted by banks. In contrast, IRR is greater for banks that generate most of their revenues from noninterest income, probably because a substantial portion of the noninterest income reflects securities-related activities (underwriting, advising, acquisitions, etc.).
Similarly, Saporoschenko (2002) investigates the association between the market and interest rate risks of various types of Japanese banks and a set of on-balance sheet financial characteristics. He concludes that the degree of interest rate exposure is significantly and positively related to the bank size, the volume of total deposits, and the
8
ratio of deposits to total assets, although the maturity gap measure does not have a significant impact on the level of bank’s IRR.
Reichert and Shyu (2003) extend previous studies by examining the impact of derivative activity on market, interest rate and exchange rate risks of a set of large international dealer banks in the US, Europe, and Japan banks including a number of key on-balance sheet measures as control variables in turn. The results for the US banks are the strongest and the most consistent ones. Concerning to bank’s IRR, it is observed that the use of options tends to increase the level of interest rate exposure in all three geographic areas. Several control variables, such as the capital ratio, the ratio of commercial loans, the bank’s liquidity ratio or the ratio of provisions for loan-loss reserves have a significant impact on IRR, although the signs of those effects are not entirely consistent.
More recently, Au Yong et al. (2007) investigate the relationship between interest rate and exchange rate risks and the derivative activities of Asia-Pacific banks, controlling for the influence of a large set of on-balance sheet banking activities. Their results suggest that the level of derivative activities is positively associated with long-term interest rate exposure but negatively associated with short-term interest rate exposure. Nevertheless, the derivative activity of banks has no significant influence on their exchange rate exposure.
Furthermore, this approach has been also used in several papers that explore the determinants of interest rate sensitivity of nonfinancial firms (e.g., O’Neal, 1998; Bartram, 2002; Soto et al., 2005).
With regard to the Spanish case, the available evidence concerning to the sources of bank’s interest rate exposure is very sparse. Jareño (2006 and 2008) examines the differential effect of real interest rate changes and expected inflation rate changes on stock returns of Spanish companies, including both financial and nonfinancial firms, at the sector level. With that aim, different extensions of the classical two-model of Stone (1974) are used and several potential explanatory factors of the real interest and inflation rate sensitivity of Spanish firms are studied. However, it can be noted that this author does not take into account bank-specific characteristics derived from balance sheets and income statements to explore the determinants of bank IRR.
9
3. Data and methodology
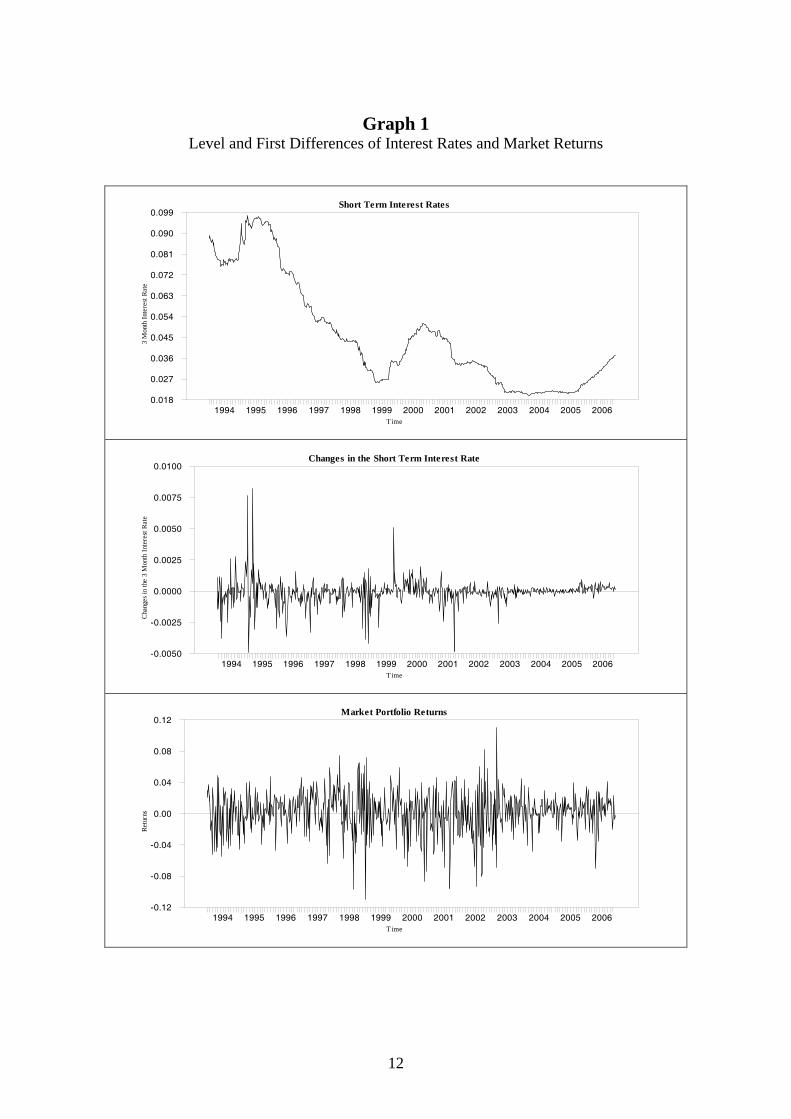
The sample consists of all Spanish commercial banks listed at the Madrid Stock Exchange during the period of January 1994 through December 2006 with stock price data available for at least a period of three years. In total, 23 banking firms meet this requirement. Closing daily prices have been used to compute weekly bank stock returns. The proxy for the market portfolio used is the Indice General de la Bolsa de Madrid, the widest Spanish stock market index. The stock data have been gathered from the Bolsa de Madrid Spanish stock exchange database. Table 1 shows the list of individual banks considered, the number of weekly observations for each bank over the sample period, and the main descriptive statistics of their weekly returns. With respect to the interest rate data, weekly data of the average three-month rate of the Spanish interbank market has been used. This choice obeys to the fact that during last years the money market has become a key reference for Spanish banking firms mainly due to two reasons. First, the great increase of adjustable-rate active and passive operations where interbank rates are used as reference rates; second, due to the fact that the interbank market has been largely used by banks to get funds needed to carry out their asset side operations, mainly in the mortgage segment in the framework of the Spanish housing boom. The interest rate data have been obtained from the Bank of Spain historical database. Graph 1 plots the evolution of this rate and its first differences as well as the weekly market portfolio returns.
With regard to the determinants of IRR, the year-end information from balance sheets and income statements used to construct the bank-specific characteristics for each bank in the sample has been drawn from Bankscope database of Bureau Van Dijk’s company, which is currently the most comprehensive data set for banks worldwide.3
The methodology employed in this paper to investigate the determinants of banks’ interest rate exposure follows closely the second approach described in Section 2. Thus, analogously to Drakos (2001), Fraser et al. (2002), Saporoschenko (2002), or Au Yong et al. (2007), a two-stage procedure has been adopted.
In the first stage, following the procedure typically used by the extant literature on bank IRR, the sensitivity of bank stock returns to changes in interest rates has been
3 As Pasiouras and Kosmidou (2007) indicate, to use Bankscope has obvious advantages. Apart from the fact that it has information for 11,000 banks, accounting for about 90% of total assets in each country, the accounting information at the bank level is presented in standardized formats, after adjustments for differences in accounting and reporting standards.
10

Table 1 List of Banks and Descriptive Statistics of Bank and Market Weekly Returns
Bank Ticker Obs. Mean Variance Minimum Maximum Skewness Kurtosis JB
Banco Alicante ALI 226 -0.0021 0.0002 -0.0622 0.1473 3.3821*** 31.9753*** 10,058.67
Banco Andalucía AND 674 0.0020 0.0006 -0.1181 0.3001 2.7313*** 31.9117*** 29,437.05
Argentaria ARG 316 0.0028 0.0015 -0.1606 0.1515 0.0142 1.4312*** 26.98
Banco Atlántico ATL 544 0.0025 0.0007 -0.1625 0.3412 4.6244*** 60.3305*** 84,440.38
Banco Bilbao Vizcaya Argentaria BBVA 674 0.0032 0.0019 -0.2340 0.1997 -0.4639*** 4.2524*** 532.01
Banco Central Hispano BCH 275 0.0051 0.0017 -0.1770 0.1990 0.4340*** 3.7411*** 169.00
Bankinter BKT 674 0.0024 0.0016 -0.1442 0.3049 0.7784*** 6.5783*** 1,283.35
Banesto BTO 674 0.0005 0.0024 -0.8299 0.2857 -7.1198*** 123.080*** 431,124.80
Banco Valencia BVA 674 0.0037 0.0007 -0.1398 0.2353 1.2495*** 10.3247*** 3,169.06
Banco de Castilla CAS 674 0.0019 0.0008 -0.1069 0.4172 4.9195*** 60.8798*** 106,805.41 Banco Crédito Balear CBL 674 0.0028 0.0009 -0.0943 0.2203 2.1870*** 13.4698*** 5,632.63
Banco Exterior EXT 172 -0.0021 0.0003 -0.0583 0.1311 2.4946*** 18.1005*** 2,526.41
Banco Galicia GAL 674 0.0021 0.0008 -0.1890 0.2980 2.9000*** 32.7571*** 31,079.08 Banco Guipuzcoano GUI 674 0.0028 0.0006 -0.0983 0.1814 1.3489*** 8.4172*** 2,194.11
Banco Herrero HRR 363 0.0041 0.0043 -0.2513 0.6171 5.8075*** 51.2885*** 41,827.08
Banco Pastor PAS 674 0.0033 0.0008 -0.1044 0.1901 0.8046*** 5.1027*** 803.98
Banco Popular Español POP 674 0.0026 0.0011 -0.1236 0.1445 0.2690*** 2.0650*** 127.89
Banco Sabadell SAB 294 0.0012 0.0007 -0.1712 0.0711 -2.1582*** 10.7599*** 1,646.50
Banco Santander SAN 674 0.0022 0.0020 -0.2550 0.2083 -0.5302*** 4.6074*** 627.74
Banco Simeón SIM 239 0.0022 0.0145 -0.9096 0.6956 0.6862*** 29.3037*** 8,570.07
Banco de Vasconia VAS 674 0.0031 0.0017 -0.1720 0.6204 6.5417*** 83.5104*** 200,660.23
Banco de Vitoria VIT 218 0.0014 0.0034 -0.2231 0.4162 2.9029*** 21.6796*** 4,575.39
Banco Zaragozano ZRG 514 0.0024 0.0014 -0.4678 0.2124 -2.8314*** 50.9399*** 56,260.39 Market Portfolio (IGBM) 674 0.0023 0.0007 -0.1097 0.1098 -0.5364*** 1.5498*** 99.78
JB is the Jarque-Bera test for normality of returns. This statistic is distributed as chi-squared with two degrees of freedom. ***,** and * represent significance at the 1%, 5% and 10%, respectively.
11
Graph 1 Level and First Differences of Interest Rates and Market Returns
Short Term Interest Rates
Time
3 M
onth
Inte
rest
Rate
1994 1995 1996 1997 1998 1999 2000 2001 2002 2003 2004 2005 20060.018
0.027
0.036
0.045
0.054
0.063
0.072
0.081
0.090
0.099
Changes in the Short Term Interest Rate
Time
Chan
ges i
n th
e 3
Mon
th In
tere
st Ra
te
1994 1995 1996 1997 1998 1999 2000 2001 2002 2003 2004 2005 2006-0.0050
-0.0025
0.0000
0.0025
0.0050
0.0075
0.0100
Market Portfolio Returns
Time
Retu
rns
1994 1995 1996 1997 1998 1999 2000 2001 2002 2003 2004 2005 2006-0.12
-0.08
-0.04
0.00
0.04
0.08
0.12
12

estimated by OLS in the framework of the traditional two-factor model postulated by Stone (1974). The specific model can be expressed as:
ittimtiiit IDRR εβα +Δ++= [1]
where denotes the return of bank i’s stock in period t, the return on the market
portfolio in period t, the change in the three-month interest rate in period t, itR mtR
tIΔ itε the
error term for period t.
Under this approach, the coefficient on the market portfolio return, iβ , describes
the sensitivity of the return on ith bank stock to general market fluctuations and, therefore, it can be viewed as a measure of market risk (market beta). In turn, the
coefficient on the interest rate term, , reflects the sensitivity of the return on ith bank
stock to movements in interest rates while controlling for changes in the return on the market. Hence, it can be interpreted as a measure of ith bank interest rate exposure. In particular, as Hirtle (1997), Czaja et al. (2006), and Reilly et al. (2007) point out, this coefficient can be seen as an estimate of the empirical duration of ith bank equity.
iD
4 A negative empirical duration implies that the value of bank equity tends to decrease when interest rates rise, while a positive duration implies the opposite.
As specified in equation [1] above, the empirical duration is only a partial measure of IRR, since changes in interest rates also affect the return on the market and, through that channel, bank stock returns. In order to get a total measure of banks’ interest rate exposure and following Lynge and Zumwalt (1980), Hirtle (1997), Fraser et al. (2002), and Czaja et al. (2006), among others, the market return variable has been orthogonalized. Specifically, the residuals from an auxiliary regression of the market return series on a constant and the interest rate fluctuations series, by construction uncorrelated with interest rate changes, have been used to replace the original market portfolio returns in equation [1]. The empirical duration so obtained reflects both the direct effect of interest rate movements on equity values and the indirect influences working through changes in the market return.
Consistently with previous empirical research (e.g., Fraser et al., 2002; Saporoschenko, 2002; Reichert and Shyu, 2003; Au Yong et al., 2007), the second stage
4 Specifically, the concept of duration, a widely used measure of interest rate sensitivity of fixed-income securities, can be extended to common stocks. Thus, the empirical duration of equity is an indicator of the interest rate risk borne by the equity, which is based upon the historical relationship between equity returns and interest rate changes.
13
in the analysis consists in regressing the empirical durations generated in the stage one on a number of bank-specific characteristics that reflect both traditional on-balance and off-balance sheet activities. This analysis is aimed to provide insight both into the adequacy of the bank variables taken out from basic financial statements as indicators of IRR, and into the contribution of off-balance sheet activities to banks’ overall interest rate exposure.
However, given the significant differences found in empirical durations across banks and along time in this study (see Section 4), neither time series analysis nor cross-section analysis in isolate is appropriate in this case. For this reason, in this second stage this study departs from the typical time series or cross-section analysis carried out in previous research and opts for panel data analysis. This approach endows regression analysis with both a spatial and temporal dimension and it has several advantages over time series or cross-section data.5 In this sense, combining cross-section and time-series data in this study is useful for three main reasons. First, the interest rate exposure of Spanish banks varies over time, and the time-series dimension of the variables of interest provides a wealth of information ignored in cross-sectional studies. Second, the use of panel data increases the sample size and the degrees of freedom, a particularly relevant issue when a relatively large number of regressors and a small number of firms are used, as in the case at hand. Third, panel data estimation can improve upon the issues that cross-section regressions fail to take into consideration, such as potential endogeneity of the regressors, and controlling for firm-specific effects. Also, panel data analysis has been recently applied in related contexts such as in the study of the factors affecting bank operational risk and bank equity risks (Haq, 2007) or bank profitability (Pasiouras and Kosmidou, 2007). A large set of financial characteristics was initially considered in order to account for the effect of different categories of bank variables on the degree of interest rate exposure. Those categories include equity capital, bank size, balance sheet composition, income structure, credit quality, profitability and off-balance sheet activities. The choice of the particular bank-specific characteristics has been guided by economic priors and early empirical literature. Specifically, the financial indicators examined in this study are described below.
The equity capital ratio (CAP), defined as the proportion of equity with respect to total assets of the bank, is as a measure of capital strength widely used as a potential
5 Baltagi (2001) and Hsiao (1986) have documented the major advantages of panel data methodology. These include, for example, controlling for individual heterogeneity, reducing problems of data multicollinearity, eliminating or reducing estimation bias, generating more accurate predictions and capturing the dynamic relationship between independent variables and dependent variables.
14
determinant of bank’s interest rate exposure (e.g., Fraser et al., 2002; Saporoschenko, 2002; Reichert and Shyu, 2003; Au Yong et al., 2007). In general, banks with high capital ratios present lower needs of external funding, hence lower level of financial leverage. For these banks interest rate fluctuations will have a smaller impact on bank revenue and, consequently, on bank stock returns. Furthermore, as Fraser et al. (2002) point out, a large level of equity capital reduces the probability of financial distress and bankruptcy, therefore avoiding strong sell-off of bank stocks in response to negative shocks such as rising interest rates. Thus, a high level of capital can be viewed as a great cushion against abnormal increases in interest rates and other adverse market shocks. As a result, a negative association between capital and interest rate exposure is predicted in the literature. The total capital ratio (TOTCAP), defined as the total capital adequacy ratio under the Basle rules, has been also used as a control variable in order to check the robustness of the equity capital ratio.
The bank size also constitutes a variable frequently considered in the literature as a potential explanatory factor of bank IRR (e.g., Fraser et al., 2002; Saporoschenko, 2002; Reichert and Shyu, 2003; Au Yong et al., 2007). In this study, the bank size variable (SIZE), defined as the natural logarithm of total bank assets, is included to control for discrepancies in terms of interest rate exposure between small and large banks that might be caused by several factors. On the one hand, differences in the type of businesses and customers at large and small banks. On the other hand, banks of different size may have very different risk attitudes. For example, large banks have better access to capital markets and products and also greater diversification benefits compared to their smaller counterparts. These operating advantages make that large banks may choose to pursue riskier activities, such as granting risky loans or taking speculative positions in derivatives, due to competitive pressures. In addition, large banks may have greater interest rate exposure due to moral hazard behaviour, where banks that are too big to fail have an incentive to incur risks that are underwritten by the government deposit insurance system. Consequently, the sign of the relationship between size and bank IRR is theoretically ambiguous and it becomes an empirical question. Nevertheless, it can be noted that several studies, focused on the impact of IRR on bank stock portfolios constructed according to size criteria, have found a positive association between bank’s size and interest rate exposure (e.g., Elyasiani and Mansur; 1998 and 2004; Faff et al., 2005; Ballester et al., 2008).
The loans to total assets ratio (LOANS) is a measure of the relative importance of loans into the bank’s balance sheet and can be interpreted as an indicator of IRR as well. On average, the maturity (or duration) of bank loans is greater than the
15
corresponding one of the rest of bank assets and liabilities. Accordingly, an increase in the proportion of loans entails an extension of the typical maturity mismatch between assets and liabilities, so increasing the bank’s interest rate exposure. Therefore, it seems natural to expect a positive association between this ratio and the bank IRR.
Similarly, the deposits to total assets ratio (DEPS) provides insight into the importance of deposits in the bank’s balance sheet. The deposit base is usually viewed as a stable and relatively cheap source of funding for banks. Additionally, a large percentage of total deposits, basically demand deposits and savings deposits, show low interest rate sensitivity due to the fact that these kind of deposits are mainly for savings rather than investment. Therefore, a negative relationship is hypothesized between this ratio and the level of bank’s interest rate exposure.
The net interest margin to total assets ratio (NIM) captures the relative weight of the income obtained from traditional banking business (taking deposits and granting loans). In principle, banks with a larger portion of their total revenues derived from interest rate income should have greater interest rate dependence and, consequently, a higher degree of interest rate exposure. Accordingly, it is expected that this ratio to be positively related to the bank IRR.
The return on average total equity ratio (ROAE) is a very popular measure of profitability and it has been used in this study to examine whether the level of bank profitability has a significant impact on the bank’s interest rate exposure. Analogously to the capital ratio, higher profitability reduces the probability of bank’s financial distress, and it can be seen as a cushion against adverse interest rate shocks. According to this, it is expected a negative relationship between the ROAE and the bank’s IRR.
Since derivative activities carried out by banks are classified as off-balance sheet operations and there is not more specific information about banks’ derivative positions in Bankscope database, the ratio of off-balance sheet exposure to total assets (OBSA) has been used as a proxy of derivative activities. Concerning to the sign of the relationship between this indicator and the degree of banks’ interest rate exposure, two opposite situations can be distinguished depending on the basic motivation underlying to the use of derivatives. On the one hand, if banks employ derivatives primarily to reduce interest rate exposure arising from their other banking activities (i.e., for hedging) a negative coefficient on OBSA is expected because a greater extent of derivative activities would be associated with a lower level of IRR. On the other hand, a positive coefficient on OBSA would suggest that banks use predominantly derivative instruments to increase income (for speculation) since a greater use of derivatives
16

implies in this case a greater risk exposure. As it is not clear a priori which of these two alternatives is more likely, the contribution of derivatives to banks’ IRR must be empirically determined.
The noninterest income ratio (NONINT), defined as the proportion of noninterest income on net income, reflects the relative importance of noninterest income arising mainly from both traditional service charges (fees and commissions) and non-traditional banking activities (investment banking, market trading, insurance, advisory activities, and asset management). Banks with a larger income share of noninterest activities are less reliant on traditional intermediation activities (deposits and loans) and, consequently, should be less affected by interest rate fluctuations. Thus, a negative association between this ratio and the interest rate exposure is hypothesized.
Finally, the loan loss reserves to gross loans ratio (RES) constitutes an indicator of the quality of the bank’s loan portfolio and, therefore, it can be seen as a proxy of credit risk. This variable is considered in the analysis in order to examine whether there exists a systematic relationship between the levels of credit risk and IRR borne by Spanish banks. The sign of this association is a priori ambiguous. The loan loss provisions to net interest revenues ratio (PROV) has been also used as a substitute of the RES variable to verify the robustness of the results.
It must be pointed out that, although the maturity gap ratio is an important theoretical measure of bank’s interest rate risk, unfortunately this indicator could not be used due to the lack of any maturity buckets information in the Bankscope database.
4. Empirical results
The empirical findings are presented in this section. We begin with the results obtained in the stage one (estimation of interest rate sensitivity) and then we discuss the results corresponding to the stage two (estimation of the IRR exposure determinants).
4.1. Estimation of the empirical duration coefficients (first stage)
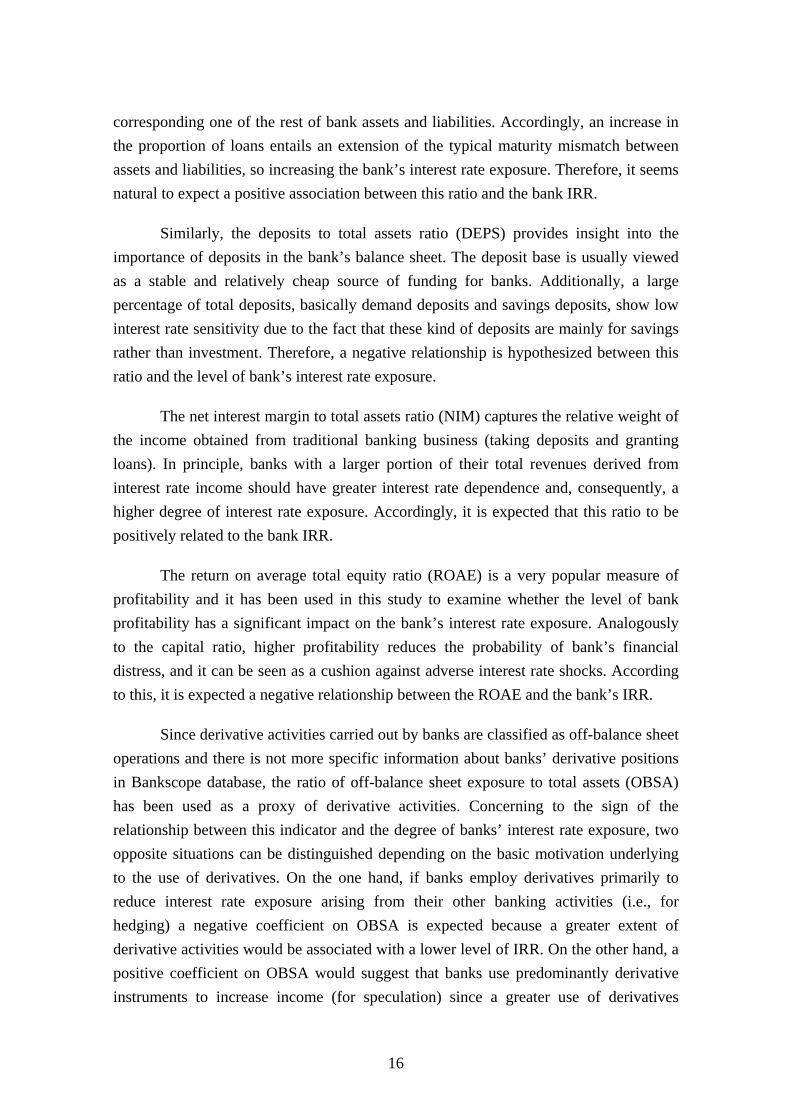
Table 2 summarizes the descriptive statistics of the empirical duration and market beta coefficients estimated from the first stage regression (equation [1]) using weekly stock return and interest rate data over annual periods from 1994 to 2006. Note that, since not all banking firms have available market data for the whole sample period,
17
Table 2 Descriptive Statistics of the Estimated Sensitivity of
Bank Stock Returns to Market and Interest Rate Movements
Obs. Mean Median Standard Deviation Minimum Maximum
D 230 1.5591 -0.1960 9.9825 -44.7156 35.1353
β 230 0.5011 0.3806 0.4616 -0.4439 1.8152 2R 230 0.2324 0.144 0.2323 0.0001 0.8956
The descriptive statistics of the coefficient estimates reported in this table are: the sensitivity of bank stock returns to changes in the short term interest rates (D) and the market portfolio returns (β ) obtained by OLS in the framework of the traditional two-factor model postulated by Stone (1974). The model can be expressed as:
ittimtiiit IDRR εβα +Δ++= .
a total of 230 out of possible 299 empirical duration and market beta coefficients have been obtained.
A major finding is that there are significant variations in estimated empirical durations across banks and across periods. Thus, the empirical durations are predominantly negative and highly significant at the conventional levels during the first part of the sample period, whereas they tend to take high positive and significant values during last years. In fact, slightly over 50% (117 out of 230) of the estimated duration coefficients are negative. As can be seen in Table 2, the mean duration coefficient has a positive value (1.56) whereas the median is negative (-0.20), probably due that the high positive values of duration in the last part of the sample cause a positive bias in the mean duration coefficient.6 In turn, the estimated market betas are positive and significant at the usual levels in practically all the cases with a mean (median) of 0.50 (0.38).7
6 The sign of the empirical duration of a bank stock can be interpreted as the difference between the average durations of the bank assets and liabilities. In this sense, if a bank achieves a perfect match between the duration of its assets and the duration of its liabilities, theoretically its interest rate risk is null, since the variation in the value of its assets and liabilities induced by a change in interest rates is the same, hence the value of the firm does not change. A negative empirical duration of the bank reflects the traditional situation of long-term assets (loans) funded with short-term liabilities (deposits) so the value of the bank decreases when interest rates increase, whereas a positive duration indicates the opposite. Thus, the spectacular growth of adjustable-rate loans and the strong increase of the number of loans securitized by banks along the last years can have reduced substantially the duration of their assets, leading to a positive value of the empirical duration of the banks. 7 As a preliminary step in the analysis, Augmented Dickey-Fuller and Phillips-Perron tests have been applied to all the series to be used in equation [1] in order to check for stationarity. The results indicate that all series of returns are stationary at levels whereas the series of short-term interest rates show a unit root at usual significance levels, so justifying the use of their first differences in equation [1].
18
Overall, the evidence presented suggests that Spanish banks exhibit significant IRR, although the traditional pattern of negative interest rate exposure does not appear to verify in the Spanish banking industry, particularly during last years. Furthermore, as expected, the market risk plays a dominant role in explaining the variability of bank stock returns. The robustness of this result can be checked through the analysis of the relative importance of the market risk and interest rate risk factors in equation [1]. Specifically, since both risk factors are linearly independent by construction because the market return variable has been orthogonalized, the total variance of the return of bank i’s stock in period t, can be expressed as
2 2( ) ( ) ( ) ( )it i mt i t itVar R Var R D Var I Varβ ε= + Δ + [2]
In order to adequately compare both factors, the previous equation has been divided by . Thus, the contribution of each individual factor, and , to
the total variance of the return of bank i’s stock is given by its coefficient squared times the ratio of the variance of that factor over the variance of the return of bank i’s stock. Table 3 shows that the market portfolio return is in all cases the variable that better helps to explain the bank stock returns variability.
)( itRVar mtR tIΔ
4.2. Estimation of the IRR exposure determinants (second stage)
Since the estimated empirical durations have both positive and negative signs, with the aim to facilitate the economic interpretation of the determinants of interest rate exposure, the absolute value of empirical durations has been used as the dependent variable in the panel estimation8, which can be expressed as:
, 0 , ,1
ˆJ
i t j j i t i tj
D Xγ γ=
= + +∑ ,v [3]
where tiD ,ˆ is the absolute value of bank i’s empirical duration for year t estimated in
stage one, Xj,i,t is the jth determinant of the IRR for bank i at time t, and ti,ν is an error
term. All the explanatory variables have been measured at the end of the year. The panel is comprised of 13×23 (number of years × number of banks) observations for each
8 Analogously to the case of fixed income securities, a higher duration, regardless of its sign, implies a higher interest rate risk for the bank (greater variation in the value of the firm for a given change in interest rates). Therefore, taking absolute values of the empirical durations obtained in the first step of the analysis helps to preserve the economic interpretation of the coefficients γ in equation [3] as explained below.
19

Table 3 Contribution of each factor to the explanation of the return stock variability
Bank tIΔ mtR Total
Banco Alicante 0.76% 99.24% 100.00% Banco Andalucía 3.24% 96.76% 100.00% Argentaria 1.54% 98.46% 100.00% Banco Atlántico 0.09% 99.91% 100.00% Banco Bilbao Vizcaya Argentaria 0.36% 99.64% 100.00% Banco Central Hispano 0.03% 99.96% 100.00% Bankinter 3.25% 96.75% 100.00% Banesto 0.91% 99.09% 100.00% Banco Valencia 0.69% 99.31% 100.00% Banco de Castilla 7.91% 92.09% 100.00% Banco Crédito Balear 8.91% 91.09% 100.00% Banco Exterior 1.33% 98.67% 100.00% Banco Galicia 4.12% 95.88% 100.00% Banco Guipuzcoano 0.92% 99.08% 100.00% Banco Herrero 8.02% 91.98% 100.00% Banco Pastor 0.27% 99.73% 100.00% Banco Popular Español 0.51% 99.49% 100.00% Banco Sabadell 9.00% 91.00% 100.00% Banco Santander 1.16% 98.84% 100.00% Banco Simeón 27.78% 72.22% 100.00% Banco de Vasconia 31.84% 68.16% 100.00% Banco de Vitoria 8.80% 91.20% 100.00% Banco Zaragozano 1.11% 98.89% 100.00%
This table shows the contribution of each individual factor to the stock return variability for each individual bank of the sample. This contribution has been obtained as the percentage of the goodness of fit (measured through R2) of the bifactorial model that can be attributed to each risk factor (interest rate risk and market risk).
variable. However, since not all banks have market data and/or balance sheet data for the whole sample period, the panel is unbalanced.
According to this specification, a positive coefficient jγ implies that the higher
the value of the jth determinant, the higher the IRR borne by the banks. The sign of the empirical duration coefficient does not affect this result, because both positive and
20
negative changes in interest rates would imply greater variation, in absolute terms, of
bank stock returns. Obviously, A negative value of jγ has the opposite meaning.
The set of potential determinants of bank IRR analyzed in this study includes the eleven variables explained in the section 3. They are listed in Table 4, including their definition, their expected sign, their source, and some references to previous papers in the literature that have used those variables as well. Table 5 provides descriptive statistics (minimum, maximum, mean, and standard deviation) for these bank variables, whereas Table 6 reports the pairwise correlations among them.
As can be seen, some variables are highly correlated. Thus, including all of them as regressors simultaneously may cause the estimated coefficients to be unstable and unreliable. To overcome this difficulty, the inclusion or removal of any explanatory variable in the model has been chosen by means of stepwise regressions techniques, which take into account the statistical significance of each variable and the effect of their inclusion or removal on the goodness of fit of the model, measured through R2.
As a result, a number of six out of the eleven variables has been proven to be effective in explaining bank IRR. This set of variables includes CAP, SIZE, DEPS, LOANS, OBSA and RES.9 This selection still holds when variables highly correlated with previously added variables are orthogonalized, but in this case the level of significance of the related variables increases. For example, SIZE and DEPS have a correlation coefficient of -70.5%. The first variable that enters into the model is SIZE, but their significance decreases dramatically when DEPS is added to the model. Orthogonalizing DEPS with respect to SIZE makes both variables highly significant, which indicates that there is informative content in DEPS, besides its relation to SIZE, about the level of interest rate risk of banks. Similar cases are those of CAP and LOANS (69.5%) and LOANS and RES (-63.7%). Consequently, the variables DEPS, LOANS, and RES have been replaced by the residuals of their linear projection over SIZE, CAP, and LOANS, respectively. The starting model can then be expressed as follows:
, 0 1 , 2 , 3 , 4 , 5 , 6 ,ˆ γ γ γ γ γ γ γ= + + + + + + +i t i t i t i t i t i t i t i tD OBSA SIZE DEPS LOANS CAP RES v ,
[4]
9 Graph 2 shows the evolution along the sample period of these six bank-specific characteristics.
21
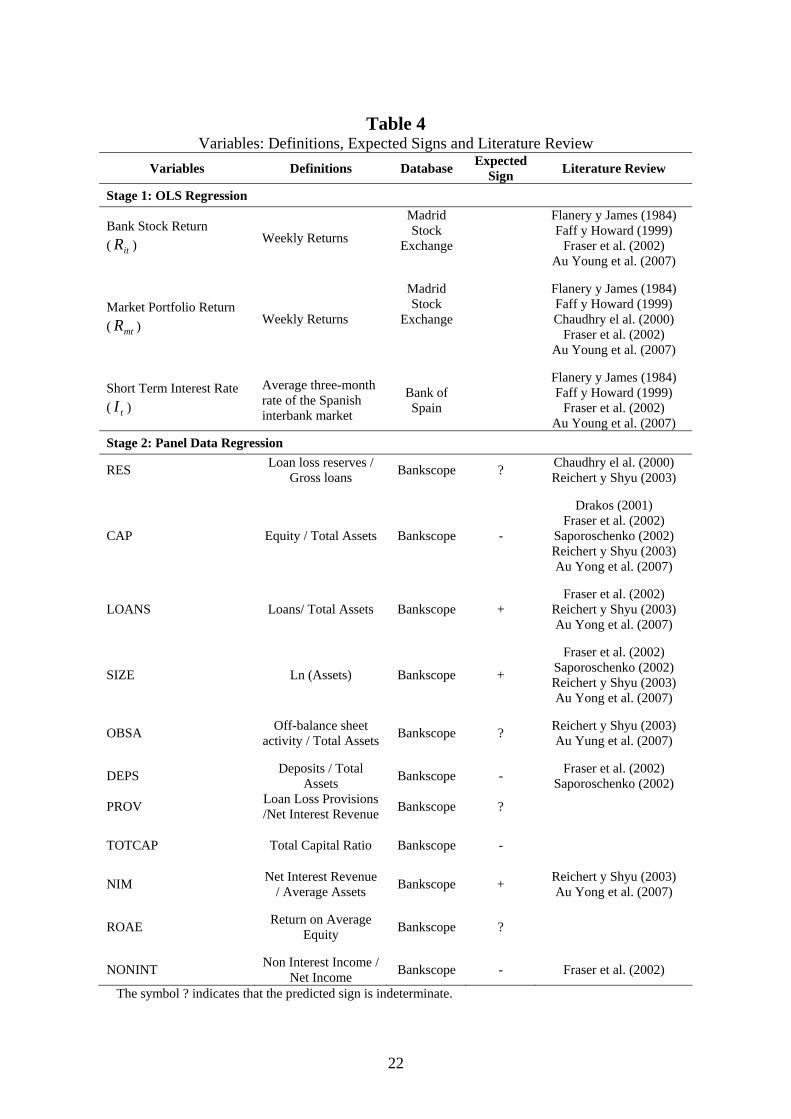
Table 4 Variables: Definitions, Expected Signs and Literature Review
Variables Definitions Database Expected Sign Literature Review
Stage 1: OLS Regression
Bank Stock Return ( ) itR Weekly Returns
Madrid Stock
Exchange
Flanery y James (1984) Faff y Howard (1999)
Fraser et al. (2002) Au Young et al. (2007)
Market Portfolio Return ( ) mtR Weekly Returns
Madrid Stock
Exchange
Flanery y James (1984) Faff y Howard (1999) Chaudhry el al. (2000)
Fraser et al. (2002) Au Young et al. (2007)
Short Term Interest Rate ( ) tI
Average three-month rate of the Spanish interbank market
Bank of Spain
Flanery y James (1984) Faff y Howard (1999)
Fraser et al. (2002) Au Young et al. (2007)
Stage 2: Panel Data Regression
RES Loan loss reserves / Gross loans Bankscope ? Chaudhry el al. (2000)
Reichert y Shyu (2003)
CAP Equity / Total Assets Bankscope -
Drakos (2001) Fraser et al. (2002)
Saporoschenko (2002) Reichert y Shyu (2003) Au Yong et al. (2007)
LOANS Loans/ Total Assets Bankscope + Fraser et al. (2002)
Reichert y Shyu (2003) Au Yong et al. (2007)
SIZE Ln (Assets) Bankscope +
Fraser et al. (2002) Saporoschenko (2002) Reichert y Shyu (2003) Au Yong et al. (2007)
OBSA Off-balance sheet activity / Total Assets Bankscope ? Reichert y Shyu (2003)
Au Yung et al. (2007)
DEPS Deposits / Total Assets Bankscope - Fraser et al. (2002)
Saporoschenko (2002)
PROV Loan Loss Provisions /Net Interest Revenue Bankscope ?
TOTCAP Total Capital Ratio Bankscope -
NIM Net Interest Revenue / Average Assets Bankscope + Reichert y Shyu (2003)
Au Yong et al. (2007)
ROAE Return on Average Equity Bankscope ?
NONINT Non Interest Income / Net Income Bankscope - Fraser et al. (2002)
The symbol ? indicates that the predicted sign is indeterminate.
22
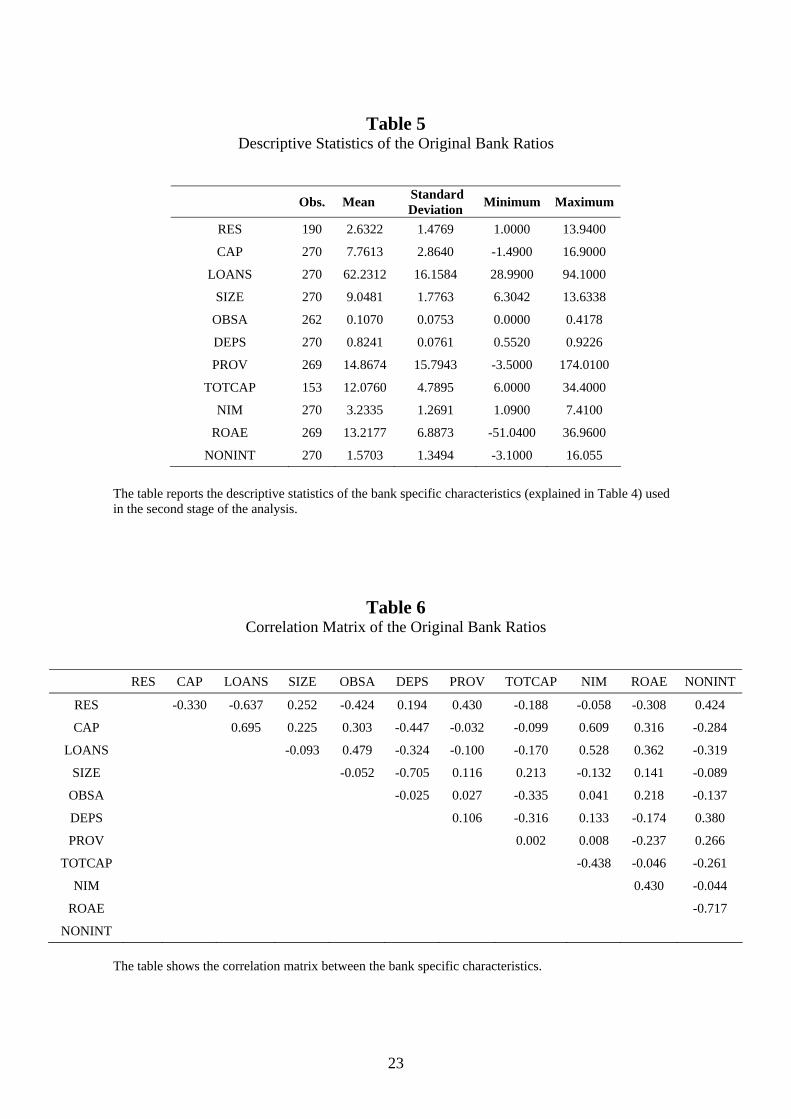
Table 5 Descriptive Statistics of the Original Bank Ratios
Obs. Mean Standard Deviation Minimum Maximum
RES 190 2.6322 1.4769 1.0000 13.9400
CAP 270 7.7613 2.8640 -1.4900 16.9000
LOANS 270 62.2312 16.1584 28.9900 94.1000
SIZE 270 9.0481 1.7763 6.3042 13.6338
OBSA 262 0.1070 0.0753 0.0000 0.4178
DEPS 270 0.8241 0.0761 0.5520 0.9226
PROV 269 14.8674 15.7943 -3.5000 174.0100
TOTCAP 153 12.0760 4.7895 6.0000 34.4000
NIM 270 3.2335 1.2691 1.0900 7.4100
ROAE 269 13.2177 6.8873 -51.0400 36.9600
NONINT 270 1.5703 1.3494 -3.1000 16.055
The table reports the descriptive statistics of the bank specific characteristics (explained in Table 4) used in the second stage of the analysis.
Table 6 Correlation Matrix of the Original Bank Ratios
RES CAP LOANS SIZE OBSA DEPS PROV TOTCAP NIM ROAE NONINT
RES -0.330 -0.637 0.252 -0.424 0.194 0.430 -0.188 -0.058 -0.308 0.424
CAP 0.695 0.225 0.303 -0.447 -0.032 -0.099 0.609 0.316 -0.284
LOANS -0.093 0.479 -0.324 -0.100 -0.170 0.528 0.362 -0.319
SIZE -0.052 -0.705 0.116 0.213 -0.132 0.141 -0.089
OBSA -0.025 0.027 -0.335 0.041 0.218 -0.137
DEPS 0.106 -0.316 0.133 -0.174 0.380
PROV 0.002 0.008 -0.237 0.266
TOTCAP -0.438 -0.046 -0.261
NIM 0.430 -0.044
ROAE -0.717
NONINT The table shows the correlation matrix between the bank specific characteristics.
23
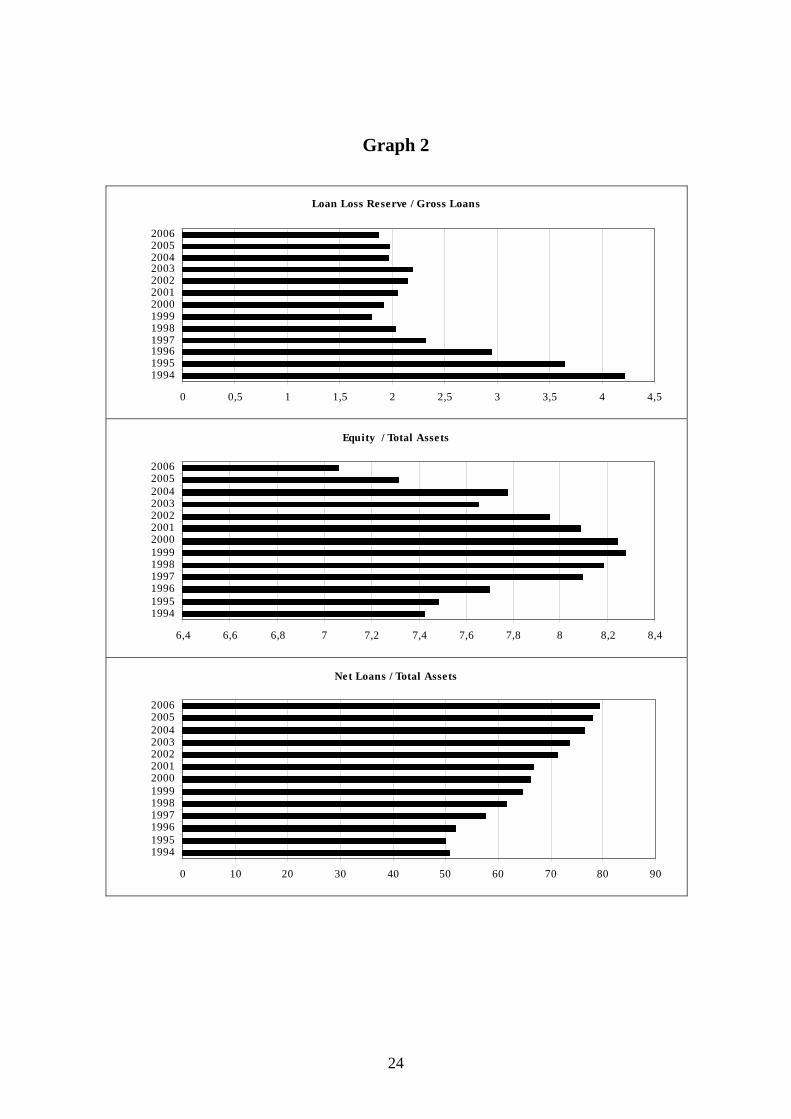
Graph 2
Loan Loss Reserve / Gross Loans
0 0,5 1 1,5 2 2,5 3 3,5 4 4,5
1994199519961997199819992000200120022003200420052006
Equity / Total Assets
6,4 6,6 6,8 7 7,2 7,4 7,6 7,8 8 8,2 8,4
1994199519961997199819992000200120022003200420052006
Net Loans / Total Assets
0 10 20 30 40 50 60 70 80 90
1994199519961997199819992000200120022003200420052006
24
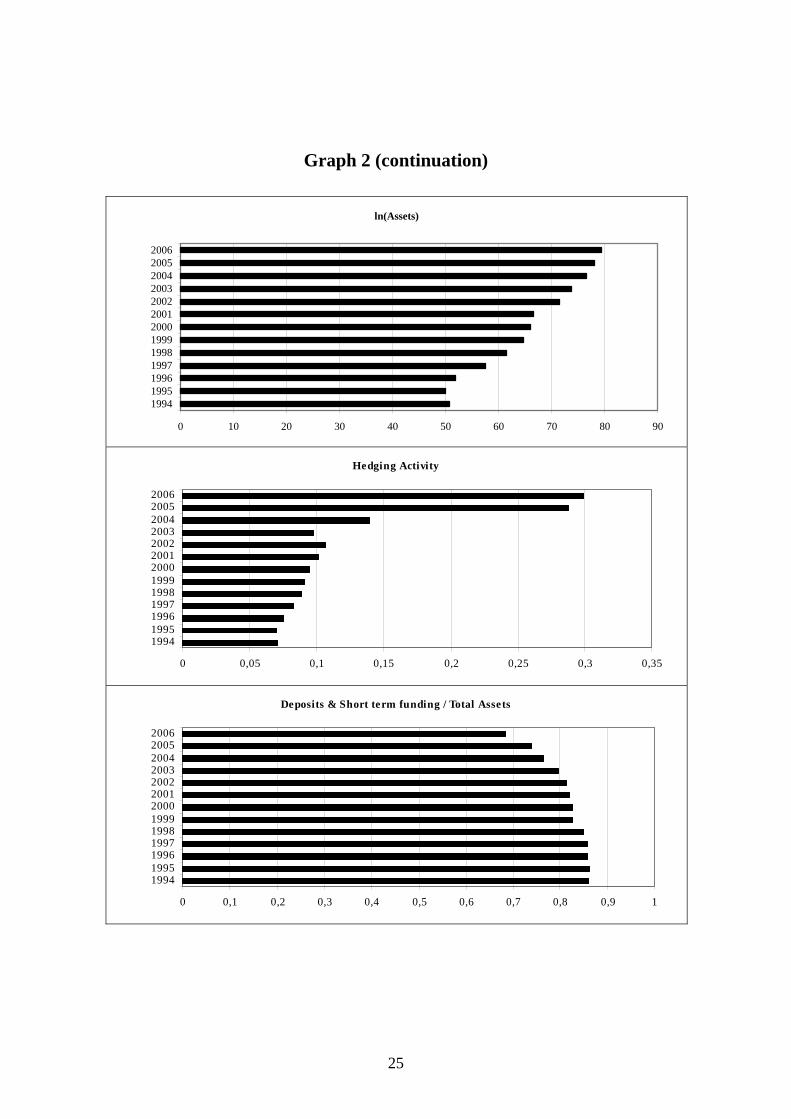
Graph 2 (continuation)
ln(Assets)
0 10 20 30 40 50 60 70 80 90
1994199519961997199819992000200120022003200420052006
Hedging Activity
0 0,05 0,1 0,15 0,2 0,25 0,3 0,35
1994199519961997199819992000200120022003200420052006
Deposits & Short term funding / Total Assets
0 0,1 0,2 0,3 0,4 0,5 0,6 0,7 0,8 0,9 1
1994199519961997199819992000200120022003200420052006
25
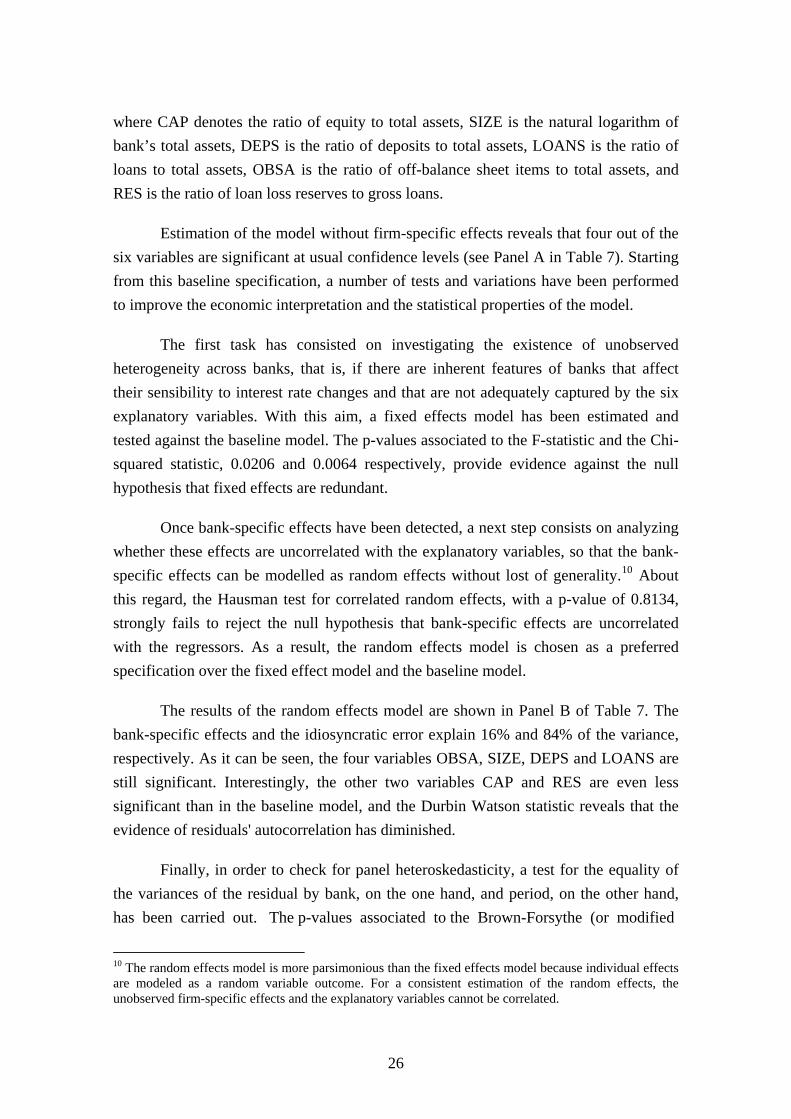
where CAP denotes the ratio of equity to total assets, SIZE is the natural logarithm of bank’s total assets, DEPS is the ratio of deposits to total assets, LOANS is the ratio of loans to total assets, OBSA is the ratio of off-balance sheet items to total assets, and RES is the ratio of loan loss reserves to gross loans.
Estimation of the model without firm-specific effects reveals that four out of the six variables are significant at usual confidence levels (see Panel A in Table 7). Starting from this baseline specification, a number of tests and variations have been performed to improve the economic interpretation and the statistical properties of the model.
The first task has consisted on investigating the existence of unobserved heterogeneity across banks, that is, if there are inherent features of banks that affect their sensibility to interest rate changes and that are not adequately captured by the six explanatory variables. With this aim, a fixed effects model has been estimated and tested against the baseline model. The p-values associated to the F-statistic and the Chi-squared statistic, 0.0206 and 0.0064 respectively, provide evidence against the null hypothesis that fixed effects are redundant.
Once bank-specific effects have been detected, a next step consists on analyzing whether these effects are uncorrelated with the explanatory variables, so that the bank-specific effects can be modelled as random effects without lost of generality.10 About this regard, the Hausman test for correlated random effects, with a p-value of 0.8134, strongly fails to reject the null hypothesis that bank-specific effects are uncorrelated with the regressors. As a result, the random effects model is chosen as a preferred specification over the fixed effect model and the baseline model.
The results of the random effects model are shown in Panel B of Table 7. The bank-specific effects and the idiosyncratic error explain 16% and 84% of the variance, respectively. As it can be seen, the four variables OBSA, SIZE, DEPS and LOANS are still significant. Interestingly, the other two variables CAP and RES are even less significant than in the baseline model, and the Durbin Watson statistic reveals that the evidence of residuals' autocorrelation has diminished.
Finally, in order to check for panel heteroskedasticity, a test for the equality of the variances of the residual by bank, on the one hand, and period, on the other hand, has been carried out. The p-values associated to the Brown-Forsythe (or modified
10 The random effects model is more parsimonious than the fixed effects model because individual effects are modeled as a random variable outcome. For a consistent estimation of the random effects, the unobserved firm-specific effects and the explanatory variables cannot be correlated.
26
Table 7 Estimation Data Panel Results: Determinants of Interest Rate Exposure
Panel A: Baseline Model Method: Panel Least Squares
C OBSA SIZE DEPS LOANS CAP RES 2R F DW
-4.0166 20.6495 1.0134 -24.1801 0.0797 -0.1645 -0.1512 0.32 12.38 1.67
(-0.92) (3.00)*** (2.95)*** (-2.62)*** (1.73)* (-0.78) (-0.30) Panel B: Bank-specific Random Effects Model
Method: Panel EGLS (Cross-section random effects)
C OBSA SIZE DEPS LOANS CAP RES 2R F DW
-7.5066 19.6238 1.2347 -24.1686 0.0879 0.0239 0.0242 0.32 12.08 1.86
(-1.14) (2.74) *** (2.36) ** (-2.32) ** (1.71) * (0.08) (0.05) Panel C: Bank-specific Random Effects Model Robust to Time Heteroskedasticity
Method: Panel EGLS (Cross-section random effects) White period standard covariances
C OBSA SIZE DEPS LOANS CAP RES 2R F DW
-7.5066 19.6238 1.2347 -24.1686 0.0879 0.0239 0.0242 0.32 12.08 1.86
(-1.65) (2.57) ** (3.57) *** (-2.49) ** (2.61) *** (0.08) (0.08)
The table shows the main results of the panel estimation for the determinants of interest rate exposure following this model:
, 0 1 , 2 , 3 , 4 , 5 , 6 ,ˆ γ γ γ γ γ γ γ= + + + + + + +i t i t i t i t i t i t i t i t,D OBSA SIZE DEPS LOANS CAP RES v .
Panel A presents the results of the panel estimation without bank-specific effects. Panel B contains the
results of the estimation including bank-specific random effects. Finally, Panel C shows the final results from the bank-specific random effects model with coefficient covariances robust to period heteroskedasticity. Value in parenthesis are the corresponding t statistic and ***,** and * represent significance at the 1%, 5% and 10%, respectively.
Levene) test provides no evidence of bank heteroskedasticity (p-value is 0.4922) but strong time heteroskedaticity (0.0000). Consequently, standard errors robust to period heteroskedasticity have been computed using the White period method. The results from this final specification of the model are reported in panel C of Table 7.
As it can be seen, again four out of six ratios (size, loans to total assets, deposits to total assets, and off-balance sheet activities) are statistically significant at the
27

conventional levels whereas the equity capital and loan loss reserve ratios are not. In terms of the direction of the effect, the signs for all significant bank characteristics are broadly consistent with the expectations formulated in section 3. Specifically, the bank size and the ratio of loans to total assets appear to be the main determinants of interest rate exposure of Spanish banks in terms of statistical significance.
The bank size variable (SIZE) is clearly significant at the 1% level and positively signed, indicating that there seems to be a direct relationship between the size of banking firms and their level of interest rate sensitivity. This finding is consistent with the results obtained by Saporoschenko (2002) and Reichert and Shyu (2003) under a similar approach and by Elyasiani and Mansur (1998 and 2004), Faff et al. (2005) and Ballester et al. (2008) by using a different methodology, confirming that larger banks bear higher IRR than smaller banks. In the Spanish case, this pattern of behaviour could be a consequence of differences between large and small banks in terms of the type of business and customers, their risk attitude (expressed, for example, in granting risky loans or the use of new and risky financial innovations), and the aggressiveness in the pricing policies. Furthermore, the less degree of diversification and the more difficult access to capital markets for Spanish smaller banks, together with their stock performance highly driven by idiosyncratic factors –e.g., rumours of possible mergers and acquisitions–, can also help to explain their lower exposure to IRR.
Additionally, it can be pointed out that the size of the financial institution not only is important by itself, but also lies behind some of the usual factors employed in the literature to explain the bank’s IRR since it is used as a denominator in many of the ratios taken as potential determinants of IRR.
The percentage of loans on total bank assets (LOANS) is significant at the 1% level and positively related to the banks’ interest rate exposure, suggesting that banks that hold a greater portion of assets in the form of loans have larger degree of IRR. One possible explanation for this finding is that the bigger relative weight of loans into the bank balance sheet causes an increase of traditional maturity mismatch between bank assets and liabilities, with the subsequent positive impact on bank IRR.
The ratio OBSA appears to be also an important determinant of bank IRR. This indicator is significant at the 5% level and positively related to the level of interest rate exposure, indicating that the use of financial derivatives corresponds to greater bank IRR. This result is in line with previous studies (e.g., Hirtle, 1997; Reichert and Shyu, 2003; Au Yong et al., 2007), providing support to the argument that Spanish banks are
28
using financial derivatives for speculation purposes rather than for risk hedging purposes.
There is also clear evidence that the DEPS ratio is also a relevant determinant of IRR exposure. This indicator has a negative and significant coefficient at the 5% level, suggesting that banks with a great proportion of deposits have less IRR. This result is consistent with the notion that deposits are a cheaper and more stable source of funding for banks and a substantial part of bank deposits are primarily demand deposit accounts, so they tend to not bear interest since they are not meant for the purpose of earning interest; consequently, they show a reduced sensitivity to movements in interest rates.
To end with the bank characteristics, note that neither the capital nor the loan loss reserves ratios are shown to be significant determinants of Spanish bank stock return interest rate sensitivity.11 Interestingly, the effect of both variables on bank’s interest rate exposure was ambiguous at the theoretical level. In this regard, it can be argued, on the one hand, that Spanish banks are in general well capitalized and hold a large cushion of equity capital as a protection against possible losses derived from negative economic shocks. Thus, capital is not perceived by market forces as a relevant source of IRR. On the other hand, it does not appear to exist a systematic relationship between the level of credit risk –measured through the loan loss reserves ratio– and the IRR borne by Spanish banks.
Finally, the estimated intercept is not statistically significant at the conventional levels. The R2 value of the model estimated is 32 per cent (29.34 per cent for the adjusted R2), indicating that the bank-specific characteristics considered are able to explain a non-trivial portion of the interest rate exposure of Spanish banks for the period of study.12 Furthermore, the F-statistic is significant at the 1% level.
11 The TOTCAP and PROV ratios have been used as substitutes for the CAP and RES ratios, respectively, in order to check for robustness, since they have similar meaning. However, the results obtained have not been significantly altered. 12 The adjusted R2 obtained in different papers on bank interest rate risk using cross-section data are comparatively much smaller than the one obtained in this study. To this regard, Saporoschenko (2002), Au Yong et al. (2007), and Haq (2007) obtain adjusted R2 values of 5.8, 16.32, and 7.0 per cent, respectively.
29
5. Concluding remarks
This paper provides a comprehensive study of the determinants of interest rate exposure of Spanish commercial banks over the period 1994-2006 using panel data techniques to control for bank heterogeneity. With that aim, based on previous literature and economic priors, a large set of bank-specific characteristics indicative of both off- and on-balance sheet activities have been considered.
The empirical analysis reveals several interesting findings. First, overall Spanish banks show a considerable degree of exposure to interest rate risk during the period of study, although the exposure pattern is not stable across banks and across time. In fact, the traditional profile of negative interest rate exposure consistent with the view of banks short-term borrowing and long-term lending, seems not to fulfil completely for the Spanish banking system, particularly during recent years. Furthermore, as expected, interest rate risk plays a secondary role in comparison with market risk. Second, it is documented that interest rate exposure is systematically related to some bank characteristics readily observable from basic financial statements. The bank size and the proportion of loans to total assets appear as the most important determinants of banks’ interest rate risk. On the one hand, a positive and highly significant relationship is found between bank size and interest rate exposure. This result seems to indicate that larger banks adopt riskier strategies, probably due to their operating advantages such as diversification or access to capital markets associated to their size, or even to their too big to fail status. On the other hand, banks that hold a great portion of assets in the form of loans present a higher exposure to interest rate risk due to the effect of widening the maturity mismatch between their assets and liabilities induced by the larger relative weight of loans.
Moreover, off-balance sheet activities are also positively and significantly linked with interest rate risk, suggesting that the usage of financial derivatives by Spanish banks is primarily driven by speculative purposes. An interesting implication of this result points out the adequacy of carefully monitor the use of derivative contracts due to their role as a potential source of additional systematic interest rate risk. In addition, banks that finance a large portion of their assets with deposits have lower exposure to interest rate risk, confirming the nature of deposits as a cheap and stable source of funding and the poor interest rate sensitivity of an important part of bank deposits. Finally, neither the equity capital nor the credit risk, seem to have a significant impact on the degree of banks’ interest rate exposure.
30

The knowledge of the underlying factors explaining bank’s interest rate exposure is particularly important for different economic agents. Good examples are bank managers, who want to adequately manage their interest rate risk; investors, concerned about the pricing of bank equities for purposes of asset allocation and hedging; and bank regulators, primarily interested about the assessment of systemic interest rate risk and the stability and soundness of the banking system.
31
References
Akella, S.R. and S.I. Greenbaum (1992): “Innovations in interest rates, duration transformation and bank stock returns”. Journal of Money, Credit and Banking 24, 27-42.
Au Yong, H.H., Faff, R. and Chalmers, K. (2007): “Derivative activities and Asia-Pacific banks’ interest rate and exchange rate exposures”. Journal of International Financial Markets, Institutions and Money, doi:10.1016/j.intfin.2007.08.2002
Bae, S.C., (1990): “Interest Rate Changes and Common Stock Returns of Financial Institutions”. Journal of Financial Research 13, 71-79.
Baltagi, B. (2001): “Econometric Analysis of Panel Data”. John Wiley & Sons. United Kingdgom.
Ballester, L., Ferrer, R. and González, C. (2008): “Determinants of interest rate exposure of Spanish commercial banks”. X Italian-Spanish Congress of Financial and Actuarial Mathematics. Venezia, Italy.
Bartram, S.M. (2002): “The Interest Rate Exposure of Nonfinancial Corporations”. European Finance Review, 6, 101-125.
Czaja, M., Scholz, H., and Wilkens, M. (2006): Interest Rate Risk of German Financial Institutions-The Impact of Level, Slope, and Curvature of the Term Structure. Working Paper, Ingolstadt School of Management. Available: http://papers.ssrn.com/sol3/papers.cfm?abstract_id=912239
Dinenis, E., and Staikouras, S.K. (1998): ”Interest rate changes and common stock returns of financial institutions: evidence from the UK”. European Journal of Finance, 2, 113-127.
Drakos, K. (2001): “Interest rate risk and bank common stock returns: Evidence from the Greek Banking sector”. Working Paper. London Guildhall University.
Elyasiani, E. and Mansur, I. (1998): “Sensitivity of the bank stock returns distribution to changes in the level and volatility of interest rate: A GARCH-M Model”. Journal of Banking and Finance, 22, 535-563.
32
Elyasiani, E. y Mansur, I. (2004): “Bank Stock Return Sensitivities to the Long-term and Short-term Interest Rate: A Multivariate GARCH Approach”. Managerial Finance, 30, 32-45.
Faff, R.W, Hodgson, A. y Kremmer, M.L. (2005): “An Investigation of the Impact of Interest Rates and Interest Rate Volatility on Australian Financial Sector Stock Return Distributions”. Journal of Business Finance & Accounting, 32, 1001-1032.
Faff, R.W. and Howard, P.F. (1999): “Interest rate risk of Australian financial sector companies in a period of regulatory change”. Pacific-Basin Finance Journal, 7,83-101.
Fama, E.F. (1975): “Short-term interest rates as predictors of inflation”. American Economic Review, 65, 269-282.
Fama, E.F. (1976): “Inflation Uncertainty and Expected Returns on Treasury Bills”. Journal of Political Economy, 34, 427-448.
Fama, E.F. and Gibbons, M. (1982): “Inflation, Real Returns, and Capital Investments”. Journal of Monetary Economics, 9, 297-324.
Flannery, M.J. and James, C.M. (1984): “The effect of interest rate changes on the common stock returns of financial institutions”. Journal of Finance, 39,1141-1153.
Fraser, D.R., Madura, J. and Weigand, R.A. (2002): “Sources of Bank Interest Rate Risk”. Financial Review, 37, 351-368.
French, K., Ruback, R. and Schwart, G. (1983): “Effects of Nominal Contracting on Stock Returns”. Journal of Political Economy, 91, 70-96.
Haq, M. (2007): “Factors determining bank risk: A European perspective”. Midwest Finance Association Conference.
Hirtle, B.J. (1997): “Derivatives, Portfolio Composition, and Bank Holding Company Interest Rate Risk Exposure”. Journal of Financial Services Research 12, 243-266.
Hsiao, C. (1986): “Analysis of data panel”. Cambridge University Press, New York.
33
Jareño, F. (2006): “Sensibilidad de los rendimientos sectoriales a tipos de interés reales e inflación”. Investigaciones Económicas, 30, 577-610.
Jareño, F. (2008): “Spanish stock market sensitivity to real interest and inflation rates: an extension of the Stone two-factor model with factors of the Fama and French three-factor model”. Applied Economics . Forthcoming.
Kessel, R. (1956): “Inflation-Caused Wealth Redistribution: A Test of a Hypothesis”. American Economic Review, 46, 128-141.
Kwan, S.H. (1991): “Re-examination of interest rate sensitivity of commercial bank stock returns using a random coefficient model”. Journal of Financial Services Research 5, 61-76.
Lynge, M.J. and Zumwalt, J.K. (1980): “An empirical study of the interest rate sensitivity of commercial bank returns: A multi-index approach”. Journal of Financial and Quantitative Analysis, 15, 731-742.
Madura, M. and Zarruk, E. (1995): “Bank exposure to interest rate risk: A global perspective”. Journal of Financial Research, 18, 1-13.
O’Neal, E.S. (1998): “Why electric utility stocks are sensitive to interest rates”. Financial Review, 33, 147-162.
Pasiouras, F. and Kosmidou, K. (2007): “Factors influencing the profitability of domestic and foreign commercial banks in the European Union”. Research in International Business and Finance, 21, 222-237.
Reichert, A., Shyu, Y. (2003): “Derivative activities and the risk of international banks: a market index and VaR approach”. International Review of Financial Analysis, 12, 489-511.
Reilly, F.K., Wright, D.J. and Johnson, R.R. (2007): “Analysis of the interest rate sensitivity of common stocks”. Journal of Portfolio Management, 33, 85-107.
Saporoschenko, A. (2002): “The sensitivity of Japanese bank stock returns to economic factors - An examination of asset/liability differences and main bank status”. Global Finance Journal, 13, 253-270.
34
Schrand, C.M. (1997): “The association between stock-price interest rate sensitivity and disclosure about derivative instruments”. The Accounting Review, 72, 87-109.
Soto, G.M., Ferrer, R. and Gonzalez, C. (2005): “Determinants of interest rate exposure of Spanish nonfinancial firms”. European Review of Economics and Finance, 4, 55-71.
Staikouras, S.K. (2003): “The interest rate risk exposure of financial intermediaries: A review of the theory and empirical evidence”. Financial Markets, Institutions and Instruments, 12, 257-289.
Stone, B.K. (1974): “Systematic interest rate risk in a two-index model of returns”. Journal of Financial and Quantitative Analysis, 9, 709-721.
Yourougou, P. (1990): “Interest-rate risk and the pricing of depository financial intermediary common stock”. Journal of Banking and Finance, 14, 803-820.
Zhao, F. y Moser, J. (2006): “Use of derivatives and bank holding company interest rate risk”. FMA Annual Meeting.
35
PUBLISHED ISSUES*
WP-EC 2008-01 “La orientación al mercado como determinante de la internacionalización de las
nuevas empresas” A. Blesa, M. Ripollés, D. Monferrer. March 2008.
WP-EC 2008-02 “El balance actuarial como indicador de la solvencia del sistema de reparto” M.C. Boado-Peñas, C. Vidal. March 2008.
WP-EC 2008-03 “La influencia de la cultura sobre la búsqueda de información. El caso de la vivienda para 'turismo residencial' en la Costa Blanca”. F.J. Sarabia, A. Kanther, J. F. Parra. April 2008.
WP-EC 2008-04 “Optimal CEO compensation and stock options”. A. Jarque. April 2008.
WP-EC 2008-05 “Un análisis bayesiano de la variación temporal del escenario de compra de los hogares”. C. Berné, P. Gargallo, N. Martínez, M. Salvador. May 2008.
WP-EC 2008-06 “Trade, tariffs and total factor productivity: the case of Spanish firms”. M. Dovis, J. Milgram-Baleix. May 2008.
WP-EC 2008-07 “The negative effects of failed service recoveries”. A.Casado, J. Nicolau, F. Mas. May 2008.
WP-EC 2008-08 “Short-term electricity futures prices: evidence on the time-varying risk premium”. J. Lucia, H. Torró. May 2008.
WP-EC 2008-09 “Wage, price and unemployment dynamics in the Spanish transition to EMU membership”. K. Juselius, J. Ordóñez. May 2008.
WP-EC 2008-10 “Determinantes de la divulgación de información previsional en España: un análisis de las empresas IBEX 35”. M.C. Abad, F. Bravo, M. Trombetta. July 2008.
WP-EC 2008-11 “Testing capital-skill complementarity across sectors in a panel of Spanish regions” F. Pérez-Sebastián. September 2008. WP-EC 2008-12 “Edad y tamaño empresarial y ciclo de vida financiero” J. Sánchez-Vidal, J.F. Martín-Ugedo. September 2008. WP-EC 2008-13 “The asymmetric effect of endowments on vertical intra-industrial trade” J. Milgram, A.I. Moro. October 2008. WP-EC 2008-14 “Health shocks, household consumption, and child nutrition” A. Galiano, M. Vera-Hernández. December 2008.
* Please contact Ivie's Publications Department to obtain a list of publications previous to 2008.
36

WP-EC 2009-01 “The effects of immigration on the productive structure of Spanish regions” J. Martín, G. Serrano, F. Requena. February 2009. WP-EC 2009-02 “Corporate governance and impression management in annual press releases” B. García, E. Guillamón-Saorín. March 2009. WP-EC 2009-03 “Factores determinantes de la salida a Bolsa en España” J.E. Farinós, V. Sanchis. April 2009. WP-EC 2009-04 “New challenges in competitiveness: knowledge development and coopetition” C. Camisón-Zornoza, M. Boronat-Navarro, A. Villar-López. April 2009. WP-EC 2009-05 “The determinants of net interest income in the Mexican banking system: an
integrated model” J. Maudos, L. Solís. April 2009. WP-EC 2009-06 “Explaining protectionism support: the role of economic factors” N. Melgar, J. Milgram-Baleix, M. Rossi. April 2009. WP-EC 2009-07 “Determinants of interest rate exposure of Spanish banking industry” L. Ballester, R. Ferrer, C. González, G.M. Soto. May 2009.
37

ecserie
IvieGuardia Civil, 22 - Esc. 2, 1º
46020 Valencia - SpainPhone: +34 963 190 050Fax: +34 963 190 055
Website: http://www.ivie.esE-mail: [email protected]