
International Money and Banking: 11. Long-Term Interest Rates
42
International Money and Banking: 11. Long-Term Interest Rates Karl Whelan School of Economics, UCD Spring 2020 Karl Whelan (UCD) Long-Term Interest Rates Spring 2020 1 / 42
-
Upload
khangminh22 -
Category
Documents
-
view
1 -
download
0
Transcript of International Money and Banking: 11. Long-Term Interest Rates

International Money and Banking:11. Long-Term Interest Rates
Karl Whelan
School of Economics, UCD
Spring 2020
Karl Whelan (UCD) Long-Term Interest Rates Spring 2020 1 / 42

Beyond Interbank Interest Rates
We have discussed how interest rates in short-term interbank markets arecontrolled by central banks.
These interbank rates receive a huge amount of attention. But economicallythey are not very important: The sums borrowed in these markets are smallwhen compared with the amounts borrowed by businesses and governmentsvia issuance of bonds or borrowing by households in the form of mortgages,car loans, credit card debt and so on.
In the euro area, where policy rates have been lowered to zero (and below)the most relevant interest rates are not zero.
Check out the “Selected Interest Rates” release on the Fed’s website. As ofMarch 6, the fed funds rate was 1.09%, one-year Treasury securities yielded0.38%, the ten-year Treasury bond yielded 0.74%. Elsewhere, you can findout that AAA-rated corporate bonds had an interest rate of 2.78% in Februaryand BAA-rated corporate bonds had an interest rate of 3.61%. The average30-year mortgage had an interest rate of 3.45%.
What accounts for the differences between all these interest rates? That’swhat we will be focusing on in the next few lectures.
Karl Whelan (UCD) Long-Term Interest Rates Spring 2020 2 / 42

Maturity, Default and Liquidity Risk
These debt instruments all have different interest rates for a reason. There arethree principal factors that influence the interest rate on a particular type ofdebt:
1 Maturity: How much time does the borrower have to pay back?Interbank loans are often overnight but most business and consumerloans are for terms of years.
2 Risk: Some types of debt (e.g. government bonds in certain countries)have very little risk of default. Others (mortgages, credit cards,corporate bonds) differ in the probability of default and in how much thelender will lose if there is a default.
3 Liquidity: Debt instruments differ in how easily they can be traded. Abond for which a liquid market does not exist will probably have to payout a higher interest rate to attract investors.
I will focus here on the first of these issues. We will look at how interest rateson assets with similar levels of risk and liquidity differ because of their varyingmaturity by focusing on the market for government bonds. I will discuss riskand liquidity later.
Karl Whelan (UCD) Long-Term Interest Rates Spring 2020 3 / 42

Part I
Bonds and Yields
Karl Whelan (UCD) Long-Term Interest Rates Spring 2020 4 / 42

What Is a Bond?
The interest rates we will focus on in this lecture will be the interest ratesassociated with bonds.
So what is a bond? Bonds are a form of IOU issued by governments orcorporations to people who provide them with money.
An investor agrees to provide the bond issuer (e.g. the government) with asum of money, say $100. This sum is called the principal.
In return, the bond issuer provides the investor with a bond certificate thatspecifies how the money will be repaid.
The terms of a bond contract specifies the length of time until the principal isrepaid. This is known as the maturity of the bond. It may be that the finalrepayment exceeds the initial principal provided.
It also specifies a schedule for potential interest payments to be made. Theseare sometimes called coupon payments
Bond certificates can generally be sold by the holder to other investors at anytime. Indeed, while the stock market gets a lot of attention, the global bondmarket is a far larger and more important one than the stock market.
Karl Whelan (UCD) Long-Term Interest Rates Spring 2020 5 / 42
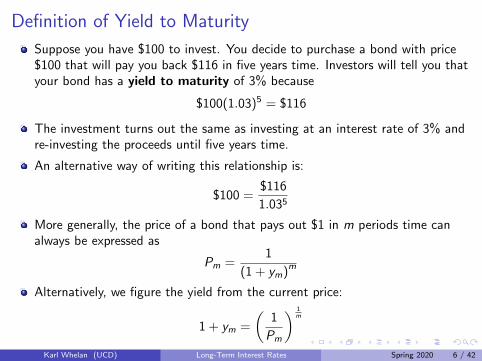
Definition of Yield to Maturity
Suppose you have $100 to invest. You decide to purchase a bond with price$100 that will pay you back $116 in five years time. Investors will tell you thatyour bond has a yield to maturity of 3% because
$100(1.03)5 = $116
The investment turns out the same as investing at an interest rate of 3% andre-investing the proceeds until five years time.
An alternative way of writing this relationship is:
$100 =$116
1.035
More generally, the price of a bond that pays out $1 in m periods time canalways be expressed as
Pm =1
(1 + ym)m
Alternatively, we figure the yield from the current price:
1 + ym =
(1
Pm
) 1m
Karl Whelan (UCD) Long-Term Interest Rates Spring 2020 6 / 42

Inverse Relationship Between Prices and Yields
Let’s still assume you’re still the guy who bought the bond that pays $116 infive years time.
Now suppose something happens in financial markets, so that the yield on allbonds has to rise to 4%.
If you had to sell your bond now, it’s price would have to be
$116
1.045= $95.34.
This increase in yields may have been good news for new investors who justarrived in the market looking for the best possible return.
But if you wanted to sell your bond today, it was bad news for you. The termsof your bond haven’t changed—it still only provides $116 in five yearstime—so to satisfy the new market-driven yield of 4%, you would have to sellyour bond today for less than the $100 you spent to acquire it.
Key Point: Bond prices and bond yields move in the opposite direction.
Karl Whelan (UCD) Long-Term Interest Rates Spring 2020 7 / 42

Coupon Bonds
The example just given involves a bond that only pays out when it matures infive years time. It doesn’t make interest coupon payments along the way. Thisis known as a zero-coupon bond.
What about bonds that make interest coupon payments? One can calculatethe yield for these bonds by viewing them simply as a series of zero-couponbonds bundled together.
For example, consider a bond that makes interest payments of C every periodfor ten years and then pays out F in the tenth year. We calculate the yield ofthe bond as the y that makes the following equation hold
P =C
1 + y+
C
(1 + y)2+
C
(1 + y)3+ ...+
C
(1 + y)10+
F
(1 + y)10
For most bonds, the final payment at maturity and the amount of thecoupons don’t change. However, the yield does change as bond prices moveup or down.
The yield is thus a simple summary statistic that you can use to summarisethe rate of return you can get from different types of bonds, whether they paycoupons or not.
Karl Whelan (UCD) Long-Term Interest Rates Spring 2020 8 / 42

Section C Examples: Bond PricingA bond will pay a $10 coupon payment next year and then for four more yearsafter that. In the fifth year, the bond will also return a final payment of $100.The bond’s yield is currently 4 percent. Show how to calculate the current priceof the bond.
In this case, the relevant formula is
P =C
1 + y+
C
(1 + y)2+
C
(1 + y)3+ +
C
(1 + y)4+
C
(1 + y)5+
F
(1 + y)5
Plugging in C = 10, F = 100 and y = 0.04, we get
P =10
1.04+
10
(1.04)2+
10
(1.04)3+
10
(1.04)4+
10
(1.04)5+
100
(1.04)5
Karl Whelan (UCD) Long-Term Interest Rates Spring 2020 9 / 42

Section C Examples: More Bond Pricing
A bond will make identical coupon payments next year and then for four moreyears after that. In the fifth year, the bond will also return a final payment of$100. Currently, the bond’s price is $120 and its yield is currently 4 percent.Show how to calculate the value of the annual coupon payments.
In this case, the relevant formula is
P =C
1 + y+
C
(1 + y)2+
C
(1 + y)3+ +
C
(1 + y)4+
C
(1 + y)5+
F
(1 + y)5
Plugging in P = 120, F = 100 and y = 0.04, we get
120 =C
1.04+
C
(1.04)2+
C
(1.04)3+
C
(1.04)4+
C
(1.04)5+
100
(1.04)5
⇒ C =
(120− 100
(1.04)5
)(1
1.04+
1
(1.04)2+
1
(1.04)3+
1
(1.04)4+
1
(1.04)5
)−1
Karl Whelan (UCD) Long-Term Interest Rates Spring 2020 10 / 42

Section C Examples: Zero Coupon Bonds
A zero coupon bond will pay out $100 five years from now. Its yield is currently 2percent. Show how to calculate the current price of the bond.
In this case, the formula is just
P =F
(1 + y)5=
100
1.025
A zero coupon bond currently has a price of $100. It will make its only paymentfive years from now. Its yield is currently 3 percent. Show how to calculate thebond’s final payment.
Again the formula is
P =F
(1 + y)5⇒ 100 =
F
1.035⇒ F = 100 ∗ 1.035
Karl Whelan (UCD) Long-Term Interest Rates Spring 2020 11 / 42

Spreadsheet ExamplesOn the website, I have linked to a spreadsheet that illustrates four differentexamples of bond yields, coupons and prices.
Excerpts from the spreadsheet are shown in the next few pages.
1 The first excerpt shows prices for bonds with an annual interest paymentof 3 and a final principle repayment of 100. The market yield is 3percent – this means all the bonds are priced equal to 100.
2 Then we show what happens to these bonds when market yields fall to 2percent. Bond prices rise, with the gains getting bigger as the maturityof the bonds increase.
3 The NTMA publishes a daily report on Irish government bonds. The lasttwo examples illustrate two of these bonds, as priced on October 29,2019.
F The bond maturing in October 2022 bond pays no interest coupons, hasa yield is -0.48 percent and a price of 101.47
F The bond maturing in May 2029 maturity (9.5 years), pays a coupon of1.1% has a yield is 0.08 percent and a price of 109.77
Karl Whelan (UCD) Long-Term Interest Rates Spring 2020 12 / 42

Example: Coupon Payments of 3%, Market Yield of 3%
Karl Whelan (UCD) Long-Term Interest Rates Spring 2020 13 / 42

Example: Coupon Payments of 3%, Market Yield of 2%
Karl Whelan (UCD) Long-Term Interest Rates Spring 2020 14 / 42

Irish 2022 Bond Example
Karl Whelan (UCD) Long-Term Interest Rates Spring 2020 15 / 42

Irish 2029 Bond Example
Karl Whelan (UCD) Long-Term Interest Rates Spring 2020 16 / 42

The Yield Curve
A nice way to summarise information about the yields available on bonds thathave different maturities (i.e. that differ according to when their final payoutoccurs) is to chart the different yields on the y -axis while charting thematurity on the x-axis.
This line in this kind of chart is known as “The Yield Curve” and financialmarket participants pay close attention to it.
Getting information on yields on government bonds is really easy.
Type “Yield Curve” into Google and you’ll find information on the yields atvarious maturities for Europe from the ECB and for the US from the USTreasury.
The next page shows a screencap of information from the ECB’s yield curvepage which shows yields for AAA-rated euro area government bond.
The pages after uses longer historical data to illustrate various yield curvesover time. Notice how the pre-crisis 2007 curve looked so different to curvesfrom recent years.
Karl Whelan (UCD) Long-Term Interest Rates Spring 2020 17 / 42
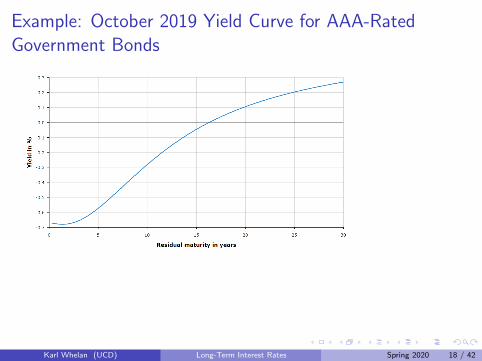
Example: October 2019 Yield Curve for AAA-RatedGovernment Bonds
Karl Whelan (UCD) Long-Term Interest Rates Spring 2020 18 / 42

Example: March 2020 Yield Curve for AAA-RatedGovernment Bonds
Karl Whelan (UCD) Long-Term Interest Rates Spring 2020 19 / 42

Pre-Crisis Euro Area AAA Yield Curves
Karl Whelan (UCD) Long-Term Interest Rates Spring 2020 20 / 42
Why Would Anyone Hold a Bond With a Negative Yield?
A look at the current yield curve for AAA-rated sovereign bonds showssomething strange: Yields on these bonds with maturities up to over 15 yearshave negative yields, meaning you will lose money by investing in them.
Why would anyone ever purchase such a bond? After all, you could just keepyour money in cash and get a return of zero.
For some European countries (e.g. Sweden and Denmark) people may expectthe currencies these bonds are denominated in to increase in value, so thereturn denominated in euros will not be negative.
For bonds like German government bonds, a few factors determine thenegative yields.
1 Banks may see these bond purchases as an alternative to keeping moneyon deposit with ECB, which ECB now charges for. A slightly lessnegative yielding bond might be a better alternative.
2 Financial institutions could keep large amounts of cash but there arestorage and security costs associated with storing billions of euros. Andcriminal masterminds might figure out ways of stealing enormousamounts of money kept in storage, which may not be a risk worth taking.
Karl Whelan (UCD) Long-Term Interest Rates Spring 2020 21 / 42

The Market for US Treasury Bonds
Much of the research on the behaviour of long-term interest rates has focusedon the market for US Treasury securities.
The US government borrows from financial markets, issuing bonds that mayoff at lots of different maturities: Short-horizons such as one to three monthsand long horizons such as ten to thirty years.
The market for these securities is enormous and highly liquid and because thedefault risk for the US government is considered to be low, you don’t have totake this factor into account.
This means that we can ignore the risk and liquidity factors and look purely athow maturity affects the interest rate on an asset.
Treasuries are of interest beyond being a useful learning tool. They are a keybenchmark for investments denominated in US dollars: They provide analternative to lending over similar maturities to corporations or mortgagelenders and thus influence those rates.
The next page shows US Treasury yield curves in the same date over the pastthree years.
Karl Whelan (UCD) Long-Term Interest Rates Spring 2020 22 / 42

Yield Curves from 2018, 2019 and 2020
Karl Whelan (UCD) Long-Term Interest Rates Spring 2020 23 / 42

How Short- and Long-Term Bonds Move Together
Karl Whelan (UCD) Long-Term Interest Rates Spring 2020 24 / 42
Bond Market Stylized Facts
1 Rates on longer-term bonds are usually higher than shorter-term bonds (i.e.yield curve usually slopes upwards.) Remember, the blue line for the ten-yearinterest rate was almost always higher than the black line for the one-year rate.
2 Short and long rates often move in the same direction and interest rates onboth short-term and long-term bonds are much lower today than in the late1970s and early 1980s.
3 But short rates are more variable than long rates.
4 Short rates tend to draw close to long rates before and at the start of arecession and then the gap tends to widen again. In other words, the yieldcurve tends to flatten out just before recessions.
Karl Whelan (UCD) Long-Term Interest Rates Spring 2020 25 / 42

Part II
The Expectations Theory
Karl Whelan (UCD) Long-Term Interest Rates Spring 2020 26 / 42

Why Do Yields Differ by Maturity?
Going back to the data from the Selected Interest Rates page, the one-yearUS Treasury bond has a current yield of 0.38% while the ten-year bond has ayield of 0.74%. You might think, at first look, that this means that you shoulddefinitely choose to buy the ten-year bond instead of the one-year bondbecause it’s a better deal.
However, that’s not necessarily the case. After the one-year bond hasmatured, you can buy another one-year bond next year, and then another theyear after. And yields on one-year bonds may go up in the future.
It might be that this strategy—buying ten one-year bonds in a row—is just asprofitable as buying a single ten-year bond now.
Indeed, if investors really all thought that one type of bond strategy was muchmore profitable than another, then they’d all sell bonds associated with thebad strategy to buy the bonds associated with the good strategy. This woulddrive down the price of the bad-strategy bonds until the point where investorswere indifferent.
This idea—that yields differ so as to make each investment strategy equallyattractive—underlies what is called the expectations theory of the termstructure.
Karl Whelan (UCD) Long-Term Interest Rates Spring 2020 27 / 42
Introducing The Expectations Theory
Suppose you have a choice between two different strategies for investing overtwo periods:
1 Invest today at a fixed interest rate of i2t per period.2 Invest today for one period at an interest rate of i1t , and then re-invest
at next period’s one-year rate of i1,t+1.
For the two-period rate to be worth taking up, these two strategies must havethe same expected return.
Two period bond has cumulative return (1 + i2t)2 = 1 + 2i2t + i22t
Rollover strategy has expected cumulative return(1 + i1t) (1 + Et i1,t+1) = 1 + i1t + Et i1,t+1 + i1t (Et i1,t+1).
For normal interest rates, both i22t and i1t (Et i1,t+1) will be negligible.
So, theory implies
i2t =1
2(i1t + Et i1,t+1)
The two-year rate is an average of the current one-year rate and the one-yearrate expected a year from now.
Karl Whelan (UCD) Long-Term Interest Rates Spring 2020 28 / 42

General Formulation of the Expectations Theory
One can apply this argument beyond two periods. So, the three period bondrate should be
i3t =1
3(i1t + Et i1,t+1 + Et i1,t+2)
and the four-period bond rate should be
i4t =1
4(i1t + Et i1,t+1 + Et i1,t+2 + Et i1,t+3)
and the n-period bond rate should be
int =1
nEt
n−1∑k=0
i1,t+k
The return on an n-period bond should equal the average of the return onone-period bonds over the n periods starting today.
According to this theory, an upward-sloping yield curve must mean thatinvestors expect future short-term rates to be higher than today’s short-termrate.
A downward-sloping yield curve would mean that investors think thatshort-term rates are going to decline in the future.
Karl Whelan (UCD) Long-Term Interest Rates Spring 2020 29 / 42

Section C Examples: The Expectations TheoryThis year’s one-year Treasury bond has a yield of 2 percent. Markets expect theone-year bond yield to rise to 4 percent next year. What does the expectationstheory predict the two-year bond yield should be now?
In this case, the formula is just
i2t =1
2(i1t + Et i1,t+1) =
1
2(2 + 4) = 3
The two-year bond should have a yield of 3 percent.
The one-year Treasury bond has a yield of 2 percent and the two-year Treasurybond has a yield of 1.5 percent. What does the expectations theory say aboutwhat financial markets expect the one-year yield to be next year?
Again, we use the same formula.
i2t =1
2(i1t + Et i1,t+1)⇒ 1.5 =
1
2(2 + Et i1,t+1)
Et i1,t+1 = 2 ∗ 1.5− 2 = 1
Markets expect the yield on the one-year bond to fall to 1 percent.
Karl Whelan (UCD) Long-Term Interest Rates Spring 2020 30 / 42

Section C Examples: The Expectations TheoryA five-year Treasury bond has a yield of 3 percent. The three-year Treasury bondhas a yield of 2 percent. What does the expectations theory predict for thetwo-year bond yield three years from now?
The three-year and five-year bond yields should be given by
i3t =1
3(i1t + Et i1,t+1 + Et i1,t+2)
i5t =1
5(i1t + Et i1,t+1 + Et i1,t+2 + Et i1,t+3 + Et i1,t+4)
The market will expect the two-year bond yield in three years time to be givenby
Et i2,t+3 =1
2(Et i1,t+3 + Et i1,t+4)
Putting these together, we get
i5t =3
5i3t +
2
5Et i2,t+3 ⇒ 3 =
3
5(2) +
2
5Et i2,t+3
Et i2,t+3 =5
2
(3− 6
5
)= 4.5
Karl Whelan (UCD) Long-Term Interest Rates Spring 2020 31 / 42

Explaining Some Facts with the Expectations TheoryThe expectations theory helps to explain some of the facts we describedearlier:
1 Long rates depend on current and expected future short rates, so if shortrates are trending in one direction, we would expect long rates to also goin that direction: This explains why rates often move together.
2 But longer rates depend on expected short rates that may be far in thefuture. Today’s developments may have little effect on theseexpectations: Explains why long rates move less than short rates.
3 If people expect a recession, they will expect the central bank to cutinterest rates. This can make long-term rates go down even if short-termrates have not yet been cut. This explains why the shape of the yieldcurve tends to change dramatically around recessions. More on this later.
But the theory does not explain why yield curve usually slopes up: We cannotalways be expecting short rates to rise.
Karl Whelan (UCD) Long-Term Interest Rates Spring 2020 32 / 42

Implications for the Transmission of Monetary Policy
Rates on longer-term government bonds have a key influence on mortgagerates, corporate debt, etc. For instance, the ten-year Treasury rate is used asa benchmark for US fixed-rate mortgages.
We can now see how monetary policy can influence these rates.
1 Central banks control overnight interest rates.2 One week interest rates will be an average of the next week’s expected
overnight rates.3 One-month interest rates will be an average of the expected one-week
interest rates over the next few weeks.4 One-year interest rates will be an average of the expected one-month
interest rates over the next twelve months.5 Ten-year interest rates will be an average of the expected one-year
interest rates over the next ten years.
Via this set of linkages, the expectations theory explains how the central bankinfluences all interest rates, not just the overnight interbank rate: All“risk-free” interest rates depend on investor expectations for averageovernight rates over the maturity of the bond.
Karl Whelan (UCD) Long-Term Interest Rates Spring 2020 33 / 42

Monetary Policy and Expectations Management
The expectations theory helps to explain why central banks are so careful intheir communications with the public.
They control a particular interest rate, but one that accounts for only a tinyfraction of total borrowing. And the linkage between this rate and many ofthe rates that matter depends on expectations of what the central bank willdo in the future. Hence, central banks are very careful in theircommunications, so financial markets will set longer-term rates in line withwhere they want them to be.
For instance, for a number of years after 2008, FOMC statements signalledthe fed funds rate would be kept near zero for some time, with the aim beingto keep longer term interest rates down.
More recently, the Fed has cut interest rates twice in 2019 and are offeringlimited forward guidance, indicating only that “the Committee will assessrealized and expected economic conditions relative to its maximumemployment objective and its symmetric 2 percent inflation objective. Thisassessment will take into account a wide range of information ...”
Karl Whelan (UCD) Long-Term Interest Rates Spring 2020 34 / 42

Part III
Term Premia
Karl Whelan (UCD) Long-Term Interest Rates Spring 2020 35 / 42

Term Premia
Recall the expectations theory
int =1
nEt
n∑k=0
i1,t+k
Yield curve should only slope upwards if markets expect that short-terminterest rates will be increasing.
But the yield curve almost always slopes up: Markets cannot always beexpecting short rates to be increasing!
Alternative: Adapt the model to allow for a positive term premium
int = µn +1
nEt
n∑k=0
i1,t+k
where µn > µn−1.
Term premia may vary over time. In this case, the model is
int = µnt +1
nEt
n∑k=0
i1,t+k
Karl Whelan (UCD) Long-Term Interest Rates Spring 2020 36 / 42

Yields, Bond Prices, and Bond Returns
For simplicity, consider a world in which the yield curve is flat, so the yield onall maturities is the same.
Consider a two-year bond issued today, paying $1000 in two years, sellingtoday for $942 = $1000
(1.03)2.
The yield on this bond is 3%. If yields don’t change, the bond will be worth$971 = $1000
1.03 next year, for a return of 3%.
Suppose that at the end of one year, yields on all newly-issued bonds havejumped to 10%.
The existing bond, with one year to run, can only be sold if it also provides a10% return, so its price must change to $909 = $1000
1.10 . The seller hasincurred a one-year return of -3.4%.
Think that’s bad? A ten-year bond bought last year for $744 = $1000(1.03)10
is now
worth only $424 = $1000(1.1)9
, a one-year return of -43%.
Karl Whelan (UCD) Long-Term Interest Rates Spring 2020 37 / 42

Comparing the Riskiness of Short- and Long-Term Bonds
Now let’s compare the riskiness of long- and short-term bonds.
In favour of long-term bonds:
1 Most investors have a long-term horizon and over that horizon thesebonds provide a guaranteed return. Remember, in our example, the bondis guaranteed to pay $1000 at the maturity.
2 They turn out to be a good investment if interest rates decline in thefuture.
Against long-term bonds:
1 Their value is very sensitive to changes in interest rates. While risk-freeif held to maturity, they are very risky investments for those with shorthorizons or those who may sometimes have to liquidate assets quickly.
2 The guaranteed payout is usually nominal, so they will turn out to be abad investment if inflation is higher than expected. In contrast, interestrates on short-term bonds will tend to rise with inflation, so a “rollover”strategy has less inflation risk.
On balance, these latter points appear to dominate most of the time, so theyield curve usually slopes upwards.
Karl Whelan (UCD) Long-Term Interest Rates Spring 2020 38 / 42

Comparing the Riskiness of Short- and Long-Term Bonds
Now let’s compare the riskiness of long- and short-term bonds.
In favour of long-term bonds:
1 Most investors have a long-term horizon and over that horizon thesebonds provide a guaranteed return. Remember, in our example, the bondis guaranteed to pay $1000 at the maturity.
2 They turn out to be a good investment if interest rates decline in thefuture.
Against long-term bonds:
1 Their value is very sensitive to changes in interest rates. While risk-freeif held to maturity, they are very risky investments for those with shorthorizons or those who may sometimes have to liquidate assets quickly.
2 The guaranteed payout is usually nominal, so they will turn out to be abad investment if inflation is higher than expected. In contrast, interestrates on short-term bonds will tend to rise with inflation, so a “rollover”strategy has less inflation risk.
On balance, these latter points appear to dominate most of the time, so theyield curve usually slopes upwards.
Karl Whelan (UCD) Long-Term Interest Rates Spring 2020 39 / 42

The Yield Curve as an Indicator of Recessions
The simple version of the expectations theory says that when the yield curveslopes up, it means that people expect interest rates to rise in the future andwhen it slopes down they expect interest rates to fall.
Once you factor in term premia, things are not so simple. The yield curveusually slopes upwards and it rarely is flat or downward-sloping.
But if the yield curve is flat to downward-sloping that means thatexpectations of declining future short-term rates are strong enough toovercome the term premia factor and stop the yield curve from sloping us.
This means that a downward-sloping yield curve (sometimes called an invertedyield curve) is a strong sign that financial markets think short-term rates aregoing to decline.
This may be because financial markets think there is going to be a recession.As you can see from the next graph, the ten-year Treasury yield being close toor below the one-year yield has regularly been an indicator that there will be arecession (as indicated by the shaded recession bars).
The recent behaviour of the yield curve is consistent with markets expecting arecession soon.
Karl Whelan (UCD) Long-Term Interest Rates Spring 2020 40 / 42

Yield Curve “Inversion” Usually Signals a Recession
Karl Whelan (UCD) Long-Term Interest Rates Spring 2020 41 / 42

Recap: Key Points from Part 11Things you need to understand from these notes:
1 The 3 characteristics that affect interest rates on debt instruments.
2 Definition of a bond and its associated terminology.
3 Definition of yield to maturity.
4 Relationship between bond prices and bond yields.
5 How coupon-paying bonds are priced.
6 What is meant by the term structure and what the yield curve is.
7 Basic facts about movements in short and long-term interest rates.
8 Definition of the expectations theory.
9 What the expectations theory explains and what it doesn’t.
10 Definition of term premium.
11 Factors affecting the riskiness of short and long-term bonds.
12 Yield curve inversion as a signal of recession.
Karl Whelan (UCD) Long-Term Interest Rates Spring 2020 42 / 42