Makhado - Municipal Money
15
+ - Leaflet | Map data © OpenStreetMap contributors, CC-BY-SA
-
Upload
khangminh22 -
Category
Documents
-
view
0 -
download
0
Transcript of Makhado - Municipal Money
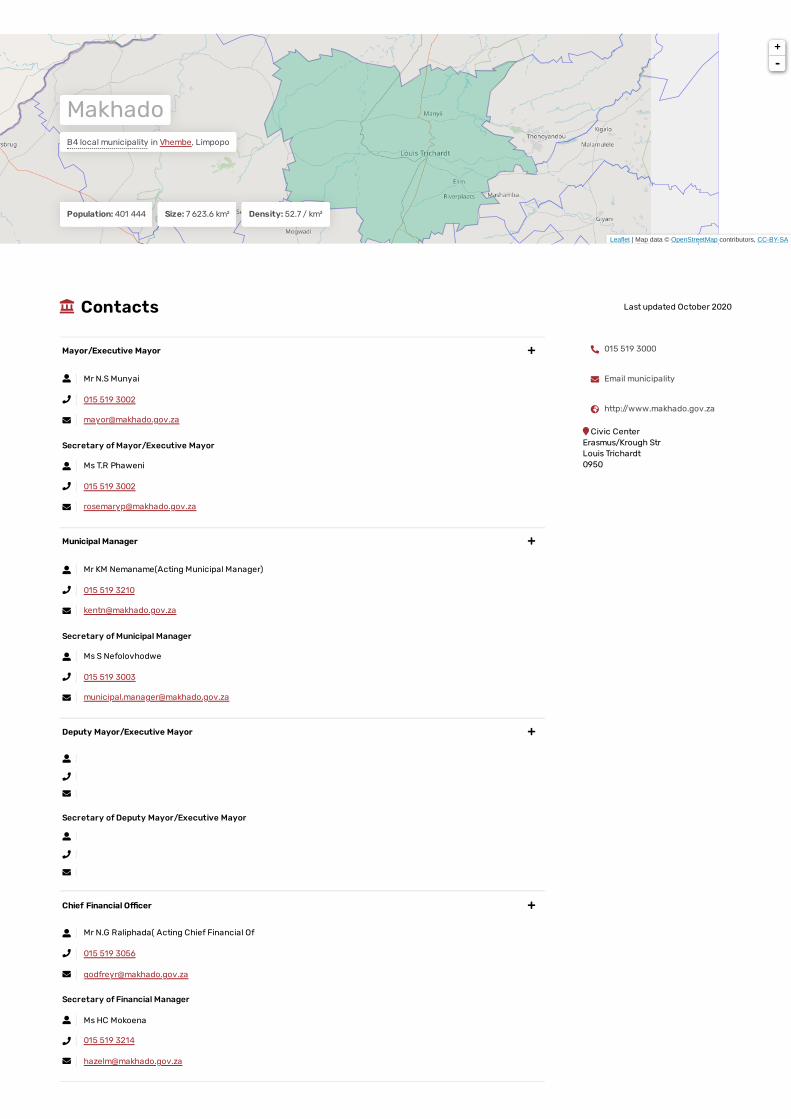
Makhado
in Vhembe, LimpopoB4 local municipality
Population: 401 444 Size: 7 623.6 km² Density: 52.7 / km²
+
-
Leaflet | Map data © OpenStreetMap contributors, CC-BY-SA
Contacts Last updated October 2020
Civic Center
Erasmus/Krough Str
Louis Trichardt
0950
Secretary of Mayor/Executive Mayor
Mayor/Executive Mayor
Mr N.S Munyai
015 519 3002
Ms T.R Phaweni
015 519 3002
Secretary of Municipal Manager
Municipal Manager
Mr KM Nemaname(Acting Municipal Manager)
015 519 3210
Ms S Nefolovhodwe
015 519 3003
Secretary of Deputy Mayor/Executive Mayor
Deputy Mayor/Executive Mayor
Secretary of Financial Manager
Chief Financial O�cer
Mr N.G Raliphada( Acting Chief Financial Of
015 519 3056
Ms HC Mokoena
015 519 3214
015 519 3000
Email municipality
http://www.makhado.gov.za
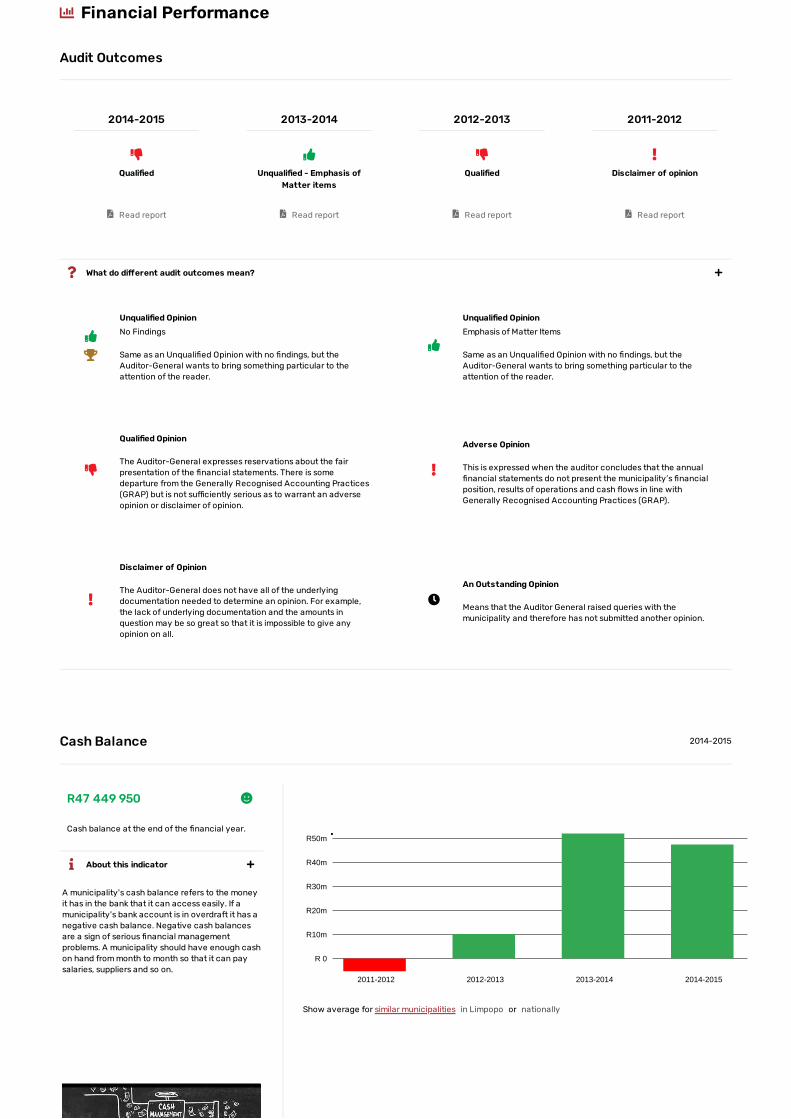
Financial Performance
Audit Outcomes
Cash Balance 2014-2015
Cash balance at the end of the �nancial year.
2011-2012 2012-2013 2013-2014 2014-2015
R 0
R10m
R20m
R30m
R40m
R50m
Show average for similar municipalities or
2014-2015
Quali�ed
Read report
2013-2014
Unquali�ed - Emphasis of
Matter items
Read report
2012-2013
Quali�ed
Read report
2011-2012
Disclaimer of opinion
Read report
What do di�erent audit outcomes mean?
Unquali�ed Opinion
No Findings
Same as an Unquali�ed Opinion with no �ndings, but the
Auditor-General wants to bring something particular to the
attention of the reader.
Unquali�ed Opinion
Emphasis of Matter Items
Same as an Unquali�ed Opinion with no �ndings, but the
Auditor-General wants to bring something particular to the
attention of the reader.
Quali�ed Opinion
The Auditor-General expresses reservations about the fair
presentation of the �nancial statements. There is some
departure from the Generally Recognised Accounting Practices
(GRAP) but is not su�ciently serious as to warrant an adverse
opinion or disclaimer of opinion.
Adverse Opinion
This is expressed when the auditor concludes that the annual
�nancial statements do not present the municipality’s �nancial
position, results of operations and cash �ows in line with
Generally Recognised Accounting Practices (GRAP).
Disclaimer of Opinion
The Auditor-General does not have all of the underlying
documentation needed to determine an opinion. For example,
the lack of underlying documentation and the amounts in
question may be so great so that it is impossible to give any
opinion on all.
An Outstanding Opinion
Means that the Auditor General raised queries with the
municipality and therefore has not submitted another opinion.
R47 449 950
A municipality's cash balance refers to the money
it has in the bank that it can access easily. If a
municipality's bank account is in overdraft it has a
negative cash balance. Negative cash balances
are a sign of serious �nancial management
problems. A municipality should have enough cash
on hand from month to month so that it can pay
salaries, suppliers and so on.
About this indicator
in Limpopo nationally
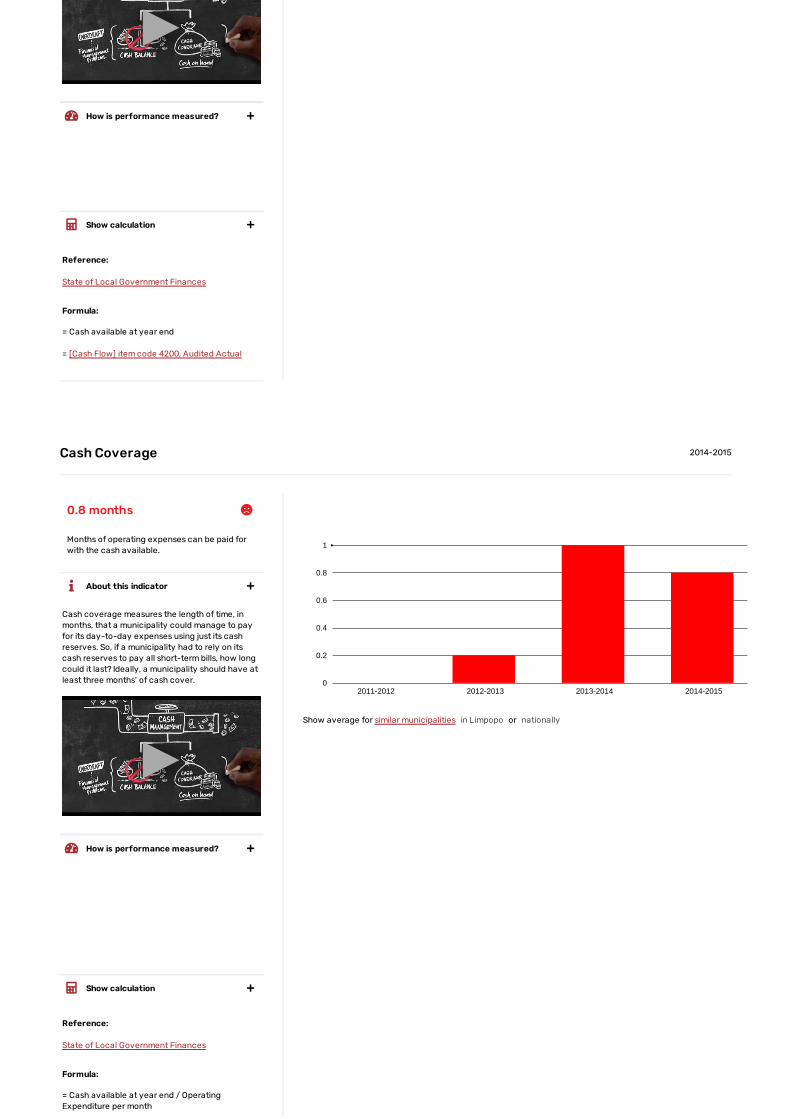
Cash Coverage 2014-2015
Months of operating expenses can be paid for
with the cash available.
2011-2012 2012-2013 2013-2014 2014-20150
0.2
0.4
0.6
0.8
1
Show average for similar municipalities or
▶▶
How is performance measured?
Good Positive balance
Bad Negative balance
Reference:
State of Local Government Finances
Formula:
= Cash available at year end
= [Cash Flow] item code 4200, Audited Actual
Show calculation
0.8 months
Cash coverage measures the length of time, in
months, that a municipality could manage to pay
for its day-to-day expenses using just its cash
reserves. So, if a municipality had to rely on its
cash reserves to pay all short-term bills, how long
could it last? Ideally, a municipality should have at
least three months' of cash cover.
▶▶
About this indicator
How is performance measured?
Good > 3 months
Average 1-3 months
Bad < 1 month
Reference:
State of Local Government Finances
Formula:
= Cash available at year end / Operating
Expenditure per month
Show calculation
in Limpopo nationally
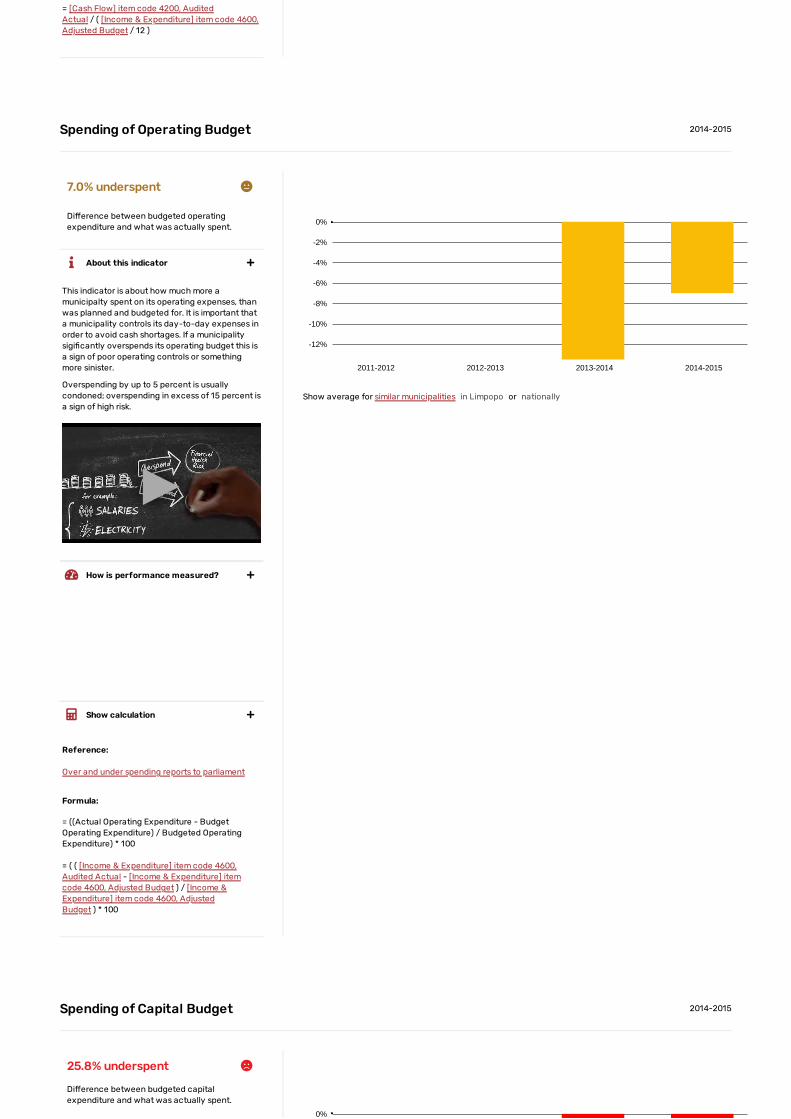
Spending of Operating Budget 2014-2015
Di�erence between budgeted operating
expenditure and what was actually spent.
2011-2012 2012-2013 2013-2014 2014-2015
-12%
-10%
-8%
-6%
-4%
-2%
0%
Show average for similar municipalities or
Spending of Capital Budget 2014-2015
Di�erence between budgeted capital
expenditure and what was actually spent.
0%
= [Cash Flow] item code 4200, Audited
Actual / ( [Income & Expenditure] item code 4600,
Adjusted Budget / 12 )
7.0% underspent
This indicator is about how much more a
municipalty spent on its operating expenses, than
was planned and budgeted for. It is important that
a municipality controls its day-to-day expenses in
order to avoid cash shortages. If a municipality
sigi�cantly overspends its operating budget this is
a sign of poor operating controls or something
more sinister.
Overspending by up to 5 percent is usually
condoned; overspending in excess of 15 percent is
a sign of high risk.
▶▶
About this indicator
How is performance measured?
Good 0% - 5%
Average 5% - 15%
Bad > 15%
Reference:
Over and under spending reports to parliament
Formula:
= ((Actual Operating Expenditure - Budget
Operating Expenditure) / Budgeted Operating
Expenditure) * 100
= ( ( [Income & Expenditure] item code 4600,
Audited Actual - [Income & Expenditure] item
code 4600, Adjusted Budget ) / [Income &
Expenditure] item code 4600, Adjusted
Budget ) * 100
Show calculation
in Limpopo nationally
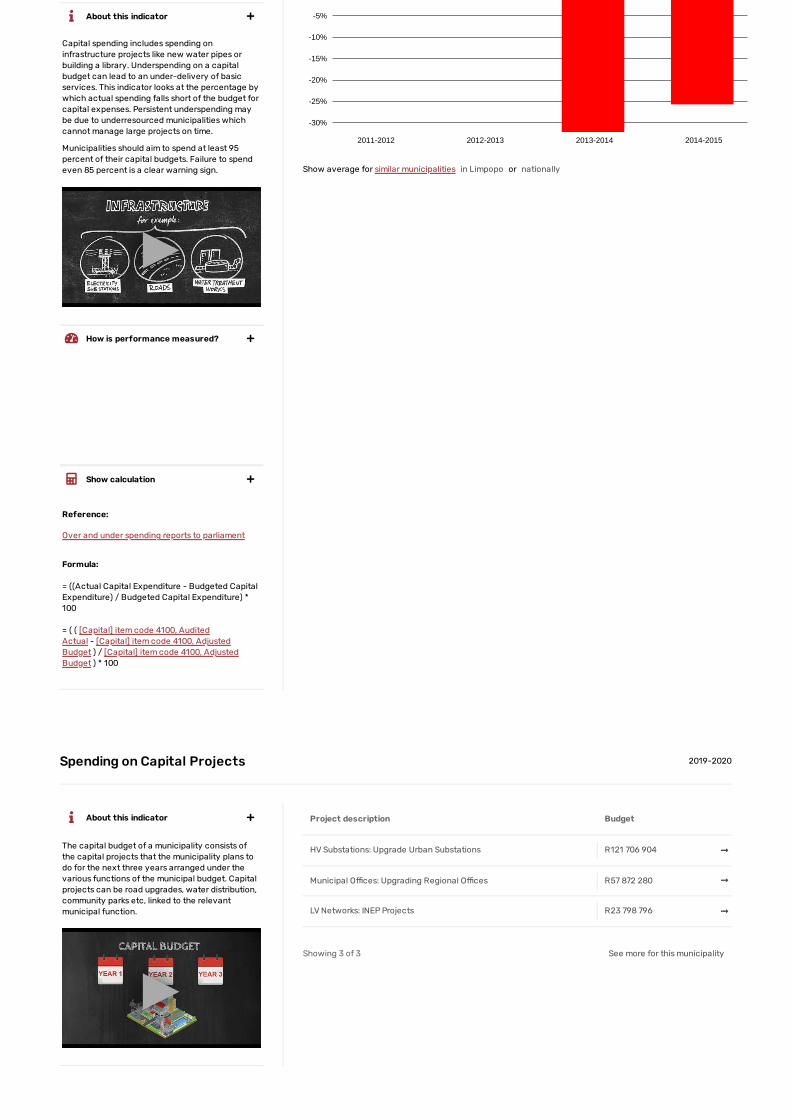
25.8% underspent
2011-2012 2012-2013 2013-2014 2014-2015
-30%
-25%
-20%
-15%
-10%
-5%
Show average for similar municipalities or
Spending on Capital Projects 2019-2020
Capital spending includes spending on
infrastructure projects like new water pipes or
building a library. Underspending on a capital
budget can lead to an under-delivery of basic
services. This indicator looks at the percentage by
which actual spending falls short of the budget for
capital expenses. Persistent underspending may
be due to underresourced municipalities which
cannot manage large projects on time.
Municipalities should aim to spend at least 95
percent of their capital budgets. Failure to spend
even 85 percent is a clear warning sign.
▶▶
About this indicator
How is performance measured?
Good 0% - 5%
Average 5% - 15%
Bad > 15%
Reference:
Over and under spending reports to parliament
Formula:
= ((Actual Capital Expenditure - Budgeted Capital
Expenditure) / Budgeted Capital Expenditure) *
100
= ( ( [Capital] item code 4100, Audited
Actual - [Capital] item code 4100, Adjusted
Budget ) / [Capital] item code 4100, Adjusted
Budget ) * 100
Show calculation
in Limpopo nationally
The capital budget of a municipality consists of
the capital projects that the municipality plans to
do for the next three years arranged under the
various functions of the municipal budget. Capital
projects can be road upgrades, water distribution,
community parks etc, linked to the relevant
municipal function.
▶▶
About this indicator Project description Budget
HV Substations: Upgrade Urban Substations R121 706 904
Municipal O�ces: Upgrading Regional O�ces R57 872 280
LV Networks: INEP Projects R23 798 796
Showing 3 of 3 See more for this municipality
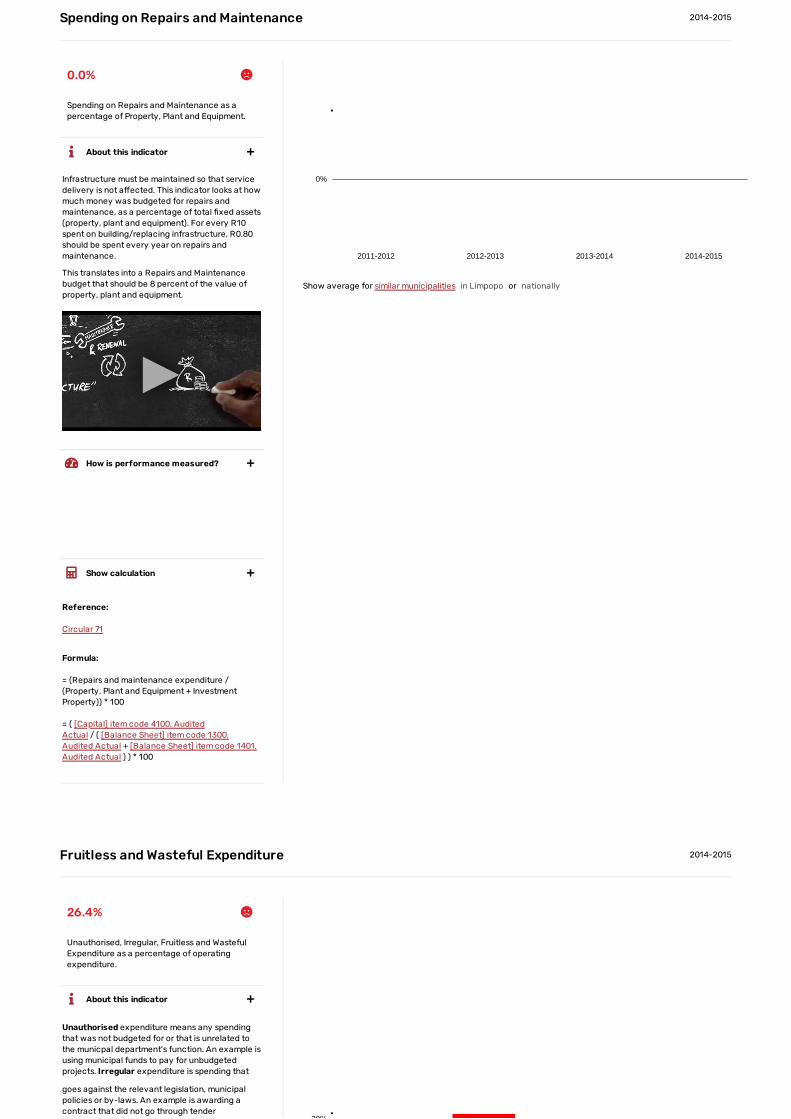
Spending on Repairs and Maintenance 2014-2015
Spending on Repairs and Maintenance as a
percentage of Property, Plant and Equipment.
2011-2012 2012-2013 2013-2014 2014-2015
0%
Show average for similar municipalities or
Fruitless and Wasteful Expenditure 2014-2015
Unauthorised, Irregular, Fruitless and Wasteful
Expenditure as a percentage of operating
expenditure.
30%
0.0%
Infrastructure must be maintained so that service
delivery is not a�ected. This indicator looks at how
much money was budgeted for repairs and
maintenance, as a percentage of total �xed assets
(property, plant and equipment). For every R10
spent on building/replacing infrastructure, R0.80
should be spent every year on repairs and
maintenance.
This translates into a Repairs and Maintenance
budget that should be 8 percent of the value of
property, plant and equipment.
▶▶
About this indicator
How is performance measured?
Good > 8%
Bad < 8%
Reference:
Circular 71
Formula:
= (Repairs and maintenance expenditure /
(Property, Plant and Equipment + Investment
Property)) * 100
= ( [Capital] item code 4100, Audited
Actual / ( [Balance Sheet] item code 1300,
Audited Actual + [Balance Sheet] item code 1401,
Audited Actual ) ) * 100
Show calculation
in Limpopo nationally
26.4%
Unauthorised expenditure means any spending
that was not budgeted for or that is unrelated to
the municpal department's function. An example is
using municipal funds to pay for unbudgeted
projects. Irregular expenditure is spending that
goes against the relevant legislation, municipal
policies or by-laws. An example is awarding a
contract that did not go through tender
About this indicator

2011-2012 2012-2013 2013-2014 2014-20150%
5%
10%
15%
20%
25%
30%
Show average for similar municipalities or
Current Ratio 2014-2015
The value of a municipality's short-term assets
as a multiple of its short-term liabilities.
2011-2012 2012-2013 2013-2014 2014-20150
0.5
1
1.5
2
2.5
Show average for similar municipalities or
procedures. Fruitless and wasteful expenditure
concerns spending which was made in vain and
would have been avoided had reasonable care
been exercised. An example of such expenditure
would include paying a deposit for a venue and
not using it and losing the deposit.
▶▶
How is performance measured?
Good 0%
Bad > 0%
Reference:
Circular 71
Formula:
= (Unauthorised, Irregular, Fruitless and Wasteful
Expenditure / Actual Operating Expenditure) * 100
= ( [unde�ned] item code
irregular,fruitless,unauthorised / [Income &
Expenditure] item code 4600, Audited
Actual ) * 100
Show calculation
in Limpopo nationally
1.90
The current ratio compares the value of a
municipality's short-term assets (cash, bank
deposits, etc) compared with its short-term
liabilities (creditors, loans due and so on). The
higher the ratio, the better. The normal range of
the current ratio is 1.5 to 2 (the municipality has
assets more than 1.5 to 2 times its current debts).
Anything less than that and the municipality may
struggle to keep up with its payments.
▶▶
About this indicator
How is performance measured?
Good > 1.5
Average 1 - 1.5
in Limpopo nationally
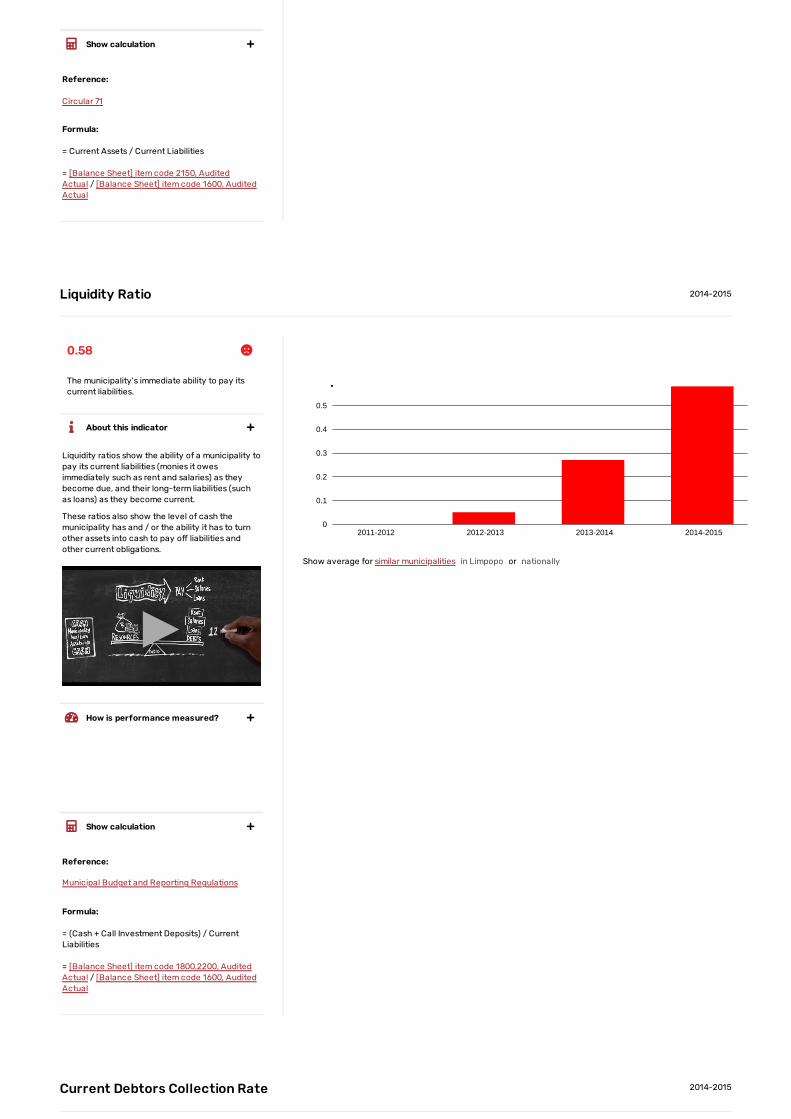
Liquidity Ratio 2014-2015
The municipality's immediate ability to pay its
current liabilities.
2011-2012 2012-2013 2013-2014 2014-20150
0.1
0.2
0.3
0.4
0.5
Show average for similar municipalities or
Current Debtors Collection Rate 2014-2015
Bad < 1
Reference:
Circular 71
Formula:
= Current Assets / Current Liabilities
= [Balance Sheet] item code 2150, Audited
Actual / [Balance Sheet] item code 1600, Audited
Actual
Show calculation
0.58
Liquidity ratios show the ability of a municipality to
pay its current liabilities (monies it owes
immediately such as rent and salaries) as they
become due, and their long-term liabilities (such
as loans) as they become current.
These ratios also show the level of cash the
municipality has and / or the ability it has to turn
other assets into cash to pay o� liabilities and
other current obligations.
▶▶
About this indicator
How is performance measured?
Good > 1
Bad < 1
Reference:
Municipal Budget and Reporting Regulations
Formula:
= (Cash + Call Investment Deposits) / Current
Liabilities
= [Balance Sheet] item code 1800,2200, Audited
Actual / [Balance Sheet] item code 1600, Audited
Actual
Show calculation
in Limpopo nationally
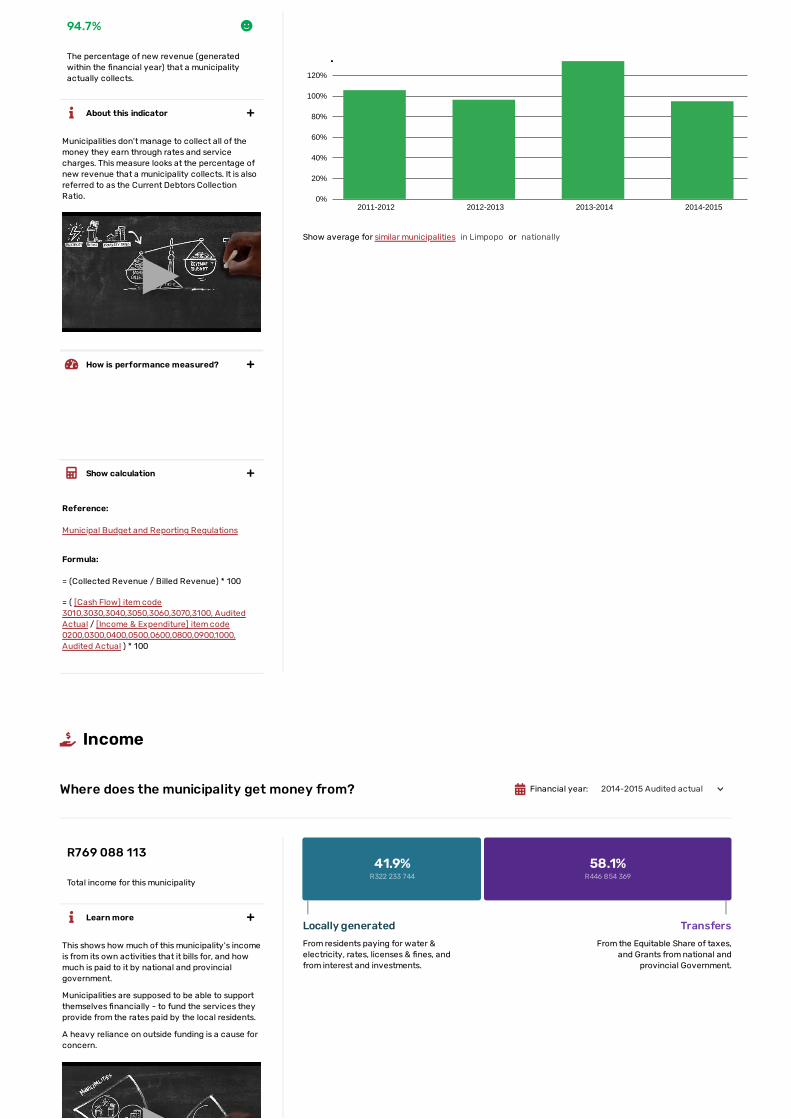
The percentage of new revenue (generated
within the �nancial year) that a municipality
actually collects.
2011-2012 2012-2013 2013-2014 2014-20150%
20%
40%
60%
80%
100%
120%
Show average for similar municipalities or
94.7%
Municipalities don't manage to collect all of the
money they earn through rates and service
charges. This measure looks at the percentage of
new revenue that a municipality collects. It is also
referred to as the Current Debtors Collection
Ratio.
▶▶
About this indicator
How is performance measured?
Good > 95%
Bad < 95%
Reference:
Municipal Budget and Reporting Regulations
Formula:
= (Collected Revenue / Billed Revenue) * 100
= ( [Cash Flow] item code
3010,3030,3040,3050,3060,3070,3100, Audited
Actual / [Income & Expenditure] item code
0200,0300,0400,0500,0600,0800,0900,1000,
Audited Actual ) * 100
Show calculation
in Limpopo nationally
Income
Where does the municipality get money from?
Total income for this municipality
R769 088 113
This shows how much of this municipality's income
is from its own activities that it bills for, and how
much is paid to it by national and provincial
government.
Municipalities are supposed to be able to support
themselves �nancially - to fund the services they
provide from the rates paid by the local residents.
A heavy reliance on outside funding is a cause for
concern.
▶▶
Learn more
41.9%R322 233 744
58.1%R446 854 369
Locally generated
From residents paying for water &
electricity, rates, licenses & �nes, and
from interest and investments.
Transfers
From the Equitable Share of taxes,
and Grants from national and
provincial Government.
Financial year: 2014-2015 Audited actual
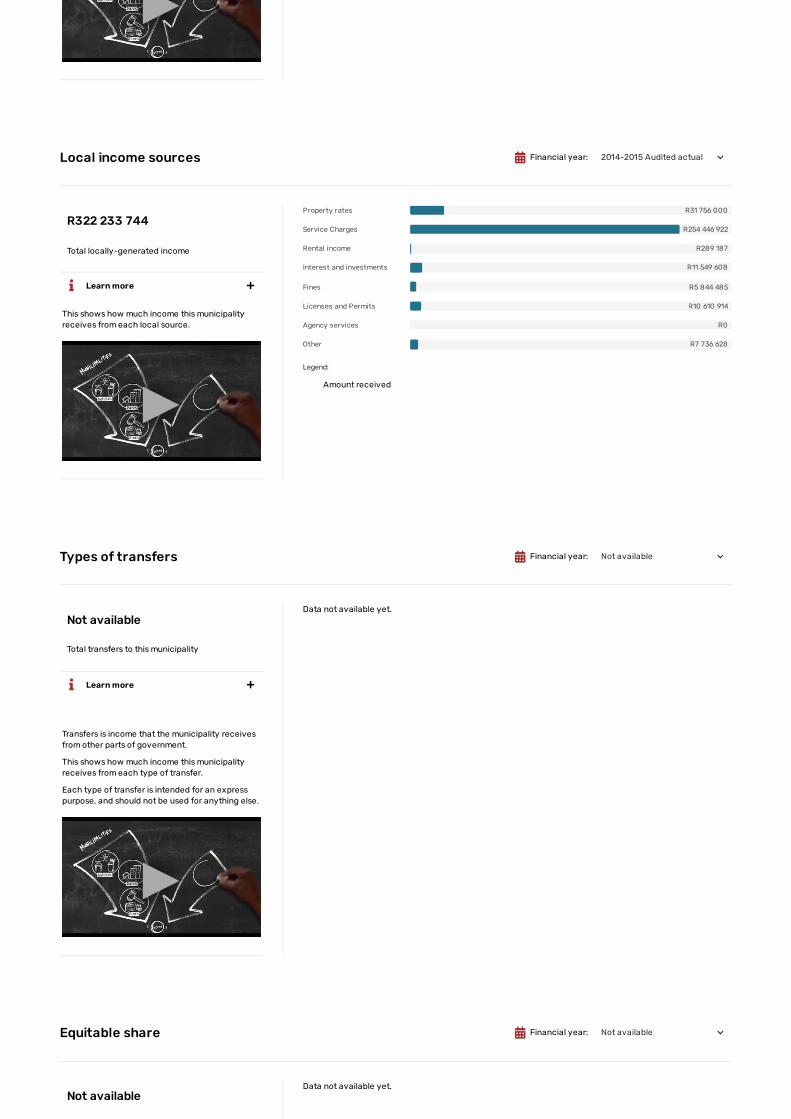
Local income sources
Total locally-generated income
R31 756 000
R254 446 922
R289 187
R11 549 608
R5 844 485
R10 610 914
R0
R7 736 628
Legend:
Types of transfers
Total transfers to this municipality
Data not available yet.
Equitable share
Data not available yet.
▶▶
R322 233 744
This shows how much income this municipality
receives from each local source.
▶▶
Learn more
Property rates
Service Charges
Rental income
Interest and investments
Fines
Licenses and Permits
Agency services
Other
Amount received
Not available
Transfers is income that the municipality receives
from other parts of government.
This shows how much income this municipality
receives from each type of transfer.
Each type of transfer is intended for an express
purpose, and should not be used for anything else.
▶▶
Learn more
Not available
Financial year:
Financial year:
Financial year:
2014-2015 Audited actual
Not available
Not available
Total equitable share allocated to this
municipality
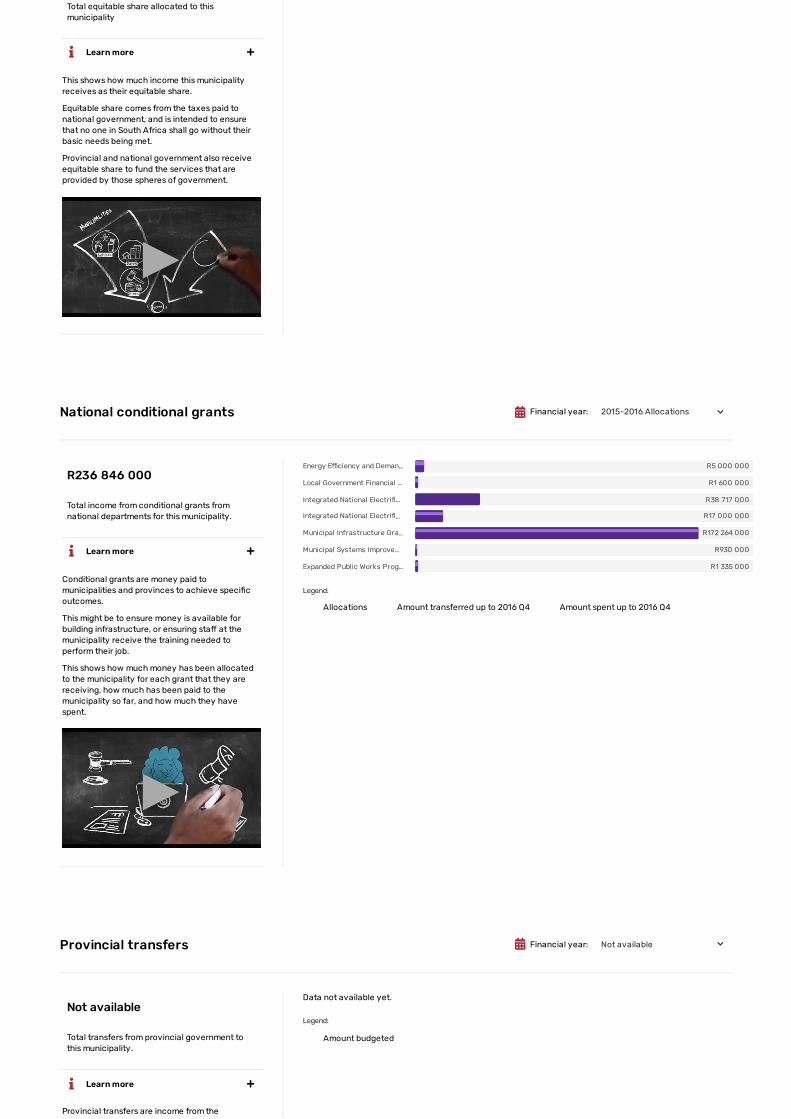
National conditional grants
Total income from conditional grants from
national departments for this municipality.
R5 000 000
R1 600 000
R38 717 000
R17 000 000
R172 264 000
R930 000
R1 335 000
Legend:
Provincial transfers
Total transfers from provincial government to
this municipality.
Data not available yet.
Legend:
This shows how much income this municipality
receives as their equitable share.
Equitable share comes from the taxes paid to
national government, and is intended to ensure
that no one in South Africa shall go without their
basic needs being met.
Provincial and national government also receive
equitable share to fund the services that are
provided by those spheres of government.
▶▶
Learn more
R236 846 000
Conditional grants are money paid to
municipalities and provinces to achieve speci�c
outcomes.
This might be to ensure money is available for
building infrastructure, or ensuring sta� at the
municipality receive the training needed to
perform their job.
This shows how much money has been allocated
to the municipality for each grant that they are
receiving, how much has been paid to the
municipality so far, and how much they have
spent.
▶▶
Learn more
Energy E�ciency and Deman…
Local Government Financial …
Integrated National Electri�…
Integrated National Electri�…
Municipal Infrastructure Gra…
Municipal Systems Improve…
Expanded Public Works Prog…
Allocations Amount transferred up to 2016 Q4 Amount spent up to 2016 Q4
Not available
Provincial transfers are income from the
Learn more
Amount budgeted
Financial year:
Financial year:
2015-2016 Allocations
Not available
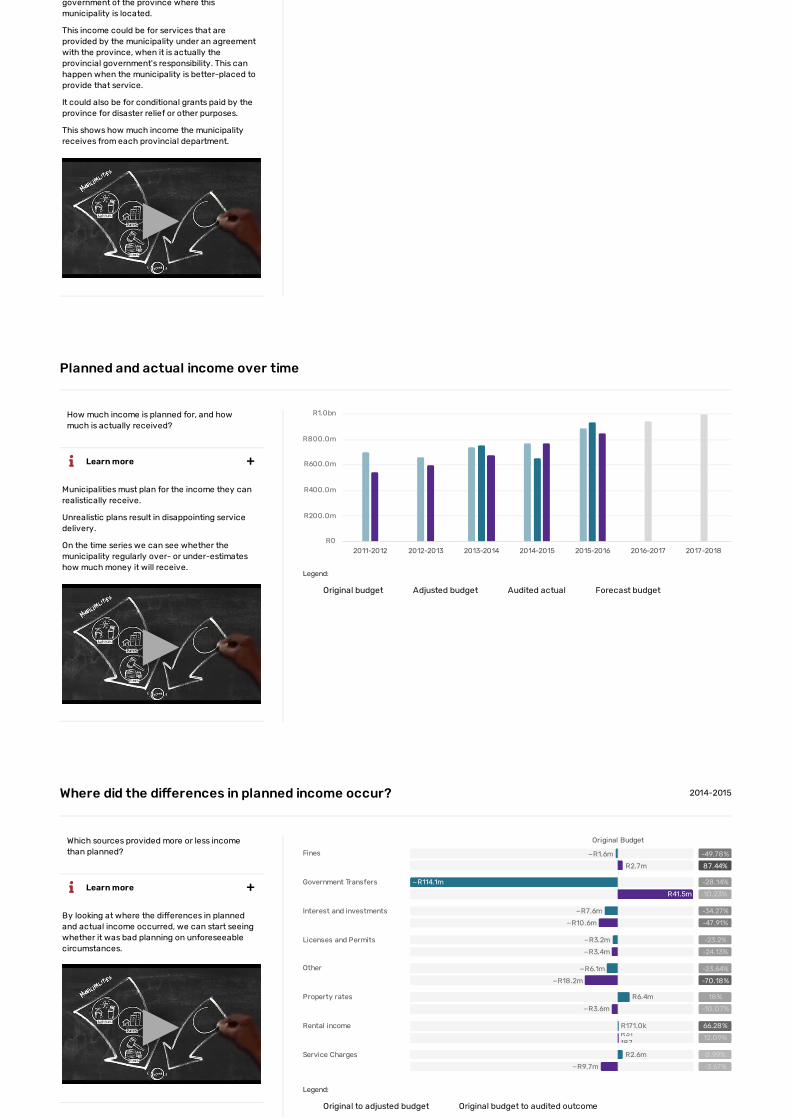
Planned and actual income over time
How much income is planned for, and how
much is actually received?
2011-2012 2012-2013 2013-2014 2014-2015 2015-2016 2016-2017 2017-2018
R0
R200.0m
R400.0m
R600.0m
R800.0m
R1.0bn
Legend:
Where did the di�erences in planned income occur? 2014-2015
Which sources provided more or less income
than planned?
Legend:
government of the province where this
municipality is located.
This income could be for services that are
provided by the municipality under an agreement
with the province, when it is actually the
provincial government's responsibility. This can
happen when the municipality is better-placed to
provide that service.
It could also be for conditional grants paid by the
province for disaster relief or other purposes.
This shows how much income the municipality
receives from each provincial department.
▶▶
Municipalities must plan for the income they can
realistically receive.
Unrealistic plans result in disappointing service
delivery.
On the time series we can see whether the
municipality regularly over- or under-estimates
how much money it will receive.
▶▶
Learn more
Original budget Adjusted budget Audited actual Forecast budget
By looking at where the di�erences in planned
and actual income occurred, we can start seeing
whether it was bad planning on unforeseeable
circumstances.
▶▶
Learn more
Original Budget
Original to adjusted budget Original budget to audited outcome
Fines
Government Transfers
Interest and investments
Licenses and Permits
Other
Property rates
Rental income
Service Charges
−R1.6m -49.78%
R2.7m 87.44%
−R114.1m -28.14%
R41.5m 10.23%
−R7.6m -34.27%
−R10.6m -47.91%
−R3.2m -23.2%
−R3.4m -24.13%
−R6.1m -23.64%
−R18.2m -70.18%
R6.4m 18%
−R3.6m -10.07%
R171.0k 66.28%R31187
12.09%
R2.6m 0.99%
−R9.7m -3.67%
Change within category%
Spending
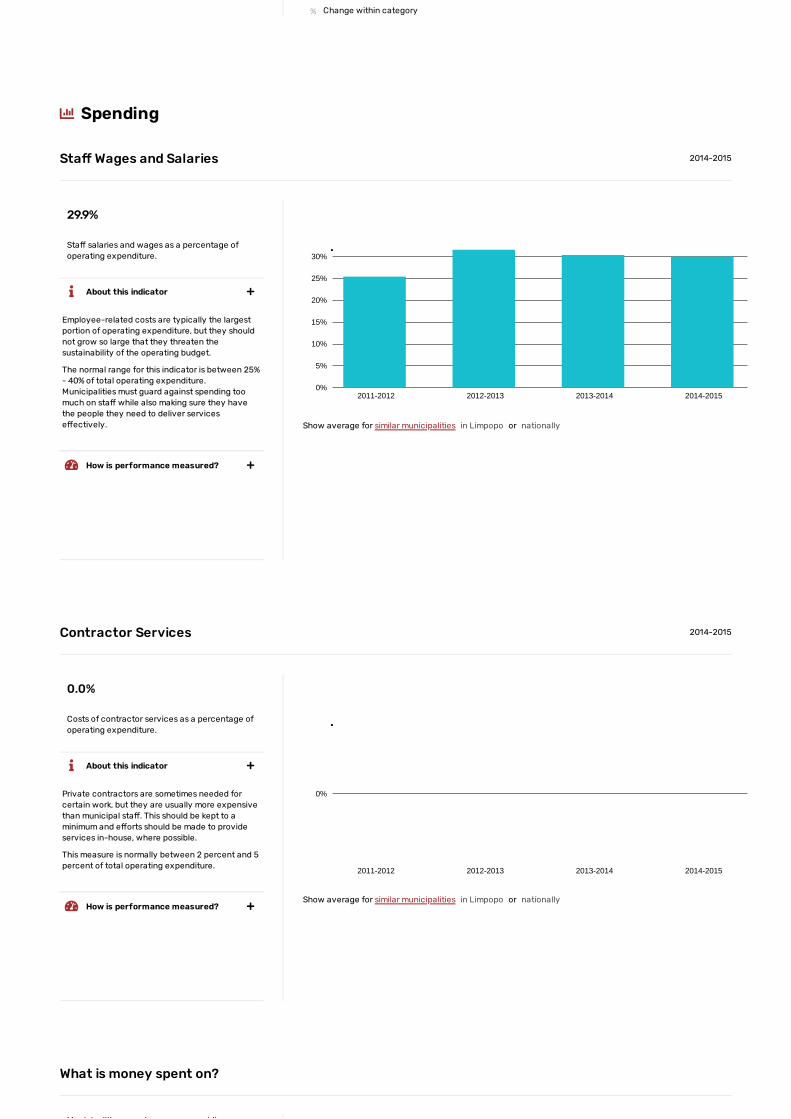
Sta� Wages and Salaries 2014-2015
Sta� salaries and wages as a percentage of
operating expenditure.
2011-2012 2012-2013 2013-2014 2014-20150%
5%
10%
15%
20%
25%
30%
Show average for similar municipalities or
Contractor Services 2014-2015
Costs of contractor services as a percentage of
operating expenditure.
2011-2012 2012-2013 2013-2014 2014-2015
0%
Show average for similar municipalities or
What is money spent on?
M i i liti d idi
29.9%
Employee-related costs are typically the largest
portion of operating expenditure, but they should
not grow so large that they threaten the
sustainability of the operating budget.
The normal range for this indicator is between 25%
- 40% of total operating expenditure.
Municipalities must guard against spending too
much on sta� while also making sure they have
the people they need to deliver services
e�ectively.
About this indicator
How is performance measured?
Good 25% - 40%
Bad < 25% or > 40%
in Limpopo nationally
0.0%
Private contractors are sometimes needed for
certain work, but they are usually more expensive
than municipal sta�. This should be kept to a
minimum and e�orts should be made to provide
services in-house, where possible.
This measure is normally between 2 percent and 5
percent of total operating expenditure.
About this indicator
How is performance measured?
Good 0% - 5%
Bad > 5%
in Limpopo nationally
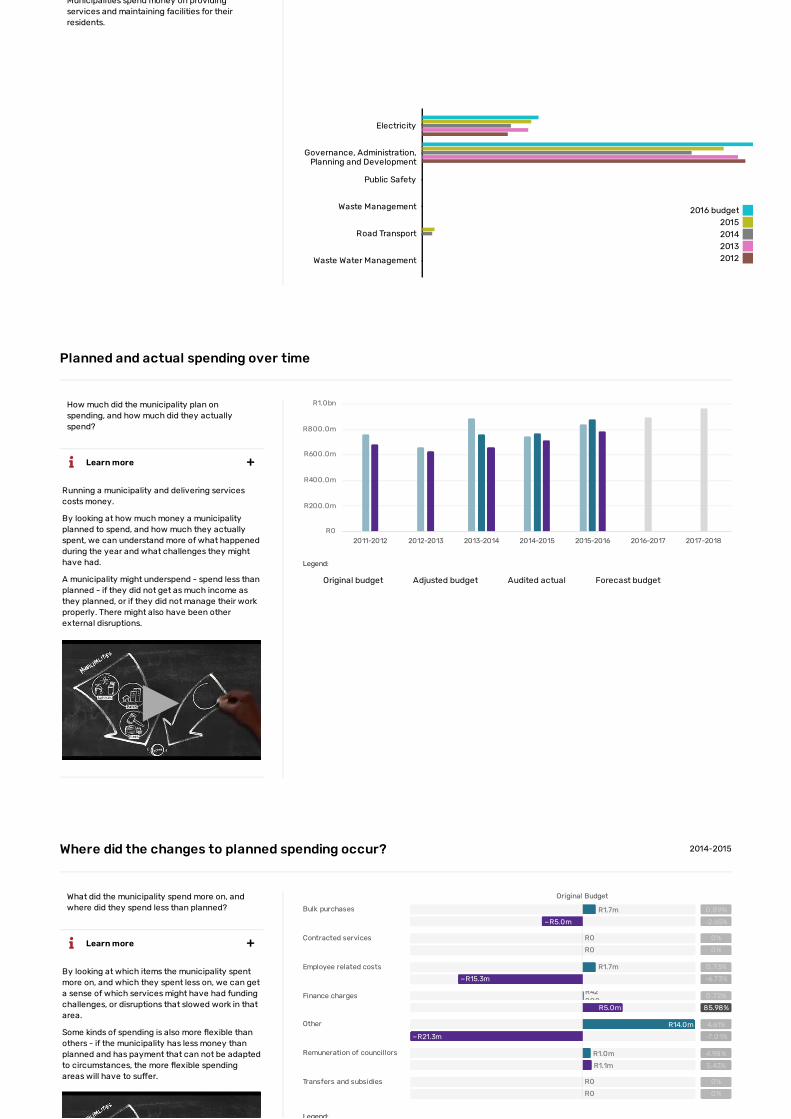
Municipalities spend money on providing
services and maintaining facilities for their
residents.
Electricity
Governance, Administration,Planning and Development
Public Safety
Waste Management
Road Transport
Waste Water Management
2016 budget
2015
2014
2013
2012
Planned and actual spending over time
How much did the municipality plan on
spending, and how much did they actually
spend?
2011-2012 2012-2013 2013-2014 2014-2015 2015-2016 2016-2017 2017-2018
R0
R200.0m
R400.0m
R600.0m
R800.0m
R1.0bn
Legend:
Where did the changes to planned spending occur? 2014-2015
What did the municipality spend more on, and
where did they spend less than planned?
Legend:
Running a municipality and delivering services
costs money.
By looking at how much money a municipality
planned to spend, and how much they actually
spent, we can understand more of what happened
during the year and what challenges they might
have had.
A municipality might underspend - spend less than
planned - if they did not get as much income as
they planned, or if they did not manage their work
properly. There might also have been other
external disruptions.
▶▶
Learn more
Original budget Adjusted budget Audited actual Forecast budget
By looking at which items the municipality spent
more on, and which they spent less on, we can get
a sense of which services might have had funding
challenges, or disruptions that slowed work in that
area.
Some kinds of spending is also more �exible than
others - if the municipality has less money than
planned and has payment that can not be adapted
to circumstances, the more �exible spending
areas will have to su�er.
Learn more
Original Budget
Bulk purchases
Contracted services
Employee related costs
Finance charges
Other
Remuneration of councillors
Transfers and subsidies
R1.7m 0.89%
−R5.0m -2.65%
R0 0%
R0 0%
R1.7m 0.73%
−R15.3m -6.73%
R42000
0.72%
R5.0m 85.98%
R14.0m 4.61%
−R21.3m -7.01%
R1.0m 4.98%
R1.1m 5.43%
R0 0%
R0 0%
Municipal Money is an initiative of the National
Treasury, which has collected extensive
municipal �nancial data over several years
and would like to share this information with
the public.
Learn more
Jump to a metro
Bu�alo City
City of Cape Town
Ekurhuleni Municipality
City of eThekwini
City of Johannesburg
Mangaung Municipality
Nelson Mandela Bay Municipality
City of Tshwane
Useful links
Help center
Municipal Money API
Terms of use
Feedback
Github
A project by National Treasury, created under The MIT License (MIT). In partnership with:
Legend:
▶▶Original to adjusted budget Original budget to audited outcome
Change within category%
Household Bills
Household bills data not available for this municipality.
Resources
Understanding MunicipalFinance
Treasury's Municipal Finance website is �lled
with resources on municipal �nance.
Circular 71 explains many of the �nancial norms
and indicators used to gauge the �nancial
performance of Municipalities.
MFMA Return Forms submitted by
Municipalities to National Treasury.
Understanding these forms can help you
understand the information on Municipal
Money.
A Million Bags of a Million Rand - a video by the
Auditor General's o�ce which simpli�es audit
outcomes.
Understanding the Standard Chart of Accounts
- a video by the National Treasury on mSCOA.
Understanding the Public Finance Management
Act & Municipal Finance Management Act - a
video by the National Treasury on irregular
expenditure and material irregularity.
Financial reportsRead more about Local Government Finances and
learn about how your money is spent.
Annual Financial Statements of municipalities
since 2002-2003. These include the Notes to
the Annual Financial Statements where you
can �nd explanations of speci�c accounting
practises and calculations used by the
municipality in its �nancial reporting and some
decision making.
State of Local Government Finances reports
are published every year by National Treasury
and describe in detail how Municipalities are
performing.
In-year Management, Monitoring and
Evaluation of Municipal Finances . Annual and
quarterly PDF and Excel reports on Municipal
�nances since 2007.
Further readingResources from the South African and international
community.
Local Government in South Africa – Part 5,
Finances, 19 March 2014 by Corruption Watch
Engaging with Government Budgets. An
Activist’s Guide to South African Government
Budgets at Local, Provincial and National Level
produced in 2012 by Ndifuna Ukwazi and the
Social Justice Coalition
Infographic: South Africa: Public Participation
Mechanisms in Fiscal Matters, 01 July 2015 by
Global Initiative for Fiscal Transparency (GIFT)
Infographic: High Level Principles on Fiscal
Transparency, 04 July 2015 by Global Initiative
for Fiscal Transparency (GIFT)
A Guide to Conducting Social Audits in South
Africa, November 2015 by International Budget
Partnership (IBP)
Infographic: Open Budget Survey 2015 by
International Budget Partnership (IBP)
Open Budget Survey 2015 by International
Budget Partnership (IBP)