credit risk management and profitability in select savings and ...
241
ISSN 2320-5407 International Journal of Advanced Research (2020) Journal homepage: http://www.journalijar.com INTERNATIONAL JOURNAL OF ADVANCED RESEARCH CREDIT RISK MANAGEMENT AND PROFITABILITY IN SELECT SAVINGS AND LOANS COMPANIES IN GHANA Thesis submitted to BANGALORE UNIVERSITY In partial fulfillment of the requirements For the award of the degree of DOCTOR OF PHILOSOPHY IN MANAGEMENT BY KWADWO BOATENG Under The Guidance of Dr. Y. Nagaraju Dean and Director Canara Bank School of Management Studies Bangalore University
-
Upload
khangminh22 -
Category
Documents
-
view
1 -
download
0
Transcript of credit risk management and profitability in select savings and ...

ISSN 2320-5407 International Journal of Advanced Research (2020)
Journal homepage: http://www.journalijar.com INTERNATIONAL JOURNAL
OF ADVANCED RESEARCH
CREDIT RISK MANAGEMENT AND
PROFITABILITY IN SELECT SAVINGS AND
LOANS COMPANIES IN GHANA
Thesis submitted to
BANGALORE UNIVERSITY
In partial fulfillment of the requirements
For the award of the degree of
DOCTOR OF PHILOSOPHY IN MANAGEMENT
BY
KWADWO BOATENG
Under The Guidance of
Dr. Y. Nagaraju Dean and Director
Canara Bank School of Management Studies
Bangalore University

ISSN 2320-5407 International Journal of Advanced Research (2020)
I
DECLARATION
I hereby declare that thesis entitled “Credit Risk Management and Profitability in
Select Savings and Loans Companies in Ghana” submitted to Bangalore University
in fulfillment of the requirements for the award of the degree of Doctor of Philosophy
(Ph.D.) in Management is a record of original and independent research work done by
me under the supervision of Dr. Y. Nagaraju, Dean and Director, Canara Bank School
of Management Studies, Bangalore University, Bangalore, India. I further declare that
the thesis submitted by me has not been submitted previously in part or full to this or
any other University for the award of any Degree, Diploma, Associateship, Fellowship
or other similar title by any candidate.
………………………………….
KWADWO BOATENG
Date:
Place:
Dr. Y. NAGARAJU
BANGALORE UNIVERSITY M.Com., M.Phil., MBA, Ph.D
Canara Bank School of Management Studies
Professor & Dean
(Post Graduate Dept. of Management)
JnanaBarathi Campus, Bangalore- 560056
ISSN 2320-5407 International Journal of Advanced Research (2020)
II
CERTIFICATE
This is to certify that this thesis entitled “Credit Risk Management and Profitability
in Select Savings and Loans Companies in Ghana” submitted by KWADWO
BOATENG to Bangalore University for the award of the degree of Doctor of
Philosophy in the Department of Management is a record of bonafide and independent
research work carried out by him under my supervision. This has not been submitted
previously in part or in full to this or any other University for the award of any Degree,
Diploma, Associateship, Fellowship or other similar title.
DR. Y. NAGARAJU
Research Guide
Place: Bangalore
Date:

ISSN 2320-5407 International Journal of Advanced Research (2020)
III
ACKNOWLEDGEMENT
My first and foremost gratitude goes to the Most High God for his protection
throughout my study period. My second appreciation goes to the government and the
entire people of India for making me achieve my lifetime dream by awarding me a
scholarship through Indian Council for Cultural Relations (ICCR).
I deem it a great pleasure with respect and deep sense of gratitude to my research
supervisor Dr. Y. Nagaraju, Professor Canara Bank School of Management Studies,
Bangalore University for his consistent support and guidance throughout my research
journey. His constructive criticisms and suggestions helped me to complete the writing
of this thesis successfully.
Without forgetting, I would like to express my sincere thanks to Dr. Cynthia Menezes,
Professor of Canara Bank School of Management Studies, Bangalore University for
extending her motherly advice to me during my study period.
I owe my last thanks and appreciation to my wife Marian Jane Adentwi for supporting
me with prayers and my children who have sacrificed for me to be away from home in
order to make this monumental life achievement.

ISSN 2320-5407 International Journal of Advanced Research (2020)
IV
TABLE OF CONTENT
Declaration I
Certificate II
Acknowledgement III
Table of Content IV
List of Tables IX
List of Figures XII
Abbreviations XIV
SI No. Particulars Page No.
CHAPTER 1 - INTRODUCTION
1.1 The Financial System in Ghana 3
1.2 Meaning and Definition of Banking 3
1.3 The Overview and Structure of the Banking System in Ghana 5
1.4 Reforms in the Ghanaian Banking Industry 7
1.5 The Emergence of the Non-bank Financial institutions (NBFIs) 15
1.6 Credit Risk Management and Profitability 16
1.7 Credit 18
1.8 Type of Risks in Banking 20
1.9 Credit Risk 21
1.10 Market Risk 24
1.11 Operational Risk 26
1.12 Non-performing Assets (NPA) 28
ISSN 2320-5407 International Journal of Advanced Research (2020)
V
1.13 Mitigating Credit Risk 31
1.14 Credit Risk Measurement 32
1.15 Credit Risk Management 37
1.16 Profitability 53
References 59
CHAPTER 2 – RESEARCH DESIGN AND METHODOLOGY
2.1 Research Design and Methodology 64
2.2 Review of Literature 65
2.3 Research Gap 97
2.4 Rational of the Study 98
2.5 Significance of the Study 98
2.6 Statement of Problem 99
2.7 Research Objectives 101
2.8 Research Questions 102
2.9 Hypothesis of the Study 102
2.10 Research Methodology 103
2.11 Ethical Consideration 103
2.12 Sampling Frame 104
2.13 Sampling Technique 104
2.14 Population of The Study 105
2.15 Sampling Size 106

ISSN 2320-5407 International Journal of Advanced Research (2020)
VI
2.16 Sources of Data 110
2.17 Instruments for Data Collection 110
2.18 Data Analysis Technique 110
2.19 Method of Data Presentation 111
2.20 Study Variables for the Secondary Data 111
2.21 Theoretical Framework of the Study 116
2.22 Pilot Testing 119
2.23 Operational Definitions 120
2.24 Limitations of the Study 122
2.25 Chapter Schemes of the Study 122
References 123
CHAPTER 3 – PROFILES OF THE SELECTED S&L
COMPANIES
3.1 Profile of the Country Ghana 137
3.2 The Profile of the Select Savings and Loans Companies 139
CHAPTER 4 – DATA ANALYSIS AND INTERPRETATION
4.1 Data Analysis and Interpretation 151
4.2 Analysis and Interpretation of the Secondary Data 151
4.3 Multiple Regression Analysis 159
4.4 Regression Results of Model 1 166
4.5 Regression Results of Model 2 170
4.6 Testing of Hypothesis 174

ISSN 2320-5407 International Journal of Advanced Research (2020)
VII
4.7 Analysis and Presentation of the Primary Data 176
4.8 Factor Analysis 181
CHAPTER 5 – FINDINGS, CONCLUSION, AND
RECOMMENDATIONS
5.1 Findings from the Analysis of the Secondary Data 196
5.2 Findings from the Analysis of The Primary Data 198
5.3 Conclusion 200
5.4 Recommendations 201
5.5 Directions for Further Research 203
Bibliography 204
Appendix 1 Research Questionnaire 209
Appendix 2 Informed Consent form 213
Appendix 3 Normality Test Graphs 214
Appendix 4 Summary statistics of the study Variables: 2011 - 2016 216
Appendix 5 Profitability Indicators of Deposit Money Banks in Ghana: 2014-2017 217
Appendix 6 Deposit Money Banks Credit by Sectorial Distribution 218
Appendix 7 Total variance explained and component matrix of types of risk 219
Appendix 8 Total variance and component matrix of types of risk 220
Appendix 9 Total variance and rotated component matrix of NPL causing factors 222
Appendix 10 Total variance and rotated component matrix of Effectiveness of credit
risk management practices factors
223
Appendix 11 Total variance and rotated component matrix of factors of difficulties in 224

ISSN 2320-5407 International Journal of Advanced Research (2020)
VIII
loan recovery
Appendix 12 List of Savings and Loans Companies in Ghana - 2017 225

ISSN 2320-5407 International Journal of Advanced Research (2020)
IX
LIST OF TABLES
TABLE NO. TITLE PAGE NO.
1.1 Pre-reforms banks in Ghana (1896-1988) 8
1.2 Tabulated stages of reforms in the Ghanaian Banking Industry 11
1.3 List of post-reform banks as at 2017 14
1.4 Number of licensed NBFIs as at 2017 16
1.5 Asset classifications and provision allocations 29
1.6 Ratings of the components of CAMELS model 52
2.1 Distribution of population by type of respondents (strata) 105
2.2 Criteria for the selection of S&L companies 107
2.3 Distribution of sample size by type of respondents (strata) 109
2.4 Variables specifications 112
2.5 Case processing summary 119
2.6 Reliability statistics 120
4.1 Aggregate mean score of NPLR 152
4.2 Average ratios of NPL, ROA, and ROE 153
4.3 Average ratios of CAR and Profitability of indicators 155
4.4 Average ratios of LTDR and Profitability of indicators 157
4.5 Average ratios of Size and Profitability of indicators 158
4.6 Results of Collinearity Statistics (Variance Inflation Factor) 161
4.7 Correlation Matrix for Model 1 162
ISSN 2320-5407 International Journal of Advanced Research (2020)
X
4.8 Correlation Matrix for Model 2 163
4.9 Descriptive Statistics 165
4.10 Model Summary of model 1 167
4.11 ANOVA Table for Model 1 167
4.12 Regression results of Model 1 168
4.13 Model Summary of model 2 171
4.14 ANOVA Tables for model 2 171
4.15 Regression results of model 2 172
4.16 Missing Data Statistics 177
4.17 Respondents by Gender 177
4.18 Respondents by position 178
4.19 Respondents based on work experience 180
4.20 KMO and Bartlett’s Test of risk types 182
4.21 Factor analysis of risk types and its frequency of occurrence 182
4.22 KMO and Bartlett’s Test of NPL causing factors 183
4.23 Factor analysis of NPL causing factors 183
4.24 KMO and Bartlett’s Test of impact of loan default 185
4.25 Factor analysis of impact of loan default 185
4.26 Existence of credit risk management practices 186
4.27 KMO and Bartlett’s Test of effectiveness of credit risk
management practices
188
4.28 Factor analysis of the effectiveness of credit risk management 188

ISSN 2320-5407 International Journal of Advanced Research (2020)
XI
practices
4.29 KMO and Bartlett’s Test of difficulties in loan recovery 189
4.30 Factor analysis of difficulties in loan recovery 190

ISSN 2320-5407 International Journal of Advanced Research (2020)
XII
LIST OF FIGURES
FIG. NO. TITLE PAGE NO.
1.1 Structural Presentation of the Ghanaian Banking System 7
1.2 Flow of Fund through the Financial System 19
1.3 Types of Risk in Banking 21
1.4 NPA Trend in the Ghanaian Banking Sector 30
1.5 The Risk Management Process 39
1.6 The Components of the CAMELS rating Model 49
3.1 The Map of Ghana 138
4.1 Graphical Trend Presentation of Average NPL Ratios 152
4.2 Trend between NPL ratio and Profitability indicators 154
4.3 Trend between CAR and Profitability indicators 156
4.4 Trend between LTDR and Profitability indicators 157
4.5 Trend between LNTA and Profitability indicators 159
4.6 Percentage Male and Female Respondents 178
4.7 Pie Chart of Respondent by Position 179
4.8 Frequency of Respondents by Work Experience 180
4.9 Existence of CRM Practices in the S&L Companies 187

XIV
ABREVIATIONS
BoG – Bank of Ghana
B&FT – Business and Financial Times
BSD – Banking Supervision Department
BBWA – British Bank West Africa
CAR – Capital Adequacy Ratio
CRM – Credit Risk Management
DV – Dependent Variable
ERP – Economic Recovery Programme
ERP – Economic Recovery Programme
GBA – Ghana Banking Association
GSE – Ghana Stock Exchange
GBP – Great Britain Pound
GAMFIN – Ghana Association of
Microfinance
IFC – International Financial Centre
IFRS – International Financial Reporting
Standard
IV – Independent Variable
LTDR – Loan to Deposit Ratio
MFIs – Microfinance Institutions
MPR – Monetary Policy Rate
NBFIs – Non-Bank Financial Institutions
NPLs – Non-performing Loans
NPLR – Non-performing Loan Ratio
RCBs – Rural and Community Banks
ROA – Return on Assets
ROE – Return on Equity
RTGS – Real Time Gross Settlement
SSNIT – Social Security and National
Insurance Trust
S&L – Savings and Loans
USD – United States Dollar
AQR – Asset Quality Review

ISSN 2320-5407 International Journal of Advanced Research (2020)
2
CHAPTER ONE
********
INTRODUCTION

ISSN 2320-5407 International Journal of Advanced Research (2020)
3
CHAPTER ONE
INTRODUCTION
1.1. THE FINANCIAL SYSTEM IN GHANA
The primary role of the financial system is to channel the surpluses arising in the economy
through the activities of corporate houses, individual households, and the government into deficit
units in the economy again in the form of individual households, corporate houses, and
government. The financial system involves the financial markets such as the Ghana stock
exchange (GSE), and financial intermediaries, which include specialized deposit taking
institutions such as the universal banks, and nonbank financial institutions (NBFIs). The
financial markets serve as ‘brokers’ that bring the surplus and deficit units together for mutual
benefit. The financial intermediaries on the other hand create assets out of the surpluses of the
economy. The financial intermediaries play three important roles in the Ghanaian economy: they
mitigate the default risk of the deficit units when surplus units lend to them, serve liquidity of
savings by surplus units, and lower information cost. The Ghana stock exchange was established
in July 1989 as a private company limited by guarantee under Ghana's companies' code, 1963.
The Exchange however, changed its status to a public company limited by guarantee in April
1994. The primary objective for the establishment of the GSE was to serve as a financial market
for the purchase and sale of bonds, shares, and other securities of any company and government
to make the financial system complete in the country.
1.2. MEANING AND DEFINITION OF BANKING
The name bank was believed to have originated from the term “banchi” because the table on
which the Italian traders in the olden days performed their money changing business was called
“Banchi or Bancheri”. Other school of thought also attributed the name Bank to have been
derived from the Greek word “Banque”. Banks play vital roles in the development and economic
growth of countries across the globe. Banking generally means engaging the business activity of
accepting and safeguarding money by individuals and entities, and subsequently onwards lending

ISSN 2320-5407 International Journal of Advanced Research (2020)
4
out this money to earn a profit (www.investorwords.com). A bank, therefore, is “an authorised
establishment by a government for deposits taking, payment of interest, clearing of cheques,
making loans, acting as an intermediary in financial transactions, and providing other financial
services to its customers” (www.businessdictionary.com). The following are some prominent
definitions of banking.
The section 5(b) of the India banking regulations Act 1949 defines banking as “the accepting for
the purpose of lending or investment of deposits of money from the public, repayable on or
otherwise and withdraw-able by cheque, draft, order, or otherwise”.
“A bank is an organisation whose principal operations are concerned with the accumulation of
the temporarily idle money of the general public for the purpose of advancing to others for
expenditure.”- R.P. Kent
“Bank is a financial intermediary institution which deals in loans and advances” - Cairn Cross.
“Bank provides service to its clients and in turn receives perquisites in different forms.” - P.A.
Samuelson.
“Bank is such an institution which creates money by money only.” - W. Hock.
“Bank is such a financial institution which collects money in current, savings or fixed deposit
account; collects cheques as deposits and pays money from the depositors‟ account through
cheques.” - Sir John Pagette.
The definitions coined by different authors boil down to the fact that banks deals in money the
same manner a businessperson deals in goods and services. Banks are business enterprises,
which deal in money, financial instruments and provide financial services for a price called
interest, discount, commission and fees.

ISSN 2320-5407 International Journal of Advanced Research (2020)
5
1.3. THE OVERVIEW AND STRUCTURE OF THE BANKING SYSTEM IN
GHANA
The Bank of Ghana is by law the mandatory body to have overall supervisory and regulatory
authority in all matters relating to banks and non-bank financial institutions’ business with the
purpose to achieve a rigorous and efficient banking system in the interest of depositors and other
customers of these institutions, and the economy at large. The Bank of Ghana has the
responsibility of safeguarding the financial system and ensuring that it facilitates the creation of
wealth, promoting economic growth and development. According to the banking Act 612 and
Act 673, the functions and responsibilities of the Central Bank as a Regulator are: (1) supervise,
regulate, and direct both the banking system and the credit system for the smooth operation,
safety and sound a banking system. (2) The board shall appoint an officer designated as the head
of the Banking Supervision Department (BSD). (3) To consider and propose reforms of the laws
relating to the banking business
The banking industry in Ghana with the Central Bank of Ghana as the regulating body involves
many categories. The categorisation of banking institutions in Ghana is based on capital
requirements and permissible activities they were licensed to undertake. The universal banks are
of two types namely; the class one, and the class two banks. The class one universal banks are
licensed to undertake the following functions Deposits mobilisation; Lending; Investment in
financial securities; Money transmission services; providing, and administering means of
payment including credit cards, travellers' cheques and bankers’ drafts; Guarantees and
commitments; Engaging in trading for own account or account of customers in, Money market
instruments; and Foreign exchange, or Transferable securities. The rest of the functions are to
participate in securities issues and provision of services related to those issues; to provide advice
to the undertakings on capital structure, acquisition and merger of an undertaking; The keeping
and administration of securities; Credit reference services; Safe custody of valuables; and
Electronic banking.

ISSN 2320-5407 International Journal of Advanced Research (2020)
6
The class two banks are international banks with their representative branches in the country.
They are permitted to undertake functions such as International Banking (Maintain accounts in
major currencies, namely, USD, GBP, EURO, YEN and currencies that the IFC may deem fit;
Accept deposits from Non-residents only). Operate Fixed Deposit Accounts; Interest-bearing
Call Accounts and Credit Facilities (ordinary loans, overdraft, guarantees, margin trading
accounts, and mortgages). Treasury products; Lending; Investment in financial securities;
Money transmission services; Administering and issuing of means of payment including credit
cards, travellers' cheques and bankers’ drafts; Guarantees and commitments; Trading for
customers or the banks' account ( Money market instruments, Foreign exchange, or Transferable
securities). Engaging in the issue of securities and provision of services related to those issues;
Provision of advice to transactions on undertakings on capital structure, acquisition and merger
of an undertaking; the keeping and administration of securities; Credit reference services; Safe
custody of valuables; Electronic banking; and Any other services as the BoG may determine.
We also have the rural banking system, which operates in rural and community levels. They are
localised banks that are restricted to operate within a confined geographical radius. The ARB
Apex bank serves as the supervisor and regulates the activities of the rural and community banks
(RCBs). It acts as the mini-central bank for the rural and community banks. The next set of
banking institutions in Ghana are the non-bank financial institutions (NBFIs). The NBFIs also
has subcategories thus – the savings and loans (S&L) companies, mortgage and leasing
companies, the finance houses, and microfinance institutions (MFIs). Another banking system is
the semiformal institutions that include credit unions, financial non-governmental organisations,
individual moneylenders, and Susu collectors. Fig.1.2 below illustrates the structure of the
Ghanaian banking system.

ISSN 2320-5407 International Journal of Advanced Research (2020)
7
Fig.1.1: Structural presentation of the Ghanaian Banking system
Source: Authors’s illustration
1.4. REFORMS IN THE GHANAIAN BANKING INDUSTRY
Various reforms have taken place in the Ghanaian banking sector, which has shaped and
streamlined the banking industry. The initial reform, which started in the late 1980s, is the reason
we have the current modern banking facilities in the country. It is because of the reforms that we
have the various subsectors in the industry. The enactment of the Non-Bank Law (1993) Act

ISSN 2320-5407 International Journal of Advanced Research (2020)
8
(328) was the birth of NBFIs such as the Savings and Loans companies, Finance houses, Hire
purchase companies, MFIs etc.
1.4.1. Post-Independence Financial Sector Policies
The operating banks in Ghana between the 1950s and 980s before the reforms were wholly or
majority owned by the public sector. The government also owned minority shares in the two
foreign banks (Barclays and Standard Chartered banks) which have been operational since the
mid-1970s. Most operational directives came from the central bank of Ghana (BoG). The BoG
controlled Interest rates as well as asset allocations of the banks such as sectorial credit
apportioning. The motive behind these interferences by the government was to streamline the
existing market imperfection that existed from the colonial masters’ regime. The policies were
short-lived as severe financial repression, negative real interest rate, and a majority of credits
going to only the public sector. There was, therefore, the need for immediate stabilisation of the
banking sector that called for series of reforms initiated in the later part of the 1980s. The series
of reforms in the banking sector was to revive the economy, which had experienced economic
crises between 1976 and 1983. Table 1.1 below shows the existed pre-independence as well as
pre-reform banks in Ghana.
Table 1.1: Pre-reform Banks in Ghana (1896 - 1988)
BANK YEAR OF ESTABLISHMENT OWNERSHIP
Standard Bank 1896 Private
Barclays Bank 1917 Private
Ghana Commercial Bank 1953 State-owned
National Investment Bank 1963 State-owned
Agricultural Development Bank 1965 State-owned
Bank for Housing and Construction 1972 State-owned
Merchant Bank 1972 State-owned
Ghana Cooperative Bank 1975 State-owned
Social Security Bank 1977 State-owned
Bank for Credit and Commerce 1978 Private
Sources: BoG Annual reports and IMF reports
The banking industry in Ghana has since 1988 experienced numerous forms of reforms. The
motive behind the gradual implementation of these reforms was to improve operational

ISSN 2320-5407 International Journal of Advanced Research (2020)
9
efficiency, competition and Sustainability. These initiated reforms by the central bank were to
foster economic growth and development of the country as a whole. The state-owned banks
dominated the banking activities in Ghana during the pre-reform era, and mainly controlled by
the government.
The Ghanaian economy in the period between 1976 and 1983 had experienced severe crises,
characterized by weak economic growth and severe balance of payments problems. The starting
of the economic recovery program in 1983 by the government, sought to restructure the economy
and reverse the trend of economic decay. It quickly became apparent to the government that it
needed to undertake a restructuring of the then distressed financial sector if the economic
reforms were to lead to a sustainable resumption of growth in the economy. This compelled the
government of Ghana in collaboration with the World Bank to introduce financial sector reforms
with a financial sector adjustment program in 1987.
Regimes upon a regime of governments of Ghana have ever since pursued various policies in the
area of economic activity to ensure rapid industrialisation, modernisation of agricultural practices
and the general welfare of the citizenry. Certain sectors of the economy enjoyed priority
treatment because of its strategic consideration. An allocation of a percentage of the loan
portfolio of the state-owned must go to some selected sectors of the economy as directed by the
government (World Bank 1988)1. Due to some weakness inherent in the policies, certain sectors
of the economy and individuals experienced excessive risk, as prominence was not on the
viability of the project or better still creditworthiness of the borrower. The excessive borrowing
by the government crowded the finances of the private sector (Bank of Ghana, 2004)2.
There were high inflation rates, negative real interest rates, and low rate of savings since the
Bank of Ghana did not set exchange rates on the market base but administratively. The effect of
the real adverse interest, for example, resulted in highly non-performing loan portfolios of banks.
Banks at the time had no or little motivation to mobilises extra savings or reduce operating costs.
The banks, therefore, were unduly inefficient (International Monetary fund, 1999)3. The banks in
Ghana were in distress at the time, especially the state-owned ones. For instance, in 1987, non-
performing loans reached 41% of the total credits (IMF, 1999).

ISSN 2320-5407 International Journal of Advanced Research (2020)
10
A study by the World Bank in the banking sector in Ghana (1988) concluded that the Ghanaian
banking sector was facing high operating costs due to inefficiency, a high rate of non-performing
loan portfolios, alarming insolvency in the banking system, reported inflated profits and capital
inadequacy. The economy of Ghana was in terrible shape due to the crash in the banking sector
because of the general economic decline during the 1970s and the early part of 1980s (World
Bank report, 1988). In 1987, the Ghanaian economic situation was in profound crisis and on the
verge of collapse. There was, therefore, the urgent need for economic and financial reform since
the banks at the time could not mobilise savings and supply credit to even the critical sectors of
the economy.
In 1988, Ghana implemented financial sector reforms as part of the economic adjustment
program, which aimed at restructuring its financial system. The system at the time was in
distortion state due to the interest rate controls and selective credit policies, lack of competition,
and weak supervision by the Bank of Ghana (World Bank, 1989)4. The same report again
indicated the high exposure of many of the banks to foreign exchange risk.
In light of all these happenings, the government initiated financial sector reform with the
objective of achieving the following goals:
a. Establishing a sound prudential and regulatory framework for guiding banking
operations in Ghana
b. Ensuring a uniform accounting and auditing standards for all bank
C.To establish a more effective banking supervision Department (BSD) equipped with
personnel with the requisite skills to enforce rules and regulations, and code of conduct for the
banks
d. To create a framework for restructuring distress banks with the intention of transferring
their non-performing assets which had chocked their balance sheets and inhibited
initiatives in credit operations to the government agency, the non-performing assets
recovery trust (NPART)

ISSN 2320-5407 International Journal of Advanced Research (2020)
11
e. To establish fully liberalised money and capital markets in Ghana (Bank of Ghana Annual
report, 1989)
1.4.2. Stages of the Banking Sector Reforms in Ghana (1988 -2018)
The banking industry in Ghana over the last decades has gone through various structural reforms,
which has transformed the banking business’s mode of operation, ranging from broadening of
the scope of their business activities, opening up for foreign bank participation, to capital
requirements. Table 1.2 below shows stage-by-stage reforms since the year 1988 up to 2017.
Table 1.2: Tabulated stages of reforms in the Ghanaian banking industry
YEAR OF
REFORM
REFORMS MADE
1988
Private banks authorised to operate, Decontrolled the minimum
banks' savings rate, Removal of sectorial credit controls except for
agriculture. Established foreign exchange bureaus
1989
The enactment of the new banking law to strengthen the regulatory
environment and supervisory authority of the Bank of Ghana, in the
areas of minimum capital requirement, disclosure, and prudential
lending guidelines
1990
Liberalization of commercial banks’ interest rates and bank charges.
Abolition of credit controls including credit allocation by sector.
Bank of Ghana bonds replaces Non-performing loans of state
enterprises in three financially distress state-owned banks. Abolition
of lending targets for the agriculture sector, replacement of Non-
performing loans of the private sector by Bank of Ghana bonds in
three financially distress state-owned banks and. Restructuring of six
financially distressed banks
1991
Bank of Ghana bonds replaces Non- performing loans of the private
sector in four sound banks
1992
New Bank of Ghana law is enacted to offer stronger supervisory and
regulatory powers to the Bank of Ghana
1995
Sale of 30% of government shares in Social Security Bank after
merging with National Savings and Credit Bank but the subscription
rate was only 21%. Placement of 60% of the capital of the Social
Security Bank through the Ghana stock exchange
1996
Sale of 30% of government shares in Ghana Commercial Bank
(GCB) through the Ghana stock exchange (GSE); after
ISSN 2320-5407 International Journal of Advanced Research (2020)
12
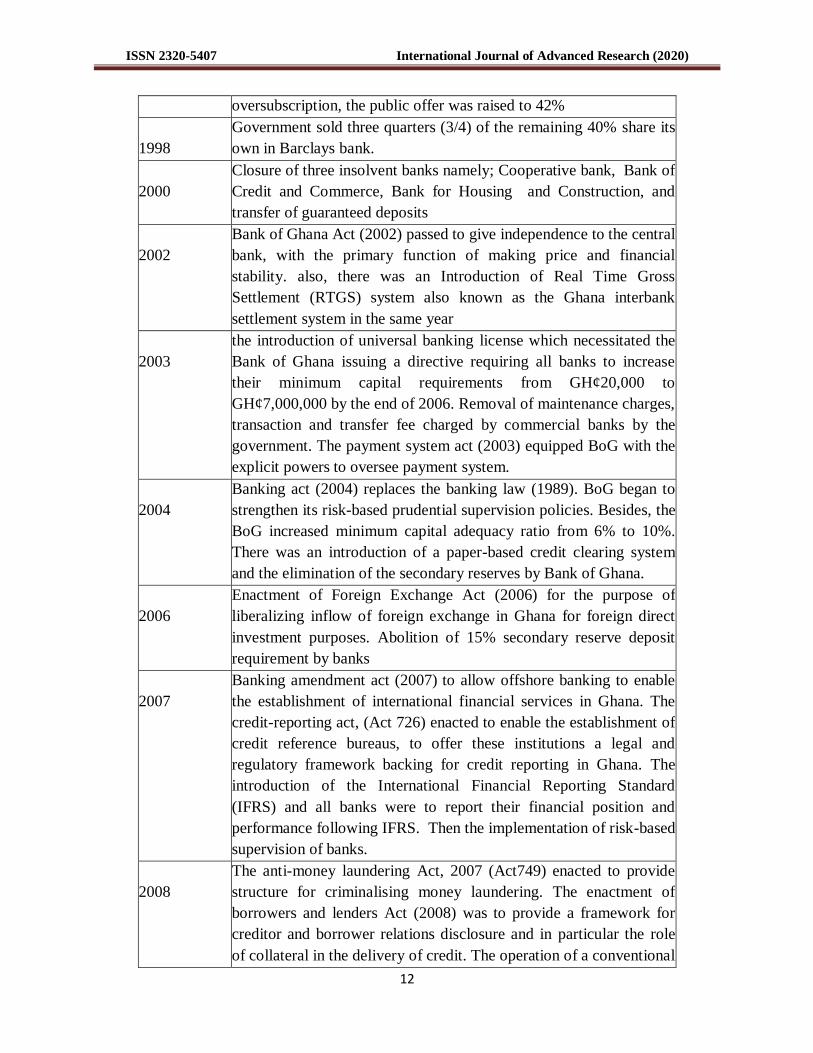
oversubscription, the public offer was raised to 42%
1998
Government sold three quarters (3/4) of the remaining 40% share its
own in Barclays bank.
2000
Closure of three insolvent banks namely; Cooperative bank, Bank of
Credit and Commerce, Bank for Housing and Construction, and
transfer of guaranteed deposits
2002
Bank of Ghana Act (2002) passed to give independence to the central
bank, with the primary function of making price and financial
stability. also, there was an Introduction of Real Time Gross
Settlement (RTGS) system also known as the Ghana interbank
settlement system in the same year
2003
the introduction of universal banking license which necessitated the
Bank of Ghana issuing a directive requiring all banks to increase
their minimum capital requirements from GH¢20,000 to
GH¢7,000,000 by the end of 2006. Removal of maintenance charges,
transaction and transfer fee charged by commercial banks by the
government. The payment system act (2003) equipped BoG with the
explicit powers to oversee payment system.
2004
Banking act (2004) replaces the banking law (1989). BoG began to
strengthen its risk-based prudential supervision policies. Besides, the
BoG increased minimum capital adequacy ratio from 6% to 10%.
There was an introduction of a paper-based credit clearing system
and the elimination of the secondary reserves by Bank of Ghana.
2006
Enactment of Foreign Exchange Act (2006) for the purpose of
liberalizing inflow of foreign exchange in Ghana for foreign direct
investment purposes. Abolition of 15% secondary reserve deposit
requirement by banks
2007
Banking amendment act (2007) to allow offshore banking to enable
the establishment of international financial services in Ghana. The
credit-reporting act, (Act 726) enacted to enable the establishment of
credit reference bureaus, to offer these institutions a legal and
regulatory framework backing for credit reporting in Ghana. The
introduction of the International Financial Reporting Standard
(IFRS) and all banks were to report their financial position and
performance following IFRS. Then the implementation of risk-based
supervision of banks.
2008
The anti-money laundering Act, 2007 (Act749) enacted to provide
structure for criminalising money laundering. The enactment of
borrowers and lenders Act (2008) was to provide a framework for
creditor and borrower relations disclosure and in particular the role
of collateral in the delivery of credit. The operation of a conventional

ISSN 2320-5407 International Journal of Advanced Research (2020)
13
electronic platform, the Nation Switch (e-Zwich) and a biometric
smartcard came into being.
2009
the introduction of the cheque codeling clearing system (CCC),
which reduced the cheque clearing period from between 5 - 8 days to
2 - 3days throughout the country. Minimum capital requirement for
banks increased from GH¢7,000,000 to GH¢60,000,000 which
aimed to strengthen the capital base of the banks to enable them to
assume higher levels of risk. The authorisation and launching of
Mobile payment services to enable mobile phone operators to offer
financial services
2010 Commencement of electronic direct credit transfer system- a
component of the automated clearinghouse project.
2013
Raising of capital requirement for banks from GH¢60,000,000 to
GH¢120,000,000 and that of NBFIs was also raised from
GH¢7,000,000 to GH¢15,000,00
2017 There was another increase in minimum capital requirement for
banks from GH¢120,000,000 to GH¢400,000,000.
2018
End of Year 2018 was the deadline for the compliance of the new
capital requirement. The 34 operating banks reduced to 23 partly due
to the banks’ inability to meet the requirement, which led to mergers,
acquisition, takeovers, consolidation and downgrading of some to
Savings and Loans Companies.
Sources: Consolidated from BoG reports, IMF reports, World Bank Reports
The implementation of the above reforms has brought about an influx of foreign banks, which
has made the banking industry very competitive. It has also strengthened and changed the
fortunes of the banking industry in Ghana as banks now operate in a liberal environment.
Because of the reforms, banks operating in Ghana have since increased in numbers year after
year as can be seen in table 1.3 below. Prior to the year 2003, the banking system in Ghana was
operating under the three-pillar model namely development, merchant and commercial. In 2003,
the central bank of Ghana replaced this three-pillar system with the universal banking system.
Universal banking system according to Mawutor (2015)5 is a financial system where banks are
permitted to provide a variety of services to their clients. A typical universal bank renders variety
of products and services including merchant banking, mutual funds, depository services,
investment services etc. under one roof.

ISSN 2320-5407 International Journal of Advanced Research (2020)
14
Table 1.3: List of post reform banks as at 2019
N0. NAME OF BANK BANK TYPE
1 Access Bank (Ghana) Ltd. Class 1 Bank
2 Agricultural Development Bank (ADB) Class 1 Bank
3 Bank of Africa (Ghana) Ltd. Class 1 Bank
4 Barclays Bank of (Ghana) Ltd Class 1 Bank
5 CAL Bank Limited Class 1 Bank
6 Consolidated Bank Ghana Limited Class 1 Bank
7 Ecobank (Ghana) Limited Class 1 Bank
8 Fidelity Bank Limited Class 1 Bank
9 First Atlantic Bank Ltd Class 1 Bank
10 FBN Bank Ghana Ltd Class 1 Bank
11 GCB Bank Limited Class 1 Bank
12 Guaranty Trust Bank (Ghana) Limited Class 1 Bank
13 National Investment Bank Ltd Class 1 Bank
14 Omni BSIC Bank Ghana Ltd Class 1 Bank
15 Prudential Bank Limited Class 1 Bank
16 Republic Bank (Ghana) Ltd Class 1 Bank
17 Societe General Ghana Limited Class 1 Bank
18 Stanbic Bank (Ghana) Ltd Class 1 Bank
19 Standard Chartered Bank (Ghana) Limited Class 1 Bank
20 United Bank for Africa (Ghana) Ltd Class 1 Bank
21 Universal Merchant Bank (Ghana) Ltd Class 1 Bank
22 Zenith Bank (Ghana) Limited Class 1 Bank
23 First National Bank Ghana Ltd Class 1 Bank
24 GHL Bank Ltd Class 1 Bank
OTHER BANKS
1 ARB Apex Bank Ltd.
REPRESENTATION OFFICES IN GHANA
1 Citibank N.A. Ghana Rep. Office Class 2 Bank
2 Ghana International Bank plc Class 2 Bank
3 Exim Bank of Korea (Representative Office) Class 2 Bank
4 Bank of Beirut (Representative Office) Class 2 Bank
Source: Bank of Ghana

ISSN 2320-5407 International Journal of Advanced Research (2020)
15
1.5. THE EMERGENCE OF THE NON-BANK FINANCIAL INSTITUTIONS
(NBFIs)
After various reforms in the banking sector, it opened up the private sector and created
opportunities in the Small, and Medium Enterprise (SMEs) bracket. The booming SME sub-
economic sector needed financial intermediation, but the nature of the products and services of
the conventional banks hindered their access to bank services. According to (Adjei, 2010)6,
Micro-entrepreneurs constitute about 66% of the labour force in the country and, thus represent a
vital economic force. These categories of entrepreneurs have financial needs such as access to
credit facilities, which the universal banks were not offering. It also became evident that these
economic players keep large amounts of unbanked funds. In order to address this financial
services gap, the government passed a law for the licensing of Non- Bank Financial Institutions
(NBFIs) to focus on the SME sector of the economy that has received less attention over the
years. The NBFIs, which were previously operating in the informal sector or under the
company’s code with special permission from the ministry of finance, or were established and
governed by specific laws, came under the supervision of BoG through NBFIs unit at the BoG
which implements the financial institutions (Non-Bank) Law (1993) Act (328). The NBFIs only
had a formal regulatory framework after the financial sector reforms had begun.
Broadly classified, the Non-Bank Financial sector comprises of the following institutions: The
Social Security and National Insurance Trust (SSNIT) (now operating under the social security
law of 1991); the Insurance Companies (operating under the 1989 insurance Law); Leasing
Companies; Mortgage Finance companies; and Discount Houses. The rest are the Ghana Stock
Exchange (GSE) (operating under the securities industries Law); Finance Houses; Savings and
Loans Companies; Hire Purchasing Companies; Forex Bureau, Financial Non-Governmental
Organizations, Microfinance Companies, Remittance companies, Credit Reference Bureau, and
Credit Unions. Table 1.4 below shows the list of licensed NBFIs under the Non-Bank (1993)
Law in Ghana as at 2017.

ISSN 2320-5407 International Journal of Advanced Research (2020)
16
Table 1.4: Number of licensed NBFIs as at 2017
SN NATURE OF BUSINES NUMBER
1. Savings & Loans Companies 37
2. Finance House Companies 23
3. Financial NGOs 11
4. Mortgage Companies 1
5. Credit Reference Bureaux 3
6. Finance And Leasing 3
7. Remittances Companies 2
8. Leasing Companies 2
9. Money Lending Companies 67
10. Credit Unions 435
11. Microfinance Companies 467
12. Forex Bureau 431
Total 1,471
Source: Bank of Ghana
1.6. CREDIT RISK MANAGEMENT AND PROFITABILITY
Credit administration is one of the significant activities of banks and non-bank financial
institutions (NBFIs) in Ghana and the world at large. The NBFIs comprises of the Savings and
Loans Companies, Financial Non-Governmental Organization (FNGOs), Money Lending
companies, Finance Houses, Credit Unions, and microfinance companies. The large proportion
that loans constitute in the overall operating assets of these lending institutions evidences their
level of credit activities. However, managing a business and maintaining a continuous growth
has become a challenge for managers of financial institutions in this era of market competition
and economic fluctuations especially in developing countries such as Ghana. Considering the
impact a healthy loan portfolio has on the lending institutions concerning liquidity, lending
capacity, earnings, and profitability, managers of these firms have no other options than to
consider and employ prudent credit-risk management practices in order to be profitable and
remain sustainable.

ISSN 2320-5407 International Journal of Advanced Research (2020)
17
A sound banking system is vital for a healthy and vibrant economy. The performance of the
Ghanaian economy mostly is dependent on the performance of the banking sector. The banking
sector’s performance portrays an image of the economic strength of every country. A healthy
banking system acts as the foundation for the socio-economic and industrial growth of a
country’s economy. In 1987 for instance, non-performing assets (NPAs) in the banking history
of Ghana, peaked at 62 billion Cedis with non-performing loans (NPLs) alone amounting to 32
billion Cedis representing 51.6% of the total credits that made the banks running into financial
distress (Kapur et al., 1991, pp60-61)7. According to Baldwin and Mason (1983)
8, “financial
distress occurs when a firm’s business deteriorates to the point where it cannot meet its financial
obligations”. The economy of Ghana was appalling at the time due to performance decline in the
banking sector as a result of the weakness in the economy as a whole during the early part of the
1980s (World Bank report, 1988). Given the above, Das and Ghosh, (2007)9, therefore opines
that the health of a country’s financial system has an essential role in the country since the failure
in the financial sector can disrupt economic development of the country.
Microfinance Institutions (MFIs) which includes the Savings and Loans companies, currently
provide financial services to an estimated 15 per cent of the country’s total population as
compared to 10 per cent for the universal banking sector (Arko, Samuel Kofi, 2012)10
. Credit
risk undoubtedly remains the largest source of risk for banking institutions across the globe
(Bank Negara Malaysia, 2011)11
. Effective credit management is therefore vital to ensure that
the credit activities of a banking institution occur prudently to reduce failure of the institutions.
Credit risk management, therefore, remains a significant predictor of the bank’s financial
performance. According to Poudel (2012)12
, among the risk management indicators used by
banking institutions in the Management of risk, default rate risk is a single most important
predictor of bank performance. Management of trade-off between risks and return is of
paramount importance to the profitability of non-bank financial institutions and the general
banking sector as a whole.
Banks grants loans with the expectation of getting it back through the agreed repayment schedule
but usually, a significant part of the loans disbursed by the lending institutions, become non-
performing and eventually generates into bad debts with its adverse consequences affecting the
overall performance of these financial institutions. The issue of loan default (NPLs) is becoming

ISSN 2320-5407 International Journal of Advanced Research (2020)
18
an increasing problem that threatens the sustainability of banking institutions in Ghana. For
example, the quarterly bank of Ghana stability report indicated that NPLs had increased from
GH¢6.14 billion in December 2016 to GH¢8.58 billion in December 2017. The 2017 stock of
NPLs represented an NPLR of 22.7%, an increase from December 2016 ratio of 17.3%. After
adjusting for fully provisioned loan loss, the net NPLR stood at 10.8%, an increase from 2016
net NPL ratio of 8.4%. It is a clear indication of how alarming the situation had become. It is
therefore paramount that, credit risk has a significant effect on income generation of financial
institutions. Hence, credit-risk management capability of a bank remains a conscious academic
discourse in finance and economics that requires research to ascertain the root cause of the
alarming incremental rate on year-on-year basis.
1.7. CREDIT
Banks in any country around the world have a very vital role to play. The primary function of the
financial system is to channel the surpluses arising in the economy through the activities of
corporate houses, individual households, and the government into deficit units in the economy
again in the form of individual households, corporate houses, and government. The financial
system includes financial markets and financial intermediaries. The financial markets serve as
‘brokers’ that bring the surplus and deficit units together for mutual benefit. In the financial
markets, largely the surplus units themselves assume the risk of lending to the deficit units. The
financial intermediaries, on the other hand, create ‘assets’ out of the surpluses of the economy
where the credit risk arises. By doing so, the risk of lending to the deficit sector is not borne by
the surplus units as in the case of the financial markets but rather the intermediaries (Suresh and
Paul, 2018, P. 146)13
. The financial intermediaries also assure liquidity to the surplus units who
have entrusted their savings to them and again reduce risk with low information costs. The
financial intermediaries, therefore, serve three main purposes:
They mitigate the default risk of deficit units when surplus units lend to them
They serve liquidity of savings by surplus units
They lower information cost

ISSN 2320-5407 International Journal of Advanced Research (2020)
19
The flow of fund through the financial system is as illustrated in fig.1.3 below.
Fig.1.2: Flow of fund through the financial system
Source: Suresh and Paul, (P.146)
1.7.1. Types of Lending
There are two main classifications of Bank lending namely; fund based lending and non-fund
based lending.
1.7.1.1. Fund-based lending:
This form of lending is the most direct form of lending that involves parting with funds to the
customer through either the account or payment made directly to the suppliers of materials or
assets to be purchased. Fund based facilities include demand loan, term loans, overdraft, cash
credit, packing credit and bills purchase/discounted. A grant of any of the fund-based credit
facilities to a borrower would result in depletion of actual liquidity of a banker immediately
(Agarwal, 2016, P.173)14
Surplus sectors of the economy: Households,
corporate houses, government etc.
Invest Cash,
Get Securities in Return
Invest Cash,
Get Deposit in Return
The Financial System
Deficit sectors of the economy: Households,
corporate houses, government etc.
Get Cash, Give Securities in
return
Get Cash, Give Loan Agreement
in Return
Financial
Markets
Financial
Intermediaries

ISSN 2320-5407 International Journal of Advanced Research (2020)
20
1.7.1.2. Non-fund based Lending Facilities
Non-fund based lending as the name implies is a type of credit facility that does not involve an
immediate outlay of cash but rather the bank makes a promise in favour of a third party to
provide a monetary compensation on behalf of their customer if certain conditions are fulfilled.
The mere fact that there is no immediate cash outflow does not suggest that the fund-based
credits are riskier than the non-fund based credits. , in general, have attested to the fact that the
non-fund based credits are even riskier than the fund-based credits. Mainly is due to lack of
proper appraisal on the part of the banker of an application for non-fund based credit limits since
it does not involve an immediate outflow of cash upon sanction of the facility. It is therefore
worth noting that whether credit proposal is fund-based or non-fund based deserves an equal
standard of security and appraisal scrutiny. There are two significant types of non-fund based
facilities, which are Bank guarantees (BG), and letter of credits (LC).
1.8. TYPES OF RISKS IN BANKING
Generally, the term risk is an uncertain event or condition that, if it occurs, affects at least one
objective. In other words, the risk is the probability or threat of quantifiable damage, injury,
liability, loss, or any other negative occurrence that happens due to external or internal
vulnerabilities, which we can avoid through preemptive action. The Reserve Bank of India
identified and categorised the risks encountered in banking into three major types namely; Credit
risks, Market risks, and Operational risks (Krishn & Sunita (2010)15
. The risks can fall under
either financial risks or non-financial risks. The financial risk comprises of credit risk and market
risk whereas operational risk falls under the non-financial risk. The fig.1.4 below illustrates the
categorisation of risk under the three main types. Risks such as counterparty or borrower risk,
intrinsic or industry risk, portfolio or concentration risk are examples of credit risk. Risks that
falls under market risk include interest rate risk, liquidity risk, hedging risk, and Forex or
currency risk. Funding risk, strategic risk, legal risk, and political risk are examples of non-
financial risk.

ISSN 2320-5407 International Journal of Advanced Research (2020)
21
Fig. 1.3: Types of risk in banking
1.9. CREDIT RISK
Kargi (2011)16
opines that credit creation is the primary income generating activity for banks. It
means bank grant credit to produce profit, but in the process, they assume and accept risks.
Because of that, credit-risk management remains critical to the growth and survival of banks
otherwise credit activities can lead to financial distress. Greuning and Bratanovic (2009)17
defined credit risk as the probability that a debtor or issuer of a financial instrument whether an
individual, a company or even a country, will default on the repayment of the principal and other
investment-related cash flows according to the terms specified in a credit agreement. Another
school of thought defines credit risk as the cost of replacing cash flow when the counterparty
defaults. In other words, the risk that counterparty fails to perform an obligation owed to its
RISKS IN BANKING
CREDIT RISKS MARKET RISKS OPERATIONAL RISKS
NON-FINANCIAL RISKS FINANCIAL RISKS
Counterparty/Borrower Risk
Intrinsic/Industry Risk
Portfolio/Concentration
Risk
Interest Rate Risk
Liquidity Risk
Hedging Risk
Currency/Forex
Risk
Funding Risk
Strategic Risk
Political Risk
Legal Risk
Source: Krishn & Sunita (2010)
ISSN 2320-5407 International Journal of Advanced Research (2020)
22
creditors. Suresh and Paul (2018, P.250) defined Credit risk as the probability that a loan
customer of a bank or counterparty will fail to meet its obligation per agreed terms.
The most acceptable definition is "the potential that debtor or a counter-party default in
satisfying predetermined obligation according to the agreed terms" (Basel, 1999)18
. Credit risk,
therefore, means that payments may delay or may not be done at all, which lead to cash flow
problems and that affects a bank’s liquidity. Credit risk broadly includes both the risk that an
obligor or counterparty fails to comply with their obligation to service debt and the risk of a
decline in the credit standing of the obligor or counterparty. According to (Kargi, 2014)19
, we
find credit risk in all activities whose success depends on the performance of counterparty. In
banks, credit risk arises when bank funds are extended, committed, invested, or exposed through
actual or contractual agreements whether it is on or off balance sheet. It implies that banks
encounter credit risk in the issuance of other financial instruments other than loans such as
interbank transactions, foreign exchange transactions, and letter of credits, guarantees,
acceptances, bonds, equities, swaps and in settlement of transactions.
Although risks such as market, and operational, affects the performance of banks in many ways,
Chijoriga (1997)20
argues that the magnitude of loss caused by credit risk as compared to the
other risks will be enough to collapse a bank. Prakash Poudel (2012) also argued that credit risk
is an essential predictor of the bank financial performance and further stressed that, among the
risk management indicators; default rate management is the single most important predictor of
the bank performance.
1.9.1. Counterparty/ Borrower Risk
Counterparty or borrower risk is the risk that arises to each party of a contract that the
counterparty will not live up to the contractual agreement. The effect of counterparty risk is a
risk to all parties involved and need consideration during the drafting and signing of contract
documents. Losses due to counterparty risk may arise under the following circumstances:
When a consumer fails to make the payment due on say mortgage loan, credit card, a line
of credit or other forms of loans

ISSN 2320-5407 International Journal of Advanced Research (2020)
23
When a business or consumer does not pay a trade invoice when due
Whenever an employer fails to pay wages and salaries to employees when is due
When an insolvent insurance company does not honour policy obligations
When an insolvent bank or any other financial institution fails to pay depositors
1.9.2. Intrinsic/ Industry Risk
Credit risks in general terms emanate from two main risks; default risk and portfolio risk. The
portfolio consists of inherent and concentration risks. In a bank’s loan portfolio, credit risk arises
from external (extrinsic) and internal (intrinsic) factors. The external factors include the state of
the economy, changes in equity prices, foreign exchange and interest rates, restrictions in trade,
economic sanctions, and government policies. The intrinsic factors have to do with certain
deficiencies in loan policies and administration, lack of credit concentration limits, insufficiently
defined lending limits for credit officers and credit committees, deficiencies in appraisal,
depending excessively on collateral and low-risk pricing, an absence of loan review mechanism
and post disbursement monitoring.
1.9.3. Portfolio/Concentration Risk
Concentration risk denotes the spread of a bank’s outstanding loan portfolio over the number
debtors. To measure concentration risk, we use a concentration ratio. It explains the percentage
of the outstanding accounts each bank loan represents. When there is an economic slowdown in a
particular sector where the bank has most of its portfolio concentrated, the rate of default will
overwhelm the bank. It is therefore advisable to diversify the portfolio by lending to different
sectors of the economy. Concentration risks are of two types, which depend on the source of the
risk. Name concentration risk arises due to uneven distribution of the exposures to its borrowers.
Sectorial concentration is another type of concentration risk, which arises when there is an
uneven distribution of exposures to a particular sector, region, industry or a product.

ISSN 2320-5407 International Journal of Advanced Research (2020)
24
1.10. MARKET RISK
Market risk is the risk of losses in position arising from movements in market prices. An
investment may face market risk due to fluctuations in the market price. The risk here is that the
investment’s value will decrease. Also known as systematic risk, the term may also refer to a
specific currency or commodity. Elmer Funke Kupper (1999)24
in an article titled risk
management in banking defined market risk as ”the risk to earnings arising from changes in
underlying economic factors such as interest rates or exchange rates, or fluctuations in bond,
equity, or commodity prices”. Market risk according to Saunders & Cornett (2006)25
is the
uncertainty relating to financial institutions earnings on their business portfolio. Market risk
according to Pyle (1997)26
is the variations in the asset value, due to changes in contributory
economic factors such as equity and commodity prices, exchange rates, and interest rate. Every
bank is subject to market risk in both the management of their balance sheets and in trading
operations. Generally, market risk is the risk value of a portfolio, either a trading portfolio or an
instrument portfolio will decrease due to the change in the value of the market risk factors.
1.10.1. Interest-rate Risks
An Interest rate risk is a negative impact on the bank’s financial dealings and earnings because of
adverse movement in interest rates. Interest rate risk refers to the possible impact on net interest
income. In other words, it is the difference between interest paid on deposits and the interest
earned on loans. These types of risk arise when a change in the market interest rate results in
financial losses related to asset and liability management. It is worthy to note that, the market
determines the interest rate and not the central bank or the individual bank that only react
appropriately to the changes in order for them to achieve the desired results. The loan portfolio in
banking institutions are funded out of a composite portfolio of short-term borrowings and
deposits and therefore cause a considerable degree of maturity risk and interest rate risk. Interest
rate risk affects lending institutions in many ways. It impacts may be on the earning of the
banking institution or the market value of the bank’s assets or both. The problem even gets more

ISSN 2320-5407 International Journal of Advanced Research (2020)
25
and more complicated by the application of fixed rates on some and floating rates on the other
assets and liabilities.
We measure it by using the past and present market volatility and profile of the assets and
liabilities of the institution and its possible exposure through gap management. We can control
Interest rate risk through hedging (in the form of swaps, options, and futures) the assets and
liabilities and doing proper research and quantifying pending changes and scenarios.
1.10.2. Liquidity Risk
A financial institution is said to be liquid if it can meet its obligations as it falls due. Liquidity in
banking is the ability of a bank to accommodate deposit and other liabilities withdrawals and
fund loan portfolio growth and off-balance sheet claims. Liquidity risk is a financial risk due to
uncertain liquidity. It arises from funding long-term assets with short-term liabilities thereby
making the liabilities subject to refinancing risk or rollover. It also arises when the bank’s credit
rating falls since it leads to unexpected cash outflow or in some instances it results to
counterparties cutting trading ties or lending to the firm. Another way that firms are exposed to
liquidity risk is when markets on which it depends are subject to loss of liquidity. Market and
funding liquidity risk have a reciprocal effect on each other as it becomes difficult to sell when
investors are also facing funding problem. Again if a trading organisation has a position in an
illiquid asset, it is limited in its ability to liquidate that position at short notice, which compounds
its market risk. Liquidity planning, therefore, remains an essential aspect of risk management
framework in banks.
1.10.3. Hedging risk
To understand hedging in a simple term is to take it as insurance cover. When deciding to hedge,
it is insurance against a negative occurrence. Hedging does not prevent an adverse event from
happening, but if it occurs, the impact will be minimal. Individual investors, portfolio managers
and corporations use hedging techniques to minimise their exposure to various kinds of risks.
Hedging in the financial markets is far more than just paying a premium to an insurance
company every year. Hedging against investment risk means that strategically using another

ISSN 2320-5407 International Journal of Advanced Research (2020)
26
form of an instrument in the financial market to compensate for the risk of any adverse price
fluctuations. For instance, when an investor buys a stock, s/he will gain if the stock market price
goes up.
On the other hand, s/he losses when the stock market price come down. However, the investor is
uncertain whether the market price will go up or down so, in order to protect him/herself against
potential losses, the investor may want to hedge the risk. To Hedge, the investor invests in
another financial instrument that will yield a profit if the stocks s/he purchased decreases in
value. Hedging the investment reduces the impact of the loss.
1.10.4. Currency/ Forex Risk
These types of risk arise when changes in the foreign exchange rate cause different denomination
assets to fall in value or liabilities to increase in expense. We can measure foreign exchange risks
by marking-to-market the value of the assets or increase of the liability, by actual movement of
the assets and liabilities, and the currency of the booked or pending assets and liabilities or
country of earning repatriation. To mitigate these types of risks, we use hedging of the assets and
liabilities and researching pending changes and scenarios.
1.11. OPERATIONAL RISK
The Basel accord (2006)27
defined operational risk as “the risk of direct or indirect loss resulting
from the inadequate or failed internal process, people and systems or external events”. Bessis
(2010)28
also explained operational risk as malfunctions of the information system, reporting
system, internal monitoring rules and internal procedures designed to take timely corrective
actions or compliance with the internal risk policy. Operational risk, therefore, appears at
different levels such as human errors, process and technology, and information technology. Since
operational risk is event risk, ineffective monitoring and reporting of risks will result in ignoring
some significant risks which will mean that there will be no trigger for corrective action and this
can result in a disaster. Greuning and Bratanovic (2009) have stated that, developments in
modern banking operations such as increased reliance on modern technology, expanding retail
operations, growing e-commerce, outsourcing of functions and activities, and greater use of

ISSN 2320-5407 International Journal of Advanced Research (2020)
27
structured finance (derivatives) techniques have claimed to reduce credit and market risks but
have contributed to higher levels of operational risk in banks. To achieve a maximum objective
of setting up an operational risk management framework requires a change in behaviour and
culture of the organisation. Management must not only ensure adherence to operational risk
policies in place but also make a regular report to senior management. Again, there will be a
need for conducting self-assessment of the controls in place to manage and mitigate operational
risk.
1.11.1. Funding Risk
It is the probability of loss from higher funding costs or from a lack of funds to finance a project
(http://www.businessdictionary.com/definition/funding-risk.html). When the cost of capital for a
project is high, it strains the project’s cash flow resulting in inadequate funds to sustain the
business.
1.11.2. Strategic Risk
This risk may arise from the pursuit of an unsuccessful business plan. For instance, the strategic
risk might arise from poor business decision making, inadequate resource allocations, and poor
execution of decisions and failure of management to respond adequately to changes in the
business environment.
1.11.3. Political Risk
It is the type of risk investors, companies, and governments encounter due to political decisions,
events, or condition in a particular country or region that affect the profitability of a business
actor. The risk of a strategic, financial, or personal loss for a firm because of such non-market
factors such as macroeconomic and social policies or events related to political instability.
Political risk occurs at both macro and micro levels. Macro-level political risks have related
impacts on all foreign actors in a specific location. Micro-level risk on the other hand focuses on
sector, firm or project specific risk.

ISSN 2320-5407 International Journal of Advanced Research (2020)
28
1.11.4. Legal and Regulatory Risk
Banking institutions on a daily basis enter into numerous contractual agreements in the cause of
their daily operational activities. As a result, banks are most at times, caught in the web of legal
disputes with counterparties. Legal risk is the risk that potential lawsuits from a disgruntled
employee, customer, negligent conduct, improper documentation, workplace regulations or
environmental contamination will massively disrupt the company’s operations. The legal
department has the responsibility to pursue any legal tussle bought against the bank. The legal
department, therefore, must prepare and scrutinise, any contract the bank decides to enter.
1.12. NON-PERFORMING ASSETS (NPA)
An asset becomes non-performing whenever it ceases to generate income for the bank. In respect
of term loan, if the interest or instalment of principal or both remains overdue for over 90 days,
then it is non-performing. Concerning running accounts like overdraft or cash credit, if the
account remains out of order for more than 90 days, it is non-performing. In respect to short
duration crop loan, if it remains overdue for two crop seasons or more, then it becomes non-
performing. In case of long duration crop loan, if the loan remains overdue for one crop season
or more, it is non-performing. In respect of securitisation transactions, if the amount of liquidity
facility remains overdue for more than 90 days, it is non-performing. For derivative transactions,
if the receivables remain overdue for over 90 days, it is non-performing.
1.12.1. Assets Classification and Provisioning
It is a requirement and responsibility of banks to classify its loan assets and make adequate
provision for diminution in value of the loan assets. It is to ensure that the bank knows the
quality its assets at any point in time. Bank of Ghana through the banking act 2004 Section 53
(1) has outlined the various categorisations of loans as summarised in Table 1.5 below. The
categorisations are Current Assets, Overdue Loans Especially Mentioned (OLEM), Substandard
Assets, Doubtful Assets, and Loss Assets.

ISSN 2320-5407 International Journal of Advanced Research (2020)
29
Table 1.5: Asset Classifications and Provision allocations
Credit Risk Rating Days Past Due Provision (%)
current 0 - less than 30 1
OLEM 30 less than90 10
Substandard 90 less than 180 25
Doubtful 180 - less than 360 50
Loss 360 and above 100
Source: Section 53(1) of Banking Act, 2004
Current Assets: these assets comprise of loans freshly disbursed yet to commence repayment
and those that have passed due but not more than 30 days.
OLEM: is an acronym for Other Loans Especially Mentioned, the risk may be minimal, but it
may involve needless risk, which depicts an inherent weakness in the assessment stages. Such
loans contain weakness such as an inadequate loan agreement or poor condition of or control
over collateral or deficient loan documentation or evidence of imprudent lending practices.
Deterioration in market conditions in future may unfavourably influence the operations or the
financials of the borrower, but may not threaten liquidation of assets held as security. The risks
carried by the special-mentioned loans are more than usual such that, had they been present
during the credit appraisal would have led to the rejection of the credit request.
Sub-standard Assets: these assets have a well-defined weakness that may threaten liquidation
of the debt since the borrower’s financial condition or the collateral given as security is not
enough to protect the facility. The consequence is that without correcting the defects, the bank is
likely to incur a loss.
Doubtful Assets: these assets contain all the inherent weakness of sub-standard assets and
recovery of the debt in full is entirely inaccessible. At this point, auditors may insist on a write-
down of the asset through a charge to loan loss reserves or a write-off of a portion of the asset or
they may call for additional capital allocation. Any portion of the balance outstanding in the

ISSN 2320-5407 International Journal of Advanced Research (2020)
30
loan, which is are not covered by the market values of the collateral, may be identified as
uncollectible and written off.
Loss Assets: all identified losses have to be charged-off. Uncollectible loans with such little
value that, their maintenance as bankable assets is unwarranted and are generally charged-off.
Losses occur in the same period in which they are written-off.
1.12.2. The NPA Trend in the Ghanaian Banking Industry (2010 – 2018)
The NPA ratio, which is the ratio of the gross non-performing assets to total advances, is a
measure of the quality of assets in the industry. The higher the ratio, the more alarming is the
situation. Higher net NPA means the bank’s profit will be under pressure in the near future. The
trend of the average NPA ratio of the entire banking industry from 2010 to 2018 is as show in
fig.1.6 below. The industry acceptable NPA ratio is 5% but the ratios from 2010 to 2018 are all
way above the benchmark ratio. In 2010, the NPA ratio stood at 18.1%, which kept on declining
in the subsequent year until 2014 and then worsened from 2015 and peaked at 21.6% in 2017 and
declined to 18.2% in 2018.
Fig.1.4: NPA trend in the Ghanaian banking sector
Source: The World Bank
18.1
14.1 13.2
12.0 11.3
14.7
17.3
21.6
18.2
2010 2011 2012 2013 2014 2015 2016 2017 2018
NPA Ratio (%)

ISSN 2320-5407 International Journal of Advanced Research (2020)
31
1.13. MITIGATING CREDIT RISK
Lenders (banks) can reduce the effect of credit risk on their institutions in many ways. The most
commonly practised mitigating measures employed by lenders are as discussed below:
Covenants – Lenders may outline the terms and conditions of a loan (covenants) into
agreements, which stipulates specific demands on the borrower such as:
- Furnishing the lender with periodic financial statements,
- The borrower desisting from making further borrowings, paying out a dividend to
shareholders or repurchasing shares as well as any other actions that may
undermine the borrower’s financial position
Diversification – When lenders end up lending to a small section of borrowers, they
subject the financial institution to an extrinsic risk called concentration risk. The surest
way to mitigate this risk is through diversification of the pool of borrowers.
Risk-based pricing – when lenders identify a risky borrower they tend to charge a higher
interest rate on the borrower’s loan since they are more likely to default. The estimation
of the interest rate is determined using the purpose of the loan, credit rating of the
borrower and loan to value ratio of the loan facility.
Tightening – lenders can also reduce credit risk by limiting the amount of loan extended
to particular individual borrowers or in some cases all
Deposit insurance – in order to protect depositors, government establish deposit
insurance to guarantee bank deposits in the event of insolvency which boosts depositors
confidence to hold their savings in banks instead of in cash.

ISSN 2320-5407 International Journal of Advanced Research (2020)
32
Credit insurance /derivatives – lenders and bondholders in order to minimise the loss
that may arise from credit risk, hedge their credit risk by purchasing credit insurance. It
allows the lenders to transfer the risk to the insurance company in exchange for payment
of premium. The most available credit derivative is the credit default swap (CDS).
1.14. CREDIT RISK MEASUREMENT
In evaluating risk, banks should assess the likely downside scenarios and their possible impact
on the borrower and their debt servicing capacity (Suresh and Paul, 2018). Bank’s ability to
achieve a significant milestone in managing credit risk depends on its ability to clearly, measure
credit risk. According to Suresh and Paul (2018, P.254), the simple means of estimating credit
risk is to assess the impact of non-performing assets (NPA) write-offs on the bank’s profit. The
estimation is made by dividing the profit before tax (PBT) by the NPAs. The PBT is critical here
because losses written-off typically enjoy tax shields. The authors added that another method of
presenting this concept is to work from the net income and NPAs as a proportion of average total
assets of the bank. The below are the formula for measuring credit risk.
i.
ii.
or simply as
iii.
The resultant proportion is often referred to as margin of safety because it is an indication of
eroded assets after write-off.
Financial institutions have traditionally attempted to minimise the occurrence of credit risk
primarily through a loan-by-loan analysis. The basis for a credit model is to determine the risk
and earnings on each credit exposure. However, bank professionals realised that it is not
sufficient to estimate earnings and risk based on qualitative groupings. A more analytical
framework evolved, which began in the early 1960s when the first credit scoring models were

ISSN 2320-5407 International Journal of Advanced Research (2020)
33
built to assist credit decisions for consumer loans. The models enabled lending institutions’
classified debtors/counterparties on default potential only on an ordinal ranking basis. By the
mid-1980s mainly, with the introduction of Risk-Adjusted Return on Capital (RAROC) as a
performance measure, many banking institutions started calibrating each credit to a particular
past due (PD) to estimate expected loss (EL) and ultimately economic capital.
There are many advanced credit measurement tools, but for this study, the discussion will base
on only commercial credit risk measurement tools. According to Baixauli and Alvarez (2009)21
,
the main variables that affect the credit risk of financial assets are the probability of default (PD),
the loss given default (LGD), and the Exposure at default (EAD).
1.14.1. Expected Loss (EL)
Two types of loses will probably affect any borrower namely expected loss (EL), and unexpected
loss (UL). Since expected loss is something we envisage, we can make a budget allocation for it
and hold provisions to offset its adverse effects on the bank’s balance sheet. EL could arise from
the risks in the industry in which the borrower operates, the business risk associated with the
borrower firm, its payments history, and future perspective to generate cash flows. Unexpected
losses are usually unpredictable. Because of that, the surest way out is for the banks to cushion
themselves by holding adequate capital. Banks can make use of the structure of the borrowers’
transactions, collateral and guarantees to mitigate identified and inherent risks, but none of these
measures can substitute for the comprehensive assessment of borrowers’ repayment capacity or
compensate for inadequate information or monitoring. Any action of credit enforcement such as
recalling the loan made or institution foreclosure proceedings, including legal actions may only
serve to erode the already small profit margins on the transaction. Although credit losses are
usually dependent on time and economic conditions, it is theoretically possible to arrive at a
statistically measured long-run average loss level. EL is therefore perceived to base on three
parameters:
The likelihood that will take place over a specified time horizon (probability of default or
PD)

ISSN 2320-5407 International Journal of Advanced Research (2020)
34
The amount owed by the counterparty at the moment of default (exposure at default or
EAD)
The portion of the exposure and net of any recoveries, which the bank will lose following
a default event (loss given default or LGD)
Since the general specification of PD is on a one-year basis, the product of the above three
factors is the one year EL
We can aggregate EL at the level of individual loans or the entire credit portfolio. It is also both
customer and facility-specific since two different loans to the same customer can have different
ELs due to differences in EAD or LGD. It is important to note that EL by itself does not
constitute risk if losses turn out as expected; they represent the anticipated cost of being in
business. In any case, the bank factors their impact in loan pricing and provision. Credit risk
emerging from adverse variations in the actual loss levels, give rise to the UL. Statistically, UL is
merely the standard deviation of EL.
1.14.2. The probability of Default (PD) models
The probability of default is the estimation of the likelihood of the borrower defaulting on its
obligation within a given horizon (Baixauli and Alvarez, 2009). We apply the PD model to a
group of borrowers with similar characteristics, and it can predict the number of borrowers that
are likely to default over a specific period (Duffie and Singleton, 2003)22
. The calculation of PD
is for each customer who has a loan in case of wholesale banking or for a portfolio of customers
with similar characteristics in the case of retail banking. The techniques for calculating PD are in
two categories: the empirical model and market-based model.
Empirical model: these models use historical default rates associated with each score to identify
the characteristics of defaulting counterparties. Usually, such models use discriminant analysis
ISSN 2320-5407 International Journal of Advanced Research (2020)
35
like Z-Scores, but recently logit or probit regressions have gained prominence to define the score
‘S.’
Market-based models: these models, which are also known as structural or reduced-form
models use counterparty market data such as bond or credit default swap (CDS) spread, and
volatility of equity market value to infer the likelihood of default. Below are the commonly used
steps to arrive at the probability of default.
Analyse the credit risk aspects of the counterparty portfolio
Map the counterparty to an internal risk grade which has an associated probability of
default
Determine the facility-specific probability of Default.
After the estimation of the PD, the related credit spread and valuation of the loan is the next step.
Sophisticated banks use these models for active portfolio-level credit management particularly,
for large corporate loans by identifying risk concentrations and opportunities for diversification
through debt instruments and credit derivatives.
PD is computed using the formula:
PD =
Where: EL = Expected Loss
LGD = Loss Given Default
EAD = Exposure at Default

ISSN 2320-5407 International Journal of Advanced Research (2020)
36
1.14.3. Loss Given Default (LGD) Models
These models attempt to predict the amount of loss in credit in the event of default. The
prediction depends on the characteristics of the facility e.g. collateral covenants (Duffie &
Singleton, 2003). LGD in the view of Baixauli and Alvarez (2009) defined LGD, as the loss
incurred in the event of default and it is equal to one minus the recovery rate at default. The
difference between the value received at default resolution from bankruptcy, distressed
exchange, outright cure, principal outstanding, and accrued interest due at resolution is the
expected Loss Given Default. Loss given assessments are assigned to an individual loan, bond
and preferred stock issues. According to Baixauli and Alvarez (2009),
LGD
Where = the value received at default resolution or the recovery rate of default instrument.
Consequently, the expected LGD rate is estimated as follows:
1.14.4. Exposure at Default (EAD) Model
According to Duffie and Singleton (2003), the model is based on the characteristics and purpose
of the facility and behaviour of the borrower. EAD, as explained by Baixauli and Alvarez (2009),
is the total value that a bank is exposed to at the time of default or the nominal value of the
borrower’s debt. Every underlying exposure that a bank has is an EAD value, which is inherent
within the bank’s internal system. Lending institutions will often use their risk management
defaults models to calculate their EAD
Mathematically,
In actual sense, EL is not part of the risk but is perceived as a cost. The actual risk is the
unexpected loss (UL). Unexpected loss thus expresses the scale of the loss in more extreme

ISSN 2320-5407 International Journal of Advanced Research (2020)
37
circumstances that is in situations where the development is not as expected (Lawer F. Tetteh,
2012)23
.
1.15. CREDIT RISK MANAGEMENT
The primary motive of granting loans by banks is to make a profit. In the process, they assume
and accept risks. In evaluating credit risk, banks should assess the likely downside scenarios and
their possible effect on the borrowers and their capacity to service debt. There are possibly two
types of losses associated with any borrower type: expected and unexpected losses (Suresh and
Paul, 2018 P.249). Expected loss can be budgeted for, and provisions held to offset their adverse
effect on the bank’s profitability. It could arise from the risks in the industry in which the
borrower operates, the business risk associated with the borrower firm, its record of
accomplishment of repayments and potential to generate cash flows. Unexpected loss is
unpredictable, and therefore must be a form of a cushion by holding adequate capital.
The business dictionary defines risk management as the identification, analysis, assessment,
control, and avoidance, minimisation, or elimination of unacceptable risks. In an attempt to
manage risk, an organisation may use risk assumption, risk avoidance, risk retention, risk
transfer or any other strategy or combination of strategies in proper management of future
events. Kalapodas, and Thompson (2006)29
defined credit risk management as reducing, or
eradicating and managing risks to avoid inevitable catastrophes such as financial losses in
organisations.
Risk management according to the economic times of India is the practice of identifying
potential risks in advance, analysing them and taking precautionary steps to reduce the risk
(www.economictimes.indiatimes.com). What this implies is that when an entity makes an
investment decision, it exposes itself to some financial risks. The value of these risks depends on
the types of financial instrument. This financial risk might be in the form of high inflation,
volatility in the capital market, recession, and bankruptcy. So in order to minimise and control
the exposure of investment to such risks, fund managers and investors must practice risk
management. Not giving the needed importance to risk management while making investment

ISSN 2320-5407 International Journal of Advanced Research (2020)
38
decisions, might cause disaster on investment in times of financial havoc in an economy.
Different levels of risk come attached to different categories of assets classes.
The cost of holding risk matters to every organisation especially, the banking sector because in
taking a financial decision, be it on capital structure, dividends, investment, revolves around the
cost of holding risk. Banks, therefore, place a significant emphasis on this since risk management
constitutes part of its core business. Banks primarily provide liquidity on demand to depositors
through the current account and extend credit as well as liquidity to borrowers through the lines
of credit (Kashyap, Rajan and Stein, 1999)30
. Due to this fundamental responsibility, the concern
of banks has always been with both solvency and liquidity.
Usually, banks hold capital as a mitigation measure against insolvency, and they hold liquid
assets to guard against unexpected withdrawals by depositors (Saidenberg and Straham, 1999)31
.
It has made banks to dynamically evaluate and take risks on a daily basis as part of their core
business processes. In order to measure, and manage risks, banks must have effective ways to
determine the appropriate amount of capital that can absorb unexpected losses arising from their
market, credit and operational risks exposures.
Even though banks face various forms of risk, market and credit risks are always at the centre of
their core business. Managers are therefore required to identify, assess, monitor and manage
these risks in a comprehensive and sophisticated way. Banks, therefore, are becoming much
more aware of the need to measure and manage the credit risk of the loans they have initiated not
only on a portfolio basis. That is because only the aggregate credit exposure is a relevant factor
for the future solvency of banks. Banks risk management in recent times has come under
increasing scrutiny in both academia and practice due to its increasing importance to the
sustainability of the banking industry.
1.15.1. The Credit Risk Management Process
An essential requirement for effective credit management is the ability to cleverly, and
efficiently manage customer credit lines. In order for banks to minimise exposure to bad debt,
over-reserving and bankruptcies, they must have greater insight into customer’s financial

ISSN 2320-5407 International Journal of Advanced Research (2020)
39
strength, credit score history and changing payment patterns. We must critically examine the
customer’s ability to penetrate new markets and the ability to quickly and easily make well-
informed credit decisions, and set appropriate lines of credit. It merely means Credit
management starts with the sale and does not stop until the full and final payment is received
(Haron et al., 2012)32
. The process of credit risk management according to Sinkey (2002)33
involves the usage of these five verbs; identity, measure, price, monitor and control. The process
involved in risk management is as illustrated in fig.1.7 below:
Fig.1.5: The risk management process
Source: Researchers illustration
The first step in risk management is the identification stage. Every activity including lending is
fraught with one or more risks. Identifying those risks, its probability of occurrence and the
consequences is risk identification. The identification and definition of potential risk usually
begin right from the initiation of the credit facility. In essence, risk identification consists of
identifying various risks associated with the transaction and examining the impact on the
portfolio and capital requirements. The credit/loan and risk officers play a crucial role at this
stage of the risk management process. The second stage has to do with measurement of the
identified risk to ascertain the severity of loss that will arise should the loan goes bad. It is the act
of determining the extent of loss regarding financial and non-financial yardstick. Though it is not
an easy task, it can still be done based on probability analysis and experience. It may be an
approximation but is still a valuable tool for risk management. It is therefore essential that the
assumptions made in measuring the risk are consistent and practical. Then the third stage where
the pricing of the measured risk takes place to know the extent of loss that may arise. That is the
extent of the risk, the scope of loss regarding material and money. During pricing of risk, the
banks have to maintain capital based on risk weight as per regulatory requirements. This required
Identify Measure Price Monitor Control
ISSN 2320-5407 International Journal of Advanced Research (2020)
40
capital will cost the bank. The next to factor into the pricing of risk is the probability of loss
associated with risks. It means that the pricing of risk should take into consideration operating
expenses, loss probabilities and capital cost. The fourth stage of the risk management process is
to monitor to know its state and direction. If the direction is moving undesirably, then the
implementation of the control measures is put in place which according to Afriyie & Akotey,
(2012 p.3)34
, Gestel & Baesens, (2008, p.43)35
, involves four control alternatives: risk avoidance,
risk reduction, risk acceptance and risk transfer. Risk avoidance is a simple way of risk treatment
where we avoid risky investments and instead invest funds in less risky transactions. Avoidance
does not necessarily mean avoiding the risk completely but rather minimising the impact by
investing in products that are not too risky. Here the cost of control measures should not be more
than the potential loss that can occur from the risk. Risk reduction comes to mind when
prevention of the risk is impossible. It includes strategies to reduce the possibility of risk as well
as lowering the potential loss (S. Arunajatesan 2015, p.5)36
. In order to reduce the impact of risk
of financial loss many finance managers hedge the risk through appropriate derivative
instruments. Management of credit lending institutions reduces potential loss by accepting
collateral as a cushion for the shock. Risk acceptance or retention involves retaining the risk with
oneself and dealing with it. Taken into consideration the level of risk, its probability and severity,
a conscious effort is made to create a fund and bear the losses. It again refers to a situation where
the lender decides fully to accept the risk when it is clear that, the transaction is of low risk and is
accommodative. Risk transfer refers to a situation where the lender finds the risk to be too much
of a burden to shoulder and decides to transfer the risk to other institutions such as insurance and
banks. Another vital risk transfer method is outsourcing the risky job. After deciding on which of
the above risk control options to adopt, the next stage is the implementation of the risk
management strategy. The implementation strategy should involve all the available resources
thus - human resource, statistical models, and IT infrastructure judicious in order to measure the
underlying risk of current and future investments. The statistical models and the IT infrastructure
should be able to benchmark for the limit of exposure to risk products, whether acceptance of
collateral for a particular loan facility should be mandatory or not, or whether to buy financial
protection to secure the investment (Gestel and Baesens, 2008, p.4). The implementation of a
risk management strategy should have the backing of a well-documented credit policy and
supervised by senior management. This cycle must be a continuous cycle for every lending
decision.

ISSN 2320-5407 International Journal of Advanced Research (2020)
41
1.15.2. Warning Signals of Loan Default
When a customer is servicing a loan account, and any of the following situations arise, it must
serve as a warning sign to the banker to probe further and put the account on a watch.
o Cheques deposited through clearing and withdrawal of round and large amounts by some
few firms without any tangible reason. What it means is that the company may be
fictitious or consist of same partners and the customer may be resorting to “ballooning”
tactics.
o Bills tendered in bills purchase account- if such bills are for round amounts and drawn
almost regularly on same parties, then the indication would be that the customer is
resorting to “Kite Flying” to supplement his cash requirement, which he is unable to
obtain in the ordinary course.
o Frequent stop payment of cheques issued- the indication would be that the customer is
cash-strapped and struggling with a liquidity problem.
o Constant enquiring with the ledger department to know whether account balance is
sufficient to meet the cheques drawn in cash as against the amount deposited at the last
moment, which may indicate that the cheques have been issued to accommodators who
allow the borrower to draw accommodation bills on them
o Minimal fluctuations in debit balances of the primary account which lack credible and
genuine turnover.
o Delay in the retirement of bills even for materials
o Asking for frequent accommodation from the bank by way of excess in limits, which is
not regularised in time
o Default in payment of monthly interests and loan installments

ISSN 2320-5407 International Journal of Advanced Research (2020)
42
1.15.3. Best Practices and Techniques of Credit Risk Management
Credit risk management has a primary goal to maximise a bank’s risk-adjusted rate of return by
maintaining credit risk and exposure within acceptable parameters. The part of a complete
approach to risk management is essential to the long-term success of any banking institution.
Banks across the globe increasingly face with credit risk in different financial instruments other
than loans, which include trade financing, foreign exchange transaction, interbank transactions,
financial futures, and in the extension of commitments and guarantees. Let us look at credit risk
management in a two-stage approach: Pre-disbursement and post-disbursement practices.
1.15.4. Pre-disbursement Credit Risk Management Practices
Bankers undertake these practices during the initial stage of the loan application. The first of the
practice is the KYC (know your customer) modalities. This practice is essential because it serves
as the foundation for all the succeeding steps in the credit-risk management process. To be
successful at knowing the customer very well, one must function on relevant, accurate and
judicious information. The information put together and the relationship built with the customer
is significant in positioning oneself as a cherished financial consultant and provider of financial
product and services. Establishing a good rapport with the potential loan customer can bring a
long stream of equity to the banking institution. When the initial call is poorly planned and
executed, it could limit the future business opportunity. One of the very best ways to knowing
the customer's needs as well as establishing yourself as a valued financial consultant is by
meeting face-to-face to discuss the customers' past and future. As a financial consultant, before
meeting the customer, find out as much information as possible about the individual/company
and its industry. Eliciting the needed information is necessary while keeping in mind that the
ability to listen effectively and responding to a customer’s needs are the most important
technique to exhibit. There is the need to listen from verbal cues and watch the non-verbal cues
in order to establish customer’s needs. The first impression counts so during the first interaction,
establishing credibility as a professional, the person must be a very knowledgeable and friendly
businessperson. The line of questions should base on the individual’s/company’s product and
services, customer base, suppliers, facilities, ownership, management, and history. Professional
interaction will let the customer to develop an initial opinion about the behaviour of management
ISSN 2320-5407 International Journal of Advanced Research (2020)
43
and the ability to carry out the company’ business strategy. The next thing to investigate should
include competition, market share, and the probable impact of economic conditions on the
business.
The next risk management practice before granting of the credit facility is the analysis of non-
financial risk. The risk is not inherent in only the financials of a loan application but also the
non-financials. Information gathered in understanding the customer’s business through the
analysis of non-financial risk is critical in order to have a reputation as a financial consultant to
the customer. The concept of risk management applies to either a single loan as well as to an
entire loan portfolio. A loan is a risk at the micro level, and at the macro level, a portfolio of
loans is level is a risk. Risk management is not static but a continuous process of identifying
risks that are at times subject to quick and volatile changes. Risk identification may result in
opportunities for portfolio growth or may aid in avoiding unacceptable exposures for the
institution. Each item of the balance sheet and income statement is full of risk and officers must
learn how to evaluate it. The risks are inherent in three broad areas: industry, business, and
management. The overall credit underwriting process is a combined analysis of risks associated
with the industry, business and management of a company. In the analysis, it is a must indicate to
the senior credit policy management committee whether:
There is enough capital available on the institution’s balance sheet to support the risk the
bank is yet to take
The compensation is adequate for the institution
There are adequate controls in place at the institution to assure the proper tracking of the
risk and to minimise the element of surprise. Evaluating industry, business, and
management risks enable the loan officer to ask questions of customers and prospects to
be able to identify fully, quantify and if possible mitigate critical risks. If the loan meets
underwriting and credit approval criteria, the risk analysis will provide the needed pieces
of information, which will help structure the loan in a way that will ensure smooth
repayment of the loan.

ISSN 2320-5407 International Journal of Advanced Research (2020)
44
The industry, business and management analysis of risks precede or sometimes done
concurrently with financial analysis of a company. When the bank wants to obtain an essential
exposure to a particular industry, its industry experts from both the lending and credit analyst
teams provides it with an intimate understanding of the industry in order to:
Understand, identify, evaluate, and mitigate the risk in of all forms.
Provide expert advice in the event of a loan workout situation with a customer
Provide marketing efficiency strategies for acquiring creditworthy and profitable clients
within a particular industry.
Since one cannot analyse a company in an abstract, it is a requirement that, the analysis must be
within the broader context of its industry and the world economy, and also, an also
understanding the economic and industry factors that influence a company’s financial stability
and financing requirements before evaluating the numbers. Business, industry, and management
risks are inherently a vital part of the overall credit underwriting process. Every company’s
financial statements reflect the company’s management decisions ass that company interacts
with the outside world. Non-financial risks (industry, business, and management risks describe
the world outside the company. The next management practice that we should not overlook is,
understanding the numbers. There are a lot of benefits and risks associated with building a
banking relationship with any entity or individual. Every lending institution should always know:
The use of the loan request and how the repayment is going to be
How to identify, categorise, and prioritise all the inherent risks in the customer’s
business at the time of the analysis, and the anticipated risk that may arise in the course of
the relationship
To understand the numbers, the financial capability of the company as deduced from the
information as well as the quality and sustainability of the financial performance should be the
focus. Before commencing the financial analysis, the banker should also know why the

ISSN 2320-5407 International Journal of Advanced Research (2020)
45
individual or company is borrowing. Knowledge of the changes in the customer’s asset structure
as it goes through its business cycle is critical to forecasting risk. The reason for borrowing again
provides insight into the company’s ability to repay. A total understanding of the historical and
projected financial performance of the customers is vital to the analysis and mostly the credit risk
management. Usually, the loan request is the most scrutinised part of a credit write-up when the
credit officer is convinced with the loan request then the process of understanding the numbers
can start. The process to understand the numbers involves:
Analysing the reputation and competency of the company (or the auditor preparing the
financial reports of your customer
Reviewing the auditor's appointment letter, financing statements, management letter, and
accounting fundamentals and generally accepted auditing principle (GAAP)
Analyse the balance sheet together with relevant liquidity and leverage ratios
Analysing the revenues and cost together with income statement ratio analysis
Analysing the operating, investing and financing cash flows, and cash flow ratios
Analysing financial efficiency cash flow drivers by calculating profitability ratios and
turnover ratios
Determining the practicality of the assumptions behind business fundamentals and swing
factors
Analysing the personal financial statements and tax returns in case of directly extending
the credit facility to or requesting additional credit support from an individual
Analysing the company’s financial statements provides an overview of the company.
Structuring the deal is the next after understanding the numbers. The characteristics that
influence a business's success include the nature of the industry, the impact of economic

ISSN 2320-5407 International Journal of Advanced Research (2020)
46
conditions, the business strategy, the nature of the business, and the competencies of deficiencies
of the management. As a credit officer, try to understand what the company does and how it
operates and also examine how it fits into its industry and how the economic conditions affect it.
Being equipped with such information provides the business strategy of the company and how
easy or difficult to carry it out. The last is to evaluate the competency of the company’s
management to undertake the various activities identified as being critical to the company’s
success. After the business analysis, the next is to analyse the financial reports (historical and
forecasted). Knowing profitability, cash flow, liquidity and leverage ratios are critical to the
structuring of the loan facility. After completing all the above steps, then the application of the
right structure becomes an easy procedure. Understanding the personal, financial, and business
strategies of the borrowers will help reach the risk profile that is within the risk appetite of the
banking institution.
The loan structure is essential because the customer needs to have a clear understanding of the
limits within which it can operate in order to continue to enjoy the financial services of the bank.
The structure of the deal accurately establishes the expectations of the customer concerning how
the bank will behave during the loan term. The customer needs this assurance in order to run the
affairs of the business efficiently. When the deal is appropriately structured which is agreeable to
all parties, then it provides a mechanism for monitoring individual transactions within the
relationship. The achievement of the monitoring process is in two ways:
Having a loan covenant checklist that routinely tracks the customer’s adherence to the
covenant
Ensure that an officer of the company on a regular basis report on the company's
compliance with all of its outstanding agreements.
When the customer defaults on the covenant, the bank must quickly send a notice to the
customer as failure to notify will render the bank’s future enforcement of the covenant very
difficult. Pricing the deal clearly by appropriately pricing the loan is a critical risk management
technique. Pricing ensures that the bank achieves adequate compensation for the risk of the deal.
The bank of Ghana usually releases a base rate, which enables the banks to price their loans by
ISSN 2320-5407 International Journal of Advanced Research (2020)
47
adding their margins. However, this resulted in disparities in the interest rates from bank to bank
due to the different overhead costs. The interest rate in the country has been the subject of debate
among industry experts as some even opine that the high rates are a contributing factor to the
high NPL rates in the country.
1.15.5. Post Disbursement Risk Management Practices
In today’s competitive environment, in order to have a competitive advantage in the market, it is
a must to monitor the risk profile of customers continuously and also looks for opportunities to
develop and expand customer relationship. There are situations where loan repayments may be
on time, but collateral deterioration, idle equipment, or unpaid taxes can lead to grave risk. It is
therefore imperative for periodic audits and ratings to ensure that the client is one that will create
long-term profitability for the bank. Asset quality is a significant success factor of a financial
institution. Every bank is subject to scrutiny from BoG, banks supplement these functions with
internal monitoring in the form of supervision and follow-up on loan clients. After the loan
disbursement, it should not be forgotten and filed away till the loan falls due — the conditions
upon which the loan was granted keeps on changing with time thereby affecting the borrower’s
financial position and the ability to repay. Fluctuations in the economy weaken some businesses
and increase the credit needs of others too. It is therefore eminent for the credit officer to be
sensitive to these changes and periodically review all the loans until they reach maturity.
There are several reasons for making follow-ups, but the most important are:
To ensure proper utilisation of the funds
To ensure that the customer complies with the terms and conditions of the sanctioned
facility
To monitor the project implementation to avoid time-lag and cost over-runs

ISSN 2320-5407 International Journal of Advanced Research (2020)
48
To assess the performance regarding production, sales, and profiles on an ongoing basis
to ensure that the borrower is sticking to the original plan and has enough income surplus
to service the outstanding debt
To determine the possible impact of changes in the external environment on the
performance of the company
To be able to identify in advance the early warning signals and symptoms of sickness in
the business for timely intervention for either recovery or rehabilitation
To be able to track the financial position of the borrower
Supervision and follow-up of advances should focus on three broad areas: legal control, physical
control, and financial control. Legal control involves proper execution of documents, keeping the
documents in force, complying with various legal formalities such as registration of charges, the
creation of a mortgage, and complying with BoG regulations and the bank’s internal guidelines
on a regular basis. Physical control also involves an inspection of the physical securities charged
to the bank. That is inspection of books of accounts, and crosschecking with the physical
securities, inspection of factory and warehouse sites to ascertain the activity levels and stock
levels and verifying the nameplate of the bank near the hypothecated stocks. Financial control,
on the other hand, involves assessing the performance of the company with the help of financial
statements like balance sheets, and profit and loss accounts. Follow up to undertake a
comprehensive review of account for not less than once a year, monitoring the utilisation of
limits through quarterly information system (QIS) and monthly select operational data. The
credit inspection and supervisions of the account could be onsite or offsite. The offsite
supervision takes place at the officers’ desk level whiles onsite inspection takes place at the
borrower’s premise.
1.15.6. The CAMELS Model Approch of Risk Management
Regulators, investors and bank analysts periodically have to assess the financial condition of
banks. The rating parameters depend on both financial and non-financial performance. One of

ISSN 2320-5407 International Journal of Advanced Research (2020)
49
the popularly used assessments is the CAMELS rating model (Suresh and Paul, 2018, P.89).
CAMELS’ model as a risk management tool is a beneficial and efficient performance evaluation
measure for an anticipated future and relative risk. The Federal Financial Institutions
Examinations Council (FFIEC) of the United States of America initially adopted this Uniform
Financial Institutions Rating System (UFIRS) CAMEL on November 13, 1979. The Federal
Deposit Insurance Corporation (FDIC) revised the model to include a sixth measure (sensitivity)
to the UFIRS in 1997 to classify a bank’s overall condition (soundness). The Acronym CAMEL
then became CAMELS. This new component (sensitivity) looks into how a bank responds to
changes in interest rates, equity prices, commodity prices, and international rates. The CAMELS
rating framework was subsequently adopted, and implemented outside the United States by
various banking supervisory regulators.
The ratings are assigned based on ratio analysis of the financial statements together with an on-
site examination by the supervisory regulator. The term CAMELS is an acronym, which is made
up of the following components: Capital adequacy, Assets quality, Management Efficiency,
Earnings ability, Liquidity (Asset –liability management), Sensitivity (sensitivity to market risk
especially interest rate risk). The constituents of the CAMELS rating model is as illustrated in
fig.1.8 below.
Fig.1.6: the Components of the CAMELS rating Model
A - ASSET
QUALITY
C - CAPITAL
ADEQUACY
ADEQUACY
S - SENSITIVITY
CAMELS
M - MANAGEMENT
EFFICIENCY
E - EARNINGS
ABILITY
L - LIQUIDITY
ISSN 2320-5407 International Journal of Advanced Research (2020)
50
Source: Researcher’s illustration
1.15.6.1. Capital Adequacy
This component of the CAMELS model is a measurement that determines the solvency of a
bank. Adequate capital reserve helps banks to expand, and increase the confidence of depositors
and regulators. The measure also provides a cushion for potential loan losses and other
unanticipated problems. Suresh and Paul (2018) illustrated the following subjective and objective
components of Capital adequacy: Size of the bank, the volume of inferior quality assets, Bank’s
growth experience, plans and prospects, Quality of capital, Retained earnings, Access to capital
markets, Non-ledger assets and values not shown on books (charge-offs with firm recovery
values, real property at nominal values, and tax adjustment).
1.15.6.2. Asset Quality
This measure shows the magnitude of credit risk prevailing in the bank due to its composition
and quality of loans, advances, investments and off-balance sheet activities. The subjective and
objective component of this measure includes Volume of classification, Special-mention loans –
ratios and trends, Levels, trend and comparison of non-accrual and renegotiation loans, Volume
of concentrations, the volume of the character of insider transactions.
1.15.6.3. Management Quality
Another critical measure as it guarantees the growth and survival of a bank as it shows the ability
of senior managers, the board of directors, to identify, measure, monitor and control risks
associated with banking. This qualitative measure uses risk management policies and processes
as indicators of sound management. The subjective and objective components of this parameter
include technical competency, the leadership of middle and senior management, compliance with
banking laws and regulations, adequacy and compliance with internal policies. The rest are
tendencies towards self-dealing, the ability to plan and respond to changing circumstances,
demonstrate the readiness to serve the legitimate credit needs of the community, adequacy of
directors, existence and adequacy of qualified staff and programmes

ISSN 2320-5407 International Journal of Advanced Research (2020)
51
1.15.6.4. Earnings
This measure indicates the bank’s ability to create appropriate returns in order to be able to
expand, retain competitiveness, and add to capital through retained earnings. This indicator does
not only show the amount of and the trend in earnings, but it also analyses the robustness of
expected earnings growth in future. High earnings quality reflects the firm’s current operating
performance and an indicator of future operating performance. The objectives and subjective
components of this parameter include the return on Assets compared to peer group averages and
bank’s trends, material components and income and expenses compared to peers and bank’s
trends, adequacy of provisions for loan losses, quality of earnings, and the dividend payout ratio
concerning the bank capital adequacy.
1.15.6.5. Liquidity
The measure of liquidity takes into account the adequacy of the bank’s current and potential
sources of liquidity including the strength of its funds' management practices. Liquidity also
means a bank’s available fund to meet its credit demands and cash flow requirements. Banks that
have a larger volume of liquid assets are perceived safe since these banks can live up to the call
of unexpected withdrawals. However, the adverse effect of keeping a larger volume of liquidity
is that it reduces management’s ability to commit credibly to an investment strategy that protects
investors’ interest. The objective and subjective components of this parameter includes the
adequacy of liquidity sources compared to present and future needs, and the availability of assets
that are readily convertible to cash without undue loss. The rest are access to money markets,
level of diversification of funding sources (on and off-balance sheet), the degree of reliance on
short-term volatile sources of funds, trend and stability of deposit, ability to securitise and sell
specific pools of assets, the competence of Management to identify, measure, monitor and
control liquidity position
1.15.6.6. Sensitivity
This recent sixth addition to the model parameters reflects the degree to which changes in
commodity prices, exchange rates, interest rates, and equity prices can affect earnings and hence

ISSN 2320-5407 International Journal of Advanced Research (2020)
52
the bank’s capital ( Suresh and Paul, 2018 p.89). The objective and subjective parameters of this
component include:
The sensitivity of the financial institution’s economic value of its capital to changes in
interest rates under various scenarios and stress environments or its net earnings
The composition, volatility of any foreign exchange, or other trading positions, and
volume taken by the financial institution
Actual or potential volatility of capital or earnings because of any changes in market
valuation of trading portfolios or financial instruments
the ability of management to identify, measure, monitor and control interest rate risk as
well as price the foreign exchange risk wherever applicable and material to an institution.
Globally, regulators who determine the supervision policies for individual banks use these
ratings. In addition to the overall rating of the bank's financial condition, ratings are assigned on
a scale of 1 to 5 for every component in addition to the overall rating of a bank’s financial
condition. The rating analysis and its interpretation are as explained in Table 1.6 below.
Table 1.6: ratings of the components of CAMELS model
RATING RANGE DESCRIPTION
1 1.0 – 1.4 Strong: Sound in every respect, no supervisory responses
required.
2 1.6 – 2.4 Satisfactory: Fundamentally sound with modest correctable
weakness
3 2.6 – 3.4 Fair (watch category): Combination of weakness if not
redressed will become severe. Watch category- requires more
than normal supervision

ISSN 2320-5407 International Journal of Advanced Research (2020)
53
4 3.6 – 4.4 Marginal (some risk of failure): Immoderate weakness unless
properly addressed could impair future viability of the bank.
Needs close supervision
5 4.6– 5.0 Unsatisfactory (high degree of failure evident): High risk of
failure in the near term which is put under constant
supervision/cease and desist order
Source: Suresh and Paul (2018, P.90)
1.16. PROFITABILITY
According to Bessis (2005)37
, Profit refers to the surplus left from revenue after covering
expenses. It means that the ability of any company to generate more revenue than its expenses
makes it profitable. Profit is usually a measure in monetary terms whereas; profitability is the
measure of the generated profit on an ongoing basis. Profitability, which is in ratios, shows a
firm’s overall efficiency and performance. There are two types of profitability ratios; a ratio that
shows returns, and ratio that shows margins. The ratios that show returns measure the firm’s
ability to generate returns for shareholders efficiently. Ratios that show margins, on the other
hand, represent the firm’s ability to convert sales into profit at all stages of measurement. For any
stakeholder to access the performance of the firm, the first measure will be the profitability.
Management of companies and for that matter banks are critically interested in its profits.
Profitable companies can increase the share value and can pay dividends to shareholders.
Profitable banks attract the attention of investors especially the listed companies. In the case of
banks, even the depositors look for profitable banks before deciding on lodging their deposits
with them.
Performance evaluation involves the analysis of the level of financial and economic performance
using both qualitative and quantitative data from the firm. The information from the financial
statements namely balance sheet, income statements, and the cash flow statements are the source
of data for the computation of the financial ratios. In order to ascertain whether the performance

ISSN 2320-5407 International Journal of Advanced Research (2020)
54
is within industry standards, to comparing the ratios with other firms in the same industry is
appropriate. It is also important to compare current and previous performances of the same
organisation for better evaluation and monitoring of the trends in the firm’s financial position.
1.15.1. Profitability Indicators
The ultimate measure of the standard of performance in any market-oriented economy is how
much net income remains for the owner of the business organisation after all expenses (except
shareholders dividend) are charged against the generated revenue. In appraising any new loan
application, most loan officers will look at both pretax net income and after-tax net income to
determine the financial success or failure of the prospective borrower relative to other firms
within the same industry. Profitability reflects the financial result of business operations. There
are many profitability indicators of measuring financial success of a firm, but generally, there are
two types of profitability ratios namely: the rate of return ratios, and profit margin ratios.
1.15.2. Rate of Return Ratios
These ratios reflect the relationship between profit and investment. The most critical measures of
rate of return include return on assets, earning power, return on capital employed, and return on
equity.
Return on Assets (ROA)
The mathematical definition of return on assets is
Although used widely, ROA is an odd measure because its numerator measures the return to
shareholders (both equity and preference) whereas its denominator represents the contribution of
all investors (shareholders as well as lenders).

ISSN 2320-5407 International Journal of Advanced Research (2020)
55
Earning Power
Mathematically;
It is a measure of business performance, which is not affected by interest charges and tax burden.
It excludes the effect of capital structure and tax factor and centres on operating performance. It
makes earning power suited for inter-firm comparison. Again, the measure is internally
consistent. The numerator represents a measure of pre-tax earnings from all sources of finance
and the denominator-representing total financing.
Return on Capital Employed (ROCE)
It is defined mathematically as:
The term ‘PBIT (1-tax rate)’ is the net operating profit after tax (NOPAT). ROCE is the post-tax
version of earning power. Also referred to as return on invested capital (ROIC), ROCE ratio
takes into consideration the effect of taxation and not the capital structure and that makes it
internally consistent. The advantage of ROCE is that it is defined such that it is comparable to
the post-tax weighted-average cost of capital of the firm.
Return on Equity (ROE)
Mathematically:
It is a measure, which is of great interest to equity shareholders. The numerator of this measure is
equal to profit after tax minus preference dividends. The denominator, on the other hand, is made
up of all contributions made by equity shareholders (i.e. Paid-up capital + reserves and surplus).

ISSN 2320-5407 International Journal of Advanced Research (2020)
56
The ROE, or return on net worth, measures the profitability of equity funds invested in the firm.
Because shareholders’ wealth maximisation is the primary objective of every firm, ROE is the
essential measure of performance in an accounting sense (Prasanna Chandra, 2011 P.82)38
.
Several factors influence ROE: earning power, debt-equity ratio, the average cost of debt funds,
and tax rate. Generally, ROE and ROA are the most used measures of profitability. Since they
are accounting rates of return, the proper names for these measures may be; return on book
equity and return on book assets respectively.
1.15.3. Profit Margin Ratios
These ratios indicate the relationship between profit and sales. Since the measurement of profit
can be at different stages, there are several measures of profit margins. The most popular profit
margin ratios include gross profit margin ratio, operating profit margin ratio, and net profit
margin ratio.
Gross Profit Margin Ratio
Mathematically, the gross profit margin ratio is:
Gross profit of any business entity is the difference between net sales and cost of goods sold.
Gross profit margin ratio indicates the profit after meeting manufacturing costs. The ratio
measures the efficiency of production as well as pricing. In order to analyse the factors
underlying the variation in gross profit margin effectively, detailed studies of the proportion of
various elements of cost (i.e. labour, materials and manufacturing overheads) to sales are
necessary.
Operating Profit Margin Ratio
The operating profit margin ratio is defined as:

ISSN 2320-5407 International Journal of Advanced Research (2020)
57
These ratios indicate the margin left after meeting manufacturing expenses, selling, general and
administration expenses and depreciation charges. It shows the operating efficiency of the firm.
Net Profit Margin Ratio
The mathematical definition of net profit margin ratio is:
This ratio shows the earning left for both equity and preference shareholders as a percentage of
net sales. Net profit margin ratio measures the overall efficiency of production, pricing,
administration, selling, financing, and management of tax. Jointly the gross and net profit margin
ratios provide a meaningful understanding of the cost, and profit structure of the firm, which
enables the analyst to identify the sources of business efficiency and inefficiency.
1.15.4. Profitability Management
Profitability management is more of a total management process rather than just an accounting or
analysis procedure. In contrast to asset and liability management, it places primary emphasis on
the profit and loss account and secondary emphasis on the balance sheet. With profitability
management, we do not just report profitability, but it is planned, measured, and interpreted. The
planning stage ensures that efforts are directed toward the accomplishment of corporate goals.
Measurement on the other hand checks and adjusts progress against the plan by matching
revenue received with related expenses whiles interpretation develop an accurate picture of
people and businesses thereby serving as a basis for the next planning cycle. Profitability
management involves the monitoring of three different types of profitability statistics namely;
organisation, product, and account making it a three-dimensional as well as a three-phase
process.

ISSN 2320-5407 International Journal of Advanced Research (2020)
58
Organisation profitability is the most familiar type since all banks have some system for
reporting the performance of their major organisational units. However, an effective profitability
measurement system will capture the performance of services and accounts. Measures of
organisational profitability are needed because they help top management allocate resources,
identify a problem, exercise cost control, and track the performance of the senior management.
Measures of product and account profitability are also required because they provide the basis
for identifying problems, collecting fees, and pricing. They again help evaluate the performance
of service managers and account managers.
Meaningful computation of organisational profitability requires extensive transfer charging,
particularly processing costs and corporate overheads. The assembly of accurate product and
account profitability requires cutting across organisational units to collect all the appropriate
revenue and expense for a particular product or account. Many banks are now realising the need
to the full integration process of profitability management and are beginning to accord top
priority to the refinement of the profitability management process by devoting substantial
managerial and financial resources to this task. Industry experts still regard profitability reporting
as a tool for analysis rather than a force that drives the entire bank. That makes the banks have a
weak or missing link in the process, which can lead to severe consequences.
The natural tendency of banks is to devote most of their efforts to the measurement of
profitability at the expense of the planning and interpretation phases. The decision that influences
profitability are made before events occur and careful planning is the only way to have a better
than even chance of being right. Intelligent interpretation is equally important because total profit
figures do not differentiate between businesses requiring a different degree of risk or asset
intensity (D. Muraleedharan, 2013 p.184)39
. Most banks do not have quantitative targets for
organisations, products, and accounts built into their profitability management process. In case
the targets exist, they usually do not support the underlying financial objectives of the bank. In
many banks, the summative target returns on earnings assets for instance for the whole
organisation units does not equal the corporate objective. It may lead to waste or duplication of
efforts, and operating costs tend to spring without any accompanying benefits. In a situation
where reporting principles are not established and communicated by top management, or when

ISSN 2320-5407 International Journal of Advanced Research (2020)
59
the application of the principles are not consistent, profitability reporting system will most likely
confuse than help.
Most banks rely more on organisation profitability as a basis for decision-making and rely
slightly on the other profitability measurements. Such neglect can result in a severe market and
operational consequences. For instance, the bank’s market share may drop due to inadequate
attention is given to marketing and pricing of profitable product lines or because of not retaining
profitable customer groups. There can also be a situation where inappropriate decisions lead to
adding or dropping a product line or customer group just because organisational profitability
does not cover the relevant income and expense. There is always a danger of misrepresenting the
reported results if banks do not have a clearly defined profitability management process with the
objectives of each component not thought through clearly. To prevent problems from arising,
and to maintain overall financial health in these difficult economic times, banks must put in place
a sound and firmly controlled the profitability management process. It worthy to note that no
single system is suitable for all banks, therefore, each bank must match its own in line with its
objectives and economic environment it operates in.
REFERENCES
[1]. World Bank Development Report (1988). An Assessment of Trends in Poverty in Ghana
1988-1992. New York: Oxford University Press for the World Bank.
[2]. Bank of Ghana Annual Report (2004). Retrieve from: https://www.bog.gov.gh/privatecontent/Publications/Annual_Reports/2004.pd
[3]. International Monetary Fund (1999). Ghana: Economic Development in a Democratic
Environment, Occasional Paper 199
[4]. World Development Report (1989). Sub-Saharan Africa: From Crisis to Sustainable Growth.
A long-term perspective Study. Washington D.C.
[5]. John Kwaku Mensah Mawutor and Awah Fred (2015). Assessment of efficiency &
profitability of listed banks in Ghana. Accounting and finance research, vol.4 No.5
[6]. Adjei, J. K. (2010), Microfinance and Poverty Reduction: The Experience of Ghana. BOLD
Communication Limited.

ISSN 2320-5407 International Journal of Advanced Research (2020)
60
[7]. Ishan Kapur & Jerald A Schiff & Michael T. Hadjimichael & Philippe Szymczak & Paul
Louis Ceriel Hilbers, (1991). "Ghana; Adjustment and Growth, 1983-91," IMF Occasional
Papers 86, International Monetary Fund
[8]. Baldwin, C. Y., & Mason, S. P. (1983). The resolution of claims in financial distress the case
of Massey Ferguson. The Journal of Finance, 38(2), 505-516
[9]. Das, Abhiman & Gosh, Saibal (2007) Determinants of Credit Risk in Indian State-owned
Banks: An Empirical Investigation, MPRA Paper. University Library of Munich,
Germany, 2 Feb. 2007. Web. 14 Sept. 2016
[10]. Arko, S. & Kofi, (2012a). Determining the causes and impact of non-performing loans on
the operations of microfinance institutions: A case of Sinapi Aba Trust. Retrieved:
http://ir.knust.edu.gh/bitstream/123456789/4958/1/FINAL%20THESISSAMUEL%20KOF
I%20ARKO.pdf
[11]. Bank Negara Malaysia (2011). Annual report retrieved on 05/07/16 from
http://www.bnm.gov.my/index.php?ch=fs&pg=fs_ovr_what&ac=112
[12]. Poudel, R.P. (2012). The impact of credit risk management on the financial performance of
commercial banks in Nepal, International Journal of Arts and Commerce, 1 (5), pp. 9-15.
Available at: http://www.ijac.org.uk/images
[13]. Padmalatha Suresh and Justin Paul (2018). Management of Banking and Financial
Services. Fourth Edition, Pearson India Education Services Pvt. Ltd., Noida, India
[14]. Agrawal, O.P. (2016). Modern Banking of India, 2nd Edition. Himalaya Publishing House,
Mumbai, India
[15]. Krishn A., Goyal and Sunita Agrawal (2010). Risk management in Indian banks: Emerging
issues and challenges, Volume 1, Issue 1, PP. 102 -109. Retrieved from
http://www.ijeronline.com/documents/volumes/vol1issue1/ijer2010010109.pdf
[16]. Hamisu Suleiman Kargi, (2011). Credit risk and the performance of Nigerian banks.
Faculty of Administration, Ahmadu Bello University, Zaria – Nigeria unpublished thesis.
[17]. Greuning, V., Henie, & Bratanovic, B. (2009). Analysing banking risk: A framework for
assessing corporate governance and risk management, Third edition. Doi: 10.1596/978-0-
8213-7728-4
[18]. Settlements, B. for I. (1999). Basel committee publications - principles for the management
of credit risk - Jul 1999. Retrieved from http://www.bis.org/publ/bcbs54.pdf

ISSN 2320-5407 International Journal of Advanced Research (2020)
61
[19]. Kargi, H.S. (2014). Credit risk and performance of Nigerian banks. American Journal of
Accounting, Economics and Finance, 1(1), pp.7-14.
[20]. Chijoriga M. M. (1997). An Application of Credit Scoring and Financial Distress
Prediction Models to commercial Bank Lending: The case of Tanzania. PhD Dissertation
Wirtschaftsuniversitatwien (WU) Vienna
[21]. Baixauli J. Samuel and Alvares Susana (2009). On the Accuracy of Loss-Given –Default
prediction intervals. The Journal of Risk Finance, Vol. 10 Issue 2, P. 131-141 retrieved from
https://doi.org/10.1108/15265940910938215
[22]. Duffie Darrel and Kenneth J. Singleton (2003). Credit Risk Pricing Measurement and
Management. Princeton University Press, New Jersey, USA.
[23]. Fredrick Laweh Tetteh (2012). Evaluation of Credit Risk Management Practices in Ghana
Commercial Bank. Unpublished master thesis retrieved from
http://dspace.knust.edu.gh/bitstream/123456789/4414/1/FREDERICK%20LAWER%20TET
TEH.pdf
[24]. Elmer Funke Kupper (1999). Risk Management in Banking. Retrieved on 23/06/18
fromhttps://www.researchgate.net/publication/4983188_Risk_Management_in_Banki
[25]. Saunders A., Cornett, M.M. (2006). Financial Institutions Management: A Risk
Management Approach. McGraw-Hill Irwin, New York NY 10020
[26]. David H. Pyle (1997) Bank Risk Management: Theory. A research program in Finance,
Working Paper RPF-272 retrieved from http://haas.berkeley.edu/finance/WP/rpflist.html
[27]. BCBS (2006). The International Convergence of Capital Measurement and Capital
Standards, available at http://www.bis.org/publ/bcbs128b.pdf [Accessed:12/3/2017]
[28]. Joel Bessis (2010). Risk Management in Banking. Third Edition, John Wiley & Sons Ltd,
United Kingdom
[29]. Kalapodas, E., Thomson, M.E. (2006) Credit risk assessment: a challenge for financial
institutions. Journal of Management Mathematics 17, 25–46
[30]. Kashyap, A. K., Rajan, R., & Stein, J. C. (1999, February 1). Banks as liquidity providers:
An explanation for the Co-Existence of lending and deposit-taking. Retrieved on September
15, 2016, from http://www.nber.org/papers/w6962

ISSN 2320-5407 International Journal of Advanced Research (2020)
62
[31]. Saidenberg, M. R., & Strahan, P. E. (1999). Are banks still important for financing large
businesses? Retrieved from
https://www.newyorkfed.org/medialibrary/media/research/current_issues/ci5-12.pdf
[32]. Haron, O. Moti et al. (2012). The effectiveness of Credit Management System on Loan
Performance: Empirical Evidence from Micro Finance Sector in Kenya. International
Journal of Business, Humanities and Technology 2(6)
[33]. Sinkey, J. F. (2002), Commercial Bank and Financial in the Financial-Services Industry,
Prentice Hall
[34]. Owusu Afriyie, H. and Oscar Akotey J. (2012). Credit Risk Management and Profitability
of Selected Rural Banks in Ghana. Retrieved on 6/07/16 from http://www.
academia.edu.documents/35497769/afriyie-credit-risk-management.pdf?
[35]. Gestel, T.V. and Baesens, B. (2008). Credit Risk Management Basic Concepts: financial
risk components, rating analysis, models, economic and regulatory capital, Oxford
University Press.
[36]. Arunajatesan S. (2015). Risk Management. Vikas Publishing House Pvt Lt. New Delhi
[37]. Bessis J. (2005). Risk Management in Banking. John Wiley & Sons Ltd, 5th ed. Core
Principles for Effective Banking Supervision, BCBS, BIS, February 2006.
[38]. Prasanna Chandra (2011). Financial Management: theory and Practice, 8th
Edition. Tata
McGraw Hill Education Private Limited, New Delhi
[3]. Muraleedharan, D. (2013). Modern Banking: theory and practice. PHI Learning Private
Limited Delhi, India

ISSN 2320-5407 International Journal of Advanced Research (2020)
63
CHAPTER TWO
********
RESEARCH DESIGN AND
METHODOLOGY
ISSN 2320-5407 International Journal of Advanced Research (2020)
64
CHAPTER TWO
2.1. RESEARCH DESIGN AND METHODOLOGY
A research design forms the blueprint for fulfilling research and answering questions. It includes
an outline of what the researcher will do from writing research questions and their operational
implication to the final data analysis. According to Green et al. (2008)1 as cited in Deepak
Chawla and Neena Sondhi (2016, Pp. 52)2, “research design is the specification of methods and
procedures for acquiring the information needed”. A research design is the overall operational
framework of the project that stipulates the information we need to collect, the procedure and
source of information. If the design is good, it will ensure that the information obtained is
relevant to the research questions and the collection procedure was objective and economical.
The design used by the researcher employed both descriptive and explanatory or causal research
designs. The primary purpose of descriptive research is to describe the characteristics of objects,
people, groups, organisations or environment. In order words, descriptive research tries to
“paint” a picture of a given situation by addressing questions such as what, who, where when,
and how. Causal or explanatory research, on the other hand, seeks to identify cause-effect
relationships that are testable (Zikmund et al. 2013, P. 59)3.
The primary data collected through a survey was analysed using descriptive research approach
whereas the analysis of the secondary obtained from the financial statements of the sampled
savings and Loans companies utilised the explanatory or causal research approach. The
researcher used Descriptive because according to Trochin (1999)4, a survey method is useful for
non-experimental and descriptive research methods. Trochin further indicated that the survey
method becomes useful when we cannot observe the data on a phenomenon we are about to
collect directly. Robson (2005)5 on the other hand explained that survey research comprises of a
cross-sectional design with which data collected are predominantly through a questionnaire, or
by structured interview. Data collection through survey can be more than a single case and at a
particular point in time to collect a body of quantitative or quantifiable data in connection with

ISSN 2320-5407 International Journal of Advanced Research (2020)
65
two or more variables, for examination and detection of the patterns of association among the
variables. This research work will follow the survey pattern described above.
2.2. REVIEW OF LITERATURE
Savings and Loans companies as per the categorisation of financial institutions in Ghana are
Non-Bank Financial institutions, which play a critical role in the banking industry of the
Ghanaian economy. Since both the commercial banks and the savings and loans companies are
all banking institutions that indulge in credit activities, the literature review will cover both
commercial banks and all other non-bank financial institutions.
Many researchers in trying to unearth the reasons behind bank problems have carried out
investigations, and several risk factors have since been identified (eg.Chijoriga, 19976, Brown
Bridge, and Harvey, 19987). Ineffectiveness in credit risk management emerged to be
predominantly part of the principal reasons behind the difficulties banks are facing. The loans
constitute a significant proportion of credit as they contribute between 10 and 15 times the total
equity of a bank (Kitwa, 1996)8. It makes the banking business face with potential difficulties,
especially where there is a slight deterioration in the loan quality. Chijoriga, 1997 opines that the
magnitude of loss caused by credit risk as compared to another risk will be enough to collapse a
bank.
The relationship between credit-risk and profitability in the banking sector has been an emerging
concern in both developed and developing countries. Among some of the recent studies on
credit-risk, management and profitability are as reviewed below:
Makkar and Hardeep (2018)9 studied the factors influencing the profitability of Indian
commercial banks. ROA was the profitability measure. The internal determinant variables
included in the study were liquid assets to total asset, current ratio, capital adequacy ratio, non-
performing assets to total assets, profit per employee, business per employee, and bank size. The
findings showed that liquidity, solvency, efficiency and size were the key factors significantly
influencing the profitability of Indian commercial banks.

ISSN 2320-5407 International Journal of Advanced Research (2020)
66
Adwaita Maiti and Sebak Kumar Jana (2017)12
in their research on determinants of
profitability of banks in India used both ROA and ROE as profitability measures. Business per
employee (BPE), profit per employee (PPE), net interest margin (NIM), or spread ratio, capital to
risk-weighted assets ratio (CRAR), non-performing assets (NPA), advance to deposit ratio
(ADR), operating expenses ratio (OER) and non-interest income ratio (NIIR) were the
independent variables. They found out from their regression analysis that four most commonly
profitability influenced factors were PPE, NIM, NPA and NIIR.
Michael Owusu A. et al., (2017)13
used a multivariate regression analysis to predict the
relationship between credit risk management and Ghanaian commercial banks’ profitability.
ROE was the dependent variable whereas NPLR and CAR were the proxies of the independent
variables. CAR contributed positively to banks profitability while NPLR showed negative
effects. In comparison, NPLR had more significant effect whiles CAR has a small and
insignificant effect on ROE.
Mendoza & Rivera (2017)14
investigated the effect of credit risk and capital adequacy on the
profitability of rural banks in the Philippines. The measures for Profitability were ROA and
ROE. Credit risk measures were loan loss provision to total loans (LLP/TL) and CAR. The
regression analysis indicated that credit risk has a negative and statistically insignificant
relationship with both the profitability indicators (ROA, ROE). Even though banks with higher
CAR are supposed to be financially stable and resilient, the relationship between CAR and
profitability of rural banks in the Philippines were statistically insignificant. It makes their
finding strange to other research findings, but they attributed it to systemic risk that probably not
captured in the study. They also attributed it to the financial crisis, which made profitability
influenced more by economic factors rather than bank-specific factors.
Ahmet Karakuza (2017)15
examined bank-specific determinants of profitability in Turkish
banks. ROA was the measure used as a proxy for profitability. The bank-specific variables that
served as the independent variables include equity to asset ratio, total deposit to total assets, total
loans and receivables to total assets, net interest income total assets, provision for loan loss to
total assets, liquidity assets to total assets and consumer loans to total assets. The results
indicated that the ratio of net interest income to operating income influenced ROA positively.

ISSN 2320-5407 International Journal of Advanced Research (2020)
67
Non-interest income to total assets affected the profitability of Turkish banks positively and
significant. Consumer loans to total loans negatively and significantly affect the profitability of
banks in Turkey.
Yusheng Kong et al. (2017)16
conducted a study to ascertain the bearing of credit risk
management on commercial banks financial performance in Ghana. ROE was an indicator for
performance whiles NPLR and CAR were proxies for credit risk management. Data from four
commercial banks were analysed using regression analysis. NPLR showed a negative and
significant relationship effect on ROE whereas CAR showed a positive and insignificant
relationship with ROE.
Juliana Stanley Isanzu (2017)17
empirically examined the impact of credit risk on the financial
performance of Chinese banks for 7 Years. She employed non-performing loans, capital
adequacy ratio, impaired loan reserve and loan impairment charges as a measure of credit risk.
For financial performance, ROA was the proxy. The results of the regression analysis conducted
showed that NPL related negatively and significant to ROA. Capital adequacy ratio (CAR) had a
positive and significant effect on ROA. The effect of impaired loan reserve to gross loan on
return on assets was negative. The ratio of impairment charges also affected ROA positively.
Pritpal Singh, B. and Pradeep Gupta, K. (2017)18
conducted an empirical analysis of the
determinants of profitability of public sector banks in India. Net profit to total fund was the
profitability measure. The independent variables employed were; profit before provision over
total funds, investment to deposit ratio, credit to deposit ratio, cash to deposit ratio, other income
to total income, interest income to total fund, and interest expended over interest earned. They
found a significant effect of other income to total income, profit before provision to total fund,
credit to deposit ratio, interest income to total fund and cash to deposit ratio on Indian public
sector banks' profitability. Investments to deposit ratio and interest expended to interest earned
have no significant effect on the profitability of Indian banks.
Yong Tan et al. (2017)19
examined the impact of risk, competition and efficiency on
profitability measured by ROA, ROE and NIM of Chinese banks. They found out from their
analysis that the relationship between credit risk and profitability was negative and insignificant.
ISSN 2320-5407 International Journal of Advanced Research (2020)
68
Liquidity risk however affected Chinese banks profitability positively and significantly. Capital
risk related negative and significant to profitability. Bank size was found to relate to profitability
positively and significant. Cost efficiency negatively and significantly influenced Chinese banks
ROA but positively affected ROE and NIM. They again found out that Chinese banks with lower
levels of competition have lower profitability compared to those with high levels of competition.
Subham and Subhas (2017)20
investigated the determinants of profitability of private sector
banks in India. To study the effect of bank-specific factors they grouped the private sector banks
into new and old. The profitability ratios used were net interest income to total income, return on
assets and return on equity. Bank specific characteristics used include liquidity, asset quality,
financial soundness and management efficiency. The external factors also included inflation,
interest rate, and political instability. The results indicated that all the four bank-specific
variables related positively to profitability. Also, both GDP and Inflation were positive but
insignificant on the profitability of new private sector banks. Inflation influenced old private
sector banks’ profitability negatively but significant. Post-crisis is positive though not significant
on the profitability of new private sector banks. Concerning old private sector banks, all the
variables related to bank-specific except soundness, were positive and significantly related to
profitability. GDP had a significant positive impact on profitability whereas inflation had an
insignificant impact. Financial crisis affected the profitability of old private sector banks
negatively
Naresh Kedia (2016)21
examined the determinants of profitability of Indian public sector banks.
The study used the bank-specific variable that includes operating expenses, NPA, net interest
income and credit to deposit ratio as the independent variables. Net profit was the measure for
profitability. Multiple-regression was the analytical tool used in the study. The result of the
analysis indicated that interest income and credit to deposit ratio related positive and significant
to net profit. NPA also related to net profit positively but was insignificant. Operating expenses,
however, had a negative and insignificant relationship with net profit.
Gathigia Muriithi J. et al. (2016)22
examined the effect of credit risk on the financial
performance of commercial banks in Kenya. ROE was the measure for performance whiles the
measure for credit risk were; risk-weighted asset, asset quality, loan loss provision, and loans and

ISSN 2320-5407 International Journal of Advanced Research (2020)
69
advances ratio. They used panel data techniques of fixed effects estimation and general method
of moments (GMM) for their analysis. Their findings indicated that credit risk had a significant
and negative impact on the financial performance of commercial banks in Kenya. The
implication is that, poor asset quality or high non-performing loans to total assets lead to poor
bank performance.
Anarfi et al. (2016)23
in a study on the determinants of bank profitability in Ghana used ROA as
a variable for profitability. The bank-specific determinants employed in the study were Asset
size, Bank loan, Deposit, Capital, and Overhead whereas the macroeconomic determinants
included GDP, Exchange rate, and Interest rate. They concluded that bank loan and capital had a
positive impact on the profitability of Ghanaian banks. The overhead cost had a negative and
highly significant impact on the profitability of Ghanaian banks. They found no effect of Bank
size and deposit on the profitability of Banks in Ghana. Concerning the macroeconomic
determinants, only exchange rate influenced profitability negatively.
Mohammad Muhiuddin (2016)24
studied the determinants of profitability of private banks in
Bangladesh. ROA was the measure for profitability whiles the independent variables included
spread ratio, non-interest income ratio, credit to deposit ratio, operating expense ratio, profit per
employee, business per employee, investment deposit ratio, capital adequacy ratio and type of
bank. The finding indicated that spread ratio, profit per employee, business per employee,
investment to deposit ratio, capital adequacy and operating expenses ratio had a significant
negative association with profitability. Credit-deposit ratio and business per employee have a
negative association with profitability.
John Bosco et al. (2016)25
investigated the co-integration and causal relationship between the
credit risk indicators, macroeconomic variables and profitability of Rwandan commercial banks
measured by Return on Assets (ROA), Return on Equity (ROE) and Net Profit Margin (NPM).
Non-performing Loan (NPL), Loan Loss Provision (LLP), and Capital adequacy ratio (CAR)
were the credit risk variables, whereas Inflation (CPI), Gross Domestic Product (GDP) and
interest Rate were the macroeconomic variables. It emerged from their analysis that the
relationship between non-performing loan ratio, return on assets and return on equity was
negative and significant; indicating that high NPL reduces the commercial bank profitability and

ISSN 2320-5407 International Journal of Advanced Research (2020)
70
a sound credit-risk management is a precondition for safeguarding the assets and equity of the
banking sector. NPM related positively to LLPR, NPLR and GDP. LLPR positively related to
ROA but negatively to ROE. CAR influenced both ROA and ROE positively. All the external
factors employed, thus Interest rate, Inflation, and GDP related positively with ROA and ROE.
Ali Sulieman Alshatti (2016)26
investigated the critical determinants that affected the
profitability of commercial banks in Jordan. ROA and ROE were the proxies of profitability
whereas; asset size, asset structure, assets quality, capital adequacy, capitalisation, financial
structure, liquidity, and Leverage were the independent variables. A panel data of 13 banks for
ten years analysed indicated that capital adequacy, capitalisation, and leverage positively impact
on ROA. Asset size, asset structure, financial structure and liquidity do not have a significant
effect on ROA. Capitalisation and Leverage positively affected ROE whereas asset quality
affects both ROE and ROA negatively. Asset size, asset structure, financial structure and
liquidity do no influence ROE.
Bhattarai (2016)27
conducted a study on four commercial banks on the determinants of lending
behaviour of Nepalese commercial banks for seven years. Loans and Advances were the
dependent variable whiles the independent variables were; bank size, liquidity, investment
portfolio, cash reserve ratio, and deposit to capital ratio. The correlation analysis revealed that
only Bank Size and Cash reserve ratio had a positive effect on Loans and Advances. The results
of the regression analysis also showed that there is a positive and statistically significant
relationship between commercial bank lending and its size. Liquidity, cash reserve ratio, and the
investment portfolio had a negative and statistically significant relationship with loans and
advances. Deposit, on the other hand, had a statistically insignificant relationship with loans and
advances.
Ofosu-Hene & Amoh (2016)28
in their study on risk management and performance of listed
banks in Ghana adopted ROA and ROE as performance measures. The explanatory variables
used were Risk Index (RI), Bank size, Solvency (CAP), Liquidity (LQT), Non-performing loan
(NPL, Inflation (INFL) and Exchange rate. They adopted a linear multiple regression model
using the least square estimator in their analysis. The results revealed that risk Index (RI) had no
significant relationship with ROA and had a significant positive relationship with ROE but with

ISSN 2320-5407 International Journal of Advanced Research (2020)
71
little impact. Bank size had no significant relationship with both of the performance measures,
ROA and ROE. It means that whether shareholders increase their equity or not it does not affect
either ROA or ROE. Capital adequacy had no significant relationship with ROA but had a
significant negative effect on ROE. NPL had a significant negative relationship with both ROA
and ROE. Since banks service NPLs with their generated profit, it means that an increase in
NPLs leads to a decline in performance. The cost to income ratio also had a significant negative
relationship with ROA and ROE. Concentration (CON) measured by market share had a
significant positive relationship with ROA and ROE. The macroeconomic variables, Inflation
and exchange rate, had a significant positive relationship with ROA and ROE.
Takyi Opoku et al. (2016)29
analysed the relationship between credit risk and profitability of
banks on the Ghana stock exchange. A panel data analysis of seven listed was conducted using
linear multiple regression model. ROE, which represents a measure for profitability, was the
dependent variable. The independent variables, on the other hand, were non-performing loans to
Loans and Advances ratio (NPLR), Loans and Advances to Total Deposits (LATD), Bank Size,
Leverage and Growth. The regression results revealed that the independent variables accounted
for 39% of the variations in the dependent variable. NPLR related negatively with the
profitability of banks listed on GSE. They again found that there was a significant negative
relationship between Loans and Advances ratio and profitability of listed banks. Size of the bank
also affected performance measured by ROE negatively. Leverage was found to be positive and
significantly related to ROE. Growth was positive and significantly related to ROE.
Perera & Morawakage (2016)30
embarked on a research to assess the effect of credit risk
management on shareholders’ value creation of listed banks in Sri Lanka. The researchers'
employed return on shares (ROS) to measure shareholders value whereas credit-risk
management indicators included non-performing loan ratio (NPLR), capital adequacy ratio
(CAR), and Loan to deposit ratio (LDR). Regression analysis through SPSS was the statistical
tool used to ascertain the relationship between credit risk management and creation of
shareholders value. The findings suggested that the credit risk management measured by NPLR,
CAR and LTDR explains 33.3% of the variation in ROS value. NPLR negatively related to the
ROS whiles CAR negatively and insignificantly related to ROS. LTDR, however, had a positive
but significant relationship with ROS.

ISSN 2320-5407 International Journal of Advanced Research (2020)
72
Ibrahim Nandom Yakubu (2016)31
investigated the bank-specific and macroeconomic
determinants of commercial banks profitability in Ghana. The bank-specific variables used in the
study included; bank size, liquidity, capital adequacy, assets management and expense
management. Macroeconomic variables employed were; real interest rate, GDP growth and
Inflation rate. The researcher employed the ordinary least square regression in his analysis in
order to ascertain the relationship between the variables. Asset management (ROA) was the
dependent variable whiles; the remaining bank-specific and macroeconomic variables
represented independent variables. The results indicated that bank size was positive and
statistically significant to profitability. Liquidity had a positive and statistically significant
relationship with profitability. CAR and Expense management related positively with
profitability. GDP and Inflation both negatively and insignificantly related to banks profitability.
Finally, real interest rate related positively but insignificant to profitability.
Fredrick Kalui, M. & Susan Kahuthu, W. (2016)32
researched the effect of credit-risk
management practices on the growth of Savings and Credit Cooperatives Societies (SACCOS) in
Nakuru, Kenya. The analysis of the primary data collection was through correlation and
regression. The dependent variable was the growth of SACCOS wealth whiles the independent
variables included, credit risk identification, credit risk analysis and credit risk monitoring. They
found out that all the credit-risk management practices related to the growth of SACCOS’ wealth
positively and statistically insignificant. They, therefore, concluded on a note that collectively
credit risk monitoring, credit risk identification and credit risk analysis do not have a significant
effect on the growth of SACCOS’ wealth hence, investing in such credit risk management
practices in order to enhance growth in wealth of SACCOS is needless.
Kofi Boadi et al. (2016)33
conducted a study on the profitability determinants of rural and
community banks in Ghana and used ROA as a measure of profitability. The bank-specific
variables comprised of Capital adequacy, asset quality, management efficiency, liquidity
management, investments, bank size, bank resilience and funding. The macroeconomic
determinants used for the study were GDP growth rate and CPI Inflation. They found that capital
adequacy, asset quality, investment, GDP growth, and bank resilience had a positive predictive
impact on the profitability of RCBs in Ghana. Inflation had a statistically negative effect on the
profitability of Rural and Community Banks. They also found no effect of Management
ISSN 2320-5407 International Journal of Advanced Research (2020)
73
efficiency and bank size on the profitability of RCBs. Funding risk, however, had a negative
impact on the profitability of RCBs.
Ketan M. & Totala N.K. (2016)34
studied the impact of macroeconomic determinants of
profitability on Indian commercial banks. ROA and ROE were the profitability measures used
whiles GDP, Interest rate and inflation were the macroeconomic variables used. The results of
their analysis indicated that all the macroeconomic variables (interest rate, GDP growth rate, and
inflation) impacted positively and insignificant on both ROE and ROA.
Anita Makkar (2016)35
presented a paper titled “key determinants affecting the credit risk of
Indian commercial banks” at an international conference on recent innovations in science,
management, education and technology. The researcher used the least square model, to analyse
data from 47 commercial banks. The non-performing assets to total advances ratio were the
proxy for credit risk. The credit-risk determinant factors that served as the independent variables
were; bank size, return on assets, advances to deposit ratio, credit to deposit ratio, operating
profit to asset ratio, and priority sector lending to total assets ratio. The results indicated that the
bank size, return on assets, credit creation, and operating activities have a significant impact on
the credit risk of Indian banks. Priority sector lending had no impact on the credit risk of Indian
commercial banks.
Mohammed Bayyoud and Nermeen Sayyad (2015)36
assessed the relationship between credit
risk management and profitability of investment and commercial banks in Palestine. ROE was an
indicator of profitability in the regression analysis whereas NPLR was the independent variable.
Their findings indicated that there was no relationship between credit risk management and
profitability of commercial and investment banks in Palestine. Credit risk management explained
only 16.3% of the variations in profitability. Commercial banks had quite an easy process of
credit risk management as compared to the investment banks.
Johannes Peyavali S. Sheefeni (2015a) 37
conducted research to assess the bank-specific
determinants of non-performing loans in commercial banks in Namibia. Time series econometric
technique of unit-root co-integration impulse, response functions, and forecast error variance
decomposition was the analytical tool used in the study. ROA and ROE the profitability

ISSN 2320-5407 International Journal of Advanced Research (2020)
74
measures among the variables that explained NPLs. The results revealed that ROA, ROE, loan to
total assets ratio, the log of total assets were the main determinants of NPLs. There was a
negative relationship between NPLs and ROA as well as ROE. A positive relationship existed
between NPLs and loan to total assets as well as the log of total assets.
Mawutor & Awah (2015)38
in their study assessed the efficiency and profitability of banks
operating in Ghana by using banks listed on the Ghana Stock Exchange (GSE) between the years
2006 and 2011. The dependent variable is profitability measured by ROA. The independent
variables were the Leverage ratio, liquidity ratio, credit ratio and size of the firm. The results
revealed that liquidity, Leverage, productivity, credit risk and size accounted for 60.74% of the
variation in the profitability of the banks. Liquidity and profitability were positively but
insignificantly related. There was a negative statistically significant relationship between firm
profitability and its credit risk. Also, productivity related negatively with the profitability of the
firms. Leverage was also negative and significantly related to profitability. The relationship
between banks size measured by total assets was not statistically significant with their
profitability.
Susan Jebet, B. et al. (2015)39
conducted a study with the primary objective of finding out how
credit-monitoring practices influence the financial performance of Kari Savings and Credit
Cooperative Society (SACCO) Ltd in Kenya. To be able to explain the relationship the
researcher used a regression analysis for the study. Credit risk identification and scoring, credit
monitoring, loan portfolio, and loan default follow-ups were the credit monitoring practices
considered in the study. It emerged from the analysis that the majority of the respondents agreed
that credit monitoring practices improve the financial performance of the cooperative society.
Viswanadhan & Nahid (2015)40
conducted a study to ascertain the determinants of non-
performing loans (NPLs) in National Bank of Commerce (NBC) Dodona, Tanzania. They used
descriptive statistics to identify the determinants of NPLs in NBC. The determinant factors
considered in the study were the concentration of lending activities, bank’s loan supervision
capacity, the prevailing economic condition, Interest rate and GDP. They conducted a
nonparametric test to find out the significance of the relationship between NPLs and the
determinant factors. The researchers found a positive association between interest rate and NPL.
ISSN 2320-5407 International Journal of Advanced Research (2020)
75
A negative relationship existed between GDP, Economic condition, the concentration of lending
activities and NPL. Loan supervision capacity of banks related positively with NPL.
Abu Hanifa et al. (2015)41
, Studied the effect of credit risk on the profitability of the banking
sectors of Bangladesh using an unbalanced panel data from 18 private commercial banks from
2003 to 2013. The study used non-performing loan to gross loan (NPLGL), loan loss ratio to
non-performing loan (LLRNPL), and capital adequacy ratio (CAR) as indicators of credit risk
and return on average assets (ROAA), return on average equity (ROAE), and net interest income
as profitability indicators. They used OLS, GLS GMM in their analysis and found a negative and
significant relationship between NPLRGL and LLRGL, and profitability in all the models. The
effect of LLRNPL on profitability related positive with ROAA and ROAE but negative to NIM.
CAR also affected ROAA and NIM positively but affected ROAE negatively.
Bizuayehu (2015)42
, conducted a study on the impact of credit risk on the financial performance
of banks in Ethiopia, a masters’ thesis submitted to the department of accounting university of
Addis Ababa Ethiopia. ROE was used to represent profitability (dependent variable) whereas
NPLR, CAR, LTDR, Interest rate spread, GDP, and inflation as independent variables. The
correlation Matrix results among dependent and independent variables showed that NPLR, CAR,
LTDR and interest spread negatively correlated to ROE whiles Bank size, GDP, and inflation
were positively correlated. The regression analysis indicated that the explanatory variables,
which are Bank-specific, industry-specific, and macroeconomic factors explained 60.18% of
variations in profitability. NPLR and CAR affect profitability negatively which means that an
increase in NPLR and CAR will result in a decrease in profitability. LTDR and Bank size, on the
other hand, affected profitability positively. GDP, Inflation, and Interest spread had no
significant impact on the level of ROE of Ethiopian commercial banks.
Gizaw et al. (2015)43
in 12 years research on the topic “the impact of credit risk on profitability
performance of commercial banks in Ethiopian” employed ROA and ROE as profitability
indicators whiles NPLR, LLPR, CAR, and LTDR were the credit risk indicators. The regression
analysis showed that the independent variables explained 46% of the variations of Profitability
measured by ROE. Besides, NPLR that measures the extent of credit default risk sustained by the
banks has a statistically significant sizeable negative effect on profitability measured by ROA.
ISSN 2320-5407 International Journal of Advanced Research (2020)
76
There was also a negative effect of NPLR on ROE. They again found LLPR to have a significant
positive effect on both ROA and ROE (profitability). CAR however related negatively with both
ROE but not ROA.
Sabeza et al. (2015)44
researched on a topic: assessing credit-risk management practices and
performance of commercial banks in Rwanda. The findings from the qualitative analysis of their
empirical data showed that profitability correlates negatively to proper credit risk management. It
means an increase in NPLs results in a reduction in the profitability of banks. Thus, the higher
the NPL, the higher the provision for bad debt and a subsequent reduction in profit margin. A
whopping 90% of the respondents of the study confirmed this assertion.
Johannes Peyavali (2015b)45
in evaluating the impact of bank-specific determinants of
nonperforming loans in Namibia used Vector Autoregression (VAR) where ROA and ROE were
proxies for profitability whereas, loan to the total asset (LTA), non-performing loans (NPL), and
log of total asset (LNT) were the bank-specific determinants. The results indicated a negative
relationship between NPL and ROA, which tend to suggest that banks with higher profitability
are less constrained to engage in risky activities such as granting risky loans. LTA had a positive
relationship with NPL. It implies that the quality of assets plays a significant role in the case of
Namibia banks since lower assets quality of a bank, means higher NPL of the bank. LNT and
NPL had a positive relationship that suggests that bank size plays a role in determining NPL.
That is, the bigger the bank size, the higher the probability of default.
Kipngetich, S. & Muturi, W. (2015)46
in a study using 18 Savings and Credit Co-operative
Society (SACCOs) were with the objective of finding the effect of credit risk management on the
financial performance of SACCOs in Kenya. The dependent variable was financial performance
measured by ROE whiles the independent variables were capital adequacy (CAR) measured by
capital to asset ratio, and management efficiency (ME) measured by the number of active
borrowers per management staff. The regression analysis results indicated that CAR has a
positive relationship with the financial performance of SACCOs in Kenya. It explains 42.3% of
SACCO’s performance. Management efficiency also explains 42.6% but relates negatively and
insignificant with the financial performance of SACCOs. The insignificant relationship was an
indication that management efficiency is not a very important indicator of bank performance.

ISSN 2320-5407 International Journal of Advanced Research (2020)
77
Isaac Boadi (2015)47
researched on the profitability determinants of the Ghanaian banking sector
and took into consideration ROA as a proxy for profitability. The bank-specific factors employed
were liquidity ratio, capital structure, deposit structure, expenditure structure, efficiency, asset
quality and bank size. The macroeconomic (external) determinants included in the study were
GDP growth, Inflation and real interest rate. The results indicated that management efficiency
positively influenced the profitability of Ghanaian banks. The capital structure also had a
statistically significant relationship with profitability. Economic growth (GDP) had a positive
effect on profitability whereas the rest of the factors deposit structure, overhead; non-performing
loans, inflation, and real interest rate had no significant effect on Ghanaian banks' profitability.
Opoku-Agyeman (2015)48
as part of his masters' thesis researched on the factors influencing
the profitability of domestic and foreign banks in Ghana. The bank-specific variables used in the
study were; operating efficiency, credit risk, liquidity, bank size, bank growth, funding cost,
years of experience and bank ownership. The external variables were bank concentration, real
GDP, Inflation and Money supply. The profitability variables were ROAA and ROAE. The
results indicated that bank-specific variables are more significant in explaining variations in
profitability than external variables. The two most significant variables that affect the
profitability of both domestic and foreign banks were operational efficiency and credit risk.
Funding cost was significant and positive to profitability. Bank capitalisation also had a
significant influence on banks in Ghana. The external variables such as GDP, money supply and
inflation did not have a significant influence on profitability in the banking industry as a whole.
Mawutor J.K.M (2015)49
analysed the relationship between credit risk management and
profitability of banks on the Ghana Stock Exchange. A linear multiple-regression was the
analytical tool employed in the analysis of data from seven banks for six years. ROA and ROE
were the performance measures whiles the credit risk variables included; NPLR and Loan and
Advance to Total Deposit (LATD). Bank Size, Leverage and growth were internal variables,
which served as control variables. The results indicated that the relationship between NPLR and
ROA were negative and insignificant but LATD was negative and significantly related to ROA.
They also found Growth relating with ROA positively and significant. Bank Size and Leverage
both related negatively to profitability measured by ROA. NPLR and LATD both negatively
related to ROE. NPLR was insignificant whiles LATD was significant to ROE. Bank Size had a

ISSN 2320-5407 International Journal of Advanced Research (2020)
78
negative and insignificant relationship with ROE. Both LEV and Growth related positively and
significantly to ROE.
Antwi and Apau (2015)50
undertook a study on the determinants of financial performance of
rural and community banks (RCBs) in Ghana. They concluded that credit risk management
affects RCBs performance measured by ROA. Operational efficiency affected negatively on
profitability. CAR was a crucial significant driver in explaining the performance of Rural and
Community Banks in Ghana. Portfolio composition and bank size were found to have no impact
on RCBs profitability. GDP growth rate, a variable for macroeconomic determinant was found to
be less significance on the profitability of RCBs. The other macroeconomic determinant inflation
affected positively on the profitability of RCB’s.
Rahman et al., (2015)51
conducted a study on the determinants of profitability of banks in
Bangladesh. Three profitability measures employed were ROA, ROE and NIM. The bank-
specific variables included in the study were; capital strength, credit risk, ownership structure,
bank size, non-interest income, cost efficiency, off-balance sheet activities and liquidity.
Inflation and GDP growth were the macroeconomic variables employed. Their findings suggest
that capital strength (regulatory and equity capital) and loan intensity had a positive and
significant impact on profitability. Besides, cost efficiency and off-balance sheet activities had a
negative and significant impact on bank profitability. The other variables were not uniform for
all three measures of profitability. Non-interest income, credit risk and GDP were essential
determinants of NIM. The size of the bank, however, had a positive and significant impact on
ROA whiles inflation had a negative and significant affected ROE and ROA.
Pankaj Sinha and Saksha Sharma (2015)52
in their study examined the determinants of
profitability using bank-specific, industry-specific and macroeconomic factors. The researchers
used the Generalized Method of Moments (GMM) to account for the profit and endogeneity
factors. They concluded from their analysis that, the bank-specific variables - capital to assets
ratio, operating efficiency and diversification significantly and positively affected the bank
profits. Credit risk measured by provisions for bad debts negatively affects Indian bank
profitability. The result of the structure conduct hypothesis (SCP) using the Herfindahl-

ISSN 2320-5407 International Journal of Advanced Research (2020)
79
Hirschman Index (HHI) indicated that bank profits are cyclical to the growth of economy whiles
increase in inflation rate affects bank profits negatively.
Nkegbe and Ustarz (2015)53
examined the trends and determinants of bank performance in
Ghana. Three measures ROE, ROA and NIM were the performance measures. Bank specific
variables employed were; liquidity, operational efficiency, Non-performing loans and markets
share loan. The industry-specific determinant was concentration whiles GDP, broad money
supply and CPI were the microeconomic variables. Their findings indicated that liquidity
affected all performance measures positive and significant. NPL negatively and significantly
related to ROE and ROA but positively related to NIM. Bank size and operational efficiency also
affected performance positively and significant. Market concentration related negatively with
ROE but positively with ROA. GDP had a negative influence on performance whereas inflation
related to ROA and NIM positively. It, however, affected ROE negatively and significant.
Rajveer Rawlin et al. (2014)54
conducted a comparative study of the determinants of
profitability of India’s largest public and private sector banks. They grouped the determinant
variables into; bank metrics, risk factors and productivity measures. Net profit was the dependent
variable. They found that there exists a strong positive correlation between the critical bank
metrics deposit, advances, total assets and bank size, and net profit for both banks. They also
found another positive relation between the risk factors capital adequacy ratio, gross and net
NPAs, and net profit. A strong positive relationship existed between productivity measures;
business per employee, profit per employee and the net profit of the public sector bank but not
the private sector bank. They further found a significant positive relationship between asset
usage, efficiency measures, return on assets, and interest income over the average working fund,
non-interest income over the average working fund and operating profit over average working
funds with net profit for the private sector bank but negatively related to the public sector bank.
Akong’a Cynthia Jenifer (2014)55
in her master's research project analysed the effect of
financial risk-management on the performance of commercial banks in Kenya. The researcher
used multiple-regression for the analysis. Financial performance measured by ROA was the
dependent variable whereas, capital risk measured by total capital to risk-weighted assets,
liquidity risk measured by liquidity ratio (current ratio and cash to deposit ratio), and non-
ISSN 2320-5407 International Journal of Advanced Research (2020)
80
performing loan ratio (NPL/TA). The regression results indicated 57% of the variation in the
dependent variable (ROA) was due to the independent variables. Again, the results indicated that
there was a negative relationship between ROA and NPLR, capital to the risk-weighted asset,
current ratio and cash to deposit ratio. Bank size correlated strongly with ROA,
Asad Abbas et al. (2014)56
collected data for 21 banks in Pakistan and examined the effect of
credit risk on the performance of the Pakistani banking sector. The independent variables
employed were non-performance loans to total loans (NPL/TL), total loan and advances to total
deposit (TL/TD) and loan loss provision to total classified loans (LLP/NPL). ROE and ROA
were performance measures employed in the study. Regression results indicated that NPL/TL,
LA/TD, LLP/NPL all negatively and significantly related to ROA. LA/TD and LLP/NPL related
negatively and significant to ROE. NPL/TL had a positive relationship with ROE.
Iwedi, M. and Onuegbu, O. (2014)57
conducted a study on credit risk and performance of
selected deposit money banks in Nigeria over 15 years. They employed ROA as a measure of
profitability while the ratio of non-performing loan to loans and assets (NPL/LA), and loan and
asset to total deposit (LA/TD) were proxies for credit risk. The regression analysis indicated that
the NPL/LA and LA/TD were and positively related to ROA. The credit risk (NPL/LA, LA/TD)
explained 29.8% of variations in ROA.
Junaidu, M. K., and Sanusi G. (2014)58
evaluated the effect of credit risk management on the
profitability of Nigerian Banks. Default rate (DR), Cost per loan asset (CLA), and capital
adequacy ratio (CAR) were the credit risk measures whiles ROA was the measure for
profitability. The regression results showed that, as the ROA (profitability) increases all the
independent variables thus, DR, CLA, and CAR also increases. These independent variables
collectively explain 43.9% of variations in profitability. It implies that the credit risk
management variables have individually and uniting effect on the profitability of Nigerian
Banks.
Idowu, A and Awoyemi S. O. (2014)59
researched the impact of credit risk management on the
commercial banks' performance in Nigeria for seven years. They adopted the panel regression
model where ROA and ROE were the performance indicators and NPL as well as CAR as credit-

ISSN 2320-5407 International Journal of Advanced Research (2020)
81
risk management indicators. They found from their analysis that, NPL was positive and
statistically significant to profitability. They said the relationship was unusual and attributed it to
banks shifting the cost of loan default to other customers in the form of high interest on loans.
CAR influenced positive and insignificant on the profitability of commercial banks, which they
again linked to the recapitalisation directives issued by the central bank of Nigeria during the
period of the study.
Maryam Mustaq et al. (2014)60
studied the determinants of Pakistani commercial banks’
profitability. Two measures EVA (value-based measure) and ROE (accounting-based measure)
were the proxies for profitability. Bank specific factors used in the model were capital adequacy,
asset quality, efficiency, and operating efficiency. Inflation and GDP were the macroeconomic
variables added to the model. The results of their analysis indicated that CAR, efficiency, and
asset quality were significant and positively related to EVA the remaining bank-specific
variables were insignificant. GDP was significant, but inflation was not. CAR and operating
efficiency were the only bank specific variables related to ROE significantly. CAR was
positively related to ROE whiles operating efficiency was negatively related. Both the
macroeconomic variables (GDP and inflation) were positively related to ROE but insignificant.
Addo Boye (2014)61
conducted a study on the topic: credit risk management in financial
institutions: A case of Ghana Commercial Bank Ltd. ROE was profitability indicator whiles
NPL/TLA was the credit risk indicator. From the simple regression analysis, his findings
indicated that there exists a significant positive relationship between ROE and loan loss ratio
(NPA/TLA). He also found an inverse relationship between interest income and loan loss, as a
unit decrease in loan loss accounts for an increase in the net interest income. It means banks with
higher profitability have lower loan losses. He added that loan loss account for a part and not the
only cause of variations in the profitability of banks as factors such as inefficiencies on the part
of employees, bad management and other factors also account for the variation in profitability.
Abata Adeolu, M. (2014)62
in a research on the relationship between the asset quality and
performance of Nigerian commercial banks used ROA as a proxy for performance whiles loan-
loss ratio (LLR) and total investment to total asset ratio (TTR) were the proxies for asset quality.
Regression and correlation matrix was the tool for their analysis to establish the relationship

ISSN 2320-5407 International Journal of Advanced Research (2020)
82
between asset quality and performance. The independent variables explained 75.6% of the
variations in ROA. Both TTR and LLR positively related to ROA, but TTR’s relationship was
very weak with R2 value of 0.009 indicating that TTR can hardly explain the variations in ROA.
Asantey & Tengey (2014)63
conducted a study to assess the effect of bad loans on the lending
potential and financial performance of banks in Ghana. Pearson’s correlation test and ordinary
least squares regression were the analytical tools used in their analysis. The results indicated that
there was a significant and highly negative relationship between bad loans and annual loan size.
Thus as the banks encounter a high amount of bad loans, their annual financial allocation for
SME lending reduces largely. It implies that bad loans limit the lending potential of banks. The
analysis further revealed that bad loans account for 67.9% of the variation in annual loan size.
The relationship between bad loans and net profit was a strong negative relationship. That means
as bad loans increases, net profit decreases. Thus, bad loans hinder the financial performance of
banks. Bad loans accounted for 84.1% of the variation in net profit. It implies that the degree to
which bad loans limit financial performance among banks in Ghana is very high.
Yeboah, M. & Yeboah, B. (2014)64
studied the effect of working capital management on banks
profitability in four listed banks in Ghana. The dependent variable was (Profitability) measured
by ROI (Earnings per share). The independent variables included cash conversion cycle (CCC),
Creditors payment period CPP), debtors collection period (DCP), bank size, risk, debt maturity
structure (LDEBT), Leverage (TDA), growth and credit risk. Their results from the correlation
analysis indicated that TDA has a positive relationship with banks profitability in Ghana. The
size of the bank had a negative relationship with profitability marginally. They also found a
statistically insignificant negative relationship between risk, growth, and credit risk and bank
profitability. The independent variables jointly accounted for 39.4% of the variation of the
profitability (dependent variable).
Owusu-Antwi et al. (2014)65
who conducted a study on the performance of rural banks in Ghana
concluded from their analysis that, investment to total assets, total overhead cost to total asset,
loan to total assets and inflation were the primary drivers to rural banks profitability in Ghana.
Liquidity had an insignificantly relationship with profitability.

ISSN 2320-5407 International Journal of Advanced Research (2020)
83
Alkhazaleh and Almsafir (2014)66
in their study on the bank-specific determinants of
profitability of banks in Jordan used fixed effect regression to analyse data of 14 banks for 11
years. ROA was the proxy for profitability whereas capital structure, liquidity, and bank size
were the bank-specific variables that served as the independent variables. They found that
liquidity was negative and insignificantly related to the profitability of Jordanian banks. Capital
structure and bank size were, however, negative but significantly related to the profitability of
banks in Jordan.
Mukaila A.A. et al. (2013)67
studied banks’ profitability in a developing economy regarding the
Nigerian banking industry. The study employed econometric analysis of co-integration and error
correction technique. The results revealed that bank size and cost efficiency did not significantly
determine bank profitability in Nigeria. Credit and Capital adequacy were significant drivers
found to affect bank profitability in both the short and long run. Liquidity affects profitability in
the short run whiles labour efficiency affected profitability in the end.
Atta Mills and Amowine (2013)68
in their research on the determinants of the profitability of
rural banks in Ghana used ROA as the measure for profitability. The bank-specific variables
included in their study were loan loss provision to total loan ratio (LLPTL), non-interest income
to total assets (NIITA), bank size (log of Assets), and total overhead expenses (NIETA). The
GDP growth rate, Inflation rate and money supply growth (MSG) were the macroeconomic
variables. From the findings, bank size was not relevant in explaining rural bank’s profitability,
as it was found to be positive and insignificant. LLPTL also influenced profitability negatively
but significant. The ratio of non-interest income to the total asset (NIITA) emerged as a vital
driver of bank performance. Total overhead expenses to the total asset (TOETA) were negative
and significant to profitability. GDP growth and money supply growth both related to
profitability positively and significant whereas, Inflation was negative and significantly related to
rural bank performance.
Fredrick Lagat et al., (2013)69
studied the effect of credit management practices on lending
portfolio among savings and credit cooperatives in Kenya. Among their objectives was to
examine risk management mitigation measures on lending portfolio among savings and credit
cooperatives. Their findings from the study after using regression analysis revealed that risk

ISSN 2320-5407 International Journal of Advanced Research (2020)
84
management practices (risk identification, risk monitoring, risk evaluation, risk mitigation and
risk analysis), except risk evaluation, all the other variables had a statistically significant
relationship on the performance of Kenyan savings and credit cooperatives. The risk
management activities together explained 48.8% of the performance of the loan portfolio of the
savings and credit cooperatives in Kenya.
Ruziqa (2013)70
in a study of the effects of both credit risk and liquidity risk on the profitability
of conventional banks in Indonesia came up with the findings that credit risk has a negative
effect on ROA and ROE (Profitability). The effect of bank capital (Liquidity) however has a
significant positive relationship with ROA and ROE, and NIM (Net Interest Margin).
Meanwhile, bank size influenced NIM negatively and significant.
Magali (2013)71
conducted a study on 37 Rural Saving and Credits Cooperative Societies
(SACCOS) in Tanzania on the topic “the impacts of credit risk management on profitability on
rural Savings and Credits Cooperative Societies”. The researcher used Univariate regression
analysis where ROA and ROE were proxies for profitability and NPL was the proxy for credit
risk management. It emerged that NPL has a negative relationship with ROA and ROE. It
implies that as NPL increases, the profitability measured by ROA and ROE decreases.
Okoth V. Ongore and Gemechu B. Kusa (2013)72
on a study of determinants of financial
performance of commercial banks in Kenya, used ROA, ROE, and NIM as the performance
variables (dependents) and independent variables were capital adequacy, Asset quality,
management efficiency, liquidity (bank specific) as well as GDP, and Inflation which are
Macroeconomic factors. They found out that there was a positive relationship between capital
ratio and ROA, as well as NIM but negatively related to ROE. Asset quality (NPL/TLA) had a
negative relationship with ROE, ROA and NIM. The other independent variables: Management
efficiency and liquidity management had a positive relationship with ROA, ROE and NIM
though liquidity weakly related. GDP was positively related to ROE and ROA though not
significant. GDP however significantly and negatively related to NIM. Inflation on the other
hand significantly and negatively related to the performance measures.

ISSN 2320-5407 International Journal of Advanced Research (2020)
85
Lillian Kisivuli (2013)73
conducted a study on the effect of credit-risk management on loans
portfolio of SACCOS in Kenya. The dependent variable was the loan portfolio while the
independent variables were the components of CAMEL (i.e. Capital adequacy, Asset quality,
Management efficiency, Earnings and Liquidity). From the regression analysis, it emerged that
CAMEL explains 56.3% of the variations in the loan portfolio of SACCOS in Kenya. The
finding also indicated that capital adequacy, earnings, and liquidity, positively correlated with
the loan portfolio. Asset quality, on the other hand, negatively related to the loan portfolio.
Kaaya and Pastory (2013)74
researched the relationship between credit risk and performance of
commercial banks in Tanzania using 11 banks. A panel data approach and regression analysis
was the method used to establish the relationship between the variables. The dependent variable
used was ROA, which measure how banks are profitable relatively to their asset and how
efficiently management utilises the company assets to generate profit. The independent variables
employed were; Loan loss to gross loan, Non- performing loan, loan loss to net loan, impaired
loan to gross loan. The control variables in the model were deposit and bank size. They found
out from their analysis that the independent variables combined have 70% ability to influence the
performance of the banks. The control variables also can increase performance by 5.79%. All the
independent variables thus, Loan loss to gross loan, loan loss to net income and non-performing
loan had a significant negative relationship with performance.
Mohamed Dore (2013)75
investigated the profitability of bank in Ghana with a focus on bank-
specific and macroeconomic indicators. The bank-specific variables were; capital adequacy,
assets quality, liquidity, and efficiency whiles the macroeconomic variables were inflation and
GDP growth. The study made use of panel regression to analyse the data. The findings indicated
that capital adequacy and liquidity related to Ghanaian banks positively and significantly, whiles,
the macroeconomic variables (Inflation and GDP) negatively and insignificantly affected the
profitability of the Ghanaian banks.
Aparna et al. (2012)76
also examined the determinants of bank profitability of private sector
banks in India. They used ROA as a measure of profitability whereas; Credit/deposit ratio,
Provisions and contingencies, Non-interest income, Spread ratio, Operating expense ratio, Profit
per employee, Business per employee, Investment/deposit ratio, Capital adequacy ratio, Non-

ISSN 2320-5407 International Journal of Advanced Research (2020)
86
performing assets and Type of bank outcome were the independent variables. The results of their
studies indicated that there was a positive relationship between bank profitability measured by
ROA and spread ratio, credit-deposit ratio, and profit per employee, business per employee,
capital adequacy ratio, and non-interest income. Investment to deposit ratio, non-performing
assets, operating expenses, and provisions and contingencies negatively influenced the
profitability of Indian private sector banks.
Haron et al., (2012)77
studied the effectiveness of credit-risk management system on loan
performance of the microfinance sector in Kenya and came out with the following findings: there
was no relationship between involvement of top management in formulating credit terms, cash
flow statements, the condition of business and loan performance. They further found out that
there was a significant relationship between high involvement of credit officers in formulating
credit terms, customers involvement, loan duration, borrowers character, collateral, customers
repayment history, size of business, the signing of covenants, diversification, credit rating,
financial condition all had a significant relationship with loan performance. Interest charged
inversely related to loan performance.
Farhan et al. (2012)78
conducted empirical research on the determinants of non-performing
loans in the Pakistani banking sector where Interest rate, Energy crisis, Unemployment, Inflation,
GDP growth and Exchange rate were the independent variables. NPL was the dependent
variable. Correlation and regression was the analytical tool for the study. The results from the
analysis indicated that except GDP that has a significant negative relationship with NPL, all
other variables related positive and significant with NPL.
Boahene et al. (2012)79
researched six commercial banks in Ghana for over five years. After a
panel data analysis model used in the study, it emerged that credit risk indicators: non-
performing loan rate, net charge-off rate, and pre-provision profit as a percentage of net total
loans and advances positively related with profitability which was measured by return on equity
(ROE). An indication that as a bank’s risk of customer loan default increases, profitability also
increases. However, they added that it might be so due to an extremely high-interest rate charged
by Ghanaian banks. Buchs and Mathisen (2005)80
findings buttressed this assertion with an

ISSN 2320-5407 International Journal of Advanced Research (2020)
87
argument that notwithstanding high overhead costs and sizable provisioning due to high NPLs,
Ghanaian banks pretax returns on assets and equity are among the highest in Sub-Sahara Africa.
Afriyie and Akotey (2012)81
also had a study on credit risk management and profitability of
selected rural banks in Ghana. ROE was the profitability indicator whiles NPL and CAR
represent credit risk. They found out that, the NPL is positive and statistically significantly
related to ROE. They said the result was unusual since the normal relationship of NPL with
banks profitability was expected to be negative. It means that even though there is a presence of
massive loan defaults, NPLs increases proportionally to profitability. They attributed this
relationship to inadequate and ineffective institutional measures by Rural Banks to deal with
credit risk management but instead shift the cost of loan default to other customers in good
standing in the form of a higher interest rate on loans. CAR also related positive and insignificant
with ROE. They attributed the positive relationship to the recapitalisation directive issued by the
central bank of Ghana (BoG) at the period of their study.
Prakash R. Poudel (2012)82
in his study on the impact of credit risk management on the
financial performance of commercial banks in Nepal found out that, there is a significant
negative relationship between return on assets (Profitability) and default rate, and capital
adequacy ratio ( credit risk). He, however, stressed that credit risk management is an essential
predictor of bank financial performance. Among the risk management indicators, default rate
management is the most critical predictor of bank performance.
Kolapo et al. (2012)83
also researched five Nigerian commercial banks for 11 years on the topic
credit risk and banks performance in Nigeria. They used ROA as a measure of profitability and
NPL/LA, LA/TD and LLP/CL as credit risk measures. In their panel model approach, they found
out that, the effect of credit risk on bank performance measured by ROA of banks is cross-
sectional invariant. It means that it is similar across banks in Nigeria. Thus, nature, and
managerial pattern of individual firms do not determine the impact. Loan and advances ratio
(LA) coefficient exerted the most significant positive effect on the profitability across the
banking firms.

ISSN 2320-5407 International Journal of Advanced Research (2020)
88
Ogilo Fredrick (2012)84
analysed the impact of credit risk management on the financial
performance of commercial banks in Kenya and also attempted to establish if there exists any
relationship between the credit risk management determinants by using CAMEL indicators and
financial performance of commercial banks in Kenya. A multiple regression analysis was the
analytical tool used in the study with ROE been proxy for profitability and the CAMEL
components: Capital adequacy, Asset quality, Management efficiency, Earnings and Liquidity.
Capital adequacy, Asset quality, and Liquidity had a weak relationship with the financial
performance of commercial banks in Kenya. Earnings quality, on the other hand, strongly related
to the performance of commercial banks in Kenya. The researcher concluded that the CAMEL
model is fit to be a proxy for credit risk management since the variables have proven to have a
significant relationship with performance.
Mabvure et al. (2012)85
study the topic; nonperforming loans in commercial banks in Zimbabwe
with the aimed to find out how NPLs have affected the bank regarding liquidity and profitability.
Their findings indicated that external and internal factors cause NPLs. The internal factors
included poor credit policy, weak credit analysis, and poor credit monitoring, inadequate risk
management and insider loans. The external factors were natural disasters, government policies
and the integrity of the borrower. They further found that NPLs have negatively affected the
performance of the bank regarding liquidity and profitability. They concluded from the study that
an increase in NPLs resulted in a reduction in profitability as well as the liquidity of the bank.
Xuezhi Qin and Dickson Pastory (2012)86
had a study on commercial banks profitability
position in Tanzania. They used three ratios as measures for profitability ROA, ROE, NIM. The
independent variables used were capital adequacy, liquidity and asset quality. Findings from the
results of the regression model indicated that the independent variables explained 81.8% of the
variations in the dependent variables. It implies that the capital adequacy, liquidity, and asset
quality are more crucial in the profitability of commercial banks as the absence of quality assets
and liquidity, commercial banks will always incur losses. Capital structure and NPLs had
negative determinant on profitability. The asset quality and liquidity ratios, on the other hand,
had positive coefficients, implying that as these ratios increase profit increases.

ISSN 2320-5407 International Journal of Advanced Research (2020)
89
Tobias, O. and Themba, M. (2011)87
studied the effect of banking sectorial factors on the
profitability of commercial banks in Kenya. The factors were in two groups: bank-specific and
market structure factors. The bank-specific factors employed in the study included capital
adequacy, assets quality, liquidity management, operational cost efficiency, and income
diversification. The market structure factors were foreign ownership structure and market
concentration. The profitability measure used was ROA. They used multiple linear regression
method to analyse the data. Their findings indicated that all the bank-specific factors had a
statistically significant impact on profitability whereas none of the market structure factors had a
significant impact on the profitability of Kenyan banks.
Saira Javaid et al. (2011)88
used the pooled ordinary least square (POLS) method to analyse the
effect of internal factors on bank profitability in Pakistan. ROA was the profitability measure
used whereas the internal factors included in the study were assets, loans, equity and deposit. The
results indicated that there was the existence of a significant negative effect of bank size on
profitability. Capital ratio and deposit to asset ratio also showed a significant positive
relationship with ROA. Total loan to asset ratio had a positive but insignificant impact on the
profitability of banks in Pakistan.
Aduda and Gitonga (2011)89
also conducted a study on the relationship between credit risk
management and profitability among commercial banks in Kenya. The researchers used ROE as
a predictor of profitability and NPLR as a credit risk indicator. They found that NPLR affects the
profitability of commercial banks in Kenya by 72.19%. It is an indication that a unit change in
NPLR will result in 72.19% change in ROE. They concluded that there is a relationship between
credit management and profitability such that credit management affects profitability.
Shipho (2011)90
conducted a study on 38 commercial banks in Kenya that aimed to determine
and evaluate the effects of bank-specific factors namely capital adequacy, asset quality, liquidity,
operational cost efficiency, and income diversification on the profitability. The next objective
was to determine and evaluate the effects of market structure factors, which comprise foreign
ownership and market concentration on profitability. The researcher used a multiple linear
regression model and t-statistics in the determination of the relative importance of each
independent variable in affecting profitability. The result indicated that there exist a strong

ISSN 2320-5407 International Journal of Advanced Research (2020)
90
negative relationship between poor asset quality and profitability. It means banks that fail in
monitoring their credit loans are less profitable than those that pay particular attention to asset
quality.
Kargi (2011)91
conducted a study on a topic: Credit risk and the performance of Nigerian banks
on six commercial banks. ROA was a proxy for profitability whiles NPL/LA, and LA/TD were
the proxies of credit risk. The correlation output results indicated that there was a negative
relationship between credit risk indicators and profitability. The regression results of the model
used also suggested that all the independent variables have a negative impact on profitability.
The parameters showed that a unit increase in NPL decreases profitability by 51.6% however, a
unit increase in the ratio of LA/TD significantly decrease profitability by 251.98%. It further
found that the credit risk indicators (NPL/LA, LA/TD) explained 16.18% of variations in ROA.
Ramadan et al. (2011)92
investigated the nature of the relationship between profitability and its
determinant factors of Jordanian banks. ROA was a proxy for profitability. The independent
variables were: asset composition, capital adequacy, credit risk, overhead cost, and bank size as
bank specific measures, market concentration, and banking sector size as industry-specific
measures whereas Inflation and economic growth were the measures of macroeconomic
determinants. From the results of the analysis, bank-specific determinants were able to explain a
significant part of the banks’ profitability in Jordan. The result indicates that banks with high
capital ratio tend to earn more profit by translating the safety advantage into profit. Again, it
emerged that, the lending activities of the Jordanian banking sector are associated with profit so,
in order to maximise profit, Banks in Jordan should maintain sizable activities of lending. Credit
risk was found to have an inverse relationship with profitability. Bank size influenced the
profitability of Jordanian banks negatively and insignificantly.
Danson, M. and Adano, S.M. (2011)93
conducted a study on the impact of credit risk
management on the financial performance of banks in Kenya for seven years. ROA was the
proxy for performance, and default rate (NPL/TL), Bad debt cost per loan (BDC/TL), cost per
loan asset (CLA/TL) were the proxies for credit risk management. The results of their analysis
showed a correlation between the dependent variables and the independent variable. There was a
significant relationship between ROA and all the credit-risk management indicators. The default

ISSN 2320-5407 International Journal of Advanced Research (2020)
91
rate was however found to have the most significant and negative effect on the performance of
banks in Kenya.
Jackson Oludhe (2011)94
in an MBA thesis submitted to the University of Nairobi researched
on the impact of credit risk management on the financial performance of commercial banks in
Kenya by using the CAMEL model components as indicators of credit risk and ROE as
performance indicators. The components of the acronym CAMEL are Capital adequacy, Asset
quality, Management efficiency, earnings quality and liquidity. Correlation and regression were
analytical tools for the data analysis. The result indicated that there was a weak relationship
between capital adequacy, asset quality, liquidity and performance of Kenyan banks measured by
ROE. Management efficiency had an average relationship with performance whiles Earnings
quality had a strong relationship with the performance of banks in Kenya. The CAMEL
components were able to explain the variations in performance up to 94.3%. The researcher
concluded that the CAMEL model could be suitable as a proxy for credit risk management.
Evelyn Richard (2011)95
in a study wanted to ascertain the factors that cause non-performing
loans in commercial banks in Tanzania and the strategies to resolve them. The analysis revealed
that internal factors controllable by the commercial banks were the major contributors to NPL
particularly weak credit analysis, and diversification of funds. Uncontrollable factors such as
court injunction when banks wanted to dispose-off collateral, low price fetched when disposing
of mortgage assets and change in policies. Establishing a good relationship with borrowers was
the most favourable strategy employed by banks in the effort of reducing NPLs. Commercial
banks in Tanzania need to strengthen their loan management process especially in monitoring
their borrowers and probably come up with new ways of monitoring them.
Akhtar et al. (2011)96
conducted a study on factors influencing the profitability of Islamic banks
of Pakistan for five years and employed bank-specific determinants only as the independent
variables. ROA was the proxy used for profitability whereas gearing ratio, NPL ratio, Asset
management, Operating efficiency, and CAR formed the independent variables for the study.
Their findings indicated that Asset management had a positive and significant relationship with
the profitability of Islamic banks in Pakistan. Bank size affected profitability negatively and
insignificant whiles, Non-performing loan ratio related negatively to profitability. The capital
ISSN 2320-5407 International Journal of Advanced Research (2020)
92
ratio had a significant impact on ROA. TD/TA and TL/TA all had a positive and significant
effect on the profitability of Islamic banks in Pakistan.
Kithinji (2010)97
studied the impact of credit risk on profitability in Kenyan commercial banks
for five years. The regression results indicated that the amount of credit extended contributes
positively to profit but marginally. Again as the level of NPLs, increases profit increases. There
was, therefore, a positive relationship between the amounts of credit extended and profit whiles;
there was a negative relationship between the level of NPLs and profit. The t-test conducted
indicated that there is no association between profits, amount of credit and the level of non-
performing loans. The implication is that other variables other than NPLs and Credit influence
profitability of Kenyan Banks. The researcher, therefore, opined that the commercial banks
should focus on other factors instead of non-performing loans if their objective is to predict
profit.
Hosna et al. (2009)98
in their masters’ thesis conducted a study on four Swedish commercial
banks for eight years on a topic credit risk management and profitability in commercial banks in
Sweden. ROA was the proxy for profitability measure whiles, NPLR and CAR were the credit
risk indicators. After their analysis using regression, they found out that there was an effect of
credit risk management on profitability on a reasonable level of 25.1% possibility of NPL and
CAR predicting the variance in ROE. NPLR, however, was found to have the most negative and
significant effect on ROE.
A study conducted by Fadzlan Sufian (2009)99
on factors influencing bank profitability in
Malaysia employed ROA as the proxy for profitability whereas the bank-specific determinants
included LLP/TL, NII/TA, NIE/TA, LOANS/TA, LOGTA, and EQUITY/TA. They also
employed LNGDP and INFL as the macroeconomic determinants in the model. The findings
indicated that Banks with higher loan concentration shows a lower profitability level. Banks with
higher-level capitalisation, a higher percentage of income from non-interest sources, as well as
high operational expenses show higher profitability. The researcher again found economic
growth has a negative effect on the Malaysian bank’s profitability. Meanwhile, a high inflation
rate has a positive effect on the profitability of Malaysian banks.

ISSN 2320-5407 International Journal of Advanced Research (2020)
93
Constantine, A. and Voyazas, S. (2009)100
conducted a study on the determinants of bank
profitability of Greek banking sector. Bank specific and macroeconomic variables were the
independent variables whereas ROA and ROE were the proxies for profitability. Using pool
ordinary least square method of analysis, they concluded that macroeconomic factors such as
inflation and private consumption play a significant role in shaping the performance of banking
institutions in Greek. Besides, bank-specific variables such as capital or measure of cost-
efficiency play an essential role in determining bank profitability in Greek.
Kosmidou (2008)101
in a research conducted on the determinant of banks’ profit in Greece
during the period of EU financial integration employed linear regression model on 23
commercial banks for twelve years. While using ROA to represent profitability and the ratio of
the loan loss reserve to gross loan for asset quality, the result showed a significant negative
impact of asset quality to bank profitability.
Kosmidou et al. (2008)102
presented a paper at the 37th annual conference of the Money, Macro
and Finance research group, Coventry University on the determinants of profitability of domestic
UK commercial banks. The researchers investigated the impact of bank-specific characteristics,
macroeconomic conditions and financial structure on the UK owned commercial banks’ profits
for seven years. The return on average assets and equity, and net interest margin (NIM) were the
dependent variables used in the study. The independent variables were in two groups: bank-
specific and macroeconomic variables. The bank-specific measures were; cost to income ratio
(COST) representing efficiency, the ratio of liquid assets to customer plus short-term funding
(LIQUID), the ratio of loan loss reserves to gross loan (LORES) as asset quality indicator, ratio
of equity to total assets (EQAS) was a measure for capital strength, whereas, the total assets of a
bank representing its size (SIZE). After the Fixed-effect regression model, the results indicated
that COST was a robust determinant of UK banks profitability as it was negative and
significantly associated with profitability. LIQUID had a positive effect on ROAA and a
negative effect on NIM. The impact of LORES had a positive and significant effect on NIM but
insignificant on ROAA. Capital strength affected profitability positively and significant. Bank
size had a negative effect on both ROAA and NIM. The macroeconomic factors, which are
FDPGR and Inflation, related positively and were significant in explaining UK banks
profitability.
ISSN 2320-5407 International Journal of Advanced Research (2020)
94
Fadzlan, S. and Royfaizal R.C. (2008)103
conducted a study on the determinants of bank
profitability in the Philippines for 15 years. ROA was the proxy for profitability. The
independent variables were internal and external determinants. The internal determinants
included bank size (LNTA), Loan loss provisions divided by total assets (LLP/TA), Total
overhead expenses divided by total assets (NIE/TA) and book value of stockholders’ equity as a
fraction of total assets (EQASS). Non-Interest Income over total assets (NII/TA) which consists
of commissions, service charges, and fees guarantee fees, net profit from the sale of investment
securities, and foreign exchange profit were the proxies for non- traditional activities. External
determinants included in the analysis were the natural log of GDP (LNGDP), Money Supply
growth (MSG), annual Inflation rate (INFL), and Market Capitalization (MKTCAP). The
findings from the regression analysis indicated that LNTA related negatively to profitability
indicating that larger banks in the Philippines tend to earn a lower profit. LLP/TL related
negative and statistically significant to profitability. It suggests that Philippines banks with
higher credit risk tend to exhibit lower profitability levels. NIIT/TA was also found to be positive
and statistically significant which indicates that banks that get a more substantial proportion of
their income from non-interest sources such as fee-based services to report a higher level of
profitability. NIE/TA had a negative and significant impact on profitability implying that an
increase in expenses reduces profitability. EQASS is positively and statistically significant to
profitability. All macroeconomic conditions and financial industry variables on ROA is positive
except for INFL.
Nor Hayati Ahmad and Mohammed Ariff (2007)104
conducted a study of the determinants of
the credit risk of commercial banks in the banking system of emerging economies banking
systems and developed economies. Australia, France, Japan, and the US represented developed
countries whiles the emerging economies were India, Korea, Malaysia, Mexico and Thailand.
The dependent variable employed was changed in impaired loans (or Non-performing loans) to
total gross loans as a measure for credit risk. The independent variables were management
efficiency, loan loss provision, loan to deposit ratio, leverage, regulatory capital, funding cost,
liquidity, spread and total assets. Their analysis revealed that management efficiency, which is
denoted by earning assets to total assets ratio is significantly positively related to credit risk in
three countries; Malaysia, India and France. The indication is that the higher the proportion of
earning assets, the greater the tendency for banks in these countries to incur potentially high

ISSN 2320-5407 International Journal of Advanced Research (2020)
95
credit risk. Management in Indian banks negatively related to credit risk. Loan Loss Provision
(LLP) significantly positively related to the credit risk of banks in Australia, Japan, Mexico and
Thailand. Loan to Deposit ratio was a significant positive determinant of credit risk in Malaysia,
the US, and France. Leverage was also found to be an insignificant factor for credit risk in all
countries except for Mexico. Liquidity (LIQ) was significant and positively related to credit risk
in Australia, India, Korea and the US, which suggest that the banks with more liquid assets tend
to have higher credit. In the case of Mexico Banks, Liquidity was significant with a negative
coefficient. Spread related negatively to banks in India and Thailand but positive for banks in
France. The regulatory capital was positive and significantly related to credit risk for banks in
Japan, Malaysia and Mexico. There was a negative but significant relationship between credit
risk and regulatory capital of both India and Australia banks. An indication, which suggests that,
undercapitalised banks take more risks than the well-capitalised ones.
Amidu and Hinson (2006)105
examined how credit risk affects a bank’s capital structure,
profitability and lending decisions in Ghanaian banks. They employed a panel regression
analysis in their study. Credit risk exposure was the dependent variable whereas capital (CAP),
liquidity (LQT), lending (LDG), profitability (PRE), risk (RSK), and size (SZE) were the
independent variables. The results showed that there exists a positive relationship between credit
risk and equity capital. Banks turn to hold a large amount of capital in order to avoid failure.
They also found a negative relationship between credit risk and banks liquidity. Thus, banks with
low credit risk keep liquid funds. Credit risk had a positive and statistically insignificant relation
with loans and advances. Thus, the advancement of loans does not necessarily depend on the
level of credit risk exposure. There was also a positive and statistically relationship between
bank size and credit risk. The bigger the size of a bank, the more their credit risk exposure.
Anna Vong and Hoi Si Chan (2006)106
in fifteen years of study on the determinants of bank
profitability in Macau opined that a well-capitalised bank is of paramount importance in
affecting profitability. ROA as a measure of profitability was the dependent variable. The
internal determinant variables considered included; the capital ratio EQTA), Asset composition
(LOTA), the effect of fund source (DETA), the effect of asset quality (PRTO), the expense
management variable (NETA), the importance of fee-based services of banks and their product
diversification (NIGI), tax variable (TOPB), and the market share (INDE). The external factors

ISSN 2320-5407 International Journal of Advanced Research (2020)
96
also included economic growth (RGDP), real interest rate and inflation. The size of the banking
sector and Lerner Monopoly Index (LMM) considered in the study were financial structure
variables. Panel regression techniques used in analysis revealed that both the internal and
external variables affected profitability significantly. Among the internal determinants, the
EQTA, LOTA, PRTO, and INDE showed a significant impact on bank profitability. They also
found an inverse relationship between LOTA, PRTO and profitability. Larger banks achieved
lower ROA than smaller banks. Among the external determinants, the inflation rate was the only
variable having a stronger impact on banks ROA. The remaining variables namely economic
growth (RGDP), real interest rate, the sector size and market power showed no impact on bank
profitability.
Fofack (2005)107
researched the causes of non-performing loans in sub-Sahara Africa and their
macroeconomic implications. The determinants of NPL were analysed using correlation and
causality analysis. The analysis made use of data from 16 African countries, which comprised of
seven CFA, and nine non-CFA countries. The correlation causality analysis was in two parts.
First, was finding the association between NPLs and the macroeconomic factors, which included
GDP, Inflation, and interest rate, Changes in the real exchange rate, Interest rate spread and
broad money supply. At the microeconomic level, the analysis centred on the relationship
between NPLs and banking sector variables that include return on assets and equity, net interest
margins and net income, and interbank loans. The results indicated a negative association
between GDP and NPLs. The relationship between inflation and NPL was also negative
signifying that hyperinflation may erode banks assets and equity. A positive association existed
between NPLs and real exchange rate appreciation. A negative association again existed between
NPLs and monetary expansion. The results further indicated a negative association between
NPLs and most banking specific variables including return on assets and equity, total deposit, net
interest margin and net income.
Nor Hayati Ahmad and Shahrul Nizam Ahmad (2004)108
analysed key factors influencing
credit risk of Islamic banks in Malaysia. A comparison of these factors between Islamic and
conventional banking systems in their study was from 1996 to 2002. NPL to total loans was a
proxy for credit risk, which served as the dependent variable. The independent variables were
Management Efficiency (MGT), Leverage (LEV), Risky sector loan exposure (RSEC),

ISSN 2320-5407 International Journal of Advanced Research (2020)
97
Regulatory capital (REGCAP), Loan Loss Provision (LLP), Funding Cost (FCOST), Risk
Weighted Assets (RWA), Natural log of Loan to Deposit (LD). The regression analysis indicated
that for Islamic Banking, three variables; MGT, RWA, and LNTA related significantly to its
credit risk. In the case of conventional banking, four variables; RSEC, REGCAP, LLP, and
RWA were found to be significantly influencing its credit risk. They found an R-square value of
75.6% in conventional banking compared to 34% in Islamic banking which suggested that these
variables collectively have a stronger influence on the credit risk of conventional banking than
the credit risk of Islamic Banking. Both Islamic and conventional banking systems experienced
similar effects of Leverage, funding cost, and risk-weighted assets on credit risk but Islamic
banking experienced a different impact of management efficiency, regulatory capital and loan
loss provisions on their credit risk. Three factors MGT, REGCAP and LLP, were statistically
different as credit risk predictors of Islamic and conventional banking. MGT was positive and
significant for Islamic banks but related negatively to the credit risk of conventional banks.
REGCAP was negative and significantly related to credit risk of conventional banks but positive
and not significantly related to credit risk in Islamic banks. LLP was positive and significant
predictor of credit risk in conventional banks and negative but not significantly related to credit
risk in Islamic banking.
2.3. RESEARCH GAP
From over a hundred literature reviewed by the researcher relating to the credit risk and
profitability of banking institutions across the globe, it was evident that there is lack of
conclusiveness on the findings of the relationship between credit risk management and
profitability. There is a mix of result from the existing literature, which makes the study on the
relationship between credit risk and profitability in banking institutions inconclusive. Besides,
there are much research works on commercial banks, but only a hand full are on the savings and
loans companies and other NBFIs especially in Ghana. The literature gaps stated above makes
this study in the savings and loans (S&L) subsector a vital exercise. The S&L companies in
Ghana whose core business is deposit taking and granting of loans to the MSMEs continue to
face the threat of non-performing loan on a daily basis that needs attention. There is, therefore,
the need to fill this gap by conducting a study in the savings and loans subsector of the banking
industry in Ghana hence, the chosen topic for the research.

ISSN 2320-5407 International Journal of Advanced Research (2020)
98
2.4. RATIONALE OF THE STUDY
For the past couple of years after the enactment of the non-bank financial institutions (NBFIs)
law, 1993 [PNDCL.328], Many microfinance companies emerged across the country but, most
of them are no more in operation due to a massive accumulation of Non-performing Loans in
their books. A report by Ghana Association of Microfinance Institutions Network (GAMFIN)
indicates that approximately, thirty microfinance institutions (MFIs) collapsed in Ghana during
the first quarter of 2013 alone. About twenty (20) more collapsed by the close of that year due to
an alleged inability to “sustain their operations” (GAMFIN, 2014 annual report). Because of the
collapse, customers of these institutions, never got a refund of their deposits reportedly because
the owners were either untraceable, or the companies did not have the funds to pay them. Not
only did this bring about economic hardship on the affected customers, but also the Ghanaian
economy as a whole. Most of these collapsed microfinance institutions maintained their
corporate accounts with the commercial banks, which made the ripple effect of the liquidity risk
experienced by the collapsed companies transferring a pass through shock to the entire banking
sector.
The Savings and Loans companies by default have the small and medium enterprises (SMEs) as
their target market. These SMEs are considered the riskiest sector but at the same time, the most
significant market opportunity for any financial institution to tap. This SMEs contribute 52% to
the economic output, and 44% of all investments go into this sector of the economy (Graphic
Business, Dec. 2011). Even though there are various causes, one of the main contributing factors
is inadequate knowledge of the industry by the owners and operators of these affected
companies, and that led to the accumulation of non-performing loans. This study is, therefore
aiming to throw more light on the need for rigorous credit-risk management practices and serve
as a reference manual for both existing and incoming operators in the industry.
2.5. SIGNIFICANCE OF THE STUDY
The study on credit risk management and profitability of Savings and Loans companies is
significant for several reasons. The loan portfolios of the savings and loans institutions just like
any other banking institutions are their major assets that contribute a significant proportion to
ISSN 2320-5407 International Journal of Advanced Research (2020)
99
their overall profits in the form of interest income. It means that loans play a critical role in
determining the financial performance of the institution. We can, therefore, conclude that the
healthier the loan portfolio of a company, the better its financial performance. Considering the
importance of a healthy loan portfolio to the sustainability of the financial institutions, a study to
identify the management practice that affects the profitability performance of these financial
institutions is therefore very essential. The findings of this study would go a long way to enable
the sampled companies as well as all the S&L companies to adopt workable strategies to control
the problem of growing non-performing loan portfolios through better credit-risk management
practices, which will also improve their financial performance in order to remain sustainable.
Generally, the study is expected to contribute to the existing credit risk management practices in
the savings and loans companies and the banking industry in general. It will also serve as a
guiding document for experts, professionals, Bank of Ghana, academia and the public. The
outcome of this study is going to contribute to knowledge and literature in the subject under
investigation. It will be useful as a source of reference for researchers, students, policymakers,
bankers, economists and other stakeholders interested in the relationship between credit risk
management and the profitability of the savings and loans companies and the banking industry as
a whole.
2.6. STATEMENT OF THE PROBLEM
The past decade has witnessed dramatic losses in the banking industry across the world.
Financial companies (e.g. Lehman Brothers) that used to perform very well all of a sudden
announced massive losses due to credit exposures that went bad or taken of the wrong position of
interest rate, or derivative exposures that may or may not have been assumed to hedge balance
sheet risk.
Credit risk in banking is the probability of a borrower defaulting on his or her loan commitments.
The very natures of the banking business make it sensitive because, more than 85% of their
liabilities are from depositors (Saunders, Cornett, 2005)109
. Banks use these deposits to generate
credit for their borrowers, which is a revenue-generating avenue for most banks. This credit
creation process exposes the banks to high default risk that can lead to financial distress,

ISSN 2320-5407 International Journal of Advanced Research (2020)
100
including bankruptcy. Nevertheless, in order to remain in the competitive market, financial
institutions must still create credit for their clients to get some returns in order to be profitable
and sustainable. The banking industry in Ghana after the enactment of the Banking Law (1993)
Act (328), witnessed a surge in the number of banks, and nonbank financial institutions in the
country. It indirectly created a keen competition among the banking industry due to the
liberalised nature of the sector that led to free operations in the banking industry with the aim of
outsmarting competitors, which instead brought about low margins and many other challenges
facing the sector.
The world has experienced remarkable instances of banking and financial crises during the last
thirty years. Caprio and Klingebiel (1997)110
identified 112 systemic banking crises in 93
countries since the late 1970s. Demirguc-Kunt and Detragiache (1998)111
have also identified 30
major banking crises encountered from the early 1980s and onwards. According to the above
researchers, most of these banking crises occurred in developing countries such as Ghana.
Surprisingly, most of the crises came about because of unsecured loans. Continuous loan defaults
have become an order of the day in developing countries such as Ghana. It is, therefore; very
uncommon for any banking institution in Ghana to say it has never experienced this persistent
loan default phenomenon. For instance, the stock of NPLs stood at GH¢6.2billion as at the end
of December 2016, expanding at a compound annual growth rate (CAGR) of 41.89% from
GH¢0.26 billion by the end of December 2007. By June 2017, the stock of NPLs in the Ghanaian
banking industry had risen to GH¢7.96billion from GH¢6.09 billion in June 2016. The NPL ratio
experienced an increasing trend between 2007 and 2010 from 6.37% to 18.08%, declined to
11.27% in 2014, and after that increased to 17.7% in 2016 and 12.2% in June 2017. The asset
quality review (AQR) exercise carried out in 2016 also revealed weaknesses in the banks’ loan
classification practices, which led to the downgrading of some already-existing credit facilities.
The importance of Healthy loan portfolios remains a vital asset for banks due to their positive
impact on bank performance. However, the unfortunate reality is that some of these loans usually
do not perform and eventually result in bad debts which affect banks earnings on such loans.
These bad loans become a cost to the institutions regarding their implications for the quality of
their assets portfolio and profitability. Because, per banking regulations, all loan-granting
institutions must make provision for non-performing loans and charge for bad loans, which

ISSN 2320-5407 International Journal of Advanced Research (2020)
101
reduce their loan portfolios and the bottom line. It is clear from the above assertions that prudent
risk management is eminent for every lending institution as it can generate into bankruptcy.
Failure of individual banks adversely affects the economy and the entire society (Kolapo et al.,
2012). Because of that, it is the concern of this research work to assess what causes these non-
performing assets and the impact it has on the profitability of the Savings and Loans companies
in Ghana.
2.7. RESEARCH OBJECTIVES
The broad objective of the study was to identify the type of risk that mostly affects the day-to-
day operational activities of the S&L companies and to examine the relationship between credit
risk management, and the profitability of the savings and loans companies in Ghana.
Specifically, the study seeks:
1. To study and analyse the effect of credit risk management indicators on profitability of
S&L Companies
2. To identify the factors causing Non-performing Loans in the S&L companies
3. To find out the impact of Non-performing Loans on the operational activities of the S&L
Companies
4. To study and analyse the existence and effectiveness of the credit risk management
measures practiced by the S&L Companies
5. To study the difficulties faced by the S&L companies at the time of loan recovery
2.8. RESEARCH QUESTIONS
The research work seeks to find answers to the following questions:

ISSN 2320-5407 International Journal of Advanced Research (2020)
102
1. What effect does the credit risk management indicators have on profitability of the S&L
Companies?
2. What are the causes of Non-performing Loans in the S&L Companies?
3. To what extent do Non-performing Loans affect the performance of S&L Companies?
4. How effective are the existing credit risk management measures practiced by the S&L
Companies?
5. What difficulties does the S&L Companies face at the time of loan recovery?
2.9. HYPOTHESIS
Non-performing Loans or assets with its associated cost have become a burden on non-bank
financial institutions in Ghana. This menace has aided the collapse of many banks and non-bank
financial institutions that faced liquidity problems because of inadequate credit-risk management
practices. Given the above objectives, the researcher proposed the following positive hypotheses:
: There exist a statistically significant relationship between Non-Performing Loan Ratio
(NPLR) and Return on Assets (ROA) of S&L companies in Ghana
: There exist a statistically significant relationship between Capital Adequacy Ratio (CAR)
and Return on Assets (ROA) of S&L companies in Ghana
: There exist a statistically significant relationship between Loans and advances to Deposit
Ratio (LTDR) and Return on Assets (ROA) of S&L companies in Ghana
: There exist a statistically significant relationship between Non-Performing Loans Ratio
(NPLR) and Return on Equity (ROE) of S&L companies in Ghana
: There exist a statistically significant relationship between Capital Adequacy Ratio (CAR)
and Return on Equity (ROE) of S&L companies in Ghana
ISSN 2320-5407 International Journal of Advanced Research (2020)
103
: There exist a statistically significant relationship between Loans and advances to Deposit
Ratio (LTDR) and Return on Equity (ROE) of S&L companies in Ghana
2.10. RESEARCH METHODOLOGY
“Research methodology is the models, procedures and techniques used to find the results of a
research problem” (R. Panneerselvam, 2016, P.2)112
. Research methodology has the aim to
finalise the activities of research design and data collection procedure which includes: selection
of research approach, the design of sampling plan, the design of the experiment, the design of the
questionnaire, determination of sample size, the design of sample frame and execution of survey
(R. Panneerselvam, 2016, P.592).
2.11. ETHICAL CONSIDERATIONS
According to Saunders et al. (2009)113
, the term ethical refers to the appropriateness of your
behaviour concerning the rights of those who become the subject of your work, or are affected
by it. Research ethics relates to the way one formulates and clarifies one’s research topic, design
one’s research and gain access, collects data, processes and stores the data, analyses data and
discloses the research findings morally and responsibly (Saunders et al., 2007:178)114
.
Different codes and considerations apply to different stages of the research, for example:
Negotiating access: there is the need to establish credibility and respect participants’
rights to privacy. A written letter sent to the companies informs them of the option to stay
anonymous to ensure that the information will be confidential and for this study purpose
only.
Ethical consideration during data collection, analysis and reporting: according to
Diener & Crandall (1978)115
, there are four main areas of ethical principles. Whether
there is the harm in participants, whether there is an invasion of privacy and deception,
since the research involves taking responses, we did the due diligence to maintain the
privacy and confidentiality of the respondents. Respondents were under no obligation to

ISSN 2320-5407 International Journal of Advanced Research (2020)
104
provide sensitive data or trade secrets. Personal data was kept secured and only used for
the intended purposes.
2.12. SAMPLING FRAME
The sampling frame, which is, also called the working population, is a list of elements from
which we draw a sample for a study (Zikmund et al., 2013 Pp.420). This study aims at drawing
statistical inferences from the collected data, which makes probability sampling chosen as
opposed to non-probability sampling (Saunders et al., 2007). In order to draw meaningful
sampled companies, it was necessary to compile a list of all Savings and Loans Companies in
Ghana. This comprehensive list of S&L companies will be used to generate a sample using rules
of probability sampling where all population elements have a known and non-zero chance of
being selected to form a study sample (Hair et al. 2007116
; Saunders et al., 2007). This sampling
approach minimises selection bias. In order to generate such a database, we took information
from the Central Bank of Ghana, which is the regulatory body of all financial institutions in
Ghana.
2.13. SAMPLING TECHNIQUE
In order to ensure bias minimisation and fair representation of the population, the researcher
employed the probability-sampling technique. The sampling of the Savings and Loans
Companies for this study was through the systematic random sampling method. Systematic
sampling involves a random start and then continue with the selection of every Kth element from
then onwards (where K = population size/sample size). The selection of respondents on the other
hand was through the stratified random sampling technique. Under this sampling design, we
divide the entire population into strata (groups) which are mutually exclusive and collectively
exhaustive. By mutually exclusive, it means that if an element belongs to one stratum, it cannot
belong to any other stratum. Strata are collectively exhaustive if all the elements of various strata
put together wholly cover all the elements of the population. The elements, however, are selected
using a simple random sampling independently from each stratum. The stratified random
sampling is more efficient as compared to a simple random sampling because, dividing the
population into various strata increases the representativeness of the sampling, as the elements of

ISSN 2320-5407 International Journal of Advanced Research (2020)
105
each stratum are homogeneous to each other (Deepak Chawla & Neena Sondhi, 2016 p.257).
The purpose of stratified sampling procedure is to ensure that the various subgroups (strata) in a
population have representation on relevant sample characteristics to the exact extent that the
investigator desire (Zikmund et al. 2013, Pp. 426). Another reason for selecting a stratified
sample method is to ensure that the sample will accurately reflect the population based on the
criteria used for stratification. The above reason is a vital concern because simple random
sampling sometimes produces an out of proportion number of one group, or another and the
sample ends up being less representative than it could be (Zikmund et al. 2013, P. 430).
The stratification was based on the roles and duties of the respondents. All respondents are in
one way or the other involved in credit administration or decision-making of their respective
companies, either at the branch level or at management level. In other words, the respondents
have knowledge of credits and access to the company’s financial reports.
2.14. POPULATION OF THE STUDY
Table 2.1 below shows the selected S&L companies with the population grouped into strata with
the distribution of the population under each stratum. The 695 target population for the study was
grouped into five strata. The strata were credit/ recovery officers (460), risk/compliance officers
(27), credit managers (7), branch managers (154), and senior executives (47).
Table 2.1: Distribution of population by type of respondents (strata)
Strata
Pan
Africa
First
Allied
First
African
First
Ghana WWBG UniCredit Beige TOTAL
Credit/recovery 85 90 10 15 42 68 150 460
Risk /compliance 4 5 3 2 4 3 6 27
Credit manager 1 1 1 1 1 1 1 7
Branch manager 16 23 3 11 14 17 70 154
Senior executives 8 7 6 4 5 11 6 47
TOTAL 114 126 23 33 66 100 233 695

ISSN 2320-5407 International Journal of Advanced Research (2020)
106
Source: research data
2.15. SAMPLE SIZE
There are several methods of determining the size of a sample. The various methods of
determining sample size are as explained below:
Using or conducting a census survey
Census is desirable for small populations (usually less than 200) just because it eliminates
sampling error, and providing data on all the individuals in the population.
Using a similar study sample size
One can replicate the sample size of similar studies in the planned research work but, without
reviewing the procedures used in those studies, there will be the chance of replicating errors that
were committed during the determination of the sample size for those studies.
Using Published tables
Another means of determining sample size is to rely on published tables that provide the sample
size for a given set of criteria.
Using formulae in sample size determination
Tables can provide a useful guide for sample size determination, but it may at times be necessary
to calculate the sample size for a different combination of levels of precision, confidence level,
and variability. This study used the formula method in determining the sample size of both the
S&L Companies and the respondents. The sampling involved two levels. The first level was
determining the sample size of S&L Companies whereas the second level of the sampling has to
do with determining the sample size of the respondents. The determination of the sample size of
S&L companies was through a systematic sampling method. Systematic sampling involves a
random start and then continue with the selection of every Kth element from then onwards

ISSN 2320-5407 International Journal of Advanced Research (2020)
107
(where K = population size/sample size). Even though the calculation method was the sampling
method used, the selection of the S&L companies took into consideration other criteria. The
geographical coverage (covering at least three regions) regarding regional distribution, five or
more years in business operation, Size of the company regarding assets, and the size of the loan
portfolio were the other criteria considered for the selection. Out of the companies that met the
criteria, only seven (7) savings and loans companies made available their financial statements to
the researcher. The refusal of some companies to avail their data for the research probably may
be due to policy issue or reasons best known only to the management of those companies. Table
2.2 below shows the criteria used for selecting the S&L companies for the study. Ghana has ten
regional demarcations and any of the S&L companies having branches in the two largest
business cities (Accra and Kumasi), qualified as a sample.
The seven (7) companies, which represent about 21% of the population of S&L companies
included Pan African Savings and Loans (PASL), First Allied Savings and Loans (FASL), First
African Savings and Loans, First Ghana Savings and Loans, Women’s World Banking Ghana
(WWBG), UniCredit Savings and Loans, and Beige Capital Savings and Loans companies
limited.
Table 2.2: Criteria for the selection of the S&L companies
S&L
Company
Regional
coverage Years in operation Loan portfolio (GH¢)
Total assets
(GH¢)
Beige 9 9 579,853,817 1,121,361,602
First Allied 8 21 172,321,981 491,449,971
UniCredit 7 10 94,388,930 488,182,009
WWBG 4 19 24,164,174 102,759,607
Pan African 5 9 32,837,569 41,378,379
First Ghana 7 11 7,934,223 17,895,812
First African 3 8 2,495,359 17,895,812
Source: field data

ISSN 2320-5407 International Journal of Advanced Research (2020)
108
The researcher used a simplified formula for proportions provided by Yamane (1967:886)117
in
the calculation of the sample sizes for the various strata. The study made use of 95% confidence
level and a margin of error of ±0.05. The formula for the calculation is as shown below:
Where = the sample size
= the population
= the margin of error
But, = 695, = 0.05
Therefore,
=
= 254
It implies that the sample size (n) for the study is 254. That is 254 out of the 695 staff of the
seven (7) selected S&L Companies would have to respond to the questionnaire.
Proportionate Allocation Scheme
In this scheme, the size of the sample in each stratum is proportional to the size of the population
of the strata. The allocation of the 254 respondents to each stratum was by using the
proportionate allocation scheme formula below:
Where: = the sample size for the first stratum
= the population of the stratum
= the sample size for the strata

ISSN 2320-5407 International Journal of Advanced Research (2020)
109
= the population of the study
For example; to calculate for the sample size for credit/recovery officers for Pan African Savings
and Loans (PASL) company;
The population of the stratum, = 85
The sample size of the strata, = 254
The calculation of the sample size for the credit/recovery officers for PASL will therefore be:
The credit/recovery officers for First Allied Savings and Loans will also be as follows:
32
Table 2.3 below shows the computed sample size subgroups (strata) under each savings and
loans company.
Table 2.3: Distribution of sample size by type of respondents (strata)
Strata
Pan
African First Allied
First
African First Ghana WWBG UniCredit
Beige
Capital Total
Credit/Recovery 31 32 5 5 15 24 52 164
Risk/Compliance 1 2 1 1 1 1 3 10
Credit manager 1 1 1 1 1 1 1 7
Branch manager 6 8 2 4 5 6 25 56
Senior executives 3 2 2 2 2 4 2 17
TOTAL 42 45 11 13 24 36 83 254
Source: Researcher’s computation
ISSN 2320-5407 International Journal of Advanced Research (2020)
110
2.16. SOURCES OF DATA
The data source for the study was from both primary and secondary sources. The responses from
the administration of the questionnaire to the employees’ provided the primary data whereas the
secondary data was from the annual financial statements of the selected savings and Loans
companies. A compilation of data on Total Loans and Advances, Net Income/Profit after tax,
Total Equity, Total Assets, Impaired loans and Total deposit was done in order to compute for
the proxies of credit risk management and profitability.
The researcher also obtained some secondary data from documentary materials in the subsector
which includes; Published reports of Bank of Ghana annual financial stability reports,
publications by the international bodies such as World Bank and International Monetary Fund
(IMF), newsletters and other printed materials such as newspapers, journals, textbooks,
conference reports, articles, and training manuals.
2.17. INSTRUMENTS FOR DATA COLLECTION
The researcher used a descriptive survey for the study. The choice of this design was to provide a
means to contextually interpret and understand the relationship between credit-risk management
and profitability of S&L companies in Ghana. The primary data collection instrument used was a
well-structured questionnaire. In order to obtain the right response, the questionnaire was
administered to Credit officers, Credit managers, Risk and internal control officers, branch
managers and senior executive officers of the selected savings and loans companies. The choice
of these categories of the staff was because of their schedules, which involves credit
administration.
2.18. DATA ANALYSIS TECHNIQUES
The data analysis techniques aspect of research method can generally be either quantitative or
qualitative. In the quantitative research method, the emphasis is on the quantification of the
collected data. We use quantitative research in a deductive approach to ascertain the relationship
between theory and research, which focus on testing theory. It involves practices and norms of

ISSN 2320-5407 International Journal of Advanced Research (2020)
111
the natural scientific model in positivism position and contains a view of social reality and
external objective reality (Bryman and Bell, 2011, p.28)118
Qualitative research on the other hand emphasis on the words rather than quantifying the data.
Inductive approach is what qualitative research use in finding the relationship between theory
and research with the aim of generating theories. Qualitative research does not employ the
combination of practices and norms of the natural science model. It, however, emphasises on the
interpretivism option, which refers to the way an individual interprets the social world. It also
includes the view of social reality as a constant changing property of the individual’s creation
(Bryman and Bell, 2011, p.27)
The current piece of research will utilise the quantitative method of data analysis. The IBM SPSS
analytical software was used for the analysis of both the primary, and the secondary data. The
analysis of these ratios was done in such a way that the proposed hypotheses could be tested. The
second part of the analysis involved the analysis and interpretation of the responses from the
survey. The analysis was done with the help of statistical tools such as Descriptive statistics,
Correlation, ANOVA, Regression, and Factor analysis.
2.19. METHOD OF DATA PRESENTATION
Data presentation refers to the organisation of data into tables, graphs or charts so that we can
derive logical and statistical conclusions from the collected measurements. There are three main
methods of data presentation in research namely textual, tabular or graphical. The presentation of
the data and results was carried out such that it answered the research questions and fulfills the
set objectives of the study as well as testing the stated hypothesis. Tables, charts, graphs, and
textual methods were used.
2.20. STUDY VARIABLES FOR THE SECONDARY DATA
According to Rosenberg (2009)119
, we use ROA and ROE as profitability indicators when the
institutions do not receive subsidies. The savings and Loans companies in Ghana are all privately
owned and do not receive any subsidy from the government. ROA measures the effectiveness of

ISSN 2320-5407 International Journal of Advanced Research (2020)
112
assets usage by bank management to generate income. The problem with ROA as a measure is
that it does not factor off-balance sheet items into the total assets. ROE as a measure of earnings
per unit equity capital also has its shortcomings. ROE does not always indicate the exact position
of the bank as it can have financial Leverage influence. Again, regulations also affect ROE. To
compensate for the shortfalls of the two prominent profitability measures both Return on Assets
(ROA) and Return on Equity (ROE) served as proxies for profitability. The independent
variables, which are credit-risk management measures comprises of Capital Adequacy Ratio
(CAR), Non-Performing Loan Ratio (NPLR), and Loans to Deposit Ratio (LTDR). Banks
profitability depends on both internal and external determinants. This study took into
consideration only internal determinants to avoid the possibility that other external factors
influenced the relationship between credit risk and profitability. In an attempt to control the
situation, there was the need to introduce a control variable. The control variable used was Bank
size to classify between the large and small banks concerning the category susceptible to higher
credit risk. Following the models used by Kaaya & Pastory, (2013), and Fan Li & Yijun Zou,
(2014)120
, the researcher adopted bank size as the control variable. Researchers in previous
studies use various measures for bank size, but the interchangeably used measure of bank size is
the natural log of total assets (Shalit and Sankar, 1977)121
.
Table 2.4: Variable specifications
VARIABLES METHOD OF COMPUTATION
Dependent Variables ROA Net Income/ Total Assets
ROE Net Income/Total Equity
Independent Variables CAR Total Capital/RWAs
NPLR Loan impairment charges/Total Loans
LTDR Loans and Advances/Total Deposit
Control Variable LNTA Natural logarithm of total assets of bank
Source: researcher’s study variables

ISSN 2320-5407 International Journal of Advanced Research (2020)
113
2.20.1. Return on Assets (ROA)
Return on Assets of the company is the ratio of the net income to the total assets. It measures the
efficiency of the banking company’s management in generating profit out of its scarce resources.
The higher the profit generated from the employed assets, the more efficient the company.
Mathematically,
ROA =
2.20.2. Return on Equity (ROE)
ROE is a measure of the company’s efficiency at generating profit from every single unit of
shareholders equity. ROE is a measure of profitability expressed as a percentage of company net
worth. ROE ratio is an essential measure of a company’s earnings performance. With ROE ratio,
investors can ascertain how their invested money is being effectively utilised. The expectation is
that the higher the ratio of equity to assets, the lower the demand for external funding and
therefore the higher the bank profitability (Kosmidou, 2008).
Mathematically,
ROE =
2.20.3. Capital Adequacy Ratio (CAR)
According to Hassan and Bashir, (2003)122
, bank supervisors use capital ratio as a rule of thumb
to measure the adequacy of a banking institution’s level of capital. Zawadi Ally, (2014)123
argues
that a bank with highly capital adequacy is in the better position to use high technology such as
ATM, online computer system, the opening of new branches and using of mobile banking which
results in high efficiency and achievement of high profitability. CAR is the proportion of banks’

ISSN 2320-5407 International Journal of Advanced Research (2020)
114
Tier1 and Tier2 equity (qualifying capital or equity) as a proportion of its risk-weighted asset
(loans). Capital Adequacy ratio is an expression of a bank’s percentage risk-weighted credit
exposures. This ratio, implemented by Basel (1999)124
, is to protect depositors and promote the
stability and efficiency of banking institutions around the world. There are two types of capital
measurement: Tier1 capital, which absorbs losses without a bank being required to stop their
trading business and Tier2 capital, which can absorb losses in the event of distress and so
provides a lesser degree of protection to depositors.
CAR =
=
Total capital = Tier1 capital + Tier2 capital
Risk-weighted Asset is the asset of the bank weighted against the risk or the respective national
regulators’ minimum total capital requirement
Tier1 capital also referred to as core capital includes equity capital and disclosed reserves. Tier 1
capital caters for absorption of losses to prevent ending the trading of the bank.
Tier1 capital = (paid up capital + statutory reserves + disclosed free reserves) – (equity
investment in subsidiary + intangible assets + current and brought forward losses).
Tier2 capital also caters for the absorption losses while winding up the trading activities of the
bank. The bank depositors enjoy a lesser degree of protection during winding up.
Tier2 capital = (a) undisclosed reserves + (b) general loss reserve + (c) hybrid debt capital
instruments and subordinate debts
When using weighted assets, CAR =
≥10%
Maintaining CAR of ≥ 10% indicates the financial robustness of the bank, which in other words
implies effective credit risk management. CAR ≤ 10% is a sign of financial weakness of the
bank, which in turn means ineffective credit risk management. .
ISSN 2320-5407 International Journal of Advanced Research (2020)
115
2.20.4. Non-Performing Loan Ratio (NPLR)
Non-performing loans are the total sum of all borrowed money upon which the debtor has not
made payments as scheduled for at least 90 days. A non-performing loan is either in default or
near to being in default. The term Default is the failure by a borrower to pay principal or interest
on a loan when due. Brewer et al. (2006)125
regarded NPLR, as a significant economic indicator.
NPL implies a loss to the company, which requires provision. The profit takes care of the
provision amount, and that reduces the profit margin. NPLR shows the level of banks’ exposure
to credit risk. A ratio of above 25% implies that the bank is getting into a weak credit risk control
zone (Agborade, 2002 as cited in Tegegne Abera, 2018)126
.
Assets quality deterioration is a common cause of bank failure. Poor asset quality (NPL) can
seriously jeopardise the financial position of a bank and adversely affect the operation of the
bank (Lafunte, 2012)127
. Assets quality deterioration distresses the performance and survival of
banks (Mileris, 2012)128
. Miller and Noulas (1997)129
suggest that as the exposure of the
financial institutions to high-risk loans increases, the accumulation of unpaid loans also increase
and profitability would decrease. The quality of loan status has to be determined from time to
time in order to differentiate between performing from non-performing loans.
2.20.5. Loans to Deposit Ratio (LTDR)
Loans to deposit ratio is a ratio between the bank’s total loans and advances and total deposit.
LTDR is a measure of the liquidity of the bank. LTDR indicates how efficiently the bank made
use of depositors fund on credit activities, which is always at the mercy of default risk. LTDR
indicates the ability of the bank to withstand the bank customers’ withdrawal needs, and the
readiness of the bank to meet the loan demands by reducing cash assets. Bank regulators utilise
this ratio as a thumb rule to measure the adequacy of the banking institution’s level of capital
strength (Hassan & Bashir, 2003).
LTDR =

ISSN 2320-5407 International Journal of Advanced Research (2020)
116
LTDR ≥ 1 means that the bank uses its mobilised deposits to provide loans to its customers
without borrowing from outside to supplement.
LTDR ≤ 1 means that the bank borrows money to grant loans to its customers. Such a position
leads to higher interest on loans compared to loans generated from deposit funds. Loans to
deposit ratio greater than 1, means that the banks might not have enough liquidity to meet any
unforeseen funding requirements or economic crisis.
2.20.6. Bank Size (LNTA)
Nagaraju and Boateng, (2018) indicated that we could measure the size of a firm using its assets,
sales, or employee strength. However, according to Saunders et al., (1990)130
, Bank size is
usually measured by the natural log of the total assets (LNTA) of the bank, hence the higher the
bank size, the higher its ability to absorb risk. We usually take Natural logarithm of the total
assets before adding it into the model since we deflate the dependent variable (ROA) by the total
asset. Large companies can manage better and put in place better financial structures. In the
banking sector, potential economies and diseconomies of scale are generally captured using the
size of the bank. Size (LNTA) therefore controls for the variations in cost, product, and risk
diversification. According to Sufian and Chong, (2008), bank size may have a positive effect on
bank profitability if there are significant economies of scale. However, if an increase in
diversification results to higher risk, the variables may exhibit a negative effect. Bank Size =
2.21. THEORETICAL FRAME WORK OF THE STUDY
David H. Pyle (1997)131
propounded a theory on risk management with emphasis on credit and
market risks. The theory indicated that credit and market risks have directly or indirectly effect
banks survival. This research work has adopted this theory as the researcher would expect the
independent variables (i.e. CAR, NPLR, and LTDR) to influence the dependent variables (i.e.
ROA, and ROE) since without effective and efficient credit risk management, banks
profitability, liquidity and solvency are unthinkable (Pyle, 1997).

ISSN 2320-5407 International Journal of Advanced Research (2020)
117
From Fig.2.1 below, it is evident that the model of this research stands on the foundation of
credit risk management. This research has the objective to find out whether there exists a
relationship between credit risk and profitability of savings & loans companies in Ghana. There
was the need to quantify both credit risk and profitability in order to be able to disclose the
relationship statistically. To achieve the above aim of the study, the two indicators for
profitability and three indicators of credit risk management namely CAR, NPLR, and LTDR
forms the foundation of the model. Profitability represented by ROA and ROE is the resultant of
the credit-risk management indicators signifying its dependence on credit risk management. The
bank size, act as the control variable in the model.
Fig.2.1: conceptual model of the study
Source: Researcher’s illustration
2.21.1. Model Specification
The study is to adopt a panel data model previously used by Million Gizaw et al., (2015)132
in
their study on “the impact of credit risk on profitability performance of commercial banks in
Ethiopia”. They used Return on Assets (ROA), and Return on Equity (ROE) as their dependent
variables whiles Non-performing Loan Ratio (NPLR), Loan Loss Provision Ratio (LLPR),
Capital Adequacy Ratio (CAR) and Loan to Deposit Ratio (LTDR) were the independent
variables. This study, however, used ROE and ROA as the dependent variables whiles, CAR,
NPLR
CAR
LTDR
LNTA
ROA
ROE
CREDIT RISKMANGEMENT MEASURES PROFITABILITY MEASURES

ISSN 2320-5407 International Journal of Advanced Research (2020)
118
NPLR, and LTDR were indicators of independent variables. Bank size was a control variable
introduced in the model. Due to the two dependent variables (ROA, ROE), two different models
were propounded for the analysis. The introduction of an error term (ε) into the model was to
account for the unexplained variation in profitability by the credit risk management measures.
Again, since the independent variables are more than one, a multiple linear regression was
suitable for the analysis. The regression equation of the study will be:
= + + + ε
Where;
= the dependent variable, = constant term
= coefficient of the independent variable
= coefficient of the independent variable
= coefficient of the independent variable
= the control variable, and ε = the disturbance or error term
The model for the study will therefore be in the same form of the regression equation as shown
below:
Model 1: ROA = + CAR + NPLR + LTDR +LNTA
Model 2: ROE + CAR + NPLR + LTDR +LNTA
Where;
CAR is capital adequacy ratio
NPLR is non-performing loan ratio

ISSN 2320-5407 International Journal of Advanced Research (2020)
119
LTDR is loan to deposit ratio
LNTA is natural log of total assets (Bank Size)
2.22. PILOT TESTING
Galloway (1997)133
suggests that a population of 5 to 10 per cent of the final sample is
considered appropriate in any pilot testing. Twenty-eight (28) respondents, which represent 11%
of the sample size of 254, (see table 2.5) were the sample size for the pilot testing for the
determination of the reliability of the questionnaire
Table 2.5: Case-Processing Summary
2.22.1. Measurement of Internal consistency reliability
Internal consistency reliability is an indicator of a measure’s internal consistency applied not to
one item, but to a group of items that measure different aspects of the same concept. Cronbach’s
coefficient alpha (α) measures the internal consistency reliability among a group of items
combined to form a single scale. Cronbach’s alpha reflects how well the different items
complement each other in their measurement of different aspects of the same variable or quality
(Cronbach, L.J., 1951)134
.
N %
Cases Valid 28 100.0
Excludeda 0 .0
Total 28 100.0
a. List wise deletion based on all variables in the procedure.

ISSN 2320-5407 International Journal of Advanced Research (2020)
120
Cronbach's alpha internal consistency is Interpreted just like a correlation coefficient, when it is
.70 is good.
• α ≥ 0.9 Excellent (High-Stakes testing)
• 0.7 ≤ α < 0.9 Good (Low-Stakes testing)
• 0.6 ≤ α < 0.7 Acceptable
• 0.5 ≤ α < 0.6 Poor
• α < 0.5 Unacceptable
Table 2.6: Reliability Statistics
Cronbach's Alpha N of Items
.760 45
From the output of the reliability statistics, as presented in Table 2.6 above has a Cronbach alpha
(α) of 0.760. Since the Cronbach alpha (α) = .76 the instrument is deemed suitable, and reliable
for data collection. To ensure content validity of the questionnaire, the researcher solicited
opinions from experts, academia, and industry for representativeness, and suitability of the
questions. Suggestions and corrections from them helped to achieve both validity and reliability
of the questionnaire.
2.23. OPERATIONAL DEFINITIONS
Credit: Credit in commerce and finance is a term used to denote transactions involving the
transfer of money or other property on a promise of repayment, usually at a fixed future date.
The transferor thereby becomes a creditor, and the transferee, a debtor; hence, credit and debt are
merely terms describing the same operation viewed from opposite standpoints (Donald

ISSN 2320-5407 International Journal of Advanced Research (2020)
121
L.2008)135
. The transfer is temporal and is for a price called interest, which varies with the risk
involved and with the demand for and supply of credit (Stiglitz and Weiss, 1981)136
.
NPL/NPA: the two terms are which are interchangeably used by finance experts refers to a
classification for loans and advances which are in default or past due or in arrears for the
scheduled payment of interest and principal (Investopedia). A past due loan repayment for 90
days or more is classified as NPL or NPA.
Risk: Risk has several definitions depending on the field or sector. Generally, risk is an
uncertain event or condition that, if it occurs, affects at least one objective. In other words, risk is
the probability or threat of quantifiable damage, injury, liability, loss, or any other negative
occurrence caused by external or internal vulnerabilities, which we can avoid through
preemptive action.
Risk in Insurance: A situation where the probability of a variable (e.g. burning down of a
building property), is known but when a mode of occurrence or the actual value of the
occurrence is not known.
Risk in Securities Trading: Risk in Trade is the probability of a loss or drop in value. Trading
risk is of two categories: (1) systematic risk or market risk which affects all securities in the
same class, linked to the overall capital-market system, and therefore cannot be eliminated by
diversification. (2) Non-systematic risk, on the other hand, is non-market related. This type of
risk also referred to as non-market risk, extra-market risk or diversifiable risk.
Economic Risk: It can manifest in lower incomes or higher expenditures than expected. The
causes for economic risk can be many, for instance, the increase in the price of raw materials, the
failure to meet deadlines for construction of a new operating facility, inter in production process,
emergence of a competitor on the market, the loss of a very key member of staff, the change of a
political regime or natural disasters.
Risk in Finance: Financial risk is the general term for many different types of risks related to
the financial industry. These types of risk encompass risks involving financial transactions such

ISSN 2320-5407 International Journal of Advanced Research (2020)
122
as loans to companies, and its exposure to loan default. The term financial risk is typically used
to reflect an investor's uncertainty of collecting returns and the potential for monetary loss
(http://www.investopedia.com). It is the possibility that an actual return on investment will be
different from the expected return, and also takes into account the size of the difference. It
includes the possibility of losing some or all of the original investment. In a view propagated by
Damodara, risk includes not only “downside risk” but also “upside risk” (i.e. returns that
exceeded expectations). Financial risk may at times be market-dependent, determined by
numerous market or operational factors, resulting from fraudulent behaviour.
2.24. LIMITATIONS OF THE STUDY
Every human endeavour has its limitations, and this piece of work is of no exception. The first,
and foremost of these limitations was money and time constraints. There was the need to travel
to Ghana for data collection, but the scholarship from Indian Council for Cultural Relations
(ICCR) does not cover the travelling expenses. Since the cost to and from Ghana was through the
personal resources of the researcher, the data collection period could not be prolonged enough.
The limited time of the study made it impossible to do extensive investigation about the subject
matter of credit risk management. The researcher also faced difficulties during the data collection
exercise as some of the institutions contacted refused to make their data available. Except for
few, most of the S&L companies do not have their financial statements posted on their official
websites. Ghanaian companies in general especially those that are not on the Ghana stock
exchange are less transparent with information and the ownership of almost all the Savings and
Loans companies in Ghana are by private investors and not listed hence the challenge. Because
of unavailability of extensive data the study was limited to only six years (2011 – 2016).
2.25. CHAPTER SCHEME OF THE THESIS
Based on the objectives of the study, there was the need to organise the study is into five (5)
chapters.
Chapter 1: Chapter one deals with the introduction to the topic. It starts with the financial
system in Ghana, meaning and definition of banking, the overview and structure of the Ghanaian

ISSN 2320-5407 International Journal of Advanced Research (2020)
123
banking system, reforms in the Ghanaian banking industry, and the emergence of the nonbank
financial institutions in the banking industry. The rest of the chapter includes categorization of
risks in banking, credit risk management and profitability.
Chapter 2: The second chapter consists of the literature review on credit risk management and
profitability of the general banking industry and the research gap of the study. It also covers the
problem statement, the significance of the study, the objectives, research questions, hypothesis,
the research methodology used in the study and the ethical research considerations. The
methodology includes; the research design, the population of the study, sampling frame,
sampling technique(s), sampling size, sources of data, the method of data presentation, data
analysis technique(s), the study variables, theoretical framework, model specification, pilot
testing, layout of the thesis and operational definitions.
Chapter 3: The third chapter focuses on the profile of Ghana and the select savings and loans
companies for the study
Chapter 4: The fourth chapter deals with the presentation, analysis and interpretation of the
research data collected,
Chapter 5: The fifth chapter deals with the evaluation of the research thus - findings,
conclusions, recommendations and suggestions. Bibliography and appendices followed.
REFERENCES
[1]. Green, C. E. L., Freeman, D., Kuipers, E., Bebbington, P., Fowler, D., Dunn, G., & Garety,
P. A. (2008). Measuring ideas of persecution & social reference: the Green et al. Paranoid
Thought Scales (GPTS). Psychological medicine, 38, 101-111
[2]. Deepak Chawla and Neena Sondhi (2016). Research Methodology- Concepts and Cases.
Second edition, Vikas Publications, New Delhi, India
[3]. Zikmund, W. G., Babin, B. J., Carr, J. C., & Griffin, M. (2013). Business research methods
9th edition, Mason, OH: Southwestern

ISSN 2320-5407 International Journal of Advanced Research (2020)
124
[4]. Trochin, W. M. (1999). Research methods knowledge base contents navigating foundations
sampling measurement design analysis write-up Appendices search. Retrieved:
http://www.anatomyfacts.com/research/researchmethodsknowledgebase.pd
[5]. Robson Collin (2005). Real World Research, second edition, Blackwell Publishing, Oxford,
UK
[6]. Chijoriga M. M. (1997). An Application of Credit Scoring and Financial Distress Prediction
Models to commercial Bank Lending: The case of Tanzania. PhD Dissertation Wirtschafts
Universitat Wien (WU) Vienna.
[7]. Brownbridge, Martin, and Charles Harvey, 1998, Banking in Africa: The Impact of Financial
Sector Reform Since Independence (Oxford: James Currey Limited).
[8]. Kitwa D.Y. (1996). Application of multiple discriminant analysis in developing of
commercial banks loans classification model and assessment of the significance of
contributing variables: a case of National Banking of Commerce. MBA thesis UDSM, Dar
es Salaam
[9]. Anita Makkar & Hardeep (2018). Key factors influencing the profitability of Indian
commercial banks, International Journal of Academic Research and Development, Volume
3; Issue 1; Page No. 373-37
[10]. Nagaraju, Y. and Boateng, K. (2018). Profitability determinants of savings & loans
companies in Ghana: Evidence on Bank Specific and macroeconomic Determinants.
International Journal of Business Studies, Vol. 5, Issue 2 (2)
[11]. Kwadwo Boateng (2018). Determinants of Bank profitability: A comparative study of
Indian and Ghanaian banks. Journal of Emerging Technologies & Innovative Research,
Vol.5 Issue 5 Pp. 643 – 654
[12]. Maiti, Adwaita & Jana, Sebak. (2017). Determinants of Profitability of Indian Banks - A
Panel Data Analysis. Scholars Journal of Economics, Business and Management, 4. 436-
445.
[13]. Michael Owusu, A. et al., (2017). Bearings of credit risk management on financial
performance: Evidence from financial institutions in Ghana. American Journal of
Multidisciplinary research, Vol.5 Issue 2
[14]. Mendoza & Rivera (2017). The effect of credit risk & capital adequacy on the profitability
of rural banks in the Philippines. Scientific Annals of Economics and Business Vol.64
Issue1 P.83-96

ISSN 2320-5407 International Journal of Advanced Research (2020)
125
[15]. Ahmet Karakuza (2017). Bank Specific Determinants of Profitability in Turkish banks.
Masters theses, Fort Hays State University.
[16]. Yusheng Kong et al. (2017) Bearing of Credit Risk Management on Financial Performance:
Evidence from Financial Institutions in Ghana. American Journal of Multidisciplinary
research Vol.5 Issue 2.
[17]. Juliana Stanley Isanzu (2017). The impact of credit-risk on the financial performance of
Chinese banks. Journal of international business and marketing Vol. 2 Issue3 Pp.14-17
[18]. Pritpal S. Bhullar and Pradeep K. Gupta (2017). Empirical Analysis of Determinants of
Profitability of Public Sector Banks. International Journal of Accounting & financial
reporting, vol.7 no. 2
[19]. Tan, Y., Floros, C., and Anchor, J. (2017). The profitability of Chinese bank: impacts of
risk, competition and efficiency. Review of Accounting and Finance 16, 86-105.
[20]. Subham Dastidar and Subhas Chandra Sarkar (2017). An Empirical Analysis of the
Determinants of Profitability of Private Sector Banks. International Journal of Advanced
Research, Vol. 5 Issue 9 Pp. 770-780
[21]. Naresh Kedia (2016). Determinants of Profitability of Public Sector Banks. International
Journal of Management and Social Sciences, Vol.2 Issue3
[22]. Gathigia Muriithi, J., Munyua Waweru, K., and Mwangi Muturi, W. (2016). Effect of
Credit Risk on the Financial Performance of Kenyan Commercial Banks in. IOSR Journal of
Economics and Finance, Vol.7 Issue 4 Ver.1 Pp.72 -83
[23]. Anarfi et al. (2016). The determinant of Bank Profitability in Ghana: The New Evidence.
Asian Journal of Finance & Accounting Vol. 8, NO.3
[24]. Mohammad Muhiuddin (2016). The determinants of profitability of Private Banks in
Bangladesh: An Empirical Analysis. Igdir University Journal of Social Sciences Vol.11, p.
141-172
[25]. John Bosco, R. et al., (2016). Credit risk and Commercial bank profitability in Rwanda.
International Journal of Advanced research. Vol.4, Issue 9.
[26]. Ali Sulieman Alshatti (2016). Determinants of bank profitability – the case of Jordan.
Investment Management and Financial Innovations, Vol. 13, Issue 1.
[27]. Yuga Raj Bhattarai (2016). Determinants of Lending Behavior of Nepalese Commercial
Banks. Journal for Studies in Management and Planning, Vol.02, Issue6

ISSN 2320-5407 International Journal of Advanced Research (2020)
126
[28]. Ofosu-Hene, E. D., & Amoh, P. (2016). Risk Management & performance of listed banks
in Ghana. European Journal of Business Science and Technology, Vol.2, Issue2.
[29]. Takyi Opoku, R., Lawer Angmor, P. and Asare Bediako, L (2016). Credit Risk and Bank
Profitability: Evidence from Ghana Stock Exchange. Journal for Studies in Management and
Planning, Vol.2, Issue3.
[30]. Perera, L. A. S. & Morawakage, P.S. (2016). Credit Risk Management and Shareholders
value creation: With special reference to Listed banks in Sri Lanka. Kelaniya Journal of
Management, Vol.5, No.2
[31]. Ibrahim Nandom Yakubu (2016). Bank-specific and Macroeconomic Determinants of
Commercial banks Profitability in Ghana. Macrothink Institute, International Finance and
Banking 3 (2)
[32]. Fredrick, M. Kalui & Susan, W. Kahuntu (2016). The Effect of Credit-risk Management
Practices on the Growth of SACCO’s Wealth in Nakuru Town. European Journal of
Business and Management, Vol. 8, No. 32
[33]. Eric Kofi Boadi, Yao Li, Victor Curtis Lartey (2016). Role of Bank Specific,
macroeconomic &risk determinants of banks profitability: Empirical evidence from
Ghana’s' rural banking industry. International journal of economic & financial issues 6(2)
[34]. Ketan Mulchandani and Totala N.K. (2016). Impact of macroeconomic determinants of
profitability of Indian commercial banks. Research Journal of management science, vol. 5,
Issue 10 Pp. 9-16
[35]. Anita Makkar (2016). Key determinants affecting the credit risk of Indian Banks.
International conference on recent innovations in Science, Management, education, and
Technology retrieved 27th February 2018 from www.conferenceworld.in
[36]. Mohammed Bayyoud & Nermeen Sayyad (2015). The Relationship between Credit Risk
management & Profitability between Investment & Commercial Banks in Palestine.
International Journal of Economics and Finance, Vol. 7, No.11
[37]. Johannes Peyavali (2015). Evaluating the Impact of Bank Specific Determinants of Non-
performing Loans in Namibia. Journal of Emerging Issues in Economics, Finance &
Banking (JEIEFB) An Online International Research Journal (ISSN: 2306-367X) 2015, Vol.
4, Issue 2.
[38]. John Kwaku Mensah Mawutor and Awah Fred (2015). Assessment of efficiency &
profitability of listed banks in Ghana. Accounting and finance research, vol.4 No.5
ISSN 2320-5407 International Journal of Advanced Research (2020)
127
[39]. Susan Jebet Biwot, Kelpha Ombui and Assumtah W. Kagiri (2015). Effect of credit-risk
management on the financial performance of KARI SACCO LTD. The strategic journal of
business and change management vol.2 issue2 (100) Pp. 1483-1491
[40]. Viswanadham, N. & Hahid, B. (2015). Determinants of Non-performing loans in
commercial banks: A study of NBC bank Dodoma Tanzania. International journal of
finance and Banking studies, Vol.4, No.1
[41]. Abu Hanifa et al. (2015). The effect of credit risk on banking profitability- A case of
Bangladesh. Global Journal of Management & Business Research C Finance, Vol.15, Issue
3, Version 1.0
[42]. Bizuayehu, M. (2015). Impact of credit-risk on the financial performance of Ethiopian
banks. A master’s thesis submitted to the department of accounting and finance, Addis
Ababa University. Retrieved on October 31, 2016, from
http://etd.aau.edu.et/bitstream/123456789/6799/1/Misker%20Bizuayehu.pdf
[43]. Gizaw, M., et al. (2015). The impact of credit-risk on profitability performance of
commercial banks in Ethiopia. African Journal of Business Management 2015 Vol.9 (2), P.
59-66
[44]. Felix Sabeza, Jaya Shukla, Gaurav Bajpai (2015). Assessing credit risk management
practices and performance of commercial banks in Rwanda. International Journal of Social
science and humanities, Vol. 3, Issue 1 Pp.323-333
[45]. Johannes Peyavali (2015). Evaluating the Impact of Bank Specific Determinants of Non-
performing Loans in Namibia. Journal of Emerging Issues in Economics, Finance &
Banking (JEIEFB) An Online International Research Journal (ISSN: 2306-367X) 2015 Vol.
4 Issue 2.
[46]. Kipngetich S. and Muturi W. (2015). Effect of Credit-risk management on the financial
performance of savings and cooperative society in Kenya. Strategic journal of business &
change management, Vol. 2, No. 44, Pp. 900-915
[47]. Isaac Boadi (2015). Profitability Determinants of Ghanaian Banking Sector in the ongoing
Wave of Consolidation. International Journal of Business & Management, Vol. 10, No. 12
[48]. Douglas Afoakwah Opoku-Agyemang (2015). Factors influencing the profitability of
domestic & foreign banks in Ghana. Unpublished Master Thesis, School of Business &
Social Sciences, Aarhus University
[49]. John Mawutor, K.M. (2015). Credit Risk Management & Profitability of Banks listed on
the GSE. International Journal of Empirical Finance, Vol.4, No.7, (Pp. 396-406).

ISSN 2320-5407 International Journal of Advanced Research (2020)
128
[50]. Frank Antwi and Ernest Victor Apau (2015). Financial performance of rural & community
banks in Ghana. The International Journal of Business &Management Vol.3 Issue2
[51]. Rahman et al., (2015). Determinants of profitability: Empirical Evidence from Bangladesh.
International Journal of business & management, Vol.10, No.8
[52]. Pankaj Sinha and Saksha Sharma (2015). Determinants of bank profitability and its
persistence in Indian banks: A study in a dynamic panel data framework. Munich Personal
RePEc Archive, Paper No.61379
[53]. Kwame Nkegbe P. and Yazidu Ustarz (2015). Banks performance in Ghana: Trends and
Determinants. Ghana Journal of Development Studies, Vol.12 No. 1 & 2
[54]. Rajveer Rawlin et al. (2014). A Comparison of Key Determinants of Profitability of India’s
Largest Public & Private Sector Banks. European Journal of Business & Management,
Vol.6, No.34, 2014
[55]. Akong’a Cynthia Jenifer (2014). Effect of the Financial Risk Management on the Financial
Performance of Commercial Banks in Kenya. An unpublished research project submitted to
the School of Business, University of Nairobi, Kenya.
[56]]. Asad Abbas et al. (2014). Credit risk Exposure & Performance of Banking Sector of
Pakistan. Journal of Basic and Applied Scientific Research. Vol.4, Issue3, P.240-245.
[57]. Iwedi, O. and Onuegbu, O (2014). Credit risk & performance of selected deposit money
banks in Nigeria: an empirical investigation. European journal of Humanities & Social
Sciences, 31 (1)
[58]. Junaidu Muhammad Kurawa and Sanusi Garba (2014). An evaluation of the effect of
credit-risk management on the profitability of Nigerian banks. Journal of modern accounting
& auditing, Vol. 10 No.1 Pp. 104 - 115
[59]. Idowu, A. and Awoyemi, S.O. (2014). The impact of credit risk management on
commercial banks' performance in Nigeria. International Journal of Management and
Sustainability, Vol. 3 Issue 5, (pp. 295-306)
[60]. Maryam Mushtaq et al. (2014). Determinants of Commercial banks performance: Empirical
Evidence from Pakistan. Journal of Applied Environmental and Biological Sciences, Vol. 4
(7S) Pp. 15-21
[61]. Addo Boye Michael Kwabena (2014) credit risk management in financial institutions: a
case study of Ghana commercial bank limited. Research Journal of Finance & Accounting,
Vol 5, No.23, from www.iiste.org (accessed on 13/09/16)

ISSN 2320-5407 International Journal of Advanced Research (2020)
129
[62]. Abata, M., & Adeolu (2014). Asset quality and bank performance: A study of commercial
banks in Nigeria. Research Journal of Finance and Accounting, 5(18). Retrieved from
http://iiste.org/Journals/index.php/RJFA/article/download/16209/16592
[63]. Asantey J. O. & Tengey S. (2014). An empirical study on the effect of bad-loans on banks’
lending potential and financial performance: the case of SME lending in Ghana.
International Journal of research in Business Management Vol.2, Issue11 p.112
[64]. Benjamin Yeboah & Micheal Yeboah (2014). The effect of working capital management of
banks on profitability: Panel approach. International Journal of Business and Social Science.
Vol.5 No. 10.
[65]. Owusu-Antwi et al. (2014). The performance of rural banks in Ghana: the Ages have
passed anything recommended for the future. International Review of Management &
Business Research, Vol. 3 Issue 2
[66]. Ayman Mansour Alkhazaleh and Mahmoud Almsafir (2014). Bank Specific Determinants
of profitability in Jordan. Journal of Advanced Social Research, 4 (10)
[67]. Mukaila A.A et al. (2013). Determinants of Banks’ profitability in a developing economy-
Evidence from the Nigerian banking industry. Interdisciplinary journal of contemporary
research in Business, 4(9) P.155-181
[68]. Atta Mills and Amowine (2013). The Rural Bank Profitability Nexus: Evidence from
Ghana - International Journal of Application or Innovation in Engineering & Management,
Vol.2 Issue 4
[69]. Fredrick Lagat et al., (2013). Effect of credit -risk management practices on lending
portfolio among SACCOs in Kenya. European Journal of Business & Management Vol.5
No.19.
[70]. Ruziqa, A. (2013). The impact of credit & liquidity risk on bank financial performance:-
The case of Indonesian Conventional Bank International Journal of Economic Policy in
Emerging Economies, Volume 6, Issue2, Pp. 93- 106.
[71]. Joseph Magali (2013). The impact of credit risk management and profitability of rural
savings and credit cooperative societies (SACCOS): The case study of Tanzania
72. Okoth V. Ongore and Gemechu B. Kusa (2013). Determinants of the financial performance
of commercial banks in Kenya. International Journal of Economics & financial issues,
Vol. 3, No. 1, pp. 237 – 252

ISSN 2320-5407 International Journal of Advanced Research (2020)
130
[73]. Lillian Kisivuli Essendi (2013). The effect of credit-risk management on loans portfolio
among SACCOs in Kenya. Unpublished thesis, the University of Nairobi. Retrieved on
1/06/17 from http://chss.uonbi
[74]. Kaaya, I. and Pastory, D. (2013). Credit Risk & Commercial Banks Performance in
Tanzania: a Panel Data Analysis, Research Journal of Finance and Accounting, 4 (16),
pp. 55-63. Available at: www.iiste.org
[75]. Mohamed Dore (2013). An Empirical Analysis of Bank Profitability in Ghana: Evidence
from Bank-specific and Macroeconomic factors. Mater Thesis, Eastern Mediterranean
University, Gazimagusa North Cyprus.
[76]. Aparna Batia et al. (2012). Determinants of PSBs in India. Journal of Commerce &
Accounting Research, Volume 1, Issue 2
[77]. Haron O. Moti et al. (2012). The effectiveness of the Credit Management System on Loan
Performance: Empirical Evidence from Micro Finance Sector in Kenya. International
Journal of Business, Humanities & Technology Vol. 2 No. 6
[78]. Farhan, M., Sattar A., Chaudhry, A. H. & Khalil, F. 2012. ‘Economic Determinants of
Non-Performing Loans: Perception of Pakistani Bankers’, 4(19): 87-99.
[79]. Samuel H. Boahene, Dr Julius Dasah and Samuel K. Agyei (2012). Credit Risk &
Profitability of some selected banks in Ghana. Retrieved from
http://www.slideshare.net/SamuelAgyei/credit-risk-and-bank-performance-in-ghana
(accessed on 29/8/2016)
[80]. Thiery Buchs and Johan Mathisen (2005). Competition and Efficiency in Banking:
Behavioral Evidence from Ghana. IMF Working Paper. Retrieved from: https://pdfs.semanticscholar.org/61e6/5415e94599db7b053c48a4d17985f1dc3f1e.pdf
[81]. Owusu Afriyie, H. and Oscar Akotey J. (2012). Credit Risk Management & Profitability of
Selected Rural Banks in Ghana. Retrieved on 6/07/16 from
http://www.academia.edu.documents/35497769/afriyie-credit-risk management.pdf
[82]. Prakash R., Poudel, (2012). The impact of credit-risk management on the financial
performance of commercial banks in Nepal, International Journal of Arts and Commerce,
1 (5), pp. 9-15. Available at: http://www.ijac.org.uk/images
[83]. Kolapo, F.T., Ayeni, K.R. & Oke, M.O. (2012). Credit risk & commercial banks’
performance in Nigeria: A panel model approach, Australian Journal of Business and
Management Research, 2 (2), pp. 31-38. Available at: http://ajbmr.com/article

ISSN 2320-5407 International Journal of Advanced Research (2020)
131
[84]. Ogilo Fredrick (2012). The Impact of Credit-risk Management on Financial Performance of
Commercial Banks in Kenya. DBA Africa Management Review, Vol.3, No.1, P. 22 – 37
[85]. Mabvure et al. (2012). Non-Performing loans in Commercial Banks: A case of CBZ Bank
Limited in Zimbabwe. Interdisciplinary journal of contemporary research in business,
Institute of interdisciplinary business research Vol. 4, No. 7
[86]. Xuezhi Qin and Dickson Pastory (2012). Commercial Banks Profitability Position:- The
Case of Tanzania. International Journal of Business & Management, Vol. 7, No. 13.
[87]. Tobias Olweny and Themba Mamba (2011). Effect of Banking Sectorial Factors on the
Profitability of Commercial Banks in Kenya. Economics and Finance review, Vol.1 (5)
Pp.01 -30
[88]. Javaid, S., Anwar, J., Zaman, K and Gaffor, A. (2011). Determinants of Bank Profitability
in Pakistan- Internal Factor Analysis, Mediterranean Journal of Social Sciences, 2(1): 59-
78.
[89]. Aduda, J. and Gitonga, J. (2011). The Relationship between Credit-Risk Management and
Profitability among the Commercial Banks in Kenya, Journal of Modern Accounting and
Auditing, 7 (9), pp. 934-946. Available at: file:///C:/Users/alial_000
[90]. Themba Mamba Shipho (2011). Effect of banking sectorial factors on the profitability of
commercial banks in Kenya. Economics and finance review, Vol.1 (5), Pp.1-30
[91]. Hamisu Suleiman Kargi (2011). Credit risk & the performance of banks in Nigerian.
Ahmadu Bello University, Department of Accounting, Faculty of Administration, Zaria –
Nigeria unpublished thesis.
[92]. Imad Z. Ramadan, Qais A. Kilani, Thair A. Kaddumi (2011). Determinants of bank
profitability: Evidence from Jordan. International Journal of academic research, Vol.3
No.
[93]. Danson, M. and Adano, S.M. (2012). The impact of credit-risk management on the
financial performance of Kenyan Banks. International Journal of Business &Public
Management Vol. 2 Issue 2 pp. 72 – 80
[94]. Jackson Oludhe (2011). The impact of credit-risk management on the financial
performance of Kenyan commercial banks, unpublished thesis submitted to the
department of finance & accounting, school of business, University of Nairobi. Retrieved
on 1/06/17 from:
http://erepository.uonbi.ac.ke:8080/xmlui/bitstream/handle/11295/12792/Oludhe

ISSN 2320-5407 International Journal of Advanced Research (2020)
132
[95]. Evelyn Richards (2011). Factors That Cause Non–Performing Loans in Commercial Banks
in Tanzania and Strategies to resolve them. Journal of Management Policy and Practice,
Vol. 12(7).
[96]. Muhammad Farhan Akhtar et al. (2011). Factors influencing Pakistani Banks profitability
of Islamic -Internal factor analysis. International Research Journal of Finance &
Economics ISSN 1450-2887, Issue 66.
[97]. Angela M. Kithinji (2010). Credit-risk management & profitability of commercial banks in
Kenya. The University of Nairobi School of business, Nairobi – Kenya.
[98]. Hosna, A, Manzura, B, & Juanjuan, S. (2009). Credit-risk Management & Profitability in
Commercial Banks in Sweden. Master Degree Project, University of Gothenburg.
Retrieved on 31/05/2017 from
https://gupea.ub.gu.se/bitstream/2077/20857/1/gupea_2077_20857_1.pdf
[99]. Fadzlan Sufian (2009). Factors influencing banks profitability in a developing economy-
Empirical evidence from Malaysia. Global Business Review, Pp.225 – 241
[100]. Constantine Alexiou and Voyazas Sofoklis (2009). Determinants of Bank profitability-
Evidence from the Greek Banking Sector. Economic Annals, Volume LIV No. 182
[101]. Kyriaki Kosmidou, (2008) "The determinants of banks' profits in Greece during the period
of EU financial integration", Managerial Finance, Vol. 34 Issue: 3, pp.146 – 159
[102]. Kosmidou, K., Tanna, S., Pasiouras, F., (2008). Determinants of UK domestic banks
profitability- panel evidence from the period 1995–2002- Proceedings of the 37th Annual
Conference of the Money, Macro & Finance (MMF) Research Group, Rethymno,
Greece, September 1–3, 2005.
[103]. Fadzlan Sufian and Royfaizal Razalia Chong (2008). Determinants of bank profitability in
developing economy: Empirical evidence from the Philippines. Asian Academy of
Management Journal of Accounting & Finance Vol.4 No.2 Pp. 91-112
[104]. Nor Hayati Ahmad and Mohammed Ariff (2007). A multi-country study of bank credit
risk determinants. The international journal of banking and finance, vol.5 No.1 Pp. 135-
152, pp.1-10
[105]. Amidu and Hinson (2006). Credit risk, capital structure and lending decisions of banks in
Ghana. Banks and Bank Systems / Volume 1, Issue 1.
[106]. Anna P.I. Vong and Hoi SI Chan (2006). Determinants of bank profitability in Macao.
Research Gate. Available at https://www.researchgate.net/publication/252081427

ISSN 2320-5407 International Journal of Advanced Research (2020)
133
[107]. Fofack, H. (2005, November 16). Nonperforming loans in Sub-Saharan Africa: Causal
analysis and macroeconomic implications by Hippolyte Fofack: SSRN. Retrieved
September 14, 2016, from http://ssrn.com/Abstract=849405
[108]. Ahmad, Nor Hayati and Ahmad, Shahrul Nizam (2004) Key factors influencing the credit-
risk of Islamic bank: A Malaysian case. The Journal of Muamalat &Islamic Finance
Research
[109]. Saunders A. and Cornett M. (2005). Financial market and Institutions: An introduction to
risk management approach. McGraw-Hill Higher education
[110]. Caprio, G., & Klingebiel, D. (1997). Bank insolvency - Bad luck, bad policy, or bad
banking? Available at
http://siteresources.worldbank.org/DEC/Resources/18701_bad_luck.pdf
[111]. Asli Demirguc-Kunt and Enrica Detragiache. (1998, March 1). The determinants of
banking crises in developing & developed countries, Fund, I. M. Staff papers Retrieved
on September 15, 2016, from https://www.imf.org/external/Pubs/FT/staffp/1998/03-
98/demirguc.htm
[112]. Panneerselvam R. (2016). Research Methodology, 2nd edition. PHI learning private
limited, Delhi India.
[113]. Saunders, M., Lewis, P., & Thornhill, A. (2009). Research methods for business students.
Fifth edition. Harlow: Financial Times Prentice Hall.
[114]. Saunders A. and Cornett M.M. (2007). Financial Institutions Management: -A Risk
Management Approach with S&P Card. McGraw-Hill Companies, Incorporated
[115]. Edward Diener and Rick Crandall (1978). Ethics in Social Behavioral Research.
University of Chicago Press, Chicago
[116]. Hair, Joseph F, Arthur H. Money, Phillip Samuel, and Mike Page (2007). Research
Methods for Business. Chichester: John Wiley and Sons,
[117]. Yamane, T. (1967). Statistics: An Introductory Analysis (Vol. 2). Harper and Row New
York
[118]. Alan Bryman and Emma Bell (2011). Business Research Methods 3rd Edition. OUP
Oxford

ISSN 2320-5407 International Journal of Advanced Research (2020)
134
[119]. Rosenberg Richard (2009). Measuring results of microfinance institutions minimum
indicators that donors and investors should track. A technical guide. CGAP, Washington
DC.
[120]. Fan Li and Yijun Zou (2014). The Impact of Credit-risk Management on the Profitability
of Commercial Banks: A case of Europe. Umea School of Business and Economics.
Available at https://www.diva-portal.org/smash/get/diva2:743402/FULLTEXT01.pdf
[121]. Shalit, S.S. & Sankar, U. (1977). The Measurement of Firm Size. Review of Economics &
Statistics, 59(3), 290-298
[122]. Hassan M. Kabir and Bashir M. Abdel-Hameed (2003). Determinants of Islamic banking
profitability. A paper presented at the 10th ERF annual conference, Morocco available at
https://www.researchgate.net/publication/228846468
[123]. Zawadi Ally (2014). The Determinants of Banks’ Profitability in a Developing Economy:-
Empirical Evidence from Tanzania. European Journal of Business & Management, Vol.6,
No.31
[124]. Settlements, B. for I. (1999). Basel committee publications - principles for the
management of credit risk - Jul 1999. Retrieved from http://www.bis.org/publ/bcbs54.pdf
[125]. Brewer III, E. & Jackson III, W. E. (2006). A note on the “risk-adjusted” price-
concentration relationship in banking. Journal of Banking & Finance, 30 (3), pp. 1041—
1054
[126]. Tegegne Abera (2018). The Impact of Credit Risk on Profitability of Private Commercial
Banks in Ethiopia. Master thesis submitted to Addis Ababa University
[127]. Lafunte Esteban (2012): Monitoring Bank Performance in the Presence of Risk
Mirceaepure: Working Papers Barcelona, Spain
[128]. Ricardas Mileris (2012). Macroeconomics determinants of loan portfolio credit in Banks.
Inzinerine Economika – Engineering Economics, 23 (5) Pp. 496-504
[129]. Miller, S. M.; Noulas, A. (1997) Portfolio mix and large bank profitability in the USA,
Applied Economics 29(4): 505–512
[130]. Saunders, Anthony, Elizabeth Strock, and Nikolaos G. Travlos, (1990). Ownership
Structure, Deregulation, and Bank Risk Taking. Journal of Finance 45, 643-654.
[131]. Pyle, D. (1997), “Bank Risk Management“, Working Paper NO.272, University of RBA

ISSN 2320-5407 International Journal of Advanced Research (2020)
135
[132]. Gizaw, M., et al. (2015).The impact of credit-risk on profitability performance of
commercial banks in Ethiopia. African Journal of Business Management 2015 Vol.9 (2),
pp. 59-66
[133]. Galloway, T.M., Lee, B.W and Roden, D.M., (1997). “Banks’ changing incentives and
opportunities for risk-taking”, Journal of Banking and Finance 21: 509- 527.
[134]. Cronbach L. J. (1951). Coefficient Alpha & the internal structure of tests. Psychometrika
Vol.16 No.3 PP. 297-334
[135]. Donald L., Kohn (2008). Risk Management and its implications for Systemic Risk.
Retrieved from: https://www.federalreserve.gov/newsevents/testimony/kohn20080619a.htm
[136]. Joseph E. Stiglitz and Andrew Weiss (1981). Credit Rationing in Markets with Imperfect
information. The American Economic Review, Vol.71, No. 3, pp. 3993-410

ISSN 2320-5407 International Journal of Advanced Research (2020)
136
CHAPTER THREE
************
THE PROFILE OF GHANA AND THE
SELECT SAVINGS AND LOANS
COMPANIES

ISSN 2320-5407 International Journal of Advanced Research (2020)
137
CHAPTER THREE
3.1. PROFILE OF THE COUNTRY GHANA
Formerly referred to as the Gold Coast, Ghana attained its independence from the Great Britain
on March 6, 1957 making it the first Sub-Saharan country to break free from colonial rule.
Ghana was named after the great medieval trading empire known as “Gana”, which was located
northwest of the modern day Ghana until its demise in the 13th century.
Ghana is often referred to as the “Gateway to West Africa” and sometimes “Island of Peace”
because of its location in one of the most Chaotic regions on the planet. Ghana is located in the
West of Africa along the Atlantic Ocean and has a landmark area of 238,533 Square kilometer
(92,098 miles) with a population of about 28.3 million people. Ghana shares its borders with
Burkina Faso from the North, Togo from the East and La Cote D’Ivoire from the West.
The economy of Ghana is dominated by agricultural, which provides employment to an
estimated 40% of the working population. Ghana is the second largest producer and exporter of
Cocoa with its neighboring sister country La Cote D’Ivoire leading. Ghana in addition is a
significant exporter of the following commodities Gold, Bauxite, Diamond, and Oil.
Kwame Nkrumah who was the Nation’s founding President after nine years of ruling was
overthrown in a coup d’état in 1966. The authoritarian decision of Nkrumah to make Ghana a
one-party state, the restriction of political freedom, and jailing of political opponents without
trial motivated his overthrown by the military. After Kwame Nkrumah was overthrown, Ghana
went through a series of military rule with intermittent experiment of democratic rule, which
were mostly truncated by military takeovers. The recent and most lasting democratic experiment
started in 1992 and it is what has gained Ghana a recognition as a leading democracy in Africa.
The country after its return to democracy in 1992 has been stable politically and economically.
The country was politically demarcated into ten (10) regions but in 2018, six (6) more regions

ISSN 2320-5407 International Journal of Advanced Research (2020)
138
were carved out of the existing ones bringing the regional demarcations to sixteen (16). The fig.1
below is the map of Ghana showing borderlines with its neighboring countries.
Fig.3.1: the map of Ghana
Source: Nations online

ISSN 2320-5407 International Journal of Advanced Research (2020)
139
3.2. THE PROFILE OF THE SELECT SAVINGS AND LOANS COMPANIES
As at end of the year 2017, the Savings and Loans Subsector of the Ghanaian banking industry
was made up of 37 Savings and Loans Companies. Out of that seven (7) were selected for the
study based on some laid down criteria. The first criteria for the selection was the S&L
companies which have been in operation for five or more years but, majority of them were
recently incorporated and do not have enough data for the studies. Secondly, the S&L companies
must have branches in the two cosmopolitan and business cities (Accra and Kumasi) which most
of them did not have because they just started operations. The Seven (7) S&L companies, which
represents about 19% of the total population of S&L companies included Women’s World
Banking Ghana (WWBG) Savings and Loans Company, Pan African Savings and Loans (PASL)
Company Ltd., and First Allied Savings and Loans (FASL) Company Ltd. The rest are First
African Savings and Loans Company Ltd., First Ghana Savings and Loans Company Ltd.,
UniCredit Savings and Loans Company Ltd, and Beige Capital Savings and Loans companies
limited.
3.3. WOMEN’S WORLD BANKING GHANA SAVINGS AND LOANS
Women’s World Banking Ghana (WWBG) S&L Company is an affiliate of the Women’s World
Banking global organisation that has a network of microfinance institutions and banks that work
to help low-income entrepreneurs around the world. Women’s world banking global is a non-
profit organisation that provides strategic support, technical assistance and information to 40
independent microfinance institutions and banks across the world that offer credit and other
financial services to low-income entrepreneurs with a particular focus on women in the
developing countries. The WWB global network serves an estimated 24 million micro-
ISSN 2320-5407 International Journal of Advanced Research (2020)
140
entrepreneurs in 28 different countries across the globe with 80 per cent of its customers being
women. WWB global, an MFI provides lending services to low-income entrepreneurs and
households in Africa, Asia, Latin America, Eastern Europe and the Middle East.
WWBG with a mission to meet the financial services needs of entrepreneurs in the small
business sector with particular attention to women, ensure a good work environment that
recognizes the value of its employees and provides an excellent return on investment to its
shareholders. WWBG established first in Ghana as an NGO in 1988 but officially licensed and
regulated by the bank of Ghana in 1996 and became operational in 1998 with the aim of serving
small/micro business entrepreneurs with an affordable range of products and services, which are
very suitable to meet the needs of its customers. Its deposit products involve savings, fixed
deposit, and checking accounts. The S&L Company’s loan products comprise of microbusiness,
SME, Financial intermediaries, and consumer loans that encompass working capital loans for
institutions and individuals in the micro, small and large micro-segment of the microfinance
market, and personal loans for salaried workers in both public and private sectors, and trade
finance. Among the services offered are virtual banking, inward remittances, and mobile
banking. WWBG with its head office in the capital of Ghana has 13 branches.
3.4. PAN AFRICAN SAVINGS AND LOANS COMPANY LTD. (PASL)
In 2006, Accion international entered into an agreement with Ecobank (the leading independent
regional bank in Africa) with support from the IFC to establish a microfinance institution as a
medium to provide financial services to low-income entrepreneurs in both West, and Central
Africa. As part of the agreement, Accion contributed technical expertise and leadership in the
microfinance sector while Ecobank offered the opportunity to leverage its infrastructure and
extensive network of banks to help standardise and deliver high-quality financial services across

ISSN 2320-5407 International Journal of Advanced Research (2020)
141
the length and breadth of Ghana. By the close of the year 2006, Ecobank and Accion launched
EB-Accion Savings and Loans Company Ltd. in Ghana. The shareholding position of the
investors were; Ecobank 49%, Accion Investment SPC 30%, Ecobank Transnational Inc. (ETI)
6%, and International Finance Corporation (IFC) 15%.
The Company received its license from the bank of Ghana in 2008 and begun operation at two
branches in the markets of ‘Tudu’ and ‘Abeka Lapaz’ all in Accra. Since launching lending
operations, Pan African Savings and Loans have experienced significant growth, now serving
clients through a network of branches and satellite kiosks. PASL has successfully launched a
diverse suite of savings product to meet a variety need of its clients. Accion played a key role in
conducting extensive quantitative and qualitative market research to determine client’s savings
needs and demand, which have contributed to the success of the deposit portfolio’s initial
growth. Accion provided extensive support to Ecobank in preparation for the launch of PASL
including training for loan officers credit methodology and branch operations. With 16 branches
and having a presence in five regions in Ghana, PASL has grown into a well-organised licensed
deposit-taking company with a loan portfolio of around $9.4 million with 11,800 borrowers and
more than 100,000 deposit accounts.
The company rebranded from EB-Accion to Pan African Savings and Loans Company Ltd. in
August 2015. The rebranding event which marked a significant milestone in the history of the
company was to reposition its brand in a more strategic manner towards achieving its vision of
being “the leader in Microfinance in Africa” PASL is powered by the Ecobank group
Microfinance which is represented in five countries thus Ghana, Sierra Leon, Cameroun, Burkina
Faso and Nigeria. Their deposit products include Hybrid savings, fixed deposit, current
(checking), and solidarity group accounts. Their loan products also include; micro express and
micro plus loans, SME loan, Solidarity group loan, and Auto loan. Others include services such
as mobile banking, mobile money, and domestic and international money transfer services.

ISSN 2320-5407 International Journal of Advanced Research (2020)
142
3.5. BEIGE CAPITAL SAVINGS AND LOANS COMPANY LIMITED
Beige Capital Savings and Loans Ltd. (BCSL) licensed by the Bank of Ghana to commence
operation as a microfinance institution in the year 2008. After four years of operation, it
transitioned into an S&L company in 2012. Beige capital has since 2014 became the leading
S&L companies among the over 30 such companies operating in Ghana.
Since its inception in 2008, the S&L Company has developed strong pillars, and structures,
which has guaranteed the consistent growth of its business, thus placing them among the top tier
brands within the S&L category of financial institutions in Ghana. In serving its clients, Beige
Capital S&L combines the core banking business of credit and deposit mobilisation with
business advisory services and relationship building. Due to their clearer understanding of
clients’ businesses, the institution has designed and developed products that are practical and
suitable for its customers. Beige capital can now boost of over 70 branches nationwide with staff
strength of over 1500 serving over 800,000 customers. Beige Capital S&L has personal banking
products such as Flex personal account, Reward account, Reward Plus account, Beige baby
account, Pesewa savings and Retirement planning. It also has packages for business institutions
that include Contract finance, Fellowship Box, Flex business account, Office mortgage, Priority
business account, Reward business account, Reward plus business account and offer business
advisory services to its cherished customers. The institution also has a fixed term deposit, which
is a short-term investment product that enables a customer to earn more yield than the ordinary
savings account. The yield depends on the prevailing interest rate for a fixed term of 30, 60, 90,
and 180 days. The invested amount can serve as collateral security against loans for customers
who borrow from the company. In the medium term ending 2018, Beige Capital has a mission to
acquire a universal banking license and seeks to be in the class of the best banks in Ghana.

ISSN 2320-5407 International Journal of Advanced Research (2020)
143
3.6. FIRST ALLIED SAVINGS AND LOANS COMPANY LTD (FASL)
First Allied Savings and Loans (FASL) Company Limited is a leading S&L Company in Ghana
the provision of financial services with a mission to provide convenient access to efficient,
innovative, and responsive financial services to the SMMEs (small, micro, and medium
enterprises) sector on a sustainable basis for the mutual benefit of all stakeholders. The vision
FASL is to create an institution of excellence and be the leader in the provision of quality
financial services to the sector of micro and small enterprise in Ghana over the years has
consistently built a differential brand through its superior services and overwhelming customer
support. FASL Being customer-centric institution cherishes the services of providing a broad
range of convenient financial solutions to its customers promptly and at optimum convenience.
Licensed by the BoG under PNDC law 328 (1993) was to provide banking services to its
prospective customers. It started operation on 25 September 1996. FASL began from Adum
Kumasi where its head office is situated and was set up to accept deposits from the general
public and provide credit-related services to businesses and individual consumers. The growth of
First Allied has been steady over the years from a single branch in 1996 to over twenty (20)
branches in almost all the economic and commercial centres across the country. FASL through
their networked branches across the country provides well-customised products and services
targeted at meeting personal financial needs and growth of businesses. The institution earned its
current enviable status as leading savings and Loans Company in Ghana through its relentless
pursuit of customer-centred services and the continuous introduction of innovative products to its
customers that are not accessible through the formal financial system. FASL has created
financial inclusion for these marginalized SMEs and individuals by introducing the traditional
“SUSU” ideology into mainstream banking. The introduction of the innovation attracted the
World Bank, which conferred on FASL the most innovative product award in 2002. Apart from
this, the institution has since its establishment won many other awards and recognitions from

ISSN 2320-5407 International Journal of Advanced Research (2020)
144
several prestigious institutions for its excellent customer-centred products and services. Among
some of the awards won by FASL are:
• International Star for leadership in Quality (ISLQ) award in Paris France on Monday 1 July
2013, the award organised by Business Initiative Directions (BID) of Spain was to recognise
outstanding companies and leaders in the world of business who achieve excellence in quality
delivery to their customers based on the QC100 Total Quality Management Model. An honour
singularly went to FASL in the category of exemplary performance in financial product
innovation and quality service delivery in micro, small, and medium enterprise sector in Ghana.
• Gold Awards: Ashanti Financial Services Excellence Awards in 2004, 2005, 2006, 2008, and
2010.
• Gold Award Winner at Ghana Business and Financial Services Excellence Awards in 2008
and 2011
• The most innovative product/ service Awards African – World Bank (African Project
Development Facility) in 2002
• The most outstanding S&L Company – Ashanti Industry, Trade and Technology Awards in
2000 and 2001
• A prestigious member, Ghana Club 100
FASL offers the following products to its customers ‘Susu’ products, deposit products, and loan
products.
Susu products offered include Golden Susu, Super Golden Susu and Community Lending. They
offer the following deposit products; Allied Suppersave Account, Current account, Savings
account fixed deposit account. They also offer loan products such as; commercial loans,
equipment financing scheme, consumer credit, travel credit, clearance credit and Gospel loan.

ISSN 2320-5407 International Journal of Advanced Research (2020)
145
3.7. UNICREDIT SAVINGS AND LOANS COMPANY LIMITED
UniCredit Savings and Loans is one of the leading savings and loans companies in Ghana
licensed by the BoG under the Non-bank financial institutions' Act 2008 (Act 774). The
company has its headquarters at No.3 North Ridge Lane Accra within the capital’s cosmopolitan
arena. Since the inception of UniCredit in 2007, its footprints on the financial and banking
landscape of Ghana have been progressively distinct, currently with seventeen (17) fully
networked branches in four regions of Ghana. Unicredit guided by its core values is to be caring,
flexible, efficient, integrity, teamwork, accountability and show of professionalism. The driving
force of the company is by the following objectives:
• To provide financial services through innovative deposit mobilisation and credit delivery
strategies
• To develop and offer attractive products to meet the different needs of customers in both the
formal and informal sectors
• To get in touch with clients as possible in its target market
• To help small savers and borrowers create wealth thereby improving the quality of their life.
• To offer business advisory services to micro, small, and medium scale entrepreneurs through
training and counselling

ISSN 2320-5407 International Journal of Advanced Research (2020)
146
UniCredit is of the vision to become the most efficient and effective S&L Company operating in
the SME banking market. In addition to this UniCredit has a mission to develop financial
products and services and make them easily accessible through:
• A comprehensive understanding of the market
• State of the art technology and systems
• Innovation, flexibility, and enthusiasm in meeting the needs of a challenging environment
and
• Strong presence and easy accessibility
The company seeks to provide its cherished customers with convenient, tailored and reliable
banking products and services through its state of the art IT infrastructure and dedicated team of
professionals working across all its branches. .UniCredit has always kept its brand promise in
going the extra mile to delight its customers, through a responsive and proactive way of handling
the business needs of its customers. The company offers a range of personal, business and
institutional financial solutions to deliver optimum value to its customers. The company offers to
its customers the following products: U-check account (current account), U-kid account (savings
for children), U-susu account, My church account (for churches), Executive save, U-trade (trade
loan), U-cap (SME loan), Smart personal loan (salary workers), Premium plus accounts, U-
clear (loan for clearing of goods at ports and harbour), E-banking, and Eazzlife (assets finance
loan).
Other services offered by UniCredit to its clients include Western Union money transfer,
Moneygram, Transfast and Ria money transfer, Business Advisory Services, Business planning,
Financial planning, Stock management and Cash flow forecasts.
UniCredit is also committed to distinguishing itself through excellence, as is evidenced by its
listing on the 2014 Ghana club 100 companies in Ghana. This recognition of the institution’s
ISSN 2320-5407 International Journal of Advanced Research (2020)
147
performance validates its focus on ensuring both productivity and operational vigilance to secure
our customer's interests.
With a continuous branch expansion drive and the imminent launch of its electronic banking
suite, UniCredit provides many reasons to own any of its deposit and credit products. The
company’s staffs are ably equipped to address the banking concerns of its customers and provide
guidance towards the realisation of the personal and business financial goals of its cherished
customers.
3.8. FIRST GHANA SAVINGS AND LOANS COMPANY LIMITED
FGSL is a Non-banking financial institution licensed under the Banking Act, 2004 (Act 673) to
carry on the banking business of Savings and Loans. FGSL assumed the assets and liabilities of
First Ghana Building Society, which was established in 1956 under the Building Societies
ordinance of 1955. FGSL has its head office in Accra, Osu with ten branches in all the regional
capitals of Ghana. The building Society in 2006, transformed into a limited liability company in
order to become more competitive and adapt to technological and economic changes in Ghana.
The BoG subsequently licensed FGSL as a Non-Bank financial institution under the Banking
Act, 2004 (Act 673) and Non-bank financial institution Act 2008 (Act774) at the moment FGSL
is a subsidiary of National Investment Bank with 90% shares and the rest owned by the Ministry
of Finance and other individual investors. FGSL products and services include Special fixed
deposit with a high yielding fixed term investment account made for 3, 6, and 12 months, Fixed
deposit, Call deposit, Savings account, Loans, Auto loan, SME loans Mortgage loans, Housing
microfinance loan, Salary advance loans, Personal finance loans and western union money
transfer

ISSN 2320-5407 International Journal of Advanced Research (2020)
148
3.9. FIRST AFRICAN SAVINGS AND LOANS COMPANY LIMITED
First African Savings and Loans Company limited belong to First African group limited with its
head office in Accra Ghana. It started as a remittance company under the name First African
Remittance until its operational activities were widened to include the provision of loan and
deposit taken services to the general public in 2009. First African Savings and Loans have many
years of experience in banking offering its services to individuals and businesses for many years.
First African S&L has grown over the years by acquiring offices in Kumasi in the Ashanti region
and Takoradi in the Western region where it carries out its core banking functions to its
numerous customers. The company offers the following banking products: Fixed deposit,
Savings account, Current account, Susu account, Burger account, Champion Kiddy account,
Remittance, Trade finance, Business loan, Group loan, Salary loan and Remittance loan
The company’s remittances services have also grown tremendously over the years leading to
expanding its offices in the United Kingdom, United States of America and Germany with agents
spread across these countries. The company has over the years in the remittances market
introduces low commission rates thereby giving real value to its customers who send money
through the first African group. The company has a long-standing arrangement in place with
Ghana commercial bank making it possible to provide a nationwide payment collection centres
across the country. They have this same arrangement with all the major banks in Ghana.
Customers who transact remittance business with First African group have associated the
company with seamless, fast, reliable and very efficient services. Because the company has the
habit of listening to its customers, it has maintained its customers for decades by improving its
services and introduction of innovative products, and services. First African offers money

ISSN 2320-5407 International Journal of Advanced Research (2020)
149
transfer services across the world through a partnership agreement with Ria Money transfer,
Xpress Money, and Herbon Envious. With low fees and trusted, reliable services, the company
has always been the preferred choice for most people with money transfer needs to Ghana. They
also undertake instant money transfer to bank accounts in both Cedis and Euros. They again
make direct payment of school fees to bank accounts of schools, colleges and universities and
offer transfer to all banks in Ghana.

ISSN 2320-5407 International Journal of Advanced Research (2020)
150
CHAPTER FOUR
*********
DATA ANALYSIS AND
INTERPRETATION

ISSN 2320-5407 International Journal of Advanced Research (2020)
151
CHAPTER FOUR
4.1. DATA ANALYSIS AND INTERPRETATION
This study intends to analyse the effect of credit risk management on the profitability of savings
and loans subsector of the Ghanaian banking system. Secondary data obtained from the annual
financial reports of the selected S&L Companies. A questionnaire structured in both nominal and
Likert scale was used to collect the primary data from employees who have direct role in the
credit administration of their respective companies. Both the primary and secondary data were
processed with the aid of IBM SPSS statistical software to be able to make meaningful
inferences.
The data analysis and interpretation was done in two parts. The first part was the analysis and
interpretation of the computed ratios of profitability and credit-risk management indicators. The
analysis of these ratios was done in such a way that the proposed hypotheses could be tested. The
second part of the analysis involved the analysis and interpretation of the responses from the
survey. The analysis was done with the help of statistical tools such as Descriptive statistics,
Correlation, ANOVA, Regression, and Factor analysis. The presentation of the data and results
was carried out such that it answered the research questions and fulfills the set objectives of the
study as well as testing the stated hypothesis. Tables, charts, and graphs were used.
4.2. ANALYSIS AND PRESENTATION OF THE SECONDARY DATA
The analysis of the secondary data was further done in two parts. In the first part, the researcher
used tables and graphs for trend analysis of the NPL ratio and the profitability indicators (ROA
and ROE). The second part of the analysis of the computed ratios involves the relational analysis
of the proxies for profitability and the credit risk management variables using correlation and
multiple regression.

ISSN 2320-5407 International Journal of Advanced Research (2020)
152
4.2.1. Trend Analysis of the Non-Performing Loan Ratios (NPLR)
The nonperforming loans constitute the primary cause of credit risk. The NPL ratio indicates the
portion of the outstanding loans that are not performing. When a loan is nonperforming, it
implies that the repayment of both interest and principal has ceased which reduces the revenue of
the financial institution. The table 4.1 and fig. 4.1 below indicates the average trend of the
nonperforming loan ratios of the selected S&L companies over the study period.
Table 4.1: Aggregate Mean Scores of NPLR
YEAR 2011 2012 2013 2014 2015 2016
NPLR (%) 5 5 12 19 6 30
Source: Annual reports
Fig. 4.1: Graphical Trend Presentation of Average NPL Ratios
Source: Annual reports
Interpretation: The NPLR trend as shown in table 4.1 and fig. 4.1 gives a very unattractive
picture of the Savings and Loans Companies in Ghana. The non-performing loans ratio within
the space of six years increased from 5% to an unacceptable rate of 30%, which is far above the
5% 5%
12%
19%
6%
30%
2011 2012 2013 2014 2015 2016

ISSN 2320-5407 International Journal of Advanced Research (2020)
153
acceptable industry NPL benchmark rate of 5%. The rate was within the acceptable rate between
2011 and 2012 but rose to 12% in 2013 and further shot up to 19% in 2014. It dropped to 6%,
which was 1% above the acceptable industry benchmark rate. However, it escalated to 30% in
2016. This escalation may not only be due to internal characteristic factors but also external
forces. For example, in the year 2011, the GDP growth rate was 14.1% whiles inflation rate was
8.7 and that might have contributed to the performance of loans. The GDP growth rate kept on
declining whiles the inflation rate also kept on increasing year after year. The GDP declined
from 14.1% in 2011 to 3.5 in 2016 whereas the inflation rate increased from 8.7% in 2011 to
17.5% in 2016. It indicates that the macroeconomic factors had effects on the performance of
loans of S&L Companies in Ghana.
4.2.2. Comparing Non Performing Loans with the Profitability Indicators
Since nonperforming loans affects the revenue of the banking institutions, a comparison between
the NPL ratios and the profitability indicators to examine the effect of NPL on the profitability.
The table 4.2 and fig. 4.2 shows the trend.
Table 4.2: Average Ratios of NPL, ROA and ROE
VARIABLES 2011 2012 2013 2014 2015 2016
NPLR 5% 5% 12% 19% 6% 30%
ROA -0.73% 1.29% 4.02% 0.40% 1.62% -5.47%
ROE 15.09% 7.07% -34.02% 3.52% 6.33% -72.51%
Source: Annual reports

ISSN 2320-5407 International Journal of Advanced Research (2020)
154
Fig.4.2: Comparison between NPLR and profitability indicators
Source: Annual report
Interpretation: The trend as indicated in table 4.2 and fig. 4.2 paints a clumsy picture of the
NPL indicator of the Savings and Loans Companies during the study period. The non-performing
loans ratio within the space of six years increased from 5% to an unacceptable rate of 30% far
above the acceptable industry rate of 5%. The S&L companies for regulation reasons cannot
undertake some commission-based activities, and that makes them rely heavily on interest
income from loans. It is therefore not surprising that both indicators of profitability (ROA, ROE)
declined drastically with the most affected being the ROE. The ROA in 2011 was -.73%, which
rose to 1.29% and 4.02% in 2012 and 2013 respectively. The ROA further reduced to .40% in
the years 2014, rose to 1.62% in 2015 but eventually declined to -5.47% in 2016. The ROE, on
the other hand, declined from 15.09% in 2011 to 7.07% in 2012. The yield worsened to -34.02%
in 2013 but rose to 3.52% in 2014 and increased further to 6.33% in 2015. It however drastically
decreased to -72.51% in 2016. The return on assets and equity are both dependent on the net
income, which is also dependent on the interest income. However, because the loan quality
deteriorated over the study period, it affected the net income and that translated into a decline in
the profitability of the S&L Companies. Fig.4.2 shows the graphical presentation of the
2011 2012 2013 2014 2015 2016
ROA -1% 1% 4% 0% 2% -5%
ROE 15% 7% -34% 4% 6% -73%
NPLR 5% 5% 12% 19% 6% 30%
-80%
-60%
-40%
-20%
0%
20%
40%

ISSN 2320-5407 International Journal of Advanced Research (2020)
155
comparison between the three ratios. It is evident that when the NPLs worsen, the profitability
ratios also declines and vice versa.
4.2.3. Comparing CAR with Profitability Indicators
Capital adequacy is a measure used by banking supervisors to measure the adequacy of a
banking institution’s level of capital. A bank with adequate capital is in a better position to use
high notch technology, and opening of new branches, which results in high efficiency, and
achievement of high profitability (Zawadi Ally, 2014). Table 4.3 and fig. 4.3 shows the
comparison between the CAR and profitability over the study period.
Table 4.3 average ratios of CAR and Profitability Indicators
Variables 2011 2012 2013 2014 2015 2016
CAR 11% 15% 13% 24% 22% 14%
ROA -0.73% 1.29% 4.02% 0.40% 1.62% -5.47%
ROE 15.09% 7.07% -34.02% 3.52% 6.33% -72.51%
Source: Annual reports

ISSN 2320-5407 International Journal of Advanced Research (2020)
156
Fig. 4.3: Comparison between CAR and profitability indicators
Interpretation: the capital adequacy ranged between 11% and 24% in the cause of the study
period, which was above the required 10%. In the year 2011 when the CAR was 11%, the ROA
was -.73% whiles ROE was 15.09%. When the CAR increased to 15% in 2012, ROA improved
to 1.29% whereas ROE declined more than half to 7.07%. The average CAR in 2013 declined to
13% which resulted to a corresponding increase in ROA to 4.02% but the ROE drastically
declined to -34.02%. The CAR in 2014 increased to 24%, which had a corresponding increase in
ROE to 3.52% but resulted in a drastic decline in ROA to .04%. There was a reduction in CAR
in 2015 by 2% to 22% but both profitability measures, ROA and ROE increased to 1.62% and
6.33% respectively. In 2016, the CAR in 2016 declined to 14%, which declined in ROA to -
5.47% and ROE to -72.51%. It can be observed from the ratios that even though the CAR during
the study period were above the minimum required 10% which even doubled in 2014 and 2015
but the profitability indicators kept on fluctuating throughout. This means that CAR though
indicates the financial robustness of the banking institution it does not guarantee profitability.
Management of S&L Companies should therefore look at other factors such as the level of NPL,
which undermine the income generation ability of the institution.
-80%
-60%
-40%
-20%
0%
20%
40%
2010 2011 2012 2013 2014 2015 2016 2017
CAR ROA ROE

ISSN 2320-5407 International Journal of Advanced Research (2020)
157
4.2.4. Comparing LTDR with Profitability Indicators
The LTDR, which is a measure of the level of liquidity of a bank, indicates how efficiently
management utilise depositors funds on meeting credit demands by reducing cash assets.
However, these funds are always exposed to default risk therefore, when the loans do not
perform, profitability will be affected.
Table 4.4: Comparison between LTDR and profitability indicators
Variables 2011 2012 2013 2014 2015 2016
LTDR 125% 64% 67% 59% 52% 41%
ROA -0.73% 1.29% 4.02% 0.40% 1.62% -5.47%
ROE 15.09% 7.07% -34.02% 3.52% 6.33% -72.51%
Source: Annual reports
Fig. 4.4: Comparison between LTDR and profitability indicators
-100%
-50%
0%
50%
100%
150%
2010 2011 2012 2013 2014 2015 2016 2017
LTDR ROA ROE

ISSN 2320-5407 International Journal of Advanced Research (2020)
158
Interpretation: In 2011, the LTDR was as high as 125% but declined over the study period to
41% in 2016, which might have contributed to the decline in profitability indicators over the
study period. The ROA started on a negative note (-.73%) in 2011 which showed improvement
in the subsequent years but declined to -5.47% in 2016. The ROE in 2011 was 15.09% but kept
on declining over the years until it touched -72.51% in 2016.
4.2.5. Comparing Bank size with Profitability Indicators
Bank size (natural logarithm of total assets) is an indication of expansion in a banking institution.
The bigger the size of the bank, the higher its ability to absorb risk. Larger banks are able to
manage better and put in place better financial structures. According to Sufian and Chong
(2008), bank size may have a positive effect on bank profitability if there are significant
economies of scale. However, if an increase in diversification result to high risk, it will have a
negative effect on the profitability of the bank.
Table 4.5: Comparison between Size and profitability indicators
VARIABLES 2011 2012 2013 2014 2015 2016
Size 15.12 15.60 15.82 16.66 16.82 16.70
ROA -0.73% 1.29% 4.02% 0.40% 1.62% -5.47%
ROE 15.09% 7.07% -34.02% 3.52% 6.33% -72.51%
Source: Annual reports

ISSN 2320-5407 International Journal of Advanced Research (2020)
159
Fig. 4.5: Comparison between LNTA and profitability indicator
Interpretation: table 4.5 and fig. 4.5 shows the comparison between the size of the size
of S&L Companies and the profitability indicators. Size of the Companies hovered
around 15.12mn and 16.82mn during the study period, which shows an increase in size
however, the profitability performance was not encouraging. The probable reason to this
incommensurable relationship between the variables may be attributed to diseconomies
of scale.
4.3. MULTIPLE REGRESSION ANALYSIS
The researcher computed ratios from the financial statements of the Sampled S&L companies
over the six years study period and used the IBM SPSS software to conduct a multiple regression
analysis of the computed ratios. The researcher adopted a multiple regression for the analysis
since it is suitable when one wants to investigate the predictive ability of a set of independent
variables on one continuous dependent variable. According to Julie Pallant (2005, P.95-96)1,
multiple regression also allows for the comparison of the predictive ability of a particular
independent variable, and to find the best set of variables to predict a dependent variable.
Multiple regression is not just one analytical technique but also a family of techniques for
-2.00
0.00
2.00
4.00
6.00
8.00
10.00
12.00
14.00
16.00
18.00
2011 2012 2013 2014 2015 2016
Size
ROA
ROE

ISSN 2320-5407 International Journal of Advanced Research (2020)
160
exploring the relationship between one continuous dependent variable and a number of
independent variables or predictors. A multiple regression addresses research questions such as
the following:
1. How a set of variables well predict a particular outcome
2. Which variable in the set of variables is the best predictor of an outcome and
3. Whether a particular variable can still be able to predict an outcome when we control the
effects of another variable
In order to achieve the first objective of the study and to be able to test the set hypotheses, the
regression analysis of the secondary data was done in two parts. The first part was a multiple
regression analysis conducted to investigate the relationship between credit-risk management
indicators and profitability measured by ROA. The second part was a multiple regression
analysis to investigate the relationship between the credit risk-management indicators and
profitability measured by ROE.
4.3.1. Normality test
Before running regression analysis on any data set, the data must be normally distributed. The
normality test conducted for both models indicated that the variables were all normally
distributed. A histogram and a P-P Plot as indicated in Appendix 3 showed that the data set was
normally distributed.
4.3.2. Multicollinearity test
This test is another important test that we perform to rule out the presence of multicollinearity.
Thus, multicollinearity is a situation where the explanatory variables are nearly linear dependent.
Tables 4.3 and 4.4 below are the correlation matrixes for both models (1&2). Usually,
researchers prefer correlation among all variables not exceeding 0.8 of which none of the
interrelationships between the variables exceeded. The highest correlation coefficient among
variables in model 1 was between ROA and NPLR, which was -.718, but since it is not above

ISSN 2320-5407 International Journal of Advanced Research (2020)
161
0.8, it is an indication that, model1 lacks multicollinearity. Table 4.4 is the correlation matrix for
model 2. The results indicated that the highest correlation among the variables was between
NPLR and ROE, which was -.790 and since it does not exceed 0.8, we can conclude that there is
no presence of multicollinearity in model 2. The researcher, therefore, retained all the variables
in both models for the analysis.
Table 4.6: Results of Collinearity Statistics (Variance Inflation factor)
VARIABLES TOLERANCE (1 – R
2) VIF (1/1-R
2)
CAR 0.985 1.016
NPLR 0.908 1.101
LTDR 0.965 1.036
LNTA 0.928 1.078
Source: Researcher’s computations
To further prove the absence of multicollinearity, Tolerance Value and Variance Inflation Factor
(VIF) are used to confirm the presence or otherwise of multicollinearity. Tolerance, on the other
hand, is an indicator of how much of variability of the specified independent variable is not,
explained by other independent variables in the model, which is calculated as for each
variable. If each value is very small (less than 0.10), it indicates that the multiple correlations
with other variables are high, suggesting the possibility of the presence of multicollinearity. VIF
is the inverse of the Tolerance Value (1/tolerance) and any value above ten (10) will be a cause
to worry, as it will mean that there is a presence of multicollinearity (Julie Pallant, 2005, P. 150).
The collinearity statistics (table 4.3) shows tolerance values of more than 0.1 and a VIF value of
less than 10 indicating the absence of multicollinearity since the rule of thumb is that tolerance
values should not be less than the cutoff point of 0.1 and VIF values also not more than the cut-
off point of 10.

ISSN 2320-5407 International Journal of Advanced Research (2020)
162
Table 4.7: Correlation Matrix for Model 1
ROA CAR NPLR LTDR LNTA
Pearson Correlation ROA 1.000
CAR -.011 1.000
NPLR -.718 -.070 1.000
LTDR .140 .037 -.177 1.000
LNTA .132 -.078 -.246 .089 1.000
Source: Annual reports
Table 4.4 indicates the correlation between the variables of Model 1 where the return of Assets
(ROA) was the dependent variable. Capital adequacy (CAR) negatively related with ROA
indicating that the higher the reserved capital, the lower the return on assets. Nonperforming loan
ratio, which is a measure of the quality of the loan portfolio, related negatively with return on
assets of the S&L Companies. The implication here is that when the quality of the loan portfolio
deteriorates, profitability is affected. This was expected since loans are the source of profit for
banks. The ratio of loans to deposit (LTDR) on the other hand related positively though not all
that significant. What it means is that when depositors’ money is efficiently utilised to finance
credit activities profitability increases. Bank size (LNTA) also had a positive relationship with
return on assets. That means if there is significant economies of scale larger banks are more
profitable.

ISSN 2320-5407 International Journal of Advanced Research (2020)
163
Table 4.8: Correlation Matrix for Model 2
ROE CAR NPLR LTDR LNTA
Pearson Correlation ROE 1.000
CAR .265 1.000
NPLR -.790 -.070 1.000
LTDR .144 .037 -.177 1.000
LNTA .249 -.078 -.246 .089 1.000
Source: Annual reports
Table 4.4 is a correlation matrix for the second model, with return on equity (ROE) as the
dependent variable. Capital adequacy ratio (CAR) related positive with return on equity meaning
the higher the CAR the profitable the bank. The finding agrees with the assertion of Zawadi Ally
(2014) who argues that a bank with highly capital adequacy is in the better position to use high
technology such as ATM, online computer system, the opening of new branches and using of
mobile banking which results in high efficiency and achievement of high profitability.
Nonperforming loan ratio (NPLR) related negatively with a correlation coefficient of -.790
which is quiet significant. The implication here is that when loans are not performing it affect
profitability of banks hence the need to put in place adequate credit risk management measures
to avert deterioration of portfolio quality. Loan to deposit ratio related positively with ROE
meaning when deposit from customers which are used to finance credit activities are efficiently
put to use profitability measured by ROE increases. Bank size again related positively with ROE
since the larger the bank, more diverse the bank can be. Large companies can manage better and
put in place better financial structures to increase profitability.

ISSN 2320-5407 International Journal of Advanced Research (2020)
164
4.3.3. Ratio of Cases to Independent Variables
The cases-to-IVs ratio has to be substantial else the solution will be perfect and meaningless. The
required sample size for regression analysis depends on a number of issues including the desired
power, alpha level, number of predictors, and expected effect sizes. In order to achieve
acceptable regression results, there is the need to include the right number of cases in the model.
According to Tabachnick & Fidell (2018, p.159)2, the simple rule of thumb for testing multiple
correlations is as shown below:
Where; N = number of cases and, m = number of independent variables
To test for individual predictors, the rule of thumb is
These rules of thumb assume a medium-size relationship between dependent variable and
independent variables, = .05 and In case you are interested in both the overall
correlation and the individual independent variables, then you need to calculate both ways and
choose the larger number of cases. The most recent suggestion by Khamis and Kepler (2010)3,
indicates that when using reliability as a criterion and power estimates are not feasible, the
formula for suggested minimum sample size is
When the data is not normally distributed then a higher cases-to-independent variable ratio is
required as a substantial measurement error is likely to occur from less reliable variables. Since
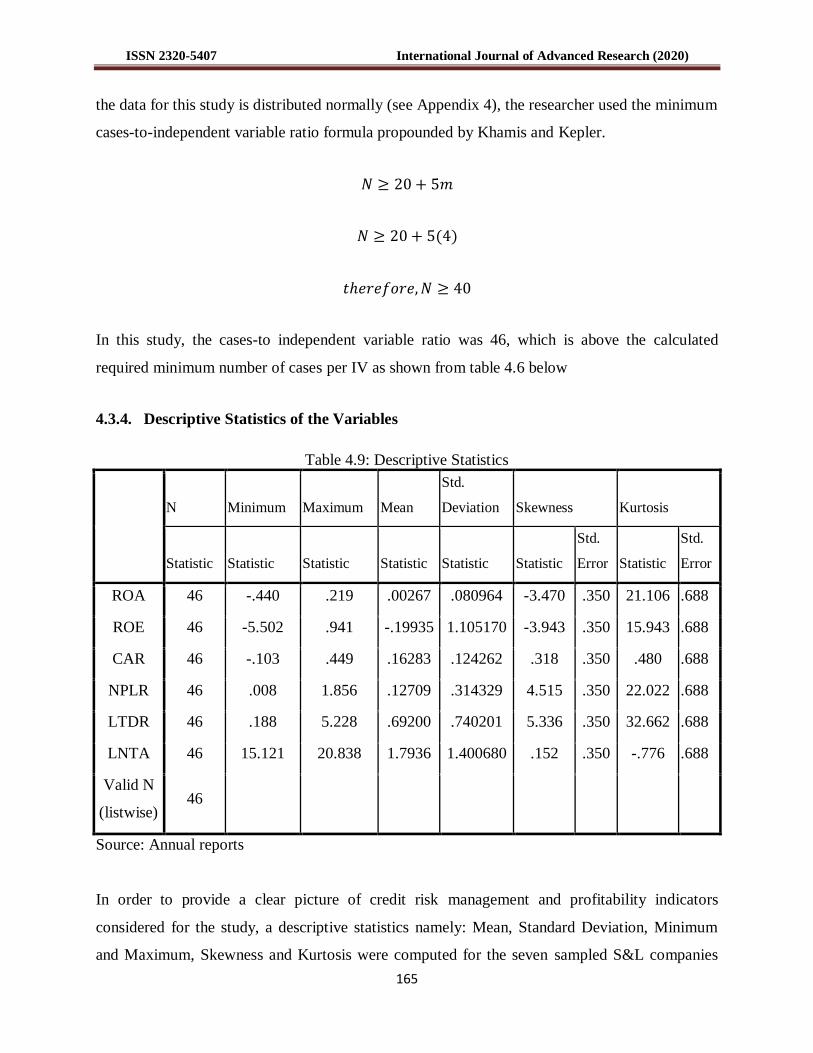
ISSN 2320-5407 International Journal of Advanced Research (2020)
165
the data for this study is distributed normally (see Appendix 4), the researcher used the minimum
cases-to-independent variable ratio formula propounded by Khamis and Kepler.
In this study, the cases-to independent variable ratio was 46, which is above the calculated
required minimum number of cases per IV as shown from table 4.6 below
4.3.4. Descriptive Statistics of the Variables
Table 4.9: Descriptive Statistics
N Minimum Maximum Mean
Std.
Deviation Skewness Kurtosis
Statistic Statistic Statistic Statistic Statistic Statistic
Std.
Error Statistic
Std.
Error
ROA 46 -.440 .219 .00267 .080964 -3.470 .350 21.106 .688
ROE 46 -5.502 .941 -.19935 1.105170 -3.943 .350 15.943 .688
CAR 46 -.103 .449 .16283 .124262 .318 .350 .480 .688
NPLR 46 .008 1.856 .12709 .314329 4.515 .350 22.022 .688
LTDR 46 .188 5.228 .69200 .740201 5.336 .350 32.662 .688
LNTA 46 15.121 20.838 1.7936 1.400680 .152 .350 -.776 .688
Valid N
(listwise) 46
Source: Annual reports
In order to provide a clear picture of credit risk management and profitability indicators
considered for the study, a descriptive statistics namely: Mean, Standard Deviation, Minimum
and Maximum, Skewness and Kurtosis were computed for the seven sampled S&L companies

ISSN 2320-5407 International Journal of Advanced Research (2020)
166
from 2011 – 2016. The ROA for the S&L companies ranged from -0.440 to 0.219 with a mean of
0.00267 (0.3%). It is an indication that even though some of the institutions make as much as
21.9% ROA, most of them too do not realise much returns from the utilisation the assets of these
S&L companies. The recording of negative ROA by some of the companies is because loans
constitute a more significant portion of their assets. Return on shareholders’ equity (ROE) also
ranged from -5.502 to 0.941 with a mean of -0.19935. The implication is that although some of
the S&L companies were able to record 94.1% ROE, most of them recorded -550% ROE hence
the average ROE of -19.9%. Average CAR was 0.16283 (16.3%) which is an indication that
most of the S&L Companies adhere to the minimum capital requirement of 10% and financed by
approximately, 16.3% shareholders’ equity. NPL ratio ranged from as low as 0.008 to 1.856 with
an average of 0.12709 (12.7%). It implies that averagely 12.7% of loans disbursed by S&L
Companies in Ghana become non-performing. The findings confirm the quarterly report by the
Central Bank of Ghana, which indicated that NPLR for the entire banking industry was 17.7% in
2016, which declined to 12.2% in June 2017. LTDR also has a minimum value of 0.188 (18.8%)
and a maximum of 5.228 (522.8%). It means that some of the S&L companies gave out 18.8% of
their deposit as loans and others too gave as high as 522.8%, which is very scary. Any default
will bring about liquidity problem that can create panic and subsequently a run on the bank.
However, the overall average LTDR of 0.69200 (69.2%) is far below the ideal industry ratio of
between 80% and 90%. Bank size of the S&L companies ranged from 15.121 to 20.838. It
means that there are no much variations in size of S&L companies.
4.4. REGRESSION RESULTS OF MODEL 1
4.4.1. Model Fit for Model 1
The traditional means of assessing the performance of a regression model is by considering the
coefficient of determination ( ). The shows the amount of variation in the dependent
variable explained by the independent variables. It implies that the higher the value, the better.
The regression results from table 4.7, indicates that there is the existence of the relationship
between the dependent variable (ROA) and the independent variables. The model is well fitted
with a 52.2% ability to influence the performance of the S&L companies in Ghana. An

ISSN 2320-5407 International Journal of Advanced Research (2020)
167
implication that credit-risk management indicators (CAR, LTDR, NPLR and LNTA), jointly
predict 52.2% variation in profitability (ROA).
Table 4.10: Model Summary of model 1
a. Predictors: (Constant), Natural log of total assets, Capital Adequacy Ratio, Loans and Advances to Total Deposit,
Non-Performing Loan Ratio b. Dependent Variable: ROA
To further cement the fitness of the model, the F-statistics is used. Usually when the overall
probability (P) value (Prob>F) ranges between 0.00 and 0.05, then the model is strong and
possess a high predictive power which can be replicated in other studies. Table 4.8 below shows
that F-statistics value is 11.179, which exceed the F-distribution table value, F (4, 41) at 5%
significance level of 2.61. Hence, the regression model as a whole is significant. It means that
credit risk management indicators; (NPLR, CAR, and LTDR), reliably predicts ROA. The P-
value (significance) of 0.000 which is less than 0.05 further proves that there exists a significant
relationship between profitability and the credit risk management indicators (NPLR, CAR, and
LTDR).
Table 4.11: ANOVA Table for Model 1
Model Sum of Squares df Mean Square F Sig.
1 Regression .154 4 .038 11.179 .000a
Residual .141 41 .003
Total .295 45
a. Predictors :( Constant), Bank Size, CAR, NPLR, LTDR b. Dependent Variable: ROA
4.4.2. The Regression Equation for model 1
Table 4.9 presents the regression analysis using ROA as the independent variable. Using the
unstandardized coefficients of the variables, the regression equation for model1 becomes
Model R R Square Adjusted R Square
Std. Error of the
Estimate
1 .722a .522 .475 .058664

ISSN 2320-5407 International Journal of Advanced Research (2020)
168
ROA = 0.89 - 0.044CAR - 0.189NPLR + 0.002LTDR - 0.003LNTA
Table 4.12: Regression results of Model 1
Model 1
Unstandardized
Coefficients
Standardized
Coefficients
t Sig.
95% Confidence
Interval for B Correlations
B
Std.
Error Beta
Lower
Bound
Upper
Bound
Zero-
order Partial Part
(Constant) .089 .119 .750 .458 -.151 .330
CAR -.044 .071 -.067 -.615 .542 -.187 .100 -.011 -.096 -.066
NPLR -.189 .029 -.733 -6.47 .000 -.248 -.130 -.718 -.710 -.698
LTDR .002 .012 .018 .160 .873 -.022 .026 .140 .025 .017
LNTA -.003 .006 -.055 -.489 .627 -.016 .010 .132 -.076 -.053
a. Dependent Variable: Return on Assets
4.4.3. The Relationship Between Capital Adequacy (CAR) and ROA
The results as indicated in table 4.9 suggest that a negative and statistically insignificant
relationship exists between CAR and profitability measured by ROA of S&L companies. A
standardised coefficient value of -0.067 means that a 1% increase in capital adequacy of S&L
companies will result to a reduction in its profitability by 6.7%. Zawadi Ally (2014)4 argues that
banks with high capital adequacy are in the position to use high technology such as ATM, online
computer system, opening new branches, and using mobile banking, which leads to high
efficiency and achievement of high profitability. Yang Tan et al. (2017)5 attributed the negative
relationship between capital risk and profitability to the fact that;
Cost of funding is always lower for banks with higher levels of capital.
Banks with higher levels of capital are most likely to engage in more prudent
lending which translates into higher profitability

ISSN 2320-5407 International Journal of Advanced Research (2020)
169
Banks with higher levels of capital borrow less and the reduction in the volume of
borrowing results in an increase in profitability.
The insignificant nature of the CAR on profitability of the S&L Companies may be attributed to
the directives issued by the bank of Ghana for all S&L companies to increase their capital
requirements from GH¢7m to GH¢15m within the period of the study. The negative relationship
between Capital adequacy and profitability is contrary to the findings of Kosmidou et al.,
(2008)6, Nandom Yakuku (2016)
7, Idowu & Awoyemi (2014)
8, Kipngetich & Muturi (2015)
9
and Ongore & Gemechu (2013)10
whose findings had a positive relationship between the two
variables. However, it agrees with the findings of Nagaraju and Boateng (2018)11
, Ofusu-Hene &
Amo (2016)12
, Poudel (2012)13
, Mendoza & Rivera (2017)14
, Hosna et al. (2009)15
, and Gizaw et
al. (2015)16
.
4.4.4. The Relationship Between Non-performing Loans (NPL) and ROA
The relationship between NPLR and ROA was negative and statistically significant with a
standardised coefficient of -0.733. It implies that an increase in non-performing loan level by 1%
will result in 73.3% reduction in return on assets of S&L companies. A one per cent increase in
NPLR leads to a substantial reduction in profitability measured by ROA therefore, for S&Ls to
reap a good return on their assets employed; management of S&L Companies must focus on
prudent risk management measures that will reduce the menace of loan defaults. The finding is
an indication that poor asset quality or high non-performing loans result in poor bank
performance. This finding contradicts the findings of Kolapo et al. (2012)17
, Marshall and
Onyekachi (201418
), and Idowu & Awoyemi (2014) who instead found a positive relationship
between the two variables. The finding however agreed with the findings of Gizaw et al (2015)
Magali (2013)19
, Hosna et al (2009), Kosmidou (2008), Ogore & Gemechu (2013), Peyavali
(2015)20
, Ofosu-Hene & Amo (2016), Mawutor (2015)21
and Kaaya & Pastory (2013)22
.
4.4.5. The Relationship Between Loan to Deposit ratio and ROA
Loan to deposit ratio is a measure of liquidity in banks. The relationship between Loan to
Deposit Ratio (LTDR) and ROA was positive and statistically insignificant with a standardised

ISSN 2320-5407 International Journal of Advanced Research (2020)
170
coefficient of 0.018. Meaning when LTDR of the S&L companies increases by 1% their
profitability measured by ROA also increases by 1.8%. The positive relationship between
liquidity and profitability relates to the fact that higher volumes of loans made by banks increase
interest income and further improve bank profitability. The finding contradicts the findings of
Kargi (2011)23
, and Mawutor (2015), but agrees with the findings of Iwedi & Onuegbu, (2014)24
,
Nagaraju and Boateng (2018), and Yong Tan et al. (2017).
4.4.6. The Relationship Between Bank Size (LNTA) and ROA
Bank size (LNTA) measured by the natural logarithm of total assets had a negative and
insignificant relationship with profitability (ROA) of S&L companies with a standardised
coefficient of -0.055. The indication is that a percentage increase in the size of an S&L Company
will lead to a reduction in its profit by 5.5%. The general expectation was that as the size of a
bank increases, its profit margin should have also increased because larger banks can
substantially reduce cost through economies of scale, but this finding is contrary to the
expectation. We can attribute this phenomenon to over-expansion, which brings about
inefficiencies due to the management control problem. The negative relationship between Bank
size and return on assets is consistent with the findings of Fadzlan & Royfaizal (2008)25
, Ofosu-
Hene & Amo (2016), Mawutor (2015), and Kosmidou et al. (2008).
4.5. REGRESSION RESULTS OF MODEL 2
4.5.1. Model Fit for Model 2
The regression results from table 4.10, shows the existence of a relationship between the
dependent variable (ROE) and the independent variables. The model is well fitted with 67.5%
ability of the IVs to influence the profitability of the S&L companies in Ghana. The implication
is that the credit-risk management indicators CAR, LTDR, NPLR, and bank size jointly predicts
67.5% variation in ROE.
When the overall probability (P) value (Prob>F) ranges between 0.00 and 0.05, then the model is
strong and possess a high predictive power which can be replicated in other studies. From table
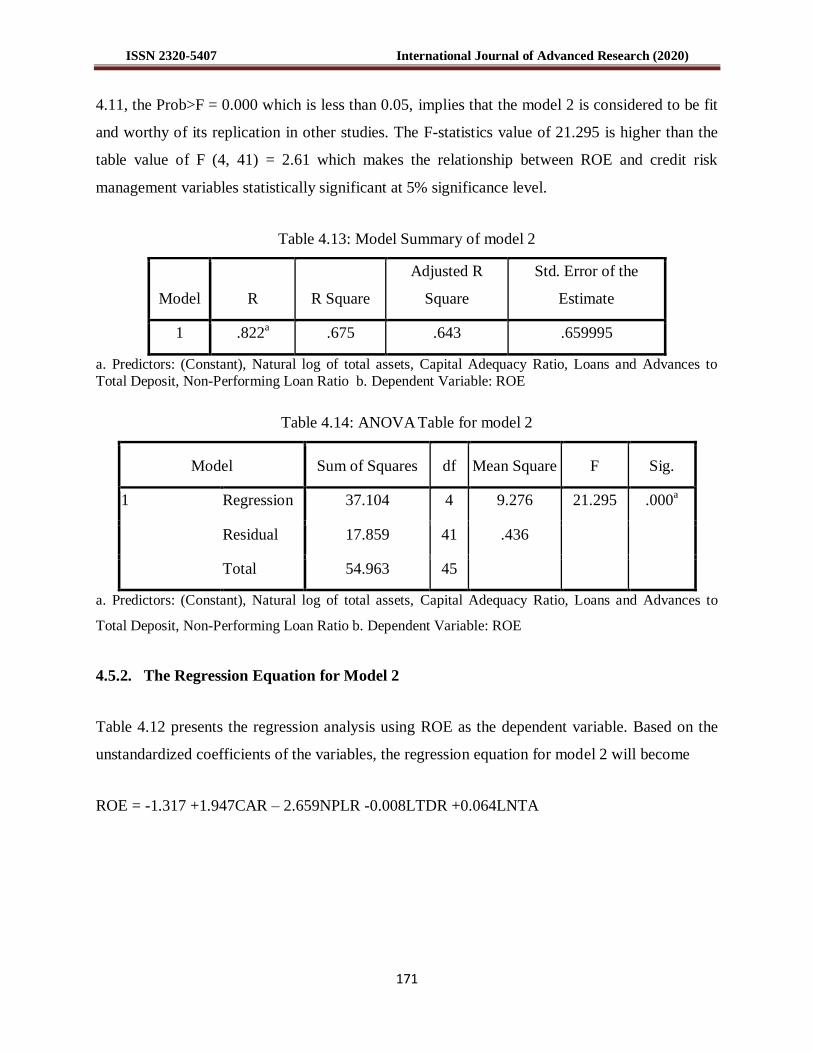
ISSN 2320-5407 International Journal of Advanced Research (2020)
171
4.11, the Prob>F = 0.000 which is less than 0.05, implies that the model 2 is considered to be fit
and worthy of its replication in other studies. The F-statistics value of 21.295 is higher than the
table value of F (4, 41) = 2.61 which makes the relationship between ROE and credit risk
management variables statistically significant at 5% significance level.
Table 4.13: Model Summary of model 2
Model R R Square
Adjusted R
Square
Std. Error of the
Estimate
1 .822a .675 .643 .659995
a. Predictors: (Constant), Natural log of total assets, Capital Adequacy Ratio, Loans and Advances to
Total Deposit, Non-Performing Loan Ratio b. Dependent Variable: ROE
Table 4.14: ANOVA Table for model 2
Model Sum of Squares df Mean Square F Sig.
1 Regression 37.104 4 9.276 21.295 .000a
Residual 17.859 41 .436
Total 54.963 45
a. Predictors: (Constant), Natural log of total assets, Capital Adequacy Ratio, Loans and Advances to
Total Deposit, Non-Performing Loan Ratio b. Dependent Variable: ROE
4.5.2. The Regression Equation for Model 2
Table 4.12 presents the regression analysis using ROE as the dependent variable. Based on the
unstandardized coefficients of the variables, the regression equation for model 2 will become
ROE = -1.317 +1.947CAR – 2.659NPLR -0.008LTDR +0.064LNTA

ISSN 2320-5407 International Journal of Advanced Research (2020)
172
Table 4.15: Regression results of model 2
Model
Unstandardized
Coefficients
Standardized
Coefficients
t Sig.
95%
Confidence
Interval for B Correlations
B
Std.
Error Beta
Lower
Bound
Upper
Bound
Zero-
order Partial Part
Constant -1.317 1.340 -.982 .332 -4.024 1.390
CAR 1.947 .798 .219 2.440 .019 .336 3.559 .265 .356 .217
NPL R -2.659 .328 -.756 -8.096 .000 -3.322 -1.996 -.790 -.784 -.721
LTDR -.008 .135 -.006 -.062 .951 -.282 .265 .144 -.010 -.006
LNTA .064 .073 .081 .875 .387 -.083 .211 .249 .135 .078
a. Dependent Variable: Return on Equity
4.5.3. The Relationship Between Capital Adequacy (CAR) and ROE
From the regression results of coefficients of the predictor variables in table 4.12 above, CAR
has a standardised coefficient of 0.219, t–statistics of 2.440, and significance (P-value) of 0.019.
It means that CAR related positively to ROE and statistically significant since the P-value is less
than 0.05 confidence level. The standardised coefficient value of 0.219 implies that 1%
increment in CAR will result in approximately 22% improvement in profitability measured by
ROE. It means S&L companies depends mostly on equity capital as a source of funding which
enhances profitability as evidenced in increment of financial performance. It can also be because
a lower level of capital risk leads to a lower return on equity. In other words, well-capitalised
banks experience a higher return on equity. The result that suggests a positive relationship
between CAR and ROE is in agreement with the findings of Afriyie & Akotey (2012)26
and
Yusheng Kong et al. (2017)27
. It, however, contradicts with the findings of Bizuayehu (2015)28
,
Gizaw et al. (2015), Hosna et al. (2009), Ongore & Gemechu (2013), Ofosu-Hene & Amo
(2016), and Mendoza & Rivera (2017).

ISSN 2320-5407 International Journal of Advanced Research (2020)
173
4.5.4. The Relationship Between Non-performing Loans (NPLR) and ROE
NPLR also recorded a standardised coefficient of -0.756, t-statistics of -8.096 and a significance
of 0.000. The interpretation is that the relationship between non-performing loan (NPLR) and
profitability (ROE) is negative and statistically significant at 5% significance level. The
standardised coefficient value of -0.756 implies that 1% increase in NPLs will results in 75.6%
reduction in profitability of S&L companies in Ghana. The negative impact of NPL ratio on the
profitability of S&L companies can be attributed to the fact that a large volume of non-
performing loans increases banking cost and subsequently, a decline in profitability. Therefore,
to be able to maximise return on shareholders’ equity, prudent risk management practices that
will reduce loan default must be a concern to the management of S&L companies in Ghana.
Mandatory loan provisioning and the associated cost involved in the recovery of bad loans
negatively affect profit generated from the equity of shareholders. The negative relationship
between NPLR and ROE is in line with the findings of Takyi Opoku et al (2016)29
, Ofosu-Hene
& Amo (2016), Hosna et al (2009), Gizaw et al (2015), Buzuayehu (2015), Magali (2013),
Mawutor (2015), and Ongore & Gemechu (2013). The result is however in contrast with the
findings of Afriyie & Akotey (2012), Addo Boye (2014)30
, Idowu & Awoyemi (2014) and
Boahene et al. (2012)31
.
4.5.5. The Relationship Between Loan to Deposit ratio (LTDR) and ROE
The results indicated that LTDR has a standardised coefficient of -0.006 and a significance value
of 0.951. It means LTDR does not uniquely contribute significantly to the prediction of the
independent variable (ROE). LTDR is a measure of liquidity and the negative coefficient of -
0.006 suggest that a 1% increase in LTDR will lead to a marginal reduction in profitability by
0.6%. The finding highlights the trade-off between liquidity and profitability. Ceteris paribus,
the more we hold up capital to meet liquidity demands, the lower the bank’s profitability. It takes
very skillful management to be able to hold up adequate liquidity without affecting profitability.
The negative relationship between loan to deposit ratio and return on equity conforms to the
findings of Takyi Opoku et al. (2016), Mawutor (2015), and Kargi (2011) but contradict the
findings of Bizuayehu (2015)

ISSN 2320-5407 International Journal of Advanced Research (2020)
174
4.5.6. The Relationship Between Bank Size (LNTA) and ROE
Bank size recorded a standardised coefficient of 0.081 with t-statistics of 0.875 and significance
value of 0.387. It makes the relationship between bank size and ROE positive and insignificant.
The standardised coefficient of 0.081 implies that when the size of the S&L Company increases
by 1%, profitability measured by ROE also increases by 8.1%. It is in line with expectation
because at the normal circumstances lager banks can reduce cost through economies of scale.
Larger banks can secure financing for their operations at a lower cost than their smaller
counterparts are because lager banks, which typically offer many different products and services,
can leverage their size to reach out to more customers with their products and services. Size
however, does not matter much when it comes to the ROE considering the contribution of the
variable (LNTA) to the prediction of the return on equity. The positive relationship between
Bank size and profitability is in contrast with the findings of Ofosu-Hene & Amo (2016),
Kosmidou et al. (2008), Mawutor (2015), and Takyi Opoku et al. (2016) who found a negative
relationship between bank size and profitability (ROE).
4.6. TESTING OF HYPOTHESIS
In the regression analysis output, the column marked coefficients has a column labeled Sig. (P-
value), these Significance values tells whether the variables are making any statistically
significant contribution to the model (equation). If the Sig value is less than 0.05, then the
variable is making a significant contribution towards the prediction of the dependent variable. If
on the other hand the Sig. Value is higher than 0.05 then we can conclude that that variable is not
making any significant unique contribution to the prediction of the dependent variable. Based
on the above preamble, the stated hypotheses are tested below:
: There exists a statistically significant relationship between Non-Performing Loan
Ratio (NPLR) and Return on Assets (ROA) of S&L companies in Ghana.
From table 4.9 above where ROA was the proxy for profitability, NPLR recorded t-statistics of -
6.465 and significance (P- value) of 0.000. Since the significance value is not more than 0.05, the

ISSN 2320-5407 International Journal of Advanced Research (2020)
175
relationship between NPLR and ROA is significant. The researcher, therefore, fails to reject
(accepts) the null hypothesis .
: There exists a statistically significant relationship between Capital Adequacy Ratio
(CAR) and Return on Assets (ROA) of S&L companies in Ghana
From table 4.9 above, CAR had a t-statistics value of -0.615 and a significance value of 0.542.
Since the significance value is above .05, the relationship between CAR and ROA is statistically
insignificant. The null hypothesis ( ) is therefore rejected (failed to be accepted)
: There exists a statistically significant relationship between Loans and advances to
Deposit Ratio (LTDR) and Return on Assets (ROA) of S&L companies in Ghana
From table 4.9, LTDR recorded t-statistics of 0.160 and significance value of 0.873. Since the
significance value is greater than 0.05, LTDR does not have a statistically significant relationship
with ROA. The null hypothesis ( is therefore rejected (fail to be accepted)
: There exists a statistically significant relationship between Non-Performing Loans
Ratio (NPLR) and Return on Equity (ROE) of S&L companies in Ghana
From table 4.12, NPLR recorded t-statistics of -8.096 and significance value of 0.000. It
therefore implies that the relationship between NPLR and ROE is statistically significant since
the significance value is less than 0.05. The null hypothesis ( is accepted (failed to be
rejected)
: There exists a statistically significant relationship between Capital Adequacy Ratio
(CAR) and Return on Equity (ROE) of S&L companies in Ghana
The t-statistics and significance values from table 4.12 were 2.440 and 0.019 respectively. The
significance value is not more than 0.05, so the relationship between CAR and ROE is
statistically significant. The null hypothesis ( ) is therefore accepted (failed to be rejected)
ISSN 2320-5407 International Journal of Advanced Research (2020)
176
: There exists a statistically significant relationship between Loans and advances to
Deposit Ratio (LTDR) and Return on Equity (ROE) of S&L companies in Ghana
LTDR had a t-statistics of -0.062 and a significance value of 0.951. The Sig. >.05, implies that
the relationship between LTDR and ROE is statistically insignificant. Null hypothesis ( ) is
therefore rejected.
4.7. ANALYSIS AND INTERPRETATION OF THE PRIMARY DATA
In order to achieve the remaining objectives of the study, data taken from the respondents of the
sampled S&L Companies through questionnaire prepared in Likert and nominal scales format
were analysed and presented using tables, charts, and graphs. The questionnaire was prepared
such that each set of questions will provide an answer to each of the research questions, which
will in effect help in achieving the set down objectives of the study.
4.7.1. Analysis of the Demographic data
There was no missing data as shown in table 4.16 below; the total valid number was 254 as
expected with the minimum and maximum numbers meeting expectation. The gender had ranged
from 1 – 2 covering only male and female, job position having a minimum of 1 and a maximum
of 5 which represents the five strata grouping of respondents based on job position. Work
experience recorded a minimum number of 1, and a maximum of 5 whiles, a maximum of 7
sampled S&L companies were used in the survey.

ISSN 2320-5407 International Journal of Advanced Research (2020)
177
Table 4.16: Missing Data Statistics
Gender Position
Work
Experience company name
N Valid 254 254 254 254
Missing 0 0 0 0
Mode 1 1 3 1
Minimum 1 1 1 1
Maximum 2 5 5 7
Source: survey data
4.7.2. Respondents by Gender
From table 4.17 below, the male respondents were the highest number as 190 out the total
sample size of 254 were males. It implies that the credit-related job schedule is mostly male
dominated when it comes to S&L Companies in Ghana. Only 64 female respondents were
involved in the credit administration of the selected S&L Companies in Ghana. Figure 4.6 shows
the pie chart of the respondents in percentage. The male respondents constituted 75% whereas
their female counterparts constituted only 25% of the 254 respondents. It is an indication that
male officers dominate the credit-related duties in the Savings and Loans companies in Ghana.
Table 4.17: Respondents by Gender
Frequency Percent
Valid
Percent
Cumulative
Percent
Valid Male 190 74.8 74.8 74.8
Female 64 25.2 25.2 100.0
Total 254 100.0 100.0
Source: survey data

ISSN 2320-5407 International Journal of Advanced Research (2020)
178
Fig.4.6: Percentage Male and Female respondents
Source: survey data
4.7.3. Respondents by Position
From table 4.18 and fig. 4.7 below, it is obvious that credit/recovery staff formed the largest
number of respondents with 164 representing 64.6% of the total sample size of 254. Branch
managers were the next highest with 56 respondents representing 22% of the total sample of 254.
Senior Executives were 17 representing 6.7%, followed by Risk/Compliance respondents, which
were 10 representing 3.9%, and lastly, Credit Managers who were only seven (7) representing
2.8% meaning each S&L Company had one credit manager who is always based at the head
office.
Table 4.18: Respondents by Position
Frequency Percent Valid Percent Cumulative Percent
Valid Credit/Recovery officer 164 64.6 64.6 64.6
Risk/Compliance Officer 10 3.9 3.9 68.5
Branch Manager 56 22.0 22.0 90.6
Credit Manager 7 2.8 2.8 93.3
Senior Executive 17 6.7 6.7 100.0
Total 254 100.0 100.0
Male 75%
Female 25%

ISSN 2320-5407 International Journal of Advanced Research (2020)
179
Source: survey data
Fig.4.7: Pie chart of respondents by Position
Source: survey data
4.7.4. Respondents by work experience
Table 4.19 and fig.4.8 show the breakdown of respondents based on their credit-related work
experiences. Ninety seven (97), representing 38.2% of the respondents had between 5 and 10
years working experience followed by between 1 and five years with 85 participants representing
33.5%. The next highest frequency regarding work experience is up to 1 year with a frequency
of 54 representing 21.3% of the respondents. Staffs with work experience between 10 and 15
years were only 17 representing 6.7%. Meanwhile, only one respondent had a work experience
of more than 15 years, which represents 0.4% of the sample size.
Credit/Recovery officers
64%
Risk/Compliance Officers
4%
Branch Managers 22%
Credit Managers 3%
Senior Executives 7%

ISSN 2320-5407 International Journal of Advanced Research (2020)
180
Table 4.19: Respondents based on Work Experience
Frequency Percent Valid Percent Cumulative Percent
Valid 0 - 1 year 54 21.3 21.3 21.3
1 - 5 years 85 33.5 33.5 54.7
5 - 10 years 97 38.2 38.2 92.9
10 - 15 years 17 6.7 6.7 99.6
15+ years 1 .4 .4 100.0
Total 254 100.0 100.0
Source: survey data
Fig. 4.8: frequency of respondents by work experience
Source: Research Data
0
10
20
30
40
50
60
70
80
90
100
0-1 year 1-5 years 5-10 years 10-15 years 15+ years
54
85
97
17
1

ISSN 2320-5407 International Journal of Advanced Research (2020)
181
4.8. FACTOR ANALYSIS
Factor analysis is a data reduction technique where it takes a large set of variables and looks for a
means of reducing the data using a smaller set of factors or components. It is usually done to
identify any unique and meaningful components within the co-variance among the set of other
variables. There are two main types of factor analysis: exploratory and confirmatory. The
exploratory factor analysis is mostly used to gather information about the interrelationship
among a set of variables. Confirmatory factor analysis on the other hand is used in testing or
confirming specific hypothesis or theories concerning the structure underlying a set of variables.
The term factor analysis includes a variety of different but related techniques. One of the main
distinctions is what is called principal component analysis (PCA) and factor analysis (FA). These
two types of techniques are similar in many respects and are mostly used interchangeably by
researchers. Both techniques attempt to produce a smaller number of linear combinations of the
original variables such that it account for most of the variability in the pattern of correlations
(Julie Pallant, 2005). For the purpose of this study, principal component analysis will be used to
identify the most unique and meaningful co-variables among the set of variables. To conduct the
factor analysis, the Kaiser-Meyer-Olkin (KMO) measure of sampling adequacy, and Bartlett’s
Test of sphericity was conducted to confirm whether the data set meets the minimum standard,
which needs to be passed before conducting factor analysis. The rule of thumb is that the KMO
measure should ideally be .6 or more but any figure above .5 is appropriate (Kaiser, 1974)32
whereas the Bartlett’s test of sphericity value should be less than .05 thus reaching statistical
significance (Bartlett, 1954)33
. Varimax rotation was further conducted since it presents an easier
interpreted pattern of loadings. According to Julie Pallant (2005), factors with Eigenvalue of
above, one (1) is retained for loading. Factors that loaded below one (1) were suppressed for
better reading and interpretation of the results. The total variance explained values and the
rotated component matrix can be found in the appendix 7, 8, 9, 10, and 11. Kaiser-Meyer-Olkin
(KMO) measure of sampling adequacy and Bartlett’s Test of sphericity results as well as the
factor loadings of the principal component analysis (PCA) for various set of variables are as
follows:

ISSN 2320-5407 International Journal of Advanced Research (2020)
182
4.8.1. Principal Component Analysis of Risk Types and its Frequency of occurrence
Table 4.20: KMO and Bartlett's Test for Risk Types
Kaiser-Meyer-Olkin Measure of Sampling Adequacy .570
Bartlett's Test of Sphericity
Approx. Chi-Square 83.043
df 3
Sig. .000
A principal component analysis (PCA) was performed on the data which produced a KMO
measure of sampling adequacy of approximately .6 whereas Bartlett’s test for sphericity was
found to be significant (ꭓ2
(3) = 83.043, P < .05) as indicated in table 4.20 above. The results
imply that the data is fit for the running of factor analysis.
Table 4.21: Factor analysis of risk types and its frequency of occurrence
No. Factors Factor
Loadings
% of
Variance
Cumulative
Variance
%
1 Credit Risk .833 54.816 54.816
2 Operational Risk .719 27.588 82.403
3 Market Risk .658 17.597 100.000
Extraction Method: Principal Component Analysis
Interpretation: Respondents were asked to indicate their opinion based on firsthand experience
the type of risk that mostly occurs in their respective S&L Companies using a Likert scale
ranging from Very Infrequent =1, Infrequent =2, Neither frequent nor Infrequent =3, Frequent
=4, and Very frequent =5. The factor loadings result indicated that credit risk alone exhibited a
percentage variance of 54.8%, which means it is the most frequently occurring risk among the
three types of risk the S&L Companies encounter in the discharge of their core mandate.
Operational risk was the second most frequent risk the S&L Companies encounter with 27.6%

ISSN 2320-5407 International Journal of Advanced Research (2020)
183
variation, and market risk being the least occurring risk in the daily operations of the Ghanaian
S&L companies with a percentage variance of 17.6%. The market risk being the least
encountered did not come as a surprise since by regulation, S&L Companies do not engage in
activities that attract market risk (e.g. foreign exchange).
4.8.2. Principal component analysis of NPL causing factors
Table 4.22: KMO and Bartlett's Test for NPL causing factors
Kaiser-Meyer-Olkin Measure of Sampling Adequacy .597
Bartlett's Test of Sphericity
Approx. Chi-Square 1097.532
df 136
Sig. .000
From table 4.22 above, it can be observed that the KMO value is approximately .6 whereas the
Bartlett’s test of sphericity value was also significant (ꭓ2
(136) = 1097.532, P < .05) which makes
the data suitable for factor analysis.
Table 4.23: Factor Analysis of NPL causing factors
No. Factors Factor
Loadings
% of
Variance
Cumulative
Variance
%
1 Inadequate loan Screening .817 19.321 19.321
2 Inexperienced loan officers .778 11.757 31.078
3 Insufficient disposable income .718 10.857 41.935
4 Repayment frequency .721 8.124 50.059
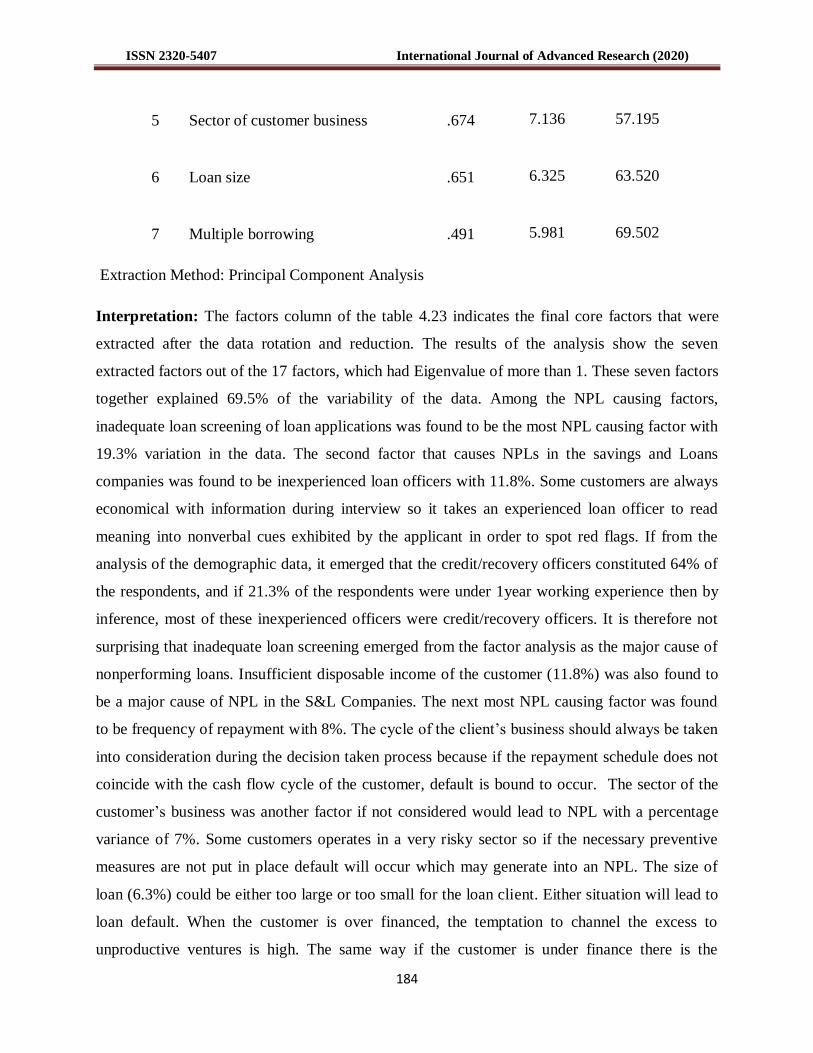
ISSN 2320-5407 International Journal of Advanced Research (2020)
184
5 Sector of customer business .674 7.136 57.195
6 Loan size .651 6.325 63.520
7 Multiple borrowing .491 5.981 69.502
Extraction Method: Principal Component Analysis
Interpretation: The factors column of the table 4.23 indicates the final core factors that were
extracted after the data rotation and reduction. The results of the analysis show the seven
extracted factors out of the 17 factors, which had Eigenvalue of more than 1. These seven factors
together explained 69.5% of the variability of the data. Among the NPL causing factors,
inadequate loan screening of loan applications was found to be the most NPL causing factor with
19.3% variation in the data. The second factor that causes NPLs in the savings and Loans
companies was found to be inexperienced loan officers with 11.8%. Some customers are always
economical with information during interview so it takes an experienced loan officer to read
meaning into nonverbal cues exhibited by the applicant in order to spot red flags. If from the
analysis of the demographic data, it emerged that the credit/recovery officers constituted 64% of
the respondents, and if 21.3% of the respondents were under 1year working experience then by
inference, most of these inexperienced officers were credit/recovery officers. It is therefore not
surprising that inadequate loan screening emerged from the factor analysis as the major cause of
nonperforming loans. Insufficient disposable income of the customer (11.8%) was also found to
be a major cause of NPL in the S&L Companies. The next most NPL causing factor was found
to be frequency of repayment with 8%. The cycle of the client’s business should always be taken
into consideration during the decision taken process because if the repayment schedule does not
coincide with the cash flow cycle of the customer, default is bound to occur. The sector of the
customer’s business was another factor if not considered would lead to NPL with a percentage
variance of 7%. Some customers operates in a very risky sector so if the necessary preventive
measures are not put in place default will occur which may generate into an NPL. The size of
loan (6.3%) could be either too large or too small for the loan client. Either situation will lead to
loan default. When the customer is over financed, the temptation to channel the excess to
unproductive ventures is high. The same way if the customer is under finance there is the

ISSN 2320-5407 International Journal of Advanced Research (2020)
185
temptation to look elsewhere for top up which may overburden the cash flow. Loan officers are
therefore expected to do due diligence during the appraisal stages of the application to determine
the right amount of fund the customer needs. Another important factor that causes customers to
default on their repayment obligation was found to be multiple borrowing with 5.9% variation of
the data. Checks from the credit reference portal and a little background check can prevent this
dishonesty.
4.8.3. Principal component analysis of Impact of Loan Defaults
Table 4.24: KMO and Bartlett's Test of Impact of Loan Defaults
Kaiser-Meyer-Olkin Measure of Sampling Adequacy .573
Bartlett's Test of Sphericity
Approx. Chi-Square 287.561
df 21
Sig. .000
From table 4.21 above, Kaiser-Meyer-Olkin Measure of Sampling Adequacy was approximately
.6 and Bartlett's Test of Sphericity was also significant (ꭓ2
(21) = 287.561, P < .05). It is an
indication that the data meet the minimum standard required for the factor analysis.
Table 4.25: Factor Analysis of Impact of Loan Default
No. Factors Factor
Loadings
% of
Variance
Cumulative
Variance
%
1 Stagnation of staff salary .907 32.079 32.079
2 Increase in provision for bad debt .811 19.106 51.185
3 Reduction in profit .806 14.481 65.667
4 Decrease in working capital .743 12.017 77.683
5 Dumping of moral spirit of loan officers .574 10.191 87.875

ISSN 2320-5407 International Journal of Advanced Research (2020)
186
Extraction Method: Principal Component Analysis
Interpretation: Table 4.22 also shows the extracted factor loadings for identified factors for
impact of loan default on the S&L Companies. The 5 distinct extracted factors together
accounted for a total variance of 87.9% of the data. The factor loadings indicate that Stagnation
of employees salary (32.1%) is the most affected when a bank is bedevilled with nonperforming
loans (NPL). The next consequence of nonperforming loans of the S&L companies is that it
balloon the provision for bad debt (19%). Since the provision is taking from the income earned
by the bank, profitability will definitely be affected. When loans are nonperforming both interest
and principal repayment ceases so reduction in profit (14.5%) being affected factor is as
anticipated. The working capital (12%) was also found to be at the receiving end when loans are
not performing. Such a situation will create liquidity problem for the lending instructions.
Dumping of moral spirit of loan officers with a variance of 10% was also found to be among the
affected factors. Because the credit officers are held responsible when their loan clients default,
their moral goes down especially when loan officers receive series of warning letters and verbal
warnings from superiors. The thought of losing their job alone is enough to make them
demoralised.
4.8.4. Existence of Credit Risk Management Practices in the S&L Companies
Table 4.26: Existence of Credit Risk Management Practices
variables Yes (%) No (%) Total %
Internal customer rating 82.3 17.7 100
Risk identification and monitoring system 92.5 7.5 100
Credit rating score model 86.2 13.8 100
Portfolio risk exposure indicators 73.2 26.8 100
Source: Field survey
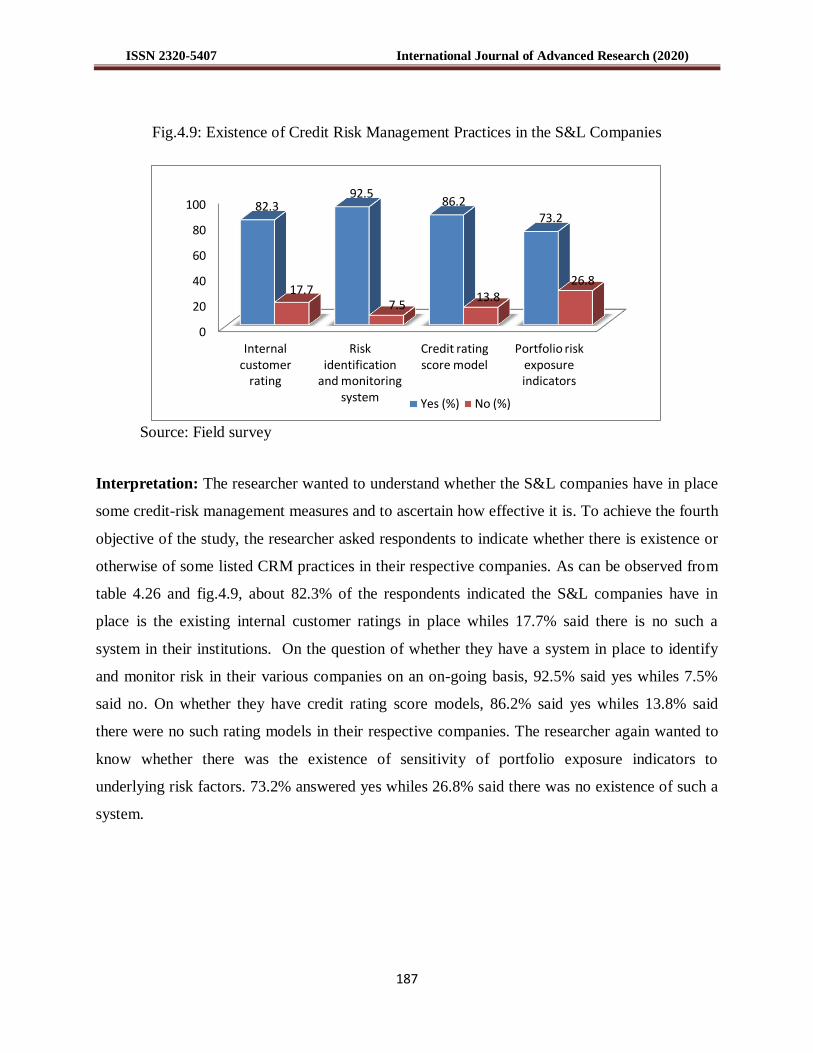
ISSN 2320-5407 International Journal of Advanced Research (2020)
187
Fig.4.9: Existence of Credit Risk Management Practices in the S&L Companies
Source: Field survey
Interpretation: The researcher wanted to understand whether the S&L companies have in place
some credit-risk management measures and to ascertain how effective it is. To achieve the fourth
objective of the study, the researcher asked respondents to indicate whether there is existence or
otherwise of some listed CRM practices in their respective companies. As can be observed from
table 4.26 and fig.4.9, about 82.3% of the respondents indicated the S&L companies have in
place is the existing internal customer ratings in place whiles 17.7% said there is no such a
system in their institutions. On the question of whether they have a system in place to identify
and monitor risk in their various companies on an on-going basis, 92.5% said yes whiles 7.5%
said no. On whether they have credit rating score models, 86.2% said yes whiles 13.8% said
there were no such rating models in their respective companies. The researcher again wanted to
know whether there was the existence of sensitivity of portfolio exposure indicators to
underlying risk factors. 73.2% answered yes whiles 26.8% said there was no existence of such a
system.
0
20
40
60
80
100
Internal customer
rating
Risk identification
and monitoring system
Credit rating score model
Portfolio risk exposure indicators
82.3 92.5
86.2 73.2
17.7 7.5
13.8 26.8
Yes (%) No (%)

ISSN 2320-5407 International Journal of Advanced Research (2020)
188
4.8.5. Principal component analysis of Effectiveness of the existing Credit Risk
Management Practices
Table 4.27: KMO and Bartlett's Test for effectiveness of CRM practices
Kaiser-Meyer-Olkin Measure of Sampling Adequacy .723
Bartlett's Test of Sphericity
Approx. Chi-Square 762.097
df 36
Sig. .000
Table 4.27 above is the Kaiser-Meyer-Olkin Measure of Sampling Adequacy and
Bartlett's Test of Sphericity for the factors of the credit risk management practices. The KMO
measure of sampling adequacy was .723, which is above the minimum .6 whereas the Bartlett's
Test of Sphericity value was observed to be significant (ꭓ2
(36) = 762.097, P < .05) which is a
confirmation of the suitability of the data for performing factor analysis.
Table 4.28: Factor Analysis of effectiveness of credit risk management practices
Factors Factor
Loadings
% of
Variance
Cumulative
Variance
%
1 Personal guarantor .883 37.947 37.947
2 Regular monitoring .881 15.925 53.872
3 Collateral pledge .873 12.556 66.428
4 Insurance cover .825 10.984 77.412
5 Credit reference bureau checking .673 6.706 84.118
Extraction Method: Principal Component Analysis

ISSN 2320-5407 International Journal of Advanced Research (2020)
189
Interpretation: Nine credit-risk management variables were constructed to understand how
effective the existed credit risk management practices in the S&L were. A Likert scale ranging
from highly ineffective = 1, ineffective = 2, neither effective nor ineffective =3, effective = 4,
and highly effective = 5. The extracted factor loading analysis is as presented in table 4.28
above. Five factors were extracted after rotation, and together explained a total variance of
87.8% in the data. Majority of the respondents indicated that demanding for personal guarantor
(37.9%) to secure the loan facility is the most effective way to mitigate credit risk. Usually a
guarantor has equal obligation as the loan customer with regard to the repayment of the loan
facility. The second most effective credit-risk management practice in the S&L Companies was
found to be regular monitoring with a percentage variance of 15.9%. The third effective means
of mitigating credit risk is demand for collateral as a security for the loan granted with a
percentage variance of 12.6%. The fourth most effective credit-risk management practice
according to the respondents was to insure the loan clients (10.98%) against unavoidable
circumstance such as flood, fire, life-threatening ailments etc. Checking the customer’s credit
history from the credit reference bureau portal (6.7%) was the next effective credit risk
management practice employed by the savings and loans companies in Ghana.
4.8.6. Principal component analysis of Difficulties in Loan Recovery
Table 4.29: KMO and Bartlett's Test of difficulties in loan recovery
Kaiser-Meyer-Olkin Measure of Sampling Adequacy .600
Bartlett's Test of Sphericity
Approx. Chi-Square 248.732
df 10
Sig. .000
Table 4.29 above indicate the Kaiser-Meyer-Olkin Measure of Sampling Adequacy and Bartlett's
Test of Sphericity. The KMO measure was .600, which meets the minimum coefficient of .6
whereas Bartlett's Test of Sphericity of .000 was observed to be significant (ꭓ2 (10) = 248.732, P
< .05) making it appropriate for factor analysis to be conducted.

ISSN 2320-5407 International Journal of Advanced Research (2020)
190
Table 4.30: Factor analysis of Difficulties in Loan Recovery
Factors Factor
Loadings
% of
Variance
Cumulative
Variance
%
1 Pursuit of legal action .850 42.574 42.574
2 Disposing off collateral .841 24.223 66.797
3 Use of recovery agencies .814 15.559 82.357
Extraction Method: Principal Component Analysis
Interpretation: Table 4.30 shows the factor loadings for analysis. Respondents were asked to
indicate the difficulties they faced during loan recovery using some recovery measures. Three
factors were extracted, and together contributed 82.4% of total variance of the data. Pursuit of
legal action against defaulters was found to be the most difficult loan recovery measure with a
percentage variance of 42.6%. Unlike other countries such as India, where special courts have
been established for loan recovery purposes there is no such courts in Ghana which makes legal
pursuits a difficult task. Lenders will have to resort to civil suits against defaulters, which makes
them disadvantaged, as the court does not take any punitive action against the defaulters.
Disposing off collaterals (24.2%) used by loan clients after they have defaulted was found to be
one of the difficult recovery measures employed by S&L Companies. Most Ghanaians consider
the buying of someone’s property especially when that person is in difficulties as ungodly so
they shun away from it and that makes it difficult for the bank to convert the asset into liquid
cash. The third difficult loan recovery measure was found to be the use of recovery agencies with
a percentage variance of 15.6%.
ISSN 2320-5407 International Journal of Advanced Research (2020)
191
REFERENCES
[1]. Julie Pallant (2005). SPSS survival manual – A step-by-step guide to data analysis using
SPSS for Windows (version 12). Allen & Unwin, Australia
[2]. Barbara G. Tabachnick and Linda S. Fidell (2018). Using Multivariate Statistics, 6th
Edition.
Person India Education Services Pvt. Ltd, Noida, India
[3]. Khamis, H., and Kepler, M. (2010). Sample size in Multiple Regression: 20 + 5k. Journal of
Applied Statistical Science, 17, P.505-507
[4]. Zawadi Ally (2014). Determinants of Banks’ Profitability in a Developing Economy:-
Empirical Evidence from Tanzania. European Journal of Business & Management, Vol.6,
No.31
[5]. Tan, Y., Floros, C., and Anchor, J. (2017). The profitability of Chinese bank: impacts of risk,
competition and efficiency. Review of Accounting and Finance Vol.16, No.1 Pp. 86-105.
[6]. Kosmidou, K., Tanna, S. & Pasiouras, F. (2008) Determinants of profitability of domestic
UK commercial banks: panel evidence from the period 1995-2002. Economics finance &
accounting applied research working paper series no. RP08-4. Coventry: Coventry
University
[7]. Ibrahim Nandom Yakubu (2016). Bank-specific and Macroeconomic Determinants of
Commercial banks Profitability in Ghana. Macrothink Institute, International Finance
and Banking Vol.3 No.2
[8]. Idowu, A. and Awoyemi, S.O. (2014). The impact of credit risk management on commercial
banks' performance in Nigeria. International Journal of Management and Sustainability,
Vol. 3 Issue 5, (pp. 295-306)
[9]. Kipngetich S. and Muturi W. (2015). Effect of Credit-risk management on the financial
performance of savings and cooperative society in Kenya. Strategic journal of business &
change management vol. 2 No. 44 Pp. 900-915
[10]. Okoth V. Ongore and Gemechu B. Kusa (2013). Determinants of the financial performance
of commercial banks in Kenya. International Journal of Economics & financial issues,
Vol. 3 NO. 1 pp. 237 – 252

ISSN 2320-5407 International Journal of Advanced Research (2020)
192
[11]. Nagaraju, Y., and Boateng, K. (2018). Profitability determinants of savings & loans
companies in Ghana: Evidence on Bank Specific and macroeconomic Determinants.
International Journal of Business Studies, Vol. 5, Issue 2 (2)
[12]. Ofosu-Hene, E. D., & Amoh, P. (2016). Risk Management & performance of listed banks
in Ghana. European Journal of Business Science and Technology Vol.2 Issue2.
[13]. Prakash, R., Poudel, S., & Student, P. (2012). The impact of credit-risk management on the
financial performance of commercial banks in Nepal. International Journal of Arts and
Commerce, 1(5). Retrieved from
http://ijac.org.uk/images/frontImages/gallery/Vol._1_No._5/2.pdf
[14]. Mendoza & Rivera (2017). The effect of credit risk and capital adequacy on the
profitability of rural banks in the Philippines. Scientific Annals of Economics and
Business Vol.64 Issue1 P.83-96.
[15]. Hosna et al. (2009). Credit Risk Management & Profitability in Commercial Banks in
Sweden. Master Degree Project, University of Gothenburg. Retrieved from
https://gupea.ub.gu.se/bitstream/2077/20857/1/gupea_2077_20857_1.pdf on 31/05/2017
[16]. Gizaw, M., et al. (2015).The impact of credit-risk on profitability performance of
commercial banks in Ethiopia. African Journal of Business Management 2015 Vol.9 (2),
pp. 59-66
[17]. Kolapo et al. (2012). Credit-risk and commercial banks’ performance in Nigerian: A panel
model approach. Australian Journal of Business & Management Research, Vol.2 No.2
Pp.31-38
[18]. Iwedi Marshal and Onuegbu Onyekachi (2014). Credit-risk and performance of selected
deposit money banks in Nigeria: an empirical investigation. European journal of
Humanities & Social Sciences, Vol.31, No.1
[19]. Magali J. J. (2013). The impact of credit-risk management on the profitability of rural
savings and credit cooperative societies (SACCOS): the case of Tanzania. International
Journal of Management Science Business Research, Vol. 2 Issue 12
[20]. Johannes Peyavali (2015). Evaluating the Impact of Bank Specific Determinants of Non-
performing Loans in Namibia. Journal of Emerging Issues in Economics, Finance &
Banking (JEIEFB) An Online International Research Journal (ISSN: 2306-367X) 2015
Vol. 4 Issue 2.
[21]. John Mawutor, K.M. (2015). Credit Risk Management & Profitability of Banks listed on
the GSE. International Journal of Empirical Finance, Vol.4 No.7 p.396-406

ISSN 2320-5407 International Journal of Advanced Research (2020)
193
[22]. Kaaya, I. and Pastory, D. (2013). Credit Risk & Commercial Banks Performance in
Tanzania: a Panel Data Analysis, Research Journal of Finance and Accounting, 4 (16),
pp. 55-63. Available at: www.iiste.org
[23]. Hamisu Suleiman Kargi (2011). Credit risk & the performance of Nigerian Banks.
Department of Accounting, Ahmadu Bello University Faculty of Administration, Zaria
Nigeria
[24]. Iwedi Marshal and Onuegbu Onyekachi (2014). Credit risk & performance of selected
deposit money banks in Nigeria: an empirical investigation. European journal of
Humanities & Social Sciences, Vol.31, No.1
[25]. Fadzlan Sufian and Royfaizal Razalia Chong (2008). Determinants of bank profitability in
developing economy: Empirical evidence from the Philippines. Asian Academy of
Management Journal of Accounting & Finance Vol.4 No.2 Pp. 91-112
[26]. Owusu Afriyie, H. and Oscar Akotey J. (2012). Credit-risk Management and Profitability
of Selected Rural Banks in Ghana. Retrieved on 6/07/16 from
http://www.academia.edu.documents/35497769/afriyie-credit-risk management.pdf
[27]. Yusheng Kong et al. (2017) Bearing of Credit Risk Management on Financial Performance:
Evidence from Financial Institutions in Ghana. American Journal of Multidisciplinary
research Vol.5 Issue 2.
[28]. Bizuayehu, M. (2015). The impact of credit-risk on the financial performance of Ethiopia
banks. Retrieved October 31, 2016, from
http://etd.aau.edu.et/bitstream/123456789/6799/1/Misker%20Bizuayehu.pdf
[29]. Takyi Opoku, R., Lawer Angmor, P. and Asare Bediako, L (2016). Credit Risk and Bank
Profitability: Evidence from Ghana Stock Exchange. Journal for Studies in Management
and Planning, Vol.2 Issue3.
[30]. Addo Boye Michael Kwabena (2014) credit risk management in financial institutions: a
case study of Ghana commercial bank limited. Research Journal of Finance &
Accounting ISSN 2222-1697 (Paper) ISSN 2222-2847 (Online) Vol.5, No.23, 2014
www.iiste.org (accessed on 13/09/16)
[31]. Samuel H. Boahene, Dr Julius Dasah and Samuel K. Agyei (2012). Credit Risk and
Profitability of some selected banks in Ghana.
http://www.slideshare.net/SamuelAgyei/credit-risk-and-bank-performance-in-ghana
(accessed on 29/8/2016)
[32]. Kaiser H. (1974). An index of factorial simplicity. Psychometrika, 39, P.31-36

ISSN 2320-5407 International Journal of Advanced Research (2020)
194
[33]. Bartlett, M.S. (1954). A note on the multiplying factors for various chisquare
approximations. Journal of the royal statistical society, 16 (series B), p.296-298

ISSN 2320-5407 International Journal of Advanced Research (2020)
195
CHAPTER FIVE
************
FINDINGS, CONCLUSION, AND
RECOMMENDATIONS
ISSN 2320-5407 International Journal of Advanced Research (2020)
196
CHAPTER FIVE
FINDINGS, CONCLUSION, RECOMMENDATIONS AND SUGGESTIONS
The study was conducted with the broad objective of identifying the type of risk that mostly
affects the day-to-day operational activities of the S&L companies and to examine the
relationship between credit risk management, and the profitability of the savings and loans
companies in Ghana. Based on the above, ratios computed from the financial statements of the
selected companies together with responses taken from the staff of sampled companies were
analysed with the aid of SPSS software. Due to the way the analysis was done in two parts, the
findings were also summarised under two headings: findings from the analysis of the Secondary
data and the primary data.
5.1. FINDINGS FROM THE ANALYSIS OF THE SECONDARY DATA
Ratios of Credit-risk management (NPLR, LTDR, and CAR) as well as the ratios of the control
variable and profitability (ROE, ROA) were computed to ascertain the relationship between
these set of important measures. The following were found from the analysis of the ratios.
1. Within the study period (2011 – 2016), there was an increase in NPLR from 5% to 30%.
The worsened NPL situation in the S&L companies had a ripple effect on their
profitability leading to fluctuations in ROA and ROE, which made ROA declining from
-.73% to -5.47%, and ROE from 15% to -73%. These scary findings of the performance
of the savings and loans companies in Ghana, which were not averted, was the reason
why the bank of Ghana revoked the licenses of 15 S&L companies in August 2019.
2. The findings also indicated a mix result regarding the relationship between CAR and the
profitability measures. Whiles excess cash holdings reduces the return on asset, it leads
to an increment in return on shareholders’ equity. The essence of maintaining Capital
adequacy is to serve as a cushion to depositors in the event of distress, but when capital

ISSN 2320-5407 International Journal of Advanced Research (2020)
197
is over-reserved expected return on assets is affected. Idle cash becomes a cost to the
companies if not put to profitable use hence the negative relationship between capital
and return on assets. Even though increase in CAR leads to a corresponding increase in
ROE, its effect was found to be insignificant and that is an indication that management
of these companies should maintain a balance in their capital reservations.
3. The findings indicated also that NPLR had negative and statistically significant
relationship with both ROA and ROE (profitability). This indicates the severity of the
impact of deterioration in asset quality (NPL) on the profitability of S&L companies in
Ghana. The negative relationship of NPL ratio with both ROA and ROE was an expected
outcome since nonperforming assets has accompanying cost such as recovery cost, and
cost of provision for bad debts, which erodes the profit of the lending institutions.
4. In addition, it was found that a negative and insignificant relationship existed between
Loans and Advances to Deposit ratio (LTDR) and ROE but had a positive and
insignificant relationship with ROA. The LTDR is a measure of how much depositors
money is used to finance credit activities so the higher the ratio the more depositors fund
is used and additional revenues generated outside the current assets of the company
hence, the positive relationship between LTDR and ROA.
5. Bank size (LNTA) had a negative and insignificant relationship with ROA but related
positive and insignificant with ROE. When an bank expands its operational activities, it
stands the chance of attaining higher profitability due to economies of scale which
translates into increase in shareholders’ equity hence the positive relationship between
bank size measured by total assets and return on equity. Even though the relationship
between bank size and return on assets was negative, its effect was insignificant. Banks
invest in assets when they expand but it takes a couple of years to recoup the return on
the acquired assets. So the negative effect of bank size on ROA may be attributed to the
fact that the companies concerned had recently embark on expansion during the study
period.

ISSN 2320-5407 International Journal of Advanced Research (2020)
198
5.2. FINDINGS FROM THE ANALYSIS OF THE PRIMARY DATA
The sample size of 254 staff from the population of 695 of the seven selected S&L companies
was used for the study. For easy analysis purposes, the researcher grouped the sample into five
stratums based on job function. The findings of the primary data are as summarized below:
1. The analysis of the demographic data revealed that male officers with 75% dominate the
credit function of the sampled S&L Companies whereas female officers represented 25%.
2. Credit/recovery officers constituted 64.5% of the respondents followed by Branch
managers (22%), senior executives (6.7%), risk/compliance officers (3.9%) and credit
managers representing 2.8%
3. Majority of the employees (38.2%) of the sampled S&L Companies have between five
and ten years of working experience. Employees who have worked for between one and
five years were the next largest group with 33.5% followed by under one year (21.3%).
6.7% have between 10 and 15 years of working experience with only 0.4% of the
employees having more than 15 years of work experience.
4. A part of the broad objective of the study was to identify the type of risks that mostly
affect the daily operations of the S&L Companies. The employees indicated that they are
faced with credit risk more often than any other risk. Operational risk was found to be the
second most occurring in the operations of the S&L Companies followed by market risk
5. On the question of what causes nonperforming loans, inadequate loan screening by loan
officers was singled out to be the major cause of NPLs in the S&L Companies in Ghana.
Inexperienced loan officers, was found to be another major cause of nonperforming
loans. Insufficient disposable income was also found to have a consequential effect on the
ability of the customer to repay. The other factors found to cause the accumulation of
nonperforming loans in the S&L companies include repayment frequency, the sector of

ISSN 2320-5407 International Journal of Advanced Research (2020)
199
the customer’s business, the size of the loan granted, and customers borrowing from
multiple banks all contribute to the rising nonperforming loans.
6. On the impact that loan defaults has on the operations of the S&L companies, employees
pointed out that their salary being stagnant for years without any adjustment was what
affects them most. Another effect of customers defaulting on their obligation to repay the
loans granted them according to the employees was that it increases provision for bad
debt which erodes profit hence reduction in profit was also found to be affected when
NPLs rise. Decrease in the working capital of the companies was another impact of NPLs
on the S&L companies. In addition, dumping the moral spirit of loan officers was also
found to be as a result of nonperforming loans.
7. As part of the objectives to find out whether the S&L companies have in place some
credit-risk management practices, about 82.3% of the respondents indicated there is
existence of internal customer ratings in place in their companies whiles 17.7% said there
is no such a system in their institutions. On whether they have a system in place to
identify and monitor risk on an on-going basis, 92.5% said yes whiles 7.5% said no. On
whether they have credit rating models, 86.2% of the respondents indicated that there is
existence of credit rating models in their respective S&L companies. 13.8% said there
were no such models in their companies. The researcher further asked respondents
whether there was existence of sensitivity of portfolio exposure indicators to underlying
risk factors. 73.2% answered yes whiles 26.8% said there was no such indicator existing
in their S&L Companies.
8. On the question of how effective the existing credit-risk management measures practiced
by the S&L Companies are, employees (respondents) indicated that demanding for a
personal guarantor is the most effective practice being used by the S&L Companies in
Ghana. Continuous monitoring of the loan customer throughout the repayment period
happens to be the second most effective credit risk management practice. Demanding for
collateral security was also identified as one of the effective risk management practices
employed by the S&L Companies. Again, it was found that insuring the loan customer
against any unforeseen circumstances is a very effective credit risk management practice.

ISSN 2320-5407 International Journal of Advanced Research (2020)
200
Another effective credit risk management practice used by the S&L Companies found
from the study was crosschecking the credit history of the loan applicant using the credit
reference bureau portal.
9. Concerning the difficulties faced in enforcing the existing recovery measures by S&L
staff during recovery of nonperforming loans, it was found that pursuing legal action
against the defaulted customers was identified as the most difficult recovery measure.
Another difficult recovery measure happens to be disposing off collateral used by
customers in securing the loan. The use of recovery agents too emerged among the
difficult measures S&L companies used in loan recovery.
5.3. CONCLUSION
Financial institutions especially banks and other lending institutions encounter a number of risks
both financial and non-financial. However, credit risk was found to be the hazardous and the
most common risk among the three prominent types of risk (credit, market, and operational risks)
S&L companies encounter in the discharge of their mandate on day-to-day basis. The results of
the study have clearly demonstrated that the S&L Companies in Ghana are inefficient, the
resultant effect is the high NPL accumulation, and a very weak profitability performance
exhibited over the study period.
The findings remind management and regulators of S&L Companies the need to pay much
attention to credit risk management considering the adverse effect it exerts on the profitability of
the financial institutions. The negative relationship found between nonperforming loans and the
profitability indicators buttress the fact that if lending institutions intend to remain profitable and
sustainable, then management of these institutions must give credit-risk management prominence
in their strategic policies.
The results of the study further pointed an accusing finger at inadequate screening of loan
applicants as the major cause of nonperforming loans in the S&L Companies. This is because
when risk analysis is poorly executed it adversely affects the lending institution, which exposes
the shareholders, depositors, as well as creditors to unwarranted risk through the depletion of
capital and funds invested in these institutions. From the analysis of the demographic data, it

ISSN 2320-5407 International Journal of Advanced Research (2020)
201
appears management of the S&L Companies engages the services of more inexperienced officers
in the credit job and has failed to give them enough training resulting in adverse selection of
borrowers hence the huge NPL accumulation.
Although the S&L companies come across market, and operational from time to time, credit risk
frequently affects the S&L Companies operation. The continuous deterioration and accumulation
of the NPLs of the S&L companies over the study period, tells us that the recovery measures
must be strengthened. Guarantor enforcement remains the most effective recovery measure to
execute during loan recovery, lenders must therefore insist on a personal guarantor irrespective
of the loans size. Because there are no dedicated recovery courts like the debt tribunal courts in
the case of India, which makes loan recovery for the S&L companies’ extremely difficult, credit
risk mitigating measures such collateral pledge, insurance cover for loan clients, and regular
monitoring of loans must be enforced. The S&L Companies should also avoid taking
unnecessary risk by indulging in aggressive lending as a means of competing since it can
increase default risk and that will impose heavy financial losses on these lending institutions.
The importance of this study cannot be overemphasized. It has made many revelations as far as
the relationship between credit risk management and profitability of S&L companies is
concerned. It has contributed to filling the literature gap on the subject matter in the savings and
loans companies’ subsector of the banking industry in Ghana. Apart from adding to the body of
existing knowledge, it will also help in decision making of management to focus more on
activities that may improve profitability of the S&L companies and the banking industry at large.
5.4. RECOMMENDATIONS
The findings of the study have made an eye opening revelations on a number of issues about the
effects of credit risk management on profitability of the savings and loans companies in Ghana.
The findings of the study again offer important policy implications for the regulators of the
banking industry, policy makers, and management of banking institutions in Ghana about the
effect of credit risk management on the profitability of the S&L Companies. Below are the
recommendations made based on the findings of the study to be utilized by management of the
S&L companies, academics, the government, and the regulators of the banking sector in Ghana

ISSN 2320-5407 International Journal of Advanced Research (2020)
202
I. The government of Ghana must learn from the Indian example by setting up
dedicated courts like the debt tribunal courts in India, for loan recovery purpose
to fast track prosecution of loan defaulters
II. Complete autonomy (devoid of political interference) should be accorded to the
central bank of Ghana (BoG) in order to exercise its regulatory mandate to the
fullest. When politicians stop medelling in the affairs of the Central bank, their
supervision powers can be executed without fear or favour. Such autonomy will
prevent the repeatition of the banking crisis, which nearly collapsed the banking
sector.
III. S&L companies must enforce and improve upon their existing credit risk
management practices in order to remain in business. Because there is no
dedicated recovery courts like the case of India, due diligence must always be
enforced during the application stages since inadequate loan application screening
was found to be the major cause of loan defaults in the S&L companies.
IV. All the S&L companies must sign a memorandum of understanding with
insurance companies to insure all their loans clients against unforeseen
circumstances to minimise loses since claiming of insurance was found to be an
easy way of recovering the non-performing loans from customers who are
indisposed.
V. Freshly recruited loan officers’ must undergo adequate training before allowing
them to process loans since inadequate screening of loan applications was
identified as a major reason loans go bad.
VI. It is further recommended that, the Central Bank of Ghana (BoG) should make it
mandatory for all loan-granting institutions to sign up and furnish the credit
reference bureaus with details of all their newly disbursed loans for easy
referencing and to avoid giving out loans to already indebted customers and those
with bad credit history.

ISSN 2320-5407 International Journal of Advanced Research (2020)
203
VII. S&L companies are encouraged to strengthen their credit management efforts in
order to minimize their level of non-performing loans.
VIII. Strict enforcement of capital adequacy to avert any bankruptcy is required
considering the role maintaining the required capital adequacy plays in ensuring
that banks do not run in to liquidity crises. From the descriptive statistics, it
emerged that the average CAR was 16.3%, which implies that S&L companies
hold excess capital above the required 10%. Management of S&Ls should
therefore desist from the practice and invest the excesses since holding capital
without investing affects the company’s profitability.
IX. Management of S&L companies should strengthen their internal control and
compliance measures when they plan to embark on expansion since when there is
expansion it becomes difficult to oversee all activities which leads to staff
indulging in inefficiencies and that defeats the advantages of economies of scale.
X. Bank management should maintain a moderate level of Loans and advance to
deposit ratio since it is a measure of the banks’ ability to survive withdrawals.
Higher rates will leads to liquidity problems
5.5. DIRECTIONS FOR FURTHER RESEARCH
Credit risk has caused havoc in the banking industry across the world, which demands further
investigations into the subject matter. For instance, the recent revocation of licenses of banks and
nonbank financial intuitions in Ghana largely was due to impaired loan portfolios of the affected
institutions. Based on the findings of the study, the following further studies are suggested:
I. To the academic researchers, further research work is required on the causes of
loan delinquency in the S&L subsector, and the microfinance companies, which
have been in bad news of late due to inadequate studies in the sector to unearth all
the possible causes of loan default that affects these companies.

ISSN 2320-5407 International Journal of Advanced Research (2020)
204
II. Further research on the topic is recommended to be conducted in the universal
banking sector since NPA rate is a canker not only in the S&L companies but also
in the overall banking sector.
III. It is further recommended that a study be conducted to ascertain the impact of
bank specific and macroeconomic indicators, on the profitability performance of
the S&L subsector.
IV. The study gathered responses from only the officials of the banking intuitions. It
is therefore recommended that further research should be conducted to include
responses from customers on the causes of loan defaults.
BIBLIOGRAPHY
Book Sources:
[1]. Alan Bryman and Emma Bell (2011). Business Research Methods 3rd Edition. OUP
Oxford.
[2]. Brownbridge, Martin, and Charles Harvey, 1998, Banking in Africa: The Impact of Financial
Sector Reform Since Independence (Oxford: James Currey Limited).
[3]. Deepak Chawla and Neena Sondhi (2016). Research Methodology- Concepts and Cases.
Second Edition, Vikas Publications, New Delhi, India
[4]. Dr. D.D. Mukherjee (2016). Credit Appraisal, Risk Analysis and Decision Making. Snow
White, India
[5]. Duffie Darrel and Kenneth J. Singleton (2003). Credit Risk Pricing Measurement and
Management. Princeton University Press, New Jersey, USA.
[6]. Edward Diener and Rick Crandall (1978). Ethics in Social Behavioral Research. University
of Chicago Press, Chicago
[7]. Gestel, T.V. and Baesens, B. (2008). Credit Risk Management Basic Concepts:- financial
risk components, rating analysis, models, economic & regulatory capital, Oxford
University Press.
[8]. G.S. Popli and S.K. Puri (2013). Strategic Credit Management in Banks. Prentice Hall India
Learning Private Limited, India

ISSN 2320-5407 International Journal of Advanced Research (2020)
205
[9]. Hair, Joseph F, Arthur H. Money, Phillip Samouel, and Mike Page (2007). Research
Methods for Business. Chichester: John Wiley and Sons,
[10]. Joel Bessis (2010). Risk Management in Banking. Third Edition, John Wiley & Sons Ltd,
United Kingdom
[11]. Julie Pallant (2005). SPSS survival manual – A step-by-step guide to data analysis using
SPSS for Windows (version 12). Allen & Unwin, Australia
[12]. K. Vaidya Nathan (2013). Credit Risk Management for Indian banks. SAGE Response,
India
[13]. Muraleedharan, D. (2013). Modern Banking: theory and practice. PHI Learning Private
Limited Delhi, India
[14]. Agarwal, O.P. (2016). Modern Banking of India. 2nd Edition, Himalaya Publishing House,
Mumbai, India.
[15]. Panneerselvam R. (2016). Research Methodology, 2nd edition. PHI learning private
limited, Delhi India.
[16]. Pyle D (1997), “Bank Risk Management“, Working Paper NO.272, University of RBA.
[17]. Padmalatha Suresh and Justin Paul (2018). Management of Banking and Financial
Services. 4th Edition, Pearson India Education Services Pvt. Ltd., Noida, India
[18]. Prasanna Chandra (2011). Financial Management: Theory and Practice 8th Edition. Tata
McGraw Hill New Delhi, India
[19]. Saunders A. and Cornett M. (2005). Financial market and Institutions: An introduction to
risk management approach. McGraw-Hill Higher education
[20]. Saunders A. and Cornett M.M. (2007). Financial Institutions Management:- A Risk
Management Approach with S&P Card. McGraw-Hill Companies, Incorporated
[21]. Saunders, M., Lewis, P., & Thornhill, A. (2009). Research methods for business students.
5th edition. Harlow: Financial Times Prentice Hall.
[22]. Sinkey, J. F. (2002), Commercial Bank & Financial in the Financial-Services Industry,
Prentice Hall
[23]. Saunders A., Cornett, M.M. (2006). Financial Institutions Management: A Risk
Management Approach. McGraw-Hill Irwin, New York NY 10020
[24]. Padmalatha Suresh and Justin Paul (2018). Management of Banking and Financial
Services. Pearson India Education Services Pvt. Ltd. Noida India
[25]. Tony Van Gestel and Bart Baesens (2009). Credit Risk Management, Basic Concepts.
Oxford University Press, Oxford

ISSN 2320-5407 International Journal of Advanced Research (2020)
206
[26]. William G. Zikmund et al. (2013) Business Research Methods. A South-Asian Perspective.
India: Cengage Learning
[27]. Yamane Taro (1967). Statistics: An Introductory Analysis (Vol. 2). Harper and Row, New
York
[28]. Zikmund, W. G., Babin, B. J., Carr, J. C., & Griffin, M. (2013). Business research methods
9th edition, Mason, OH: Southwestern
Theses Sources:
[1]. Ahmet Karakuza (2017). Bank Specific Determinants of Profitability in Turkish banks.
Masters theses, Fort Hays State University.
[2]. Akong’a Cynthia Jenifer (2014). The Effect of Financial Risk Management on the Financial
Performance of Commercial Banks in Kenya. An unpublished research project submitted
to the School of Business, University of Nairobi, Kenya.
[3]. Arko, S. & Kofi, (2012a). Determining the causes and impact of non-performing loans on
the operations of microfinance institutions: A case of Sinapi Aba Trust, thesis submitted to
Kwame Nkrumah University of Science and Technology. Retrieved
from:http://ir.knust.edu.gh/bitstream/123456789/4958/1/FINAL%20THESISSAMUEL%2
0KOFI%20ARKO.pdf
[4]. Chijoriga M. M. (1997). An Application of Credit Scoring & Financial Distress Prediction
Models to commercial Bank Lending: The case of Tanzania. PhD Dissertation
Wirtschafts Universitat Wien (WU) Vienna
[5]. Douglas Afoakwah Opoku-Agyemang (2015). Factors influencing the profitability of
domestic & foreign banks in Ghana. Unpublished Master Thesis, School of Business and
Social Sciences, Aarhus University
[6]. Hamisu Suleiman Kargi (2011). Credit-risk & the performance of banks in Nigeria
Unpublished thesis submitted to Ahmadu Bello University, Department of Accounting,
Faculty of Administration, Zaria – Nigeria
[7]. Hosna, A, Manzura, B, and Juanjuan, S. (2009). Credit Risk Management & Profitability in
Commercial Banks in Sweden. Master Degree Project, University of Gothenburg.
Retrieved on 31/05/2017 from
https://gupea.ub.gu.se/bitstream/2077/20857/1/gupea_2077_20857_1.pdf
[9]. Jackson Oludhe (2011). The impact of credit-risk management on the financial performance
of Kenyan commercial banks, unpublished thesis submitted to the department of finance
& accounting, school of business, University of Nairobi. Retrieved on 1/06/17.
http://erepository.uonbi.ac.ke:8080/xmlui/bitstream/handle/11295/12792/Oludhe
ISSN 2320-5407 International Journal of Advanced Research (2020)
207
[10]. Kitwa D.Y. (1996). Application of multiple discriminant analysis in developing a
commercial banks loans classification model and assessment of the significance of
contributing variables: a case of National Banking of Commerce. MBA thesis UDSM,
Dar es Salaam
Annual Reports/Working Paper Sources:
[1]. BCBS. (2006) International Convergence of Capital Measurement & Capital Standards
[online] Available at http://www.bis.org/publ/bcbs128b.pdf [Accessed: 12 Mar 2017]
[2]. Bessis J. (2005). Risk Management in Banking. John Wiley & Sons Ltd, 5th ed. Core
Principles for Effective Banking Supervision, BCBS, BIS, February 2006.
[3]. Bank of Ghana (1990). The annual financial stability report
Bank Negara Malaysia (2011). Annual report retrieved on 05/07/16 from
http://www.bnm.gov.my/index.php?ch=fs&pg=fs_ovr_what&ac=112
[4]. Ishan Kapur & Jerald A Schiff & Michael T. Hadjimichael & Philippe Szymczak & Paul
Louis Ceriel Hilbers, (1991). "Ghana; Adjustment and Growth, 1983-91," IMF
Occasional Papers 86, International Monetary Fund
[5]. IMF Occasional Papers 86, International Monetary Fund
[6] Lafunte Esteban (2012): Monitoring Bank Performance in the Presence of Risk Mirceaepure:
Working Papers Barcelona, Spain
[7]. Mohamed Dore (2013). An Empirical Analysis of Bank Profitability in Ghana: Evidence
from Bank-specific and Macroeconomic factors. Mater Thesis, Eastern Mediterranean
University, Gazimagusa North Cyprus.
[8]. Rosenberg Richard (2009). Measuring results of microfinance institutions minimum
indicators that donors and investors should track. A technical guide. CGAP, Washington
DC.
[9]. Settlements, B. for I. (1999). Basel committee publications - principles for the management
of credit risk - Jul 1999. Retrieved from http://www.bis.org/publ/bcbs54.pdf
[10]. World Bank (1994). Ghana Financial Sector Review: Bringing Savers and Investors
Together, Country Operations Division, West-Central Africa Department Report
No.l3423-GH. Washington, DC: World Bank
[11]. World Bank (1989) World Development Report 1989. New York: Oxford University Press
for the World Bank.
[12]. World Bank (1990) The World Bank Development report

ISSN 2320-5407 International Journal of Advanced Research (2020)
208
WEBSITES
www.businessdictionary.com
www.economictimes.indiantimes.com
www.sciencedirect.com
www.economictimes.indiantimes.com
http://www.documents.worldbank.org
http://www.wwbg.com.gh/Index.php
www.panafricansl.com
http://www.beigecapital.com
http://www.firstalliedghana.com/about-fasl.html
https://www.unicreditghana.com/about
www.first-ghana.com/
http://www.firstafrican.org/about-us
http://www.ghamfin.org/#
https://www.graphic.com.gh/business/
www.historyworld.net
www.businessdictionary.com
www.economictimes.indiantimes.com
http://www.documents.worldbank.org
APPENDIX 1

ISSN 2320-5407 International Journal of Advanced Research (2020)
209
CANARA BANK SCHOOL OF MANAGEMENT STUDIES (CBSMS)
BANGALORE UNIVERSITY, BANGALORE INDIA
RESEARCH QUESTIONNAIRE
Introduction:
The intention of this questionnaire is to seek responses for issues pertaining to Credit Risk
Management and its relationship with the profitability of the Savings and Loans Companies in
Ghana. The exercise is purely for academic purpose and respondents’ credibility and
confidentiality will be highly observed.
PERSONAL PROFILE OF RESPONDENTS
1. Gender
Male
Female
2. Name of S&L company……………………………………………
3. How long have you been an employee of this company
0 -1 year
1 - 5 years
5- 10years
10– 15 year
15 + years
4. Which of these best describes your position in the company? Please tick the correct
answer
Credit/Recovery officer
Risk/compliance officer
Branch Manager
Credit Manager
Senior executive
5. How long have you been involved in credit administration?
0 -1year
1 - 5years
5- 10 years
10 – 15 years
Above 15 years
RISK AWARENESS
6. Which of the following type of risks affects your daily operations most in terms of its
frequency of occurrence?

ISSN 2320-5407 International Journal of Advanced Research (2020)
210
Very
frequent
Frequent Neither frequent
nor Infrequent
Infrequent Very Infrequent
6a. Credit risk
6b. Market risk
6c. Operational risk
CAUSES OF NON-PERFORMING ASSETS
7. Please indicate your agreement or disagreement with the following factors in their
ability to cause NPAs.
Strongly
agree
agree Neither agree
nor disagree
Disagree Strongly
disagree 7a. Inexperienced loan officers
7b. Lack of adequate collateral
7c. Inadequate loan screening and
documentation
7d. Repayment frequency
7e. Interest on loan
7f. Sector of the customer’s business
7g. Multiple borrowing by customers
7h. Lack of Post disbursement
monitoring
7i. Diversion of funds
7j. Influential loans/political loans
7k. Fraudulent loan officers
7l. Loan size
7m. Credit history of customer
7n. Insufficient disposable income
7o. Delay in taking decision on loan
(approval)

ISSN 2320-5407 International Journal of Advanced Research (2020)
211
7p. Natural disasters
7q. Economic state of the country
IMPACT OF NPAs
8. Please indicate your agreement or otherwise to these resultant effects of NPLs on
the operational activities of your S&L company.
Strongly
agree
agree Not
sure
disagree Strongly
disagree
8a. Decrease in working capital
8b. Increase in loan recovery expenses
8c. Increase in provision for bad debt
8d. Leads to high pricing of loan (interest
rate)
8e. Stagnation of salary increment of
employees
8f. Demoralizing loan officers
8g. Reduction in profit
CREDIT RISK MANAGEMENT PRACTICES
9. Please rank the following risk management measures in your company in terms of
its effectiveness in mitigating risk
Highly
effective
effective Neither
effective nor
ineffective
Ineffective Highly ineffective
9a. Insurance cover
9b. Collateral pledge
9c. Credit reference bureau
checking
9d. Loan application review
by risk officers
9e. Personal Guarantor

ISSN 2320-5407 International Journal of Advanced Research (2020)
212
10. Please indicate the existence of or otherwise of the following credit risk management
practices in you company
Yes No
10a. Do your company have internal rating system in place
10b. Does the bank has adequate system in place to identify and monitor risk on an
ongoing basis
10c. Does your S & L company has credit rating score models
10d. Is there existence of sensitivity of portfolio exposure indicators to underlying risk
factors
DIFFICULTIES IN LOAN RECOVERY
11. From your own experience, how difficulty is the enforcement of the following
recovery measures?
Highly
difficult
difficult Neither
difficult nor not
difficult
Not
difficult
Highly not
difficult
11a. Disposing off collateral
11b. Guarantor enforcement
11c. Claiming of insurance
11d. Pursuit of legal action
11e. Use of recovery
agencies
9f. Cash flow analysis
9g. Post-sanction
relationship management
9h. Regular monitoring
9i. Background check on
customer
ISSN 2320-5407 International Journal of Advanced Research (2020)
213
APPENDIX 2
CANARA BANK SCHOOL OF MANAGEMENT STUDIES (CBSMS)
BANGALORE UNIVERSITY, BANGALORE INDIA
INFORMED CONSENT FORM
Dear Respondent,
You are invited to participate in an academic research study on the topic: “Credit Risk
Management and Profitability in Select Savings and Loans Companies in Ghana” which is
been undertaken by Kwadwo Boateng, a PhD research scholar from the Department of
Management, Canara Bank School of Management Studies, Bangalore University, India.
The purpose of this study is to find the relationship between credit risk management and
profitability in the Savings and Loans Companies in Ghana
Pease note the following:
This study involves the use of questionnaires. Your name will not appear
in the study and answers you give will be treated as strictly confidential. You
cannot be identified in person based on the answers you provide.
Your participating in this study is very important to us. You may however,
choose not to participate and you may also stop participating at any time without
any negative consequences
The results of the study will be used for academic purposes only and may
be published in an academic journal. We will provide you with a summary of our
findings on request.
Please contact my supervisor, Professor Y. Nagaraju on (+919448558169)
if you have question or comments regarding the study.
Please sign the form to indicate that:
You have read and understood the information provided above
You give your consent to participate in the study on a voluntary basis
Respondent’s signature: _____________ Date: --------------

ISSN 2320-5407 International Journal of Advanced Research (2020)
214
APPENDIX 3
NORMALITY GRAPHS

ISSN 2320-5407 International Journal of Advanced Research (2020)
215

ISSN 2320-5407 International Journal of Advanced Research (2020)
216
APPENDIX 4
Summary statistics of the study Variables: 2011 - 2016
YEAR 2011 2012 2013 2014 2015 2016
ROA
Mean -0.007 0.013 0.040 0.004 0.016 -0.055
Standard Deviation 0.052 0.010 0.079 0.070 0.015 0.170
ROE
Mean 0.151 0.071 -0.340 0.035 0.063 -0.725
Standard Deviation 0.486 0.086 0.079 0.174 0.084 2.107
NPLR
Mean 0.045 0.048 0.121 0.190 0.056 0.304
Standard Deviation 0.105 0.024 0.211 0.378 0.035 0.685
CAR
Mean 0.111 0.148 0.132 0.241 0.224 0.145
Standard Deviation 0.105 0.112 0.166 0.142 0.119 0.068
LA/TD
Mean 1.250 0.636 0.667 0.587 0.524 0.414
Standard Deviation 0.030 0.328 0.296 0.294 0.248 0.207
LNTA
Mean 17.050 17.473 17.756 18.437 18.526 18.768
Standard Deviation 1.774 1.261 1.460 1.317 1.401 1.535
Source: research data

ISSN 2320-5407 International Journal of Advanced Research (2020)
217
APPENDIX 5
Profitability Indicators of Deposit Money Banks in Ghana
Indicators 2014 2015 2016 2017
Return on Equity (ROE) 32.3 21.4 17.l 18.7
Return on Assets (ROA) 6.4 4.5 3.82 3.6
Return on Earning Assets 8.6 6.1 5.07 4.7
Net Interest Spread (NIS) 12.9 12.5 11.4 10.2
Cost to Income Ratio 49.2 53.2 57.4 59
Net Interest Margin (NIM) 13.6 13.8 13 11
Source: Bank of Ghana annual report (2017)

ISSN 2320-5407 International Journal of Advanced Research (2020)
218
APPENDIX 6
Deposit Money Banks’ Credits by Sectorial Distribution
Levels
Year- On-Year Variations (%)
Dec.-15 Dec. -16 Dec.-17 Dec.-15 Dec. -16 Dec.-17
Public Sector Banks 3,896.00 5,435.50 3,842.50 27.40 39.30 -29.20
Private Sector Banks 26,203.10 29,983.50 33,819.30 24.50 14.40 12.80
Agric, For. & Fish 1,020.70 1,130.60 1,343.50 14.70 10.80 18.80
Export Trade 145.00 162.30 314.80 -36.10 11.90 94.00
Manufacturing 2,363.80 2,576.00 2,930.90 20.40 9.00 13.80
Import Trade 2,140.90 2,048.40 1,868.40 16.90 -4.30 -8.80
Construction 2,759.90 3,133.60 3,707.90 25.20 13.50 18.30
Commerce & Finance 4,309.00 7,013.40 7,156.70 40.30 62.80 2.00
Electricity, Gas, Water 3,307.50 3,445.60 2,898.00 62.10 4.20 -15.90
Services
5,866.90 5,591.10 6,238.00 24.30 -4.70 11.60
Miscellaneous 2,548.90 2,925.50 4,071.60 16.70 14.80 39.20
Total 30,099.10 35,409.00 37,661.80 24.90 17.60 6.40
Source: Bank of Ghana annual report (2017)

ISSN 2320-5407 International Journal of Advanced Research (2020)
219
APPENDIX 7: Total variance explained and component matrix of types of risk
Total Variance Explained
Component
Initial Eigenvalues Extraction Sums of Squared Loadings
Total % of Variance Cumulative % Total % of Variance Cumulative %
1 1.644 54.816 54.816 1.644 54.816 54.816
2 .828 27.588 82.403
3 .528 17.597 100.000
Extraction Method: Principal Component Analysis.
Component Matrix
a
Component
1
Credit Risk .833
Operational Risk .719
Market Risk .658
Extraction Method: Principal Component Analysis.
a. 1 components extracted.

ISSN 2320-5407 International Journal of Advanced Research (2020)
220
APPENDIX 8: Total variance explained and rotated component matrix of NPL causing
factors
Total Variance Explained
Component
Initial Eigenvalues Extraction Sums of Squared Loadings
Total % of Variance Cumulative % Total % of Variance Cumulative %
1 3.285 19.321 19.321 3.285 19.321 19.321
2 1.999 11.757 31.078 1.999 11.757 31.078
3 1.846 10.857 41.935 1.846 10.857 41.935
4 1.381 8.124 50.059 1.381 8.124 50.059
5 1.213 7.136 57.195 1.213 7.136 57.195
6 1.075 6.325 63.520 1.075 6.325 63.520
7 1.017 5.981 69.502 1.017 5.981 69.502
8 .955 5.619 75.121
9 .835 4.910 80.031
10 .674 3.962 83.993
11 .586 3.448 87.442
12 .493 2.900 90.342
13 .423 2.487 92.829
14 .373 2.195 95.025
15 .352 2.071 97.096
16 .257 1.509 98.605
17 .237 1.395 100.000
Extraction Method: Principal Component Analysis.

ISSN 2320-5407 International Journal of Advanced Research (2020)
221
Rotated Component Matrixa
Component
1 2 3
Inadequate screening .817
Inexperience Loan Officers .778
Diversion of funds .475
Lack of post disbursement monitoring .451 .379
Lack of adequate collateral .444 .364
Fraudulent loan officer .437 .394 .402
Insufficient disposable Income .718
Delay in taken decision on loan(approval) .637
Multiple borrowing .491
Credit History .455 .465
Economic State of the country .451
Interest on loan .344
Natural disasters
Repayment frequency .721
Sector of business .674
Loan size .651
Influential/political loans .393 .439
Extraction Method: Principal Component Analysis.
Rotation Method: Varimax with Kaiser Normalization.
a. Rotation converged in 8 iterations.

ISSN 2320-5407 International Journal of Advanced Research (2020)
222
APPENNDIX 9: Total Variance explained and Rotated Component Matrix of factors of
impact of NPLs
Total Variance Explained
Component
Initial Eigenvalues
Extraction Sums of Squared
Loadings
Rotation Sums of Squared
Loadings
Total
% of
Variance
Cumulative
% Total
% of
Variance
Cumulative
% Total
% of
Variance
Cumulative
%
1 2.246 32.079 32.079 2.246 32.079 32.079 1.919 27.410 27.410
2 1.337 19.106 51.185 1.337 19.106 51.185 1.340 19.142 46.553
3 1.014 14.481 65.667 1.014 14.481 65.667 1.338 19.114 65.667
4 .841 12.017 77.683
5 .713 10.191 87.875
6 .508 7.254 95.129
7 .341 4.871 100.000
Extraction Method: Principal Component Analysis.
Rotated Component Matrixa
Component
1 2 3
Increase in provision for bad debt .811
reduction in profit .806 .301
Increase in loan recovery expenses .654 .371
Decrease in working capital .743
dumping of moral spirit of loan officers .574
stagnation of salary increment of employees .907
Leads to high loan interest rate .557 .599
Extraction Method: Principal Component Analysis.
Rotation Method: Varimax with Kaiser Normalization.
a. Rotation converged in 8 iterations.

ISSN 2320-5407 International Journal of Advanced Research (2020)
223
APPENDIX 10: Total Variance explained and Rotated Component Matrix of Effectiveness
of Credit risk management practices factors
Total Variance Explained
Component
Initial Eigenvalues Extraction Sums of Squared Loadings
Total % of Variance Cumulative % Total % of Variance Cumulative %
1 3.415 37.947 37.947 3.415 37.947 37.947
2 1.433 15.925 53.872 1.433 15.925 53.872
3 1.130 12.556 66.428 1.130 12.556 66.428
4 .989 10.984 77.412
5 .604 6.706 84.118
6 .461 5.126 89.244
7 .427 4.743 93.987
8 .302 3.353 97.340
9 .239 2.660 100.000
Extraction Method: Principal Component Analysis.
Rotated Component Matrixa
Component
1 2 3
Insurance cover .825
Collateral Pledge .873
Credit reference bureau checking .673
Risk review by risk officer .666 .465 .359
Peronal Guarantor .883
cash flow analysis .473 .705
Post-santion relationship
managment .347 .554
Regular monitoring .881
Extraction Method: Principal Component Analysis.
Rotation Method: Varimax with Kaiser Normalization.
a. Rotation converged in 5 iterations.
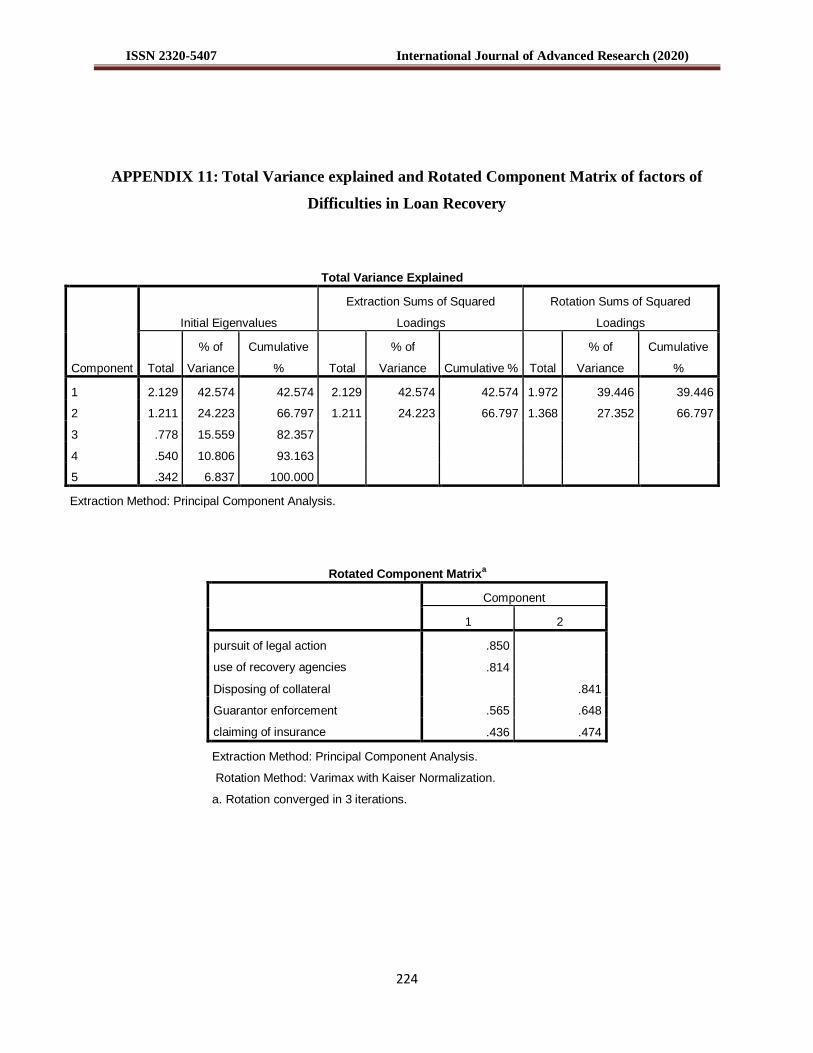
ISSN 2320-5407 International Journal of Advanced Research (2020)
224
APPENDIX 11: Total Variance explained and Rotated Component Matrix of factors of
Difficulties in Loan Recovery
Total Variance Explained
Component
Initial Eigenvalues
Extraction Sums of Squared
Loadings
Rotation Sums of Squared
Loadings
Total
% of
Variance
Cumulative
% Total
% of
Variance Cumulative % Total
% of
Variance
Cumulative
%
1 2.129 42.574 42.574 2.129 42.574 42.574 1.972 39.446 39.446
2 1.211 24.223 66.797 1.211 24.223 66.797 1.368 27.352 66.797
3 .778 15.559 82.357
4 .540 10.806 93.163
5 .342 6.837 100.000
Extraction Method: Principal Component Analysis.
Rotated Component Matrixa
Component
1 2
pursuit of legal action .850
use of recovery agencies .814
Disposing of collateral .841
Guarantor enforcement .565 .648
claiming of insurance .436 .474
Extraction Method: Principal Component Analysis.
Rotation Method: Varimax with Kaiser Normalization.
a. Rotation converged in 3 iterations.

ISSN 2320-5407 International Journal of Advanced Research (2020)
225
APPENDIX 12: List of Savings and Loans Companies in Ghana - 2017
SI
No.
Name of Institution Address
1 ABii National Savings and
Loans Ltd.
Priority House, Adjacent C.Woermann, Avenor
Junction Or P. O. Box CT10067, Cantonments Accra
2 Adehyeman Savings and
Loans Company Ltd.
No. 58 Faanofa Street, Kokomlemle (Near Avenor
Traffic
Light) Or P.O. Box GP 13249, Accra - Ghana
3 Adom Savings and Loans
Ltd.
Ayikai Street, Abossey Okai Opposite Mamprobi Trotro
Station, Kaneshie or P.O. Box CT 18454, Cantonments,
Accra
4 Advans Ghana Savings and
Loans Ltd.
Ground floor Oxford Cinema building (Accra New
Town)
Or P. O. Box AN 11426 Accra – North
5 Alpha Capital Savings and
Loans Ltd
No. D 422/4 Liberty Link Adabraka
Or P.O. Box CT 10339 Cantonments Accra
6 Asa Savings and Loans
Company Ltd.
H/No 612 South Odorkor, Busia Junction,
Odorkor-Mallam Road Or P. O. Box MP 1834 Mamprobi
Accra
7 Assurance Savings and
Loans Ltd.
1st Floor, Gina Villa, Achimota School, GIMPA Road
Accra

ISSN 2320-5407 International Journal of Advanced Research (2020)
226
Or P.O. Box KIA 16192 Accra
8 Bayport Savings and Loans
Ltd.
71 Osu Badu Street, Airport West, Accra PMB 248,
Accra North, Accra
9 Best Point Savings and Loans
Ltd.
Old Peace FM Building Mile 7, Off Achimota-
Ofankor Road Or P. O. Box CT 10191
Cantonments Accra
10 Bond Savings and Loans Ltd Bond House, Meridian Road Community 2, Tema
Or P.O Box CO PMB 95, Tema
11 CDH Savings and Loans Ltd. CDH House, No. 36 Independence Avenue, North Ridge,
Accra Or P.O. Box 14911 Accra
12 Commerz Savings and Loans
Ltd.
No. 54 Olusegun Obasanjo Highway opposite Accra
Girls’
Senior High School, Accra Or P.O. Box GP 21835 Accra
13 Direct Savings and Loans
Limited
No. 42A, Asofoanye A. Opeku Avenue, North Dzorwulu,
off the Fiesta Royal Hotel and GIMPA Road. or P.O. Box
CT
8360CantonmentsAccra
14 Equity Savings and Loans
Ltd.
No. 16 Maseru Avenue, East Legon Or P.O. Box CT
6382 Cantoments Accra
15 Express Savings and Loans
Company Ltd
No. 2 Bobolink Because Junction Tesano-Abeka Road
Or P.O. Box AN 10476 Accra- North
16 First Allied Savings and
Loans Co. Ltd.
OTB 662 Asomfo Road Adum ,Kumasi Or P. O. Box
5308

ISSN 2320-5407 International Journal of Advanced Research (2020)
227
Adum, Kumasi
17 First Ghana Savings and
Loans Company Ltd
FGSL House No. 10.44, Opposite Former Public
Procurement Authority Building Ringway East Or P.O. Box
2958Accra
18 First Trust Savings Loans Ltd. First Trust Towers George Walker Bush Highway
Dzorwulu Or P.O. Box AN 5261, Accra-North
19 First African Savings & Loans
Company Ltd
No. 124, Kwame Nkrumah Avenue, 1st African House,
(Former PTC Building) P.O. Box AN 11337, Accra- North
20 Global Access Savings and
Loans Company Ltd.
Citizen Kofi Building Osu, Accra Or P. O. Box AT 1479
Achimota Accra
21 Golden Link Savings and
Loans Ltd
2 North Street, Tesano Or P.O. Box 14117 Accra
22 Golden Pride Savings and
Loans Ltd
House No. E187/9, 5th Estate Road, Kanda Or P.O. Box
TU 66 Accra
23 Jins Savings and Loans Ltd P.O. Box OF 402 Ofankor – Accra
24 Legacy Capital Savings and
Loans Ltd.
House No. 359/1 – 3rd Kuku Hill Crescent Osu – Accra
Or P. O. Box GP 19210Accra
25 Midland Savings and Loans
Company Ltd.
No. 7 Nii Yemoh Avenue OIC Road Zion House 2nd
Floor
Shiashie, East Legon Or P. O. Box CT 3744 Cantonments –
Accra
26 Multi Credit Savings and
Loans Co. Ltd.
Trust House Bantama High Street P.O. Box 1920,
Kumasi – Ashanti
27 Opportunity International No. D765/3 Kwame Nkrumah Avenue Or P. O. Box JT

ISSN 2320-5407 International Journal of Advanced Research (2020)
228
Savings and Loans Co. Ltd 323 James Town Accra
28 Pacific Savings & Loans Co.
Ltd.
Plot Q.T.B, Adum, Kumasi Or P.O. Box KS 1922, Kumasi
- Ashanti
29 Pan - African Savings and
Loans Company Ltd.
No. 19 Seventh Avenue (Mayor Road), West Ridge,
Accra
Or PMB CT 127 Cantonments Accra
30 Progress Savings and Loans
Limited
No. 7 Nii Yemoh Avenue OIC Road 3rd Floor Zion House
Shiashie, East Legon Accra Or P. O. Box ST 237 Accra
31 Services Integrity Savings
and Loans Ltd.
Block 1, Labadi Villas, Business Center Giffard Road,
Burma Camp Accra Or PMB, Burma Camp Post Office
Accra
32 SIC Life Savings and Loans
Ltd.
Room 108 Swanzy Shopping Arcade Kwame Nkrumah
Avenue SIC Life Trust Finance Ltd P. O. Box KN 4768
Kaneshie Accra Adabraka - Accra
33 Sinapi Aba Savings and
Loans Company Ltd
22A Ellis Avenue Or P. O. Box 4911, Nhyiaeso Kumasi
34 The Seed Funds Savings and
Loans Ltd.
Plot 32, 6 Circular Road P.O. Box CT 11172
Cantonments - Accra
35 uniCredit Savings and Loans
Ltd.
UniCredit Ghana Limited No. 3 North Ridge Lane North
Ridge, Accra. Or P. O. Box GP 18729 Accra
36 Utrak Savings and Loans Ltd Opposite Mckeown Pentecost Church, Behind former
spirit FM, Asokwa, Kumasi Or P. O. Box UP 1011, Kumasi
37 Women’s' World Banking
Savings and Loans Co. Ltd
Global Haulage Complex Near Tesano Police
Station, Accra Or P.O. Box 2989 Accra.
Source: BoG annual report (2017)