Savings Determinants in Colombia: 1925-1994
31
- 1 - Banco Interamericano de Desarrollo Oficina del Economista Jefe Red de Centros de Investigación Documento de Trabajo R-310 Septiembre 1997 Determinants of Savings in Colombia 1925-1994 1 Mauricio Cárdenas Fedesarrollo, A.A. 75074, Bogotá-Colombia Andrés Escobar Fedesarrollo, A.A. 75074, Bogotá-Colombia 1 This paper is part of a regional research project sponsored by the Inter-American Development Bank. It has been presented at seminars at Fedesarrollo, the IDB, and at the Ninth Inter-American Seminar on Economics (NBER - Universidad de San Andrés) in Buenos Aires, Argentina, November 18-20, 1996. We would like to thank Sebastian Edwards, Martin Feldstein, Ricardo Hausmann, Santiago Herrera, Leonardo Letelier, Maurice Obstfeld, Roberto Steiner, Alejandro López, and Jorge Streb for comments. We are also grateful to Natalia Salazar and Raquel Bernal for their valuable help throughout the project. Fabio Sánchez generously provided the firm-level data.
-
Upload
independent -
Category
Documents
-
view
0 -
download
0
Transcript of Savings Determinants in Colombia: 1925-1994
- 1 -
Banco Interamericano de Desarrollo
Oficina del Economista Jefe
Red de Centros de Investigación
Documento de Trabajo R-310
Septiembre 1997
Determinants of Savings in Colombia 1925-19941
Mauricio Cárdenas
Fedesarrollo, A.A. 75074, Bogotá-Colombia
Andrés Escobar
Fedesarrollo, A.A. 75074, Bogotá-Colombia
1 This paper is part of a regional research project sponsored by the Inter-American Development Bank. It has been presented at seminarsat Fedesarrollo, the IDB, and at the Ninth Inter-American Seminar on Economics (NBER - Universidad de San Andrés) in Buenos Aires,Argentina, November 18-20, 1996. We would like to thank Sebastian Edwards, Martin Feldstein, Ricardo Hausmann, Santiago Herrera,Leonardo Letelier, Maurice Obstfeld, Roberto Steiner, Alejandro López, and Jorge Streb for comments. We are also grateful to NataliaSalazar and Raquel Bernal for their valuable help throughout the project. Fabio Sánchez generously provided the firm-level data.
- 2 -
© 1997Banco Interamericano de Desarrollo1300 New York Avenue, N.W.Washington, D.C. 20577
Las opiniones y puntos de vista expresados en este documento son del autor y no reflejan necesariamente los
del Banco Interamericano de Desarrollo.
- 1 -
Table of Contents
1. Introduction 3
2. Conceptual Framework 5
3. Savings in Colombia: Stylized Facts 9
4. Savings, Investment, and Growth: Correlations and Causality tests 13
5. Empirical Results: the Intertemporal Model 16
6. Empirical Results: Additional Evidence on the Determinants of
Private Savings 17
7. A Note on the Determinants of Private Firms Savings 23
8. Conclusions 26

- 2 -
Abstract
This paper analyzes the determinants of savings in Colombia using the framework of an intertemporal model. National
saving partially responds to temporary changes in output, according to the permanent income hypothesis. Higher
government expenditures (in relation to their permanent level) are associated with lower national saving, refuting the
existence of ricardian equivalence. The paper also tests other common hypotheses in regard to saving behavior. In
particular, we find that changes in national savings and changes in investment are perfectly correlated, and that savings
cause growth (in the Granger sense). The results also indicate that increases in urbanization and age dependency have
had a significantly negative effect on private savings in Colombia. Finally, we find that much of the recent reduction in
private savings can be accounted for by the increase in current government consumption, as well as by the effects of
higher taxation.

3
1. Introduction
This paper analyzes the determinants of national savings in Colombia with a long-term perspective. Colombia is
a good case study for several reasons. First, the interaction between private and public savings has played a key role in the
determination of national savings2. Second, inflows of foreign savings have been a key force behind the investment process.
Third, household saving rates have experienced a secular decline since the early 1970s, while firms= savings (as a share of
GNP) have fallen by as much as 5 percentage points since the structural reform package was introduced in 1990. In this
sense, the rich experience of Colombia is useful for understanding long-run trends in the level and composition of savings,
as well as the initial effects of trade, pension, and financial reforms. Moreover, the recent fall in national (especially private)
savings has coincided with a period of high investment growth3. As a consequence, the growing gap between national
savings and investment has been matched by increasing inflows of foreign savings, which in 1994 were at a record high.
Concerns about the sustainability of the current account deficits have been at the center of the policy debate in Colombia.
Many argue in favor of increasing saving rates to raise investment and speed up economic growth. However, there is little
consensus about how to achieve this goal.
Several factors have been mentioned as possible explanations for the decline in private saving rates. Many have
argued that trade liberalization, combined with the recent real appreciation of the peso, have reduced the relative prices of
durable goods. In addition, capital inflows as well as financial reform have had the effect of relaxing liquidity constraints and
have provided the necessary resources for an increase in consumption. Others place the emphasis on increased taxation,
which may have reduced private savings. From a different angle, labor reform increased disposable income by introducing
a new type of labor contract (“integral salaries”) that includes all fringe benefits as part of the salary. This change in the wage
regime may have increased consumption in credit-constrained households. Also, funds for severance payments are now held
in the workers= own accounts at private institutions. This, of course, represents a shift of saving from firms to households.
Finally, Colombia is at the beginning of a significant oil boom that has affected the perception of permanent income.
According to our results, the recent decline in private savings is of temporary nature, so no major offsetting policy
interventions are required. However, we recommend a change in fiscal policy in order to obtain an overall increase in
national savings. In particular, higher public savings are required, especially through a reduction in government expenditures.
The key aspect to emphasize is that counter-reforms that reintroduce protection and financial repression would be unwise.
Increases in private savings will come only as pension reform matures and firms= margins recover based on productivity
gains. Moreover, this paper establishes a close inverse relationship between private and foreign savings, so the lower current
account deficit expected in future years will probably be matched by an increase in private savings.
The paper is structured as follows. Section 2 presents an intertemporal optimization model that provides some
2 At present, national saving rates in Colombia are similar to their postwar average (18.3 percent of GNP) as well as the average fordeveloping countries. They are, however, below the world average. See Schmidt-Hebbel and Servén (1996).3 According to Cárdenas and Olivera (1995), the increase in investment rates is the result of a reduction in the user cost of capital due tothe real appreciation of the peso, as well as the reduction in real interest rates and tariffs on capital goods.

4
insights and testable hypotheses into the dynamics of savings. Section 3 shows the data and discusses the stylized facts of
saving in Colombia during the 1925-1994 period. Based on the data, section 4 explores the nature of the correlations among
national savings, investment, and growth. The tests indicate that inflows of foreign savings are positively correlated with
investment, while the correlation between national savings and investment has been much weaker over the last 25 years. In
spite of that, we cannot reject the hypothesis that national savings cause growth in the Granger sense.
According to the results of section 5, Colombian time series conform well to the predictions of the intertemporal
model of section 2. Section 6 contains other econometric results based on a more eclectic approach to the determinants of
savings. The main conclusions are that national savings depend negatively on foreign savings inflows and positively on
public savings, thus rejecting the ricardian equivalence hypothesis. Also, tariffs seem to have a positive effect on savings,
meaning that trade liberalization may result in a reduction in saving rates. However, the results of a VAR model indicate that
this effect tends to vanish relatively fast. Other variables, such as the interest rate, do not come out significant in the
regressions.
Finally, much of the recent reduction in savings in Colombia is explained by the collapse in firms= saving rates. To
analyze this issue in detail, section 7 estimates determinants of savings in a panel of 397 firms for the 1985-1993 period.
The results indicate that the relaxation of liquidity constraints was associated with an increase in indebtedness and a reduction
in the retention of profits. The paper ends with a section that summarizes the main conclusions and policy recommendations.

5
2. Conceptual Framework
The starting point for savings accounting is the national income identity (in current prices):
I I Y T C T G X M
S S St
pt
gt t t t t t t
tp
tg
tx
+ = − − + − − −= + +
( ) ( ) ( )(1)
where Ipt and Ig
t denote gross private and public investment, respectively. Private savings (Spt) are defined as GDP (Yt)
minus taxes net of transfers and subsidies from the public to the private sector (Tt) minus private consumption (Ct). Public
savings (Sgt) are equal to net taxes minus current government expenditures (Gt). Foreign savings (Sx
t) are defined as the
negative of net exports of goods and nonfactor services (Xt-Mt). In this case, the sum of Spt and Sg
t is called internal or
domestic savings.
Often, it is useful to write eq. 1 in terms of GNP, which is the sum of GDP and net international factor payments
and unrequited transfers, which we call FBt. In this case the proper expression becomes:
( ) ( ) ( )Y FB T C T G X FB M S S St t t t t t t t t tp
tg
tx+ − − + − − + − = + + (2)
where we have assumed that net factor payments accrue to the private sector. Under this definition the sum of Spt and Sg
t
corresponds to national savings, which we denote as St, and Sxt (foreign savings) is the negative of the current account
balance.
However, measurements of savings based on the national accounts can be imprecise, for various reasons. First, only
the flow of services from the stock of consumer durables should be considered as consumption4. Second, inflationary taxation
is a form of forced saving by the private sector which transfers funds to the public sector, and should be considered
accordingly5. To correct this problem we follow Schmidt-Hebbel and Servén (1996) and define the inflationary tax (IT) as:
IT Bt t-1= +π
π1
where p is the inflation rate and B is the monetary base. Correcting for inflation tax, we define the private saving rate as:
S ITGNP T
pt
t t
−−
(3)
and the public saving rate,
S ITGNP T
gt
t t
+−
. (4)
The model
The determinants of national saving can be captured with a model borrowed from the intertemporal approach to
the current account literature. In particular, we follow Obstfeld and Rogoff (1995 and 1996) and consider a one-good small
4 This source of possible mismeasurement will be dealt with in section 6.5 There are other problems with Colombian data. See López (1996).
6
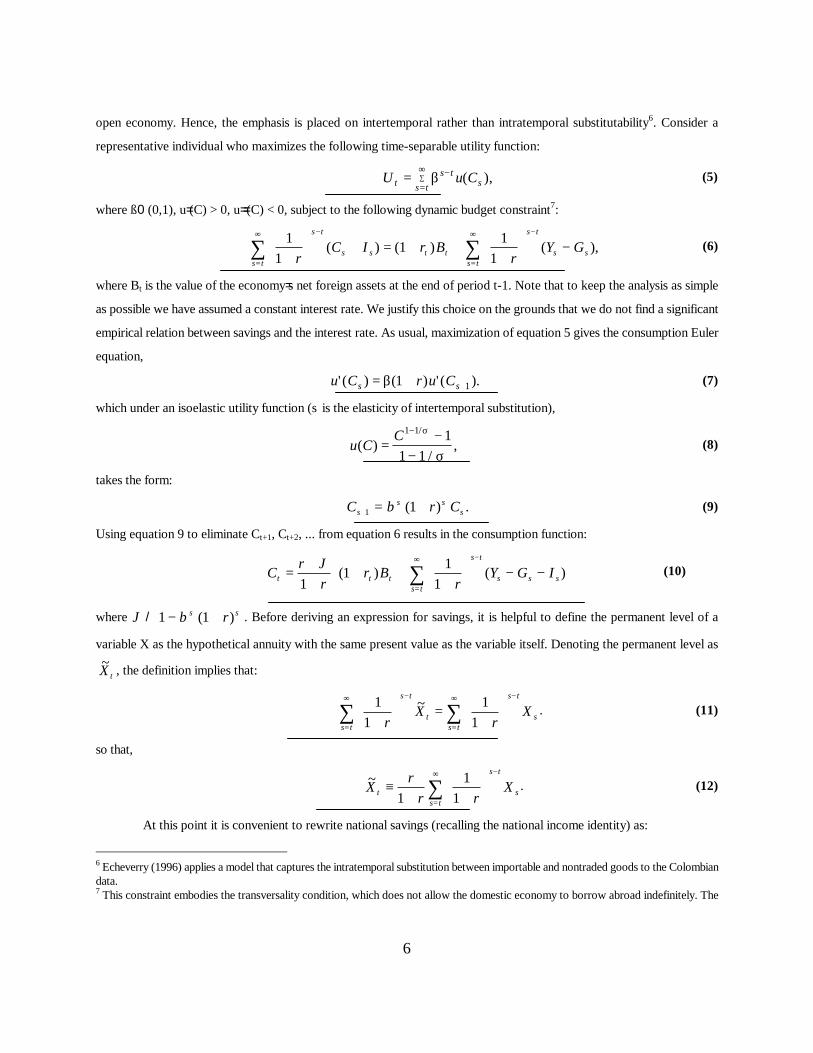
open economy. Hence, the emphasis is placed on intertemporal rather than intratemporal substitutability6. Consider a
representative individual who maximizes the following time-separable utility function:
U u Cts t
ss t= −
=
∞∑ β ( ), (5)
where ß0 (0,1), u=(C) > 0, u==(C) < 0, subject to the following dynamic budget constraint7:
11
11
1+
+ = + +
+
−
− −
=
∞
=
∞
∑∑ rC I r B
rY G
s t
s s t t
s t
s ss ts t
( ) ( ) ( ), (6)
where Bt is the value of the economy=s net foreign assets at the end of period t-1. Note that to keep the analysis as simple
as possible we have assumed a constant interest rate. We justify this choice on the grounds that we do not find a significant
empirical relation between savings and the interest rate. As usual, maximization of equation 5 gives the consumption Euler
equation,
u C r u Cs s' ( ) ( ) ' ( ).= + +β 1 1 (7)
which under an isoelastic utility function (s is the elasticity of intertemporal substitution),
u CC
( )/
,/
= −−
−1 1 11 1
σ
σ (8)
takes the form:
C r Cs s+ = +1 1βσ σ( ) . (9)
Using equation 9 to eliminate Ct+1, Ct+2, ... from equation 6 results in the consumption function:
Cr
rr B
rY G It t t
s t
s s ss t
= ++
+ ++
− −
−
=
∞
∑ϑ1
11
1( ) ( ) (10)
where ϑ / 1 1− +βσ σ( )r . Before deriving an expression for savings, it is helpful to define the permanent level of a
variable X as the hypothetical annuity with the same present value as the variable itself. Denoting the permanent level as~X t , the definition implies that:
11
11+
=
+
−
=
∞ −
=
∞
∑ ∑rX
rX
s t
s tt
s t
s ts
~ . (11)
so that,
~Xr
r rXt
s t
s ts≡
+ +
−
=
∞
∑11
1. (12)
At this point it is convenient to rewrite national savings (recalling the national income identity) as:
6 Echeverry (1996) applies a model that captures the intratemporal substitution between importable and nontraded goods to the Colombiandata.7 This constraint embodies the transversality condition, which does not allow the domestic economy to borrow abroad indefinitely. The
7
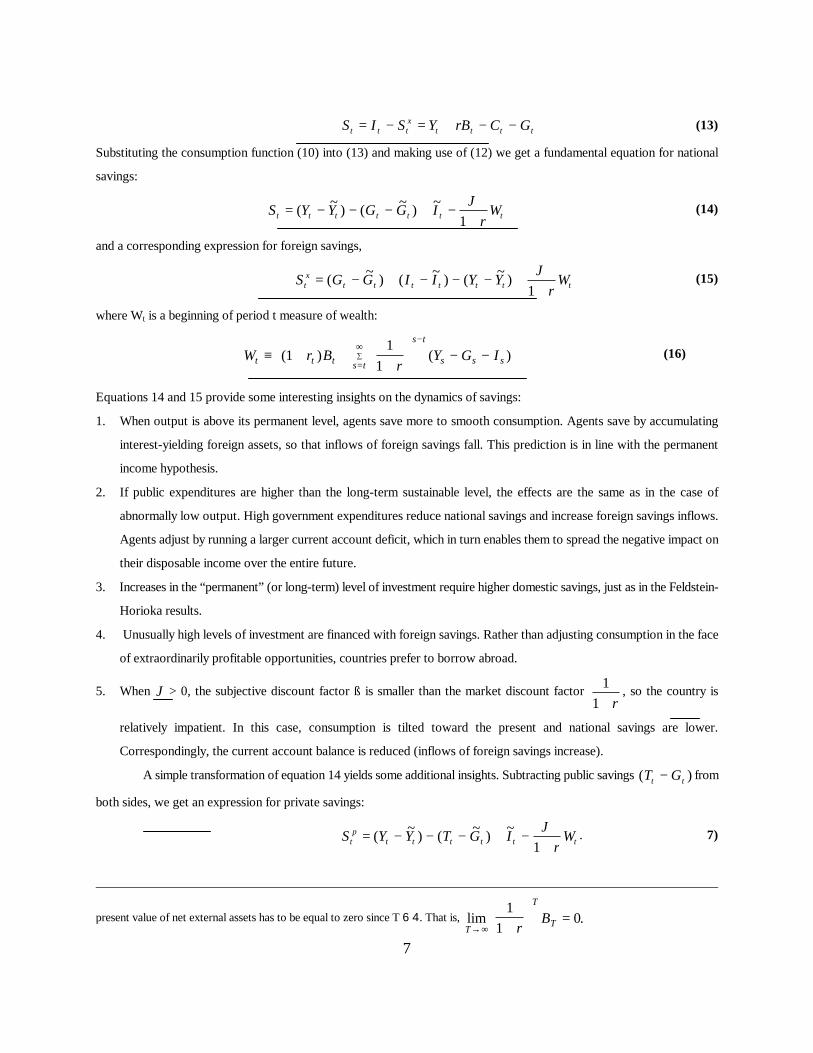
S I S Y rB C Gt t tx
t t t t= − = + − − (13)
Substituting the consumption function (10) into (13) and making use of (12) we get a fundamental equation for national
savings:
S Y Y G G Ir
Wt t t t t t t= − − − + −+
( ~ ) ( ~ ) ~ ϑ1
(14)
and a corresponding expression for foreign savings,
S G G I I Y Yr
Wtx
t t t t t t t= − + − − − ++
( ~ ) ( ~ ) ( ~ )ϑ
1 (15)
where Wt is a beginning of period t measure of wealth:
W r Br
Y G It t t
s t
s s ss t≡ + +
+
− −
−
=
∞∑( ) ( )1
11
(16)
Equations 14 and 15 provide some interesting insights on the dynamics of savings:
1. When output is above its permanent level, agents save more to smooth consumption. Agents save by accumulating
interest-yielding foreign assets, so that inflows of foreign savings fall. This prediction is in line with the permanent
income hypothesis.
2. If public expenditures are higher than the long-term sustainable level, the effects are the same as in the case of
abnormally low output. High government expenditures reduce national savings and increase foreign savings inflows.
Agents adjust by running a larger current account deficit, which in turn enables them to spread the negative impact on
their disposable income over the entire future.
3. Increases in the “permanent” (or long-term) level of investment require higher domestic savings, just as in the Feldstein-
Horioka results.
4. Unusually high levels of investment are financed with foreign savings. Rather than adjusting consumption in the face
of extraordinarily profitable opportunities, countries prefer to borrow abroad.
5. When ϑ > 0, the subjective discount factor ß is smaller than the market discount factor 11 + r
, so the country is
relatively impatient. In this case, consumption is tilted toward the present and national savings are lower.
Correspondingly, the current account balance is reduced (inflows of foreign savings increase).
A simple transformation of equation 14 yields some additional insights. Subtracting public savings ( )T Gt t− from
both sides, we get an expression for private savings:
S Y Y T G Ir
Wtp
t t t t t t= − − − + −+
( ~ ) ( ~ ) ~ ϑ1
. 7)
present value of net external assets has to be equal to zero since T 6 4. That is, lim .T
T
TrB
→ ∞ +
=
11
0

8
In this model, when taxes are above their permanent level private agents adjust by lowering their savings8. Unusually high
public savings are matched with lower private savings, so that ricardian equivalence holds. In other words, government
budget imbalances are irrelevant for resource allocation (they do not affect national savings). This, of course, does not
necessarily hold when world capital markets are imperfect, agents do not live infinitely, and taxes generate distortions.9
The model presented in this section leaves out some other aspects of potential relevance in explaining savings in
Colombia. Some of these factors are:10
1. Life cycle: The model does not capture heterogeneous agents whose savings depend on their age, according to the life
cycle hypothesis. Typically, the young and the retired dissave so that the higher the dependency ratio the lower the saving
rate.
2. Precautionary motive: The model assumes perfect foresight. When uncertainty is introduced and u’’’(C) > 0 it is
possible that individuals engage in precautionary saving behavior11. Agents save more when output is more variable.
For example, if the variability in rural production is higher than in urban output it is possible that saving rates fall as
the urbanization rate increases. It is also possible that greater macroeconomic instability, as captured by the variability
of inflation, results in higher precautionary saving.
3. Openness: The model assumes free trade and perfect capital mobility. When restrictions apply, distortions alter the
allocation of resources. For instance, when durable goods are imported, tariff and nontariff protection increases their relative
price and reduces overall consumption. It is also possible that firms= margins (as well as their savings) are higher under
protection.
4. Liquidity constraints: Capital market imperfections, such as borrowing constraints, have been a major focus of the
savings literature. In this case, the consumption Euler equation fails to hold, since agents cannot borrow against future
income if some form of collateral is not available12.
These four factors have some empirical support. In the case of the dependency ratio, Edwards (1995) and Jappelli
8 In this model the present value of government expenditures is equal to the present value of taxes (i.e., the government pays back its debt),so that the permanent level of expenditures is equal to the permanent level of taxes.9 The empirical evidence often refutes ricardian equivalence in the context of developing countries. The most frequent result is that anincrease in public savings reduces private savings but less than proportionally. Edwards (1995) estimates a -0.55 coefficient. Corbo andSchmidt-Hebbel (1991) distinguish between an increase in taxes (with coefficients between -0.48 and -0.65) and reductions in governmentexpenditures which lower private savings by less (between -0.16 and -0.50). The implication is that larger public savings are effective ingenerating increases in national savings. However, in the Colombian case, Carrasquilla and Rincón (1990) have failed to reject ricardianequivalence.10 Schmidt-Hebbel and Servén (1996) and Deaton (1995) provide excellent surveys of this literature.11 See Deaton (1995).12 Income distribution has also been mentioned as a possible determinant of savings. However, in this case the results are not conclusive.Menchnik and David (1983), Bunting (1991), Sahota (1993), Cook (1995) and Hong (1995), among others, find that savings dependpositively on inequality. But Della Valle and Oguchi (1976), Musgrove (1980), Edwards (1995), and Schmidt-Hebbel and Servén (1996)do not find a significant relation. In the Colombian case, Steiner and Escobar (1994) find a negative relation between labor/nonlaborincome ratio and savings in the national accounts.

9
and Pagano (1994) have found a negative relationship with savings, but the evidence is not yet conclusive (see Gersovitz,
1988). Based on the Colombian income and expenditure survey (1984-1985), Ramírez (1992) found that the young and the
retired save little. Indirect measures of the precautionary motive (such as the degree of urbanization) have shown a negative
relationship with savings (Edwards, 1995).
The evidence is more conclusive regarding liquidity constraints. For example, Jappelli and Pagano (1994) use the
loan-to-value ratio and consumption credit as proxies of borrowing constraints and find that these variables affect savings
negatively (in a panel of 19 countries). These results are consistent with those found by Hayashi, Ito, and Slemrod (1988),
Muellbauer and Murphy (1990), Bayoumi (1991), Miles (1992), and Guiso, Jappelli, and Terlizzese (1994). In the
Colombian context, López (1994) presents evidence in the same direction.
3. Savings in Colombia: Stylized Facts
Figure 1 shows national savings, foreign savings, and investment in Colombia during the 1925-1994 period13.
Although there are problems with the quality of data before 1950, on average it can be said that investment and national
saving rates have been lower in the postwar period. In this sense, it seems that these rates have shifted from a higher plateau
before 1950 to a lower one in the last 45 years. Figure 1 also suggests that national saving and investment rates move in
opposite directions (especially since the 1950s). Consequently, periods of high investment correspond to periods of high
foreign savings.
Figure 1
13 Expressed as percentages of GDP for the 1925-1949 period and as percentages of GNP for the 1950-1994 period. These unadjustedseries come from Cepal (1957) for the period 1925-1949, Banco de la República=s national accounts (1950-1969) and DANE´s nationalaccounts (1970 onward). Due to quality problems, data prior to 1950 should be used with caution.
Colombia: Saving and Investment Rates *1925-1994
-10
-5
0
5
10
15
20
25
30
35
40
Investment
National Saving
Foreign Saving

10
Figure 2A breaks down national savings into private and public savings14, while Figure 2B plots the permanent
or trend components of the same variables15. Clearly, there is a negative long-run trend in private saving rates, which fell
from over 20 percent in the pre-1950 period to less than 10 percent in recent years. However, this trend can be a
consequence of poor data quality before 1950. More reliable information (1950 onward) suggests greater stability in
private savings, especially since 1970. In fact, between 1972 and 1990 private saving rates fluctuated between 13 and
15 percent, a narrow margin given the variability of other macro variables in Colombia16.
Figure 2
14 Adjusted for inflation tax since 1950.15 In order to define the Apermanent@ level of the variables we use the filter suggested by Hodrick-Prescott . Besides the low applicationcost, this filter allows for better adjustment of the cyclical component to high and low frequencies of the series. This is done by minimizingthe sum of squared transitory fluctuations, subject to a Lagrange multiplier (?) that penalizes the variability of the trend component. Inorder to apply this filter it is necessary to establish a priori a value for ?. Although Hodrick and Prescott have recommended a valuebetween 100-400 for U.S. data, in a recent paper Suescún (1996) finds that 500 is the level that better reproduces Colombian businesscycles. We use this result in generating the permanent levels of GDP, government consumption, and investment.16 Such stable performance could explain the lack of studies on private savings in Colombia.
A. Components of Saving*1925-1994
-10
-5
0
5
10
15
20
25
30
35
1925
1928
1931
1934
1937
1940
1943
1946
1949
1952
1955
1958
1961
1964
1967
1970
1973
1976
1979
1982
1985
1988
1991
1994
National Saving
Private Saving
Public Saving
Foreign Saving
B. Permanent Components1925-1994
-3%
2%
7%
12%
17%
22%
27%
1925
1928
1931
1934
1937
1940
1943
1946
1949
1952
1955
1958
1961
1964
1967
1970
1973
1976
1979
1982
1985
1988
1991
1994
National Saving
Private Saving
Public Saving
Foreign Saving

11
Nonetheless, private saving rates have fallen abruptly since 1991, reaching a record low (8.5 percent) in 1994, due
both to households= and to private firms= saving decisions. Figure 3 shows that household saving rates have had a negative
trend since the early 1970s. On the other hand, private firms= savings (see Figure 3) were relatively stable between 1970
and 1984 and then, after a rapid increase during the late 1980s, collapsed in 1992.
Figure 3
Private Saving by Components
(as a % of GNP)
Finally, public saving rates have steadily increased from 2.5 percent before 1950, to 5 percent in the 1950s, to 10
percent in the 1990s (see figures 2A and 2B)17. In 1994, public savings became larger than private savings.
The interaction between public and foreign savings
A cursory look at Figure 2A suggests a negative correlation between public and foreign savings, except for the
1991-1994 period. Figure 4 decomposes foreign savings into public sector foreign borrowing, private sector foreign
17 Cárdenas and Olivera (1995) show that public investment rates also have an upward long-run trend in the case of Colombia.
A. Households
5
6
7
8
9
10
11
1970
1971
1972
1973
1974
1975
1976
1977
1978
1979
1980
1981
1982
1983
1984
1985
1986
1987
1988
1989
1990
1991
1992
1993
1994
B. Private Firms
1.0
2.0
3.0
4.0
5.0
6.0
7.0
1970
1971
1972
1973
1974
1975
1976
1977
1978
1979
1980
1981
1982
1983
1984
1985
1986
1987
1988
1989
1990
1991
1992
1993
1994
C. Financial Institutions
0.5
0.7
0.9
1.1
1.3
1.5
1.7
1.9
2.1
2.3
1970
1971
1972
1973
1974
1975
1976
1977
1978
1979
1980
1981
1982
1983
1984
1985
1986
1987
1988
1989
1990
1991
1992
1993
1994

12
borrowing, foreign direct investment, and change in foreign reserves (all the items below the current account in the balance
of payments). Interestingly, external savings mainly took the form of public sector foreign borrowing, at least until the 1990s.
It is worth mentioning that during the present decade the nature of external savings has been related to foreign direct
investment.
Figure 4
Much of the correlation between foreign and public saving is explained by the existence of the National Coffee
Fund, a public account created in 1940 that operates as a producers' price stabilization device. When world coffee prices
are above trend, an increase in the current account surplus is generated and, thus, Colombia experiences a reduction in its
foreign savings. On the other hand, due to its specific institutional design, the Fund saves more, generating an increase in
public savings. In other countries where stabilization funds exist, such as Côte d'Ivoire, surpluses are generally redistributed
to other sectors with low saving propensities, undermining their macroeconomic effectiveness18.
In addition, Colombia=s central government has traditionally run a countercyclical fiscal policy: high world coffee
prices are matched by lower government expenditures and, consequently, by a reduction in foreign borrowing. In sum, the
effects of exogenous shocks on the current account (e.g., coffee booms) have been partially offset by increases in public
savings19. However, Gómez and Thoumi (1986) argue in favor of the opposite causality; i.e., that higher public savings
substitute external savings.
18 See Cárdenas (1994).19 There is a broad literature on the countercyclical character of fiscal policy in Colombia. See, for example, Perry and Cárdenas (1986),and Ocampo, Londoño and Villar (1985). More recently, Cárdenas (1992) has shown that the amplitude of the Colombian business cycle
Foreign Savings Decomposition: 1950-1994Decade Averages (% of GDP)
-3.0
-2.0
-1.0
0.0
1.0
2.0
3.0
4.0
1950-1959 1960-1969 1970-1979 1980-1989 1990-1994
Public Sector Foreign Borrowing Private Sector Foreign Borrowing Foreign Direct Investment - Change in Reserves

13
We explore the nature of the negative correlation between public and foreign savings by implementing some
Granger causality tests on the data of Figure 2A. More specifically, we estimate a second-order VAR on foreign and public
savings. The coefficients on the two lags of public savings (in the foreign savings equation) are not significantly different
from zero. Similarly, the joint F-test on the two lags of foreign savings in the public savings equation indicates that the
coefficients are not statistically significant. In conclusion, using long-term data we do not find evidence of causality in either
direction20.
However, we can reject the null hypothesis that foreign savings do not cause public savings when the sample is
restricted to the 1950-1992 period. This is a puzzling result, which suggests that the nature of the relationship between
foreign and national savings has changed since the early 1990s. In fact, Figure 2A shows a rapid increase in the current
account deficit (foreign savings) matched by a decrease in private savings. Meanwhile, public savings have remained stable.
4. Savings, Investment, and Growth: Correlations and Causality tests
This section looks in detail at the savings-investment correlations in Colombia. The starting point of this literature
is Feldstein and Horioka (1980), who used cross-section data to estimate:
( / ) ( / )I Y S Y ut t t= + +α β 18)
Under full capital mobility the slope coefficient (ß) should be less than one: national savings look for the best investment
opportunity available in the international economy. However, they found that the coefficient is not significantly different from
one21. There are many possible explanations for this result, so the existence of a high correlation between national savings
and investment is by no means sufficient proof of capital immobility22.
Nonetheless, the framework of equation 18 is of limited use for time series analysis. A more adequate test of the
savings-investment correlation in the context of a single country over a time period is provided by Jensen and Schulze
(1996). They use an Error Correction Model (ECM) that captures the long-run theoretical relationship between the two
variables (the current account should revert to some equilibrium value in the long run) and also allows for a short-run
dynamic adjustment between them. In particular, we use the following ECM specification:
∆ ∆( / ) ( / ) ( / / )I Y S Y I Y S Y ut t t t= + + − +−α β γ 1 , (19)
where ß corresponds to the first-differences version of the Feldstein-Horioka coefficient and measures the impact of changes
in national savings on contemporaneous investment (short-run relationship). The error correction term, γ( / / )I Y S Y t− − 1 ,
captures the long-run identity or cointegrating relationship between both aggregates. Specifically, ? indicates the speed of
has been lower than in other coffee-producing nations.20 This is true when the VAR (2) is estimated with the full sample (1925-1994) as well as with the higher quality data (1950-1994). Theseresults are not reported but are available upon request.21 Feldstein and Bachetta (1991) reinforce the early findings with more recent data.22 The literature offers a wide array of models able to produce comovements in savings and investment in response to exogenous shocks.Market imperfections, in the context of labor mobility and international trade, are one possibility. But even under almost perfect marketsit is possible to reach similar results when technological shocks occur simultaneously in different countries. See Tesar (1991), Frankel(1993), and Obstfeld (1988 and 1995).
14
adjustment to short-run discrepancies between savings and investment (until the identity is reestablished). Low values of
? imply that short-run gaps take a long time to be corrected.
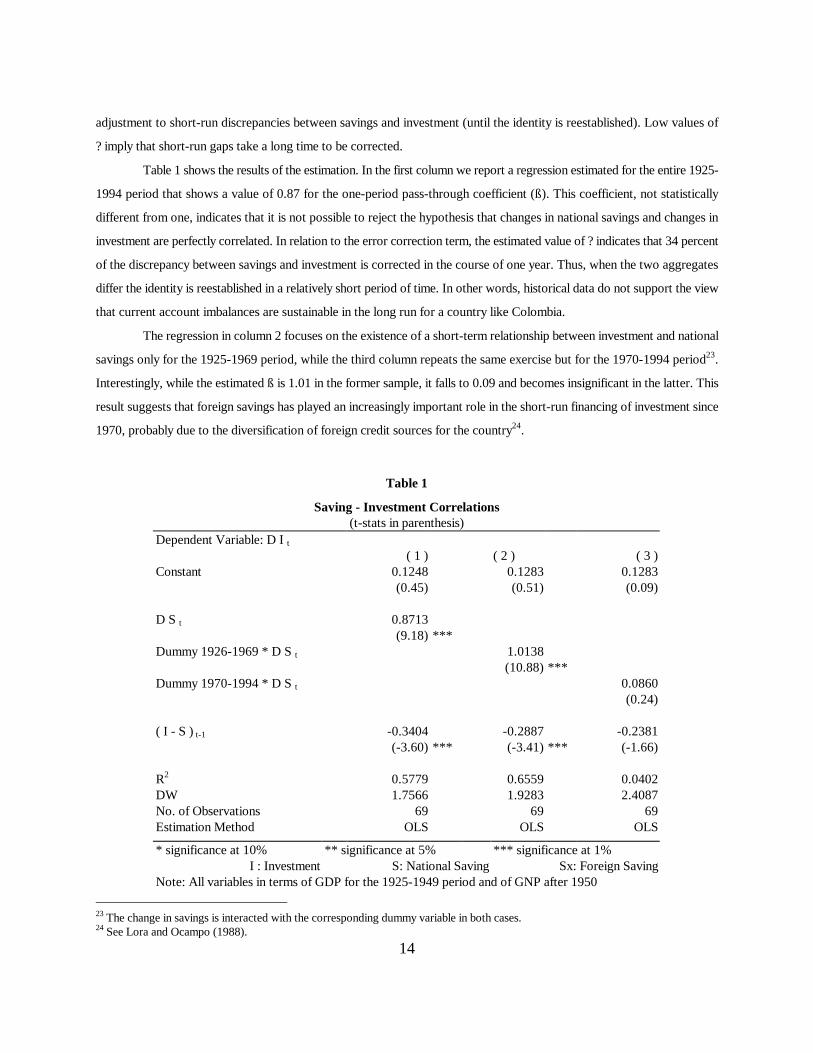
Table 1 shows the results of the estimation. In the first column we report a regression estimated for the entire 1925-
1994 period that shows a value of 0.87 for the one-period pass-through coefficient (ß). This coefficient, not statistically
different from one, indicates that it is not possible to reject the hypothesis that changes in national savings and changes in
investment are perfectly correlated. In relation to the error correction term, the estimated value of ? indicates that 34 percent
of the discrepancy between savings and investment is corrected in the course of one year. Thus, when the two aggregates
differ the identity is reestablished in a relatively short period of time. In other words, historical data do not support the view
that current account imbalances are sustainable in the long run for a country like Colombia.
The regression in column 2 focuses on the existence of a short-term relationship between investment and national
savings only for the 1925-1969 period, while the third column repeats the same exercise but for the 1970-1994 period23.
Interestingly, while the estimated ß is 1.01 in the former sample, it falls to 0.09 and becomes insignificant in the latter. This
result suggests that foreign savings has played an increasingly important role in the short-run financing of investment since
1970, probably due to the diversification of foreign credit sources for the country24.
Table 1
Saving - Investment Correlations(t-stats in parenthesis)
Dependent Variable: D I t( 1 ) ( 2 ) ( 3 )
Constant 0.1248 0.1283 0.1283(0.45) (0.51) (0.09)
D S t 0.8713(9.18) ***
Dummy 1926-1969 * D S t 1.0138(10.88) ***
Dummy 1970-1994 * D S t 0.0860(0.24)
( I - S ) t-1 -0.3404 -0.2887 -0.2381(-3.60) *** (-3.41) *** (-1.66)
R2 0.5779 0.6559 0.0402DW 1.7566 1.9283 2.4087No. of Observations 69 69 69Estimation Method OLS OLS OLS
* significance at 10% ** significance at 5% *** significance at 1%I : Investment S: National Saving Sx: Foreign Saving
Note: All variables in terms of GDP for the 1925-1949 period and of GNP after 1950 23 The change in savings is interacted with the corresponding dummy variable in both cases.24 See Lora and Ocampo (1988).

15
The high value of the pass-through coefficient for national savings can be indicative of a strong relationship
between savings and growth. We look at this issue by estimating a first-order vector autoregression of the growth rate and
the saving rate for the 1925-1994 period25. In order to concentrate on the low-frequency relationships we apply two different
procedures. First, we estimate a VAR with 10-year moving averages; and second, we define the growth rate as the
percentage change in the permanent component of GDP and use the ratio between permanent national savings and permanent
income as a measure of the saving rate26. The results, reported in Table 2, indicate no evidence of causality in either direction
when the 10-year moving averages are used. However, the opposite is true when the VAR (1) is estimated with the
permanent components. In fact, as indicated by the F-statistic, the coefficient on the lagged saving rate (in the growth
equation) is significantly different from zero, suggesting that past saving performance is helpful in predicting growth.
Similarly, the coefficient on the lagged growth (in the savings equation) is statistically significant. Thus, the evidence cannot
reject a strong relation between growth and savings, with causalities running in both directions.
Table 2
Granger Causality between Saving and GrowthCausality Sample # lags F-Stat P-ValueA. 10-year Moving Averages
From Growth to National Saving 1925-1994 1 0.1795 0.6739From National Saving to Growth 1925-1994 1 0.7440 0.3933
From Growth to National Saving 1950-1994 1 0.7440 0.3933From National Saving to Growth 1950-1994 1 0.1795 0.6739
B. Permanent Components
From Growth to Private Saving 1925-1994 1 6.2087 0.0034 **From Private Saving to Growth 1925-1994 1 2.5398 0.0870 *
From Growth to Private Saving 1950-1994 1 4.7396 0.0142 *From Private Saving to Growth 1950-1994 1 6.6022 0.0033 **
* significance at 10% ** significance at 5% Growth is the percentage rate of change in permanent income.
25 The results do not change when the sample is restricted to 1950-1994.26 As before, the permanent components are obtained using the Hodrick-Prescott filter.

16
5. Empirical Results: the Intertemporal Model
This section presents the estimation of the model discussed in Section 2. In particular, we analyze the determinants
of national, foreign, and private savings, based on equations 14, 15, and 17, respectively27. Variables with a tilde (~) denote
permanent components. Figure 5 presents Y Yt t− ~ , G Gt t− ~ , and I It − ~ (all as percentages of ~Yt ). The graphs replicate
the conventional wisdom about business cycles in Colombia, and confirm the perception that the 1990s have been
characterized by increases in government expenditures and investment over their permanent levels. Figure 6 shows two
additional variables of interest: T Tt t− ~ and T Gt t− ~ . They clearly indicate that taxes are not only above their permanent
level, but also well above the permanent level of government expenditures.
Figure 5
Deviations from Permanent Levels: 1950-1994
(as % of GDP’s permanent level)
Table 3 presents the results of the estimation. All the equations were estimated with ordinary least squares28. The
27 Unfortunately, it was not possible to construct a series of wealth (W).28 An alternative set of regressions estimated with two-stage least squares (not reported but available upon request) was used to performa Hausmann test to check for endogeneity of the regressors (the determinants of private investment presented in Cárdenas and Olivera,
A. GDP
-0.06
-0.04
-0.02
0.00
0.02
0.04
0.06
0.08
1950
1952
1954
1956
1958
1960
1962
1964
1966
1968
1970
1972
1974
1976
1978
1980
1982
1984
1986
1988
1990
1992
1994
B. Government expenditures
-0.03
-0.02
-0.01
0.00
0.01
0.02
0.03
0.04
1950 1953 1956 1959 1962 1965 1968 1971 1974 1977 1980 1983 1986 1989 1992
C. Investment
-0.05
-0.04
-0.03
-0.02
-0.01
0.00
0.01
0.02
0.03
0.04
1950 1953 1956 1959 1962 1965 1968 1971 1974 1977 1980 1983 1986 1989 1992
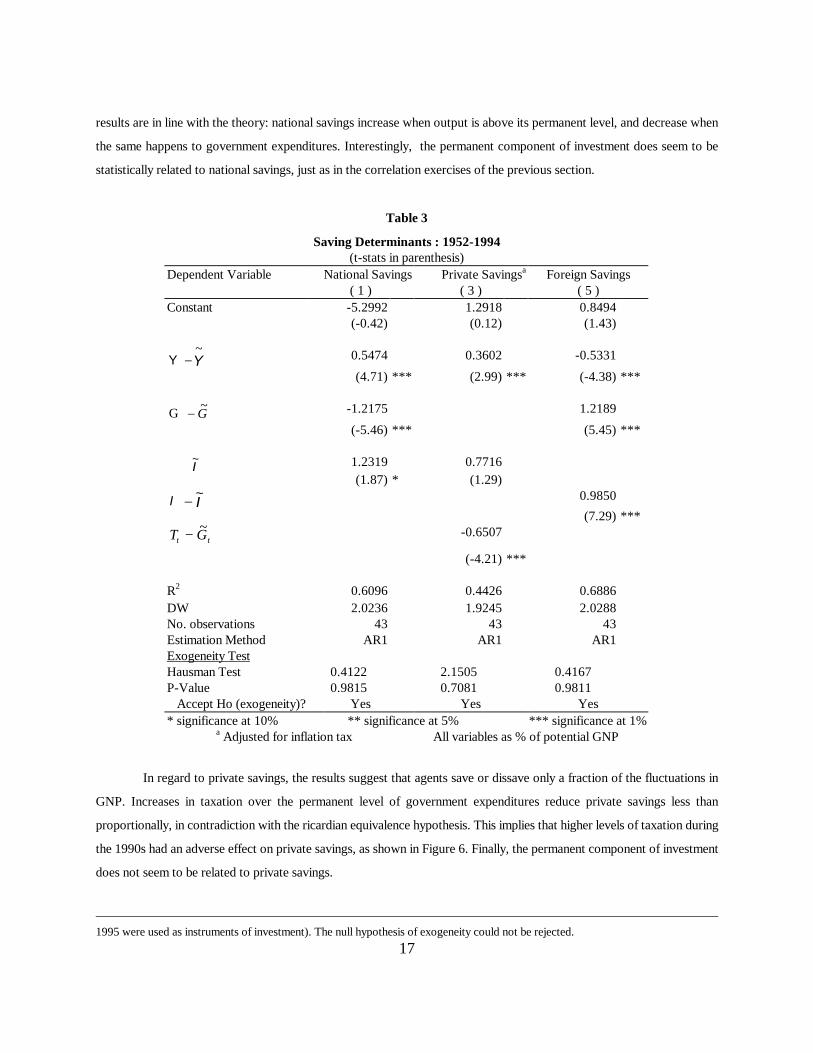
17
results are in line with the theory: national savings increase when output is above its permanent level, and decrease when
the same happens to government expenditures. Interestingly, the permanent component of investment does seem to be
statistically related to national savings, just as in the correlation exercises of the previous section.
Table 3
Saving Determinants : 1952-1994(t-stats in parenthesis)
Dependent Variable National Savings Private Savingsa Foreign Savings( 1 ) ( 3 ) ( 5 )
Constant -5.2992 1.2918 0.8494(-0.42) (0.12) (1.43)
Y Y−~ 0.5474 0.3602 -0.5331
(4.71) *** (2.99) *** (-4.38) ***
G G− ~ -1.2175 1.2189
(-5.46) *** (5.45) ***
I~ 1.2319 0.7716
(1.87) * (1.29)
I I− ~ 0.9850(7.29) ***
T Gt t− ~ -0.6507
(-4.21) ***
R2 0.6096 0.4426 0.6886DW 2.0236 1.9245 2.0288No. observations 43 43 43Estimation Method AR1 AR1 AR1Exogeneity TestHausman Test 0.4122 2.1505 0.4167P-Value 0.9815 0.7081 0.9811
Accept Ho (exogeneity)? Yes Yes Yes* significance at 10% ** significance at 5% *** significance at 1%
a Adjusted for inflation tax All variables as % of potential GNP
In regard to private savings, the results suggest that agents save or dissave only a fraction of the fluctuations in
GNP. Increases in taxation over the permanent level of government expenditures reduce private savings less than
proportionally, in contradiction with the ricardian equivalence hypothesis. This implies that higher levels of taxation during
the 1990s had an adverse effect on private savings, as shown in Figure 6. Finally, the permanent component of investment
does not seem to be related to private savings.
1995 were used as instruments of investment). The null hypothesis of exogeneity could not be rejected.

18
Figure 6
Taxes: 1950-1994
(as % of the GDP permanent level)
In turn, the determinants of foreign savings are explored in the last set of regressions. When output is above trend,
foreign savings decline (foreign debt is paid back). Increases in government expenditures over their permanent level tend
to be financed by running current account deficits and borrowing abroad. Also, as mentioned before, changes in the
investment rate (above trend) are financed with foreign savings.
6. Empirical Results: Additional Evidence on the Determinants of Private Savings
This section takes a more eclectic approach and assesses the determinants of private savings in a more general
framework. In addition to public and foreign savings, the estimated regressions include other variables that capture some
of the factors not included in the intertemporal model and listed at the end of section 2. In particular, the explanatory
D e v i a t i o n s f r o m o w n p e r m a n e n t l e v e l
- 0 . 0 4
- 0 . 0 3
- 0 . 0 2
- 0 . 0 1
0
0 . 0 1
0 . 0 2
0 . 0 3
0 . 0 4
0 . 0 5
1 9 5 0 1 9 5 3 1 9 5 6 1 9 5 9 1 9 6 2 1 9 6 5 1 9 6 8 1 9 7 1 1 9 7 4 1 9 7 7 1 9 8 0 1 9 8 3 1 9 8 6 1 9 8 9 1 9 9 2
D e v i a t i o n s f r o m g o v e r n m e n t e x p . p e r m a n e n t l e v e l
0
0 .02
0 .04
0 .06
0 .08
0 .1
0 .12
0 .14
0 .16
1950
1952
1954
1956
1958
1960
1962
1964
1966
1968
1970
1972
1974
1976
1978
1980
1982
1984
1986
1988
1990
1992
1994
19
variables include inflation volatility and the urbanization rate as proxies of the precautionary motive for saving. Age
dependency is used to capture the implications of the life-cycle hypothesis, and the average tariff measures the degree of
openness of the economy. Variables that measure liquidity constraints and the real interest rate were included but did not
come out significant.
Table 4 reports the results of the estimation. The regression reported in column 1 uses the entire 1925-1994 sample
and indicates that foreign and public savings have a negative impact on private savings. In addition, both the degree of
urbanization and the age dependency of the population have a negative effect on private savings. The volatility of inflation
does not seem to affect private savings in the long run (although the regressions with post-1970 data report the expected
positive sign).
The remaining regressions in Table 4 use data for the last 25 years, which are more reliable and can be further
disaggregated. It should be noticed that the negative effect of foreign savings on private savings is quite stable, always
between -0.3 and -0.4. Interestingly, this effect operates through household savings (column 7). Private firms= savings, on
the other hand, do not seem to depend on foreign savings. The negative effect of public savings on private savings confirms
the results of the previous section. On average, one extra peso of public savings reduces private savings by 50 cents.
However, as column 5 shows, the negative effect on private savings is larger when the increase in public savings comes from
an increase in taxes rather than a decrease in government expenditures. Average tariffs seem to have a positive effect on
savings, due entirely to the behavior of firms (column 8), the presumption here being that protection increases margins and
undistributed profits. Finally, real interest rates were not significant (columns 4 and 6), an important though common result
found in both theoretical and empirical literature on savings.
To capture the dynamics of these relationships we estimated a VAR (1) model on private, public, and foreign
savings, as well as average tariffs and inflation volatility. Urbanization and dependency rates were excluded given the low
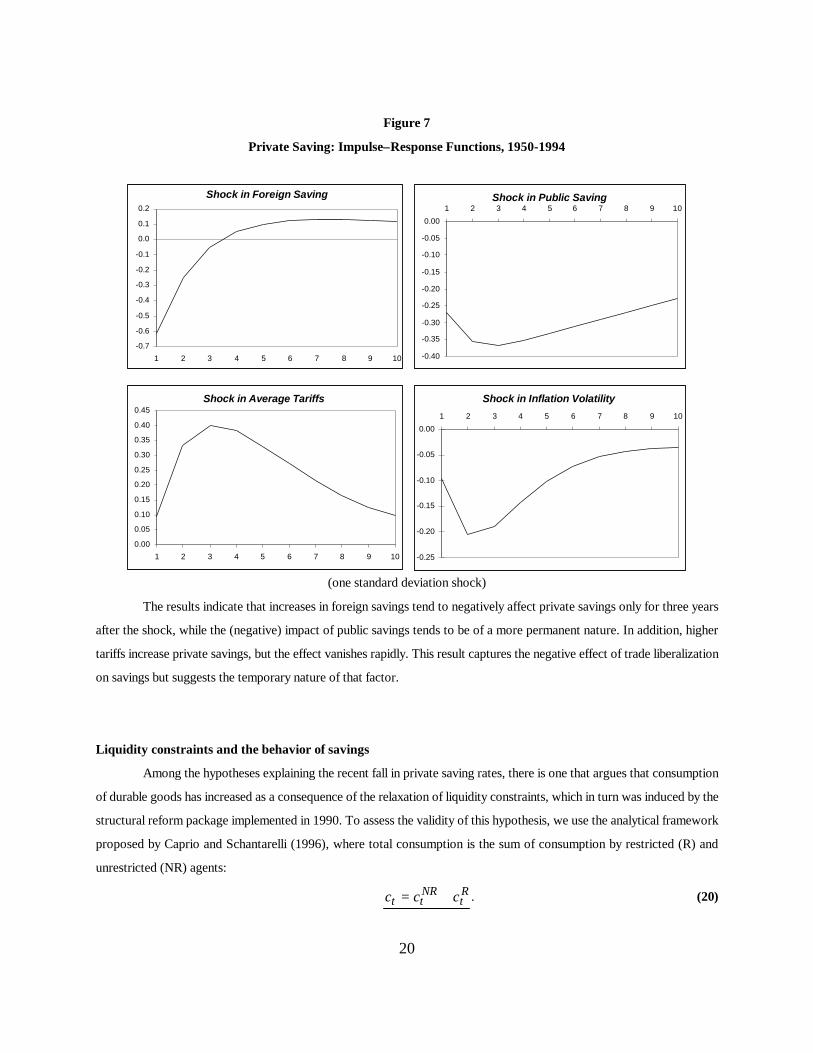
variance of the series29. The impulse response functions from this estimation are plotted in Figure 7. In particular, we
concentrate on the effects on private savings of a one standard deviation change in all the other variables. The VAR was
estimated with data from 1950 to 1994.
29 In all cases, the augmented Dickey-Fuller tests (reported in Table 1) did not reject the presence of unit roots in the series. The numberof lags (L) in the test corresponds to:
L Min j= +( , ),2 10
where j is the number of lags that minimizes the Akaike criteria (AIC). See Pantula et al. (1994). Under some specifications it is possibleto reject that foreign savings are I(1). For that reason, the VAR was also estimated excluding this variable without much change in theresults.
20
Figure 7
Private Saving: Impulse–Response Functions, 1950-1994
(one standard deviation shock)
The results indicate that increases in foreign savings tend to negatively affect private savings only for three years
after the shock, while the (negative) impact of public savings tends to be of a more permanent nature. In addition, higher
tariffs increase private savings, but the effect vanishes rapidly. This result captures the negative effect of trade liberalization
on savings but suggests the temporary nature of that factor.
Liquidity constraints and the behavior of savings
Among the hypotheses explaining the recent fall in private saving rates, there is one that argues that consumption
of durable goods has increased as a consequence of the relaxation of liquidity constraints, which in turn was induced by the
structural reform package implemented in 1990. To assess the validity of this hypothesis, we use the analytical framework
proposed by Caprio and Schantarelli (1996), where total consumption is the sum of consumption by restricted (R) and
unrestricted (NR) agents:
c c ct tNR
tR= + . (20)
Shock in Public Saving
-0.40
-0.35
-0.30
-0.25
-0.20
-0.15
-0.10
-0.05
0.00
1 2 3 4 5 6 7 8 9 10
Shock in Foreign Saving
-0.7
-0.6
-0.5
-0.4
-0.3
-0.2
-0.1
0.0
0.1
0.2
1 2 3 4 5 6 7 8 9 10
Shock in Average Tariffs
0.00
0.05
0.10
0.15
0.20
0.25
0.30
0.35
0.40
0.45
1 2 3 4 5 6 7 8 9 10
Shock in Inflation Volatility
-0.25
-0.20
-0.15
-0.10
-0.05
0.00
1 2 3 4 5 6 7 8 9 10

21
If the utility function is quadratic, the Euler equation for the unrestricted consumer is a random walk without drift:
c ctNR
tNR
t= +− 1 ε , (21)
while the restricted agents consume a fraction of their income:
c ytR
tR
t= +γ ω . (22)
Assuming that restricted consumers get a fraction ? of total income y (in logs), one can get:
c c yt tNR
t t t t= + + +− 1 γλ ε ω (23)
Lagging equations 21 and 23 in order to replace the unobservable value of , and assuming that ?_=_a + d=xt (where
xt is a dummy variable with a value of one after financial reform, i.e. 1991-1994), we get:
∆ ∆ ∆ ∆c y x y d y x vt t t t t t t= + + +− −γα γδ γ' '1 1 , (24)
where vt = et + ? ? t. Table 5 shows the results of estimating this last equation. The second term in equation 24 captures the
increase in the income elasticity of consumption after reforms, in line with the hypothesis of a relaxation in liquidity
constraints.
Table 5
Liquidity Constraints on Consumption Test(t-Statistics in parenthesis)
Dependent Variable: Consumption Growth
Sample 1926-1994 1950-1994 1970-1994( 1 ) ( 2 ) ( 3 )
Constant -1.8415 1.0300 0.8003(-1.36) (1.00) (0.62)
Growth in GDP 0.4488 -0.2421 -0.2242(1.72) * (-1.16) (-0.86)
Growth in GDP* Dummy9194 0.6422 0.7716 0.7985(1.07) (2.69) *** (2.78) **
GDP* Dummy91 0.0000 0.0000 0.0000(0.29) (0.04) (0.12)
R2 0.0617 0.1665 0.2786DW 2.6132 1.9832 1.8329No. of Observations 69 45 25Estimation Method MCO MCO MCO* significance at 10% ** significance at 5% *** significance at 1%
However, it is important to mention that other studies deemphasize the importance of this factor as an explanation
of the fall in private savings. For example, Echeverry (1996) argues that the temporary real appreciation induced by capital
inflows generated the expectation of a future real depreciation, overshooting the demand for durables. López, Misas, and

22
Oliveros (1996) conclude that other studies (e.g., Urrutia and López, 1994) overestimate the effects of financial liberalization
on private consumption. In their results, recent increases in consumption are attributed to higher labor income. López (1996)
argues that the collapse of private savings can hardly be explained by an adjustment in the stock of consumer durables (as
a consequence of trade liberalization).
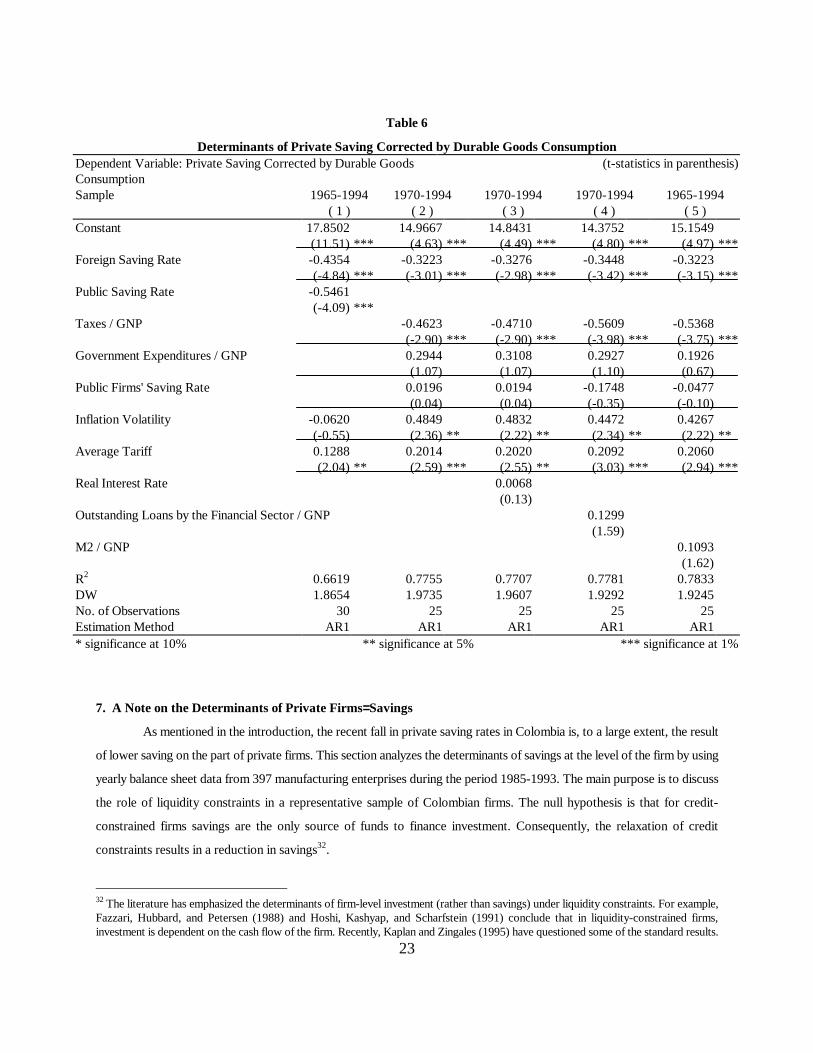
To gain more insight on this in the case of Colombia, we performed a last set of regressions on a different measure
of private savings. In the equations of Table 6 we follow the theory and measure consumption of durable goods as the flow
of services from the corresponding stock, assuming the remaining portion as saved in the current period.30. The results
confirm the negative effect of foreign and public savings on private savings (with coefficients similar to those found in Table
4), but financial variables such as M2/GNP and Total Credit/GNP were not significant31. This result could be taken as going
against the theory that structural reforms have relaxed existing liquidity constraints in Colombia. However, it should be
noticed that the correction of savings data by adding the saved portion of durable goods consumption left the behavior of the
series practically unchanged (see Figure 8).
Figure 8
30 We assume that durable goods depreciate linearly at a rate of 10 percent per year, meaning that the remaining 90 percent correspondto a saving decision. The results do not change when we correct with a factor equal to 1 minus the real interest rate. The definition ofconsumer durables used here is consistent with the one used in López (1996). See Table 2.31 Once more, the real interest rate was not significant.
P r i v a t e S a v i n g C o r r e c t e d b y D u r a b l e G o o d s C o n s u m p t i o nV a r i a b l e s a s % o f G N P
0
2
4
6
8
10
12
14
16
18
20Pr i va te Sav ing co r rec ted by du rab le goods consumpt ion
Pr i va te Sav ing
Saved po r t i on o f du rab le goods consumpt ion
23
Table 6
Determinants of Private Saving Corrected by Durable Goods ConsumptionDependent Variable: Private Saving Corrected by Durable GoodsConsumption
(t-statistics in parenthesis)
Sample 1965-1994 1970-1994 1970-1994 1970-1994 1965-1994( 1 ) ( 2 ) ( 3 ) ( 4 ) ( 5 )
Constant 17.8502 14.9667 14.8431 14.3752 15.1549(11.51) *** (4.63) *** (4.49) *** (4.80) *** (4.97) ***
Foreign Saving Rate -0.4354 -0.3223 -0.3276 -0.3448 -0.3223(-4.84) *** (-3.01) *** (-2.98) *** (-3.42) *** (-3.15) ***
Public Saving Rate -0.5461(-4.09) ***
Taxes / GNP -0.4623 -0.4710 -0.5609 -0.5368(-2.90) *** (-2.90) *** (-3.98) *** (-3.75) ***
Government Expenditures / GNP 0.2944 0.3108 0.2927 0.1926(1.07) (1.07) (1.10) (0.67)
Public Firms' Saving Rate 0.0196 0.0194 -0.1748 -0.0477(0.04) (0.04) (-0.35) (-0.10)
Inflation Volatility -0.0620 0.4849 0.4832 0.4472 0.4267(-0.55) (2.36) ** (2.22) ** (2.34) ** (2.22) **
Average Tariff 0.1288 0.2014 0.2020 0.2092 0.2060(2.04) ** (2.59) *** (2.55) ** (3.03) *** (2.94) ***
Real Interest Rate 0.0068(0.13)
Outstanding Loans by the Financial Sector / GNP 0.1299(1.59)
M2 / GNP 0.1093(1.62)
R2 0.6619 0.7755 0.7707 0.7781 0.7833DW 1.8654 1.9735 1.9607 1.9292 1.9245No. of Observations 30 25 25 25 25Estimation Method AR1 AR1 AR1 AR1 AR1* significance at 10% ** significance at 5% *** significance at 1%
7. A Note on the Determinants of Private Firms= Savings
As mentioned in the introduction, the recent fall in private saving rates in Colombia is, to a large extent, the result
of lower saving on the part of private firms. This section analyzes the determinants of savings at the level of the firm by using
yearly balance sheet data from 397 manufacturing enterprises during the period 1985-1993. The main purpose is to discuss
the role of liquidity constraints in a representative sample of Colombian firms. The null hypothesis is that for credit-
constrained firms savings are the only source of funds to finance investment. Consequently, the relaxation of credit
constraints results in a reduction in savings32.
32 The literature has emphasized the determinants of firm-level investment (rather than savings) under liquidity constraints. For example,Fazzari, Hubbard, and Petersen (1988) and Hoshi, Kashyap, and Scharfstein (1991) conclude that in liquidity-constrained firms,investment is dependent on the cash flow of the firm. Recently, Kaplan and Zingales (1995) have questioned some of the standard results.

24
Echavarría and Tenjo (1993), Ospina (1994), Sánchez, Murcia, and Oliva (1996), and Tenjo (1995) have analyzed
the determinants of firms= savings and investment in Colombia. Ospina (1994) finds that the elasticity of investment with
respect to variables that measure liquidity is larger in firms that are credit constrained. Tenjo (1995) argues that due to the
financial reform of 1991 firms have reduced their retention of profits. In the most comprehensive study on the topic, Sánchez,
Murcia and Oliva (1996) estimate a model that simultaneously determines investment, saving, and borrowing by firms. They
use the framework suggested in Dhrymes and Kurz (1967), as well as Myers and Maljuf (1984), and split the sample in two
periods (1983-1991 and 1992-1994) in order to test the effects of the financial reform of 1991. In their results, firms= savings
decreased after financial reform, partially due to capital inflows (large firms substituted savings for external credit, while
medium-sized firms substituted domestic credit for saving).
We explore this issue by estimating the following equation with panel data, where savings are defined as retained
profits (plus depreciation) by firms:
S f Taxes Liquidity Borrowing Liabilities Assetsfirms =+ − − − +
( , , , , / )Profits , (25)
where it is expected that firms save more when they get more profits. In turn, taxation (which corresponds to the difference
between total and pre-tax profits) negatively affects retained profits, greater liquidity (i.e., cash flow), and access to credit
(measured by the actual increase in the firm=s liabilities), all of which are associated with lower savings. However, the higher
the indebtedness of the firm (in relation to its own assets), the more difficulty it has obtaining new loans, so the higher the
need for savings. A dummy variable for the period after reforms (1991-1993) was included in all the equations. In addition,
the dummy variable was interacted with the other explanatory variables in order to capture changes in the coefficients after
the reform was implemented. According to the results of the Hausmann test, all regressions were estimated with random
effects.
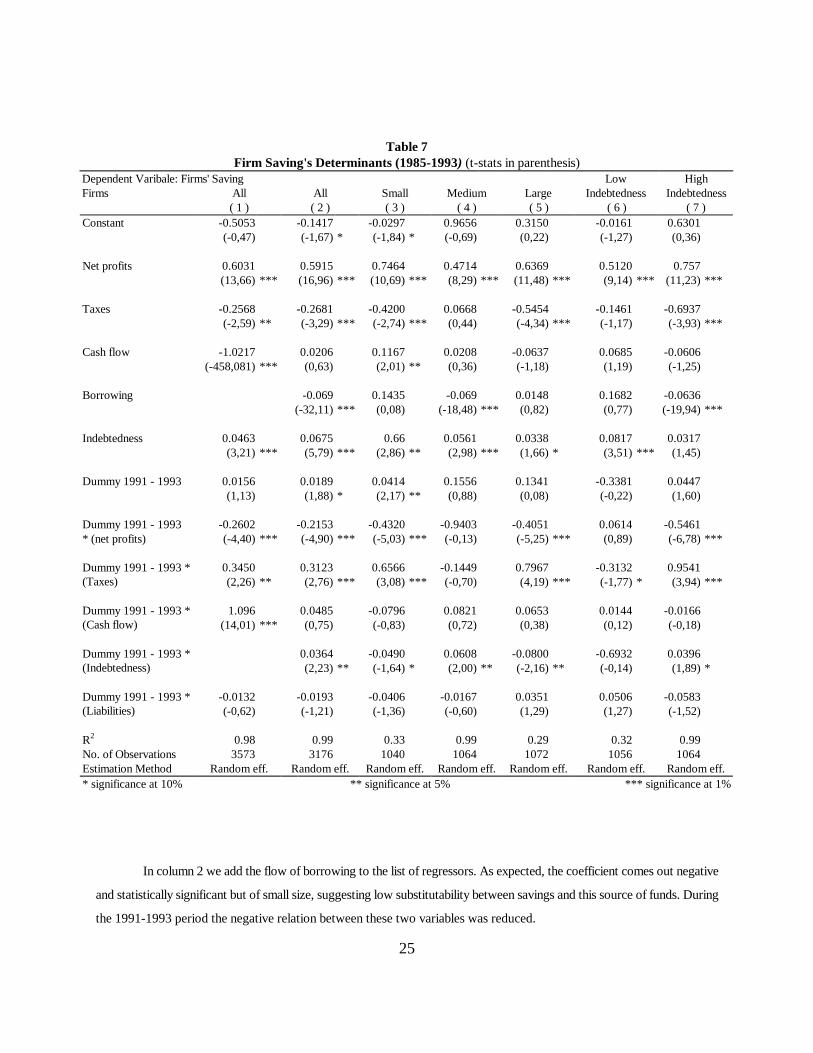
Column 1 in Table 7 indicates that all the variables are statistically significant and have the expected signs. In
particular, the propensity of firms to save (out of their net profits) fell from 0.6 to 0.34 after reforms. Higher taxation reduces
a firm=s saving rate but less than proportionally (although there does not seem to be an effect after 1991). The cash flow
variable has the expected negative sign until 1992. However, cash flow and saving decisions seem to be independent of each
other after the reforms. In addition, firms that have higher indebtedness (liabilities over assets) save more. Note that the
dummy variable alone is not significant, so the effects of reform operate through
the variables included in the regression.
25
Table 7Firm Saving's Determinants (1985-1993) (t-stats in parenthesis)
Dependent Varibale: Firms' Saving Low HighFirms All All Small Medium Large Indebtedness Indebtedness
( 1 ) ( 2 ) ( 3 ) ( 4 ) ( 5 ) ( 6 ) ( 7 )Constant -0.5053 -0.1417 -0.0297 0.9656 0.3150 -0.0161 0.6301
(-0,47) (-1,67) * (-1,84) * (-0,69) (0,22) (-1,27) (0,36)
Net profits 0.6031 0.5915 0.7464 0.4714 0.6369 0.5120 0.757(13,66) *** (16,96) *** (10,69) *** (8,29) *** (11,48) *** (9,14) *** (11,23) ***
Taxes -0.2568 -0.2681 -0.4200 0.0668 -0.5454 -0.1461 -0.6937(-2,59) ** (-3,29) *** (-2,74) *** (0,44) (-4,34) *** (-1,17) (-3,93) ***
Cash flow -1.0217 0.0206 0.1167 0.0208 -0.0637 0.0685 -0.0606(-458,081) *** (0,63) (2,01) ** (0,36) (-1,18) (1,19) (-1,25)
Borrowing -0.069 0.1435 -0.069 0.0148 0.1682 -0.0636(-32,11) *** (0,08) (-18,48) *** (0,82) (0,77) (-19,94) ***
Indebtedness 0.0463 0.0675 0.66 0.0561 0.0338 0.0817 0.0317(3,21) *** (5,79) *** (2,86) ** (2,98) *** (1,66) * (3,51) *** (1,45)
Dummy 1991 - 1993 0.0156 0.0189 0.0414 0.1556 0.1341 -0.3381 0.0447(1,13) (1,88) * (2,17) ** (0,88) (0,08) (-0,22) (1,60)
-0.2602 -0.2153 -0.4320 -0.9403 -0.4051 0.0614 -0.5461Dummy 1991 - 1993* (net profits) (-4,40) *** (-4,90) *** (-5,03) *** (-0,13) (-5,25) *** (0,89) (-6,78) ***
0.3450 0.3123 0.6566 -0.1449 0.7967 -0.3132 0.9541Dummy 1991 - 1993 *(Taxes) (2,26) ** (2,76) *** (3,08) *** (-0,70) (4,19) *** (-1,77) * (3,94) ***
1.096 0.0485 -0.0796 0.0821 0.0653 0.0144 -0.0166Dummy 1991 - 1993 *(Cash flow) (14,01) *** (0,75) (-0,83) (0,72) (0,38) (0,12) (-0,18)
0.0364 -0.0490 0.0608 -0.0800 -0.6932 0.0396Dummy 1991 - 1993 *(Indebtedness) (2,23) ** (-1,64) * (2,00) ** (-2,16) ** (-0,14) (1,89) *
-0.0132 -0.0193 -0.0406 -0.0167 0.0351 0.0506 -0.0583Dummy 1991 - 1993 *(Liabilities) (-0,62) (-1,21) (-1,36) (-0,60) (1,29) (1,27) (-1,52)
R2 0.98 0.99 0.33 0.99 0.29 0.32 0.99No. of Observations 3573 3176 1040 1064 1072 1056 1064Estimation Method Random eff. Random eff. Random eff. Random eff. Random eff. Random eff. Random eff.* significance at 10% ** significance at 5% *** significance at 1%
In column 2 we add the flow of borrowing to the list of regressors. As expected, the coefficient comes out negative
and statistically significant but of small size, suggesting low substitutability between savings and this source of funds. During
the 1991-1993 period the negative relation between these two variables was reduced.

26
The remaining regressions in Table 7 repeat the same exercise for different groups of firms according to their size
(small, medium, and large) and level of indebtedness (low and high). Columns 3 through 5 indicate that saving by small firms
depends crucially on their profits, tax payments, and cash flow (this last variable with a positive sign). Borrowing (which
was severely limited for these firms) has a negative relation with saving in the recent period. In contrast, indebtedness (stock)
and borrowing (flow) are the only determinants of saving for medium-sized firms (column 4). In the case of presumably less
credit-constrained large corporations, neither cash flow nor borrowing affect saving (column 5). Only in the latter period
(1991-1993) can one observe a negative relation between borrowing and savings, indicating some substitutability between
these two sources of funds.
Other interesting results emerge when the sample is divided according to borrowing levels. In the case of firms with
low levels of indebtedness, saving depends on their own profits (column 6). For highly indebted firms (column 7) the impact
of profits on savings was substantially reduced after reforms. Also, the greater the cash flow the lower their savings,
reflecting greater substitutability between these two sources of financing. It is worth noticing that for these firms, increases
in the stock of debt are not associated with a larger saving effort.
8. Conclusions
This paper has analyzed the determinants of savings in Colombia using the framework of an intertemporal model.
National savings partially respond to temporary changes in output, according to the permanent income hypothesis. Higher
government expenditures (in relation to their permanent level) are associated with lower national saving rates, thus
disproving the ricardian equivalence hypothesis. In other words, it is possible to increase national saving rates by raising
the public sector saving rate (preferably through cuts in expenditures rather than higher taxation).
Apart from the predictions obtained from the intertemporal approach, the paper tests other common hypotheses
regarding saving behavior. In particular, we find that changes in national savings and changes in investment are perfectly
correlated, and that savings cause growth (in the Granger sense). Moreover, 34 percent of the national savings-investment
deviations are corrected in the course of one year. Thus, the historical data do not support the view that current account
imbalances are sustainable in the long run for a country like Colombia. Additional econometric evidence found in the paper
suggests that increases in urbanization and age dependency have had a significantly negative effect on private savings in
Colombia.
The paper also argues that much of the recent reduction in private savings can be accounted by the increase in
current government expenditures as well as by the effects of higher taxation. On the other hand, lower margins induced by
trade liberalization explain the reduction in saving by firms.
According to our results, the recent decline in private savings is of temporary nature, so no major offsetting policy
interventions are required. However, we recommend a change in fiscal policy in order to obtain an overall increase in

27
national savings. In particular, higher public savings are required, especially through a reduction in current levels of
government expenditures. The key aspect to emphasize is that counter-reforms reintroducing protection and financial
repression would be unwise. Increases in private savings will come only as pension reform matures and firms= margins
recover based on productivity gains. Moreover, the paper establishes a close inverse relationship between private and foreign
savings, so the lower current account deficit expected in future years will probably be matched by an increase in private
savings.
References
Bayoumi, Tamim (1991) “Financial Deregulation and Household Behavior,” mimeo, Bank of England.
Bunting, D. (1991) “Savings and the Distribution of Income,” Journal of Post-Keynesian Economics 14: 3-22.
Cárdenas, Mauricio (1992) “Ciclos Económicos y Bonanzas Exportadoras: Teoría y evidencia en cuatro países productores de café,”
Ensayos sobre Política Económica, June.
Cárdenas, Mauricio (1994) “Stabilization and Redistribution of Coffee Revenues: A Political Economy Model of Commodity Marketing
Boards,” Journal of Development Economics, 44: 351-380.
Cárdenas, Mauricio and Andrés Escobar (1996) “Macroeconomía y Mercado de Capitales,” mimeo, Misión de Estudios del Mercado
de Capitales.
Cárdenas, Mauricio and Mauricio Olivera (1995) “La Crítica de Lucas y la Inversión en Colombia: Nueva evidencia,” Ensayos sobre
Política Económica, 27: 95-138, June.
Carrasquilla, A. and H. Rincón (1990) “Relaciones entre el Déficit Público y Ahorro Privado: Aproximaciones al caso colombiano,”
Ensayos sobre Política Económica, 18:
Carroll and Weil (1994) “Saving and Growth: A Reinterpretation,” Carnegie-Rochester Conference Series on Public Policy 40: 133-191.
Cook, C. (1995) “Saving Rates and Income Distribution: Further Evidence from LDCs,” Applied Economics 27: 71-82
Corbo, Vittorio and Klaus Schmidt-Hebbel (1991) “Public Policies and Saving in Developing Countries,” Journal of Development
Economics 36: 89-115.
Deaton, Angus (1995) “Growth and saving: What do we know, what do we need to know, and what might we learn?” mimeo, Research
Program in Development Studies, Princeton University.
Della Valle, P. and N. Oguchi (1976) “Distribution, the Aggregate Consumption Function and the Level of Economic Development: Some
Cross-Country Results,” Journal of Political Economy 84: 1325-1334.
Dhrymes, P. and M. Kurz (1967) “Investment, Dividends, and External Finance Behavior of Firms,” in R. Ferver (ed.), Determinants of
Investment Behavior, Columbia University Press, for NBER.
Echavarría, Juan José and F. Tenjo (1993), “Inversión, liquidez y fuentes de financiación en la industria colombiana,” Coyuntura
Económica, 103-137, June.
Echeverry, Juan Carlos (1996) “The Fall in Colombian Savings During the 1990s: Theory and Evidence,” mimeo, Banco de la República,
Colombia.
Edwards, Sebastian (1995) “Why are Saving Rates so Different Across Countries?: An International Comparative Analysis,” NBER
28
Working Paper 5097.
Fazzari, Steven M, R. Glenn Hubbard, and Bruce C. Petersen (1988) “Financing Constraints and Corporate Investment,” Brookings
Papers on Economic Activity 1: 141-195.
Feldstein, Martin (1983) “Domestic Savings and International Capital Movements in the Long Run and the Short Run,” European
Economic Review, 21: 129-151.
Feldstein, Martin and C. Horioka (1980) “Domestic Savings and International Capital Flows,” Economic Journal 90: 314-329.
Feldstein, M. and P. Bachetta (1991) “National Saving and International Investment,” in B. D. Bernheim and J. B. Shoven (eds.), National
Saving and Economic Performance, University of Chicago Press, Chicago.
Frankel, Jeffrey A. (1989) “Quantifying International Capital Mobility in the 1980s,” NBER Working Paper 2856.
Frankel, Jeffrey A. (1993) “Quantifying Capital Mobility in the 1980s,” in J. A. Frankel, On Exchange Rates, MIT Press, Cambridge, MA.
Gersovitz, M. (1988) “Savings and Development,” in H. Chenery and T. Srinivasan (eds.), Handbook of Development Economics Vol.
1, North-Holland, Amsterdam.
Giovannini, Alberto (1985) “Saving and the Interest Rate in LDCs,” Journal of Development Economics, 18: 197-217.
Gómez, Hernando José and F. Thoumi (1986) “Una nota sobre la relación entre el financiamiento externo y la inversión pública en
Colombia," Coyuntura Económica, 3: 196-203, October.
Guiso, Luigi, Tullio Jappelli, and Daniele Terlizzese (1994) “Why is Italy=s Saving Rate so High?”, in Albert Ando, Luigi Guiso, and
Ignazio Visco (eds.), Saving and the Accumulation of Wealth, Essays on Italian Household Government Behavior, Cambridge
University Press.
Hayashi, Fumio, Takatoshi Ito, and Joel Slemrod (1988) “Housing Finance Imperfections, Taxation and Private Saving: a Comparative
Simulation Analysis of the United States and Japan,” Journal of Japanese and International Economics, II: 215-238.
Hong, K. (1995) “Income Distribution and Aggregate Saving,” mimeo, Harvard University.
Hoshi, Takeo, Anil Kashyap, and David Scharfstein (1991) “Corporate Structure, Liquidity and Investment: Evidence from Japanese
Industrial Groups,” Quarterly Journal of Economics, 33-60, February.
Jappelli, Tullio and Marco Pagano (1994) “Saving, Growth and Liquidity Constraints,” Quarterly Journal of Economics, 83-109,
February.
Jensen, W. J. and G. Schulze (1996) “Theory-Based Measurement of the Saving-Investment Correlation with an Application to Norway,”
Economic Inquiry, XXXIV: 116-132.
Kaplan, Steven N. and Luigi Zingales (1995) “Do Financing Constraints Explain Why Investment Is Correlation is Correlated with Cash
Flows?” NBER Working Paper 5267.
López, Alejandro (1994) “La Teoría del Ingreso Permanente y las Restricciones de Liquidez en Colombia,” in R. Steiner (ed.),
Estabilización y Crecimiento, Tercer Mundo-Fedesarrollo, Bogotá.
López, Alejandro (1996) “)Por qué cayó el ahorro en Colombia a comienzos de la década del noventa?” Coyuntura Económica XXVI,
4: 137-168, December.
López, Alejandro, M. Misas, and Hugo Oliveros (1996) “Understanding Consumption in Colombia,” mimeo, The World Bank, July.
Menchnik, P. and M. David (1983) “Income Distribution, Lifetime Savings, and Bequests,” American Economic Review, 73: 672-690.
Miles, David (1992) “Housing Markets, Consumption and Financial Liberalisation in the Major Economies,” European Economic Review,
XXXVI: 1093-1127.
Miller, Merton H. and Franco Modigliani (1961) “Dividend Policy, Growth and the Valuation of Shares,” Journal of Business, 34: 411-
29
433, October.
Muellbauer, John and Anthony Murphy (1990) “The UK Current Account Deficit,” Economic Policy, 347-395, October.
Musgrove, P. (1980) “Income Distribution and the Aggregate Consumption Function,” Journal of Political Economy, 88: 504-525.
Myers, S. C. and N. S. Majluf (1984) “Corporate Financing and Investment Decisions When Firms Have Information that Investors Do
Not Have,” Journal of Financial Economics 13: 187-221.
Obstfeld, Maurice (1988) “How Integrated Are World Capital Markets,” in Ronald Findlay et. al (eds.), Debt, Stabilization, and
Development: Essays in Memory of Carlos Diaz-Alejandro, Basil Blackwell, Oxford.
Obstfeld, Maurice (1995) “International Capital Mobility in the 1990s,” in Peter B. Kenen (ed.), Understanding Interdependence. The
Macroeconomics of the Open Economy, Princeton University Press, Princeton.
Obstfeld, Maurice and K. Rogoff (1995) “The Intertemporal Approach to the Current Account,” in Gene Grossman and Kenneth Rogoff
(eds.), Handbook of International Economics, Vol. 3, North-Holland, Amsterdam.
Obstfeld, Maurice and K. Rogoff (1996) Foundations of International Macroeconomics, MIT Press, Cambridge, MA.
Ocampo, José Antonio and Eduardo Lora (1988) Colombia y la Deuda Externa: de la Moratoria de los Treinta a la Encrucijada de
los Ochenta, Fedesarrollo-Tercer Mundo.
Ocampo, José Antonio, J. L. Londoño, and L. Villar (1985) “Ahorro e Inversión en Colombia,” Coyuntura Económica, June.
Ogaki, Masao, Johnathan D. Ostry, and Carmen M. Reinhart (1994) “Saving Behavior in Low- and Middle-Income Developing Countries:
A Comparison,” mimeo, International Monetary Fund.
Ospina, Sandra Patricia (1994) “Firm Heterogeneity, Liquidity Variables and Investment Decisions: The Colombian Case,” mimeo,
University of Illinois.
Perry, Guillermo and M. Cárdenas (1986) Diez años de reformas tributarias en Colombia: 1974-1984, Universidad Nacional de
Colombia (CID)-Fedesarrollo, Bogotá.
Ramírez, Manuel (1992) “El ahorro en Colombia,” in , Cambios Estructurales y Crecimiento, Ediciones Uniandes, Bogotá.
Sahota, G. (1993) “Saving and Distribution,” in J. H. Gapinski (ed.), The Economics of Saving, Kluwer Academic Publishers,
Sánchez, Fabio, Guillermo Murcia, and Carlos Oliva (1996) “La Dinámica de la Inversión y el Ahorro Empresarial en Colombia: 1983-
1994,” mimeo, Departamento Nacional de Planeación and Inter-American Development Bank.
Schmidt-Hebbel, Klaus and Luis Servén (1996) “Income Inequality and Aggregate Saving, The Cross Country Evidence,” Policy Research
Working Paper 1561, The World Bank.
Steiner, Roberto and Andrés Escobar (1994): Colombia: Ahorro en Declive, Financiamiento en Auge, mimeo, Fedesarrollo.
Suescún, Rodrigo (1996) “Commodity booms, dutch disease, and real business cycles in a small semi-open economy: the case of coffee
in Colombia,” mimeo, Banco de la República, June.
Tenjo, Fernando (1995) “Restricciones Financieras, Comportamiento de las Empresas Manufactureras y Perspectivas para el Desarrollo
del Mercado de Capitales en Colombia,” mimeo, Misión de Estudios del Mercado de Capitales.
Tesar, L. L. (1991) “Savings, Investment, and International Capital Flows,” Journal of International Economics 31: 55-78.
Urrutia, Miguel and Alejandro López (1994) “La relajación de las restricciones de liquidez y el aumento del consumo privado,” Revista
del Banco de la República, August.