FIM SAVINGS SUMMARY Annual Electric Consumption
359
Proprietary and Confidential © Siemens Industry IGA Report – May, 2019 – | Page 361 Siemens – Broward County, Investment Grade Audit | May 2019 FIM SAVINGS SUMMARY Annual Electric Consumption: 32,814 kWh Annual Electric Demand: 539 kW FIM Financial Summary Building or Facility Description SAVINGS Electric KWh $ SAVINGS Electric KW $ SAVINGS Water $ SAVINGS O & M Total Savings Project Costs Simple Payback Lauderhill Library Split System 1,903.30 $ 6,168.40 $ - $ - $ 8,071.70 $ 109,239.74 $ 13.5 Exhibit 2B Page 1
-
Upload
khangminh22 -
Category
Documents
-
view
2 -
download
0
Transcript of FIM SAVINGS SUMMARY Annual Electric Consumption

Proprietary and Confidential © Siemens Industry IGA Report – May, 2019 – | Page 361
Siemens – Broward County, Investment Grade Audit | May 2019
FIM SAVINGS SUMMARY
Annual Electric Consumption: 32,814 kWh
Annual Electric Demand: 539 kW
FIM Financial Summary
Building or Facility DescriptionSAVINGS
Electric KWh $SAVINGS
Electric KW $SAVINGSWater $
SAVINGSO & M
TotalSavings Project Costs Simple
PaybackLauderhill Library Split System 1,903.30$ 6,168.40$ -$ -$ 8,071.70$ 109,239.74$ 13.5
Exhibit 2B Page 1

Proprietary and Confidential © Siemens Industry IGA Report – May, 2019 – | Page 362
Siemens – Broward County, Investment Grade Audit | May 2019
D.27. Library - Main
FACILITY DESCRIPTION
The Main Library is an 8-story, 281,000square foot building constructed in 1983and located at 100 S Andrew Ave. Thebuilding itself is a County protectedarchitectural landmark. The interior spacesconsist of book stacks, reading spaces,archives, small museum exhibits andgalleries, offices, meeting rooms, and theCultural Information Center. These entities,as well as the remaining library space, andtheir hours of operations are as follows:
Main Library:
Sunday: closed
Monday: 10AM – 6PM
Tuesday: 12 noon – 8PM
Wednesday: 12 noon – 8PM
Thursday: 10AM – 6PM
Friday: 10AM – 6PM
Saturday: 10AM – 6PM
Observations during Visit:
∂ Water leaks in the building from concrete planters in patios
∂ Windows were recently replaced
∂ Water infiltration issues from fire dampers (largest problem on the 8th floor)
Water Leak Sources
Exhibit 2B Page 2

Proprietary and Confidential © Siemens Industry IGA Report – May, 2019 – | Page 363
Siemens – Broward County, Investment Grade Audit | May 2019
COOLING SYSTEM:
Cooling for the building is provided by a chiller plant consisting of two (2) water-cooled Yorkchillers. Chiller #1 is a two-pass machine of approximately 350 tons with a heat recoverypackage connected to the condenser barrel. Two 15 HP pumps used to circulate therecovered hot water. Chiller #2 is also a two-pass system without the heat recovery bundleand is approximately a 350 ton machine. Chillers are operated as lead/lag.
Chiller #1
Chiller #2
Chilled-water is distributed via two (2) chilled-water and two (2) condenser water pumps. Allhave 25 HP motors, 1050 GPM pumps, and each is equipped with a variable frequency drive(VFD).
Chiller Plant Pumps
Exhibit 2B Page 3

Proprietary and Confidential © Siemens Industry IGA Report – May, 2019 – | Page 364
Siemens – Broward County, Investment Grade Audit | May 2019
Plant Observations during Visit:
∂ Chiller #1, CHWP #1 and CWP #1 were running∂ Chiller #2 was off (down for repair)∂ CHWP #2 and CWP #2 were off and VFD was locked out∂ Chilled-water temperature leaving: 45.2F∂ Chilled-water temperature returning: 54.6F∂ Delta T of: 9.4F∂ Condenser water leaving temperature: 89.3F∂ Condenser water return temperature: 81.1F∂ Amperage: 257, 271, 266; Average of 264.7 Amps∂ BTU/Hr: 2633 x 1k (219 tons)∂ Calculated chiller efficiency: 0.9 kW/ton
There are two (2) cooling towers for the chiller plant located on the roof. At the time of thevisit, one floor was experiencing an overspill of water.
Chiller Plant Cooling Towers
AIR DISTRIBUTION SYSTEM
Chilled-water is distributed to approximately 18 air handling units (AHUs) throughout thebuilding. Typically, each floor has two (2) AHUs; serving each the west and east sides of thebuilding. There are a couple of units that are used for dedicated spaces; such an AHU for thearchives section of the 6th floor and a couple of Liebert machines for the data center on the7th floor. The AHUs on the west side of the building have been recently replaced.
All AHUs are located in mechanical rooms, usedas plenums, and are all equipped with VFDs.The units are capable of modulating return andoutside air intake via dampers situated withinthe ductwork.
The layout to the right helps to identifylocations of AHUs and areas served. TheOrange Wall is considered the west side of thebuilding and the Blue wall the east. Mechanicalrooms are situated above each other on eachfloor along these colored walls.
Exhibit 2B Page 4

Proprietary and Confidential © Siemens Industry IGA Report – May, 2019 – | Page 365
Siemens – Broward County, Investment Grade Audit | May 2019
The air is distributed throughout the building via a variable air volume (VAV) system. It wasapproximated that half of these VAV boxes are currently reliable. The VAV boxes observedduring the site visit appear to utilize electric reheating.
The following table breaks down the AHU equipment information as noted during the audit.
Location / Service Area AHU Fan HP VFD? Hz
1st Floor East AHU-1 25 Yes 41
1st Floor West AHU-2 20 Yes 28
2nd Floor East AHU-6 40 Yes 24
2nd Floor West AHU-7 25 Yes 24
3 rd Floor East AHU-4 15 Yes 60
3 rd Floor West AHU-8 40 Yes 24
4th Floor East AHU-9 30 Yes 24
4th Floor West AHU-10 40 Yes 37
5th Floor East AHU-11 30 Yes 24
5th Floor West AHU-12 40 Yes 44
6th Floor East AHU-13 30 Yes 45
6th Floor East AHU-15 25 Yes 45
6th Floor Archives AHU-6-1 No -
7th Floor West AHU-14 40 Yes 35
7th Floor West AHU-16 40 Yes 40
7th Floor Data Center Liebert 1 No -
7th Floor Data Center Liebert 2 No -
8th Floor AHU-17 25 Yes 45
8th Floor East AHU-19 20 Yes 45
8th Floor West AHU-18 30 Yes 45
Air Handing Units
Exhibit 2B Page 5

Proprietary and Confidential © Siemens Industry IGA Report – May, 2019 – | Page 366
Siemens – Broward County, Investment Grade Audit | May 2019
Observed Issues:
∂ Humidity and condensation issues at both entrances
∂ 8th floor outside the elevators is consistently a warm spot
∂ AHU 18 – large water build up in the drip pan that spilled over onto the mechanicalroom floor. Wetvac required once every two (2) weeks
Namplate Data of Mechanical Equipment
Main LibraryChiller York YTE1R1C2-CLGS GLFM 035146 R-123 1995 480 3 387 289.6
oil pump 0.75 480 3 1.68 1.3
Chiller York YTH3B2C3-CKH CGFM 104882 R-123 1995 480 3 311 232.7oil pump 0.75 480 3 1.75 1.3
CWP-1 Century 850017MOJ E514M2 motor with VFD 25 480 3 30.5 93.6% 20.9Allis-Chalmers 150 821-46281-3-2 pump
CWP-2 GE 5K284AD205A TJK4A017E41 motor with VFD 25 460 3 31.2 89.5% 22.4ITT 6100 1-28536-01-1 pump
CHWP-1 GE 5K284AD205A PHK3A010E50 motor with VFD 25 460 3 31.2 89.5% 22.4Allis-Chalmers pump
CHWP-2 Marathon MH284TTDR7026 motor with VFD 25 460 3 32.5 88.5% 21.0pump
Cooling Tower 1Cooling Tower 2
Water Pump Marathon ME254TTDR5026AA motor 15 460 3 19.5 88.5% 12.7Water Pump Marathon ME254TTDR5026AA motor 15 460 3 19.5 88.5% 12.7
Heat Rec Pump Baldor JMM3711T 37M031T96B motor 10 460 3 11.9 87.5% 8.5Heat Rec Pump Baldor motor 10 460 3 11.9 87.5% 8.5
AHU-1 with VFD 25 460 3 29.2 93.0% 19.8AHU-2 Trane MCCB025UA0D0 K09E894C with VFD 20 460 3 27 18.7AHU-3AHU-4 Trane MCCB021NOG K09E90548A with VFD 15 460 3 21 14.6AHU-5AHU-6 with VFD 40 460 3 46 94.1% 31.9
FCU-6-1 M1-2410 1996 460 3 4.8 3.3AHU-7 W Trane MCCB025UA0D0 K09E90568A with VFD 25 460 3 34 23.6
AHU-8 Trane MCCB035N0G0 K09E90541A with VFD 40 460 3 52 36.0AHU-9 Trane with VFD 30 460 3 29 20.1AHU-10 Trane MCCB030UA0D0 K09E90585A with VFD 40 460 3 52 36.0AHU-11 York with VFD 30 460 3 37 93.8% 25.6AHU-12 Trane MCCB030N0G0 K09E90592A with VFD 40 460 3 52 36.0AHU-13 York with VFD 30 460 3 35.4 94.1% 23.4AHU-14 Trane MCCB035N0G0 K09E90606A with VFD 40 460 3 52 36.0AHU-15 York with VFD 25 460 3 29.9 93.6% 19.8AHU-16 Trane MCCB035N0G0 K09E90599A with VFD 40 460 3 52 36.0AHU-17 with VFD 25 460 3 29.9 93.6% 19.8AHU-18 Trane MCCB035UA0D0 K09E90570A with VFD 30 460 3 40 27.7AHU-19 with VFD 2002 20 460 3 24.4 91.0% 16.5
Liebert 1 Liebert C15F2F0162 2015 0.75 460 3 1.8 1.3Liebert 2 Liebert C15F2F0154 2015 0.75 460 3 2.5 1.8
Larkin 0.75 460 3 2.4 1.7
General Information Size / Capacity Nameplate Information
Cal kWHP Tons/MBTU V Ph Amps Eff /EEREQUIPMENT Mfctr Model Serial Description Notes
Exhibit 2B Page 6

Proprietary and Confidential © Siemens Industry IGA Report – May, 2019 – | Page 367
Siemens – Broward County, Investment Grade Audit | May 2019
LIGHTING SYSTEM
Interior lighting primarily consists of 32 Watt, T8 fluorescent lamps in either 2-lamp 2x4fixtures or single lamp runners.
Interior Lighting Examples
Exterior Lighting consists of HPS high bays,
Exterior Lighting Examples
The building does not make use of occupancy sensors or any other types of lighting control.Some observed problems with the lighting system include:
Occupancy Sensor Opportunities
Exhibit 2B Page 7

Proprietary and Confidential © Siemens Industry IGA Report – May, 2019 – | Page 368
Siemens – Broward County, Investment Grade Audit | May 2019
DOMESTIC WATER SYSTEM
Domestic water usage is limited to restroom, the chiller plant and kitchen sinks. Thefollowing are example of the types of fixture found within the restroom of the facility:
∂ 0.5 and 2,2gpm faucets
Some faucets are operated manually while other have been equipped with sensors. All toiletsand urinal are operated manually.
Sample Restroom Fixtures
BUILDING CONTROLS SYSTEM
The building is equipped with a Siemens building automation system. Any changes to thecontrols operation is handled from the Government Center. Available trending data wasdownloaded from the BAU. The following lists the available points being trended:
∂ Chiller plant
o supply and return chilled-water temperatures
o supply and return chilled-water setpoints
o GPM
o amperages
∂ Air Handlers
o supply and return air temperatures
o supply and return air setpoints
o relative humidity
∂ VAV Terminals
o Heating options
o Zone static pressures
o Zone temperatures
The full point list is far more extensive but eh above listed points provided the most usefuldata to help develop the usage baseline and identify improvement opportunities.
Exhibit 2B Page 8

Proprietary and Confidential © Siemens Industry IGA Report – May, 2019 – | Page 369
Siemens – Broward County, Investment Grade Audit | May 2019
UTILITY DATA ANALYSIS - ELECTRIC
The electric usage at this facility is monitored by one (1) electric meter. The billing accountutilizes the General Service Large Demand Time-of-Use (GSLDT-1) rate structure. Whencreating the baseline shown below, the most recent 24 month of electric billing data wasutilized as obtained directly from the Florida Power and Light website. The data was madeavailable via website’s the user portal and historical data from the facility’s smart meters.
The following table documents both the rate structure values used to calculate energysavings based on most recent electric billing data as well as the established demand andconsumption values representing baseline electric usage for the facility.
Electric Baseline Summary
The data in the table above was generated using the following electric billing data.
Meter PV8910D; Account: 72166-40321; Address: 100 S Andrews Ave
on peak off peak
Main Library 1 GSLDT-1 0.06661$ 0.04525$ 13.36$ 4,363,400 8,354 843
$ / kWAverage
Consumptionper Year
AverageDemand per Year
MaxDemand
Facility # of Meters Rate StructureYear-Round
TotalConsumption On Peak Off Peak Storm
Chargegross
receipts taxFranchise
FeeJun-15 75.00$ 414,400 132,785 281,615 20,299$ 737 9,257$ 307$ 724$ 1,773$ 30,728$Jul-15 75.00$ 380,000 121,762 258,238 18,614$ 765 9,608$ 298$ 703$ 1,722$ 29,831$Aug-15 75.00$ 392,000 125,607 266,393 19,202$ 751 9,433$ 300$ 708$ 1,735$ 30,058$Sep-15 75.00$ 401,600 128,683 272,917 19,672$ 843 10,588$ 306$ 722$ 1,769$ 30,658$Oct-15 75.00$ 363,200 116,379 246,821 17,791$ 715 8,980$ 281$ 663$ 1,624$ 28,130$Nov-15 75.00$ 341,600 109,458 232,142 16,733$ 727 9,131$ 254$ 598$ 1,465$ 25,391$Dec-15 75.00$ 383,600 122,916 260,684 18,790$ 614 7,712$ 258$ 608$ 1,490$ 25,817$Jan-16 75.00$ 281,600 90,232 191,368 13,794$ 575 7,222$ 202$ 477$ 1,169$ 20,262$Feb-16 75.00$ 322,000 103,177 218,823 15,773$ 651 8,177$ 266$ 627$ 1,537$ 26,635$Mar-16 75.00$ 336,000 107,663 228,337 16,459$ 636 7,988$ 233$ 550$ 1,348$ 23,353$Apr-16 75.00$ 342,800 109,842 232,958 16,792$ 689 8,654$ 250$ 590$ 1,444$ 25,028$May-16 75.00$ 392,400 125,736 266,664 19,221$ 667 8,378$ 267$ 631$ 1,546$ 26,780$Jun-16 75.00$ 418,000 133,938 284,062 20,475$ 726 9,119$ 288$ 679$ 1,664$ 28,833$Jul-16 75.00$ 398,800 127,786 271,014 19,535$ 785 9,860$ 287$ 677$ 1,658$ 28,735$Aug-16 75.00$ 431,600 138,296 293,304 21,142$ 827 10,387$ 305$ 720$ 1,765$ 30,577$Sep-16 75.00$ 365,200 117,020 248,180 17,889$ 713 8,955$ 262$ 618$ 1,514$ 26,230$Oct-16 75.00$ -$ -$ -$Nov-16 75.00$ -$ -$ -$Dec-16 75.00$ -$ -$ -$Jan-17 75.00$ -$ -$ -$Feb-17 75.00$ -$ -$ -$Mar-17 75.00$ -$ -$ -$Apr-17 75.00$ -$ -$ -$May-17 75.00$ 391,200 125,351 265,849 19,163$ 679 8,528$ 305$ 720$ 1,763$ 30,554$
4,363,400 1,398,151 2,965,249 155,672$ 8,354 75,988$ 2,335$ 7,564$ 18,533$ 321,108$
TotalCharges
Yearly Averages
Consumption (kwh) Other Fees/TaxesDate Customer
ChargeConsumption
ChargeDemand
(kW)DemandCharge
Exhibit 2B Page 9

Proprietary and Confidential © Siemens Industry IGA Report – May, 2019 – | Page 370
Siemens – Broward County, Investment Grade Audit | May 2019
The resulting energy usage profile, illustrated above, for this account is not influenced bycooling needs throughout the year; as identified by the comparison of monthly consumptionto bin weather data’s cooling degree days (CDD). Electric demand usage is closely mirrorsthe consumption profile indicating a strong building automation presence. The average peakfor the 24 month period evaluated occurs in March while the average low occurs in June. Itcan be determined that building occupancy, events onsite, and public interest governs theenergy usage needs of this building.
The billing is, as previously shown, analyzed as a combination of all meters. As described ina previous section, an index value is calculated and compared to similar facilities within thesame geographic region. Below are the results of this comparison.
Benchmarking Summary
Overall, this building is operating at the 75th percentile of comparable facilities. Given theage and condition of known equipment onsite, this is a favorable metric value that can beattributed to advanced building automation applications already existing and maintained bythe County. Data collected onsite still supports the opportunity and need to equipmentefficiency upgrades.
0
100
200
300
400
500
600
700
800
900
0
50,000
100,000
150,000
200,000
250,000
300,000
350,000
400,000
450,000
Jan Feb Mar Apr May Jun Jul Aug Sep Oct Nov Dec
Dem
and
(kW
)
Cons
umpt
ion
(kW
h)
Month
Electric Consumption Profile
Consumption (kWh) Demand (kW) CDD
25thpercentile Median
75thpercentile
Main Library Library 15.53 10.7 14.3 15.6
kWh/Sq FtCBECS - 2012 kWh/Sq Ft Data
Facility Faclity Type
Exhibit 2B Page 10

Proprietary and Confidential © Siemens Industry IGA Report – May, 2019 – | Page 371
Siemens – Broward County, Investment Grade Audit | May 2019
UTILITY DATA ANALYSIS - WATER
The following table(s) summarizes the water consumption data that was available for thisfacility.
The average monthly consumption for this account is 349 thousand gallons. The averagemonthly expenses are $4675.78. The blended dollar per thousand gallons rate is $13.39.This blended rate could be representative of the actual rate being charged to this account butwithout knowing the breakdown of the fees and charges this cannot be determined.
Account # 2015412 Meter # 114751700-MRate AddressMeter Size 4" Meter Type W/S/ST/FL-CT
Main Library
Date Consumption (kgal)
TotalCharges
Jun-15 410 5,025.96$Jul-15 510 6,049.62$Aug-15 420 5,181.06$Sep-15 430 5,315.48$Oct-15 350 4,304.02$Nov-15 325 4,086.82$Dec-15 300 3,435.22$Jan-16 240 3,087.10$Feb-16 200Mar-16 238 3,326.62$Apr-16 290 3,978.22$May-16 285 3,793.60$Jun-16 285 3,804.46$Jul-16 480 6,030.76$Aug-16 310 4,304.02$Sep-16 450 5,835.28$Oct-16 330 4,858.40$Nov-16 793 9,935.19$Dec-16 560 7,050.99$Jan-17 250 3,927.39$Feb-17 225 3,391.59$Mar-17 250 3,733.59$Apr-17 200 3,254.79$May-17 250 3,832.85$
TOTALS 8381 107,543.03$
Exhibit 2B Page 11

Proprietary and Confidential © Siemens Industry IGA Report – May, 2019 – | Page 372
Siemens – Broward County, Investment Grade Audit | May 2019
The average monthly consumption for this account is 119 thousand gallons. The averagemonthly expenses are $875.29. The blended dollar per thousand gallons rate is $7.34. Thisblended rate could be representative of the actual rate being charged to this account butwithout knowing the breakdown of the fees and charges this cannot be determined.
Account # 2015157 Meter # 201001004-MRate AddressMeter Size 2" Meter Type IRR
Main Library
Date Consumption (kgal)
TotalCharges
Jun-17 25 189.44$Jun-17 32 224.30$May-17 96 590.33$Apr-17 46 288.21$Mar-17 60 392.79$Feb-17 44 305.64$Jan-17 3 73.24$Dec-16 123 696.03$Nov-16 43 285.18$Oct-16 85 242.63$Sep-16 89Aug-16 87 534.26$Jul-16 2 42.09$Jun-16 330 3,554.76$May-16 136Apr-16 110 879.24$Mar-16 198 1,440.93$Feb-16 110Jan-16 180 610.32$Dec-15 130 1,321.80$Nov-15 90 797.07$Oct-15 140 580.44$Sep-15 155 944.17$Aug-15 145 837.52$Jul-15 212 1,526.86$Jun-15 430 3,774.44$
TOTALS 3101 20,131.69$
Exhibit 2B Page 12
Proprietary and Confidential © Siemens Industry IGA Report – May, 2019 – | Page 373
Siemens – Broward County, Investment Grade Audit | May 2019
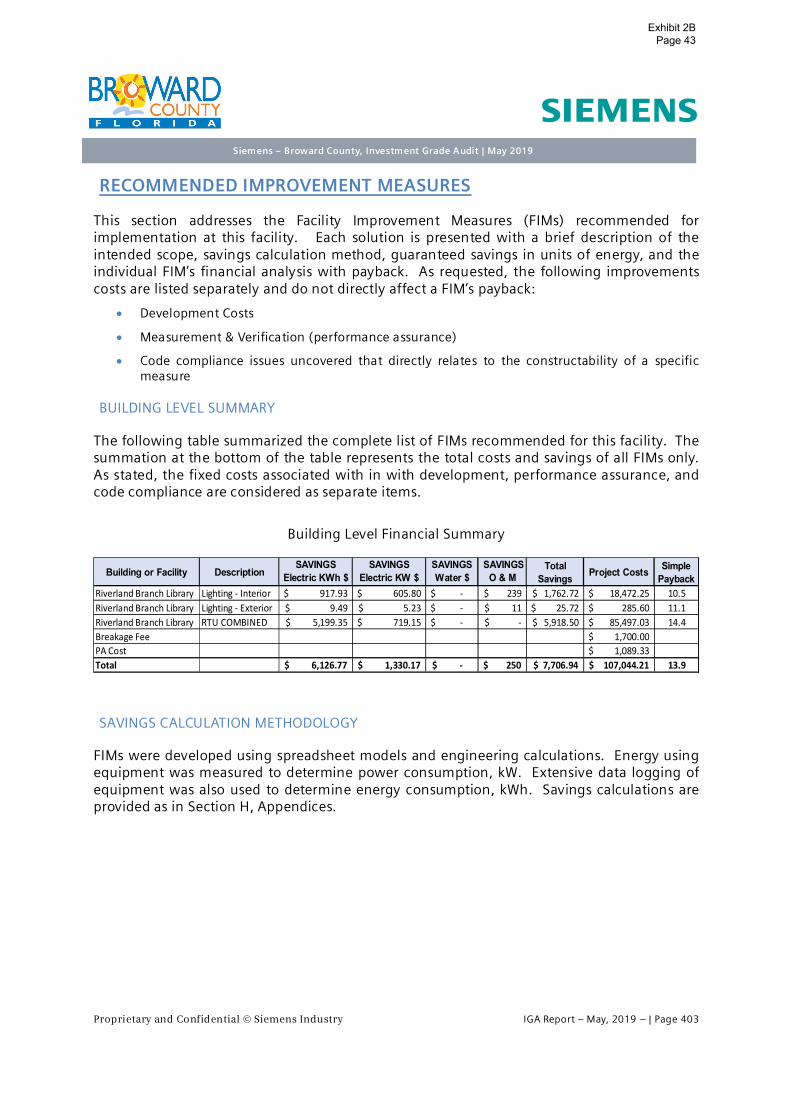
RECOMMENDED IMPROVEMENT MEASURES
This section addresses the Facility Improvement Measures (FIMs) recommended forimplementation at this facility. Each solution is presented with a brief description of theintended scope, savings calculation method, guaranteed savings in units of energy, and theindividual FIM’s financial analysis with payback. As requested, the following improvementscosts are listed separately and do not directly affect a FIM’s payback:
∂ Development Costs
∂ Measurement & Verification (performance assurance)
∂ Code compliance issues uncovered that directly relates to the constructability of a specificmeasure
BUILDING LEVEL SUMMARY
The following table summarized the complete list of FIMs recommended for this facility. Thesummation at the bottom of the table represents the total costs and savings of all FIMs only.As stated, the fixed costs associated with in with development, performance assurance, andcode compliance is considered as separate items.
Building Level Financial Summary
SAVINGS CALCULATION METHODOLOGY
FIMs were developed using spreadsheet models and engineering calculations. Energy usingequipment was measured to determine power consumption, kW. Extensive data logging ofequipment was also used to determine energy consumption, kWh. Savings calculations areprovided as in Section H, Appendices.
Building or Facility DescriptionSAVINGS
Electric KWh $SAVINGS
Electric KW $SAVINGSWater $
SAVINGSO & M
TotalSavings Project Costs Simple
PaybackMain Library Lighting - Interior 45,730.15$ -$ -$ 8,014$ 53,744.15$ 527,341.86$ 9.8Breakage Fee 18,936.34$PA Cost 1,146.90$Total 45,730.15$ -$ -$ 8,014$ 53,744.15$ 547,425.10$ 10.2
Exhibit 2B Page 13

Proprietary and Confidential © Siemens Industry IGA Report – May, 2019 – | Page 374
Siemens – Broward County, Investment Grade Audit | May 2019
LIGHTING RETROFIT
The following section describes all lighting scope of work proposed for implementation.
PROJECT SCOPE – INTERIOR LIGHTING
LED Replacement of Linear Lamps
The design strategy is to specify and standardize on the same type of linear LED T8 and T5lamps types throughout the buildings to be included in this project. We select a non-proprietary proven LED tube that will provide the greatest performance and energy savings ofany of the lighting systems considered. The proposed LED Linear tubes are a premium highlumen, extended life with best in class warranty.
The predominant LED lamp we have selected for this project is an UL Type B LED linear type.The UL Type B lamp a direct wire lamp that doesn’t require an external ballast or driver. Theexisting T-8 or T5 ballast will be removed from the fixture and disposed of. New lampsockets approved for direct wire LED lamps will also be installed on the feed ends to ensureproblem free installation and reduce future maintenance. This LED retrofit strategy will allowus to maintain recommended light levels while providing a reduction in energy usage in alllinear lamp fixtures and still standardize on lamp types. All fixtures retrofitted will be drywiped to remove dust and particulate matter to improve fixture lumen efficiency.
Fixture types associated with these lamps are surface or recessed linear fixtures.
In the case of existing 2’x2’ troffers, a different approach is used. There is less flexibility inlamp wattage when dealing with U-shaped lamps, and installing linear lamp kits can be achallenge due to variation in fixture construction. Additionally, in many cases, it is possibleto reduce light output if the fixture can be made more efficient. To provide consistency ofcomponents and reduce energy use, we have proposed installing 2x2 volumetric style retrofitdoor kits with dedicated LED boards and drivers.
LED Replacement for Pin-Based Compact Fluorescent Fixtures
In keeping with the direction to remove fluorescent ballasts, reduce energy use and minimizecost, our design strategy for existing pin-based compact fluorescent lamps is to retrofit theexisting fixtures with line voltage pin based LED lamps and remove the existing fluorescentballasts. In some cases, it is possible to remove two fluorescent lamps and replace them witha single higher powered LED lamp without sacrificing luminaire output and distribution.
LED Replacement for High Intensity Discharge Interior
The replacement of HID (high intensity discharge), including metal halide or high-pressuresodium provide significant energy reduction opportunities when changing to LED. Newtypes of LED fixtures and retrofit kits can be installed across many existing HID applicationsnot previously available.
Exhibit 2B Page 14
Proprietary and Confidential © Siemens Industry IGA Report – May, 2019 – | Page 375
Siemens – Broward County, Investment Grade Audit | May 2019
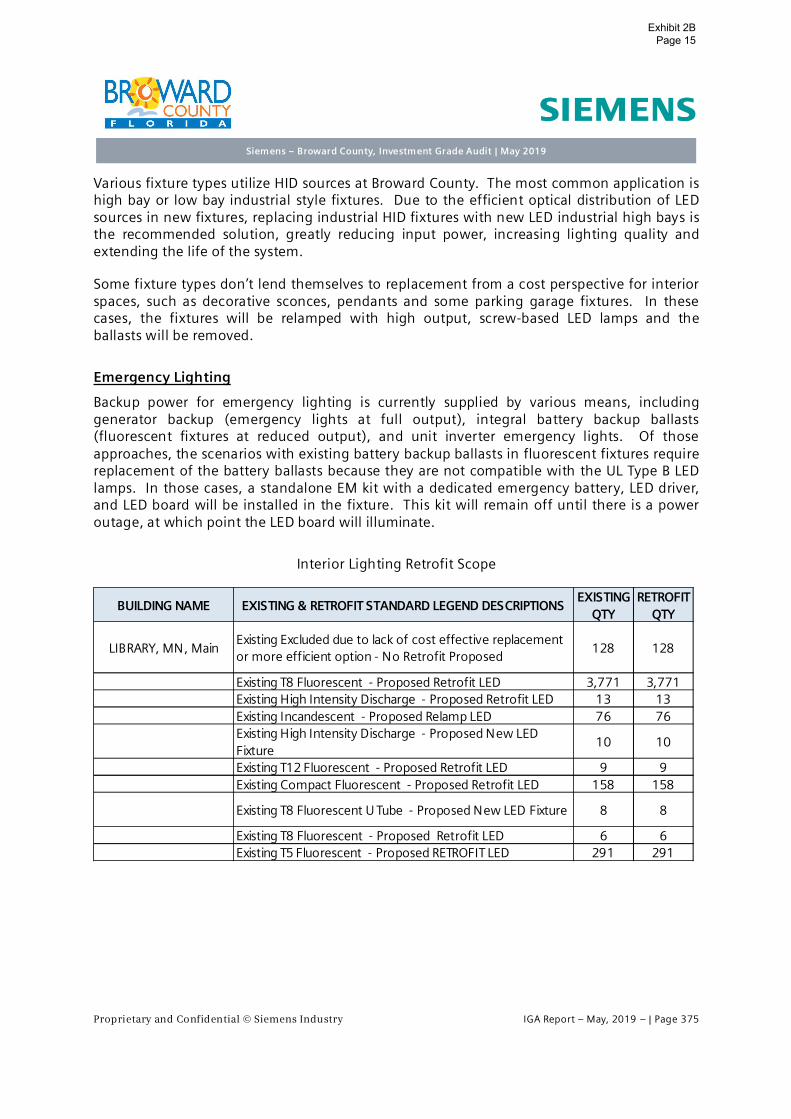
Various fixture types utilize HID sources at Broward County. The most common application ishigh bay or low bay industrial style fixtures. Due to the efficient optical distribution of LEDsources in new fixtures, replacing industrial HID fixtures with new LED industrial high bays isthe recommended solution, greatly reducing input power, increasing lighting quality andextending the life of the system.
Some fixture types don’t lend themselves to replacement from a cost perspective for interiorspaces, such as decorative sconces, pendants and some parking garage fixtures. In thesecases, the fixtures will be relamped with high output, screw-based LED lamps and theballasts will be removed.
Emergency Lighting
Backup power for emergency lighting is currently supplied by various means, includinggenerator backup (emergency lights at full output), integral battery backup ballasts(fluorescent fixtures at reduced output), and unit inverter emergency lights. Of thoseapproaches, the scenarios with existing battery backup ballasts in fluorescent fixtures requirereplacement of the battery ballasts because they are not compatible with the UL Type B LEDlamps. In those cases, a standalone EM kit with a dedicated emergency battery, LED driver,and LED board will be installed in the fixture. This kit will remain off until there is a poweroutage, at which point the LED board will illuminate.
Interior Lighting Retrofit Scope
BUILDING NAME EXISTING & RETROFIT STANDARD LEGEND DESCRIPTIONSEXISTING
QTYRETROFIT
QTY
LIBRARY, MN, MainExisting Excluded due to lack of cost effective replacementor more efficient option - No Retrofit Proposed
128 128
Existing T8 Fluorescent - Proposed Retrofit LED 3,771 3,771Existing High Intensity Discharge - Proposed Retrofit LED 13 13Existing Incandescent - Proposed Relamp LED 76 76Existing High Intensity Discharge - Proposed New LEDFixture
10 10
Existing T12 Fluorescent - Proposed Retrofit LED 9 9Existing Compact Fluorescent - Proposed Retrofit LED 158 158
Existing T8 Fluorescent U Tube - Proposed New LED Fixture 8 8
Existing T8 Fluorescent - Proposed Retrofit LED 6 6Existing T5 Fluorescent - Proposed RETROFIT LED 291 291
Exhibit 2B Page 15

Proprietary and Confidential © Siemens Industry IGA Report – May, 2019 – | Page 376
Siemens – Broward County, Investment Grade Audit | May 2019
SAVINGS
The energy and cost savings were developed using a spreadsheet model. In the analysis, theexisting lighting wattage per fixture was reduced to reflect the installation of higherefficiency technology. A detailed room by room survey of the facility, available in Section H,Appendices, was performed to accurately determine the existing lighting type and quantity.
The runtime operations of the new lighting fixtures are reduced in areas that arerecommended for lighting occupancy sensors. This runtime reduction was determined basedon the results of lighting and occupancy data logging sessions conducted at various facilities.The results of these data logging session, as well as the resulting hour of operations of lightsper space type are provided also provided in Section H, Appendices.
FIM SAVINGS SUMMARY
Annual Electric Consumption: 498,835 kWh
Annual Electric Demand: 1,340.64 kW
FIM Financial Summary
Building or Facility DescriptionSAVINGS
Electric KWh $SAVINGS
Electric KW $SAVINGSWater $
SAVINGSO & M
TotalSavings Project Costs Simple
PaybackMain Library Lighting - Interior 45,730.15$ -$ -$ 8,014$ 53,744.15$ 527,341.86$ 9.8
Exhibit 2B Page 16

Proprietary and Confidential © Siemens Industry IGA Report – May, 2019 – | Page 377
Siemens – Broward County, Investment Grade Audit | May 2019
D.28. Library - Miramar
FACILITY DESCRIPTION
Miramar Library is a 3-story, 70,000 square foot building constructed in 2008 and located at2050 Civic Center Pl, Miramar, FL. The first floor of the building is the library, and 2nd and3rd floors are rented out to Broward County College and Nova University. The 2nd and 3rdfloors consist of classrooms, offices, computer labs, and common areas
The library and two colleges have their own operation hours based on occupancy demand.
Library Office Hours
Monday – Wednesday: 10:00AM – 8:00PM
Thursday – Saturday: 10:00AM – 6:00PM
Sunday: Closed
Observed Issues:
∂ Lights were on in some individual rooms even though they were not occupied
∂ The library computers were on although they were not in use
∂ Some areas on 2nd floor were warm
∂ An Unoccupied classroom on 3rd floor was 69oF as displayed by the thermostat.
∂ No occupancy sensors are installed in classrooms, conference rooms and otherindividual space.
Exhibit 2B Page 17

Proprietary and Confidential © Siemens Industry IGA Report – May, 2019 – | Page 378
Siemens – Broward County, Investment Grade Audit | May 2019
COOLING SYSTEM:
Cooling for the building is provided by 1 Air-cooled 230-Ton R-134a chiller made in 2007 byYork. The unit is located at the outside of the building near the loading deck. Design chilledwater supply and return temperature is 44/54OF. The chilled water loop is configured as avariable primary system with a bypass line serving 4 air handling units (AHU). Two 15-HPchilled water pumps with variable frequency drives (VFD) were installed and the two pumpsback up each other. Chilled water pump speed is adjusted to maintain the chilled waterdifferential pressure setpoint. Two-way control valves are employed at AHUs.
Chilled Water System
Four AHUs manufactured by York were installed in the building located at 3 mechanicalrooms. The total design airflow for the 4 AHUs is 78,000 CFM, The 4 AHUs are equipped withheat pipes for dehumidification, and the leaving design supply air temperature is 58.85oF.The first floor most area of the library is conditioned by 2 single duct VAV air handlingsystems, AHU-1 and AHU-2. Both units are located in the same mechanical room on the firstfloor. There are also 2 split air conditioners to serve Library Material Return and Break Roomarea. Most space of the second floor is served by AHU-3, and there is also AC-3 servingscience laboratory. Third floor is served by AHU-4. AHU-3 and AHU-4 are located in the 2nd
floor mechanical room and 3rd floor mechanical room respectively. All 4 AHUs are equippedwith 20-HP supply fans and VFDs were manufactured by ABB.
Building HVAC
Exhibit 2B Page 18
Proprietary and Confidential © Siemens Industry IGA Report – May, 2019 – | Page 379
Siemens – Broward County, Investment Grade Audit | May 2019
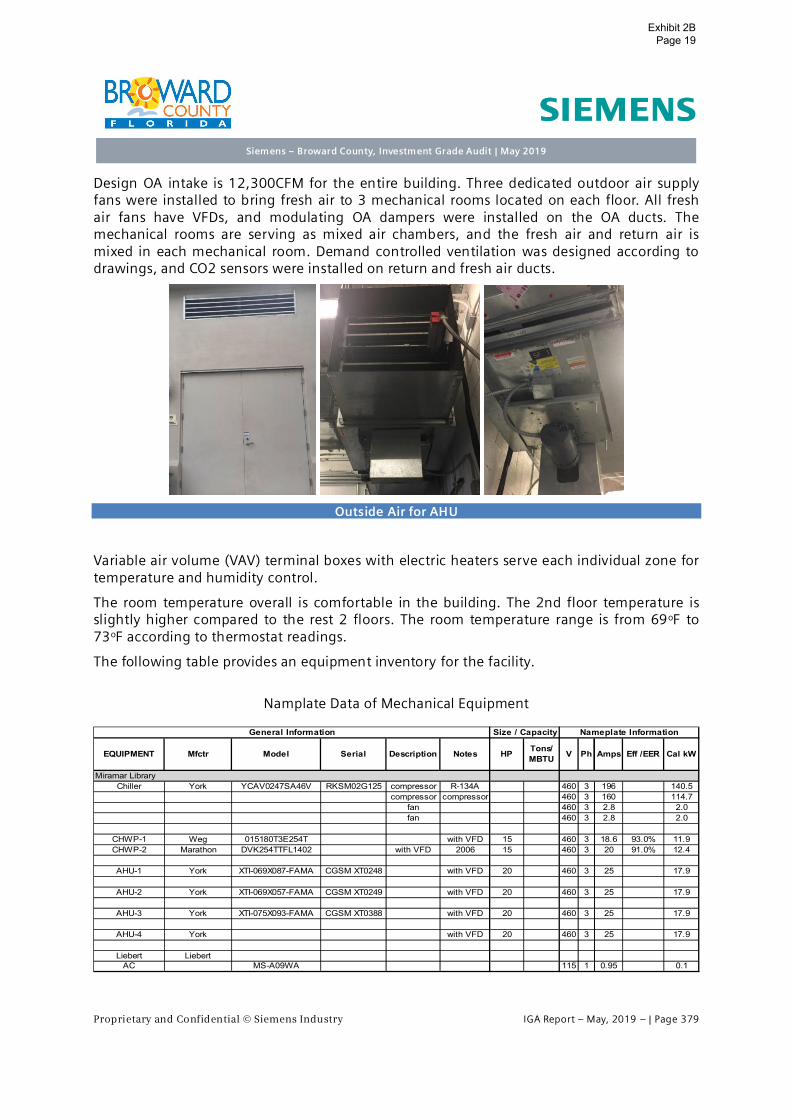
Design OA intake is 12,300CFM for the entire building. Three dedicated outdoor air supplyfans were installed to bring fresh air to 3 mechanical rooms located on each floor. All freshair fans have VFDs, and modulating OA dampers were installed on the OA ducts. Themechanical rooms are serving as mixed air chambers, and the fresh air and return air ismixed in each mechanical room. Demand controlled ventilation was designed according todrawings, and CO2 sensors were installed on return and fresh air ducts.
Outside Air for AHU
Variable air volume (VAV) terminal boxes with electric heaters serve each individual zone fortemperature and humidity control.
The room temperature overall is comfortable in the building. The 2nd floor temperature isslightly higher compared to the rest 2 floors. The room temperature range is from 69oF to73oF according to thermostat readings.
The following table provides an equipment inventory for the facility.
Namplate Data of Mechanical Equipment
Miramar LibraryChiller York YCAV0247SA46V RKSM02G125 compressor R-134A 460 3 196 140.5
compressor compressor 460 3 160 114.7fan 460 3 2.8 2.0fan 460 3 2.8 2.0
CHWP-1 Weg 015180T3E254T with VFD 15 460 3 18.6 93.0% 11.9CHWP-2 Marathon DVK254TTFL1402 with VFD 2006 15 460 3 20 91.0% 12.4
AHU-1 York XTI-069X087-FAMA CGSM XT0248 with VFD 20 460 3 25 17.9
AHU-2 York XTI-069X057-FAMA CGSM XT0249 with VFD 20 460 3 25 17.9
AHU-3 York XTI-075X093-FAMA CGSM XT0388 with VFD 20 460 3 25 17.9
AHU-4 York with VFD 20 460 3 25 17.9
Liebert LiebertAC MS-A09WA 115 1 0.95 0.1
General Information Size / Capacity Nameplate Information
Cal kWHP Tons/MBTU V Ph Amps Eff /EEREQUIPMENT Mfctr Model Serial Description Notes
Exhibit 2B Page 19

Proprietary and Confidential © Siemens Industry IGA Report – May, 2019 – | Page 380
Siemens – Broward County, Investment Grade Audit | May 2019
Observed Issues with the cooling system:
∂ In unoccupied classrooms on 3rd floor, lights were off, and room temperature was69oF.
Examples of Observed Issues
LIGHTING SYSTEM
Interior lighting primarily consists of 50W 2’x2’ recessed parabolic fluorescent light fixtureswith 2 lamps, 32W T8 2x4 recessed fixtures with 2 or 3 lamps, and 32W CFL lights.
Interior Lighting Examples
Exterior Lighting consists of HPS wall packs
Motion sensors are installed at the main entrance, and some areas are with occupancysensors. No occupancy sensors are installed in classrooms, conference rooms and otherindividual space.
Exhibit 2B Page 20

Proprietary and Confidential © Siemens Industry IGA Report – May, 2019 – | Page 381
Siemens – Broward County, Investment Grade Audit | May 2019
DOMESTIC WATER SYSTEM
Domestic water usage is limited to restrooms. Fixtures and water closets are all operatedmanually. The following are example of the types of fixture found within the restroom of thefacility: FIM: Water Conservation
∂ 0.5 gpm faucets
∂ 1.0 gpf urinals
∂ 1.28 gpf toilets
Sample Restroom Fixtures
BUILDING CONTROLS SYSTEM
The building is equipped with a Johnson Metasys building automation system. Any changesto the controls operation is handled from the Government Center.
Building Controls
Exhibit 2B Page 21

Proprietary and Confidential © Siemens Industry IGA Report – May, 2019 – | Page 382
Siemens – Broward County, Investment Grade Audit | May 2019
HVAC Occupied Schedule
Unit Occupied
AHU-1, AHU-2 Monday – Wednesday: 7:00AM – 9:30PM
Thursday: 8:30AM – 7:30PM
Friday: 8:30AM – 12:00AM
Saturday: 4:00AM – 12:00AM
Sunday: Entire day
AHU-3 Monday – Thursday: 5:30AM – 10:30PM
Friday: 5:30AM – 12:00AM
Saturday: 4:00AM – 12:00AM
Sunday: entire day
AHU-4 Monday – Friday: 4:30AM – 10:30PM
Saturday: 4:30AM – 12:00AM
Sunday: Entire day
Exhibit 2B Page 22

Proprietary and Confidential © Siemens Industry IGA Report – May, 2019 – | Page 383
Siemens – Broward County, Investment Grade Audit | May 2019
UTILITY DATA ANALYSIS - ELECTRIC
The electric usage at this facility is monitored by one (1) electric meter. The billing accountutilizes the Seasonal Demand Time-of-Use Rider (SDTR-1A) rate structure. When creating thebaseline shown below, the most recent 24 month of electric billing data was utilized asobtained directly from the Florida Power and Light website. The data was made available viawebsite’s the user portal and historical data from the facility’s smart meters.
The following table documents both the rate structure values used to calculate energysavings based on most recent electric billing data as well as the established demand andconsumption values representing baseline electric usage for the facility.
Electric Baseline Summary
The data in the table above was generated using the following electric billing data.
Meter MV5690A; Account: 471941112; Address: 2250 CIVIC CENTER PL # LIBRARY
on peak off peak
Miramar Library 1 SDTR-1A 0.12886$ 0.04066$ 0.05624$ 10.94$ 908,820 2,451 286
$ / kWAverage
Consumptionper Year
AverageDemand per Year
MaxDemandFacility # of Meters Rate Structure
June - Sept$ / kWh
TotalConsumption On Peak Off Peak Storm
Chargegross
receipts taxFranchise
FeeJun-15 25.96$ 76,320 8,520 67,800 3,283$ 198 2,400$ 42$ 147$ 1,034$ 6,933$Jul-15 25.96$ 75,960 11,040 64,920 3,331$ 218 2,642$ 42$ 155$ 1,214$ 7,409$Aug-15 25.96$ 81,000 11,400 69,600 3,542$ 198 2,400$ 45$ 154$ 1,251$ 7,417$Sep-15 25.96$ 78,240 11,280 66,960 3,428$ 204 2,472$ 43$ 153$ 1,207$ 7,330$Oct-15 25.96$ 72,000 2,520 69,480 2,901$ 258 3,127$ 40$ 156$ 757$ 7,006$Nov-15 25.96$ 72,720 0 72,720 2,930$ 203 2,460$ 40$ 140$ 837$ 6,433$Dec-15 25.96$ 73,680 0 73,680 2,969$ 181 2,194$ 41$ 134$ 879$ 6,241$Jan-16 25.96$ 68,280 0 68,280 3,415$ 191 1,868$ 44$ 137$ 330$ 5,820$Feb-16 25.96$ 60,240 0 60,240 3,013$ 181 1,770$ 39$ 124$ 299$ 5,271$Mar-16 25.96$ 69,360 0 69,360 3,469$ 176 1,721$ 45$ 135$ 339$ 5,735$Apr-16 25.96$ 72,120 0 72,120 3,607$ 184 1,800$ 47$ 140$ 153$ 5,772$May-16 25.96$ 67,560 0 67,560 3,379$ 197 1,927$ 44$ 138$ 166$ 5,679$Jun-16 26.97$ 78,960 8,640 70,320 3,740$ 245 2,881$ 73$ 172$ 414$ 7,307$Jul-16 26.97$ 92,520 12,120 80,400 4,548$ 286 3,363$ 85$ 205$ 494$ 8,723$Aug-16 26.97$ 93,120 13,200 79,920 4,661$ 251 2,952$ 86$ 198$ 476$ 8,399$Sep-16 26.97$ 91,800 11,160 80,640 4,441$ 233 2,740$ 84$ 187$ 432$ 7,911$Oct-16 26.97$ 81,120 2,520 78,600 3,787$ 192 1,935$ 75$ 149$ 344$ 6,316$Nov-16 26.97$ 70,320 0 70,320 3,283$ 191 1,925$ 65$ 136$ 313$ 5,749$Dec-16 26.97$ 75,120 0 75,120 3,507$ 223 2,248$ 69$ 150$ 346$ 6,347$Jan-17 25.00$ 78,480 0 78,480 3,978$ 173 1,782$ 63$ 150$ 357$ 6,354$Feb-17 25.00$ 63,840 0 63,840 3,236$ 173 1,782$ 51$ 130$ 311$ 5,535$Mar-17 25.00$ 66,000 0 66,000 3,495$ 172 1,772$ 53$ 137$ 329$ 5,810$Apr-17 25.00$ 77,400 0 77,400 4,098$ 176 1,813$ 62$ 154$ 369$ 6,521$May-17 25.00$ 81,480 0 81,480 4,314$ 198 2,039$ 65$ 165$ 397$ 7,006$
908,820 46,200 862,620 43,176$ 2,451 27,007$ 670$ 1,822$ 6,524$ 79,512$
Date
Yearly Averages
TotalCharges
DemandCharge
Demand(kW)
ConsumptionCharge
CustomerCharge
Consumption (kwh) Other Fees/Taxes
Exhibit 2B Page 23

Proprietary and Confidential © Siemens Industry IGA Report – May, 2019 – | Page 384
Siemens – Broward County, Investment Grade Audit | May 2019
The resulting energy usage profile, illustrated above, for this account is influenced by coolingneeds throughout the year; as identified by the comparison of monthly consumption to binweather data’s cooling degree days (CDD). Electric demand usage also somewhat mirrors theconsumption profile. The average peak for the 24 month period evaluated occurs in Augustwhile the average low occurs in February; further confirming the influence of outdoorweather conditions on building electric consumption.
The billing is, as previously shown, analyzed as a combination of all meters. As described ina previous section, an index value is calculated and compared to similar facilities within thesame geographic region. Below are the results of this comparison.
Benchmarking Summary
Overall, this building is operating just above the 25th percentile of comparable facilities.Being a relatively new facility, equipped with new, high efficiency HVAC equipment andbuilding controls, there is very limited opportunities for additional energy savings at this site.
0
100
200
300
400
500
600
700
0
10,000
20,000
30,000
40,000
50,000
60,000
70,000
80,000
90,000
100,000
Jan Feb Mar Apr May Jun Jul Aug Sep Oct Nov Dec
Dem
and
(kW
)
Cons
umpt
ion
(kW
h)
Month
Electric Consumption Profile
Consumption (kWh) Demand (kW) CDD
25thpercentile Median
75thpercentile
Miramar Library Library 12.98 10.7 14.3 15.6
kWh/Sq FtCBECS - 2012 kWh/Sq Ft Data
Facility Faclity Type
Exhibit 2B Page 24

Proprietary and Confidential © Siemens Industry IGA Report – May, 2019 – | Page 385
Siemens – Broward County, Investment Grade Audit | May 2019
UTILITY DATA ANALYSIS - WATER
The following table(s) summarizes the water consumption data that was available for thisfacility.
These accounts only had total expense amounts per month available for water usage utilitydata. No relevant conclusions can be drawn from this data.
Account # 40262001-01 Meter #Rate AddressMeter Size Meter Type
Miramar Library
Date
Feb-16Jan-16Dec-15Nov-15Oct-15Sep-15Aug-15Jul-15Jun-15May-15Apr-15Mar-15Feb-15Jan-15Dec-14Nov-14Oct-14Sep-14Aug-14Jul-14Jun-14May-14Apr-14Mar-14Feb-14
TOTALS
Consumption TotalCharges
8,176.64$20,161.76$
2,107.52$2,279.20$2,413.76$1,813.82$1,567.98$1,677.73$1,805.04$1,589.93$1,906.01$1,857.72$2,160.63$2,441.59$4,057.11$3,863.95$
1,495.32$1,489.03$1,482.74$1,476.45$1,476.45$
47.59$1,476.45$1,457.58$
70,282.00$
Account # 40440448-00 Meter #Rate AddressMeter Size Meter Type
Miramar Library
Date
Jan-16Dec-15Nov-15Oct-15Sep-15Aug-15Jul-15Jun-15May-15Apr-15Mar-15Feb-15Jan-15Dec-14Nov-14Oct-14Sep-14Aug-14Jul-14Jun-14May-14Apr-14Mar-14Feb-14Jan-14
TOTALS
Consumption TotalCharges
707.31$713.01$701.62$262.91$268.84$313.32$242.76$245.70$253.49$240.31$234.92$248.15$240.31$245.70$245.94$235.38$
1,005.83$1,005.83$1,005.83$1,005.83$1,005.83$
-$1,005.83$
-$1,005.83$
12,440.48$
Exhibit 2B Page 25

Proprietary and Confidential © Siemens Industry IGA Report – May, 2019 – | Page 386
Siemens – Broward County, Investment Grade Audit | May 2019
The below accounts only had total expense amounts per month available for water usageutility data. No relevant conclusions can be drawn from this data.
Account # 40262001 Meter #Rate AddressMeter Size Meter Type
Miramar Library
Date
Jan-16Dec-15Nov-15Oct-15Sep-15Aug-15Jul-15Jun-15May-15Apr-15Mar-15Feb-15Jan-15Dec-14Nov-14Oct-14Sep-14Aug-14Jul-14Jun-14May-14Apr-14Mar-14Feb-14Jan-14
TOTALS
Consumption TotalCharges
1,568.52$1,533.17$1,540.24$1,568.52$1,499.12$1,526.56$1,540.28$1,547.14$1,547.14$1,533.42$1,540.28$1,526.56$1,512.84$1,560.86$1,540.28$1,489.03$
24,573.96$
Account # 40440448 Meter #Rate AddressMeter Size Meter Type
Miramar Library
Date Consumption
Jan-16Dec-15Nov-15Oct-15Sep-15Aug-15Jul-15Jun-15May-15Apr-15Mar-15Feb-15Jan-15Dec-14Nov-14Oct-14Sep-14Aug-14Jul-14Jun-14May-14Apr-14Mar-14Feb-14Jan-14
TOTALS
Consumption TotalCharges
1,005.83$1,005.83$1,005.83$1,005.83$1,005.83$1,005.83$1,005.83$1,005.83$1,005.83$1,005.83$1,005.83$1,022.63$1,005.83$1,005.83$1,005.83$1,005.83$
16,110.08$
Exhibit 2B Page 26

Proprietary and Confidential © Siemens Industry IGA Report – May, 2019 – | Page 387
Siemens – Broward County, Investment Grade Audit | May 2019
RECOMMENDED IMPROVEMENT MEASURES
All recommended FIMs for this facility have been removed from the final scope by BrowardCounty. Please refer to Section G of this report for documentation of these originallyproposed opportunities.
Exhibit 2B Page 27

Proprietary and Confidential © Siemens Industry IGA Report – May, 2019 – | Page 388
Siemens – Broward County, Investment Grade Audit | May 2019
D.29. Library - Pompano Beach Branch
FACILITY DESCRIPTION
Pompano Beach Branch Library wasconstructed approximately in 2015. It is a2,000 square foot 1-story new buildinglocated at 3250 NE 2nd St, Pompano Beach,FL 33062. The building consists of a lobbyand offices. The library hours are thefollowing:
Library Office Hours
Monday, Wednesday: 10:00AM – 8:00PM
The rest of week: 10:00AM – 6:00PM
Sunday: Closed
COOLING SYSTEM:
The cooling is provided by 3 split heat pump A/C units with electric heaters. Those units weremade by Lennox around 2015. The refrigerant is R-410a. Programmable touch-screenthermostats were installed.
Examples of Building HVAC Systems
Namplate Data of Mechanical Equipment
Pompano Beach Branch LibraryAHU-3 TAA090S4D 5614B06985 2 230 3 7.5 2.7
CU Lennox TSA090S4SN1Y 5613A03520 compressor R-410A 230 3 25 13 SEER 9.0fan 0.5 230 1 3 0.6
AHU-2 Lennox CBX27UH-024-230-6 1614C13147 0.5 208 1 4.1 0.8CU 13ACX-018-230-18 1914A04194 compressor R-410A 230 1 9 13 SEER 1.9
fan 0.1 230 1 0.7 0.1
AHU-1 Lennox CBX27UH-036-230-6 1614B14502 0.5 208 1 4.1 13 SEER 0.8CU 13ACX-030-230-17 1914A27414 compressor R-410A 230 1 14.1 2.9
fan 0.2 230 1 1.1 0.2
General Information Size / Capacity Nameplate Information
EQUIPMENT Mfctr Model Serial Description Eff /EER Cal kWNotes HPTons/MBTU V Ph Amps
Exhibit 2B Page 28

Proprietary and Confidential © Siemens Industry IGA Report – May, 2019 – | Page 389
Siemens – Broward County, Investment Grade Audit | May 2019
LIGHTING SYSTEM
Interior lighting primarily consists of 32 Watt, T8 fluorescent lamps in 2-lamp 2x4 parabolicfixtures. The occupancy sensors were installed for lighting control.
Interior Lighting Examples
DOMESTIC WATER SYSTEM
Domestic water usage is limited to restrooms. Fixtures and water closets are all operatedmanually. The following are example of the types of fixture found within the restroom of thefacility: FIM: Water Conservation
∂ 0.5 gpm faucets
∂ 1.0 gpf urinals
Sample Restroom Fixtures
BUILDING CONTROLS SYSTEM
No web-based building control system was installed. The HVAC equipment is controlled byprogrammable thermostats set of time of use schedules and setbacks.
Exhibit 2B Page 29

Proprietary and Confidential © Siemens Industry IGA Report – May, 2019 – | Page 390
Siemens – Broward County, Investment Grade Audit | May 2019
UTILITY DATA ANALYSIS - ELECTRIC
The information provided in order to obtain electric usage at this facility relates to a previouslocation. The new site for the Pompano Beach Branch library has not yet developed enoughbilling data to generate historical data. Being a relatively new facility, equipped with new,high efficiency HVAC equipment and building controls, there is very limited opportunities foradditional energy savings at this site.
UTILITY DATA ANALYSIS - WATER
The following table(s) summarizes the water consumption data that was available for thisfacility.
This account had two sets of consumption data for two meters. There was no information onhow the expenses were divided for those two meters. Due to the lack of information for thisaccount, no relevant conclusions can be drawn.
Account # 16219-4336 Meter #Rate AddressMeter Size 2" Meter Type
Pompano Beach Branch Library
1102760211027601Irrigation
DateConsumpti
on C1(kgal)
Consumption C2(kgal)
TotalCharges
Jun-17 8 84 772.32$May-17 5 103 915.19$Apr-17 6 111 986.94$Mar-17 6 96 862.14$Feb-17 5 90 807.21$Jan-17 5 102 907.05$Dec-16 5 95 848.81$Nov-16 5 79 717.93$Oct-16 5 96 845.91$Sep-16 5 84 745.31$Aug-16 5 102 895.07$Jul-16 5 63 574.77$Jun-16 5 94 828.51$May-16 6 82 733.68$Apr-16 5 86 761.95$Mar-16 95Feb-16 54 795.23$Jan-16 237 487.55$Dec-15 86 733.68$Nov-15 93 717.04$Oct-15 159 775.28$Sep-15 85 700.06$Aug-15 96 784.96$Jul-15 84 685.12$Jun-15 89 730.03$
TOTALS 1159 1367 18,611.74$
Exhibit 2B Page 30

Proprietary and Confidential © Siemens Industry IGA Report – May, 2019 – | Page 391
Siemens – Broward County, Investment Grade Audit | May 2019
RECOMMENDED IMPROVEMENT MEASURES
This section addresses the Facility Improvement Measures (FIMs) recommended forimplementation at this facility. Each solution is presented with a brief description of theintended scope, savings calculation method, guaranteed savings in units of energy, and theindividual FIM’s financial analysis with payback. As requested, the following improvementscosts are listed separately and do not directly affect a FIM’s payback:
∂ Development Costs
∂ Measurement & Verification (performance assurance)
∂ Code compliance issues uncovered that directly relates to the constructability of a specificmeasure
BUILDING LEVEL SUMMARY
The following table summarized the complete list of FIMs recommended for this facility. Thesummation at the bottom of the table represents the total costs and savings of all FIMs only.As stated, the fixed costs associated with in with development, performance assurance, andcode compliance are considered as separate items.
Building Level Financial Summary
SAVINGS CALCULATION METHODOLOGY
FIMs were developed using spreadsheet models and engineering calculations. Energy usingequipment was measured to determine power consumption, kW. Extensive data logging ofequipment was also used to determine energy consumption, kWh. Savings calculations areprovided as in Section H, Appendices.
Building or Facility DescriptionSAVINGS
Electric KWh $SAVINGS
Electric KW $SAVINGSWater $
SAVINGSO & M
TotalSavings Project Costs Simple
PaybackPompano Beach Branch Library Lighting - Interior 472.15$ -$ -$ 58$ 530.15$ 5,546.18$ 10.5Pompano Beach Branch Library Lighting - Exterior 76.00$ -$ -$ 25$ 101.00$ 822.69$ 8.1Breakage Fee 340.00$PA Cost 66.68$Total 548.15$ -$ -$ 83$ 631.15$ 6,775.55$ 10.7
Exhibit 2B Page 31

Proprietary and Confidential © Siemens Industry IGA Report – May, 2019 – | Page 392
Siemens – Broward County, Investment Grade Audit | May 2019
LIGHTING RETROFIT
The following section describes all lighting scope of work proposed for implementation.
PROJECT SCOPE – INTERIOR LIGHTING
LED Replacement of Linear Lamps: The design strategy is to specify and standardize on thesame type of linear LED T8 and T5 lamps types throughout the buildings to be included inthis project. We select a non-proprietary proven LED tube that will provide the greatestperformance and energy savings of any of the lighting systems considered. The proposedLED Linear tubes are a premium high lumen, extended life with best in class warranty.
The predominant LED lamp we have selected for this project is an UL Type B LED linear type.The UL Type B lamp a direct wire lamp that doesn’t require an external ballast or driver. Theexisting T-8 or T5 ballast will be removed from the fixture and disposed of. New lampsockets approved for direct wire LED lamps will also be installed on the feed ends to ensureproblem free installation and reduce future maintenance. This LED retrofit strategy will allowus to maintain recommended light levels while providing a reduction in energy usage in alllinear lamp fixtures and still standardize on lamp types. All fixtures retrofitted will be drywiped to remove dust and particulate matter to improve fixture lumen efficiency.
Fixture types associated with these lamps are surface or recessed linear fixtures: In thecase of existing 2’x2’ troffers, a different approach is used. There is less flexibility in lampwattage when dealing with U-shaped lamps, and installing linear lamp kits can be achallenge due to variation in fixture construction. Additionally, in many cases, it is possibleto reduce light output if the fixture can be made more efficient. To provide consistency ofcomponents and reduce energy use, we have proposed installing 2x2 volumetric style retrofitdoor kits with dedicated LED boards and drivers.
Emergency Lighting: Backup power for emergency lighting is currently supplied by variousmeans, including generator backup (emergency lights at full output), integral battery backupballasts (fluorescent fixtures at reduced output), and unit inverter emergency lights. Ofthose approaches, the scenarios with existing battery backup ballasts in fluorescent fixturesrequire replacement of the battery ballasts because they are not compatible with the UL TypeB LED lamps. In those cases, a standalone EM kit with a dedicated emergency battery, LEDdriver, and LED board will be installed in the fixture. This kit will remain off until there is apower outage, at which point the LED board will illuminate.
Interior Lighting Retrofit Scope
BUILDING NAME EXISTING & RETROFIT STANDARD LEGEND DESCRIPTIONSEXISTING
QTYRETROFIT
QTY
LIBRARY, BE, PompanoBeach Branch
Existing Excluded due to lack of cost effective replacementor more efficient option - No Retrofit Proposed
17 17
Existing T8 Fluorescent - Proposed Retrofit LED 48 48
Exhibit 2B Page 32

Proprietary and Confidential © Siemens Industry IGA Report – May, 2019 – | Page 393
Siemens – Broward County, Investment Grade Audit | May 2019
PROJECT SCOPE – EXTERIOR LIGHTING
LED Replacement for Fluorescent Exterior
Luminaires with pin based compact fluorescent lamps will generally be retrofit by removingthe existing fluorescent lamps and ballast, and installing new line voltage, pin based LEDlamps. Existing screw based incandescent and fluorescent lamps will be replaced with newscrew based LED lamps.
Exterior fixtures with existing linear fluorescent lamps, such as surface mounted enclosedand gasketed fixtures in park pavilions are evaluated for fixture condition, and either retrofitwith new LED T8, UL Type B lamps, or replaced with new luminaires utilizing dedicated LEDboards and drivers.
Exterior Lighting Retrofit Scope
SAVINGS
The energy and cost savings were developed using a spreadsheet model. In the analysis, theexisting lighting wattage per fixture was reduced to reflect the installation of higherefficiency technology. A detailed room by room survey of the facility, available in Section H,Appendices, was performed to accurately determine the existing lighting type and quantity.
The runtime operations of the new lighting fixtures are reduced in areas that arerecommended for lighting occupancy sensors. This runtime reduction was determined basedon the results of lighting and occupancy data logging sessions conducted at various facilities.The results of these data logging session, as well as the resulting hour of operations of lightsper space type are provided also provided in Section H, Appendices.
BUILDING EXISTING & RETROFIT STANDARD LEGEND DESCRIPTIONSEXISTING
QTYRETROFIT
QTYLIBRARY, BE,
Pompano BeachBranch
Existing Excluded due to lack of cost effective replacement or more efficientoption - No Retrofit Proposed
11 11
Existing Compact Fluorescent - Proposed Retrofit LED 5 5
Exhibit 2B Page 33

Proprietary and Confidential © Siemens Industry IGA Report – May, 2019 – | Page 394
Siemens – Broward County, Investment Grade Audit | May 2019
FIM SAVINGS SUMMARY
Annual Electric Consumption: 4,837 kWh
Annual Electric Demand: 18.24 kW
FIM Financial Summary
Building or Facility DescriptionSAVINGS
Electric KWh $SAVINGS
Electric KW $SAVINGSWater $
SAVINGSO & M
TotalSavings Project Costs Simple
PaybackPompano Beach Branch Library Lighting - Interior 472.15$ -$ -$ 58$ 530.15$ 5,546.18$ 10.5Pompano Beach Branch Library Lighting - Exterior 76.00$ -$ -$ 25$ 101.00$ 822.69$ 8.1
Exhibit 2B Page 34

Proprietary and Confidential © Siemens Industry IGA Report – May, 2019 – | Page 395
Siemens – Broward County, Investment Grade Audit | May 2019
D.30. Library - Riverland Branch
FACILITY DESCRIPTION
The Riverland Library was constructedapproximately in 1983. It is a 10,000 squarefoot 1-story building located at 2710 WestDavie Blvd, Fort Lauderdale, FL 33312. Thebuilding has a main lobby and offices. Thelibrary hours are the following:
Library Office Hours
Monday, Thursday: 12:00PM – 8:00PM
Sunday: Closed
The rest of week: 10:00AM – 6:00PM
Observed Issues:
∂ Room temperature at lobby was hot, and couldn’t feel air movement
∂ Missing return air grille
∂ Missing diffuser parts
∂ Water marks on ceiling tiles from roof water leakage
∂ Outdated control system and components
Examples of observed issues
COOLING SYSTEM:
The temperature of the library is maintained by 2 rooftop units with electric heaters. It wassaid one unit is over 10 years old and another was rebuilt recently. The total nominaltonnage is 30Ton.
According to mechanical drawings, constant air volume terminal boxes were installed, and itwas said they are original.
As shown in the following pictures, old Carrier non-programmable thermostats are still inuse, and outdated diffusers were installed in the library. Room temperature was high andhard to feel air movement during the visit.
Exhibit 2B Page 35

Proprietary and Confidential © Siemens Industry IGA Report – May, 2019 – | Page 396
Siemens – Broward County, Investment Grade Audit | May 2019
Building HVAC
Namplate Data of Mechanical Equipment
LIGHTING SYSTEM
Interior lighting primarily consists of T8 fluorescent lamps in 3-lamp 2x4 fixtures.
Interior Lighting Examples
Riverland LibraryRTU 1 Carrier 50TFF012--V511 4303G50596 compressor R-22 10 230 3 15.8 9 4.7
compressor 230 3 14.7 4.4Outdoor fan 230 1 1.4 0.2Outdoor fan 230 1 1.4 0.2Indoor fan 230 3 5.8 1.7
RTU 2 Carrier 50TJ-024--V5A1YA 4203F59320 compressor R-22 20 230 3 38 9 11.4compressor 230 3 30.1 9.0Outdoor fan 230 3 6.6 2.0Outdoor fan 230 3 6.6 2.0Indoor fan 230 3 2.5 0.7
Cal kWHP Tons/MBTU V Ph Amps Eff /EEREQUIPMENT Mfctr Model Serial Description Notes
General Information Size / Capacity Nameplate Information
Exhibit 2B Page 36

Proprietary and Confidential © Siemens Industry IGA Report – May, 2019 – | Page 397
Siemens – Broward County, Investment Grade Audit | May 2019
Exterior Lighting consists of recessed flood lights.
Exterior Lighting Examples
The building does not make use of occupancy sensors or any other types of lighting control.Motion sensors are for security and not connected to lighting and HVAC controls.
DOMESTIC WATER SYSTEM
Domestic water usage is limited to restrooms. Fixtures and water closets are all operatedmanually. The following are example of the types of fixture found within the restroom of thefacility:
∂ 0.5 gpm faucets
∂ 1.0 gpf urinals
ENVELOPE
There were noticeable water marks on ceiling tiles from roof leakage.
BUILDING CONTROLS SYSTEM
There is no web-based building control system installed in the building. The HVAC system islocally controlled by thermostats together with rooftop unit factory installed controllers.
TRENDING ADAT ANALYSIS
In order to determine the runtime operation of each unit, data loggers were installed tomonitor amperage and/or supply air temperature. This data was trended for a minimum ofseven (7) days in order to capture a typical week. The following graphs illustrate theresulting data from this logging session.
Exhibit 2B Page 37

Proprietary and Confidential © Siemens Industry IGA Report – May, 2019 – | Page 398
Siemens – Broward County, Investment Grade Audit | May 2019
Trending Data – 20 Ton Condensing Unit
This unit registered an average of 53 amps when two compressors are running and anaverage of 21 amps when only one compressor was running. The operating hours totaled31.95 and 120.02 when one and two compressors were running, respectively, during a oneweek period.
Trending Data – 10 Ton Condensing Unit
This unit registered an average of 31 amps when two compressors are running and anaverage of 20 amps when only one compressor was running. The operating hours totaled82.38 and 67.47 when one and two compressors were running, respectively, during a oneweek period.
Exhibit 2B Page 38

Proprietary and Confidential © Siemens Industry IGA Report – May, 2019 – | Page 399
Siemens – Broward County, Investment Grade Audit | May 2019
UTILITY DATA ANALYSIS - ELECTRIC
The electric usage at this facility is monitored by one (1) electric meter. The billing accountutilizes the General Service Demand (GSD-1) rate structure. When creating the baselineshown below, the most recent 24 month of electric billing data was utilized as obtaineddirectly from the Florida Power and Light website. The data was made available via website’sthe user portal and historical data from the facility’s smart meters.
The following table documents both the rate structure values used to calculate energysavings based on most recent electric billing data as well as the established demand andconsumption values representing baseline electric usage for the facility.
Electric Baseline Summary
The data in the table above was generated using the following electric billing data.
Meter KJ42079; Account: 5353044018; Address: 2710 DAVIE BLVD FORT LAUD
Riverland Branch Library 1 GSD-1 0.05809$ 11.47$ 180,913 518 59
$ / kWAverage
Consumptionper Year
AverageDemand per Year
MaxDemandFacility # of Meters Rate Structure $ / kWh
Date CustomerCharge
Consumption(kwh)
ConsumptionCharge
Demand(kW)
DemandCharge
OtherFees/Taxes
TotalCharges
Jun-15 19.48$ 15,267 841$ 42 446$ 74$ 1,380$Jul-15 19.48$ 22,296 1,228$ 55 584$ 102$ 1,933$
Aug-15 19.48$ 27,891 1,537$ 52 552$ 111$ 2,219$Sep-15 19.48$ 25,246 1,391$ 59 626$ 103$ 2,140$Oct-15 19.48$ 18,216 1,004$ 52 552$ 84$ 1,659$Nov-15 19.48$ 14,880 820$ 43 456$ 69$ 1,364$Dec-15 19.48$ 11,696 593$ 41 435$ 113$ 1,160$Jan-16 19.48$ 7,721 391$ 39 394$ 71$ 876$Feb-16 19.48$ 8,079 409$ 36 364$ 70$ 862$Mar-16 19.48$ 11,046 560$ 49 495$ 97$ 1,171$Apr-16 19.48$ 11,233 569$ 42 425$ 66$ 1,079$
May-16 19.48$ 12,475 632$ 41 415$ 66$ 1,132$Jun-16 20.24$ 14,743 702$ 49 511$ 108$ 1,341$Jul-16 20.24$ 18,248 869$ 51 531$ 125$ 1,545$
Aug-16 20.24$ 18,022 858$ 45 469$ 118$ 1,465$Sep-16 20.24$ 17,742 845$ 36 375$ 105$ 1,345$Oct-16 20.24$ 15,073 717$ 35 365$ 94$ 1,196$Nov-16 20.24$ 13,090 623$ 35 365$ 86$ 1,095$Dec-16 20.24$ 15,764 750$ 40 417$ 102$ 1,289$Jan-17 25.00$ 13,720 706$ 40 424$ 102$ 1,257$Feb-17 25.00$ 10,918 562$ 43 456$ 92$ 1,134$Mar-17 25.00$ 12,479 670$ 37 392$ 97$ 1,184$Apr-17 25.00$ 12,266 659$ 37 392$ 96$ 1,172$
May-17 25.00$ 13,714 736$ 37 392$ 103$ 1,256$180,913 9,335$ 518 5,416$ 1,125$ 16,126$Yearly Averges
Exhibit 2B Page 39

Proprietary and Confidential © Siemens Industry IGA Report – May, 2019 – | Page 400
Siemens – Broward County, Investment Grade Audit | May 2019
The resulting energy usage profile, illustrated above, for this account is directly influenced bycooling needs throughout the year; as identified by the comparison of monthly consumptionto bin weather data’s cooling degree days (CDD). Electric demand usage is relativelyconstant from month to month, indicating a base consumption need. The average peak forthe 24 month period evaluated occurs in August while the average low occurs in February;further confirming the influence of outdoor weather conditions on building electricconsumption.
The billing is, as previously shown, analyzed as a combination of all meters. As described ina previous section, an index value is calculated and compared to similar facilities within thesame geographic region. Below are the results of this comparison.
Benchmarking Summary
Overall, this building is operating above the 75th percentile of comparable facilities. Thisindicates improvement opportunities for both equipment upgrades and building automation.
0
100
200
300
400
500
600
700
0
5,000
10,000
15,000
20,000
25,000
Jan Feb Mar Apr May Jun Jul Aug Sep Oct Nov Dec
Dem
and
(kW
)
Cons
umpt
ion
(kW
h)
Month
Electric Consumption Profile
Consumption (kWh) Demand (kW) CDD
25thpercentile Median
75thpercentile
Riverland Branch Library Library 18.09 10.7 14.3 15.6
kWh/Sq FtCBECS - 2012 kWh/Sq Ft Data
Facility Faclity Type
Exhibit 2B Page 40

Proprietary and Confidential © Siemens Industry IGA Report – May, 2019 – | Page 401
Siemens – Broward County, Investment Grade Audit | May 2019
UTILITY DATA ANALYSIS - WATER
The following table(s) summarizes the water consumption data that was available for thisfacility.
Account # 2041452 Meter # 201000204Rate AddressMeter Size Meter Type
Riverland Branch Library
Date
Feb-16Jan-16Dec-15Nov-15Oct-15Sep-15Aug-15Jul-15Jun-15May-15Apr-15Mar-15Feb-15Jan-15Dec-14Nov-14Oct-14Sep-14Aug-14Jul-14Jun-14May-14Apr-14Mar-14Feb-14
TOTALS
Consump TotalCharges
40.05$17.07$51.54$
120.47$0.86$
27.19$27.19$27.19$27.19$27.19$27.19$16.25$27.19$27.19$27.19$16.25$26.70$25.89$15.48$25.89$15.48$25.89$25.89$14.75$25.89$
709.06$
Exhibit 2B Page 41

Proprietary and Confidential © Siemens Industry IGA Report – May, 2019 – | Page 402
Siemens – Broward County, Investment Grade Audit | May 2019
These accounts only had total expense amounts per month available for water usage utilitydata. No relevant conclusions can be drawn from this data.
Account # 2041453 Meter # 200213997Rate AddressMeter Size Meter Type
Riverland Branch Library
DateConsump
Feb-16Jan-16Dec-15Nov-15Oct-15Sep-15Aug-15Jul-15Jun-15May-15Apr-15Mar-15Feb-15Jan-15Dec-14Nov-14Oct-14Sep-14Aug-14Jul-14Jun-14May-14Apr-14Mar-14Feb-14
TOTALS
Consump TotalCharges
40.56$40.56$
255.35$279.19$225.75$260.47$156.07$143.02$27.97$27.97$27.97$86.39$
2,347.36$36.67$41.02$32.32$36.01$43.18$30.76$30.76$34.90$18.34$36.49$(2.55)$
105.28$4,361.81$
Exhibit 2B Page 42
Proprietary and Confidential © Siemens Industry IGA Report – May, 2019 – | Page 403
Siemens – Broward County, Investment Grade Audit | May 2019
RECOMMENDED IMPROVEMENT MEASURES
This section addresses the Facility Improvement Measures (FIMs) recommended forimplementation at this facility. Each solution is presented with a brief description of theintended scope, savings calculation method, guaranteed savings in units of energy, and theindividual FIM’s financial analysis with payback. As requested, the following improvementscosts are listed separately and do not directly affect a FIM’s payback:
∂ Development Costs
∂ Measurement & Verification (performance assurance)
∂ Code compliance issues uncovered that directly relates to the constructability of a specificmeasure
BUILDING LEVEL SUMMARY
The following table summarized the complete list of FIMs recommended for this facility. Thesummation at the bottom of the table represents the total costs and savings of all FIMs only.As stated, the fixed costs associated with in with development, performance assurance, andcode compliance are considered as separate items.
Building Level Financial Summary
SAVINGS CALCULATION METHODOLOGY
FIMs were developed using spreadsheet models and engineering calculations. Energy usingequipment was measured to determine power consumption, kW. Extensive data logging ofequipment was also used to determine energy consumption, kWh. Savings calculations areprovided as in Section H, Appendices.
Building or Facility DescriptionSAVINGS
Electric KWh $SAVINGS
Electric KW $SAVINGSWater $
SAVINGSO & M
TotalSavings Project Costs Simple
PaybackRiverland Branch Library Lighting - Interior 917.93$ 605.80$ -$ 239$ 1,762.72$ 18,472.25$ 10.5Riverland Branch Library Lighting - Exterior 9.49$ 5.23$ -$ 11$ 25.72$ 285.60$ 11.1Riverland Branch Library RTU COMBINED 5,199.35$ 719.15$ -$ -$ 5,918.50$ 85,497.03$ 14.4Breakage Fee 1,700.00$PA Cost 1,089.33$Total 6,126.77$ 1,330.17$ -$ 250$ 7,706.94$ 107,044.21$ 13.9
Exhibit 2B Page 43

Proprietary and Confidential © Siemens Industry IGA Report – May, 2019 – | Page 404
Siemens – Broward County, Investment Grade Audit | May 2019
LIGHTING RETROFIT
The following section describes all lighting scope of work proposed for implementation.
PROJECT SCOPE – INTERIOR LIGHTING
LED Replacement of Linear Lamps
The design strategy is to specify and standardize on the same type of linear LED T8 and T5lamps types throughout the buildings to be included in this project. We select a non-proprietary proven LED tube that will provide the greatest performance and energy savings ofany of the lighting systems considered. The proposed LED Linear tubes are a premium highlumen, extended life with best in class warranty.
The predominant LED lamp we have selected for this project is an UL Type B LED linear type.The UL Type B lamp a direct wire lamp that doesn’t require an external ballast or driver. Theexisting T-8 or T5 ballast will be removed from the fixture and disposed of. New lampsockets approved for direct wire LED lamps will also be installed on the feed ends to ensureproblem free installation and reduce future maintenance. This LED retrofit strategy will allowus to maintain recommended light levels while providing a reduction in energy usage in alllinear lamp fixtures and still standardize on lamp types. All fixtures retrofitted will be drywiped to remove dust and particulate matter to improve fixture lumen efficiency.
Fixture types associated with these lamps are surface or recessed linear fixtures.
In the case of existing 2’x2’ troffers, a different approach is used. There is less flexibility inlamp wattage when dealing with U-shaped lamps, and installing linear lamp kits can be achallenge due to variation in fixture construction. Additionally, in many cases, it is possibleto reduce light output if the fixture can be made more efficient. To provide consistency ofcomponents and reduce energy use, we have proposed installing 2x2 volumetric style retrofitdoor kits with dedicated LED boards and drivers.
LED Replacement for Screw Based Incandescent and Compact fluorescent fixtures
Our design strategy for the replacement of screw based incandescent and compactfluorescent lamps is to replace them with screw based LED where the application permits.LED has become an attractive replacement option when incandescent fixtures are controlledby dimmers due to its excellent dimming capability.
LED Replacement for Pin-Based Compact Fluorescent Fixtures
In keeping with the direction to remove fluorescent ballasts, reduce energy use and minimizecost, our design strategy for existing pin-based compact fluorescent lamps is to retrofit theexisting fixtures with line voltage pin based LED lamps and remove the existing fluorescentballasts. In some cases, it is possible to remove two fluorescent lamps and replace them witha single higher powered LED lamp without sacrificing luminaire output and distribution.
Exhibit 2B Page 44

Proprietary and Confidential © Siemens Industry IGA Report – May, 2019 – | Page 405
Siemens – Broward County, Investment Grade Audit | May 2019
Emergency Lighting
Backup power for emergency lighting is currently supplied by various means, includinggenerator backup (emergency lights at full output), integral battery backup ballasts(fluorescent fixtures at reduced output), and unit inverter emergency lights. Of thoseapproaches, the scenarios with existing battery backup ballasts in fluorescent fixtures requirereplacement of the battery ballasts because they are not compatible with the UL Type B LEDlamps. In those cases, a standalone EM kit with a dedicated emergency battery, LED driver,and LED board will be installed in the fixture. This kit will remain off until there is a poweroutage, at which point the LED board will illuminate.
Interior Lighting Retrofit Scope
PROJECT SCOPE – EXTERIOR LIGHTING
LED Replacement for Fluorescent Exterior
Luminaires with pin based compact fluorescent lamps will generally be retrofit by removingthe existing fluorescent lamps and ballast, and installing new line voltage, pin based LEDlamps. Existing screw based incandescent and fluorescent lamps will be replaced with newscrew based LED lamps.
Exterior fixtures with existing linear fluorescent lamps, such as surface mounted enclosedand gasketed fixtures in park pavilions are evaluated for fixture condition, and either retrofitwith new LED T8, UL Type B lamps, or replaced with new luminaires utilizing dedicated LEDboards and drivers.
Exterior Lighting Retrofit Scope
BUILDING NAME EXISTING & RETROFIT STANDARD LEGEND DESCRIPTIONSEXISTING
QTYRETROFIT
QTY
LIBRARY, RV, RiverlandBranch
Existing Excluded due to lack of cost effective replacementor more efficient option - No Retrofit Proposed
3 3
Existing T8 Fluorescent - Proposed Retrofit LED 109 109Existing Incandescent - Proposed Relamp LED 9 9Existing Compact Fluorescent - Proposed Relamp LED 1 1
Existing T8 Fluorescent U Tube - Proposed New LED Fixture 16 16
BUILDING EXISTING & RETROFIT STANDARD LEGEND DESCRIPTIONSEXISTING
QTYRETROFIT
QTYLIBRARY, RV,
Riverland BranchExisting Compact Fluorescent - Proposed Relamp LED 10 10
Exhibit 2B Page 45

Proprietary and Confidential © Siemens Industry IGA Report – May, 2019 – | Page 406
Siemens – Broward County, Investment Grade Audit | May 2019
SAVINGS
The energy and cost savings were developed using a spreadsheet model. In the analysis, theexisting lighting wattage per fixture was reduced to reflect the installation of higherefficiency technology. A detailed room by room survey of the facility, available in Section H,Appendices, was performed to accurately determine the existing lighting type and quantity.
The runtime operations of the new lighting fixtures are reduced in areas that arerecommended for lighting occupancy sensors. This runtime reduction was determined basedon the results of lighting and occupancy data logging sessions conducted at various facilities.The results of these data logging session, as well as the resulting hour of operations of lightsper space type are provided also provided in Section H, Appendices.
FIM SAVINGS SUMMARY
Annual Electric Consumption: 15,800 kWh
Annual Electric Demand: 52.44 kW
FIM Financial Summary
MECHANICAL
As DX equipment ages and the condition of the equipment deteriorate, the energy efficiencyof these units also degrades. In recent years the energy efficiency of DX equipment hasimproved due to mandates as well as manufacture improvements. DX air-conditioningsystems are rated by their Seasonal Energy Efficiency Ratios (SEER). The higher the SEERrating the more energy efficient the units are. Older units have average SEER ratingsbetween 8-10 while new units have average SEER ratings of 13 or greater.
Cooling for this building is provided by a total of two (2) roof-top units that have reached theend of their useful lives.
PROJECT SCOPE
This FIM addresses the replacement of two (2) roof top units. The new equipment will be ofequal capacity and include, as part of the installation, package new programmablethermostats provided by Siemens. The thermostats will be able to communicated, via theirown IP address, to remote BAUs for additional access. The units will be placed on a time ofday schedule. The new schedule will command the units to turn on 1.5 hours before thefacility opens and 1.5 hours after it closes.
Building or Facility DescriptionSAVINGS
Electric KWh $SAVINGS
Electric KW $SAVINGSWater $
SAVINGSO & M
TotalSavings Project Costs Simple
PaybackRiverland Branch Library Lighting - Interior 917.93$ 605.80$ -$ 239$ 1,762.72$ 18,472.25$ 10.5Riverland Branch Library Lighting - Exterior 9.49$ 5.23$ -$ 11$ 25.72$ 285.60$ 11.1
Exhibit 2B Page 46

Proprietary and Confidential © Siemens Industry IGA Report – May, 2019 – | Page 407
Siemens – Broward County, Investment Grade Audit | May 2019
Scope of Work
Building Equipment Make Model Tons ExistingEER
NewEER
Riverland Branch Library RTU Carrier 50TFF012--V511 10 9 12.5
Riverland Branch Library RTU Carrier 50TJ-024--V5A1YA 20 9 11
SAVINGS
The energy and cost savings were developed using a spreadsheet model. Using nameplatedata, onsite electrical spot measurements, and data logging information, the total HVACelectrical contribution of this facility’s electric utility bill was determined. The calculationstook into consideration current conditions and efficiencies. Savings were obtained byreplacing existing efficiency values with the higher efficiency value of the new equipment; aspublished by the manufacturer. The detailed calculations are available in the Section H,Appendices. All calculations were based off Trane manufacturer cut-sheets, also provided.
FIM SAVINGS SUMMARY
Annual Electric Consumption: 89,500 kWh
Annual Electric Demand: 62.7 kW
FIM Financial Summary
Building or Facility DescriptionSAVINGS
Electric KWh $SAVINGS
Electric KW $SAVINGSWater $
SAVINGSO & M
TotalSavings Project Costs Simple
PaybackRiverland Branch Library RTU COMBINED 5,199.35$ 719.15$ -$ -$ 5,918.50$ 85,497.03$ 14.4
Exhibit 2B Page 47

Proprietary and Confidential © Siemens Industry IGA Report – May, 2019 – | Page 408
Siemens – Broward County, Investment Grade Audit | May 2019
D.31. Library - Tamarac
FACILITY DESCRIPTION
The newest Tamarac Branch Library wasconstructed approximately in 2003, and wasrenovated in 2007. It is a 30,000 squarefoot 1-story building located at 8701 westCommercial Blvd, Tamarac, FL 33351. Thebuilding has a main lobby, individual studyrooms, a large multipurpose room, acomputer lab, and offices. The library hoursare the following:
Library Office Hours
Monday – Wednesday: 10:00AM – 8:00PM
Thursday – Saturday: 10:00AM – 6:00PM
Sunday: Closed
COOLING SYSTEM:
The chilled water is provided by a constant chilled water flow system. The system consists ofan air-cooled chiller and 2 constant speed 5-HP chilled water pumps. The old York chiller wasreplaced in September 2013 by the current Trane air-cooled chiller. The nominal tonnage ofthe chiller is 100 tons. The refrigerant is R-410a. One of the two pumps is a standby pump.Three-way chilled water DDC control valves were installed at AHUs.
Chilled Water System
Two single duct air handling systems with VAV terminal boxes are serving the building. Thereare 2 chilled water VAV air handling units (AHU-1, AHU-2), which are located in the samemechanical room. The 20-horsepower supply fan of each AHU was equipped with a YorkVFD, Air modular. The VFDs seem 14 years old. The fan speed is controlled to maintain astatic pressure setpoint at the main supply duct located in the mechanical room.
Exhibit 2B Page 48

Proprietary and Confidential © Siemens Industry IGA Report – May, 2019 – | Page 409
Siemens – Broward County, Investment Grade Audit | May 2019
A CO2 sensor exists at the main return air duct in each mechanical room. A two-position OAdamper was installed, and the design OA intake is 5500CFM, which is approximately 19% ofthe total supply airflow.
The fresh air has a dedicated supply air fan installed on the fresh air duct. The fan isequipped with an ABB VFD, but the display was zero Hz although the fan was running. It issuspicious for a faulty VFD.
There are also 2 split air conditioning units dedicatedly serving Library Material Return andStaff Lounge.
According to design drawings, 26 single duct VAV terminal boxes are controlled to maintainzone space temperature set points. Some boxes have electric heaters. The design minimumair flow for boxes without reheat is zero, and approximately 20% for boxes with heaters. Nodedicated humidity control systems are installed. The thermostats are with guard covers, andthe temperature adjustment is not accessible.
Building HVAC
Observed Issues with the cooling system
∂ VFDs were no display or faulty display
Namplate Data of Mechanical Equipment
Tamarac Branch LibraryChiller Trane CGAM ???F 2J02 U13J38373 compressor 460 3 42 30.1
compressor 460 3 42 30.1compressor 460 3 42 30.1compressor 460 3 42 30.1
Pump M3615T 5 460 3 5.7 87.5% 4.1
AHU-1 York CCMM 16821D with VFD 20 460 3 24.8 17.8AHU-2 York with VFD 20 460 3 29 20.8
Eff /EER Cal kWNotes HPTons/MBTU V Ph Amps
General Information Size / Capacity Nameplate Information
EQUIPMENT Mfctr Model Serial Description
Exhibit 2B Page 49

Proprietary and Confidential © Siemens Industry IGA Report – May, 2019 – | Page 410
Siemens – Broward County, Investment Grade Audit | May 2019
LIGHTING SYSTEM
Interior lighting primarily consists of 32 Watt, T8 fluorescent lamps in 2-lamp 2x4 fixtures.About 20% lights burnt out and are waiting for replacement.
Interior Lighting Examples
Exterior Lighting consists of HPS wall packs. Facility personnel has retrofitted one of thesewall packs to compact fluorescent (CFL) lighting.
The building does not make use of occupancy sensors or any other types of lighting control.Motion sensors are for security and not connected to lighting and HVAC controls. The overallbuilding lights can be controlled by the control system.
DOMESTIC WATER SYSTEM
Domestic water usage is limited to restrooms and kitchen sinks. Fixtures and water closetsare all operated manually. The following are example of the types of fixture found within therestroom of the facility:
∂ 2.2 gpm faucets
∂ 1.0 gpf urinals
Sample Restroom Fixtures
Exhibit 2B Page 50

Proprietary and Confidential © Siemens Industry IGA Report – May, 2019 – | Page 411
Siemens – Broward County, Investment Grade Audit | May 2019
BUILDING CONTROLS SYSTEM
The building is equipped with a Johnson Controls DDC building automation system. Anychanges to the controls operation is handled from the Government Center
HVAC Operational Schedule
Unit Operating
AHU-1, AHU-2 Monday 7:30AM – 8:15PM
Tuesday–Wednesday: 8:00AM – 8:15PM
Thursday: 8:00AM – 6:15PM
Friday-Sunday 4:00AM – 12:00AM
Exhibit 2B Page 51

Proprietary and Confidential © Siemens Industry IGA Report – May, 2019 – | Page 412
Siemens – Broward County, Investment Grade Audit | May 2019
UTILITY DATA ANALYSIS - ELECTRIC
The electric usage at this facility is monitored by one (1) electric meter. The billing accountutilizes the General Service Demand (GSD-1) rate structure. When creating the baselineshown below, the most recent 24 month of electric billing data was utilized as obtaineddirectly from the Florida Power and Light website. The data was made available via website’sthe user portal and historical data from the facility’s smart meters.
The following table documents both the rate structure values used to calculate energysavings based on most recent electric billing data as well as the established demand andconsumption values representing baseline electric usage for the facility.
Electric Baseline Summary
The data in the table above was generated using the following electric billing data.
Meter KV52540; Account: 7864325506; Address: 8701 W COMMERCIAL BLVD
Tamarac Library 1 GSD-1 0.05808$ 11.46$ 536,580 1,702 191
$ / kWAverage
Consumptionper Year
AverageDemand per Year
MaxDemandFacility # of Meters Rate Structure $ / kWh
Date CustomerCharge
Consumption(kwh)
ConsumptionCharge
Demand(kW)
DemandCharge
OtherFees/Taxes
TotalCharges
Jun-15 19.48$ 47,880 2,638$ 160 1,698$ 247$ 4,602$Jul-15 19.48$ 47,640 2,624$ 160 1,698$ 246$ 4,588$
Aug-15 19.48$ 51,720 2,849$ 158 1,676$ 253$ 4,798$Sep-15 19.48$ 48,960 2,697$ 130 1,379$ 205$ 4,301$Oct-15 19.48$ 50,280 2,770$ 128 1,358$ 206$ 4,353$Nov-15 19.48$ 54,360 2,995$ 136 1,443$ 222$ 4,679$Dec-15 19.48$ 42,720 2,164$ 164 1,740$ 417$ 4,340$Jan-16 19.48$ 32,640 1,654$ 107 1,082$ 239$ 2,994$Feb-16 19.48$ 37,320 1,891$ 137 1,385$ 286$ 3,581$Mar-16 19.48$ 41,640 2,109$ 136 1,375$ 313$ 3,817$Apr-16 19.48$ 37,440 1,897$ 168 1,698$ 243$ 3,858$
May-16 19.48$ 44,160 2,237$ 174 1,759$ 257$ 4,273$Jun-16 20.24$ 43,800 2,085$ 161 1,678$ 328$ 4,111$Jul-16 20.24$ 48,120 2,291$ 191 1,990$ 373$ 4,674$
Aug-16 20.24$ 54,600 2,599$ 155 1,615$ 367$ 4,601$Sep-16 20.24$ 44,760 2,131$ 131 1,365$ 296$ 3,812$Oct-16 20.24$ 46,080 2,193$ 119 1,240$ 291$ 3,744$Nov-16 20.24$ 48,480 2,308$ 125 1,303$ 306$ 3,936$Dec-16 20.24$ 45,600 2,171$ 126 1,313$ 295$ 3,799$Jan-17 25.00$ 44,160 2,272$ 127 1,346$ 316$ 3,959$Feb-17 25.00$ 37,680 1,939$ 106 1,124$ 272$ 3,360$Mar-17 25.00$ 41,520 2,230$ 155 1,643$ 346$ 4,244$Apr-17 25.00$ 37,320 2,004$ 113 1,198$ 287$ 3,514$
May-17 25.00$ 44,280 2,378$ 137 1,452$ 342$ 4,197$536,580 27,562$ 1,702 17,779$ 3,476$ 49,067$Yearly Averages
Exhibit 2B Page 52

Proprietary and Confidential © Siemens Industry IGA Report – May, 2019 – | Page 413
Siemens – Broward County, Investment Grade Audit | May 2019
The resulting energy usage profile, illustrated above, for this account is influenced by coolingneeds throughout the year; as identified by the comparison of monthly consumption to binweather data’s cooling degree days (CDD). Electric demand usage is relatively constant frommonth to month, indicating a base consumption need. The average peak for the 24 monthperiod evaluated occurs in August while the average low occurs in February; furtherconfirming the influence of outdoor weather conditions on building electric consumption.
The billing is, as previously shown, analyzed as a combination of all meters. As described ina previous section, an index value is calculated and compared to similar facilities within thesame geographic region. Below are the results of this comparison.
Benchmarking Summary
Overall, this building is operating above the 75th percentile of comparable facilities. Thisindicates improvement opportunities in equipment upgrades and building automation.However, the low annual billing costs may negatively affect FIM payback values.
0
100
200
300
400
500
600
700
0
10,000
20,000
30,000
40,000
50,000
60,000
Jan Feb Mar Apr May Jun Jul Aug Sep Oct Nov Dec
Dem
and
(kW
)
Cons
umpt
ion
(kW
h)
Month
Electric Consumption Profile
Consumption (kWh) Demand (kW) CDD
25thpercentile Median
75thpercentile
Tamarac Library Library 17.89 10.7 14.3 15.6
kWh/Sq FtCBECS - 2012 kWh/Sq Ft Data
Facility Faclity Type
Exhibit 2B Page 53

Proprietary and Confidential © Siemens Industry IGA Report – May, 2019 – | Page 414
Siemens – Broward County, Investment Grade Audit | May 2019
UTILITY DATA ANALYSIS - WATER
The following table(s) summarizes the water consumption data that was available for thisfacility.
This account had a mostly complete 24 month data set for water consumption and utilitycost. The average monthly consumption is 25 thousand gallons. The average monthly cost is$506.73. The average monthly blended rate in dollars per thousand gallons is $19.92. Thisblended rate is much higher than the rate being used for savings calculations but any feesand charges to this account are unknown so the rate is not an accurate representation ofconsumption cost.
Account # 58199-10009868 Meter # WT 60340741 04Rate AddressMeter Size Meter Type
Tamarac Branch Library
Date Consumption () TotalCharges
Mar-17 29 516.12$Feb-17 26 501.80$Jan-17 20 468.03$Dec-16 25 494.64$Nov-16 42 623.52$Oct-16 21 483.12$Sep-16 30 540.61$Aug-16 34 544.76$Jul-16 26 501.80$Jun-16 24 507.65$May-16 29 516.12$Apr-16 29 561.12$Mar-16 33 544.76$Feb-16 24Jan-16 21 487.48$Dec-15 19 473.16$Nov-15 21 444.52$Oct-15 21 466.00$Sep-15 21 484.09$Aug-15 22 473.16$Jul-15 21 474.78$Jun-15 20 471.94$May-15 27 508.96$Apr-15 30 575.44$Mar-15 21 497.98$
TOTALS 636 12,161.56$
Exhibit 2B Page 54

Proprietary and Confidential © Siemens Industry IGA Report – May, 2019 – | Page 415
Siemens – Broward County, Investment Grade Audit | May 2019
RECOMMENDED IMPROVEMENT MEASURES
This section addresses the Facility Improvement Measures (FIMs) recommended forimplementation at this facility. Each solution is presented with a brief description of theintended scope, savings calculation method, guaranteed savings in units of energy, and theindividual FIM’s financial analysis with payback. As requested, the following improvementscosts are listed separately and do not directly affect a FIM’s payback:
∂ Development Costs
∂ Measurement & Verification (performance assurance)
∂ Code compliance issues uncovered that directly relates to the constructability of a specificmeasure
BUILDING LEVEL SUMMARY
The following table summarized the complete list of FIMs recommended for this facility. Thesummation at the bottom of the table represents the total costs and savings of all FIMs only.As stated, the fixed costs associated with in with development, performance assurance, andcode compliance are considered as separate items.
Building Level Financical Summary
SAVINGS CALCULATION METHODOLOGY
FIMs were developed using spreadsheet models and engineering calculations. Energy usingequipment was measured to determine power consumption, kW. Extensive data logging ofequipment was also used to determine energy consumption, kWh. Savings calculations areprovided as in Section H, Appendices.
Building or Facility DescriptionSAVINGS
Electric KWh $SAVINGS
Electric KW $SAVINGSWater $
SAVINGSO & M
TotalSavings Project Costs Simple
PaybackTamarac Library Lighting - Exterior 1,705.08$ 939.27$ -$ 346$ 2,990.34$ 35,482.27$ 11.9Breakage Fee 5,100.00$PA Cost 371.49$Total 1,705.08$ 939.27$ -$ 346$ 2,990.34$ 40,953.76$ 13.7
Exhibit 2B Page 55

Proprietary and Confidential © Siemens Industry IGA Report – May, 2019 – | Page 416
Siemens – Broward County, Investment Grade Audit | May 2019
LIGHTING RETROFIT
The following section describes all lighting scope of work proposed for implementation.
PROJECT SCOPE – EXTERIOR LIGHTING
LED Replacement for High Intensity Discharge Exterior
The replacement of HID (high intensity discharge), including metal halide or high-pressuresodium n exterior applications provides significant energy reduction opportunities whenchanging over to LED. For exterior pole mounted applications, often the number of fixturescan be reduce based on the improved photometric and light distribution of the new LEDfixtures that wasn’t previously available in HID fixtures. All proposed LED fixtures are fromrecognized manufacturers that have met the required standards for light quality, efficiencyand longevity. In our design effort and fixture selection process, consideration is given tothe maintenance benefits of the prescribed solution resulting in less future costs to maintainexterior fixtures in difficult to reach applications. The proposed LED fixture replacement hasbeen specified to furnish light levels that are in compliance with recommended light levelsand support the existing site condition requirements. Where time clocks or automatedlighting controls are not in place, proposed LED building and site lighting will incorporate anintegral photocell to maximize energy savings.
In general, the design approach is to replace existing HID luminaires with new LED luminairesof like type, ie: shoeboxes, wallpacks, floodlights. Some fixture types are replaced with newLED fixtures of a different type, ie: recessed canopy lights replaced with low profile LEDcanopy lights.
Where deemed appropriate in parks and office buildings, integral occupancy sensors havebeen used on pole mounted shoebox luminaires in parking lots to automatically dim thelighting during hours of inactivity.
Decorative post top luminaires, recessed step lights, and bollards typically use low wattageHID lamps in architectural form factors. Replacement luminaires of this type are relativelyhigh in cost, with relatively low energy savings potential. As a result, the proposed designtypically calls for removing the HID lamp and ballast, and installing a new screw based LEDlamp.
LED Replacement for Fluorescent Exterior
Luminaires with pin based compact fluorescent lamps will generally be retrofit by removingthe existing fluorescent lamps and ballast, and installing new line voltage, pin based LEDlamps. Existing screw based incandescent and fluorescent lamps will be replaced with newscrew based LED lamps.
Exterior fixtures with existing linear fluorescent lamps, such as surface mounted enclosedand gasketed fixtures in park pavilions are evaluated for fixture condition, and either retrofitwith new LED T8, UL Type B lamps, or replaced with new luminaires utilizing dedicated LEDboards and drivers.
Exhibit 2B Page 56

Proprietary and Confidential © Siemens Industry IGA Report – May, 2019 – | Page 417
Siemens – Broward County, Investment Grade Audit | May 2019
Exterior Lighting Retrofit Scope Considered
SAVINGS
The energy and cost savings were developed using a spreadsheet model. In the analysis, theexisting lighting wattage per fixture was reduced to reflect the installation of higherefficiency technology. A detailed room by room survey of the facility, available in Section H,Appendices, was performed to accurately determine the existing lighting type and quantity.
The runtime operations of the new lighting fixtures are reduced in areas that arerecommended for lighting occupancy sensors. This runtime reduction was determined basedon the results of lighting and occupancy data logging sessions conducted at various facilities.The results of these data logging session, as well as the resulting hour of operations of lightsper space type are provided also provided in Section H, Appendices.
FIM SAVINGS SUMMARY
Annual Electric Consumption: 29,357 kWh
Annual Electric Demand: 82.08 kW
FIM Financial Summary
BUILDING EXISTING & RETROFIT STANDARD LEGEND DESCRIPTIONSEXISTING
QTYRETROFIT
QTYLIBRARY, TA,
TamaracExisting High Intensity Discharge - Proposed New LED Fixture 20 20
Existing Compact Fluorescent - Proposed Relamp LED 5 5Existing Compact Fluorescent - Proposed Retrofit LED 48 48
Building or Facility DescriptionSAVINGS
Electric KWh $SAVINGS
Electric KW $SAVINGSWater $
SAVINGSO & M
TotalSavings Project Costs Simple
PaybackTamarac Library Lighting - Exterior 1,705.08$ 939.27$ -$ 346$ 2,990.34$ 35,482.27$ 11.9
Exhibit 2B Page 57

Proprietary and Confidential © Siemens Industry IGA Report – May, 2019 – | Page 418
Siemens – Broward County, Investment Grade Audit | May 2019
D.32. Library - Tyrone Bryant
FACILITY DESCRIPTION
The Tyrone Bryant Library was constructedapproximately in 2008. It is a 10,250 square foot 1-story building located at 2230 NW 21 Ave, FortLauderdale, FL 33311. The building has a main lobby,individual study rooms, a large multipurpose room, acomputer lab, and offices. The library hours are the following:
Library Office Hours
Monday and Thursday: 12:00PM – 6:00PM
Tuesday, Wednesday, Friday: 10:00AM – 6:00PM
Saturday: 10:00AM – 6:00PM
Sunday: Closed
COOLING SYSTEM:
Cooling for the building is provided by a split DX system consisting of one AHU with twocondensing of 15 and 20 tons. The condensing units were manufactured in 2007 and stillutilize R-22 refrigerant.
Split DX System
One air handling unit with VAV terminal boxes serves the building; located in a dedicatedmechanical room next to the outdoor condensing units. The 15-horsepower supply fan isequipped with An ABB VFD.
Exhibit 2B Page 58

Proprietary and Confidential © Siemens Industry IGA Report – May, 2019 – | Page 419
Siemens – Broward County, Investment Grade Audit | May 2019
Building HVAC
Namplate Data of Mechanical Equipment
LIGHTING SYSTEM
Interior lighting primarily consists of 32 Watt, T8 fluorescent lamps in 1-lamp 2x4 fixtures.
Interior Lighting Examples
The building does not make use of occupancy sensors or any other types of lighting control.Motion sensors are for security and not connected to lighting and HVAC controls.
Tyrone Bryant Branch LibraryAHU-1 Trane MCCB030UA K07G93928 with VFD 15 200 3 48.3 15.1
CU Trane TTA240B300FB 7472PG2AD compressor R-22 20 230 3 33.7 10 12.1compressor 2007 230 3 33.7 12.1
fan 230 1 6 1.2fan 230 1 6 1.2
CU Trane TTA180B300FA 7443NMMAD compressor R-22 15 230 1 25.1 10 5.2compressor 2007 230 1 25.1 5.2
fan 230 1 3.1 0.6fan 230 1 3.1 0.6
Cal kWHP Tons/MBTU V Ph Amps Eff /EEREQUIPMENT Mfctr Model Serial Description Notes
General Information Size / Capacity Nameplate Information
Exhibit 2B Page 59

Proprietary and Confidential © Siemens Industry IGA Report – May, 2019 – | Page 420
Siemens – Broward County, Investment Grade Audit | May 2019
DOMESTIC WATER SYSTEM
Domestic water usage is limited to restrooms and kitchen sinks. Fixtures and water closetsare all operated manually. The following are example of the types of fixture found within therestroom of the facility:
∂ 2.2 gpm faucets
∂ 1.5 gpf urinals
BUILDING CONTROLS SYSTEM
The building is equipped with a Johnson Controls DDC building automation system. Anychanges to the controls operation is handled from the Government Center. The spacesaround the library do contain CO2 sensors; however, it was not conclusive whether or notthey were operational.
Building Controls
TRENDING DATA AQUISITION:
In order to determine the runtime and power draw of onsite HVAC equipment, data loggerswere installed to obtain more data than currently available. This data was trended for aminimum of seven (7) days in order to capture a typical week. The following graphsillustrate the resulting data from this logging session.
Exhibit 2B Page 60
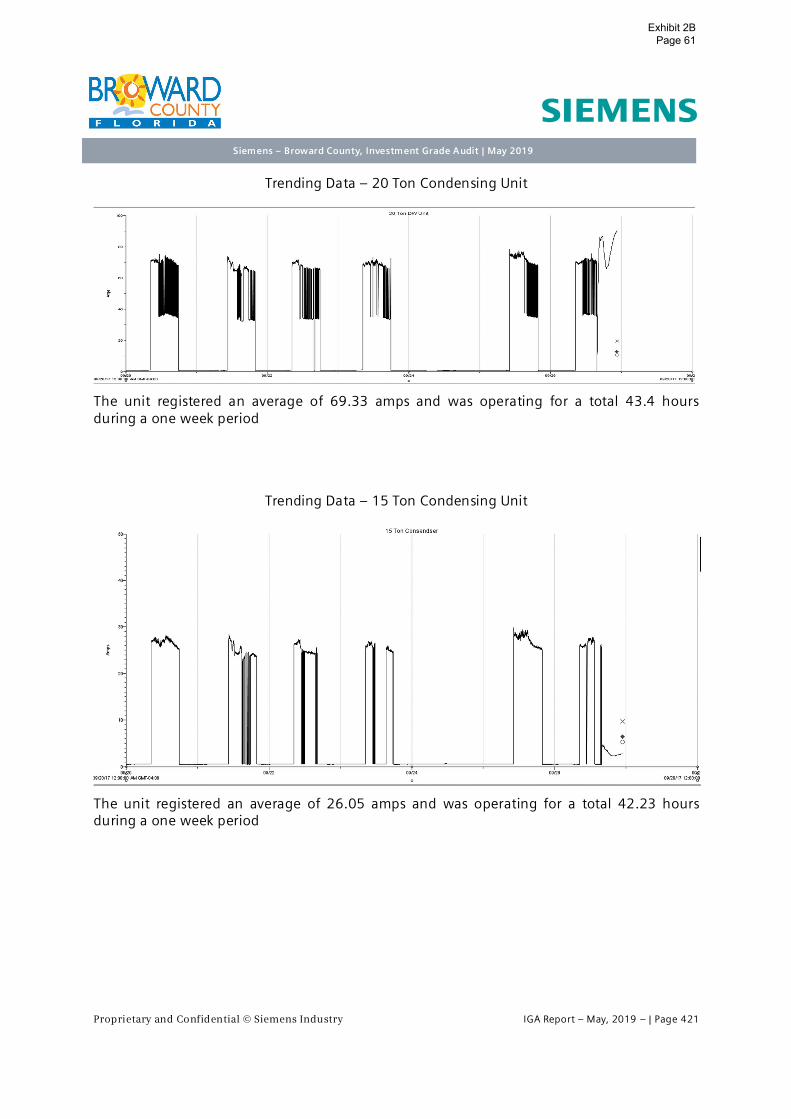
Proprietary and Confidential © Siemens Industry IGA Report – May, 2019 – | Page 421
Siemens – Broward County, Investment Grade Audit | May 2019
Trending Data – 20 Ton Condensing Unit
The unit registered an average of 69.33 amps and was operating for a total 43.4 hoursduring a one week period
Trending Data – 15 Ton Condensing Unit
The unit registered an average of 26.05 amps and was operating for a total 42.23 hoursduring a one week period
Exhibit 2B Page 61

Proprietary and Confidential © Siemens Industry IGA Report – May, 2019 – | Page 422
Siemens – Broward County, Investment Grade Audit | May 2019
UTILITY DATA ANALYSIS – ELECTRIC
The electric usage at this facility is monitored by one (1) electric meter. The billing accountutilizes the General Service Demand (GSD-1) rate structure. When creating the baselineshown below, the most recent 24 month of electric billing data was utilized as obtaineddirectly from the Florida Power and Light website. The data was made available via website’sthe user portal and historical data from the facility’s smart meters.
The following table documents both the rate structure values used to calculate energysavings based on most recent electric billing data as well as the established demand andconsumption values representing baseline electric usage for the facility.
Electric Baseline Summary
The data in the table above was generated using the following electric billing data.
Meter KU51264; Account: 375767084; Address: 2230 NW 21ST AVE #LIB FORT LAUD
Tyrone Bryant Library 1 GSD-1 0.05809$ 11.47$ 213,120 712 78
$ / kWAverage
Consumptionper Year
AverageDemand per Year
MaxDemandFacility # of Meters Rate Structure $ / kWh
Date CustomerCharge
Consumption(kwh)
ConsumptionCharge
Demand(kW)
DemandCharge
OtherFees/Taxes
TotalCharges
Jun-15 19.48$ 25,200 1,388$ 56 594$ 109$ 2,111$Jul-15 19.48$ 24,600 1,355$ 53 562$ 105$ 2,042$
Aug-15 19.48$ 24,840 1,368$ 52 552$ 104$ 2,044$Sep-15 19.48$ 26,760 1,474$ 52 552$ 99$ 2,145$Oct-15 19.48$ 22,920 1,263$ 53 562$ 93$ 1,938$Nov-15 19.48$ 21,360 1,177$ 53 562$ 90$ 1,848$Dec-15 19.48$ 30,360 1,538$ 54 573$ 241$ 2,372$Jan-16 19.48$ 20,160 1,021$ 55 556$ 140$ 1,737$Feb-16 19.48$ 16,560 839$ 54 546$ 123$ 1,527$Mar-16 19.48$ 21,960 1,112$ 49 495$ 147$ 1,775$Apr-16 19.48$ 12,960 657$ 73 738$ 105$ 1,519$
May-16 19.48$ 14,160 717$ 66 667$ 98$ 1,502$Jun-16 20.24$ 14,760 703$ 72 750$ 129$ 1,602$Jul-16 20.24$ 15,600 743$ 71 740$ 132$ 1,634$
Aug-16 20.24$ 17,160 817$ 78 813$ 145$ 1,794$Sep-16 20.24$ 14,520 691$ 74 771$ 127$ 1,610$Oct-16 20.24$ 12,360 588$ 64 667$ 110$ 1,385$Nov-16 20.24$ 12,120 577$ 65 677$ 110$ 1,385$Dec-16 20.24$ 12,600 600$ 54 563$ 102$ 1,285$Jan-17 25.00$ 12,600 648$ 50 530$ 106$ 1,309$Feb-17 25.00$ 11,640 599$ 56 594$ 107$ 1,325$Mar-17 25.00$ 12,480 670$ 54 572$ 113$ 1,380$Apr-17 25.00$ 12,840 690$ 56 594$ 116$ 1,425$
May-17 25.00$ 15,720 844$ 59 625$ 133$ 1,628$213,120 11,040$ 712 7,428$ 1,443$ 20,161$Yearly Averages
Exhibit 2B Page 62

Proprietary and Confidential © Siemens Industry IGA Report – May, 2019 – | Page 423
Siemens – Broward County, Investment Grade Audit | May 2019
The resulting energy usage profile, illustrated above, for this account appears to be mostlyinfluenced by cooling needs throughout the year; as identified by the comparison of monthlyconsumption to bin weather data’s cooling degree days (CDD). Electric demand usage isrelatively constant from month to month, indicating a base consumption need. However, theaverage peak for the 24 month period evaluated occurs in December while the average lowoccurs in February. The facility most experience increased activity or events and functionstowards the end of the year, increasing visitor traffic, that results in this unexpected peak.
The billing is, as previously shown, analyzed as a combination of all meters. As described ina previous section, an index value is calculated and compared to similar facilities within thesame geographic region. Below are the results of this comparison.
Benchmarking Summary
Overall, this building is operating above the 75th percentile of comparable facilities. Thisindicates improvement opportunities in equipment upgrades and building automation.However, the low annual billing costs may negatively affect FIM payback values.
0
100
200
300
400
500
600
700
0
5,000
10,000
15,000
20,000
25,000
Jan Feb Mar Apr May Jun Jul Aug Sep Oct Nov Dec
Dem
and
(kW
)
Cons
umpt
ion
(kW
h)
Month
Electric Consumption Profile
Consumption (kWh) Demand (kW) CDD
25thpercentile Median
75thpercentile
Tyrone Bryant Library Library 20.79 10.7 14.3 15.6
kWh/Sq FtCBECS - 2012 kWh/Sq Ft Data
Facility Faclity Type
Exhibit 2B Page 63

Proprietary and Confidential © Siemens Industry IGA Report – May, 2019 – | Page 424
Siemens – Broward County, Investment Grade Audit | May 2019
UTILITY DATA ANALYSIS – WATER
The following table(s) summarizes the water consumption data that was available for thisfacility.
This account only had total expense amounts per month available for water usage utilitydata. No relevant conclusions can be drawn from this data.
Account # 2028503 Meter # 200701699Rate AddressMeter Size Meter Type
Tyrone Bryant Branch Library
Date
Feb-16Jan-16Dec-15Nov-15Oct-15Sep-15Aug-15Jul-15Jun-15May-15Apr-15Mar-15Feb-15Jan-15Dec-14Nov-14Oct-14Sep-14Aug-14Jul-14Jun-14May-14Apr-14Mar-14Feb-14
TOTALS
TotalCharges
637.24$714.58$685.45$599.89$602.40$612.74$668.23$619.85$595.29$668.20$657.89$605.63$699.13$626.93$605.63$649.29$590.30$579.83$665.85$587.23$626.53$569.99$583.53$553.38$
15,005.01$
Exhibit 2B Page 64

Proprietary and Confidential © Siemens Industry IGA Report – May, 2019 – | Page 425
Siemens – Broward County, Investment Grade Audit | May 2019
RECOMMENDED IMPROVEMENT MEASURES
This section addresses the Facility Improvement Measures (FIMs) recommended forimplementation at this facility. Each solution is presented with a brief description of theintended scope, savings calculation method, guaranteed savings in units of energy, and theindividual FIM’s financial analysis with payback. As requested, the following improvementscosts are listed separately and do not directly affect a FIM’s payback:
∂ Development Costs
∂ Measurement & Verification (performance assurance)
∂ Code compliance issues uncovered that directly relates to the constructability of a specificmeasure
BUILDING LEVEL SUMMARY
The following table summarized the complete list of FIMs recommended for this facility. Thesummation at the bottom of the table represents the total costs and savings of all FIMs only.As stated, the fixed costs associated with in with development, performance assurance, andcode compliance are considered as separate items.
Building Level Financial Summary
SAVINGS CALCULATION METHODOLOGY
FIMs were developed using spreadsheet models and engineering calculations. Energy usingequipment was measured to determine power consumption, kW. Extensive data logging ofequipment was also used to determine energy consumption, kWh. Savings calculations areprovided as in Section H, Appendices.
Building or Facility DescriptionSAVINGS
Electric KWh $SAVINGS
Electric KW $SAVINGSWater $
SAVINGSO & M
TotalSavings Project Costs Simple
PaybackTyrone Bryant Library Water - Retrofits 64.40$ -$ 862.12$ 83$ 1,009.24$ 10,782.87$ 10.7Breakage Fee 1,742.50$PA Cost 112.89$Total 64.40$ -$ 862.12$ 83$ 1,009.24$ 12,638.26$ 12.5
Exhibit 2B Page 65
Proprietary and Confidential © Siemens Industry IGA Report – May, 2019 – | Page 426
Siemens – Broward County, Investment Grade Audit | May 2019
WATER CONSERVATION
This FIM addresses the reduction of water consumption, wastewater production, and hotwater energy usage through the installation of highly efficient, plumbing products andcontrols. The use of these devices and others are detailed below and were selected not onlyfor their efficiency, but also to provide for durable, long-term use with minimal maintenanceand improved hygiene.
PROJECT SCOPE
Tank Style Water Closets: Tank style water closets utilize a tank fill valve on top of the bowlwhich uses gravity to drain large volumes of water into the bowl during evacuation. Pressureassisted tank valves use domestic water pressure to pressurize the tank water allowing formore forceful evacuations with less water volume. Installation of 1.00 gallons per flush (GPF)tank type, pressure assist, ADA style water closet will replace existing equipment thatcurrently consumes 1.6 to 3.5 GPF.
Urinals: High efficiency flush valve and china combinations for urinals can enable a facility togreatly reduce its water consumption by reducing flush valve flow rates and the amount ofwater required for evacuation. Installation of 0.125 GPF high efficiency urinal systems willreplace existing equipment that currently consumes 1.0 to 1.5 GPF.
Bathroom Faucets/Aerators: Most faucets utilize aerators to restrict the volume of water atthe mouth of a faucet and to generate a more comfortable flow. High efficiency aerators cangreatly reduce flow rates from faucets and create a comfortable flow for hand washing andcleaning. Restricting faucet flow rates enables a facility to conserve water and reduce energyusage associated with heating water. Faucets without the threading necessary to accept anaerator can be replaced with threaded faucets. Installation of 0.5 GPM aerator or faucetretrofit will replace existing equipment that currently consumes 2.2 GPM.
SAVINGS
The energy and cost savings were developed using spreadsheet modeling. Based on siteinterviews, facility type, square footage, and standard factors for allocation of business insquare foot per person and visitors per day the total population and occupancy days for thisfacility were determined. Total water closet, urinal, faucet and shower use figures weredetermined for the facility using standard factors for equipment use based on industryresearch and case studies coupled together with the total population of the facility and theoccupancy days. The current water usage minus the proposed water usage leads to the totalwater savings in gallons.
The savings value take the water savings and multiply them by the rate detailed in the UtilityData Analysis section of this Report. Energy savings were only taken in the form of hot watersavings for any equipment that utilize hot water.
Exhibit 2B Page 66

Proprietary and Confidential © Siemens Industry IGA Report – May, 2019 – | Page 427
Siemens – Broward County, Investment Grade Audit | May 2019
Deferred maintenance savings were considered and calculated by a percentage of reductionin replacement cost for any new fixtures that will be installed. These savings are referred toas Savings O&M on the financial summary table below.
FIM SAVINGS SUMMARY
Annual Water savings: 75,625 gallons
Annual Energy savings: 1,109 kWh
All analysis for water savings, energy savings, deferred maintenance savings, and financialdetails is provided in Section H, Appendices this Report.
Fim Financial Summary
Building or Facility DescriptionSAVINGS
Electric KWh $SAVINGS
Electric KW $SAVINGSWater $
SAVINGSO & M
TotalSavings Project Costs Simple
PaybackTyrone Bryant Library Water - Retrofits 64.40$ -$ 862.12$ 83$ 1,009.24$ 10,782.87$ 10.7
Exhibit 2B Page 67

Proprietary and Confidential © Siemens Industry IGA Report – May, 2019 – | Page 428
Siemens – Broward County, Investment Grade Audit | May 2019
D.33. Library - Young at Arts
FACILITY DESCRIPTION
Young at Art Museum is a 69,916 squarefoot 1-story building located at 751 SW 121st
Ave, Davie, FL 33325. The Gold LEEDcertified modern new building opened inMay, 2012. The building consists of BrowardCounty Library and museum that featuresexhibition galleries, preschool, teen playcenter, classrooms for art activities andeducation. It also hosts camps, workshops,and parties. The library hours are thefollowing:
Library Office Hours
Monday – Thursday: 10:00AM – 5:00PM
Friday – Sunday: 10:00AM – 6:00PM
COOLING SYSTEM:
Cooling for the building is provided by 1 Air-cooled 157-Ton R-134a chiller made in 2011 byYork. The unit is located at the outside of the building. The chilled water loop is configured asa variable primary system with a bypass line at the end of run and a bypass valve wasinstalled at the bypass line. Two 15-HP chilled water pumps with variable frequency drives(VFD) were installed and one of the two pumps is standby pump. Chilled water pump speedis adjusted to maintain the chilled water differential pressure set point at the end of run.Two-way control valves are employed at AHUs.
ONICON flow meter was installed for chilled water flow measurement.
Chilled Water System
Exhibit 2B Page 68

Proprietary and Confidential © Siemens Industry IGA Report – May, 2019 – | Page 429
Siemens – Broward County, Investment Grade Audit | May 2019
HEATING SYSTEM:
One hot water boiler and 2 hot water pumps were installed. Both hot water pumps wereequipped with VFDs.
Hot Water System
HVAC SYSTEMS:
There are 3 chilled water VAV air handling units (AHU-1, AHU-2, AHU-3) serving the building.The manufacturer of the 3 units is York. The units, which were located at 3 mechanicalrooms, were put into use in 2011. Heat pipes are equipped in each unit for dehumidification,and the leaving design supply air temperature is 58.85oF. Supply fans of AHUs are with VFDs.
A CO2 sensor exists at the main return air duct in each mechanical room. Outdoor air ismixed with return air at each AHU. There is airflow station on OA intake duct of each unit.
AHU examples
According to control submittal (2009), the VAV boxes have hot water reheat coils, and spacehas CO2 sensors. There are also constant volume boxes with reheating coils for culturalspace, exhibition, workshops, and party rooms (1st floor Area C)
The following table documents nameplate data acquired both onsite and from online ProductData Sheets.
Exhibit 2B Page 69
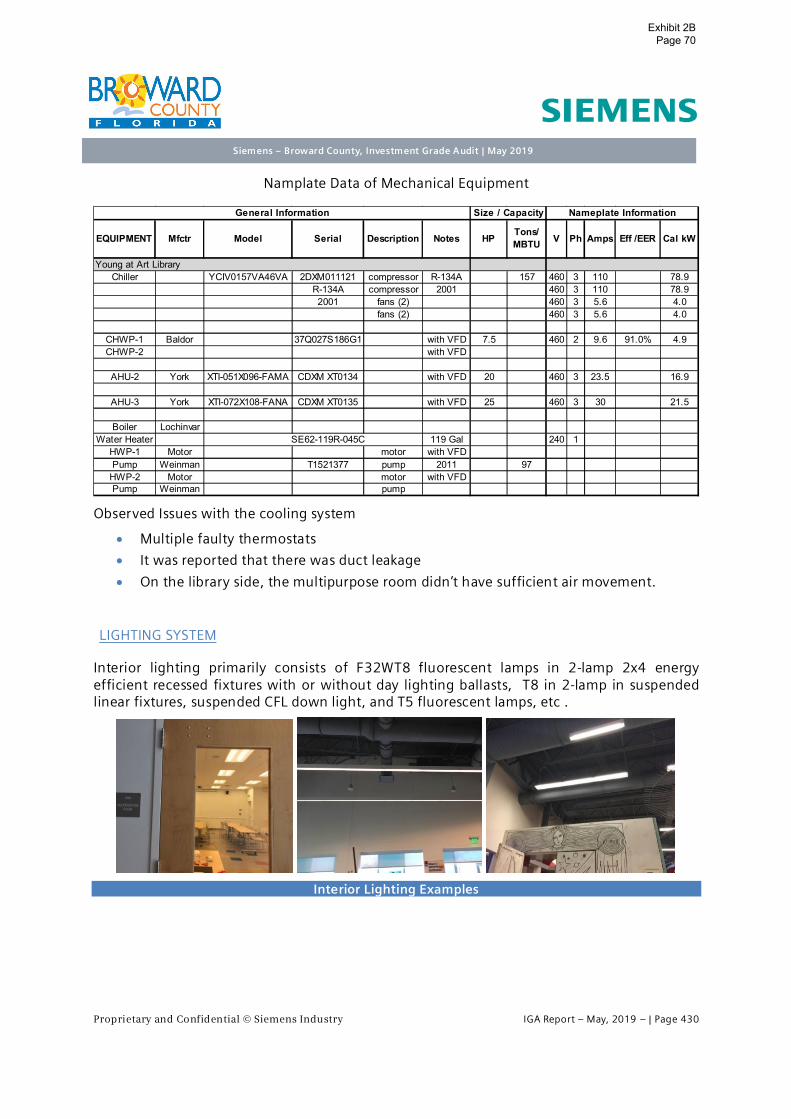
Proprietary and Confidential © Siemens Industry IGA Report – May, 2019 – | Page 430
Siemens – Broward County, Investment Grade Audit | May 2019
Namplate Data of Mechanical Equipment
Observed Issues with the cooling system
∂ Multiple faulty thermostats
∂ It was reported that there was duct leakage
∂ On the library side, the multipurpose room didn’t have sufficient air movement.
LIGHTING SYSTEM
Interior lighting primarily consists of F32WT8 fluorescent lamps in 2-lamp 2x4 energyefficient recessed fixtures with or without day lighting ballasts, T8 in 2-lamp in suspendedlinear fixtures, suspended CFL down light, and T5 fluorescent lamps, etc .
Interior Lighting Examples
Young at Art LibraryChiller YCIV0157VA46VA 2DXM011121 compressor R-134A 157 460 3 110 78.9
R-134A compressor 2001 460 3 110 78.92001 fans (2) 460 3 5.6 4.0
fans (2) 460 3 5.6 4.0
CHWP-1 Baldor 37Q027S186G1 with VFD 7.5 460 2 9.6 91.0% 4.9CHWP-2 with VFD
AHU-2 York XTI-051X096-FAMA CDXM XT0134 with VFD 20 460 3 23.5 16.9
AHU-3 York XTI-072X108-FANA CDXM XT0135 with VFD 25 460 3 30 21.5
Boiler LochinvarWater Heater SE62-119R-045C 119 Gal 240 1
HWP-1 Motor motor with VFDPump Weinman T1521377 pump 2011 97
HWP-2 Motor motor with VFDPump Weinman pump
Cal kWNotes HPTons/MBTU V Ph Amps
General Information Size / Capacity Nameplate Information
EQUIPMENT Mfctr Model Serial Description Eff /EER
Exhibit 2B Page 70

Proprietary and Confidential © Siemens Industry IGA Report – May, 2019 – | Page 431
Siemens – Broward County, Investment Grade Audit | May 2019
Exterior Lighting consists of T8 fluorescent lamps, HID exterior up lights, LED walkway andpaver lights, LED exterior wall luminaries, etc.
Exterior Lighting Examples
The building has motion and occupancy sensors. The overall building lights can be controlledby the control system.
DOMESTIC WATER SYSTEM
Domestic water usage is limited to restrooms. Fixtures and water closets are all operatedmanually. The following are example of the types of fixture found within the restroom of thefacility:
∂ 0.5 gpm faucets
∂ 1.0 gpf urinals
∂ 1.28 gpf toilets
Sample Restroom Fixtures
BUILDING CONTROLS SYSTEM
The building is equipped with a Johnson Controls DDC building automation system. Anychanges to the controls operation is handled from the Government Center.
Exhibit 2B Page 71

Proprietary and Confidential © Siemens Industry IGA Report – May, 2019 – | Page 432
Siemens – Broward County, Investment Grade Audit | May 2019
UTILITY DATA ANALYSIS - ELECTRIC
The electric usage at this facility is monitored by one (1) electric meter. The billing accountutilizes the Seasonal Demand Time-of-Use Rider (SDTR-1A) rate structure. When creating thebaseline shown below, the most recent 24 month of electric billing data was utilized asobtained directly from the Florida Power and Light website. The data was made available viawebsite’s the user portal and historical data from the facility’s smart meters.
The following table documents both the rate structure values used to calculate energysavings based on most recent electric billing data as well as the established demand andconsumption values representing baseline electric usage for the facility.
Electric Baseline Summary
The data in the table above was generated using the following electric billing data.
Meter MV5747A; Account: 6220951187; Address: 751 SW 121ST AVE DAVIE
on peak off peak
Young at Art Library 1 SDTR-1A 0.12886$ 0.04066$ 0.05624$ 10.94$ 1,095,660 3,044 289
$ / kWAverage
Consumptionper Year
AverageDemand per Year
MaxDemandFacility # of Meters Rate Structure
June - Sept$ / kWh
TotalConsumption On Peak Off Peak Storm
Chargegross
receipts taxFranchise
FeeJun-15 25.96$ 99,480 8,760 90,720 4,222$ 217 2,630$ 55$ 177$ 1,153$ 8,264$Jul-15 25.96$ 99,840 13,080 86,760 4,343$ 263 3,188$ 55$ 195$ 1,483$ 9,288$Aug-15 25.96$ 104,160 13,560 90,600 4,528$ 265 3,212$ 57$ 200$ 1,536$ 9,560$Sep-15 25.96$ 88,560 10,800 77,760 3,832$ 210 2,545$ 49$ 165$ 1,217$ 7,834$Oct-15 25.96$ 84,600 2,880 81,720 3,409$ 264 3,200$ 47$ 171$ 938$ 7,790$Nov-15 25.96$ 94,800 0 94,800 3,819$ 289 3,503$ 52$ 189$ 1,060$ 8,649$Dec-15 25.96$ 86,400 0 86,400 3,481$ 270 3,272$ 48$ 175$ 958$ 7,959$Jan-16 25.96$ 82,320 0 82,320 4,117$ 275 2,690$ 54$ 176$ 424$ 7,486$Feb-16 25.96$ 70,680 0 70,680 3,535$ 263 2,572$ 46$ 158$ 380$ 6,717$Mar-16 25.96$ 79,200 0 79,200 3,961$ 254 2,484$ 51$ 167$ 419$ 7,108$Apr-16 25.96$ 80,760 0 80,760 4,039$ 194 1,897$ 52$ 154$ 160$ 6,329$May-16 25.96$ 94,200 0 94,200 4,711$ 239 2,337$ 61$ 183$ 198$ 7,516$Jun-16 26.97$ 104,880 9,240 95,640 4,782$ 234 2,752$ 96$ 196$ 472$ 8,325$Jul-16 26.97$ 112,080 13,800 98,280 5,436$ 241 2,834$ 103$ 215$ 517$ 9,133$Aug-16 26.97$ 117,480 15,240 102,240 5,763$ 260 3,058$ 108$ 229$ 551$ 9,736$Sep-16 26.97$ 98,280 11,760 86,520 4,739$ 218 2,564$ 90$ 190$ 439$ 8,048$Oct-16 26.97$ 97,080 3,000 94,080 4,532$ 272 2,742$ 89$ 189$ 437$ 8,016$Nov-16 26.97$ 76,440 0 76,440 3,568$ 254 2,560$ 70$ 159$ 369$ 6,754$Dec-16 26.97$ 83,040 0 83,040 3,876$ 265 2,671$ 76$ 170$ 394$ 7,215$Jan-17 25.00$ 90,600 0 90,600 4,593$ 289 2,977$ 72$ 196$ 468$ 8,331$Feb-17 25.00$ 72,960 0 72,960 3,698$ 276 2,843$ 58$ 170$ 405$ 7,199$Mar-17 25.00$ 80,760 0 80,760 4,276$ 233 2,400$ 65$ 173$ 417$ 7,356$Apr-17 25.00$ 88,080 0 88,080 4,664$ 274 2,822$ 70$ 194$ 467$ 8,242$May-17 25.00$ 104,640 0 104,640 5,541$ 268 2,760$ 84$ 215$ 518$ 9,143$
1,095,660 51,060 1,044,600 51,732$ 3,044 33,256$ 805$ 2,204$ 7,690$ 96,000$
DemandCharge
TotalCharges
Other Fees/Taxes
Yearly Averages
Consumption (kwh)Date Customer
ChargeConsumption
ChargeDemand
(kW)
Exhibit 2B Page 72

Proprietary and Confidential © Siemens Industry IGA Report – May, 2019 – | Page 433
Siemens – Broward County, Investment Grade Audit | May 2019
The resulting energy usage profile, illustrated above, for this account is influenced by coolingneeds throughout the year; as identified by the comparison of monthly consumption to binweather data’s cooling degree days (CDD). Electric demand usage is relatively constant frommonth to month, indicating a base consumption need. The average peak for the 24 monthperiod evaluated occurs in August while the average low occurs in February; furtherconfirming the influence of outdoor weather conditions on building electric consumption.
The billing is, as previously shown, analyzed as a combination of all meters. As described ina previous section, an index value is calculated and compared to similar facilities within thesame geographic region. Below are the results of this comparison.
Benchmarking Summary
Overall, this building is operating above the 75th percentile of comparable facilities. Giventhe age and enhanced equipment and building automation systems present in this facility,this higher than expected metric value can only be attributed to the additional capabilities ofthis site. It cannot only be described as a typical library under CBECs standards.
0
100
200
300
400
500
600
700
0
20,000
40,000
60,000
80,000
100,000
120,000
Jan Feb Mar Apr May Jun Jul Aug Sep Oct Nov Dec
Dem
and
(kW
)
Cons
umpt
ion
(kW
h)
Month
Electric Consumption Profile
Consumption (kWh) Demand (kW) CDD
25thpercentile Median
75thpercentile
Young at Art Library Library 17.41 10.7 14.3 15.6
kWh/Sq FtCBECS - 2012 kWh/Sq Ft Data
Facility Faclity Type
Exhibit 2B Page 73

Proprietary and Confidential © Siemens Industry IGA Report – May, 2019 – | Page 434
Siemens – Broward County, Investment Grade Audit | May 2019
UTILITY DATA ANALYSIS - WATER
The following table(s) summarizes the water consumption data that was available for thisfacility.
This account has consumption data measured in cubic feet. There are a few data points forconsumption for the 24 month period but not enough data to draw any relevant conclusions.
Account # 427311-207648 Meter # 60723804&90879373Rate AddressMeter Size Meter Type
Young at Art Library
Date Consumption(cubic feet?)
TotalCharges
May-17 23 2,714.19$Apr-17 28 2,763.74$Mar-17 2,783.56$Feb-17 2,744.01$Jan-17 2,793.65$Dec-16 23 2,714.19$Nov-16 2,664.64$Oct-16 2,823.20$Sep-16 2,676.58$Aug-16 42 2,790.22$Jul-16 2,960.68$Jun-16 73 3,083.79$May-16 3,045.91$Apr-16 2,989.62$Mar-16 26 2,648.70$Feb-16Jan-16 2,619.76$Dec-15 2,591.35$Nov-15 2,619.76$Oct-15 2,667.64$Sep-15 2,645.29$Aug-15 2,698.99$Jul-15 2,698.99$Jun-15 2,494.19$May-15 2,456.29$
TOTALS 215 65,688.94$
Exhibit 2B Page 74
Proprietary and Confidential © Siemens Industry IGA Report – May, 2019 – | Page 435
Siemens – Broward County, Investment Grade Audit | May 2019
RECOMMENDED IMPROVEMENT MEASURES
All measures considered for this facility did not meet the payback requirements of theCounty.
Exhibit 2B Page 75

Proprietary and Confidential © Siemens Industry IGA Report – May, 2019 – | Page 436
Siemens – Broward County, Investment Grade Audit | May 2019
D.34. Park - CB Smith
FACILITY DESCRIPTION
CB Smith Park is a 12,839,400 square footpark located at 900 North Flamingo Road,Pembroke Pines, FL 33028. This park isBroward County’s most diverse park as wellas it’s most popular. The park features awater park named Paradise Cove, RVcampgrounds, a tennis complex, golfingcenter, batting cages, basketball courts, andother amenities and activities. Park hours areas follows:
Park OfficeMon – Sun: 9AM – 5:30PM
November – MarchPark hours: 8AM – 6PM
March – NovemberPark hours: 8AM-7:30PM
COOLING SYSTEM – PARK OFFICE:
The cooling for the park office is provided by a DX split system that is comprised of two5 ton Rheem condensing units connected to one Carrier air handler. The system utilizesR-22 refrigerant.
Park Office HVAC
Exhibit 2B Page 76

Proprietary and Confidential © Siemens Industry IGA Report – May, 2019 – | Page 437
Siemens – Broward County, Investment Grade Audit | May 2019
COOLING SYSTEM – CAMPGROUND OFFICE
The cooling for the campground office is provided by a DX split system that utilizes R-22refrigerant. At the time of the site visit the air handler for this system could not be located.
Campground Office HVAC
COOLING SYSTEM – POOL BUILDING/KITCHEN
The cooling for the pool building and kitchen is provided by a Rheem 10 ton DX splitsystem that utilizes R-410a refrigerant. This building also holds a walk in cooler that ispowered by a Trenton refrigeration system that utilizes R404a/R507.
Pool Building Cooling and Refrigeration
Exhibit 2B Page 77

Proprietary and Confidential © Siemens Industry IGA Report – May, 2019 – | Page 438
Siemens – Broward County, Investment Grade Audit | May 2019
Namplate Data of Mechanical Equipment
LIGHTING SYSTEM
Interior lighting primarily consists of 60 Watt T8 lighting and compact fluorescent lighting
Interior Lighting Examples
CB Smith ParkAHU Carrier 40RR012540 F997692 fan 2 230 3 6.3 2.3CU1 Rheem RAKB-060DAS 7134 M0805 05763 compressor R-22 460 3 8.6 6.2
fan 0.33 460 3 1 0.7CU2 Rheem RAKB-060DAS 7134 M2604 17920 compressor R-22 460 3 8.6 6.2
fan 0.33 460 3 1 0.7
AHU Rheem RHGL-120ZL F021004510 fan 2 208 3 7.5CU Rheem RAWL-120DAZ 7760f041004345 compressor R410a 10 460 3 16.7
fan 0.33 460 3 1.4
AHUCU Trenton TEHA010E6-HT3B-B 170162553T compressorR-404a/R-507 208 3 4.9
fan 0.0667 208 1 0.5CU Trenton TEHA030L6-HT3B-B 170162580T compressorR-404a/R-507 208 3 11
fan 0.1667 208 1 1.1
AHUCU HABE-F036SD WHGP141750 compressor R-22 208 1 13.5
fan 0.2 208 1 1.3Pool Pump Baldor EM4103T C1301150217 pump 25 230 3 60 93.60%Pool Pump Baldor EM4104T C1211280517 pump 30 230 3 76 93.60%Pool Pump Baldor pump 30 230 3 76 93.60%Pool Pump Baldor pump 30 230 3 76 93.60%Pool Pump Baldor pump 30 230 3 76 93.60%
Vertical Motor Triclad 5K256DP5012 25 460 3 30Vertical Motor U.S. Electric Motors S314A 50 230 3 128
U.S. Electric Motors 50 230 3 128
Pool Pump Weg 03018EP3E286T pump 30 208 3 75.7 92.40%Pool Pump Baldor EM4104T pump 30 230 3 76 93.60%Pool Pump Weg 02018ET3E256JP-W22 pump 20 208 3 53.6 93%Pool Pump Emerson AR48 pump 75 230 3 172 93%Pool Pump Emerson AR48 pump 75 230 3 172 94.10%Pool Pump Baldor M12H013Y141G1 pump 50 208 3 128 94.50%
Irrigation PumpIrrigation Pump Weg 05036ES3E326JP pump 50 208 3 114 92.20% 36.1Irrigation Pump
Cal kWHPTons/MBTU V Ph Amps Eff /EEREQUIPMENT Mfctr Model Serial Description Notes
General Information Size / Capacity Nameplate Information
Exhibit 2B Page 78

Proprietary and Confidential © Siemens Industry IGA Report – May, 2019 – | Page 439
Siemens – Broward County, Investment Grade Audit | May 2019
Exterior lighting primarily consists of metal halide lighting, T8 lighting and compactfluorescent lights. The building does not make use of occupancy sensors or any other typesof lighting control.
DOMESTIC WATER SYSTEM
Domestic water usage for this park is primarily at the water park, restrooms, andcampground hookups and washing machines. The following are examples of the types offixtures found within the restrooms of the park.
∂ 0.5 and 2.2 gpm faucets
∂ 1.5 gpf urinals
∂ 1.6 and 3.5 gpf toilets
∂ 2.5 gps showerhead
Sample Restroom Fixtures
Domestic water usage at the pool is mainly make-up water.
Paradise Cove Water Park
Exhibit 2B Page 79

Proprietary and Confidential © Siemens Industry IGA Report – May, 2019 – | Page 440
Siemens – Broward County, Investment Grade Audit | May 2019
Camp grounds water usage is primarily in RV hook ups and pay-to-wash washing machinesfor camping and RV patrons.
Campground Water Usage Examples
BUILDING CONTROLS SYSTEM
The split DX units are controlled locally via dedicated thermostats.
HVAC Controls Equipment
TRENDING DATA AQUISITION:
In order to determine the runtime and power draw of onsite HVAC equipment, data loggerswere installed to obtain more data than currently available. This data was trended for aminimum of seven (7) days in order to capture a typical week. The following graphsillustrate the resulting data from this logging session.
Exhibit 2B Page 80

Proprietary and Confidential © Siemens Industry IGA Report – May, 2019 – | Page 441
Siemens – Broward County, Investment Grade Audit | May 2019
Trending Data – 5 Ton Condensing Unit
The unit registered an average of 7.75 amps and was operating for a total 136 hours during aone week period
Trending Data – 5 Ton Condensing Unit
The unit registered an average of 7.23 amps and was operating for a total of 64.1 hoursduring a one week period.
Exhibit 2B Page 81

Proprietary and Confidential © Siemens Industry IGA Report – May, 2019 – | Page 442
Siemens – Broward County, Investment Grade Audit | May 2019
Trending Data – 3 Ton Unit
This unit registered an average of 10.42 amps and was operating for a total of 31 hoursduring a one week period.
The following table compares the operating hours of each unit with the hours of service forthe facility.
The unit on the table above is the unit with serial number ending in 17920. Althoughthe unit does turn off for some period at night, it is not running in a scheduledmanner. The other two units that were logged run 24 hours a day with normal cyclingpatterns.
Day Hours of Service Run HoursMonday: 9 AM - 5:30 PM 8:30 AM - 9:00 PMTuesday: 9 AM - 5:30 PM 9:00 AM - 10:30 PMWednesday: 9 AM - 5:30 PM 8:30 AM - 10:00 PMThursday: 9 AM - 5:30 PM 8:30 AM - 6:30 PMFriday: 9 AM - 5:30 PM 8:30 AM - 10:00 PMSaturday: 9 AM - 5:30 PM 12:00 PM - 2:00 AMSunday: 9 AM - 5:30 PM 12:00 PM - 11:30 PM
Exhibit 2B Page 82

Proprietary and Confidential © Siemens Industry IGA Report – May, 2019 – | Page 443
Siemens – Broward County, Investment Grade Audit | May 2019
UTILITY DATA ANALYSIS - ELECTRIC
The electric usage at this facility is monitored by seven (7) electric meters; each with theirown electric rate structure. When creating the baseline shown below, the most recent 24month of electric billing data was utilized as obtained directly from the Florida Power andLight website. The data was made available via website’s the user portal and historical datafrom the facility’s smart meters.
The following table documents both the rate structure values used to calculate energysavings based on most recent electric billing data as well as the established demand andconsumption values representing baseline electric usage for the facility.
Electric Baseline Summary
The data in the table above was generated using the following electric billing data.
Meter KV38519; Account: 825312501; Address: 900 NW 124TH AVE # MAINT BLDG
on peak off peak on peak off peak
Maint Bldg GSD - - - - 0.05758$ 11.53$ 214,230 1,159 101New RV SDTR-1A 0.128914294 0.04068$ - - 0.05627$ 10.95$ 111,330 409 65
Parking Garage SDTR-1A 0.129022223 0.04071$ - - 0.05632$ 10.95$ 834,030 1,591 170Park SDTR-1A 0.128917664 0.04068$ - - 0.05627$ 10.95$ 562,650 1,437 164
Water Slide GSTD-1 - - 0.08279$ 0.04460$ - 11.26$ 1,106,160 3,174 413Restroom GS-1 - - - - 0.10089$ - 36,960 - -
Tram GS-1 - - - - 0.10081$ - 26,598 - -
CB Smith Park
$ / kWAverage
Consumptionper Year
AverageDemand per Year
MaxDemandFacility # of Meters Rate Structure
June - Sept Year-Round$ / kWh
Date CustomerCharge
Consumption(kwh)
ConsumptionCharge
Demand(kW)
DemandCharge
OtherFees/Taxes
TotalCharges
Jun-15 19.48$ 19,440 1,060$ 100 1,061$ 144$ 2,285$Jul-15 19.48$ 21,960 1,198$ 99 1,050$ 152$ 2,419$Aug-15 19.48$ 20,880 1,139$ 101 1,072$ 151$ 2,381$Sep-15 19.48$ 18,480 1,008$ 101 1,072$ 138$ 2,237$Oct-15 19.48$ 19,200 1,047$ 100 1,061$ 139$ 2,267$Nov-15 19.48$ 19,140 1,044$ 101 1,072$ 141$ 2,276$Dec-15 19.48$ 20,700 1,129$ 99 1,050$ 143$ 2,341$Jan-16 19.48$ 16,140 807$ 91 920$ 165$ 1,911$Feb-16 19.48$ 15,780 789$ 98 991$ 169$ 1,968$Mar-16 19.48$ 19,140 957$ 94 950$ 187$ 2,114$Apr-16 19.48$ 16,680 834$ 95 960$ 147$ 1,961$May-16 19.48$ 16,800 840$ 97 981$ 150$ 1,990$Jun-16 20.24$ 18,420 860$ 97 1,011$ 184$ 2,075$Jul-16 20.24$ 20,880 975$ 100 1,042$ 200$ 2,236$Aug-16 20.24$ 20,580 961$ 98 1,021$ 196$ 2,198$Sep-16 20.24$ 18,000 840$ 98 1,021$ 180$ 2,061$Oct-16 20.24$ 16,380 765$ 100 1,042$ 174$ 2,000$Nov-16 20.24$ 15,420 720$ 95 990$ 164$ 1,894$Dec-16 20.24$ 17,580 821$ 95 990$ 175$ 2,006$Jan-17 25.00$ 14,640 775$ 91 965$ 131$ 1,896$Feb-17 25.00$ 13,560 718$ 95 1,007$ 131$ 1,881$Mar-17 25.00$ 15,300 810$ 92 975$ 172$ 1,982$Apr-17 25.00$ 15,900 842$ 92 975$ 175$ 2,018$May-17 25.00$ 17,460 925$ 89 943$ 181$ 2,074$
214,230 10,931$ 1,159 12,111$ 1,944$ 25,236$AVERAGE TOTALS
Exhibit 2B Page 83
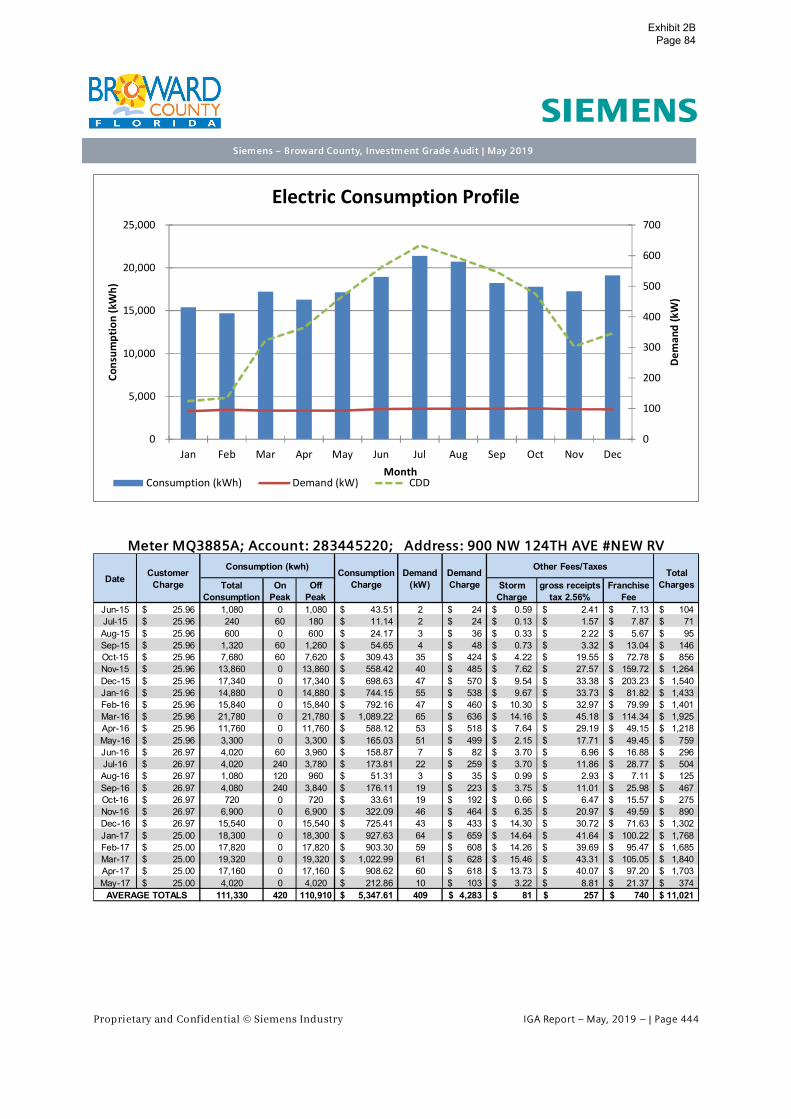
Proprietary and Confidential © Siemens Industry IGA Report – May, 2019 – | Page 444
Siemens – Broward County, Investment Grade Audit | May 2019
Meter MQ3885A; Account: 283445220; Address: 900 NW 124TH AVE #NEW RV
0
100
200
300
400
500
600
700
0
5,000
10,000
15,000
20,000
25,000
Jan Feb Mar Apr May Jun Jul Aug Sep Oct Nov Dec
Dem
and
(kW
)
Cons
umpt
ion
(kW
h)
Month
Electric Consumption Profile
Consumption (kWh) Demand (kW) CDD
TotalConsumption
OnPeak
OffPeak
StormCharge
gross receiptstax 2.56%
FranchiseFee
Jun-15 25.96$ 1,080 0 1,080 43.51$ 2 24$ 0.59$ 2.41$ 7.13$ 104$Jul-15 25.96$ 240 60 180 11.14$ 2 24$ 0.13$ 1.57$ 7.87$ 71$Aug-15 25.96$ 600 0 600 24.17$ 3 36$ 0.33$ 2.22$ 5.67$ 95$Sep-15 25.96$ 1,320 60 1,260 54.65$ 4 48$ 0.73$ 3.32$ 13.04$ 146$Oct-15 25.96$ 7,680 60 7,620 309.43$ 35 424$ 4.22$ 19.55$ 72.78$ 856$Nov-15 25.96$ 13,860 0 13,860 558.42$ 40 485$ 7.62$ 27.57$ 159.72$ 1,264$Dec-15 25.96$ 17,340 0 17,340 698.63$ 47 570$ 9.54$ 33.38$ 203.23$ 1,540$Jan-16 25.96$ 14,880 0 14,880 744.15$ 55 538$ 9.67$ 33.73$ 81.82$ 1,433$Feb-16 25.96$ 15,840 0 15,840 792.16$ 47 460$ 10.30$ 32.97$ 79.99$ 1,401$Mar-16 25.96$ 21,780 0 21,780 1,089.22$ 65 636$ 14.16$ 45.18$ 114.34$ 1,925$Apr-16 25.96$ 11,760 0 11,760 588.12$ 53 518$ 7.64$ 29.19$ 49.15$ 1,218$May-16 25.96$ 3,300 0 3,300 165.03$ 51 499$ 2.15$ 17.71$ 49.45$ 759$Jun-16 26.97$ 4,020 60 3,960 158.87$ 7 82$ 3.70$ 6.96$ 16.88$ 296$Jul-16 26.97$ 4,020 240 3,780 173.81$ 22 259$ 3.70$ 11.86$ 28.77$ 504$Aug-16 26.97$ 1,080 120 960 51.31$ 3 35$ 0.99$ 2.93$ 7.11$ 125$Sep-16 26.97$ 4,080 240 3,840 176.11$ 19 223$ 3.75$ 11.01$ 25.98$ 467$Oct-16 26.97$ 720 0 720 33.61$ 19 192$ 0.66$ 6.47$ 15.57$ 275$Nov-16 26.97$ 6,900 0 6,900 322.09$ 46 464$ 6.35$ 20.97$ 49.59$ 890$Dec-16 26.97$ 15,540 0 15,540 725.41$ 43 433$ 14.30$ 30.72$ 71.63$ 1,302$Jan-17 25.00$ 18,300 0 18,300 927.63$ 64 659$ 14.64$ 41.64$ 100.22$ 1,768$Feb-17 25.00$ 17,820 0 17,820 903.30$ 59 608$ 14.26$ 39.69$ 95.47$ 1,685$Mar-17 25.00$ 19,320 0 19,320 1,022.99$ 61 628$ 15.46$ 43.31$ 105.05$ 1,840$Apr-17 25.00$ 17,160 0 17,160 908.62$ 60 618$ 13.73$ 40.07$ 97.20$ 1,703$May-17 25.00$ 4,020 0 4,020 212.86$ 10 103$ 3.22$ 8.81$ 21.37$ 374$
111,330 420 110,910 5,347.61$ 409 4,283$ 81$ 257$ 740$ 11,021$AVERAGE TOTALS
Other Fees/TaxesDate Total
ChargesDemandCharge
Demand(kW)
ConsumptionCharge
CustomerCharge
Consumption (kwh)
Exhibit 2B Page 84

Proprietary and Confidential © Siemens Industry IGA Report – May, 2019 – | Page 445
Siemens – Broward County, Investment Grade Audit | May 2019
Meter MV3662A; Account: 6102446389; Address: 151 SW 2ND ST # PKNG GARAGE
0
100
200
300
400
500
600
700
0
5,000
10,000
15,000
20,000
25,000
Jan Feb Mar Apr May Jun Jul Aug Sep Oct Nov Dec
Dem
and
(kW
)
Cons
umpt
ion
(kW
h)
Month
Electric Consumption Profile
Consumption (kWh) Demand (kW) CDD
TotalConsumption
OnPeak
OffPeak
StormCharge
gross receiptstax 2.56%
FranchiseFee
Jun-15 25.96$ 71,760 4,620 67,140 3,004$ 120 1,454$ 39$ 116$ 699$ 5,339$Jul-15 25.96$ 69,840 6,420 63,420 2,971$ 123 1,491$ 38$ 116$ 819$ 5,461$Aug-15 25.96$ 71,100 6,900 64,200 3,033$ 126 1,527$ 39$ 118$ 860$ 5,604$Sep-15 25.96$ 76,740 6,840 69,900 3,259$ 131 1,588$ 42$ 126$ 857$ 5,898$Oct-15 25.96$ 68,100 2,220 65,880 2,744$ 170 2,060$ 37$ 125$ 814$ 5,807$Nov-15 25.96$ 66,360 0 66,360 2,674$ 134 1,624$ 36$ 112$ 830$ 5,302$Dec-15 25.96$ 69,240 0 69,240 2,790$ 131 1,588$ 38$ 114$ 877$ 5,433$Jan-16 25.96$ 66,660 0 66,660 3,334$ 142 1,389$ 43$ 123$ 298$ 5,212$Feb-16 25.96$ 55,920 0 55,920 2,797$ 133 1,301$ 36$ 106$ 258$ 4,524$Mar-16 25.96$ 69,120 0 69,120 3,457$ 146 1,428$ 45$ 127$ 323$ 5,405$Apr-16 25.96$ 66,180 0 66,180 3,310$ 127 1,242$ 43$ 118$ 104$ 4,843$May-16 25.96$ 66,480 0 66,480 3,325$ 135 1,320$ 43$ 121$ 112$ 4,946$Jun-16 26.97$ 75,540 4,320 71,220 3,250$ 127 1,494$ 69$ 124$ 301$ 5,265$Jul-16 26.97$ 80,940 7,020 73,920 3,681$ 135 1,588$ 74$ 137$ 333$ 5,841$Aug-16 26.97$ 78,780 6,840 71,940 3,584$ 129 1,517$ 72$ 133$ 323$ 5,656$Sep-16 26.97$ 73,980 6,420 67,560 3,365$ 122 1,435$ 68$ 125$ 290$ 5,310$Oct-16 26.97$ 69,480 2,340 67,140 3,243$ 135 1,361$ 64$ 120$ 279$ 5,094$Nov-16 26.97$ 62,400 0 62,400 2,913$ 161 1,623$ 57$ 118$ 278$ 5,016$Dec-16 26.97$ 69,780 0 69,780 3,257$ 128 1,290$ 64$ 119$ 278$ 5,035$Jan-17 25.00$ 71,520 0 71,520 3,625$ 119 1,226$ 57$ 126$ 306$ 5,365$Feb-17 25.00$ 59,040 0 59,040 2,993$ 121 1,246$ 47$ 110$ 267$ 4,689$Mar-17 25.00$ 63,540 0 63,540 3,364$ 132 1,360$ 51$ 123$ 302$ 5,224$Apr-17 25.00$ 68,520 0 68,520 3,628$ 125 1,288$ 55$ 128$ 314$ 5,437$May-17 25.00$ 77,040 0 77,040 4,079$ 129 1,329$ 62$ 141$ 345$ 5,981$
834,030 26,970 807,060 38,840$ 1,591 17,383$ 612$ 1,463$ 5,234$ 63,845$AVERAGE TOTALS
TotalCharges
DemandCharge
Demand(kW)
ConsumptionCharge
CustomerChargeDate
Other Fees/TaxesConsumption (kwh)
Exhibit 2B Page 85

Proprietary and Confidential © Siemens Industry IGA Report – May, 2019 – | Page 446
Siemens – Broward County, Investment Grade Audit | May 2019
Meter MV3339A; Account: 8260155596; Address: 900 NW 124TH AVE
0
100
200
300
400
500
600
700
0
10,000
20,000
30,000
40,000
50,000
60,000
70,000
80,000
Jan Feb Mar Apr May Jun Jul Aug Sep Oct Nov Dec
Dem
and
(kW
)
Cons
umpt
ion
(kW
h)
Month
Electric Consumption Profile
Consumption (kWh) Demand (kW) CDD
TotalConsumption
OnPeak
OffPeak
StormCharge
gross receiptstax 2.56%
FranchiseFee
Jun-15 25.96$ 47,520 4,320 43,200 2,020$ 99 1,200$ 26$ 84$ 555$ 3,911$Jul-15 25.96$ 56,280 5,460 50,820 2,401$ 107 1,297$ 31$ 96$ 681$ 4,532$Aug-15 25.96$ 46,080 4,920 41,160 1,977$ 106 1,285$ 25$ 85$ 599$ 3,996$Sep-15 25.96$ 38,760 3,900 34,860 1,657$ 99 1,200$ 21$ 74$ 479$ 3,457$Oct-15 25.96$ 32,820 720 32,100 1,322$ 83 1,006$ 18$ 61$ 389$ 2,822$Nov-15 25.96$ 32,760 0 32,760 1,320$ 91 1,103$ 18$ 63$ 380$ 2,910$Dec-15 25.96$ 43,560 0 43,560 1,755$ 121 1,467$ 24$ 84$ 504$ 3,860$Jan-16 25.96$ 41,640 0 41,640 2,082$ 122 1,193$ 27$ 85$ 207$ 3,620$Feb-16 25.96$ 39,840 0 39,840 1,992$ 104 1,017$ 26$ 78$ 190$ 3,330$Mar-16 25.96$ 50,520 0 50,520 2,527$ 139 1,359$ 33$ 101$ 256$ 4,302$Apr-16 25.96$ 36,900 0 36,900 1,845$ 130 1,271$ 24$ 81$ 115$ 3,362$May-16 25.96$ 47,040 0 47,040 2,352$ 138 1,350$ 31$ 96$ 119$ 3,974$Jun-16 26.97$ 62,520 5,280 57,240 2,832$ 138 1,623$ 58$ 116$ 282$ 4,937$Jul-16 26.97$ 67,800 6,180 61,620 3,109$ 134 1,576$ 62$ 122$ 296$ 5,192$Aug-16 26.97$ 59,520 6,540 52,980 2,821$ 134 1,576$ 55$ 115$ 278$ 4,872$Sep-16 26.97$ 51,120 4,740 46,380 2,350$ 109 1,282$ 47$ 95$ 221$ 4,022$Oct-16 26.97$ 37,860 960 36,900 1,767$ 112 1,129$ 35$ 76$ 177$ 3,210$Nov-16 26.97$ 35,880 0 35,880 1,675$ 111 1,119$ 33$ 73$ 171$ 3,097$Dec-16 26.97$ 46,560 0 46,560 2,173$ 116 1,169$ 43$ 87$ 203$ 3,703$Jan-17 25.00$ 43,980 0 43,980 2,229$ 115 1,185$ 35$ 89$ 214$ 3,777$Feb-17 25.00$ 42,060 0 42,060 2,132$ 130 1,339$ 34$ 90$ 217$ 3,837$Mar-17 25.00$ 49,500 0 49,500 2,621$ 123 1,267$ 40$ 101$ 245$ 4,299$Apr-17 25.00$ 51,720 0 51,720 2,739$ 148 1,524$ 41$ 111$ 269$ 4,709$May-17 25.00$ 63,060 0 63,060 3,339$ 164 1,689$ 50$ 131$ 317$ 5,551$
562,650 21,510 541,140 26,520$ 1,437 15,612$ 418$ 1,097$ 3,682$ 47,642$
TotalCharges
Other Fees/Taxes
AVERAGE TOTALS
Date CustomerCharge
ConsumptionCharge
Demand(kW)
DemandCharge
Consumption (kwh)
Exhibit 2B Page 86

Proprietary and Confidential © Siemens Industry IGA Report – May, 2019 – | Page 447
Siemens – Broward County, Investment Grade Audit | May 2019
Meter MV55669; Account: 8261151511; Address: 900 NW 124TH AVE # WATER SLIDE
0
100
200
300
400
500
600
700
0
10,000
20,000
30,000
40,000
50,000
60,000
70,000
Jan Feb Mar Apr May Jun Jul Aug Sep Oct Nov Dec
Dem
and
(kW
)
Cons
umpt
ion
(kW
h)
Month
Electric Consumption Profile
Consumption (kWh) Demand (kW) CDD
TotalConsumption
OnPeak
OffPeak
StormCharge
gross receiptstax 2.56%
FranchiseFee
Jun-15 25.96$ 133,080 42,804 90,276 7,438$ 396 4,202$ 73$ 301$ 264$ 12,304$Jul-15 25.96$ 158,280 49,109 109,171 8,759$ 399 4,233$ 87$ 336$ 288$ 13,729$Aug-15 25.96$ 142,320 48,850 93,470 8,104$ 382 4,053$ 78$ 314$ 255$ 12,830$Sep-15 25.96$ 105,600 24,720 80,880 5,454$ 352 3,735$ 58$ 237$ 246$ 9,756$Oct-15 25.96$ 100,200 20,160 80,040 5,015$ 352 3,735$ 55$ 226$ 259$ 9,316$Nov-15 25.96$ 75,000 17,400 57,600 3,866$ 124 1,316$ 41$ 134$ 96$ 5,479$Dec-15 25.96$ 69,240 15,360 53,880 3,535$ 139 1,475$ 38$ 130$ 108$ 5,312$Jan-16 25.96$ 43,200 9,840 33,360 2,034$ 79 799$ 28$ 74$ 179$ 3,140$Feb-16 25.96$ 30,240 7,680 22,560 1,460$ 106 1,072$ 20$ 66$ 160$ 2,803$Mar-16 25.96$ 88,560 18,000 70,560 4,070$ 373 3,771$ 58$ 203$ 511$ 8,639$Apr-16 25.96$ 99,960 21,960 78,000 4,669$ 283 2,861$ 65$ 195$ 267$ 8,084$May-16 25.96$ 132,120 35,520 96,600 6,469$ 402 4,064$ 86$ 273$ 369$ 11,287$Jun-16 26.97$ 150,960 44,400 106,560 7,070$ 413 4,303$ 139$ 295$ 717$ 12,551$Jul-16 26.97$ 170,760 51,000 119,760 8,030$ 406 4,231$ 157$ 319$ 773$ 13,536$Aug-16 26.97$ 149,640 49,440 100,200 7,235$ 396 4,126$ 138$ 295$ 716$ 12,536$Sep-16 26.97$ 116,280 23,400 92,880 4,996$ 304 3,168$ 107$ 212$ 494$ 9,003$Oct-16 26.97$ 95,880 21,240 74,640 4,200$ 214 2,230$ 88$ 168$ 389$ 7,102$Nov-16 26.97$ 37,560 7,920 29,640 1,629$ 131 1,365$ 35$ 78$ 183$ 3,316$Dec-16 26.97$ 27,000 5,760 21,240 1,174$ 86 896$ 25$ 54$ 127$ 2,303$Jan-17 25.00$ 24,720 5,760 18,960 1,189$ 101 1,071$ 21$ 59$ 141$ 2,506$Feb-17 25.00$ 21,960 5,280 16,680 1,063$ 48 509$ 18$ 41$ 98$ 1,754$Mar-17 25.00$ 55,080 12,360 42,720 2,757$ 118 1,251$ 46$ 104$ 251$ 4,435$Apr-17 25.00$ 96,240 24,120 72,120 4,908$ 391 4,145$ 81$ 234$ 564$ 9,958$May-17 25.00$ 88,440 20,160 68,280 4,438$ 353 3,742$ 74$ 212$ 510$ 9,002$
1,106,160 291,122 815,039 54,781$ 3,174 33,175$ 808$ 2,280$ 3,983$ 95,340$AVERAGE TOTALS
Date CustomerCharge
ConsumptionCharge
Demand(kW)
DemandCharge
TotalCharges
Other Fees/TaxesConsumption (kwh)
Exhibit 2B Page 87

Proprietary and Confidential © Siemens Industry IGA Report – May, 2019 – | Page 448
Siemens – Broward County, Investment Grade Audit | May 2019
Meter KV39331; Account: 7850857793; Address: 900 NW 124TH AVE # REST ROOM
0
100
200
300
400
500
600
700
0
20,000
40,000
60,000
80,000
100,000
120,000
140,000
160,000
180,000
Jan Feb Mar Apr May Jun Jul Aug Sep Oct Nov Dec
Dem
and
(kW
)
Cons
umpt
ion
(kW
h)
Month
Electric Consumption Profile
Consumption (kWh) Demand (kW) CDD
Date CustomerCharge
Consumption(kwh)
ConsumptionCharge
OtherFees/Taxes
TotalCharges
Jun-15 10.00$ 3,780 363.71$ 19.90$ 394$Jul-15 10.00$ 4,620 440.98$ 28.77$ 480$
Aug-15 10.00$ 4,200 400.89$ 25.97$ 437$Sep-15 10.00$ 2,880 274.90$ 15.86$ 301$Oct-15 10.00$ 3,120 297.80$ 17.37$ 325$Nov-15 10.00$ 2,640 251.99$ 14.51$ 277$Dec-15 10.00$ 3,240 309.26$ 18.27$ 338$Jan-16 10.00$ 2,640 237.15$ 21.51$ 269$Feb-16 10.00$ 2,640 237.15$ 21.51$ 269$Mar-16 10.00$ 3,180 285.66$ 27.30$ 323$Apr-16 10.00$ 2,880 258.71$ 18.53$ 287$
May-16 10.00$ 2,760 247.93$ 17.69$ 276$Jun-16 10.00$ 3,540 310.81$ 30.66$ 351$Jul-16 10.00$ 4,320 379.30$ 37.75$ 427$
Aug-16 10.00$ 3,840 337.15$ 33.39$ 381$Sep-16 10.00$ 3,060 268.67$ 25.45$ 304$Oct-16 10.00$ 2,460 215.99$ 20.13$ 246$Nov-16 10.00$ 2,460 215.99$ 20.13$ 246$Dec-16 10.00$ 2,820 247.60$ 23.33$ 281$Jan-17 10.00$ 2,340 208.42$ 21.80$ 240$Feb-17 10.00$ 2,640 235.14$ 24.49$ 270$Mar-17 10.00$ 2,820 251.18$ 35.58$ 297$Apr-17 10.00$ 2,700 240.49$ 34.08$ 285$
May-17 10.00$ 2,340 208.42$ 29.67$ 248$36,960 3,362.64$ 291.83$ 3,774.47$AVERAGE TOTALS
Exhibit 2B Page 88

Proprietary and Confidential © Siemens Industry IGA Report – May, 2019 – | Page 449
Siemens – Broward County, Investment Grade Audit | May 2019
The billing is, as previously shown, analyzed as a combination of all meters. As described ina previous section, an index value is calculated and compared to similar facilities within thesame geographic region. Below are the results of this comparison.
Benchmarking Summary
Overall, this building is operating well above the 75th percentile of comparable facilities.However, this park includes facilities not normally present in parks; such as the water park. Areasonable comparison cannot be made.
0
100
200
300
400
500
600
700
0
500
1,000
1,500
2,000
2,500
3,000
3,500
4,000
4,500
5,000
Jan Feb Mar Apr May Jun Jul Aug Sep Oct Nov Dec
CDD
Cons
umpt
ion
(kW
h)
Month
Electric Consumption Profile
Consumption (kWh) CDD
25thpercentile Median 75th
percentileCB Smith Park Recreation 44.36 3.7 7.3 17.6
kWh/Sq FtCBECS - 2012 kWh/Sq Ft Data
Facility Faclity Type
Exhibit 2B Page 89

Proprietary and Confidential © Siemens Industry IGA Report – May, 2019 – | Page 450
Siemens – Broward County, Investment Grade Audit | May 2019
UTILITY DATA ANALYSIS - WATER
The following table(s) summarizes the water consumption data that was available for thisfacility.
This account only had total expense amounts per month available for water usage utilitydata. No relevant conclusions can be drawn from this data.
Account # 03-297-51816-0015 Meter #Rate AddressMeter Size Meter Type Trash
CB Smith Park
Date
Mar-17Feb-17Jan-17Dec-16Nov-16Oct-16Sep-16Aug-16Jul-16Jun-16May-16Apr-16Mar-16Feb-16Jan-16Dec-15Nov-15Oct-15Sep-15Aug-15Jul-15Jun-15May-15Apr-15Mar-15
TOTALS
TotalCharges
3,559.74$3,358.62$2,961.49$4,111.66$3,072.54$3,378.59$5,851.04$3,868.59$4,132.68$
-$-$-$-$-$-$-$-$-$-$-$-$-$-$
34,294.95$
Exhibit 2B Page 90
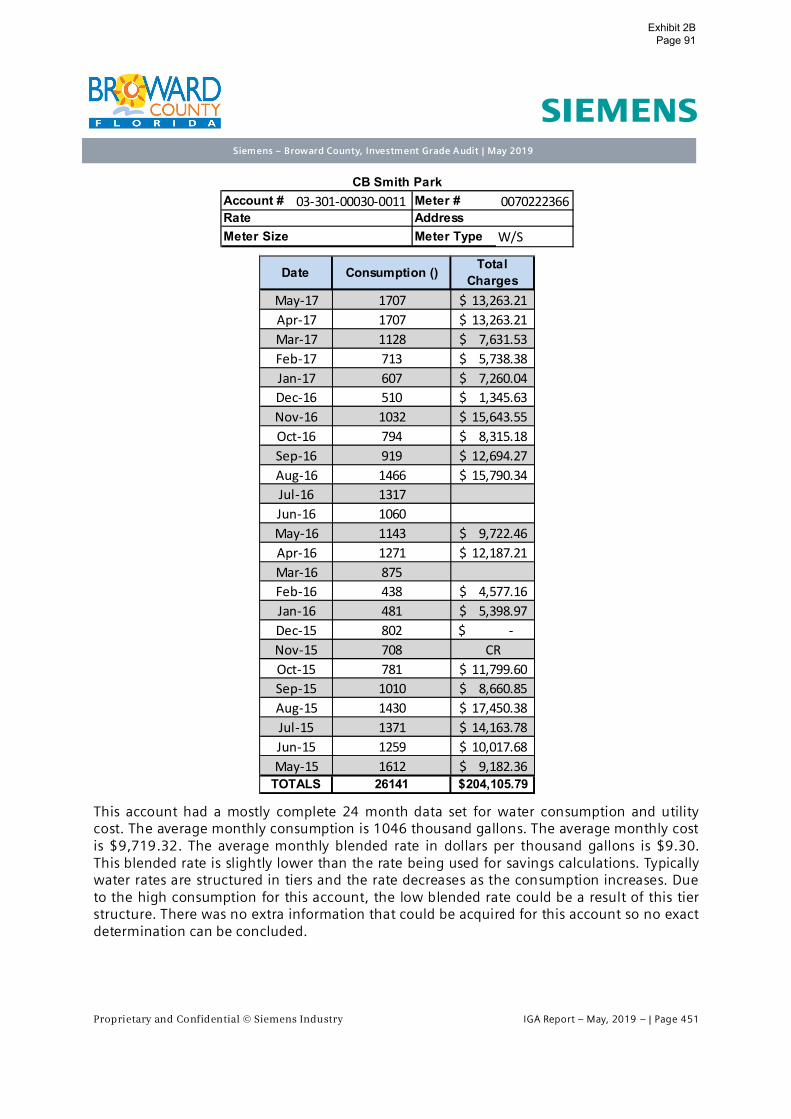
Proprietary and Confidential © Siemens Industry IGA Report – May, 2019 – | Page 451
Siemens – Broward County, Investment Grade Audit | May 2019
This account had a mostly complete 24 month data set for water consumption and utilitycost. The average monthly consumption is 1046 thousand gallons. The average monthly costis $9,719.32. The average monthly blended rate in dollars per thousand gallons is $9.30.This blended rate is slightly lower than the rate being used for savings calculations. Typicallywater rates are structured in tiers and the rate decreases as the consumption increases. Dueto the high consumption for this account, the low blended rate could be a result of this tierstructure. There was no extra information that could be acquired for this account so no exactdetermination can be concluded.
Account # 03-301-00030-0011 Meter # 0070222366Rate AddressMeter Size Meter Type W/S
CB Smith Park
Date Consumption () TotalCharges
May-17 1707 13,263.21$Apr-17 1707 13,263.21$Mar-17 1128 7,631.53$Feb-17 713 5,738.38$Jan-17 607 7,260.04$Dec-16 510 1,345.63$Nov-16 1032 15,643.55$Oct-16 794 8,315.18$Sep-16 919 12,694.27$Aug-16 1466 15,790.34$Jul-16 1317Jun-16 1060May-16 1143 9,722.46$Apr-16 1271 12,187.21$Mar-16 875Feb-16 438 4,577.16$Jan-16 481 5,398.97$Dec-15 802 -$Nov-15 708 CROct-15 781 11,799.60$Sep-15 1010 8,660.85$Aug-15 1430 17,450.38$Jul-15 1371 14,163.78$Jun-15 1259 10,017.68$May-15 1612 9,182.36$
TOTALS 26141 204,105.79$
Exhibit 2B Page 91

Proprietary and Confidential © Siemens Industry IGA Report – May, 2019 – | Page 452
Siemens – Broward County, Investment Grade Audit | May 2019
RECOMMENDED IMPROVEMENT MEASURES
This section addresses the Facility Improvement Measures (FIMs) recommended forimplementation at this facility. Each solution is presented with a brief description of theintended scope, savings calculation method, guaranteed savings in units of energy, and theindividual FIM’s financial analysis with payback. As requested, the following improvementscosts are listed separately and do not directly affect a FIM’s payback:
∂ Development Costs
∂ Measurement & Verification (performance assurance)
∂ Code compliance issues uncovered that directly relates to the constructability of a specificmeasure
BUILDING LEVEL SUMMARY
The following table summarized the complete list of FIMs recommended for this facility. Thesummation at the bottom of the table represents the total costs and savings of all FIMs only.As stated, the fixed costs associated with in with development, performance assurance, andcode compliance is considered as separate items.
Building Level Financial Summary
SAVINGS CALCULATION METHODOLOGY
FIMs were developed using spreadsheet models and engineering calculations. Energy usingequipment was measured to determine power consumption, kW. Extensive data logging ofequipment was also used to determine energy consumption, kWh. Savings calculations areprovided as in Section H, Appendices.
Building orFacility Description
SAVINGSElectric KWh $
SAVINGSElectric KW $
SAVINGSWater $
SAVINGSWater
SAVINGSO & M
TotalSavings
ProjectCosts
SimplePayback
CB Smith Park Split System Replacement 1,012.70$ 579.50$ -$ 0 -$ 1,592.20$ 35,207.81$ 22.1CB Smith Park Split System Code Compiance -$ -$ -$ 0 -$ -$ 7,873.79$ -Breakage Fee 7,823.40$PA Cost 450.15$Total 1,012.70$ 579.50$ -$ -$ -$ 1,592.20$ 51,355.15$ 32.3
Exhibit 2B Page 92

Proprietary and Confidential © Siemens Industry IGA Report – May, 2019 – | Page 453
Siemens – Broward County, Investment Grade Audit | May 2019
MECHANICAL
As DX equipment ages and the condition of the equipment deteriorate, the energy efficiencyof these units also degrades. In recent years the energy efficiency of DX equipment hasimproved due to mandates as well as manufacture improvements. DX air-conditioningsystems are rated by their Seasonal Energy Efficiency Ratios (SEER). The higher the SEERrating the more energy efficient the units are. Older units have average SEER ratingsbetween 8-10 while new units have average SEER ratings of 13 or greater.
Cooling for buildings around the park is provided by various split DX units of varyingtonnages. The focus of this FIM involved the main office building and the former camp sitecheck-in building.
PROJECT SCOPE
This FIM addresses the replacement of three (3) DX systems. The scope of work includes thereplacement of both the condensing unit and air handlers. The new equipment will be ofequal capacity and have efficiency ratings of those stated in the following table.
Scope of Work
Building Equipment Make Model Tons ExistingkW
NewkW
CB Smith Condenser Rheem RAKB-060DAS 5 6.88 5.4
CB Smith Condenser Rheem RAKB-060DAS 5 6.88 5.4
CB Smith Condenser HABE-F036SD 3 7.8 6.4
CB Smith AHU Carrier 40RR012540
CB Smith AHU
CB Smith AHU
SAVINGS
The energy and cost savings were developed using a spreadsheet model. Using nameplatedata, onsite electrical spot measurements, and data logging information, the total HVACelectrical contribution of this facility’s electric utility bill was determined. The calculationstook into consideration current conditions and efficiencies. Savings were obtained byreplacing existing efficiency values with the higher efficiency value of the new equipment; aspublished by the manufacturer. The detailed calculations are available in the Section H,Appendices. All calculations were based off Trane manufacturer cut-sheets, also provided.
Exhibit 2B Page 93

Proprietary and Confidential © Siemens Industry IGA Report – May, 2019 – | Page 454
Siemens – Broward County, Investment Grade Audit | May 2019
FIM SAVINGS SUMMARY
Annual Electric Consumption: 17,280 kWh
Annual Electric Demand: 51.3 kW
FIM Financial Summary
CB Smith Park SavingskWh
SavingskW
SavingsWater
SavingsO&M
SavingsCapital
TotalSavings
Project Cost Payback
Split SystemReplacements
$1012.70 $579.50 $1,592.20 $35,207.81 22.1
Savings Capital: Capital budget dollars were used in order to improve the payback to therequested limitation values. These dollars represent unused amounts left over from theCapital Project Plan total. Funds were first applied to their respective capital project until therequired payback was achieved. All remaining amounts were distributed to FIM opportunitessuch as the one above.
Code Compliance: Associated with the scope of work summarized above are codecompliance issued uncovered by contracted MEPs (mechanical, electrical, andplumbing vendor). This cost was requested to be listed separately. For this facility, thecode compliance cost is:
∂ $7,873.79
The identified issue at CB Smith Park includes changes in outside air requirements as statedby current building code.
Exhibit 2B Page 94

Proprietary and Confidential © Siemens Industry IGA Report – May, 2019 – | Page 455
Siemens – Broward County, Investment Grade Audit | May 2019
D.35. Park - Delevoe
FACILITY DESCRIPTION
Delevoe Park has a one-story, 9,593 squarefoot building constructed approximately in1997 and located at 2520 NW 6th St. Thebuilding consists of a large multipurposeroom, small meeting room/computer lab,and a fitness center. It is the onlyconditioned building at this park. The parkalso consists of 2 pavilions, a semi-coveredplayground, an outdoor basketball court,and an outdoor exercise facility. Theoperating hours for the entire park are asfollows.
Park Hours
Monday – Fridays: 8AM – 9PM
Saturday: 8AM – 6PM
Sunday: 10AM – 6PM
COOLING SYSTEM:
Cooling for the building is provided by four split DX package configuration located on theoutside of the building. Three of the units are 6 ton, air-cooled Carrier units that serve threesingle-zone, 100% return air handling units (AHU). The fourth unit is a 7.5 ton, air-cooledYork unit that serves a single-zone, 100% outside air AHU.
Building HVAC
The Carrier equipment is reported to be original to the building; 1996 and 1997manufacturing dates. The York unit appears to be newer. 2008 manufacturing date
Exhibit 2B Page 95

Proprietary and Confidential © Siemens Industry IGA Report – May, 2019 – | Page 456
Siemens – Broward County, Investment Grade Audit | May 2019
Namplate Data of Mechanical Equipment
Observed Issues during Visit:
∂ DX units are 20 years old and use R-22 refrigerant
∂ Insulation of refrigerant piping is either worn out or non-existent.
Examples of Observed Issues
Delevoe ParkAHU1 Carrier 40RM-007-B600HC 0397F47740 fan 2.4 208 3 7.3 2.0CU1 Carrier 38AK-007--V511 0200G00157 compressor R-22 6 208 3 21.8 9 7.1
fan 208 1 2.8 0.5
AHU2 Carrier 40RM-007-B600HC 4396F36470 fan 2.4 208 3 7.3 2.0CU2 Carrier 38AK-007--V511 0200G00154 compressor R-22 6 208 3 21.8 9 7.1
fan 208 1 2.8 0.5
AHU3 Carrier 40RM-007-B600HC 4996F42772 fan 2.4 208 3 7.3 2.0CU3 Carrier 38ARZ007--K501 2509G30115 compressor R-22 6 208 3 19 11 6.2
fan 230 1 0.9 0.2fan 230 1 0.9 0.2
AHU4 York LA090C00A6AAA1B N0H8170650 fan 1.5 208 3 6 1.6CU4 York HA090C00A2AAA1A N0M8454757 compressor R-22 7.5 208 3 25.6 10.7 8.3
fan 0.75 208 1 3.03 0.6fan 0.75 208 1 3.03 0.6
Irrigation Pump Baldor JML4091 36K077H92561 pump 5 230 1 21.5 80% 4.7
Cal kWNotes HP Tons/MBTU V Ph Amps
General Information Size / Capacity Nameplate Information
EQUIPMENT Mfctr Model Serial Description Eff /EER
Exhibit 2B Page 96

Proprietary and Confidential © Siemens Industry IGA Report – May, 2019 – | Page 457
Siemens – Broward County, Investment Grade Audit | May 2019
LIGHTING SYSTEM
Interior lighting primarily consists of 60 Watt, T8 fluorescent lamps in either 2 or 3-lamp 2x4fixtures. The building also contains a few U-bend fixtures consisting of 2-lamp T8fluorescents.
Interior Lighting Examples
Exterior Lighting consists of 250W metal halide and LED parking lot lights.
Exterior Lighting Examples
The facility does use switch/motion sensor devices to control the lighting in the bathrooms.
Motion Sensor in Bathroom
Exhibit 2B Page 97

Proprietary and Confidential © Siemens Industry IGA Report – May, 2019 – | Page 458
Siemens – Broward County, Investment Grade Audit | May 2019
DOMESTIC WATER SYSTEM
Domestic water usage is limited to restrooms. Fixtures and water closets are all operatedmanually. The following are example of the types of fixture found within the restroom of thefacility:
∂ 2.2 gpm faucets
∂ 1.0 gpf urinals
∂ 1.6 and 3.5 GPF toilets
Sample Restroom Fixtures
BUILDING CONTROLS SYSTEM
The building is currently not equipped with a building automation system. Each zone has adedicated thermostat. The basketball court lights are controlled by a timer.
Building Controls
TRENDING DATA ACQUISITION
In order to determine the runtime operation of each unit, data loggers were installed tomonitor amperage and/or supply air temperature. This data was trended for a minimum ofseven (7) days in order to capture a typical week. The following graphs illustrate theresulting data from this logging session.
Exhibit 2B Page 98

Proprietary and Confidential © Siemens Industry IGA Report – May, 2019 – | Page 459
Siemens – Broward County, Investment Grade Audit | May 2019
Trending Data – 6 Ton Condensing Unit – AHU 1
This unit registered a total of 44 hours of operation in the week of data logging with averageamperage of 16.84 amps when in operation. Setback controls seem to be in effect for thisunit.
Trending Data – 6 Ton Condensing Unit – AHU 2
Exhibit 2B Page 99

Proprietary and Confidential © Siemens Industry IGA Report – May, 2019 – | Page 460
Siemens – Broward County, Investment Grade Audit | May 2019
This unit registered continuous operation with no evidence of scheduling through the weekof data collection.
Trending Data – 6 Ton Condensing Unit – AHU 3
This unit registered continuous operation with no evidence of scheduling through the weekof data collection. Normal patterns of cycling are evident in this unit by the way itconsistently turns on and off.
Trending Data – 7.5 Ton Condensing Unit – AHU 4
Exhibit 2B Page 100

Proprietary and Confidential © Siemens Industry IGA Report – May, 2019 – | Page 461
Siemens – Broward County, Investment Grade Audit | May 2019
This unit registered continuous operation with no evidence of scheduling through the weekof data collection. Abnormal patterns of cycling are evident in this unit by the way itcontinuously turns on and off.
The following table compares the operating hours of each unit with the hours of service forthe facility.
Unit 1 starts about 0.5 hours before the park opening on Monday through Friday. The rest ofthe time the unit schedule does not seem to have a correlation to the building operatinghours. Units 2, 3, and 4 are running 24 hours a day
Run Hours Run Hours Run Hours Run HoursAHU 1 AHU 2 AHU 3 AHU 4
Monday: 8:00AM - 9:00PM 7:40AM - 7:30PM 12:00AM - 12:00PM 12:00AM - 12:00PM 12:00AM - 12:00PMTuesday: 8:00AM - 9:00PM 7:40AM - 5:40PM 12:00AM - 12:00PM 12:00AM - 12:00PM 12:00AM - 12:00PM
Wednesday: 8:00AM - 9:00PM 8:40AM - Pickup 12:00AM - 12:00PM 12:00AM - 12:00PM 12:00AM - 12:00PMThursday: 8:00AM - 9:00PM 7:30AM 8:40PM 12:00AM - 12:00PM 12:00AM - 12:00PM 12:00AM - 12:00PM
Friday: 8:00AM - 9:00PM 7:40AM - 7:30PM 12:00AM - 12:00PM 12:00AM - 12:00PM 12:00AM - 12:00PMSaturday: 8:00AM - 6:00PM 10:40AM - 10:00PM 12:00AM - 12:00PM 12:00AM - 12:00PM 12:00AM - 12:00PMSunday: 10:00AM - 6:00PM 10:30AM - 5:40PM 12:00AM - 12:00PM 12:00AM - 12:00PM 12:00AM - 12:00PM
Day Hours of Service
Exhibit 2B Page 101

Proprietary and Confidential © Siemens Industry IGA Report – May, 2019 – | Page 462
Siemens – Broward County, Investment Grade Audit | May 2019
UTILITY DATA ANALYSIS - ELECTRIC
The electric usage at this facility is monitored by two (2) electric meters; each with their ownelectric rate structure. When creating the baseline shown below, the most recent 24 monthof electric billing data was utilized as obtained directly from the Florida Power and Lightwebsite. The data was made available via website’s the user portal and historical data fromthe facility’s smart meters.
The following table documents both the rate structure values used to calculate energysavings based on most recent electric billing data as well as the established demand andconsumption values representing baseline electric usage for the facility.
Electric Baseline Summary
Meter MLL657A; Account: 2188013532; Address: 2520 NW 6TH ST FORT LAUDERDALE
on peak off peak
GS-1 - - 0.09874$ - 44,695 - -SDTR-1A 0.126104863 0.03979$ 0.05353$ 10.71$ 200,666 447 45
Delevoe Park
$ / kWAverage
Consumptionper Year
AverageDemand per Year
MaxDemand
Facility # of Meters Rate StructureJune - Sept
$ / kWh
TotalConsumption On Peak Off Peak gross receipts
tax 2.56%Franchise
FeeJun-15 25.96$ 17,263 1,614 15,649 745$ 40 484.80$ 32$ 181$ 1,468$Jul-15 25.96$ 20,532 2,235 18,297 893$ 35 424.20$ 34$ 233$ 1,611$Aug-15 25.96$ 19,266 2,254 17,012 842$ 39 472.68$ 34$ 232$ 1,606$Sep-15 25.96$ 18,428 1,845 16,583 798$ 34 412.08$ 32$ 193$ 1,461$Oct-15 25.96$ 17,987 382 17,605 735$ 42 509.04$ 33$ 190$ 1,492$Nov-15 25.96$ 15,894 0 15,894 649$ 42 509.04$ 30$ 159$ 1,374$Dec-15 25.96$ 15,482 0 15,482 632$ 36 436.32$ 28$ 162$ 1,285$Jan-16 25.96$ 10,485 0 10,485 531$ 25 244.50$ 21$ 32$ 854$Feb-16 25.96$ 10,106 0 10,106 512$ 40 391.20$ 24$ 37$ 990$Mar-16 25.96$ 15,055 0 15,055 763$ 27 264.06$ 27$ 45$ 1,125$Apr-16 25.96$ 14,482 0 14,482 734$ 45 440.10$ 31$ 15$ 1,246$May-16 25.96$ 16,631 0 16,631 843$ 41 400.98$ 32$ 10$ 1,312$Jun-16 26.97$ 19,685 1,458 18,227 893$ 39 458.64$ 35$ 55$ 1,469$Jul-16 26.97$ 22,582 2,044 20,538 1,055$ 40 470.40$ 40$ 62$ 1,654$Aug-16 26.97$ 21,448 2,157 19,291 1,020$ 38 446.88$ 38$ 60$ 1,592$Sep-16 26.97$ 22,749 1,905 20,844 1,050$ 38 446.88$ 39$ 57$ 1,620$Oct-16 26.97$ 16,524 340 16,184 787$ 40 403.20$ 31$ 46$ 1,294$Nov-16 26.97$ 14,058 0 14,058 669$ 36 362.88$ 27$ 40$ 1,126$Dec-16 26.97$ 16,814 0 16,814 800$ 32 322.56$ 29$ 43$ 1,222$Jan-17 25.00$ 13,173 0 13,173 678$ 37 381.10$ 28$ 43$ 1,155$Feb-17 25.00$ 11,783 0 11,783 607$ 35 360.50$ 25$ 39$ 1,056$Mar-17 25.00$ 15,514 0 15,514 834$ 31 319.30$ 30$ 47$ 1,255$Apr-17 25.00$ 16,492 0 16,492 886$ 42 432.60$ 34$ 53$ 1,432$May-17 25.00$ 18,898 0 18,898 1,016$ 40 412.00$ 37$ 57$ 1,547$
200,666 8,117 192,549 9,485$ 447 4,902.97$ 376$ 1,046$ 16,123$
CustomerChargeDate
Other Fees/Taxes
AVERAGE TOTALS
Consumption (kwh)Total
ChargesDemandCharge
Demand(kW)
ConsumptionCharge
Exhibit 2B Page 102

Proprietary and Confidential © Siemens Industry IGA Report – May, 2019 – | Page 463
Siemens – Broward County, Investment Grade Audit | May 2019
The billing is, as previously shown, analyzed as a combination of all meters. As described ina previous section, an index value is calculated and compared to similar facilities within thesame geographic region. Below are the results of this comparison.
Benchmarking Summary
Overall, this building is operating above the 75th percentile of comparable facilities.
0
200
400
600
800
1,000
1,200
0
5,000
10,000
15,000
20,000
25,000
Jan Feb Mar Apr May Jun Jul Aug Sep Oct Nov Dec
Dem
and
(kW
)
Cons
umpt
ion
(kW
h)
Month
Electric Consumption Profile
Consumption (kWh) Demand (kW) CDD
25thpercentile Median 75th
percentileDelevoe Park Recreation 25.58 3.7 7.3 17.6
kWh/Sq FtCBECS - 2012 kWh/Sq Ft Data
Facility Faclity Type
Exhibit 2B Page 103

Proprietary and Confidential © Siemens Industry IGA Report – May, 2019 – | Page 464
Siemens – Broward County, Investment Grade Audit | May 2019
UTILITY DATA ANALYSIS - WATER
The following table(s) summarizes the water consumption data that was available for thisfacility.
This account has some consumption data during the 24 month period but because there areso few consumption data points, no relevant conclusions can be drawn from theseconsumption and expense data points.
Account # 2041829 Meter # 200701417MRate AddressMeter Size 1.5" Meter Type W/S
Delevoe Park
Date Consumption ()
TotalCharges
May-17 217 3,183.65$Apr-17 217 3,183.65$Mar-17 1,430.44$Feb-17 143 2,113.78$Jan-17 2,684.76$Dec-16 1,715.51$Nov-16 1,261.56$Oct-16 1,367.76$Sep-16 85 1,239.83$Aug-16 1,009.12$Jul-16 846.27$Jun-16 1,022.69$May-16 520.55$Apr-16 439.12$Mar-16 357.70$Feb-16 289.84$Jan-16 344.13$Dec-15 466.26$Nov-15 405.49$Oct-15 (33.63)$Sep-15 469.61$Aug-15 430.87$Jul-15 560.02$Jun-15 611.68$May-15 392.12$
TOTALS 662 26,312.78$
Exhibit 2B Page 104

Proprietary and Confidential © Siemens Industry IGA Report – May, 2019 – | Page 465
Siemens – Broward County, Investment Grade Audit | May 2019
RECOMMENDED IMPROVEMENT MEASURES
This section addresses the Facility Improvement Measures (FIMs) recommended forimplementation at this facility. Each solution is presented with a brief description of theintended scope, savings calculation method, guaranteed savings in units of energy, and theindividual FIM’s financial analysis with payback. As requested, the following improvementscosts are listed separately and do not directly affect a FIM’s payback:
∂ Development Costs
∂ Measurement & Verification (performance assurance)
∂ Code compliance issues uncovered that directly relates to the constructability of a specificmeasure
BUILDING LEVEL SUMMARY
The following table summarized the complete list of FIMs recommended for this facility. Thesummation at the bottom of the table represents the total costs and savings of all FIMs only.As stated, the fixed costs associated with in with development, performance assurance, andcode compliance are considered as separate items.
Building Level Financial Summary
SAVINGS CALCULATION METHODOLOGY
FIMs were developed using spreadsheet models and engineering calculations. Energy usingequipment was measured to determine power consumption, kW. Extensive data logging ofequipment was also used to determine energy consumption, kWh. Savings calculations areprovided as in Section H, Appendices.
Building orFacility Description
SAVINGSElectric KWh $
SAVINGSElectric KW $
SAVINGSWater $
SAVINGSO & M
TotalSavings Project Costs Simple
PaybackDelevoe Park Water - Retrofits 66.55$ -$ 1,034.77$ 62$ 1,163.59$ 11,923.20$ 10.2Delevoe Park Split Systems 3,860.80$ 898.70$ -$ -$ 4,759.50$ 102,809.13$ 21.6Delevoe Park Split System Code -$ -$ -$ -$ -$ 12,891.34$ -Breakage Fee 1,151.61$PA Cost 1,333.55$Total 3,927.35$ 898.70$ 1,034.77$ 62$ 5,923.09$ 130,108.84$ 22.0
Exhibit 2B Page 105

Proprietary and Confidential © Siemens Industry IGA Report – May, 2019 – | Page 466
Siemens – Broward County, Investment Grade Audit | May 2019
WATER CONSERVATION
This FIM addresses the reduction of water consumption, wastewater production, and hotwater energy usage through the installation of highly efficient, plumbing products andcontrols. The use of these devices and others are detailed below and were selected not onlyfor their efficiency, but also to provide for durable, long-term use with minimal maintenanceand improved hygiene.
PROJECT SCOPE
Flush Valves: Most commercial facilities utilize flush valve water closets. Flush valves aredesigned to release precise volumes of water when activated. High efficiency flush valvescan enable a facility to greatly reduce its water consumption by reducing flush valve flowrates and the amount of water required for evacuation. Installation of 1.28 gallons per flush(GPF) flush valve will replace existing equipment that currently consumes 1.6 to 3.5 GPF.
For those water closets that require a total equipment change, the china will be replaced aswell. The High efficiency flush valve and china combination will reduce water flow rates to1.28 GPF.
Urinals: High efficiency flush valve and china combinations for urinals can enable a facility togreatly reduce its water consumption by reducing flush valve flow rates and the amount ofwater required for evacuation. Installation of 0.125 GPF high efficiency urinal systems willreplace existing equipment that currently consumes 1.0 to 1.5 GPF.
Bathroom Faucets/Aerators: Most faucets utilize aerators to restrict the volume of water atthe mouth of a faucet and to generate a more comfortable flow. High efficiency aerators cangreatly reduce flow rates from faucets and create a comfortable flow for hand washing andcleaning. Restricting faucet flow rates enables a facility to conserve water and reduce energyusage associated with heating water. Faucets without the threading necessary to accept anaerator can be replaced with threaded faucets. Installation of 0.5 GPM aerator or faucetretrofit will replace existing equipment that currently consumes 2.2 GPM.
SAVINGS
The energy and cost savings were developed using spreadsheet modeling. Based on siteinterviews, facility type, square footage, and standard factors for allocation of business insquare foot per person and visitors per day the total population and occupancy days for thisfacility were determined. Total water closet, urinal, faucet and shower use figures weredetermined for the facility using standard factors for equipment use based on industryresearch and case studies coupled together with the total population of the facility and theoccupancy days. The current water usage minus the proposed water usage leads to the totalwater savings in gallons.
The savings value take the water savings and multiply them by the rate detailed in the UtilityData Analysis section of this report. Energy savings were only taken in the form of hot watersavings for any equipment that utilize hot water.
Exhibit 2B Page 106

Proprietary and Confidential © Siemens Industry IGA Report – May, 2019 – | Page 467
Siemens – Broward County, Investment Grade Audit | May 2019
Deferred maintenance savings were considered and calculated by a percentage of reductionin replacement cost for any new fixtures that will be installed. These savings are referred toas Savings O&M on the financial summary table below.
FIM SAVINGS SUMMARY
Annual Water savings: 90,769 gallons
Annual Energy savings: 876 kWh
All analysis for water savings, energy savings, deferred maintenance savings, and financialdetails is provided in Section H, Appendices of this Report.
FIM Financial Summary
Building orFacility Description
SAVINGSElectric KWh $
SAVINGSElectric KW $
SAVINGSWater $
SAVINGSO & M
TotalSavings Project Costs Simple
PaybackDelevoe Park Water - Retrofits 66.55$ -$ 1,034.77$ 62$ 1,163.59$ 11,923.20$ 10.2
Exhibit 2B Page 107

Proprietary and Confidential © Siemens Industry IGA Report – May, 2019 – | Page 468
Siemens – Broward County, Investment Grade Audit | May 2019
MECHANICAL
As DX equipment ages and the condition of the equipment deteriorate, the energy efficiencyof these units also degrades. In recent years the energy efficiency of DX equipment hasimproved due to mandates as well as manufacture improvements. DX air-conditioningsystems are rated by their Seasonal Energy Efficiency Ratios (SEER). The higher the SEERrating the more energy efficient the units are. Older units have average SEER ratingsbetween 8-10 while new units have average SEER ratings of 13 or greater.
Cooling for the building is provided by four (4) split DX package configuration located on theoutside of the building. Three of the units are 6 ton, air-cooled Carrier units that serve threesingle-zones, 100% return air handling units (AHU). The fourth unit is a 7.5 ton, air-cooledYork unit that serves a single-zone, 100% outside air AHU. The Carrier equipment is reportedto be original to the building; 1996 and 1997 manufacturing dates. The York unit appears tobe newer; a 2008 manufacturing date.
PROJECT SCOPE
This FIM addresses the replacement of four (4) DX systems. The scope of work includes thereplacement of both the condensing unit and air handlers. The new equipment will be ofequal capacity and include, as part of the installation, package new programmablethermostats provided by Siemens. The thermostats will be able to communicated, via theirown IP address, to remote BAUs for additional access. The units will be placed on a time ofday schedule. The new schedule will command the units to turn on 1.5 hours before thefacility opens and 1.5 hours after it closes.
Scope of Work
Bldg Equipment Make Model Tons ExistingEER
NewEER
Delevoe Park AHU Carrier 40RM-007-B600HC
Delevoe Park Condenser Carrier 38AK-007--V511 6 9 12.5
Delevoe Park AHU Carrier 40RM-007-B600HC
Delevoe Park Condenser Carrier 38AK-007--V511 6 9 12.5
Delevoe Park AHU Carrier 40RM-007-B600HC
Delevoe Park Condenser Carrier 38ARZ007--K501 6 11 12.5
Delevoe Park AHU York LA090C00A6AAA1B
Delevoe Park Condenser York HA090C00A2AAA1A 7.5 10.7 11.2
SAVINGS
The energy and cost savings were developed using a spreadsheet model. Using nameplatedata, onsite electrical spot measurements, and data logging information, the total HVACelectrical contribution of this facility’s electric utility bill was determined. The calculationstook into consideration current conditions and efficiencies. Savings were obtained byreplacing existing efficiency values with the higher efficiency value of the new equipment; as
Exhibit 2B Page 108

Proprietary and Confidential © Siemens Industry IGA Report – May, 2019 – | Page 469
Siemens – Broward County, Investment Grade Audit | May 2019
published by the manufacturer. The detailed calculations are available in the Section H,Appendices. All calculations were based off Trane manufacturer cut-sheets, also provided.
FIM SAVINGS SUMMARY
Annual Electric Consumption: 67,685 kWh
Annual Electric Demand: 79.8 kW
FIM Financial Summary
Savings Capital: Capital budget dollars were used in order to improve the payback to therequested limitation values. These dollars represent unused amounts left over from theCapital Project Plan total. Funds were first applied to their respective capital project until therequired payback was achieved. All remaining amounts were distributed to FIM opportunitessuch as the one above.
Code Compliance: Associated with the scope of work summarized above are codecompliance issued uncovered by contracted MEPs (mechanical, electrical, and plumbingvendor). This cost was requested to be listed separately. For this facility, the codecompliance cost is:
∂ $12,891.34
The identified issue at Delevoe Park includes lack of outside air intakes as required by currentbuilding code.
Building orFacility Description
SAVINGSElectric KWh $
SAVINGSElectric KW $
SAVINGSWater $
SAVINGSO & M
TotalSavings Project Costs Simple
PaybackDelevoe Park Split Systems 3,860.80$ 898.70$ -$ -$ 4,759.50$ 102,809.13$ 21.6
Exhibit 2B Page 109

Proprietary and Confidential © Siemens Industry IGA Report – May, 2019 – | Page 470
Siemens – Broward County, Investment Grade Audit | May 2019
D.36. Park - Everglades Holiday
FACILITY DESCRIPTION
Everglades Holiday Park is a multipurposefacility and grounds that has been inoperation for public recreational purposessince 1964 and located at 21940 Griffin Rd,Fort Lauderdale, FL 33332. The park offersair boat rides, boat ramps, fishing, wildlifeviewing, food concessions, boat rentals,alligator shows, and campgrounds. Thereare two buildings on the grounds that areconditioned. The main building consists of asmall gift shop, concession area, andoffices. The other conditioned building isthe campground office that is a single spacesingle wide trailer conditioned by bard units.Access to this building was not possible at the time of the site visit. The operating hours forthe entire park are as follows.
Park Hours
7 days a week, 6AM – 10PM
Observed Issues during Visit:
∂ Some DX units are 10 years old and use R-22 refrigerant
∂ Indoor air quality issues
Examples of Observed Issues
COOLING SYSTEM:
Cooling for the Main building is provided by three split DX package configuration located onthe outside of the building. One of the units is a 5 ton, air-cooled Trane unit that is a single-zone, 100% return air handling unit (AHU). The next unit is a 5 ton, air-cooled Carrier unitthat is a single-zone, 100% return AHU. The last unit is a 3.5 ton, air cooled Carries unit thatis a single-zone, 100% return AHU.
Exhibit 2B Page 110

Proprietary and Confidential © Siemens Industry IGA Report – May, 2019 – | Page 471
Siemens – Broward County, Investment Grade Audit | May 2019
Main Building HVAC
The cooling for the camp ground office is provided by one packaged DX 2 ton Bard unit.
Camp Grounds Office HVAC
The Trane unit was manufactured in 2014, the Carrier units were manufactured in 2007 &2008, and the Bard unit was manufactured in 2011
Namplate Data of Mechanical Equipment
Everglades Holiday ParkAHU Trane TAM7B0C6CH51SCB 14414M7PAV fan 1 200 1 5.5 1.0CU Trane 4TTB6061B1000AA 14384JWS2F compressor R-410a 5 208 1 23.7 12.8 4.4
fan 0.33 208 1 2.8 0.5
Pump AMT T63CXDPT-1885 pond pump 1 2 208 1 10.7 2.0Pump Everbuilt EFLS20-HD T010902 pond pump 2 2 115 27 0.0
AHU could not locate 0.0CU Payne PA13NR060 4107X0624 compressor R-22 5 208 1 25.3 11 4.7
fan 0.25 208 1 1.4 0.3
AHU could not locate 0.0CU Carrier 24ABS360A300 2108E23960 compressor R-22 3.5 208 1 25.3 12 4.7
fan 0.25 208 1 1.2 0.2
Bard Unit Bard W24A1 314L112840461-02 compressor R-410a 2 208 1 12.4 2.3fan 0.2 208 1 1.2 0.2fan 0.17 208 1 1 0.2
Cal kWHP Tons/MBTU V Ph Amps Eff /EEREQUIPMENT Mfctr Model Serial Description Notes
General Information Size / Capacity Nameplate Information
Exhibit 2B Page 111
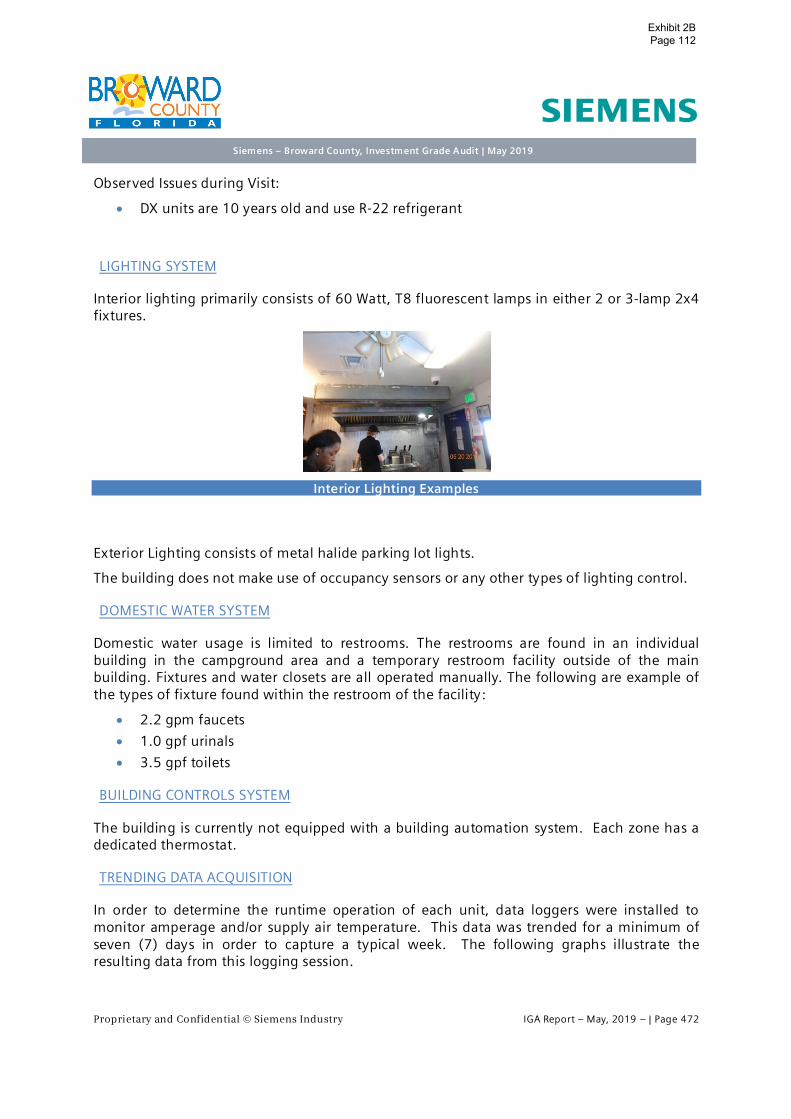
Proprietary and Confidential © Siemens Industry IGA Report – May, 2019 – | Page 472
Siemens – Broward County, Investment Grade Audit | May 2019
Observed Issues during Visit:
∂ DX units are 10 years old and use R-22 refrigerant
LIGHTING SYSTEM
Interior lighting primarily consists of 60 Watt, T8 fluorescent lamps in either 2 or 3-lamp 2x4fixtures.
Interior Lighting Examples
Exterior Lighting consists of metal halide parking lot lights.
The building does not make use of occupancy sensors or any other types of lighting control.
DOMESTIC WATER SYSTEM
Domestic water usage is limited to restrooms. The restrooms are found in an individualbuilding in the campground area and a temporary restroom facility outside of the mainbuilding. Fixtures and water closets are all operated manually. The following are example ofthe types of fixture found within the restroom of the facility:
∂ 2.2 gpm faucets
∂ 1.0 gpf urinals
∂ 3.5 gpf toilets
BUILDING CONTROLS SYSTEM
The building is currently not equipped with a building automation system. Each zone has adedicated thermostat.
TRENDING DATA ACQUISITION
In order to determine the runtime operation of each unit, data loggers were installed tomonitor amperage and/or supply air temperature. This data was trended for a minimum ofseven (7) days in order to capture a typical week. The following graphs illustrate theresulting data from this logging session.
Exhibit 2B Page 112

Proprietary and Confidential © Siemens Industry IGA Report – May, 2019 – | Page 473
Siemens – Broward County, Investment Grade Audit | May 2019
Trending Data – 5 Ton Condensing Unit – Trane AHU
This unit registered an average of 15.32 amps and was operating continuously throughoutthe data collection period.
Trending Data – 5 Ton Condensing Unit – Payne AHU
This unit registered an average of 11.85 amps and was operating continuously throughoutthe data collection period.
Exhibit 2B Page 113

Proprietary and Confidential © Siemens Industry IGA Report – May, 2019 – | Page 474
Siemens – Broward County, Investment Grade Audit | May 2019
Trending Data – 3.5 Ton Condensing Unit – Carrier AHU
This unit registered an average of 19.89 amps and was operating continuously throughoutthe data collection period.
The following table compares the operating hours of each unit with the hours of service forthe facility.
The units are running 24 hours a day with no signs of any type of controls for the week thatdata was collected.
Run Hours Run Hours Run HoursTrane Unit Payne Unit Carrier Unit
Monday 6:00AM - 10:00PM 12:00AM - 12:00PM 12:00AM - 12:00PM 12:00AM - 12:00PMTuesday 6:00AM - 10:00PM 12:00AM - 12:00PM 12:00AM - 12:00PM 12:00AM - 12:00PM
Wednesday 6:00AM - 10:00PM 12:00AM - 12:00PM 12:00AM - 12:00PM 12:00AM - 12:00PMThursday 6:00AM - 10:00PM 12:00AM - 12:00PM 12:00AM - 12:00PM 12:00AM - 12:00PM
Friday 6:00AM - 10:00PM 12:00AM - 12:00PM 12:00AM - 12:00PM 12:00AM - 12:00PMSaturday 6:00AM - 10:00PM 12:00AM - 12:00PM 12:00AM - 12:00PM 12:00AM - 12:00PMSunday 6:00AM - 10:00PM 12:00AM - 12:00PM 12:00AM - 12:00PM 12:00AM - 12:00PM
Day Hours of Service
Exhibit 2B Page 114
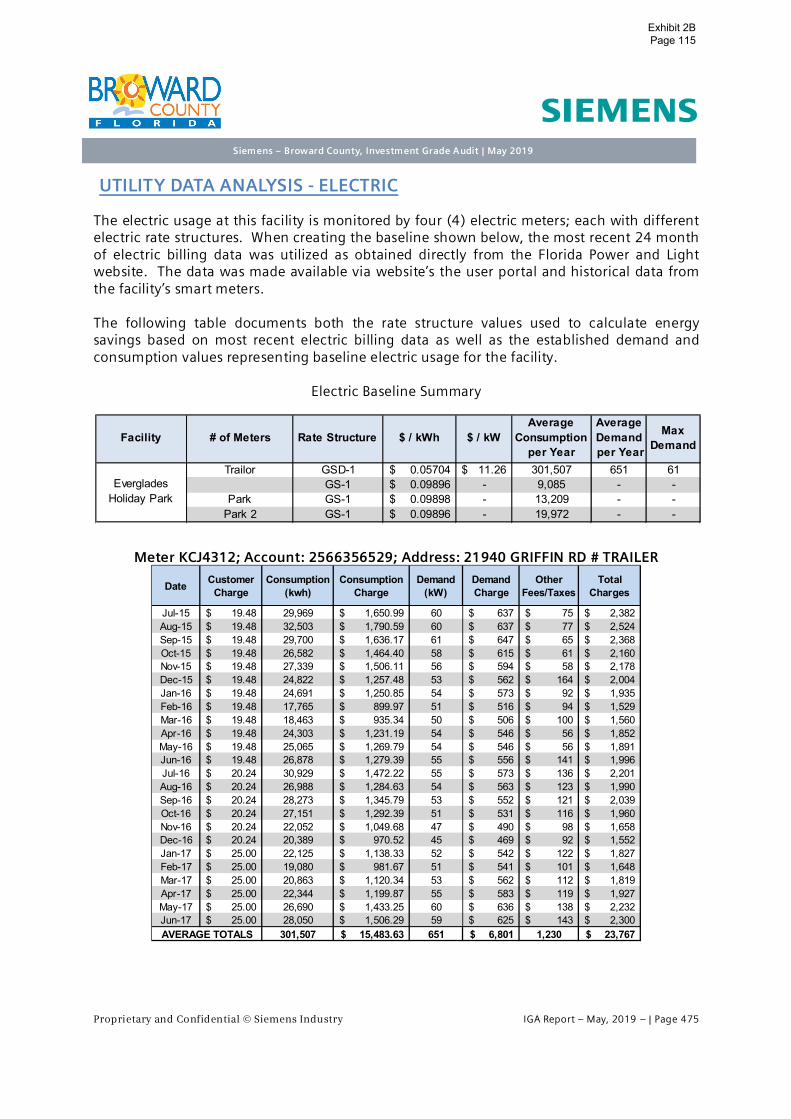
Proprietary and Confidential © Siemens Industry IGA Report – May, 2019 – | Page 475
Siemens – Broward County, Investment Grade Audit | May 2019
UTILITY DATA ANALYSIS - ELECTRIC
The electric usage at this facility is monitored by four (4) electric meters; each with differentelectric rate structures. When creating the baseline shown below, the most recent 24 monthof electric billing data was utilized as obtained directly from the Florida Power and Lightwebsite. The data was made available via website’s the user portal and historical data fromthe facility’s smart meters.
The following table documents both the rate structure values used to calculate energysavings based on most recent electric billing data as well as the established demand andconsumption values representing baseline electric usage for the facility.
Electric Baseline Summary
Meter KCJ4312; Account: 2566356529; Address: 21940 GRIFFIN RD # TRAILER
Trailor GSD-1 0.05704$ 11.26$ 301,507 651 61GS-1 0.09896$ - 9,085 - -
Park GS-1 0.09898$ - 13,209 - -Park 2 GS-1 0.09896$ - 19,972 - -
EvergladesHoliday Park
$ / kWAverage
Consumptionper Year
AverageDemand per Year
MaxDemandFacility # of Meters Rate Structure $ / kWh
Date CustomerCharge
Consumption(kwh)
ConsumptionCharge
Demand(kW)
DemandCharge
OtherFees/Taxes
TotalCharges
Jul-15 19.48$ 29,969 1,650.99$ 60 637$ 75$ 2,382$Aug-15 19.48$ 32,503 1,790.59$ 60 637$ 77$ 2,524$Sep-15 19.48$ 29,700 1,636.17$ 61 647$ 65$ 2,368$Oct-15 19.48$ 26,582 1,464.40$ 58 615$ 61$ 2,160$Nov-15 19.48$ 27,339 1,506.11$ 56 594$ 58$ 2,178$Dec-15 19.48$ 24,822 1,257.48$ 53 562$ 164$ 2,004$Jan-16 19.48$ 24,691 1,250.85$ 54 573$ 92$ 1,935$Feb-16 19.48$ 17,765 899.97$ 51 516$ 94$ 1,529$Mar-16 19.48$ 18,463 935.34$ 50 506$ 100$ 1,560$Apr-16 19.48$ 24,303 1,231.19$ 54 546$ 56$ 1,852$May-16 19.48$ 25,065 1,269.79$ 54 546$ 56$ 1,891$Jun-16 19.48$ 26,878 1,279.39$ 55 556$ 141$ 1,996$Jul-16 20.24$ 30,929 1,472.22$ 55 573$ 136$ 2,201$Aug-16 20.24$ 26,988 1,284.63$ 54 563$ 123$ 1,990$Sep-16 20.24$ 28,273 1,345.79$ 53 552$ 121$ 2,039$Oct-16 20.24$ 27,151 1,292.39$ 51 531$ 116$ 1,960$Nov-16 20.24$ 22,052 1,049.68$ 47 490$ 98$ 1,658$Dec-16 20.24$ 20,389 970.52$ 45 469$ 92$ 1,552$Jan-17 25.00$ 22,125 1,138.33$ 52 542$ 122$ 1,827$Feb-17 25.00$ 19,080 981.67$ 51 541$ 101$ 1,648$Mar-17 25.00$ 20,863 1,120.34$ 53 562$ 112$ 1,819$Apr-17 25.00$ 22,344 1,199.87$ 55 583$ 119$ 1,927$May-17 25.00$ 26,690 1,433.25$ 60 636$ 138$ 2,232$Jun-17 25.00$ 28,050 1,506.29$ 59 625$ 143$ 2,300$
301,507 15,483.63$ 651 6,801$ 1,230 23,767$AVERAGE TOTALS
Exhibit 2B Page 115

Proprietary and Confidential © Siemens Industry IGA Report – May, 2019 – | Page 476
Siemens – Broward County, Investment Grade Audit | May 2019
Meter KC78911; Account: 2074304334; Address: 21940 GRIFFIN RD FORT LAUDERDALE
0
100
200
300
400
500
600
700
0
5,000
10,000
15,000
20,000
25,000
30,000
35,000
Jan Feb Mar Apr May Jun Jul Aug Sep Oct Nov Dec
Dem
and
(kW
)
Cons
umpt
ion
(kW
h)
Month
Electric Consumption Profile
Consumption (kWh) Demand (kW) CDD
Date Consumption(kwh)
ConsumptionCharge
OtherFees/Taxes
TotalCharges
Jul-15 1,104 106.23$ 4.84$ 119$Aug-15 1,047 100.74$ 4.63$ 113$Sep-15 921 88.62$ 3.70$ 100$Oct-15 832 80.06$ 3.39$ 91$Nov-15 776 74.67$ 3.11$ 85$Dec-15 675 64.95$ 2.77$ 75$Jan-16 701 63.61$ 4.67$ 76$Feb-16 580 52.63$ 3.95$ 64$Mar-16 551 50.00$ 3.96$ 61$Apr-16 759 68.87$ 3.91$ 80$
May-16 819 74.32$ 4.17$ 86$Jun-16 884 78.76$ 5.67$ 92$Jul-16 1,125 100.23$ 7.08$ 115$
Aug-16 954 84.99$ 6.09$ 99$Sep-16 1,019 90.78$ 6.20$ 105$Oct-16 794 70.74$ 4.94$ 83$Nov-16 222 19.78$ 1.73$ 29$Dec-16 510 45.44$ 3.35$ 57$Jan-17 551 49.65$ 3.92$ 64$Feb-17 599 53.98$ 4.18$ 68$Mar-17 575 53.55$ 4.18$ 68$Apr-17 656 61.09$ 4.68$ 76$
May-17 724 67.43$ 5.10$ 83$Jun-17 792 73.86$ 5.46$ 89$
AVERAGES 9,085 837.47$ 52.86$ 988.49$
Exhibit 2B Page 116

Proprietary and Confidential © Siemens Industry IGA Report – May, 2019 – | Page 477
Siemens – Broward County, Investment Grade Audit | May 2019
Meter KJ65810; Account: 1516157334; Address: 21940 GRIFFIN RD #EVERGLADES
0
100
200
300
400
500
600
700
0
200
400
600
800
1,000
1,200
Jan Feb Mar Apr May Jun Jul Aug Sep Oct Nov Dec
CDD
Cons
umpt
ion
(kW
h)
Month
Electric Consumption Profile
Consumption (kWh) CDD
Date Consumption(kwh)
ConsumptionCharge
OtherFees/Taxes
TotalCharges
Jul-15 889 85.54$ 4.00$ 97$Aug-15 1,242 119.51$ 5.38$ 132$Sep-15 2,712 260.95$ 9.94$ 278$Oct-15 715 68.80$ 2.98$ 79$Nov-15 824 79.29$ 3.28$ 90$Dec-15 1,131 108.82$ 4.32$ 121$Jan-16 1,265 114.79$ 8.01$ 130$Feb-16 884 80.21$ 5.76$ 93$Mar-16 1,168 105.98$ 7.81$ 121$Apr-16 1,442 130.85$ 6.71$ 145$
May-16 1,420 128.85$ 6.61$ 143$Jun-16 1,340 119.38$ 8.35$ 135$Jul-16 1,685 150.12$ 10.35$ 168$
Aug-16 1,304 116.17$ 8.15$ 132$Sep-16 1,298 115.64$ 7.76$ 131$Oct-16 1,295 115.37$ 7.72$ 131$Nov-16 950 84.64$ 5.81$ 98$Dec-16 1,014 90.34$ 6.17$ 104$Jan-17 1,131 101.91$ 7.35$ 119$Feb-17 757 68.21$ 5.10$ 83$Mar-17 675 62.86$ 4.81$ 78$Apr-17 430 40.05$ 3.30$ 53$
May-17 453 42.19$ 3.43$ 56$Jun-17 394 36.74$ 3.06$ 50$
AVERAGES 13,209 1,213.60$ 73.08$ 1,384.84$
Exhibit 2B Page 117

Proprietary and Confidential © Siemens Industry IGA Report – May, 2019 – | Page 478
Siemens – Broward County, Investment Grade Audit | May 2019
Meter KJL6224; Account: 4187108339; Address: 21940 GRIFFIN RD #EVRGLDS PRK 2
0
100
200
300
400
500
600
700
0
500
1,000
1,500
2,000
2,500
Jan Feb Mar Apr May Jun Jul Aug Sep Oct Nov Dec
CDD
Cons
umpt
ion
(kW
h)
Month
Electric Consumption Profile
Consumption (kWh) CDD
Date Consumption(kwh)
ConsumptionCharge
OtherFees/Taxes
TotalCharges
Jul-15 431 41.47$ 2.19$ 51$Aug-15 799 76.88$ 3.63$ 88$Sep-15 1,086 104.49$ 4.28$ 116$Oct-15 908 87.37$ 3.66$ 98$Nov-15 1,011 97.28$ 3.90$ 109$Dec-15 1,364 131.24$ 5.11$ 144$Jan-16 1,482 134.48$ 9.32$ 151$Feb-16 1,593 144.55$ 9.98$ 162$Mar-16 1,914 173.68$ 12.47$ 194$Apr-16 1,656 150.27$ 7.60$ 165$
May-16 1,977 179.39$ 8.90$ 196$Jun-16 2,218 197.60$ 13.49$ 219$Jul-16 2,668 237.69$ 16.11$ 262$
Aug-16 2,293 204.28$ 13.94$ 226$Sep-16 2,391 213.01$ 13.86$ 235$Oct-16 1,948 173.55$ 11.39$ 193$Nov-16 1,758 156.62$ 10.32$ 175$Dec-16 1,404 125.08$ 8.35$ 141$Jan-17 1,654 149.04$ 10.44$ 169$Feb-17 1,661 149.67$ 10.41$ 170$Mar-17 1,357 126.38$ 8.99$ 145$Apr-17 1,642 152.92$ 10.73$ 174$
May-17 1,850 172.29$ 12.01$ 194$Jun-17 2,879 268.50$ 18.13$ 297$
AVERAGES 19,972 1,823.87$ 114.60$ 2,036.63$
Exhibit 2B Page 118

Proprietary and Confidential © Siemens Industry IGA Report – May, 2019 – | Page 479
Siemens – Broward County, Investment Grade Audit | May 2019
The billing is, as previously shown, analyzed as a combination of all meters. As described ina previous section, an index value is calculated and compared to similar facilities within thesame geographic region. Below are the results of this comparison.
Benchmarking Summary
Overall, this building is operating above the 75th percentile of comparable facilities.
UTILITY DATA ANALYSIS - WATER
Water consumption data could not be acquired for this facility
0
100
200
300
400
500
600
700
0
500
1,000
1,500
2,000
2,500
3,000
Jan Feb Mar Apr May Jun Jul Aug Sep Oct Nov Dec
CDD
Cons
umpt
ion
(kW
h)
Month
Electric Consumption Profile
Consumption (kWh) CDD
25thpercentile Median
75thpercentile
Everglades Holiday Park Recreation 20.22 3.7 7.3 17.6
kWh/Sq FtCBECS - 2012 kWh/Sq Ft Data
Facility Faclity Type
Exhibit 2B Page 119

Proprietary and Confidential © Siemens Industry IGA Report – May, 2019 – | Page 480
Siemens – Broward County, Investment Grade Audit | May 2019
RECOMMENDED IMPROVEMENT MEASURES
This section addresses the Facility Improvement Measures (FIMs) recommended forimplementation at this facility. Each solution is presented with a brief description of theintended scope, savings calculation method, guaranteed savings in units of energy, and theindividual FIM’s financial analysis with payback. As requested, the following improvementscosts are listed separately and do not directly affect a FIM’s payback:
∂ Development Costs
∂ Measurement & Verification (performance assurance)
∂ Code compliance issues uncovered that directly relates to the constructability of a specificmeasure
BUILDING LEVEL SUMMARY
The following table summarized the complete list of FIMs recommended for this facility. Thesummation at the bottom of the table represents the total costs and savings of all FIMs only.As stated, the fixed costs associated with in with development, performance assurance, andcode compliance is considered as separate items.
Building Level Financial Summary
SAVINGS CALCULATION METHODOLOGY
FIMs were developed using spreadsheet models and engineering calculations. Energy usingequipment was measured to determine power consumption, kW. Extensive data logging ofequipment was also used to determine energy consumption, kWh. Savings calculations areprovided as in Section H, Appendices.
Building or Facility DescriptionSAVINGS
Electric KWh $SAVINGS
Electric KW $SAVINGSWater $
SAVINGSO & M
TotalSavings Project Costs Simple
PaybackEverglades Holiday Park Lighting - Interior 1,518.10$ -$ -$ 212$ 1,730.10$ 13,393.86$ 7.7Everglades Holiday Park Water - Retrofits 171.15$ -$ 923.58$ 33$ 1,128.01$ 11,167.36$ 9.9Everglades Holiday Park Split System Scheduling 771.40$ -$ -$ -$ 771.40$ 8,076.78$ 10.5Breakage Fee 1,151.61$PA Cost 341.50$Total 2,460.65$ -$ 923.58$ 245$ 3,629.51$ 34,131.12$ 9.4
Exhibit 2B Page 120

Proprietary and Confidential © Siemens Industry IGA Report – May, 2019 – | Page 481
Siemens – Broward County, Investment Grade Audit | May 2019
LIGHTING RETROFIT
The following section describes all lighting scope of work proposed for implementation.
PROJECT SCOPE – INTERIOR LIGHTING
LED Replacement of Linear Lamps: The design strategy is to specify and standardize on thesame type of linear LED T8 and T5 lamps types throughout the buildings to be included inthis project. We select a non-proprietary proven LED tube that will provide the greatestperformance and energy savings of any of the lighting systems considered. The proposedLED Linear tubes are a premium high lumen, extended life with best in class warranty.
The predominant LED lamp we have selected for this project is an UL Type B LED linear type.The UL Type B lamp a direct wire lamp that doesn’t require an external ballast or driver. Theexisting T-8 or T5 ballast will be removed from the fixture and disposed of. New lampsockets approved for direct wire LED lamps will also be installed on the feed ends to ensureproblem free installation and reduce future maintenance. This LED retrofit strategy will allowus to maintain recommended light levels while providing a reduction in energy usage in alllinear lamp fixtures and still standardize on lamp types. All fixtures retrofitted will be drywiped to remove dust and particulate matter to improve fixture lumen efficiency.
Fixture types associated with these lamps are surface or recessed linear fixtures: In thecase of existing 2’x2’ troffers, a different approach is used. There is less flexibility in lampwattage when dealing with U-shaped lamps, and installing linear lamp kits can be achallenge due to variation in fixture construction. Additionally, in many cases, it is possibleto reduce light output if the fixture can be made more efficient. To provide consistency ofcomponents and reduce energy use, we have proposed installing 2x2 volumetric style retrofitdoor kits with dedicated LED boards and drivers.
Emergency Lighting: Backup power for emergency lighting is currently supplied by variousmeans, including generator backup (emergency lights at full output), integral battery backupballasts (fluorescent fixtures at reduced output), and unit inverter emergency lights. Ofthose approaches, the scenarios with existing battery backup ballasts in fluorescent fixturesrequire replacement of the battery ballasts because they are not compatible with the UL TypeB LED lamps. In those cases, a standalone EM kit with a dedicated emergency battery, LEDdriver, and LED board will be installed in the fixture. This kit will remain off until there is apower outage, at which point the LED board will illuminate.
Interior Lighting Retrofit Scope
BUILDING NAME EXISTING & RETROFIT STANDARD LEGEND DESCRIPTIONSEXISTING
QTYRETROFIT
QTYEVERGLADES HOLIDAY
PARKExisting T8 Fluorescent - Proposed Retrofit LED 76 76
Exhibit 2B Page 121

Proprietary and Confidential © Siemens Industry IGA Report – May, 2019 – | Page 482
Siemens – Broward County, Investment Grade Audit | May 2019
SAVINGS
The energy and cost savings were developed using a spreadsheet model. In the analysis, theexisting lighting wattage per fixture was reduced to reflect the installation of higherefficiency technology. A detailed room by room survey of the facility, available in Section H,Appendices, was performed to accurately determine the existing lighting type and quantity.
The runtime operations of the new lighting fixtures are reduced in areas that arerecommended for lighting occupancy sensors. This runtime reduction was determined basedon the results of lighting and occupancy data logging sessions conducted at various facilities.The results of these data logging session, as well as the resulting hour of operations of lightsper space type are provided also provided in Section H, Appendices.
FIM SAVINGS SUMMARY
Annual Electric Consumption: 19,496 kWh
Annual Electric Demand: 39.9 kW
FIM Financial Summary
WATER CONSERVATION
This FIM addresses the reduction of water consumption, wastewater production, and hotwater energy usage through the installation of highly efficient, plumbing products andcontrols. The use of these devices and others are detailed below and were selected not onlyfor their efficiency, but also to provide for durable, long-term use with minimal maintenanceand improved hygiene.
PROJECT SCOPE
Flush Valves: Most commercial facilities utilize flush valve water closets. Flush valves aredesigned to release precise volumes of water when activated. High efficiency flush valvescan enable a facility to greatly reduce its water consumption by reducing flush valve flowrates and the amount of water required for evacuation. Installation of 1.28 gallons per flush(GPF) flush valve will replace existing equipment that currently consumes 1.6 to 3.5 GPF.
For those water closets that require a total equipment change, the china will be replaced aswell. The High efficiency flush valve and china combination will reduce water flow rates to1.28 GPF.
Building or Facility DescriptionSAVINGS
Electric KWh $SAVINGS
Electric KW $SAVINGSWater $
SAVINGSO & M
TotalSavings Project Costs Simple
PaybackEverglades Holiday Park Lighting - Interior 1,518.10$ -$ -$ 212$ 1,730.10$ 13,393.86$ 7.7
Exhibit 2B Page 122

Proprietary and Confidential © Siemens Industry IGA Report – May, 2019 – | Page 483
Siemens – Broward County, Investment Grade Audit | May 2019
Urinals: High efficiency flush valve and china combinations for urinals can enable a facility togreatly reduce its water consumption by reducing flush valve flow rates and the amount ofwater required for evacuation. Installation of 0.125 GPF high efficiency urinal systems willreplace existing equipment that currently consumes 1.0 to 1.5 GPF.
Bathroom Faucets/Aerators: Most faucets utilize aerators to restrict the volume of water atthe mouth of a faucet and to generate a more comfortable flow. High efficiency aerators cangreatly reduce flow rates from faucets and create a comfortable flow for hand washing andcleaning. Restricting faucet flow rates enables a facility to conserve water and reduce energyusage associated with heating water. Faucets without the threading necessary to accept anaerator can be replaced with threaded faucets. Installation of 0.5 GPM aerator or faucetretrofit will replace existing equipment that currently consumes 2.2 GPM.
SAVINGS
The energy and cost savings were developed using spreadsheet modeling. Based on siteinterviews, facility type, square footage, and standard factors for allocation of business insquare foot per person and visitors per day the total population and occupancy days for thisfacility were determined. Total water closet, urinal, faucet and shower use figures weredetermined for the facility using standard factors for equipment use based on industryresearch and case studies coupled together with the total population of the facility and theoccupancy days. The current water usage minus the proposed water usage leads to the totalwater savings in gallons.
The savings value take the water savings and multiply them by the rate detailed in the UtilityData Analysis Section of this report. Energy savings were only taken in the form of hot watersavings for any equipment that utilize hot water.
Deferred maintenance savings were considered and calculated by a percentage of reductionin replacement cost for any new fixtures that will be installed. These savings are referred toas Savings O&M on the financial summary table below.
FIM SAVINGS SUMMARY
Annual Water savings: 120,888 gallons
Annual Energy savings: 1,934 kWh
All analysis for water savings, energy savings, deferred maintenance savings, and financialdetails is provided in Section H, Appendices of this Report.
FIM Financial Summary
Building or Facility DescriptionSAVINGS
Electric KWh $SAVINGS
Electric KW $SAVINGSWater $
SAVINGSO & M
TotalSavings Project Costs Simple
PaybackEverglades Holiday Park Water - Retrofits 171.15$ -$ 923.58$ 33$ 1,128.01$ 11,167.36$ 9.9
Exhibit 2B Page 123

Proprietary and Confidential © Siemens Industry IGA Report – May, 2019 – | Page 484
Siemens – Broward County, Investment Grade Audit | May 2019
AUTOMATION – SCHEDULES
Standard thermostats control an HVAC unit by measuring the ambient temperature at thethermostat and either turning the unit on if the ambient temperature is above thetemperature setpoint or turning the unit off when the ambient temperature reaches thesetpoint. Most commercial facilities have set hours of operation where the facility is occupiedand there is a need for conditioned space. Outside of hours of operation a facility will usuallynot have occupancy and won’t have a need for air conditioning. Advanced Siemensthermostats allow for the utilization of this fact to translate into energy savings by changingthe setpoint temperatures of a building automatically depending on the hours of operation.In addition, these thermostats have the capability to be wirelessly connected to a BAS systemfor remote monitoring and control.
PROJECT SCOPE
This FIM address the turn-key replacement and installation of two (2) thermostats withscheduling capabilities.
SAVINGS
The energy cost and savings were developed using a spreadsheet model. Using nameplatedata, onsite electrical spot measurements, and data logging information, the total HVACelectrical consumption of the equipment to be controlled by the thermostat was determined.A run time analysis was completed by logging the use of the equipment for a 7 day period.The equipment run time was compared to an optimal run time to meet the needs of thatfacility. Optimal run times were determined by taking the daily hours of operation of thefacility plus 1.5 hours before and after. The difference between the existing run time and theoptimal run time are equal to the unnecessary amount of time the unit is running. This timethen was multiplied by the electrical consumption for each unit to acquire the calculatedenergy savings per HVAC unit. Full calculations are provided in Section H, Appendices thisReport.
FIM SAVINGS SUMMARY
Annual Electric Consumption: 13,531 kWh
FIM Financial Summary
Building or Facility DescriptionSAVINGS
Electric KWh $SAVINGS
Electric KW $SAVINGSWater $
SAVINGSO & M
TotalSavings Project Costs Simple
PaybackEverglades Holiday Park Split System Scheduling 771.40$ -$ -$ -$ 771.40$ 8,076.78$ 10.5
Exhibit 2B Page 124

Proprietary and Confidential © Siemens Industry IGA Report – May, 2019 – | Page 485
Siemens – Broward County, Investment Grade Audit | May 2019
D.37. Park - Franklin
FACILITY DESCRIPTION
Franklin Park is a multipurpose facility thathas been in operation as it currently standssince 2000 and located at 2501 FranklinDr., Fort Lauderdale, FL 33311. The facilityis a 6,000-square-foot community centerwith a kitchen, office space, storage,restrooms, activity rooms, a large meetingroom, and a fitness center. This is the onlyconditioned space in the park. The park alsooffers two shelters, two covered basketballcourts, and a playground. The park has afterschool programs for the children ages 6 -17as well as offering summer recreationalprograms. The operating hours for theentire park are as follows.
Park Hours
Mon – Friday: 8AM – 9PM
Sat – Sun: 10AM – 6PM
Observed Issues during Visit:
∂ AHU is past its useful life
COOLING SYSTEM:
Cooling for the facility is provided by 5 DX Systems. 4 of the units are packaged DX Carrierroof top units (RTU). Two of the RTUs are 4 ton units and the other two are 5 ton units. Thelast unit is a split system DX unit consisting of two Thermal Zone condensing units that are7.5 tons each that feed into one Carrier mixed air handling unit (AHU)
Main Building HVAC
Exhibit 2B Page 125

Proprietary and Confidential © Siemens Industry IGA Report – May, 2019 – | Page 486
Siemens – Broward County, Investment Grade Audit | May 2019
Nameplate Data of Mechanical Equipment
The Carrier RTUs were manufactured in 2013, the Carrier air handler was manufactured in2000, and the Thermal Zone condensing units were manufactured in 2014.
LIGHTING SYSTEM
Interior lighting primarily consists of LED fixtures.
Exterior Lighting consists of LED wall pack lighting, metal halide parking lot lighting, andmetal halide lighting for a covered basketball court.
Exterior Lighting Examples
The building does not make use of occupancy sensors or any other types of lighting controlthat could be found.
Franklin ParkAHU Carrier 39TVRNAB--U-CJL-AB 1700F96354 fan 1.0CU1 Thermal Zone TZAA-090CA757 F171703307 compressor R-22 7.5 208 3 22.4 11.18 7.3
fan 0.33 208 3 2.2 0.7CU2 Thermal Zone TZAA-090CA757 F171403303 compressor R-22 7.5 208 3 22.4 11.18 7.3
fan 0.33 208 3 2.2 0.7
RTU4 Carrier 50LC0005A0C5A0A0A0 4413C89786 compressor R-410a 4 208 3 14 13.475 4.5fan 208 1 3.5 0.7fan 208 1 7.4 1.4
RTU3 Carrier 50LC0006A0C5A0A0A0 4413C89790 compressor R-410a 5 208 3 16.2 13.35 5.3fan 208 1 3.5 0.7fan 208 1 7.4 1.4
RTU2 Carrier 50LC0005A0C5A0A0A0 4413C89787 compressor R-410a 4 208 3 14 13.475 4.5fan 208 1 3.5 0.7fan 208 1 7.4 1.4
RTU1 Carrier 50LC0006A0C5A0A0A0 4413C89791 compressor R-410a 5 208 3 16.2 13.35 5.3fan 208 1 3.5 0.7fan 208 1 7.4 1.4
Irrigation Pump U.S. Electric Motors C536A pump 5 208 3 14.9 4.8
Cal kWNotes HP Tons/MBTU V Ph Amps
General Information Size / Capacity Nameplate Information
EQUIPMENT Mfctr Model Serial Description Eff /EER
Exhibit 2B Page 126

Proprietary and Confidential © Siemens Industry IGA Report – May, 2019 – | Page 487
Siemens – Broward County, Investment Grade Audit | May 2019
DOMESTIC WATER SYSTEM
Domestic water usage is limited to restrooms. Fixtures andwater closets are all operated manually. The following areexample of the types of fixture found within the restroom ofthe facility:
∂ 2.2 gpm faucets
∂ 1.0 gpf urinals
∂ 1.6 gpf toilets
A RainBird irrigation system was found at the site. Based on the size of the area beingirrigated, it is estimated that there are around 12 zones and around 120 sprinkler heads.
Onsite Irrigation
BUILDING CONTROLS SYSTEM
The building is currently not equipped with a building automation system. Each zone has adedicated thermostat. The basketball court lights are controlled by a manual timer.
Building Controls
TRENDING DATA ACQUISITION
In order to determine the runtime operation of each unit, data loggers were installed tomonitor amperage and/or supply air temperature. This data was trended for a minimum of
Exhibit 2B Page 127

Proprietary and Confidential © Siemens Industry IGA Report – May, 2019 – | Page 488
Siemens – Broward County, Investment Grade Audit | May 2019
seven (7) days in order to capture a typical week. The following graphs illustrate theresulting data from this logging session.
Trending Data – 7.5 Ton Condensing Unit
Trending Data – 7.5 Ton Condensing Unit
The two condensing units above were running continuously and present normal cyclingpatterns. Both of these condensing units are supplying one Carrier air handler that services alarge meeting hall inside the facility. Data was not acquired for the 4 roof top units at thisfacility as the equipment is from 2013, is in good condition, and utilizes R-410a as its
Exhibit 2B Page 128
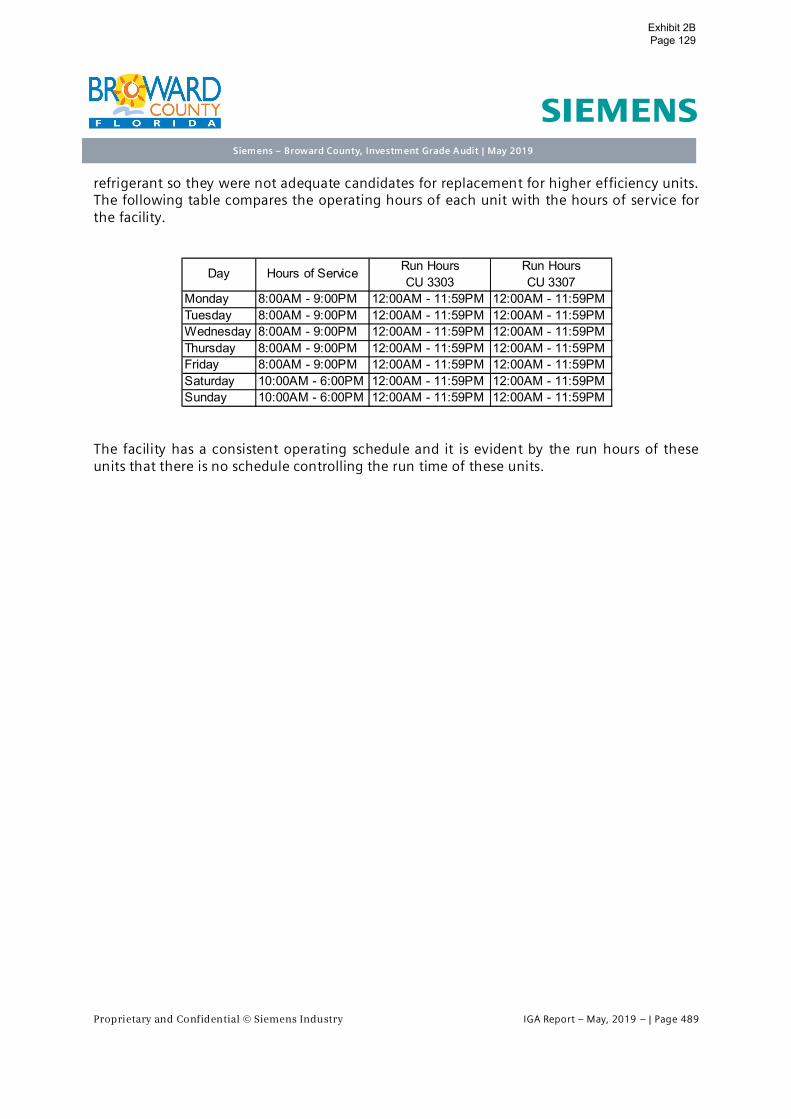
Proprietary and Confidential © Siemens Industry IGA Report – May, 2019 – | Page 489
Siemens – Broward County, Investment Grade Audit | May 2019
refrigerant so they were not adequate candidates for replacement for higher efficiency units.The following table compares the operating hours of each unit with the hours of service forthe facility.
The facility has a consistent operating schedule and it is evident by the run hours of theseunits that there is no schedule controlling the run time of these units.
Run Hours Run HoursCU 3303 CU 3307
Monday 8:00AM - 9:00PM 12:00AM - 11:59PM 12:00AM - 11:59PMTuesday 8:00AM - 9:00PM 12:00AM - 11:59PM 12:00AM - 11:59PMWednesday 8:00AM - 9:00PM 12:00AM - 11:59PM 12:00AM - 11:59PMThursday 8:00AM - 9:00PM 12:00AM - 11:59PM 12:00AM - 11:59PMFriday 8:00AM - 9:00PM 12:00AM - 11:59PM 12:00AM - 11:59PMSaturday 10:00AM - 6:00PM 12:00AM - 11:59PM 12:00AM - 11:59PMSunday 10:00AM - 6:00PM 12:00AM - 11:59PM 12:00AM - 11:59PM
Day Hours of Service
Exhibit 2B Page 129

Proprietary and Confidential © Siemens Industry IGA Report – May, 2019 – | Page 490
Siemens – Broward County, Investment Grade Audit | May 2019
UTILITY DATA ANALYSIS - ELECTRIC
The electric usage at this facility is monitored by one (1) electric meter. The billing accountutilize the General Service Demand (GSD-1) rate structure. When creating the baselineshown below, the most recent 24 month of electric billing data was utilized as obtaineddirectly from the Florida Power and Light website. The data was made available via website’sthe user portal and historical data from the facility’s smart meters.
The following table documents both the rate structure values used to calculate energysavings based on most recent electric billing data as well as the established demand andconsumption values representing baseline electric usage for the facility.
Electric Baseline Summary
Meter KLL0911; Account: 3595633078; Address: 2501 FRANKLIN DR FORT LAUDERDALE
Franklin Park 1 GSD-1 0.05701$ 11.25$ 145,604 444 47
$ / kWAverage
Consumptionper Year
AverageDemand per Year
MaxDemandFacility # of Meters Rate Structure $ / kWh
Date CustomerCharge
Consumption(kwh)
ConsumptionCharge
Demand(kW)
DemandCharge
TotalCharges
Jun-15 19.48$ 15,701 865$ 47 499$ 1,434$Jul-15 19.48$ 18,754 865$ 47 499$ 1,605$Aug-15 19.48$ 17,447 1,033$ 46 488$ 1,521$Sep-15 19.48$ 15,199 961$ 41 435$ 1,333$Oct-15 19.48$ 12,876 837$ 42 446$ 1,215$Nov-15 19.48$ 11,624 709$ 37 393$ 1,087$Dec-15 19.48$ 12,170 589$ 39 414$ 1,140$Jan-16 19.48$ 7,872 617$ 32 340$ 790$Feb-16 19.48$ 7,105 399$ 28 283$ 706$Mar-16 19.48$ 10,506 360$ 40 404$ 1,021$Apr-16 19.48$ 9,586 532$ 33 334$ 874$May-16 19.48$ 12,051 486$ 35 354$ 1,021$Jun-16 19.48$ 16,291 574$ 40 404$ 1,292$Jul-16 20.24$ 18,025 775$ 42 438$ 1,402$Aug-16 20.24$ 18,314 858$ 39 406$ 1,384$Sep-16 20.24$ 13,069 872$ 40 417$ 1,126$Oct-16 20.24$ 10,385 622$ 35 365$ 935$Nov-16 20.24$ 9,785 494$ 32 333$ 871$Dec-16 20.24$ 9,685 466$ 30 313$ 844$Jan-17 25.00$ 7,698 498$ 26 271$ 742$Feb-17 25.00$ 7,646 396$ 31 329$ 796$Mar-17 25.00$ 9,002 483$ 35 371$ 937$Apr-17 25.00$ 9,079 488$ 34 360$ 930$May-17 25.00$ 11,338 609$ 37 392$ 1,093$
AVERAGE TOTALS 145,604 7,694$ 444 4,643$ 13,050$
Exhibit 2B Page 130

Proprietary and Confidential © Siemens Industry IGA Report – May, 2019 – | Page 491
Siemens – Broward County, Investment Grade Audit | May 2019
The billing is, as previously shown, analyzed as a combination of all meters. As described ina previous section, an index value is calculated and compared to similar facilities within thesame geographic region. Below are the results of this comparison.
Benchmarking Summary
Overall, this building is operating just above the average percentile of comparable facilities.
0
100
200
300
400
500
600
700
0
2,000
4,000
6,000
8,000
10,000
12,000
14,000
16,000
18,000
20,000
Jan Feb Mar Apr May Jun Jul Aug Sep Oct Nov Dec
Dem
and
(kW
)
Cons
umpt
ion
(kW
h)
Month
Electric Consumption Profile
Consumption (kWh) Demand (kW) CDD
25thpercentile Median 75th
percentileFranklin Park Recreation 8.81 3.7 7.3 17.6
kWh/Sq FtCBECS - 2012 kWh/Sq Ft Data
Facility Faclity Type
Exhibit 2B Page 131

Proprietary and Confidential © Siemens Industry IGA Report – May, 2019 – | Page 492
Siemens – Broward County, Investment Grade Audit | May 2019
UTILITY DATA ANALYSIS - WATER
The following table(s) summarizes the water consumption data that was available for thisfacility.
This account only had total expense amounts per month available for water usage utilitydata. No relevant conclusions can be drawn from this data.
Account # Meter #Rate AddressMeter Size Meter Type
Franklin Park
2025883 2025884
Date Consumption ()
TotalCharges
TotalCharges
May-17 239.69$ 168.63$Apr-17 239.69$ 168.63$Mar-17 239.69$ 168.63$Feb-17 402.44$ 134.90$Jan-17 207.13$ 168.63$Dec-16 571.22$ 168.63$Nov-16 215.91$ 129.28$Oct-16 217.59$ 164.74$Sep-16 274.77$ 160.60$Aug-16 367.78$ 160.60$Jul-16 336.77$ 160.60$Jun-16 228.28$ 160.60$May-16 228.28$ 160.60$Apr-16 228.28$ 160.60$Mar-16 464.03$ 160.60$Feb-16 259.27$ 160.60$Jan-16 197.27$ 160.60$Dec-15 212.77$ 160.60$Nov-15 228.28$ 139.19$Oct-15 191.68$ 156.65$Sep-15 202.60$ 152.95$Aug-15 305.87$ 152.95$Jul-15 305.87$ 152.95$Jun-15 237.36$ 152.95$May-15 202.60$ 152.95$TOTALS 0 6,805.12$ 3,938.66$
Exhibit 2B Page 132

Proprietary and Confidential © Siemens Industry IGA Report – May, 2019 – | Page 493
Siemens – Broward County, Investment Grade Audit | May 2019
RECOMMENDED IMPROVEMENT MEASURES
This section addresses the Facility Improvement Measures (FIMs) recommended forimplementation at this facility. Each solution is presented with a brief description of theintended scope, savings calculation method, guaranteed savings in units of energy, and theindividual FIM’s financial analysis with payback. As requested, the following improvementscosts are listed separately and do not directly affect a FIM’s payback:
∂ Development Costs
∂ Measurement & Verification (performance assurance)
∂ Code compliance issues uncovered that directly relates to the constructability of a specificmeasure
BUILDING LEVEL SUMMARY
The following table summarized the complete list of FIMs recommended for this facility. Thesummation at the bottom of the table represents the total costs and savings of all FIMs only.As stated, the fixed costs associated with in with development, performance assurance, andcode compliance is considered as separate items.
Building Level Financial Summary
SAVINGS CALCULATION METHODOLOGY
FIMs were developed using spreadsheet models and engineering calculations. Energy usingequipment was measured to determine power consumption, kW. Extensive data logging ofequipment was also used to determine energy consumption, kWh. Savings calculations areprovided as in Section H, Appendices.
Building or Facility DescriptionSAVINGS
Electric KWh $SAVINGS
Electric KW $SAVINGSWater $
SAVINGSO & M
TotalSavings Project Costs Simple
PaybackFranklin Park Lighting - Exterior 2,351.54$ 1,005.80$ -$ 347$ 3,704.34$ 75,893.81$ 20.5Franklin Park Water - Retorfits 99.86$ -$ 949.75$ 55$ 1,104.17$ 7,692.75$ 7.0Franklin Park Split System Scheduling 1,428.80$ -$ -$ -$ 1,428.80$ 2,692.26$ 1.9Breakage Fee 1,983.00$PA Cost 734.66$Total 3,880.20$ 1,005.80$ 949.75$ 402$ 6,237.31$ 88,996.48$ 14.3
Exhibit 2B Page 133

Proprietary and Confidential © Siemens Industry IGA Report – May, 2019 – | Page 494
Siemens – Broward County, Investment Grade Audit | May 2019
LIGHTING RETROFIT
The following section describes all lighting scope of work proposed for implementation.
PROJECT SCOPE – INTERIOR LIGHTING
LED Replacement for High Intensity Discharge Exterior
The replacement of HID (high intensity discharge), including metal halide or high-pressuresodium n exterior applications provides significant energy reduction opportunities whenchanging over to LED. For exterior pole mounted applications, often the number of fixturescan be reduce based on the improved photometric and light distribution of the new LEDfixtures that wasn’t previously available in HID fixtures. All proposed LED fixtures are fromrecognized manufacturers that have met the required standards for light quality, efficiencyand longevity. In our design effort and fixture selection process, consideration is given tothe maintenance benefits of the prescribed solution resulting in less future costs to maintainexterior fixtures in difficult to reach applications. The proposed LED fixture replacement hasbeen specified to furnish light levels that are in compliance with recommended light levelsand support the existing site condition requirements. Where time clocks or automatedlighting controls are not in place, proposed LED building and site lighting will incorporate anintegral photocell to maximize energy savings.
In general, the design approach is to replace existing HID luminaires with new LED luminairesof like type, ie: shoeboxes, wallpacks, floodlights. Some fixture types are replaced with newLED fixtures of a different type, ie: recessed canopy lights replaced with low profile LEDcanopy lights.
Where deemed appropriate in parks and office buildings, integral occupancy sensors havebeen used on pole mounted shoebox luminaires in parking lots to automatically dim thelighting during hours of inactivity.
Decorative post top luminaires, recessed step lights, and bollards typically use low wattageHID lamps in architectural form factors. Replacement luminaires of this type are relativelyhigh in cost, with relatively low energy savings potential. As a result, the proposed designtypically calls for removing the HID lamp and ballast, and installing a new screw based LEDlamp.
Exterior Lighting Retrofit Scope
BUILDING EXISTING & RETROFIT STANDARD LEGEND DESCRIPTIONSEXISTING
QTYRETROFIT
QTY
FRANKLIN PARKExisting Excluded due to lack of cost effective replacement or more efficientoption - No Retrofit Proposed
22 22
Existing High Intensity Discharge - Proposed New LED Fixture With Sensor 12 12Existing High Intensity Discharge - Proposed New LED High-Bay Fixture WithSensor
20 20
Exhibit 2B Page 134

Proprietary and Confidential © Siemens Industry IGA Report – May, 2019 – | Page 495
Siemens – Broward County, Investment Grade Audit | May 2019
Exterior Lighting Sensor scope
SAVINGS
The energy and cost savings were developed using a spreadsheet model. In the analysis, theexisting lighting wattage per fixture was reduced to reflect the installation of higherefficiency technology. A detailed room by room survey of the facility, available in Section H,Appendices, was performed to accurately determine the existing lighting type and quantity.
The runtime operations of the new lighting fixtures are reduced in areas that arerecommended for lighting occupancy sensors. This runtime reduction was determined basedon the results of lighting and occupancy data logging sessions conducted at various facilities.The results of these data logging session, as well as the resulting hour of operations of lightsper space type are provided also provided in Section H, Appendices.
FIM SAVINGS SUMMARY
Annual Electric Consumption: 41,247 kWh
Annual Electric Demand: 88.92 kW
FIM Financial Summary
Building NameAreas Controlled
by sensorsFRANKLIN PARK 2
Building or Facility DescriptionSAVINGS
Electric KWh $SAVINGS
Electric KW $SAVINGSWater $
SAVINGSO & M
TotalSavings Project Costs Simple
PaybackFranklin Park Lighting - Exterior 2,351.54$ 1,005.80$ -$ 347$ 3,704.34$ 75,893.81$ 20.5
Exhibit 2B Page 135

Proprietary and Confidential © Siemens Industry IGA Report – May, 2019 – | Page 496
Siemens – Broward County, Investment Grade Audit | May 2019
WATER CONSERVATION
This FIM addresses the reduction of water consumption, wastewater production, and hotwater energy usage through the installation of highly efficient, plumbing products andcontrols. The use of these devices and others are detailed below and were selected not onlyfor their efficiency, but also to provide for durable, long-term use with minimal maintenanceand improved hygiene.
PROJECT SCOPE
Flush Valves: Most commercial facilities utilize flush valve water closets. Flush valves aredesigned to release precise volumes of water when activated. High efficiency flush valvescan enable a facility to greatly reduce its water consumption by reducing flush valve flowrates and the amount of water required for evacuation. Installation of 1.28 gallons per flush(GPF) flush valve will replace existing equipment that currently consumes 1.6 to 3.5 GPF.
Urinals: High efficiency flush valve and china combinations for urinals can enable a facility togreatly reduce its water consumption by reducing flush valve flow rates and the amount ofwater required for evacuation. Installation of 0.125 GPF high efficiency urinal systems willreplace existing equipment that currently consumes 1.0 to 1.5 GPF.
Bathroom Faucets/Aerators: Most faucets utilize aerators to restrict the volume of water atthe mouth of a faucet and to generate a more comfortable flow. High efficiency aerators cangreatly reduce flow rates from faucets and create a comfortable flow for hand washing andcleaning. Restricting faucet flow rates enables a facility to conserve water and reduce energyusage associated with heating water. Faucets without the threading necessary to accept anaerator can be replaced with threaded faucets. Installation of 0.5 GPM aerator or faucetretrofit will replace existing equipment that currently consumes 2.2 GPM.
SAVINGS
The energy and cost savings were developed using spreadsheet modeling. Based on siteinterviews, facility type, square footage, and standard factors for allocation of business insquare foot per person and visitors per day the total population and occupancy days for thisfacility were determined. Total water closet, urinal, faucet and shower use figures weredetermined for the facility using standard factors for equipment use based on industryresearch and case studies coupled together with the total population of the facility and theoccupancy days. The current water usage minus the proposed water usage leads to the totalwater savings in gallons.
The savings value take the water savings and multiply them by the rate detailed in the UtilityData Analysis Section of this report. Energy savings were only taken in the form of hot watersavings for any equipment that utilize hot water.
Deferred maintenance savings were considered and calculated by a percentage of reductionin replacement cost for any new fixtures that will be installed. These savings are referred toas Savings O&M on the financial summary table below.
Exhibit 2B Page 136

Proprietary and Confidential © Siemens Industry IGA Report – May, 2019 – | Page 497
Siemens – Broward County, Investment Grade Audit | May 2019
FIM SAVINGS SUMMARY
Annual Water savings: 83,311 gallons
Annual Energy savings: 1,752 kWh
All analysis for water savings, energy savings, deferred maintenance savings, and financialdetails is provided in Section H, Appendices of this Report.
FIM Financial Summary
Building orFacility Description
SAVINGSElectric KWh $
SAVINGSElectric KW $
SAVINGSWater $
SAVINGSO & M
TotalSavings Project Costs Simple
PaybackFranklin Park Water - Retorfits 99.86$ -$ 949.75$ 55$ 1,104.17$ 7,692.75$ 7.0
Exhibit 2B Page 137
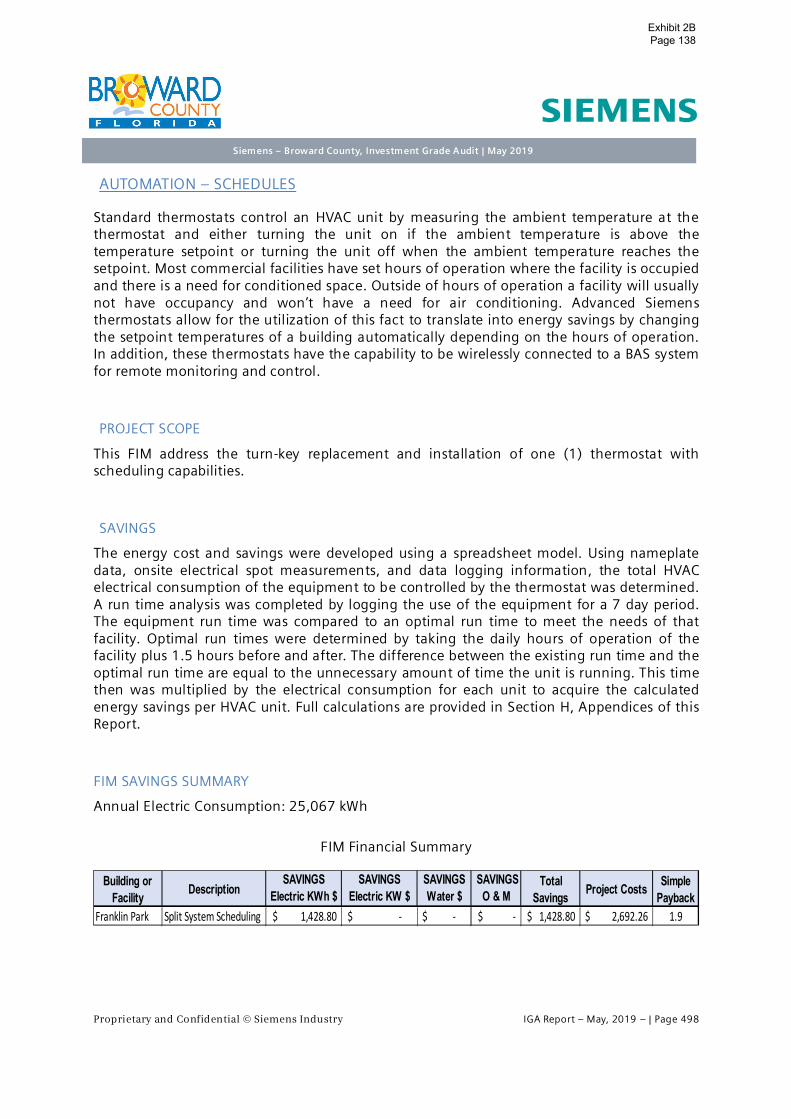
Proprietary and Confidential © Siemens Industry IGA Report – May, 2019 – | Page 498
Siemens – Broward County, Investment Grade Audit | May 2019
AUTOMATION – SCHEDULES
Standard thermostats control an HVAC unit by measuring the ambient temperature at thethermostat and either turning the unit on if the ambient temperature is above thetemperature setpoint or turning the unit off when the ambient temperature reaches thesetpoint. Most commercial facilities have set hours of operation where the facility is occupiedand there is a need for conditioned space. Outside of hours of operation a facility will usuallynot have occupancy and won’t have a need for air conditioning. Advanced Siemensthermostats allow for the utilization of this fact to translate into energy savings by changingthe setpoint temperatures of a building automatically depending on the hours of operation.In addition, these thermostats have the capability to be wirelessly connected to a BAS systemfor remote monitoring and control.
PROJECT SCOPE
This FIM address the turn-key replacement and installation of one (1) thermostat withscheduling capabilities.
SAVINGS
The energy cost and savings were developed using a spreadsheet model. Using nameplatedata, onsite electrical spot measurements, and data logging information, the total HVACelectrical consumption of the equipment to be controlled by the thermostat was determined.A run time analysis was completed by logging the use of the equipment for a 7 day period.The equipment run time was compared to an optimal run time to meet the needs of thatfacility. Optimal run times were determined by taking the daily hours of operation of thefacility plus 1.5 hours before and after. The difference between the existing run time and theoptimal run time are equal to the unnecessary amount of time the unit is running. This timethen was multiplied by the electrical consumption for each unit to acquire the calculatedenergy savings per HVAC unit. Full calculations are provided in Section H, Appendices of thisReport.
FIM SAVINGS SUMMARY
Annual Electric Consumption: 25,067 kWh
FIM Financial Summary
Building orFacility Description
SAVINGSElectric KWh $
SAVINGSElectric KW $
SAVINGSWater $
SAVINGSO & M
TotalSavings Project Costs Simple
PaybackFranklin Park Split System Scheduling 1,428.80$ -$ -$ -$ 1,428.80$ 2,692.26$ 1.9
Exhibit 2B Page 138

Proprietary and Confidential © Siemens Industry IGA Report – May, 2019 – | Page 499
Siemens – Broward County, Investment Grade Audit | May 2019
D.38. Park - Lafayette Hart
FACILITY DESCRIPTION
Lafayette Hart Park is a small multipurposefacility and grounds that has been largelyremodeled and updated in 2016 and islocated at 2851 NW 8th Rd, Fort Lauderdale,FL 33311. The park features a triple widemodular building with meeting room,kitchen area, computer lab, and office.Additional amenities at the park include abasketball court, shelters, playground/playstructure, a tennis court, and a racquetballcourt. The operating hours for the entirepark are as follows.
Park Hours
Mon-Fri: 8AM – 6PM
Saturday: 10AM – 6PM
Sunday: Closed
Observed Issues during Visit:
∂ No issues were found at this facility as it has gone through recent renovations
COOLING SYSTEM:
Cooling for the Main building is provided by three packaged wall DX Bard units. Each has a 3ton cooling capacity. The units were manufactured in 2015.
Main Building HVAC
Exhibit 2B Page 139

Proprietary and Confidential © Siemens Industry IGA Report – May, 2019 – | Page 500
Siemens – Broward County, Investment Grade Audit | May 2019
The following table documents nameplate data acquired both onsite and from online ProductData Sheets.
Namplate Data of Mechanical Equipment
LIGHTING SYSTEM
Interior lighting primarily consists of 32 Watt and 60 Watt T8 fluorescent lamps in either 2 or3-lamp 2x4 fixtures. There are only 33 lamps in this building as the size of the building isonly 400 square feet
Exterior Lighting consists of 3 parking lot lights that are metal halide and two pavilion lightswith compact fluorescent bulbs. According to the site contact, the basketball court lights thatare on site never get used as the park is not open after sunset.
The building does not make use of occupancy sensors or any other types of lighting control.
DOMESTIC WATER SYSTEM
Domestic water usage is limited to restrooms. Fixtures and water closets are all operatedmanually. The following are example of the types of fixture found within the restroom of thefacility:
∂ 0.5 gpm faucets
∂ 1.0 gpf urinals
∂ 3.5 gpf toilets
The irrigation for the park is provided by a Rain Bird system that was installed in 2016, perthe site contact. The system utilizes rain sensors.
Lafayette Hart ParkBard Unit1 Bard W36A2-A10XX4XXX 309L153271878-02 compressor R-410a 3 208 1 15.3 9 2.9
fan 0.2 208 1 1.5 0.3fan 0.33 208 1 2.1 0.4
Bard Unit2 Bard W36A2-A10XX4XXX 309L153271878-02 compressor R-410a 3 208 1 15.3 9 2.9fan 0.2 208 1 1.5 0.3fan 0.33 208 1 2.1 0.4
Bard Unit3 Bard W36A2-A10XX4XXX 309L153271878-02 compressor R-410a 3 208 1 15.3 9 2.9fan 0.2 208 1 1.5 0.3fan 0.33 208 1 2.1 0.4
Irrigation Pump
Cal kWHPTons/MBTU V Ph Amps Eff /EEREQUIPMENT Mfctr Model Serial Description Notes
General Information Size / Capacity Nameplate Information
Exhibit 2B Page 140

Proprietary and Confidential © Siemens Industry IGA Report – May, 2019 – | Page 501
Siemens – Broward County, Investment Grade Audit | May 2019
Irrigation System
BUILDING CONTROLS SYSTEM
The building is currently not equipped with a building automation system. Each zone has adedicated thermostat. The thermostats do not have any sort of scheduling capabilities.
HVAC Controls Equipment
TRENDING DATA ACQUISITION
Due to the recent renovations at this facility, the equipment found here is in good workingconcision. Since the equipment is in good condition and the facility has a small conditionedarea, there was no need to track the equipment run time.
Exhibit 2B Page 141

Proprietary and Confidential © Siemens Industry IGA Report – May, 2019 – | Page 502
Siemens – Broward County, Investment Grade Audit | May 2019
UTILITY DATA ANALYSIS - ELECTRIC
The electric usage at this facility is monitored by one (1) electric meter. The billing accountutilizes the General Service (GS-1) rate structure. When creating the baseline shown below,the most recent 24 month of electric billing data was utilized as obtained directly from theFlorida Power and Light website. The data was made available via website’s the user portaland historical data from the facility’s smart meters.
The following table documents both the rate structure values used to calculate energysavings based on most recent electric billing data as well as the established demand andconsumption values representing baseline electric usage for the facility.
Electric Baseline Summary
Meter AC40011; Account: 1510548330; Address: 2851 NW 8TH RD FORT LAUDERDALE
Lafayette HartPark
1 GS-1 0.09892$ - 6,850 - -
$ / kWAverage
Consumptionper Year
AverageDemand per Year
MaxDemandFacility # of Meters Rate Structure $ / kWh
Date CustomerCharge
Consumption(kwh)
ConsumptionCharge
OtherFees/Taxes
TotalCharges
Jun-15 7.46$ 858 82.56$ 3.88$ 94$Jul-15 7.46$ 945 90.93$ 4.24$ 103$Aug-15 7.46$ 835 80.34$ 3.79$ 92$Sep-15 7.46$ 869 83.62$ 3.52$ 95$Oct-15 7.46$ 785 75.53$ 3.24$ 86$Nov-15 7.46$ 791 76.11$ 3.18$ 87$Dec-15 7.46$ 1,136 109.31$ 4.33$ 121$Jan-16 7.46$ 884 80.21$ 5.76$ 93$Feb-16 7.46$ 852 77.31$ 5.56$ 90$Mar-16 7.46$ 973 88.29$ 6.58$ 102$Apr-16 7.46$ 769 69.78$ 3.95$ 81$May-16 7.46$ 297 26.95$ 2.02$ 36$Jun-16 7.75$ 326 29.04$ 2.42$ 39$Jul-16 7.75$ 302 26.91$ 2.28$ 37$Aug-16 7.75$ 333 29.67$ 2.46$ 40$Sep-16 7.75$ 303 26.99$ 2.21$ 37$Oct-16 7.75$ 294 26.19$ 2.15$ 36$Nov-16 7.75$ 325 28.95$ 2.32$ 39$Dec-16 7.75$ 303 26.99$ 2.21$ 37$Jan-17 10.00$ 303 27.30$ 2.45$ 40$Feb-17 10.00$ 285 25.68$ 2.34$ 38$Mar-17 10.00$ 333 31.01$ 2.71$ 44$Apr-17 10.00$ 296 27.57$ 2.45$ 40$May-17 10.00$ 303 28.26$ 2.47$ 41$
6,850 637.75$ 39.26$ 774$AVERAGE TOTALS
Exhibit 2B Page 142

Proprietary and Confidential © Siemens Industry IGA Report – May, 2019 – | Page 503
Siemens – Broward County, Investment Grade Audit | May 2019
The billing is, as previously shown, analyzed as a combination of all meters. As described ina previous section, an index value is calculated and compared to similar facilities within thesame geographic region. Below are the results of this comparison.
Benchmarking Summary
Overall, this building is operating at the 75th percentile of comparable facilities.
0
100
200
300
400
500
600
700
0
100
200
300
400
500
600
700
800
Jan Feb Mar Apr May Jun Jul Aug Sep Oct Nov Dec
CDD
Cons
umpt
ion
(kW
h)
Month
Electric Consumption Profile
Consumption (kWh) CDD
25thpercentile Median
75thpercentile
Lafayette Hart Park Recreation 16.79 3.7 7.3 17.6
kWh/Sq FtCBECS - 2012 kWh/Sq Ft Data
Facility Faclity Type
Exhibit 2B Page 143

Proprietary and Confidential © Siemens Industry IGA Report – May, 2019 – | Page 504
Siemens – Broward County, Investment Grade Audit | May 2019
UTILITY DATA ANALYSIS - WATER
The following table(s) summarizes the water consumption data that was available for thisfacility.
This account has a mostly complete 24 month data set for water consumption and cost.There was no other information provided with this data set but it can be assumed that at 0consumption, the only cost left is the base charge. Taking into account the possible basecharges derived from months were there is 0 consumption, the blended rate in dollars perthousand gallons is $13.72.
Account # 2042246 Meter # 200114403Rate AddressMeter Size 1.5" Meter Type W/S
Lafayette Hart Park
Date Consumption ()
TotalCharges
May-17 0 90.59$Apr-17 0 90.59$Mar-17 0 90.59$Feb-17 0 90.59$Jan-17 0 90.59$Dec-16 4 147.60$Nov-16 4 135.52$Oct-16 0 89.15$Sep-16 0 86.27$Aug-16 1 99.84$Jul-16 11 235.55$Jun-16 0 86.27$May-16 1 99.84$Apr-16 1 99.84$Mar-16 99.84$Feb-16 0 86.27$Jan-16 1 99.84$Dec-15 1 99.84$Nov-15 0 86.27$Oct-15 1 98.41$Sep-15 0 82.16$Aug-15 2 107.99$Jul-15 5 146.74$Jun-15 3 120.90$May-15 1 95.07$
TOTALS 36 2,656.16$
Exhibit 2B Page 144

Proprietary and Confidential © Siemens Industry IGA Report – May, 2019 – | Page 505
Siemens – Broward County, Investment Grade Audit | May 2019
RECOMMENDED IMPROVEMENT MEASURES
This section addresses the Facility Improvement Measures (FIMs) recommended forimplementation at this facility. Each solution is presented with a brief description of theintended scope, savings calculation method, guaranteed savings in units of energy, and theindividual FIM’s financial analysis with payback. As requested, the following improvementscosts are listed separately and do not directly affect a FIM’s payback:
∂ Development Costs
∂ Measurement & Verification (performance assurance)
∂ Code compliance issues uncovered that directly relates to the constructability of a specificmeasure
BUILDING LEVEL SUMMARY
The following table summarized the complete list of FIMs recommended for this facility. Thesummation at the bottom of the table represents the total costs and savings of all FIMs only.As stated, the fixed costs associated with in with development, performance assurance, andcode compliance is considered as separate items.
Building Level Financial Summary
SAVINGS CALCULATION METHODOLOGY
FIMs were developed using spreadsheet models and engineering calculations. Energy usingequipment was measured to determine power consumption, kW. Extensive data logging ofequipment was also used to determine energy consumption, kWh. Savings calculations areprovided as in Section H, Appendices.
Building or Facility DescriptionSAVINGS
Electric KWh $SAVINGS
Electric KW $SAVINGSWater $
SAVINGSO & M
TotalSavings Project Costs Simple
PaybackLafayette Hart Park Lighting - Exterior 166.49$ -$ -$ 29$ 195.49$ 4,949.18$ 25.3Breakage Fee 48.96$PA Cost 14.54$Total 166.49$ -$ -$ 29$ 195.49$ 5,012.68$ 25.6
Exhibit 2B Page 145

Proprietary and Confidential © Siemens Industry IGA Report – May, 2019 – | Page 506
Siemens – Broward County, Investment Grade Audit | May 2019
LIGHTING RETROFIT
The following section describes all lighting scope of work proposed for implementation.
PROJECT SCOPE – EXTERIOR LIGHTING
LED Replacement for High Intensity Discharge Exterior
The replacement of HID (high intensity discharge), including metal halide or high-pressuresodium n exterior applications provides significant energy reduction opportunities whenchanging over to LED. For exterior pole mounted applications, often the number of fixturescan be reduce based on the improved photometric and light distribution of the new LEDfixtures that wasn’t previously available in HID fixtures. All proposed LED fixtures are fromrecognized manufacturers that have met the required standards for light quality, efficiencyand longevity. In our design effort and fixture selection process, consideration is given tothe maintenance benefits of the prescribed solution resulting in less future costs to maintainexterior fixtures in difficult to reach applications. The proposed LED fixture replacement hasbeen specified to furnish light levels that are in compliance with recommended light levelsand support the existing site condition requirements. Where time clocks or automatedlighting controls are not in place, proposed LED building and site lighting will incorporate anintegral photocell to maximize energy savings.
In general, the design approach is to replace existing HID luminaires with new LED luminairesof like type, ie: shoeboxes, wallpacks, floodlights. Some fixture types are replaced with newLED fixtures of a different type, ie: recessed canopy lights replaced with low profile LEDcanopy lights.
Where deemed appropriate in parks and office buildings, integral occupancy sensors havebeen used on pole mounted shoebox luminaires in parking lots to automatically dim thelighting during hours of inactivity.
Decorative post top luminaires, recessed step lights, and bollards typically use low wattageHID lamps in architectural form factors. Replacement luminaires of this type are relativelyhigh in cost, with relatively low energy savings potential. As a result, the proposed designtypically calls for removing the HID lamp and ballast, and installing a new screw based LEDlamp.
LED Replacement for Fluorescent Exterior
Luminaires with pin based compact fluorescent lamps will generally be retrofit by removingthe existing fluorescent lamps and ballast, and installing new line voltage, pin based LEDlamps. Existing screw based incandescent and fluorescent lamps will be replaced with newscrew based LED lamps.
Exterior fixtures with existing linear fluorescent lamps, such as surface mounted enclosedand gasketed fixtures in park pavilions are evaluated for fixture condition, and either retrofitwith new LED T8, UL Type B lamps, or replaced with new luminaires utilizing dedicated LEDboards and drivers.
Exhibit 2B Page 146

Proprietary and Confidential © Siemens Industry IGA Report – May, 2019 – | Page 507
Siemens – Broward County, Investment Grade Audit | May 2019
Exterior Lighting Retrofit Scope
SAVINGS
The energy and cost savings were developed using a spreadsheet model. In the analysis, theexisting lighting wattage per fixture was reduced to reflect the installation of higherefficiency technology. A detailed room by room survey of the facility, available in Section H,Appendices, was performed to accurately determine the existing lighting type and quantity.
The runtime operations of the new lighting fixtures are reduced in areas that arerecommended for lighting occupancy sensors. This runtime reduction was determined basedon the results of lighting and occupancy data logging sessions conducted at various facilities.The results of these data logging session, as well as the resulting hour of operations of lightsper space type are provided also provided in Section H, Appendices.
FIM SAVINGS SUMMARY
Annual Electric Consumption: 1,683 kWh
Annual Electric Demand: 5.7 kW
FIM Financial Summary
BUILDING EXISTING & RETROFIT STANDARD LEGEND DESCRIPTIONSEXISTING
QTYRETROFIT
QTYLAFAYETTE HART
PARKExisting High Intensity Discharge - Proposed Retrofit LED 3 3
Existing Compact Fluorescent - Proposed Relamp LED 2 2
Building or Facility DescriptionSAVINGS
Electric KWh $SAVINGS
Electric KW $SAVINGSWater $
SAVINGSO & M
TotalSavings Project Costs Simple
PaybackLafayette Hart Park Lighting - Exterior 166.49$ -$ -$ 29$ 195.49$ 4,949.18$ 25.3
Exhibit 2B Page 147

Proprietary and Confidential © Siemens Industry IGA Report – May, 2019 – | Page 508
Siemens – Broward County, Investment Grade Audit | May 2019
D.39. Park - Markham
FACILITY DESCRIPTION
Markham Park is a large area of land thathosts a variety of small buildings andfacilities for outdoor activities. The parkcovers roughly 542 acres and has been inoperation since 1973. The park is located at16001 W State Rd 84, Sunrise, FL 33326.The park and its facilities serve for activitiesand attractions such as an airfield, dog park,boat ramps, campgrounds, disk golf course,observatory, outdoor fitness zone,mountain bike trails, playgrounds,racquetball courts, shelters, and shootingranges. Because of the variety of activitiesthere are several different sources of utility use such as air conditioning, water heating,campgrounds trailer hook-up, outdoor lighting, pumping for lift stations/irrigation/pool justto name a few. The hours of operation for the different areas of the park are as follows.
Park Hours
November – March: 8AM – 6PM
March – November: 8AM – 7:30PM
Park Office Hours
Mon – Sun: 9AM – 5:30PM
Target Range Hours
Monday: Closed
Tuesday: 1PM – 9PM
Wednesday: 1PM – 9PM
Thursday: 10AM – 9PM
Friday: 1PM – 5PM (Only September – April)
Saturday: 8AM – 5PM
Sunday: 8AM – 5PM
Exhibit 2B Page 148

Proprietary and Confidential © Siemens Industry IGA Report – May, 2019 – | Page 509
Siemens – Broward County, Investment Grade Audit | May 2019
COOLING SYSTEM – PARK OFFICE
Cooling for the park office building is provided by two split DX units. The condensing unitsare Carrier 6 ton units. These units were manufactured in 2007. The air handlers are mixedair Carrier units. It is important to note that these units run on R22 refrigerant. These unitswere manufactured in 2004.
Park Office HVAC
COOLING SYSTEM – MAINTENANCE BUILDING
The cooling for the maintenance building is provided by one Carrier 7.5 ton packaged DX unitthat provides mixed air to the building. The Carrier equipment was manufactured in 2012.The cooling system comes equipped a programmable thermostat for the building.
Maintenance Building HVAC
COOLING SYSTEM – GATEHOUSE
The cooling for the gatehouse is provided by one Carrier 1.5 ton split DX unit that provides100% return air into the space. The carrier equipment was manufactured in 2008.
COOLING SYSTEM – OBSERVATORY
The cooling for the observatory is provided by wall units. No access to the building wasavailable at the time of the site visit so a survey of the HVAC equipment was taken by whatwas outside the building.
Exhibit 2B Page 149

Proprietary and Confidential © Siemens Industry IGA Report – May, 2019 – | Page 510
Siemens – Broward County, Investment Grade Audit | May 2019
Observatory HVAC
COOLING SYSTEM – SKEET/TRAP SPORTING CLAYS BUILDING
The cooling for the skeet/trap building is provided by four split DX units providing 100%return air. The first unit is a Goodman 3 ton unit that was manufactured in 2012. The secondunit is a Thermal Zone 4 ton unit that was manufactured in 2013. The third unit is a ThermalZone 4 ton unit that was manufactured in 2014. The last unit is a ICP unit with an assumedtonnage of 4 tons. Product data could not be found for the ICP but the tonnage was derivedbased on the unit size and the size of the other units at this building. The air handling unitscorresponding to each split system are located in the attic area of the building. All four unitsutilize R22 refrigerant. There is no controls system or strategy for the HVAC system of thisbuilding.
Skeet/Trap Building HVAC
COOLING SYSTEM – RIFLE/PISTOL RANGE BUILDING
The cooling for the rifle/pistol range building is provided by two split DX units providing100% return air. The first unit is a Ruud 5 ton unit that was manufactured in 2008. Thesecond unit is an American Standard 4 ton unit that was manufactured in 2006. Both unitsutilize R22 refrigerant. There is no controls system or strategy for the HVAC system of thisbuilding.
Rifle/Pistol Range HVAC
Exhibit 2B Page 150

Proprietary and Confidential © Siemens Industry IGA Report – May, 2019 – | Page 511
Siemens – Broward County, Investment Grade Audit | May 2019
The following table is a summary of all the relevant mechanical equipment that was foundduring the site visit and displays all the important data regarding each piece of equipment.
Namplate Data of Mechanical Equipment
Observed Issues during Visit:
∂ DX units use R-22 refrigerant
∂ High humidity in this building
Markham ParkOffice AHU1 Carrier 40RM-008--H611HC 1304F23377 fan 2.4 208 3 5.8 1.9Office CU1 Carrier 38ARZ007--K501-- 1404G50042 compressor R-22 208 3 19.2 6.2
fan 230 1 0.9 0.2fan 230 1 0.9 0.2
Office AHU2 Carrier 40RM-008--H611HC 1304F23375 fan 2.4 208 3 5.8 1.9Office CU2 Carrier 38ARZ007--K501-- 1404G50045 compressor R-22 208 3 19.2 6.2
fan 230 1 0.9 0.2fan 230 1 0.9 0.2
Maintenance Unit Carrier 50HC-D08A2B5A0A0A0 3712G10021 compressor R-410a 7.4 208 3 13.6 12 4.4compressor R-410a 208 3 13.6 12 4.4
fan 208 1 1.5 0.3fan 208 1 1.5 0.3fan 208 3 6.9 2.2
Compactor nameplate unreadable
Gatehouse AHU equipment unaccessable 0.0Gatehouse CU Carrier 24ABR318A316 0108E11463 nameplate unreadable 0.0
Pool Pump Baldor JPM2513T 37H295T867G1 pump 15 208 3 41 91% 12.0Irrigation Pump Weg 01036ES3E215JM pump 10 208 3 24.4 87.60% 7.6
Skeet/Trap Building Central AHU ICP FEM2X4800A A071384572 fan R-22 0.75 208 1 6 1.1Skeet/Trap Building CU1 Goodman VSX130361DA 1204711982 compressor R-410a 208 1 14.1 2.6
fan 0.25 208 1 1.5 0.3
Skeet/Trap Building East AHU equipment unaccessable 0.0Skeet/Trap Building CU2 ICP M2A348AKA200 E071132428 compressor R-22 208 1 20.2 3.8
fan 0.25 208 1 1.2 0.2
Skeet/Trap Building Lobby AHU nameplate unreadable 0.0Skeet/Trap Building CU3 Thermal Zone TZAA-348-2C757 W331421556 compressor R-22 208 1 19.9 3.7
fan 0.2 208 1 1.2 0.2Skeet/Trap Building CU4 Thermal Zone TZAA-348-2A757 8346W261318228 compressor R-22 208 1 19.9 3.7
fan 0.2 208 1 1.2 0.2
Shooting Range AHU1 York AHR60D3XH21A W1F2950462 fan 0.75 208 3 3 1.0Shooting Range CU1 American Standard 2A7A4048B1000AA 6313U831F compressor R-22 208 1 21.2 4.0
fan 0.17 200 1 1.4
Shooting Range AHU2 equipment unaccessable 0.0Shooting Range CU2 Ruud 13AJA60A01 7658N410804461 compressor R-22 208 1 25.3 4.7
fan 0.2 208 1 1.2 0.2
Cal kWHP Tons/MBTU V Ph Amps Eff /EEREQUIPMENT Mfctr Model Serial Description Notes
General Information Size / Capacity Nameplate Information
Exhibit 2B Page 151

Proprietary and Confidential © Siemens Industry IGA Report – May, 2019 – | Page 512
Siemens – Broward County, Investment Grade Audit | May 2019
LIGHTING SYSTEM
There are several types of light fixtures that are used at this park due to the number offacilities that are on site. 55 Watt T8 fixtures in a 2 by 4 arrangement are the most commonin the park. There are also 108 Watt T8 lamps, 30 Watt T8 lamps, compact fluorescent bulbs,and a few other miscellaneous types of lights throughout the park buildings.
Interior Lighting Examples
Exterior Lighting consists of wall packs, metal halide parking lot lights, compact fluorescentlamps, and a few other miscellaneous types of lights throughout the park.
Exterior Lighting Examples
Some bathrooms at this park make use of occupancy sensors. Occupancy sensors are alsoused at the maintenance building of the park.
Exhibit 2B Page 152

Proprietary and Confidential © Siemens Industry IGA Report – May, 2019 – | Page 513
Siemens – Broward County, Investment Grade Audit | May 2019
Occupancy Sensor Examples
DOMESTIC WATER SYSTEM
Domestic water usage is found at the restrooms and the pool. Fixtures and water closets areoperated both manually and with sensors. The following are example of the types of fixturefound within the restroom of the facility:
∂ 0.5 gpm faucets
∂ 1.0 gpf urinals
∂ Waterless urinals
∂ 3.5 gpf toilets
∂ 2.5 gpm shower head
Sample Restroom Fixtures
The pool at this park only gets used for training by the local police department and is closedoff to the public. The pool only uses domestic water for make-up water. The exact amount orthe rate of domestic water being used for the pool is unknown.
Pool at Markham Park
Exhibit 2B Page 153
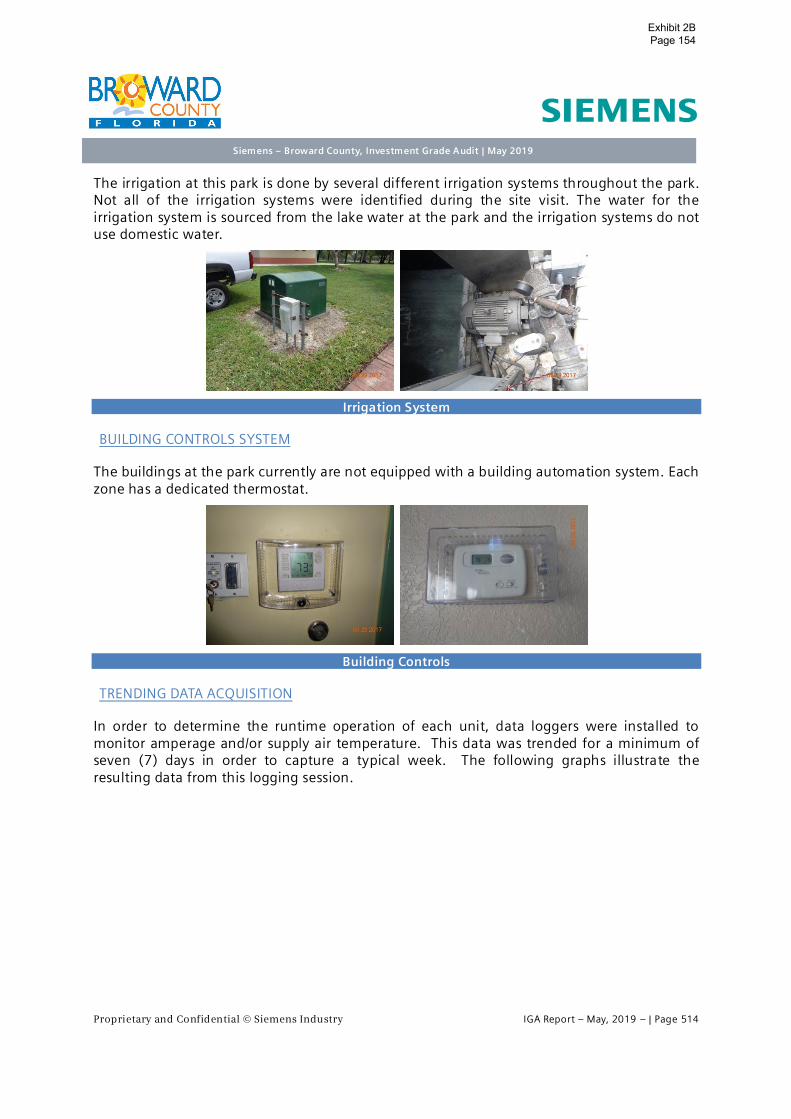
Proprietary and Confidential © Siemens Industry IGA Report – May, 2019 – | Page 514
Siemens – Broward County, Investment Grade Audit | May 2019
The irrigation at this park is done by several different irrigation systems throughout the park.Not all of the irrigation systems were identified during the site visit. The water for theirrigation system is sourced from the lake water at the park and the irrigation systems do notuse domestic water.
Irrigation System
BUILDING CONTROLS SYSTEM
The buildings at the park currently are not equipped with a building automation system. Eachzone has a dedicated thermostat.
Building Controls
TRENDING DATA ACQUISITION
In order to determine the runtime operation of each unit, data loggers were installed tomonitor amperage and/or supply air temperature. This data was trended for a minimum ofseven (7) days in order to capture a typical week. The following graphs illustrate theresulting data from this logging session.
Exhibit 2B Page 154

Proprietary and Confidential © Siemens Industry IGA Report – May, 2019 – | Page 515
Siemens – Broward County, Investment Grade Audit | May 2019
Trending Data – Office Condensing Unit 1
This unit registered an average of 18.13 amps and was operating for a total of 135.05 hoursduring a one week period.
Trending Data – Office Condensing Unit 2
This unit registered an average of 15.31 amps and was operating for a total of 121.25 hoursduring a one week period.
Exhibit 2B Page 155

Proprietary and Confidential © Siemens Industry IGA Report – May, 2019 – | Page 516
Siemens – Broward County, Investment Grade Audit | May 2019
The following table compares the operating hours of each unit with the hours of service forthe park office.
The units are currently running continuously with normal cycling patterns. The units are notfollowing the operation schedule of this building.
Trending Data – Rifle Range/Skeet Trap Buildings Condensing Unit
This unit registered an average of 43.06 amps and was operating for a total of 154.95 hoursduring a one week period. The variance of amperage for this unit suggests that this unit hasmultiple stages or multiple compressors.
Run Hours Run HoursCU 0042 CU 0045
Monday 9:00AM - 5:30PM 12:00AM - 11:59PM 12:00AM - 11:59PMTuesday 9:00AM - 5:30PM 12:00AM - 11:59PM 12:00AM - 11:59PMWednesday 9:00AM - 5:30PM 12:00AM - 8:00PM 12:00AM - 11:59PMThursday 9:00AM - 5:30PM 8:30AM - 11:59PM 12:00AM - 11:59PMFriday 9:00AM - 5:30PM 12:00AM - 11:59PM 12:00AM - 11:59PMSaturday 9:00AM - 5:30PM 12:00AM - 11:59PM 12:00AM - 11:59PMSunday 9:00AM - 5:30PM 12:00AM - 11:59PM 12:00AM - 11:59PM
Day Hours of Service
Exhibit 2B Page 156
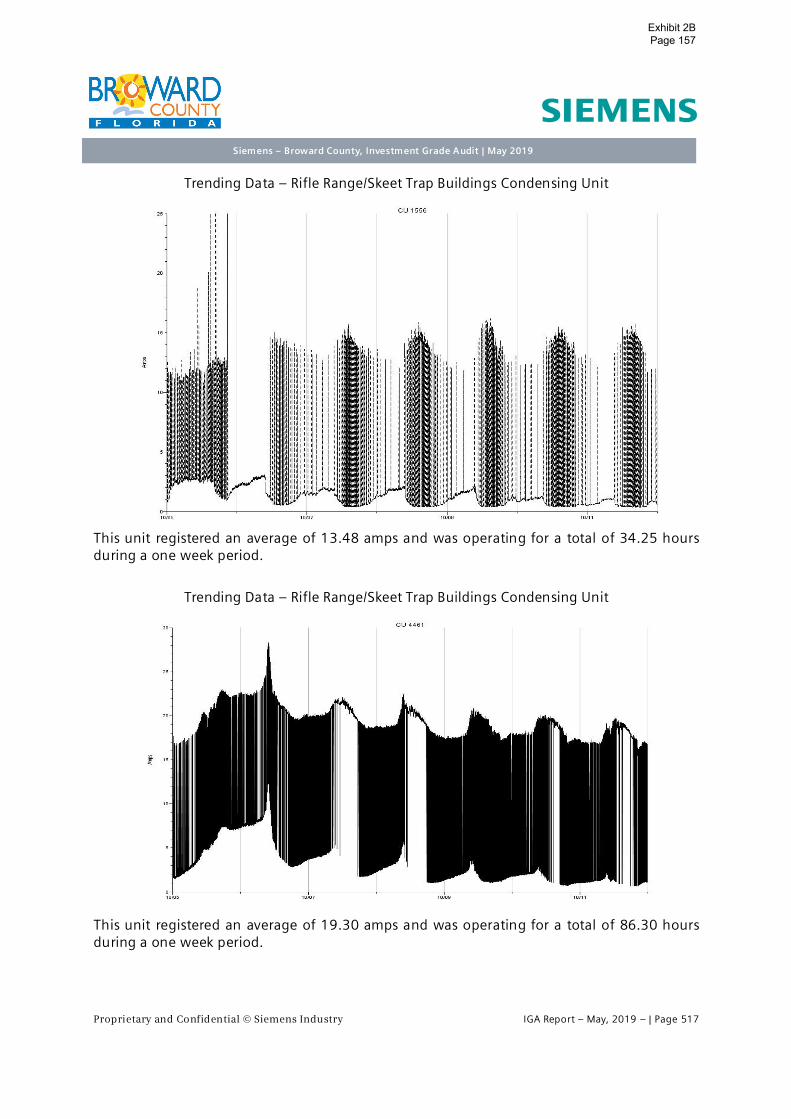
Proprietary and Confidential © Siemens Industry IGA Report – May, 2019 – | Page 517
Siemens – Broward County, Investment Grade Audit | May 2019
Trending Data – Rifle Range/Skeet Trap Buildings Condensing Unit
This unit registered an average of 13.48 amps and was operating for a total of 34.25 hoursduring a one week period.
Trending Data – Rifle Range/Skeet Trap Buildings Condensing Unit
This unit registered an average of 19.30 amps and was operating for a total of 86.30 hoursduring a one week period.
Exhibit 2B Page 157

Proprietary and Confidential © Siemens Industry IGA Report – May, 2019 – | Page 518
Siemens – Broward County, Investment Grade Audit | May 2019
Trending Data – Rifle Range/Skeet Trap Buildings Condensing Unit
This unit registered an average of 14.73 amps and was operating for a total of 34.25 hoursduring a one week period.
Trending Data – Rifle Range/Skeet Trap Buildings Condensing Unit
This unit registered an average of 17.43 amps and was operating for a total of 115.77 hoursduring a one week period.
Exhibit 2B Page 158

Proprietary and Confidential © Siemens Industry IGA Report – May, 2019 – | Page 519
Siemens – Broward County, Investment Grade Audit | May 2019
The following table compares the operating hours of each unit with the hours of service forboth the buildings that serve the riffle range and the skeet/trap range.
The units are currently running continuously with normal cycling patterns. The units are notfollowing the operation schedule of this building. Although the units are runningcontinuously, the weekly run time varies from unit to unit. The unit schedules are hard tonarrow down because there is no time when the units are off for an extended period of time.The schedules shown in the tables above are derived from analysis of the run time data.
Run Hours Run Hours Run HoursCU 831F CU 1556 CU 4461
Monday Closed 12:00AM - 11:59PM 11:00AM - 9:00PM 12:00AM - 11:59PMTuesday 1:00PM - 9:00PM 12:00AM - 11:59PM 10:30AM - 10:00PM 12:00AM - 11:59PMWednesday 1:00PM - 9:00PM 12:00AM - 11:59PM 10:30AM - 10:00PM 12:00AM - 11:59PMThursday 10:00AM - 9:00PM 12:00AM - 11:59PM 12:00AM - 9:00PM 12:00AM - 11:59PMFriday 1:00PM - 5:00PM 12:00AM - 11:59PM 11:30AM - 11:59PM 12:00AM - 11:59PMSaturday 8:00AM - 5:00PM 12:00AM - 11:59PM 10:30AM - 10:00PM 12:00AM - 11:59PMSunday 8:00AM - 5:00PM 12:00AM - 11:59PM 10:30AM - 9:30PM 12:00AM - 11:59PM
Day Hours of Service
Run Hours Run HoursCU 8228 CU A200
Monday Closed 11:00AM - 9:00PM 12:00AM - 11:59PMTuesday 1:00PM - 9:00PM 10:30AM - 10:00PM 12:00AM - 11:59PMWednesday 1:00PM - 9:00PM 10:30AM - 10:00PM 12:00AM - 11:59PMThursday 10:00AM - 9:00PM 12:00AM - 9:00PM 12:00AM - 11:59PMFriday 1:00PM - 5:00PM 11:30AM - 11:59PM 12:00AM - 11:59PMSaturday 8:00AM - 5:00PM 10:30AM - 10:00PM 12:00AM - 11:59PMSunday 8:00AM - 5:00PM 10:30AM - 9:30PM 12:00AM - 11:59PM
Day Hours of Service
Exhibit 2B Page 159

Proprietary and Confidential © Siemens Industry IGA Report – May, 2019 – | Page 520
Siemens – Broward County, Investment Grade Audit | May 2019
UTILITY DATA ANALYSIS - ELECTRIC
The electric usage at this facility is monitored by 25 electric meters; each of varying electricrate structures. When creating the baseline shown below, the most recent 24 month ofelectric billing data was utilized as obtained directly from the Florida Power and Lightwebsite. The data was made available via website’s the user portal and historical data fromthe facility’s smart meters.
The following table documents both the rate structure values used to calculate energysavings based on most recent electric billing data as well as the established demand andconsumption values representing baseline electric usage for the facility.
Electric Baseline Summary
For ease of presentation in this report, all 25 meter and their historical data was combinedinto the following table. Thus, the table represents the consumption baseline of the entirepark as a whole. However, the table above still governs the baseline of individual sites withinthe park when considering FIMs.
on peak off peak
Corp Pavilion GS-1 - - 0.10071$ - 4,837 - -E GSD-1 - - 0.05804$ 11.46$ 49,572 210 26
ABC GSD-1 - - 0.05806$ 11.46$ 192,600 633 71Restroom GS-1 - - 0.10076$ - 2,362 - -
Arena Lights GS-1 - - 0.10080$ - 307 - -Shoot House GS-1 - - 0.10080$ - 759 - -
Dog Park GS-1 - - 0.10071$ - 3,502 - -Maint Bldg GS-1 - - 0.10074$ - 47,901 - -
Admin Office GSD-1 - - 0.05806$ 11.46$ 87,872 233 22Core IS-RR GS-1 - - 0.10076$ - 2,790 - -
GS-1 - - 0.10074$ - 24,104 - -Air field GS-1 - - 0.10073$ - 3,900 - -
GS-1 - - 0.10079$ - 959 - -SDTR-1A 0.142896488 0.04924$ 0.05697$ 12.19$ 3,762 365 33SDTR-1A 0.142896488 0.04924$ 0.05697$ 12.19$ 118,080 674 78
GSD-1 - - 0.05805$ 11.46$ 71,830 244 30GSD-1 - - 0.05805$ 11.46$ 59,804 251 29GS-1 - - 0.10075$ - 14,698 - -
GSD-1 - - 0.05806$ 11.46$ 57,707 225 27Guard House GS-1 - - 0.10076$ - 5,912 - -
Comfort Station GS-1 - - 0.10074$ - 19,546 - -Comfort Station 2 GS-1 - - 0.10075$ - 15,279 - -South Pump Core GSD-1 - - 0.05804$ 11.46$ 33,427 60 28
Food Stand GSD-1 - - 0.05807$ 11.46$ 140,640 235 26North Pump Core GS-1 - - 0.10073$ - 7,882 - -
Markham
$ / kWAverage
Consumptionper Year
AverageDemand per Year
MaxDemandFacility # of Meters Rate Structure
June - Sept$ / kWh
Exhibit 2B Page 160

Proprietary and Confidential © Siemens Industry IGA Report – May, 2019 – | Page 521
Siemens – Broward County, Investment Grade Audit | May 2019
The billing is, as previously shown, analyzed as a combination of all meters. As described ina previous section, an index value is calculated and compared to similar facilities within thesame geographic region. Below are the results of this comparison.
Benchmarking Summary
Overall, this building is operating above the 75th percentile of comparable facilities.
Date CustomerCharges
Consumption(kwh)
ConsumptionCharge
Demand(kW)
DemandCharge
OtherFees/Taxes
TotalCharges
Jul-15 300.18$ 78,407 4,766$ 199 2,191$ 1,000$ 8,258$Aug-15 300.18$ 77,590 4,765$ 202 2,226$ 954$ 8,245$Sep-15 300.18$ 72,321 4,413$ 197 2,187$ 1,115$ 8,016$Oct-15 300.18$ 70,447 4,375$ 229 2,584$ 1,756$ 9,015$Nov-15 300.18$ 78,727 4,814$ 274 3,069$ 1,805$ 9,989$Dec-15 300.18$ 83,604 4,898$ 283 3,161$ 2,088$ 10,447$Jan-16 300.18$ 93,005 5,374$ 303 3,127$ 1,933$ 10,734$Feb-16 300.18$ 78,977 4,578$ 270 2,696$ 1,776$ 9,350$Mar-16 300.18$ 79,161 4,619$ 273 2,726$ 1,840$ 9,485$Apr-16 300.18$ 85,510 4,971$ 301 3,008$ 1,740$ 10,020$
May-16 300.18$ 77,827 4,551$ 272 2,714$ 1,636$ 9,201$Jun-16 306.55$ 86,489 4,680$ 248 2,588$ 866$ 8,441$Jul-16 311.87$ 92,158 5,125$ 228 2,451$ 969$ 8,857$
Aug-16 311.87$ 79,954 4,447$ 215 2,310$ 976$ 8,046$Sep-16 311.87$ 84,026 4,683$ 238 2,595$ 1,004$ 8,594$Oct-16 311.87$ 77,117 4,361$ 235 2,418$ 1,858$ 8,950$Nov-16 324.36$ 73,107 3,979$ 285 2,939$ 1,866$ 9,108$Dec-16 324.36$ 77,512 4,224$ 286 2,947$ 1,990$ 9,486$Jan-17 390.00$ 87,045 4,971$ 304 3,155$ 2,172$ 10,688$Feb-17 390.00$ 77,714 4,438$ 284 2,982$ 1,954$ 9,763$Mar-17 390.00$ 78,635 4,697$ 299 3,139$ 2,077$ 10,303$Apr-17 390.00$ 78,936 4,746$ 294 3,086$ 1,991$ 10,213$
May-17 390.00$ 84,256 5,069$ 285 2,992$ 1,968$ 10,419$Jun-17 390.00$ 87,525 5,192$ 251 2,704$ 970$ 9,256$
970,025 56,369$ 3,128 32,998$ 19,152$ 112,441$AVERAGE TOTALS
25thpercentile Median
75thpercentile
Markham Recreation 20.60 3.7 7.3 17.6
kWh/Sq FtCBECS - 2012 kWh/Sq Ft Data
Facility Faclity Type
Exhibit 2B Page 161

Proprietary and Confidential © Siemens Industry IGA Report – May, 2019 – | Page 522
Siemens – Broward County, Investment Grade Audit | May 2019
UTILITY DATA ANALYSIS - WATER
The following table(s) summarizes the water consumption data that was available for thisfacility.
For this account, the average monthly consumption is 268 thousand gallons. The averagemonthly consumption cost is $3,960.39. The blended rate in dollars per thousand gallons is$14.77. This blended rate is slightly higher than the rate being used for savings calculations.
Account # 84339-107458 Meter # 60378336Rate AddressMeter Size Meter Type W/S//RE/G
Markham Park
Date Consumption()
TotalCharges
May-17 353 5,021.09$Apr-17 353 5,021.09$Mar-17 308 4,664.24$Feb-17 386 5,282.78$Jan-17 370 5,175.90$Dec-16 263 3,970.59$Nov-16 252 3,883.36$Oct-16 221 3,637.53$Sep-16 197 3,328.27$Aug-16 294 4,062.56$Jul-16 176 3,169.30$Jun-16 217 3,479.67$May-16 183 3,222.29$Apr-16 207 3,423.97$Mar-16 225 3,540.23$Feb-16 362 4,577.32$Jan-16 311 4,201.25$Dec-15 272 3,896.02$Nov-15 260 3,805.18$Oct-15 246 3,709.20$Sep-15 251 3,597.63$Aug-15 230 3,447.27$Jul-15 279 3,808.11$Jun-15 272 3,747.99$May-15 216 3,337.03$
TOTALS 6704 99,009.87$
Exhibit 2B Page 162

Proprietary and Confidential © Siemens Industry IGA Report – May, 2019 – | Page 523
Siemens – Broward County, Investment Grade Audit | May 2019
The average monthly consumption for this account is 183 thousand gallons. The averagemonthly consumption cost for this account is $7,262.45. The blended rate in dollars perthousand gallons is $39.70. Without having any additional information for this account, it isunknown why this blended rate came out so large. Further analysis would be needed.
Account # 84341-107460 Meter # 31826643Rate AddressMeter Size Meter Type W/S/ST
Markham Park
Date Consumption()
TotalCharges
May-17 284 8,444.79$Apr-17 284 8,444.79$Mar-17 246 8,638.78$Feb-17 321 8,612.00$Jan-17 289 8,228.07$Dec-16 202 7,612.15$Nov-16 193 7,428.55$Oct-16 112 6,077.36$Sep-16 68 6,397.93$Aug-16 172 8,518.69$Jul-16 66 6,569.36$Jun-16 163 7,009.58$May-16 59 6,643.47$Apr-16 108 7,166.21$Mar-16 152 5,445.52$Feb-16 305 7,592.17$Jan-16 252 8,710.48$Dec-15 180 7,023.99$Nov-15 181 6,524.83$Oct-15 165 7,163.97$Sep-15 145 6,274.16$Aug-15 125 6,603.52$Jul-15 187 6,685.42$Jun-15 168 7,099.34$May-15 146 6,646.12$
TOTALS 4573 181,561.25$
Exhibit 2B Page 163

Proprietary and Confidential © Siemens Industry IGA Report – May, 2019 – | Page 524
Siemens – Broward County, Investment Grade Audit | May 2019
RECOMMENDED IMPROVEMENT MEASURES
This section addresses the Facility Improvement Measures (FIMs) recommended forimplementation at this facility. Each solution is presented with a brief description of theintended scope, savings calculation method, guaranteed savings in units of energy, and theindividual FIM’s financial analysis with payback. As requested, the following improvementscosts are listed separately and do not directly affect a FIM’s payback:
∂ Development Costs
∂ Measurement & Verification (performance assurance)
∂ Code compliance issues uncovered that directly relates to the constructability of a specificmeasure
BUILDING LEVEL SUMMARY
The following table summarized the complete list of FIMs recommended for this facility. Thesummation at the bottom of the table represents the total costs and savings of all FIMs only.As stated, the fixed costs associated with in with development, performance assurance, andcode compliance is considered as separate items.
Building Level Finanical Summary
SAVINGS CALCULATION METHODOLOGY
FIMs were developed using spreadsheet models and engineering calculations. Energy usingequipment was measured to determine power consumption, kW. Extensive data logging ofequipment was also used to determine energy consumption, kWh. Savings calculations areprovided as in Section H, Appendices.
Building orFacility Description
SAVINGSElectric KWh $
SAVINGSElectric KW $
SAVINGSWater $
SAVINGSWater
SAVINGSO & M
TotalSavings
ProjectCosts
SimplePayback
Markham Park Lighting - Interior 6,369.75$ -$ -$ 0 1,162$ 7,531.75$ 88,909.46$ 11.8Markham Park Split System Scheduling 6,578.75$ -$ -$ 0 -$ 6,578.75$ 18,845.82$ 2.9Breakage Fee 5,651.64$PA Cost 1,127.68$Total 12,948.50$ -$ -$ 0 1,162$ 14,110.50$ 114,534.59$ 8.1
Exhibit 2B Page 164

Proprietary and Confidential © Siemens Industry IGA Report – May, 2019 – | Page 525
Siemens – Broward County, Investment Grade Audit | May 2019
LIGHTING RETROFIT
The following section describes all lighting scope of work proposed for implementation.
PROJECT SCOPE – INTERIOR LIGHTING
LED Replacement of Linear Lamps
The design strategy is to specify and standardize on the same type of linear LED T8 and T5lamps types throughout the buildings to be included in this project. We select a non-proprietary proven LED tube that will provide the greatest performance and energy savings ofany of the lighting systems considered. The proposed LED Linear tubes are a premium highlumen, extended life with best in class warranty.
The predominant LED lamp we have selected for this project is an UL Type B LED linear type.The UL Type B lamp a direct wire lamp that doesn’t require an external ballast or driver. Theexisting T-8 or T5 ballast will be removed from the fixture and disposed of. New lampsockets approved for direct wire LED lamps will also be installed on the feed ends to ensureproblem free installation and reduce future maintenance. This LED retrofit strategy will allowus to maintain recommended light levels while providing a reduction in energy usage in alllinear lamp fixtures and still standardize on lamp types. All fixtures retrofitted will be drywiped to remove dust and particulate matter to improve fixture lumen efficiency.
Fixture types associated with these lamps are surface or recessed linear fixtures.
In the case of existing 2’x2’ troffers, a different approach is used. There is less flexibility inlamp wattage when dealing with U-shaped lamps, and installing linear lamp kits can be achallenge due to variation in fixture construction. Additionally, in many cases, it is possibleto reduce light output if the fixture can be made more efficient. To provide consistency ofcomponents and reduce energy use, we have proposed installing 2x2 volumetric style retrofitdoor kits with dedicated LED boards and drivers.
LED Replacement for Pin-Based Compact Fluorescent Fixtures
In keeping with the direction to remove fluorescent ballasts, reduce energy use and minimizecost, our design strategy for existing pin-based compact fluorescent lamps is to retrofit theexisting fixtures with line voltage pin based LED lamps and remove the existing fluorescentballasts. In some cases, it is possible to remove two fluorescent lamps and replace them witha single higher powered LED lamp without sacrificing luminaire output and distribution.
LED Replacement for Screw Based Incandescent and Compact fluorescent fixtures
Our design strategy for the replacement of screw based incandescent and compactfluorescent lamps is to replace them with screw based LED where the application permits.LED has become an attractive replacement option when incandescent fixtures are controlledby dimmers due to its excellent dimming capability.
LED Replacement for High Intensity Discharge Interior
Exhibit 2B Page 165

Proprietary and Confidential © Siemens Industry IGA Report – May, 2019 – | Page 526
Siemens – Broward County, Investment Grade Audit | May 2019
The replacement of HID (high intensity discharge), including metal halide or high-pressuresodium provide significant energy reduction opportunities when changing to LED. Newtypes of LED fixtures and retrofit kits can be installed across many existing HID applicationsnot previously available.
Various fixture types utilize HID sources at Broward County. The most common application ishigh bay or low bay industrial style fixtures. Due to the efficient optical distribution of LEDsources in new fixtures, replacing industrial HID fixtures with new LED industrial high bays isthe recommended solution, greatly reducing input power, increasing lighting quality andextending the life of the system.
Some fixture types don’t lend themselves to replacement from a cost perspective for interiorspaces, such as decorative sconces, pendants and some parking garage fixtures. In thesecases, the fixtures will be relamped with high output, screw-based LED lamps and theballasts will be removed.
Emergency Lighting
Backup power for emergency lighting is currently supplied by various means, includinggenerator backup (emergency lights at full output), integral battery backup ballasts(fluorescent fixtures at reduced output), and unit inverter emergency lights. Of thoseapproaches, the scenarios with existing battery backup ballasts in fluorescent fixtures requirereplacement of the battery ballasts because they are not compatible with the UL Type B LEDlamps. In those cases, a standalone EM kit with a dedicated emergency battery, LED driver,and LED board will be installed in the fixture. This kit will remain off until there is a poweroutage, at which point the LED board will illuminate.
Interior Lighting Retrofit Scope
BUILDING NAME EXISTING & RETROFIT STANDARD LEGEND DESCRIPTIONSEXISTING
QTYRETROFIT
QTY
MARKHAM PARKExisting Excluded due to lack of cost effective replacementor more efficient option - No Retrofit Proposed
185 185
Existing T8 Fluorescent - Proposed Retrofit LED 150 150Existing T8 Fluorescent - Proposed New LED Fixture 2 2Existing Incandescent - Proposed Relamp LED 31 31Existing T5 Fluorescent - Proposed New LED Fixture 4 4Existing Compact Fluorescent - Proposed Relamp LED 16 16Existing T8 Fluorescent - Proposed Retrofit LED ReduceLamp Qty
23 23
Existing T12 Fluorescent - Proposed New LED Fixture 40 40Existing Exit Sign - Proposed New LED Fixture 4 4Existing High Intensity Discharge - Proposed New LEDFixture
4 4
Existing T12 Fluorescent - Proposed Retrofit LED 42 42Existing High Intensity Discharge - Proposed New LED High-Bay Fixture With Sensor
24 24
Exhibit 2B Page 166

Proprietary and Confidential © Siemens Industry IGA Report – May, 2019 – | Page 527
Siemens – Broward County, Investment Grade Audit | May 2019
SAVINGS
The energy and cost savings were developed using a spreadsheet model. In the analysis, theexisting lighting wattage per fixture was reduced to reflect the installation of higherefficiency technology. A detailed room by room survey of the facility, available in Section H,Appendices, was performed to accurately determine the existing lighting type and quantity.
The runtime operations of the new lighting fixtures are reduced in areas that arerecommended for lighting occupancy sensors. This runtime reduction was determined basedon the results of lighting and occupancy data logging sessions conducted at various facilities.The results of these data logging session, as well as the resulting hour of operations of lightsper space type are provided also provided in Section H, Appendices.
FIM SAVINGS SUMMARY
Annual Electric Consumption: 75421 kWh
Annual Electric Demand: 192.66 kW
FIM Financial Summary
AUTOMATION – SCHEDULES
Standard thermostats control an HVAC unit by measuring the ambient temperature at thethermostat and either turning the unit on if the ambient temperature is above thetemperature setpoint or turning the unit off when the ambient temperature reaches thesetpoint. Most commercial facilities have set hours of operation where the facility is occupiedand there is a need for conditioned space. Outside of hours of operation a facility will usuallynot have occupancy and won’t have a need for air conditioning. Advanced Siemensthermostats allow for the utilization of this fact to translate into energy savings by changingthe setpoint temperatures of a building automatically depending on the hours of operation.In addition, these thermostats have the capability to be wirelessly connected to a BAS systemfor remote monitoring and control.
PROJECT SCOPE
This FIM address the turn-key replacement and installation of seven (7) thermostats withscheduling capabilities.
Building orFacility Description
SAVINGSElectric KWh $
SAVINGSElectric KW $
SAVINGSO & M
TotalSavings
ProjectCosts
SimplePayback
Markham Park Lighting - Interior 6,369.75$ -$ 1,162$ 7,531.75$ 88,909.46$ 11.8
Exhibit 2B Page 167

Proprietary and Confidential © Siemens Industry IGA Report – May, 2019 – | Page 528
Siemens – Broward County, Investment Grade Audit | May 2019
SAVINGS
The energy cost and savings were developed using a spreadsheet model. Using nameplatedata, onsite electrical spot measurements, and data logging information, the total HVACelectrical consumption of the equipment to be controlled by the thermostat was determined.A run time analysis was completed by logging the use of the equipment for a 7 day period.The equipment run time was compared to an optimal run time to meet the needs of thatfacility. Optimal run times were determined by taking the daily hours of operation of thefacility plus 1.5 hours before and after. The difference between the existing run time and theoptimal run time are equal to the unnecessary amount of time the unit is running. This timethen was multiplied by the electrical consumption for each unit to acquire the calculatedenergy savings per HVAC unit. Full calculations are provided in Section H, Appendices of thisReport.
FIM SAVINGS SUMMARY
Annual Electric Consumption: 93,974 kWh
FIM Financial Summary
Building orFacility Description
SAVINGSElectric KWh $
SAVINGSElectric KW $
SAVINGSO & M
TotalSavings
ProjectCosts
SimplePayback
Markham Park Split System Scheduling 6,578.75$ -$ -$ 6,578.75$ 18,845.82$ 2.9
Exhibit 2B Page 168

Proprietary and Confidential © Siemens Industry IGA Report – May, 2019 – | Page 529
Siemens – Broward County, Investment Grade Audit | May 2019
D.40. Park - Quiet Waters
FACILITY DESCRIPTION
Quiet Waters Park is a large area of land thathosts a variety of small buildings andfacilities for outdoor activities. The parkcovers roughly 431 acres and has been inoperation since 1983. The park is locatedat401 S Powerline Rd, Deerfield Beach, FL33442. The park and its facilities serve foractivities and attractions such as a waterpark, water skiing, bicycle shop/rentals,campgrounds, basketball courts, bikingtrails, shelters, and small boat marinas.Because of the variety of activities there areseveral different sources of utility use such as air conditioning, water heating, campgroundstrailer hook-up, outdoor lighting, pumping for lift stations/irrigation/pool just to name a few.The hours of operation for the different areas of the park are as follows.
Park Hours
November – March: 8AM – 6PM
March – November: 8AM – 7:30PM
Park Office Hours
Mon – Sun: 9AM – 5:30PM
Observed Issues during Visit:
∂ Some DX units are 10 years old and use R-22 refrigerant
Examples of Observed Issues
Exhibit 2B Page 169

Proprietary and Confidential © Siemens Industry IGA Report – May, 2019 – | Page 530
Siemens – Broward County, Investment Grade Audit | May 2019
COOLING SYSTEM – PARK OFFICE
Cooling for the park office building is provided by one split DX unit. The condensing unit is aPayne 5 ton unit. These units were manufactured in 2014. The air handler is a Payne unitthat is 100% return air that was manufactured in 2014. The HVAC system has programmablethermostat controls. There are wall units in the building that get seldom used in the summerto reach comfortable indoor conditions.
Park Office HVAC
COOLING SYSTEM- POOL CONCESSIONS & LIFEGUARD OFFICE
The cooling for the pool concessions building is provided by one Rheem7.5 ton split DX unit tthat was manufactured in 2012. The air handler is 100% return air and was manufactured in2011. The cooling system comes equipped a programmable thermostat for the building. Thelifeguard office cooling is provided by one wall unit.
Concessions & Lifeguard Office HVAC
Exhibit 2B Page 170

Proprietary and Confidential © Siemens Industry IGA Report – May, 2019 – | Page 531
Siemens – Broward County, Investment Grade Audit | May 2019
COOLING SYSTEM – MAINTENANCE BUILDING
The cooling for the maintenance building is provided by one Carrier 7.5 ton split DX unitmanufactured in 2011, which provides mixed air into the space. The cooling system comeswith a programmable thermostat. There are some wall units in certain rooms to aid thebuilding cooling that are seldom used.
Maintenance Building HVAC
COOLING SYSTEM – GATEHOUSE
The cooling for the gatehouse buildings is provided by one Carrier 1.5 ton split system DXand two DX wall units. The carrier equipment was manufactured in 2010. The gatehouseHVAC equipment only gets used on weekends and holidays.
Gatehouse HVAC
COOLING SYSTEM – BIKE SHOP AND SKI RIXEN
The cooling system for the bike shop is provided by one Carrier 7.5 ton split DX system that is100% return air. The carrier equipment was manufactured in 2001. The cooling system forthe Ski Rixen building is a Rheem 3 ton split DX system manufactured in 2012. The airhandler of this system was not located at the time of the site visit.
Bike Shop & Sky Rixen HVAC
Exhibit 2B Page 171

Proprietary and Confidential © Siemens Industry IGA Report – May, 2019 – | Page 532
Siemens – Broward County, Investment Grade Audit | May 2019
The following table is a summary of all the relevant mechanical equipment that was foundduring the site visit and displays all the important data regarding each piece of equipment.
Namplate Data of Mechanical Equipment
Observed Issues during Visit:
∂ DX units use R-22 refrigerant
Quietwaters ParkAdmin AHU Payne PF4MNA061 1514A82249 fan 0.75 208 1 6Admin CU Payne PA13NA060-E 3114X73788 compressor R-410a 5 208 1 22.1 11.18
fan 0.25 208 1 1.4Irrigation Pump A.O. Smith F-391189-61 pump 3 230 3 7.8 82.50%
Pool Pump Nidec FK51 pump 20 208 3 53 93%Pool Pump Baldor EM4104T pump 30 230 3 76 93.60%
Feature Pump Baldor EJMM3218T pump 5 230 3 13.2 90.20%Chemical Pump Gentury C48J2PA105C5 30715CH pump 0.75 115 1 13.4Chemical Pump Century C48J2PA105C1 pump 0.75 115 1 13.4Chemical Pump CentriPro C48C04A06 23216J2 pump 0.5 115 1 9.8Consession AHU Rheem RHGL-120ZL F481102433 fan 2 208 3 7.5Consession CU Rheem RAWL-090DAZ 7754F241202657 compressor R-410a 7.5 460 3 12.2 11.2
fan 0.33 460 3 1.3Maintenance Air Compressor Baldor 35J826T56801 compressor 5 208 3 13 82.50%
Irrigation Pump Baldor pump 25 230 3 56 90.20%Maintenance Air Compressor2 AO Smith 7-C56AB22E29-02 compressor 5 230 1 22
Maintenance AHU Carrier no nameplateMaintenance CU Carrier 38AUZA08A0B6A0A0A0 2411G50055 compressor R-410a 7.5 460 3 12.2 11.2
fan 460 1 0.8fan 460 1 0.8
Gatehouse AHU equipment unaccessableGatehouse CU Carrier 5110E06258 24ABB318A320 compressor R-410a 1.5 208 1 9 11
fan 0.0833 208 1 0.5Irrigitaion Pump Century PJAA41A01C pump 7.5 230 3 18 88.50%Bike Shop AHU Carrier 40RM-012--B610HC 5001F27728 fan 2.4 208 3 5.8Bike Shop CU Carrier 38ARZ008--K501 5001G30026 compressor R-22 7.5 208 3 25.6 11
fan 230 1 1.5fan 230 1 1.5
Irrigation Pump A.O.Smith F-391290-62 pump 5 230 3 13 88.50%Ski Rixen AHU equipment unaccessableSki Rixen CU Rheem 14AJM36A01 7996W461212736 compressor R-410a 3 208 1 16.7 11.76
fan 0.2 208 1 1.9
Cal kWNotes HP Tons/MBTU V Ph Amps
General Information Size / Capacity Nameplate Information
EQUIPMENT Mfctr Model Serial Description Eff /EER
Exhibit 2B Page 172

Proprietary and Confidential © Siemens Industry IGA Report – May, 2019 – | Page 533
Siemens – Broward County, Investment Grade Audit | May 2019
LIGHTING SYSTEM
Interior lighting primarily consists of T8 light fixtures throughout the buildings of the park.The wattage of these light fixtures varies. A few LED fixtures were found during the site visitas well.
Interior Lighting Examples
Exterior Lighting consists of metal halide parking lot and street lights and compactfluorescent light fixtures.
Exterior Lighting Examples
The building makes use of occupancy sensors in most of the restroom facilities and themaintenance building.
Occupancy Sensor
Exhibit 2B Page 173

Proprietary and Confidential © Siemens Industry IGA Report – May, 2019 – | Page 534
Siemens – Broward County, Investment Grade Audit | May 2019
DOMESTIC WATER SYSTEM
Domestic water usage is limited to restrooms and the pool. Fixtures and water closets areoperated manually and by occupancy sensors. The following are example of the types offixture found within the restroom of the facility
∂ 0.5 gpm and 2.2 gpm faucets
∂ 1.5 gpf urinals
∂ 3.5 gpf and 1.6 gpf toilets
∂ 2.5 gpm showerheads
Sample Restroom Fixtures
The pool at this park is a splash park that is used by the community for recreational purposes.The pool closes for the winter every year. The pool pumps utilize VFDs for maximumefficiency.
Quiet Waters Splash Park
The irrigation system for the park is divided up to multiple pump stations. The irrigationsystems utilize a Rain Bird controls system.
Irrigation Systems
Exhibit 2B Page 174

Proprietary and Confidential © Siemens Industry IGA Report – May, 2019 – | Page 535
Siemens – Broward County, Investment Grade Audit | May 2019
BUILDING CONTROLS SYSTEM
The building is currently not equipped with a building automation system. Each zone has adedicated thermostat.
Building Controls
Some of this park’s exterior lighting is controlled via time clocks.
Exterior Lighting Controls
Exhibit 2B Page 175

Proprietary and Confidential © Siemens Industry IGA Report – May, 2019 – | Page 536
Siemens – Broward County, Investment Grade Audit | May 2019
UTILITY DATA ANALYSIS - ELECTRIC
The electric usage at this facility is monitored by nine (9) electric meters of varying electricrate structures. When creating the baseline shown below, the most recent 24 month ofelectric billing data was utilized as obtained directly from the Florida Power and Lightwebsite. The data was made available via website’s the user portal and historical data fromthe facility’s smart meters.
The following table documents both the rate structure values used to calculate energysavings based on most recent electric billing data as well as the established demand andconsumption values representing baseline electric usage for the facility.
Electric Baseline Summary
For ease of presentation in this report, all nine (9) meters and their historical data wascombined into the following table. Thus, the table represents the consumption baseline ofthe entire park as a whole. However, the table above still governs the baseline of individualsites within the park when considering FIMs.
on peak off peak
Park 3 GS-1 - - 0.09532$ - 2,582 - -Park GS-1 - - 0.10069$ - 511 - -
Pavilion GS-1 - - 0.10069$ - 16,262 - -#2 GS-1 - - 0.10066$ - 3,662 - -
Pool GSD-1 - - 0.05804$ 11.46$ 128,202 405 44Campsite GSD-1 - - 0.05801$ 11.45$ 26,799 132 57
Park SDTR-1A 0.142691154 0.04917$ 0.05689$ 12.17$ 72,152 269 84Park SDTR-1A 0.142607834 0.04914$ 0.05686$ 12.17$ 85,140 490 57Park SDTR-1A 0.142534149 0.04911$ 0.05683$ 12.16$ 259,170 599 58
Quiet Waters
$ / kWAverage
Consumptionper Year
AverageDemand per Year
MaxDemandFacility # of Meters Rate Structure
June - Sept$ / kWh
Exhibit 2B Page 176

Proprietary and Confidential © Siemens Industry IGA Report – May, 2019 – | Page 537
Siemens – Broward County, Investment Grade Audit | May 2019
The billing is, as previously shown, analyzed as a combination of all meters. As described ina previous section, an index value is calculated and compared to similar facilities within thesame geographic region. Below are the results of this comparison.
Benchmarking Summary
Overall, this building is operating above the 75th percentile of comparable facilities.
Date CustomerCharges
Consumption(kwh)
ConsumptionCharge
Demand(kW)
DemandCharge
OtherFees/Taxe
s
TotalCharges
Jul-15 146.68$ 55,943 2,712$ 119 1,376$ 614$ 4,848$Aug-15 146.68$ 54,009 2,633$ 118 1,367$ 606$ 4,753$Sep-15 146.68$ 54,480 2,642$ 113 1,305$ 552$ 4,646$Oct-15 146.68$ 43,700 2,072$ 160 1,874$ 442$ 4,535$Nov-15 146.68$ 43,205 2,018$ 140 1,661$ 425$ 4,250$Dec-15 146.68$ 37,918 1,722$ 127 1,506$ 431$ 3,806$Jan-16 146.68$ 41,710 2,168$ 132 1,308$ 304$ 3,927$Feb-16 146.68$ 36,031 1,877$ 159 1,565$ 313$ 3,901$Mar-16 146.68$ 74,800 3,840$ 262 2,589$ 590$ 7,165$Apr-16 146.68$ 70,983 3,648$ 275 2,721$ 425$ 6,941$
May-16 146.68$ 46,771 2,469$ 161 1,587$ 270$ 4,473$Jun-16 150.87$ 50,740 2,256$ 133 1,491$ 356$ 4,255$Jul-16 152.39$ 51,576 2,478$ 141 1,602$ 369$ 4,601$
Aug-16 152.39$ 55,700 2,719$ 118 1,333$ 367$ 4,571$Sep-16 152.39$ 44,388 2,140$ 104 1,168$ 293$ 3,754$Oct-16 152.39$ 38,084 1,859$ 134 1,364$ 287$ 3,662$Nov-16 152.39$ 40,317 2,014$ 137 1,391$ 303$ 3,859$Dec-16 152.39$ 43,151 2,184$ 134 1,358$ 314$ 4,008$Jan-17 165.00$ 34,277 1,881$ 127 1,310$ 293$ 3,649$Feb-17 165.00$ 36,510 1,980$ 173 1,793$ 340$ 4,278$Mar-17 165.00$ 72,707 4,001$ 277 2,882$ 613$ 7,661$Apr-17 165.00$ 63,153 3,490$ 274 2,851$ 562$ 7,068$
May-17 165.00$ 46,389 2,593$ 156 1,620$ 378$ 4,756$Jun-17 165.00$ 52,416 2,715$ 112 1,250$ 348$ 4,478$
594,479 30,055$ 1,893 20,136$ 4,898$ 56,923$AVERAGE TOTALS
25thpercentile Median 75th
percentileQuiet Waters Recreation 20.77 3.7 7.3 17.6
kWh/Sq FtCBECS - 2012 kWh/Sq Ft Data
Facility Faclity Type
Exhibit 2B Page 177
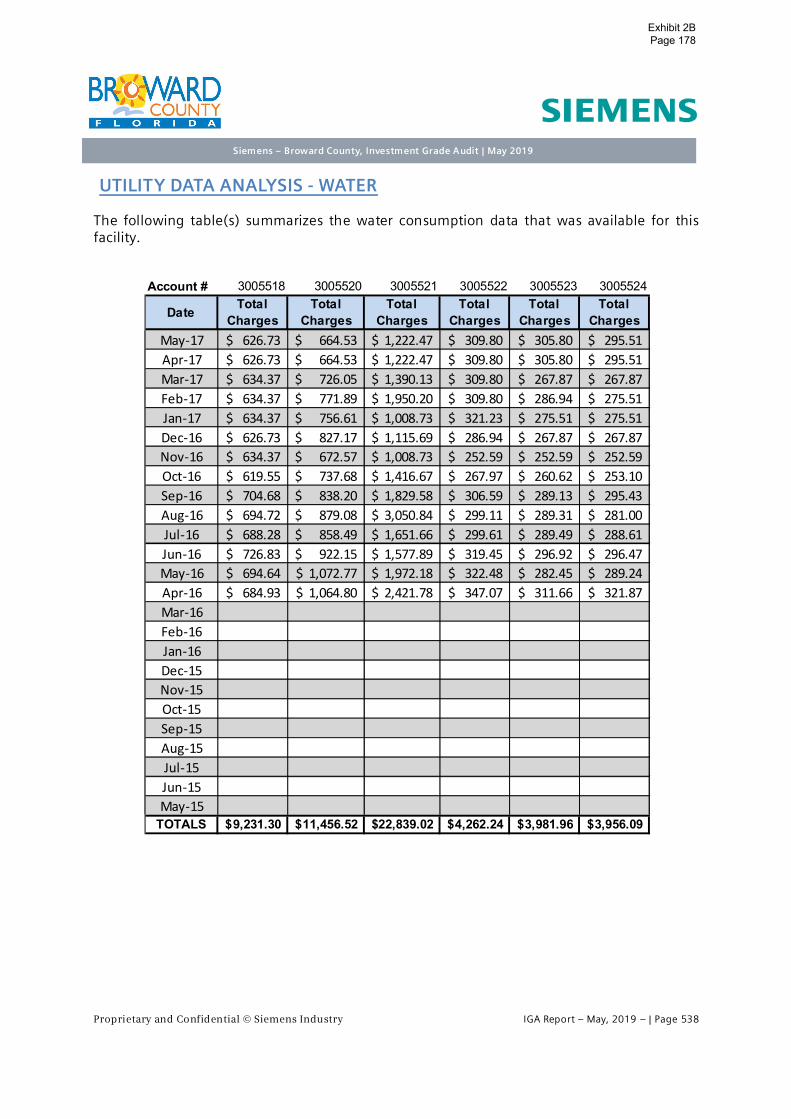
Proprietary and Confidential © Siemens Industry IGA Report – May, 2019 – | Page 538
Siemens – Broward County, Investment Grade Audit | May 2019
UTILITY DATA ANALYSIS - WATER
The following table(s) summarizes the water consumption data that was available for thisfacility.
Account # 3005518 3005520 3005521 3005522 3005523 3005524
Date TotalCharges
TotalCharges
TotalCharges
TotalCharges
TotalCharges
TotalCharges
May-17 626.73$ 664.53$ 1,222.47$ 309.80$ 305.80$ 295.51$Apr-17 626.73$ 664.53$ 1,222.47$ 309.80$ 305.80$ 295.51$Mar-17 634.37$ 726.05$ 1,390.13$ 309.80$ 267.87$ 267.87$Feb-17 634.37$ 771.89$ 1,950.20$ 309.80$ 286.94$ 275.51$Jan-17 634.37$ 756.61$ 1,008.73$ 321.23$ 275.51$ 275.51$Dec-16 626.73$ 827.17$ 1,115.69$ 286.94$ 267.87$ 267.87$Nov-16 634.37$ 672.57$ 1,008.73$ 252.59$ 252.59$ 252.59$Oct-16 619.55$ 737.68$ 1,416.67$ 267.97$ 260.62$ 253.10$Sep-16 704.68$ 838.20$ 1,829.58$ 306.59$ 289.13$ 295.43$Aug-16 694.72$ 879.08$ 3,050.84$ 299.11$ 289.31$ 281.00$Jul-16 688.28$ 858.49$ 1,651.66$ 299.61$ 289.49$ 288.61$Jun-16 726.83$ 922.15$ 1,577.89$ 319.45$ 296.92$ 296.47$May-16 694.64$ 1,072.77$ 1,972.18$ 322.48$ 282.45$ 289.24$Apr-16 684.93$ 1,064.80$ 2,421.78$ 347.07$ 311.66$ 321.87$Mar-16Feb-16Jan-16Dec-15Nov-15Oct-15Sep-15Aug-15Jul-15Jun-15May-15
TOTALS 9,231.30$ 11,456.52$ 22,839.02$ 4,262.24$ 3,981.96$ 3,956.09$
Exhibit 2B Page 178

Proprietary and Confidential © Siemens Industry IGA Report – May, 2019 – | Page 539
Siemens – Broward County, Investment Grade Audit | May 2019
Account # 3005525 3005526 3005527 3005528 3005529 3022890
Date TotalCharges
TotalCharges
TotalCharges
TotalCharges
TotalCharges
TotalCharges
May-17 127.15$ 129.21$ 97.34$ 2,018.84$ 110.47$ 195.41$Apr-17 127.15$ 129.21$ 97.34$ 2,018.84$ 110.47$ 195.41$Mar-17 119.47$ 129.16$ 97.34$ 1,813.10$ 104.90$ 195.27$Feb-17 121.16$ 127.11$ 98.42$ 946.44$ 104.90$ 195.13$Jan-17 119.47$ 134.75$ 104.90$ 817.73$ 104.90$ 189.57$Dec-16 127.11$ 134.75$ 101.12$ 817.73$ 108.68$ 199.57$Nov-16 119.47$ 134.75$ 97.34$ 779.53$ 101.12$ 189.57$Oct-16 117.95$ 140.33$ 102.09$ 877.75$ 105.77$ 194.49$Sep-16 141.13$ 149.72$ 124.38$ 1,169.89$ 116.00$ 208.14$Aug-16 130.46$ 138.83$ 175.12$ 2,483.21$ 127.50$ 203.06$Jul-16 137.77$ 153.56$ 123.73$ 2,505.93$ 162.96$ 212.93$Jun-16 133.63$ 149.86$ 125.94$ 2,971.09$ 111.55$ 207.75$May-16 137.60$ 160.60$ 108.55$ 1,989.79$ 112.41$ 202.68$Apr-16 127.02$ 135.00$ 105.90$ 2,287.48$ 197.74$Mar-16Feb-16Jan-16Dec-15Nov-15Oct-15Sep-15Aug-15Jul-15Jun-15May-15
TOTALS 1,786.54$ 1,946.84$ 1,559.51$ 23,497.35$ 1,481.63$ 2,786.72$
Exhibit 2B Page 179
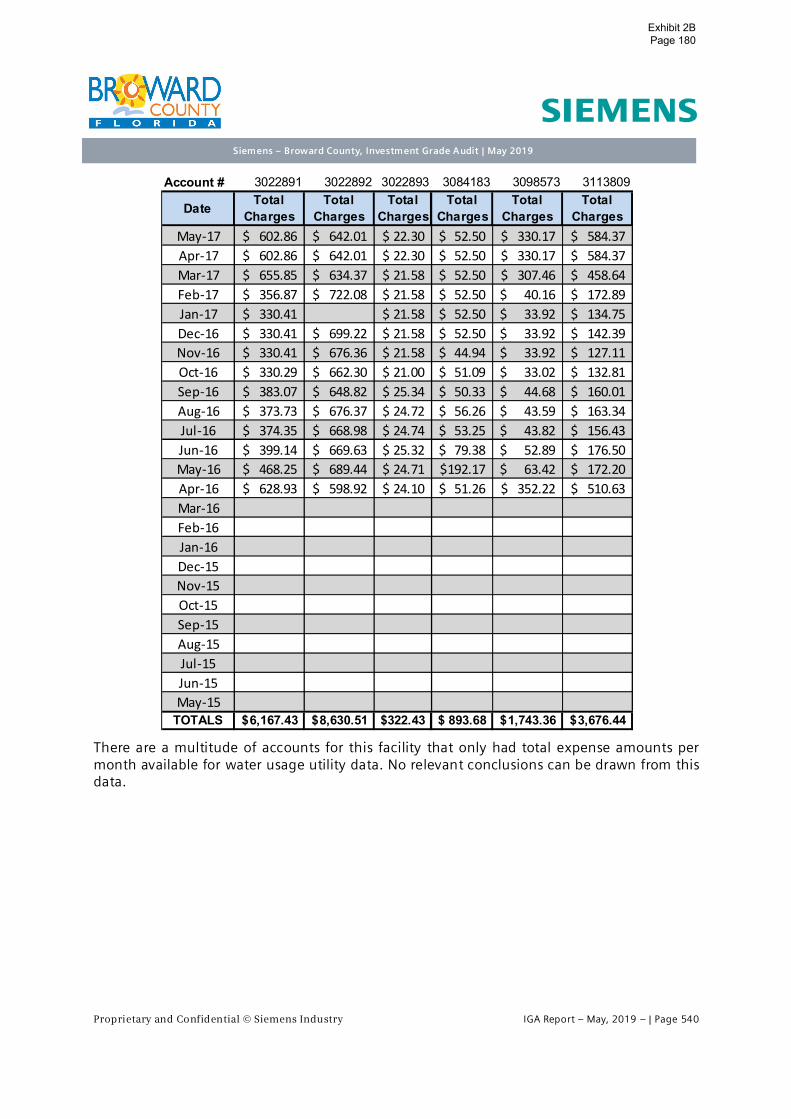
Proprietary and Confidential © Siemens Industry IGA Report – May, 2019 – | Page 540
Siemens – Broward County, Investment Grade Audit | May 2019
There are a multitude of accounts for this facility that only had total expense amounts permonth available for water usage utility data. No relevant conclusions can be drawn from thisdata.
Account # 3022891 3022892 3022893 3084183 3098573 3113809
Date TotalCharges
TotalCharges
TotalCharges
TotalCharges
TotalCharges
TotalCharges
May-17 602.86$ 642.01$ 22.30$ 52.50$ 330.17$ 584.37$Apr-17 602.86$ 642.01$ 22.30$ 52.50$ 330.17$ 584.37$Mar-17 655.85$ 634.37$ 21.58$ 52.50$ 307.46$ 458.64$Feb-17 356.87$ 722.08$ 21.58$ 52.50$ 40.16$ 172.89$Jan-17 330.41$ 21.58$ 52.50$ 33.92$ 134.75$Dec-16 330.41$ 699.22$ 21.58$ 52.50$ 33.92$ 142.39$Nov-16 330.41$ 676.36$ 21.58$ 44.94$ 33.92$ 127.11$Oct-16 330.29$ 662.30$ 21.00$ 51.09$ 33.02$ 132.81$Sep-16 383.07$ 648.82$ 25.34$ 50.33$ 44.68$ 160.01$Aug-16 373.73$ 676.37$ 24.72$ 56.26$ 43.59$ 163.34$Jul-16 374.35$ 668.98$ 24.74$ 53.25$ 43.82$ 156.43$Jun-16 399.14$ 669.63$ 25.32$ 79.38$ 52.89$ 176.50$May-16 468.25$ 689.44$ 24.71$ 192.17$ 63.42$ 172.20$Apr-16 628.93$ 598.92$ 24.10$ 51.26$ 352.22$ 510.63$Mar-16Feb-16Jan-16Dec-15Nov-15Oct-15Sep-15Aug-15Jul-15Jun-15May-15
TOTALS 6,167.43$ 8,630.51$ 322.43$ 893.68$ 1,743.36$ 3,676.44$
Exhibit 2B Page 180

Proprietary and Confidential © Siemens Industry IGA Report – May, 2019 – | Page 541
Siemens – Broward County, Investment Grade Audit | May 2019
RECOMMENDED IMPROVEMENT MEASURES
This section addresses the Facility Improvement Measures (FIMs) recommended forimplementation at this facility. Each solution is presented with a brief description of theintended scope, savings calculation method, guaranteed savings in units of energy, and theindividual FIM’s financial analysis with payback. As requested, the following improvementscosts are listed separately and do not directly affect a FIM’s payback:
∂ Development Costs
∂ Measurement & Verification (performance assurance)
∂ Code compliance issues uncovered that directly relates to the constructability of a specificmeasure
BUILDING LEVEL SUMMARY
The following table summarized the complete list of FIMs recommended for this facility. Thesummation at the bottom of the table represents the total costs and savings of all FIMs only.As stated, the fixed costs associated with in with development, performance assurance, andcode compliance are considered as separate items.
Building Level Financical Summary
SAVINGS CALCULATION METHODOLOGY
FIMs were developed using spreadsheet models and engineering calculations. Energy usingequipment was measured to determine power consumption, kW. Extensive data logging ofequipment was also used to determine energy consumption, kWh. Savings calculations areprovided as in Section H, Appendices.
Building orFacility Description
SAVINGSElectric KWh $
SAVINGSElectric KW $
SAVINGSWater $
SAVINGSO & M
TotalSavings Project Costs Simple
PaybackQuietwaters Park Lighting - Interior 1,348.05$ -$ -$ 216$ 1,564.05$ 13,996.16$ 8.9Breakage Fee 1,151.61$PA Cost 146.53$Total 1,348.05$ -$ -$ 216$ 1,564.05$ 15,294.31$ 9.8
Exhibit 2B Page 181

Proprietary and Confidential © Siemens Industry IGA Report – May, 2019 – | Page 542
Siemens – Broward County, Investment Grade Audit | May 2019
LIGHTING RETROFIT
The following section describes all lighting scope of work proposed for implementation.
PROJECT SCOPE – INTERIOR LIGHTING
LED Replacement of Linear Lamps: The design strategy is to specify and standardize on thesame type of linear LED T8 and T5 lamps types throughout the buildings to be included inthis project. We select a non-proprietary proven LED tube that will provide the greatestperformance and energy savings of any of the lighting systems considered. The proposedLED Linear tubes are a premium high lumen, extended life with best in class warranty.
The predominant LED lamp we have selected for this project is an UL Type B LED linear type.The UL Type B lamp a direct wire lamp that doesn’t require an external ballast or driver. Theexisting T-8 or T5 ballast will be removed from the fixture and disposed of. New lampsockets approved for direct wire LED lamps will also be installed on the feed ends to ensureproblem free installation and reduce future maintenance. This LED retrofit strategy will allowus to maintain recommended light levels while providing a reduction in energy usage in alllinear lamp fixtures and still standardize on lamp types. All fixtures retrofitted will be drywiped to remove dust and particulate matter to improve fixture lumen efficiency.
Fixture types associated with these lamps are surface or recessed linear fixtures: In thecase of existing 2’x2’ troffers, a different approach is used. There is less flexibility in lampwattage when dealing with U-shaped lamps, and installing linear lamp kits can be achallenge due to variation in fixture construction. Additionally, in many cases, it is possibleto reduce light output if the fixture can be made more efficient. To provide consistency ofcomponents and reduce energy use, we have proposed installing 2x2 volumetric style retrofitdoor kits with dedicated LED boards and drivers.
LED Replacement for Pin-Based Compact Fluorescent Fixtures: In keeping with thedirection to remove fluorescent ballasts, reduce energy use and minimize cost, our designstrategy for existing pin-based compact fluorescent lamps is to retrofit the existing fixtureswith line voltage pin based LED lamps and remove the existing fluorescent ballasts. In somecases, it is possible to remove two fluorescent lamps and replace them with a single higherpowered LED lamp without sacrificing luminaire output and distribution.
Emergency Lighting: Backup power for emergency lighting is currently supplied by variousmeans, including generator backup (emergency lights at full output), integral battery backupballasts (fluorescent fixtures at reduced output), and unit inverter emergency lights. Ofthose approaches, the scenarios with existing battery backup ballasts in fluorescent fixturesrequire replacement of the battery ballasts because they are not compatible with the UL TypeB LED lamps. In those cases, a standalone EM kit with a dedicated emergency battery, LEDdriver, and LED board will be installed in the fixture. This kit will remain off until there is apower outage, at which point the LED board will illuminate.
Exhibit 2B Page 182
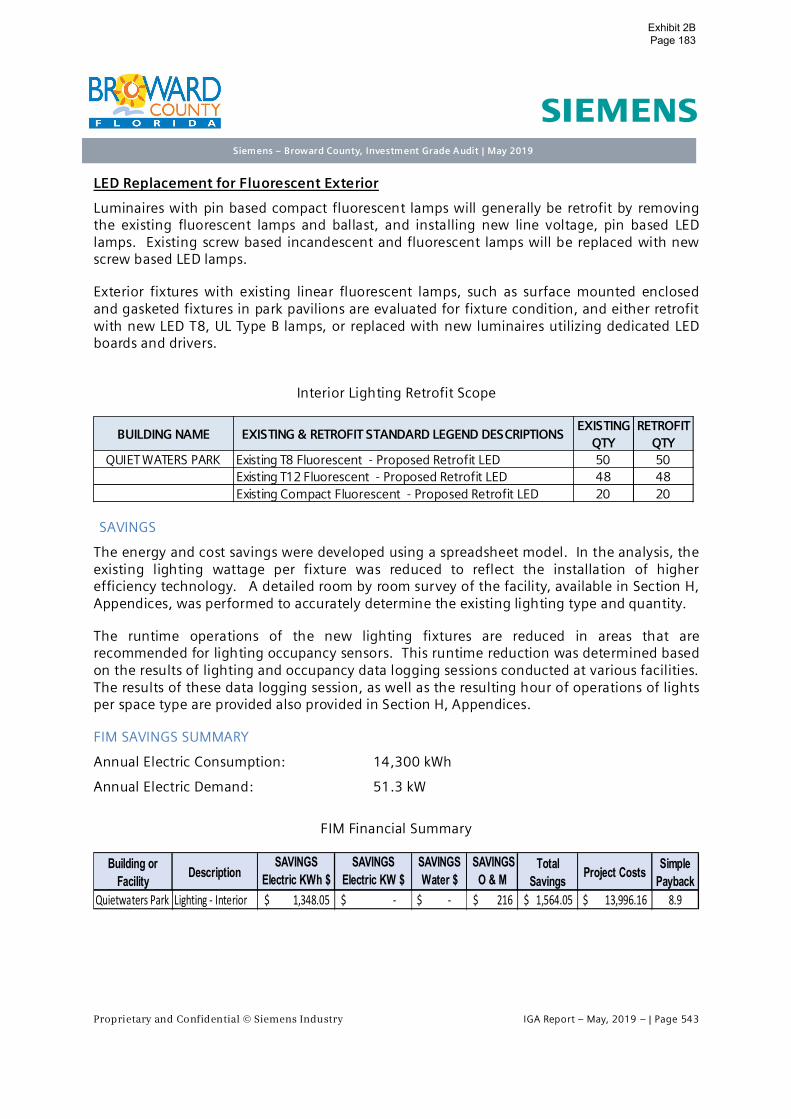
Proprietary and Confidential © Siemens Industry IGA Report – May, 2019 – | Page 543
Siemens – Broward County, Investment Grade Audit | May 2019
LED Replacement for Fluorescent Exterior
Luminaires with pin based compact fluorescent lamps will generally be retrofit by removingthe existing fluorescent lamps and ballast, and installing new line voltage, pin based LEDlamps. Existing screw based incandescent and fluorescent lamps will be replaced with newscrew based LED lamps.
Exterior fixtures with existing linear fluorescent lamps, such as surface mounted enclosedand gasketed fixtures in park pavilions are evaluated for fixture condition, and either retrofitwith new LED T8, UL Type B lamps, or replaced with new luminaires utilizing dedicated LEDboards and drivers.
Interior Lighting Retrofit Scope
SAVINGS
The energy and cost savings were developed using a spreadsheet model. In the analysis, theexisting lighting wattage per fixture was reduced to reflect the installation of higherefficiency technology. A detailed room by room survey of the facility, available in Section H,Appendices, was performed to accurately determine the existing lighting type and quantity.
The runtime operations of the new lighting fixtures are reduced in areas that arerecommended for lighting occupancy sensors. This runtime reduction was determined basedon the results of lighting and occupancy data logging sessions conducted at various facilities.The results of these data logging session, as well as the resulting hour of operations of lightsper space type are provided also provided in Section H, Appendices.
FIM SAVINGS SUMMARY
Annual Electric Consumption: 14,300 kWh
Annual Electric Demand: 51.3 kW
FIM Financial Summary
BUILDING NAME EXISTING & RETROFIT STANDARD LEGEND DESCRIPTIONSEXISTING
QTYRETROFIT
QTYQUIET WATERS PARK Existing T8 Fluorescent - Proposed Retrofit LED 50 50
Existing T12 Fluorescent - Proposed Retrofit LED 48 48Existing Compact Fluorescent - Proposed Retrofit LED 20 20
Building orFacility Description
SAVINGSElectric KWh $
SAVINGSElectric KW $
SAVINGSWater $
SAVINGSO & M
TotalSavings Project Costs Simple
PaybackQuietwaters Park Lighting - Interior 1,348.05$ -$ -$ 216$ 1,564.05$ 13,996.16$ 8.9
Exhibit 2B Page 183
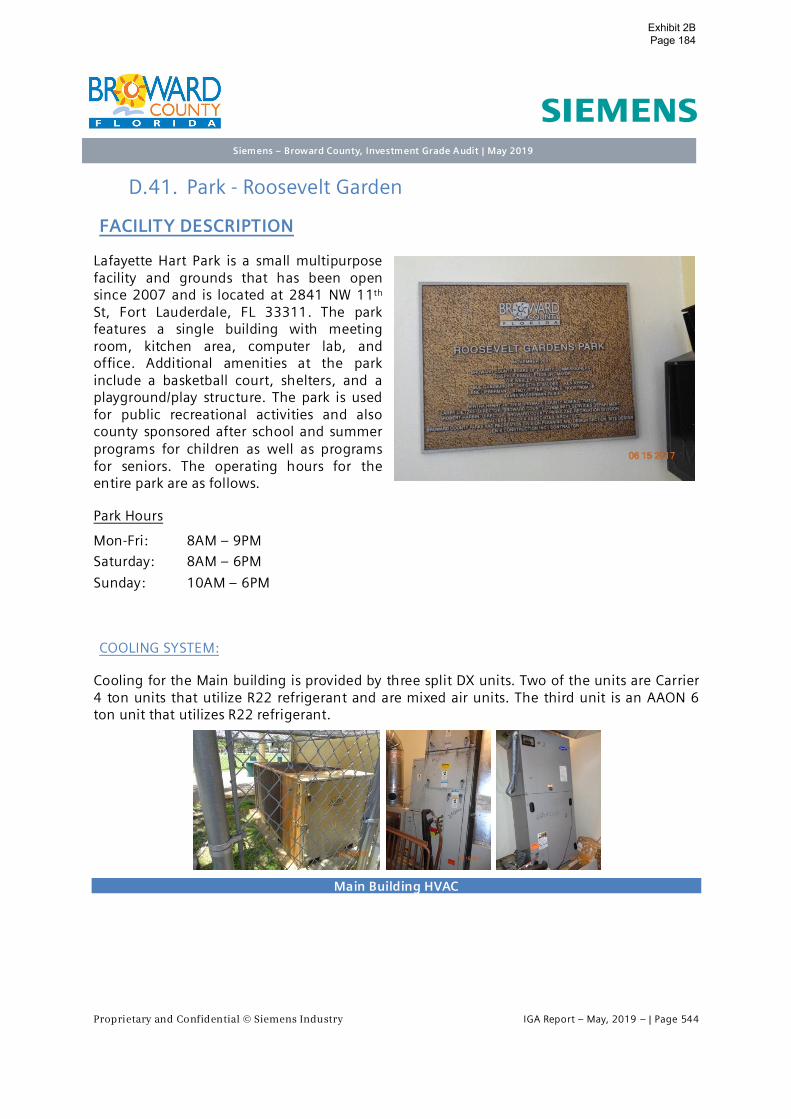
Proprietary and Confidential © Siemens Industry IGA Report – May, 2019 – | Page 544
Siemens – Broward County, Investment Grade Audit | May 2019
D.41. Park - Roosevelt Garden
FACILITY DESCRIPTION
Lafayette Hart Park is a small multipurposefacility and grounds that has been opensince 2007 and is located at 2841 NW 11th
St, Fort Lauderdale, FL 33311. The parkfeatures a single building with meetingroom, kitchen area, computer lab, andoffice. Additional amenities at the parkinclude a basketball court, shelters, and aplayground/play structure. The park is usedfor public recreational activities and alsocounty sponsored after school and summerprograms for children as well as programsfor seniors. The operating hours for theentire park are as follows.
Park Hours
Mon-Fri: 8AM – 9PM
Saturday: 8AM – 6PM
Sunday: 10AM – 6PM
COOLING SYSTEM:
Cooling for the Main building is provided by three split DX units. Two of the units are Carrier4 ton units that utilize R22 refrigerant and are mixed air units. The third unit is an AAON 6ton unit that utilizes R22 refrigerant.
Main Building HVAC
Exhibit 2B Page 184

Proprietary and Confidential © Siemens Industry IGA Report – May, 2019 – | Page 545
Siemens – Broward County, Investment Grade Audit | May 2019
The following table is a summary of all the relevant mechanical equipment that was foundduring the site visit and displays all the important data regarding each piece of equipment.
Namplate Data of Mechanical Equipment
Observed Issues during Visit:
∂ Cooling system uses R22 refrigerant.
∂ Lack of controls in the cooling system
LIGHTING SYSTEM
Interior lighting primarily consists of 60 Watt and 87 Watt, T8 fluorescent lamps in either 2x2or 2x4 fixtures.
Interior Lighting Examples
Exterior Lighting consists of 210 Watt metal halide parking lot lights and compact florescentflood lights.
Exterior Lighting Examples
The building does not make use of occupancy sensors or any other types of lighting control.
Roosevelt Gardens ParkAHU1 Aaon fanCU1 Aaon CA1305 200710-CCCF07870 compressor R-22 6 230 1 21 12 4.3
compressor R-22 230 1 21 4.3fan 0.75 230 1 5.4 1.1
AHU2 Carrier FA4CNC060 4007A82521 fan 0.75 208 1 5.2 1.0CU2 Carrier 24ABR350A350 3707E24294 compressor R-22 208 3 25.3 8.2
fan 0.25 208 1 1.2 0.2
AHU3 Carrier FA4CNC060 4007A82537 fan 0.75 208 1 5.2 1.0CU3 Carrier 24ABR360HB0330 0307E13587 compressor R-22 208 3 25.3 8.2
fan 0.25 208 1 1.2 0.2
Cal kWHP Tons/MBTU V Ph Amps Eff /EEREQUIPMENT Mfctr Model Serial Description Notes
General Information Size / Capacity Nameplate Information
Exhibit 2B Page 185

Proprietary and Confidential © Siemens Industry IGA Report – May, 2019 – | Page 546
Siemens – Broward County, Investment Grade Audit | May 2019
DOMESTIC WATER SYSTEM
Domestic water usage is limited to restrooms. Fixtures and water closets are all operatedmanually. The following are example of the types of fixture found within the restroom of thefacility.
∂ 2.2 gpm faucets
∂ 1.0 gpf urinals
∂ 1.6 and 2.5 gpf toilets
Sample Restroom Fixtures
The irrigation system could not be accessed as it was underneath a hard cover protectorunder lock and key. It could not be determined whether the irrigation system uses domesticwater or another water source.
Irrigation System
BUILDING CONTROLS SYSTEM
The building is currently not equipped with a building automation system. Each zone has adedicated thermostat.
Building Controls
Exhibit 2B Page 186

Proprietary and Confidential © Siemens Industry IGA Report – May, 2019 – | Page 547
Siemens – Broward County, Investment Grade Audit | May 2019
TRENDING DATA ACQUISITION
In order to determine the runtime operation of each unit, data loggers were installed tomonitor amperage and/or supply air temperature. This data was trended for a minimum ofseven (7) days in order to capture a typical week. The following graphs illustrate theresulting data from this logging session.
Trending Data – 6 Ton Aaon Condensing Unit.
This unit registered an average of 34.93 amps and was operating for a total of 123.48 hoursduring a one week period.
Trending Data – Carrier Condensing Unit 1.
This unit registered an average of 16.59 amps and was operating for a total of 141.28 hoursduring a one week period.
Exhibit 2B Page 187

Proprietary and Confidential © Siemens Industry IGA Report – May, 2019 – | Page 548
Siemens – Broward County, Investment Grade Audit | May 2019
Trending Data – Carrier Condensing Unit 2.
This unit registered an average of 17.75 amps and was operating for a total of 96.20 hoursduring a one week period.
The following table compares the operating hours of each unit with the hours of service forthe facility.
The Aaon unit and the Carrier unit with the serial number ending in 3587 are runningcontinuously and show no evidence of being under a schedule control sequence. The Carrierunit with the serial number ending in A350 is turning on around 4 hours before the facilitybegins operation and turns off 1 hour before the facility closes. Due to the consistent patternof this unit’s operation it can be assumed that the unit has scheduling capabilities.
Run Hours Run Hours Run HoursAaon CU CU 3587 CU A350
Monday 8:00AM - 9:00PM 12:00AM - 11:59PM 12:00AM - 11:59PM 4:00AM - 8:00PMTuesday 8:00AM - 9:00PM 12:00AM - 11:59PM 12:00AM - 11:59PM 4:00AM - 8:00PMWednesday 8:00AM - 9:00PM 12:00AM - 11:59PM 12:00AM - 11:59PM 4:00AM - 8:00PMThursday 8:00AM - 9:00PM 12:00AM - 11:59PM 12:00AM - 11:59PM 10:00AM- 8:00PMFriday 8:00AM - 9:00PM 12:00AM - 11:59PM 12:00AM - 11:59PM 4:00AM - 8:00PMSaturday 8:00AM - 6:00PM 12:00AM - 11:59PM 12:00AM - 11:59PM 4:00AM - 8:00PMSunday 10:00AM - 6:00PM 12:00AM - 11:59PM 12:00AM - 11:59PM 4:00AM - 8:00PM
Day Hours of Service
Exhibit 2B Page 188

Proprietary and Confidential © Siemens Industry IGA Report – May, 2019 – | Page 549
Siemens – Broward County, Investment Grade Audit | May 2019
UTILITY DATA ANALYSIS - ELECTRIC
The electric usage at this facility is monitored by one (1) electric meter. The billing accountutilizes the Seasonal Demand Time of Use Rider (SDTR-1A) rate structure. When creating thebaseline shown below, the most recent 24 month of electric billing data was utilized asobtained directly from the Florida Power and Light website. The data was made available viawebsite’s the user portal and historical data from the facility’s smart meters.
The following table documents both the rate structure values used to calculate energysavings based on most recent electric billing data as well as the established demand andconsumption values representing baseline electric usage for the facility.
Electric Baseline Summary
Meter MQ3274A; Account: 2907402123; Address: 2841 NW 11TH ST, FORT LAUDERDALE
on peak off peak
RooseveltGardens Park SDTR-1A 0.127063453 0.04075$ 0.05588$ 10.71$ 158,190 400 41
$ / kWAverage
Consumptionper Year
AverageDemand per Year
MaxDemandFacility # of Meters Rate Structure
June - Sept$ / kWh
TotalConsumption On Peak Off Peak gross receipts
tax 2.56%Franchise
FeeJun-15 25.96$ 13,800 1,320 12,480 596$ 34 412$ 26.47$ 147$ 1,208$Jul-15 25.96$ 14,280 1,500 12,780 620$ 29 351$ 25.53$ 160$ 1,183$Aug-15 25.96$ 15,780 1,500 14,280 681$ 34 412$ 28.65$ 167$ 1,314$Sep-15 25.96$ 16,800 1,320 15,480 718$ 28 339$ 27.74$ 151$ 1,262$Oct-15 25.96$ 13,320 180 13,140 544$ 34 412$ 25.14$ 137$ 1,144$Nov-15 25.96$ 13,020 0 13,020 532$ 38 461$ 26.07$ 125$ 1,170$Dec-15 25.96$ 15,780 0 15,780 644$ 34 412$ 27.71$ 170$ 1,280$Jan-16 25.96$ 10,140 0 10,140 514$ 35 342$ 22.58$ 35$ 940$Feb-16 25.96$ 9,660 0 9,660 489$ 31 303$ 20.95$ 33$ 872$Mar-16 25.96$ 12,780 0 12,780 647$ 29 284$ 24.50$ 41$ 1,023$Apr-16 25.96$ 12,060 0 12,060 611$ 34 333$ 24.82$ 11$ 1,005$May-16 25.96$ 12,000 0 12,000 608$ 28 274$ 23.24$ 6$ 937$Jun-16 26.97$ 13,440 1,200 12,240 626$ 32 376$ 26.36$ 41$ 1,097$Jul-16 26.97$ 16,980 1,860 15,120 820$ 34 400$ 31.92$ 50$ 1,329$Aug-16 26.97$ 17,700 1,740 15,960 838$ 34 400$ 32.39$ 51$ 1,348$Sep-16 26.97$ 13,200 1,380 11,820 632$ 29 341$ 25.60$ 38$ 1,063$Oct-16 26.97$ 11,460 180 11,280 545$ 31 312$ 22.65$ 33$ 941$Nov-16 26.97$ 10,860 0 10,860 517$ 31 312$ 21.92$ 32$ 911$Dec-16 26.97$ 12,240 0 12,240 583$ 32 323$ 23.86$ 35$ 991$Jan-17 25.00$ 11,580 0 11,580 596$ 39 402$ 26.19$ 40$ 1,090$Feb-17 25.00$ 11,280 0 11,280 581$ 41 422$ 26.32$ 40$ 1,095$Mar-17 25.00$ 12,720 0 12,720 684$ 37 381$ 27.90$ 43$ 1,161$Apr-17 25.00$ 12,060 0 12,060 648$ 39 402$ 27.52$ 42$ 1,145$May-17 25.00$ 13,440 0 13,440 722$ 32 330$ 27.57$ 43$ 1,147$
AVERAGE TOTALS 158,190 6,090 152,100 7,499$ 400 4,368$ 311.80$ 836$ 13,327$
DemandCharge
TotalCharges
Other Fees/TaxesConsumption (kwh)Date Customer
ChargeConsumption
ChargeDemand
(kW)
Exhibit 2B Page 189

Proprietary and Confidential © Siemens Industry IGA Report – May, 2019 – | Page 550
Siemens – Broward County, Investment Grade Audit | May 2019
The billing is, as previously shown, analyzed as a combination of all meters. As described ina previous section, an index value is calculated and compared to similar facilities within thesame geographic region. Below are the results of this comparison.
Benchmarking Summary
Overall, this building is operating above the 75th percentile of comparable facilities.
0
100
200
300
400
500
600
700
800
0
2,000
4,0006,000
8,000
10,00012,000
14,000
16,000
18,000
Jan Feb Mar Apr May Jun Jul Aug Sep Oct Nov Dec
Dem
and
(kW
)
Cons
umpt
ion
(kW
h)
Month
Electric Consumption Profile
Consumption (kWh) Demand (kW) CDD
25thpercentile Median
75thpercentile
Roosevelt Gardens Park Recreation 28.28 3.7 7.3 17.6
kWh/Sq FtCBECS - 2012 kWh/Sq Ft Data
Facility Faclity Type
Exhibit 2B Page 190

Proprietary and Confidential © Siemens Industry IGA Report – May, 2019 – | Page 551
Siemens – Broward County, Investment Grade Audit | May 2019
UTILITY DATA ANALYSIS - WATER
The following table(s) summarizes the water consumption data that was available for thisfacility.
This account has very few months of consumption data in the 24 month period. There is costdata for every month of the 24 month period but no relevant conclusions can be drawn fromthis data.
Account # 2027814 Meter # 200219366Rate AddressMeter Size 2" Meter Type W/S
Roosevelt Gardens Park
Date Consumption ()
TotalCharges
May-17 8 256.71$Apr-17 8 256.71$Mar-17Feb-17 14 342.24$Jan-17Dec-16 6 228.21$Nov-16 209.18$Oct-16Sep-16 285.19$Aug-16 393.77$Jul-16 366.62$Jun-16 271.62$May-16 230.91$Apr-16 11 285.19$Mar-16 339.48$Feb-16 366.62$Jan-16 285.19$Dec-15 258.05$Nov-15 248.97$Oct-15 302.96$Sep-15 232.76$Aug-15 310.25$Jul-15 323.17$Jun-15 219.85$May-15 297.34$
TOTALS 47 6,310.99$
Exhibit 2B Page 191

Proprietary and Confidential © Siemens Industry IGA Report – May, 2019 – | Page 552
Siemens – Broward County, Investment Grade Audit | May 2019
RECOMMENDED IMPROVEMENT MEASURES
This section addresses the Facility Improvement Measures (FIMs) recommended forimplementation at this facility. Each solution is presented with a brief description of theintended scope, savings calculation method, guaranteed savings in units of energy, and theindividual FIM’s financial analysis with payback. As requested, the following improvementscosts are listed separately and do not directly affect a FIM’s payback:
∂ Development Costs
∂ Measurement & Verification (performance assurance)
∂ Code compliance issues uncovered that directly relates to the constructability of a specificmeasure
BUILDING LEVEL SUMMARY
The following table summarized the complete list of FIMs recommended for this facility. Thesummation at the bottom of the table represents the total costs and savings of all FIMs only.As stated, the fixed costs associated with in with development, performance assurance, andcode compliance is considered as separate items.
Building Level Financial Summary
SAVINGS CALCULATION METHODOLOGY
FIMs were developed using spreadsheet models and engineering calculations. Energy usingequipment was measured to determine power consumption, kW. Extensive data logging ofequipment was also used to determine energy consumption, kWh. Savings calculations areprovided as in Section H, Appendices.
Building or Facility DescriptionSAVINGS
Electric KWh $SAVINGS
Electric KW $SAVINGSWater $
SAVINGSO & M
TotalSavings Project Costs Simple
PaybackRoosevelt Gardens Park Water - Retrofits 83.73$ -$ 765.33$ 45$ 893.80$ 7,102.19$ 7.9Roosevelt Gardens Park Split Systems 3,991.90$ 1,885.75$ -$ -$ 5,877.65$ 71,833.19$ 12.2Breakage Fee 671.28$PA Cost 824.59$Total 4,075.63$ 1,885.75$ 765.33$ 45$ 6,771.45$ 80,431.25$ 11.9
Exhibit 2B Page 192

Proprietary and Confidential © Siemens Industry IGA Report – May, 2019 – | Page 553
Siemens – Broward County, Investment Grade Audit | May 2019
WATER CONSERVATION
This FIM addresses the reduction of water consumption, wastewater production, and hotwater energy usage through the installation of highly efficient, plumbing products andcontrols. The use of these devices and others are detailed below and were selected not onlyfor their efficiency, but also to provide for durable, long-term use with minimal maintenanceand improved hygiene.
PROJECT SCOPE
Flush Valves: Most commercial facilities utilize flush valve water closets. Flush valves aredesigned to release precise volumes of water when activated. High efficiency flush valvescan enable a facility to greatly reduce its water consumption by reducing flush valve flowrates and the amount of water required for evacuation. Installation of 1.28 gallons per flush(GPF) flush valve will replace existing equipment that currently consumes 1.6 to 3.5 GPF.
Urinals: High efficiency flush valve and china combinations for urinals can enable a facility togreatly reduce its water consumption by reducing flush valve flow rates and the amount ofwater required for evacuation. Installation of 0.125 GPF high efficiency urinal systems willreplace existing equipment that currently consumes 1.0 to 1.5 GPF.
Bathroom Faucets/Aerators: Most faucets utilize aerators to restrict the volume of water atthe mouth of a faucet and to generate a more comfortable flow. High efficiency aerators cangreatly reduce flow rates from faucets and create a comfortable flow for hand washing andcleaning. Restricting faucet flow rates enables a facility to conserve water and reduce energyusage associated with heating water. Faucets without the threading necessary to accept anaerator can be replaced with threaded faucets. Installation of 0.5 GPM aerator or faucetretrofit will replace existing equipment that currently consumes 2.2 GPM.
SAVINGS
The energy and cost savings were developed using spreadsheet modeling. Based on siteinterviews, facility type, square footage, and standard factors for allocation of business insquare foot per person and visitors per day the total population and occupancy days for thisfacility were determined. Total water closet, urinal, faucet and shower use figures weredetermined for the facility using standard factors for equipment use based on industryresearch and case studies coupled together with the total population of the facility and theoccupancy days. The current water usage minus the proposed water usage leads to the totalwater savings in gallons.
The savings value take the water savings and multiply them by the rate detailed in the UtilityData Analysis Section of this Report. Energy savings were only taken in the form of hot watersavings for any equipment that utilize hot water.
Exhibit 2B Page 193

Proprietary and Confidential © Siemens Industry IGA Report – May, 2019 – | Page 554
Siemens – Broward County, Investment Grade Audit | May 2019
Deferred maintenance savings were considered and calculated by a percentage of reductionin replacement cost for any new fixtures that will be installed. These savings are referred toas Savings O&M on the financial summary table below.
FIM SAVINGS SUMMARY
Annual Water savings: 67,135 gallons
Annual Energy savings: 1,499 kWh
All analysis for water savings, energy savings, deferred maintenance savings, and financialdetails is provided in Section H, Appendices of this Report.
FIM Financial Summary
Building or Facility DescriptionSAVINGS
Electric KWh $SAVINGS
Electric KW $SAVINGSWater $
SAVINGSO & M
TotalSavings Project Costs Simple
PaybackRoosevelt Gardens Park Water - Retrofits 83.73$ -$ 765.33$ 45$ 893.80$ 7,102.19$ 7.9
Exhibit 2B Page 194

Proprietary and Confidential © Siemens Industry IGA Report – May, 2019 – | Page 555
Siemens – Broward County, Investment Grade Audit | May 2019
MECHANICAL
As DX equipment ages and the condition of the equipment deteriorate, the energy efficiencyof these units also degrades. In recent years the energy efficiency of DX equipment hasimproved due to mandates as well as manufacture improvements. DX air-conditioningsystems are rated by their Seasonal Energy Efficiency Ratios (SEER). The higher the SEERrating the more energy efficient the units are. Older units have average SEER ratingsbetween 8-10 while new units have average SEER ratings of 13 or greater.
Cooling for the Main building is provided by three split DX units. Two of the units are Carrier4 ton units that utilize R22 refrigerant and are mixed air units. The third unit is an AAON 6ton unit that utilizes R22 refrigerant.
PROJECT SCOPE
This FIM addresses the replacement three (3) DX systems. The scope of work includes thereplacement of both the condensing unit and air handlers. The new equipment will be ofequal capacity and include, as part of the installation, package new programmablethermostats provided by Siemens. The thermostats will be able to communicated, via theirown IP address, to remote BAUs for additional access. The units will be placed on a time ofday schedule. The new schedule will command the units to turn on 1.5 hours before thefacility opens and 1.5 hours after it closes.
Scope of Work
Building Equipment Make Model Tons ExistingkW
NewkW
Roosevelt Park AHU Aaon
Roosevelt Park Condenser Aaon CA1305 6 9.77 4.9
Roosevelt Park AHU Carrier FA4CNC060
Roosevelt Park Condenser Carrier 24ABR350A350 4 6.16 3.6
Roosevelt Park AHU Carrier FA4CNC060
Roosevelt Park Condenser Carrier 24ABR360HB0330 4 6.48 3.8
Exhibit 2B Page 195

Proprietary and Confidential © Siemens Industry IGA Report – May, 2019 – | Page 556
Siemens – Broward County, Investment Grade Audit | May 2019
SAVINGS
The energy and cost savings were developed using a spreadsheet model. Using nameplatedata, onsite electrical spot measurements, and data logging information, the total HVACelectrical contribution of this facility’s electric utility bill was determined. The calculationstook into consideration current conditions and efficiencies. Savings were obtained byreplacing existing efficiency values with the higher efficiency value of the new equipment; aspublished by the manufacturer. The detailed calculations are available in the Section H,Appendices. All calculations were based off Trane manufacturer cut-sheets, also provided.
FIM SAVINGS SUMMARY
Annual Electric Consumption: 61,204 kWh
Annual Electric Demand: 175.75 kW
FIM Financial Summary
Building or Facility DescriptionSAVINGS
Electric KWh $SAVINGS
Electric KW $SAVINGSWater $
SAVINGSO & M
TotalSavings Project Costs Simple
PaybackRoosevelt Gardens Park Split Systems 3,991.90$ 1,885.75$ -$ -$ 5,877.65$ 71,833.19$ 12.2
Exhibit 2B Page 196

Proprietary and Confidential © Siemens Industry IGA Report – May, 2019 – | Page 557
Siemens – Broward County, Investment Grade Audit | May 2019
D.42. Park - Sunview
FACILITY DESCRIPTION
Sunview park is a sports complex withseveral athletic fields used for multiplesports. The park is a 20.8 acre site that hasbeen used as a center of athletic andrecreational activity for the community since1963. The park is located at 1500 SW 42nd
Ave, Fort Lauderdale, FL 33317. The parkcontains four baseball/softball fields, abasketball court, and a multipurpose fieldused for soccer, football, rugby, and othersports. The only conditioned building at thepark was destroyed by a fire in 2010 and hasbeen replaced with the current modularbuilding.
Occupancy Hours
Mon – Fri: 9AM – 9PM
Saturday: 9AM – 6PM
Sunday: 10AM – 6PM
COOLING SYSTEM:
The cooling for the Sunview park modular building is provided by three Bard packaged DXwall units with 3 tons of capacity each. The units were manufactured in 2007. It is importantto note that the units use R22 refrigerant.
HVAC Equipment
The table below summarizes the important technical information found for the mechanicalequipment at this facility.
Exhibit 2B Page 197

Proprietary and Confidential © Siemens Industry IGA Report – May, 2019 – | Page 558
Siemens – Broward County, Investment Grade Audit | May 2019
Namplate Data of Mechanical Equipment
Observed Issues during Visit:
∂ Cooling system uses R22 refrigerant.
LIGHTING SYSTEM
Interior lighting primarily consists of 60 Watt and 114 Watt T8 fluorescent lamps and 30 Wattcompact florescent lamps.
Exterior Lighting consists of metal halide parking lot lighting and sports field lighting.
The building does not make use of occupancy sensors or any other types of lighting control.
Sunview ParkIrrigation Pump Marathon Electric 5vb215ttdw7022aa pump 15 208 3 42 86.50% 13.6Irrigation Pump US Motors C55CXJZE-4760CAT pump 1 208 1 13 2.4Irrigation Pump US Electrical Motors e683auiou227r004f pump 15 230 3 37 89.50% 13.3
Fan Dayton XXMTKZ6804 fan storage room 0.25 115 1 4.5 0.5
Bard Unit1 Bard WA372-A10XX4XXX compressor R-22 3 208 1 16.5 9.2 3.1fan 0.2 208 1 1.5 0.3fan 0.33 208 1 2.2 0.4
Bard Unit2 Bard WA372-A10XX4XXX compressor R-22 3 208 1 16.5 9.2 3.1fan 0.2 208 1 1.5 0.3fan 0.33 208 1 2.2 0.4
Bard Unit3 Bard WA372-A10XX4XXX compressor R-22 3 208 1 16.5 9.2 3.1fan 0.2 208 1 1.5 0.3fan 0.33 208 1 2.2 0.4
Cal kWNotes HP Tons/MBTU V Ph Amps
General Information Size / Capacity Nameplate Information
EQUIPMENT Mfctr Model Serial Description Eff /EER
Exhibit 2B Page 198
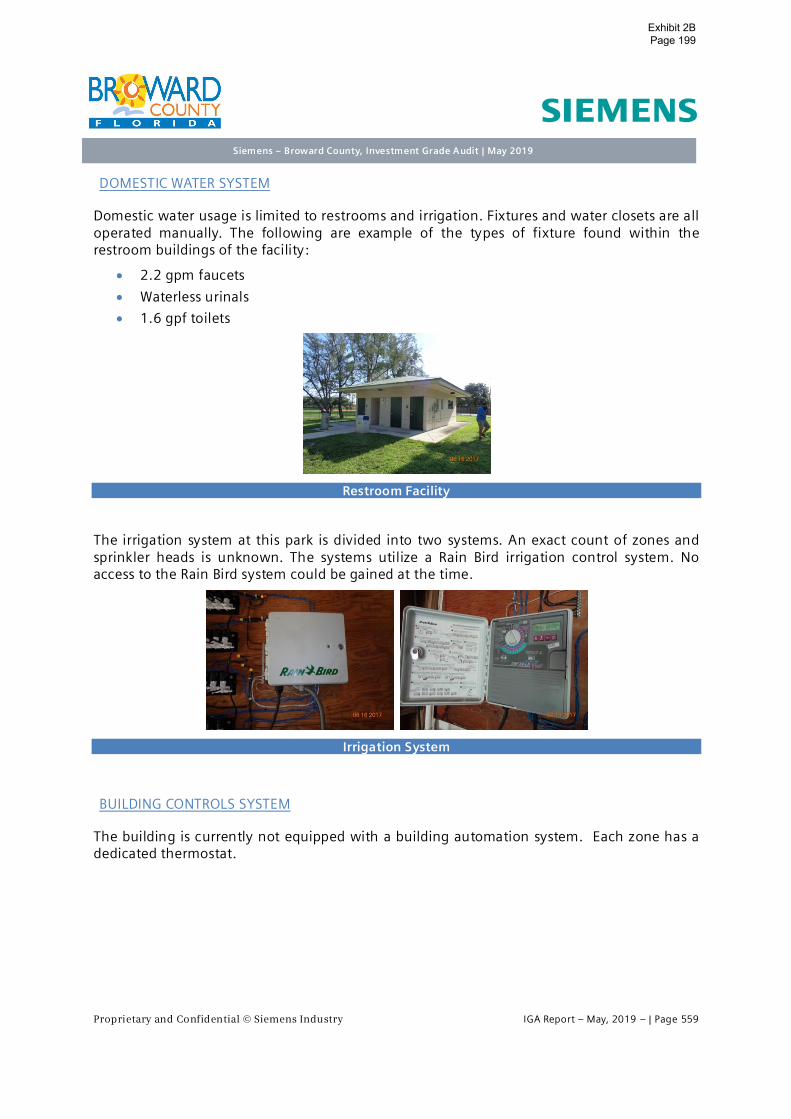
Proprietary and Confidential © Siemens Industry IGA Report – May, 2019 – | Page 559
Siemens – Broward County, Investment Grade Audit | May 2019
DOMESTIC WATER SYSTEM
Domestic water usage is limited to restrooms and irrigation. Fixtures and water closets are alloperated manually. The following are example of the types of fixture found within therestroom buildings of the facility:
∂ 2.2 gpm faucets
∂ Waterless urinals
∂ 1.6 gpf toilets
Restroom Facility
The irrigation system at this park is divided into two systems. An exact count of zones andsprinkler heads is unknown. The systems utilize a Rain Bird irrigation control system. Noaccess to the Rain Bird system could be gained at the time.
Irrigation System
BUILDING CONTROLS SYSTEM
The building is currently not equipped with a building automation system. Each zone has adedicated thermostat.
Exhibit 2B Page 199

Proprietary and Confidential © Siemens Industry IGA Report – May, 2019 – | Page 560
Siemens – Broward County, Investment Grade Audit | May 2019
UTILITY DATA ANALYSIS - ELECTRIC
The electric usage at this facility is monitored by eight (8) electric meters with differentelectric rate structures. When creating the baseline shown below, the most recent 24 monthof electric billing data was utilized as obtained directly from the Florida Power and Lightwebsite. The data was made available via website’s the user portal and historical data fromthe facility’s smart meters.
The following table documents both the rate structure values used to calculate energysavings based on most recent electric billing data as well as the established demand andconsumption values representing baseline electric usage for the facility.
Electric Baseline Summary
For ease of presentation in this report, all nine (9) meters and their historical data wascombined into the following table. Thus, the table represents the consumption baseline ofthe entire park as a whole. However, the table above still governs the baseline of individualsites within the park when considering FIMs.
on peak off peak
Restroom GS-1 - - 0.09896$ - 3,093 - -Basketball Lights GS-1 - - 0.09897$ - 15,723 - -
OS-2 Sports Field - - 0.13107$ - 8,680 - -F2 GS-1 - - 0.09899$ - 2,179 - -F4 GS-1 - - 0.09896$ - 3,962 - -
OS-2 Sports Field - - 0.13106$ - 56,324 - -Trail GS-1 - - 0.09896$ - 44,499 - -
Pump SDTR-1B 0.13394$ 0.04828$ - 11.95$ 362 32 26
Sunview Park
$ / kWAverage
Consumptionper Year
AverageDemand per Year
MaxDemandFacility # of Meters Rate Structure
Year-Round$ / kWh
Exhibit 2B Page 200

Proprietary and Confidential © Siemens Industry IGA Report – May, 2019 – | Page 561
Siemens – Broward County, Investment Grade Audit | May 2019
The billing is, as previously shown, analyzed as a combination of all meters. As described ina previous section, an index value is calculated and compared to similar facilities within thesame geographic region. Below are the results of this comparison.
Benchmarking Summary
Overall, this building is operating above the 75th percentile of comparable facilities.
Date CustomerCharges
Consumption(kwh)
ConsumptionCharge
Demand(kW)
DemandCharge
OtherFees/Taxes
TotalCharges
Jul-15 286.16$ 10,117 971$ 0 -$ 134$ 1,392$Aug-15 286.16$ 10,727 1,030$ 5 60.60$ 145$ 1,521$Sep-15 286.16$ 12,825 1,231$ 0 -$ 166$ 1,684$Oct-15 286.16$ 10,394 999$ 0 -$ 134$ 1,419$Nov-15 286.16$ 11,936 1,148$ 0 -$ 160$ 1,595$Dec-15 286.16$ 11,176 1,075$ 0 -$ 149$ 1,511$Jan-16 286.16$ 11,368 1,103$ 14 169.68$ 60$ 1,619$Feb-16 286.16$ 7,971 753$ 0 -$ 65$ 1,104$Mar-16 286.16$ 9,235 900$ 4 39.12$ 81$ 1,306$Apr-16 286.16$ 11,163 1,099$ 26 254.28$ 108$ 1,747$
May-16 286.16$ 11,172 1,100$ 0 -$ 83$ 1,468$Jun-16 297.32$ 11,215 1,072$ 0 -$ 90$ 1,459$Jul-16 297.32$ 12,945 1,235$ 0 -$ 101$ 1,633$
Aug-16 297.32$ 14,434 1,375$ 0 -$ 110$ 1,782$Sep-16 297.32$ 14,554 1,399$ 0 -$ 102$ 1,799$Oct-16 297.32$ 12,238 1,187$ 0 -$ 89$ 1,574$Nov-16 297.32$ 14,279 1,414$ 4 40.32$ 104$ 1,856$Dec-16 297.32$ 11,961 1,189$ 0 -$ 88$ 1,575$Jan-17 325.00$ 6,604 638$ 0 -$ 63$ 1,026$Feb-17 325.00$ 5,853 576$ 0 -$ 59$ 960$Mar-17 325.00$ 10,979 1,222$ 10 103.00$ 110$ 1,760$Apr-17 325.00$ 12,297 1,381$ 0 -$ 114$ 1,820$
May-17 325.00$ 12,863 1,424$ 0 -$ 117$ 1,866$Jun-17 325.00$ 11,335 1,215$ 0 -$ 100$ 1,641$
AVERAGE TOTALS 134,821 13,368$ 32 333.50$ 1,266$ 18,558$
25thpercentile Median
75thpercentile
Sunview Park Recreation 33.84 3.7 7.3 17.6
kWh/Sq FtCBECS - 2012 kWh/Sq Ft Data
Facility Faclity Type
Exhibit 2B Page 201

Proprietary and Confidential © Siemens Industry IGA Report – May, 2019 – | Page 562
Siemens – Broward County, Investment Grade Audit | May 2019
UTILITY DATA ANALYSIS - WATER
The following table(s) summarizes the water consumption data that was available for thisfacility.
This account does not have enough water consumption or cost data to draw any relevantconclusions from this data.
Account # 3062113 Meter # 1552649Rate AddressMeter Size Meter Type
Sunview Park
Date Consumption ()
TotalCharges
May-17 6 6,594.01$Apr-17 6 6,594.01$Mar-17 64 7,256.95$Feb-17 14 6,685.45$Jan-17 6,578.73$Dec-16 6,594.01$Nov-16 5 6,586.37$Oct-16 8 6,524.07$Sep-16Aug-16 7 7,007.25$Jul-16 7,192.13$Jun-16 6,995.02$May-16 6,999.61$Apr-16 6,886.67$Mar-16Feb-16Jan-16Dec-15Nov-15Oct-15Sep-15Aug-15Jul-15Jun-15May-15
TOTALS 110 88,494.28$
Exhibit 2B Page 202

Proprietary and Confidential © Siemens Industry IGA Report – May, 2019 – | Page 563
Siemens – Broward County, Investment Grade Audit | May 2019
RECOMMENDED IMPROVEMENT MEASURES
This section addresses the Facility Improvement Measures (FIMs) recommended forimplementation at this facility. Each solution is presented with a brief description of theintended scope, savings calculation method, guaranteed savings in units of energy, and theindividual FIM’s financial analysis with payback. As requested, the following improvementscosts are listed separately and do not directly affect a FIM’s payback:
∂ Development Costs
∂ Measurement & Verification (performance assurance)
∂ Code compliance issues uncovered that directly relates to the constructability of a specificmeasure
BUILDING LEVEL SUMMARY
The following table summarized the complete list of FIMs recommended for this facility. Thesummation at the bottom of the table represents the total costs and savings of all FIMs only.As stated, the fixed costs associated with in with development, performance assurance, andcode compliance are considered as separate items.
Building Level Finanical Summary
SAVINGS CALCULATION METHODOLOGY
FIMs were developed using spreadsheet models and engineering calculations. Energy usingequipment was measured to determine power consumption, kW. Extensive data logging ofequipment was also used to determine energy consumption, kWh. Savings calculations areprovided as in Section H, Appendices.
Building or Facility DescriptionSAVINGS
Electric KWh $SAVINGS
Electric KW $SAVINGSWater $
SAVINGSO & M
TotalSavings Project Costs Simple
PaybackSunview Park Lighting - Interior 1,516.20$ -$ -$ 223$ 1,739.20$ 14,885.35$ 8.6Sunview Park Lighting - Exterior 2,195.45$ -$ -$ 143$ 2,338.45$ 36,457.79$ 15.6Sunview Park Water - COMBINED 36.65$ -$ 9,442.08$ 730$ 10,209.21$ 57,729.10$ 5.7Breakage Fee 478.08$PA Cost 1,064.12$Total 3,748.30$ -$ 9,442.08$ 1,096$ 14,286.86$ 110,614.44$ 7.7
Exhibit 2B Page 203

Proprietary and Confidential © Siemens Industry IGA Report – May, 2019 – | Page 564
Siemens – Broward County, Investment Grade Audit | May 2019
LIGHTING RETROFIT
The following section describes all lighting scope of work proposed for implementation.
PROJECT SCOPE – INTERIOR LIGHTING
LED Replacement of Linear Lamps
The design strategy is to specify and standardize on the same type of linear LED T8 and T5lamps types throughout the buildings to be included in this project. We select a non-proprietary proven LED tube that will provide the greatest performance and energy savings ofany of the lighting systems considered. The proposed LED Linear tubes are a premium highlumen, extended life with best in class warranty.
The predominant LED lamp we have selected for this project is an UL Type B LED linear type.The UL Type B lamp a direct wire lamp that doesn’t require an external ballast or driver. Theexisting T-8 or T5 ballast will be removed from the fixture and disposed of. New lampsockets approved for direct wire LED lamps will also be installed on the feed ends to ensureproblem free installation and reduce future maintenance. This LED retrofit strategy will allowus to maintain recommended light levels while providing a reduction in energy usage in alllinear lamp fixtures and still standardize on lamp types. All fixtures retrofitted will be drywiped to remove dust and particulate matter to improve fixture lumen efficiency.
Fixture types associated with these lamps are surface or recessed linear fixtures.
In the case of existing 2’x2’ troffers, a different approach is used. There is less flexibility inlamp wattage when dealing with U-shaped lamps, and installing linear lamp kits can be achallenge due to variation in fixture construction. Additionally, in many cases, it is possibleto reduce light output if the fixture can be made more efficient. To provide consistency ofcomponents and reduce energy use, we have proposed installing 2x2 volumetric style retrofitdoor kits with dedicated LED boards and drivers.
LED Replacement for Screw Based Incandescent and Compact fluorescent fixtures
Our design strategy for the replacement of screw based incandescent and compactfluorescent lamps is to replace them with screw based LED where the application permits.LED has become an attractive replacement option when incandescent fixtures are controlledby dimmers due to its excellent dimming capability.
LED Replacement for Pin-Based Compact Fluorescent Fixtures
In keeping with the direction to remove fluorescent ballasts, reduce energy use and minimizecost, our design strategy for existing pin-based compact fluorescent lamps is to retrofit theexisting fixtures with line voltage pin based LED lamps and remove the existing fluorescentballasts. In some cases, it is possible to remove two fluorescent lamps and replace them witha single higher powered LED lamp without sacrificing luminaire output and distribution.
Emergency Lighting
Exhibit 2B Page 204

Proprietary and Confidential © Siemens Industry IGA Report – May, 2019 – | Page 565
Siemens – Broward County, Investment Grade Audit | May 2019
Backup power for emergency lighting is currently supplied by various means, includinggenerator backup (emergency lights at full output), integral battery backup ballasts(fluorescent fixtures at reduced output), and unit inverter emergency lights. Of thoseapproaches, the scenarios with existing battery backup ballasts in fluorescent fixtures requirereplacement of the battery ballasts because they are not compatible with the UL Type B LEDlamps. In those cases, a standalone EM kit with a dedicated emergency battery, LED driver,and LED board will be installed in the fixture. This kit will remain off until there is a poweroutage, at which point the LED board will illuminate.
Interior Lighting Retrofit Scope
PROJECT SCOPE – EXTERIOR LIGHTING
LED Replacement for High Intensity Discharge Exterior
The replacement of HID (high intensity discharge), including metal halide or high-pressuresodium n exterior applications provides significant energy reduction opportunities whenchanging over to LED. For exterior pole mounted applications, often the number of fixturescan be reduce based on the improved photometric and light distribution of the new LEDfixtures that wasn’t previously available in HID fixtures. All proposed LED fixtures are fromrecognized manufacturers that have met the required standards for light quality, efficiencyand longevity. In our design effort and fixture selection process, consideration is given tothe maintenance benefits of the prescribed solution resulting in less future costs to maintainexterior fixtures in difficult to reach applications. The proposed LED fixture replacement hasbeen specified to furnish light levels that are in compliance with recommended light levelsand support the existing site condition requirements. Where time clocks or automatedlighting controls are not in place, proposed LED building and site lighting will incorporate anintegral photocell to maximize energy savings.
In general, the design approach is to replace existing HID luminaires with new LED luminairesof like type, ie: shoeboxes, wallpacks, floodlights. Some fixture types are replaced with newLED fixtures of a different type, ie: recessed canopy lights replaced with low profile LEDcanopy lights.
Where deemed appropriate in parks and office buildings, integral occupancy sensors havebeen used on pole mounted shoebox luminaires in parking lots to automatically dim thelighting during hours of inactivity.
BUILDING NAME EXISTING & RETROFIT STANDARD LEGEND DESCRIPTIONSEXISTING
QTYRETROFIT
QTY
SUNVIEW PARKExisting Excluded due to lack of cost effective replacementor more efficient option - No Retrofit Proposed
2 2
Existing T8 Fluorescent - Proposed Retrofit LED 62 62Existing Incandescent - Proposed Relamp LED 27 27Existing T12 Fluorescent - Proposed Retrofit LED 1 1Existing Compact Fluorescent - Proposed Retrofit LED 16 16
Exhibit 2B Page 205

Proprietary and Confidential © Siemens Industry IGA Report – May, 2019 – | Page 566
Siemens – Broward County, Investment Grade Audit | May 2019
Decorative post top luminaires, recessed step lights, and bollards typically use low wattageHID lamps in architectural form factors. Replacement luminaires of this type are relativelyhigh in cost, with relatively low energy savings potential. As a result, the proposed designtypically calls for removing the HID lamp and ballast, and installing a new screw based LEDlamp.
Exterior Lighting Retrofit Scope
Exterior Lighting Sensor Scope
SAVINGS
The energy and cost savings were developed using a spreadsheet model. In the analysis, theexisting lighting wattage per fixture was reduced to reflect the installation of higherefficiency technology. A detailed room by room survey of the facility, available in Section H,Appendices, was performed to accurately determine the existing lighting type and quantity.
The runtime operations of the new lighting fixtures are reduced in areas that arerecommended for lighting occupancy sensors. This runtime reduction was determined basedon the results of lighting and occupancy data logging sessions conducted at various facilities.The results of these data logging session, as well as the resulting hour of operations of lightsper space type are provided also provided in Section H, Appendices.
FIM SAVINGS SUMMARY
Annual Electric Consumption: 37,145 kWh
Annual Electric Demand: 116.28 kW
FIM Financial Summary
BUILDING EXISTING & RETROFIT STANDARD LEGEND DESCRIPTIONSEXISTING
QTYRETROFIT
QTY
SUNVIEW PARKExisting Excluded due to lack of cost effective replacement or more efficientoption - No Retrofit Proposed
50 50
Existing High Intensity Discharge - Proposed New LED Fixture With Sensor 2 2Existing High Intensity Discharge - Proposed New LED Fixture 15 15
Building NameAreas Controlled
by sensorsSUNVIEW PARK 1
Building or Facility DescriptionSAVINGS
Electric KWh $SAVINGS
Electric KW $SAVINGSWater $
SAVINGSO & M
TotalSavings Project Costs Simple
PaybackSunview Park Lighting - Interior 1,516.20$ -$ -$ 223$ 1,739.20$ 14,885.35$ 8.6Sunview Park Lighting - Exterior 2,195.45$ -$ -$ 143$ 2,338.45$ 36,457.79$ 15.6
Exhibit 2B Page 206

Proprietary and Confidential © Siemens Industry IGA Report – May, 2019 – | Page 567
Siemens – Broward County, Investment Grade Audit | May 2019
WATER CONSERVATION
This FIM addresses the reduction of water consumption, wastewater production, and hotwater energy usage through the installation of highly efficient, plumbing products andcontrols. The use of these devices and others are detailed below and were selected not onlyfor their efficiency, but also to provide for durable, long-term use with minimal maintenanceand improved hygiene.
PROJECT SCOPE
Tank Style Water Closets: Tank style water closets utilize a tank fill valve on top of the bowlwhich uses gravity to drain large volumes of water into the bowl during evacuation. Pressureassisted tank valves use domestic water pressure to pressurize the tank water allowing formore forceful evacuations with less water volume. Installation of 1.00 gallons per flush (GPF)tank type, pressure assist, ADA style water closet will replace existing equipment thatcurrently consumes 1.6 to 3.5 GPF.
Flush Valves: Most commercial facilities utilize flush valve water closets. Flush valves aredesigned to release precise volumes of water when activated. High efficiency flush valvescan enable a facility to greatly reduce its water consumption by reducing flush valve flowrates and the amount of water required for evacuation. Installation of 1.28 gallons per flush(GPF) flush valve will replace existing equipment that currently consumes 1.6 to 3.5 GPF.
Bathroom Faucets/Aerators: Most faucets utilize aerators to restrict the volume of water atthe mouth of a faucet and to generate a more comfortable flow. High efficiency aerators cangreatly reduce flow rates from faucets and create a comfortable flow for hand washing andcleaning. Restricting faucet flow rates enables a facility to conserve water and reduce energyusage associated with heating water. Faucets without the threading necessary to accept anaerator can be replaced with threaded faucets. Installation of 0.5 GPM aerator or faucetretrofit will replace existing equipment that currently consumes 2.2 GPM.
Ice Machine Heat Exchanger: With a refrigeration heat exchanger system installed, colddischarge water from an ice machine or refrigeration unit is exposed to incoming domesticwater in a reservoir. This heat exchange can cool incoming water by more than 16%. Thisdrop in temperature improves the efficiency of the ice machine by more than 18%. Thiscreates energy savings by reducing the cooling load and cycle time of the ice machine orrefrigeration unit.
Smart Irrigation System: This system links daily with a climate center that compiles 8million data points daily to calculate and deliver site-specific, local weather data accuratedown to one square kilometer to each controller. This central control system enables allfeatures of each controller to be controlled and monitored by the irrigation manager from aremote location. Savings are achieved by receiving or collecting data daily to calculate the ETrates (evapotranspiration rates) of the controller’s microclimate. ET calculations incorporatevarious climate parameters (wind, sunlight, temperature, and precipitation) to determine thebase water demand of the irrigation system. This enables the system to create a waterefficient daily irrigation schedule to water as conservatively as possible.
Exhibit 2B Page 207

Proprietary and Confidential © Siemens Industry IGA Report – May, 2019 – | Page 568
Siemens – Broward County, Investment Grade Audit | May 2019
SAVINGS
The energy and cost savings for water retrofits were developed using spreadsheet modeling.Based on site interviews, facility type, square footage, and standard factors for allocation ofbusiness in square foot per person and visitors per day the total population and occupancydays for this facility were determined. Total water closet, urinal, faucet and shower usefigures were determined for the facility using standard factors for equipment use based onindustry research and case studies coupled together with the total population of the facilityand the occupancy days. The current water usage minus the proposed water usage leads tothe total water savings in gallons.
The savings value take the water savings and multiply them by the rate detailed in the UtilityData Analysis Section of this report. Energy savings were only taken in the form of hot watersavings for any equipment that utilize hot water.
Deferred maintenance savings were considered and calculated by a percentage of reductionin replacement cost for any new fixtures that will be installed. These savings are referred toas Savings O&M on the financial summary table below.
Ice machine heat exchanger savings were calculated with a spreadsheet model by taking theenergy consumption of the existing ice machine and subtracting the proposed energyconsumption with the heat exchanger. Current energy consumption was calculated usingnameplate data on the existing ice machine.
Irrigation water savings were calculated with a spreadsheet model by taking the waterconsumption of the existing irrigation system and subtracting the proposed energyconsumption with the more efficient irrigation system. Because there was no water billingdata available for the irrigation system, standard values for irrigation consumption for thisfacility’s irrigation area were used
FIM SAVINGS SUMMARY
Annual Water savings: 1,9067,07 gallons
Annual Energy savings: 339 kWh
All analysis for water savings, energy savings, deferred maintenance savings, and financialdetails is provided in Section H, Appendices of this Report.
FIM Financial Summary
Building or Facility DescriptionSAVINGS
Electric KWh $SAVINGS
Electric KW $SAVINGSWater $
SAVINGSO & M
TotalSavings Project Costs Simple
PaybackSunview Park Water - 36.65$ -$ 9,442.08$ 730$ 10,209.21$ 57,729.10$ 5.7
Exhibit 2B Page 208

Proprietary and Confidential © Siemens Industry IGA Report – May, 2019 – | Page 569
Siemens – Broward County, Investment Grade Audit | May 2019
D.43. Park - Tradewinds
FACILITY DESCRIPTION
Tradewinds Park is a large area of land thathosts a variety of small buildings andfacilities for outdoor activities. The parkcovers roughly 625 acres and has been inoperation since 1977. The park is located at3600 W Sample Rd, Coconut Creek, FL33073. The park and its facilities serve foractivities and attractions such as stables,picnic shelters, Butterfly World, modelsteam train rides, athletic fields, andmuseum. Because of the variety of activitiesthere are several different sources of utilityuse such as air conditioning, water heating,sports lighting, outdoor lighting, pumpingfor lift stations/irrigation just to name a few. It is important to note that this park houses twobusinesses, Butterfly World and Equine-Assisted Therapies of South Florida, which areindependently owned and were not a part of this study because these businesses do nothave their utilities paid by Broward County. The hours of operation for the different areas ofthe park are as follows.
Park Hours
November – March: 8AM – 6PM
March – November: 8AM – 7:30PM
Park Office Hours
Mon – Sun: 9AM – 5:30PM
General Store Hours
Weekends and Select Holidays: 8:30AM – 3:30PM
Steam Train Ride Hours
Third weekend of each month: 10AM – 4PM
Soccer and Softball Field Hours
Mon - Fri: 8AM – 10PM
Sat – Sun: 8AM – 6PM
Sat – Sun (Daylight Savings Time): 8AM – 7:30PM
Cricket Field Hours
Daily: 9AM – 6PM
Daily (Daylight Savings Time): 9AM – 7:30PM
Exhibit 2B Page 209

Proprietary and Confidential © Siemens Industry IGA Report – May, 2019 – | Page 570
Siemens – Broward County, Investment Grade Audit | May 2019
COOLING SYSTEM – PARK OFFICE
Cooling for the park office building is provided by two split DX unit. The condensing units areCarrier 3 ton and 10 ton units. These units were manufactured in 2012 and 2011,respectively. The air handlers are Carrier units that provide mixed air and were manufacturedin 2012. The HVAC system has programmable thermostat controls.
Park Office HVAC
COOLING SYSTEM- POOL CONCESSIONS & LIFEGUARD OFFICE
The cooling for the pool concessions building is provided by one Rheem7.5 ton split DX unit tthat was manufactured in 2012. The air handler is 100% return air and was manufactured in2011. The cooling system comes equipped a programmable thermostat for the building. Thelifeguard office cooling is provided by one wall unit.
Concessions & Lifeguard Office HVAC
COOLING SYSTEM – MAINTENANCE BUILDING
The cooling for the maintenance building is provided by one Carrier 7.5 ton split DX unit,manufactured in 2011, that provides mixed air into the space. The cooling system comeswith a programmable thermostat. There are some wall units in certain rooms to aid thebuilding cooling that are seldom used.
Maintenance Building HVAC
Exhibit 2B Page 210

Proprietary and Confidential © Siemens Industry IGA Report – May, 2019 – | Page 571
Siemens – Broward County, Investment Grade Audit | May 2019
COOLING SYSTEM – GATEHOUSE
There are two sets of gatehouses as the park has two entrances. The cooling for the southgatehouse buildings is provided by one Carrier 1.5 ton split system DX and two DX wall units.The carrier equipment was manufactured in 2010. The gatehouse HVAC equipment only getsused on weekends and holidays.
Gatehouse HVAC
The table below summarizes the mechanical equipment inventory for this facility.
Namplate Data of Mechanical Equipment
Tradewinds ParkWelcome Center AHU1 Carrier 40RUAA12A2A6A0A0A0 4012U45819 fan 2.4 208 3 6.9 2.2Welcome Center CU1 Carrier 38AUZA12A0B6A0A0A0 3011G50075 compressor R-410a 10 460 3 16.7 11.5 12.0
fan 460 1 0.8 0.3fan 460 1 0.8 0.3
Welcome Center AHU2 Carrier FX4DNF037 4812A81986 fan 0.5 208 1 4.1 0.8Welcome Center CU2 Carrier 24ABB336A610 1812E03173 compressor R-410a 3 460 3 5.6 11 4.0
fan 0.25 460 1 0.7 0.3
South Gatehouse AHU equipment unaccessableSouth Gatehouse CU Carrier 24ABB318A320 4610E02106 compressor R-410a 208 1 9 1.7
fan 0.0833 208 1 0.5 0.1
South Irrigation Pump1 Weg 1016246916 pump 50 230 3 112 93% 39.7South Irrigation Pump2 Weg 1017167198 pump 50 230 3 112 93% 39.7
South Jokey Pump Echtop GA3ALTF215JM2BD10 pump 10 230 22.8 89.40%South Compactor Hydrolec HYD-D-750-4-1A induction motor 10 230 3 92.50% 0.0
Maintenance AHU1 Trane 4TEC3F60B1000AA 10276P7A1V fan 1 200 1 7.6 1.4Maintenance CU1 Trane 4TTB3060D1000AA 10353N0M2F compressor R-410a 5 208 1 26.8 11.18 5.0
fan 0.2 200 1 1 0.2
Maintenance AHU2 Trane 4TEC3F60B1000AA 10276P671V fan 1 200 1 7.6 1.4Maintenance CU2 Trane 4TTB3060D1000AA 10353N812F compressor R-410a 5 208 1 26.8 11.18 5.0
fan 0.2 200 1 1 0.2
Sandblaster Compressor Champion 7-850003--.1-JJ 159106M compressor 25 200 3 72 87.50% 21.3
Admin AHU equipment unaccessableAdmin CU RAND-036-JAZ nameplate unreadable 3
Admin Ductless System Carrier 38MGQC18---3 2016V10066 compresser R-410a 208 1 10 1.9fan 0.16 208 1 0.74 0.1fan 208 1 0.0
Stable AHU equipment unaccessable 0.0Stable CU Weather King 14AJM49A01 8254W411003342 compressor R-410a 4 208 1 19.9 12 3.7
fan 0.33 208 1 1.9 0.4
Museum AHU Ruud UBHK-21J11SFC TM460207480 fan 0.5 208 1 5 0.9Museum CU Ruud UAMB-036JBZ 6316M420203041 compresor R-22 208 1 16 3.0
fan 0.33 208 1 2 0.4
Cal kWHP Tons/MBTU V Ph Amps Eff /EEREQUIPMENT Mfctr Model Serial Description Notes
General Information Size / Capacity Nameplate Information
Exhibit 2B Page 211

Proprietary and Confidential © Siemens Industry IGA Report – May, 2019 – | Page 572
Siemens – Broward County, Investment Grade Audit | May 2019
Observed Issues during Visit:
∂ Some DX units are 10 years old and use R-22 refrigerant
Examples of Observed Issues
LIGHTING SYSTEM
Interior lighting primarily consists of 60 Watt, T8 fluorescent lamps in the restroom buildingsand maintenance building and LED lighting in the park office building.
Interior Lighting Examples
Exterior Lighting consists of LED street and parking lot lighting, PL32 light fixtures at therestroom buildings, T8 lighting at the pavilions, and metal halide lighting at the equestrianarea.
Exterior Lighting Examples
Exhibit 2B Page 212

Proprietary and Confidential © Siemens Industry IGA Report – May, 2019 – | Page 573
Siemens – Broward County, Investment Grade Audit | May 2019
There are occupancy sensors that are used throughout the park in the restroom buildings,office buildings, and maintenance building.
Lighting Sensor Examples
DOMESTIC WATER SYSTEM
Domestic water usage is limited to restrooms and irrigation. Fixtures and water closets areoperated manually and via motion sensors. The following are example of the types of fixturefound within the restroom of the facility:
∂ 2.2 gpm faucets
∂ 1.5 gpf urinals
∂ Waterless urinals
∂ 3.5 toilets
There are two irrigation systems that are used at this park. This park is divided into a northsection and a south section by a main road. The irrigation system is split the same way. Theirrigation system uses water from the lake by the park.
Irrigation System
Exhibit 2B Page 213

Proprietary and Confidential © Siemens Industry IGA Report – May, 2019 – | Page 574
Siemens – Broward County, Investment Grade Audit | May 2019
BUILDING CONTROLS SYSTEM
The building is currently not equipped with a building automation system. Each zone has adedicated thermostat.
Building Controls
Some of the exterior lighting of the buildings at this park is controlled via time clock.
Exterior Lighting Controls
TRENDING DATA ACQUISITION
In order to determine the runtime operation of each unit, data loggers were installed tomonitor amperage and/or supply air temperature. This data was trended for a minimum ofseven (7) days in order to capture a typical week. The following graphs illustrate theresulting data from this logging session.
Exhibit 2B Page 214

Proprietary and Confidential © Siemens Industry IGA Report – May, 2019 – | Page 575
Siemens – Broward County, Investment Grade Audit | May 2019
Trending Data – 3 Ton Condensing Unit
This unit registered an average of 10.82 amps and was operating for a total of 42.95 hoursduring a one week period.
Trending Data – 3 Ton Condensing Unit
This unit registered an average of 3.67 amps and was operating for a total of 72.5 hoursduring a one week period.
Exhibit 2B Page 215

Proprietary and Confidential © Siemens Industry IGA Report – May, 2019 – | Page 576
Siemens – Broward County, Investment Grade Audit | May 2019
Trending Data – 10 Ton Condensing Unit
This unit registered an average of 12.77 amps and was operating for a total of 36.87 hoursduring a one week period.
Exhibit 2B Page 216

Proprietary and Confidential © Siemens Industry IGA Report – May, 2019 – | Page 577
Siemens – Broward County, Investment Grade Audit | May 2019
UTILITY DATA ANALYSIS - ELECTRIC
The electric usage at this facility is monitored by 22 electric meters with different electric ratestructures. When creating the baseline shown below, the most recent 24 month of electricbilling data was utilized as obtained directly from the Florida Power and Light website. Thedata was made available via website’s the user portal and historical data from the facility’ssmart meters.
The following table documents both the rate structure values used to calculate energysavings based on most recent electric billing data as well as the established demand andconsumption values representing baseline electric usage for the facility.
Electric Baseline Summary
For ease of presentation in this report, all 22 meters and their historical data was combinedinto the following table. Thus, the table represents the consumption baseline of the entirepark as a whole. However, the table above still governs the baseline of individual sites withinthe park when considering FIMs.
on peak off peak
Restroom 2 GS-1 - - 0.10068$ - 2,717 - -South Corp Pavilion GS-1 - - 0.10068$ - 4,335 - -
Stables GS-1 - - 0.10068$ - 60,976 - -North Maintenance GSD-1 - - 0.05803$ 11.46$ 95,701 - -
Boat Restroom GS-1 - - 0.10068$ - 21,429 - -Softball SDTR-1A 0.129757172 0.04161$ 0.05706$ 10.93$ 120,794 2,624 351Soccer SDTR-1A 0.129756272 0.04161$ 0.05706$ 10.93$ 99,789 1,147 156Pump GS-1 - - 0.10080$ - 7 - -
Trail Restrooms GS-1 - - 0.10069$ - 14,867 - -North Maintenance GSD-1 - - 0.05803$ - 95,701 - -
Lights S2 GSD-1 - - 0.05799$ 11.45$ 9,058 98 34Park GS-1 - - 0.10074$ - 4,678 - -
Gen Str GS-1 - - 0.10068$ - 21,550 - -Maintenance GS-1 - - 0.10073$ - 2,569 - -
GS-1 - - 0.10069$ - 19,096 - -Barn GS-1 - - 0.10069$ - 25,590 - -
Picnic GS-1 - - 0.10068$ - 5,534 - -Booth 1 GS-1 - - 0.10069$ - 14,444 - -
Youth Camp GS-1 - - 0.10070$ - 12,298 - -Irrigation SDTR-1A 0.129759006 0.04161$ 0.05706$ 10.93$ 71,113 491 75
Restroom ABC GS-1 - - 0.10069$ - 5,080 - -Booth 2 SDTR-1A 0.129750942 0.04161$ 0.05706$ 10.93$ 25,856 209 75
Trade Winds
$ / kWAverage
Consumptionper Year
AverageDemand per Year
MaxDemandFacility # of Meters Rate Structure
June - Sept$ / kWh
Exhibit 2B Page 217

Proprietary and Confidential © Siemens Industry IGA Report – May, 2019 – | Page 578
Siemens – Broward County, Investment Grade Audit | May 2019
The billing is, as previously shown, analyzed as a combination of all meters. As described ina previous section, an index value is calculated and compared to similar facilities within thesame geographic region. Below are the results of this comparison.
Benchmarking Summary
Overall, this building is operating at the 75th percentile of comparable facilities.
Date CustomerCharges
Consumption(kwh)
ConsumptionCharge
Demand(kW)
DemandCharge
OtherFees/Taxes
TotalCharges
Jun-15 274.18$ 55,637 3,625$ 83 924$ 314$ 5,138$Jul-15 274.18$ 59,665 597$ 89 994$ 3,716$ 5,582$Aug-15 274.18$ 67,210 726$ 89 991$ 3,952$ 5,943$Sep-15 274.18$ 67,223 747$ 86 958$ 3,947$ 5,926$Oct-15 274.18$ 62,359 680$ 539 6,451$ 3,302$ 10,707$Nov-15 274.18$ 73,145 707$ 640 7,633$ 3,927$ 12,541$Dec-15 274.18$ 76,484 635$ 625 7,447$ 4,140$ 12,496$Jan-16 293.62$ 65,040 507$ 638 6,307$ 4,366$ 11,474$Feb-16 293.62$ 41,223 239$ 560 5,487$ 2,969$ 8,989$Mar-16 293.62$ 56,796 261$ 548 5,370$ 3,969$ 9,894$Apr-16 293.62$ 46,461 318$ 549 5,380$ 3,513$ 9,504$May-16 293.62$ 52,289 338$ 596 5,842$ 3,847$ 10,320$Jun-16 302.01$ 55,441 418$ 76 818$ 3,327$ 4,866$Jul-16 284.85$ 68,018 458$ 87 959$ 4,072$ 5,774$Aug-16 284.85$ 63,957 458$ 85 935$ 3,747$ 5,425$Sep-16 284.85$ 58,375 422$ 78 853$ 3,551$ 5,111$Oct-16 284.85$ 61,654 390$ 586 5,923$ 4,118$ 10,715$Nov-16 284.85$ 63,935 349$ 685 6,930$ 4,255$ 11,818$Dec-16 284.85$ 81,793 349$ 702 7,102$ 5,284$ 13,020$Jan-17 325.00$ 68,606 385$ 697 7,189$ 4,843$ 12,742$Feb-17 325.00$ 46,828 368$ 436 4,505$ 3,231$ 8,429$Mar-17 325.00$ 54,301 412$ 604 6,236$ 3,982$ 10,955$Apr-17 325.00$ 59,011 479$ 599 6,185$ 4,251$ 11,240$May-17 325.00$ 60,904 495$ 588 6,071$ 4,366$ 11,258$
AVERAGE TOTALS 733,178 7,182$ 5,133 53,745$ 45,495$ 109,933$
25thpercentile Median 75th
percentileTrade Winds Recreation 17.17 3.7 7.3 17.6
kWh/Sq FtCBECS - 2012 kWh/Sq Ft Data
Facility Faclity Type
Exhibit 2B Page 218

Proprietary and Confidential © Siemens Industry IGA Report – May, 2019 – | Page 579
Siemens – Broward County, Investment Grade Audit | May 2019
UTILITY DATA ANALYSIS - WATER
The following table(s) summarizes the water consumption data that was available for thisfacility.
For this account there is very low consumption throughout the 24 month period. Withouttaking into account the base charge per month, the average monthly blended rate in dollarsper thousand gallons is $5.74.
Account # 000266-01 Meter #Rate AddressMeter Size 3" Meter Type W
Tradewinds Park
Date Consumption ()
TotalCharges
May-17 0 243.55$Apr-17 0 243.55$Mar-17 1 257.64$Feb-17 0 251.86$Jan-17 0 251.86$Dec-16 0 251.86$Nov-16 3 269.20$Oct-16 0 251.86$Sep-16 2 263.42$Aug-16 2 263.42$Jul-16 5 280.76$Jun-16 0 251.86$May-16 0 251.86$Apr-16 0 244.66$Mar-16 0 239.87$Feb-16 0 239.87$Jan-16 0 239.87$Dec-15 0 239.87$Nov-15 1 245.37$Oct-15 1 245.37$Sep-15 0 239.87$Aug-15 0 239.87$Jul-15 0 239.87$Jun-15 0 239.87$May-15 0 239.87$
TOTALS 15 6,226.93$
Exhibit 2B Page 219
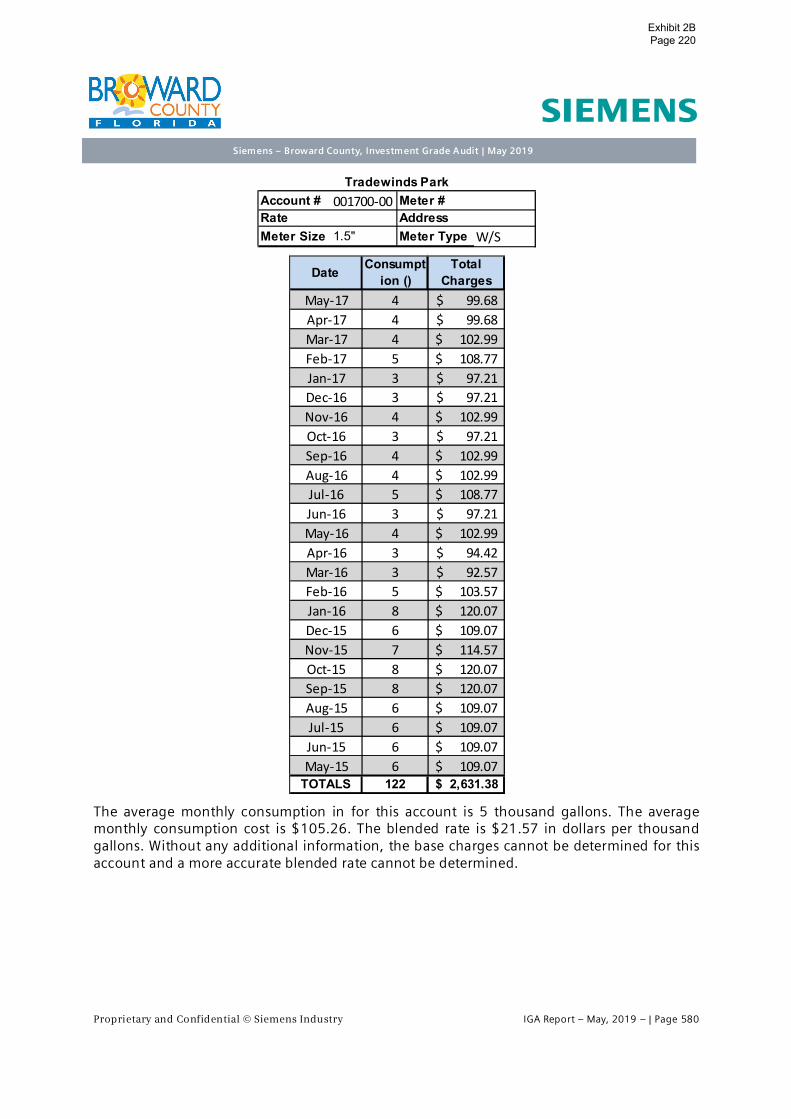
Proprietary and Confidential © Siemens Industry IGA Report – May, 2019 – | Page 580
Siemens – Broward County, Investment Grade Audit | May 2019
The average monthly consumption in for this account is 5 thousand gallons. The averagemonthly consumption cost is $105.26. The blended rate is $21.57 in dollars per thousandgallons. Without any additional information, the base charges cannot be determined for thisaccount and a more accurate blended rate cannot be determined.
Account # 001700-00 Meter #Rate AddressMeter Size 1.5" Meter Type W/S
Tradewinds Park
Date Consumption ()
TotalCharges
May-17 4 99.68$Apr-17 4 99.68$Mar-17 4 102.99$Feb-17 5 108.77$Jan-17 3 97.21$Dec-16 3 97.21$Nov-16 4 102.99$Oct-16 3 97.21$Sep-16 4 102.99$Aug-16 4 102.99$Jul-16 5 108.77$Jun-16 3 97.21$May-16 4 102.99$Apr-16 3 94.42$Mar-16 3 92.57$Feb-16 5 103.57$Jan-16 8 120.07$Dec-15 6 109.07$Nov-15 7 114.57$Oct-15 8 120.07$Sep-15 8 120.07$Aug-15 6 109.07$Jul-15 6 109.07$Jun-15 6 109.07$May-15 6 109.07$
TOTALS 122 2,631.38$
Exhibit 2B Page 220

Proprietary and Confidential © Siemens Industry IGA Report – May, 2019 – | Page 581
Siemens – Broward County, Investment Grade Audit | May 2019
The average monthly consumption in for this account is 1 thousand gallons. The averagemonthly consumption cost is $45.89. The blended rate is $42.50 in dollars per thousandgallons. Without any additional information, the base charges cannot be determined for thisaccount and a more accurate blended rate cannot be determined.
Account # 001722-01 Meter #Rate AddressMeter Size 1" Meter Type W/S
Tradewinds Park
Date Consumption ()
TotalCharges
May-17 8 84.34$Apr-17 8 84.34$Mar-17 8 87.03$Feb-17 0 40.79$Jan-17 0 40.79$Dec-16 0 40.79$Nov-16 0 40.79$Oct-16 0 40.79$Sep-16 0 40.79$Aug-16 0 40.79$Jul-16 0 40.79$Jun-16 1 46.57$May-16 0 40.79$Apr-16 0 39.63$Mar-16 0 38.85$Feb-16 1 44.35$Jan-16 0 38.85$Dec-15 0 38.85$Nov-15 0 38.85$Oct-15 0 38.85$Sep-15 0 38.85$Aug-15 0 38.85$Jul-15 0 38.85$Jun-15 0 38.85$May-15 1 44.35$
TOTALS 27 1,147.37$
Exhibit 2B Page 221

Proprietary and Confidential © Siemens Industry IGA Report – May, 2019 – | Page 582
Siemens – Broward County, Investment Grade Audit | May 2019
The average monthly consumption in for this account is 1 thousand gallons. The averagemonthly consumption cost is $85.32. The blended rate is $64.64 in dollars per thousandgallons. Without any additional information, the base charges cannot be determined for thisaccount and a more accurate blended rate cannot be determined.
Account # 001754-00 Meter #Rate AddressMeter Size 1.5" Meter Type W/S
Tradewinds Park
Date Consumption ()
TotalCharges
May-17 3 94.07$Apr-17 3 94.07$Mar-17 2 91.43$Feb-17 1 85.65$Jan-17 1 85.65$Dec-16 1 85.65$Nov-16 1 85.65$Oct-16 1 85.65$Sep-16 1 85.65$Aug-16 0 79.87$Jul-16 1 85.65$Jun-16 1 85.65$May-16 1 85.65$Apr-16 4 100.04$Mar-16 2 87.07$Feb-16 1 81.57$Jan-16 1 81.57$Dec-15 2 87.07$Nov-15 1 81.57$Oct-15 2 87.07$Sep-15 0 76.07$Aug-15 0 76.07$Jul-15 0 76.07$Jun-15 1 81.57$May-15 2 87.07$
TOTALS 33 2,133.10$
Exhibit 2B Page 222

Proprietary and Confidential © Siemens Industry IGA Report – May, 2019 – | Page 583
Siemens – Broward County, Investment Grade Audit | May 2019
The average monthly consumption in for this account is 3 thousand gallons. The averagemonthly consumption cost is $93.04. The blended rate is $34.72 in dollars per thousandgallons. Without any additional information, the base charges cannot be determined for thisaccount and a more accurate blended rate cannot be determined.
Account # 013003-01 Meter #Rate AddressMeter Size 1.5" Meter Type W/S
Tradewinds Park
Date Consumption ()
TotalCharges
May-17 3 94.07$Apr-17 3 94.07$Mar-17 3 97.21$Feb-17 2 91.43$Jan-17 2 91.43$Dec-16 5 108.77$Nov-16 4 102.99$Oct-16 2 91.43$Sep-16 0 79.87$Aug-16 2 91.43$Jul-16 2 91.43$Jun-16 8 126.11$May-16 2 91.43$Apr-16 4 100.04$Mar-16 3 92.57$Feb-16 3 92.57$Jan-16 1 81.57$Dec-15 4 98.07$Nov-15 3 92.57$Oct-15 3 92.57$Sep-15 0 76.07$Aug-15 1 81.57$Jul-15 1 81.57$Jun-15 2 87.07$May-15 4 98.07$
TOTALS 67 2,325.98$
Exhibit 2B Page 223

Proprietary and Confidential © Siemens Industry IGA Report – May, 2019 – | Page 584
Siemens – Broward County, Investment Grade Audit | May 2019
The average monthly consumption in for this account is 1 thousand gallons. The averagemonthly consumption cost is $81.05. The blended rate is $81.05 in dollars per thousandgallons. Without any additional information, the base charges cannot be determined for thisaccount and a more accurate blended rate cannot be determined.
Account # 013004-01 Meter #Rate AddressMeter Size 1.5" Meter Type W/S/ST
Tradewinds Park
Date Consumption ()
TotalCharges
May-17 2 88.46$Apr-17 2 88.46$Mar-17 0 79.87$Feb-17 1 85.65$Jan-17 0 79.87$Dec-16 1 85.65$Nov-16 0 79.87$Oct-16 1 85.65$Sep-16 0 79.87$Aug-16 1 85.65$Jul-16 0 79.87$Jun-16 1 85.65$May-16 0 79.87$Apr-16 0 77.59$Mar-16 1 81.57$Feb-16 0 76.07$Jan-16 1 81.57$Dec-15 0 76.07$Nov-15 1 81.57$Oct-15 0 76.07$Sep-15 1 81.57$Aug-15 0 76.07$Jul-15 0 76.07$Jun-15 1 81.57$May-15 0 76.07$
TOTALS 14 2,026.25$
Exhibit 2B Page 224

Proprietary and Confidential © Siemens Industry IGA Report – May, 2019 – | Page 585
Siemens – Broward County, Investment Grade Audit | May 2019
The average monthly consumption in for this account is 6 thousand gallons. The averagemonthly consumption cost is $112.67. The blended rate is $18.29 in dollars per thousandgallons. Without any additional information, the base charges cannot be determined for thisaccount and a more accurate blended rate cannot be determined.
Account # 013005-01 Meter #Rate AddressMeter Size 1.5" Meter Type W/S
Tradewinds Park
Date Consumption ()
TotalCharges
May-17 9 127.74$Apr-17 9 127.74$Mar-17 7 120.33$Feb-17 7 120.33$Jan-17 6 114.55$Dec-16 14 160.79$Nov-16 4 102.99$Oct-16 5 108.77$Sep-16 3 97.21$Aug-16 6 114.55$Jul-16 5 108.77$Jun-16 6 114.55$May-16 7 120.33$Apr-16 7 116.87$Mar-16 8 120.07$Feb-16 5 103.57$Jan-16 7 114.57$Dec-15 5 103.57$Nov-15 4 98.07$Oct-15 3 92.57$Sep-15 2 87.07$Aug-15 5 103.57$Jul-15 7 114.57$Jun-15 7 114.57$May-15 6 109.07$
TOTALS 154 2,816.79$
Exhibit 2B Page 225

Proprietary and Confidential © Siemens Industry IGA Report – May, 2019 – | Page 586
Siemens – Broward County, Investment Grade Audit | May 2019
The average monthly consumption in for this account is 4 thousand gallons. The averagemonthly consumption cost is $100.02. The blended rate is $25.78 in dollars per thousandgallons. Without any additional information, the base charges cannot be determined for thisaccount and a more accurate blended rate cannot be determined.
Account # 013006-01 Meter #Rate AddressMeter Size 1.5" Meter Type W/S
Tradewinds Park
Date Consumption ()
TotalCharges
May-17 1 82.84$Apr-17 1 82.84$Mar-17 2 91.43$Feb-17 30 253.27$Jan-17 2 91.43$Dec-16 2 91.43$Nov-16 5 108.77$Oct-16 2 91.43$Sep-16 1 85.65$Aug-16 2 91.43$Jul-16 2 91.43$Jun-16 18 183.91$May-16 2 91.43$Apr-16 4 100.04$Mar-16 4 98.07$Feb-16 1 81.57$Jan-16 1 81.57$Dec-15 2 87.07$Nov-15 2 87.07$Oct-15 2 87.07$Sep-15 0 76.07$Aug-15 2 87.07$Jul-15 2 87.07$Jun-15 6 109.07$May-15 1 81.57$
TOTALS 97 2,500.60$
Exhibit 2B Page 226

Proprietary and Confidential © Siemens Industry IGA Report – May, 2019 – | Page 587
Siemens – Broward County, Investment Grade Audit | May 2019
There is not enough consumption data in the 24 month period to make any conclusions onthis account.
Account # 013007-01 Meter #Rate AddressMeter Size 1.5" Meter Type W/S
Tradewinds Park
Date Consumption ()
TotalCharges
May-17 0 77.23$Apr-17 0 77.23$Mar-17 0 79.87$Feb-17 2 91.43$Jan-17 2 91.43$Dec-16 2 91.43$Nov-16 2 91.43$Oct-16 1 85.65$Sep-16 1 85.65$Aug-16 2 91.43$Jul-16 2 91.43$Jun-16 3 97.21$May-16 2 91.43$Apr-16 0 94.42$Mar-16 130.11$Feb-16 485.07$Jan-16 179.41$Dec-15 130.11$Nov-15 149.83$Oct-15 174.83$Sep-15 9.86$Aug-15 279.94$Jul-15 289.80$Jun-15May-15 299.66$
TOTALS 19 3,365.89$
Exhibit 2B Page 227

Proprietary and Confidential © Siemens Industry IGA Report – May, 2019 – | Page 588
Siemens – Broward County, Investment Grade Audit | May 2019
The average monthly consumption in for this account is 6 thousand gallons. The averagemonthly consumption cost is $110.03. The blended rate is $19.37 in dollars per thousandgallons. Without any additional information, the base charges cannot be determined for thisaccount and a more accurate blended rate cannot be determined.
Account # 013008-01 Meter # 34309968Rate AddressMeter Size 1.5" Meter Type W/S
Tradewinds Park
Date Consumption ()
TotalCharges
May-17 7 116.52$Apr-17 7 116.52$Mar-17 12 149.23$Feb-17 22 207.03$Jan-17 4 102.99$Dec-16 7 120.33$Nov-16 3 97.21$Oct-16 3 97.21$Sep-16 3 97.21$Aug-16 6 114.55$Jul-16 1 85.65$Jun-16 3 97.21$May-16 8 126.11$Apr-16 6 111.26$Mar-16 7 114.57$Feb-16 4 98.07$Jan-16 4 98.07$Dec-15 5 103.57$Nov-15 4 98.07$Oct-15 5 103.57$Sep-15 3 92.57$Aug-15 4 98.07$Jul-15 3 92.57$Jun-15 3 92.57$May-15 8 120.07$
TOTALS 142 2,750.80$
Exhibit 2B Page 228
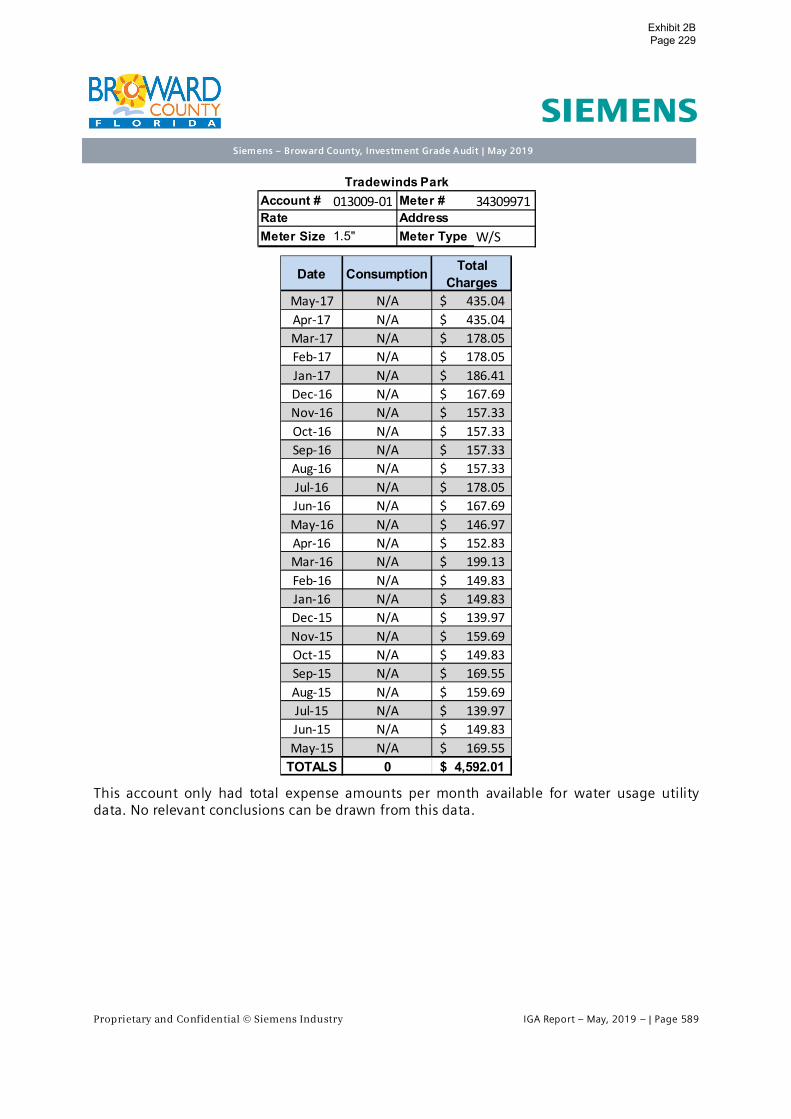
Proprietary and Confidential © Siemens Industry IGA Report – May, 2019 – | Page 589
Siemens – Broward County, Investment Grade Audit | May 2019
This account only had total expense amounts per month available for water usage utilitydata. No relevant conclusions can be drawn from this data.
Account # 013009-01 Meter # 34309971Rate AddressMeter Size 1.5" Meter Type W/S
Tradewinds Park
Date Consumption TotalCharges
May-17 N/A 435.04$Apr-17 N/A 435.04$Mar-17 N/A 178.05$Feb-17 N/A 178.05$Jan-17 N/A 186.41$Dec-16 N/A 167.69$Nov-16 N/A 157.33$Oct-16 N/A 157.33$Sep-16 N/A 157.33$Aug-16 N/A 157.33$Jul-16 N/A 178.05$Jun-16 N/A 167.69$May-16 N/A 146.97$Apr-16 N/A 152.83$Mar-16 N/A 199.13$Feb-16 N/A 149.83$Jan-16 N/A 149.83$Dec-15 N/A 139.97$Nov-15 N/A 159.69$Oct-15 N/A 149.83$Sep-15 N/A 169.55$Aug-15 N/A 159.69$Jul-15 N/A 139.97$Jun-15 N/A 149.83$May-15 N/A 169.55$
TOTALS 0 4,592.01$
Exhibit 2B Page 229

Proprietary and Confidential © Siemens Industry IGA Report – May, 2019 – | Page 590
Siemens – Broward County, Investment Grade Audit | May 2019
The average monthly consumption in for this account is 156 thousand gallons. The averagemonthly consumption cost is $997.42. The blended rate is $6.39 in dollars per thousandgallons.
Account # 019010-01 Meter #Rate AddressMeter Size 2" Meter Type W
Tradewinds Park
Date Consumption ()
TotalCharges
May-17 128 841.06$Apr-17 128 841.06$Mar-17 86 623.87$Feb-17 82 600.75$Jan-17 95 675.89$Dec-16 110 762.59$Nov-16 87 629.65$Oct-16 87 629.65$Sep-16 92 658.55$Aug-16 93 664.33$Jul-16 87 629.65$Jun-16 152 1,005.35$May-16 197 1,265.45$Apr-16 145 936.91$Mar-16 121 786.25$Feb-16 79 555.25$Jan-16 90 615.75$Dec-15 172 1,066.75$Nov-15 278 1,649.75$Oct-15 244 1,462.75$Sep-15 250 1,495.75$Aug-15 293 1,732.25$Jul-15 318 1,869.75$Jun-15 286 1,693.75$May-15 204 1,242.75$
TOTALS 3904 24,935.51$
Exhibit 2B Page 230

Proprietary and Confidential © Siemens Industry IGA Report – May, 2019 – | Page 591
Siemens – Broward County, Investment Grade Audit | May 2019
The average monthly consumption in for this account is 5 thousand gallons. The averagemonthly consumption cost is $104.48. The blended rate is $22.13 in dollars per thousandgallons. Without any additional information, the base charges cannot be determined for thisaccount and a more accurate blended rate cannot be determined
Account # 019013-01 Meter #Rate AddressMeter Size 1.5" Meter Type W
Tradewinds Park
Date Consumption ()
TotalCharges
May-17 5 105.29$Apr-17 5 105.29$Mar-17 4 102.99$Feb-17 1 85.65$Jan-17 2 91.43$Dec-16 5 108.77$Nov-16 6 114.55$Oct-16 6 114.55$Sep-16 4 102.99$Aug-16 5 108.77$Jul-16 6 114.55$Jun-16 5 108.77$May-16 5 108.77$Apr-16 6 111.26$Mar-16 5 103.57$Feb-16 3 92.57$Jan-16 3 92.57$Dec-15 5 103.57$Nov-15 5 103.57$Oct-15 5 103.57$Sep-15 3 92.57$Aug-15 5 103.57$Jul-15 7 114.57$Jun-15 7 114.57$May-15 5 103.57$
TOTALS 118 2,611.90$
Exhibit 2B Page 231

Proprietary and Confidential © Siemens Industry IGA Report – May, 2019 – | Page 592
Siemens – Broward County, Investment Grade Audit | May 2019
The average monthly consumption in for this account is 5 thousand gallons. The averagemonthly consumption cost is $104.48. The blended rate is $22.13 in dollars per thousandgallons. Without any additional information, the base charges cannot be determined for thisaccount and a more accurate blended rate cannot be determined
Account # 019014-01 Meter #Rate AddressMeter Size 1.5" Meter Type IRR
Tradewinds Park
Date Consumption ()
TotalCharges
May-17 5 105.29$Apr-17 5 105.29$Mar-17 4 102.99$Feb-17 1 85.65$Jan-17 2 91.43$Dec-16 5 108.77$Nov-16 6 114.55$Oct-16 6 114.55$Sep-16 4 102.99$Aug-16 5 108.77$Jul-16 6 114.55$Jun-16 5 108.77$May-16 5 108.77$Apr-16 6 111.26$Mar-16 5 103.57$Feb-16 3 92.57$Jan-16 3 92.57$Dec-15 5 103.57$Nov-15 5 103.57$Oct-15 5 103.57$Sep-15 3 92.57$Aug-15 5 103.57$Jul-15 7 114.57$Jun-15 7 114.57$May-15 5 103.57$
TOTALS 118 2,611.90$
Exhibit 2B Page 232

Proprietary and Confidential © Siemens Industry IGA Report – May, 2019 – | Page 593
Siemens – Broward County, Investment Grade Audit | May 2019
RECOMMENDED IMPROVEMENT MEASURES
All recommended FIMs for this facility have been removed from the final scope by BrowardCounty. Please refer to Section G of this report for documentation of these originallyproposed opportunities.
Exhibit 2B Page 233

Proprietary and Confidential © Siemens Industry IGA Report – May, 2019 – | Page 594
Siemens – Broward County, Investment Grade Audit | May 2019
D.44. Park - Vista View
FACILITY DESCRIPTION
Vista View Park is a large area of land,approximately 272 acres, that was a cappedlandfill that was repurposed to a multi-activity park. The park hosts picnic shelters,basketball courts, a playground,walking/fitness trails, and recreational airfield. The park is located at 4001 SW 142nd
Ave, Davie, FL 33330. The only sources ofutility consumption at this park come fromthe office building, maintenance building,restroom buildings, and outdoor lighting.
Park Hours
November – March: 8AM – 6PM
March – November: 8AM – 7:30PM
Park Office Hours
Mon – Sun: 9AM – 5:30AM
COOLING SYSTEM – PARK OFFICE
Cooling for the park office building is provided by a Carrier direct expansion split system. Thesystem is a 100% return air system in fair operating condition with a 13 SEER rating. Theinsulation of the copper refrigerant lines is in poor condition.
Park Office HVAC
Exhibit 2B Page 234

Proprietary and Confidential © Siemens Industry IGA Report – May, 2019 – | Page 595
Siemens – Broward County, Investment Grade Audit | May 2019
COOLING SYSTEM – MAINTENANCE BUILDING
The cooling for the maintenance building is provided by one Carrier split DX unit thatprovides return air into the space. The carrier equipment was manufactured in 2009.
Maintenance Building HVAC
COOLING SYSTEM – GATEHOUSE
The cooling for the gatehouse building is provided by one Mitsubishi split system heat pumpunit. The gatehouse HVAC equipment only gets used on weekends and holidays.
Gatehouse HVAC
The table below summarizes the mechanical equipment inventory for this facility.
Exhibit 2B Page 235

Proprietary and Confidential © Siemens Industry IGA Report – May, 2019 – | Page 596
Siemens – Broward County, Investment Grade Audit | May 2019
Namplate Data of Mechanical Equipment
LIGHTING SYSTEM
Interior lighting primarily consists of 55 Watt, T8 fluorescent lighting and compact florescentlighting in the office building, maintenance building, and restroom buildings.
Interior Lighting Examples
Exterior Lighting consists of metal halide street and parking lot lighting, PL32 light fixturesand compact florescent light fixtures.
Exterior Lighting Examples
The building does not make use of occupancy sensors or any other types of lighting control
Vista View ParkAHU1 Carrier FY4ANF036 2209A68123 fan 0.33 208 1 2.4 0.4AHU2 Carrier 40RM-008--H611HC 0909U04312 fan 2.4 208 3 5.8 1.9CU1 Carrier 24ACB336A500 1909E20097 compressor R-410a 208 3 9.2 13 SEER 3.0
fan 0.24 208 1 1.4 0.3CU2 Carrier 38ARZ008--K511 3409G40129 compressor R-22 208 3 29 13 SEER 9.4
fan 230 1 1.5 0.3fan 230 1 1.5 0.3
Heat Pump Mitsubishi MUZ-FE12NA 9000182T compressor R-410a 208 1 8.6 1.6fan 208 1 0.56 0.1fan
Irrigation Pump 1 nameplate unreadableIrrigation Pump 2 Weg pump 10 208 3 26.1 88.50% 7.5Irrigation Pump 3 Weg pump 10 208 3 26.1 88.50% 7.5
Cal kWNotes HPTons/MBTU V Ph Amps
General Information Size / Capacity Nameplate Information
EQUIPMENT Mfctr Model Serial Description Eff /EER
Exhibit 2B Page 236

Proprietary and Confidential © Siemens Industry IGA Report – May, 2019 – | Page 597
Siemens – Broward County, Investment Grade Audit | May 2019
DOMESTIC WATER SYSTEM
Domestic water usage is limited to restrooms and irrigation. Fixtures and water closets areoperated manually and via motion sensors. The following are example of the types of fixturefound within the restroom of the facility:
∂ 2.2 gpm faucets
∂ 1.5 and 1 gpf urinals
∂ 3.5 and 1.6 gpf toilets
Restroom Fixture Examples
There are two irrigation systems that are used at this park. The irrigation system is dividedinto a north section and a south section. The irrigation system uses water from the lake inthe park.
Irrigation System
BUILDING CONTROLS SYSTEM
The building is currently not equipped with a building automation system. Each zone has adedicated thermostat.
Building Controls
Exhibit 2B Page 237

Proprietary and Confidential © Siemens Industry IGA Report – May, 2019 – | Page 598
Siemens – Broward County, Investment Grade Audit | May 2019
Some of the exterior lighting of the buildings at this park is controlled via time clock.
Exterior Lighting Controls
TRENDING DATA ACQUISITION
No trending data for HVAC equipment was collected for this facility.
Exhibit 2B Page 238

Proprietary and Confidential © Siemens Industry IGA Report – May, 2019 – | Page 599
Siemens – Broward County, Investment Grade Audit | May 2019
UTILITY DATA ANALYSIS - ELECTRIC
The electric usage at this facility is monitored by three (3) electric meters of varying ratestructures. When creating the baseline shown below, the most recent 24 month of electricbilling data was utilized as obtained directly from the Florida Power and Light website. Thedata was made available via website’s the user portal and historical data from the facility’ssmart meters.
The following table documents both the rate structure values used to calculate energysavings based on most recent electric billing data as well as the established demand andconsumption values representing baseline electric usage for the facility.
Electric Baseline Summary
Meter ACD2111; Account: 1842267765; Address: 4001 SW 142ND AVE # TRLR
Trailor GS-1 0.10069$ - 6,146 - -Lift GS-1 0.10069$ - 20,261 - -
Maintenance GSD-1 0.05803$ 11.46$ 74,136 94 21Vista View
$ / kWAverage
Consumptionper Year
AverageDemand per Year
MaxDemand
Facility # of Meters Rate Structure $ / kWh
Date CustomerCharge
Consumption(kwh)
ConsumptionCharge
OtherFees/Taxes
TotalCharges
Jun-15 7.46$ 477 45.90$ 3.43$ 57$Jul-15 7.46$ 501 48.21$ 3.59$ 59$Aug-15 7.46$ 463 44.55$ 3.36$ 55$Sep-15 7.46$ 646 62.16$ 4.13$ 74$Oct-15 7.46$ 461 44.36$ 3.14$ 55$Nov-15 7.46$ 474 45.61$ 3.22$ 56$Dec-15 7.46$ 425 40.89$ 2.94$ 51$Jan-16 7.46$ 404 36.66$ 3.83$ 48$Feb-16 7.46$ 409 37.11$ 3.88$ 48$Mar-16 7.46$ 517 46.91$ 4.92$ 59$Apr-16 7.46$ 513 46.55$ 4.07$ 58$May-16 7.46$ 556 50.45$ 4.32$ 62$Jun-16 7.75$ 610 54.34$ 5.41$ 68$Jul-16 7.75$ 553 49.27$ 4.97$ 62$Aug-16 7.75$ 604 53.81$ 5.37$ 67$Sep-16 7.75$ 579 51.58$ 5.01$ 64$Oct-16 7.75$ 538 47.93$ 4.71$ 60$Nov-16 7.75$ 547 48.73$ 4.78$ 61$Dec-16 7.75$ 442 39.38$ 3.99$ 51$Jan-17 10.00$ 506 45.60$ 4.84$ 60$Feb-17 10.00$ 439 39.56$ 4.32$ 54$Mar-17 10.00$ 607 56.53$ 5.86$ 72$Apr-17 10.00$ 492 45.82$ 4.90$ 61$May-17 10.00$ 528 49.24$ 5.13$ 64$
AVERAGE TOTALS 6,146 565.57$ 52.06$ 714.52$
Exhibit 2B Page 239

Proprietary and Confidential © Siemens Industry IGA Report – May, 2019 – | Page 600
Siemens – Broward County, Investment Grade Audit | May 2019
Meter KLL0901; Account: 9874947436; Address: 14801 ORANGE DR #LIFT
0
100
200
300
400
500
600
700
0
100
200
300
400
500
600
700
Jan Feb Mar Apr May Jun Jul Aug Sep Oct Nov Dec
CDD
Cons
umpt
ion
(kW
h)
Month
Electric Consumption Profile
Consumption (kWh) CDD
Date CustomerCharge
Consumption(kwh)
ConsumptionCharge
OtherFees/Taxes
TotalCharges
Jun-15 7.46$ 1,620 155.88$ 10.15$ 173$Jul-15 7.46$ 1,955 188.11$ 12.13$ 208$Aug-15 7.46$ 1,749 168.29$ 10.91$ 187$Sep-15 7.46$ 1,920 184.74$ 11.00$ 203$Oct-15 7.46$ 1,600 153.95$ 9.30$ 171$Nov-15 7.46$ 1,519 146.16$ 8.84$ 162$Dec-15 7.46$ 2,089 201.00$ 11.95$ 220$Jan-16 7.46$ 1,339 121.50$ 11.25$ 140$Feb-16 7.46$ 1,336 121.23$ 11.21$ 140$Mar-16 7.46$ 1,561 141.65$ 13.47$ 163$Apr-16 7.46$ 1,561 141.65$ 10.35$ 159$May-16 7.46$ 1,483 134.57$ 9.87$ 152$Jun-16 7.75$ 1,724 153.59$ 14.06$ 175$Jul-16 7.75$ 1,649 146.91$ 13.49$ 168$Aug-16 7.75$ 1,798 160.18$ 14.64$ 183$Sep-16 7.75$ 1,623 144.59$ 12.84$ 165$Oct-16 7.75$ 1,567 139.60$ 12.42$ 160$Nov-16 7.75$ 1,844 164.28$ 14.50$ 187$Dec-16 7.75$ 1,618 144.15$ 12.78$ 165$Jan-17 10.00$ 1,975 177.97$ 16.39$ 204$Feb-17 10.00$ 1,840 165.80$ 15.34$ 191$Mar-17 10.00$ 2,016 187.75$ 17.39$ 215$Apr-17 10.00$ 1,532 142.68$ 13.42$ 166$May-17 10.00$ 1,603 149.50$ 13.80$ 173$
AVERAGE TOTALS 20,261 1,867.86$ 150.75$ 2,115.50$
Exhibit 2B Page 240

Proprietary and Confidential © Siemens Industry IGA Report – May, 2019 – | Page 601
Siemens – Broward County, Investment Grade Audit | May 2019
Meter KLJ5249; Account: 7044259435; Address: 4001 SW 142ND AVE #MAINT
0
100
200
300
400
500
600
700
0
200
400
600
800
1,000
1,200
1,400
1,600
1,800
2,000
Jan Feb Mar Apr May Jun Jul Aug Sep Oct Nov Dec
CDD
Cons
umpt
ion
(kW
h)
Month
Electric Consumption Profile
Consumption (kWh) CDD
Date CustomerCharge
Consumption(kwh)
Demand(kW)
DemandCharge
OtherFees/Taxes
TotalCharges
Jun-15 7.46$ 6,659 0 -$ 39.72$ 687.91$Jul-15 7.46$ 7,907 0 -$ 47.05$ 815.32$Aug-15 7.46$ 7,325 0 -$ 43.63$ 755.90$Sep-15 7.46$ 7,604 0 -$ 41.71$ 780.83$Oct-15 7.46$ 6,438 0 -$ 35.40$ 662.32$Nov-15 7.46$ 6,058 0 -$ 33.37$ 623.73$Dec-15 7.46$ 6,392 0 -$ 35.16$ 657.66$Jan-16 7.46$ 4,364 0 -$ 35.16$ 438.61$Feb-16 7.46$ 4,240 0 -$ 34.20$ 426.40$Mar-16 7.46$ 5,913 0 -$ 49.27$ 593.28$Apr-16 7.46$ 5,399 0 -$ 33.46$ 530.83$May-16 7.46$ 6,143 0 -$ 37.94$ 602.82$Jun-16 7.75$ 7,342 0 -$ 57.70$ 719.55$Jul-16 20.24$ 7,706 21 218.82$ 52.80$ 658.67$Aug-16 20.24$ 8,246 19 197.98$ 53.24$ 663.97$Sep-16 20.24$ 6,894 18 187.56$ 45.45$ 581.40$Oct-16 20.24$ 5,994 19 197.98$ 42.80$ 546.33$Nov-16 20.24$ 5,573 14 145.88$ 36.59$ 467.98$Dec-16 20.24$ 5,580 17 177.14$ 39.34$ 502.33$Jan-17 25.00$ 4,981 14 145.88$ 39.97$ 467.12$Feb-17 25.00$ 4,468 15 159.00$ 36.08$ 449.96$Mar-17 25.00$ 5,312 15 159.00$ 41.20$ 510.45$Apr-17 25.00$ 5,335 17 180.20$ 43.15$ 534.84$May-17 25.00$ 6,399 18 190.80$ 49.12$ 608.55$
AVERAGE TOTALS 74,136 94 980.12$ 501.76$ 7,143.38$
Exhibit 2B Page 241

Proprietary and Confidential © Siemens Industry IGA Report – May, 2019 – | Page 602
Siemens – Broward County, Investment Grade Audit | May 2019
The billing is, as previously shown, analyzed as a combination of all meters. As described ina previous section, an index value is calculated and compared to similar facilities within thesame geographic region. Below are the results of this comparison.
Benchmarking Summary
Overall, this building is operating just below the 75th percentile of comparable facilities.
0
100
200
300
400
500
600
700
0
1,000
2,000
3,000
4,000
5,000
6,000
7,000
8,000
9,000
Jan Feb Mar Apr May Jun Jul Aug Sep Oct Nov Dec
Dem
and
(kW
)
Cons
umpt
ion
(kW
h)
Month
Electric Consumption Profile
Consumption (kWh) Demand (kW) CDD
25thpercentile Median
75thpercentile
Vista View Recreation 16.09 3.7 7.3 17.6
kWh/Sq FtCBECS - 2012 kWh/Sq Ft Data
Facility Faclity Type
Exhibit 2B Page 242

Proprietary and Confidential © Siemens Industry IGA Report – May, 2019 – | Page 603
Siemens – Broward County, Investment Grade Audit | May 2019
UTILITY DATA ANALYSIS - WATER
This account had very few water consumption data points in the 24 month period.Additionally, the expenses recorded take into account 7 different meters. Without additionalinformation, ne relevant conclusions can be drawn from this data. Further breakdown for theconsumption from each meter is needed.
Account # 266317-164646 Meter #
77559675,60325956,86745021,86744980,70218879duel,70218880dual
Rate AddressMeter Size Meter Type W/S
Date Consumption()
TotalCharges
May-17 1,596.51$Apr-17 1,596.51$Mar-17 42 1,576.60$Feb-17 1,754.98$Jan-17 62 1,774.80$Dec-16 1,745.07$Nov-16 1,497.32$Oct-16 1,715.34$Sep-16 30 1,400.74$Aug-16 1,391.27$Jul-16 1,467.03$Jun-16 1,514.38$May-16 1,448.09$Apr-16 1,562.79$Mar-16Feb-16 1,391.27$Jan-16 1,732.19$Dec-15 3,124.28$Nov-15 1,391.27$Oct-15 1,439.15$Sep-15 1,355.54$Aug-15 1,335.54$Jul-15 1,417.14$Jun-15 1,355.54$May-15 1,398.19$
TOTALS 134 37,981.54$
Exhibit 2B Page 243

Proprietary and Confidential © Siemens Industry IGA Report – May, 2019 – | Page 604
Siemens – Broward County, Investment Grade Audit | May 2019
RECOMMENDED IMPROVEMENT MEASURES
All recommended FIMs for this facility have been removed from the final scope by BrowardCounty. Please refer to Section G of this report for documentation of these originallyproposed opportunities.
Exhibit 2B Page 244

Proprietary and Confidential © Siemens Industry IGA Report – May, 2019 – | Page 605
Siemens – Broward County, Investment Grade Audit | May 2019
E. Recommended Solar Projects
Exhibit 2B Page 245

Proprietary and Confidential © Siemens Industry IGA Report – May, 2019 – | Page 606
Siemens – Broward County, Investment Grade Audit | May 2019
E. Recommended Solar Projects
SOLAR ENERGY PRODUCTION FIM
Currently, the only source of energy for Broward County facilities is through the utilityservices provided by the local electric utility provider Florida Power and Light. The powerprovided by Florida Power and Light is primarily generated using non-renewable resourcessuch as natural gas, nuclear power, and oil. Solar power in the form of photovoltaic cellsprovide a method for on-site energy generation that allows for diversification of energysourcing at the facility and a reduction of that facility’s overall carbon footprint.
EXISTING CONDITIONS
Three facilities were selected as prime candidates for on-site solar power generation. Thefacilities chosen were Hollywood Library, Tamarac Library, and CB Smith Park. These facilitieswere visited to gain an understanding of where the solar structures would be placed, howthe current conditions would affect the placement, and asses the conditions of the existingelectrical equipment.
Siemens developed preliminary designs, budgets, and energy production numbers for solarPV installations at each of these sites. Based on budget constraints and logistical concerns,Broward County ultimately selected the proposed installation at CB Smith park for inclusionin the project. Accordingly, the recommended FIMs at the Hollywood and Tamarac Librarieshave been removed from the final scope. Please refer to Section G of this report fordocumentation of these originally proposed opportunities
CB SMITH PARK
The proposed solar solution for this facility is two canopy installations. One canopy isdesigned to go over a section of the picnic area currently shaded by “Funbrellas”. The secondarea is the pump/chemical reservoir area of the recreational water park within CB Smith Park.This is the area of the park with the highest energy intensity. The site visit revealed that thereare no obstacles in the existing areas that would render them unsuitable for solar carportinstallation. The interconnection voltage is 480V/277V.
Exhibit 2B Page 246

Proprietary and Confidential © Siemens Industry IGA Report – May, 2019 – | Page 607
Siemens – Broward County, Investment Grade Audit | May 2019
CB Smith Park Site Visit
PROJECT SCOPE – CANOPY
The canopy solar energy production FIM begins by conduction a detailed structural andgeotechnical analysis of the site where the foundation for the structural members of thecanopies will be placed to verity it can withstand the different loads and forces that will bepresent when the canopies are erected. The canopies will be built in an area of high energyintensity to displace as much energy needed from the utility grid as possible. Once complete,the canopies will meet all necessary height regulations pertaining to this type of structure.The canopies will provide the benefit of offsetting facility utility costs, shading to customersvisiting the site, and lowering the carbon footprint of this facility. Below are renderings of theproposed solar layout for this facility.
Exhibit 2B Page 247

Proprietary and Confidential © Siemens Industry IGA Report – May, 2019 – | Page 608
Siemens – Broward County, Investment Grade Audit | May 2019
CB Smith Park-Proposed Solar Layout
Exhibit 2B Page 248

Proprietary and Confidential © Siemens Industry IGA Report – May, 2019 – | Page 609
Siemens – Broward County, Investment Grade Audit | May 2019
CB Smith Park-Proposed Solar Layout
Exhibit 2B Page 249

Proprietary and Confidential © Siemens Industry IGA Report – May, 2019 – | Page 610
Siemens – Broward County, Investment Grade Audit | May 2019
CB Smith Park-Proposed Solar Layout
Exhibit 2B Page 250

Proprietary and Confidential © Siemens Industry IGA Report – May, 2019 – | Page 611
Siemens – Broward County, Investment Grade Audit | May 2019
CB Smith Park-Proposed Solar Layout
Exhibit 2B Page 251
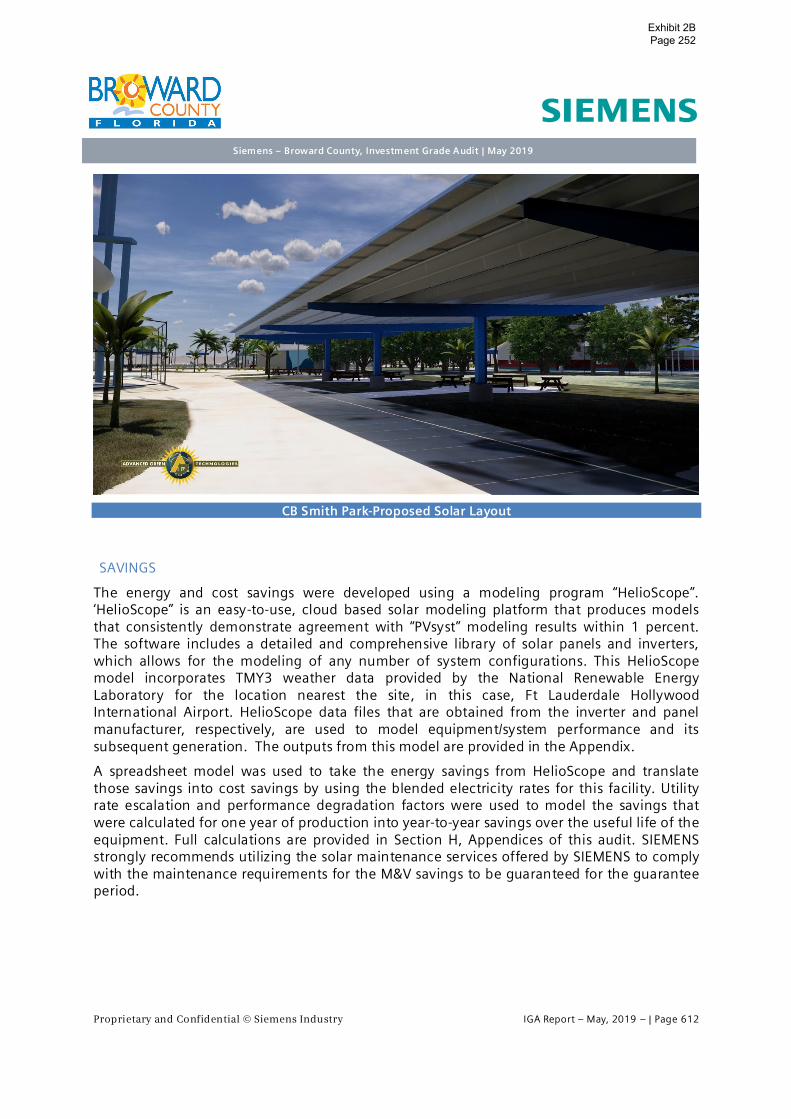
Proprietary and Confidential © Siemens Industry IGA Report – May, 2019 – | Page 612
Siemens – Broward County, Investment Grade Audit | May 2019
CB Smith Park-Proposed Solar Layout
SAVINGS
The energy and cost savings were developed using a modeling program “HelioScope”.‘HelioScope” is an easy-to-use, cloud based solar modeling platform that produces modelsthat consistently demonstrate agreement with “PVsyst” modeling results within 1 percent.The software includes a detailed and comprehensive library of solar panels and inverters,which allows for the modeling of any number of system configurations. This HelioScopemodel incorporates TMY3 weather data provided by the National Renewable EnergyLaboratory for the location nearest the site, in this case, Ft Lauderdale HollywoodInternational Airport. HelioScope data files that are obtained from the inverter and panelmanufacturer, respectively, are used to model equipment/system performance and itssubsequent generation. The outputs from this model are provided in the Appendix.
A spreadsheet model was used to take the energy savings from HelioScope and translatethose savings into cost savings by using the blended electricity rates for this facility. Utilityrate escalation and performance degradation factors were used to model the savings thatwere calculated for one year of production into year-to-year savings over the useful life of theequipment. Full calculations are provided in Section H, Appendices of this audit. SIEMENSstrongly recommends utilizing the solar maintenance services offered by SIEMENS to complywith the maintenance requirements for the M&V savings to be guaranteed for the guaranteeperiod.
Exhibit 2B Page 252
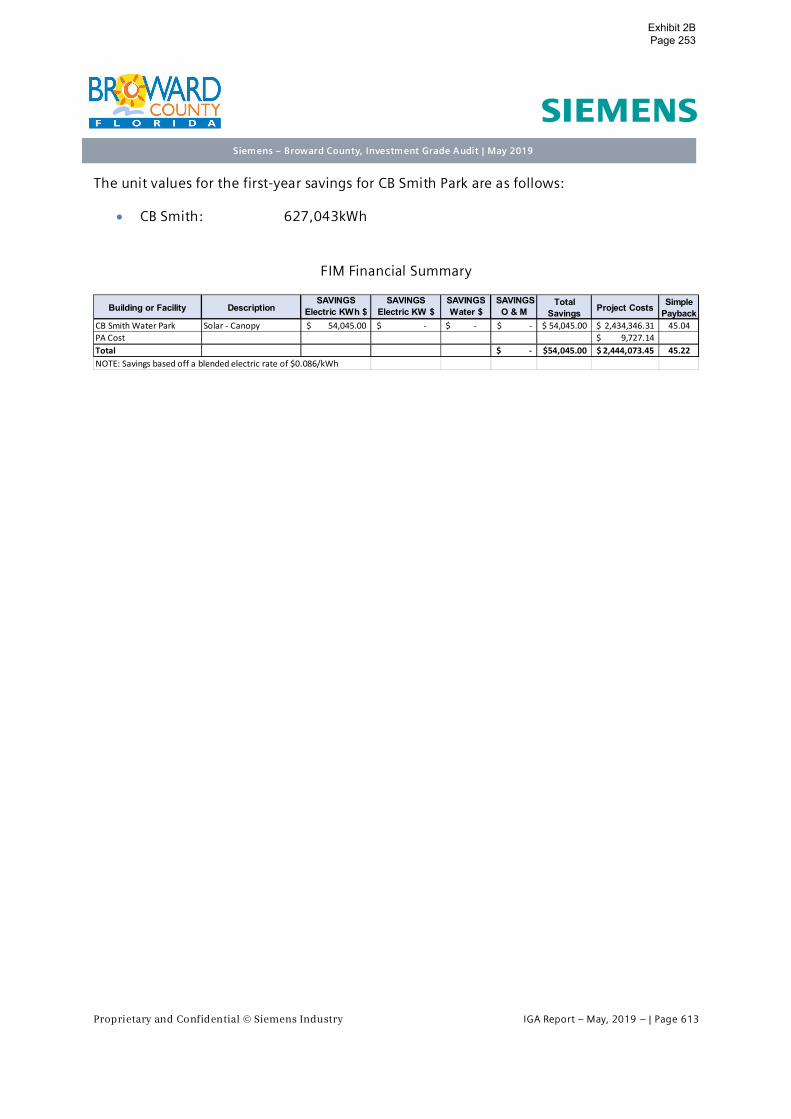
Proprietary and Confidential © Siemens Industry IGA Report – May, 2019 – | Page 613
Siemens – Broward County, Investment Grade Audit | May 2019
The unit values for the first-year savings for CB Smith Park are as follows:
∂ CB Smith: 627,043kWh
FIM Financial Summary
Building or Facility DescriptionSAVINGS
Electric KWh $SAVINGS
Electric KW $SAVINGSWater $
SAVINGSO & M
TotalSavings Project Costs Simple
PaybackCB Smith Water Park Solar - Canopy 54,045.00$ -$ -$ -$ 54,045.00$ 2,434,346.31$ 45.04PA Cost 9,727.14$Total -$ 54,045.00$ 2,444,073.45$ 45.22NOTE: Savings based off a blended electric rate of $0.086/kWh
Exhibit 2B Page 253

Proprietary and Confidential © Siemens Industry IGA Report – May, 2019 – | Page 614
Siemens – Broward County, Investment Grade Audit | May 2019
F. FIMs Not Recommended
Exhibit 2B Page 254

Proprietary and Confidential © Siemens Industry IGA Report – May, 2019 – | Page 615
Siemens – Broward County, Investment Grade Audit | May 2019
F. Description of FIMs Not Recommended
F.1. Lighting Systems SolutionsA complete lighting audit was perfromed at all facilities included within the scope provided.In an effort to create the desired paybacks, scope was removed from the comprehensivelighting solution apporach of specific facilities. This included such scope as interior andexterior retrofits and sensor applications. The following identifies the scope of work that wasremoved and their resulting, stand-alone, paybacks.
SOUTH REGIONAL COURTHOUSE
Exterior Lighting Retrofit Scope Considered
FIM Financial Summary
BUILDING EXISTING & RETROFIT STANDARD LEGEND DESCRIPTIONSEXISTING
QTYRETROFIT
QTY South Regional
CourthouseExisting High Intensity Discharge - Proposed New LED Fixture 18 18
Existing Compact Fluorescent - Proposed New LED Fixture 48 48Existing T8 Fluorescent - Proposed Retrofit LED 57 47Existing Compact Fluorescent - Proposed Retrofit LED 5 5
Lighting - Exterior 1,734$ -$ 546$ -$ 2,280$ 51,257$ 22.5Lighting - Occupancy 55$ -$ -$ -$ 55$ 6,302$ 114.4
South RegionalCourthouse
SavingsKWH
SavingsKW Savings O&M Savings
CapitalTotal
Savings Project Cost Payback
Exhibit 2B Page 255

Proprietary and Confidential © Siemens Industry IGA Report – May, 2019 – | Page 616
Siemens – Broward County, Investment Grade Audit | May 2019
HIGH & BRDG ADMINISTRATION
Exterior Lighting Retrofit Scope Considered
FIM Financial Summary
MASS TRAN, DOWNTOWN TERMINAL
Exterior Lighting Retrofit Scope Considered
FIM Financial Summary
BUILDING EXISTING & RETROFIT STANDARD LEGEND DESCRIPTIONSEXISTING
QTYRETROFIT
QTYHIGH & BRDGAdministration,
Pompano
Existing Excluded due to lack of cost effective replacement or more efficientoption - No Retrofit Proposed
3 3
Existing High Intensity Discharge - Proposed Retrofit LED 5 5Existing High Intensity Discharge - Proposed New LED Fixture 24 24
Lighting - Exterior 2,247$ -$ 298$ -$ 2,545$ 41,922$ 16.5
HIGH & BRDGAdministration, Pompano
SavingsKWH
SavingsKW Savings O&M Savings
CapitalTotal
Savings Project Cost Payback
BUILDING EXISTING & RETROFIT STANDARD LEGEND DESCRIPTIONSEXISTING
QTYRETROFIT
QTY
MASS TRAN,Downtown Terminal
Existing Excluded due to lack of cost effective replacement or more efficientoption - No Retrofit Proposed
3 3
Existing High Intensity Discharge - Proposed New LED Fixture 46 46Existing T5 Fluorescent - Proposed RETROFIT LED 136 136
Lighting - Exterior 2,975$ -$ 676$ -$ 3,651$ 55,391$ 15.2
MASS TRAN, DowntownTerminal
SavingsKWH
SavingsKW PaybackSavings O&M Savings
CapitalTotal
Savings Project Cost
Exhibit 2B Page 256

Proprietary and Confidential © Siemens Industry IGA Report – May, 2019 – | Page 617
Siemens – Broward County, Investment Grade Audit | May 2019
PARK, CB SMITH
Exterior Lighting Retrofit Scope Considered
FIM FINANCIAL SUMMARY
PARK, QUIET WATERS
Exterior Lighting Retrofit Scope Considered
FIM Financial Summary
BUILDING EXISTING & RETROFIT STANDARD LEGEND DESCRIPTIONSEXISTING
QTYRETROFIT
QTY
CB SMITH PARKExisting Excluded due to lack of cost effective replacement or more efficientoption - No Retrofit Proposed
124 124
Existing High Intensity Discharge - Proposed New LED Fixture With Sensor 93 65Existing High Intensity Discharge - Proposed Retrofit LED 34 34Existing High Intensity Discharge - Proposed New LED Fixture 23 23Existing Incandescent - Proposed New LED Fixture 4 4Existing T8 Fluorescent - Proposed New LED Fixture 84 84Existing Compact Fluorescent - Proposed New LED Fixture 47 47Existing Incandescent - Proposed Relamp LED 10 10Existing Compact Fluorescent - Proposed Relamp LED 28 28Existing T8 Fluorescent - Proposed Retrofit LED 48 48
Lighting - Exterior and Sensors 10,758$ -$ 2,309$ -$ 13,067$ 194,441$ 14.9Lightgin - COMBINED 14,152$ -$ 2,733$ -$ 16,885$ 237,100$ 14.0
CB SMITH PARK SavingsKWH
SavingsKW Savings O&M Savings
CapitalTotal
Savings Project Cost Payback
BUILDING EXISTING & RETROFIT STANDARD LEGEND DESCRIPTIONSEXISTING
QTYRETROFIT
QTYQUIET WATERS
PARKExisting High Intensity Discharge - Proposed New LED Fixture With Sensor 169 132
Existing High Intensity Discharge - Proposed Retrofit LED 4 4Existing High Intensity Discharge - Proposed New LED Fixture 20 20Existing Compact Fluorescent - Proposed Relamp LED 36 36
Lighting - Exterior and Sensors 10,629$ -$ 2,412$ -$ 13,041$ 208,075$ 16.0
QUIET WATERS PARK Project Cost PaybackSavingsKWH
SavingsKW Savings O&M Savings
CapitalTotal
Savings
Exhibit 2B Page 257

Proprietary and Confidential © Siemens Industry IGA Report – May, 2019 – | Page 618
Siemens – Broward County, Investment Grade Audit | May 2019
LIBRARY, TAMARAC
Interior Lighting Retrofit Scope Considered
FIM Financial Summary
BUILDING NAME EXISTING & RETROFIT STANDARD LEGEND DESCRIPTIONSEXISTING
QTYRETROFIT
QTY
LIBRARY, TA, TamaracExisting Excluded due to lack of cost effective replacementor more efficient option - No Retrofit Proposed
17 17
Existing T8 Fluorescent - Proposed Retrofit LED 34 34Existing T8 Fluorescent - Proposed New LED Fixture 135 135Existing Compact Fluorescent - Proposed Relamp LED 121 121Existing Compact Fluorescent - Proposed Retrofit LED 35 35
Existing T8 Fluorescent U Tube - Proposed New LED Fixture 3 3
Existing T5 Fluorescent HO - Proposed RETROFIT LED 20 20Existing T5 Fluorescent HO - Proposed New LED Fixture 474 339
Lighting - Interior 4,557$ 3,396$ 2,189$ -$ 10,142$ 159,519$ 15.7
SavingsKWH
SavingsKW Savings O&M Savings
CapitalTotal
Savings Project Cost PaybackLIBRARY, TA, Tamarac
Exhibit 2B Page 258

Proprietary and Confidential © Siemens Industry IGA Report – May, 2019 – | Page 619
Siemens – Broward County, Investment Grade Audit | May 2019
LIBRARY, TYRONE BRYANT
Interior Lighting Retrofit Scope Considered
Exterior Lighting Retrofit Scope Considered
FIM Financial Summary
BUILDING NAME EXISTING & RETROFIT STANDARD LEGEND DESCRIPTIONSEXISTING
QTYRETROFIT
QTY
LIBRARY, BR, TyroneBryant
Existing Excluded due to lack of cost effective replacementor more efficient option - No Retrofit Proposed
3 3
Existing T8 Fluorescent - Proposed Retrofit LED 23 23Existing Compact Fluorescent - Proposed Retrofit LED 28 28
Existing T8 Fluorescent U Tube - Proposed New LED Fixture 2 2
Existing T5 Fluorescent HO - Proposed RETROFIT LED 92 92
Existing Compact Fluorescent - Proposed New LED Fixture 67 67
BUILDING EXISTING & RETROFIT STANDARD LEGEND DESCRIPTIONSEXISTING
QTYRETROFIT
QTYLIBRARY, BR,Tyrone Bryant
Existing High Intensity Discharge - Proposed New LED Fixture 41 41
Lighting - Interior 1,067$ 982$ 446$ -$ 2,495$ 32,632$ 13.1Lighting - Exterior 867$ 477$ 343$ -$ 1,687$ 28,365$ 16.8
Project Cost PaybackLIBRARY, BR, TyroneBryant
SavingsKWH
SavingsKW Savings O&M Savings
CapitalTotal
Savings
Exhibit 2B Page 259

Proprietary and Confidential © Siemens Industry IGA Report – May, 2019 – | Page 620
Siemens – Broward County, Investment Grade Audit | May 2019
LIBRARY, YOUNG AT ART
Interior Lighting Retrofit Scope Considered
Exterior Lighting Retrofit Scope Considered
FIM Financial Summary
BUILDING NAME EXISTING & RETROFIT STANDARD LEGEND DESCRIPTIONSEXISTING
QTYRETROFIT
QTY
LIBRARY, YAA, Young atArt
Existing Excluded due to lack of cost effective replacementor more efficient option - No Retrofit Proposed
508 508
Existing T8 Fluorescent - Proposed Retrofit LED 233 233Existing Compact Fluorescent - Proposed Relamp LED 10 10Existing Compact Fluorescent - Proposed Retrofit LED 78 78Existing T5 Fluorescent - Proposed RETROFIT LED 136 136
BUILDING EXISTING & RETROFIT STANDARD LEGEND DESCRIPTIONSEXISTING
QTYRETROFIT
QTYLIBRARY, YAA,
Young at ArtExisting Excluded due to lack of cost effective replacement or more efficientoption - No Retrofit Proposed
122 122
Existing High Intensity Discharge - Proposed New LED Fixture 10 10Existing Compact Fluorescent - Proposed New LED Fixture 65 65Existing Compact Fluorescent - Proposed Retrofit LED 2 2Existing T5 Fluorescent - Proposed RETROFIT LED 45 45
Lighting - Interior 3,733$ -$ 711$ -$ 4,444$ 58,079$ 13.1Lighting - Exterior 1,488$ -$ 575$ -$ 2,063$ 44,385$ 21.5
LIBRARY, YAA, Young atArt
SavingsKWH
SavingsKW Savings O&M Savings
CapitalTotal
Savings Project Cost Payback
Exhibit 2B Page 260

Proprietary and Confidential © Siemens Industry IGA Report – May, 2019 – | Page 621
Siemens – Broward County, Investment Grade Audit | May 2019
LIBRARY, MIRAMAR
Interior Lighting Retrofit Scope Considered
FIM Financial Summary
BUILDING NAME EXISTING & RETROFIT STANDARD LEGEND DESCRIPTIONSEXISTING
QTYRETROFIT
QTY
LIBRARY, MI, MiramarExisting Excluded due to lack of cost effective replacementor more efficient option - No Retrofit Proposed
79 79
Existing T8 Fluorescent - Proposed Retrofit LED 119 119Existing T8 Fluorescent - Proposed New LED Fixture 631 631Existing Incandescent - Proposed Relamp LED 14 14Existing Compact Fluorescent - Proposed Relamp LED 279 279
Existing T8 Fluorescent U Tube - Proposed New LED Fixture 21 21
Existing T5 Fluorescent HO - Proposed RETROFIT LED 35 35
Existing Compact Fluorescent - Proposed New LED Fixture 270 196
Lighting - Interior 15,678$ -$ 3,057$ -$ 18,735$ 274,322$ 14.6
SavingsKWH
SavingsKW Savings O&M Savings
CapitalTotal
SavingsLIBRARY, MI, Miramar Project Cost Payback
Exhibit 2B Page 261

Proprietary and Confidential © Siemens Industry IGA Report – May, 2019 – | Page 622
Siemens – Broward County, Investment Grade Audit | May 2019
PARK, ROOSEVELT GARDENS
Interior Lighting Retrofit Scope Considered
Exterior Lighting Retrofit Scope Considered
FIM Financial Summary
PARK, FRANKLIN
Interior Lighting Retrofit Scope Considered
BUILDING NAME EXISTING & RETROFIT STANDARD LEGEND DESCRIPTIONSEXISTING
QTYRETROFIT
QTYROOSEVELT GARDENS
PARKExisting T8 Fluorescent - Proposed Retrofit LED 46 46
Existing T8 Fluorescent - Proposed New LED Fixture 9 9
Existing T8 Fluorescent U Tube - Proposed New LED Fixture 15 15
BUILDING EXISTING & RETROFIT STANDARD LEGEND DESCRIPTIONSEXISTING
QTYRETROFIT
QTYROOSEVELT
GARDENS PARKExisting High Intensity Discharge - Proposed New LED Fixture With Sensor 44 44
Existing Compact Fluorescent - Proposed New LED Fixture 11 11
Lighting - Interior 464$ -$ 102$ -$ 566$ 10,610$ 18.8Lighting - Exterior and Sensors 1,825$ -$ 546$ -$ 2,371$ 58,996$ 24.9Lighting - Occupancy 10$ -$ -$ -$ 10$ 1,137$ 119.6
ROOSEVELT GARDENSPARK
SavingsKWH
SavingsKW Savings O&M Savings
CapitalTotal
Savings Project Cost Payback
BUILDING NAME EXISTING & RETROFIT STANDARD LEGEND DESCRIPTIONSEXISTING
QTYRETROFIT
QTY
FRANKLIN PARKExisting Excluded due to lack of cost effective replacementor more efficient option - No Retrofit Proposed
200 200
Exhibit 2B Page 262

Proprietary and Confidential © Siemens Industry IGA Report – May, 2019 – | Page 623
Siemens – Broward County, Investment Grade Audit | May 2019
PARK, VISTA VIEW
Interior Lighting Retrofit Scope Considered
Exterior Lighting Retrofit Scope Considered
FIM Financial Summary
The following further details the sensor scope mentioed in a few of the above tables:
Controls: Occupancy Sensors and Photocells
The addition of new occupancy sensors and daylighting controls (photocells) were evaluatedwith project payback as the primary metric. Due to the low power density of the proposedlighting retrofit, occupancy sensing controls do not improve payback unless there is asubstantial amount of time lights are on in unoccupied spaces. The proposed designincludes the addition of occupancy sensors only in spaces where logger data indicatessubstantial opportunities exist. Similarly, a few buildings have perimeter spaces with glazingfrom floor to ceiling where daylighting controls could be used to reduce energy use.Evaluation of proposed simple daylighting controls indicated in many cases, more than 100%or the retrofit energy use would need to be removed in order to match payback. Additionally,the linear UL Type B LED tubes are not dimmable, which results in the need to use an on/offprotocol which can be distracting to occupants, and generally not desired.
BUILDING NAME EXISTING & RETROFIT STANDARD LEGEND DESCRIPTIONSEXISTING
QTYRETROFIT
QTY
VISTA VIEW PARKExisting Excluded due to lack of cost effective replacementor more efficient option - No Retrofit Proposed
10 10
Existing T8 Fluorescent - Proposed Retrofit LED 58 58Existing T8 Fluorescent - Proposed New LED Fixture 27 27Existing Compact Fluorescent - Proposed Retrofit LED 6 6
BUILDING EXISTING & RETROFIT STANDARD LEGEND DESCRIPTIONSEXISTING
QTYRETROFIT
QTY
VISTA VIEW PARKExisting Excluded due to lack of cost effective replacement or more efficientoption - No Retrofit Proposed
1 1
Existing High Intensity Discharge - Proposed New LED Fixture 62 62Existing Compact Fluorescent - Proposed New LED Fixture 22 22Existing Compact Fluorescent - Proposed Relamp LED 13 13Existing T8 Fluorescent - Proposed Retrofit LED 4 4
Lighting - Interior 398$ 394$ 98$ -$ 890$ 12,485$ 14.0Lighting - Exterior and Sensors 1,250$ 685$ 592$ -$ 2,527$ 39,199$ 15.5
VISTA VIEW PARK SavingsKW Savings O&M Savings
CapitalTotal
Savings Project Cost PaybackSavingsKWH
Exhibit 2B Page 263

Proprietary and Confidential © Siemens Industry IGA Report – May, 2019 – | Page 624
Siemens – Broward County, Investment Grade Audit | May 2019
Interior Sensor Scope Considered
Exterior Sensor Scope Considered
Building NameAreas Controlled
by sensorsMARKHAM PARK 8BCJC N Wing 23BC Agriculture Extension 5ROOSEVELT GARDENS PARK 2South Regional Courthouse 10West Regional Courthouse 7
Building NameAreas Controlled
by sensorsCB SMITH PARK 3QUIET WATERS PARK 5BC Agriculture Extension 2ROOSEVELT GARDENS PARK 1
Exhibit 2B Page 264

Proprietary and Confidential © Siemens Industry IGA Report – May, 2019 – | Page 625
Siemens – Broward County, Investment Grade Audit | May 2019
F.2. Water Conservation SolutionsA water audit was performed at all facilities within the scope provided except for at the Mid-rise/East Parking building, the Young at Arts library, Pompano Beach Branch Library andLafayette Hart Park. This audit was performed in an effort to create the desired paybacks.Scope, in the form of flush valve and china replacements, flow restrictors, and low flowshowerheads, was removed from the comprehensive water retrofit approach of specificfacilities. The following identifies those facilities that were removed and their resulting,stand alone, paybacks.
Ice Machine Heat Exchanger: With a refrigeration heat exchanger system installed, colddischarge water from an ice machine or refrigeration unit is exposed to incoming domesticwater in a reservoir. This heat exchange can cool incoming water by more than 16%. Thisdrop in temperature improves the efficiency of the ice machine by more than 18%. Thiscreates energy savings by reducing the cooling load and cycle time of the ice machine orrefrigeration unit.
In the water audit, ice machines at the facilities within the scope of work were identified andanalyzed for potential sources for energy savings. This audit was performed in an effort tocreate the desired paybacks. The following identifies those facilities that were removed andtheir resulting, stand alone, paybacks.
CB Smith Park 199$ 1,539$ 1,288$ 3,026$ 189,622$ 62.7Markham Park 188$ 1,098$ 673$ 1,960$ 67,188$ 34.3Quiet Waters Park 103$ 1,050$ 455$ 1,608$ 46,046$ 28.6Main Library 117$ 3,706$ 765$ 4,588$ 98,575$ 21.5Mirmar Library 1,065$ 1,233$ 481$ 2,779$ 50,905$ 18.3East Regional Library 76$ 1,183$ 175$ 1,435$ 24,525$ 17.1Tamarac Library 114$ 1,188$ 175$ 1,477$ 25,565$ 17.3Imperial Point Library 7$ 79$ 1$ 87$ 3,463$ 39.9Lauderhill Library 60$ 652$ 105$ 817$ 12,479$ 15.3EOC 14$ 56$ 237$ 307$ 23,518$ 76.6West Regional Courthouse 206$ 3,580$ 377$ 4,164$ 56,612$ 13.6HIGH & Bridge Admin 28$ 299$ 201$ 528$ 33,037$ 62.6BCJC State Att (LTS) 44$ 439$ 24$ 507$ 8,669$ 17.1Hunter & Hughes 276$ 1,261$ 303$ 1,840$ 38,683$ 21.0South Regional Health Center 256$ 1,258$ 246$ 1,760$ 31,724$ 18.0NW Health Center 42$ 316$ 29$ 387$ 10,176$ 26.3Fleet Services 3&4 11$ 162$ 85$ 258$ 7,194$ 27.9State Attorney & Clerks Warhouse 2$ 20$ 22$ 43$ 2,794$ 64.9Fleet Services 2 2$ 55$ 85$ 142$ 6,565$ 46.1West Regional Maintenance 11$ 30$ 12$ 53$ 2,794$ 52.7BC Government Center 2,393$ 23,140$ 1,387$ 26,920$ 209,108$ 7.8
Water - RetrofitsSavings
KWHSavingsWater
SavingsO&M
TotalSavings
Project Cost Payback
Exhibit 2B Page 265

Proprietary and Confidential © Siemens Industry IGA Report – May, 2019 – | Page 626
Siemens – Broward County, Investment Grade Audit | May 2019
Smart Irrigation Controls: Most automated irrigation systems develop watering schedulesbased on manual time-based irrigation controllers. These controllers require manualadjustments, cannot be controlled remotely, and develop watering schedules based on dailyor weekly time schedules. Due to the fact they operate without consideration of weatherconditions, these systems are prone to overwatering on days when there is little to no needfor irrigation due to favorable weather conditions. Central controlled smart irrigationsystems receive or collect data daily to calculate the ET rates (evapotranspiration rates) of thecontroller’s microclimate. ET calculations incorporate various climate parameters (wind,sunlight, temperature, and precipitation) to determine the base water demand of theirrigation system. This enables the system to create a water efficient daily irrigation scheduleto water as conservatively as possible. Central controlled smart irrigation systems can bemonitored and controlled remotely through various management software.
In the water audit, irrigation systems at the facilities within the scope of work were identifiedand analyzed for potential sources for energy savings. This audit was performed in an effortto create the desired paybacks. The following identifies those facilities that were removedand their resulting, stand alone, paybacks.
On-Site Hypochlorite Generation: Sodium hypochlorite generators produce poolchlorination chemicals from the electrochemical reaction between salt, water, and electricity.On-site production of chlorine as a solution of sodium hypochlorite alleviates the risks topublic health and safety relating to the storage and transportation of hazardous acid andconcentrated chlorine solutions. The only raw material, salt, is an inert, safe compound thatis stored in a feeder on-site and used as required by the chlorine generator. On-sitegeneration systems create a pH neutral chlorine allowing for a more stable, effective chlorineto treat your commercial pool or aquatic center. On-site hypochlorite is a dilute form ofdisinfectant compared to chlorine gas or concentrated commercial hypochlorite. The rawmaterials required by on-site generators are 75% to 90% cheaper than the annual cost oftraditional chlorine and pool chemicals. On-site generation also allows for improvedinactivation of microorganisms, increased water quality by reduced disinfection byproducts,and reduced threat to public safety.
In the water audit, pool and aquatic systems at the facilities within the scope of work wereidentified and analyzed for potential sources for cost savings. This audit was performed in aneffort to create the desired paybacks. The following identifies those facilities that wereremoved and their resulting, stand alone, paybacks.
EOC 83$ 83$ 1,303$ 15.7CB Smith Park 193$ 193$ 2,607$ 13.5
Total Savings Project Cost PaybackSavings KWH
Hunter and Hughes 2,640$ 2,640$ 34,948$ 13.2
Water - IrrigationSavingsWater
TotalSavings
ProjectCost Payback
Exhibit 2B Page 266

Proprietary and Confidential © Siemens Industry IGA Report – May, 2019 – | Page 627
Siemens – Broward County, Investment Grade Audit | May 2019
Quiet Waters Park 9,649$ 165,596$ 17.2
Total Savings Project Cost Payback
Water - Pool Solutions
Exhibit 2B Page 267

Proprietary and Confidential © Siemens Industry IGA Report – May, 2019 – | Page 628
Siemens – Broward County, Investment Grade Audit | May 2019
F.3. Building Envelope
A complete building envelope audit was conducted for all facilities within the scope of workissued for this investment grade audit. The following is a summary of those facilities wherescope was excluded due to their financial results.
SAVINGS
The energy and cost savings were developed using a spreadsheet model. In the analysis,multiple variable were taken into consideration; including: HVAC equipment operatingefficiency, runhours, age and condition. Other variables include building occupancy, hoursof operation, and bin weather data for the geographic area where the facility resides. Inputvariables that were not directly measured onsite or obtained from the County includematerial properties; such as of walls, ceiling tiles, as well as the recommended insulation forinstallation. The spreadsheet simulated a current operating conditions of the facility andcompared them to proposed conditions to obtain savings.
The resulting economics of implementing the following building envelope projects at thesefacilities resulted in paybacks in excess of 12 years. In an effort to adhere to required projectpayback and overall cash flows, these FIMs were not included in the final scope.
GALT OCEAN LIBRARY
PROJECT SCOPE
Galt Ocean library is contained within a strip-mall style complex. The building contains alarge soffit that stretches out over the sidewalk located in front of the building. This soffitcontains no insulation. The soffit also contains six large vent openings, in addition to acontinuous strip vent, that directly connect the exterior environment to the interior of thebuilding. The soffit should be isolated from the interior of the building with an insulated, air-tight barrier.
Large vents (red arrows) and strip vent (yellow line) shown here
Exhibit 2B Page 268

Proprietary and Confidential © Siemens Industry IGA Report – May, 2019 – | Page 629
Siemens – Broward County, Investment Grade Audit | May 2019
View of soffit from interior of building. All light is coming from the exterior through the vents.
SCOPE SCHEMATICS
The following are illustrations depicting the specific locations at each building where therecommended improvement measures are to be implemented.
Exhibit 2B Page 269

Proprietary and Confidential © Siemens Industry IGA Report – May, 2019 – | Page 630
Siemens – Broward County, Investment Grade Audit | May 2019
FIM Financial Summary
Most building envelope improvements will not depreciate over time and will be there, andcontributing to decrease energy costs, for the remaining useful life of the building.Insulation within a building can have an expected life of 20 years. Moving forward with thissolution will benefit the County beyond the years specified by the simple payback value. Ifan addition, monetary value is assigned and calculated taking into account the additionalyears of useful life on the material, an additional source of savings can be used to moreaccurately represent the long-term impact of this FIM.
He following table presents the calculated salvage value of building insulation beyond that ofthe resulting simple payback for this project; resulting in a modified payback to beconsidered.
Modified Payback
Building Envelope - Door Gaskets 1$ -$ -$ -$ 1$ 377$ 264.6Building Envelope - Insulation 423$ -$ -$ -$ 423$ 8,208$ 19.4Building Envelope - COMBINED 425$ -$ -$ -$ 425$ 8,585$ 20.2
LIBRARY, GO, GaltOcean
SavingsKWH
SavingsKW
Savings O&M SavingsCapital
TotalSavings
Project Cost Payback
Building Envelope - Door Gaskets
Building Envelope - Insulation 20 $2,173 14.3Building Envelope - COMBINED 20 $2,273 14.9
LIBRARY, GO, GaltOcean
FIM Life(Yr)
Salvage Value($)
ModifiedPayback (Yr)
Exhibit 2B Page 270

Proprietary and Confidential © Siemens Industry IGA Report – May, 2019 – | Page 631
Siemens – Broward County, Investment Grade Audit | May 2019
EVERGLADES HOLIDAY PARK
PROJECT SCOPE
The Everglades park building is mostly uninsulated at the attic boundary. The attic alsocontains all of the ductwork. To mitigate the large amount of heat gain from the attic, theductwork, and duct leakage, we propose to encapsulate the attic using SPF on the interiorroof decking.
Attic is largely uninsulated.
There is a small section (gift shop area) that contains a little insulation. It is not installed insuch a way as to result in good performance though.
Exhibit 2B Page 271

Proprietary and Confidential © Siemens Industry IGA Report – May, 2019 – | Page 632
Siemens – Broward County, Investment Grade Audit | May 2019
SCOPE SCHEMATICS
The following are illustrations depicting the specific locations at each building where therecommended improvement measures are to be implemented.
FIM Financial Summary
Most building envelope improvements will not depreciate over time and will be there, andcontributing to decrease energy costs, for the remaining useful life of the building.Insulation within a building can have an expected life of 20 years. Moving forward with thissolution will benefit the County beyond the years specified by the simple payback value. Ifan addition, monetary value is assigned and calculated taking into account the additionalyears of useful life on the material, an additional source of savings can be used to moreaccurately represent the long-term impact of this FIM.
He following table presents the calculated salvage value of building insulation beyond that ofthe resulting simple payback for this project; resulting in a modified payback to beconsidered.
Modified Payback
Building Envelope - Insulation 2,539$ -$ -$ -$ 2,539$ 62,274$ 24.5
EVERGLADES HOLIDAYPARK
SavingsKWH
SavingsKW Savings O&M Savings
CapitalTotal
Savings Project Cost Payback
20 $16,485 18.0
FIM Life(Yr)
Salvage Value($)
ModifiedPayback (Yr)
Exhibit 2B Page 272
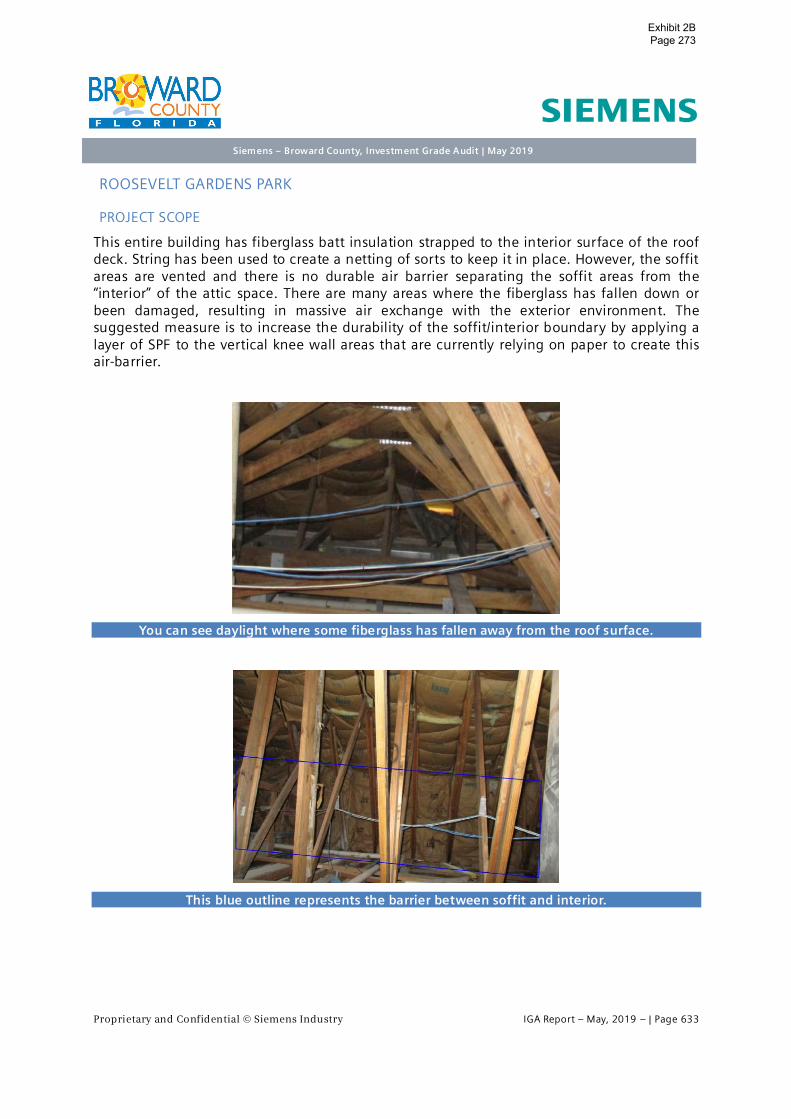
Proprietary and Confidential © Siemens Industry IGA Report – May, 2019 – | Page 633
Siemens – Broward County, Investment Grade Audit | May 2019
ROOSEVELT GARDENS PARK
PROJECT SCOPE
This entire building has fiberglass batt insulation strapped to the interior surface of the roofdeck. String has been used to create a netting of sorts to keep it in place. However, the soffitareas are vented and there is no durable air barrier separating the soffit areas from the“interior” of the attic space. There are many areas where the fiberglass has fallen down orbeen damaged, resulting in massive air exchange with the exterior environment. Thesuggested measure is to increase the durability of the soffit/interior boundary by applying alayer of SPF to the vertical knee wall areas that are currently relying on paper to create thisair-barrier.
You can see daylight where some fiberglass has fallen away from the roof surface.
This blue outline represents the barrier between soffit and interior.
Exhibit 2B Page 273

Proprietary and Confidential © Siemens Industry IGA Report – May, 2019 – | Page 634
Siemens – Broward County, Investment Grade Audit | May 2019
SCOPE SCHEMATICS
The following are illustrations depicting the specific locations at each building where therecommended improvement measures are to be implemented.
Fim Financial Summary
Insulation within a building can have an expected life of 20 years. Moving forward with thissolution will benefit the County beyond the years specified by the simple payback value. Ifan addition, monetary value is assigned and calculated taking into account the additionalyears of useful life on the material, an additional source of savings can be used to moreaccurately represent the long-term impact of this FIM.
He following table presents the calculated salvage value of building insulation beyond that ofthe resulting simple payback for this project; resulting in a modified payback to beconsidered.
Modified Payback
Building Envelope - Door Seals 8$ -$ -$ -$ 8$ 2,114$ 272.9Building Envelope - Insulation 1,187$ -$ -$ -$ 1,187$ 23,055$ 19.4
ROOSEVELT GARDENSPARK
SavingsKWH
SavingsKW Savings O&M Savings
CapitalTotal
Savings Project Cost Payback
15 $280 236.720 $6,103 14.3
FIM Life(Yr)
Salvage Value($)
ModifiedPayback (Yr)
Exhibit 2B Page 274

Proprietary and Confidential © Siemens Industry IGA Report – May, 2019 – | Page 635
Siemens – Broward County, Investment Grade Audit | May 2019
IMPERIAL POINT LIBRARY
PROJECT SCOPE
Imperial Point library has an entry stairwell which contains large amounts of glass, facingboth east and south. Solar film is recommended on the east and south aspects to reduce heatgain.
Interior view of area to receive film.
SCOPE SCHEMATICS
The following are illustrations depicting the specific locations at each building where therecommended improvement measures are to be implemented.
Blue is east. Green is south.
Exhibit 2B Page 275

Proprietary and Confidential © Siemens Industry IGA Report – May, 2019 – | Page 636
Siemens – Broward County, Investment Grade Audit | May 2019
FIM Financial Summary
Most building envelope improvements will not depreciate over time and will be there, andcontributing to decrease energy costs, for the remaining useful life of the building.Insulation within a building can have an expected life of 20 years. Moving forward with thissolution will benefit the County beyond the years specified by the simple payback value. Ifan addition, monetary value is assigned and calculated taking into account the additionalyears of useful life on the material, an additional source of savings can be used to moreaccurately represent the long-term impact of this FIM.
He following table presents the calculated salvage value of building insulation beyond that ofthe resulting simple payback for this project; resulting in a modified payback to beconsidered.
Modified Payback
Building Envelope - Door Gaskets 1$ -$ -$ -$ 1$ 377$ 360.3Building Envelope - Window Film 768$ -$ -$ -$ 768$ 13,942$ 18.1Building Envelope - COMBINED 769$ -$ -$ -$ 769$ 14,319$ 18.6
SavingsKWH
SavingsKW Savings O&M Savings
CapitalTotal
SavingsLIBRARY, IP, Imperial
Point Project Cost Payback
Building Envelope - Door Gaskets 15 $50 312.6Building Envelope - Window Film 20 $3,691 13.3Building Envelope - COMBINED 20 $3,790 13.7
FIM Life(Yr)
Salvage Value($)
ModifiedPayback (Yr)
LIBRARY, IP, ImperialPoint
Exhibit 2B Page 276

Proprietary and Confidential © Siemens Industry IGA Report – May, 2019 – | Page 637
Siemens – Broward County, Investment Grade Audit | May 2019
BG AGRICULTURAL CENTER
PROJECT SCOPE
The extension office contains a good deal of single pane glass that is contributing toexcessive heat gain and comfort issues. These should receive solar film.
Desks have been removed from the sunny area due to comfort issues resulting from heatgain.
Occupants are attempting to keep heat out by use of paper and fabric
Exhibit 2B Page 277

Proprietary and Confidential © Siemens Industry IGA Report – May, 2019 – | Page 638
Siemens – Broward County, Investment Grade Audit | May 2019
SCOPE SCHEMATICS
The following are illustrations depicting the specific locations at each building where therecommended improvement measures are to be implemented.
Fim Financial Summary
Insulation within a building can have an expected life of 20 years. Moving forward with thissolution will benefit the County beyond the years specified by the simple payback value. Ifan addition, monetary value is assigned and calculated taking into account the additionalyears of useful life on the material, an additional source of savings can be used to moreaccurately represent the long-term impact of this FIM.
He following table presents the calculated salvage value of building insulation beyond that ofthe resulting simple payback for this project; resulting in a modified payback to beconsidered.
Modified Payback
Building Envelope - Window Film 1,264$ -$ -$ -$ 1,264$ 28,266$ 22.4
SavingsKWH
SavingsKW Savings O&M Savings
CapitalTotal
SavingsBC Agriculture Extension Project Cost Payback
15 $3,741 19.4
FIM Life(Yr)
Salvage Value($)
ModifiedPayback (Yr)
Exhibit 2B Page 278

Proprietary and Confidential © Siemens Industry IGA Report – May, 2019 – | Page 639
Siemens – Broward County, Investment Grade Audit | May 2019
F.4. DX Replacements
As DX equipment ages and the condition of the equipment deteriorate, the energy efficiencyof these units also degrades. In recent years the energy efficiency of DX equipment hasimproved due to mandates as well as manufacture improvements. DX air-conditioningsystems are rated by their Seasonal Energy Efficiency Ratios (SEER). The higher the SEERrating the more energy efficient the units are. Older units have average SEER ratingsbetween 8-10 while new units have average SEER ratings of 13 or greater.
SAVINGS
The energy and cost savings were developed using a spreadsheet model. Using nameplatedata, onsite electrical spot measurements, and data logging information, the total HVACelectrical contribution of this facility’s electric utility bill was determined. The calculationstook into consideration current conditions and efficiencies. Savings were obtained byreplacing existing efficiency values with the higher efficiency value of the new equipment; aspublished by the manufacturer. All calculations were based off Trane manufacturer cut-sheets.
The resulting economics of implementing HVAC replacements at these facilities resulted inpaybacks in excess of 12 years. In an effort to adhere to required project payback and overallcash flows, these FIMs were not included in the final scope.
The following is a summary of those facilities where DX replacements were excluded andtheir financial results.
BC AGRICULTURAL EXTENSION – SCOPE CONSIDERED
This FIM consider replacing the condensing unit of the building’s DX system. The multizoneair handler is in good physical condition; therefore, the coils were to be replaced in order toaccommodate the change from R-22 to R-410A.
Scope of Work ConsideredBuilding Equipment Make Model
BG Agricultural Extension Condenser Carrier 38AKS034---501
BG Agricultural Extension AHU Trane MCCA025GAMOAA
FIM Financial Summary
Split System Replacement 568$ 875$ -$ -$ 1,443$ 83,462$ 57.8
SavingsKWH
SavingsKW Savings O&M Savings
CapitalTotal
SavingsBC Agriculture Extension Project Cost Payback
Exhibit 2B Page 279

Proprietary and Confidential © Siemens Industry IGA Report – May, 2019 – | Page 640
Siemens – Broward County, Investment Grade Audit | May 2019
MARKHAM PARK – SCOPE CONSIDERED
The following seven (7) DX systems were identified for replacement. The DX spit systemsrequire replacement of both the condensing unit and air handler.
Scope of Work Considered
Building Equipment Make Model
Markham Park Condenser Carrier 38ARZ007--K501--
Markham Park Condenser Carrier 38ARZ007--K501--
Markham Park AHU Carrier 40RM-008--H611HC
Markham Park AHU Carrier 40RM-008--H611HC
Markham Park AHU
Markham Park AHU
Markham Park AHU
Markham Park Condenser ICP M2A348AKA200
Markham Park Condenser Thermal Zone TZAA-348-2C757
Markham Park Condenser Thermal Zone TZAA-348-2A757
Markham Park Condenser American Standard 2A7A4048B1000AA
Markham Park Condenser Ruud 13AJA60A01
Markham Park AHU York AHR60D3XH21A
Markham Park AHU
FIM Financial Summary
Additional Costs: Associated with the scope of work summarized above are additionalcosts uncovered by contracted MEPs (mechanical, electrical, and plumbing vendor).This cost was requested to be listed separately. For this facility, the cost is:
∂ $10,027
The identified issue at Markham Park concerns the location of the air handlers in some of thebuildings. In order to replace the units, trusses and supporting roof beams need to be cutand later replaced as the units are situated in the attic space.
Split System Replacements 2,469$ 1,187$ -$ -$ 3,656$ 180,848$ 49.5
MARKHAM PARK SavingsKWH
SavingsKW Savings O&M Savings
CapitalTotal
Savings Project Cost Payback
Exhibit 2B Page 280

Proprietary and Confidential © Siemens Industry IGA Report – May, 2019 – | Page 641
Siemens – Broward County, Investment Grade Audit | May 2019
TRADEWINDS PARK – SCOPE CONSIDERED
This FIM assessed replacing the condensing unit and air handler of following two (2) DXunits.
Scope of Work Considered
Bldg Equipment Make Model
Tradewinds Park AHU
Tradewinds Park Condenser
Tradewinds Park AHU Ruud UBHK-21J11SFC
Tradewinds Park Condenser Ruud UAMB-036JBZ
FIM Financial Summary
Code Compliance: Associated with the scope of work summarized above are codecompliance issued uncovered by contracted MEPs (mechanical, electrical, and plumbingvendor). This cost was requested to be listed separately. For this facility, the codecompliance cost is:
∂ $2,000
The identified issue at Tradewinds Park includes changes in outside air requirements asstated by current building code.
QUIET WATERS PARK – SCOPE CONSIDERED
This FIM assessed replacing the condensing units and air handlers of the following DX units.
Scope of Work Considered
Building Equipment Make Model
Quiet Waters Park AHU Carrier 40RM-012--B610HC
Quiet Waters Park Condenser Carrier 38ARZ008--K501
FIM Financial Summary
Split System Replacements 70$ -$ -$ -$ 70$ 20,262$ 288.2
TRADEWINDS PARK SavingsKWH
SavingsKW Savings O&M Savings
CapitalTotal
Savings Project Cost Payback
Split System Replacements -$ -$ -$ -$ -$ 16,223$
QUIET WATERS PARK Project Cost PaybackSavingsKWH
SavingsKW Savings O&M Savings
CapitalTotal
Savings
Exhibit 2B Page 281

Proprietary and Confidential © Siemens Industry IGA Report – May, 2019 – | Page 642
Siemens – Broward County, Investment Grade Audit | May 2019
EVERGLADES HOLIDAY PARK – SCOPE CONSIDERED
This FIM assessed replacing the condensing units and air handlers of the following DX units.
Scope of Work Considered
Building Equipment Make Model
Everglades Holiday Park AHU
Everglades Holiday Park Condenser Payne PA13NR060
Everglades Holiday Park AHU
Everglades Holiday Park Condenser Carrier 24ABS360A300
FIM Financial Summary
FRANKLIN PARK – SCOPE CONSIDERED
This FIM assessed replacing the condensing units of the following DX units. The AHUs are ingood physical condition; therefore, the coils would have been replaced in order toaccommodate the change from R-22 to R-410A.
Scope of Work Considered
Building Equipment Make Model
Franklin Park AHU Carrier 39TVRNAB--U-CJL-AB
Franklin Park Condenser Thermal Zone TZAA-090CA757
Franklin Park Condenser Thermal Zone TZAA-090CA757
FIM Financial Summary
Code Compliance: Associated with the scope of work summarized above are codecompliance issued uncovered by contracted MEPs (mechanical, electrical, and plumbingvendor). This cost was requested to be listed separately. For this facility, the codecompliance cost is:
∂ $4,178
The identified issue at Tradewinds Park includes changes in outside air requirements asstated by current building code.
Split System Replacements 1,057$ 296$ -$ -$ 1,354$ 90,744$ 67.0
EVERGLADES HOLIDAYPARK
SavingsKWH
SavingsKW Savings O&M Savings
CapitalTotal
Savings Project Cost Payback
Split System Replacements 181$ 155$ -$ -$ 336$ 40,343$ 120.0
FRANKLIN PARK Project Cost PaybackSavingsKWH
SavingsKW Savings O&M Savings
CapitalTotal
Savings
Exhibit 2B Page 282

Proprietary and Confidential © Siemens Industry IGA Report – May, 2019 – | Page 643
Siemens – Broward County, Investment Grade Audit | May 2019
VISTA VIEW PARK – SCOPE CONSIDERED
This FIM assessed replacing the condensing units and air handlers of the following DX units.
Scope of Work Considered
Building Equipment Make Model
Vista View Park AHU Carrier 40RM-008--H611HC
Vista View Park Condenser Carrier 38ARZ008--K511
FM Financial Summary
TYRONE BRYANT LIBRARY – SCOPE CONSIDERED
This FIM assessed replacing the condensing units of the following DX units. The AHUs are ingood physical condition; therefore, the coils would have been replaced in order toaccommodate the change from R-22 to R-410A.
Scope of Work Considered
Building Equipment Make Model
Tyrone Bryant Library Condenser Trane TTA240B300FB
Tyrone Bryant Library Condenser Trane TTA180B300FA
Tyrone Bryant Library AHU Trane MCCB030UA
FIM Financial Summary
Split System Replacements -$ -$ -$ -$ -$ 17,603$
VISTA VIEW PARK SavingsKW Savings O&M Savings
CapitalTotal
Savings Project Cost PaybackSavingsKWH
Split System Replacement 450$ 561$ -$ -$ 1,011$ 60,442$ 59.8
Project Cost PaybackLIBRARY, BR, TyroneBryant
SavingsKWH
SavingsKW Savings O&M Savings
CapitalTotal
Savings
Exhibit 2B Page 283

Proprietary and Confidential © Siemens Industry IGA Report – May, 2019 – | Page 644
Siemens – Broward County, Investment Grade Audit | May 2019
STATE ATTORNEY & CLERKS WAREHOUSE – SCOPE CONSIDERED
This FIM assessed replacing the condensing units and air handlers of the following DX units.
Scope of Work Considered
Building Equipment Make Model
State Attorney & Clerks Warehouse Condenser 8 Rheem RAND-060JAZ
State Attorney & Clerks Warehouse Condenser 3 Rheem RAND-060CAZ
State Attorney & Clerks Warehouse Condenser 2 Rheem RAND-042JAZ
State Attorney & Clerks Warehouse Condenser 1 Rheem RAKA-060CAS
State Attorney & Clerks Warehouse AHU 8 RheemRBEA-
24J10NUBAI
State Attorney & Clerks Warehouse AHU 3 Rheem RHGE-075ZK
State Attorney & Clerks Warehouse AHU 2 Rheem
State Attorney & Clerks Warehouse AHU 1 Rheem
FIM Financial Summary
Split System COMBINED 1,664$ 479$ -$ -$ 2,143$ 65,031$ 30.3
SavingsKWH
SavingsKW Savings O&M Savings
CapitalTotal
Savings Project CostState Attorney & ClerksWarehouse Payback
Exhibit 2B Page 284

Proprietary and Confidential © Siemens Industry IGA Report – May, 2019 – | Page 645
Siemens – Broward County, Investment Grade Audit | May 2019
F.5. Additional Solar Opportunities
SOLAR PV
The possibility for the installation of on-site solar generation plants whether in the form ofrooftop or carport design was assessed for 11 total sites. Due to the restrictions on projectpayback, only 1 facility was able to be proposed as a viable project in this IGA. BrowardCounty instructed Siemens to discontinue the analysis of 2 facilities, East Regional Libraryand Young at Arts Library, before a comprehensive savings analysis could be completed.Broward County did not select to move forward with 2 other facilities, Hollywood Library andTamarac Library after being reported in the IGA. The scope of work for those facilities can befound in the FIMs not selected section. The following list will identify the remaining 6facilities were assessed but not chosen for this project along with their proposed first yearenergy savings.
ROOFTOP
∂ Edgar Mills Center: 187,376 kWh∂ Emergency Operations Center: 163,878 kWh
∂ Fleet Services 2: 145,286 kWh∂ Highway & Bridge Administration: 280,845 kWh
CARPORT
∂ Miramar Library: 860,582 kWh∂ Quiet Waters Park: 502,763 kWh
FIM Financial Summary
The table above summarizes the financial impact of the 6 facilities that were analyzed butnot selected for this project. With a total project cost of $5,254,580 and a first year savingsof $167,044, the simple payback calculates to 31.5 years.
TOTAL 167,044$ 167,044$ 5,254,580$ 31.5
Project Cost PaybackSavings KWH Total SavingsSolar PV
Exhibit 2B Page 285

Proprietary and Confidential © Siemens Industry IGA Report – May, 2019 – | Page 646
Siemens – Broward County, Investment Grade Audit | May 2019
F.6. Plug Load Management
Miscellaneous plug loads from copiers, computers, computer screens, and coffee machines canmake up enough of a portion of the energy consumption of a building to merit monitoring andcontrolling. Some of these loads may operate on standby during unoccupied periods that mayreduce to amount of wattage draw from receptacles. Alternatively, many plug load devices leakenergy in standby or off mode. Bert, which stands for Best Energy Reduction Technologies, is apatented Wi-Fi based solution that automatically and remotely controls and schedules plug loaddevices to turn on/off.
Bert controllers function with a built in relay operating on a timer. The relay severs electricalconnection between the device and the electrical receptacle. Each Bert controller is equippedwith an override button which allows an operator working beyond the schedule to release theconnected device from its OFF command. This reestablishes the electrical connected and allowsthe device to be used as normal. The Bert units do not limit device usage to a couple of hoursonce the override is pushed. It will not schedule the connected device to turn off until the nextscheduled time.
PROJECT SCOPE
This FIM addresses the installation ofwireless Bert controllers at the outlet ofspecified equipment. The wirelesscontrollers will be integrated in theexisting Wi-Fi Network of each buildingand scheduled from a centralcomputer. Not every device merits theinstallation of a Bert controller. Due tothe habits of City employees, someequipment is shut off at the end of thework day. Energy leaks through electricreceptacles are not significant enoughto produce energy savings of value.
Other plug load equipment, such and vending and ice machines, have alternative energysaving devices that have already been included in the scope of work to be performed. Theremaining opportunities for plug load management do not result in enough energy savingsto justify the installation of these controls.
Exhibit 2B Page 286
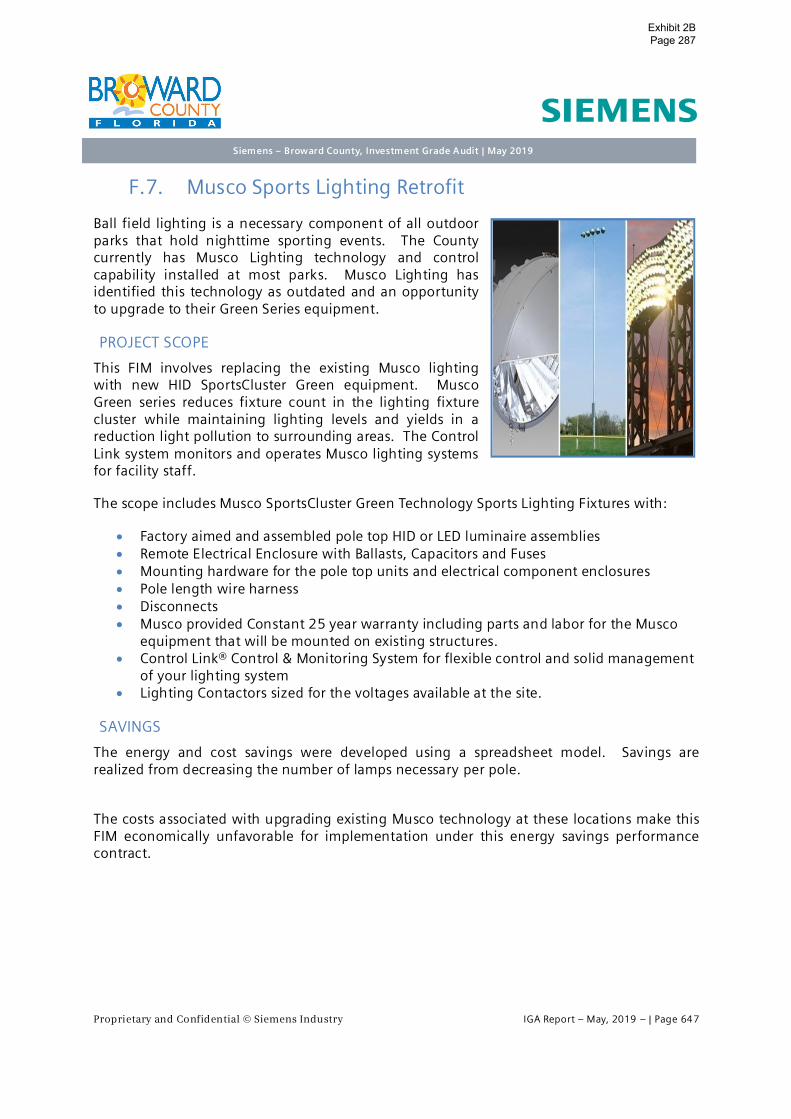
Proprietary and Confidential © Siemens Industry IGA Report – May, 2019 – | Page 647
Siemens – Broward County, Investment Grade Audit | May 2019
F.7. Musco Sports Lighting Retrofit
Ball field lighting is a necessary component of all outdoorparks that hold nighttime sporting events. The Countycurrently has Musco Lighting technology and controlcapability installed at most parks. Musco Lighting hasidentified this technology as outdated and an opportunityto upgrade to their Green Series equipment.
PROJECT SCOPE
This FIM involves replacing the existing Musco lightingwith new HID SportsCluster Green equipment. MuscoGreen series reduces fixture count in the lighting fixturecluster while maintaining lighting levels and yields in areduction light pollution to surrounding areas. The ControlLink system monitors and operates Musco lighting systemsfor facility staff.
The scope includes Musco SportsCluster Green Technology Sports Lighting Fixtures with:
∂ Factory aimed and assembled pole top HID or LED luminaire assemblies∂ Remote Electrical Enclosure with Ballasts, Capacitors and Fuses∂ Mounting hardware for the pole top units and electrical component enclosures∂ Pole length wire harness∂ Disconnects∂ Musco provided Constant 25 year warranty including parts and labor for the Musco
equipment that will be mounted on existing structures.∂ Control Link® Control & Monitoring System for flexible control and solid management
of your lighting system∂ Lighting Contactors sized for the voltages available at the site.
SAVINGS
The energy and cost savings were developed using a spreadsheet model. Savings arerealized from decreasing the number of lamps necessary per pole.
The costs associated with upgrading existing Musco technology at these locations make thisFIM economically unfavorable for implementation under this energy savings performancecontract.
Exhibit 2B Page 287

Proprietary and Confidential © Siemens Industry IGA Report – May, 2019 – | Page 648
Siemens – Broward County, Investment Grade Audit | May 2019
G. Description of FIMs Not Selected
This section itemizes those Facility Improvement Measures included in the Investment GradeAudit submitted on January 17, 2018 but where not selected by Broward County to beincluded in the final scope of work.
G.1. CB Smith Park
PROJECT SCOPE – INTERIOR LIGHTING
The following section summarizes the lighting scope of work originally proposed:
∂ LED Replacement of Linear Lamps∂ LED Replacement for High Intensity Discharge Interior∂ Emergency Lighting
Interior Lighting Retrofit Scope
FIM SAVINGS SUMMARY
Annual Electric Consumption: 38,560 kWh
Annual Electric Demand: 133.38 kW
FIM Financial Summary
BUILDING EXISTING & RETROFIT STANDARD LEGEND DESCRIPTIONSEXISTING
QTYRETROFIT
QTY
CB SMITH PARKExisting Excluded due to lack of cost effective replacementor more efficient option - No Retrofit Proposed
48 48
Existing T8 Fluorescent - Proposed Retrofit LED 204 204Existing T8 Fluorescent - Proposed New LED Fixture 8 8Existing High Intensity Discharge - Proposed New LED High-Bay Fixture
9 9
Existing High Intensity Discharge - Proposed Retrofit LED 5 5Existing T8 Fluorescent - Proposed Retrofit LED WithReflector kit
8 8
Lighting - Interior 3,394$ -$ 424$ -$ 3,818$ 42,658$ 11.2
CB SMITH PARK SavingsKWH
SavingsKW Savings O&M Savings
CapitalTotal
Savings Project Cost Payback
Exhibit 2B Page 288

Proprietary and Confidential © Siemens Industry IGA Report – May, 2019 – | Page 649
Siemens – Broward County, Investment Grade Audit | May 2019
G.2. Markham Park
PROJECT SCOPE – EXTERIOR LIGHTING
The following section summarizes the lighting scope of work originally proposed:
∂ LED Replacement for High Intensity Discharge Exterior∂ LED Replacement for Fluorescent Exterior
Exterior Lighting Retrofit Scope
FIM SAVINGS SUMMARY
Annual Electric Consumption: 147,012 kWh
Annual Electric Demand: 395.58 kW
FIM Financial Summary
BUILDING EXISTING & RETROFIT STANDARD LEGEND DESCRIPTIONSEXISTING
QTYRETROFIT
QTY
MARKHAM PARKExisting Excluded due to lack of cost effective replacement or more efficientoption - No Retrofit Proposed
115 115
Existing High Intensity Discharge - Proposed Retrofit LED 2 2Existing High Intensity Discharge - Proposed New LED Fixture 78 78Existing Incandescent - Proposed New LED Fixture 1 1Existing Compact Fluorescent - Proposed New LED Fixture 13 13Existing Incandescent - Proposed Relamp LED 28 28Existing Compact Fluorescent - Proposed Relamp LED 92 92Existing T8 Fluorescent - Proposed Retrofit LED 46 46Existing T12 Fluorescent - Proposed Retrofit LED 2 2
Lightgin - COMBINED 11,299$ -$ 2,313$ -$ 13,612$ 147,476$ 10.8
MARKHAM PARK SavingsKWH
SavingsKW Savings O&M Savings
CapitalTotal
Savings Project Cost Payback
Exhibit 2B Page 289

Proprietary and Confidential © Siemens Industry IGA Report – May, 2019 – | Page 650
Siemens – Broward County, Investment Grade Audit | May 2019
BUILDING ENVELOPE
A complete building envelope audit was conducted for all facilities within the scope of workissued for this investment grade audit. The building envelope audit’s primary goal is todiscover and define improvements that can reduce energy consumption, improve occupantcomfort and productivity, and increase building and structural durability. Recommendedimprovements will decrease energy consumption and provide a calculated financial returnthat can be projected to pay for the cost of the improvements over a defined period of time.
PROJECT SCOPE
The three buildings included in the scope all have attic related deficiencies. The Front Officeand Target Range both rely on a suspended tile ceiling as an air barrier, while the Trap Shootbuilding has a drywall/T&G ceiling. All three buildings have ductwork located within the atticspaces. The suggested measure for all three buildings is to encapsulate the attic using SPF onthe roof deck. This will dramatically reduce the attic temperature (reducing gains throughductwork surface area and duct leakage) and create an effective air barrier betweeninside/outside reducing uncontrolled air exchange.
FIM SAVINGS SUMMARY
Annual Electric Consumption: 124,492 kWh
FIM Financial Summary
Building Envelope - COMBINED 9,427$ -$ -$ -$ 9,427$ 121,052$ 12.8
MARKHAM PARK SavingsKWH
SavingsKW Savings O&M Savings
CapitalTotal
Savings Project Cost Payback
Exhibit 2B Page 290

Proprietary and Confidential © Siemens Industry IGA Report – May, 2019 – | Page 651
Siemens – Broward County, Investment Grade Audit | May 2019
G.3. Tradewinds Park
PROJECT SCOPE – INTERIOR LIGHTING
The following section summarizes the lighting scope of work originally proposed:
∂ LED Replacement of Linear Lamps:∂ Emergency Lighting
Interior Lighting Retrofit Scope
PROJECT SCOPE – EXTERIOR LIGHTING
The following section summarizes the lighting scope of work originally proposed:
∂ LED Replacement for High Intensity Discharge Exterior∂ LED Replacement for Fluorescent Exterior
Exterior Lighting Retrofit Scope
EXTERIOR LIGHTING SENSOR SCOPE
FIM SAVINGS SUMMARY
Annual Electric Consumption: 37,327 kWh
Annual Electric Demand: 107.16 kW
FIM Financial Summary
BUILDING NAME EXISTING & RETROFIT STANDARD LEGEND DESCRIPTIONSEXISTING
QTYRETROFIT
QTY
TRADEWINDS PARKExisting Excluded due to lack of cost effective replacementor more efficient option - No Retrofit Proposed
20 20
Existing T8 Fluorescent - Proposed Retrofit LED 28 28
BUILDING EXISTING & RETROFIT STANDARD LEGEND DESCRIPTIONSEXISTING
QTYRETROFIT
QTYT RADEWINDS
PARKExisting Excluded due to lack of cost effective replacement or more efficientoption - No Retrofit Proposed
103 103
Existing Compact Fluorescent - Proposed New LED Fixture 12 12Existing T8 Fluorescent - Proposed Retrofit LED 14 14Existing High Intensity Discharge - Proposed New LED High-Bay Fixture WithSensor
40 40
Building NameAreas Controlled
by sensorsTRADEWINDS PARK 1
Exhibit 2B Page 291
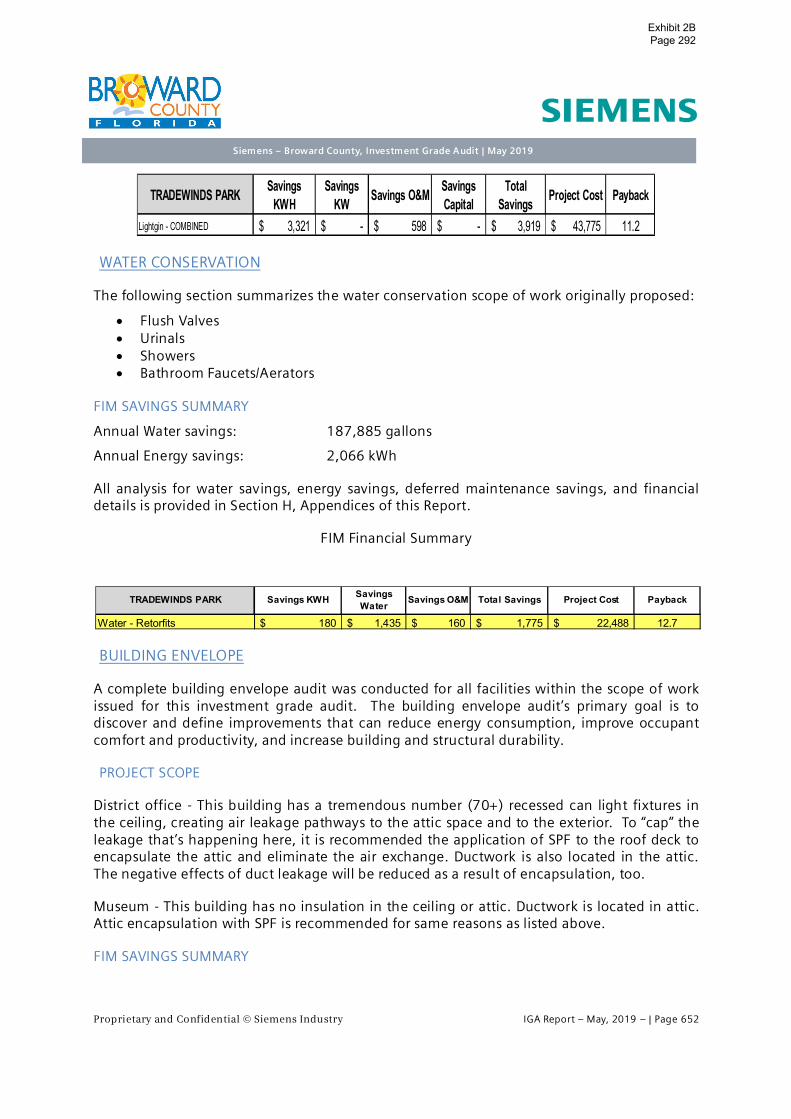
Proprietary and Confidential © Siemens Industry IGA Report – May, 2019 – | Page 652
Siemens – Broward County, Investment Grade Audit | May 2019
WATER CONSERVATION
The following section summarizes the water conservation scope of work originally proposed:
∂ Flush Valves∂ Urinals∂ Showers∂ Bathroom Faucets/Aerators
FIM SAVINGS SUMMARY
Annual Water savings: 187,885 gallons
Annual Energy savings: 2,066 kWh
All analysis for water savings, energy savings, deferred maintenance savings, and financialdetails is provided in Section H, Appendices of this Report.
FIM Financial Summary
BUILDING ENVELOPE
A complete building envelope audit was conducted for all facilities within the scope of workissued for this investment grade audit. The building envelope audit’s primary goal is todiscover and define improvements that can reduce energy consumption, improve occupantcomfort and productivity, and increase building and structural durability.
PROJECT SCOPE
District office - This building has a tremendous number (70+) recessed can light fixtures inthe ceiling, creating air leakage pathways to the attic space and to the exterior. To “cap” theleakage that’s happening here, it is recommended the application of SPF to the roof deck toencapsulate the attic and eliminate the air exchange. Ductwork is also located in the attic.The negative effects of duct leakage will be reduced as a result of encapsulation, too.
Museum - This building has no insulation in the ceiling or attic. Ductwork is located in attic.Attic encapsulation with SPF is recommended for same reasons as listed above.
FIM SAVINGS SUMMARY
Lightgin - COMBINED 3,321$ -$ 598$ -$ 3,919$ 43,775$ 11.2
TRADEWINDS PARK SavingsKWH
SavingsKW Savings O&M Savings
CapitalTotal
Savings Project Cost Payback
Water - Retorfits 180$ 1,435$ 160$ 1,775$ 22,488$ 12.7
TRADEWINDS PARK Savings KWH SavingsWater Savings O&M Total Savings Project Cost Payback
Exhibit 2B Page 292

Proprietary and Confidential © Siemens Industry IGA Report – May, 2019 – | Page 653
Siemens – Broward County, Investment Grade Audit | May 2019
Annual Electric Consumption: 36,908 kWh
FIM Financial Summary
G.4. Everglades Holiday Park
PROJECT SCOPE – EXTERIOR LIGHTING
The following section summarizes the lighting scope of work originally proposed:
1. LED Replacement for High Intensity Discharge Exterior
Exterior Lighting Retrofit Scope
FIM SAVINGS SUMMARY
Annual Electric Consumption: 23,295 kWh
Annual Electric Demand: 50.16 kW
FIM Financial Summary
Building Envelope - COMBINED 2,386$ -$ -$ -$ 2,386$ 31,349$ 13.1
TRADEWINDS PARK SavingsKWH
SavingsKW Savings O&M Savings
CapitalTotal
Savings Project Cost Payback
BUILDING EXISTING & RETROFIT STANDARD LEGEND DESCRIPTIONSEXISTING
QTYRETROFIT
QTYEVERGLADESHOLIDAY PARK
Existing Excluded due to lack of cost effective replacement or more efficientoption - No Retrofit Proposed
5 5
Existing High Intensity Discharge - Proposed New LED Fixture 10 10
Lightgin - COMBINED 1,775$ -$ 303$ -$ 2,078$ 20,188$ 9.7
EVERGLADES HOLIDAYPARK
SavingsKWH
SavingsKW Savings O&M Savings
CapitalTotal
Savings Project Cost Payback
Exhibit 2B Page 293

Proprietary and Confidential © Siemens Industry IGA Report – May, 2019 – | Page 654
Siemens – Broward County, Investment Grade Audit | May 2019
G.5. Delevoe Park
PROJECT SCOPE – INTERIOR LIGHTING
The following section summarizes the lighting scope of work originally proposed:
∂ LED Replacement of Linear Lamps:∂ LED Replacement for Pin-Based Compact Fluorescent Fixtures:∂ Emergency Lighting
Interior Lighting Retrofit Scope
PROJECT SCOPE – EXTERIOR LIGHTING
The following section summarizes the lighting scope of work originally proposed:
∂ LED Replacement for High Intensity Discharge Exterior
Exterior Lighting Retrofit Scope
Exterior Lighting Sensor Scope
FIM SAVINGS SUMMARY
Annual Electric Consumption: 78,805 kWh
Annual Electric Demand: 62.8 kW
FIM Financial Summary
BUILDING NAME EXISTING & RETROFIT STANDARD LEGEND DESCRIPTIONSEXISTING
QTYRETROFIT
QTYDELEVOE PARK Existing T8 Fluorescent - Proposed Retrofit LED 51 51
Existing T8 Fluorescent - Proposed Retrofit LED WithReflector kit
10 10
Existing Compact Fluorescent - Proposed Retrofit LED 5 5Existing T8 Fluorescent U Tube - Proposed Retrofit LEDWith Reflector kit
33 33
BUILDING EXISTING & RETROFIT STANDARD LEGEND DESCRIPTIONSEXISTING
QTYRETROFIT
QTY
DELEVOE PARKExisting Excluded due to lack of cost effective replacement or more effic ientoption - No Retrofit Proposed
34 34
Existing High Intensity Discharge - Proposed New LED Fixture With Sensor 22 22Existing High Intensity Discharge - Proposed Retrofit LED 63 63Existing High Intensity Discharge - Proposed New LED Fixture 6 6
Building NameAreas Controlled
by sensorsDELEVOE PARK 2
Lightgin - COMBINED 5,788$ -$ 1,223$ -$ 7,011$ 75,490$ 10.8
DELEVOE PARK SavingsKWH
SavingsKW Savings O&M Savings
CapitalTotal
Savings Project Cost Payback
Exhibit 2B Page 294

Proprietary and Confidential © Siemens Industry IGA Report – May, 2019 – | Page 655
Siemens – Broward County, Investment Grade Audit | May 2019
G.6. Vista View Park
WATER CONSERVATION
The following section summarizes the water conservation scope of work originally proposed:
∂ Flush Valves
∂ Urinals
∂ Bathroom Faucets/Aerators
FIM SAVINGS SUMMARY
Annual Water savings: 118,625 gallons
Annual Energy savings: 1,555 kWh
FIM Financial Summary
G.7. Lafayette Hart Park
PROJECT SCOPE – INTERIOR LIGHTING
The following section summarizes the lighting scope of work originally proposed:
∂ LED Replacement of Linear Lamps∂ Emergency Lighting
Interior Lighting Retrofit Scope
FIM SAVINGS SUMMARY
Annual Electric Consumption: 3,403 kWh
FIM Financial Summary
Water - Retorfits 134$ 1,452$ 143$ 1,729$ 19,916$ 11.5
VISTA VIEW PARK SavingsWater Savings O&M Total Savings Project Cost PaybackSavings KWH
BUILDING NAME EXISTING & RETROFIT STANDARD LEGEND DESCRIPTIONSEXISTING
QTYRETROFIT
QTYLAFAYETTE HART PARK Existing T8 Fluorescent - Proposed Retrofit LED 33 33
Lightgin - COMBINED 337$ -$ 51$ -$ 388$ 4,364$ 11.3
LAFAYETTE HART PARK SavingsKWH
SavingsKW Savings O&M Savings
CapitalTotal
Savings Project Cost Payback
Exhibit 2B Page 295

Proprietary and Confidential © Siemens Industry IGA Report – May, 2019 – | Page 656
Siemens – Broward County, Investment Grade Audit | May 2019
G.8. Main Library
PROJECT SCOPE – EXTERIOR LIGHTING
The following section summarizes the lighting scope of work originally proposed:
∂ LED Replacement for High Intensity Discharge Exterior
Exterior Lighting Retrofit Scope
FIM SAVINGS SUMMARY
Annual Electric Consumption: 526,172 kWh
Annual Electric Demand: 1,417 kW
FIM Financial Summary
BUILDING ENVELOPE
A complete building envelope audit was conducted for all facilities within the scope of workissued for this investment grade audit. The building envelope audit’s primary goal is todiscover and define improvements that can reduce energy consumption, improve occupantcomfort and productivity, and increase building and structural durability.
PROJECT SCOPE
The library has limited envelope potential due to the exposed nature of the exterior shell,which is composed of concrete and glass. Few areas are “hidden” by suspended ceilings andthe like, that typically allow insulation to be applied. The library does, however, have asignificant portion of east facing glass that would benefit from window film to reduce heatgain in the morning hours.
BUILDING EXISTING & RETROFIT STANDARD LEGEND DESCRIPTIONSEXISTING
QTYRETROFIT
QTY
LIBRARY, MN, MainExisting Excluded due to lack of cost effective replacement or more efficientoption - No Retrofit Proposed
3 3
Existing High Intensity Discharge - Proposed Retrofit LED 37 37Existing High Intensity Discharge - Proposed New LED Fixture 74 74Existing High Intensity Discharge - Proposed New LED High-Bay Fixture WithSensor
7 7
Existing Compact Fluorescent - Proposed Retrofit LED 10 10
Lightgin - COMBINED 47,453$ -$ 9,079$ -$ 56,532$ 541,139$ 9.6
LIBRARY, MN, Main SavingsKWH
SavingsKW Savings O&M Savings
CapitalTotal
Savings Project Cost Payback
Exhibit 2B Page 296

Proprietary and Confidential © Siemens Industry IGA Report – May, 2019 – | Page 657
Siemens – Broward County, Investment Grade Audit | May 2019
FIM SAVINGS SUMMARY
Annual Electric Consumption: 146,502 kWh
FIM Financial Summary
CHILLER REPLACEMENT AND OPTIMAL CHILLER START
The chiller replacement aims to improve chiller plant energy efficiency by replacing the agedinefficient lead chiller (Chiller 2) with a new chiller of a similar model and better efficiency.The associated optimal chiller start control will also be implemented.
PROJECT SCOPE
The followings are included in the scope of work of the chiller replacement:
∂ Provide one (1) 350 nominal ton R-123 water-cooled centrifugal chiller
∂ Remove the old chiller and be responsible for the proper demolition of the unit.
∂ Replace the old lead chiller with the new chiller
∂ Connect the new chiller to the piping system.
∂ Start up the new chiller
To reduce the electric demand, the optimal chiller start control will be implemented with thechiller replacement. The following is included in this measure:
∂ Sequence of operations for those proposed measures will be developed
∂ Associated control program will be implemented.
Chiller Replacement:
Cooling for the building is provided by a chiller plant consisting of two (2) water-cooled Yorkchillers. Chiller #1 is a two-pass machine of approximately 350 tons. The spot measuredchiller efficiency of Chiller # 1 was approximately 0.90 kW/Ton. Chiller #2 is currently not inuse due to its inefficient conditions. The new chiller with design efficiency of 0.66 kW/Tonwill be installed to replace the existing inefficient Chiller #2, and then Chiller #2 will becomethe lead chiller to reduce chiller plant energy consumption.
Optimal Chiller Start to Reduce Electric Demand: The purpose of this measure is to avoidhigh electric demand charge caused by both chillers starting at the full load. When the 2ndchiller is called due to cooling load increase or lead- lag switch, limit the lead chiller currentto 80% (adjustable) before turning on the second chiller. The current limit for the 2nd chilleris also limited to 80% (adjustable) during starting. After both chillers are on for 30 minutes(adjustable), release the current limits back to normal values.
Building Envelope - Window Film 12,152$ -$ -$ -$ 12,152$ 187,080$ 15.4
LIBRARY, MN, Main SavingsKWH
SavingsKW Savings O&M Savings
CapitalTotal
Savings Project Cost Payback
Exhibit 2B Page 297

Proprietary and Confidential © Siemens Industry IGA Report – May, 2019 – | Page 658
Siemens – Broward County, Investment Grade Audit | May 2019
During lead-lag switch, reduce the current of the running chiller before turning on anotherchiller. When the 2nd chiller is turned on, limiting its current to 80% (adjustable) for 30minutes (adjustable) before changing back to the normal limit.
SAVINGS
The energy and cost savings were developed using a spreadsheet model. Using nameplatedata, onsite electrical spot measurements, and data logging information, the total HVACelectrical contribution of this facility’s electric utility bill was determined. The calculationstook into consideration current conditions and efficiencies. Savings were obtained byreplacing existing efficiency values with the higher efficiency value of the new equipment; aspublished by the manufacturer. The detailed calculations are available in the Appendix. Allcalculations were based off Trane manufacturer cut-sheets, also provided as part of theAppendix.
Full calculations are provided in Section H, Appendices of this audit.
FIM SAVINGS SUMMARY
Annual Electric Consumption: 227,000 kWh
Annual Demand Consumption: 370 kW
FIM Financial Summary
Savings Capital: This facility had two capital projects listed to be completed within the nextfive years: retrottiting stairwell and exterior lighting. Therefore, the financials incorporatedsome capital cost in order to improve the payback within requested parameters.
OPTIMAL CHILLER START
PROJECT SCOPE
To reduce the electric demand, the optimal chiller start control will be implemented with thechiller replacement. The following is included in this measure:
∂ Sequence of operations for those proposed measures will be developed
∂ Associated control program will be implemented.
SAVINGSFIM Financial Summary
Lead Chiller Replacement /Optimal Start 15,203$ 5,053$ -$ -$ -$ 18,750$ 39,005$ 491,329$ 12.6
LIBRARY, MN, Main SavingsWater
SavingsO&M
SavingsCapital
SavingsKWH
SavingsKW
SavingsGas
TotalSavings Project Cost Payback
Building or Facility DescriptionSAVINGS
Electric KWh $SAVINGS
Electric KW $SAVINGSWater $
SAVINGSO & M
TotalSavings Project Costs Simple
PaybackMain Library Optimal chiller -$ 5,052.60$ -$ -$ 5,052.60$ 20,431.98$ 4.0
Exhibit 2B Page 298

Proprietary and Confidential © Siemens Industry IGA Report – May, 2019 – | Page 659
Siemens – Broward County, Investment Grade Audit | May 2019
G.9. Miramar Library
PROJECT SCOPE – EXTERIOR LIGHTING
The following section summarizes the lighting scope of work originally proposed:
∂ LED Replacement for High Intensity Discharge Exterior:∂ LED Replacement for Fluorescent Exterior
Exterior Lighting Retrofit Scope Considered
FIM SAVINGS SUMMARY
Annual Electric Consumption: 38,301 kWh
Annual Electric Demand: 107.16 kW
FIM Financial Summary
G.10. Hollywood Library
PROJECT SCOPE – INTERIOR LIGHTING
The following section summarizes the lighting scope of work originally proposed:
∂ LED Replacement of Linear Lamps∂ LED Replacement for Screw Based Incandescent and Compact fluorescent fixtures∂ LED Replacement for Pin-Based Compact Fluorescent Fixtures∂ LED Replacement for High Intensity Discharge Interior∂ Emergency Lighting
BUILDING EXISTING & RETROFIT STANDARD LEGEND DESCRIPTIONSEXISTING
QTYRETROFIT
QTYLIBRARY, MI,
MiramarExisting High Intensity Discharge - Proposed Retrofit LED 38 38
Existing High Intensity Discharge - Proposed New LED Fixture 12 12Existing Incandescent - Proposed Relamp LED 2 2Existing Compact Fluorescent - Proposed Retrofit LED 25 25
Lighting - Exterior 2,316$ -$ 670$ -$ 2,986$ 31,372$ 10.5
SavingsKWH
SavingsKW Savings O&M Savings
CapitalTotal
SavingsLIBRARY, MI, Miramar Project Cost Payback
Exhibit 2B Page 299

Proprietary and Confidential © Siemens Industry IGA Report – May, 2019 – | Page 660
Siemens – Broward County, Investment Grade Audit | May 2019
Interior Lighting Retrofit Scope
PROJECT SCOPE – EXTERIOR LIGHTING
The following section summarizes the lighting scope of work originally proposed:
∂ LED Replacement for High Intensity Discharge Exterior∂ LED Replacement for Fluorescent Exterior
Exterior Lighting Retrofit Scope
FIM SAVINGS SUMMARY
Annual Electric Consumption: 63,312 kWh
Annual Electric Demand: 257.64 kW
FIM Financial Summary
BUILDING NAME EXISTING & RETROFIT STANDARD LEGEND DESCRIPTIONSEXISTING
QTYRETROFIT
QTY
LIBRARY, HO,Hollywood
Existing Excluded due to lack of cost effective replacementor more efficient option - No Retrofit Proposed
21 21
Existing T8 Fluorescent - Proposed Retrofit LED 284 284Existing T8 Fluorescent - Proposed New LED Fixture 84 84Existing High Intensity Discharge - Proposed Retrofit LED 31 31Existing Incandescent - Proposed Relamp LED 8 8Existing Compact Fluorescent - Proposed Relamp LED 32 32Existing Compact Fluorescent - Proposed Retrofit LED 66 66
Existing T8 Fluorescent U Tube - Proposed New LED Fixture 12 12
BUILDING EXISTING & RETROFIT STANDARD LEGEND DESCRIPTIONSEXISTING
QTYRETROFIT
QTYLIBRARY, HO,
HollywoodExisting High Intensity Discharge - Proposed New LED Fixture 8 8
Existing Compact Fluorescent - Proposed Retrofit LED 25 25
Lightgin - COMBINED 3,795$ 2,952$ 1,093$ -$ 7,839$ 84,659$ 10.8
SavingsKWH
SavingsKW Savings O&M Savings
CapitalTotal
SavingsLIBRARY, HO, Hollywood Project Cost Payback
Exhibit 2B Page 300

Proprietary and Confidential © Siemens Industry IGA Report – May, 2019 – | Page 661
Siemens – Broward County, Investment Grade Audit | May 2019
G.11. East Regional Library
PROJECT SCOPE – EXTERIOR LIGHTING
The following section summarizes the lighting scope of work originally proposed:
∂ LED Replacement for High Intensity Discharge Exterior
Exterior Lighting Retrofit Scope
FIM SAVINGS SUMMARY
Annual Electric Consumption: 52,454 kWh
Annual Electric Demand: 171 kW
FIM Financial Summary
BUILDING ENVELOPE
A complete building envelope audit was conducted for all facilities within the scope of workissued for this investment grade audit. The building envelope audit’s primary goal is todiscover and define improvements that can reduce energy consumption, improve occupantcomfort and productivity, and increase building and structural durability.
PROJECT SCOPE
The East Regional Library has large air leakage pathways at the two ends of the old buildingarea. The original design of the building included large openings at these two ends,connecting the soffit area to the interior of the building. It is suggested that these air leakagepathways be sealed off to eliminate this source of heat and moisture intrusion.
FIM SAVINGS SUMMARY
Annual Electric Consumption: 13,227 kWh
FIM Financial Summary
BUILDING EXISTING & RETROFIT STANDARD LEGEND DESCRIPTIONSEXISTING
QTYRETROFIT
QTYLIBRARY, FL, East
RegionalExisting High Intensity Discharge - Proposed Retrofit LED 6 6
Existing High Intensity Discharge - Proposed New LED Fixture 10 10
Lightgin - COMBINED 3,047$ 1,960$ 836$ -$ 5,843$ 58,477$ 10.0
LIBRARY, FL, EastRegional
SavingsKWH
SavingsKW Savings O&M Savings
CapitalTotal
Savings Project Cost Payback
Building Envelope - COMBINED 1,097$ -$ -$ -$ 1,097$ 18,481$ 16.8
LIBRARY, FL, EastRegional
SavingsKWH
SavingsKW Savings O&M Savings
CapitalTotal
Savings Project Cost Payback
Exhibit 2B Page 301

Proprietary and Confidential © Siemens Industry IGA Report – May, 2019 – | Page 662
Siemens – Broward County, Investment Grade Audit | May 2019
G.12. Deerfield Beach Library
PROJECT SCOPE – EXTERIOR LIGHTING
The following section summarizes the lighting scope of work originally proposed:
∂ LED Replacement for High Intensity Discharge Exterior
Exterior Lighting Retrofit Scope
FIM SAVINGS SUMMARY
Annual Electric Consumption: 42,842 kWh
Annual Electric Demand: 177.84 kW
FIM Financial Summary
WATER CONSERVATION
PROJECT SCOPE
The following section summarizes the water conservation scope of work originally proposed:
∂ Flush Valves∂ Urinals∂ Bathroom Faucets/Aerators
FIM SAVINGS SUMMARY
Annual Water savings: 86,803 gallons
Annual Energy savings: 1,034 kWh
FIM Financial Summary
BUILDING EXISTING & RETROFIT STANDARD LEGEND DESCRIPTIONSEXISTING
QTYRETROFIT
QTYLIBRARY, DB,
Deerfield BeachExisting High Intensity Discharge - Proposed Retrofit LED 12 12
Existing High Intensity Discharge - Proposed New LED Fixture 18 18
Lightgin - COMBINED 2,486$ 2,037$ 703$ -$ 5,226$ 55,056$ 10.5
SavingsKWH
SavingsKW Savings O&M Savings
CapitalTotal
Savings Project Cost PaybackLIBRARY, DB, DeerfieldBeach
Water - Retorfits 60$ 663$ 51$ 774$ 8,031$ 10.4
Savings KWH SavingsWater Savings O&M Total Savings Project Cost PaybackLIBRARY, DB, Deerfield Beach
Exhibit 2B Page 302

Proprietary and Confidential © Siemens Industry IGA Report – May, 2019 – | Page 663
Siemens – Broward County, Investment Grade Audit | May 2019
G.13. Imperial Point Library
The use of occupancy sensors have been proposed in the majority of the offices, warehouses,garages, and locker rooms. Sensor savings have been determined from logger reportsindicating the estimated sensor savings for each space type for every building.
Interior Lighting Occupancy Sensor Scope
G.14. Collier Library
PROJECT SCOPE – INTERIOR LIGHTING
The following section summarizes the lighting scope of work originally proposed:
∂ LED Replacement of Linear Lamps∂ LED Replacement for Pin-Based Compact Fluorescent Fixtures∂ Emergency Lighting
Interior Lighting Retrofit Scope
PROJECT SCOPE – EXTERIOR LIGHTING
The following section summarizes the lighting scope of work originally proposed:
∂ LED Replacement for High Intensity Discharge Exterior
Exterior Lighting Retrofit Scope
Building NameAreas Controlled
by sensorsLIBRARY, IP, Imperial Point 4
BUILDING NAME EXISTING & RETROFIT STANDARD LEGEND DESCRIPTIONSEXISTING
QTYRETROFIT
QTY
LIBRARY, CC, Collier CityExisting Excluded due to lack of cost effective replacementor more efficient option - No Retrofit Proposed
16 16
Existing T8 Fluorescent - Proposed Retrofit LED 163 163Existing T8 Fluorescent - Proposed Retrofit LED WithReflector kit
42 42
Existing Compact Fluorescent - Proposed Relamp LED 30 30Existing Compact Fluorescent - Proposed Retrofit LED 10 10
Existing T8 Fluorescent U Tube - Proposed New LED Fixture 21 21
BUILDING EXISTING & RETROFIT STANDARD LEGEND DESCRIPTIONSEXISTING
QTYRETROFIT
QTYLIBRARY, CC,
Collier CityExisting High Intensity Discharge - Proposed Retrofit LED 33 33
Existing High Intensity Discharge - Proposed New LED Fixture 13 13
Exhibit 2B Page 303

Proprietary and Confidential © Siemens Industry IGA Report – May, 2019 – | Page 664
Siemens – Broward County, Investment Grade Audit | May 2019
FIM SAVINGS SUMMARY
Annual Electric Consumption: 50,375 kWhAnnual Electric Demand: 182.4 kW
FIM Financial Summary
WATER CONSERVATION
The following section summarizes the water conservation scope of work originally proposed:
∂ Flush Valves∂ Urinals∂ Bathroom Faucets/Aerators
FIM SAVINGS SUMMARY
Annual Water savings: 42,746 gallonsAnnual Energy savings: 991 kWh
FIM Financial Summary
BUILDING ENVELOPE
A complete building envelope audit was conducted for all facilities within the scope of workissued for this investment grade audit. The building envelope audit’s primary goal is todiscover and define improvements that can reduce energy consumption, improve occupantcomfort and productivity, and increase building and structural durability.
The old portion of Collier library contains an uninsulated soffit area, part of which containselectrical penetrations (lighting) which allow air to transfer into the building from theexterior. This thin plastered soffit should be sealed and insulated to eliminate air leakage andreduce conductive heat gain.
FIM SAVINGS SUMMARY
Annual Electric Consumption: 2,092 kWh
FIM Financial Summary
Lightgin - COMBINED 2,922$ 2,082$ 784$ -$ 5,789$ 63,752$ 11.0
LIBRARY, CC, Collier City SavingsKWH
SavingsKW Savings O&M Savings
CapitalTotal
Savings Project Cost Payback
Water - Retorfits 58$ 327$ 143$ 206$ 733$ 8,877$ 12.1
LIBRARY, CC, Collier City Savings KWH SavingsWater
Savings O&M SavingsCapital
Total Savings Project Cost Payback
Building Envelope - COMBINED 173$ -$ -$ 390$ 564$ 6,821$ 12.1
LIBRARY, CC, Collier City SavingsKWH
SavingsKW Savings O&M Savings
CapitalTotal
Savings Project Cost Payback
Exhibit 2B Page 304

Proprietary and Confidential © Siemens Industry IGA Report – May, 2019 – | Page 665
Siemens – Broward County, Investment Grade Audit | May 2019
G.15. Lauderhill Library
PROJECT SCOPE – INTERIOR LIGHTING
The following section summarizes the lighting scope of work originally proposed:
∂ LED Replacement of Linear Lamps∂ LED Replacement for Pin-Based Compact Fluorescent Fixtures∂ Emergency Lighting
Interior Lighting Retrofit Scope
FIM SAVINGS SUMMARY
Annual Electric Consumption: 52,711 kWh
Annual Electric Demand: 186.96 kW
FIM Financial Summary
BUILDING NAME EXISTING & RETROFIT STANDARD LEGEND DESCRIPTIONSEXISTING
QTYRETROFIT
QTY
LIBRARY, LC, LauderhillExisting Excluded due to lack of cost effective replacementor more efficient option - No Retrofit Proposed
7 7
Existing T8 Fluorescent - Proposed Retrofit LED 215 215Existing Compact Fluorescent - Proposed Retrofit LED 18 18
Existing T8 Fluorescent U Tube - Proposed New LED Fixture 10 10
Lightgin - COMBINED 3,057$ 2,140$ 630$ -$ 5,827$ 64,767$ 11.1
SavingsKWH
SavingsKW Savings O&M Savings
CapitalTotal
Savings Project Cost PaybackLIBRARY, LC, Lauderhill
Exhibit 2B Page 305

Proprietary and Confidential © Siemens Industry IGA Report – May, 2019 – | Page 666
Siemens – Broward County, Investment Grade Audit | May 2019
G.16. Riverland Branch Library
PROJECT SCOPE – LIGHTING OCCUPANCY SENSORS
The use of occupancy sensors have been proposed in the majority of the offices, warehouses,garages, and locker rooms. Sensor savings have been determined from logger reportsindicating the estimated sensor savings for each space type for every building.
Interior Lighting Occupancy Sensor Scope
WATER CONSERVATION
The following section summarizes the water conservation scope of work originally proposed:
∂ Tank Style Water Closets∂ Urinals∂ Bathroom Faucets/Aerators
FIM SAVINGS SUMMARY
Annual Water savings: 12,022 gallons
Annual Energy savings: 276 kWh
FIM Financial Summary
Building NameAreas Controlled
by sensorsLIBRARY, RV, Riverland Branch 2
Water - Retorfits 16$ 137$ 11$ 197$ 362$ 4,380$ 12.1
LIBRARY, RV, Riverland Branch Savings KWH SavingsWater
Savings O&M SavingsCapital
Total Savings Project Cost Payback
Exhibit 2B Page 306

Proprietary and Confidential © Siemens Industry IGA Report – May, 2019 – | Page 667
Siemens – Broward County, Investment Grade Audit | May 2019
G.17. Hollywood Beach Library
PROJECT SCOPE – EXTERIOR LIGHTING
The following section summarizes the lighting scope of work originally proposed:
∂ LED Replacement for High Intensity Discharge Exterior
Exterior Lighting Retrofit Scope
FIM SAVINGS SUMMARY
Annual Electric Consumption: 6,419 kWh
FIM Financial Summary
WATER CONSERVATION
The following section summarizes the water conservation scope of work originally proposed:
∂ Bathroom Faucets/Aerators
FIM SAVINGS SUMMARY
Annual Water savings: 21,134 gallons
Annual Energy savings: 1,242 kWh
FIM Financial Summary
BUILDING EXISTING & RETROFIT STANDARD LEGEND DESCRIPTIONSEXISTING
QTYRETROFIT
QTYLIBRARY, HB,
Hollywood BeachExisting High Intensity Discharge - Proposed New LED Fixture 7 7
Lightgin - COMBINED 647$ -$ 104$ -$ 751$ 7,553$ 10.1
LIBRARY, HB, HollywoodBeach
SavingsKWH
SavingsKW Savings O&M Savings
CapitalTotal
Savings Project Cost Payback
Water - Retorfits 125$ 161$ 2$ 288$ 220$ 0.8
LIBRARY, HB, Hollywood Beach Savings KWH SavingsWater Savings O&M Total Savings Project Cost Payback
Exhibit 2B Page 307

Proprietary and Confidential © Siemens Industry IGA Report – May, 2019 – | Page 668
Siemens – Broward County, Investment Grade Audit | May 2019
G.18. Galt Ocean Library
LIGHTING RETROFIT
The following section describes all lighting scope of work proposed for implementation.
PROJECT SCOPE – INTERIOR LIGHTING
The following section summarizes the lighting scope of work originally proposed:
∂ LED Replacement of Linear Lamps∂ LED Replacement for Pin-Based Compact Fluorescent Fixtures∂ Emergency Lighting
NOTE: Lighting systems in some of the buildings fall outside of the dominant scenario andrequire an adjusted design approach. In this case, the main library spaces in this building arescheduled to be remodeled, including reconfiguration of walls in some spaces. Theremodeling will remove the existing suspended grid ceiling and replace it with new ceilings.In this scenario, new LED luminaires have been specified in new and existing locations. Thisvaries from other spaces in that new luminaires will be used instead of retrofitting of existingluminaires. Additionally, any payback evaluation must consider that “doing nothing” is notan option, as the labor to install luminaires in a new ceiling is required regardless of thefixtures used.
Interior Lighting Retrofit Scope
FIM SAVINGS SUMMARY
Annual Electric Consumption: 12,475 kWh
FIM Financial Summary
BUILDING NAME EXISTING & RETROFIT STANDARD LEGEND DESCRIPTIONSEXISTING
QTYRETROFIT
QTY
LIBRARY, GO, GaltOcean
Existing Excluded due to lack of cost effective replacementor more efficient option - No Retrofit Proposed
3 3
Existing T8 Fluorescent - Proposed New LED Fixture 35 33Existing Exit Sign - Proposed New LED Fixture 7 9Existing Compact Fluorescent - Proposed Retrofit LED 9 9
Existing T8 Fluorescent U Tube - Proposed New LED Fixture 46 46
Existing Miscellaneous - Proposed New LED Fixture 0 1
Lighting - Interior 1,217$ -$ 277$ 1,370$ 2,864$ 34,616$ 12.1
LIBRARY, GO, GaltOcean
SavingsKWH
SavingsKW
Savings O&M SavingsCapital
TotalSavings
Project Cost Payback
Exhibit 2B Page 308

Proprietary and Confidential © Siemens Industry IGA Report – May, 2019 – | Page 669
Siemens – Broward County, Investment Grade Audit | May 2019
WATER CONSERVATION
The following section summarizes the water conservation scope of work originally proposed:
∂ Flush Valves∂ Urinals∂ Bathroom Faucets/Aerators
FIM SAVINGS SUMMARY
Annual Water savings: 72,204 gallons
Annual Energy savings: 922 kWh
FIM Financial Summary
G.19. BC Agricultural Center
WATER CONSERVATION
The following section summarizes the water conservation scope of work originally proposed:
∂ Showers∂ Flush Valves
FIM SAVINGS SUMMARY
Annual Water savings: 12,689 gallons
Annual Energy savings: 215 kWh
FIM FINANCIAL SUMMARY
Water - Retorfits 90$ 823$ 75$ 989$ 10,208$ 10.3
LIBRARY, GO, Galt Ocean Savings KWH SavingsWater
Savings O&M Total Savings Project Cost Payback
Water - Retorf its 11$ 155$ 32$ 198$ 2,348$ 11.8
Savings KWH SavingsWater Savings O&M Total SavingsBC Agriculture Extension Project Cost Payback
Exhibit 2B Page 309
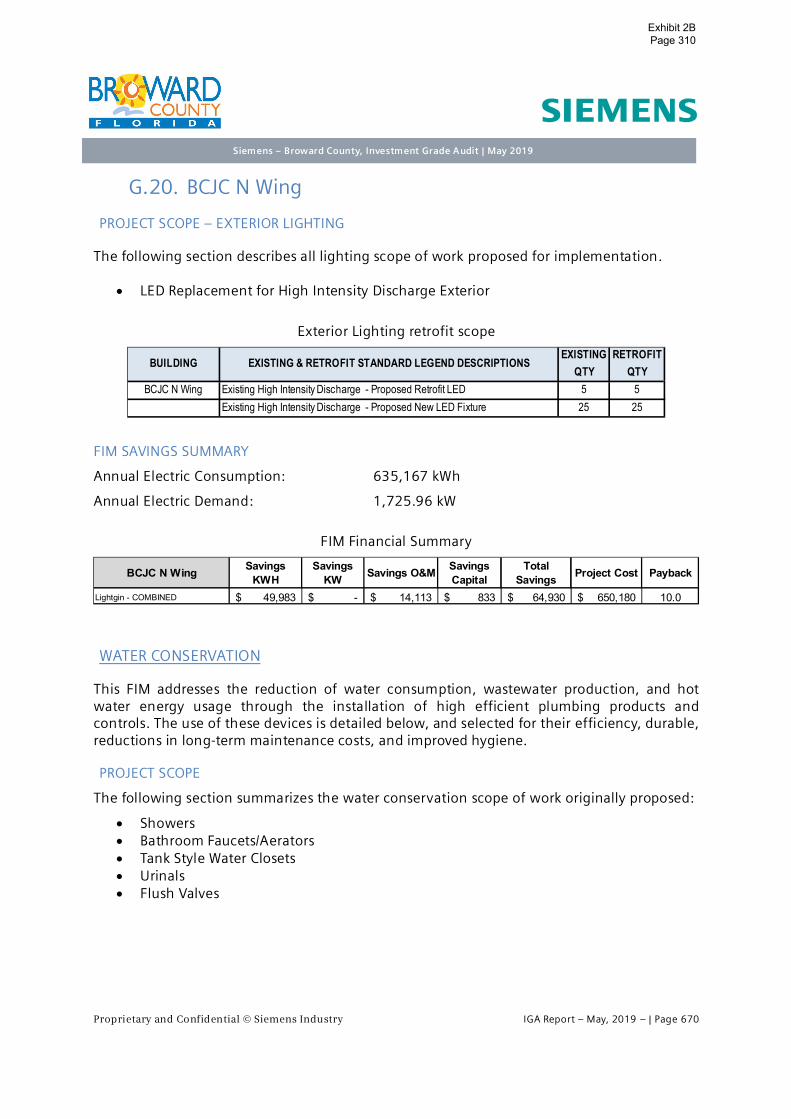
Proprietary and Confidential © Siemens Industry IGA Report – May, 2019 – | Page 670
Siemens – Broward County, Investment Grade Audit | May 2019
G.20. BCJC N Wing
PROJECT SCOPE – EXTERIOR LIGHTING
The following section describes all lighting scope of work proposed for implementation.
∂ LED Replacement for High Intensity Discharge Exterior
Exterior Lighting retrofit scope
FIM SAVINGS SUMMARY
Annual Electric Consumption: 635,167 kWh
Annual Electric Demand: 1,725.96 kW
FIM Financial Summary
WATER CONSERVATION
This FIM addresses the reduction of water consumption, wastewater production, and hotwater energy usage through the installation of high efficient plumbing products andcontrols. The use of these devices is detailed below, and selected for their efficiency, durable,reductions in long-term maintenance costs, and improved hygiene.
PROJECT SCOPE
The following section summarizes the water conservation scope of work originally proposed:
∂ Showers∂ Bathroom Faucets/Aerators∂ Tank Style Water Closets∂ Urinals∂ Flush Valves
BUILDING EXISTING & RETROFIT STANDARD LEGEND DESCRIPTIONSEXISTING
QTYRETROFIT
QTYBCJC N Wing Existing High Intensity Discharge - Proposed Retrofit LED 5 5
Existing High Intensity Discharge - Proposed New LED Fixture 25 25
Lightgin - COMBINED 49,983$ -$ 14,113$ 833$ 64,930$ 650,180$ 10.0
Project Cost PaybackBCJC N Wing SavingsKWH
SavingsKW Savings O&M Savings
CapitalTotal
Savings
Exhibit 2B Page 310

Proprietary and Confidential © Siemens Industry IGA Report – May, 2019 – | Page 671
Siemens – Broward County, Investment Grade Audit | May 2019
FIM SAVINGS SUMMARY
Annual Water savings: 1,438,862 gallons
Annual Energy savings: 6,390 kWh
FIM Financial Summary
NOTE: This facility had water retrofits identified as a capital project. Therefore, the financialsincorporated capital cost in order to show an accurate payback.
MECHNICAL / AUTOMATION OPTIMIZATION
Automation optimization improves the energy efficiency of existing central chiller plant andheating, cooling and air conditioning (HVAC) systems by reducing energy consumption.During automation optimization, the sequence of operation for each controlled device isdeveloped using in-depth investigations of existing mechanical and control systems, andimproved through control programming.
PROJECT SCOPE
Based on trending data and site visits, the following facility improvement measures areproposed to improve the energy efficiency of the existing systems.
∂ Chiller plant optimization
o Automation
o VFD installation on all pumps
o Replace all existing pump motors
o Installation of new control valves
∂ Optimal chiller start to reduce electric demand
∂ Air handling unit (AHU) static pressure reset at unoccupied hours
To implement the optimization measures:
∂ Sequence of operations for those proposed measures will be developed, andassociated control program will be implemented.
∂ Sensors required for the measures will be either calibrated, repaired or installed
The implementation of optimization measures assume that existing mechanical equipmentand control devices are operable normally, and support implementation of the proposedmeasures. If during the implementation mechanical equipment and/or control devices aredeteriorated such as to prevent proper operations, the measures may be cancelled ormodified accordingly.
Water - Retorfits 511$ 16,403$ 968$ 10,833$ 28,716$ 345,689$ 12.0
Project Cost PaybackBCJC N Wing Savings KWH SavingsWater Savings O&M Savings
Capital Total Savings
Exhibit 2B Page 311

Proprietary and Confidential © Siemens Industry IGA Report – May, 2019 – | Page 672
Siemens – Broward County, Investment Grade Audit | May 2019
Chiller Plant Optimization: Chiller plant optimization systematically controls plantmechanical components to improve the overall efficiency. Chiller plant optimization includeschilled water pump speed control (based on dynamic differential pressure that reflects thecooling load), condenser water temperature control (to improve chiller efficiency), andcondenser water pump control.
Optimal Equipment Start to Reduce Electric Demand: The purpose of this measure is toavoid high electric demand charges caused by both chillers starting at full load. When the2nd chiller is called due to cooling load increases or lead- lag switches, limit the lead chillercurrent to 80% (adjustable) before turning on the second chiller. The current limit for the 2ndchiller is also limited to 80% (adjustable) during starting. After both chillers are on for 30minutes (adjustable), release the current limits back to normal values.
During lead-lag switch, reduce the current of the running chiller before turning on anotherchiller. When the 2nd chiller is turned on, limiting its current to 80% (adjustable) for 30minutes (adjustable) before changing back to the normal limit.
The same strategy can be applied to other HVAC equipment.
AHU Static Pressure Reset at Unoccupied Hours: Based on trending data, the existing HVACsystems use the same static pressure set points to control AHU supply air fan speed duringboth occupied and unoccupied hours. Resetting static pressure to lower values duringunoccupied hours can reduce AHU fan energy consumption.
AHU occupied and unoccupied modes are defined based on schedules. During unoccupiedmode, reset AHU static pressure set points to lower values, and modulate AHU fan speed tomaintain the set points.
To simply the implementation, each AHU equipped with a VFD will have 2 static pressure setpoints, one for the occupied mode, and another for the unoccupied mode.
SAVINGS
The savings for Automation Optimization were calculated as followings:
∂ Building load profiles which were simulated based on available trending data
∂ Building electricity use for the past 24 months
∂ Existing operation schedules provided by the County in June 2017
∂ Nameplate data, onsite measurements, and trending data from control systems
Models and calculations were created and conducted in Excel spreadsheets. The Bin weatherdata was used for annual energy consumption simulation. The average blended electric ratecalculated based on electric bills from 24 months was applied for energy cost calculations.
Exhibit 2B Page 312

Proprietary and Confidential © Siemens Industry IGA Report – May, 2019 – | Page 673
Siemens – Broward County, Investment Grade Audit | May 2019
FIM SAVINGS SUMMARY
The annual energy savings for each measure is summarized as follows:
∂ Chiller plant optimization: 1,086,000 kWh per year∂ Optimal chiller start to reduce electric demand: 450 kW per year∂ AHU static pressure at unoccupied hours: 44,000 kWh per year
FIM Financial Summary
RETRO-COMMISSIONING
The purpose of retro-commissioning is to improve the efficiency of existing mechanical andcontrol systems, and address issues developed due to equipment and/or device performancedegradations, and facility use changes. In the retro-commissioning process, systematicevaluation of system performance is conducted, and energy efficiency improvementmeasures of no-cost or low-cost are identified and implemented.
PROJECT SCOPE
The following scopes are included in the retro-commissioning process:
∂ Sensor calibrations and repair
∂ Identifications and evaluations of energy efficiency measures, which are not proposedin the Automation Optimization section
∂ Implementations of low-cost or no-cost measures
FIM SAVINGS SUMMARY
Annual Energy Consumption Savings: 224,000 kWh.
FIM Financial Summary
Retrocommissioning 15,728$ -$ -$ -$ -$ -$ 15,728$ 77,837$ 4.9
Project Cost PaybackBCJC N Wing SavingsWater
SavingsO&M
SavingsCapital
TotalSavings
SavingsKWH
SavingsKW
SavingsGas
Exhibit 2B Page 313

Proprietary and Confidential © Siemens Industry IGA Report – May, 2019 – | Page 674
Siemens – Broward County, Investment Grade Audit | May 2019
CHILLER PLANT OPTIMIZATION
PROJECT SCOPE
Based on trending data and site visits, the following facility improvement measures areproposed to improve the energy efficiency of the existing systems.
Optimal Equipment Start to Reduce Electric Demand: The purpose of this measure is toavoid high electric demand charges caused by both chillers starting at full load. When the2nd chiller is called due to cooling load increases or lead- lag switches, limit the lead chillercurrent to 80% (adjustable) before turning on the second chiller. The current limit for the 2ndchiller is also limited to 80% (adjustable) during starting. After both chillers are on for 30minutes (adjustable), release the current limits back to normal values.
During lead-lag switch, reduce the current of the running chiller before turning on anotherchiller. When the 2nd chiller is turned on, limiting its current to 80% (adjustable) for 30minutes (adjustable) before changing back to the normal limit.
The same strategy can be applied to other HVAC equipment.
SAVINGS
Models and calculations were created and conducted in Excel spreadsheets. The Bin weatherdata was used for annual energy consumption simulation. The average blended electric ratecalculated based on electric bills from 24 months was applied for energy cost calculations.
FIM SAVINGS SUMMARY
Annual Electric Consumption: - kWh
Annual Electric Demand: 76.5 kW
FIM Financial Summary
Building or Facility DescriptionSAVINGS
Electric KWh $SAVINGS
Electric KW $SAVINGSWater $
SAVINGSO & M
TotalSavings Project Costs Simple
PaybackBCJC N Wing Chiller start to -$ 7,429.85$ -$ -$ 7,429.85$ 23,871.37$ 3.2
Exhibit 2B Page 314

Proprietary and Confidential © Siemens Industry IGA Report – May, 2019 – | Page 675
Siemens – Broward County, Investment Grade Audit | May 2019
G.21. South Regional Courthouse
PROJECT SCOPE – INTERIOR LIGHTING
The following section describes all lighting scope of work proposed for implementation.
∂ LED Replacement of Linear Lamps∂ LED Replacement for Screw Based Incandescent and Compact fluorescent fixtures∂ LED Replacement for Pin-Based Compact Fluorescent Fixtures∂ Emergency Lighting
Interior Lighting Retrofit Scope
FIM SAVINGS SUMMARY
Annual Electric Consumption: 118,092 kWh
Annual Electric Demand: 476.52 kW
FIM Financial Summary
BUILDING ENVELOPE
A complete building envelope audit was conducted for all facilities within the scope of workissued for this investment grade audit. The building envelope audit’s primary goal is todiscover and define improvements that can reduce energy consumption, improve occupantcomfort and productivity, and increase building and structural durability.
PROJECT SCOPE
The South Regional Courthouse contains large quantities of soffit areas that extend out overthe exterior environment. These soffits are all very leaky, allowing outside air/moisture toeasily infiltrate the building. These soffits should be air-sealed to eliminate this air intrusion.
BUILDING NAME EXISTING & RETROFIT STANDARD LEGEND DESCRIPTIONSEXISTING
QTYRETROFIT
QTY
South RegionalCourthouse
Existing Excluded due to lack of cost effective replacementor more efficient option - No Retrofit Proposed
45 45
Existing T8 Fluorescent - Proposed Retrofit LED 292 292Existing Incandescent - Proposed Relamp LED 7 7Existing Compact Fluorescent - Proposed Relamp LED 196 196Existing Compact Fluorescent - Proposed Retrofit LED 29 29
Existing T8 Fluorescent U Tube - Proposed New LED Fixture 892 892
Lighting - Interior 11,080$ -$ 3,888$ -$ 14,968$ 193,863$ 13.0
South RegionalCourthouse
SavingsKWH
SavingsKW Savings O&M Savings
CapitalTotal
Savings Project Cost Payback
Exhibit 2B Page 315

Proprietary and Confidential © Siemens Industry IGA Report – May, 2019 – | Page 676
Siemens – Broward County, Investment Grade Audit | May 2019
FIM SAVINGS SUMMARY
Annual Electric Consumption: 4,097 kWh
FIM Financial Summary
AUTOMATION OPTIMIZATION
Automation optimization improves the energy efficiency of existing central chiller plant, andheating, cooling and air conditioning systems (HVAC) to reduce energy consumption andcosts by implementing optimization control strategies. During automation optimization, thesequence of operation for each measure for controlled devices is developed based on in-depth investigations of the existing mechanical and control systems, and the measure isimplemented in existing control systems through control programming.
PROJECT SCOPE
Based on trending data and site visits, the following facility improvement measures areproposed to improve the energy efficiency of the existing systems.
Supply air or room temperature reset: For variable air volume (VAV) terminal box, whencalling reheating, reset supply air temperature while satisfying the room humidityrequirements. This measure can reduce the energy consumption caused by reheating. Inaddition, room temperature at not critical areas can be reset at unoccupied hours to reduceenergy consumption of HVAC systems.
FIM SAVINGS SUMMARY
The annual energy savings for each measure is summarized as follows:
Supply air or room temperature reset: 34,000 kWh per year
FIM Financial Summary
Building Envelope - Air-Seal Soffits 340$ -$ -$ 606$ 946$ 11,453$ 12.1
South Regional Courthouse SavingsKWH
SavingsKW Savings O&M Savings
CapitalTotal
Savings Project Cost Payback
Chiller Lead/Lag Optimization -$ 1,742$ -$ -$ -$ -$ 1,742$ 6,673$ 3.8
AHU SAT Reset 2,800$ -$ -$ -$ -$ -$ 2,800$ 6,673$ 2.4
OA Intake Control 5,585$ -$ -$ -$ -$ -$ 5,585$ 22,937$ 4.1
SavingsCapital
TotalSavings
ProjectCost Payback South Regional Courthouse
SavingsKWH
SavingsKW
SavingsGas
SavingsWater
SavingsO&M
Exhibit 2B Page 316

Proprietary and Confidential © Siemens Industry IGA Report – May, 2019 – | Page 677
Siemens – Broward County, Investment Grade Audit | May 2019
AUTOMATION OPTIMIZATION
Automation optimization improves the energy efficiency of existing central chiller plant, andheating, cooling and air conditioning systems (HVAC) to reduce energy consumption andcosts by implementing optimization control strategies. During automation optimization, thesequence of operation for each measure for controlled devices is developed based on in-depth investigations of the existing mechanical and control systems, and the measure isimplemented in existing control systems through control programming.
PROJECT SCOPE
Based on trending data and site visits, the following facility improvement measures areproposed to improve the energy efficiency of the existing systems.
∂ Outdoor air (OA) intake control
Outdoor air intake control: Based on trending data, it was found that the existing HVACsystems were turned on when the building was still unoccupied, and off several hours afterthe building was unoccupied. Closing the OA dampers at unoccupied hours at warm andhumid seasons can reduce energy consumption and better control indoor humidity levels. Atoccupied hours, using demand controlled ventilation to control the amount of OA intake tosave energy.
SAVINGS
FIM SAVINGS SUMMARY
The annual energy savings for each measure is summarized as follows:
OA intake control: 68,099 kWh per year
FIM Financial Summary
Building or Facility DescriptionSAVINGS
Electric KWh $SAVINGS
Electric KW $SAVINGSWater $
SAVINGSO & M
TotalSavings Project Costs Simple
PaybackSouth Regional Courthouse Chiller Lead/Lag -$ 1,741.65$ -$ -$ 1,741.65$ 7,166.56$ 4.1South Regional Courthouse OA Reduction 5,584.50$ -$ -$ -$ 5,584.50$ 24,574.99$ 4.4
Exhibit 2B Page 317

Proprietary and Confidential © Siemens Industry IGA Report – May, 2019 – | Page 678
Siemens – Broward County, Investment Grade Audit | May 2019
G.22. Emergency Operations Center
EXTERIOR LIGHTING
The following section describes all lighting scope of work proposed for implementation.
∂ LED Replacement for High Intensity Discharge Exterior∂ LED Replacement for Fluorescent Exterior
Exterior Lighting Retrofit Scope
FIM SAVINGS SUMMARY
Annual Electric Consumption: 178,191 kWh
Annual Electric Demand: 452.58 kW
Fim Financial Summary
CHILLER REPLACEMENT AND ROOM TEMPERATURE RESET
The chiller replacement aims to improve chiller energy efficiency by replacing the agedinefficient chiller with a new chiller of a similar model and better efficiency. This measurewill also fulfill the County’s request to add redundancy to the existing plant.
Resetting room temperature at unoccupied hours is a common strategy to reduce buildingenergy consumption. This work will be done in conjunction with the plant upgrades as there-sequencing and updates of current sequences within the BAU will be required.
PROJECT SCOPE
The followings are included in the scope of work of the combined FIM:
∂ Provide two (2) 115 nominal ton R-134a air-cooled screw chiller
∂ Remove the old chiller and be responsible for the proper demolition of the unit.
∂ Expand the current plant enclose
∂ Connect the new chiller to the existing piping system
BUILDING EXISTING & RETROFIT STANDARD LEGEND DESCRIPTIONSEXISTING
QTYRETROFIT
QTYEmergency
Operations CenterExisting High Intensity Discharge - Proposed New LED Fixture 24 24
Existing Compact Fluorescent - Proposed Retrofit LED 8 8
Lightgin - COMBINED 14,363$ -$ 2,289$ -$ 16,652$ 171,394$ 10.3
SavingsKWH
SavingsKW Savings O&M Savings
CapitalTotal
Savings Project Cost PaybackEmergency OperationsCenter
Exhibit 2B Page 318

Proprietary and Confidential © Siemens Industry IGA Report – May, 2019 – | Page 679
Siemens – Broward County, Investment Grade Audit | May 2019
∂ Additional piping for new redundant chiller
∂ Additional electrical needs for redundant chiller
∂ Start up the new chillers
∂ Reset room temperatures
Chiller Replacement: Cooling for the building is provided by a chiller plant consisting of one(1) air-cooled 110-ton Trane rotary liquid chiller. The chiller is original to the building’sconstruction, 1997, and has a history of failures and the coils are visibly, extensivelydamaged. It is at the end of its useful life. The existing chiller will be replaced by one (1) new115-nominal ton air-cooled R-134a chiller with better efficiency.
Room Temperature Reset: Based on trending data, most rooms in the building usedconstant room temperature set point. For spaces that need HVAC for comfort, roomtemperature can be reset during unoccupied hours to save energy. During unoccupied mode,reset the room temperature cooling set point to 78oF (adjustable), and reset roomtemperature heating set point to 65oF (adjustable). The occupied and unoccupied modes aredefined based on schedules.
FIM SAVINGS SUMMARY
Annual Energy Consumption Savings: 241,000 kWh.
FIM Financial Summary
ROOM TEMPERATURE RESET - ONLY
PROJECT SCOPE
Room Temperature Reset: Based on trending data, most rooms in the building usedconstant room temperature set point. For spaces that need HVAC for comfort, roomtemperature can be reset during unoccupied hours to save energy. During unoccupied mode,reset the room temperature cooling set point to 78oF (adjustable), and reset roomtemperature heating set point to 65oF (adjustable). The occupied and unoccupied modes aredefined based on schedules.
SAVINGS
FIM Financial Summary
Chiller Replace & Redundancy & Resets 17,767$ -$ -$ -$ -$ 38,250$ 56,017$ 707,434$ 12.6
TotalSavings Project Cost Payback
SavingsKWH
SavingsKW
SavingsGas
SavingsCapitalEmergency Operations Center
SavingsWater
SavingsO&M
Building or Facility DescriptionSAVINGS
Electric KWh $SAVINGS
Electric KW $SAVINGSWater $
SAVINGSO & M
TotalSavings Project Costs Simple
Payback
Emergency Operations CenterAHU temp reset atunoccupied hours
5,029.45$ -$ -$ -$ 5,029.45$ 24,171.26$ 4.8
Exhibit 2B Page 319
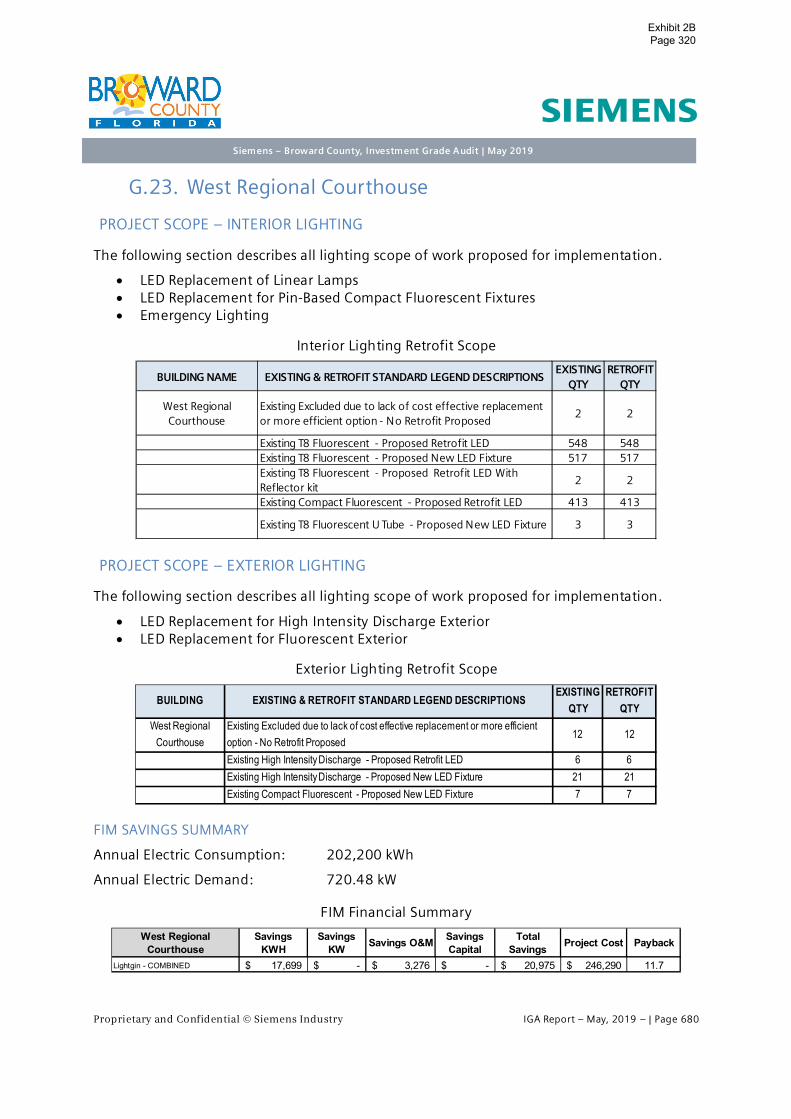
Proprietary and Confidential © Siemens Industry IGA Report – May, 2019 – | Page 680
Siemens – Broward County, Investment Grade Audit | May 2019
G.23. West Regional Courthouse
PROJECT SCOPE – INTERIOR LIGHTING
The following section describes all lighting scope of work proposed for implementation.
∂ LED Replacement of Linear Lamps∂ LED Replacement for Pin-Based Compact Fluorescent Fixtures∂ Emergency Lighting
Interior Lighting Retrofit Scope
PROJECT SCOPE – EXTERIOR LIGHTING
The following section describes all lighting scope of work proposed for implementation.
∂ LED Replacement for High Intensity Discharge Exterior∂ LED Replacement for Fluorescent Exterior
Exterior Lighting Retrofit Scope
FIM SAVINGS SUMMARY
Annual Electric Consumption: 202,200 kWh
Annual Electric Demand: 720.48 kW
FIM Financial Summary
BUILDING NAME EXISTING & RETROFIT STANDARD LEGEND DESCRIPTIONSEXISTING
QTYRETROFIT
QTY
West RegionalCourthouse
Existing Excluded due to lack of cost effective replacementor more efficient option - No Retrofit Proposed
2 2
Existing T8 Fluorescent - Proposed Retrofit LED 548 548Existing T8 Fluorescent - Proposed New LED Fixture 517 517Existing T8 Fluorescent - Proposed Retrofit LED WithReflector kit
2 2
Existing Compact Fluorescent - Proposed Retrofit LED 413 413
Existing T8 Fluorescent U Tube - Proposed New LED Fixture 3 3
BUILDING EXISTING & RETROFIT STANDARD LEGEND DESCRIPTIONSEXISTING
QTYRETROFIT
QTYWest Regional
CourthouseExisting Excluded due to lack of cost effective replacement or more efficientoption - No Retrofit Proposed
12 12
Existing High Intensity Discharge - Proposed Retrofit LED 6 6Existing High Intensity Discharge - Proposed New LED Fixture 21 21Existing Compact Fluorescent - Proposed New LED Fixture 7 7
Lightgin - COMBINED 17,699$ -$ 3,276$ -$ 20,975$ 246,290$ 11.7
West RegionalCourthouse
SavingsKWH
SavingsKW PaybackSavings O&M Savings
CapitalTotal
Savings Project Cost
Exhibit 2B Page 320

Proprietary and Confidential © Siemens Industry IGA Report – May, 2019 – | Page 681
Siemens – Broward County, Investment Grade Audit | May 2019
G.24. Highway and Bridge Administration
PROJECT SCOPE – INTERIOR LIGHTING
The following section describes all lighting scope of work proposed for implementation.
∂ LED Replacement of Linear Lamps∂ LED Replacement for Screw Based Incandescent and Compact fluorescent fixtures∂ LED Replacement for High Intensity Discharge Interior∂ Emergency Lighting
Interior Lighting Retrofit Scope
FIM SAVINGS SUMMARY
Annual Electric Consumption: 12,668 kWh
Annual Electric Demand: 55.86 kW
FIM Financial Summary
BUILDING NAME EXISTING & RETROFIT STANDARD LEGEND DESCRIPTIONSEXISTING
QTYRETROFIT
QTYHIGH & BRDGAdministration,
Pompano
Existing Excluded due to lack of cost effective replacementor more efficient option - No Retrofit Proposed
10 10
Existing T8 Fluorescent - Proposed Retrofit LED 107 107Existing High Intensity Discharge - Proposed New LED High-Bay Fixture
4 4
Existing Incandescent - Proposed Relamp LED 6 6
Existing T8 Fluorescent U Tube - Proposed New LED Fixture 2 2
Lighting - Interior 1,217$ -$ 169$ -$ 1,386$ 13,846$ 10.0
HIGH & BRDGAdministration, Pompano
SavingsKWH
SavingsKW Savings O&M Savings
CapitalTotal
Savings Project Cost Payback
Exhibit 2B Page 321

Proprietary and Confidential © Siemens Industry IGA Report – May, 2019 – | Page 682
Siemens – Broward County, Investment Grade Audit | May 2019
AUTOMATION – SCHEDULES
Standard thermostats control an HVAC unit by measuring the ambient temperature at thethermostat and either turning the unit on if the ambient temperature is above thetemperature setpoint or turning the unit off when the ambient temperature reaches thesetpoint. Most commercial facilities have set hours of operation where the facility is occupiedand there is a need for conditioned space. Outside of hours of operation a facility will usuallynot have occupancy and won’t have a need for air conditioning. Advanced Siemensthermostats allow for the utilization of this fact to translate into energy savings by changingthe setpoint temperatures of a building automatically depending on the hours of operation.In addition, these thermostats have the capability to be wirelessly connected to a BAS systemfor remote monitoring and control.
PROJECT SCOPE
This FIM address the turn-key replacement and installation of two (2) thermostats withscheduling capabilities.
FIM SAVINGS SUMMARY
Annual Electric Consumption: 59,375 kWh
FIM Financial Summary
HVAC Schedules 3,902$ 3,902$ 6,381$ 1.6
HIGH & BRDG Administration,Pompano
Savings KWH Total Savings Project Cost Payback
Exhibit 2B Page 322

Proprietary and Confidential © Siemens Industry IGA Report – May, 2019 – | Page 683
Siemens – Broward County, Investment Grade Audit | May 2019
G.25. BCJC State Attorney’s Office (LTS)
PROJECT SCOPE – EXTERIOR LIGHTING
The following section describes all lighting scope of work proposed for implementation.
∂ LED Replacement for High Intensity Discharge Exterior
Exterior Lighting Retrofit Scope
FIM SAVINGS SUMMARY
Annual Electric Consumption: 22,714 kWh
Annual Electric Demand: 66.12 kW
FIM Financial Summary
BUILDING EXISTING & RETROFIT STANDARD LEGEND DESCRIPTIONSEXISTING
QTYRETROFIT
QTY
BCJC StatesAttorney Office (LTS)
Existing High Intensity Discharge - Proposed New LED Fixture 1 1
Lightgin - COMBINED 1,354$ 740$ 261$ -$ 2,355$ 19,466$ 8.3
BCJC States AttorneyOffice (LTS)
SavingsKWH
SavingsKW Savings O&M Project Cost PaybackSavings
CapitalTotal
Savings
Exhibit 2B Page 323

Proprietary and Confidential © Siemens Industry IGA Report – May, 2019 – | Page 684
Siemens – Broward County, Investment Grade Audit | May 2019
G.26. BC Government Center
RETRO-COMMISSIONING
The purpose of retro-commissioning is to improve the efficiency of existing mechanical andcontrol systems. It addresses issues that have developed during buildings’ life due toperformance degradations and facility use changes. In the retro-commissioning process,systematic evaluation of system performance is conducted, and energy efficiencyimprovement measures of no-cost or low-cost are identified and implemented.
PROJECT SCOPE
The following scopes are included in retro-commissioning:
∂ Sensor calibration and repair
∂ Identifications and evaluations of energy efficiency measures, which are not alreadyproposed in the Automation Optimization section
∂ Implementations of low cost or no cost measures
FIM SAVINGS SUMMARY
Annual Energy Consumption Savings: 301,000 kWh.
FIM Financial Summary
Retrocommissioning 21,121$ -$ -$ -$ -$ -$ 21,121$ 104,529$ 4.9
SavingsKWH
SavingsKW
SavingsGas
SavingsWater
SavingsO&M
SavingsCapital
TotalSavings
Project Cost PaybackBC Gov. Center
Exhibit 2B Page 324

Proprietary and Confidential © Siemens Industry IGA Report – May, 2019 – | Page 685
Siemens – Broward County, Investment Grade Audit | May 2019
G.27. Edgar Mills Center
INTERIOR LIGHTING PROJECT SCOPE
The following section describes all lighting scope of work proposed for implementation.
∂ LED Replacement of Linear Lamps∂ LED Replacement for Pin-Based Compact Fluorescent Fixtures∂ Emergency Lighting
Interior Lighting Retrofit Scope
FIM SAVINGS SUMMARY
Annual Electric Consumption: 9,015 kWh
Annual Electric Demand: 763.08 kW
FIM Financial Summary
LIGHTING RETROFIT
The following section describes all lighting scope of work proposed for implementation.
PROJECT SCOPE – EXTERIOR LIGHTING
LED Replacement for High Intensity Discharge Exterior
The replacement of HID (high intensity discharge), including metal halide or high-pressuresodium n exterior applications provides significant energy reduction opportunities whenchanging over to LED. For exterior pole mounted applications, often the number of fixturescan be reduce based on the improved photometric and light distribution of the new LEDfixtures that wasn’t previously available in HID fixtures. All proposed LED fixtures are fromrecognized manufacturers that have met the required standards for light quality, efficiencyand longevity. In our design effort and fixture selection process, consideration is given to
BUILDING NAME EXISTING & RETROFIT STANDARD LEGEND DESCRIPTIONSEXISTING
QTYRETROFIT
QTY
Edgar Mills CenterExisting Excluded due to lack of cost effective replacementor more efficient option - No Retrofit Proposed
74 74
Existing Compact Fluorescent - Proposed Retrofit LED 111 111Existing T5 Fluorescent - Proposed RETROFIT LED 877 877
Lightgin - COMBINED 10,258$ 6,733$ 3,513$ -$ 20,503$ 206,018$ 10.0
SavingsKWH
SavingsKWEdgar Mills Center Total
Savings Project Cost PaybackSavings O&M SavingsCapital
Exhibit 2B Page 325

Proprietary and Confidential © Siemens Industry IGA Report – May, 2019 – | Page 686
Siemens – Broward County, Investment Grade Audit | May 2019
the maintenance benefits of the prescribed solution resulting in less future costs to maintainexterior fixtures in difficult to reach applications. The proposed LED fixture replacement hasbeen specified to furnish light levels that are in compliance with recommended light levelsand support the existing site condition requirements. Where time clocks or automatedlighting controls are not in place, proposed LED building and site lighting will incorporate anintegral photocell to maximize energy savings.
In general, the design approach is to replace existing HID luminaires with new LED luminairesof like type, ie: shoeboxes, wallpacks, floodlights. Some fixture types are replaced with newLED fixtures of a different type, ie: recessed canopy lights replaced with low profile LEDcanopy lights.
Where deemed appropriate in parks and office buildings, integral occupancy sensors havebeen used on pole mounted shoebox luminaires in parking lots to automatically dim thelighting during hours of inactivity.
Decorative post top luminaires, recessed step lights, and bollards typically use low wattageHID lamps in architectural form factors. Replacement luminaires of this type are relativelyhigh in cost, with relatively low energy savings potential. As a result, the proposed designtypically calls for removing the HID lamp and ballast, and installing a new screw based LEDlamp.
LED Replacement for Fluorescent Exterior
Luminaires with pin based compact fluorescent lamps will generally be retrofit by removingthe existing fluorescent lamps and ballast, and installing new line voltage, pin based LEDlamps. Existing screw based incandescent and fluorescent lamps will be replaced with newscrew based LED lamps.
Exterior fixtures with existing linear fluorescent lamps, such as surface mounted enclosedand gasketed fixtures in park pavilions are evaluated for fixture condition, and either retrofitwith new LED T8, UL Type B lamps, or replaced with new luminaires utilizing dedicated LEDboards and drivers.
Exterior Lighting Retrofit Scope
SAVINGS
The energy and cost savings were developed using a spreadsheet model. In the analysis, theexisting lighting wattage per fixture was reduced to reflect the installation of higherefficiency technology. A detailed room by room survey of the facility, available in Section H,Appendices, was performed to accurately determine the existing lighting type and quantity.
BUILDING EXISTING & RETROFIT STANDARD LEGEND DESCRIPTIONSEXISTING
QTYRETROFIT
QTYEdgar Mills Center Existing High Intensity Discharge - Proposed Retrofit LED 2 2
Existing High Intensity Discharge - Proposed New LED Fixture 59 59Existing T5 Fluorescent HO - Proposed RETROFIT LED 180 180
Exhibit 2B Page 326

Proprietary and Confidential © Siemens Industry IGA Report – May, 2019 – | Page 687
Siemens – Broward County, Investment Grade Audit | May 2019
The runtime operations of the new lighting fixtures are reduced in areas that arerecommended for lighting occupancy sensors. This runtime reduction was determined basedon the results of lighting and occupancy data logging sessions conducted at various facilities.The results of these data logging session, as well as the resulting hour of operations of lightsper space type are provided also provided in Section H, Appendices.
FIM SAVINGS SUMMARY
Annual Electric Consumption: 88,886 kWh
Annual Electric Demand: 248.52 kW
FIM Financial Summary
CHILLER COIL REPLACEMENT AND ROOM TEMPERATURE RESET
PROJECT SCOPE
The followings are included in the scope of work for the combined FIM:
∂ Provide evaporator coils for the two air-cooled chillers
∂ Remove the old coils.
∂ Test the chillers with new coils
∂ Reset room temperature
SAVINGS
FIM SAVINGS SUMMARY
Annual Energy Consumption Savings: 57,268 kWh.
FIM Financial Summary
Building or Facility DescriptionSAVINGS
Electric KWh $SAVINGS
Electric KW $SAVINGSWater $
SAVINGSO & M
TotalSavings Project Costs Simple
PaybackEdgar Mills Center Lighting - Exterior 5,068.25$ 2,790.60$ -$ 1,184$ 9,042.85$ 93,236.12$ 10.3
Building or Facility DescriptionSAVINGS
Electric KWh $SAVINGS
Electric KW $SAVINGSWater $
SAVINGSO & M
TotalSavings Project Costs Simple
PaybackEdgar Mills Center Chiller Coil Replacement & 4,743.85$ -$ -$ -$ 4,743.85$ 127,888.56$ 27.0
Exhibit 2B Page 327

Proprietary and Confidential © Siemens Industry IGA Report – May, 2019 – | Page 688
Siemens – Broward County, Investment Grade Audit | May 2019
G.28. Hunter Hughes Health Center
PROJECT SCOPE – EXTERIOR LIGHTING
The following section describes all lighting scope of work proposed for implementation.
∂ LED Replacement for High Intensity Discharge Exterior∂ LED Replacement for Fluorescent Exterior
Exterior Lighting Retrofit Scope
Exterior Lighting Sensor Scope
PROJECT SCOPE – OCCUPANCY SENSORS
The use of occupancy sensors have been proposed in the majority of the offices, warehouses,garages, and locker rooms. Sensor savings have been determined from logger reportsindicating the estimated sensor savings for each space type for every building.
Interior Lighting Occupancy Sensor Scope
FIM SAVINGS SUMMARY
Annual Electric Consumption: 254,435 kWh
Annual Electric Demand: 526.68 kW
FIM Financial Summary
BUILDING EXISTING & RETROFIT STANDARD LEGEND DESCRIPTIONSEXISTING
QTYRETROFIT
QTYhunter & hughes
bldgExisting High Intensity Discharge - Proposed New LED Fixture With Sensor 15 15
Existing High Intensity Discharge - Proposed New LED Fixture 23 23Existing T8 Fluorescent - Proposed New LED Fixture 20 20
Building NameAreas Controlled
by sensorshunter & hughes bldg 2
Building NameAreas Controlled
by sensorshunter & hughes bldg 85
Lightgin - COMBINED 14,614$ 5,045$ 2,525$ -$ 22,183$ 199,350$ 9.0
SavingsKWH
SavingsKWHunter & Hughes bldg Project Cost PaybackSavings O&M Savings
CapitalTotal
Savings
Exhibit 2B Page 328
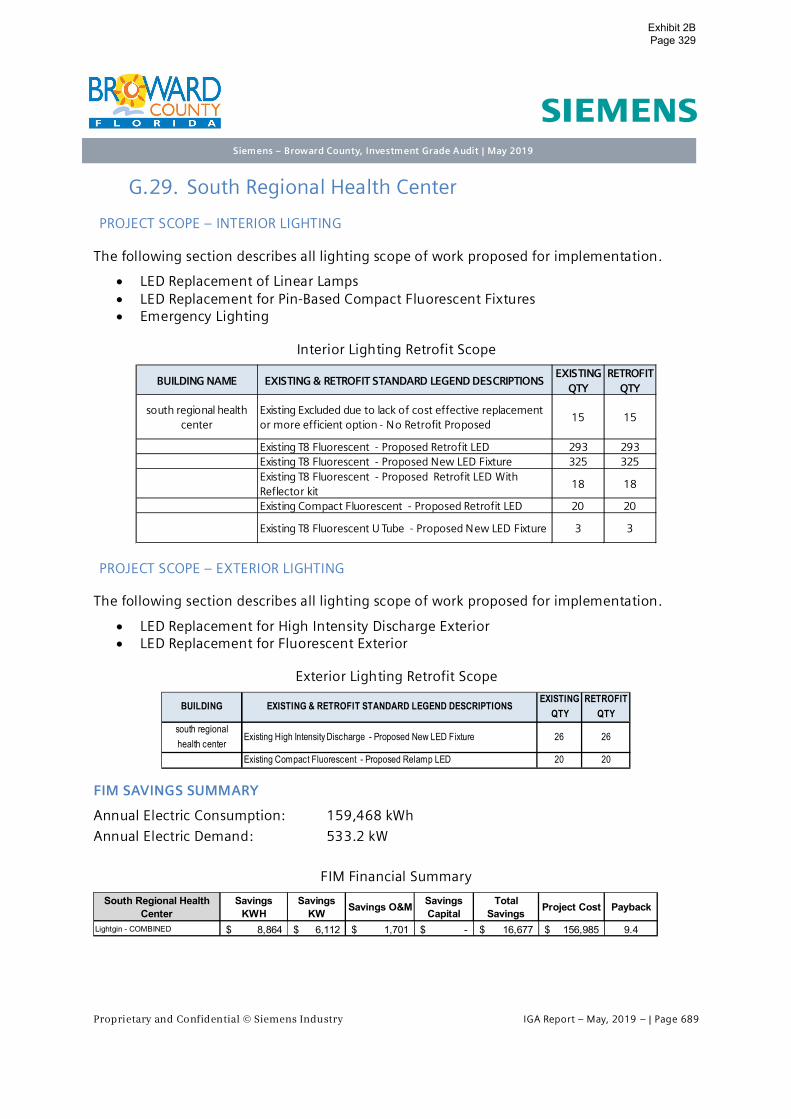
Proprietary and Confidential © Siemens Industry IGA Report – May, 2019 – | Page 689
Siemens – Broward County, Investment Grade Audit | May 2019
G.29. South Regional Health Center
PROJECT SCOPE – INTERIOR LIGHTING
The following section describes all lighting scope of work proposed for implementation.
∂ LED Replacement of Linear Lamps∂ LED Replacement for Pin-Based Compact Fluorescent Fixtures∂ Emergency Lighting
Interior Lighting Retrofit Scope
PROJECT SCOPE – EXTERIOR LIGHTING
The following section describes all lighting scope of work proposed for implementation.
∂ LED Replacement for High Intensity Discharge Exterior∂ LED Replacement for Fluorescent Exterior
Exterior Lighting Retrofit Scope
FIM SAVINGS SUMMARY
Annual Electric Consumption: 159,468 kWh
Annual Electric Demand: 533.2 kW
FIM Financial Summary
BUILDING NAME EXISTING & RETROFIT STANDARD LEGEND DESCRIPTIONSEXISTING
QTYRETROFIT
QTY
south regional healthcenter
Existing Excluded due to lack of cost effective replacementor more efficient option - No Retrofit Proposed
15 15
Existing T8 Fluorescent - Proposed Retrofit LED 293 293Existing T8 Fluorescent - Proposed New LED Fixture 325 325Existing T8 Fluorescent - Proposed Retrofit LED WithReflector kit
18 18
Existing Compact Fluorescent - Proposed Retrofit LED 20 20
Existing T8 Fluorescent U Tube - Proposed New LED Fixture 3 3
BUILDING EXISTING & RETROFIT STANDARD LEGEND DESCRIPTIONSEXISTING
QTYRETROFIT
QTYsouth regionalhealth center
Existing High Intensity Discharge - Proposed New LED Fixture 26 26
Existing Compact Fluorescent - Proposed Relamp LED 20 20
Lightgin - COMBINED 8,864$ 6,112$ 1,701$ -$ 16,677$ 156,985$ 9.4
South Regional HealthCenter
SavingsKWH
SavingsKW Savings O&M Savings
CapitalTotal
Savings Project Cost Payback
Exhibit 2B Page 329

Proprietary and Confidential © Siemens Industry IGA Report – May, 2019 – | Page 690
Siemens – Broward County, Investment Grade Audit | May 2019
MECHANICAL
In recent years the energy efficiency of DX equipment has improved due to mandates as wellas manufacture improvements. DX air-conditioning systems are rated by their SeasonalEnergy Efficiency Ratios (SEER). The higher the SEER rating the more energy efficient theunits are. Older units have average SEER ratings between 8-10 while new units have averageSEER ratings of 13 or greater.
Cooling for this building is primarily provided by a chiller plant. This FIM addresses the roof-top unit that formerly served the TB ward and now cools a storage space.
PROJECT SCOPE
This FIM addresses the replacement of one (1) roof top unit (Aon) This Aon unit wasoriginally installed and designed to condition patient rooms. The space has been repurposedfor storage. New unit specifications for a smaller OA makeup unit will be incorporated intothe location where the current RTU sits.
The new equipment will be of equal capacity and include, as part of the installation, packagenew programmable thermostats provided by Siemens. The thermostats will be able tocommunicated, via their own IP address, to remote BAUs for additional access. The units willbe placed on a time of day schedule. The new schedule will command the units to turn on1.5 hours before the facility opens and 1.5 hours after it closes.
Scope of Work
Building Equipment Make Model Tons ExistingEER
NewEER
South Regional Health Center RTU Aon RQ-006-3-V-FB19 6 13.1
FIM SAVINGS SUMMARY
Annual Electric Consumption: 6,876 kWh
Annual Electric Demand: 39.9 kW
FIM Financial Summary
Savings Capital: Capital budget dollars were used in order to improve the payback to therequested limitation values. These dollars represent unused amounts left over from theCapital Project Plan total. Funds were first applied to their respective capital project until therequired payback was achieved. All remaining amounts were distributed to FIM opportunitessuch as the one above.
RTU Replacement 382$ 454$ -$ 1,133$ 1,969$ 24,331$ 12.4
South Regional HealthCenter
SavingsKWH
SavingsKW Savings O&M Savings
CapitalTotal
Savings Project Cost Payback
Exhibit 2B Page 330

Proprietary and Confidential © Siemens Industry IGA Report – May, 2019 – | Page 691
Siemens – Broward County, Investment Grade Audit | May 2019
AUTOMATION OPTIMIZATION
PROJECT SCOPE
Based on trending data and site visits, the following facility improvement measures areproposed to improve the energy efficiency of the existing systems.
∂ Room temperature reset
∂ AHU runtime reschedule
∂ Outdoor air (OA) intake control
To implement the optimization measures:
∂ Sequence of operations for those proposed measures will be developed, andassociated control program will be implemented.
∂ Sensors required for the measures will be calibrated, repaired or installed
The implementation of the optimization measures are based on the condition that theexisting mechanical equipment and control devices are operable normally and allow theimplementation of the proposed measures. If during the implementation, the mechanicalequipment, and the devices are deteriorated and prevent the implementations, the measuresmay be cancelled or modified accordingly.
Room Temperature Reset: Based on trending data, most rooms in the building usedconstant room temperature set point. For spaces that need HVAC for comfort, roomtemperature can be reset during unoccupied hours to save energy. During unoccupied mode,reset the room temperature cooling set point to 78oF (adjustable), and reset roomtemperature heating set point to 65oF (adjustable). The occupied and unoccupied modes aredefined based on schedules.
AHU Runtime Reschedule: Based on trending data, AHU1, 2 and 7 existing operation hourswere from 4:00Am to 11:00PM. Schedule the operation hours to 6:00AM to 7:00PM toreduce energy consumption.
Outdoor air intake control: Based on trending data, it was found that the OA dampers of theexisting HVAC systems were open during unoccupied hours. Closing the OA dampers atunoccupied hours at warm and humid seasons can reduce energy consumption and bettercontrol indoor humidity levels.
FIM SAVINGS SUMMARY
Annual Energy Consumption Savings: 57,000 kWh per year.
FIM Financial Summary
Reschedules, Resets, and OA Control 3,915$ -$ -$ -$ -$ -$ 3,915$ 32,823$ 8.4
PaybackSavingsKWH
SavingsKW
SavingsGasSouth Regional Health Center Savings
WaterSavings
O&MSavingsCapital
TotalSavings Project Cost
Exhibit 2B Page 331

Proprietary and Confidential © Siemens Industry IGA Report – May, 2019 – | Page 692
Siemens – Broward County, Investment Grade Audit | May 2019
G.30. NW Family Success Center
EXTERIOR LIGHTING PROJECT SCOPE
The following section describes all lighting scope of work proposed for implementation.
∂ LED Replacement for High Intensity Discharge Exterior∂ LED Replacement for Fluorescent Exterior
Exterior Lighting Retrofit Scope
Exterior Lighting Sensor Scope
OCCUPANCY SENSORS PROJECT SCOPE
The use of occupancy sensors have been proposed in the majority of the offices, warehouses,garages, and locker rooms. Sensor savings have been determined from logger reportsindicating the estimated sensor savings for each space type for every building.
Interior Lighting Occupancy Sensor Scope
FIM SAVINGS SUMMARY
Annual Electric Consumption: 35,121 kWh
Annual Electric Demand: 126.54 kW
FIM Financial Summary
NOTE: This facility had a capital project listed to be completed within the next five years:retrofitting all lights.
BUILDING EXISTING & RETROFIT STANDARD LEGEND DESCRIPTIONSEXISTING
QTYRETROFIT
QTYFamily Success
Center, NWExisting High Intensity Discharge - Proposed New LED Fixture With Sensor 13 13
Existing High Intensity Discharge - Proposed Retrofit LED 12 12Existing High Intensity Discharge - Proposed New LED Fixture 3 3Existing Compact Fluorescent - Proposed Relamp LED 6 6Existing Compact Fluorescent - Proposed Retrofit LED 1 1
Building NameAreas Controlled
by sensorsFamily Success Center, NW 3
Building NameAreas Controlled
by sensorsFamily Success Center, NW 1
Lightgin - COMBINED 2,100$ 1,111$ 571$ 2,439$ 6,222$ 66,767$ 10.7
Project Cost PaybackSavingsKWH
SavingsKW Savings O&MFamily Success Center,
NWSavingsCapital
TotalSavings
Exhibit 2B Page 332

Proprietary and Confidential © Siemens Industry IGA Report – May, 2019 – | Page 693
Siemens – Broward County, Investment Grade Audit | May 2019
WATER CONSERVATION
This FIM addresses the reduction of water consumption, wastewater production, and hotwater energy usage through the installation of highly efficient, plumbing products andcontrols. The use of these devices and others are detailed below and were selected not onlyfor their efficiency, but also to provide for durable, long-term use with minimal maintenanceand improved hygiene.
PROJECT SCOPE
The following section describes all water conservation scope of work proposed:
∂ Flush Valves∂ Urinals∂ Bathroom Faucets/Aerators
FIM SAVINGS SUMMARY
Annual Water savings: 42,842 gallons
Annual Energy savings: 399 kWh
FIM Financial Summary
Water - Retorfits 22$ 327$ 74$ 23$ 447$ 5,408$ 12.1
Project Cost PaybackSavings KWH SavingsWater
Savings O&MFamily Success Center, NW SavingsCapital
Total Savings
Exhibit 2B Page 333

Proprietary and Confidential © Siemens Industry IGA Report – May, 2019 – | Page 694
Siemens – Broward County, Investment Grade Audit | May 2019
G.31. Mid-Rise / East Parking
EXTERIOR LIGHTING PROJECT SCOPE
The following section describes all lighting scope of work proposed:
∂ LED Replacement for High Intensity Discharge Exterior
Exterior Lighting Retrofit Scope
FIM SAVINGS SUMMARY
Annual Electric Consumption: 442,235 kWh
Annual Electric Demand: 638.4 kW
FIM Financial Summary
BUILDING EXISTING & RETROFIT STANDARD LEGEND DESCRIPTIONSEXISTING
QTYRETROFIT
QTYMid-Rise / East
ParkingExisting High Intensity Discharge - Proposed New LED Fixture 19 19
Lightgin - COMBINED 24,859$ -$ 8,571$ -$ 33,430$ 212,771$ 6.4
SavingsKWH
SavingsKW Savings O&M Savings
CapitalTotal
SavingsMid-Rise / East Parking Project Cost Payback
Exhibit 2B Page 334

Proprietary and Confidential © Siemens Industry IGA Report – May, 2019 – | Page 695
Siemens – Broward County, Investment Grade Audit | May 2019
G.32. State Attorney & Clerks Warehouse
LIGHTING RETROFIT
The following section describes all lighting scope of work proposed for implementation.
PROJECT SCOPE – INTERIOR LIGHTING
The following section describes all lighting scope of work proposed:
∂ LED Replacement of Linear Lamps∂ LED Replacement for Screw Based Incandescent and Compact fluorescent fixtures∂ Emergency Lighting
Interior Lighting Retrofit Scope
PROJECT SCOPE – EXTERIOR LIGHTING
The following section describes all lighting scope of work proposed:
∂ LED Replacement for Fluorescent Exterior
Exterior Lighting Retrofit Scope
FIM SAVINGS SUMMARY
Annual Electric Consumption: 26,303 kWh
Annual Electric Demand: 77.52 kW
FIM Financial Summary
BUILDING NAME EXISTING & RETROFIT STANDARD LEGEND DESCRIPTIONSEXISTING
QTYRETROFIT
QTY
State Attorney & ClerksWarehouse
Existing Excluded due to lack of cost effective replacementor more efficient option - No Retrofit Proposed
4 4
Existing T8 Fluorescent - Proposed Retrofit LED 42 42Existing Incandescent - Proposed Relamp LED 2 2Existing T8 Fluorescent - Proposed Retrofit LED 84 84
BUILDING EXISTING & RETROFIT STANDARD LEGEND DESCRIPTIONSEXISTING
QTYRETROFIT
QTYState Attorney &
Clerks WarehouseExisting Compact Fluorescent - Proposed Relamp LED 7 7
Lightgin - COMBINED 2,318$ -$ 449$ -$ 2,767$ 26,081$ 9.4
SavingsKWH
SavingsKW Savings O&M Savings
CapitalTotal
Savings Project CostState Attorney & ClerksWarehouse Payback
Exhibit 2B Page 335

Proprietary and Confidential © Siemens Industry IGA Report – May, 2019 – | Page 696
Siemens – Broward County, Investment Grade Audit | May 2019
AUTOMATION – SCHEDULES
Standard thermostats control an HVAC unit by measuring the ambient temperature at thethermostat and either turning the unit on if the ambient temperature is above thetemperature setpoint or turning the unit off when the ambient temperature reaches thesetpoint. Most commercial facilities have set hours of operation where the facility is occupiedand there is a need for conditioned space. Outside of hours of operation a facility will usuallynot have occupancy and won’t have a need for air conditioning. Advanced Siemensthermostats allow for the utilization of this fact to translate into energy savings by changingthe setpoint temperatures of a building automatically depending on the hours of operation.In addition, these thermostats have the capability to be wirelessly connected to a BAS systemfor remote monitoring and control.
PROJECT SCOPE
This FIM address the turn-key replacement and installation of two (2) thermostats withscheduling capabilities for the units with the serial number ending in 5679 and 3984.
FIM SAVINGS SUMMARY
Annual Electric Consumption: 19,089 kWh
FIM Financial Summary
Split Sustem Scheduling 1,138$ 1,138$ 5,013$ 4.4
PaybackState Attorney & Clerks Warehouse Total Savings Project CostSavings KWH
Exhibit 2B Page 336
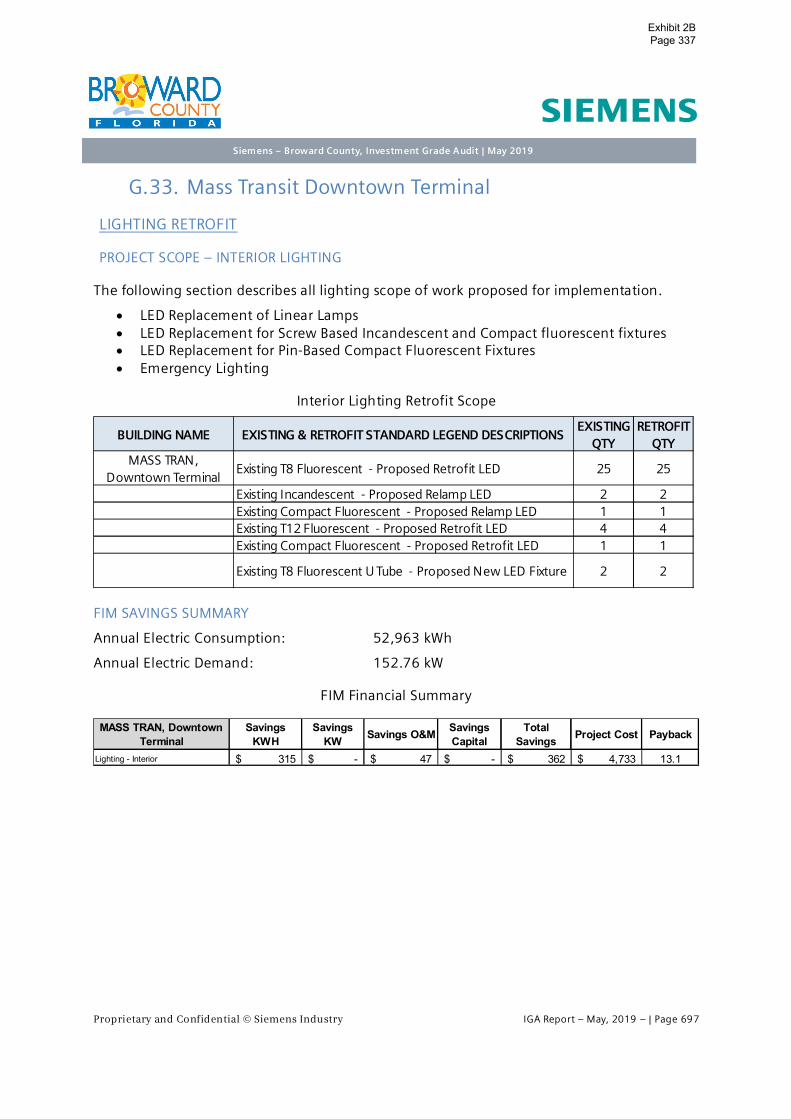
Proprietary and Confidential © Siemens Industry IGA Report – May, 2019 – | Page 697
Siemens – Broward County, Investment Grade Audit | May 2019
G.33. Mass Transit Downtown Terminal
LIGHTING RETROFIT
PROJECT SCOPE – INTERIOR LIGHTING
The following section describes all lighting scope of work proposed for implementation.
∂ LED Replacement of Linear Lamps∂ LED Replacement for Screw Based Incandescent and Compact fluorescent fixtures∂ LED Replacement for Pin-Based Compact Fluorescent Fixtures∂ Emergency Lighting
Interior Lighting Retrofit Scope
FIM SAVINGS SUMMARY
Annual Electric Consumption: 52,963 kWh
Annual Electric Demand: 152.76 kW
FIM Financial Summary
BUILDING NAME EXISTING & RETROFIT STANDARD LEGEND DESCRIPTIONSEXISTING
QTYRETROFIT
QTYMASS TRAN,
Downtown TerminalExisting T8 Fluorescent - Proposed Retrofit LED 25 25
Existing Incandescent - Proposed Relamp LED 2 2Existing Compact Fluorescent - Proposed Relamp LED 1 1Existing T12 Fluorescent - Proposed Retrofit LED 4 4Existing Compact Fluorescent - Proposed Retrofit LED 1 1
Existing T8 Fluorescent U Tube - Proposed New LED Fixture 2 2
Lighting - Interior 315$ -$ 47$ -$ 362$ 4,733$ 13.1
MASS TRAN, DowntownTerminal
SavingsKWH
SavingsKW PaybackSavings O&M Savings
CapitalTotal
Savings Project Cost
Exhibit 2B Page 337

Proprietary and Confidential © Siemens Industry IGA Report – May, 2019 – | Page 698
Siemens – Broward County, Investment Grade Audit | May 2019
WATER CONSERVATION
This FIM addresses the reduction of water consumption, wastewater production, and hotwater energy usage through the installation of highly efficient, plumbing products andcontrols. The use of these devices and others are detailed below and were selected not onlyfor their efficiency, but also to provide for durable, long-term use with minimal maintenanceand improved hygiene.
PROJECT SCOPE
The following section describes all lighting scope of work proposed for implementation.
∂ Flush Valves∂ Urinals∂ Bathroom Faucets/Aerators
FIM SAVINGS SUMMARY
Annual Water savings: 78,921 gallons
Annual Energy savings: 1,096 kWh
FIM Financial Summary
Water - Retorfits 62$ 900$ 65$ 1,027$ 10,559$ 10.3
MASS TRAN, Downtown Terminal Savings KWH PaybackSavingsWater Savings O&M Total Savings Project Cost
Exhibit 2B Page 338

Proprietary and Confidential © Siemens Industry IGA Report – May, 2019 – | Page 699
Siemens – Broward County, Investment Grade Audit | May 2019
G.34. Fleet Services #2
LIGHTING RETROFIT
PROJECT SCOPE – INTERIOR LIGHTING
The following section describes all lighting scope of work proposed for implementation.
∂ LED Replacement of Linear Lamps∂ LED Replacement for High Intensity Discharge Interior∂ Emergency Lighting
Interior Lighting Retrofit Scope
PROJECT SCOPE – EXTERIOR LIGHTING
The following section describes all lighting scope of work proposed for implementation.
∂ LED Replacement for High Intensity Discharge Exterior∂ LED Replacement for Fluorescent Exterior
Exterior Lighting Retrofit Scope
Exterior Lighting Sensor Scope
BUILDING NAME EXISTING & RETROFIT STANDARD LEGEND DESCRIPTIONSEXISTING
QTYRETROFIT
QTY
Fleet Services # 2, SR84
Existing Excluded due to lack of cost effective replacementor more efficient option - No Retrofit Proposed
4 4
Existing T8 Fluorescent - Proposed Retrofit LED 8 8Existing High Intensity Discharge - Proposed New LED High-Bay Fixture
48 48
Existing T8 Fluorescent - Proposed Retrofit LED WithReflector kit
30 30
Existing High Intensity Discharge - Proposed New LEDFixture
12 12
BUILDING EXISTING & RETROFIT STANDARD LEGEND DESCRIPTIONSEXISTING
QTYRETROFIT
QTYFleet Services #2,
SR 84Existing Excluded due to lack of cost effective replacement or more efficientoption - No Retrofit Proposed
7 7
Existing High Intensity Discharge - Proposed New LED Fixture With Sensor 18 14Existing High Intensity Discharge - Proposed New LED Fixture 12 12Existing T8 Fluorescent - Proposed New LED Fixture 4 4
Building NameAreas Controlled
by sensorsFleet Services #2, SR 84 3
Exhibit 2B Page 339

Proprietary and Confidential © Siemens Industry IGA Report – May, 2019 – | Page 700
Siemens – Broward County, Investment Grade Audit | May 2019
FIM SAVINGS SUMMARY
Annual Electric Consumption: 79,010 kWh
Annual Electric Demand: 278.16 kW
FIM Financial Summary
G.35. West Regional Maintenance
PROJECT SCOPE – EXTERIOR LIGHTING
The following section describes all lighting scope of work proposed for implementation.
∂ LED Replacement for High Intensity Discharge Exterior∂ LED Replacement for Fluorescent Exterior
Exterior Lighting retrofit scope
FIM SAVINGS SUMMARY
Annual Electric Consumption: 3,234 kWh
FIM Financial Summary
Lightgin - COMBINED 6,312$ -$ 834$ -$ 7,146$ 79,706$ 11.2
SavingsCapitalFleet Services #2, SR 84 Savings
KWH PaybackTotalSavings Project CostSavings
KW Savings O&M
BUILDING EXISTING & RETROFIT STANDARD LEGEND DESCRIPTIONSEXISTING
QTYRETROFIT
QTY
West RegionalMaintenance Center
Existing Excluded due to lack of cost effective replacement or more efficientoption - No Retrofit Proposed
2 2
Existing High Intensity Discharge - Proposed New LED Fixture 2 2Existing Compact Fluorescent - Proposed Relamp LED 1 1
Lightgin - COMBINED 326$ -$ 46$ -$ 372$ 3,891$ 10.5
West RegionalMaintenance Center
SavingsKWH
SavingsKW Savings O&M Savings
CapitalTotal
Savings Project Cost Payback
Exhibit 2B Page 340

Proprietary and Confidential © Siemens Industry IGA Report – May, 2019 – | Page 701
Siemens – Broward County, Investment Grade Audit | May 2019
G.36. Solar Opportunities
PROJECT SCOPE – SOLAR CARPORT AND ROOFTOP
The following section describes all solar scope of work proposed for implementation.
∂ Hollywood Library – Rooftop Solar∂ Tamarac Library – Rooftop Solar’∂ CB Smith Park – Carport Solar
HOLLYWOOD LIBRARY
The proposed solar solution for this facility is a rooftop solar installation. Although therooftop was not accessible at the time of the site visit, satellite imaging showed no apparentdegradation of the roof. The roof type is modified bitumen and the structural deck isconcrete. The interconnection voltage is 480V/277V.
Hollywood Library Site Visit
Exhibit 2B Page 341

Proprietary and Confidential © Siemens Industry IGA Report – May, 2019 – | Page 702
Siemens – Broward County, Investment Grade Audit | May 2019
Below is the rendering of the proposed solar layout for this facility.
Hollywood Library-Proposed Solar Layout
TAMARAC LIBRARY
The proposed solar solution for this facility is a rooftop solar installation. The rooftop showedno apparent degradation and was in good condition. The roof type is modified and thestructural deck is concrete. The interconnection voltage is 480V/277V.
Tamarac Library Site Visit
Exhibit 2B Page 342

Proprietary and Confidential © Siemens Industry IGA Report – May, 2019 – | Page 703
Siemens – Broward County, Investment Grade Audit | May 2019
Below is the rendering of the proposed solar layout for this facility.
Tamarac Library-Proposed Solar Layout
CB SMITH PARK
The proposed solar solution for this facility is a carport installation. The carport was designedto go over the parking lot of the recreational water park within CB Smith Park as this is thearea of the park with the highest energy intensity. The site visit revealed that there are noobstacles in the existing parking lot that would render it unsuitable for solar carportinstallation. The interconnection voltage is 480V/277V.
CB Smith Park Site Visit
Exhibit 2B Page 343

Proprietary and Confidential © Siemens Industry IGA Report – May, 2019 – | Page 704
Siemens – Broward County, Investment Grade Audit | May 2019
Below is the rendering of the proposed solar layout for this facility.
CB Smith Park-Proposed Solar Layout
Exhibit 2B Page 344
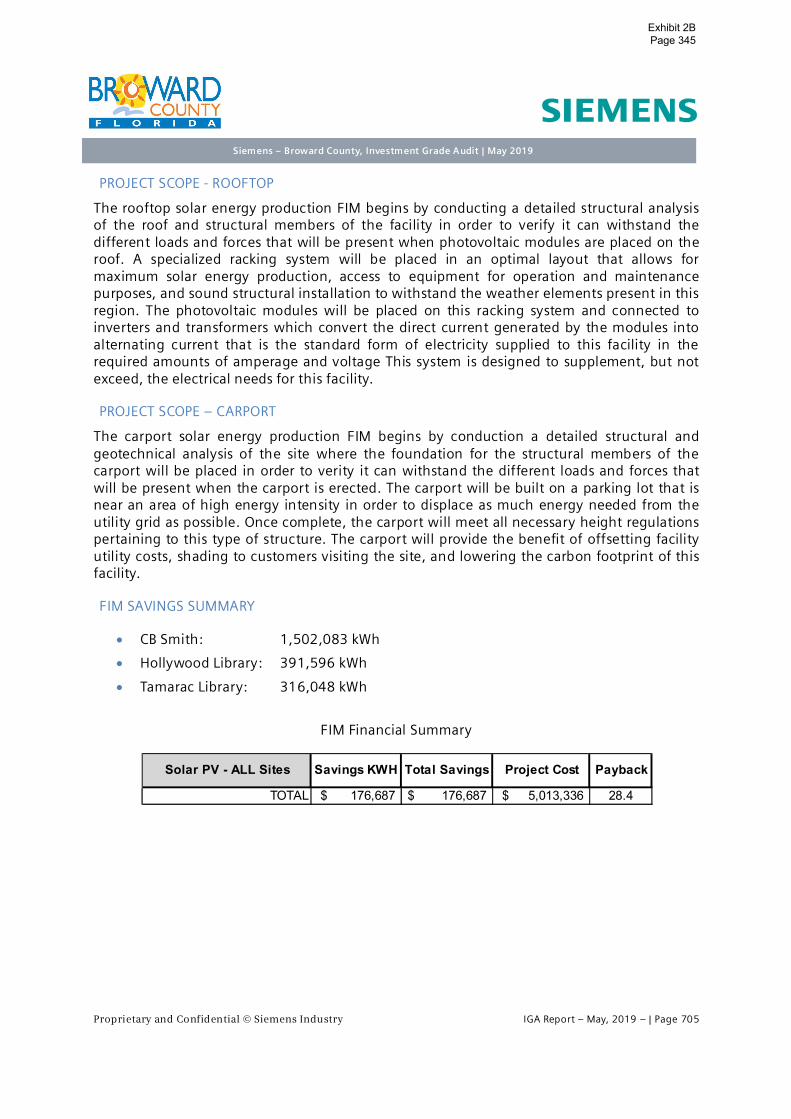
Proprietary and Confidential © Siemens Industry IGA Report – May, 2019 – | Page 705
Siemens – Broward County, Investment Grade Audit | May 2019
PROJECT SCOPE - ROOFTOP
The rooftop solar energy production FIM begins by conducting a detailed structural analysisof the roof and structural members of the facility in order to verify it can withstand thedifferent loads and forces that will be present when photovoltaic modules are placed on theroof. A specialized racking system will be placed in an optimal layout that allows formaximum solar energy production, access to equipment for operation and maintenancepurposes, and sound structural installation to withstand the weather elements present in thisregion. The photovoltaic modules will be placed on this racking system and connected toinverters and transformers which convert the direct current generated by the modules intoalternating current that is the standard form of electricity supplied to this facility in therequired amounts of amperage and voltage This system is designed to supplement, but notexceed, the electrical needs for this facility.
PROJECT SCOPE – CARPORT
The carport solar energy production FIM begins by conduction a detailed structural andgeotechnical analysis of the site where the foundation for the structural members of thecarport will be placed in order to verity it can withstand the different loads and forces thatwill be present when the carport is erected. The carport will be built on a parking lot that isnear an area of high energy intensity in order to displace as much energy needed from theutility grid as possible. Once complete, the carport will meet all necessary height regulationspertaining to this type of structure. The carport will provide the benefit of offsetting facilityutility costs, shading to customers visiting the site, and lowering the carbon footprint of thisfacility.
FIM SAVINGS SUMMARY
∂ CB Smith: 1,502,083 kWh
∂ Hollywood Library: 391,596 kWh
∂ Tamarac Library: 316,048 kWh
FIM Financial Summary
TOTAL 176,687$ 176,687$ 5,013,336$ 28.4
Solar PV - ALL Sites Project Cost PaybackSavings KWH Total Savings
Exhibit 2B Page 345

Proprietary and Confidential © Siemens Industry IGA Report – May, 2019 – | Page 706
Siemens – Broward County, Investment Grade Audit | May 2019
H. Appendices
Refer to submitted files contained on USB
Exhibit 2B Page 346

Proprietary and Confidential © Siemens Industry IGA Report – May, 2019 – | Page 707
Siemens – Broward County, Investment Grade Audit | May 2019
Performance Assurance Baseline DocumentationHVAC Replacements – Pre-retrofit Building Conditions
Locations Unit / Serial Number Make / ModelNumber of
Compressors Running
AnnualOperating Hours
(AOH)
Pre-Retrofit
Unit Draw(kWpre)
Pre-RetrofitElectric
Consumption
(kWhpre)
Delevoe Park CU / 0200G00157 Carrier / 38AK-007-V511 1 1,617 6.3 10,129
Delevoe Park CU / 0200G00154 Carrier / 38AK-007-V511 1 5,898 9.6 56,507
Delevoe Park CU / 2509G30115 Carrier / 38ARZ007-K501 1 2,769 6.1 16,833
Delevoe Park CU / N0M8454757 York / HA090C00A2AAA1A 1 3,056 6.4 19,579
Roosevelt GardensPark
CU / 200710-CCCF07870 Aaon / CA1305 1 4,495 9.8 43,896
Roosevelt GardensPark
CU / 3707E24294 Carrier / 24ABR350A3501 3,001 4.7 14,190
2 500 7.6 3,794
Roosevelt GardensPark
CU / 0307E13587 Carrier / 24ABR360HB03301 4,408 5.4 23,711
2 735 7.6 5,572
BCJC StateAttorney’s Office CU / E041019146 Heil / HAC260AKC4 1 319 5.8 1,837
BCJC StateAttorney’s Office
CU / E031042841 Heil / HAC260AKA5 1 3,457 5.6 19,437
BCJC StateAttorney’s Office
CU / E041051921 Heil / HAC260AKC4 1 4,342 4.9 21,326
BCJC StateAttorney’s Office
CU 1 3,286 3.3 10,732
BCJC StateAttorney’s Office CU / E031626923 Heil / HAC260AKA5 1 22 5.2 115
BCJC StateAttorney’s Office CU / L021633160 Heil / HAC260AKA4 1 22 6.3 142
Fleet Services #2 CU / W101505366Thermal Zone / TZAA-360-
CC757 1 7,318 6.3 46,112
Fleet Services #2 CU / R162N4N4FAllegiance 10 /7C0060B300A0
1 6,979 7.8 54,439
Imperial PointLibrary
RTU / 1204G20562 Carrier / 501FF012-511 1 3,995 7.1 28,300
Imperial PointLibrary
RTU Carrier1 6,908 12.2 83,919
2 604 18.8 11,340
Imperial PointLibrary
RTU / 927100499D Trane / TCD180E300AA 1 3,165 16.1 51,080
Exhibit 2B Page 347

Proprietary and Confidential © Siemens Industry IGA Report – May, 2019 – | Page 708
Siemens – Broward County, Investment Grade Audit | May 2019
Imperial PointLibrary RTU Trane / TSC120E3R0A0000 1 5,121 12.2 62,335
Collier City Library RTU / NFMM065842 DS-03C00AFDAA 1 5,076 4.8 24,191
Collier City Library RTU / NFMM063451 DU-08C00ATDAA3A1 2,384 5.2 12,362
2 7,299 9.5 69,103
Collier City Library RTU / NFMM063455 DU-07C00ATDAA3A1 3,178 8.5 26,834
2 308 11.0 3,411
Riverland BranchLibrary
RTU / 4303G50596 Carrier / 50TFF012-V5111 3,856 6.2 24,040
2 2,806 10.8 30,207
Riverland BranchLibrary RTU / 4203F59320 Carrier / 50TJ-024-V5A1YA
1 1,495 6.6 9,790
2 4,993 16.1 80,165
Exhibit 2B Page 348

Proprietary and Confidential © Siemens Industry IGA Report – May, 2019 – | Page 709
Siemens – Broward County, Investment Grade Audit | May 2019
HVAC Replacements – Pre-retrofit Building Conditions (continued)
Locations Unit / Serial Number Make / ModelNumber of
Compressors Running
AnnualOperating Hours
(AOH)
Pre-Retrofit
Unit Draw(kWpre)
Pre-RetrofitElectric
Consumption
(kWhpre)
Northwest FamilySuccess Center
DX Unit / 4032MMBAD Trane / TTA090A300FA1 3,994 5.7 22,713
2 888 7.7 6,846
Northwest FamilySuccess Center DX Unit / 4042KKR2F Trane / 2TTA0072A3000AA 1 2,746 5.6 15,429
Northwest FamilySuccess Center
RTU Trane / TCD211C300BA 1 3,890 14.3 55,755
Northwest FamilySuccess Center
RTU / 217101092D Trane / TCD211C300BA 1 5,189 13.4 69,657
Fleet Services #3 DX Unit / 3708X70430 PA13HR048-H 1 1,707 7.4 12,658
Fleet Services #3 DX Unit / 4991 M1903 Rheem / RAKA-060CAS 1 5,639 3.5 19,836
Fleet Services #3 RTU / 1001G40510 Carrier / 50HS-024-311AA 1 416 3.0 1,257
CB Smith ParkCU / 7134 M0805
05763Rheem / RAKB-060DAS 1 7,072 6.9 48,683
CB Smith ParkCU / 7134 M2604
17920 Rheem / RAKB-060DAS 1 3,333 6.9 22,945
CB Smith Park CU / WHGP141750 HABE-F036SD 1 1,611 7.8 12,564
Deerfield BeachLibrary
CU / 2007Q06731 Carrier / 38AKS044 1 3,037 44.5 135,156
Deerfield BeachLibrary
CU / 1208G40045 Carrier / 38AKS014-K521 1 2,596 12.8 33,129
Deerfield BeachLibrary
CU / 4204E28652 Carrier / 38KC060 1 3,588 5.5 19,634
Lauderhill Library CU / NBNM018535 York / HB360C00A4
1 628 12.7 7,956
2 628 25.3 15,912
3 628 38.0 23,868
4 628 50.7 31,824
Lauderhill Library CU / NBNM019280 York / HB180C00A1 1,256 10.2 12,789
2 1,256 20.4 25,579
Hunter & Hughes CU / L412TPNBF Trane / TTH060C10042 1 436 8.3 3,607
Hunter & Hughes CU / L433YG1AH Trane / TTA180B300CB1 4,024 6.6 26,563
2 1,207 17.7 21,415
Hunter & Hughes CU / 63953Y4AD Trane / TTA240B300FA 1 1,820 11.4 20,654
Exhibit 2B Page 349

Proprietary and Confidential © Siemens Industry IGA Report – May, 2019 – | Page 710
Siemens – Broward County, Investment Grade Audit | May 2019
2 3,874 24.2 93,580
Hunter & Hughes CU / 13051S7LTA Trane / TTA240B300AA1 8,736 12.6 110,158
2 1,162 27.1 31,492
Hunter & Hughes CU / 8281411AD Trane / TTA150B300FA1 4,576 6.5 29,904
2 1,196 16.2 19,390
Hunter & Hughes CU / 831504RAD Trane / TTA180B300FA1 1,352 8.4 11,398
2 2,496 15.6 38,847
HVAC Replacements – Pre-retrofit Building Conditions (continued)
Locations Unit / Serial Number Make / ModelNumber of
Compressors Running
AnnualOperating Hours
(AOH)
Pre-Retrofit
Unit Draw(kWpre)
Pre-RetrofitElectric
Consumption
(kWhpre)
Hunter & Hughes CU / 10092Y5YTD Trane / TTA180B300AA1 4,118 8.4 34,452
2 1,235 17.4 21,461
Hunter & Hughes CU / 10091Y Trane / TTA180B300AA1 4,918 7.1 34,745
2 1,204 13.5 16,236
Hunter & Hughes CU / 7421UPSAD Trane / TTA180B300FA1 3,462 8.3 28,827
2 1,039 17.4 18,024
Exhibit 2B Page 350

Proprietary and Confidential © Siemens Industry IGA Report – May, 2019 – | Page 711
Siemens – Broward County, Investment Grade Audit | May 2019
Time of Day Scheduling – Pre-Retrofit Building Conditions
Location Unit / SerialNumber
Existing UnitMake / Model
ProposedUnit Make /
Model
Pre-Retrofit
Scheduled Hours
per Week(HPWpre)
Compressor Cycling
Factor
Pre-Retrofit
Operating Hours
per Week(HPWpre)
UnitElectricDeman
d(kWunit)
Pre-Retrofi
tElectric Use
(kWhpr
e)
MarkhamPark (Office)
CU /1404G50042
Carrier / 38ARZ007-K501 Not Replaced 161.0 0.75 120.8 7.3 45,837
MarkhamPark (Office)
CU /1404G50045
Carrier / 38ARZ007-K501
Not Replaced 168.0 0.75 126.0 7.3 47,830
MarkhamPark (TargetRange)
CU /W331421556
Thermal Zone /TZAA-348-2C757 Not Replaced 83.5 0.75 62.6 4.2 13,677
MarkhamPark (TargetRange)
CU /8346W26131822
8
Thermal Zone /TZAA-348-2A757
Not Replaced 83.0 0.75 62.3 4.2 13,595
MarkhamPark (TargetRange)
CU / 6313U831FAmerican Standard
/2A7A4048B1000AA
Not Replaced 153.5 0.75 115.1 4.2 25,143
MarkhamPark (TargetRange)
CU /7658N41080446
1Ruud / 13AJA60A01 Not Replaced 153.5 0.75 115.1 5.3 31,728
MarkhamPark (TargetRange)
CU / E071132428ICP /
M2A348AKA200Not Replaced 153.5 0.75 115.1 4.2 25,143
EvergladesHoliday Park
CU / 4107X0624 Payne / PA13NR060 Not Replaced 168.0 0.75 126.0 5.2 34,070
EvergladesHoliday Park
CU / 2108E23960 Carrier /24ABS360A300
Not Replaced 168.0 0.75 126.0 5.2 34,070
FranklinPark CU / F171703307
Thermal Zone /TZAA-090CA757 Not Replaced 168.0 0.75 126.0 6.0 39,312
FranklinPark CU / F171403303
Thermal Zone /TZAA-090CA757 Not Replaced 168.0 0.75 126.0 6.2 40,622
Exhibit 2B Page 351

Proprietary and Confidential © Siemens Industry IGA Report – May, 2019 – | Page 712
Siemens – Broward County, Investment Grade Audit | May 2019
Time of Day Scheduling – Pre-Retrofit Building Conditions (continued)
LocationUnit / Serial
NumberExisting UnitMake / Model
ProposedUnit Make /
Model
Pre-Retrofit
Scheduled Hours
per Week(HPWpre)
Compressor Cycling
Factor
Pre-Retrofit
Operating Hours
per Week(HPWpre)
UnitElectricDeman
d(kWunit)
Pre-Retrofi
tElectric Use
(kWhpr
e)
Delevoe ParkCU /
0200G00154Carrier / 38AK-007-
V511Trane /
TTA073G30SA 168.0 0.75 126.0 5.8 38,002
Delevoe ParkCU /
2509G30115Carrier / 38ARZ007-
K501Trane /
TTA073G30SA168.0 0.75 126.0 5.4 35,381
Delevoe ParkCU /
N0M8454757York /
HA090C00A2AAA1ATrane /
TTA090G30SA168.0 0.75 126.0 5.5 36,036
RooseveltGardensPark
CU / 200710-CCCF07870
Aaon / CA1305Trane /
4TTR6060J1168.0 0.75 126.0 4.9 32,105
RooseveltGardensPark
CU / 0307E13587Carrier /
24ABR360HB0330Trane /
4TTR6060J1
84.0 0.75 63.0 3.1 10,156
84.0 0.75 63.0 4.4 14,414
RooseveltGardensPark
CU / 3707E24294Carrier /
24ABR350A350Trane /
4TTR6060J1
56.0 0.75 42.0 2.8 6,115
56.0 0.75 42.0 4.4 9,610
BCJC StateAttorney’sOffice
CU 4TTR6060J1 168.0 0.75 126.0 2.6 17,035
BCJC StateAttorney’sOffice
CU/ E041051921 Heil / HAC260AKC4 4TTR6060J1 168.0 0.75 126.0 4.1 26,863
BCJC StateAttorney’sOffice
CU / E031042841 Heil / HAC260AKA5 4TTR6060J1 168.0 0.75 126.0 4.1 26,863
NorthwestHealthCenter
CU / 4415E11282Carrier /
24ABB342005Not Replaced 153.5 0.75 115.1 3.7 22,150
NorthwestHealthCenter
CU / 3916E01941Carrier /
24ABB342A500 Not Replaced 88.5 0.75 66.4 3.5 12,011
FleetServices #2 CU / R162N4N4F
Allegiance 10 /7C0060B300A0 4TTR4060L1 168.0 0.75 126.0 1.0 6,224
FleetServices #2
CU /W101505366
Thermal Zone /TZAA-360-CC757 4TTR4060L1 168.0 0.75 126.0 1.0 6,224
Hunter &Hughes CU / L412TPNBF
Trane /TTH060C10042 4TTR6060J1 69.0 0.65 44.9 5.1 11,894
Hunter & CU / L433YG1AH Trane / TTA180J30TA 84.0 0.75 63.0 4.7 15,397
Exhibit 2B Page 352

Proprietary and Confidential © Siemens Industry IGA Report – May, 2019 – | Page 713
Siemens – Broward County, Investment Grade Audit | May 2019
Hughes TTA180B300CB84.0 0.75 63.0 12.7 41,605
Hunter &Hughes
CU / 63953Y4ADTrane /
TTA240B300FATTA240030T0
53.8 0.75 40.3 8.5 17,821
114.2 0.75 85.7 18.1 80,642
Hunter &Hughes
CU / 13051S7LTATrane /
TTA240E300AATTA240030T0
115.9 0.75 86.9 8.4 37,975
52.1 0.75 39.1 18.0 36,560
Hunter &Hughes
CU / 8281411AD Trane /TTA150B300FA
TTA150030S0132.7 0.75 99.5 4.6 23,810
35.3 0.75 26.5 11.4 15,685
Hunter &Hughes
CU / 831504RADTrane /
TTA180B300FATTA180030S0
58.8 0.75 44.1 6.1 13,989
109.2 0.75 81.9 11.4 48,550
Exhibit 2B Page 353
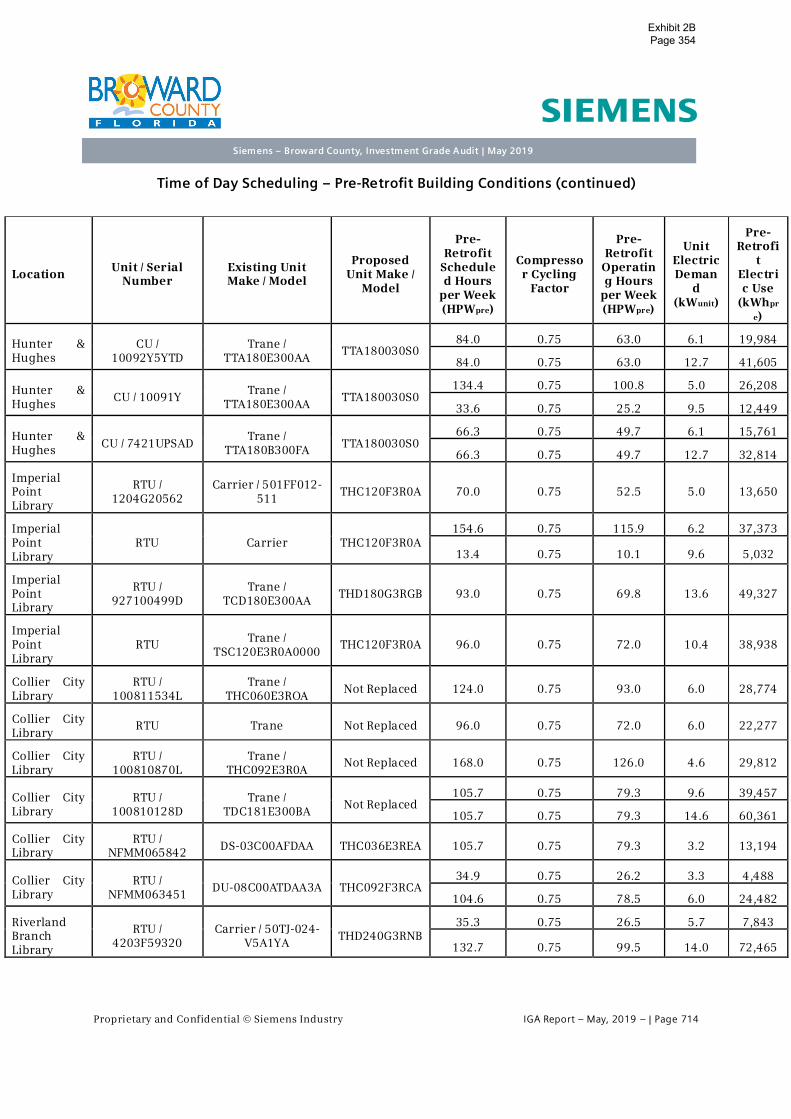
Proprietary and Confidential © Siemens Industry IGA Report – May, 2019 – | Page 714
Siemens – Broward County, Investment Grade Audit | May 2019
Time of Day Scheduling – Pre-Retrofit Building Conditions (continued)
LocationUnit / Serial
NumberExisting UnitMake / Model
ProposedUnit Make /
Model
Pre-Retrofit
Scheduled Hours
per Week(HPWpre)
Compressor Cycling
Factor
Pre-Retrofit
Operating Hours
per Week(HPWpre)
UnitElectricDeman
d(kWunit)
Pre-Retrofi
tElectric Use
(kWhpr
e)
Hunter &Hughes
CU /10092Y5YTD
Trane /TTA180E300AA
TTA180030S084.0 0.75 63.0 6.1 19,984
84.0 0.75 63.0 12.7 41,605
Hunter &Hughes
CU / 10091YTrane /
TTA180E300AATTA180030S0
134.4 0.75 100.8 5.0 26,208
33.6 0.75 25.2 9.5 12,449
Hunter &Hughes CU / 7421UPSAD
Trane /TTA180B300FA TTA180030S0
66.3 0.75 49.7 6.1 15,761
66.3 0.75 49.7 12.7 32,814
ImperialPointLibrary
RTU /1204G20562
Carrier / 501FF012-511
THC120F3R0A 70.0 0.75 52.5 5.0 13,650
ImperialPointLibrary
RTU Carrier THC120F3R0A154.6 0.75 115.9 6.2 37,373
13.4 0.75 10.1 9.6 5,032
ImperialPointLibrary
RTU /927100499D
Trane /TCD180E300AA
THD180G3RGB 93.0 0.75 69.8 13.6 49,327
ImperialPointLibrary
RTU Trane /TSC120E3R0A0000
THC120F3R0A 96.0 0.75 72.0 10.4 38,938
Collier CityLibrary
RTU /100811534L
Trane /THC060E3ROA
Not Replaced 124.0 0.75 93.0 6.0 28,774
Collier CityLibrary
RTU Trane Not Replaced 96.0 0.75 72.0 6.0 22,277
Collier CityLibrary
RTU /100810870L
Trane /THC092E3R0A
Not Replaced 168.0 0.75 126.0 4.6 29,812
Collier CityLibrary
RTU /100810128D
Trane /TDC181E300BA
Not Replaced105.7 0.75 79.3 9.6 39,457
105.7 0.75 79.3 14.6 60,361
Collier CityLibrary
RTU /NFMM065842 DS-03C00AFDAA THC036E3REA 105.7 0.75 79.3 3.2 13,194
Collier CityLibrary
RTU /NFMM063451
DU-08C00ATDAA3A THC092F3RCA34.9 0.75 26.2 3.3 4,488
104.6 0.75 78.5 6.0 24,482
RiverlandBranchLibrary
RTU /4203F59320
Carrier / 50TJ-024-V5A1YA
THD240G3RNB35.3 0.75 26.5 5.7 7,843
132.7 0.75 99.5 14.0 72,465
Exhibit 2B Page 354

Proprietary and Confidential © Siemens Industry IGA Report – May, 2019 – | Page 715
Siemens – Broward County, Investment Grade Audit | May 2019
RiverlandBranchLibrary
RTU /4303G50596
Carrier / 50TFF012-V511
THC120F3RGA--B0C5A
92.4 0.75 69.3 5.3 19,099
75.6 0.75 56.7 9.1 26,830
NorthwestFamilySuccessCenter
DX Unit /4032MMBAD
Trane /TTA090A300FA
THD210G3RNB
84.0 0.75 63.0 4.3 14,087
84.0 0.75 63.0 5.8 19,001
NorthwestFamilySuccessCenter
DX Unit /4042KKR2F
Trane /2TTA0072A3000AA
THD210G3RNB 168.0 0.75 126.0 4.6 30,139
NorthwestFamilySuccessCenter
RTU Trane /TCD211C300BA
THD210G3RNB 168.0 0.75 126.0 13.8 90,418
Time of Day Scheduling – Pre-Retrofit Building Conditions (continued)
LocationUnit / Serial
NumberExisting UnitMake / Model
ProposedUnit Make /
Model
Pre-Retrofit
Scheduled Hours
per Week(HPWpre)
Compressor Cycling
Factor
Pre-Retrofit
Operating Hours
per Week(HPWpre)
UnitElectricDeman
d(kWunit)
Pre-Retrofi
tElectric Use
(kWhpr
e)
NorthwestFamilySuccessCenter
RTU /217101092D
Trane /TCD211C300BA THD210G3RNB 168.0 0.75 126.0 11.5 75,348
FleetServices #3
DX Unit /3708X70430 PA13HR048-H 4TTR4048L1 168.0 0.75 126.0 7.1 46,519
FleetServices #3
RTU /1001G40510
Carrier / 50HS-024-311AA
4TCC4024-1000
168.0 0.75 126.0 4.1 26,863
Exhibit 2B Page 355

Proprietary and Confidential © Siemens Industry IGA Report – May, 2019 – | Page 716
Siemens – Broward County, Investment Grade Audit | May 2019
East Regional Library Pre-Retrofit Design Air Flow
Unit Serves
Pre-Retrofit OutsideAir Damper Position,
OA%Pre
Design AirFlow
(CFM)
AHU-1 Corridor 30 12500
AHU-2 Mail, Parole Extension 30 900
AHU-3 Lounge 30 1000
AHU-4 Health Department 30 2000
AHU-5 Property Appraiser 30 2400
AHU-6 Social & Health Services 30 3500
AHU-7 Youth Services 30 2300
AHU-8 30 2700
AHU-9 Community Room 30 1830
AHU-10 Supervisor of Elections 30 2000
AHU-11 Veterans Services 30 1000
AHU-12 Tax Collector 30 4300
AHU-13 Public Defender 30 3300
AHU-14 Clerk of Circuit Court 30 7650
AHU-15 State Attorney 30 3600
AHU-16
Court Room #1, 2, 3
30 5200
AHU-17 30 5200
AHU-18 30 5200
AHU-19 Court Room Waiting 30 1200
Total (CFMTOT) 67,780
Exhibit 2B Page 356

Proprietary and Confidential © Siemens Industry IGA Report – May, 2019 – | Page 717
Siemens – Broward County, Investment Grade Audit | May 2019
Contracted Baseline Operating Parameters: East Regional Library ‒ Art Serve
OA% Sunday/Holiday Monday Tuesday Wednesday Thursday Friday Saturday
Hour 1 2 3 4 5 6 7
0 0% 0% 0% 0% 0% 0% 0%
1 0% 0% 0% 0% 0% 0% 0%
2 0% 0% 0% 0% 0% 0% 0%
3 0% 0% 0% 0% 0% 0% 0%
4 0% 0% 0% 0% 0% 0% 0%
5 0% 0% 0% 0% 0% 0% 0%
6 0% 0% 0% 0% 0% 0% 0%
7 0% 0% 0% 0% 0% 0% 0%
8 0% 0% 0% 0% 0% 0% 0%
9 0% Existing Existing Existing Existing Existing 0%
10 0% Existing Existing Existing Existing Existing Existing
11 0% Existing Existing Existing Existing Existing Existing
12 0% Existing Existing Existing Existing Existing Existing
13 0% Existing Existing Existing Existing Existing Existing
14 0% Existing Existing Existing Existing Existing Existing
15 0% Existing Existing Existing Existing Existing Existing
16 0% Existing Existing Existing Existing Existing Existing
17 0% Existing Existing Existing Existing Existing Existing
18 0% Existing Existing Existing Existing Existing 0%
19 0% Existing Existing Existing Existing Existing 0%
20 0% 0% 0% 0% 0% 0% 0%
21 0% 0% 0% 0% 0% 0% 0%
22 0% 0% 0% 0% 0% 0% 0%
23 0% 0% 0% 0% 0% 0% 0%
Exhibit 2B Page 357
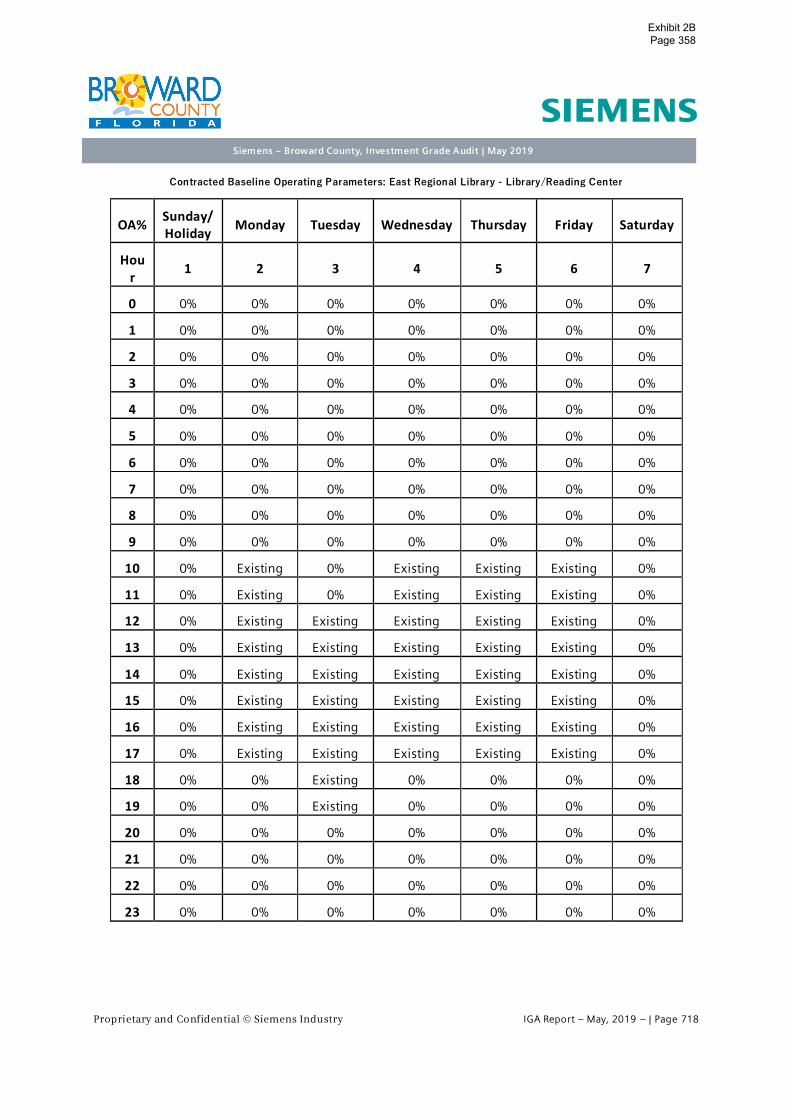
Proprietary and Confidential © Siemens Industry IGA Report – May, 2019 – | Page 718
Siemens – Broward County, Investment Grade Audit | May 2019
Contracted Baseline Operating Parameters: East Regional Library - Library/Reading Center
OA% Sunday/Holiday Monday Tuesday Wednesday Thursday Friday Saturday
Hour 1 2 3 4 5 6 7
0 0% 0% 0% 0% 0% 0% 0%
1 0% 0% 0% 0% 0% 0% 0%
2 0% 0% 0% 0% 0% 0% 0%
3 0% 0% 0% 0% 0% 0% 0%
4 0% 0% 0% 0% 0% 0% 0%
5 0% 0% 0% 0% 0% 0% 0%
6 0% 0% 0% 0% 0% 0% 0%
7 0% 0% 0% 0% 0% 0% 0%
8 0% 0% 0% 0% 0% 0% 0%
9 0% 0% 0% 0% 0% 0% 0%
10 0% Existing 0% Existing Existing Existing 0%
11 0% Existing 0% Existing Existing Existing 0%
12 0% Existing Existing Existing Existing Existing 0%
13 0% Existing Existing Existing Existing Existing 0%
14 0% Existing Existing Existing Existing Existing 0%
15 0% Existing Existing Existing Existing Existing 0%
16 0% Existing Existing Existing Existing Existing 0%
17 0% Existing Existing Existing Existing Existing 0%
18 0% 0% Existing 0% 0% 0% 0%
19 0% 0% Existing 0% 0% 0% 0%
20 0% 0% 0% 0% 0% 0% 0%
21 0% 0% 0% 0% 0% 0% 0%
22 0% 0% 0% 0% 0% 0% 0%
23 0% 0% 0% 0% 0% 0% 0%
Exhibit 2B Page 358

Proprietary and Confidential © Siemens Industry IGA Report – May, 2019 – | Page 719
Siemens – Broward County, Investment Grade Audit | May 2019
Contracted Baseline Operating Parameters: East Regional Library ‒ Stonewall Library & Archives
OA% Sunday/Holiday Monday Tuesday Wednesday Thursday Friday Saturday
Hour 1 2 3 4 5 6 7
0 0% 0% 0% 0% 0% 0% 0%
1 0% 0% 0% 0% 0% 0% 0%
2 0% 0% 0% 0% 0% 0% 0%
3 0% 0% 0% 0% 0% 0% 0%
4 0% 0% 0% 0% 0% 0% 0%
5 0% 0% 0% 0% 0% 0% 0%
6 0% 0% 0% 0% 0% 0% 0%
7 0% 0% 0% 0% 0% 0% 0%
8 0% 0% 0% 0% 0% 0% 0%
9 0% 0% 0% 0% 0% 0% 0%
10 0% 0% 0% 0% 0% 0% Existing
11 0% Existing Existing Existing Existing Existing Existing
12 0% Existing Existing Existing Existing Existing Existing
13 0% Existing Existing Existing Existing Existing Existing
14 0% Existing Existing Existing Existing Existing Existing
15 0% Existing Existing Existing Existing Existing Existing
16 0% Existing Existing Existing Existing Existing Existing
17 0% Existing Existing Existing Existing Existing 0%
18 0% 0% 0% 0% 0% 0% 0%
19 0% 0% 0% 0% 0% 0% 0%
20 0% 0% 0% 0% 0% 0% 0%
21 0% 0% 0% 0% 0% 0% 0%
22 0% 0% 0% 0% 0% 0% 0%
23 0% 0% 0% 0% 0% 0% 0%
Exhibit 2B Page 359