annual report - 2016/17 - Lesotho Electricity and Water Authority

MAKERERE UNIVERSITY COLLEGE OF BUSINESS AND MANAGEMENT SCIENCES (COBAMS)
SCHOOL OF ECONOMICS
Patterns of Gender Savings Differences in Lesotho
BY
Nkareng A. Letsie
Research Paper: MAGAE
October 2011

i
Abstract
This study employed the household survey data of Lesotho to empirically examine the patterns of gender variations in personal savings. Pairwise correlations and cross tabulation were used to establish the strength and existence of relationship between savings and other variables in question. It has been found that income do influence both men and women to safe though women tend to safe more than men do at all levels of income. Ownership of productive resources compels both men and women alike to safe. It has been found that income is a major determinant of differences in savings and women tend to safe more at all levels of income. Productive assets ownership compels all the individuals to safe even more. Savings was found to grow with the size of the household that the bigger the household the more the consumption will be. Age on the other hand adversely affect women while compelling me to safe. Marital statuses more adversely affect women than men. Education tends to compel both men and women to safe. The study concluded that urban dwellers are more savers than their rural counterparts irrespective of their gender differences. Women savings respond positively to income generating activities, more opportunities to them will yield even higher levels of savings. Sustainable income generating projects are therefore advocated. Women’s independence in saving is also important in ensuring their economic empowerment to reduce dependency syndrome
ii
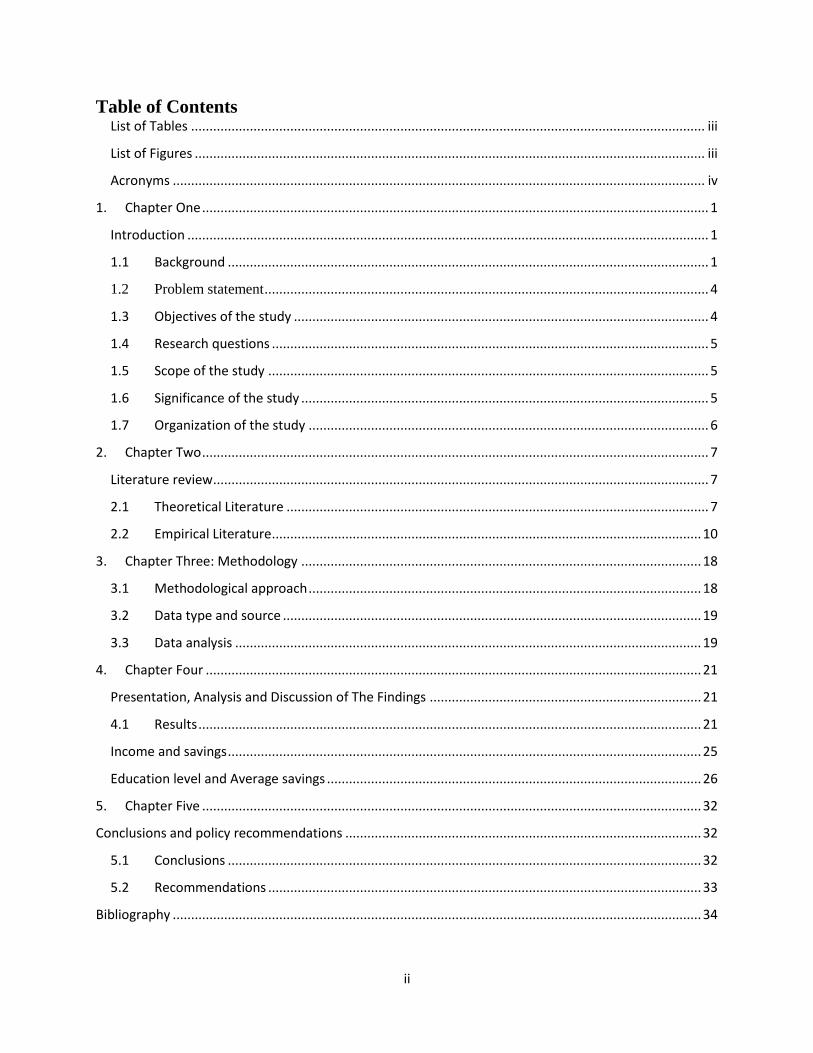
Table of Contents List of Tables ............................................................................................................................................ iii
List of Figures ........................................................................................................................................... iii
Acronyms ................................................................................................................................................. iv
1. Chapter One .......................................................................................................................................... 1
Introduction .............................................................................................................................................. 1
1.1 Background ................................................................................................................................... 1
1.2 Problem statement ......................................................................................................................... 4
1.3 Objectives of the study ................................................................................................................. 4
1.4 Research questions ....................................................................................................................... 5
1.5 Scope of the study ........................................................................................................................ 5
1.6 Significance of the study ............................................................................................................... 5
1.7 Organization of the study ............................................................................................................. 6
2. Chapter Two .......................................................................................................................................... 7
Literature review ....................................................................................................................................... 7
2.1 Theoretical Literature ................................................................................................................... 7
2.2 Empirical Literature ..................................................................................................................... 10
3. Chapter Three: Methodology ............................................................................................................. 18
3.1 Methodological approach ........................................................................................................... 18
3.2 Data type and source .................................................................................................................. 19
3.3 Data analysis ............................................................................................................................... 19
4. Chapter Four ....................................................................................................................................... 21
Presentation, Analysis and Discussion of The Findings .......................................................................... 21
4.1 Results ......................................................................................................................................... 21
Income and savings ................................................................................................................................. 25
Education level and Average savings ...................................................................................................... 26
5. Chapter Five ........................................................................................................................................ 32
Conclusions and policy recommendations ................................................................................................. 32
5.1 Conclusions ................................................................................................................................. 32
5.2 Recommendations ...................................................................................................................... 33
Bibliography ................................................................................................................................................ 34
iii
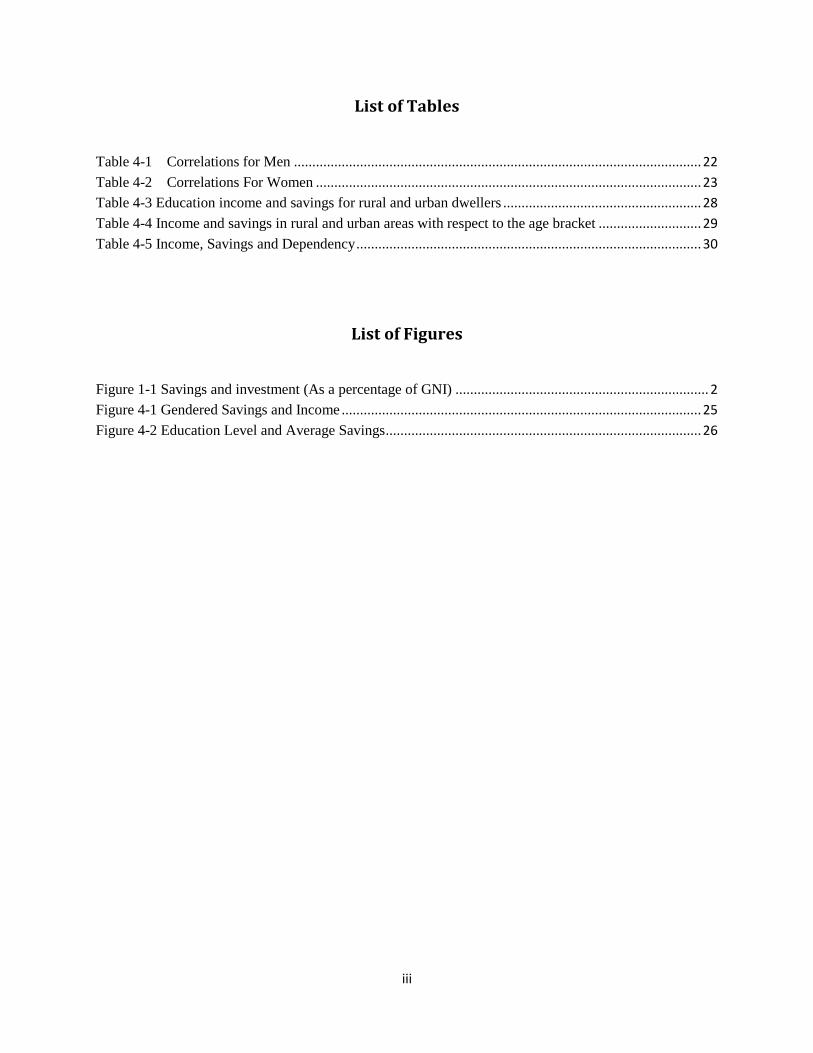
List of Tables
Table 4-1 Correlations for Men ............................................................................................................... 22
Table 4-2 Correlations For Women ......................................................................................................... 23
Table 4-3 Education income and savings for rural and urban dwellers ...................................................... 28
Table 4-4 Income and savings in rural and urban areas with respect to the age bracket ............................ 29
Table 4-5 Income, Savings and Dependency .............................................................................................. 30
List of Figures
Figure 1-1 Savings and investment (As a percentage of GNI) ..................................................................... 2
Figure 4-1 Gendered Savings and Income .................................................................................................. 25
Figure 4-2 Education Level and Average Savings ...................................................................................... 26

iv
Acronyms
BOS - Lesotho bureau of Statistics
CBL – Central Bank of Lesotho
RSA- Republic of South Africa
GDP- Gross National Product
GNI- Gross National Income
LCH- Life Cycle Hypothesis
PIH- Permanent Income Hypothesis
LDCs- Least Developed Countries

1
1. Chapter One
Introduction
1.1 Background
Lesotho is a small landlocked, mountainous country that is completely surrounded by the
Republic of South Africa (RSA). The country is about 30,000 square kilometres, with a total
population of about 1.88 million people (2006 census report). Three-quarters of the land is made
up of highlands and the remaining one-quarter are lowlands. However, the low land is home to
over 55% of the population. According to the 2006 population census report only 23.8 % of the
population lives in urban areas while 76.2% is located in rural areas. The country is divided into
six regions Maseru urban, other urban, rural low lands, rural foothills, rural mountains, and rural
Senqu (Orange) river valley ecological zones. Individual choices across the regions differ due to
region specific challenges that are faced by individuals in each region. It follows therefore that
these regions shape the way men and women behave and cope with uncertainties. It has been
documented that across the country women save more than men in Lesotho (Central Bank of
Lesotho, 2010).
The higher contribution of women in savings is more in developing countries, Lesotho inclusive.
However, so far, limited research on the topic, have revealed little information (Floro & Seguino,
2002). In Lesotho gross national savings in 2009 alone was estimated at 31.0 per cent of gross
national income (Central Bank of Lesotho, 2010). In 2000, according to the Earth Trends (2003),
gross national savings accounted for 18% of the GDP compared to 13% average for the Sub-
Saharan Africa and 23% worldwide. Net national savings recorded 12% as opposed to the

2
regional average of 5% (Floro & Seguino, 2002). The implication is that Lesotho has high
savings rate in the region. On the other hand the Bureau of Statistics (BOS, 2009) maintains that
the private savings in Lesotho accounted for 23.2% of GDP, of which 56.4% accrue to women
and 43.6% accrue to men. This is evident that men and women have different propensities to
save (Floro & Seguino, 2002). However the patterns of the differences are not known in Lesotho.
The economic literature suggests differences between; education, age, number of dependents
(dependency ratio), geographical location and productive resource ownership; to perpetuate the
gender differences.
Figure 1-1 Savings and investment (As a percentage of GNI)
Source: Central Bank of Lesotho
Savings in Lesotho has been ranging above 20 percent of Gross National Income (GNI) for the
past six years. It has been above the sub-Saharan African average and along the period men and
women have been saving differently.

3
In line with the above mentioned facts, this study aims at examining the patterns of gender
differences in household savings between men and women in Lesotho. There are a number of
reasons why we should be concerned about studying inter and intra-household savings or
economic behaviour. According to Burgoyne & Kirchler (2008), a household is the smallest unit
of economics where decisions are made, negotiations, resolution and settlement of conflicting
interest. Understanding the household dynamics and socialization becomes a cornerstone in
finding and analysing the gender differential in saving behaviour.
Historically, women in Lesotho have been dependent on men for financial security (Ferguson &
Lohmann, 1994). However, of late, with increased women participation in employment and men
being retrenched from the RSA mines, one would expect the gender relations to change and
experience paradigm shift in financial independence.
According to Hurst (2005), people who are ill prepared for retirement experience the extreme
poor economic life after retirement. Lesotho, as a small economy with around 1.8 million people
of which 48.6 per cent are male and 51.4 represented by females (Bureau of Statistic, 2010),
need also to look for the preparedness of citizens to cope with the trends as it is not different
from other developing nations.
From the household point of view, savings represent a decision not to consume current income
for the future benefit. In a lifetime, an individual passes through three stages, young age,
working years and retirement age (the pension years). Economic literature has identified three
motives leading to savings decisions and they can be distinguished as retirement savings,
precautionary savings and saving for bequest (Sturm, 1983).

4
In recent years, the focus of the debates on aggregate saving has shifted from a Keynesian
approach of capacity-to-save factors to the question of interest rate sensitivity of saving as well
as the influence of age structure of the population. Furthermore, the possible effects of fiscal
policy instruments in the form of taxation and social welfare policies have been examined and
found to be gender neutral. Moreover, the great deal of gender differentials in propensities to
save. Nevertheless, little or no attention has been paid to the country wide patterns of differences
in propensities to save between men and women. A small but growing body of literature strongly
suggests there are gender differences in saving decisions and in risk attitude, at least in some
developed countries; the story however, remains untold about the patterns of differences. This
study therefore unfolds the likely patterns of the differences that exist in Lesotho economy.
1.2 Problem statement
The statistics show that private savings is currently at 23.2% of gross national income. Of this
figure, male contribution is 43.6% while that of women is 56.4%. The patterns of these gender
differentials are unknown.
1.3 Objectives of the study
The objective of the study is to investigate the patterns of gender variations in savings between
men and women in Lesotho.
The specific objectives of the study are to:
Establish the rural urban patterns of savings in Lesotho
Establish income savings patterns in Lesotho

5
Establish age savings patterns in Lesotho
1.4 Research questions
Does the geographical location leads to different patterns in savings between men and
women?
Does income help to explain the patterns in gender differences in savings and financial
asset building?
Does age influences the patterns of savings save in Lesotho?
1.5 Scope of the study
The study covers the whole economy in both rural and urban settings. The study is also limited to
2006/2007 household budget survey due to availability of data.
1.6 Significance of the study
It is important for the government (policy makers) to understand the differences in saving habits
and their patterns between men and women. The findings of this study can be used to develop
and plan policies and projects that will economically empower women as they are found to save
more than men. To the government the findings shed some light on what can be done to
economically empower women for example ownership and control over livestock and land.

6
These patterns can help even the financial institution to tailor their financial intermediation to
help the disadvantaged groups to generate income that will enhance savings.
1.7 Organization of the study
The study is divided into five chapters. Chapter one is the introduction, then, chapter two focuses
on the Literature review, the theoretical Literature and empirical literature. Chapter three
comprises the methodology, data type and sources, and data analysis. Chapter four present the
result and findings of the study then last but not least chapter five takes a glance at the discussion
of the results, conclusions and recommendations.

7
2. Chapter Two
Literature review
This chapter is divided in to two sections. The first section look in to existing theoretical
literature and the second section looks in to the existing empirical literature.
2.1 Theoretical Literature
Savings play a profound role in achieving high levels of growth in the economy, as it is viewed
as the lifeblood for investment and asset accumulation as well as wealth creation more especially
through the financial wealth channel. According to the classical theory of savings the higher the
country’s savings rate, the higher the country’s investment rate. Investment in capital stock
(human, infrastructure and machinery) prompts industrial growth, economic efficiency,
production of quality products, and higher levels of employment. With abundant products there
exist stable prices and hence stable high growth. Household savings represent the largest
component of National savings in both developing and developed countries (Hafeez, Imran,
Faridi, & Farrukh, 2011) for example according to the bureau of statistics (2009), the private
savings in Lesotho accounted for 23.2% of GDP, of which 56.4% accrue to women and 43.6%
accrue to men. As Hafeez et. al. (2011) pointed out, agriculture plays a pivotal role in enhancing
savings level in low income or primary sector based economy. This is the sector that employs
women in most of the developing economies. The implication is that the sustainability of capital
formation is significantly influenced by the willingness of households to save.
There is a rich literature with regard to individual savings and the motives to save both in
developed and developing economies but little attention has been paid to patterns of differences

8
in gender, race, and ethnicity and so on. Both theoretical and empirical work on savings have
consistently outlined the major potential determinants to fall in either of the two categories;
financial and non-financial saving as disaggregate saving in literature. As Dercon (2002)
findings suggests about data from Africa, the returns to the assets used by households for
“saving” are often positively correlated with incomes. Moreover, it is argued that the male
headed households tend to save more than the female headed households but little or nothing is
said about the factors that influence these disparities (Floro & Seguino, 2002).
According to the orthodox economics, there are three main theoretical approaches to this issue
and they are; Keynesian consumption theory, the life-cycle-permanent-income hypothesis under
rational expectations, and the theory of the infinitely lived agent or altruistically linked
consumers. Existing literature suggests a variety of motives for savings by the household, and
these motives point to a number of variables that affect the capability and willingness of the
economic agent to pursue the saving goal. For example Keynes (1936) in (Webley & Nyhus,
2008), maintains that people save for different reasons which can be grouped in to eight motives
of saving. The list as Webley & Nyhus, (2008) stated, goes as follows; i) People save to build up
a reserve against unforeseen contingencies, ii) They also save to finance anticipated future
relationship between income and needs, for example to finance the retirement, iii) People save to
earn interest, this motive is for wealth creation, iv) people have a motive to enjoy gradually
improving expenditure, v) Sense of independence and power to do things, vi) Many people save
to facilitate or to finance the business venture, vii) They are also interested to bequeath the
fortune, viii) And finally people are much more willing to satisfy pure miserliness. This motive
can tell a little story about who is likely to safe more in the house hold between men and women.
Saving for retirement is generally considered quantitatively the most important saving motive.

9
Much of the analysis of households’ consumption and savings decisions is conducted using
versions of the life-cycle model (Gilles & Denise, 2000).
Keynes as in Webley & Nyhus (2008), identified absolute disposable income as the important
determinant of saving. Other two traditional theories Friedman (1957), Permanent Income
Hypothesis (PIH) and Ando and Modigliani (1964), Life Cycle Hypothesis (LCH) explaining the
determinants of saving point out that other variables also affect the saving of the households.
Friedman (1957) differentiated between permanent and transitory income and indicated that
saving is influenced by both permanent and transitory income as well as present level of wealth,
both human and non-human. As per Ando and Modigliani (1964), the main reason for saving is
to meet the expenses after the retirement and to acquire wealth. Hence, the age of the household
head plays an important role in the saving behaviour. Retirement savings form the basis for the
life cycle hypothesis (LCH) models of household consumption behaviour. The underlying
assumption is that the household maximizes utility subject to the available resource constraint. It
is argued that the household decision to save is underpinned by the simple heuristics (Webley &
Nyhus, 2008).
The simple permanent-income theory envisages that higher growth (that is, higher future
income) reduces current saving. But in the life-cycle model growth have an ambiguous effect on
saving, depending on which cohort benefit the most from income growth, how steep their
earning profiles are, and the extent to which borrowing constraints apply (Deaton, 1994).
Reverse causation from saving to growth also is possible, taking place through capital
accumulation.

10
The cornerstone of the life-cycle hypothesis is age-related consumer heterogeneity and the
prediction that saving follows a hump-shaped pattern (that is, high at middle age and low at
young and old ages). Research has shown that this hypothesis is not problem-free when it comes
to interpreting actual saving behaviour. Life-cycle saving is not sufficient to account for the high
level of aggregate wealth in industrial economies. Changes in growth do not cause the cohort-
specific differences in saving levels or in inter-temporal consumption patterns (Deaton, 1994).
Elderly people save or at least do not dis-save as much as predicted by the life-cycle hypothesis
(Deaton, 1994), and consumers appear to value bequests. Another demographic force that
typically affects private saving rates is the degree of urbanization. Its effect on saving has been
found to be negative empirically, a result that has been explained along the lines of the
precautionary saving motive.
2.2 Empirical Literature
In light of these three traditional theories a lot of research has been done and their variation used
on the household savings behaviour across developing and developed nations (Hafeez, Imran,
Faridi, & Farrukh, 2011; Fisher, 2010; Muradoglu & Taskin, 1996). There is a divergence
between the findings in developing from the findings in developed countries. In developed
economies the analysis is based on the premises of perfect capital markets. These theories are
found to be inadequate to explain the experiences and saving behaviour of households in
developing countries where poverty is prevalent in most if not all the households, operating
under uncertainties and imperfect financial markets. According to Besley (1995), due to low
level of literacy and numeracy, mistrust of financial institutions, and high transaction costs,
individuals in the LDCs often accumulate savings in forms other than demand deposits. They

11
resort to informal institutions like Susu men in West Africa1 and Shroffs in India; some undertake
direct investment in assets like livestock (Besley, 1995). However a clearer picture can be
painted by finding out the trends or patterns of the differential in savings for people with the
same life expectancy, same age bracket and the same income bracket to reveal the factors that
play the major role. It is argued that, the limited capacity to save which is basically determined
by the income has a direct implication on the financial resources. What bring about the income
disparities on the other hand are the prices the factors receive on the individual basis from their
resources. How the income is distributed depends on the resource ownership and prices paid for
resources of different kinds in different employments. The ownership patterns of resources is
unequal due to cultural believes and institutions these give raise to an unequal distribution of
income in the society, hence unequal savings.
There is ample literature on savings behaviour, however, any test of the savings behaviour is
limited by the availability of data; reliable savings data are naturally difficult to obtain as they
enter in to individuals private life. Nevertheless, studies came to the conclusion that there is a
disparity in wealth accumulation between men and women around the world in both developed
and developing economies. Recent research suggests gender discrimination in earnings and to
access and control over the productive asset to be the source. These discriminations cannot be
traced to a specific factor but it is a function of a number of socio, economic, behavioural and
institutional factors that impact the household on daily basis. Emphasis is made on differential
access to education and knowledge, economic discrimination, inheritance patterns, family size
and makeup (Besley, 1995).
1 Susu men are informal bankers used by market women in West Africa. They collect funds from them and return them at
the end of the month, less a commission. The savings earn a negative rate of interest in exchange for safe keeping.

12
There is overwhelming evidence as Fisher (2010), pointed out that financial behaviour and
economic wellbeing of men and women differ significantly. Evidence shows that women have
lower earning potential and hold lower levels of wealth than men. Furthermore, females have a
longer life expectancy. However, it is argued that the primary determinant of wealth is the
propensity to save during working life rather than the availability of the disposable income.
Most of the empirical literature that analysed savings behaviour concentrated on aggregate
savings due to the lack of consistent information on household behaviour and possible
differences in the household savings in developing countries. However, evidence is mounting
that many households even those well below the poverty line are indeed interested in saving.
Beatriz (2005), indicates that even the slum dwellers of Dhaka testify to the demand of savings
once a well-designed program is in place.
According to Loayza et. al. (2000), on the other hand comparing the regional differences found
out that saving rates around the world vary widely: on average East Asia saves more than 30 per
cent of gross national disposable income (GNDI), while Sub-Saharan Africa saves less than 15
per cent. Lack of safe, secure, convenient institutions in which to save and costs are cited as the
major determinants. Collecting small deposits generates higher transaction costs per dollar
transacted than collecting large deposits. As a result, banks often exclude poorer depositors
through the use of high minimum balance requirements, thus leaving many small savers to rely
on informal savings mechanisms.
Cronqvist and Siegel (2010), undertook the inquiry on the origins of savings behaviour, and they
targeted the twins’ population. Using the data from the Swedish Twin Registry (STR) containing
individual’s annual financial and demographic data, they found out that savings propensity is

13
governed by social transmissions from parents to children, and the environments. They argued
that individual specific life expectancies play a profound role in explaining the behaviour in
savings sphere more especially among urban dwellers. However, the findings were not sex
disaggregated.
French et. al. (2006) carried out the investigation on the elderly population in the United States
of America (USA). They put their interest on the differential mortality, medical expenses and the
savings. Using simulated moments, they came up with the findings that the risk of living longer
and high medical expenses goes a long way towards explaining the elderly saving decisions.
Another, factor that plays a big role in explaining elderly saving was found to be the social
insurance. However, the findings are silent about the gendered saving behaviour though it is well
documented that women outlive men.
For the Australian economy, Islam et. al. (2010), investigated the disparity between the
immigrants and native population saving behaviour. Using the Australian household expenditure
surveys (HES) for the four periods 1988/89, 1993/94, 1998/99 and 2003/04, they applied
quantile regression and semi-parametric decomposition methods. Their finding affirms the
observed differentials in wealth holdings of immigrants and the native population. They found
out that yes income elucidates explanation for the differences but most importantly the
observation is that different characteristics continue to explain the differences. However, given
similar characteristics immigrants’ savings are superior to native/Australian born households.
These findings are in line with what French et. al. (2006), concluded in the USA about the
immigrants and the USA citizens. Immigrants may be thought as the marginalised group or the
disadvantaged group as they may not be holding or commanding the productive resources apart

14
from their own labour. So the same analogy can be applied in the case of gender as it is a social
phenomenon.
As Butelmann & Gallego, (2000), indicated in their work, empirical evidence shows that
countries that increase the funding of their mandatory retirement programs tend to achieve higher
private saving rates. Time-series evidence for Chile, the first country that reformed its pension
system, suggests that 3.8 percentage points of the 12.2 percentage-point increase in the national
saving rate since 1986 can be attributed to pension reform. However, Samwick in Butelmann
also reports that pay-as-you go systems had significant negative effects on saving (Butelmann &
Gallego, 2000). However, analytical considerations suggest that the impact of pension reform on
saving is not a given, but rather hinges on the way the transition deficit is financed and on the
reform’s efficiency gains. As pointed out by Raut and Virmani (1990), pension reform should
have little short-run impact on private saving if it is financed by issuing public debt, since this
entails converting an implicit government liability into an explicit one. If, however, the transition
is financed by reducing the non-pension public deficit (by lowering net benefits to current
retirees, imposing higher taxes on current generations, or lowering government expenditures),
saving levels of current generations will decline, while those of future generations will rise,
although their saving rates will not necessarily change.
In Pakistan Hafeez et. al. (2011), also undertook the enquiry on savings differentials between the
urban and rural residents. They found out that rural households are less likely to save compared
to their urban counterparts due to the expenditure on children education, total dependency rate,
other liabilities and the value of the house to be paid. Urban savings on the other hand are
dictated by the household heads’ age, household income and the size of the land they have. Like
15
Cronqvist and Siegel (2010) findings, Hafeez’s findings were not assessed from the gender
perspective.
In his findings (Bunting, 2009), maintains that saving by high income households accounts for
all of aggregate saving. But the changes in the savings behaviour of this group do not explain the
decline. The findings were in line with the lifecycle hypothesis models only for those who are
able to save and tend to explain the lifetime spending behaviour. However, for households
unable to generate savings the models become irrelevant. Browning and Lusardi (1996), on the
other hand argue that the demographic heterogeneity explains cross-sectional variations (for
example the number of children or dependents in the household).
There are also distinct gender-specific motives, which in turn influences the savings and asset
building behaviour of men and women. In the case of India for example, because of cultural and
social norms, women are the ones to pay dowry, so they need to raise funds for a dowry, they
therefore have to save more than men in same age cohort (Floro & Seguino, 2002). It is
therefore argued that gender-based norm influence the patterns of saving. However in the context
of dowry, in Lesotho it is men who are expected to pay the bright price not the other way round.
The other angel to take is to look in to the differences in risk aversion. Sung and Hanna (1996),
found that, single women were less risk tolerant than single men or married couples, and Sunden
and Surrette (1998), reinforces Sung and Hanna findings as they found out that, single women
were less risk tolerant than single men. In addition, Bajtelsmit, Bernasek, and Jianakopolos
(1996) found women were more risk averse than men when examining gender differences in
distinct contribution pension allocations. According to Xiao (1995), men were more likely to
hold stocks and less likely to hold certificates of deposit as compared with women. The results of

16
Bajtelsmit and Bernasek, (1996), indicated that women received more conservative investment
advice than men. This is also true from the studies that were taken in psychology, they support
the idea of women being more risk averse than men (Croson & Gneezy, 2004).
Theory predicts that the expansion of credit should reduce private saving as individuals are able
to finance higher consumption at their current income level. This prediction is well supported by
the empirical evidence: a 1 percentage-point increase in the ratio of private credit flows to
income reduces the long-term private saving rate by 0.74 percentage point (Loayza, Schmidt-
Hebbel, & Servén, 2000). The determinants of savings generally and the specific effects of
government policies on savings and consumption are pivotal forces in investment and economic
growth as Raut and Virmani (1990), pointed out.
Fisher (2010) noted that savings behaviour between men and women exhibits the differences. In
low income households the risk tolerance variable dictates the differences. Education and health
account for the medium income differences in savings. However the severity of the disparity is
not noted.
To add more flesh on the theorization by Keynes Personal savings decisions are driven by
several motives, including the need to build up assets to finance consumption after retirement,
precautionary saving related to the uncertainty about the future, the desire to leave bequests to a
subsequent generation, and saving for the acquisition of tangible assets or for large current
expenditures. For the same reason that Basu (1997), pointed out, the households save their way
out of subsistence constraints. Platteau, (2010), argues that difficulties in saving may have
origins in social arrangements. The main factors influencing private saving as explained by de
Serres and Pelgrin (2002) in Platteau, (2010), appear to be public-sector saving rates, the
17
demographic structure of the population (as measured by the old-age dependency ratio), the
growth rate of labour productivity, changes in the terms of trade, the real interest rate and the
inflation rate. For example, as a result of increasing life expectancy and declining birth rates
(demographic changes) private savings have become increasingly important in developing
economies to put up with life after retirement. Though, most of the studies in relations to savings
are silent about gender, studies like the one undertaken by Fisher (2010), prove to be of special
importance to understanding the roots of differences in savings behaviour between men and
women in different parts of the world.
Chapter summary
The literature establishes that there is a difference in savings between the marginalised and the
dominating group in both developed and developing countries. In developed countries the
migrants are found to save more than the natives. For factors that were found to have relationship
with savings; income has been named number one, then other socio economic characteristics
such as; age, sex, culture, marital status, education, employment status and the number of
children across different geographical locations. Savings also are found to be different between
urban and rural. Studies came to a conclusion that gender discrimination in earnings, access and
control over productive resources (assets), determine the patterns of the differences in savings.

18
3. Chapter Three: Methodology
This section presents the methodological approach used to uncover the causes from economic to
social factors that creates gendered differences in savings.
3.1 Methodological approach
In order to establish the patterns of the differences in savings, pair-wise correlations were used to
establish the strength of relationship between savings and other variables in question. The major
factors like income, marital status, household size, social protection, ownership of livestock, and
geographical location were compared against savings. Separate gender specific causal Pearson
correlations were run to identify the nature of relationships.
Savings differential between men and women are captured in the differences in the expected
value of savings between the age brackets, income brackets, geographical location and also the
educational attainments. Since income is the major determinant of savings, its effect on savings
is examined in details to ensure that the differences that arise are not over shadowed by the
differentials in earnings. The expectation is that savings will also be different between the age
groups across the stage at which the agent is on the life cycle. Consideration is also made to the
age of the agent as the expectation is that savings will not be distributed evenly along the age
groups as they are likely to vary over the life cycle (where reproductive roles overlap with the
productive roles). Also age appear to be the important variable as women participation in the
formal employment is disrupted by their participation in reproductive roles. Therefore,
individuals divided amongst five distinct age groups: less than or equals to 15 years, 16- 25
years, 26-35years, 36-45years, 46-55years 56-65 years, and then more than 65.

19
The mean or average savings differential is conditional on household characteristics. It should be
noted, however, that as Islam (2010) pointed out, the average is not suitable if the distribution is
skewed, for example (savings data is typically characterized by skewed distribution). It follows
therefore that, there is likelihood that the exogenous variable not only determine the mean but
also influence other interesting parameters of interest in the conditional distribution, as it has
been the case noted by Koenker and Basset in Islam (2010).
3.2 Data type and source
For the purpose of the study cross sectional data is used to unveil the causes of difference in
saving between men and women in Lesotho. The micro data including income, savings,
household size education attainment and geographical location are used in the analysis. These
data is sourced from Lesotho Bureau of Statistics household budget survey 2006/2007
3.3 Data analysis
To ensure the liability, reliability, accuracy, and consistency of the results the data was first
edited to eliminate the missing values and only capture the individuals who save. Pair-wise
relationships were examined between savings and the following variables: income bracket,
education, age of the respondent, geographical location, social support, and the household size.
For the purpose of this study we consider the household as composed of individual agents, even
if married. Use is made of descriptive statistics, as the characteristics of the population of interest
are shaped by the social characteristics and customs.
The average savings per age bracket is compared with the income bracket, education attainment,
number of dependents, access to social protection, and geographical location. This is done ensure

20
that the factors that play the major role in influencing the differences in savings are clearly
identified.
21
4. Chapter Four
PRESENTATION, ANALYSIS AND DISCUSSION OF THE FINDINGS
This chapter presents and interprets the findings of the study. The findings present the Pearson
correlation between savings and other variables. Then, pair-wise comparison between income
and savings, education and savings are presented. In addition, the group comparisons between
income, education, savings and geographical location are presented. The presentation of income
and savings in rural and urban areas with respect to the age bracket is made. Last but not least,
income, savings and dependency in rural and urban areas are presented.
4.1 Results
The Pearson correlations for male members of the society depict relationships between the
savings by men and other variables in the society. The initial information from table 4-1 suggests
that income tend to determine the patterns in savings for men, then, the geographical location.
The table indicates that marriage and savings are inversely related for men; this could be
possibly due to the cultural norms as men have to accumulate some wealth to pay the bright
price, after getting married men do not think about the household consumption hence the
smoothing process is the women’s responsibility.
Animal husbandry as the proxy for ownership of productive resources tends to increase with
savings however, for the small animals like sheep and goats and poultry tend to reduce as
savings increases. Put in another way small animals tend to increase consumption and leach out

22
the savings for men. This can possibly be due to the fact that the small animals are not used to
help the farmers to produce other commodities.
Table 4-1 Correlations for Men
Save
Total
Income
Big
Animals
Small
Animals
Household
size Age
Marital
Status
Social
support
Urban/
Rural
Save Pearson
Correlation
1 .085** .017** -.007** .006** .011** -.011** .005** .078**
Sig. (2-tailed) .000 .000 .000 .000 .000 .000 .005 .000
Total
Income
Pearson
Correlation
.085** 1 .023** .018** .064** .019** -.018** .041** .142**
Sig. (2-tailed) .000 .000 .000 .000 .000 .000 .000 .000
Big
Animals
Pearson
Correlation
.017** .023** 1 .223** .137** -
.017**
-.046** -.012** -.138**
Sig. (2-tailed) .000 .000 .000 .000 .000 .000 .000 .000
Small
Animals
Pearson
Correlation
-.007** .018** .223** 1 .081** .001 -.007** -.003 -.061**
Sig. (2-tailed) .000 .000 .000 .000 .725 .000 .060 .000
Househo
ld size
Pearson
Correlation
.006** .064** .137** .081** 1 -
.099**
-.200** -.008** -.205**
Sig. (2-tailed) .000 .000 .000 .000 .000 .000 .000 .000
Age Pearson
Correlation
.011** .019** -.017** .001 -.099** 1 .528** .006** .041**
Sig. (2-tailed) .000 .000 .000 .725 .000 .000 .000 .000
Marital
Status
Pearson
Correlation
-.011** -.018** -.046** -.007** -.200** .528** 1 -.012** .029**
Sig. (2-tailed) .000 .000 .000 .000 .000 .000 .000 .000
Social
support
Pearson
Correlation
.005** .041** -.012** -.003 -.008** .006** -.012** 1 .023**
Sig. (2-tailed) .005 .000 .000 .060 .000 .000 .000 .000
Urban/
Rural
Pearson
Correlation
.078** .142** -.138** -.061** -.205** .041** .029** .023** 1
Sig. (2-tailed) .000 .000 .000 .000 .000 .000 .000 .000
**. Correlation is significant at the 0.01 level (2-tailed).

23
Table 4-2 Correlations For Women
Save
Total
Income
Big
Animals
Small
Animals
Household
size Age
Marital
Status
Social
support
Urban/
Rural
Save Pearson
Correlation
1 .087** .027** -.005** .018** -.005** -.029** .008** .071**
Sig. (2-tailed) .000 .000 .001 .000 .002 .000 .000 .000
Total
Income
Pearson
Correlation
.087** 1 .023** .009** .065** -.041** -.076** .019** .163**
Sig. (2-tailed) .000 .000 .000 .000 .000 .000 .000 .000
Big
Animals
Pearson
Correlation
.027** .023** 1 .137** .107** .014** -.014** -.009** -.113**
Sig. (2-tailed) .000 .000 .000 .000 .000 .000 .000 .000
Small
Animals
Pearson
Correlation
-.005** .009** .137** 1 .062** .001 -.007** -.004** -.062**
Sig. (2-tailed) .001 .000 .000 .000 .426 .000 .009 .000
Househol
d size
Pearson
Correlation
.018** .065** .107** .062** 1 -.138** -.187** -.009** -.175**
Sig. (2-tailed) .000 .000 .000 .000 .000 .000 .000 .000
Age Pearson
Correlation
-.005** -.041** .014** .001 -.138** 1 .611** -.011** -.075**
Sig. (2-tailed) .002 .000 .000 .426 .000 .000 .000 .000
Marital
Status
Pearson
Correlation
-.029** -.076** -.014** -.007** -.187** .611** 1 -.014** -.066**
Sig. (2-tailed) .000 .000 .000 .000 .000 .000 .000 .000
Social
support
Pearson
Correlation
.008** .019** -.009** -.004** -.009** -.011** -.014** 1 .023**
Sig. (2-tailed) .000 .000 .000 .009 .000 .000 .000 .000
Urban/
Rural
Pearson
Correlation
.071** .163** -.113** -.062** -.175** -.075** -.066** .023** 1
Sig. (2-tailed) .000 .000 .000 .000 .000 .000 .000 .000
**. Correlation is significant at the 0.01 level (2-tailed).
From the two tables (4-1 and 4-2) it is evident that income determines the pattern of savings for
men and women. Women tend to save more of their income than men at all levels of income.
That is irrespective of the level of income women always save more than men do. This is
possibly because women in Lesotho have fewer options of accumulating wealth as opposed to
men. The inheritance law of Lesotho prohibits women from even inheriting the husband’s
property. According to customary law, the heir is the firstborn son in the family this applies even
in the polygamist family (Habitat & Federation of Women Lawyers, 2008). This therefore,
compels women to save more at any income level.

24
Ownership of big animals (horses, donkeys and cattle) compels women to save more than men
do. However ownership of small animals (for example sheep, goats, poultry, etc.) adversely
affects savings for both men and women though it is more severe for men.
The size of the household also is found to have a role to play, as the bigger the household size
the higher savings for women than men. This can possibly be because of the relationship
between household size and the provision of unpaid labour. With a larger household there is
additional unpaid labour that contributes to the household production and hence savings thereon.
Age adversely affect women’s savings while compelling men to save more. The implication is
that as women grow older they save less and less compared to men, while men on the other hand
save more at their elderly age.
It is established that being married causes women to relax. The implication is that being married
inversely affects the individual savings for both men and women but more for women. Women
when they access social protection they tend to save more than men. On the other hand
urbanization although it affects both men and women savings, it makes men to take a step ahead
of women. This can be attributed to gendered population distribution of the labour force in the
urban areas and also the population distribution in the rural areas.

25
Figure 4-1 Gendered Savings and Income
Income and savings
In figure 4-1 it is shown that women are more responsive than men to the change in income for
the increased savings. At first the savings increase with income and start to fall between the
2101-2800 and 2801-3500 income brackets. As income increases from 2801-3500 to 6301-7000
women’s savings on average increases continuously while the one for men drop at the income
bracket 4901-5600. However, when the income increases beyond 7000 threshold both men and
women reduce their average savings from 1000 and 1400 respectively to just 800. These are in
line with the findings by Bunting (2009), that marginal propensity to save reduces as income
increases, that is savings increase but at the decreasing rate, however, as the income increase
beyond 7000 the behaviour is contradictory in both men and women cases. This is possibly
because of the security, since according to Lesotho custom all the family assets are registered in
the names of the husband and historically men were the ones who had control over the land and
other productive assets women are forced to save more in order to create the fall-back position.

26
Furthermore, as Besley (1995) concluded on what bring about the income disparities, are the
prices the factors receive on the individual basis from their resources. How the income is
distributed depends on the resource ownership and prices paid for resources of different kinds in
different employments. The ownership patterns of resources is unequal due to cultural believes
and institutions these gives rise to an unequal distribution of income in the society.
Furthermore, possibly due to high retrenchment from RSA mines, the gender roles have been
challenged and men who were previously considered to be the providers are running out of
option so women have to generate more savings to provide for their families future demands.
Figure 4-2 Education Level and Average Savings
Education level and Average savings
Figure 4-2 presents the average savings as a function of educational level for both men and
women in the population. Education proves to be a major determinant of savings and this is in
line with the existing literature. From the literature the expectation is that the more an individual
is educated the more would be the savings level which translates in to more assets being

27
accumulated by the educated ones. At the initial stages where one may say that the individuals
are not educated, women seem to save more than men on average. However, with secondary
education men doubles what is saved by women with the same level of education. Women with
vocational education save more than their male counterparts. For teachers and technicians males
doubles what is saved by the ones with vocational education while women hold their savings
constant. However, with the university education women slightly save more than men. It must be
noted however, that men are more represented in the university category than women.
In Lesotho the inheritance laws are not gendered, as a result women are compelled to save their
way out of poverty as every asset that they command; they must earn it for themselves. Wealth to
women is not bequeathed this dictates why women without education will save more than their
male counterparts in the same education bracket.
Figure 4-2 provides patterns of savings between males and females given the education level and
the income bracket of the participants. From the diagram, it is evident that only females without
education are able to save in addition to being able to earn higher income than men. However,
for their male counter parts the education tends to explain their savings.

28
Table 4-3 Education income and savings for rural and urban dwellers
Mean Income Average Savings savings as % of average income
Educational Attainment Male Female Male Female Men Women
Rural None 983.55 623.63 22.72 12.75 2.31 2.04
None but read/write 1194.98 881.31 48.27 40.63 4.04 4.61
Primary 1335.94 1196.74 64.80 76.08 4.85 6.36
Secondary 1652.86 1806.02 235.22 100.36 14.23 5.56
Vocational 2928.66 2793.66 733.08 547.54 25.03 19.60
Teacher/technical 3255.01 3099.66 0.00 215.06 0.00 6.94
University/higher 2811.07 4328.11 147.70 0.00 5.25 0.00
Urban None 1132.82 1312.81 46.20 150.16 4.08 11.44
None but read/write 1518.52 1443.99 184.65 285.72 12.16 19.79
Primary 1858.50 1934.38 142.67 206.40 7.68 10.67
Secondary 2996.58 2555.70 426.85 202.92 14.24 7.94
Vocational 3081.38 2754.22 310.47 551.38 10.08 20.02
Teacher/technical 3290.78 4948.37 877.82 615.59 26.68 12.44
University/higher 8237.21 9202.29 644.07 664.70 7.82 7.22
Table 4-3 represent education attainment against average income and savings in Rands for men
and women in rural and urban areas. Although the returns to education are higher in the urban
areas than in the rural areas, the patterns of savings is not that much different. From the data it is
evident that earnings are the increasing function of education. However, savings do not follow
the same trend that income takes. Not all the differences in savings are explained by income and
education, as in the rural areas both men and women who are earning the highest salary are not
saving at all. People with vocational training tend to save more in the rural areas though they are
not at the pick of the earnings pyramid. Education and income are found to cause some
differences in savings between men and women in the rural areas, although, they do not fully
explain the differences. As with higher education beyond vocational, both men and women tend
to save less or nothing.

29
In the urban areas income seems to follow the educational attainment. The higher the education
the higher is the earnings. Also savings seem to follow the level of education though they are
fluctuating. On average the higher the education the higher the earnings and hence the higher is
the savings. However, in both rural and urban areas men and women with the university
education or higher tend to save less in relation to their earnings though the rate is a bit low for
women. This can be possibly due the sense of security that individuals have with higher
education. The higher the education the more an individual is secured about finding a new job
hence less precautionary savings.
Table 4-4 Income and savings in rural and urban areas with respect to the age bracket
Mean Income Average Savings
Age Bracket Male Female Male Female
Rural <=15 1146.74 795.15 35.26 10.43
16-25 1109.35 1053.08 46.14 39.59
26-35 1283.53 1345.53 61.86 86.57
36-45 1474.10 1190.18 65.74 66.29
46-55 1450.68 1113.74 80.98 84.07
56-65 972.09 863.25 27.44 32.56
65< 806.06 593.69 39.99 37.54
Urban <=15 3117.15 2689.19 .00 331.79
16-25 2020.79 1889.69 316.53 274.82
26-35 2001.39 2498.30 197.57 248.99
36-45 2502.19 2528.42 238.22 243.63
46-55 2748.37 2716.50 210.00 265.09
56-65 2534.91 1947.18 532.46 446.85
65< 2025.36 1328.75 169.03 155.89
Table 4-4 depicts rural and urban incomes and savings distribution with respect to the age
bracket. It is evident that irrespective of age urban people attract more income and hence higher
level of savings. However, for males at the age of 15 and below, although they earn more than

30
anyone else in the urban areas, they do not save any of their income. Savings seem to respond
more to changes in income than the age, except for men at the age of 15 years and bellow in the
urban areas as they earn more income but do not save at all. Age seem to become more important
in the urban areas for individuals who are very close to the retirement. This can be seen from
table 4-4 as savings more than doubles even though the income has reduced. However, women
save proportionately larger amount for example, 22.9% compared to 21.0% saved by men, taking
their earnings potential in to account.
Table 4-5 Income, Savings and Dependency
Mean Income Average Savings
Household size Males females Males females
Rural 1 - 2 Persons 525.79 441.88 21.63 45.97
3 - 4 Persons 782.18 750.75 19.65 39.18
5 - 6 Persons 1,247.55 1,157.64 65.89 59.19
7 - 8 Persons 1,482.85 1,226.09 78.79 77.35
9 + Persons 1,513.86 1,355.56 56.71 62.74
Urban 1 - 2 Persons 1,400.06 1,295.26 166.61 114.04
3 - 4 Persons 2,079.00 1,920.87 271.59 233.68
5 - 6 Persons 2,527.84 2,515.49 156.49 203.25
7 - 8 Persons 2,907.08 3,298.33 601.53 613.19
9 + Persons 2,401.16 2,137.25 140.72 204.11
Table 4-5 shows the dependency, average income and average savings in rural and urban areas.
It can clearly be seen that the number of the household members to some extent can explain the
patterns in income distribution and savings. In both rural and urban areas the family of 7-8
persons save more than any other group although income is not that different. When the family
size is bigger women tend to save more than men by more than 50% in the urban areas.

31
Although, it has been difficult to disentangle the separate effects on savings of the gender
education gap and earnings shares on saving since these variables are likely to be
correlated/collinear. It has been found that income and education strongly influences the way
people undertake their savings. Even though, there is no gendered income inequality, women
seemed to save more than men in the early years of their lives while men are more prudent
towards retirement and during pension years.

32
5. Chapter Five
Conclusions and policy recommendations
This chapter presents the conclusions and recommendations based on the study findings
5.1 Conclusions
Based on the findings, the following conclusions can be drawn.
Rural urban patterns are such that both men and women in the urban areas save more than their
counterparts in the rural areas. Since urban population seem to save more than the rural
population it is found necessary to look at the degree of urbanization. It also becomes important
to look in to the relationship between growth and the financial intermediation, in the rural or the
urban areas in order to improve the degree of urbanization.
Women’s savings seem to respond positively to income generating activities therefore if more
and more income generating opportunities are presented to women there will be even higher
levels of savings in the economy. Women’s access to big animals also proof to play a profound
role in influencing women to save more than men. It follows therefore that, the heifer project
which has been implemented in other countries can reinforce women’s financial empowerment.
The observation that savings are positively influenced by the individual income level suggests
that more even distribution of income across the population may encourage greater savings
Age and family size prove to have roles to play in the differences in savings between men and
women. At early age women dominate the savings, while at the later stage of life men tend to
dominate. Family size on the other hand, in the urban areas, increases with the savings.

33
5.2 Recommendations
5.2.1 The government should come up with the income generating projects.
For rural people as their earnings are less than those of the urban dwellers. Projects like the
heifer project can improve their financial status, more especially women in the rural areas as
there is a strong correlation between animal husbandry and the level of savings. Productive
assets like land and livestock ownership need immediate attention in order to unleash full
potential of Basotho women. Savings reflect the sense of security and empowerment. As income
alone is not a satisfactory measure of financial inclusion. More sensitization is needed for
women as marital status seem to negatively affect their savings more than men. This is due to the
dependency syndrome as there is some evidence that women within couple households are
relying on male partners to save for them, particularly for long-term needs (Browning & Lusardi,
1996).

34
Bibliography
Abdelkhalek, T., Arestoff, F., Freitas, N. E., & Mage, S. (2009). A Microeconometric Analysis of
Households Saving Determinants in Morocco.
Ando, A., & Modigliani, F. (1963, March). The 'Life Cycle' Hypothesis of Saving: AggregateImplications
and Tests. American Economic review, 53, 55-84.
Ando, A., & Modigliani, F. (1964, March). The "Life Cycle" Hypothesis of Saving: A Correction. Retrieved
June 07, 2011, from JSTOR archive Web site: http://www.jstor.org/stable/1810904
Ando, A., & Modigliani, F. (1964). The "Life Cycle" Hypothesis of Saving: A Correction. The American
Economic Review, 54(2), 111-113.
Antonopoulos, R., & Floro, M. S. (2005, February). Asset Owner ship along Gender L ines:E vidence from
T hailand. Retrieved May 02, 2011, from Levy Economics Institute Web site:
http://www.levyinstitute.org/pubs/wp418.pdf
Bajtelsmit, V. L., & Bernasek, A. (1996). Why do women invest differently than men? Financial
Counseling and Planning, 7, 1-10.
Bajtelsmit, V. L., Bernasek, A., & Jianakopolos, N. A. (1996). Gender effects in pension investment
allocation decisions. Center for Pension and Retirement Research, 145-156.
Basu, S. (1997). The conservatism principle and the asymmetric timeliness of earnings. Journal of
Accounting and Economics, 24(1), 3-37.
Beatriz, A. d. (2005). The Economics of Microfinance. London: Massachusetts Institute of Technology,
Cambridge.
Besley, T. (1995). Savings, Credit and Insurance. In T. Besley, J. Behrman, & T. Srinivasan (Eds.),
Handbook of Development Economics, (Vol. III, pp. 2123-2207). Elsevier Science B.V.
Borjas, G. J. (1994). The Economics of Immigration. Journal of Economic Literature, XXXII, 1667–1717.
Browning, M., & Lusardi, A. (1996, December). Household Savings: Macro Theories and Micro Facts.
Journal of Economic Literature, 34(4), 1796-1855.

35
Bunting, D. (2009, January 21). The saving decline: Macro-facts, micro-behavior. Journal of Economic
Behavior & Organization, 70(2), 282–295.
Bureau of Statistic. (2010). Statistical Yearbook 2010. Bureau of Statistics. Maseru: Ministry of Finance
and Development Planning Bureau of Statistic.
Burgoyne, C., & Kirchler, E. (2008). Financial decisions in the household. In A. Lewis, The Cambridge
Handbook of Psychology and Economic Behaviour (pp. 132-154). New York: Cambridge
University Press.
Butelmann, A., & Gallego, F. (2000). Household Saving in Chile: Microeconomic Evidence. Central Bank of
Chile.
Central Bank of Lesotho. (2010, March). Central Bank of Lesotho Annual Report 2009. Retrieved October
20, 2010, from Central Bank of Lesotho web site: http:// cbl.co.ls
Cronqvist, H., & Siegel, S. (2010, July 30). The Origins of Savings Behavior. Retrieved June 22, 2011, from
YALE Website: http://www.econ.yale.edu/~shiller/behfin/2010_10/cronqvist-siegel.pdf
Croson, R., & Gneezy, U. (2004). Gender differences in preferences. Journal of Economic Literature, 47,
448-474.
De Nardi, M., French, E., & Jones, J. B. (2006, September 13). Differential Mortality, Uncertain Medical
Expenses, and the Saving of Elderly Singles. Retrieved June 28, 2011, from RAND Website:
http://www.rand.org/content/dam/rand/www/external/labor/seminars/adp/pdfs/2006_french
.
Deaton, A. (1994). Saving and Growth. In K. Schmidt-Hebbel, & L. Serven, The Economicsof Saving:
Theory, evidence and implications for policy. Cambridge University Press.
Dercon, S., & Krishnan, P. (2002). Informal insurance, public transfers and consumption smoothing.
Oxford: Cambridge.
Essig, L. D. (2005). Savings Behavior of Private Households in Germany. Retrieved June 28, 2011, from
http://d-nb.info/97521652X/34
Ferguson, J., & Lohmann, L. (1994). The Anti-Politics Machine: Development and Bureaucratic Power in
Lesotho. The Ecologist, 24(5).

36
Fisher, P. J. (2010). Gender Differences in Personal Saving Behaviors. Retrieved March 10, 2011, from
Journal of Financial Counseling and Planning Web site:
http://6aa7f5c4a9901a3e1a1682793cd11f5a6b732d29.gripelements.com/pdf/volume_21_issue
_1/pattiejfis
Floro, M. S., & Seguino, S. (2002). Gender Effects on Aggregate Saving. Retrieved May 24, 2011, from
Social Science Research etwork: http://poseidon01.ssrn.com
Friedman, M. (1957). A Theory of the Consumption Function. Retrieved June 07, 2011, from National
Bureau of Economic Research: http://www.nber.org/books/frie57-1
Gilles, B., & Denise, C. (2000). Long-Term Determinants of the Personal Savings Rate: Literature Review
and Some Empirical Results for Canada. Toronto: Bank of Canada.
Greene, W. H. (2003). Econometric Analysis (5th ed.). New Jersey: Prentice Hall Pearson Education
Upper Saddle River.
Grossbard, S. A., & Pereira, A. M. (2010, August). Will Women Save more than Men? A Theoretical Model
of Savings and Marriage. Retrieved May 24, 2011, from Social Science Research Network Web
site: http://www.SSRN.com
Habitat & Federation of Women Lawyers. (2008). BASELINE RESEARCH ON CULTURAL PRACTICES
RELATED TO LAND TENURE SECURITY AND INHERITANCE RIGHTS FOR LESOTHO WIDOWS AND
ORPHANS AND VULNERABLE CHILDREN. Maseru: Habitat for Humanity Lesotho.
Hafeez, u. R., Imran, S. C., Faridi, M. Z., & Farrukh, B. (2011, January- June 1). Rural-Urban Saving
Differentials in Pakistan: Investigation from Primary Data. Retrieved June 28, 2011, from A
Research Journal of South Asian Studies, Vol. 26, No. 1, pp. 19-35:
http://pu.edu.pk/images/journal/csas/PDF/2-Dr.%20Hafeezur%20Rehman.pdf
Hurst, E. (2005, August). Household Propensities to Plan for Retirement: A Life Cycle Analysis; NBER
workingpaper #10098. Retrieved June 22, 2011, from Retirement Research Consortium Website:
http://www.mrrc.isr.umich.edu/publications/conference/pdf/Hurst%2004-SIA0805C.pdf
Islam, A., Parasnis, J., & Fausten, D. (2010, May). Immigrant and Native Saving Behaviour in Australia.
Retrieved June 2, 2011, from

37
http://www.nzae.org.nz/conferences/2010/Papers/Session2/Islam_et_al__Immigrant_and_Nati
ve_Savings_Behaviour
Loayza, N., Schmidt-Hebbel, K., & Servén, L. (2000). THE WORLD BANK ECONOMIC REVIEW, 14(3), 393–
414.
Muradoglu, G., & Taskin, F. (1996, June). Differences In Household Savings Behavior: Evidence From
Industrial and Developing Countries. Retrieved February 1, 2011
Platteau, J.-P. (2010). Redistributive Pressures in Sub-Saharan Africa: Causes, Consequences, and Coping
Strategies. Accra: IIAS.
Raut, L. K., & Virmani, a. A. (1990). Determinants of Consumption and Savings Behaviour in Developing
Countries. The World Bank Bank Economic Review, 3(3), 379-393.
Sharp, A. M., Register, C. A., & Grimes, P. W. (2006). Economics of Social Issues (Seventeenth ed.). New
York: McGraw-Hill/Irwin.
Sturm, P. H. (1983). Determinants of Savings Theory and Evidence. Retrieved March 04, 2011, from
http://www.oecd.org/dataoecd/60/63/35527853.pdf
Sunden, A. E., & Surrette, B. J. (1998). Gender differences in the allocation of assets in retirement
savings plans. American Economic Review, 88, 207-211.
Sung, J., & Hanna, S. (1996). Factors related to risk tolerance. Financial Counseling and Planning, 7, 11-
20.
The University of Hong Kong. (1999). Gender Policy Analysis: What it is and why it is important for the
HKSAR. Retrieved April 26, 2011, from Centre for Comparative and Public Law, Faculty of Law,
The University of Hong Kong Web site:
http://www.hku.hk/ccpl/research_projects_issues/cedaw/gendermemo.html
Webley, P., & Nyhus, E. K. (2008). Inter-temporal choice and self-control: saving and borrowing. In A.
Lewis, The Cambridge Handbook of Psychology and Economic Behaviour (pp. 105-131). New
York: Cambridge University Press.

38
Wilber, S. C. (2003, February). The Effectiveness of Tax-Preferred Savings Vehicles in Promoting Saving
and Retirement Security. Retrieved June 22, 2011, from AMERICAN COUNCIL FOR CAPITAL
FORMATION CENTER FOR POLICY RESEARCH Web site: www.accf.org.
Willie, B., & Ruth, U. O. (2008, July 15). The racial saving gap enigma: unraveling the role of institutions.
Retrieved June 28, 2011, from Department of Economics, Georgia Institute of Technology Web
site: http://www.econ.gatech.edu/files/papers/savingspaperfinal.pdf
Xiao, J. J. (1995). Patterns of household financial asset ownership. Financial Counseling and Planning, 6,
99-106.
Copyright © 2022 FDOKUMEN