Information Rigidities: Comparing Average and Individual Forecasts for a Large International Panel
Upload
khangminh22Category
view
2download
0
1
Consumer price rigidities in Lesotho: the role of outlet
characteristics and competition1
February 2014
Mamello Nchake, School of Economics, University of Cape Town
Lawrence Edwards, School of Economics, University of Cape Town
Asha Sundaram, School of Economics, University of Cape Town
Preliminary Draft. Please do not cite without permission from the authors
Abstract
This paper extends the microeconomic empirical evidence on price-setting in
emerging economies using micro price data and outlet survey data for Lesotho, a small low-
income landlocked economy in Southern Africa. The paper looks at how price-setting
behaviour differs by outlet size, location and type. It also analyses the various sources of
price changes and price rigidities, including the effect of competition on the frequency of
price changes. Our results reveal many similarities and some important differences in price-
setting behaviour between outlets in Lesotho and those in advanced economies. The
flexibility of prices in Lesotho is comparable to that of the US, but higher than in South
Africa. Prices change more often in large outlets and less frequently in outlets where labour
costs are an important component of costs. Implicit contracts with consumers and co-
ordination failure in the setting of prices across competitors rank highly as sources of price
rigidity, while menu costs and explicit contracts are found to be relatively unimportant. Cost
shocks have a stronger influence on price increases than price decreases, while shocks to
market conditions (demand and competitor's price) are more relevant for price decreases than
for price increases. These results corroborate findings in advanced economies. However,
contrary to theoretical expectations and other empirical findings, no consistent relationship
between the frequency of price changes and the perceived competition in the market is found.
Key words: Price rigidity, competition, survey data, micro price data, emerging economies
JEL: E30, D40, D21, L21 1 We are grateful for the Exploratory Research Grant (ref. 223) provided by the Private Enterprise Development
in Low-Income Countries (PEDL) research initiative of the Centre for Economic Policy Research (CEPR) and
the Department for International Development (DFID). We are especially indebted to the Lesotho Bureau of
Statistics for the provision of data and their active participation in the project. Particular thanks go to Pauline
Makopela and Ts'eliso Phafoli. We also thank Vimal Ranchhod, Lukas Grzybowski, Dale Mudenda and Neil
Balchin for advisory support provided during the project. Excellent research assistance was provided by JP
Sebastian. All views expressed in this article are those of the authors and do not necessarily represent the views
of, and should not be attributed to, the funders or the Lesotho Bureau of Statistics.
2
Consumer price rigidities in Lesotho: the role of outlet
characteristics and competition
1. Introduction
Evidence of price rigidities is widespread. Prices are found to be sticky and price increases
and decreases often respond asymmetrically to cost and demand shocks (Blinder et al., 2008;
Peltzman 2000). Accounting for these rigidities poses challenges to economic theory
(Carlton, 1989; Blinder, 1991; Blinder et al., 1998; Peltzman, 2000), macro models (Klenow
and Malin, 2011) and the conduct of economic policies such as monetary policy (Greenslade
and Parker, 2012).
A wide range of price data underpins the empirical research on price-setting. Some
studies analyse price-setting behaviour using the micro price data used to construct consumer
price and producer price indices (Bils and Klenow, 2004; Dhyne et al., 2006; Alvarez and
Hernando, 2007b; Klenow and Kryvtsov, 2008; Nakamura and Steinsson, 2008; Bunn and
Ellis, 2012), while others make use of barcode data (Midrigan, 2009; Bunn and Ellis, 2012)
or scraped price data from websites (Cavallo, 2012). Other studies, led by Blinder (1991) and
Blinder et al. (1998) for the US have drawn on price-setting surveys. These include Fabiani et
al. (2006) and Álvarez et al. (2006) for the Euro area and Hall et al. (1997, 2000) and
Greenslade and Parker (2012) for the United Kingdom.
Despite the growth in the empirical literature, there is strikingly little evidence on
price setting behaviour within emerging economies. Klenow and Malin (2011) only record
six micro price data based studies of emerging economies (Brazil, Chile, Colombia, Mexico,
Sierra Leone and South Africa) and only three (Mexico, Romania and Turkey) that have used
firm survey data. Yet, price setting behaviour of firms in emerging economies, where
economic shocks are frequent, inflation rates are often high and variable, and weak
infrastructure, poor distribution networks and ‘thin’ markets create frictions to price
adjustments, can be expected to be very different to firms in advanced economies (Nchake et
al., 2014).
This study extends the microeconomic empirical evidence on price-setting in
emerging economies with a focus on Lesotho, a small low-income landlocked economy in
Southern Africa. For instance, we look at how price-setting behaviour differs by outlet size,
location and type. We also study factors that drive price changes and provide insight into why
price increases and decreases respond asymmetrically to cost and demand shocks. Finally, we
3
look at how price-setting, particularly the frequency of price changes, is related to
competition and outlet characteristics.
Our results reveal many similarities in price-setting behaviour between outlets in
Lesotho and those in advanced economies. The flexibility of prices in Lesotho is comparable
to that of the US, but higher than in South Africa. As found in other studies, prices change
more often in large outlets and less frequently in outlets where labour costs are an important
component of costs. Implicit contracts with consumers and co-ordination failure in the setting
of prices across competitors rank highly as sources of price rigidity, while menu costs,
attractive thresholds, bureaucratic rigidities and explicit contracts are found to be relatively
unimportant. As found by Fabiani et al. (2006) for the Euro area, cost shocks have a stronger
influence on price increases than price decreases, while shocks to market conditions (demand
and competitor's price) are more relevant for price decreases than for price increases.
We also find some important differences. The market structure for consumer goods
and services in Lesotho is characterised by a high degree of imperfect competition. A very
high proportion of outlets apply mark-ups over costs when setting prices. Contrary to
theoretical predictions and empirical findings (Carlton, 1986; Rotemberg and Saloner, 1987;
Hannan and Berger, 1991; Powers and Powers, 2001; Álvarez and Hernando, 2007b), we find
no consistent relationship between the frequency of price changes and the perceived
competition in the market.
This study is unique, both in its focus on an emerging African economy and its use of
a database that combines historical product level price data with firm survey data. The micro
price database consists of monthly consumer prices for 391 products collected from 506 retail
and services outlets in Lesotho over the period January 2011 to December 2012. The outlet
survey data is drawn from face-to-face questionnaires administered to managers/owners of
441 of these outlets.2 The survey questionnaire contains detailed information on firm
attributes, price-setting behaviour, competition and costs. The integrated database combines
the richness of the micro price data in terms of product range and time dimension with
detailed information on outlet characteristics and manager responses to how prices are set,
reviewed and changed. This allows for a more precise testing of the determinants or
2 The survey sample is large relative to other studies, particularly when taking into account the relative sizes of
the economies. For example, the Blinder (1991) and Blinder et al. (1998) survey covered approximately 200
firms in the US, the survey of UK firms used by Greenslade and Parker (2012) covered 693 firms and the Euro
area study by Fabiani et al. (2006) covered 11 000 companies in 9 countries. All these studies covered mostly
producers, with relatively few retail or services outlets.
4
correlates of price setting behaviour than is possible in other studies that use either micro
price or price-survey data.
The rest of the paper is organised as follows. In section 2, we discuss the outlet survey
and micro price data used in the paper. Section 3 explores the dynamics of pricing strategies
according to the responses in the survey data. Section 4 uses the survey data to evaluate the
relevance of alternative theories of price rigidities and asymmetries in price setting. Section 5
then draws on the micro-price data to estimate some of the main determinants of the
frequency of price changes, including the role of competition and outlet attributes. Finally,
Section 6 concludes the paper.
2. Data
Outlet price-setting survey
The price-setting surveys were designed to collect detailed information on outlet
characteristics, with a particular focus on how prices were set and changed. The survey
questionnaire included modules on general background information (age of outlet, location,
ownership), assets (for example, ownership of fridges, vehicles), sales and prices (sales value
and setting of prices), competition (number of competitors, constraints to entry), transport
and supplies, finance, employment and labour (number of employees, wages) and
productivity (detailed information on costs).3
The survey was administered during the first two weeks of March and April 2013,
under the supervision of a work team consisting of academics and PhD scholars based at the
University of Cape Town. The initial sample of the survey consisted of the 774 retail and
services outlets that the BOS use for the collection of CPI monthly price data across regions
of Lesotho. This is not necessarily a representative sample of retail outlets in Lesotho. The
selection of firms by the BOS is not random and firms are selected based on their willingness
to provide price data and to ensure adequate coverage of the products included in the CPI
basket.
Various outlets were excluded from the interview process. Outlets from which
product prices were collected once or twice a year, such as taxi fares, housing rent, petrol and
diesel were dropped. As economic theory of price-setting is based on the actions of a profit-
maximising firm, we also excluded businesses that are subject to regulatory controls such as
3 The questionnaire was designed using the World Bank Enterprise Survey questionnaires and those of Blinder
(1991) and Fabiani et al. (2006). The survey questionnaire and additional details on the implementation of the
survey are available from the authors upon request.
5
water and electricity companies, hospitals and schools (except for driving schools). Other
outlets were excluded as they were closed during the survey period. In total the final sample
consisted of 535 outlets.
Interviews were conducted by professional data collectors, employed by the Bureau of
Statistics Lesotho to collect price data on a monthly basis for the construction of the CPI in
Lesotho. The survey was administered to either the manager or the owner of the outlet. A
total of 436 outlets (343 retail outlets and 93 services outlets) were successfully surveyed, a
response rate of 81.5 per cent.4
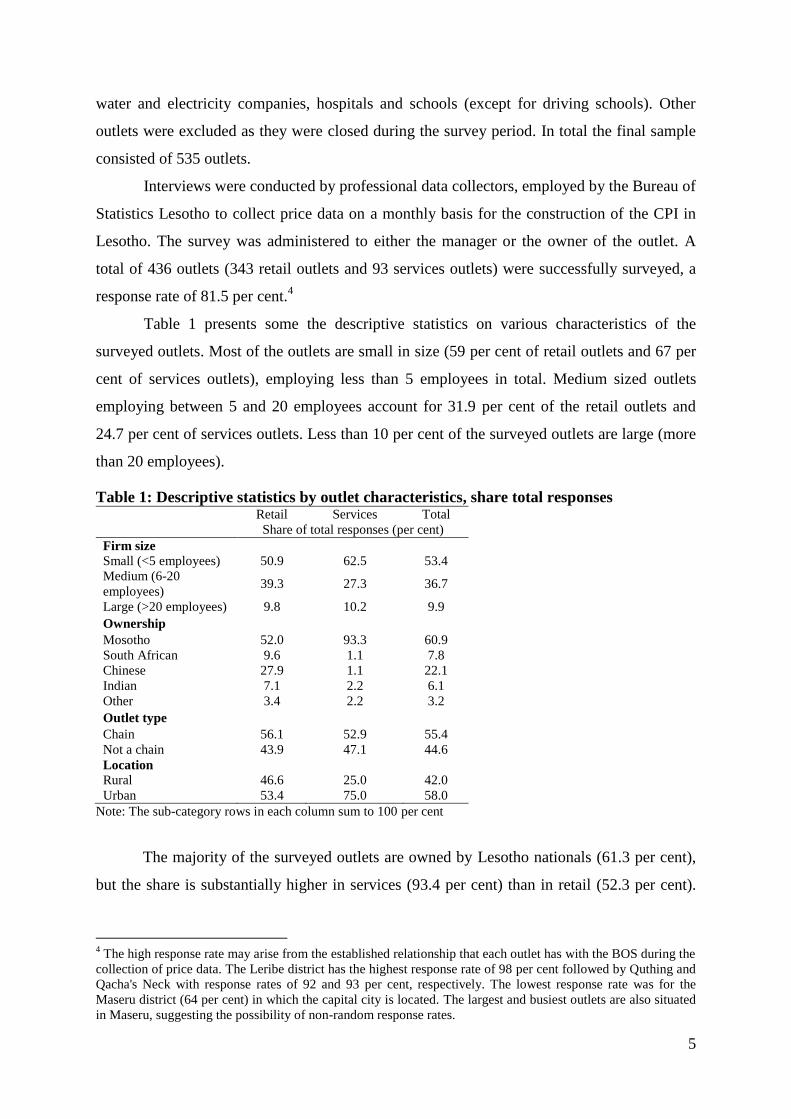
Table 1 presents some the descriptive statistics on various characteristics of the
surveyed outlets. Most of the outlets are small in size (59 per cent of retail outlets and 67 per
cent of services outlets), employing less than 5 employees in total. Medium sized outlets
employing between 5 and 20 employees account for 31.9 per cent of the retail outlets and
24.7 per cent of services outlets. Less than 10 per cent of the surveyed outlets are large (more
than 20 employees).
Table 1: Descriptive statistics by outlet characteristics, share total responses
Retail Services Total
Share of total responses (per cent)
Firm size
Small (<5 employees) 50.9 62.5 53.4
Medium (6-20
employees) 39.3 27.3 36.7
Large (>20 employees) 9.8 10.2 9.9
Ownership Mosotho 52.0 93.3 60.9
South African 9.6 1.1 7.8
Chinese 27.9 1.1 22.1
Indian 7.1 2.2 6.1
Other 3.4 2.2 3.2
Outlet type Chain 56.1 52.9 55.4
Not a chain 43.9 47.1 44.6
Location
Rural 46.6 25.0 42.0
Urban 53.4 75.0 58.0
Note: The sub-category rows in each column sum to 100 per cent
The majority of the surveyed outlets are owned by Lesotho nationals (61.3 per cent),
but the share is substantially higher in services (93.4 per cent) than in retail (52.3 per cent).
4 The high response rate may arise from the established relationship that each outlet has with the BOS during the
collection of price data. The Leribe district has the highest response rate of 98 per cent followed by Quthing and
Qacha's Neck with response rates of 92 and 93 per cent, respectively. The lowest response rate was for the
Maseru district (64 per cent) in which the capital city is located. The largest and busiest outlets are also situated
in Maseru, suggesting the possibility of non-random response rates.
6
The remaining retail outlets are owned by Chinese (27.7 per cent), South African (9.5 per
cent), Indian (7.1 per cent) and other (3.4 per cent) nationals.
Just over half of the surveyed outlets are branches of retail or services chains.5 These
chain store branches tend to be relatively large with a median (mean) employment of 5 (9.8)
full-time or part-time workers compared to 3 (7.1) for other outlets. Most of the branches are
from chain stores that originate in Lesotho, but 14 per cent of them originate from South
Africa. These South African chains are also substantially larger than the other chain stores
averaging 20 employees per store compared to between 4 and 7 employees per store. This
reflects the relative importance of South African supermarkets and services chains in regional
markets.
Like in most emerging economies, many of the outlets, particularly the retail outlets,
are located in rural areas (42.2 per cent of all outlets are in rural areas) reflecting the high
proportion of the population living in rural areas.6
Micro price data
The historical product price data for these outlets was also provided by the BOS. The price
data covers a relatively short period from January 2011 to December 2012.7 Each individual
price record (termed price quote) for an item has information on the date (month and year),
retail outlet, district, product (including brand in many cases) and unit codes and the price of
that item. We were also provided with the outlet name sheet that enabled us to merge the
micro price data with the outlet survey responses. This approach therefore makes it possible
to trace the pricing history of individual items within each retail outlet over the period. A
limitation of the data is that it is not possible to identify price changes in response to
temporary promotions and seasonal sales. All price changes in the data are therefore treated
as regular changes.
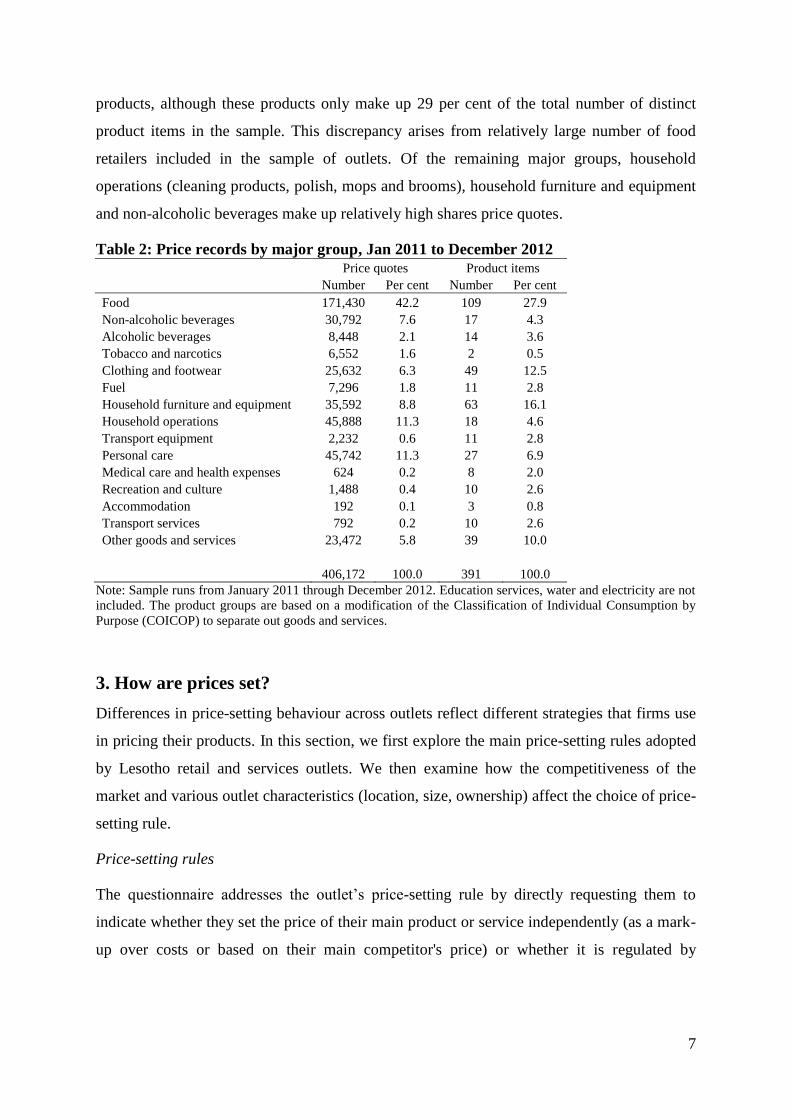
Table 2 presents a breakdown of the price records by major product group. The data
in the table covers all products (391) and all outlets (506) and is not restricted to the sample
of outlets for which survey data has been collected. The sample consists of over 400 000
price quotes and 391 product items. Just over 40 per cent of price quotes are made up of food
5 A chain store is a group of retail or services outlets that deal in the same products, share a brand and central
management and usually have a standardised business method and practice. 6 According to the World Bank Development Indicators, the rural population made up 72 per cent of the total
population in Lesotho in 2012. 7 The base sample of firms used by the BOS to construct the CPI was revised in early 2010. Many data points
during 2010 are missing. We therefore excluded 2010 from the analysis. For an overview of price-setting from
March 2002 to December 2009 using micro price data for Lesotho, see Nchake et al. (2014).
7
products, although these products only make up 29 per cent of the total number of distinct
product items in the sample. This discrepancy arises from relatively large number of food
retailers included in the sample of outlets. Of the remaining major groups, household
operations (cleaning products, polish, mops and brooms), household furniture and equipment
and non-alcoholic beverages make up relatively high shares price quotes.
Table 2: Price records by major group, Jan 2011 to December 2012
Price quotes Product items
Number Per cent Number Per cent
Food 171,430 42.2 109 27.9
Non-alcoholic beverages 30,792 7.6 17 4.3
Alcoholic beverages 8,448 2.1 14 3.6
Tobacco and narcotics 6,552 1.6 2 0.5
Clothing and footwear 25,632 6.3 49 12.5
Fuel 7,296 1.8 11 2.8
Household furniture and equipment 35,592 8.8 63 16.1
Household operations 45,888 11.3 18 4.6
Transport equipment 2,232 0.6 11 2.8
Personal care 45,742 11.3 27 6.9
Medical care and health expenses 624 0.2 8 2.0
Recreation and culture 1,488 0.4 10 2.6
Accommodation 192 0.1 3 0.8
Transport services 792 0.2 10 2.6
Other goods and services 23,472 5.8 39 10.0
406,172 100.0 391 100.0
Note: Sample runs from January 2011 through December 2012. Education services, water and electricity are not
included. The product groups are based on a modification of the Classification of Individual Consumption by
Purpose (COICOP) to separate out goods and services.
3. How are prices set?
Differences in price-setting behaviour across outlets reflect different strategies that firms use
in pricing their products. In this section, we first explore the main price-setting rules adopted
by Lesotho retail and services outlets. We then examine how the competitiveness of the
market and various outlet characteristics (location, size, ownership) affect the choice of price-
setting rule.
Price-setting rules
The questionnaire addresses the outlet’s price-setting rule by directly requesting them to
indicate whether they set the price of their main product or service independently (as a mark-
up over costs or based on their main competitor's price) or whether it is regulated by
8
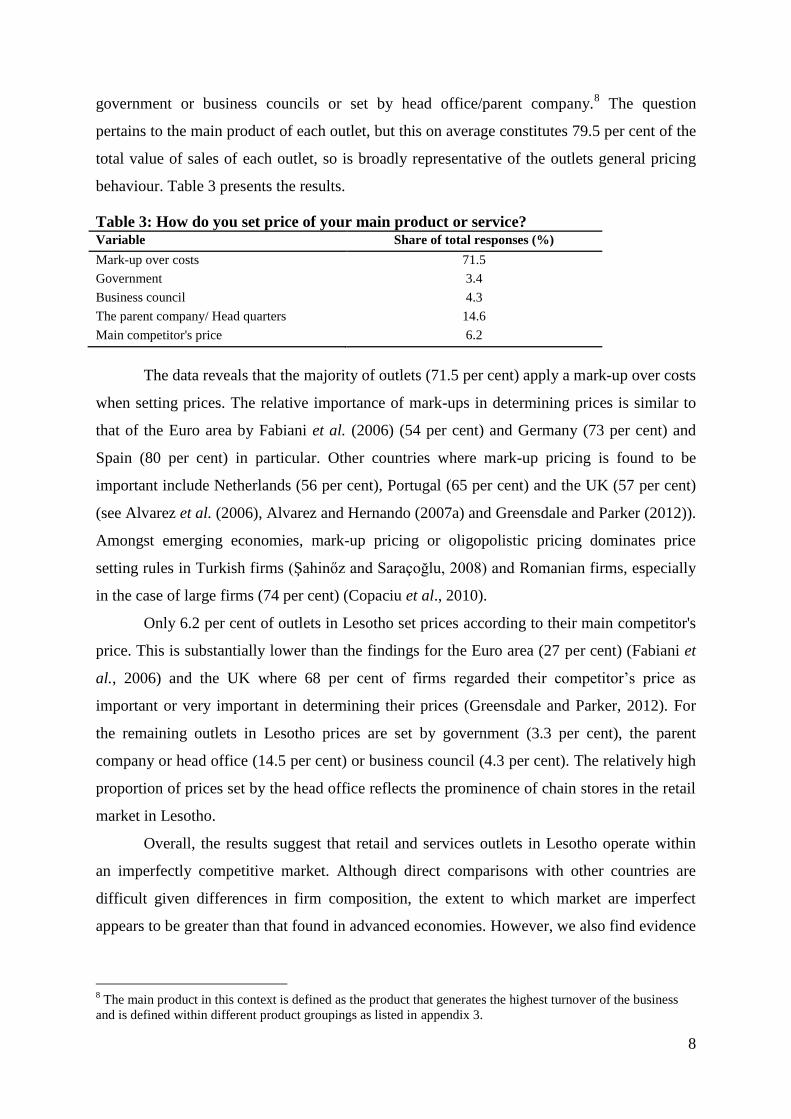
government or business councils or set by head office/parent company.8 The question
pertains to the main product of each outlet, but this on average constitutes 79.5 per cent of the
total value of sales of each outlet, so is broadly representative of the outlets general pricing
behaviour. Table 3 presents the results.
Table 3: How do you set price of your main product or service? Variable Share of total responses (%)
Mark-up over costs 71.5
Government 3.4
Business council 4.3
The parent company/ Head quarters 14.6
Main competitor's price 6.2
The data reveals that the majority of outlets (71.5 per cent) apply a mark-up over costs
when setting prices. The relative importance of mark-ups in determining prices is similar to
that of the Euro area by Fabiani et al. (2006) (54 per cent) and Germany (73 per cent) and
Spain (80 per cent) in particular. Other countries where mark-up pricing is found to be
important include Netherlands (56 per cent), Portugal (65 per cent) and the UK (57 per cent)
(see Alvarez et al. (2006), Alvarez and Hernando (2007a) and Greensdale and Parker (2012)).
Amongst emerging economies, mark-up pricing or oligopolistic pricing dominates price
setting rules in Turkish firms (Şahinőz and Saraçoğlu, 2008) and Romanian firms, especially
in the case of large firms (74 per cent) (Copaciu et al., 2010).
Only 6.2 per cent of outlets in Lesotho set prices according to their main competitor's
price. This is substantially lower than the findings for the Euro area (27 per cent) (Fabiani et
al., 2006) and the UK where 68 per cent of firms regarded their competitor’s price as
important or very important in determining their prices (Greensdale and Parker, 2012). For
the remaining outlets in Lesotho prices are set by government (3.3 per cent), the parent
company or head office (14.5 per cent) or business council (4.3 per cent). The relatively high
proportion of prices set by the head office reflects the prominence of chain stores in the retail
market in Lesotho.
Overall, the results suggest that retail and services outlets in Lesotho operate within
an imperfectly competitive market. Although direct comparisons with other countries are
difficult given differences in firm composition, the extent to which market are imperfect
appears to be greater than that found in advanced economies. However, we also find evidence
8 The main product in this context is defined as the product that generates the highest turnover of the business
and is defined within different product groupings as listed in appendix 3.
9
of heterogeneity across firms in price-setting rules adopted. In what follows, we try to isolate
some of the outlets characteristics associated with differences in price setting behaviour.
Price-setting rules, competition and outlet characteristics
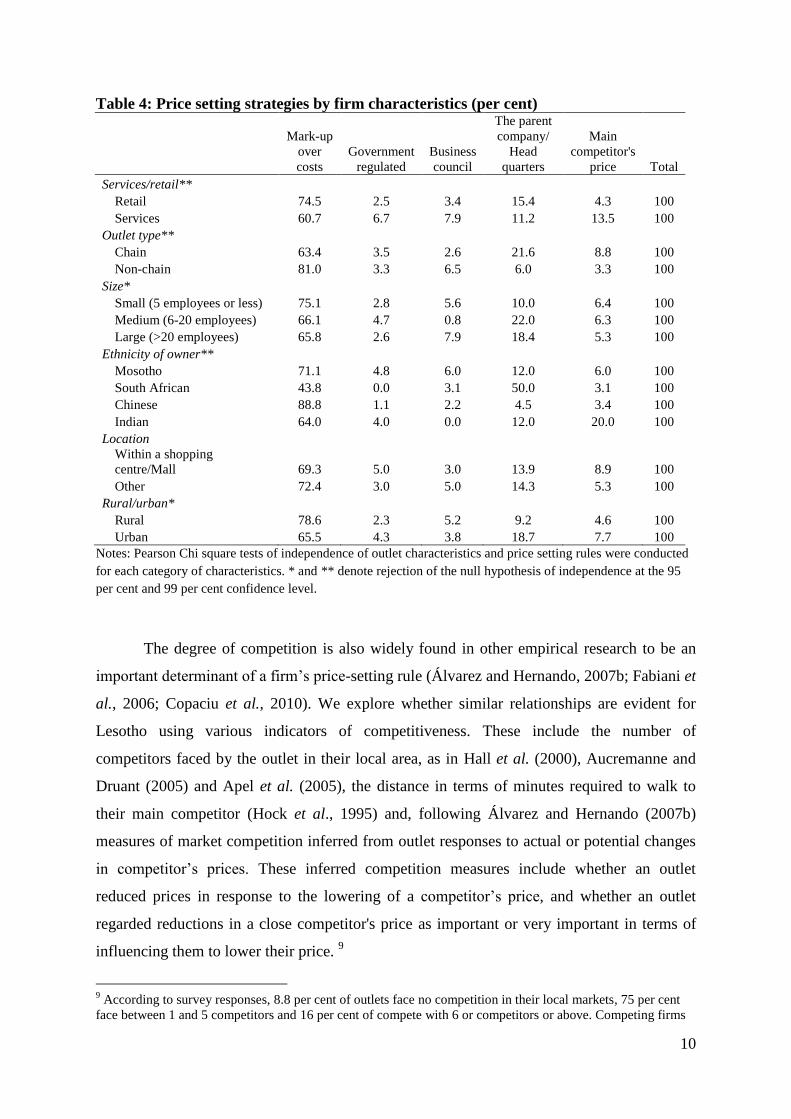
Table 4 summarises the price setting strategies of outlets according to characteristics
of the outlet such as size, ownership, and location. Price-setting rules followed by outlets
differ significantly according to the characteristics of the outlet. Compared to retail outlets,
services outlets are more likely to set prices according to competitor prices than through a
mark-up over cost. The share of outlets that fix prices as a mark-up over cost falls as the size
of the firm increases, but this does not necessarily reflect the effect of market power. The
share of firms setting prices according to the main competitor’s price does not rise with the
size of the firm. Rather, the setting of prices by business councils and the head office of the
parent company are the main alternatives to mark-up pricing in large firms.
Ethnicity of ownership and location also matter for price-setting strategies (Craig et
al. (1984); Hoch et al., 1995; Dhar and Hoch, 1997; Neslin et al., 1995; Shankar and Bolton,
2004). Prices are set by the parent company in half of the South African owned firms
reflecting the presence of chain-stores in this group. Close to 90 per cent of Chinese owned
firms use mark-up pricing, while a relatively high proportion (20 per cent) of Indian owned
firms set prices according to their competitor prices. Outlets in rural areas are more likely to
set prices as a mark-up over cost, whereas in urban areas prices in a relatively high proportion
of outlets are set according to their competitor’s price or by the head office. The latter reflects
the importance of the South African retail and services chains in the urban areas of Lesotho.
Finally, whether the outlet is situated in a shopping centre/mall or not, appears to have no
significant bearing on price-setting rules adopted.
10
Table 4: Price setting strategies by firm characteristics (per cent)
Mark-up
over
costs
Government
regulated
Business
council
The parent
company/
Head
quarters
Main
competitor's
price Total
Services/retail**
Retail 74.5 2.5 3.4 15.4 4.3 100
Services 60.7 6.7 7.9 11.2 13.5 100
Outlet type**
Chain 63.4 3.5 2.6 21.6 8.8 100
Non-chain 81.0 3.3 6.5 6.0 3.3 100
Size*
Small (5 employees or less) 75.1 2.8 5.6 10.0 6.4 100
Medium (6-20 employees) 66.1 4.7 0.8 22.0 6.3 100
Large (>20 employees) 65.8 2.6 7.9 18.4 5.3 100
Ethnicity of owner**
Mosotho 71.1 4.8 6.0 12.0 6.0 100
South African 43.8 0.0 3.1 50.0 3.1 100
Chinese 88.8 1.1 2.2 4.5 3.4 100
Indian 64.0 4.0 0.0 12.0 20.0 100
Location
Within a shopping
centre/Mall 69.3 5.0 3.0 13.9 8.9 100
Other 72.4 3.0 5.0 14.3 5.3 100
Rural/urban*
Rural 78.6 2.3 5.2 9.2 4.6 100
Urban 65.5 4.3 3.8 18.7 7.7 100
Notes: Pearson Chi square tests of independence of outlet characteristics and price setting rules were conducted
for each category of characteristics. * and ** denote rejection of the null hypothesis of independence at the 95
per cent and 99 per cent confidence level.
The degree of competition is also widely found in other empirical research to be an
important determinant of a firm’s price-setting rule (Álvarez and Hernando, 2007b; Fabiani et
al., 2006; Copaciu et al., 2010). We explore whether similar relationships are evident for
Lesotho using various indicators of competitiveness. These include the number of
competitors faced by the outlet in their local area, as in Hall et al. (2000), Aucremanne and
Druant (2005) and Apel et al. (2005), the distance in terms of minutes required to walk to
their main competitor (Hock et al., 1995) and, following Álvarez and Hernando (2007b)
measures of market competition inferred from outlet responses to actual or potential changes
in competitor’s prices. These inferred competition measures include whether an outlet
reduced prices in response to the lowering of a competitor’s price, and whether an outlet
regarded reductions in a close competitor's price as important or very important in terms of
influencing them to lower their price. 9
9 According to survey responses, 8.8 per cent of outlets face no competition in their local markets, 75 per cent
face between 1 and 5 competitors and 16 per cent of compete with 6 or competitors or above. Competing firms
11
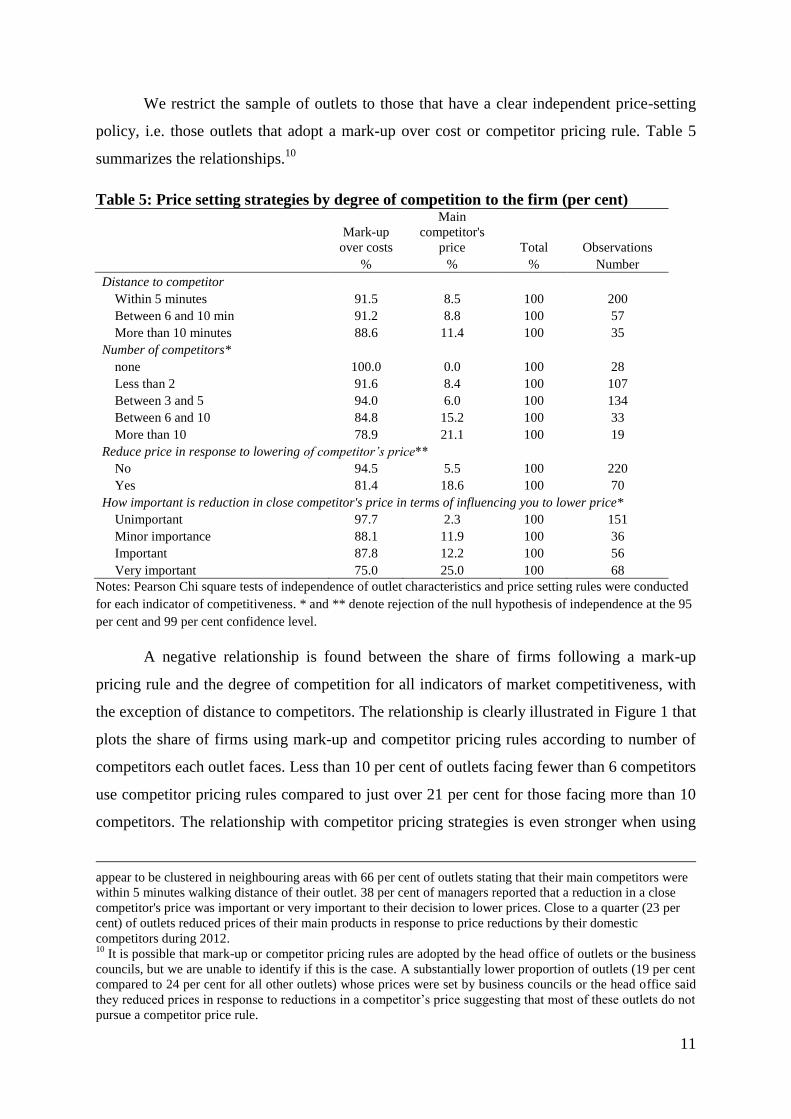
We restrict the sample of outlets to those that have a clear independent price-setting
policy, i.e. those outlets that adopt a mark-up over cost or competitor pricing rule. Table 5
summarizes the relationships.10
Table 5: Price setting strategies by degree of competition to the firm (per cent)
Mark-up
over costs
Main
competitor's
price Total Observations
% % % Number
Distance to competitor
Within 5 minutes 91.5 8.5 100 200
Between 6 and 10 min 91.2 8.8 100 57
More than 10 minutes 88.6 11.4 100 35
Number of competitors*
none 100.0 0.0 100 28
Less than 2 91.6 8.4 100 107
Between 3 and 5 94.0 6.0 100 134
Between 6 and 10 84.8 15.2 100 33
More than 10 78.9 21.1 100 19
Reduce price in response to lowering of competitor’s price**
No 94.5 5.5 100 220
Yes 81.4 18.6 100 70
How important is reduction in close competitor's price in terms of influencing you to lower price*
Unimportant 97.7 2.3 100 151
Minor importance 88.1 11.9 100 36
Important 87.8 12.2 100 56
Very important 75.0 25.0 100 68
Notes: Pearson Chi square tests of independence of outlet characteristics and price setting rules were conducted
for each indicator of competitiveness. * and ** denote rejection of the null hypothesis of independence at the 95
per cent and 99 per cent confidence level.
A negative relationship is found between the share of firms following a mark-up
pricing rule and the degree of competition for all indicators of market competitiveness, with
the exception of distance to competitors. The relationship is clearly illustrated in Figure 1 that
plots the share of firms using mark-up and competitor pricing rules according to number of
competitors each outlet faces. Less than 10 per cent of outlets facing fewer than 6 competitors
use competitor pricing rules compared to just over 21 per cent for those facing more than 10
competitors. The relationship with competitor pricing strategies is even stronger when using
appear to be clustered in neighbouring areas with 66 per cent of outlets stating that their main competitors were
within 5 minutes walking distance of their outlet. 38 per cent of managers reported that a reduction in a close
competitor's price was important or very important to their decision to lower prices. Close to a quarter (23 per
cent) of outlets reduced prices of their main products in response to price reductions by their domestic
competitors during 2012. 10
It is possible that mark-up or competitor pricing rules are adopted by the head office of outlets or the business
councils, but we are unable to identify if this is the case. A substantially lower proportion of outlets (19 per cent
compared to 24 per cent for all other outlets) whose prices were set by business councils or the head office said
they reduced prices in response to reductions in a competitor’s price suggesting that most of these outlets do not
pursue a competitor price rule.

12
indirect measures of competitiveness such as whether outlets reduced prices in response to
lower competitor prices (5.5 per cent vs. 18.6 per cent) and the importance of reductions in
competitor prices in influencing the outlet to lower its own price.
Figure 1: Price setting according to mark-up pricing and main competitor by degree of
competition
Note: The sample only includes outlets that set prices according to a mark-up or competitor pricing rule.
The competitiveness of the environment has a strong influence on the price-setting
rules adopted by retail and services outlets in Lesotho. The more competitive the
environment, the more likely an outlet sets prices according to its competitor’s price. This
relationship corroborates similar findings in other countries such as the Euro area (Fabiani et
al., 2006). However, the overall share of outlets pursuing competitor pricing strategies is low
relative to these countries. Very few firms set prices according to competitor’s prices. What
may account for this is the relatively low number of competitors each outlet faces as well as
the high share of outlets located in rural areas where high transports costs enable outlets to
segment product markets.11
11
In the UK survey analysed by Hall et al. (2000), only 33 per cent of firms faced from zero to 5 competitors,
compared to 84 per cent in Lesotho. Their sample also includes manufacturing, construction and other services,
so may not be directly comparable.
13
4. Price stickiness: Theory and evidence
Price rigidities
Individual outlets do not adjust prices continuously. Prices tend to be sticky implying a
resistance to change despite changes in the economic environment (Amirault et al., 2006). As
outlined in Blinder (1991) and summarized in Fabiani et al. (2007), theoretical literature
provides different explanations for price rigidity.12
Below, we summarise the most relevant
theories to this study.
a. Explicit contracts. In this theory, prices are sticky as firms have explicit
contractual arrangements with their customers (written or oral) in which they guarantee to
offer certain products at specific prices. These contracts are utilised to build long-run
customer relationships to stabilise future sales and reduce future uncertainty and costs for
customers. Price changes occur when contracts are re-negotiated or renewed.
b. Implicit contracts. As with explicit contracts, firms desire long-term relationships
with customers, but in this case no formal agreement with the customer is established.
Consumers are resistant to price increases, but more so when increases are perceived as
unfair, as when firms raise prices in response to demand shocks (Okun, 1981; Rotemberg,
2005). Firms try to signal ‘loyalty’ to customers and avoid antagonizing them by changing
prices as infrequently as possible, or only in response to cost shocks.
c. Co-ordination failure. In this theory firms are hesitant to change prices for fear of
other firms not responding similarly. The intuition is that the firm assumes that if it were to
raise its price, it would lose customers as no other firm would follow suit. On the other hand,
if the firm were to decrease its price, it would not increase its market share as all competitors
would follow suit. Without a coordinating mechanism that allows firms to move together,
prices remain rigid.
d. Physical cost of changing price (menu costs). Menu costs theories were derived
on the assumption that retailers may be reluctant to change prices due to costs associated with
changing prices (Sheshinski and Weiss, 1977). Firms only adjust prices once the expected
additional profits exceed the menu costs. As shown by Mankiw (1985), even small menu
costs can lead to nominal rigidities with large macroeconomic effects.
e. Psychological attractive thresholds. Firms set their prices at psychologically
attractive thresholds, for example, R9.99 instead of R10.00. This gives rise to price stickiness
12
See Carlton (1989) on why standard models of competitive and imperfectly competitive market structures are
insufficient to explain why demand and costs shocks do not transmit seamlessly through to price changes.
14
as firms postpone price adjustments in face of small shocks as they do wish not to deviate
from the pricing point.
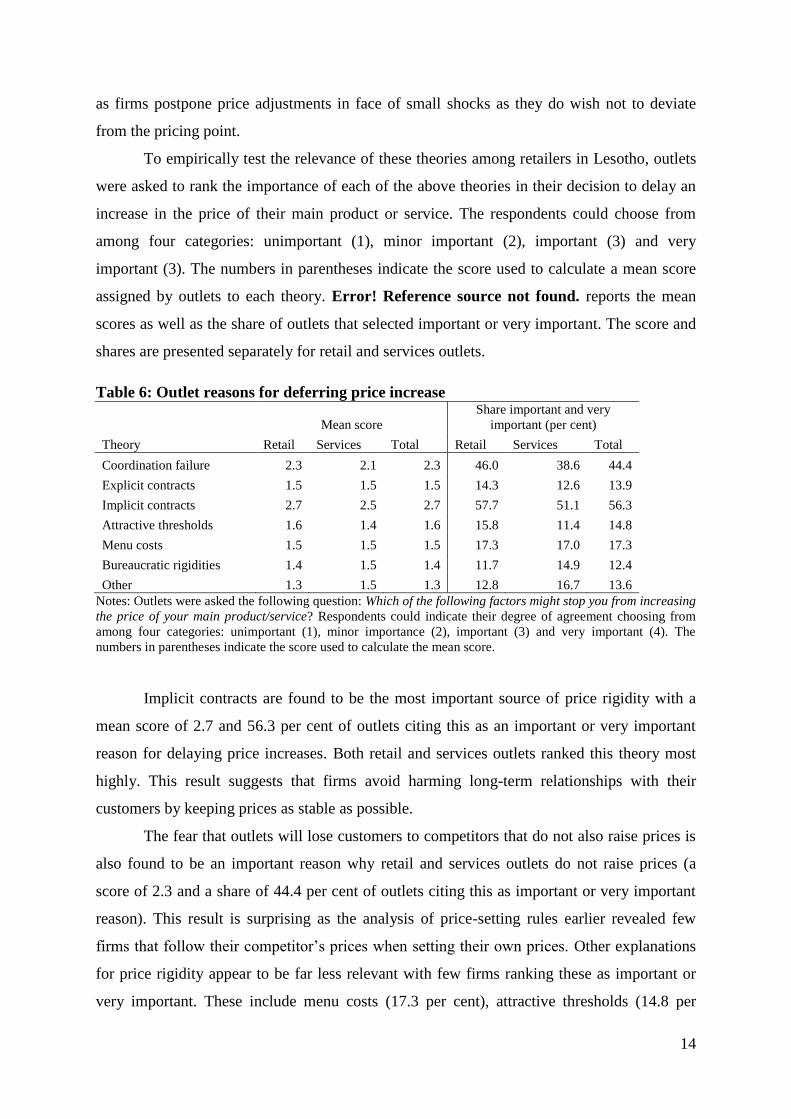
To empirically test the relevance of these theories among retailers in Lesotho, outlets
were asked to rank the importance of each of the above theories in their decision to delay an
increase in the price of their main product or service. The respondents could choose from
among four categories: unimportant (1), minor important (2), important (3) and very
important (3). The numbers in parentheses indicate the score used to calculate a mean score
assigned by outlets to each theory. Error! Reference source not found. reports the mean
scores as well as the share of outlets that selected important or very important. The score and
shares are presented separately for retail and services outlets.
Table 6: Outlet reasons for deferring price increase
Mean score
Share important and very
important (per cent)
Theory Retail Services Total Retail Services Total
Coordination failure 2.3 2.1 2.3 46.0 38.6 44.4
Explicit contracts 1.5 1.5 1.5 14.3 12.6 13.9
Implicit contracts 2.7 2.5 2.7 57.7 51.1 56.3
Attractive thresholds 1.6 1.4 1.6 15.8 11.4 14.8
Menu costs 1.5 1.5 1.5 17.3 17.0 17.3
Bureaucratic rigidities 1.4 1.5 1.4 11.7 14.9 12.4
Other 1.3 1.5 1.3 12.8 16.7 13.6
Notes: Outlets were asked the following question: Which of the following factors might stop you from increasing
the price of your main product/service? Respondents could indicate their degree of agreement choosing from
among four categories: unimportant (1), minor importance (2), important (3) and very important (4). The
numbers in parentheses indicate the score used to calculate the mean score.
Implicit contracts are found to be the most important source of price rigidity with a
mean score of 2.7 and 56.3 per cent of outlets citing this as an important or very important
reason for delaying price increases. Both retail and services outlets ranked this theory most
highly. This result suggests that firms avoid harming long-term relationships with their
customers by keeping prices as stable as possible.
The fear that outlets will lose customers to competitors that do not also raise prices is
also found to be an important reason why retail and services outlets do not raise prices (a
score of 2.3 and a share of 44.4 per cent of outlets citing this as important or very important
reason). This result is surprising as the analysis of price-setting rules earlier revealed few
firms that follow their competitor’s prices when setting their own prices. Other explanations
for price rigidity appear to be far less relevant with few firms ranking these as important or
very important. These include menu costs (17.3 per cent), attractive thresholds (14.8 per
15
cent), explicit contracts (13.9 per cent) and bureaucratic rigidities (12.4 per cent). The
rankings of the various theories are very similar across retail and services outlets.
The results are broadly consistent with other survey based studies. Fabiani et al.
(2006) and Greenslade and Parker (2012) also find that implicit contracts and coordination
failure are the main explanations for price rigidity in the Euro area and UK, respectively.
Amongst emerging economies for which data are available, implicit contracts rank high in
Romania (Copaciu et al., 2010) and Pakistan (Malik et al., 2008) and for sales of consumer
durable goods in Turkey (Şahinőz and Saraçoğlu, 2008). Unlike our study, explicit contracts
are ranked highly in Romania (Copaciu et al., 2010), UK (Hall et al., 1997), the Euro area
(Fabiani et al., 2006) and Pakistan (Malik et al., 2008). Finally, the relatively low importance
attributed to menu costs and attractive thresholds in Lesotho corroborates the similar findings
initially found for the US (Blinder, 1991) and subsequently for the UK, Euro area, Romania
and Pakistan (Hall et al., 1997; Fabiani et al., 2006; Copaciu et al., 2010; Malik et al., 2008).
Lack of similar price-setting surveys in other African and Asian economies, prevents a
comparison with firms in these regions.
Asymmetries in price reactions
Additional insights on the sources of price stickiness are provided by questions asking outlets
to assess the importance of different cost and demand factors that lead to an increase or
decrease in the price of their main product. Price-setting surveys have generally shown that
cost shocks are a more important source of price increases than price decreases (Peltzman,
2000), while demand shocks and competitor’s prices contribute more readily to price
decreases. This asymmetry in price reactions is found in the US (Peltzman, 2000), Euro area
(Fabiani et al., 2006; Avarez et al., 2006), Romania (Copaciu et al., 2010), Turkey (Şahinőz
and Saraçoğlu, 2008) and the UK (Hall et al., 1997). Such asymmetries can have
macroeconomic implications as the consequences for the real economy may differ in
response to monetary policy expansions or contractions (Hall et al., 1997).
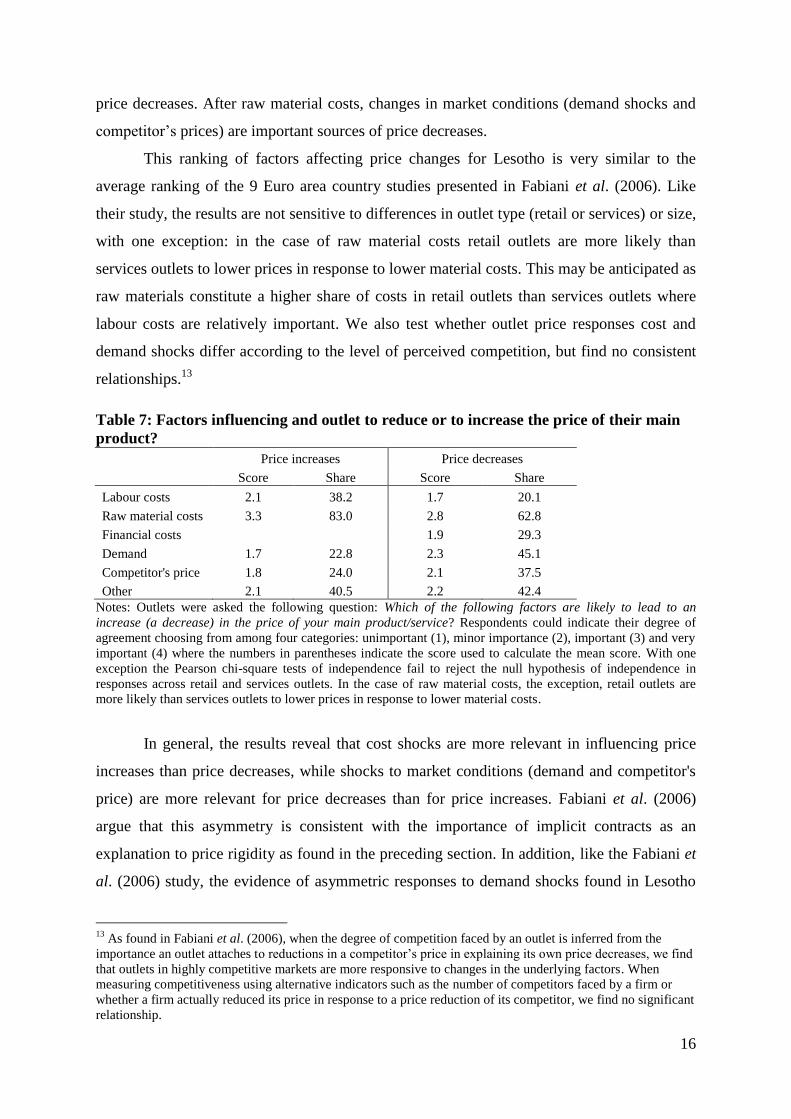
The results for Lesotho presented in Table 7 broadly corroborate these findings. The
table presents the mean score and the share of outlets that found each factor to be important
or very important in increasing or reducing their prices. While changes in the costs of raw
materials were cited as the most important factor influencing an outlet’s decision to change
prices, its importance is relatively stronger for price increases (score of 3.3) than price
decreases (score of 2.8). Rising labour costs are the second most important factor leading to a
price increase (score of 2.1), but lower labour costs are the least important factor driving
16
price decreases. After raw material costs, changes in market conditions (demand shocks and
competitor’s prices) are important sources of price decreases.
This ranking of factors affecting price changes for Lesotho is very similar to the
average ranking of the 9 Euro area country studies presented in Fabiani et al. (2006). Like
their study, the results are not sensitive to differences in outlet type (retail or services) or size,
with one exception: in the case of raw material costs retail outlets are more likely than
services outlets to lower prices in response to lower material costs. This may be anticipated as
raw materials constitute a higher share of costs in retail outlets than services outlets where
labour costs are relatively important. We also test whether outlet price responses cost and
demand shocks differ according to the level of perceived competition, but find no consistent
relationships.13
Table 7: Factors influencing and outlet to reduce or to increase the price of their main
product?
Price increases Price decreases
Score Share Score Share
Labour costs 2.1 38.2 1.7 20.1
Raw material costs 3.3 83.0 2.8 62.8
Financial costs
1.9 29.3
Demand 1.7 22.8 2.3 45.1
Competitor's price 1.8 24.0 2.1 37.5
Other 2.1 40.5 2.2 42.4
Notes: Outlets were asked the following question: Which of the following factors are likely to lead to an
increase (a decrease) in the price of your main product/service? Respondents could indicate their degree of
agreement choosing from among four categories: unimportant (1), minor importance (2), important (3) and very
important (4) where the numbers in parentheses indicate the score used to calculate the mean score. With one
exception the Pearson chi-square tests of independence fail to reject the null hypothesis of independence in
responses across retail and services outlets. In the case of raw material costs, the exception, retail outlets are
more likely than services outlets to lower prices in response to lower material costs.
In general, the results reveal that cost shocks are more relevant in influencing price
increases than price decreases, while shocks to market conditions (demand and competitor's
price) are more relevant for price decreases than for price increases. Fabiani et al. (2006)
argue that this asymmetry is consistent with the importance of implicit contracts as an
explanation to price rigidity as found in the preceding section. In addition, like the Fabiani et
al. (2006) study, the evidence of asymmetric responses to demand shocks found in Lesotho
13
As found in Fabiani et al. (2006), when the degree of competition faced by an outlet is inferred from the
importance an outlet attaches to reductions in a competitor’s price in explaining its own price decreases, we find
that outlets in highly competitive markets are more responsive to changes in the underlying factors. When
measuring competitiveness using alternative indicators such as the number of competitors faced by a firm or
whether a firm actually reduced its price in response to a price reduction of its competitor, we find no significant
relationship.
17
extend the earlier finding of asymmetry in response to cost shocks in the US by Peltzman
(2000).
5. Outlet characteristics and the frequency of price changes
Evidence of price rigidities is also revealed by the frequency at which outlets change prices.
In this section, we draw on the micro price database to analyse the extent and determinants of
the frequency of price changes by retail outlets in Lesotho.
Frequency of price changes
A stylized fact emerging from micro price studies is the tremendous amount of heterogeneity
in the frequency of price changes across products (Klenow and Malin, 2011). This is also
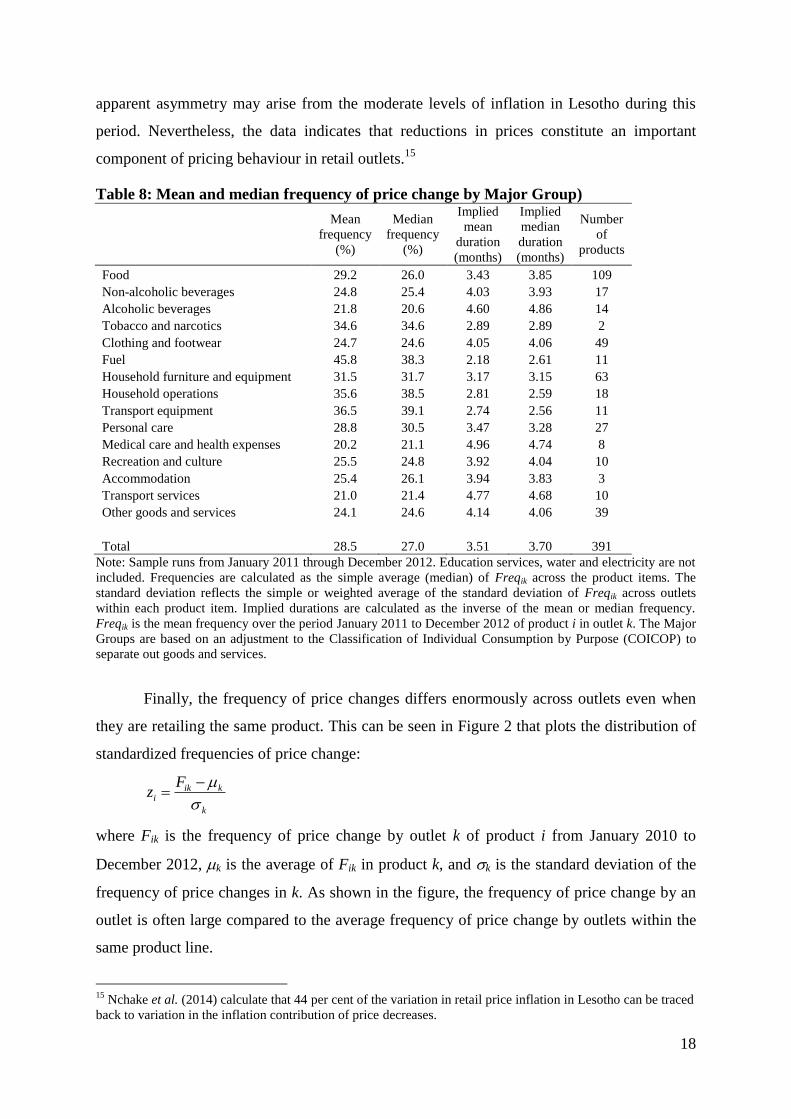
evident in the Lesotho data. Table 8 presents the mean and median frequencies and implied
durations of price changes in Lesotho by major group. The data sample covers the period
January 2011 to December 2012 and includes all price quotes, not only those from the outlets
included in the survey.
On average, 28.5 per cent of consumer prices are changed in a given month in
Lesotho. Individual prices therefore change on average every 3.5 months, which is slightly
longer than the 3.2 month duration estimated by Nchake et al. (2014) for Lesotho during the
earlier period March 2002 to December 2009. One explanation is the lower levels of inflation
in the latter period, which may have led to fewer price changes by outlets.14
Compared to other countries, the flexibility of prices in Lesotho is similar to that of
the US where between 25 and 36 per cent of prices are changed in a given month (Klenow
and Kryvtsov, 2008; Klenow and Malin, 2011), but is greater than the 15 to 20 per cent found
for the Euro area (Dhyne et al., 2006; Álvarez et al., 2006), UK (Bunn and Ellis, 2012) and
South Africa (Creamer et al., 2012).
As found in the international literature, the frequency of price changes varies widely
across products. It is lowest for transport services (21 per cent) and highest for fuel products
(45.8 per cent). Food products also have a relatively high frequency of price change (29.2 per
cent), while services on average have relatively low frequencies.
When the frequency of price change is split into price increases and price decreases,
prices increase more frequently than they decrease (16.2 per cent vs. 12.2 per cent), but this
14
While Nchake et al. (2014) find no relationship between frequency and inflation in Lesotho, they find a
positive association between the frequency of price increases and inflation and a negative association between
inflation and the frequency of price decreases.
18
apparent asymmetry may arise from the moderate levels of inflation in Lesotho during this
period. Nevertheless, the data indicates that reductions in prices constitute an important
component of pricing behaviour in retail outlets.15
Table 8: Mean and median frequency of price change by Major Group)
Mean
frequency
(%)
Median
frequency
(%)
Implied
mean
duration
(months)
Implied
median
duration
(months)
Number
of
products
Food 29.2 26.0 3.43 3.85 109
Non-alcoholic beverages 24.8 25.4 4.03 3.93 17
Alcoholic beverages 21.8 20.6 4.60 4.86 14
Tobacco and narcotics 34.6 34.6 2.89 2.89 2
Clothing and footwear 24.7 24.6 4.05 4.06 49
Fuel 45.8 38.3 2.18 2.61 11
Household furniture and equipment 31.5 31.7 3.17 3.15 63
Household operations 35.6 38.5 2.81 2.59 18
Transport equipment 36.5 39.1 2.74 2.56 11
Personal care 28.8 30.5 3.47 3.28 27
Medical care and health expenses 20.2 21.1 4.96 4.74 8
Recreation and culture 25.5 24.8 3.92 4.04 10
Accommodation 25.4 26.1 3.94 3.83 3
Transport services 21.0 21.4 4.77 4.68 10
Other goods and services 24.1 24.6 4.14 4.06 39
Total 28.5 27.0 3.51 3.70 391
Note: Sample runs from January 2011 through December 2012. Education services, water and electricity are not
included. Frequencies are calculated as the simple average (median) of Freqik across the product items. The
standard deviation reflects the simple or weighted average of the standard deviation of Freqik across outlets
within each product item. Implied durations are calculated as the inverse of the mean or median frequency.
Freqik is the mean frequency over the period January 2011 to December 2012 of product i in outlet k. The Major
Groups are based on an adjustment to the Classification of Individual Consumption by Purpose (COICOP) to
separate out goods and services.
Finally, the frequency of price changes differs enormously across outlets even when
they are retailing the same product. This can be seen in Figure 2 that plots the distribution of
standardized frequencies of price change:
k
kiki
Fz
where Fik is the frequency of price change by outlet k of product i from January 2010 to
December 2012, k is the average of Fik in product k, and k is the standard deviation of the
frequency of price changes in k. As shown in the figure, the frequency of price change by an
outlet is often large compared to the average frequency of price change by outlets within the
same product line.
15
Nchake et al. (2014) calculate that 44 per cent of the variation in retail price inflation in Lesotho can be traced
back to variation in the inflation contribution of price decreases.

19
Figure 2: Distribution of standardized frequency of price changes
Notes: Figure plots the distribution of standardized frequencies of price change. Period covers January 2011 to
December 2012.
This heterogeneity in the frequency of price changes within product lines is consistent
with international evidence (Powers and Powers, 2001) and is indicative of the importance of
differences in market structure, consumer demand, firm characteristics and the cost of
changing prices. It is this variation in price setting behaviour across outlets retailing the same
product that the survey is unique in being able to explain.
Outlet attributes and the frequency of price changes
Various explanations have arisen for the heterogeneity in price changes across products.
These include the frequency and magnitude of cost and demand shocks, the level and
variability of inflation and differences in price collecting methods of statistical agencies
(Klenow and Malin, 2011: 254).
Firm-specific attributes also help to explain the observed differences in the frequency
of price changes across outlets operating within narrowly defined product markets. For
example, consumer prices are found to be more flexible in large outlets, such as supermarkets
and department stores (Buckle and Carlson, 2000; Amirault et al., 2006; Klenow and Malin,
2011; Greenslade and Parker, 2010). Firms in which labour costs make up a relatively high
proportion of total costs change prices less frequently as wage changes typically take place
once a year (Álvarez and Hernando, 2007a). Shops that are located in low density areas
change their prices less frequently while those that are located in clustered areas change their
0
.05
.1.1
5
Fra
ctio
n
-4 -2 0 2 4Standardized frequency of price change
20
prices more frequently (Shankar and Bolton, 2004). Further, firms that are able to store
inventories adjust to shocks through changes in inventories rather than through output and
price changes leading to a reduction in price fluctuations (Blinder, 1982).
An additional explanatory factor is market structure (Carlton, 1986; Powers and
Powers, 2001; Álvarez and Hernando, 2007b). As shown theoretically by Rotemberg and
Saloner (1987) and empirically using micro price data by Carlton (1986), Hannan and Berger
(1991), Powers and Powers (2001) and Lunnemann and Mathä (2005) firms adjust prices
more frequently in responsive to costs shocks the more competitive the market.16
These
results are corroborated by the price-survey studies of Hall et al. (2000), Álvarez and
Hernando (2005 & 2007b), Fabiani et al. (2006) and Hoeberichts and Stokman (2006).
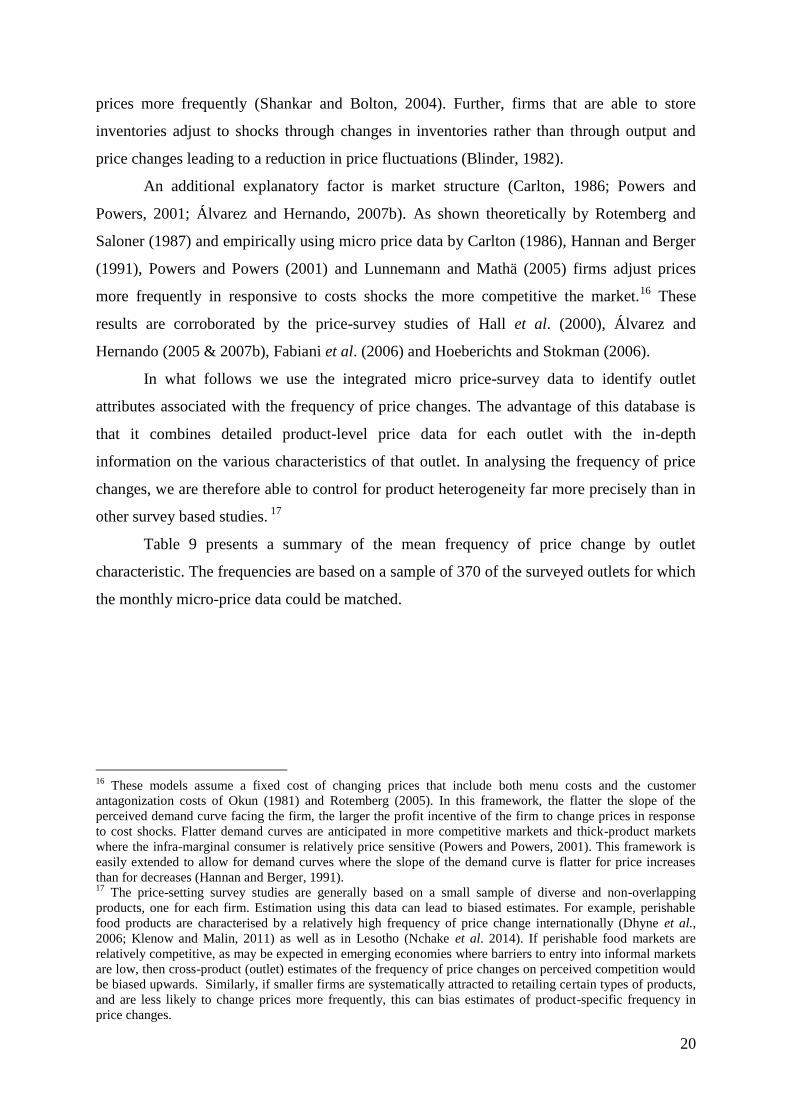
In what follows we use the integrated micro price-survey data to identify outlet
attributes associated with the frequency of price changes. The advantage of this database is
that it combines detailed product-level price data for each outlet with the in-depth
information on the various characteristics of that outlet. In analysing the frequency of price
changes, we are therefore able to control for product heterogeneity far more precisely than in
other survey based studies. 17
Table 9 presents a summary of the mean frequency of price change by outlet
characteristic. The frequencies are based on a sample of 370 of the surveyed outlets for which
the monthly micro-price data could be matched.
16
These models assume a fixed cost of changing prices that include both menu costs and the customer
antagonization costs of Okun (1981) and Rotemberg (2005). In this framework, the flatter the slope of the
perceived demand curve facing the firm, the larger the profit incentive of the firm to change prices in response
to cost shocks. Flatter demand curves are anticipated in more competitive markets and thick-product markets
where the infra-marginal consumer is relatively price sensitive (Powers and Powers, 2001). This framework is
easily extended to allow for demand curves where the slope of the demand curve is flatter for price increases
than for decreases (Hannan and Berger, 1991). 17
The price-setting survey studies are generally based on a small sample of diverse and non-overlapping
products, one for each firm. Estimation using this data can lead to biased estimates. For example, perishable
food products are characterised by a relatively high frequency of price change internationally (Dhyne et al.,
2006; Klenow and Malin, 2011) as well as in Lesotho (Nchake et al. 2014). If perishable food markets are
relatively competitive, as may be expected in emerging economies where barriers to entry into informal markets
are low, then cross-product (outlet) estimates of the frequency of price changes on perceived competition would
be biased upwards. Similarly, if smaller firms are systematically attracted to retailing certain types of products,
and are less likely to change prices more frequently, this can bias estimates of product-specific frequency in
price changes.
21
Table 9: The mean frequency of price changes by outlet attribute
Frequency of
price change
Frequency
of price
increases
Frequency
of price
decreases
Services/retail
Retail 29.7 17.6 12.1
Services 24.2 13.7 10.5
Size
Small (<5 employees) 28.9 17.0 11.9
Medium (6-20 employees) 29.6 17.6 12.0
Large (>20 employees) 31.0 18.5 12.5
Chain
Yes 29.4 17.5 11.9
No 30.0 17.6 12.4
Location
Within a shopping centre/Mall 30.7 18.1 12.6
Private Location 29.3 17.4 11.9
Taxi rank/street/open space 27.0 16.1 10.8
Rural/urban
Rural 29.7 17.6 12.0
Urban 29.5 17.4 12.1
Note: The sample comprises 370 outlets (301 retail and 69 services outlets) and 378 products. The sample of
price data runs from January 2011 through December 2012. See prior tables for further details on calculation of
frequencies.
The table reveals little variation in the frequency of price changes by outlet attribute.
As is found in the literature, prices change more frequency in retail outlets (29.7 per cent)
than services outlets (24.2 per cent) and are marginally higher in large outlets (31 per cent)
compared to small outlets (28.9 per cent). Outlets within shopping centres also change their
prices more often than those located in taxi ranks or on the street. These relationships also
hold for the frequency of price increases and decreases. However, we find no clear
relationship between frequency of price changes and being part of a chain or location in rural
or urban areas.18
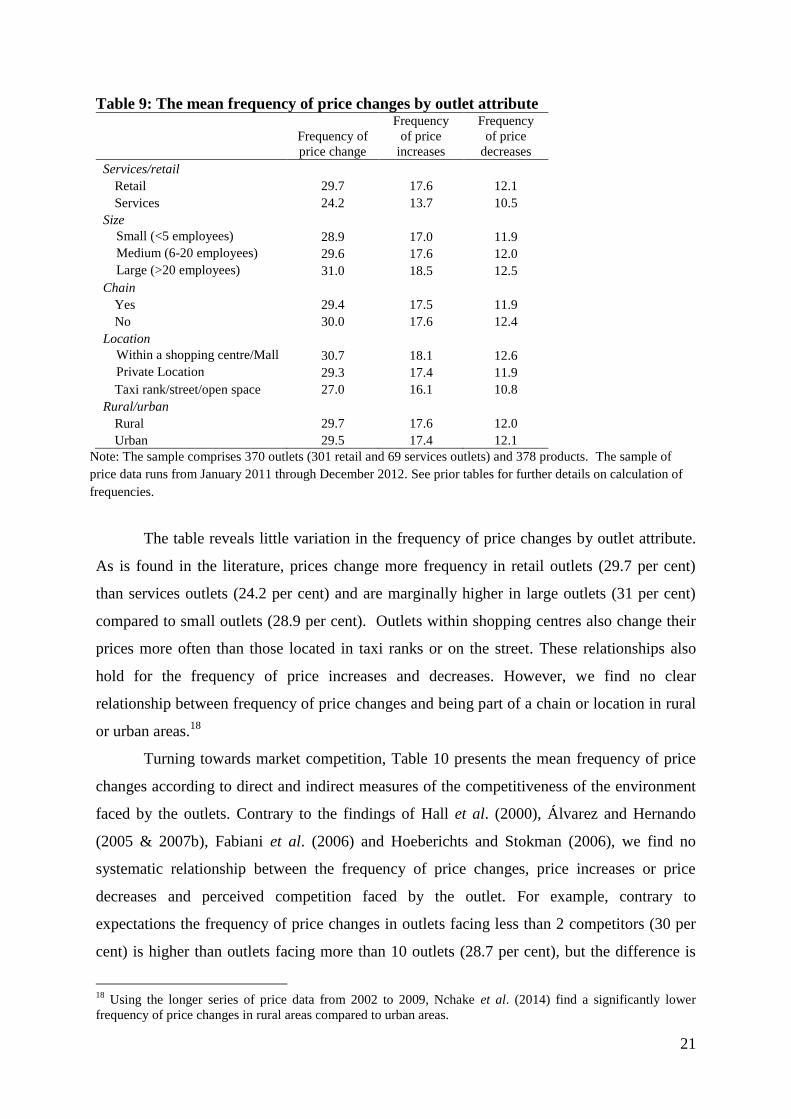
Turning towards market competition, Table 10 presents the mean frequency of price
changes according to direct and indirect measures of the competitiveness of the environment
faced by the outlets. Contrary to the findings of Hall et al. (2000), Álvarez and Hernando
(2005 & 2007b), Fabiani et al. (2006) and Hoeberichts and Stokman (2006), we find no
systematic relationship between the frequency of price changes, price increases or price
decreases and perceived competition faced by the outlet. For example, contrary to
expectations the frequency of price changes in outlets facing less than 2 competitors (30 per
cent) is higher than outlets facing more than 10 outlets (28.7 per cent), but the difference is
18
Using the longer series of price data from 2002 to 2009, Nchake et al. (2014) find a significantly lower
frequency of price changes in rural areas compared to urban areas.
22
not significant. As predicted by the theory, outlets with competitors in close proximity
(within 5 minutes walking distance) change prices more frequently than outlets with more
distant competitors (more than 10 minutes walking distance), but again the difference is not
statistically significant.
Table 10: The mean frequency of price changes and competition
Frequency
of price
change
Frequency
of price
increases
Frequency
of price
decreases
Competition
None 29.9 17.6 12.3
Less than 2 30.0 17.6 12.4
Between 3 and 5 29.4 17.6 11.9
Between 6 and 10 29.1 17.4 11.7
More than 10 28.7 17.1 11.6
Distance to competitor
Within 5 minutes 29.7 17.7 12.0
Between 6 and 10 min 29.4 17.4 12.0
More than 10 minutes 27.0 15.6 11.5
How important is reduction in close competitor's price in influencing you to
lower price?
Important/very important 29.7 17.5 12.2
Minor/Unimportant 29.3 17.4 11.9
What stops you from increasing price - fear competitor's price will remain fixed
Important/very important 29.5 17.4 12.1
Minor/Unimportant 29.7 17.7 12.0
Did you reduce price in response to reduction in price by competitor?
No 29.9 17.7 12.2
Yes 28.4 16.9 11.4
Note: The sample comprises 370 outlets (301 retail and 69 services outlets) and 378 products. The sample of
price data runs from January 2011 through December 2012. See prior tables for further details on calculation of
frequencies.
Regression analysis
To test the robustness of these relationships to the inclusion of other factors, we regress the
frequency of price change at the outlet level on a number of explanatory variables. To deal
with functional form and inference concerns when using bounded data such as the frequency
of price changes as the dependent variable, we follow Álvarez and Hernando (2007b) and use
the quasi-maximum likelihood (QML) approach of Papke and Wooldridge (1996) to estimate
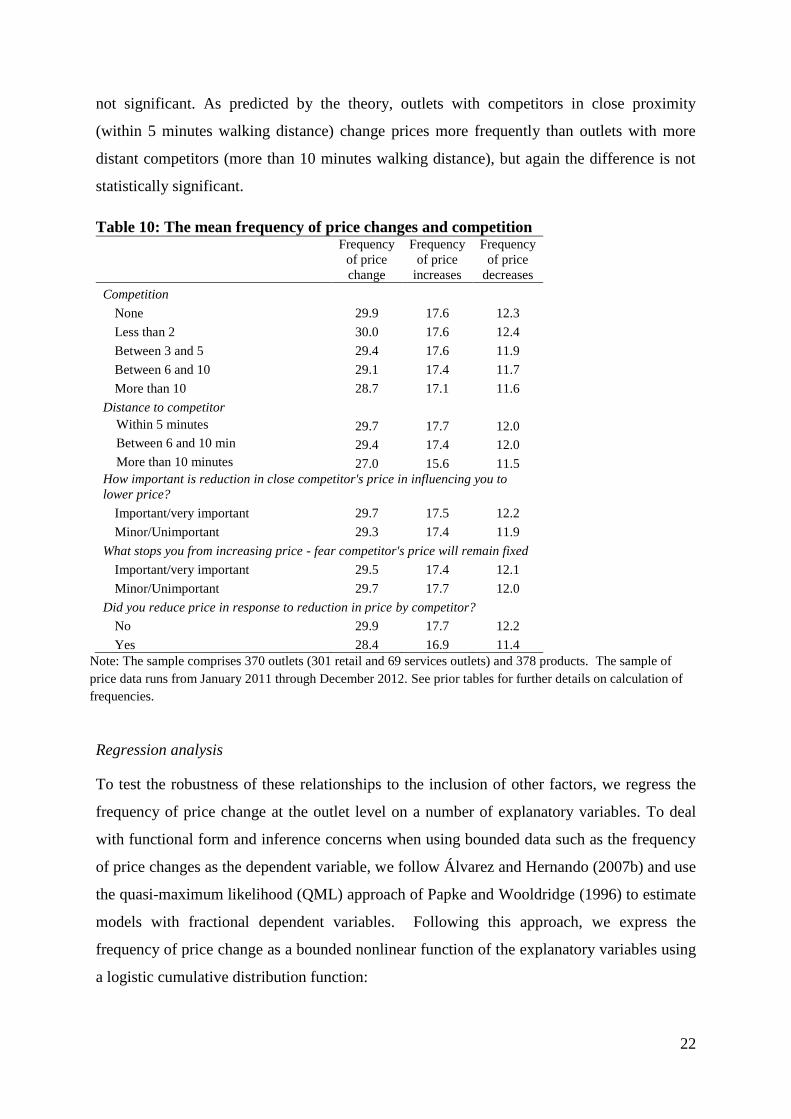
models with fractional dependent variables. Following this approach, we express the
frequency of price change as a bounded nonlinear function of the explanatory variables using
a logistic cumulative distribution function:
23
x
x
1 e
efreqik
.
The coefficients are then estimated using a Bernoulli quasi-maximum likelihood estimator.19
The set of explanatory variables includes three alternative indicators of perceived
competition: (a) the reported number of competitors (Number of competitors), (b) a dummy
variables for whether a firm reduced their price in response to a competitor’s lower price
(Reduced price), and (c) a dummy variable equal to one if the firms assesses that the fear
competing firm’s prices will remain fixed as important or very important in stopping their
own price increases (Fear fixed competitor price).20
To capture the importance of cost and demand drivers of price changes, we follow
Álvarez and Hernando (2007b) and include dummy variables that equal 1 if firms assessed as
important or very important the role of labour costs (Labour costs) and Material costs
(Material costs) in driving price increases. Given the asymmetry in responses found earlier,
we include a variable capturing whether the outlet regarded demand shocks (Demand) as
important or very important in driving price decreases.21
Finally, other outlet attributes were
accounted for through the inclusion of dummy variables for location in urban areas (Urban)
and/or malls (Mall), whether the firm was a services outlet (Services) and/or part of a chain
(Chain), firm size, and firm ownership of fridges (Fridge) and storage facilities (Storage).
Table 11 presents the regression results for data at two different levels of aggregation.
In columns (1) to (3) the dependent variable is the frequency of price change of product i in
outlet k. In column (4), the product-level frequency data are aggregated up to the outlet level
so that the dependent variable is the average frequency of price change of all of that outlet’s
products. All estimates include district fixed effects and product fixed effects. Note that
because frequency is expressed as a non-linear function of the explanatory variables the
coefficients should not be interpreted as elasticities.22
19
An alternative approach is to model the log-odds ration as a linear function (i.e. E(log[freq/(1-freq)]|x) = x),
but this approach requires adjustments when the frequency takes on values of 0 or 1, as is the case in our data. 20
In other estimates we included measures of competitiveness based on (a) whether a firm’s price is determined
by the main competitor’s price, and (b) the outlet’s assessment of the importance of reductions in competitor’s
prices in leading to a reduction in their own prices. The coefficients on the competitiveness variables were not
significantly different from zero. We also interact the number of competitors with firm size, but the coefficients
on competition and the interaction are insignificantly different from zero. 21
In other regressions we included labour and material costs as shares of total sales value. The sample size was
much reduced in these estimates as many firms did not provide the cost information. We also test for the
robustness of the relationships when excluding the perception based material, demand and labour cost
indicators. The results remain broadly the same. 22
The partial effect of variable x1 on the expected frequency can be calculated as 1exp(x)/[1+exp(x)]2
(Papke and Wooldridge, 1996: 628).
24
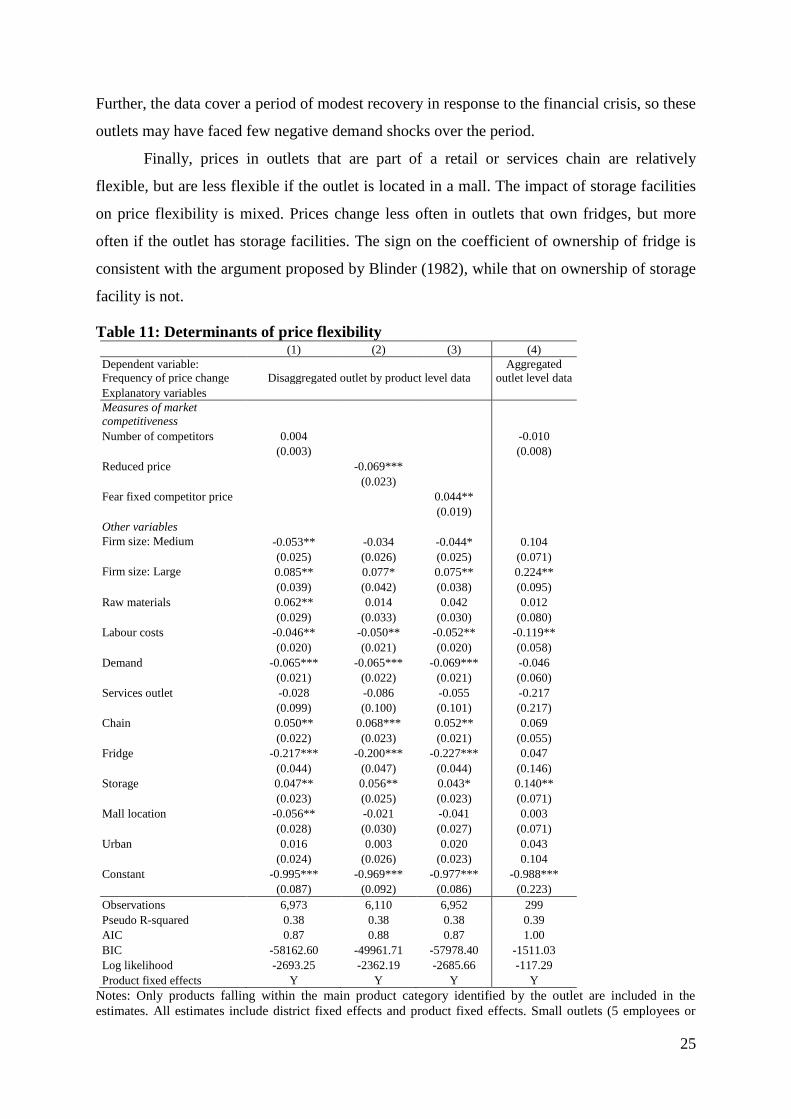
Looking first at the competition effects, we find no consistent relationship with the
frequency of price changes. Outlets that reduced prices in response to a competitor’s
reduction in price were significantly less likely to change prices over the period January 2011
to December 2012. In contrast, firms in more competitive environments as revealed using the
Fear fixed competitor price indicator changed prices more frequently. No significant
relationship is found when using the reported number of competitors as the indicator of the
competitiveness of the environment.
This lack of consistency in the relationship reflects the danger of using perceived
measures of the competitiveness of the environment and alternative exogenously derived
indicators of market competition (e.g. the national register of firms) may be better suited to
the task. Indicators of the entry or exit of competitors may also provide an additional source
of variation to identify the effect on price-setting behaviour. These areas are left for future
research.
Looking at the remaining coefficients, we find a convex relationship between the
frequency of price changes and the size of firms. Large firms are more likely to change prices
compared to small firms, but medium sized firms are less likely to change prices.23
This
relationship holds using both the disaggregated and aggregated data. The higher frequency of
price changes for large firms corroborates the international empirical evidence (Klenow and
Malin, 2011).
Our results for the variables proxying the cost structure corroborate those for the Euro
area by Álvarez and Hernando (2007b). As expected, firms that place a greater importance on
changes in labour cost in driving price changes, adjust prices less frequently. Wage changes
generally take place once a year leading to a more stable cost structure. In contrast, outlets
where material costs make up a relatively high share of total costs are expected to change
prices more frequently as material costs are more volatile. The significant positive coefficient
in the first regression supports this view, although the relationship is not robust to changes in
measure of competitiveness or aggregation of the data to the outlet level (column 4).
We also estimate negative and significant coefficients on the demand variable. Outlets
that emphasised the importance of demand shocks in reducing their prices were less likely to
change prices than other outlets. This may reflect the relative stability of demand compared
to costs over the period and hence the lower frequency of price changes by these outlets.
23
We test the robustness of this relationship using the natural logarithm of the number of employees and its
square as the variables for outlet size. A convex relationship between firm size and frequency is estimated.
25
Further, the data cover a period of modest recovery in response to the financial crisis, so these
outlets may have faced few negative demand shocks over the period.
Finally, prices in outlets that are part of a retail or services chain are relatively
flexible, but are less flexible if the outlet is located in a mall. The impact of storage facilities
on price flexibility is mixed. Prices change less often in outlets that own fridges, but more
often if the outlet has storage facilities. The sign on the coefficient of ownership of fridge is
consistent with the argument proposed by Blinder (1982), while that on ownership of storage
facility is not.
Table 11: Determinants of price flexibility (1) (2) (3) (4)
Dependent variable:
Frequency of price change Disaggregated outlet by product level data
Aggregated
outlet level data
Explanatory variables
Measures of market
competitiveness
Number of competitors 0.004
-0.010
(0.003)
(0.008)
Reduced price
-0.069***
(0.023)
Fear fixed competitor price
0.044**
(0.019)
Other variables
Firm size: Medium -0.053** -0.034 -0.044* 0.104
(0.025) (0.026) (0.025) (0.071)
Firm size: Large 0.085** 0.077* 0.075** 0.224**
(0.039) (0.042) (0.038) (0.095)
Raw materials 0.062** 0.014 0.042 0.012
(0.029) (0.033) (0.030) (0.080)
Labour costs -0.046** -0.050** -0.052** -0.119**
(0.020) (0.021) (0.020) (0.058)
Demand -0.065*** -0.065*** -0.069*** -0.046
(0.021) (0.022) (0.021) (0.060)
Services outlet -0.028 -0.086 -0.055 -0.217
(0.099) (0.100) (0.101) (0.217)
Chain 0.050** 0.068*** 0.052** 0.069
(0.022) (0.023) (0.021) (0.055)
Fridge -0.217*** -0.200*** -0.227*** 0.047
(0.044) (0.047) (0.044) (0.146)
Storage 0.047** 0.056** 0.043* 0.140**
(0.023) (0.025) (0.023) (0.071)
Mall location -0.056** -0.021 -0.041 0.003
(0.028) (0.030) (0.027) (0.071)
Urban 0.016 0.003 0.020 0.043
(0.024) (0.026) (0.023) 0.104
Constant -0.995*** -0.969*** -0.977*** -0.988***
(0.087) (0.092) (0.086) (0.223)
Observations 6,973 6,110 6,952 299
Pseudo R-squared 0.38 0.38 0.38 0.39
AIC 0.87 0.88 0.87 1.00
BIC -58162.60 -49961.71 -57978.40 -1511.03
Log likelihood -2693.25 -2362.19 -2685.66 -117.29
Product fixed effects Y Y Y Y
Notes: Only products falling within the main product category identified by the outlet are included in the
estimates. All estimates include district fixed effects and product fixed effects. Small outlets (5 employees or
26
less) are the omitted category in the firm size variable. Medium firms employ 6 to 20 employees, while large
firms employ above 20 workers. See main text for definition of explanatory variables. Robust standard errors in
parentheses, *** p<0.01, ** p<0.05, * p<0.1
6. Conclusion
This paper extends our understanding of price-setting behaviour in emerging economies,
focussing specifically on Lesotho. The empirical analysis draws on a unique database that
combines product level prices with outlet level survey information.
The survey data suggest that most retail and services outlets in Lesotho operate within
an imperfectly competitive market. The large majority of outlets (72 per cent) apply a mark-
up over costs when setting prices, while very few outlets (just over 6 per cent) set prices
according to the price of their main competitor. The latter firms tend to operate in more
competitive environments, as perceived by the firm, and are more likely to be located in
urban areas. This finding is consistent with international evidence (Fabiani et al., 2006).
Implicit contracts are cited by outlets as the most important source of price rigidity.
The fear of antagonizing and harming long-term relationships with their customers causes
outlets to delay price increases, providing support for the theories of Okun (1981) and
Rotemberg (2005). The fear that outlets will lose customers to competitors that do not also
raise prices is also an important reason provided for deferring price increases. This result is
surprising given the low number of firms that follow their competitor’s prices when setting
their own prices. Other explanations for price rigidity such as menu costs, attractive
thresholds, bureaucratic rigidities and explicit contracts are found to be relatively unimportant
sources of price rigidities.
We also provide evidence of asymmetries in price responses to cost and demand
shocks. Like Fabiani et al. (2006) for the Euro area, cost shocks are revealed to be more
relevant in influencing price increases than price decreases, while shocks to market
conditions (demand and competitor's price) are more relevant for price decreases than for
price increases. This asymmetry provides support for the role of implicit contracts as a source
of price rigidity.
Finally, we use the historical micro price data for each firm to analyse the frequency
of price changes over the period January 2011 to December 2012. As found in Nchake et al.
(2014), the frequency of price changes varies enormously across products and outlets.
Compared to many other countries, prices appear to be relatively flexible in Lesotho. We then
27
use this data to investigate the influence of outlet-specific attributes and competition on the
frequency of price changes. Large firms change prices relatively frequently, while firms in
which labour costs are an important determinant of price changes, change prices less
frequently. These results corroborate those found in Fabiani et al. (2006) for the Euro area.
However, we find no consistent relationship between the frequency of price changes and
perceived competition in the market. Alternative measures of competition obtained
independently of the firm may prove to be a better method of identifying the impact of
competition on price-setting behaviour.
28
References
Álvarez, L. J. & Hernando, I. (2004). Price setting behaviour in Spain: Stylised facts using
consumer price microdata. European Central Bank Working Paper, No. 416.
Álvarez, L.J. & Hernando, I. (2007a). The price setting behaviour of Spanish firms: Evidence
from survey data. In: Fabiani, S., Loupias, C., Martins, F., Sabbatini, R. (Eds.), Pricing
decisions in the Euro Area: How firms set prices and why. Oxford University Press,
Oxford, UK.
Álvarez, L.J. & Hernando, I. ( 2007b). Competition and price adjustment in the Euro Area.
In: Fabiani, S., Loupias, C., Martins, F., Sabbatini, R. (Eds.), Pricing decisions in the Euro
Area: How firms set prices and why. Oxford University Press, Oxford, UK.
Alvarez, L., Dhyne, E., Hoeberichts, M., Kwapil, C., Le Bihan, H., Lunnemann, P., Martins,
F., Sabbatini, R., Stahl, H., Vermeulen, P. & Vilmunen, J. (2006). Sticky prices in the
Euro Area: A summary of new micro evidence. Journal of the European Economic
Association, 4 (2-3), 575-584.
Amirault, D., Kwan, C. & Wilkinson, G. (2006). Survey of price-setting behaviour of
Canadian companies. Bank of Canada Working Paper, No. 2006-35.
Apel, M., Friberg, R. & Hallsten, K. (2005). Micro foundations of macroeconomic price
adjustment: survey evidence from Swedish firms. Journal of Money, Credit and Banking,
37(2), 313–38.
Aucremanne, L. & Druant, M. (2005). Price-setting behaviour in Belgium: What can be
learned from an ad hoc survey. European Central Bank Working Paper, No. 448.
Aucremanne, L., Brys, G., Hubert, M., Rousseeuw, P.J. & Struyf, A. (2002). Inflation,
relative prices and nominal rigidities. National Bank of Belgium Working Paper.
Bils, M. & Klenow, P. J. (2004). Some evidence on the importance of sticky prices. Journal
of Political Economy, 112(5), 947-985.
Blinder, A.S. (1982). Inventories and sticky prices: More on the micro-foundations of
macroeconomics. American Economic Review, 72(3), 334-348.
Blinder, A.S. (1991). Why are prices sticky? Preliminary results from an interview study.
American Economic Review, 81 (2), 89–100.
Blinder, A. S., Canetti, E., Lebow, D.E. & Rudd, J.B. (1998). Asking about prices: A new
approach to understanding price stickiness. Russell Sage Foundation Publications.
Buckle, R. & Carlson, J. (2000). Menu costs, firm size and price rigidity. Economics Letters,
66, 59–63.
Bunn, P. & Ellis, C. (2012). Examining the behaviour of individual UK consumer prices.
Economic Journal, 122, F35-F55.
Bunn, P. & Ellis, C. (2012). How do individual UK producer prices behave? Economic
Journal, 122(558), F16-F34.
29
Carlson, J. A. (1992). Some evidence on lump sum versus convex costs of changing prices.
Economic Inquiry, 30, 322–331.
Carlton, D. W. (1986). The Rigidity of prices. American Economic Review, 76, 637-658.
Carlton, D. W. (1989). The theory and the facts of how markets clear: is industrial
organization valuable for understanding macroeconomics?. Handbook of industrial
organization, 1, 909-946.
Cavallo, A. (2012). Scraped data and sticky prices. unpublished paper, MIT Sloan, Harvard
University.
Copaciu, M., Neagu, F., & Braun‐Erdei, H. (2010). Survey evidence on price‐setting patterns
of Romanian firms. Managerial and Decision Economics, 31(2‐3), 235-247.
Craig, C.S., Ghosh, A. & McLafferty, S. 1984. Model of the retail location process: A
review. Journal of Retailing, 60(1): 5–36.
Creamer, K., & Rankin, N. A. (2008). Price setting in South Africa 2001-2007-stylised facts
using consumer price micro data. Journal of Development Perspectives, 1(4): 93-118.
Creamer, K., Farrell, G. & Rankin, N. (2012). What price‐level data can tell us about pricing
conduct in South Africa. South African Journal of Economics, 80(4), 490-509.
Dhar, Sanjay K. & Hoch, Stephen J. (1997). Why store brand penetration varies by retailer.
Marketing Science, 16(3), 208–227.
Dhyne, E., Álvarez, L. J., Le Bihan, H., Veronese, G., Dias, D., Hoffmann, J. & Vilmunen, J.
(2006). Price changes in the Euro Area and the United States: Some facts from individual
consumer price data. The Journal of Economic Perspectives, 20(2), 171-192.
Fabiani, S. Gattulli, A. & Sabbatini, R. (2003). Price stickiness in Italy. Mimeo, Bank of Italy.
Fabiani, S., Gatulli, A. & Sabbatini, R. (2007). The pricing behavior of Italian firms. New
survey evidence on price stickiness. In: Fabiani, S., Loupias, C., Martins, F., Sabbatini, R.
(Eds.), Pricing decisions in the Euro Area: How firms set prices and why. Oxford
University Press, Oxford, UK.
Fabiani, S., Druant M., Hernando I., Kwapil C., Landau B., Loupias C., Martins F., Mathae
T., Sabbatini R. & Stokman A. (2005). The pricing behaviour of firms in the Euro area:
New survey evidence. European Central Bank Working Paper, No. 535.
Fabiani, S., Druant M., Hernando I., Kwapil C., Landau B., Loupias C., Martins F., Mathae
T., Sabbatini R. & Stokman A. (2006). What firms' surveys tell us about price-setting
behaviour in the euro area. International Journal of Central Banking, 2(3), 3–47.
Greenslade, J. V. & Parker, M. (2012). New insights into price setting behaviour in the UK:
Introduction and survey results. The Economic Journal, 122(558), F1-F15.
Hall, S., Walsh, M. & Yates A. (1997). How do UK companies set prices? Bank of England
Working, No. 67.
Hall, S., Walsh, M. & Yates, A. (2000). Are UK companies prices sticky? Oxford Economic
Papers, 52(3), 425–46.
30
Hannan, T. H. & Berger, A. N. (1991). The rigidity of prices: Evidence from the banking
industry. American Economic Review, American Economic Association, 81(4), 938-45.
Hoeberichts, M. & Stokman, A. (2006). Pricing behaviour of Dutch companies: Results of a
survey. ECP Working Paper No. 607.
Hoch, S. J., K., Byung Do, Montgomery A. & Rossi P. (1995). Determinants of store-level
price elasticity. Journal of Marketing Research, 32, 17–29.
Klenow, P. J. & Malin, B. A. (2011). Microeconomic evidence on price-setting. In B.
Friedman and M. Woodford (eds.), Handbook of Monetary Economics, edition 1, volume
3, chapter 6, 231-284.
Klenow, P. J. & Kryvtsov, O. (2008). State-dependent or time-dependent pricing: Does it
matter for recent US inflation? The Quarterly Journal of Economics, 123(3), 863-904.
Lünnemann, P., & Mathä, T. Y. (2005). Consumer Price Behaviour in Luxembourg:
Evidence from Micro CPI data. European Central Bank Working Paper No.541.
Malik, W. S., Satti, A. H. & Saghir, G. (2008). Price setting behaviour of Pakistani firms:
Evidence from four industrial cities of Punjab. The Pakistan Development Review, 47(3),
247-266.
Mankiw, N. G. (1985). Small menu costs and large business cycles: A macroeconomic model
of monopoly. Quarterly Journal of Economics, 100, 529–538.
Nakamura, E. & Steinsson, J. (2008). Five facts about prices: A re-evaluation of menu cost
models. The Quarterly Journal of Economics, 123(4), 1415-1464.
Nchake M.A., Edwards L. & Rankin N. (2014). Price setting behaviour in Lesotho: Stylised
facts from consumer retail prices, ERSA working paper No. 417.
Neslin, S. A., Powell, S. G., & Stone, L. S. (1995). The effects of retailer and consumer
response on optimal manufacturer advertising and trade promotion strategies. Management
Science, 41(5), 749–766.
Okun, A. M. (1981) Prices and quantities: A macroeconomic analysis. Washington, D.C.:
The Brookings Institution.
Papke, L. & Wooldridge, J. (1996). Econometric methods for fractional response variables
with an application to 401(k) plan participation rates. The Journal of Applied
Econometrics, 11, 619-632.
Peltzman, S. (2000). Prices rise faster than they fall. Journal of Political Economy, 108(3),
466-502.
Powers, E., and Powers, N., (2001) The size and frequency of price changes: Evidence from
grocery stores. Review of Industrial Organization, 18(4), 397-416.
Rotemberg, J. & Saloner, G. (1987). The relative rigidity of monopoly pricing. American
Economic Review, 77(5), 917–26.
Rotemberg, J. (2005). Customer anger at price increases, changes in the frequency of price
adjustment and monetary policy. Journal of Monetary Economics, 829-852.
31
Şahinőz, S. and Saraçoğlu, B. (2008) Price setting behaviour in Turkish industries: Evidence
from survey data. Turkish Economic Association Discussion paper 2008/3.
Shankar, V. & Bolton, R. N. (2004). An empirical analysis of determinants of retailer pricing
strategy. Marketing Science, 23(1), 28 - 49.
Sheshinski, E. & Weiss, Y. (1977). Inflation and costs of price adjustment. Review of
Economic Studies, 44(2), 287–303.
Suvanto, A. & Hukkinen, J. (2002). Stable price level and changing prices. mimeo, Bank
of Finland.
Yates, A. (1998), “Downward nominal rigidity and monetary policy”, Bank of England
Working Paper.
Copyright © 2022 FDOKUMEN