National Electrification Master Plan for Lesotho - Amazon AWS
200
The Government of Lesotho National Electrification Master Plan for Lesotho Final Report October 2007
-
Upload
khangminh22 -
Category
Documents
-
view
0 -
download
0
Transcript of National Electrification Master Plan for Lesotho - Amazon AWS
The Government of Lesotho
National Electrification Master Plan for Lesotho Final Report
October 2007
The Government of Lesotho
National Electrification Master Plan for Lesotho Final Report
October 2007
Report no. 64131-0-13
Issue no. 3.2
Date of issue 20 October 2007
Prepared NBP
Checked DH/ABR/CW/GB
Approved NBP
National Electrification Master Plan for Lesotho - Final Report
P:\64131A\3_Pdoc\DOC\Final Report\færdige\Final Report October 2007\Final Report\Final Report-october.doc
1
.
Table of Contents
1 Executive Summary 6 1.1 Introduction 6 1.2 Electrification Target 6 1.3 Settlements 7 1.4 Load Forecast 8 1.5 Technical Standards 9 1.6 Systems in Remote Areas 10 1.7 Transmission System 11 1.8 Distribution Systems 11 1.9 Financial Aspects 13 1.10 Prioritisation of Settlements 14 1.11 Project Schedule Years 1 to 5 - Distribution 15 1.12 Project Schedule for Years 6 - 15 - Distribution 18 1.13 Allocation of Responsibilities 19 1.14 Future Service Models for Electricity Supply 21 1.15 Tariffs and Connection Fee 21 1.16 Subsidies 22 1.17 Institutional Development and Training 23 1.18 Monitoring and Evaluation Framework 23 1.19 Environmental Issues 25
2 Introduction 27 2.1 Electrification Target for Lesotho 27 2.2 Balancing Policy Objectives 28 2.3 Planning Criteria and Approach 29 2.4 Report Structure and Terminology 32
3 Background 34 3.1 Context 34 3.2 Energy Policy and Power Sector Reform 35 3.3 Institutions Involved in Electrification 37 3.4 Existing Power System 42
National Electrification Master Plan for Lesotho - Final Report
P:\64131A\3_Pdoc\DOC\Final Report\færdige\Final Report October 2007\Final Report\Final Report-october.doc
2
.
4 Socio-Economic Data and Analysis 51 4.1 Demography and Settlement Identification 51 4.2 Poverty Mapping and Energy Demand Surveys 62 4.3 WAP Studies for Electricity 63 4.4 Social Impact of Household Electrification 65 4.5 Conclusions Regarding Socio-Economic Information 66
5 Load Demand Forecast 70 5.1 Methodology and General Assumptions 70 5.2 System Load Curve and Losses 71 5.3 Residential Sector 72 5.4 Other Customer Groups 73 5.5 Load Forecast 74
6 Electrical Design Issues 79 6.1 Technical Standards used in LEC 79 6.2 Power Supply Quality 81 6.3 Recommendations 82
7 Off-grid Power Supply Options and Standards 87 7.1 Decentralised Options 87 7.2 Centralised Options 88 7.3 Suitability of Power Supply Options in the Context of
Lesotho 88 7.4 Standards 91 7.5 Supply of Off-grid Schemes 91 7.6 Cost per Settlement (Off-Grid) 97
8 System Design and Cost Estimates in Transmission and Distribution 98
8.1 Transmission System 98 8.2 Distribution System 104 8.3 Investment Costs 109
9 Economic and Financial Analyses 114 9.1 Financial Analyses 114 9.2 Results of the Financial Analysis 118
10 Prioritisation and Scheduling of Electrification Projects 121
10.1 Outline of Electrification Projects 121 10.2 Ranking of Settlements by Viability 122
National Electrification Master Plan for Lesotho - Final Report
P:\64131A\3_Pdoc\DOC\Final Report\færdige\Final Report October 2007\Final Report\Final Report-october.doc
3
.
10.3 Outline of Settlements included in the Plan for the First Five Years 123
10.4 Outline of Settlements Included in the Plan for the Next 10 Years 129
10.5 Transmission System Reinforcement 131 10.6 Main Responsibilities for Implementation of the Plan 132 10.7 Connection Fee and Tariff 135 10.8 Densification Measures 136 10.9 Institutional Development and Training 137 10.10 Monitoring and Evaluation Framework 139
11 Future Service Delivery in Lesotho 143 11.1 Problems Facing the Power Sector 143 11.2 Inside the ST - Future Role of LEC 144 11.3 Concession Model Approach for Lesotho 145 11.4 Outside the ST Areas – Grid Connection 146 11.5 Delivery Models Off-grid 149 11.6 Conclusions 150
12 Environmental Issues 151 12.1 Impact and Mitigation 151 12.2 Impacts from Transmission and Distribution 152
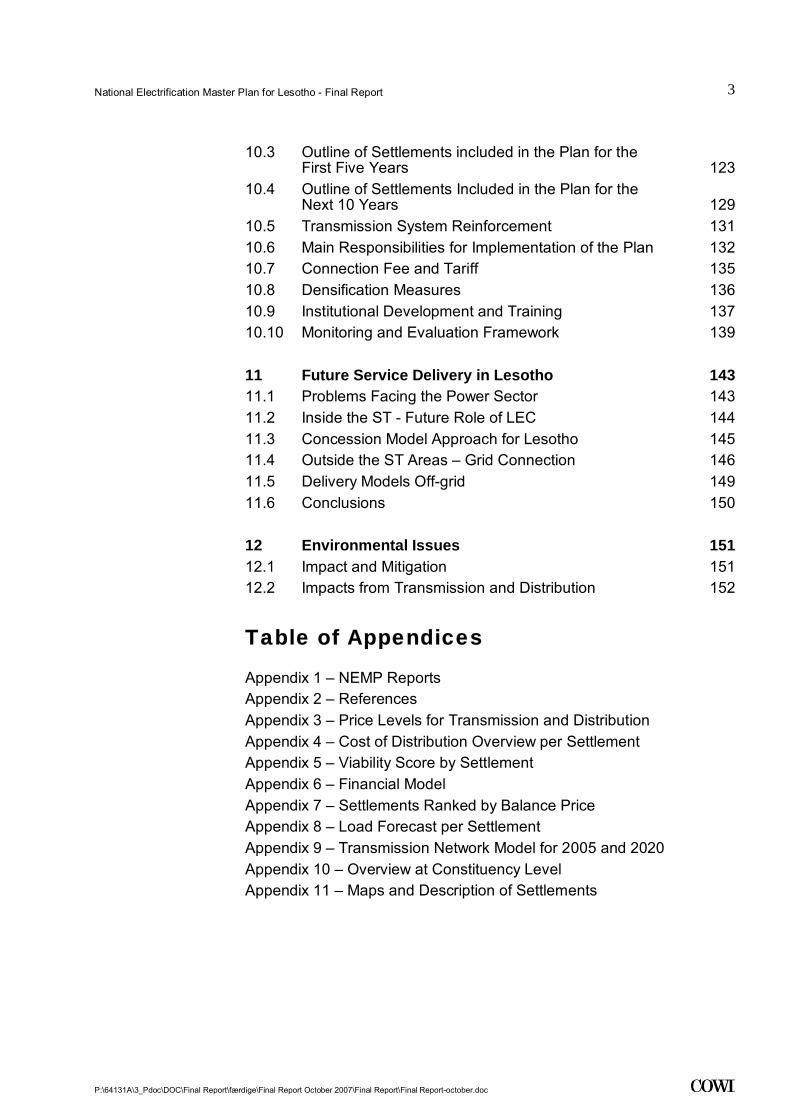
Table of Appendices
Appendix 1 – NEMP Reports Appendix 2 – References Appendix 3 – Price Levels for Transmission and Distribution Appendix 4 – Cost of Distribution Overview per Settlement Appendix 5 – Viability Score by Settlement Appendix 6 – Financial Model Appendix 7 – Settlements Ranked by Balance Price Appendix 8 – Load Forecast per Settlement Appendix 9 – Transmission Network Model for 2005 and 2020 Appendix 10 – Overview at Constituency Level Appendix 11 – Maps and Description of Settlements

National Electrification Master Plan for Lesotho - Final Report
P:\64131A\3_Pdoc\DOC\Final Report\færdige\Final Report October 2007\Final Report\Final Report-october.doc
4
.
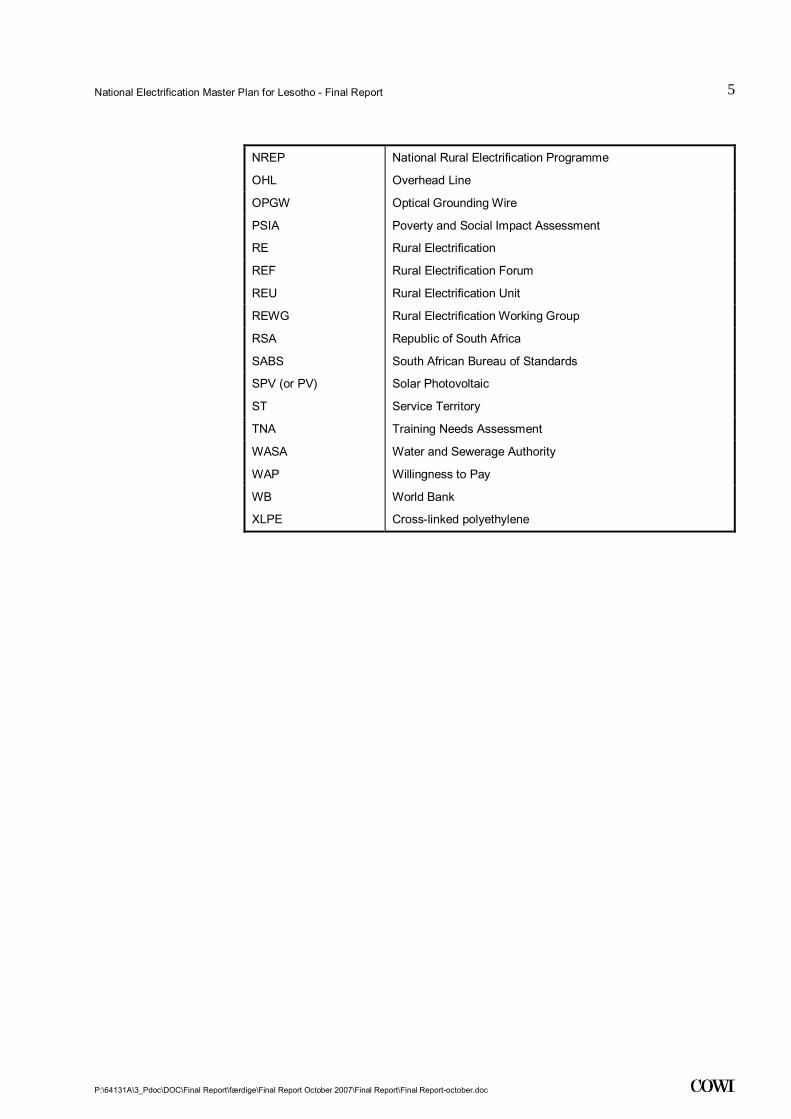
Abbreviations
ABC Arial Bundled Cables
ACSR Aluminium Conductor Steel Reinforced
ADMD After Diversity Maximum Demand
AES Access to Electricity Study
AfDB African Development Bank
AGOA African Growth and Opportunity Act
BEC-meter Budget Energy Controller - (Prepaid meter system)
BOS Bureau of Statistics (Lesotho)
CCA Community Council Areas
DOE Department of Energy
EAPPs Electricity Access Pilot Projects
GOL Government of Lesotho
GIS Geographical Information System
HH Households
HV High Voltage - a nominal phase-to-phase voltage between the range 11 kV and 132 kV both inclusive
ICB International Competitive Bidding
IEC International Electro-technical Commission
IMTF Interim Management Task Force
kV kilo Volt
kWh kilo Watt hours
LCB Local Competitive Bidding
LDHS Lesotho Demographic and Health Survey, 2004
LEA Lesotho Electricity Authority
LEC Lesotho Electricity Company
LHDA Lesotho Highlands Development Authority
LHWP Lesotho Highlands Water Project
LURP Lesotho Utilities Reform Project
LRMC Long Run Marginal Cost
LSL Lesotho Maloti = 100 Lisente (l), 1 USD = 7.5 LSL
LV Low Voltage
MCB Miniature Circuit Breaker
MHPP Muela Hydro Power Plant
MNR Ministry of Natural Resources
MV Medium Voltage
MW Mega Watt
NEMP National Electrification Master Plan
NREF National Rural Electrification Fund
National Electrification Master Plan for Lesotho - Final Report
P:\64131A\3_Pdoc\DOC\Final Report\færdige\Final Report October 2007\Final Report\Final Report-october.doc
5
.
NREP National Rural Electrification Programme
OHL Overhead Line
OPGW Optical Grounding Wire
PSIA
RE
Poverty and Social Impact Assessment
Rural Electrification
REF Rural Electrification Forum
REU Rural Electrification Unit
REWG Rural Electrification Working Group
RSA Republic of South Africa
SABS South African Bureau of Standards
SPV (or PV) Solar Photovoltaic
ST Service Territory
TNA Training Needs Assessment
WASA Water and Sewerage Authority
WAP Willingness to Pay
WB World Bank
XLPE Cross-linked polyethylene

National Electrification Master Plan for Lesotho - Final Report
P:\64131A\3_Pdoc\DOC\Final Report\færdige\Final Report October 2007\Final Report\Final Report-october.doc
6
.
1 Executive Summary
1.1 Introduction The objective of this National Electrification Master Plan Study (NEMP) is to provide clear guidelines and establish priorities for providing access to electric-ity in Lesotho in a co-ordinated and cost-effective manner, which will enable the Government of Lesotho (GOL) to meet its electrification targets in particu-lar, and rural development goals in general. The NEMP study has been organ-ised in three distinct steps:
1 Inception;
2 Electrification Master Planning;
3 Electrification Master Plan Implementation Strategy.
This Final Report presents the outcome and results of the study.
1.2 Electrification Target The target of the Government of Lesotho is to ensure that in 2020 at least 40% of all households have access to electricity either from the national power grid, from an isolated system or from individual solutions (solar PV/generators). The table below shows the projection of population and number of households in Lesotho and specifies the number of electrified households required to achieve the electrification target.
Table 1-1 Population, households and electrification targets
Year 2005 2010 2015 2020
Total population 2,200,000 2,300,000 2,320,000 2,320,000
Total number of households 564,000 590,000 595,000 595,000
Electrification level 8% 20% 35% 40%
No. of domestic customers 42,610 118,000 208,000 238,000
Source: Consultant's calculations. The electrification level of 2005 as well as the projections are based on an average household size of 3.9
National Electrification Master Plan for Lesotho - Final Report
P:\64131A\3_Pdoc\DOC\Final Report\færdige\Final Report October 2007\Final Report\Final Report-october.doc
7
.
Briefly, the number of electrified households should increase from 42,000 to 238,000. This corresponds to an annual average of new connections of ap-proximately 13,000. Currently, 5,000-6,000 new customers are added annually to the system. The commercialised LEC is foreseen to connect 8,000 new cus-tomers within its service territory (ST). Through the Rural Electrification Unit (REU), the Government is foreseen to be in charge of the remaining.
In order to achieve this goal, Lesotho faces two main challenges: (1) to moti-vate LEC to fulfil their commitment, and (2) to establish a parallel structure that can plan for and handle approximately 5,000 connections per year outside the ST.
This National Electrification Master Plan provides a framework for the actions over the next 15 years, including the following:
• The cluster approach (see Section 1.3) identifies large and viable planning areas for electrification of Lesotho over the next 15 years;
• The plan establishes a clear priority of settlements to be electrified;
• The plan includes an estimate of the investment and operational cost of the plan using recommended technologies and projects;
• The plan demonstrates that considerable subsidies are required for its im-plementation;
• The plan clearly identifies the role and responsibilities of LEC, REU, Le-sotho Electrification Authority (LEA) and Department of Energy (DOE);
• The plan provides a capacity building framework that will enable the key players to fulfil their role.
1.3 Settlements The viability of the constituencies and type of settlement has been used as a starting point for the ranking of the settlements to be electrified. The ranking was both based on economic and social criteria, with emphasis on the potential for economic development. There are a number of settlements that are already served with electricity, but where only few households have been connected to the grid. The potential for densification of these underserved electrified settle-ments is important and should be met concurrently with grid extension to new areas.
To maximise the number of electricity customers in each area in a cost-effective way, a ‘cluster’ approach was used. This entailed identifying groups of villages or neighbourhoods that are situated within no more than one kilome-tre from each other, forming a continuous area of settlement. These ‘settle-ments’, which form distinct types ranging from the capital city down to clusters of relatively small villages, have been analysed and described in some detail.
National Electrification Master Plan for Lesotho - Final Report
P:\64131A\3_Pdoc\DOC\Final Report\færdige\Final Report October 2007\Final Report\Final Report-october.doc
8
.
Recommendations have been made on how each one should be served, taking into account its type, population, level of poverty, economic viability, number of social services and distance from the grid.
A total of 140 clusters have been identified: 106 settlements in the Lowlands, with a population of 2,500 or more, and further 34 settlements in the Highlands or as special cases. The 140 settlements have been divided into 6 categories re-flecting their characteristics (Capital City, Industrial Towns, Large Institutional Towns, Medium Settlements, Small Settlements and Special Cases). Each set-tlement has been described in terms of electrification status, local resources and distance to the national grid and assessed with the most updated socio-economic information that can be provided currently. Population data have been estimated using a "block building" approach to population estimates, as the results of the census from 2006 have not been available.
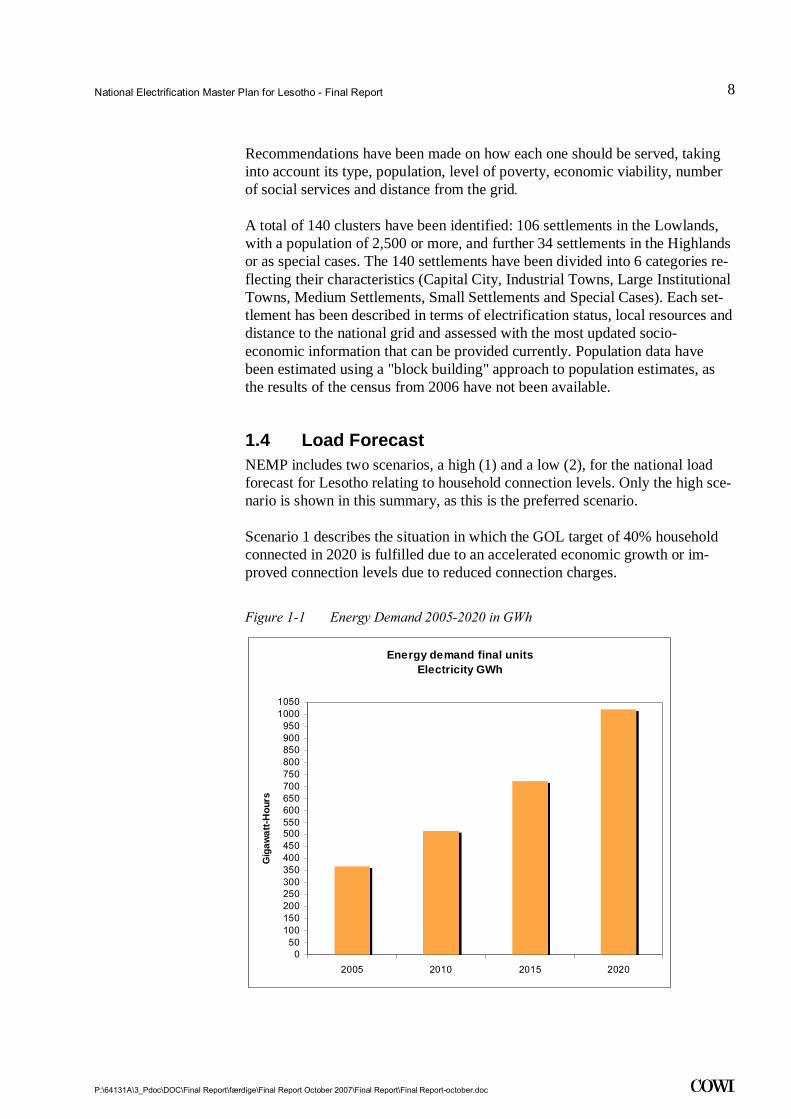
1.4 Load Forecast NEMP includes two scenarios, a high (1) and a low (2), for the national load forecast for Lesotho relating to household connection levels. Only the high sce-nario is shown in this summary, as this is the preferred scenario.
Scenario 1 describes the situation in which the GOL target of 40% household connected in 2020 is fulfilled due to an accelerated economic growth or im-proved connection levels due to reduced connection charges.
Figure 1-1 Energy Demand 2005-2020 in GWh
Energy demand final unitsElectricity GWh
050
100150200250300350400450500550600650700750800850900950
10001050
2005 2010 2015 2020
Gig
awat
t-Hou
rs
National Electrification Master Plan for Lesotho - Final Report
P:\64131A\3_Pdoc\DOC\Final Report\færdige\Final Report October 2007\Final Report\Final Report-october.doc
9
.
The annual consumption (excl. losses) is forecast to increase from 350 GWh in 2005 to 1,000 GWh in 2020.
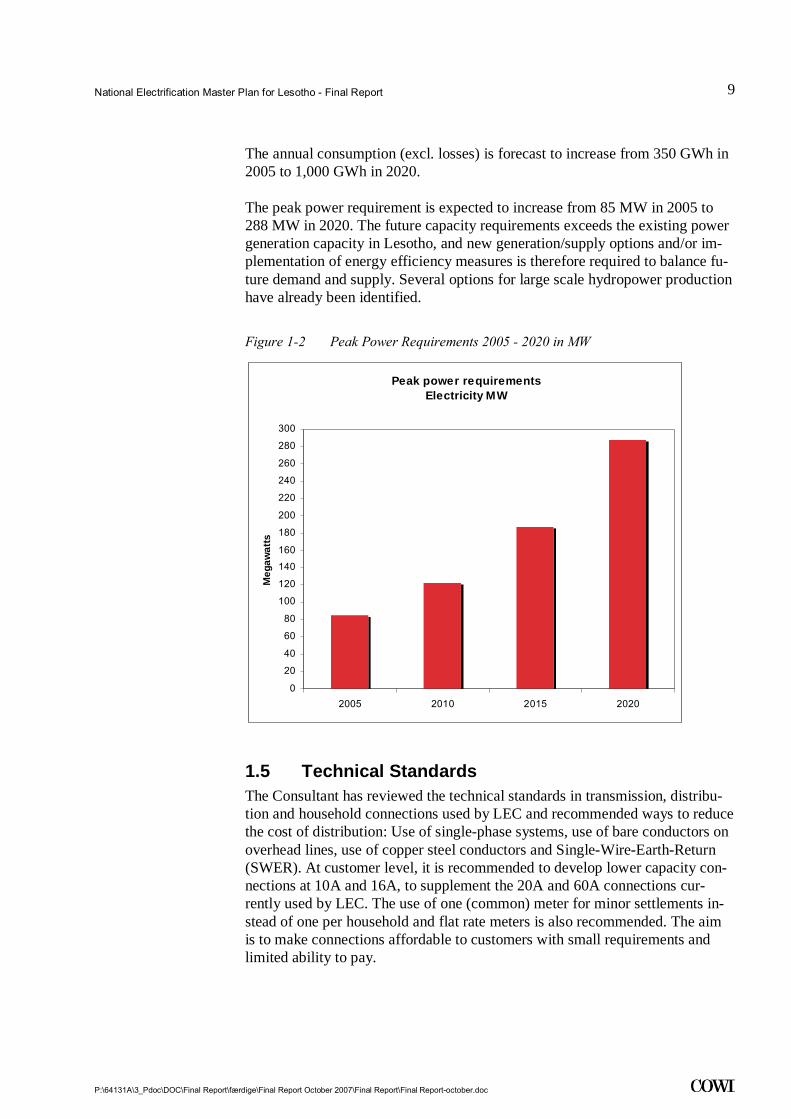
The peak power requirement is expected to increase from 85 MW in 2005 to 288 MW in 2020. The future capacity requirements exceeds the existing power generation capacity in Lesotho, and new generation/supply options and/or im-plementation of energy efficiency measures is therefore required to balance fu-ture demand and supply. Several options for large scale hydropower production have already been identified.
Figure 1-2 Peak Power Requirements 2005 - 2020 in MW
Peak power requirementsElectricity MW
0
20
40
60
80
100
120
140
160
180
200
220
240
260
280
300
2005 2010 2015 2020
Meg
awat
ts
1.5 Technical Standards The Consultant has reviewed the technical standards in transmission, distribu-tion and household connections used by LEC and recommended ways to reduce the cost of distribution: Use of single-phase systems, use of bare conductors on overhead lines, use of copper steel conductors and Single-Wire-Earth-Return (SWER). At customer level, it is recommended to develop lower capacity con-nections at 10A and 16A, to supplement the 20A and 60A connections cur-rently used by LEC. The use of one (common) meter for minor settlements in-stead of one per household and flat rate meters is also recommended. The aim is to make connections affordable to customers with small requirements and limited ability to pay.

National Electrification Master Plan for Lesotho - Final Report
P:\64131A\3_Pdoc\DOC\Final Report\færdige\Final Report October 2007\Final Report\Final Report-october.doc
10
.
1.6 Systems in Remote Areas Off-grid supply options and standards have been reviewed. Settlements located more than 15 km from the existing grid have been identified, and the power supply options (grid extension, off-grid) for the next 15 years have been ana-lysed taking local resources into consideration.
Table 1-2 Settlements far from existing grid that have been analysed for potential off-grid supply
Settlement/Village cluster District Technology Investment Cost
in 1000 LSL
Mpharane Mohale's Hoek Grid Extension 1,447
Mokhalinyane Maseru Grid Extension 2,210
Kolo Mafeteng Grid Extension 1,775
Tebellong (Mapote, Liphakoeng) Qacha's Neck Grid Extension* 1,765
Ramabanta Maseru Grid Extension/ SPV 218
Sekake Qacha's Neck Grid Extension* 1,180
Sehlabathebe (Mavuka, Polasi) Qacha's Neck Mini Hydro 1,972
Seforong (Mosi, Aupolasi) Mohale's Hoek Grid Extension* 943
Ketane Mohale's Hoek SPV 347
Mphaki (Mahlomola) Quthing SPV/hydro 364
Linakeng Thaba-Tseka SPV 330
Nkau Mohale's Hoek SPV 312
Sehonghong Thaba-Tseka SPV 737
Kolobere Thaba-Tseka Grid Extension/SPV 127
Lesobeng Thaba-Tseka Mini Hydro 1,954
Letsika Thaba-Tseka SPV 127
Malingoaneng Mokhotlong SPV 127
Molikaliko Mokhotlong SPV 165
Motete
Kao
Liqhobong** Butha-Buthe
Mini Hydro/Grid Ext
9,392
Seng Maseru SPV 127
Sani Pass Thaba-Tseka SPV 127* From Qacha's Neck ** Motete has a potential for hydro supply that is large enough to supply the nearby settlements of
Kao and Liqhobong as well. The investment estimate covers all three settlements as this provides sufficient demand for the proposed hydro power supply.
The table above shows the recommended technology and investment cost for 23 settlements of interest for isolated supply. Some of these settlements form part of planned projects, such as Electricity Access Pilot Projects or RSA Vil-lage Border Projects. Mphaki Rural Electrification Project is scheduled for grid extension by DOE.
It is estimated that 20 to 30 per cent can be saved on investment costs by apply-ing low-cost technologies like SWER instead of 3-phase overhead line for grid extension to remote settlements.
National Electrification Master Plan for Lesotho - Final Report
P:\64131A\3_Pdoc\DOC\Final Report\færdige\Final Report October 2007\Final Report\Final Report-october.doc
11
.
1.7 Transmission System As part of the planning procedure, the Consultant made a load flow analysis of the transmission system based on the load forecast in order to identify existing and future bottlenecks in the system. The result of this analysis shows that there will be a need for reinforcing the 132 kV grid that connects the Northern and Southern parts of Lesotho. The existing double 132 kV line between Maputsoe and Mabote should be extended by an additional double line with the same conductor type and cross section as the existing line.
Besides the 132 kV grid reinforcements, a number of 33 kV lines have to be upgraded in order to avoid line overload due to heavy power flows from the 132 kV to the 33 kV system. The main bottlenecks in the 33 kV network are the lines connecting 33 kV busbars Mabote to Highway and LEC33. To improve the transfer capacity in the load centre, an upgrading of the line Mabote-Highway from a single line to three lines is proposed. For the same reason, it is recommended to upgrade the line Mabote-LEC from two lines to four lines.
The overall cost requirement for the transmission system is LSL 485 Million, as shown below.
Table 1-3 Investment in transmission system
Item No. of Items Investment in 1000 USD
Investment in Million LSL
Transformers - transmission system
27 32,750 246
Lines - km 341 31,860 239
Total 64,610 485
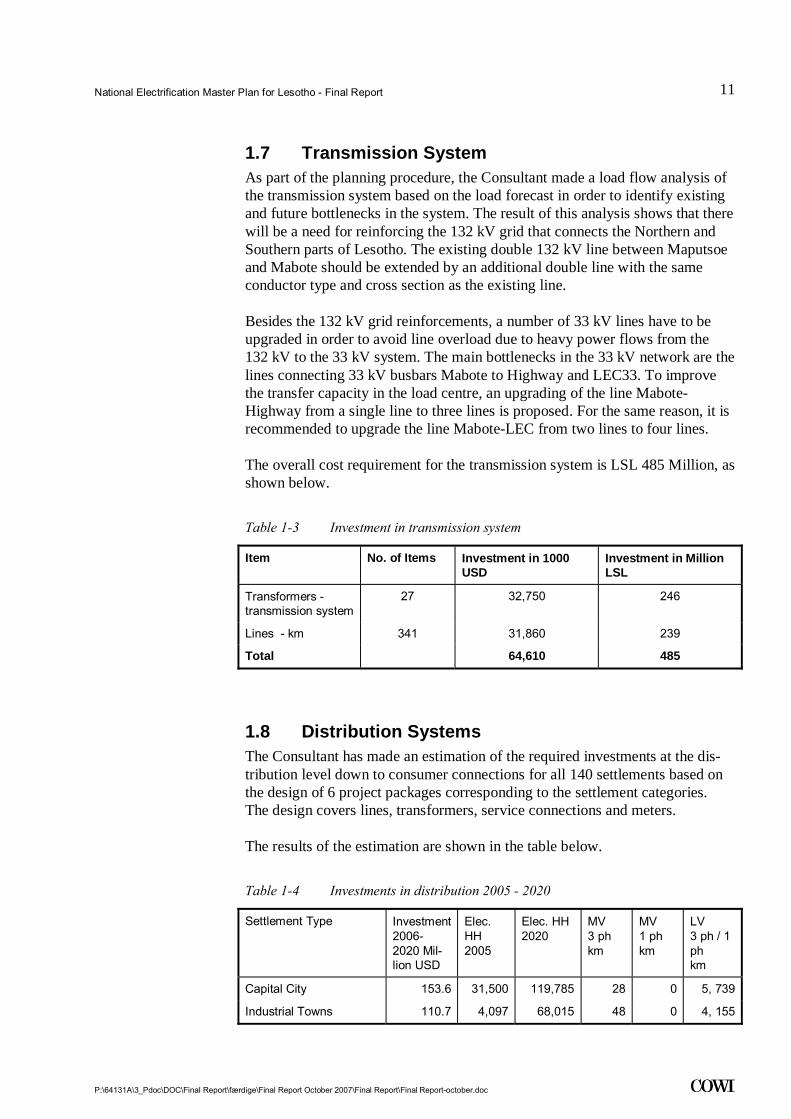
1.8 Distribution Systems The Consultant has made an estimation of the required investments at the dis-tribution level down to consumer connections for all 140 settlements based on the design of 6 project packages corresponding to the settlement categories. The design covers lines, transformers, service connections and meters.
The results of the estimation are shown in the table below.
Table 1-4 Investments in distribution 2005 - 2020
Settlement Type Investment 2006- 2020 Mil-lion USD
Elec. HH 2005
Elec. HH 2020
MV 3 ph km
MV 1 ph km
LV 3 ph / 1 ph km
Capital City 153.6 31,500 119,785 28 0 5, 739
Industrial Towns 110.7 4,097 68,015 48 0 4, 155

National Electrification Master Plan for Lesotho - Final Report
P:\64131A\3_Pdoc\DOC\Final Report\færdige\Final Report October 2007\Final Report\Final Report-october.doc
12
.
Institutional Towns 17.0 3,766 12,833 20 7 589
Medium-size Settlements 29.9 1,696 16,715 66 66 971
Large villages 24.1 1,498 13,021 0 158 747
Special Cases 3.4 3 1,619 0 24 105
All 338.8 42,560 231,988 162 255 12,306
The investment required over the next 15 years is USD 339 Million or LSL 2,543 Million, of which the bulk is targeted Maseru and the large industrial towns.
The following table shows the investment allocated on districts and electrifica-tion status. Appendix 10 displays similar information at the constituency level.
Table 1-5 Investment in distribution by District and Electrification Class
Electrification Class
1000 USD
District
1 2 3 4 5 Total
Berea 16,903 2,796 505 20,204
Butha-Buthe 26,917 1,389 505 642 29,453
Leribe 42,163 1,626 3,102 46,891
Mafeteng 22,032 926 1,515 886 25,359
Maseru 171,386 1,066 505 1,019 266 174,242
Mohale's Hoek 28,224 463 139 513 542 29,881
Mokhotlong 952 505 258 1,715
Qacha's Neck 1,050 915 1,965
Quthing 7,014 186 7,200
Thaba-Tseka 675 189 1,040 1,904
Total 1000 USD 317,316 8,266 6,966 2,418 3,859 338,825
Total in Million LSL 2 ,379 62 52 18 29 2,543
% 94 2 2 1 1
Elec Class 1: Settlements within 3.5 km from grid and electrified in 2005 Elec Class 2: Settlements within 3.5 km from grid and non-electrified in
2005 Elec Class 3: Non-electrified settlements between 3.5 and 10 km from grid Elec Class 4: Settlements between 10 and 15 km from grid Elec Class 5: Settlements more than 15 km from grid
94 per cent of the investment are in areas less than 3.5 km from the existing grid and already electrified. These areas should undergo 'densification', i.e. in-creasing the number of connections within already serviced areas.
National Electrification Master Plan for Lesotho - Final Report
P:\64131A\3_Pdoc\DOC\Final Report\færdige\Final Report October 2007\Final Report\Final Report-october.doc
13
.
There are good reasons for the emphasis on Class 1 settlements and particularly the major towns, such as Maseru. The population in these settlements grows by a higher rate than the rest of the country. A very large portion of the population is and will in the future be located in Maseru and the major cities. The number of households in the rural areas is not high enough to ensure that the electrifica-tion target of 40 per cent can be fulfilled in an economically justifiable way. In order to meet the target, a large share of the resources will therefore have to be spent on further electrifying the peri-urban areas of particularly Maseru and the larger towns.
Electrification of Class 2 and 3 settlements can be carried out more cost-effectively if less costly technologies are used in the rural areas. By increasing the use of single-phase distribution, the costs could be reduced by 10% in Class 2 and 3 settlements.
Class 4 settlements, which typically have a quite low energy demand, can often be electrified by means of a SWER system. The use of this technology offers not only 20-30% lower investment costs but also shorter construction time.
The Class 5 settlements can be electrified within a relatively short time by means of off-grid power supply systems, because procurement and construction time are often shorter than seen for conventional grid extension electrification projects.
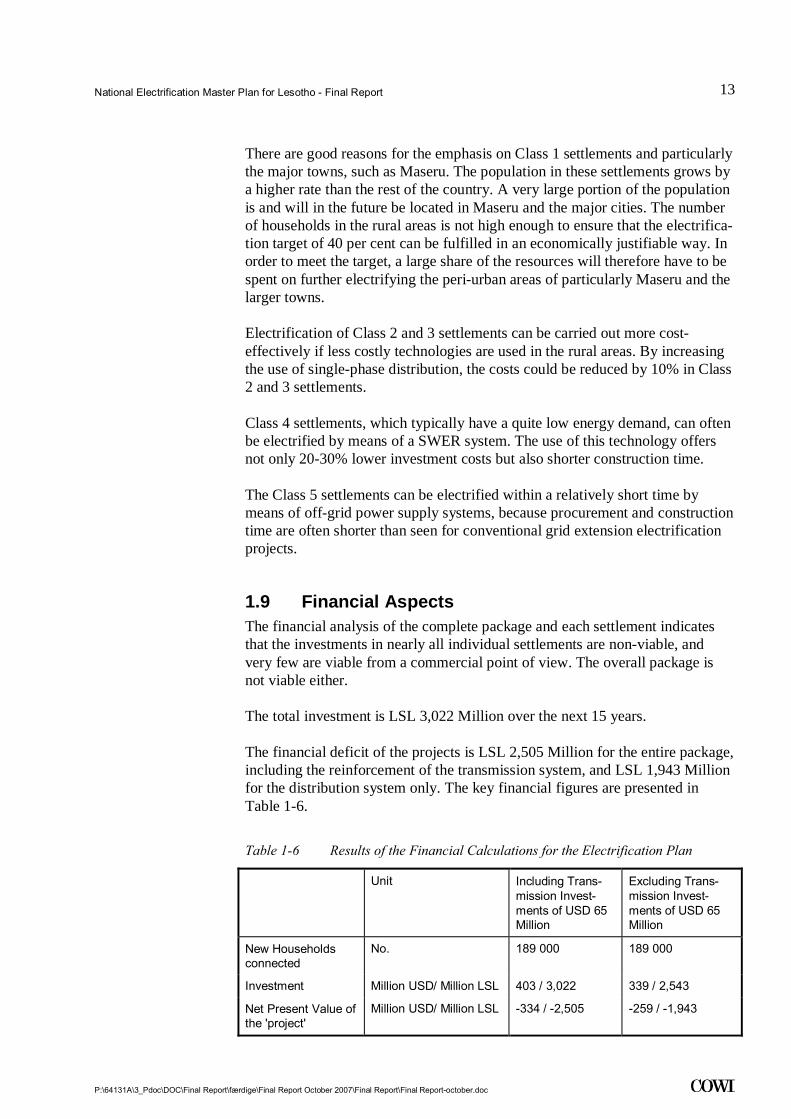
1.9 Financial Aspects The financial analysis of the complete package and each settlement indicates that the investments in nearly all individual settlements are non-viable, and very few are viable from a commercial point of view. The overall package is not viable either.
The total investment is LSL 3,022 Million over the next 15 years.
The financial deficit of the projects is LSL 2,505 Million for the entire package, including the reinforcement of the transmission system, and LSL 1,943 Million for the distribution system only. The key financial figures are presented in Table 1-6.
Table 1-6 Results of the Financial Calculations for the Electrification Plan
Unit Including Trans-mission Invest-ments of USD 65 Million
Excluding Trans-mission Invest-ments of USD 65 Million
New Households connected
No. 189 000 189 000
Investment Million USD/ Million LSL 403 / 3,022 339 / 2,543
Net Present Value of the 'project'
Million USD/ Million LSL -334 / -2,505 -259 / -1,943
National Electrification Master Plan for Lesotho - Final Report
P:\64131A\3_Pdoc\DOC\Final Report\færdige\Final Report October 2007\Final Report\Final Report-october.doc
14
.
Balance Price LSL/kWh 2.29 1.92
IRR % n.a. -9%
Subsidy Require-ment
LSL/kWh 1.58 1.20
Subsidy Require-ment (NPV)
Total Million LSL 2,505 1,943
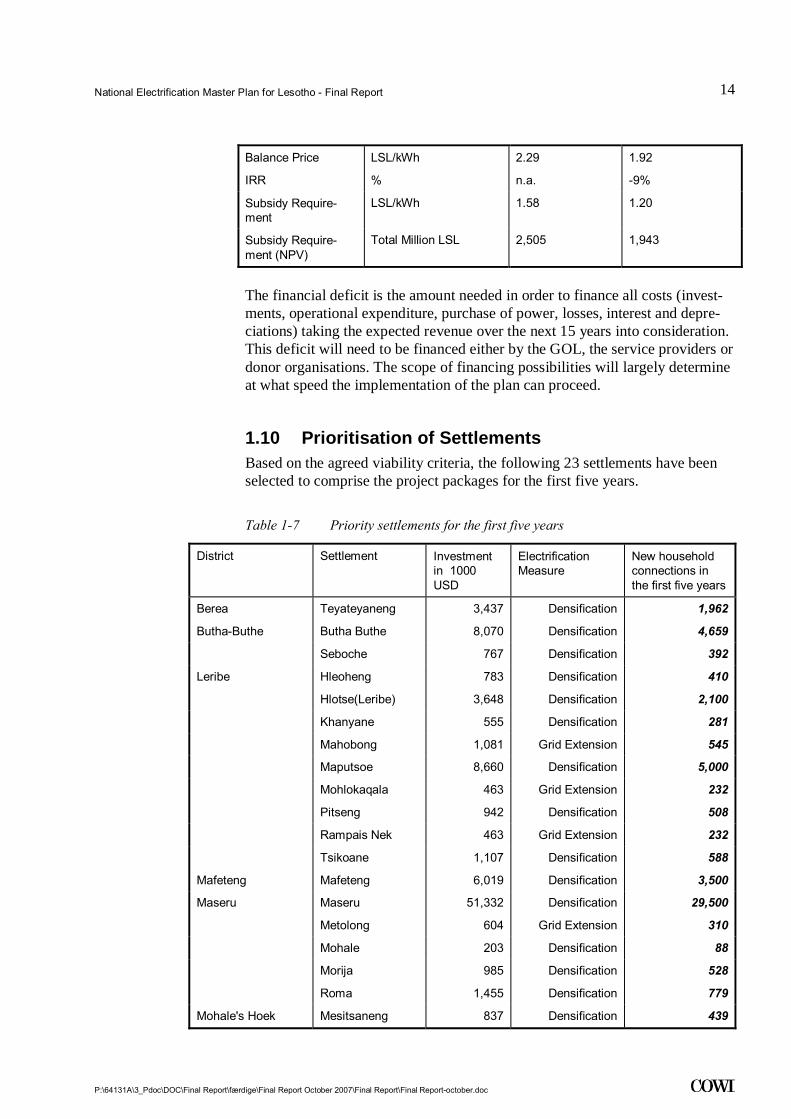
The financial deficit is the amount needed in order to finance all costs (invest-ments, operational expenditure, purchase of power, losses, interest and depre-ciations) taking the expected revenue over the next 15 years into consideration. This deficit will need to be financed either by the GOL, the service providers or donor organisations. The scope of financing possibilities will largely determine at what speed the implementation of the plan can proceed.
1.10 Prioritisation of Settlements Based on the agreed viability criteria, the following 23 settlements have been selected to comprise the project packages for the first five years.
Table 1-7 Priority settlements for the first five years
District Settlement Investment in 1000 USD
Electrification Measure
New household connections in the first five years
Berea Teyateyaneng 3,437 Densification 1,962
Butha-Buthe Butha Buthe 8,070 Densification 4,659
Seboche 767 Densification 392
Leribe Hleoheng 783 Densification 410
Hlotse(Leribe) 3,648 Densification 2,100
Khanyane 555 Densification 281
Mahobong 1,081 Grid Extension 545
Maputsoe 8,660 Densification 5,000
Mohlokaqala 463 Grid Extension 232
Pitseng 942 Densification 508
Rampais Nek 463 Grid Extension 232
Tsikoane 1,107 Densification 588
Mafeteng Mafeteng 6,019 Densification 3,500
Maseru Maseru 51,332 Densification 29,500
Metolong 604 Grid Extension 310
Mohale 203 Densification 88
Morija 985 Densification 528
Roma 1,455 Densification 779
Mohale's Hoek Mesitsaneng 837 Densification 439
National Electrification Master Plan for Lesotho - Final Report
P:\64131A\3_Pdoc\DOC\Final Report\færdige\Final Report October 2007\Final Report\Final Report-october.doc
15
.
District Settlement Investment in 1000 USD
Electrification Measure
New household connections in the first five years
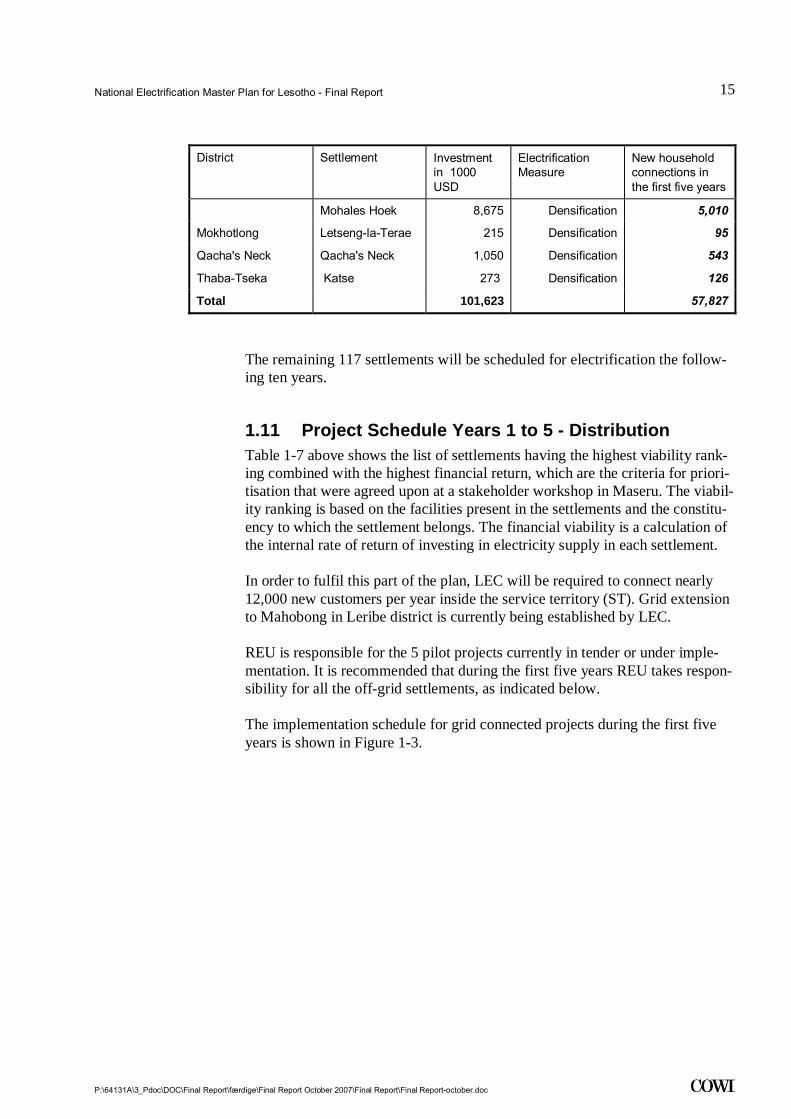
Mohales Hoek 8,675 Densification 5,010
Mokhotlong Letseng-la-Terae 215 Densification 95
Qacha's Neck Qacha's Neck 1,050 Densification 543
Thaba-Tseka Katse 273 Densification 126
Total 101,623 57,827
The remaining 117 settlements will be scheduled for electrification the follow-ing ten years.
1.11 Project Schedule Years 1 to 5 - Distribution Table 1-7 above shows the list of settlements having the highest viability rank-ing combined with the highest financial return, which are the criteria for priori-tisation that were agreed upon at a stakeholder workshop in Maseru. The viabil-ity ranking is based on the facilities present in the settlements and the constitu-ency to which the settlement belongs. The financial viability is a calculation of the internal rate of return of investing in electricity supply in each settlement.
In order to fulfil this part of the plan, LEC will be required to connect nearly 12,000 new customers per year inside the service territory (ST). Grid extension to Mahobong in Leribe district is currently being established by LEC.
REU is responsible for the 5 pilot projects currently in tender or under imple-mentation. It is recommended that during the first five years REU takes respon-sibility for all the off-grid settlements, as indicated below.
The implementation schedule for grid connected projects during the first five years is shown in Figure 1-3.

National Electrification Master Plan for Lesotho - Final Report
P:\64131A\3_Pdoc\DOC\Final Report\færdige\Final Report October 2007\Final Report\Final Report-october.doc
16
.
Figure 1-3 Implementation schedule for grid connection, years 1- 5 District Works Pack. Year 1 Year 2 Year 3 Year 4 Year 5
No. 1 2 3 4 1 2 3 4 1 2 3 4 1 2 3 4 1 2 3 4 Months
DesignTenderPre-constr.Works for: Pack.1 22
Berea Teyateyaneng 6.5Butha-Buthe Butha Buthe 15
Seboche 1.3DesignTenderPre-constr.Works for: Pack. 2 23
Leribe Hleoheng 1.4Hlotse(Leribe) 7Khanyane 0.9Mahobong 1.8Maputsoe 16.7DesignTenderPre-constr.Works for: Pack.3 17Mohlokaqala 0.8Pitseng 1.7Rampais Nek 0.8Tsikoane 2
Mafeteng Mafeteng 11.7DesignTenderPre-constr.Works for: Pack.4 56
Maseru Maseru 50DesignTenderPre-constr.Works for: Pack.5 24Metolong 1Mohale 0.3Morija 1.8Roma 2.6
Mohale's Hoek Mesitsaneng 1.5Mohales Hoek 16.7
Mokhotlong Letseng La Terai 0.3Qacha's Nek Qacha's Nek 1.8Katse Katse 0.5
The electrification projects are grouped following their geographic location. The proposed grouping is related to districts. Each of the five proposed project packages contains works for approximately 5-8,000 household connections, except Maseru, which contains approx. 31,000 house connections.
The works are expected to be finalised in year four, except for Maseru which will run in all five years. The number of connections in Maseru made in year five will increase in order to keep a stable overall number of new connections per year. The table below shows the sequence of these packages.
National Electrification Master Plan for Lesotho - Final Report
P:\64131A\3_Pdoc\DOC\Final Report\færdige\Final Report October 2007\Final Report\Final Report-october.doc
17
.
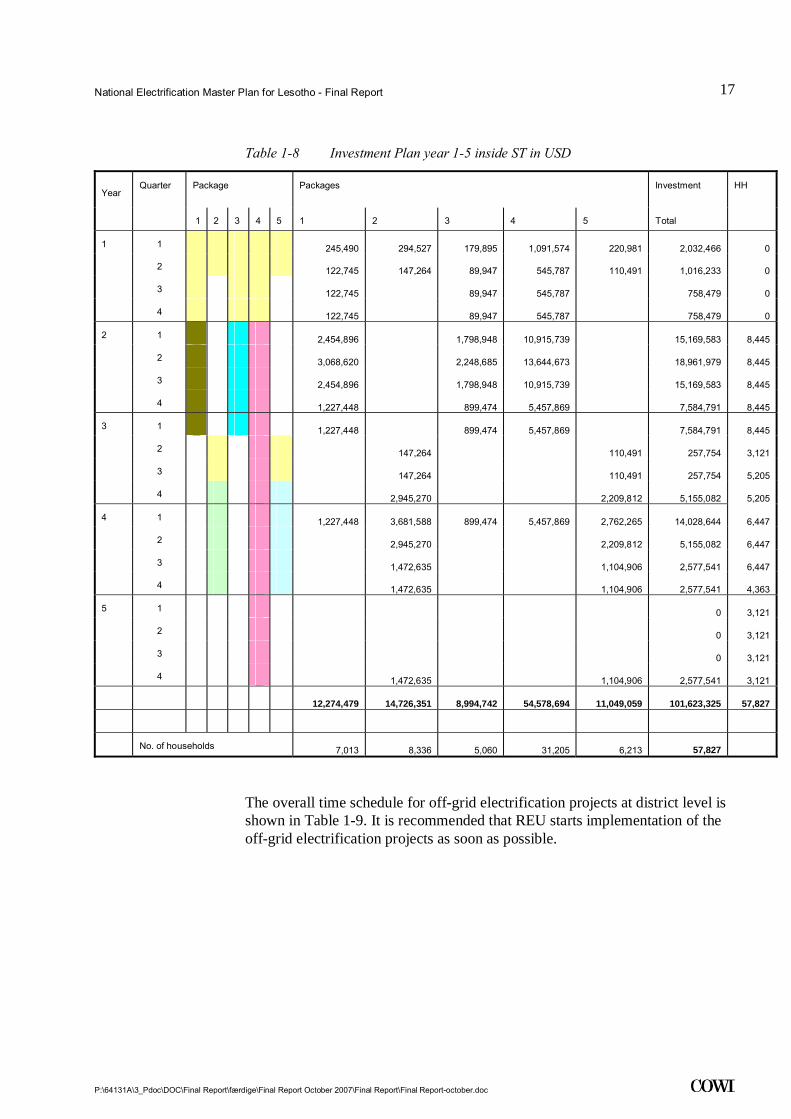
Table 1-8 Investment Plan year 1-5 inside ST in USD
Year Quarter Package Packages Investment HH
1 2 3 4 5 1 2 3 4 5 Total
1 1 245,490 294,527 179,895 1,091,574 220,981 2,032,466 0
2 122,745 147,264 89,947 545,787 110,491 1,016,233 0
3 122,745 89,947 545,787 758,479 0
4 122,745 89,947 545,787 758,479 0
2 1 2,454,896 1,798,948 10,915,739 15,169,583 8,445
2 3,068,620 2,248,685 13,644,673 18,961,979 8,445
3 2,454,896 1,798,948 10,915,739 15,169,583 8,445
4 1,227,448 899,474 5,457,869 7,584,791 8,445
3 1 1,227,448 899,474 5,457,869 7,584,791 8,445
2 147,264 110,491 257,754 3,121
3 147,264 110,491 257,754 5,205
4 2,945,270 2,209,812 5,155,082 5,205
4 1 1,227,448 3,681,588 899,474 5,457,869 2,762,265 14,028,644 6,447
2 2,945,270 2,209,812 5,155,082 6,447
3 1,472,635 1,104,906 2,577,541 6,447
4 1,472,635 1,104,906 2,577,541 4,363
5 1 0 3,121
2 0 3,121
3 0 3,121
4 1,472,635 1,104,906 2,577,541 3,121
12,274,479 14,726,351 8,994,742 54,578,694 11,049,059 101,623,325 57,827
No. of households 7,013 8,336 5,060 31,205 6,213 57,827
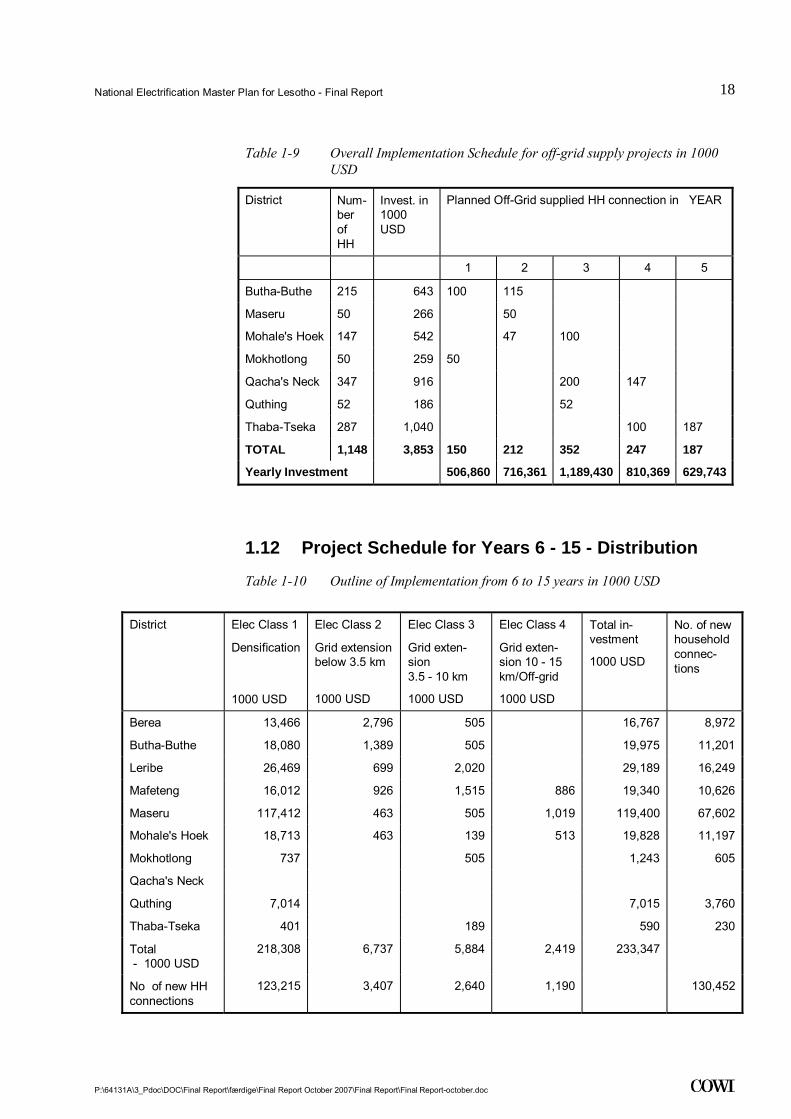
The overall time schedule for off-grid electrification projects at district level is shown in Table 1-9. It is recommended that REU starts implementation of the off-grid electrification projects as soon as possible.
National Electrification Master Plan for Lesotho - Final Report
P:\64131A\3_Pdoc\DOC\Final Report\færdige\Final Report October 2007\Final Report\Final Report-october.doc
18
.
Table 1-9 Overall Implementation Schedule for off-grid supply projects in 1000 USD
District Num-ber of HH
Invest. in 1000 USD
Planned Off-Grid supplied HH connection in YEAR
1 2 3 4 5
Butha-Buthe 215 643 100 115
Maseru 50 266 50
Mohale's Hoek 147 542 47 100
Mokhotlong 50 259 50
Qacha's Neck 347 916 200 147
Quthing 52 186 52
Thaba-Tseka 287 1,040 100 187
TOTAL 1,148 3,853 150 212 352 247 187
Yearly Investment 506,860 716,361 1,189,430 810,369 629,743
1.12 Project Schedule for Years 6 - 15 - Distribution
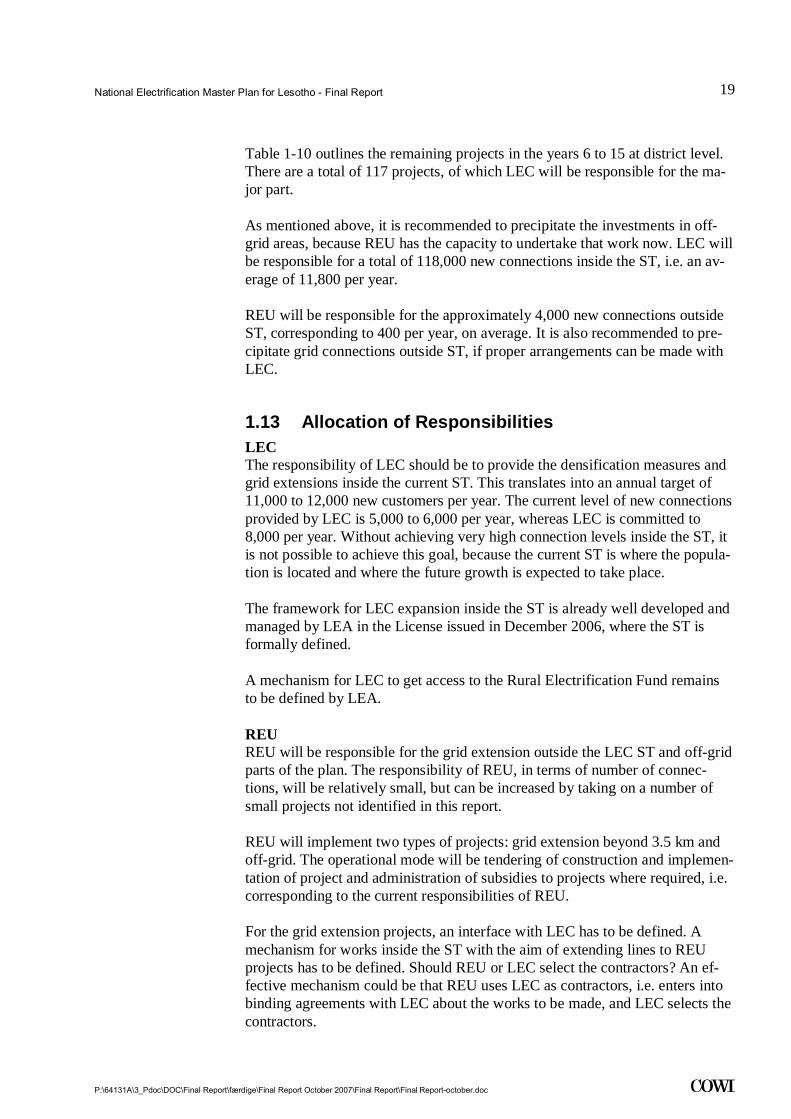
Table 1-10 Outline of Implementation from 6 to 15 years in 1000 USD
District Elec Class 1
Densification
1000 USD
Elec Class 2
Grid extensionbelow 3.5 km
1000 USD
Elec Class 3
Grid exten-sion 3.5 - 10 km
1000 USD
Elec Class 4
Grid exten-sion 10 - 15 km/Off-grid
1000 USD
Total in-vestment
1000 USD
No. of new household connec-tions
Berea 13,466 2,796 505 16,767 8,972
Butha-Buthe 18,080 1,389 505 19,975 11,201
Leribe 26,469 699 2,020 29,189 16,249
Mafeteng 16,012 926 1,515 886 19,340 10,626
Maseru 117,412 463 505 1,019 119,400 67,602
Mohale's Hoek 18,713 463 139 513 19,828 11,197
Mokhotlong 737 505 1,243 605
Qacha's Neck
Quthing 7,014 7,015 3,760
Thaba-Tseka 401 189 590 230
Total - 1000 USD
218,308 6,737 5,884 2,419 233,347
No of new HH connections
123,215 3,407 2,640 1,190 130,452
National Electrification Master Plan for Lesotho - Final Report
P:\64131A\3_Pdoc\DOC\Final Report\færdige\Final Report October 2007\Final Report\Final Report-october.doc
19
.
Table 1-10 outlines the remaining projects in the years 6 to 15 at district level. There are a total of 117 projects, of which LEC will be responsible for the ma-jor part.
As mentioned above, it is recommended to precipitate the investments in off-grid areas, because REU has the capacity to undertake that work now. LEC will be responsible for a total of 118,000 new connections inside the ST, i.e. an av-erage of 11,800 per year.
REU will be responsible for the approximately 4,000 new connections outside ST, corresponding to 400 per year, on average. It is also recommended to pre-cipitate grid connections outside ST, if proper arrangements can be made with LEC.
1.13 Allocation of Responsibilities LEC The responsibility of LEC should be to provide the densification measures and grid extensions inside the current ST. This translates into an annual target of 11,000 to 12,000 new customers per year. The current level of new connections provided by LEC is 5,000 to 6,000 per year, whereas LEC is committed to 8,000 per year. Without achieving very high connection levels inside the ST, it is not possible to achieve this goal, because the current ST is where the popula-tion is located and where the future growth is expected to take place.
The framework for LEC expansion inside the ST is already well developed and managed by LEA in the License issued in December 2006, where the ST is formally defined.
A mechanism for LEC to get access to the Rural Electrification Fund remains to be defined by LEA.
REU REU will be responsible for the grid extension outside the LEC ST and off-grid parts of the plan. The responsibility of REU, in terms of number of connec-tions, will be relatively small, but can be increased by taking on a number of small projects not identified in this report.
REU will implement two types of projects: grid extension beyond 3.5 km and off-grid. The operational mode will be tendering of construction and implemen-tation of project and administration of subsidies to projects where required, i.e. corresponding to the current responsibilities of REU.
For the grid extension projects, an interface with LEC has to be defined. A mechanism for works inside the ST with the aim of extending lines to REU projects has to be defined. Should REU or LEC select the contractors? An ef-fective mechanism could be that REU uses LEC as contractors, i.e. enters into binding agreements with LEC about the works to be made, and LEC selects the contractors.
National Electrification Master Plan for Lesotho - Final Report
P:\64131A\3_Pdoc\DOC\Final Report\færdige\Final Report October 2007\Final Report\Final Report-october.doc
20
.
Power Purchase Agreements (PPA) and points of metering have to be consid-ered in the case of grid extension projects. One option is that the operators/REU go into contractual relationships with LEC on a case-to-case basis and LEA in each case approves the PPA. Another option would be that LEC defines tariffs for bulk supply, which are regulated by LEA. Finally, there is also the option that LEC defines tariffs for transportation and supplies at various voltage lev-els, again regulated by LEA. The main issue is that it is important that the regu-lator ensures a stable and lasting set of agreements which are secure and trans-parent for the operators/investors.
REU should also administer applications from villages that, based on their own initiative, have provided a basis for grid extension or off-grid supply. For in-stance in cases where the CCA or other local operators have made the prepara-tions for electrification of one of more areas, but subsidies are required.
Further, it could be considered whether REU should be responsible for supply-ing individual solutions, i.e. SPV/Gen-sets, inside ST. During the next 10 years, there will still be many villages/settlements left without grid supply, and it makes sense to make an authority responsible for the existence of credible al-ternatives for these households until the grid is extended.
1.13.2 Private Sector The overall capacity needs to be increased significantly in the short term by using foreign contractors and in the longer term by education and training of Basotho technicians and engineers.
One way of increasing the capacity and keeping the benefits inside Lesotho is to select Basotho consultants and contractors. The problem in Lesotho is that there are only few local consultants and few contractors. It is important that the Basotho private sector is strengthened in terms of numbers of staff/companies and capacity. In the longer term, the scope of maintenance work on electrical supply systems will increase significantly, and LEC will also require external capacity to cope with the upkeep. As a result of the NEMP, the room for the private sector will increase dramatically, and strategies to ensure that the local private sector is capable of assisting and benefiting from this development are necessary.
International Competitive Bidding (ICB) disadvantages the local expertise, be-cause it not always results in transfer of skills. Experience shows that external contractors/consultants may yield expected results, but the method is not effec-tive for transfer of skills. Adoption of partnership models will result in an effec-tive capacity building in the Basotho community. Partnerships between Baso-tho and foreign companies should be encouraged, and advantage should be given to partnerships with local firms in the tender evaluation criteria.
It is highly desirable that the design of new extensions and supply systems are made by local consultants. In order to ensure that the projects are implemented, a mixture of ICB and Local Competitive Bidding (LCB) is recommended. Tar-
National Electrification Master Plan for Lesotho - Final Report
P:\64131A\3_Pdoc\DOC\Final Report\færdige\Final Report October 2007\Final Report\Final Report-october.doc
21
.
gets and indicators for Basotho participation should be developed and moni-tored. It is recommended to allocate 80% of the design Basotho consultants, and a mix of ICB and LCB should be used in contracting the actual implemen-tation.
1.14 Future Service Models for Electricity Supply It is the formulated goal of the government to promote competition and effi-ciency in power distribution by involving the private sector and Local Govern-ment more in operation of utilities. Until recently, LEC was the only supplier in the country, and therefore there is only limited experience of involving other players.
Due to the low viability and low ability to pay among the Basotho households, power distribution is only attractive, if investors are guaranteed access to large institutional/commercial/industrial customers. Therefore, a system of conces-sions in order to provide some security for the investments is required. The Consultant recommends investigating a concession model with four sustainable areas as soon as possible. The four areas could be the districts of Mokhotlong, Qacha's Neck, Mohales Hoek and Thaba-Theka.
Outside the Service Territories, the Consultant recommends a "lease and trans-fer model", which has already been proposed as a suitable solution for Lesotho, where private operators lease the generation/distribution facilities from the Government (REU) for a specific period of time. The Government provides the assets for the operators against a fee. In the long run, this system will also en-able the Government to involve the Local Government actively in the power supply. REU could play an important role in capacitating and supporting the Local Government in this effort.
For the individual solutions (SHS and SPV), a number of options for involving the private sector exist. These are currently being tested by REU.
1.15 Tariffs and Connection Fee The Consultant recommends the connection fee to be lowered to a maximum level of 500 LSL, because the current connection fee seems to be an important barrier for increasing the connection level in Lesotho.
The current method of setting tariffs is based on LRMC, and tariffs are cost-reflective. The advantage of cost-reflective tariffs is that the LEC will obtain the resources to support and maintain the current and new system from its reve-nue, and therefore can operate on commercial conditions without any direct subsidies. Instead, subsidies, where needed, are provided directly to projects on a case-to-case basis, or directly to the customers. The Consultant strongly sup-ports this approach to tariff setting.
Collection and billing by LEC consist mainly of pre-payment that basically works well, i.e. limits the commercial losses - it is, however expensive in in-
National Electrification Master Plan for Lesotho - Final Report
P:\64131A\3_Pdoc\DOC\Final Report\færdige\Final Report October 2007\Final Report\Final Report-october.doc
22
.
vestment and require a certain volume of customers. The conditions of the fu-ture electrification areas are different from the existing areas, and with lower population and lower average demand, the cost of the system will increase. Therefore, ideas of using simpler and less expensive metering systems are re-quired.
The following methods have been used with success in other countries in terms of accelerating connection levels:
• Paying a premium to existing consumers who get new consumers to con-nect;
• Financing the connection of new consumers over the electricity bill (dis-tribute the payment of connection fee plus interest over 10 years);
• Financing of internal house wiring and basic appliance packages;
• Extending the network to a village only if 70% of the potential consumers will connect and pay in advance;
• Giving introduction discounts or connection discounts, which decrease over a period, so that it is cheapest to connect at the beginning;
• Providing discount in selected areas in 3-month to one-year campaigns;
• Using a system of differentiated tariffs according to quality, for instance introducing a special low tariff for power supply to a basic 5 A installation with a load limiter, instead of a meter. This is suitable for households with limited ability to pay and limited power requirements.
1.16 Subsidies It is clearly demonstrated in the financial analysis, that a subsidy is required to achieve the aims of the NEMP. In most cases, when analysing the individual settlement, the subsidy requirement exceeds the capital investment, i.e. there is also a need for subsidies on operational costs.
Special funding mechanisms therefore need to be put in place (levies, fiscal al-locations, donor funds, Output-based Aid), consolidated in a rural electrifica-tion fund, and linked to electrification planning with a transparent fund alloca-tion process.
The pricing system needs to accommodate tariffs that are affordable for poor households, yet also sustainable for the electricity supply industry and the gov-ernment budget, e.g. through cross-subsidization from large consumers. The pricing system for poor households also needs to be targeted - this can be done through restricting lifeline or social tariffs to those consumers who consume less than 50 kWh per month, or they could be targeted to consumers who accept current-limited supply systems or pre-paid systems, provided these are proxies for poverty.

National Electrification Master Plan for Lesotho - Final Report
P:\64131A\3_Pdoc\DOC\Final Report\færdige\Final Report October 2007\Final Report\Final Report-october.doc
23
.
1.17 Institutional Development and Training A training needs assessment of four institutions, DOE, LEC, REU and LEA was made as part of the NEMP, focusing on the skills needed for monitoring and implementation of the NEMP. It is assessed that approximately LSL 4 Mil-lion should be allocated annually for training and institutional development over the 15-year period.
Only at the end of the period would it be relevant to include the Local Govern-ment into the programme due to their focus on other tasks in the coming 10 to 15 years.
1.18 Monitoring and Evaluation Framework National/ Central Requirement The NEMP provides indicators for monitoring electrification progress and im-pact in Lesotho, i.e. number of households electrified at national and district level. This information should be collected for monitoring at monthly or quar-terly intervals.
The key provider of data will be LEC, which must operate its customer data-base so that detailed customer data can be provided on a regular basis. All other future service providers (including REU) should also be required to submit data on the number and types of connections achieved over a given period of time.
National monitoring should focus on the extent to which the targets of the NEMP are fulfilled. This implies comparing coverage records with national population trends to derive the percentage served. It is important that this is done by settlement type as the population growth rates will differ significantly according to type. The BOS should provide population updates on an annual basis, based on the 2006 census data. They should also be used to improve the accuracy of the data on the population and the number of households for the base year (2005).
At the national level, it is important to monitor the extent to which the provi-sion of electricity contributes to the Poverty Reduction Strategy of the Gov-ernment, in particular the extent to which new jobs are created and education and health services are improved. The key objective here will be to look at the long-term benefits or outcomes of electrification.
Ministry/ Sector At the sector level, indicators for the impact of rural electrification on the use of other sources of energy and the environment need to be identified. Of particular importance will be the environmental data about use of wood and scrubs. In addition, indicators measuring the effect on business in rural centres, effect on development of institutions and effects on schools should be established. It will be necessary to carry out regular surveys to collect this information and this need to be budgeted for by sector institutions.

National Electrification Master Plan for Lesotho - Final Report
P:\64131A\3_Pdoc\DOC\Final Report\færdige\Final Report October 2007\Final Report\Final Report-october.doc
24
.
Strategic/ Corporate level (LEC / REU) At this level, the focus will primarily be on matching resources requirements with demand. Demand estimates will have to be revised on a regular basis, par-ticularly if any adjustments are made to tariffs or connection fees. National economic trends, notably employment, should also be monitored as these will have a major influence on the demand.
Indicators will address the extent to which funding and human resources are made available to meet demand. Progress and efficiency indicators will include coverage by district and constituency and degree to which these are achieved within the estimated NEMP budget.
Planning/ Operational Level (LEC / REU) Indicators should cover both implementation and impact/results, and include number of projects, costing, implementation schedules and performance indica-tors.
Project Level Individual project indicators will deal with inputs, outputs, implementation tar-gets, and milestones.
District Level At district level, key indicators will address:
• Number and percentage of households with electricity;
• Number and percentage of villages/towns with electricity;
• Presence of schemes in the district;
• Local representation in institutions in charge of electricity services in the district etc;
• Amounts collected by schemes;
• Total funds generated for electrification.
Communities/ Consumers At the community levels/ service recipient’s key indicators will include:
• Number of applications;
• Processing time for applications;
• Number of applications approved;
• Time between approval and contractor starting;
• Time between payment and construction; construction and connection.
At consumer level, citizen report cards could be used to measure consumer per-ceptions of service efficiency, for example number of power cuts or surges, speed of response and response efficiency, cost of power cuts (inconveniences).
National Electrification Master Plan for Lesotho - Final Report
P:\64131A\3_Pdoc\DOC\Final Report\færdige\Final Report October 2007\Final Report\Final Report-october.doc
25
.
Institutional Arrangements The responsibility for monitoring and evaluation of the electricity sector is rec-ommended to continue to lie with the LEA. The LEA will probably need to es-tablish an M&E unit. Different types of monitoring will need to be undertaken using different or a mix of methodologies. Although some of these activities will probably be sub-contracted to private expertise, some capacity building for the M&E Unit should be foreseen.
Institutionally, the monitoring and evaluation role of LEA will be performed through a number of structures. In particular, the Rural Electrification Unit will advise the Board through an Advisory Committee on Rural Electrification. Among other things, the Advisory Committee will advise on implementation of the Electrification Master Plan and monitoring of projects. Membership of the Board of the proposed National Electrification Fund and the participation in planning of the electrification policy will provide further tools for LEA to fulfil its mandate.
LEA expects the monitoring and evaluation function to be housed in one of the departments, possibly the Technical Department or the Economics Department. In this way, the Authority will play a very active role in the overall M&E of the NEMP.
At the national level, the Lesotho Electricity Company will be the major im-plementing agency and data provider, while the Rural Electrification Unit (Agency) will also take responsibility for M&E of the rural electrification pro-gramme, and may require a unit for M&E, as well as a related programme of capacity building.
1.19 Environmental Issues Impact and Mitigation Major constructions should be avoided in protected areas. Lesotho has few and small national parks and protected areas. A new protected area along the north-eastern border is under development, and parts of this will be protected as re-serves.
It is a prerequisite for tourism that electricity is available, but large pylons and power lines can be a sore to the eye. In tourism development areas, special care must be taken to either avoid (high tension) transmission lines or to be very careful with the blending into the landscape.
In the sandstone areas, it is a good idea to screen for archaeological finds, rock paintings etc. before constructing new alignments in order to avoid delays when inspections and possible excavation are taking place.
Lesotho houses a number of rare animal species; some of these are legally pro-tected. Most of the species occur in the highlands where the impact from people is the least. One species of fish is not protected by the law but is only found in
National Electrification Master Plan for Lesotho - Final Report
P:\64131A\3_Pdoc\DOC\Final Report\færdige\Final Report October 2007\Final Report\Final Report-october.doc
26
.
Lesotho in the upper parts of the Orange River. The construction of a dam here must be avoided.
The Wetlands attract large (protected) species of birds that are especially prone to collisions with power lines.
Impact from Distribution and Transmission Lines The same houses that benefit from having electricity will also experience a number of disadvantages, such as loss of small tracts of land for pylons, risk of lightning and health hazards. Most of these can be ameliorated through a careful planning of the pylons and raising of awareness.
The pylons for the transmission networks are galvanized with zinc, which also contains elements of heavy metals. Lead and cadmium will normally leak in quantities that might damage aquatic life. Pylons must be avoided in the wetlands.
The negative impacts of the proposed transmission lines are caused during the construction phase when surface areas become exposed due to vegetation clear-ing, and this may in turn give rise to erosion. Clearing of vegetation from the site, access roads and tower pads may also give rise to negative impacts.
Un-insulated overhead lines are more prone to lightning strikes and short-circuit incidents than insulated overhead lines. Insulated overhead lines should be used in areas of Lesotho that are known to be prone to lightning strikes, as well as to ensure a more reliable energy supply.
Potential sources of waste include lead acid batteries that are used particularly in the rural areas to power televisions, video casette players, radios and satellite systems. The appropriate disposal of spent lead acid batteries is a potential impact as Lesotho does not currently have a registered hazardous waste disposal facility.
The use of diesel generators gives rise to spent oil, the disposal of which is regarded as problematic as there are no companies in Lesotho recycling used oil.
National Electrification Master Plan for Lesotho - Final Report
P:\64131A\3_Pdoc\DOC\Final Report\færdige\Final Report October 2007\Final Report\Final Report-october.doc
27
.
2 Introduction The objective of this National Electrification Master Plan Study is to provide clear guidelines and establish priorities for providing access to electricity in Lesotho in a co-ordinated and cost-effective manner, which will enable the Government of Lesotho (GOL) to meet its electrification targets in particular, and rural development goals in general.
The plan provides prioritised electrification schedules that indicate the annual number of connections to be made and systems to be installed, as well as cost.
The contract for preparing the National Electrification Master Plan (NEMP) has been granted to COWI A/S, Denmark, in association with Sechaba Consultants of Lesotho. The contract was carried out from 1 July 2006 to 15 March 2007 and was extended to 31 July 2007.
The NEMP has been organised in three distinct steps:
• STEP 1: Inception;
• STEP 2: Electricity Master Planning;
• STEP 3: Electricity Master Plan Implementation Strategy.
This Final Report captures the results of all three steps of the study.
2.1 Electrification Target for Lesotho The overall electrification target for Lesotho is a minimum of 35% by 2015 and 40% by 2020. The target is defined as the number of households actually con-nected to the grid or supplied by off-grid means (e.g. hydro/diesel mini-grid or PV solar home systems).
While awaiting the results of the 2006 census, estimates based on current in-formation have been used to estimate the number of households in Lesotho to-wards 2020 and the targeted number of electrified households, when meeting the Government's electrification targets.
National Electrification Master Plan for Lesotho - Final Report
P:\64131A\3_Pdoc\DOC\Final Report\færdige\Final Report October 2007\Final Report\Final Report-october.doc
28
.
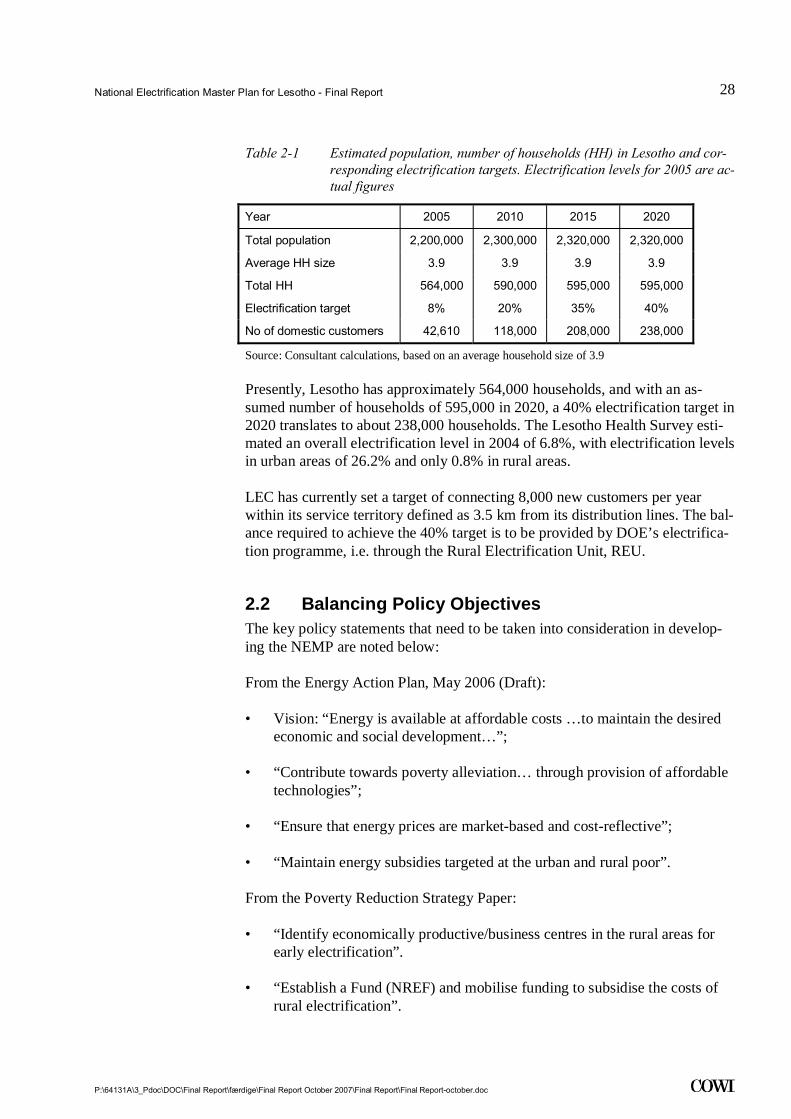
Table 2-1 Estimated population, number of households (HH) in Lesotho and cor-responding electrification targets. Electrification levels for 2005 are ac-tual figures
Year 2005 2010 2015 2020
Total population 2,200,000 2,300,000 2,320,000 2,320,000
Average HH size 3.9 3.9 3.9 3.9
Total HH 564,000 590,000 595,000 595,000
Electrification target 8% 20% 35% 40%
No of domestic customers 42,610 118,000 208,000 238,000
Source: Consultant calculations, based on an average household size of 3.9
Presently, Lesotho has approximately 564,000 households, and with an as-sumed number of households of 595,000 in 2020, a 40% electrification target in 2020 translates to about 238,000 households. The Lesotho Health Survey esti-mated an overall electrification level in 2004 of 6.8%, with electrification levels in urban areas of 26.2% and only 0.8% in rural areas.
LEC has currently set a target of connecting 8,000 new customers per year within its service territory defined as 3.5 km from its distribution lines. The bal-ance required to achieve the 40% target is to be provided by DOE’s electrifica-tion programme, i.e. through the Rural Electrification Unit, REU.
2.2 Balancing Policy Objectives The key policy statements that need to be taken into consideration in develop-ing the NEMP are noted below:
From the Energy Action Plan, May 2006 (Draft):
• Vision: “Energy is available at affordable costs …to maintain the desired economic and social development…”;
• “Contribute towards poverty alleviation… through provision of affordable technologies”;
• “Ensure that energy prices are market-based and cost-reflective”;
• “Maintain energy subsidies targeted at the urban and rural poor”.
From the Poverty Reduction Strategy Paper:
• “Identify economically productive/business centres in the rural areas for early electrification”.
• “Establish a Fund (NREF) and mobilise funding to subsidise the costs of rural electrification”.

National Electrification Master Plan for Lesotho - Final Report
P:\64131A\3_Pdoc\DOC\Final Report\færdige\Final Report October 2007\Final Report\Final Report-october.doc
29
.
As can be seen from the above, there is a trade-off between provision of mar-ket-based/least cost and cost-reflective services (demand-driven, by those able to pay) and services that can be afforded by the poor (i.e. subsidized, targeting the poor) and that sustain social development. The selection criteria for new areas to be electrified will have to reflect these different policy objectives to achieve a balanced approach to service provision.
2.3 Planning Criteria and Approach
2.3.1 Current LEC Practice Traditionally, the criterion for a community to be considered for electrification by LEC is the creation of a “scheme” (an organised group of potential custom-ers) and a registration of this with LEC.
The priority of the schemes is then primarily made according to the estimated average cost per connection, but is often subject to inexplicit political priorities. The ranking is determined by the distance to the grid connection point, the number of scheme members and the amount of funds collected from scheme members. Ability and willingness-to-pay assessments are sometimes made by LEC to determine the group’s financial viability. Thus, the approach is based on a mix of the cost of the scheme, the number of potential customers and the ability of the scheme members to pay.
2.3.2 Approach of Other Planning Projects In the Lesotho Lowlands Water Supply Feasibility Study, LLWSFS, a cluster approach was used to identify viable areas for supply. The cluster approach means that instead of taking the village name as a point of departure, an effort was made to group minor villages situated within short distances (less than 1 km) of each other into a cluster of min. 2,500 inhabitants.
The clusters were identified in eight zones in the Lowlands and indicated on maps. The approach was later accepted for telecommunications development planning and extended to cover also the Highlands.
The villages or clusters of villages were then classified according to the Na-tional Settlement Plan into 6 settlement types: Capital city, industrial towns, large “institutional” towns, medium-sized settlements, large villages and small villages, each with different expectations regarding population growth.
The study, Access to Electricity (2001), used a large number of socio-economic variables for the ranking of settlements for electrification that were more than 10 km from LEC distribution lines. The point score was used to select five elec-trification pilot projects to test different approaches to rural electrification. Al-though surveys were carried out on indications of ability and willingness to pay, this did not form part of the selection criteria.
National Electrification Master Plan for Lesotho - Final Report
P:\64131A\3_Pdoc\DOC\Final Report\færdige\Final Report October 2007\Final Report\Final Report-october.doc
30
.
A similar approach, used for the Telecommunications Demand Study (2004), was to establish a number of viability criteria that also included criteria on in-come levels and business potential. The criteria used were:
• Population density;
• Proportion of area within 5 km of electricity line;
• Proportion of area within 5 km of a road;
• Number of registered businesses;
• Services, such as schools, clinics and police stations;
• Average income per household per month.
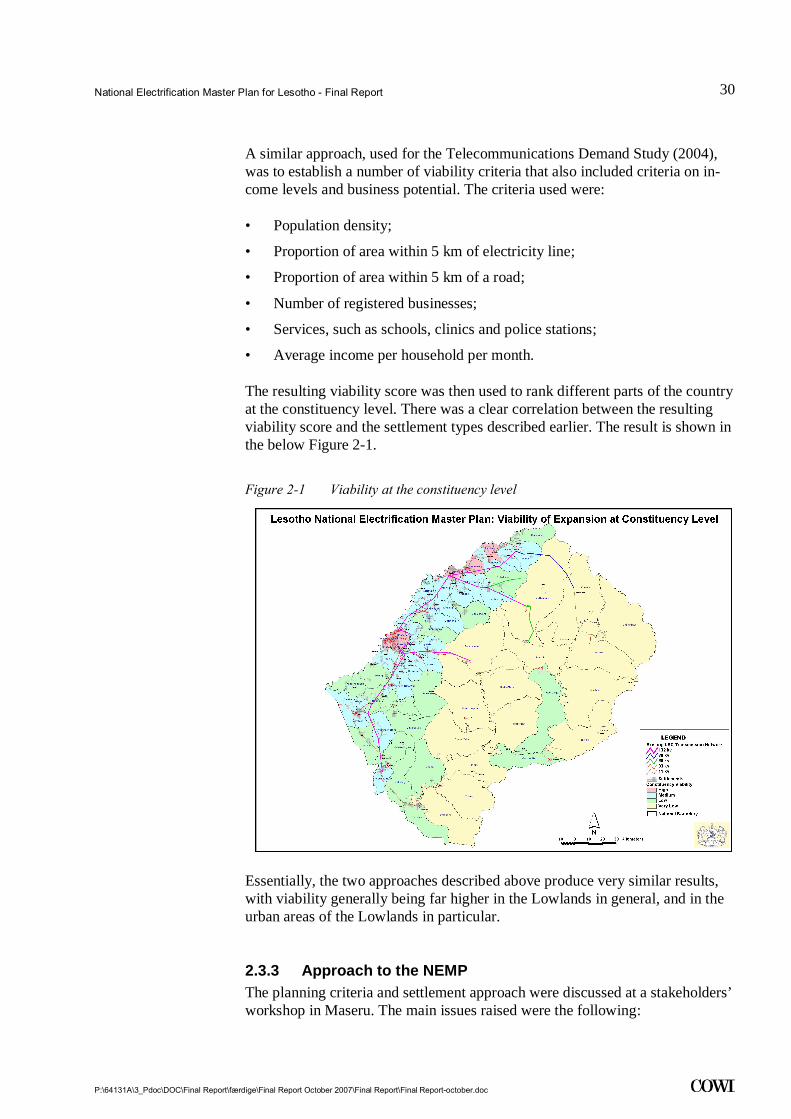
The resulting viability score was then used to rank different parts of the country at the constituency level. There was a clear correlation between the resulting viability score and the settlement types described earlier. The result is shown in the below Figure 2-1.
Figure 2-1 Viability at the constituency level
Essentially, the two approaches described above produce very similar results, with viability generally being far higher in the Lowlands in general, and in the urban areas of the Lowlands in particular.
2.3.3 Approach to the NEMP The planning criteria and settlement approach were discussed at a stakeholders’ workshop in Maseru. The main issues raised were the following:
National Electrification Master Plan for Lesotho - Final Report
P:\64131A\3_Pdoc\DOC\Final Report\færdige\Final Report October 2007\Final Report\Final Report-october.doc
31
.
Selection Criteria It was stressed that the plan is a national plan, meaning that a settlement falling within or outside the service territory of LEC should not be a criterion for se-lection.
Several participants stressed that the electrification plan should contribute to economic development in general and income generation in the rural areas in particular. Focus should therefore be on criteria, such as the existence of private sector development opportunities, e.g. mining, tourism and agriculture. The number of registered businesses in a settlement area could be an indicator for this.
The national development plan should be consulted to identify plans for new activities.
A special issue to be looked at was resettled communities, as these are normally not indicated on maps, but have funds for infrastructure development, such as electrification.
Planning Assumptions It is important that electrification contributes to the creation of wealth, espe-cially in the rural areas. The planning should take potential for productive uses into account as an important parameter in the planning, e.g. the presence of other infrastructure, such as roads, telecommunication and water.
Design and Standards The current practice of LEC only to offer 20 and 60 A underground connec-tions does not provide future consumers with the possibility of choosing a cheaper solution. If people were provided with the choice of a cheaper connec-tion, such as 10 A, overhead connection, ready-board, more people would be able to afford the connection charges.
Other Issues Raised Environmental considerations should be made upfront. A strategic environ-mental impact assessment of the electrification plan is programmed and would deal with both placement of electricity lines (sensitive areas, proximity to houses, etc.) and assessment of production facilities (hydro dams, generators).
2.3.4 Conclusions The discussion above of the various factors that need to be taken into consid-eration in developing the Master Plan suggests that a new approach is needed, which is not purely demand-driven and takes into consideration social criteria without being driven solely by development requirements (balance).
For the sake of cost effectiveness, it is important to optimize the uptake (get as many customers at the lowest costs). For this reason, the ‘cluster approach’ to scheme choice is proposed, in which small settlements situated close to each other are grouped into “clusters”. Chapter 4.1 presents the cluster approach in
National Electrification Master Plan for Lesotho - Final Report
P:\64131A\3_Pdoc\DOC\Final Report\færdige\Final Report October 2007\Final Report\Final Report-october.doc
32
.
more detail. Each settlement or cluster of settlements of a certain size has been analysed and recommendations made on how it should be served, taking into consideration population, settlement type, social services, levels of poverty and distance from the grid. These issues are described further in Chapters 6 and 7.
The NEMP has taken the ranking of viability of the constituencies as a starting point for the settlement analysis. Priority is therefore given to the more devel-oped settlement types that are unconnected at present, as well as to reaching existing schemes registered with LEC, especially in cases where payments have already been made. The refining of the proposed sequencing of electrifying the settlements of Lesotho is based on an analysis of the future electricity demand of each settlement, technical considerations and cost as well as a financial analysis. The ranking is therefore both based on economic and social criteria, with emphasis on the potential for economic development.
There are a number of settlements that are already served with electricity, but where only few households have been connected to the grid. The potential for densification of these underserved electrified settlements is clear and should be concurrent with the grid extension to new areas.
2.4 Report Structure and Terminology
2.4.1 Reporting The reporting of this NEMP study allows for five major reports:
1 Inception Report: Captured the results of STEP 1 of the project with the main outputs being an agreement on the planning criteria, the need for fur-ther socio-economic surveys and the further process. A detailed work plan for the completion of the project was included, serving as the basis for the entire project.
2 Electrification Master Planning Report: Captured the results of STEP 2 with the main outputs being: A national load forecast, design of electrical systems, selection of and prioritisation of settlements, investment schedule for 15 years, financial analysis, assessment of future delivery systems and environmental analysis.
3 Implementation Strategy Report: Captured the outcomes of STEP 3 and includes a project schedule for 15 years and details from the first five years as well as recommendations for a monitoring and evaluation framework for the project implementation.
4 Stakeholder Consultation Report: Captured the outcome of Stakeholder Consultations undertaken in Maseru from 11 to 14 June 2007.
5 Final Report: This report, which summarises the results of the master planning process.

National Electrification Master Plan for Lesotho - Final Report
P:\64131A\3_Pdoc\DOC\Final Report\færdige\Final Report October 2007\Final Report\Final Report-october.doc
33
.
During the project, a number of Working Papers have been issued. A list of the Working Papers can be found in Appendix 1.
2.4.2 Terminology Used In this report, “up-take levels” and “connection levels” are used interchangea-bly, referring to the number of electrified households in an area or settlement in relation to the total number of households in the same area. At national level, this translates into the share of all households in Lesotho using electricity sup-plied from the electricity mains, a generator or solar panels for their electricity needs (thus excluding households using car batteries for television or lighting or small batteries for radio cassettes, etc).
The electrification level refers to the share of households using electricity as their main source of lighting. It should the noted that the Government’s electri-fication target is not defined as access to supply, but as actually connected households.
All cost and prices items are provided in fixed 2006 prices.
National Electrification Master Plan for Lesotho - Final Report
P:\64131A\3_Pdoc\DOC\Final Report\færdige\Final Report October 2007\Final Report\Final Report-october.doc
34
.
3 Background
3.1 Context Lesotho is a small, mountainous, landlocked country covering an area of ap-proximately 33,000 square kilometres entirely surrounded by the Republic of South Africa (RSA). Lesotho’s economy is dependent on its close relationship with the RSA, which supplies the bulk of consumer goods and significant em-ployment opportunities for Lesotho workers. Historically, agricultural and pas-toral productions have sustained many rural communities, with very limited surplus produce being sold, other than wool and mohair. More recently, light manufacturing, notably of textiles, has become important and now forms the bulk of Lesotho’s exports. Lesotho is currently the biggest exporter in Sub-Saharan Africa of denim jeans to the United States and the country has suc-ceeded in maintaining relatively high levels of foreign direct investments at a time of rapid global changes in the garment sector. Garment factories, located primarily in Maseru and Maputsoe, are the largest employers in the country.
The economy is supplemented by large, but declining, remittances from Leso-tho miners in RSA and, recently, the receipt of royalties from supplying water to RSA through the Lesotho Highlands Water Project (LHWP). The LHWP played an important role in opening up previously inaccessible parts of the country, allowing for new infrastructure, particularly roads, electricity and tele-communications.
In a country that is largely mountainous, it is not surprising that the bulk of the population and of economic activity is concentrated in the more accessible Lowlands areas in general, and in the urban areas in particular. Utility services are largely focused on these areas, with electricity being no exception.
So far, about 51,000 customers are connected to the network, and between 2,000 and 3,000 use PV systems for electricity supply. Although no statistics exist on generators, it was estimated in 1999 that less than 500 households were supplied from generators. According to the Demographic and Health Survey from 2004, 18% of the household use either batteries/generator or solar energy, but it has not been possible to identify the split between the three sources.
The difficult mountainous terrain with low population density increases the cost of grid electrification.
National Electrification Master Plan for Lesotho - Final Report
P:\64131A\3_Pdoc\DOC\Final Report\færdige\Final Report October 2007\Final Report\Final Report-october.doc
35
.
3.2 Energy Policy and Power Sector Reform Through its energy policy and poverty reduction strategy, the Government of Lesotho (GOL) is geared for the ultimate goals of sustainable rapid economic growth, job creation and poverty reduction through development of the private sector. The key challenge of the Government in the energy sector is to increase access to electricity for both the urban and the rural population. Through the Department of Energy (DOE), the Ministry of Natural Resources (MNR) is the Government’s principal entity charged with the national energy planning and policy development.
The major energy policy elements of the GOL are to:
1 Increase access to electricity for economic, social and environmental rea-sons;
2 Introduce competition in the power sector;
3 Encourage private sector participation;
4 Restructure 'Muela Hydropower Plant and LEC and then privatise them;
5 Charge the customer with cost-reflective tariffs;
6 Develop appropriate institutional energy sector framework.
The decision to privatise LEC is currently under review.
Before the independence in 1966, electricity supply was very limited, confined essentially to cross-border supply from South Africa to the administrative and commercial centres of the main Lowland towns and off-grid systems run by missionaries and traders in the more remote areas.
A key point in the history of Lesotho’s electrification came in 1969 with the establishment of the Lesotho Electricity Company (LEC) in terms of the Elec-tricity Act of 1969. LEC was mandated by the Act for the generation, transmis-sion, distribution and supply of electricity in the entire country. Subsequently, under provisions of the Treaty (between GOL and RSA) for the LHWP, GOL established an autonomous body, Lesotho Highlands Development Authority (LHDA), as the implementing agency for the LHWP, which included the gen-eration of hydroelectricity at Muela.
GOL has approved a policy statement, stating that LEC will purchase the elec-tricity generated at the 'Muela Hydro Power Plant (MHPP) from LHDA and will act as the distributor of electricity within Lesotho. LHDA will own MHPP and the related transmission lines. LEC will operate and maintain the transmis-sion lines owned by LHDA as a contractor of LHDA. Currently, this policy statement is being changed through the reforming and restructuring of the elec-tricity sector, including a provision to transfer the transmission assets to LEC.

National Electrification Master Plan for Lesotho - Final Report
P:\64131A\3_Pdoc\DOC\Final Report\færdige\Final Report October 2007\Final Report\Final Report-october.doc
36
.
The table below shows the number of connections per district in 2003.
Table 3-1 LEC connections as per 2003 by district
District Population Number of households
Connections end of 2003
Electrification level in %
Butha-Buthe 150,815 30,163 977 3
Leribe 280,766 56,153 4,338 8
Berea 201,852 40,370 1,735 4
Maseru 441,741 88,348 29,106 33
Mafeteng 190,301 38,060 1,983 5
Mohale's Hoek 159,939 31,988 1,544 5
Quthing 102,429 20,486 345 2
Qacha's Neck 127,179 25,436 337 1
Mokhotlong 106,286 21,257 216 1
Thaba-Tseka 167,176 33,435 352 1
Total 1,928,484 385, 697 40, 933 11
Source: DOE 2006, using an average household size of 5.
In 2003, the Lesotho Government estimated that only about 11% of the house-holds in Lesotho had access to electricity. This prompted GOL to set an ambi-tious target of 40% electrification by 2020 and to embark on reforming and re-structuring the electricity sector with a view to introducing private sector par-ticipation.
Currently, LEC is adding 5,000-6,000 new customers per year to their customer base. LEC has, however, a commitment to connect 8,000 new customers per year within its Service Territory (ST). A considerable increase in the resources and changes in policies towards new connections are required to achieve this target.
The restructuring process started with the restructuring of LEC in early 2001 through the appointment of an Interim Management Task Force (IMTF). The Management Contract Team succeeded the IMTF and is currently managing LEC. The ultimate aim is privatisation, but this is currently on hold, although the commercialisation process continues. LEC was transformed into a Com-pany in December 2006 and licensed for import, transmission and distribution in December 2006.
Lesotho Electricity Authority (LEA), the regulator of the electricity sector, be-came operational in August 2004 (in conformity with the LEA Act 2002).
GOL has reviewed its institutional framework for Rural Electrification (RE) and approved an implementation strategy, which involves the implementation of Electricity Access Pilot Projects (EAPPs) at five locations outside the Ser-vice Territory of the LEC; initially, to test various grid and off-grid institutional
National Electrification Master Plan for Lesotho - Final Report
P:\64131A\3_Pdoc\DOC\Final Report\færdige\Final Report October 2007\Final Report\Final Report-october.doc
37
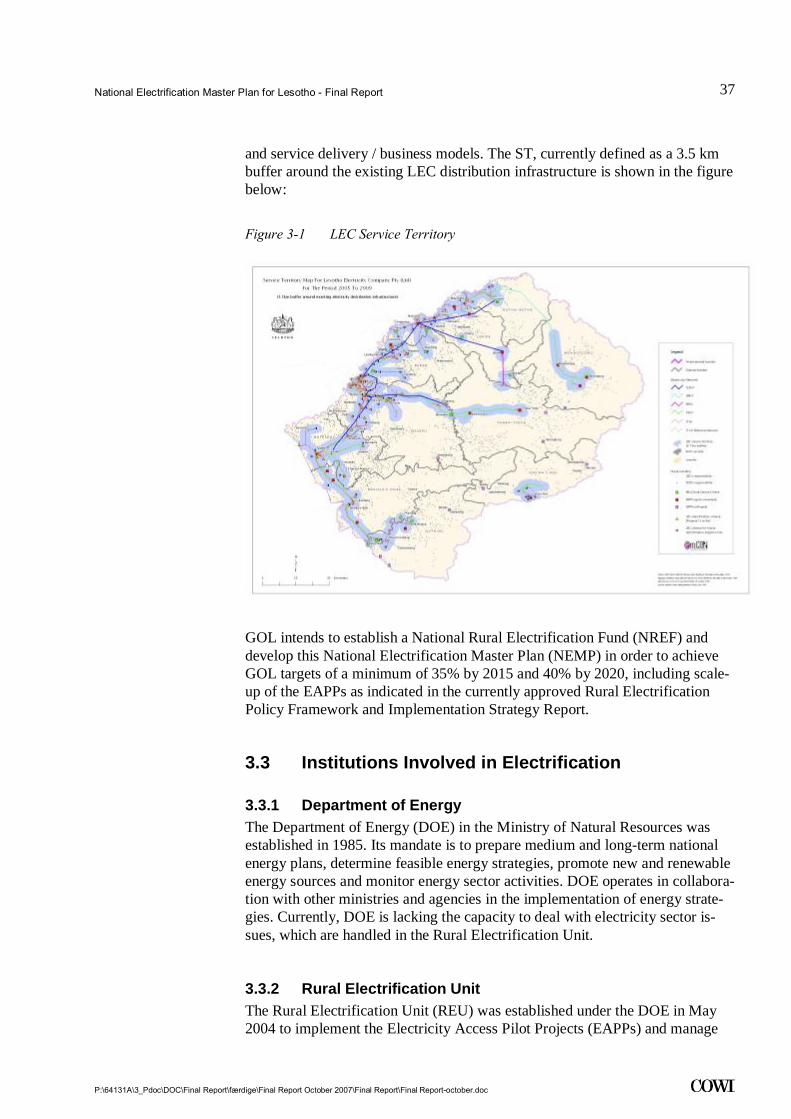
.
and service delivery / business models. The ST, currently defined as a 3.5 km buffer around the existing LEC distribution infrastructure is shown in the figure below:
Figure 3-1 LEC Service Territory
GOL intends to establish a National Rural Electrification Fund (NREF) and develop this National Electrification Master Plan (NEMP) in order to achieve GOL targets of a minimum of 35% by 2015 and 40% by 2020, including scale-up of the EAPPs as indicated in the currently approved Rural Electrification Policy Framework and Implementation Strategy Report.
3.3 Institutions Involved in Electrification
3.3.1 Department of Energy The Department of Energy (DOE) in the Ministry of Natural Resources was established in 1985. Its mandate is to prepare medium and long-term national energy plans, determine feasible energy strategies, promote new and renewable energy sources and monitor energy sector activities. DOE operates in collabora-tion with other ministries and agencies in the implementation of energy strate-gies. Currently, DOE is lacking the capacity to deal with electricity sector is-sues, which are handled in the Rural Electrification Unit.
3.3.2 Rural Electrification Unit The Rural Electrification Unit (REU) was established under the DOE in May 2004 to implement the Electricity Access Pilot Projects (EAPPs) and manage
National Electrification Master Plan for Lesotho - Final Report
P:\64131A\3_Pdoc\DOC\Final Report\færdige\Final Report October 2007\Final Report\Final Report-october.doc
38
.
the development and implementation of the National Electrification Master Plan (NEMP) and facilitate coordination with the National Rural Electrification Fund (NREF).
The initial focus of the REU is to implement the five (5) prioritised EAPPs. In order to facilitate the efficient operation and development of the REU during its initial phase, funds have been obtained to secure the services of two locally re-cruited Project Engineers, who commenced their work in May 2004, and a Pro-ject Manager, who commenced his work in September 2006, and the provision of equipment to establish the REU.
REU currently assists DOE on matters related to the power sector.
REU aims at performing its duties in a cost-effective, efficient, timely and pro-fessional way, with appropriate use of external advice and assistance. The proc-ess is co-financed by the World Bank (WB), the African Development Bank (ADB) and the European Union (EU) under the Lesotho Utilities Sector Re-form Project (LURP).
The five EAPPs are:
• Dilli-Dilli / Sixondo in Quthing (cross-border connection);
• Ha-Sekake in Qacha's Neck (diesel generator mini-grid);
• Qholaqhoe in Botha-Bothe (grid extension);
• Semonkong in Maseru (Hydropower with diesel backup);
• Linakaneng in Mokhotlong (Solar PV electrification).
Of the above, only Semonkong is currently in operation - and has been in op-eration since 1988. The other three are in the implementation process and will be commissioned in 2007, whereas Linakaneng is in the planning and tendering process. As a result, the experience obtained so far with the EAPPs is rather limited at this stage.
In the project 'RSA Villages Project', 15 villages have been identified for cross border supply from RSA. Various distribution models will be implemented in these cross border supply areas.
It is envisaged that the current REU will become an independent Rural Electri-fication Agency/Authority responsible for Rural Electrification outside LEC service territory. The REA will develop rural electrification projects, transfer the projects to service providers (local authorities and private sector) and man-age subsidies for rural electrification.
The LURP will also support public, community and other stakeholder educa-tion, awareness creation and training programmes; and it has been recognised that extensive education of all stakeholders would be necessary throughout EAPPs and NEMP design, implementation, monitoring and evaluation.
National Electrification Master Plan for Lesotho - Final Report
P:\64131A\3_Pdoc\DOC\Final Report\færdige\Final Report October 2007\Final Report\Final Report-october.doc
39
.
The promotion of the productive uses of electricity, especially for income-generating activities, is also a key GOL objective, and the DOE has established a Rural Electrification Working Group (REWG) to start the EAPPs and NEMP, and to ensure effective stakeholder consultations and to leverage GOL invest-ments in rural development through efficient GOL policy coordination and pro-ject implementation.
The REU Project staffs are members of the REWG and provide strategic advice to the DOE. The mandate of REWG is currently being reviewed, and its name is being changed to Rural Electrification Forum (REF).
3.3.3 Rural Electrification Working Group The REWG was established in April 2003 to accelerate the rural electrifica-tionn planning process. Its original mandate was the drafting of a comprehen-sive policy proposal, including an action plan for the rural electrification devel-opment, to serve as the roadmap for RE in Lesotho.
As a stakeholder forum, the REWG has a key role to play in the conceptualisa-tion and implementation of the National Rural Electrification Programme (NREP), by ensuring that stakeholder concerns are addressed, and stakeholder buy-in is obtained. It has been recommended to amend the mandate of the REWG to reflect its essential role as a stakeholder forum focusing on electrifi-cation, specifically in rural areas.
3.3.4 LEA As the regulator of the electricity sector, the LEA was established in terms of the LEA Act of 2002 to promote the expansion of electricity supply in Lesotho, where it is economic and cost-effective. The functions of LEA in relation to off-grid include:
• Monitoring and enforcing of technical standards;
• Overseeing of all contractual arrangements;
• Resolution of disputes;
• Assistance with analytical aspects of the tariff setting and collection proc-ess;
• Facilitation of efforts to expand rural electrification;
• Issuing of licenses.
In terms of rural electrification, the LEA is mandated to facilitate efforts to ex-pand rural electrification, both in terms of grid expansion and off-grid supplies. Its main aim in this regard should be the creation of conditions that are condu-cive to service provision in generally unattractive circumstances (remote areas,

National Electrification Master Plan for Lesotho - Final Report
P:\64131A\3_Pdoc\DOC\Final Report\færdige\Final Report October 2007\Final Report\Final Report-october.doc
40
.
low customer density, limited ability to pay, lack of institutional capacity). Pos-sible strategies that the LEA might employ to promote rural electricity services are light-handed licensing arrangements instead of formal licensing, non-uniform tariff structures and lower service and supply standards.
The LEA is establishing a rural electrification fund, into which providers of electricity services shall pay any fees that the Authority may prescribe as uni-versal access development fees. The Authority may make it a condition of a grant or a licence that every provider of electricity service shall establish a uni-versal access fund. The proceeds shall solely target the development and ex-pansion of electricity service infrastructure in not served and distant areas.
3.3.5 National Rural Electrification Fund Lesotho’s Energy Policy Framework commits the Government to establish the NREF aimed at achieving universal access to electricity. The NREF will be an independent fund established by the Minister of Finance and Development Planning in terms of the Finance Order (1988), and it will be administered by a board appointed by GOL. It will liaise with the LEA in order that the LEA may issue a licence for the successful developers.
The purpose of the Fund, as set out in the draft NREF Regulations, 2004 is to:
• Receive and disburse funds for subsidising the capital cost of new area electrification so as to facilitate the development and expansion of electric-ity service infrastructure in areas, where there are no services, and to pro-vide access to the greatest number of users;
• Provide concessionary financing to developers towards the upgrading of electrical systems for new area electrification;
• Provide financial assistance towards the education and training of local communities in the safe and efficient use of electricity;
• Provide financial assistance to local entrepreneurs towards facilitating their becoming developers; and
• Provide financial assistance to support research relevant to the supply of electricity in rural areas.
The NREF is a crucial element for a sustainable rural electrification programme in Lesotho, as most RE projects will not be financially viable on commercial terms. The fund is envisaged to be resourced from a variety of sources, includ-ing the GOL budget, donor funds, surcharges from LURP-funded connections and a rural electrification levy on electricity sales. Money disbursed from the fund will mainly be used as one-off capital subsidies for grid and off-grid elec-trification.
National Electrification Master Plan for Lesotho - Final Report
P:\64131A\3_Pdoc\DOC\Final Report\færdige\Final Report October 2007\Final Report\Final Report-october.doc
41
.
3.3.6 LEC LEC is the national electricity utility of Lesotho, and as such it plays a key role in the rural electrification process. LEC has concession on supply in the ST, but can, in principle, supply all over the country.
As noted earlier, LEC is currently in the process of commercialization. This process was finalized in 2006 with LEC obtaining licences for its operations.
The ST was defined with the aim of making a privatized LEC attractive to pri-vate investors. In the Service Territory Study, it was estimated that an investor would obtain an attractive return by connecting 8,000 new customers per year, and this could be achieved in the ST.
However, during the privatization process it was not possible to reach an agreement with any of the interested investors. The privatization process is therefore currently on hold. However, the commitment of 8,000 new customers per year remains with LEC. During 2006, about 5,500 new connections were made.
Supply conditions for households are uniform all over the country, and the tar-iff was LSL 0.49 LSL per kWh for households in 2006. The tariff was adjusted in April 2007, and a rural electrification levy is collected; however the tariff remained the same for all categories.
LEC currently only supplies 20A and 60A connections. In August 2001, the Government of Lesotho approved a connection fee policy where the connection fees for 20A and 60A were LSL 2,000 and LSL 3,500 LSL, respectively. LSL 500 and LSL 2,000 were paid for 20A and 60A,respectively, at the time of con-nection and the remainder over 7 years. The connection fee policy was revised in 2006. All customers will pay LSL 2,000 or more, depending on the distance to the grid. LSL 500 is paid upfront and the balance over 24 months. It is also suggested that all new customers should be provided with a 60 A connection.
There are basically three sources for new customers:
• Specific projects financed by donors (World Bank, African Development Bank) are among the projects undertaken currently. These include about 20 projects with some 5,000 immediate connections, but with a potential to create access to the grid for 10,000 households;
• A number of so-called schemes, i.e. small projects with between 25 and 150 new customers, who have joined and already (partly) paid to be con-nected. The list currently includes 19,000 new connections; not all have however actually paid yet;
• LEC provides new connections to individual customers in already electri-fied areas.

National Electrification Master Plan for Lesotho - Final Report
P:\64131A\3_Pdoc\DOC\Final Report\færdige\Final Report October 2007\Final Report\Final Report-october.doc
42
.
LEC's financial position was restructured in 2005 and the management strengthened. It is expected that these measures will increase the future re-sources that can be allocated to electrification.
3.4 Existing Power System
3.4.1 Power Generation and Supply Lesotho has moved from a situation a few years ago when it was buying almost all its electricity from Eskom, South Africa (mainly at 132 and 88 kV voltage levels) to a far better situation, where it now generates most of the present load requirements of the country, being 74.4 MW of the estimated 95 MW load de-mand in the country (2005).
The main source of power is the 'Muela Hydro Power Plant at 132 kV voltage level which is the main generation source of Lesotho. It has a nominal installed capacity of 72 MW - 3 units of 24 MW each. The effective capacity depends on the reservoir level and can be up to 87 MW. Import from South Africa covers the deficiencies in the power production at 'Muela. LEC is also operating small hydro power plants and a diesel generator.
Currently, LEC has bilateral bulk Power Purchase Agreements with 'Muela and Eskom. LEC became a full Operating Member of the Southern African Power Pool (SAPP) in April 1999. This opened an opportunity for participation in the regional electricity competitive environment on equal trading partnership con-ducted under the SAPP principles.
The total electricity purchases in 2004, 2005 and 2006 are shown in Table 3-2.
Table 3-2 LEC Power purchases and sales in 2004 to 2006
Source Unit 2004 2005 2005/2006
'Muela MWh 397 941 432 788 440 481
Eskom MWh 32 681 36 667 38 891
Other LEC MWh 3 278 3 632 3 988
Total MWh 433 900 473 087 483 360
Losses MWh 92 189 (21%) 70 458 (15%) 63 214(13%)
Sales MWh 341 713 401 629 420 146
Two external intake points from South Africa provide essential additional power for the country. They are: Khukhune substation at 88 kV in the Butha-Buthe district in the North of the country, and Mabote substation at 132 kV in the Maseru district. A third intake point from South Africa supplies the town of Qacha's Neck in the Southern part of the country.
National Electrification Master Plan for Lesotho - Final Report
P:\64131A\3_Pdoc\DOC\Final Report\færdige\Final Report October 2007\Final Report\Final Report-october.doc
43
.
A mini-hydroplant of 2 MW is connected to the grid at Mantšonyane. This hy-dropower plant assists with the boosting of the voltage at 33 kV during the pe-riods when it is operational. Low inflow of water brings the hydroplant off-line for some time during the year.
A small mini-hydropower plant backed by a diesel generator during the dry season supplies a small island grid in Semonkong. Further, solar energy is used (although in a limited manner) mainly by private individuals either to reduce dependency on conventional electrical power for water heating (solar water heaters) or where no electrical network exists (solar photovoltaic panels). Likewise, a limited number of generators can also be found in areas without network.
It is worth noting that according to some studies made, 'Muela Hydro Power Plant on the border of Thaba-Tseka and Leribe districts has a potential for 110MW generation capacity.
3.4.2 Main Transmission System Over the years, the main transmission system voltages evolved into the follow-ing voltages:
• 132 kV, used for energy generated locally and imported from South Af-rica;
• 88 kV, used for energy imported from South Africa;
• 66 kV, used for energy generated locally;
• 33 kV, used for distribution voltage used also for sub-transmission.
The transmission system in Lesotho was developed mainly along the western part of the country, including the Northern and South Western parts, where the geography of the terrain is less mountainous, and where the main transmission grid is well developed. The only areas covered by electricity, which are not linked to the main grid at this stage, are Qacha's Neck and Semonkong.
The two links from South Africa remain in operation and form an integral part of the main transmission grid.
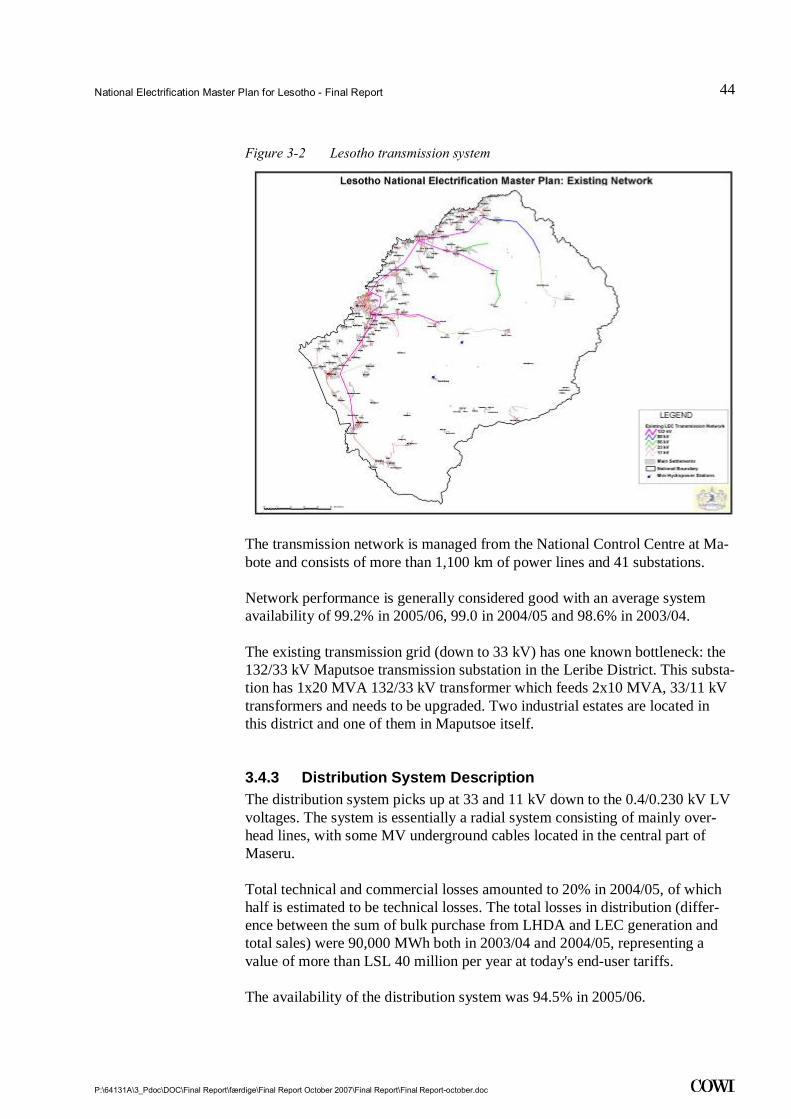
National Electrification Master Plan for Lesotho - Final Report
P:\64131A\3_Pdoc\DOC\Final Report\færdige\Final Report October 2007\Final Report\Final Report-october.doc
44
.
Figure 3-2 Lesotho transmission system
The transmission network is managed from the National Control Centre at Ma-bote and consists of more than 1,100 km of power lines and 41 substations.
Network performance is generally considered good with an average system availability of 99.2% in 2005/06, 99.0 in 2004/05 and 98.6% in 2003/04.
The existing transmission grid (down to 33 kV) has one known bottleneck: the 132/33 kV Maputsoe transmission substation in the Leribe District. This substa-tion has 1x20 MVA 132/33 kV transformer which feeds 2x10 MVA, 33/11 kV transformers and needs to be upgraded. Two industrial estates are located in this district and one of them in Maputsoe itself.
3.4.3 Distribution System Description The distribution system picks up at 33 and 11 kV down to the 0.4/0.230 kV LV voltages. The system is essentially a radial system consisting of mainly over-head lines, with some MV underground cables located in the central part of Maseru.
Total technical and commercial losses amounted to 20% in 2004/05, of which half is estimated to be technical losses. The total losses in distribution (differ-ence between the sum of bulk purchase from LHDA and LEC generation and total sales) were 90,000 MWh both in 2003/04 and 2004/05, representing a value of more than LSL 40 million per year at today's end-user tariffs.
The availability of the distribution system was 94.5% in 2005/06.

National Electrification Master Plan for Lesotho - Final Report
P:\64131A\3_Pdoc\DOC\Final Report\færdige\Final Report October 2007\Final Report\Final Report-october.doc
45
.
Industrial development has offered Lesotho the opportunity of creating indus-trial estates through the Lesotho National Development Corporation (LNDC). There are 11 estates spread around the districts of Maseru, Leribe, Mafeteng, Mohale’s Hoek, Botha-Bothe and Berea, of which 5 are fully developed, 3 par-tially developed with electricity already available and 3 being developed at pre-sent. While it is obviously important for planners to take these into considera-tion when estimating future demand, it should also be noted that LNDC's plans for rapid industrialisation have not always materialised as envisioned, espe-cially since the ending of the Multiple Fibre Agreement, which once acted as an incentive for Chinese investors to come to Lesotho. They are now able to ac-cess US markets more directly and are therefore less likely to invest in Lesotho.
3.4.4 Electricity Demand Consistent electricity sales statistics for various customer groups are only avail-able for the past few years due to significant changes in metering, billing and management of the LEC customer database since 2001.
Trends (excluding the crisis years in the late 90s) over the past 15 years indi-cate a relatively stable annual growth of the maximum peak demand of ap-proximately 5% and a slightly higher growth in total consumption (6%).
Figure 3-3 Maximum demand and total energy purchased by LEC1987-1999, and the years 2003/2004 and 2004/2005. Trend lines towards 2020
LEC Historic max demand and energy
0
200
400
600
800
1000
1200
1987 1992 1997 2002
Year
GW
h
0
20
40
60
80
100
120
140
160
180
200
MW
Max. Demand MWTotal Energy GWh)Expon. (Total Energy GWh)Expon. (Max. Demand MW
By the end of October 2006, the LEC database registered 51,881 customers, of whom domestic customers accounted for 89%, General Purpose for 10% and large customers for the remaining 1%. The approximately 330 large customers accounted for well over 50% (203 GWh) of the total electricity sales in 2004/2005 according to the LEC annual report 2004/2005.
The maximum system peak demand in Lesotho remained below 100 MW in 2005, with a maximum system load of around 60 MW (35,000 MWh per month) in summer and up to 90 MW (50,000 MWh per month) during the cold
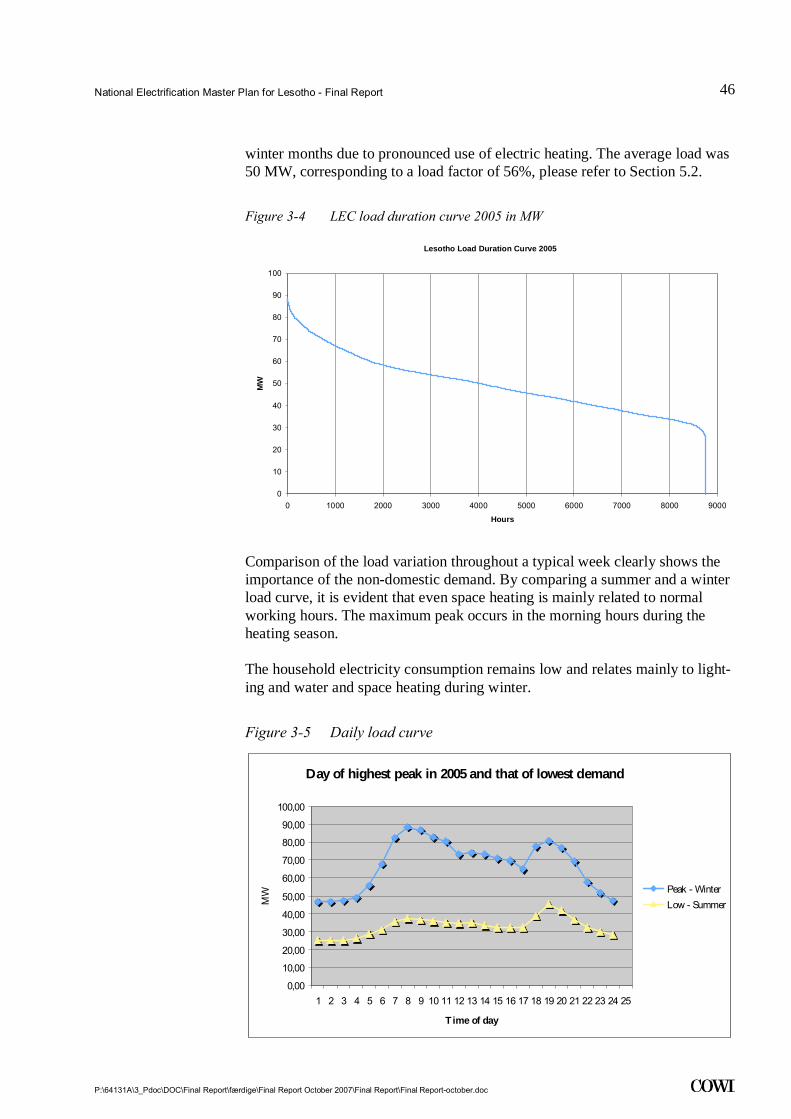
National Electrification Master Plan for Lesotho - Final Report
P:\64131A\3_Pdoc\DOC\Final Report\færdige\Final Report October 2007\Final Report\Final Report-october.doc
46
.
winter months due to pronounced use of electric heating. The average load was 50 MW, corresponding to a load factor of 56%, please refer to Section 5.2.
Figure 3-4 LEC load duration curve 2005 in MW
Lesotho Load Duration Curve 2005
0
10
20
30
40
50
60
70
80
90
100
0 1000 2000 3000 4000 5000 6000 7000 8000 9000
Hours
MW
Comparison of the load variation throughout a typical week clearly shows the importance of the non-domestic demand. By comparing a summer and a winter load curve, it is evident that even space heating is mainly related to normal working hours. The maximum peak occurs in the morning hours during the heating season.
The household electricity consumption remains low and relates mainly to light-ing and water and space heating during winter.
Figure 3-5 Daily load curve
Day of highest peak in 2005 and that of lowest demand
0,00
10,00
20,00
30,00
40,00
50,00
60,00
70,00
80,00
90,00
100,00
1 2 3 4 5 6 7 8 9 10 11 12 13 14 15 16 17 18 19 20 21 22 23 24 25
Time of day
MW Peak - Winter
Low - Summer
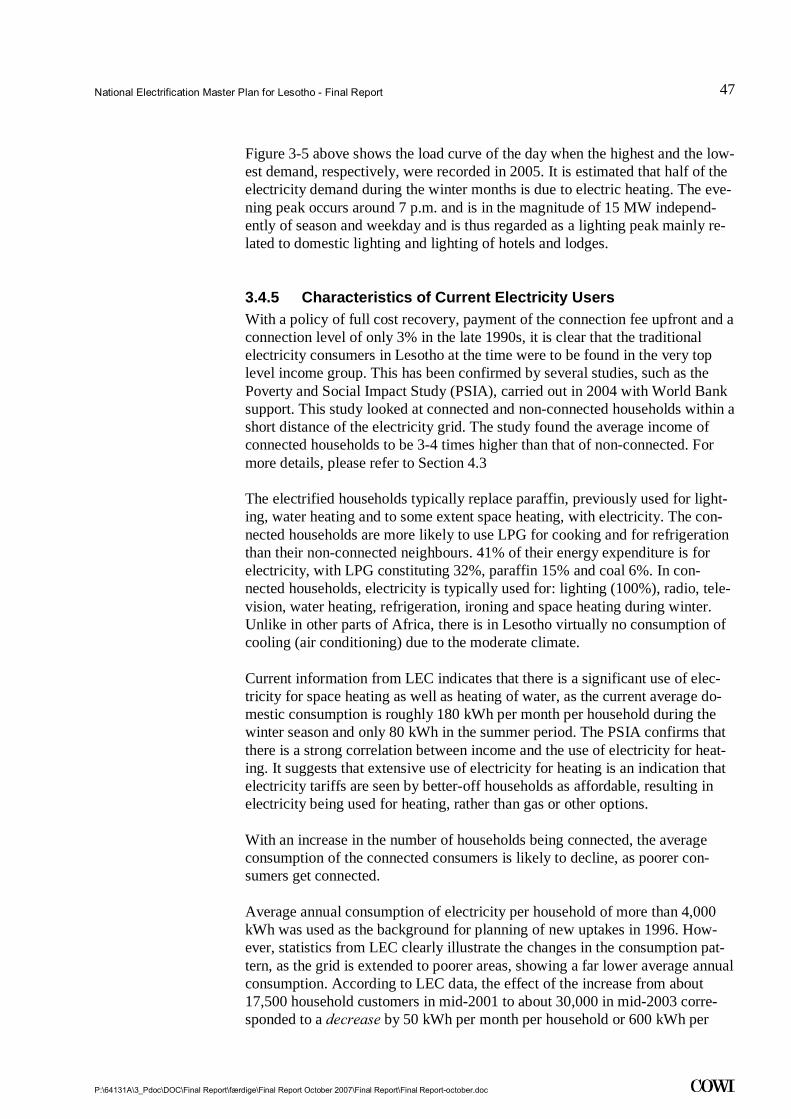
National Electrification Master Plan for Lesotho - Final Report
P:\64131A\3_Pdoc\DOC\Final Report\færdige\Final Report October 2007\Final Report\Final Report-october.doc
47
.
Figure 3-5 above shows the load curve of the day when the highest and the low-est demand, respectively, were recorded in 2005. It is estimated that half of the electricity demand during the winter months is due to electric heating. The eve-ning peak occurs around 7 p.m. and is in the magnitude of 15 MW independ-ently of season and weekday and is thus regarded as a lighting peak mainly re-lated to domestic lighting and lighting of hotels and lodges.
3.4.5 Characteristics of Current Electricity Users With a policy of full cost recovery, payment of the connection fee upfront and a connection level of only 3% in the late 1990s, it is clear that the traditional electricity consumers in Lesotho at the time were to be found in the very top level income group. This has been confirmed by several studies, such as the Poverty and Social Impact Study (PSIA), carried out in 2004 with World Bank support. This study looked at connected and non-connected households within a short distance of the electricity grid. The study found the average income of connected households to be 3-4 times higher than that of non-connected. For more details, please refer to Section 4.3
The electrified households typically replace paraffin, previously used for light-ing, water heating and to some extent space heating, with electricity. The con-nected households are more likely to use LPG for cooking and for refrigeration than their non-connected neighbours. 41% of their energy expenditure is for electricity, with LPG constituting 32%, paraffin 15% and coal 6%. In con-nected households, electricity is typically used for: lighting (100%), radio, tele-vision, water heating, refrigeration, ironing and space heating during winter. Unlike in other parts of Africa, there is in Lesotho virtually no consumption of cooling (air conditioning) due to the moderate climate.
Current information from LEC indicates that there is a significant use of elec-tricity for space heating as well as heating of water, as the current average do-mestic consumption is roughly 180 kWh per month per household during the winter season and only 80 kWh in the summer period. The PSIA confirms that there is a strong correlation between income and the use of electricity for heat-ing. It suggests that extensive use of electricity for heating is an indication that electricity tariffs are seen by better-off households as affordable, resulting in electricity being used for heating, rather than gas or other options.
With an increase in the number of households being connected, the average consumption of the connected consumers is likely to decline, as poorer con-sumers get connected.
Average annual consumption of electricity per household of more than 4,000 kWh was used as the background for planning of new uptakes in 1996. How-ever, statistics from LEC clearly illustrate the changes in the consumption pat-tern, as the grid is extended to poorer areas, showing a far lower average annual consumption. According to LEC data, the effect of the increase from about 17,500 household customers in mid-2001 to about 30,000 in mid-2003 corre-sponded to a decrease by 50 kWh per month per household or 600 kWh per
National Electrification Master Plan for Lesotho - Final Report
P:\64131A\3_Pdoc\DOC\Final Report\færdige\Final Report October 2007\Final Report\Final Report-october.doc
48
.
year to an average annual consumption level of approximately 3,000 kWh per year.
The decline in consumption has been attributed to the shift from conventional credit meters to pre-payment meters as well as the connection of more lower-income consumers. Recent data from LEC seem to indicate that average house-hold consumption levels continue to decline, a factor that may also relate to a slow-down in economic growth after 2003.
The Access to Electricity Study carried out in 2001 and updated in 2004 pro-posed an annual consumption figure of 1,800 kWh per household within a dis-tance of 3.5 km of the grid and only 1,200 kWh further away as the basis for future planning. Analyses of consumption patterns of new schemes imple-mented in 2005 indicate that the consumption levels are even lower.
These trends - combined with knowledge of the future consumers' ability to pay for utility services - are crucial when planning the future electrification.
3.4.6 Characteristics of Future Electricity Users The PSIA indicates that for the households that do not have electricity connec-tion, paraffin constitutes 66% of modern energy expenditure, and LPG accounts for 29% of it, the rest 5% formed by coal. From the studies listed earlier we know that ‘traditional fuels’ (wood, shrubs, crop residues, dung) remain impor-tant, especially in rural areas.
As part of the Poverty and Social Impact Assessment Study, an assessment was made of the monthly electricity consumption and bill of the future electrified households. The assessment was made on the basis of a presentation of 6 typi-cal consumption levels and use of appliances. The options presented and related electricity bill (updated to current tariff levels) are shown in Table 3-3.
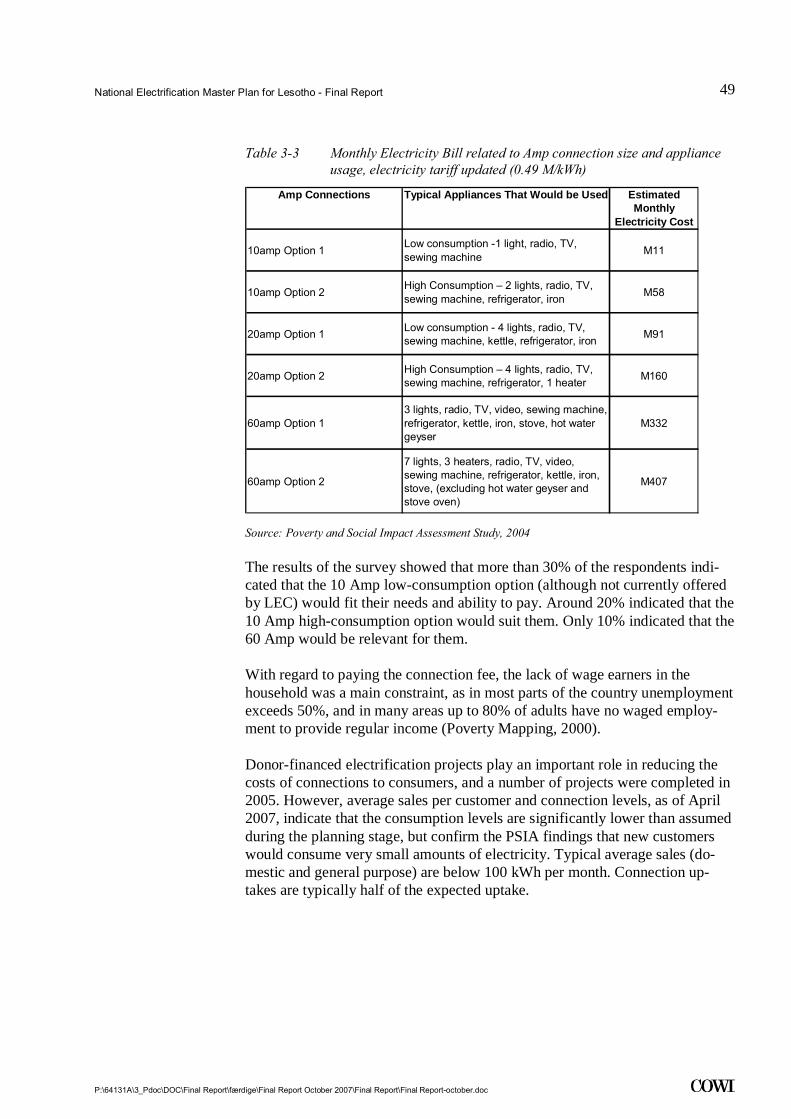
National Electrification Master Plan for Lesotho - Final Report
P:\64131A\3_Pdoc\DOC\Final Report\færdige\Final Report October 2007\Final Report\Final Report-october.doc
49
.
Table 3-3 Monthly Electricity Bill related to Amp connection size and appliance usage, electricity tariff updated (0.49 M/kWh)
Amp Connections Typical Appliances That Would be Used Estimated Monthly
Electricity Cost
10amp Option 1 Low consumption -1 light, radio, TV, sewing machine M11
10amp Option 2 High Consumption – 2 lights, radio, TV, sewing machine, refrigerator, iron M58
20amp Option 1 Low consumption - 4 lights, radio, TV, sewing machine, kettle, refrigerator, iron M91
20amp Option 2 High Consumption – 4 lights, radio, TV, sewing machine, refrigerator, 1 heater M160
60amp Option 13 lights, radio, TV, video, sewing machine, refrigerator, kettle, iron, stove, hot water geyser
M332
60amp Option 2
7 lights, 3 heaters, radio, TV, video, sewing machine, refrigerator, kettle, iron, stove, (excluding hot water geyser and stove oven)
M407
Source: Poverty and Social Impact Assessment Study, 2004
The results of the survey showed that more than 30% of the respondents indi-cated that the 10 Amp low-consumption option (although not currently offered by LEC) would fit their needs and ability to pay. Around 20% indicated that the 10 Amp high-consumption option would suit them. Only 10% indicated that the 60 Amp would be relevant for them.
With regard to paying the connection fee, the lack of wage earners in the household was a main constraint, as in most parts of the country unemployment exceeds 50%, and in many areas up to 80% of adults have no waged employ-ment to provide regular income (Poverty Mapping, 2000).
Donor-financed electrification projects play an important role in reducing the costs of connections to consumers, and a number of projects were completed in 2005. However, average sales per customer and connection levels, as of April 2007, indicate that the consumption levels are significantly lower than assumed during the planning stage, but confirm the PSIA findings that new customers would consume very small amounts of electricity. Typical average sales (do-mestic and general purpose) are below 100 kWh per month. Connection up-takes are typically half of the expected uptake.
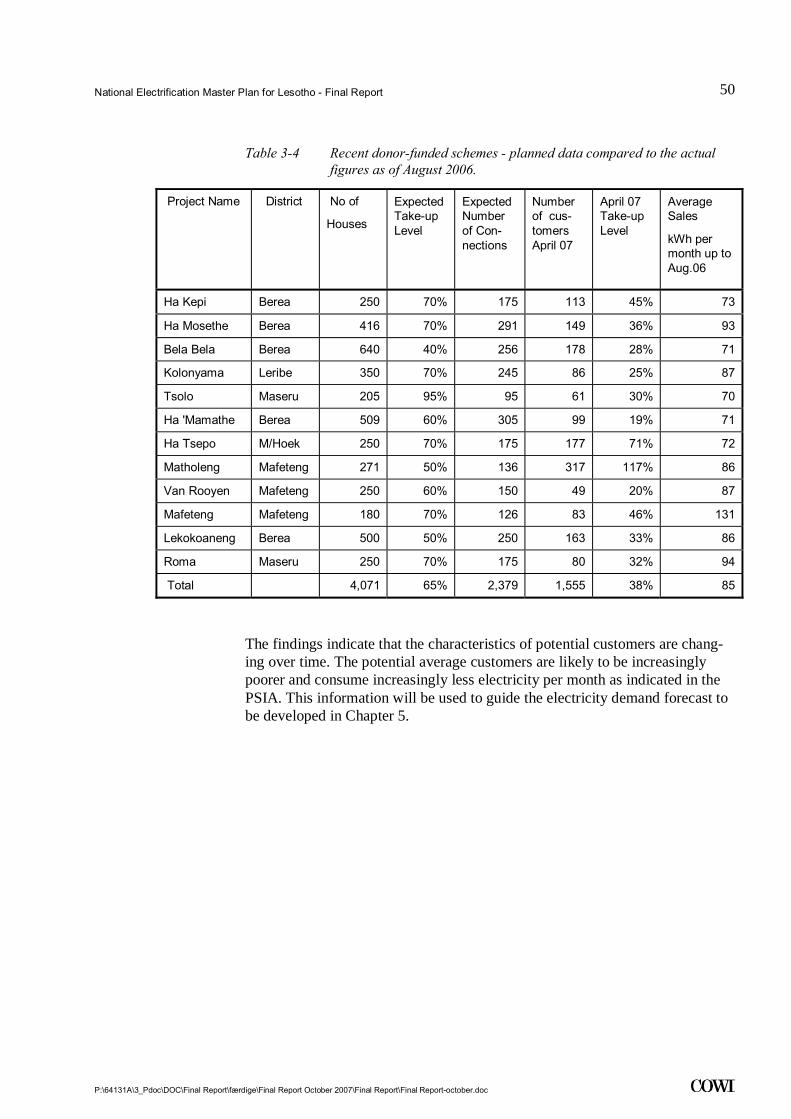
National Electrification Master Plan for Lesotho - Final Report
P:\64131A\3_Pdoc\DOC\Final Report\færdige\Final Report October 2007\Final Report\Final Report-october.doc
50
.
Table 3-4 Recent donor-funded schemes - planned data compared to the actual figures as of August 2006.
The findings indicate that the characteristics of potential customers are chang-ing over time. The potential average customers are likely to be increasingly poorer and consume increasingly less electricity per month as indicated in the PSIA. This information will be used to guide the electricity demand forecast to be developed in Chapter 5.
Project Name District No of
Houses
Expected Take-up Level
Expected Number of Con-nections
Number of cus-tomers April 07
April 07 Take-up Level
Average Sales
kWh per month up to Aug.06
Ha Kepi Berea 250 70% 175 113 45% 73
Ha Mosethe Berea 416 70% 291 149 36% 93
Bela Bela Berea 640 40% 256 178 28% 71
Kolonyama Leribe 350 70% 245 86 25% 87
Tsolo Maseru 205 95% 95 61 30% 70
Ha 'Mamathe Berea 509 60% 305 99 19% 71
Ha Tsepo M/Hoek 250 70% 175 177 71% 72
Matholeng Mafeteng 271 50% 136 317 117% 86
Van Rooyen Mafeteng 250 60% 150 49 20% 87
Mafeteng Mafeteng 180 70% 126 83 46% 131
Lekokoaneng Berea 500 50% 250 163 33% 86
Roma Maseru 250 70% 175 80 32% 94
Total 4,071 65% 2,379 1,555 38% 85
National Electrification Master Plan for Lesotho - Final Report
P:\64131A\3_Pdoc\DOC\Final Report\færdige\Final Report October 2007\Final Report\Final Report-october.doc
51
.
4 Socio-Economic Data and Analysis This chapter of the report looks at the key findings of a long list of recent socio-economic studies and surveys that have guided the work of the NEMP. The work includes demographic and settlement analyses, which were part of the Lesotho Lowlands Water Feasibility Study (LLWFS), Poverty Mapping and energy demand as well as willingness, ability to pay (WAP) studies carried out for utilities in Lesotho. Furthermore, a survey of the benefits of electrification at the household level was undertaken by the NEMP.
The chapter is concluded by presenting how the socio-economic information, together with knowledge of the LEC customers, has been used in the NEMP.
4.1 Demography and Settlement Identification It is evident that the starting point for any planning exercises that aim at result-ing in services being provided to people is an assessment of how many people are located in what areas. Unfortunately, achieving this simple demographic aim is complicated by a variety of factors. The first – and most critical – factor is the amount of time that has passed since the last census in 1996. This results in the degree of reliability declining, the further you move towards the next census (2006). Unfortunately, this places the master planning exercise as the worst possible point in the census cycle.
The other major constraint in the census data is that the village lists do not take into consideration any neighbouring settlements. In other words, a place may be listed with a very small population (making it seem unviable as a target for util-ity services) ignoring the fact that it is very close to larger, more viable settle-ments, or is part of a large conglomeration that is perfectly viable. For this rea-son, settlements need to be examined carefully in their local geographic con-text, and joined where necessary to others to form viable ‘clusters’.
The electricity sector is not the only one to face these challenges. The recently completed Lesotho Lowlands Water Supply Feasibility Study (LLWSFS) bat-tled with similar issues and had to devise solutions. In this section, the approach and the results of the LLWSFS are reviewed in some details as they present an opportunity for two closely related sectors with similar goals to join forces and share common planning methods.
National Electrification Master Plan for Lesotho - Final Report
P:\64131A\3_Pdoc\DOC\Final Report\færdige\Final Report October 2007\Final Report\Final Report-october.doc
52
.
4.1.1 Broad Demographic Trends Important Factors Impacting Lesotho’s Population since 1990 Whereas Lesotho’s population exhibited a relatively regular and smooth up-ward growth in the first 25 years after the independence, the period since 1990 has seen the emergence of a number of factors affecting total growth, as well as modifying existing internal population movements. Four of the key factors are listed below, some of which will be discussed in more detail at relevant points later in this report:
(1) Regime change in South Africa.
(2) The advent of HIV/AIDS as an unprecedented killer of adults mainly in the 15 to 49 age group is having the most sombre demographic implica-tions for Lesotho.
(3) Independent of HIV/AIDS, fertility rates in Lesotho, which were nearly unchanged for many years, were already falling in the 1990s.
(4) An unprecedented wave of industrial development, centred on the gar-ment industry, has created over 60,000 jobs, acting as an incentive for population movements to where the jobs are located (primarily in Maseru and Maputsoe). New factories that have recently been opened or are planned for Mafeteng, Mohale’s Hoek and Butha-Buthe will result in new population shifts to district towns. This trend has a strong gender bias as the recruitment is primarily of young women.
Unfortunately, as noted earlier, the NEMP Feasibility Study comes late in the 10-year population census cycle (with the next census in 2006). As a result, it is difficult to quantify the exact impact of the factors described above. Partly to address this uncertainty, BOS conducted a sample census or Demographic Sur-vey in 2001 and 2004, which provides useful background detail for population planning purposes, although it does not replace a complete census with a defini-tive national population estimate.
The key findings from the 2001/2004 survey show that the average household size is 2.9 in urban areas and 4.2 in rural with a national average of 3.9.
4.1.2 Population Projections for Target Settlement Identification of Target Settlements LLWSFS involved the identification of high-priority areas on the basis of de-mography. The LLWSFS identified and projected population growth for all Lowlands and Foothills settlements with a population of 2,500 or more in 2003.
For the NEMP, the Consultant extended this approach to the rest of the country (Mountains and Senqu River Valley, taken collectively as the Mountains), but at a lower cut-off point.

National Electrification Master Plan for Lesotho - Final Report
P:\64131A\3_Pdoc\DOC\Final Report\færdige\Final Report October 2007\Final Report\Final Report-october.doc
53
.
44 settlements were identified in the Lowlands. Further 62 settlements were identified, which since 1994 have grown to the extent that they have now popu-lations of over 2,500 persons. In some cases, these settlements were villages that did not individually meet the 2,500 population criterion, but which as a re-sult of growth had coalesced into one effectively continuously built-up area. Most of these 62 settlements are in effect expanded villages, which have at-tracted population from elsewhere in Lesotho because of services such as mis-sions, schools, village health centres, postal agencies etc. or because of their strategic locations at road junctions, close to border posts, or within commuting distance of urban areas with employment opportunities.
Finally, 34 additional settlements were identified in the mountains or as special cases which under ordinary circumstances would not qualify, but which were included because of special developments such as tourism, mining activities, irrigation schemes and potential for utilising local renewable energy sources.
Settlement Categories Having identified the settlements, it made sense to sort these according to spe-cific categories. The categories were chosen partly by size, and partly because of the inherent dynamics of each type. The six categories used are:
Category 1: Capital City. Maseru falls into a category of its own. It is the only real city in the country with a large population, significant industrial develop-ment, major communication links, numerous hotels and extended commercial activities. In addition to this, it is the home of all Government departments, in-ternational agencies and national institutions. In terms of population, it was the only town with a population of more than 220,000 in the year 2000, exceeding the largest district towns by a factor of four or five. Despite the impact of HIV/AIDS, the capital city is expected to grow at significantly higher levels than other parts of the country.
Category 2: Industrial Towns. The second category is made up of other Low-land towns that are already industrialised or are likely to have industrial estates in the near future.
Category 3: Large Institutional Towns. This category is made up of towns which do not have industry (or any concrete plans for industry), but have one or more large institution. Here, towns have been included that are district head-quarters, or which have e.g. a hospital, as opposed to a clinic. Examples of this are Hlotse, Moyeni, Mapoteng and Morija. In other cases, settlements have been included that have a number of schools or institutes of higher learning (especially if these are boarding schools). Examples of these are Roma and Mazenod. These places will grow faster than towns without institutions, but clearly not at the pace of those with industry.
Category 4: Medium Settlements. This category is made of minor settlements that have small institutions, such as schools and clinics, but no other significant drivers of growth. They are unlikely to grow much faster than the natural rate.

National Electrification Master Plan for Lesotho - Final Report
P:\64131A\3_Pdoc\DOC\Final Report\færdige\Final Report October 2007\Final Report\Final Report-october.doc
54
.
Category 5: Small Settlements. These are villages (or closely linked villages) with populations of more than 2,500 in 2000, but less than 5,000 (the average being 3,250) or Highlands settlements with a population of 1,000 or more. They have no large institutions, but may have a school, a postal agency or a clinic. They are quite often ‘junction’ or commuter settlements located not very far from larger settlements. They are not expected to grow in the future given out migration and HIV/AIDS.
Category 6: Special Cases. There are settlements which under ordinary cir-cumstances would not remain in one of the lower categories, but because of special developments – such as mining or tourism – they will be subject to much higher levels of growth in the future.
Defining the Boundaries For the purposes of planning, the best way to project population within settle-ments is to delineate the boundaries to be used for all areas. For the official ur-ban areas, the boundaries that have been used are the existing gazetted bounda-ries adding, where appropriate, adjacent settlements which are likely to merge with these towns over the project planning period. For all other settlements, the continuously built-area as shown on the 1:250,000 map of 1994 (the most re-cent available map) has been used with similar additions of closely adjoining settlements, for example villages which are currently less than one kilometre away and are likely soon to merge with the larger built-up area.
Natural features such as rivers, streams, escarpments, etc. were used to deline-ate settlement boundaries where adjustments have been made. This detailed work was done for all parts of the study area using 1:50,000 maps.
Where appropriate, care was taken to keep boundaries within predicted Com-munity Council Areas (CCA). This process can be illustrated with reference to the map below. The detailed map to the right is an extract from a 1:50,000 map of the Matsieng area (Sheet 42), while the smaller map to the left shows the same area from the national map of 1:250,000.
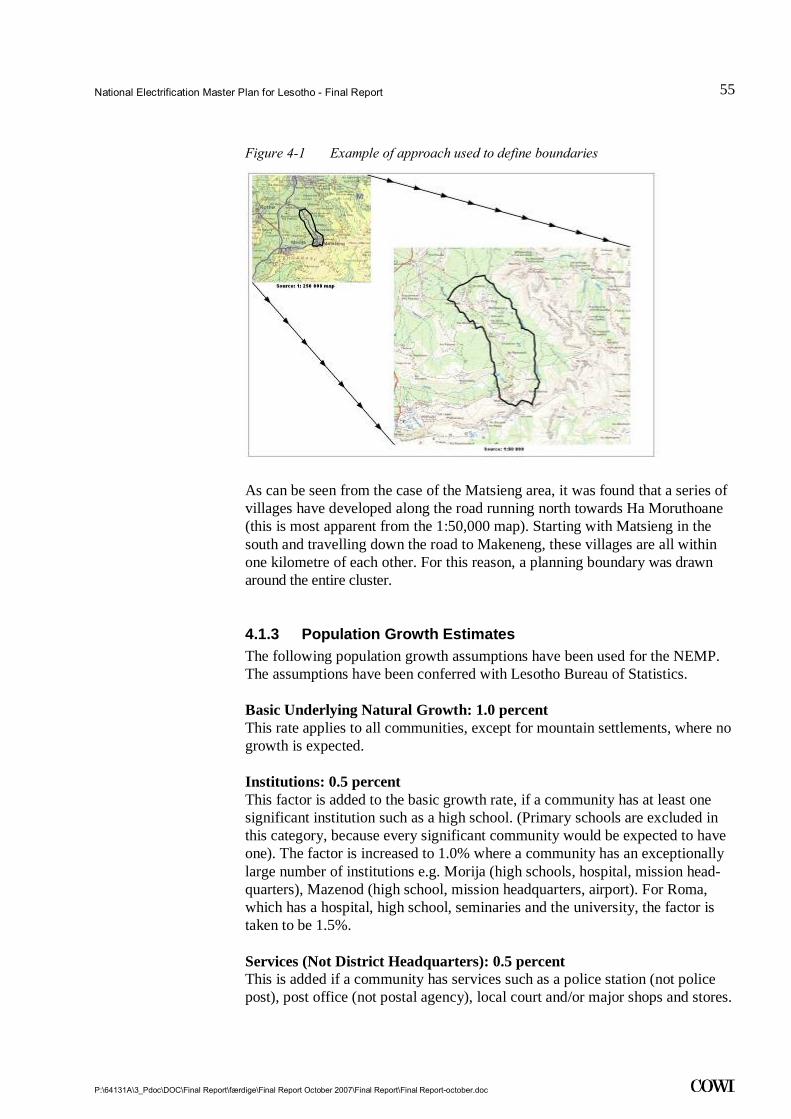
National Electrification Master Plan for Lesotho - Final Report
P:\64131A\3_Pdoc\DOC\Final Report\færdige\Final Report October 2007\Final Report\Final Report-october.doc
55
.
Figure 4-1 Example of approach used to define boundaries
As can be seen from the case of the Matsieng area, it was found that a series of villages have developed along the road running north towards Ha Moruthoane (this is most apparent from the 1:50,000 map). Starting with Matsieng in the south and travelling down the road to Makeneng, these villages are all within one kilometre of each other. For this reason, a planning boundary was drawn around the entire cluster.
4.1.3 Population Growth Estimates The following population growth assumptions have been used for the NEMP. The assumptions have been conferred with Lesotho Bureau of Statistics.
Basic Underlying Natural Growth: 1.0 percent This rate applies to all communities, except for mountain settlements, where no growth is expected.
Institutions: 0.5 percent This factor is added to the basic growth rate, if a community has at least one significant institution such as a high school. (Primary schools are excluded in this category, because every significant community would be expected to have one). The factor is increased to 1.0% where a community has an exceptionally large number of institutions e.g. Morija (high schools, hospital, mission head-quarters), Mazenod (high school, mission headquarters, airport). For Roma, which has a hospital, high school, seminaries and the university, the factor is taken to be 1.5%.
Services (Not District Headquarters): 0.5 percent This is added if a community has services such as a police station (not police post), post office (not postal agency), local court and/or major shops and stores.
National Electrification Master Plan for Lesotho - Final Report
P:\64131A\3_Pdoc\DOC\Final Report\færdige\Final Report October 2007\Final Report\Final Report-october.doc
56
.
Services (District Headquarters): 1.0 percent District headquarters all have additional services such as passport and licensing offices, magistrate’s courts, sub-accountancy, prison and district administrators' and town clerks' offices. They are thus awarded 1.0% additional growth.
Existing Industry: 1.0 percent Communities with an industrial estate are a draw for job seekers, and warrant an additional 1.0% growth.
New Industry: 2.0 percent Communities where an AGOA-type estate is currently planned - or where exist-ing industry is being expanded, are awarded 2.0% for industry because indus-trial growth is a very significant draw for job seekers. However, because of the uncertainty of AGOA in the long-term future, the 2.0% is used for the periods 2000/5 and 2005/10, and 1.5% thereafter.
Capital (Maseru): 2.0 percent The capital city has additional services and institutions that provide an addi-tional incentive for people to move to the capital. These include social as well as economic incentives. 2% has been allocated to the capital.
Commuter Settlements: 0.5 percent There are certain settlements that are commuter towns, from which people commute to areas with better employment opportunities. Distance in such cases is important, and such settlements are taken to be not more than 20 km away from the place of work. Commuter settlements are allocated 0.5 %.
The smaller 62 communities with an average population of 3,250 as well as the mountain centres are not expected to grow and have, therefore, been attributed a score of zero.
Including the settlements in the Highlands, 140 have been identified. Informa-tion from LEC as well as verification on the ground, if needed, formed the background for assessing the electrification status of each of the settle-ments/clusters. A complete list of the settlements, estimated population as well as electrification status as of 2006 is shown in Table 4-1. Figure 4-2 shows the spatial allocation of settlements/clusters, whereas maps and more detailed de-scriptions of the 140 settlements can be found in Appendix 11.

National Electrification Master Plan for Lesotho - Final Report
P:\64131A\3_Pdoc\DOC\Final Report\færdige\Final Report October 2007\Final Report\Final Report-october.doc
57
.
Table 4-1 List of NEMP settlements and towns, settlement types, electrification status and estimated population
District Village cluster Settle-ment type
Elec. status 2006
Settlement population 2005
Settlement population 2020
Berea Teyateyaneng 2 √ 24,876 29,158
Berea Mapoteng 3 √ 7,276 7,724
Berea Koali 4 4,908 5,530
Berea Lekokoaneng 4 √ 4,168 4,426
Berea Makhoroana 4 √ 4,102 4,622
Berea Mamathe 4 √ 7,574 8,534
Berea Baruting 5 √ 3,250 3,250
Berea Bataung 5 3,250 3,250
Berea Bela Bela 5 √ 3,250 3,250
Berea Bethany 5 3,250 3,250
Berea Buasono 5 √ 3,250 3,250
Berea Corn Exchange 5 √ 3,250 3,250
Berea Hangers drift 5 3,250 3,250
Berea Kolojane 5 √ 3,250 3,250
Berea Majaheng 5 3,250 3,250
Berea Maqhaka 5 √ 3,250 3,250
Berea Mokhethoaneng 5 3,250 3,250
Berea Senekane 5 √ 3,250 3,250
Berea Sefikeng 6 3,930 4,429
Total Berea 19 95,834 103,423
District Village cluster Settle-
ment type
Elec. status 2006
Settlement population 2005
Settlement population 2020
Butha-Buthe Butha Buthe 2 √ 37,627 67,554
Butha-Buthe Seboche 3 √ 3,000 3,000
Butha-Buthe Boinyatso 4 √ 3,096 3,035
Butha-Buthe Khukune 4 √ 3,319 3,524
Butha-Buthe Lejone 4 √ 1,403 1,403
Butha-Buthe Qalo 4 √ 4,469 4,745
Butha-Buthe Belo 5 3,250 3,250
Butha-Buthe Motete 5 < 1,000 < 1,000
Butha-Buthe Phelantaba 5 3,250 3,250
Butha-Buthe Qholaqhoe (EAPP 2007) 5 3,250 3,250
Butha-Buthe Selomo 5 3,250 3,250
Butha-Buthe Serutle 5 √ 3,250 3,250
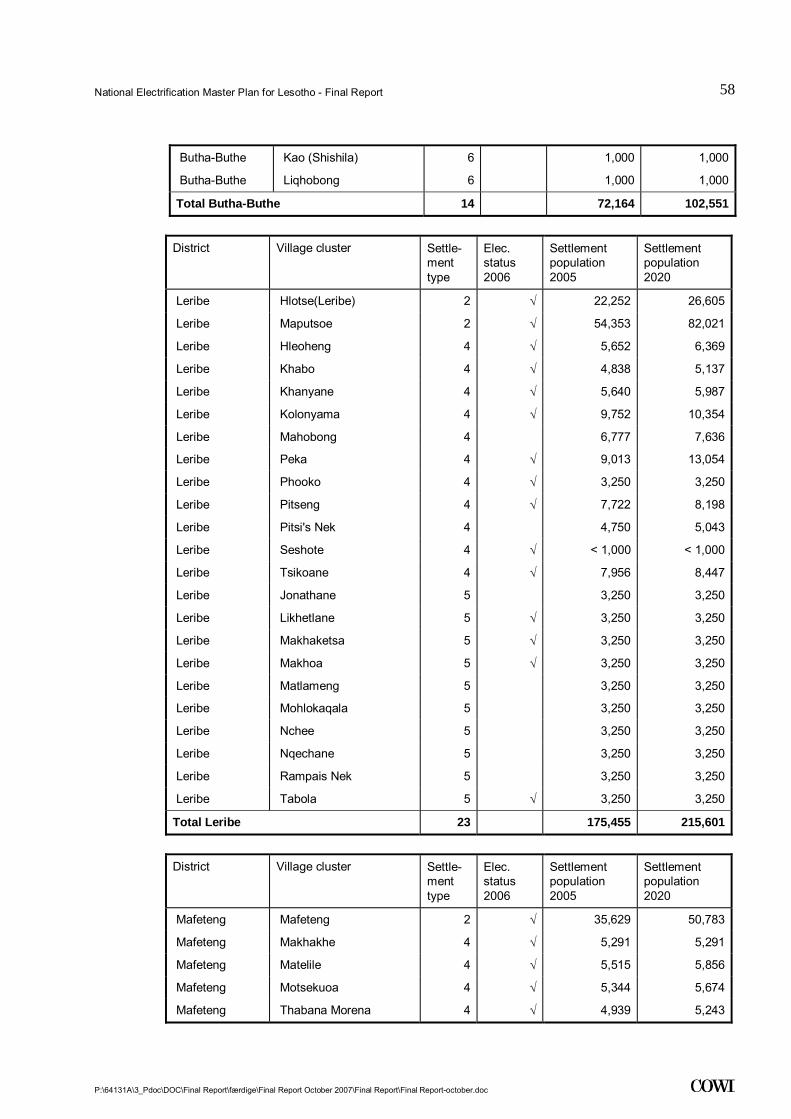
National Electrification Master Plan for Lesotho - Final Report
P:\64131A\3_Pdoc\DOC\Final Report\færdige\Final Report October 2007\Final Report\Final Report-october.doc
58
.
Butha-Buthe Kao (Shishila) 6 1,000 1,000
Butha-Buthe Liqhobong 6 1,000 1,000
Total Butha-Buthe 14 72,164 102,551
District Village cluster Settle-
ment type
Elec. status 2006
Settlement population 2005
Settlement population 2020
Leribe Hlotse(Leribe) 2 √ 22,252 26,605
Leribe Maputsoe 2 √ 54,353 82,021
Leribe Hleoheng 4 √ 5,652 6,369
Leribe Khabo 4 √ 4,838 5,137
Leribe Khanyane 4 √ 5,640 5,987
Leribe Kolonyama 4 √ 9,752 10,354
Leribe Mahobong 4 6,777 7,636
Leribe Peka 4 √ 9,013 13,054
Leribe Phooko 4 √ 3,250 3,250
Leribe Pitseng 4 √ 7,722 8,198
Leribe Pitsi's Nek 4 4,750 5,043
Leribe Seshote 4 √ < 1,000 < 1,000
Leribe Tsikoane 4 √ 7,956 8,447
Leribe Jonathane 5 3,250 3,250
Leribe Likhetlane 5 √ 3,250 3,250
Leribe Makhaketsa 5 √ 3,250 3,250
Leribe Makhoa 5 √ 3,250 3,250
Leribe Matlameng 5 3,250 3,250
Leribe Mohlokaqala 5 3,250 3,250
Leribe Nchee 5 3,250 3,250
Leribe Nqechane 5 3,250 3,250
Leribe Rampais Nek 5 3,250 3,250
Leribe Tabola 5 √ 3,250 3,250
Total Leribe 23 175,455 215,601
District Village cluster Settle-
ment type
Elec. status 2006
Settlement population 2005
Settlement population 2020
Mafeteng Mafeteng 2 √ 35,629 50,783
Mafeteng Makhakhe 4 √ 5,291 5,291
Mafeteng Matelile 4 √ 5,515 5,856
Mafeteng Motsekuoa 4 √ 5,344 5,674
Mafeteng Thabana Morena 4 √ 4,939 5,243
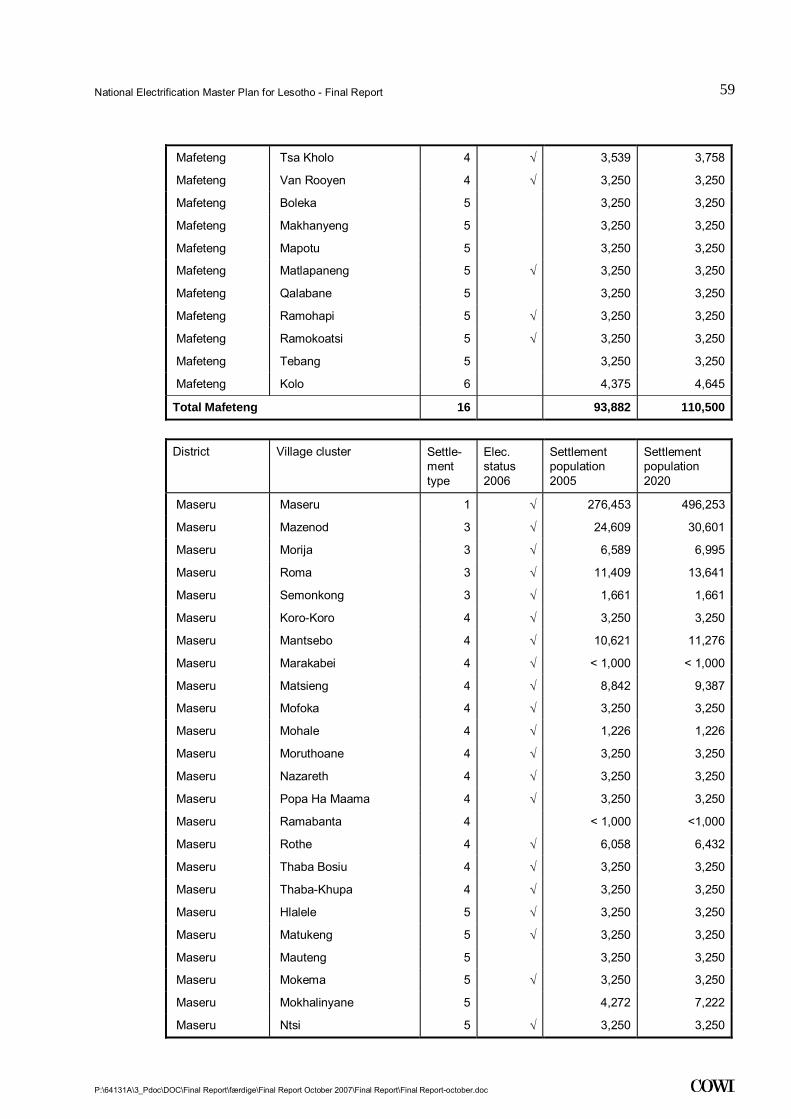
National Electrification Master Plan for Lesotho - Final Report
P:\64131A\3_Pdoc\DOC\Final Report\færdige\Final Report October 2007\Final Report\Final Report-october.doc
59
.
Mafeteng Tsa Kholo 4 √ 3,539 3,758
Mafeteng Van Rooyen 4 √ 3,250 3,250
Mafeteng Boleka 5 3,250 3,250
Mafeteng Makhanyeng 5 3,250 3,250
Mafeteng Mapotu 5 3,250 3,250
Mafeteng Matlapaneng 5 √ 3,250 3,250
Mafeteng Qalabane 5 3,250 3,250
Mafeteng Ramohapi 5 √ 3,250 3,250
Mafeteng Ramokoatsi 5 √ 3,250 3,250
Mafeteng Tebang 5 3,250 3,250
Mafeteng Kolo 6 4,375 4,645
Total Mafeteng 16 93,882 110,500
District Village cluster Settle-
ment type
Elec. status 2006
Settlement population 2005
Settlement population 2020
Maseru Maseru 1 √ 276,453 496,253
Maseru Mazenod 3 √ 24,609 30,601
Maseru Morija 3 √ 6,589 6,995
Maseru Roma 3 √ 11,409 13,641
Maseru Semonkong 3 √ 1,661 1,661
Maseru Koro-Koro 4 √ 3,250 3,250
Maseru Mantsebo 4 √ 10,621 11,276
Maseru Marakabei 4 √ < 1,000 < 1,000
Maseru Matsieng 4 √ 8,842 9,387
Maseru Mofoka 4 √ 3,250 3,250
Maseru Mohale 4 √ 1,226 1,226
Maseru Moruthoane 4 √ 3,250 3,250
Maseru Nazareth 4 √ 3,250 3,250
Maseru Popa Ha Maama 4 √ 3,250 3,250
Maseru Ramabanta 4 < 1,000 <1,000
Maseru Rothe 4 √ 6,058 6,432
Maseru Thaba Bosiu 4 √ 3,250 3,250
Maseru Thaba-Khupa 4 √ 3,250 3,250
Maseru Hlalele 5 √ 3,250 3,250
Maseru Matukeng 5 √ 3,250 3,250
Maseru Mauteng 5 3,250 3,250
Maseru Mokema 5 √ 3,250 3,250
Maseru Mokhalinyane 5 4,272 7,222
Maseru Ntsi 5 √ 3,250 3,250
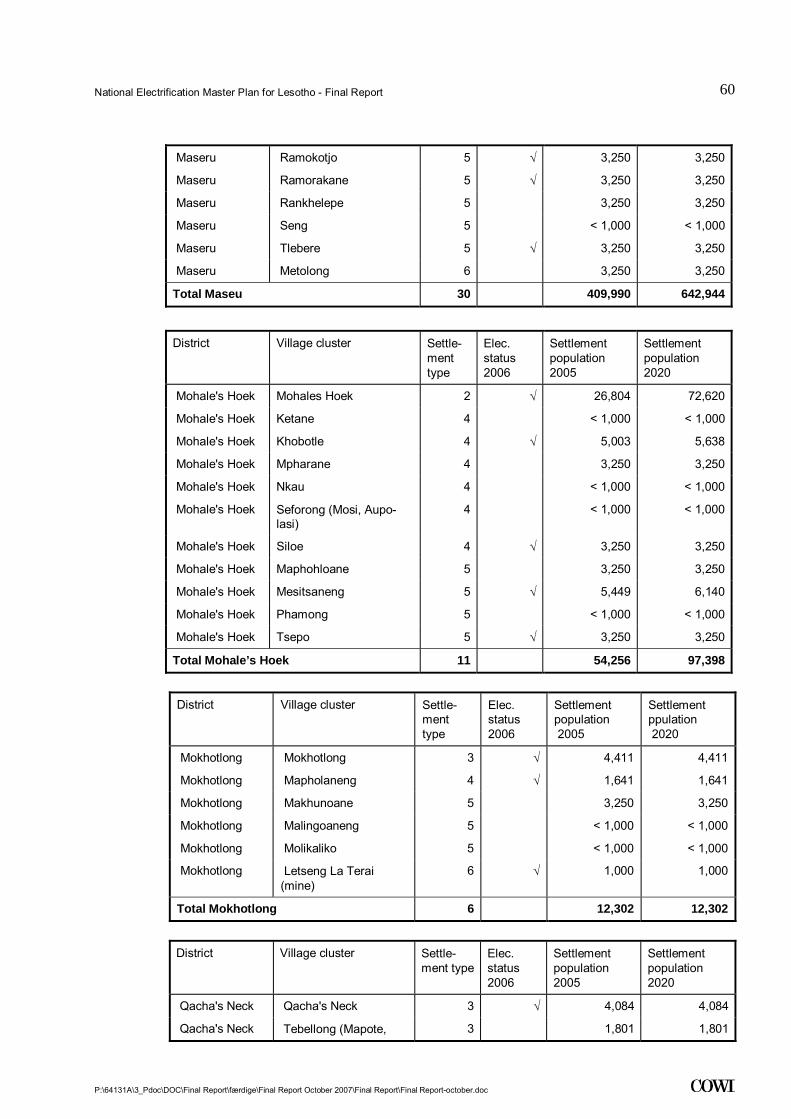
National Electrification Master Plan for Lesotho - Final Report
P:\64131A\3_Pdoc\DOC\Final Report\færdige\Final Report October 2007\Final Report\Final Report-october.doc
60
.
Maseru Ramokotjo 5 √ 3,250 3,250
Maseru Ramorakane 5 √ 3,250 3,250
Maseru Rankhelepe 5 3,250 3,250
Maseru Seng 5 < 1,000 < 1,000
Maseru Tlebere 5 √ 3,250 3,250
Maseru Metolong 6 3,250 3,250
Total Maseu 30 409,990 642,944
District Village cluster Settle-ment type
Elec. status 2006
Settlement population 2005
Settlement population 2020
Mohale's Hoek Mohales Hoek 2 √ 26,804 72,620
Mohale's Hoek Ketane 4 < 1,000 < 1,000
Mohale's Hoek Khobotle 4 √ 5,003 5,638
Mohale's Hoek Mpharane 4 3,250 3,250
Mohale's Hoek Nkau 4 < 1,000 < 1,000
Mohale's Hoek Seforong (Mosi, Aupo-lasi)
4 < 1,000 < 1,000
Mohale's Hoek Siloe 4 √ 3,250 3,250
Mohale's Hoek Maphohloane 5 3,250 3,250
Mohale's Hoek Mesitsaneng 5 √ 5,449 6,140
Mohale's Hoek Phamong 5 < 1,000 < 1,000
Mohale's Hoek Tsepo 5 √ 3,250 3,250
Total Mohale’s Hoek 11 54,256 97,398
District Village cluster Settle-
ment type
Elec. status 2006
Settlement population 2005
Settlement ppulation 2020
Mokhotlong Mokhotlong 3 √ 4,411 4,411
Mokhotlong Mapholaneng 4 √ 1,641 1,641
Mokhotlong Makhunoane 5 3,250 3,250
Mokhotlong Malingoaneng 5 < 1,000 < 1,000
Mokhotlong Molikaliko 5 < 1,000 < 1,000
Mokhotlong Letseng La Terai (mine)
6 √ 1,000 1,000
Total Mokhotlong 6 12,302 12,302
District Village cluster Settle-
ment typeElec. status 2006
Settlement population 2005
Settlement population 2020
Qacha's Neck Qacha's Neck 3 √ 4,084 4,084
Qacha's Neck Tebellong (Mapote, 3 1,801 1,801
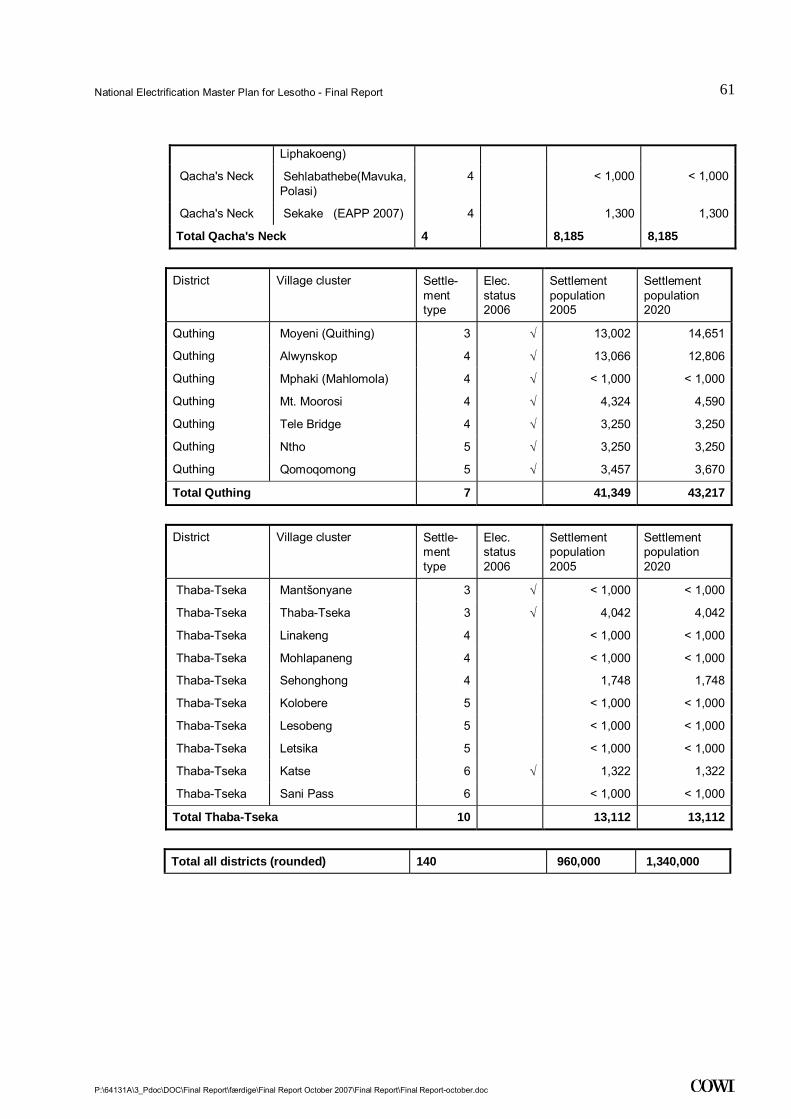
National Electrification Master Plan for Lesotho - Final Report
P:\64131A\3_Pdoc\DOC\Final Report\færdige\Final Report October 2007\Final Report\Final Report-october.doc
61
.
Liphakoeng)
Qacha's Neck Sehlabathebe(Mavuka, Polasi)
4 < 1,000 < 1,000
Qacha's Neck Sekake (EAPP 2007) 4 1,300 1,300
Total Qacha's Neck 4 8,185 8,185
District Village cluster Settle-
ment type
Elec. status 2006
Settlement population 2005
Settlement population 2020
Quthing Moyeni (Quithing) 3 √ 13,002 14,651
Quthing Alwynskop 4 √ 13,066 12,806
Quthing Mphaki (Mahlomola) 4 √ < 1,000 < 1,000
Quthing Mt. Moorosi 4 √ 4,324 4,590
Quthing Tele Bridge 4 √ 3,250 3,250
Quthing Ntho 5 √ 3,250 3,250
Quthing Qomoqomong 5 √ 3,457 3,670
Total Quthing 7 41,349 43,217
District Village cluster Settle-
ment type
Elec. status 2006
Settlement population 2005
Settlement population 2020
Thaba-Tseka Mantšonyane 3 √ < 1,000 < 1,000
Thaba-Tseka Thaba-Tseka 3 √ 4,042 4,042
Thaba-Tseka Linakeng 4 < 1,000 < 1,000
Thaba-Tseka Mohlapaneng 4 < 1,000 < 1,000
Thaba-Tseka Sehonghong 4 1,748 1,748
Thaba-Tseka Kolobere 5 < 1,000 < 1,000
Thaba-Tseka Lesobeng 5 < 1,000 < 1,000
Thaba-Tseka Letsika 5 < 1,000 < 1,000
Thaba-Tseka Katse 6 √ 1,322 1,322
Thaba-Tseka Sani Pass 6 < 1,000 < 1,000
Total Thaba-Tseka 10 13,112 13,112
Total all districts (rounded) 140 960,000 1,340,000

National Electrification Master Plan for Lesotho - Final Report
P:\64131A\3_Pdoc\DOC\Final Report\færdige\Final Report October 2007\Final Report\Final Report-october.doc
62
.
Figure 4-2 Spatial allocation of the 140 identified NEMP settlements and towns in Lesotho
4.2 Poverty Mapping and Energy Demand Surveys In the 1980s and 1990s, a number of household surveys were carried out in Le-sotho which included some information on types of fuel and the devices which use these fuels. 11 of these surveys have been re-analyzed. Although the sur-veys were conducted for a variety of reasons, they all contain some relevant information.
In summary, in 1980s and 1990s, electricity use was rare and confined largely to wealthy urban residents. Gas use was increasing, but was also mainly used by wealthy households. Coal use decreased slightly, although the number of coal stoves remained high, and remained mainly a fuel for the wealthy. Paraffin use remained high and steady, slightly more often by wealthier households. Wood, shrub, dung and crop were less often used in the late 1990s than in the 1980s, but remained the main sources of energy for poorer, less educated households. Candle use was widespread and continues to be common.
There are no indications of important changes in energy consumption patterns since 2000 apart from a larger number of high and middle-income families us-ing electricity, as will be presented in Section 4.3 below.
National Electrification Master Plan for Lesotho - Final Report
P:\64131A\3_Pdoc\DOC\Final Report\færdige\Final Report October 2007\Final Report\Final Report-october.doc
63
.
4.3 WAP Studies for Electricity
4.3.1 2001 - Access to Electricity – Off-grid Rural Areas This study contains valuable information on villages outside of the LEC service territory, at the time defined as a boundary of 10 km to the existing distribution lines.
Ability to Pay The study confirmed findings from the Poverty Mapping Exercises, which all showed high levels of unemployment in the mountains.
The average monthly household income for the study households was LSL 312 (in 2001 prices). Looking at sources of income, the sale of traditional beer (joala) was the most common, practised by 20% of households (and creating a significant demand for firewood in the process). The other sources of income in descending order of reporting were as follows: sales of crops and vegetables (12.7%), wages in Lesotho (11.6%), casual work in Lesotho (10.3%), sales of livestock (9.0%), mine work in South Africa (7.0%), gifts (6.6%), informal business (3.5%) and other work in South Africa (2.6%).
In order to gauge ability to pay, the survey looked at sources of household in-comes for those households that had in excess of LSL 1,000 per month. This changed the order of income sources as follows: Wages in Lesotho (18.4%), mine work in South Africa (11.9%), casual work in Lesotho (11.9%), sale of livestock and products (9.7%), sale of joala/beer (9.7%), sale of crops and vegetables (9.7%), gifts (6.8%) and informal business. Clearly, those with wages tended to be in this higher income bracket.
The average monthly household expenditure was LSL 299. The average monthly total cost for all energy use at the household level was LSL 118, based on an analysis of energy for cooking, lighting, space heating, hot water, ironing clothes and power appliances such as radio, TV, fridge and Hi-fi.
The survey results show something of a mismatch between the willingness to pay and the ability to pay. When asked whether they would be willing to pay about LSL 4,000 for an electricity connection, 85% of the respondents said that they would pay, but then most of these (84%) indicated that they would prefer to pay by instalments. The average deposit that they would be willing to pay is LSL 530, but the most frequently mentioned figure (mode) is LSL 200, proba-bly a more accurate reflection of most households’ capacity given the incomes shown above. The average amount of money that they said they would be pre-pared to pay as monthly instalments for the connection is LSL 211 (being two thirds of their stated income) and the most frequently mentioned figure is LSL 100 (still an unrealistic amount considering the incomes).
Asked how much they would be prepared to pay for their monthly consump-tion, an average figure of LSL 90 was given with a mode of LSL 50 (which at 17% of average stated income is still very high).
National Electrification Master Plan for Lesotho - Final Report
P:\64131A\3_Pdoc\DOC\Final Report\færdige\Final Report October 2007\Final Report\Final Report-october.doc
64
.
A more realistic reflection of what these future electricity consumers might ac-tually pay comes from questions posed regarding appliances. When asked if they would buy a single electric hot plate if it costs about LSL130, 78% of re-spondents said no. In a similar vein, 70% would not pay for a double hot plate that costs LSL 140. On the other hand, 71% of the respondents would be will-ing to pay for an electric kettle if it costs LSL 60. When asked if they would be willing to buy an electric iron that costs LSL 85, 67% indicated that they would pay. The main reason they gave for ‘looking forward to having electricity’ was for lighting. Ownership of paraffin stoves and heater was relatively high.
Taken together, the above findings indicate: (i) low ability to pay for electricity due to high levels of unemployment; (ii) high willingness to obtain a connec-tion, but inability to pay for this without connection costs being spread; (iii) little interest in purchasing low-cost electrical stoves, but high interest in light-ing, suggesting that future consumption patterns will be very low.
4.3.2 2003 – Barrier to Adoption - Rural and Peri-Urban Areas This report noted that in the rural and peri-urban Lesotho, the majority of un-electrified households live on less than USD 1 per capita per day, with over 80% having incomes of below LSL 80 per household member per month.
Households with electricity in the rural and peri-urban areas are less poor than their un-electrified counterparts. This is reflected by their household amenities (better toilets, more working radios, more convenient water supply, etc.) and assets.
4.3.3 PSIA Consumer Assessment, Urban and Rural Areas near LEC Grid from 2003
The report was an outcome of a broader assessment involving a Poverty and Social Impact Analysis (PSIA) of the tariff and connection fee reform of the Lesotho electricity sector.
Key observations from this study were:
• Pent-up demand – One main factor which emerged from the survey is that 16.6% of non-connected households living near the grid have applied, but have not been connected largely owing to difficulties experienced by LEC. These factors have discouraged many households from even applying for connection, that is why only less than one-fifth of total non-households in-terviewed have applied.
• Strong demand for electricity - It appears that there is a strong demand for households to get connected. Out of the total of non-connected households, which have not even applied for electricity (83.4%), 54.8% of them have discussed applying, but the majority of these (64.9%) claim not to afford electricity because they are “never able to pay” or “are saving up for it”.
National Electrification Master Plan for Lesotho - Final Report
P:\64131A\3_Pdoc\DOC\Final Report\færdige\Final Report October 2007\Final Report\Final Report-october.doc
65
.
• Constrained ability to pay - For the non-connected, their ability to electrify their houses is inhibited by the connection fee policy. This is confirmed by the fact that 66% of their households agreed that ‘the over time recurrent cost of electricity is less important than trying to come up with funds for the down payment’. This implies that a low connection fee will to a large extent increase the number of households connected.
• Low-wage employment - 52.6% of all non-connected households inter-viewed have no wage employment. For those without wage employment, raising funds for connection will be very difficult. For those who are em-ployed, 47.5% are burdened with the pressure of providing for the house-hold since only one member on average is employed in each household. This implies that even if the unit cost of electricity is lowered, consump-tion of households will be low considering that most households would only use electricity for basic necessities due to low income.
• Low potential revenue for LEC - 91.4% of the households which have ap-plied, but have not yet been connected, indicated that electricity purchase amounting to 5% of their total income would be affordable. This level of affordability refers to an average expenditure ranging from LSL 38 – LSL 50. This implies that if LEC were to connect these households, many of them would spend between LSL 38-LSL 50 per month on electricity, which would yield low potential revenue for LEC.
• Greater preference given to low amp connection – The choice of 10 amp installation, which when introduced will require very little electricity con-sumption, was chosen by 52.3% of the unconnected households. 20 amp connections, which allows for more electricity to be consumed, was chosen by 37.4% of the unconnected households and 60 amp connections, by 10.1%. Clearly, this implies that if LEC were to connect these households, most of them would opt for the low amp connection of 10 amps.
• Health, education and environmental implications from tariff increase - As wiring is expected to take place before connection can be established, only 11.4% of those who have applied have completed wiring. Of those who have not completed wiring, 59.4% claim that it is due to shortage of funds. Assuming that these households were all connected and tariffs should in-crease by at least 50%, 70% of them indicated that they will have no other choice but to limit their use of electrical appliances and increase their con-sumption of other energy fuel, particularly paraffin. This of course has health, education and environmental implications. Clearly, a tariff increase of at least this magnitude will have far reaching repercussions on many non-connected households.
4.4 Social Impact of Household Electrification In order to assess the benefits (or losses) that electricity brings to newly electri-fied households, a household survey was set up targeting those who have had power for between one and two years. The survey covered 400 households.

National Electrification Master Plan for Lesotho - Final Report
P:\64131A\3_Pdoc\DOC\Final Report\færdige\Final Report October 2007\Final Report\Final Report-october.doc
66
.
In summary, mains electricity is a greatly appreciated household benefit. A lim-ited average financial saving of around LSL 16 per month per household can be made while enjoying a range of new appliances and social benefits. These so-cial benefits, which outweigh the costs, include cooking, food preservation, space heating and entertainment, and it allows the next generation of children to study and thus prepare for a good future life. Mains electricity, however, is only in a small minority of cases tied to using household electricity and facili-ties to generate income.
4.5 Conclusions Regarding Socio-Economic Information
The abundance of relatively recent and highly relevant households surveys suggested that before embarking on any new additional fieldwork, every effort should be made to draw on existing data to inform the NEMP. Additional in-formation has been sought on specific settlements where information was either lacking or new developments likely to have taken place. This information has been included in the settlement descriptions in Appendix 11.
The socio-economic information obtained is sufficient to carry through the planning exercise, the load forecasting as well as the preliminary ranking of electrification projects.
4.5.1 Planning Assumptions The following assumptions have been used in the planning work based on the available socio-economic information:
Demographic developments: Population estimates for the 140 identified settlements for the years 2005, 2010, 2015 as well as for 2020 have been based on the block building approach. For some smaller settlements, the data have not been available and therefore have been assessed based on population of similar settlements. The estimate of the number of households is based on the LDHS information of average household sizes for urban (2.9) and rural areas (4.2), respectively. Settlement types 1, 2 and 3 have been regarded as mainly urban whereas settlement types 4, 5 and 6 have been regarded as mainly rural.
Available data from LEC on domestic customers and their average electricity demand in relation to settlement types confirm that there is a correlation be-tween the settlement types and existing consumer characteristics.
Assumptions regarding household size, energy demand per household and long-term uptake levels for the different settlement types are presented in Table 4-2. The uptake rates have been estimated based on experience from recent do-nor-funded electrification projects in Lesotho, analyses of ability to pay and share of households with waged persons as well as experience from similar countries (electrification rates in other African capitals and industrialized towns). The uptake levels necessary to reach the electrification target are pre-sented in scenario 1. This level of connection assumes an accelerated growth in
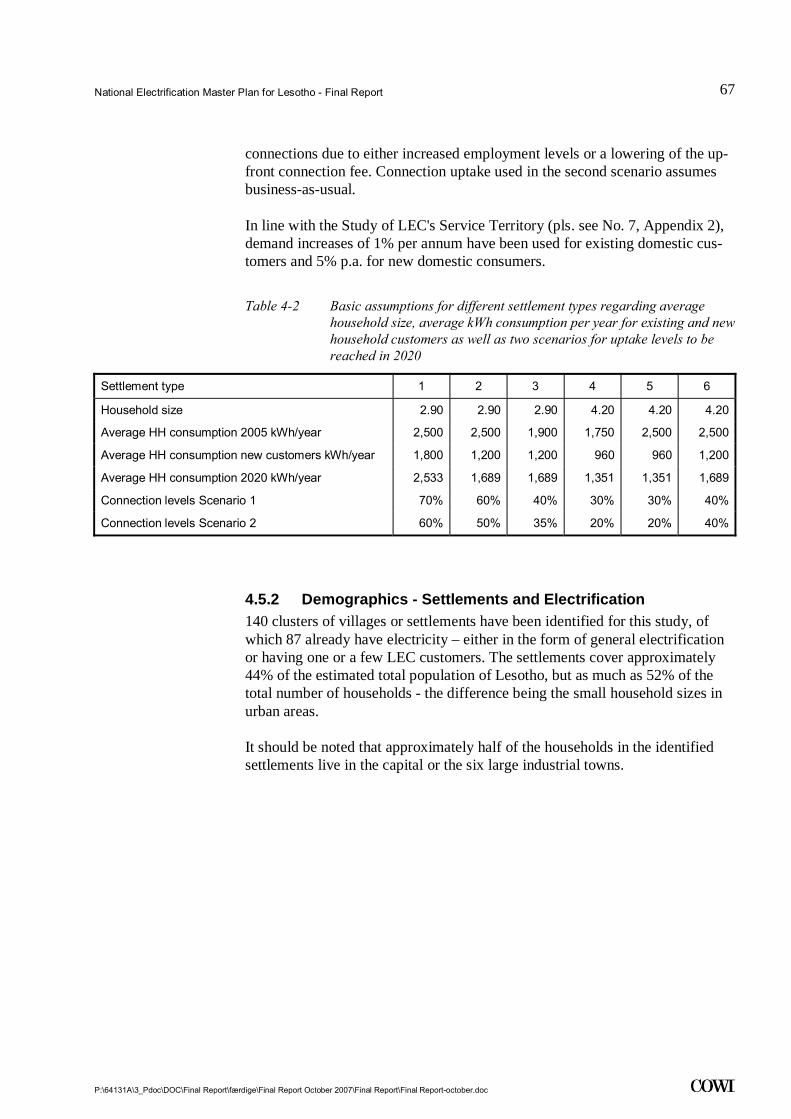
National Electrification Master Plan for Lesotho - Final Report
P:\64131A\3_Pdoc\DOC\Final Report\færdige\Final Report October 2007\Final Report\Final Report-october.doc
67
.
connections due to either increased employment levels or a lowering of the up-front connection fee. Connection uptake used in the second scenario assumes business-as-usual.
In line with the Study of LEC's Service Territory (pls. see No. 7, Appendix 2), demand increases of 1% per annum have been used for existing domestic cus-tomers and 5% p.a. for new domestic consumers.
Table 4-2 Basic assumptions for different settlement types regarding average household size, average kWh consumption per year for existing and new household customers as well as two scenarios for uptake levels to be reached in 2020
Settlement type 1 2 3 4 5 6
Household size 2.90 2.90 2.90 4.20 4.20 4.20
Average HH consumption 2005 kWh/year 2,500 2,500 1,900 1,750 2,500 2,500
Average HH consumption new customers kWh/year 1,800 1,200 1,200 960 960 1,200
Average HH consumption 2020 kWh/year 2,533 1,689 1,689 1,351 1,351 1,689
Connection levels Scenario 1 70% 60% 40% 30% 30% 40%
Connection levels Scenario 2 60% 50% 35% 20% 20% 40%
4.5.2 Demographics - Settlements and Electrification 140 clusters of villages or settlements have been identified for this study, of which 87 already have electricity – either in the form of general electrification or having one or a few LEC customers. The settlements cover approximately 44% of the estimated total population of Lesotho, but as much as 52% of the total number of households - the difference being the small household sizes in urban areas.
It should be noted that approximately half of the households in the identified settlements live in the capital or the six large industrial towns.
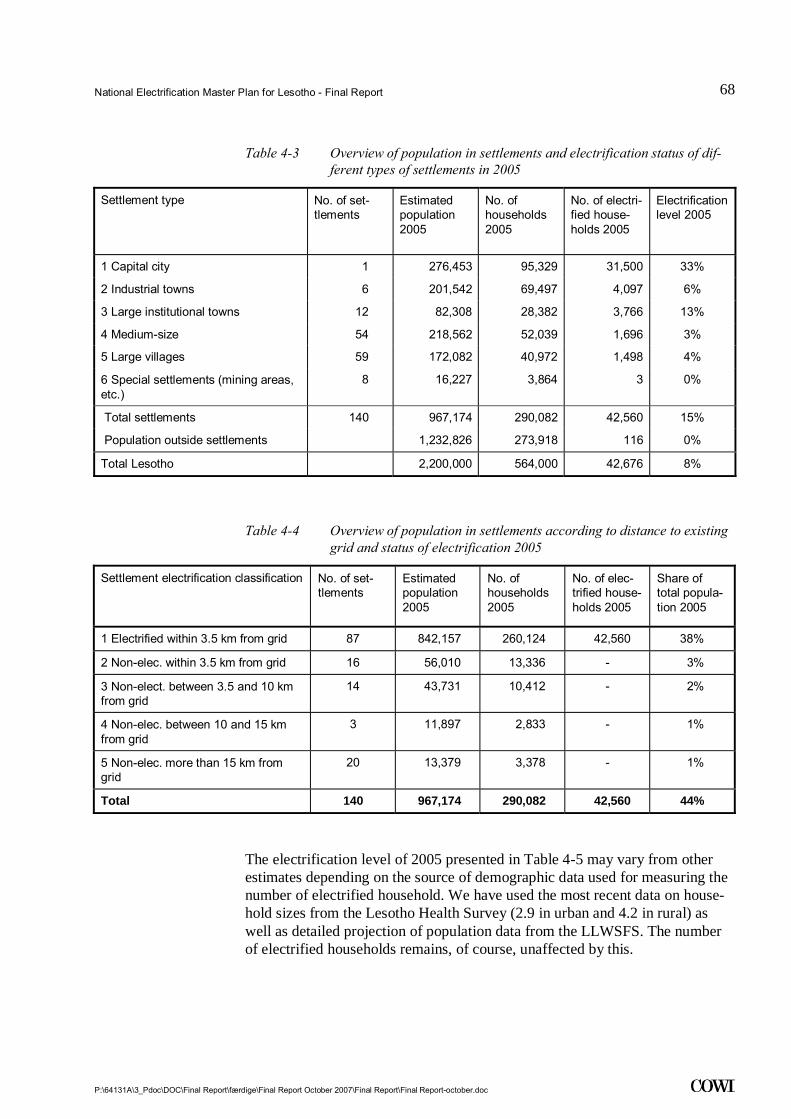
National Electrification Master Plan for Lesotho - Final Report
P:\64131A\3_Pdoc\DOC\Final Report\færdige\Final Report October 2007\Final Report\Final Report-october.doc
68
.
Table 4-3 Overview of population in settlements and electrification status of dif-ferent types of settlements in 2005
Settlement type No. of set-tlements
Estimated population 2005
No. of households 2005
No. of electri-fied house-holds 2005
Electrification level 2005
1 Capital city 1 276,453 95,329 31,500 33%
2 Industrial towns 6 201,542 69,497 4,097 6%
3 Large institutional towns 12 82,308 28,382 3,766 13%
4 Medium-size 54 218,562 52,039 1,696 3%
5 Large villages 59 172,082 40,972 1,498 4%
6 Special settlements (mining areas, etc.)
8 16,227 3,864 3 0%
Total settlements 140 967,174 290,082 42,560 15%
Population outside settlements 1,232,826 273,918 116 0%
Total Lesotho 2,200,000 564,000 42,676 8%
Table 4-4 Overview of population in settlements according to distance to existing grid and status of electrification 2005
Settlement electrification classification No. of set-tlements
Estimated population 2005
No. of households 2005
No. of elec-trified house-holds 2005
Share of total popula-tion 2005
1 Electrified within 3.5 km from grid 87 842,157 260,124 42,560 38%
2 Non-elec. within 3.5 km from grid 16 56,010 13,336 - 3%
3 Non-elect. between 3.5 and 10 km from grid
14 43,731 10,412 - 2%
4 Non-elec. between 10 and 15 km from grid
3 11,897 2,833 - 1%
5 Non-elec. more than 15 km from grid
20 13,379 3,378 - 1%
Total 140 967,174 290,082 42,560 44%
The electrification level of 2005 presented in Table 4-5 may vary from other estimates depending on the source of demographic data used for measuring the number of electrified household. We have used the most recent data on house-hold sizes from the Lesotho Health Survey (2.9 in urban and 4.2 in rural) as well as detailed projection of population data from the LLWSFS. The number of electrified households remains, of course, unaffected by this.

National Electrification Master Plan for Lesotho - Final Report
P:\64131A\3_Pdoc\DOC\Final Report\færdige\Final Report October 2007\Final Report\Final Report-october.doc
69
.
Table 4-5 Overview of population in settlements in 2005 according to districts
District No. of set-tlements
Estimated population 2005
No. of households 2005
No. of electri-fied house-holds 2005
Electrification level 2005
Berea 19 95,833 26,249 1,199 5%
Butha-Buthe 14 71,514 21,364 207 1%
Leribe 23 174,956 49,832 3,935 8%
Mafeteng 16 93,883 26,156 821 3%
Maseru 30 408,673 131,534 35,185 27%
Mohale's Hoek 11 52,764 15,424 181 1%
Mokhotlong 6 11,002 3,090 343 11%
Qacha's Neck 4 7,039 2,304 20 1%
Quthing 7 41,073 11,167 230 2%
Thaba-Tseka 10 10,436 2,961 439 15%
Total 140 967,174 290,082 42,560 15%
It should be noted that the distribution of electrified households by LEC ac-cording to the various settlements used for this study is not complete and will still need updating and verification. The number of electrified customers in Maseru (capital) and Maputsoe (large industrial town), which make up more than 80 percent of the total LEC domestic customers, is based on the Consult-ant’s estimate. Estimates have also been used for other settlements: Semon-kong, Qacha's Neck and Lejone. Towns like Katse and Mohale (Likalaneng) are metered in bulk, and LEC does not therefore register the number of residen-tial and general purpose customers in these particular settlements. The electric-ity demand of these towns, however, is captured as part of the “commercial” energy demand.

National Electrification Master Plan for Lesotho - Final Report
P:\64131A\3_Pdoc\DOC\Final Report\færdige\Final Report October 2007\Final Report\Final Report-october.doc
70
.
5 Load Demand Forecast A number of forecasts of the electricity demand in Lesotho have been made over the past 15 years.
This present load forecast attempts to build on the previous studies while ad-justing for some of the previous shortfalls by using the latest available data from LEC and other infrastructure projects and placing a strong emphasis on accurate and up-to-date socio-economic information.
The load forecast focuses on the 140 identified settlements and clusters of vil-lages presented in Chapter 4. The potential for electrifying villages outside the defined settlements has not been included directly in the load forecast as electri-fication over the next 15 years will give priority to areas of some density and potential for economic growth.
The more dispersed villages would be relevant for electrification hereafter or for individual solutions (such as solar PV, gen-sets or similar).
5.1 Methodology and General Assumptions The load forecast for the electricity sector in Lesotho covers a 15-year period with its starting point in 2005, which is the latest year for which a reasonably complete data set is available on electricity demand and supply. Due to the sig-nificant changes in the electricity developments in Lesotho since 2001, the his-torically very low electrification level, as well as the Government's plan for an accelerated development of electrification, relying on historical data for the forecasting of the future demand, have only limited value.
The main parameters in the determination of the future load are the most recent estimates of the demographic evolution as well as the predictions of the overall economic development.
The load forecasting is made in relation to two main dimensions using a bot-tom-up approach to the load forecast:
The cluster approach – identification of electricity demand of identified settle-ments or clusters of settlements based on demographics and classification of the settlements into six characteristic types, as described in Chapter 4.
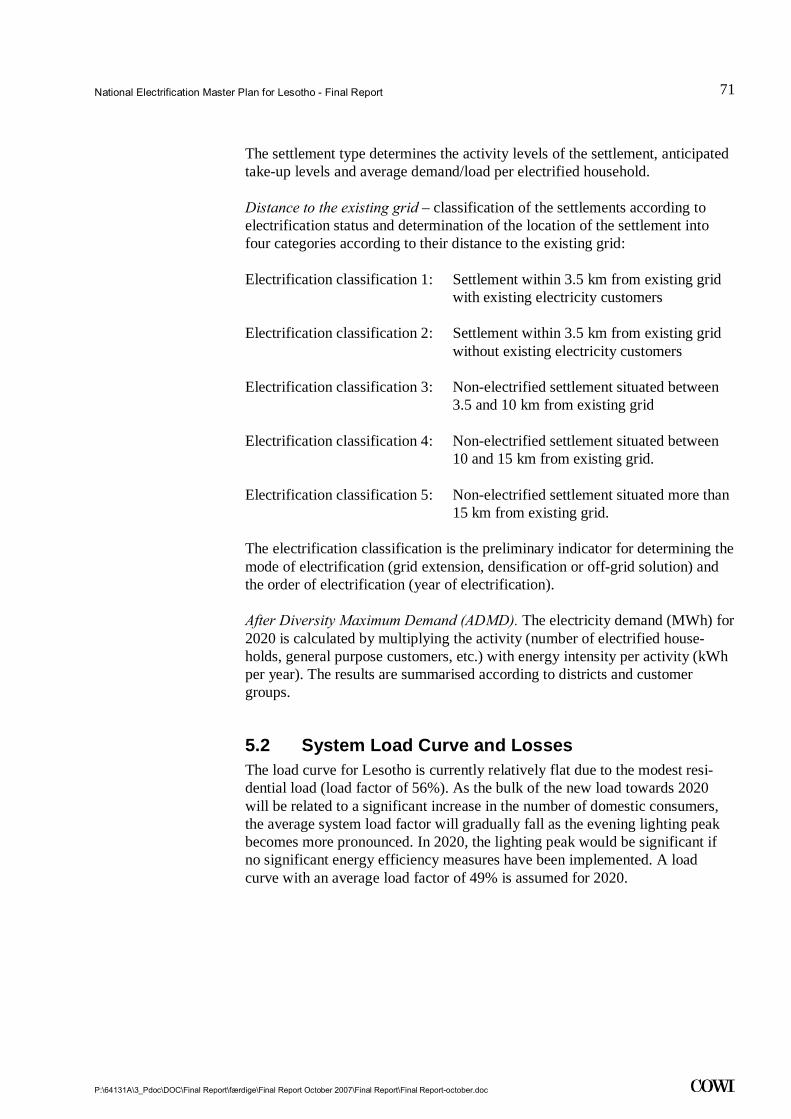
National Electrification Master Plan for Lesotho - Final Report
P:\64131A\3_Pdoc\DOC\Final Report\færdige\Final Report October 2007\Final Report\Final Report-october.doc
71
.
The settlement type determines the activity levels of the settlement, anticipated take-up levels and average demand/load per electrified household.
Distance to the existing grid – classification of the settlements according to electrification status and determination of the location of the settlement into four categories according to their distance to the existing grid:
Electrification classification 1: Settlement within 3.5 km from existing grid with existing electricity customers
Electrification classification 2: Settlement within 3.5 km from existing grid without existing electricity customers
Electrification classification 3: Non-electrified settlement situated between 3.5 and 10 km from existing grid
Electrification classification 4: Non-electrified settlement situated between 10 and 15 km from existing grid.
Electrification classification 5: Non-electrified settlement situated more than 15 km from existing grid.
The electrification classification is the preliminary indicator for determining the mode of electrification (grid extension, densification or off-grid solution) and the order of electrification (year of electrification).
After Diversity Maximum Demand (ADMD). The electricity demand (MWh) for 2020 is calculated by multiplying the activity (number of electrified house-holds, general purpose customers, etc.) with energy intensity per activity (kWh per year). The results are summarised according to districts and customer groups.
5.2 System Load Curve and Losses The load curve for Lesotho is currently relatively flat due to the modest resi-dential load (load factor of 56%). As the bulk of the new load towards 2020 will be related to a significant increase in the number of domestic consumers, the average system load factor will gradually fall as the evening lighting peak becomes more pronounced. In 2020, the lighting peak would be significant if no significant energy efficiency measures have been implemented. A load curve with an average load factor of 49% is assumed for 2020.
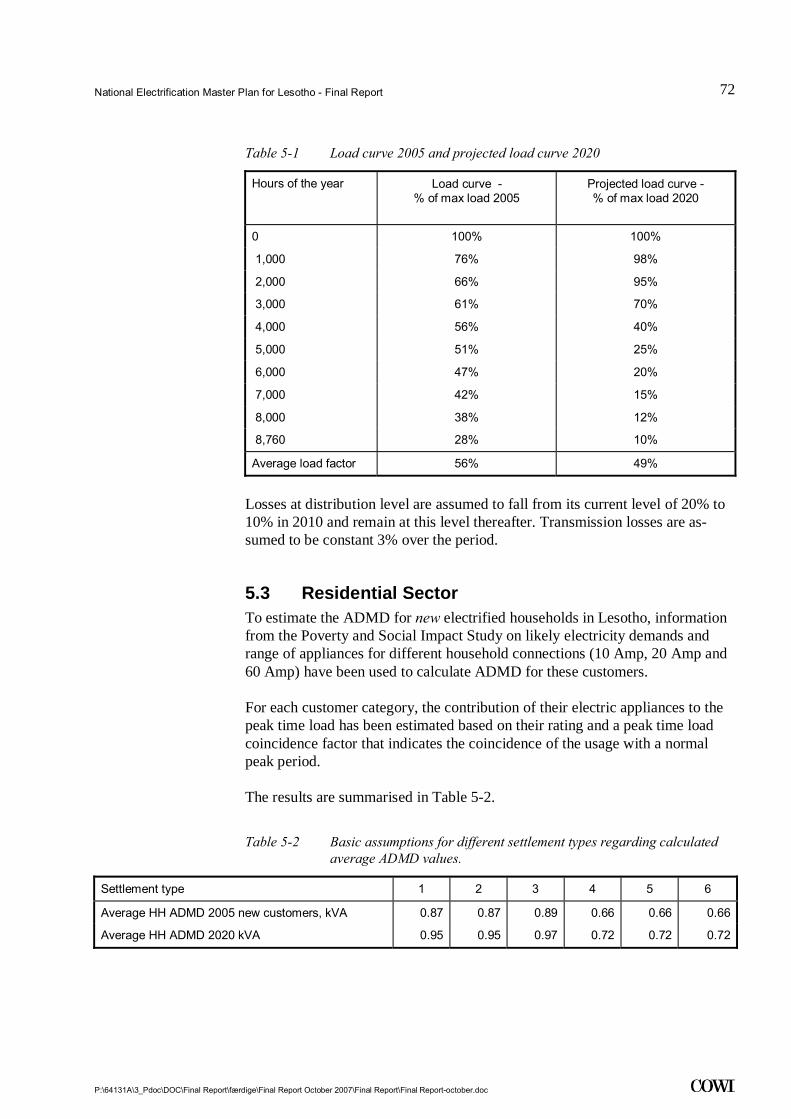
National Electrification Master Plan for Lesotho - Final Report
P:\64131A\3_Pdoc\DOC\Final Report\færdige\Final Report October 2007\Final Report\Final Report-october.doc
72
.
Table 5-1 Load curve 2005 and projected load curve 2020
Hours of the year Load curve - % of max load 2005
Projected load curve - % of max load 2020
0 100% 100%
1,000 76% 98%
2,000 66% 95%
3,000 61% 70%
4,000 56% 40%
5,000 51% 25%
6,000 47% 20%
7,000 42% 15%
8,000 38% 12%
8,760 28% 10%
Average load factor 56% 49%
Losses at distribution level are assumed to fall from its current level of 20% to 10% in 2010 and remain at this level thereafter. Transmission losses are as-sumed to be constant 3% over the period.
5.3 Residential Sector To estimate the ADMD for new electrified households in Lesotho, information from the Poverty and Social Impact Study on likely electricity demands and range of appliances for different household connections (10 Amp, 20 Amp and 60 Amp) have been used to calculate ADMD for these customers.
For each customer category, the contribution of their electric appliances to the peak time load has been estimated based on their rating and a peak time load coincidence factor that indicates the coincidence of the usage with a normal peak period.
The results are summarised in Table 5-2.
Table 5-2 Basic assumptions for different settlement types regarding calculated average ADMD values.
Settlement type 1 2 3 4 5 6
Average HH ADMD 2005 new customers, kVA 0.87 0.87 0.89 0.66 0.66 0.66
Average HH ADMD 2020 kVA 0.95 0.95 0.97 0.72 0.72 0.72

National Electrification Master Plan for Lesotho - Final Report
P:\64131A\3_Pdoc\DOC\Final Report\færdige\Final Report October 2007\Final Report\Final Report-october.doc
73
.
5.4 Other Customer Groups
5.4.1 General Purpose Customers The relationship between the number of electrified households and the number of general purpose customers has for the past 5 years been 15:1 according to LEC records (Management Contract for LEC, Monthly Reports). This relation-ship has been applied to estimate the number of general purpose customers in 2020.
As of October 2006, LEC registered 5,289 general purpose customers with an average consumption of approximately 12,000 kWh per year. There are no sta-tistics on the number of general purpose customers in Maseru and Maputsoe. A relationship of 1:12 electrified households has been assumed in Maseru for the year 2005.
A growth rate for the electricity consumption per meter of 3% per year is as-sumed.
The consumption of LHDA and special domestic and special general purpose customers have been kept constant over the period.
5.4.2 Maximum Demand Customers Maximum demand customers cover four consumer categories: Commercial Low Voltage (LV), Commercial Medium Voltage (MV), Industrial LV and In-dustrial MV. There were approximately 325 maximum demand customers by the end of 2005, of which 255 were low-voltage customers.
Table 5-3 LEC statistics for maximum demand customers.
Max demand customers
Total con-sumption 2004 MWh
Total con-sumption 2005 MWh
Average growth 2004/2005
Average an-nual consump-tion 2004 MWh/meter
Average an-nual consump-tion 2005 MWh/meter
Average an-nual growth per meter 2004/2005
Commercial LV 33,311 34,560 2% 258 247 -2%
Commercial MV 46,405 51,031 5% 1,406 1,546 5%
Industrial LV 27,605 25,566 -4% 253 222 -6%
Industrial MV 68,277 73,968 4% 1,845 1,999 4%
Total 175,599 185,125 3%
Towards 2020, a modest growth of 3% per annum in electricity consumption has been assumed for the maximum demand customer group.
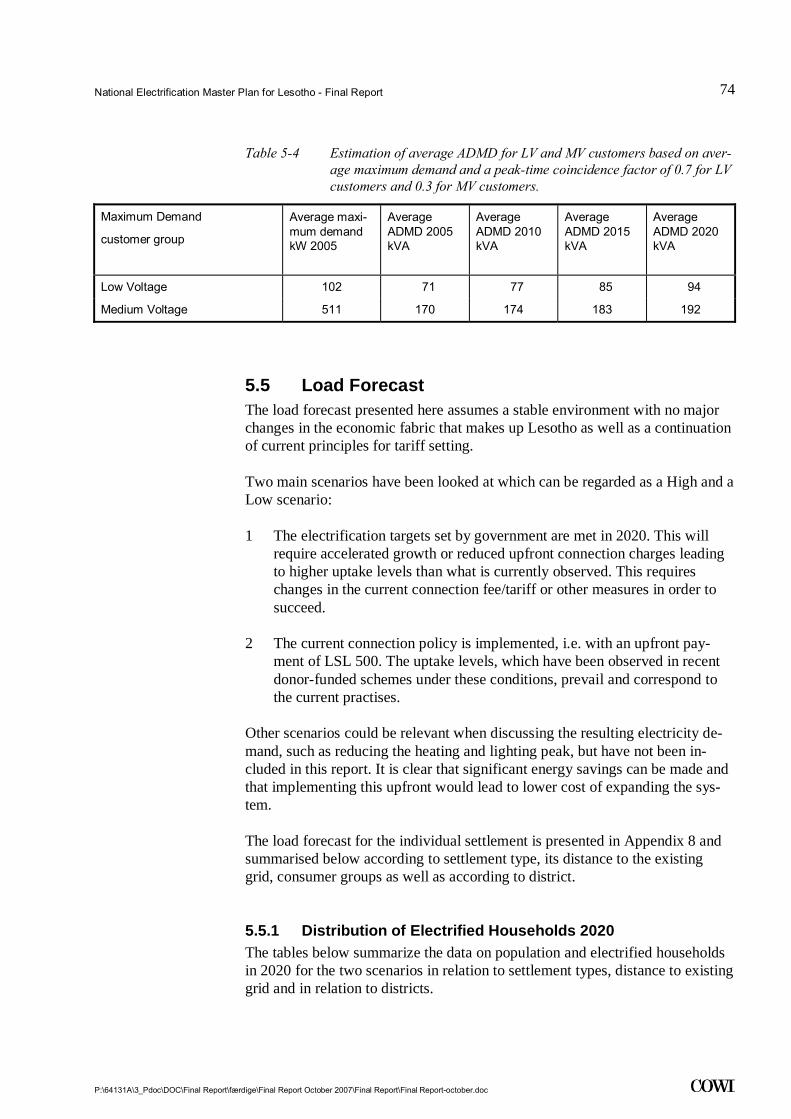
National Electrification Master Plan for Lesotho - Final Report
P:\64131A\3_Pdoc\DOC\Final Report\færdige\Final Report October 2007\Final Report\Final Report-october.doc
74
.
Table 5-4 Estimation of average ADMD for LV and MV customers based on aver-age maximum demand and a peak-time coincidence factor of 0.7 for LV customers and 0.3 for MV customers.
Maximum Demand
customer group
Average maxi-mum demand kW 2005
Average ADMD 2005 kVA
Average ADMD 2010 kVA
Average ADMD 2015 kVA
Average ADMD 2020 kVA
Low Voltage 102 71 77 85 94
Medium Voltage 511 170 174 183 192
5.5 Load Forecast The load forecast presented here assumes a stable environment with no major changes in the economic fabric that makes up Lesotho as well as a continuation of current principles for tariff setting.
Two main scenarios have been looked at which can be regarded as a High and a Low scenario:
1 The electrification targets set by government are met in 2020. This will require accelerated growth or reduced upfront connection charges leading to higher uptake levels than what is currently observed. This requires changes in the current connection fee/tariff or other measures in order to succeed.
2 The current connection policy is implemented, i.e. with an upfront pay-ment of LSL 500. The uptake levels, which have been observed in recent donor-funded schemes under these conditions, prevail and correspond to the current practises.
Other scenarios could be relevant when discussing the resulting electricity de-mand, such as reducing the heating and lighting peak, but have not been in-cluded in this report. It is clear that significant energy savings can be made and that implementing this upfront would lead to lower cost of expanding the sys-tem.
The load forecast for the individual settlement is presented in Appendix 8 and summarised below according to settlement type, its distance to the existing grid, consumer groups as well as according to district.
5.5.1 Distribution of Electrified Households 2020 The tables below summarize the data on population and electrified households in 2020 for the two scenarios in relation to settlement types, distance to existing grid and in relation to districts.
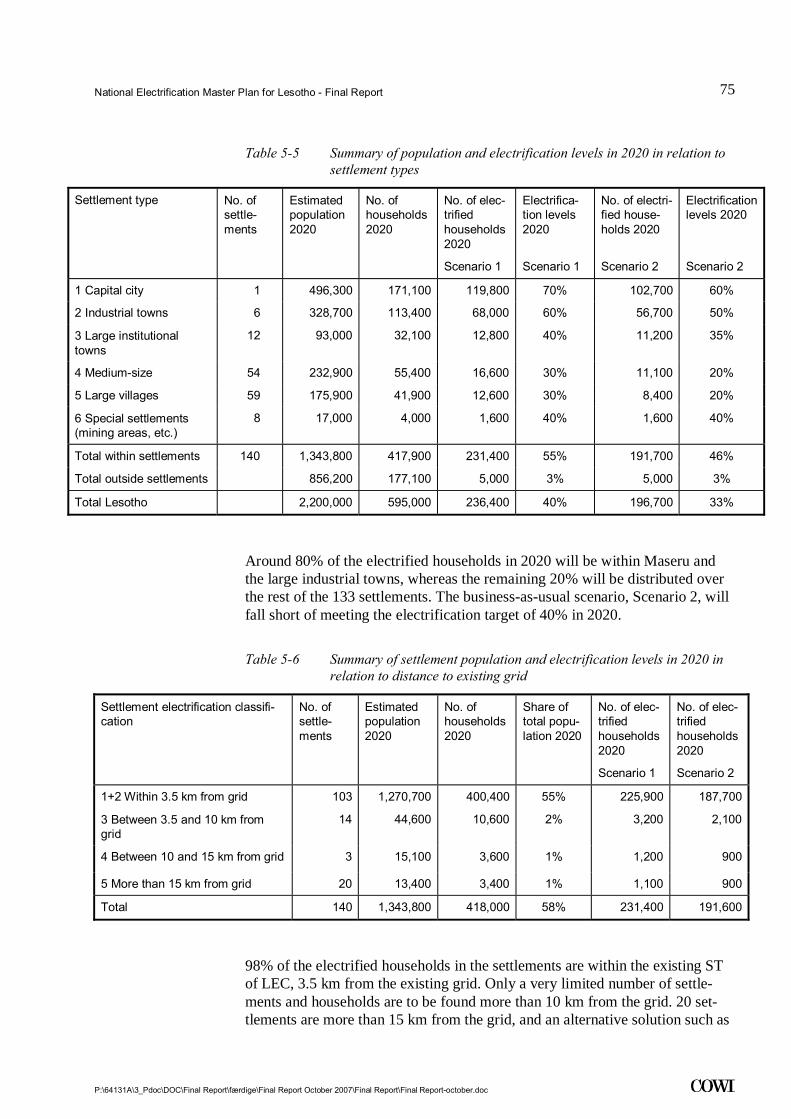
National Electrification Master Plan for Lesotho - Final Report
P:\64131A\3_Pdoc\DOC\Final Report\færdige\Final Report October 2007\Final Report\Final Report-october.doc
75
.
Table 5-5 Summary of population and electrification levels in 2020 in relation to settlement types
Settlement type No. of settle-ments
Estimated population 2020
No. of households 2020
No. of elec-trified households 2020
Scenario 1
Electrifica-tion levels 2020
Scenario 1
No. of electri-fied house-holds 2020
Scenario 2
Electrification levels 2020
Scenario 2
1 Capital city 1 496,300 171,100 119,800 70% 102,700 60%
2 Industrial towns 6 328,700 113,400 68,000 60% 56,700 50%
3 Large institutional towns
12 93,000 32,100 12,800 40% 11,200 35%
4 Medium-size 54 232,900 55,400 16,600 30% 11,100 20%
5 Large villages 59 175,900 41,900 12,600 30% 8,400 20%
6 Special settlements (mining areas, etc.)
8 17,000 4,000 1,600 40% 1,600 40%
Total within settlements 140 1,343,800 417,900 231,400 55% 191,700 46%
Total outside settlements 856,200 177,100 5,000 3% 5,000 3%
Total Lesotho 2,200,000 595,000 236,400 40% 196,700 33%
Around 80% of the electrified households in 2020 will be within Maseru and the large industrial towns, whereas the remaining 20% will be distributed over the rest of the 133 settlements. The business-as-usual scenario, Scenario 2, will fall short of meeting the electrification target of 40% in 2020.
Table 5-6 Summary of settlement population and electrification levels in 2020 in relation to distance to existing grid
Settlement electrification classifi-cation
No. of settle-ments
Estimated population 2020
No. of households 2020
Share of total popu-lation 2020
No. of elec-trified households 2020
Scenario 1
No. of elec-trified households 2020
Scenario 2
1+2 Within 3.5 km from grid 103 1,270,700 400,400 55% 225,900 187,700
3 Between 3.5 and 10 km from grid
14 44,600 10,600 2% 3,200 2,100
4 Between 10 and 15 km from grid 3 15,100 3,600 1% 1,200 900
5 More than 15 km from grid 20 13,400 3,400 1% 1,100 900
Total 140 1,343,800 418,000 58% 231,400 191,600
98% of the electrified households in the settlements are within the existing ST of LEC, 3.5 km from the existing grid. Only a very limited number of settle-ments and households are to be found more than 10 km from the grid. 20 set-tlements are more than 15 km from the grid, and an alternative solution such as
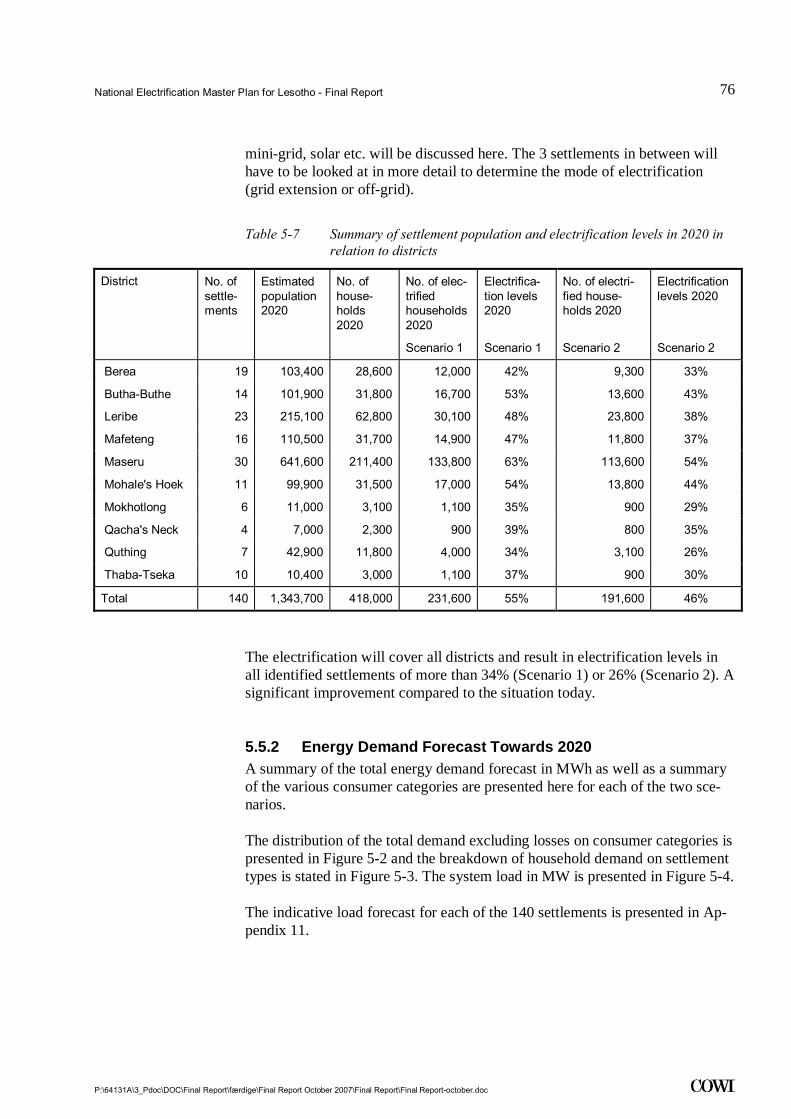
National Electrification Master Plan for Lesotho - Final Report
P:\64131A\3_Pdoc\DOC\Final Report\færdige\Final Report October 2007\Final Report\Final Report-october.doc
76
.
mini-grid, solar etc. will be discussed here. The 3 settlements in between will have to be looked at in more detail to determine the mode of electrification (grid extension or off-grid).
Table 5-7 Summary of settlement population and electrification levels in 2020 in relation to districts
District No. of settle-ments
Estimated population 2020
No. of house-holds 2020
No. of elec-trified households 2020
Scenario 1
Electrifica-tion levels 2020
Scenario 1
No. of electri-fied house-holds 2020
Scenario 2
Electrification levels 2020
Scenario 2
Berea 19 103,400 28,600 12,000 42% 9,300 33%
Butha-Buthe 14 101,900 31,800 16,700 53% 13,600 43%
Leribe 23 215,100 62,800 30,100 48% 23,800 38%
Mafeteng 16 110,500 31,700 14,900 47% 11,800 37%
Maseru 30 641,600 211,400 133,800 63% 113,600 54%
Mohale's Hoek 11 99,900 31,500 17,000 54% 13,800 44%
Mokhotlong 6 11,000 3,100 1,100 35% 900 29%
Qacha's Neck 4 7,000 2,300 900 39% 800 35%
Quthing 7 42,900 11,800 4,000 34% 3,100 26%
Thaba-Tseka 10 10,400 3,000 1,100 37% 900 30%
Total 140 1,343,700 418,000 231,600 55% 191,600 46%
The electrification will cover all districts and result in electrification levels in all identified settlements of more than 34% (Scenario 1) or 26% (Scenario 2). A significant improvement compared to the situation today.
5.5.2 Energy Demand Forecast Towards 2020 A summary of the total energy demand forecast in MWh as well as a summary of the various consumer categories are presented here for each of the two sce-narios.
The distribution of the total demand excluding losses on consumer categories is presented in Figure 5-2 and the breakdown of household demand on settlement types is stated in Figure 5-3. The system load in MW is presented in Figure 5-4.
The indicative load forecast for each of the 140 settlements is presented in Ap-pendix 11.

National Electrification Master Plan for Lesotho - Final Report
P:\64131A\3_Pdoc\DOC\Final Report\færdige\Final Report October 2007\Final Report\Final Report-october.doc
77
.
Figure 5-1 Development of electricity consumption in Lesotho, exclusive of losses (MWh).
Scenario 2Scenario 1
Energy demand final unitsFuel: Electricity GWh
2005 2010 2015 2020
Gig
awat
t-H
ours
1,000
950
900
850
800
750
700
650
600
550
500
450
400
350
300
250
200
150
100
50
0
Figure 5-2 Electricity demand for different consumer categories in Lesotho, MWh
LHDA and specialMax demand customersGeneral PurposeDomestic
Demand Results: Energy demand final unitsScenario: Scenario 1, Fuel: Electricity
2005 2010 2015 2020
Thou
sand
Meg
awat
t-H
ours
1,000
950
900
850
800
750
700
650
600
550
500
450
400
350
300
250
200
150
100
50
0
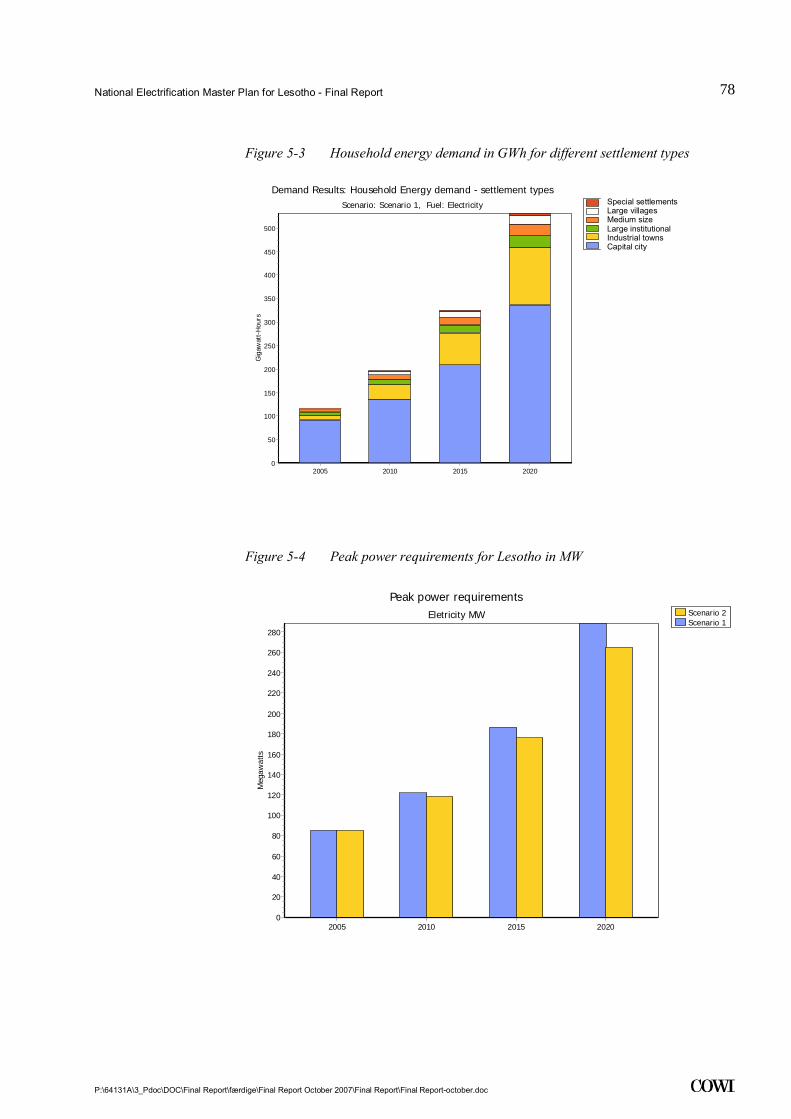
National Electrification Master Plan for Lesotho - Final Report
P:\64131A\3_Pdoc\DOC\Final Report\færdige\Final Report October 2007\Final Report\Final Report-october.doc
78
.
Figure 5-3 Household energy demand in GWh for different settlement types
Settlement type 6Settlement type 5Settlement type 4Settlement type 3Settlement type 2Settlement type 1
Demand Results: Household Energy demand - settlement typesScenario: Scenario 1, Fuel: Electricity
2005 2010 2015 2020
Gig
awat
t-H
ours
500
450
400
350
300
250
200
150
100
50
0
Special settlementsLarge villages Medium size Large institutional Industrial towns Capital city
Figure 5-4 Peak power requirements for Lesotho in MW
Scenario 2Scenario 1
Peak power requirementsEletricity MW
2005 2010 2015 2020
Meg
awat
ts
280
260
240
220
200
180
160
140
120
100
80
60
40
20
0
National Electrification Master Plan for Lesotho - Final Report
P:\64131A\3_Pdoc\DOC\Final Report\færdige\Final Report October 2007\Final Report\Final Report-october.doc
79
.
6 Electrical Design Issues
6.1 Technical Standards used in LEC
6.1.1 Transmission System The transmission systems within LEC's supply area cover the following trans-mission voltages: 132 kV, 88 kV, 66 kV and 33 kV.
The transmission system is based on international standards.
If new 132 kV lines are installed, it is recommended that the system ground wire should be OPGW.
The substations are outdoor substations.
The transmission lines are overhead lines. The 132 kV lines are constructed on steel towers. Other lines are either on wooden or concrete poles to SABC stan-dards.
All lines are protected against lightning by means of a ground wire.
Lightning arrestors are located at incoming circuits in the substations.
The National Control Centre is situated in Maseru and connected to a very large part of the network. The efficient and effective system operations operate with an Energy Management System equipped with computer-based on-line Super-visory Control and Data Acquisition, Automatic Generation Control and Short-Term Load Forecast model. The communication systems are: Power Line Car-rier, two-way radio system UHF/VHF, national landline telecommunications and mobile phone systems.
6.1.2 Distribution System The distribution systems within LEC's supply area cover the following distribu-tion voltages: 33 kV and 11 kV.
The substations are outdoor substations, mostly pole-mounted.
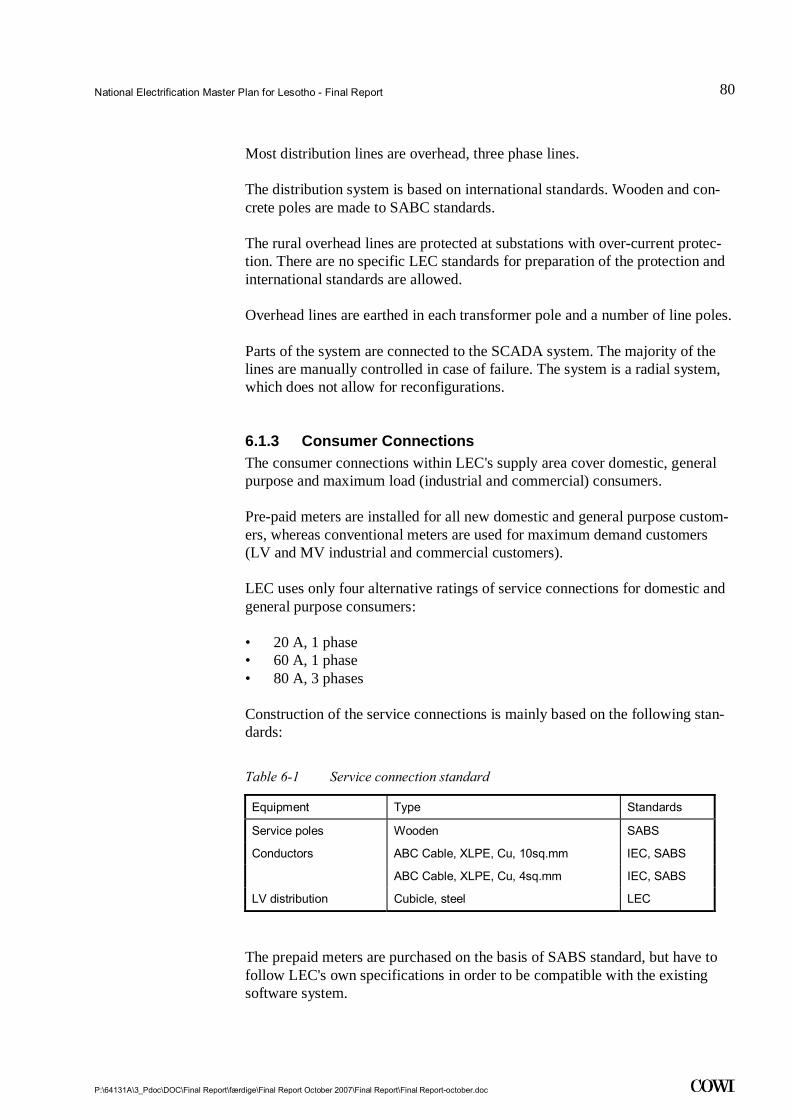
National Electrification Master Plan for Lesotho - Final Report
P:\64131A\3_Pdoc\DOC\Final Report\færdige\Final Report October 2007\Final Report\Final Report-october.doc
80
.
Most distribution lines are overhead, three phase lines.
The distribution system is based on international standards. Wooden and con-crete poles are made to SABC standards.
The rural overhead lines are protected at substations with over-current protec-tion. There are no specific LEC standards for preparation of the protection and international standards are allowed.
Overhead lines are earthed in each transformer pole and a number of line poles.
Parts of the system are connected to the SCADA system. The majority of the lines are manually controlled in case of failure. The system is a radial system, which does not allow for reconfigurations.
6.1.3 Consumer Connections The consumer connections within LEC's supply area cover domestic, general purpose and maximum load (industrial and commercial) consumers.
Pre-paid meters are installed for all new domestic and general purpose custom-ers, whereas conventional meters are used for maximum demand customers (LV and MV industrial and commercial customers).
LEC uses only four alternative ratings of service connections for domestic and general purpose consumers:
• 20 A, 1 phase • 60 A, 1 phase • 80 A, 3 phases
Construction of the service connections is mainly based on the following stan-dards:
Table 6-1 Service connection standard
Equipment Type Standards
Service poles Wooden SABS
Conductors ABC Cable, XLPE, Cu, 10sq.mm IEC, SABS
ABC Cable, XLPE, Cu, 4sq.mm IEC, SABS
LV distribution Cubicle, steel LEC
The prepaid meters are purchased on the basis of SABS standard, but have to follow LEC's own specifications in order to be compatible with the existing software system.

National Electrification Master Plan for Lesotho - Final Report
P:\64131A\3_Pdoc\DOC\Final Report\færdige\Final Report October 2007\Final Report\Final Report-october.doc
81
.
LEC has a standard for installation of a BEC meter and connection to ready boards.
6.2 Power Supply Quality
6.2.1 Frequency In accordance with "Electricity Quality of Service and Supply Standards", the standard frequency of supply voltage is 50 Hz.
The limits within which the frequency of supply voltage must be regulated are given in Table 6-2 below.
Table 6-2 Minimum standards for frequency regulation
Supply pa-rameter
Measure of sup-ply standards
Minimum standard
Target
Compatibility levels
Compatibility lev-els for the fre-quency of supply voltage
± 3.0% (±1.5 Hz)
For grid networks, the frequency devia-tion for 99.5% of one year shall be re-tained.
For island networks, the frequency devia-tion for 95% of one year shall be retained
The following note supplements the above table:
• The assessed levels, to be compared with the compatibility levels, shall be the instantaneous measured values of frequency.
6.2.2 Voltage Voltage Levels The standard voltages shall be chosen between the voltages given in Table 6-3 below.
Table 6-3 Standard voltage levels
System Configuration Voltage level
HV main transmission 3 phase >=132 kV; 88 kV; 66 kV; 33 kV
MV distribution 3 phase 33 kV; 11 kV;
MV low-cost distribution 2 phase 33 kV; 11 kV;
1 phase, SWER 19.1 kV; 6.35 kV
LV distribution 3 phase + neutral + earth 400/230 V
1 phase + neutral + earth 230 V
LV low-cost distribution 1 phase, SWER 230 V
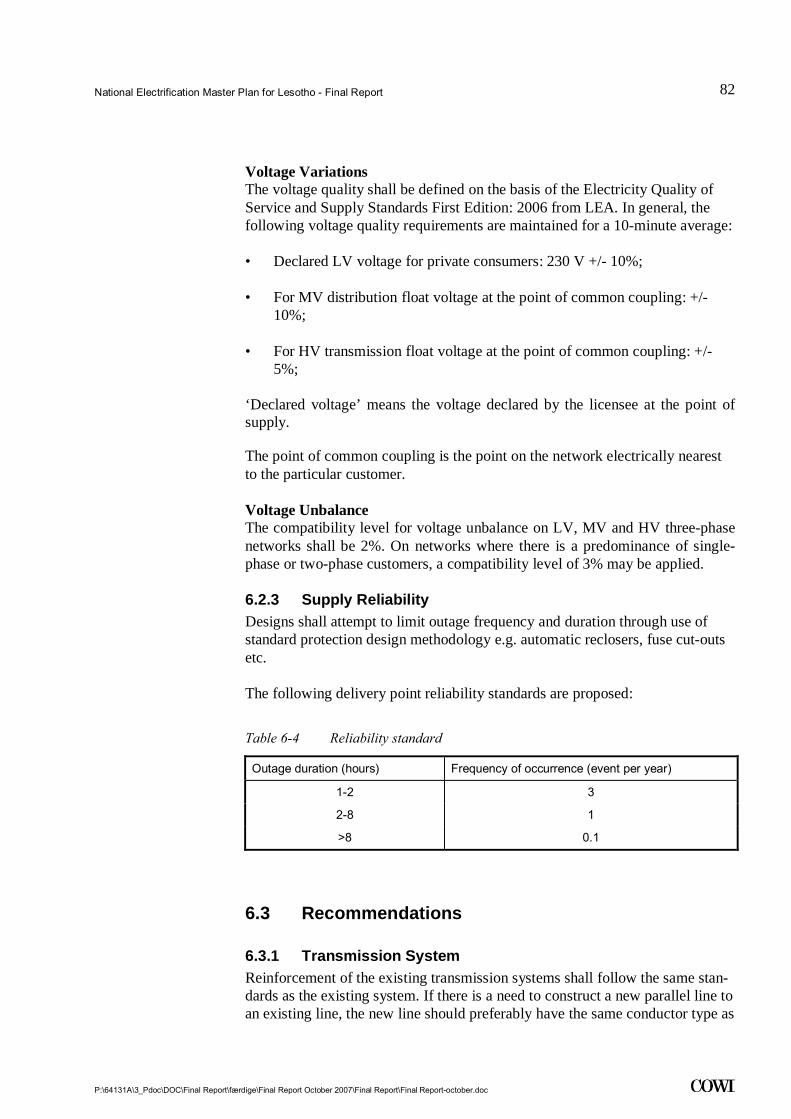
National Electrification Master Plan for Lesotho - Final Report
P:\64131A\3_Pdoc\DOC\Final Report\færdige\Final Report October 2007\Final Report\Final Report-october.doc
82
.
Voltage Variations The voltage quality shall be defined on the basis of the Electricity Quality of Service and Supply Standards First Edition: 2006 from LEA. In general, the following voltage quality requirements are maintained for a 10-minute average:
• Declared LV voltage for private consumers: 230 V +/- 10%;
• For MV distribution float voltage at the point of common coupling: +/- 10%;
• For HV transmission float voltage at the point of common coupling: +/- 5%;
‘Declared voltage’ means the voltage declared by the licensee at the point of supply.
The point of common coupling is the point on the network electrically nearest to the particular customer.
Voltage Unbalance The compatibility level for voltage unbalance on LV, MV and HV three-phase networks shall be 2%. On networks where there is a predominance of single-phase or two-phase customers, a compatibility level of 3% may be applied.
6.2.3 Supply Reliability Designs shall attempt to limit outage frequency and duration through use of standard protection design methodology e.g. automatic reclosers, fuse cut-outs etc.
The following delivery point reliability standards are proposed:
Table 6-4 Reliability standard
Outage duration (hours) Frequency of occurrence (event per year)
1-2 3
2-8 1
>8 0.1
6.3 Recommendations
6.3.1 Transmission System Reinforcement of the existing transmission systems shall follow the same stan-dards as the existing system. If there is a need to construct a new parallel line to an existing line, the new line should preferably have the same conductor type as
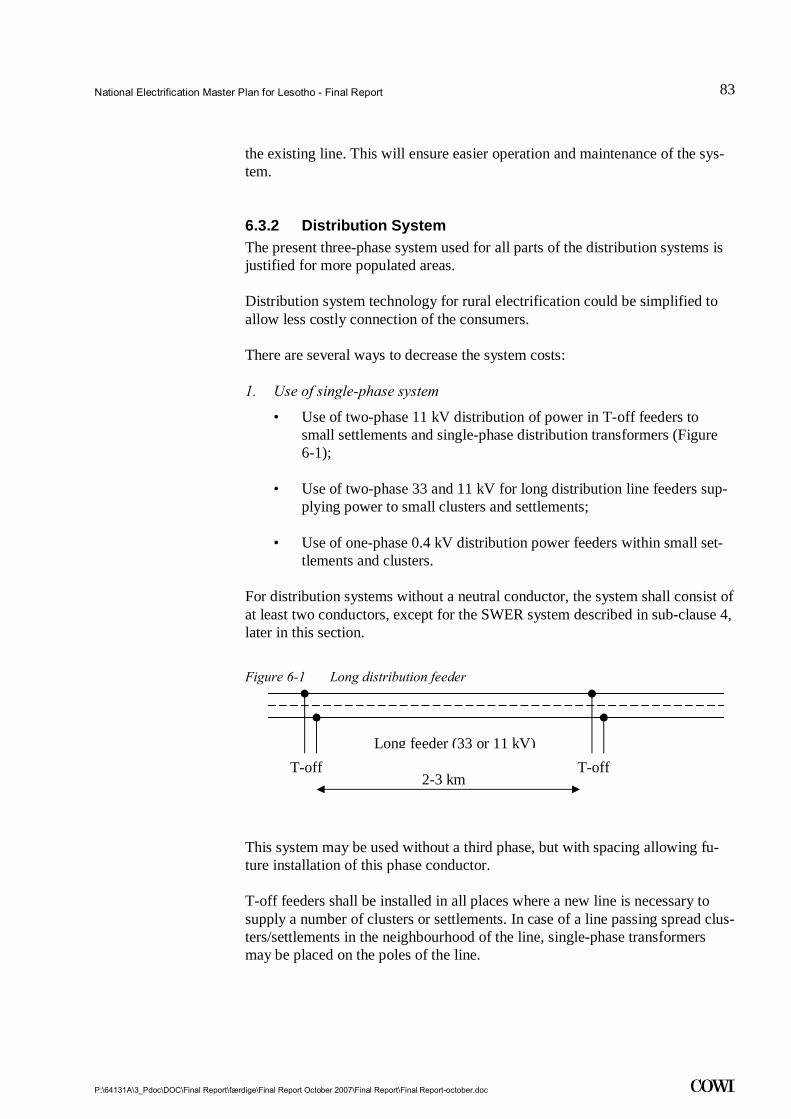
National Electrification Master Plan for Lesotho - Final Report
P:\64131A\3_Pdoc\DOC\Final Report\færdige\Final Report October 2007\Final Report\Final Report-october.doc
83
.
the existing line. This will ensure easier operation and maintenance of the sys-tem.
6.3.2 Distribution System The present three-phase system used for all parts of the distribution systems is justified for more populated areas.
Distribution system technology for rural electrification could be simplified to allow less costly connection of the consumers.
There are several ways to decrease the system costs:
1. Use of single-phase system
• Use of two-phase 11 kV distribution of power in T-off feeders to small settlements and single-phase distribution transformers (Figure 6-1);
• Use of two-phase 33 and 11 kV for long distribution line feeders sup-plying power to small clusters and settlements;
• Use of one-phase 0.4 kV distribution power feeders within small set-tlements and clusters.
For distribution systems without a neutral conductor, the system shall consist of at least two conductors, except for the SWER system described in sub-clause 4, later in this section.
Figure 6-1 Long distribution feeder
This system may be used without a third phase, but with spacing allowing fu-ture installation of this phase conductor.
T-off feeders shall be installed in all places where a new line is necessary to supply a number of clusters or settlements. In case of a line passing spread clus-ters/settlements in the neighbourhood of the line, single-phase transformers may be placed on the poles of the line.
Long feeder (33 or 11 kV)T-off T-off
2-3 km
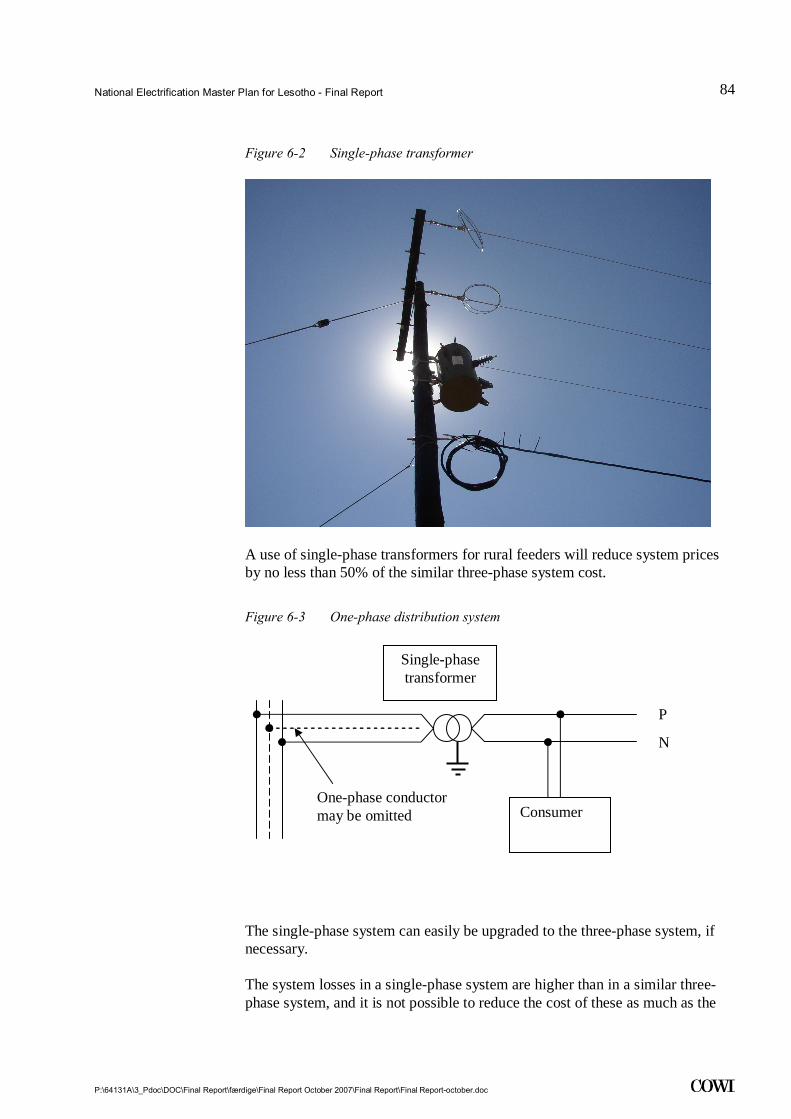
National Electrification Master Plan for Lesotho - Final Report
P:\64131A\3_Pdoc\DOC\Final Report\færdige\Final Report October 2007\Final Report\Final Report-october.doc
84
.
Figure 6-2 Single-phase transformer
A use of single-phase transformers for rural feeders will reduce system prices by no less than 50% of the similar three-phase system cost.
Figure 6-3 One-phase distribution system
The single-phase system can easily be upgraded to the three-phase system, if necessary.
The system losses in a single-phase system are higher than in a similar three-phase system, and it is not possible to reduce the cost of these as much as the
P
N
Consumer One-phase conductor may be omitted
Single-phase transformer
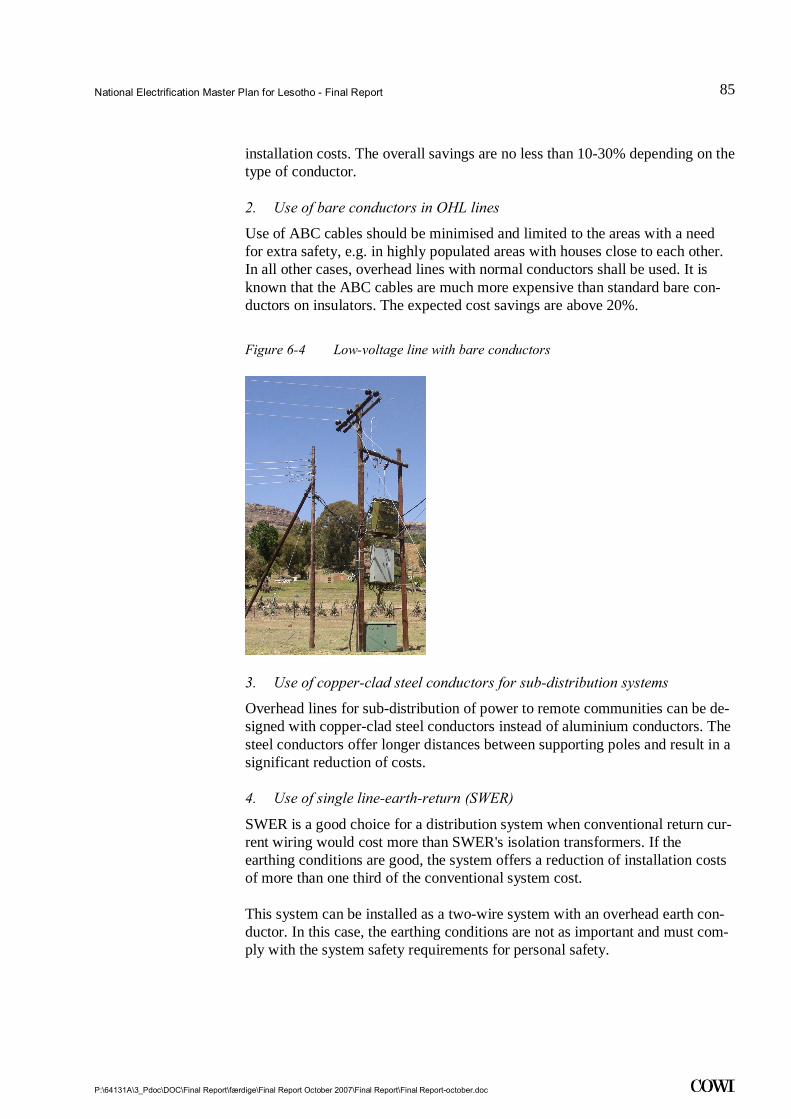
National Electrification Master Plan for Lesotho - Final Report
P:\64131A\3_Pdoc\DOC\Final Report\færdige\Final Report October 2007\Final Report\Final Report-october.doc
85
.
installation costs. The overall savings are no less than 10-30% depending on the type of conductor.
2. Use of bare conductors in OHL lines
Use of ABC cables should be minimised and limited to the areas with a need for extra safety, e.g. in highly populated areas with houses close to each other. In all other cases, overhead lines with normal conductors shall be used. It is known that the ABC cables are much more expensive than standard bare con-ductors on insulators. The expected cost savings are above 20%.
Figure 6-4 Low-voltage line with bare conductors
3. Use of copper-clad steel conductors for sub-distribution systems
Overhead lines for sub-distribution of power to remote communities can be de-signed with copper-clad steel conductors instead of aluminium conductors. The steel conductors offer longer distances between supporting poles and result in a significant reduction of costs.
4. Use of single line-earth-return (SWER)
SWER is a good choice for a distribution system when conventional return cur-rent wiring would cost more than SWER's isolation transformers. If the earthing conditions are good, the system offers a reduction of installation costs of more than one third of the conventional system cost.
This system can be installed as a two-wire system with an overhead earth con-ductor. In this case, the earthing conditions are not as important and must com-ply with the system safety requirements for personal safety.
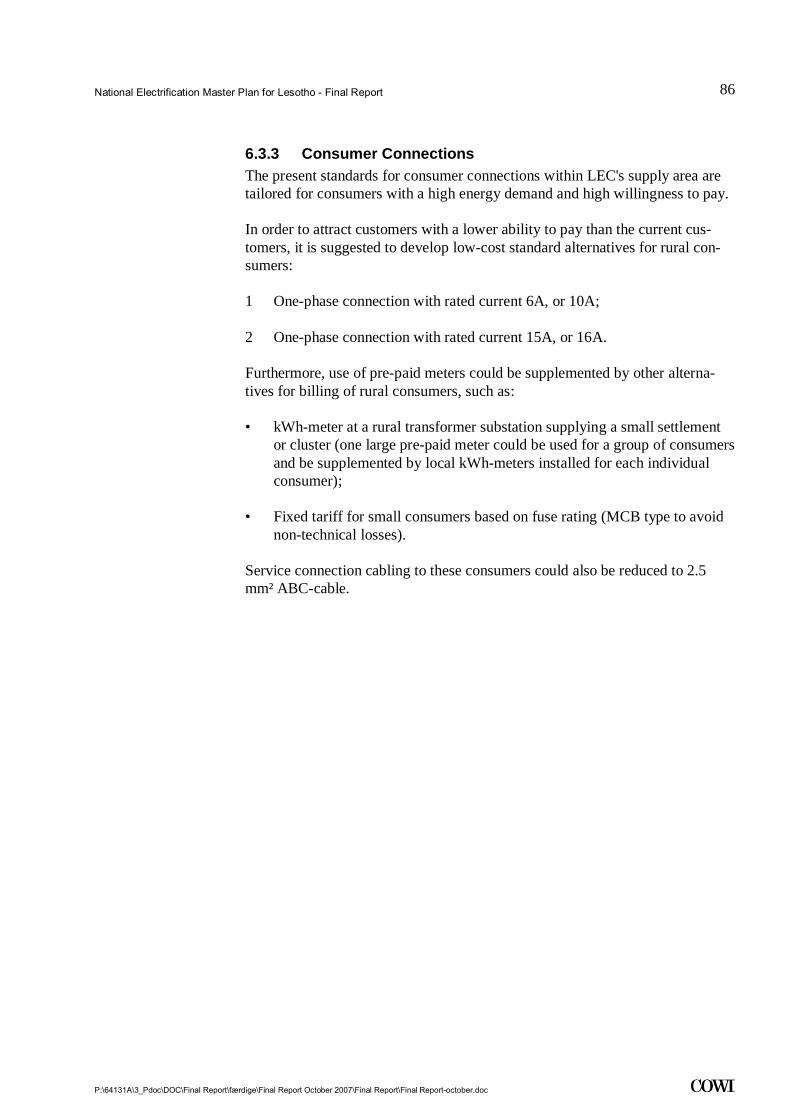
National Electrification Master Plan for Lesotho - Final Report
P:\64131A\3_Pdoc\DOC\Final Report\færdige\Final Report October 2007\Final Report\Final Report-october.doc
86
.
6.3.3 Consumer Connections The present standards for consumer connections within LEC's supply area are tailored for consumers with a high energy demand and high willingness to pay.
In order to attract customers with a lower ability to pay than the current cus-tomers, it is suggested to develop low-cost standard alternatives for rural con-sumers:
1 One-phase connection with rated current 6A, or 10A;
2 One-phase connection with rated current 15A, or 16A.
Furthermore, use of pre-paid meters could be supplemented by other alterna-tives for billing of rural consumers, such as:
• kWh-meter at a rural transformer substation supplying a small settlement or cluster (one large pre-paid meter could be used for a group of consumers and be supplemented by local kWh-meters installed for each individual consumer);
• Fixed tariff for small consumers based on fuse rating (MCB type to avoid non-technical losses).
Service connection cabling to these consumers could also be reduced to 2.5 mm² ABC-cable.

National Electrification Master Plan for Lesotho - Final Report
P:\64131A\3_Pdoc\DOC\Final Report\færdige\Final Report October 2007\Final Report\Final Report-october.doc
87
.
7 Off-grid Power Supply Options and Standards
The purpose of this chapter is to give an overview of the power supply options that have been considered for those areas of the country identified as “off-grid areas”, i.e. isolated land areas to which the grid will not be extended in the fore-seeable future.
In Section 7.5, these considerations are applied to 23 non-electrified settlements that have been listed as potential for off-grid electrification.
Off-grid electrification can provide power for domestic use, productive use and community use. The extent to which power can be provided relates to the choice of technology made for generating power under the prevailing local conditions.
A number of technical options exist for the electrification of off-grid areas. They can be divided into two basic categories:
• Decentralised options in the form of isolated (or stand-alone) systems de-signed to supply one or two users;
• Centralised options in the form of mini grids designed to supply a village with a sizeable number of users.
Both decentralised and centralised options can be based on various generating technologies that can either be based on the use of fossil fuels or renewable en-ergy sources.
7.1 Decentralised Options In decentralised isolated systems, power is generated from one single renew-able energy source, or a non-renewable energy source. The concept of decen-tralised isolated systems, or distributed generation as it is also called, covers all individual power supply options where power is utilised where it is generated, as it happens with solar home systems or pico-hydro. In such situations, there is no need to build and operate a reticulation system covering a specific area as a remote village.

National Electrification Master Plan for Lesotho - Final Report
P:\64131A\3_Pdoc\DOC\Final Report\færdige\Final Report October 2007\Final Report\Final Report-october.doc
88
.
Decentralised options based on renewable energy sources are the following:
(i) Solar energy-based systems Solar energy-based systems are typically solar lanterns or solar home systems (SHS).
(ii) Wind energy-based systems Wind home systems (WHS) consist of a small wind turbine usually rated be-tween 400 W – 10 kW, a charge controller and a battery.
(iii) Pico-hydro systems Pico-hydroelectric schemes are in the range a few hundred W – 5 kW. They are self-contained portable units. A water head for a 300 W scheme is 1-2 meters, for a 1 kW scheme it is 5-6 meters.
7.2 Centralised Options Centralised options are based on power generation from non-renewable or re-newable energy sources, or a combination of these. Generation systems based on such a combination are called hybrid systems. The generated power is dis-tributed through a small distribution network, hence the generic name of mini grid, as is common practice in grid-connected distribution systems.
7.2.1 Generating Technologies The generating technologies applicable to Lesotho are the following:
(i) Diesel generators; (ii) Micro/mini hydro; (iii) Solar photovoltaic power systems (SPVs); (iv) Wind turbines; (v) Hybrid systems.
7.2.2 Mini Grids The neglect of rural areas by utilities has led individuals and communities to construct rudimentary distribution systems supplied by isolated power sources. Such systems are called mini grids. There is no international standard definition of a mini grid, but it usually refers to a low voltage network within a village or neighbourhood.
7.3 Suitability of Power Supply Options in the Context of Lesotho
In order to determine the suitability of the respective power supply options in off-grid areas for Lesotho, an overall assessment of their suitability in Lesotho is provided below.

National Electrification Master Plan for Lesotho - Final Report
P:\64131A\3_Pdoc\DOC\Final Report\færdige\Final Report October 2007\Final Report\Final Report-october.doc
89
.
7.3.1 PV Systems Lesotho receives an estimated 3.7 to 7.0 kWh per square metre per day of solar insulation and is thus well suited for large-scale use of solar energy.
The target areas for the use of this technology are off-grid rural or peri-urban areas for all applications where limited amounts of electricity have to be pro-vided, as is the case for households, schools, health posts/clinics, small rural enterprises and where such areas are likely to remain out of reach of the na-tional grid for the coming 10-15 years. Solar lanterns, SHS/PVs of various rat-ings are options that should be taken into consideration.
7.3.2 Wind Energy-based Systems With respect to the use of WHS and small wind turbines in general, the lack of wind data in the country is an impairing factor. Assessments and measurements are still needed to get a comprehensive picture of the wind potential for energy generation.
From the Wind Power Study carried out in 20021 it appears that the top of the mountain range between Oxbow and Letšeng-la Terai would be suitable for setting up hundreds of MW of wind farms.
As regards isolated systems, the already mentioned study looked into the possi-bility of setting up a wind-diesel hybrid system at Sani Top with an 11 kW wind turbine. Taking into consideration the high investment cost, the high en-ergy generation cost (from approx. LSL 3.0/kWh in the first years of operation to LSL 1.2/kWh after ten years) and the complexity of such a system, the study could not recommend such a system, unless investment costs were heavily sub-sidised.
7.3.3 Small Hydro Systems Mini and micro hydropower can be used both in mini grid systems and to sup-ply a grid system. Electrification by hydropower may be a better way of electri-fication in remote areas than putting up a long transmission line to the central grid or using a diesel generator.
The potential for small-scale hydropower plants in the Lowlands and Highlands of Lesotho has been investigated in a number of studies. A total capacity of 18 MW has been identified at some 20 sites for the implementation of mainly mini hydro plants, as well as three micro hydro power plants. Four of these sites have been developed, but today only two are in operation: Semonkong supply-ing the off-grid system there and the grid-connected plant at Mantšonyane.
Sites in the following table have been given as options to be considered for de-velopment.
1 Pre-feasibility Report Wind Power Lesotho, DANCED Ref. No. 129-008

National Electrification Master Plan for Lesotho - Final Report
P:\64131A\3_Pdoc\DOC\Final Report\færdige\Final Report October 2007\Final Report\Final Report-october.doc
90
.
Table 7-1 Small-scale hydro power sites
Name of plant or project River Nominal discharge
Head Installed capacity
Annual power gen-eration
Unit m3/s m kW GWh
GWh
Motete Motete 2 28 - 33 524 2,46
Mokhotlong N Bafali 0,675 66 242 1,36
Mokhotlong S Sehonghong 1,8 15 - 16 205 0,96
Lesobeng Lesobeng 0,625 22 110 0,7
Sehlabathebe Leqooa 2,5 - 7 100 0,46
Pitseng Tsainyane 1,1 9 70 0,32
Ha Ntsi Liphiring 0,4 9,4 30 0,08
TOTAL 1281 6,34
In total, they represent an installed capacity of 1.2 MW and an annual power generation capability of 6.3 GWh. In addition to this, a possibility at Mphaki – Letseng Dam of 15 MW has been mentioned, but no further information on this option has been identified.
The original feasibility studies or pre-feasibility studies made during the 1980s are no longer available and only sketchy information as presented above has been available for the Consultant.
7.3.4 Hybrid Systems As already mentioned, Sani Top would be a potential site for a wind-diesel hy-brid system. However, the assessment made in 2004 shows that this option cannot be recommended for both financial and technical reasons. Another fac-tor to be considered is the accessibility of the plant for maintenance and servic-ing. In this case, Sani Top would be too far away to ensure a quick response in the event of technical problems.
The latter difficulty is most likely to be a recurrent fact in all off-grid areas where a hybrid system could be an option. Moreover, the issues of high invest-ment and power generation costs will, at this stage, remain a barrier to the broad development of this technology.
7.3.5 Diesel-based Systems Diesel generators are used extensively for rural electrification purposes and in many instances in off-grid areas to supply a mini grid.
The crucial issues when operating diesel generators are fuel supply and mainte-nance problems.

National Electrification Master Plan for Lesotho - Final Report
P:\64131A\3_Pdoc\DOC\Final Report\færdige\Final Report October 2007\Final Report\Final Report-october.doc
91
.
Diesel-based rural electrification schemes and mini grids are not the lowest cost option if the supplied loads are solely residential lighting and other light load applications, like radios and TVs.
Last but not least, environmental problems linked to diesel operation are sel-dom properly addressed, such as proper disposal of used lube oil and soil/water contaminated by leaking fuel.
The use of this technology should be restricted as much as possible and used mostly as a back-up power source like in the Semonkong hybrid system, where hydro is associated to diesel generation in a technically unsophisticated way.
However, a number of areas have already been pointed out for diesel develop-ment. They are Sehlabathebe, Mavuka and Tebellong in Qacha's Neck district as well as Ketane in Mohale’s Hoek district.
7.4 Standards Lesotho has not established specific standards for renewable energy sources, except for the "PV CODE OF PRACTICE. October 2003".
IEC, SABC and ISO standards will be used for the isolated generation systems.
7.5 Supply of Off-grid Schemes
7.5.1 Initial Identification and Listing of Schemes Out of the 140 settlements identified for electrification, 3 are situated more than 10 km from the existing grid and 20 more than 15 km away. These 23 non-electrified settlements have been listed as potentially suitable for off-grid elec-trification. They are shown in the table below, which also lists information on settlement type, electrification class, estimated population and number of households for each settlement.

National Electrification Master Plan for Lesotho - Final Report
P:\64131A\3_Pdoc\DOC\Final Report\færdige\Final Report October 2007\Final Report\Final Report-october.doc
92
.
Table 7-2 Initial listing of off-grid schemes
Village cluster District
Settle-
ment type
Elec.
class
Population
2005
Popula-
tion 2020
House-
holds 2005
House-
holds 2020
Mpharane Mohale's Hoek 4 4 3,250
3,250 774 774
Mokhalinyane (RSA border
village) Maseru 5 4 4,272
7,222 1,017 1,720
Kolo (RSA border village) Mafeteng 6 4 4,375
4,645 1,042 1,106
Tebellong (Mapote,
Liphakoeng) Qacha's Neck 3 5 1,801
1,801 621 621
Ramabanta Maseru 4 5 < 1,000 < 1,000 < 240 < 240
Sekake Qacha's Neck 4 5 798 798 190 190
Sehlabathebe (Mavuka,
Polasi) (RSA border village) Qacha's Neck 4 5 < 1,000 < 1,000 < 240 140
Seforong (Mosi, Aupolasi) Mohale's Hoek 4 5 < 1,000 < 1,000 < 240 154
Ketane Mohale's Hoek 4 5 < 1,000 < 1,000 < 240 156
Mphaki (Mahlomola) * Quthing 4 5 < 1,000 < 1,000 < 240 173
Linakeng Thaba-Tseka 4 5 < 1,000 < 1,000 < 240 179
Nkau Mohale's Hoek 4 5 < 1,000 < 1,000 < 240 179
Sehonghong Thaba-Tseka 4 5 1.748
1.748 416 416
Kolobere Thaba-Tseka 5 5 < 1,000 < 1,000 < 240 83
Lesobeng Thaba-Tseka 5 5 < 1,000 < 1,000 < 240 83
Letsika Thaba-Tseka 5 5 < 1,000 < 1,000 < 240 83
Malingoaneng Mokhotlong 5 5 < 1,000 < 1,000 < 240 83
Molikaliko Mokhotlong 5 5 < 1,000 < 1,000 < 240 83
Motete Butha-Buthe 5 5 < 1,000 < 1,000 < 240 83
Seng Maseru 5 5 < 1,000 < 1,000 < 240 83
Sani Pass (RSA border
village) Thaba-Tseka 6 5 < 1,000 < 1,000 < 240 83
Kao (Shishila) Butha-Buthe 6 5 1,000 1,000 240 238
Liqhobong Butha-Buthe 6 5 1,000 1,000 240 238
Out of the 23 clusters, 5 have an estimated population equal to or larger than 1,000 inhabitants, namely Mpharane, Mokhalinyane, Kolo, Sehonghong, Kao and Lighobong. The area around Sekake might also have a population of more than 1,000. Four villages are included in the 'Cross border village electrification project' on a pilot basis, namely Mokhalinyane, Kolo, Sani Pass and Sehla-bathebe.
For the vast majority of settlements under consideration (types 3 and 4), the prospects of local economic development through productive uses of energy
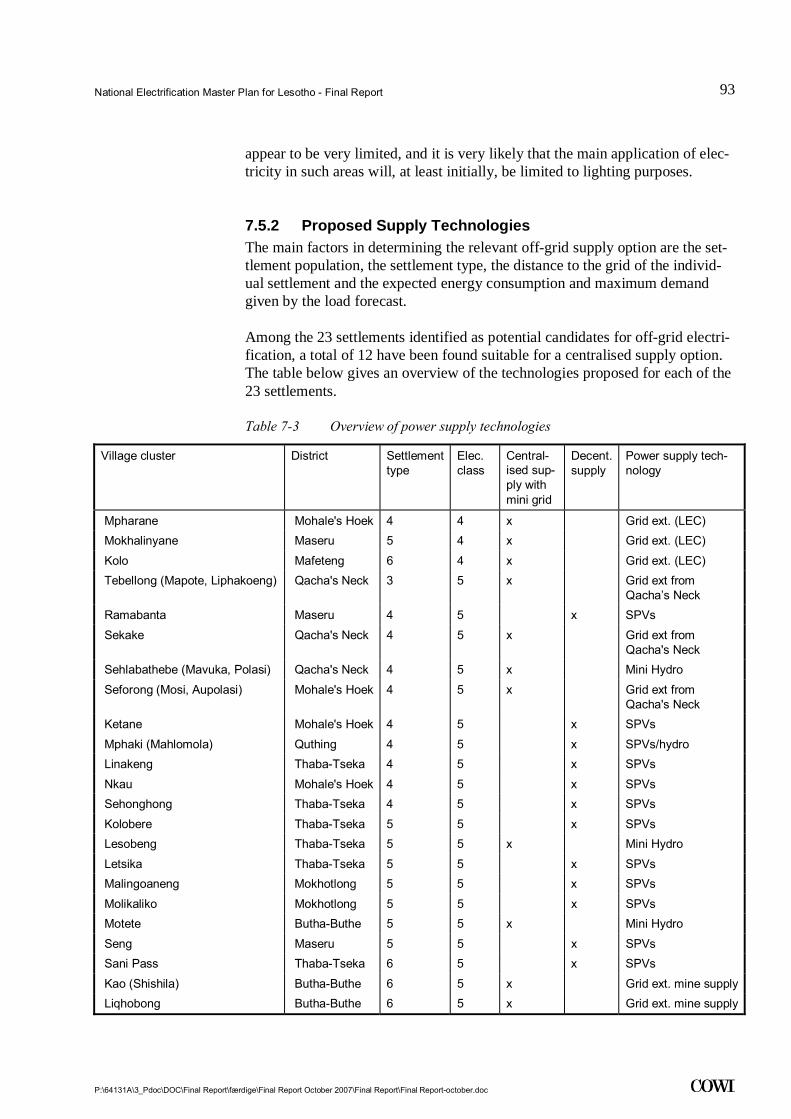
National Electrification Master Plan for Lesotho - Final Report
P:\64131A\3_Pdoc\DOC\Final Report\færdige\Final Report October 2007\Final Report\Final Report-october.doc
93
.
appear to be very limited, and it is very likely that the main application of elec-tricity in such areas will, at least initially, be limited to lighting purposes.
7.5.2 Proposed Supply Technologies The main factors in determining the relevant off-grid supply option are the set-tlement population, the settlement type, the distance to the grid of the individ-ual settlement and the expected energy consumption and maximum demand given by the load forecast.
Among the 23 settlements identified as potential candidates for off-grid electri-fication, a total of 12 have been found suitable for a centralised supply option. The table below gives an overview of the technologies proposed for each of the 23 settlements.
Table 7-3 Overview of power supply technologies
Village cluster District Settlement type
Elec. class
Central-ised sup-ply with mini grid
Decent. supply
Power supply tech-nology
Mpharane Mohale's Hoek 4 4 x Grid ext. (LEC) Mokhalinyane Maseru 5 4 x Grid ext. (LEC) Kolo Mafeteng 6 4 x Grid ext. (LEC) Tebellong (Mapote, Liphakoeng) Qacha's Neck 3 5 x Grid ext from
Qacha’s Neck Ramabanta Maseru 4 5 x SPVs Sekake Qacha's Neck 4 5 x Grid ext from
Qacha's Neck Sehlabathebe (Mavuka, Polasi) Qacha's Neck 4 5 x Mini Hydro Seforong (Mosi, Aupolasi) Mohale's Hoek 4 5 x Grid ext from
Qacha's Neck Ketane Mohale's Hoek 4 5 x SPVs Mphaki (Mahlomola) Quthing 4 5 x SPVs/hydro Linakeng Thaba-Tseka 4 5 x SPVs Nkau Mohale's Hoek 4 5 x SPVs Sehonghong Thaba-Tseka 4 5 x SPVs Kolobere Thaba-Tseka 5 5 x SPVs Lesobeng Thaba-Tseka 5 5 x Mini Hydro Letsika Thaba-Tseka 5 5 x SPVs Malingoaneng Mokhotlong 5 5 x SPVs Molikaliko Mokhotlong 5 5 x SPVs Motete Butha-Buthe 5 5 x Mini Hydro Seng Maseru 5 5 x SPVs Sani Pass Thaba-Tseka 6 5 x SPVs Kao (Shishila) Butha-Buthe 6 5 x Grid ext. mine supply Liqhobong Butha-Buthe 6 5 x Grid ext. mine supply
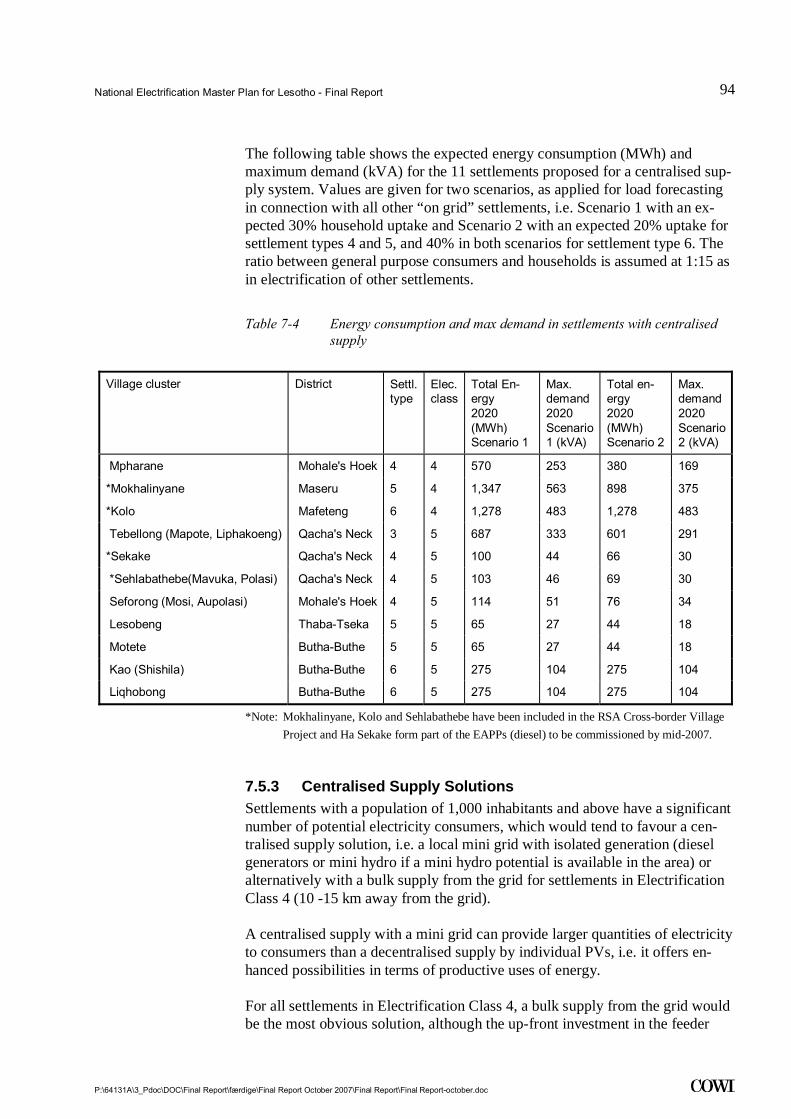
National Electrification Master Plan for Lesotho - Final Report
P:\64131A\3_Pdoc\DOC\Final Report\færdige\Final Report October 2007\Final Report\Final Report-october.doc
94
.
The following table shows the expected energy consumption (MWh) and maximum demand (kVA) for the 11 settlements proposed for a centralised sup-ply system. Values are given for two scenarios, as applied for load forecasting in connection with all other “on grid” settlements, i.e. Scenario 1 with an ex-pected 30% household uptake and Scenario 2 with an expected 20% uptake for settlement types 4 and 5, and 40% in both scenarios for settlement type 6. The ratio between general purpose consumers and households is assumed at 1:15 as in electrification of other settlements.
Table 7-4 Energy consumption and max demand in settlements with centralised supply
*Note: Mokhalinyane, Kolo and Sehlabathebe have been included in the RSA Cross-border Village Project and Ha Sekake form part of the EAPPs (diesel) to be commissioned by mid-2007.
7.5.3 Centralised Supply Solutions Settlements with a population of 1,000 inhabitants and above have a significant number of potential electricity consumers, which would tend to favour a cen-tralised supply solution, i.e. a local mini grid with isolated generation (diesel generators or mini hydro if a mini hydro potential is available in the area) or alternatively with a bulk supply from the grid for settlements in Electrification Class 4 (10 -15 km away from the grid).
A centralised supply with a mini grid can provide larger quantities of electricity to consumers than a decentralised supply by individual PVs, i.e. it offers en-hanced possibilities in terms of productive uses of energy.
For all settlements in Electrification Class 4, a bulk supply from the grid would be the most obvious solution, although the up-front investment in the feeder
Village cluster District Settl. type
Elec. class
Total En-ergy 2020 (MWh) Scenario 1
Max. demand 2020 Scenario 1 (kVA)
Total en-ergy 2020 (MWh) Scenario 2
Max. demand 2020 Scenario 2 (kVA)
Mpharane Mohale's Hoek 4 4 570 253 380 169
*Mokhalinyane Maseru 5 4 1,347 563 898 375
*Kolo Mafeteng 6 4 1,278 483 1,278 483
Tebellong (Mapote, Liphakoeng) Qacha's Neck 3 5 687 333 601 291
*Sekake Qacha's Neck 4 5 100 44 66 30
*Sehlabathebe(Mavuka, Polasi) Qacha's Neck 4 5 103 46 69 30
Seforong (Mosi, Aupolasi) Mohale's Hoek 4 5 114 51 76 34
Lesobeng Thaba-Tseka 5 5 65 27 44 18
Motete Butha-Buthe 5 5 65 27 44 18
Kao (Shishila) Butha-Buthe 6 5 275 104 275 104
Liqhobong Butha-Buthe 6 5 275 104 275 104
National Electrification Master Plan for Lesotho - Final Report
P:\64131A\3_Pdoc\DOC\Final Report\færdige\Final Report October 2007\Final Report\Final Report-october.doc
95
.
line will be higher than the investment in diesel generation capacity. However, it should not be forgotten that the economic lifetime of the competing tech-nologies is vastly different, 25–30 years for a line compared to maximum 4–5 years for small, high-speed diesel generators, which will have to be renewed at least five times during the period, corresponding to the life expectancy of a feeder line. Likewise, their operating and maintenance costs will vary widely.
Another interesting case of bulk supply through a grid extension is that of the three settlements in Electrification Class 5; Tebellong, Sekake and Seforong. For the first 3 settlements, the source of supply would be Qacha's Neck, a town which has a cross-border connection from South Africa. The proposed solution here would be to consider the three settlements as one large cluster and have them interlinked by a MV feeder that would be an extension of the cross-border connection feeding at Qacha's Neck.
Three settlements in Electrification Class 5 have a potential for utilising hydro power for electricity generation. These are Sehlabathebe, Lesobeng and Motete, and possibly Mphaki. For these three settlements the estimated hydro potential seems to be much higher than the estimated demand, at least on the basis of the very limited information available on the hydro sites. Regarding Sehlabathebe and Lesobeng, the development of the identified hydro potential would provide a quantitatively interesting source of power supply for these areas. A detailed study of the two sites will be necessary to verify the actual potential and assess how they could best be developed (for instance choice of turbine type and load control system). The hydrological conditions also have to be verified in order to assess likely fluctuations in water flow patterns, including the need for some form of power supply back-up during the dry season. For Motete, the possible surplus capacity in terms of generation potential raises the issue of investigating the feasibility of connecting the mini hydro plant to Liqhobong and Kao.
It is proposed to supply the settlements of Kao and Liqhobong by a grid exten-sion from the Kao mine, assuming that an agreement on bulk supply can be reached with the mine company. As mentioned above, the possibility of a more intensive use of the Motete mini hydro power plant is worth analysing further, to determine whether it could benefit both Liqhobong and Kao, including the mine company. The available information on the potential hydro sites is not sufficient to carry out this analysis.
7.5.4 Decentralised Supply Solutions Decentralised supply is proposed for 12 settlements, all with a population be-low 1,000 inhabitants, with the exception of Sehonghong (approx. 1,750 in-habitants). The settlements are type 4 (six settlements), type 5 (five settlements) and type 6 (one settlement).
The technology selected for decentralised supply is solar photovoltaic (PV) in the form of solar home systems (SHS) and/or solar lanterns. The use of SHS of different output ratings has been assumed as shown in the following table.

National Electrification Master Plan for Lesotho - Final Report
P:\64131A\3_Pdoc\DOC\Final Report\færdige\Final Report October 2007\Final Report\Final Report-october.doc
96
.
Table 7-5 SHS output and ratings
SHS type Load
25 W panel, 100 Ah battery, 5 A regulator 2 lights, 9V radio, cell phone charger
50 W panel, 100 Ah battery, 8 A regulator 4 lights, 9 V radio, 12 V Hi-Fi, black and white TV, cell phone charger
100 W panel, 200 Ah battery, 10 A regulator 6 lights, 9 V radio, 12 V Hi-Fi, 12 V colour TV, cell phone charger
150 W panel, 300 Ah battery, 20 A regulator 10 lights, 9 V radio, 12 V Hi-Fi, 12 V colour TV, cell phone charger
200 W panel, 300 Ah battery, 20 A regulator, 300 W inverter
8 lights, 230 V AC, Hi-Fi, video, colour TV, decoder, cell phone charger
250 W panel, 400 Ah battery, 30 A regulator, 300 W inverter
12 lights, 230 V AC, Hi-Fi, video, colour TV, decoder, cell phone charger
300 W panel, 500 Ah battery, 40 A regulator, 600 W inverter
16 lights, 230 V AC, Hi-Fi, video, colour TV, decoder, cell phone charger
For solar lanterns, units in the 5–7 W range have been foreseen.
Regarding the diffusion of SHS, the following assumptions have been made:
• Uptake level:
- For households an uptake level of 30%, corresponding to the percent-age of households assessed to have a regular income;
- For institutions one unit SHS per institution (school, clinic, police sta-tion, etc.) in the settlement.
• SHS ratings:
- Households: 25 W SHS for 60% of households, 50 W SHS for 30% of households and 100 W SHS for 10% of households;
- Institutions: AC SHS in the range 150 W – 300 W according to the type and size of the institution.
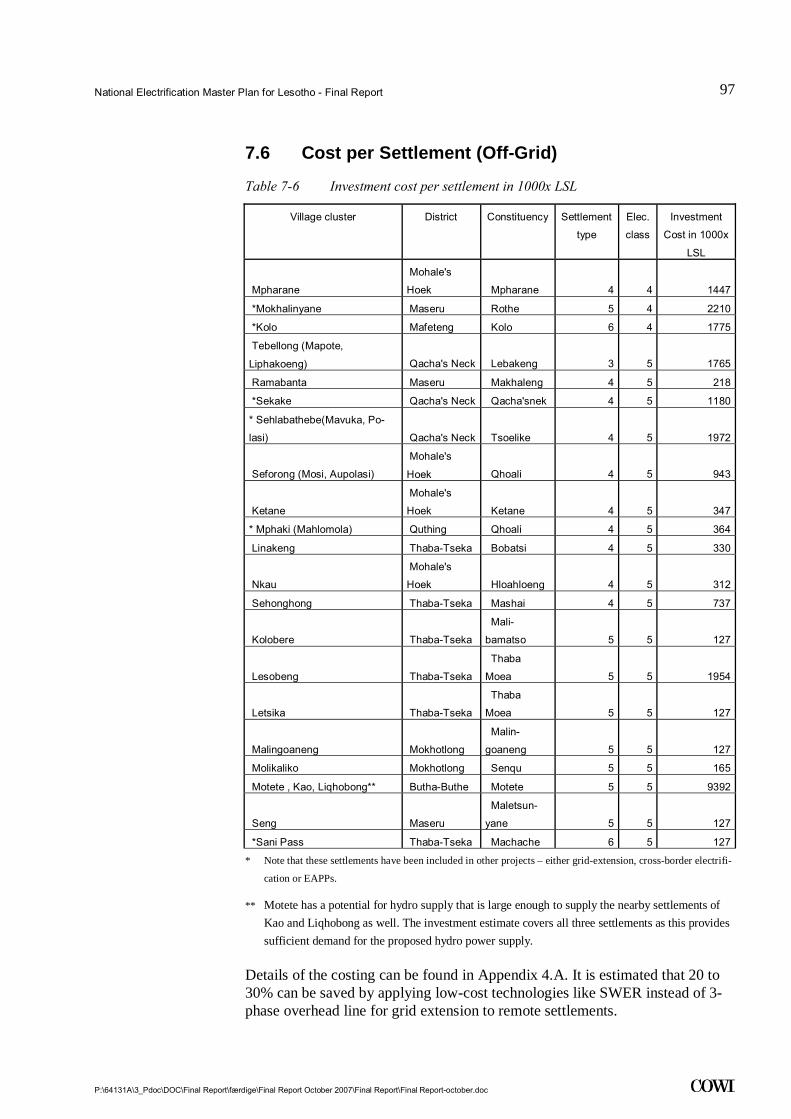
National Electrification Master Plan for Lesotho - Final Report
P:\64131A\3_Pdoc\DOC\Final Report\færdige\Final Report October 2007\Final Report\Final Report-october.doc
97
.
7.6 Cost per Settlement (Off-Grid)
Table 7-6 Investment cost per settlement in 1000x LSL
Village cluster District Constituency Settlement
type
Elec.
class
Investment
Cost in 1000x
LSL
Mpharane
Mohale's
Hoek Mpharane 4 4 1447
*Mokhalinyane Maseru Rothe 5 4 2210
*Kolo Mafeteng Kolo 6 4 1775
Tebellong (Mapote,
Liphakoeng) Qacha's Neck Lebakeng 3 5 1765
Ramabanta Maseru Makhaleng 4 5 218
*Sekake Qacha's Neck Qacha'snek 4 5 1180
* Sehlabathebe(Mavuka, Po-
lasi) Qacha's Neck Tsoelike 4 5 1972
Seforong (Mosi, Aupolasi)
Mohale's
Hoek Qhoali 4 5 943
Ketane
Mohale's
Hoek Ketane 4 5 347
* Mphaki (Mahlomola) Quthing Qhoali 4 5 364
Linakeng Thaba-Tseka Bobatsi 4 5 330
Nkau
Mohale's
Hoek Hloahloeng 4 5 312
Sehonghong Thaba-Tseka Mashai 4 5 737
Kolobere Thaba-Tseka
Mali-
bamatso 5 5 127
Lesobeng Thaba-Tseka
Thaba
Moea 5 5 1954
Letsika Thaba-Tseka
Thaba
Moea 5 5 127
Malingoaneng Mokhotlong
Malin-
goaneng 5 5 127
Molikaliko Mokhotlong Senqu 5 5 165
Motete , Kao, Liqhobong** Butha-Buthe Motete 5 5 9392
Seng Maseru
Maletsun-
yane 5 5 127
*Sani Pass Thaba-Tseka Machache 6 5 127
* Note that these settlements have been included in other projects – either grid-extension, cross-border electrifi-
cation or EAPPs.
** Motete has a potential for hydro supply that is large enough to supply the nearby settlements of Kao and Liqhobong as well. The investment estimate covers all three settlements as this provides sufficient demand for the proposed hydro power supply.
Details of the costing can be found in Appendix 4.A. It is estimated that 20 to 30% can be saved by applying low-cost technologies like SWER instead of 3-phase overhead line for grid extension to remote settlements.
National Electrification Master Plan for Lesotho - Final Report
P:\64131A\3_Pdoc\DOC\Final Report\færdige\Final Report October 2007\Final Report\Final Report-october.doc
98
.
8 System Design and Cost Estimates in Transmission and Distribution
This section concerns the technical planning of the extension of the current net-work system that is required in the load forecast in Scenario 1.
It describes and analyses the calculation results from the load flow analysis of the Lesotho transmission network. The load flow calculations are used to iden-tify bottlenecks in the existing transmission grid 2005 and evaluate the need for network reinforcements due to increasing system load in 2020. The identified need for reinforcement is presented with the related estimated investment cost.
Conceptual designs and costs of electrification at the distribution level, densifi-cation in settlements already supplied with electricity as well as new electrifica-tion by grid extension are presented at the end of the section.
8.1 Transmission System
8.1.1 Applicability The transmission systems within LEC's supply area cover the following trans-mission voltages: 132 kV, 88 kV and 66 kV. However, a number of sub-transmission lines operate with 33 kV as the nominal voltage.
8.1.2 Network Arrangements Main Transmission System General Transmission system configuration in Lesotho is mostly a radial system. 33 kV ring connections exist for example in Maseru. The system is fed from two generation stations in Lesotho and connected to South Africa in two supply points.
Any future reinforcements of the existing system must be carried out as a stan-dard three-phase system within the appropriate voltage levels chosen between the standard voltage levels specified in Table 8-1.

National Electrification Master Plan for Lesotho - Final Report
P:\64131A\3_Pdoc\DOC\Final Report\færdige\Final Report October 2007\Final Report\Final Report-october.doc
99
.
Table 8-1 Standard voltage levels
System Configuration Voltage level
HV main transmission 3 phase >132 kV; 88 kV; 66 kV; 33 kV
MV distribution 3 phase 33 kV; 11 kV;
MV low-cost distribution 2 phase 33 kV; 11 kV;
1 phase, SWER 19.1 kV; 6.35 kV
LV distribution 3 phase + neutral + earth 400/230 V
1 phase + neutral + earth 230 V
LV low-cost distribution 1 phase, SWER 230 V
Design of system extensions and reinforcements shall be carried out by means of LEC's standard software, based on the existing system data and new line pa-rameters and survey data made available in this software package.
Transmission Lines New lines shall be designed on the basis of existing line standard principles, using the same criteria for allowable spans, wind and weight under similar loading cases as the existing lines.
It is recommended to design the new lines with OPGW.
Substations It is recommended to design the new substations in the same way as existing new substations in order to benefit from the limitation of spare components for operation and maintenance.
Distribution System General The distribution system is configured in the same way as the main transmission system and is a radial system, normally without ties between substations.
Overhead Lines The existing distribution lines are typically 33 kV and 11 kV lines on wooden poles, constructed as 3-phase lines with either AAAC or ACSR conductors.
It is recommended to design all new lines based on a least-cost analysis, taking into consideration conservative load growth, but allowing for future reinforce-ment of the system, if necessary.
Sub-transmission lines for supply to areas with low load density and spread- load centres should primarily be designed as two-phase systems or SWER sys-tem, where applicable.
National Electrification Master Plan for Lesotho - Final Report
P:\64131A\3_Pdoc\DOC\Final Report\færdige\Final Report October 2007\Final Report\Final Report-october.doc
100
.
Substations Most substations are outdoors and constructed either on poles or on a founda-tion next to the line poles.
All substations are prepared for a three-phase system with oil transformers and overhead distribution feeders with three-phase overhead conductors or ABC cables.
For rural applications, the following substations may be constructed:
1. Three-phase distribution substations
Three-phase substations are recommended for high load density areas.
2. Single-phase substation
Single-phase substations are recommended for low load density areas with spread consumers.
3. SWER substation
SWER-system substations are recommended for areas with very low load densities in areas with few consumers in small clusters. Since earth resis-tance can be a problem, SWER systems can be designed as two-wire sys-tems with phase and earth wires installed on poles.
The distribution transformer arrangement shall be for: 16-25 kVA, 12.7 kV SWER system or 19.1 kV SWER.
The top of the pole shows the single SWER conductor, a surge arrester, down to a drop-out fuse and then to the 16kVA transformer. The secondary voltage is 230-0-230 Volts, in this instance the two 230 volt windings have to be connected in parallel.
Alternatively, by connecting across the two 230 volt windings, 460 volts can be derived. This can be used for large single-phase motors for irriga-tion or agricultural machinery.
The standard top arrangement uses a post insulator. Pin post insulators shall be used due to lightning conditions in Lesotho. Pin insulators should be avoided.
8.1.3 State of the System in 2020 The transmission system is modelled in NEPLAN v.5.3 simulation program for the years 2005 and 2020 (Appendix 9). The simulation of winter load flow for 2005 in the actual network is based on LEC's load list for 2003 peak load data. The transmission system planning is performed as a top-down approach on the basis of geographic load forecasting for year 2020. Network reinforcement al-ternatives are developed and analysed for the peak demand scenario.
National Electrification Master Plan for Lesotho - Final Report
P:\64131A\3_Pdoc\DOC\Final Report\færdige\Final Report October 2007\Final Report\Final Report-october.doc
101
.
In the simulation, the main 132 kV grid is assumed to be isolated from the 88 kV grid at the Clarens substation connecting Lesotho to South Africa.
The expected load increase is simulated without introducing new generation capacity in Lesotho. Establishment of a number of new transmission lines/substations and rehabilitation of existing ones is necessary to meet the in-creased load demand in 2020. The Mohaleshoek, Quthing, Pitseng, Khukune, Mabote, Maputsoe and Mazenod supply areas are among the areas that achieve the largest increment of electricity consumption. The main challenge in the future grid is to obtain sufficient transfer capacity in the system by reinforcing the existing 132 kV transmission lines.
The network model for 2020, described in Appendix 9, shows that the load in-crease is followed by decreased voltage at system buses in case of insufficient reactive power supply near Thesane (industrial load centre) and Khukune. Thus, adequate local voltage control is an important task especially in heavily loads and areas distant from the main generation capacities. Acceptable volt-ages in the Thetsane and Khukune regions can be obtained by applying bulk capacitor banks of 25 MVAr and 10 MVAr, respectively. The voltage control at Khukune may alternatively be supplied from South Africa.
8.1.4 Proposed Improvements Based on simulations for 2020, it is recommended to reinforce the main 132 kV grid that connects the Northern to the Southern part of Lesotho. The existing double 132 kV line between Maputsoe and Mabote should be extended with an additional double line with the same conductor type and cross-section. The ex-tension is proposed in order to improve the power supply security of the sys-tem. The single 132 kV lines Mabote-Mazenod, Mazenod-Likhoele and Lik-hoele-Mohales’ Hoek should be extended with a double 132 kV line with the same conductor type and cross-section. These reinforcements are important for transfer of active and reactive power over large distances to regions in the southern part of Lesotho, where significant load increase is expected. The rec-ommended 132 kV lines are primarily used to maintain acceptable voltage lev-els in the transmission grid.
Besides the 132 kV grid reinforcements, a number of 33 kV lines have to be upgraded in order to avoid line overload due to heavy power flows from the 132 kV to the 33 kV system. The main bottlenecks in the 33 kV network are the lines connecting 33 kV busbars Mabote to Highway and LEC33. To improve the transfer capacity in the load centre, it is suggested to upgrade the line Ma-bote-Highway from a single line to three lines. For the same reason, it is rec-ommended to upgrade the line Mabote-LEC from two to four lines.
By constructing a new line between substations LEC-Pioneer and Pioneer-Thestsane, the 33 kV line reinforcements are primarily used to improve the voltage level in the grid around Thesane. In the same way, the reinforcements Mohaleshoek2-Mohaleshoek1 and Mohaleshoek-Mafeteng help to increase the 33 kV voltage level around Mohale's Hoek and Quithing.
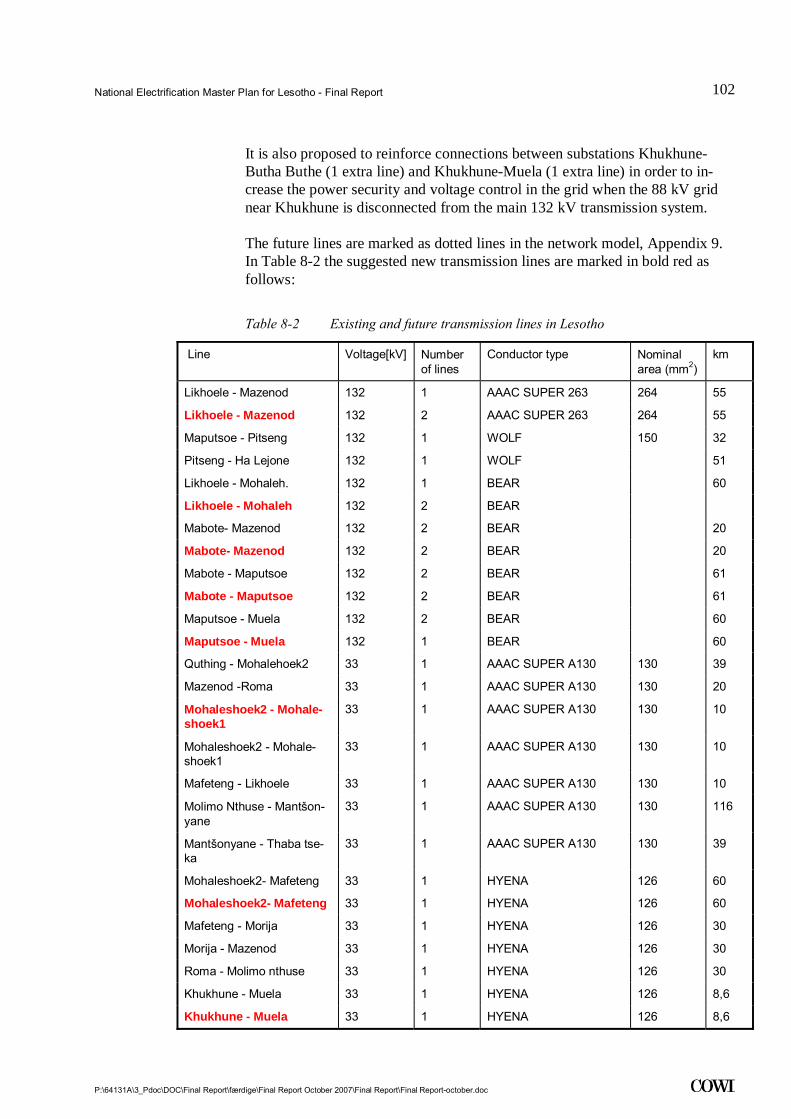
National Electrification Master Plan for Lesotho - Final Report
P:\64131A\3_Pdoc\DOC\Final Report\færdige\Final Report October 2007\Final Report\Final Report-october.doc
102
.
It is also proposed to reinforce connections between substations Khukhune-Butha Buthe (1 extra line) and Khukhune-Muela (1 extra line) in order to in-crease the power security and voltage control in the grid when the 88 kV grid near Khukhune is disconnected from the main 132 kV transmission system.
The future lines are marked as dotted lines in the network model, Appendix 9. In Table 8-2 the suggested new transmission lines are marked in bold red as follows:
Table 8-2 Existing and future transmission lines in Lesotho
Line Voltage[kV] Number of lines
Conductor type Nominal area (mm2)
km
Likhoele - Mazenod 132 1 AAAC SUPER 263 264 55
Likhoele - Mazenod 132 2 AAAC SUPER 263 264 55
Maputsoe - Pitseng 132 1 WOLF 150 32
Pitseng - Ha Lejone 132 1 WOLF 51
Likhoele - Mohaleh. 132 1 BEAR 60
Likhoele - Mohaleh 132 2 BEAR
Mabote- Mazenod 132 2 BEAR 20
Mabote- Mazenod 132 2 BEAR 20
Mabote - Maputsoe 132 2 BEAR 61
Mabote - Maputsoe 132 2 BEAR 61
Maputsoe - Muela 132 2 BEAR 60
Maputsoe - Muela 132 1 BEAR 60
Quthing - Mohalehoek2 33 1 AAAC SUPER A130 130 39
Mazenod -Roma 33 1 AAAC SUPER A130 130 20
Mohaleshoek2 - Mohale-shoek1
33 1 AAAC SUPER A130 130 10
Mohaleshoek2 - Mohale-shoek1
33 1 AAAC SUPER A130 130 10
Mafeteng - Likhoele 33 1 AAAC SUPER A130 130 10
Molimo Nthuse - Mantšon-yane
33 1 AAAC SUPER A130 130 116
Mantšonyane - Thaba tse-ka
33 1 AAAC SUPER A130 130 39
Mohaleshoek2- Mafeteng 33 1 HYENA 126 60
Mohaleshoek2- Mafeteng 33 1 HYENA 126 60
Mafeteng - Morija 33 1 HYENA 126 30
Morija - Mazenod 33 1 HYENA 126 30
Roma - Molimo nthuse 33 1 HYENA 126 30
Khukhune - Muela 33 1 HYENA 126 8,6
Khukhune - Muela 33 1 HYENA 126 8,6

National Electrification Master Plan for Lesotho - Final Report
P:\64131A\3_Pdoc\DOC\Final Report\færdige\Final Report October 2007\Final Report\Final Report-october.doc
103
.
Khukhune - Ngoajane 33 1 HYENA 126 8,8
Khukhune - Butha buthe 33 1 HYENA 126 18
Khukhune - Butha buthe 33 1 HYENA 126 18
Letseng - Mokhotlong 33 1 HYENA 126 30
Botsabelo - Mazenod 33 1 PANTHER 200 10
Thetsane - Tikoe 33 2 PANTHER 200 4
Tikoe - Mazenod 33 1 PANTHER 200 13
Pioneer - Thetsane 33 2 PANTHER 200 4
Pioneer - Thetsane 33 2 PANTHER 200 4
LEC - Pioneer 33 1 PANTHER 200 4,5
LEC - Pioneer 33 1 PANTHER 200 4,5
Highway - Pioneer 33 1 PANTHER 200 8
Highway - Botsabelo 33 1 PANTHER 200 4,5
Mabote - Highway 33 1 PANTHER 200 6,5
Mabote - Highway 33 1+2 PANTHER 200 6,5
Mabote - LEC 33 2 PANTHER 200 12
Mabote - LEC 33 2 PANTHER 200 12
Mabote- Botsabelo 33 1 PANTHER 200 9,6
Mabote - St Agnes 33 1 PANTHER 200 25
Pitseng - Hlotse adit 66 1 HYENA 126 32
Ha Lejone - Katse intake 66 1 BEAR 326 9
Katse Intake - Katse dam 66 1 BEAR 326 37
Khukhune - Letseng 88 1 DOG 100 86
The capacity of the existing double 132 kV line Maseru Bulk-Mabote is suffi-cient to deal with the forecast load in 2020. In a peak load situation with a maximum operating temperature of 80ºC, the line can be overloaded to 105% of its capacity. This overload does not exceed the line emergency limit of 110%. Due to cost savings, the reinforcement of the line Maseru Bulk-Mabote is not recommended. However, an increase of power supply reliability should be considered in the future.
Due to the increased system loading, it is necessary to increase the transformer capacity in the following substations:
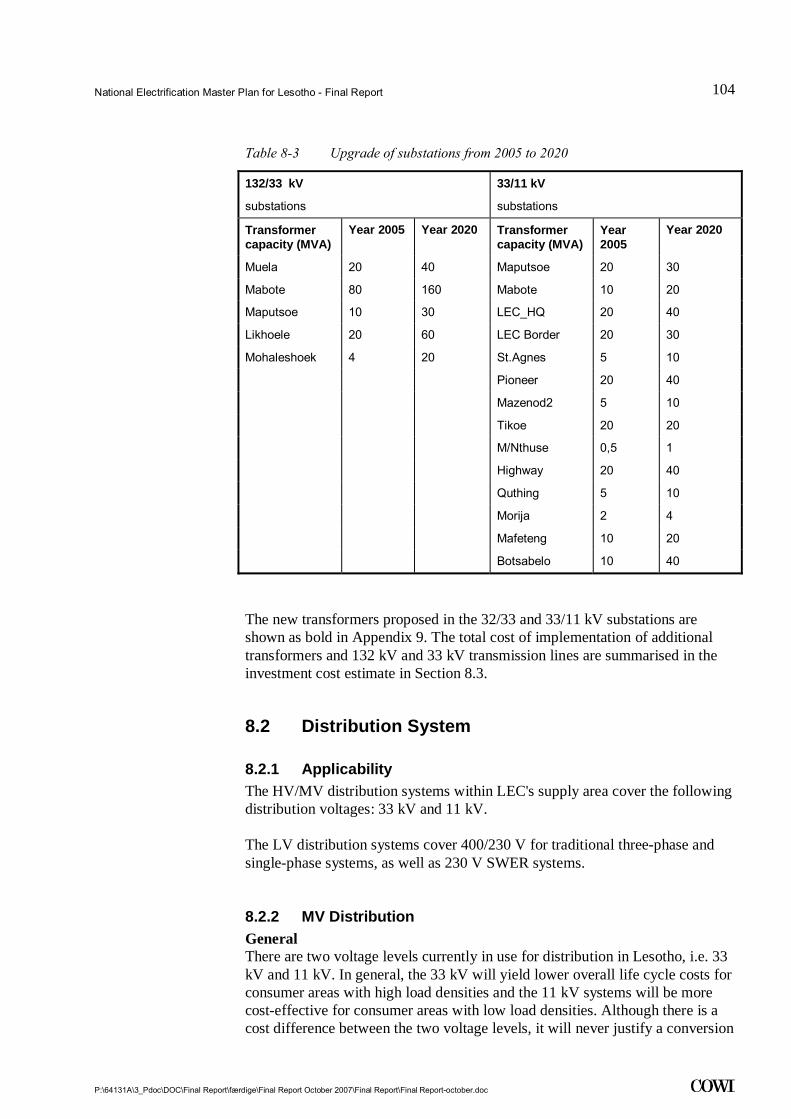
National Electrification Master Plan for Lesotho - Final Report
P:\64131A\3_Pdoc\DOC\Final Report\færdige\Final Report October 2007\Final Report\Final Report-october.doc
104
.
Table 8-3 Upgrade of substations from 2005 to 2020
132/33 kV
substations
33/11 kV
substations
Transformer capacity (MVA)
Year 2005 Year 2020 Transformer capacity (MVA)
Year 2005
Year 2020
Muela 20 40 Maputsoe 20 30
Mabote 80 160 Mabote 10 20
Maputsoe 10 30 LEC_HQ 20 40
Likhoele 20 60 LEC Border 20 30
Mohaleshoek 4 20 St.Agnes 5 10
Pioneer 20 40
Mazenod2 5 10
Tikoe 20 20
M/Nthuse 0,5 1
Highway 20 40
Quthing 5 10
Morija 2 4
Mafeteng 10 20
Botsabelo 10 40
The new transformers proposed in the 32/33 and 33/11 kV substations are shown as bold in Appendix 9. The total cost of implementation of additional transformers and 132 kV and 33 kV transmission lines are summarised in the investment cost estimate in Section 8.3.
8.2 Distribution System
8.2.1 Applicability The HV/MV distribution systems within LEC's supply area cover the following distribution voltages: 33 kV and 11 kV.
The LV distribution systems cover 400/230 V for traditional three-phase and single-phase systems, as well as 230 V SWER systems.
8.2.2 MV Distribution General There are two voltage levels currently in use for distribution in Lesotho, i.e. 33 kV and 11 kV. In general, the 33 kV will yield lower overall life cycle costs for consumer areas with high load densities and the 11 kV systems will be more cost-effective for consumer areas with low load densities. Although there is a cost difference between the two voltage levels, it will never justify a conversion
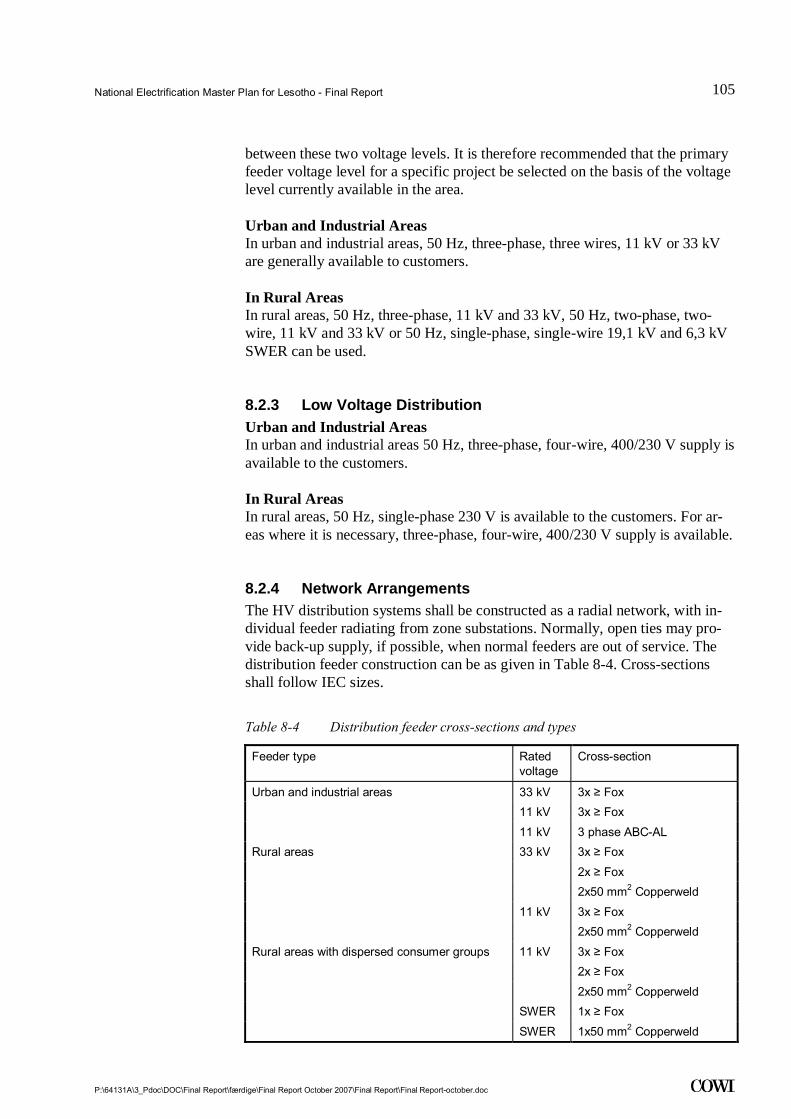
National Electrification Master Plan for Lesotho - Final Report
P:\64131A\3_Pdoc\DOC\Final Report\færdige\Final Report October 2007\Final Report\Final Report-october.doc
105
.
between these two voltage levels. It is therefore recommended that the primary feeder voltage level for a specific project be selected on the basis of the voltage level currently available in the area.
Urban and Industrial Areas In urban and industrial areas, 50 Hz, three-phase, three wires, 11 kV or 33 kV are generally available to customers.
In Rural Areas In rural areas, 50 Hz, three-phase, 11 kV and 33 kV, 50 Hz, two-phase, two- wire, 11 kV and 33 kV or 50 Hz, single-phase, single-wire 19,1 kV and 6,3 kV SWER can be used.
8.2.3 Low Voltage Distribution Urban and Industrial Areas In urban and industrial areas 50 Hz, three-phase, four-wire, 400/230 V supply is available to the customers.
In Rural Areas In rural areas, 50 Hz, single-phase 230 V is available to the customers. For ar-eas where it is necessary, three-phase, four-wire, 400/230 V supply is available.
8.2.4 Network Arrangements The HV distribution systems shall be constructed as a radial network, with in-dividual feeder radiating from zone substations. Normally, open ties may pro-vide back-up supply, if possible, when normal feeders are out of service. The distribution feeder construction can be as given in Table 8-4. Cross-sections shall follow IEC sizes.
Table 8-4 Distribution feeder cross-sections and types
Feeder type Rated voltage
Cross-section
Urban and industrial areas 33 kV 3x ≥ Fox 11 kV 3x ≥ Fox 11 kV 3 phase ABC-AL Rural areas 33 kV 3x ≥ Fox 2x ≥ Fox 2x50 mm2 Copperweld 11 kV 3x ≥ Fox 2x50 mm2 Copperweld Rural areas with dispersed consumer groups 11 kV 3x ≥ Fox 2x ≥ Fox 2x50 mm2 Copperweld SWER 1x ≥ Fox SWER 1x50 mm2 Copperweld
National Electrification Master Plan for Lesotho - Final Report
P:\64131A\3_Pdoc\DOC\Final Report\færdige\Final Report October 2007\Final Report\Final Report-october.doc
106
.
8.2.5 Project Packages for the Settlement Types Type 1 This type is applied to the capital city of Maseru and consists of one large clus-ter.
This cluster is in electrification Class 1 - Electrification measure: Densification, there are already electricity consumers.
All extensions will be carried out as 11 kV 3x100 mm2 ACSR overhead lines.
The total length of the distribution system extension is estimated at 4 x 7 km.
New transformers are assumed to be 11/0.4 kV 3-phase 200 kVA or 400 kVA for industrial customers and 200 kVA for others. However, smaller transform-ers may be considered in parts by areas with a lower number of consumers.
All extensions on low voltage level will consist of service connections and ex-tension lines. The service connections will consist of 3x10 mm2 Airdac of an average length of 50 m per household, and the extension lines will consist of 3x35 mm2 ABC-AL of an average length of 16 m per household.
Use of prepaid meters is assumed for "domestic" and "general purpose" cus-tomers.
Type 2 This type covers areas with large industrial customers (Maputsoe, Mafeteng, Mohale's Hoek, Butha Buthe, TY).
This type covers six clusters. Clusters are in electrification Class 1 - Electrifica-tion measure: Densification, there are already electricity consumers.
All extensions will be carried out as 11 kV 3x100 mm2 ACSR overhead lines.
An average length of 2 km per cluster and voltage level is assumed.
New transformers are assumed to be 11/0.4 kV 3-phase 200 kVA or 400 kVA for industrial customers and 200 kVA for others. However, smaller transform-ers may be considered in areas with a lower number of consumers.
All extensions at low voltage level will consist of service connections and ex-tension lines. The service connections will consist of 3x10 mm2 Airdac of an average length of 50 m pr. household, and the extension lines will consist of 3x35 mm2 ABC-AL of an average length of 16 m per household.
Use of prepaid meters is assumed for "domestic" and "general purpose" cus-tomers.
National Electrification Master Plan for Lesotho - Final Report
P:\64131A\3_Pdoc\DOC\Final Report\færdige\Final Report October 2007\Final Report\Final Report-october.doc
107
.
Type 3 This type covers large institutional towns (district capitals, places with impor-tant institutions).
It consists of twelve clusters, all of which are served by LEC.
Clusters are in electrification Class 1 - Electrification measure: Densification, there are already electricity consumers.
All extensions will be carried out as 75% 11 kV 3x100 mm2 ACSR overhead line, and 25% 11 kV 2x100 mm2 ACSR overhead lines.
An average length of 1.5 km three-phase and 0.5 km one-phase is assumed per cluster in electrification Class 1.
An average length of 3 km three-phase and 1 km one-phase is assumed per cluster in electrification Class 5.
New transformers are assumed to be 75% three-phase 11/0.4 kV 25 kVA and 25% one-phase 11/0.23 kV 25 kVA. However, other sizes of transformers may be considered during detailed design of the system.
All extensions at low voltage level will be carried out as 75% three-phase and 25% one-phase. They will consist of service connections and extension lines.
For three-phase systems, the service connections will consist of 3x10 mm2 Airdac of an average length of 50 m per household, and the extension lines will consist of 3x35 mm2 ABC-AL of an average length of 16 m per household.
For one-phase systems, the service connections will consist of 2x10 mm2 Air-dac of an average length of 50 m per household, and the extension lines will consist of 2x35 mm2 ABC-AL of an average length of 16 m per household.
Use of prepaid meters is assumed for "domestic" and "general purpose" cus-tomers.
Type 4 This type covers medium-size settlements (population of 5,000-10,000) and consists of 54 clusters, some of which are supplied by LEC, others qualify for grid extension of alternative supply.
These clusters are in electrification Classes 1, 2, 3, 4 and 5.
All extensions will be carried out as 50% 11 kV 3x100 mm2 ACSR overhead line, and 50% 11 kV 2x100 mm2 ACSR overhead lines.
An average length of 1 km three-phase and 1 km one-phase is assumed per cluster in electrification Classes 1 and 2.
National Electrification Master Plan for Lesotho - Final Report
P:\64131A\3_Pdoc\DOC\Final Report\færdige\Final Report October 2007\Final Report\Final Report-october.doc
108
.
An average length of 2 km three-phase and 2 km one-phase is assumed per cluster in electrification Classes 3, 4 and 5.
New transformers are assumed to be 50% three-phase 11/0.4 kV 25 kVA and 50% one-phase 11/0.23 kV 25 kVA. However, other sizes of transformers may be considered during detailed design of the system.
All extensions at low voltage level will be carried out as 50% three-phase and 50% one-phase. They will consist of service connections and extension lines.
For three-phase systems, the service connections will consist of 3x10 mm2 Airdac of an average length of 50 m per household, and the extension lines will consist of 3x35 mm2 ABC-AL of an average length of 16 m per household.
For 1-phase systems, the service connections will consist of 2x10 mm2 Airdac of an average length of 50 m per household, and the extension lines will consist of 2x35 mm2 ABC-AL of an average length of 16 m per household.
Use of prepaid meters is assumed for "domestic" and "general purpose" cus-tomers.
Type 5 This type covers large villages (Lowland settlements with a population of 2,500 or more, but less than 5,000, or Highland settlement with a population of 1,000 or more) and consists of 60 clusters.
Clusters are in electrification Classes 1, 2, 3, 4 and 5.
All extensions will be carried out as 11 kV 2x100 mm2 ACSR overhead lines.
An average length of 2 km one-phase is assumed per cluster in electrification Classes 1 and 2.
An average length of 4 km one-phase is assumed per cluster in electrification Classes 3, 4 and 5.
The new transformers are assumed to be one-phase 11/0.23 kV 25 kVA. How-ever, other sizes of transformers may be considered during detailed design of the system.
All extensions at low voltage level will consist of service connections and ex-tension lines. The service connections will consist of 2x10 mm2 Airdac of an average length of 50 m per household, and the extension lines will consist of 2x35 mm2 ABC-AL of an average length of 16 m per household.
Use of prepaid meters is assumed for "domestic" and "general purpose" cus-tomers.
National Electrification Master Plan for Lesotho - Final Report
P:\64131A\3_Pdoc\DOC\Final Report\færdige\Final Report October 2007\Final Report\Final Report-october.doc
109
.
Type 6 This type covers special settlements (e.g. mining communities) or sites identi-fied with a potential for off-grid electrification and consists of 8 clusters.
Clusters are in electrification Classes 1, 2, 4 and 5.
The suggested extensions for this type do not comprise large consumers, but only households.
All extensions will be carried out as 11 kV 2x100 mm2 ACSR overhead line.
An average length of 2 km one-phase is assumed per cluster in electrification Classes 1 and 2.
An average length of 4 km one-phase is assumed per cluster in electrification Classes 4 and 5.
New transformers are assumed to be one-phase 11/0.23 kV 25 kVA. However, other sizes of transformers may be considered during detailed design of the sys-tem.
All extensions at low voltage level will consist of service connections and ex-tension lines. The service connections will consist of 2x10 mm2 Airdac of an average length of 50 m per household, and the extension lines will consist of 2x35 mm2 ABC-AL of an average length of 16 m per household.
Use of prepaid meters is assumed for "domestic" and "general purpose" cus-tomers.
8.3 Investment Costs
8.3.1 General The project cost estimates were calculated using unit costs for overhead lines and MV and LV equipment in the following project components:
• Transmission system; • MV distribution lines; • Distribution substations; • LV distribution lines; • Service connections.
The estimates are based on the average cost of components in the Southern Af-rica region, provided that the works are tendered as international competitive bidding.
It should be noted that the project cost estimates provided in this report are based on a conceptual design, and will therefore require revisions upon comple-tion of detailed design of the project packages.

National Electrification Master Plan for Lesotho - Final Report
P:\64131A\3_Pdoc\DOC\Final Report\færdige\Final Report October 2007\Final Report\Final Report-october.doc
110
.
The price levels used for the estimation of system costs are based on the price level lists in Appendix 3.
8.3.2 Investment Cost Estimate for Transmission System Reinforcement
Table 8-5 shows the overall investment required in the transmission system. The investment schedule is based on indicative prices from South Africa from 2003. The total costs of transmission investments are updated to 2006 prices due to an approx. 12% increase in the price level.
Table 8-5 Investment in future transmission lines
Transmission lines
Line ID Single/ double line
Total length
(km)
Unit price (USD/km)
Line cost
(USD)
Muela132- Maputsoe132 1 60 65,000 3,900,000
Maputsoe132 -Mabote132 2 61 65,000 7,930,000
Mabote132-Mazenod132 2 20 65,000 2,600,000
Mazenod 132 -Likhoele132 2 55 65,000 7,150,000
Likhoele132-Mohaleh.132 2 30 65,000 3,900,000
Mabote33 Highway33 1+2 3,6 50,000 540,000
Mabote33 - LEC33 2 6,5 50,000 650,000
LEC33-Pioner33 1 4,5 50,000 225,000
Pioner33-Thetsane33 2 4 50,000 400,000
Mhoek33-Mafeteng33 1 60 50,000 3,000,000
Mohaleh.2_ Mohaleh.1 1 10 50,000 1,000,000
Khukhune33-Butha buthe33 1 18 50,000 900,000
Khukhune33-Muela33 1 8,6 50,000 430,000
Lines total cost
(Million USD)
31.86

National Electrification Master Plan for Lesotho - Final Report
P:\64131A\3_Pdoc\DOC\Final Report\færdige\Final Report October 2007\Final Report\Final Report-october.doc
111
.
Table 8-6 Investment in future transformer capacity
Number of trans-formers
Transformer size (MVA)
Unit price USD/piece)
Transformer cost (Million USD)
1 0,5 50,000 50,000
1 2 200,000 200,000
5 5 500,000 2,500,000
14 10 1,000,000 14,000,000
4 20 2,000,000 8,000,000
2 40 4,000,000 8,000,000
Total cost transformers (Million USD)
32.75
Table 8-7 Total investment for future transmission grid reinforcements
Transmission lines
(Million USD)
Transformers
(Million USD)
Total reinforcements
(Million USD)
Cost of transmission grid reinforcements
31.86 32.75 64.61
Table 8-8 shows indicatively how the investments in the transmission system could be allocated in time.
Table 8-8 Indicative allocation of investment in transmission grid in 2010, 2015 and 2020 - Million USD
Transmission lines
Lines cost
Million USD
Transformers Transform-ers cost
Million USD
Total
Million USD
2010 First circuit of 132 kV lines
(approx. half cost for 132 kV lines)
Muela132- Maputsoe132
Maputsoe132 -Mabote132
Mabote132-Mazenod132
Mazenod 132 -Likhoele132
Likhoele132-
11.6 Mabote 132/33 kV
(2x40 MVA)
Maputsoe 132/33 kV
(1x20 MVA)
Likhoele 132/33 kV
(2x20 MVA)
MHoek 132/33 kV
(4x5 MVA)
Muela 132/33 kV
(1x20MVA)
18.0 29,6
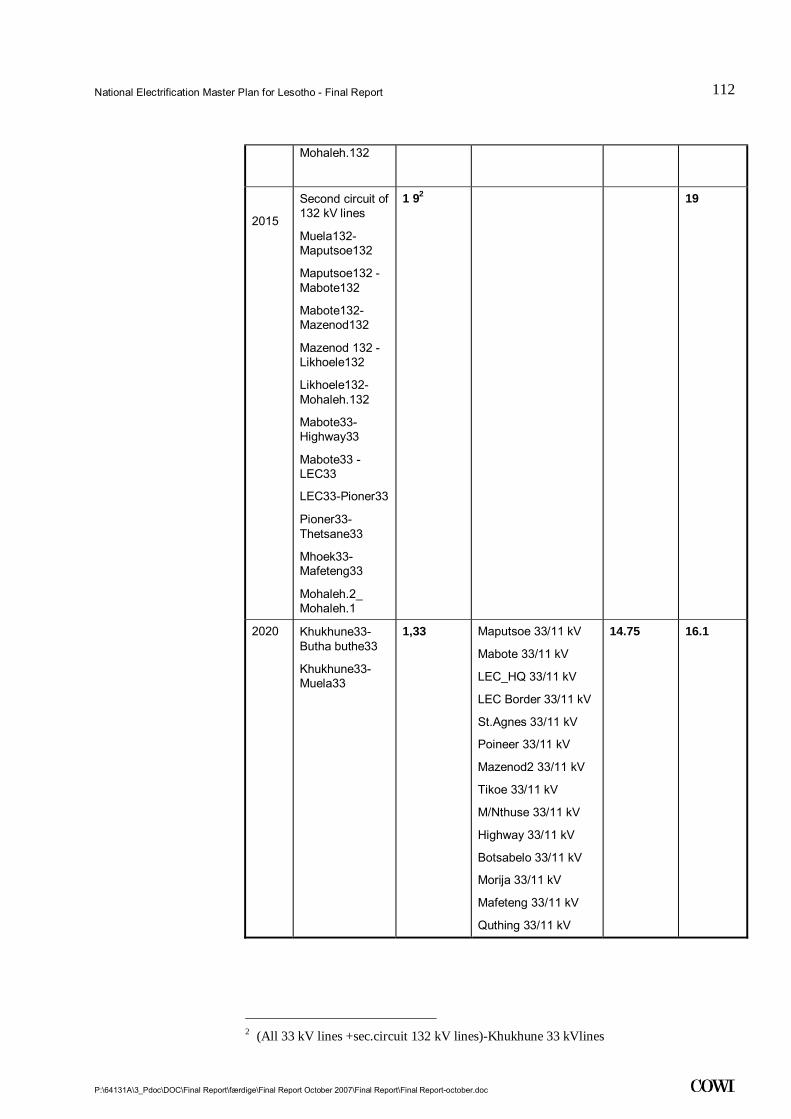
National Electrification Master Plan for Lesotho - Final Report
P:\64131A\3_Pdoc\DOC\Final Report\færdige\Final Report October 2007\Final Report\Final Report-october.doc
112
.
Mohaleh.132
2015
Second circuit of 132 kV lines
Muela132- Maputsoe132
Maputsoe132 -Mabote132
Mabote132-Mazenod132
Mazenod 132 -Likhoele132
Likhoele132-Mohaleh.132
Mabote33- Highway33
Mabote33 - LEC33
LEC33-Pioner33
Pioner33-Thetsane33
Mhoek33-Mafeteng33
Mohaleh.2_ Mohaleh.1
1 92 19
2020 Khukhune33-Butha buthe33
Khukhune33-Muela33
1,33 Maputsoe 33/11 kV
Mabote 33/11 kV
LEC_HQ 33/11 kV
LEC Border 33/11 kV
St.Agnes 33/11 kV
Poineer 33/11 kV
Mazenod2 33/11 kV
Tikoe 33/11 kV
M/Nthuse 33/11 kV
Highway 33/11 kV
Botsabelo 33/11 kV
Morija 33/11 kV
Mafeteng 33/11 kV
Quthing 33/11 kV
14.75 16.1
2 (All 33 kV lines +sec.circuit 132 kV lines)-Khukhune 33 kVlines
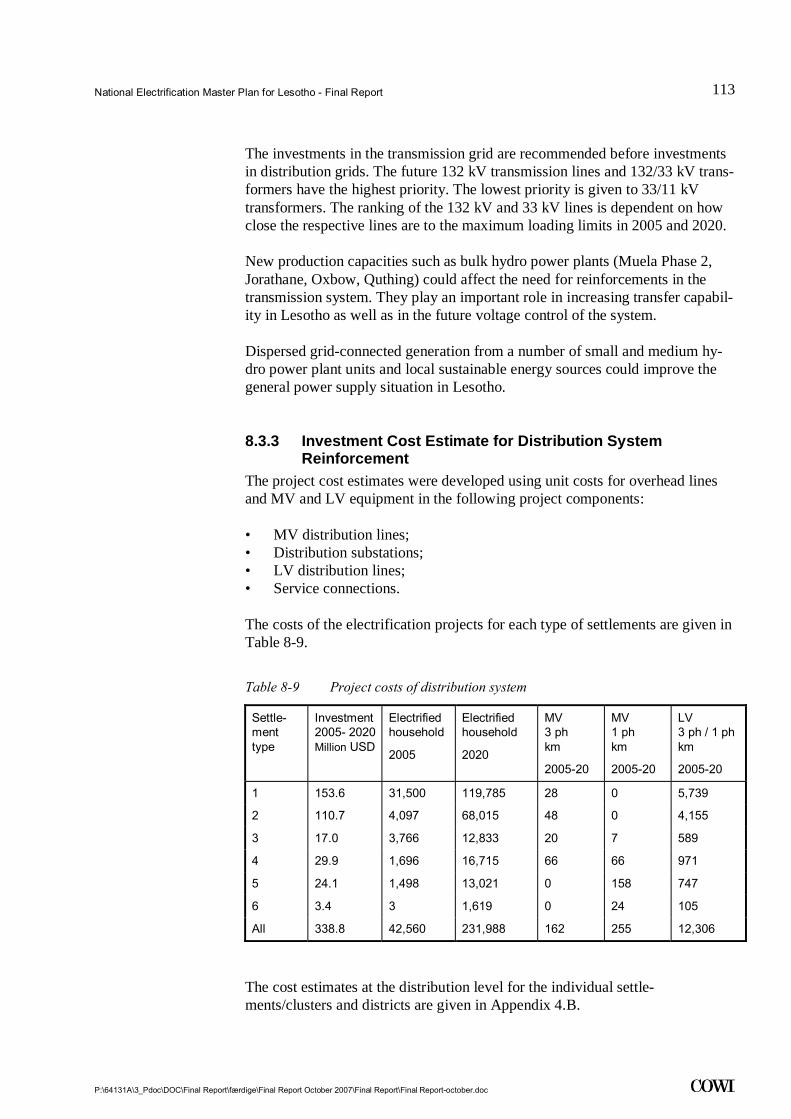
National Electrification Master Plan for Lesotho - Final Report
P:\64131A\3_Pdoc\DOC\Final Report\færdige\Final Report October 2007\Final Report\Final Report-october.doc
113
.
The investments in the transmission grid are recommended before investments in distribution grids. The future 132 kV transmission lines and 132/33 kV trans-formers have the highest priority. The lowest priority is given to 33/11 kV transformers. The ranking of the 132 kV and 33 kV lines is dependent on how close the respective lines are to the maximum loading limits in 2005 and 2020.
New production capacities such as bulk hydro power plants (Muela Phase 2, Jorathane, Oxbow, Quthing) could affect the need for reinforcements in the transmission system. They play an important role in increasing transfer capabil-ity in Lesotho as well as in the future voltage control of the system.
Dispersed grid-connected generation from a number of small and medium hy-dro power plant units and local sustainable energy sources could improve the general power supply situation in Lesotho.
8.3.3 Investment Cost Estimate for Distribution System Reinforcement
The project cost estimates were developed using unit costs for overhead lines and MV and LV equipment in the following project components:
• MV distribution lines; • Distribution substations; • LV distribution lines; • Service connections.
The costs of the electrification projects for each type of settlements are given in Table 8-9.
Table 8-9 Project costs of distribution system
Settle-ment type
Investment 2005- 2020 Million USD
Electrified household
2005
Electrified household
2020
MV 3 ph km
2005-20
MV 1 ph km
2005-20
LV 3 ph / 1 phkm
2005-20
1 153.6 31,500 119,785 28 0 5,739
2 110.7 4,097 68,015 48 0 4,155
3 17.0 3,766 12,833 20 7 589
4 29.9 1,696 16,715 66 66 971
5 24.1 1,498 13,021 0 158 747
6 3.4 3 1,619 0 24 105
All 338.8 42,560 231,988 162 255 12,306
The cost estimates at the distribution level for the individual settle-ments/clusters and districts are given in Appendix 4.B.

National Electrification Master Plan for Lesotho - Final Report
P:\64131A\3_Pdoc\DOC\Final Report\færdige\Final Report October 2007\Final Report\Final Report-october.doc
114
.
9 Economic and Financial Analyses
9.1 Financial Analyses Financial analyses have been applied to the design and costing of the extension of the distribution systems and reinforcement of the transmission system that have been described in the previous chapters.
9.1.1 Assumptions for the Financial Analysis Current Tariff and Connection Fee Table 9-1 shows the average tariff per kWh since 2003, when a plan for tariff transition was formulated and implemented. The transition plan has gradually brought the LEC tariff into line with the cost of services. The table shows that dramatic increases (58% for domestic customers) have taken place since 2003.
The transition plan expired by the end of 2006. New tariffs have been approved from 1 April 2007. For the customer the tariff remains the same;, however, a rural electrification levy (0.01 LSL/kWh) and an LEA customer levy (0.009 LSL/kWh) have been charged. From the perspective of LEC, the tariff de-creased in 2007.
For the purpose of evaluating revenues in the financial and economic analyses, the tariff listed for 2006/07 will be applied in the following.
Table 9-1 Average tariff from 2003 to 2007 (exclusive of. VAT)
Customer Unit 2003 2004 2005 2006 2007 Increase from 2003 to 2007 %
Domestic l/kWh 31.00 36.58 43.00 49.00 49.00 58%
General Purpose l/kWh 48.00 56.64 68.00 68.00 68.00 42%
Commercial LV l/kWh 45.70 50.19 59.37 59.37 59.37 30%
Commercial MV l/kWh 42.13 46.09 54.30 54.30 54.30 29%
Industrial LV l/kWh 42.13 46.09 54.30 54.30 54.30 29%
Industrial MV l/kWh 37.77 42.00 58.77 58.77 58.77 56%

National Electrification Master Plan for Lesotho - Final Report
P:\64131A\3_Pdoc\DOC\Final Report\færdige\Final Report October 2007\Final Report\Final Report-october.doc
115
.
According to LEC's Annual Reports, the average sales price was 45 l/kWh in 2004 and 44 l/kWh in 2005.
The connection fee policy has recently been changed by LEC. In August 2001, the Government of Lesotho approved a connection fee policy where the con-nection fees for 20 and 60 amps were LSL 2 000 and LSL 3 500 LSL, respec-tively. LSL 500 and LSL 2000 were paid for 20 and 60 amps, respectively, at the time of connection and the remainder over 7 years. LEC only supplies 20 and 60 amp connections.
LEC has proposed all customers to pay LSL 2 000 or more, depending on the distance to the grid. LSL 500 is paid up-front and the balance over 24 months. It is also suggested that all new customers be provided with a 60 Amp connec-tion.
In the calculations, it has been assumed that each new household pays an aver-age connection fee of LSL 2 500 up-front.
Current Cost of Power Supply The electricity Purchase Price was known to be 10.5 l/kWh in 2003. Based on LEC accounts for 2004/05, the average cost of supply can be calculated to be 15.8 l/kWh, i.e. the combined cost of purchasing from LHDA and Eskom.
Other Assumptions • Inflation: 5% p.a.;
• Technical losses: 20% until 2010 and then 10%;
• Commercial losses: 3%;
• Operational expenditure 5% of investment;
• LEC Taxation: 25% of net income;
• Discount rate (real): Weighted Average Capital Cost: 14.5% (25% return on equity and 10% p.a. external finance);
• Currency Exchange rate: USD = 7.5 LSL.
The estimation of losses is based on the average between 2004 and 2006 for the first years. After 2010, the current strong tendency to lower global losses is re-flected.
Connections and Sales In this analysis of the financial viability of Scenario 1, it has also been assumed that the built-up (take-up) in the settlement is linear over the next 15 years in order to make the viability analysis uniform and comparable. In the implemen-tation strategy when the final prioritisation has taken place, the up-take will be allocated on an annual basis and on a quarterly basis for the first five years.
National Electrification Master Plan for Lesotho - Final Report
P:\64131A\3_Pdoc\DOC\Final Report\færdige\Final Report October 2007\Final Report\Final Report-october.doc
116
.
In this financial analysis, all settlements have been included, also those with electrification status 4, maybe off-grid, and electrification Class 5, off-grid.
9.1.2 Financial Analysis of each Settlement A calculation of the financial viability of each settlement using the proposed technical measure (densification, grid extension and off-grid) has been calcu-lated. The viability measures include:
• Balance price, i.e. the sales price that will balance the investment and op-erational cost with the revenue over a 15-year period taking the discount rate into consideration;
• NPV over 15 years using the above discount rate of 14.5% p.a.;
• F-IRR has also been calculated using the average prices per tariff as listed in Table 9-1. The F-IRR is measured for the viability of the investment. When F-IRR is larger than the discount rate, the investment is viable and if it is lower, the investment is not viable.
The methodology is using discounted cash flows. The load forecast only fore-cast sales in 2005, 2010, 2015 and 2020. Linear interpolation has been used between these years in order to allocate the sales per year.
9.1.3 Investment Overview Distribution Systems Based on the design and costing for distribution, an overall investment has been estimated for the distribution network systems of USD 339 Mill (LSL 2 543 Mill).
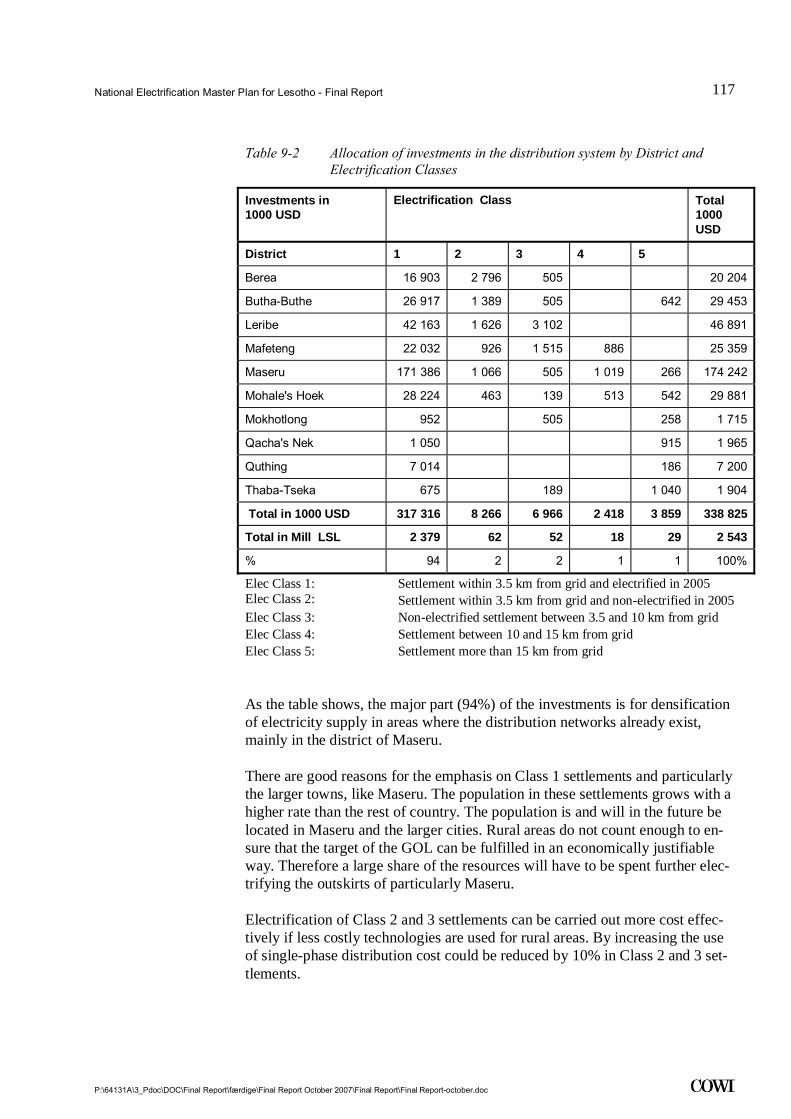
National Electrification Master Plan for Lesotho - Final Report
P:\64131A\3_Pdoc\DOC\Final Report\færdige\Final Report October 2007\Final Report\Final Report-october.doc
117
.
Table 9-2 Allocation of investments in the distribution system by District and Electrification Classes
Investments in 1000 USD
Electrification Class Total 1000 USD
District 1 2 3 4 5
Berea 16 903 2 796 505 20 204
Butha-Buthe 26 917 1 389 505 642 29 453
Leribe 42 163 1 626 3 102 46 891
Mafeteng 22 032 926 1 515 886 25 359
Maseru 171 386 1 066 505 1 019 266 174 242
Mohale's Hoek 28 224 463 139 513 542 29 881
Mokhotlong 952 505 258 1 715
Qacha's Nek 1 050 915 1 965
Quthing 7 014 186 7 200
Thaba-Tseka 675 189 1 040 1 904
Total in 1000 USD 317 316 8 266 6 966 2 418 3 859 338 825
Total in Mill LSL 2 379 62 52 18 29 2 543
% 94 2 2 1 1 100%
Elec Class 1: Settlement within 3.5 km from grid and electrified in 2005 Elec Class 2: Settlement within 3.5 km from grid and non-electrified in 2005 Elec Class 3: Non-electrified settlement between 3.5 and 10 km from grid Elec Class 4: Settlement between 10 and 15 km from grid Elec Class 5: Settlement more than 15 km from grid
As the table shows, the major part (94%) of the investments is for densification of electricity supply in areas where the distribution networks already exist, mainly in the district of Maseru.
There are good reasons for the emphasis on Class 1 settlements and particularly the larger towns, like Maseru. The population in these settlements grows with a higher rate than the rest of country. The population is and will in the future be located in Maseru and the larger cities. Rural areas do not count enough to en-sure that the target of the GOL can be fulfilled in an economically justifiable way. Therefore a large share of the resources will have to be spent further elec-trifying the outskirts of particularly Maseru.
Electrification of Class 2 and 3 settlements can be carried out more cost effec-tively if less costly technologies are used for rural areas. By increasing the use of single-phase distribution cost could be reduced by 10% in Class 2 and 3 set-tlements.
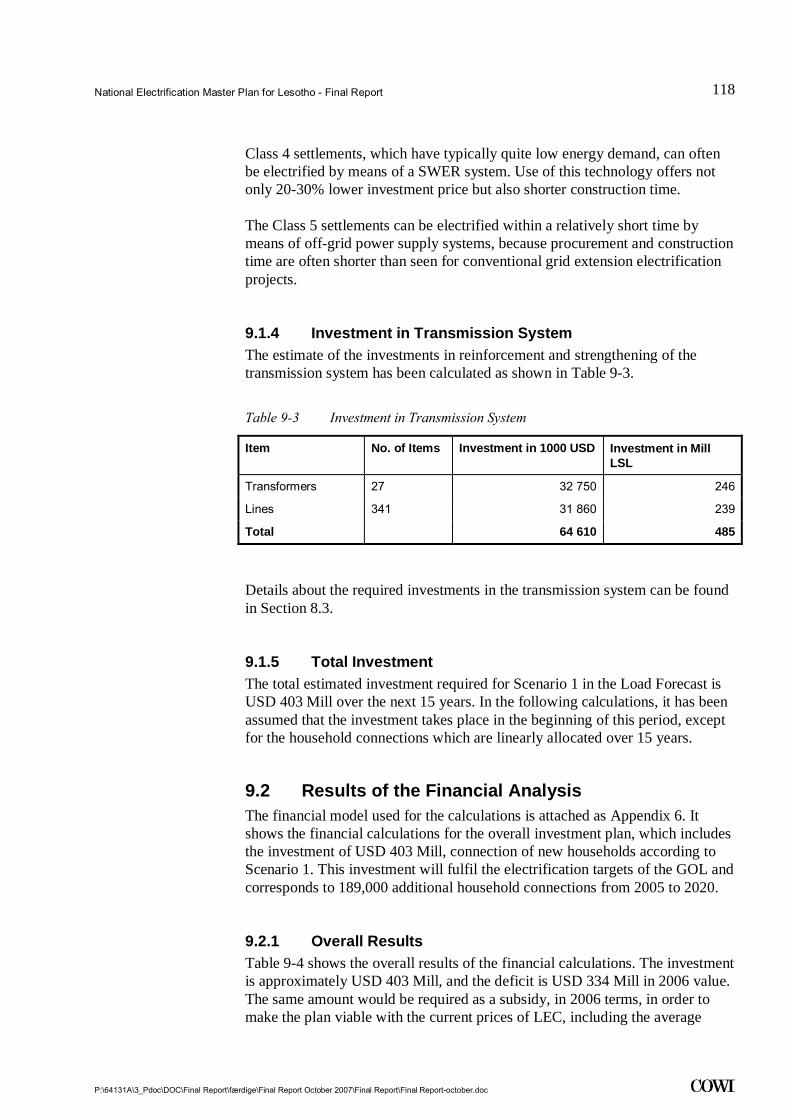
National Electrification Master Plan for Lesotho - Final Report
P:\64131A\3_Pdoc\DOC\Final Report\færdige\Final Report October 2007\Final Report\Final Report-october.doc
118
.
Class 4 settlements, which have typically quite low energy demand, can often be electrified by means of a SWER system. Use of this technology offers not only 20-30% lower investment price but also shorter construction time.
The Class 5 settlements can be electrified within a relatively short time by means of off-grid power supply systems, because procurement and construction time are often shorter than seen for conventional grid extension electrification projects.
9.1.4 Investment in Transmission System The estimate of the investments in reinforcement and strengthening of the transmission system has been calculated as shown in Table 9-3.
Table 9-3 Investment in Transmission System
Item No. of Items Investment in 1000 USD Investment in Mill LSL
Transformers 27 32 750 246
Lines 341 31 860 239
Total 64 610 485
Details about the required investments in the transmission system can be found in Section 8.3.
9.1.5 Total Investment The total estimated investment required for Scenario 1 in the Load Forecast is USD 403 Mill over the next 15 years. In the following calculations, it has been assumed that the investment takes place in the beginning of this period, except for the household connections which are linearly allocated over 15 years.
9.2 Results of the Financial Analysis The financial model used for the calculations is attached as Appendix 6. It shows the financial calculations for the overall investment plan, which includes the investment of USD 403 Mill, connection of new households according to Scenario 1. This investment will fulfil the electrification targets of the GOL and corresponds to 189,000 additional household connections from 2005 to 2020.
9.2.1 Overall Results Table 9-4 shows the overall results of the financial calculations. The investment is approximately USD 403 Mill, and the deficit is USD 334 Mill in 2006 value. The same amount would be required as a subsidy, in 2006 terms, in order to make the plan viable with the current prices of LEC, including the average

National Electrification Master Plan for Lesotho - Final Report
P:\64131A\3_Pdoc\DOC\Final Report\færdige\Final Report October 2007\Final Report\Final Report-october.doc
119
.
connection fee of 2 500 LSL. The value of the connection fee in 2006 terms is USD 25.5 Mill over the said 15 years.
The balance price is 2.29 LSL/kWh, which means that the cost of each kWh is much higher than the revenue generated per kWh with the current power prices, i.e. on average each kWh will have to be supported or prices increased accord-ingly. It is not possible to calculate the IRR, which is below the target of 14.5% p.a.
Table 9-4 Results of financial calculations for Electrification Plan - Scenario 1
Unit Including Transmis-sion Investments of USD 65 Mill
Excluding Transmis-sion Investments of USD 65 Mill
New Households connected No. 189 000 189 000
Investment Mill USD/ Mill LSL 403 / 3 022 339 / 2 543
Net Present Value of the 'project' Mill USD/ Mill LSL -334/-2 505 -259/-1 943
Balance Price LSL/kWh 2.29 1.92
Balance Price USD/kWh 0.305 0.256
IRR % n.a. -9%
Subsidy Requirement LSL/kWh 1.58 1.20
Subsidy Requirement (NPV) Total Mill LSL 2 505 1 943
Value of connection fee (NPV) Mill USD / Mill LSL 25.5 / 191 25.5 / 191
If the investments in the transmission system are disregarded, the overall in-vestment is still far from being viable and requires massive subsidies with the current tariffs and connection fee. In this case, the internal rate of return will be negative (-9%). The balance price drops to 1.92 l/kWh. However, the average subsidy required per kWh is LSL 1.20, based on the average sales price of 0.45 l/kWh.
The financial deficit is the amount lacking in order to finance all cost (invest-ments, operational expenditure, purchase of power, losses, interest and depre-ciations), taking the expected revenue over the next 15 years into consideration. This deficit will need to be financed either by the GOL, the service providers or donor organisations. The scope of financing possibilities will largely determine with what speed the implementation of the plan can proceed.
9.2.2 Results per Settlement A similar calculation has been made for each settlement based on the design principles and costing. The same financial model and the assumptions have been used. However, the investments in the transmission system are not in-cluded, as they are not spatially allocated to the settlements.
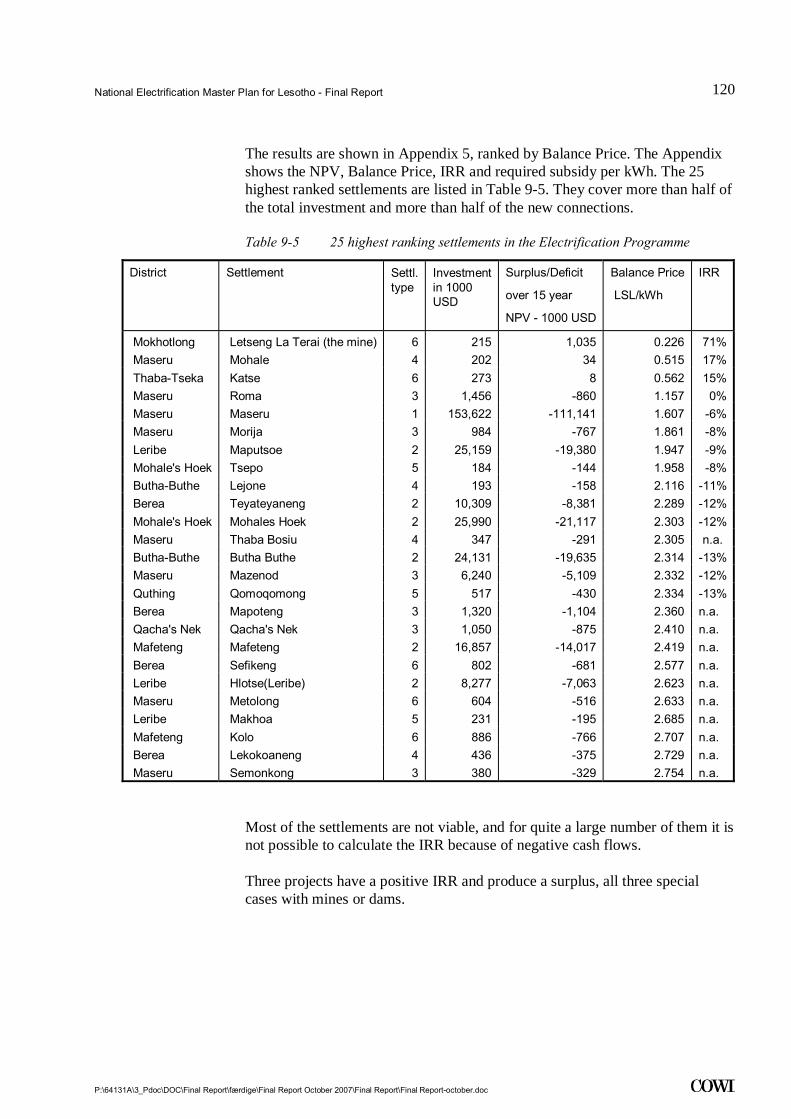
National Electrification Master Plan for Lesotho - Final Report
P:\64131A\3_Pdoc\DOC\Final Report\færdige\Final Report October 2007\Final Report\Final Report-october.doc
120
.
The results are shown in Appendix 5, ranked by Balance Price. The Appendix shows the NPV, Balance Price, IRR and required subsidy per kWh. The 25 highest ranked settlements are listed in Table 9-5. They cover more than half of the total investment and more than half of the new connections.
Table 9-5 25 highest ranking settlements in the Electrification Programme
District Settlement Settl. type
Investment in 1000 USD
Surplus/Deficit
over 15 year
NPV - 1000 USD
Balance Price
LSL/kWh
IRR
Mokhotlong Letseng La Terai (the mine) 6 215 1,035 0.226 71% Maseru Mohale 4 202 34 0.515 17% Thaba-Tseka Katse 6 273 8 0.562 15% Maseru Roma 3 1,456 -860 1.157 0% Maseru Maseru 1 153,622 -111,141 1.607 -6% Maseru Morija 3 984 -767 1.861 -8% Leribe Maputsoe 2 25,159 -19,380 1.947 -9% Mohale's Hoek Tsepo 5 184 -144 1.958 -8% Butha-Buthe Lejone 4 193 -158 2.116 -11% Berea Teyateyaneng 2 10,309 -8,381 2.289 -12% Mohale's Hoek Mohales Hoek 2 25,990 -21,117 2.303 -12% Maseru Thaba Bosiu 4 347 -291 2.305 n.a. Butha-Buthe Butha Buthe 2 24,131 -19,635 2.314 -13% Maseru Mazenod 3 6,240 -5,109 2.332 -12% Quthing Qomoqomong 5 517 -430 2.334 -13% Berea Mapoteng 3 1,320 -1,104 2.360 n.a. Qacha's Nek Qacha's Nek 3 1,050 -875 2.410 n.a. Mafeteng Mafeteng 2 16,857 -14,017 2.419 n.a. Berea Sefikeng 6 802 -681 2.577 n.a. Leribe Hlotse(Leribe) 2 8,277 -7,063 2.623 n.a. Maseru Metolong 6 604 -516 2.633 n.a. Leribe Makhoa 5 231 -195 2.685 n.a. Mafeteng Kolo 6 886 -766 2.707 n.a. Berea Lekokoaneng 4 436 -375 2.729 n.a. Maseru Semonkong 3 380 -329 2.754 n.a.
Most of the settlements are not viable, and for quite a large number of them it is not possible to calculate the IRR because of negative cash flows.
Three projects have a positive IRR and produce a surplus, all three special cases with mines or dams.
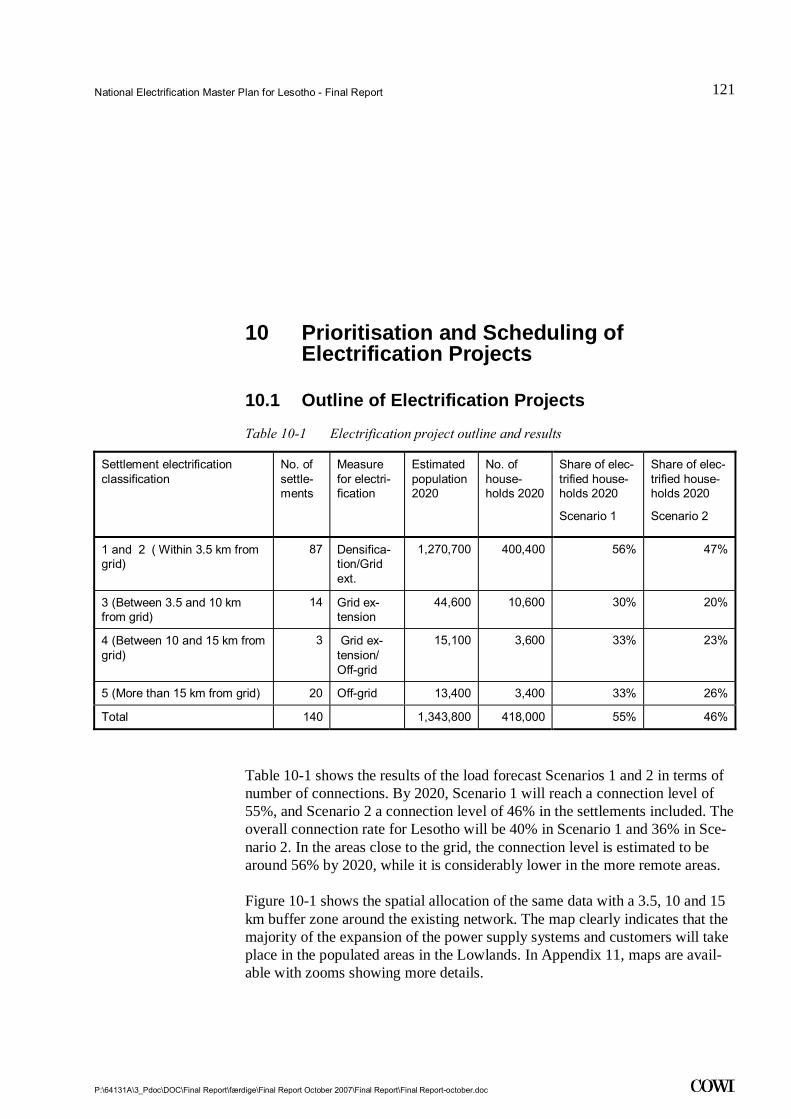
National Electrification Master Plan for Lesotho - Final Report
P:\64131A\3_Pdoc\DOC\Final Report\færdige\Final Report October 2007\Final Report\Final Report-october.doc
121
.
10 Prioritisation and Scheduling of Electrification Projects
10.1 Outline of Electrification Projects
Table 10-1 Electrification project outline and results
Settlement electrification classification
No. of settle-ments
Measure for electri-fication
Estimated population 2020
No. of house-holds 2020
Share of elec-trified house-holds 2020
Scenario 1
Share of elec-trified house-holds 2020
Scenario 2
1 and 2 ( Within 3.5 km from grid)
87 Densifica-tion/Grid ext.
1,270,700 400,400 56% 47%
3 (Between 3.5 and 10 km from grid)
14 Grid ex-tension
44,600 10,600 30% 20%
4 (Between 10 and 15 km from grid)
3 Grid ex-tension/ Off-grid
15,100 3,600 33% 23%
5 (More than 15 km from grid) 20 Off-grid 13,400 3,400 33% 26%
Total 140 1,343,800 418,000 55% 46%
Table 10-1 shows the results of the load forecast Scenarios 1 and 2 in terms of number of connections. By 2020, Scenario 1 will reach a connection level of 55%, and Scenario 2 a connection level of 46% in the settlements included. The overall connection rate for Lesotho will be 40% in Scenario 1 and 36% in Sce-nario 2. In the areas close to the grid, the connection level is estimated to be around 56% by 2020, while it is considerably lower in the more remote areas.
Figure 10-1 shows the spatial allocation of the same data with a 3.5, 10 and 15 km buffer zone around the existing network. The map clearly indicates that the majority of the expansion of the power supply systems and customers will take place in the populated areas in the Lowlands. In Appendix 11, maps are avail-able with zooms showing more details.

National Electrification Master Plan for Lesotho - Final Report
P:\64131A\3_Pdoc\DOC\Final Report\færdige\Final Report October 2007\Final Report\Final Report-october.doc
122
.
Figure 10-1 Electrification expansion opportunities in Lesotho
10.2 Ranking of Settlements by Viability During the early stages of the project it was agreed that the general viability of the areas where the settlements are located should be an important parameter in the ranking. A viability score has been calculated based on a number of socio-economic factors, such as household income, employment opportunities, num-ber of schools, hospitals, already existing infrastructure and population density. It should be noted that the calculated score is based on the previous 60 con-stituencies. In November 2004, the constituency borders were redefined, and currently there are 80 constituencies.
The general viability is an important parameter for the success of the electrifi-cation. The higher the general income and employment level, the higher the chances of high connection rates and higher electricity consumption – both these factors will enhance the financial viability of the electrification projects.
The map in Figure 10-2 shows the viability at the constituency level and how it relates to the current network. The viability reflects to a very large extent the population density in the constituencies.
The 140 settlements in this analysis have been sorted by the viability score as-sociated with the constituency in which they are located. The result is shown in Appendix 5.
This prioritisation reflects that the constituencies harbouring the major towns and population centres should be targeted in the electrification process and that

National Electrification Master Plan for Lesotho - Final Report
P:\64131A\3_Pdoc\DOC\Final Report\færdige\Final Report October 2007\Final Report\Final Report-october.doc
123
.
the first priority in electrification must be higher electrification up-take rates in the areas where the distribution network is already in place.
Figure 10-2 Viability at the constituency level
10.3 Outline of Settlements included in the Plan for the First Five Years
Table 10-2 shows the list of settlements having the highest viability ranking combined with the highest financial return. The table shows estimated invest-ment and estimated number of household connections in the first 5 years.
The investment in the priority areas is nearly USD 100 Mill during the first 5 years and USD 176 Mill during the following 15 years in the 23 listed settle-ments.
Table 10-2 shows a breakdown of the investment for the first 5 years by electri-fication class and the number of new customers in the first 5 years. The total number of connected households during the first five years is nearly 58,000.
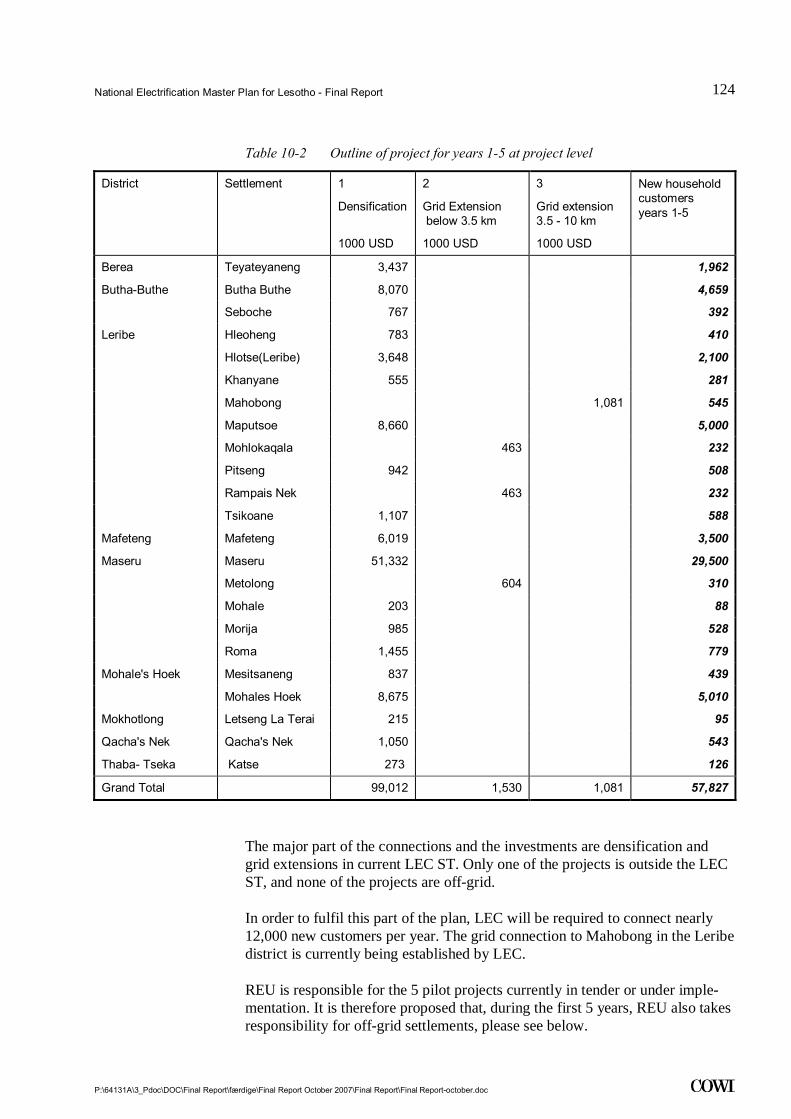
National Electrification Master Plan for Lesotho - Final Report
P:\64131A\3_Pdoc\DOC\Final Report\færdige\Final Report October 2007\Final Report\Final Report-october.doc
124
.
Table 10-2 Outline of project for years 1-5 at project level
District Settlement 1
Densification
1000 USD
2
Grid Extension below 3.5 km
1000 USD
3
Grid extension 3.5 - 10 km
1000 USD
New household customers years 1-5
Berea Teyateyaneng 3,437 1,962
Butha-Buthe Butha Buthe 8,070 4,659
Seboche 767 392
Leribe Hleoheng 783 410
Hlotse(Leribe) 3,648 2,100
Khanyane 555 281
Mahobong 1,081 545
Maputsoe 8,660 5,000
Mohlokaqala 463 232
Pitseng 942 508
Rampais Nek 463 232
Tsikoane 1,107 588
Mafeteng Mafeteng 6,019 3,500
Maseru Maseru 51,332 29,500
Metolong 604 310
Mohale 203 88
Morija 985 528
Roma 1,455 779
Mohale's Hoek Mesitsaneng 837 439
Mohales Hoek 8,675 5,010
Mokhotlong Letseng La Terai 215 95
Qacha's Nek Qacha's Nek 1,050 543
Thaba- Tseka Katse 273 126
Grand Total 99,012 1,530 1,081 57,827
The major part of the connections and the investments are densification and grid extensions in current LEC ST. Only one of the projects is outside the LEC ST, and none of the projects are off-grid.
In order to fulfil this part of the plan, LEC will be required to connect nearly 12,000 new customers per year. The grid connection to Mahobong in the Leribe district is currently being established by LEC.
REU is responsible for the 5 pilot projects currently in tender or under imple-mentation. It is therefore proposed that, during the first 5 years, REU also takes responsibility for off-grid settlements, please see below.

National Electrification Master Plan for Lesotho - Final Report
P:\64131A\3_Pdoc\DOC\Final Report\færdige\Final Report October 2007\Final Report\Final Report-october.doc
125
.
10.3.1 Detailed Time Schedule for Grid-supplied Settlements Years 1 - 5
In order to fulfil the requirement for establishing 57,827 new customer connec-tions within a 5-year period, LEC shall prepare a detailed plan for implementa-tion of a number of activities to obtain a successful result.
In order to initialise the implementation process, the following initial activities shall be carried out:
• Detailed survey of the chosen new electrification areas for potential new customers including a preliminary tender design of the system reinforce-ment works as well as definition of new customers;
• Preparation of tender documents for the works to be carried out;
• Agreement on tendering and contracting procedures.
These initial activities have to be carried out as soon as possible after the re-sponsible authority has committed itself to implement the electrification proc-ess.
A general time schedule for initialisation of a typical project is present in the table below:
Table 10-3 Initialisation of electrification activities
Activity Time
Awareness campaign and registration of new consumers 1 month
Tender design of the works to be carried out 1 month
Preparation of commercial Tender Documents 1 month
Tender period 2 months
Preparation of contract documents and obtaining of approvals 1 month
Total time for initialising of the new electrification works 6 months
In order to speed up the initial process, it is recommended to:
• combine electrification works into large project packages;
• consider making one or two packages covering the supply of materials, in order to obtain lower material costs and unify materials to be used during the construction works.
The outline time schedule for implementation of the new connections during the first 5-year period is shown in Figure 10-3 below.
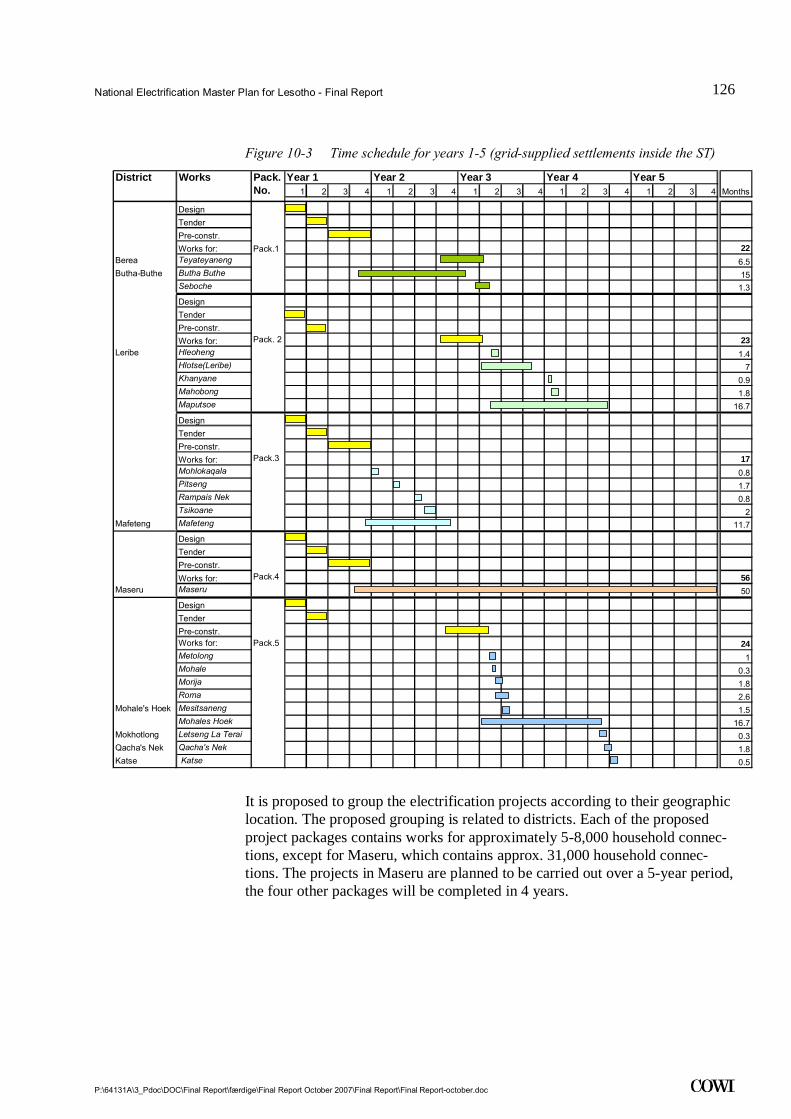
National Electrification Master Plan for Lesotho - Final Report
P:\64131A\3_Pdoc\DOC\Final Report\færdige\Final Report October 2007\Final Report\Final Report-october.doc
126
.
Figure 10-3 Time schedule for years 1-5 (grid-supplied settlements inside the ST)
District Works Pack. Year 1 Year 2 Year 3 Year 4 Year 5No. 1 2 3 4 1 2 3 4 1 2 3 4 1 2 3 4 1 2 3 4 Months
DesignTenderPre-constr.Works for: Pack.1 22
Berea Teyateyaneng 6.5Butha-Buthe Butha Buthe 15
Seboche 1.3DesignTenderPre-constr.Works for: Pack. 2 23
Leribe Hleoheng 1.4Hlotse(Leribe) 7Khanyane 0.9Mahobong 1.8Maputsoe 16.7DesignTenderPre-constr.Works for: Pack.3 17Mohlokaqala 0.8Pitseng 1.7Rampais Nek 0.8Tsikoane 2
Mafeteng Mafeteng 11.7DesignTenderPre-constr.Works for: Pack.4 56
Maseru Maseru 50DesignTenderPre-constr.Works for: Pack.5 24Metolong 1Mohale 0.3Morija 1.8Roma 2.6
Mohale's Hoek Mesitsaneng 1.5Mohales Hoek 16.7
Mokhotlong Letseng La Terai 0.3Qacha's Nek Qacha's Nek 1.8Katse Katse 0.5
It is proposed to group the electrification projects according to their geographic location. The proposed grouping is related to districts. Each of the proposed project packages contains works for approximately 5-8,000 household connec-tions, except for Maseru, which contains approx. 31,000 household connec-tions. The projects in Maseru are planned to be carried out over a 5-year period, the four other packages will be completed in 4 years.
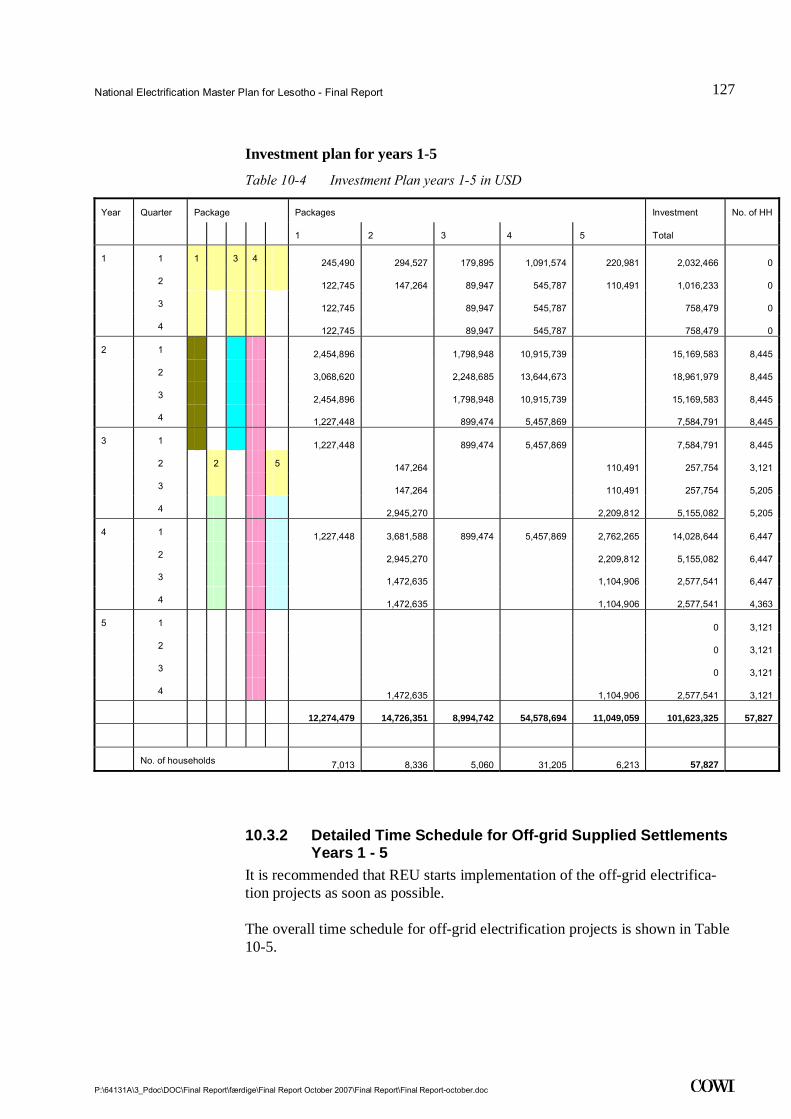
National Electrification Master Plan for Lesotho - Final Report
P:\64131A\3_Pdoc\DOC\Final Report\færdige\Final Report October 2007\Final Report\Final Report-october.doc
127
.
Investment plan for years 1-5
Table 10-4 Investment Plan years 1-5 in USD
Year Quarter Package Packages Investment No. of HH
1 2 3 4 5 Total
1 1 1 3 4 245,490 294,527 179,895 1,091,574 220,981 2,032,466 0
2 122,745 147,264 89,947 545,787 110,491 1,016,233 0
3 122,745 89,947 545,787 758,479 0
4 122,745 89,947 545,787 758,479 0
2 1 2,454,896 1,798,948 10,915,739 15,169,583 8,445
2 3,068,620 2,248,685 13,644,673 18,961,979 8,445
3 2,454,896 1,798,948 10,915,739 15,169,583 8,445
4 1,227,448 899,474 5,457,869 7,584,791 8,445
3 1 1,227,448 899,474 5,457,869 7,584,791 8,445
2 2 5 147,264 110,491 257,754 3,121
3 147,264 110,491 257,754 5,205
4 2,945,270 2,209,812 5,155,082 5,205
4 1 1,227,448 3,681,588 899,474 5,457,869 2,762,265 14,028,644 6,447
2 2,945,270 2,209,812 5,155,082 6,447
3 1,472,635 1,104,906 2,577,541 6,447
4 1,472,635 1,104,906 2,577,541 4,363
5 1 0 3,121
2 0 3,121
3 0 3,121
4 1,472,635 1,104,906 2,577,541 3,121
12,274,479 14,726,351 8,994,742 54,578,694 11,049,059 101,623,325 57,827
No. of households 7,013 8,336 5,060 31,205 6,213 57,827
10.3.2 Detailed Time Schedule for Off-grid Supplied Settlements Years 1 - 5
It is recommended that REU starts implementation of the off-grid electrifica-tion projects as soon as possible.
The overall time schedule for off-grid electrification projects is shown in Table 10-5.

National Electrification Master Plan for Lesotho - Final Report
P:\64131A\3_Pdoc\DOC\Final Report\færdige\Final Report October 2007\Final Report\Final Report-october.doc
128
.
Table 10-5 Overall Implementation Schedule for off-grid supply projects in USD
Num-ber of HH
Invest. in 1000 USD
District
Planned Off-Grid supplied HH connection in period (Year 1-5)
YEAR
1 2 3 4 5
Butha-Buthe 215 643 100 115
Maseru 50 266 50
Mohale's Hoek 147 542 47 100
Mokhotlong 50 259 50
Qacha's Neck 347 916 200 147
Quthing 52 186 52
Thaba-Tseka 287 1,040 100 187
TOTAL 1,131 3,853 150 212 352 247 187
Yearly Investment 506,860 716,361 1,189,430 810,369 629,743
It is assumed that International Competitive Bidding (ICB) will be required to recruit external consultants and that the preparation of initial design and tender documents will be carried out by the selected consultant(s).
It is recommended to purchase materials for 2-3 projects in a separate ICB process in order to obtain lower prices and avoid delays related to late arrival of materials to the site.
It is also assumed that the materials will available at a central store, preferably 5-6 months before the construction time.
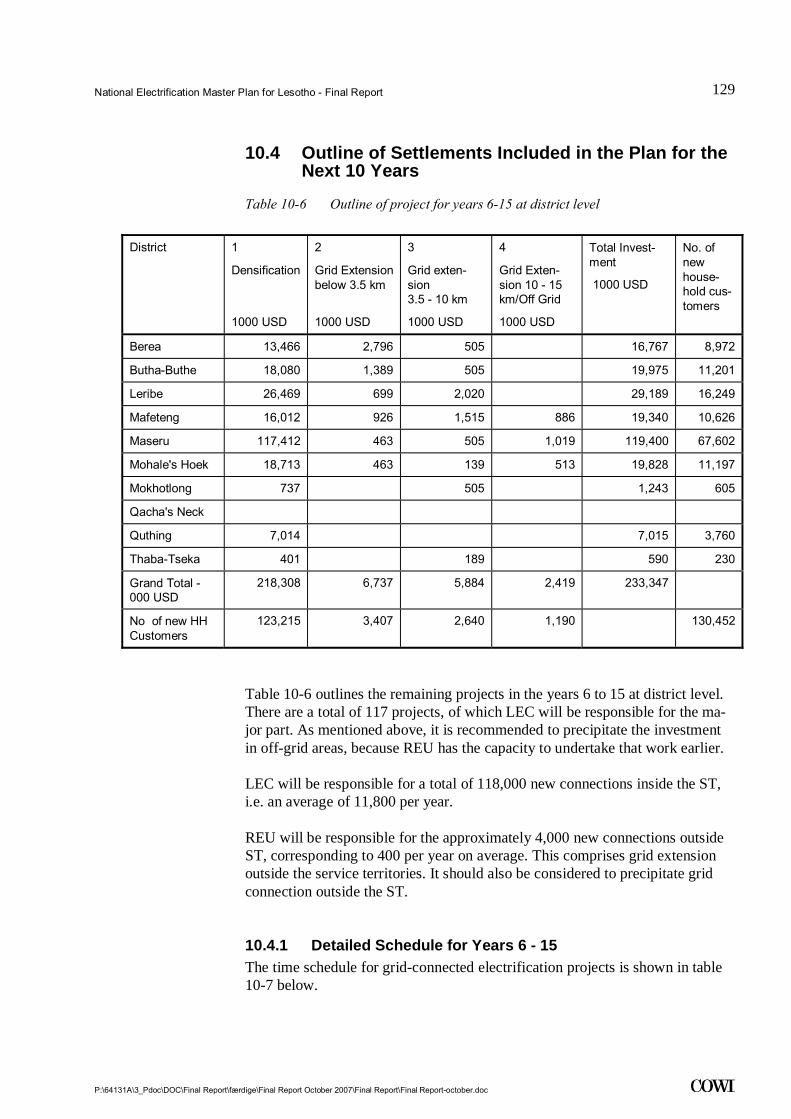
National Electrification Master Plan for Lesotho - Final Report
P:\64131A\3_Pdoc\DOC\Final Report\færdige\Final Report October 2007\Final Report\Final Report-october.doc
129
.
10.4 Outline of Settlements Included in the Plan for the Next 10 Years
Table 10-6 Outline of project for years 6-15 at district level
Table 10-6 outlines the remaining projects in the years 6 to 15 at district level. There are a total of 117 projects, of which LEC will be responsible for the ma-jor part. As mentioned above, it is recommended to precipitate the investment in off-grid areas, because REU has the capacity to undertake that work earlier.
LEC will be responsible for a total of 118,000 new connections inside the ST, i.e. an average of 11,800 per year.
REU will be responsible for the approximately 4,000 new connections outside ST, corresponding to 400 per year on average. This comprises grid extension outside the service territories. It should also be considered to precipitate grid connection outside the ST.
10.4.1 Detailed Schedule for Years 6 - 15 The time schedule for grid-connected electrification projects is shown in table 10-7 below.
District 1
Densification
1000 USD
2
Grid Extensionbelow 3.5 km
1000 USD
3
Grid exten-sion 3.5 - 10 km
1000 USD
4
Grid Exten-sion 10 - 15 km/Off Grid
1000 USD
Total Invest-ment
1000 USD
No. of new house-hold cus-tomers
Berea 13,466 2,796 505 16,767 8,972
Butha-Buthe 18,080 1,389 505 19,975 11,201
Leribe 26,469 699 2,020 29,189 16,249
Mafeteng 16,012 926 1,515 886 19,340 10,626
Maseru 117,412 463 505 1,019 119,400 67,602
Mohale's Hoek 18,713 463 139 513 19,828 11,197
Mokhotlong 737 505 1,243 605
Qacha's Neck
Quthing 7,014 7,015 3,760
Thaba-Tseka 401 189 590 230
Grand Total - 000 USD
218,308 6,737 5,884 2,419 233,347
No of new HH Customers
123,215 3,407 2,640 1,190 130,452
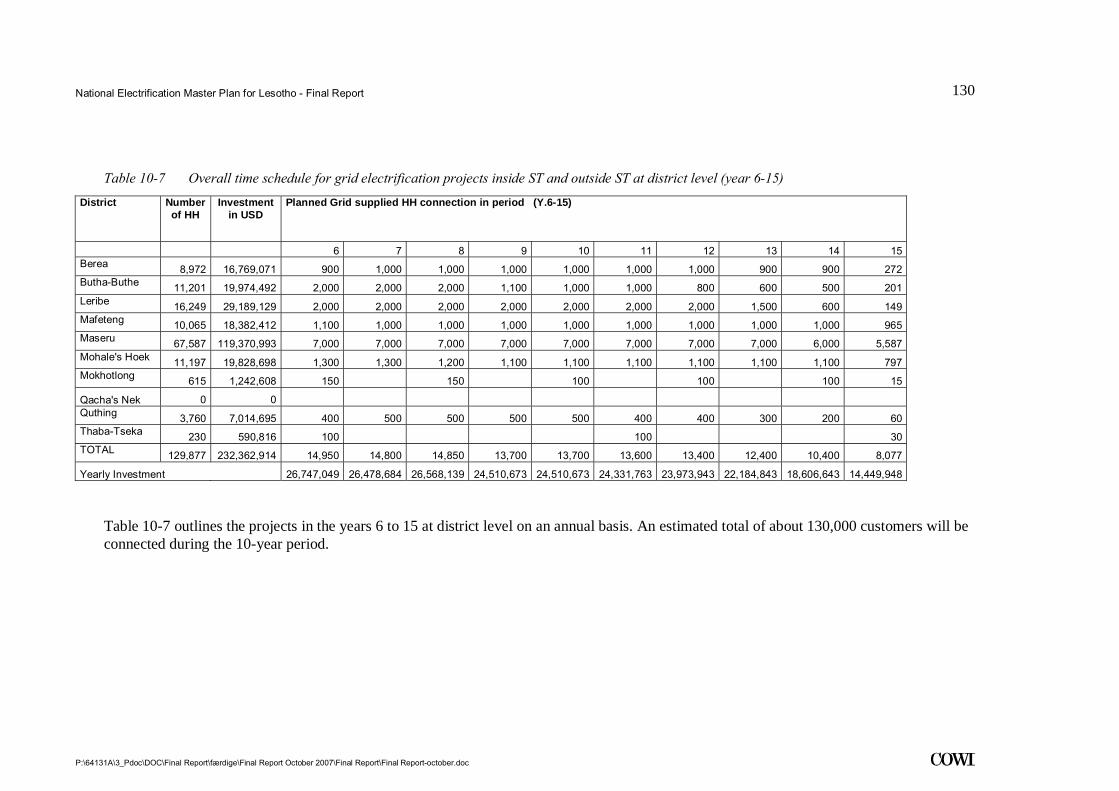
National Electrification Master Plan for Lesotho - Final Report
P:\64131A\3_Pdoc\DOC\Final Report\færdige\Final Report October 2007\Final Report\Final Report-october.doc
130
.
Table 10-7 Overall time schedule for grid electrification projects inside ST and outside ST at district level (year 6-15)
District Number of HH
Investment in USD
Planned Grid supplied HH connection in period (Y.6-15)
6 7 8 9 10 11 12 13 14 15Berea 8,972 16,769,071 900 1,000 1,000 1,000 1,000 1,000 1,000 900 900 272Butha-Buthe 11,201 19,974,492 2,000 2,000 2,000 1,100 1,000 1,000 800 600 500 201Leribe 16,249 29,189,129 2,000 2,000 2,000 2,000 2,000 2,000 2,000 1,500 600 149Mafeteng 10,065 18,382,412 1,100 1,000 1,000 1,000 1,000 1,000 1,000 1,000 1,000 965Maseru 67,587 119,370,993 7,000 7,000 7,000 7,000 7,000 7,000 7,000 7,000 6,000 5,587Mohale's Hoek 11,197 19,828,698 1,300 1,300 1,200 1,100 1,100 1,100 1,100 1,100 1,100 797Mokhotlong 615 1,242,608 150 150 100 100 100 15
Qacha's Nek 0 0 Quthing 3,760 7,014,695 400 500 500 500 500 400 400 300 200 60Thaba-Tseka 230 590,816 100 100 30TOTAL 129,877 232,362,914 14,950 14,800 14,850 13,700 13,700 13,600 13,400 12,400 10,400 8,077
Yearly Investment 26,747,049 26,478,684 26,568,139 24,510,673 24,510,673 24,331,763 23,973,943 22,184,843 18,606,643 14,449,948
Table 10-7 outlines the projects in the years 6 to 15 at district level on an annual basis. An estimated total of about 130,000 customers will be connected during the 10-year period.
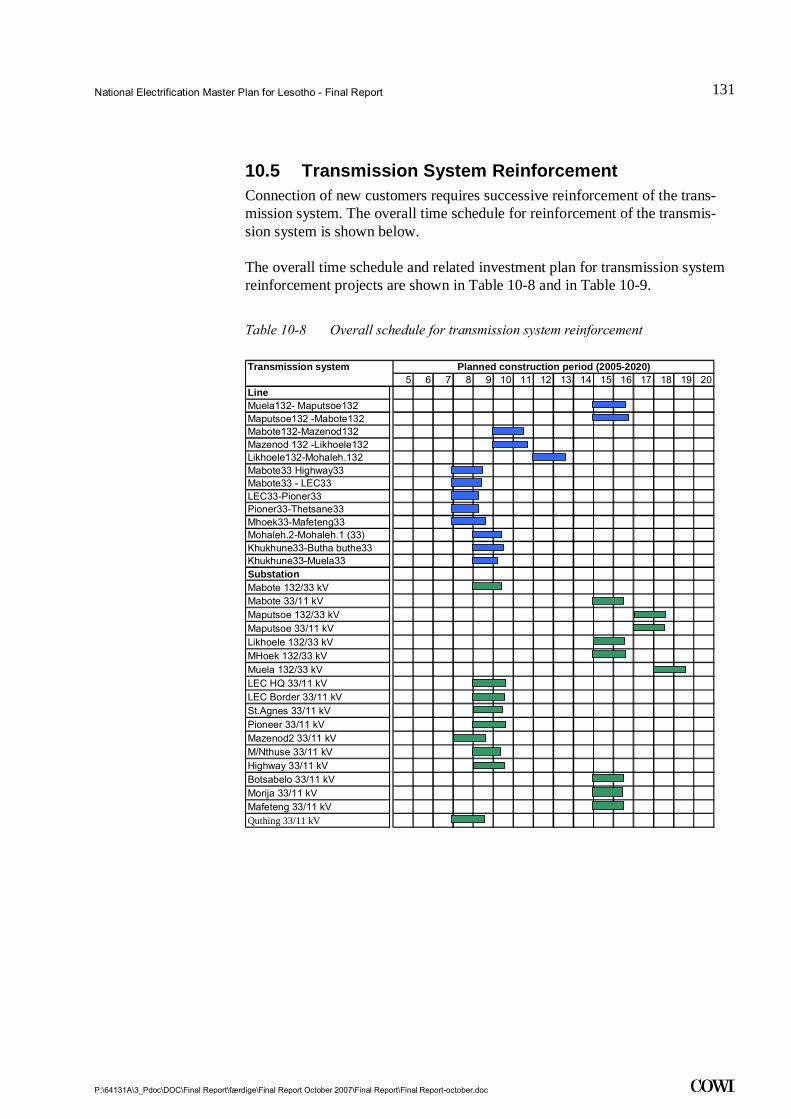
National Electrification Master Plan for Lesotho - Final Report
P:\64131A\3_Pdoc\DOC\Final Report\færdige\Final Report October 2007\Final Report\Final Report-october.doc
131
.
10.5 Transmission System Reinforcement Connection of new customers requires successive reinforcement of the trans-mission system. The overall time schedule for reinforcement of the transmis-sion system is shown below.
The overall time schedule and related investment plan for transmission system reinforcement projects are shown in Table 10-8 and in Table 10-9.
Table 10-8 Overall schedule for transmission system reinforcement
Transmission system5 6 7 8 9 10 11 12 13 14 15 16 17 18 19 20
LineMuela132- Maputsoe132Maputsoe132 -Mabote132Mabote132-Mazenod132Mazenod 132 -Likhoele132Likhoele132-Mohaleh.132Mabote33 Highway33Mabote33 - LEC33LEC33-Pioner33Pioner33-Thetsane33Mhoek33-Mafeteng33Mohaleh.2-Mohaleh.1 (33)Khukhune33-Butha buthe33Khukhune33-Muela33SubstationMabote 132/33 kVMabote 33/11 kVMaputsoe 132/33 kVMaputsoe 33/11 kVLikhoele 132/33 kVMHoek 132/33 kV Muela 132/33 kVLEC HQ 33/11 kVLEC Border 33/11 kVSt.Agnes 33/11 kVPioneer 33/11 kVMazenod2 33/11 kVM/Nthuse 33/11 kVHighway 33/11 kV Botsabelo 33/11 kVMorija 33/11 kVMafeteng 33/11 kV Quthing 33/11 kV
Planned construction period (2005-2020)
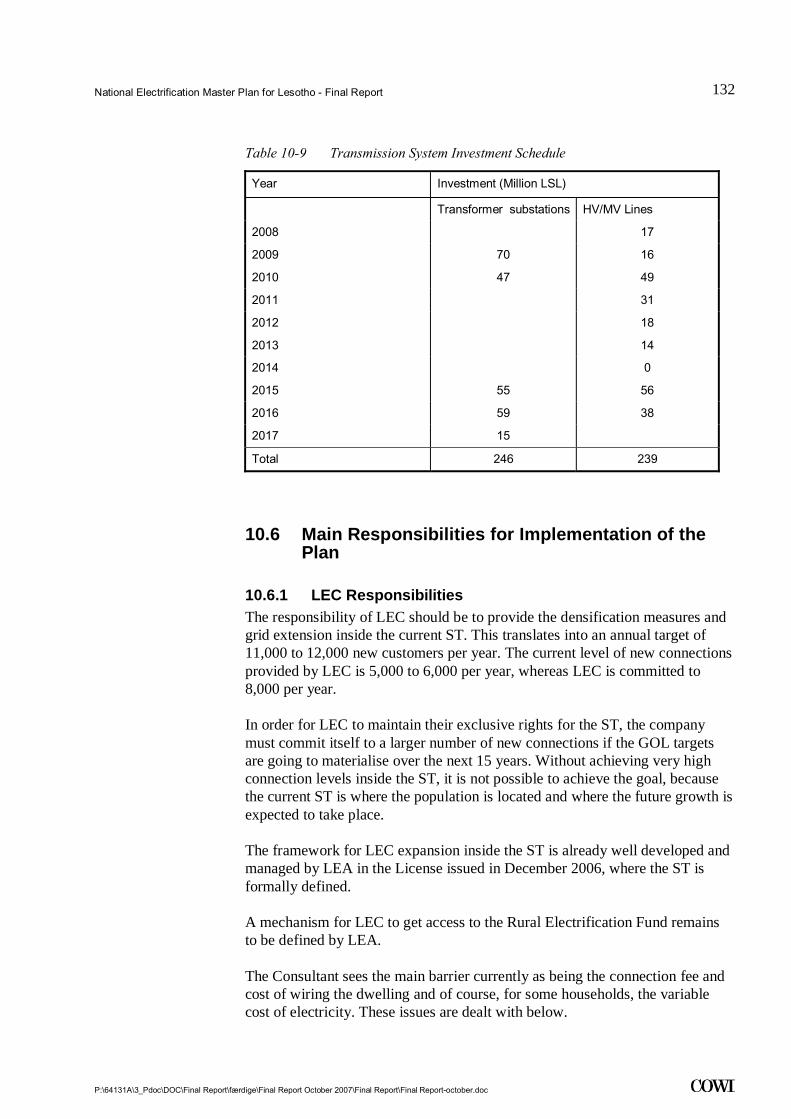
National Electrification Master Plan for Lesotho - Final Report
P:\64131A\3_Pdoc\DOC\Final Report\færdige\Final Report October 2007\Final Report\Final Report-october.doc
132
.
Table 10-9 Transmission System Investment Schedule
Year Investment (Million LSL)
Transformer substations HV/MV Lines
2008 17
2009 70 16
2010 47 49
2011 31
2012 18
2013 14
2014 0
2015 55 56
2016 59 38
2017 15
Total 246 239
10.6 Main Responsibilities for Implementation of the Plan
10.6.1 LEC Responsibilities The responsibility of LEC should be to provide the densification measures and grid extension inside the current ST. This translates into an annual target of 11,000 to 12,000 new customers per year. The current level of new connections provided by LEC is 5,000 to 6,000 per year, whereas LEC is committed to 8,000 per year.
In order for LEC to maintain their exclusive rights for the ST, the company must commit itself to a larger number of new connections if the GOL targets are going to materialise over the next 15 years. Without achieving very high connection levels inside the ST, it is not possible to achieve the goal, because the current ST is where the population is located and where the future growth is expected to take place.
The framework for LEC expansion inside the ST is already well developed and managed by LEA in the License issued in December 2006, where the ST is formally defined.
A mechanism for LEC to get access to the Rural Electrification Fund remains to be defined by LEA.
The Consultant sees the main barrier currently as being the connection fee and cost of wiring the dwelling and of course, for some households, the variable cost of electricity. These issues are dealt with below.
National Electrification Master Plan for Lesotho - Final Report
P:\64131A\3_Pdoc\DOC\Final Report\færdige\Final Report October 2007\Final Report\Final Report-october.doc
133
.
The only alternative to impose a very high commitment on LEC will be to rede-fine the ST, but that might have adverse impacts on the financial position of LEC in the longer term.
10.6.2 REU/DOE Responsibilities for the Implementation Plan REU will be responsible for grid extension outside the LEC ST and off-grid parts of the plan. The responsibility of REU, in terms of number of connec-tions, will be relatively small, but can be increased by taking on a number of small projects not identified in this report.
REU will implement two types of projects: grid extension beyond 3.5 km and off-grid. The operational mode will be tendering of construction and implemen-tation of project and administration of subsidies to the project where required, i.e. corresponding to the current responsibilities of REU.
It is recommended to precipitate the off-grid settlements and possibly also the grid extension outside ST to the first 5 years of the implementation plan.
For the grid extension projects, an interface with LEC has to be defined. A mechanism for works inside the ST with the aim of extending lines to REU projects has to be defined. Should REU or LEC select the contractors? An ef-fective mechanism could be that REU uses LEC as contractors, i.e. enters into binding agreement with LEC about the works to be made and LEC selects the contractors.
Power Purchase Agreements (PPA) and points of metering have to be consid-ered in the case of grid extension projects. Should LEC conditions prevail, or should a mechanism allowing the service operator to conclude PPA's with LEC and sell the power on his own conditions to the households and other custom-ers? One option is that the operators/REU goes into contractual relationships with LEC on a case-to-case basis and LEA in each case approves the PPA. An-other option would be that LEC defines tariffs for bulk supply, which are regu-lated by LEA. Finally, there are also the options that LEC defines tariffs for transportation and supplies at various voltage levels, again regulated by LEA. The main issue being that it is important that the regulation ensures a stable and lasting set of agreements, which is secure and transparent for the opera-tor/investor.
REU should also administer applications from villages that, based on their own initiative, have provided a basis for grid extension or off-grid supply. For in-stance in cases where the CCA or other local operators have made the prepara-tions for electrification of one of more areas, but a subsidy is required. This function is a parallel to the LEC schemes outside ST, and specific procedures to handle such applications by REU will need to be produced and agreed on.
Further, it could be considered that REU is responsible for supplying individual solutions, i.e. SPV/Diesel, inside ST. In the next 10 years, there will still be many villages/settlements left without grid supply, and it makes sense to make an authority responsible for the existence of credible alternatives for these

National Electrification Master Plan for Lesotho - Final Report
P:\64131A\3_Pdoc\DOC\Final Report\færdige\Final Report October 2007\Final Report\Final Report-october.doc
134
.
households until the grid is extended. The role of REU should be to support private operators with information of the areas in question and ensure (in co-operation with LEA) monitoring of the market and that quality solutions are provided.
10.6.3 Private Sector The most important contribution from the private sector will be to establish the required capacity to extend the networks and connect new customers. The cur-rent contractor / consultant capacity is 3 to 4 contractors with limited capacity. Additionally, LEC has limited capacity internally. The overall capacity needs to be increased significantly in the short term by using foreign contractors and in the longer term by education and training of Basotho technicians and engineers. The private sector could also be contributing as local service providers.
One way of increasing capacity and keeping the benefits inside Lesotho is to select Basotho consultants and contractors. The problem in Lesotho is that there are only few local consultants and few contractors; there is also a lack of finan-cial and project management capacity to undertake large electrification projects. It is important that the Basotho private sector is strengthened in terms of num-bers of staff/companies and capacity. Expansion of the private sector will re-quire that the brain drain currently taking place is reduced and that profession-als, who have already left, return to the country. In the longer term, the scope of maintenance work on electrical supply systems will increase quickly and LEC will also require external capacity to cope with the up-keeping. In the future, the room for private sector will increase dramatically and strategies to ensure that the local private sector is able to assist and benefit from this development are necessary.
Currently ICB therefore disadvantage the local expertise for the above reasons. Experience shows that external contractors/consultants may yield expected re-sults, but the method is not effective for transfer of skills. A national strategy to capacitate the local business community should be developed. Adoption of partnership models will result in effective capacity building in the Basotho community. Partnerships between Basotho and foreign companies should be encouraged, and a high weight should be given to partnerships with a majority of Basotho ownership in the tender evaluation criteria.
It is highly desirable that the design of new extensions and supply systems are made by local consultants. In order to ensure that the projects are implemented, a mixture of ICB and LCB is recommended in the actual implementation. Tar-gets and indicators for Basotho participation should be developed and moni-tored. We would recommend 80% of the design to be allocated to Basotho con-sultants and a mix of ICB and LCB to be used in contracting the actual imple-mentation in accordance with the new Lesotho procurement policy.
In order to make the implementation projects attractive to a variety of contrac-tors, a combination of smaller projects targeting a single village and larger pro-jects with multiple villages/cluster should be used. This approach will make them attractive and optimise the implementation.

National Electrification Master Plan for Lesotho - Final Report
P:\64131A\3_Pdoc\DOC\Final Report\færdige\Final Report October 2007\Final Report\Final Report-october.doc
135
.
10.7 Connection Fee and Tariff
10.7.1 Connection Fee An important precondition for the success of the National Electrification Mas-ter Plan is the implementation of measures that will ensure that the connection levels are increased in the future. Therefore, a short discussion of the purpose of requiring an up-front payment from new customers before connection is pre-sented below.
The connection fee claimed by LEC is cost based, i.e. a new customer should cover the costs associated with his connection. However, it is an ambiguous issue what costs are associated with one additional customer. How long up-stream in the supply system should costs be identified? The cost calculation covers at least service connection and meter and some administrative fees, even in cases where the costs are much higher.
The connection fee should not necessarily cover the actual cost of connecting a new customer. The interest of the power distributor is to safeguard the long-term revenue stream, not the short-term revenue stream, i.e. to cover his short-term cost of the new connection.
By paying a connection charge, a consumer demonstrates his willingness to receive and utilise the service. A connection fee should be fixed accordingly, i.e. it ensures that the new customer is serious and capable of consum-ing/paying for his electricity consumption.
In all distribution systems it is an advantage, also for existing customers, to maximise the connection level and usage of the system, i.e. the tariff will de-crease to the benefit of all customers.
LEC's practise of charging >2 000 LSL for a new connection is a barrier for households to connect; this is a clear conclusion in several surveys. LEC re-quires an upfront payment of 500 LSL and the remaining over a period of 24 months over the electricity bill. The credit period is rather short and should be extended to between 5 and 10 years, or even better, the cost of connecting new customers could be allocated in the kWh price.
The Consultant would recommend connection fees at the level of 500 LSL or lower, as indicated by the result of the PSIA study. However, the only way to find the correct level is to make some experiments with different systems and collect experience.
10.7.2 Tariff and Collection The current method for setting tariffs is based on LRMC, and tariffs are cost-reflective. The advantage of cost-reflective tariffs is that the LEC will obtain the resources to support and maintain the current and new systems introduced, and therefore can operate on commercial conditions without any direct subsi-dies. Instead, subsidies, where needed, are provided directly to projects on a case-to-case basis, or directly to the customers. The Consultant strongly sup-

National Electrification Master Plan for Lesotho - Final Report
P:\64131A\3_Pdoc\DOC\Final Report\færdige\Final Report October 2007\Final Report\Final Report-october.doc
136
.
ports this approach to tariff setting and recommends continuing working with the methodology and principles defined in the Synex study.
Pre-payment is the preferred collection and billing method for the majority of the customers. This works basically well, i.e. it limits the commercial losses. However, it is expensive in investment and administration. The conditions in the future electrification areas are different and with lower population and lower average demand, the cost of the system will increase. Therefore, ideas to use simpler and less expensive metering systems are required.
Billing and fee collection from consumers could be made by a village organisa-tion e.g. headed by a private agent or a village committee being paid for ser-vices as a percentage of the dues collected and with in-built incentives for re-duced losses. The main meter could be pre-paid with a number of cheap (<10 USD) meters in each household for allocation of the overall bill. Payment dis-cipline is then enforced locally. This method of billing and fee collection re-quires standards for losses in the local distribution grid as a starting point for instituting an incentive structure in the collection mechanism.
10.8 Densification Measures How to increase the number of connections? The following methods have been used with success in other countries:
• Paying a premium to existing consumers who get new consumers to con-nect;
• Financing the connection of new consumers over the electricity bill (split connection fee plus interest over 10 years);
• Financing of internal house wiring and basic appliance package;
• Only to extend the network to a village if 70% of the potential consumers will connect and pay;
• Give introduction discounts or connection discounts which decrease over a period so that it is cheapest to connect at the beginning;
• Provide discount in selected areas in 3 months to 1 year – campaigns;
• Using a system of differentiated tariffs according to quality, for instance introducing a special low tariff for power supply to a basic 5 A installation with a load limiter, instead of a meter. This is suitable for households with low ability to pay and limited power requirements.
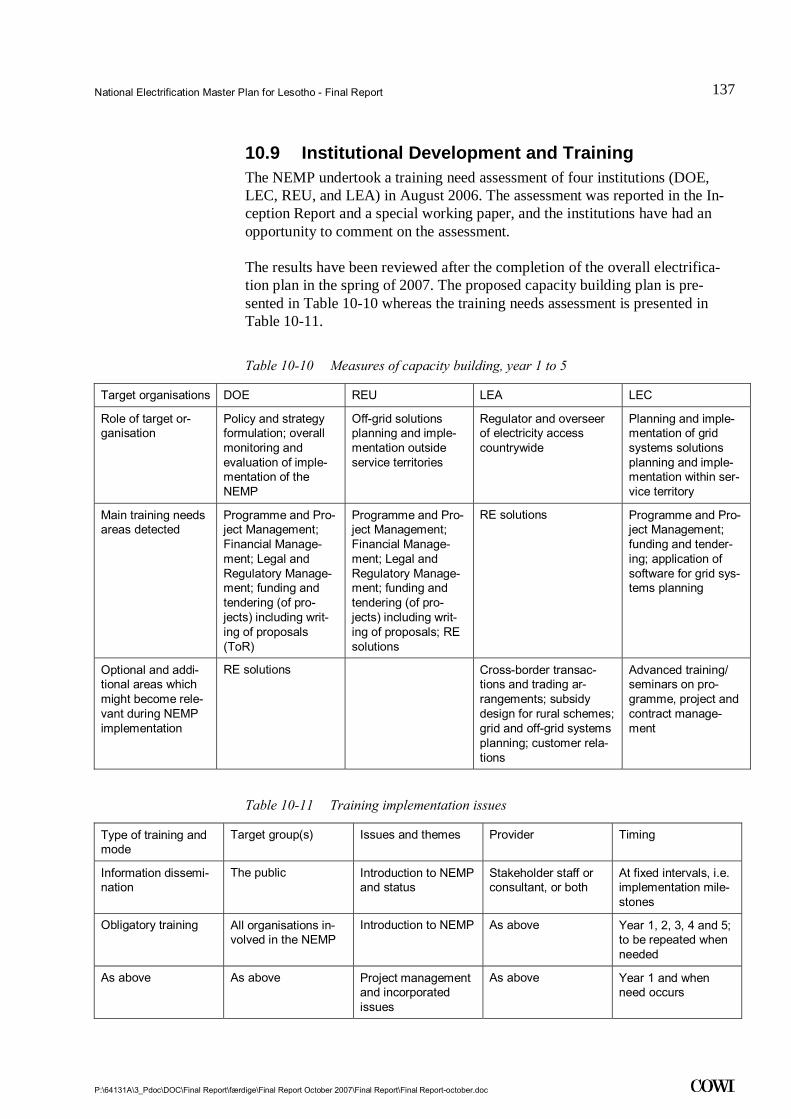
National Electrification Master Plan for Lesotho - Final Report
P:\64131A\3_Pdoc\DOC\Final Report\færdige\Final Report October 2007\Final Report\Final Report-october.doc
137
.
10.9 Institutional Development and Training The NEMP undertook a training need assessment of four institutions (DOE, LEC, REU, and LEA) in August 2006. The assessment was reported in the In-ception Report and a special working paper, and the institutions have had an opportunity to comment on the assessment.
The results have been reviewed after the completion of the overall electrifica-tion plan in the spring of 2007. The proposed capacity building plan is pre-sented in Table 10-10 whereas the training needs assessment is presented in Table 10-11.
Table 10-10 Measures of capacity building, year 1 to 5
Target organisations DOE REU LEA LEC
Role of target or-ganisation
Policy and strategy formulation; overall monitoring and evaluation of imple-mentation of the NEMP
Off-grid solutions planning and imple-mentation outside service territories
Regulator and overseer of electricity access countrywide
Planning and imple-mentation of grid systems solutions planning and imple-mentation within ser-vice territory
Main training needs areas detected
Programme and Pro-ject Management; Financial Manage-ment; Legal and Regulatory Manage-ment; funding and tendering (of pro-jects) including writ-ing of proposals (ToR)
Programme and Pro-ject Management; Financial Manage-ment; Legal and Regulatory Manage-ment; funding and tendering (of pro-jects) including writ-ing of proposals; RE solutions
RE solutions Programme and Pro-ject Management; funding and tender-ing; application of software for grid sys-tems planning
Optional and addi-tional areas which might become rele-vant during NEMP implementation
RE solutions Cross-border transac-tions and trading ar-rangements; subsidy design for rural schemes; grid and off-grid systems planning; customer rela-tions
Advanced training/ seminars on pro-gramme, project and contract manage-ment
Table 10-11 Training implementation issues
Type of training and mode
Target group(s) Issues and themes Provider Timing
Information dissemi-nation
The public Introduction to NEMP and status
Stakeholder staff or consultant, or both
At fixed intervals, i.e. implementation mile-stones
Obligatory training All organisations in-volved in the NEMP
Introduction to NEMP As above Year 1, 2, 3, 4 and 5; to be repeated when needed
As above As above Project management and incorporated issues
As above Year 1 and when need occurs
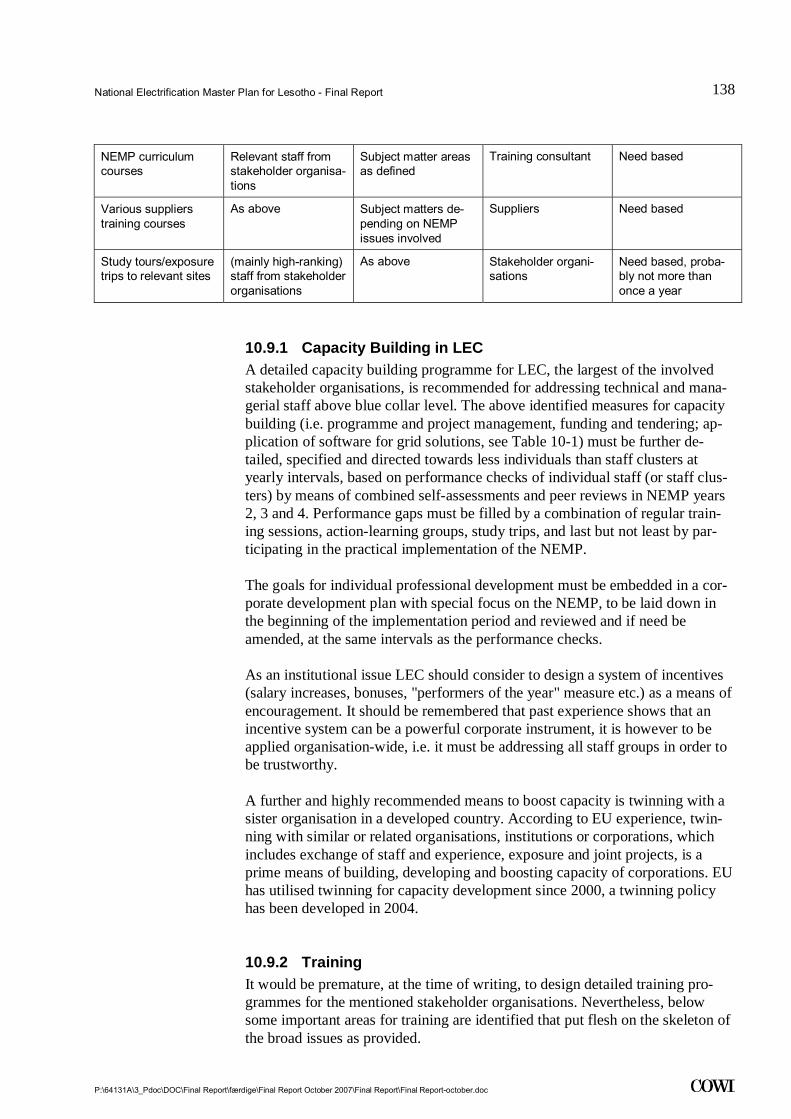
National Electrification Master Plan for Lesotho - Final Report
P:\64131A\3_Pdoc\DOC\Final Report\færdige\Final Report October 2007\Final Report\Final Report-october.doc
138
.
NEMP curriculum courses
Relevant staff from stakeholder organisa-tions
Subject matter areas as defined
Training consultant Need based
Various suppliers training courses
As above Subject matters de-pending on NEMP issues involved
Suppliers Need based
Study tours/exposure trips to relevant sites
(mainly high-ranking) staff from stakeholder organisations
As above Stakeholder organi-sations
Need based, proba-bly not more than once a year
10.9.1 Capacity Building in LEC A detailed capacity building programme for LEC, the largest of the involved stakeholder organisations, is recommended for addressing technical and mana-gerial staff above blue collar level. The above identified measures for capacity building (i.e. programme and project management, funding and tendering; ap-plication of software for grid solutions, see Table 10-1) must be further de-tailed, specified and directed towards less individuals than staff clusters at yearly intervals, based on performance checks of individual staff (or staff clus-ters) by means of combined self-assessments and peer reviews in NEMP years 2, 3 and 4. Performance gaps must be filled by a combination of regular train-ing sessions, action-learning groups, study trips, and last but not least by par-ticipating in the practical implementation of the NEMP.
The goals for individual professional development must be embedded in a cor-porate development plan with special focus on the NEMP, to be laid down in the beginning of the implementation period and reviewed and if need be amended, at the same intervals as the performance checks.
As an institutional issue LEC should consider to design a system of incentives (salary increases, bonuses, "performers of the year" measure etc.) as a means of encouragement. It should be remembered that past experience shows that an incentive system can be a powerful corporate instrument, it is however to be applied organisation-wide, i.e. it must be addressing all staff groups in order to be trustworthy.
A further and highly recommended means to boost capacity is twinning with a sister organisation in a developed country. According to EU experience, twin-ning with similar or related organisations, institutions or corporations, which includes exchange of staff and experience, exposure and joint projects, is a prime means of building, developing and boosting capacity of corporations. EU has utilised twinning for capacity development since 2000, a twinning policy has been developed in 2004.
10.9.2 Training It would be premature, at the time of writing, to design detailed training pro-grammes for the mentioned stakeholder organisations. Nevertheless, below some important areas for training are identified that put flesh on the skeleton of the broad issues as provided.

National Electrification Master Plan for Lesotho - Final Report
P:\64131A\3_Pdoc\DOC\Final Report\færdige\Final Report October 2007\Final Report\Final Report-october.doc
139
.
• (1) Programme and Project Management; (2) Financial Management; (3) Legal and Regulatory Management; (4) funding and tendering of projects including writing of proposals. For these areas formal training courses should be arranged for relevant staff from DOE, REU and LEC. Standard courses for (1), (2) and (4) are available, among others Danida provides such courses (a duration of approximately 6 weeks); the World Bank Insti-tute in Harare provides similar courses, and so does ESAMI of Arusha in Tanzania. (3) This course must be designed especially for the NEMP. The faculty should be peers from similar organisations in Africa and/or Europe. The standard courses must be adjusted to the needs of the NEMP/the spe-cific demands of Lesotho.
• RE solutions. Training in this area is relevant to DOE, REU and LEA. A multiple approach to training is suggested for this area, comprising tailor-made formal training by consultants specialised in this area and suppliers of hardware (Siemens has for instance standard courses in wind farm solu-tions) with excursions to relevant sites, preferably to African (e.g. Egyp-tian) sites or sites in other developing countries (India). Twinning with sis-ter organisations would be relevant.
(1) Cross-border transactions and trading arrangements;(2) subsidy design for rural schemes; (3) grid and off-grid systems planning; (4) customer relations. Again a multiple approach is suggested, comprising tailor-made formal training by consultants specialised in these areas with excursions/study visits to sister organisations. Twinning might again be relevant.
10.9.3 Local Government Capacity building targeting Local Government is foreseen, but cannot be de-fined due to institutional uncertainties in the short term. It is envisaged that in-volvement of Local Government would not be possible in the first 10 to 15 years due to lack of resources and focus on other tasks.
10.9.4 Funding We recommend that not less than 2.0% of NEMP costs should be set aside for training and institutional development. This corresponds to app. LSL 60 Mill over the 15-year period, or at least LSL 4 Mill per year.
10.10 Monitoring and Evaluation Framework
10.10.1 National/ Central Requirement The Electrification Master Plan provides indicators for monitoring electrifica-tion progress and impact in Lesotho, i.e. number of households electrified at national and district level. This information should be collected for monitoring at monthly or quarterly intervals.
The key provider of data will be LEC that must operate its customer database, so that detailed customer data can be provided on a regular basis. All other fu-

National Electrification Master Plan for Lesotho - Final Report
P:\64131A\3_Pdoc\DOC\Final Report\færdige\Final Report October 2007\Final Report\Final Report-october.doc
140
.
ture service providers (incl. REU) should also be required to submit data on the number of connections achieved over a given period of time.
National monitoring should focus on the extent to which the targets of the NEMP are fulfilled. This implies comparing coverage records with national population trends to derive the percentage served. It is important that this should be done by settlement type as the population growth rates will differ significantly according to type. The BOS should provide population updates on an annual basis, based on the 2006 census data. They should also be used to improve the accuracy of the data on the population and the number of house-holds for the base year (2005).
At the national level it is important to monitor the extent to which the provision of electricity contributes to the Poverty Reduction Strategy of the Government, in particular the extent to which new jobs are created and education and health services are improved. The key objective here will be to look at the long-term benefits or outcomes of electrification.
10.10.2 Ministry/ Sector At the sector level, indicators will have to measure the impact of rural electrifi-cation with the use of other sources of energy and the environment. In this re-spect, the environmental data about use of wood and scrubs that is harmful to the environment and the health will be of particular importance. In addition, indictors measuring the effect on business in rural centres, effect on develop-ment of institutions and effects on schools must be established.
10.10.3 Strategic/ Corporate level (LEC / REU) At this level, the focus will be more on matching resources requirements with demand. Demand estimates will have to be revised on a regular basis, particu-larly if any adjustments are made to tariffs or connection fees. National eco-nomic trends, notably employment, should also be monitored as these will have a major influence on the demand.
Here the indicators will address the extent to which funding and human re-sources are made available to meet the demand. Progress and efficiency indica-tors will include coverage by district and constituency and degree to which these are achieved within the estimated NEMP budget.
10.10.4 Planning/ Operational Level (LEC / REU) Probable indicators cover both implementation and impact/results, including number of projects, costing, implementation schedules and performance indica-tors.
10.10.5 Project Level Individual project indicators will deal with inputs, outputs, implementation tar-gets, and deadlines etc, contained in the project document.
National Electrification Master Plan for Lesotho - Final Report
P:\64131A\3_Pdoc\DOC\Final Report\færdige\Final Report October 2007\Final Report\Final Report-october.doc
141
.
10.10.6 District Level At district level, the key indicators will address:
• Number and percentage of households with electricity;
• Number and percentage of villages/towns with electricity;
• Presence of schemes in the district;
• Local representation in institutions in charge of electricity services in the district etc;
• Amounts collected by schemes;
• Total funds generated for electrification.
10.10.7 Communities/ Consumers At the community levels/ service recipient’s key indicator:
• Number of applications;
• Processing time for applications;
• Number of applications approved;
• Time between approval and contractor starting;
• Time between payment and construction; construction and connection.
At consumer level, citizen report cards could be used to measure consumer per-ceptions of service efficiency, for example, number of power cuts or surges, speed of response and response efficiency, cost of cuts (inconveniences).
10.10.8 Institutional Arrangements The responsibility for monitoring and evaluation of the electricity sector is rec-ommended to continue to lie with the LEA. The LEA will probably need to es-tablish an M&E unit.
The central responsibility of LEA for monitoring and evaluation is contained in Section 21 (i) of The Lesotho Electricity Authority Act, which charges LEA with the responsibility: “…to ensure collections, publication and dissemination of information relating to standards of performance of licensed operators and on the electricity sector in Lesotho for use by the industry, consumers and pro-spective investors”, and further in Section 21 (k) “…to develop annual supply targets for the purpose of ensuring that such services are accessible to the wid-est number of electricity users.”
The Act also confers general functions and powers on LEA to: (a) review the provision of electricity supplies in Lesotho; (b) establish, maintain and review and amend as appropriate technical and performance standards; (c) establish, maintain, review, monitor and amend appropriate customer care standards. Thus, the legal and institutional mandate of LEA clearly intends a central moni-toring and evaluation role for the organization.

National Electrification Master Plan for Lesotho - Final Report
P:\64131A\3_Pdoc\DOC\Final Report\færdige\Final Report October 2007\Final Report\Final Report-october.doc
142
.
Institutionally, the monitoring and evaluation role of LEA will be performed through a number of structures. In particular the Rural Electrification Unit will advise the Board through the (yet to be established) Advisory Committee on Rural Electrification, being a revival of the Rural Electrification Working Group. The Advisory Committee will among other things advise on implemen-tation of the Electrification Master Plan and monitoring of projects. Member-ship on the Board of the proposed National Electrification Fund (to be estab-lished in the Ministry Finance) and the participation in the planning of electrifi-cation policy will provide further tools for LEA to fulfil its mandate.
Currently, LEA has a number of departments: Technical Departments, Eco-nomics Department, Customer Affairs, Legal Affairs and Finance and Admini-stration. The current challenge is to recruit staff and build capacity of these de-partments. LEA expects the monitoring and evaluation function to be housed in one of these departments, possibly the Technical Department or the Economics Department. In this way, the Authority will play a very active role in the overall M&E of the NEMP.
At the national level, the Lesotho Electricity Company will be the major im-plementing agency and data provider, while the Rural Electrification Unit (Agency) will also take responsibility for M&E of the rural electrification pro-gramme and may require a unit for M&E.
National Electrification Master Plan for Lesotho - Final Report
P:\64131A\3_Pdoc\DOC\Final Report\færdige\Final Report October 2007\Final Report\Final Report-october.doc
143
.
11 Future Service Delivery in Lesotho A number of general delivery models for off-grid and on-grid electrification outside the ST of LEC have been discussed over the past five years, and a num-ber of pilot projects were initiated to get a background for deciding the most suitable solutions for Lesotho.
The envisaged distribution of responsibilities between LEC and REU is that LEC should account for 8,000 new connections in the ST annually and REU or other agencies for the remaining new connections required (app. 4000) to reach the GOL targets. However, LEC is producing 5,000-6,000 new connections per year currently, and the operational modus of REU has not been determined yet.
From previous sections, it is clear that the LEC ST should contribute with a ma-jor share of new connections, even beyond the 8,000 per year that LEC is obliged to connect, because it is sound to increase the connections in the al-ready established system.
It might therefore also be required to allow other operators into the currently defined LEC ST in order to achieve the GOL targets in a financially sustainable way.
With the privatisation of LEC on halt, uncertainty about the establishment and the role of the REU, delays in obtaining the results from the EAPPs and low viability of the said off-grid schemes (and therefore low priority), any conclu-sions on how to proceed would benefit from awaiting the general progress in the sector management and overall electrification.
11.1 Problems Facing the Power Sector The power sector development in Lesotho faces a number of challenges:
• Low connection levels - low ability to pay;
• Rural electrification is comparatively expensive;
• Inside the ST, greater participation of electrical contractors and consultants is required, even if this has improved recently;
• Outside the ST, stronger involvement of new operators is required (private, local government) in distribution and generation;

National Electrification Master Plan for Lesotho - Final Report
P:\64131A\3_Pdoc\DOC\Final Report\færdige\Final Report October 2007\Final Report\Final Report-october.doc
144
.
• Lack of capital for utility management;
• Local government lacks the competence and financial basis for involving in power distribution;
• Lack of access to capital for private operators;
• Lack of local operators with the required qualification;
• Lack of access to information about future plans;
• Small size of the market and very low viability of electrification.
11.2 Inside the ST - Future Role of LEC It is imperative that the status of LEC is clarified and its responsibilities to-wards electrification are enforced. Under the current system, LEC will be the main operator in the electrification process. If it turns out that privatisation is impossible, e.g. if there are no interested investors, alternatives must be consid-ered.
Alternatively, LEC's role could be changed in line with a more competitive model as introduced in Europe and other places. LEC could be transformed into a transmission system operator (TSO), and competition could be introduced in generation and in distribution, also in the currently served areas. LEC could establish a subsidiary for distribution, which could compete with other distribu-tion companies. LEC's current distribution infrastructure assets should be placed at the disposal of other distributors against a fee to the extent that capac-ity is available.
The distributors should have access to generate electricity or purchase from other generators.
It is, however, questionable if the market of Lesotho is large enough to effec-tively generate competition in distribution. The market is still small and imma-ture with a number of difficult problems facing the distributors. Therefore, we recommend staying on the path with privatisation of the current LEC with re-sponsibility for import, transmission and distribution in the ST and a specific requirement on the number of new connections to be generated, which is higher than 8,000 per year.
11.2.1 Improvement of LEC Efficiency in New Connections Over the last years, LEC has outsourced the establishment of new distribution systems and new connections to the private sector and thereby increased the capacity considerably.
It is imperative that LEC achieves a higher number of new connections in the coming years if the targets for electrification of the GOL should be achieved.
National Electrification Master Plan for Lesotho - Final Report
P:\64131A\3_Pdoc\DOC\Final Report\færdige\Final Report October 2007\Final Report\Final Report-october.doc
145
.
LEC must make a plan for improvement of the efficiency in the connection of new customers and implement this plan.
The Consultant strongly believes that the current connection policy and connec-tion fee are barriers to increased up-take. It is strongly recommend to introduce the 10 amp, which could be sold for a connection fee of about LSL 500 or be-low, instead LSL 2 000 for the 20 amp.
11.3 Concession Model Approach for Lesotho The AES conducted by the IMTF addressed some electrification models and came up with the conclusion that a light regulation concession approach ap-pears to be best fitted for Lesotho. The Consultant agrees with this approach and it is taken as a starting point for the further discussion.
A separate national Rural Electrification Utility alongside with LEC will proba-bly not be able to finance the required investments based on customers' reve-nues.
Therefore, the challenge is to design alternative arrangements for areas outside of LEC’s supply areas. A concession arrangement represents a flexible ap-proach to providing rural electricity services. LEC can apply for any concession offered to the market and extend its services.
Similarly, a concession approach would not exclude local private investors, co-operatives, or governmental or NGO-based electricity supply operations. These agencies could apply for any concessions that were offered to the market. It must be anticipated that such options will be limited to specific locations where there is a presence of co-operative commercial operations, or active NGOs with an interest in infrastructure provision. DOE could use this to stimulate local activity and control.
Finally, a concession approach would allow Lesotho to identify discrete and priority areas as candidates for rural electrification, and invite potential conces-sionaires to prepare a supply plan. GOL could thereby implement a prioritised rural electrification programme and get support from resources, skills and fi-nances of various agents in the private sector and local government sector.
It is possible to package several agreements into a concession:
• The appropriate licenses;
• A lease agreement for the use of existing assets;
• A power purchase agreement from the central grid or a generator;
• A subsidy award contract, if required.
For a concession to be financially viable, it is imperative that it should include a substantial industrial and/or commercial sector to subsidize the non-profitable

National Electrification Master Plan for Lesotho - Final Report
P:\64131A\3_Pdoc\DOC\Final Report\færdige\Final Report October 2007\Final Report\Final Report-october.doc
146
.
domestic customers. The more rural domestic customers are contained in the concession, the larger the consumption of the commercial/industrial sector should be to allow for cross subsidization at an affordable tariff. This imposes a problem as most of the currently attractive commercial/industrial customers are currently within the LEC ST, which in that case has to be redefined.
In principle, the concessions are flexible in terms of areas covered – they can cover a small settlement, or they can cover larger areas according to the needs as identified by LEA, who will be responsible for issuing licences and conces-sions. LEA should undertake the task of zoning the country outside the ST into a suitable number of concessions.
It is worth considering, if possible, to create four (4) self-sustainable conces-sions in Lesotho exclusive of LEC, as proposed by CV Engineering. These should include the existing distribution systems in the districts of Mokhotlong, Qacha's Nek, Mohales Hoek and Thaba-Tseka and should furthermore, as a minimum, include the Letseng Diamond Mine, Mantšonyane town and hydro-plant and Quthing.
The model to divide Lesotho into 4 large sustainable concession areas, not in-cluding LEC, should be investigated as soon as possible.
In the context of Lesotho, the local governments are currently weak and fully occupied with a number of other important tasks than the electricity supply. REU could, however, play an important role in the future to enhance the re-source of local governments in terms of training the required skills and techni-cal support in electro, technical, financial and project management skills.
11.4 Outside the ST Areas – Grid Connection The electrical infrastructure required to accommodate all services needed will rapidly grow with the number of rural customers. With rural electrification, the customers are much more spread out over the country and will require more manpower to service the same number of customers than what is required in densely populated urban areas.
Outside the ST areas, COWI will recommend the lease and transfer model, which is a variant of the Build Operate and Transfer model. In a lease contract, the assets in a concession area are rented by an operator/service provider for a specified time period, say 15 years. The concessionaire is obliged to operate according to agreed standards, maintain the system to an acceptable standard, develop the system and connect new customers according to levels agreed in advance.
The investment in the infrastructure has to be provided by the GOL through REU and placed at the disposal of the operator for a fee.
Existing and possible future assets in a concession area are to be leased to the concessionaire/service operator. In the case where new assets have to be con-
National Electrification Master Plan for Lesotho - Final Report
P:\64131A\3_Pdoc\DOC\Final Report\færdige\Final Report October 2007\Final Report\Final Report-october.doc
147
.
structed, the construction of the back-bone infrastructure is provided by REU and leased to the concessionaire.
The concessionaire will be responsible for operating the system, including ac-count, metering, customer billing and maintenance, and the leasing fee should be calculated giving the operator opportunity to perform these functions.
After the stipulated period has ended, the leasing contract has provisions for either (i) a continuation of the current arrangement, (ii) the operators buy the assets and continue operation, or (iii) the assets are transferred to the GOL. The Government can then decide to make a new agreement with another operator or sell the assets.
The service operators could be LEC, private companies, rural communities, municipalities etc. The actual terms may vary depending on the socio-economic situation in the rural area in question.
Ownership of existing assets outside the LEC ST should be transferred to the Government, – a special entity set up to own these assets, for instance REU. Concessions to operate and extend these assets should be tendered to commer-cial operators and investors, with assets grouped into concessions by geo-graphic location.
Ownership of assets will be the same whether a private entity, an NGO or a co-operative is awarded the concession. Any assets that are leased remain the property of the GOL. Any assets that are purchased by the concessionaire are the property of the concessionaire. Concession documents need to clarify the ownership of assets, and arrangements for transfer and compensation of assets owned by the Concessionaire; once the concession term expires.
The concessionaire will be required to establish and manage the business of electricity provision. All revenue from electricity sales and all costs associated with operations will be the responsibility of the concessionaire.
The most important issues relating to the success of implementing rural electri-fication concessions are:
• Adequate tariff levels; and
• Subsidies as capital investment incentives to expand access to electricity.
It is not within the scope of this project to make detailed recommendations on the general tariffs methodologies. For ease of comparison during the bidding process, it would be advantageous if the LEA lay down clear guidelines for electricity pricing and tariff determination. The Consultant recommends that tariffs should transparently reflect the costs of the service provision, indicating tariff differentiation between the concessions.
If the concession approach is to be successful, the concessionaire will need as-surance that the tariffs used in the business planning will be maintained in real
National Electrification Master Plan for Lesotho - Final Report
P:\64131A\3_Pdoc\DOC\Final Report\færdige\Final Report October 2007\Final Report\Final Report-october.doc
148
.
terms. This will need to be built into licences awarded to concessionaires, for example in terms of an agreed tariff adjustment procedure, as it exists today.
Subsidies It is generally acknowledged that rural electrification is not financially sustain-able. This is clearly demonstrated in the financial analysis of the NEMP, where the subsidy requirement for the overall electrification plan and for each of the settlements is calculated, and in most cases the subsidy requirement exceeds the capital investment, i.e. there is also a need for subsidies to the operations of the system. With this principle and amounts accepted, the method of subsidization should be discussed.
Special mechanisms for promoting access are therefore required supported by electrification planning capacity/capability. This function could reside in a spe-cial electrification Agency (REU). Special funding mechanisms need to be put in place (levies, fiscal allocations, donor funds, Output-based Aid), consoli-dated in a rural electrification fund, and linked to electrification planning and in a transparent fund allocation process.
Transparency and accountability in the allocation of these funds are crucial. Subsidies for electrification can be allocated on a competitive basis. Least-cost subsidies can be provided for the current tariff level, and the bidder with the lowest subsidy requirement wins the tender. The fund could be distributed through an Output-based Aid mechanism, providing incentives to reduce the costs of electrification and also improve the efficiency of fund allocation.
Establishing and maintaining cost-reflective prices with suitable incentives to reduce thefts and non-payments are essential in order to restore financial per-formance and attract investment. Compromising on this will undermine the vi-ability of the utilities in Lesotho. Cost-reflective tariffs often mean substantially high cost for poor households, which results in reduced consumption and wel-fare and, in serious cases, fuel switching to dirtier and less convenient fuels, as previously mentioned. Special pricing systems for low-income households can mitigate some of the negative impacts of price reforms and are almost always necessary.
The pricing system needs to be set at levels that are affordable for poor house-holds, yet also sustainable for the electricity supply industry and the govern-ment budget. The pricing system for poor households also need to be targeted - this can be done through restricting lifeline or social tariffs to those consumers who consume less than 50 kWh per month, or they could be targeted to con-sumers who accept current-limited supplies or on pre-paid systems, provided they are proxies for poverty.
National Electrification Master Plan for Lesotho - Final Report
P:\64131A\3_Pdoc\DOC\Final Report\færdige\Final Report October 2007\Final Report\Final Report-october.doc
149
.
11.5 Delivery Models Off-grid A few remarks on the possible settlements suitable for off-grid and the pro-posed technology will be made below, bearing in mind that any conclusions on delivery models for both off-grid and on-grid electrification outside the ST of LEC should be closely linked to the long-term vision of the development of the sector and the choice of sector management.
11.5.1 Centralised Off-grid – Mini hydro and Grid Extension from Possible Supply to Mine
Semonkong forms part of the pilot schemes although it has been in operation for more than a decade. The options discussed for the existing hydro/diesel power system in Semonkong would also be relevant for any future off-grid mini hydro scheme in Lesotho, with the difference being the option of attract-ing a private investor to build, run and operate the scheme from its outset, thus tailoring the setup to suit the local ability to pay for the services and their qual-ity demands.
Electricity supply of the mines in Kao and Liqhobong (as well as Letseng la Terai) provides an opportunity to supply the nearby communities with electric-ity by extending the electricity grid to these areas.
Significant subsidies would probably be necessary to make these schemes at-tractive both for the private investor in hydro or for the mining company, unless it is seen as part of a social responsibility, inline with support for schools, health facilities, etc. which often form part of “the community compensation package” of industrial or infrastructure developments.
The communities in Katse and Mohale are currently supplied in this way, and experience from these areas could be used for future developments where one or a few large “maximum-demand customers” are present. The additional cost of extending and operating the supply to nearby communities would either form part of a negotiated “package” or be compensated directly from the govern-ment.
None of the identified schemes here would be viable/attractive on their own.
11.5.2 Individual Solutions – PV The potential for individual solutions, such as PV SHS or solar lanterns is not confined to the identified settlement clusters. The potential settlements that would benefit from an individual solution would include settlements that are not on the list for electrification in the immediate future as well as individual households and institutions situated “in-between” the identified 140 settle-ments.
It is assumed that a significant potential exists in the Lowlands both within and outside the LEC ST, and that it would be worthwhile for REU to analyse this in further detail. Establishing access to finance for private/individual/institutions to satisfy their energy needs would be an important issue to look into, be it in-
National Electrification Master Plan for Lesotho - Final Report
P:\64131A\3_Pdoc\DOC\Final Report\færdige\Final Report October 2007\Final Report\Final Report-october.doc
150
.
dividual PV systems or small gen-sets for larger loads or productive uses. This access should not be limited to the “off-grid areas or outside the LEC ST area” but extended to the entire country.
The settlements identified for individual solutions (PV) all have a very small number of potential customers that would hardly justify any concession ar-rangements.
One of the main barriers to the widespread diffusion of PV SHS in the rural areas is financial, as the majority of rural households have little expandable capital for purchasing such systems and lack access to credit.
SHS can be financed through the following alternative approaches:
1 Direct sales and cash financing;
2 Credit financing;
3 Institutionally owned and maintained SHS
• Leasing of SHS • Government-granted RE concession • Energy Service Company (ESCO).
11.6 Conclusions Due to the low viability and low ability to pay among the Basotho households, power distribution is only attractive if investors are guaranteed access to larger institutional/commercial/industrial customers. A system of concessions in order to provide some security for the investments is therefore required.
A lease and transfer model, which has already been proposed, seems to be a suitable solution for Lesotho, where private operators lease the genera-tion/distribution facilities from the Government (REU) for a specific period of time. The Government provides the assets for the operators against a fee. This system will also enable the Government to involve the Local Government ac-tively in power supply. REU could play an important role in capacitating and supporting local governments.
For the individual solutions (SHS and SPV), a variety of options for involving the private sector are available.

National Electrification Master Plan for Lesotho - Final Report
P:\64131A\3_Pdoc\DOC\Final Report\færdige\Final Report October 2007\Final Report\Final Report-october.doc
151
.
12 Environmental Issues This section investigates the possible environmental impacts of electrification and how it can be mitigated.
12.1 Impact and Mitigation Protected Areas Lesotho only has few and small national parks and protected areas, a new pro-tected area along the north east border is under development, and parts of this will be protected as reserves. Large constructions should be avoided in the few and small protected areas.
Touristic and Scenic Areas It is a prerequisite for tourism that electricity is available, but large pylons and power lines can be a sore to the eye. In tourism development areas, special care must be taken to either avoid (high tension) transmission lines or to be very careful with the blending into the landscape.
Prohibited Areas Prohibited areas are military exercise areas. Special permits from the military must be obtained, and the areas are best avoided as pylons and power lines might get in the way for the exercises.
Archaeological Sites, Monuments and Cultural Heritage Most archaeological finds are from the more populated areas. There are several thousand rock paintings in sandstone areas, and in these areas fossil foot print from dinosaurs can also be found. Especially in the sand stone areas it is a good idea to screen for archaeological finds, rock paintings etc. before constructing new alignments in order to avoid delays when inspections and possible excava-tion are taking place.
Areas with Rare Habitat or Animal Species Lesotho houses a number of rare animal species, some of these and also some more common ones are legally protected. It has not been possible to map the distribution of all of these, but most of the species occur in the Highlands where the impact from people is the least. One species of fish is not protected by the law but is only found in Lesotho in the upper parts of the Orange River. It is self explanatory that the construction of a dam here must be avoided if the spe-cies is to survive.
National Electrification Master Plan for Lesotho - Final Report
P:\64131A\3_Pdoc\DOC\Final Report\færdige\Final Report October 2007\Final Report\Final Report-october.doc
152
.
Wetlands In the wetlands, there is a major risk of leakage of zinc and copper, but first of all the wetlands attract large (protected) species of birds that are especially prone to collisions with power lines.
12.2 Impacts from Transmission and Distribution Houses near the Transmission Lines The same houses that benefit from having electricity will also experience a number of disadvantages, such as loss of small tracts of land for pylons, risk of lightning and health hazards. Most of these can be ameliorated through a careful planning of the pylons and raising of awareness.
Leakage of Metals The pylons for the transmission networks are galvanized with zinc, which also contains elements of heavy metals. Lead and cadmium will normally leak in quantities that might damage aquatic life. Pylons must be avoided in the wetlands.
Clearing of Vegetation The negative impacts of the proposed transmission lines are caused during the construction phase when surface areas become exposed due to vegetation clear-ing, and this may in turn give rise to erosion. Clearing of vegetation from the site, access road and tower pads may also give rise to negative impacts.
Lightning and Abnormal Weather Un-insulated overhead lines are more prone to lightning strikes and short-circuit incidents than insulated overhead lines. Insulated overhead lines should be used in areas of Lesotho that are known to be prone to lightning strikes, as well as to ensure a more reliable energy supply.
Waste Management, Hazardous Waste and Recycling Potential sources of waste include lead acid batteries that are used particularly in the rural areas to power televisions, video casette players, radios and satellite systems. The appropriate disposal of spent lead acid batteries is a potential impact as Lesotho does not currently have a registered hazardous waste disposal facility.
The use of diesel generators gives rise to spent oil, the disposal of which is regarded as problematic as there are no companies in Lesotho recycling used oil.

National Electrification Master Plan for Lesotho - Final Report
P:\64131A\3_Pdoc\DOC\Final Report\færdige\Final Report October 2007\Final Report\Final Report-october.doc
153
.
Appendix 1 – NEMP Reports 1 Inception Report: Captured the results of STEP 1 of the project with the
main outputs being an agreement on the planning criteria, the need for fur-ther socio-economic surveys, and the further process. A detailed work plan for the completion of the project was included, which served as the basis for the entire project.
The reporting of STEP 1 was based on the following working papers:
1A Technical diagnosis of the LEC Network; 1B LEC planned network and Planning Procedures; 1C Capacity Building and Training Needs Assessment; 1D Result of the Socio-Economic Surveys; 1E Rural Electrification Standards; 1F Planning Criteria - Results of the Stakeholder Workshop.
2 Electrification Master Planning Report: Captured the results of STEP 2 and linked it with the outcome of STEP 1. The working papers included in STEP 2 are:
2A Spatial allocation of LEC network and Customer Database with de-scription of settlements; 2B Consumer demand and load forecast; 2C Technical standards and cost for transmission networks; 2D Technical standards and cost for distribution networks; 2E Technical standards and cost for off-grid solutions; 2F Transmission and distribution network reinforcement plan for 15
years; 2G Service delivery models; 2H Outline of electrification projects 1- 15 years; 2I Financial, Economic, tariff and social impact analysis of Electrifica-
tion Plans; 2J Environmental Assessment of the Electrification Plans.
Working Papers 2C plus 2D have been merged to one paper. Likewise have 2H and 2I been merged to one Working Paper.
3 Implementation Strategy Report: Included a project schedule for 15 years and details on the first 5 years as well as recommendations for a monitoring and evaluation framework for the project implementation.
4 Stakeholder Consultation Report: Documented the outcomes of consul-tative meetings with stakeholders.
5 Final Report: Summarises the results of the master planning process.
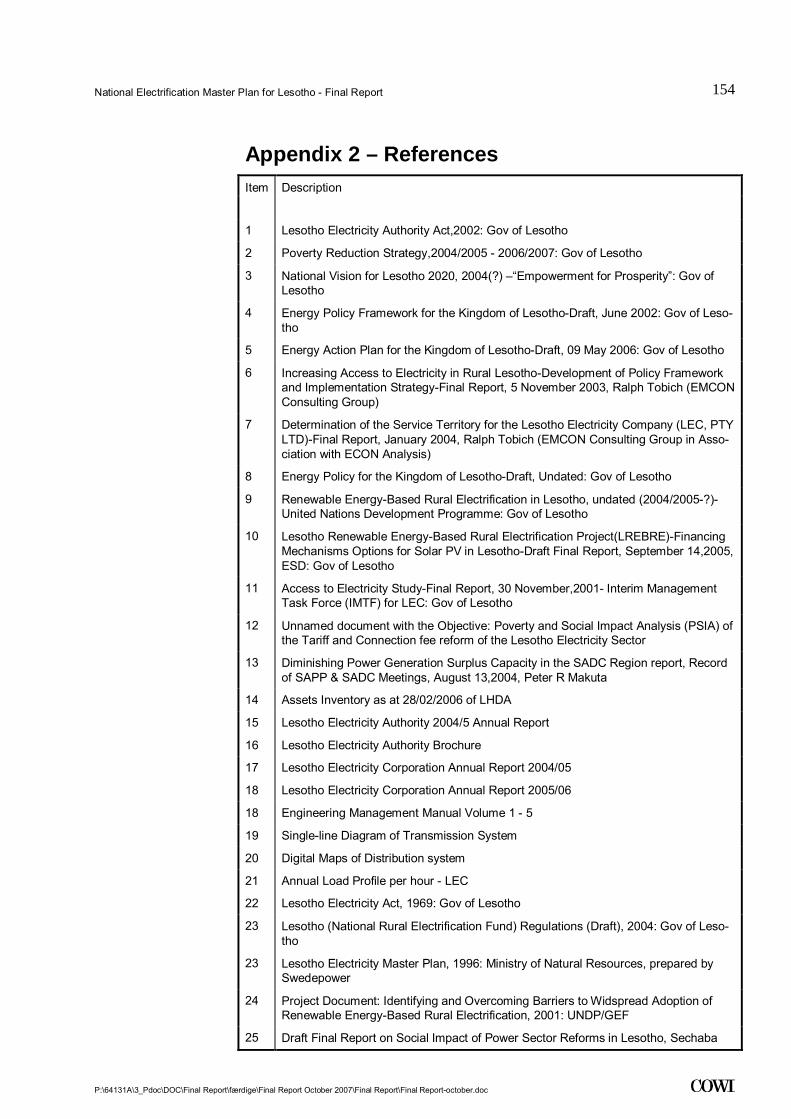
National Electrification Master Plan for Lesotho - Final Report
P:\64131A\3_Pdoc\DOC\Final Report\færdige\Final Report October 2007\Final Report\Final Report-october.doc
154
.
Appendix 2 – References Item Description
1 Lesotho Electricity Authority Act,2002: Gov of Lesotho
2 Poverty Reduction Strategy,2004/2005 - 2006/2007: Gov of Lesotho
3 National Vision for Lesotho 2020, 2004(?) –“Empowerment for Prosperity”: Gov of Lesotho
4 Energy Policy Framework for the Kingdom of Lesotho-Draft, June 2002: Gov of Leso-tho
5 Energy Action Plan for the Kingdom of Lesotho-Draft, 09 May 2006: Gov of Lesotho
6 Increasing Access to Electricity in Rural Lesotho-Development of Policy Framework and Implementation Strategy-Final Report, 5 November 2003, Ralph Tobich (EMCON Consulting Group)
7 Determination of the Service Territory for the Lesotho Electricity Company (LEC, PTY LTD)-Final Report, January 2004, Ralph Tobich (EMCON Consulting Group in Asso-ciation with ECON Analysis)
8 Energy Policy for the Kingdom of Lesotho-Draft, Undated: Gov of Lesotho
9 Renewable Energy-Based Rural Electrification in Lesotho, undated (2004/2005-?)-United Nations Development Programme: Gov of Lesotho
10 Lesotho Renewable Energy-Based Rural Electrification Project(LREBRE)-Financing Mechanisms Options for Solar PV in Lesotho-Draft Final Report, September 14,2005, ESD: Gov of Lesotho
11 Access to Electricity Study-Final Report, 30 November,2001- Interim Management Task Force (IMTF) for LEC: Gov of Lesotho
12 Unnamed document with the Objective: Poverty and Social Impact Analysis (PSIA) of the Tariff and Connection fee reform of the Lesotho Electricity Sector
13 Diminishing Power Generation Surplus Capacity in the SADC Region report, Record of SAPP & SADC Meetings, August 13,2004, Peter R Makuta
14 Assets Inventory as at 28/02/2006 of LHDA
15 Lesotho Electricity Authority 2004/5 Annual Report
16 Lesotho Electricity Authority Brochure
17 Lesotho Electricity Corporation Annual Report 2004/05
18 Lesotho Electricity Corporation Annual Report 2005/06
18 Engineering Management Manual Volume 1 - 5
19 Single-line Diagram of Transmission System
20 Digital Maps of Distribution system
21 Annual Load Profile per hour - LEC
22 Lesotho Electricity Act, 1969: Gov of Lesotho
23 Lesotho (National Rural Electrification Fund) Regulations (Draft), 2004: Gov of Leso-tho
23 Lesotho Electricity Master Plan, 1996: Ministry of Natural Resources, prepared by Swedepower
24 Project Document: Identifying and Overcoming Barriers to Widspread Adoption of Renewable Energy-Based Rural Electrification, 2001: UNDP/GEF
25 Draft Final Report on Social Impact of Power Sector Reforms in Lesotho, Sechaba
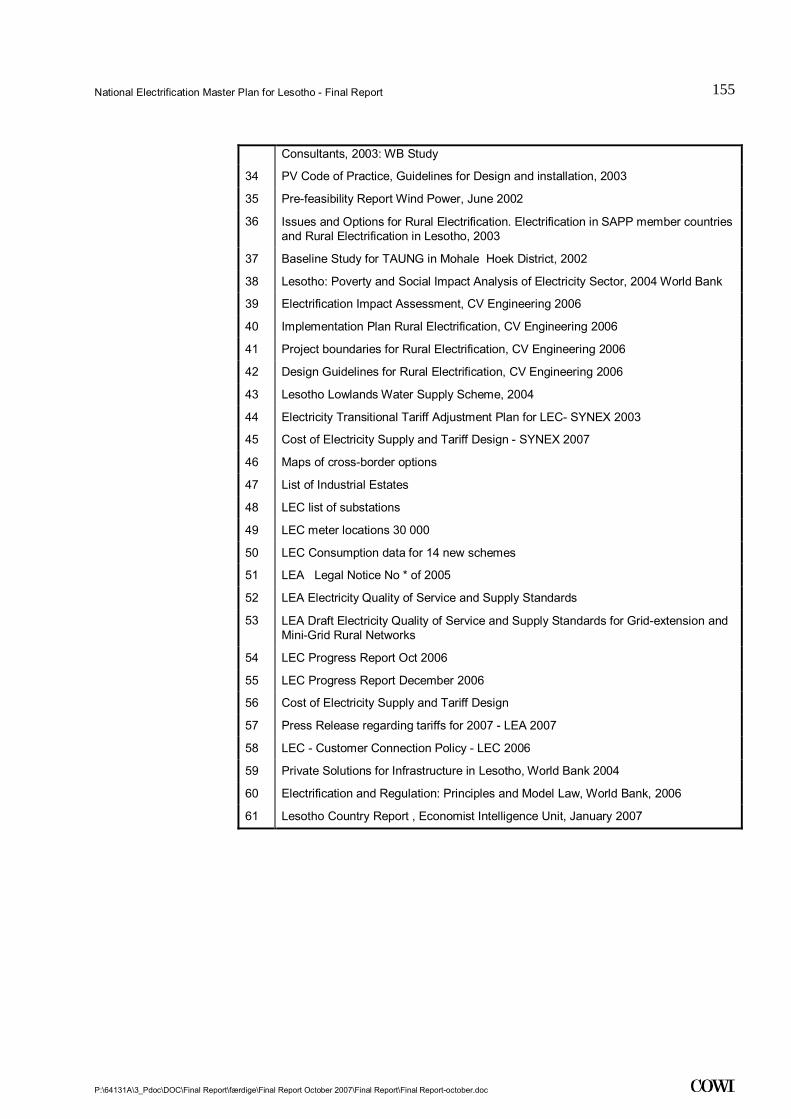
National Electrification Master Plan for Lesotho - Final Report
P:\64131A\3_Pdoc\DOC\Final Report\færdige\Final Report October 2007\Final Report\Final Report-october.doc
155
.
Consultants, 2003: WB Study
34 PV Code of Practice, Guidelines for Design and installation, 2003
35 Pre-feasibility Report Wind Power, June 2002
36 Issues and Options for Rural Electrification. Electrification in SAPP member countries and Rural Electrification in Lesotho, 2003
37 Baseline Study for TAUNG in Mohale Hoek District, 2002
38 Lesotho: Poverty and Social Impact Analysis of Electricity Sector, 2004 World Bank
39 Electrification Impact Assessment, CV Engineering 2006
40 Implementation Plan Rural Electrification, CV Engineering 2006
41 Project boundaries for Rural Electrification, CV Engineering 2006
42 Design Guidelines for Rural Electrification, CV Engineering 2006
43 Lesotho Lowlands Water Supply Scheme, 2004
44 Electricity Transitional Tariff Adjustment Plan for LEC- SYNEX 2003
45 Cost of Electricity Supply and Tariff Design - SYNEX 2007
46 Maps of cross-border options
47 List of Industrial Estates
48 LEC list of substations
49 LEC meter locations 30 000
50 LEC Consumption data for 14 new schemes
51 LEA Legal Notice No * of 2005
52 LEA Electricity Quality of Service and Supply Standards
53 LEA Draft Electricity Quality of Service and Supply Standards for Grid-extension and Mini-Grid Rural Networks
54 LEC Progress Report Oct 2006
55 LEC Progress Report December 2006
56 Cost of Electricity Supply and Tariff Design
57 Press Release regarding tariffs for 2007 - LEA 2007
58 LEC - Customer Connection Policy - LEC 2006
59 Private Solutions for Infrastructure in Lesotho, World Bank 2004
60 Electrification and Regulation: Principles and Model Law, World Bank, 2006
61 Lesotho Country Report , Economist Intelligence Unit, January 2007

National Electrification Master Plan for Lesotho - Final Report
P:\64131A\3_Pdoc\DOC\Final Report\færdige\Final Report October 2007\Final Report\Final Report-october.doc
156
.
Appendix 3 – Price Levels for Transmission and Distribution
HV Feeders
Table A3-1 Estimated OHL costs
Feeder type Rated voltage
Cross section Installation cost COWI USD/km
Installation cost LEC
USD/km
Urban and industrial areas 33 kV 3x100 mm2 ACSR 30,100 50,000
11 kV 3x100 mm2 ACSR 25,000 25,000
Rural areas 33 kV 3x100 mm2 ACSR 30,100 50,000
2x100 mm2 ACSR 26,450 43,850
11 kV 3x100 mm2 ACSR 25,000 25,000
2x100 mm2 ACSR 21,000 21,000
Rural areas with spread con-sumer groups
11 kV 3x100 mm2 ACSR 25,000 25,000
2x100 mm2 ACSR 21,000 21,000
SWER 1x100 mm2 Cop-perweld
15,000 15,000
Table A3-2 Component Prices
Equipment Rated voltage
Cross section Unit Cost (USD)
Conductor 100 mm2 AAAC m 4.10
50 mm2 AAAC m 2.50
100 mm2 ACSR m 3.00
63 mm2 ACSR m 2.20
25 mm2 ABC - AL m 6.00
50 mm2 Copperweld m 5.00
25 mm2 Copperweld m 4.00
Poles 33 kV 12 m wood Pcs 120
12 m concrete Pcs
11 kV 12 m wood Pcs 120
12 m concrete Pcs
Recloser 33 kV 1 phase Pcs 4,000
3 phase Pcs 12,000
11 kV 1 phase Pcs 3,000
3 phase Pcs 9,000
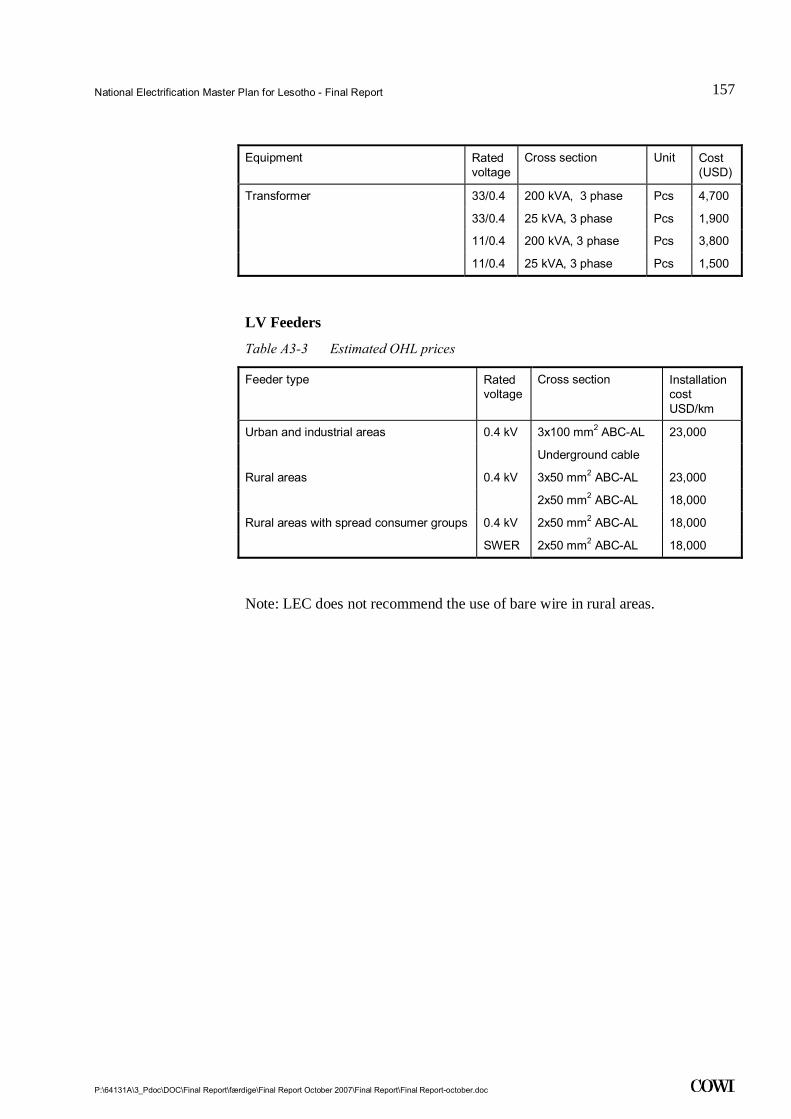
National Electrification Master Plan for Lesotho - Final Report
P:\64131A\3_Pdoc\DOC\Final Report\færdige\Final Report October 2007\Final Report\Final Report-october.doc
157
.
Equipment Rated voltage
Cross section Unit Cost (USD)
Transformer 33/0.4 200 kVA, 3 phase Pcs 4,700
33/0.4 25 kVA, 3 phase Pcs 1,900
11/0.4 200 kVA, 3 phase Pcs 3,800
11/0.4 25 kVA, 3 phase Pcs 1,500
LV Feeders
Table A3-3 Estimated OHL prices
Feeder type Rated voltage
Cross section Installation cost USD/km
Urban and industrial areas 0.4 kV 3x100 mm2 ABC-AL 23,000
Underground cable
Rural areas 0.4 kV 3x50 mm2 ABC-AL 23,000
2x50 mm2 ABC-AL 18,000
Rural areas with spread consumer groups 0.4 kV 2x50 mm2 ABC-AL 18,000
SWER 2x50 mm2 ABC-AL 18,000
Note: LEC does not recommend the use of bare wire in rural areas.
National Electrification Master Plan for Lesotho - Final Report
P:\64131A\3_Pdoc\DOC\Final Report\færdige\Final Report October 2007\Final Report\Final Report-october.doc
158
.
Appendix 4 – Cost of Distribution Overview per Settlement Appendix 4A - Details of proposed solution for each off-grid settlement.
Appendix 4B - Details of investment estimates for grid-connected settlements.

National Electrification Master Plan for Lesotho - Final Report
P:\64131A\3_Pdoc\DOC\Final Report\færdige\Final Report October 2007\Final Report\Final Report-october.doc
159
.
4.A - Details of Proposed Solution for each Off-grid Settlement Information on the number of households and the expected number of connec-tions according to the two load forecast scenarios is shown in the tables below. Please note that costs relate to low-cost solutions specific for villages.
1. Mpharane Table 1 Households & connections Mpharane cluster Number of households 774Number of hh connections Scenario 1 232Number of hh connections Scenario 2 155Number of GP connections Sc. 1 15Number of GP connections Sc. 2 10 Table 2 Mpharane cluster investment estimate
System component Unit price (LSL) Quantity Cost (LSL)Bulk supply
MV Feeder line (11 kV) ACSR Rabbit 42.000 15 630.000Mini grid
3-phase 11 kV Dist. line ACSR Gopher 40.500 02-phase 11 kV Dist. line ACSR Gopher 32.000 2 64.000LV Dist line ABC 35 sq.mm conductors 50.000 3 150.0002-phase Dist. Transformer 18.000 6 108.000Total mini grid 322.000
Consumer connections1-ph service con. w/prep. Meter Sc.1 2.000 248 495.3601-ph service con. w/prep. Meter Sc.2 2.000 165 330.240
Total investmentScenario 1 1.447.360Scenario 2 1.282.240
2. Mokhalinyane Table 3 Households & connections Mokhalinyane cluster Year 2020 2005Number of households 1720 1017Number of hh connections Scenario 1 516 305Number of hh connections Scenario 2 344 203Number of GP connections Sc. 1 34 20Number of GP connections Sc. 2 23 14
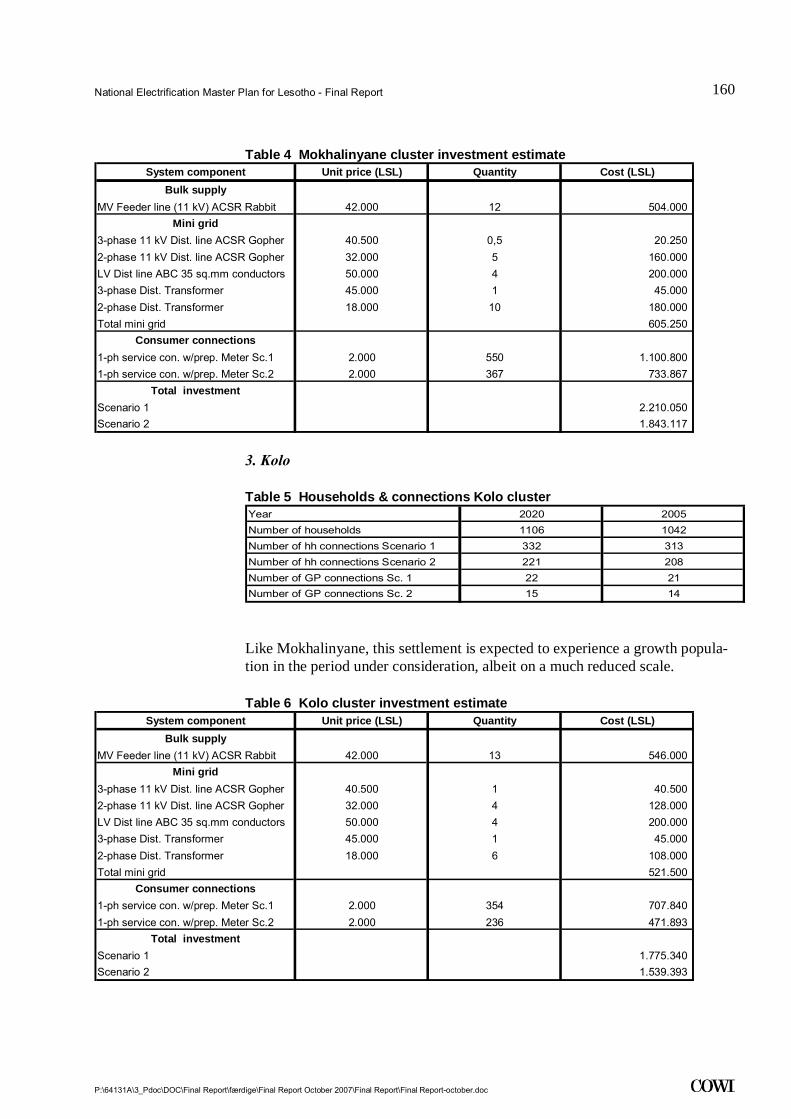
National Electrification Master Plan for Lesotho - Final Report
P:\64131A\3_Pdoc\DOC\Final Report\færdige\Final Report October 2007\Final Report\Final Report-october.doc
160
.
Table 4 Mokhalinyane cluster investment estimate System component Unit price (LSL) Quantity Cost (LSL)
Bulk supplyMV Feeder line (11 kV) ACSR Rabbit 42.000 12 504.000
Mini grid3-phase 11 kV Dist. line ACSR Gopher 40.500 0,5 20.250 2-phase 11 kV Dist. line ACSR Gopher 32.000 5 160.000 LV Dist line ABC 35 sq.mm conductors 50.000 4 200.000 3-phase Dist. Transformer 45.000 1 45.000 2-phase Dist. Transformer 18.000 10 180.000 Total mini grid 605.250
Consumer connections1-ph service con. w/prep. Meter Sc.1 2.000 550 1.100.800 1-ph service con. w/prep. Meter Sc.2 2.000 367 733.867
Total investmentScenario 1 2.210.050 Scenario 2 1.843.117
3. Kolo Table 5 Households & connections Kolo cluster Year 2020 2005Number of households 1106 1042Number of hh connections Scenario 1 332 313Number of hh connections Scenario 2 221 208Number of GP connections Sc. 1 22 21Number of GP connections Sc. 2 15 14
Like Mokhalinyane, this settlement is expected to experience a growth popula-tion in the period under consideration, albeit on a much reduced scale. Table 6 Kolo cluster investment estimate
System component Unit price (LSL) Quantity Cost (LSL)Bulk supply
MV Feeder line (11 kV) ACSR Rabbit 42.000 13 546.000 Mini grid
3-phase 11 kV Dist. line ACSR Gopher 40.500 1 40.500 2-phase 11 kV Dist. line ACSR Gopher 32.000 4 128.000 LV Dist line ABC 35 sq.mm conductors 50.000 4 200.000 3-phase Dist. Transformer 45.000 1 45.000 2-phase Dist. Transformer 18.000 6 108.000 Total mini grid 521.500
Consumer connections1-ph service con. w/prep. Meter Sc.1 2.000 354 707.840 1-ph service con. w/prep. Meter Sc.2 2.000 236 471.893
Total investmentScenario 1 1.775.340 Scenario 2 1.539.393
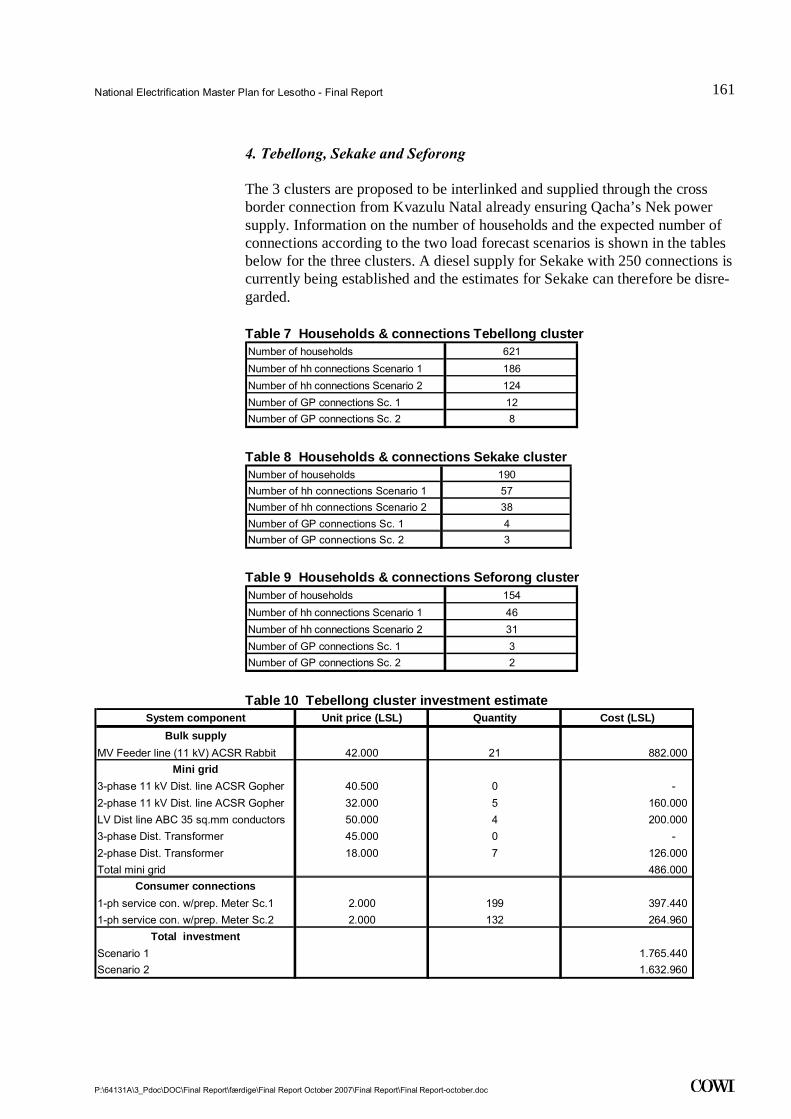
National Electrification Master Plan for Lesotho - Final Report
P:\64131A\3_Pdoc\DOC\Final Report\færdige\Final Report October 2007\Final Report\Final Report-october.doc
161
.
4. Tebellong, Sekake and Seforong The 3 clusters are proposed to be interlinked and supplied through the cross border connection from Kvazulu Natal already ensuring Qacha’s Nek power supply. Information on the number of households and the expected number of connections according to the two load forecast scenarios is shown in the tables below for the three clusters. A diesel supply for Sekake with 250 connections is currently being established and the estimates for Sekake can therefore be disre-garded.
Table 7 Households & connections Tebellong cluster Number of households 621Number of hh connections Scenario 1 186Number of hh connections Scenario 2 124Number of GP connections Sc. 1 12Number of GP connections Sc. 2 8 Table 8 Households & connections Sekake cluster Number of households 190Number of hh connections Scenario 1 57Number of hh connections Scenario 2 38Number of GP connections Sc. 1 4Number of GP connections Sc. 2 3 Table 9 Households & connections Seforong cluster Number of households 154Number of hh connections Scenario 1 46Number of hh connections Scenario 2 31Number of GP connections Sc. 1 3Number of GP connections Sc. 2 2 Table 10 Tebellong cluster investment estimate
System component Unit price (LSL) Quantity Cost (LSL)Bulk supply
MV Feeder line (11 kV) ACSR Rabbit 42.000 21 882.000 Mini grid
3-phase 11 kV Dist. line ACSR Gopher 40.500 0 - 2-phase 11 kV Dist. line ACSR Gopher 32.000 5 160.000 LV Dist line ABC 35 sq.mm conductors 50.000 4 200.000 3-phase Dist. Transformer 45.000 0 - 2-phase Dist. Transformer 18.000 7 126.000 Total mini grid 486.000
Consumer connections1-ph service con. w/prep. Meter Sc.1 2.000 199 397.440 1-ph service con. w/prep. Meter Sc.2 2.000 132 264.960
Total investmentScenario 1 1.765.440 Scenario 2 1.632.960

National Electrification Master Plan for Lesotho - Final Report
P:\64131A\3_Pdoc\DOC\Final Report\færdige\Final Report October 2007\Final Report\Final Report-october.doc
162
.
Table 11 Sekake cluster investment estimate System component Unit price (LSL) Quantity Cost (LSL)
Bulk supplyMV Feeder line (11 kV) ACSR Rabbit 42.000 18 756.000
Mini grid3-phase 11 kV Dist. line ACSR Gopher 40.500 0 - 2-phase 11 kV Dist. line ACSR Gopher 32.000 3 96.000 LV Dist line ABC 35 sq.mm conductors 50.000 3 150.000 3-phase Dist. Transformer 45.000 0 - 2-phase Dist. Transformer 18.000 3 54.000 Total mini grid 300.000
Consumer connections1-ph service con. w/prep. Meter Sc.1 2.000 62 124.000 1-ph service con. w/prep. Meter Sc.2 2.000 40 80.000
Total investmentScenario 1 1.180.000 Scenario 2 1.136.000
Table 12 Seforong cluster investment estimate
System component Unit price (LSL) Quantity Cost (LSL)Bulk supply
MV Feeder line (11 kV) ACSR Rabbit 42.000 12 504.000 Mini grid
3-phase 11 kV Dist. line ACSR Gopher 40.500 1 40.500 2-phase 11 kV Dist. line ACSR Gopher 32.000 3 96.000 LV Dist line ABC 35 sq.mm conductors 50.000 3 150.000 3-phase Dist. Transformer 45.000 0 - 2-phase Dist. Transformer 18.000 3 54.000 Total mini grid 340.500
Consumer connections1-ph service con. w/prep. Meter Sc.1 2.000 49 98.560 1-ph service con. w/prep. Meter Sc.2 2.000 33 65.707
Total investmentScenario 1 943.060 Scenario 2 910.207
5. Ramabanta Table 13 Households & institutions Ramabanta cluster Number of households 83 SHS OutputInstitutions:Mission 1 200W ACSchool 1 250 W ACHealth centre 1 300 W ACPostal agency 1 150 W Principal Chief 1 100 W
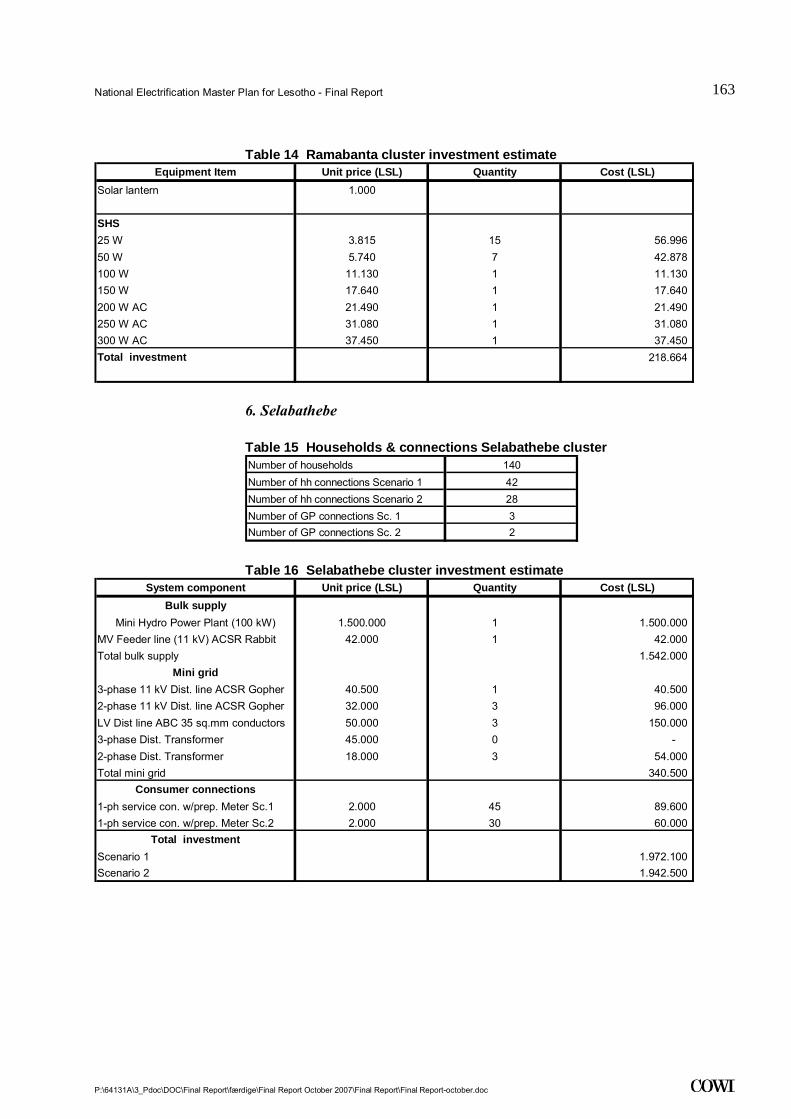
National Electrification Master Plan for Lesotho - Final Report
P:\64131A\3_Pdoc\DOC\Final Report\færdige\Final Report October 2007\Final Report\Final Report-october.doc
163
.
Table 14 Ramabanta cluster investment estimate Equipment Item Unit price (LSL) Quantity Cost (LSL)
Solar lantern 1.000
SHS25 W 3.815 15 56.996 50 W 5.740 7 42.878 100 W 11.130 1 11.130 150 W 17.640 1 17.640 200 W AC 21.490 1 21.490 250 W AC 31.080 1 31.080 300 W AC 37.450 1 37.450 Total investment 218.664
6. Selabathebe Table 15 Households & connections Selabathebe cluster Number of households 140Number of hh connections Scenario 1 42Number of hh connections Scenario 2 28Number of GP connections Sc. 1 3Number of GP connections Sc. 2 2 Table 16 Selabathebe cluster investment estimate
System component Unit price (LSL) Quantity Cost (LSL)Bulk supply
Mini Hydro Power Plant (100 kW) 1.500.000 1 1.500.000 MV Feeder line (11 kV) ACSR Rabbit 42.000 1 42.000 Total bulk supply 1.542.000
Mini grid3-phase 11 kV Dist. line ACSR Gopher 40.500 1 40.500 2-phase 11 kV Dist. line ACSR Gopher 32.000 3 96.000 LV Dist line ABC 35 sq.mm conductors 50.000 3 150.000 3-phase Dist. Transformer 45.000 0 - 2-phase Dist. Transformer 18.000 3 54.000 Total mini grid 340.500
Consumer connections1-ph service con. w/prep. Meter Sc.1 2.000 45 89.600 1-ph service con. w/prep. Meter Sc.2 2.000 30 60.000
Total investmentScenario 1 1.972.100 Scenario 2 1.942.500
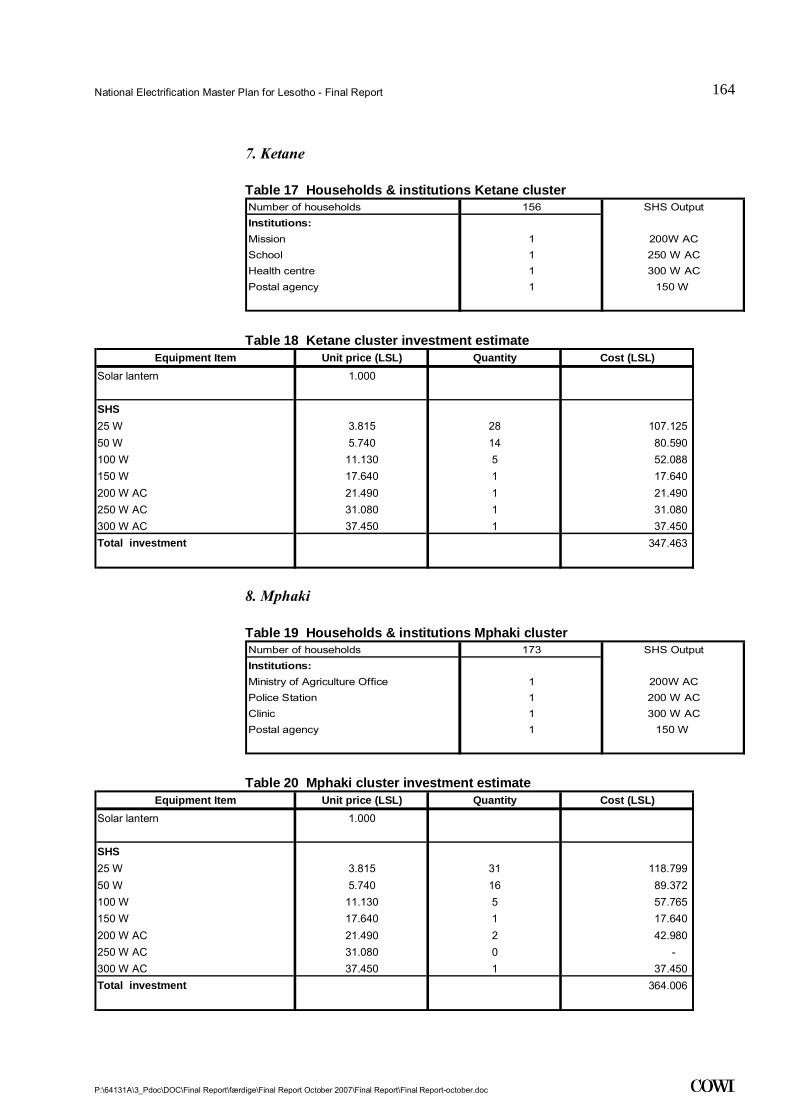
National Electrification Master Plan for Lesotho - Final Report
P:\64131A\3_Pdoc\DOC\Final Report\færdige\Final Report October 2007\Final Report\Final Report-october.doc
164
.
7. Ketane Table 17 Households & institutions Ketane cluster Number of households 156 SHS OutputInstitutions:Mission 1 200W ACSchool 1 250 W ACHealth centre 1 300 W ACPostal agency 1 150 W
Table 18 Ketane cluster investment estimate
Equipment Item Unit price (LSL) Quantity Cost (LSL)Solar lantern 1.000
SHS25 W 3.815 28 107.125 50 W 5.740 14 80.590 100 W 11.130 5 52.088 150 W 17.640 1 17.640 200 W AC 21.490 1 21.490 250 W AC 31.080 1 31.080 300 W AC 37.450 1 37.450 Total investment 347.463
8. Mphaki Table 19 Households & institutions Mphaki cluster Number of households 173 SHS OutputInstitutions:Ministry of Agriculture Office 1 200W ACPolice Station 1 200 W ACClinic 1 300 W ACPostal agency 1 150 W
Table 20 Mphaki cluster investment estimate
Equipment Item Unit price (LSL) Quantity Cost (LSL)Solar lantern 1.000
SHS25 W 3.815 31 118.799 50 W 5.740 16 89.372 100 W 11.130 5 57.765 150 W 17.640 1 17.640 200 W AC 21.490 2 42.980 250 W AC 31.080 0 - 300 W AC 37.450 1 37.450 Total investment 364.006
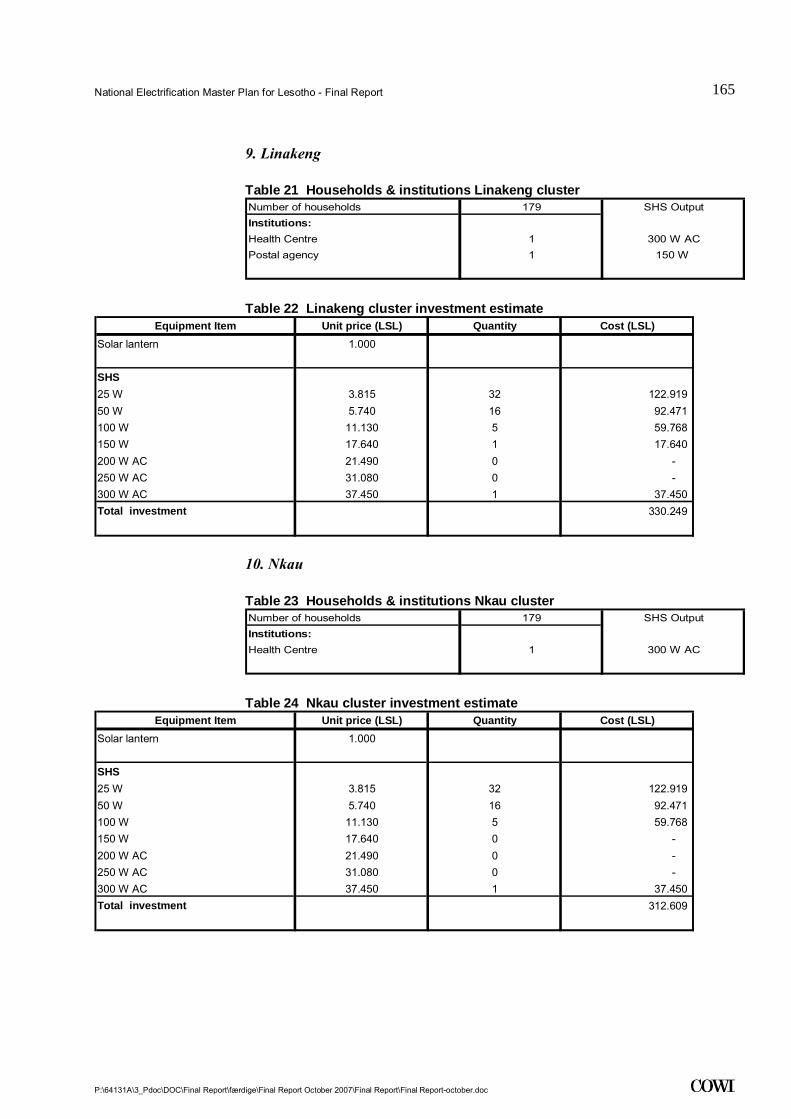
National Electrification Master Plan for Lesotho - Final Report
P:\64131A\3_Pdoc\DOC\Final Report\færdige\Final Report October 2007\Final Report\Final Report-october.doc
165
.
9. Linakeng Table 21 Households & institutions Linakeng cluster Number of households 179 SHS OutputInstitutions:Health Centre 1 300 W ACPostal agency 1 150 W
Table 22 Linakeng cluster investment estimate
Equipment Item Unit price (LSL) Quantity Cost (LSL)Solar lantern 1.000
SHS25 W 3.815 32 122.919 50 W 5.740 16 92.471 100 W 11.130 5 59.768 150 W 17.640 1 17.640 200 W AC 21.490 0 - 250 W AC 31.080 0 - 300 W AC 37.450 1 37.450 Total investment 330.249
10. Nkau Table 23 Households & institutions Nkau cluster Number of households 179 SHS OutputInstitutions:Health Centre 1 300 W AC
Table 24 Nkau cluster investment estimate
Equipment Item Unit price (LSL) Quantity Cost (LSL)Solar lantern 1.000
SHS25 W 3.815 32 122.919 50 W 5.740 16 92.471 100 W 11.130 5 59.768 150 W 17.640 0 - 200 W AC 21.490 0 - 250 W AC 31.080 0 - 300 W AC 37.450 1 37.450 Total investment 312.609
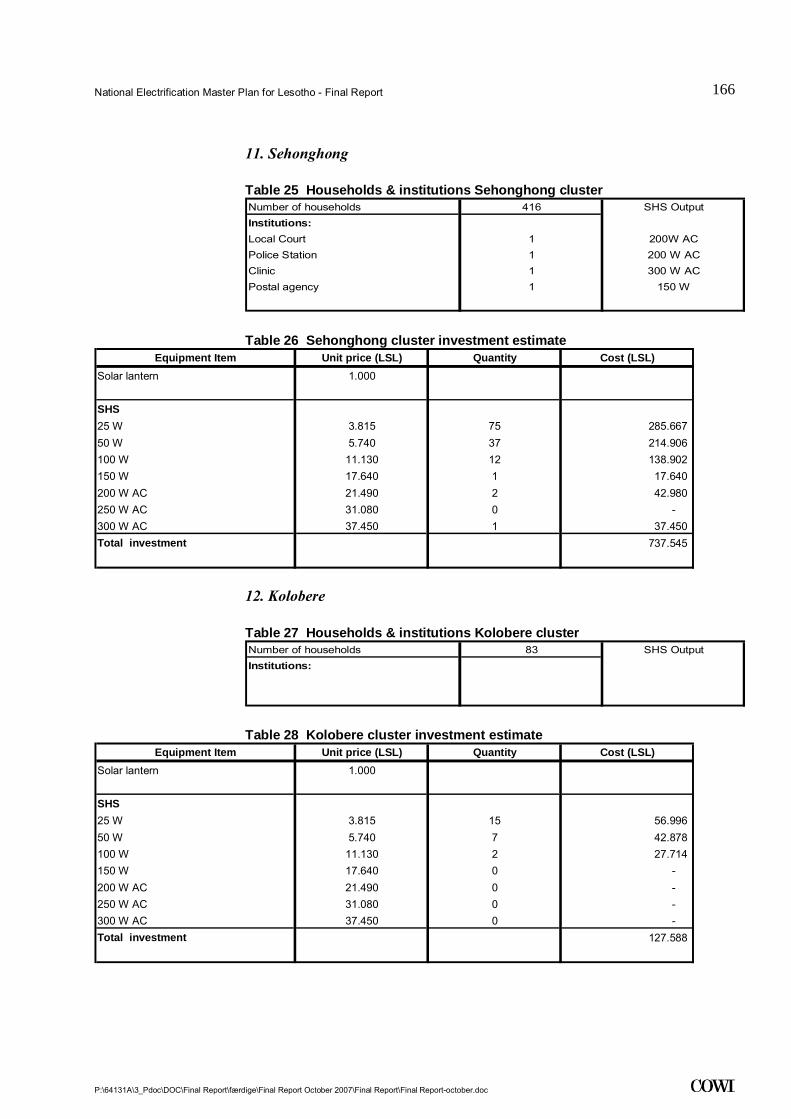
National Electrification Master Plan for Lesotho - Final Report
P:\64131A\3_Pdoc\DOC\Final Report\færdige\Final Report October 2007\Final Report\Final Report-october.doc
166
.
11. Sehonghong Table 25 Households & institutions Sehonghong cluster Number of households 416 SHS OutputInstitutions:Local Court 1 200W ACPolice Station 1 200 W ACClinic 1 300 W ACPostal agency 1 150 W
Table 26 Sehonghong cluster investment estimate
Equipment Item Unit price (LSL) Quantity Cost (LSL)Solar lantern 1.000
SHS25 W 3.815 75 285.667 50 W 5.740 37 214.906 100 W 11.130 12 138.902 150 W 17.640 1 17.640 200 W AC 21.490 2 42.980 250 W AC 31.080 0 - 300 W AC 37.450 1 37.450 Total investment 737.545
12. Kolobere Table 27 Households & institutions Kolobere cluster Number of households 83 SHS OutputInstitutions:
Table 28 Kolobere cluster investment estimate
Equipment Item Unit price (LSL) Quantity Cost (LSL)Solar lantern 1.000
SHS25 W 3.815 15 56.996 50 W 5.740 7 42.878 100 W 11.130 2 27.714 150 W 17.640 0 - 200 W AC 21.490 0 - 250 W AC 31.080 0 - 300 W AC 37.450 0 - Total investment 127.588

National Electrification Master Plan for Lesotho - Final Report
P:\64131A\3_Pdoc\DOC\Final Report\færdige\Final Report October 2007\Final Report\Final Report-october.doc
167
.
13. Lesobeng Table 29 Households & connections Lesobeng cluster Number of households 83Number of hh connections Scenario 1 25Number of hh connections Scenario 2 17Number of GP connections Sc. 1 2Number of GP connections Sc. 2 1 Table 30 Lesobeng cluster investment estimate
System component Unit price (LSL) Quantity Cost (LSL)Bulk supply
Mini Hydro Power Plant (100 kW) 1.500.000 1 1.500.000MV Feeder line (11 kV) ACSR Rabbit 42.000 4 168.000 Total bulk supply 1.668.000
Mini grid3-phase 11 kV Dist. line ACSR Gopher 40.500 0 - 2-phase 11 kV Dist. line ACSR Gopher 32.000 3 96.000 LV Dist line ABC 35 sq.mm conductors 50.000 2 100.000 3-phase Dist. Transformer 45.000 0 02-phase Dist. Transformer 18.000 2 36.000 Total mini grid 232.000
Consumer connections1-ph service con. w/prep. Meter Sc.1 2.000 27 54.0001-ph service con. w/prep. Meter Sc.2 2.000 18 36.000
Total investmentScenario 1 1.954.000 Scenario 2 1.936.000
14. Letsika Table 31 Households & institutions Letsika cluster Number of households 83 SHS OutputInstitutions:
Table 32 Letsika cluster investment estimate
Equipment Item Unit price (LSL) Quantity Cost (LSL)Solar lantern 1.000
SHS25 W 3.815 15 56.996 50 W 5.740 7 42.878 100 W 11.130 2 27.714 150 W 17.640 0 - 200 W AC 21.490 0 - 250 W AC 31.080 0 - 300 W AC 37.450 0 - Total investment 127.588

National Electrification Master Plan for Lesotho - Final Report
P:\64131A\3_Pdoc\DOC\Final Report\færdige\Final Report October 2007\Final Report\Final Report-october.doc
168
.
15. Malingoaneng Table 33 Households & institutions Malingoaneng cluster Number of households 83 SHS Output
Institutions:
Table 34 Malingoaneng cluster investment estimate
Equipment Item Unit price (LSL) Quantity Cost (LSL)Solar lantern 1.000
SHS25 W 3.815 15 56.996 50 W 5.740 7 42.878 100 W 11.130 2 27.714 150 W 17.640 0 - 200 W AC 21.490 0 - 250 W AC 31.080 0 - 300 W AC 37.450 0 - Total investment 127.588
16. Molikaliko Table 35 Households & institutions Molikaliko cluster Number of households 83 SHS OutputInstitutions:Health Centre 1 300 W AC
Table 36 Molikaliko cluster investment estimate
Equipment Item Unit price (LSL) Quantity Cost (LSL)Solar lantern 1.000
SHS25 W 3.815 15 56.996 50 W 5.740 7 42.878 100 W 11.130 2 27.714 150 W 17.640 0 - 200 W AC 21.490 0 - 250 W AC 31.080 0 - 300 W AC 37.450 1 37.450 Total investment 165.038
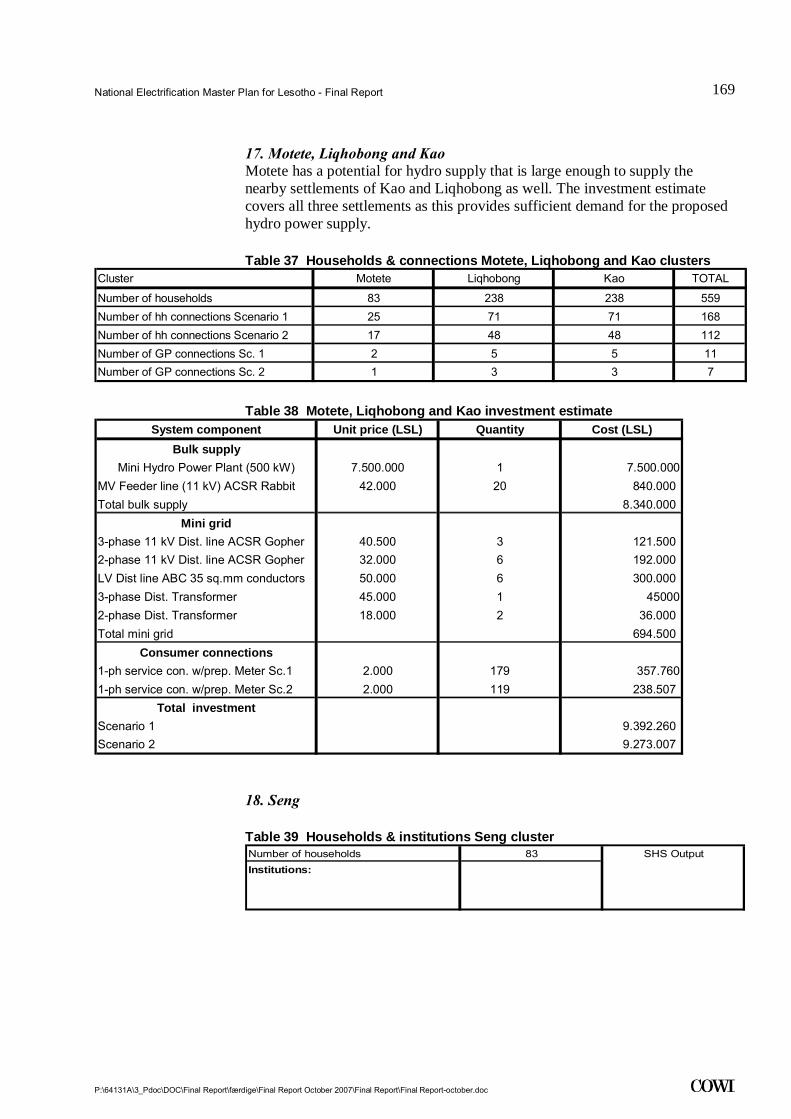
National Electrification Master Plan for Lesotho - Final Report
P:\64131A\3_Pdoc\DOC\Final Report\færdige\Final Report October 2007\Final Report\Final Report-october.doc
169
.
17. Motete, Liqhobong and Kao Motete has a potential for hydro supply that is large enough to supply the nearby settlements of Kao and Liqhobong as well. The investment estimate covers all three settlements as this provides sufficient demand for the proposed hydro power supply. Table 37 Households & connections Motete, Liqhobong and Kao clusters
Cluster Motete Liqhobong Kao TOTAL
Number of households 83 238 238 559Number of hh connections Scenario 1 25 71 71 168Number of hh connections Scenario 2 17 48 48 112Number of GP connections Sc. 1 2 5 5 11Number of GP connections Sc. 2 1 3 3 7
Table 38 Motete, Liqhobong and Kao investment estimate
System component Unit price (LSL) Quantity Cost (LSL)Bulk supply
Mini Hydro Power Plant (500 kW) 7.500.000 1 7.500.000MV Feeder line (11 kV) ACSR Rabbit 42.000 20 840.000 Total bulk supply 8.340.000
Mini grid3-phase 11 kV Dist. line ACSR Gopher 40.500 3 121.500 2-phase 11 kV Dist. line ACSR Gopher 32.000 6 192.000 LV Dist line ABC 35 sq.mm conductors 50.000 6 300.000 3-phase Dist. Transformer 45.000 1 450002-phase Dist. Transformer 18.000 2 36.000 Total mini grid 694.500
Consumer connections1-ph service con. w/prep. Meter Sc.1 2.000 179 357.7601-ph service con. w/prep. Meter Sc.2 2.000 119 238.507
Total investmentScenario 1 9.392.260 Scenario 2 9.273.007
18. Seng Table 39 Households & institutions Seng cluster Number of households 83 SHS OutputInstitutions:
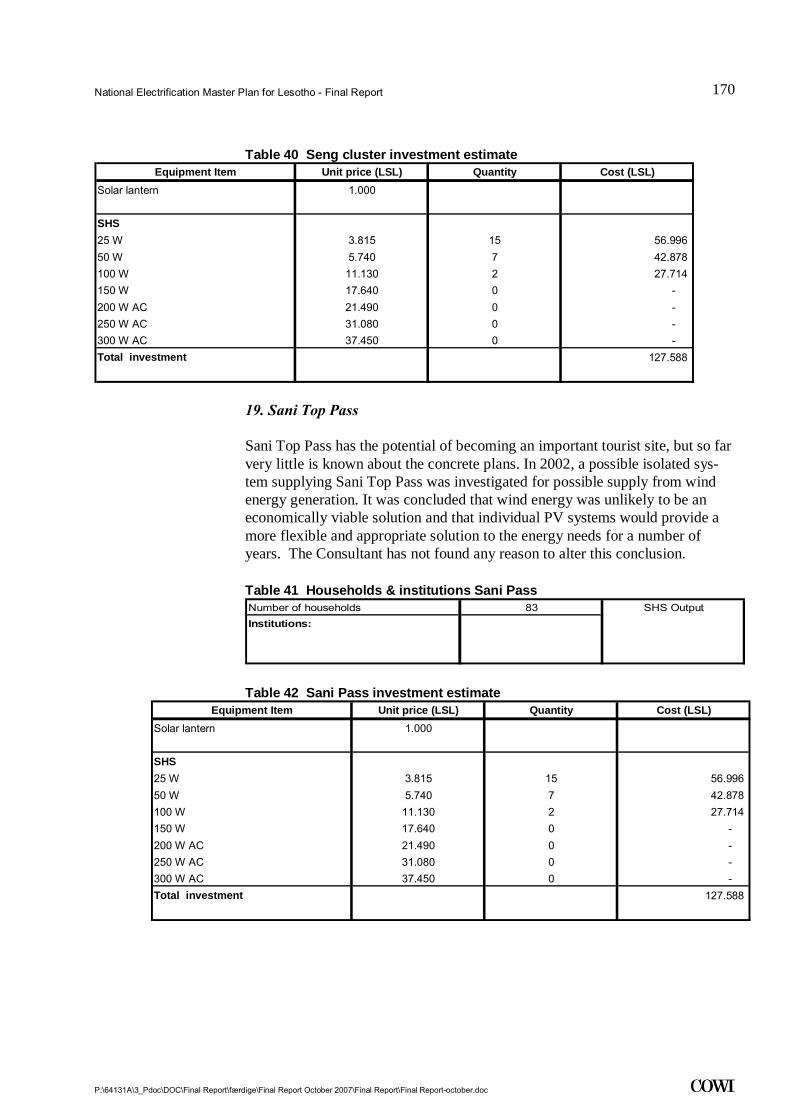
National Electrification Master Plan for Lesotho - Final Report
P:\64131A\3_Pdoc\DOC\Final Report\færdige\Final Report October 2007\Final Report\Final Report-october.doc
170
.
Table 40 Seng cluster investment estimate Equipment Item Unit price (LSL) Quantity Cost (LSL)
Solar lantern 1.000
SHS25 W 3.815 15 56.996 50 W 5.740 7 42.878 100 W 11.130 2 27.714 150 W 17.640 0 - 200 W AC 21.490 0 - 250 W AC 31.080 0 - 300 W AC 37.450 0 - Total investment 127.588
19. Sani Top Pass Sani Top Pass has the potential of becoming an important tourist site, but so far very little is known about the concrete plans. In 2002, a possible isolated sys-tem supplying Sani Top Pass was investigated for possible supply from wind energy generation. It was concluded that wind energy was unlikely to be an economically viable solution and that individual PV systems would provide a more flexible and appropriate solution to the energy needs for a number of years. The Consultant has not found any reason to alter this conclusion. Table 41 Households & institutions Sani Pass Number of households 83 SHS OutputInstitutions:
Table 42 Sani Pass investment estimate
Equipment Item Unit price (LSL) Quantity Cost (LSL)Solar lantern 1.000
SHS25 W 3.815 15 56.996 50 W 5.740 7 42.878 100 W 11.130 2 27.714 150 W 17.640 0 - 200 W AC 21.490 0 - 250 W AC 31.080 0 - 300 W AC 37.450 0 - Total investment 127.588
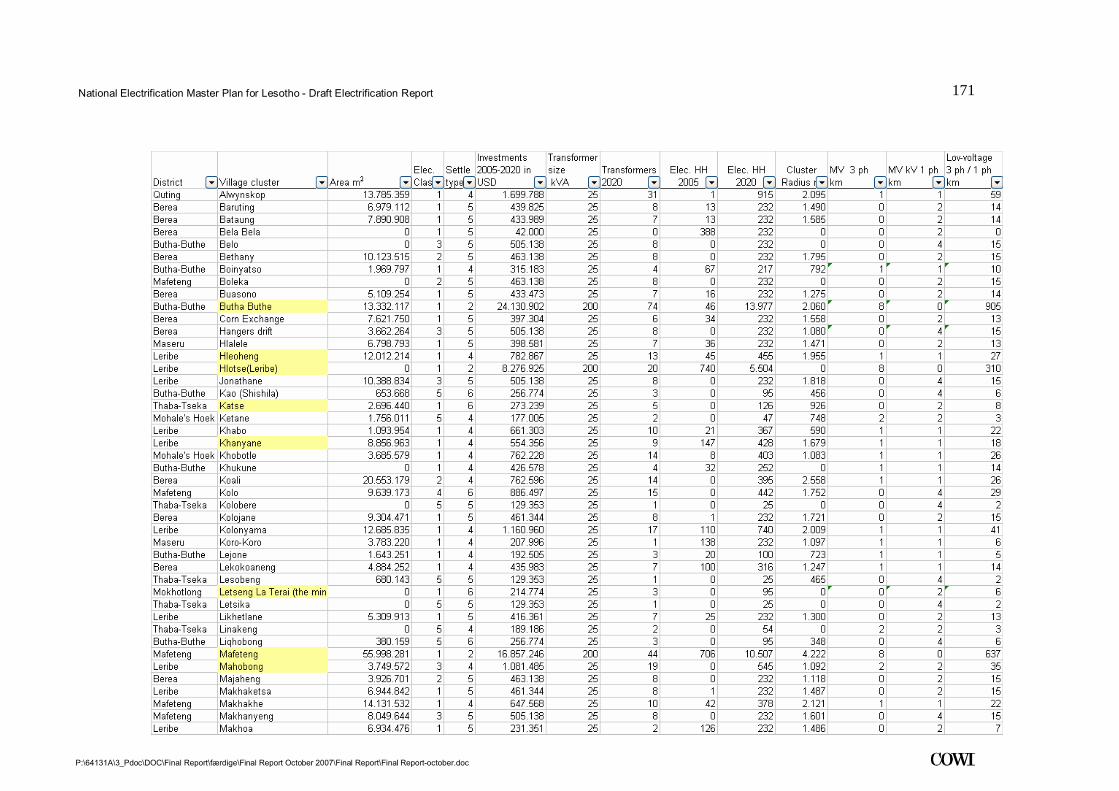
National Electrification Master Plan for Lesotho - Draft Electrification Report
P:\64131A\3_Pdoc\DOC\Final Report\færdige\Final Report October 2007\Final Report\Final Report-october.doc
171
.

National Electrification Master Plan for Lesotho - Draft Electrification Report
P:\64131A\3_Pdoc\DOC\Final Report\færdige\Final Report October 2007\Final Report\Final Report-october.doc
172
.
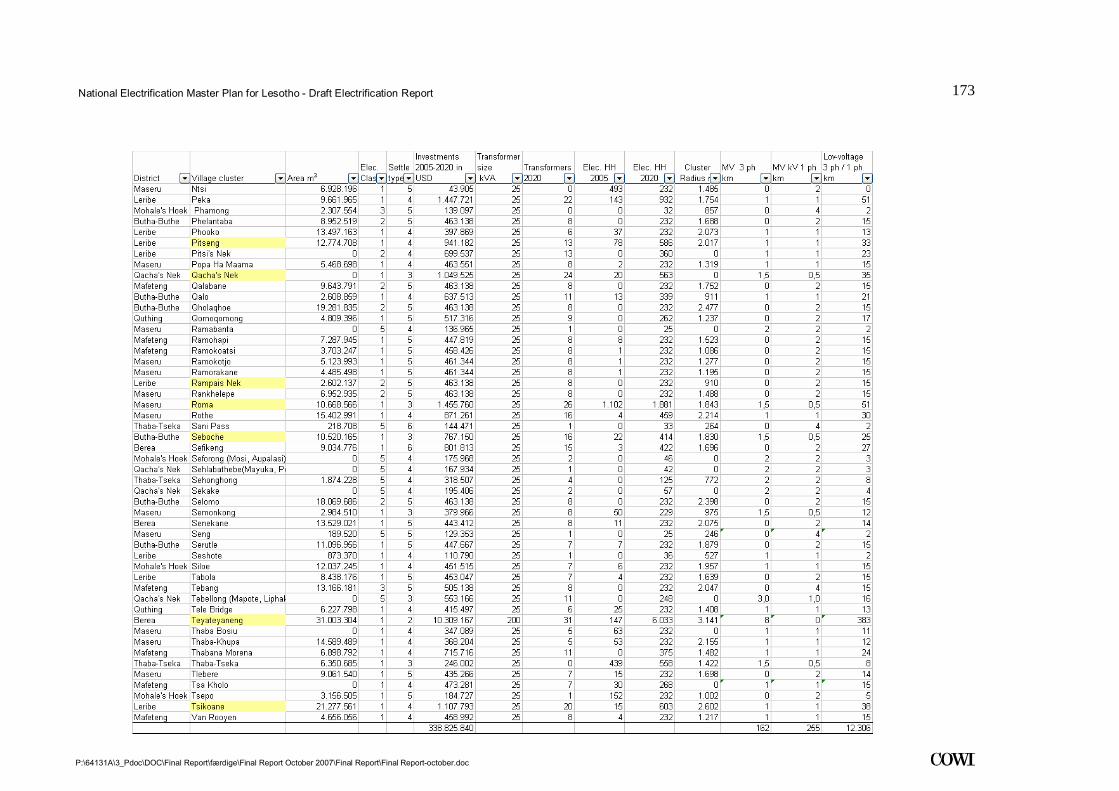
National Electrification Master Plan for Lesotho - Draft Electrification Report
P:\64131A\3_Pdoc\DOC\Final Report\færdige\Final Report October 2007\Final Report\Final Report-october.doc
173
.

National Electrification Master Plan for Lesotho - Electrification Report
P:\64131A\3_Pdoc\DOC\Final Report\færdige\Final Report October 2007\Final Report\Final Report-october.doc
174
.
Appendix 5 – Viability Score by Settlement
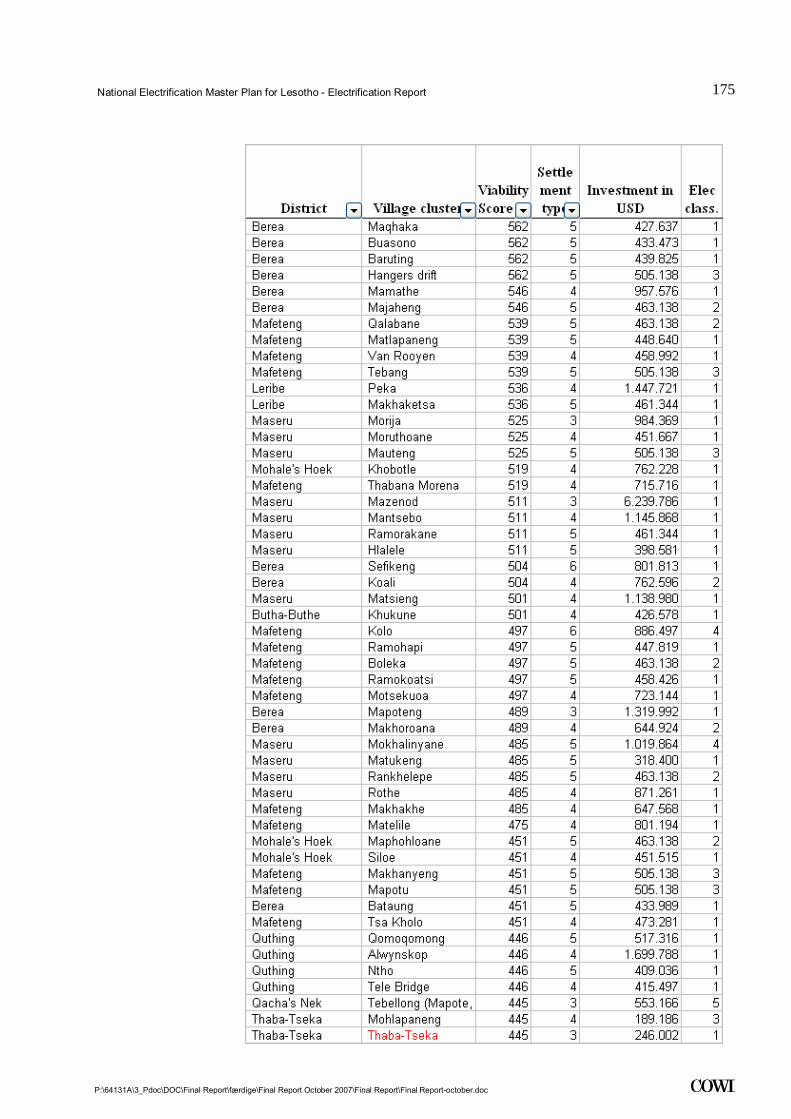
National Electrification Master Plan for Lesotho - Electrification Report
P:\64131A\3_Pdoc\DOC\Final Report\færdige\Final Report October 2007\Final Report\Final Report-october.doc
175
.
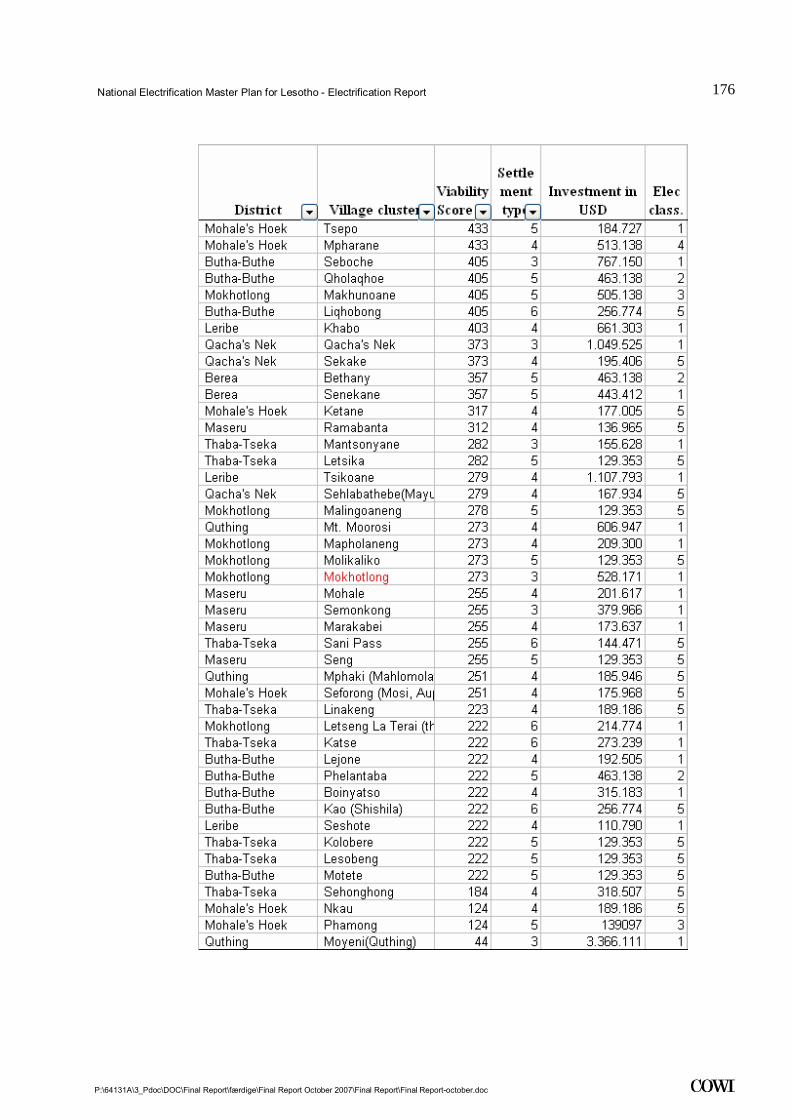
National Electrification Master Plan for Lesotho - Electrification Report
P:\64131A\3_Pdoc\DOC\Final Report\færdige\Final Report October 2007\Final Report\Final Report-october.doc
176
.
National Electrification Master Plan for Lesotho - Electrification Report
P:\64131A\3_Pdoc\DOC\Final Report\færdige\Final Report October 2007\Final Report\Final Report-october.doc
177
.
Appendix 6 – Financial Model

National Electrification Master Plan for Lesotho - Electrification Report
P:\64131A\3_Pdoc\DOC\Final Report\færdige\Final Report October 2007\Final Report\Final Report-october.doc
178
.
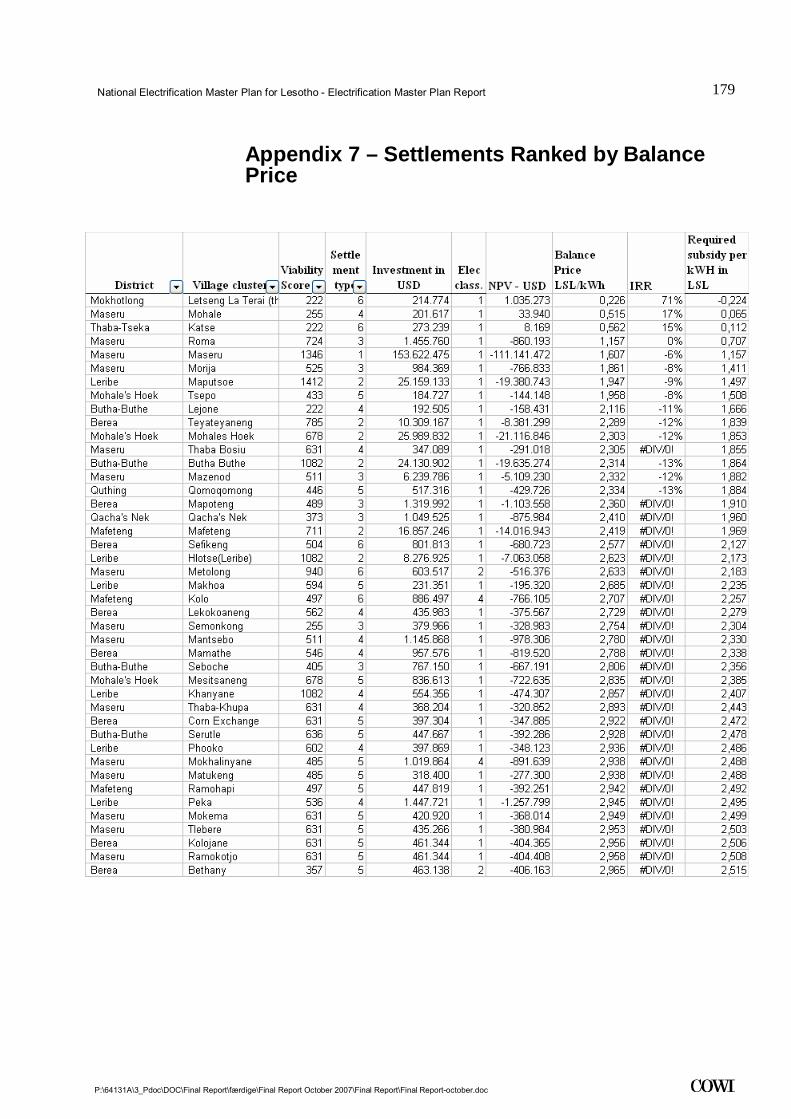
National Electrification Master Plan for Lesotho - Electrification Master Plan Report
P:\64131A\3_Pdoc\DOC\Final Report\færdige\Final Report October 2007\Final Report\Final Report-october.doc
179
.
Appendix 7 – Settlements Ranked by Balance Price
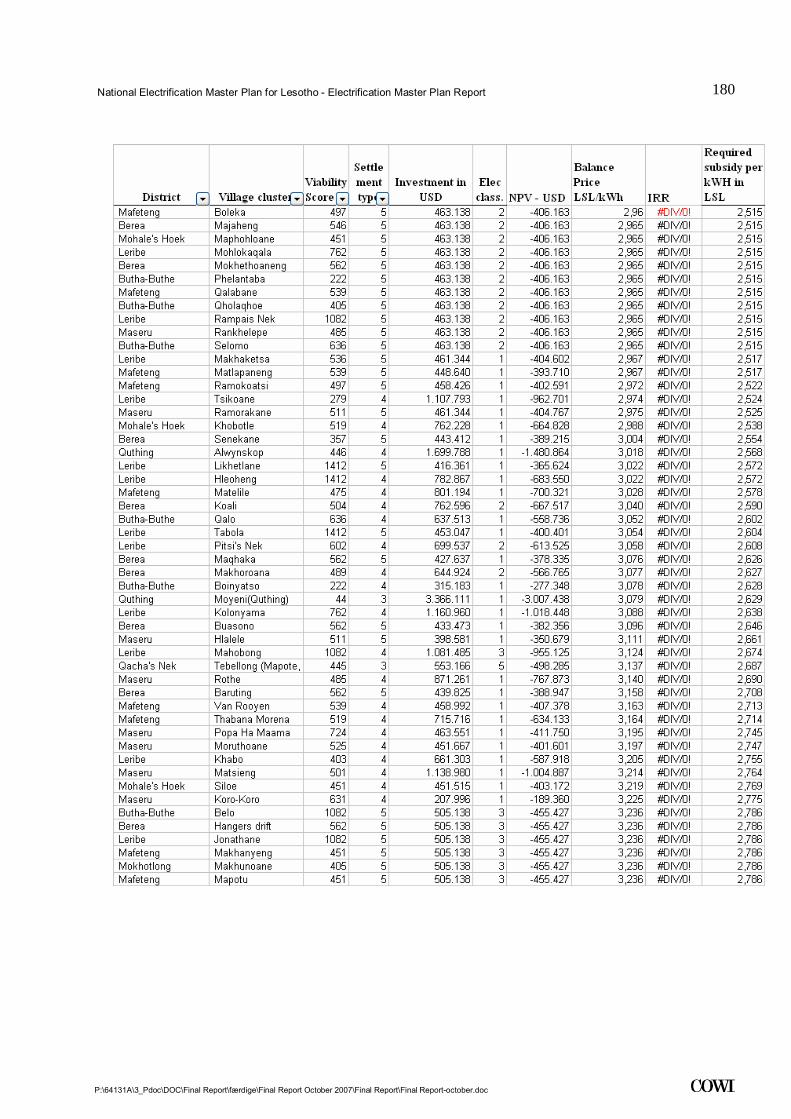
National Electrification Master Plan for Lesotho - Electrification Master Plan Report
P:\64131A\3_Pdoc\DOC\Final Report\færdige\Final Report October 2007\Final Report\Final Report-october.doc
180
.
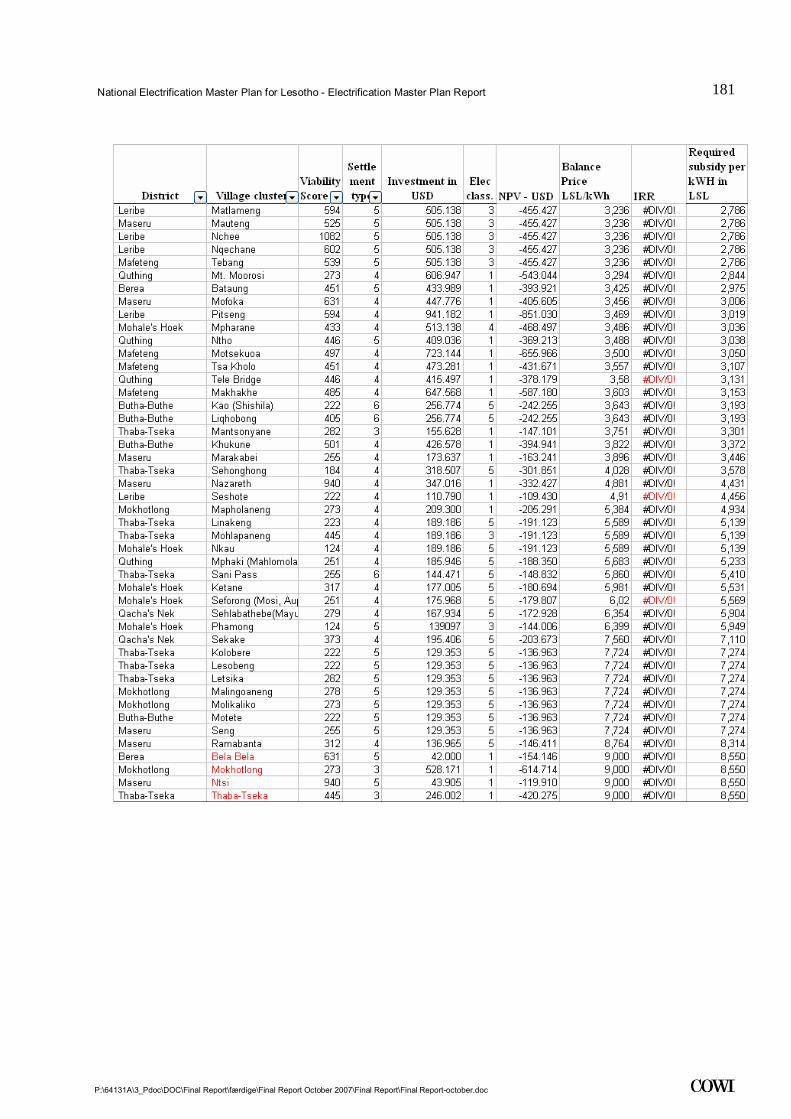
National Electrification Master Plan for Lesotho - Electrification Master Plan Report
P:\64131A\3_Pdoc\DOC\Final Report\færdige\Final Report October 2007\Final Report\Final Report-october.doc
181
.
National Electrification Master Plan for Lesotho - Electrification Master Plan Report
P:\64131A\3_Pdoc\DOC\Final Report\færdige\Final Report October 2007\Final Report\Final Report-october.doc
182
.
Appendix 8 – Load Forecast per Settlement

National Electrification Master Plan for Lesotho - Draft Electrification Report
P:\64131A\3_Pdoc\DOC\Final Report\færdige\Final Report October 2007\Final Report\Final Report-october.doc
183
.
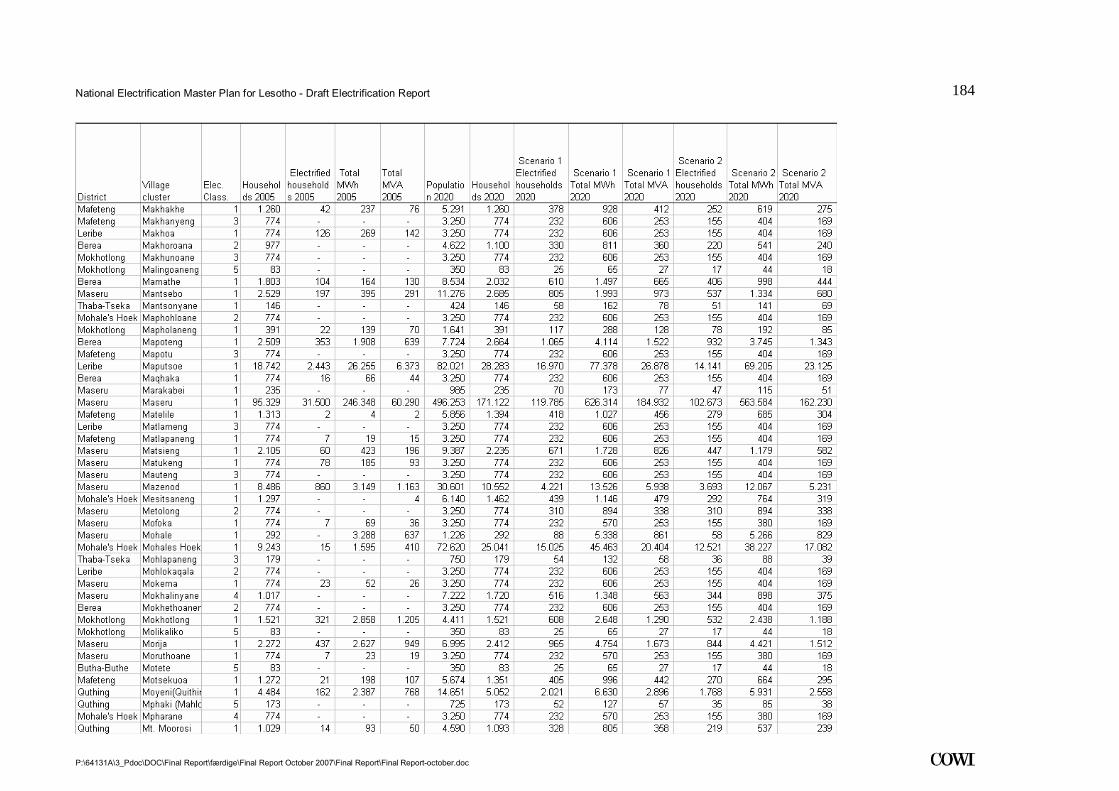
National Electrification Master Plan for Lesotho - Draft Electrification Report
P:\64131A\3_Pdoc\DOC\Final Report\færdige\Final Report October 2007\Final Report\Final Report-october.doc
184
.

National Electrification Master Plan for Lesotho - Draft Electrification Report
P:\64131A\3_Pdoc\DOC\Final Report\færdige\Final Report October 2007\Final Report\Final Report-october.doc
185
.
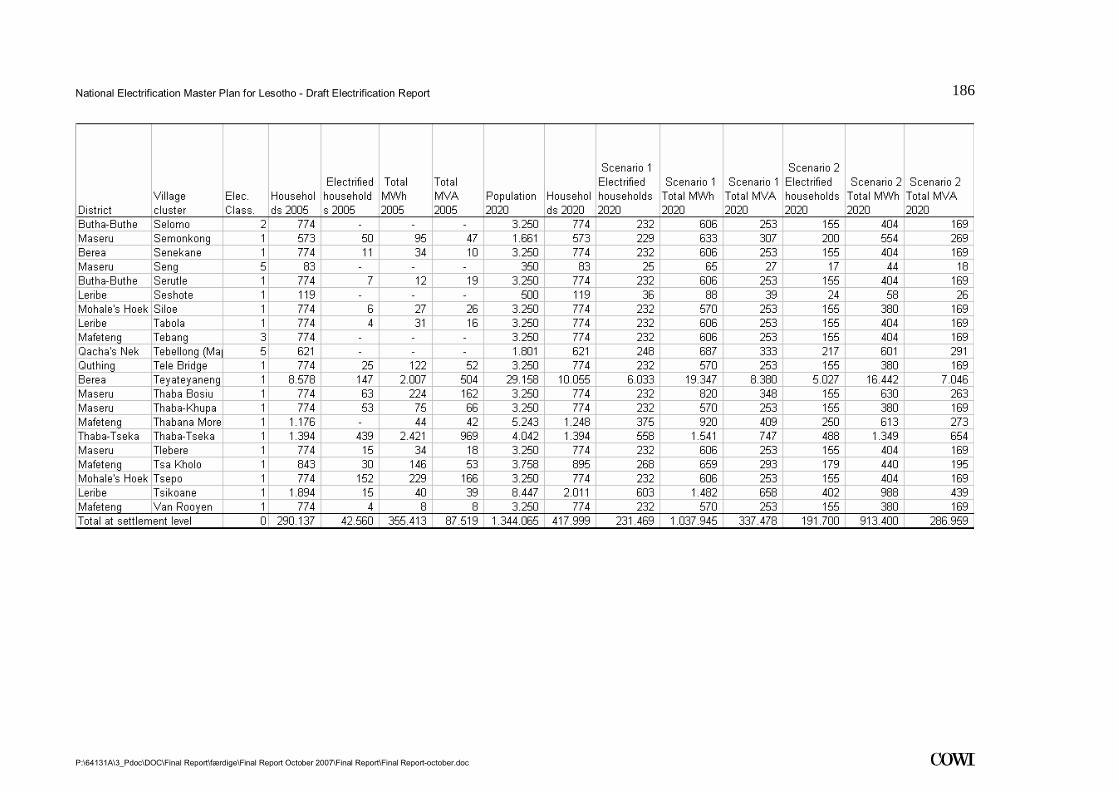
National Electrification Master Plan for Lesotho - Draft Electrification Report
P:\64131A\3_Pdoc\DOC\Final Report\færdige\Final Report October 2007\Final Report\Final Report-october.doc
186
.

National Electrification Master Plan for Lesotho - Draft Final Report
P:\64131A\3_Pdoc\DOC\Final Report\færdige\Final Report October 2007\Final Report\Final Report-october.doc
187
.
Appendix 9 – Transmission Network Model for 2005 and 2020
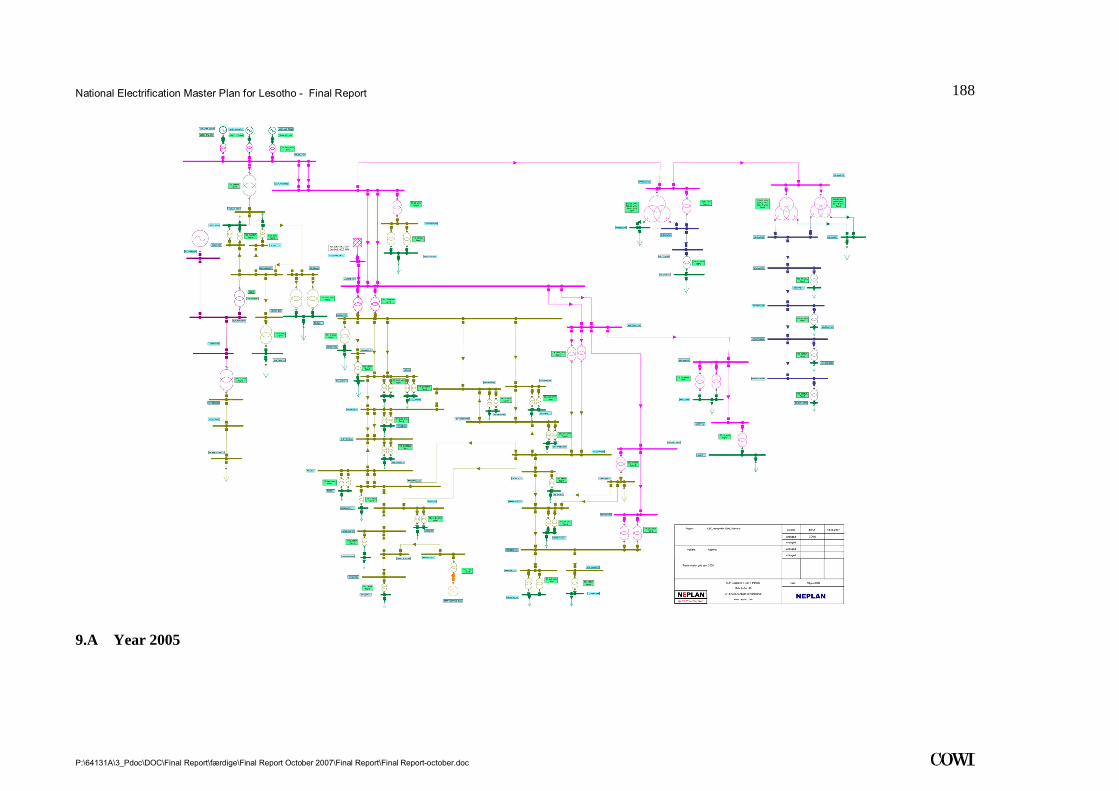
National Electrification Master Plan for Lesotho - Final Report
P:\64131A\3_Pdoc\DOC\Final Report\færdige\Final Report October 2007\Final Report\Final Report-october.doc
188
.
9.A Year 2005

National Electrification Master Plan for Lesotho - Final Report
P:\64131A\3_Pdoc\DOC\Final Report\færdige\Final Report October 2007\Final Report\Final Report-october.doc
189
.
9.B Year 2020
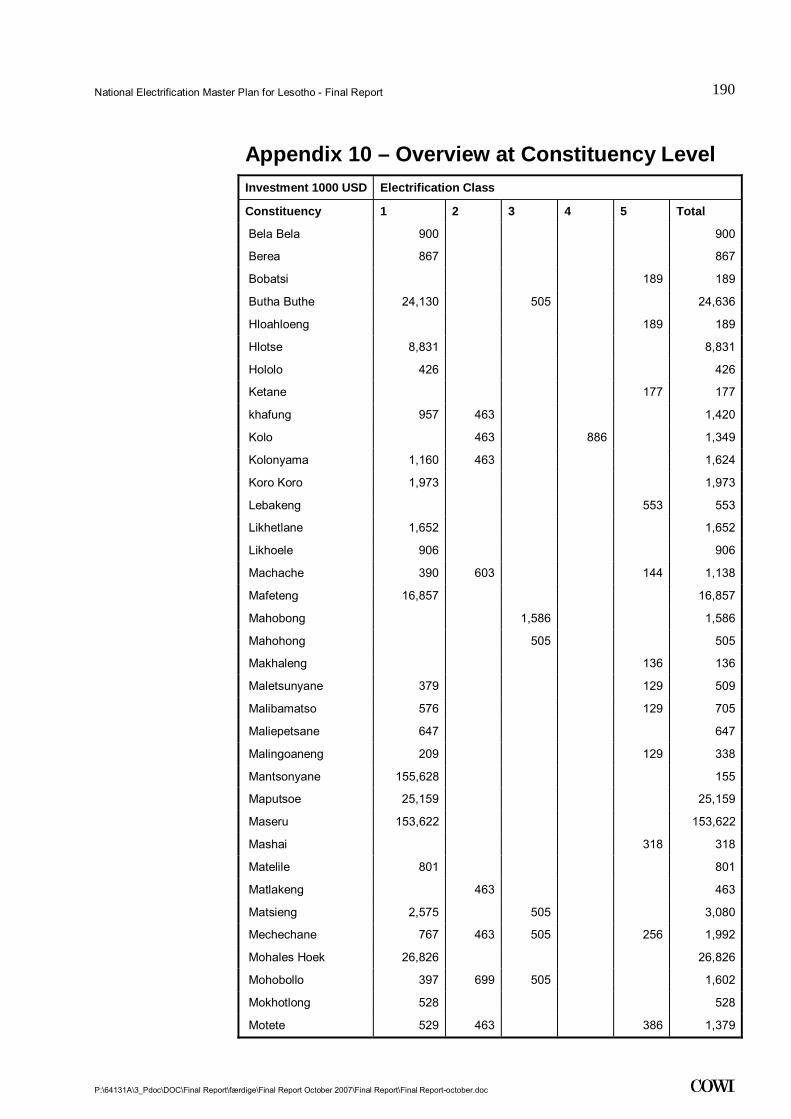
National Electrification Master Plan for Lesotho - Final Report
P:\64131A\3_Pdoc\DOC\Final Report\færdige\Final Report October 2007\Final Report\Final Report-october.doc
190
.
Appendix 10 – Overview at Constituency Level Investment 1000 USD Electrification Class
Constituency 1 2 3 4 5 Total
Bela Bela 900 900
Berea 867 867
Bobatsi 189 189
Butha Buthe 24,130 505 24,636
Hloahloeng 189 189
Hlotse 8,831 8,831
Hololo 426 426
Ketane 177 177
khafung 957 463 1,420
Kolo 463 886 1,349
Kolonyama 1,160 463 1,624
Koro Koro 1,973 1,973
Lebakeng 553 553
Likhetlane 1,652 1,652
Likhoele 906 906
Machache 390 603 144 1,138
Mafeteng 16,857 16,857
Mahobong 1,586 1,586
Mahohong 505 505
Makhaleng 136 136
Maletsunyane 379 129 509
Malibamatso 576 129 705
Maliepetsane 647 647
Malingoaneng 209 129 338
Mantsonyane 155,628 155
Maputsoe 25,159 25,159
Maseru 153,622 153,622
Mashai 318 318
Matelile 801 801
Matlakeng 463 463
Matsieng 2,575 505 3,080
Mechechane 767 463 505 256 1,992
Mohales Hoek 26,826 26,826
Mohobollo 397 699 505 1,602
Mokhotlong 528 528
Motete 529 463 386 1,379

National Electrification Master Plan for Lesotho - Final Report
P:\64131A\3_Pdoc\DOC\Final Report\færdige\Final Report October 2007\Final Report\Final Report-october.doc
191
.
Investment 1000 USD Electrification Class
Moyeni 4,292 4,292
Mpharane 184 513 697
Mphosong 941 505 1,446
Mt Moorosi 606 606
Maama 1,919 1,919
Nokong 1,319 644 1,964
Peka 1,909 1,909
Pela Tsoeu 661 661
Pulane 801 762 1,564
Qacha'snek 195 195
Qalabane 907 505 1,412
Qalatsi 463 463
Qalo 1,085 463 1,548
Qeme 8,245 8,245
Qhoali 361 361
Rothe 1,189 463 1,019 2,672
Senqu 129 129
Seqonoka 869 463 505 1,837
Taung 885 885
Tebang 463 463
Tele 2,115 2,115
Teyateyaneng 10,309 10,309
Thaba Bosiu 715 715
Thaba Kubu 443 463 906
Thaba Moea 258 258
Thaba Phatsoa 432 432
Thaba Phechela 505 505
Thaba Phekeche 473 505 978
Thaba Putsoa 173 173
Thaba Tseka 246 189 435
Thaba Tsoeu 723 723
Thabana Morena 1,477 1,477
Tsoelike 1,107 167 1,275
Qacha's Nek 1,049 1,049
Qaqatu 139 139
Total 317,319 8,268 6,966 2,419 3,852 338,825
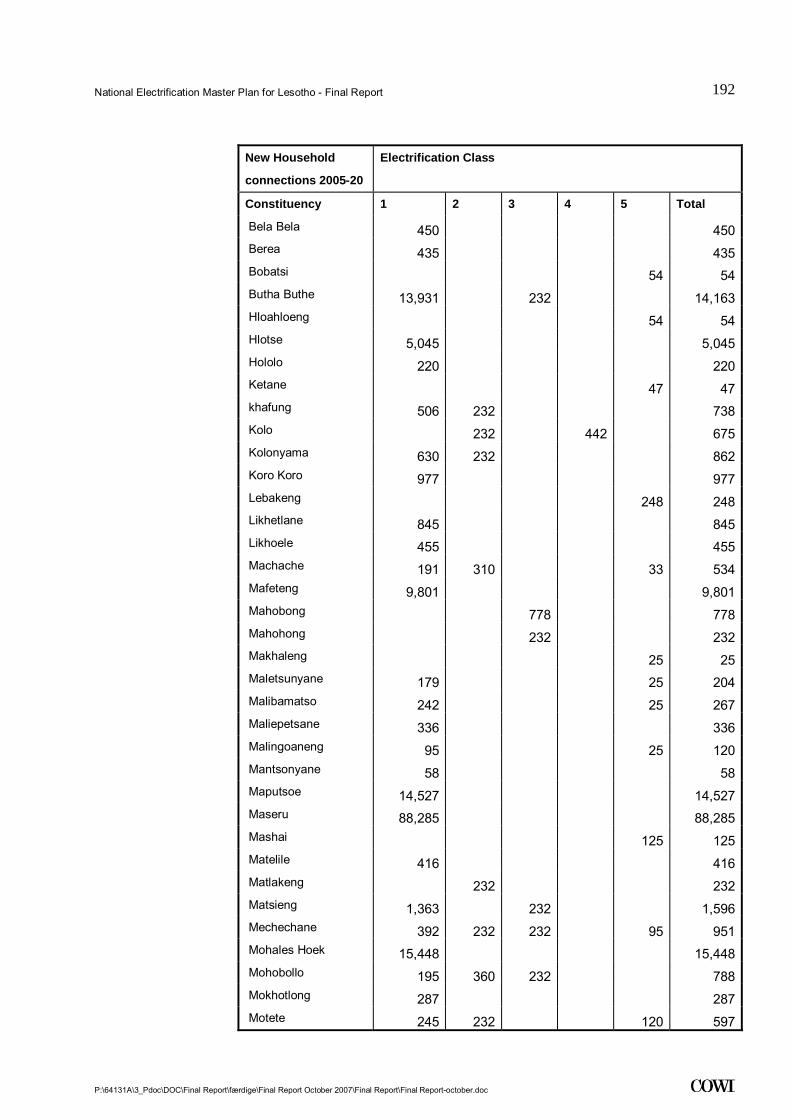
National Electrification Master Plan for Lesotho - Final Report
P:\64131A\3_Pdoc\DOC\Final Report\færdige\Final Report October 2007\Final Report\Final Report-october.doc
192
.
New Household
connections 2005-20
Electrification Class
Constituency 1 2 3 4 5 Total
Bela Bela 450 450 Berea 435 435 Bobatsi 54 54 Butha Buthe 13,931 232 14,163 Hloahloeng 54 54 Hlotse 5,045 5,045 Hololo 220 220 Ketane 47 47 khafung 506 232 738 Kolo 232 442 675 Kolonyama 630 232 862 Koro Koro 977 977 Lebakeng 248 248 Likhetlane 845 845 Likhoele 455 455 Machache 191 310 33 534 Mafeteng 9,801 9,801 Mahobong 778 778 Mahohong 232 232 Makhaleng 25 25 Maletsunyane 179 25 204 Malibamatso 242 25 267 Maliepetsane 336 336 Malingoaneng 95 25 120 Mantsonyane 58 58 Maputsoe 14,527 14,527 Maseru 88,285 88,285 Mashai 125 125 Matelile 416 416 Matlakeng 232 232 Matsieng 1,363 232 1,596 Mechechane 392 232 232 95 951 Mohales Hoek 15,448 15,448 Mohobollo 195 360 232 788 Mokhotlong 287 287 Motete 245 232 120 597
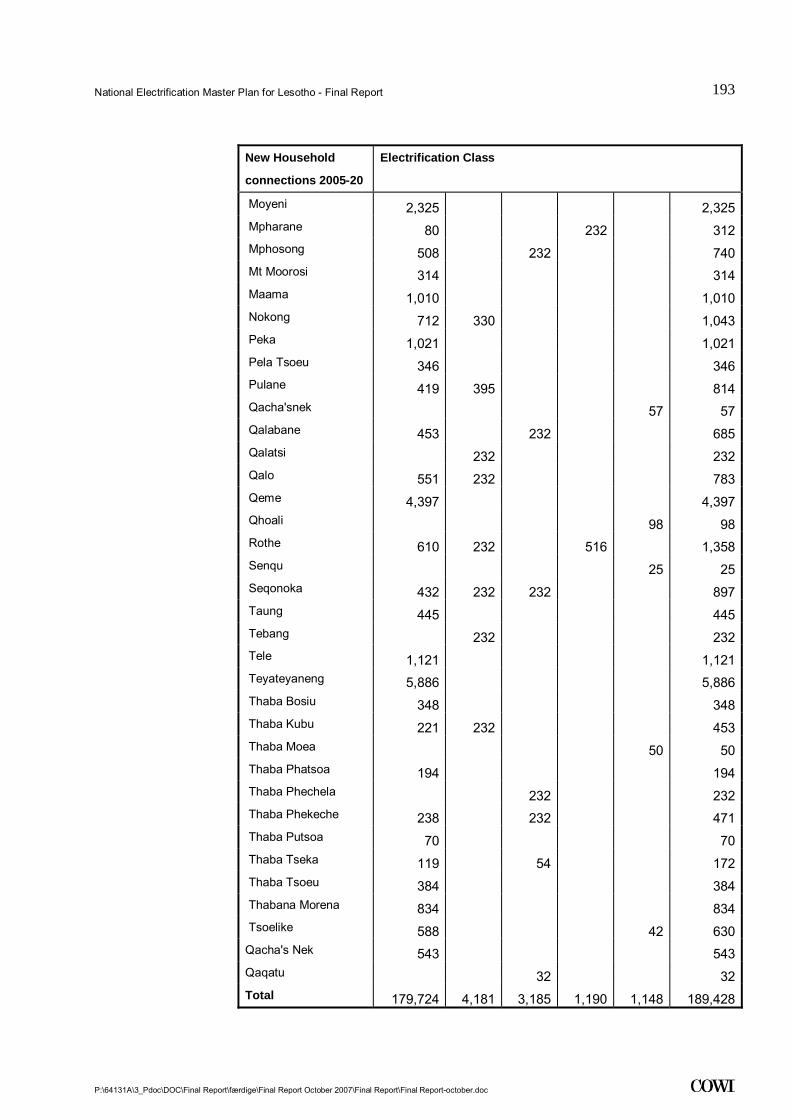
National Electrification Master Plan for Lesotho - Final Report
P:\64131A\3_Pdoc\DOC\Final Report\færdige\Final Report October 2007\Final Report\Final Report-october.doc
193
.
New Household
connections 2005-20
Electrification Class
Moyeni 2,325 2,325 Mpharane 80 232 312 Mphosong 508 232 740 Mt Moorosi 314 314 Maama 1,010 1,010 Nokong 712 330 1,043 Peka 1,021 1,021 Pela Tsoeu 346 346 Pulane 419 395 814 Qacha'snek 57 57 Qalabane 453 232 685 Qalatsi 232 232 Qalo 551 232 783 Qeme 4,397 4,397 Qhoali 98 98 Rothe 610 232 516 1,358 Senqu 25 25 Seqonoka 432 232 232 897 Taung 445 445 Tebang 232 232 Tele 1,121 1,121 Teyateyaneng 5,886 5,886 Thaba Bosiu 348 348 Thaba Kubu 221 232 453 Thaba Moea 50 50 Thaba Phatsoa 194 194 Thaba Phechela 232 232 Thaba Phekeche 238 232 471 Thaba Putsoa 70 70 Thaba Tseka 119 54 172 Thaba Tsoeu 384 384 Thabana Morena 834 834 Tsoelike 588 42 630Qacha's Nek 543 543Qaqatu 32 32Total 179,724 4,181 3,185 1,190 1,148 189,428

National Electrification Master Plan for Lesotho - Final Report
P:\64131A\3_Pdoc\DOC\Final Report\færdige\Final Report October 2007\Final Report\Final Report-october.doc
194
.
New Household
connection 2005-2010
Electrification Class
Constituency 1 2 3 4 5
Bela Bela 0 0
Berea 0 0
Bobatsi 0 0
Butha Buthe 4,659 0 4,659
Hloahloeng 0 0
Hlotse 2,381 2,381
Hololo 0 0
Ketane 0 0
khafung 0 0 0
Kolo 0 0 0
Kolonyama 0 232 232
Koro Koro 0 0
Lebakeng 0 0
Likhetlane 410 410
Likhoele 0 0
Machache 0 310 0 310
Mafeteng 3,500 3,500
Mahobong 545 545
Mahohong 0 0
Makhaleng 0 0
Maletsunyane 0 0 0
Malibamatso 126 0 126
Maliepetsane 0 0
Malingoaneng 0 0 0
Mantsonyane 0 0
Maputsoe 5,000 5,000
Maseru 29,500 29,500
Mashai 0 0
Matelile 0 0
Matlakeng 232 232
Matsieng 528 0 528
Mechechane 392 0 0 0 392
Mohaleshoek 5,449 5,449
Mohobollo 0 0 0 0
Mokhotlong 0 0
Motete 95 0 0 95
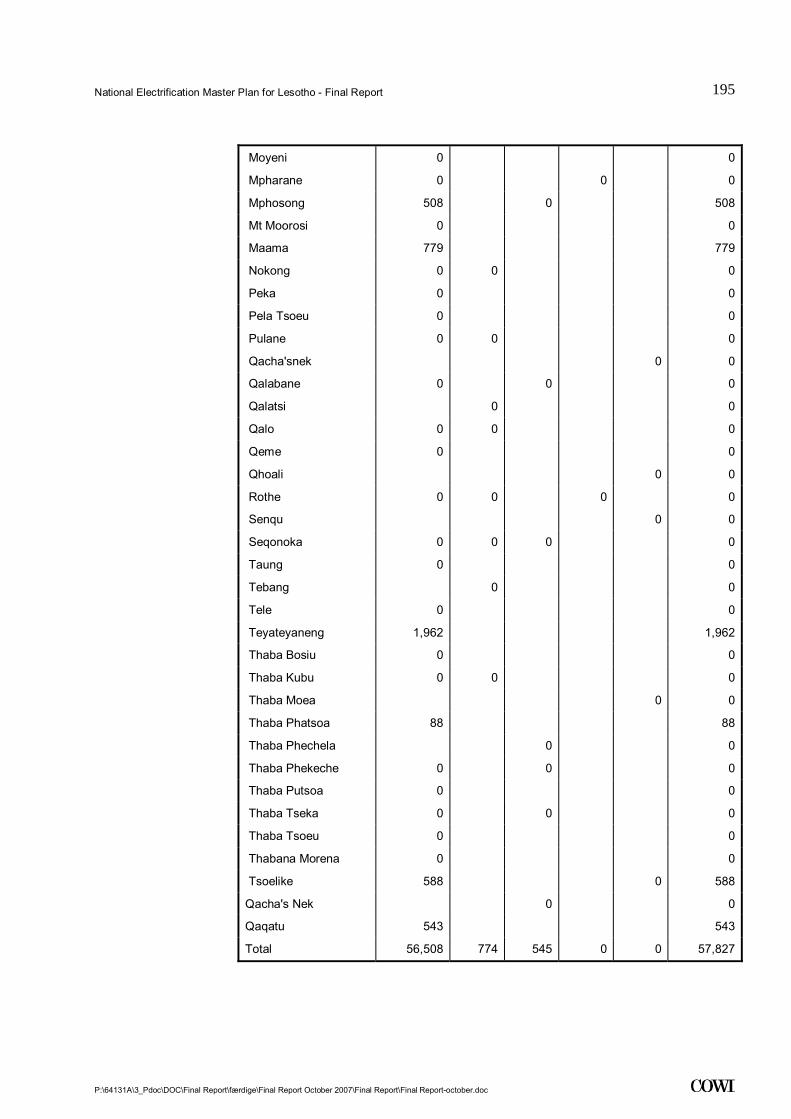
National Electrification Master Plan for Lesotho - Final Report
P:\64131A\3_Pdoc\DOC\Final Report\færdige\Final Report October 2007\Final Report\Final Report-october.doc
195
.
Moyeni 0 0
Mpharane 0 0 0
Mphosong 508 0 508
Mt Moorosi 0 0
Maama 779 779
Nokong 0 0 0
Peka 0 0
Pela Tsoeu 0 0
Pulane 0 0 0
Qacha'snek 0 0
Qalabane 0 0 0
Qalatsi 0 0
Qalo 0 0 0
Qeme 0 0
Qhoali 0 0
Rothe 0 0 0 0
Senqu 0 0
Seqonoka 0 0 0 0
Taung 0 0
Tebang 0 0
Tele 0 0
Teyateyaneng 1,962 1,962
Thaba Bosiu 0 0
Thaba Kubu 0 0 0
Thaba Moea 0 0
Thaba Phatsoa 88 88
Thaba Phechela 0 0
Thaba Phekeche 0 0 0
Thaba Putsoa 0 0
Thaba Tseka 0 0 0
Thaba Tsoeu 0 0
Thabana Morena 0 0
Tsoelike 588 0 588
Qacha's Nek 0 0
Qaqatu 543 543
Total 56,508 774 545 0 0 57,827

National Electrification Master Plan for Lesotho - Final Report
P:\64131A\3_Pdoc\DOC\Final Report\færdige\Final Report October 2007\Final Report\Final Report-october.doc
196
.
New Household
connections 2010-2020
Electrification Class
Constituency 1 2 3 4 5
Bela Bela 450 450
Berea 435 435
Bobatsi 54 54
Butha Buthe 9,272 232 9,504
Hloahloeng 54 54
Hlotse 2,664 2,664
Hololo 220 220
Ketane 47 47
khafung 506 232 738
Kolo 232 442 675
Kolonyama 630 0 630
Koro Koro 977 977
Lebakeng 248 248
Likhetlane 435 435
Likhoele 455 455
Machache 191 0 33 224
Mafeteng 6,301 6,301
Mahobong 233 233
Mahohong 232 232
Makhaleng 25 25
Maletsunyane 179 25 204
Malibamatso 116 25 141
Maliepetsane 336 336
Malingoaneng 95 25 120
Mantsonyane 58 58
Maputsoe 9,527 9,527
Maseru 58,785 58,785
Mashai 125 125
Matelile 416 416
Matlakeng 0 0
Matsieng 835 232 1,068
Mechechane 0 232 232 95 559
Mohaleshoek 9,999 9,999
Mohobollo 195 360 232 788
Mokhotlong 287 287
Motete 150 232 120 502

National Electrification Master Plan for Lesotho - Final Report
P:\64131A\3_Pdoc\DOC\Final Report\færdige\Final Report October 2007\Final Report\Final Report-october.doc
197
.
Moyeni 2,325 2,325
Mpharane 80 232 312
Mphosong 0 232 232
Mt Moorosi 314 314
Maama 231 231
Nokong 712 330 1,043
Peka 1,021 1,021
Pela Tsoeu 346 346
Pulane 419 395 814
Qacha'snek 57 57
Qalabane 453 232 685
Qalatsi 232 232
Qalo 551 232 783
Qeme 4,397 4,397
Qhoali 98 98
Rothe 610 232 516 1,358
Senqu 25 25
Seqonoka 432 232 232 897
Taung 445 445
Tebang 232 232
Tele 1,121 1,121
Teyateyaneng 3,924 3,924
Thaba Bosiu 348 348
Thaba Kubu 221 232 453
Thaba Moea 50 50
Thaba Phatsoa 106 106
Thaba Phechela 232 232
Thaba Phekeche 238 232 471
Thaba Putsoa 70 70
Thaba Tseka 119 54 172
Thaba Tsoeu 384 384
Thabana Morena 834 834
Tsoelike 0 42 42
Qacha's Nek 32 32
Qaqatu 0 0
Total 123,216 3,407 2,640 1,190 1,148 131,601
National Electrification Master Plan for Lesotho - Final Report
P:\64131A\3_Pdoc\DOC\Final Report\færdige\Final Report October 2007\Final Report\Final Report-october.doc
198
.
Appendix 11 – Maps and Description of Settlements In separate document.