Critical raw materials and transportation sector electrification

lable at ScienceDirect
Renewable Energy 75 (2015) 745e761
Contents lists avai
Renewable Energy
journal homepage: www.elsevier .com/locate/renene
Mini-grid based electrification in Bangladesh: Technical configurationand business analysis
Subhes C. Bhattacharyya*
Institute of Energy and Sustainable Development, De Montfort University, Leicester LE1 9BH, UK
a r t i c l e i n f o
Article history:Received 1 August 2013Accepted 15 October 2014Available online 14 November 2014
Keywords:Mini-gridOff-grid electrificationBangladesh
* Tel.: 44 (0) 1162577975.E-mail addresses: [email protected], subhes_bh
http://dx.doi.org/10.1016/j.renene.2014.10.0340960-1481/© 2014 The Author. Published by Elsevier
a b s t r a c t
This paper presents a local level study of a village off-grid system in Bangladesh. It applies an integratedmethodology that identifies the demand in the off-grid village context using alternative scenarios. Thetechno-economic analysis of the optimal off-grid system architecture is then presented using HOMERsoftware. Three energy resources are considered, namely solar energy, wind and diesel fuel. The optimalconfiguration suggested for the scenarios consists of diesel generators for the basic level of demand andPV-diesel hybrid for higher demand and reliable supply scenarios. The cost of electricity per kWh re-mains high for the basic level of supply and decreases as the system size increases. However, the capitaland asset replacement costs increased considerably for bigger systems. The business case is then ana-lysed for each scenario and it was found that it is practically impossible to reach grid price parity evenwith full capital cost subsidy, indicating significant amount of operating cost subsidy requirement thatmakes the larger systems financially unsustainable. Moreover, the small mini-grid system for the basiclevel of supply emerges as a cheaper option than providing the consumers with solar home systems. Butthe monthly electricity bill will become unaffordable for most consumers when demand restrictions areremoved. Accordingly, the paper suggests a mini-grid based electricity supply to provide the basic levelof provision alongside productive energy use during off-peak hours as the starting point. If the businessdevelops and the demand improves, the system can be expanded subsequently using appropriatetechnology combinations.
© 2014 The Author. Published by Elsevier Ltd. This is an open access article under the CC BY license(http://creativecommons.org/licenses/by/3.0/).
1. Introduction
Being at the forefront of Solar Home System (SHS) dissemina-tion in theworld, Bangladesh holds a special place in any discussionon off-grid electrification. In this densely populated, low-incomecountry of 152 million people (in 2012), the overall rate of electri-fication is reported at 56% in 2011, thereby forcing about 40% of thepopulation to rely on kerosene for lighting purposes [1]. However,there exists a significant variation between the rural and urbanareas. 80% of the population resides in rural areas but only about49% of the rural population is electrified whereas about 89% of theurban population is said to be electrified [1]. Although SHS has beensuccessfully introduced in the country, particularly by GrameenShakti, it has reached only 4% of the rural households and 0.5% ofthe urban households so far [1]. The Government aims to provideelectricity to all by 2021 and although the strategy appears to
Ltd. This is an open access article
consider both off-grid and grid extension options, the task looksincreasingly challenging.
Although a lot of academic and other studies have analysed thecase of Bangladesh, the literature focuses on two dimensions: thesuccess of Bangladesh in introducing rural electrification throughthe rural electrification co-operatives (Palli Bidyut Samitis or PBS)(see Ref. [2] for example) and the success of Grameen Shakti inintroducing SHS (see Refs. [3,9] and [11] for example). However,neither PBS nor SHS has succeeded in ensuring universal electrifi-cation of the country and in the case of SHS the use of electricity forproductive purposes has remained insignificant. Moreover, a field-based appraisal of SHS in Bangladesh [9] reported various short-comings including use of poor quality components, poor installa-tion and an inadequate quality control mechanism. A few otherstudies (e.g. Refs. [4e6] and [10]), among others) have consideredthe case of hybrid off-grid systems for rural electricity supply buttheir analysis remains limited to just techno-economic analysisusing a simulation tool, namely HOMER. Most of these studies arehypothetical in nature, rely on representative householdsconsuming identical levels of energy for a given period of time, usegeneric technology/financial information and thus provide an
under the CC BY license (http://creativecommons.org/licenses/by/3.0/).

S.C. Bhattacharyya / Renewable Energy 75 (2015) 745e761746
overall understanding of the hybrid option. Although these provideuseful information, such techno-economic analysis does not reallyindicate whether the service can be provided as a viable business,whether costs can be recovered through affordable tariffs andwhether the investment can be mobilized and if so, under whatconditions.
The purpose of this paper is to argue for a transition to mini-gridbased off-grid power supply in Bangladesh through a comprehen-sive analysis of the business case. The main aim is to understand theneeds of the rural communities and identify the appropriate solu-tions based on local resource availability so that an affordable solu-tion can be proposed that is financially viable and socially desirable.This work thus goes beyond the standard application of a simulationtool and adds value by bridging the above knowledge gap.
The paper is organized as follows: Section 2 presents themethodology used in this work; Section 3 presents the case studybackground information, Section 4 presents the techno-economicanalysis of alternative scenarios using HOMER, and Section 5 pre-sents the business case analysis. Finally some concluding remarksare provided in the concluding section.
2. Methodology
Unlike most studies that focus on techno-economic feasibility ofa given solution or alternative solutions (e.g. see Refs. [13e16]), thisstudy presents a multi-dimensional analysis covering the techno-economic, business and governance dimensions. Although techno-economic analysis still remains relevant, the work does not stopthere. The outcome is further processed to consider the appropriatebusiness delivery option and the conditions required to achieve sucha delivery model. Moreover, given the diversity of local conditionsthat exist in reality, instead of using a stereotypical representativevillage or locality with fixed characteristics, this paper relies onscenarios of cases that capture different socio-economic conditions,stakeholder preferences, potential opportunities and alternativeoptions. Thus this analysis aims to add value by expanding theknowledge frontier through a holistic analysis of off-grid systems.
The analysis starts with a detailed needs assessment which in-volves local information gathering to understand the socio-economic characteristics of the local population, their existing andpotential livelihood, commercial and productive activities (agricul-ture and small-scale industries) as well as community-related needs.Instead of developing a single point energy demand estimate,alternative scenarios are developed considering different levels ofenergy service development (e.g. basic lighting needs, lighting andsome livelihood/productive needs, service for a limited period oftime, and reliable round-the-clock service, among others). It is alsopossible to consider multi-village systems for economies of scale.
The techno-economic analysis of appropriate electricity supplysystem for each scenario is then carried out using HOMER softwarepackage developed by NREL. Each case study considers alternativeresource options taking local resource availability into consider-ation as well as alternative scenarios for electricity needs devel-oped in the previous step. This also leads to a further level ofiteration that provides a rich set of system configurations and theirlife-cycle costs corresponding to alternative development paths.Information has also been used to reflect the local cost of energysystem components wherever possible.
Whereas other studies end here, this study takes a step furtherto analyse the results obtained from the techno-economic analysisto consider the practical electricity supply business issues such asviability, funding, tariff and cost recovery, as well as issues relatedto business environment such as regulatory governance. Theflowchart of the framework is presented in Fig. 1. This work thusenhances the framework suggested in Ref. [12] and complements it.
In the following section, the above framework is implementedusing a case study.
3. Case study of a village electricity system in Bangladesh
3.1. Village background
This paper considers a non-electrified village in Netrokonadistrict of Dhaka division. Netrokona has the lowest level of elec-trification in the Dhaka division and is comparable to other poorlyelectrified districts of the country. Although Netrolona Palli BidyutSamiti (PBS or village co-operative) exists and has electrified theurban areas, the villages remain non-electrified. The district is inthe north of the country and its remoteness has resulted in poorlevel of electrification in many semi-urban and rural areas.
The chosen village, Mahishpur, comes under Atpara sub-districtand is situated at 90�500E and 24�480N. Atpara is a remote sub-district, many parts of which are not well connected by road. Thevillage under consideration holds 108 households with a totalpopulation of 546 people as per 2011 Census (of which 295 aremaleand 251 female). The average household size is 5.1 persons but thehousehold size follows a bell-shaped curve with a minimum of 2persons and amaximum of 8þ persons. The village is not electrifiedand does not have pipedwater supply. All households live in housesowned by them but more than 97% of the houses are “kutcha”. 47%of the population is less than 14 years old while about 5% is above60 years of age. Of theworking-age population, women largely takecare of household activities and men work in agriculture for living.The village is connected through rural roads from Atpara andBaniajan, which are bigger villages nearby but part of it getsdisconnected during the rainy season.
Being non-electrified, the local population relies on keroseneand candles for lighting purposes and fuel-wood, agricultural res-idues (e.g. jute sticks) and cow-dung cakes for cooking energy. Theenergy resources for cooking are collected or procured locally.
3.2. Needs assessment and scenarios
As an agricultural village, the local population is highly depen-dent on agricultural activities for living. The soil is fertile andgenerally multiple crops are produced. The main crops are paddy,wheat, jute, mustard seed and potato. The village also suppliesvarious fruits, namely mango, jackfruit, banana, and papaya. Thearea receives more than 2400 ml of rainfall during the year but themonsoon brings most of the rain, thereby causing floods in the areaon a regular basis. The area, being part of the freshwater wetlandecosystem, boasts of a number of large water bodies (ponds, lakes,etc.) and fishing is also an important activity. However, due to lackof electricity no processing of food or fish takes place locally andmost of the produce is sold in raw form in the nearby markets.However, natural drying of food crops, fruit and cash crops like jutetakes place in the village.
To analyse the possibility of electrification through off-grid sys-tems, the scenario approach is used to develop alternative electri-fication options and pathways. Given the non-electrified nature ofthe village, the demand is unknown but through alternative sce-narios, a range of demand possibilities is considered as follows:
a) Basic: Basic Service (residential demand)e In this scenario, itis assumed that the poor households only use electricity forlighting purposes, while the middle income and richhouseholds use it for fans, TV and battery charging. There isno demand for productive use and the service is available fora limited period of time in the evening hours.
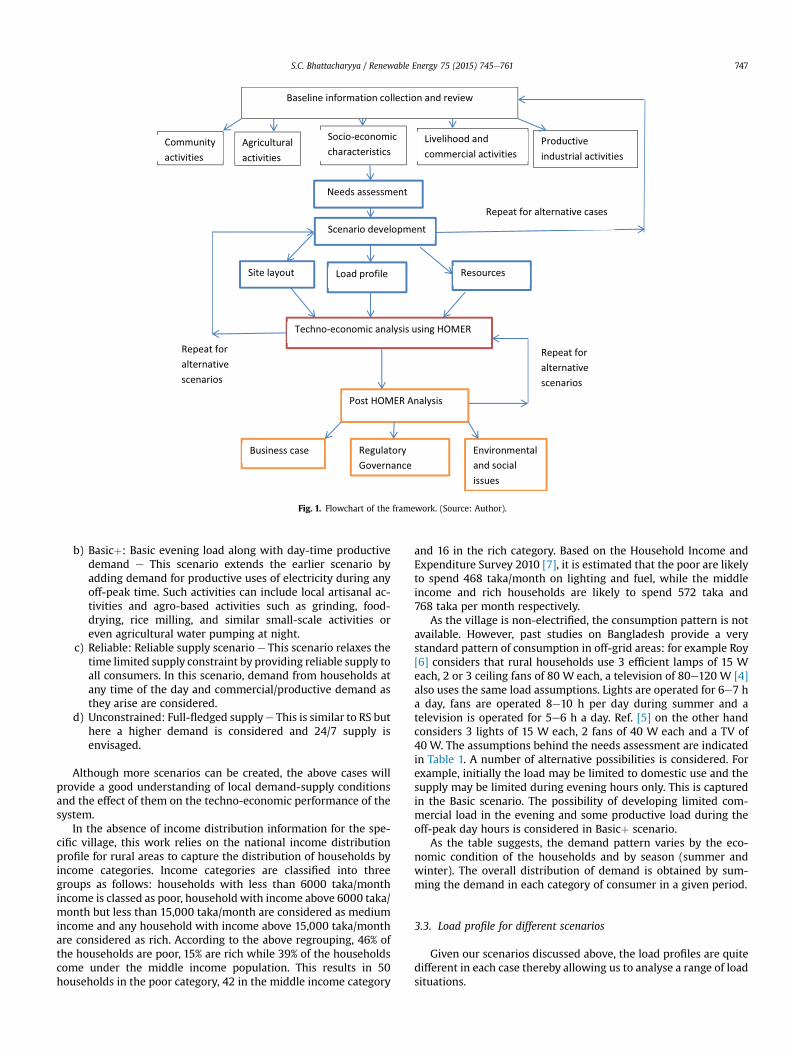
Fig. 1. Flowchart of the framework. (Source: Author).
S.C. Bhattacharyya / Renewable Energy 75 (2015) 745e761 747
b) Basicþ: Basic evening load along with day-time productivedemand e This scenario extends the earlier scenario byadding demand for productive uses of electricity during anyoff-peak time. Such activities can include local artisanal ac-tivities and agro-based activities such as grinding, food-drying, rice milling, and similar small-scale activities oreven agricultural water pumping at night.
c) Reliable: Reliable supply scenario e This scenario relaxes thetime limited supply constraint by providing reliable supply toall consumers. In this scenario, demand from households atany time of the day and commercial/productive demand asthey arise are considered.
d) Unconstrained: Full-fledged supplye This is similar to RS buthere a higher demand is considered and 24/7 supply isenvisaged.
Although more scenarios can be created, the above cases willprovide a good understanding of local demand-supply conditionsand the effect of them on the techno-economic performance of thesystem.
In the absence of income distribution information for the spe-cific village, this work relies on the national income distributionprofile for rural areas to capture the distribution of households byincome categories. Income categories are classified into threegroups as follows: households with less than 6000 taka/monthincome is classed as poor, household with income above 6000 taka/month but less than 15,000 taka/month are considered as mediumincome and any household with income above 15,000 taka/monthare considered as rich. According to the above regrouping, 46% ofthe households are poor, 15% are rich while 39% of the householdscome under the middle income population. This results in 50households in the poor category, 42 in the middle income category
and 16 in the rich category. Based on the Household Income andExpenditure Survey 2010 [7], it is estimated that the poor are likelyto spend 468 taka/month on lighting and fuel, while the middleincome and rich households are likely to spend 572 taka and768 taka per month respectively.
As the village is non-electrified, the consumption pattern is notavailable. However, past studies on Bangladesh provide a verystandard pattern of consumption in off-grid areas: for example Roy[6] considers that rural households use 3 efficient lamps of 15 Weach, 2 or 3 ceiling fans of 80 W each, a television of 80e120 W [4]also uses the same load assumptions. Lights are operated for 6e7 ha day, fans are operated 8e10 h per day during summer and atelevision is operated for 5e6 h a day. Ref. [5] on the other handconsiders 3 lights of 15 W each, 2 fans of 40 W each and a TV of40 W. The assumptions behind the needs assessment are indicatedin Table 1. A number of alternative possibilities is considered. Forexample, initially the load may be limited to domestic use and thesupply may be limited during evening hours only. This is capturedin the Basic scenario. The possibility of developing limited com-mercial load in the evening and some productive load during theoff-peak day hours is considered in Basicþ scenario.
As the table suggests, the demand pattern varies by the eco-nomic condition of the households and by season (summer andwinter). The overall distribution of demand is obtained by sum-ming the demand in each category of consumer in a given period.
3.3. Load profile for different scenarios
Given our scenarios discussed above, the load profiles are quitedifferent in each case thereby allowing us to analyse a range of loadsituations.

Table 1Electricity demand constituents by households and scenarios.
Items Poor HH Middle income HH Rich HH Commercial load Productive load
Basic 2 � 10W lighting load for 5 h inthe evening (5e10pm)
3 � 10W lighting,2 � 40W fans (summertime), 1 TV 80W for 5 hin the evening
4 � 10W lighting,3 � 40W fans (summertime) and 1 TV 80W for5 h in the evening
nil nil
Basicþ -do- -do- -do- 500W load for 5 h in theevening
Up to 10 kW off-peakload during day hours
Reliable 2 � 10 W lighting load for 5 h inthe evening (5e10pm) and 2 h inthe morning
3 � 10W lighting for 2 hin the morning and 6 hin the evening, 2 � 40Wfans (summer time)operating for 18 h, 1 TV80 W for 10 h.
4 � 10W lighting for 8 hper day, 3 � 40 W fans(summer time) for 18 hand 1 TV 80 W for 10 hin the day.
500 W load for 14 h aday
Up to 10 kW load at anyhour
Unconstrained Same as reliable Same as reliable with anadditional load of 80 Woperating for 10 h
Same as reliable but anadditional load of 500 Woperating for 24 h
2 kW operating for 24 h Up to 10 kW load at anytime
S.C. Bhattacharyya / Renewable Energy 75 (2015) 745e761748
a) Basic e basic load profileAs the demand is restricted only during evening hours,
following the demand logic indicated in Table 2, the daily demandprofile for the basic load is shown in Fig. 2 while the seasonal profileis shown in Fig. 3. The winter load is almost half of that in summerdue to absence of fan load of middle and high income households. A5% day-to-day random variation in load is assumed. The peak loadof the system is 15.7 kW for 108 households and the average energyneed is 53 kWh/day.
Clearly, the average to peak load is low in this case, therebyresulting in a low system load factor of 0.14.
b) Basicþ scenario (off-peak productive load and some com-mercial load added to Basic case)
In this case, it is considered that 10 kW of productive load isserviced during the day time (between 7 AM and 5 PM) duringsummer months while the load reduces to 5 kW during the wintermonths. The average load improves, resulting in a better system loadfactor of 0.34. The average daily energy need comes to 135 kWh. Thepeak load is 16.3 kW. The summer and winter daily load profiles arepresented in Fig. 4 while the seasonal profile is indicated in Fig. 5.
c) The Reliable supply scenario focuses on reliable supply in ruralareas both for residential needs as well as productive needs. Thisallows any load to operate at any time of the day. The load profilechanges considerably here as some residential load at night (mainlyfor fans in summer) and up to 10 kW water pumping load for irri-gation in summer has been considered. In winter, the demand forirrigation water reduces but a 5 kW load is considered at night.During the day time, up to 10 kWproductive load in summer and upto 5 kW inwinter have been considered. Here the system load factorfurther improves to 0.472 due to a better load distribution. The dailyload profile and seasonal load profile are presented in Figs. 6 and 7respectively. The peak load here is 28.5 kW and the daily energydemand is 323 kWh. Note that the winter base load is 5 kWwhereasthe summer base load is 10 kW in this case, whichmakes the systemrequirement quite different from the previous cases.
d) Unconstrained supply scenarioThe scenario allows full demand potential development for the
rich consumers and removes all supply restrictions. Consequently,
Table 2Comparison of load profiles of different scenarios.
Scenarios Peak load (kW) Daily averageenergy (kWh/day)
Load factor
Basic 15.7 53 0.14Basicþ 16.3 134 0.344Reliable supply 28.5 323 0.472Unconstrained Supply 44.4 589 0.553
the peak demand increases to 44 kW here and the overall loadfactor improves to 0.55. The average daily energy requirement in-creases to 589 kWh. The daily load profiles and seasonal profile arepresented in Figs. 8 and 9 respectively.
Table 2 compares load profiles of different scenarios.
3.4. Energy resources
For the case study, three energy resources, namely solar PV,wind and diesel fuel have been considered. The site does not haveany micro-hydro potential but biomass is readily available and iswidely used for cooking purposes. However, as there is limited useof biomass for power generation in Bangladesh, this option has notbeen considered in this study, although it may be considered in afuture study.
The solar energy availability in the case study village is obtainedfromHOMER. Based on the latitudee longitude information for thevillage location, HOMER estimated the annual average solar inso-lation of 4.58 kWh/m2/d. However, the insolation level increasesbetween March and May and reduces during the monsoon season(JulyeSeptember). The monthly pattern of radiation and the trendof cleanliness index are shown in Fig. 10.
Fig. 2. a: Daily load profile in winter for Basic scenario. b: Daily load profile in summerfor Basic scenario.

Fig. 3. Seasonal load profile for Basic scenario.
Fig. 4. a: Winter daily load profile corresponding to Basicþ. b: Summer daily loadprofile corresponding to Basicþ.
S.C. Bhattacharyya / Renewable Energy 75 (2015) 745e761 749
The data for wind resources is not readily available for Bangla-deshi villages. However [4], provides monthly average wind speedfor a nearby location in the Dhaka Division. In the absence of anyspecific data for the village, this information has been used (seeFig. 11). It can be seen that wind blows all year round but the speedtends to be higher during the summer-monsoon months. Thediurnal pattern strength of 0.0323 is used for the location and thewind speed peaks at 15 h.
For diesel generators, it has been assumed that the fuel isavailable from the national supply system and being incremental innature, the village level demand will not affect the market condi-tions adversely. The prevailing local rates for diesel have been used,which may not reflect the true economic cost of the fuel.
Fig. 5. Seasonal load profile c
3.5. Component details
Based on the above resource and demand considerations, thefollowing components were considered: Solar PV, a generic 1 kWwind turbine, a generic 3 kW wind turbine, a diesel generator,batteries and converters. The specific details of each are providedbelow.
3.5.1. Solar PVThe unit cost of solar PV systems has declined considerably in
recent time. For this study, a 1 kW PV system is assumed to require$2800 and the replacement cost is $2000 per kW. A low operatingand maintenance cost of $10/year/kW is considered. The cost isbased on [8]. It is assumed that no tracking device is used. The life ofsolar panels is assumed to be 20 years. The simulation is carried outfor various quantityecapacity combinations to facilitate optimalsizing of the system.
3.5.2. Wind turbinesTwo generic small wind turbines, namely of 1 kW capacity and
3 kW capacity suitable for rural application are included. Accordingto [8], the civil construction and erection cost of wind turbines canbe significant compared to the equipment cost, particularly in thesmall size range. Although the capital cost of 1 kWwind turbine canbe close to $2500/kW, the overall cost of installation can be as highas $5000 to 6000. Accordingly, a capital cost of $4000/kW is usedwhile the replacement cost is taken as $2500. The O&M cost istaken as $50/year for this turbine. It is assumed to have a life of 15years and the hub height is 25 m. For the 3 kW wind turbine, thecapital cost is taken as $10,000 whereas the replacement cost istaken as $8000, with $250/year considered towards O&M costs.Although [5] and others have used lower costs for Bangladesh, ourcost assumptions are closer to the reality.
3.5.3. Diesel generatorDiesel generators are widely used for electricity generation in
rural areas and are widely available. There is minimal civil work
orresponding to Basicþ.

Fig. 6. a: Winter daily load profile corresponding to reliable supply scenario. b:Summer daily load profile corresponding to reliable supply scenario.
Fig. 8. (a): Daily load profile corresponding to unconstrained supply (winter). (b):Daily load profile corresponding to unconstrained supply (summer).
S.C. Bhattacharyya / Renewable Energy 75 (2015) 745e761750
involved in this case and the generator cost captures the overall in-vestment requirement. The capital cost of 1 kW of generator isconsidered to be $600 and the replacement cost is considered as$500. The operational andmaintenance cost of the generator is takenas $0.5/hr for every 10 kW of generator size. It is assumed that thegenerator can be operated for 15,000 h in its lifetime and the mini-mum load it can take is 10% of its rated capacity. Diesel price is takenas $0.6/litre which is based on the local market price in Bangladesh.
3.5.4. BatteryFor this analysis, Trojan L16P has been considered. This is a 6 V
battery with a nominal capacity of 360 Ah and a normal life of 10years. 4 batteries in a string are used so that a 24 V bus bar can beused. The cost of batteries varies widely depending on the makeand source of supply. For this study, a cost of $150 for each battery isused while the replacement cost is taken as $100.
3.5.5. InverterThe cost of converter is taken as $200/kW and the replacement
cost is taken as $150/kW. It has a normal life of 15 years and isassumed to have an efficiency of 85%.
Other system costs: As HOMER does not include the cost ofdistribution network separately, a capital cost of $3000 towards thecost distribution network for 108 households is used and $200 peryear towards fixed O&M costs.
Fig. 7. Seasonal load profile fo
The project life is taken as 15 years e this is done to match theproject life with the debt repayment period. HOMER calculates anysalvage value of the assets based on its remaining life and thereplacement cost of the asset. Therefore, although componentshave different life periods, the project cost is fairly attributed for theproject life. A real discount rate of 5.3% has been used in theanalysis, based on the cost of capital in dollar terms.
Clearly, the economic parameters affect the overall resultssignificantly. As mentioned earlier, some recent studies onBangladesh have used quite different economic parameters (seeTable 3 for some examples). Clearly, a lower capital and operatingcost of any equipment makes it more desirable for the optimalsolution and the cost of generation reduces. However, unrealisticcosts reduce the relevance of the analysis and distort the optimalsolution.
4. Results of the techno-economic analysis
For the techno-economic analysis, HOMER software packagewas used. The results for each scenario are presented below.
4.1. Basic supply scenario
Considering the demand, component cost characteristics andresource availability, a diesel generator of 20 kW emerges as theoptimal architecture for this scenario. The capital cost comes to
r reliable supply scenario.
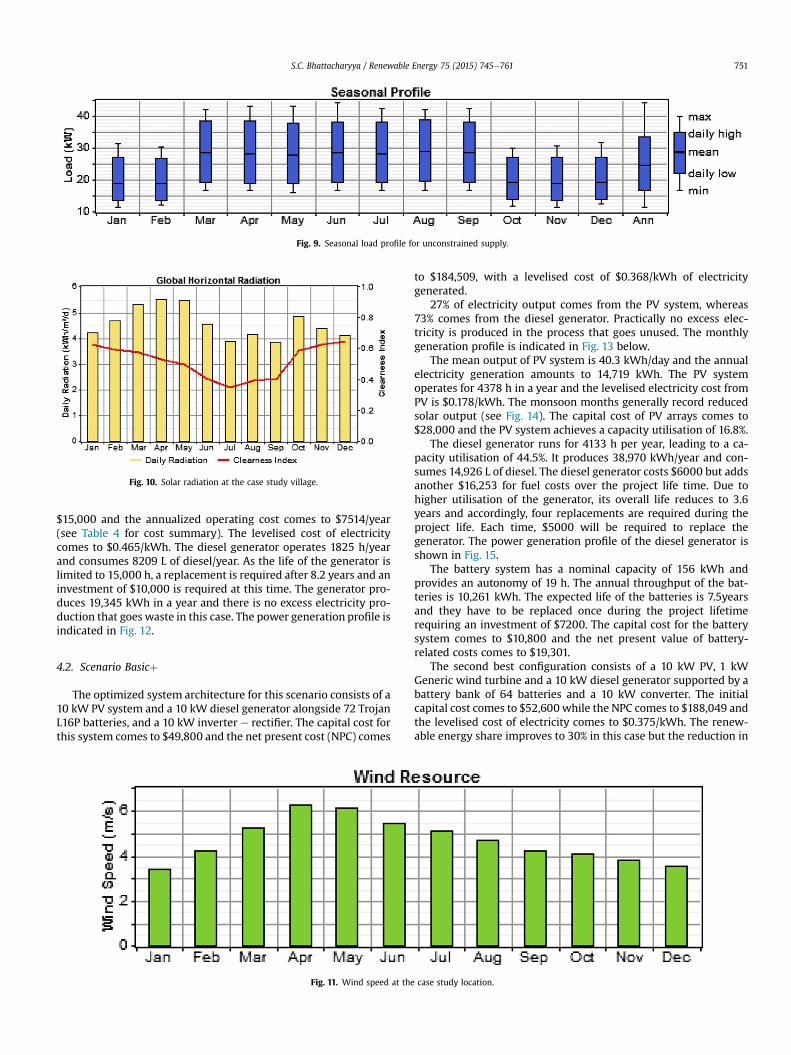
Fig. 9. Seasonal load profile for unconstrained supply.
Fig. 10. Solar radiation at the case study village.
S.C. Bhattacharyya / Renewable Energy 75 (2015) 745e761 751
$15,000 and the annualized operating cost comes to $7514/year(see Table 4 for cost summary). The levelised cost of electricitycomes to $0.465/kWh. The diesel generator operates 1825 h/yearand consumes 8209 L of diesel/year. As the life of the generator islimited to 15,000 h, a replacement is required after 8.2 years and aninvestment of $10,000 is required at this time. The generator pro-duces 19,345 kWh in a year and there is no excess electricity pro-duction that goes waste in this case. The power generation profile isindicated in Fig. 12.
4.2. Scenario Basicþ
The optimized system architecture for this scenario consists of a10 kW PV system and a 10 kW diesel generator alongside 72 TrojanL16P batteries, and a 10 kW inverter e rectifier. The capital cost forthis system comes to $49,800 and the net present cost (NPC) comes
Fig. 11. Wind speed at the
to $184,509, with a levelised cost of $0.368/kWh of electricitygenerated.
27% of electricity output comes from the PV system, whereas73% comes from the diesel generator. Practically no excess elec-tricity is produced in the process that goes unused. The monthlygeneration profile is indicated in Fig. 13 below.
The mean output of PV system is 40.3 kWh/day and the annualelectricity generation amounts to 14,719 kWh. The PV systemoperates for 4378 h in a year and the levelised electricity cost fromPV is $0.178/kWh. The monsoon months generally record reducedsolar output (see Fig. 14). The capital cost of PV arrays comes to$28,000 and the PV system achieves a capacity utilisation of 16.8%.
The diesel generator runs for 4133 h per year, leading to a ca-pacity utilisation of 44.5%. It produces 38,970 kWh/year and con-sumes 14,926 L of diesel. The diesel generator costs $6000 but addsanother $16,253 for fuel costs over the project life time. Due tohigher utilisation of the generator, its overall life reduces to 3.6years and accordingly, four replacements are required during theproject life. Each time, $5000 will be required to replace thegenerator. The power generation profile of the diesel generator isshown in Fig. 15.
The battery system has a nominal capacity of 156 kWh andprovides an autonomy of 19 h. The annual throughput of the bat-teries is 10,261 kWh. The expected life of the batteries is 7.5yearsand they have to be replaced once during the project lifetimerequiring an investment of $7200. The capital cost for the batterysystem comes to $10,800 and the net present value of battery-related costs comes to $19,301.
The second best configuration consists of a 10 kW PV, 1 kWGeneric wind turbine and a 10 kW diesel generator supported by abattery bank of 64 batteries and a 10 kW converter. The initialcapital cost comes to $52,600 while the NPC comes to $188,049 andthe levelised cost of electricity comes to $0.375/kWh. The renew-able energy share improves to 30% in this case but the reduction in
case study location.

Table 3Examples of cost assumption from literature.
Cost parameter In Ref. [5] In Ref. [6]
Capital cost for PV 274 taka/W ($3.65/W) $270,950 for100 kW PV arrays
Replacement cost of PV 206 taka/W ($2.75/W) $45,000 for100 kW PV arrays
O&M cost 50 taka/W/year ($0.67/W) $500/year for500 kW
Capital cost of a 3 kWWind turbine
86,584 taka/kW ($1155/kW)
$455,000 for a300 kW turbine
Replacement cost of a3 kW wind turbine
75,000 taka/kW ($1000/kW)
$65,000 for a300 kW turbine
O&M cost of a 3 kWwind turbine
1000 taka/year/turbine (or$13)
$1000/year for a300 kW turbine
Capital cost of dieselgenerator
10,000 taka/kW (or $133/kW)
$ 116,883 for a500 kW generator
Diesel price 45 taka/l (or $0.6/l) $ 0.7/lO&M cost of a diesel
generator20 taka/h for 10 kW ($0.27/h); 30 taka/h for 20 kW($0.4/h)
$5/h
Table 4Net present cost summary of the optimal system architecture for Basic supplyscenario.
Component Capitalcost ($)
Replacementcost ($)
O&Mcost ($)
Fuelcost ($)
Salvagevalue ($)
Net presentcost ($)
Diesel 12,000 6541 18,565 50,102 �807 86,401Other 3000 0 2034 0 0 5034System 15,000 6541 20,599 50,102 �807 91,436
S.C. Bhattacharyya / Renewable Energy 75 (2015) 745e761752
diesel use is more than offset by the increased investment requiredfor the wind turbine, thereby increasing the capital requirementand the levelised cost of supply.
A diesel-only system comes as the least capital intensive optionbut in terms of cost of supply, it ranks towards the bottom of therange. A 20 kW diesel generator that runs for 5475 h and consumes21,736 L of diesel can meet the demand effectively. But the cost ofelectricity increases to $0.471/kWh, making this one of the leastpreferred option in terms of net present cost. However, the systemrequirement simplifies here as the generator can be operated asrequired. The excess electricity generation is practically non-existent in this case and the capacity utilisation improves to 28%.
Although this scenario requires a bigger system compared to theBasic Supply Scenario, a better loaddistribution improves thecapacityutilization of the system and hence reduces the unit cost of electricity
Fig. 12. Average electricity produc
generation. However, the capital cost is about 3.3 times higher thanthe basic system suggested in Basic Supply scenario. This requiresfurther attention, which is considered in the business case analysis.
4.3. Reliable supply scenario
The optimal system corresponding to this scenario requires30 kW PV and a 20 kWdiesel generator alongside 160 batteries, anda 15 kW inverter-rectifier. The capital cost comes to $126,000 whilethe NPC comes to $435,552. The levelised electricity generationcost comes to $0.363/kWh.
As shown in Fig. 16, PV arrays provide 34% of the electricityoutput while the remaining 66% comes from the diesel generator.The system also produces about 1% excess electricity that remainsunused. The solar PV produces 121 kWh/day and operates for4378 h per year producing 44,157 kWh of electricity per year (seeFig. 17). The levelised cost of solar electricity comes to $0.178/kWhand achieves a capacity factor of 16.8%. The capital cost of PV systemcomes to $84,000.
The diesel generator operates for 4939 h and produces86,701 kWh/year. It consumes 33,550 L of diesel and achieves acapacity utilization rate of 49.5%. The capital cost required for thediesel generator is $ 12,000 but the fuel cost comes to $204,767over the life of the project. Accordingly, the diesel system accountsfor the highest share of the net present cost in this scenario. Thepower output is shown in Fig. 18. The expected life of the generatoris about 3 years and consequently, 4 replacements are requiredduring the project life, requiring $10,000 each time in investment.
The battery system has a nominal capacity of 346 kWh in thiscase and provides an autonomy of 18 h. The charging status of thebatteries is shown in Fig. 19. The capital cost of batteries comes to$24,000 but the expected life of batteries is 5.9 years, thus requiringtwo replacements during the project life.
The second-best solution comes with a 30 kW PV systemalongside a 1 kW wind turbine and a 20 kW diesel generatorsupported by a set of 160 batteries and a 15 kW converter. Thecapital cost comes to $130,000 but the net present cost comes to$436,792. The diesel generator requires 441 L of diesel less than theoptimal case but this does not offset the capital cost of a windturbine, making the option less attractive in terms of cost of elec-tricity supply. However, it achieves 35% renewable energy sharecompared to 34% in the optimal case.
A 30 kW diesel generator could also meet the needs effectivelyand would require about $21,000 in capital investment but theoperating cost makes this the least preferred solution in terms of
tion in Basic supply scenario.

Fig. 13. Monthly average electricity generation corresponding to Basicþ scenario.
Fig. 14. PV power production in Basicþ scenario.
S.C. Bhattacharyya / Renewable Energy 75 (2015) 745e761 753
cost of supply. The levelised cost of electricity comes to $0.463/kWh. The diesel requirement also increases to 52,045 L in this case.In terms of levelised cost, this becomes the least preferred option,despite being the least capital intensive option. However, a 20 kWdiesel generator along with 56 batteries and 1 10 kW converterturns out to be a better option than a diesel generator alone, as itcan serve the load at a cost of $0.379/kWh. The capital cost in-creases to $25,400 but the fuel requirement reduces by more than3600 L, thereby reducing the cost of supply substantially.
Fig. 15. Power generation profile of the
4.4. Unconstrained supply scenario
The optimal system architecture for this scenario requires50 kW PV, and a 30 kW diesel plant supported by 200 Trojan L16Pbatteries and a 25 kW inverter-rectifier. The capital cost for thissystem is $196,000 while the NPC comes to $752,290. The levelisedcost of electricity for the system is $0.344/kWh.
The electricity generation mix for this scenario is as follows: 31%of output comes from PV, and 69% from the diesel plant. Thus,
diesel generator in Basicþ scenario.

Fig. 16. Monthly electricity production profile corresponding to reliable supply scenario.
Fig. 17. PV power in reliable supply scenario.
S.C. Bhattacharyya / Renewable Energy 75 (2015) 745e761754
renewable energy penetration in the optimal system is 31%. Likeother scenarios, excess electricity amounting to about 1% of thedemand is produced which is not used. The electricity productionmix is shown in Fig. 20.
The PV arrays produce 202 kWh/day and over the year produce73,595 kWh. The monthly distribution of solar output is shown inFig. 21. The capital cost for the PV system comes to $140,000.
The diesel generator operates 5889 h per year and produces160,621 kWh (see Fig. 22). It consumes 61,835 L of diesel and has an
Fig. 18. Diesel power output in
expected life of 2.55 years. Thus, although the initial capitalrequired for the diesel generator is $18,000, the present worth ofthe replacement cost comes to $51,424. The present value of thefuel-related cost, $377,407, is however the most important costelement for this scenario.
The second best solution consists of a 50 kW PV system, 1 kWwind turbine and a 30 kW diesel generator alongside 200 TrojanL16P batteries and a 25 kW converter. The capital cost of thissystem comes to $200,000 but the NPC comes to $753,517,
reliable supply scenario.

Fig. 19. Battery charging status in reliable supply scenario.
Fig. 20. Electricity mix in unconstrained supply scenario.
S.C. Bhattacharyya / Renewable Energy 75 (2015) 745e761 755
making the levelised cost higher than the optimal solution($0.345/kWh).
A 50 kW diesel generator can meet the demand with the leastcapital investment (of $33,000) but as before it emerges as a lesspreferred solution due to high operating cost. The diesel require-ment increases to 92,845 L and the generator operates 8760 h peryear.
The above scenarios provide alternative pathways of develop-ment of the off-grid electrification system. They also can be viewed
Fig. 21. PV power in uncons
as pathways to improve the system as the benefits of electrificationlead to higher demand.
A comparison of the optimal solutions for four scenarios shows(see Table 5) the following:
- It appears that a diesel-based system is a preferable solutionwhen the demand is limited and the supply is restricted. As thedemand improves and the supply is provided round the clock,hybrid systems appear to be more appropriate.
trained supply scenario.

Fig. 22. Diesel power output in unconstrained supply scenario.
S.C. Bhattacharyya / Renewable Energy 75 (2015) 745e761756
- The initial investment cost is considerable for the hybrid sys-tems. This happens due to intermittent nature of the renewableresources that require back-up capacities. Accordingly, all hybridsystems require a significant spare capacity, thereby reducingthe overall system capacity factor. The reserve capacity in allthese cases is high.
- Depending on the size of excess capacity maintained in eachscenario, the cost per kW of peak load serviced varies. But theinitial investment cost of diesel-based systems tends to becomparatively low but the capacity replacement charges can behigh for both diesel-based systems and hybrid systems. This isan important consideration for business viability analysis. Whileinitial capital grants can help develop a system, unless there isadequate revenue generation to meet future costs, the long-term sustainability of a solution cannot be guaranteed. Thisaspect is hardly considered in the techno-economic analyses.
- The cost of service remains quite high for all cases and consid-ering the size of the poor population in the area, the cost can beunaffordable to many users.
The electricity tariff approved by the Electricity RegulatoryCommission for residential consumers is just $0.04/kWh for con-sumption up to 100 kWh. It is evident that in all scenarios thelevelised cost of supply from off-grid sources is much higher.Therefore, the issue of business case for the investment needs to beconsidered separately, which is considered next.
5. Business and governance analysis of alternative scenarios
The techno-economic analysis considered above is useful inanalysing the optimal technology combinations for a given energydemand. However, it does not perform any financial analysis ofbusiness investment. For example, the capital requirement is
Table 5Comparison of optimal solutions.
Scenarios Architecture Peakload (kW)
Capitalcost ($)
Basic supply 20 kW diesel generator 15.7 $15,000Basicþ 10 kW PV, and a 10 kW
diesel generator16.3 $49,800
Reliable supply 30 kW PV, and a 20 kWdiesel generator
28.5 $126,000
Unconstrained supply 50 kW PV, and a 30 kWdiesel plant
44.4 $196,000
different for different optimal solutions and some sub-optimal so-lutions in a technical sense may even make more business sense,particularly when private investment is being looked into. More-over, as the cost of supply turned out to be high, options forreducing the supply cost becomes important to make supplyaffordable to consumers. However, any such cost reduction mech-anism has financial implications for the government, or the supplybusiness or both. Therefore, a balance has to be achieved betweenaffordable supply to consumers and business viability from theinvestors' perspective. In this section a number of business-relatedquestions is considered to see how the off-grid options consideredin the previous scenarios can be delivered.
5.1. Financial cost-benefit analysis
The analysis presented here follows the principles of financialcost-benefit analysis. It is considered that a viable investmentproject (from the investors' perspective) must generate positive netpresent benefits (i.e. the net present value of costs should be lessthan the net present value of benefits). In the case of our off-gridelectricity supply project, the costs include initial investment,fuel-related costs, operating andmaintenance related costs, and thecost of replacing assets. The benefits on the other hand come fromsale of electricity and for the financial analysis, this only considersthe revenue generated from sale of electricity.
For each type of stakeholder (namely investor, consumer andthe government), different aspects are considered. For example, aninvestor while looking for adequate return on the investment has toensure that the debt is repaid on time and the asset is replaced onschedule so that the business can be run effectively. This requiresensuring adequate funding for debt repayment and asset replace-ment. Similarly, consumers of different groups pay different tariffsfor grid connected supply. A similar approach is used here as well.
Capital costper kW ofpeak ($/kW)
Levelised costof electricity($/kWh)
Installedcapacity topeak load ratio
Diesel use(litres)
RE share
955 0.465 1.27 8209 03055 0.368 1.23 14,926 0.27
4421 0.363 1.77 33,550 0.34
4414 0.344 1.80 61,835 0.31

S.C. Bhattacharyya / Renewable Energy 75 (2015) 745e761 757
As the consumers are likely to compare the charges for off-gridservice to the tariff charged for grid-based supply, this is consid-ered in our analysis to see if grid price parity can be achieved. Theeffect of grid parity tariff on other stakeholders is also considered.Further, the rental charges paid for solar home systems is consid-ered as an alternative and analyse the effects of such tariffs on thebusiness. Finally, the burden on the government finances is alsoanalysed.
5.2. Analysis of different scenarios
5.2.1. Basic supply scenarioHere, an initial investment of $15,000 is required, followed by an
investment of $10,000 in the 9th year. In addition, $4925 per year isspent on fuel and $1825/year is spent on operating and mainte-nance costs. Accordingly, these recurring costs contribute signifi-cantly to the overall cost of electricity supply. In this scenario onlyresidential demand exists and each household, whether rich orpoor, consumes less than 40 kWh per month. All consumers useelectricity when it is available and hence contribute to the peakload in proportion to their demand. The regulated tariff for resi-dential consumers using up to 100 kWh per month is set at taka3.05 ($0.04). Is it possible to achieve grid tariff parity for the off-gridsupply in this scenario?
Out of the twomajor cost components, if the capital required forthe assets is supported through a grant, the consumers would needto bear the operating costs only. Assuming that 100% of the assetreplacement costs are borne through a grant, the cost of electricitycomes to $0.387/kWh. This implies that even if $15,000 is providedto the project operator as a capital grant, the cost of electricity re-duces slightly and the average electricity cost remains almost 10times higher than the grid-based electricity. If the initial capital aswell as the capital required for asset replacement is providedthrough a grant fund, thereby reducing the entire capital-relatedcost, the electricity charge per unit for the operating cost recov-ery comes to $0.359. Thus, just capital subsidy cannot ensure gridtariff-parity for this off-grid solutione some operating cost subsidywill also be required. In fact, if grid parity pricing is charged, the netpresent value of revenue comes to $7871 over the project life whichwill not recover even the operator's cost and the distribution sys-tem fixed cost. Thus, it appears that aiming for a grid parity price forthe off-grid system is a non-starter from any perspective. Nobusiness case can be made for such an option.
However, a more appropriate reference point could involve acomparison with the solar home systems (SHS). Given that solarhome systems are popular in Bangladesh, it is legitimate to askwhether it makes economic sense to go for a diesel-basedmini-gridinstead of promoting SHS in such off-grid areas. Grameen Shakti,the leading SHS provider in Bangladesh, provides the equipmentcosts for various system capacities. A 10 W system costs $130, a20 W system costs $170, a 50 W system costs $380, a 80 W systemcosts $560 and a 135 W system costs $970.1 In our scenario, a lowincome consumer is considered to use a 20 W load, while themedium and rich consumers use 190 W and 240W respectively. Asthe systems are not directly comparable, it is assumed that the lowincome groups would go for a 10 W SHS, while the medium andhigh income groups would go for 50 W and 80 W systemsrespectively. Based on the household distribution used in ouranalysis, there are 50 poor households, 42 medium incomehouseholds and 16 rich families. The total system cost for SHS for all
1 Based on Grameen Shakti cost data as reported in http://www.gshakti.org/index.php?option¼com_content&view¼article&id¼115&Itemid¼124. 75 taka ¼ 1US dollar is used for conversion.
these families comes to $31,420. Even considering a 4% discountoffered for 100% down-payment, the capital requirement comes to$30,163 (i.e. two times the capital requirement for the mini-grid inBasic supply case). Clearly, from the capital cost perspective, thediesel mini-grid makes economic sense. As the batteries have to bereplaced at least twice over the 15 year period and the electricityoutput will be much less than the diesel-based system, the cost ofelectricity delivered from the SHS would come to $0.715/kWh.2
Thus, from the life-cycle cost perspective, the SHS investmentdoes not make economic sense compared to the diesel-based mini-grid considered in the Basic supply Scenario.
If consumers are buying SHS in Bangladesh, it is likely thatconsumers elsewhere will be willing to pay similar charges forelectricity from a mini-grid. Grameen Shakti offers a number offinancing options to SHS owners. The least demanding option re-quires them to pay 15% initially and the rest 85% in 36 equalmonthly instalments with a flat rate service charge of 8%. For ourthree chosen system sizes of 20 Wp, 50 Wp and 80 Wp, the initialpayment comes to $20, $59, and $80 respectively while themonthly payment comes to a flat charge of $3.3, $10 and $14.3respectively. Can these amounts be sufficient for the off-grid servicesuggested in BS Scenario?
In this scenario, our households consume more in summer thanin winter due to fan loads for the medium and high income groupsbut for the low income group, the consumption pattern does notvary seasonally. Accordingly, the summer consumption is consid-ered to find out their monthly expenditure at full levelised cost andwith capital grant support. This is presented in Table 6.
As can be seen, the poor consumer groups would be payingabout 50% of the cost they would be paying for a SHS while themiddle income and high income groups would pay slightly morethan that for a SHS in summermonths. However, it needs to be keptin mind that the SHSwould not provide the same level of electricityservice as they get from the diesel-based mini-grid. But if theyconsume less, as is shown in the case of winter months, theirpayment will be reduced and can be lower than that of the SHS.Similarly, with 100% capital grant subsidy, the cost reduces but notvery dramatically.
It can thus be concluded that for a limited level of supply over afixed number of evening hours, a diesel-generator based mini-gridoption can be a suitable option that requires about one-half of thecapital cost of SHS based supply and provides a higher installedcapacity. Poorer consumers with just fixed lighting loads can becharged a fixed monthly rate whereas other consumers can becharged based on their consumption level. The cost recovery isconsidered based on the costs payable for a SHS, this option can besuitable for implementation by socially-responsible private entitiesand by community-based organisations. Moreover, the technologyin this case is widely available and can be operated using locallyavailable skills. The option is however less environment friendly asit depends on a fossil fuel. It also faces the risk of fuel price fluc-tuations, but as a less capital intensive option, this offers a goodstarting point for building demand in off-grid areas. However, evenfor such a small-scale initiative, the investor has to secure morethan a million taka, which may need financial and organizationalsupport.
5.2.2. Basicþ scenarioIn this scenario, a day-time productive load of 10 kW has been
considered in addition to the evening residential-commercial loads.
2 This assumes the capital cost of $30,163, battery replacement cost of $10,800 onthe 6th year and 11th year, electricity output based on a 5 h use of the system at thesystem peak load, and a discount factor of 5.3% for a 15 year project life.

Table 6Consumer spending on electricity under different recovery considerations.
Item Unit LI MI HI
Consumption in summer kWh/month/HH 3 28.5 36Cost at full levelised cost $ 1.395 13.2525 16.74Consumption in winter kWh/month/HH 3 16.5 18Cost at full levelised cost $ 1.395 7.6725 8.37Cost at 100% capital subsidy
for summer consumption$ 1.17 11.115 14.04
S.C. Bhattacharyya / Renewable Energy 75 (2015) 745e761758
Thus, the productive load is serviced outside the evening peak. Thesystem configuration changes in this case and a hybrid systememerges as the optimal choice. The capital cost required for thisoption is $49,800. In addition, the batteries require one replace-ment in the 8th year ($7200) and the diesel generator requires fourreplacements in the 4th, 8th, 11th and 15th years. The total capitalrequirement for asset replacement is $27,000 but its net presentvalue comes to $17,671.
Following the economic pricing principle, if the off-peak con-sumption is charged to cover the operating cost only, the tariff forproductive use comes to $0.242 (or about 18 taka per kWh).Although this is about 3 times the prevailing rate for this categoryof consumers of grid electricity, it is cheaper than the alternativesupply from a diesel generator (which comes to $0.33/kWh foroperating cost coverage and $0.423 for full cost coverage). For otherpeak load consumers, the economic principle requires the tariff torecover full costs including capital costs. The levelised cost for fullcost recovery comes to $0.368, which is lower than that for Basicscenario. Consequently, residential consumers pay less on averagecompared to the previous scenario and they can expect to reducetheir spending even compared to owning a SHS. However, as shownin Table 7, the revenue so generated is not sufficient to meet therevenue requirement of the electricity supplier. Thus, the stricteconomic cost recovery principle cannot be applied in this case.
One option could be to allocate the balancing cost to the pro-ductive users. This can be done in a number of ways but the mostcommon options would be either to charge a fixed per kW/monthcharge in addition to the energy rate or to increase the energy ratewithout adding any fixed charge. The fixed charge has some meritas a part of the revenue will flow even if the user does not consumeenergy for any reason. Given the size of the productive loadconsidered here, a monthly fixed charge per kW can be a logicalchoice.
It becomes clear that the addition of a productive load brings theaverage cost of supply down and improves the financial position ofthe supplier. This happens despite an increase in the capitalrequirement, although only small companies may become inter-ested in this size of business. As the cost recovery is likely to bepossible even without any government intervention, this canbecome a viable business opportunity in Bangladesh. However, itmay be difficult to realise the full potential of productive loadinstantaneously. This highlights the importance of mapping local
Table 7Revenue generation using economic tariff.
Item Unit LI MI
Summer cons kWh/month 3 28.5Winter cons kWh/month 3 16.5Annual cons kWh/year 36 282Tariff $/kWh 0.368 0.368Revenue $ 13.2 103.8Av monthly expense $/month 1.1 8.6Income from all consumers $/year 662.4 4358.592Revenue requirement $/year
level opportunities and enlisting support of local stakeholders earlyin the development process. In addition, support for such venturesthrough some risk sharing arrangements can improve the attrac-tiveness of the business.
Although this is a hybrid system, the diesel generator still playsan important role. Thus, this option can be viewed as an extensionof the previous scenario where the operation starts with a dieselgenerator for a restricted period of supply and then expands toinclude off-peak productive load. However, the supplier is likely tocontinue with its diesel generator in such a case, which, asmentioned earlier, is not the least-cost option given the high fuelcost and asset replacement cost. However, such a gradual approachmay make practical sense given the limited stress on initial capitalrequirement.
5.2.3. Reliable supply scenarioIn this scenario, the supply reliability is considered, when 24 h
of service is made available, allowing consumers to use electricity atnight. This changes the demand situation considerably and thesystem configuration changes accordingly. All consumers nowcontribute to the peak demand, which increases the peak capacityrequirement. Accordingly, all consumers should bear the re-sponsibility for the peak load. In such a case, a time-differentiatedtariff could be appropriate but given the small volume of con-sumption involved, the metering cost is likely to outweigh thebenefits. Accordingly, a simple pricing system with flat rates forresidential and commercial consumers and a fixed charge coupledwith an energy charge for the productive uses could be appropriate.
The supply system for this scenario requires more PV arrayscompared to Basicþ scenario. The capital cost increases to $122,000while the diesel generator requires four replacements (at a non-discounted cost of $40,000) and the batteries require two re-placements (at a non-discounted cost of $32,000). The levelisedcost of electricity comes to $0.363/kWh, whereas the energy-related charge comes to $0.227/kWh. However, as before, suffi-cient revenue will not be recovered if productive users are chargedonly at the energy-related charge while others are charged at thefull levelised cost. Moreover, in this case, there is no justification forthe preferential treatment of the productive use, particularly whenpart of it coincides with the peak hours. Therefore, the tariff has tobe carefully designed to avoid undesirable effects. An example isprovided in Table 8 where an energy-related charge of $0.31 is usedfor productive uses supplemented by a fixed charge of $30/kW/month. Alternative tariff schemes can be developed to suit thespecific requirements but a full-scale analysis of this aspect isbeyond the scope of this paper.
Table 8 shows that the low income consumers will still pay lessthan that required for owning a SHS for a comparable service.However, a comparison with the SHS cost becomes somewhat lessrelevant for the middle and high income groups as they receiveround-the-clock power from the mini-grid compared to a limitedsupply from the SHS. Although they are likely to spend more on
HI Commercial Productive Total
36 75 300018 75 1500
342 900 28,5000.368 0.368 0.242
125.8 331.2 689710.5 27.6 574.7
2013.696 331.2 6897 14,262.917,676.1

Table 8An example of tariff schemes for Reliable supply scenario.
Item Unit LI MI HI Co Prod Total
Summer cons kWh/month 4.2 75.9 102 210 7200Winter cons kWh/month 4.2 30.3 33.6 210 3600Annual cons kWh/year 50.4 682.8 882 2520 68,400Tariff $/kWh 0.363 0.363 0.363 0.363 0.31Revenue $ 18.3 247.9 320.2 914.8 24,804Av monthly expense $/month 1.5 20.6 26.7 76.2 2067Income from all consumers $/year 914.8 10409.9 5122.6 914.8 24,804 42,166.1Revenue requirement $/year 41,516
S.C. Bhattacharyya / Renewable Energy 75 (2015) 745e761 759
electricity cost for a reliable supply, the cost per unit of electricity isless. The average monthly bill between $20 and $27 for these cat-egories is however much higher than these groups pay on fuel andelectricity as per the Household Income Expenditure Survey.Moreover, the monthly bill for productive loads will be significantdue to high consumption level and this can be a disincentive forpromoting productive loads. A 100% capital grant would reduce thecost to $0.261/kWh but this could still make productive activitiesreluctant to consume significant quantities of electricity.
As the system size increases, the capital requirement increasesas well. More importantly, the cost of asset replacement becomesimportant. Depending on the capital structure and repaymentrequirement, it is possible that the supplier faces some fundingmismatch. This would require access to flexible funding arrange-ments and short term funding for working capital. However, unlessthe business is not organized around a bankable contractualarrangement, securing finance from traditional sources can be achallenge.
As indicated before, this option can also be considered as anextension of the earlier scenarios, particularly Basic Supply sce-nario. The advantage here is that the PV system along with thebattery and converters can be appended to the diesel generatorsystem suggested for Basic supply scenario. This gradual expansionof the system canwork for rural areas where the demand is likely todevelop once the benefits of electricity are realized by the popu-lation. Similarly, this also allows time for developing the productiveload that can act as an anchor for the system.
3 http://www.powerdivision.gov.bd/pdf/RAPSS.pdf.
5.2.4. Unconstrained supply scenarioThis scenario removes supply restriction and allows for full
demand development. Accordingly, the high income consumerscan use electric appliances like refrigerators, while commercialconsumers can use electricity at any time. Consequently, the con-sumption of middle income and high income households as well ascommercial activities increases compared to reliable supply sce-nario. This scenario results in the least levelised cost of electricity offour scenarios.
As in Reliable supply scenario, all consumer categoriescontribute to peak demand and accordingly are required to bear theconsequences by paying appropriate charges. Although theeconomically efficient tariff would have to distinguish betweenpeak and off-peak periods, the time-of-use metering cost may bedifficult to justify for such small consumers. Accordingly, energy-related tariff supplemented by fixed charges may be relevant.However, as the consumption of poor households does not changecompared to reliable supply, theymay be charged at a flat rate only.As shown in Table 9, if electricity is charged at the levelised cost ofenergy, the required revenue can be collected but the monthly billfor average high income households, commercial users and pro-ductive consumers becomes quite big, even by developed countrystandards, thereby suggesting limited attractiveness of such highlevel consumption for these categories of consumers. The operating
cost component in the charge comes to $0.224/kWh, which isclosely related to diesel fuel use in the system. The monthly bill willnot change significantly even if the charge recovers only theoperating costs. This perhaps shows the limitation of a diesel-basedhybrid system.
Moreover, the capital cost of this system increases to $196,000(or about 15million taka), whichmay be attractive tomedium sizedfirms. As before, the capital requirement for asset replacement alsoincreases to $115,000 (non-discounted). Thus, financing the capitalrequirement becomes another constraint for this option.
Based on the above, analysis, it becomes clear that small-scalesupply as indicated in the first three scenarios (Basic, Basicþ andreliable) can be developed into businesses for rural electricity de-livery but as the system becomes bigger with higher demand, themonthly bill can be very high for high energy using consumers. Therelatively high cost of supply may not be attractive for consumersand is unlikely to be sustainable. The capital constraint is anotherissue that can become difficult to overcome. Moreover, capitalsubsidy alone will not reduce the costs significantly as the oper-ating costs remain high and providing capital and operating sub-sidy for village level supplies will not be sustainable in the long-run.
5.3. Remote area power supply system in Bangladesh
Bangladesh has set a target of providing universal electrificationby 2020. The state-owned agencies like Bangladesh Power Devel-opment Board (BPDB), Rural Electricity Board (REB) and Palli BidyutSamity (PBS) are involved in providing electricity in rural areas. Inaddition, Grameen Shakti, a non-profit organization, is also activelyinvolved in promoting renewable energy solutions, mainly the SHS.However, recognizing the challenge faced by the country inreaching its target, the Government introduced a new initiative,called the Remote Area Power Supply System (RAPSS) in 2007. Thisallows the private sector to get involved in rural power supply andthe guidelines3 for the RAPSS indicate that:
a) The Power Division of the Government will identify the po-tential RAPSS areas. These areas would cover the geograph-ical area of two or more sub-districts.
b) The system can cover both off-grid and on-grid areas.c) The operator will be selected through a competitive bidding
process.d) The operator will operate under a licence from the
Bangladesh Electricity Regulatory Commission for a periodup to 20 years.
e) A fund called RAPSS Fund will be created to support the ruralelectrification process and will receive funds from the gov-ernment, donor agencies and other sources. The fund can be

Table 9Example of electricity bill and revenue generation at the levelised cost of electricity for unconstrained supply scenario.
Item Unit LI MI HI Co Prod Total
Summer cons kWh/month 4.2 99.9 462 1440 7200Winter cons kWh/month 4.2 54.3 393.6 1440 3600Annual cons kWh/year 50.4 970.8 5202 17280 68400 212,205.6Tariff $/kWh 0.344 0.344 0.344 0.344 0.344Revenue $ 17.3 333.9 1789.5 5944.3 23,529.6Av monthly expense $/month 1.4 27.8 149.1 495.4 1960.8Income from all consumers $/year 866.9 14,026.1 28,631.8 5944.3 23,529.6 72,998.7Revenue requirement $/year 71,544
S.C. Bhattacharyya / Renewable Energy 75 (2015) 745e761760
used for providing capital grant support, to provide loans of5e10 years duration, to subsidise connection charges and tooffset duty, tax and VAT.
f) The retail supply tariff will be set initially through the bid-ding process but if the tariff is significantly higher than thetariff charged by the nearest PBS, then the government maydecide to provide subsidy to close the gap, depending on thefunding available from the RAPSS Fund.4
g) The capital cost subsidy can be given up to a maximum limitof 60% and if the retail tariff still remains high, soft loan canbe provided from the fund.
The RAPSS Guidelines provide a framework for private sectorinvolvement in rural electricity supply but from our analysis itbecomes clear that even if 100% capital cost subsidy is provided, thecost of supply will remain higher than the retail tariff approved bythe regulatory commission for different categories of consumers.Table 10 shows the amount of capital subsidy required underdifferent scenarios and the operating subsidy required to reach thegrid price parity in rural areas under the optimal configurationsconsidered in this study.
Clearly, it shows that trying to reach the grid price parity willimpose significant financial burden on the government, particularlyfor reliable supply, and unconstrained supply scenarios. They areunlikely to be sustainable solutions. This happens even afterproviding significant capital support. The first two options couldstill be considered as the capital subsidy requirement is not toodemanding and the price parity can be restricted to poor con-sumers while others may be charged the levelised cost. This willreduce the operating cost subsidy.
The case of sub-district level operation can provide the requiredscale economy and may ensure larger systems for local grids wherehigher technical efficiency of operation can also be expected. Thiscan be an area for further research where an analysis using theterms and conditions offered by RAPSS guidelines can also beconsidered.
Table 10Financial support required for grid price parity.
Description Unit BS BS-Plus RS FSS
Capital required at100% capitalcost subsidy
$ 15,000 49,800 126,000 196,000
Average tariff at100% capitalcost support
$/kWh 0.39 0.272 0.261 0.255
Target tariff(weighted byconsumption)
$/kWh 0.04 0.069 0.08 0.083
Difference $/kWh 0.35 0.203 0.181 0.172Amount of $/year 6770.75 10,002.83 21339 36,977.42
6. Conclusions
This paper has considered the village-level electrification inBangladesh and analysed the viability and business case of a hybridmini-grid system for a remote non-electrified village in Dhaka di-vision. The analysis developed alternative demand scenarios,considered local resources for electricity generation, conductedtechno-economic analyses of all scenarios using HOMER and per-formed business analysis. The demand scenarios captured alter-native development pathwayse starting from basic level supply for5 h per day to unrestricted, reliable supply consisting of residential,commercial and productive loads. The techno-economic analysis
4 http://www.powerdivision.gov.bd/pdf/RAPSS%20Fund.pdf.
suggested optimal configurations that consisted of diesel genera-tors for the basic level of supply and hybrid PV-diesel solutions formore elaborate services. The renewable energy share in all con-figurations varies between 0% (in the basic cases) to 60% (in S5) andthe cost of electricity per kWh decreases as the system size in-creases. However, the hybrid systems require significant excesscapacity due to intermittent nature of solar energy and conse-quently, the initial investment requirement increases. Moreover,during the project life some assets (such as batteries and dieselgenerators) need to be replaced depending on their life and extentof use. This requires significant investment at regular intervals tokeep the system going.
The analysis of business case of the investments revealed thatthe levelised cost of electricity from the off-grid options is muchhigher than the regulated tariff for various categories of consumerswho receive grid electricity. However, the cost of off-grid supply islikely to be cheaper than the cost of owning a SHS. Low incomeconsumers will pay almost one half of the cost of owning a SHS for acomparable level of energy use while the high income users may bepaying somewhat more for the restricted level of supply, althoughthe monthly bill will not be too burdensome for low level of sup-plies. However, the problem arises when demand restrictions areremoved allowing consumers to use high volumes of energy. Theirmonthly bills will be burdensome, making higher consumptionunattractive. This happens despite a reduction in cost of electricityper kWh due to high capacity-related costs and operating costs ofthe system.
It is also found that capital cost subsidy will not be sufficient toensure grid price parity and significant amount of operating costsubsidy will be required. As the operating cost subsidy will imposea recurring burden on government's finances, it is unlikely to besustainable. This makes the energy access challenge significant. Ouranalysis suggests that the basic electricity supply provision througha mini grid is the most preferable business solution e it requiresless capital, less subsidy volume and moderate monthly bills for
operatingsubsidyrequired/year

S.C. Bhattacharyya / Renewable Energy 75 (2015) 745e761 761
consumers. Such a business can be organized by local entrepre-neurs, private investors or local community organisations.
Bangladesh has been promoting Remote Area Power SupplySystem since 2007 where private investors can enter into ruralelectricity supply through a competitive bidding process for amaximum period of 20 years. This allows sub-district levelgeographical areas under the jurisdiction of the licensee. However,the objective of achieving grid-like pricing may be difficult to attainwith capital subsidy and soft loans, unless the system has a lowoperating cost. This is an area for further investigation.
Acknowledgements
The work reported in this paper is funded by an EPSRC/DfIDresearch grant (EP/G063826/2) from the RCUK Energy Programme.The Energy Programme is a RCUK cross-council initiative led byEPSRC and contributed to by ESRC, NERC, BBSRC and STFC. Theauthor gratefully acknowledges the funding support. I also thankthe anonymous reviewers for helpful comments. Usual disclaimersapply.
References
[1] BBS, 2012, Socio-economic and Demographic Report, Bangladesh Populationand Housing Census 2011, Bangladesh Bureau of Statistics, Ministry of Plan-ning, Government of the People's Republic of Bangladesh, Dhaka (see http://www.bbs.gov.bd/WebTestApplication/userfiles/Image/BBS/Socio_Economic.pdf, [accessed 05.03.13].
[2] Yadoo A, Cruickshank H. The value of cooperatives in rural electrification,.Energy Policy 2010;38(6):2941e7.
[3] Sovacool BK, Drupady IM. Energy access, poverty and development: thegovernance of small-scale renewable energy in developing Asia, Chapter 3:Grameen Shakti in Bangladesh. Surrey, England: Ashgate Publishing; 2013.
[4] Nandi SK, Ghosh HR. A wind-PV-battery hybrid power system at Sitakunda inBangladesh,. Energy Policy 2009;37 ():3659e64.
[5] Mondal AH, Denich M. Hybrid systems for distributed power generation inBangladesh. Energy Sustain Dev 2010;14(1):48e55.
[6] Roy RB. Design and cost analysis of hybrid power system for off-grid ruralareas of Bangladesh. Can J Electr Electron Eng 2012;3(7):413e23.
[7] BBS. Report of the household income and expenditure survey, 2010.Bangladesh Bureau of Statistics, Ministry of Planning, Government of thePeople’s Republic of Bangladesh, Dhaka; 2011. see, http://www.bbs.gov.bd/PageWebMenuContent.aspx?MenuKey¼320 [viewed on 23/6/2013].
[8] ESMAP. Technical and economic assessment of off-grid, mini-grid and grid-electrification technologies. ESMAP Technical Paper 121-07. The WorldBank; 2007., http://siteresources.worldbank.org/EXTENERGY/Resources/336805-1157034157861/ElectrificationAssessmentRptSummaryFINAL17May07.pdf.
[9] Chowdhury Sharhriar, Mourshed M, Raiyan Kabir SM, Isam M, Morshed T,Khan MR, et al. Technical appraisal of solar home systems in Bangladesh: afield investigation,. Renew Energy 2011;36(2):772e8.
[10] Mondal AH, Sadrul Islam AKM. Potential and viability of grid-connected solarPV System in Bangladesh. Renew Energy 2011;36(6):1869e74.
[11] Urmee T, Harries D. Determinants of the success and sustainability of Ban-gladesh's SHS Program. Renew Energy 2011;36(11):2822e30.
[12] Sen R, Bhattacharyya SC. Off-grid electricity generation with renewable en-ergy technologies in India: an application of HOMER. Renew Energy 2014;62:388e98.
[13] Khan M, Iqbal M. Pre-feasibility study of stand-alone hybrid energy systemsfor applications in Newfoundland. Renew Energy 2005;30(6):835e54.
[14] Hafez O, Bhattacharya K. Optimal planning and design of a renewable energybased supply system for microgrids. Renew Energy 2012;45:7e15.
[15] Lau KY, Yousof MFM, Arshad SNM, Anwari M, Yatim AHM. Performanceanalysis of hybrid photovoltaic/diesel energy system under Malaysian con-ditions. Energy 2010;35(8):3245e55.
[16] Bekele G, Palm B. Feasibility study for a sustainable solar-wind-based hybridenergy system for application in Ethiopia. Appl Energy 2010;87(2):487e95.
Copyright © 2022 FDOKUMEN


![[Automation, Electrification, and Shared Mobility in Freight]](https://static.fdokumen.com/doc/165x107/632813a2e491bcb36c0b98fc/automation-electrification-and-shared-mobility-in-freight.jpg)