Outlet Survey Nigeria 2009 Survey Report - ACTwatch
170
www. ACTwatch.info Copyright © 2009 Population Services International (PSI). All rights reserved. Evidence for Malaria Medicines Policy Outlet Survey Nigeria 2009 Survey Report
-
Upload
khangminh22 -
Category
Documents
-
view
4 -
download
0
Transcript of Outlet Survey Nigeria 2009 Survey Report - ACTwatch
www.ACTwatch.info Copyright © 2009 Population Services International (PSI). All rights reserved.
Evidence for Malaria Medicines Policy
Outlet Survey Nigeria
2009 Survey Report
www.ACTwatch.info
2
Acknowledgements ACTwatch is funded by the Bill and Melinda Gates Foundation.
This study was implemented by Population Services International (PSI).
ACTwatch’s Advisory Committee:
Mr. Suprotik Basu Advisor to the UN Secreta ry General's Special Envoy for Malaria Mr. Rik Bosman Supply Chain Expert, Former Senior Vice President, Unilever Ms. Renia Coghlan Global Access Associate Director, Medicines for Malaria Venture (MMV) Dr. Thom Eisele Assistant Professor, Tulane University Mr. Louis Da Gama Malaria Advocacy & Communications Director, Global Health Advocates Dr. Paul Lalvani Executive Director, RaPID Pharmacovigila nce Program Dr. Ramanan Laxminarayan Senior Fellow, Resources for the Future Dr. Matthew Lynch Project Director, VOICES, Johns Hopkins University Centre for Communication
Dr. Bernard Nahlen Deputy Coordinator, President's Malaria Initiative (PMI) Dr. Jayesh M. Pandit Head, Pharmacovigilance Department, Pha rmacy and Poisons Board-Kenya Dr. Melanie Renshaw Advisor to the UN Secreta ry General's Special Envoy for Malaria Mr. Oliver Sabot Vice-President, Vaccines Clinton Foundation Ms. Rima Shretta Senior Program Associate, Strengthening Pharmaceutical Systems Program,
Dr. Rick Steketee Science Director, Malaria Control and Evaluation Pa rtnership in Africa (MACEPA) Dr. Warren Stevens Health Economist Dr. Gladys Tetteh CDC Resident Advisor, President’s Malaria Initia tive-Kenya Prof. Nick White, OBE Professor of T ropical Medicine, Mahidol and Oxford Univers ities Prof. Prashant Yadav Professor of Supply Chain Management, MIT-Zaragoza International Logistics
Dr. Shunmay Yeung Paediatrician & Senior Lecturer, LSHTM
www.ACTwatch.info
The following individuals contributed as follows to the research study in Nigeria:
Dr. Jide Coker
National Coordinator, National Malaria Control Programme, FMOH/Nigeria, assisted with advocacy and survey implementation.
Dr. Audu Bal
M & E Branch Head, National Malaria Control Programme, FMOH/ Nigeria, assisted with advocacy and survey implementation.
Dr. Jennifer Anyanti
Director, Technical Services, Research and Evaluation Division, SFH/Nigeria, provided overall guidance during the survey.
Dr. Samson Adebayo
Associate Director, Research and Evaluation Division, SFH/Nigeria, assisted with advocacy and survey implementation.
Wale Adedeji
Director, Field Operations, SFH/Nigeria, provided logistical support during the survey.
Dr. Ronke Ladipo Director, Global Fund, SFH/Nigeria, provided logistical support during the
survey.
Dr. Ernest Nwokolo Associate Director, Global Fund – Malaria, SFH/Nigeria, provided information on the national malaria context in Nigeria.
Uche Ndukwu Deputy Director, Finance, SFH/Nigeria, provided financial oversight during
the survey.
Kene Eruchalu Deputy Director, Procurement, SFH/Nigeria, assisted in procurement of all survey materials.
Mrs. Ekundayo D. Arogundade
ACTwatch Country Program Coordinator, SFH/Nigeria, was responsible for all aspects of implementation and management of the survey.
Hellen Gatakaa Senior Research Associate, ACTwatch Central, provided overall guidance on the analysis and construction of indicators.
Tsione Solomon Research Associate, ACTwatch Central, assisted the Country Program
Coordinator and assisted with the coordination and facilitation of trainings, data collection, and data entry.
Emily Harris Research Associate, ACTwatch Central, assisted the Country Program
Coordinator and was responsible for the coordination of trainings, data collection, and data entry.
Julius Ngigi Research Associate, ACTwatch Central, conducted analysis on the data.
www.ACTwatch.info
Dr. Kathryn O’Connell Principal Investigator, ACTwatch Central, provided overall technical
guidance on the study.
Tanya Shewchuk Project Director, ACTwatch Central, provided overall oversight and dissemination.
The ACTwatch Group is comprised of the following individuals: PSI ACTwatch Central Tanya Shewchuk, Project Director; Dr. Kathryn O’Connell, Principal
Investigator; Hellen Gatakaa, Senior Research Associate; Stephen Poyer, Illah Evance, Julius Ngigi, Research Associates.
PSI ACTwatch Country Program Coordinators
Cyprien Zinsou, PSI/Benin; Sochea Phok, PSI/Cambodia; Dr. Louis Akulayi, SFH/DRC; Jacky Raharinjatovo, PSI/Madagascar; Ekundayo Arogundade, SFH/Nigeria; Peter Buyungo, PACE/Uganda; Felton Mpasela, SFH/Zambia.
LSHTM Dr. Kara Hanson, Principal Investigator; Edith Patouillard, Dr. Catherine
Goodman, Benjamin Palafox, Sarah Tougher, Immo Kleinschmidt, co-investigators. LSHTM is responsible for the supply chain research component of ACTwatch.
The Independent Evaluator for the Affordable Medicines Facility-malaria Phase 1 Evaluation is comprised of the following individuals: LSHTM Dr. Kara Hanson, Principal Investigator, Dr. Catherine Goodman, Sarah
Tougher, Dr. Barbara Willey, Dr. Andrea Mann, co-investigators.
ICF International Dr. Fred Arnold, Director, Dr. Yazoume Ye, Dr. Ruilin Run, co-investigators.
Suggested citation: ACTwatch Group, SFH/Nigeria and the Independent Evaluation Team. (2009). Outlet Survey Report 2009 for the Baseline Independent Evaluation of the Affordable Medicines Facility (AMFm), Nigeria, ACTwatch/SFH/PSI. www.actwatch.info
Nigeria Mrs. Ekundayo D. Arogundade Society for Family Health/ Nigeria 8, Portha rcourt Crescent Area 11, Garki Abuja, Nigeria Phone: + 234 8033116065 Email: [email protected]
ACTwatch Contacts ACTwatch Central Dr. Kathryn O’Connell ACTwatch Principal Investigator Malaria Control & Child Survival Department Population Services International Regional Technical Office P.O. Box 14355-00800 Nairobi, Kenya Phone: + 254 20 4440125/6/7/8 Email: [email protected]
www.ACTwatch.info
I | P a g e
Table of Contents
TABLE OF CONTENTS..............................................................................................................I
LIST OF ACTWATCH TABLES ............................................................................................... IV
LIST OF AMFM TABLES ......................................................................................................... V
LIST OF FIGURES..................................................................................................................VII
DEFINITIONS ...................................................................................................................... VIII
CLASSIFICATION OF ACTS .....................................................................................................X
LIST OF ABBREVIATIONS ................................................................................................. XIII
EXECUTIVE SUMMARY.......................................................................................................XIV
Overview ....................................................................................................................... XIV
Overview of the AMFm independent evaluation process ....................................................... XIV
Nigeria Outlet Survey Methods........................................................................................... XV
Key findings .................................................................................................................... XVI
1. BACKGROUND .............................................................................................................1
Overview of the ACTwatch Research Project ........................................................................... 1
Overview of the AMFm phase 1 ............................................................................................ 2
Overview of the AMFm Phase 1 Independent Evaluation (IE)..................................................... 2
1. Background .................................................................................................................... 7 Overview of the country ........................................................................................... 7 Description of health care system .............................................................................. 8 Epidemiology of malaria ........................................................................................... 9 Antimalarial Policies and Regulatory Environment........................................................10 Malaria control stra tegy ..........................................................................................11 Malaria financing ...................................................................................................12
2. Methods .......................................................................................................................13
Key ACTwatch indicators ....................................................................................................13
Key AMFm Phase 1 Independent Evaluation indicators ............................................................15
Background on ACTWatch and the AMFm Phase 1 Indicators ...................................................16 Classification of antimalarials ...................................................................................16
www.ACTwatch.info
II | P a g e
ACTwatch versus AMFm classifications.......................................................................17 ACTwatch versus AMFm denominators ......................................................................17 ACTwatch versus AMFm evaluation exchange rates ......................................................18
Outlet survey ....................................................................................................................19 Sampling Approa ch ................................................................................................19 Data collection ......................................................................................................20 Data processing .....................................................................................................22 Data Analysis.........................................................................................................23
3. RESULTS - OUTLET SURVEY .......................................................................................... 25
Characteristics of the sample...............................................................................................25
ACTwatch Indicators ..........................................................................................................27
AMFm Phase 1 Indicators....................................................................................................57
Additional Characteristics of the sample ...............................................................................58
Availability of antimalaria l drugs..........................................................................................63 Antimalarials in s tock ..............................................................................................63 Antimalarials in s tock by type ...................................................................................64 Stock-outs of quality assured ACTs ............................................................................68 Population coverage of outlets with quality assured ACTs ..............................................69
Pricing of antimalarials (Affordability)...................................................................................70 Cost to patients of antimalarials ................................................................................70 Gross percentage markup between purchase price and reta il selling price ........................75 Availability and cost to pa tients of diagnostic tests (RDT/microscopy) ..............................79
Quality assured ACTs market share ......................................................................................83
Provider knowledge of first-line antimalaria l treatment and ACT regimen ..................................85
AMFm logo.......................................................................................................................89
4. SUMMARY OF KEY FINDINGS ................................................................................ 93
Quality of the data collected ...............................................................................................93
Availability of quality assured ACTs ......................................................................................93
5. CONCLUSION AND RECOMMENDATIONS ............................................................ 95
6. REFERENCES ............................................................................................................. 96
7. ACKNOWLEDGEMENTS .......................................................................................... 99
8. APPENDICES ........................................................................................................... 100
8.1 Country profile - Fact sheet .......................................................................................... 100
www.ACTwatch.info
III | P a g e
8.2 Country document log book ......................................................................................... 102
8.3 Questionnaire ............................................................................................................ 103
8.4 ACTs class ified as quality assured .................................................................................. 118
8.5 Final sample .............................................................................................................. 123
8.6 Survey team .............................................................................................................. 126
8.7 Description of outlet types vis ited for this survey ............................................................ 127
8.8 Sampling weig hts ....................................................................................................... 130
8.9 Assumptions for ca lculating Adult-Equivalent Treatment Doses (AETDs) ............................. 132
8.10 Nationally registered ACTs ......................................................................................... 142
8.11 Additional table, market share by outlet category.......................................................... 145
www.ACTwatch.info
IV | P a g e
List of ACTwatch Tables Table A.1: Availability of antimalarials, by outlet type ................................................................... 28Table A.2: Availability of antimalarials among outlets stocking at least one antimalarial, by outlet
type ................................................................................................................................... 29Table A.3: Disruption in stock, expiry and storage conditions of antimalarials, by outlet type .......... 31Table A.4: Price of antimalarials, by outlet type ............................................................................ 32
Table A.5: Affordability of antimalarials, by outlet type ................................................................. 34Table A.6: Availability of diagnostic tests & cost to patients, by outlet type .................................... 35
Table A.7: Market share, by outlet type ....................................................................................... 36Table A.8: Provider knowledge, by outlet type .............................................................................. 37
Table A.9: Provider perceptions, by outlet type ............................................................................ 38Table A.10: Availability of antimalarials, by strata ......................................................................... 40Table A.11: Disruption in stock, expiry and storage conditions of antimalarials, by strata ................ 41
Table A.12: Price of antimalarials, by strata .................................................................................. 42Table A.13: Affordability of antimalarials, by strata ....................................................................... 43
Table A.14: Availability of diagnostic tests & cost to patients, by strata .......................................... 44Table A.15: Market share, by strata ............................................................................................. 45
Table A.16: Provider knowledge, by strata .................................................................................... 46Table A.17: Provider perceptions, by strata .................................................................................. 47Table A.18: Availability of antimalarials, by urban/rural classification ............................................. 49
Table A.19: Disruption in stock, expiry and storage conditions of antimalarials, .............................. 50Table A.20: Price of antimalarials, by urban/rural classification ..................................................... 51
Table A.21: Affordability of antimalarials, by urban/rural classification .......................................... 52Table A.22: Availability of diagnostic tests & cost to patients, by urban/rural classification ............. 53
Table A.23: Market share, by urban/rural classification ................................................................. 54Table A.24: Provider knowledge, by urban/rural classification ....................................................... 55Table A.25: Provider perceptions, by urban/rural classification ...................................................... 56
Table 8.11.1: Market share, by outlet type ................................................................................. 145
www.ACTwatch.info
V | P a g e
List of AMFm Tables Table 3.1.1: Outlets enumerated by location, drugs stocked and final interview status ................... 26
Table 3.1.2: Outlets enumerated* in Nigeria, 2009 ....................................................................... 58Table 3.1.3: Outlets with antimalarials in stock* in Nigeria, 2009** ............................................... 59
Table 3.1.4: Number of products audited in Nigeria, 2009 ............................................................. 60Table 3.1.5: Outlets with at least one staff member who completed secondary school or primary
school in Nigeria, 2009 ........................................................................................................ 61
Table 3.1.6: Outlets with a staff member with a health-related qualification* in Nigeria, 2009 ........ 62
Table 3.2.1: Outlets with antimalarials in stock in Nigeria, 2009 ..................................................... 63Table 3.2.2: Outlets with non-artemisinin therapy in stock in Nigeria, 2009 .................................... 64
Table 3.2.3: Outlets with artemisinin monotherapy in stock in Nigeria, 2009 .................................. 65Table 3.2.4: Outlets with non-quality-assured ACTs in stock in Nigeria, 2009 .................................. 66Table 3.2.5: Outlets with quality assured ACTs in stock in Nigeria, 2009 ......................................... 67
Table 3.2.6: Outlets with stock-outs of quality assured ACTs in Nigeria, 2009 ................................. 68Table 3.2.7: Percentage of the population living in censused localities with outlets with quality
assured ACTs in stock at the time of survey in Nigeria, 2009 .................................................. 69
Table 3.3.1: Cost to patients of non-artemisinin therapy, in US dollars* in Nigeria, 2009 ................. 70Table 3.3.2: Cost to patients of artemisinin monotherapy, in US dollars* in Nigeria, 2009 ............... 72Table 3.3.3: Cost to patients of non-quality-assured ACTs, in US dollars* in Nigeria, 2009 ............... 73
Table 3.3.4: Cost to patients of quality assured ACTs in US dollars* in Nigeria, 2009 ....................... 74Table 3.3.5: Gross percentage mark-up between purchase price and retail selling price of non-
artemisinin therapy in Nigeria, 2009 .................................................................................... 75Table 3.3.6: Gross percentage mark-up between purchase price and retail selling price of artemisinin
monotherapy in Nigeria, 2009 ............................................................................................. 76Table 3.3.7: Gross percentage mark-up between purchase price and retail selling price of non-
quality-assured ACTs in Nigeria, 2009 .................................................................................. 77
Table 3.3.8: Gross percentage mark-up between purchase price and retail selling price of quality assured ACTs in Nigeria, 2009 ............................................................................................. 78
Table 3.3.9: Availability of malaria microscopy, in Nigeria, 2009 .................................................... 79Table 3.3.10: Cost to patients of malaria microscopy in US dollars in Nigeria, 2009 ......................... 80
Table 3.3.11: Availability of rapid diagnostic tests for malaria, in Nigeria, 2009 ............................... 81Table 3.3.12: Cost to patients of rapid diagnostic tests (RDTs) for malaria in US dollars in Nigeria,
2009 .................................................................................................................................. 82
Table 3.4.1: Percentage breakdown of antimalarial sales volumes in Nigeria, 2009 ......................... 83
www.ACTwatch.info
VI | P a g e
Table 3.5.1: Provider knowledge of first-line antimalarial treatment in Nigeria, 2009 ...................... 85
Table 3.5.2: Provider knowledge of dosing regimen for quality assured ACTs (QAACTs) for an adult in Nigeria, 2009 ...................................................................................................................... 86
Table 3.5.3: Provider knowledge of dosing regimen for quality assured ACTs (QAACTs) for a child in Nigeria, 2009 ...................................................................................................................... 87
Table 3.5.4: Reasons for not stocking quality assured ACTs (QAACTs) by private providers in Nigeria, 2009 .................................................................................................................................. 88
Table 3.6.1: Provider recognition of AMFm logo in Nigeria, 2009 ................................................... 89Table 3.6.2: Provider knowledge of the AMFm Logo in Nigeria, 2009 ............................................. 90
Table 3.6.3: Sources from which providers have seen or heard of the AMFm Logo in Nigeria, 2009 . 91Table 3.6.4: Percentage of antimalarials bearing the AMFm logo, in Nigeria, 2009 .......................... 92
Table 8.2.1: List of documents reviewed, Nigeria, 2009 ............................................................... 102Table 8.4.1: List of Quality Assured ACTs for availability, price and market share indicators .......... 119Table 8.5.1: List of clusters/localities sampled and their population, Nigeria, 2009 ....................... 123Table 8.6.1: List of staff members involved in the survey, Nigeria, 2009 ....................................... 126Table 8.9.1: AETD Calculation details by antimalarial type ........................................................... 136
www.ACTwatch.info
VII | P a g e
List of Figures Figure 1. Availability of antimalarials among all outlets, by outlet type .......................................... XVI
Figure 2. Outlet types stocking antimalarials .............................................................................. XVIIFigure 3. Availability of antimalarials, among outlets stocking at least one antimalarial, by outlet type
........................................................................................................................................ XVIIFigure 4. Proportion of outlets with microscopic blood testing facilities and rapid diagnostic tests XVIII
Figure 5. Median price of antimalarial treatment per AETD in the private sector, by outlet type ..... XIXFigure 6. Market share of AETDs sold/distributed in the past week (7 days) .................................. XIXFigure 7. Provider knowledge of recommended first-line treatment and dosing regimens ............... XX
Figure 8: AMFm Phase 1 Results Framework .................................................................................. 3Figure 9: The Independent Evaluation Impact Model ...................................................................... 4
Figure 10: The Independent Evaluation Design ............................................................................... 5Figure 11: Location of Nigeria ........................................................................................................ 7
Figure 12: Malaria prevalence map (MARA prevalence model), Nigeria, 2001 ................................ 10Figure 13: Primary ACTwatch indicators ....................................................................................... 13Figure 14: Primary AMFm indicators measured by the ACTwatch survey ........................................ 15
Figure 15: Survey flow diagram, in Nigeria, 2009 .......................................................................... 25
www.ACTwatch.info
VIII | P a g e
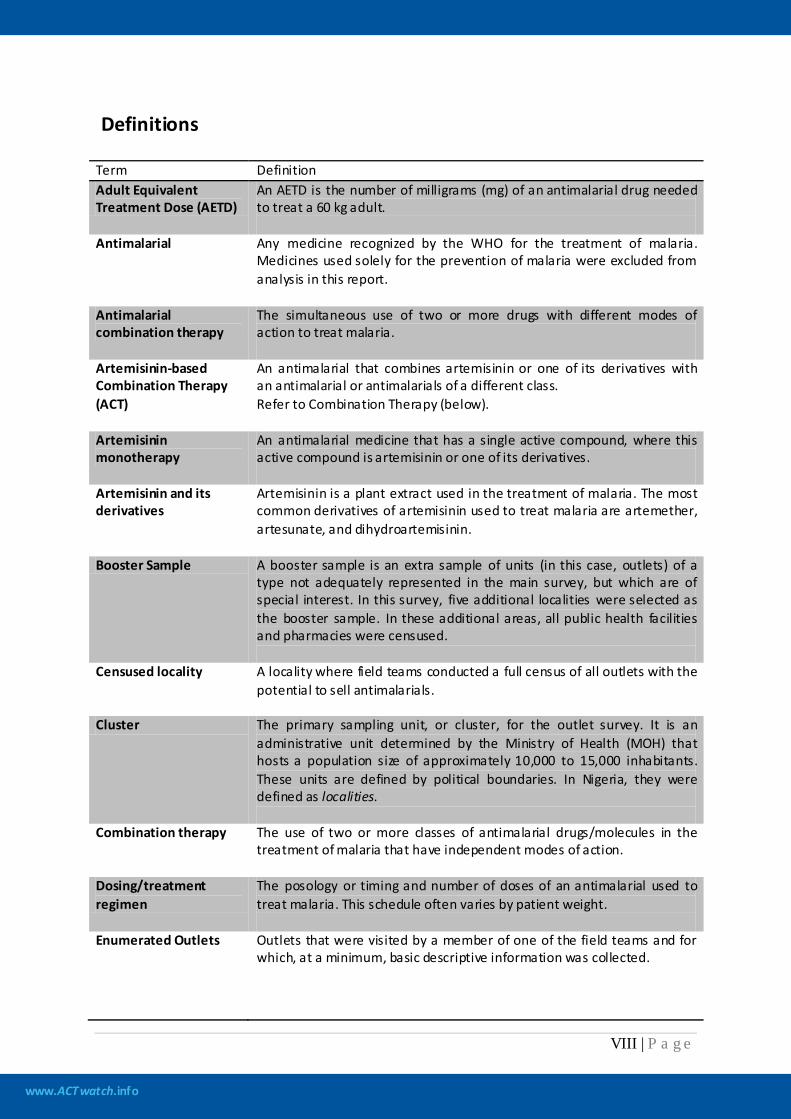
Definitions Term Definition Adult Equivalent Treatment Dose (AETD)
An AETD is the number of milligrams (mg) of an antimalarial drug needed to treat a 60 kg adult.
Antimalarial Any medicine recognized by the WHO for the treatment of malaria. Medicines used solely for the prevention of malaria were excluded from analysis in this report.
Antimalarial combination therapy
The simultaneous use of two or more drugs with different modes of action to treat malaria.
Artemisinin-based Combination Therapy (ACT)
An antimalarial that combines artemisinin or one of its derivatives with an antimalarial or antimalarials of a different class. Refer to Combination Therapy (below).
Artemisinin monotherapy
An antimalarial medicine that has a single active compound, where this active compound is artemisinin or one of its derivatives.
Artemisinin and its derivatives
Artemisinin is a plant extract used in the treatment of malaria. The most common derivatives of artemisinin used to treat malaria are artemether, artesunate, and dihydroartemisinin.
Booster Sample A booster sample is an extra sample of units (in this case, outlets) of a type not adequately represented in the main survey, but which are of special interest. In this survey, five additional localities were selected as the booster sample. In these additional areas, all public health facilities and pharmacies were censused.
Censused locality A locality where field teams conducted a full census of all outlets with the potential to sell antimalarials.
Cluster The primary sampling unit, or cluster, for the outlet survey. It is an administrative unit determined by the Ministry of Health (MOH) that hosts a population size of approximately 10,000 to 15,000 inhabitants. These units are defined by political boundaries. In Nigeria, they were defined as localities.
Combination therapy
The use of two or more classes of antimalarial drugs/molecules in the treatment of malaria that have independent modes of action.
Dosing/treatment regimen
The posology or timing and number of doses of an antimalarial used to treat malaria. This schedule often varies by patient weight.
Enumerated Outlets Outlets that were visited by a member of one of the field teams and for which, at a minimum, basic descriptive information was collected.
www.ACTwatch.info
IX | P a g e
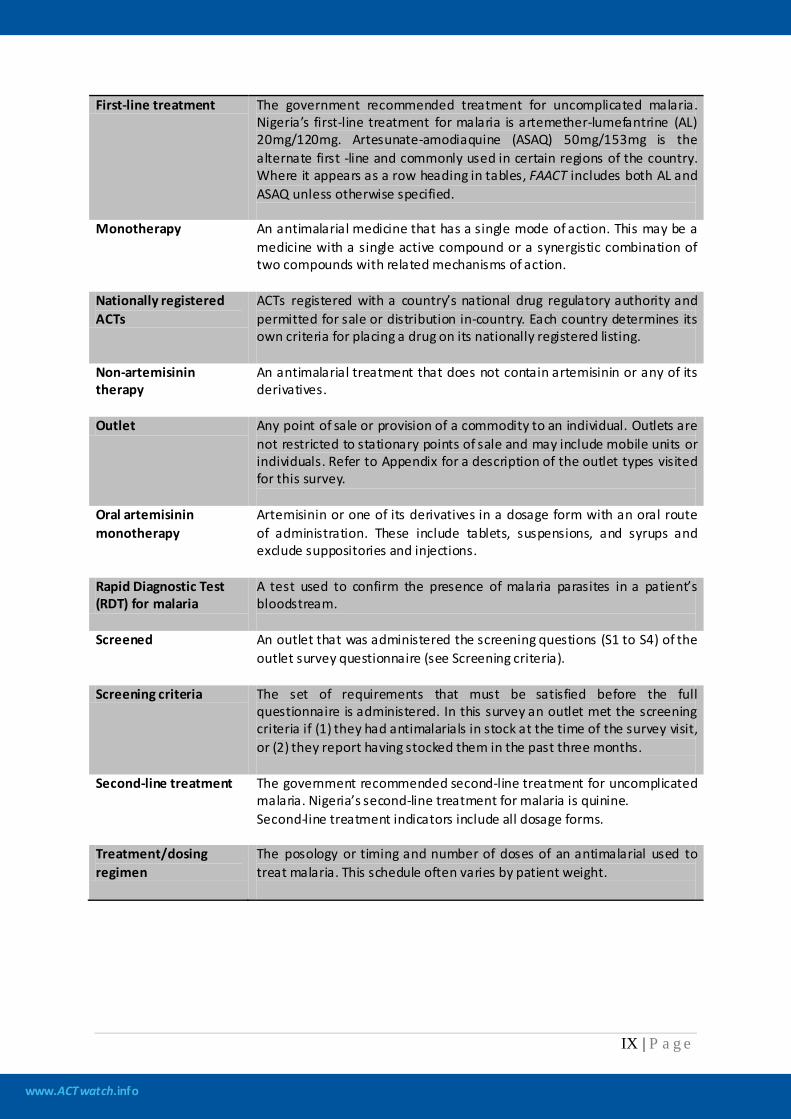
First-line treatment The government recommended treatment for uncomplicated malaria. Nigeria’s first-line treatment for malaria is artemether-lumefantrine (AL) 20mg/120mg. Artesunate-amodiaquine (ASAQ) 50mg/153mg is the alternate first -line and commonly used in certain regions of the country. Where it appears as a row heading in tables, FAACT includes both AL and ASAQ unless otherwise specified.
Monotherapy An antimalarial medicine that has a single mode of action. This may be a medicine with a single active compound or a synergistic combination of two compounds with related mechanisms of action.
Nationally registered ACTs
ACTs registered with a country’s national drug regulatory authority and permitted for sale or distribution in-country. Each country determines its own criteria for placing a drug on its nationally registered listing.
Non-artemisinin therapy
An antimalarial treatment that does not contain artemisinin or any of its derivatives.
Outlet Any point of sale or provision of a commodity to an individual. Outlets are not restricted to stationary points of sale and may include mobile units or individuals. Refer to Appendix for a description of the outlet types visited for this survey.
Oral artemisinin monotherapy
Artemisinin or one of its derivatives in a dosage form with an oral route of administration. These include tablets, suspensions, and syrups and exclude suppositories and injections.
Rapid Diagnostic Test (RDT) for malaria
A test used to confirm the presence of malaria parasites in a patient’s bloodstream.
Screened An outlet that was administered the screening questions (S1 to S4) of the outlet survey questionnaire (see Screening criteria).
Screening criteria The set of requirements that must be satisfied before the full questionnaire is administered. In this survey an outlet met the screening criteria if (1) they had antimalarials in stock at the time of the survey visit, or (2) they report having stocked them in the past three months.
Second-line treatment The government recommended second-line treatment for uncomplicated malaria. Nigeria’s second-line treatment for malaria is quinine. Second-line treatment indicators include all dosage forms.
Treatment/dosing regimen
The posology or timing and number of doses of an antimalarial used to treat malaria. This schedule often varies by patient weight.
www.ACTwatch.info
X | P a g e
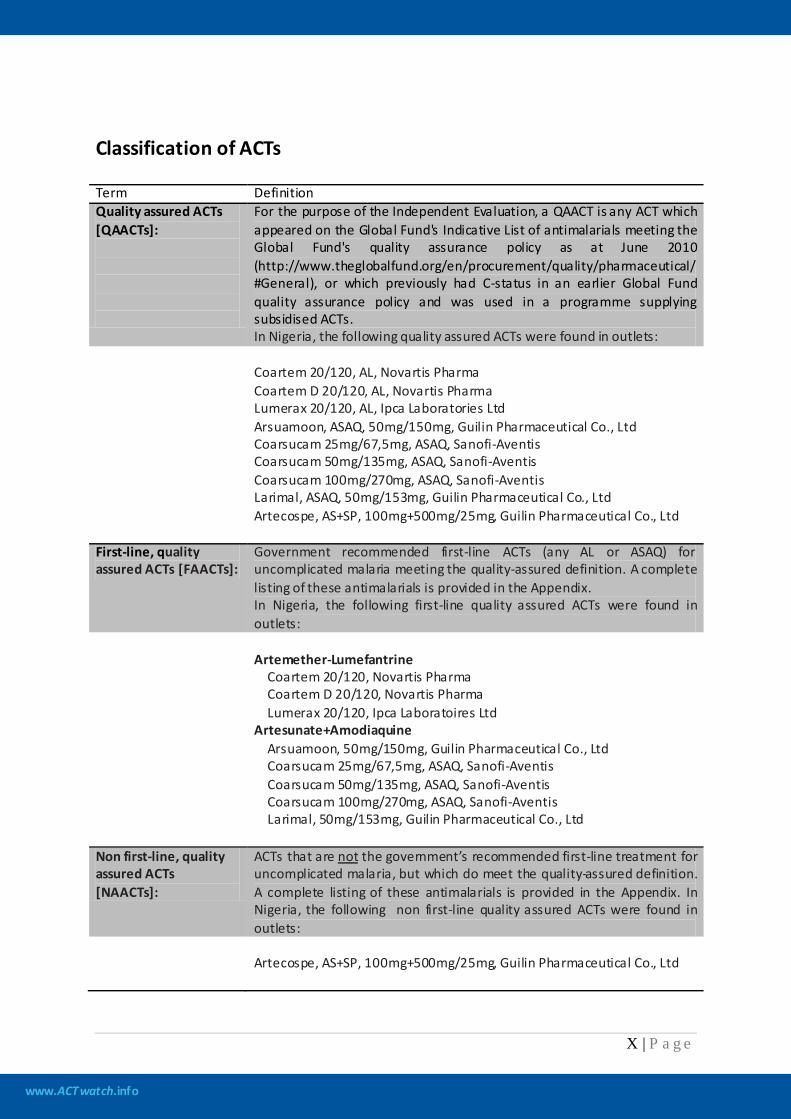
Classification of ACTs Term Definition Quality assured ACTs [QAACTs]:
For the purpose of the Independent Evaluation, a QAACT is any ACT which appeared on the Global Fund's Indicative List of antimalarials meeting the Global Fund's quality assurance policy as at June 2010 (http://www.theglobalfund.org/en/procurement/quality/pharmaceutical/#General), or which previously had C-status in an earlier Global Fund quality assurance policy and was used in a programme supplying subsidised ACTs. In Nigeria, the following quality assured ACTs were found in outlets:
Coartem 20/120, AL, Novartis Pharma Coartem D 20/120, AL, Novartis Pharma Lumerax 20/120, AL, Ipca Laboratories Ltd Arsuamoon, ASAQ, 50mg/150mg, Guilin Pharmaceutical Co., Ltd Coarsucam 25mg/67,5mg, ASAQ, Sanofi-Aventis Coarsucam 50mg/135mg, ASAQ, Sanofi-Aventis Coarsucam 100mg/270mg, ASAQ, Sanofi-Aventis Larimal, ASAQ, 50mg/153mg, Guilin Pharmaceutical Co., Ltd Artecospe, AS+SP, 100mg+500mg/25mg, Guilin Pharmaceutical Co., Ltd
First-line, quality assured ACTs [FAACTs]:
Government recommended first-line ACTs (any AL or ASAQ) for uncomplicated malaria meeting the quality-assured definition. A complete listing of these antimalarials is provided in the Appendix. In Nigeria, the following first-line quality assured ACTs were found in outlets:
Artemether-Lumefantrine
Coartem 20/120, Novartis Pharma Coartem D 20/120, Novartis Pharma Lumerax 20/120, Ipca Laboratoires Ltd
Artesunate+Amodiaquine Arsuamoon, 50mg/150mg, Guilin Pharmaceutical Co., Ltd Coarsucam 25mg/67,5mg, ASAQ, Sanofi-Aventis Coarsucam 50mg/135mg, ASAQ, Sanofi-Aventis Coarsucam 100mg/270mg, ASAQ, Sanofi-Aventis Larimal, 50mg/153mg, Guilin Pharmaceutical Co., Ltd
Non first-line, quality assured ACTs [NAACTs]:
ACTs that are not the government’s recommended first-line treatment for uncomplicated malaria, but which do meet the quality-assured definition. A complete listing of these antimalarials is provided in the Appendix. In Nigeria, the following non first-line quality assured ACTs were found in outlets:
Artecospe, AS+SP, 100mg+500mg/25mg, Guilin Pharmaceutical Co., Ltd
www.ACTwatch.info
XI | P a g e
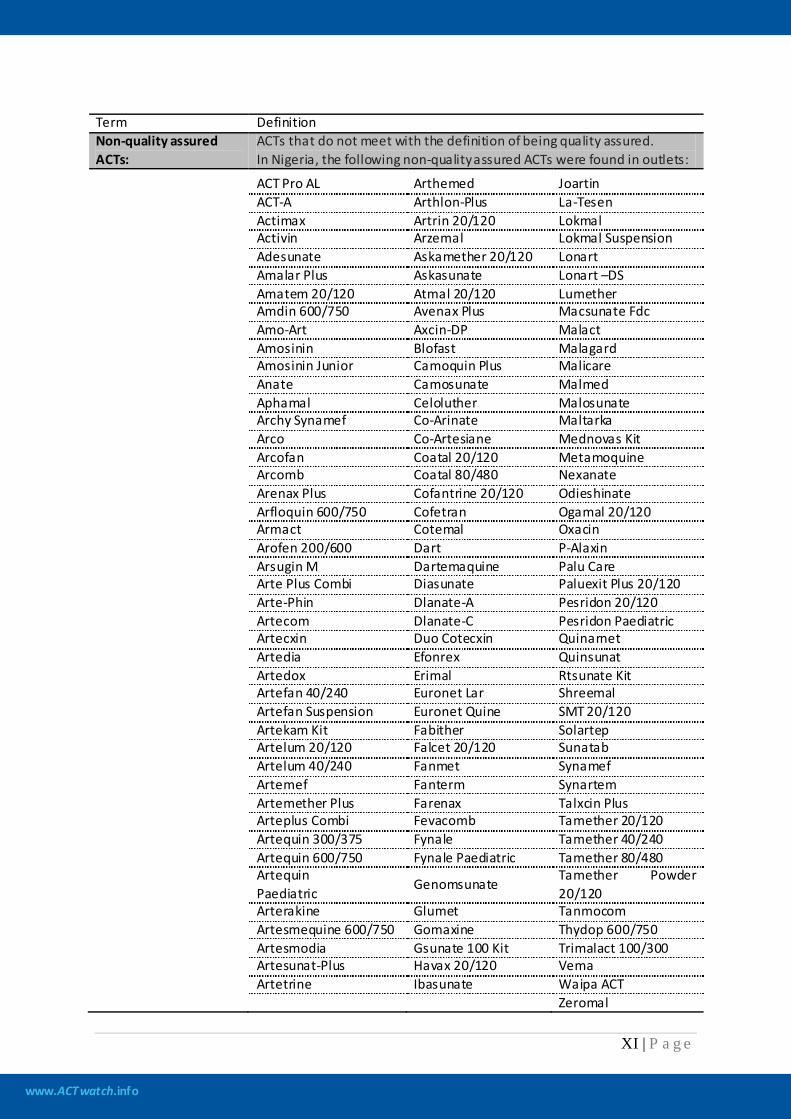
Term Definition Non-quality assured ACTs:
ACTs that do not meet with the definition of being quality assured. In Nigeria, the following non-quality assured ACTs were found in outlets:
ACT Pro AL Arthemed Joartin ACT-A Arthlon-Plus La-Tesen Actimax Artrin 20/120 Lokmal Activin Arzemal Lokmal Suspension Adesunate Askamether 20/120 Lonart Amalar Plus Askasunate Lonart –DS Amatem 20/120 Atmal 20/120 Lumether Amdin 600/750 Avenax Plus Macsunate Fdc Amo-Art Axcin-DP Malact Amosinin Blofast Malagard Amosinin Junior Camoquin Plus Malicare Anate Camosunate Malmed Aphamal Celoluther Malosunate Archy Synamef Co-Arinate Maltarka Arco Co-Artesiane Mednovas Kit Arcofan Coatal 20/120 Metamoquine Arcomb Coatal 80/480 Nexanate Arenax Plus Cofantrine 20/120 Odieshinate Arfloquin 600/750 Cofetran Ogamal 20/120 Armact Cotemal Oxacin Arofen 200/600 Dart P-Alaxin Arsugin M Dartemaquine Palu Care Arte Plus Combi Diasunate Paluexit Plus 20/120 Arte-Phin Dlanate-A Pesridon 20/120 Artecom Dlanate-C Pesridon Paediatric Artecxin Duo Cotecxin Quinarnet Artedia Efonrex Quinsunat Artedox Erimal Rtsunate Kit Artefan 40/240 Euronet Lar Shreemal Artefan Suspension Euronet Quine SMT 20/120 Artekam Kit Fabither Solartep Artelum 20/120 Falcet 20/120 Sunatab Artelum 40/240 Fanmet Synamef Artemef Fanterm Synartem Artemether Plus Farenax Talxcin Plus Arteplus Combi Fevacomb Tamether 20/120 Artequin 300/375 Fynale Tamether 40/240 Artequin 600/750 Fynale Paediatric Tamether 80/480 Artequin
Paediatric Genomsunate
Tamether Powder 20/120
Arterakine Glumet Tanmocom Artesmequine 600/750 Gomaxine Thydop 600/750 Artesmodia Gsunate 100 Kit Trimalact 100/300 Artesunat-Plus Havax 20/120 Vema Artetrine Ibasunate Waipa ACT Zeromal
www.ACTwatch.info
XII | P a g e
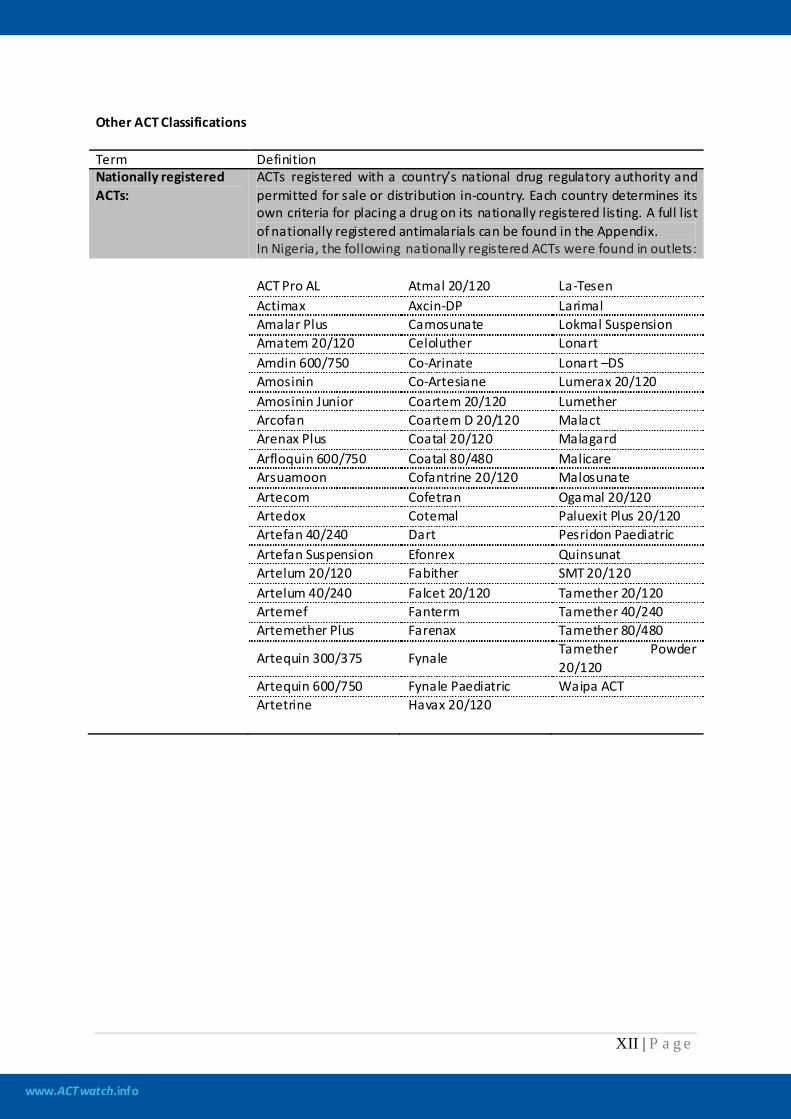
Other ACT Classifications Term Definition Nationally registered ACTs:
ACTs registered with a country’s national drug regulatory authority and permitted for sale or distribution in-country. Each country determines its own criteria for placing a drug on its nationally registered listing. A full list of nationally registered antimalarials can be found in the Appendix. In Nigeria, the following nationally registered ACTs were found in outlets:
ACT Pro AL Atmal 20/120 La-Tesen Actimax Axcin-DP Larimal Amalar Plus Camosunate Lokmal Suspension Amatem 20/120 Celoluther Lonart Amdin 600/750 Co-Arinate Lonart –DS Amosinin Co-Artesiane Lumerax 20/120 Amosinin Junior Coartem 20/120 Lumether Arcofan Coartem D 20/120 Malact Arenax Plus Coatal 20/120 Malagard Arfloquin 600/750 Coatal 80/480 Malicare Arsuamoon Cofantrine 20/120 Malosunate Artecom Cofetran Ogamal 20/120 Artedox Cotemal Paluexit Plus 20/120 Artefan 40/240 Dart Pesridon Paediatric Artefan Suspension Efonrex Quinsunat Artelum 20/120 Fabither SMT 20/120 Artelum 40/240 Falcet 20/120 Tamether 20/120 Artemef Fanterm Tamether 40/240 Artemether Plus Farenax Tamether 80/480
Artequin 300/375 Fynale Tamether Powder 20/120
Artequin 600/750 Fynale Paediatric Waipa ACT Artetrine Havax 20/120
www.ACTwatch.info
XIII | P a g e
List of Abbreviations -- No data were available
*** Undefined ratio as a non-zero value is being divided by a value of zero
ACT Artemisinin-based Combination Therapy
AETD Adult Equivalent Treatment Dose
AL Artemether-Lumefantrine
AMFm Affordable Medicines Facility – malaria
ASAQ Artesunate Amodiaquine
CHW Community Health Worker (called Community Health Extension Workers in Nigeria [CHEW])
CQ Chloroquine
FAACT First-line Quality Assured ACT
FBO Faith Based Organization
Global Fund The Global Fund to Fight AIDS, Tuberculosis and Malaria
GPS Global Positioning System
IE Independent Evaluation
IQR Inter-Quartile Range
ITN Insecticide Treated Net
LLIN Long Lasting Insecticidal Net
LSHTM London School of Hygiene and Tropical Medicine
MOH Ministry of Health
n/a Not applicable: Indicates statistic cannot be calculated as the numerator is zero
NAACT Non-First-line Quality Assured ACT
NMCP National Malaria Control Program
PMI President’s Malaria Initiative
PPS Probability Proportional to Size
PSI Population Services International
QAACT Quality Assured ACT
SP Sulfadoxine-Pyrimethamine
UN United Nations
UNICEF United Nations Children’s Fund
WHO World Health Organization
www.ACTwatch.info
XIV | P a g e
Executive Summary
Overview
The ACTwatch Outlet Survey involves quantitative research at the outlet level in ACTwatch countries (Cambodia, Uganda, Zambia, Nigeria, Benin, Madagascar and the Democratic Republic of Congo). Other elements of ACTwatch research include Household Surveys led by Population Services International (PSI) and Supply Chain Research led by the London School of Hygiene & Tropical Medicine (LSHTM). This report presents the results of a cross-sectional survey of outlets conducted in Nigeria from August to September 2009 and also serves as the baseline for the Affordable Medicines Facilities –malaria (AMFm) Phase 1 Independent Evaluation.
Overview of the AMFm independent evaluation process
The independent evaluation is part of a multi-faceted monitoring and evaluation framework developed for Phase 1 of the Affordable Medicines Facility – malaria (AMFm). It is intended to assess whether, and to what extent, AMFm Phase 1 achieves its objectives. The findings of the independent evaluation will be summarized in a report to be considered by the Global Fund Board at the end of Phase 1. The four main objectives of AMFm are: (i) to increase ACT affordability, (ii) to increase ACT availability, (iii) to increase ACT use, including among vulnerable groups, and (iv) to “crowd out” other oral antimalarials by gaining market share. Through a competitive bid, the Global Fund contracted ICF Macro and the London School of Hygiene and Tropical Medicine (LSHTM) to carry out the Independent Evaluation (IE) in all of the currently operational Phase 1 countries (Ghana, Kenya, Madagascar, Niger, Nigeria, Tanzania mainland, Uganda, and Zanzibar). The baseline of the AMFm assessment relied on primary data collected from outlet surveys. In addition, with the exception of Nigeria, in-depth interviews with key stakeholders involved in the drug supply chain in the country, and a review of documents was also collected. ACTwatch provided data for Kenya, Madagascar, Nigeria, Tanzania mainland, Uganda, and Zanzibar. Baseline outlet surveys were carried out in 8 pilots in 7 countries with the objectives of assessing availability, affordability, and market share of co-paid ACTs in rural and urban areas in each of the seven participating countries. The Independent Evaluation uses outlet survey data from two groups: 1) those in which nationally representative outlet surveys have been conducted under the ACTwatch program (Madagascar and Nigeria), and 2) those in which new outlet surveys were conducted under the AMFm Phase 1 IE (Ghana, Kenya, Niger, Tanzania mainland, Uganda and Zanzibar). The surveys were conducted in all the countries between August 2009 and December 2010.
www.ACTwatch.info
XV | P a g e
Nigeria Outlet Survey Methods
A nationally representative sample of all outlets that could sell or provide antimalarials to a consumer was taken through a census approach in 114 clusters across six geo-political strata in Nigeria. A cluster sampling approach was used because there were no reliable lists of all outlets stocking antimalarials. Clusters were localities, with an average of 10,000 to 15,000 inhabitants. Clusters were selected with probability proportional to size (PPS)—a sampling technique in which the probability that a particular commune is selected is proportional to its population size. For all localities (i.e. regardless of the locality population size) a full census of public health facilities, private health facilities, and pharmacies was conducted. For localities with fewer than 50,000 inhabitants, a full census of drug stores (known as Proprietary Patent Medicine Vendors [PPMVs]), grocery stores (general retailers), Community Health Workers (CHWs), and hawkers was conducted. For localities with more than 50,000 inhabitants, the census of PPMVs, general retailers, CHWs, and hawkers was restricted to 3 randomly selected Enumeration Areas of that locality. The sample size was powered to detect a change of 20% percentage points in availability of ACTs over time. Outlet inclusion criteria for this study included outlets which stocked an antimalarial at the time of survey or in the previous three months. An outlet is defined as any point of sale or provision of commodities for individuals. Outlets included in the survey are as follows: 1) public health facilities (government hospitals, health centres and CHWs); 2) pharmacies; 3) private health facilities (private clinics, private practices, NGO health centres and dispensaries); 4) drug stores (PPMVs); 5) grocery stores (general retailers); and 6) hawkers (itinerant drug vendors). Three paper based questionnaire modules were administered to participating outlets: 1) Screening Module, 2) Audit Sheet and 3) Provider Module. For all outlets, trained interviewers administered the screening module to collect information on the outlet type; location, including the outlet’s longitude and latitude; and information on availability of antimalarials. Among those outlets that stocked antimalarials at the time of survey, the audit sheet was administered. For each antimalarial, information was recorded on the brand and generic names, strength, expiry, amount sold in the last week and price to the consumer. Among outlets that stocked antimalarials at the time of interview, or in the past three months, the interviewer collected information on provider demographics, knowledge, and perceptions. Interviewers also observed outlet licensing and storage conditions of medicines using the provider module. Double data entry was conducted using Microsoft Access (Microsoft Cooperation, Seattle, WA, USA). To ensure a high level of data quality, ACTwatch performed cleaning using standard ACTwatch guidelines, and cleaning was performed in SPSS version 14. For the analysis, the Independent Evaluators provided a tabulation plan for all tables presented in this report for the IE indicators, and analysis do-files in STATA, which produced all the required indicators and automatically generated the tables. ACTwatch adapted these analysis files to the country setting and ran the analysis using STATA version 11, recording results in a log file. Additional analysis for other ACTwatch specific indicators was conducted by ACTwatch following standard guidelines in STATA. More information on the study design is available at www.actwatch.info.
www.ACTwatch.info
XVI | P a g e
Key findings
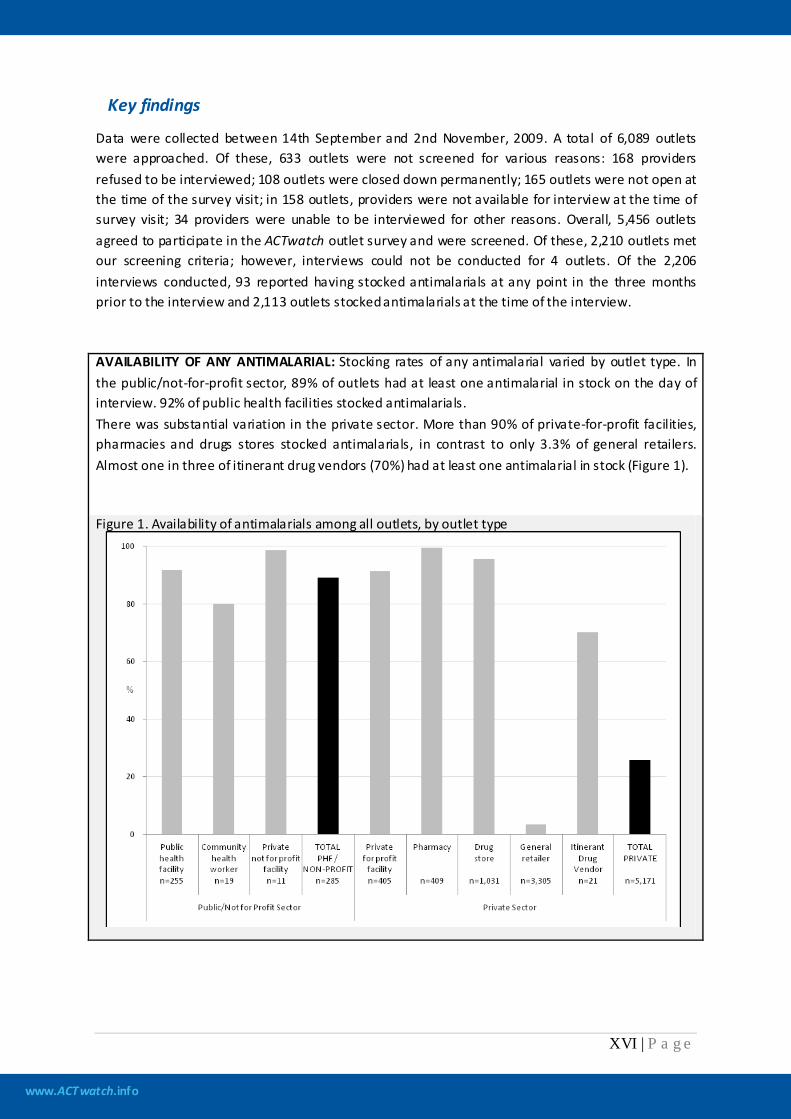
Data were collected between 14th September and 2nd November, 2009. A total of 6,089 outlets were approached. Of these, 633 outlets were not screened for various reasons: 168 providers refused to be interviewed; 108 outlets were closed down permanently; 165 outlets were not open at the time of the survey visit; in 158 outlets, providers were not available for interview at the time of survey visit; 34 providers were unable to be interviewed for other reasons. Overall, 5,456 outlets agreed to participate in the ACTwatch outlet survey and were screened. Of these, 2,210 outlets met our screening criteria; however, interviews could not be conducted for 4 outlets. Of the 2,206 interviews conducted, 93 reported having stocked antimalarials at any point in the three months prior to the interview and 2,113 outlets stocked antimalarials at the time of the interview. AVAILABILITY OF ANY ANTIMALARIAL: Stocking rates of any antimalarial varied by outlet type. In the public/not-for-profit sector, 89% of outlets had at least one antimalarial in stock on the day of interview. 92% of public health facilities stocked antimalarials. There was substantial variation in the private sector. More than 90% of private-for-profit facilities, pharmacies and drugs stores stocked antimalarials, in contrast to only 3.3% of general retailers. Almost one in three of itinerant drug vendors (70%) had at least one antimalarial in stock (Figure 1).
Figure 1. Availability of antimalarials among all outlets, by outlet type
www.ACTwatch.info
XVII | P a g e
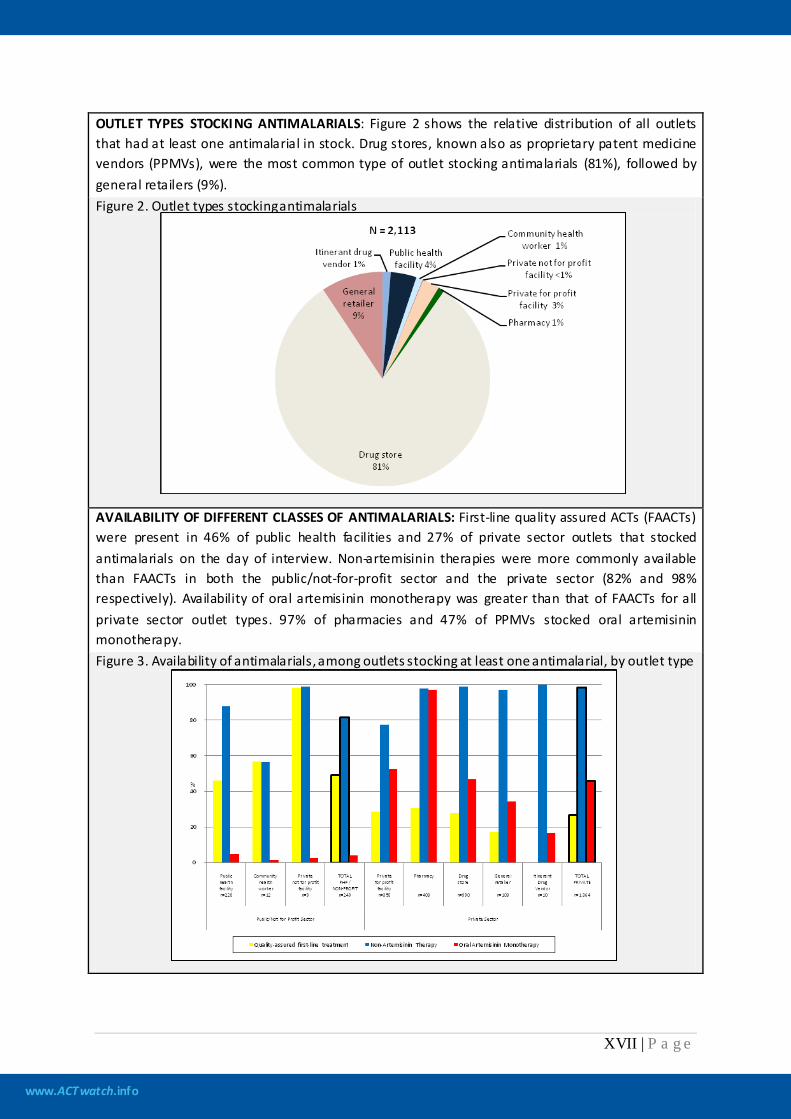
OUTLET TYPES STOCKING ANTIMALARIALS: Figure 2 shows the relative distribution of all outlets that had at least one antimalarial in stock. Drug stores, known also as proprietary patent medicine vendors (PPMVs), were the most common type of outlet stocking antimalarials (81%), followed by general retailers (9%). Figure 2. Outlet types stocking antimalarials
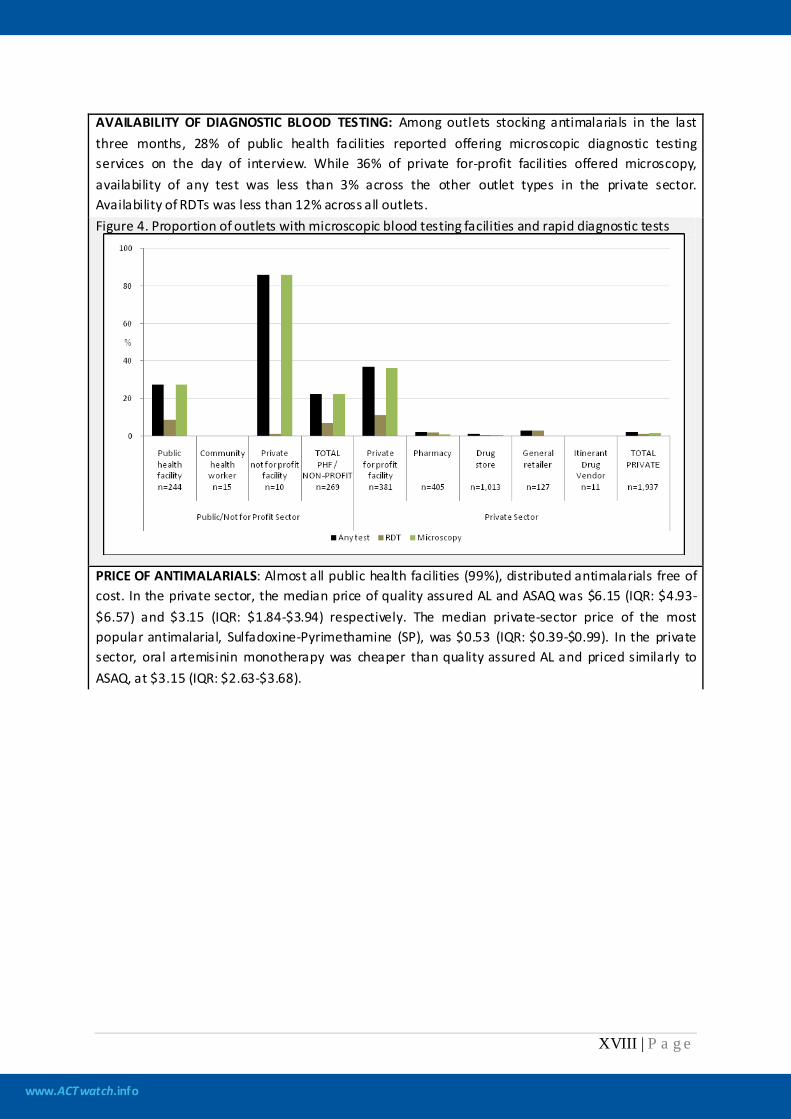
AVAILABILITY OF DIFFERENT CLASSES OF ANTIMALARIALS: First-line quality assured ACTs (FAACTs) were present in 46% of public health facilities and 27% of private sector outlets that stocked antimalarials on the day of interview. Non-artemisinin therapies were more commonly available than FAACTs in both the public/not-for-profit sector and the private sector (82% and 98% respectively). Availability of oral artemisinin monotherapy was greater than that of FAACTs for all private sector outlet types. 97% of pharmacies and 47% of PPMVs stocked oral artemisinin monotherapy. Figure 3. Availability of antimalarials, among outlets stocking at least one antimalarial, by outlet type
www.ACTwatch.info
XVIII | P a g e
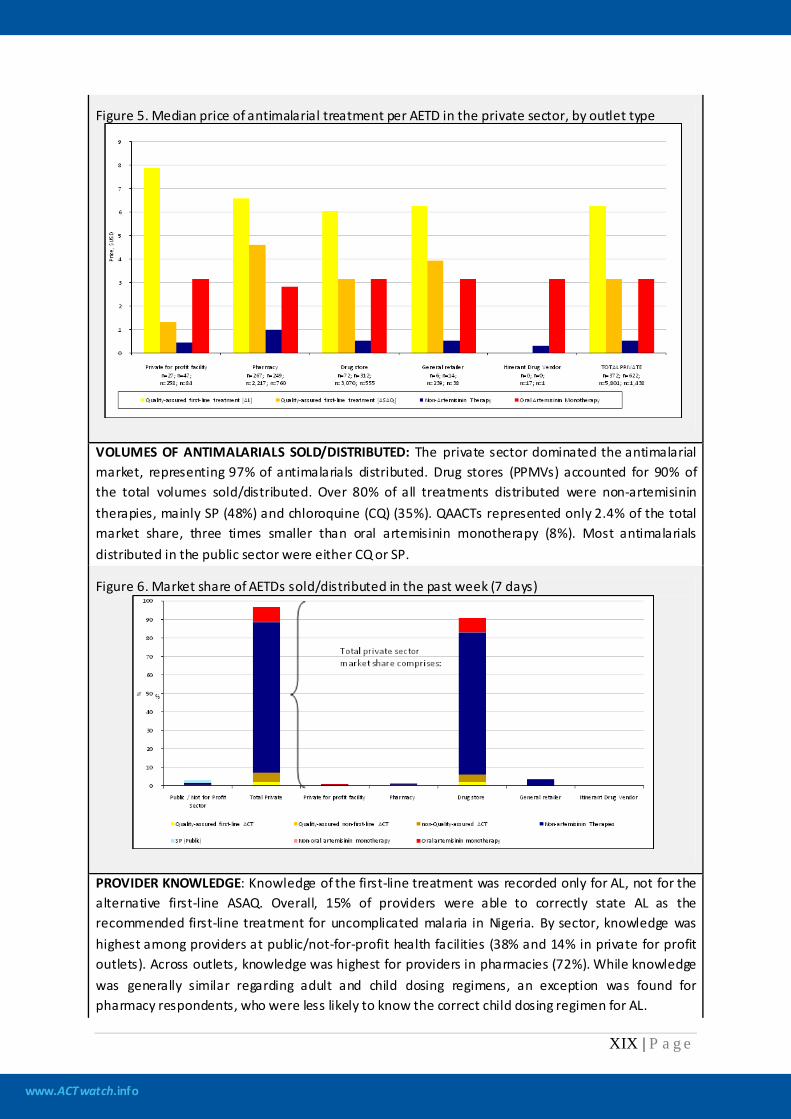
AVAILABILITY OF DIAGNOSTIC BLOOD TESTING: Among outlets stocking antimalarials in the last three months, 28% of public health facilities reported offering microscopic diagnostic testing services on the day of interview. While 36% of private for-profit facilities offered microscopy, availability of any test was less than 3% across the other outlet types in the private sector. Availability of RDTs was less than 12% across all outlets. Figure 4. Proportion of outlets with microscopic blood testing facilities and rapid diagnostic tests
PRICE OF ANTIMALARIALS: Almost all public health facilities (99%), distributed antimalarials free of cost. In the private sector, the median price of quality assured AL and ASAQ was $6.15 (IQR: $4.93-$6.57) and $3.15 (IQR: $1.84-$3.94) respectively. The median private-sector price of the most popular antimalarial, Sulfadoxine-Pyrimethamine (SP), was $0.53 (IQR: $0.39-$0.99). In the private sector, oral artemisinin monotherapy was cheaper than quality assured AL and priced similarly to ASAQ, at $3.15 (IQR: $2.63-$3.68).
www.ACTwatch.info
XIX | P a g e
Figure 5. Median price of antimalarial treatment per AETD in the private sector, by outlet type
VOLUMES OF ANTIMALARIALS SOLD/DISTRIBUTED: The private sector dominated the antimalarial market, representing 97% of antimalarials distributed. Drug stores (PPMVs) accounted for 90% of the total volumes sold/distributed. Over 80% of all treatments distributed were non-artemisinin therapies, mainly SP (48%) and chloroquine (CQ) (35%). QAACTs represented only 2.4% of the total market share, three times smaller than oral artemisinin monotherapy (8%). Most antimalarials distributed in the public sector were either CQ or SP.
Figure 6. Market share of AETDs sold/distributed in the past week (7 days)
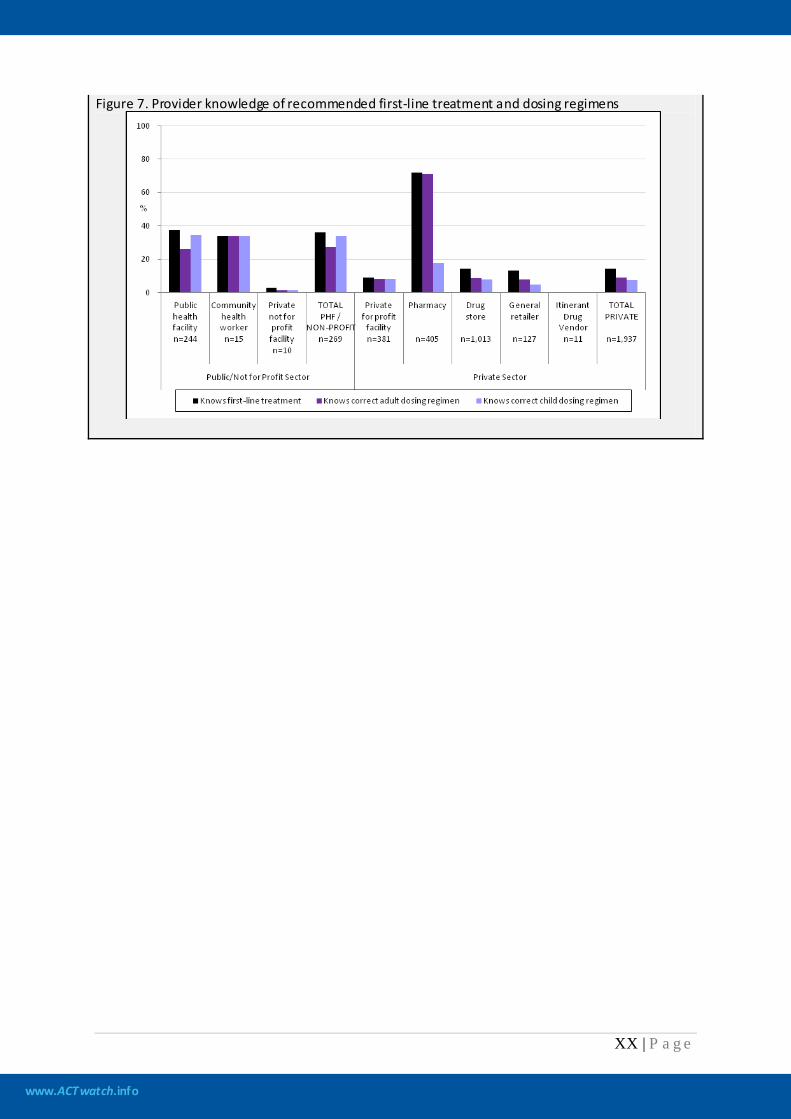
PROVIDER KNOWLEDGE: Knowledge of the first-line treatment was recorded only for AL, not for the alternative first-line ASAQ. Overall, 15% of providers were able to correctly state AL as the recommended first-line treatment for uncomplicated malaria in Nigeria. By sector, knowledge was highest among providers at public/not-for-profit health facilities (38% and 14% in private for profit outlets). Across outlets, knowledge was highest for providers in pharmacies (72%). While knowledge was generally similar regarding adult and child dosing regimens, an exception was found for pharmacy respondents, who were less likely to know the correct child dosing regimen for AL.
www.ACTwatch.info
XX | P a g e
Figure 7. Provider knowledge of recommended first-line treatment and dosing regimens
www.ACTwatch.info
1 | P a g e
1. Background
Overview of the ACTwatch Research Project
In 2008, Population Services International (PSI) in partnership with the London School of Hygiene and Tropical Medicine (LSHTM) launched a five-year multi-country research project called ACTwatch. The project is designed to provide a comprehensive picture of the antimalarial market to inform national and international antimalarial drug policy evolution. The research is designed to detect changes in the availability, price and use of antimalarials over time and between sectors, and to monitor the effects of policy or intervention developments at country level. ACTwatch addresses both the supply and demand side of the market. The supply side is evaluated by collecting level and trend data on antimalarials and rapid diagnostic tests (RDTs) in public and private sector outlets and wholesalers of antimalarial drugs. To evaluate demand, data are collected at the household level on consumer treatment-seeking behaviour and knowledge. In combination, the research components thread together the antimalarial market and consumer behaviour. Findings can help determine where and to what extent interventions may positively impact access to and use of quality-assured ACTs and RDTs as well as resistance containment efforts. The project is being conducted in seven malaria-endemic countries: Benin, Cambodia, Democratic Republic of Congo, Madagascar, Nigeria, Uganda and Zambia between 2008 and 2012. Countries were selected with the aim of studying a diverse range of markets from which comparisons and contrasts could be made. The research in Nigeria is planned as follows: three outlet surveys (2008, 2009 and 2011); supply chain research (2009); and two household surveys (2009 and 2012). This report presents the results of a cross-sectional survey of outlets conducted in Nigeria between September and November 2009. Indicators to address the research questions were developed in consultation with partners and the ACTwatch Advisory Committee. Indicators were selected to provide relevant information for policy makers in relation to price, availability, volumes, mark-ups and treatment seeking behaviour, including type of treatment and source. While data were collected prior to the AMFm Phase 1 Independent Evaluation, data were retrospectively analysed to produce indicators to inform the evaluation. The Independent Evaluator provided technical oversight on the analysis presented in this report, to ensure that results are aligned as far as possible with the AMFm indicators. The 2009 Nigeria Outlet Survey is being employed as part of the baseline for the Independent Evaluation of the AMFm Phase 1. Information on other ACTwatch studies can be found at www.actwatch.info.
www.ACTwatch.info
2 | P a g e
Overview of the AMFm phase 1
The success of malaria control efforts depends on high level of coverage in use of effective antimalarials such as artemisinin-based combination therapies (ACTs). Although these antimalarials have been procured in large amounts by countries, evidence suggests that ACT use still remains far below target levels. Reasons suggested for the low uptake of ACTs include interruptions in public sector supply; limited availability outside major urban centers; the high prices of the drugs, particularly in the private sector; lack of provider adherence to new recommendations; and patient self-treatment with other more common and cheaper antimalarials (Sabot et al., 2009). Lowering the cost of ACTs to the end user through a subsidy mechanism could be an effective way to increase their uptake (Arrow et al., 2004). In response to this issue, the Affordable Medicines Facility – malaria (AMFm) hosted by Fund the Global Fund to Fight AIDS, Tuberculosis and Malaria (Global Fund) was set up. As described by Adeyi and Atun (2010), AMFm is a financing mechanism designed to incorporate three elements: (1) price reductions through negotiations with manufacturers of ACTs; (2) a buyer subsidy, via a co-payment at the top of the global supply chain by AMFm on behalf of eligible buyers from the public, private for-profit and private not-for-profit sectors; and (3) support of interventions to promote appropriate use of ACTs. Examples of these “supporting interventions” include training providers and outreach to communities to promote ACT utilization. AMFm is being tested in a first phase that includes 9 pilots in 8 countries: Cambodia, Ghana, Kenya, Madagascar, Niger, Nigeria, Republic of Tanzania (mainland and Zanzibar) and Uganda. It is expected that in the last quarter of 2012, the Global Fund Board will make a decision regarding the future of the AMFm on the basis of evidence gathered during Phase 1 that the initiative is likely to achieve its four stated objectives: (i) increased ACT affordability, (ii) increased ACT availability, (iii) increased ACT use, including among vulnerable groups, and (iv) “crowding out” oral artemisinin monotherapies, chloroquine and sulfadoxine-pyrimethamine by gaining market share. The AMFm Phase 1 Independent Evaluation has been commissioned to address the need for evidence on which to base the Global Fund Board decision.
Overview of the AMFm Phase 1 Independent Evaluation (IE)
Through a competitive bid, the Global Fund contracted ICF Macro and the London School of Hygiene and Tropical Medicine (LSHTM) to carry out the Independent Evaluation (IE) in all the Phase 1 countries1
1 In March 2011 the AMFm Ad Hoc Committee decided to drop Cambodia from the evaluation due to the lack of an eligible ACT for subsidy.
. In addition, the Global Fund contracted three other institutions (Population Services International (PSI), Drugs for Neglected Diseases initiative and Centre de Recherche pour le Développement Humain) to serve as data collection contractors (DCCs) responsible for collecting required data and information within countries. PSI is responsible for data collection in Cambodia, Kenya, Madagascar, Nigeria, Uganda, Tanzania mainland (subcontracted to the Ifakara Health Institute) and Zanzibar. With funding from the Bill and Melinda Gates Foundation, in Nigeria data were collected prior to the AMFm Phase 1 Independent Evaluation as part of the ACTwatch Project.
www.ACTwatch.info
3 | P a g e
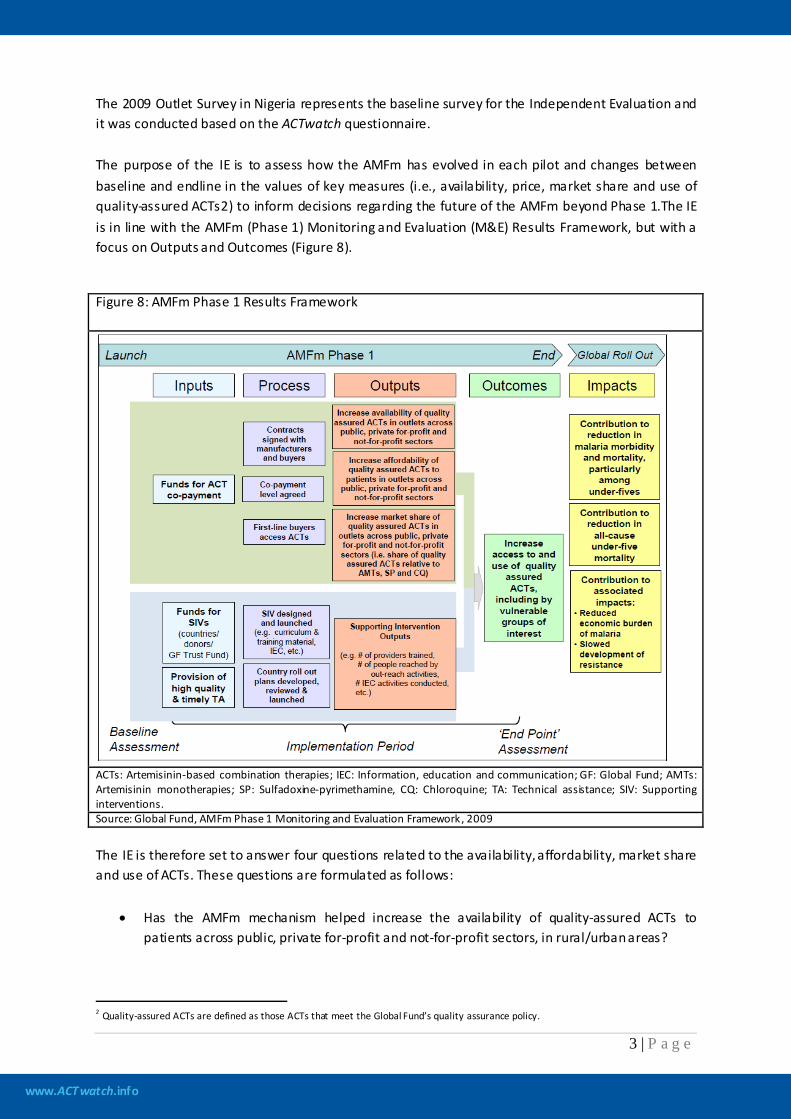
The 2009 Outlet Survey in Nigeria represents the baseline survey for the Independent Evaluation and it was conducted based on the ACTwatch questionnaire. The purpose of the IE is to assess how the AMFm has evolved in each pilot and changes between baseline and endline in the values of key measures (i.e., availability, price, market share and use of quality-assured ACTs2
Figure 8: AMFm Phase 1 Results Framework
) to inform decisions regarding the future of the AMFm beyond Phase 1.The IE is in line with the AMFm (Phase 1) Monitoring and Evaluation (M&E) Results Framework, but with a focus on Outputs and Outcomes (Figure 8).
ACTs: Artemisinin-based combination therapies; IEC: Information, education and communication; GF: Global Fund; AMTs: Artemisinin monotherapies; SP: Sulfadoxine-pyrimethamine, CQ: Chloroquine; TA: Technical assistance; SIV: Supporting interventions. Source: Global Fund, AMFm Phase 1 Monitoring and Evaluation Framework, 2009 The IE is therefore set to answer four questions related to the availability, affordability, market share and use of ACTs. These questions are formulated as follows:
• Has the AMFm mechanism helped increase the availability of quality-assured ACTs to patients across public, private for-profit and not-for-profit sectors, in rural/urban areas?
2 Quality-assured ACTs are defined as those ACTs that meet the Global Fund’s quality assurance policy.
www.ACTwatch.info
4 | P a g e
• Has the AMFm mechanism helped to reduce the cost of quality-assured ACTs to patients at public, private for-profit and not-for-profit outlets in rural/urban areas to a price comparable to the price of most popular antimalarials?
• Has the AMFm mechanism helped increase use of quality-assured ACTs, including among vulnerable groups, such as poor people, rural residents and children?
• Has the AMFm mechanism helped increase the market share of quality-assured ACTs relative to all antimalarial treatments in the public, private for-profit and not-for-profit sectors in rural/urban areas?
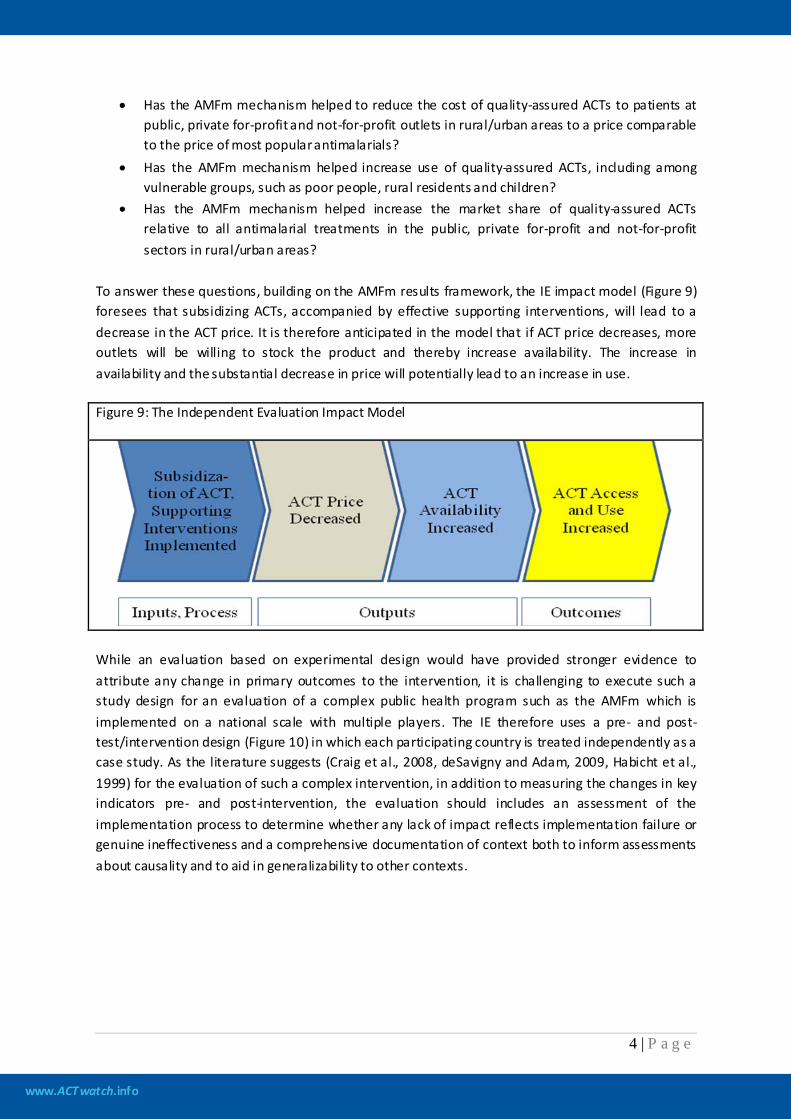
To answer these questions, building on the AMFm results framework, the IE impact model (Figure 9) foresees that subsidizing ACTs, accompanied by effective supporting interventions, will lead to a decrease in the ACT price. It is therefore anticipated in the model that if ACT price decreases, more outlets will be willing to stock the product and thereby increase availability. The increase in availability and the substantial decrease in price will potentially lead to an increase in use. Figure 9: The Independent Evaluation Impact Model
While an evaluation based on experimental design would have provided stronger evidence to attribute any change in primary outcomes to the intervention, it is challenging to execute such a study design for an evaluation of a complex public health program such as the AMFm which is implemented on a national scale with multiple players. The IE therefore uses a pre- and post-test/intervention design (Figure 10) in which each participating country is treated independently as a case study. As the literature suggests (Craig et al., 2008, deSavigny and Adam, 2009, Habicht et al., 1999) for the evaluation of such a complex intervention, in addition to measuring the changes in key indicators pre- and post-intervention, the evaluation should includes an assessment of the implementation process to determine whether any lack of impact reflects implementation failure or genuine ineffectiveness and a comprehensive documentation of context both to inform assessments about causality and to aid in generalizability to other contexts.
www.ACTwatch.info
5 | P a g e
Figure 10: The Independent Evaluation Design
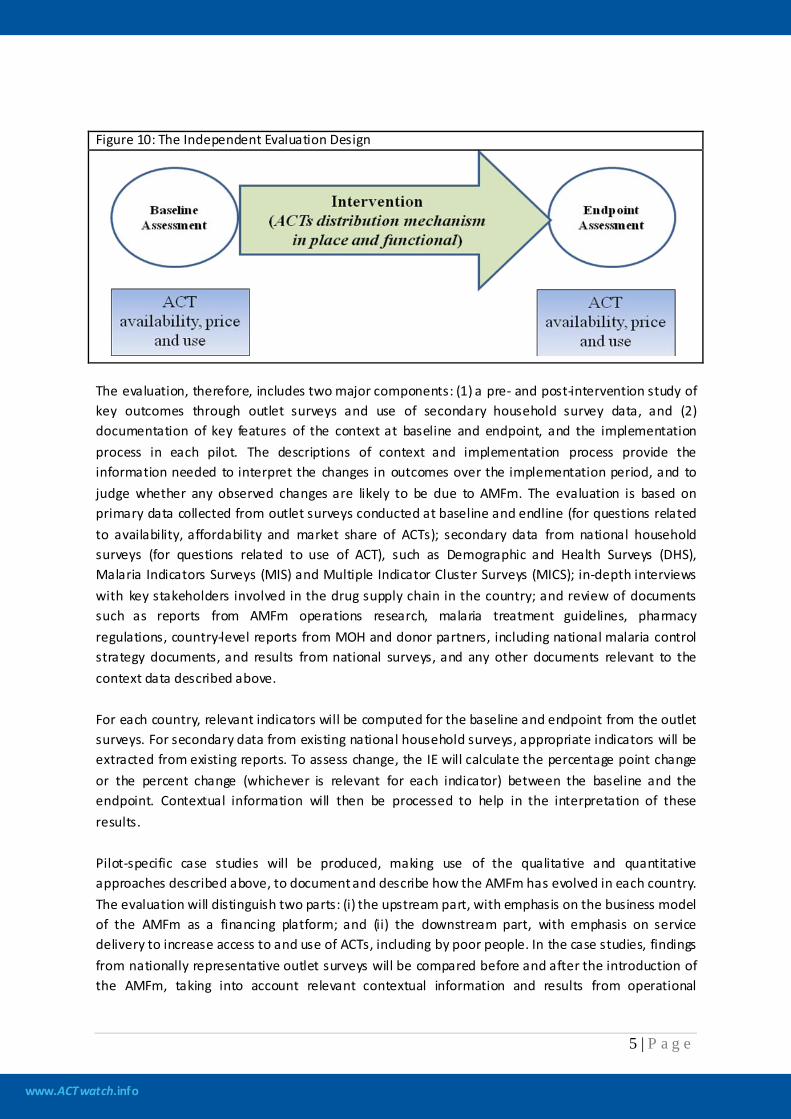
The evaluation, therefore, includes two major components: (1) a pre- and post-intervention study of key outcomes through outlet surveys and use of secondary household survey data, and (2) documentation of key features of the context at baseline and endpoint, and the implementation process in each pilot. The descriptions of context and implementation process provide the information needed to interpret the changes in outcomes over the implementation period, and to judge whether any observed changes are likely to be due to AMFm. The evaluation is based on primary data collected from outlet surveys conducted at baseline and endline (for questions related to availability, affordability and market share of ACTs); secondary data from national household surveys (for questions related to use of ACT), such as Demographic and Health Surveys (DHS), Malaria Indicators Surveys (MIS) and Multiple Indicator Cluster Surveys (MICS); in-depth interviews with key stakeholders involved in the drug supply chain in the country; and review of documents such as reports from AMFm operations research, malaria treatment guidelines, pharmacy regulations, country-level reports from MOH and donor partners, including national malaria control strategy documents, and results from national surveys, and any other documents relevant to the context data described above. For each country, relevant indicators will be computed for the baseline and endpoint from the outlet surveys. For secondary data from existing national household surveys, appropriate indicators will be extracted from existing reports. To assess change, the IE will calculate the percentage point change or the percent change (whichever is relevant for each indicator) between the baseline and the endpoint. Contextual information will then be processed to help in the interpretation of these results. Pilot-specific case studies will be produced, making use of the qualitative and quantitative approaches described above, to document and describe how the AMFm has evolved in each country. The evaluation will distinguish two parts: (i) the upstream part, with emphasis on the business model of the AMFm as a financing platform; and (ii) the downstream part, with emphasis on service delivery to increase access to and use of ACTs, including by poor people. In the case studies, findings from nationally representative outlet surveys will be compared before and after the introduction of the AMFm, taking into account relevant contextual information and results from operational
www.ACTwatch.info
6 | P a g e
research that become available to help learn how and why the new model unfolds in a variety of contexts while drawing lessons that can help future operations. While this section gives an overview of the IE to provide the reader with the relevant context, this report presents the country context and results of the baseline outlet survey for Nigeria. This is Step 1 of a four step process. These baseline results from Step 1 will be integrated into a “Comprehensive Baseline Report” to be produced by the Independent Evaluation Team (i.e., Step 2). In Step 3, later in 2011, a national level outlet survey will be conducted to produce endline results, resulting in an end-line report for Nigeria. These findings will be used to inform Step 4, the development of the full AMFm Phase 1 Independent Evaluation report to be submitted to the Global Fund Board.
www.ACTwatch.info
7 | P a g e
1. Background
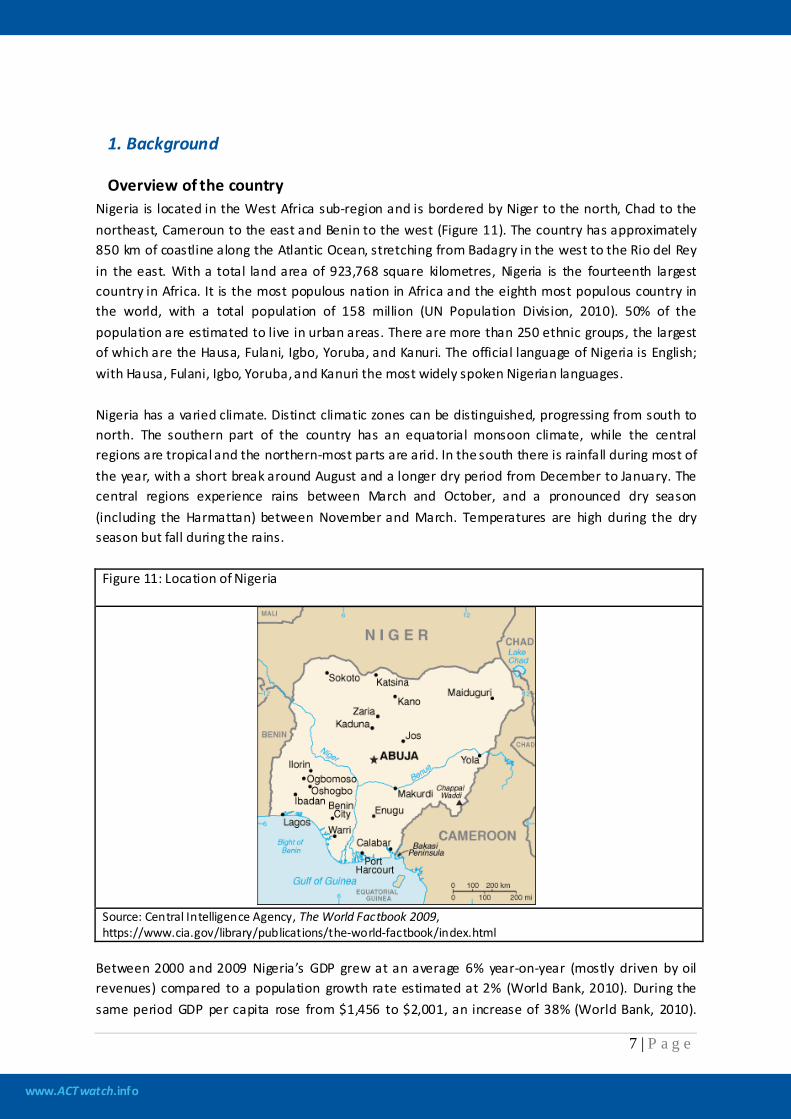
Overview of the country Nigeria is located in the West Africa sub-region and is bordered by Niger to the north, Chad to the northeast, Cameroun to the east and Benin to the west (Figure 11). The country has approximately 850 km of coastline along the Atlantic Ocean, stretching from Badagry in the west to the Rio del Rey in the east. With a total land area of 923,768 square kilometres, Nigeria is the fourteenth largest country in Africa. It is the most populous nation in Africa and the eighth most populous country in the world, with a total population of 158 million (UN Population Division, 2010). 50% of the population are estimated to live in urban areas. There are more than 250 ethnic groups, the largest of which are the Hausa, Fulani, Igbo, Yoruba, and Kanuri. The official language of Nigeria is English; with Hausa, Fulani, Igbo, Yoruba, and Kanuri the most widely spoken Nigerian languages. Nigeria has a varied climate. Distinct climatic zones can be distinguished, progressing from south to north. The southern part of the country has an equatorial monsoon climate, while the central regions are tropical and the northern-most parts are arid. In the south there is rainfall during most of the year, with a short break around August and a longer dry period from December to January. The central regions experience rains between March and October, and a pronounced dry season (including the Harmattan) between November and March. Temperatures are high during the dry season but fall during the rains.
Figure 11: Location of Nigeria
Source: Central Intelligence Agency, The World Factbook 2009, https://www.cia.gov/library/publications/the-world-factbook/index.html
Between 2000 and 2009 Nigeria’s GDP grew at an average 6% year-on-year (mostly driven by oil revenues) compared to a population growth rate estimated at 2% (World Bank, 2010). During the same period GDP per capita rose from $1,456 to $2,001, an increase of 38% (World Bank, 2010).
www.ACTwatch.info
8 | P a g e
Despite this recent positive economic growth, an estimated 84% of the population continues to live on under $2 a day, and the country ranks 142nd out of 169 in the 2010 Human Development Index. Under-five mortality has dropped significantly, from 201 per 1000 births between 1998 and 2003, (National Population Commission, 2004) to 157 per 1000 births between 2003 and 2008 (DHS, 2008). However, this is still higher than the figure for sub-Saharan Africa as a region. Only 23% of children are fully vaccinated. Malaria remains largely unchecked and leads to an estimated 300,000 deaths in children under five each year (Federal MOH, 2009). Nigeria is sub-divided into 6 geopolitical zones, 36 states (plus the Federal Capital Territory, Abuja), and 774 Local Government Areas (LGAs). The public health system in Nigeria operates through three tiers, linked to the three levels of health care. At the highest level, the Federal Ministry of Health (FMOH) provides policy and technical guidance for the health sector. The FMOH also supports and manages tertiary level care, research and academic “centres of excellence”. State Ministries of Health (SMOH) fund and manage state hospitals, maternities, and teaching colleges. SMOHs are also responsible for the professional development of health sector staff for secondary and primary health care, from midwives and nurses to Community Health Extension Workers (CHEWS). At the third tier, LGAs are tasked with planning, managing, staffing, supporting and implementing primary health care (PHC) services. 71% of Nigerians have access to a PHC facility within five kilometres of their homes (Federal MOH, 2010); however, many of these centres are not effectively functional due to lack of equipment, essential supplies, and qualified staff.
Description of health care system A national health facilities census was conducted in 2007. According to the census, the public sector comprises 42 teaching hospitals and federal medical centres; 533 secondary-level hospitals, including general and specialist hospitals; and 14,635 primary-level facilities, including 4,149 dispensaries (NPHCDA, 2007). The private health care system consists of formal tertiary-, secondary- and primary facilities, and pharmacies, as well as informal proprietary patent medicine vendors (PPMVs) and drug sellers. Private health facility figures for the period 1999 to 2001 include 2,147 secondary facilities and 7,000 PHC facilities (Federal MOH, 2009). For the same period there were a total of 2,751 registered pharmacies, and an estimated 36,000 PPMVs (2002 estimate). The private sector provides over 65% of healthcare delivery in Nigeria (Onwujekwe O et al., 2005). PPMVs are usually the first choice in health care and are a recognized primary source of manufactured drugs for both rural and urban populations, especially the poor (Uzochukwu & Onwujekwe, 2004; Uzochukwu et al., 2008; Oladepo et al., 2008). In addition to selling drugs, they are also a major source of advice about illness and drug therapy (Ross-Degnan et al., 1996). As a general policy, healthcare consumers are expected to pay for curative services, but preventive services are often subsidized. Health financing has been largely out of pocket and efforts are made to provide public assistance to the socially and economically disadvantaged segments of the population (Federal MoH, 2004a). To reduce the financial barriers that prevent people in Nigeria, especially children, from accessing healthcare services, pre-payment schemes such as the National Health Insurance Scheme (NHIS) are being introduced (Federal MoH, 2006).
www.ACTwatch.info
9 | P a g e
The public and private sectors have distinct and independent drug supply chains, although both are regulated by the National Agency for Food and Drug Administration and Control (NAFDAC). Quality control is provided by NAFDAC at the point of entry for imported products and at the factory gate for locally-manufactured products. The public sector system is highly fragmented, with each disease having its own supply chain system. Government agencies and partners are first-line buyers and purchase medicines directly from manufacturers. Manufacturers bid to supply the government through local and international competitive bid processes, managed by the Tenders Unit of the FMOH. However, donors also supply commodities directly to state-level medical stores, and both States and LGAs have funding for procurement. In anticipation of the AMFm pilot, donors are supporting the development of an improved logistics management information system for malaria commodities (PMI, 2010). Procurement in the private sector is informed by government treatment guidelines, but predominantly driven by demand. In-country manufacturers are a key source of commodities for Nigerian wholesalers and distributors: there are almost 40 nationally-registered ACTs that are manufactured in-country (PMI, 2010). For products manufactured outside of Nigeria, it is common practice for an importer to act as the sole agent for a manufacturer. While importers are free to choose their suppliers, a tendency to enter into exclusivity agreements is fostered by the stringency of the registration requirements, the amount of time that it takes to develop a relationship with the supplier, and the amount of investment that goes into developing the local market for the imported product.
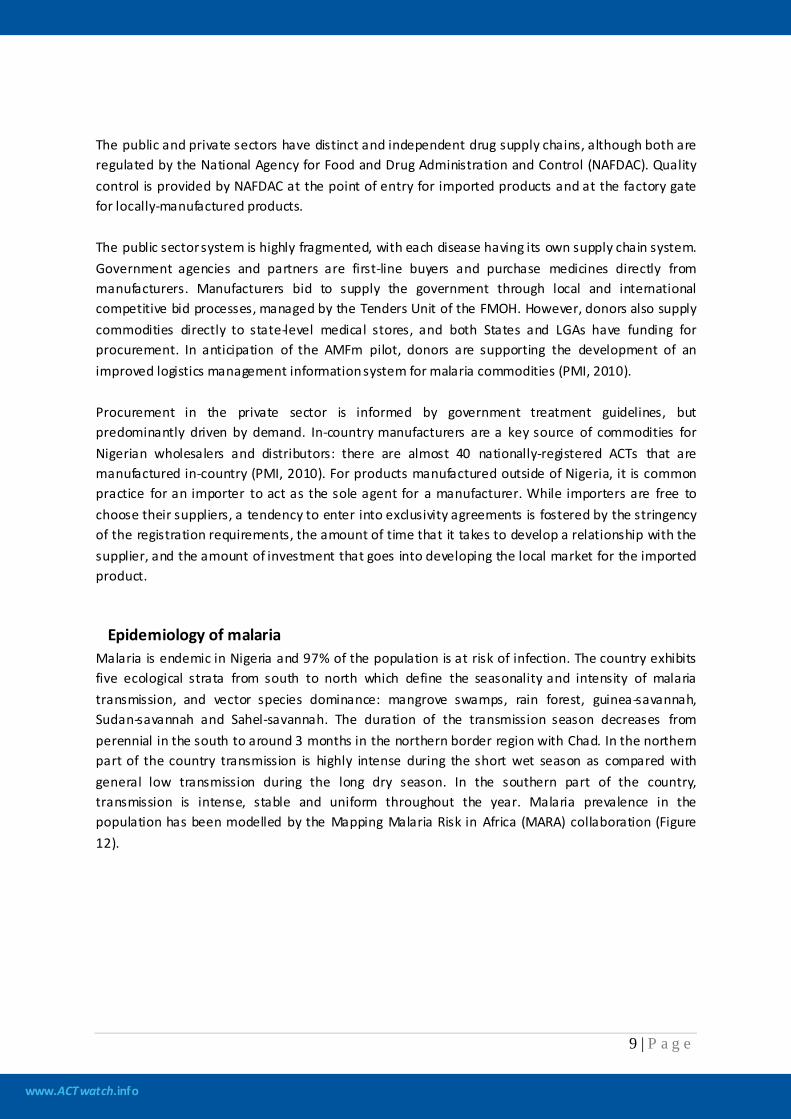
Epidemiology of malaria Malaria is endemic in Nigeria and 97% of the population is at risk of infection. The country exhibits five ecological strata from south to north which define the seasonality and intensity of malaria transmission, and vector species dominance: mangrove swamps, rain forest, guinea-savannah, Sudan-savannah and Sahel-savannah. The duration of the transmission season decreases from perennial in the south to around 3 months in the northern border region with Chad. In the northern part of the country transmission is highly intense during the short wet season as compared with general low transmission during the long dry season. In the southern part of the country, transmission is intense, stable and uniform throughout the year. Malaria prevalence in the population has been modelled by the Mapping Malaria Risk in Africa (MARA) collaboration (Figure 12).
www.ACTwatch.info
10 | P a g e
Figure 12: Malaria prevalence map (MARA prevalence model), Nigeria, 2001
Source: Kleinschmidt I. et al. 2001. Map available online at http://www.mara.org.za
Malaria is considered to be a major public health problem in Nigeria. It causes more than 50% of the disease burden (Federal MoH, 2005) and almost 50% of all-cause health expenditure (Onwujekwe O, et al., 2000). 20% of all hospital admissions, 30% of outpatient visits, and 10% of hospital deaths are attributable to malaria, and half of Nigeria’s population is exposed to at least one episode of malaria every year (Okeke et al., 2003). Results of a modelling exercise presented in the National Malaria Control Program (NMCP) Strategic Plan 2009-2013 show that malaria accounts for an estimated 300,000 deaths in children under five each year, and 11% of the maternal mortality burden in Nigeria. Malaria is responsible for 25% of all infant-related mortality and 30% of child-related mortality (National Population Commission, 2009). In relative terms, Nigeria contributes more than a third of the total African malaria burden (RBM, 2008). Health facility data show that between 2001 and 2007 there was an increase in the number of malaria deaths: from 4,317 in 2001 to 10,289 in 2007 (all ages), and 721 to 2,695 for under five year olds. This upward trend may be due to improvements in reporting of cases (WHO, 2008).
Antimalarial Policies and Regulatory Environment In January 2005 the NMCP adopted artemether-lumefantrine (AL) as the first-line treatment for uncomplicated malaria (Federal MoH, 2004b). Artesunate+amodiaquine (ASAQ) is recommended as the alternative first-line treatment, should AL not be available. At the time of the policy change, AL and ASAQ were prescription-only medications; NAFDAC reclassified these medicines as over-the-counter in 2006.
www.ACTwatch.info
11 | P a g e
Parenteral quinine is recommended for the treatment of severe malaria and as pre-referral treatment. In addition, artemether and artesunate injections are included on the list of current medicines for severe malaria. Artesunate suppositories are also used at peripheral health facilities where parenteral treatment cannot be administered (they are included in the national policy on malaria treatment as a pre-referral treatment only). Oral artemisinin monotherapies have been banned in Nigeria since 2006, under legislation that prohibits their importation and local production. In order to support broader adoption of ACTs, NAFDAC stopped registering new artemisinin monotherapies in 2006. Licenses for the sale of oral artemisinin monotherapies were not renewed when they expired (which was by late 2009). In order to mitigate the risk of artemisinin monotherapy stockpiling prior to the end of valid registration, NAFDAC provided several incentives including a reduction in the cost of registering ACTs.
Malaria control strategy The core interventions for malaria control in Nigeria include long lasting insecticide-treated net (LLIN) distribution through antenatal care clinics, immunization visits, large-scale stand-alone campaigns, and subsidized and at-cost sales in the commercial sector; intermittent preventive treatment for pregnant women (IPTp); case management following prompt diagnosis at all levels of health care; and, to a more-limited extent, indoor residual spaying (IRS). Up to late 2008, public sector bed net distribution campaigns focussed on the most vulnerable groups: children under five and pregnant women. Initially starting with insecticide-treated nets (ITNs), distribution switched to LLINs in 2006. Nigeria has removed import tariffs on bed nets (M-TAP, 2010). More than 19 million ITNs were distributed during 2009 (WHO, 2010a), a substantial increase on previous years. Results from the 2008 DHS show low net ownership and use: an estimated 8% of households own at least one ITN, and only 6% of children under five are reported to have slept under an ITN the night before the survey. Looking to the future, sufficient donor funds have been mobilised to enable the procurement of more than 62 million nets, enough to achieve universal coverage with two LLINs per household (PMI, 2010). Large-scale IRS campaigns have not been conducted in Nigeria since the mid-1970s, and present institutional capacity for spraying is weak. Several trials have been conducted in recent years with the support of insecticide manufacturing companies, and World Bank-supported campaigns are present in 7 states. The NMCP Strategic Plan 2009-2013 sees an increased role for IRS in specific situations (such as where ITN usage rates remain low, and in more densely populated areas), and sets a target of 20% of households covered by IRS by 2013. Nationwide, an estimated 58% of pregnant women have access to antenatal care (ANC) from a skilled provider, but only 5% receive the recommended two doses of sulphadoxine-pyrimethamine (SP) for IPTp (National Population Commission, 2009). These figures vary widely by State, and coverage is greater in urban areas than in rural areas. IPTp is free when given through ANC at public and NGO health facilities. However due to the supply chain problems, it is unclear if LGAs have sufficient stocks of SP to meet demand for IPTp.
www.ACTwatch.info
12 | P a g e
Case management for malaria is based on prompt treatment with effective ACT. The NMCP’s desire that such treatment be available close to home is aided by the classification of AL and ASAQ as over-the-counter medicines, and the policy supporting community case management of malaria with ACTs. The National Antimalarial Treatment Policy states that parasitological diagnosis is essential for all suspected cases of malaria, with microscopy providing the gold-standard. However, there is an understanding that the cost and capacity for providing laboratory services present a barrier to achieving coverage with microscopy, and as such RDTs should be introduced in facilities with no microscopes. Within the public sector, policy states that ACT is available free of charge for both under fives (as of 2006) and over fives (as of 2009).
Malaria financing Despite government and donor funding increasing from $18.5 million in 2005 to $84.5 million in 2008 there is no evidence of a systematic decline in malaria burden in Nigeria (WHO, 2008). The NMCP delivered about 17 million insecticide treated bed nets during 2005-2007, enough to cover only 23% of the population at risk. The programme delivered 4.5 million courses of ACT in 2006 and 9 million in 2007 which is far below the country's total requirements (WHO, 2008). A subsidy program run by SFH and funded by the Global Fund has made child doses of ASAQ available since 2008 through private sector health facilities, pharmacies and PPMVs in 18 of the 36 states and the Federal Capital Territory. These products, with brand names Arsuamoon and Larimal, were sold for a wholesale purchase price of 5 NGN (US$ 0.03) per treatment with an approved retail price set at 30 NGN (US$ 0.20). However, the subsidized Arsuamoon and Larimal products distributed under this program had identical packaging to their non-subsidized commercial equivalents that were being concurrently sold by private sector wholesalers and retailers across the entire country at considerably higher prices. Therefore, to ensure that the target retail price was achieved and also to minimize leakage of the subsidized product outside of program areas and target retail outlet types, SFH chose to bypass private sector wholesalers and distributed these subsidized products directly to target outlets in the participating states from their own warehouses and only in limited quantities (e.g. PPMVs were permitted to purchase 2 packages from SFH per transaction). Subsidized ASAQ was also distributed through several civil society partners (Africare Nigeria, Errand Express, Planned Parenthood Federation of Nigeria) strategically selected by SFH in order to improve coverage in underserviced rural areas. In 2007, a total of 17.5 million doses of ACTs (AL and ASAQ) were distributed in the public and NGO sectors or sold in the private sector at subsidized prices through SFH. While this represents notable progress compared to 2006 when less than half of this volume was distributed, it still only provided treatment for about 25% of the estimated number of malaria cases (FMOH, 2009). Since 2007 funding for malaria control has dramatically increased. Nigeria signed a $461 million Global Fund Round 8 grant in 2008, and additional funds were made available through the World Bank Malaria Booster Program and the UK Department for International Development (DfID). The Round 8 grant will contribute to providing universal coverage with LLINs; continued roll-out of ACT; and increased access to malaria diagnostics, including roll-out of RDTs to primary health facilities.
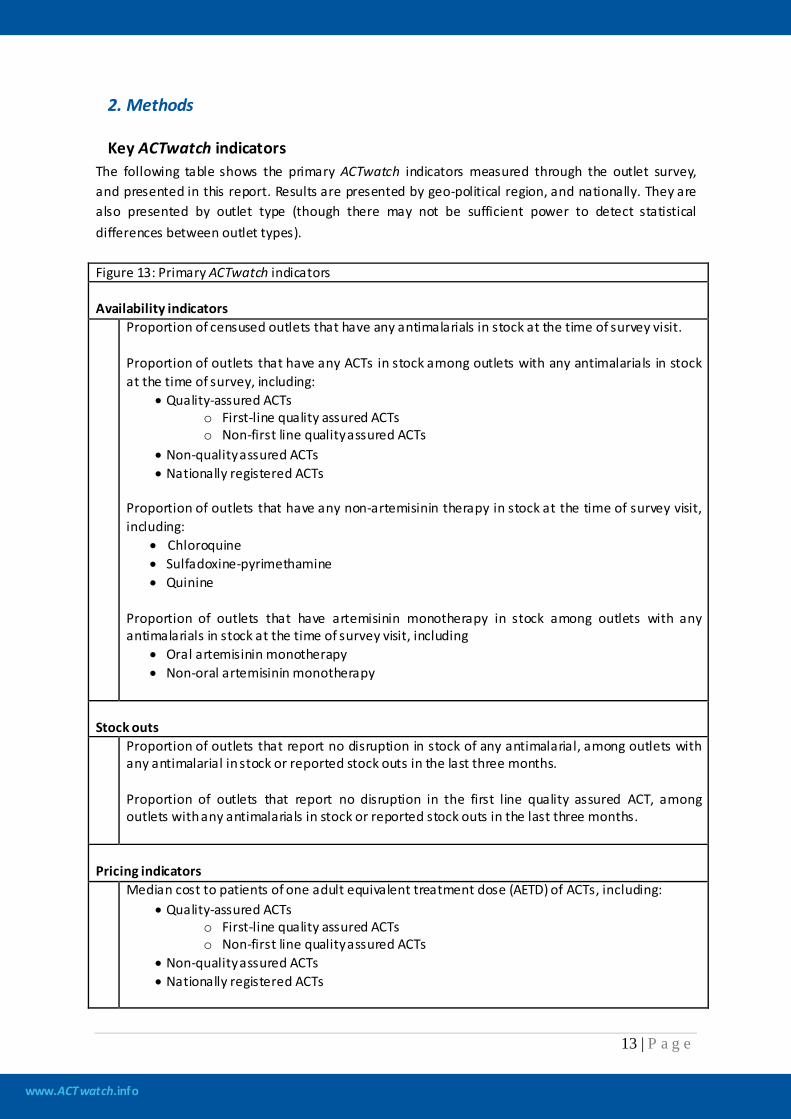
www.ACTwatch.info
13 | P a g e
2. Methods
Key ACTwatch indicators The following table shows the primary ACTwatch indicators measured through the outlet survey, and presented in this report. Results are presented by geo-political region, and nationally. They are also presented by outlet type (though there may not be sufficient power to detect statistical differences between outlet types). Figure 13: Primary ACTwatch indicators Availability indicators Proportion of censused outlets that have any antimalarials in stock at the time of survey visit.
Proportion of outlets that have any ACTs in stock among outlets with any antimalarials in stock at the time of survey, including:
• Quality-assured ACTs o First-line quality assured ACTs o Non-first line quality assured ACTs
• Non-quality assured ACTs • Nationally registered ACTs
Proportion of outlets that have any non-artemisinin therapy in stock at the time of survey visit, including:
• Chloroquine • Sulfadoxine-pyrimethamine • Quinine
Proportion of outlets that have artemisinin monotherapy in stock among outlets with any antimalarials in stock at the time of survey visit, including
• Oral artemisinin monotherapy • Non-oral artemisinin monotherapy
Stock outs Proportion of outlets that report no disruption in stock of any antimalarial, among outlets with
any antimalarial in stock or reported stock outs in the last three months. Proportion of outlets that report no disruption in the first line quality assured ACT, among outlets with any antimalarials in stock or reported stock outs in the last three months.
Pricing indicators Median cost to patients of one adult equivalent treatment dose (AETD) of ACTs, including:
• Quality-assured ACTs o First-line quality assured ACTs o Non-first line quality assured ACTs
• Non-quality assured ACTs • Nationally registered ACTs
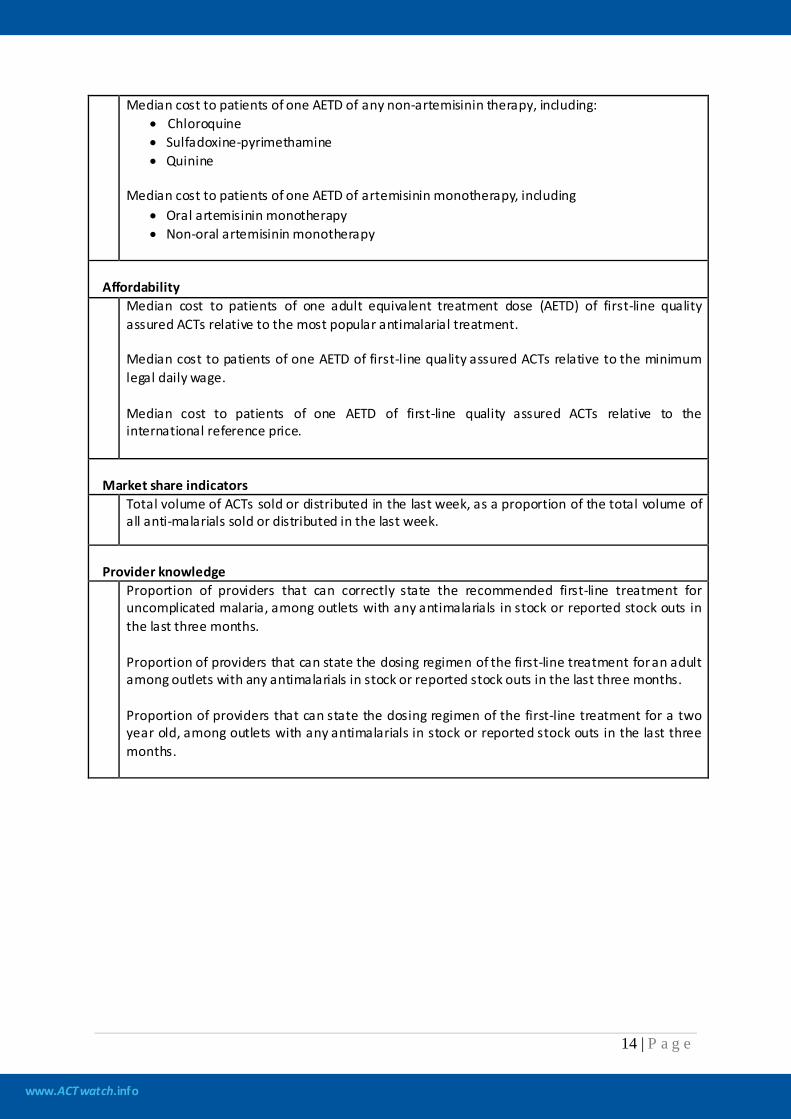
www.ACTwatch.info
14 | P a g e
Median cost to patients of one AETD of any non-artemisinin therapy, including: • Chloroquine • Sulfadoxine-pyrimethamine • Quinine
Median cost to patients of one AETD of artemisinin monotherapy, including
• Oral artemisinin monotherapy • Non-oral artemisinin monotherapy
Affordability
Median cost to patients of one adult equivalent treatment dose (AETD) of first-line quality assured ACTs relative to the most popular antimalarial treatment. Median cost to patients of one AETD of first-line quality assured ACTs relative to the minimum legal daily wage. Median cost to patients of one AETD of first-line quality assured ACTs relative to the international reference price.
Market share indicators
Total volume of ACTs sold or distributed in the last week, as a proportion of the total volume of all anti-malarials sold or distributed in the last week.
Provider knowledge
Proportion of providers that can correctly state the recommended first-line treatment for uncomplicated malaria, among outlets with any antimalarials in stock or reported stock outs in the last three months. Proportion of providers that can state the dosing regimen of the first-line treatment for an adult among outlets with any antimalarials in stock or reported stock outs in the last three months. Proportion of providers that can state the dosing regimen of the first-line treatment for a two year old, among outlets with any antimalarials in stock or reported stock outs in the last three months.
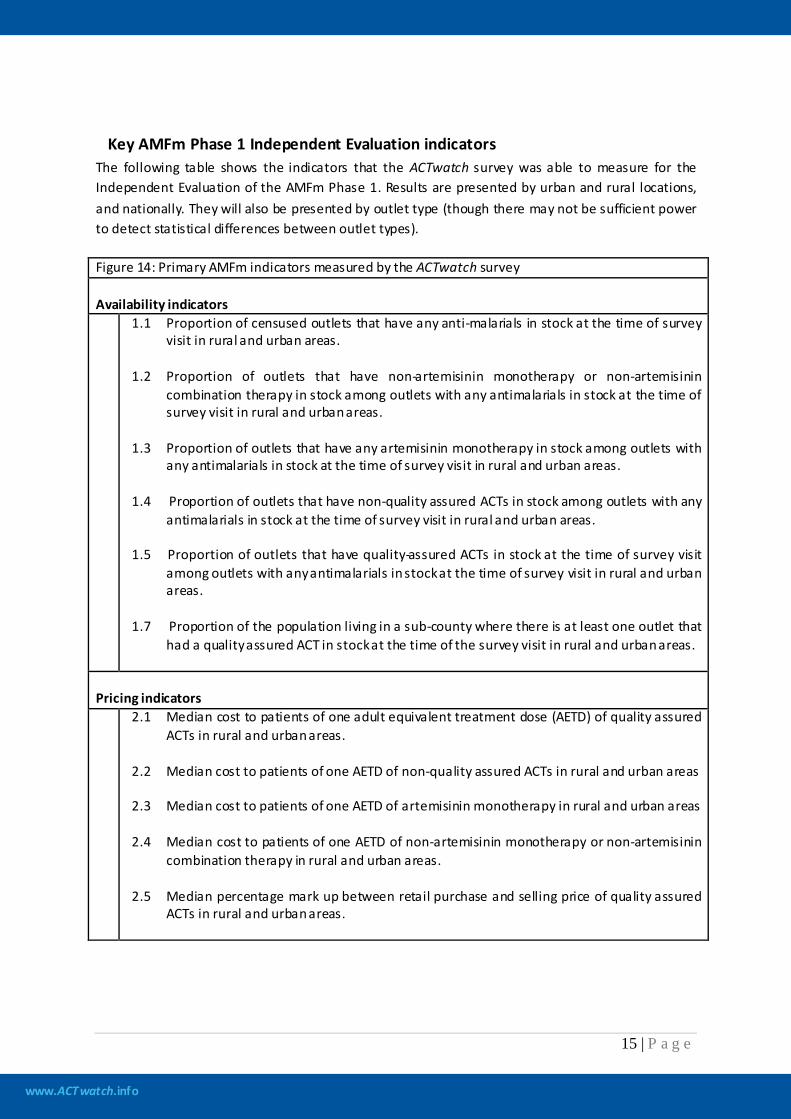
www.ACTwatch.info
15 | P a g e
Key AMFm Phase 1 Independent Evaluation indicators The following table shows the indicators that the ACTwatch survey was able to measure for the Independent Evaluation of the AMFm Phase 1. Results are presented by urban and rural locations, and nationally. They will also be presented by outlet type (though there may not be sufficient power to detect statistical differences between outlet types). Figure 14: Primary AMFm indicators measured by the ACTwatch survey Availability indicators 1.1 Proportion of censused outlets that have any anti-malarials in stock at the time of survey
visit in rural and urban areas. 1.2 Proportion of outlets that have non-artemisinin monotherapy or non-artemisinin
combination therapy in stock among outlets with any antimalarials in stock at the time of survey visit in rural and urban areas.
1.3 Proportion of outlets that have any artemisinin monotherapy in stock among outlets with
any antimalarials in stock at the time of survey visit in rural and urban areas. 1.4 Proportion of outlets that have non-quality assured ACTs in stock among outlets with any
antimalarials in stock at the time of survey visit in rural and urban areas. 1.5 Proportion of outlets that have quality-assured ACTs in stock at the time of survey visit
among outlets with any antimalarials in stock at the time of survey visit in rural and urban areas.
1.7 Proportion of the population living in a sub-county where there is at least one outlet that
had a quality assured ACT in stock at the time of the survey visit in rural and urban areas.
Pricing indicators 2.1 Median cost to patients of one adult equivalent treatment dose (AETD) of quality assured
ACTs in rural and urban areas. 2.2 Median cost to patients of one AETD of non-quality assured ACTs in rural and urban areas 2.3 Median cost to patients of one AETD of artemisinin monotherapy in rural and urban areas 2.4 Median cost to patients of one AETD of non-artemisinin monotherapy or non-artemisinin
combination therapy in rural and urban areas. 2.5 Median percentage mark up between retail purchase and selling price of quality assured
ACTs in rural and urban areas.
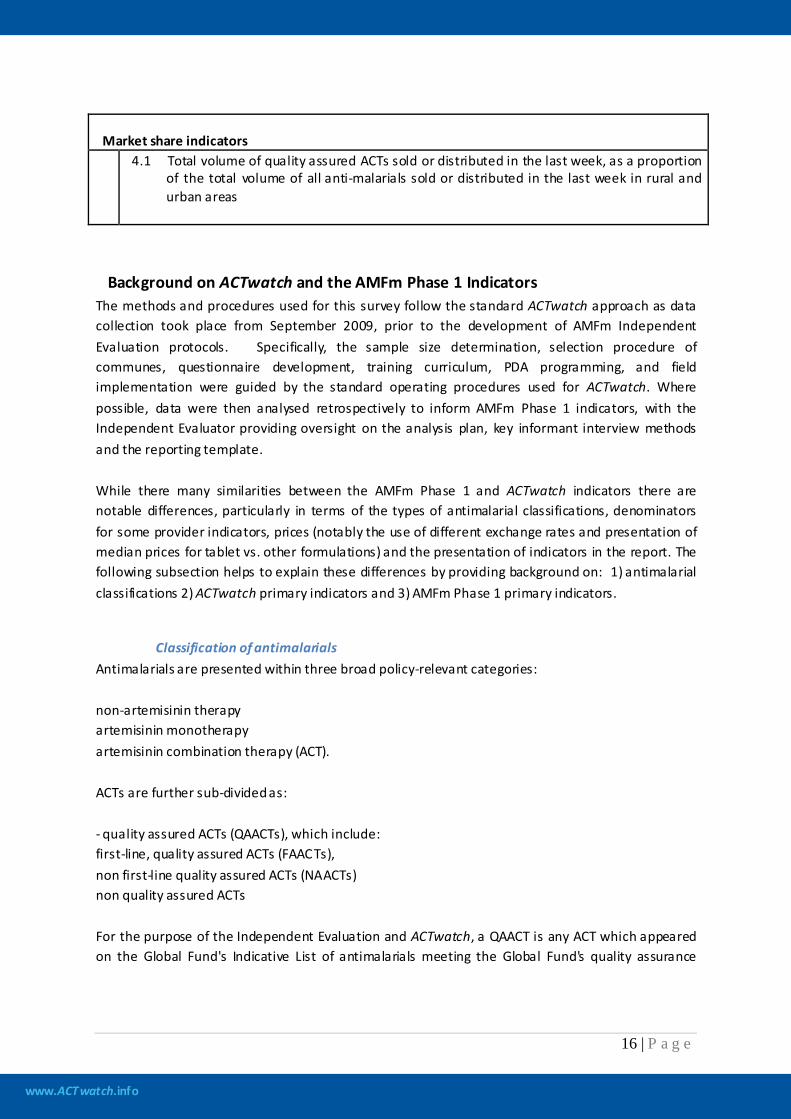
www.ACTwatch.info
16 | P a g e
Market share indicators
4.1 Total volume of quality assured ACTs sold or distributed in the last week, as a proportion of the total volume of all anti-malarials sold or distributed in the last week in rural and urban areas
Background on ACTwatch and the AMFm Phase 1 Indicators The methods and procedures used for this survey follow the standard ACTwatch approach as data collection took place from September 2009, prior to the development of AMFm Independent Evaluation protocols. Specifically, the sample size determination, selection procedure of communes, questionnaire development, training curriculum, PDA programming, and field implementation were guided by the standard operating procedures used for ACTwatch. Where possible, data were then analysed retrospectively to inform AMFm Phase 1 indicators, with the Independent Evaluator providing oversight on the analysis plan, key informant interview methods and the reporting template. While there many similarities between the AMFm Phase 1 and ACTwatch indicators there are notable differences, particularly in terms of the types of antimalarial classifications, denominators for some provider indicators, prices (notably the use of different exchange rates and presentation of median prices for tablet vs. other formulations) and the presentation of indicators in the report. The following subsection helps to explain these differences by providing background on: 1) antimalarial classifications 2) ACTwatch primary indicators and 3) AMFm Phase 1 primary indicators.
Classification of antimalarials Antimalarials are presented within three broad policy-relevant categories: non-artemisinin therapy artemisinin monotherapy artemisinin combination therapy (ACT). ACTs are further sub-divided as: - quality assured ACTs (QAACTs), which include: first-line, quality assured ACTs (FAACTs), non first-line quality assured ACTs (NAACTs) non quality assured ACTs For the purpose of the Independent Evaluation and ACTwatch, a QAACT is any ACT which appeared on the Global Fund's Indicative List of antimalarials meeting the Global Fund's quality assurance
www.ACTwatch.info
17 | P a g e
policy as at June 20103
ACTwatch versus AMFm classifications
, or which previously had C-status in an earlier Global Fund quality assurance policy and was used in a programme supplying subsidised ACTs. FAACTs and NAACTs are sub-classifications of QAACTs. FAACTs are government recommended first-line ACTs (i.e. ASAQ in Madagascar) for uncomplicated malaria meeting the quality assured definition. NAACTs are ACTs that are not the government’s recommended first-line treatment for uncomplicated malaria (for example, AL in Madagascar), but which do meet the quality-assured definition. For ACTwatch only, indicators are also calculated for nationally registered ACTs. Nationally registered ACTs are ACTs registered with a country’s national drug regulatory authority and permitted for sale or distribution in-country. Each country determines its own criteria for placing a drug on its nationally registered listing. A list of nationally registered ACTs at the time of data collection is given in the appendix.
Given the objectives of the AMFm Phase 1, indicators focus on the following antimalarial classifications: 1) non-artemisinin therapy, 2) artemisinin monotherapy, 3) QAACTs and 4) non-quality assured ACTs. In addition to these classifications, ACTwatch also presents data on FAACTs, NAACTs, and nationally registered antimalarials, which are relevant for national policy. Artemisnin monotherapy is also further classified as oral and non-oral artemisinin monotherapy as per WHO recommendations that intravenous artesunate should be used as fi rs t-line treatment in the management of severe P. falciparum malaria in African children and adults (WHO, 2010b). ACTwatch further classifies non-artemisinin therapy into chloroquine, sulfadoxine-pyrimethamine and quinine.
ACTwatch versus AMFm denominators
Provider knowledge The ACTwatch indicator on provider knowledge of the first-line antimalarial treatment includes outlets that had an antimalarial at the time of survey or in the previous three months. For the AMFm Evaluation Indicator, only outlets that had an antimalarial in stock at the time of survey are included in the denominator. Therefore there are slight differences in the results for these knowledge indicators.
Rapid diagnostic tests and malaria microscopy The ACTwatch indicator on availability of RDTs and malaria microscopy includes outlets that had an antimalarial at the time of survey or in the previous three months. For the AMFm Evaluation Indicator, only outlets that had an antimalarial in stock at the time of survey are included in the denominator. Therefore there are slight differences in the results for these diagnosis indicators.
3 List available at: http://www.theglobalfund.org/en/procurement/quality/pharmaceutical/#General
www.ACTwatch.info
18 | P a g e
ACTwatch versus AMFm evaluation exchange rates
Price Price data were collected in local currencies and converted to their US$ equivalent. The US$ conversion used in this report (for both ACTwatch and AMFm indicators) is equivalent to the average interbank rate for the period of data collection. This approach is used to facilitate comparisons over time between other rounds of ACTwatch data collection, and between other ACTwatch countries. This differs from the AMFm approach, which uses the average 2010 exchange rate over the whole year in which data collection took place. Given these differences, separate tables for price indicators were provided to the Independent Evaluator for AMFm using the 2010 exchange rate. The prices presented in this report are therefore slightly different from those presented in the “Multicounty Baseline Report” produced by the Independent Evaluation Team, which synthesizes results from all pilot AMFm countries. In addition, another notable difference between the price measures for the AMFm indicators and the ACTwatch indicators is the presentation of price for tablets and other formulations. Price measures for ACTwatch only include tablet formulations. The price of non-tablet formulations, such as powders for reconstitution, suspensions, suppositories and syrups, are excluded. In contrast to this, the AMFm indicators present information for both tablet and non-tablet formulations.
www.ACTwatch.info
19 | P a g e
Outlet survey
Sampling Approach The target sampling units were all types of outlets that have the potential to sell or provide antimalarials in Nigeria. The outlets were classified into two main categories: Category 1: public health facilities (University Teaching Hospitals, Federal Medical Centres, General or Specialist Hospitals, Primary Health Care Centres) and pharmacies. Category 2: other antimalarial drug sellers, including ward-level extensions of the public health system such as Community Health Extension Workers (CHEWs), private, NGO and Mission health clinics, Proprietary Patent Medicine Vendors (PPMVs), general retailers (supermarkets, market stalls, provision stores) and hawkers (itinerant drug vendors). Sampling procedures were employed to select outlets within each category, as described below.
Sample size determination The proportion of outlets with any ACT, estimated to be 40%, was the primary outcome measure. A minimum of 290 outlets with antimalarials in stock were needed to provide detectable changes in ACT availability per stratum (urban, rural) and between the public and private sectors. With this number, 19 clusters per stratum provided a representative sample to detect a 20% point increase in availability at 80% power, setting the level of significance at 5% and adjusting for an estimated design effect of 3.
Selection procedure of the sub-districts The desired cluster size for the outlet survey was approximately 10,000 to 15,000 inhabitants, which corresponded most closely to localities in Nigeria. It is notable that there were a wide range of population sizes, from as few as 500 people per locality to 250,000. Each locality was classified according to one of the six geo-political zones. Facility listings obtained from the Ministry of Health were used as a sampling frame to confirm the location of public sector Category 1 outlets. The sample was selected using a stratified cluster design, according to the 6 geo-political zones. A total of 114 clusters were selected with probability proportional to population size (19 clusters per zone). For localities with population sizes greater than 50,000, a second stage of selection was conducted and 3 Enumeration Areas (EAs) were randomly selected within the locality. Localities were designated as urban or rural according to their definition in the sampling frame. For localities that had population sizes smaller than 50,000, a census of all Category 1 and Category 2 outlets was conducted. For localities with population sizes greater than 50,000, a census of all Category 1 and Category 2 outlets was conducted; however, the census of PPMVs, general retailers, CHEWs, and hawkers was restricted to the 3 Enumeration Areas. All outlets that stocked antimalarials at the time of survey or in the past three months were eligible for interview.
www.ACTwatch.info
20 | P a g e
Selection procedure of the booster sample The sample was supplemented by a booster sample of Category 1 outlets. Oversampling ensured adequate representation of relatively rare but important antimalarial outlet types. The booster sample comprised five additional localities, selected purposively on the basis of having a large population size. All Category 1 outlets in the booster localities that stocked antimalarials at the time of the survey or in the past 3 months were eligible for interview.
Data collection
Preparatory phase A Memorandum of Understanding was obtained from the Federal Ministry of Health (FMOH) (MH:1156/5.127, dated 17/09/2009), which outlined the purpose of the study and stipulated the FMOH’s approval of the outlet survey. The questionnaire mirrored the ACTwatch questionnaire employed in Nigeria in 2008. Three modules were used in the outlet survey: 1) a screening module identified outlets that were eligible for the audit and provider interview; 2) a provider module collected information on outlet demographics (e.g. health qualifications of staff, number of staff that prescribe or dispense medicines), provider knowledge of the first-line treatment, and provider perceptions; and 3) an antimalarial audit module collected data for each antimalarial stocked, including information on brand name, generic name and strengths, package type and size, recall of volumes sold over the week before the survey, recall of last purchase price and selling price. Paper questionnaires were administered during data collection. The questionnaires were written and administered in English (the official language in Nigeria), and in some cases Pidgin English (a local English variant). Prior to finalisation, the questionnaire was pilot tested to assess the appropriateness of question wording as well as to verify the skip patterns and interviewer instructions. Given the large number of staff required to conduct data collection, 2 central-level trainings were conducted in the north and south of Nigeria. Supervisor, quality controller and interviewer trainings were conducted in Abuja from September 4th–12th and in Lagos from 24th September until October 1st 2009. All trainings were facilitated by staff from SFH/Nigeria and the ACTwatch Central team. Supervisors and quality controllers were selected in advance of the interviewer training and received a separate, two-day training before the interviewer training. The supervisor and quality controller training agenda focused on sampling procedures, outlet types, timelines, advocacy, monitoring tools and terms of reference for field staff. A field visit was incorporated to discern the differences between particular outlet types which were ambiguous, in particular the differences between pharmacies and PPMVs.
www.ACTwatch.info
21 | P a g e
A six-day training program was followed by all interviewers, in addition to the supervisors and quality controllers. Standardised training materials developed by ACTwatch were adapted to the national setting, and administered by research staff from SFH/Nigeria and ACTwatch Central. Training sessions covered completing the questionnaire, informed consent, conducting the census, and identifying outlet types. Interviewers were trained to identify antimalarial medicines, including the differences between ACTs and non-ACTs, trade names and generics, packaged and loose tablets, and the various formulations. A field practice session was undertaken to mimic actual data collection. From the 2 central trainings, 12 supervisors, 6 quality controllers and 72 interviewers were selected to conduct fieldwork.
Fieldwork Twelve teams carried out data collection across the six strata, with two teams operating in each region. Each team comprised one supervisor and six interviewers, with one quality controller operating between teams in each region. Two coordinators were responsible for managing the supervisors and ensuring that standardized methodologies were implemented. Fieldwork commenced on the 14th September, 2009 in the North and on the 3rd October in the South; data collection was completed on the 2nd November, 2009. Upon arrival in a study area, team supervisors first met with local leaders to introduce themselves and seek permission to carry out the study. For small and/or rural localities, team supervisors conferred with local authorities and residents to identify locality boundaries, roads and outlet locations. For large and/or urbanized localities, maps had been procured from the National Population Commission of Nigeria prior to data collection. In these localities, boundaries were confirmed with local authorities and outlet locations marked-up for reference. Team supervisors assigned data collectors to a particular area within the locality based on these maps and boundaries. During fieldwork, data collectors systematically canvassed the locality, approaching every outlet with the potential to sell antimalarials, according to the outlet type definitions designated for this study. Official lists of public health facilities operating in selected localities were obtained from the Ministry of Health prior to fieldwork, and were then used to help verify outlets within each locality. In addition, supervisors identified key informants (such as health officials and other local government officials) and, through discussion with these key informants, obtained a list of potential medicine outlets in their area. Finally, during data collection a snowball technique was used whereby outlets included in the survey were asked to identify other outlets stocking, or with the potential to stock, medicine in the locality. For each outlet that was identified during the census, the outlet type and location were noted, along with its longitude and latitude coordinates (obtained via hand-held GPS units). The fieldworker then identified the most senior staff member present at the outlet, and screening questions were administered. For outlets that were eligible, the interviewer read the information sheet to the senior staff person and obtained witnessed oral consent to proceed with the full interview. The questionnaire is included in the appendix. To identify mobile providers, information regarding their presence in the communities was initially sought during visits to SFH field offices, state or local government medical offices, and/or to medical
www.ACTwatch.info
22 | P a g e
detailers. Similarly, data collectors systematically asked about their existence at all public health facilities, rural PPMVs and of community residents. Mobile providers were screened and administered the questionnaire in the same manner as any stationary point of sale. Longitude and latitude coordinates were taken, if possible, from the location the mobile providers considered their “base”. If this was not possible, then the coordinates were taken where the interview was conducted.
Quality Control During data collection, supervisors and quality controllers performed back-checks on approximately 30% of questionnaires. Key variables were checked for accuracy, including eligibility criteria and the number and price of antimalarials in stock. Providers were also asked if the interviewer had explained the study fully and left an information sheet, and to estimate the length of the interview. Two reviews of questionnaires were performed on the same day the interview was conducted. The supervisor performed the first review, scrutinizing for verbal consent; completion; filter errors; and consistency between questions. Second reviews were conducted by the quality controller. Queries were followed-up with the interviewer and, as required, a call-back was performed by the interviewer, supervisor, or quality controller. SFH Nigeria and ACTwatch Central staff also provided monitoring and supervision during data collection. Staff travelled from team to team and conducted spot-checks to ensure supervisors and quality controllers were performing their responsibilities adequately. Spot-checks included re-examining audit sheets and questionnaires already reviewed by supervisors and quality controllers, re-visiting randomly selected outlets to verify questionnaires, and informal meetings with interviewers to get feedback on the supervisors. Supervisors and quality controllers followed data safeguarding procedures during data collection including: collecting questionnaires from interviewers at the end of each day; storing questionnaires in envelopes labelled with the total number, locality name, and supervisor name; and sending questionnaires to the SFH head office in Abuja whenever an opportunity to do so arose, for example, relinquishing questionnaires to SFH staff who were in the field for monitoring trips.
Data processing Double data entry was performed using Microsoft Access by experienced data entry clerks hired from the SFH Nigeria pool of consultants. A trained SFH Nigeria research staff member was responsible for validating the double data entry. After the first round of data entry, errors were flagged and corrected with reference to the hard-copy questionnaires. This process continued until the two data entry files were identical. A final Access database file was sent to ACTwatch Central. Staff reviewed these data, and any entries requiring clarification were documented and raised with SFH Nigeria. SFH Nigeria staff responded to these requests by making reference to the hard-copy questionnaires. In addition to the hard-copy questionnaires, the electronic data entry files are backed up at SFH Nigeria. Additional electronic copies are kept at ACTwatch Central.
www.ACTwatch.info
23 | P a g e
Accounting for the survey design in data analysis We accounted for three aspects of the sampling design during the analysis: Sampling weights: Sample weights were calculated for the outlet survey data to allow for 1) differences in sampling probabilities due to variation in the size of strata; 2) the oversampling of the booster sample; and 3) the sampling strategy which involved a census of outlets in localities of varying size selected with probability proportional to size (PPS). Weights were based on sampling probabilities and were calculated by the IE after data cleaning was complete. Refer to the Appendix for a detailed description of the calculations performed and weights used. Clustering: The sample was clustered at the level of the locality for all outlets. PPMVs, general retailers, CHEWs and hawkers in populous localities were clustered a lower level within the locality, that of the 3 enumeration areas. The calculation of standard errors took this clustering into account because outlets in a given cluster are likely to be more similar to each other than to outlets in other clusters. The standard errors did not take into account clustering of products within outlets because a complete list of all relevant products in each outlet was obtained and no sampling was performed. Stratification: Localities were sampled separately in each stratum and this was also adjusted for in the calculation of the standard error terms during analysis. To account for these design features in the tabulations, we used the Stata svy commands for analyzing complex survey data to weight the data and calculate confidence intervals which account for clustering and stratification. We declared the primary sampling unit (locality), the weight variable (wt), the strata and the finite population correction (fpc) in the svy command. The fpc equalled the sampling fraction for each stratum (the number of sampled localities in a stratum divided by the total number of localities in the stratum, or 0.5 if the sampling fraction was greater than 50 percent)4
Data Analysis
. This was specified as: svyset district [pweight=wt], strata(strata) fpc(fpc) We calculated a proportion and its 95 percent confidence interval (CI) as: svy: proportion VariableName
Calculation of antimalarial volumes, prices and markups
Antimalarial volume and price data are reported in terms of adult equivalent treatment doses (AETDs). An AETD is defined as the number of milligrams (mg) of an antimalarial drug needed to treat a 60kg adult (refer to the Appendix for details). The number of mg/kg used to calculate one AETD was defined as what was recommended for a particular drug in the treatment guidelines for
4 For simplicity we used the locality as the primary sampling unit for all outlets. No localities were chosen more than once during sample selection and thus any group of 3 second-stage EAs are from a unique locality. We defined the fpc on the basis of the number of localities in the stratum to present a true picture of the proportion of clusters selected.
www.ACTwatch.info
24 | P a g e
uncomplicated malaria in areas of low drug resistance issued by WHO (as of 5 April 2011). Where WHO treatment guidelines did not exist, AETDs were based on the product manufacturer’s treatment guidelines. In the case of ACTs, which have two or more active antimalarial ingredients packaged together (either co-formulated or co-blistered), the strength of the artemisinin-based component was used as the basis for the AETD calculations. Information collected on the medicine strength and unit size, as listed on the product packaging, was then used to calculate the number of AETDs contained in each unit. Market share was calculated by dividing the number of AETDs of a particular antimalarial category sold by the total number of AETDs of all antimalarials sold. In cases where outlets stocked antimalarials but some or all sales volumes were missing we did not impute for missing values. Price data were collected in local currencies and converted to their US$ equivalent using the average interbank rate for the period of data collection (US$ = 152.25 Naira, source: www.oanda.com). This differs from the IE approach, which uses the average 2010 exchange rate for the baseline surveys (thus inflating prices for Nigeria, given data were collected in 2009, but ensuring that results are comparable with other AMFm baseline pilot country price results). Given these differences, separate tables for price indicators were provided to the Independent Evaluator using the 2010 exchange rate. Price data are reported using median and inter-quartile range, which are appropriate for describing distributions likely to be skewed. Retail percentage mark-ups were calculated for each product as the difference between selling price and purchase price, divided by purchase price. In cases where an outlet received an antimalarial for free from its supplier and distributed the product for free, the retail mark-up was set to 0%. In cases where an outlet received an antimalarial for free from its supplier, but did not distribute the product for free, the retail mark-up was set to missing. The tables that present mark-up data indicate the number of observations set to missing for this reason.
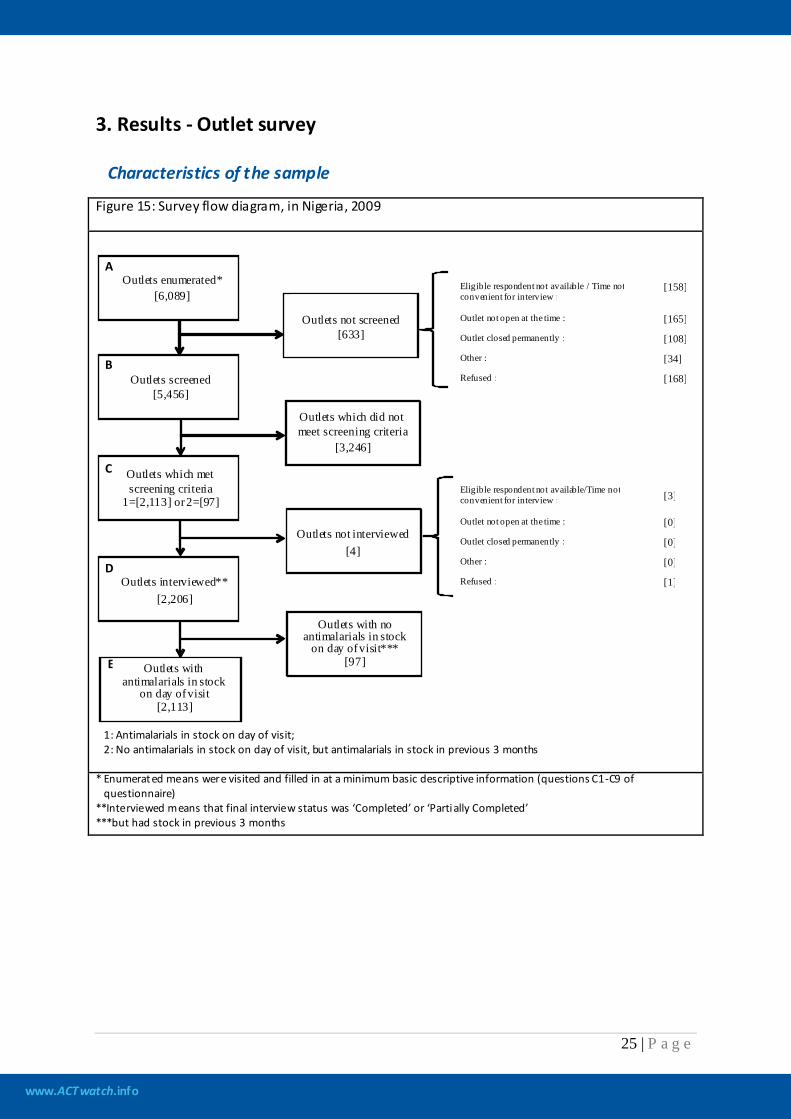
www.ACTwatch.info
25 | P a g e
3. Results - Outlet survey
Characteristics of the sample
Figure 15: Survey flow diagram, in Nigeria, 2009
* Enumerated means were visited and filled in at a minimum basic descriptive information (questions C1-C9 of questionnaire) **Interviewed means that final interview status was ‘Completed’ or ‘Partially Completed’ ***but had stock in previous 3 months
Eligible respondent not available / Time not convenient for interview : [158]
Outlet not open at the time : [165] Outlet closed permanently : [108] Other : [34] Refused : [168]
Eligible respondent not available/Time not convenient for interview : [3] Outlet not open at the time : [0] Outlet closed permanently : [0] Other : [0] Refused : [1]
A
B
C
D
E
Outlets not screened
[633]
Outlets enumerated* [6,089]
Outlets screened [5,456]
Outlets which did not meet screening criteria
[3,246]
Outlets which met screening criteria
1=[2,113] or 2=[97]
Outlets not interviewed [4]
Outlets interviewed**
[2,206]
Outlets with no antimalarials in stock
on day of visit*** [97] Outlets with
antimalarials in stock on day of visit
[2,113]
1: Antimalarials in stock on day of visit; 2: No antimalarials in stock on day of visit, but antimalarials in stock in previous 3 months
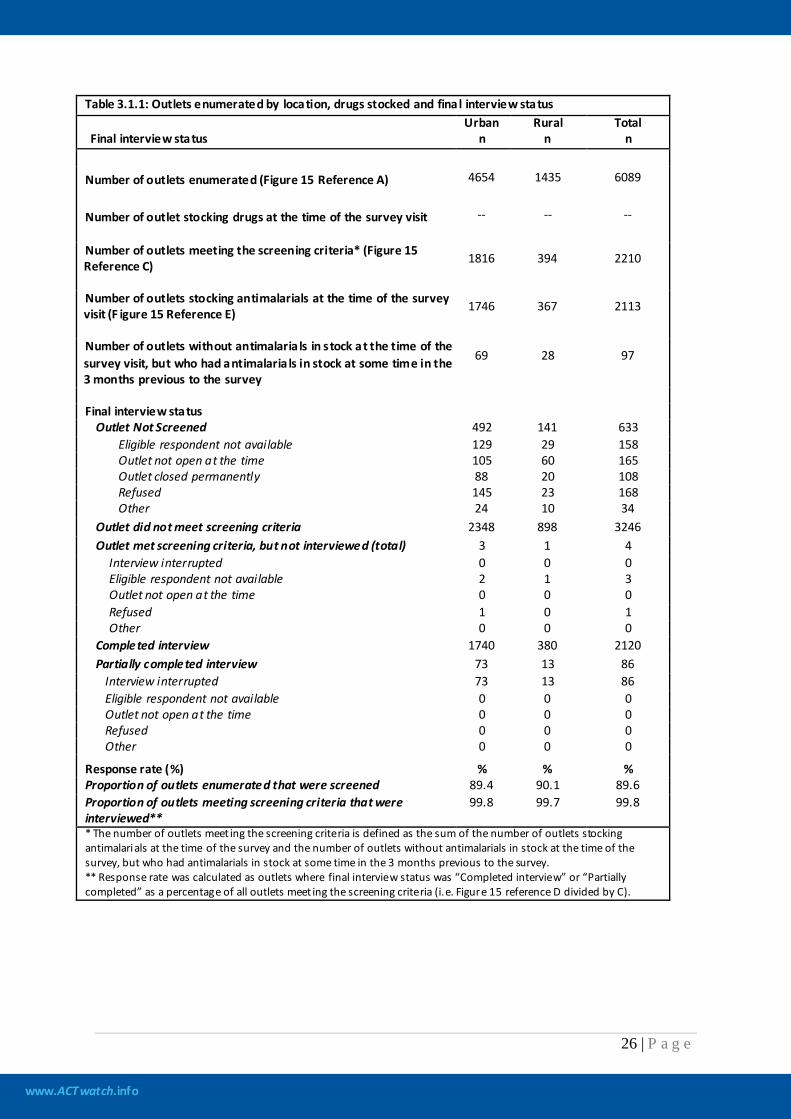
www.ACTwatch.info
26 | P a g e
Table 3.1.1: Outlets enumerated by location, drugs stocked and fina l interview status
Final interview status Urban
n Rural
n Total
n
Number of outlets enumerated (Figure 15 Reference A) 4654 1435 6089
Number of outlet stocking drugs at the time of the survey visit -- -- --
Number of outlets meeting the screening criteria* (Figure 15 Reference C) 1816 394 2210
Number of outlets stocking antimalarials at the time of the survey visit (F igure 15 Reference E) 1746 367 2113
Number of outlets without antimalaria ls in stock at the time of the survey visit, but who had antimalaria ls in stock at some time in the 3 months previous to the survey
69 28 97
Final interview status
Outlet Not Screened 492 141 633 Eligible respondent not available 129 29 158 Outlet not open at the time 105 60 165 Outlet closed permanently 88 20 108 Refused 145 23 168 Other 24 10 34
Outlet did not meet screening criteria 2348 898 3246 Outlet met screening criteria, but not interviewed (total) 3 1 4
Interview interrupted 0 0 0 Eligible respondent not available 2 1 3 Outlet not open at the time 0 0 0 Refused 1 0 1 Other 0 0 0
Completed interview 1740 380 2120 Partially completed interview 73 13 86
Interview interrupted 73 13 86 Eligible respondent not available 0 0 0 Outlet not open at the time 0 0 0 Refused 0 0 0 Other 0 0 0
Response rate (%) % % % Proportion of outlets enumerated that were screened 89.4 90.1 89.6 Proportion of outlets meeting screening criteria that were interviewed**
99.8 99.7 99.8
* The number of outlets meet ing the screening criteria is defined as the sum of the number of outlets stocking antimalarials at the time of the survey and the number of outlets without antimalarials in stock at the time of the survey, but who had antimalarials in stock at some time in the 3 months previous to the survey. ** Response rate was calculated as outlets where final interview status was “Completed interview” or “Partially completed” as a percentage of all outlets meet ing the screening criteria (i.e. Figure 15 reference D divided by C).
www.ACTwatch.info
27 | P a g e
ACTwatch Indicators
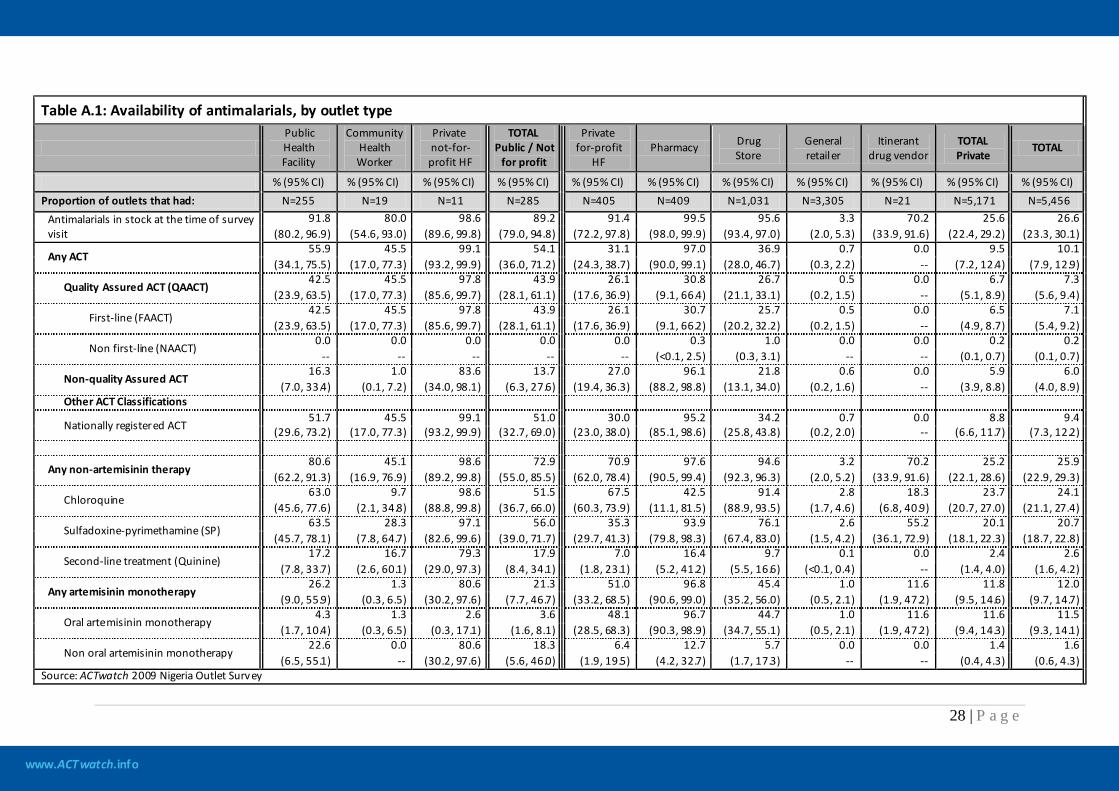
www.ACTwatch.info
28 | P a g e
Table A.1: Availability of antimalarials, by outlet type
Public Health Facility
Community Health Worker
Private not-for-profit HF
TOTAL Public / Not
for profit
Private for-profit
HF Pharmacy Drug
Store General retailer
Itinerant drug vendor
TOTAL Private
TOTAL
% (95% CI) % (95% CI) % (95% CI) % (95% CI) % (95% CI) % (95% CI) % (95% CI) % (95% CI) % (95% CI) % (95% CI) % (95% CI) Proportion of outlets that had: N=255 N=19 N=11 N=285 N=405 N=409 N=1,031 N=3,305 N=21 N=5,171 N=5,456
Antimalarials in stock at the time of survey visit
91.8 80.0 98.6 89.2 91.4 99.5 95.6 3.3 70.2 25.6 26.6 (80.2, 96.9) (54.6, 93.0) (89.6, 99.8) (79.0, 94.8) (72.2, 97.8) (98.0, 99.9) (93.4, 97.0) (2.0, 5.3) (33.9, 91.6) (22.4, 29.2) (23.3, 30.1)
Any ACT 55.9 45.5 99.1 54.1 31.1 97.0 36.9 0.7 0.0 9.5 10.1
(34.1, 75.5) (17.0, 77.3) (93.2, 99.9) (36.0, 71.2) (24.3, 38.7) (90.0, 99.1) (28.0, 46.7) (0.3, 2.2) -- (7.2, 12.4) (7.9, 12.9)
Quality Assured ACT (QAACT) 42.5 45.5 97.8 43.9 26.1 30.8 26.7 0.5 0.0 6.7 7.3
(23.9, 63.5) (17.0, 77.3) (85.6, 99.7) (28.1, 61.1) (17.6, 36.9) (9.1, 66.4) (21.1, 33.1) (0.2, 1.5) -- (5.1, 8.9) (5.6, 9.4)
First-line (FAACT) 42.5 45.5 97.8 43.9 26.1 30.7 25.7 0.5 0.0 6.5 7.1
(23.9, 63.5) (17.0, 77.3) (85.6, 99.7) (28.1, 61.1) (17.6, 36.9) (9.1, 66.2) (20.2, 32.2) (0.2, 1.5) -- (4.9, 8.7) (5.4, 9.2)
Non first-line (NAACT) 0.0 0.0 0.0 0.0 0.0 0.3 1.0 0.0 0.0 0.2 0.2
-- -- -- -- -- (<0.1, 2.5) (0.3, 3.1) -- -- (0.1, 0.7) (0.1, 0.7)
Non-quality Assured ACT 16.3 1.0 83.6 13.7 27.0 96.1 21.8 0.6 0.0 5.9 6.0
(7.0, 33.4) (0.1, 7.2) (34.0, 98.1) (6.3, 27.6) (19.4, 36.3) (88.2, 98.8) (13.1, 34.0) (0.2, 1.6) -- (3.9, 8.8) (4.0, 8.9) Other ACT Classifications
Nationally registered ACT 51.7 45.5 99.1 51.0 30.0 95.2 34.2 0.7 0.0 8.8 9.4
(29.6, 73.2) (17.0, 77.3) (93.2, 99.9) (32.7, 69.0) (23.0, 38.0) (85.1, 98.6) (25.8, 43.8) (0.2, 2.0) -- (6.6, 11.7) (7.3, 12.2)
Any non-artemisinin therapy 80.6 45.1 98.6 72.9 70.9 97.6 94.6 3.2 70.2 25.2 25.9
(62.2, 91.3) (16.9, 76.9) (89.2, 99.8) (55.0, 85.5) (62.0, 78.4) (90.5, 99.4) (92.3, 96.3) (2.0, 5.2) (33.9, 91.6) (22.1, 28.6) (22.9, 29.3)
Chloroquine 63.0 9.7 98.6 51.5 67.5 42.5 91.4 2.8 18.3 23.7 24.1
(45.6, 77.6) (2.1, 34.8) (88.8, 99.8) (36.7, 66.0) (60.3, 73.9) (11.1, 81.5) (88.9, 93.5) (1.7, 4.6) (6.8, 40.9) (20.7, 27.0) (21.1, 27.4)
Sulfadoxine-pyrimethamine (SP) 63.5 28.3 97.1 56.0 35.3 93.9 76.1 2.6 55.2 20.1 20.7
(45.7, 78.1) (7.8, 64.7) (82.6, 99.6) (39.0, 71.7) (29.7, 41.3) (79.8, 98.3) (67.4, 83.0) (1.5, 4.2) (36.1, 72.9) (18.1, 22.3) (18.7, 22.8)
Second-line treatment (Quinine) 17.2 16.7 79.3 17.9 7.0 16.4 9.7 0.1 0.0 2.4 2.6
(7.8, 33.7) (2.6, 60.1) (29.0, 97.3) (8.4, 34.1) (1.8, 23.1) (5.2, 41.2) (5.5, 16.6) (<0.1, 0.4) -- (1.4, 4.0) (1.6, 4.2)
Any artemisinin monotherapy 26.2 1.3 80.6 21.3 51.0 96.8 45.4 1.0 11.6 11.8 12.0
(9.0, 55.9) (0.3, 6.5) (30.2, 97.6) (7.7, 46.7) (33.2, 68.5) (90.6, 99.0) (35.2, 56.0) (0.5, 2.1) (1.9, 47.2) (9.5, 14.6) (9.7, 14.7)
Oral artemisinin monotherapy 4.3 1.3 2.6 3.6 48.1 96.7 44.7 1.0 11.6 11.6 11.5
(1.7, 10.4) (0.3, 6.5) (0.3, 17.1) (1.6, 8.1) (28.5, 68.3) (90.3, 98.9) (34.7, 55.1) (0.5, 2.1) (1.9, 47.2) (9.4, 14.3) (9.3, 14.1)
Non oral artemisinin monotherapy 22.6 0.0 80.6 18.3 6.4 12.7 5.7 0.0 0.0 1.4 1.6
(6.5, 55.1) -- (30.2, 97.6) (5.6, 46.0) (1.9, 19.5) (4.2, 32.7) (1.7, 17.3) -- -- (0.4, 4.3) (0.6, 4.3) Source: ACTwatch 2009 Nigeria Outlet Survey
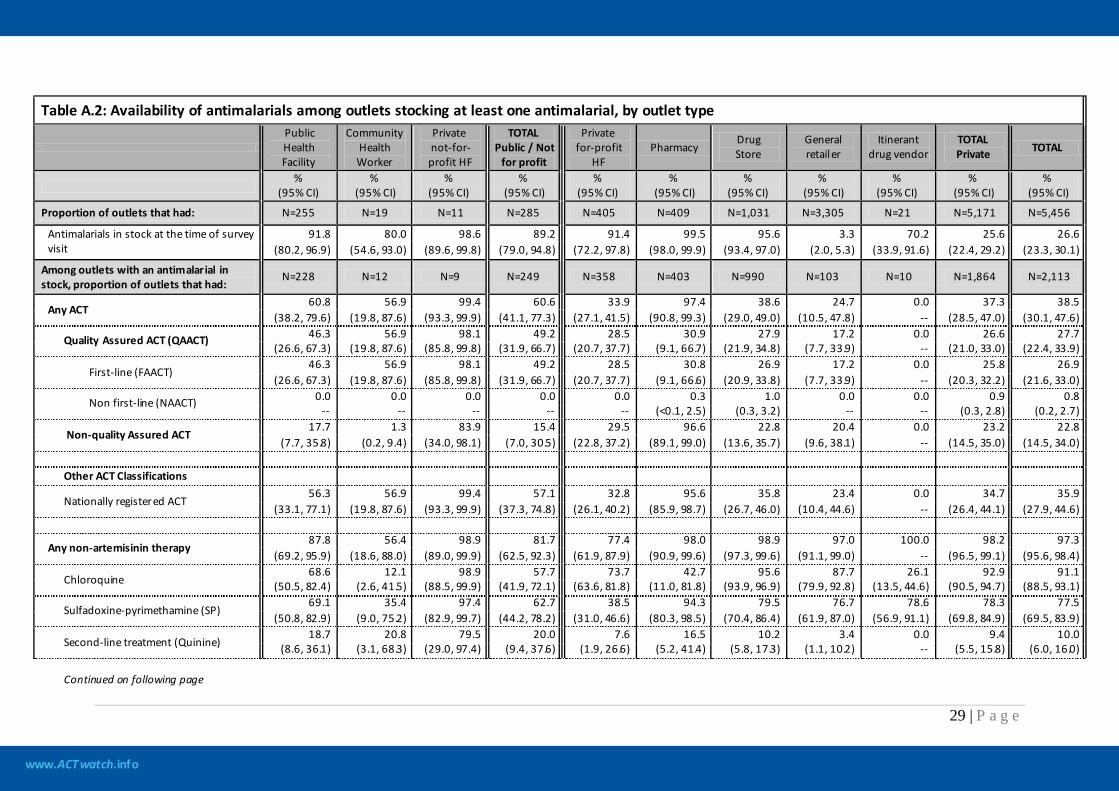
www.ACTwatch.info
29 | P a g e
Table A.2: Availability of antimalarials among outlets stocking at least one antimalarial, by outlet type
Public Health Facility
Community Health Worker
Private not-for-profit HF
TOTAL Public / Not
for profit
Private for-profit
HF Pharmacy
Drug Store
General retailer
Itinerant drug vendor
TOTAL Private TOTAL
% (95% CI)
% (95% CI)
% (95% CI)
% (95% CI)
% (95% CI)
% (95% CI)
% (95% CI)
% (95% CI)
% (95% CI)
% (95% CI)
% (95% CI)
Proportion of outlets that had: N=255 N=19 N=11 N=285 N=405 N=409 N=1,031 N=3,305 N=21 N=5,171 N=5,456
Antimalarials in stock at the time of survey visit
91.8 80.0 98.6 89.2 91.4 99.5 95.6 3.3 70.2 25.6 26.6 (80.2, 96.9) (54.6, 93.0) (89.6, 99.8) (79.0, 94.8) (72.2, 97.8) (98.0, 99.9) (93.4, 97.0) (2.0, 5.3) (33.9, 91.6) (22.4, 29.2) (23.3, 30.1)
Among outlets with an antimalarial in stock, proportion of outlets that had:
N=228 N=12 N=9 N=249 N=358 N=403 N=990 N=103 N=10 N=1,864 N=2,113
Any ACT 60.8 56.9 99.4 60.6 33.9 97.4 38.6 24.7 0.0 37.3 38.5
(38.2, 79.6) (19.8, 87.6) (93.3, 99.9) (41.1, 77.3) (27.1, 41.5) (90.8, 99.3) (29.0, 49.0) (10.5, 47.8) -- (28.5, 47.0) (30.1, 47.6)
Quality Assured ACT (QAACT) 46.3 56.9 98.1 49.2 28.5 30.9 27.9 17.2 0.0 26.6 27.7 (26.6, 67.3) (19.8, 87.6) (85.8, 99.8) (31.9, 66.7) (20.7, 37.7) (9.1, 66.7) (21.9, 34.8) (7.7, 33.9) -- (21.0, 33.0) (22.4, 33.9)
First-line (FAACT) 46.3 56.9 98.1 49.2 28.5 30.8 26.9 17.2 0.0 25.8 26.9
(26.6, 67.3) (19.8, 87.6) (85.8, 99.8) (31.9, 66.7) (20.7, 37.7) (9.1, 66.6) (20.9, 33.8) (7.7, 33.9) -- (20.3, 32.2) (21.6, 33.0)
Non first-line (NAACT) 0.0 0.0 0.0 0.0 0.0 0.3 1.0 0.0 0.0 0.9 0.8 -- -- -- -- -- (<0.1, 2.5) (0.3, 3.2) -- -- (0.3, 2.8) (0.2, 2.7)
Non-quality Assured ACT 17.7 1.3 83.9 15.4 29.5 96.6 22.8 20.4 0.0 23.2 22.8
(7.7, 35.8) (0.2, 9.4) (34.0, 98.1) (7.0, 30.5) (22.8, 37.2) (89.1, 99.0) (13.6, 35.7) (9.6, 38.1) -- (14.5, 35.0) (14.5, 34.0) Other ACT Classifications
Nationally registered ACT 56.3 56.9 99.4 57.1 32.8 95.6 35.8 23.4 0.0 34.7 35.9
(33.1, 77.1) (19.8, 87.6) (93.3, 99.9) (37.3, 74.8) (26.1, 40.2) (85.9, 98.7) (26.7, 46.0) (10.4, 44.6) -- (26.4, 44.1) (27.9, 44.6)
Any non-artemisinin therapy 87.8 56.4 98.9 81.7 77.4 98.0 98.9 97.0 100.0 98.2 97.3
(69.2, 95.9) (18.6, 88.0) (89.0, 99.9) (62.5, 92.3) (61.9, 87.9) (90.9, 99.6) (97.3, 99.6) (91.1, 99.0) -- (96.5, 99.1) (95.6, 98.4)
Chloroquine 68.6 12.1 98.9 57.7 73.7 42.7 95.6 87.7 26.1 92.9 91.1
(50.5, 82.4) (2.6, 41.5) (88.5, 99.9) (41.9, 72.1) (63.6, 81.8) (11.0, 81.8) (93.9, 96.9) (79.9, 92.8) (13.5, 44.6) (90.5, 94.7) (88.5, 93.1)
Sulfadoxine-pyrimethamine (SP) 69.1 35.4 97.4 62.7 38.5 94.3 79.5 76.7 78.6 78.3 77.5
(50.8, 82.9) (9.0, 75.2) (82.9, 99.7) (44.2, 78.2) (31.0, 46.6) (80.3, 98.5) (70.4, 86.4) (61.9, 87.0) (56.9, 91.1) (69.8, 84.9) (69.5, 83.9)
Second-line treatment (Quinine) 18.7 20.8 79.5 20.0 7.6 16.5 10.2 3.4 0.0 9.4 10.0
(8.6, 36.1) (3.1, 68.3) (29.0, 97.4) (9.4, 37.6) (1.9, 26.6) (5.2, 41.4) (5.8, 17.3) (1.1, 10.2) -- (5.5, 15.8) (6.0, 16.0) Continued on following page
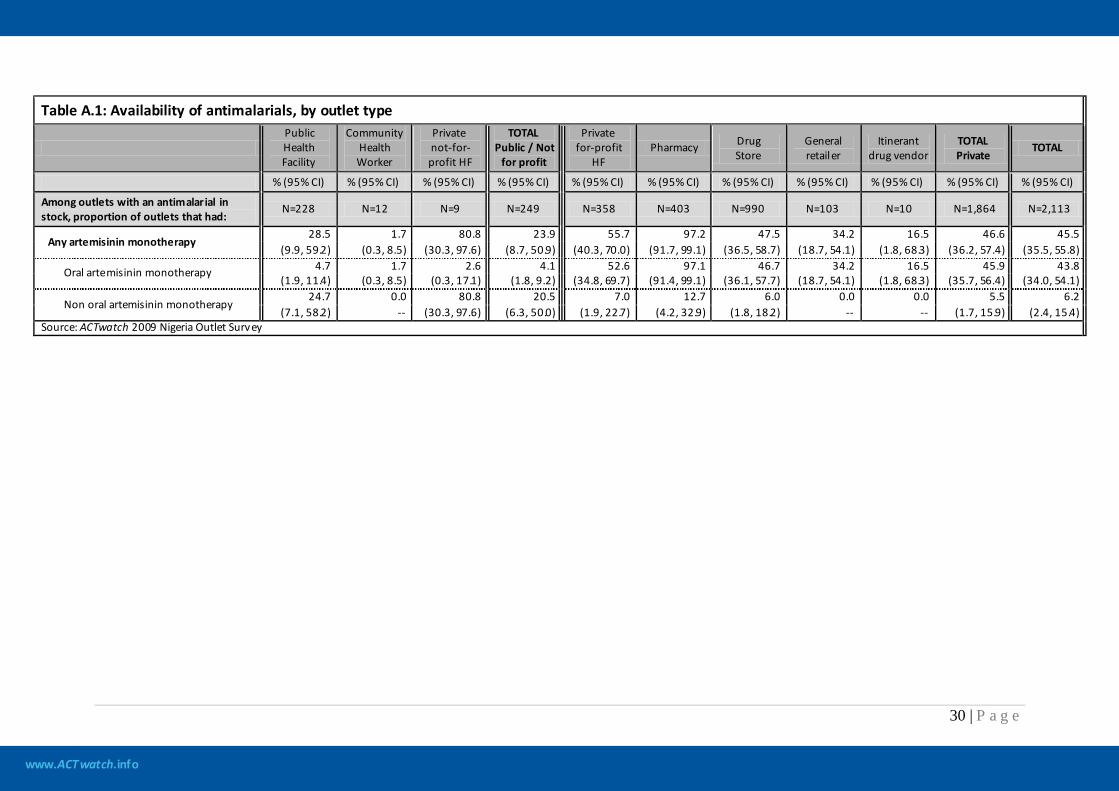
www.ACTwatch.info
30 | P a g e
Table A.1: Availability of antimalarials, by outlet type
Public Health Facility
Community Health Worker
Private not-for-profit HF
TOTAL Public / Not
for profit
Private for-profit
HF Pharmacy Drug
Store General retailer
Itinerant drug vendor
TOTAL Private
TOTAL
% (95% CI) % (95% CI) % (95% CI) % (95% CI) % (95% CI) % (95% CI) % (95% CI) % (95% CI) % (95% CI) % (95% CI) % (95% CI)
Among outlets with an antimalarial in stock, proportion of outlets that had:
N=228 N=12 N=9 N=249 N=358 N=403 N=990 N=103 N=10 N=1,864 N=2,113
Any artemisinin monotherapy 28.5 1.7 80.8 23.9 55.7 97.2 47.5 34.2 16.5 46.6 45.5
(9.9, 59.2) (0.3, 8.5) (30.3, 97.6) (8.7, 50.9) (40.3, 70.0) (91.7, 99.1) (36.5, 58.7) (18.7, 54.1) (1.8, 68.3) (36.2, 57.4) (35.5, 55.8)
Oral artemisinin monotherapy 4.7 1.7 2.6 4.1 52.6 97.1 46.7 34.2 16.5 45.9 43.8 (1.9, 11.4) (0.3, 8.5) (0.3, 17.1) (1.8, 9.2) (34.8, 69.7) (91.4, 99.1) (36.1, 57.7) (18.7, 54.1) (1.8, 68.3) (35.7, 56.4) (34.0, 54.1)
Non oral artemisinin monotherapy 24.7 0.0 80.8 20.5 7.0 12.7 6.0 0.0 0.0 5.5 6.2
(7.1, 58.2) -- (30.3, 97.6) (6.3, 50.0) (1.9, 22.7) (4.2, 32.9) (1.8, 18.2) -- -- (1.7, 15.9) (2.4, 15.4) Source: ACTwatch 2009 Nigeria Outlet Survey
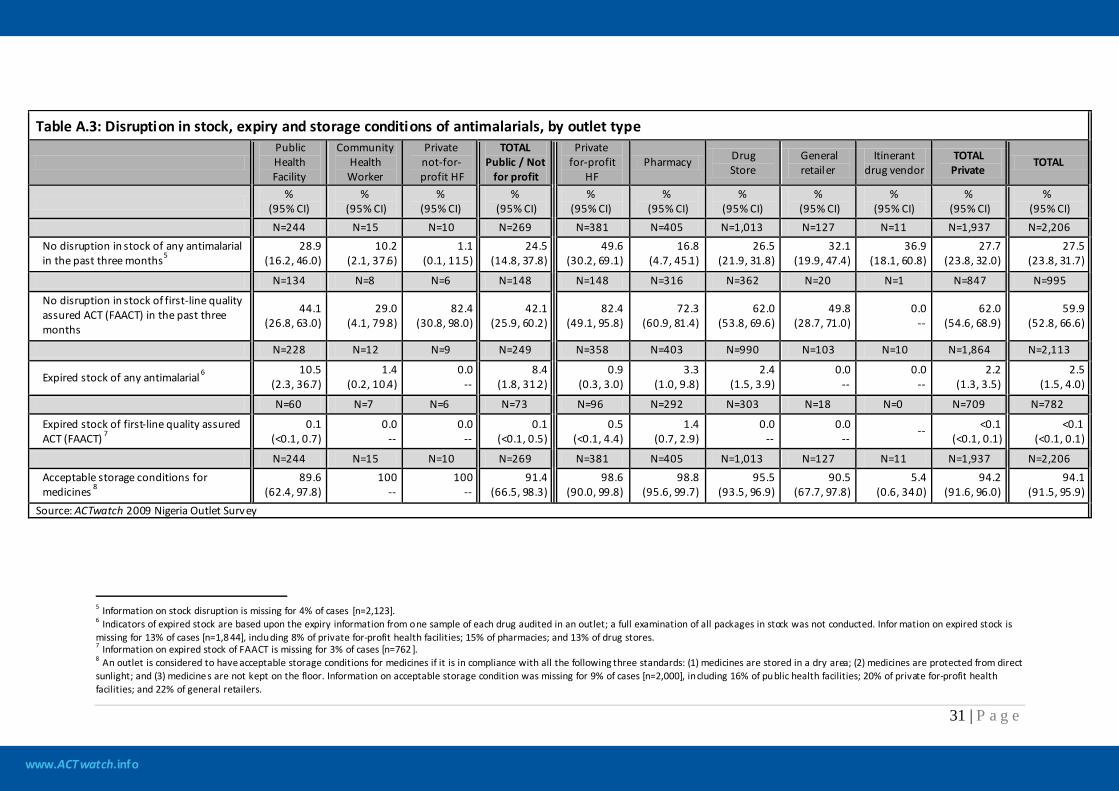
www.ACTwatch.info
31 | P a g e
Table A.3: Disruption in stock, expiry and storage conditions of antimalarials, by outlet type
Public Health Facility
Community Health Worker
Private not-for-profit HF
TOTAL Public / Not
for profit
Private for-profit
HF Pharmacy Drug
Store General retailer
Itinerant drug vendor
TOTAL Private
TOTAL
%
(95% CI) %
(95% CI) %
(95% CI) %
(95% CI) %
(95% CI) %
(95% CI) %
(95% CI) %
(95% CI) %
(95% CI) %
(95% CI) %
(95% CI) N=244 N=15 N=10 N=269 N=381 N=405 N=1,013 N=127 N=11 N=1,937 N=2,206 No disruption in stock of any antimalarial in the past three months5
28.9 (16.2, 46.0)
10.2 (2.1, 37.6)
1.1 (0.1, 11.5)
24.5 (14.8, 37.8)
49.6 (30.2, 69.1)
16.8 (4.7, 45.1)
26.5 (21.9, 31.8)
32.1 (19.9, 47.4)
36.9 (18.1, 60.8)
27.7 (23.8, 32.0)
27.5 (23.8, 31.7)
N=134 N=8 N=6 N=148 N=148 N=316 N=362 N=20 N=1 N=847 N=995
No disruption in stock of first-line quality assured ACT (FAACT) in the past three months
44.1 (26.8, 63.0)
29.0 (4.1, 79.8)
82.4 (30.8, 98.0)
42.1 (25.9, 60.2)
82.4 (49.1, 95.8)
72.3 (60.9, 81.4)
62.0 (53.8, 69.6)
49.8 (28.7, 71.0)
0.0 --
62.0 (54.6, 68.9)
59.9 (52.8, 66.6)
N=228 N=12 N=9 N=249 N=358 N=403 N=990 N=103 N=10 N=1,864 N=2,113
Expired stock of any antimalarial 6 10.5 (2.3, 36.7)
1.4 (0.2, 10.4)
0.0 --
8.4 (1.8, 31.2)
0.9 (0.3, 3.0)
3.3 (1.0, 9.8)
2.4 (1.5, 3.9)
0.0 --
0.0 --
2.2 (1.3, 3.5)
2.5 (1.5, 4.0)
N=60 N=7 N=6 N=73 N=96 N=292 N=303 N=18 N=0 N=709 N=782
Expired stock of first-line quality assured ACT (FAACT) 7
0.1 (<0.1, 0.7)
0.0 --
0.0 --
0.1 (<0.1, 0.5)
0.5 (<0.1, 4.4)
1.4 (0.7, 2.9)
0.0 --
0.0 --
-- <0.1 (<0.1, 0.1)
<0.1 (<0.1, 0.1)
N=244 N=15 N=10 N=269 N=381 N=405 N=1,013 N=127 N=11 N=1,937 N=2,206 Acceptable storage conditions for medicines 8
89.6 (62.4, 97.8)
100 --
100 --
91.4 (66.5, 98.3)
98.6 (90.0, 99.8)
98.8 (95.6, 99.7)
95.5 (93.5, 96.9)
90.5 (67.7, 97.8)
5.4 (0.6, 34.0)
94.2 (91.6, 96.0)
94.1 (91.5, 95.9)
Source: ACTwatch 2009 Nigeria Outlet Survey
5 Information on stock disruption is missing for 4% of cases [n=2,123]. 6 Indicators of expired stock are based upon the expiry information from one sample of each drug audited in an outlet; a full examination of all packages in stock was not conducted. Infor mation on expired stock is missing for 13% of cases [n=1,8 44], including 8% of private for-profit health facilities; 15% of pharmacies; and 13% of drug stores. 7 Information on expired stock of FAACT is missing for 3% of cases [n=762 ]. 8 An outlet is considered to have acceptable storage conditions for medicines if it is in compliance with all the following three standards: (1) medicines are stored in a dry area; (2) medicines are protected from direct sunlight; and (3) medicine s are not kept on the floor. Information on acceptable storage condition was missing for 9% of cases [n=2,000], including 16% of public health facilities; 20% of private for-profit health facilities; and 22% of general retailers.
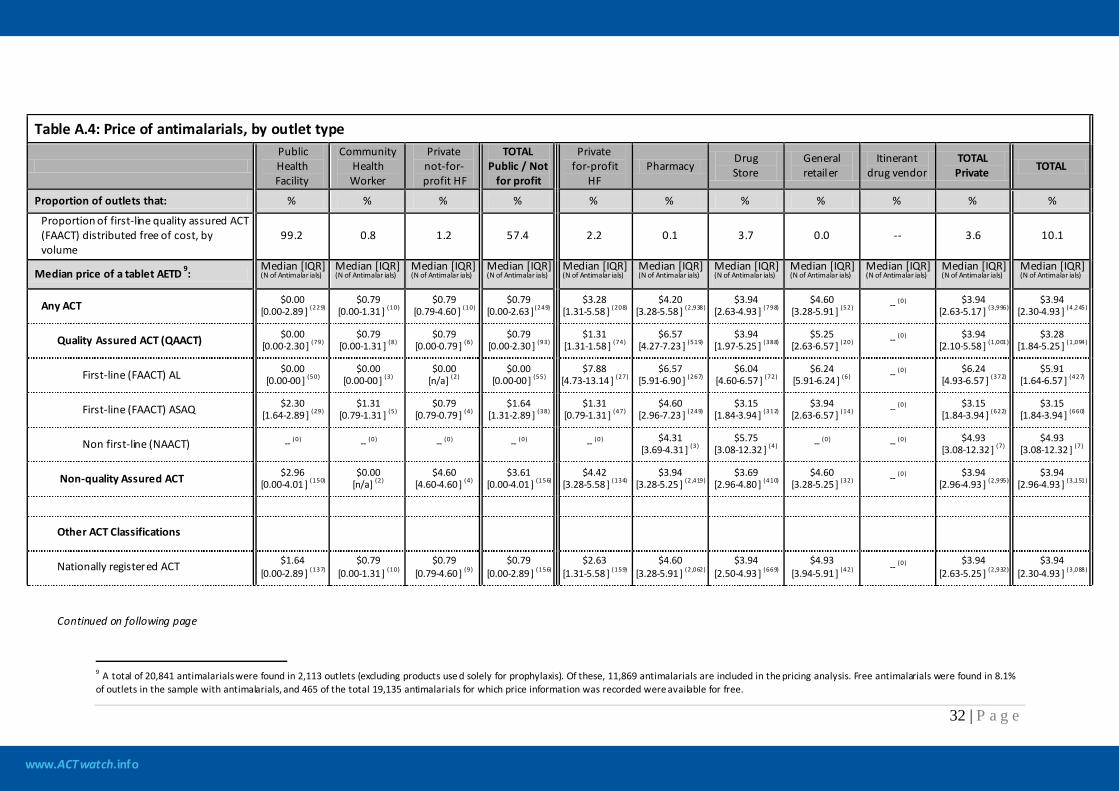
www.ACTwatch.info
32 | P a g e
Table A.4: Price of antimalarials, by outlet type
Public Health Facility
Community Health Worker
Private not-for-profit HF
TOTAL Public / Not
for profit
Private for-profit
HF Pharmacy
Drug Store
General retailer
Itinerant drug vendor
TOTAL Private TOTAL
Proportion of outlets that: % % % % % % % % % % %
Proportion of first-line quality assured ACT (FAACT) distributed free of cost, by volume
99.2 0.8 1.2 57.4 2.2 0.1 3.7 0.0 -- 3.6 10.1
Median price of a tablet AETD 9: Median [IQR] (N of Antimalar ials)
Median [IQR] (N of Antimalar ials)
Median [IQR] (N of Antimalar ials)
Median [IQR] (N of Antimalar ials)
Median [IQR] (N of Antimalar ials)
Median [IQR] (N of Antimalar ials)
Median [IQR] (N of Antimalar ials)
Median [IQR] (N of Antimalar ials)
Median [IQR] (N of Antimalar ials)
Median [IQR] (N of Antimalar ials)
Median [IQR] (N of Antimalar ials)
Any ACT $0.00 [0.00-2.89 ] (229)
$0.79 [0.00-1.31 ] (10)
$0.79 [0.79-4.60 ] (10)
$0.79 [0.00-2.63 ] (249)
$3.28 [1.31-5.58 ] (208)
$4.20 [3.28-5.58 ] (2,938)
$3.94 [2.63-4.93 ] (798)
$4.60 [3.28-5.91 ] (52) -- (0) $3.94
[2.63-5.17 ] (3,996) $3.94
[2.30-4.93 ] (4,245)
Quality Assured ACT (QAACT) $0.00 [0.00-2.30 ] (79)
$0.79 [0.00-1.31 ] (8)
$0.79 [0.00-0.79 ] (6)
$0.79 [0.00-2.30 ] (93)
$1.31 [1.31-1.58 ] (74)
$6.57 [4.27-7.23 ] (519)
$3.94 [1.97-5.25 ] (388)
$5.25 [2.63-6.57 ] (20) -- (0) $3.94
[2.10-5.58 ] (1,001) $3.28
[1.84-5.25 ] (1,094)
First-line (FAACT) AL $0.00 [0.00-00 ] (50)
$0.00 [0.00-00 ] (3)
$0.00 [n/a] (2)
$0.00 [0.00-00 ] (55)
$7.88 [4.73-13.14 ] (27)
$6.57 [5.91-6.90 ] (267)
$6.04 [4.60-6.57 ] (72)
$6.24 [5.91-6.24 ] (6) -- (0) $6.24
[4.93-6.57 ] (372) $5.91
[1.64-6.57 ] (427)
First-line (FAACT) ASAQ $2.30 [1.64-2.89 ] (29)
$1.31 [0.79-1.31 ] (5)
$0.79 [0.79-0.79 ] (4)
$1.64 [1.31-2.89 ] (38)
$1.31 [0.79-1.31 ] (47)
$4.60 [2.96-7.23 ] (249)
$3.15 [1.84-3.94 ] (312)
$3.94 [2.63-6.57 ] (14) -- (0) $3.15
[1.84-3.94 ] (622) $3.15
[1.84-3.94 ] (660)
Non first-line (NAACT) -- (0) -- (0) -- (0) -- (0) -- (0) $4.31 [3.69-4.31 ] (3)
$5.75 [3.08-12.32 ] (4) -- (0) -- (0) $4.93
[3.08-12.32 ] (7) $4.93
[3.08-12.32 ] (7)
Non-quality Assured ACT $2.96 [0.00-4.01 ] (150)
$0.00 [n/a] (2)
$4.60 [4.60-4.60 ] (4)
$3.61 [0.00-4.01 ] (156)
$4.42 [3.28-5.58 ] (134)
$3.94 [3.28-5.25 ] (2,419)
$3.69 [2.96-4.80 ] (410)
$4.60 [3.28-5.25 ] (32) -- (0) $3.94
[2.96-4.93 ] (2,995) $3.94
[2.96-4.93 ] (3,151)
Other ACT Classifications
Nationally registered ACT $1.64 [0.00-2.89 ] (137)
$0.79 [0.00-1.31 ] (10)
$0.79 [0.79-4.60 ] (9)
$0.79 [0.00-2.89 ] (156)
$2.63 [1.31-5.58 ] (159)
$4.60 [3.28-5.91 ] (2,062)
$3.94 [2.50-4.93 ] (669)
$4.93 [3.94-5.91 ] (42) -- (0) $3.94
[2.63-5.25 ] (2,932) $3.94
[2.30-4.93 ] (3,088)
Continued on following page
9 A total of 20,841 antimalarials were found in 2,113 outlets (excluding products use d solely for prophylaxis). Of these, 11,869 antimalarials are included in the pricing analysis. Free antimalarials were found in 8.1% of outlets in the sample with antimalarials, and 465 of the total 19,135 antimalarials for which price information was recorded were available for free.
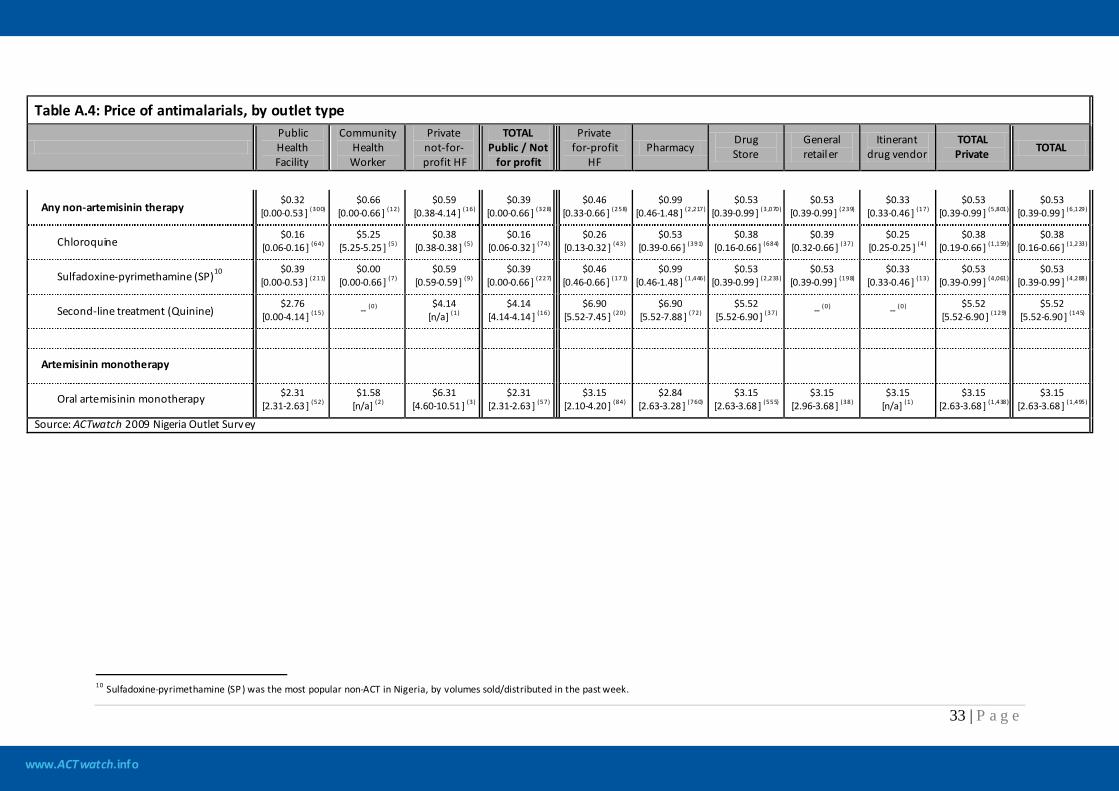
www.ACTwatch.info
33 | P a g e
Table A.4: Price of antimalarials, by outlet type
Public Health Facility
Community Health Worker
Private not-for-profit HF
TOTAL Public / Not
for profit
Private for-profit
HF Pharmacy
Drug Store
General retailer
Itinerant drug vendor
TOTAL Private TOTAL
Any non-artemisinin therapy $0.32
[0.00-0.53 ] (300) $0.66
[0.00-0.66 ] (12) $0.59
[0.38-4.14 ] (16) $0.39
[0.00-0.66 ] (328) $0.46
[0.33-0.66 ] (258) $0.99
[0.46-1.48 ] (2,217) $0.53
[0.39-0.99 ] (3,070) $0.53
[0.39-0.99 ] (239) $0.33
[0.33-0.46 ] (17) $0.53
[0.39-0.99 ] (5,801) $0.53
[0.39-0.99 ] (6,129)
Chloroquine $0.16
[0.06-0.16 ] (64) $5.25
[5.25-5.25 ] (5) $0.38
[0.38-0.38 ] (5) $0.16
[0.06-0.32 ] (74) $0.26
[0.13-0.32 ] (43) $0.53
[0.39-0.66 ] (391) $0.38
[0.16-0.66 ] (684) $0.39
[0.32-0.66 ] (37) $0.25
[0.25-0.25 ] (4) $0.38
[0.19-0.66 ] (1,159) $0.38
[0.16-0.66 ] (1,233)
Sulfadoxine-pyrimethamine (SP)10 $0.39 [0.00-0.53 ] (211)
$0.00 [0.00-0.66 ] (7)
$0.59 [0.59-0.59 ] (9)
$0.39 [0.00-0.66 ] (227)
$0.46 [0.46-0.66 ] (171)
$0.99 [0.46-1.48 ] (1,446)
$0.53 [0.39-0.99 ] (2,233)
$0.53 [0.39-0.99 ] (198)
$0.33 [0.33-0.46 ] (13)
$0.53 [0.39-0.99 ] (4,061)
$0.53 [0.39-0.99 ] (4,288)
Second-line treatment (Quinine) $2.76
[0.00-4.14 ] (15) -- (0) $4.14 [n/a] (1)
$4.14 [4.14-4.14 ] (16)
$6.90 [5.52-7.45 ] (20)
$6.90 [5.52-7.88 ] (72)
$5.52 [5.52-6.90 ] (37) -- (0) -- (0) $5.52
[5.52-6.90 ] (129) $5.52
[5.52-6.90 ] (145)
Artemisinin monotherapy
Oral artemisinin monotherapy $2.31 [2.31-2.63 ] (52)
$1.58 [n/a] (2)
$6.31 [4.60-10.51 ] (3)
$2.31 [2.31-2.63 ] (57)
$3.15 [2.10-4.20 ] (84)
$2.84 [2.63-3.28 ] (760)
$3.15 [2.63-3.68 ] (555)
$3.15 [2.96-3.68 ] (38)
$3.15 [n/a] (1)
$3.15 [2.63-3.68 ] (1,438)
$3.15 [2.63-3.68 ] (1,495)
Source: ACTwatch 2009 Nigeria Outlet Survey
10 Sulfadoxine-pyrimethamine (SP) was the most popular non-ACT in Nigeria, by volumes sold/distributed in the past week.
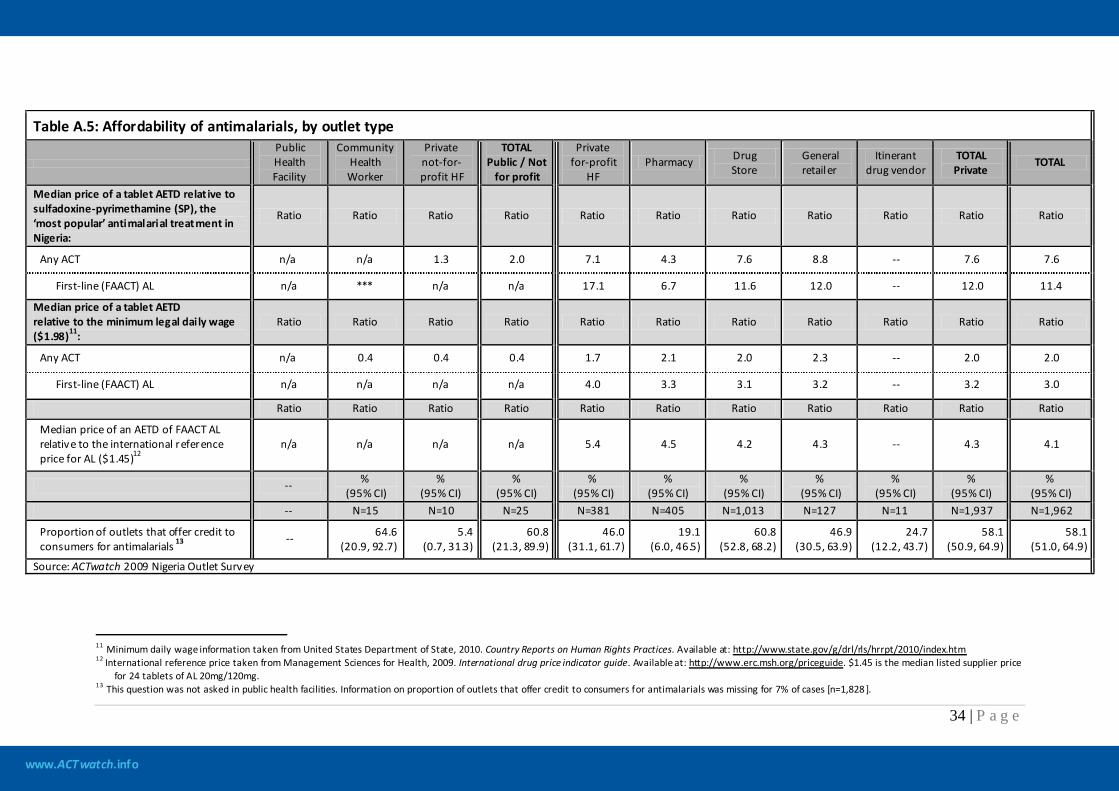
www.ACTwatch.info
34 | P a g e
Table A.5: Affordability of antimalarials, by outlet type
Public Health Facility
Community Health Worker
Private not-for-profit HF
TOTAL Public / Not
for profit
Private for-profit
HF Pharmacy Drug
Store General retailer
Itinerant drug vendor
TOTAL Private
TOTAL
Median price of a tablet AETD relat ive to sulfadoxine-pyrimethamine (SP), the ‘most popular’ antimalarial treatment in Nigeria:
Ratio Ratio Ratio Ratio Ratio Ratio Ratio Ratio Ratio Ratio Ratio
Any ACT n/a n/a 1.3 2.0 7.1 4.3 7.6 8.8 -- 7.6 7.6
First-line (FAACT) AL n/a *** n/a n/a 17.1 6.7 11.6 12.0 -- 12.0 11.4
Median price of a tablet AETD relative to the minimum legal daily wage ($1.98)11:
Ratio Ratio Ratio Ratio Ratio Ratio Ratio Ratio Ratio Ratio Ratio
Any ACT n/a 0.4 0.4 0.4 1.7 2.1 2.0 2.3 -- 2.0 2.0
First-line (FAACT) AL n/a n/a n/a n/a 4.0 3.3 3.1 3.2 -- 3.2 3.0
Ratio Ratio Ratio Ratio Ratio Ratio Ratio Ratio Ratio Ratio Ratio
Median price of an AETD of FAACT AL relative to the international reference price for AL ($1.45)12
n/a n/a n/a n/a 5.4 4.5 4.2 4.3 -- 4.3 4.1
-- % (95% CI)
% (95% CI)
% (95% CI)
% (95% CI)
% (95% CI)
% (95% CI)
% (95% CI)
% (95% CI)
% (95% CI)
% (95% CI)
-- N=15 N=10 N=25 N=381 N=405 N=1,013 N=127 N=11 N=1,937 N=1,962
Proportion of outlets that offer credit to consumers for antimalarials 13 --
64.6
(20.9, 92.7) 5.4
(0.7, 31.3) 60.8
(21.3, 89.9) 46.0
(31.1, 61.7) 19.1
(6.0, 46.5) 60.8
(52.8, 68.2) 46.9
(30.5, 63.9) 24.7
(12.2, 43.7) 58.1
(50.9, 64.9) 58.1
(51.0, 64.9)
Source: ACTwatch 2009 Nigeria Outlet Survey
11 Minimum daily wage information taken from United States Department of State, 2010. Country Reports on Human Rights Practices. Available at: http://www.state.gov/g/drl/rls/hrrpt/2010/index.htm 12 International reference price taken from Management Sciences for Health, 2009. International drug price indicator guide. Available at: http://www.erc.msh.org/priceguide. $1.45 is the median listed supplier price
for 24 tablets of AL 20mg/120mg. 13 This question was not asked in public health facilities. Information on proportion of outlets that offer credit to consumers for antimalarials was missing for 7% of cases [n=1,828 ].
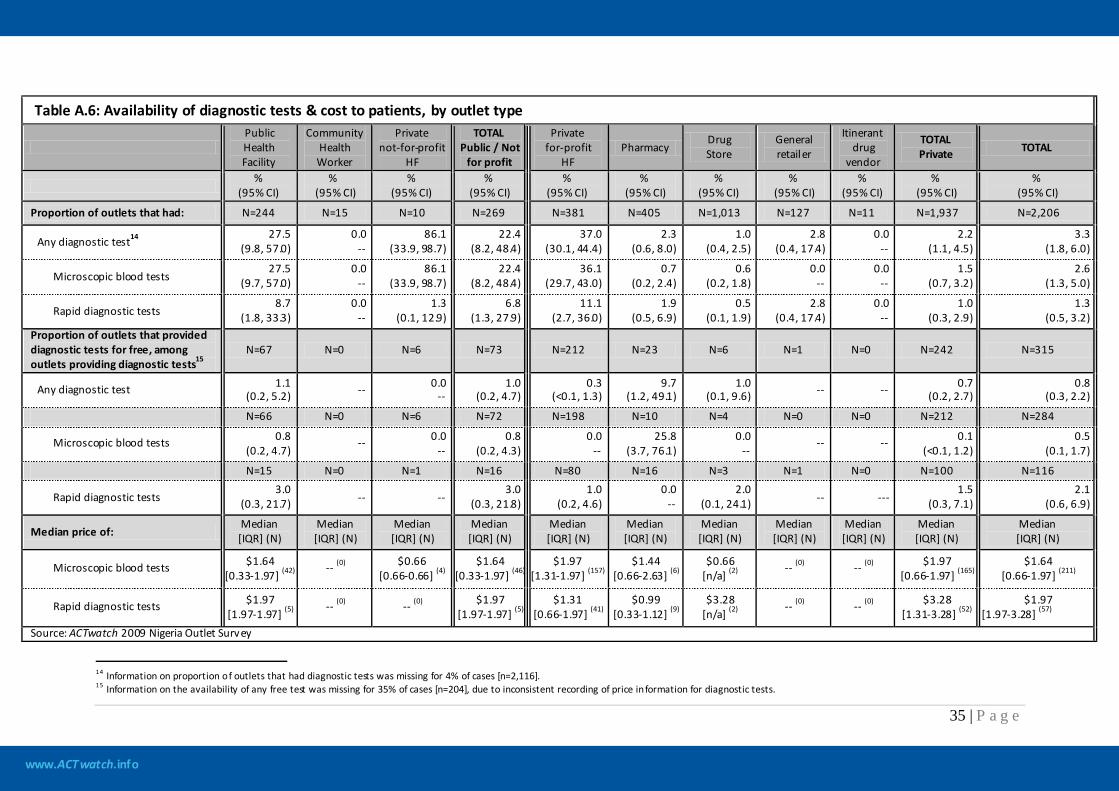
www.ACTwatch.info
35 | P a g e
Table A.6: Availability of diagnostic tests & cost to patients, by outlet type
Public Health Facility
Community Health Worker
Private not-for-profit
HF
TOTAL Public / Not
for profit
Private for-profit
HF Pharmacy
Drug Store
General retailer
Itinerant drug
vendor
TOTAL Private TOTAL
% (95% CI)
% (95% CI)
% (95% CI)
% (95% CI)
% (95% CI)
% (95% CI)
% (95% CI)
% (95% CI)
% (95% CI)
% (95% CI)
% (95% CI)
Proportion of outlets that had: N=244 N=15 N=10 N=269 N=381 N=405 N=1,013 N=127 N=11 N=1,937 N=2,206
Any diagnostic test14 27.5
(9.8, 57.0) 0.0
-- 86.1
(33.9, 98.7) 22.4
(8.2, 48.4) 37.0
(30.1, 44.4) 2.3
(0.6, 8.0) 1.0
(0.4, 2.5) 2.8
(0.4, 17.4) 0.0
-- 2.2
(1.1, 4.5) 3.3
(1.8, 6.0)
Microscopic blood tests 27.5
(9.7, 57.0) 0.0
-- 86.1
(33.9, 98.7) 22.4
(8.2, 48.4) 36.1
(29.7, 43.0) 0.7
(0.2, 2.4) 0.6
(0.2, 1.8) 0.0
-- 0.0
-- 1.5
(0.7, 3.2) 2.6
(1.3, 5.0)
Rapid diagnostic tests 8.7
(1.8, 33.3) 0.0
-- 1.3
(0.1, 12.9) 6.8
(1.3, 27.9) 11.1
(2.7, 36.0) 1.9
(0.5, 6.9) 0.5
(0.1, 1.9) 2.8
(0.4, 17.4) 0.0
-- 1.0
(0.3, 2.9) 1.3
(0.5, 3.2) Proportion of outlets that provided diagnostic tests for free, among outlets providing diagnostic tests15
N=67 N=0 N=6 N=73 N=212 N=23 N=6 N=1 N=0 N=242 N=315
Any diagnostic test 1.1 (0.2, 5.2) -- 0.0
-- 1.0
(0.2, 4.7) 0.3
(<0.1, 1.3) 9.7
(1.2, 49.1) 1.0
(0.1, 9.6) -- -- 0.7 (0.2, 2.7)
0.8 (0.3, 2.2)
N=66 N=0 N=6 N=72 N=198 N=10 N=4 N=0 N=0 N=212 N=284
Microscopic blood tests 0.8 (0.2, 4.7)
-- 0.0 --
0.8 (0.2, 4.3)
0.0 --
25.8 (3.7, 76.1)
0.0 --
-- -- 0.1 (<0.1, 1.2)
0.5 (0.1, 1.7)
N=15 N=0 N=1 N=16 N=80 N=16 N=3 N=1 N=0 N=100 N=116
Rapid diagnostic tests 3.0
(0.3, 21.7) -- -- 3.0
(0.3, 21.8) 1.0
(0.2, 4.6) 0.0
-- 2.0
(0.1, 24.1) -- --- 1.5
(0.3, 7.1) 2.1
(0.6, 6.9)
Median price of: Median [IQR] (N)
Median [IQR] (N)
Median [IQR] (N)
Median [IQR] (N)
Median [IQR] (N)
Median [IQR] (N)
Median [IQR] (N)
Median [IQR] (N)
Median [IQR] (N)
Median [IQR] (N)
Median [IQR] (N)
Microscopic blood tests $1.64 [0.33-1.97] (42)
-- (0) $0.66 [0.66-0.66] (4)
$1.64 [0.33-1.97] (46)
$1.97 [1.31-1.97] (157)
$1.44 [0.66-2.63] (6)
$0.66 [n/a] (2)
-- (0) -- (0) $1.97 [0.66-1.97] (165)
$1.64 [0.66-1.97] (211)
Rapid diagnostic tests $1.97 [1.97-1.97] (5)
-- (0) -- (0) $1.97 [1.97-1.97] (5)
$1.31 [0.66-1.97] (41)
$0.99 [0.33-1.12] (9)
$3.28 [n/a] (2)
-- (0) -- (0) $3.28 [1.31-3.28] (52)
$1.97 [1.97-3.28] (57)
Source: ACTwatch 2009 Nigeria Outlet Survey
14 Information on proportion of outlets that had diagnostic tests was missing for 4% of cases [n=2,116]. 15 Information on the availability of any free test was missing for 35% of cases [n=204], due to inconsistent recording of price information for diagnostic tests.
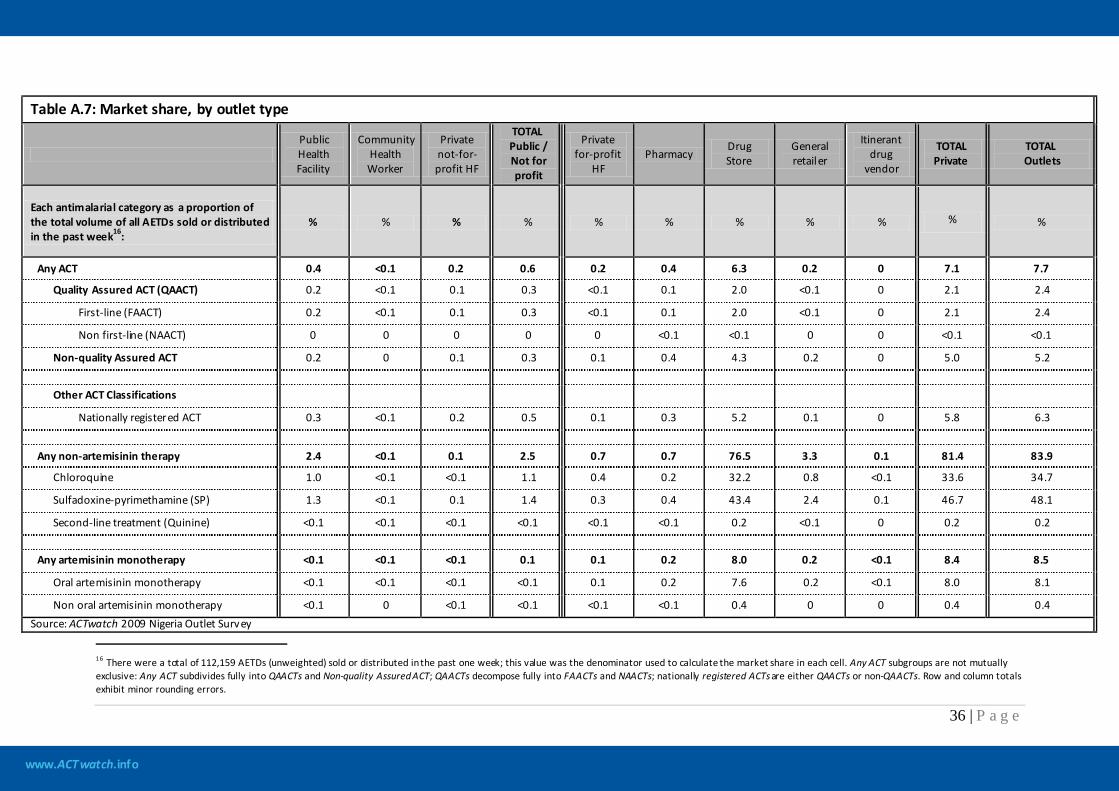
www.ACTwatch.info
36 | P a g e
Table A.7: Market share, by outlet type
Public Health Facility
Community Health Worker
Private not-for-profit HF
TOTAL Public / Not for profit
Private for-profit
HF Pharmacy
Drug Store
General retailer
Itinerant drug
vendor
TOTAL Private
TOTAL Outlets
Each antimalarial category as a proportion of the total volume of all AETDs sold or distributed in the past week16:
% % % % % % % % % % %
Any ACT 0.4 <0.1 0.2 0.6 0.2 0.4 6.3 0.2 0 7.1 7.7
Quality Assured ACT (QAACT) 0.2 <0.1 0.1 0.3 <0.1 0.1 2.0 <0.1 0 2.1 2.4
First-line (FAACT) 0.2 <0.1 0.1 0.3 <0.1 0.1 2.0 <0.1 0 2.1 2.4
Non first-line (NAACT) 0 0 0 0 0 <0.1 <0.1 0 0 <0.1 <0.1
Non-quality Assured ACT 0.2 0 0.1 0.3 0.1 0.4 4.3 0.2 0 5.0 5.2 Other ACT Classifications
Nationally registered ACT 0.3 <0.1 0.2 0.5 0.1 0.3 5.2 0.1 0 5.8 6.3
Any non-artemisinin therapy 2.4 <0.1 0.1 2.5 0.7 0.7 76.5 3.3 0.1 81.4 83.9
Chloroquine 1.0 <0.1 <0.1 1.1 0.4 0.2 32.2 0.8 <0.1 33.6 34.7
Sulfadoxine-pyrimethamine (SP) 1.3 <0.1 0.1 1.4 0.3 0.4 43.4 2.4 0.1 46.7 48.1
Second-line treatment (Quinine) <0.1 <0.1 <0.1 <0.1 <0.1 <0.1 0.2 <0.1 0 0.2 0.2
Any artemisinin monotherapy <0.1 <0.1 <0.1 0.1 0.1 0.2 8.0 0.2 <0.1 8.4 8.5
Oral artemisinin monotherapy <0.1 <0.1 <0.1 <0.1 0.1 0.2 7.6 0.2 <0.1 8.0 8.1
Non oral artemisinin monotherapy <0.1 0 <0.1 <0.1 <0.1 <0.1 0.4 0 0 0.4 0.4 Source: ACTwatch 2009 Nigeria Outlet Survey
16 There were a total of 112,159 AETDs (unweighted) sold or distributed in the past one week; this value was the denominator used to calculate the market share in each cell. Any ACT subgroups are not mutually exclusive: Any ACT subdivides fully into QAACTs and Non-quality Assured ACT; QAACTs decompose fully into FAACTs and NAACTs; nationally registered ACTs are either QAACTs or non-QAACTs. Row and column totals exhibit minor rounding errors.
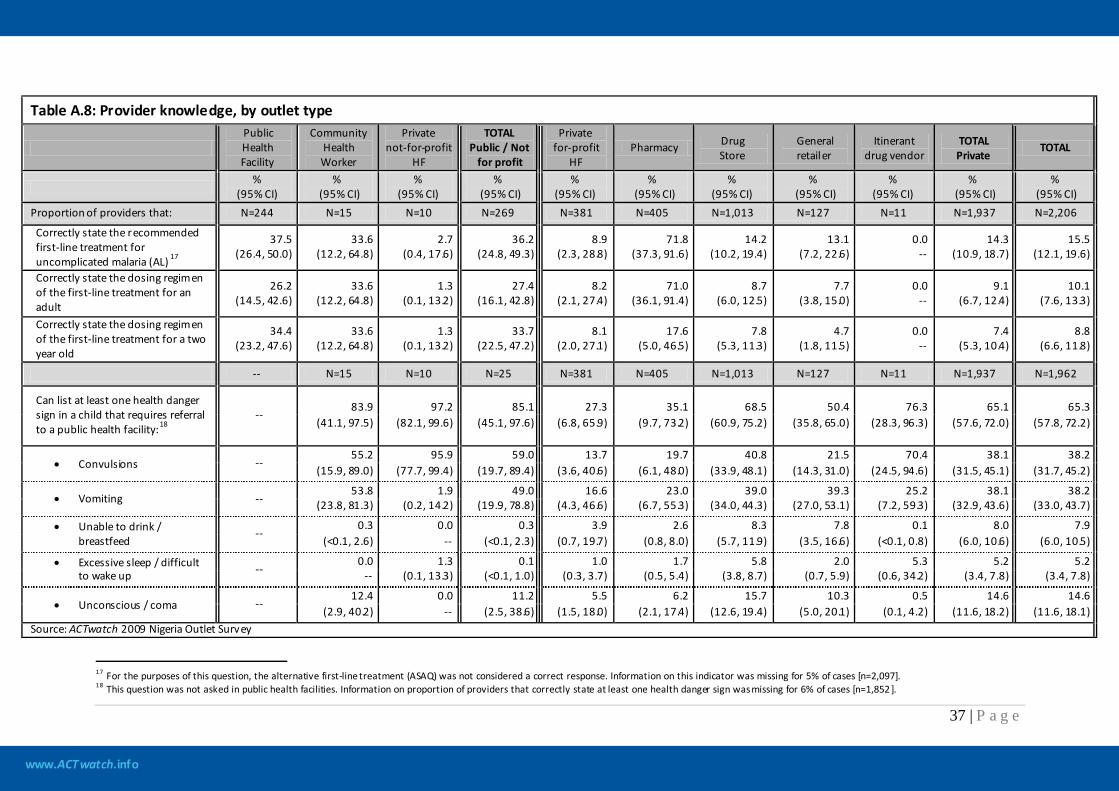
www.ACTwatch.info
37 | P a g e
Table A.8: Provider knowledge, by outlet type
Public Health Facility
Community Health Worker
Private not-for-profit
HF
TOTAL Public / Not
for profit
Private for-profit
HF Pharmacy Drug
Store General retailer
Itinerant drug vendor
TOTAL Private
TOTAL
% (95% CI)
% (95% CI)
% (95% CI)
% (95% CI)
% (95% CI)
% (95% CI)
% (95% CI)
% (95% CI)
% (95% CI)
% (95% CI)
% (95% CI)
Proportion of providers that: N=244 N=15 N=10 N=269 N=381 N=405 N=1,013 N=127 N=11 N=1,937 N=2,206
Correctly state the recommended first-line treatment for uncomplicated malaria (AL) 17
37.5 (26.4, 50.0)
33.6 (12.2, 64.8)
2.7 (0.4, 17.6)
36.2 (24.8, 49.3)
8.9 (2.3, 28.8)
71.8 (37.3, 91.6)
14.2 (10.2, 19.4)
13.1 (7.2, 22.6)
0.0 --
14.3 (10.9, 18.7)
15.5 (12.1, 19.6)
Correctly state the dosing regimen of the first-line treatment for an adult
26.2 (14.5, 42.6)
33.6 (12.2, 64.8)
1.3 (0.1, 13.2)
27.4 (16.1, 42.8)
8.2 (2.1, 27.4)
71.0 (36.1, 91.4)
8.7 (6.0, 12.5)
7.7 (3.8, 15.0)
0.0 --
9.1 (6.7, 12.4)
10.1 (7.6, 13.3)
Correctly state the dosing regimen of the first-line treatment for a two year old
34.4 (23.2, 47.6)
33.6 (12.2, 64.8)
1.3 (0.1, 13.2)
33.7 (22.5, 47.2)
8.1 (2.0, 27.1)
17.6 (5.0, 46.5)
7.8 (5.3, 11.3)
4.7 (1.8, 11.5)
0.0 --
7.4 (5.3, 10.4)
8.8 (6.6, 11.8)
-- N=15 N=10 N=25 N=381 N=405 N=1,013 N=127 N=11 N=1,937 N=1,962
Can list at least one health danger sign in a child that requires referral to a public health facility:18
--
83.9 97.2 85.1 27.3 35.1 68.5 50.4 76.3 65.1 65.3 (41.1, 97.5) (82.1, 99.6) (45.1, 97.6) (6.8, 65.9) (9.7, 73.2) (60.9, 75.2) (35.8, 65.0) (28.3, 96.3) (57.6, 72.0) (57.8, 72.2)
• Convulsions -- 55.2 95.9 59.0 13.7 19.7 40.8 21.5 70.4 38.1 38.2
(15.9, 89.0) (77.7, 99.4) (19.7, 89.4) (3.6, 40.6) (6.1, 48.0) (33.9, 48.1) (14.3, 31.0) (24.5, 94.6) (31.5, 45.1) (31.7, 45.2)
• Vomiting -- 53.8 1.9 49.0 16.6 23.0 39.0 39.3 25.2 38.1 38.2
(23.8, 81.3) (0.2, 14.2) (19.9, 78.8) (4.3, 46.6) (6.7, 55.3) (34.0, 44.3) (27.0, 53.1) (7.2, 59.3) (32.9, 43.6) (33.0, 43.7)
• Unable to drink / breastfeed
-- 0.3 0.0 0.3 3.9 2.6 8.3 7.8 0.1 8.0 7.9
(<0.1, 2.6) -- (<0.1, 2.3) (0.7, 19.7) (0.8, 8.0) (5.7, 11.9) (3.5, 16.6) (<0.1, 0.8) (6.0, 10.6) (6.0, 10.5)
• Excessive sleep / difficult to wake up --
0.0 1.3 0.1 1.0 1.7 5.8 2.0 5.3 5.2 5.2 -- (0.1, 13.3) (<0.1, 1.0) (0.3, 3.7) (0.5, 5.4) (3.8, 8.7) (0.7, 5.9) (0.6, 34.2) (3.4, 7.8) (3.4, 7.8)
• Unconscious / coma -- 12.4 0.0 11.2 5.5 6.2 15.7 10.3 0.5 14.6 14.6
(2.9, 40.2) -- (2.5, 38.6) (1.5, 18.0) (2.1, 17.4) (12.6, 19.4) (5.0, 20.1) (0.1, 4.2) (11.6, 18.2) (11.6, 18.1) Source: ACTwatch 2009 Nigeria Outlet Survey
17 For the purposes of this question, the alternative first-line treatment (ASAQ) was not considered a correct response. Information on this indicator was missing for 5% of cases [n=2,097]. 18 This question was not asked in public health facilities. Information on proportion of providers that correctly state at least one health danger sign was missing for 6% of cases [n=1,852 ].
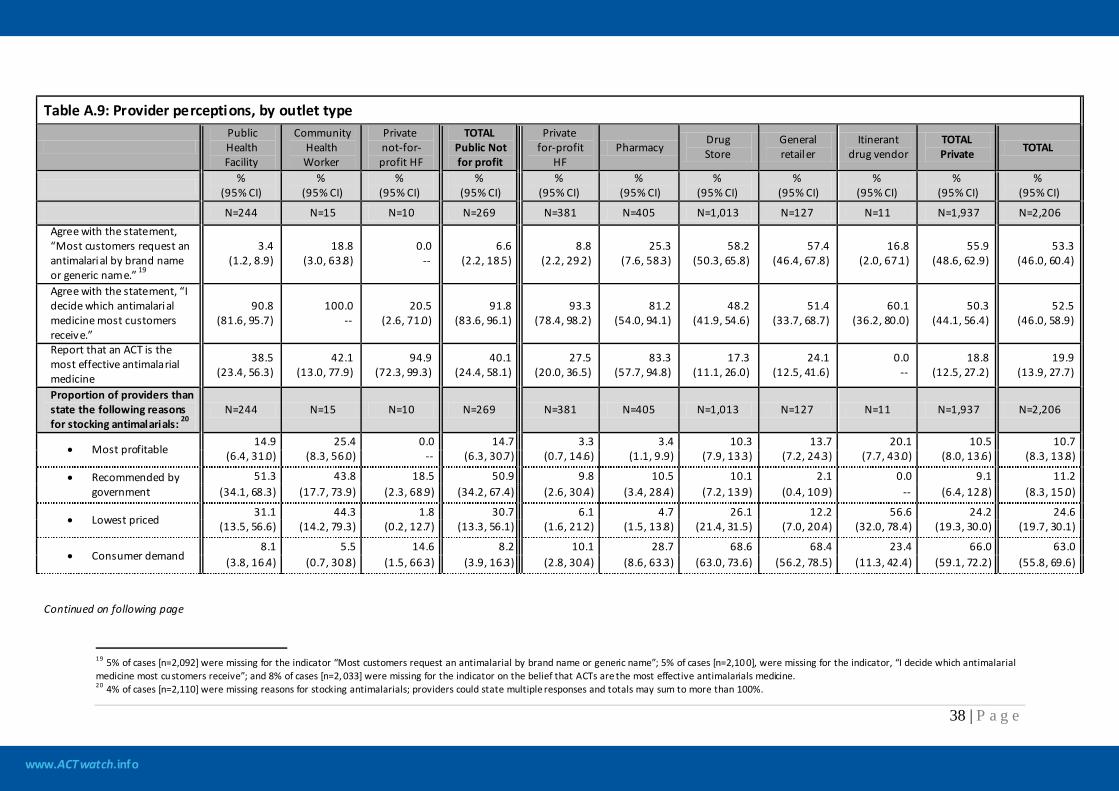
www.ACTwatch.info
38 | P a g e
Table A.9: Provider perceptions, by outlet type
Public Health Facility
Community Health Worker
Private not-for-profit HF
TOTAL Public Not for profit
Private for-profit
HF Pharmacy
Drug Store
General retailer
Itinerant drug vendor
TOTAL Private TOTAL
%
(95% CI) %
(95% CI) %
(95% CI) %
(95% CI) %
(95% CI) %
(95% CI) %
(95% CI) %
(95% CI) %
(95% CI) %
(95% CI) %
(95% CI)
N=244 N=15 N=10 N=269 N=381 N=405 N=1,013 N=127 N=11 N=1,937 N=2,206 Agree with the statement, “Most customers request an antimalarial by brand name or generic name.” 19
3.4 (1.2, 8.9)
18.8 (3.0, 63.8)
0.0 --
6.6 (2.2, 18.5)
8.8 (2.2, 29.2)
25.3 (7.6, 58.3)
58.2 (50.3, 65.8)
57.4 (46.4, 67.8)
16.8 (2.0, 67.1)
55.9 (48.6, 62.9)
53.3 (46.0, 60.4)
Agree with the statement, “I decide which antimalarial medicine most customers receive.”
90.8 (81.6, 95.7)
100.0 --
20.5 (2.6, 71.0)
91.8 (83.6, 96.1)
93.3 (78.4, 98.2)
81.2 (54.0, 94.1)
48.2 (41.9, 54.6)
51.4 (33.7, 68.7)
60.1 (36.2, 80.0)
50.3 (44.1, 56.4)
52.5 (46.0, 58.9)
Report that an ACT is the most effective antimalarial medicine
38.5 (23.4, 56.3)
42.1 (13.0, 77.9)
94.9 (72.3, 99.3)
40.1 (24.4, 58.1)
27.5 (20.0, 36.5)
83.3 (57.7, 94.8)
17.3 (11.1, 26.0)
24.1 (12.5, 41.6)
0.0 --
18.8 (12.5, 27.2)
19.9 (13.9, 27.7)
Proportion of providers than state the following reasons for stocking antimalarials: 20
N=244 N=15 N=10 N=269 N=381 N=405 N=1,013 N=127 N=11 N=1,937 N=2,206
• Most profitable 14.9 25.4 0.0 14.7 3.3 3.4 10.3 13.7 20.1 10.5 10.7
(6.4, 31.0) (8.3, 56.0) -- (6.3, 30.7) (0.7, 14.6) (1.1, 9.9) (7.9, 13.3) (7.2, 24.3) (7.7, 43.0) (8.0, 13.6) (8.3, 13.8)
• Recommended by government
51.3 43.8 18.5 50.9 9.8 10.5 10.1 2.1 0.0 9.1 11.2 (34.1, 68.3) (17.7, 73.9) (2.3, 68.9) (34.2, 67.4) (2.6, 30.4) (3.4, 28.4) (7.2, 13.9) (0.4, 10.9) -- (6.4, 12.8) (8.3, 15.0)
• Lowest priced 31.1 44.3 1.8 30.7 6.1 4.7 26.1 12.2 56.6 24.2 24.6
(13.5, 56.6) (14.2, 79.3) (0.2, 12.7) (13.3, 56.1) (1.6, 21.2) (1.5, 13.8) (21.4, 31.5) (7.0, 20.4) (32.0, 78.4) (19.3, 30.0) (19.7, 30.1)
• Consumer demand 8.1 5.5 14.6 8.2 10.1 28.7 68.6 68.4 23.4 66.0 63.0
(3.8, 16.4) (0.7, 30.8) (1.5, 66.3) (3.9, 16.3) (2.8, 30.4) (8.6, 63.3) (63.0, 73.6) (56.2, 78.5) (11.3, 42.4) (59.1, 72.2) (55.8, 69.6) Continued on following page
19 5% of cases [n=2,092] were missing for the indicator “Most customers request an antimalarial by brand name or generic name”; 5% of cases [n=2,10 0], were missing for the indicator, “I decide which antimalarial medicine most customers receive”; and 8% of cases [n=2, 033] were missing for the indicator on the belief that ACTs are the most effective antimalarials medicine. 20 4% of cases [n=2,110] were missing reasons for stocking antimalarials; providers could state multiple responses and totals may sum to more than 100%.
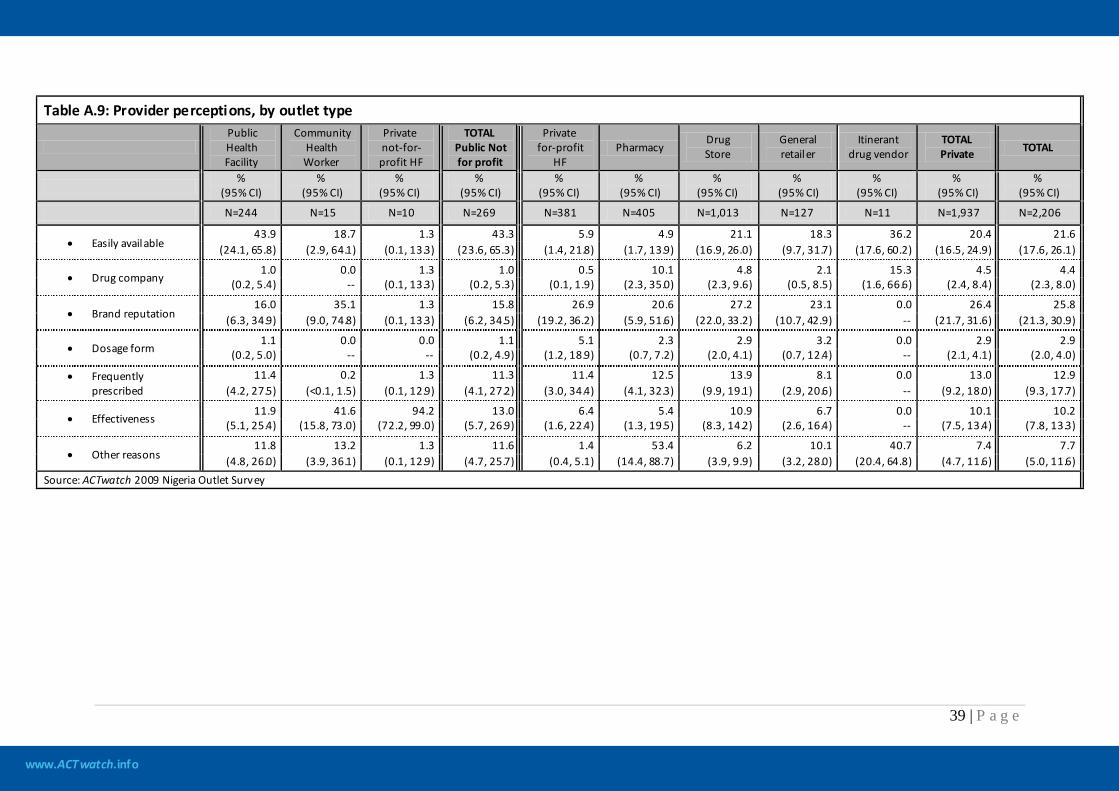
www.ACTwatch.info
39 | P a g e
Table A.9: Provider perceptions, by outlet type
Public Health Facility
Community Health Worker
Private not-for-profit HF
TOTAL Public Not for profit
Private for-profit
HF Pharmacy
Drug Store
General retailer
Itinerant drug vendor
TOTAL Private TOTAL
%
(95% CI) %
(95% CI) %
(95% CI) %
(95% CI) %
(95% CI) %
(95% CI) %
(95% CI) %
(95% CI) %
(95% CI) %
(95% CI) %
(95% CI)
N=244 N=15 N=10 N=269 N=381 N=405 N=1,013 N=127 N=11 N=1,937 N=2,206
• Easily available 43.9 18.7 1.3 43.3 5.9 4.9 21.1 18.3 36.2 20.4 21.6
(24.1, 65.8) (2.9, 64.1) (0.1, 13.3) (23.6, 65.3) (1.4, 21.8) (1.7, 13.9) (16.9, 26.0) (9.7, 31.7) (17.6, 60.2) (16.5, 24.9) (17.6, 26.1)
• Drug company 1.0 0.0 1.3 1.0 0.5 10.1 4.8 2.1 15.3 4.5 4.4
(0.2, 5.4) -- (0.1, 13.3) (0.2, 5.3) (0.1, 1.9) (2.3, 35.0) (2.3, 9.6) (0.5, 8.5) (1.6, 66.6) (2.4, 8.4) (2.3, 8.0)
• Brand reputation 16.0 35.1 1.3 15.8 26.9 20.6 27.2 23.1 0.0 26.4 25.8
(6.3, 34.9) (9.0, 74.8) (0.1, 13.3) (6.2, 34.5) (19.2, 36.2) (5.9, 51.6) (22.0, 33.2) (10.7, 42.9) -- (21.7, 31.6) (21.3, 30.9)
• Dosage form 1.1 0.0 0.0 1.1 5.1 2.3 2.9 3.2 0.0 2.9 2.9
(0.2, 5.0) -- -- (0.2, 4.9) (1.2, 18.9) (0.7, 7.2) (2.0, 4.1) (0.7, 12.4) -- (2.1, 4.1) (2.0, 4.0)
• Frequently prescribed
11.4 0.2 1.3 11.3 11.4 12.5 13.9 8.1 0.0 13.0 12.9 (4.2, 27.5) (<0.1, 1.5) (0.1, 12.9) (4.1, 27.2) (3.0, 34.4) (4.1, 32.3) (9.9, 19.1) (2.9, 20.6) -- (9.2, 18.0) (9.3, 17.7)
• Effectiveness 11.9 41.6 94.2 13.0 6.4 5.4 10.9 6.7 0.0 10.1 10.2
(5.1, 25.4) (15.8, 73.0) (72.2, 99.0) (5.7, 26.9) (1.6, 22.4) (1.3, 19.5) (8.3, 14.2) (2.6, 16.4) -- (7.5, 13.4) (7.8, 13.3)
• Other reasons 11.8 13.2 1.3 11.6 1.4 53.4 6.2 10.1 40.7 7.4 7.7
(4.8, 26.0) (3.9, 36.1) (0.1, 12.9) (4.7, 25.7) (0.4, 5.1) (14.4, 88.7) (3.9, 9.9) (3.2, 28.0) (20.4, 64.8) (4.7, 11.6) (5.0, 11.6) Source: ACTwatch 2009 Nigeria Outlet Survey
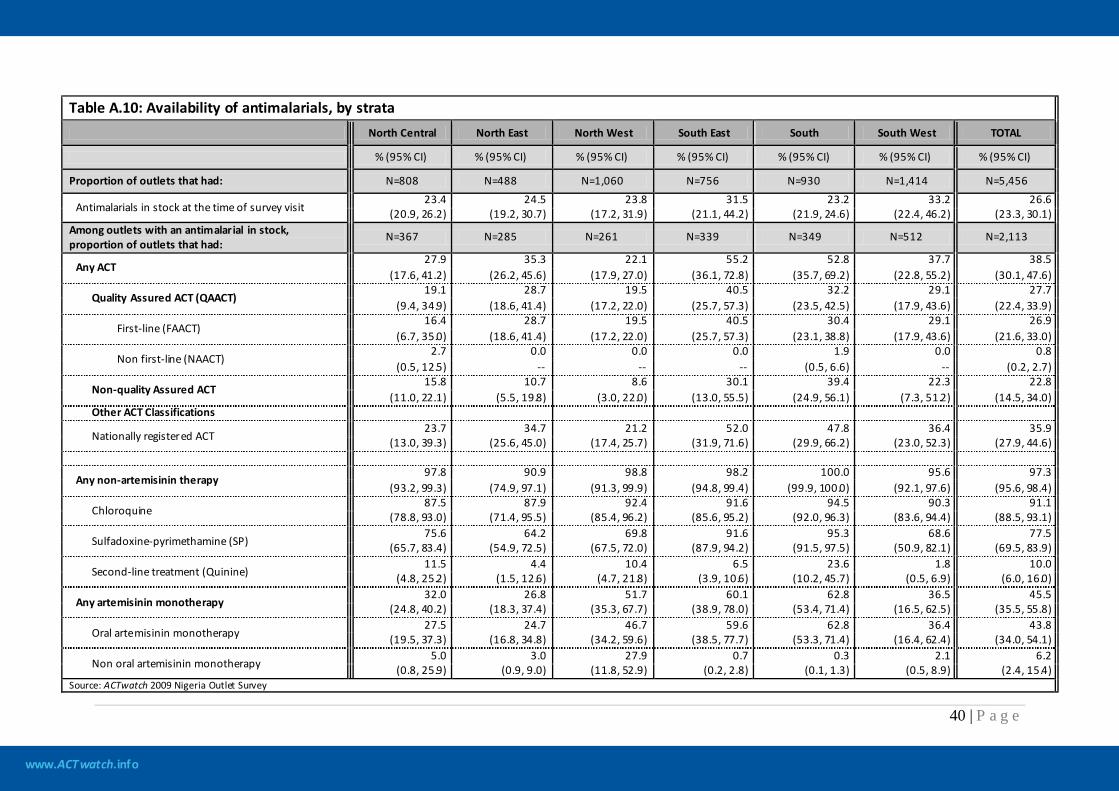
www.ACTwatch.info
40 | P a g e
Table A.10: Availability of antimalarials, by strata North Central North East North West South East South South West TOTAL
% (95% CI) % (95% CI) % (95% CI) % (95% CI) % (95% CI) % (95% CI) % (95% CI)
Proportion of outlets that had: N=808 N=488 N=1,060 N=756 N=930 N=1,414 N=5,456
Antimalarials in stock at the time of survey visit 23.4 24.5 23.8 31.5 23.2 33.2 26.6
(20.9, 26.2) (19.2, 30.7) (17.2, 31.9) (21.1, 44.2) (21.9, 24.6) (22.4, 46.2) (23.3, 30.1) Among outlets with an antimalarial in stock, proportion of outlets that had:
N=367 N=285 N=261 N=339 N=349 N=512 N=2,113
Any ACT 27.9 35.3 22.1 55.2 52.8 37.7 38.5
(17.6, 41.2) (26.2, 45.6) (17.9, 27.0) (36.1, 72.8) (35.7, 69.2) (22.8, 55.2) (30.1, 47.6)
Quality Assured ACT (QAACT) 19.1 28.7 19.5 40.5 32.2 29.1 27.7
(9.4, 34.9) (18.6, 41.4) (17.2, 22.0) (25.7, 57.3) (23.5, 42.5) (17.9, 43.6) (22.4, 33.9)
First-line (FAACT) 16.4 28.7 19.5 40.5 30.4 29.1 26.9
(6.7, 35.0) (18.6, 41.4) (17.2, 22.0) (25.7, 57.3) (23.1, 38.8) (17.9, 43.6) (21.6, 33.0)
Non first-line (NAACT) 2.7 0.0 0.0 0.0 1.9 0.0 0.8
(0.5, 12.5) -- -- -- (0.5, 6.6) -- (0.2, 2.7)
Non-quality Assured ACT 15.8 10.7 8.6 30.1 39.4 22.3 22.8
(11.0, 22.1) (5.5, 19.8) (3.0, 22.0) (13.0, 55.5) (24.9, 56.1) (7.3, 51.2) (14.5, 34.0) Other ACT Classifications
Nationally registered ACT 23.7 34.7 21.2 52.0 47.8 36.4 35.9
(13.0, 39.3) (25.6, 45.0) (17.4, 25.7) (31.9, 71.6) (29.9, 66.2) (23.0, 52.3) (27.9, 44.6)
Any non-artemisinin therapy 97.8 90.9 98.8 98.2 100.0 95.6 97.3
(93.2, 99.3) (74.9, 97.1) (91.3, 99.9) (94.8, 99.4) (99.9, 100.0) (92.1, 97.6) (95.6, 98.4)
Chloroquine 87.5 87.9 92.4 91.6 94.5 90.3 91.1
(78.8, 93.0) (71.4, 95.5) (85.4, 96.2) (85.6, 95.2) (92.0, 96.3) (83.6, 94.4) (88.5, 93.1)
Sulfadoxine-pyrimethamine (SP) 75.6 64.2 69.8 91.6 95.3 68.6 77.5
(65.7, 83.4) (54.9, 72.5) (67.5, 72.0) (87.9, 94.2) (91.5, 97.5) (50.9, 82.1) (69.5, 83.9)
Second-line treatment (Quinine) 11.5 4.4 10.4 6.5 23.6 1.8 10.0
(4.8, 25.2) (1.5, 12.6) (4.7, 21.8) (3.9, 10.6) (10.2, 45.7) (0.5, 6.9) (6.0, 16.0)
Any artemisinin monotherapy 32.0 26.8 51.7 60.1 62.8 36.5 45.5
(24.8, 40.2) (18.3, 37.4) (35.3, 67.7) (38.9, 78.0) (53.4, 71.4) (16.5, 62.5) (35.5, 55.8)
Oral artemisinin monotherapy 27.5 24.7 46.7 59.6 62.8 36.4 43.8
(19.5, 37.3) (16.8, 34.8) (34.2, 59.6) (38.5, 77.7) (53.3, 71.4) (16.4, 62.4) (34.0, 54.1)
Non oral artemisinin monotherapy 5.0 3.0 27.9 0.7 0.3 2.1 6.2
(0.8, 25.9) (0.9, 9.0) (11.8, 52.9) (0.2, 2.8) (0.1, 1.3) (0.5, 8.9) (2.4, 15.4) Source: ACTwatch 2009 Nigeria Outlet Survey
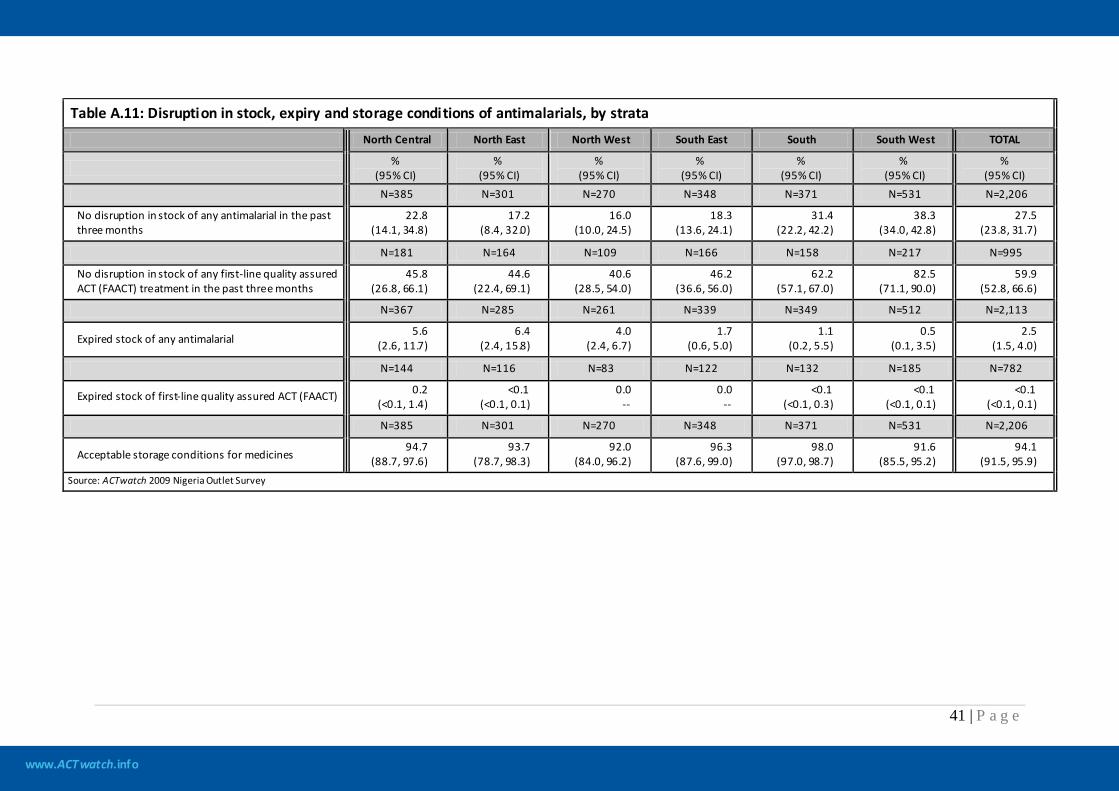
www.ACTwatch.info
41 | P a g e
Table A.11: Disruption in stock, expiry and storage conditions of antimalarials, by strata
North Central North East North West South East South South West TOTAL
% (95% CI)
% (95% CI)
% (95% CI)
% (95% CI)
% (95% CI)
% (95% CI)
% (95% CI)
N=385 N=301 N=270 N=348 N=371 N=531 N=2,206
No disruption in stock of any antimalarial in the past three months
22.8 (14.1, 34.8)
17.2 (8.4, 32.0)
16.0 (10.0, 24.5)
18.3 (13.6, 24.1)
31.4 (22.2, 42.2)
38.3 (34.0, 42.8)
27.5 (23.8, 31.7)
N=181 N=164 N=109 N=166 N=158 N=217 N=995
No disruption in stock of any first-line quality assured ACT (FAACT) treatment in the past three months
45.8 (26.8, 66.1)
44.6 (22.4, 69.1)
40.6 (28.5, 54.0)
46.2 (36.6, 56.0)
62.2 (57.1, 67.0)
82.5 (71.1, 90.0)
59.9 (52.8, 66.6)
N=367 N=285 N=261 N=339 N=349 N=512 N=2,113
Expired stock of any antimalarial 5.6
(2.6, 11.7) 6.4
(2.4, 15.8) 4.0
(2.4, 6.7) 1.7
(0.6, 5.0) 1.1
(0.2, 5.5) 0.5
(0.1, 3.5) 2.5
(1.5, 4.0)
N=144 N=116 N=83 N=122 N=132 N=185 N=782
Expired stock of first-line quality assured ACT (FAACT) 0.2 (<0.1, 1.4)
<0.1 (<0.1, 0.1)
0.0 --
0.0 --
<0.1 (<0.1, 0.3)
<0.1 (<0.1, 0.1)
<0.1 (<0.1, 0.1)
N=385 N=301 N=270 N=348 N=371 N=531 N=2,206
Acceptable storage conditions for medicines 94.7
(88.7, 97.6) 93.7
(78.7, 98.3) 92.0
(84.0, 96.2) 96.3
(87.6, 99.0) 98.0
(97.0, 98.7) 91.6
(85.5, 95.2) 94.1
(91.5, 95.9) Source: ACTwatch 2009 Nigeria Outlet Survey
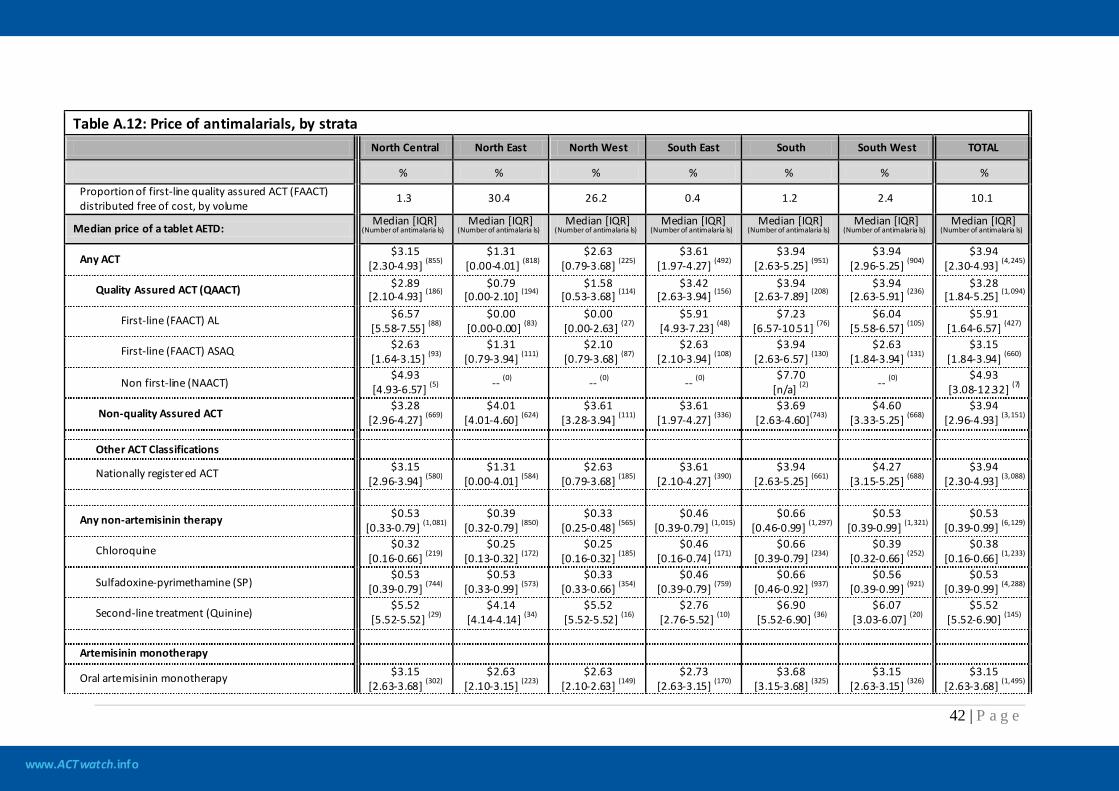
www.ACTwatch.info
42 | P a g e
Table A.12: Price of antimalarials, by strata
North Central North East North West South East South South West TOTAL
% % % % % % % Proportion of first-line quality assured ACT (FAACT) distributed free of cost, by volume
1.3 30.4 26.2 0.4 1.2 2.4 10.1
Median price of a tablet AETD: Median [IQR]
(Number of antimalaria ls) Median [IQR]
(Number of antimalaria ls) Median [IQR]
(Number of antimalaria ls) Median [IQR]
(Number of antimalaria ls) Median [IQR]
(Number of antimalaria ls) Median [IQR]
(Number of antimalaria ls) Median [IQR]
(Number of antimalaria ls)
Any ACT $3.15
[2.30-4.93] (855) $1.31
[0.00-4.01] (818) $2.63
[0.79-3.68] (225) $3.61
[1.97-4.27] (492) $3.94
[2.63-5.25] (951) $3.94
[2.96-5.25] (904) $3.94
[2.30-4.93] (4,245)
Quality Assured ACT (QAACT) $2.89 [2.10-4.93] (186)
$0.79 [0.00-2.10] (194)
$1.58 [0.53-3.68] (114)
$3.42 [2.63-3.94] (156)
$3.94 [2.63-7.89] (208)
$3.94 [2.63-5.91] (236)
$3.28 [1.84-5.25] (1,094)
First-line (FAACT) AL $6.57 [5.58-7.55] (88)
$0.00 [0.00-0.00] (83)
$0.00 [0.00-2.63] (27)
$5.91 [4.93-7.23] (48)
$7.23 [6.57-10.51] (76)
$6.04 [5.58-6.57] (105)
$5.91 [1.64-6.57] (427)
First-line (FAACT) ASAQ $2.63 [1.64-3.15] (93)
$1.31 [0.79-3.94] (111)
$2.10 [0.79-3.68] (87)
$2.63 [2.10-3.94] (108)
$3.94 [2.63-6.57] (130)
$2.63 [1.84-3.94] (131)
$3.15 [1.84-3.94] (660)
Non first-line (NAACT) $4.93
[4.93-6.57] (5) -- (0) -- (0) -- (0) $7.70
[n/a] (2) -- (0) $4.93
[3.08-12.32] (7)
Non-quality Assured ACT $3.28
[2.96-4.27] (669) $4.01
[4.01-4.60] (624) $3.61
[3.28-3.94] (111) $3.61
[1.97-4.27] (336) $3.69
[2.63-4.60](743) $4.60
[3.33-5.25] (668) $3.94
[2.96-4.93] (3,151)
Other ACT Classifications
Nationally registered ACT $3.15 [2.96-3.94] (580)
$1.31 [0.00-4.01] (584)
$2.63 [0.79-3.68] (185)
$3.61 [2.10-4.27] (390)
$3.94 [2.63-5.25] (661)
$4.27 [3.15-5.25] (688)
$3.94 [2.30-4.93] (3,088)
Any non-artemisinin therapy $0.53 [0.33-0.79] (1,081)
$0.39 [0.32-0.79] (850)
$0.33 [0.25-0.48] (565)
$0.46 [0.39-0.79] (1,015)
$0.66 [0.46-0.99] (1,297)
$0.53 [0.39-0.99] (1,321)
$0.53 [0.39-0.99] (6,129)
Chloroquine $0.32 [0.16-0.66] (219)
$0.25 [0.13-0.32] (172)
$0.25 [0.16-0.32] (185)
$0.46 [0.16-0.74] (171)
$0.66 [0.39-0.79] (234)
$0.39 [0.32-0.66] (252)
$0.38 [0.16-0.66] (1,233)
Sulfadoxine-pyrimethamine (SP) $0.53
[0.39-0.79] (744) $0.53
[0.33-0.99] (573) $0.33
[0.33-0.66] (354) $0.46
[0.39-0.79] (759) $0.66
[0.46-0.92] (937) $0.56
[0.39-0.99] (921) $0.53
[0.39-0.99] (4,288)
Second-line treatment (Quinine) $5.52
[5.52-5.52] (29) $4.14
[4.14-4.14] (34) $5.52
[5.52-5.52] (16) $2.76
[2.76-5.52] (10) $6.90
[5.52-6.90] (36) $6.07
[3.03-6.07] (20) $5.52
[5.52-6.90] (145)
Artemisinin monotherapy
Oral artemisinin monotherapy $3.15 [2.63-3.68] (302)
$2.63 [2.10-3.15] (223)
$2.63 [2.10-2.63] (149)
$2.73 [2.63-3.15] (170)
$3.68 [3.15-3.68] (325)
$3.15 [2.63-3.15] (326)
$3.15 [2.63-3.68] (1,495)
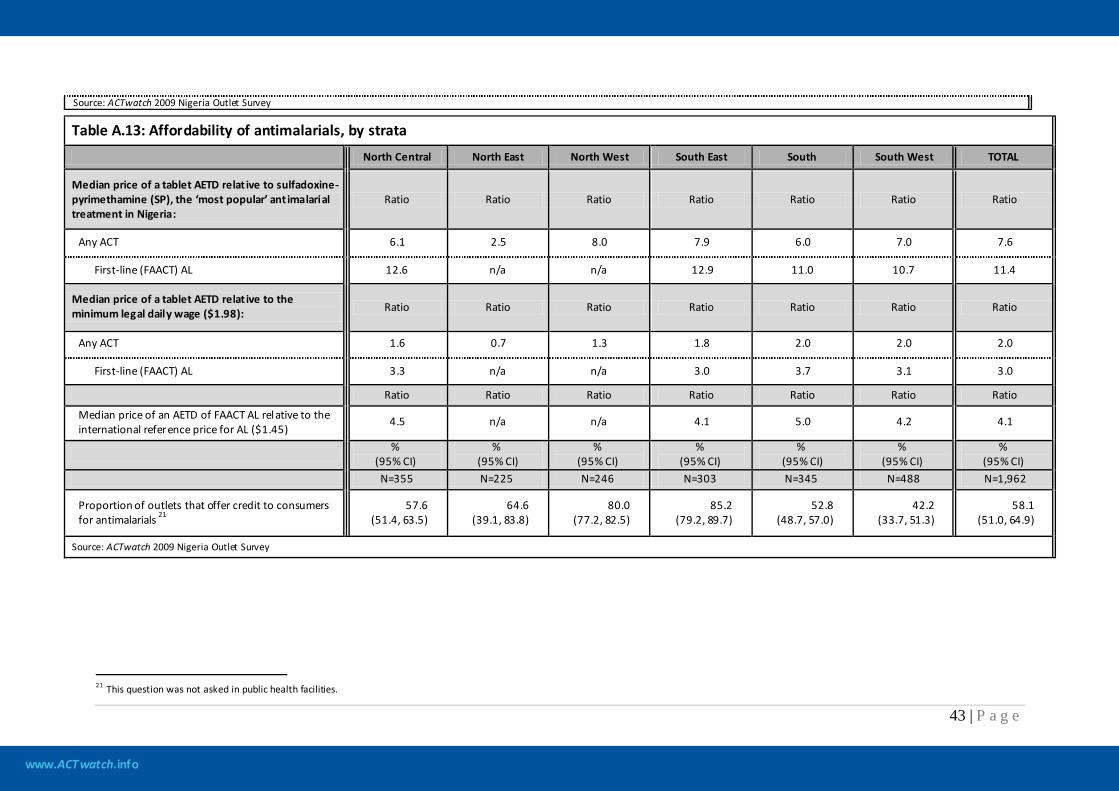
www.ACTwatch.info
43 | P a g e
Source: ACTwatch 2009 Nigeria Outlet Survey
Table A.13: Affordability of antimalarials, by strata
North Central North East North West South East South South West TOTAL
Median price of a tablet AETD relat ive to sulfadoxine-pyrimethamine (SP), the ‘most popular’ antimalarial treatment in Nigeria:
Ratio Ratio Ratio Ratio Ratio Ratio Ratio
Any ACT 6.1 2.5 8.0 7.9 6.0 7.0 7.6
First-line (FAACT) AL 12.6 n/a n/a 12.9 11.0 10.7 11.4
Median price of a tablet AETD relat ive to the minimum legal daily wage ($1.98): Ratio Ratio Ratio Ratio Ratio Ratio Ratio
Any ACT 1.6 0.7 1.3 1.8 2.0 2.0 2.0
First-line (FAACT) AL 3.3 n/a n/a 3.0 3.7 3.1 3.0
Ratio Ratio Ratio Ratio Ratio Ratio Ratio
Median price of an AETD of FAACT AL relative to the international reference price for AL ($1.45)
4.5 n/a n/a 4.1 5.0 4.2 4.1
%
(95% CI) %
(95% CI) %
(95% CI) %
(95% CI) %
(95% CI) %
(95% CI) %
(95% CI) N=355 N=225 N=246 N=303 N=345 N=488 N=1,962
Proportion of outlets that offer credit to consumers for antimalarials 21
57.6 (51.4, 63.5)
64.6 (39.1, 83.8)
80.0 (77.2, 82.5)
85.2 (79.2, 89.7)
52.8 (48.7, 57.0)
42.2 (33.7, 51.3)
58.1 (51.0, 64.9)
Source: ACTwatch 2009 Nigeria Outlet Survey
21 This question was not asked in public health facilities.
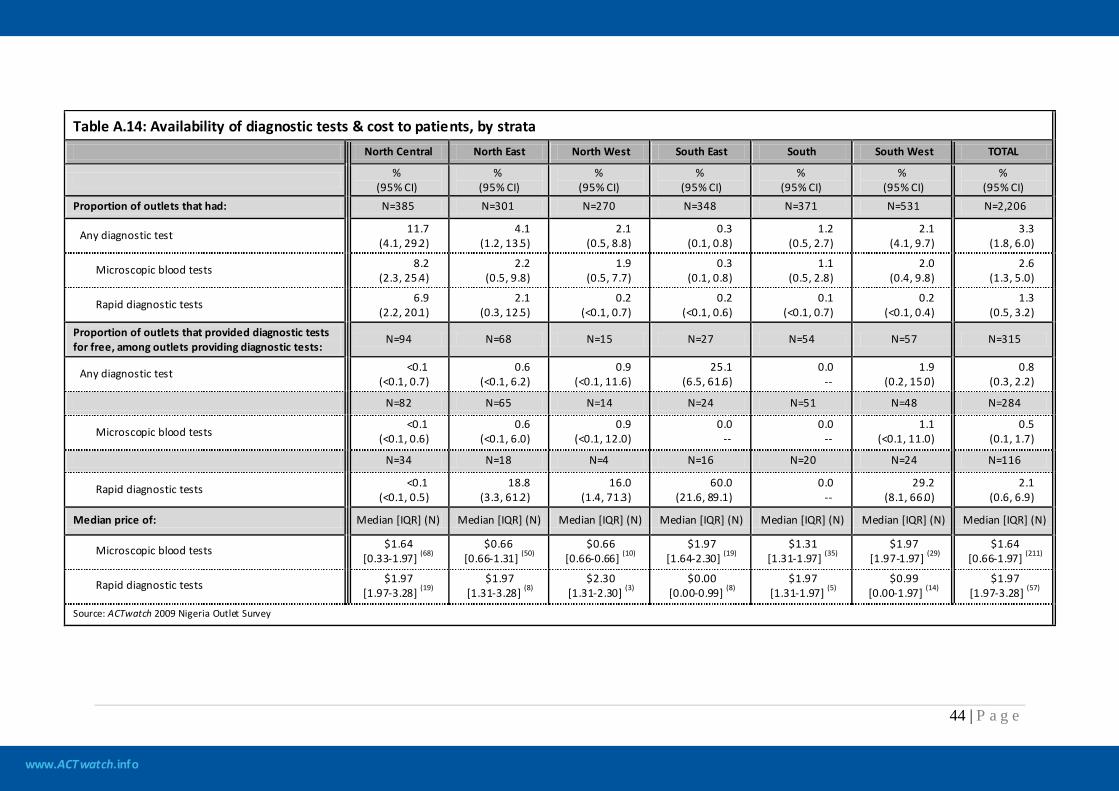
www.ACTwatch.info
44 | P a g e
Table A.14: Availability of diagnostic tests & cost to patients, by strata North Central North East North West South East South South West TOTAL
% (95% CI)
% (95% CI)
% (95% CI)
% (95% CI)
% (95% CI)
% (95% CI)
% (95% CI)
Proportion of outlets that had: N=385 N=301 N=270 N=348 N=371 N=531 N=2,206
Any diagnostic test 11.7 (4.1, 29.2)
4.1 (1.2, 13.5)
2.1 (0.5, 8.8)
0.3 (0.1, 0.8)
1.2 (0.5, 2.7)
2.1 (4.1, 9.7)
3.3 (1.8, 6.0)
Microscopic blood tests 8.2 (2.3, 25.4)
2.2 (0.5, 9.8)
1.9 (0.5, 7.7)
0.3 (0.1, 0.8)
1.1 (0.5, 2.8)
2.0 (0.4, 9.8)
2.6 (1.3, 5.0)
Rapid diagnostic tests 6.9 (2.2, 20.1)
2.1 (0.3, 12.5)
0.2 (<0.1, 0.7)
0.2 (<0.1, 0.6)
0.1 (<0.1, 0.7)
0.2 (<0.1, 0.4)
1.3 (0.5, 3.2)
Proportion of outlets that provided diagnostic tests for free, among outlets providing diagnostic tests:
N=94 N=68 N=15 N=27 N=54 N=57 N=315
Any diagnostic test <0.1 (<0.1, 0.7)
0.6 (<0.1, 6.2)
0.9 (<0.1, 11.6)
25.1 (6.5, 61.6)
0.0 --
1.9 (0.2, 15.0)
0.8 (0.3, 2.2)
N=82 N=65 N=14 N=24 N=51 N=48 N=284
Microscopic blood tests <0.1
(<0.1, 0.6) 0.6
(<0.1, 6.0) 0.9
(<0.1, 12.0) 0.0
-- 0.0
-- 1.1
(<0.1, 11.0) 0.5
(0.1, 1.7)
N=34 N=18 N=4 N=16 N=20 N=24 N=116
Rapid diagnostic tests <0.1 (<0.1, 0.5)
18.8 (3.3, 61.2)
16.0 (1.4, 71.3)
60.0 (21.6, 89.1)
0.0 --
29.2 (8.1, 66.0)
2.1 (0.6, 6.9)
Median price of: Median [IQR] (N) Median [IQR] (N) Median [IQR] (N) Median [IQR] (N) Median [IQR] (N) Median [IQR] (N) Median [IQR] (N)
Microscopic blood tests $1.64 [0.33-1.97] (68)
$0.66 [0.66-1.31] (50)
$0.66 [0.66-0.66] (10)
$1.97 [1.64-2.30] (19)
$1.31 [1.31-1.97] (35)
$1.97 [1.97-1.97] (29)
$1.64 [0.66-1.97] (211)
Rapid diagnostic tests $1.97 [1.97-3.28] (19)
$1.97 [1.31-3.28] (8)
$2.30 [1.31-2.30] (3)
$0.00 [0.00-0.99] (8)
$1.97 [1.31-1.97] (5)
$0.99 [0.00-1.97] (14)
$1.97 [1.97-3.28] (57)
Source: ACTwatch 2009 Nigeria Outlet Survey
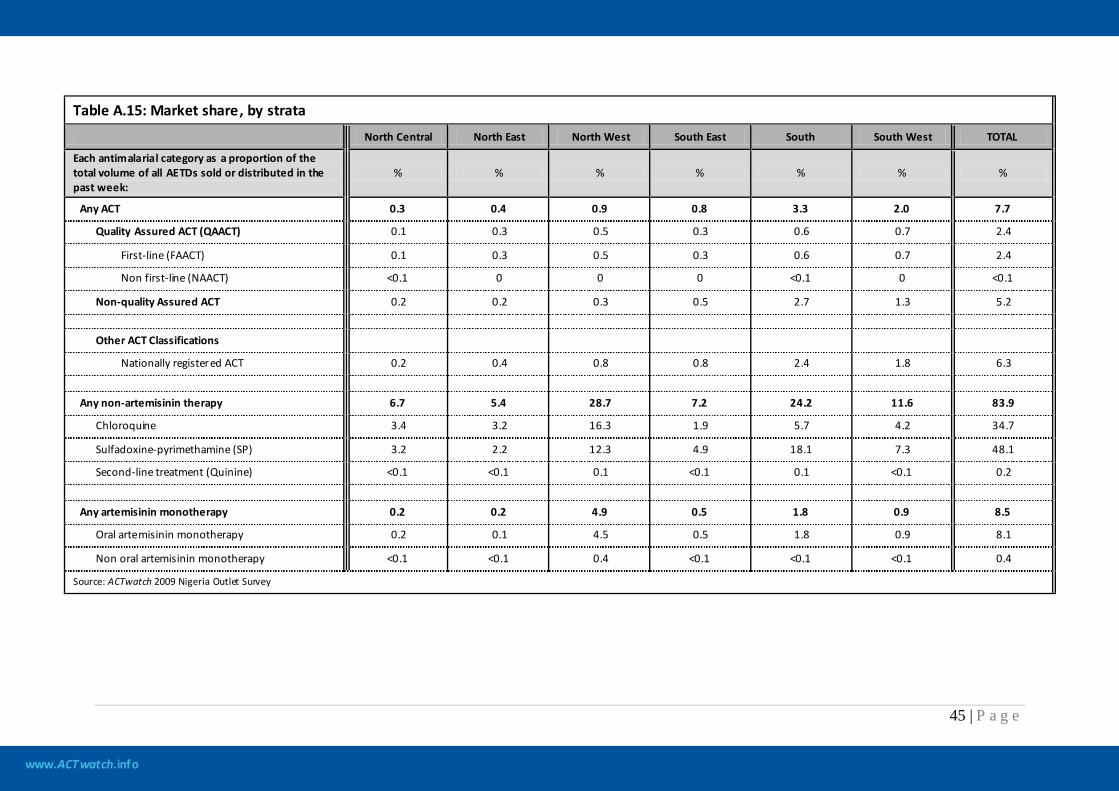
www.ACTwatch.info
45 | P a g e
Table A.15: Market share, by strata
North Central North East North West South East South South West TOTAL
Each antimalarial category as a proportion of the total volume of all AETDs sold or distributed in the past week:
% % % % % % %
Any ACT 0.3 0.4 0.9 0.8 3.3 2.0 7.7
Quality Assured ACT (QAACT) 0.1 0.3 0.5 0.3 0.6 0.7 2.4
First-line (FAACT) 0.1 0.3 0.5 0.3 0.6 0.7 2.4
Non first-line (NAACT) <0.1 0 0 0 <0.1 0 <0.1
Non-quality Assured ACT 0.2 0.2 0.3 0.5 2.7 1.3 5.2
Other ACT Classifications
Nationally registered ACT 0.2 0.4 0.8 0.8 2.4 1.8 6.3
Any non-artemisinin therapy 6.7 5.4 28.7 7.2 24.2 11.6 83.9
Chloroquine 3.4 3.2 16.3 1.9 5.7 4.2 34.7
Sulfadoxine-pyrimethamine (SP) 3.2 2.2 12.3 4.9 18.1 7.3 48.1
Second-line treatment (Quinine) <0.1 <0.1 0.1 <0.1 0.1 <0.1 0.2
Any artemisinin monotherapy 0.2 0.2 4.9 0.5 1.8 0.9 8.5
Oral artemisinin monotherapy 0.2 0.1 4.5 0.5 1.8 0.9 8.1
Non oral artemisinin monotherapy <0.1 <0.1 0.4 <0.1 <0.1 <0.1 0.4
Source: ACTwatch 2009 Nigeria Outlet Survey
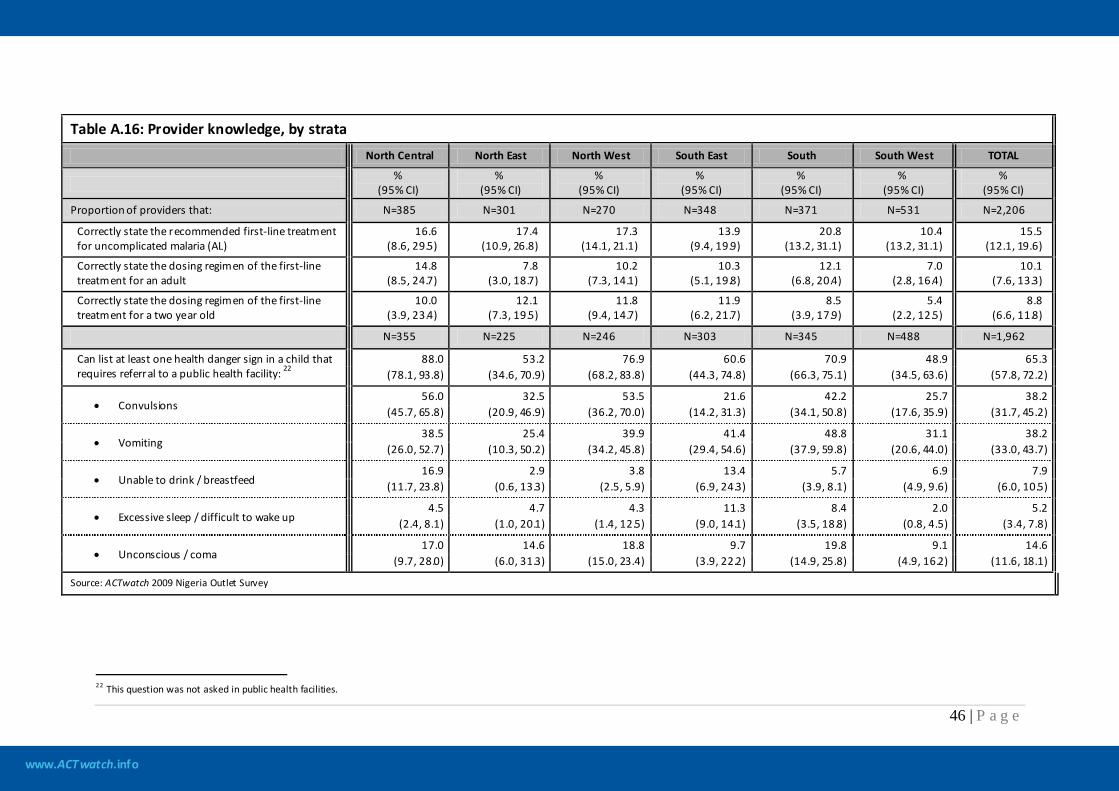
www.ACTwatch.info
46 | P a g e
Table A.16: Provider knowledge, by strata
North Central North East North West South East South South West TOTAL
%
(95% CI) %
(95% CI) %
(95% CI) %
(95% CI) %
(95% CI) %
(95% CI) %
(95% CI)
Proportion of providers that: N=385 N=301 N=270 N=348 N=371 N=531 N=2,206
Correctly state the recommended first-line treatment for uncomplicated malaria (AL)
16.6 (8.6, 29.5)
17.4 (10.9, 26.8)
17.3 (14.1, 21.1)
13.9 (9.4, 19.9)
20.8 (13.2, 31.1)
10.4 (13.2, 31.1)
15.5 (12.1, 19.6)
Correctly state the dosing regimen of the first-line treatment for an adult
14.8 (8.5, 24.7)
7.8 (3.0, 18.7)
10.2 (7.3, 14.1)
10.3 (5.1, 19.8)
12.1 (6.8, 20.4)
7.0 (2.8, 16.4)
10.1 (7.6, 13.3)
Correctly state the dosing regimen of the first-line treatment for a two year old
10.0 (3.9, 23.4)
12.1 (7.3, 19.5)
11.8 (9.4, 14.7)
11.9 (6.2, 21.7)
8.5 (3.9, 17.9)
5.4 (2.2, 12.5)
8.8 (6.6, 11.8)
N=355 N=225 N=246 N=303 N=345 N=488 N=1,962
Can list at least one health danger sign in a child that requires referral to a public health facility: 22
88.0
53.2 76.9 60.6 70.9 48.9 65.3 (78.1, 93.8) (34.6, 70.9) (68.2, 83.8) (44.3, 74.8) (66.3, 75.1) (34.5, 63.6) (57.8, 72.2)
• Convulsions 56.0 32.5 53.5 21.6 42.2 25.7 38.2
(45.7, 65.8) (20.9, 46.9) (36.2, 70.0) (14.2, 31.3) (34.1, 50.8) (17.6, 35.9) (31.7, 45.2)
• Vomiting 38.5 25.4 39.9 41.4 48.8 31.1 38.2
(26.0, 52.7) (10.3, 50.2) (34.2, 45.8) (29.4, 54.6) (37.9, 59.8) (20.6, 44.0) (33.0, 43.7)
• Unable to drink / breastfeed 16.9 2.9 3.8 13.4 5.7 6.9 7.9
(11.7, 23.8) (0.6, 13.3) (2.5, 5.9) (6.9, 24.3) (3.9, 8.1) (4.9, 9.6) (6.0, 10.5)
• Excessive sleep / difficult to wake up 4.5 4.7 4.3 11.3 8.4 2.0 5.2
(2.4, 8.1) (1.0, 20.1) (1.4, 12.5) (9.0, 14.1) (3.5, 18.8) (0.8, 4.5) (3.4, 7.8)
• Unconscious / coma 17.0 14.6 18.8 9.7 19.8 9.1 14.6
(9.7, 28.0) (6.0, 31.3) (15.0, 23.4) (3.9, 22.2) (14.9, 25.8) (4.9, 16.2) (11.6, 18.1)
Source: ACTwatch 2009 Nigeria Outlet Survey
22 This question was not asked in public health facilities.
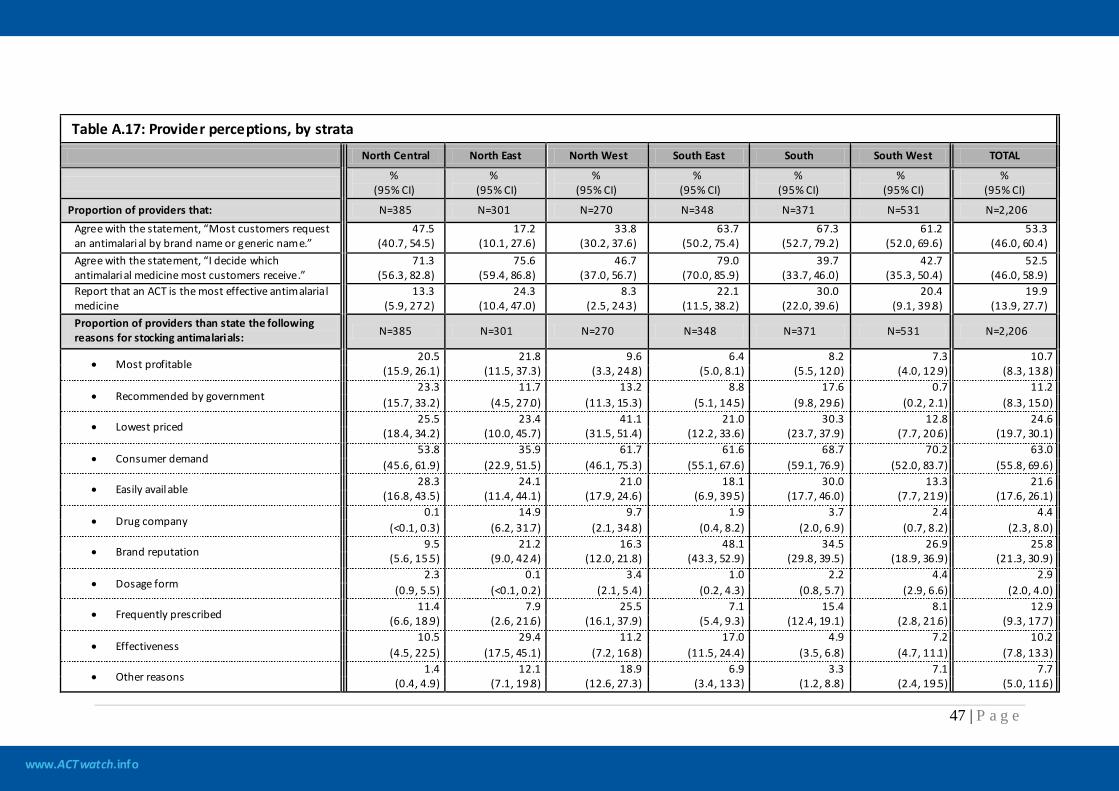
www.ACTwatch.info
47 | P a g e
Table A.17: Provider perceptions, by strata
North Central North East North West South East South South West TOTAL
%
(95% CI) %
(95% CI) %
(95% CI) %
(95% CI) %
(95% CI) %
(95% CI) %
(95% CI)
Proportion of providers that: N=385 N=301 N=270 N=348 N=371 N=531 N=2,206 Agree with the statement, “Most customers request an antimalarial by brand name or generic name.”
47.5 (40.7, 54.5)
17.2 (10.1, 27.6)
33.8 (30.2, 37.6)
63.7 (50.2, 75.4)
67.3 (52.7, 79.2)
61.2 (52.0, 69.6)
53.3 (46.0, 60.4)
Agree with the statement, “I decide which antimalarial medicine most customers receive.”
71.3 (56.3, 82.8)
75.6 (59.4, 86.8)
46.7 (37.0, 56.7)
79.0 (70.0, 85.9)
39.7 (33.7, 46.0)
42.7 (35.3, 50.4)
52.5 (46.0, 58.9)
Report that an ACT is the most effective antimalarial medicine
13.3 (5.9, 27.2)
24.3 (10.4, 47.0)
8.3 (2.5, 24.3)
22.1 (11.5, 38.2)
30.0 (22.0, 39.6)
20.4 (9.1, 39.8)
19.9 (13.9, 27.7)
Proportion of providers than state the following reasons for stocking antimalarials: N=385 N=301 N=270 N=348 N=371 N=531 N=2,206
• Most profitable 20.5 21.8 9.6 6.4 8.2 7.3 10.7
(15.9, 26.1) (11.5, 37.3) (3.3, 24.8) (5.0, 8.1) (5.5, 12.0) (4.0, 12.9) (8.3, 13.8)
• Recommended by government 23.3 11.7 13.2 8.8 17.6 0.7 11.2
(15.7, 33.2) (4.5, 27.0) (11.3, 15.3) (5.1, 14.5) (9.8, 29.6) (0.2, 2.1) (8.3, 15.0)
• Lowest priced 25.5 23.4 41.1 21.0 30.3 12.8 24.6
(18.4, 34.2) (10.0, 45.7) (31.5, 51.4) (12.2, 33.6) (23.7, 37.9) (7.7, 20.6) (19.7, 30.1)
• Consumer demand 53.8 35.9 61.7 61.6 68.7 70.2 63.0
(45.6, 61.9) (22.9, 51.5) (46.1, 75.3) (55.1, 67.6) (59.1, 76.9) (52.0, 83.7) (55.8, 69.6)
• Easily available 28.3 24.1 21.0 18.1 30.0 13.3 21.6
(16.8, 43.5) (11.4, 44.1) (17.9, 24.6) (6.9, 39.5) (17.7, 46.0) (7.7, 21.9) (17.6, 26.1)
• Drug company 0.1 14.9 9.7 1.9 3.7 2.4 4.4
(<0.1, 0.3) (6.2, 31.7) (2.1, 34.8) (0.4, 8.2) (2.0, 6.9) (0.7, 8.2) (2.3, 8.0)
• Brand reputation 9.5 21.2 16.3 48.1 34.5 26.9 25.8
(5.6, 15.5) (9.0, 42.4) (12.0, 21.8) (43.3, 52.9) (29.8, 39.5) (18.9, 36.9) (21.3, 30.9)
• Dosage form 2.3 0.1 3.4 1.0 2.2 4.4 2.9
(0.9, 5.5) (<0.1, 0.2) (2.1, 5.4) (0.2, 4.3) (0.8, 5.7) (2.9, 6.6) (2.0, 4.0)
• Frequently prescribed 11.4 7.9 25.5 7.1 15.4 8.1 12.9
(6.6, 18.9) (2.6, 21.6) (16.1, 37.9) (5.4, 9.3) (12.4, 19.1) (2.8, 21.6) (9.3, 17.7)
• Effectiveness 10.5 29.4 11.2 17.0 4.9 7.2 10.2
(4.5, 22.5) (17.5, 45.1) (7.2, 16.8) (11.5, 24.4) (3.5, 6.8) (4.7, 11.1) (7.8, 13.3)
• Other reasons 1.4 12.1 18.9 6.9 3.3 7.1 7.7
(0.4, 4.9) (7.1, 19.8) (12.6, 27.3) (3.4, 13.3) (1.2, 8.8) (2.4, 19.5) (5.0, 11.6)
www.ACTwatch.info
48 | P a g e
Table A.17: Provider perceptions, by strata
North Central North East North West South East South South West TOTAL
%
(95% CI) %
(95% CI) %
(95% CI) %
(95% CI) %
(95% CI) %
(95% CI) %
(95% CI) Source: ACTwatch 2009 Nigeria Outlet Survey
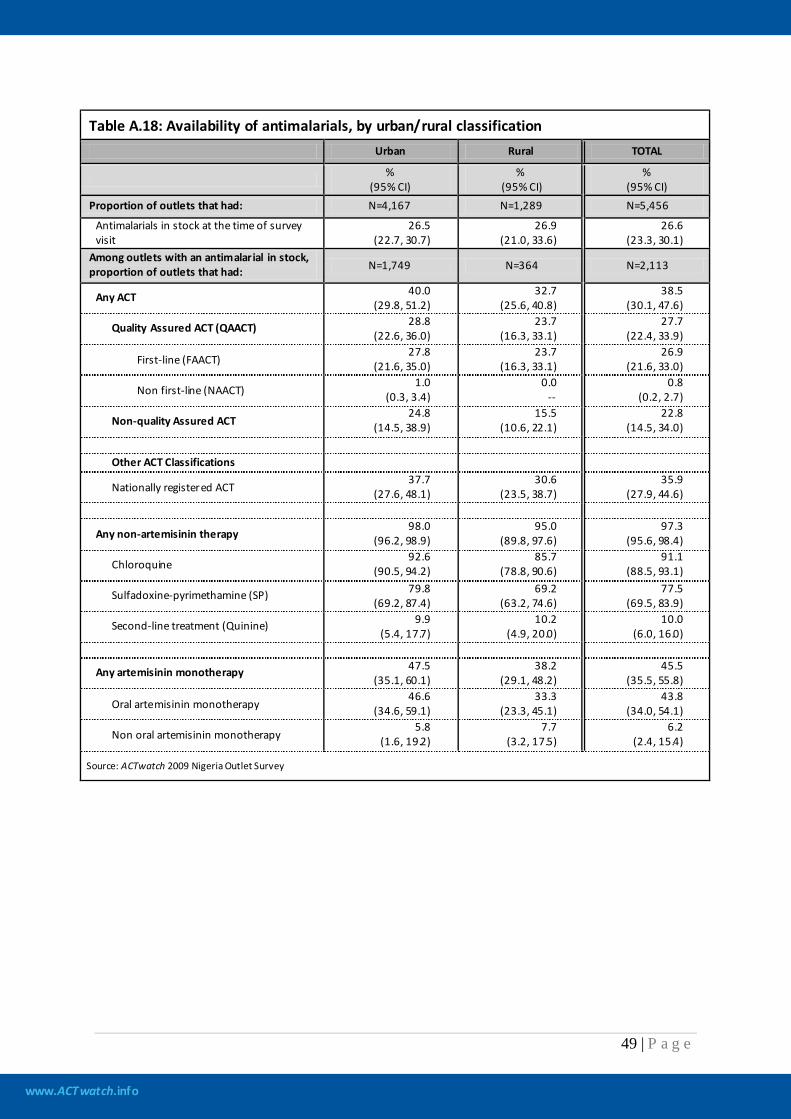
www.ACTwatch.info
49 | P a g e
Table A.18: Availability of antimalarials, by urban/rural classification
Urban Rural TOTAL
% (95% CI)
% (95% CI)
% (95% CI)
Proportion of outlets that had: N=4,167 N=1,289 N=5,456
Antimalarials in stock at the time of survey visit
26.5 (22.7, 30.7)
26.9 (21.0, 33.6)
26.6 (23.3, 30.1)
Among outlets with an antimalarial in stock, proportion of outlets that had: N=1,749 N=364 N=2,113
Any ACT 40.0 (29.8, 51.2)
32.7 (25.6, 40.8)
38.5 (30.1, 47.6)
Quality Assured ACT (QAACT) 28.8 (22.6, 36.0)
23.7 (16.3, 33.1)
27.7 (22.4, 33.9)
First-line (FAACT) 27.8
(21.6, 35.0) 23.7
(16.3, 33.1) 26.9
(21.6, 33.0)
Non first-line (NAACT) 1.0
(0.3, 3.4) 0.0
-- 0.8
(0.2, 2.7)
Non-quality Assured ACT 24.8
(14.5, 38.9) 15.5
(10.6, 22.1) 22.8
(14.5, 34.0) Other ACT Classifications
Nationally registered ACT 37.7
(27.6, 48.1) 30.6
(23.5, 38.7) 35.9
(27.9, 44.6)
Any non-artemisinin therapy 98.0
(96.2, 98.9) 95.0
(89.8, 97.6) 97.3
(95.6, 98.4)
Chloroquine 92.6
(90.5, 94.2) 85.7
(78.8, 90.6) 91.1
(88.5, 93.1)
Sulfadoxine-pyrimethamine (SP) 79.8 (69.2, 87.4)
69.2 (63.2, 74.6)
77.5 (69.5, 83.9)
Second-line treatment (Quinine) 9.9 (5.4, 17.7)
10.2 (4.9, 20.0)
10.0 (6.0, 16.0)
Any artemisinin monotherapy 47.5 (35.1, 60.1)
38.2 (29.1, 48.2)
45.5 (35.5, 55.8)
Oral artemisinin monotherapy 46.6
(34.6, 59.1) 33.3
(23.3, 45.1) 43.8
(34.0, 54.1)
Non oral artemisinin monotherapy 5.8
(1.6, 19.2) 7.7
(3.2, 17.5) 6.2
(2.4, 15.4)
Source: ACTwatch 2009 Nigeria Outlet Survey
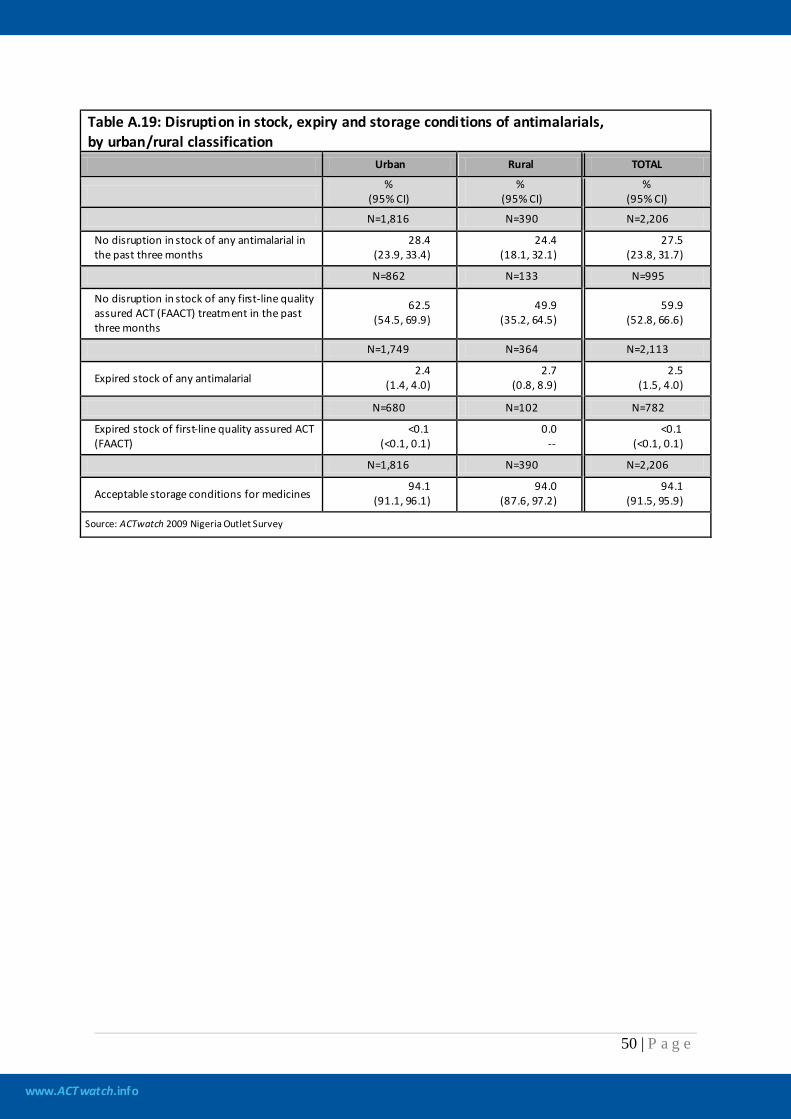
www.ACTwatch.info
50 | P a g e
Table A.19: Disruption in stock, expiry and storage conditions of antimalarials, by urban/rural classification Urban Rural TOTAL
%
(95% CI) %
(95% CI) %
(95% CI)
N=1,816 N=390 N=2,206
No disruption in stock of any antimalarial in the past three months
28.4 (23.9, 33.4)
24.4 (18.1, 32.1)
27.5 (23.8, 31.7)
N=862 N=133 N=995
No disruption in stock of any first-line quality assured ACT (FAACT) treatment in the past three months
62.5 (54.5, 69.9)
49.9 (35.2, 64.5)
59.9 (52.8, 66.6)
N=1,749 N=364 N=2,113
Expired stock of any antimalarial 2.4
(1.4, 4.0) 2.7
(0.8, 8.9) 2.5
(1.5, 4.0)
N=680 N=102 N=782
Expired stock of first-line quality assured ACT (FAACT)
<0.1 (<0.1, 0.1)
0.0 --
<0.1 (<0.1, 0.1)
N=1,816 N=390 N=2,206
Acceptable storage conditions for medicines 94.1
(91.1, 96.1) 94.0
(87.6, 97.2) 94.1
(91.5, 95.9)
Source: ACTwatch 2009 Nigeria Outlet Survey
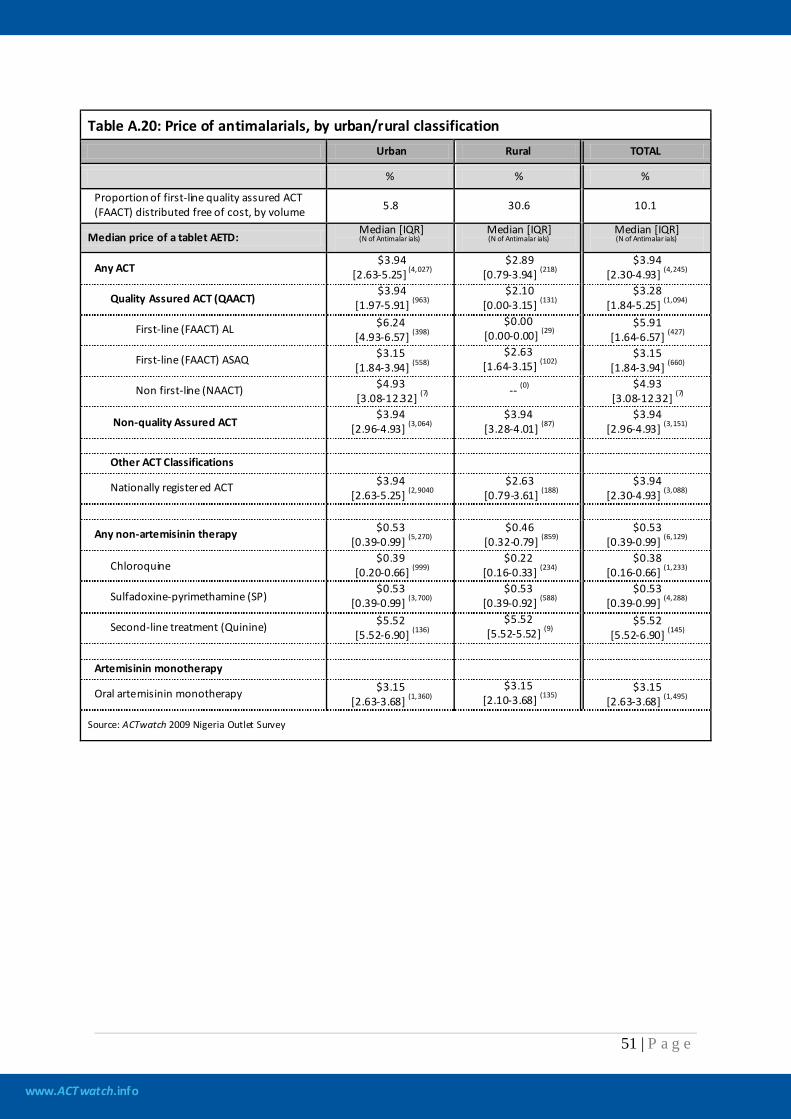
www.ACTwatch.info
51 | P a g e
Table A.20: Price of antimalarials, by urban/rural classification
Urban Rural TOTAL
% % %
Proportion of first-line quality assured ACT (FAACT) distributed free of cost, by volume 5.8 30.6 10.1
Median price of a tablet AETD: Median [IQR] (N of Antimalar ials)
Median [IQR] (N of Antimalar ials)
Median [IQR] (N of Antimalar ials)
Any ACT $3.94
[2.63-5.25] (4,027) $2.89
[0.79-3.94] (218) $3.94
[2.30-4.93] (4,245)
Quality Assured ACT (QAACT) $3.94
[1.97-5.91] (963) $2.10
[0.00-3.15] (131) $3.28
[1.84-5.25] (1,094)
First-line (FAACT) AL $6.24 [4.93-6.57] (398)
$0.00 [0.00-0.00] (29)
$5.91 [1.64-6.57] (427)
First-line (FAACT) ASAQ $3.15 [1.84-3.94] (558)
$2.63 [1.64-3.15] (102)
$3.15 [1.84-3.94] (660)
Non first-line (NAACT) $4.93 [3.08-12.32] (7)
-- (0) $4.93 [3.08-12.32] (7)
Non-quality Assured ACT $3.94
[2.96-4.93] (3,064) $3.94
[3.28-4.01] (87) $3.94
[2.96-4.93] (3,151) Other ACT Classifications
Nationally registered ACT $3.94 [2.63-5.25] (2,9040
$2.63 [0.79-3.61] (188)
$3.94 [2.30-4.93] (3,088)
Any non-artemisinin therapy $0.53 [0.39-0.99] (5,270)
$0.46 [0.32-0.79] (859)
$0.53 [0.39-0.99] (6,129)
Chloroquine $0.39
[0.20-0.66] (999) $0.22
[0.16-0.33] (234) $0.38
[0.16-0.66] (1,233)
Sulfadoxine-pyrimethamine (SP) $0.53
[0.39-0.99] (3,700) $0.53
[0.39-0.92] (588) $0.53
[0.39-0.99] (4,288)
Second-line treatment (Quinine) $5.52 [5.52-6.90] (136)
$5.52 [5.52-5.52] (9)
$5.52 [5.52-6.90] (145)
Artemisinin monotherapy
Oral artemisinin monotherapy $3.15 [2.63-3.68] (1,360)
$3.15 [2.10-3.68] (135)
$3.15 [2.63-3.68] (1,495)
Source: ACTwatch 2009 Nigeria Outlet Survey
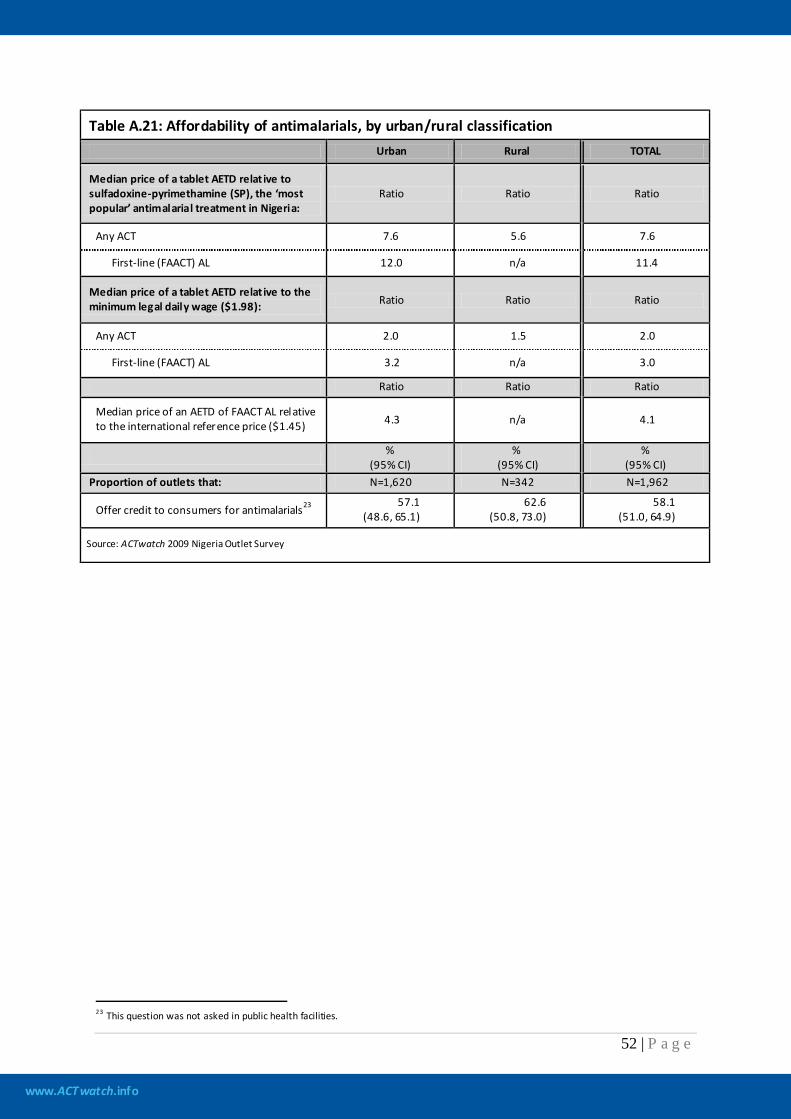
www.ACTwatch.info
52 | P a g e
Table A.21: Affordability of antimalarials, by urban/rural classification
Urban Rural TOTAL
Median price of a tablet AETD relat ive to sulfadoxine-pyrimethamine (SP), the ‘most popular’ antimalarial treatment in Nigeria:
Ratio Ratio Ratio
Any ACT 7.6 5.6 7.6
First-line (FAACT) AL 12.0 n/a 11.4
Median price of a tablet AETD relat ive to the minimum legal daily wage ($1.98): Ratio Ratio Ratio
Any ACT 2.0 1.5 2.0
First-line (FAACT) AL 3.2 n/a 3.0
Ratio Ratio Ratio
Median price of an AETD of FAACT AL relative to the international reference price ($1.45) 4.3 n/a 4.1
% (95% CI)
% (95% CI)
% (95% CI)
Proportion of outlets that: N=1,620 N=342 N=1,962
Offer credit to consumers for antimalarials23 57.1 (48.6, 65.1)
62.6 (50.8, 73.0)
58.1 (51.0, 64.9)
Source: ACTwatch 2009 Nigeria Outlet Survey
23 This question was not asked in public health facilities.
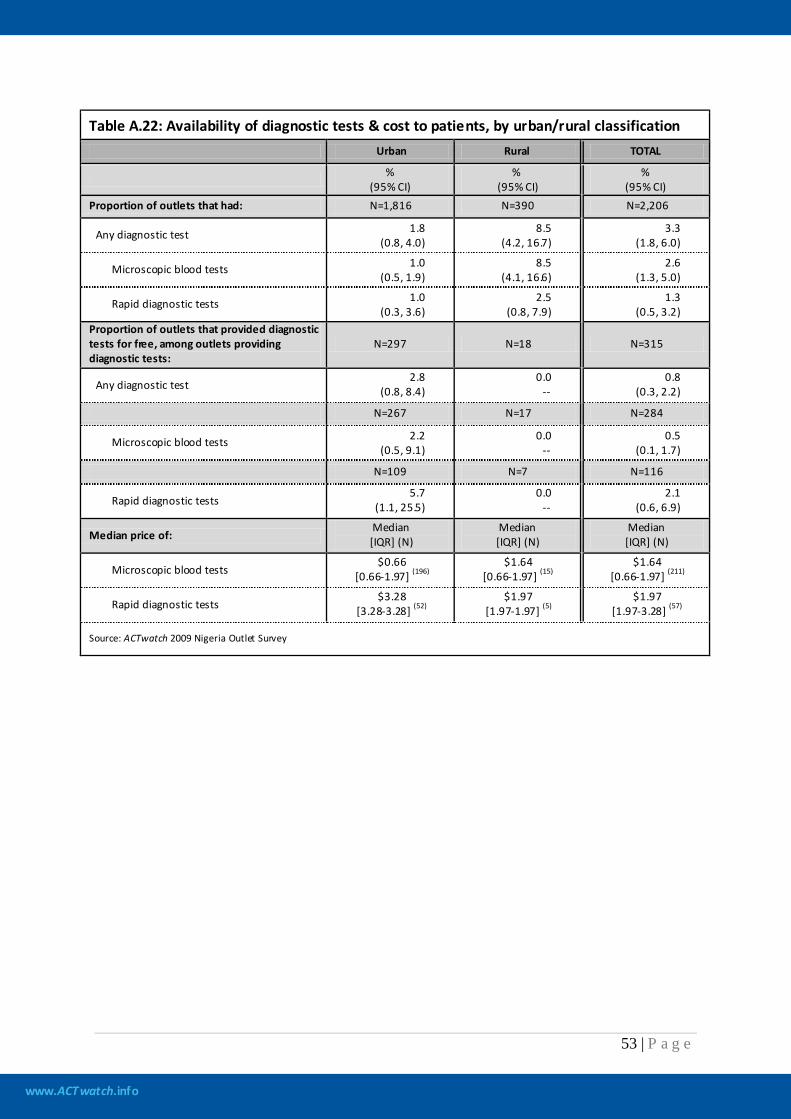
www.ACTwatch.info
53 | P a g e
Table A.22: Availability of diagnostic tests & cost to patients, by urban/rural classification
Urban Rural TOTAL
% (95% CI)
% (95% CI)
% (95% CI)
Proportion of outlets that had: N=1,816 N=390 N=2,206
Any diagnostic test 1.8 (0.8, 4.0)
8.5 (4.2, 16.7)
3.3 (1.8, 6.0)
Microscopic blood tests 1.0 (0.5, 1.9)
8.5 (4.1, 16.6)
2.6 (1.3, 5.0)
Rapid diagnostic tests 1.0 (0.3, 3.6)
2.5 (0.8, 7.9)
1.3 (0.5, 3.2)
Proportion of outlets that provided diagnostic tests for free, among outlets providing diagnostic tests:
N=297 N=18 N=315
Any diagnostic test 2.8
(0.8, 8.4) 0.0
-- 0.8
(0.3, 2.2)
N=267 N=17 N=284
Microscopic blood tests 2.2 (0.5, 9.1)
0.0 --
0.5 (0.1, 1.7)
N=109 N=7 N=116
Rapid diagnostic tests 5.7
(1.1, 25.5) 0.0
-- 2.1
(0.6, 6.9)
Median price of: Median [IQR] (N)
Median [IQR] (N)
Median [IQR] (N)
Microscopic blood tests $0.66
[0.66-1.97] (196) $1.64
[0.66-1.97] (15) $1.64
[0.66-1.97] (211)
Rapid diagnostic tests $3.28
[3.28-3.28] (52) $1.97
[1.97-1.97] (5) $1.97
[1.97-3.28] (57)
Source: ACTwatch 2009 Nigeria Outlet Survey
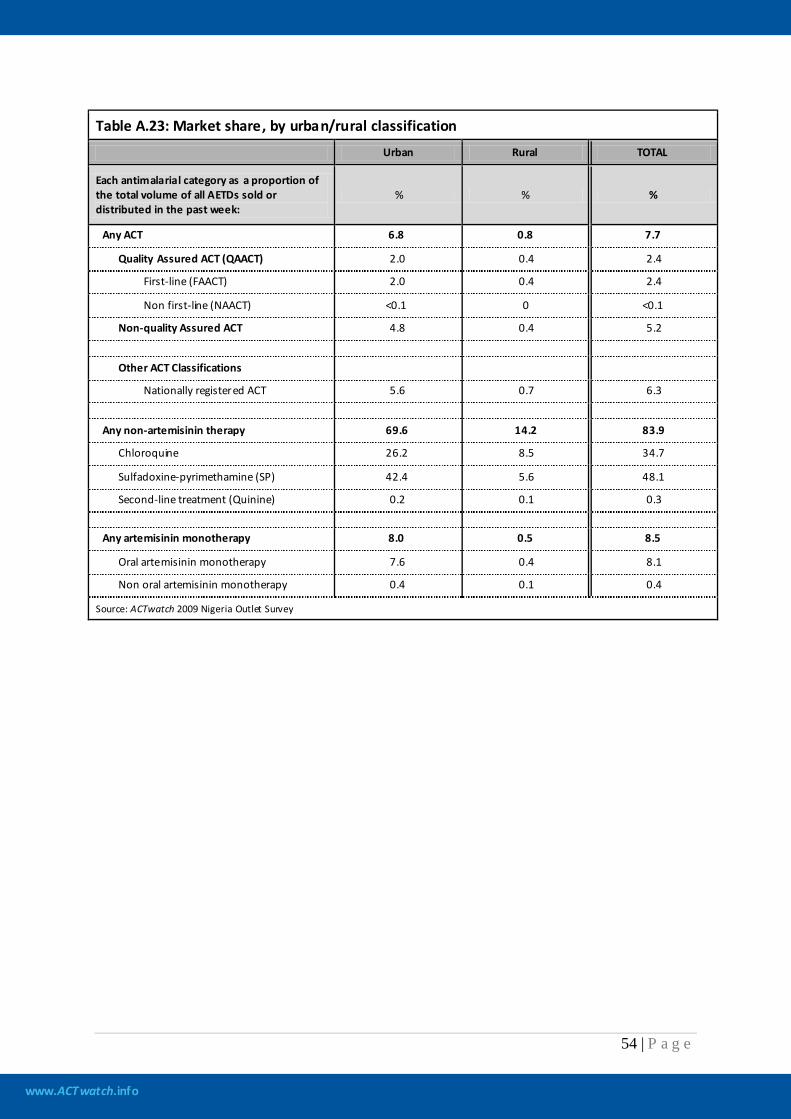
www.ACTwatch.info
54 | P a g e
Table A.23: Market share, by urban/rural classification
Urban Rural TOTAL
Each antimalarial category as a proportion of the total volume of all AETDs sold or distributed in the past week:
% % %
Any ACT 6.8 0.8 7.7
Quality Assured ACT (QAACT) 2.0 0.4 2.4
First-line (FAACT) 2.0 0.4 2.4
Non first-line (NAACT) <0.1 0 <0.1
Non-quality Assured ACT 4.8 0.4 5.2
Other ACT Classifications
Nationally registered ACT 5.6 0.7 6.3
Any non-artemisinin therapy 69.6 14.2 83.9
Chloroquine 26.2 8.5 34.7
Sulfadoxine-pyrimethamine (SP) 42.4 5.6 48.1
Second-line treatment (Quinine) 0.2 0.1 0.3
Any artemisinin monotherapy 8.0 0.5 8.5
Oral artemisinin monotherapy 7.6 0.4 8.1
Non oral artemisinin monotherapy 0.4 0.1 0.4
Source: ACTwatch 2009 Nigeria Outlet Survey
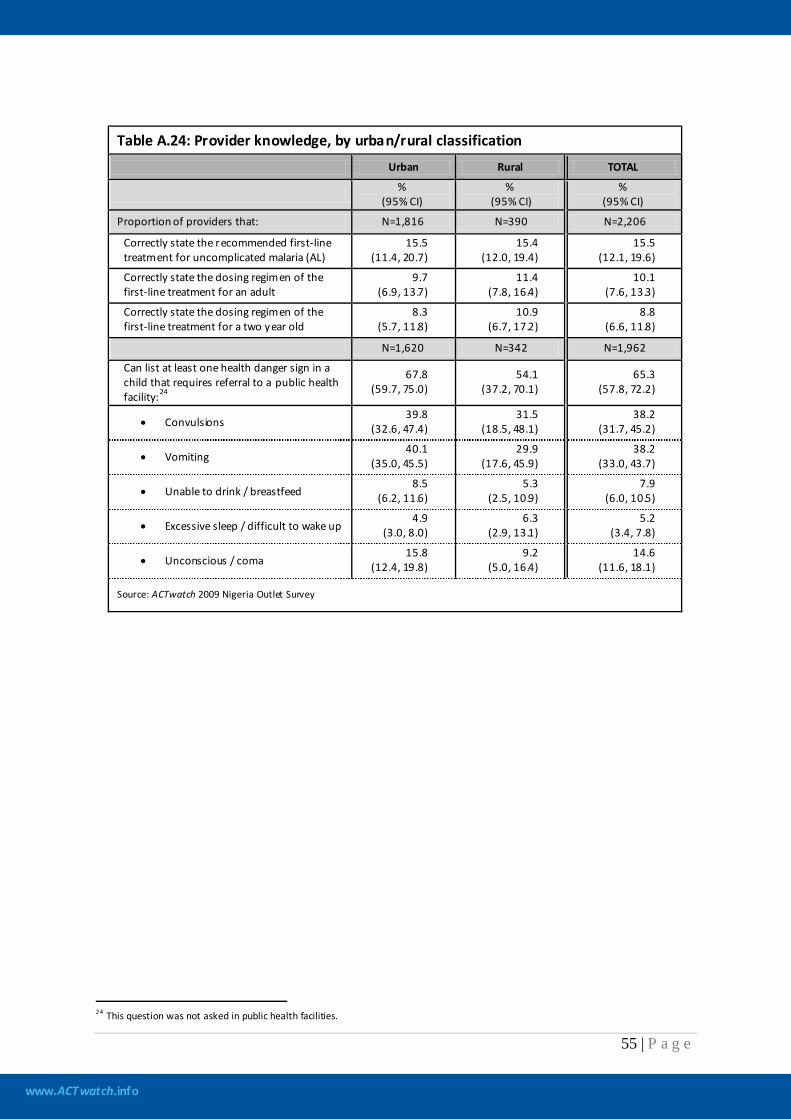
www.ACTwatch.info
55 | P a g e
Table A.24: Provider knowledge, by urban/rural classification
Urban Rural TOTAL
%
(95% CI) %
(95% CI) %
(95% CI)
Proportion of providers that: N=1,816 N=390 N=2,206
Correctly state the recommended first-line treatment for uncomplicated malaria (AL)
15.5 (11.4, 20.7)
15.4 (12.0, 19.4)
15.5 (12.1, 19.6)
Correctly state the dosing regimen of the first-line treatment for an adult
9.7 (6.9, 13.7)
11.4 (7.8, 16.4)
10.1 (7.6, 13.3)
Correctly state the dosing regimen of the first-line treatment for a two year old
8.3 (5.7, 11.8)
10.9 (6.7, 17.2)
8.8 (6.6, 11.8)
N=1,620 N=342 N=1,962
Can list at least one health danger sign in a child that requires referral to a public health facility:24
67.8 (59.7, 75.0)
54.1 (37.2, 70.1)
65.3 (57.8, 72.2)
• Convulsions 39.8
(32.6, 47.4) 31.5
(18.5, 48.1) 38.2
(31.7, 45.2)
• Vomiting 40.1
(35.0, 45.5) 29.9
(17.6, 45.9) 38.2
(33.0, 43.7)
• Unable to drink / breastfeed 8.5
(6.2, 11.6) 5.3
(2.5, 10.9) 7.9
(6.0, 10.5)
• Excessive sleep / difficult to wake up 4.9
(3.0, 8.0) 6.3
(2.9, 13.1) 5.2
(3.4, 7.8)
• Unconscious / coma 15.8
(12.4, 19.8) 9.2
(5.0, 16.4) 14.6
(11.6, 18.1)
Source: ACTwatch 2009 Nigeria Outlet Survey
24 This question was not asked in public health facilities.
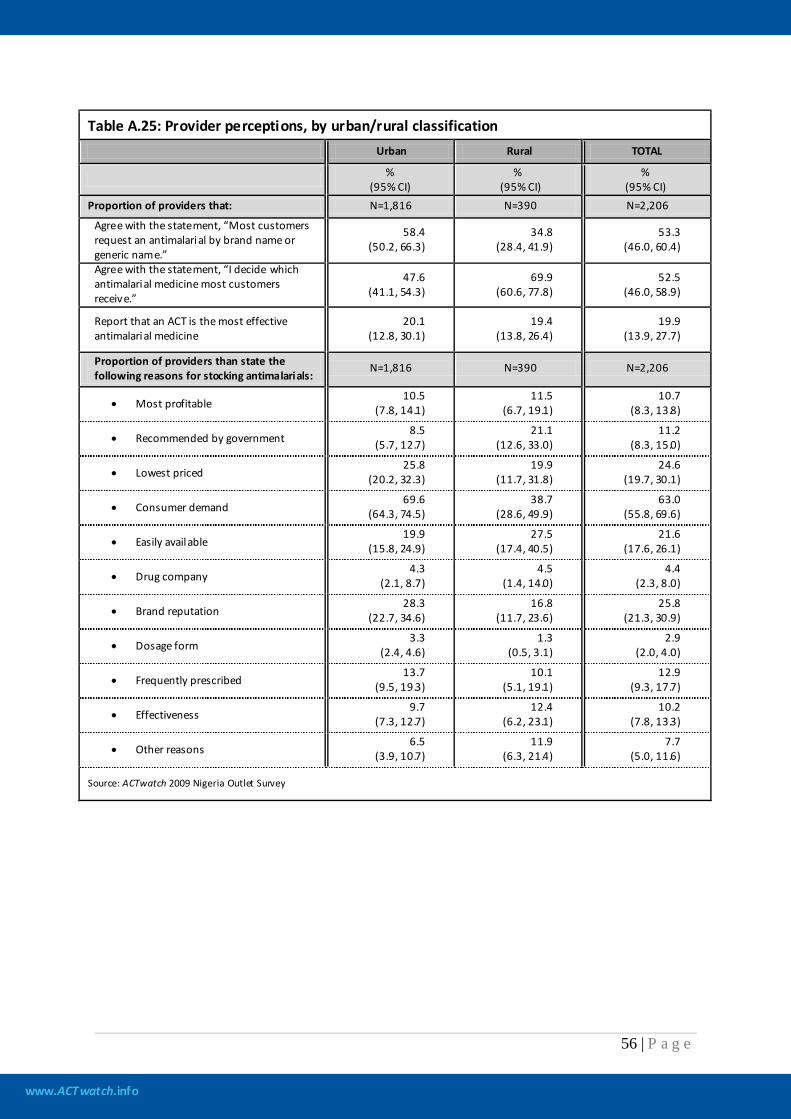
www.ACTwatch.info
56 | P a g e
Table A.25: Provider perceptions, by urban/rural classification
Urban Rural TOTAL
% (95% CI)
% (95% CI)
% (95% CI)
Proportion of providers that: N=1,816 N=390 N=2,206
Agree with the statement, “Most customers request an antimalarial by brand name or generic name.”
58.4 (50.2, 66.3)
34.8 (28.4, 41.9)
53.3 (46.0, 60.4)
Agree with the statement, “I decide which antimalarial medicine most customers receive.”
47.6 (41.1, 54.3)
69.9 (60.6, 77.8)
52.5 (46.0, 58.9)
Report that an ACT is the most effective antimalarial medicine
20.1 (12.8, 30.1)
19.4 (13.8, 26.4)
19.9 (13.9, 27.7)
Proportion of providers than state the following reasons for stocking antimalarials:
N=1,816 N=390 N=2,206
• Most profitable 10.5
(7.8, 14.1) 11.5
(6.7, 19.1) 10.7
(8.3, 13.8)
• Recommended by government 8.5
(5.7, 12.7) 21.1
(12.6, 33.0) 11.2
(8.3, 15.0)
• Lowest priced 25.8
(20.2, 32.3) 19.9
(11.7, 31.8) 24.6
(19.7, 30.1)
• Consumer demand 69.6
(64.3, 74.5) 38.7
(28.6, 49.9) 63.0
(55.8, 69.6)
• Easily available 19.9
(15.8, 24.9) 27.5
(17.4, 40.5) 21.6
(17.6, 26.1)
• Drug company 4.3
(2.1, 8.7) 4.5
(1.4, 14.0) 4.4
(2.3, 8.0)
• Brand reputation 28.3
(22.7, 34.6) 16.8
(11.7, 23.6) 25.8
(21.3, 30.9)
• Dosage form 3.3
(2.4, 4.6) 1.3
(0.5, 3.1) 2.9
(2.0, 4.0)
• Frequently prescribed 13.7
(9.5, 19.3) 10.1
(5.1, 19.1) 12.9
(9.3, 17.7)
• Effectiveness 9.7
(7.3, 12.7) 12.4
(6.2, 23.1) 10.2
(7.8, 13.3)
• Other reasons 6.5
(3.9, 10.7) 11.9
(6.3, 21.4) 7.7
(5.0, 11.6)
Source: ACTwatch 2009 Nigeria Outlet Survey
www.ACTwatch.info
57 | P a g e
AMFm Phase 1 Indicators
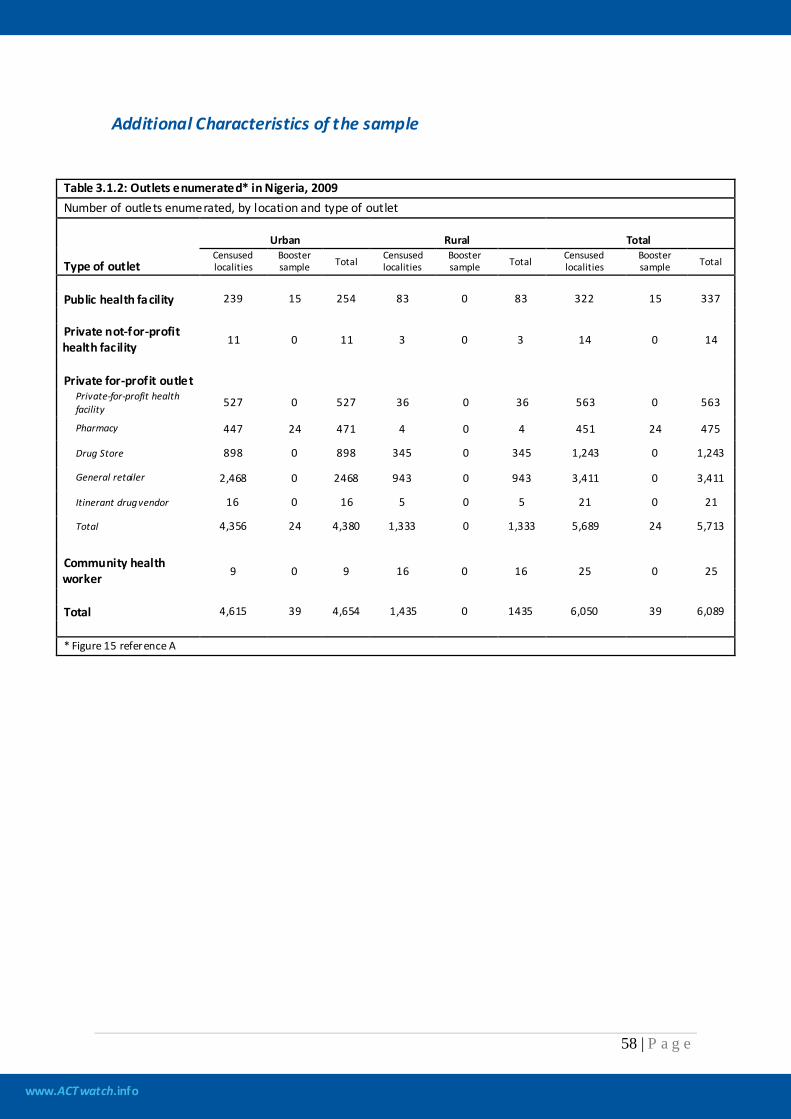
www.ACTwatch.info
58 | P a g e
Additional Characteristics of the sample
Table 3.1.2: Outlets enumerated* in Nigeria, 2009 Number of outlets enumerated, by location and type of outlet
Type of outlet
Urban Rural Total Censused localities
Booster sample Total Censused
localities Booster sample Total Censused
localities Booster sample Total
Public health facility 239 15 254 83 0 83 322 15 337 Private not-for-profit health facility 11 0 11 3 0 3 14 0 14
Private for-profit outlet
Private-for-profit health facility 527 0 527 36 0 36 563 0 563
Pharmacy 447 24 471 4 0 4 451 24 475
Drug Store 898 0 898 345 0 345 1,243 0 1,243
General retailer 2,468 0 2468 943 0 943 3,411 0 3,411
Itinerant drug vendor 16 0 16 5 0 5 21 0 21
Total 4,356 24 4,380 1,333 0 1,333 5,689 24 5,713
Community health worker 9 0 9 16 0 16 25 0 25
Total 4,615 39 4,654 1,435 0 1435 6,050 39 6,089 * Figure 15 reference A
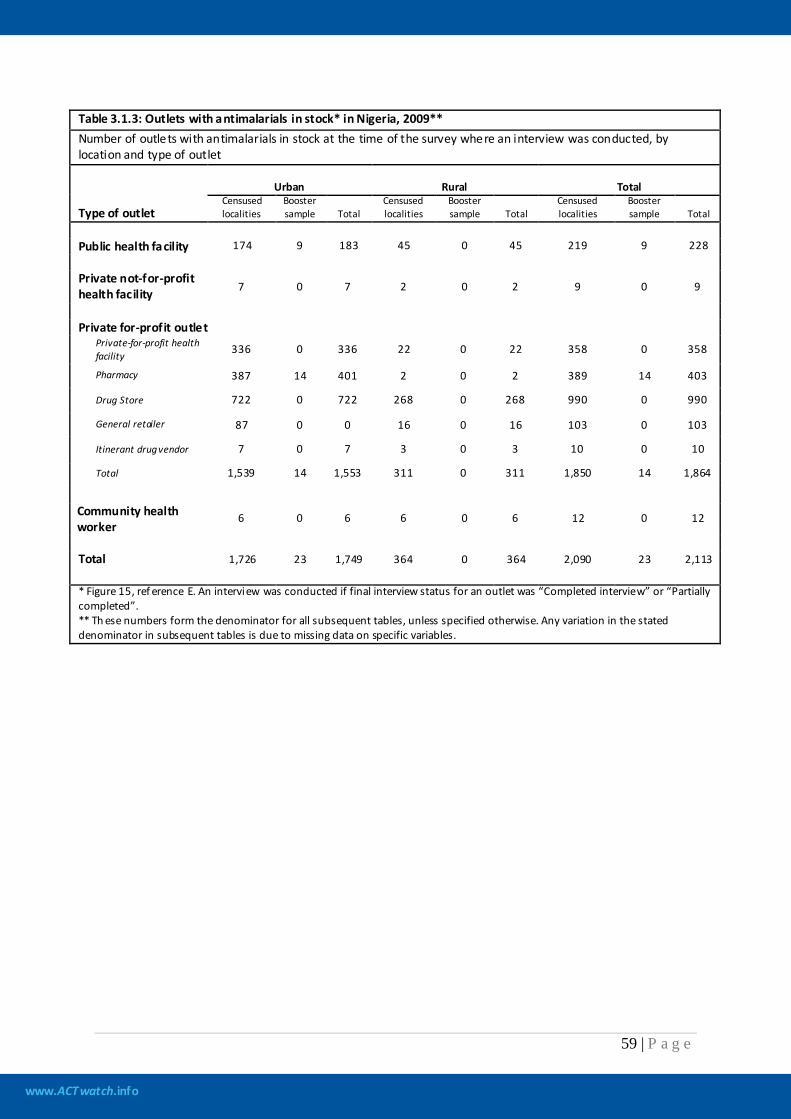
www.ACTwatch.info
59 | P a g e
Table 3.1.3: Outlets with antimalarials in stock* in Nigeria, 2009** Number of outlets with antimalarials in stock at the time of the survey where an interview was conducted, by location and type of outlet
Type of outlet
Urban Rural Total Censused localities
Booster sample Total
Censused localities
Booster sample Total
Censused localities
Booster sample Total
Public health facility 174 9 183 45 0 45 219 9 228 Private not-for-profit health facility 7 0 7 2 0 2 9 0 9
Private for-profit outlet
Private-for-profit health facility 336 0 336 22 0 22 358 0 358
Pharmacy 387 14 401 2 0 2 389 14 403
Drug Store 722 0 722 268 0 268 990 0 990
General retailer 87 0 0 16 0 16 103 0 103
Itinerant drug vendor 7 0 7 3 0 3 10 0 10
Total 1,539 14 1,553 311 0 311 1,850 14 1,864
Community health worker
6 0 6 6 0 6 12 0 12
Total 1,726 23 1,749 364 0 364 2,090 23 2,113 * Figure 15, ref erence E. An interview was conducted if final interview status for an outlet was “Completed interview” or “Partially completed”. ** Th ese numbers form the denominator for all subsequent tables, unless specified otherwise. Any variation in the stated denominator in subsequent tables is due to missing data on specific variables.
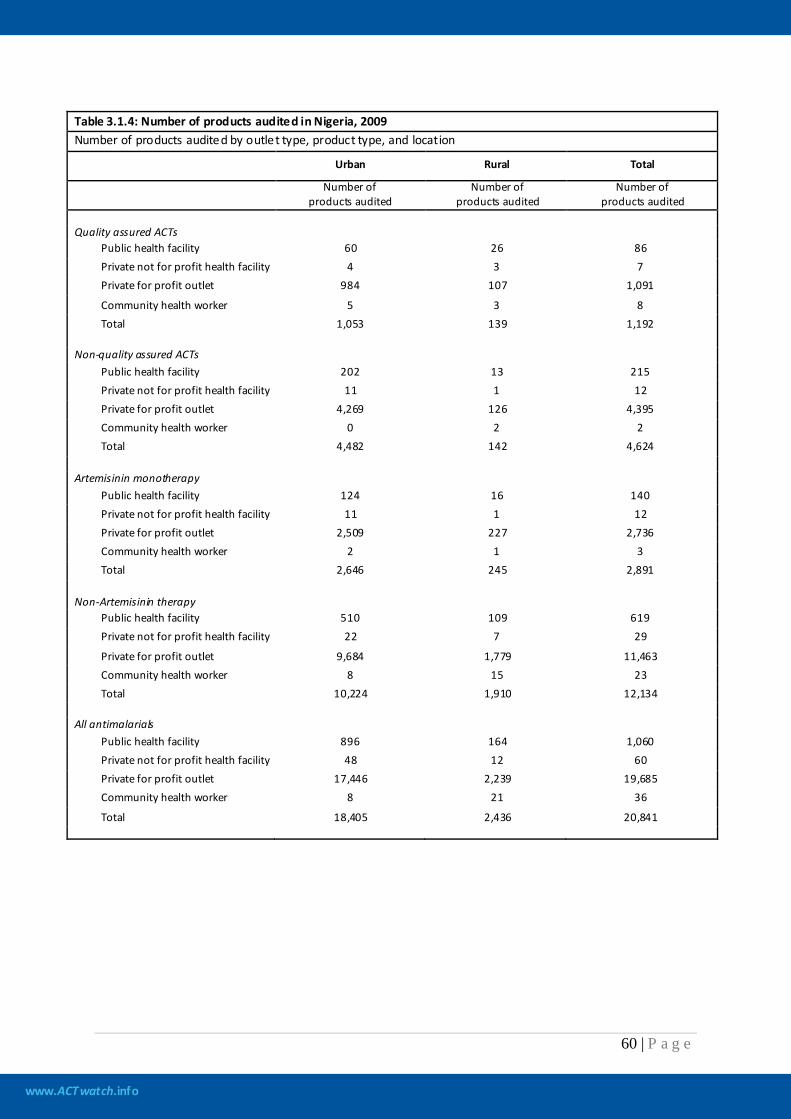
www.ACTwatch.info
60 | P a g e
Table 3.1.4: Number of products audited in Nigeria, 2009 Number of products audited by outlet type, product type, and location
Urban Rural Total
Number of
products audited Number of
products audited Number of
products audited Quality assured ACTs
Public health facility 60 26 86 Private not for profit health facility 4 3 7 Private for profit outlet 984 107 1,091
Community health worker 5 3 8 Total 1,053 139 1,192
Non-quality assured ACTs
Public health facility 202 13 215 Private not for profit health facility 11 1 12 Private for profit outlet 4,269 126 4,395 Community health worker 0 2 2 Total 4,482 142 4,624
Artemisinin monotherapy
Public health facility 124 16 140 Private not for profit health facility 11 1 12 Private for profit outlet 2,509 227 2,736 Community health worker 2 1 3 Total 2,646 245 2,891
Non-Artemisinin therapy
Public health facility 510 109 619 Private not for profit health facility 22 7 29
Private for profit outlet 9,684 1,779 11,463 Community health worker 8 15 23 Total 10,224 1,910 12,134
All antimalarials
Public health facility 896 164 1,060 Private not for profit health facility 48 12 60 Private for profit outlet 17,446 2,239 19,685 Community health worker 8 21 36
Total 18,405 2,436 20,841
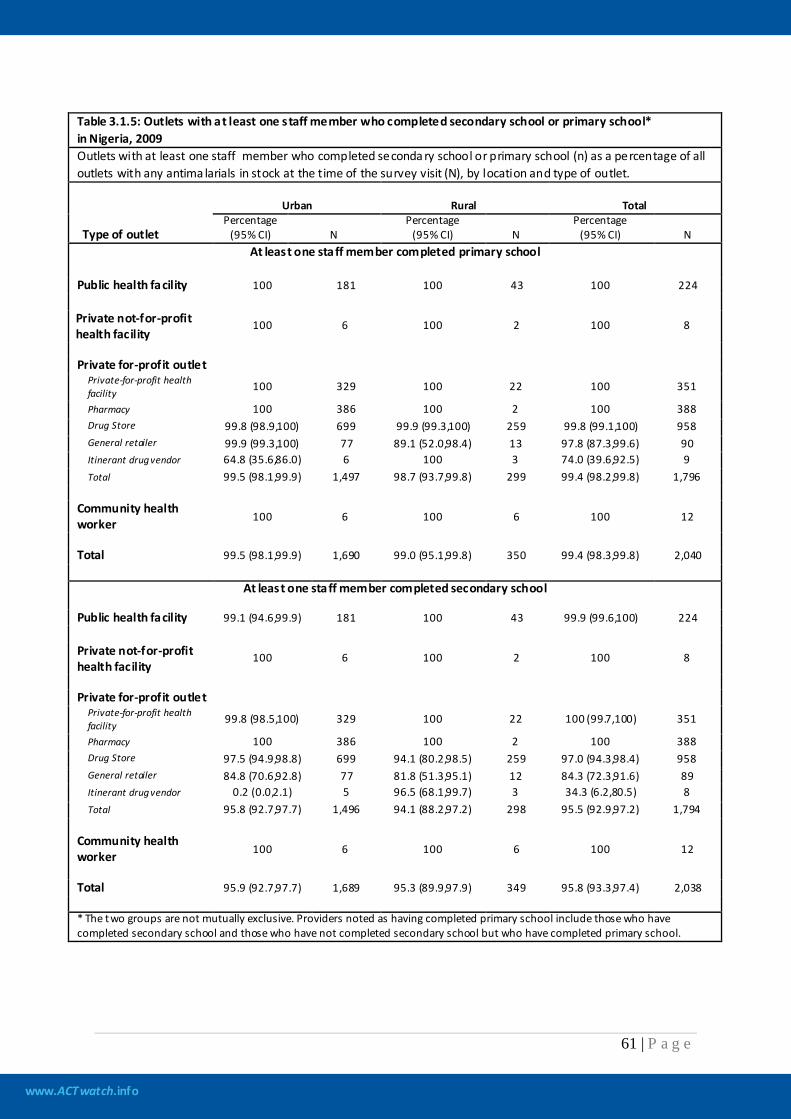
www.ACTwatch.info
61 | P a g e
Table 3.1.5: Outlets with at least one staff member who completed secondary school or primary school* in Nigeria, 2009 Outlets with at least one staff member who completed seconda ry school or primary school (n) as a percentage of all outlets with any antima larials in stock at the time of the survey visit (N), by location and type of outlet.
Type of outlet
Urban Rural Total Percentage
(95% CI) N Percentage
(95% CI) N Percentage
(95% CI) N At least one staff member completed primary school
Public health facility 100 181 100 43 100 224 Private not-for-profit health facility
100 6 100 2 100 8
Private for-profit outlet
Private-for-profit health facility 100 329 100 22 100 351
Pharmacy 100 386 100 2 100 388 Drug Store 99.8 (98.9,100) 699 99.9 (99.3,100) 259 99.8 (99.1,100) 958 General retailer 99.9 (99.3,100) 77 89.1 (52.0,98.4) 13 97.8 (87.3,99.6) 90 Itinerant drug vendor 64.8 (35.6,86.0) 6 100 3 74.0 (39.6,92.5) 9 Total 99.5 (98.1,99.9) 1,497 98.7 (93.7,99.8) 299 99.4 (98.2,99.8) 1,796
Community health worker
100 6 100 6 100 12
Total 99.5 (98.1,99.9) 1,690 99.0 (95.1,99.8) 350 99.4 (98.3,99.8) 2,040
At least one staff member completed secondary school
Public health facility 99.1 (94.6,99.9) 181 100 43 99.9 (99.6,100) 224
Private not-for-profit health facility
100 6 100 2 100 8
Private for-profit outlet
Private-for-profit health facility 99.8 (98.5,100) 329 100 22 100 (99.7,100) 351
Pharmacy 100 386 100 2 100 388 Drug Store 97.5 (94.9,98.8) 699 94.1 (80.2,98.5) 259 97.0 (94.3,98.4) 958 General retailer 84.8 (70.6,92.8) 77 81.8 (51.3,95.1) 12 84.3 (72.3,91.6) 89 Itinerant drug vendor 0.2 (0.0,2.1) 5 96.5 (68.1,99.7) 3 34.3 (6.2,80.5) 8 Total 95.8 (92.7,97.7) 1,496 94.1 (88.2,97.2) 298 95.5 (92.9,97.2) 1,794
Community health worker
100 6 100 6 100 12
Total 95.9 (92.7,97.7) 1,689 95.3 (89.9,97.9) 349 95.8 (93.3,97.4) 2,038 * The two groups are not mutually exclusive. Providers noted as having completed primary school include those who have completed secondary school and those who have not completed secondary school but who have completed primary school.
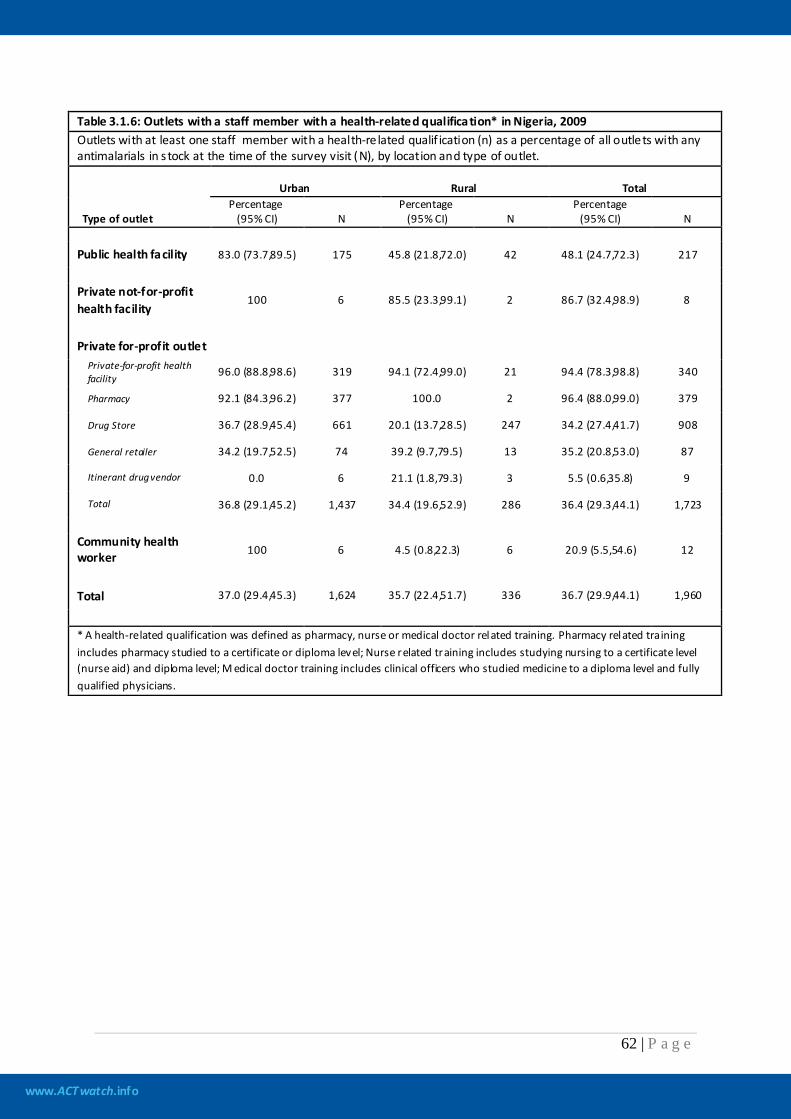
www.ACTwatch.info
62 | P a g e
Table 3.1.6: Outlets with a staff member with a health-related qualification* in Nigeria, 2009 Outlets with at least one staff member with a health-re lated qualif ication (n) as a percentage of all outlets with any antimalarials in s tock at the time of the survey visit (N), by location and type of outlet.
Type of outlet
Urban Rural Total Percentage
(95% CI) N Percentage
(95% CI) N Percentage
(95% CI) N
Public health facility 83.0 (73.7,89.5) 175 45.8 (21.8,72.0) 42 48.1 (24.7,72.3) 217
Private not-for-profit health facility
100 6 85.5 (23.3,99.1) 2 86.7 (32.4,98.9) 8
Private for-profit outlet
Private-for-profit health facility 96.0 (88.8,98.6) 319 94.1 (72.4,99.0) 21 94.4 (78.3,98.8) 340
Pharmacy 92.1 (84.3,96.2) 377 100.0 2 96.4 (88.0,99.0) 379
Drug Store 36.7 (28.9,45.4) 661 20.1 (13.7,28.5) 247 34.2 (27.4,41.7) 908
General retailer 34.2 (19.7,52.5) 74 39.2 (9.7,79.5) 13 35.2 (20.8,53.0) 87
Itinerant drug vendor 0.0 6 21.1 (1.8,79.3) 3 5.5 (0.6,35.8) 9
Total 36.8 (29.1,45.2) 1,437 34.4 (19.6,52.9) 286 36.4 (29.3,44.1) 1,723
Community health worker 100 6 4.5 (0.8,22.3) 6 20.9 (5.5,54.6) 12
Total 37.0 (29.4,45.3) 1,624 35.7 (22.4,51.7) 336 36.7 (29.9,44.1) 1,960
* A health-related qualification was defined as pharmacy, nurse or medical doctor related training. Pharmacy related training includes pharmacy studied to a certificate or diploma level; Nurse related training includes studying nursing to a certificate level (nurse aid) and diploma level; M edical doctor training includes clinical officers who studied medicine to a diploma level and fully qualified physicians.
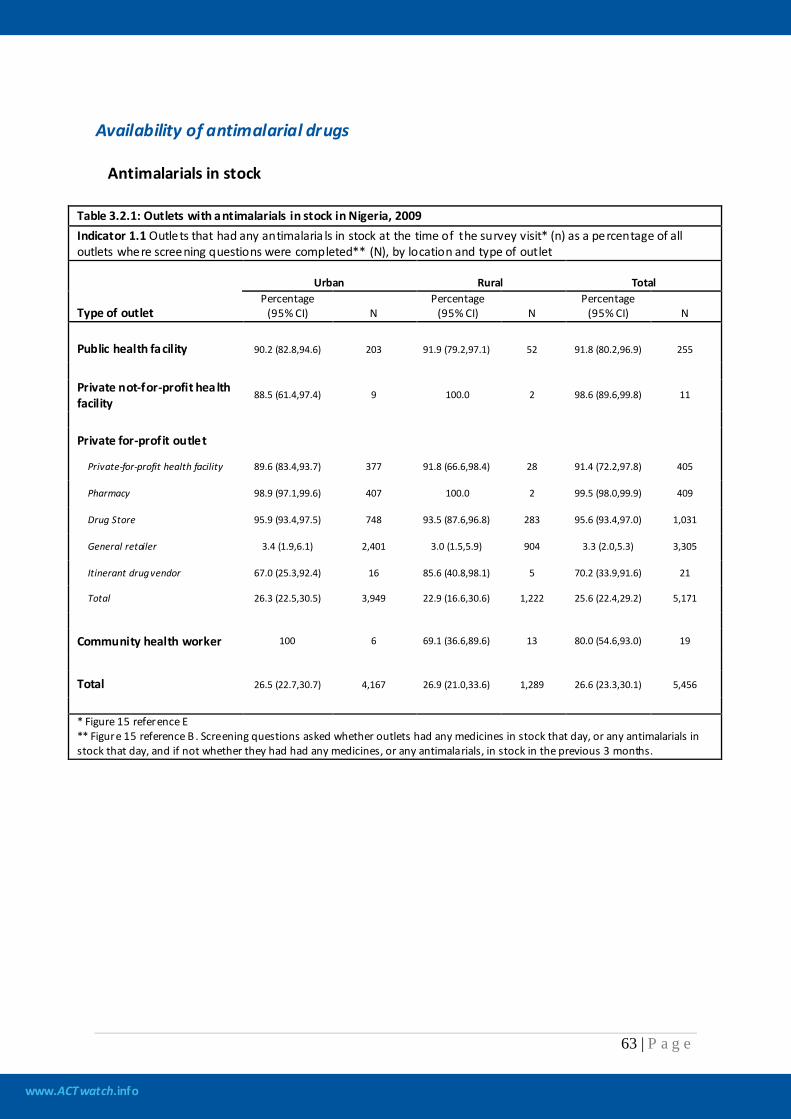
www.ACTwatch.info
63 | P a g e
Availability of antimalarial drugs
Antimalarials in stock
Table 3.2.1: Outlets with antimalarials in stock in Nigeria, 2009 Indicator 1.1 Outlets that had any antimalaria ls in stock at the time of the survey visit* (n) as a percentage of all outlets where screening questions were completed** (N), by location and type of outlet
Type of outlet
Urban Rural Total Percentage
(95% CI) N Percentage
(95% CI) N Percentage
(95% CI) N
Public health facility 90.2 (82.8,94.6) 203 91.9 (79.2,97.1) 52 91.8 (80.2,96.9) 255
Private not-for-profit health facility
88.5 (61.4,97.4) 9 100.0 2 98.6 (89.6,99.8) 11
Private for-profit outlet
Private-for-profit health facility 89.6 (83.4,93.7) 377 91.8 (66.6,98.4) 28 91.4 (72.2,97.8) 405
Pharmacy 98.9 (97.1,99.6) 407 100.0 2 99.5 (98.0,99.9) 409
Drug Store 95.9 (93.4,97.5) 748 93.5 (87.6,96.8) 283 95.6 (93.4,97.0) 1,031
General retailer 3.4 (1.9,6.1) 2,401 3.0 (1.5,5.9) 904 3.3 (2.0,5.3) 3,305
Itinerant drug vendor 67.0 (25.3,92.4) 16 85.6 (40.8,98.1) 5 70.2 (33.9,91.6) 21
Total 26.3 (22.5,30.5) 3,949 22.9 (16.6,30.6) 1,222 25.6 (22.4,29.2) 5,171
Community health worker 100 6 69.1 (36.6,89.6) 13 80.0 (54.6,93.0) 19
Total 26.5 (22.7,30.7) 4,167 26.9 (21.0,33.6) 1,289 26.6 (23.3,30.1) 5,456
* Figure 15 reference E ** Figure 15 reference B . Screening questions asked whether outlets had any medicines in stock that day, or any antimalarials in stock that day, and if not whether they had had any medicines, or any antimalarials, in stock in the previous 3 months.
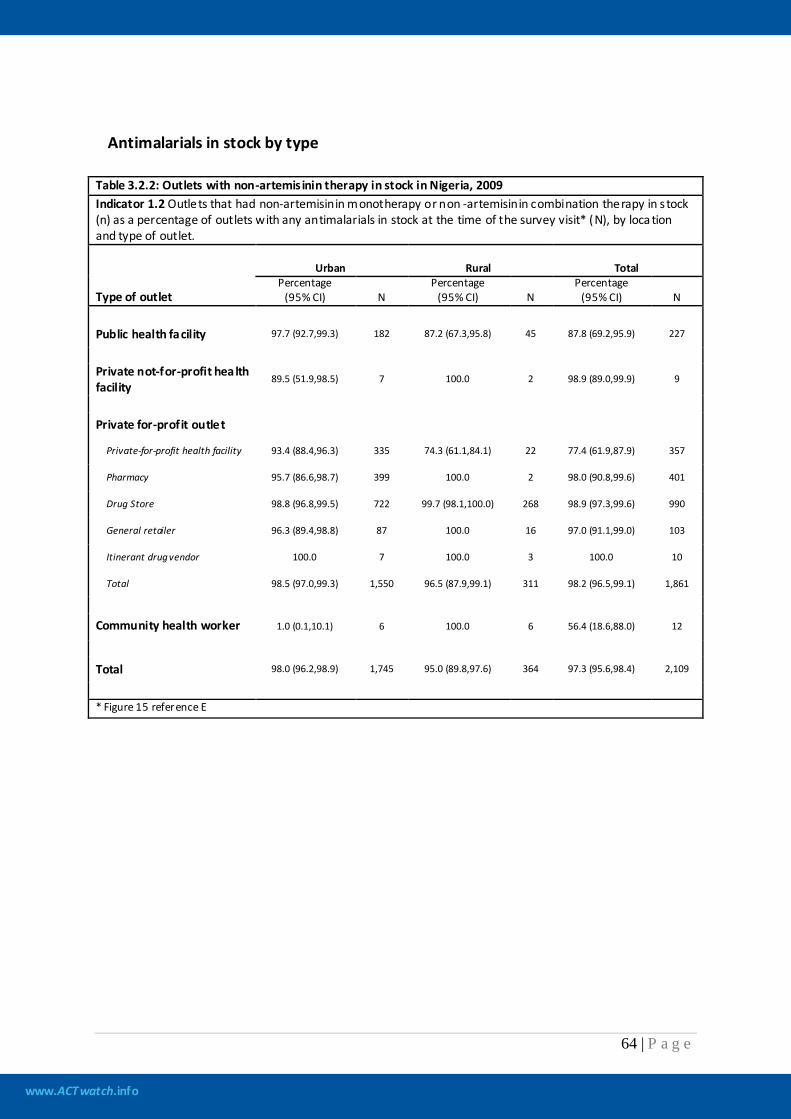
www.ACTwatch.info
64 | P a g e
Antimalarials in stock by type Table 3.2.2: Outlets with non-artemis inin therapy in stock in Nigeria, 2009 Indicator 1.2 Outlets that had non-artemisinin monotherapy or non -artemisinin combination therapy in s tock (n) as a percentage of outlets with any antimalarials in stock at the time of the survey visit* (N), by loca tion and type of outlet.
Type of outlet
Urban Rural Total Percentage
(95% CI) N Percentage
(95% CI) N Percentage
(95% CI) N
Public health facility 97.7 (92.7,99.3) 182 87.2 (67.3,95.8) 45 87.8 (69.2,95.9) 227
Private not-for-profit health facility
89.5 (51.9,98.5) 7 100.0 2 98.9 (89.0,99.9) 9
Private for-profit outlet
Private-for-profit health facility 93.4 (88.4,96.3) 335 74.3 (61.1,84.1) 22 77.4 (61.9,87.9) 357
Pharmacy 95.7 (86.6,98.7) 399 100.0 2 98.0 (90.8,99.6) 401
Drug Store 98.8 (96.8,99.5) 722 99.7 (98.1,100.0) 268 98.9 (97.3,99.6) 990
General retailer 96.3 (89.4,98.8) 87 100.0 16 97.0 (91.1,99.0) 103
Itinerant drug vendor 100.0 7 100.0 3 100.0 10
Total 98.5 (97.0,99.3) 1,550 96.5 (87.9,99.1) 311 98.2 (96.5,99.1) 1,861
Community health worker 1.0 (0.1,10.1) 6 100.0 6 56.4 (18.6,88.0) 12
Total 98.0 (96.2,98.9) 1,745 95.0 (89.8,97.6) 364 97.3 (95.6,98.4) 2,109
* Figure 15 reference E
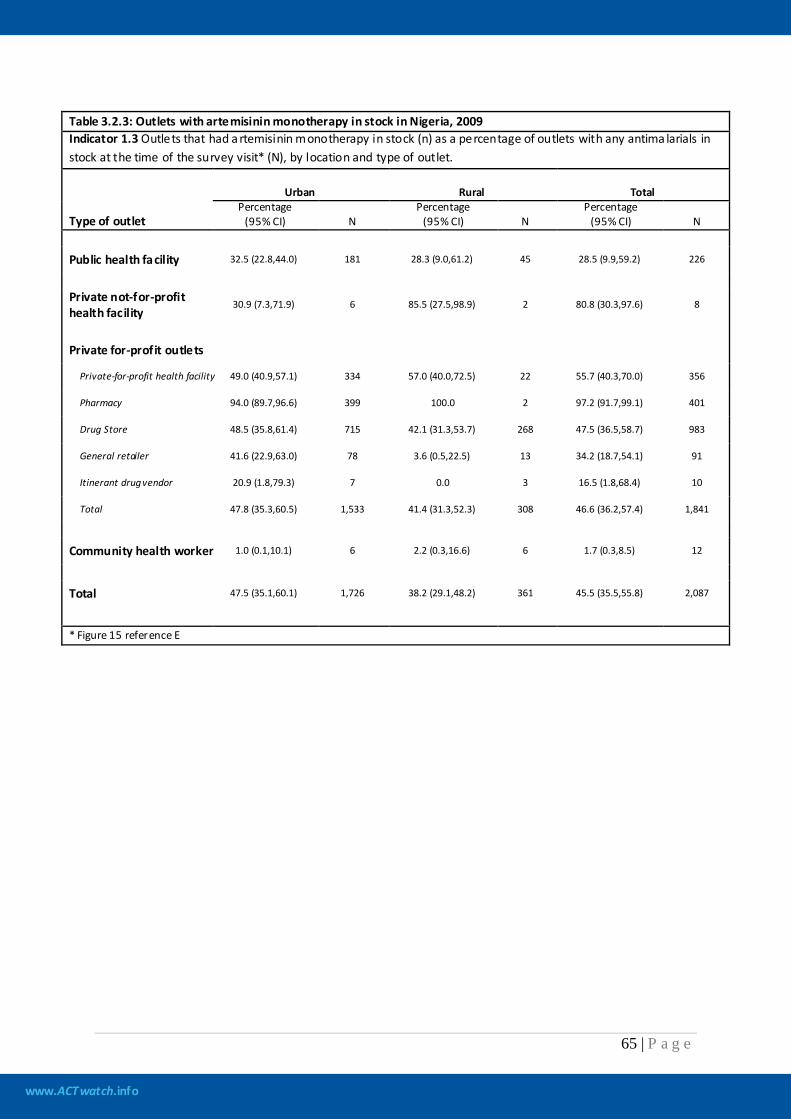
www.ACTwatch.info
65 | P a g e
Table 3.2.3: Outlets with artemisinin monotherapy in stock in Nigeria, 2009 Indicator 1.3 Outlets that had a rtemisinin monotherapy in stock (n) as a percentage of outlets with any antima larials in stock at the time of the survey visit* (N), by location and type of outlet.
Type of outlet
Urban Rural Total Percentage
(95% CI) N Percentage
(95% CI) N Percentage
(95% CI) N
Public health facility 32.5 (22.8,44.0) 181 28.3 (9.0,61.2) 45 28.5 (9.9,59.2) 226
Private not-for-profit health facility
30.9 (7.3,71.9) 6 85.5 (27.5,98.9) 2 80.8 (30.3,97.6) 8
Private for-profit outlets
Private-for-profit health facility 49.0 (40.9,57.1) 334 57.0 (40.0,72.5) 22 55.7 (40.3,70.0) 356
Pharmacy 94.0 (89.7,96.6) 399 100.0 2 97.2 (91.7,99.1) 401
Drug Store 48.5 (35.8,61.4) 715 42.1 (31.3,53.7) 268 47.5 (36.5,58.7) 983
General retailer 41.6 (22.9,63.0) 78 3.6 (0.5,22.5) 13 34.2 (18.7,54.1) 91
Itinerant drug vendor 20.9 (1.8,79.3) 7 0.0 3 16.5 (1.8,68.4) 10
Total 47.8 (35.3,60.5) 1,533 41.4 (31.3,52.3) 308 46.6 (36.2,57.4) 1,841
Community health worker 1.0 (0.1,10.1) 6 2.2 (0.3,16.6) 6 1.7 (0.3,8.5) 12
Total 47.5 (35.1,60.1) 1,726 38.2 (29.1,48.2) 361 45.5 (35.5,55.8) 2,087
* Figure 15 reference E

www.ACTwatch.info
66 | P a g e
Table 3.2.4: Outlets with non-quality-assured ACTs in stock in Nigeria, 2009 Indicator 1.4 Outlets that had non-quality-assured ACTs in stock (n) as a percentage of outlets with any antimala rials in stock at the time of the survey visit* (N), by location and type of outlet.
Type of outlet
Urban Rural Total Percentage
(95% CI) N Percentage
(95% CI) N Percentage
(95% CI) N
Public health facility 44.0 (33.3,55.3) 180 16.0 (5.9,36.5) 45 17.7 (7.7,35.8) 225
Private not-for-profit health facility
70.2 (33.8,91.6) 7 85.5 (27.5,98.9) 2 83.9 (34.0,98.1) 9
Private for-profit outlet
Private-for-profit health facility 33.5 (20.7,49.2) 334 28.7 (20.7,38.3) 22 29.5 (22.8,37.2) 356
Pharmacy 92.5 (85.9,96.2) 400 100.0 2 96.6 (89.1,99.0) 402
Drug Store 24.7 (14.1,39.7) 714 12.1 (7.0,20.0) 266 22.8 (13.6,35.7) 980
General retailer 25.3 (12.9,43.6) 78 0.0 13 20.4 (9.6,38.1) 91
Itinerant drug vendor 0.0 7 0.0 3 0.0 10
Total 24.9 (14.6,39.2) 1,533 15.5 (9.8,23.7) 306 23.2 (14.5,35.0) 1,839
Community health worker 0.0 6 2.3 (0.3,17.3) 6 1.3 (0.2,9.4) 12
Total 24.8 (14.6,39.0) 1,726 15.5 (10.6,22.1) 359 22.8 (14.5,34.0) 2,085
* Figure 15 reference E

www.ACTwatch.info
67 | P a g e
Table 3.2.5: Outlets with quality assured ACTs in stock in Nigeria, 2009 Indicator 1.5 Outlets that had quality assured ACTs in stock (n) as a percentage of outlets with any antimalarials in stock at the time of the survey visit* (N), by location and type of outlet.
Type of outlet
Urban Rural Total Percentage
(95% CI) N Percentage
(95% CI) N Percentage
(95% CI) N
Public health facility 18.3 (11.0,28.7) 181 48.1 (27.3,69.5) 45 46.3 (26.5,67.3) 226
Private not-for-profit health facility
77.1 (36.0,95.3) 6 100.0 2 98.1 (85.8,99.8) 8
Private for-profit outlet
Private-for-profit health facility 21.0 (12.7,32.7) 333 30.0 (22.0,39.4) 22 28.5 (20.7,37.8) 355
Pharmacy 63.2 (44.7,78.6) 392 3.6 (0.2,36.3) 2 30.9 (9.1,66.7) 394
Drug Store 29.4 (22.7,37.2) 715 19.3 (12.4,28.7) 266 27.9 (21.9,34.8) 981
General retailer 21.1 (10.2,38.5) 78 0.7 (0.1,5.2) 13 17.2 (7.7,33.9) 91
Itinerant drug vendor 0.0 7 0.0 3 0.0 10
Total 28.5 (22.2,35.8) 1,525 18.1 (12.6,25.2) 306 26.6 (21.0,33.0) 1,831
Community health worker 99.5 (94.8,100.0) 6 23.5 (3.4,72.7) 6 56.9 (19.9,87.6) 12
Total 28.8 (22.6,36.0) 1,718 23.7 (16.3,33.1) 359 27.7 (22.4,33.9) 2,077
* Figure 15 reference E
www.ACTwatch.info
68 | P a g e
Stock-outs of quality assured ACTs
Table 3.2.6: Outlets with stock-outs of quality assured ACTs in Nigeria, 2009 Indicator 1.6 Outlets that were out of s tock of a ll quality assured ACTs for at least 1 day in the last 7 days (n) as a percentage of outlets with any quality assured ACTs in s tock at the time of the survey visit or in the 4 weeks preceding the survey visit (N), by location and type of outlet.* Indicator not available This is an indicator of the Independent Evaluation of the AMFm which was determined only after the fieldwork for this study was launched. This survey round was not designed to collect data needed to calculate this indicator and therefore this indicator cannot be calculated given the data set.
www.ACTwatch.info
69 | P a g e
Population coverage of outlets with quality assured ACTs
Table 3.2.7: Percentage of the population living in censused loca lities with outlets with quality assured ACTs in stock at the time of survey in Nigeria, 2009 Indicator 1.7: Population living in a censused localities where there was at least one of a given type of outlet with a QAACT in stock at the time of the survey visit (n) as a percentage of the tota l population living in all the censused localities (N), by location. Indicator not available This is an indicator of the Independent Evaluation of the AMFm which was determined only after the fieldwork for this study was launched. This indicator was not calculated for Nigeria because of the highly variable size of the clusters sampled in the ACTwatch survey.
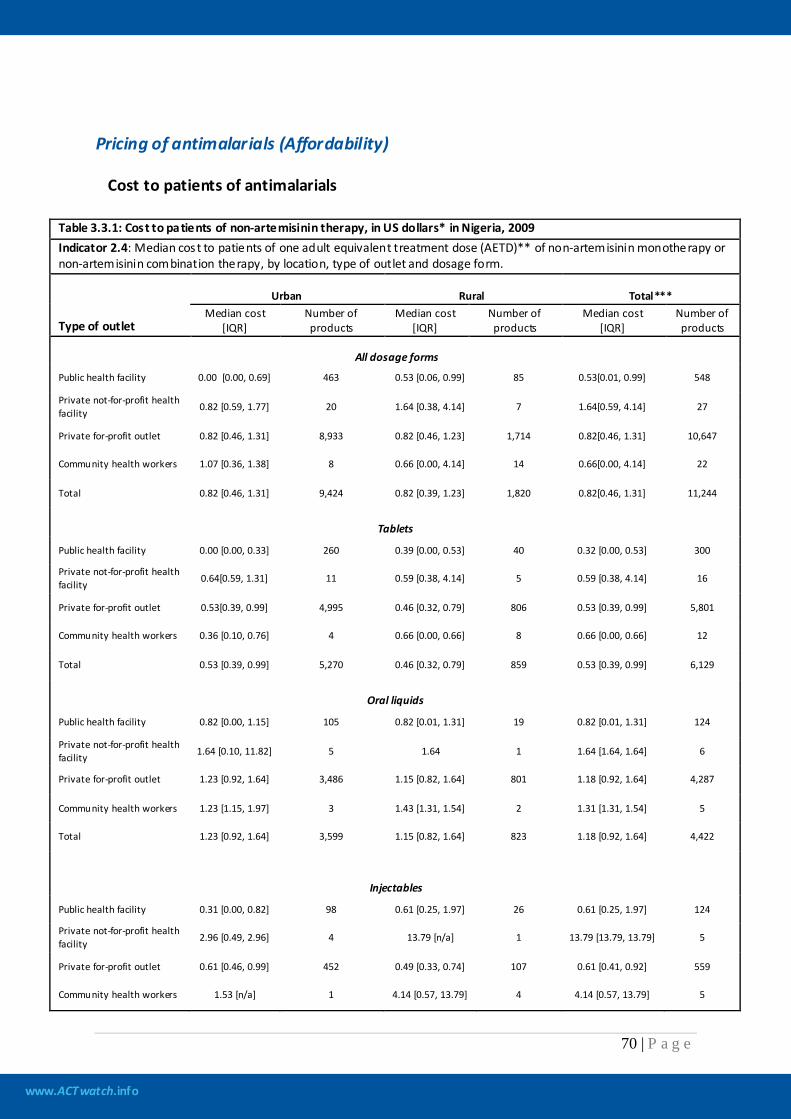
www.ACTwatch.info
70 | P a g e
Pricing of antimalarials (Affordability)
Cost to patients of antimalarials
Table 3.3.1: Cost to patients of non-artemisinin therapy, in US dollars* in Nigeria, 2009 Indicator 2.4: Median cost to patients of one adult equivalent treatment dose (AETD)** of non-artemisinin monotherapy or non-artemisinin combination therapy, by location, type of outlet and dosage form.
Type of outlet
Urban Rural Total*** Median cost
[IQR] Number of products
Median cost [IQR]
Number of products
Median cost [IQR]
Number of products
All dosage forms
Public health facility 0.00 [0.00, 0.69] 463 0.53 [0.06, 0.99] 85 0.53[0.01, 0.99] 548
Private not-for-profit health facility 0.82 [0.59, 1.77] 20 1.64 [0.38, 4.14] 7 1.64[0.59, 4.14] 27
Private for-profit outlet 0.82 [0.46, 1.31] 8,933 0.82 [0.46, 1.23] 1,714 0.82[0.46, 1.31] 10,647
Community health workers 1.07 [0.36, 1.38] 8 0.66 [0.00, 4.14] 14 0.66[0.00, 4.14] 22
Total 0.82 [0.46, 1.31] 9,424 0.82 [0.39, 1.23] 1,820 0.82[0.46, 1.31] 11,244
Tablets
Public health facility 0.00 [0.00, 0.33] 260 0.39 [0.00, 0.53] 40 0.32 [0.00, 0.53] 300
Private not-for-profit health facility 0.64[0.59, 1.31] 11 0.59 [0.38, 4.14] 5 0.59 [0.38, 4.14] 16
Private for-profit outlet 0.53[0.39, 0.99] 4,995 0.46 [0.32, 0.79] 806 0.53 [0.39, 0.99] 5,801
Community health workers 0.36 [0.10, 0.76] 4 0.66 [0.00, 0.66] 8 0.66 [0.00, 0.66] 12
Total 0.53 [0.39, 0.99] 5,270 0.46 [0.32, 0.79] 859 0.53 [0.39, 0.99] 6,129
Oral liquids
Public health facility 0.82 [0.00, 1.15] 105 0.82 [0.01, 1.31] 19 0.82 [0.01, 1.31] 124
Private not-for-profit health facility 1.64 [0.10, 11.82] 5 1.64 1 1.64 [1.64, 1.64] 6
Private for-profit outlet 1.23 [0.92, 1.64] 3,486 1.15 [0.82, 1.64] 801 1.18 [0.92, 1.64] 4,287
Community health workers 1.23 [1.15, 1.97] 3 1.43 [1.31, 1.54] 2 1.31 [1.31, 1.54] 5
Total 1.23 [0.92, 1.64] 3,599 1.15 [0.82, 1.64] 823 1.18 [0.92, 1.64] 4,422
Injectables
Public health facility 0.31 [0.00, 0.82] 98 0.61 [0.25, 1.97] 26 0.61 [0.25, 1.97] 124
Private not-for-profit health facility 2.96 [0.49, 2.96] 4 13.79 [n/a] 1 13.79 [13.79, 13.79] 5
Private for-profit outlet 0.61 [0.46, 0.99] 452 0.49 [0.33, 0.74] 107 0.61 [0.41, 0.92] 559
Community health workers 1.53 [n/a] 1 4.14 [0.57, 13.79] 4 4.14 [0.57, 13.79] 5
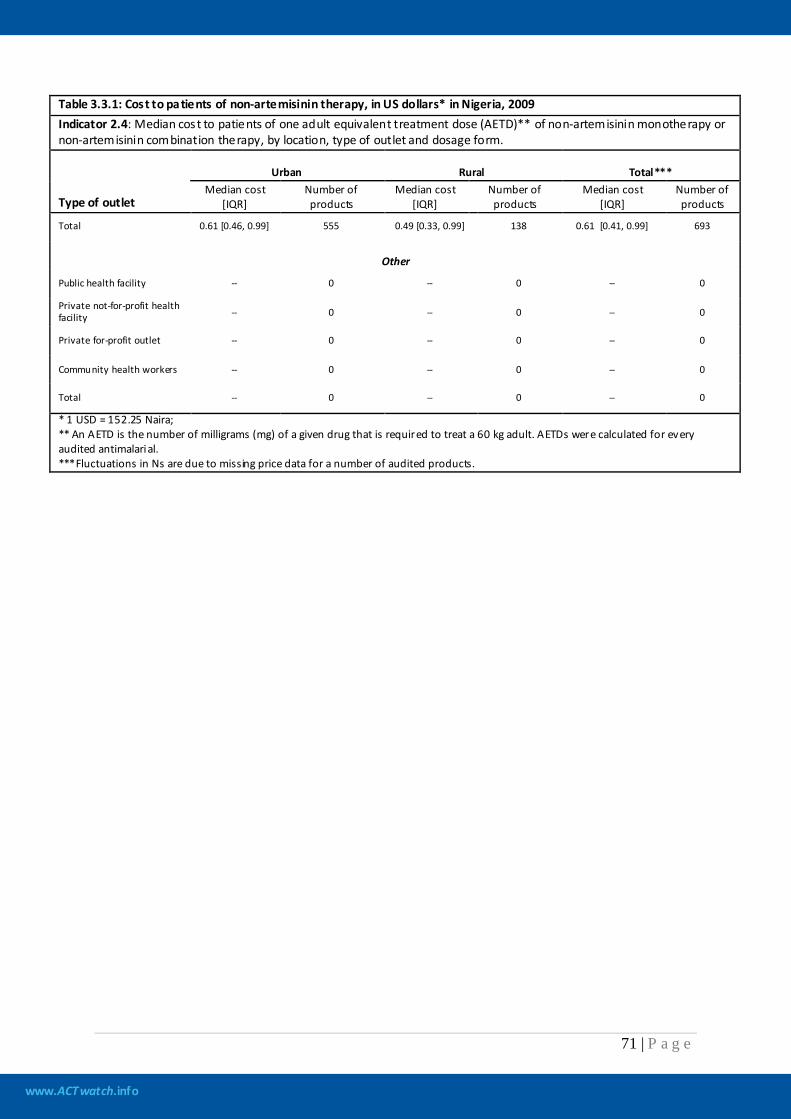
www.ACTwatch.info
71 | P a g e
Table 3.3.1: Cost to patients of non-artemisinin therapy, in US dollars* in Nigeria, 2009 Indicator 2.4: Median cost to patients of one adult equivalent treatment dose (AETD)** of non-artemisinin monotherapy or non-artemisinin combination therapy, by location, type of outlet and dosage form.
Type of outlet
Urban Rural Total*** Median cost
[IQR] Number of products
Median cost [IQR]
Number of products
Median cost [IQR]
Number of products
Total 0.61 [0.46, 0.99] 555 0.49 [0.33, 0.99] 138 0.61 [0.41, 0.99] 693
Other
Public health facility -- 0 -- 0 -- 0
Private not-for-profit health facility -- 0 -- 0 -- 0
Private for-profit outlet -- 0 -- 0 -- 0
Community health workers -- 0 -- 0 -- 0
Total -- 0 -- 0 -- 0
* 1 USD = 152.25 Naira; ** An AETD is the number of milligrams (mg) of a given drug that is required to treat a 60 kg adult. AETDs were calculated for every audited antimalarial. ***Fluctuations in Ns are due to missing price data for a number of audited products.
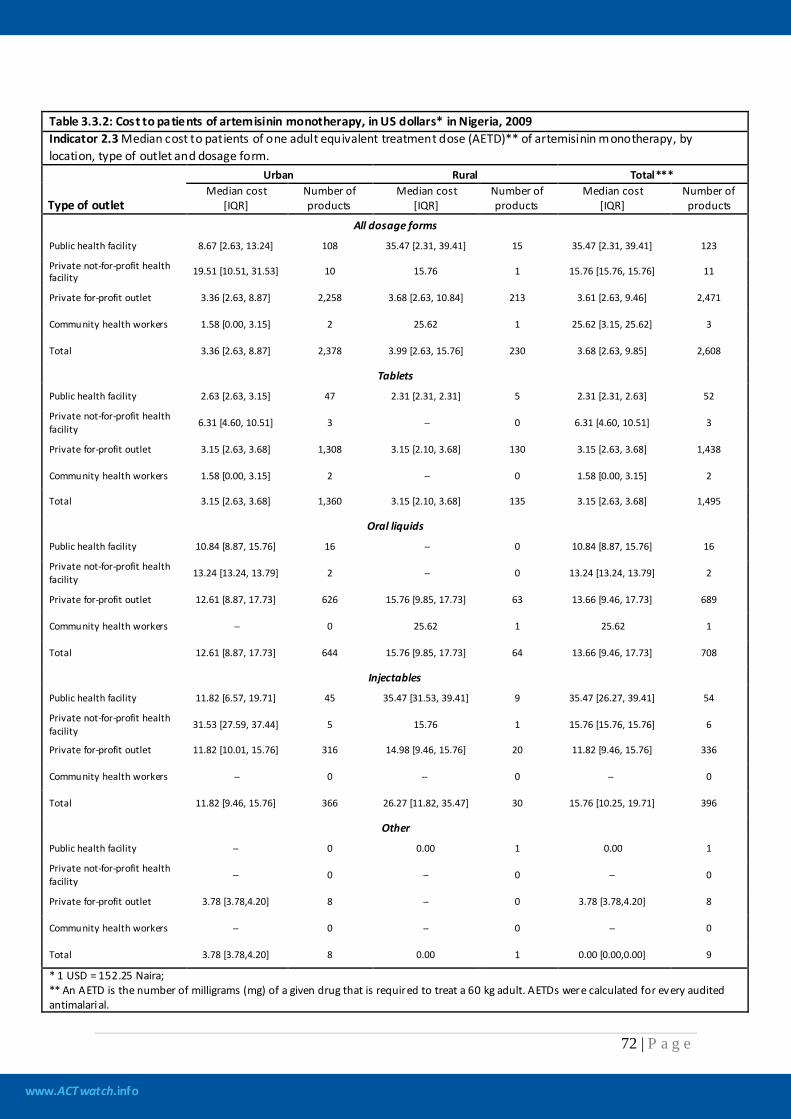
www.ACTwatch.info
72 | P a g e
Table 3.3.2: Cost to patients of artemisinin monotherapy, in US dollars* in Nigeria, 2009 Indicator 2.3 Median cost to patients of one adult equivalent treatment dose (AETD)** of artemisinin monotherapy, by location, type of outlet and dosage form.
Type of outlet
Urban Rural Total*** Median cost
[IQR] Number of products
Median cost [IQR]
Number of products
Median cost [IQR]
Number of products
All dosage forms
Public health facility 8.67 [2.63, 13.24] 108 35.47 [2.31, 39.41] 15 35.47 [2.31, 39.41] 123
Private not-for-profit health facility 19.51 [10.51, 31.53] 10 15.76 1 15.76 [15.76, 15.76] 11
Private for-profit outlet 3.36 [2.63, 8.87] 2,258 3.68 [2.63, 10.84] 213 3.61 [2.63, 9.46] 2,471
Community health workers 1.58 [0.00, 3.15] 2 25.62 1 25.62 [3.15, 25.62] 3
Total 3.36 [2.63, 8.87] 2,378 3.99 [2.63, 15.76] 230 3.68 [2.63, 9.85] 2,608
Tablets
Public health facility 2.63 [2.63, 3.15] 47 2.31 [2.31, 2.31] 5 2.31 [2.31, 2.63] 52
Private not-for-profit health facility 6.31 [4.60, 10.51] 3 -- 0 6.31 [4.60, 10.51] 3
Private for-profit outlet 3.15 [2.63, 3.68] 1,308 3.15 [2.10, 3.68] 130 3.15 [2.63, 3.68] 1,438
Community health workers 1.58 [0.00, 3.15] 2 -- 0 1.58 [0.00, 3.15] 2
Total 3.15 [2.63, 3.68] 1,360 3.15 [2.10, 3.68] 135 3.15 [2.63, 3.68] 1,495
Oral liquids
Public health facility 10.84 [8.87, 15.76] 16 -- 0 10.84 [8.87, 15.76] 16
Private not-for-profit health facility 13.24 [13.24, 13.79] 2 -- 0 13.24 [13.24, 13.79] 2
Private for-profit outlet 12.61 [8.87, 17.73] 626 15.76 [9.85, 17.73] 63 13.66 [9.46, 17.73] 689
Community health workers -- 0 25.62 1 25.62 1
Total 12.61 [8.87, 17.73] 644 15.76 [9.85, 17.73] 64 13.66 [9.46, 17.73] 708
Injectables
Public health facility 11.82 [6.57, 19.71] 45 35.47 [31.53, 39.41] 9 35.47 [26.27, 39.41] 54
Private not-for-profit health facility 31.53 [27.59, 37.44] 5 15.76 1 15.76 [15.76, 15.76] 6
Private for-profit outlet 11.82 [10.01, 15.76] 316 14.98 [9.46, 15.76] 20 11.82 [9.46, 15.76] 336
Community health workers -- 0 -- 0 -- 0
Total 11.82 [9.46, 15.76] 366 26.27 [11.82, 35.47] 30 15.76 [10.25, 19.71] 396
Other
Public health facility -- 0 0.00 1 0.00 1
Private not-for-profit health facility -- 0 -- 0 -- 0
Private for-profit outlet 3.78 [3.78,4.20] 8 -- 0 3.78 [3.78,4.20] 8
Community health workers -- 0 -- 0 -- 0
Total 3.78 [3.78,4.20] 8 0.00 1 0.00 [0.00,0.00] 9
* 1 USD = 152.25 Naira; ** An AETD is the number of milligrams (mg) of a given drug that is required to treat a 60 kg adult. AETDs were calculated for every audited antimalarial.
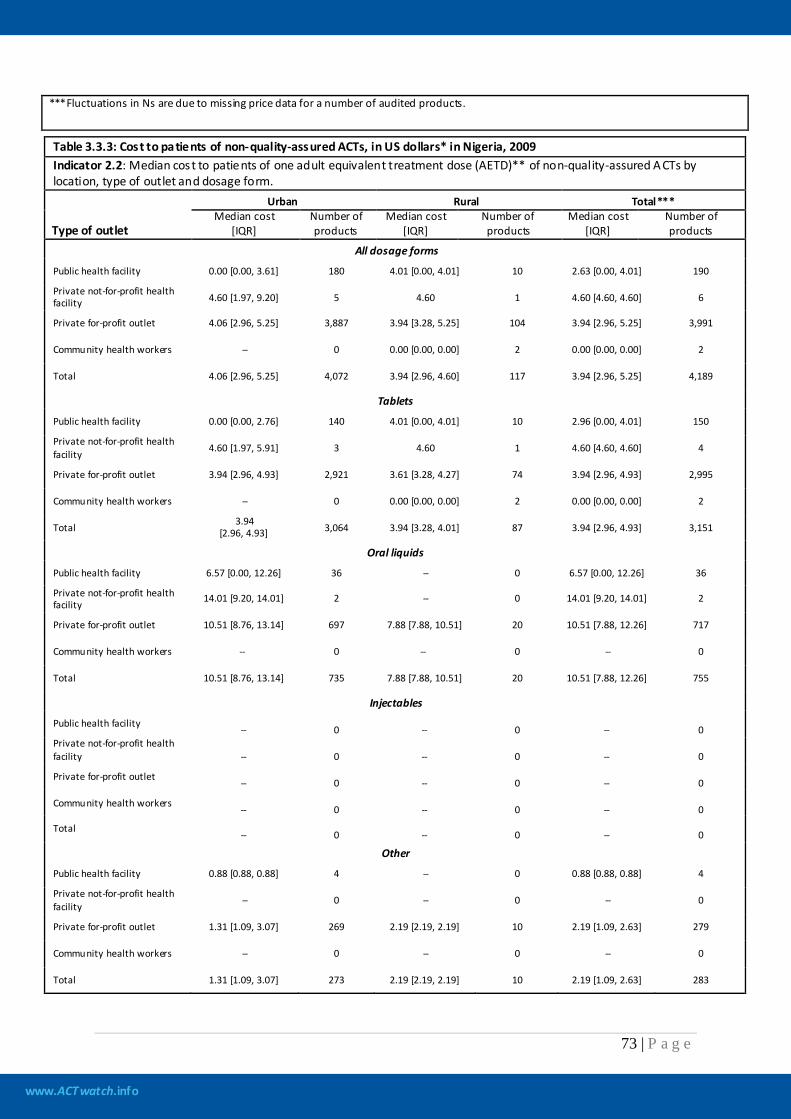
www.ACTwatch.info
73 | P a g e
***Fluctuations in Ns are due to missing price data for a number of audited products.
Table 3.3.3: Cost to patients of non-quality-assured ACTs, in US dollars* in Nigeria, 2009 Indicator 2.2: Median cost to patients of one adult equivalent treatment dose (AETD)** of non-quality-assured A CTs by location, type of outlet and dosage form.
Type of outlet
Urban Rural Total*** Median cost
[IQR] Number of products
Median cost [IQR]
Number of products
Median cost [IQR]
Number of products
All dosage forms
Public health facility 0.00 [0.00, 3.61] 180 4.01 [0.00, 4.01] 10 2.63 [0.00, 4.01] 190
Private not-for-profit health facility 4.60 [1.97, 9.20] 5 4.60 1 4.60 [4.60, 4.60] 6
Private for-profit outlet 4.06 [2.96, 5.25] 3,887 3.94 [3.28, 5.25] 104 3.94 [2.96, 5.25] 3,991
Community health workers -- 0 0.00 [0.00, 0.00] 2 0.00 [0.00, 0.00] 2
Total 4.06 [2.96, 5.25] 4,072 3.94 [2.96, 4.60] 117 3.94 [2.96, 5.25] 4,189
Tablets
Public health facility 0.00 [0.00, 2.76] 140 4.01 [0.00, 4.01] 10 2.96 [0.00, 4.01] 150
Private not-for-profit health facility 4.60 [1.97, 5.91] 3 4.60 1 4.60 [4.60, 4.60] 4
Private for-profit outlet 3.94 [2.96, 4.93] 2,921 3.61 [3.28, 4.27] 74 3.94 [2.96, 4.93] 2,995
Community health workers -- 0 0.00 [0.00, 0.00] 2 0.00 [0.00, 0.00] 2
Total 3.94 [2.96, 4.93] 3,064 3.94 [3.28, 4.01] 87 3.94 [2.96, 4.93] 3,151
Oral liquids
Public health facility 6.57 [0.00, 12.26] 36 -- 0 6.57 [0.00, 12.26] 36
Private not-for-profit health facility 14.01 [9.20, 14.01] 2 -- 0 14.01 [9.20, 14.01] 2
Private for-profit outlet 10.51 [8.76, 13.14] 697 7.88 [7.88, 10.51] 20 10.51 [7.88, 12.26] 717
Community health workers -- 0 -- 0 -- 0
Total 10.51 [8.76, 13.14] 735 7.88 [7.88, 10.51] 20 10.51 [7.88, 12.26] 755
Injectables
Public health facility -- 0 -- 0 -- 0 Private not-for-profit health facility -- 0 -- 0 -- 0
Private for-profit outlet -- 0 -- 0 -- 0
Community health workers -- 0 -- 0 -- 0
Total -- 0 -- 0 -- 0
Other
Public health facility 0.88 [0.88, 0.88] 4 -- 0 0.88 [0.88, 0.88] 4
Private not-for-profit health facility -- 0 -- 0 -- 0
Private for-profit outlet 1.31 [1.09, 3.07] 269 2.19 [2.19, 2.19] 10 2.19 [1.09, 2.63] 279
Community health workers -- 0 -- 0 -- 0
Total 1.31 [1.09, 3.07] 273 2.19 [2.19, 2.19] 10 2.19 [1.09, 2.63] 283
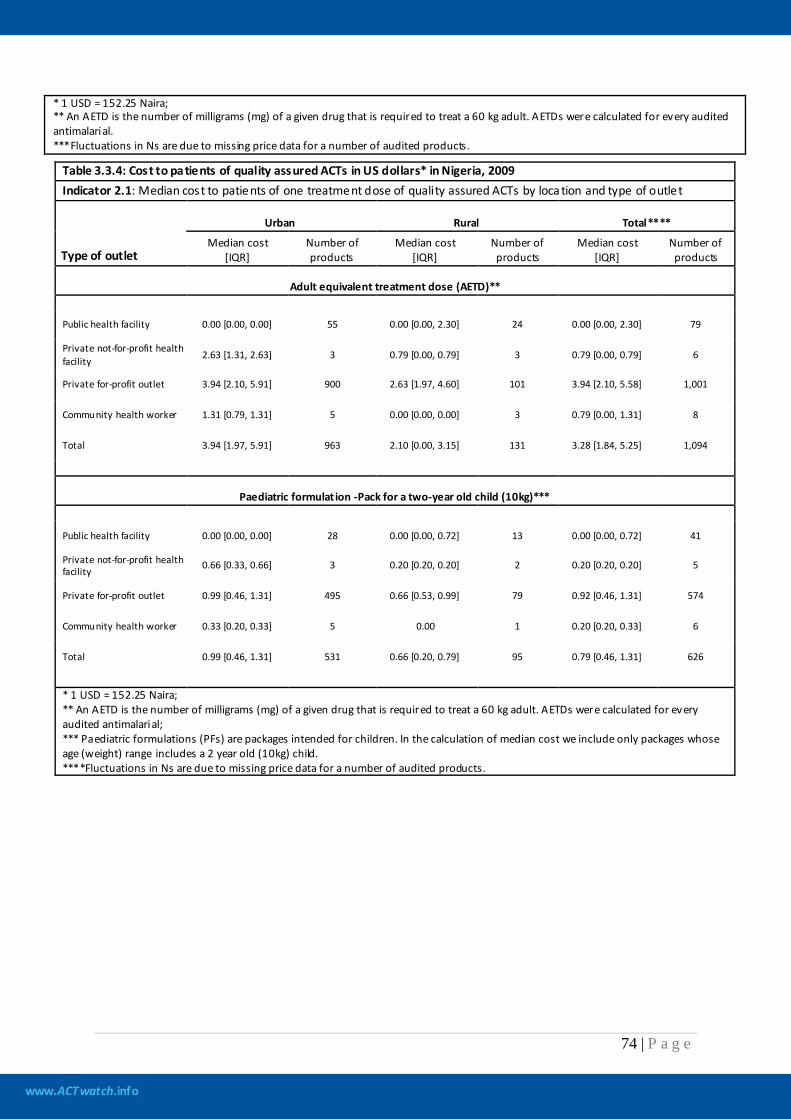
www.ACTwatch.info
74 | P a g e
* 1 USD = 152.25 Naira; ** An AETD is the number of milligrams (mg) of a given drug that is required to treat a 60 kg adult. AETDs were calculated for every audited antimalarial. ***Fluctuations in Ns are due to missing price data for a number of audited products.
Table 3.3.4: Cost to patients of quality assured ACTs in US dollars* in Nigeria, 2009 Indicator 2.1: Median cost to patients of one treatment dose of quality assured ACTs by loca tion and type of outlet
Type of outlet
Urban Rural Total****
Median cost [IQR]
Number of products
Median cost [IQR]
Number of products
Median cost [IQR]
Number of products
Adult equivalent treatment dose (AETD)**
Public health facility 0.00 [0.00, 0.00] 55 0.00 [0.00, 2.30] 24 0.00 [0.00, 2.30] 79
Private not-for-profit health facility 2.63 [1.31, 2.63] 3 0.79 [0.00, 0.79] 3 0.79 [0.00, 0.79] 6
Private for-profit outlet 3.94 [2.10, 5.91] 900 2.63 [1.97, 4.60] 101 3.94 [2.10, 5.58] 1,001
Community health worker 1.31 [0.79, 1.31] 5 0.00 [0.00, 0.00] 3 0.79 [0.00, 1.31] 8
Total 3.94 [1.97, 5.91] 963 2.10 [0.00, 3.15] 131 3.28 [1.84, 5.25] 1,094
Paediatric formulat ion -Pack for a two-year old child (10kg)***
Public health facility 0.00 [0.00, 0.00] 28 0.00 [0.00, 0.72] 13 0.00 [0.00, 0.72] 41
Private not-for-profit health facility 0.66 [0.33, 0.66] 3 0.20 [0.20, 0.20] 2 0.20 [0.20, 0.20] 5
Private for-profit outlet 0.99 [0.46, 1.31] 495 0.66 [0.53, 0.99] 79 0.92 [0.46, 1.31] 574
Community health worker 0.33 [0.20, 0.33] 5 0.00 1 0.20 [0.20, 0.33] 6
Total 0.99 [0.46, 1.31] 531 0.66 [0.20, 0.79] 95 0.79 [0.46, 1.31] 626
* 1 USD = 152.25 Naira; ** An AETD is the number of milligrams (mg) of a given drug that is required to treat a 60 kg adult. AETDs were calculated for every audited antimalarial; *** Paediatric formulations (PFs) are packages intended for children. In the calculation of median cost we include only packages whose age (weight) range includes a 2 year old (10kg) child. ****Fluctuations in Ns are due to missing price data for a number of audited products.
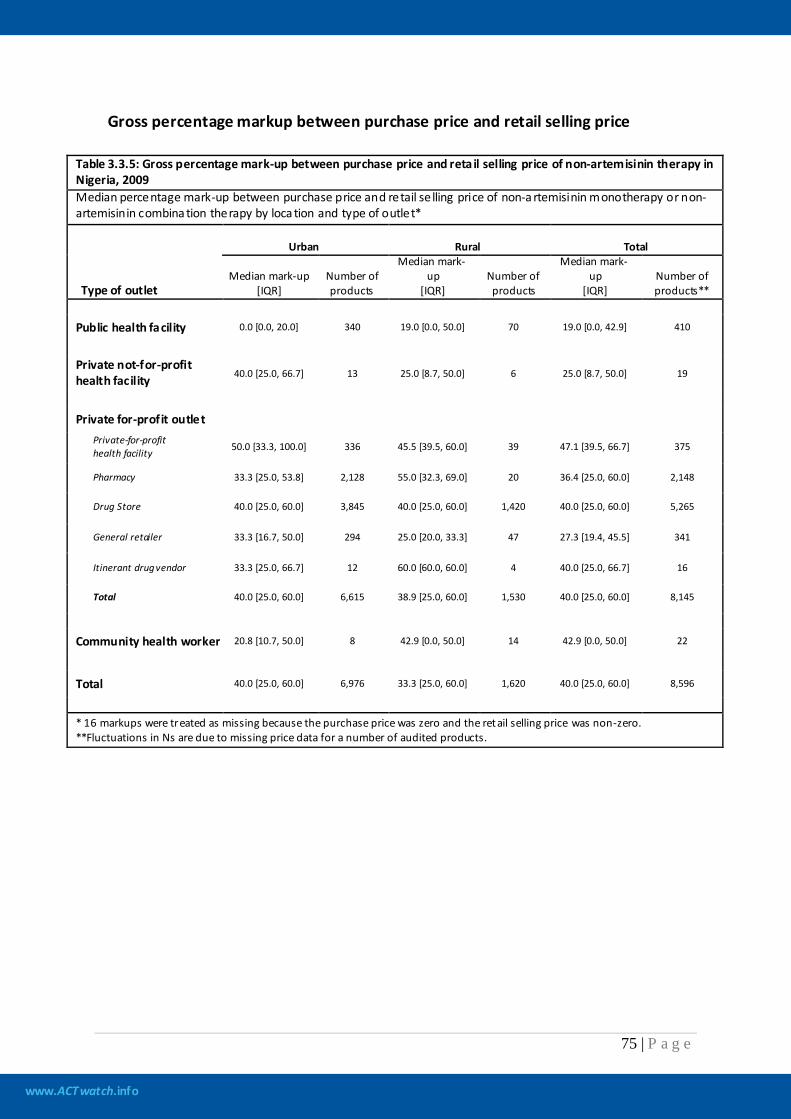
www.ACTwatch.info
75 | P a g e
Gross percentage markup between purchase price and retail selling price
Table 3.3.5: Gross percentage mark-up between purchase price and reta il selling price of non-artemisinin therapy in Nigeria, 2009 Median percentage mark-up between purchase price and retail se lling price of non-a rtemisinin monotherapy or non-artemisinin combina tion therapy by loca tion and type of outlet*
Type of outlet
Urban Rural Total
Median mark-up [IQR]
Number of products
Median mark-up
[IQR] Number of products
Median mark-up
[IQR] Number of products**
Public health facility 0.0 [0.0, 20.0] 340 19.0 [0.0, 50.0] 70 19.0 [0.0, 42.9] 410
Private not-for-profit health facility 40.0 [25.0, 66.7] 13 25.0 [8.7, 50.0] 6 25.0 [8.7, 50.0] 19
Private for-profit outlet
Private-for-profit health facility 50.0 [33.3, 100.0] 336 45.5 [39.5, 60.0] 39 47.1 [39.5, 66.7] 375
Pharmacy 33.3 [25.0, 53.8] 2,128 55.0 [32.3, 69.0] 20 36.4 [25.0, 60.0] 2,148
Drug Store 40.0 [25.0, 60.0] 3,845 40.0 [25.0, 60.0] 1,420 40.0 [25.0, 60.0] 5,265
General retailer 33.3 [16.7, 50.0] 294 25.0 [20.0, 33.3] 47 27.3 [19.4, 45.5] 341
Itinerant drug vendor 33.3 [25.0, 66.7] 12 60.0 [60.0, 60.0] 4 40.0 [25.0, 66.7] 16
Total 40.0 [25.0, 60.0] 6,615 38.9 [25.0, 60.0] 1,530 40.0 [25.0, 60.0] 8,145
Community health worker 20.8 [10.7, 50.0] 8 42.9 [0.0, 50.0] 14 42.9 [0.0, 50.0] 22
Total 40.0 [25.0, 60.0] 6,976 33.3 [25.0, 60.0] 1,620 40.0 [25.0, 60.0] 8,596
* 16 markups were treated as missing because the purchase price was zero and the retail selling price was non-zero. **Fluctuations in Ns are due to missing price data for a number of audited products.
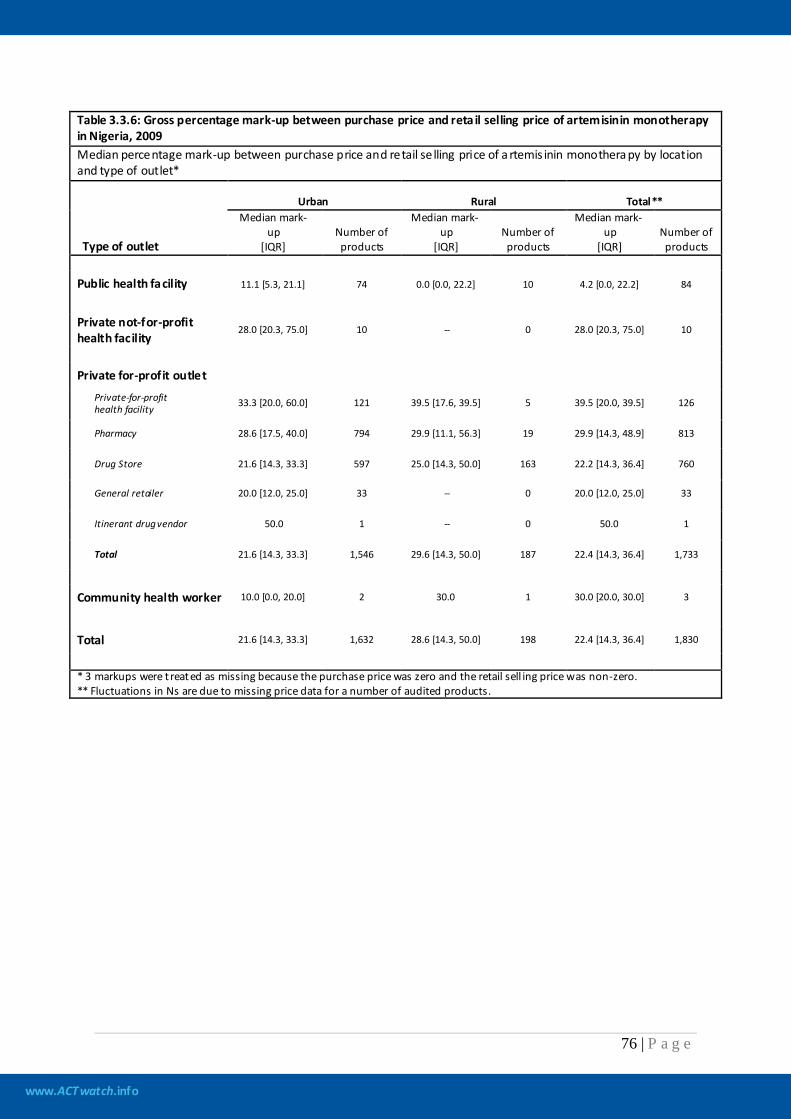
www.ACTwatch.info
76 | P a g e
Table 3.3.6: Gross percentage mark-up between purchase price and reta il selling price of artemisinin monotherapy in Nigeria, 2009 Median percentage mark-up between purchase price and retail se lling price of a rtemis inin monothera py by location and type of outlet*
Type of outlet
Urban Rural Total** Median mark-
up [IQR]
Number of products
Median mark-up
[IQR] Number of products
Median mark-up
[IQR] Number of products
Public health facility 11.1 [5.3, 21.1] 74 0.0 [0.0, 22.2] 10 4.2 [0.0, 22.2] 84
Private not-for-profit health facility
28.0 [20.3, 75.0] 10 -- 0 28.0 [20.3, 75.0] 10
Private for-profit outlet
Private-for-profit health facility 33.3 [20.0, 60.0] 121 39.5 [17.6, 39.5] 5 39.5 [20.0, 39.5] 126
Pharmacy 28.6 [17.5, 40.0] 794 29.9 [11.1, 56.3] 19 29.9 [14.3, 48.9] 813
Drug Store 21.6 [14.3, 33.3] 597 25.0 [14.3, 50.0] 163 22.2 [14.3, 36.4] 760
General retailer 20.0 [12.0, 25.0] 33 -- 0 20.0 [12.0, 25.0] 33
Itinerant drug vendor 50.0 1 -- 0 50.0 1
Total 21.6 [14.3, 33.3] 1,546 29.6 [14.3, 50.0] 187 22.4 [14.3, 36.4] 1,733
Community health worker 10.0 [0.0, 20.0] 2 30.0 1 30.0 [20.0, 30.0] 3
Total 21.6 [14.3, 33.3] 1,632 28.6 [14.3, 50.0] 198 22.4 [14.3, 36.4] 1,830
* 3 markups were t reated as missing because the purchase price was zero and the retail sell ing price was non-zero. ** Fluctuations in Ns are due to missing price data for a number of audited products.
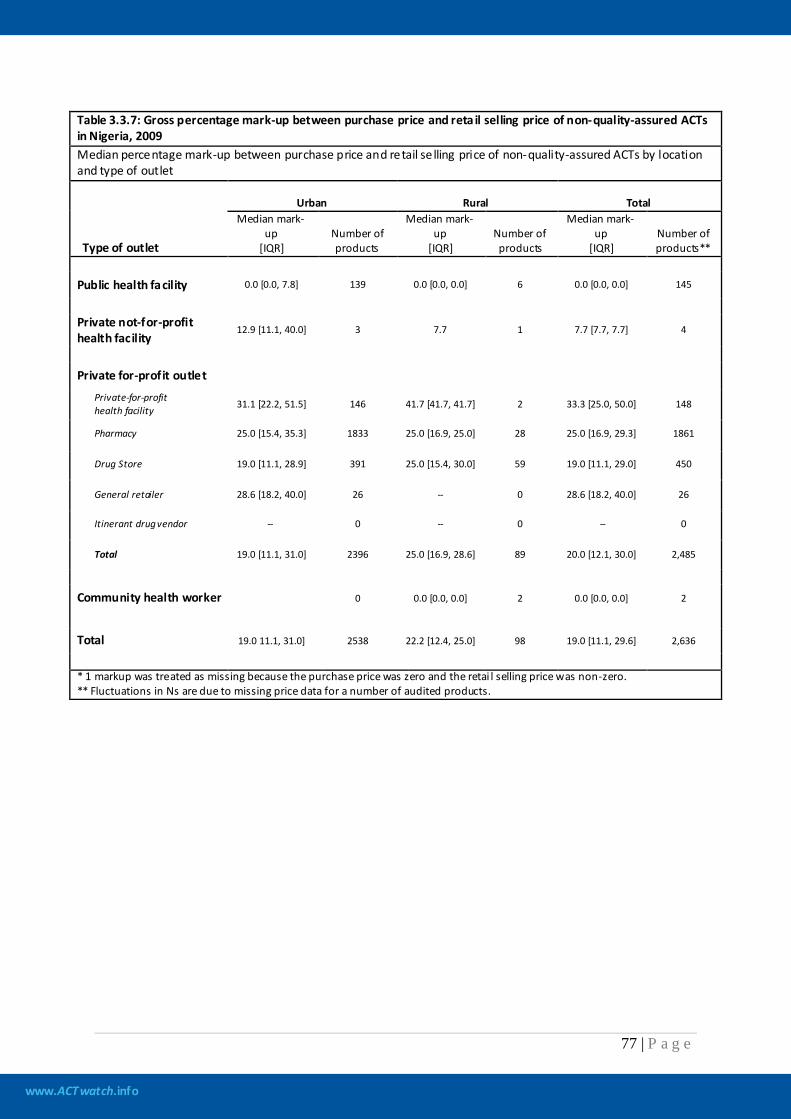
www.ACTwatch.info
77 | P a g e
Table 3.3.7: Gross percentage mark-up between purchase price and reta il selling price of non-quality-assured ACTs in Nigeria, 2009 Median percentage mark-up between purchase price and retail se lling price of non-quality-assured ACTs by location and type of outlet
Type of outlet
Urban Rural Total Median mark-
up [IQR]
Number of products
Median mark-up
[IQR] Number of products
Median mark-up
[IQR] Number of products**
Public health facility 0.0 [0.0, 7.8] 139 0.0 [0.0, 0.0] 6 0.0 [0.0, 0.0] 145
Private not-for-profit health facility
12.9 [11.1, 40.0] 3 7.7 1 7.7 [7.7, 7.7] 4
Private for-profit outlet
Private-for-profit health facility 31.1 [22.2, 51.5] 146 41.7 [41.7, 41.7] 2 33.3 [25.0, 50.0] 148
Pharmacy 25.0 [15.4, 35.3] 1833 25.0 [16.9, 25.0] 28 25.0 [16.9, 29.3] 1861
Drug Store 19.0 [11.1, 28.9] 391 25.0 [15.4, 30.0] 59 19.0 [11.1, 29.0] 450
General retailer 28.6 [18.2, 40.0] 26 -- 0 28.6 [18.2, 40.0] 26
Itinerant drug vendor -- 0 -- 0 -- 0
Total 19.0 [11.1, 31.0] 2396 25.0 [16.9, 28.6] 89 20.0 [12.1, 30.0] 2,485
Community health worker 0 0.0 [0.0, 0.0] 2 0.0 [0.0, 0.0] 2
Total 19.0 11.1, 31.0] 2538 22.2 [12.4, 25.0] 98 19.0 [11.1, 29.6] 2,636
* 1 markup was treated as missing because the purchase price was zero and the retai l selling price was non-zero. ** Fluctuations in Ns are due to missing price data for a number of audited products.
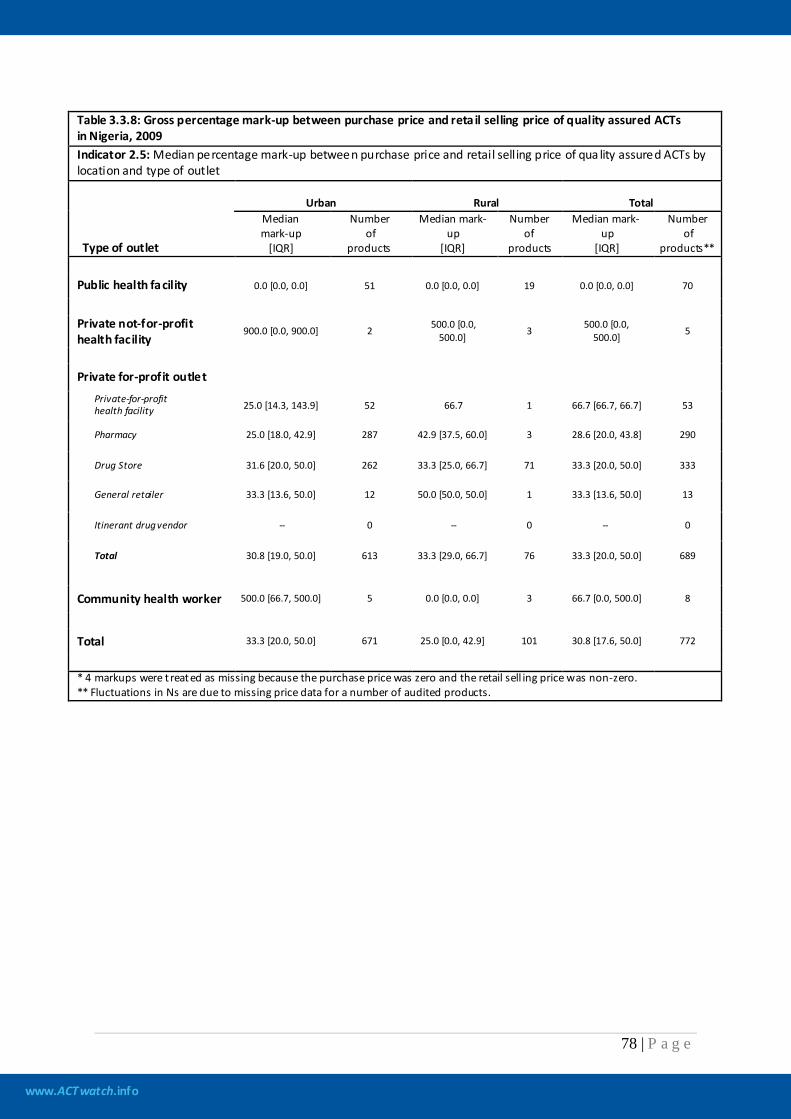
www.ACTwatch.info
78 | P a g e
Table 3.3.8: Gross percentage mark-up between purchase price and reta il selling price of quality assured ACTs in Nigeria, 2009 Indicator 2.5: Median percentage mark-up between purchase price and retail selling price of qua lity assured ACTs by location and type of outlet
Type of outlet
Urban Rural Total Median mark-up
[IQR]
Number of
products
Median mark-up
[IQR]
Number of
products
Median mark-up
[IQR]
Number of
products**
Public health facility 0.0 [0.0, 0.0] 51 0.0 [0.0, 0.0] 19 0.0 [0.0, 0.0] 70
Private not-for-profit health facility
900.0 [0.0, 900.0] 2 500.0 [0.0, 500.0] 3 500.0 [0.0,
500.0] 5
Private for-profit outlet
Private-for-profit health facility 25.0 [14.3, 143.9] 52 66.7 1 66.7 [66.7, 66.7] 53
Pharmacy 25.0 [18.0, 42.9] 287 42.9 [37.5, 60.0] 3 28.6 [20.0, 43.8] 290
Drug Store 31.6 [20.0, 50.0] 262 33.3 [25.0, 66.7] 71 33.3 [20.0, 50.0] 333
General retailer 33.3 [13.6, 50.0] 12 50.0 [50.0, 50.0] 1 33.3 [13.6, 50.0] 13
Itinerant drug vendor -- 0 -- 0 -- 0
Total 30.8 [19.0, 50.0] 613 33.3 [29.0, 66.7] 76 33.3 [20.0, 50.0] 689
Community health worker 500.0 [66.7, 500.0] 5 0.0 [0.0, 0.0] 3 66.7 [0.0, 500.0] 8
Total 33.3 [20.0, 50.0] 671 25.0 [0.0, 42.9] 101 30.8 [17.6, 50.0] 772
* 4 markups were t reated as missing because the purchase price was zero and the retail sell ing price was non-zero. ** Fluctuations in Ns are due to missing price data for a number of audited products.
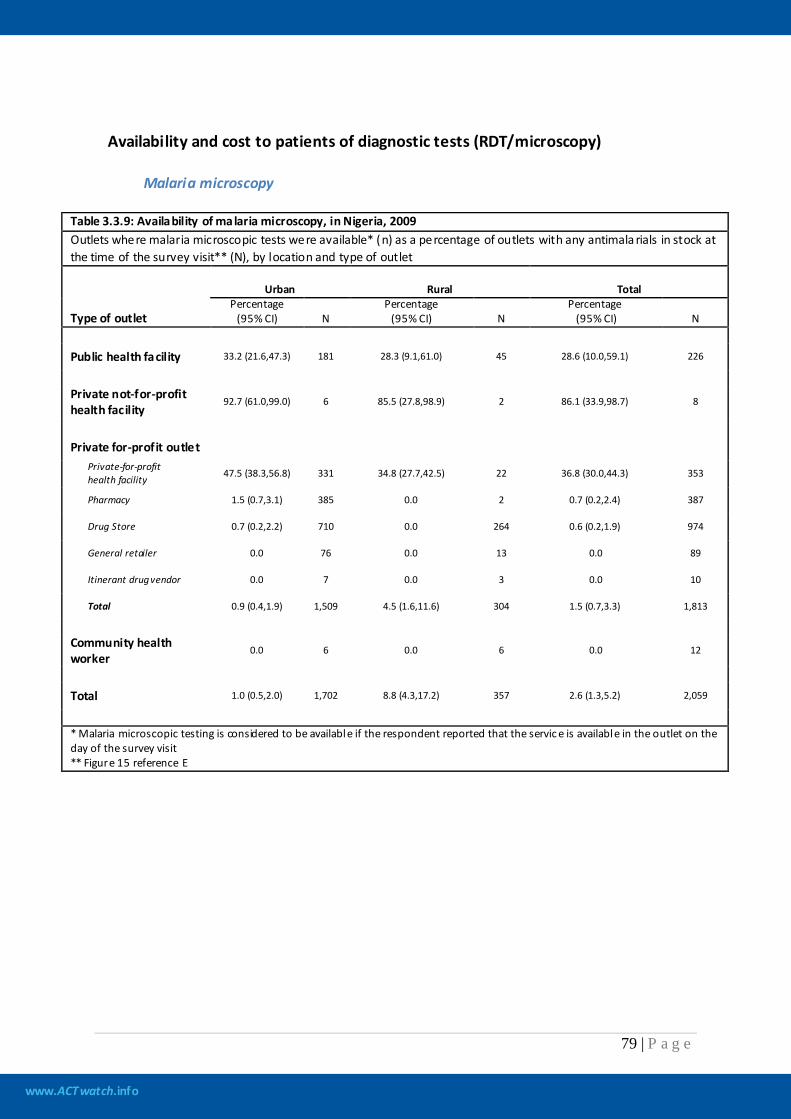
www.ACTwatch.info
79 | P a g e
Availability and cost to patients of diagnostic tests (RDT/microscopy) Malaria microscopy
Table 3.3.9: Availability of malaria microscopy, in Nigeria, 2009 Outlets where malaria microscopic tests were available* (n) as a percentage of outlets with any antimala rials in stock at the time of the survey visit** (N), by location and type of outlet
Type of outlet
Urban Rural Total Percentage
(95% CI) N Percentage
(95% CI) N Percentage
(95% CI) N
Public health facility 33.2 (21.6,47.3) 181 28.3 (9.1,61.0) 45 28.6 (10.0,59.1) 226
Private not-for-profit health facility
92.7 (61.0,99.0) 6 85.5 (27.8,98.9) 2 86.1 (33.9,98.7) 8
Private for-profit outlet
Private-for-profit health facility 47.5 (38.3,56.8) 331 34.8 (27.7,42.5) 22 36.8 (30.0,44.3) 353
Pharmacy 1.5 (0.7,3.1) 385 0.0 2 0.7 (0.2,2.4) 387
Drug Store 0.7 (0.2,2.2) 710 0.0 264 0.6 (0.2,1.9) 974
General retailer 0.0 76 0.0 13 0.0 89
Itinerant drug vendor 0.0 7 0.0 3 0.0 10
Total 0.9 (0.4,1.9) 1,509 4.5 (1.6,11.6) 304 1.5 (0.7,3.3) 1,813
Community health worker
0.0 6 0.0 6 0.0 12
Total 1.0 (0.5,2.0) 1,702 8.8 (4.3,17.2) 357 2.6 (1.3,5.2) 2,059
* Malaria microscopic testing is considered to be available if the respondent reported that the servic e is available in the outlet on the day of the survey visit ** Figure 15 reference E
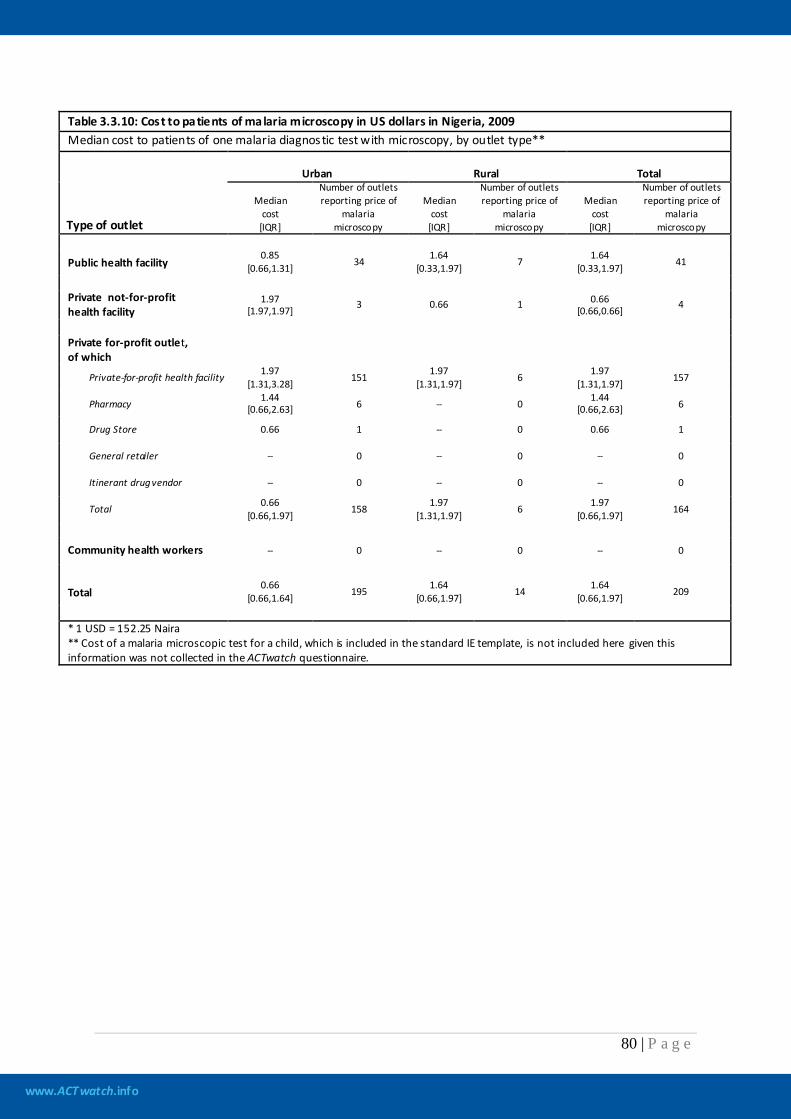
www.ACTwatch.info
80 | P a g e
Table 3.3.10: Cost to patients of malaria microscopy in US dollars in Nigeria, 2009 Median cost to patients of one malaria diagnostic test with microscopy, by outlet type**
Type of outlet
Urban Rural Total
Median cost
[IQR]
Number of outlets reporting price of
malaria microscopy
Median cost
[IQR]
Number of outlets reporting price of
malaria microscopy
Median cost
[IQR]
Number of outlets reporting price of
malaria microscopy
Public health facility 0.85
[0.66,1.31] 34 1.64 [0.33,1.97] 7 1.64
[0.33,1.97] 41
Private not-for-profit health facility
1.97 [1.97,1.97] 3 0.66 1 0.66
[0.66,0.66] 4
Private for-profit outlet, of which
Private-for-profit health facility 1.97 [1.31,3.28] 151 1.97
[1.31,1.97] 6 1.97 [1.31,1.97] 157
Pharmacy 1.44 [0.66,2.63] 6 -- 0 1.44
[0.66,2.63] 6
Drug Store 0.66 1 -- 0 0.66 1
General retailer -- 0 -- 0 -- 0
Itinerant drug vendor -- 0 -- 0 -- 0
Total 0.66 [0.66,1.97] 158 1.97
[1.31,1.97] 6 1.97 [0.66,1.97] 164
Community health workers -- 0 -- 0 -- 0
Total 0.66
[0.66,1.64] 195 1.64 [0.66,1.97] 14 1.64
[0.66,1.97] 209
* 1 USD = 152.25 Naira ** Cost of a malaria microscopic test for a child, which is included in the standard IE template, is not included here given this information was not collected in the ACTwatch questionnaire.
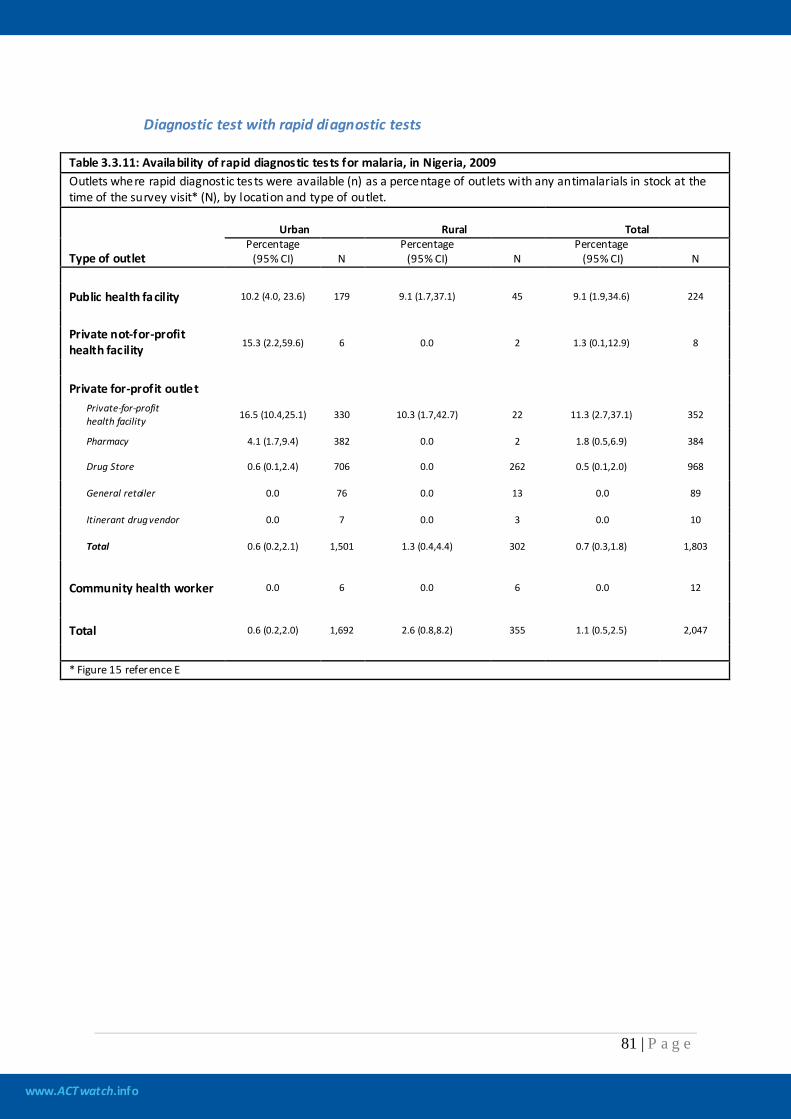
www.ACTwatch.info
81 | P a g e
Diagnostic test with rapid diagnostic tests
Table 3.3.11: Availability of rapid diagnostic tests for malaria, in Nigeria, 2009 Outlets where rapid diagnostic tests were available (n) as a percentage of outlets with any antimalarials in stock at the time of the survey visit* (N), by location and type of outlet.
Type of outlet
Urban Rural Total Percentage
(95% CI) N Percentage
(95% CI) N Percentage
(95% CI) N
Public health facility 10.2 (4.0, 23.6) 179 9.1 (1.7,37.1) 45 9.1 (1.9,34.6) 224
Private not-for-profit health facility 15.3 (2.2,59.6) 6 0.0 2 1.3 (0.1,12.9) 8
Private for-profit outlet
Private-for-profit health facility 16.5 (10.4,25.1) 330 10.3 (1.7,42.7) 22 11.3 (2.7,37.1) 352
Pharmacy 4.1 (1.7,9.4) 382 0.0 2 1.8 (0.5,6.9) 384
Drug Store 0.6 (0.1,2.4) 706 0.0 262 0.5 (0.1,2.0) 968
General retailer 0.0 76 0.0 13 0.0 89
Itinerant drug vendor 0.0 7 0.0 3 0.0 10
Total 0.6 (0.2,2.1) 1,501 1.3 (0.4,4.4) 302 0.7 (0.3,1.8) 1,803
Community health worker 0.0 6 0.0 6 0.0 12
Total 0.6 (0.2,2.0) 1,692 2.6 (0.8,8.2) 355 1.1 (0.5,2.5) 2,047
* Figure 15 reference E
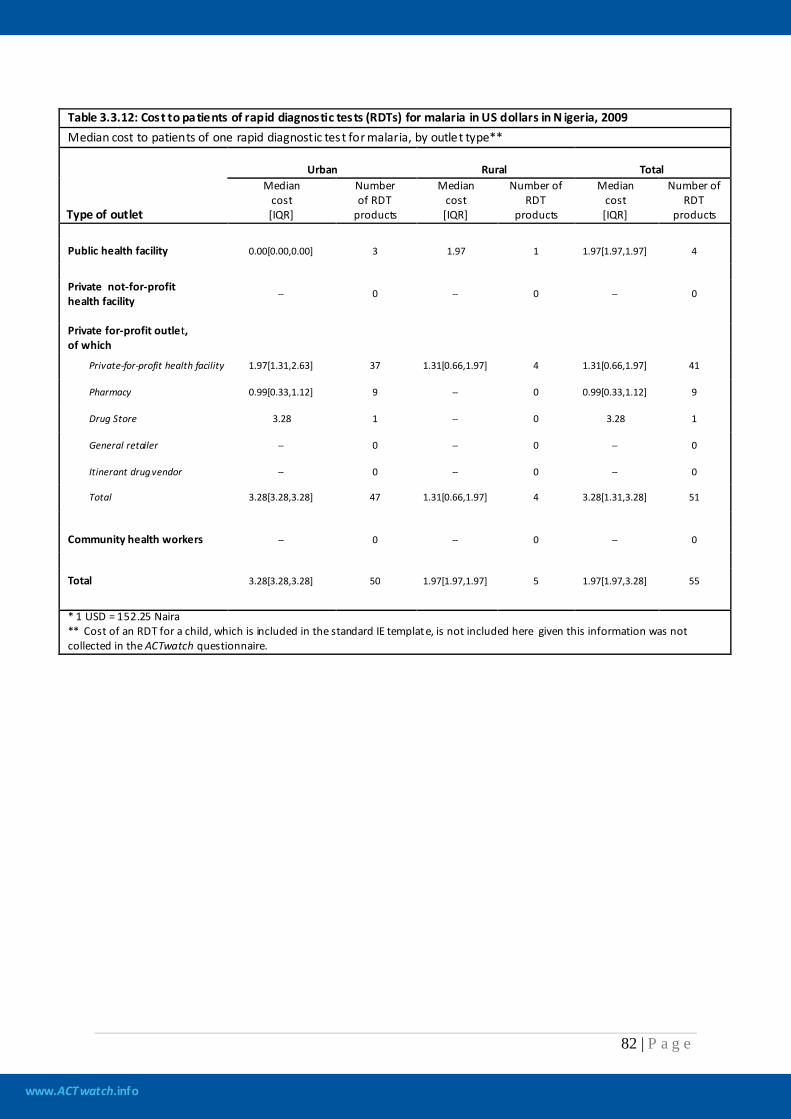
www.ACTwatch.info
82 | P a g e
Table 3.3.12: Cost to patients of rapid diagnostic tests (RDTs) for malaria in US dollars in N igeria, 2009 Median cost to patients of one rapid diagnostic test for malaria, by outlet type**
Type of outlet
Urban Rural Total Median
cost [IQR]
Number of RDT
products
Median cost [IQR]
Number of RDT
products
Median cost [IQR]
Number of RDT
products
Public health facility 0.00[0.00,0.00] 3 1.97 1 1.97[1.97,1.97] 4
Private not-for-profit health facility
-- 0 -- 0 -- 0
Private for-profit outlet, of which
Private-for-profit health facility 1.97[1.31,2.63] 37 1.31[0.66,1.97] 4 1.31[0.66,1.97] 41
Pharmacy 0.99[0.33,1.12] 9 -- 0 0.99[0.33,1.12] 9
Drug Store 3.28 1 -- 0 3.28 1
General retailer -- 0 -- 0 -- 0
Itinerant drug vendor -- 0 -- 0 -- 0
Total 3.28[3.28,3.28] 47 1.31[0.66,1.97] 4 3.28[1.31,3.28] 51
Community health workers -- 0 -- 0 -- 0
Total 3.28[3.28,3.28] 50 1.97[1.97,1.97] 5 1.97[1.97,3.28] 55
* 1 USD = 152.25 Naira ** Cost of an RDT for a child, which is included in the standard IE template, is not included here given this information was not collected in the ACTwatch questionnaire.
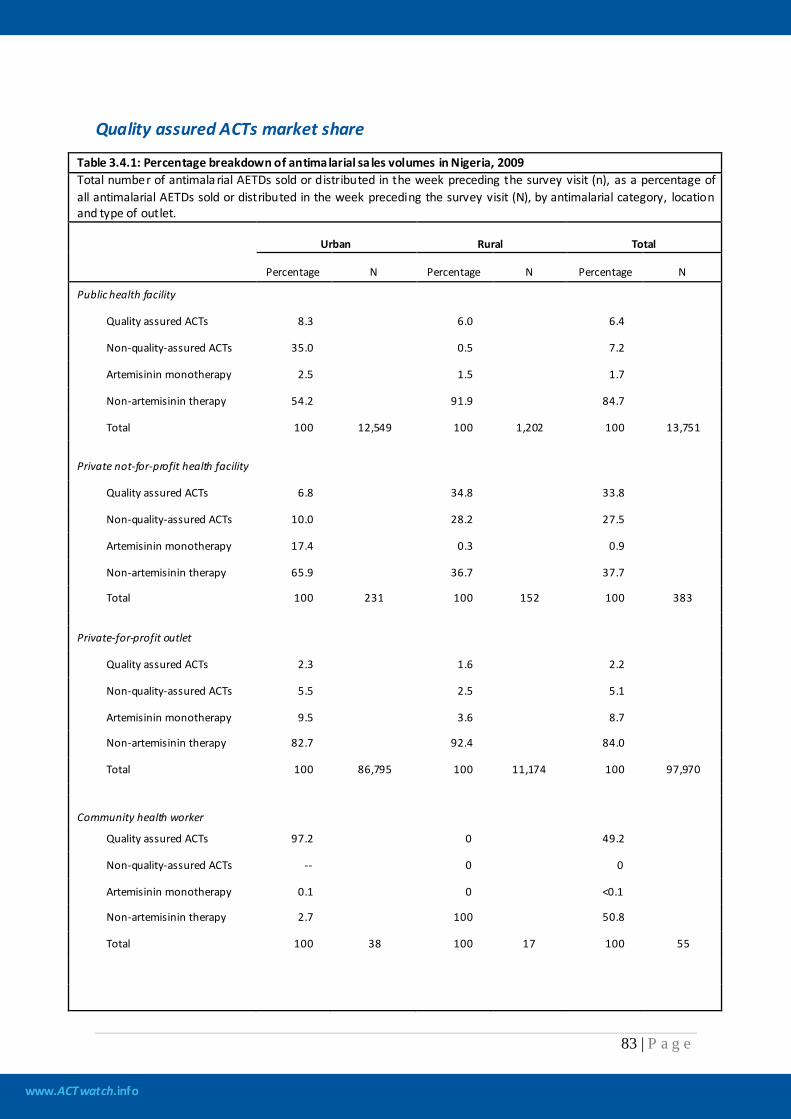
www.ACTwatch.info
83 | P a g e
Quality assured ACTs market share
Table 3.4.1: Percentage breakdown of antimalarial sa les volumes in Nigeria, 2009 Total number of antimala rial AETDs sold or distributed in the week preceding the survey visit (n), as a percentage of all antimalarial AETDs sold or distributed in the week preceding the survey visit (N), by antimalarial category, location and type of outlet.
Urban Rural Total
Percentage N Percentage N Percentage N
Public health facility
Quality assured ACTs 8.3 6.0 6.4
Non-quality-assured ACTs 35.0 0.5 7.2
Artemisinin monotherapy 2.5 1.5 1.7
Non-artemisinin therapy 54.2 91.9 84.7
Total 100 12,549 100 1,202 100 13,751
Private not-for-profit health facility
Quality assured ACTs 6.8 34.8 33.8
Non-quality-assured ACTs 10.0 28.2 27.5
Artemisinin monotherapy 17.4 0.3 0.9
Non-artemisinin therapy 65.9 36.7 37.7
Total 100 231 100 152 100 383
Private-for-profit outlet
Quality assured ACTs 2.3 1.6 2.2
Non-quality-assured ACTs 5.5 2.5 5.1
Artemisinin monotherapy 9.5 3.6 8.7
Non-artemisinin therapy 82.7 92.4 84.0
Total 100 86,795 100 11,174 100 97,970
Community health worker
Quality assured ACTs 97.2 0 49.2
Non-quality-assured ACTs -- 0 0
Artemisinin monotherapy 0.1 0 <0.1
Non-artemisinin therapy 2.7 100 50.8
Total 100 38 100 17 100 55
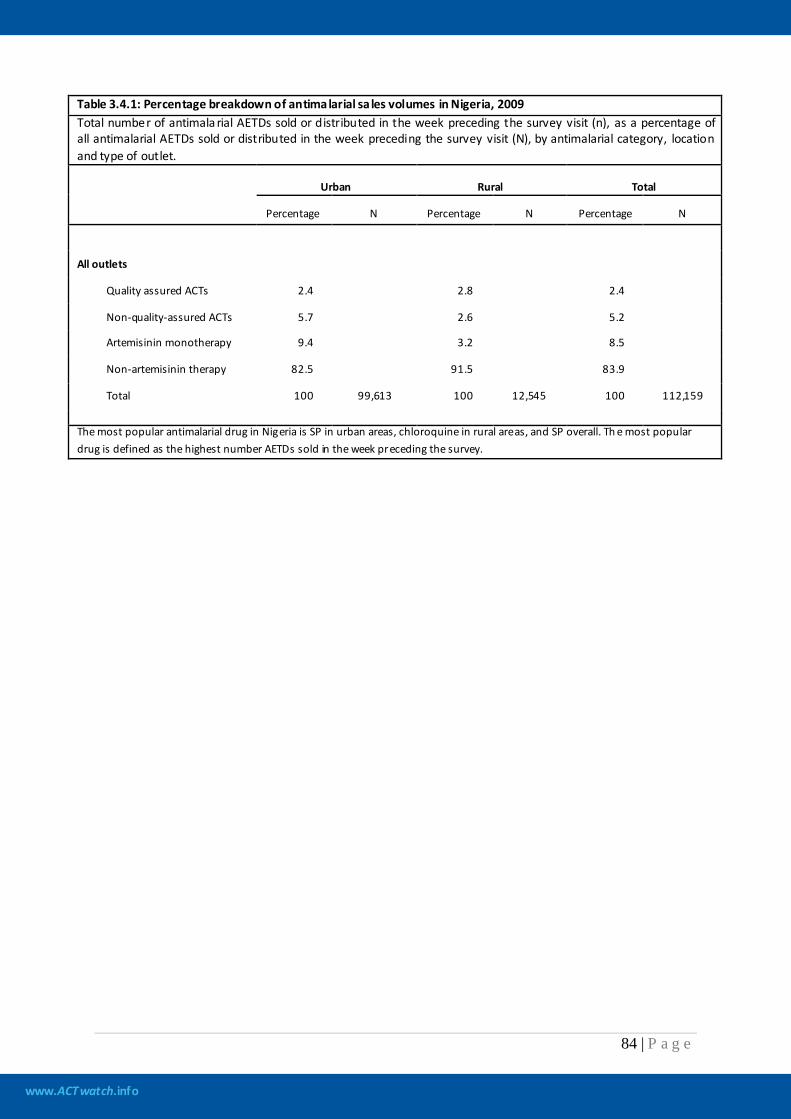
www.ACTwatch.info
84 | P a g e
Table 3.4.1: Percentage breakdown of antimalarial sa les volumes in Nigeria, 2009 Total number of antimala rial AETDs sold or distributed in the week preceding the survey visit (n), as a percentage of all antimalarial AETDs sold or distributed in the week preceding the survey visit (N), by antimalarial category, location and type of outlet.
Urban Rural Total
Percentage N Percentage N Percentage N
All outlets
Quality assured ACTs 2.4 2.8 2.4
Non-quality-assured ACTs 5.7 2.6 5.2
Artemisinin monotherapy 9.4 3.2 8.5
Non-artemisinin therapy 82.5 91.5 83.9
Total 100 99,613 100 12,545 100 112,159
The most popular antimalarial drug in Nigeria is SP in urban areas, chloroquine in rural areas, and SP overall. Th e most popular drug is defined as the highest number AETDs sold in the week preceding the survey.
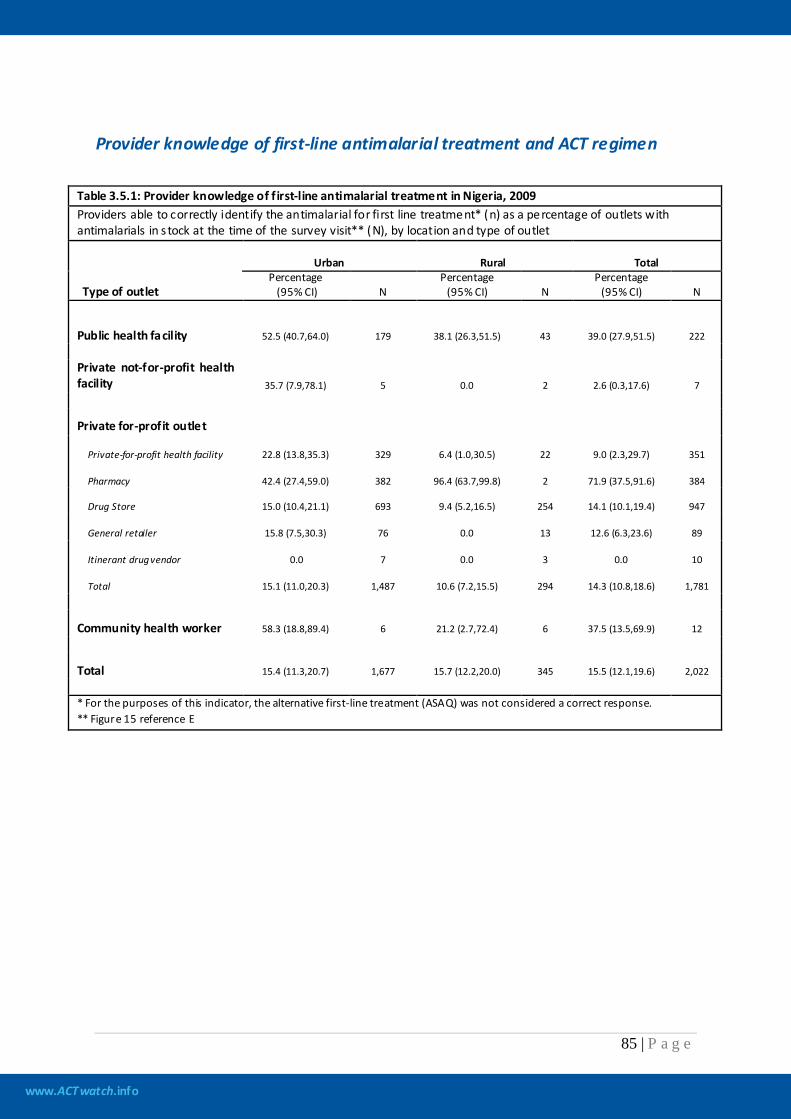
www.ACTwatch.info
85 | P a g e
Provider knowledge of first-line antimalarial treatment and ACT regimen
Table 3.5.1: Provider knowledge of f irst-line antimalarial treatment in Nigeria, 2009 Providers able to correctly identify the antimalarial for first line treatment* (n) as a percentage of outlets with antimalarials in s tock at the time of the survey visit** (N), by location and type of outlet
Type of outlet
Urban Rural Total Percentage
(95% CI) N Percentage
(95% CI) N Percentage
(95% CI) N
Public health facility 52.5 (40.7,64.0) 179 38.1 (26.3,51.5) 43 39.0 (27.9,51.5) 222 Private not-for-profit health facility 35.7 (7.9,78.1) 5 0.0 2 2.6 (0.3,17.6) 7
Private for-profit outlet
Private-for-profit health facility 22.8 (13.8,35.3) 329 6.4 (1.0,30.5) 22 9.0 (2.3,29.7) 351
Pharmacy 42.4 (27.4,59.0) 382 96.4 (63.7,99.8) 2 71.9 (37.5,91.6) 384
Drug Store 15.0 (10.4,21.1) 693 9.4 (5.2,16.5) 254 14.1 (10.1,19.4) 947
General retailer 15.8 (7.5,30.3) 76 0.0 13 12.6 (6.3,23.6) 89
Itinerant drug vendor 0.0 7 0.0 3 0.0 10
Total 15.1 (11.0,20.3) 1,487 10.6 (7.2,15.5) 294 14.3 (10.8,18.6) 1,781
Community health worker 58.3 (18.8,89.4) 6 21.2 (2.7,72.4) 6 37.5 (13.5,69.9) 12
Total 15.4 (11.3,20.7) 1,677 15.7 (12.2,20.0) 345 15.5 (12.1,19.6) 2,022 * For the purposes of this indicator, the alternative first-line treatment (ASAQ) was not considered a correct response. ** Figure 15 reference E
www.ACTwatch.info
86 | P a g e
Table 3.5.2: Provider knowledge of dosing regimen for quality assured ACTs (QAACTs) for an adult in Nigeria, 2009 Providers able to describe correctly the dosing regimen for quality assured ACTs for an adult (n) as a percentage of the number of outlets with QAACTs in s tock at the time of the survey visit (N), by location and type of outlet* Indicator not available This is an indicator of the Independent Evaluation of the AMFm which was determined only after the fieldwork for this study was launched. This survey round was not designed to collect data needed to calculate this indicator and therefore this indicator cannot be calculated given the data set.
www.ACTwatch.info
87 | P a g e
Table 3.5.3: Provider knowledge of dosing regimen for quality assured ACTs (QAACTs) for a child in Nigeria, 2009 Providers able to describe correctly the dosing regimen for quality assured ACT for a child (n) as a percentage of the number of outlets with QAACTs in stock at the time of the survey visit (N), by location and type of outlet* Indicator not available This is an indicator of the Independent Evaluation of the AMFm which was determined only after the fieldwork for this study was launched. This survey round was not designed to collect data needed to calculate this indicator and therefore this indicator cannot be calculated given the data set.
www.ACTwatch.info
88 | P a g e
Table 3.5.4: Reasons for not stocking quality assured ACTs (QAACTs) by private providers in Nigeria, 2009 Providers stating a specif ic reason for why they were not stocking QAACTs (n) as a percentage of all outlets not stocking QAACTs at the time of the survey visit (N),* by location Indicator not available This is an indicator of the Independent Evaluation of the AMFm which was determined only after the fieldwork for this study was launched. This survey round was not designed to collect data needed to calculate this indicator and therefore this indicator cannot be calculated given the data set.
www.ACTwatch.info
89 | P a g e
AMFm logo
Table 3.6.1: Provider recognition of AMFm logo in Nigeria, 2009 Providers able to recognize the AMFm logo* (n) as a percentage of the number of outlets with antimala rials in stock at the time of the survey visit** (N), by location and type of outlet Indicator not available This is an indicator of the Independent Evaluation of the AMFm which was determined only after the fieldwork for this study was launched. This survey round was not designed to collect data needed to calculate this indicator and therefore this indicator cannot be calculated given the data set.
www.ACTwatch.info
90 | P a g e
Table 3.6.2: Provider knowledge of the AMFm Log o in Nigeria, 2009 Providers stating a specif ic meaning of the AMFm Logo (n) as a percentage of outlets with any antimalarials in stock at the time of the survey visit* (N),* by location Indicator not available This is an indicator of the Independent Evaluation of the AMFm which was determined only after the fieldwork for this study was launched. This survey round was not designed to collect data needed to calculate this indicator and therefore this indicator cannot be calculated given the data set.
www.ACTwatch.info
91 | P a g e
Table 3.6.3: Sources from which providers have seen or heard of the AMFm Logo in Nigeria, 2009 Providers stating a specif ic source where they have seen or hea rd of the AMFm Logo (n) as a percentage of outlets with any antimalaria ls in stock at the time of the survey visit* (N),* by location Indicator not available This is an indicator of the Independent Evaluation of the AMFm which was determined only after the fieldwork for this study was launched. This survey round was not designed to collect data needed to calculate this indicator and therefore this indicator cannot be calculated given the data set.
www.ACTwatch.info
92 | P a g e
Table 3.6.4: Percentage of antimalarials bearing the AMFm logo, in Nigeria, 2009 Antimalarials bearing the AMFm logo (n) as a percentage of all antimala rials audited (N), by location and antimalarial type Indicator not available This is an indicator of the Independent Evaluation of the AMFm which was determined only after the fieldwork for this study was launched. This survey round was not designed to collect data needed to calculate this indicator and therefore this indicator cannot be calculated given the data set.
www.ACTwatch.info
93 | P a g e
4. Summary of key findings Quality of the data collected
No major issues were found during data cleaning and data appeared to be logical. Efforts were made during data collection and planning to ensure data quality. The presence of ACTwatch Central researchers during training and the first weeks of field work along with regular communication with ACTwatch Central ensured that problems could be resolved quickly when issues arose in the field. Additional field monitoring tools were used to help keep track of the number of outlets sampled and number of antimalarials audited. Also, additional quality controllers were added to the team in order to review the data as it was collected. Two trainings in the north and south were also conducted to help address the size of the survey and help manage data collection. Availability of quality assured ACTs
Public/not for profit sector Among all public health facilities interviewed, 91.8% stocked antimalarials at any time in the three months preceding the survey, and 42.5% stocked a quality assured ACT (QAACT) at the time of the survey. Among public/not for profit sector facilities stocking at least one antimalarial on the day of survey, higher stocking rates were found for chloroquine (57.7%) and SP (62.7%) than QAACTs (49.2%). Non quality assured ACTs were found in 15.4% of the public/not for profit sector facilities that stocked any antimalarial on the day of survey. Findings from community health workers (CHWs) and private not for profit outlets are difficult to interpret given small sample sizes (n=12 and n=8, respectively). Availability of QAACTs/FAACTs in outlets stocking at least one antimalarial on the day of survey was 56.9% for CHWs and 98.1% for private not for profit outlets. Private for profit sector Among all private for profit outlets interviewed, 25.6% stocked any antimalarial, and only 6.7% stocked a QAACT (6.5% stocked FAACTs) at the time of survey. Of those private for profit sector outlets stocking at least one antimalarial on the day of survey, 26.6% stocked QAACTs (25.8% FAACTs). Around one-third of private health facilities, pharmacies and drugs stores stocking at least one antimalarial on the day of survey stocked QAACTs (28.5%, 30.9% and 27.9% respectively) compared to 17.2% of general retailers. Stocking rates of non-quality assured ACTs among private for profit facilities stocking at least one antimalarial on the day of survey were similar to stocking rates of QAACTs, except in pharmacies: 96.6% of which had non quality assured ACT in stock.
www.ACTwatch.info
94 | P a g e
There were high stocking rates of non-artemisinin therapy (98.2%) in private for profit sector outlets stocking at least one antimalarial on the day of survey. Chloroquine was found in 95.6% of drug stores, 87.7% of general retailers, 73.7% of private health facilities and 42.7% of pharmacies stocking at least one antimalarial. High stocking rates of SP was found in pharmacies (94.3%), drug stores (79.5%) and general retailers (76.7%) in private for profit sector outlets stocking at least one antimalarial on the day of survey. Urban and Rural differences Among public health facilities that stocked antimalarials at any time in the three months preceding the survey, those located in rural areas were more likely to stock QAACTs than those in urban areas (48.1% and 18.3% respectively). By contrast, in the private sector figures were higher for outlets in urban areas (28.5% urban versus 18.1% rural outlets stocking antimalarials at any time in the previous three months preceding the survey).
Pricing/affordability of quality assured ACTs Of those public health facilities stocking a QAACT on the day of interview, 99.2% provided the drug for free. Community health workers charged a median of $0.79 (IQR: $0.00-$1.31, n=8) for a QAACT. In the private sector the median price of an AETD QAACT was $3.94. There was variation in the median price across outlet types, with QAACTs being most expensive in pharmacies ($6.57) and least expensive in private for-profit facilities ($1.31). There was also substantial variation in the price of FACCTs, when presented as either AL or ASAQ. The median price of AL in the private sector was $6.24 and there was less variation between outlet types (range of median prices: $6.04 to $7.88) as compared with ASAQ at $3.15 (range of median prices: $1.31 to $4.60). In the private sector QAACTs were over seven times more expensive than SP, the most popular antimalarial by volumes, which had a median price of $0.53.
Market share of quality assured ACTs QAACTs made up only 2.4% of the total market share while 83.9% of volumes sold in the last week were non-artemisinin therapies. SP represented 48.1% of total market share, and chloroquine 34.7%. Oral artemisinin monotherapy made up 8.1% of total market share, almost all of which moved through urban PPMVs (drug stores). The private sector dominated the antimalarial market, representing 97% of all antimalarials distributed. Drug stores accounted for almost 90% of the total volumes sold/distributed in the private sector.
www.ACTwatch.info
95 | P a g e
5. Conclusion and Recommendations Given the variation in population size of localities in Nigeria, a modified sampling approach was employed for the survey. This complicated field logistics and directions for interviewers in the field. Given that localities will be used as clusters for the endline survey, it should be ensured that maps are provided in advance to field teams to facilitate clear demarcation of the areas. It is also recommended that if a sufficient sample of public health facilities and pharmacies are found through the census approach, the booster component should be removed from the endline survey. The survey should also take into account the sheer number of antimalarials found at certain outlets – up to 60 different brands of antimalarials were found in some outlets. The data collection teams should have an adequate number of interviewers to ensure such large numbers of antimalarials can be audited within a reasonable time period.
www.ACTwatch.info
96 | P a g e
6. References Adeyi O, Atun R, 2010. Universal access to malaria medicines: innovation in financing and delivery.
The Lancet, vol: 376, pages: 1869-1871. Arrow, K. J., C. B. Panosian, and H. Gellband., eds. 2004. Saving Lives, Buying Time: Economics of
Malaria Drugs in an Age of Resistance. Washington, DC: National Academies Press. Craig, P., P Dieppe, et al. 2008. Developing and evaluating complex interventions: new guidance.
[online] Available at: <www.mrc.ac.uk/complexinterventionsguidance> Medical Research Council.
de Savigny, D and T Adam, eds. 2009. Systems thinking for health systems strengthening. Geneva :
Alliance for Health Policy and Systems Research and WHO. Federal Ministry of Health [Nigeria], 2004a. Revised national health policy. Abuja: FMOH. Federal Ministry of Health [Nigeria] National Malaria and Vector Control Division, 2004b. National
Antimalarial Treatment Policy. Abuja: FMOH. Federal Ministry of Health [Nigeria] National Malaria and Vector Control Division, 2005. National
Antimalarial Treatment Guidelines. Abuja: FMOH. Federal Ministry of Health [Nigeria], 2006. National child health policy (draft). Abuja: FMOH. Federal Ministry of Health [Nigeria], 2008. Monitoring and Evaluation plan for Malaria control in
Nigeria. Abuja: FMOH. Federal Ministry of Health [Nigeria], 2009. National Malaria Control Programme Strategic Plan 2009-
2013. Abuja: FMOH. FMOH, 2009. Malaria Strategic Plan 2009-2013: A Road Map for Malaria Control in Nigeria. Abuja: Federal Ministry of Health, National Malaria Control Programme. Global Fund (Global Fund to Fight AIDS, Tuberculosis and Malaria), 2010. Global Fund Quality
Assurance Policy for Pharmaceutical Products. [online] Available at: <http://www.theglobalfund.org/documents/psm/PSM_QAPharm_Policy_en.pdf> Geneva: Global Fund to Fight AIDS, Tuberculosis and Malaria.
Habicht, JP, CG Victora, et al. 1999. Evaluation designs for adequacy, plausibility and probability of
public health programme performance and impact. International Journal of Epidemiology 28: 10-18.
www.ACTwatch.info
97 | P a g e
International Monetary Fund (IMF), 2011. World Economic Outlook Database. [online] Available at: <http://www.imf.org/external/pubs/ft/weo/2011/01/weodata/index.aspx> Kleinschmidt I., et al., 2001. An empirical malaria distribution map for West Africa. Tropical Medicine
and International Health 6: 779-786. Map available online at <http://www.mara.org.za> Malaria Taxes and Tariffs Advocacy Project (M-TAP), 2010. Current Status of Tariffs on Antimalarial
Commodities, February 2010. [online] Available at: <http://www.m-tap.org> [accessed 16 March 2011].
National Population Commission (NPC) [Nigeria] and ICF Macro, 2004. Nigeria Demographic and
Health Survey 2003. Abuja, Nigeria: National Population Commission and ICF Macro. National Population Commission (NPC) [Nigeria] and ICF Macro, 2009. Nigeria Demographic and
Health Survey 2008. Abuja, Nigeria: National Population Commission and ICF Macro. NPHDCA (National Primary Healthcare Development Agency) [Nigeria], 2007. Health Facilities
Survey, 2007. Okeke TA., Uzochukwu BSC., Okafor HU. 2006. An in-depth study of patent medicine sellers’
perspectives on malaria in a rural Nigerian community. Malaria Journal 2006 5: 97. Oladepo O, et al., 2008. Malaria treatment in Nigeria: the role of patent medicine vendors. Future
Health Systems Nigeria, Policy Brief 1. [online] Available at: <http://www.futurehealthsystems.org/publications/category/nigeria>
Olusoji Adeyi and Rifat Atun, 2010. Universal access to malaria medicines: innovation in financing
and delivery. The Lancet, 376. Onwujekwe O, Chima R, Okonkwo P., 2000. Economic burden of malaria illness versus that of a
combination of all other illnesses. A study in five malaria holo endemic communities. Health Policy 54: 143–159.
Onwujekwe O, Ojukwu J, Uzochukwu B, Dike N, Shu E., 2005. Where do people from different socio-
economic groups receive diagnosis and treatment for malaria in southeast Nigeria. Annals of Tropical Medicine and Parasitology, 2005: 99(5): 473–81.
President’s Malaria Initiative (PMI), 2010. FY 2011 Malaria Operation Plan: Nigeria. [online] Available
at: <www.pmi.gov/countries/mops/fy11/nigeria_mop-fy11.pdf > [accessed 16 March 2011]. Roll Back Malaria Partnership (RBM), 2008. The Global Malaria Action Plan. [online] Available at:
<http://www.rollbackmalaria.org/gmap/>
www.ACTwatch.info
98 | P a g e
Ross-Degnan D, et al., 1996. The impact of face-to-face educational outreach on diarrhea treatment
in pharmacies. Health Policy Planning, 1996, 11: 308-318. Sabot OJ, et al., 2009. Piloting the global subsidy: The impact of subsidized artemisinin-based
combination therapies distributed through private drug shops in rural Tanzania. PLoS ONE 4(9): e6857.
Uzochukwu BSC and Onwujekwe OE., 2004. Socio-economic differences and health seeking
behaviour for the diagnosis and treatment of malaria: a case study of four local government areas operating the Bamako initiative programme in south-east Nigeria. International Journal of Equity in Health, 2004, 3:6.
Uzochukwu BSC, Onwujekwe EO, Onoka CA, Ughasoro MD., 2008. Rural-urban differences in
maternal responses to childhood fever in south east Nigeria. PLoS ONE, 2008, 3:e1788. UN Population Division, Department of Economic and Social Affairs, 2009. World Urbanization
Prospects: The 2009 Revision. [online] Available at: <http://esa.un.org/wup2009/unup> UN Population Division, Department of Economic and Social Affairs, 2010. World Population
Prospects: The 2010 Revision. [online] Available at: <http://esa.un.org/unpd/wpp/index.htm> World Bank, 2010. World databank. [online] Available at: <http://databank.worldbank.org>
Values given in constant 2005 international PPP US$ for comparison over time. World Health Organization (WHO), 2008. World Malaria Report 2008. Geneva: WHO Press. World Health Organization (WHO), 2010a. World Malaria Report 2010. Geneva: WHO Press. World Health Organization (WHO), 2010b. Guidelines for the treatment of malaria, second edition.
Geneva: WHO Press.
www.ACTwatch.info
99 | P a g e
7. Acknowledgements This report presents the results of the 2009 Nigerian Outlet Survey. It is a comprehensive, nationally representative outlet survey designed to the evaluation of the Affordable Medicines Facility for malaria. This report would not have been possible without the efforts of a large number of people who assisted with the data analysis, data processing, and preparation of the report, as well as those who worked tirelessly to collect the baseline survey data and analyze the results. We particularly appreciate the efforts of the National Malaria Control Program for providing overall support for the survey. Additional thanks are expressed to Society for Family Health for providing project management support and implementing the survey. We would like to thank the Bill and Melinda Gates Foundation for their support. We would like to express our thanks to the field teams and individuals involved in the survey. Their names are presented in the Appendix. Finally, we would like to thank the thousands of providers who took time to complete the interview. Without them, we would have nothing to say.
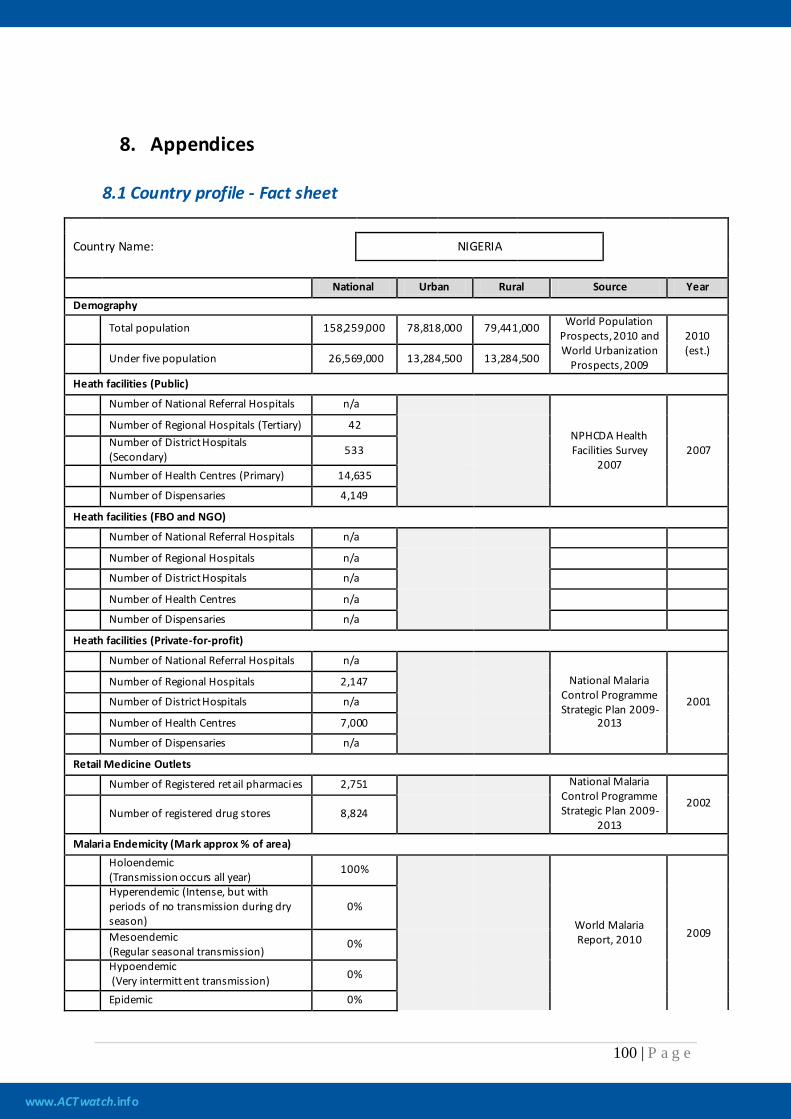
www.ACTwatch.info
100 | P a g e
8. Appendices 8.1 Country profile - Fact sheet
Country Name: NIGERIA
National Urban Rural Source Year Demography
Total population 158,259,000 78,818,000 79,441,000 World Population Prospects, 2010 and World Urbanization
Prospects, 2009
2010 (est.)
Under five population 26,569,000 13,284,500 13,284,500
Heath facilities (Public)
Number of National Referral Hospitals n/a
NPHCDA Health Facilities Survey
2007 2007
Number of Regional Hospitals (Tertiary) 42
Number of District Hospitals (Secondary) 533
Number of Health Centres (Primary) 14,635 Number of Dispensaries 4,149
Heath facilities (FBO and NGO)
Number of National Referral Hospitals n/a
Number of Regional Hospitals n/a Number of District Hospitals n/a
Number of Health Centres n/a Number of Dispensaries n/a
Heath facilities (Private-for-profit)
Number of National Referral Hospitals n/a
National Malaria Control Programme Strategic Plan 2009-
2013
2001
Number of Regional Hospitals 2,147 Number of District Hospitals n/a
Number of Health Centres 7,000 Number of Dispensaries n/a
Retail Medicine Outlets
Number of Registered retail pharmacies 2,751
National Malaria Control Programme Strategic Plan 2009-
2013
2002 Number of registered drug stores 8,824
Malaria Endemicity (Mark approx % of area)
Holoendemic (Transmission occurs all year)
100%
World Malaria Report, 2010 2009
Hyperendemic (Intense, but with periods of no transmission during dry season)
0%
Mesoendemic (Regular seasonal transmission)
0%
Hypoendemic (Very intermittent transmission) 0%
Epidemic 0%
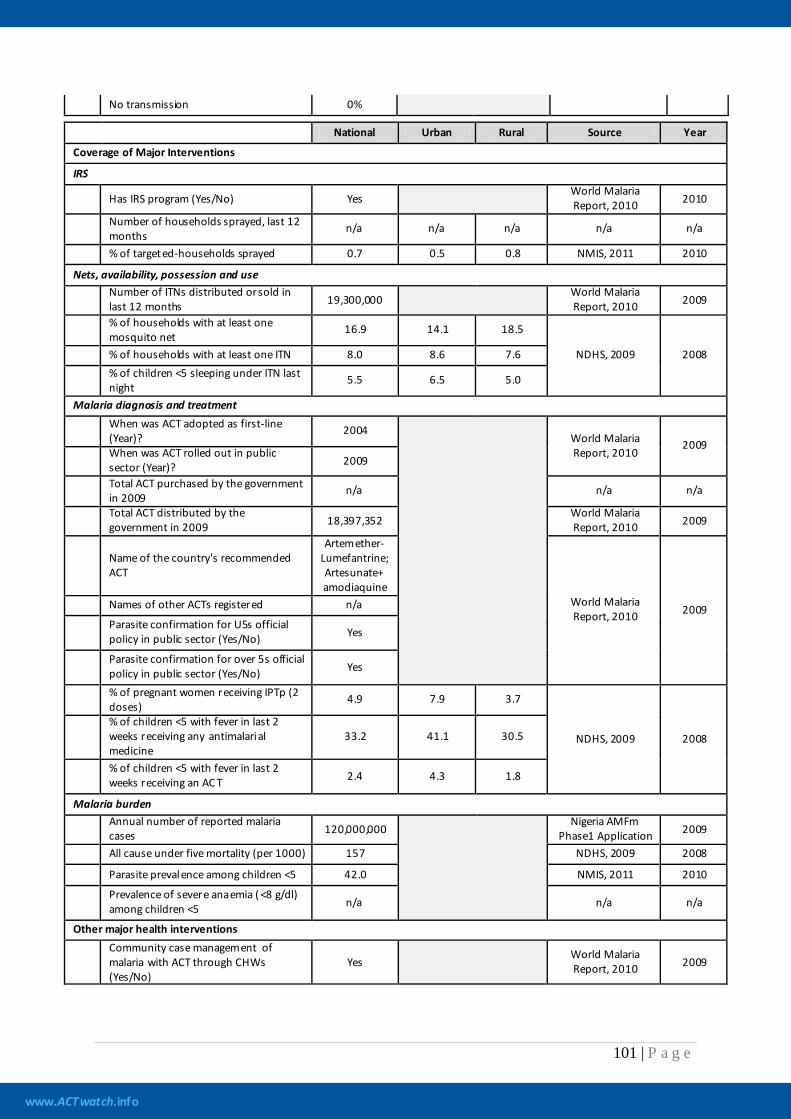
www.ACTwatch.info
101 | P a g e
No transmission 0%
National Urban Rural Source Year
Coverage of Major Interventions
IRS
Has IRS program (Yes/No) Yes World Malaria Report, 2010 2010
Number of households sprayed, last 12 months
n/a n/a n/a n/a n/a
% of targeted-households sprayed 0.7 0.5 0.8 NMIS, 2011 2010
Nets, availability, possession and use
Number of ITNs distributed or sold in last 12 months 19,300,000
World Malaria Report, 2010 2009
% of households with at least one mosquito net
16.9 14.1 18.5
NDHS, 2009 2008 % of households with at least one ITN 8.0 8.6 7.6
% of children <5 sleeping under ITN last night
5.5 6.5 5.0
Malaria diagnosis and treatment
When was ACT adopted as first-line (Year)?
2004 World Malaria
Report, 2010 2009
When was ACT rolled out in public sector (Year)? 2009
Total ACT purchased by the government in 2009
n/a
n/a n/a
Total ACT distributed by the government in 2009 18,397,352
World Malaria Report, 2010 2009
Name of the country's recommended ACT
Artemether- Lumefantrine; Artesunate+ amodiaquine
World Malaria Report, 2010 2009 Names of other ACTs registered n/a
Parasite confirmation for U5s official policy in public sector (Yes/No) Yes
Parasite confirmation for over 5s official policy in public sector (Yes/No) Yes
% of pregnant women receiving IPTp (2 doses)
4.9 7.9 3.7
NDHS, 2009 2008 % of children <5 with fever in last 2 weeks receiving any antimalarial medicine
33.2 41.1 30.5
% of children <5 with fever in last 2 weeks receiving an AC T 2.4 4.3 1.8
Malaria burden
Annual number of reported malaria cases 120,000,000
Nigeria AMFm Phase1 Application 2009
All cause under five mortality (per 1000) 157
NDHS, 2009 2008
Parasite prevalence among children <5 42.0 NMIS, 2011 2010
Prevalence of severe anaemia ( <8 g/dl) among children <5 n/a n/a n/a
Other major health interventions
Community case management of malaria with ACT through CHWs (Yes/No)
Yes World Malaria Report, 2010 2009
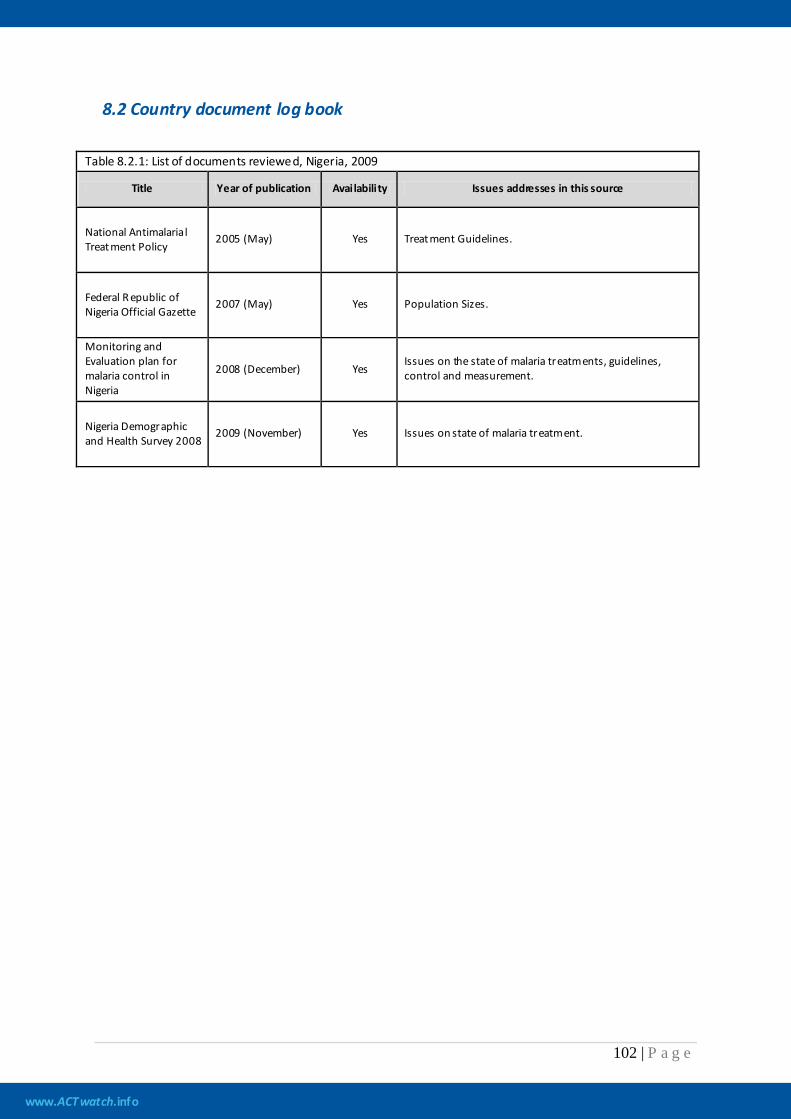
www.ACTwatch.info
102 | P a g e
8.2 Country document log book
Table 8.2.1: List of documents reviewed, Nigeria, 2009
Title Year of publication Availability Issues addresses in this source
National Antimalarial Treatment Policy
2005 (May) Yes Treatment Guidelines.
Federal R epublic of Nigeria Official Gazette
2007 (May) Yes Population Sizes.
Monitoring and Evaluation plan for malaria control in Nigeria
2008 (December) Yes Issues on the state of malaria treatments, guidelines, control and measurement.
Nigeria Demographic and Health Survey 2008
2009 (November) Yes Issues on state of malaria treatment.
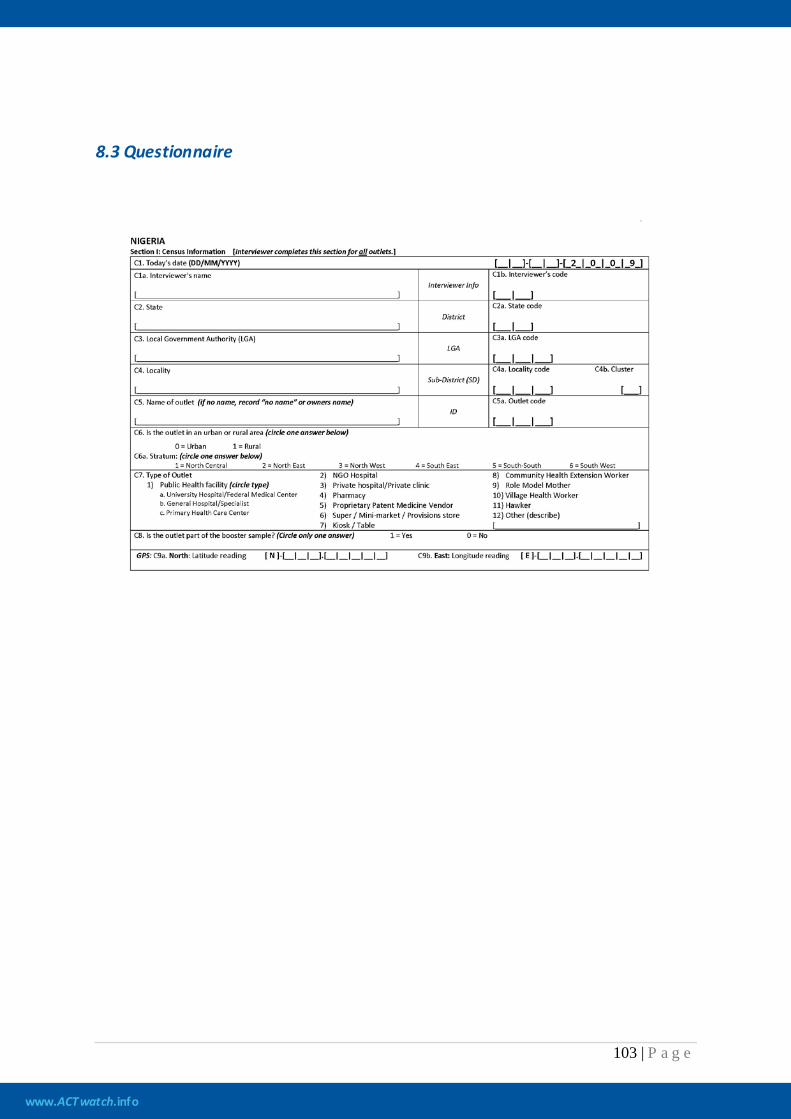
www.ACTwatch.info
103 | P a g e
8.3 Questionnaire
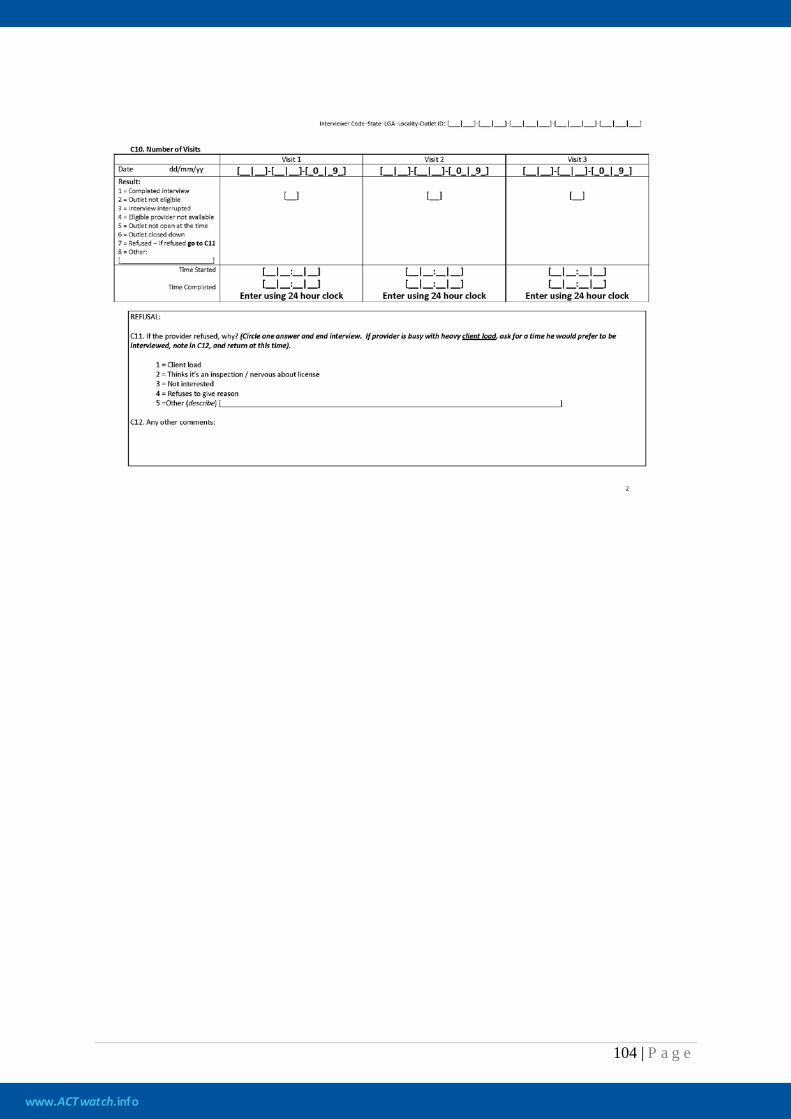
www.ACTwatch.info
104 | P a g e
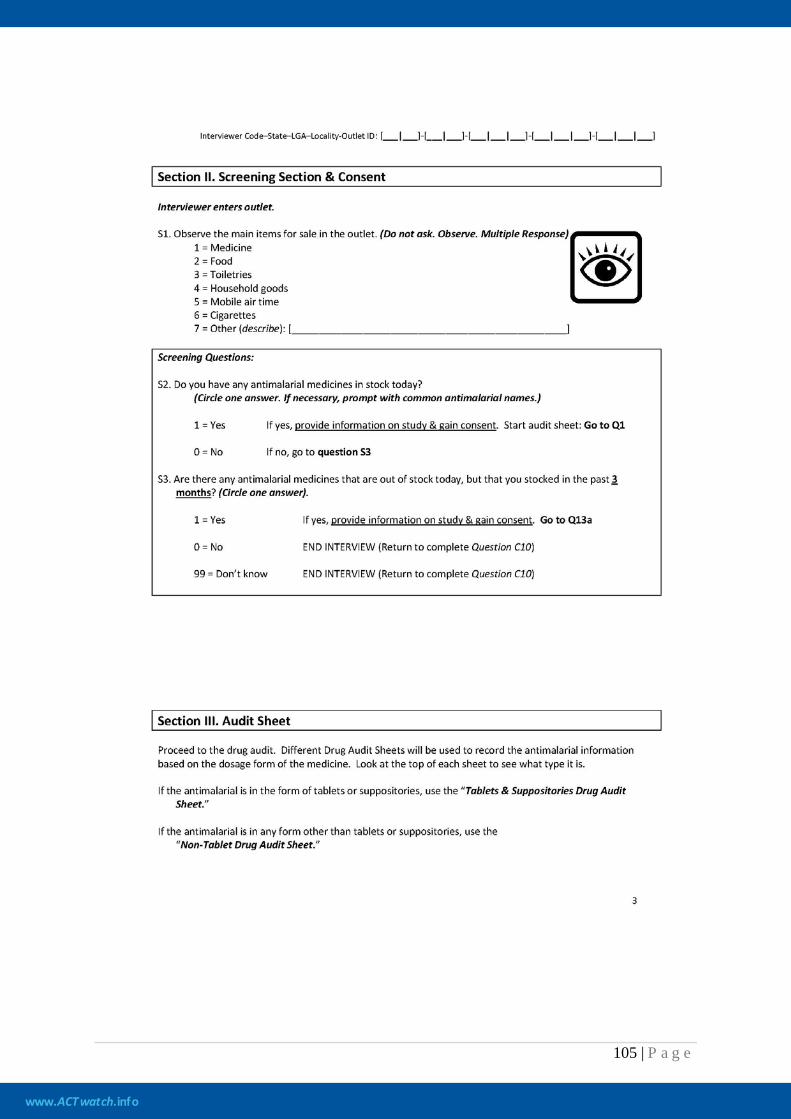
www.ACTwatch.info
105 | P a g e
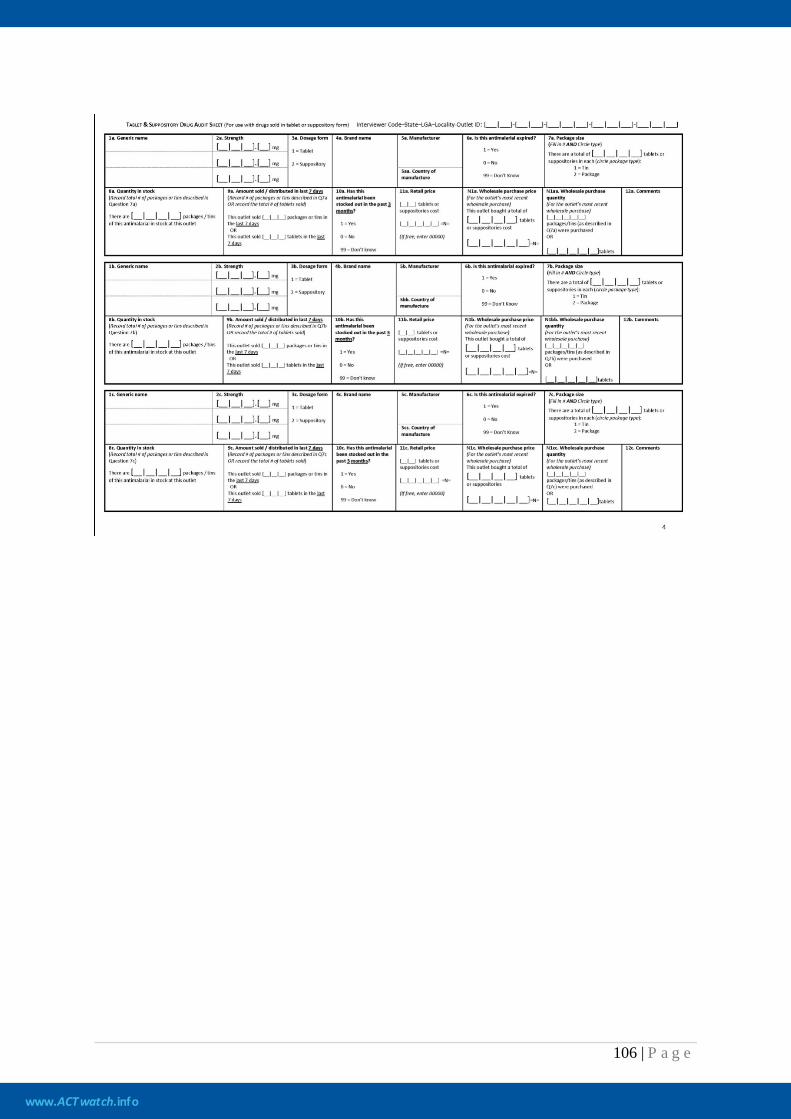
www.ACTwatch.info
106 | P a g e

www.ACTwatch.info
107 | P a g e
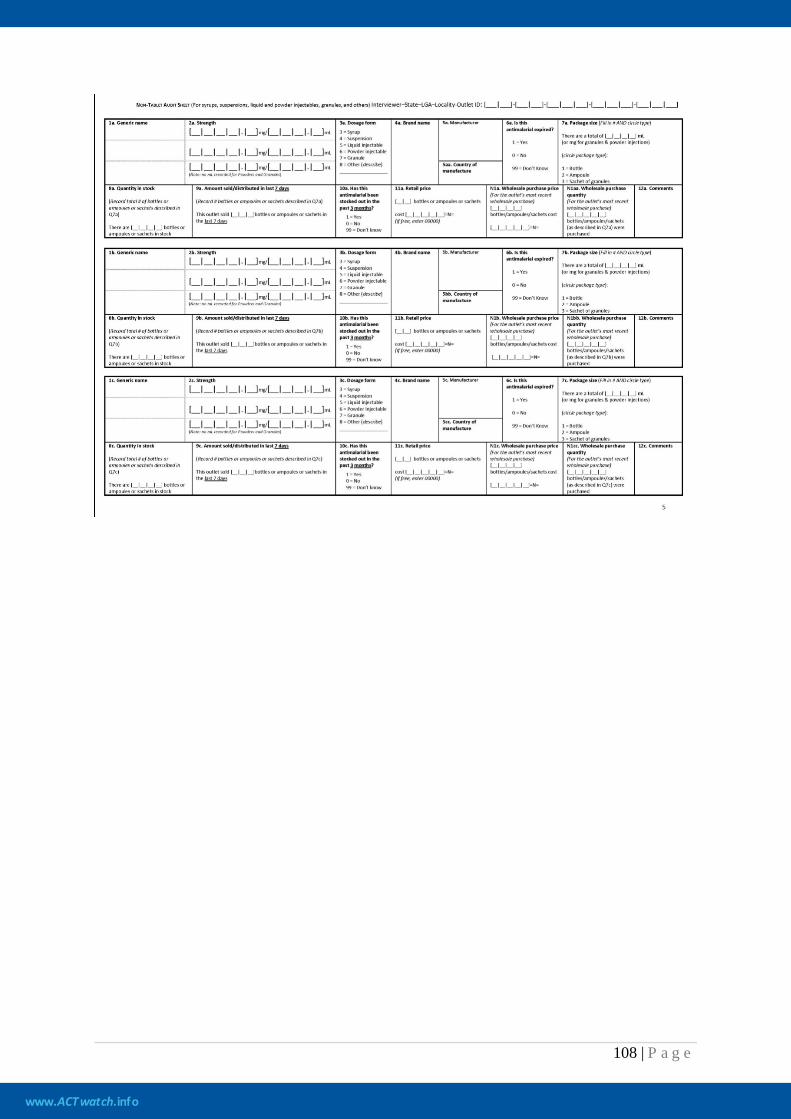
www.ACTwatch.info
108 | P a g e
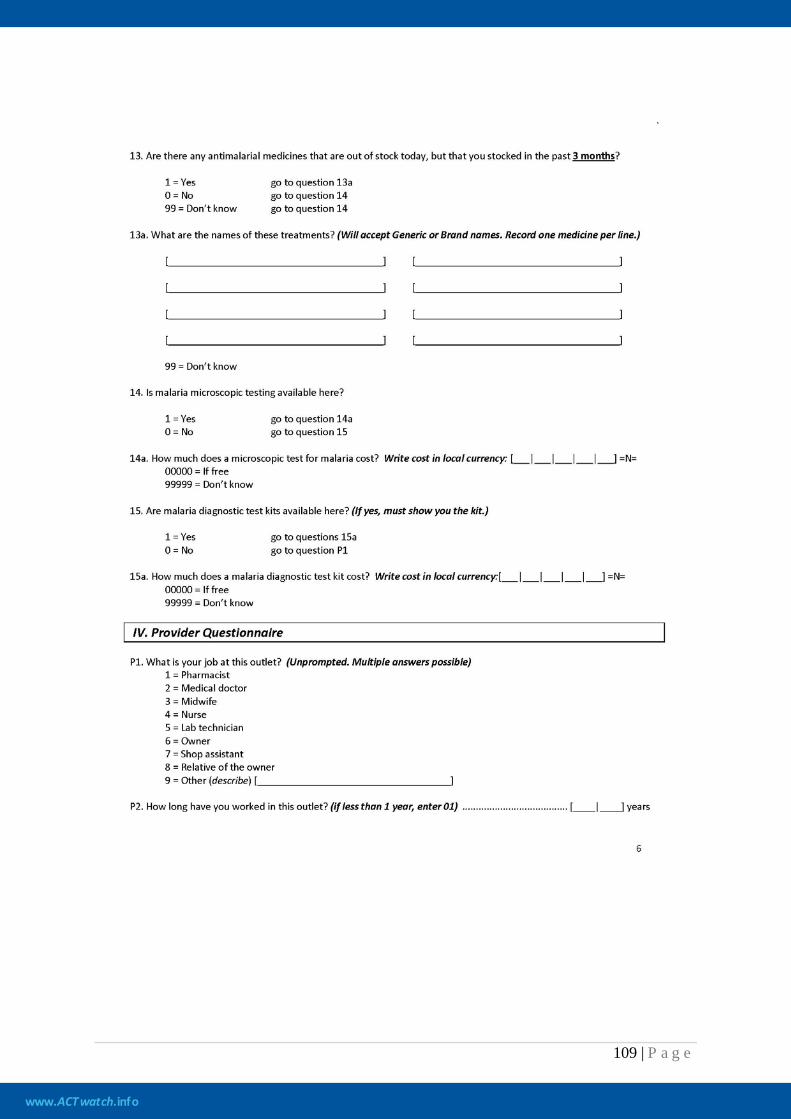
www.ACTwatch.info
109 | P a g e
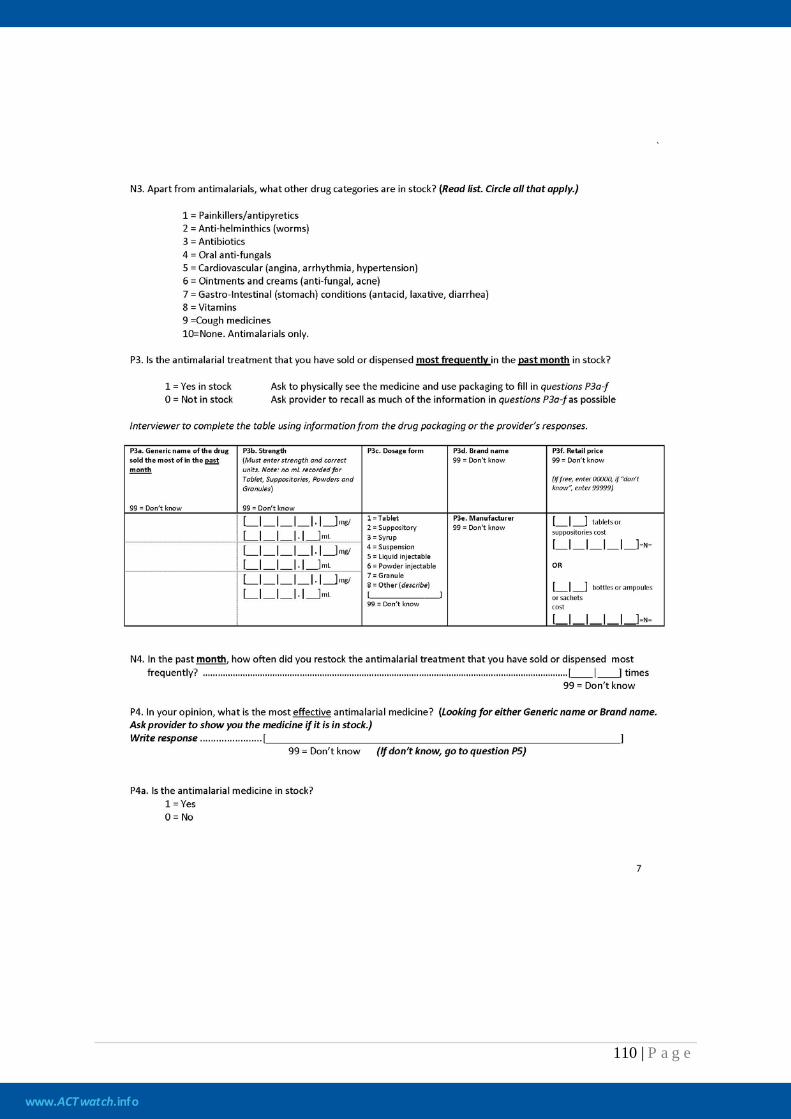
www.ACTwatch.info
110 | P a g e
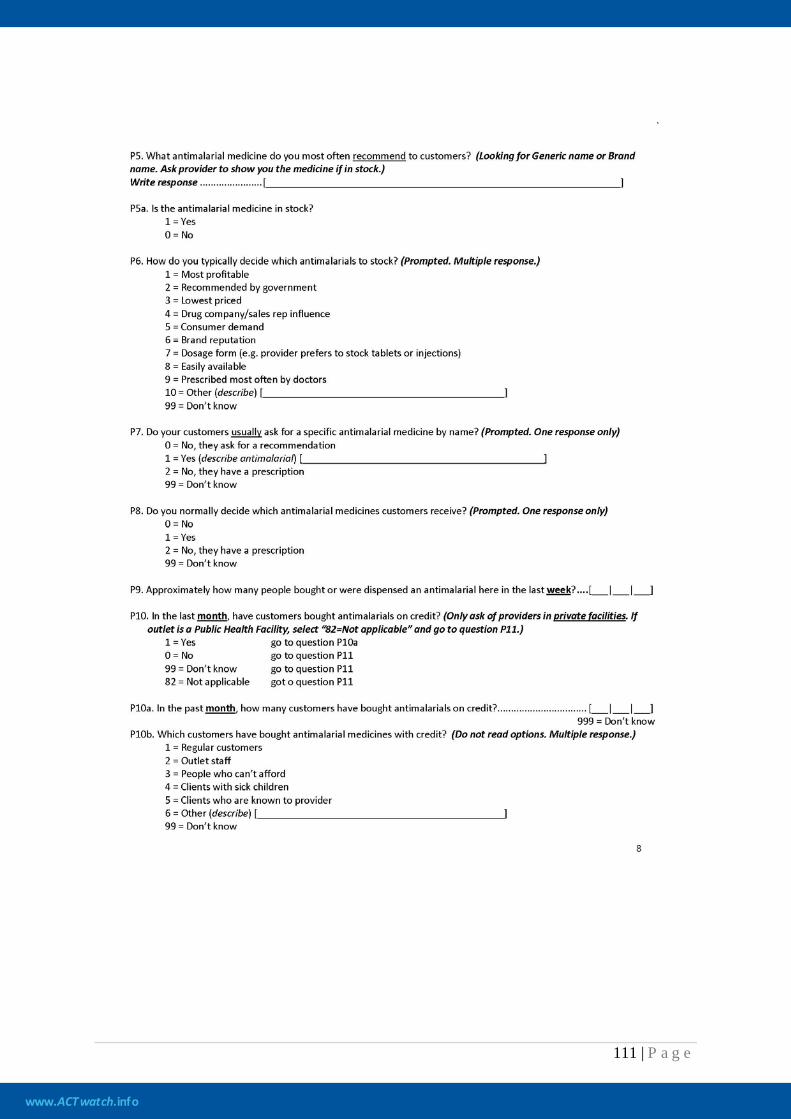
www.ACTwatch.info
111 | P a g e

www.ACTwatch.info
112 | P a g e
www.ACTwatch.info
113 | P a g e
www.ACTwatch.info
114 | P a g e
www.ACTwatch.info
115 | P a g e
www.ACTwatch.info
116 | P a g e
www.ACTwatch.info
117 | P a g e
www.ACTwatch.info
118 | P a g e
8.4 ACTs classified as quality assured
Key indicators for the Independent Evaluation of AMFm measure the price, availability and market share of quality assured ACTs (QAACT). A QAACT is defined as any ACT that meets the Global Fund to Fight AIDS, Tuberculosis and Malaria’s quality-assurance policy. According to this policy, a quality-assured product must be either WHO pre-qualified and/or authorized for marketing by a Stringent Drug Regulatory Authority. Products that have not yet been WHO pre-qualified or approved by a Stringent Drug Regulatory Authority must be evaluated and recommended for use by an independent panel of technical experts hosted by World Health Organization’s Department for Essential Medicines and Pharmaceutical Policies (Global Fund, 2010). The list of antimalarials that complies with the quality-assurance policy varies over time. Consequently, an operational definition that would establish a fixed list of QAACTs was adopted for the purpose of the baseline outlet survey. For the purpose of the Independent Evaluation, a QAACT is any ACT which appeared on the Global Fund's Indicative List of antimalarials meeting the Global Fund's quality assurance policy as at June 201025
, or which previously had C-status in an earlier Global Fund quality assurance policy and was used in a programme supplying subsidised ACTs. In June 2010, the Global Fund provided the Independent Evaluator with the indicative list of antimalarials that met the quality-assurance policy. Since brand names are not pre-qualified by the WHO or registered when recommended by the Expert Review Panel, the Independent Evaluator contacted each manufacturer on the list to get details on all of the brand names used for each product appearing on the list and produced at the approved manufacturing site. In addition, quality-assured products are also often re-packaged and re-branded for the use in domestic social marketing or subsidy programmes. Details on the brand names used in in-country marketing programmes were compiled by contacting national authorities, or the organization involved in the marketing campaign (e.g. PSI and MENTOR). For the availability, price, mark-up and market-share indicators, products were classified as quality-assured ACTs if the brand name, generic name, strength, manufacturer and country of manufacturer matched one of the entries in Table 9.2 (below). For the stock-out indicator, a prompt card showing photographs of the ACTs classified as quality-assured was used so the interviewer and respondent could identify QAACTs in stock during the survey visit or in stock in the previous 4 weeks. Photographs of QAACTs used for social marketing/subsidy programme were not included in the prompt card, unless the country in which data collection took place had a social marketing or subsidy programme which used a QAACT. In addition, two QAACTs appearing on the list in Table 9.2 (Artecospe and Artequin 600/1500) were not included in the prompt card, because the Independent Evaluator was not notified about the existence of these QAACT in time for data collection.
25 Refer to http://www.theglobalfund.org/en/procurement/quality/pharmaceutical/#General for the most up to date list.
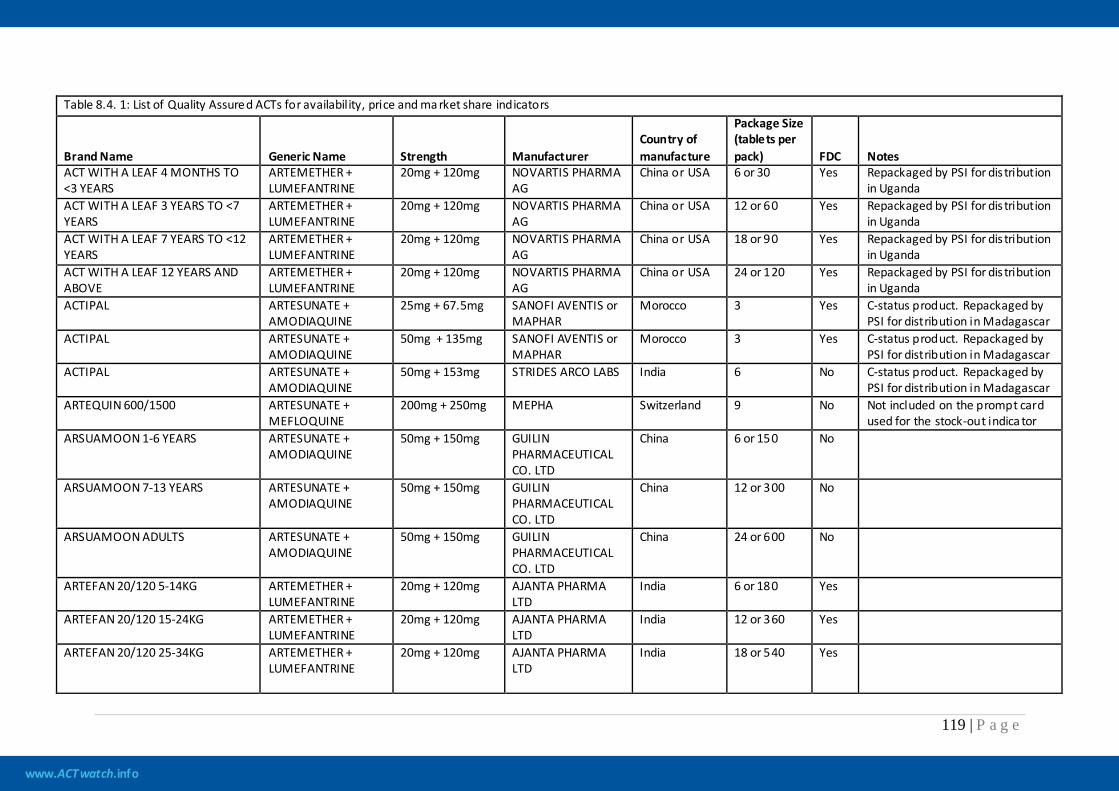
www.ACTwatch.info
119 | P a g e
Table 8.4. 1: List of Quality Assured ACTs for availability, price and ma rket share indicators
Brand Name Generic Name Strength Manufacturer Country of manufacture
Package Size (tablets per pack) FDC Notes
ACT WITH A LEAF 4 MONTHS TO <3 YEARS
ARTEMETHER + LUMEFANTRINE
20mg + 120mg NOVARTIS PHARMA AG
China or USA 6 or 30 Yes Repackaged by PSI for dis tribution in Uganda
ACT WITH A LEAF 3 YEARS TO <7 YEARS
ARTEMETHER + LUMEFANTRINE
20mg + 120mg NOVARTIS PHARMA AG
China or USA 12 or 60 Yes Repackaged by PSI for dis tribution in Uganda
ACT WITH A LEAF 7 YEARS TO <12 YEARS
ARTEMETHER + LUMEFANTRINE
20mg + 120mg NOVARTIS PHARMA AG
China or USA 18 or 90 Yes Repackaged by PSI for dis tribution in Uganda
ACT WITH A LEAF 12 YEARS AND ABOVE
ARTEMETHER + LUMEFANTRINE
20mg + 120mg NOVARTIS PHARMA AG
China or USA 24 or 120 Yes Repackaged by PSI for dis tribution in Uganda
ACTIPAL
ARTESUNATE + AMODIAQUINE
25mg + 67.5mg SANOFI AVENTIS or MAPHAR
Morocco 3 Yes C-status product. Repackaged by PSI for distribution in Madagascar
ACTIPAL
ARTESUNATE + AMODIAQUINE
50mg + 135mg SANOFI AVENTIS or MAPHAR
Morocco 3
Yes C-status product. Repackaged by PSI for distribution in Madagascar
ACTIPAL ARTESUNATE + AMODIAQUINE
50mg + 153mg STRIDES ARCO LABS India 6 No C-status product. Repackaged by PSI for distribution in Madagascar
ARTEQUIN 600/1500 ARTESUNATE + MEFLOQUINE
200mg + 250mg MEPHA Switzerland 9 No Not included on the prompt card used for the stock-out indica tor
ARSUAMOON 1-6 YEARS ARTESUNATE + AMODIAQUINE
50mg + 150mg GUILIN PHARMACEUTICAL CO. LTD
China 6 or 150 No
ARSUAMOON 7-13 YEARS ARTESUNATE + AMODIAQUINE
50mg + 150mg GUILIN PHARMACEUTICAL CO. LTD
China 12 or 300 No
ARSUAMOON ADULTS ARTESUNATE + AMODIAQUINE
50mg + 150mg GUILIN PHARMACEUTICAL CO. LTD
China 24 or 600 No
ARTEFAN 20/120 5-14KG
ARTEMETHER + LUMEFANTRINE
20mg + 120mg AJANTA PHARMA LTD
India 6 or 180 Yes
ARTEFAN 20/120 15-24KG ARTEMETHER + LUMEFANTRINE
20mg + 120mg AJANTA PHARMA LTD
India 12 or 360 Yes
ARTEFAN 20/120 25-34KG ARTEMETHER + LUMEFANTRINE
20mg + 120mg AJANTA PHARMA LTD
India 18 or 540 Yes
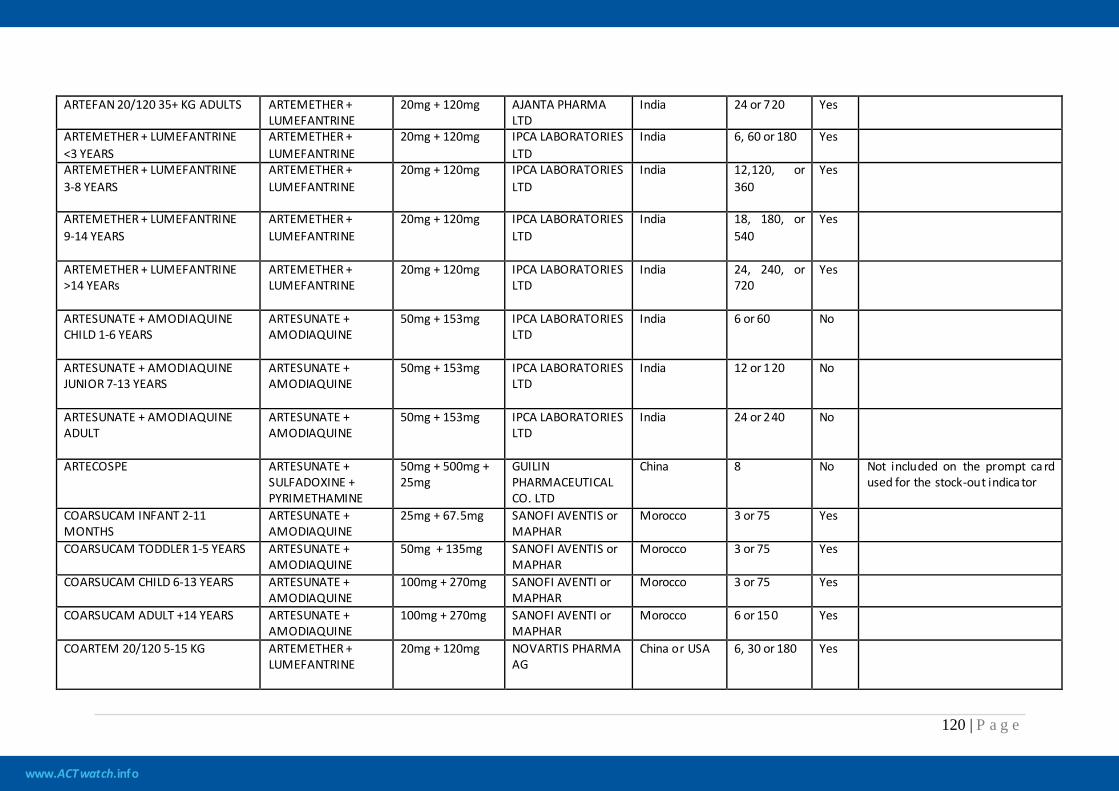
www.ACTwatch.info
120 | P a g e
ARTEFAN 20/120 35+ KG ADULTS ARTEMETHER + LUMEFANTRINE
20mg + 120mg AJANTA PHARMA LTD
India 24 or 720 Yes
ARTEMETHER + LUMEFANTRINE <3 YEARS
ARTEMETHER + LUMEFANTRINE
20mg + 120mg IPCA LABORATORIES LTD
India 6, 60 or 180 Yes
ARTEMETHER + LUMEFANTRINE 3-8 YEARS
ARTEMETHER + LUMEFANTRINE
20mg + 120mg IPCA LABORATORIES LTD
India 12,120, or 360
Yes
ARTEMETHER + LUMEFANTRINE 9-14 YEARS
ARTEMETHER + LUMEFANTRINE
20mg + 120mg IPCA LABORATORIES LTD
India 18, 180, or 540
Yes
ARTEMETHER + LUMEFANTRINE >14 YEARs
ARTEMETHER + LUMEFANTRINE
20mg + 120mg IPCA LABORATORIES LTD
India 24, 240, or 720
Yes
ARTESUNATE + AMODIAQUINE CHILD 1-6 YEARS
ARTESUNATE + AMODIAQUINE
50mg + 153mg IPCA LABORATORIES LTD
India 6 or 60 No
ARTESUNATE + AMODIAQUINE JUNIOR 7-13 YEARS
ARTESUNATE + AMODIAQUINE
50mg + 153mg IPCA LABORATORIES LTD
India 12 or 120 No
ARTESUNATE + AMODIAQUINE ADULT
ARTESUNATE + AMODIAQUINE
50mg + 153mg IPCA LABORATORIES LTD
India 24 or 240 No
ARTECOSPE ARTESUNATE + SULFADOXINE + PYRIMETHAMINE
50mg + 500mg + 25mg
GUILIN PHARMACEUTICAL CO. LTD
China 8 No Not included on the prompt ca rd used for the stock-out indica tor
COARSUCAM INFANT 2-11 MONTHS
ARTESUNATE + AMODIAQUINE
25mg + 67.5mg SANOFI AVENTIS or MAPHAR
Morocco 3 or 75 Yes
COARSUCAM TODDLER 1-5 YEARS ARTESUNATE + AMODIAQUINE
50mg + 135mg SANOFI AVENTIS or MAPHAR
Morocco 3 or 75 Yes
COARSUCAM CHILD 6-13 YEARS ARTESUNATE + AMODIAQUINE
100mg + 270mg SANOFI AVENTI or MAPHAR
Morocco 3 or 75 Yes
COARSUCAM ADULT +14 YEARS ARTESUNATE + AMODIAQUINE
100mg + 270mg SANOFI AVENTI or MAPHAR
Morocco 6 or 150 Yes
COARTEM 20/120 5-15 KG ARTEMETHER + LUMEFANTRINE
20mg + 120mg NOVARTIS PHARMA AG
China or USA 6, 30 or 180 Yes
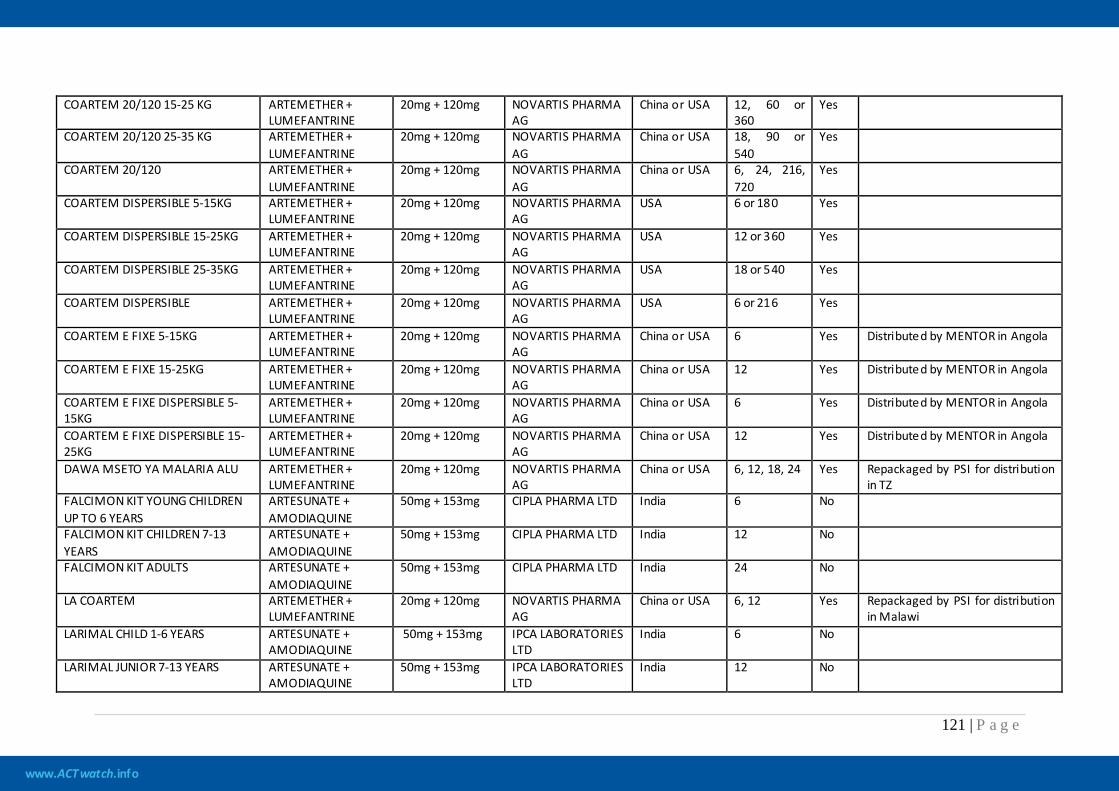
www.ACTwatch.info
121 | P a g e
COARTEM 20/120 15-25 KG ARTEMETHER + LUMEFANTRINE
20mg + 120mg NOVARTIS PHARMA AG
China or USA 12, 60 or 360
Yes
COARTEM 20/120 25-35 KG ARTEMETHER + LUMEFANTRINE
20mg + 120mg NOVARTIS PHARMA AG
China or USA 18, 90 or 540
Yes
COARTEM 20/120 ARTEMETHER + LUMEFANTRINE
20mg + 120mg NOVARTIS PHARMA AG
China or USA 6, 24, 216, 720
Yes
COARTEM DISPERSIBLE 5-15KG ARTEMETHER + LUMEFANTRINE
20mg + 120mg NOVARTIS PHARMA AG
USA 6 or 180 Yes
COARTEM DISPERSIBLE 15-25KG ARTEMETHER + LUMEFANTRINE
20mg + 120mg NOVARTIS PHARMA AG
USA 12 or 360 Yes
COARTEM DISPERSIBLE 25-35KG ARTEMETHER + LUMEFANTRINE
20mg + 120mg NOVARTIS PHARMA AG
USA 18 or 540 Yes
COARTEM DISPERSIBLE ARTEMETHER + LUMEFANTRINE
20mg + 120mg NOVARTIS PHARMA AG
USA 6 or 216 Yes
COARTEM E FIXE 5-15KG ARTEMETHER + LUMEFANTRINE
20mg + 120mg NOVARTIS PHARMA AG
China or USA 6 Yes Distributed by MENTOR in Angola
COARTEM E FIXE 15-25KG ARTEMETHER + LUMEFANTRINE
20mg + 120mg NOVARTIS PHARMA AG
China or USA 12 Yes Distributed by MENTOR in Angola
COARTEM E FIXE DISPERSIBLE 5-15KG
ARTEMETHER + LUMEFANTRINE
20mg + 120mg NOVARTIS PHARMA AG
China or USA 6 Yes Distributed by MENTOR in Angola
COARTEM E FIXE DISPERSIBLE 15-25KG
ARTEMETHER + LUMEFANTRINE
20mg + 120mg NOVARTIS PHARMA AG
China or USA 12 Yes Distributed by MENTOR in Angola
DAWA MSETO YA MALARIA ALU ARTEMETHER + LUMEFANTRINE
20mg + 120mg NOVARTIS PHARMA AG
China or USA 6, 12, 18, 24 Yes Repackaged by PSI for distribution in TZ
FALCIMON KIT YOUNG CHILDREN UP TO 6 YEARS
ARTESUNATE + AMODIAQUINE
50mg + 153mg CIPLA PHARMA LTD India 6 No
FALCIMON KIT CHILDREN 7-13 YEARS
ARTESUNATE + AMODIAQUINE
50mg + 153mg CIPLA PHARMA LTD India 12 No
FALCIMON KIT ADULTS ARTESUNATE + AMODIAQUINE
50mg + 153mg CIPLA PHARMA LTD India 24 No
LA COARTEM ARTEMETHER + LUMEFANTRINE
20mg + 120mg NOVARTIS PHARMA AG
China or USA 6, 12 Yes Repackaged by PSI for distribution in Malawi
LARIMAL CHILD 1-6 YEARS ARTESUNATE + AMODIAQUINE
50mg + 153mg
IPCA LABORATORIES LTD
India 6 No
LARIMAL JUNIOR 7-13 YEARS ARTESUNATE + AMODIAQUINE
50mg + 153mg IPCA LABORATORIES LTD
India 12 No
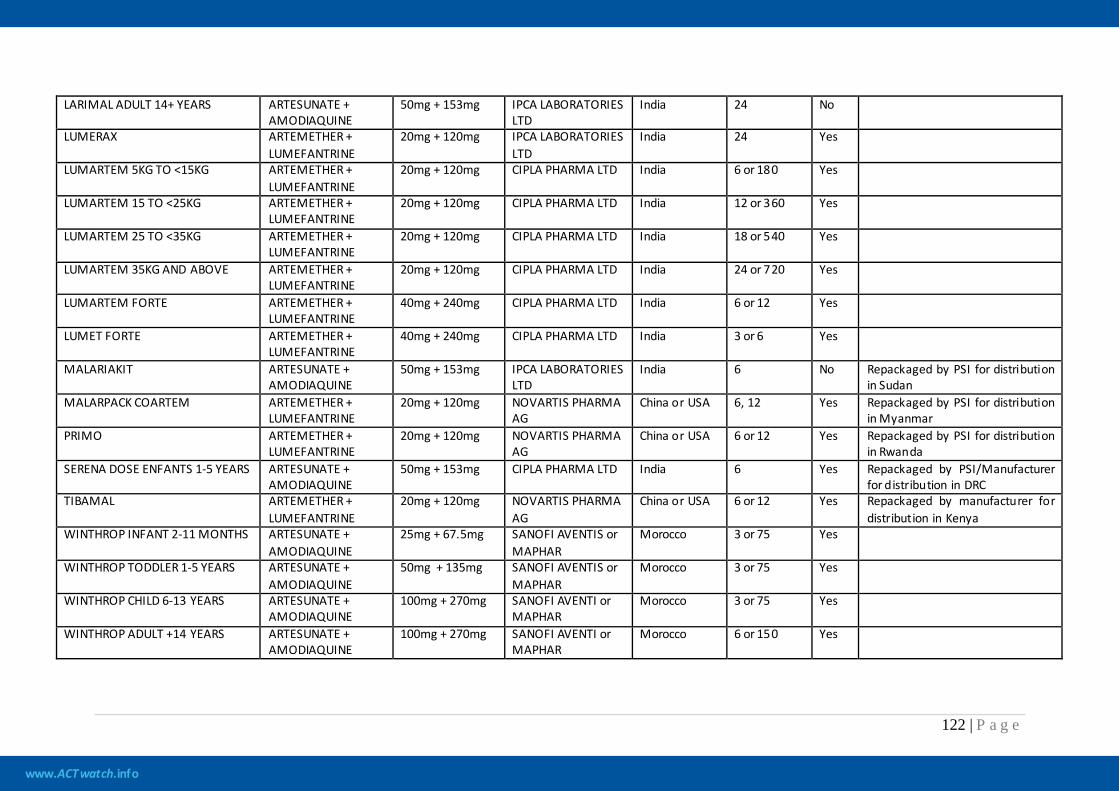
www.ACTwatch.info
122 | P a g e
LARIMAL ADULT 14+ YEARS ARTESUNATE + AMODIAQUINE
50mg + 153mg IPCA LABORATORIES LTD
India 24 No
LUMERAX ARTEMETHER + LUMEFANTRINE
20mg + 120mg IPCA LABORATORIES LTD
India 24 Yes
LUMARTEM 5KG TO <15KG ARTEMETHER + LUMEFANTRINE
20mg + 120mg CIPLA PHARMA LTD India 6 or 180 Yes
LUMARTEM 15 TO <25KG ARTEMETHER + LUMEFANTRINE
20mg + 120mg CIPLA PHARMA LTD India 12 or 360 Yes
LUMARTEM 25 TO <35KG ARTEMETHER + LUMEFANTRINE
20mg + 120mg CIPLA PHARMA LTD India 18 or 540 Yes
LUMARTEM 35KG AND ABOVE ARTEMETHER + LUMEFANTRINE
20mg + 120mg CIPLA PHARMA LTD India 24 or 720 Yes
LUMARTEM FORTE ARTEMETHER + LUMEFANTRINE
40mg + 240mg CIPLA PHARMA LTD India 6 or 12 Yes
LUMET FORTE ARTEMETHER + LUMEFANTRINE
40mg + 240mg CIPLA PHARMA LTD India 3 or 6 Yes
MALARIAKIT ARTESUNATE + AMODIAQUINE
50mg + 153mg IPCA LABORATORIES LTD
India 6 No Repackaged by PSI for distribution in Sudan
MALARPACK COARTEM ARTEMETHER + LUMEFANTRINE
20mg + 120mg NOVARTIS PHARMA AG
China or USA 6, 12 Yes Repackaged by PSI for distribution in Myanmar
PRIMO ARTEMETHER + LUMEFANTRINE
20mg + 120mg NOVARTIS PHARMA AG
China or USA 6 or 12 Yes Repackaged by PSI for distribution in Rwanda
SERENA DOSE ENFANTS 1-5 YEARS ARTESUNATE + AMODIAQUINE
50mg + 153mg CIPLA PHARMA LTD India 6 Yes Repackaged by PSI/Manufacturer for distribution in DRC
TIBAMAL ARTEMETHER + LUMEFANTRINE
20mg + 120mg NOVARTIS PHARMA AG
China or USA 6 or 12 Yes Repackaged by manufacturer for distribution in Kenya
WINTHROP INFANT 2-11 MONTHS ARTESUNATE + AMODIAQUINE
25mg + 67.5mg SANOFI AVENTIS or MAPHAR
Morocco 3 or 75 Yes
WINTHROP TODDLER 1-5 YEARS ARTESUNATE + AMODIAQUINE
50mg + 135mg SANOFI AVENTIS or MAPHAR
Morocco 3 or 75 Yes
WINTHROP CHILD 6-13 YEARS ARTESUNATE + AMODIAQUINE
100mg + 270mg SANOFI AVENTI or MAPHAR
Morocco 3 or 75 Yes
WINTHROP ADULT +14 YEARS ARTESUNATE + AMODIAQUINE
100mg + 270mg SANOFI AVENTI or MAPHAR
Morocco 6 or 150 Yes
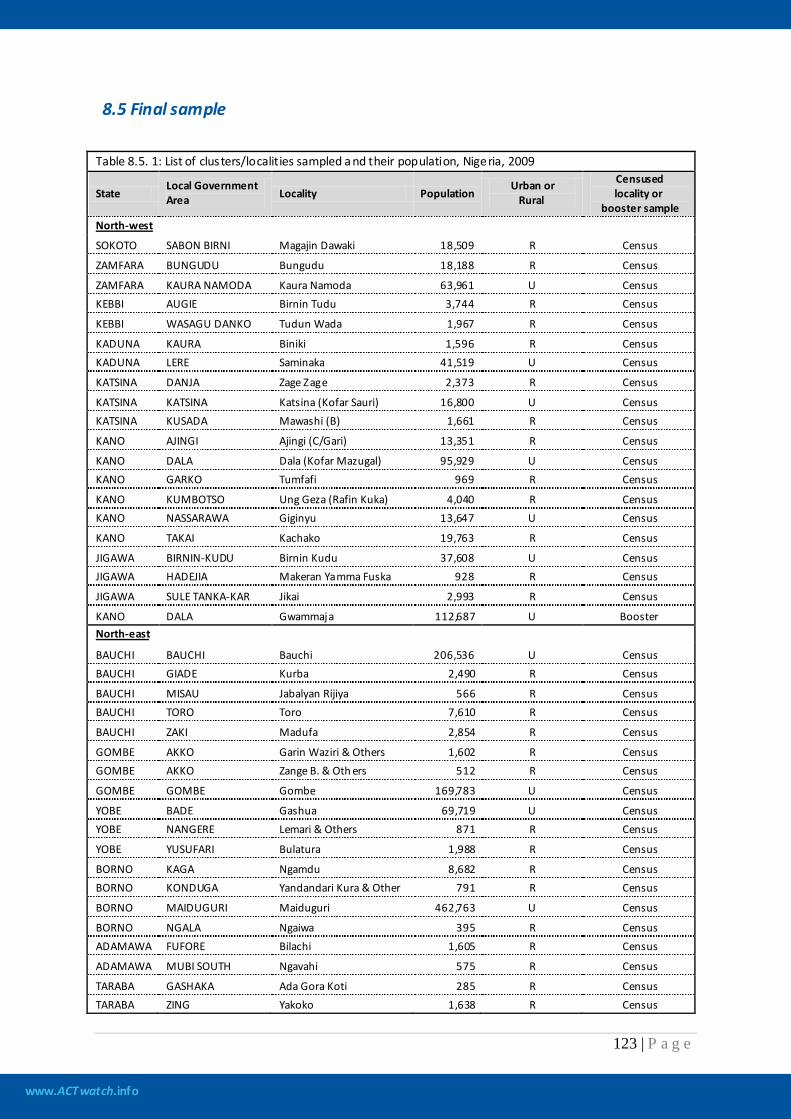
www.ACTwatch.info
123 | P a g e
8.5 Final sample
Table 8.5. 1: List of clusters/localities sampled a nd their population, Nigeria, 2009
State Local Government Area Locality Population
Urban or Rural
Censused locality or
booster sample North-west
SOKOTO SABON BIRNI Magajin Dawaki 18,509 R Census
ZAMFARA BUNGUDU Bungudu 18,188 R Census
ZAMFARA KAURA NAMODA Kaura Namoda 63,961 U Census KEBBI AUGIE Birnin Tudu 3,744 R Census
KEBBI WASAGU DANKO Tudun Wada 1,967 R Census
KADUNA KAURA Biniki 1,596 R Census KADUNA LERE Saminaka 41,519 U Census
KATSINA DANJA Zage Zage 2,373 R Census
KATSINA KATSINA Katsina (Kofar Sauri) 16,800 U Census KATSINA KUSADA Mawashi (B) 1,661 R Census
KANO AJINGI Ajingi (C/Gari) 13,351 R Census
KANO DALA Dala (Kofar Mazugal) 95,929 U Census KANO GARKO Tumfafi 969 R Census
KANO KUMBOTSO Ung Geza (Rafin Kuka) 4,040 R Census KANO NASSARAWA Giginyu 13,647 U Census
KANO TAKAI Kachako 19,763 R Census
JIGAWA BIRNIN-KUDU Birnin Kudu 37,608 U Census JIGAWA HADEJIA Makeran Yamma Fuska 928 R Census
JIGAWA SULE TANKA-KAR Jikai 2,993 R Census
KANO DALA Gwammaja 112,687 U Booster North-east
BAUCHI BAUCHI Bauchi 206,536 U Census BAUCHI GIADE Kurba 2,490 R Census
BAUCHI MISAU Jabalyan Rijiya 566 R Census BAUCHI TORO Toro 7,610 R Census
BAUCHI ZAKI Madufa 2,854 R Census
GOMBE AKKO Garin Waziri & Others 1,602 R Census GOMBE AKKO Zange B. & Oth ers 512 R Census
GOMBE GOMBE Gombe 169,783 U Census
YOBE BADE Gashua 69,719 U Census YOBE NANGERE Lemari & Others 871 R Census
YOBE YUSUFARI Bulatura 1,988 R Census
BORNO KAGA Ngamdu 8,682 R Census BORNO KONDUGA Yandandari Kura & Other 791 R Census
BORNO MAIDUGURI Maiduguri 462,763 U Census
BORNO NGALA Ngaiwa 395 R Census ADAMAWA FUFORE Bilachi 1,605 R Census
ADAMAWA MUBI SOUTH Ngavahi 575 R Census
TARABA GASHAKA Ada Gora Koti 285 R Census TARABA ZING Yakoko 1,638 R Census
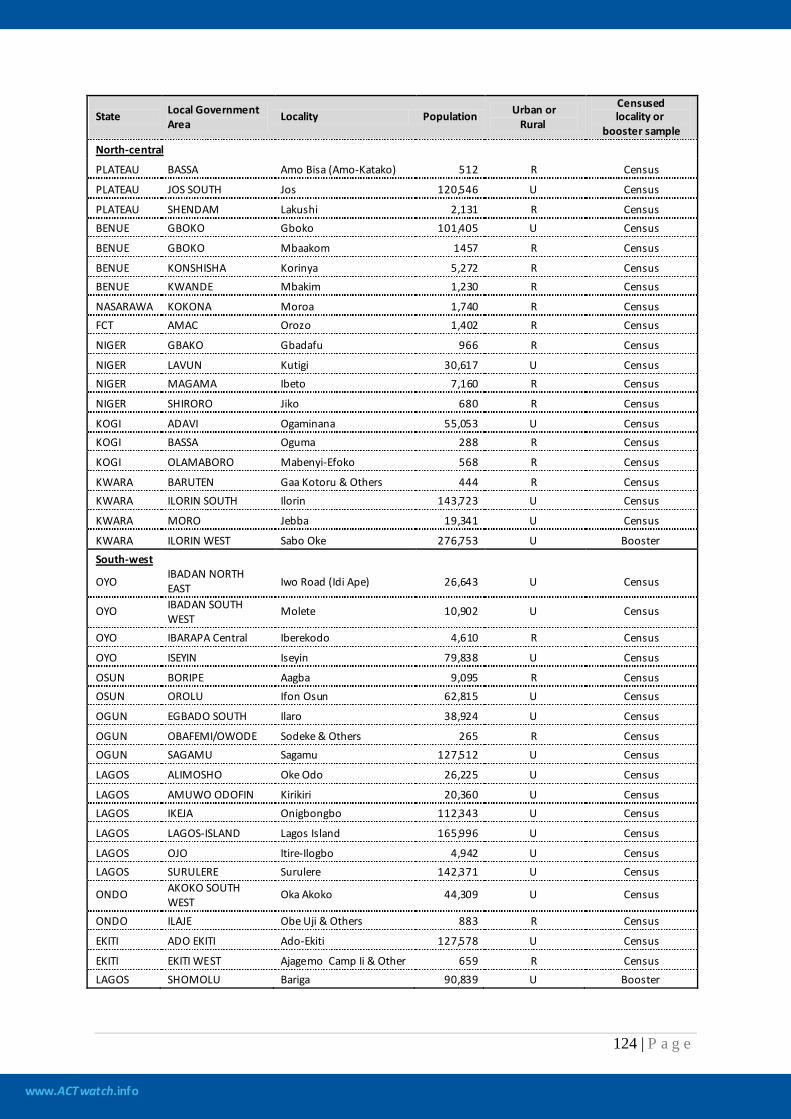
www.ACTwatch.info
124 | P a g e
State Local Government Area
Locality Population Urban or Rural
Censused locality or
booster sample North-central
PLATEAU BASSA Amo Bisa (Amo-Katako) 512 R Census
PLATEAU JOS SOUTH Jos 120,546 U Census
PLATEAU SHENDAM Lakushi 2,131 R Census BENUE GBOKO Gboko 101,405 U Census
BENUE GBOKO Mbaakom 1457 R Census
BENUE KONSHISHA Korinya 5,272 R Census BENUE KWANDE Mbakim 1,230 R Census
NASARAWA KOKONA Moroa 1,740 R Census FCT AMAC Orozo 1,402 R Census
NIGER GBAKO Gbadafu 966 R Census
NIGER LAVUN Kutigi 30,617 U Census NIGER MAGAMA Ibeto 7,160 R Census
NIGER SHIRORO Jiko 680 R Census
KOGI ADAVI Ogaminana 55,053 U Census KOGI BASSA Oguma 288 R Census
KOGI OLAMABORO Mabenyi-Efoko 568 R Census
KWARA BARUTEN Gaa Kotoru & Others 444 R Census KWARA ILORIN SOUTH Ilorin 143,723 U Census
KWARA MORO Jebba 19,341 U Census
KWARA ILORIN WEST Sabo Oke 276,753 U Booster South-west
OYO IBADAN NORTH EAST Iwo Road (Idi Ape) 26,643 U Census
OYO IBADAN SOUTH WEST
Molete 10,902 U Census
OYO IBARAPA Central Iberekodo 4,610 R Census
OYO ISEYIN Iseyin 79,838 U Census
OSUN BORIPE Aagba 9,095 R Census OSUN OROLU Ifon Osun 62,815 U Census
OGUN EGBADO SOUTH Ilaro 38,924 U Census
OGUN OBAFEMI/OWODE Sodeke & Others 265 R Census OGUN SAGAMU Sagamu 127,512 U Census
LAGOS ALIMOSHO Oke Odo 26,225 U Census
LAGOS AMUWO ODOFIN Kirikiri 20,360 U Census LAGOS IKEJA Onigbongbo 112,343 U Census
LAGOS LAGOS-ISLAND Lagos Island 165,996 U Census
LAGOS OJO Itire-Ilogbo 4,942 U Census LAGOS SURULERE Surulere 142,371 U Census
ONDO AKOKO SOUTH WEST
Oka Akoko 44,309 U Census
ONDO ILAJE Obe Uji & Others 883 R Census
EKITI ADO EKITI Ado-Ekiti 127,578 U Census
EKITI EKITI WEST Ajagemo Camp Ii & Other 659 R Census LAGOS SHOMOLU Bariga 90,839 U Booster
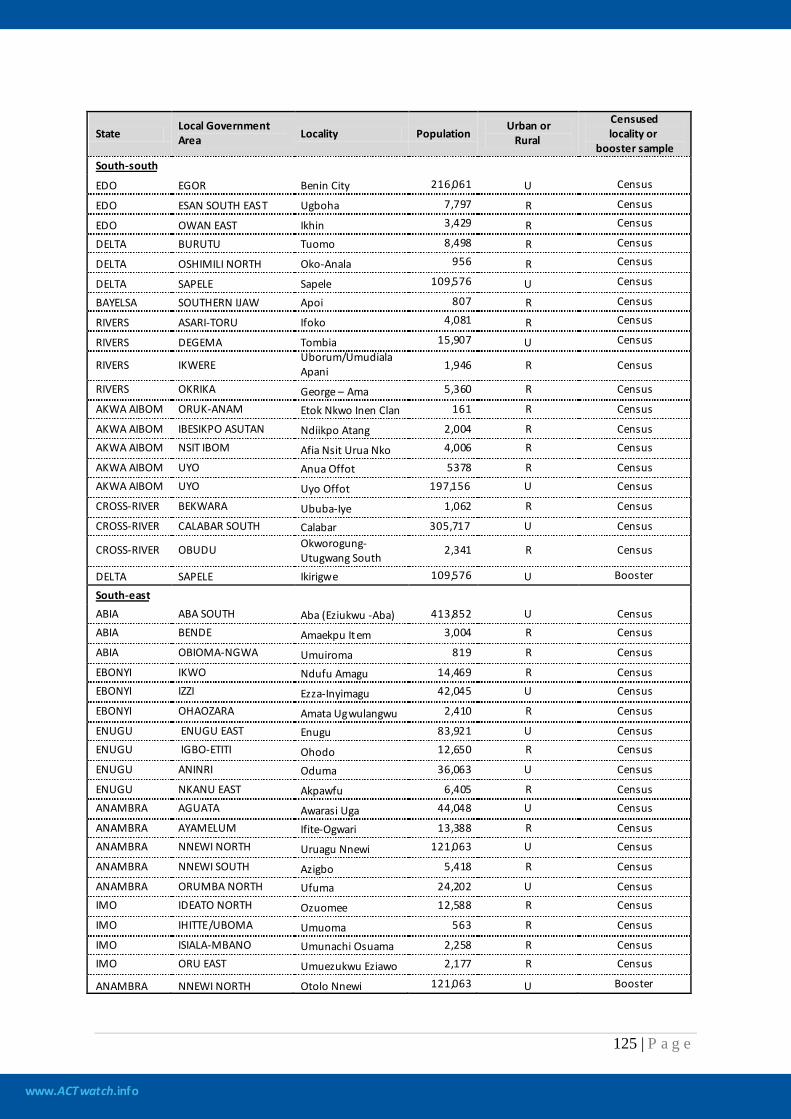
www.ACTwatch.info
125 | P a g e
State Local Government Area Locality Population
Urban or Rural
Censused locality or
booster sample South-south
EDO EGOR Benin City 216,061 U Census
EDO ESAN SOUTH EAST Ugboha 7,797 R Census
EDO OWAN EAST Ikhin 3,429 R Census
DELTA BURUTU Tuomo 8,498 R Census
DELTA OSHIMILI NORTH Oko-Anala 956 R Census
DELTA SAPELE Sapele 109,576 U Census
BAYELSA SOUTHERN IJAW Apoi 807 R Census
RIVERS ASARI-TORU Ifoko 4,081 R Census
RIVERS DEGEMA Tombia 15,907 U Census
RIVERS IKWERE Uborum/Umudiala Apani 1,946 R Census
RIVERS OKRIKA George – Ama 5,360 R Census
AKWA AIBOM ORUK-ANAM Etok Nkwo Inen Clan 161 R Census
AKWA AIBOM IBESIKPO ASUTAN Ndiikpo Atang 2,004 R Census AKWA AIBOM NSIT IBOM Afia Nsit Urua Nko 4,006 R Census
AKWA AIBOM UYO Anua Offot 5378 R Census AKWA AIBOM UYO Uyo Offot 197,156 U Census
CROSS-RIVER BEKWARA Ububa-Iye 1,062 R Census
CROSS-RIVER CALABAR SOUTH Calabar 305,717 U Census
CROSS-RIVER OBUDU Okworogung-Utugwang South
2,341 R Census
DELTA SAPELE Ikirigwe 109,576 U Booster
South-east ABIA ABA SOUTH Aba (Eziukwu -Aba) 413,852 U Census ABIA BENDE Amaekpu Item 3,004 R Census
ABIA OBIOMA-NGWA Umuiroma 819 R Census
EBONYI IKWO Ndufu Amagu 14,469 R Census EBONYI IZZI Ezza-Inyimagu 42,045 U Census
EBONYI OHAOZARA Amata Ugwulangwu 2,410 R Census
ENUGU ENUGU EAST Enugu 83,921 U Census ENUGU IGBO-ETITI Ohodo 12,650 R Census
ENUGU ANINRI Oduma 36,063 U Census
ENUGU NKANU EAST Akpawfu 6,405 R Census ANAMBRA AGUATA Awarasi Uga 44,048 U Census
ANAMBRA AYAMELUM Ifite-Ogwari 13,388 R Census ANAMBRA NNEWI NORTH Uruagu Nnewi 121,063 U Census
ANAMBRA NNEWI SOUTH Azigbo 5,418 R Census
ANAMBRA ORUMBA NORTH Ufuma 24,202 U Census IMO IDEATO NORTH Ozuomee 12,588 R Census
IMO IHITTE/UBOMA Umuoma 563 R Census
IMO ISIALA-MBANO Umunachi Osuama 2,258 R Census IMO ORU EAST Umuezukwu Eziawo 2,177 R Census
ANAMBRA NNEWI NORTH Otolo Nnewi 121,063 U Booster
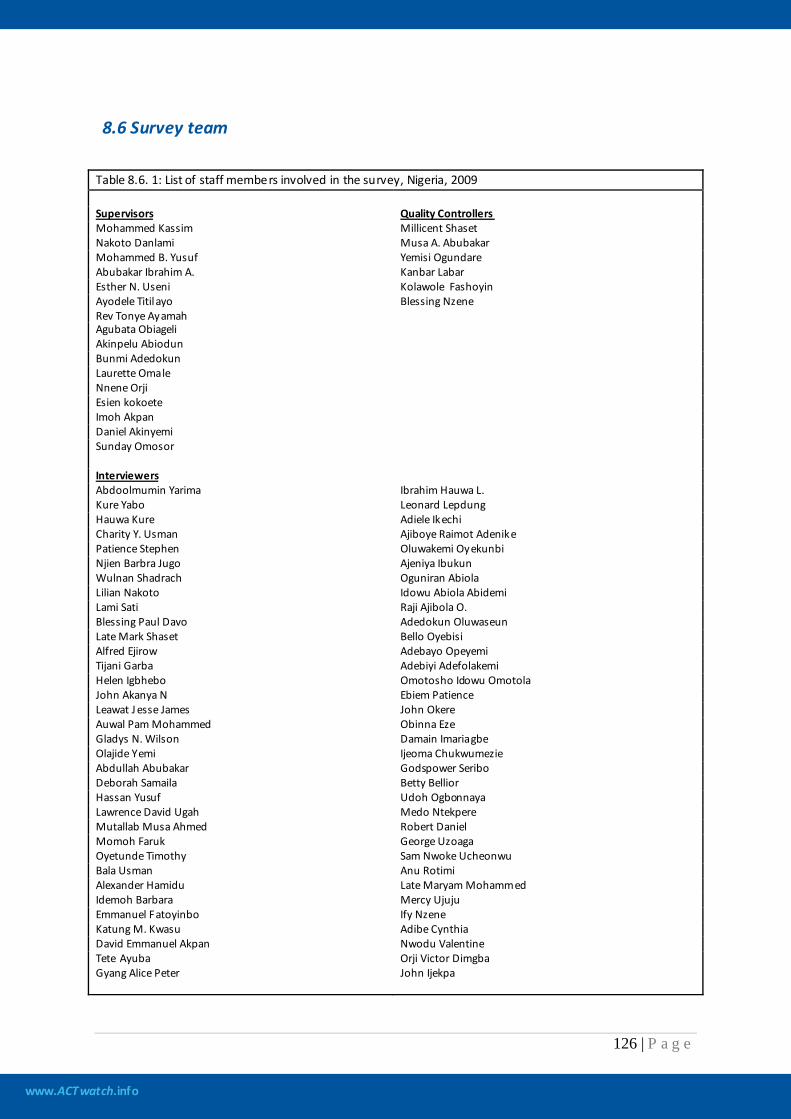
www.ACTwatch.info
126 | P a g e
8.6 Survey team
Table 8.6. 1: List of staff members involved in the survey, Nigeria, 2009 Supervisors Quality Controllers Mohammed Kassim Millicent Shaset Nakoto Danlami Musa A. Abubakar Mohammed B. Yusuf Yemisi Ogundare Abubakar Ibrahim A. Kanbar Labar Esther N. Useni Kolawole Fashoyin Ayodele Titilayo Blessing Nzene Rev Tonye Ayamah Agubata Obiageli Akinpelu Abiodun Bunmi Adedokun Laurette Omale Nnene Orji Esien kokoete Imoh Akpan Daniel Akinyemi Sunday Omosor
Interviewers Abdoolmumin Yarima Ibrahim Hauwa L. Kure Yabo Leonard Lepdung Hauwa Kure Adiele Ikechi Charity Y. Usman Ajiboye Raimot Adenike Patience Stephen Oluwakemi Oyekunbi Njien Barbra Jugo Ajeniya Ibukun Wulnan Shadrach Oguniran Abiola Lilian Nakoto Idowu Abiola Abidemi Lami Sati Raji Ajibola O. Blessing Paul Davo Adedokun Oluwaseun Late Mark Shaset Bello Oyebisi Alfred Ejirow Adebayo Opeyemi Tijani Garba Adebiyi Adefolakemi Helen Igbhebo Omotosho Idowu Omotola John Akanya N Ebiem Patience Leawat J esse James John Okere Auwal Pam Mohammed Obinna Eze Gladys N. Wilson Damain Imariagbe Olajide Yemi Ijeoma Chukwumezie Abdullah Abubakar Godspower Seribo Deborah Samaila Betty Bellior Hassan Yusuf Udoh Ogbonnaya Lawrence David Ugah Medo Ntekpere Mutallab Musa Ahmed Robert Daniel Momoh Faruk George Uzoaga Oyetunde Timothy Sam Nwoke Ucheonwu Bala Usman Anu Rotimi Alexander Hamidu Late Maryam Mohammed Idemoh Barbara Mercy Ujuju Emmanuel Fatoyinbo Ify Nzene Katung M. Kwasu Adibe Cynthia David Emmanuel Akpan Nwodu Valentine Tete Ayuba Orji Victor Dimgba Gyang Alice Peter John Ijekpa
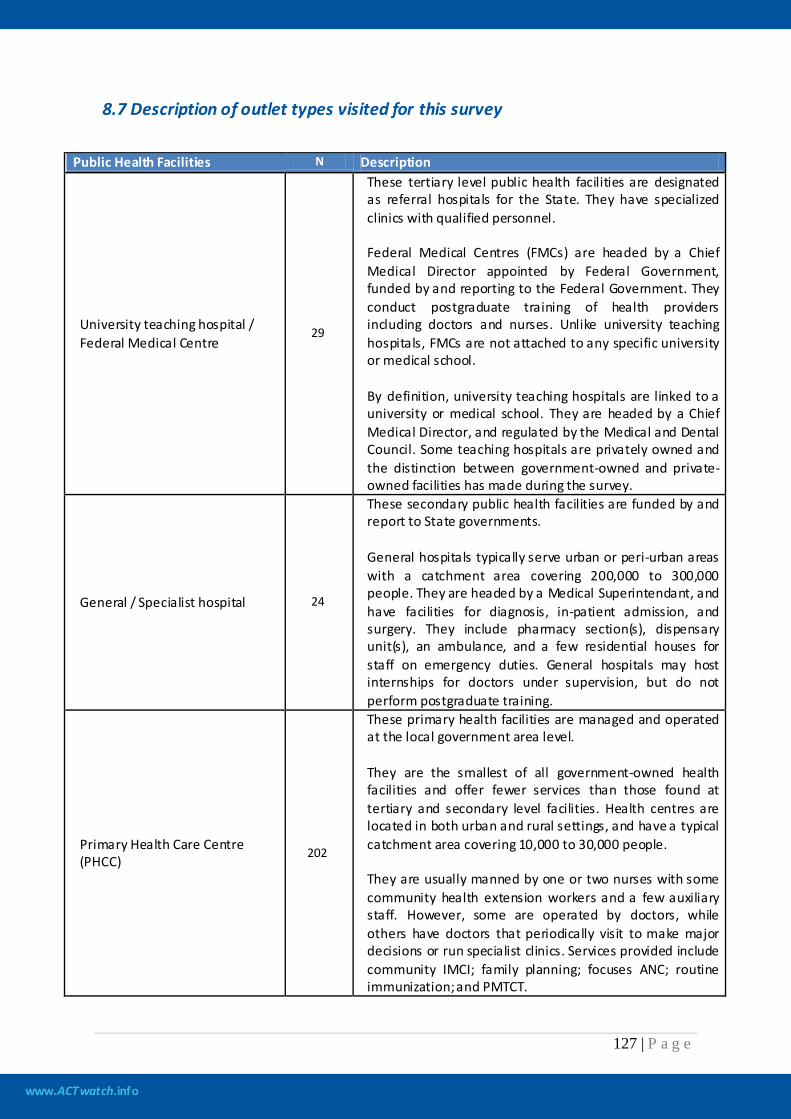
www.ACTwatch.info
127 | P a g e
8.7 Description of outlet types visited for this survey
Public Health Facilities N Description
University teaching hospital / Federal Medical Centre
29
These tertiary level public health facilities are designated as referral hospitals for the State. They have specialized clinics with qualified personnel. Federal Medical Centres (FMCs) are headed by a Chief Medical Director appointed by Federal Government, funded by and reporting to the Federal Government. They conduct postgraduate training of health providers including doctors and nurses. Unlike university teaching hospitals, FMCs are not attached to any specific university or medical school. By definition, university teaching hospitals are linked to a university or medical school. They are headed by a Chief Medical Director, and regulated by the Medical and Dental Council. Some teaching hospitals are privately owned and the distinction between government-owned and private-owned facilities has made during the survey.
General / Specialist hospital 24
These secondary public health facilities are funded by and report to State governments. General hospitals typically serve urban or peri-urban areas with a catchment area covering 200,000 to 300,000 people. They are headed by a Medical Superintendant, and have facilities for diagnosis, in-patient admission, and surgery. They include pharmacy section(s), dispensary unit(s), an ambulance, and a few residential houses for staff on emergency duties. General hospitals may host internships for doctors under supervision, but do not perform postgraduate training.
Primary Health Care Centre (PHCC)
202
These primary health facilities are managed and operated at the local government area level. They are the smallest of all government-owned health facilities and offer fewer services than those found at tertiary and secondary level facilities. Health centres are located in both urban and rural settings, and have a typical catchment area covering 10,000 to 30,000 people. They are usually manned by one or two nurses with some community health extension workers and a few auxiliary staff. However, some are operated by doctors, while others have doctors that periodically visit to make major decisions or run specialist clinics. Services provided include community IMCI; family planning; focuses ANC; routine immunization; and PMTCT.
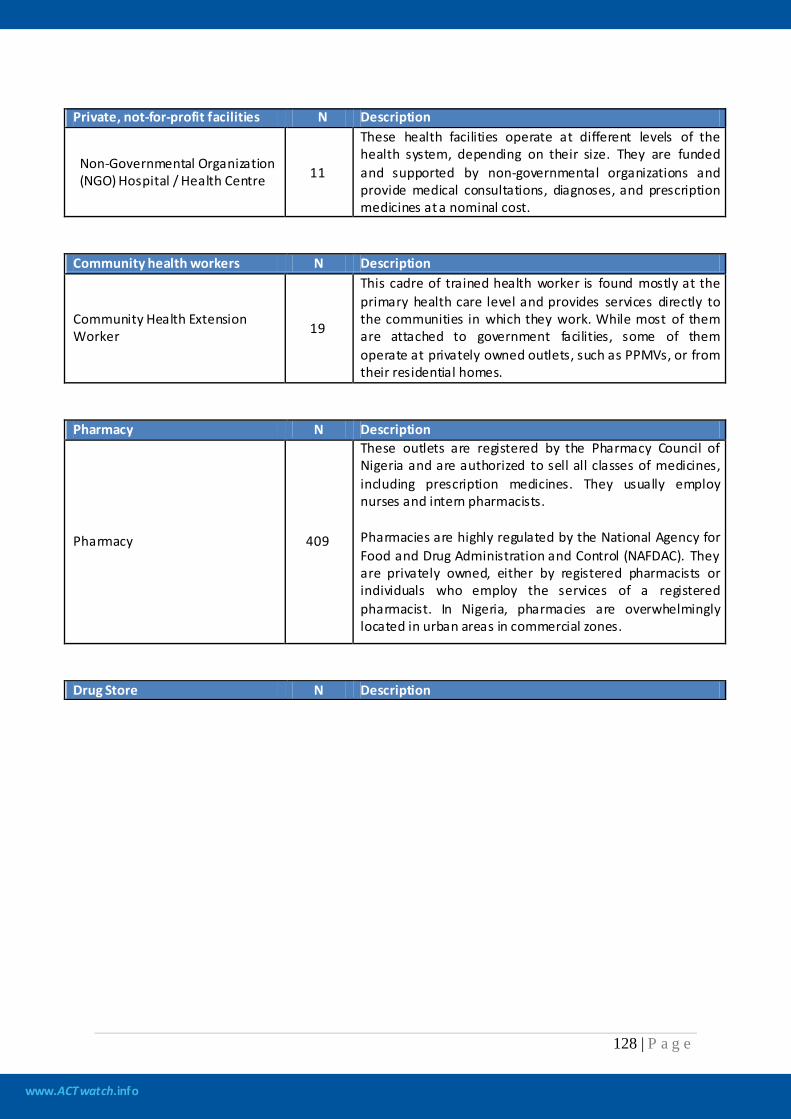
www.ACTwatch.info
128 | P a g e
Private, not-for-profit facilities N Description
Non-Governmental Organization (NGO) Hospital / Health Centre 11
These health facilities operate at different levels of the health system, depending on their size. They are funded and supported by non-governmental organizations and provide medical consultations, diagnoses, and prescription medicines at a nominal cost.
Community health workers N Description
Community Health Extension Worker 19
This cadre of trained health worker is found mostly at the primary health care level and provides services directly to the communities in which they work. While most of them are attached to government facilities, some of them operate at privately owned outlets, such as PPMVs, or from their residential homes.
Pharmacy N Description
Pharmacy 409
These outlets are registered by the Pharmacy Council of Nigeria and are authorized to sell all classes of medicines, including prescription medicines. They usually employ nurses and intern pharmacists. Pharmacies are highly regulated by the National Agency for Food and Drug Administration and Control (NAFDAC). They are privately owned, either by registered pharmacists or individuals who employ the services of a registered pharmacist. In Nigeria, pharmacies are overwhelmingly located in urban areas in commercial zones.
Drug Store N Description
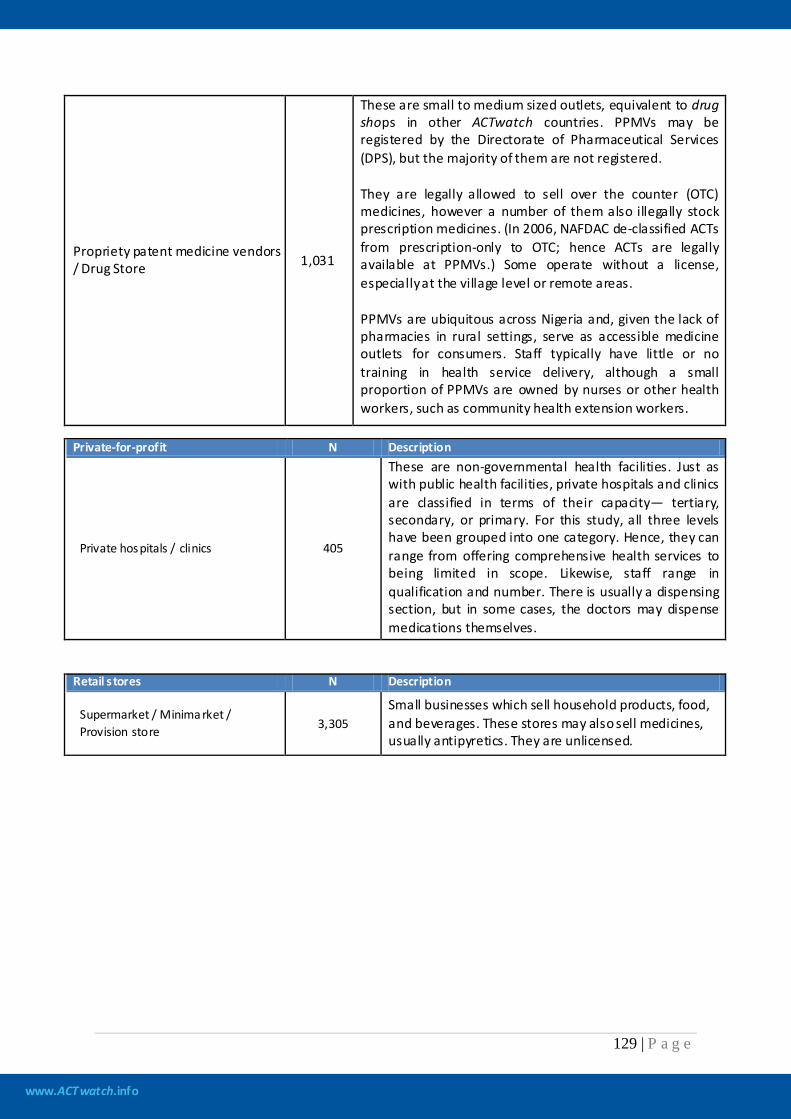
www.ACTwatch.info
129 | P a g e
Propriety patent medicine vendors / Drug Store 1,031
These are small to medium sized outlets, equivalent to drug shops in other ACTwatch countries. PPMVs may be registered by the Directorate of Pharmaceutical Services (DPS), but the majority of them are not registered. They are legally allowed to sell over the counter (OTC) medicines, however a number of them also illegally stock prescription medicines. (In 2006, NAFDAC de-classified ACTs from prescription-only to OTC; hence ACTs are legally available at PPMVs.) Some operate without a license, especially at the village level or remote areas. PPMVs are ubiquitous across Nigeria and, given the lack of pharmacies in rural settings, serve as accessible medicine outlets for consumers. Staff typically have little or no training in health service delivery, although a small proportion of PPMVs are owned by nurses or other health workers, such as community health extension workers.
Private-for-profit N Description
Private hospitals / clinics 405
These are non-governmental health facilities. Just as with public health facilities, private hospitals and clinics are classified in terms of their capacity— tertiary, secondary, or primary. For this study, all three levels have been grouped into one category. Hence, they can range from offering comprehensive health services to being limited in scope. Likewise, staff range in qualification and number. There is usually a dispensing section, but in some cases, the doctors may dispense medications themselves.
Retail stores N Description
Supermarket / Minima rket / Provision store 3,305
Small businesses which sell household products, food, and beverages. These stores may also sell medicines, usually antipyretics. They are unlicensed.
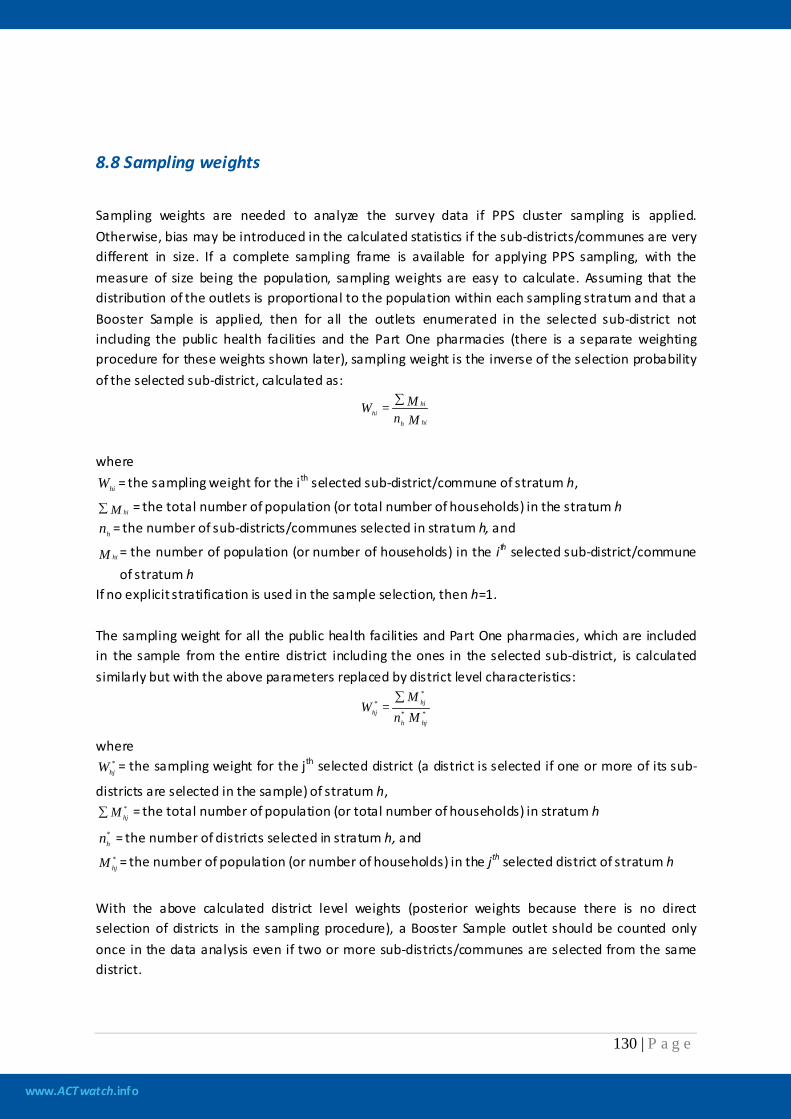
www.ACTwatch.info
130 | P a g e
8.8 Sampling weights
Sampling weights are needed to analyze the survey data if PPS cluster sampling is applied. Otherwise, bias may be introduced in the calculated statistics if the sub-districts/communes are very different in size. If a complete sampling frame is available for applying PPS sampling, with the measure of size being the population, sampling weights are easy to calculate. Assuming that the distribution of the outlets is proportional to the population within each sampling stratum and that a Booster Sample is applied, then for all the outlets enumerated in the selected sub-district not including the public health facilities and the Part One pharmacies (there is a separate weighting procedure for these weights shown later), sampling weight is the inverse of the selection probability of the selected sub-district, calculated as:
M nM =W
hih
hihi
∑
where
hiW = the sampling weight for the ith selected sub-district/commune of stratum h,
M hi∑ = the total number of population (or total number of households) in the stratum h
hn = the number of sub-districts/communes selected in stratum h, and
M hi = the number of population (or number of households) in the ith selected sub-district/commune of stratum h
If no explicit stratification is used in the sample selection, then h=1. The sampling weight for all the public health facilities and Part One pharmacies, which are included in the sample from the entire district including the ones in the selected sub-district, is calculated similarly but with the above parameters replaced by district level characteristics:
**
**
hjh
hjhj Mn
M =W∑
where
*hjW = the sampling weight for the jth selected district (a district is selected if one or more of its sub-
districts are selected in the sample) of stratum h, *hj M∑ = the total number of population (or total number of households) in stratum h
*hn = the number of districts selected in stratum h, and
*hjM = the number of population (or number of households) in the jth selected district of stratum h
With the above calculated district level weights (posterior weights because there is no direct selection of districts in the sampling procedure), a Booster Sample outlet should be counted only once in the data analysis even if two or more sub-districts/communes are selected from the same district.
www.ACTwatch.info
131 | P a g e
The above calculated sampling weights are cluster-wide weights. This means that all the outlets interviewed in the same sub-district/commune share the same sampling weight, for both public health facilities and Part One pharmacies and all other facilities.
www.ACTwatch.info
132 | P a g e
8.9 Assumptions for calculating Adult-Equivalent Treatment Doses (AETDs)
Introduction Antimalarial medicines are manufactured in a variety of active pharmaceutical ingredients, dosage forms, strengths and package sizes. To analyze prices and volumes across products with different characteristics, they are standardized using the AETD. Indicators based on price and volume data, namely market share and antimalarial prices, are presented in terms of AETDs. Assumptions for calculating AETDs One AETD is defined as the number of milligrams (mg) of an antimalarial drug required to treat a 60 kilogram (kg) adult. For each antimalarial medicine category, the number of mg in one AETD is set to what was recommended in the treatment guidelines for uncomplicated malarial in areas of low drug resistance issued by the WHO. Where WHO treatment guidelines did not exist, AETDs were based on peer reviewed research, or the product manufacturer’s recommended treatment course for a 60kg adult. A list of AETDs by antimalarial category prepared by PSI for the ACTwatch project was reviewed and updated by the Independent Evaluator in April 2010. Refer to Table 9.9.1 for the list used for the baseline report.
1) For combination therapies, which have two or more active antimalarial ingredient packaged together (either co-formulated or co-blistered) the AETD is based on the total amount of
Additional assumptions
one
of the active ingredients. For ACTs, the artemisinin derivative was used as the basis of the AETD.
2) Co-blistered combinations are assumed to be in a 1:1 ratio of tablets, with the following exceptions:
• Amodiaquine + Sulfadoxine + Pyrimethamine manufactured under the brand name Dualkin;
• Artesunate + Amodiaquine manufactured under the brand names Amonate Junior and Amonate Adult;
• Artesunate + Mefloquine manufactured under the brand names Artequin 600/1500, Artequn 300/750, A + M1, A + M2, A + M3, A + M4, A + M5, Malarine for Adults, Malarine for Teenagers, and Malarine for Children;
• Artesunate + Sulfadoxine + Pyrimethamine manufactured under the brand names SulamonPlus 500, Malosunat, Amalar, Artescope, Farenax, Artidox, Artedar, Asunatedenk 100, Asunatedenk 200, Co-arinate, Arte-Plus.
3) Sulfamethoxypyrazine-pyrimethamine is assumed to have the same full adult treatment
dose as Sulfadoxine-pyrimethamine.
4) Artequick lacking strength information is assumed to contain Artemisinin 62.4mg and Piperaquine phosphate 375mg.

www.ACTwatch.info
133 | P a g e
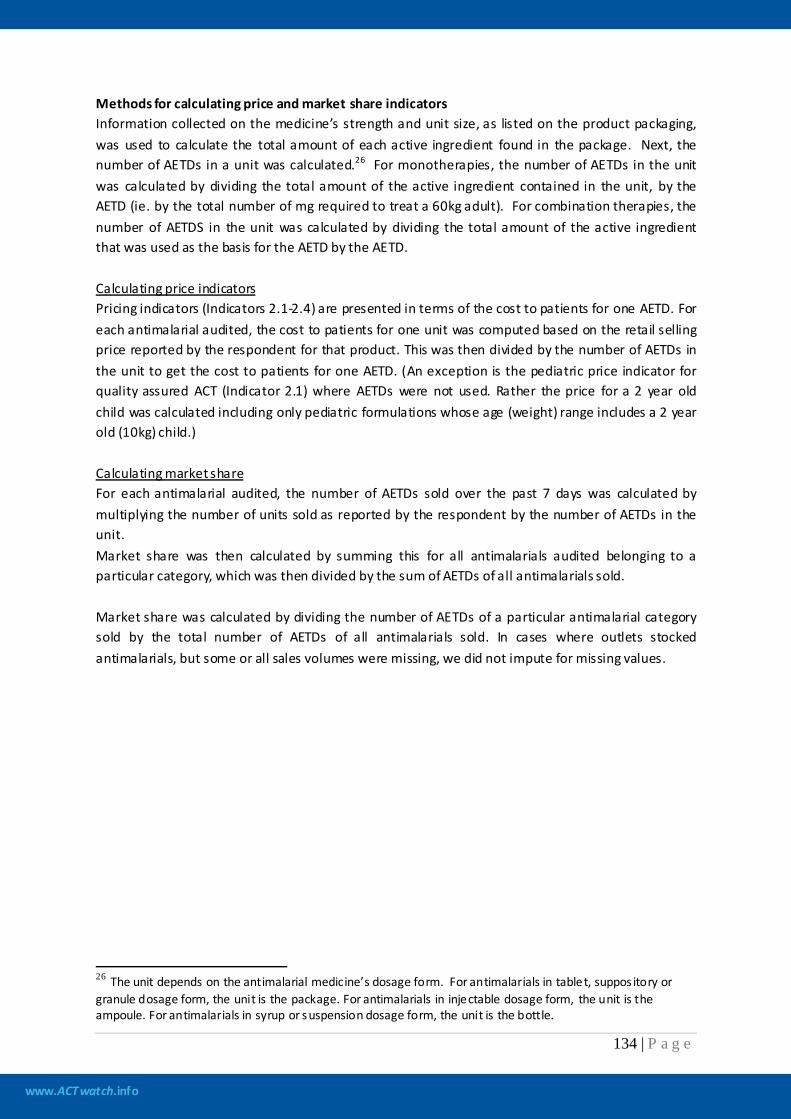
www.ACTwatch.info
134 | P a g e
Methods for calculating price and market share indicators Information collected on the medicine’s strength and unit size, as listed on the product packaging, was used to calculate the total amount of each active ingredient found in the package. Next, the number of AETDs in a unit was calculated.26 For monotherapies, the number of AETDs in the unit was calculated by dividing the total amount of the active ingredient contained in the unit, by the AETD (ie. by the total number of mg required to treat a 60kg adult). For combination therapies, the number of AETDS in the unit was calculated by dividing the total amount of the active ingredient that was used as the basis for the AETD by the AETD. Calculating price indicators Pricing indicators (Indicators 2.1-2.4) are presented in terms of the cost to patients for one AETD. For each antimalarial audited, the cost to patients for one unit was computed based on the retail selling price reported by the respondent for that product. This was then divided by the number of AETDs in the unit to get the cost to patients for one AETD. (An exception is the pediatric price indicator for quality assured ACT (Indicator 2.1) where AETDs were not used. Rather the price for a 2 year old child was calculated including only pediatric formulations whose age (weight) range includes a 2 year old (10kg) child.)
Calculating market share For each antimalarial audited, the number of AETDs sold over the past 7 days was calculated by multiplying the number of units sold as reported by the respondent by the number of AETDs in the unit. Market share was then calculated by summing this for all antimalarials audited belonging to a particular category, which was then divided by the sum of AETDs of all antimalarials sold. Market share was calculated by dividing the number of AETDs of a particular antimalarial category sold by the total number of AETDs of all antimalarials sold. In cases where outlets stocked antimalarials, but some or all sales volumes were missing, we did not impute for missing values.
26 The unit depends on the antimalarial medicine’s dosage form. For antimalarials in tablet, suppos itory or granule dosage form, the unit is the package. For antimalarials in injectable dosage form, the unit is the ampoule. For antimalarials in syrup or suspension dosage form, the unit is the bottle.

www.ACTwatch.info
135 | P a g e
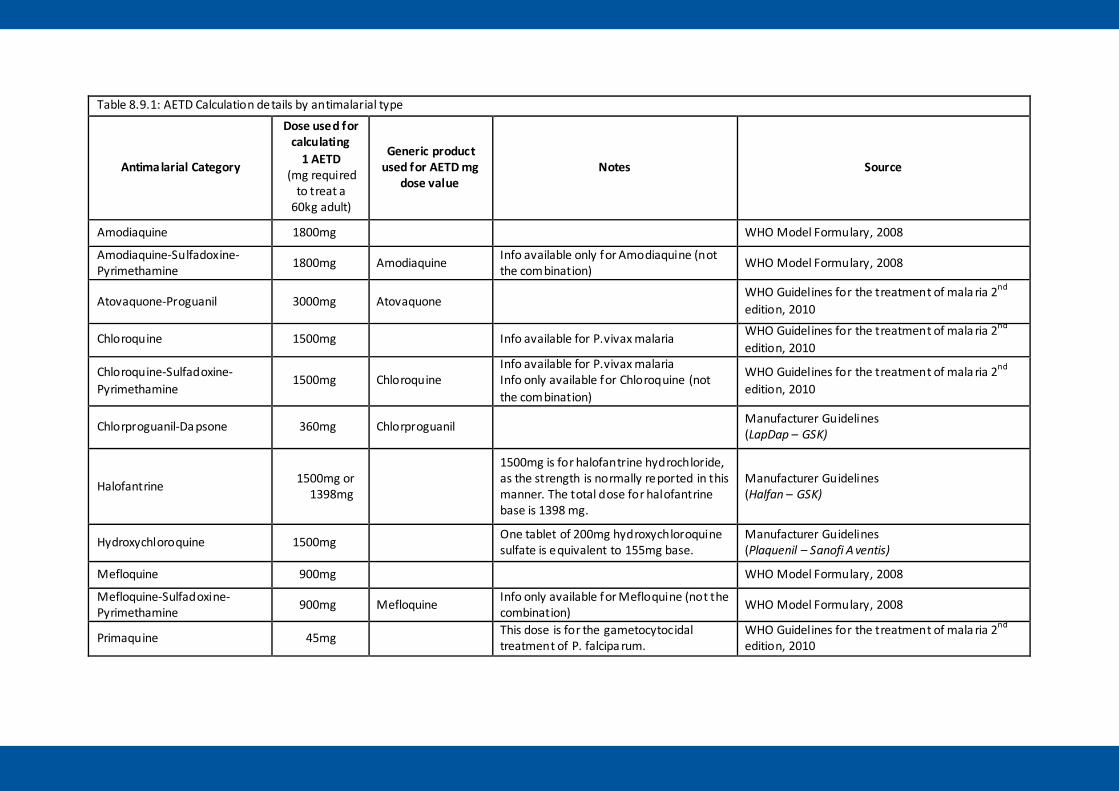
Table 8.9.1: AETD Calculation details by antimalarial type
Antimalarial Category
Dose used for calculating
1 AETD (mg required
to treat a 60kg adult)
Generic product used for AETD mg
dose value Notes Source
Amodiaquine 1800mg WHO Model Formulary, 2008
Amodiaquine-Sulfadoxine-Pyrimethamine 1800mg Amodiaquine Info available only for Amodiaquine (not
the combination) WHO Model Formulary, 2008
Atovaquone-Proguanil 3000mg Atovaquone WHO Guidelines for the treatment of mala ria 2nd edition, 2010
Chloroquine 1500mg Info available for P.vivax malaria WHO Guidelines for the treatment of mala ria 2nd edition, 2010
Chloroquine-Sulfadoxine-Pyrimethamine
1500mg Chloroquine Info available for P.vivax malaria Info only available for Chloroquine (not the combination)
WHO Guidelines for the treatment of mala ria 2nd edition, 2010
Chlorproguanil-Da psone 360mg Chlorproguanil Manufacturer Guidelines (LapDap – GSK)
Halofantrine 1500mg or 1398mg
1500mg is for halofantrine hydrochloride, as the strength is normally reported in this manner. The total dose for halofantrine base is 1398 mg.
Manufacturer Guidelines (Halfan – GSK)
Hydroxychloroquine 1500mg One tablet of 200mg hydroxychloroquine sulfate is equivalent to 155mg base.
Manufacturer Guidelines (Plaquenil – Sanofi A ventis)
Mefloquine 900mg WHO Model Formulary, 2008
Mefloquine-Sulfadoxine-Pyrimethamine 900mg Mefloquine Info only available for Mefloquine (not the
combination) WHO Model Formulary, 2008
Primaquine 45mg This dose is for the gametocytocidal treatment of P. falcipa rum.
WHO Guidelines for the treatment of mala ria 2nd edition, 2010
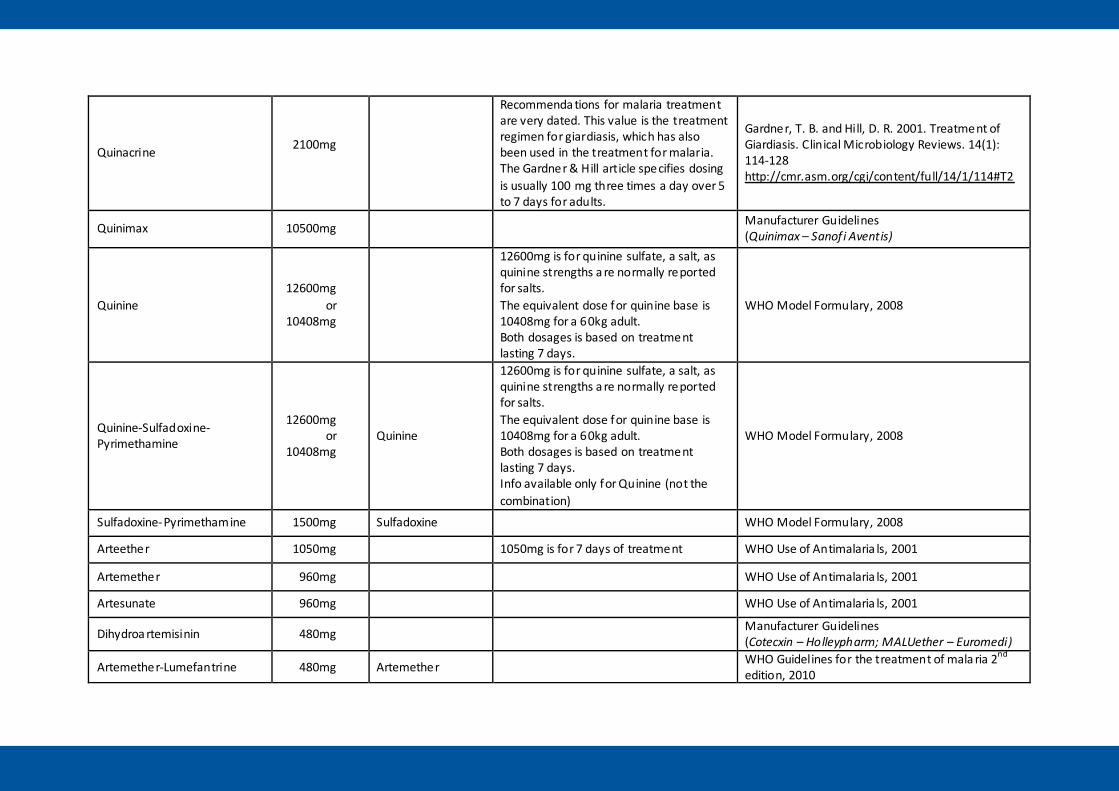
Quinacrine 2100mg
Recommenda tions for malaria treatment are very dated. This value is the treatment regimen for giardiasis, which has also been used in the treatment for malaria. The Gardner & Hill article specifies dosing is usually 100 mg three times a day over 5 to 7 days for adults.
Gardner, T. B. and Hill, D. R. 2001. Treatment of Giardiasis. Clinical Microbiology Reviews. 14(1): 114-128 http://cmr.asm.org/cgi/content/full/14/1/114#T2
Quinimax 10500mg Manufacturer Guidelines (Quinimax – Sanof i Aventis)
Quinine 12600mg
or 10408mg
12600mg is for quinine sulfate, a salt, as quinine strengths a re normally reported for salts. The equivalent dose for quinine base is 10408mg for a 60kg adult. Both dosages is based on treatment lasting 7 days.
WHO Model Formulary, 2008
Quinine-Sulfadoxine-Pyrimethamine
12600mg or
10408mg Quinine
12600mg is for quinine sulfate, a salt, as quinine strengths a re normally reported for salts. The equivalent dose for quinine base is 10408mg for a 60kg adult. Both dosages is based on treatment lasting 7 days. Info available only for Quinine (not the combination)
WHO Model Formulary, 2008
Sulfadoxine-Pyrimethamine 1500mg Sulfadoxine WHO Model Formulary, 2008
Arteether 1050mg 1050mg is for 7 days of treatment WHO Use of Antimalaria ls, 2001
Artemether 960mg WHO Use of Antimalaria ls, 2001
Artesunate 960mg WHO Use of Antimalaria ls, 2001
Dihydroa rtemisinin 480mg Manufacturer Guidelines (Cotecxin – Holleypharm; MALUether – Euromedi)
Artemether-Lumefantrine 480mg Artemether WHO Guidelines for the treatment of mala ria 2nd edition, 2010
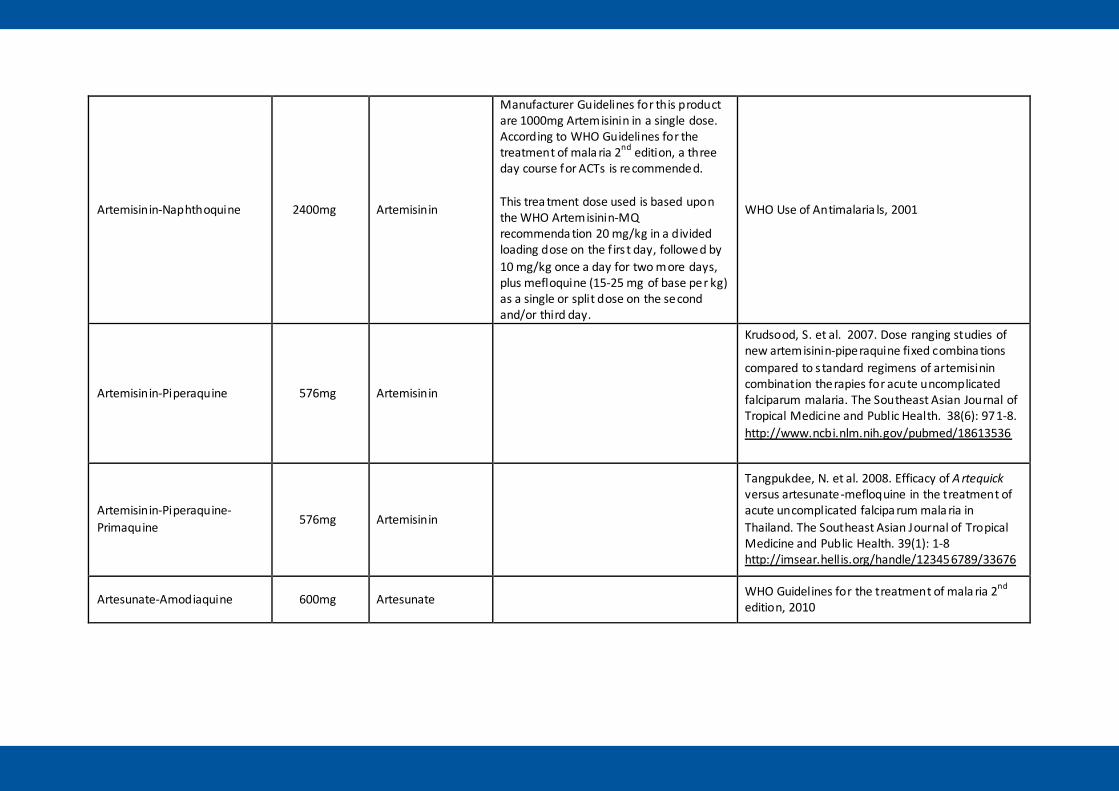
Artemisinin-Naphthoquine 2400mg Artemisinin
Manufacturer Guidelines for this product are 1000mg Artemisinin in a single dose. According to WHO Guidelines for the treatment of mala ria 2nd edition, a three day course for ACTs is recommended. This trea tment dose used is based upon the WHO Artemisinin-MQ recommenda tion 20 mg/kg in a divided loading dose on the f irs t day, followed by 10 mg/kg once a day for two more days, plus mefloquine (15-25 mg of base per kg) as a single or split dose on the second and/or third day.
WHO Use of Antimalaria ls, 2001
Artemisinin-Piperaquine 576mg Artemisinin
Krudsood, S. et al. 2007. Dose ranging studies of new artemisinin-piperaquine fixed combina tions compared to s tandard regimens of artemisinin combination therapies for acute uncomplicated falciparum malaria. The Southeast Asian Journal of Tropical Medicine and Public Health. 38(6): 971-8. http://www.ncbi.nlm.nih.gov/pubmed/18613536
Artemisinin-Piperaquine-Primaquine 576mg Artemisinin
Tangpukdee, N. et al. 2008. Efficacy of A rtequick versus artesunate-mefloquine in the treatment of acute uncomplicated falcipa rum mala ria in Thailand. The Southeast Asian Journal of Tropical Medicine and Public Health. 39(1): 1-8 http://imsear.hellis.org/handle/123456789/33676
Artesunate-Amodiaquine 600mg Artesunate WHO Guidelines for the treatment of mala ria 2nd edition, 2010
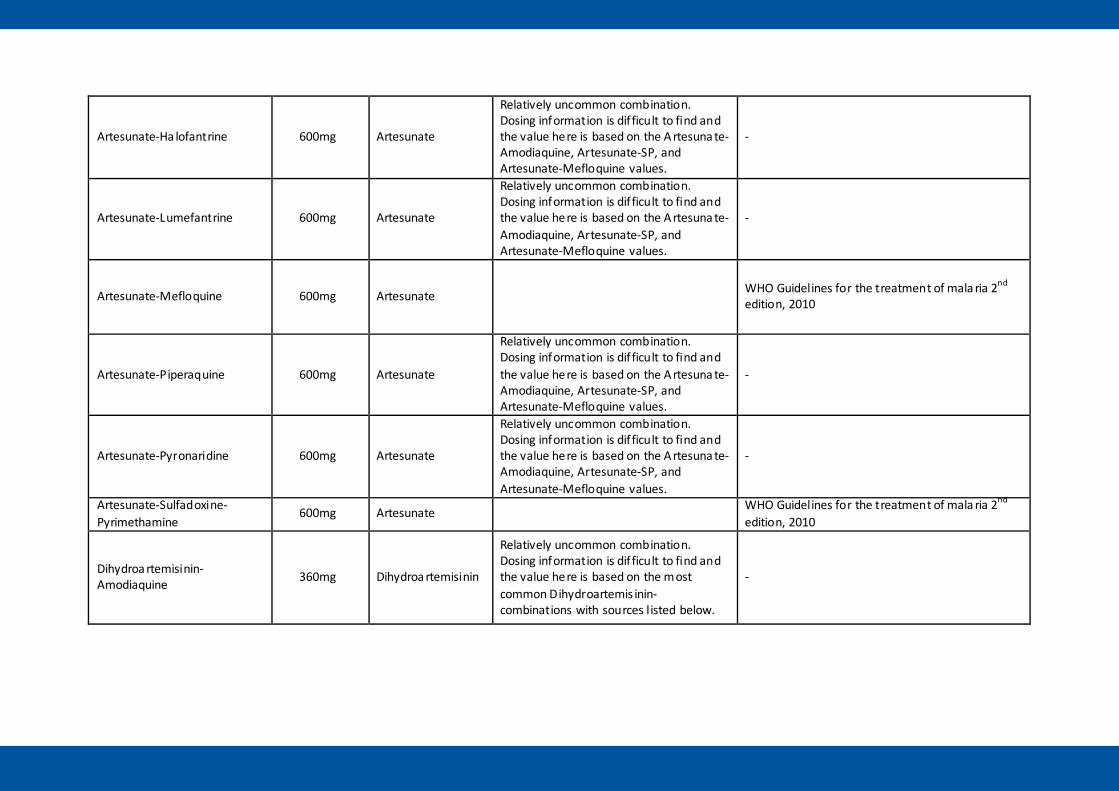
Artesunate-Ha lofantrine 600mg Artesunate
Relatively uncommon combination. Dosing information is dif ficult to find and the value here is based on the A rtesuna te-Amodiaquine, Artesunate-SP, and Artesunate-Mefloquine values.
-
Artesunate-Lumefantrine 600mg Artesunate
Relatively uncommon combination. Dosing information is dif ficult to find and the value here is based on the A rtesuna te-Amodiaquine, Artesunate-SP, and Artesunate-Mefloquine values.
-
Artesunate-Mefloquine 600mg Artesunate WHO Guidelines for the treatment of mala ria 2nd edition, 2010
Artesunate-Piperaquine 600mg Artesunate
Relatively uncommon combination. Dosing information is dif ficult to find and the value here is based on the A rtesuna te-Amodiaquine, Artesunate-SP, and Artesunate-Mefloquine values.
-
Artesunate-Pyronaridine 600mg Artesunate
Relatively uncommon combination. Dosing information is dif ficult to find and the value here is based on the A rtesuna te-Amodiaquine, Artesunate-SP, and Artesunate-Mefloquine values.
-
Artesunate-Sulfadoxine-Pyrimethamine
600mg Artesunate WHO Guidelines for the treatment of mala ria 2nd edition, 2010
Dihydroa rtemisinin-Amodiaquine 360mg Dihydroa rtemisinin
Relatively uncommon combination. Dosing information is dif ficult to find and the value here is based on the most common Dihydroartemis inin-combinations with sources listed below.
-
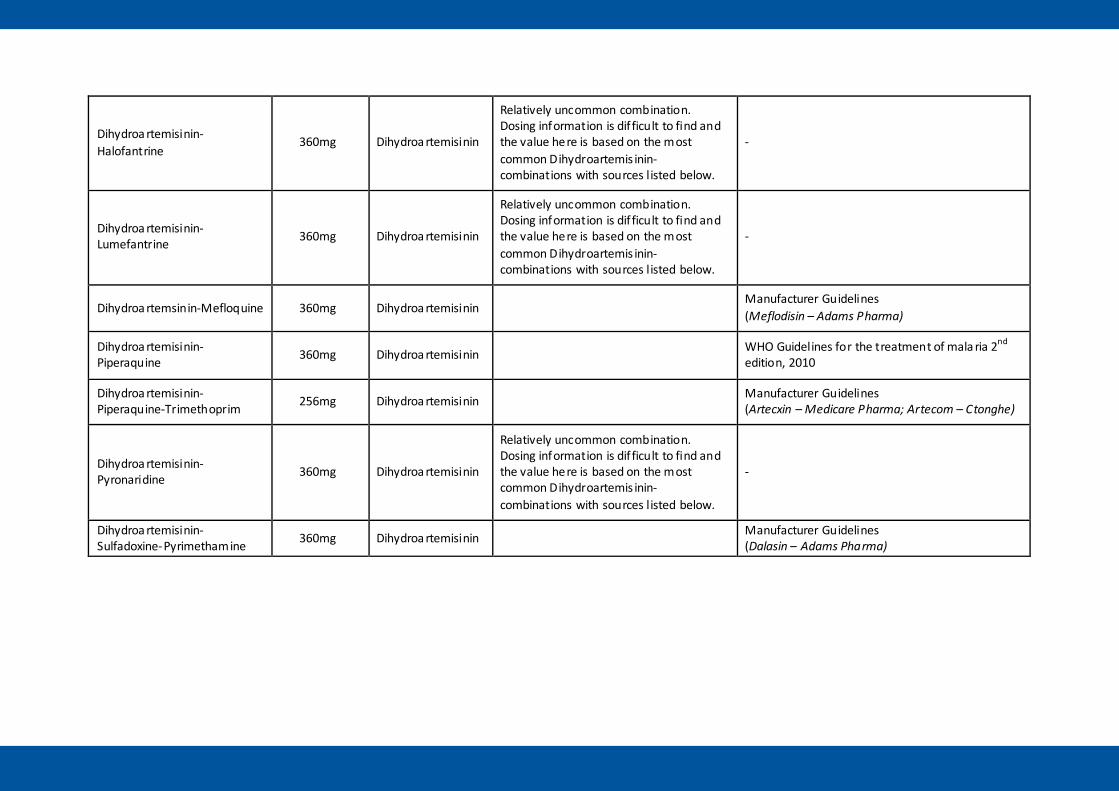
Dihydroa rtemisinin-Halofantrine
360mg Dihydroa rtemisinin
Relatively uncommon combination. Dosing information is dif ficult to find and the value here is based on the most common Dihydroartemis inin-combinations with sources listed below.
-
Dihydroa rtemisinin-Lumefantrine 360mg Dihydroa rtemisinin
Relatively uncommon combination. Dosing information is dif ficult to find and the value here is based on the most common Dihydroartemis inin-combinations with sources listed below.
-
Dihydroa rtemsinin-Mefloquine 360mg Dihydroa rtemisinin Manufacturer Guidelines (Meflodisin – Adams Pharma)
Dihydroa rtemisinin-Piperaquine 360mg Dihydroa rtemisinin WHO Guidelines for the treatment of mala ria 2nd
edition, 2010
Dihydroa rtemisinin-Piperaquine-Trimethoprim 256mg Dihydroa rtemisinin Manufacturer Guidelines
(Artecxin – Medicare Pharma; Artecom – Ctonghe)
Dihydroa rtemisinin-Pyronaridine 360mg Dihydroa rtemisinin
Relatively uncommon combination. Dosing information is dif ficult to find and the value here is based on the most common Dihydroartemis inin-combinations with sources listed below.
-
Dihydroa rtemisinin-Sulfadoxine-Pyrimethamine 360mg Dihydroa rtemisinin Manufacturer Guidelines
(Dalasin – Adams Pharma)

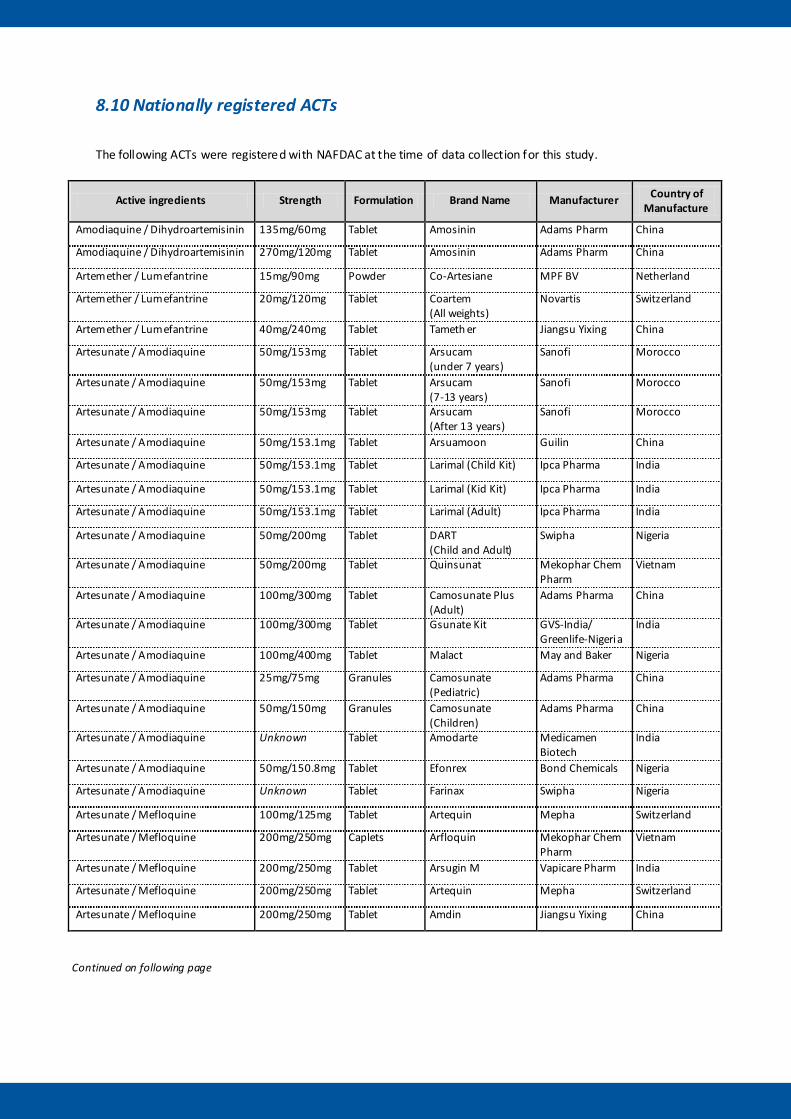
8.10 Nationally registered ACTs
The following ACTs were registered with NAFDAC at the time of data collection for this study.
Active ingredients Strength Formulation Brand Name Manufacturer Country of Manufacture
Amodiaquine / Dihydroartemisinin 135mg/60mg Tablet Amosinin Adams Pharm China
Amodiaquine / Dihydroartemisinin 270mg/120mg Tablet Amosinin Adams Pharm China
Artemether / Lumefantrine 15mg/90mg Powder Co-Artesiane MPF BV Netherland
Artemether / Lumefantrine 20mg/120mg Tablet Coartem (All weights)
Novartis Switzerland
Artemether / Lumefantrine 40mg/240mg Tablet Tameth er Jiangsu Yixing China
Artesunate / Amodiaquine 50mg/153mg Tablet Arsucam (under 7 years)
Sanofi Morocco
Artesunate / Amodiaquine 50mg/153mg Tablet Arsucam (7-13 years)
Sanofi Morocco
Artesunate / Amodiaquine 50mg/153mg Tablet Arsucam (After 13 years)
Sanofi Morocco
Artesunate / Amodiaquine 50mg/153.1mg Tablet Arsuamoon Guilin China
Artesunate / Amodiaquine 50mg/153.1mg Tablet Larimal (Child Kit) Ipca Pharma India
Artesunate / Amodiaquine 50mg/153.1mg Tablet Larimal (Kid Kit) Ipca Pharma India
Artesunate / Amodiaquine 50mg/153.1mg Tablet Larimal (Adult) Ipca Pharma India
Artesunate / Amodiaquine 50mg/200mg Tablet DART (Child and Adult)
Swipha Nigeria
Artesunate / Amodiaquine 50mg/200mg Tablet Quinsunat Mekophar Chem Pharm
Vietnam
Artesunate / Amodiaquine 100mg/300mg Tablet Camosunate Plus (Adult)
Adams Pharma China
Artesunate / Amodiaquine 100mg/300mg Tablet Gsunate Kit GVS-India/ Greenlife-Nigeria
India
Artesunate / Amodiaquine 100mg/400mg Tablet Malact May and Baker Nigeria
Artesunate / Amodiaquine 25mg/75mg Granules Camosunate (Pediatric)
Adams Pharma China
Artesunate / Amodiaquine 50mg/150mg Granules Camosunate (Children)
Adams Pharma China
Artesunate / Amodiaquine Unknown Tablet Amodarte Medicamen Biotech
India
Artesunate / Amodiaquine 50mg/150.8mg Tablet Efonrex Bond Chemicals Nigeria
Artesunate / Amodiaquine Unknown Tablet Farinax Swipha Nigeria
Artesunate / Mefloquine 100mg/125mg Tablet Artequin Mepha Switzerland
Artesunate / Mefloquine 200mg/250mg Caplets Arfloquin Mekophar Chem Pharm
Vietnam
Artesunate / Mefloquine 200mg/250mg Tablet Arsugin M Vapicare Pharm India
Artesunate / Mefloquine 200mg/250mg Tablet Artequin Mepha Switzerland
Artesunate / Mefloquine 200mg/250mg Tablet Amdin Jiangsu Yixing China
Continued on following page
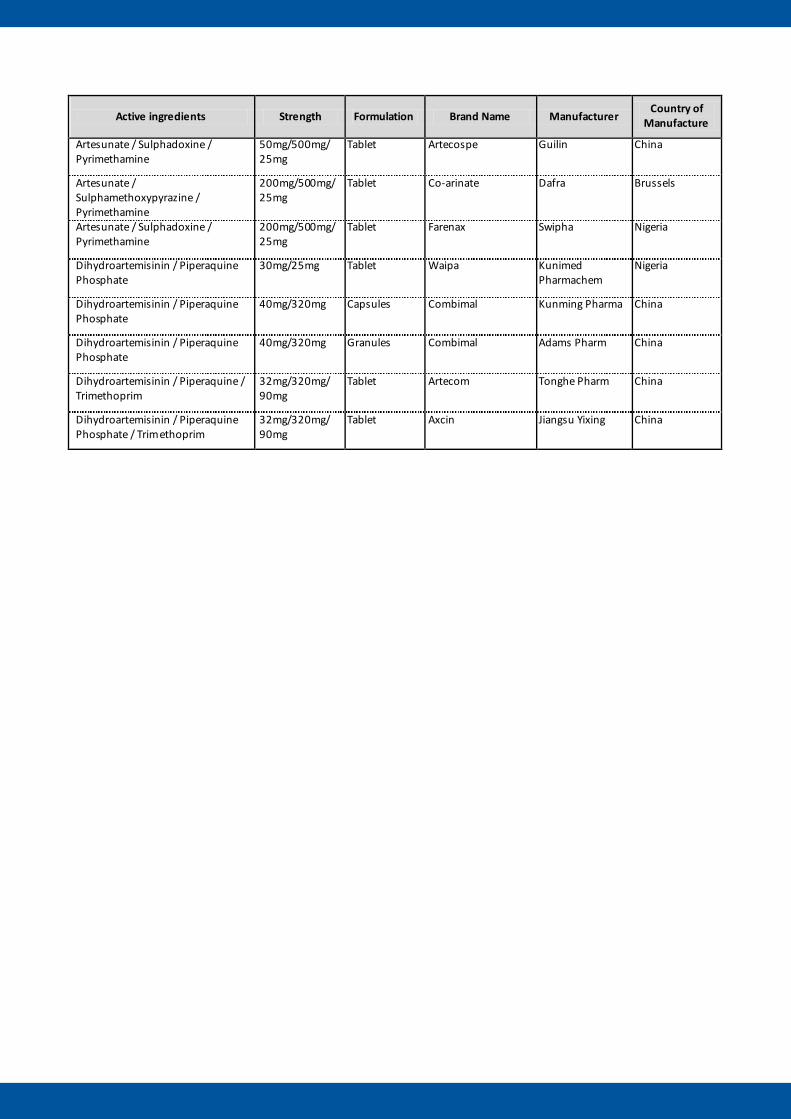
Active ingredients Strength Formulation Brand Name Manufacturer Country of
Manufacture
Artesunate / Sulphadoxine / Pyrimethamine
50mg/500mg/ 25mg
Tablet Artecospe Guilin China
Artesunate / Sulphamethoxypyrazine / Pyrimethamine
200mg/500mg/ 25mg
Tablet Co-arinate Dafra Brussels
Artesunate / Sulphadoxine / Pyrimethamine
200mg/500mg/ 25mg
Tablet Farenax Swipha Nigeria
Dihydroartemisinin / Piperaquine Phosphate
30mg/25mg Tablet Waipa Kunimed Pharmachem
Nigeria
Dihydroartemisinin / Piperaquine Phosphate
40mg/320mg Capsules Combimal Kunming Pharma China
Dihydroartemisinin / Piperaquine Phosphate
40mg/320mg Granules Combimal Adams Pharm China
Dihydroartemisinin / Piperaquine / Trimethoprim
32mg/320mg/ 90mg
Tablet Artecom Tonghe Pharm China
Dihydroartemisinin / Piperaquine Phosphate / Trimethoprim
32mg/320mg/ 90mg
Tablet Axcin Jiangsu Yixing China

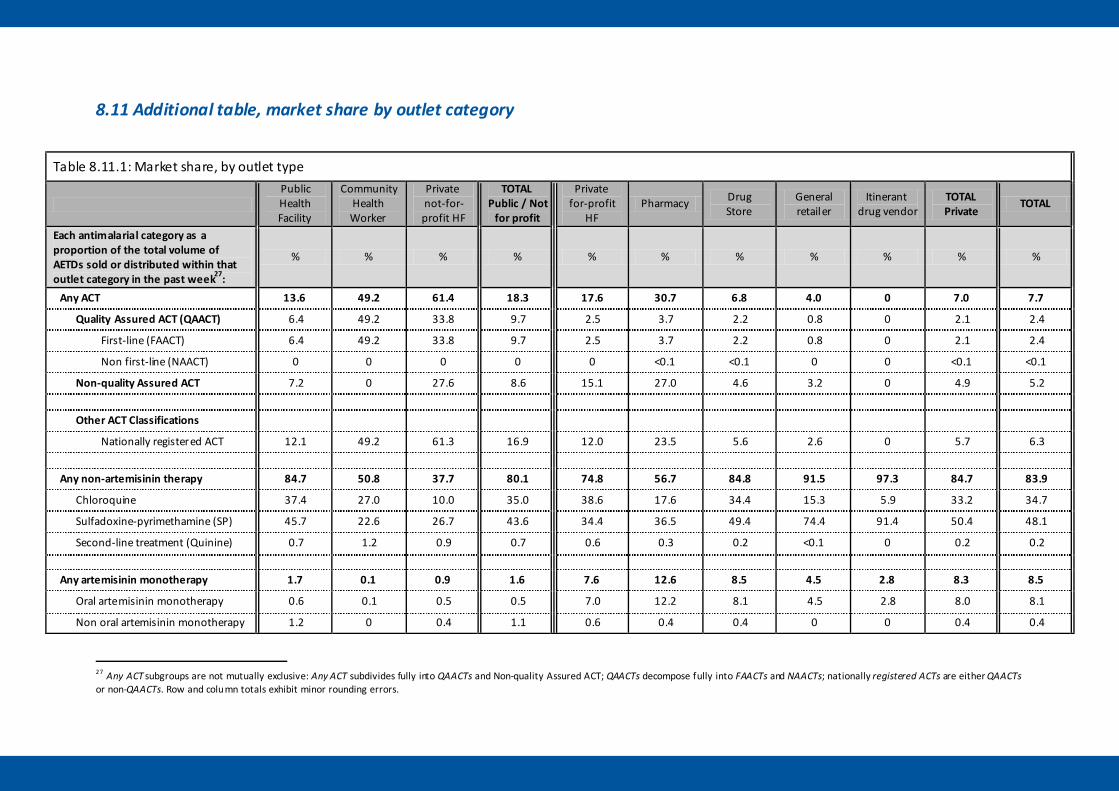
8.11 Additional table, market share by outlet category
Table 8.11.1: Market share, by outlet type
Public Health Facility
Community Health Worker
Private not-for-profit HF
TOTAL Public / Not
for profit
Private for-profit
HF Pharmacy Drug
Store General retailer
Itinerant drug vendor
TOTAL Private
TOTAL
Each antimalarial category as a proportion of the total volume of AETDs sold or distributed within that outlet category in the past week27:
% % % % % % % % % % %
Any ACT 13.6 49.2 61.4 18.3 17.6 30.7 6.8 4.0 0 7.0 7.7
Quality Assured ACT (QAACT) 6.4 49.2 33.8 9.7 2.5 3.7 2.2 0.8 0 2.1 2.4
First-line (FAACT) 6.4 49.2 33.8 9.7 2.5 3.7 2.2 0.8 0 2.1 2.4
Non first-line (NAACT) 0 0 0 0 0 <0.1 <0.1 0 0 <0.1 <0.1
Non-quality Assured ACT 7.2 0 27.6 8.6 15.1 27.0 4.6 3.2 0 4.9 5.2 Other ACT Classifications
Nationally registered ACT 12.1 49.2 61.3 16.9 12.0 23.5 5.6 2.6 0 5.7 6.3
Any non-artemisinin therapy 84.7 50.8 37.7 80.1 74.8 56.7 84.8 91.5 97.3 84.7 83.9
Chloroquine 37.4 27.0 10.0 35.0 38.6 17.6 34.4 15.3 5.9 33.2 34.7
Sulfadoxine-pyrimethamine (SP) 45.7 22.6 26.7 43.6 34.4 36.5 49.4 74.4 91.4 50.4 48.1
Second-line treatment (Quinine) 0.7 1.2 0.9 0.7 0.6 0.3 0.2 <0.1 0 0.2 0.2
Any artemisinin monotherapy 1.7 0.1 0.9 1.6 7.6 12.6 8.5 4.5 2.8 8.3 8.5
Oral artemisinin monotherapy 0.6 0.1 0.5 0.5 7.0 12.2 8.1 4.5 2.8 8.0 8.1
Non oral artemisinin monotherapy 1.2 0 0.4 1.1 0.6 0.4 0.4 0 0 0.4 0.4
27 Any ACT subgroups are not mutually exclusive: Any ACT subdivides fully into QAACTs and Non-quality Assured ACT; QAACTs decompose fully into FAACTs and NAACTs; nationally registered ACTs are either QAACTs or non-QAACTs. Row and column totals exhibit minor rounding errors.
Evidence for Malaria Medicines Policy