Chapter 8 - Cost of cultivation and profitability of CF and NCF
18
153 Chapter 8 - Cost of cultivation and profitability of CF and NCF 8.1. Introduction Contract farming would be sustainable from farmers‟ perspective if it enhances its profits and reduces its risks and uncertainty. Thus, the farmer would continue to remain in the contract provided that contracting would provide him better returns than alternative markets (Barrett et al., 2012). It is important to know whether growing the CGP or onion under contract is profitable compared to without contract. This chapter helps us in understanding the cultivation and profitability aspects of CF and NCF for CGP and onion. Productivity, input-use pattern, costing analysis, gross and net returns, benefit-cost ratios per unit of land for CF and NCF of CGP and onion in sample regions is presented. Section 8.2 presents the methodology and data limitations. Section 8.3 examines the costs, input-use pattern, and returns from CGP and onion cultivation respectively. Section 8.4 synthesises the results. 8.2. Methodology Economic analysis measuring the productivity, input-use pattern, costing analysis, gross and net returns, benefit-cost ratios per unit of land for CF and NCF of CGP and onion in sample regions was done. There were direct and indirect costs borne by farmers during production as well as the time of marketing the crop. In the thesis, both production and marketing costs have been accounted. 8.2.1. Production costs Total production costs comprise of fixed and operational costs. Although the cash expenses such as buying of inputs like seeds, fertilizers, plant protection material, etc., are directly observed, but utilization of his fixed assets (like land, machinery, implements, etc.) and owned inputs like family labour (FL) in production are also accounted to give a realistic picture of the total costs incurred. In addition to fixed and operational costs, the cost concepts (Costs A, B, C) used by Commission for Agricultural Costs and Prices (CACP) is presented in this section. Based on the present Comprehensive scheme of CACP cited in Sen and Bhatia (2004), CACP (2012), and
-
Upload
khangminh22 -
Category
Documents
-
view
0 -
download
0
Transcript of Chapter 8 - Cost of cultivation and profitability of CF and NCF
153
Chapter 8 - Cost of cultivation and profitability of CF and
NCF
8.1. Introduction
Contract farming would be sustainable from farmers‟ perspective if it enhances its
profits and reduces its risks and uncertainty. Thus, the farmer would continue to remain
in the contract provided that contracting would provide him better returns than
alternative markets (Barrett et al., 2012). It is important to know whether growing the
CGP or onion under contract is profitable compared to without contract. This chapter
helps us in understanding the cultivation and profitability aspects of CF and NCF for
CGP and onion. Productivity, input-use pattern, costing analysis, gross and net returns,
benefit-cost ratios per unit of land for CF and NCF of CGP and onion in sample regions
is presented. Section 8.2 presents the methodology and data limitations. Section 8.3
examines the costs, input-use pattern, and returns from CGP and onion cultivation
respectively. Section 8.4 synthesises the results.
8.2. Methodology
Economic analysis measuring the productivity, input-use pattern, costing analysis,
gross and net returns, benefit-cost ratios per unit of land for CF and NCF of CGP and
onion in sample regions was done. There were direct and indirect costs borne by farmers
during production as well as the time of marketing the crop. In the thesis, both
production and marketing costs have been accounted.
8.2.1. Production costs
Total production costs comprise of fixed and operational costs. Although the cash
expenses such as buying of inputs like seeds, fertilizers, plant protection material, etc.,
are directly observed, but utilization of his fixed assets (like land, machinery,
implements, etc.) and owned inputs like family labour (FL) in production are also
accounted to give a realistic picture of the total costs incurred. In addition to fixed and
operational costs, the cost concepts (Costs A, B, C) used by Commission for Agricultural
Costs and Prices (CACP) is presented in this section. Based on the present
Comprehensive scheme of CACP cited in Sen and Bhatia (2004), CACP (2012), and

154
Manual on Cost of Cultivation Surveys (CSO, 2008) various cost concepts calculated are
explained in Figure 8.1
Figure 8.1: CACP Cost Concepts
Cost A1 = Value of hired human labour (HL), value of hired bullock labour (BL), value of
owned bullock labour, value of owned machine labour (ML), hired machinery
charges, value of seed (both farm produced and purchased), value of
insecticides and pesticides, value of manure (owned and purchase) value of
fertilizers, irrigation charges, depreciation on implements and farm building,
land revenue, cesses and other taxes, and interest on working capital
Cost A2 = Cost A1+ Rent paid for leased-in land,
Cost B1 = Cost A1 + interest value of owned fixed capital assets (excluding land)
Cost B2 = Cost B1 + Rental value of owned land (net of land revenue) and rent paid for
leased-in land
Cost C1 = Cost B1 + imputed value of family labour
Cost C2 = Cost B2 + Imputed value of family labour
Modified Cost (C2M) = Cost C2 + marketing costs and transportation report
Source: Compiled from Sen and Bhatia (2004, p.96) and CACP (2012)
COST A2 are paid out costs. Operational costs are nothing but deducting
depreciation from COST A2. While fixed cost comprises of depreciation, rental value of
land, and interest on fixed capital. Apart from productions costs, marketing costs have
been included which include expenses such as assembling, grading, packing, local
transportation, loading-unloading, transport, and commission and market fees. In
addition to costs, corresponding gross returns and net returns were worked out. Gross
return is the total value of the output. While net returns per acre of a crop, defined as
gross returns per acre minus the total costs per acre, is one of the indicators of
profitability.
The details of the computation of specific cost items mentioned in Figure 8.1are:
k) HL, BL, ML – valued at the actual rates paid by the farmer.
l) FL – valued at the rate of wages paid for hired labour for similar work.
m) BL and ML (owned) – valued at rates paid to hire the same.
n) Exchange labour & exchange Bullock has been treated as HL & BL
respectively.
155
o) Seeds (purchased), and irrigation charges – valued at rates paid by the farmers.
Irrigation charges include maintenance on irrigations systems and electricity
charges, whether paid or unpaid and also fuel. For e.g., drip irrigation systems
require flushing of a chemical after each season.
p) Seeds (farm produced), manure (owned) – valued at the prevailing market
prices
q) Chemical Fertilizer – Fertilizers are evaluated at the purchase price including
the transport charges.
r) Cost of insecticides and pesticides (plant protection kit) – It is evaluated at the
purchase price. Physical input such as fuel used for application for plant
protection kit has been included under the plant protection kit category.
s) Expenses incurred on getting Farm yard manure (FYM) to field, for e.g., HL,
FL, ML, and BL has been included under the respective labour categories of
land preparation category.
t) Miscellaneous and overhead charges – expenses incurred on bringing seeds
from collection centre to farm/home. Expenses on maintenance and repair of
implements if any is included in this category
u) Rental value of own land – Farmers were asked a hypothetical question that if
they had given the plot of land where the reference crop was sown, and for the
crop duration, and how much rent you would have received? In some cases
farmer was unaware about lease rates, then the rental value of owned land has
been set at a rate similar to what other people in the area are charging for the
type of land owned by the farmer.
v) Depreciation - is calculated for assets which were utilized for reference crop
cultivation. Depreciation was calculated by the straight-line method
[(Purchased value – Scrap value)/ Life span]. Details regarding how the
depreciation has been apportioned for particular asset is explained below:
i. Bullock cart: Assets such as bullock cart were excluded from the
calculation of depreciation and repair. The reason being as it was observed
during the field survey and also mentioned in Panse (1954) that bullock

156
carts are used mainly for transportation and not directly for crop
production.
ii. Agricultural machinery - It was observed that only handful of farmers
owned tractors and its associated machinery, and STP sprayer within the
village. These farmers used it for custom hiring purpose and was a source
of revenue for them. Moreover, in our survey, the prevailing custom hiring
rates have been imputed, for those who owned these machinery and thus
no further estimations like depreciation, repairs, and interest on fixed
capital were apportioned41
. While the assets such as hand sprayer or petrol
sprayer used for spraying plant protection chemicals have an average life
of 10 years and are used on other crops as well. Moreover, they are
borrowed and used by other fellow farmers. Thus, it is cumbersome to
calculate the exact share of depreciation for the reference crop. Also, this
depreciation amount was very small. Hence, depreciation and interest on
fixed costs have not been calculated for hand sprayer or petrol sprayers.
iii. Electric motor/ diesel pump - It was observed that mostly more than one
crop is grown on a farm and moreover, the farmer may have more than one
electric motor. Thus, depreciation for the electric motor is charged to the
reference crop acreage in proportion to the GCA.
iv. Drip/Sprinkler Irrigation system: While depreciation for the irrigation
system is carried as per the proportion of irrigation system applied to
reference crop in the proportion of irrigation system to GCA. The
estimated life of drip and sprinkler irrigation system for onion growers is
estimated to be seven years and ten years, with the salvage value of 12.5%
and 10% respectively of the purchase price. Whereas estimated life of drip
and sprinkler irrigation system for CGP growers is estimated to be ten
years with the salvage value of 10% respectively of the purchase price42
.
41
According to Agrawal (1961), if the item is just a negligible percentage of total cost, but involves too
much calculation in arriving at its actual cost, then it is desirable to follow a simpler procedure although
less perfect in evaluating such an item. As the amount were so small compared to total cost of production,
custom hiring rates in case of valuation of bullock and machine labour are accounted. 42
The number of irrigations and water consumption is high among cotton and onion compared to potato
(INCID, 1994; Narayanamoorthy, 2004). Based on the discussion with irrigation suppliers and farmers as

157
w) Interest on working capital is charged at 12% per annum for half the crop
duration (applicable for both the crops).
x) Interest on Fixed Capital on electric/diesel pump and drip and sprinkler
irrigation systems is charged @10% per annum to the reference crop in
proportion to the acreage for which irrigation system was used in the
agricultural year. While interest on electric/diesel pump was calculated in
proportion of the reference crop to the GIA.
8.2.2. Marketing Costs
Marketing Costs include expenses incurred on physical inputs (gunny bags for
packing or other inputs used while storage); FL, HL related to packing, loading and also
in case of onion NCF has gone to APMC market for sale, as that requires a day
commitment; APMC charges (commission and market fees) and transportation costs.
Transportation costs incurred during storage (if any), farm to firm‟s collection centre (in
case of some CGP CF) or firm‟s plant (in case of onion), from farm to APMC Market
have been accounted.
8.2.3. Gross Value of Output
The actual price at which the farm produce is sold has been used for calculating
gross receipts. The unsold stock used for family or bullock consumption has been
evaluated at the prevailing farm price during the harvest period. In case if there are
marketing costs involved in selling this stock, it has been accounted (Agrawal, 1961).
Similarly, Gross output (kgs) for the farm is defined as total sales plus the output of farm
produce which was unsold to the company and used for domestic use such as home or
cattle consumption or gifted to relatives.
8.2.4 Data Limitations
The cost of cultivation data analysed in this section refers to the data collected by
primary survey from the sample CGP farmers for Kharif season 2012-13 and onion for
Rabi season 2011-12. The survey was carried out after three-four months of the output
harvested and sold. Farmers were encouraged to show or refer to any written records
such as bills or receipts of purchases of inputs and sale of selected crops respectively or
well as review of literature, for e.g. (Singh A. , 2008) the life span and salvage value of irrigation system
was estimated.
158
any statement about income and expenditure accounts they had. However, in many cases,
farmers relied on recall. The detailed account of costs and returns was obtained using the
interview schedule in Appendix B. Data related to prices of inputs were cross-checked
wherever possible with respective input dealers. Similarly, output sale data i.e. price and
quantity sold was cross-verified by hundekari in case of CGP, and by company staff for
onion. In case of onion NCF, the name of APMC market was recorded along with the
month of sale. This helped in verifying the price of the crop from the respective APMC,
which gives the modal, minimum, and maximum price. Similarly, w.r.t. CGP NCF, to
whom they had sold the output was noted, and wherever possible it was cross-checked.
This approach enabled wherever possible crosschecks, ensuring that such recall data on
costing and sale of output was reliable.
Given that the primary survey was specific to a farmers of particular crop and
contracting firm, hence, results of it could not be generalised. Moreover, the analysis of
data is from a single season. Therefore, results need to be viewed with caution. However,
results do give us the broad understanding and helps to fulfil the objectives of the thesis.
8.3. Results and Discussion
Before presenting the results of production, costs and returns of reference crops,
the type of irrigation and seed variety used by CGP and onion growers are discussed.
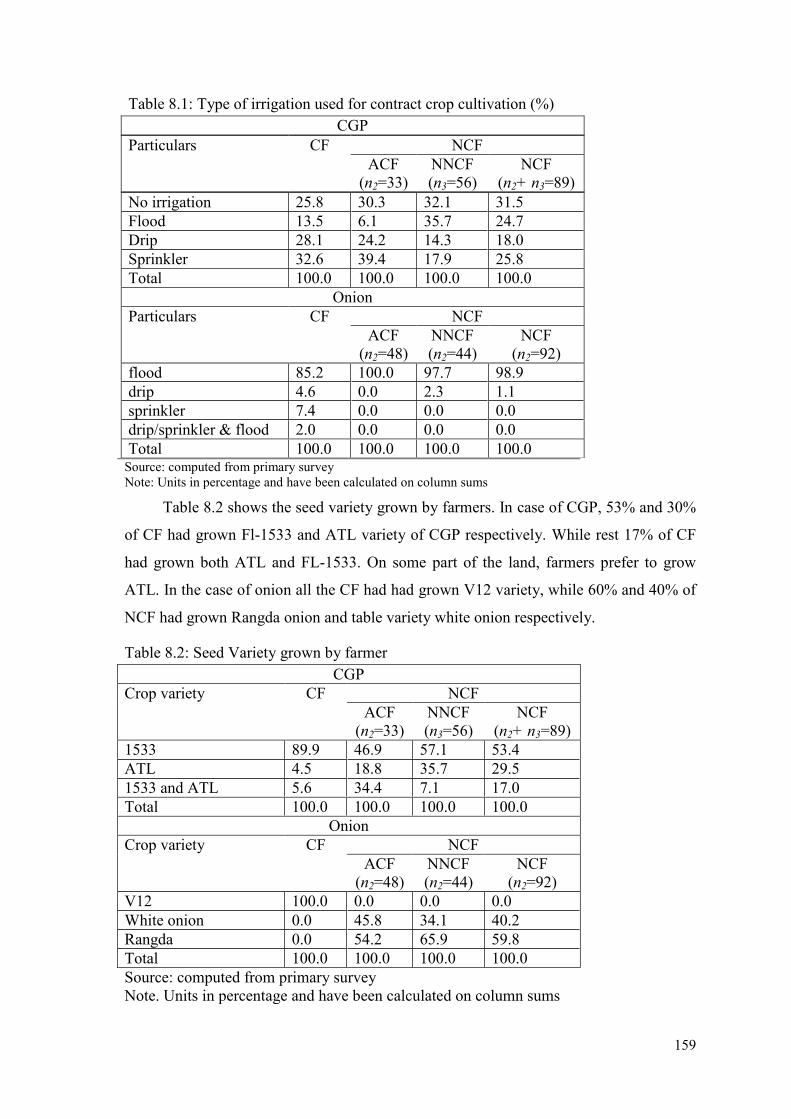
Usage of drip and sprinkler was higher in case of CF and ACF compared to NNCF.
Overall, nearly 65% of ACF and 61% of CF had used either drip or sprinkler irrigation
for CGP cultivation compared to 31% of NNCF. But in case of onion, only one NCF
used drip for onion cultivation, while rest all used flood irrigation. While 85% of CF
used flood irrigation, while rest used drip/sprinkler irrigation for onion cultivation (Table
8.1).
159
Source: computed from primary survey
Note: Units in percentage and have been calculated on column sums
Table 8.2 shows the seed variety grown by farmers. In case of CGP, 53% and 30%
of CF had grown Fl-1533 and ATL variety of CGP respectively. While rest 17% of CF
had grown both ATL and FL-1533. On some part of the land, farmers prefer to grow
ATL. In the case of onion all the CF had had grown V12 variety, while 60% and 40% of
NCF had grown Rangda onion and table variety white onion respectively.
Table 8.2: Seed Variety grown by farmer
CGP
Crop variety CF NCF
ACF
(n2=33)
NNCF
(n3=56)
NCF
(n2+ n3=89)
1533 89.9 46.9 57.1 53.4
ATL 4.5 18.8 35.7 29.5
1533 and ATL 5.6 34.4 7.1 17.0
Total 100.0 100.0 100.0 100.0
Onion
Crop variety CF NCF
ACF
(n2=48)
NNCF
(n2=44)
NCF
(n2=92)
V12 100.0 0.0 0.0 0.0
White onion 0.0 45.8 34.1 40.2
Rangda 0.0 54.2 65.9 59.8
Total 100.0 100.0 100.0 100.0
Source: computed from primary survey
Note. Units in percentage and have been calculated on column sums
Table 8.1: Type of irrigation used for contract crop cultivation (%)
CGP
Particulars CF NCF
ACF
(n2=33)
NNCF
(n3=56)
NCF
(n2+ n3=89)
No irrigation 25.8 30.3 32.1 31.5
Flood 13.5 6.1 35.7 24.7
Drip 28.1 24.2 14.3 18.0
Sprinkler 32.6 39.4 17.9 25.8
Total 100.0 100.0 100.0 100.0
Onion
Particulars CF NCF
ACF
(n2=48)
NNCF
(n2=44)
NCF
(n2=92)
flood 85.2 100.0 97.7 98.9
drip 4.6 0.0 2.3 1.1
sprinkler 7.4 0.0 0.0 0.0
drip/sprinkler & flood 2.0 0.0 0.0 0.0
Total 100.0 100.0 100.0 100.0

160
8.3.1. Production costs
In this section, the details about various aspects of cost of production and
marketing of CGP and onion is explained. Weighted average production and marketing
costs and net returns for CGP and onion growers is presented in Tables 8.5 and 8.6. Total
production costs of an acre of CGP is 6% higher in CF, Rs.50,411 compared to
Rs.47,571 for NCF. Total production costs comprise of fixed and operational costs.
Similarly, operational and fixed costs were 1% and 6% higher in CGP CF compared to
NCF. While marketing cost were very less incase of CGP compared to onion. This is
mainly because both contracting firm and the non-contracting firm were procuring
harvests mostly from farmers‟ field. Also, transportation costs were borne by respective
firms. In the case of onion, NCF had to take the produce to the APMC. Which involved
marketing and APMC charges w.r.t. sale of output. In the following sub-sections,
different production aspects are discussed.
8.3.1.1. Material inputs
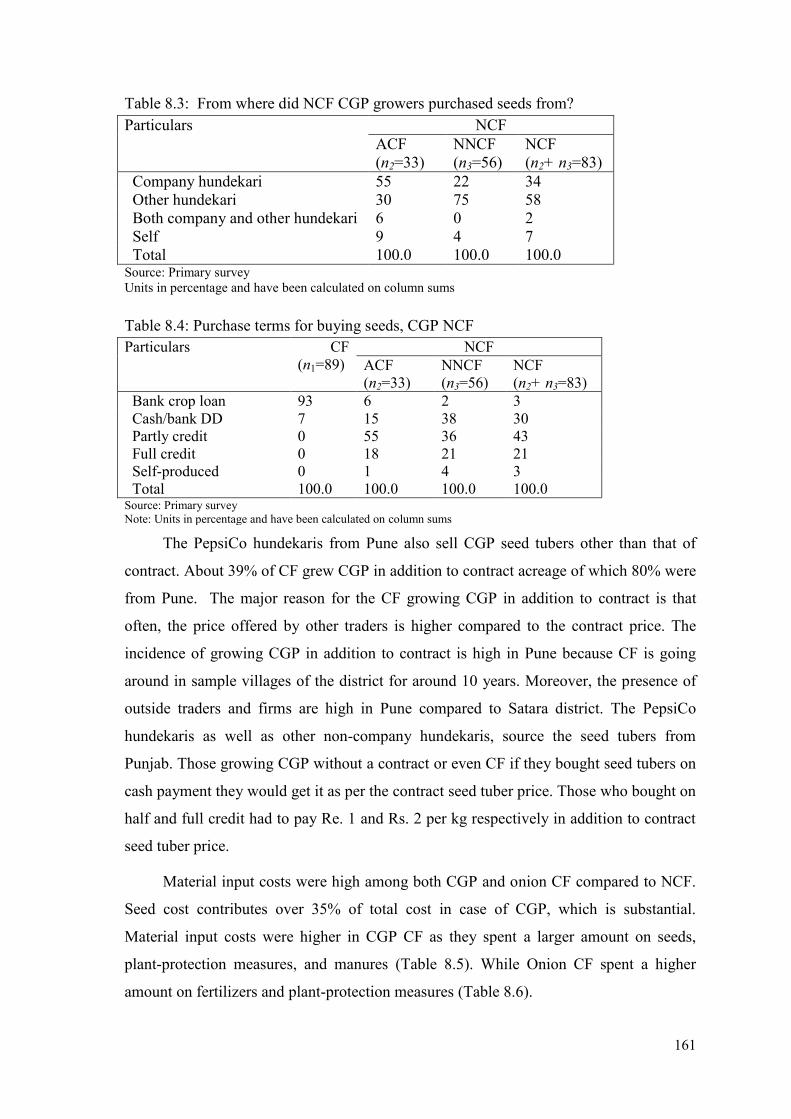
CGP CF farmers used to buy most of the input materials such as seed tubers, plant
protection material except fertilizers from Company‟s hundekari. The majority (58%) of
the NCF had bought seeds also from other than company hundekari, while one-third
bought from Company hundekari itself. Within NCF, 55% of ACF and 22% of NNCF
had bought from company hundekari, whereas 30% of ACF and 75% of NNCF had
bought from other hundekaris (Table 8.3). Whereas three-fourth of NNCF farmers had
bought seeds from other hundekari. This shows that although ACF grew CGP without a
contract, they were still associated with company hundekari with regard to purchasing
seeds and sale of output, while NNCF were associated with other hundekaris for the
same.
About 93% of CF had taken a bank loan to pay for material inputs (seeds,
fertilizers, plant protection kit) for CGP cultivation while rest had paid through Bank
Demand draft. Three-fourth of ACF and half of NNCF had bought material inputs either
on partly or fully credit from the hundekaris. While 15% of ACF and 38% of NNCF had
bought material inputs on cash. Thus, the majority of the NCF grew CGP based on the
purchase of materials inputs on credit.
161
Table 8.3: From where did NCF CGP growers purchased seeds from?
Particulars NCF
ACF
(n2=33)
NNCF
(n3=56)
NCF
(n2+ n3=83)
Company hundekari 55 22 34
Other hundekari 30 75 58
Both company and other hundekari 6 0 2
Self 9 4 7
Total 100.0 100.0 100.0 Source: Primary survey
Units in percentage and have been calculated on column sums
Table 8.4: Purchase terms for buying seeds, CGP NCF
Particulars CF
(n1=89)
NCF
ACF
(n2=33)
NNCF
(n3=56)
NCF
(n2+ n3=83)
Bank crop loan 93 6 2 3
Cash/bank DD 7 15 38 30
Partly credit 0 55 36 43
Full credit 0 18 21 21
Self-produced 0 1 4 3
Total 100.0 100.0 100.0 100.0 Source: Primary survey
Note: Units in percentage and have been calculated on column sums
The PepsiCo hundekaris from Pune also sell CGP seed tubers other than that of
contract. About 39% of CF grew CGP in addition to contract acreage of which 80% were
from Pune. The major reason for the CF growing CGP in addition to contract is that
often, the price offered by other traders is higher compared to the contract price. The
incidence of growing CGP in addition to contract is high in Pune because CF is going
around in sample villages of the district for around 10 years. Moreover, the presence of
outside traders and firms are high in Pune compared to Satara district. The PepsiCo
hundekaris as well as other non-company hundekaris, source the seed tubers from
Punjab. Those growing CGP without a contract or even CF if they bought seed tubers on
cash payment they would get it as per the contract seed tuber price. Those who bought on
half and full credit had to pay Re. 1 and Rs. 2 per kg respectively in addition to contract
seed tuber price.
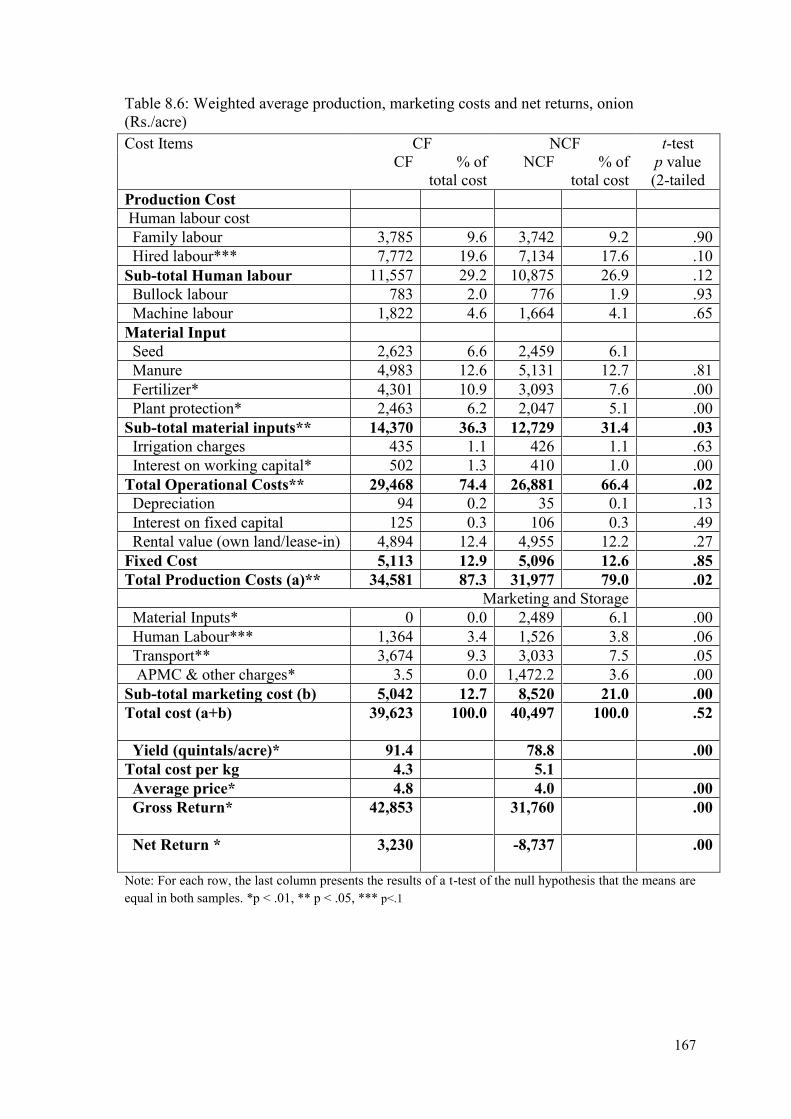
Material input costs were high among both CGP and onion CF compared to NCF.
Seed cost contributes over 35% of total cost in case of CGP, which is substantial.
Material input costs were higher in CGP CF as they spent a larger amount on seeds,
plant-protection measures, and manures (Table 8.5). While Onion CF spent a higher
amount on fertilizers and plant-protection measures (Table 8.6).
162
The weighted average seed cost per acre of CGP CF was Rs. 18,369 was slightly
higher compared to that of NCF, which was 17,682. This is mainly because, 90% of CF
and 53% of NCF used FL-1533 variety exclusively, which is priced Rs. 23/kg in contract
and Rs. 24-25/kg without a contract. While rest used ATL variety which is priced Rs. 20
in the contract and around Rs. 20-22 in without a contract. ATL was preferred by farmers
in Visapur village, Khatav taluka, ass it was yielding good results. The unweighted
average seed costs per acre of CF and ACF were similar, while that of NCF were lower
(Table 8.7).
In the case of onion, V12 seed cost is Rs. 700. Of which CF has to pay Rs. 600 and
Rs. 100 is deducted from final payment. For one acre, 3-4 kg seeds are required. Thus,
the cost of seeds for an acre cultivation is not very high. While NCF buys seed which is
available on any agriculture store. Within NCF, seed costs were similar for both ACF
and NCF (Table 8.7)
8.3.1.2. Labour costs
Human labour (both FL and HL), were similar for CGP. Most of the CGP farm
households (96%) used exchange labour. Overall, for both crops, it was found total
production labour costs do not significantly different from each other. However, in the
case of onion, hired labour for cultivation was significantly higher in CF compared to
NCF at 10% level of significance. This was mainly because as due to higher yields, more
farm labour is needed. Also, average weeding hired labour costs was higher for CF was
Rs. 1,689 compared to Rs. 1,434 for onion NCF and it was significantly different from
each other at 5% level of significance. Overall, onion contract farming seems to have a
positive impact on rural employment in the region.
The average bullock labour costs for CGP were higher in case of NCF compared to
CF, while for machine labour it was vice-versa. This shows that CGP CF farmers were
inclined to use modern technology. Some of CF in Satara had used potato harvesters for
harvesting CGP output, while NCF had mostly relied on bullock labour for the same. As
per Table 8.7, unweighted average bullock labour was similar for CF and ACF, while it
was higher in case of NNCF. This shows that it is NNCF which relies on traditional
practices of cultivation.
On an average total operational costs of CF was significantly higher (p < .01) than
that of NCF for both the crops. On average, total operational costs of CGP CF were Rs.

163
44,486 compared to Rs. 41,709 of NCF. While average total operational costs of onion
CF were Rs. 29,468 compared to Rs. 26,881 of NCF. Total operational costs constituted
around 85% of both CGP CF and NCF. While in case of onion, operational production
costs constituted around 75% and 66% of total costs CF and NCF respectively.
8.3.1.3. Fixed costs and other costs
Overall fixed production costs accounted for around 12% of the total costs. The
fixed costs were significantly not different for CF and NCF among both the crops. Of the
fixed costs, the rental value of owned land was the major constituent. In case of onion,
the rental value of owned land costs was significantly not different for CF and NCF.
However, in case of CGP, NCF had a significantly higher rental value of owned land
compared to CF, suggesting that NCF had a better quality of land or due to a locational
aspect. In fixed costs for CGP, depreciation and interest on fixed costs were higher for
CF, but these constituted a marginal percentage of the total costs.
8.3.2 Marketing Costs
The marketing costs did not make a difference in case of CGP, as the marketing
channel was similar, i.e., both for CF and NCF it was sold via an intermediary and
mostly truck used to come on the farm for procuring the produce. However, for onion,
marketing channels were different, as CF used to sell it directly to JISL, with the Jain
Sevak making arrangements to procure from the farm directly. While most of the NCF
had to take produce to APMC, incurring substantial marketing costs. As marketing costs
of onion, NCF constituted 21% of total costs compared to 12% of onion CF. Onion NCF
had to incur extra marketing costs with respect to labour, material inputs, and APMC
charges. NCF had to spend on gunny bags as well as on storage material. While for CF,
gunny bags was provided by the company and they had to sell produce immediately after
harvest, thus no storage costs were involved.
8.3.3. Total Costs
Overall, total costs per acre was not significantly different for both the crops. For
CGP weighted average total costs per acre was Rs. 52,331 for CF and Rs.49,680 for
NCF. While for onion, weighted average total costs per acre was Rs. 39,623 for CF and
Rs.40,497 for NCF.

164
Different cost concepts discussed in Figure 8.1, its results for CGP and onion are
presented in Table 8.8: Weighted average cost of cultivation and returns (cost
concepts)Table 8.8. Costs A2, B1, B2, C1, C2, and C2M were significantly higher in CF
compared to NCF, with percentage change being in the range of 5-8%. Although costs of
CF were higher, but the net returns over Costs A2, B1, B2, C1, C2, and C2M were
significantly not different between CF and NCF. This suggests that either yield and/or
price was higher in the contract.
8.3.4. Yields
Yields were significantly higher in CF compared to NCF for both the crops
(Tables 8.5 and 8.6). The weighted average physical yield obtained by CGP CF was 44.6
quintals per acre, which was 18% higher of yield of 37.7 quintals per acre in NCF.
Similarly, for onion, weighted average yield in CF was 91.4 quintals, which was 16%
higher of yield of 78.8 quintals per acre in NCF. This, shows that contract production has
resulted in higher yields. The results are in line with the literature viz. Awotide et al.
(2015); Cai et al. (2008); Narayanan (2011); and Swain (2011). Due to higher yields in
CGP and onion CF resulted in per quintal total costs are lower over NCF, though the per
acre costs are higher. Also cost average cost per kg of CGP was Rs. 16.8 compared to
Rs. 13.8 that of both CF and ACF. As stated in Dev and Rao (2007, p. 42), “economic
theory states that the average costs matter in decision-making and deciding the
profitability rather than absolute costs”.
One of the reasons for higher yields is that the CF had spent higher money on
material inputs (seeds, fertilizers, plant protection kit) so that they get good yields. Also,
CF had access to extension services.
One of the point to note is that in case of CGP, many of the farmers had stored part
of produce and by the time they had sold, some part had got spoiled, therefore not all
harvested output was sold. Similar was the case of NCF onion. Thus, the marketable
surplus was less than marketed surplus. While for CF, JISL used to pay only for 97.5%
of produce. This is perhaps the reason that when total yield is multiplied by average
selling price, the value is greater than that of gross returns.

165
8.3.5. Net returns
Net returns matter in deciding which crop to grow and under which governance
mode (CF or NCF). Net returns over different cost concepts for CGP and onion are
presented in Table 8.8. Average selling price of CGP CF for the reference season was
Rs. 11.8 per kg, which was 19% lower compared to NCF. This is mainly because
Pepsico commanded a price leadership position. Thus, the non-contracting firms had to
pay more than the PesiCo price, in order to entice farmers to sell to them. Thus, NCF
fetched a higher price. This resulted in average NCF net returns (i.e., deducting
production and marketing costs from gross returns) of Rs. 1,047 per acre, while that for
CF was a loss of Rs. 2,443. However, this return was significantly not different from
each other. The average selling price per kg in case of CGP CF could easily cover the
Cost C1 and fall short of Cost C2 with a small margin of Rs. 523. But NCF were able to
cover all the imputed costs along with paid-up costs (production and marketing) at their
average selling price per kg.
Average selling price of onion CF for the reference season was Rs. 4.8, which was
21% higher compared to NCF. Thus, CF fetched both the higher price and yields. This
resulted in average CF net returns (i.e., deducting production and marketing costs from
gross returns) of Rs. 3,230 per acre, while that for NCF was a loss of Rs. 8,737 per acre.
This result was significantly higher at 1% level of significance. The average price per kg
in case of onion, NCF could easily cover the Cost C1 and fall short of Cost C2. But
onion CF were able to cover all the imputed costs along with paid-up costs (production
and marketing) at their average selling price per kg (Table 8.8).

166
Table 8.5: Weighted average production, marketing costs and net returns, CGP (Rs./acre)
Note: For each row, the last column presents the results of a t-test of the null hypothesis that the means are
equal in both samples. *p < .01, ** p < .05, *** p<.1
Cost Items CF NCF t-test
CF % of total
cost
NCF % of
total cost
p value
(2-tailed)
Production Cost
Human Labour Cost
Hired labour 2,465 4.7 2,664 5.4 .30
Family labour 1,887 3.6 1,921 3.9 .94
Sub-total Human labour 4,352 8.3 4,584 9.2 .11
Bullock labour** 2,426 4.6 2,863 5.8 .05
Machine labour** 2,351 4.5 1,909 3.8 .01
Material Input
Seed** 18,369 35.1 17,682 35.6 .05
Manure 4,883 9.3 3,688 7.4 .26
Fertilizer 5,780 11.0 5,736 11.5 .42
Plant protection* 5,379 10.3 4,363 8.8 .00
Sub-total material inputs* 34,410 65.8 31,468 63.3 .00
Irrigation charges** 240 0.5 140 0.3 .01
Miscellaneous expenses 149 0.3 196 0.4 .95
Interest on working capital 559 1.1 547 1.1 .92
Total Operational Costs* 44,486 85.0 41,709 84.0 .00
Depreciation* 555 1.1 243 0.5 .00
Rental value (own land)* 4,716 9.0 5,316 10.7 .00
Interest on fixed capital* 654 1.2 304 0.6 .00
Fixed Cost 5,925 11.3 5,862 11.8 .66
Total Production Costs (a) 50,411 96.3 47,571 95.8 .00
Marketing and Storage
Material Inputs 690 1.3 640 1.3 .15
Human Labour 896 1.7 853 1.7 .25
Transport and APMC 334 0.7 415 1.2 .11
Sub-total marketing cost (b) 1,920 3.7 2,109 4.2 .36
Total Cost (a+b)* 52,331 100.0 49,680 100.0 .00
Yield (quintals/acre)* 44.6 37.7 .00
Total cost per kg 11.7 13.2 .44
Average price* 11.8 14.6 .00
Gross Return (c) 49,888 50,727 .92
Net Return (a+b-c) -2,443 1,047 .17
167
Table 8.6: Weighted average production, marketing costs and net returns, onion
(Rs./acre)
Cost Items CF NCF t-test
p value
(2-tailed
CF % of
total cost
NCF % of
total cost
Production Cost
Human labour cost
Family labour 3,785 9.6 3,742 9.2 .90
Hired labour*** 7,772 19.6 7,134 17.6 .10
Sub-total Human labour 11,557 29.2 10,875 26.9 .12
Bullock labour 783 2.0 776 1.9 .93
Machine labour 1,822 4.6 1,664 4.1 .65
Material Input
Seed 2,623 6.6 2,459 6.1
Manure 4,983 12.6 5,131 12.7 .81
Fertilizer* 4,301 10.9 3,093 7.6 .00
Plant protection* 2,463 6.2 2,047 5.1 .00
Sub-total material inputs** 14,370 36.3 12,729 31.4 .03
Irrigation charges 435 1.1 426 1.1 .63
Interest on working capital* 502 1.3 410 1.0 .00
Total Operational Costs** 29,468 74.4 26,881 66.4 .02
Depreciation 94 0.2 35 0.1 .13
Interest on fixed capital 125 0.3 106 0.3 .49
Rental value (own land/lease-in) 4,894 12.4 4,955 12.2 .27
Fixed Cost 5,113 12.9 5,096 12.6 .85
Total Production Costs (a)** 34,581 87.3 31,977 79.0 .02
Marketing and Storage
Material Inputs* 0 0.0 2,489 6.1 .00
Human Labour*** 1,364 3.4 1,526 3.8 .06
Transport** 3,674 9.3 3,033 7.5 .05
APMC & other charges* 3.5 0.0 1,472.2 3.6 .00
Sub-total marketing cost (b) 5,042 12.7 8,520 21.0 .00
Total cost (a+b) 39,623
100.0 40,497
100.0 .52
Yield (quintals/acre)* 91.4 78.8 .00
Total cost per kg 4.3 5.1
Average price* 4.8 4.0 .00
Gross Return* 42,853
31,760 .00
Net Return * 3,230
-8,737
.00
Note: For each row, the last column presents the results of a t-test of the null hypothesis that the means are
equal in both samples. *p < .01, ** p < .05, *** p<.1

168
Table 8.7: Unweighted average costs and net returns for CF, ACF, and NCF
(Rs./acre)
Particulars CGP Onion
CF ACF NNCF CF ACF NNCF
Production Cost
Human Labour Cost
Family labour 1,894 1,771 2,245 3,687 3,452 4,353
Hired labour 2,460 2,522 2,450 7,660 8,112 6,150
Sub-total Human labour 4,354 4,293 4,695 11,347 11,564 10,503
Bullock labour 2,476 2,582 2,995 759 893 755
Machine labour 2,326 1,971 2,038 1,838 1,686 1,538
Material Input
Seed 18,411 18,238 17,274 2,632 2,438 2,433
Manure 5,011 2,270 4,712 4,962 5,941 4,548
Fertilizer 5,773 5,472 5,964 4,250 3,345 2,879
Plant protection kit 5,390 4,788 4,166 2,445 2,169 1,939
Sub-total material inputs 34,362 31,375 32,118 14,289 13,893 11,799
Irrigation charges 241 202 141 442 411 428
Miscellaneous expenses 147 184 126 -- -- --
Interest on working capital 559 547 564 498 447 370
Total Operational Costs 43,905 40,607 42,113 29,174 28,894 25,394
Depreciation 557 364 254 102 16 43
Interest on fixed capital 669 359 374 132 65 136
Rental value (own land/lease-in) 4,726 5,277 5,046 4,938 4,926 4,951
Fixed Cost 5,953 6,000 5,675 5,171 5,007 5,131
Total Production Costs (a) 49,858 46,607 47,788 34,345 33,901 30,524
Marketing and Storage
Material Inputs 693 685 610 0 2,762 2,342
Human Labour 900 877 768 1,360 1,674 1,539
Transport 17 13 161 3,680 3,571 2,873
APMC & other charges 321 368 334 3 1,851 1,391
Sub-total marketing cost (b) 1,924 1,886 1,804 5,043 9,857 8,145
Total cost (a+b) 51,782 48,493 49,592 39,388 43,758 38,669
Yield (quintals/acre) 45.0 37.8 34.6 92.0 82.0 74.5
Total cost per kg 13.7 13.8 16.8 4.3 5.3 5.2
Average price 11.8 13.7 14.3 4.8 4.3 3.8
Gross Return 50,453 48,970 46,519 43,094 35,573 29,013
Net Return -1,328 477 -3,073 3,705 -8,185 -9,656 Source: Computed from primary survey
Table 8.8: Weighted average cost of cultivation and returns (cost concepts)
Particulars CF NCF
% change
over NCF
Independent
sample t-test
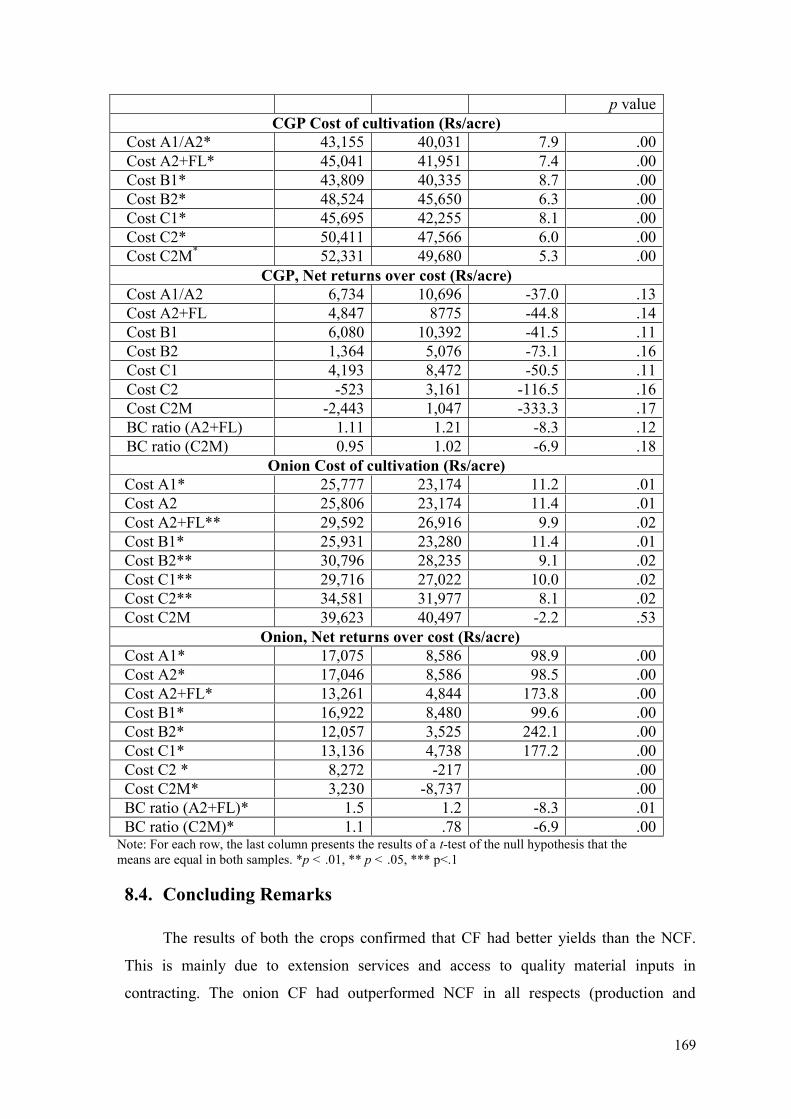
169
p value
CGP Cost of cultivation (Rs/acre)
Cost A1/A2* 43,155 40,031 7.9 .00
Cost A2+FL* 45,041 41,951 7.4 .00
Cost B1* 43,809 40,335 8.7 .00
Cost B2* 48,524 45,650 6.3 .00
Cost C1* 45,695 42,255 8.1 .00
Cost C2* 50,411 47,566 6.0 .00
Cost C2M*
52,331 49,680 5.3 .00
CGP, Net returns over cost (Rs/acre)
Cost A1/A2 6,734 10,696 -37.0 .13
Cost A2+FL 4,847 8775 -44.8 .14
Cost B1 6,080 10,392 -41.5 .11
Cost B2 1,364 5,076 -73.1 .16
Cost C1 4,193 8,472 -50.5 .11
Cost C2 -523 3,161 -116.5 .16
Cost C2M -2,443 1,047 -333.3 .17
BC ratio (A2+FL) 1.11 1.21 -8.3 .12
BC ratio (C2M) 0.95 1.02 -6.9 .18
Onion Cost of cultivation (Rs/acre)
Cost A1* 25,777 23,174 11.2 .01
Cost A2 25,806 23,174 11.4 .01
Cost A2+FL** 29,592 26,916 9.9 .02
Cost B1* 25,931 23,280 11.4 .01
Cost B2** 30,796 28,235 9.1 .02
Cost C1** 29,716 27,022 10.0 .02
Cost C2** 34,581 31,977 8.1 .02
Cost C2M 39,623 40,497 -2.2 .53
Onion, Net returns over cost (Rs/acre)
Cost A1* 17,075 8,586 98.9 .00
Cost A2* 17,046 8,586 98.5 .00
Cost A2+FL* 13,261 4,844 173.8 .00
Cost B1* 16,922 8,480 99.6 .00
Cost B2* 12,057 3,525 242.1 .00
Cost C1* 13,136 4,738 177.2 .00
Cost C2 * 8,272 -217 .00
Cost C2M* 3,230 -8,737 .00
BC ratio (A2+FL)* 1.5 1.2 -8.3 .01
BC ratio (C2M)* 1.1 .78 -6.9 .00 Note: For each row, the last column presents the results of a t-test of the null hypothesis that the
means are equal in both samples. *p < .01, ** p < .05, *** p<.1
8.4. Concluding Remarks
The results of both the crops confirmed that CF had better yields than the NCF.
This is mainly due to extension services and access to quality material inputs in
contracting. The onion CF had outperformed NCF in all respects (production and
170
marketing). Although overall costs were higher in CF for both the crops, but they gain in
terms of increase in yields, this overall reduces the per quintal costs. The average per
quintal costs was higher in onion NNCF compared to CF and ACF. In case of CGP,
although net returns over the total cost of CF were negative, while those of NCF were
positive, but they were not significantly different from each other. CGP CF could easily
cover the Cost C1 and fall short of Cost C2 with a small margin of Rs. 523.
CF also save on marketing costs, which improves their overall profitability. Thus,
contracting seems to increase yields, and help farmers reduce their marketing costs.
Given the imperfections in input markets in India, contract farming seems to facilitate
positive change in the overall agricultural sector.