Sample Content Profitability and Cost Management
39
Sample Content for Profitability and Cost Management SAP Profitability and Performance Management Document Version: 3.0 SP15 – 2021-09-21 PUBLIC Sample Content for Profitability and Cost Management Processes and Functions supporting Sample Business Scenarios
-
Upload
khangminh22 -
Category
Documents
-
view
0 -
download
0
Transcript of Sample Content Profitability and Cost Management

Sample Content for Profitability and Cost Management SAP Profitability and Performance Management
Document Version: 3.0 SP15 – 2021-09-21
PUBLIC
Sample Content for Profitability and Cost Management Processes and Functions supporting Sample Business Scenarios

Sample Content for Profitability and Cost Management
Typographic Conventions
PUBLIC
2
Typographic Conventions
Type Style Description
Example Words or characters quoted from the screen. These include field names, screen
titles, pushbuttons labels, menu names, menu paths, and menu options.
Textual cross-references to other documents.
Example Emphasized words or expressions.
EXAMPLE Technical names of system objects. These include report names, program names,
transaction codes, table names, and key concepts of a programming language
when they are surrounded by body text, for example, SELECT and INCLUDE.
Example Output on the screen. This includes file and directory names and their paths,
messages, names of variables and parameters, source text, and names of
installation, upgrade and database tools.
Example Exact user entry. These are words or characters that you enter in the system
exactly as they appear in the documentation.
<Example> Variable user entry. Angle brackets indicate that you replace these words and
characters with appropriate entries to make entries in the system.
EXAMPLE Keys on the keyboard, for example, F 2 or ENTER .
Sample Content for Profitability and Cost Management
Contents
PUBLIC
3
Contents
1 Introduction and Basics............................................................................................................................ 6
1.1 About this Guide .................................................................................................................................... 6
1.2 Constraints ............................................................................................................................................. 6
1.3 Related Documentation ......................................................................................................................... 7
1.4 Glossary ................................................................................................................................................. 7
2 Business Example ..................................................................................................................................... 8
2.1 Scope and Business Definition ............................................................................................................... 9
3 Profitability and Cost Management in Detail ......................................................................................... 10
3.1 Integrate Data Sources ........................................................................................................................ 12
Financial Statement Items ............................................................................................................... 13
Financial Statement Dependency.................................................................................................... 14
Test Plan and Forecast Data ............................................................................................................ 15
Enrich Plan and Forecast Data ......................................................................................................... 16
Write Plan and Forecast Data .......................................................................................................... 16
Plan and Forecast Data .................................................................................................................... 16
Resource Assignments .................................................................................................................... 18
Resource Drivers ............................................................................................................................. 18
Activity Survey Data ........................................................................................................................ 19
Activity Drivers ............................................................................................................................ 20
Customer and Channel Positions ................................................................................................ 20
Acquired Customers .................................................................................................................... 21
Integrate Master Data and Hierarchy (Optional) ........................................................................ 22
Master Data Fields .................................................................................................................. 22
Retrieve Mater Data Hierarchy............................................................................................... 22
3.2 Data Review and Update ..................................................................................................................... 22
Review Financial Statement Items .................................................................................................. 23
Update Financial Statement Dependency ....................................................................................... 23
Update Plan and Forecast Data ....................................................................................................... 23
Update Resource Assignments ........................................................................................................ 23
Update Resource Drivers ................................................................................................................. 24
Fill Activity Survey Data ................................................................................................................... 24
Update Activity Driver Data............................................................................................................. 24
3.3 Processing ............................................................................................................................................ 24
Union GL, Plan and Forecast Data ................................................................................................... 25
Union Activity and Survey Activity Drivers ...................................................................................... 25
Calculate additional Activity Drivers ............................................................................................... 26
Assign Resources ............................................................................................................................. 26
Allocate Resources to Activities ...................................................................................................... 27
Sample Content for Profitability and Cost Management
Contents
PUBLIC
4
Allocate Activities to Products and Services.................................................................................... 27
Allocate Products and Services to Customers ................................................................................. 27
Assign GL Accounts to Balance Sheet Positions .............................................................................. 27
Financial Results .............................................................................................................................. 28
Collect Results from Financial Statements.................................................................................. 28
Calculate Additional KPI and Join Final Results ........................................................................... 28
3.4 Reporting ............................................................................................................................................. 28
Review Results................................................................................................................................. 29
Activity Results ................................................................................................................................ 30
Product and Service Results ............................................................................................................ 30
Review Planned Results Baseline .................................................................................................... 31
Review Planned Results Simulation ................................................................................................ 32
Product and Service Results Baseline .............................................................................................. 32
Product and Service Results Simulation .......................................................................................... 33
Profit Margin Per Quarter [%] ......................................................................................................... 34
Value Flow ....................................................................................................................................... 35
Liquidity Ratio ............................................................................................................................. 35
Customer Acquisition Cost (USD per Customer) ......................................................................... 36
Balance Sheet Comparison ......................................................................................................... 36
Return on Equity ......................................................................................................................... 36
Sample Content for Profitability and Cost Management
Table of F
PUBLIC
5
Table of Figures
Figure 1: Digital Imperative .................................................................................................................... 8
Figure 2: Sample Content Information and Calculation Model ............................................................ 9

Sample Content for Profitability and Cost Management
PUBLIC
6
1 Introduction and Basics
1.1 About this Guide
This guide provides information about the sample content for Profitability and Cost Management,
which can be installed on top of SAP Profitability and Performance Management. This sample content
describes a project accelerator, ideas, and best practices for modeling an end-to-end profitability and
cost calculation model that is feasible for actuals, planning, forecasting and simulations. It covers the
full contribution margin scheme at a granular product level. It also contains references to further
documentation that you should read before performing these tasks.
The structure of this document is organized around the following topic:
Business Example
This part of the guide covers the main features of the sample content. It describes the information
model and calculation model.
Target Audience:
• Business experts
• Solution consultants
• Presales teams
Considerations
It is essential to be accustomed with the content of the corresponding guides and documents related
to this topic before beginning with this example. For more information about the available guides and
documents, as well as integration with other systems, roles, configuration information, users and
authorization concept, see section Related Documentation.
1.2 Constraints
This guide does not provide information about the installation of the sample content. For more
information about this, see section Related Documentation.
Sample Content for Profitability and Cost Management
PUBLIC
7
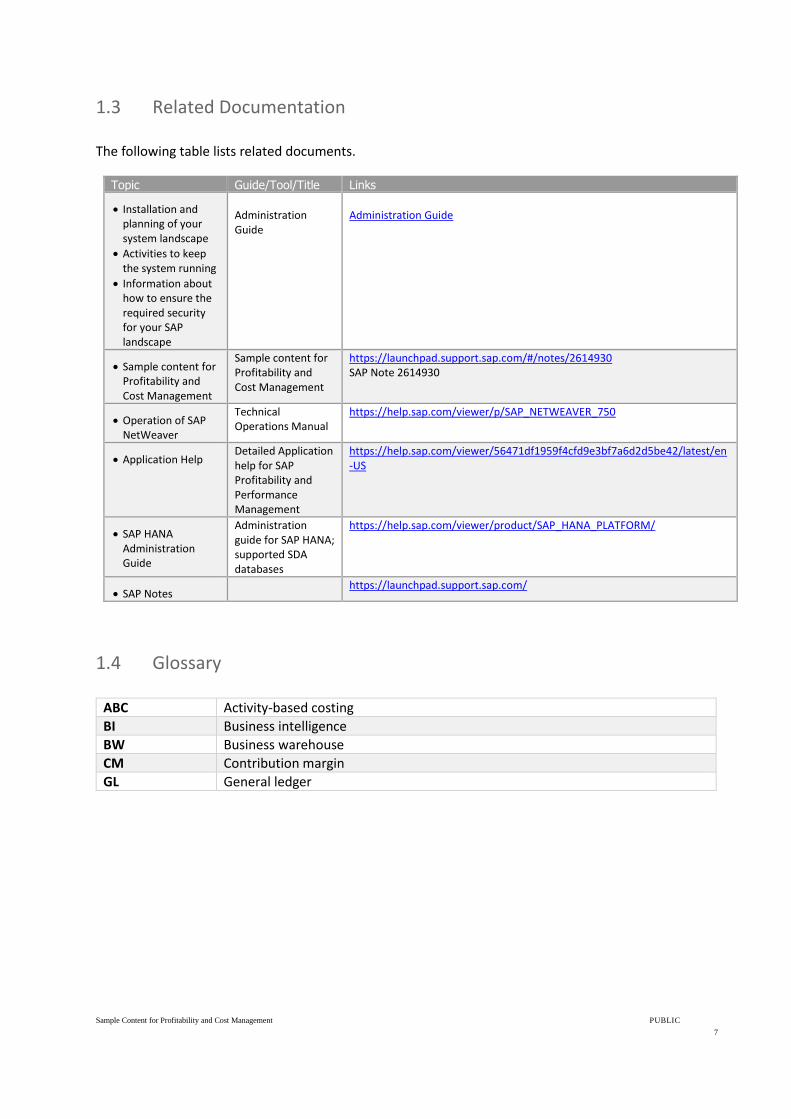
1.3 Related Documentation
The following table lists related documents.
Topic Guide/Tool/Title Links
• Installation and planning of your system landscape
• Activities to keep the system running
• Information about how to ensure the required security for your SAP landscape
Administration Guide
Administration Guide
• Sample content for Profitability and Cost Management
Sample content for Profitability and Cost Management
https://launchpad.support.sap.com/#/notes/2614930 SAP Note 2614930
• Operation of SAP NetWeaver
Technical Operations Manual
https://help.sap.com/viewer/p/SAP_NETWEAVER_750
• Application Help Detailed Application help for SAP Profitability and Performance Management
https://help.sap.com/viewer/56471df1959f4cfd9e3bf7a6d2d5be42/latest/en-US
• SAP HANA Administration Guide
Administration guide for SAP HANA; supported SDA databases
https://help.sap.com/viewer/product/SAP_HANA_PLATFORM/
• SAP Notes https://launchpad.support.sap.com/
1.4 Glossary
ABC Activity-based costing
BI Business intelligence
BW Business warehouse
CM Contribution margin
GL General ledger

Sample Content for Profitability and Cost Management
PUBLIC
8
2 Business Example
The market is at the dawn of the next big technology change where everything is connected and
software is embedded in people’s lives. This technology change is bringing new opportunities and new
threats. Cycle time for innovation is 5–10 times faster, and enterprises can no longer compete unless
complexity is reduced. Business efficiency is ahead of the market and product and service profitability
are constantly tracked and optimized.
That is why digital performance management will be the game-changer for companies who want to
be successful in the digital economy. A digital performance management solution for 21st century
business needs to measure and manage enterprise efficiency and drive product and service
profitability in real time.
Built on SAP HANA, SAP Profitability and Performance Management is a next generation digital
performance management solution that provides breakthrough real-time business data aggregation
capabilities for SAP and non-SAP systems, a high-speed finance and risk calculation engine and
comprehensive simulation and scenario management.
Figure 1: Digital Imperative

Sample Content for Profitability and Cost Management
PUBLIC
9
2.1 Scope and Business Definition
This sample content covers the sample end-to-end profitability and cost process of an enterprise,
comprising certain aspects of data integration, data input, processing (including calculations and
allocations following an ABC (activity-based costing) approach) as well as reporting.
This allows business users to manage and analyze enterprise profitability and cost in one central
solution.
The following screenshot shows the function hierarchy of the sample content and the process
template.
Figure 2: Sample Content Information and Calculation Model
You can also find the information contained in the following chapters on the respective
Documentation tabs for the model.

Sample Content for Profitability and Cost Management
PUBLIC
10
3 Profitability and Cost Management in Detail
Profitability and Cost Management is an important task for every enterprise in the industry. It enables
them to optimize profitability and minimize cost by providing deep insights into granular revenue and
cost information at product, service or channel level.
This sample content Profitability and Cost Management (Environment ID=SXP, Version=12) covers an
end-to-end example of an Activity-based Costing Model, applicable to both actual and planning data,
which focuses on product and service profitability. It incorporates a predefined process template with
activities to run the model in production as well as for what-if simulation purposes.
This sample content comes with the SAP Profitability and Performance Management Software
Installation.
It consists of one Calculation Unit function that is structured underneath by Description functions in
the following sections:
1. Integrate Data Sources Defines manually loaded data used in the subsequent functions.
2. Data Review and Update Provides specific input options for the following:
− General Ledger Data
− Plan and forecast data
− Resource assignments
− Resource drivers
− Activity Survey Data
− Activity drivers
− Customer and Channel Positions
3. Processing Here the core of the calculation model is defined to get to a complete multidimensional P&L
on granular level.
− The union of general ledger with plan and forecast data
− The union of activity data usually coming from source systems, with the aggregated and weighted activity survey data
− The assignment of GL accounts to resources
− The allocation of resources to activities
− The allocation of activities to products & services
− The allocation of products & services to customers
− The assignment of GL accounts to balance sheet positions and financial results for the retained earnings / loss for the balance sheet in the beginning of the next fiscal year

Sample Content for Profitability and Cost Management
PUBLIC
11
− Collecting final results and calculating additional KPI (Customer Acquisition Costs)
4. Reporting, which provides one review report for the P&L, plus several specific reports for results on activity and product level as well as a value flow report, which gives the user end-to-end traceability from resources through all applied drivers to the final result.
The Profitability and Cost Management calculation unit defines the process template SXP_P_ - Process
Template with the following activities:
• Review Input Data:
− Review Financial Statement Items, where the user can check the GL data used in the process
• Update Input Attributes:
− Update Financial Statement Dependency, where you can apply changes to financial statement dependency data.
− Update Plan and Forecast Data, where the user can apply plan and forecast data changes
− Update Resource Assignments, where the user decides which GL accounts are allocated to which resource(s). It also allows to take over only a specific percentage from a GL account or to spread the GL account value to various resources.
− Update Resource Drivers, where changes can be applied to the allocation logic if needed
− Fill Activity Survey Data, where specific activity driver values can be entered by several survey users
− Update Activity Drivers, where changes can be applied to the allocation logic if needed
• Execution
• Results:
− Review Results, which provides a predefined profit and loss result report per quarter.
− Activity Results, which provides a predefined activity result report per quarter.
− Product and Service Results, which provides a predefined profit and loss result report per product and service.
− Review Planned Results Baseline, which provides a predefined profit and loss result report per quarter and scenario.
− Review Planned Results Simulation, which provides a predefined profit and loss result report per quarter and scenario.
− Product and Service Results Baseline, which provides a predefined profit and loss result report per product and service and per scenario.
− Product and Service Results Simulation, which provides a predefined profit and loss result report per product and service and per scenario.
− Profit Margin Per Quarter [%], which provides a predefined profit and loss result report for product and service per quarter.
− Value Flow, which provides a granular traceability report from the originating resources through all applied drivers and portions to the final amount on product & service level

Sample Content for Profitability and Cost Management
PUBLIC
12
− Liquidity Ratio, which shows financial ratio analysis provided from balance sheet calculated for the next fiscal year, as a result of the previous balance sheet and changes in transactions.
− Customer Acquisition Cost, which shows how much the company invested per quarter in order to acquire new customers in the next quarter.
− Balance Sheet Comparison, which shows balance sheet comparison for the beginning and the end of the fiscal year, as a result of the previous balance sheet and changes in transactions.
− Return on Equity, which provides read data access to the Return on Equity for the period under consideration.
Note
All execution activities are configured without dependency, so that they can be executed in parallel for demo
purposes. In implementation projects dependent activities can be defined instead if needed.
For execution activities no performer and reviewer teams are assigned, that means every execution user can run the
activities. In implementation projects teams need to be assigned to restrict the authorizations to relevant users.
For the used environment fields, no characteristic based authorization is defined, that means every execution user
can read all data and possibly apply data changes. In implementation projects authorizations can be defined on
characteristic value level by IT Administrators in line with the general SAP authorization and security management,
so that for example in the “Review Financial Statement Item” report the company data for “Sunshine New York” is
only readable to selected users. Another example would be, that for "Update Plan and Forecast Data" team members
can only input data for cost centers, for which they are responsible.
3.1 Integrate Data Sources
In this section, you can define the required data sources.
Note
This sample content does not work with specific customer data and cannot presume any customer-specific system
landscape, application or interface.
The integration of data sources uses therefore functions of type Model Tableto make test data available in an implementation project to connect to the real and concrete customer data sources and targets.
The complete information model is kept lean to ease the adaption in an implementation project. For example, it assumes just 10 fields as a general ledger data feed, which is enough in most cases and obviously much easier to provide, than if 50 fields or more would be required.
This section defines manually loaded data used in the subsequent functions:
• Financial Statement Items
• Financial Statement Dependency
• Test Plan and Forecast Data
• Enrich Plan and Forecast Data
Sample Content for Profitability and Cost Management
PUBLIC
13
• Write Plan and Forecast Data
• Plan and Forecast Data
• Resource Assignments
• Resource Drivers
• Activity Survey Data
• Activity Drivers
• Customer and Channel Positions
• Acquired Customers
• Master Data Fields
• Retrieve Master Data and Hierarchy
Example
The Integrate Data Sources section assumes just ten fields as a general ledger data feed. In most cases this is sufficient
and is much easier to provide than 50 fields.
Financial Statement Items
This Model Table function is used to provide test data with periodic actual totals for the relevant accounts and data for Balance Sheet Items.
It defines the following fields:
1. Value in Original Transaction Currency:
Currency used for reporting at a global level.
2. Company Code Currency:
Transaction currency is the currency, which is chosen in the sample content to calculate profitability. No matter, which currency is used in an implementation project, the common practice is to translate every amount into one and the same currency, so that in the complete profitability model only one currency (also called controlling area currency) is used.
3. Cost Center:
This is the lowest granularity in a company or legal entity, where costs are pooled and controlled. Quite often the plan and forecast data is maintained by the corresponding cost center business owner.
4. Company Code:
Profitability and Cost Management is usually executed on controlling area level, which spans across multiple companies and legal entities. In that cases this field can have different values and is still available in reporting.
5. Functional Area:
Sometimes this field is also called business segment. No matter, how it is called, the sample content includes such a field to allow segment-reporting and drill down.

Sample Content for Profitability and Cost Management
PUBLIC
14
6. Account Number:
Sometimes this field is also called Cost Element. No matter, how it is called, the sample content includes such a field to catch revenues and costs at a granular level.
7. Profit Center:
This field is necessary, because the model incorporates beside costs also revenues and so the profit center is the lowest granularity in a company or legal entity, which have responsibility to generate profit.
8. Posting Date:
This field gives flexibility to provide GL totals on a yearly, quarterly, monthly or even daily basis to run the profitability and cost management process.
9. Amount in Company Code Currency:
Amount in transaction currency, which represents costs or revenues.
10. Currency Key of Original Transaction Currency:
Transaction currency is the currency, which is chosen in the sample content to calculate profitability. No matter, which currency is used in an implementation project, the common practice is to translate every amount into one and the same currency, so that in the complete profitability model only one currency (also called controlling area currency) is used.
11. Statement Type:
Field used for representing which part of dataset belongs to which specific financial statement.
12. Structure of FS:
Field is used to shows positions in Balance Sheet that belong to Asset and Capital and Liabilities.
Financial Statement Dependency
1. Account Number:
Sometimes this field is also called “Cost Element”. No matter, how it is called, the sample
content includes such a field to catch revenues and costs at a granular level.
2. Posting Date:
This field gives flexibility to provide GL totals on a yearly, quarterly, monthly or even daily basis
to run the profitability and cost management process.
3. BS Items:
This field shows positions in Balance Sheet Statement.
4. Allocation Driver Value:
This field shows in which portion will be amount allocated from GL accounts to Balance Sheet
Positions.
Sample Content for Profitability and Cost Management
PUBLIC
15
Test Plan and Forecast Data
This Model Table function is used to provide periodic plan and forecast totals for the relevant accounts.
It defines the following fields:
1. Posting Date: This field gives flexibility to provide GL totals on a yearly, quarterly, monthly or even daily basis to run the profitability and cost management process.
2. Company Code: Profitability and Cost Management is usually executed on controlling area level, which spans across multiple companies and legal entities. In that cases this field can have different values and is still available in reporting.
3. Functional Area: Sometimes this field is also called business segment. No matter, how it is called, the sample content includes such a field to allow segment-reporting and drill down.
4. Profit Center: This field is necessary, because the model incorporates beside costs also revenues and so the profit center is the lowest granularity in a company or legal entity, which have responsibility to generate profit.
5. Cost Center: This is the lowest granularity in a company or legal entity, where costs are pooled and controlled. Quite often the plan and forecast data is maintained by the corresponding cost center business owner.
6. Account Number: Sometimes this field is also called “Cost Element”. No matter, how it is called, the sample content includes such a field to catch revenues and costs at a granular level.
7. Value in Original Transaction Currency:
Currency used for reporting at a global level.
8. Amount in Company Code Currency: Amount in transaction currency, which represents costs or revenues.
9. Currency Key of Original Transaction Currency: Transaction currency is the currency, which is chosen in the sample content to calculate profitability. No matter, which currency is used in an implementation project, the common practice is to translate every amount into one and the same currency, so that in the complete profitability model only one currency (also called controlling area currency) is used.
10. Amount (TC):
Amount in transaction currency, which represents costs or revenues
11. Partition Key: ID or key of subset of dataset which was produced with Enrich Plan and Forecast Data.
12. Scenario:
Field used to identify which dataset has Standard or any other scenario.
Sample Content for Profitability and Cost Management
PUBLIC
16
13. Statement Type:
Field used for representing which part of dataset belongs to which specific financial statement.
14. Structure of FS:
Field is used to shows positions in Balance Sheet that belong to Asset and Capital and Liabilities.
Enrich Plan and Forecast Data
This View function adds the technical field Partition Key to the original test data, to increase the processing speed further in two ways, if needed.
1. Partitioning: A partition key can increase the reading and writing speed of mass data further in scale-out system landscapes.
2. Package Parallelization: A partition key can increase the calculation speed of mass data further, in case the data in a package can be calculated independently from each other without affecting the result. This is usually the case in all kinds of linear, step down or network processes. It is usually not the case in all kinds of circular and iterative processes.
Both techniques can be used alone or in combination. A prerequisite is that the data across different partition key values should be quite evenly distributed, so that each package/partition has roughly the same data volume and therefore processing time will be quite the same too.
In this environment in the Partition-Tab one Partitioning ID P1 is prepared and final user can change ranges for demo purposes. The package parallelization is not used by default in this sample content, because it is not using mass data. Hint: For example, if you want to generate 30 partitions you need to go in Process Template and then in tab selection change the value in field Parameter by entering number 30 in formula. After making this change, activate the function again and run it again to insert 30 partitioned data sets into Plan and Forecast Data model table.
Write Plan and Forecast Data
This writer function is used to read from View function Enrich Plan and Forecast Data and writes the data into Model Table function Plan and Forecast Data.
This demonstrates of the Writer function to write to Model Tables.
See Model Table function Plan and Forecast Data for details about the fields.
Plan and Forecast Data
This Model Table function is used to provide periodic general ledger totals from the relevant accounts.

Sample Content for Profitability and Cost Management
PUBLIC
17
It defines the following fields:
1. Posting Date: This field gives you the flexibility to provide GL totals on a yearly, quarterly, monthly or even daily basis to run the profitability and cost management process.
2. Company: Profitability and Cost Management is usually executed at controlling area level,
which spans multiple companies and legal entities. In these cases, this field can have different
values and is still available in reporting.
3. Functional Area: This field is also referred to as business segment. It allows segment reporting
and drill-down.
4. Profit Center: This field is required because the model incorporates revenues as well as costs.
The profit center is the lowest level of granularity in a company or legal entity that is
responsible for generating profit.
5. Cost Center: This is the lowest level of granularity in a company or legal entity, where costs
are pooled and controlled. The plan and forecast data is often maintained by the
corresponding cost center business owner.
6. Account Number: This field is also referred to as Cost Element and is used to record revenues
and costs at a granular level.
7. Currency:
Currency used for reporting at a global level.
8. Amount in Company Code Currency: Amount in transaction currency that represents costs or
revenues.
9. Currency Key of Original Transaction Currency: Transaction currency is the currency chosen in
the sample content to calculate profitability. It is common practice to translate every amount
into the same currency so that only one currency (also called controlling area currency) is used
in the complete profitability model.
10. Amount (TC): Amount in transaction currency that represents costs or revenues.
11. Partition Key: Technical key field which helps to increase the calculation speed of mass data even further. More information can be found in the Enrich General Ledger Data function.
12. Scenario:
Field used to identify which dataset has Standard or any other scenario.
13. Statement Type:
Field used for representing which part of dataset belongs to which specific financial statement.
14. Structure of FS:
This field shows in which portion will be amount allocated from GL accounts to Balance Sheet
Positions.

Sample Content for Profitability and Cost Management
PUBLIC
18
Resource Assignments
This Model Table function is used to provide periodic assignment data for the relevant accounts to the
according resources.
Because relevant GL accounts in a Profitability and Cost Management process can change quite
frequently it makes sense to decouple them from the more stable calculation model by using
resources. It also allows you to use only an adjusted part of the total amount and to split the GL
account values across various resources.
It defines the following fields:
1. Posting Date:
This field gives flexibility to provide GL totals on a yearly, quarterly, monthly or even daily basis to run the profitability and cost management process.
2. Company:
Profitability and Cost Management is usually executed at controlling area level, which spans
multiple companies and legal entities. In these cases, this field can have different values and
is still available in reporting.
3. Cost Center:
This is the lowest level of granularity in a company or legal entity, where costs are pooled and
controlled. The plan and forecast data is often maintained by the corresponding cost center
business owner.
4. Account Number:
This field is also referred to as Cost Element. It is used to record revenues and costs at a
granular level.
5. Resource:
This is the starting point of the calculation model and the resource is referred to in various
functions.
6. Adjustment (%):
Percentage of the GL account total to be assigned to a resource.
Resource Drivers
This Model Table function is used to provide periodic resource drivers for the relevant resources and activities.
It defines the following fields:
1. Posting Date:
Sample Content for Profitability and Cost Management
PUBLIC
19
This field gives you the flexibility to provide plan and forecast totals on a yearly, quarterly, monthly or even daily basis to run the profitability and cost management process.
2. Resource Source:
There are customer system landscapes, where resource driver data is coming from multiple systems like data warehouses, timesheet systems or entered manually. In this case the Resource Source field has different values and is still available in reporting.
3. Resource:
To abstract the data coming from General Ledger Systems and Planning systems from the Profitability model and ease reassignments, the resource driver data is based on an explicit Resource field instead of the original source system fields like GL Account, Cost Center, Profit Center, etc.. The Assign Resources function takes care of enriching the original data by the resource field. So even if for the underlying GL Accounts quite frequently new accounts are added and others get obsolete, just the Resource Assignments data need to be updated by Execution Users and not the calculation model.
4. Resource Driver: This field contains the unit description of the resource, like Pieces, Hours and
FTE’s etc.
5. Resource Value: Contains the key figure used to allocate resources to activities and refers to
the Resource Driver as a unit.
6. Activity: Defines the activity that uses the Resource Value as a variable portion to allocate the
resources.
Activity Survey Data
This model table function is used to provide periodic activity survey drivers for the relevant activities and products & services.
It defines the following fields:
1. Activity:
Activities usually stem from company internal surveys or are already defined in company
internal processes.
2. Survey:
This field separates the conducted surveys from each other and ensures that multiple surveys can be done at the same time in parallel without interference.
3. Posting Date:
This field gives flexibility to provide plan and forecast totals on a yearly, quarterly, monthly or
even daily basis to run the profitability and cost management process.
4. Activity Value:
Contains the key figure, which is used to allocate activities down to products & services and it
refers to the Activity Driver as a unit.
5. Product Profitability Analysis:
Sample Content for Profitability and Cost Management
PUBLIC
20
Defines the product or service which is using the Activity Value as a variable portion to allocate
the activities.
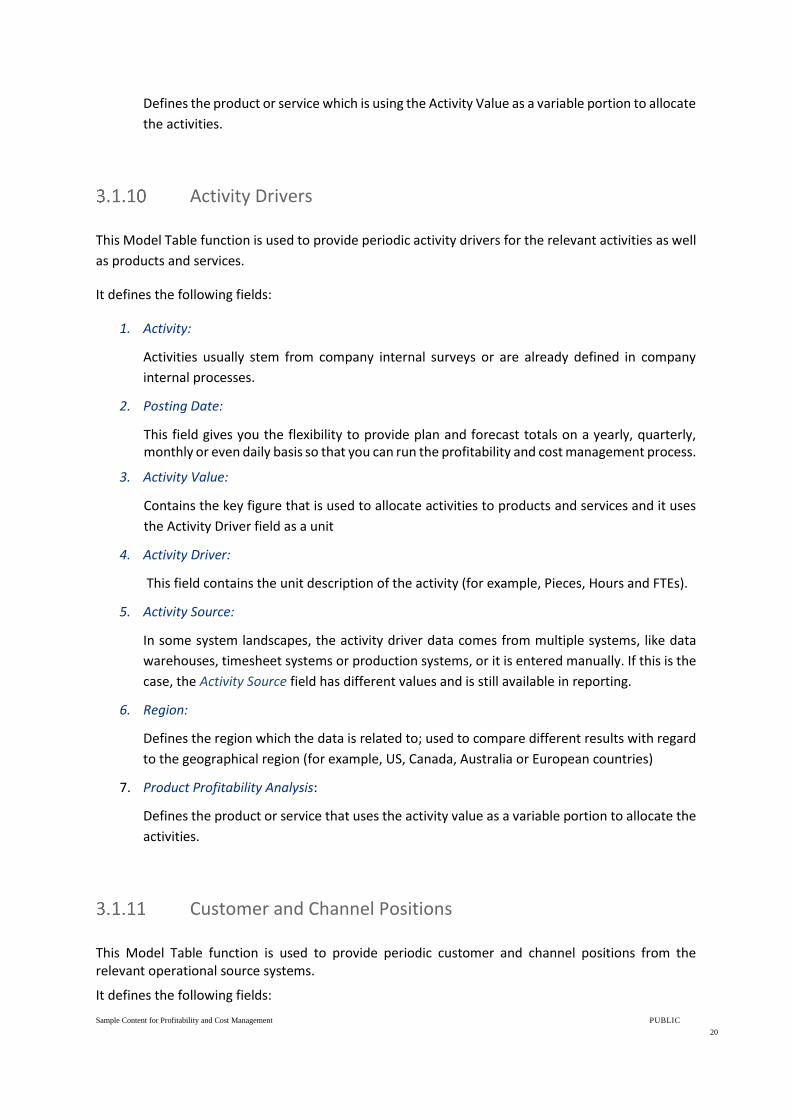
Activity Drivers
This Model Table function is used to provide periodic activity drivers for the relevant activities as well
as products and services.
It defines the following fields:
1. Activity:
Activities usually stem from company internal surveys or are already defined in company
internal processes.
2. Posting Date:
This field gives you the flexibility to provide plan and forecast totals on a yearly, quarterly, monthly or even daily basis so that you can run the profitability and cost management process.
3. Activity Value:
Contains the key figure that is used to allocate activities to products and services and it uses
the Activity Driver field as a unit
4. Activity Driver:
This field contains the unit description of the activity (for example, Pieces, Hours and FTEs).
5. Activity Source:
In some system landscapes, the activity driver data comes from multiple systems, like data
warehouses, timesheet systems or production systems, or it is entered manually. If this is the
case, the Activity Source field has different values and is still available in reporting.
6. Region:
Defines the region which the data is related to; used to compare different results with regard
to the geographical region (for example, US, Canada, Australia or European countries)
7. Product Profitability Analysis:
Defines the product or service that uses the activity value as a variable portion to allocate the
activities.
Customer and Channel Positions
This Model Table function is used to provide periodic customer and channel positions from the relevant operational source systems.
It defines the following fields:

Sample Content for Profitability and Cost Management
PUBLIC
21
1. Posting Date:
This field gives flexibility to provide GL totals on a yearly, quarterly, monthly or even daily basis to run the profitability and cost management process.
2. Position ID:
This is a unique ID to identify the position.
3. Product Profitability Analysis:
Defines the product or service.
4. Channel:
Distribution channel like wholesale or retail, etc.
5. Customer ID:
This is an ID to identify the customer in that position.
6. Quantity:
Defines the quantity of products & services, which the customer received via the given
channel on the posting date.
7. Unit:
Defines the quantity unit like pieces.
8. Position Amount:
Defines the price the customer paid for the quantity of products & services.
9. Currency Key of Original Transaction Currency :
Transaction currency is the currency chosen in the sample content to calculate profitability. It is common practice to translate every amount into the same currency so that only one currency (also called controlling area currency) is used in the complete profitability model.
Acquired Customers
This Model Table function is used to provide information about new customers acquired for each
product and services for the given period.
It defines the following fields:
1. Posting Date:
This field gives flexibility to provide GL totals on a yearly, quarterly, monthly or even daily basis
to run the profitability and cost management process.
2. Product for Profitability Analysis:
Defines the product or services.
3. Number of New Customer:
Sample Content for Profitability and Cost Management
PUBLIC
22
It shows how much new customers this company acquired in each quarter, with investing in
acquisition costs in the previous quarter.
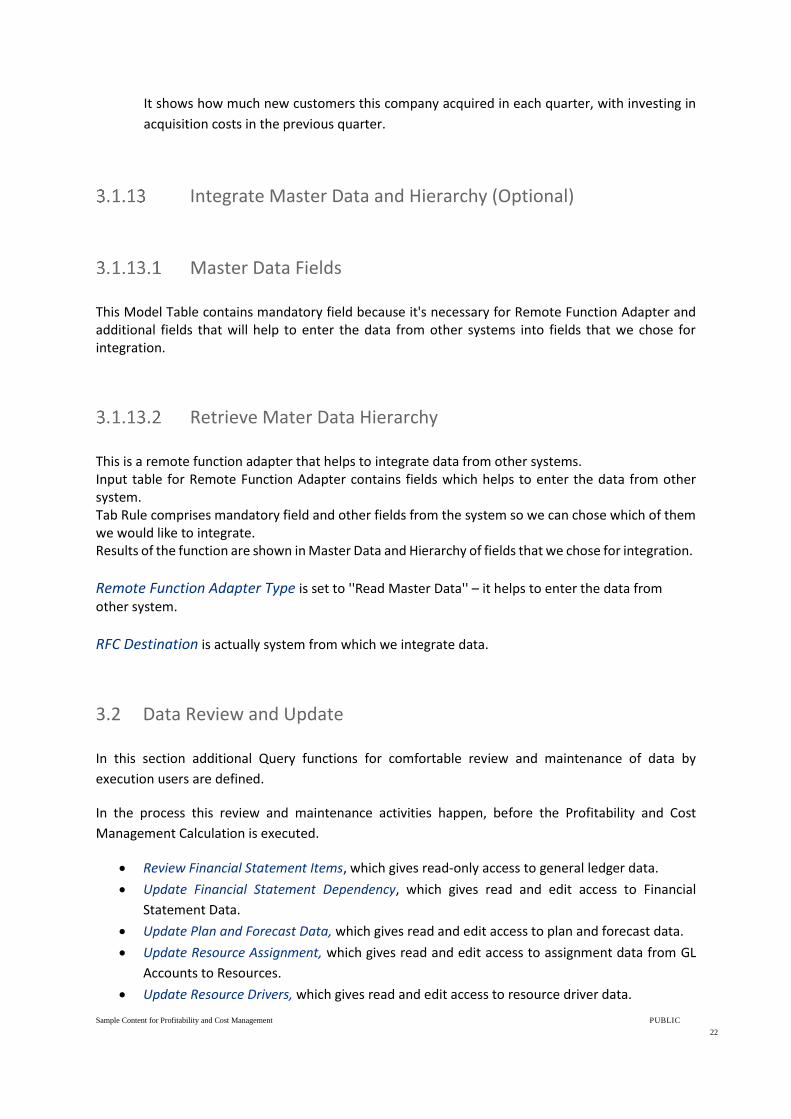
Integrate Master Data and Hierarchy (Optional)
Master Data Fields
This Model Table contains mandatory field because it's necessary for Remote Function Adapter and additional fields that will help to enter the data from other systems into fields that we chose for integration.
Retrieve Mater Data Hierarchy
This is a remote function adapter that helps to integrate data from other systems. Input table for Remote Function Adapter contains fields which helps to enter the data from other system. Tab Rule comprises mandatory field and other fields from the system so we can chose which of them we would like to integrate. Results of the function are shown in Master Data and Hierarchy of fields that we chose for integration.
Remote Function Adapter Type is set to ''Read Master Data'' – it helps to enter the data from other system.
RFC Destination is actually system from which we integrate data.
3.2 Data Review and Update
In this section additional Query functions for comfortable review and maintenance of data by
execution users are defined.
In the process this review and maintenance activities happen, before the Profitability and Cost
Management Calculation is executed.
• Review Financial Statement Items, which gives read-only access to general ledger data.
• Update Financial Statement Dependency, which gives read and edit access to Financial
Statement Data.
• Update Plan and Forecast Data, which gives read and edit access to plan and forecast data.
• Update Resource Assignment, which gives read and edit access to assignment data from GL
Accounts to Resources.
• Update Resource Drivers, which gives read and edit access to resource driver data.
Sample Content for Profitability and Cost Management
PUBLIC
23
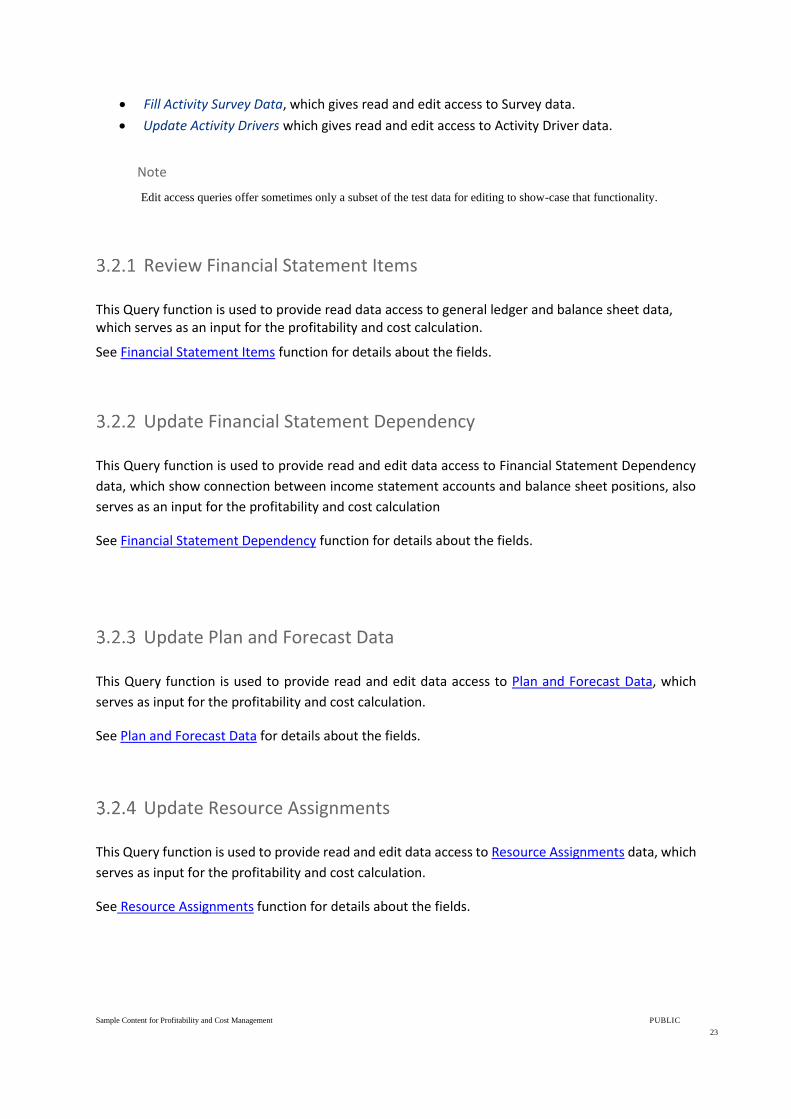
• Fill Activity Survey Data, which gives read and edit access to Survey data.
• Update Activity Drivers which gives read and edit access to Activity Driver data.
Note
Edit access queries offer sometimes only a subset of the test data for editing to show-case that functionality.
Review Financial Statement Items
This Query function is used to provide read data access to general ledger and balance sheet data, which serves as an input for the profitability and cost calculation.
See Financial Statement Items function for details about the fields.
Update Financial Statement Dependency
This Query function is used to provide read and edit data access to Financial Statement Dependency
data, which show connection between income statement accounts and balance sheet positions, also
serves as an input for the profitability and cost calculation
See Financial Statement Dependency function for details about the fields.
Update Plan and Forecast Data
This Query function is used to provide read and edit data access to Plan and Forecast Data, which
serves as input for the profitability and cost calculation.
See Plan and Forecast Data for details about the fields.
Update Resource Assignments
This Query function is used to provide read and edit data access to Resource Assignments data, which
serves as input for the profitability and cost calculation.
See Resource Assignments function for details about the fields.

Sample Content for Profitability and Cost Management
PUBLIC
24
Update Resource Drivers
This Query function is used to provide read and edit data access to Resource Drivers data, which serves
as input for the profitability and cost calculation.
See Resource Drivers function for details about the fields.
Fill Activity Survey Data
This Query function is used to provide read and edit data access to Activity Survey Data, which serves as an input for the profitability and cost calculation.
See Activity Survey Data function for details about the fields.
Update Activity Driver Data
This Query function is used to provide read and edit data access to Activity Drivers data, which serves
as input for the profitability and cost calculation.
See Activity Drivers function for details about the fields.
3.3 Processing
In this section the core functions of the model to calculate the profitability and cost results are defined.
In the process this execution happens, after the input data is reviewed and updated.
It comprises the following functions:
1. Union GL, Plan and Forecast Data, which combines actual and plan/forecast data into one data stream.
2. Union Activity and Survey Activity Drivers, which combines the typically external delivered activity data with the manually entered activity survey data.
3. Calculate additional Activity Drivers, which uses the Union Activity and Survey Activity Drivers function as an input and calculates an additional Activity Driver.
4. Assign Resources, which uses the Union GL, Plan and Forecast Data as an input and applies the according Resources.
5. Allocate Resources to Activities, which uses the Assign Resources function as the allocation sender and the Resource Drivers function as the allocation receiver on which the allocation of the data is then executed.
Sample Content for Profitability and Cost Management
PUBLIC
25
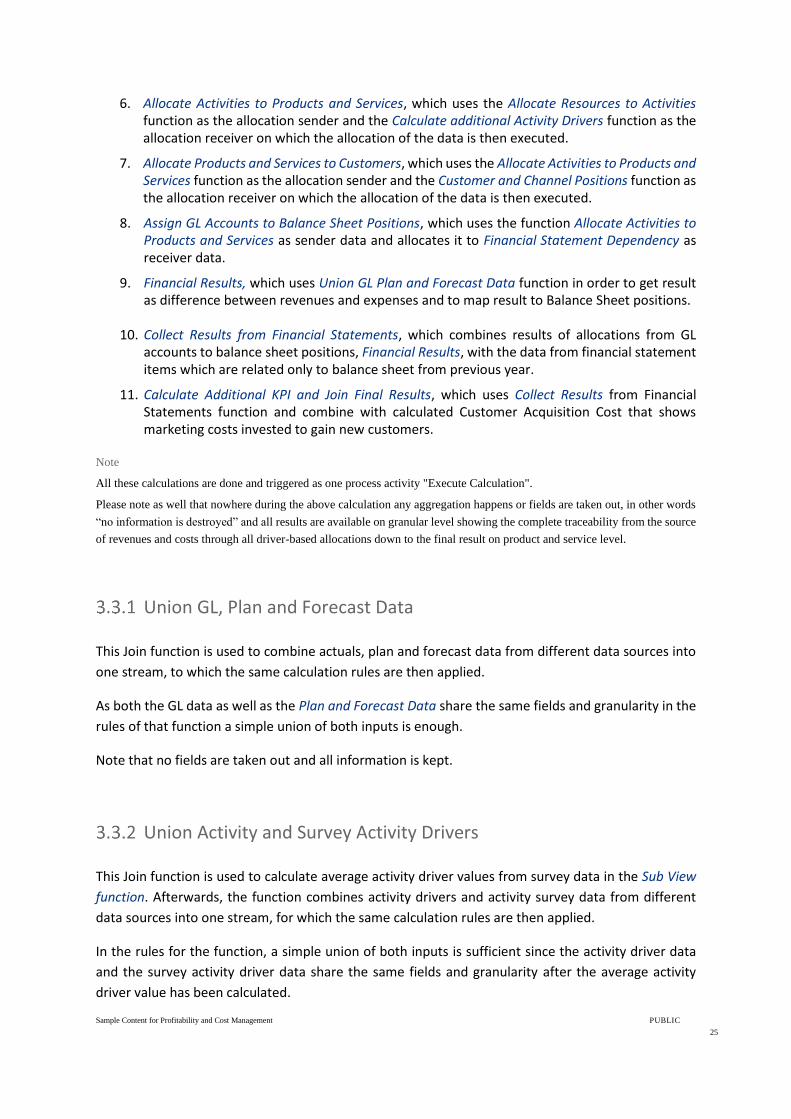
6. Allocate Activities to Products and Services, which uses the Allocate Resources to Activities function as the allocation sender and the Calculate additional Activity Drivers function as the allocation receiver on which the allocation of the data is then executed.
7. Allocate Products and Services to Customers, which uses the Allocate Activities to Products and Services function as the allocation sender and the Customer and Channel Positions function as the allocation receiver on which the allocation of the data is then executed.
8. Assign GL Accounts to Balance Sheet Positions, which uses the function Allocate Activities to Products and Services as sender data and allocates it to Financial Statement Dependency as receiver data.
9. Financial Results, which uses Union GL Plan and Forecast Data function in order to get result as difference between revenues and expenses and to map result to Balance Sheet positions.
10. Collect Results from Financial Statements, which combines results of allocations from GL accounts to balance sheet positions, Financial Results, with the data from financial statement items which are related only to balance sheet from previous year.
11. Calculate Additional KPI and Join Final Results, which uses Collect Results from Financial Statements function and combine with calculated Customer Acquisition Cost that shows marketing costs invested to gain new customers.
Note
All these calculations are done and triggered as one process activity "Execute Calculation".
Please note as well that nowhere during the above calculation any aggregation happens or fields are taken out, in other words
“no information is destroyed” and all results are available on granular level showing the complete traceability from the source
of revenues and costs through all driver-based allocations down to the final result on product and service level.
Union GL, Plan and Forecast Data
This Join function is used to combine actuals, plan and forecast data from different data sources into
one stream, to which the same calculation rules are then applied.
As both the GL data as well as the Plan and Forecast Data share the same fields and granularity in the
rules of that function a simple union of both inputs is enough.
Note that no fields are taken out and all information is kept.
Union Activity and Survey Activity Drivers
This Join function is used to calculate average activity driver values from survey data in the Sub View
function. Afterwards, the function combines activity drivers and activity survey data from different
data sources into one stream, for which the same calculation rules are then applied.
In the rules for the function, a simple union of both inputs is sufficient since the activity driver data
and the survey activity driver data share the same fields and granularity after the average activity
driver value has been calculated.
Sample Content for Profitability and Cost Management
PUBLIC
26
Note
No fields are removed and all information is retained.
Calculate additional Activity Drivers
This Calculation function is used to calculate an activity driver, which is not delivered from a source
system or entered manually, but can be calculated based on existing driver data.
For demo purposes 3 rules are maintained:
1. RSET - Setup Activity is just selecting from existing activity driver data the subset about number of
production setups per year.
2. RPRO - Production Activity is just selecting from existing activity driver data the subset about
number of productions run per year.
3. In rule RCALC, Calculate Steps + Production Runs is selected as well as the basis to fill all
characteristics and then a simple calculation is done adding the setups and production runs (RSET +
RPRO) for the field Activity Value. Also, the activity name ‘SXP_SETPRO’ - Setups and Production Runs
is then assigned and the activity source is set to ‘CAL’ as calculated to make clear it is a calculated
activity.
Note
The formula RSET + RPRO looks simple, but actually behind the scene not just one record with one calculation result
is produced and added, but instead this calculation is done on granular level, first matching the setup activities with
the according production activities based on the granularity fields defined in the signature tab, then executing the
calculation for each matching record and adding all new results to the output. In other words, even if the calculation
is defined on a higher level, it is actually executed on the most granular level.
Assign Resources
This Allocation function uses the Union GL, Plan and Forecast Data function as sender data and
allocates it to resources using the Resource Assignments function as receiver data. To make use of the
hierarchy structure of Accounts for allocation, two rules are included to separate the allocations for
Operating expenses account from the rest of the accounts.
Here the receiver rule ‘’Variable Percentages’’ is used to allocate the sender data using the Adjustment
driver from the receiver.
Sample Content for Profitability and Cost Management
PUBLIC
27
Allocate Resources to Activities
This Allocation function uses the function Assign Resources as sender data and allocates it to activities
using Resource Drivers as receiver data.
Therefore we just maintain one rule here, which does a direct allocation (keeping all fields and thus
provides maximum granular results) allocating the amount by using the Resource Value as Distribution
Base and calculating in addition for comfort reasons the driver result in the field Resource Portion,
which is available then later on in reporting to understand very easily which fraction was used for the
allocation.
Allocate Activities to Products and Services
This Allocation function uses the function Allocate Resources to Activities as sender data and allocates
it to products & services using Activity Drivers as receiver data.
Because it is using the result of another allocation as input, it can also be called a step-down or step-
ladder allocation.
Therefore we just maintain one rule here, which does a direct allocation (keeping all fields and thus
provides maximum granular results) allocating the Amount by using the Activity Value as Base and
calculating in addition for comfort reasons the driver result in the field Activity Portion, which is
available then later on in reporting to understand very easily which fraction was used for the
allocation.
Allocate Products and Services to Customers
This Allocation function uses the Allocate Activities to Products and Services function as sender data
and allocates it to Customer and Channel Positions as receiver data.
Here the receiver rule Variable Portions is used to allocate the sender data using the quantity tracing
factor from the receiver.
Assign GL Accounts to Balance Sheet Positions
This Allocation function uses the function Allocate Activities to Products and Services as sender data and allocates it to Financial Statement Dependency as receiver data.

Sample Content for Profitability and Cost Management
PUBLIC
28
Financial Results
In this Join function we get results as a difference between revenues and expenses and it’s actually
our Financial Result which will be mapped as position Capital in Balance Sheet Statement.
Collect Results from Financial Statements
This Join function is used to combine results of allocations from GL accounts to Balance Sheet positions
with the data from Financial Statement Items which are related only to Balance Sheet from previous
year.
Calculate Additional KPI and Join Final Results
This Join function use results from previous function Collect Results from Financial Statements and
join with Customer Acquisition Cost which is calculated additional KPI that shows how much money is
invested to gain new customers by each product or service at certain period.
3.4 Reporting
In this section, additional Query functions for reviewing results by execution users are defined.
In the process these review and reporting activities happen, after the Profitability and Cost
Management Calculation is executed.
• Review Results: Provides read-only access to the profit and loss results at general ledger
account level.
• Activity Results: Focuses on the results at activity level.
• Product and Service Results: Focuses on the results at product and service level.
• Review Planned Results Baseline: Provides a predefined profit and loss result report per
quarter and scenario.
• Review Planned Results Simulation: Provides a predefined profit and loss result report per
quarter and scenario.
• Product and Service Results Baseline: Provides a predefined profit and loss result report per
product and service and per scenario.
• Product and Service Results Simulation: Provides a predefined profit and loss result report per
product and service and per scenario.

Sample Content for Profitability and Cost Management
PUBLIC
29
• Profit Margin per Quarter [%]: Provides a predefined profit and loss result report for product
and service per quarter.
• Value Flow: Provides read-only access to the granular results with a predefined layout to trace
results from resources through all applied drivers and portions to the final allocated amount
on one screen.
• Liquidity Ratio: Provides read data access for balance sheet positions that will be used in short
term period. It shows relation between current asset and current liabilities.
• Customer Acquisition Costs (USD per Customer): Provides cost for acquiring new customer by
periods and products or services.
• Balance Sheet Comparison: Provides positions and amounts for every balance sheet item
between two periods.
• Return on Equity: Provides read data access to the Return on Equity for the period under
consideration.
Note
Specific chart types have not been defined in this sample content. Reports, therefore, use the default "Column" chart
type. However, end users can change this type on the fly and save their chart type as the default layout.
Review Results
This Query function is used to provide read data access to the Profit and Loss results.
The following fields are preconfigured in the report:
• Posting Date
• Activity
• Product Profitability Analysis
• Amount in Company Code Currency
• Activity Driver
• Activity Source
• Region
• Cost Center
• Company
• Functional Area
• Account Number
• Profit Center
• Currency Key of Original Transaction Currency
• Channel
• Customer ID
• Resource
• Resource Driver
• Resource Source
• Scenario
• Partition Key
• Position ID

Sample Content for Profitability and Cost Management
PUBLIC
30
• Unit
• Scenario
Activity Results
This Query function is used to provide read data access to the Profitability and Cost Management Results at activity level.
The following fields are preconfigured in the report:
• Posting Date
• Activity
• Product Profitability Analysis
• Amount in Company Code Currency
• Activity Driver
• Activity Source
• Region
• Cost Center
• Company
• Functional Area
• GL Account
• Profit Center
• Currency Key of Original Transaction Currency
• Channel
• Customer ID
• Resource
• Resource Driver
• Resource Source
• Scenario
• Partition Key
• Position ID
• Unit
• Scenario
Product and Service Results
This Query function is used to provide read data access to the Profitability and Cost Management Results on Product and Service Level.
The following fields are also available in this report:
• Posting Date
• Activity
• Product & Service
• Amount (TC)
• Activity Driver
• Activity
Sample Content for Profitability and Cost Management
PUBLIC
31
• Region
• Cost Center
• Company
• Functional Area
• GL Account: Hierarchy PL is applied to this characteristic field.
• Profit Center
• Currency (TC)
• Channel
• Customer ID
• Resource
• Resource Driver
• Resource Source
• Scenario
• Partition Key
• Position ID
• Unit
• Scenario
Review Planned Results Baseline
This Query function is used to provide read data access to the profit and loss results by different planning scenarios in parallel.
The following fields are preconfigured in the report:
• Posting Date
• Activity
• Product Profitability Analysis
• Amount in Company Code Currency
• Activity Driver
• Activity Source
• Region
• Cost Center
• Company
• Functional Area
• Account Number
• Profit Center
• Currency Key of Original Transaction Currency
• Channel
• Customer ID
• Resource
• Resource Driver
• Resource Source

Sample Content for Profitability and Cost Management
PUBLIC
32
• Scenario
• Partition Key
• Position ID
• Unit
• Statement Type
Review Planned Results Simulation
This Query function is used to provide read data access to the profit and loss results by different planning scenarios in parallel.
The following fields are preconfigured in the report:
• Posting Date
• Activity
• Product Profitability Analysis
• Amount in Company Code Currency
• Activity Driver
• Activity Source
• Region
• Cost Center
• Company
• Functional Area
• Account Number
• Profit Center
• Currency Key of Original Transaction Currency
• Channel
• Customer ID
• Resource
• Resource Driver
• Resource Source
• Scenario
• Partition Key
• Position ID
• Unit
• Statement Type
Product and Service Results Baseline
This Query function is used to provide read data access to the Profitability and Cost Management
Results at Product and Service level.

Sample Content for Profitability and Cost Management
PUBLIC
33
The following fields are preconfigured in the report:
• Posting Date
• Activity
• Product Profitability Analysis
• Amount in Company Code Currency
• Activity Driver
• Activity Source
• Region
• Cost Center
• Company
• Functional Area
• Account number
• Profit Center
• Currency Key of Original Transaction Currency
• Channel
• Customer ID
• Resource
• Resource Driver
• Resource Source
• Scenario
• Partition Key
• Position ID
• Unit
• Statement Type
Product and Service Results Simulation
This Query function is used to provide read data access to the Profitability and Cost Management
Results at Product and Service level.
The following fields are preconfigured in the report:
• Posting Date
• Activity
• Product Profitability Analysis
• Amount in Company Code Currency
• Activity Driver
• Activity Source
• Region
• Cost Center
• Company
• Functional Area
• Account number
• Profit Center
• Currency Key of Original Transaction Currency
• Channel
• Customer ID

Sample Content for Profitability and Cost Management
PUBLIC
34
• Resource
• Resource Driver
• Resource Source
• Scenario
• Partition Key
• Position ID
• Unit
• Statement Type
Profit Margin Per Quarter [%]
This Query function is used to provide read data access to the Profitability and Cost Management Results on Product and Service Level.
The following fields are also available in the report:
• Posting Date
• Activity
• Product Profitability Analysis
• Amount in Company Code Currency
• Activity Driver
• Activity Source
• Region
• Cost Center
• Company
• Functional Area
• Account number
• Profit Center
• Currency Key of Original Transaction Currency
• Channel
• Customer ID
• Resource
• Resource Driver
• Resource Source
• Scenario
• Position ID
• Partition Key
• Unit
• Statement Type
• Revenue
• Profit and Loss
Sample Content for Profitability and Cost Management
PUBLIC
35
Value Flow
This Query function is used to provide a graphical representation of the final results of Profitability
and Cost Management at resource, activity and product and service level.
Amount (TC) is shown at resource, activity and product and service level.
Display option Show Result Rows is set to "No" for every field in the report.
The following fields are preconfigured in the report:
• Posting Date
• Activity
• Product Profitability Analysis
• Amount in Company Code Currency
• Activity Driver
• Activity Source
• Region
• Cost Center
• Company
• Functional Area
• Account number: Hierarchy PL is applied to this characteristic field.
• Profit Center
• Currency Key of Original Transaction Currency
• Channel
• Customer ID
• Resource
• Resource Driver
• Resource Source
• Scenario
• Partition Key
• Position ID
• Unit
• Statement Type
Liquidity Ratio
This Query function is used to provide read data access for Balance sheet positions that will be used
in short term period.
It shows relation between current asset and current liabilities.
Sample Content for Profitability and Cost Management
PUBLIC
36
The following fields are available in that report:
• Posting Date
• Amount (TC)
• Balance Sheet Items
• Cost Center
• Functional Area
• GL Account
• Profit Center
• Statement Type
• Product for Profitability Analysis
Customer Acquisition Cost (USD per Customer)
In this Query function we can see cost for acquiring new customer by periods and products or services.
The following field is available in that report:
• Posting Date
• Amount in Company Code Currency
• Customer Acquisition Cost • Product for Profitability Analysis
• Statement Type
Balance Sheet Comparison
This Query function shows positions and amounts for every balance sheet item between two periods.
The following field is available in that report:
• Statement type
• Amount in Company Code Currency
• BS Items
• Posting Date
Return on Equity
This query function is used to provide read data access to the Return on Equity for the period under
consideration. It shows relation between Equity and Net Income.
The following field is available in that report:

Sample Content for Profitability and Cost Management
PUBLIC
37
• Posting Date
• Amount in Company Code Currency
• Balance Sheet Items
• Cost Center
• Functional Area
• Product for Profitability Analysis
• Profit Center
• Statement Type

Sample Content for Profitability and Cost Management
PUBLIC
38
Important Disclaimers and Legal Information
Hyperlinks
Some links are classified by an icon and/or a mouse over text. These links provide additional
information.
About the icons:
• Links with the icon : You are entering a Web site that is not hosted by SAP. By using such
links, you agree (unless expressly stated otherwise in your agreements with SAP) to this:
o The content of the linked-to-site is not SAP documentation. You may not infer any
product claims against SAP based on this information.
o SAP does not agree or disagree with the content on the linked-to-site, nor does SAP
warrant the availability and correctness. SAP shall not be liable for any damages
caused by the use of such content unless damages have been caused by SAP’s gross
negligence or willful misconduct.
• Links with the icon : You are leaving the documentation for that particular SAP product
or service and are entering a SAP-hosted Web site. By using such links, you agree that (unless
expressly stated otherwise in your agreements with SAP) you may not infer any product claims
against SAP based on this information.
Beta and Other Experimental Features
Experimental features are not part of the officially delivered scope that SAP guarantees for future
releases. This means that experimental features may be changed by SAP at any time for any reason
without notice. Experimental features are not for productive use. You may not demonstrate, test,
examine, evaluate or otherwise use the experimental features in a live operating environment or with
data that has not been sufficiently backed up.
The purpose of experimental features is to get feedback early on, allowing customers and partners to
influence the future product accordingly. By providing your feedback (e.g. in the SAP Community), you
accept that intellectual property rights of the contributions or derivative works shall remain the
exclusive property of SAP.
Example Code
Any software coding and/or code snippets are examples. They are not for productive use. The example
code is only intended to better explain and visualize the syntax and phasing rules. SAP does not
warrant the correctness and completeness of the example code. SAP shall not be liable for errors or
damages caused by the use of example code unless damages have been caused by SAP’s gross
negligence or willful misconduct.
Gender-Related Language
We try not to use gender-specific word forms and formulations. As appropriate for context and
readability, SAP may use masculine word forms to refer to all genders.

Sample Content for Profitability and Cost Management
PUBLIC
39
www.sap.com
© 2021 SAP SE or an SAP affiliate company. All rights reserved.
No part of this publication may be reproduced or transmitted in any form or for any purpose
without the express permission of SAP SE or an SAP affiliate company. The information
contained herein may be changed without prior notice.
Some software products marketed by SAP SE and its distributors contain proprietary
software components of other software vendors. National product specifications may vary.
These materials are provided by SAP SE or an SAP affiliate company for informational
purposes only, without representation or warranty of any kind, and SAP or its affiliated
companies shall not be liable for errors or omissions with respect to the materials. The only
warranties for SAP or SAP affiliate company products and services are those that are set
forth in the express warranty statements accompanying such products and services, if any.
Nothing herein should be construed as constituting an additional warranty.
SAP and other SAP products and services mentioned herein as well as their respective logos
are trademarks or registered trademarks of SAP SE (or an SAP affiliate company) in Germany
and other countries. All other product and service names mentioned are the trademarks of
their respective companies.
Please see https://www.sap.com/corporate/en/legal/copyright.html for additional
trademark information and notices.