Determinants of Bank Profitability (Return of Equity)
52
MASTER THESIS Determinants of Bank Profitability (Return of Equity) Collins Chigozie Nnakuba 10681787 Master International Finance MSc University of Amsterdam August 2016 Supervised by: Dennis Jullens
-
Upload
khangminh22 -
Category
Documents
-
view
0 -
download
0
Transcript of Determinants of Bank Profitability (Return of Equity)

MASTER THESIS
Determinants of Bank Profitability
(Return of Equity)
Collins Chigozie Nnakuba
10681787
Master International Finance MSc
University of Amsterdam
August 2016
Supervised by: Dennis Jullens

1
Abstract
This paper is a practical based analysis conducted for ING Bank. The purpose is to analyze
the drivers of profitability particularly return on equity of banks competing with ING. The
competitors are banks that offer similar financial products as ING across the globe. This paper
examines whether internal factors such as management strategy, assets size, operational
efficiency, capitalization, risk management, diversification, business model, ownership and
external factors such as inflation, interest rate, supervisory influence and tax regime have an
impact on the bank profitability. I observed that internal factors such as the management
strategy/decision, bank model, and operational efficiency have an impact on individual bank
profitability while external factors have an impact on the overall industry. This paper also
investigated whether business model has an impact on the profitability. This business model
was derived by clustering the assets composition of the sample (selected banks) into lending,
hybrid and investment bank using the percentage of the net loan. Lending banks have net loan
above 50%, Hybrid banks have net loan between 50% and 37%, while investment banks have
net loan below 37%. The observable outcome is that some lending banks are more profitable
than hybrid and investment. Hybrid banks profit from a more diverse income stream
specifically fee income whilst investment bank sometimes profits during the downturn
economy. Furthermore, I decomposed return on equity into profitability, sanity, risk weight
and leverage factor using DuPont analysis to capture the underlying drivers of RoE. The
observation with DuPont analysis is that banks with sustainable RoE showed high
profitability ratio, good sanity, moderate risk weight and leverage ratio within the regulatory
requirement. Finally, an indicative regression analysis using OLS model was conducted to
capture the variables that correlate with RoE.

2
Table of Contents
1. Introduction ......................................................................................................................... 3
2. Literature Review on bank profitability .............................................................................. 5
3. Bank business Model (Clustering of Bank model) ........................................................... 13
4. Bank Performance (model, income share, and DuPont analysis) ..................................... 26
5. Statistical model and result ............................................................................................... 34
6. Conclusion ........................................................................................................................ 37
7. Appendices ........................................................................................................................ 39
8. References ......................................................................................................................... 50

3
1. Introduction
European Banks profitability is heavily under pressure as a result of ever increasing
regulations, a slowdown in economic growth (volatility in commodities prices, negative
interest rates), new entrants (Fintech) and pressure from shareholders to receive a decent
return on investment. Despite the above-mentioned pressure, some banks still posted an
impressive result with a decent return on equity (RoE) at year-end 2015.
As part of the project during my short term assignment with ING Wholesale Banking Strategy
and Business Management team (WB S&BM), I was given the assignment to analyze ING
competitors financial performance. ING competitors are banks that offer similar financial
products, operate in the same geography and co-exist in some businesses. This triggered my
research as I wanted to understand the core drivers of ING competitors profitability especially
the return on equity. The analysis was conducted from the selection of 21 top European banks
which include some global systemically important financial institutions (G-SIFIs) and other
local banks. The data used for the analysis was last five years result (2011-2015) extracted
from Bankscope.
To narrow my research on the determinants of bank profitability, the samples were analyzed
on the total level and then clustered into three categories: lending, hybrid, and investment
based on the asset composition. By this clustering, I wanted to investigate whether the
categories or individual bank strategy plays a major role in determining the bank’s
profitability. Furthermore, I decomposed the return of equity of each bank using DuPont
analysis; these are Profitability (net income / total income), Sanity (total income / average
risk-weighted assets (RWA)), risk weight (average RWA / total assets) and leverage factor
(total assets / average common equity). This is geared towards understanding the underlying
drivers of RoE of ING competitors.

4
I hope the outcome of the analysis will add to the empirical studies which suggested that the
determinants of bank profitability are banks-specific factors (internal), macroeconomic factors
and structural factors by fully concentrating on individual bank RoE driver. I also hope that
ING WB S&BM team will use the outcome of the analysis in decision making. The rest of
this paper is organized into five sections. The first section analyses the literature review of the
empirical studies on determinants of bank profitability. In the second section, I introduced the
bank business model, the current model, changes in the business model and the highlight of
year-end 2015 performance result of the sample. The third section introduced the mechanism
used in clustering the samples, the analysis of the income composition of the sample, the
impact on RoE and the decomposition of RoE. In the fourth section, I did an indicative
regression analysis using OLS model to capture the variables that significantly
impact/correlate with RoE. The last section summarizes the outcome of the analysis and the
observations on the drivers of bank profitability.

5
2. Literature Review on bank profitability
In the literature, bank profitability is commonly expressed as a function of both internal and
external determinants. The internal determinants might be called bank-specific determinants
of profitability while the external determinants are variables that are not related to bank
management but reflect the economic and legal environment that affects the operation and
performance of the banks. For the purpose of this paper, Bank profitability is simply what the
financial institutions return to the shareholder, which is denoted as Return on Equity (RoE).
To get a proper understanding of the variables that could impact the profitability of the bank, I
visited both the internal and external factors that have an impact on the profitability. A large
body of empirical studies has investigated the role of different factors influencing bank
performance. These factors are shown and broadly discussed below;
Figure 1. Factors influencing Bank Profitability
Internal factors
Banks size/Assets
Efficiency
Capitalization
Risk management
Diversification
Business model
Ownership
External factors
Macroeconomics
Inflation
Interest rate
Industry specifics
Supervisory influence
Tax regime
Profitability (RoE)

6
Bank-specific factors (internal factors)
Bank-specific determinants of profitability include factors that are internally controlled by
bank management decision and strategy, namely bank size with respect to balance sheets
volume, efficiency, Agile way of working and innovation-minded, risk and prudent costs
management, solid capital base and assets diversification.
Bank size
The empirical literature evidence exploring the impact of bank size on profitability is highly
unsettled. According to Shehzad and Scholten (2013), the proponents of size benefits argue
that larger banks are likely to have a higher degree of product and loan diversification than
smaller banks and should benefit from economies of scale and scope, which in turn leads to
higher profits. Goddard et al. (2004) findings suggest that size/profitability relationship may
be either non-linear. They stated that growth regressions reveal little or no evidence of mean-
reversion bank sizes. Banks that maintain a high capital-assets ratio tend to grow slowly, and
growth is linked to macroeconomic conditions. Otherwise, there are few systematic influences
on bank growth. The persistence of profit appears higher for savings and co-operative banks
than for commercial banks. Banks that maintain high capital assets or liquidity ratios tend to
record relatively low profitability. Berger and Humphrey (1997) argues that even if large
banks are more efficient than small ones, profitability benefits derive from emulating industry
best practice in terms of technology, management structure, instead of focusing on increasing
the size of the bank. Tregenna (2009) argued that economies of scale only exist for smaller
banks and that larger banks suffer from diseconomies of scale owing, for example, to agency
costs, overhead costs of bureaucratic processes and other costs related to managing large
banks. My view is that the size of the bank plays some role in determining the profitability of
the bank. However, strategy and decision of the management play more vital role in bank's

7
profitability. Management decides how, when, and where to expand the organization. After
the crisis of 2007-2009, governments bailed some vulnerable banks on the conditions that
they deleverage and become smaller and concentrate on the core banking business. They
argue that banks are more manageable and profitable when they are smaller. Adding to above
literature on the impact of size on bank profitability, large banks might profit from economies
of scale and scope. However, some smaller banks are easily manageable, efficient and
profitable. It really depends on the management style, strategy and business model.
Operational Efficiency
Bank expenses are also a very important determinant of profitability, closely comparable to
the idea of efficient management. Many empirical studies stated that operational efficiency is
an important driver of bank profitability. Most studies find that higher efficiency typically
measured by cost to income ratio or risk adjusted cost to income (including risk cost)
positively affects bank profitability. Bourke (1989) and Molyneux and Thornton (1992) found
a positive relationship between better-quality management and profitability. Lower ratios
related to higher efficiency, other factors such as the business model, bank size, and
management intent play a measured role in determining profitability.
Bank Capitalization
Bank capitalization is another vital factor influencing profitability, based on various research.
This is a number of capital banks are required to hold to withstand shocks/market volatility by
the regulators. Existing literature suggests that the impact of bank capital on profitability is
unclear, despite that the majority of the studies came out with a positive relationship.
Nevertheless, banks with higher capital ratios tend to face lower funding costs owing to lower
probability of default. However, higher capitalization could also mean lower risk taking
which could negatively impact return and profitability.

8
Risk Management
Risk management and the level of risk are among the most important bank-specific factors
determining performance. Risk management in the banking is essential due to the nature of
the business. Poor asset and liquidity management are among the major causes of bank
failures. Banks might choose to diversify their portfolio or raise liquidity in a time of
uncertainty. Molyneux and Thornton (1992), among others, find a negative and significant
relationship between the level of liquidity and profitability. In contrast, Bourke (1989) reports
an opposite result, Miller and Noulas (1997) result on the effect of credit risk on profitability
appears clearly negative. The inclusiveness in the empirical results and differences on how
bank manage risk triggered the implementation of Standard Approach of calculating risk by
the regulators instead of the Advance Internal Rating Based traditionally used by banks. In my
view, banks profitability partly depend on the willingness and risk appetites of the individual
banks. Using the standard approach of calculating the risk-weighted assets will create more
visibility and transparency in the banking industry.
Diversification
Recent studies on the impact of diversification on bank performance argue that more
diversified banks are more profitable. Other studies identified a “diversification quality”,
inferring that banks with more diversified revenue streams are more profitable. According to
the study of Stiroh, potential diversification benefits in the U.S. banking industry from the
steady shift toward activities that generate fee income, trading revenue, and other types of
non-interest income. In the aggregate, declining volatility of net operating revenue reflects
reduced volatility of net interest income, not diversification benefits from noninterest income,
which is quite volatile and increasingly correlated with net interest income. At the bank level,
greater reliance on noninterest income, particularly trading revenue, is associated with lower
9
risk-adjusted profits and higher risk. I partly support that diversification especially in the
income stream contribute to bank profitability but to a certain degree.
Business model
A recent research on the identification of banks business models and the evaluation of banks
performance and risk across these business models. According to the result from the study of
Gambacorta and van Rixtel (2013), retail (or diversified retail) banks tend to outperform
banks with other business models, such as wholesale and investment banks. My view is that
banks engage deliberately in different intermediation activities and select the balance sheet
structure (model) to fit their business objectives. In a pursuit of growth opportunities in a
competitive environment, banks choose a business model that suits the strategy of the
organization to leverage their strengths.
Ownership
Some studies explore the relationship between ownership type and bank performance, the
results varies according to the geographical region and/or time period of the investigation.
Recent evidence for European banks by Iannotta et al (2007) on the performance of the bank
and the evaluation of the impact of alternative ownership models, together with the degree of
ownership concentration, on their profitability, cost efficiency and risk. Three main results
emerge. Firstly, mutual banks and government-owned banks exhibit a lower profitability than
privately owned banks, in spite of their lower costs. Secondly, public sector banks have
poorer loan quality and higher insolvency risk than other types of banks while mutual banks
have better loan quality and lower asset risk than both private and public sector banks. Lastly,
while ownership concentration does not significantly affect a bank’s profitability, a higher
ownership concentration is associated with better loan quality, lower asset risk, and lower
insolvency risk.

10
Macroeconomic factors (external factors)
A Large number of studies combine the macroeconomic variables into the analysis in order to
examine cyclical impact in bank performance and behavior. Albertazzi and Gambacorta
(2009) study find that bank profits pro-cyclicality derive from the effect that the economic
cycle uses on net interest income (via lending activity) and loan loss provisions (via credit
portfolio quality). An increase in economic activity through higher demand for bank
intermediation services which includes lending, securities underwriting, advisory services and
trading activities will tend to increase banks' net interest income and income generated from
fees and commissions. In contrary, downturn economic activity contributes to a worsening of
banks asset quality and higher loan loss provisioning, thus demonstrating a negative influence
on bank profits. Current negative interest environment is a case whereby most of the
traditional lending banks are under margin pressure.
Inflation and Interest rate
Other macroeconomic factors such as inflation and the term structure of interest rates
supposed to have an impact on bank profitability. The inflation rate, the long-term interest
rate and/or the growth rate of money supply. Revell (1979) introduces the issue of the
relationship between bank profitability and inflation. He noted that the effect of inflation on
bank profitability depends on whether banks’ wages and other operating expenses increase at
a faster rate than inflation. The question is how mature an economy is so that future inflation
can be accurately forecasted and thus banks can accordingly manage their operating costs.
Perry (1992) indicated that the extent to which inflation affects bank profitability depends on
whether inflation expectations are fully anticipated. An inflation rate fully anticipated by the
bank’s management implies that banks can appropriately adjust interest rates in order to
increase their revenues faster than their costs and thus acquire higher economic profits. Other

11
studies from Bourke (1989), Molyneux and Thornton (1992) have shown a positive
relationship between either inflation or long-term interest rate and profitability.
Structural factors (external factors)
Turning to structural factors affecting bank profitability, Mirzaei et al ( 2013) investigated the
effects of market structure on profitability and stability for 1929 banks in 40 emerging and
advanced economies over 1999–2008 by incorporating the traditional structure-conduct-
performance (SCP) and relative-market-power (RMP) hypotheses. They observed that a
greater market share leads to higher bank profitability being biased toward the RMP
hypothesis in advanced economies, yet neither of the hypotheses is supported for profitability
in emerging economies. The SCP appears to exert a destabilizing effect on advanced banks,
suggesting that a more concentrated banking system may be vulnerable to financial instability,
however, the RMP seems to perform a stabilizing effect in both economies. Their evidence
also highlights that profitability and stability increase with an increased interest-margin
revenues in a less competitive environment for emerging markets. By contrast, the “efficient
structure” hypothesis states that the positive relationship between profitability and
concentration can be driven by efficiency, in that more efficient banks gain market share and
improve profitability. Another structural factor that could impact the profitability of the bank
is the capital market orientation, the evidence of the impact on bank profitability is
inconclusive. Supervisory power is expected to have some impact on bank profitability.
However, the empirical evidence is again inconclusive despite the extensive amount of on-
going work at the Basel Committee on Banking Supervision (BCSB) and European Banking
Authority (EBA) to evaluate the possible impact of regulatory measures to bank business
model. A global overview of the potential implications for business models resulting from the
collective implementation of the regulatory measures developed since the financial crisis (see
appendix VI) for the recent regulatory measures to bank business model.

12
In summary, bank profitability is commonly expressed as a function of both internal and
external determinants. The internal determinants are known as bank-specific determinants of
profitability while the external determinants are variables that are not related to bank
management but reflect the economic and legal environment that affects the operation and
performance of the banks. The empirical studies and literature review on the determinants of
profitability are in some case inconclusive. Just like the study of Shehzad and Scholten (2013)
which argue that larger banks are likely to have a high degree of product and loan
diversification than the smaller bank. Larger banks might profit from diversification but this is
not a guarantee for higher profitability. Operational efficiency plays a vital role in the profit
maximization just like Bourke (1989) and Molyneux and Thornton (1992) find a positive
correlation between quality management and profitability. Empirical research on the impact
of risk management, diversification capitalization, and ownership structure is inconclusive.
However, risk management is crucial for effective portfolio management. Diversification help
in tapping into other source of revenue generation and capitalization could demonstrate that
bank will withstand shocks and market volatility. Macroeconomic factors such as inflation
and interest rate have shown a positive relationship with profitability based on the studies of
Bourke (1989), Molyneux and Thornton (1992).The impact of supervisory power is rather
inconclusive. Based on the summary of the literature review some internal and external
factors have an either positive or negative relationship with bank profitability. Despite my
support for the studies, I am of the opinion that banks profitability should be analyzed on the
individual basis and return on equity fully decompose using DuPont analysis, to capture the
real determinant of the profitability. This will be the value added of this paper to the study of
the bank profitability.

13
3. Bank business Model (Clustering of Bank model)
According to Porter (1979), The concept of business models originates from the literature
concerning strategic groups that basically mean sets of firms that are active in a single sector
and use similar strategies. The notion of business strategies in banking, and also the business
models originate from a number of strategic variables that reflect the long-term choices of
bank management with respect to assets, funding, capitalization, and diversification. Seeing
that a strategy is essentially a long-term concept, my conclusion is that individual banks
business models will be stable over the years. This means that the differences between banks
are more important than changes over time within banks to identify the performance impact of
business model choices.
There are many types of banks model namely; private banking & asset management, retail
banking/commercial bank and Investment bank. Most of the banks with the exception of
American bank operate as universal bank meaning that they offer all products ranging from
private banking to investment banking. Seeing that this paper is built around ING competitors,
I will focus on the retail/commercial banking model. The identification of retail/commercial
bank business models requires a set of variables that determine the possible strategies. With
this in mind, the use of balance sheet data seems logical for the composition of bank business
model. From the assets composition of the samples, three categories of bank model were
derived.
Firstly, the lending banks which are traditional lenders that provide loans to individuals,
organizations and other institutions. Banks in this category mostly dependent on interest
income and to lesser extend non-interest income as a source of income. Secondly, the hybrid
banks which have more diversified asset composition than lending banks. Income source is
also well-diversified between interest and non-interest income (notable fee). Lastly, the

14
investment banks are mostly trading in derivatives and securities. Main income stream
revenue are other income, fee income and also interest income.
Giving the introduction of bank business model, the rest of this section will concentrate on the
current model, the change in business model and FY 2015 financial performance of the
sample (ING competitors analysis).
3.1 Current model
Bank has simply two functions: deposit and lender. This means that bank has two clients
namely one that deposits money and one that borrows. The bank intermediates between the
borrower and depositor. This means that bank offers lower interest to depositors and lend to
borrowers at a higher rate. The spread is the profit margin. This is the basic business model of
the bank.
Individuals, businesses, and institutions will have the preference of keeping money in the
bank rather than in a safe, cellar or other places. They prefer to deposit the money in the bank
and sometimes receive an interest payment. They trust that the bank will safeguard their
money and make it available when needed. For the borrowers perspective, they prefer to go
the bank to lend money at a slightly higher interest rate.
The customers of the bank (borrowers and depositors) are from Retail and Corporate. Retail
clients are individuals, household or private persons whilst Corporates are commercial
institutions, businesses, and governments. Banks offer many services to the clients; for retails
clients bank offer mortgages, car loans, personal loan and wealth management. To corporate
clients, the bank offers different services and intermediation from loans for project, hedging,
advisory, structured finance. The key element in lending is the ability to manage client risk

15
profile. This is to ensure that customer will be able to pay the principal and also the interest.
Banks will usually do a risk assessment of customers before lending.
Banks use multiple channels to reach out to their customers. This ranging from operating from
branches to physically meet clients to installing ATM in some convenient locations to
encourage self-services. Some banks are using direct banking using internet and mobile apps
to offer a basic product to customers.
Due to complexities in product offering, packaging, risk management, regulatory requirement,
competition and operational excellence, Banks are partnering with technology (FinTech) to
create innovative and simplify banking models such as dis-intermediation, multi-channel
integration, business intelligence and predictive analysis.
The banking industry is well regulated by many institutions and governmental organizations
ranging from local bank authority, European Banking Authority, Basel Committee on
Banking Supervision. It is essential that banks are constantly supervised due to the importance
of banks to the economy. The supervision is also to protect the taxpayers and depositors. This
is the reason why the regulators set the minimum reserves that each bank must hold.
Some basic income streams of the banks are interest income from the lenders, fee income for
operations such as trading portfolios, advisory, and other income. Costs line are the channel
costs, interest paid to depositors, risk cost from loan loss and other operational costs.
Despite that, most of the banks in the European union/community are labeled universal bank
which may offer credit, loans, deposits, asset management, investment advisory, payment
processing, securities transactions, underwriting and financial analysis. While a universal
banking system allows banks to offer a multitude of services, it does not require them to do
so. Banks in a universal system may still choose to specialize in a subset of banking services.

16
Universal banking combines the services of a commercial bank and an investment bank,
providing all services from within one entity. The services can include deposit accounts, a
variety of investment services and may even provide insurance services. Deposit accounts
within a universal bank may include savings and checking. Under this system, a bank can
choose to participate in any or all of the permitted activities. They are expected to comply
with all guidelines that govern or direct proper management of assets and transactions. Since
not all institutions participate in the same activities, the regulations in play may vary from one
institution to another.
3.2 Change in business model
After the financial crisis of 2007-09 as banks were bailed with tax payers money,
policymakers, regulators, and supervisors have worked toward improving the safety and
soundness of the global financial system through a range of regulatory changes towards
banks. Banks are being forced to consider radical changes to the business models that support
some of their core banking services. Changes are in various stages of progress, with some
already taken place, some just starting, and others still to be determined. Few changes to the
banking model after the crisis are discussed below;
Originate to distribute: Traditionally, banks used deposits to fund loans and book it on their
balance sheets awaiting maturity. Recently, banking model started to change. Banks started
to increase the funding source with alternative products such as bond financing, commercial
paper financing, and repurchase agreement (repo) funding. Some Bank even started to replace
the traditional originate-to-hold model of lending with another strategic securitization
mechanism named originate-to-distribute model. At the earlier stage, banks limited the
distribution model to mortgages, credit card credits, and car and student loans, but over time
they started to apply it to even corporate loans. Few plausible reason for so called originate to

17
distribute is that banks will share the risk with other banks, shrink the balance sheet, gain
from lower risk-weighted assets, gain from higher fee income via income diversification and
possibly increase profitability (RoE).
Regulators influence: The highlight of the regulatory debate has been concentrated on the
"too-big-to-fail". International and domestic regulators are identifying SIFIs, the largest and
most interconnected firms, for greater scrutiny and additional regulation. The regulators are
being given new tools to manage the buildup of credit in the system, including countercyclical
capital buffers. The name too big to fail is not well appreciated by the regulator and they
simply want to shrink banks either directly through regulation or indirectly through rules that
make some businesses less appealing or limit the benefits of scale. Some regulators want
SIFIs banks to pay an insurance premium for the risks they represent to society or to limit the
potential capital advantage SIFIs may have over smaller banks.
Customer Centric and Clients profitably: Banks are making major changes to the business
models of their core services, and the growing cost of delivery requires major investments in
information technology. This is to improving customer service as a means to improve the
industry’s reputation and create pathways to more loyal, profitable customer and client
relationships. Few banks are moving from product driven organization to a more client focus.
Activities like know your client (KYC), Net promoter score, new innovations to empower
clients and digitalization are a key focus of bank to promote customer services and
profitability.
Risk governance: Banks are focusing on their ability to react quickly to stress scenarios so
they can be agile as the crises and uncertainties continuously exist within the industry. Banks
are constantly working with the regulator to improve regulatory reporting. Even the regulators
suggested a shift from Advance Internal Reporting method of calculating risk-weighted asset

18
to more standardize method. Banks are not in favor of this due to the anticipated increase in
risk-weighted assets. This is still to be decided by the regulators in the course of 2016.
Focus on growth and profitability levels: Banks will have to reduce costs radically, deploy
capital more dynamically and efficiently, capture growth opportunities in emerging markets,
and consider material changes to compensation levels. They must also redesign service
delivery and business models while rethinking the fundamental rationale for some existing
businesses. Banks are streamlining and moving some activities to a low-cost environment.
On the revenue generation, well-diversified income source such as an increase in non-interest
income will ultimately contribute to higher profitability/return on equity of the banks.
3.3 Analysis of the bank full year 2015 figures (at a glance)
Looking back, 2015 will be remembered as a year in which the global and domestic economic
landscape remained difficult to navigate. Factors like a higher regulatory requirement,
volatility in oil and commodity prices, negative in interest rate and economic sentiments
weighted heavily on the profitability of banks in 2015. Despite the pressure, few EU bank
posted a good result in 2015. As curiosity emerges on the drivers of financial performance
and profitability, Table 1. shows the performance of ING competitors financials of FY 2015
and the last reported full years. Key results as income lines (net interest and non-interest
income), costs, risk costs, efficiency (cost/income ratio), Net interest margin, Return on
equity, total assets, common equity, average risk-weighted assets, loan to asset and loan to
customer deposit were analyzed.

19
Table 1 Full Year 2015 banks key results and performance indicators
Net interest income (NII) is the different between interest earned from loan and interest paid
on deposit
Net Interest Income = Interest paid on earning assets - Interest paid on deposits
The net-interest income generated by the selected in FY 2015 is € 291bln compared to FY
2014 € 277bln showing a growth of 5% (see appendix I). One observation is that banks with
higher NII growth do not necessary have higher total assets with the exception of BBVA and
Santander (appendix I). This could be an evidence that higher interest income growth does not
fully correlate with assets growth. Another observation is that traditional lending banks such
as ING, Santander, ABN, and Rabo have high NII dependency (see graph A).
FY 2015 key result
in EUR bln & %
Net
interest
income
Fees &
other
income
Total
incomeCosts
Risk
costsPBT PAT
C/I
ratioNIM RoE
Total
assets
common
equity
Average
RWALTA LTD
ABN 6.1 2.4 8.5 5.2 0.5 2.7 1.9 61.8% 1.6% 11.9% 390.3 16.2 108.8 66.4% 114.5%
Barclays 17.1 17.0 34.1 22.5 2.9 2.8 0.8 66.0% 1.1% 1.0% 1524.5 85.9 502.2 35.6% 96.6%
BBVA 16.4 6.8 23.2 12.1 4.2 4.6 3.3 52.2% 2.7% 6.3% 750.1 52.8 376.1 54.3% 112.1%
BNPP 23.1 19.8 42.9 29.3 3.6 10.4 7.0 68.2% 1.2% 7.6% 1994.2 93.2 622.0 34.1% 101.7%
BPCE 11.3 12.5 23.7 16.2 1.6 6.1 3.8 68.4% 1.1% 6.1% 1166.5 62.1 392.1 50.6% 128.2%
Commerz 5.8 3.9 9.7 7.2 0.7 1.8 1.2 74.0% 1.1% 4.1% 532.6 29.1 206.7 38.3% 83.4%
Credit Agricole 21.3 10.6 31.8 19.8 2.3 9.4 6.4 62.3% 1.3% 6.9% 1698.9 93.4 247.5 43.3% 114.9%
Credit Suisse 8.6 11.7 20.3 18.6 0.3 -2.2 -2.7 91.7% 1.3% -6.6% 759.9 41.3 257.9 33.3% 80.0%
Deutsche 15.9 17.2 33.1 31.9 0.9 -6.1 -6.8 96.4% 1.1% -10.0% 1629.1 68.0 397.0 26.3% 76.5%
HSBC 30.0 24.0 54.0 36.5 3.3 17.3 13.9 67.7% 1.4% 7.7% 2213.3 180.1 1008.9 38.4% 72.4%
ING 12.8 3.7 16.5 9.3 1.3 6.4 4.7 56.3% 1.6% 11.9% 838.5 39.9 307.3 63.9% 106.5%
Intesa Sanpaolo 10.3 7.2 17.4 11.0 3.4 4.2 2.8 62.8% 1.7% 6.0% 676.5 47.0 277.1 51.7% 162.7%
Lloyds 14.6 8.3 22.9 14.1 0.6 1.9 1.0 61.3% 1.5% 1.6% 1113.3 66.4 307.4 55.7% 109.5%
Nordea 5.1 4.9 10.0 4.9 0.5 4.7 3.7 49.4% 0.8% 12.3% 646.9 29.8 144.4 46.6% 165.3%
Rabo 9.1 3.5 12.6 8.5 1.1 2.9 2.2 67.1% 1.5% 6.9% 670.4 31.9 212.5 65.4% 132.6%
RBS 11.9 5.4 17.3 20.4 -1.2 -3.7 -1.6 117.9% 1.1% -2.2% 1109.9 72.5 393.9 37.5% 91.2%
Santander 33.3 12.3 45.5 25.2 10.2 9.5 7.3 55.4% 2.9% 7.5% 1340.3 98.1 585.4 56.6% 128.7%
SocGen 10.0 15.3 25.3 17.5 2.4 6.1 4.4 69.2% 0.9% 7.9% 1334.4 55.6 355.0 28.9% 111.5%
Standard Chartered 8.7 4.6 13.3 10.3 4.4 -1.4 -2.0 77.0% 1.7% -4.7% 588.3 43.1 279.8 40.2% 73.5%
UBS 6.2 21.3 27.5 22.2 0.1 5.0 5.8 80.6% 1.0% 11.5% 873.3 51.1 190.5 33.2% 77.9%
Unicredit 12.8 9.3 22.0 15.9 4.8 2.4 2.0 72.1% 1.6% 3.8% 860.4 53.7 399.9 51.8% 123.1%
Total 290.5 221.4 511.9 358.6 48.0 84.9 59.4 70.1% 22,712 1,311 7,572
Average 24.4 10.5 24.4 17.1 2.3 4.0 2.8 70.4% 1.4% 4.6% 1,082 62 361 45.3% 107.8%
Data compiled March 31, 2016
List containing FY 2015 key results for 21 top EU Banks (Source Bankscope BvD)

20
Graph A: net interest share of the sample
Non-interest income of the bank income derived primarily from fees including deposit, and
transaction fees, fees from financial market trading portfolios, advisory fees annual fees, and
other alternative income not related to Interest income. From the sample, Investment banks
such as UBS, SocGen, Credit Suisse Deutsche generate more non-interest income than
lending banks (see graph B).
Graph B: non-interest share of the sample
77%73% 72% 72% 71% 69% 67% 66% 64%
60% 59% 58%56% 54%
51% 50% 48% 48%42%
40%
23%
Net interest income dependency
23%27% 28% 28% 29% 31% 33% 34% 36%
40% 41% 42%44% 46%
49% 50%52% 52%
58%60%
77%
Non-interest income share

21
Costs are total expenses the business spend during the normal business operations. Costs
include rent, payroll, professional services, regulatory costs and other expenditures. One of
the key responsibility of the management is to effectively reduce costs without massively
affecting the company ability to compete with the peers. From our sample, FY 2015 costs
were € 359bln this an increase of 7% compared to FY 2014. Drivers to costs increases were
regulatory costs (all banks), impairments of goodwill & intangibles and litigation costs
(Deutsche).
Risk cost includes the net impairment charge in relation to the bank's loans and advances as
well as off-balance sheet. Risk cost is mostly higher in lending banks an even higher amongst
bank that operate in some geography. Santander, Unicredit, Standard Chartered and BBVA
reported risk cost of € 10bln, € 5bln, € 4bln and € 4bln respectively. However, overall risk
costs from our sample declined by -5% compared to FY 2014.
Efficiency ratio is commonly regarded as the cost to income ratio which the is a measure of
total expenses as the percentage of total income.
Cost income ratio = total expenses / total income
Efficiency ratio measures operating expense as a percentage of operating income, it is
basically used to evaluate the efficiency and productivity of a corporation. Lower ratios
basically show higher efficiency, however, few factors can impact the ratio such as bank
business model (asset class), the size of the organization and other unforeseen costs. From our
sample, average C/I slightly increased in 2015 mainly observed within the investment banks
such as RBS, Deutsche, Credit Suisse, and UBS.

22
Net interest margin (NIM) is a measure of the difference between the interest income
generated by banks (interest received) and interest paid (customer deposit) over total earning
assets.
NIM = (interest received-interest paid) / total earning assets
The sample average NIM at 1.4% was at the same level as FY 2014 despite pressure on the
interest rate (negative interest rate environment). With the exception of Santander and BBVA
which profit with higher interest margin due to high yield bonds in South Americas but also a
very risky business, all other banks NIM are under pressure due to ultra-interest rate
environment.
Return on Equity (RoE) is a profitability ratio that measures the ability of a firm to generate
profits from the shareholder's investments in the organization. It basically shows how much
profit each amount invested in the by the shareholder returns. It calculated as:
RoE = Net income / Equity
In this paper, RoE was decomposed using DuPont analysis. This is to properly analyze the
underlying drivers of RoE (this will be discussed in the next chapter). From the sample,
Nordea, ING, ABN and UBS reported RoE of 12% in 2015 whilst Deutsche, Credit Suisse,
Standard Chartered and RBS reported -10%,-7%,-5% and -2% respectively. Deutsche bank
lower RoE was mainly due to higher litigation costs, Credit Suisse due to higher costs,
Standard Chartered was primarily driven by higher risk costs while RBS was attributable to
higher costs base.
Total assets are the total amount of assets owned by an entity. It is basically referred to items
of economic value which are used over a period of time to generated profit for the owners.
Viewing from the sample, total asset of the banks decreased by -2.2% vs 2014 (€ 22.7tln vs

23
€-23.3tln). One reason for assets decline might be the balance sheet optimization and
deleveraging exercise going on in some banks.
Common equity refers to the amount that all common shareholders have invested in a
company. This includes the value of the common shares, retained earnings, and additional
paid-in capital. From the sample, common equity increased by 10% compared to 2014. One
possible reason for higher common equity is the ability to reinvest the income instead of
distribution to shareholders (plow-back).
Risk-weighted asset (RWA) is a bank's assets or off-balance-sheet exposures, weighted
according to risk. It is used for the calculation of asset and computing the capital requirement
or Capital Adequacy Ratio (CAR) for the banks. Viewing from the sample, average RWA
slightly decreased compared to 2014 (0.5%). Few observations are; lending banks such as
BBVA and Santander reported higher RWA. Again, lending banks have higher risk weight
(average RWA / total assets) compared to investment banks. This means that investment used
originate to distribute mechanism to reduce RWA on the book, unlike the originate and hold
strategy mostly seen with lending banks.
Loan to assets ratio measures the total net loans as a percentage of total assets. The higher
this ratio indicates a bank is loaned up and its liquidity is low. However, there is a strong
correlation between higher loan to asset and Net interest margin. Banks with higher LTA tend
to show higher NIM.
Loan to asset = Net loan / total assets

24
Graph C: loan to asset of the sample
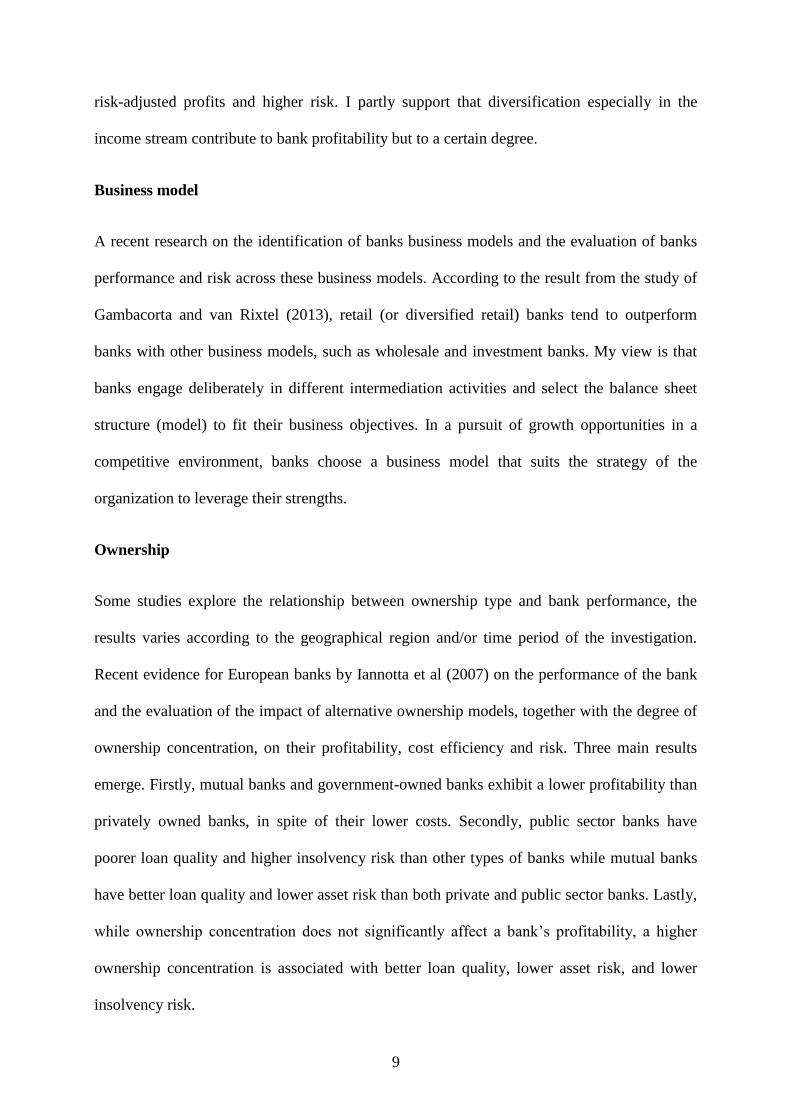
Loan to customer deposit is a measure loan to deposit ratio is used to calculate a lending
institution's ability to cover withdrawals made by its customers.
Loan to deposit = Net loan / deposit
It is also a measure of stable funding. A lending bank that received a deposit and gives loans
to the customer must have must have a certain amount of reserve (liquidity) to maintain it
normal operation. However, a bank with LTD in the in the range of 100% has stable funding
base. If the LTD of a bank is higher than 100% that means that the bank might not have
enough liquidity for fund requirement. On the other hand, if LTD is too low, the bank may not
be earning enough as expected. From the sample RBS, Barclays, ING, and Lloyds have LTD
in the range of 100%, Nordea, Intesa Sanpaolo and Rabo have higher LTD whilst HSBC,
Standard Chartered, Deutsche, and UBS reported lower LTD (see graph D).
66% 65% 64%
57% 56% 54%52% 52% 51%
47%43%
40%38% 38% 38%
36% 34% 33% 33%29%
26%
Loan to asset
25
Graph D: loan to deposit of the sample
In conclusion, Bank chooses a business model that suits the strategy of the organization
despite flexibility in the universal banking model. Some bank is more into private banking,
some are in retail/commercial banking and some are leverage more in investment banking.
Bank business experience slight changes after the financial crises of 2007-2009 ranging from
Originate-to-hold model, to originate to distribute model, a more regulatory power to hold
more capital, plan to introduce standard approach methodology in calculating risk-weighted
asset, customer centric, increase profitability and investment in innovation. These are the
strategies implemented by banks to maximizes profitability and regulators to ensure the
sustainability of the industry. Comparing the overall financial performance of the ING
competitors (sample) in FY 2015 vs. FY 2014, total income increased by 5.2%, total costs
increased by 6.6 % mostly due to higher regulatory costs, risk costs decreased by -5.5%, total
assets decreased by -2.2% mainly due to deleveraging and balance sheet optimization,
shareholders common equity increased by 10.1% and risk-weighted asset decreased by 0.5%.
All in all, FY 2015 financial demonstrate that banks are much better shape despite the all the
headwinds (see appendix I for delta FY 2015 and FY 2014).
165% 163%
133% 129% 128%123%
115% 114% 112% 112% 110% 107%102%
97%91%
83% 80% 78% 76% 74% 72%
Loan to deposit

26
4. Bank Performance (model, income share, and DuPont analysis)
Bank business model is structured based on the vision and strategy of the management of an
organization. Bank’s strategy defines the asset class and the business model. To understand
the business model of the sample, I constructed an asset composition of the banks using five
years (2011-2015) average asset split into loans, derivatives & securities, other earning assets,
and non-earning assets. Based on the outcome of asset class, the banks were clustered in
lending, hybrid and investment banks (graph E). the reason is to actually see the average
assets composition of ING competitors in the 5-years period.
lending banks (LB) with loan asset above 50%
Hybrid banks (HB) with loan asset in the range of 49% - 37%
Investment banks (IB) with loan portfolio below 37%
Graph E: 5-years average asset composition of the sample (ING competitors)
67%65% 63%
57% 56% 55% 55%53%
49%46%
42% 41%39%
37%34%
31%33%
29%27% 26%
22%
0%
10%
20%
30%
40%
50%
60%
70%
80%
Loans Der & Ser others EA Non-NEA
Lending banks
Hybrid banks Investment banks

27
4.1 Income composition and RoE of the sample
The supporters of diversification often claim that well-diversified income stream improves the
overall income and profitability of the bank. However looking at the income diversification of
the sample (graph F), there is no much deviation in the income composition of the sample in
the last five years. Interest income was in the range 56%-58%, fee income 27%-29% and
other income 13%-16%. The conclusion is that banks do not often deviate from chosen
strategy. Looking at the RoE trend of the sample in the last five years, the average RoE was
highest in 2015 (5.7%) and lowest in 2013 (3.6%). The is an indication that banks are in a
better financial shape in 2015.
Graph F: income share and RoE of the sample
Analyzing the income composition of the three categories lending, hybrid, and
investment banks:
Lending banks income share was consistency in the last five years. Interest income share was
in the range of 65% to 69%, fee income was in the range of 21% to 23% and other income
was in the range of 8% to 13%. From the average income composition of the last five years, it
is obvious that lending banks do not have a well-diversified income source. Banks operating
58% 56% 56% 58% 58%
28% 27% 28% 29% 29%
13%16% 16%
13% 13%
2011 2012 2013 2014 2015
Income split sample
Interest Fee Other
4.9
3.5 3.0
5.0 4.6
2011 2012 2013 2014 2015
RoE Sample (in %)

28
with this model might experience interest margin pressure in a low/negative interest
environment due to high-interest income dependency. Looking at the RoE trend, 2015 was the
best year for lending banks with average RoE around 7%. RoE was under pressure in 2011
and 2013 driving by higher risk cost (write-offs) from Intesa Sanpaolo and Unicredit.
Graph G: income share and RoE lending banks
Hybrid banks are BCPE, Nordea, Standard Chartered, Credit Agricole, HSBC, Commerz,
and Nordea. These banks have on average lower interest income compared to lending banks
but higher fee income. Hybrid banks have better income stream diversification than lending
banks but that does not result in higher profitability. Looking at the RoE, there is a declining
trend for banks in this cluster. However, looking on the individual bank, Nordea reported RoE
above 12% in 2015 due to prudent cost management while Standard chartered reported low
RoE due higher costs base and risk cost.
Graph H: income share and RoE hybrid banks
69%65% 65%
69% 68%
23% 21% 23% 22% 22%
8%13% 13%
8% 9%
2011 2012 2013 2014 2015
Income split Lending Banks
Interest Fee Other
1.5
4.5
0.6
6.0
7.0
2011 2012 2013 2014 2015
RoE Lending Banks (in %)
60% 60% 61% 59% 58%
28% 27% 29% 30% 30%
12% 13% 11% 12% 12%
2011 2012 2013 2014 2015
Income split Hybrid Banks
Interest Fee Other
7.8
5.5
7.3
6.4
5.4
2011 2012 2013 2014 2015
RoE Hybrid Banks (in %)
29
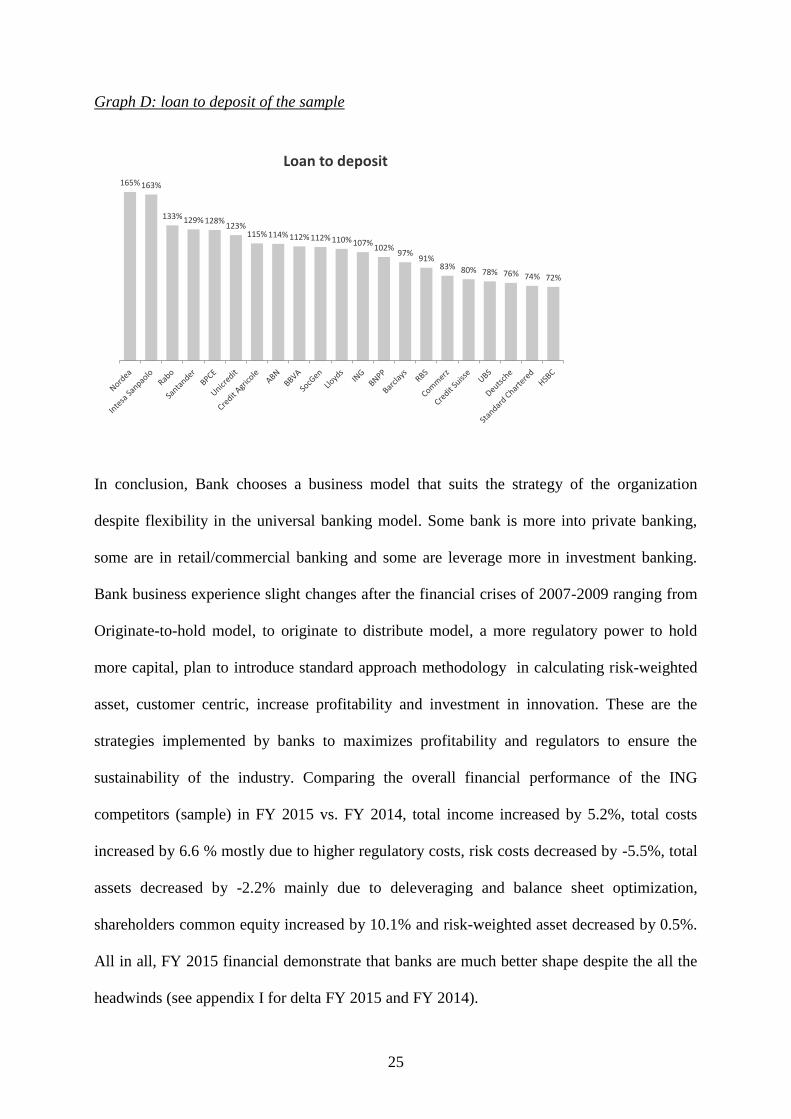
Investment banks are typically Deutsche, Credit Suisse, UBS, SocGen, Barclays, BNPP,
RBS, and SocGen. On average, IB business model on average has low net loan portfolio, high
derivatives, and securities. IB tend to have a well-diversified model with interest income
dependency in the range of 42% to 47%, fee income 34% to 36% and other income 19%-23%
on average over the last five years. RoE is massively under pressure. This might be an
evidence which supports the argument that having a well-diversified income composition
does not guarantee better profitability. However, looking at the individual banks, UBS,
SocGen and BNPP reported RoE of 11.4%, 7.8% and 7.6% respectively in 2015. Deutsche,
Credit Suisse, and RBS all showed negative RoE in 2o15 driven by higher costs base.
Graph I: income share and RoE investment banks
4.2 Analyzing Bank Performance of ING competitors (sample) using DuPont analysis
The decomposition of RoE using DuPont analysis is important in defining the drivers of
return on equity, especially for a bank. The drivers are Profitability (profit after tax over total
income), Sanity (total income over Average RWA), Risk-weight (average RWA over average
assets) and leverage factor (average assets over average equity). The multiplication of the
outcome of the four variables gives the return on equity.
45% 43% 42%45% 47%
35% 34% 35% 36% 35%
21%23% 23%
19% 19%
2011 2012 2013 2014 2015
Income split Investment Banks
Interest Fee Other
6.2
0.5
2.1 2.6
1.3
2011 2012 2013 2014 2015
RoE Investment Banks (in %)

30
RoE = Profit after / Average equity
Profitability (P)= Profit after tax / Total revenue
Sanity (efficiency) (S)= Total revenue / Average risk-weighted assets
Risk weight (RW) = Average risk-weighted assets / Average assets
Leverage factor (LR)= Average assets / average equity
RoE for total sample: looking at the average five-year trend of the sample, RoE was in the
range of 3%-5%. 2014 and 2011were on the high side with average RoE of 5.0% and 4.9%
respectively. Analyzing the average RoE drivers of 4.9% in 2011, profitability ratio was 9%,
Sanity was 7%, risk weight was 34% and leverage ratio 4.2% (100/24). The observation is
that on average, bank leverage ratio was very low resulting from high debt in 2011. In 2014,
the outcome shows that profitability was at 12% and leverage ratio improved to 5.0%
(100/20). Examining 2015 average RoE of the sample which ended at 4.6%. I observed that
profitability ratio is moderate at 11%, sanity ratio was at the same level as other years, risk
weight was stable whilst leverage ratio improved to 5.6% (100/18). This proofs that on
average banks are more capitalized than preceding years.

31
Graph J: RoE drivers and RoE Sample (Profitability, sanity, risk weight in %)
RoE Lending banks: I observed that on average, lending banks RoE was under pressure in
2011 and 2013 (graph K). This was due to higher pressure on profitability driven by high-risk
costs and write-off of some bank in this cluster .Some bank operates in risk region like Latin
Americas where the interest rate is very high but also risk costs. FY 2015 was a good year for
lending banks as profitability ratio surged to 16%, sanity ratio 7%, risk-weight was on the
better side at 38% and leverage ratio at 5.5% (100/18). All these drivers pushed RoE of the
lending banks to 7% in 2015. Analyzing the drivers of RoE of individual banks within this
cluster (see alsoAppendix IILending Banks income split, asset composition, and drivers RoE),
I observed the result varies per bank for example, ING and ABN posted the same RoE of 12%
in 2015 but the drivers are different (ING 29%, S 5%, RW 37% and LR 4.8% (100/21) whilst
ABN P 23%, S 8%, RW 28% and LR 4.2%). This is an evidence that banks use different
strategies and mechanism in achieving the return on equity. Another observation was that
some bank in this category didn’t perform well due to the nature of the business and
geographical presence such as the aforementioned Latin Americas.
9 75
12 11
7 7 7 7 7
34 3436
34 34
2422
20 2018
2011 2012 2013 2014 2015
Drivers of RoE sample
Profitability Sanity Risk weight Leverage factor
4.9
3.5 3.0
5.0 4.6
2011 2012 2013 2014 2015
RoE Sample (in %)

32
Graph K: RoE drivers and RoE lending banks (Profitability, sanity, risk weight in %)
RoE Hybrid banks: the observation from this cluster is that the bank in this segment profit
from a well-diversified income. However, the diversified income stream does not guarantee
higher returns. Looking at the RoE drivers, Profitability ratio is in the range of 14%-19% this
is best in class compared to lending and investment banks, Sanity is also on a moderate level,
risk weight is on moderate side and lower than lending banks. Leverage ratio increased
toward 2015 meaning that the best are well capitalized. However one can argue that on
average banks in this cluster are a bit conservative and not aggressive in taking a risk. RoE
drivers for the bank in this cluster also varies, some banks are very profitable while some are
still navigating a stormy water. For the dynamics of RoE driver for the banks in this cluster
(see Appendix III – Hybrid Banks income split, asset composition, and drivers RoE)
Graph L: RoE drivers and RoE hybrid banks (Profitability, sanity, risk weight in %)
0
10
-1
1416
6 6 6 6 7
42 40 4239 38
20 19 18 19 18
2011 2012 2013 2014 2015
Drivers of RoE Lending Banks
Profitability Sanity Risk weight Leverage factor
1.5
4.5
0.6
6.0
7.0
2011 2012 2013 2014 2015
RoE Lending Banks (in %)
17
14
19 1816
6 6 6 6 7
37 37 3734 34
2421
20 1917
2011 2012 2013 2014 2015
Drivers of RoE Hybrid Banks
Profitability Sanity Risk weight Leverage factor
7.8
5.5
7.3
6.4
5.4
2011 2012 2013 2014 2015
RoE Hybrid Banks (in %)

33
RoE Investment banks: Bank in this cluster on average are deemed a very risky bank with
an exception of BNPP, SocGen, and UBS (see Appendix IV – Investment Banks income split,
asset composition, and drivers RoE). Looking at the RoE trend, 2011 was the best year for the
banks in this cluster. They performance better than lending banks. This might be an evidence
that IB profits in an adverse market scenario.
Graph M: RoE drivers and RoE investment banks (Profitability, sanity, risk weight in %)
In conclusion, using the assets composition of the ING competitors (sample) in clustering the
banks into lending, hybrid, and investment banking help in understanding the dynamics,
business model and return on equity drivers. Banks profitability highly depend on the
decision of the management, the strategy of the organization and the business model. From
the decomposition of the RoE, I observed that lending banking which is retail/commercial
bank like are on average much profitable than hybrid bank and investment bank. Hybrid
banks on average profit from a well-diversified revenue stream such as fee and other income
but some of them are well capitalized and practically risk averse. The investment bank is the
best in class when it comes to income diversification but higher costs in running IB business
have massive pressure on the returns of some bank in this cluster. To maximize profitability
and have a decent RoE on equity, a bank should make the right decision, choose a sustainable
business model and effectively manage costs and risk.
11
-1
14
2
8 8 8 8 8
2426
2927
2928
2622 23
20
2011 2012 2013 2014 2015
Drivers of RoE Investment Banks
Profitability Sanity Risk weight Leverage factor
6.2
0.5
2.1 2.6
1.3
2011 2012 2013 2014 2015
RoE Investment Banks (in %)

34
5. Statistical model and result
This section shows an indicative statistical analysis. Explaining and summarizing the data of
the sample selection. Seeing that the number of observations is limited, the outcome of
analysis will be deemed indicative and might not robust enough.
Firstly, I constructed the correlation table to capture the variables that correlate with RoE.
Few observations were;
Table 2: Correlation matrix for several variables
Cost income ratio (CIR) negatively correlates with the RoE, the higher the CIR, the lower the
RoE. this is in-line with the empirical studies.
Loan loss provision over total loan (LLPOTL) as well negatively correlates with RoE, an
increase in write-off and risk costs lead to a decrease in RoE. This is in-line with empirical
studies.
Total loan growth (TLGr) positively correlates with RoE, an increase in loan might result in
an increase in revenue.
Total assets growth (TAGr) positively correlates with RoE, this is similar to loan growth.
RoE RoA NIM CIR EOTA ETR FC GDP IIS LLPOTL LTD LTIR TLGr TAGr TLS NIOTI TIORWA RWA0TL LF
RoE 1.00
RoA 0.96 1.00
NIM 0.12 0.21 1.00
CIR -0.49 -0.47 -0.06 1.00
EOTA -0.05 0.09 0.71 0.05 1.00
ETR -0.05 -0.12 -0.02 0.12 -0.19 1.00
FC 0.21 0.20 0.54 -0.09 0.06 0.26 1.00
GDP 0.11 0.09 0.07 -0.16 0.06 -0.17 -0.12 1.00
IIS 0.08 0.07 0.63 -0.06 0.28 -0.02 0.39 0.07 1.00
LLPOTL -0.36 -0.30 0.59 0.47 0.48 0.19 0.41 -0.19 0.30 1.00
LTD -0.07 -0.16 0.26 -0.02 0.11 0.13 0.35 -0.01 0.42 0.32 1.00
LTIR -0.03 -0.09 -0.01 0.14 -0.28 0.76 0.35 -0.34 -0.02 0.20 0.18 1.00
TLGr 0.33 0.34 0.20 -0.27 0.06 -0.15 0.08 0.20 -0.16 -0.17 -0.08 -0.12 1.00
TAGr 0.37 0.37 0.33 -0.29 0.07 -0.15 0.34 0.34 0.18 0.03 0.19 0.13 0.48 1.00
TLS 0.12 0.08 0.56 -0.05 0.30 0.01 0.41 0.01 0.72 0.26 0.60 -0.03 -0.05 0.11 1.00
NIOTI 0.98 0.96 0.09 -0.55 -0.03 -0.11 0.16 0.10 0.07 -0.39 -0.05 -0.09 0.31 0.37 0.11 1.00
TIORWA 0.15 0.14 -0.19 -0.07 -0.18 -0.02 -0.12 0.05 -0.61 -0.25 -0.39 -0.06 0.37 -0.06 -0.41 0.12 1.00
RWA0TL -0.14 -0.04 0.76 0.15 0.79 0.06 0.24 -0.04 0.51 0.64 0.28 0.03 -0.09 0.09 0.48 -0.15 -0.58 1.00
LR -0.23 -0.09 0.66 0.13 0.97 -0.13 0.04 0.04 0.26 0.53 0.14 -0.26 -0.02 -0.03 0.29 -0.21 -0.20 0.79 1.00

35
Net income over total income (NIOTI) is profitability ratio. An increase in profitability ratio
will ultimately result in an increase in RoE keeping all the other variable of DuPont analysis
stable.
The rest of the variables are less than 0.25 and -0.25 which I consider not significant.
Secondly, I conducted an empirical study using OLS estimation using the following linear
regression equation;
RoEit = c + β1CIRit + β2EOTA it + β3ETR it + β4FCit + β5GDPit + β6IISit + β7LLPOTLit +
β8LTD it + β9TAGR it + β10TLGR it + β11TLS it + ε it
Where profitability = RoE, c is a constant term; i = 1,…,N and t =1,…N is the dependent
variable, the rest on the right part of equation are the independent of bank internal specific
factor, macro-economic factors.
The R-square of the regression showed that 44% of the model was explained. The results
showed that funding costs, loan loss provisions, and total asset growth are significant
determinants of bank profitability. Despite the limited number of the observations, the
outcome in-line with the empirical studies.

36
Abbreviations
CIR Cost-to-income ratio
EOTA Equity-over-total loan
ETR Effective tax rate
FC Funding cost
GDP Global domestic product
IIS Interest income share
LLPOTL Loan loss provision-over-total loan
LTD Loan to deposit
LTIR Long term interest rate
RoE Return on equity
TAGr Total asset growth
TLGr Total loan growth
TLS Total loan share
Summary RoE banks
Regression Statistics Regression Statistics
Multiple R 0.664
R Square 0.440
Adjusted R Square 0.367
Standard Error 5.064
Observations 105
ANOVA
df SS MS F Significance F
Regression 12 1855.368 154.614 6.030 0.000
Residual 92 2358.838 25.640
Total 104 4214.207
Coefficients Standard Error t Stat P-value Lower 95% Upper 95%
Intercept -49.520 46.451 -1.066 0.289 -141.776 42.735
CIR -0.073 0.045 -1.620 0.109 -0.163 0.017
EOTA 0.415 0.523 0.793 0.430 -0.624 1.454
ETR 3.089 2.361 1.308 0.194 -1.600 7.778
FC 2.242 1.062 2.112 0.037 0.134 4.351
GDP -0.793 0.653 -1.213 0.228 -2.090 0.505
IIS -0.011 0.056 -0.190 0.849 -0.122 0.100
LLPOTL -4.923 1.577 -3.122 0.002 -8.055 -1.791
LTD -0.038 0.022 -1.696 0.093 -0.082 0.006
LTIR -0.960 0.930 -1.033 0.304 -2.806 0.886
TLGr 0.053 0.102 0.515 0.608 -0.150 0.256
TAGr 0.248 0.097 2.564 0.012 0.056 0.440
TLS 0.087 0.065 1.344 0.182 -0.042 0.216

37
6. Conclusion
Banking Industry, especially in the Eurozone, is experiencing some headwinds rising from the
ultra-low interest rate, increases in regulatory requirement, increases in bank tax, competition
from non-licensed financial services institutions and disruptors commercial known as
financial technology (Fin-tech). Profitability in the industry is massively under pressure,
simplification, automation, costs reduction, jobs cut, branch closure and consultation with the
regulatory are the hype and headline of almost all the bank's annual report. Amongst all the
headwinds, some banks still make a reasonable profit and report a higher return on equity.
The key question is what drive the profitability of the bank? Considering that RoE is one of
the key measure of bank profitability and without disputing the results of the empirical
studies. It is of great important to decompose the Return on equity into profitability, sanity
(efficiency), risk weight and leverage factor to capture the drivers of return on equity. From
the sample, I observed that in general, higher income does not correlate with higher
profitability. The chosen business model and management strategy might impact the
profitability of the bank. On average, Lending banks are more profitable than Hybrid and
Investments Banks due to stable interest income but are also more vulnerable in a low-interest
rate environment. Hybrid banks do not necessarily deliver higher returns but benefit from
more diversified sources of income (interest, fee and other income). Most of the investment
banks are not delivering up to expectation despite the well-diversified source of income
mainly due to a high-cost base.
In conclusion, it is very difficult and unrealistic to quantify the determinants of bank
profitability notable return on equity without decomposing and analyzing the core drivers
from individual bank perspectives. By using DuPont analysis in decomposing RoE, It is
obvious and transparent to see the sustainable banks from risky ones. A sustainable and

38
profitable bank return on equity should show high profitability ratio, good sanity, moderate
risk weight and leverage ratio within the regulatory requirement. This paper might have some
limitation, further investigation is necessary on this topic.

39
7. Appendices
Appendix I – List of banks in the data sample FY 2015 key figures
FY 2015 key result
in EUR bln & %
Net
interest
income
Fees &
other
income
Total
incomeCosts
Risk
costsPBT PAT
C/I
ratioNIM RoE
Total
assets
common
equity
Average
RWALTA LTD
ABN 6.1 2.4 8.5 5.2 0.5 2.7 1.9 61.8% 1.6% 11.9% 390.3 16.2 108.8 66.4% 114.5%
Barclays 17.1 17.0 34.1 22.5 2.9 2.8 0.8 66.0% 1.1% 1.0% 1524.5 85.9 502.2 35.6% 96.6%
BBVA 16.4 6.8 23.2 12.1 4.2 4.6 3.3 52.2% 2.7% 6.3% 750.1 52.8 376.1 54.3% 112.1%
BNPP 23.1 19.8 42.9 29.3 3.6 10.4 7.0 68.2% 1.2% 7.6% 1994.2 93.2 622.0 34.1% 101.7%
BPCE 11.3 12.5 23.7 16.2 1.6 6.1 3.8 68.4% 1.1% 6.1% 1166.5 62.1 392.1 50.6% 128.2%
Commerz 5.8 3.9 9.7 7.2 0.7 1.8 1.2 74.0% 1.1% 4.1% 532.6 29.1 206.7 38.3% 83.4%
Credit Agricole 21.3 10.6 31.8 19.8 2.3 9.4 6.4 62.3% 1.3% 6.9% 1698.9 93.4 247.5 43.3% 114.9%
Credit Suisse 8.6 11.7 20.3 18.6 0.3 -2.2 -2.7 91.7% 1.3% -6.6% 759.9 41.3 257.9 33.3% 80.0%
Deutsche 15.9 17.2 33.1 31.9 0.9 -6.1 -6.8 96.4% 1.1% -10.0% 1629.1 68.0 397.0 26.3% 76.5%
HSBC 30.0 24.0 54.0 36.5 3.3 17.3 13.9 67.7% 1.4% 7.7% 2213.3 180.1 1008.9 38.4% 72.4%
ING 12.8 3.7 16.5 9.3 1.3 6.4 4.7 56.3% 1.6% 11.9% 838.5 39.9 307.3 63.9% 106.5%
Intesa Sanpaolo 10.3 7.2 17.4 11.0 3.4 4.2 2.8 62.8% 1.7% 6.0% 676.5 47.0 277.1 51.7% 162.7%
Lloyds 14.6 8.3 22.9 14.1 0.6 1.9 1.0 61.3% 1.5% 1.6% 1113.3 66.4 307.4 55.7% 109.5%
Nordea 5.1 4.9 10.0 4.9 0.5 4.7 3.7 49.4% 0.8% 12.3% 646.9 29.8 144.4 46.6% 165.3%
Rabo 9.1 3.5 12.6 8.5 1.1 2.9 2.2 67.1% 1.5% 6.9% 670.4 31.9 212.5 65.4% 132.6%
RBS 11.9 5.4 17.3 20.4 -1.2 -3.7 -1.6 117.9% 1.1% -2.2% 1109.9 72.5 393.9 37.5% 91.2%
Santander 33.3 12.3 45.5 25.2 10.2 9.5 7.3 55.4% 2.9% 7.5% 1340.3 98.1 585.4 56.6% 128.7%
SocGen 10.0 15.3 25.3 17.5 2.4 6.1 4.4 69.2% 0.9% 7.9% 1334.4 55.6 355.0 28.9% 111.5%
Standard Chartered 8.7 4.6 13.3 10.3 4.4 -1.4 -2.0 77.0% 1.7% -4.7% 588.3 43.1 279.8 40.2% 73.5%
UBS 6.2 21.3 27.5 22.2 0.1 5.0 5.8 80.6% 1.0% 11.5% 873.3 51.1 190.5 33.2% 77.9%
Unicredit 12.8 9.3 22.0 15.9 4.8 2.4 2.0 72.1% 1.6% 3.8% 860.4 53.7 399.9 51.8% 123.1%
Total 290.5 221.4 511.9 358.6 48.0 84.9 59.4 70.1% 22,712 1,311 7,572
Average 24.4 10.5 24.4 17.1 2.3 4.0 2.8 70.4% 1.4% 4.6% 1,082 62 361 45.3% 107.8%
Data compiled March 31, 2016
List containing FY 2015 key results for 21 top EU Banks (Source Bankscope BvD)
FY 2014 key result
in EUR bln & %
Net
interest
income
Fees &
other
income
Total
incomeCosts
Risk
costsPBT PAT
C/I
ratioNIM RoE
Total
assets
common
equity
Average
RWALTA LTD
ABN 6.0 2.0 8.0 5.3 1.2 1.5 1.1 66.2% 1.6% 8.0% 386.9 14.2 109.3 67.7% 123.5%
Barclays 15.5 16.9 32.5 23.0 2.8 2.9 1.1 70.9% 1.0% 1.5% 1745.8 75.1 522.5 31.5% 101.3%
BBVA 14.9 5.5 20.4 10.6 4.3 4.0 3.1 51.8% 2.8% 6.5% 631.9 47.1 337.2 52.2% 116.8%
BNPP 20.9 18.3 39.2 26.5 3.7 3.2 0.5 67.7% 1.2% 0.6% 2077.8 87.6 618.2 31.7% 107.7%
BPCE 11.8 11.7 23.5 16.3 1.7 5.3 3.4 69.4% 1.1% 5.6% 1223.3 59.6 380.9 47.4% 132.9%
Commerz 5.4 3.4 8.7 6.9 1.1 0.6 0.4 79.5% 1.0% 1.4% 558.3 27.2 202.9 37.7% 94.3%
Credit Agricole 21.0 9.5 30.5 19.2 2.7 7.8 5.3 62.8% 1.4% 6.3% 1762.8 83.9 485.9 40.1% 119.0%
Credit Suisse 7.5 12.8 20.3 17.4 0.2 3.0 1.9 85.4% 1.2% 5.2% 767.4 36.9 232.7 29.6% 74.1%
Deutsche 14.3 16.8 31.0 27.2 1.1 3.1 1.7 87.6% 1.0% 2.7% 1708.7 63.6 348.5 23.7% 77.1%
HSBC 28.8 21.3 50.1 34.0 3.3 15.4 12.1 67.8% 1.4% 7.8% 2169.7 154.6 898.5 37.0% 73.1%
ING 12.6 2.9 15.5 10.2 1.6 3.9 2.8 65.9% 1.6% 8.1% 828.6 35.0 298.6 62.3% 106.8%
Intesa Sanpaolo 10.6 6.4 17.0 10.4 4.6 3.0 1.3 61.1% 1.8% 2.9% 646.4 45.1 273.0 49.8% 168.5%
Lloyds 13.1 8.4 21.5 14.4 0.9 2.9 2.4 66.8% 1.4% 4.0% 1113.9 60.1 312.5 55.1% 108.3%
Nordea 5.5 4.7 10.2 5.1 0.5 4.3 3.3 49.5% 0.9% 11.4% 669.3 29.2 177.4 44.6% 174.2%
Rabo 9.1 3.6 12.7 8.5 2.8 1.7 1.8 67.0% 1.5% 6.0% 681.1 30.9 211.3 65.1% 139.7%
RBS 11.9 7.1 19.0 17.1 -1.7 3.4 -3.5 90.1% 1.0% -4.9% 1351.2 71.6 459.0 31.8% 99.2%
Santander 30.0 12.4 42.4 23.4 10.5 10.7 6.9 55.3% 2.9% 8.2% 1266.3 85.0 537.5 56.8% 131.5%
SocGen 10.4 13.4 23.8 16.4 2.6 4.4 3.0 68.9% 0.9% 5.9% 1308.1 51.1 347.9 27.2% 113.5%
Standard Chartered 9.1 5.8 15.0 9.1 1.8 3.5 2.2 60.8% 1.9% 5.8% 597.9 38.5 257.5 39.2% 69.7%
UBS 5.5 17.6 23.0 20.7 0.1 2.1 3.0 90.0% 1.0% 7.0% 884.7 43.4 185.0 29.7% 77.1%
Unicredit 13.1 8.9 21.9 14.6 4.8 3.7 2.4 66.4% 1.7% 4.6% 844.2 51.6 416.5 52.5% 135.8%
Total 277.1 209.2 486.4 336.3 50.6 90.2 56.4 69.1% 23,224 1,191 7,613
Average 24.4 10.0 23.2 16.0 2.4 4.3 2.7 69.1% 1.4% 5.0% 1,106 57 363 43.5% 111.6%
Delta 2015 vs 2014
figures
Net
interest
income
Fees &
other
income
Total
incomeCosts
Risk
costsPBT PAT
Total
assets
common
equity
Average
RWA
ABN 0.9% 20.0% 5.6% -1.5% -56.9% 76.1% 69.7% 0.9% 14.4% -0.5%
Barclays 10.1% 0.2% 4.9% -2.3% 1.5% -2.7% -21.9% -12.7% 14.4% -3.9%
BBVA 10.2% 23.4% 13.8% 14.7% -1.3% 15.6% 8.0% 18.7% 12.1% 11.5%
BNPP 10.9% 8.1% 9.6% 10.3% -1.0% 229.5% 1289.3% -4.0% 6.3% 0.6%
BPCE -4.6% 6.5% 0.9% -0.5% -4.6% 16.0% 12.9% -4.6% 4.2% 2.9%
Commerz 7.9% 15.9% 11.0% 3.3% -39.2% 185.8% 216.4% -4.6% 7.0% 1.9%
Credit Agricole 1.5% 10.5% 4.3% 3.4% -15.9% 21.6% 21.8% -3.6% 11.3% -49.1%
Credit Suisse 14.4% -8.8% -0.2% 7.2% 93.7% -174.2% -240.9% -1.0% 11.9% 10.8%
Deutsche 11.3% 3.0% 6.8% 17.5% -21.9% -295.7% -500.5% -4.7% 6.9% 13.9%
HSBC 4.0% 12.7% 7.7% 7.5% -1.2% 12.6% 14.5% 2.0% 16.5% 12.3%
ING 1.3% 30.2% 6.7% -9.0% -15.5% 66.4% 67.6% 1.2% 13.9% 2.9%
Intesa Sanpaolo -3.4% 12.7% 2.6% 5.4% -26.4% 40.7% 114.2% 4.7% 4.0% 1.5%
Lloyds 11.4% -0.7% 6.7% -2.1% -36.2% -36.5% -57.0% -0.1% 10.4% -1.6%
Nordea -6.8% 3.3% -2.1% -2.2% -12.5% 9.2% 9.9% -3.4% 2.2% -18.6%
Rabo 0.2% -3.2% -0.8% -0.6% -58.9% 70.7% 20.2% -1.6% 3.2% 0.5%
RBS 0.3% -24.1% -8.9% 19.3% -33.6% -208.3% -53.7% -17.9% 1.2% -14.2%
Santander 11.0% -1.1% 7.4% 7.6% -3.1% -10.6% 5.8% 5.8% 15.4% 8.9%
SocGen -3.9% 14.1% 6.2% 6.6% -9.0% 39.6% 46.9% 2.0% 8.9% 2.0%
Standard Chartered -4.4% -21.4% -11.0% 12.8% 151.7% -140.1% -190.5% -1.6% 11.7% 8.7%
UBS 14.1% 21.1% 19.5% 7.0% 66.8% 143.4% 92.4% -1.3% 17.8% 3.0%
Unicredit -2.3% 4.6% 0.5% 9.0% 0.0% -34.9% -14.3% 1.9% 4.0% -4.0%
Total 4.8% 5.8% 5.2% 6.6% -5.1% -5.9% 5.3% -2.2% 10.1% -0.5%

40
Appendix II – Lending Banks income split, asset composition, and drivers RoE
(Profitability, sanity, risk-weight, RoE in %)
66%69%
74% 75%72%
24% 21% 23% 21% 22%
10% 9%4% 4% 6%
2011 2012 2013 2014 2015
Income split ABN
Interest Fee Other
9
16 1614
23
7 6 6 7 8
2930 31
28 28
3331
28 27
24
2011 2012 2013 2014 2015
Drivers of RoE ABN
Profitability Sanity Risk weight Leverage factor
67% 67% 69% 67% 66%
20% 20% 20%24%
21%
8% 8% 6% 4% 4%5% 5% 5% 5%9%
2011 2012 2013 2014 2015
Asset composition ABN
Loans Der & Ser others EA Non-NEA
5.6
9.0 8.6 8.0
11.9
2011 2012 2013 2014 2015
RoE ABN
82% 80% 78% 81%77%
15% 14% 15% 15% 14%
3% 6% 7%4%
9%
2011 2012 2013 2014 2015
Income split ING
Interest Fee Other
2522
2018
29
5 5 5 5 5
37 36 37 36 37
28
23 2224
21
2011 2012 2013 2014 2015
Drivers of RoE ING
Profitability Sanity Risk weight Leverage factor
60%65% 64% 62% 64%
23% 25% 26%30% 28%
5% 5% 5% 4% 3%
12%
5% 4% 4% 5%
2011 2012 2013 2014 2015
Asset composition ING
Loans Der & Ser Non-NEA Non-NEA
11.9
9.2 8.8 8.1
11.9
2011 2012 2013 2014 2015
RoE ING
76%69% 70% 72% 72%
19% 17% 15% 15% 15%
5%
15% 14% 14% 13%
2011 2012 2013 2014 2015
Income split Rabo
Interest Fee Other
22
15 15 1418
5 6 6 6 6
30 3032
31 32
21 21 21 22 21
2011 2012 2013 2014 2015
Drivers of RoE Rabo
Profitability Sanity Risk weight Leverage factor
62% 63%66% 65% 65%
19% 21% 20%23%
20%
3% 3% 3% 3% 2%
15% 13% 11% 9%13%
2011 2012 2013 2014 2015
Asset composition Rabo
Loans Der & Ser others EA Non-NEA
7.5
5.9 6.3
6.0
6.9
2011 2012 2013 2014 2015
RoE Rabo
69% 68% 67%71% 73%
23% 23% 25% 23% 22%
8% 9% 8% 6% 5%
2011 2012 2013 2014 2015
Income split Santander
Interest Fee Other
14
7
1416 16
8 8 7 8 8
4744
4742 44
17 1614 15 14
2011 2012 2013 2014 2015
Drivers of RoE Santander
Profitability Sanity Risk weight Leverage factor
58%55% 57% 57% 57%
24% 25% 27%29% 29%
4% 4% 3% 1% 1%
14% 16% 14% 12% 13%
2011 2012 2013 2014 2015
Asset composition Santander
Loans Der & Ser others EA Non-NEA
8.6
3.8
6.5
8.2 7.5
2011 2012 2013 2014 2015
RoE Santander
57%
36% 37%
61%64%
16% 16% 15% 14%11%
27%
48% 48%
25% 25%
2011 2012 2013 2014 2015
Income split Lloyds
Interest Fee Other
-4-6
-2
11
56 6 7 7 7
3835 34
28 28
20 19 18 19 17
2011 2012 2013 2014 2015
Drivers of RoE Lloyds
Profitability Sanity Risk weight Leverage factor
59%54%
57% 55% 56%
27% 27% 25%29% 28%
5% 5% 4% 4% 4%10%
14% 13% 12% 13%
2011 2012 2013 2014 2015
Asset composition Lloyds
Loans Der & Ser others EA Non-NEA
-1.6
-2.5
-0.8
4.0
1.6
2011 2012 2013 2014 2015
RoE Lloyds
69% 71% 70% 73% 71%
23% 20% 21% 20% 20%
8% 9% 8% 6% 9%
2011 2012 2013 2014 2015
Income split BBVA
Interest Fee Other
17
1114 15 14
6 7 6 6 6
54 5256
5350
15 1513 13 14
2011 2012 2013 2014 2015
Drivers of RoE BBVA
Profitability Sanity Risk weight Leverage factor
58%55% 55% 52% 54%
27% 29% 30%33%
30%
4% 4% 3% 3% 3%
11% 12% 12% 11% 12%
2011 2012 2013 2014 2015
Asset composition BBVA
Loans Der & Ser others EA Non-NEA
9.0
5.5 6.2 6.5 6.3
2011 2012 2013 2014 2015
RoE BBVA
64%61%
57% 60% 58%
32% 32% 32% 34% 35%
4%7%
11%6% 7%
2011 2012 2013 2014 2015
Income split Unicredit
Interest Fee Other
-35
5
-57
11 95 5 6 5 6
49 48 50 49 46
15 15 13 16 16
2011 2012 2013 2014 2015
Drivers of RoE Unicredit
Profitability Sanity Risk weight Leverage factor
58%54% 55%
52% 51%
29% 29% 31%35% 35%
4% 4% 4% 5% 4%8%
12% 10% 8% 10%
2011 2012 2013 2014 2015
Asset composition Unicredit
Loans Der & Ser others EA Non-NEA
-14.1
1.9
-21.7
4.6 3.8
2011 2012 2013 2014 2015
RoE Unicredit
73%68% 65% 62%
59%
30% 29%36% 38% 40%
-3%
4%
0% -1%
1%
2011 2012 2013 2014 2015
Income split Intesa Sanpaolo
Interest Fee Other
-48
9
-28
816
5 6 6 6 6
5146 46 42 41
12 14 13 14 14
2011 2012 2013 2014 2015
Drivers of RoE Intesa Sanpaolo
Profitability Sanity Risk weight Leverage factor
58%53% 52%
50% 51%
30%35% 37% 39% 37%
4% 3% 3% 4% 3%9% 9% 8% 8% 8%
2011 2012 2013 2014 2015
Asset composition Intesa Sanpaolo
Loans Der & Ser others EA Non-NEA
-14.7
3.4
-9.3
2.9
6.0
2011 2012 2013 2014 2015
RoE Intesa Sanpaolo

41
Appendix III – Hybrid Banks income split, asset composition, and drivers RoE
(Profitability, sanity, risk-weight, RoE in %)
56%51% 51% 50%
48%
32% 33% 33% 35%39%
12%17% 15% 15% 14%
2011 2012 2013 2014 2015
Income split BPCE
Interest Fee Other
1311
13 1416
6 6 6 6 6
35 34 3331
34
24 2321 21
19
2011 2012 2013 2014 2015
Drivers of RoE BPCE
Profitability Sanity Risk weight Leverage factor
48% 48% 50%47%
51%
33% 32% 30%35%
32%
11% 10% 9% 8% 7%8%11% 11% 10% 10%
2011 2012 2013 2014 2015
Asset composition BPCE
Loans Der & Ser others EA Non-NEA
6.4
4.7
5.5 5.6 6.1
2011 2012 2013 2014 2015
RoE BPCE
58% 57% 57%54% 51%
25% 25% 27% 28% 30%
17% 18% 16% 18% 19%
2011 2012 2013 2014 2015
Income split Nordea
Interest Fee Other
28
32 32 33
37
4 4 5 6 7
3133 34
26
22
29
2522 23 22
2011 2012 2013 2014 2015
Drivers of RoE Nordea
Profitability Sanity Risk weight Leverage factor
43%48% 48%
45% 47%
40% 41% 39%45%
41%
13%
2% 3% 3% 3%4%9% 10% 8% 9%
2011 2012 2013 2014 2015
Asset composition Nordea
Loans Der & Ser others EA Non-NEA
10.6
11.6
11.0
11.4
12.3
2011 2012 2013 2014 2015
RoE Nordea
71% 75%71% 69% 67%
31%27% 28% 29% 28%
-3% -2%
1% 2% 5%
2011 2012 2013 2014 2015
Income split Credit_Agricole
Interest Fee Other
3
-11
18 1720
6 6 6 6
13
31 30 28 28
15
25 23 22 2118
2011 2012 2013 2014 2015
Drivers of RoE Credit_Agricole
Profitability Sanity Risk weight Leverage factor
40% 40% 42% 40%43%
38%
32%29% 31%
26%
13%
18% 19% 21%24%
9% 9% 10% 9% 7%
2011 2012 2013 2014 2015
Asset composition Credit_Agricole
Loans Der & Ser others EA Non-NEA
1.5
-4.8
7.2 6.3
6.9
2011 2012 2013 2014 2015
RoE Credit_Agricole
58% 58% 61% 61%66%
23% 22% 22% 23% 25%19% 20% 17% 16%
10%
2011 2012 2013 2014 2015
Income split Standard_Chartered
Interest Fee Other
28 2723
15
-15
7 6 6 6 5
43 46 4743
48
16 15 15 16 14
2011 2012 2013 2014 2015
Drivers of RoE Standard_Chartered
Profitability Sanity Risk weight Leverage factor
44% 44% 42%39% 40%
28% 28% 30% 29%33%
11% 11% 12% 12% 10%
17% 17%15%
20%17%
2011 2012 2013 2014 2015
Asset composition Standard_Chartered
Loans Der & Ser others EA Non-NEA
12.9 12.1
9.5
5.8
-4.7
2011 2012 2013 2014 2015
RoE Standard_Chartered
57%64% 67%
61% 60%
30% 32% 35% 37% 35%
14%
4%
-2%
1%5%
2011 2012 2013 2014 2015
Income split Commerz
Interest Fee Other
6
1 24
12
5 5 5 4 5
3835 36 36
3936
26
21 2118
2011 2012 2013 2014 2015
Drivers of RoE Commerz
Profitability Sanity Risk weight Leverage factor
41%38% 40% 38% 38%
50% 52% 50%53%
49%
6% 5% 6% 6% 5%3% 4% 5% 3%8%
2011 2012 2013 2014 2015
Asset composition Commerz
Loans Der & Ser others EA Non-NEA
4.0
0.2 0.7
1.4
4.0
2011 2012 2013 2014 2015
RoE Commerz
60%56% 57% 58% 56%
25% 24% 26% 26% 25%
15%19% 17% 16%
19%
2011 2012 2013 2014 2015
Income split HSBC
Interest Fee Other
2623
2824 26
6 6 6 6 5
45 44 42 4146
16 16 15 14 12
2011 2012 2013 2014 2015
Drivers of RoE HSBC
Profitability Sanity Risk weight Leverage factor
37% 36% 37% 37% 38%
45%49% 48% 49% 48%
9%5% 5% 4% 4%
9% 10% 10% 10% 10%
2011 2012 2013 2014 2015
Asset composition HSBC
Loans Der & Ser others EA Non-NEA
11.3
9.0 10.1
7.8 7.7
2011 2012 2013 2014 2015
RoE HSBC

42
Appendix IV – Investment Banks income split, asset composition, and drivers RoE
(Profitability, sanity, risk-weight, RoE in %)
54% 56% 55%63%
69%
24% 24% 23% 24% 23%23% 21% 22%
14%8%
2011 2012 2013 2014 2015
Income split RBS
Interest Fee Other
-9
-29
-52
-18-9
5 5 4 4 4
3034
4134 35
21 19 17 19 15
2011 2012 2013 2014 2015
Drivers of RoE RBS
Profitability Sanity Risk weight Leverage factor
30%33%
38%
32%
38%
57% 55%
47% 49% 47%
4% 3% 3% 3% 3%
9% 10% 11%17%
12%
2011 2012 2013 2014 2015
Asset composition RBS
Loans Der & Ser others EA Non-NEA
-2.8
-8.6
-13.8
-4.9
-2.2
2011 2012 2013 2014 2015
RoE RBS
42% 40% 41%
48%50%
29% 29% 31% 32% 32%29%
32%28%
20% 18%
2011 2012 2013 2014 2015
Income split Barclays
Interest Fee Other
13
1
5 3 2
8 8 7 6 7
25 26
31 3033
28 2725
23
18
2011 2012 2013 2014 2015
Drivers of RoE Barclays
Profitability Sanity Risk weight Leverage factor
28% 28%32% 32%
36%
61% 61% 60% 60%54%
3% 3% 3% 3% 4%8% 7% 5% 6% 7%
2011 2012 2013 2014 2015
Asset composition Barclays
Loans Der & Ser others EA Non-NEA
6.9
0.3
2.4
1.4 1.0
2011 2012 2013 2014 2015
RoE Barclays
59%55% 54% 53% 54%
20% 19% 18% 19% 18%20%27% 28% 28% 28%
2011 2012 2013 2014 2015
Income split BNPP
Interest Fee Other
17 18
15
1
16
7 7 6 6 7
31 3132
3031
2623
20
2421
2011 2012 2013 2014 2015
Drivers of RoE BNPP
Profitability Sanity Risk weight Leverage factor
34% 33% 34% 32%34%
53% 52% 50%54%
50%
3% 2% 3% 2% 2%
10%13% 13% 13% 14%
2011 2012 2013 2014 2015
Asset composition BNPP
Loans Der & Ser others EA Non-NEA
9.0 8.6
6.1
0.6
7.6
2011 2012 2013 2014 2015
RoE BNPP
28%33% 34%
37%42%
48%51%
48% 47% 48%
24%
17% 18% 16%
10%
2011 2012 2013 2014 2015
Income split Credit_Suisse
Interest Fee Other
128
1210
-13
11 9 8 9 8
20
27
3330
34
25 2420 21
18
2011 2012 2013 2014 2015
Drivers of RoE Credit_Suisse
Profitability Sanity Risk weight Leverage factor
20%
26% 28% 30%33%
53% 54%50% 50%
44%
4% 3% 2% 3% 3%
24%
17% 19% 18% 19%
2011 2012 2013 2014 2015
Asset composition Credit_Suisse
Loans Der & Ser others EA Non-NEA
6.8
4.3
6.7 5.2
-6.6 2011 2012 2013 2014 2015
RoE Credit_Suisse
26%22% 21%
24% 23%
58% 55%58%
62%58%
16%
23% 21%15%
20%
2011 2012 2013 2014 2015
Income split UBS
Interest Fee Other
17
-8
12 13
21
12 13 13 121415
1721 21 22
29
2521 20
17
2011 2012 2013 2014 2015
Drivers of RoE UBS
Profitability Sanity Risk weight Leverage factor
19%22%
28% 30%33%
74%68%
58%55%
51%
2% 2% 1% 1% 1%6% 8%
12% 14% 15%
2011 2012 2013 2014 2015
Asset composition UBS
Loans Der & Ser others EA Non-NEA
9.1
-4.4
7.2 7.0
11.4
2011 2012 2013 2014 2015
RoE UBS
52%48%
42% 44%40%
29% 29%25% 27% 26%
19%24%
32%29%
34%
2011 2012 2013 2014 2015
Income split SocGen
Interest Fee Other
11
5
1013
17
7 7 7 7 7
2927 27 27 27
25 2624
2624
2011 2012 2013 2014 2015
Drivers of RoE SocGen
Profitability Sanity Risk weight Leverage factor
32%28% 28% 27% 29%
53% 55% 55% 57%54%
3% 4% 4% 4% 4%
11% 12% 12% 12% 13%
2011 2012 2013 2014 2015
Asset composition SocGen
Loans Der & Ser others EA Non-NEA
5.9
2.6
4.8 5.9
7.9
2011 2012 2013 2014 2015
RoE SocGen
52%48% 48% 46% 48%
35% 36%40% 40% 39%
13%16%
13% 14% 14%
2011 2012 2013 2014 2015
Income split Deutsche
Interest Fee Other
13
1 25
-20
9 9 10 9 8
17 18 20 2024
4136
29 27 24
2011 2012 2013 2014 2015
Drivers of RoE Deutsche
Profitability Sanity Risk weight Leverage factor
19% 20%23% 24% 26%
64% 65%62% 62%
58%
7% 6% 5%1% 1%
9% 9% 9%14% 14%
2011 2012 2013 2014 2015
Asset composition Deutsche
Loans Der & Ser others EA Non-NEA
8.3
0.6 1.2 2.7
-10.0
2011 2012 2013 2014 2015
RoE Deutsche

43
Appendix V – Impact of regulatory measures to bank business model extracted from EBA
report (overview of the potential implications of regulatory measures for banks)
There are an extensive amount of on-going work at the Basel Committee on Banking
Supervision (BCSB) and European Banking Authority (EBA) to evaluate the possible impact
of regulatory measures to bank business model. A global overview of the potential
implications for business models resulting from the collective implementation of the
regulatory measures developed since the financial crisis. The rules considered based on the
report from EBA on overview of the potential implications of regulatory measures for banks'
business models. Some of the key :
Capital Requirements Regulation (CRR) and Capital Requirements Directive (CRD IV)
The Capital Requirements Regulation and Capital Requirements Directive transpose the Basel
III capital framework into European Law. The new rules entered into force on 1 January 2014
and will be fully implemented as of 1 January 2022. Under these rules, while the total capital
an institution will need to hold remains at 8%, the proportion that has to be the highest quality
– common equity tier 1 (CET1) – increases from 2% to 4.5%. The criteria for each capital
instrument will also become more stringent. Furthermore, the new rules harmonize the
adjustments made to capital in order to determine the amount of regulatory capital that it is
prudent to recognize for regulatory purposes. This new harmonized definition significantly
increases the effective level of regulatory capital institutions are required to hold. While the
basic own fund's requirement stays at 8% of RWA, the new rules also establish five new
capital buffers: the capital conservation buffer, the counter-cyclical buffer, the systemic risk
buffer, the global systemic institution's buffer and the other systemic institution's buffer. On
top of all these own funds requirements, supervisors may add extra capital to cover for other

44
risks following a supervisory review (Pillar 2) and institutions may also decide themselves
hold additional capital
On the one hand, the stricter capital definition lowers banks' available capital and the required
capital ratio increases over the next few years until 2019 (for most classes). At the same time,
the RWA for some credit risk exposures is significantly increased. Added together, these two
effects will make it difficult for some banks to meet the required capital ratio, making
business model adjustments inevitable.
Leverage ratio (LR)
Since the LR is a non-risk-weighted measure, it would especially affect banks whose business
model involves low-margin and low-risk but high-volume lending (e.g. certain types of
mortgage lending and municipal finance). For those banks, the LR might become the de-facto
limiting factor, although regulatory capital ratios would leave room for further lending. These
banks might face challenges to generate sufficient earnings if for a given amount of business a
price adjustment is not possible, hence might be forced to alter their business model. This
might involve changing the asset structure towards riskier assets to generate higher margins.
Banks might thus shift their exposure from government financing or retail banking activities
with high amounts of mortgage lending towards corporate banking, trading book, and other
non-traditional banking activities (though the final effects on retail may only be ascertained
once the adjustments have taken place). Furthermore, evidence suggests that investment
banking activities might be reduced if some divisions use a lower average risk weight
compared to other business areas. As off-balance-sheet exposures are included in the
calculation of the LR, they might fall, while the effect of private banking activities is
inconclusive due to the different business elements of which they comprise.

45
Liquidity coverage ratio (LCR) and Net stable Funding ratio (NSFR)
One of the new minimum standards is a 30-day liquidity coverage ratio (LCR) which is
intended to promote short-term resilience to potential liquidity disruptions. The LCR requires
banks to have sufficient high-quality liquid assets to withstand a stressed 30-day funding
scenario. The LCR defines the minimum stock of unencumbered, high-quality liquid assets
that must be available to cover the net outflow expected to occur in a severe stress scenario.
Cash inflows are subject to a cap at 75% of total outflows. Consequently, 25% of cash
outflows have to be covered by liquid assets. The European Commission's delegated act on
the LCR introduces it as of 1 October 2015. According to the recent revisions to the LCR, the
minimum requirement will be set at 60% and rise in equal annual steps to reach 100% in
2018.
The second liquidity standard is the net stable funding ratio (NSFR) (currently under
consultation), a longer-term structural ratio to address liquidity mismatches and to provide
incentives for banks to use stable sources to fund their activities. In broad terms, the NSFR is
calculated by dividing a bank’s available stable funding (ASF) by its required stable funding
(RSF). The ratio must always be greater than 1. The ASF and RSF requirements specified in
the NSFR are adjusted to reflect the degree of stability of liabilities and liquidity of assets.
The ASF measure broadly regards the most stable sources of funding to be regulatory capital,
funding which has a maturity of at least a year, and deposits. The RSF measure grades various
assets in terms of the stable funding required to support them. For example, loans to financial
institutions, assets that are encumbered for a period of one year or more, net amounts
receivable under derivative trades, non-performing loans, fixed assets, pension assets,
intangibles and deferred tax assets require matched stable funding. Residential mortgages
would typically require stable funding in the order of 65% of the mortgage amount. Further,
certain short-dated assets maturing in less than one year require a smaller proportion of stable

46
funding as banks may allow some proportion of those assets to mature instead of rolling them
over. The NSFR also factors in asset quality and liquidity value, recognizing that some assets
do not require full financing by stable funding where they can be securitized or are tradable to
secure additional funding. Off-balance-sheet commitments and contingencies which create
potential calls on liquidity require additional stable funding sources.
Reforms in banking structures
There are three main structural reforms affecting the global banking system.
Firstly, in the EU, the Liikanen Report aims to separate proprietary trading activities from the
rest of the group if these activities represent a significant share of a bank's business, or if the
volume of these activities can be considered significant from the viewpoint of financial
stability. This separation is to enhance financial stability, protect insured depositors and
safeguard banking groups' ability to lend to the economy. It applies to credit institutions,
financial holding companies, and mixed financial holding companies beyond a threshold that
is yet to be defined.
Secondly, The UK is implementing the recommendations of the Independent Commission on
Banking (ICB) which will lead to; the introduction of a ring-fence around retail and SME
deposits and associated payment and overdraft facilities to separate core everyday banking
activities from investment banking activities, preference for deposits protected under the
Financial Services Compensation Scheme (FSCS) and higher loss-absorbency requirements
on banks to ensure they can absorb more losses in a resolution scenario.
Lastly, the US authorities despite the introduction of the ‘Volcker rule' which bans proprietary
are in consultation on the implementation of intermediate holding companies (IHC) for large
foreign banks operating (FBO) in the US. The proposal requires the establishment of a
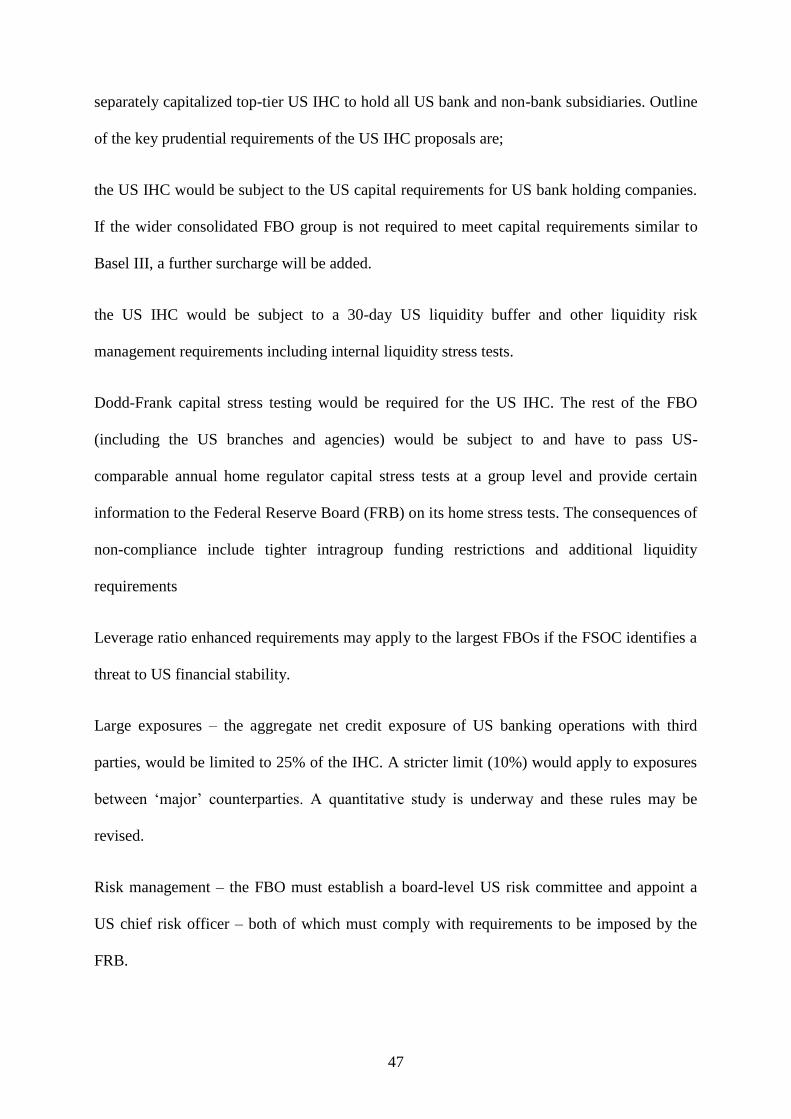
47
separately capitalized top-tier US IHC to hold all US bank and non-bank subsidiaries. Outline
of the key prudential requirements of the US IHC proposals are;
the US IHC would be subject to the US capital requirements for US bank holding companies.
If the wider consolidated FBO group is not required to meet capital requirements similar to
Basel III, a further surcharge will be added.
the US IHC would be subject to a 30-day US liquidity buffer and other liquidity risk
management requirements including internal liquidity stress tests.
Dodd-Frank capital stress testing would be required for the US IHC. The rest of the FBO
(including the US branches and agencies) would be subject to and have to pass US-
comparable annual home regulator capital stress tests at a group level and provide certain
information to the Federal Reserve Board (FRB) on its home stress tests. The consequences of
non-compliance include tighter intragroup funding restrictions and additional liquidity
requirements
Leverage ratio enhanced requirements may apply to the largest FBOs if the FSOC identifies a
threat to US financial stability.
Large exposures – the aggregate net credit exposure of US banking operations with third
parties, would be limited to 25% of the IHC. A stricter limit (10%) would apply to exposures
between ‘major’ counterparties. A quantitative study is underway and these rules may be
revised.
Risk management – the FBO must establish a board-level US risk committee and appoint a
US chief risk officer – both of which must comply with requirements to be imposed by the
FRB.

48
Resolution – the FRB has said that it will take the following steps as concerns arise about the
health of the financial sector: increased supervisory review; initial remediation; recovery then
recommended the resolution. The triggers for these steps are related to the capital adequacy of
the FBO and US IHC; stress tests of the IHC; risk management; liquidity risk management
and FRB market indicator thresholds (relating to both the FBO and US IHC).
Resolution regimes
The EU Bank Recovery and Resolution Directive (BRRD) defines the means by which a
failing bank can be resolved. Among the resolution tools, the Directive enables the resolution
authority to impose losses on shareholders and unsecured creditors. Bail-in liabilities may be
written down or converted into equity when the resolution authority puts a failing bank into
resolution. If a bank is assessed as non-viable, the Directive also provides for capital
instruments to be written down or converted into equity even if the bank does yet not meet all
of the conditions for resolution. The scope of bail-in is broad, As regards banking activities,
the implementation of resolution rules is not intended to affect the structure of assets directly
as the regulatory measures are only focused on the liability side of the balance sheet. In order
to prevent banks from circumventing the bail-in rules, the Directive also defines minimum
requirements for own funds and eligible liabilities ensuring that banks have sufficient loss-
absorbing capacity.
European Market Infrastructure Regulation (EMIR)
EMIR has been designed to reduce the counterparty risk in OTC derivative markets and to
increase transparency within the markets. The key different of EMIR other regulations which
applied only to regulated companies such as banks or investment firms is that it imposes
obligations on all participants in EU derivatives markets. EMIR covers all entities established
in the EU (banks, insurance companies, pension funds, investment firms, corporates, special

49
purpose Vehicles – SPVs) that enter into derivatives trades, whether they do so for trading
purposes, to hedge commercial exposure or as part of their investment strategy. EMIR
addresses the risk of OTC derivatives trading by using three key criteria;
Clearing: standardized OTC derivatives, as determined by the European Securities and
Markets Authority (ESMA), must be cleared through a central counterparty (CCP), unless the
counterparty has an exemption although strict conditions apply (i.e. intragroup transactions or
subject to certain clearing thresholds for trades with non-financial counterparties).
Margin and capital: clearing counterparties should have permanent, available and separate
initial and variation margins in the form of highly liquid collateral. The counterparty risk
mitigation on cleared OTC derivative transactions forces counterparties to pay (from day one)
initial and variation margins in highly liquid collateral (cash, gold, government bonds, etc.).
All entities covered (i.e. financial firms and systemically important non-financial entities) that
engage in non-centrally cleared derivatives will be subject to strengthened risk management
requirements and must exchange initial and variation margin as appropriate to the
counterparty risks posed by such transactions. In addition, non-cleared transactions will be
subject to additional capital requirements.
Reporting: all derivative contracts should be reported to trade repositories. Daily reporting
will be required for all trades (OTC cleared, OTC not cleared but also exchange traded) in
order to identify potential pockets of systemic risk.

50
8. References
Albertazzi, U., and Gambacorta, L., 2009. Bank profitability and the business cycle. Journal
of Financial Stability 5, 393-409.
Berger, A. N., 1995. The profit-structure relationship in banking-tests of market-power and
efficient structure hypotheses. Journal of Money, Credit and Banking 27, 404-431.
Berger, A. and Humphrey, D., 1997. Efficiency of financial institutions: International survey
and directions for future research. European Journal of Operational Research 98, 175-212.
Bikker, J.A., and Hu, H., 2002. Cyclical patterns in profits, provisioning and lending of banks
and procyclicality of the new Basel capital requirements. BNL Quarterly Review 221, 143-
175.
Bord V.M, Santos J.A.C, 2012. The Rise of the Originate-to-Distribute Model. FRBNY
Economic Policy Review 7.
Bourke, P., 1989. Concentration and other determinants of bank profitability in Europe, North
America and Australia. Journal of Banking and Finance 13, 65–79.
Carbo Valverde, S. and Rodriguez Fernandez, F., 2007. The determinants of bank margins in
European banking. Journal of Banking and Finance 31, 2043-2063.
Demirguc-Kunt, A. and Huizinga, H., 2000. Financial Structure and Bank Profitability. Policy
Research Working Papers 2430, World Bank.
European Banking Authority report, 2015. Overview of the potential implications of
regulatory measures for banks’ business models. 02.
Gambacorta, L., Scatigna, M. and Yang, J., 2014. Diversification and bank profitability: a
nonlinear approach. Applied Economics Letters 21, 438-441. 75-212.
Gambacorta, L. and van Rixtel, A., 2013. Structural bank regulation initiatives: approaches
and implications. BIS Working Papers 412.
Goddard, J., Molyneux, P. and Wilson, J. O., 2004. Dynamics of Growth and Profitability in
Banking. Journal of Money, Credit and Banking 36, 1069-1090.
Iannotta, G., Nocera, G. and Sironi, A., 2007. Ownership structure, risk, and performance in
the European banking industry. Journal of Banking and Finance 31, 2127-2149.
Llewellyn, D., 2005. Competition and Profitability in European Banking: Why Are British
Banks So Profitable?. Economic Notes 3, 279-311.
Lown, C.S., Osler, C.L, Strahan, P.E, and Sufi, A. 2000. The Changing Landscape of the
Financial Service Industry: What Lies Ahead. Economic Policy Review, Federal Reserve
Bank of New York 6, 39-54.
Mergaerts, F., Venne Vander, R., 2016. Business models and bank performance: A long-term
perspective. Journal of Financial Stability 22 57–75.

51
Miller, S.M., Noulas, A.G., 1997. Portfolio mix and large-bank profitability in the USA.
Applied Economics 29, 505–512.
Mirzaei, A., Moore, T. and Liu, G., 2013. Does market structure matter on banks’ profitability
and stability? Emerging vs. advanced economies. Journal of Banking and Finance 37, 2920-
2937.
Molyneux, P., and Thornton, J., 1992. Determinants of European bank profitability: a note.
Journal of Banking and Finance 16, 1173-1178.
Perry, P., 1992. Do banks gain or lose from inflation?. Journal of Retail Banking 14, 25–30.
Porter, M.E., 1979. The structure within industries and companies’ performance. Rev. Econ.
Stat., 61 (2) 214–227
Revell, J., 1979. Inflation and financial institutions. Financial Times, London.
Roengpitya, R., Tarashev, N., Tsatsaronis, K. 2014. Bank business models. BIS Quarterly
Review,
Shehzad, C.T., De Haan, J. and Scholtens, B., 2013. The relationship between size, growth,
and profitability of commercial banks. Applied Economics 45, 1751-1765.
Stiroh, K., 2004. Diversification in banking: is noninterest income the answer?. Journal of
Money, Credit and Banking 36, 853-882.
TAPESTRY NETWORKS, INC incorporation with Ernst & Young and Bank Governance
Leadership Network 2011.Global banking adapts to adverse economics and restrictive
regulations.
Tregenna, F., 2009. The fat years: the structure and profitability of the US banking sector in
the pre-crisis period. Cambridge Journal of Economics 33, 609-632.