Equity sensitivity as a moderator between equity perception ...
54
Equity sensitivity as a moderator between equity perception and pay satisfaction BY CHUI KA LOK 04004043 Human Resources Management Option An Honors Degree Project Submitted to the School of Business in Partial Fulfillment of the Graduation Requirement for the Degree of Bachelor of Business Administration (Honors) Hong Kong Baptist University Hong Kong April 2007
-
Upload
khangminh22 -
Category
Documents
-
view
3 -
download
0
Transcript of Equity sensitivity as a moderator between equity perception ...
Equity sensitivity as a moderator
between equity perception and pay satisfaction
BY
CHUI KA LOK
04004043
Human Resources Management Option
An Honors Degree Project Submitted to the School of Business
in Partial Fulfillment of the Graduation Requirement for the
Degree of Bachelor of Business Administration (Honors)
Hong Kong Baptist University
Hong Kong
April 2007

Equity sensitivity as a moderator between equity perception and pay satisfaction
i
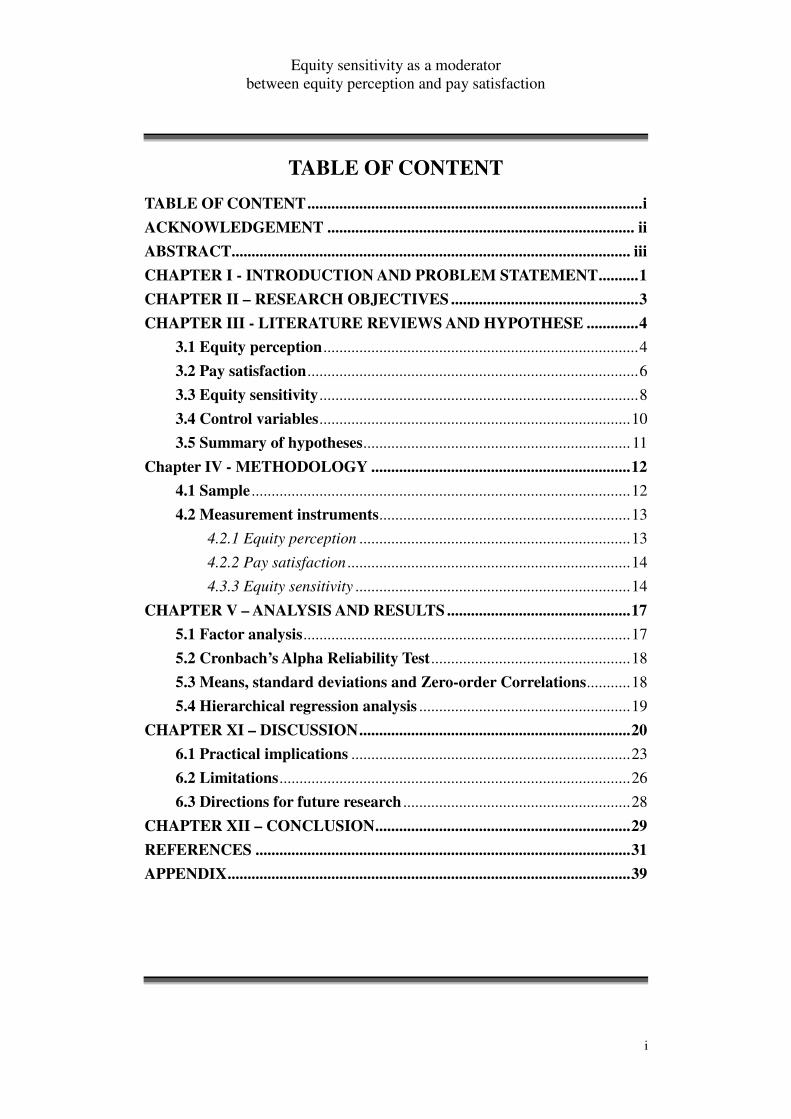
TABLE OF CONTENT
TABLE OF CONTENT....................................................................................i
ACKNOWLEDGEMENT ............................................................................. ii
ABSTRACT.................................................................................................... iii
CHAPTER I - INTRODUCTION AND PROBLEM STATEMENT..........1
CHAPTER II – RESEARCH OBJECTIVES ...............................................3
CHAPTER III - LITERATURE REVIEWS AND HYPOTHESE .............4
3.1 Equity perception...............................................................................4
3.2 Pay satisfaction...................................................................................6
3.3 Equity sensitivity................................................................................8
3.4 Control variables..............................................................................10
3.5 Summary of hypotheses...................................................................11
Chapter IV - METHODOLOGY .................................................................12
4.1 Sample ...............................................................................................12
4.2 Measurement instruments...............................................................13
4.2.1 Equity perception ....................................................................13
4.2.2 Pay satisfaction .......................................................................14
4.3.3 Equity sensitivity .....................................................................14
CHAPTER V – ANALYSIS AND RESULTS ..............................................17
5.1 Factor analysis..................................................................................17
5.2 Cronbach’s Alpha Reliability Test..................................................18
5.3 Means, standard deviations and Zero-order Correlations...........18
5.4 Hierarchical regression analysis .....................................................19
CHAPTER XI – DISCUSSION....................................................................20
6.1 Practical implications ......................................................................23
6.2 Limitations........................................................................................26
6.3 Directions for future research .........................................................28
CHAPTER XII – CONCLUSION................................................................29
REFERENCES ..............................................................................................31
APPENDIX.....................................................................................................39
Equity sensitivity as a moderator between equity perception and pay satisfaction
ii
ACKNOWLEDGEMENT
First of all, I would like to express my deepest gratitude to Dr. Wei
Li-Qun, the supervisor of my Honor Project, for her generous guidance on my
work. Whenever I met any challenges on my research, she was always
patient to give advice to me. Her experiences in research do not only bring
me new insights, but also inspire me to carry out the project in a great success.
Moreover, credits should also be given to my friends, who assisted me to
distribute and collected questionnaires, and gave comment on my research
design. Without their kindness, this study could not be done in such a smooth
progress.
Last but never the least, I would like to thank all the respondents for
sharing with me their information and points of view on the studied issues.
Their generous support is undoubtedly the foundation of my study.
Equity sensitivity as a moderator between equity perception and pay satisfaction
iii
ABSTRACT
Previous studies have confirmed that level of pay is not the sole predictor
of employees’ pay satisfaction. Based on this assertion, this study
investigates antecedents other than the actual pay level which have significant
impacts on pay satisfaction.
This study examines the predictive relationship between employees’
equity perception on their reward systems and the pay satisfaction. Yet, the
perception of equity varies among people and is hard to be measured
objectively. The study also examines the moderating effect of employees’
personality type, equity sensitivity, on the constructed relationship.
Questionnaires were collected from 115 full time local employees
working in different industries. Their scores on equity perception regarding
their reward systems, pay satisfaction and equity sensitivity were analyzed and
compared.
Results indicate that, in general, if employees perceive their reward
system equitable, they score higher on pay satisfaction. In addition, this
Equity sensitivity as a moderator between equity perception and pay satisfaction
iv
positive relationship is found to be particularly strong for the equity sensitive
group than the equity insensitive group, further confirming the influences of
individual personality on the constructed relationship.
Based on the results of the study, organizations could do several things to
improve overall pay satisfaction. Practical implications and
recommendations for future research are further discusses.
Equity sensitivity as a moderator between equity perception and pay satisfaction
1
CHAPTER I - INTRODUCTION AND PROBLEM STATEMENT
For many years, literatures have explored numerous impacts of pay
satisfaction in organizational settings (Smola, Karen Wey, 2003). Evidence
indicates that pay satisfaction is related to overall job satisfaction, motivation
and performance. Pay satisfaction levels are also strongly related to
absenteeism and turnover rates. Dissatisfaction with pay may also lead to
more pay-related grievances and litigation (David E Terpstra, Andre L
Honoree, 2003). As a result, increasing interests are shown on the following
question:
What can an organization do if they would like to raise employees’
satisfaction on pay?
As noted by Rice, Phillips, and McFarlin (1990), although the
relationship between how much an individual is actually paid and that
individual’s pay satisfaction is positive and statistically significant, it has
explained well under 25 percent of the variance in pay satisfaction.
If the argument made by Rice, Phillips, and McFarlin(1990) stands, there
Equity sensitivity as a moderator between equity perception and pay satisfaction
2
should be a room for higher pay satisfaction without raising the employees’
actual salaries.
In an organizational setting, it is not uneasy to hear employees’
grievances on unfair treatment regarding rewards. As Adams’ equity theory
suggests, everybody evaluates and compares the exchange relationship with
their organization in terms of effort spent and rewards received (Adams, 1965).
Their grievances on unfair rewards are possibly based on the social
comparisons between their and their peers’ pay (Berkowitz, Fraser, Treasure,
and Cochran,1987).
According to Heneman’s (1985) review of the pay-satisfaction literatures,
the relationship between employees’ equity perception on pay and pay
satisfaction is always positive. Perceived pay equity is always followed by
employee’s pay satisfaction. These two factors are strongly correlated.
The above two scholars’ findings make it rationale to assume that if
organizations pay more attention to reward equity, it is likely to enhance
employees’ satisfaction on pay.
Equity sensitivity as a moderator between equity perception and pay satisfaction
3
One of the potential problems in proving this construct is that the
standards of pay satisfaction and equity are always vague and vary among
people. For some people, equity is the main concern, but not for others.
Given the same reward system, some may perceive equity, but others may not.
Therefore, measuring perceived equity should not isolate the effect of
individuals’ personality types.
To enhance the implications of this study, Huseman’s equity sensitivity
(Huseman et al., 1985, 1987; King el at., 1993; Miles el at., 1989) is also
reviewed. Employees’ personality types are added into the study with a
purpose to explore individual differences between their equity perception and
pay satisfaction.
CHAPTER II – RESEARCH OBJECTIVES
As mentioned above, this research will emphasize on how employees’
equity perception to their rewards influences their satisfaction on pay. The
purposes of this research are to:
• Suggest organizations ways other than pay raise to enhance employees’
Equity sensitivity as a moderator between equity perception and pay satisfaction
4
pay satisfaction
• Explore the relationship between equity perception and pay satisfaction
• Investigate how individuals’ personality, equity sensitivity, will
moderate this relationship
CHAPTER III - LITERATURE REVIEWS AND HYPOTHESE
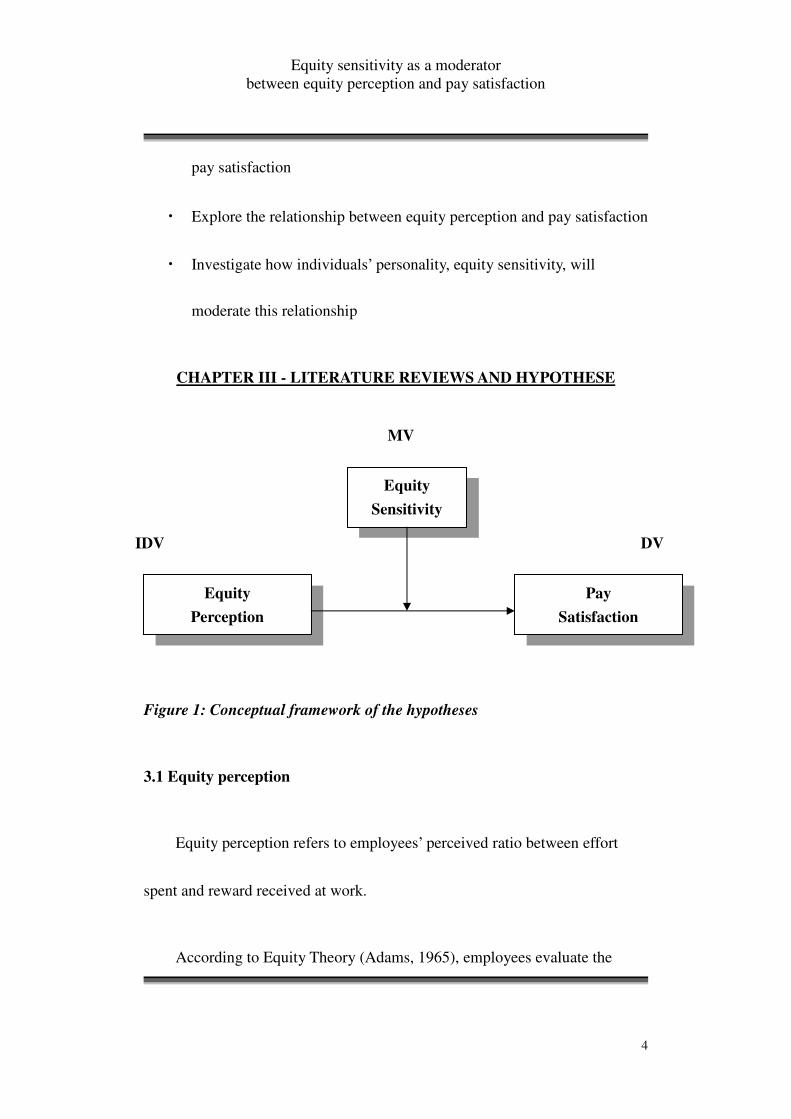
Figure 1: Conceptual framework of the hypotheses
3.1 Equity perception
Equity perception refers to employees’ perceived ratio between effort
spent and reward received at work.
According to Equity Theory (Adams, 1965), employees evaluate the
Equity
Perception
Pay
Satisfaction
Equity
Sensitivity
IDV DV
MV
Equity sensitivity as a moderator between equity perception and pay satisfaction
5
exchange relationship in terms of a ratio between effort spent (input) and
reward received (output) at work. They tend to compare their ratio to their
counterparts’. Those inputs include education, experience, training, skills, as
well as all their devotion to their job. Outputs refer to inducements an
employee may receive from an organization, including all kinds of monetary
rewards, desired job-related responsibilities, esteem, status, and social identity.
The equity perception can also be referred as distributive justice in some
literatures.
Employees will compare their actual ratio to their perceived one.
Gartrell (1982), for example, studied employees in a public works department
in a large north-eastern city in the U.S. He found that they frequently
compared themselves to construction workers, a very different job. Law and
Wong (1998) also found that bank clerks in Hong Kong compared themselves
to other clerks in the same office. If the actual ratio matches with their
perceived one, reward equity is achieved. In contrast, if discrepancies occur,
reward inequality is resulted.
Equity sensitivity as a moderator between equity perception and pay satisfaction
6
Inequity can reflect both under-reward or over-reward equity. Both of
them will trigger workers’ adverse reaction, especially the former (Mowday,
1991). Any pay system which measures carefully individuals’ output/input
ratio and theoretically brings equity to employees is to be considered as an
equitable reward system.
3.2 Pay satisfaction
Another variable emphasized in this research is pay satisfaction. It
refers to the magnitude which employees are satisfied with their current pay.
Many earlier researchers had examined the impacts and antecedents of
pay satisfaction. For examples, Lawler (1976) proposed that pay contributes
to total organizational effectiveness and is important to workers. Some
researches (Shaw, J.D., Duffy, M. K., Jenkins, G.. D. Jr., & Gupta, N., 1999)
revealed that pay was a significant organizational expense and was valued
individual outcome. Despite the diversified points of view made by different
researchers, pay satisfaction is still a hot investigation area.
Besides, early pay satisfaction researchers treated the construct and its
Equity sensitivity as a moderator between equity perception and pay satisfaction
7
measurement as one-dimensional. Some researchers used ad hoc measures
designed for individual studies, while some (Dyer &Theriault, 1976; Schwab
& Wallace, 1974; Weiner, 1980) used the pay satisfaction sub-scales of the
Minnesota Satisfaction Questionnaire (MSQ) and the Job Descriptive Index
(JDI). A major advancement in the study of pay satisfaction is the work done
by Heneman and Schwab (1985), who were the first to explicitly
conceptualize pay satisfaction as a multidimensional construct.
Initially, Heneman and Schwab (1985) hypothesized five dimensions of
pay satisfaction: pay level, benefits, pay raise, pay structure and pay
administration. Based on initially factor analysis results, the validity of pay
level, benefits, pay raise dimensions were supported, but the pay structure and
pay administration dimensions were later combined. As a result, when
examining pay satisfaction, a four-factor structure is usually referred to.
According to Rice, Philips, and McFarlin(1990), pay satisfaction was not
only an outcome of actual pay level. These findings encourage others to
examine the prediction of pay satisfaction based on multiple discrepancies or
Equity sensitivity as a moderator between equity perception and pay satisfaction
8
multiple monetary standards of comparison (Law & Wong, 1998).
According to Heneman’s (1985) review of the pay-satisfaction literature, pay
satisfaction was closely linked to Adam’s Equity Theory (1965). Pay
satisfaction was enhanced once an employee perceives equity to their rewards.
Hence, Heneman’s (1985) point of view will be the core of study in this paper.
H1: Equity perception significantly influences pay satisfaction (pay level,
benefit, pay raise and pay structure and administration).
3.3 Equity sensitivity
The last, but also the most interesting variable in the study, is the equity
sensitivity. This concept proposes that individuals have a unique sensitivity
to fair and unfair situations that can thereby influence their attitudes and
reactions, either positively or negatively (Huseman et al., 1985, 1987; King el
at., 1993; Miles el at., 1989).
The equity sensitivity concept investigates a person’s perceptions of what
is and what is not equity and then uses that information to make predictions
about reactions to inequity (King, Miles and Day 1993). According to
Equity sensitivity as a moderator between equity perception and pay satisfaction
9
Huseman’s study (1985, 1987), people can be generally categorized into three
groups:
i. Benevolents – concern about the relationship with employers
ii. Equity sensitives – concern both the relationship and the outcomes
iii. Entitleds– concern about their personal outcomes
Benevolents are basically defined as “givers” and are satisfied easily.
They do not mind providing more inputs to their counterparts. Since what
they concern most is their relationship with their boss, they can be satisfied
even if they are under-paid.
Another extreme is entitleds, who demand a larger reward and effort ratio.
Defined as “takers”, they always look rewards as “entitled” and never stop
requesting higher pay. They will not be satisfied until an over-rewarded
situation occurs.
Despite their extreme personalities, these two groups of people share one
common characteristic, that is, they do not really care about reward equity
suggested by Adams. Having different concern in mind, they are indeed not
Equity sensitivity as a moderator between equity perception and pay satisfaction
10
seekers of an optimum exchange ratio. In other words, they can be regarded
as equity insensitives.
Equity sensitives are different. They adhere to the predictions of the
current equity theory model as proposed by Adams (1963, 1965). They are
satisfied if and only if they get a balanced actual effort and reward ratio.
This group of people really concern about equity defined by Adams.
H2: The relationship between equity perception and pay satisfaction (pay level,
benefit, pay raise and pay structure and administration) is stronger for equity
sensitives than equity insensitives.
3.4 Control variables
In order to test the impact of the above variables, 7 other variables, which
were not the core of this research, were controlled.
Previous work had found that employee attitudes were related to
demographic and position variables (Robinson, 1996; Onne Janssen, 2001).
Therefore, demographic information like age, gender and current positions of
Equity sensitivity as a moderator between equity perception and pay satisfaction
11
respondents were collected.
According to H. Hememan and Schwab & Wallace (1985, 1974), salary
level, salary increase, tenure and job satisfaction also had certain extent of
impacts on pay satisfaction. These factors were assumed constant in this
analysis.
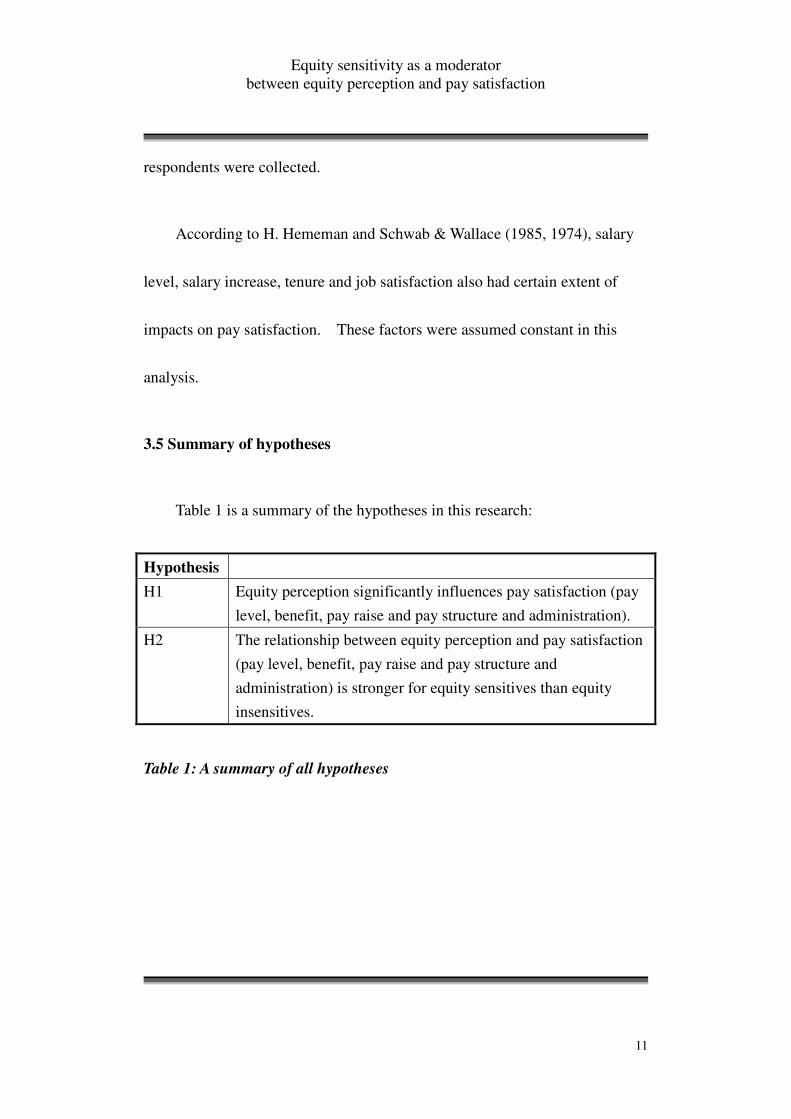
3.5 Summary of hypotheses
Table 1 is a summary of the hypotheses in this research:
Hypothesis
H1 Equity perception significantly influences pay satisfaction (pay
level, benefit, pay raise and pay structure and administration).
H2 The relationship between equity perception and pay satisfaction
(pay level, benefit, pay raise and pay structure and
administration) is stronger for equity sensitives than equity
insensitives.
Table 1: A summary of all hypotheses
Equity sensitivity as a moderator between equity perception and pay satisfaction
12
Chapter IV - METHODOLOGY
4.1 Sample
A quantitative survey was conducted by sending questionnaires to
full-time employees in local firms between March and April in the year 2007.
Participants were picked on a voluntary based. Cover letters were attached to
indicate the purpose of this survey and to assure the confidentiality of the
questionnaires returned.
Of the 150 questionnaires distributed, 115 were returned and were all
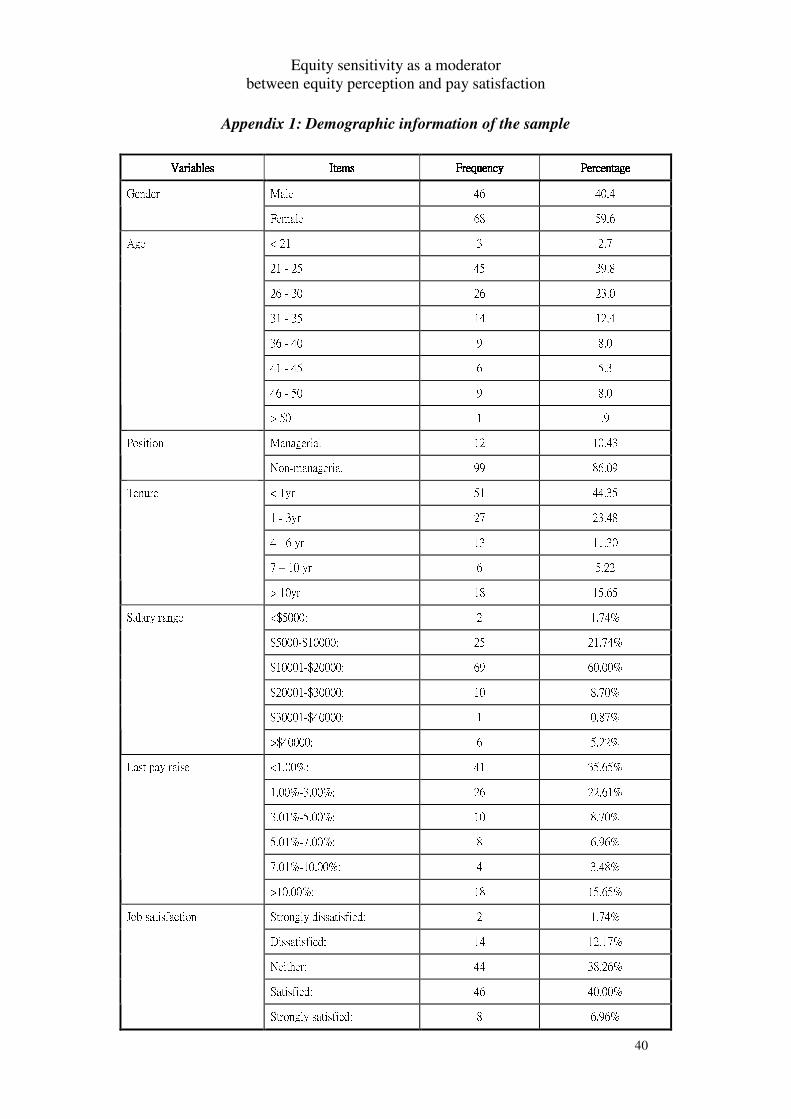
usable. The response rate was 77%. As shown in appendix 1, 46 of the
respondents were male and 68 were female, consisted of 40% and 60% of the
total sample. A large proportion of the same were aged between 21 and 25
(45%). A majority of them had served their companies for less than 3 year
(less than 1 year: 44.35%; 1-3 years: 23.48%), and were holding a
non-managerial position in their company (86%). More than 80% of the
respondents were earning less than $20,000 a month. Although some
respondents (15.65%) reported a “more-than-ten-per-cent” salary increment
Equity sensitivity as a moderator between equity perception and pay satisfaction
13
last year, a majority of them (58.26%) received a merit less than 3%. In a
question simply asking respondent’s overall satisfaction towards their current
jobs, around 80% of them chose either “satisfied” or “neither satisfied nor
dissatisfied”. The demographic information indicated that the survey
included a wide variety of respondents.
4.2 Measurement instruments
To assure the reliability and validity of the designed questions, all the
questions included in the questionnaire were supported by past literatures and
were commonly used in other researches.
4.2.1 Equity perception
Adams’s equity theory (1965) would be the basis for measuring equity
equity. Based on the Equity theory (1965), Van Yperen, (1996) developed six
statements to measure employees’ perception of job effort-reward equity.
These statements are “I work too hard considering my outcomes.”, “I give a
great deal of time and attention to the organization, but do not feel
appreciated.”, “I invest more in my job than I receive in return.”, “The rewards
Equity sensitivity as a moderator between equity perception and pay satisfaction
14
I receive are not proportional to my investments.”,”I put more energy in my
job than it is worth.”, “I feel unfairly treated in my job.” Each of these
statements was followed by a seven-point response scale ranging from “totally
disagree” (1) to “totally agree” (7). All responses were reversely coded, so
that higher ratings indicated more perceived effort-reward fairness.
4.2.2 Pay satisfaction
In order to examine all the dimensions of pay satisfaction, the whole set
of Pay Satisfaction Questionnaire (PQS), consisting of sixteen items,
developed by Heneman & Schwab (1985) was used. This measure consisted
of four subscales measuring satisfaction with pay level, benefits, pay raise, and
pay structure and administration. The coefficient alpha reliability estimates
for these subscales ranged from 0.81 to 0.95 for a sample of white-collar
employees and a second sample of nurses (Heneman & Schwab, 1985).
Similar estimates of reliability were reported by Scarpello, Hucer, and
Vandenberg (1988).
4.3.3 Equity sensitivity
Equity sensitivity as a moderator between equity perception and pay satisfaction
15
To assess each individuals’ equity sensitivity, King and Miles (1994)
Equity Instrument (ESI) of 5 items was used. This forced-distribution scale
measures responses on a continuum from benevolent to entitleds. For each
item, respondents allocate 10 points between 2 statements, one representing a
benevolent response and the other representing an entitled response.
Examples of the items are “It would be more important for me to: A) help
others; B) watch out for my own good.”, and “The hard work I would do
should: A) Benefit the organization; B) Benefit me.”
In order to generate 3 sub-groups representing benevolents, equity
sensitives and entitleds, the conventional rule set by previous researchers was
utilized (cf., King, Miles and Day 1993; Allen and White 2002). The points
of statements representing benevolent response were summed (Jill Kickul &
Scott W. Lester, 2001). The decision rule of plus/minus one-half of the
standard deviation from the ESI mean was used to define the breakpoints for
each sub-group. King, Miles and Day (1993) suggested that “sample-specific
breakpoints are necessary because of the unique characteristics on any
particular sample that can influence response to the ESI”.
Equity sensitivity as a moderator between equity perception and pay satisfaction
16
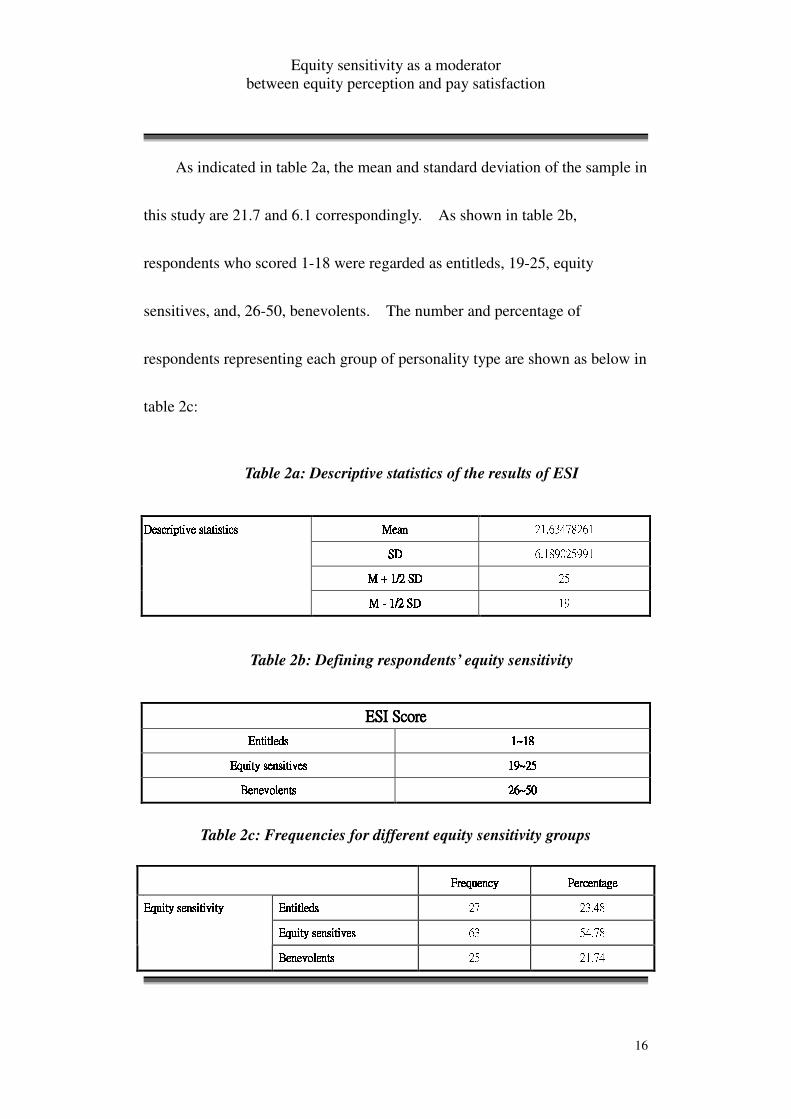
As indicated in table 2a, the mean and standard deviation of the sample in
this study are 21.7 and 6.1 correspondingly. As shown in table 2b,
respondents who scored 1-18 were regarded as entitleds, 19-25, equity
sensitives, and, 26-50, benevolents. The number and percentage of
respondents representing each group of personality type are shown as below in
table 2c:
Table 2a: Descriptive statistics of the results of ESI MeanMeanMeanMean 21.63478261 SDSDSDSD 6.189025991 M + 1/2 SDM + 1/2 SDM + 1/2 SDM + 1/2 SD 25 DescripDescripDescripDescriptive statisticstive statisticstive statisticstive statistics M M M M ---- 1/2 SD 1/2 SD 1/2 SD 1/2 SD 19 Table 2b: Defining respondents’ equity sensitivity
ESI ScoreESI ScoreESI ScoreESI Score EntitledsEntitledsEntitledsEntitleds 1~181~181~181~18 Equity sensitivesEquity sensitivesEquity sensitivesEquity sensitives 19~2519~2519~2519~25 BenevolentsBenevolentsBenevolentsBenevolents 26~5026~5026~5026~50 Table 2c: Frequencies for different equity sensitivity groups FrequencyFrequencyFrequencyFrequency PercentPercentPercentPercentageageageage EntitledsEntitledsEntitledsEntitleds 27 23.48 Equity sensitivesEquity sensitivesEquity sensitivesEquity sensitives 63 54.78 Equity sensitivityEquity sensitivityEquity sensitivityEquity sensitivity BenevolentsBenevolentsBenevolentsBenevolents 25 21.74
Equity sensitivity as a moderator between equity perception and pay satisfaction
17
CHAPTER V – ANALYSIS AND RESULTS
5.1 Factor analysis
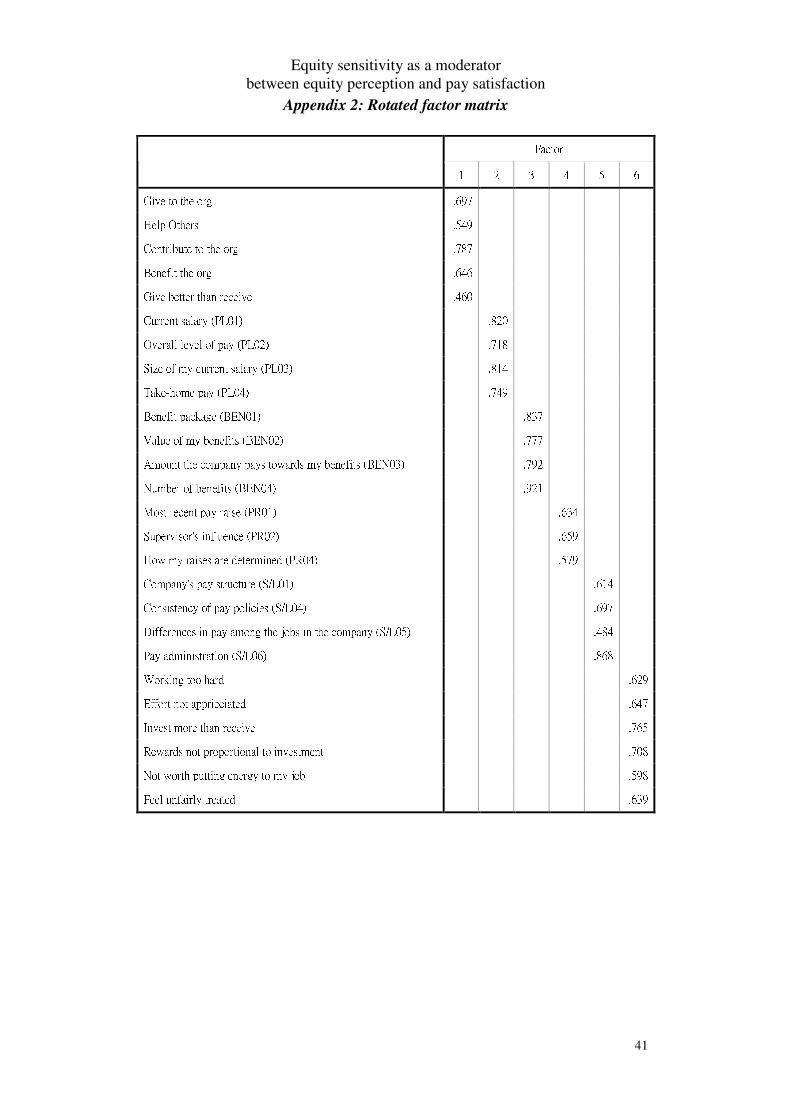
To test respondents’ perception on the questions, a factor analysis of was
conducted on the observed sample (N = 115) to examine their distinctiveness.
Appendix 2 presents the results of factors analyzing the all the items in
questionnaires. The factors were extracted using principal axis factoring and
the resulting factor structure was rotated using VARIMAX.
The factor analysis grouped all the items into 6 factors, namely equity
sensitivity, pay level satisfaction, benefit satisfaction, pay raise satisfaction,
pay structure and administration satisfaction, and equity perception.
The result of Kaiser-Meyer-Olkin Measure of Sampling Adequacy
(0.840), Bartlett’s test of Sphericity (2136.749) and Significance (.000)
indicated that the factor analysis method was appropriate. The resultant
factor structure explained 61.768% of the item variance. All the six created
factors had eigenvalue greater than 1.0, so it would be used for subsequent
Equity sensitivity as a moderator between equity perception and pay satisfaction
18
analysis.
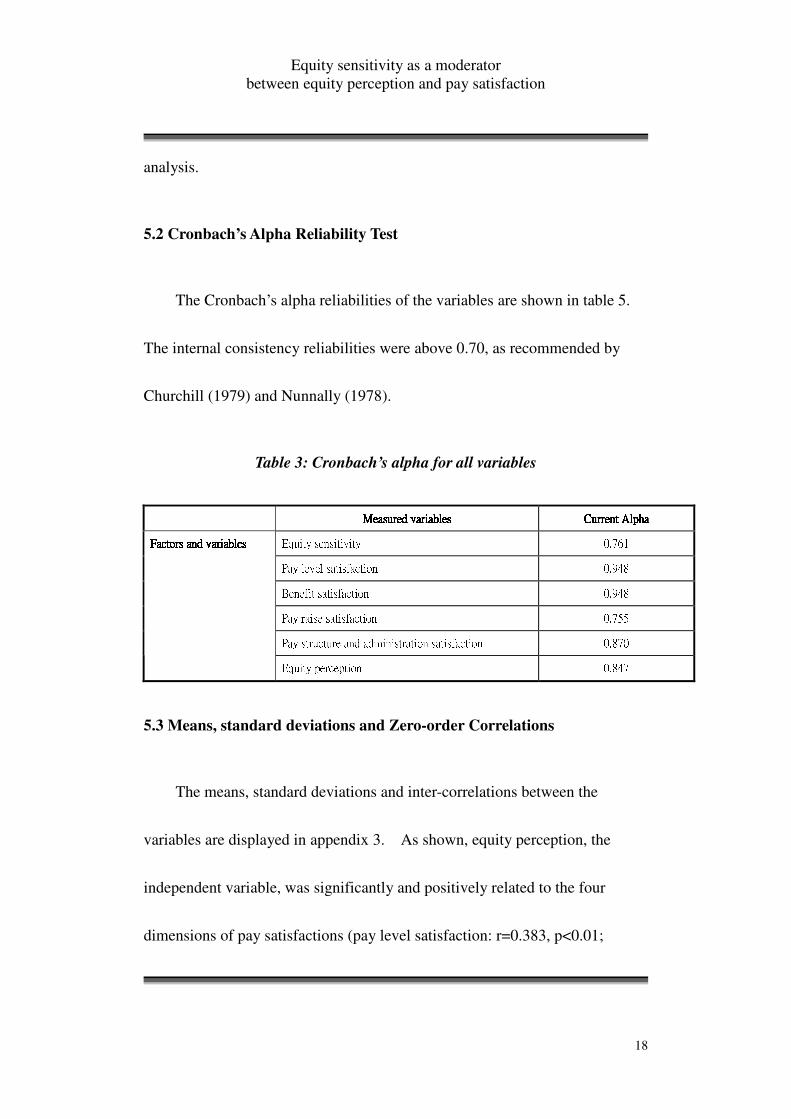
5.2 Cronbach’s Alpha Reliability Test
The Cronbach’s alpha reliabilities of the variables are shown in table 5.
The internal consistency reliabilities were above 0.70, as recommended by
Churchill (1979) and Nunnally (1978).
Table 3: Cronbach’s alpha for all variables Measured Measured Measured Measured variablesvariablesvariablesvariables Current AlphaCurrent AlphaCurrent AlphaCurrent Alpha Equity sensitivity 0.761 Pay level satisfaction 0.948 Benefit satisfaction 0.948 Pay raise satisfaction 0.755 Pay structure and administration satisfaction 0.870 Factors and variablesFactors and variablesFactors and variablesFactors and variables
Equity perception 0.847 5.3 Means, standard deviations and Zero-order Correlations
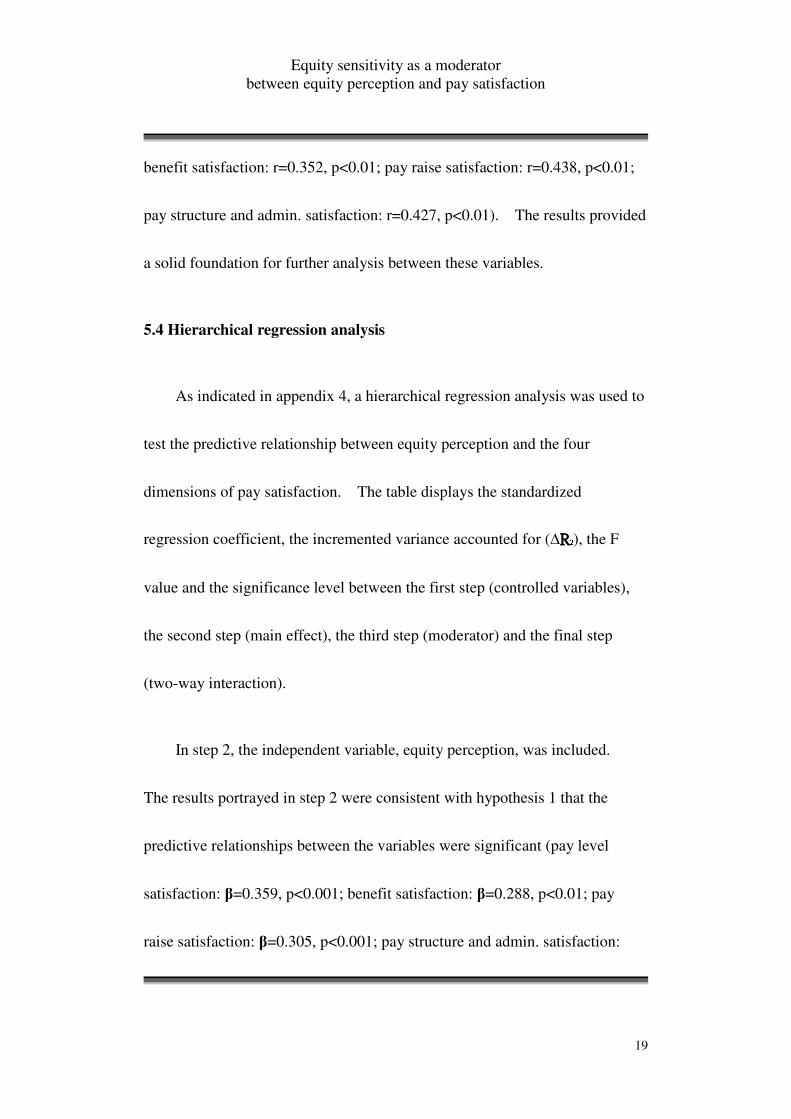
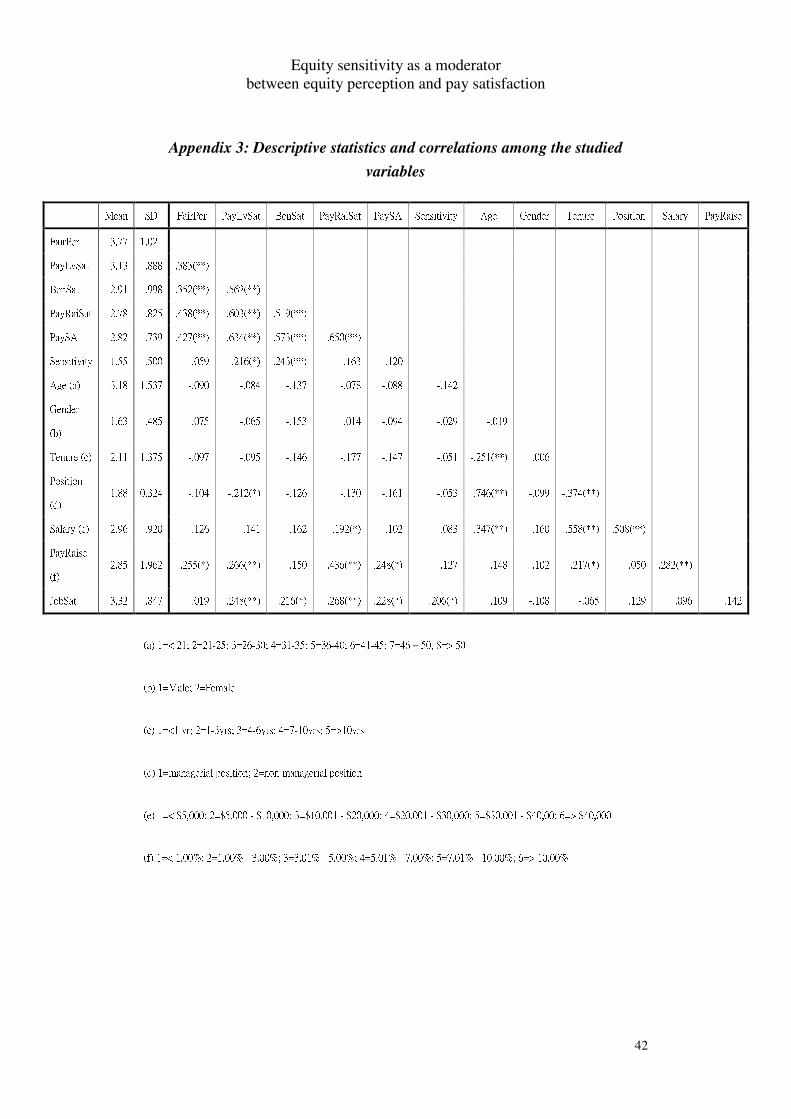
The means, standard deviations and inter-correlations between the
variables are displayed in appendix 3. As shown, equity perception, the
independent variable, was significantly and positively related to the four
dimensions of pay satisfactions (pay level satisfaction: r=0.383, p<0.01;
Equity sensitivity as a moderator between equity perception and pay satisfaction
19
benefit satisfaction: r=0.352, p<0.01; pay raise satisfaction: r=0.438, p<0.01;
pay structure and admin. satisfaction: r=0.427, p<0.01). The results provided
a solid foundation for further analysis between these variables.
5.4 Hierarchical regression analysis
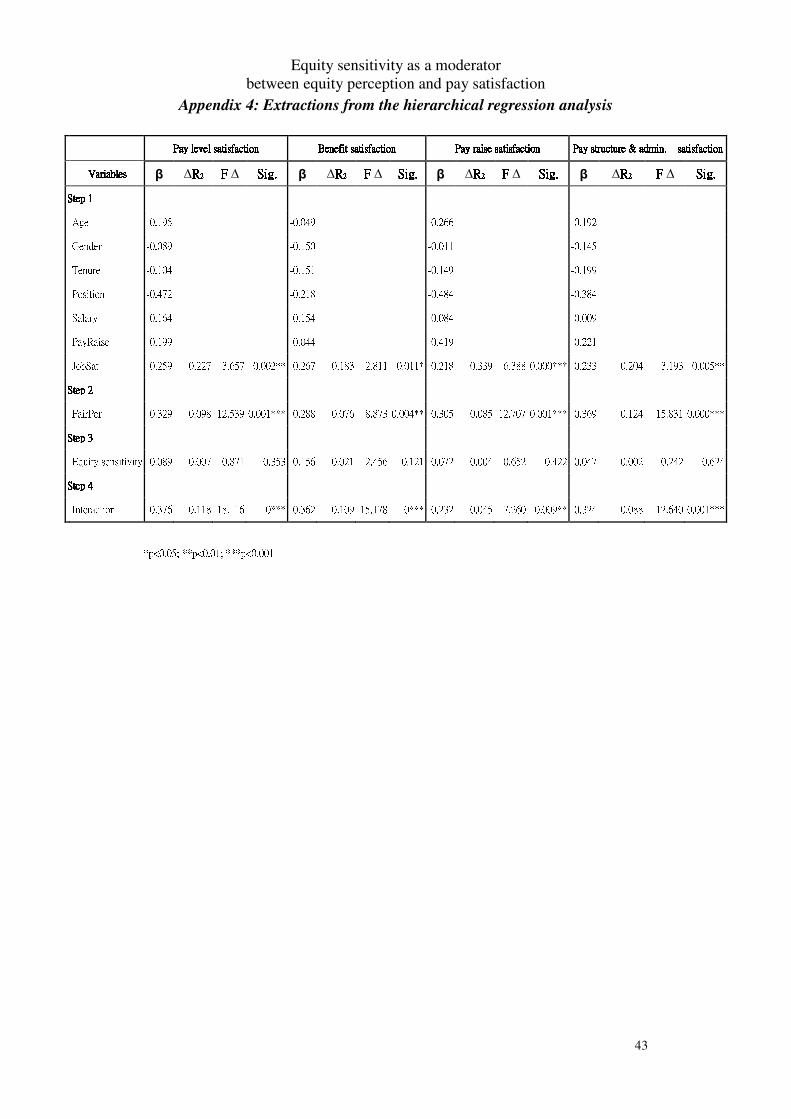
As indicated in appendix 4, a hierarchical regression analysis was used to
test the predictive relationship between equity perception and the four
dimensions of pay satisfaction. The table displays the standardized
regression coefficient, the incremented variance accounted for (∆RRRR2222), the F
value and the significance level between the first step (controlled variables),
the second step (main effect), the third step (moderator) and the final step
(two-way interaction).
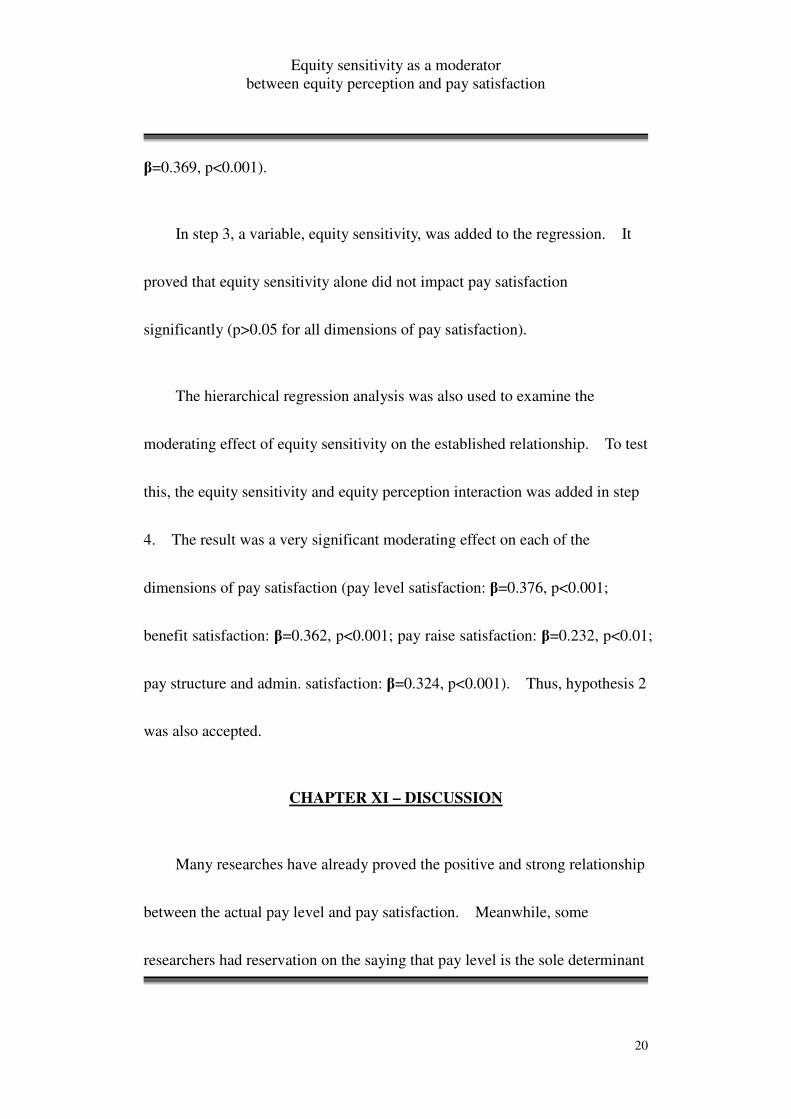
In step 2, the independent variable, equity perception, was included.
The results portrayed in step 2 were consistent with hypothesis 1 that the
predictive relationships between the variables were significant (pay level
satisfaction: β=0.359, p<0.001; benefit satisfaction: β=0.288, p<0.01; pay
raise satisfaction: β=0.305, p<0.001; pay structure and admin. satisfaction:
Equity sensitivity as a moderator between equity perception and pay satisfaction
20
β=0.369, p<0.001).
In step 3, a variable, equity sensitivity, was added to the regression. It
proved that equity sensitivity alone did not impact pay satisfaction
significantly (p>0.05 for all dimensions of pay satisfaction).
The hierarchical regression analysis was also used to examine the
moderating effect of equity sensitivity on the established relationship. To test
this, the equity sensitivity and equity perception interaction was added in step
4. The result was a very significant moderating effect on each of the
dimensions of pay satisfaction (pay level satisfaction: β=0.376, p<0.001;
benefit satisfaction: β=0.362, p<0.001; pay raise satisfaction: β=0.232, p<0.01;
pay structure and admin. satisfaction: β=0.324, p<0.001). Thus, hypothesis 2
was also accepted.
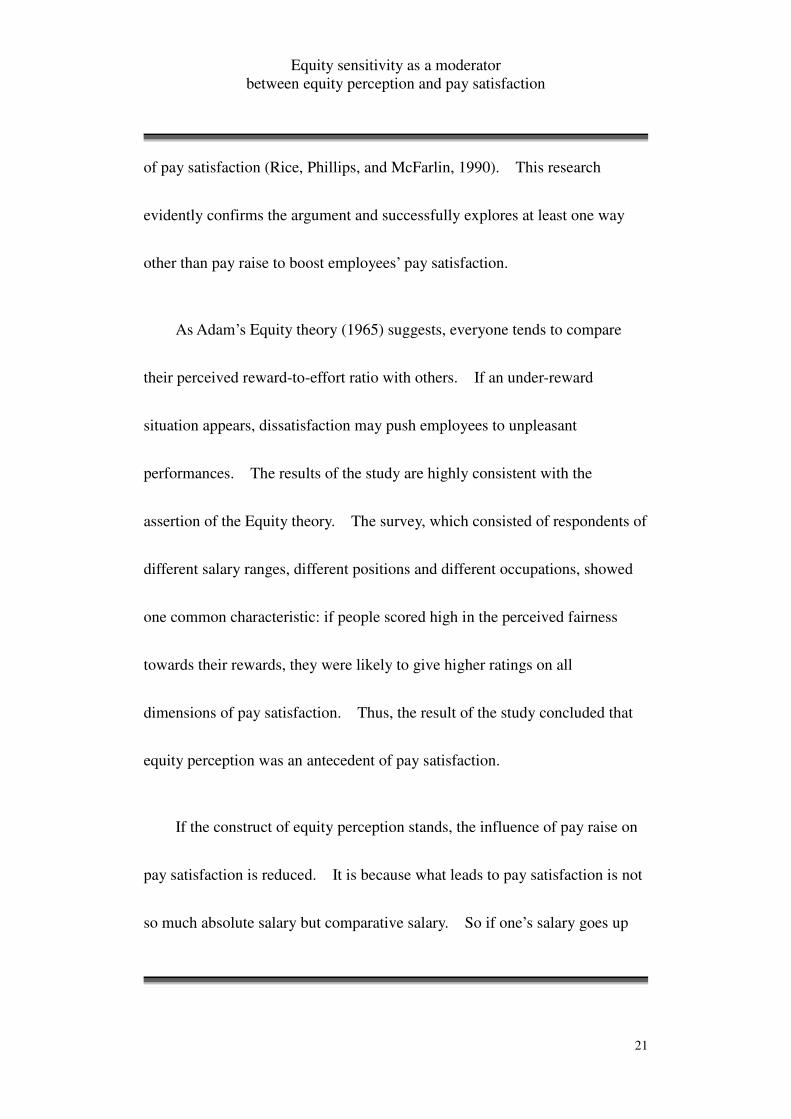
CHAPTER XI – DISCUSSION
Many researches have already proved the positive and strong relationship
between the actual pay level and pay satisfaction. Meanwhile, some
researchers had reservation on the saying that pay level is the sole determinant
Equity sensitivity as a moderator between equity perception and pay satisfaction
21
of pay satisfaction (Rice, Phillips, and McFarlin, 1990). This research
evidently confirms the argument and successfully explores at least one way
other than pay raise to boost employees’ pay satisfaction.
As Adam’s Equity theory (1965) suggests, everyone tends to compare
their perceived reward-to-effort ratio with others. If an under-reward
situation appears, dissatisfaction may push employees to unpleasant
performances. The results of the study are highly consistent with the
assertion of the Equity theory. The survey, which consisted of respondents of
different salary ranges, different positions and different occupations, showed
one common characteristic: if people scored high in the perceived fairness
towards their rewards, they were likely to give higher ratings on all
dimensions of pay satisfaction. Thus, the result of the study concluded that
equity perception was an antecedent of pay satisfaction.
If the construct of equity perception stands, the influence of pay raise on
pay satisfaction is reduced. It is because what leads to pay satisfaction is not
so much absolute salary but comparative salary. So if one’s salary goes up
Equity sensitivity as a moderator between equity perception and pay satisfaction
22
dramatically, but so does that of his/her comparison group, there is no change.
No matter what people are paid, if they believe that they are not equitably and
fairly paid, they become dissatisfied(Adrian Furnham., 2005). This suggests
that attention should also be put on comparative salaries, rather than actual
amount of salaries alone.
As shown in step of appendix 4, as well as appendix 5, 6, 7 and 8, the
research proved that employees’ equity sensitivity had a moderating effect on
the relationship between equity perception and different dimensions of pay
satisfaction. More specifically, equity sensitive group will result in higher
pay satisfaction than the equity insensitive group, given a highly equitable
working condition. One possible explanation is that the equity insensitive
group is not really concern about reward fairness. As suggested by
literatures, a benevolent could be satisfied with the underpaid situation
because they would like to establish long-term relationship with employers
(Huseman et al., 1985, 1987; King el at., 1993; Miles el at., 1989). As a
result, the equity insensitive group showed a weaker influence to the
relationship between equity perception and pay satisfaction.
Equity sensitivity as a moderator between equity perception and pay satisfaction
23
Previous researches regarding the above-mentioned individual-level
variables, like gender, age, seniority, and tenure- status, has been contradictory
and inconclusive (Keaveny & Inderrieden, 2000; Oshagbemi, 2000a;
Oshagbemi, 2000b; Kalleberg & Loscocco, 1983; Oshagbemi, 1997; Bediean,
Ferris, & Kacmar, 1992). The zero-order correlation table in appendix 3
revealed that none of the control variables, except job satisfaction and the last
pay raise, did influence the four dimensions of pay satisfaction. Perhaps it
was best to assume that most individual-level variables had little, if any, effect
upon job and pay satisfaction. Further analysis between these factors and
pay satisfaction, hence, was not recommended.
6.1 Practical implications
The findings presented several important conclusions for organizations to
recognize.
First of all, in order to have higher pay satisfaction, rewards should be
closely linked with employees’ effort. If employees’ input and performances
are not recognized, they are likely to perceive a poor reward-to-effort ratio;
Equity sensitivity as a moderator between equity perception and pay satisfaction
24
and, pay dissatisfaction would appear subsequently. For organizations still
using a pay system based on year of services, experiences and loyalty, it is
time to consider shifting to a more performance-based pay system (Adrian
Furnham, 2005), if pay satisfaction is on top of their HR objectives.
Second, while it is impossible to avoid comparison between employees,
increasing emphasis should be put on improving the transparency and
communication of the remuneration system. In some cases, employees
misunderstand the criteria in the appraisal and the critical success factors of
their positions that they put effort in irrelevant areas. When their “wrongful
input” is not recognized, they perceive a low reward-to-effort ratio and get a
very low pay satisfaction. Lowered pay satisfaction will lead to poorer
performances, followed by an even poorer reward-to-effort ratio. This is
merely a vicious cycle. In contrast, employees who received performance
feedback and were compensated accordingly enjoyed higher pay satisfaction
than any other group of employees. (Mary Jo Ducharme, Parbudyal Singh,
Mark Podolsky, 2005). If employees are given adequate information about
salary arrangement, there will be less misunderstandings and pay satisfaction
Equity sensitivity as a moderator between equity perception and pay satisfaction
25
will be followed (Paul D Sweeney, Dean B McFarlin (2005).
Followed by improved transparency and communication should be a
grievances channel. Organizations should be opened for anyone who would
like to air their perceived unfair treatment. The grievances channel, on the
other side, could provide a platform for HR departments to explain to and
comfort the unsatisfied. Once employees are explained the appropriateness
and rationale of the salary arrangement, they will obtain perceived equity
again.
Fourth, organizations should be more aware to the equity sensitivity
groups their employees belong to. As proved above, equity sensitivity has a
strong impact on pay satisfaction. Investigations could be carried out within
organizations to explore the equity sensitivity of employees. Results of the
investigation could be the foundation in designing the remuneration system.
Finally, this research provided concrete evidences to Rice, Phillips, and
McFarlin’s findings (1990) that there were other predictors to pay satisfaction
other than the actual pay level. In order to retain and attract talents,
Equity sensitivity as a moderator between equity perception and pay satisfaction
26
organizations should continue to explore and should offer employees other
antecedents of pay satisfaction. It helps to minimize the effect of the actual
pay level on overall pay satisfaction.
6.2 Limitations
One of the limitations of this study is that data is gathered in a self-report
format. In the research setting, only the employees are accessed, but not their
supervisors or their peers. This self-report survey setting could attribute to a
response bias.
Moreover, measurements on variables, like perceived equity and pay
satisfaction, are rather subjective. It is somehow difficult to ensure the
inter-respondent reliability in answering the items in the questionnaire.
Simply comparing their scores on corresponding items could constitute a bias.
Additionally, like many of the researches conducted previously, the study
is a cross-sectional study. Causal inferences created from cross-sectional
designs are only inferences (Spector, 1981). A further longitudinal research
on the topic is highly recommended.
Equity sensitivity as a moderator between equity perception and pay satisfaction
27
Last but not the least, the method to define respondents’ equity sensitivity
is controversial. According to the conventional rule set by previous
researchers (cf., King, Miles and Day 1993; Allen and White 2002), people
who score between 1/2 standard deviation from the mean score are regarded
equity sensitives. Unlike other personality tests, such as MBTI, there are no
standard and clear-cut boundaries to define benevolents, equity sensitives and
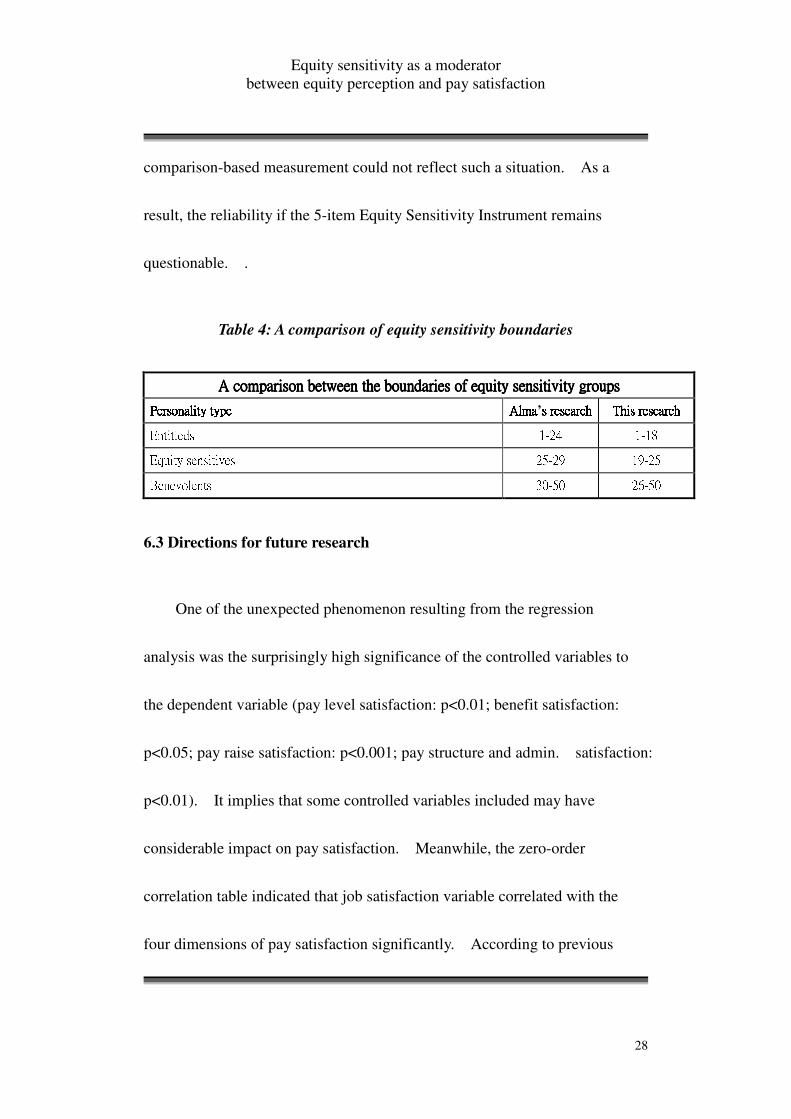
entitleds. For example, as shown in table 4, the boundaries of entitleds,
equity sensitives and benevolents in Alma’s research (2005), were totally
different from that of this study. This comparison-based measurement could
be challenged on 3 areas: i) Given all other factors constant, an entitled in
one’s research may be considered as a benevolent in the other’s. The
information from the same person, who answers the same questions in the
same way, may be interpreted in totally different ways in two separate samples.
ii) If more high-scorers are added into a group of sample, the mean and
standard deviation will be changed, so will be the boundaries. An entitled may
be shifted to a benevolent accordingly. iii) It is possible that all the
employees in the organization belong to one equity sensitivity group, but the
Equity sensitivity as a moderator between equity perception and pay satisfaction
28
comparison-based measurement could not reflect such a situation. As a
result, the reliability if the 5-item Equity Sensitivity Instrument remains
questionable. .
Table 4: A comparison of equity sensitivity boundaries
A comparison between the A comparison between the A comparison between the A comparison between the boundariesboundariesboundariesboundaries of equity sensitivity groups of equity sensitivity groups of equity sensitivity groups of equity sensitivity groups Personality typePersonality typePersonality typePersonality type AlmaAlmaAlmaAlma’s researchs researchs researchs research This researchThis researchThis researchThis research Entitleds 1-24 1-18 Equity sensitives 25-29 19-25 Benevolents 30-50 26-50 6.3 Directions for future research
One of the unexpected phenomenon resulting from the regression
analysis was the surprisingly high significance of the controlled variables to
the dependent variable (pay level satisfaction: p<0.01; benefit satisfaction:
p<0.05; pay raise satisfaction: p<0.001; pay structure and admin. satisfaction:
p<0.01). It implies that some controlled variables included may have
considerable impact on pay satisfaction. Meanwhile, the zero-order
correlation table indicated that job satisfaction variable correlated with the
four dimensions of pay satisfaction significantly. According to previous
Equity sensitivity as a moderator between equity perception and pay satisfaction
29
researches, pay satisfaction has been shown to influence overall job
satisfaction, motivation and performance, absenteeism and turnover, and may
be related to pay-related grievances and lawsuits (Cable & Judge, 1994;
Gerhart & Milkovich, 1990; Huber & Crandall, 1994; Huselid, 1995;
Milkovich & Newman, 2002). Further analysis is recommended to
investigate the specific relationship between job satisfaction and pay
satisfaction.
CHAPTER XII – CONCLUSION
It is pleased to conclude from the result of the study that there is at least
one factor other than the actual pay received by employees influencing pay
satisfaction.
As equity perception towards the pay system was found to be a predictor
of pay satisfaction, organizations should shift their focus from “how much to
allocate” to “how to allocate” rewards to employees. Perhaps, it is a piece of
good news to those small- and medium-sized enterprises which show less
capability to attract and retain talents by market-leading compensation
Equity sensitivity as a moderator between equity perception and pay satisfaction
30
packages.
The study also provides adequate evidence to show that employees’
personality types constitute great influences on their pay satisfaction level. No
single form of reward system in the World is perfect. The effectiveness of a
reward system in terms of pay satisfaction is partly determined by the equity
sensitivity of the major stakeholders, the employees. If a comprehensive and
well-designed reward system still receives complaints from employees, it may
be explained by employees’ distinctive equity sensitivity. HR practitioners
should never ignore this factor when evaluating the effectiveness of a reward
system.
Equity sensitivity as a moderator between equity perception and pay satisfaction
31
REFERENCES
Adams, J. S. (1965). Inequity in social exchange. In L. Berkowitz (Ed.),
Advances in experimental social psychology, vol. 2: 267-299. New York:
Academic Press
Adrian Furnham. European Business Forum (2005). London: Winter 2005., Iss.
20; pg. 16, 2 pgs
Allen, R. and C. White. (2002). “Equity Sensitivity Theory: A Test of
Responses To Two Types of Under-Reward Situations.” Journal of
Managerial Issues. 14: 435-451.
Alma Mintu-Wimsatt (2005), Equity Sensitivity and Negotiation Behaviors: A
Look at Mexican Exporters; Academy of Marketing Science Review
volume 2005 no. 01
Bedeian, A.G., Ferris, G.R., & Kacmar, K.M. 1992. Age, tenure, and job
satisfaction: A tale of two perspectives. Journal of Vocational Behavior,
February: 33-48.
Berkowitz, L., Fraser, C., Treasure, F. P., & Cochran, S. (1987). Pay equity,
job gratifications, and comparisons in pay satisfaction. Journal of
Equity sensitivity as a moderator between equity perception and pay satisfaction
32
Applied Psychology, 72, 544-551
Cable, D.M., & Judge, T.A. (1994). Pay preferences and job search decisions:
A person - organization fit perspective. Personnel Psychology, 47:
317-348.
Churchill, G.A. (1979). A paradigm for developing better measures of
marketing constructs. Journal of Marketing Research, 16 (2), 64-73
David E Terpstra, Andre L Honoree. (2003) The relative importance of
external, internal, individual and procedural equity to pay satisfaction,
Compensation and Benefits Review. Saranac Lake: Nov/Dec 2003.Vol.35,
Iss. 6; pg. 67
Dyer, L. T., & R. Theriault. (1976). The Determinants of Pay Satisfaction.
Journal of Applied Psychology,61: 594-604.
Gerhart, B., & Milkovich, G.T. (1990). Organizational differences in
managerial compensation financial performance. Academy of
Management Journal, 33: 663-691
Gartrell, D. C. (1982). On the visibility of wage referents. Canadian Journal
of Sociology, 7, 117-143.
Equity sensitivity as a moderator between equity perception and pay satisfaction
33
Heneman HG III, (1985), Pay satisfaction. In Rowland KW, Ferris G (Eds.)
Research in personnel and human resource management Vol. III, pp.
115-139, Greenwich, CN: JAI Press.
Heneman & Schwab, (1985) Pay satisfaction: Its multidimensional nature and
measurement. International Journal of Psychology, 20 (s), 129-141
Huber, V., & Crandall, S. (1994). Job measurement: A social-cognitive
decision perspective. InG.R. Ferris (Ed.), Research in personnel and
human resources management, vol.12: 223-269.Greenwich, CT: JAI
Press.
Huselid, M.A. (1995). The impact of human resource management practices
on turnover, productivity, and corporate financial performance. Academy
of Management Journal, 38: 635-672.
Huseman, R.C., Hatfield, J.D. and Miles, E.W. (1985). ‘Test for individual
perceptions of job equity: Some preliminary findings’, Perceptual and
Motor Skills, 61, 1055-1064
Huseman, R.C., Hatfield, J.D. and Miles, E.W. (1987). ‘A new perspective on
equity theory: The equity sensitivity construct’, The Academy of
Equity sensitivity as a moderator between equity perception and pay satisfaction
34
Management Review, 12, 222-234
Jill Kickul & Scott W. Lester, (2001) Broken promises: Equity sensitivity as a
moderator between psychological contract breach and employee attitudes
and behavior, The Academy of Management Review, 12, 300-311
Kalleberg, A.L., & Loscocco, K.A. (1983). Aging, values, and rewards:
Explaining age differences in job satisfaction. American Sociological
Review, 78-90.
Keaveny, T.J., & Inderrieden, E.J. (2000). Gender differences in pay
satisfaction and pay expectations. Journal of Managerial Issues, 12 (3):
363-379.
King, W., & Miles, E., & Day D. (1993) A Test and refinement of the equity
sensitivity construct. Journal of Organizational Behavior, 14, 301-317
King, W., & Miles, E., & Day, D. (1993). A test and refinement of the equity
sensitivity. Journal of Occupational and Organizational Psychology, 67,
133-142
King, W.C., Jr., Miles, E.W. and Day, D.D. (1993). ‘The measurement of
equity sensitivity’. Manuscript submitted for publication.
Equity sensitivity as a moderator between equity perception and pay satisfaction
35
Kulik, C. T, & Ambrose, M. L. (1992). Personal and situational determinants
of referent choice. Academy of Management Review, 17, 212-237.
Law, K. & Wong, C. (1998). Relative importance of referents on pay
satisfaction: A review and test of a new policy-capturing approach.
Journal of Occupational and Organizational Psychology, 71 (1), 47-60.
Lawler, E.E., III (1976). New approaches to pay – Innovations that work.
Personnel, 53 (5), 11
Mary Jo Ducharme, Parbudyal Singh, Mark Podolsky (2005). Exploring the
Links between Performance Appraisals and Pay Satisfaction,
Compensation and Benefits Review. Saranac Lake: Sep/Oct
2005.Vol.37, Iss. 5; pg. 46, 7 pgs
Miles, E.W., Hatfield, J.D. and Huseman, R.C. (1989). ‘The equity sensitivity
construct: Potential implications for worker performance’. Journal of
Management, 15, 581-588.
Milkovich, G.T., & Newman, J.M. (2002). Compensation. Boston:
McGraw-Hill Irwin. pg. 80, 7 pgs
Mowday, R.T. (1991). Equity theory perceptions of behavior in organizations.
Equity sensitivity as a moderator between equity perception and pay satisfaction
36
In R.M. Steers & L.W. Porter (Eds.). Motivation and work behavior:
111-131. New York: McGraw-Hill
Nunnally, J. (1978). Psychometric theory. New York: McGraw-Hall
Onne Janssen, (2004), ABI/INFORM Global, Academy of Management
Journal Oct 2001; 44, 5;
Oshagbemi, T. (2000a). Correlates of pay satisfaction in higher education.
International Journal of Educational Management, 14(1): 31-39.
Oshagbemi, T. (2000b). Gender differences in the job satisfaction of university
teachers. Women in Management Review, 15 (7): 331-343.
Oshagbemi, T. (1997). The influence of rank on the job satisfaction of
organizational members. Journal of Managerial Psychology, 12 (8):
511-519.
Paul D Sweeney, Dean B McFarlin (2005). Wage comparisons with similar
and dissimilar others; Journal of Occupational and Organizational
Psychology..Vol.78 Part 1. pg. 113, 19 pgs
Rice, R.W., Phillips, S.M. & McFarlin, D.B. (1990). Multiple discrepancies
and pay satisfaction. Journal of Applied Psychology, 75, 386-393
Equity sensitivity as a moderator between equity perception and pay satisfaction
37
Robinson, S.L., (1996), Trust and breach of the psychological contract.
Administrative Science Quarterly, 41, 574-599.
Scarpello, V., V. Huber & R.J. Vandenberg. (1988). Compensation Satisfaction:
Its Measurement and Dimensionality. Journal of Applied Psychology,
73(2): 163-171.
Schwab, D. P., & M.J. Jr. Wallace. (1974). Correlates of Employees
Satisfaction with Pay. IndustrialRelations, 13: 78-89.
Shaw, J.D., Duffy, M. K., Jenkins, G. D. Jr., & Gupta, N. (1999). Positive and
negative affect, signal sensitivity, and pay satisfaction. Journal of
Management, 25 (2), 189-206
Smola, Karen Wey, Ph.D. (2003), Incorporating individual-difference,
monetary-based constructs into a multi-dimensional pay satisfaction
model, Auburn University, 122 pages; AAT 3095815
Spector, P.E. (1981) Research designs. Newbury Park, CA: Sage Publications
Van Yperen, N.W. (1996). Communal orientation and the burnout syndrome
among nurses: A replication and extension. Journal of Applied Social
Psychology, 26: 338-351.
Equity sensitivity as a moderator between equity perception and pay satisfaction
38
Weiner, N. (1980). Determinants and Consequences of Pay Satisfaction: A
Comparison of Two Models. Personnel Psychology, 33: 741-757.

Equity sensitivity as a moderator between equity perception and pay satisfaction
39
APPENDIX
Tables and Questionnaires
Equity sensitivity as a moderator between equity perception and pay satisfaction
40
Appendix 1: Demographic information of the sample VariablesVariablesVariablesVariables ItemsItemsItemsItems FrequencyFrequencyFrequencyFrequency PercentPercentPercentPercentaaaagegegege Male 46 40.4 Gender Female 68 59.6 < 21 3 2.7 21 - 25 45 39.8 26 - 30 26 23.0 31 - 35 14 12.4 36 - 40 9 8.0 41 - 45 6 5.3 46 - 50 9 8.0 Age
> 50 1 .9 Managerial 12 10.43 Position Non-managerial 99 86.09 < 1yr 51 44.35 1 - 3yr 27 23.48 4 - 6 yr 13 11.30 7 – 10 yr 6 5.22 Tenure > 10yr 18 15.65 <$5000: 2 1.74% $5000-$10000: 25 21.74% $10001-$20000: 69 60.00% $20001-$30000: 10 8.70% $30001-$40000: 1 0.87%
Salary range >$40000: 6 5.22% <1.00%: 41 35.65% 1.00%-3.00%: 26 22.61% 3.01%-5.00%: 10 8.70% 5.01%-7.00%: 8 6.96% 7.01%-10.00%: 4 3.48%
Last pay raise >10.00%: 18 15.65% Strongly dissatisfied: 2 1.74% Dissatisfied: 14 12.17% Neither: 44 38.26% Satisfied: 46 40.00% Job satisfaction Strongly satisfied: 8 6.96%
Equity sensitivity as a moderator between equity perception and pay satisfaction
41
Appendix 2: Rotated factor matrix Factor 1 2 3 4 5 6 Give to the org .697 Help Others .549 Contribute to the org .787 Benefit the org .646 Give better than receive .460 Current salary (PL01) .820 Overall level of pay (PL02) .718 Size of my current salary (PL03) .814 Take-home pay (PL04) .749 Benefit package (BEN01) .837 Value of my benefits (BEN02) .777 Amount the company pays towards my benefits (BEN03) .792 Number of benefits (BEN04) .921 Most recent pay raise (PR01) .634 Supervisor's influence (PR02) .659 How my raises are determined (PR04) .579 Company's pay structure (S/L01) .614 Consistency of pay policies (S/L04) .697 Differences in pay among the jobs in the company (S/L05) .484 Pay administration (S/L06) .868 Working too hard .629 Effort not apprieciated .647 Invest more than receive .765 Rewards not proportional to investment .708 Not worth putting energy to my job .598 Feel unfairly treated .639
Equity sensitivity as a moderator between equity perception and pay satisfaction
42
Appendix 3: Descriptive statistics and correlations among the studied
variables Mean SD FairPer PayLvSat BenSat PayRaiSat PaySA Sensitivity Age Gender Tenure Position Salary PayRaise FairPer 3.77 1.021 PayLvSat 3.13 .888 .383(**) BenSat 2.91 .998 .352(**) .562(**) PayRaiSat 2.78 .825 .438(**) .603(**) .519(**) PaySA 2.82 .739 .427(**) .634(**) .573(**) .650(**) Sensitivity 1.55 .500 .059 .216(*) .243(**) .163 .120 Age (a) 3.18 1.537 -.090 -.084 -.137 -.078 -.088 -.142 Gender (b) 1.63 .485 .075 -.065 -.153 .014 -.094 -.029 -.019 Tenure (c) 2.11 1.375 -.097 -.095 -.146 -.177 -.147 -.051 -.251(**) .006 Position (d) 1.88 0.324 -.104 -.212(*) -.126 -.130 -.161 -.053 .746(**) -.099 -.374(**) Salary (e) 2.96 .920 .126 .141 .162 .192(*) .102 .083 .347(**) -.160 -.558(**) .508(**) PayRaise (f) 2.85 1.962 .255(*) .266(**) .150 .436(**) .248(*) .127 -.148 .102 -.217(*) .050 .282(**) JobSat 3.32 .847 .019 .248(**) .216(*) .268(**) .228(*) .206(*) .109 -.108 -.065 .129 .096 .142 (a) 1=< 21; 2=21-25; 3=26-30; 4=31-35; 5=36-40; 6=41-45; 7=46 – 50, 8=> 50 (b) 1=Male; 2=Female (c) 1=<1 yr; 2=1-3yrs; 3=4-6yrs; 4=7-10yrs; 5=>10yrs (d) 1=managerial position; 2=non-managerial position (e) 1=< $5,000; 2=$5,000 - $10,000; 3=$10,001 - $20,000; 4=$20,001 - $30,000; 5=$30,001 - $40,00; 6=> $40,000 (f) 1=< 1.00%; 2=1.00% - 3.00%; 3=3.01% - 5.00%; 4=5.01% - 7.00%; 5=7.01% - 10.00%; 6=> 10.00%
Equity sensitivity as a moderator between equity perception and pay satisfaction
43
Appendix 4: Extractions from the hierarchical regression analysis Pay level satisfactionPay level satisfactionPay level satisfactionPay level satisfaction Benefit satisfactionBenefit satisfactionBenefit satisfactionBenefit satisfaction Pay raise satisfactionPay raise satisfactionPay raise satisfactionPay raise satisfaction Pay structure & adminPay structure & adminPay structure & adminPay structure & admin. . . . satisfactiosatisfactiosatisfactiosatisfactionnnn VariablesVariablesVariablesVariables β ∆RRRR2222 F F F F ∆ Sig.Sig.Sig.Sig. β ∆RRRR2222 F F F F ∆ Sig.Sig.Sig.Sig. β ∆RRRR2222 F F F F ∆ Sig.Sig.Sig.Sig. β ∆RRRR2222 F F F F ∆ Sig.Sig.Sig.Sig. Step 1Step 1Step 1Step 1 Age 0.195 -0.049 0.266 0.192 Gender -0.089 -0.150 -0.011 -0.145 Tenure -0.104 -0.151 -0.149 -0.199 Position -0.472 -0.218 -0.484 -0.384 Salary 0.164 0.154 0.084 0.009 PayRaise 0.199 0.044 0.419 0.221 JobSat 0.259 0.227 3.657 0.002** 0.267 0.183 2.811 0.011* 0.218 0.339 6.388 0.000*** 0.233 0.204 3.193 0.005** Step 2Step 2Step 2Step 2 FairPer 0.329 0.098 12.539 0.001*** 0.288 0.076 8.873 0.004** 0.305 0.085 12.707 0.001*** 0.369 0.124 15.831 0.000*** Step 3Step 3Step 3Step 3 Equity sensitivity 0.089 0.007 0.871 0.353 0.156 0.021 2.456 0.121 0.072 0.004 0.652 0.422 0.047 0.002 0.242 0.624 Step 4Step 4Step 4Step 4 Interaction 0.376 0.118 18.116 0*** 0.362 0.109 15.178 0*** 0.232 0.045 7.260 0.009** 0.324 0.088 12.640 0.001*** *p<0.05; **p<0.01; ***p<0.001
Equity sensitivity as a moderator between equity perception and pay satisfaction
44
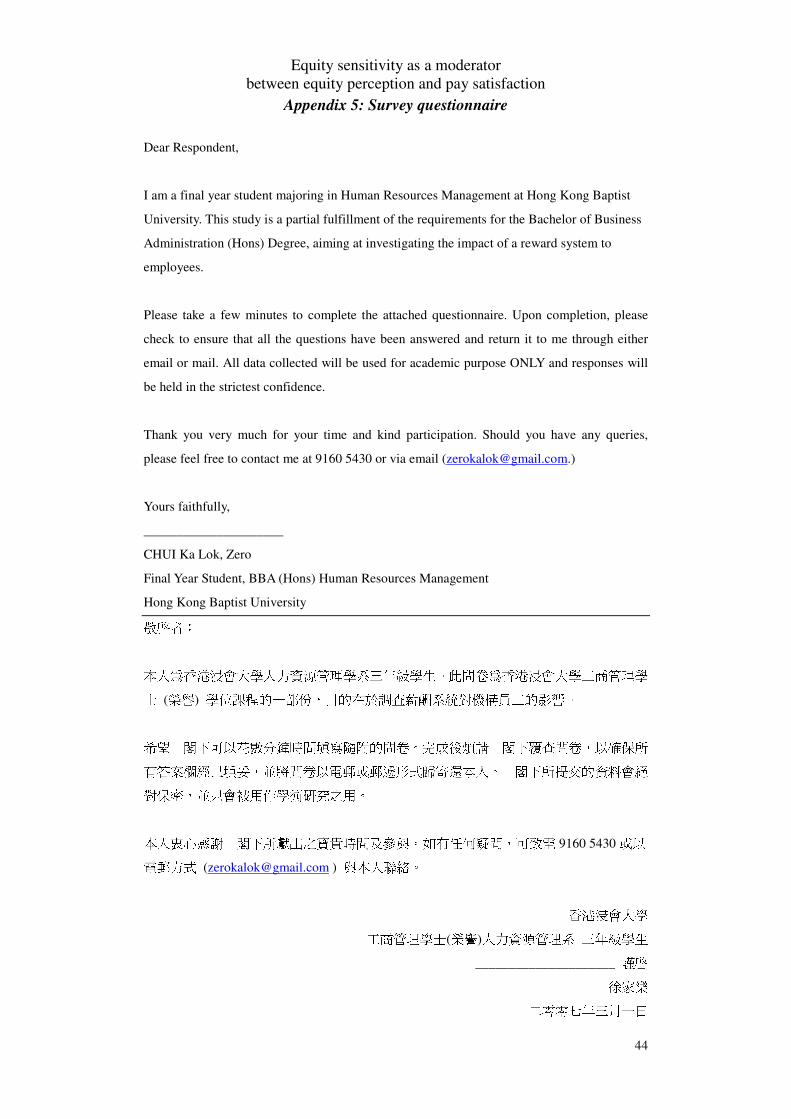
Appendix 5: Survey questionnaire
Dear Respondent,
I am a final year student majoring in Human Resources Management at Hong Kong Baptist
University. This study is a partial fulfillment of the requirements for the Bachelor of Business
Administration (Hons) Degree, aiming at investigating the impact of a reward system to
employees.
Please take a few minutes to complete the attached questionnaire. Upon completion, please
check to ensure that all the questions have been answered and return it to me through either
email or mail. All data collected will be used for academic purpose ONLY and responses will
be held in the strictest confidence.
Thank you very much for your time and kind participation. Should you have any queries,
please feel free to contact me at 9160 5430 or via email ([email protected].)
Yours faithfully,
_____________________
CHUI Ka Lok, Zero
Final Year Student, BBA (Hons) Human Resources Management
Hong Kong Baptist University 敬啟者:
本人為香港浸會大學人力資源管理學系三年級學生。此問卷為香港浸會大學工商管理學士 (榮譽) 學位課程的一部份,目的在於調查薪酬系統對機構員工的影響。
希望 閣下可以花數分鐘時間填寫隨附的問卷。完成後煩請 閣下覆查問卷,以確保所有答案欄經已填妥,並將問卷以電郵或郵遞形式歸寄還本人。 閣下所提交的資料會絕對保密,並只會被用作學術研究之用。
本人衷心感謝 閣下所獻出之寶貴時間及參與。如有任何疑問,可致電 9160 5430 或以電郵方式 ([email protected] ) 與本人聯絡。
香港浸會大學 工商管理學士(榮譽)人力資源管理系 三年級學生
_____________________ 謹啟 徐家樂 二零零七年三月一日
Equity sensitivity as a moderator between equity perception and pay satisfaction
45
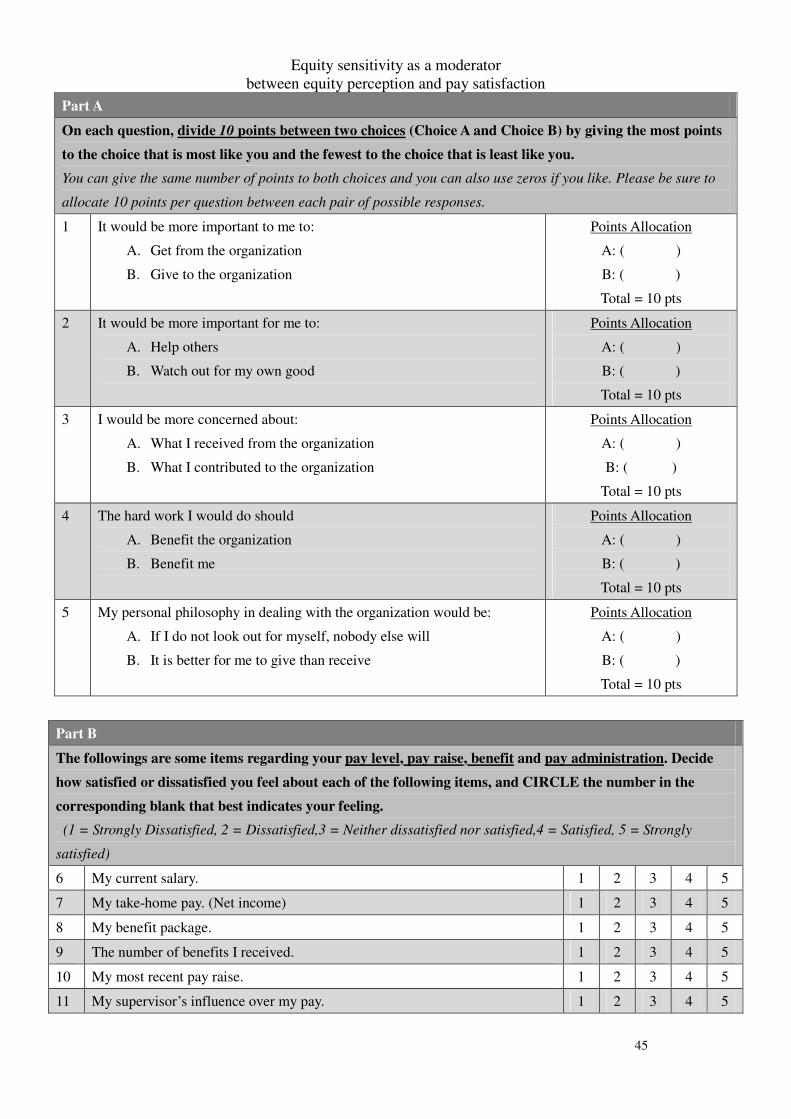
Part A
On each question, divide 10 points between two choices (Choice A and Choice B) by giving the most points
to the choice that is most like you and the fewest to the choice that is least like you.
You can give the same number of points to both choices and you can also use zeros if you like. Please be sure to
allocate 10 points per question between each pair of possible responses.
1 It would be more important to me to:
A. Get from the organization
B. Give to the organization
Points Allocation
A: ( )
B: ( )
Total = 10 pts
2 It would be more important for me to:
A. Help others
B. Watch out for my own good
Points Allocation
A: ( )
B: ( )
Total = 10 pts
3 I would be more concerned about:
A. What I received from the organization
B. What I contributed to the organization
Points Allocation
A: ( )
B: ( )
Total = 10 pts
4 The hard work I would do should
A. Benefit the organization
B. Benefit me
Points Allocation
A: ( )
B: ( )
Total = 10 pts
5 My personal philosophy in dealing with the organization would be:
A. If I do not look out for myself, nobody else will
B. It is better for me to give than receive
Points Allocation
A: ( )
B: ( )
Total = 10 pts
Part B
The followings are some items regarding your pay level, pay raise, benefit and pay administration. Decide
how satisfied or dissatisfied you feel about each of the following items, and CIRCLE the number in the
corresponding blank that best indicates your feeling.
(1 = Strongly Dissatisfied, 2 = Dissatisfied,3 = Neither dissatisfied nor satisfied,4 = Satisfied, 5 = Strongly
satisfied)
6 My current salary. 1 2 3 4 5
7 My take-home pay. (Net income) 1 2 3 4 5
8 My benefit package. 1 2 3 4 5
9 The number of benefits I received. 1 2 3 4 5
10 My most recent pay raise. 1 2 3 4 5
11 My supervisor’s influence over my pay. 1 2 3 4 5
Equity sensitivity as a moderator between equity perception and pay satisfaction
46
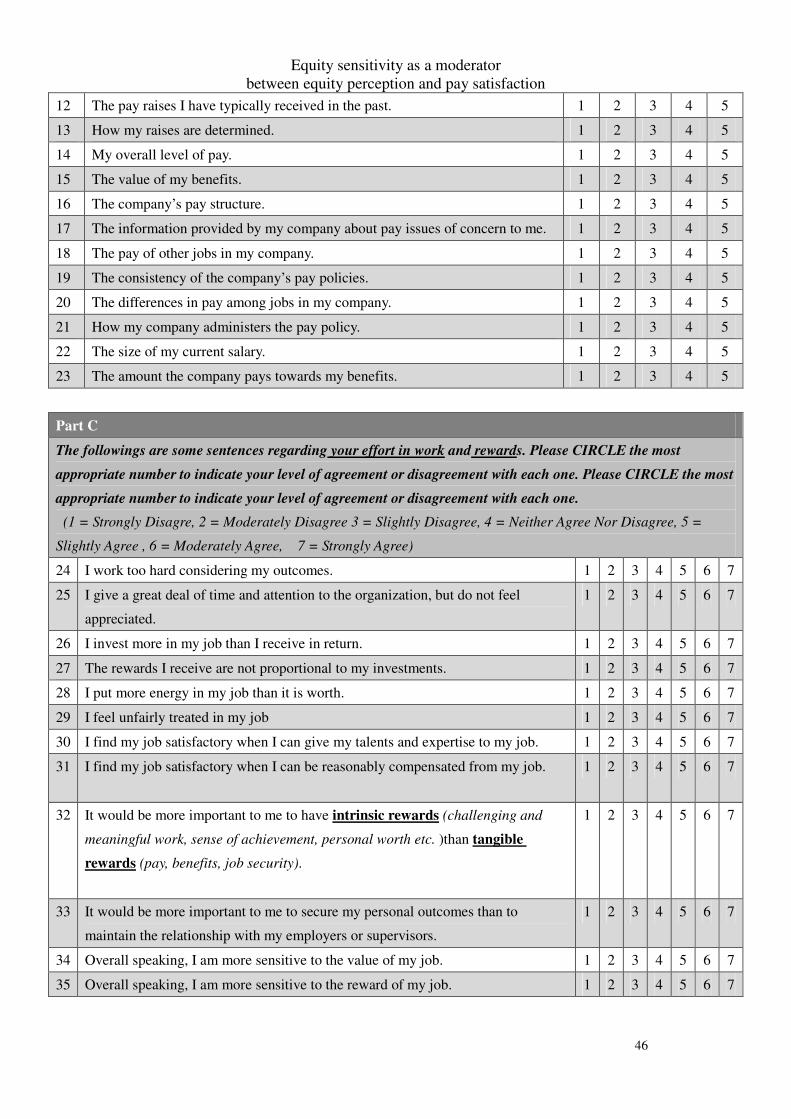
12 The pay raises I have typically received in the past. 1 2 3 4 5
13 How my raises are determined. 1 2 3 4 5
14 My overall level of pay. 1 2 3 4 5
15 The value of my benefits. 1 2 3 4 5
16 The company’s pay structure. 1 2 3 4 5
17 The information provided by my company about pay issues of concern to me. 1 2 3 4 5
18 The pay of other jobs in my company. 1 2 3 4 5
19 The consistency of the company’s pay policies. 1 2 3 4 5
20 The differences in pay among jobs in my company. 1 2 3 4 5
21 How my company administers the pay policy. 1 2 3 4 5
22 The size of my current salary. 1 2 3 4 5
23 The amount the company pays towards my benefits. 1 2 3 4 5
Part C
The followings are some sentences regarding your effort in work and rewards. Please CIRCLE the most
appropriate number to indicate your level of agreement or disagreement with each one. Please CIRCLE the most
appropriate number to indicate your level of agreement or disagreement with each one.
(1 = Strongly Disagre, 2 = Moderately Disagree 3 = Slightly Disagree, 4 = Neither Agree Nor Disagree, 5 =
Slightly Agree , 6 = Moderately Agree, 7 = Strongly Agree)
24 I work too hard considering my outcomes. 1 2 3 4 5 6 7
25 I give a great deal of time and attention to the organization, but do not feel
appreciated.
1 2 3 4 5 6 7
26 I invest more in my job than I receive in return. 1 2 3 4 5 6 7
27 The rewards I receive are not proportional to my investments. 1 2 3 4 5 6 7
28 I put more energy in my job than it is worth. 1 2 3 4 5 6 7
29 I feel unfairly treated in my job 1 2 3 4 5 6 7
30 I find my job satisfactory when I can give my talents and expertise to my job. 1 2 3 4 5 6 7
31 I find my job satisfactory when I can be reasonably compensated from my job.
1 2 3 4 5 6 7
32 It would be more important to me to have intrinsic rewards (challenging and
meaningful work, sense of achievement, personal worth etc. )than tangible
rewards (pay, benefits, job security).
1 2 3 4 5 6 7
33 It would be more important to me to secure my personal outcomes than to
maintain the relationship with my employers or supervisors.
1 2 3 4 5 6 7
34 Overall speaking, I am more sensitive to the value of my job. 1 2 3 4 5 6 7
35 Overall speaking, I am more sensitive to the reward of my job. 1 2 3 4 5 6 7
Equity sensitivity as a moderator between equity perception and pay satisfaction
47
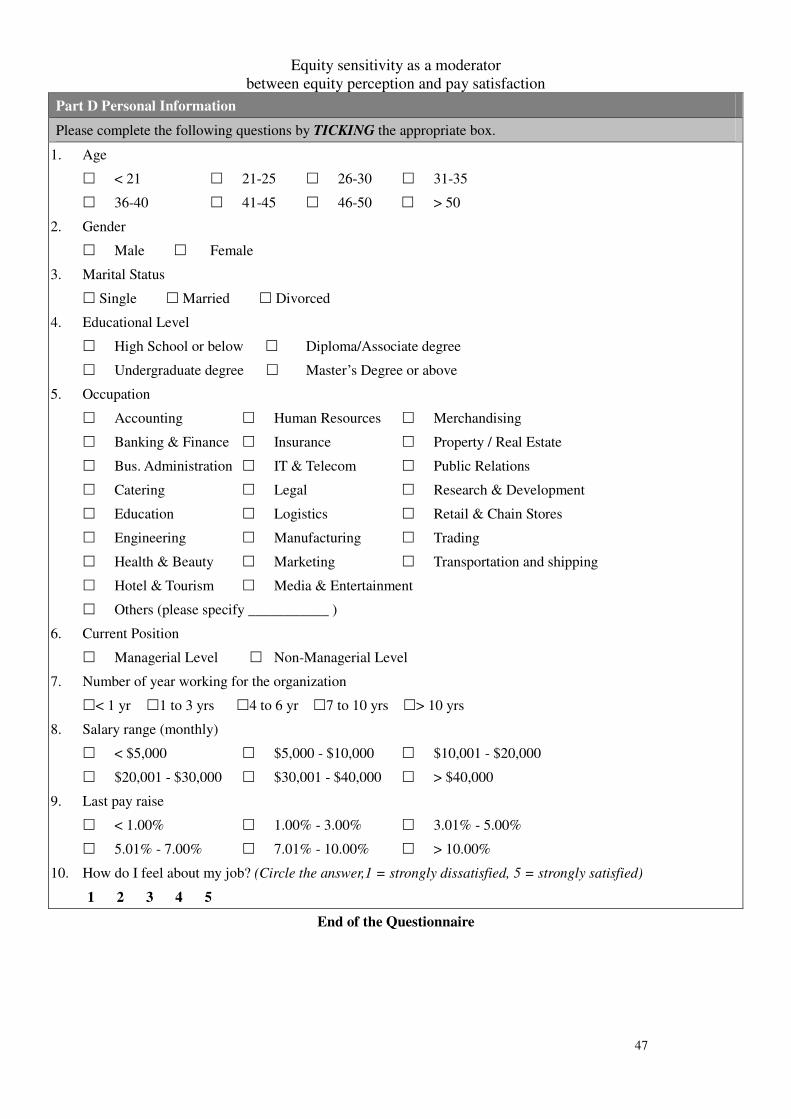
Part D Personal Information
Please complete the following questions by TICKING the appropriate box.
1. Age
� < 21 � 21-25 � 26-30 � 31-35
� 36-40 � 41-45 � 46-50 � > 50
2. Gender
� Male � Female
3. Marital Status
� Single � Married � Divorced
4. Educational Level
� High School or below � Diploma/Associate degree
� Undergraduate degree � Master’s Degree or above
5. Occupation
� Accounting � Human Resources � Merchandising
� Banking & Finance � Insurance � Property / Real Estate
� Bus. Administration � IT & Telecom � Public Relations
� Catering � Legal � Research & Development
� Education � Logistics � Retail & Chain Stores
� Engineering � Manufacturing � Trading
� Health & Beauty � Marketing � Transportation and shipping
� Hotel & Tourism � Media & Entertainment
� Others (please specify ___________ )
6. Current Position
� Managerial Level � Non-Managerial Level
7. Number of year working for the organization
�< 1 yr �1 to 3 yrs �4 to 6 yr �7 to 10 yrs �> 10 yrs
8. Salary range (monthly)
� < $5,000 � $5,000 - $10,000 � $10,001 - $20,000
� $20,001 - $30,000 � $30,001 - $40,000 � > $40,000
9. Last pay raise
� < 1.00% � 1.00% - 3.00% � 3.01% - 5.00%
� 5.01% - 7.00% � 7.01% - 10.00% � > 10.00%
10. How do I feel about my job? (Circle the answer,1 = strongly dissatisfied, 5 = strongly satisfied)
1 2 3 4 5
End of the Questionnaire