Vijaya Diagnostic Centre - Equity Research
26
Please refer to important disclosures at the end of this report Market Cap Rs61.1bn/ US$822mn Year to Mar FY21 FY22E FY23E FY24E Bloomberg VIJAYA IN Revenue (Rs mn) 3,767 4,477 4,987 5,782 Shares Outstanding (mn) 102.0 Net Income (Rs mn) 843 969 987 1,209 52-week Range (Rs) 644 / 511 EPS (Rs) 8.3 9.5 9.7 11.9 Free Float (%) 45.2 % Chg YoY 34.7 15.0 1.9 22.5 FII (%) 25.1 P/E (x) 72.5 63.0 61.9 50.5 Daily Volume (US$/'000) NA CEPS (Rs) 13.2 15.3 16.8 19.5 Absolute Return 3m (%) 8.6 EV/E (x) 36.3 31.1 28.3 23.9 Absolute Return 12m (%) NA Dividend Yield (%) - - - - Sensex Return 3m (%) 0.9 RoCE (%) 20.3 19.4 16.8 17.2 Sensex Return 12m (%) 24.9 RoE (%) 26.6 23.8 19.5 19.7 Equity Research January 4, 2022 BSE Sensex: 59183 ICICI Securities Limited is the author and distributor of this report Initiating coverage Pharmaceuticals Target price: Rs700 Shareholding pattern Jun ’21 Sep ’21 Promoters 54.8 54.8 Institutional investors 30.9 39.2 MFs and others 6.9 14.1 FI/Banks 0.2 0.0 FIIs 11.7 25.1 Others 14.3 6.0 Source: NSE Price chart Vijaya Diagnostic Centre BUY B2C-focused dominant Southern player Rs599 500 520 540 560 580 600 620 640 660 Sep-21 Oct-21 Oct-21 Nov-21 Dec-21 Jan-22 (Rs) Research Analysts: Vinay Bafna [email protected] +91 22 6807 7339 Mitesh Shah, CFA [email protected] +91 22 6807 7452 Rohan John [email protected] +91 22 6807 7453 Vijaya Diagnostic (Vijaya) is one of the largest integrated diagnostic chains in southern India and is primarily based in Andhra Pradesh and Telangana. Other factors that differentiate Vijaya from other diagnostic chains are: 1) ~92% of business is its B2C (provides stickiness) and 2) it offers a comprehensive basket of diagnostic services in both pathology and radiology. Owing to its B2C focus and higher radiology contribution, Vijaya commands the highest margin (~44% in FY21) within the industry. The company’s focus on deeper expansion in its dominant regions, along with supportive macro factors and expectation of a faster shift of market to organised players will help it to maintain its growth momentum. Further expansion in East, especially in Kolkata, may drive medium to long term growth. We initiate coverage on the stock with BUY rating and target price of Rs700/share. One of the largest South Indian chain with B2C focus: South Indian diagnostic industry is estimated to grow at 13-14% CAGR over FY21-FY23E, a bit higher than industry growth of 12-13% led by higher than average non-communicable diseases and higher population above 15 years of age. Vijaya is one of the largest and a renowned integrated diagnostic chain in the southern India, particularly, Andhra Pradesh and Telangana (~96% of revenue). The company puts a lot of emphasis on its brand recall, customer service and superior quality which helps in pushing individual consumer business as well as brand strengthening. This is the key strategy to focus on the B2C business which contributed ~92% to Vijaya’s revenue in FY21. B2C business is not only more profitable than B2B but also provides high level of customer stickiness. Integrated offering: Unlike other large chains, Vijaya not only focuses on pathology services but also radiology services. In pathology, it offers 1,610 tests including 740 routines and 870 specialised tests. In radiology, its test menu has 220 basic and 320 advanced radiology tests including MRI, HRCT, SPECT, PET CT etc. Due to its focused approach, wide test menu, strong brand recall, B2C focus and continuous deepening of presence in key geographies, we expect the company to provide continuous industry-leading growth. Strong margins with consistent free cashflow generation: With higher radiology contribution and B2C focus, Vijaya commands best-in-industry EBITDA margin which we expect to continue and remain at ~41-42% in near to medium term. We expect revenues to grow at 15.3% CAGR with EBITDA/PAT CAGR of 13.0%/12.7% over FY21-FY24E. Despite continuous expansion, the company is likely to generate free cashflow of ~Rs3bn over FY21-24E. RoIC would improve to 42.5% by FY24E from 35% in FY21. Initiate coverage with BUY: We initiate coverage on Vijaya with BUY rating and DCF- based TP of Rs700(59.0x of FY24 P/E and 28.2x of FY24 EV/EBITDA). Key downside risks: Slowdown in growth in Southern region and regulatory hurdles. INDIA
-
Upload
khangminh22 -
Category
Documents
-
view
0 -
download
0
Transcript of Vijaya Diagnostic Centre - Equity Research

Please refer to important disclosures at the end of this report
Market Cap Rs61.1bn/ US$822mn Year to Mar FY21 FY22E FY23E FY24E Bloomberg VIJAYA IN Revenue (Rs mn) 3,767 4,477 4,987 5,782 Shares Outstanding (mn) 102.0 Net Income (Rs mn) 843 969 987 1,209 52-week Range (Rs) 644 / 511 EPS (Rs) 8.3 9.5 9.7 11.9 Free Float (%) 45.2 % Chg YoY 34.7 15.0 1.9 22.5 FII (%) 25.1 P/E (x) 72.5 63.0 61.9 50.5 Daily Volume (US$/'000) NA CEPS (Rs) 13.2 15.3 16.8 19.5 Absolute Return 3m (%) 8.6 EV/E (x) 36.3 31.1 28.3 23.9 Absolute Return 12m (%) NA Dividend Yield (%) - - - - Sensex Return 3m (%) 0.9 RoCE (%) 20.3 19.4 16.8 17.2 Sensex Return 12m (%) 24.9 RoE (%) 26.6 23.8 19.5 19.7
Equity Research January 4, 2022 BSE Sensex: 59183 ICICI Securities Limited is the author and distributor of this report
Initiating coverage
Pharmaceuticals
Target price: Rs700 Shareholding pattern
Jun ’21
Sep ’21
Promoters 54.8 54.8 Institutional investors 30.9 39.2 MFs and others 6.9 14.1 FI/Banks 0.2 0.0 FIIs 11.7 25.1 Others 14.3 6.0
Source: NSE Price chart
Vijaya Diagnostic Centre BUY B2C-focused dominant Southern player Rs599
500520540560580600620640660
Sep-
21O
ct-2
1O
ct-2
1N
ov-2
1D
ec-2
1Ja
n-22
(Rs)
Research Analysts:
Vinay Bafna [email protected] +91 22 6807 7339 Mitesh Shah, CFA [email protected] +91 22 6807 7452 Rohan John [email protected] +91 22 6807 7453
Vijaya Diagnostic (Vijaya) is one of the largest integrated diagnostic chains in southern India and is primarily based in Andhra Pradesh and Telangana. Other factors that differentiate Vijaya from other diagnostic chains are: 1) ~92% of business is its B2C (provides stickiness) and 2) it offers a comprehensive basket of diagnostic services in both pathology and radiology. Owing to its B2C focus and higher radiology contribution, Vijaya commands the highest margin (~44% in FY21) within the industry. The company’s focus on deeper expansion in its dominant regions, along with supportive macro factors and expectation of a faster shift of market to organised players will help it to maintain its growth momentum. Further expansion in East, especially in Kolkata, may drive medium to long term growth. We initiate coverage on the stock with BUY rating and target price of Rs700/share. One of the largest South Indian chain with B2C focus: South Indian diagnostic
industry is estimated to grow at 13-14% CAGR over FY21-FY23E, a bit higher than industry growth of 12-13% led by higher than average non-communicable diseases and higher population above 15 years of age. Vijaya is one of the largest and a renowned integrated diagnostic chain in the southern India, particularly, Andhra Pradesh and Telangana (~96% of revenue). The company puts a lot of emphasis on its brand recall, customer service and superior quality which helps in pushing individual consumer business as well as brand strengthening. This is the key strategy to focus on the B2C business which contributed ~92% to Vijaya’s revenue in FY21. B2C business is not only more profitable than B2B but also provides high level of customer stickiness.
Integrated offering: Unlike other large chains, Vijaya not only focuses on pathology services but also radiology services. In pathology, it offers 1,610 tests including 740 routines and 870 specialised tests. In radiology, its test menu has 220 basic and 320 advanced radiology tests including MRI, HRCT, SPECT, PET CT etc. Due to its focused approach, wide test menu, strong brand recall, B2C focus and continuous deepening of presence in key geographies, we expect the company to provide continuous industry-leading growth.
Strong margins with consistent free cashflow generation: With higher radiology contribution and B2C focus, Vijaya commands best-in-industry EBITDA margin which we expect to continue and remain at ~41-42% in near to medium term. We expect revenues to grow at 15.3% CAGR with EBITDA/PAT CAGR of 13.0%/12.7% over FY21-FY24E. Despite continuous expansion, the company is likely to generate free cashflow of ~Rs3bn over FY21-24E. RoIC would improve to 42.5% by FY24E from 35% in FY21.
Initiate coverage with BUY: We initiate coverage on Vijaya with BUY rating and DCF-based TP of Rs700(59.0x of FY24 P/E and 28.2x of FY24 EV/EBITDA). Key downside risks: Slowdown in growth in Southern region and regulatory hurdles.
INDIA

Vijaya Diagnostic Centre, January 4, 2022 ICICI Securities
2
TABLE OF CONTENT Strong industry outlook .................................................................................................. 3
Largest South India focused diagnostic chain ............................................................. 6
Financial analysis .......................................................................................................... 12
Key concerns ................................................................................................................. 16
Valuations ....................................................................................................................... 17
Company background & key management personnel ............................................... 19
Financial summary ........................................................................................................ 20
Index of Tables and Charts ........................................................................................... 25

Vijaya Diagnostic Centre, January 4, 2022 ICICI Securities
3
Strong industry outlook With diagnostic services becoming the cornerstone for recommending requisite treatments as well as monitoring recovery post the treatment, the industry has posted healthy growth over the past few years. The diagnostic industry is divided between pathology (analysis of body fluids (blood, urine, etc) or organs and tissues to diagnose diseases) and radiology (usage of imaging technologies such as X-rays, radiography, ultrasound, CT scans, MRI scans to diagnose diseases). The pathology segment is ~57% of the market with the remaining ~43% forming the radiology segment. Diagnostics industry in India is highly fragmented with unorganised (standalone) players having 45-50% market share, 35-40% with hospitals and organised chains like Thyrocare, Dr Lal Pathlab (DRPL), SRL and Vijaya having 12-17% market share. There has been a shift from standalone centers to diagnostic chains with patients preferring more organised chains for quality services.
Diagnostic industry achieved a CAGR of 13-14% over FY17-20 tracking the growth of healthcare delivery services. Diagnostic services currently have ~8-14% share in the overall healthcare spending. In FY21, the industry’s growth rate was temporarily impacted, especially, small laboratories due to covid. Industry growth is expected to be healthy over FY21-23 at 12-13% CAGR, reaching Rs920-980bn.
Chart 1: Size of the Indian diagnostic industry
Source: Industry data, I-Sec research
Chart 2: Diagnostic chains contribute ~12-17% of overall diagnostic industry
Source: Industry data, I-Sec research
472
684 710-720
920-980
-
100
200
300
400
500
600
700
800
900
1,000
FY17 FY20 FY21E FY23E
(Rsb
n)
Hospital Based37%
Stanalone48%
Chain15%
Vijaya Diagnostic Centre, January 4, 2022 ICICI Securities
4
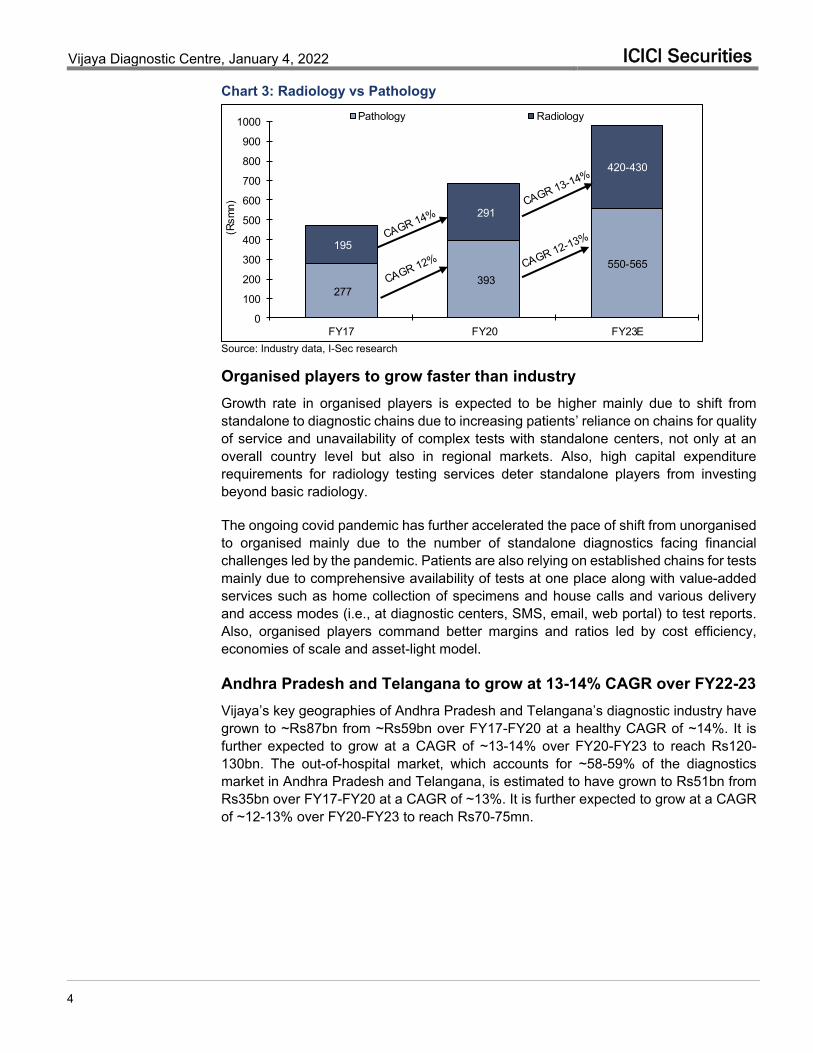
Chart 3: Radiology vs Pathology
Source: Industry data, I-Sec research Organised players to grow faster than industry Growth rate in organised players is expected to be higher mainly due to shift from standalone to diagnostic chains due to increasing patients’ reliance on chains for quality of service and unavailability of complex tests with standalone centers, not only at an overall country level but also in regional markets. Also, high capital expenditure requirements for radiology testing services deter standalone players from investing beyond basic radiology.
The ongoing covid pandemic has further accelerated the pace of shift from unorganised to organised mainly due to the number of standalone diagnostics facing financial challenges led by the pandemic. Patients are also relying on established chains for tests mainly due to comprehensive availability of tests at one place along with value-added services such as home collection of specimens and house calls and various delivery and access modes (i.e., at diagnostic centers, SMS, email, web portal) to test reports. Also, organised players command better margins and ratios led by cost efficiency, economies of scale and asset-light model.
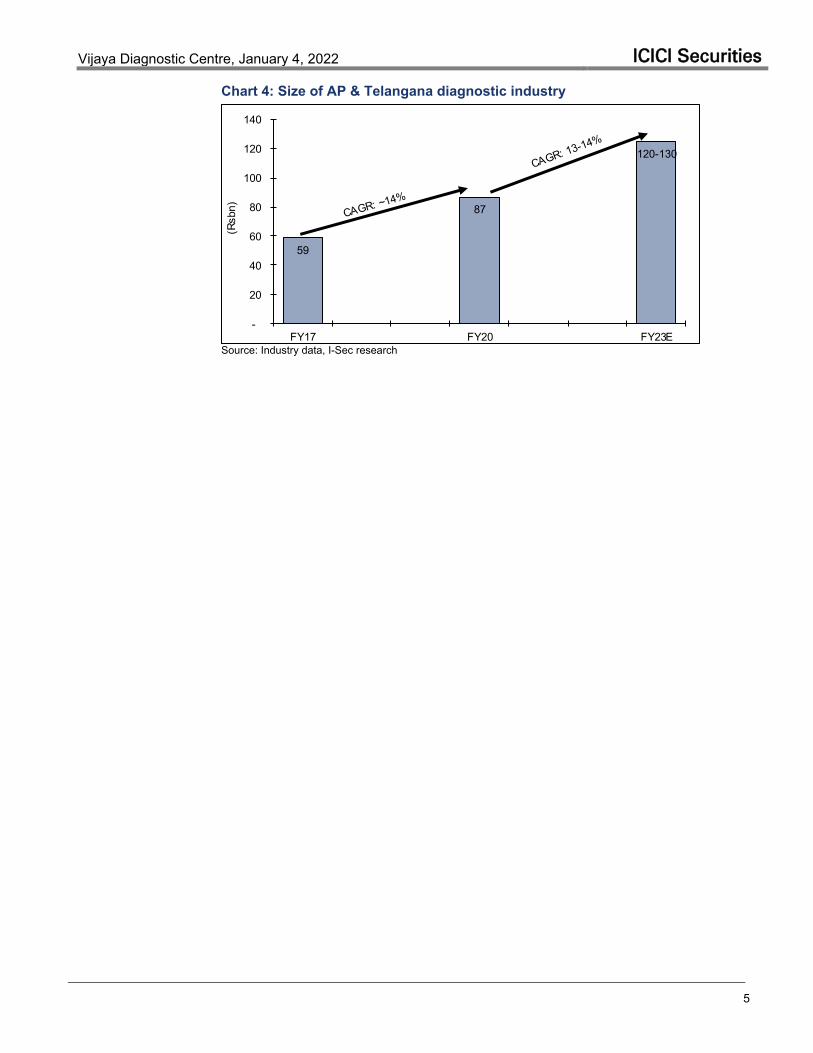
Andhra Pradesh and Telangana to grow at 13-14% CAGR over FY22-23 Vijaya’s key geographies of Andhra Pradesh and Telangana’s diagnostic industry have grown to ~Rs87bn from ~Rs59bn over FY17-FY20 at a healthy CAGR of ~14%. It is further expected to grow at a CAGR of ~13-14% over FY20-FY23 to reach Rs120-130bn. The out-of-hospital market, which accounts for ~58-59% of the diagnostics market in Andhra Pradesh and Telangana, is estimated to have grown to Rs51bn from Rs35bn over FY17-FY20 at a CAGR of ~13%. It is further expected to grow at a CAGR of ~12-13% over FY20-FY23 to reach Rs70-75mn.
277 393
550-565
195
291
420-430
0
100
200
300
400
500
600
700
800
900
1000
FY17 FY20 FY23E
(Rsm
n)
Pathology Radiology
Vijaya Diagnostic Centre, January 4, 2022 ICICI Securities
5
Chart 4: Size of AP & Telangana diagnostic industry
Source: Industry data, I-Sec research
59
87
120-130
-
20
40
60
80
100
120
140
FY17 FY20 FY23E
(Rsb
n)

Vijaya Diagnostic Centre, January 4, 2022 ICICI Securities
6
Largest South India focused diagnostic chain Vijaya is the oldest and the largest integrated diagnostic chain in the Southern India, by operating revenue, and also one of the fastest-growing diagnostic chains by revenue in FY20. Its network consists of 80 diagnostic centers including a flagship center in Hyderabad, and 11 co-located reference laboratories, across 13 cities and towns in Telangana, Andhra Pradesh, National Capital Region and Kolkata, as of FY21. In FY21, the company derived ~96% of its revenue from Telangana (86% of sales) and Andhra Pradesh (10%).
The diagnostics market in Telangana and Andhra Pradesh, where Vijaya has significant presence, is projected to grow to ~Rs120-130bn by FY23. Led by a combination of its strong brand position and long operating history in core geographies with extensive operational network and reputation for providing quality diagnostic services positions, we believe it would likely continue to grow its business in Telangana and Andhra Pradesh and will take the advantage of the growing Indian diagnostic market.
Chart 5: 96% of revenue from Telangana and Andhra Pradesh (FY21)
Source: Company data, I-Sec research
Chart 6: Peer comparison - South Indian revenue contribution
Source: Industry data, I-Sec research; DLPL – Dr Lal PathLabs
Hyderabad81%
AP and Rest of Telangana
15%
Others4%
6
26
12
26
97.3
0
10
20
30
40
50
60
70
80
90
100
DLPL Thyrocare SRL Metropolis Vijaya
(%)
South Indian contribution in Revenues (FY20)

Vijaya Diagnostic Centre, January 4, 2022 ICICI Securities
7
Integrated diagnostics provider offering one-stop solution Vijaya offers a comprehensive range of ~1,610 pathology tests, which are organised into ~740 routine tests and 870 specialised tests, as well as ~220 basic and 320 advanced radiology tests that cover a range of specialties and disciplines, as on FY21. The test menu includes (i) pathology tests ranging from basic biochemistry and clinical pathology to cytogenetics and high-end molecular diagnostic tests including protein chemistry, cellular immunology, flow cytometry, genetics, cytogenetics, immunohistochemistry and advanced microbiology tests, and (ii) radiology tests ranging from basic echocardiograms, X-rays and ultrasounds to advanced radiology tests such as MRI, HRCT, SPECT and PET CT. The company also offers RT-PCR testing and/or CT scan for covid diagnosis across 33 diagnostic centres in 11 cities and towns and covid vaccination services in its Kolkata and Gurugram diagnostic centres. Given the focus on providing integrated diagnostic services, Vijaya has provided 2.8 tests per customer on an average in FY20.
Table 1: Comprehensive test offering by Vijaya in both radiology and pathology
Source: Company data, Industry data, I-Sec research
Offers both radiology and pathology services in all centers Vijaya’s diagnostic centers offer a mix of pathology specimens collection and radiology testing services with smaller spokes offering basic radiology and hub centres (ARCs) offering advanced radiology testing services such as MRI, HRCT, SPECT and PET CT. As on FY21, the operational network consists of diagnostic centre network of (i) a flagship centre located in Hyderabad, which is the main ‘hub’ and equipped to conduct all pathology specimens collection, basic and advanced radiology tests; (ii) 19 hub centres, which are equipped to conduct all pathology specimens collection and basic radiology tests and certain advanced radiology tests; and (iii) 60 diagnostic centres, which are equipped to conduct a majority of pathology specimens collection and certain basic radiology tests. Its radiology laboratory network consists of (i) a national reference laboratory co-located with the flagship diagnostic centre; and (ii) 10 reference laboratories co-located with certain hub centres and diagnostic centres.
Table 2: Number of centers and service offerings Diagnostic Centres FY19 FY20 FY21 1HFY22 Service offering Flagship Centre 1 1 1 1 pathology and basic and
advanced radiology Hub Centres 15 16 19 21 Diagnostic Centres/Spokes 45 56 60 63 pathology and basic radiology Total 61 73 80 85 Source: Company data, I-Sec research Expanding reach and service offerings The company continues to focus on expanding its network by setting up spokes and select hub centres in existing catchment areas. In addition, the company will also add
Vijaya Thyrocare SRL Metropolis DLPL
Diagnostic services Pathology and radiology Pathology and radiology Pathology and radiology Pathology Pathology and radiology
Test offerings ~2,150 408 >3700 >4000 4953
Basic radiology offerings
Digital X-ray, ultrasound, mammography, among others NA
Digital X-ray, ultrasound scanning, among others. NA
Digital X-ray, ECG, ultrasound, mammography, among others
Advanced radiology offerings
MRI, Multi slice CT, CBCT (3D dental), PET CT, SPECT, DEXA/bone densitometry, among others.
PET/CT imaging services
PET CT scan, MRI, cardiac CT, Myocardial perfusion imaging test, among others. NA Bone densitometry

Vijaya Diagnostic Centre, January 4, 2022 ICICI Securities
8
reference laboratories in existing core geographies. Total number of diagnostic centres have grown from 61 in FY19 to 85 in H1FY22. We believe the company will continue to add centers every year in Telangana and Andhra Pradesh. Similarly, it is also looking to offer additional preventive and wellness services as well as increase its home collection services in core geographies to reach out to more customers.
Apart from this, the company intends to enhance its pathology and radiology test offerings by creating customised packages to its customers, based on demography and medical history, to cater to their specific needs. These packages will increase revenue per customer visit.
The company also offers RT-PCR testing for covid diagnosis across 25 diagnostic centers in 9 cities and towns and covid vaccination services at its diagnostic centers in Kolkata and Gurugram. It is also looking to grow these test offerings to few other diagnostic centers/hubs. The company’s dedicated sales and marketing team will continue to promote its specialty tests and disease specific profiles and grow the corporate customer base by marketing healthcare proposition to human resource departments and other corporate decision makers.
Plans to expand in adjacent geographies and East India Leveraging on its strong brand recall, Vijaya is looking to establish presence in adjacent geographies of Telangana and Andhra Pradesh and expand in concentric circles. It has identified key cities and towns that are underserved, and where its brand is well-regarded. It expects a wider geographic reach to expand its customer base as well as improve profitability by allowing it to better leverage the infrastructure.
The company also plans to expand presence in East India, especially, Kolkata. In 2014, Vijaya acquired majority stake in Medinova, a diagnostic service provider which currently has an established hub in Kolkata, and successfully integrated it into the operational network. Medinova has contributed 3.4% to the revenue in FY21. Given the expected increase in demand for diagnostic services in East India, the company is looking at Kolkata to be one of the focus areas of medium- to long-term growth. Also, the company has certain contracts with the Bengal government for covid testing. Vijaya is already a known brand in Bengal, hence, the company will do all its future expansion in this geography under its brand.
We believe the company would continue to add 15-16 centers every year with a mix of both hub and spoke in home markets and East India.
Chart 7: Continuous expansion of centers
Source: Company data, I-Sec research
61 73
80
95
111
127
-
20
40
60
80
100
120
140
FY19 FY20 FY21 FY22E FY23E FY24E
No.
Vijaya Diagnostic Centre, January 4, 2022 ICICI Securities
9
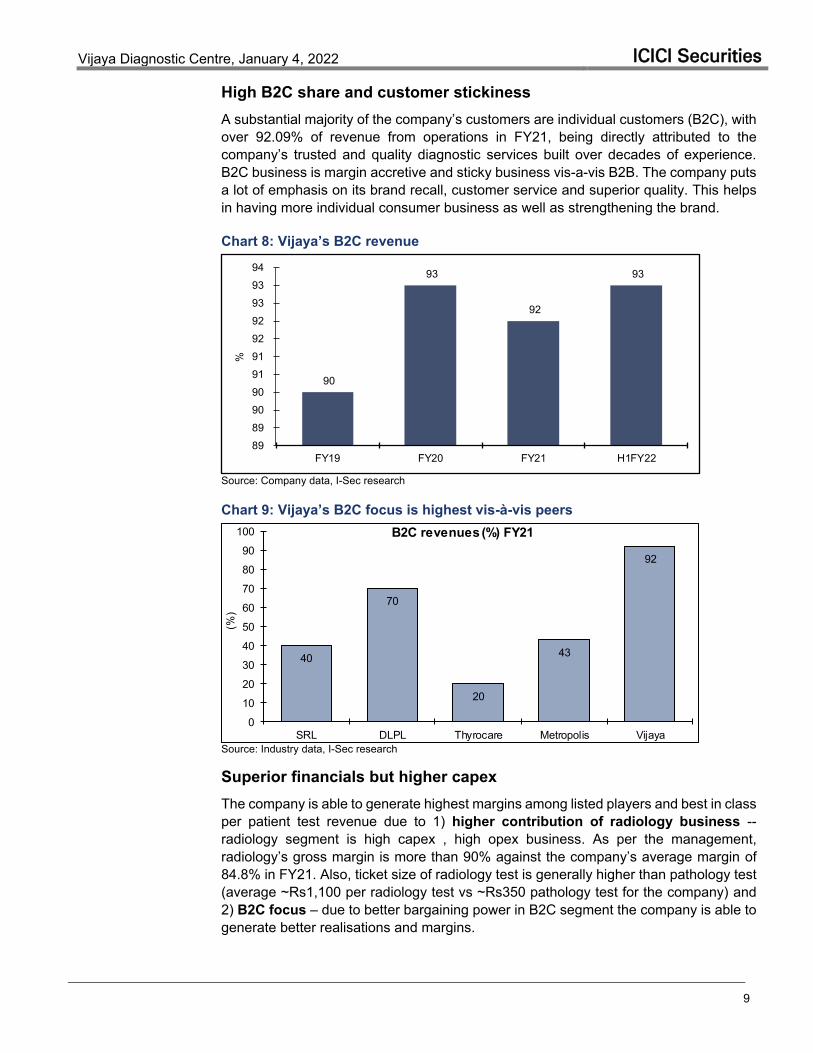
High B2C share and customer stickiness A substantial majority of the company’s customers are individual customers (B2C), with over 92.09% of revenue from operations in FY21, being directly attributed to the company’s trusted and quality diagnostic services built over decades of experience. B2C business is margin accretive and sticky business vis-a-vis B2B. The company puts a lot of emphasis on its brand recall, customer service and superior quality. This helps in having more individual consumer business as well as strengthening the brand.
Chart 8: Vijaya’s B2C revenue
Source: Company data, I-Sec research
Chart 9: Vijaya’s B2C focus is highest vis-à-vis peers
Source: Industry data, I-Sec research Superior financials but higher capex The company is able to generate highest margins among listed players and best in class per patient test revenue due to 1) higher contribution of radiology business -- radiology segment is high capex , high opex business. As per the management, radiology’s gross margin is more than 90% against the company’s average margin of 84.8% in FY21. Also, ticket size of radiology test is generally higher than pathology test (average ~Rs1,100 per radiology test vs ~Rs350 pathology test for the company) and 2) B2C focus – due to better bargaining power in B2C segment the company is able to generate better realisations and margins.
90
93
92
93
89 89 90 90 91 91 92 92 93 93 94
FY19 FY20 FY21 H1FY22
%
40
70
20
43
92
0
10
20
30
40
50
60
70
80
90
100
SRL DLPL Thyrocare Metropolis Vijaya
(%)
B2C revenues (%) FY21
Vijaya Diagnostic Centre, January 4, 2022 ICICI Securities
10
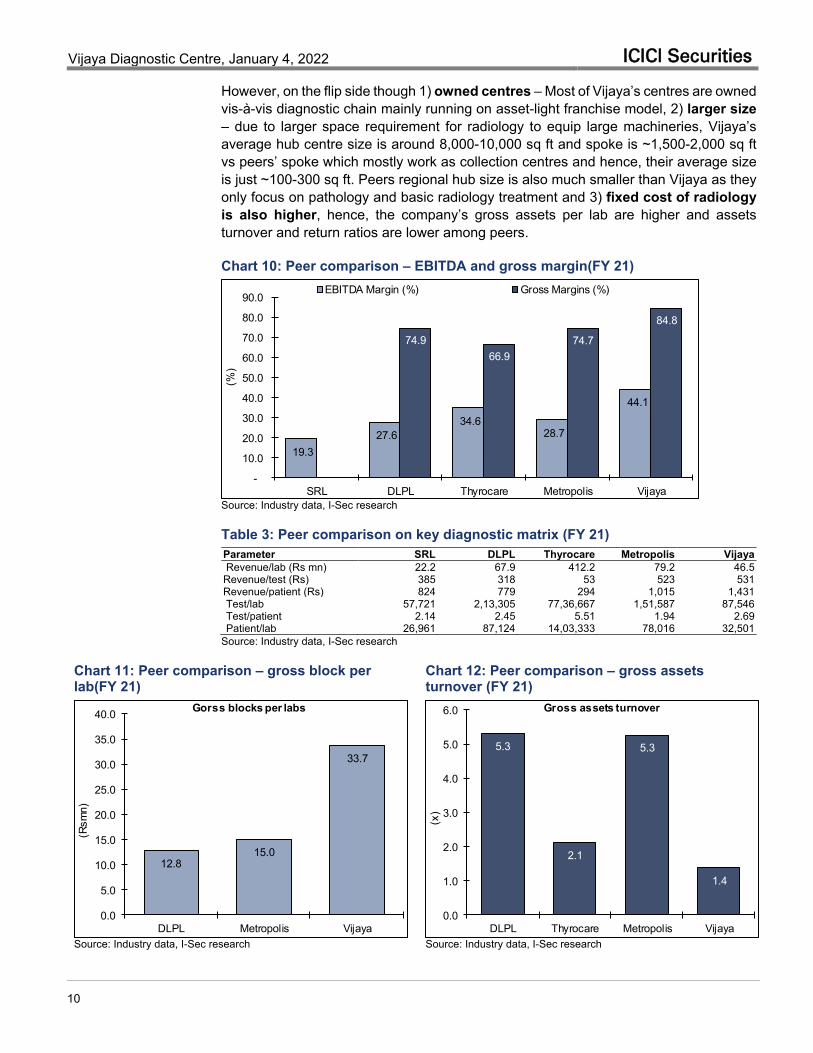
However, on the flip side though 1) owned centres – Most of Vijaya’s centres are owned vis-à-vis diagnostic chain mainly running on asset-light franchise model, 2) larger size – due to larger space requirement for radiology to equip large machineries, Vijaya’s average hub centre size is around 8,000-10,000 sq ft and spoke is ~1,500-2,000 sq ft vs peers’ spoke which mostly work as collection centres and hence, their average size is just ~100-300 sq ft. Peers regional hub size is also much smaller than Vijaya as they only focus on pathology and basic radiology treatment and 3) fixed cost of radiology is also higher, hence, the company’s gross assets per lab are higher and assets turnover and return ratios are lower among peers.
Chart 10: Peer comparison – EBITDA and gross margin(FY 21)
Source: Industry data, I-Sec research
Table 3: Peer comparison on key diagnostic matrix (FY 21) Parameter SRL DLPL Thyrocare Metropolis Vijaya Revenue/lab (Rs mn) 22.2 67.9 412.2 79.2 46.5 Revenue/test (Rs) 385 318 53 523 531 Revenue/patient (Rs) 824 779 294 1,015 1,431 Test/lab 57,721 2,13,305 77,36,667 1,51,587 87,546 Test/patient 2.14 2.45 5.51 1.94 2.69 Patient/lab 26,961 87,124 14,03,333 78,016 32,501 Source: Industry data, I-Sec research
Chart 11: Peer comparison – gross block per lab(FY 21)
Chart 12: Peer comparison – gross assets turnover (FY 21)
Source: Industry data, I-Sec research Source: Industry data, I-Sec research
19.3 27.6
34.6 28.7
44.1
74.966.9
74.7
84.8
-
10.0
20.0
30.0
40.0
50.0
60.0
70.0
80.0
90.0
SRL DLPL Thyrocare Metropolis Vijaya
(%)
EBITDA Margin (%) Gross Margins (%)
12.815.0
33.7
0.0
5.0
10.0
15.0
20.0
25.0
30.0
35.0
40.0
DLPL Metropolis Vijaya
(Rsm
n)
Gorss blocks per labs
5.3
2.1
5.3
1.4
0.0
1.0
2.0
3.0
4.0
5.0
6.0
DLPL Thyrocare Metropolis Vijaya
(x)
Gross assets turnover
Vijaya Diagnostic Centre, January 4, 2022 ICICI Securities
11
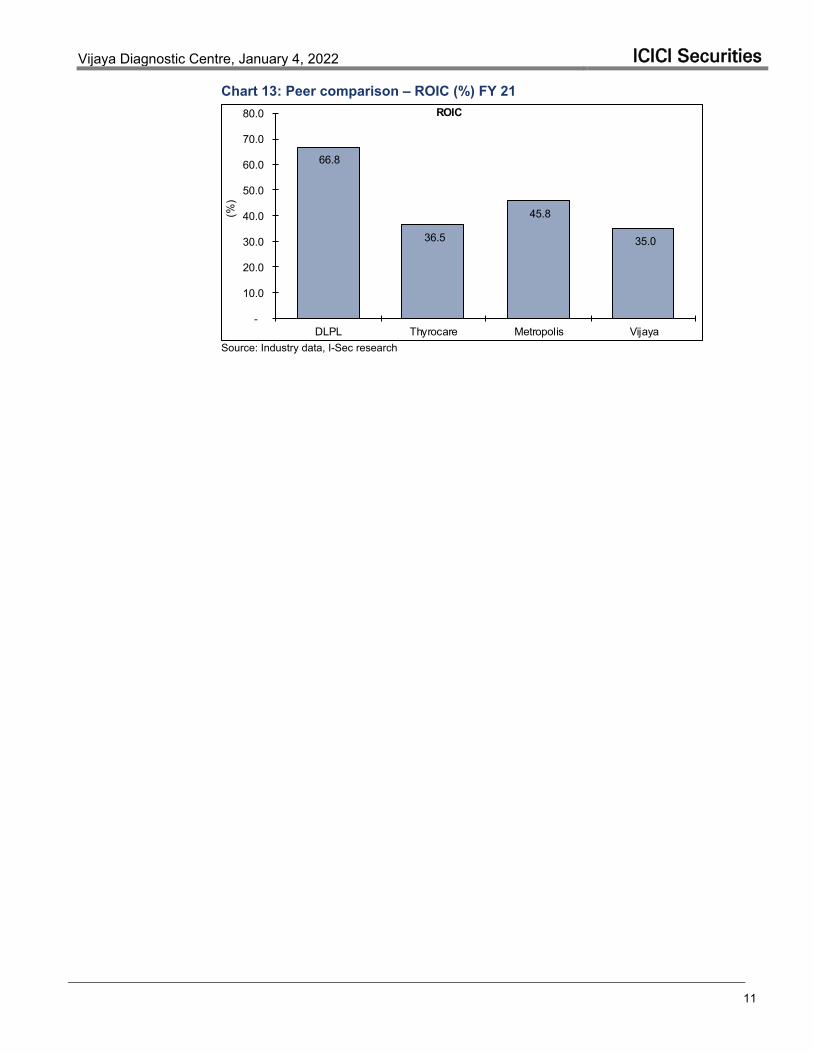
Chart 13: Peer comparison – ROIC (%) FY 21
Source: Industry data, I-Sec research
66.8
36.5
45.8
35.0
-
10.0
20.0
30.0
40.0
50.0
60.0
70.0
80.0
DLPL Thyrocare Metropolis Vijaya
(%)
ROIC

Vijaya Diagnostic Centre, January 4, 2022 ICICI Securities
12
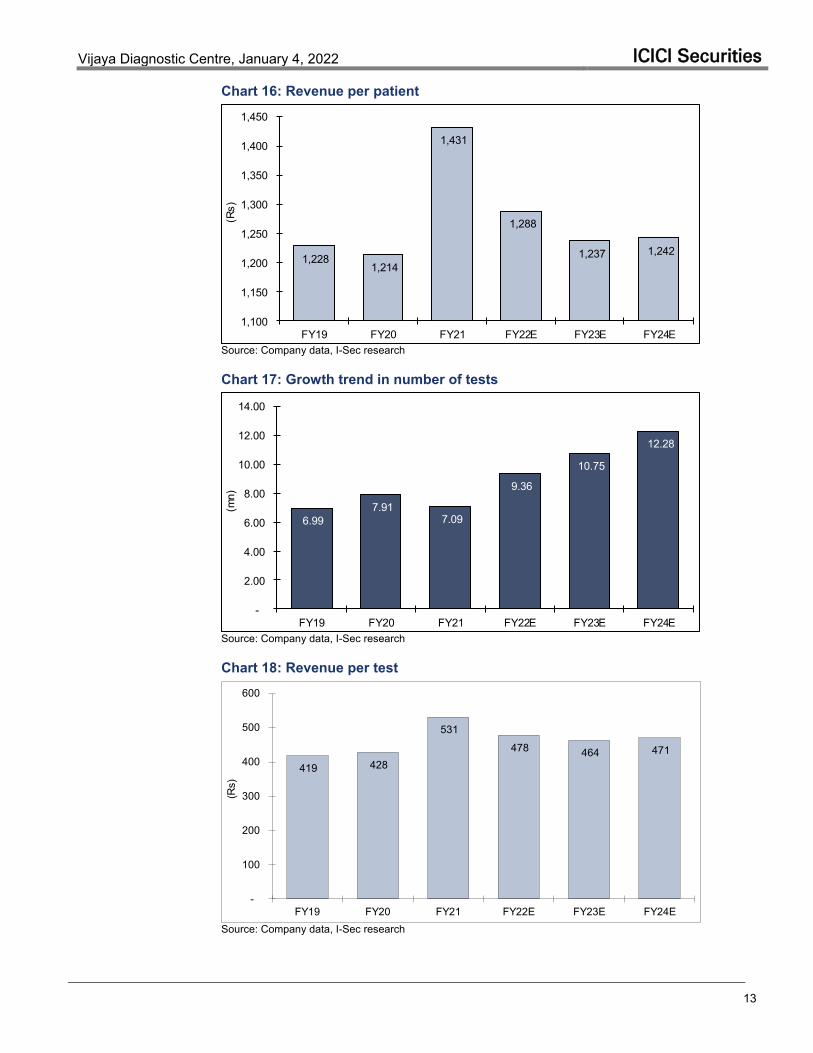
Financial analysis Revenue is expected to grow at 15% CAGR over FY21-24E Vijaya’s revenue grew at 13.5% CAGR to reach Rs3.8bn over FY19-FY21. During this period, revenue per test grew 12.6% to Rs531 while the number of tests grew from 6.99mn to 7.09mn. Revenue per patient grew 8% to Rs1,431 over FY19-FY21 while number of patients grew from 2.38mn to 2.63mn. The company’s diagnostic centers also expanded to 80 in FY21 from 61 in FY19. The company’s revenue is expected to grow 15.3% to Rs5.8bn over FY21-24E mainly driven by the potential expansion of diagnostic centers to 127 in FY24 from 80 in FY21 which could lead to an increase in the total patient count.
Chart 14: Revenue trend
Source: Company data, I-Sec research
Chart 15: Number of patients
Source: Company data, I-Sec research
2,926 3,388
3,767
4,477 4,987
5,782
-
1,000
2,000
3,000
4,000
5,000
6,000
FY19 FY20 FY21 FY22E FY23E FY24E
(Rs
mn)
2.38 2.79 2.63
3.48
4.03
4.66
-
0.50
1.00
1.50
2.00
2.50
3.00
3.50
4.00
4.50
5.00
FY19 FY20 FY21 FY22E FY23E FY24E
(mn)
Vijaya Diagnostic Centre, January 4, 2022 ICICI Securities
13
Chart 16: Revenue per patient
Source: Company data, I-Sec research
Chart 17: Growth trend in number of tests
Source: Company data, I-Sec research
Chart 18: Revenue per test
Source: Company data, I-Sec research
1,228 1,214
1,431
1,288
1,237 1,242
1,100
1,150
1,200
1,250
1,300
1,350
1,400
1,450
FY19 FY20 FY21 FY22E FY23E FY24E
(Rs)
6.99 7.91
7.09
9.36
10.75
12.28
-
2.00
4.00
6.00
8.00
10.00
12.00
14.00
FY19 FY20 FY21 FY22E FY23E FY24E
(mn)
419 428
531
478 464 471
-
100
200
300
400
500
600
FY19 FY20 FY21 FY22E FY23E FY24E
(Rs)

Vijaya Diagnostic Centre, January 4, 2022 ICICI Securities
14
EBITDA margin is expected to remain healthy at ~41.5% The company’s EBITDA margin has seen a sharp improvement from 37.0% to 44.1% over FY19-FY21 driven by higher growth in realisation and lower costs. This resulted in EBITDA growth of 24% to Rs1.7bn over FY19-FY21. We expect the company to maintain healthy ~41-42% industry leading margins henceforth. We expect EBITDA to grow at 13% CAGR over FY21-24E.
Chart 19: Adjusted EBITDA and margin
Source: Company data, I-Sec research Profit performance Vijaya’s net profit grew 35.5% to Rs843mn over FY19-FY21 driven by strong operating performance and declining tax rate. We expect net profit to grow at 12.8% CAGR to Rs1.2bn over FY21-24E mainly in sync with operational performance.
Chart 20: Profit trend
Source: Company data, I-Sec research
1,081 1,326 1,660 1,920 2,068 2,397
37.0
39.1
44.1 42.9
41.5 41.5
32.0
34.0
36.0
38.0
40.0
42.0
44.0
46.0
-
500
1,000
1,500
2,000
2,500
3,000
FY19 FY20 FY21 FY22E FY23E FY24E
(%)
(Rsm
n)Adjusted EBITDA % margin (RHS)
459
625
843 969 987
1,209
-
200
400
600
800
1,000
1,200
1,400
FY19 FY20 FY21 FY22E FY23E FY24E
(Rsm
n)

Vijaya Diagnostic Centre, January 4, 2022 ICICI Securities
15
Return ratios The company’s return ratios have improved in tandem with revenue growth which helped in raising profitability.
Chart 21: Return ratios
Source: Company data, I-Sec research RoE: Return on Equity, RoCE: Return on capital employed Operating cash flow The company is continuously generating healthy operating cashflow. OCF/adjusted EBITDA also remains high indicating strong cash generation.
Chart 22: Operating cashflow
Source: Company data, I-Sec research
22.1
26.0 26.623.8
19.5
19.715.518.7 20.3 19.4
16.8
17.2
0
5
10
15
20
25
30
FY19 FY20 FY21 FY22E FY23E FY24E
(%)
RoE RoCE (pre-cash)
83.7
80.0 78.1
92.3 92.7 91.7
70.0
75.0
80.0
85.0
90.0
95.0
-
500
1,000
1,500
2,000
2,500
3,000
FY19 FY20 FY21 FY22E FY23E FY24E
(%)
(Rsm
n)
OCF Adjusted EBITDA OCF/EBITDA (RHS)
Vijaya Diagnostic Centre, January 4, 2022 ICICI Securities
16
Key concerns Covid-19 impact The Covid-19 pandemic has had significant repercussions across local, national and global economies and financial markets. This has resulted in significant disruptions and volatility in the business. Any intensification of the pandemic may adversely affect business, results of operations and financial condition.
Failure to maintain and grow brand name and brand image Since Vijaya primarily derives almost all of its revenue from walk-in customers, its brand and reputation are critical for the success of its business and operations.
Competitive risk The diagnostics industry in India is highly competitive, fragmented with lack of regulations and low entry barriers. If competition may intensify and the company is unable to compete effectively, its business could decline or contract and its results of operations and financial condition could be adversely affected.
Concentration risk Vijaya derived more than 96% of FY21 revenue from Telangana and Andhra Pradesh. Further, its 63 out of 80 diagnostic centres were in Hyderabad in FY21. Any event of a regional slowdown, political unrest, disruption or sustained economic downturn could adversely affect its business.

Vijaya Diagnostic Centre, January 4, 2022 ICICI Securities
17
Valuations We estimate earnings to grow at a CAGR of 12.8% over FY21-FY24E driven by revenue CAGR of 15.3% and rise in other income with strong free cashflow generation. Further, we expect RoCE to remain at ~17% despite continuous deeper network expansion in its key geographies. Dominating position in South India, B2C focus, strong brand equity in organised diagnostics market and continuing financial growth across parameters would help the company command premium valuations, in our view.
The stock currently trades at valuations of 61.9xFY23E and 50.5xFY24E earnings and EV/EBITDA multiple of 28.3xFY23E and 23.9xFY24E. The company has dominating position in South India, B2C focus with continuous deeper network expansion in its dominating geographies, along with supportive macro factors and expectation of faster shift of market to organised players. We initiate coverage on the stock with BUY rating and DCF-based target price of Rs700/share, implying 59.0xFY24E EPS and 28.2xFY24E EV/EBITDA.
Chart 23: 1-year forward EV/EBITDA
Source: I-Sec research, Bloomberg
Table 4: Listed peer projections - Ratios Rating CMP TP M Cap PE (x) EV/EBITDA (x) ROE (%) RoIC (%) (Rs) (Rs) (Rs bn) FY22E FY23E FY24E FY22E FY23E FY24E FY22E FY23E FY24E FY22E FY23E FY24E Dr Lal Pathlabs HOLD 3,860 3,601 322 78.2 70.4 59.4 52.0 45.6 39.9 29.6 27.0 26.5 47.9 37.0 44.7 Metropolis HOLD 3,450 3,190 176 76.2 60.6 50.6 48.2 39.1 33.4 30.2 32.3 33.4 32.3 28.2 33.8 Thyrocare BUY 1,106 1,231 58 28.0 37.6 36.1 19.1 25.3 24.0 47.7 34.2 34.5 64.6 49.7 49.3 Vijaya BUY 599 700 61 63.0 61.9 50.5 31.1 28.3 23.9 23.8 19.5 19.7 35.5 34.4 42.5 Source: Company data, I-Sec research
Table 5: Listed peer projections - Financials Revenue (Rs m) EBITDA Margin (%) Adjusted PAT (Rs m) CAGR FY21-24 FY22E FY23E FY24E FY22E FY23E FY24E FY22E FY23E FY24E Rev EPS EBITDA Dr Lal Pathlabs 21,401 24,143 26,849 28.0 28.3 29.1 4,114 4,570 5,415 19.3 22.9 21.4 Metropolis 12,547 14,880 16,370 29.5 30.4 32.0 2,314 2,908 3,487 17.9 24.0 22.4 Thyrocare 6,734 6,059 6,444 44.3 37.3 37.0 2,085 1,556 1,621 9.2 12.7 11.6 Vijaya 4,477 4,987 5,782 42.9 41.5 41.5 969 987 1,209 15.3 13.0 12.8 Source: Company data, I-Sec research
22
24
26
28
30
32
Sep
-21
Sep
-21
Sep
-21
Oct
-21
Oct
-21
Oct
-21
Oct
-21
Nov
-21
Nov
-21
Nov
-21
Nov
-21
Nov
-21
Dec
-21
Dec
-21
Dec
-21
Dec
-21
Jan-
22
(x)
EV/EBITDA Mean +1x SD -1x SD

Vijaya Diagnostic Centre, January 4, 2022 ICICI Securities
18
Table 6: DCF-based valuation (Rs mn) FY21 FY22E FY23E FY24E FY25E FY26E FY27E FY28E FY29E FY30E FY31E FY32E FY33E FY34E FY35E Operating Cashflow 1,296 1,772 1,918 2,197 2,536 2,933 3,394 3,907 4,503 5,119 5,753 6,413 7,182 7,998 8,923 Less: Capex (312) (1,000) (700) (700) (650) (550) (550) (550) (550) (600) (600) (650) (650) (700) (700) Free Cashflow 984 772 1,218 1,497 1,886 2,383 2,844 3,357 3,953 4,519 5,153 5,763 6,532 7,298 8,223 Years from now - - - 1 2 3 4 5 6 7 8 9 10 11 12 Discounted Free Cashflow 984 772 1,218 1,358 1,552 1,779 1,926 2,062 2,203 2,285 2,364 2,398 2,466 2,499 2,555 WACC (%) 10.2 Terminal growth (%) 5.0 Discounted free cashflows 27,437 Terminal value 46,500 Enterprise value 73,937 Less: Net Debt (2,493) Less: Minority Interest (22) Implied Market-cap 71,422 No. of equity shares (mn) 102 Value per share (Rs) 700 Source: Company data, I-Sec research
Table 7: Sensitivity index of DCF valuation Weighted average cost of capital (%) 700 7.2 8.2 9.2 10.2 11.2 12.2 13.2
Term
inal
gro
wth
(%) 2.0 934 751 622 526 452 394 348
3.0 1,091 847 684 568 482 416 363 4.0 1,346 988 770 624 520 442 383 5.0 1,829 1,216 896 700 569 476 406 6.0 3,097 1,648 1,100 814 638 521 437 7.0 15,245 2,782 1,487 997 740 583 477 8.0 NA 13,650 2,502 1,344 904 674 533
Source: I-Sec research

Vijaya Diagnostic Centre, January 4, 2022 ICICI Securities
19
Company background & key management personnel Vijaya Diagnostic Centre was established by Dr. S Surendranath Reddy in 1981 in Hyderabad. It is a dominant diagnostic player in the Southern India, Particularly-Andhra Pradesh and Telangana. The company offers a comprehensive basket of diagnostic services across pathology and radiology. It offers ~1,610 pathology tests, which include ~740 routine, 870 specialised pathology tests and ~220 basic and 320 advanced radiology tests that cover a range of specialties and disciplines.
Table 8: Region-wise revenue mix (FY21)
Source: Company data
The company follows ‘hub and spoke’ model. Smaller spokes offer pathology tests and basic radiology tests and hub centres (ARCs) offer pathology tests, basic radiology tests and advanced radiology tests such as MRI, HRCT, SPECT and PET CT.
Table 9: Key management personnel
Source: Company data
Hyderabad81%
AP and Rest of Telangana
15%
Others4%
Name Designation Background Dr. S Surendranath Reddy
Promotor and Executive Chairperson
He holds a bachelor’s degree in medicine from Shri Venkatesvara University and a provisional degree of Doctor of Medicine in Radiology from Osmania Medical College, Hyderabad. He has over 19 years of experience with the company. He is a life member of the Indian Radiological and Imaging Association.
Sura Suprita Reddy CEO
She has been associated with the company since its inception in 2002. She holds a bachelor’s degree in commerce from Osmania University. She has been heading the overall strategy, clinical excellence, operations and expansion of the company. She has previously been a director of Medinova Diagnostic Services Limited, Namrata Diagnostic Centre Pvt. Ltd., Park Health Systems Pvt. Ltd. and Doctorslab Medical Services Pvt. Ltd.
Sunil Chandra Kondapally ED
He has been associated with the company since its inception. He holds a bachelor’s degree in science in electrical engineering from Florida State University. He has over 17 years of experience in the field of pharmaceutical industry. He founded two pharmaceutical services companies namely QPS Bioserve India Pvt. Ltd. in 2004 and Trikona Pharmaceuticals Pvt. Ltd. in 2016, which focuses on the development of innovative pharmachemical products. He has worked in operations, quality accreditation, finance, marketing and network expansion departments of the company since its inception in 2002.

Vijaya Diagnostic Centre, January 4, 2022 ICICI Securities
20
Financial summary Table 10: Profit and loss statement (Rs mn, year ending Mar 31, unless otherwise specified)
Source: Company data, I-Sec research
FY21 FY22E FY23E FY24E Net Sales 3,767 4,477 4,987 5,782 Other operating income - - - - Net Sales 3,767 4,477 4,987 5,782
Less:
COGS 571 667 723 838 Employee cost 574 735 879 1,023 Others 962 1,155 1,317 1,523
Total Operating Expenses 2,108 2,557 2,918 3,385
EBITDA 1,660 1,920 2,068 2,397
Depreciation 505 594 731 777 Other income 118 130 143 158
EBIT 1,274 1,457 1,481 1,778
Less: Financial expenses 152 152 152 152 Extraordinary Items - - - - Recurring Pre-tax Income 1,121 1,304 1,329 1,625
Less: Taxation 272 329 335 410 Less: Minority Interest / Subsidiary loss 6 6 6 6 Reported Income 843 969 987 1,209
Adjusted Net Income 843 969 987 1,209

Vijaya Diagnostic Centre, January 4, 2022 ICICI Securities
21
Table 11: Restated consolidated balance sheet (Rs mn, year ending Mar 31, unless otherwise specified)
FY21 FY22E FY23E FY24E ASSETS Current Assets, Loan & Advances Current investments 276 276 276 276 Inventories 26 31 33 39 Sundry debtors 64 76 85 98 Cash and bank balances 1,942 2,562 3,627 4,972 Loans and advances 65 65 66 66 Other current assets 203 217 227 243 Total Current Assets 2,577 3,228 4,315 5,695
Current Liabilities & Provisions Current Liabilities 222 269 307 356 Provisions and other liabilities 183 217 242 280 Total Current Liabilities & Provisions 404 486 549 636
Net Current Assets 2,172 2,742 3,766 5,059
Investments 0 0 0 0
Fixed Assets
Tangible Assets 2,618 3,024 2,993 2,917 Intangible assets 18 18 18 18 Goodwill 53 53 53 53
Total fixed assets 2,689 3,096 3,065 2,988 CWIP 82 82 82 82
Miscellaneous Expenses not written off - - - -
Total Assets 4,944 5,920 6,913 8,129
LIABILITIES AND SHAREHOLDERS' EQUITY Shareholders Fund Equity share capital 45 102 102 102 Reserves and surplus 3,545 4,457 5,445 6,654 Total Shareholders Fund 3,590 4,559 5,547 6,756
Borrowings Long term 1,297 1,297 1,297 1,297 Short term 113 113 113 113 Total Borrowings 1,410 1,410 1,410 1,410
Deferred Tax Liability (61) (61) (61) (61) Minority interest 2 9 15 22 Other long term liabilities 2 2 2 2
Total Liabilities & Shareholders' Equity 4,944 5,920 6,913 8,129 Source: Company data, I-Sec research
Vijaya Diagnostic Centre, January 4, 2022 ICICI Securities
22
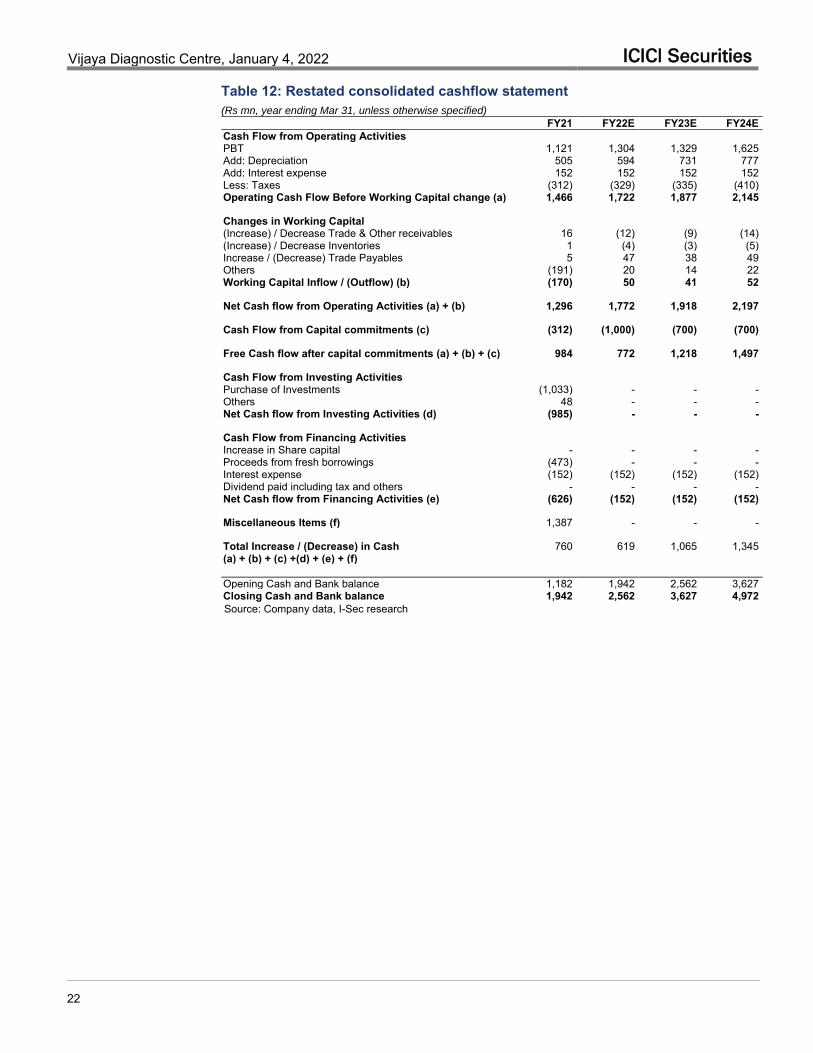
Table 12: Restated consolidated cashflow statement (Rs mn, year ending Mar 31, unless otherwise specified)
Source: Company data, I-Sec research
FY21 FY22E FY23E FY24E Cash Flow from Operating Activities PBT 1,121 1,304 1,329 1,625 Add: Depreciation 505 594 731 777 Add: Interest expense 152 152 152 152 Less: Taxes (312) (329) (335) (410) Operating Cash Flow Before Working Capital change (a) 1,466 1,722 1,877 2,145 Changes in Working Capital (Increase) / Decrease Trade & Other receivables 16 (12) (9) (14) (Increase) / Decrease Inventories 1 (4) (3) (5) Increase / (Decrease) Trade Payables 5 47 38 49 Others (191) 20 14 22 Working Capital Inflow / (Outflow) (b) (170) 50 41 52 Net Cash flow from Operating Activities (a) + (b) 1,296 1,772 1,918 2,197 Cash Flow from Capital commitments (c) (312) (1,000) (700) (700) Free Cash flow after capital commitments (a) + (b) + (c) 984 772 1,218 1,497 Cash Flow from Investing Activities Purchase of Investments (1,033) - - - Others 48 - - - Net Cash flow from Investing Activities (d) (985) - - - Cash Flow from Financing Activities Increase in Share capital - - - - Proceeds from fresh borrowings (473) - - - Interest expense (152) (152) (152) (152) Dividend paid including tax and others - - - - Net Cash flow from Financing Activities (e) (626) (152) (152) (152) Miscellaneous Items (f) 1,387 - - - Total Increase / (Decrease) in Cash 760 619 1,065 1,345 (a) + (b) + (c) +(d) + (e) + (f) Opening Cash and Bank balance 1,182 1,942 2,562 3,627 Closing Cash and Bank balance 1,942 2,562 3,627 4,972

Vijaya Diagnostic Centre, January 4, 2022 ICICI Securities
23
Table 13: Key ratios (based on restated consolidated financials) (Year ending Mar 31)
FY21 FY22E FY23E FY24E Per Share Data (Rs) EPS 8.3 9.5 9.7 11.9 Cash EPS 13.2 15.3 16.8 19.5 Dividend per share (DPS) - - - - Book Value per share (BV) 35.2 44.7 54.4 66.3
Growth (%) Net Sales 11.2 18.8 11.4 15.9 EBITDA 25.2 15.7 7.7 15.9 PAT 34.7 15.0 1.9 22.5 Cash EPS 20.6 16.0 9.9 15.6
Valuation Ratios (x) P/E 72.5 63.0 61.9 50.5 P/CEPS 45.3 39.1 35.5 30.8 P/BV 17.0 13.4 11.0 9.0 EV / EBITDA 36.3 31.1 28.3 23.9 EV / Sales 16.0 13.3 11.8 9.9
Operating Ratio Raw Material / Sales (%) 15.2 14.9 14.5 14.5 Employee cost / Sales (%) 15.2 16.4 17.6 17.7 SG&A / Sales (%) 25.5 25.8 26.4 26.3 Effective Tax Rate (%) 24.3 25.2 25.2 25.2 Working Capital (days) (12) (12) (13) (13) Inventory Turnover (days) 3 2 2 2 Receivables (days) 7 6 6 6 Payables (days) 21 20 21 21 Net D/E Ratio (x) (0.2) (0.3) (0.4) (0.6)
Return/Profitability Ratio (%) Net Income Margins 22.4 21.6 19.8 20.9 RoCE 20.3 19.4 16.8 17.2 RoE 26.6 23.8 19.5 19.7 RoIC 35.0 35.5 34.4 42.5 Dividend Payout - - - - Dividend Yield - - - - EBITDA Margins 44.1 42.9 41.5 41.5 Source: Company data, I-Sec research
Vijaya Diagnostic Centre, January 4, 2022 ICICI Securities
24
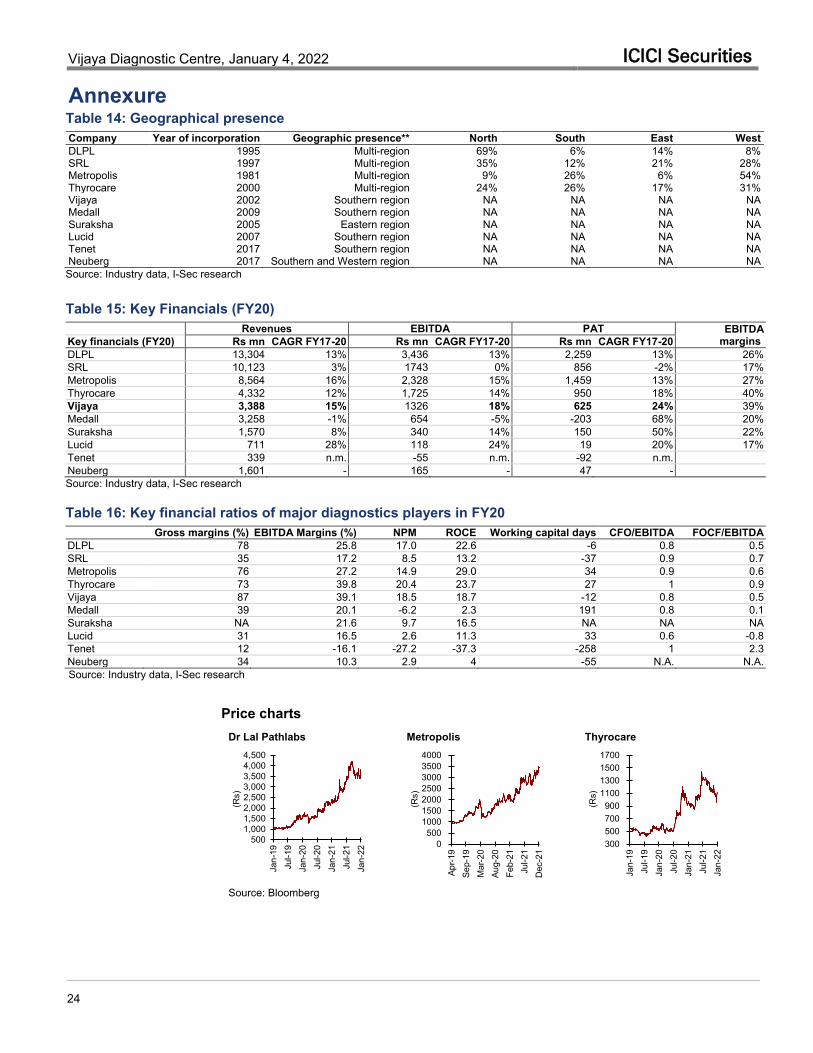
Annexure
Table 14: Geographical presence Company Year of incorporation Geographic presence** North South East West DLPL 1995 Multi-region 69% 6% 14% 8% SRL 1997 Multi-region 35% 12% 21% 28% Metropolis 1981 Multi-region 9% 26% 6% 54% Thyrocare 2000 Multi-region 24% 26% 17% 31% Vijaya 2002 Southern region NA NA NA NA Medall 2009 Southern region NA NA NA NA Suraksha 2005 Eastern region NA NA NA NA Lucid 2007 Southern region NA NA NA NA Tenet 2017 Southern region NA NA NA NA Neuberg 2017 Southern and Western region NA NA NA NA Source: Industry data, I-Sec research
Table 15: Key Financials (FY20) Revenues EBITDA PAT EBITDA
margins Key financials (FY20) Rs mn CAGR FY17-20 Rs mn CAGR FY17-20 Rs mn CAGR FY17-20 DLPL 13,304 13% 3,436 13% 2,259 13% 26% SRL 10,123 3% 1743 0% 856 -2% 17% Metropolis 8,564 16% 2,328 15% 1,459 13% 27% Thyrocare 4,332 12% 1,725 14% 950 18% 40% Vijaya 3,388 15% 1326 18% 625 24% 39% Medall 3,258 -1% 654 -5% -203 68% 20% Suraksha 1,570 8% 340 14% 150 50% 22% Lucid 711 28% 118 24% 19 20% 17% Tenet 339 n.m. -55 n.m. -92 n.m. Neuberg 1,601 - 165 - 47 - Source: Industry data, I-Sec research
Table 16: Key financial ratios of major diagnostics players in FY20 Gross margins (%) EBITDA Margins (%) NPM ROCE Working capital days CFO/EBITDA FOCF/EBITDA DLPL 78 25.8 17.0 22.6 -6 0.8 0.5 SRL 35 17.2 8.5 13.2 -37 0.9 0.7 Metropolis 76 27.2 14.9 29.0 34 0.9 0.6 Thyrocare 73 39.8 20.4 23.7 27 1 0.9 Vijaya 87 39.1 18.5 18.7 -12 0.8 0.5 Medall 39 20.1 -6.2 2.3 191 0.8 0.1 Suraksha NA 21.6 9.7 16.5 NA NA NA Lucid 31 16.5 2.6 11.3 33 0.6 -0.8 Tenet 12 -16.1 -27.2 -37.3 -258 1 2.3 Neuberg 34 10.3 2.9 4 -55 N.A. N.A. Source: Industry data, I-Sec research
Price charts Dr Lal Pathlabs Metropolis Thyrocare
Source: Bloomberg
5001,0001,5002,0002,5003,0003,5004,0004,500
Jan-
19Ju
l-19
Jan-
20Ju
l-20
Jan-
21Ju
l-21
Jan-
22
(Rs)
0500
1000150020002500300035004000
Apr-1
9Se
p-19
Mar
-20
Aug-
20Fe
b-21
Jul-2
1D
ec-2
1
(Rs)
300500700900
1100130015001700
Jan-
19Ju
l-19
Jan-
20Ju
l-20
Jan-
21Ju
l-21
Jan-
22
(Rs)

Vijaya Diagnostic Centre, January 4, 2022 ICICI Securities
25
Index of Tables and Charts
Tables Table 1: Comprehensive test offering by Vijaya in both radiology and pathology ................ 7 Table 2: Number of centers and service offerings ................................................................ 7 Table 3: Peer comparison on key diagnostic matrix (FY 21) .............................................. 10 Table 4: Listed peer projections - Ratios ............................................................................ 17 Table 5: Listed peer projections - Financials ...................................................................... 17 Table 6: DCF-based valuation ............................................................................................ 18 Table 7: Sensitivity index of DCF valuation ........................................................................ 18 Table 8: Region-wise revenue mix (FY21) ......................................................................... 19 Table 9: Key management personnel ................................................................................. 19 Table 10: Profit and loss statement .................................................................................... 20 Table 11: Restated consolidated balance sheet ................................................................. 21 Table 12: Restated consolidated cashflow statement ........................................................ 22 Table 13: Key ratios (based on restated consolidated financials) ...................................... 23 Table 14: Geographical presence ....................................................................................... 24 Table 15: Key Financials (FY20) ........................................................................................ 24 Table 16: Key financial ratios of major diagnostics players in FY20 .................................. 24 Charts Chart 1: Size of the Indian diagnostic industry ..................................................................... 3 Chart 2: Diagnostic chains contribute ~12-17% of overall diagnostic industry ..................... 3 Chart 3: Radiology vs Pathology .......................................................................................... 4 Chart 4: Size of AP & Telangana diagnostic industry ........................................................... 5 Chart 5: 96% of revenue from Telangana and Andhra Pradesh (FY21) .............................. 6 Chart 6: Peer comparison - South Indian revenue contribution ............................................ 6 Chart 7: Continuous expansion of centers ............................................................................ 8 Chart 8: Vijaya’s B2C revenue .............................................................................................. 9 Chart 9: Vijaya’s B2C focus is highest vis-à-vis peers ......................................................... 9 Chart 10: Peer comparison – EBITDA and gross margin(FY 21) ....................................... 10 Chart 11: Peer comparison – gross block per lab(FY 21) .................................................. 10 Chart 12: Peer comparison – gross assets turnover (FY 21) ............................................. 10 Chart 13: Peer comparison – ROIC (%) FY 21 ................................................................... 11 Chart 14: Revenue trend ..................................................................................................... 12 Chart 15: Number of patients .............................................................................................. 12 Chart 16: Revenue per patient ............................................................................................ 13 Chart 17: Growth trend in number of tests .......................................................................... 13 Chart 18: Revenue per test ................................................................................................. 13 Chart 19: Adjusted EBITDA and margin ............................................................................. 14 Chart 20: Profit trend ........................................................................................................... 14 Chart 21: Return ratios ........................................................................................................ 15 Chart 22: Operating cashflow ............................................................................................. 15 Chart 23: 1-year forward EV/EBITDA ................................................................................. 17

Vijaya Diagnostic Centre, January 4, 2022 ICICI Securities
26
This report may be distributed in Singapore by ICICI Securities, Inc. (Singapore branch). Any recipients of this report in Singapore should contact ICICI Securities,
Inc. (Singapore branch) in respect of any matters arising from, or in connection with, this report. The contact details of ICICI Securities, Inc. (Singapore branch) are
as follows: Address: 10 Collyer Quay, #40-92 Ocean Financial Tower, Singapore - 049315, Tel: +65 6232 2451 and email: [email protected],
"In case of eligible investors based in Japan, charges for brokerage services on execution of transactions do not in substance constitute charge for research reports
and no charges are levied for providing research reports to such investors."
New I-Sec investment ratings (all ratings based on absolute return; All ratings and target price refers to 12-month performance horizon, unless mentioned otherwise)
BUY: >15% return; ADD: 5% to 15% return; HOLD: Negative 5% to Positive 5% return; REDUCE: Negative 5% to Negative 15% return; SELL: < negative 15% return
ANALYST CERTIFICATION I/We, Vinay Bafna, MBA; Mitesh Shah, CFA; Rohan John; MBA; authors and the names subscribed to this report, hereby certify that all of the views expressed in this research report accurately reflect our views about the subject issuer(s) or securities. We also certify that no part of our compensation was, is, or will be directly or indirectly related to the specific recommendation(s) or view(s) in this report. Analysts are not registered as research analysts by FINRA and are not associated persons of the ICICI Securities Inc. It is also confirmed that above mentioned Analysts of this report have not received any compensation from the companies mentioned in the report in the preceding twelve months and do not serve as an officer, director or employee of the companies mentioned in the report. Terms & conditions and other disclosures: ICICI Securities Limited (ICICI Securities) is a full-service, integrated investment banking and is, inter alia, engaged in the business of stock brokering and distribution of financial products. ICICI Securities is Sebi registered stock broker, merchant banker, investment adviser, portfolio manager and Research Analyst. ICICI Securities is registered with Insurance Regulatory Development Authority of India Limited (IRDAI) as a composite corporate agent and with PFRDA as a Point of Presence. ICICI Securities Limited Research Analyst SEBI Registration Number – INH000000990. ICICI Securities Limited SEBI Registration is INZ000183631 for stock broker. ICICI Securities is a subsidiary of ICICI Bank which is India’s largest private sector bank and has its various subsidiaries engaged in businesses of housing finance, asset management, life insurance, general insurance, venture capital fund management, etc. (“associates”), the details in respect of which are available on www.icicibank.com. ICICI Securities is one of the leading merchant bankers/ underwriters of securities and participate in virtually all securities trading markets in India. We and our associates might have investment banking and other business relationship with a significant percentage of companies covered by our Investment Research Department. ICICI Securities and its analysts, persons reporting to analysts and their relatives from maintaining a financial interest in the securities or derivatives of any companies that the analysts cover. Recommendation in reports based on technical and derivative analysis centre on studying charts of a stock's price movement, outstanding positions, trading volume etc as opposed to focusing on a company's fundamentals and, as such, may not match with the recommendation in fundamental reports. Investors may visit icicidirect.com to view the Fundamental and Technical Research Reports. Our proprietary trading and investment businesses may make investment decisions that are inconsistent with the recommendations expressed herein. ICICI Securities Limited has two independent equity research groups: Institutional Research and Retail Research. This report has been prepared by the Institutional Research. The views and opinions expressed in this document may or may not match or may be contrary with the views, estimates, rating, and target price of the Retail Research. The information and opinions in this report have been prepared by ICICI Securities and are subject to change without any notice. The report and information contained herein is strictly confidential and meant solely for the selected recipient and may not be altered in any way, transmitted to, copied or distributed, in part or in whole, to any other person or to the media or reproduced in any form, without prior written consent of ICICI Securities. While we would endeavour to update the information herein on a reasonable basis, ICICI Securities is under no obligation to update or keep the information current. Also, there may be regulatory, compliance or other reasons that may prevent ICICI Securities from doing so. Non-rated securities indicate that rating on a particular security has been suspended temporarily and such suspension is in compliance with applicable regulations and/or ICICI Securities policies, in circumstances where ICICI Securities might be acting in an advisory capacity to this company, or in certain other circumstances. This report is based on information obtained from public sources and sources believed to be reliable, but no independent verification has been made nor is its accuracy or completeness guaranteed. This report and information herein is solely for informational purpose and shall not be used or considered as an offer document or solicitation of offer to buy or sell or subscribe for securities or other financial instruments. Though disseminated to all the customers simultaneously, not all customers may receive this report at the same time. ICICI Securities will not treat recipients as customers by virtue of their receiving this report. Nothing in this report constitutes investment, legal, accounting and tax advice or a representation that any investment or strategy is suitable or appropriate to your specific circumstances. The securities discussed and opinions expressed in this report may not be suitable for all investors, who must make their own investment decisions, based on their own investment objectives, financial positions and needs of specific recipient. This may not be taken in substitution for the exercise of independent judgment by any recipient. The recipient should independently evaluate the investment risks. The value and return on investment may vary because of changes in interest rates, foreign exchange rates or any other reason. ICICI Securities accepts no liabilities whatsoever for any loss or damage of any kind arising out of the use of this report. Past performance is not necessarily a guide to future performance. Investors are advised to see Risk Disclosure Document to understand the risks associated before investing in the securities markets. Actual results may differ materially from those set forth in projections. Forward-looking statements are not predictions and may be subject to change without notice. ICICI Securities or its associates might have managed or co-managed public offering of securities for the subject company or might have been mandated by the subject company for any other assignment in the past twelve months. ICICI Securities or its associates might have received any compensation from the companies mentioned in the report during the period preceding twelve months from the date of this report for services in respect of managing or co-managing public offerings, corporate finance, investment banking or merchant banking, brokerage services or other advisory service in a merger or specific transaction. ICICI Securities or its associates might have received any compensation for products or services other than investment banking or merchant banking or brokerage services from the companies mentioned in the report in the past twelve months. ICICI Securities encourages independence in research report preparation and strives to minimize conflict in preparation of research report. ICICI Securities or its associates or its analysts did not receive any compensation or other benefits from the companies mentioned in the report or third party in connection with preparation of the research report. Accordingly, neither ICICI Securities nor Research Analysts and their relatives have any material conflict of interest at the time of publication of this report. Compensation of our Research Analysts is not based on any specific merchant banking, investment banking or brokerage service transactions. ICICI Securities or its subsidiaries collectively or Research Analysts or their relatives do not own 1% or more of the equity securities of the Company mentioned in the report as of the last day of the month preceding the publication of the research report. Since associates of ICICI Securities and ICICI Securities as a entity are engaged in various financial service businesses, they might have financial interests or beneficial ownership in various companies including the subject company/companies mentioned in this report. ICICI Securities may have issued other reports that are inconsistent with and reach different conclusion from the information presented in this report. Neither the Research Analysts nor ICICI Securities have been engaged in market making activity for the companies mentioned in the report. We submit that no material disciplinary action has been taken on ICICI Securities by any Regulatory Authority impacting Equity Research Analysis activities. This report is not directed or intended for distribution to, or use by, any person or entity who is a citizen or resident of or located in any locality, state, country or other jurisdiction, where such distribution, publication, availability or use would be contrary to law, regulation or which would subject ICICI Securities and affiliates to any registration or licensing requirement within such jurisdiction. The securities described herein may or may not be eligible for sale in all jurisdictions or to certain category of investors. Persons in whose possession this document may come are required to inform themselves of and to observe such restriction. This report has not been prepared by ICICI Securities, Inc. However, ICICI Securities, Inc. has reviewed the report and, in so far as it includes current or historical information, it is believed to be reliable, although its accuracy and completeness cannot be guaranteed.