Successful Outsourcing: - AVCJ Private Equity & Venture Forum
Upload
khangminh22Category
view
5download
0
About the survey
The SAVCA 2021 Private Equity Industry Survey is presented by SAVCA and EY. The survey was based on responses from over 50 Private Equity firms operating in Southern Africa. The survey covers analysis of the industry’s strategic priorities, investment & divestment activity, fund raising, funds under management, the impact of private equity, BBBEE and the diversity of PE investment professionals. The data is based on annual calendar year data up to 31 December 2020. SAVCA reviews the reports prior to their public release.
SAVCA does not have access to any of the individually completed surveys submitted to EY. While care has been taken in the compilation of the survey results, SAVCA and EY do not guarantee the reliability of its sources nor of the results presented. Any liability is disclaimed, including incidental or consequential damage arising from errors or omissions in this report.
Private Equity Industry SurveyVolume 2 – Fundraising, Investments, Exits and Funds Under Management
Insights into the Southern Africa Private Equity Industry
Research partner
2021SAVCA

Private Equity Industry Survey - Volume 2 Fundraising, Investments, Exits and Funds Under Management Insights | 2
0.2
0.8
0.7
1.4
1.2
1.5
7.0
2020
Late stage
Early stage
Fundraising declined in 2020, however was still higher than 2016-2018 despite the fundraising headwinds caused by COVID-19. 14 funds raised capital for late stage funds and 6 funds raised capital for early stage funds. The 22.1% decline in fundraising compares to a 19.1% decline in global PE fundraising, however global PE fundraising has rebounded significantly in 2021 with H1 2021 global PE fundraising being 57.9% up on H1 2020 (source: www.ey.com/PEpulse). Will Southern Africa PE fundraising rebound in a similar way?
2011
9.9
10.7
3.66.1
2015
26.0
27.5
20.5
2018
3.2
10.2
7.5
12.8
21.7
16.9
20192012
2.2
1.4
1.0
1.5
201620142013
11.1
11.3
11.1
11.8
11.8
15.4
2017
Value of funds raised by fund stage, 2011-2020 (R bn)
Funds raised by investment destination, 2016-2020 (R bn)
Geographical source of funds raised, 2018-2020 (% of total)
Fundraising activity insights
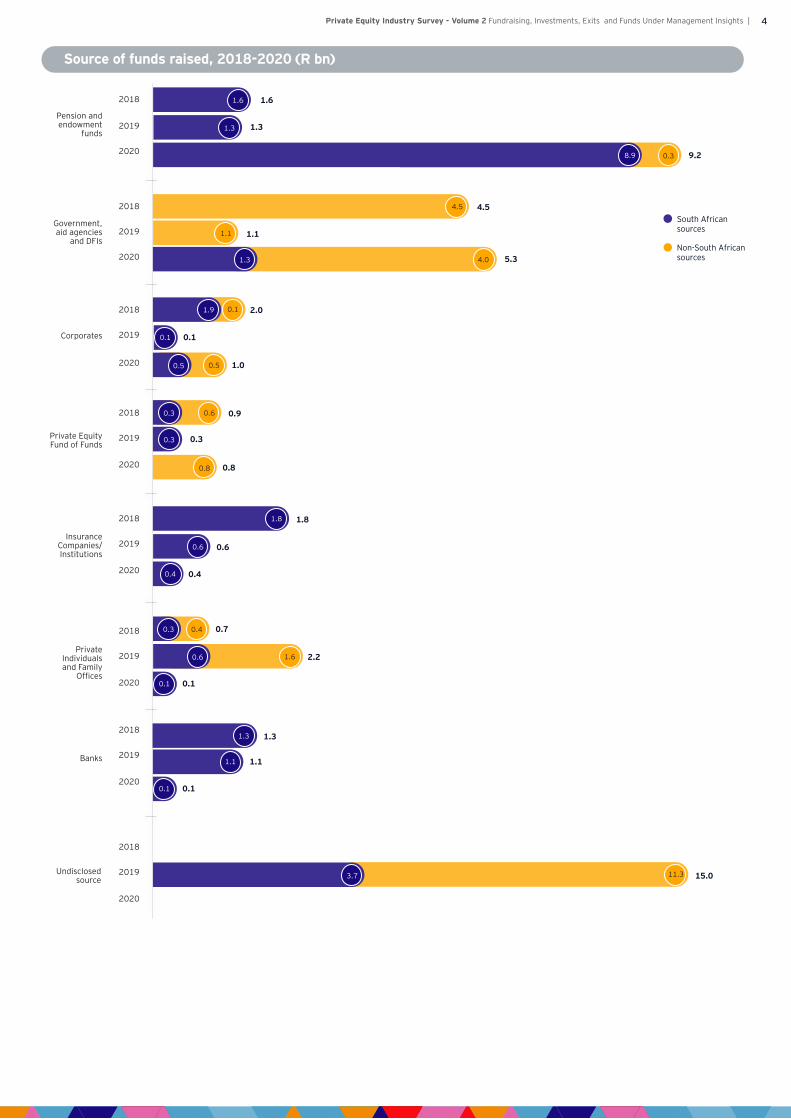
Funds raised from South African investors, especially local pension and endowment funds (see page 4 for breakdown by type of investor), increased sharply in 2020 showing strong confidence in the Private Equity industry. Funds raised are also largely being mandated for investments in South Africa, more than in any other year for the last 5 years.
Outside South Africa
Non South Africa
South Africa
South Africa
2016
5.6
4.6
5.8
2020
11.1
5.7
2018
7.1
2017
3.9 3.6
2019
18.0
3.7
2018 2019 2020
56.6 35.343.4 64.772.5
27.5

Private Equity Industry Survey - Volume 2 Fundraising, Investments, Exits and Funds Under Management Insights | 3
302.3
365.3 365.8
379.9
Breakdown of non-South African sources of funds raised by geography, 2020
For funds raised from investors outside South Africa, the majority (67%+) were from European and UK investors. No funds were raised in 2020 from the rest of Africa. Albeit disappointing as the PE sector would benefit from more backing from African investors outside of South Africa, it may speak to the investment mandate of the funds that were able to raise funds in 2020 with a largely South African mandate for investments.
2021 is becoming a landmark fundraising year globally for private equity as an asset class off the back of the strong rebound seen in the second half of 2020.
40%
23%
1%
1%
6%
3%
27%
Europe (excluding UK)
Unclassified
Middle East
Asia
Canada
United States
United Kingdom
Global PE fundraising trends - 2010 to 1H 2021 (US$b)
EY Global PE Pulse report for H1 2021
Number of PE funds
US$ b funds raised
450
350
400
400
700
500
800
300
500
250
150
200300
600
Num
ber o
f PE
fund
s
US$
b va
lue
of P
E fu
nds
clos
ed
100200
50100
0 0
2012
H1
2012
H2
2017
H1
2017
H2
2010
H1
2010
H2
2014
H1
2014
H2
2015
H2
2019
H1
2013
H1
2013
H2
2018
H1
2018
H2
2019
H2
2011
H1
2011
H2
2016
H1
2016
H2
2015
H1
2021
H1
2020
H1
2020
H2
69.887.8
236
332
325300
352
405
362
443
420
545
689
657
734
684
694
499462
553
427
486
500
552534
99.8118.0
97.9 96.0
144.4163.3
180.6182.2
232.4
158.6
267.8
286.5
224.4
271.8275.0
231.6
309.7
Private Equity Industry Survey - Volume 2 Fundraising, Investments, Exits and Funds Under Management Insights | 4
0.1
0.4
0.5
0.6
4.0
Government, aid agencies
and DFIs
Corporates
Insurance Companies/Institutions
Private Individuals and Family
Offices
2018
2018
2018
2018
2018
2018
2018
2018
2019
2019
2019
2019
2019
2019
2019
2019
2020
2020
2020
2020
2020
2020
2020
2020
Private Equity Fund of Funds
Banks
4.5
1.3
1.9
1.8
1.1
0.6
0.5
0.4
0.3
0.3
0.8
1.1
0.1
0.1
South African sources
2.0
1.8
0.7
2.2
0.9
1.3
4.5
0.6
0.3
0.8
1.1
11.3Undisclosed source 3.7 15.0
1.1
1.0
0.4
0.1
0.1
5.3Non-South African sources
0.3
1.3
1.60.6
0.3
1.6
Pension and endowment
funds
8.9
1.6
1.3
9.2
1.3
0.1 0.1
Source of funds raised, 2018-2020 (R bn)

Private Equity Industry Survey - Volume 2 Fundraising, Investments, Exits and Funds Under Management Insights | 5
14.9
Investment activity insights
Cost of investments by stage, 2018-2020 (% of total)
Cost (2011-2020 in R bn) and number (2018-2020) of investments split by new and follow-on investments
2020
Follow-on investments (R bn)
New investments (R bn)
The volume of new and follow-on investments, excluding Business Partners, decreased to 73 and 96 respectively in 2020. This compares to 132 new and 117 follow-investments in 2019, which had declined from 162 new and 282 follow-investments in 2018. While the value and volume of investments declined in 2020, the decline was not as sharp as expected and PE firms still managed to make investments, despite the challenges to dealmaking caused by COVID-19. The cost of investment values were similar to those experienced during 2012-2016. The average cost per investment was relatively consistent from 2018 to 2020, averaging between R80m and R102m (excluding Business Partners). There has been a sharp uptick in investment activity in 2021 globally with Global PE investments in H1 2021 almost tripling the value for H1 2020 and increasing 53.1% on H2 2020 to reach R584.3bn, an all-time half-year high beating the previous high of H1 2007 (source: www.ey.com/PEpulse).
2011
8.8
18.9
7.7
16.5
11.1
13.413.9
12.5
15.5
31.1
35.4
25.4
14.5
2015
18.4
2018
10.1
10.2
20192012
5.0
6.1
6.2
12.2
20.5
7.0
4.7 4.3
201620142013
2019 2020
5.8 5.4
7.67.7
7.8
2017
2018
Expansion & Development
Buy-out
Start-up & Early Stage
Unclassified
In 2020, the investments in Start Up and Early Stage largely arose from investments in early-stage infrastructure projects.
3.7%
8.6%
42.5%
45.2%
52.0% 45.8%
27.4% 41.9%
20.6% 12.3%

Private Equity Industry Survey - Volume 2 Fundraising, Investments, Exits and Funds Under Management Insights | 6
0.2%
Investments by sector, 2018-2020 (% of total cost)
In 2020, investments in Infrastructure and Real Estate represented over 41.7% of the cost of total investments. By number, investments in the Manufacturing (28 in SA and 8 outside SA) and Services (22 in SA and 12 outside SA) were the most popular sectors. There were 27 and 25 investments in Infrastructure and Real Estate respectively.
Infrastructure
Travel & Leisure
Real Estate
Information Technology
Telecommunications
Services
Energy & Related
Manufacturing
Agri & Agri Processing Media
Banks, Financial Services & Insurance Infrastructure Related Services
Education
Healthcare
Mining & Natural Resources
Retail
Other
2018
6.1%
17.0%
6.5%11.2%
6.1%
17.6%
14.3%
3.3%
4.4%
2.5%
2.3%
0.3%
0.3%1.0%3.1%
2.8%
34.7%
5.6%
4.2%1.9%
11.0%
2.1%
14.5%
3.8%
3.3%
3.3%
1.8%
0.1%
10.7%
22.8%
2.9%
18.9%
2.3%
8.5%
10.0%
8.5%
7.2%
3.1%
3.8%
0%
8.5%
2019
2020
1.7% 1.2% 1.1%
1.0%
0.9%
0.1%
0.7%
0.2%
0.6%

Private Equity Industry Survey - Volume 2 Fundraising, Investments, Exits and Funds Under Management Insights | 7
Number of exits (excluding Business Partners), 2018-2020
723
7.0
Exit activity insights
Funds returned to investors, 2011-2020 (R bn)
20202011 2015 2018 20192012 201620142013 2017
15.6
12.0
9.8
11.0
7.2
2019
2019
2020
2020
2018 29
30
14
2018
6 71
17
Trade sale
Share buy- back by portfolio company
Sale to management (Buy-back)
Sale to another PE firm or financial investor
Sale of listed shares or IPOs
Total proceeds and cost of investments exited, 2018-2020 (R bn)
1.7
6.7
0.8
5.2
2.3
6.3
Cost
Proceeds
18.3
17.6
25.7
8.2
2103213
Emphasis will need to be placed on increasing exit volumes going forward. The sharp increase in global PE exits to an all-time half-year high in H1 2021 (per www.ey.com/PEpulse) might be a leading indicator for greater exit activity from Southern Africa PE firms.

Private Equity Industry Survey - Volume 2 Fundraising, Investments, Exits and Funds Under Management Insights | 8
Exits to other PE firms or financial investors represented 62.1% of funds returned to investors in 2020 versus < 6% in 2019 and 2018. This was driven by a few high value exits to PE / financial investors - the number of exits to PE / financial investors however reduced from 10 and 7 in 2019 and 2018 respectively, to 5 exits in 2020. The high % of proceeds from sales to another PE or financial investor is not expected to continue post 2020, but rather we expect PE firms to increasingly target exits to trade buyers. Once more certainty exists on the impact of COVID-19 on portfolio companies, we also expect proceeds from dividends, interest payments and repayments of preference shares / loans to increase.
Nature of funds returned based on proceeds, 2018-2020 (% of total)
Sale to another PE firm or financial investor Sale to management with no equity involvement of another financial institution
Trade sale Write-offs including sales for a nominal amount
Repayment of preference shares/loans Share buy-back by portfolio company
Dividends and interest payments Sales of listed shares
Other/Unspecified Listing or IPO
5.8%0.3%
0.5%
0%
0% 0%
0.3%
36.0%
26.5%
15.6%
15.0%
4.6% 2.1%
1.4%
0.2%
0%
35.0%
38.5%
11.5%
6.7%
62.1%
0.8%
0%
0%
0%
0%
24.4%
6.6%
4.5%
1.6%
2018
2019
2020

Private Equity Industry Survey - Volume 2 Fundraising, Investments, Exits and Funds Under Management Insights | 9
98.6
97.5
Funds under management insights
Funds under management by type of PE fund, 2011-2020 (R bn)
Composition of FUM by amount invested and undrawn commitments, 2011-2020 (R bn)
2020
2020
2011
113.6113.3
119.7
150.3
158.5
171.8
158.6
171.0
205.7
184.4
2011
56.0
88.4
57.6
2015
2015
112.0
2018
2018
108.0
105.2
2019
2019
2012
2012
54.6
58.7
59.8
70.272.4 72.4
61.0
100.5
2016
2016
2014
2014
2013
2013
60.7
63.8
59.0
90.5
2017
2017
Captives
Undrawn commitments for outside South Africa
Independents
Undrawn commitments for South Africa
Unrealised investments
The increase in funds under management (FUM) was mainly driven by a few captive PE firms having increased values of unrealised investments (also reflected in the chart below). The value of dry powder available for new investments stayed relatively flat at slightly over R30 billion with approximately 1/3 available for investing in South Africa.
13.4 12.2 11.2 11.815.4 15.515.8 16.922.3
20.421.3 21.6
33.7
17.217.9 17.9
23.5 24.7
24.6
83.0
80.080.4
108.7109.6
113.5122.7
140.9
26.6
151.9172.3

Private Equity Industry Survey - Volume 2 Fundraising, Investments, Exits and Funds Under Management Insights | 10
Significant improvements were made in the number of PE firms with a BBBEE rating of Level 1 with 36% of firms that participated in the survey reporting they had a Level 1 rating. Of the FUM, 30.7% are being managed by Level 1 rated PE firms, up from the 6.5% reported in 2019. The % of non-compliant or PE firms that did not disclose their BBBEE level also decreased.
Sector focused funds gained further prominence as the proportion of FUM managed by Generalist PE funds continues to decrease, with Infrastructure focused PE funds the largest gainer. Other sector specific funds cover healthcare, agri and agri-processing, manufacturing, ICT and financial services focused funds.
Composition of FUM by BBBEE level of fund manager 2018-2020 (% of total FUM)
Composition of total FUM by focus of the fund (% of total at 31 December 2018, 2019 and 2020)
Level 1
Level 4
Level 2
Level 5
Energy & related
Level 3
Level 6
Level 7
Real Estate
Level 8
Infrastructure
Non disclosed or non -compliant
Generalist
Other
30.7%
13.4%
2.7% 6.5%
22.0%
10.7%
10.5%
25.6%23.4%2.2%
2.9%
1.9%
0.3% 5.8%17.0%
0.7%
13.9%
18.5%30.2%
33.2%27.9%
2019
2019
2020
2020
2018
2018
79.0% 65.3%
56.6%
3.4%1.1% 1.6% 4.1%1.8% 1.7% 4.4%
3.0% 3.9%
14.7%
26.0%
33.4%

EY | Building a better working world
EY exists to build a better working world, helping to create long-term value for clients, people and society and build trust in the capital markets.
Enabled by data and technology, diverse EY teams in over 150 countries provide trust through assurance and help clients grow, transform and operate.
Working across assurance, consulting, law, strategy, tax and transactions, EY teams ask better questions to find new answers for the complex issues facing our world today.
About EY Strategy and TransactionsEY Strategy and Transactions teams work with clients to navigate complexity by helping them to reimagine their eco-systems, reshape their portfolios and reinvent themselves for a better future. With global connectivity and scale, EY Strategy and Transactions teams help clients drive corporate, capital, transaction and turnaround strategies through to execution, supporting fast-track value creation in all types of market environments. EY Strategy and Transactions teams help support the flow of capital across borders and help bring new products and innovation to market. In doing so, EY Strategy and Transactions teams help clients to build a better working world by fostering long-term value. For more information please visit ey.com/StrategyandTransactions.
© 2021 EYGM Limited. All Rights Reserved.
ED None
This material has been prepared for general information purposes only and is not intended to be relied upon as accounting, tax, or other professional advice. Please refer to your advisors for specific advice. The information contained herein has been prepared as of the current date, is of a general nature, and is not intended to address the circumstances nor needs of all individuals or entities. No one should act upon such information without obtaining appropriate professional advice. Although we endeavor to provide accurate and timely information at the current date, there can be no guarantee that such information will continue to be accurate in the future.
This material has been prepared for general informational purposes only and is not intended to be relied upon as accounting, tax, or other professional advice. Please refer to your advisors for specific advice.
ey.com
Contact:SAVCA+27 11 268 [email protected]
Thank you and what next?
Thank you to the PE firms that participated in this survey, without whom the survey and its findings would not have been possible.
This report is the 2nd in a series of reports covering the key findings from the survey. This 2nd volume is the Fundraising, Investments, Exits and Funds Under Management Insights volume. Volume 1 was the Strategic Insights volume.
In Volume 3, we will look at the role that PE firms play in shaping the transformation of the Southern African economy, diversity within PE teams, value creation and other market insights.
About SAVCA
The Southern African Venture Capital and Private Equity Association (SAVCA) is the industry body and public policy advocate for private equity and venture capital in Southern Africa. SAVCA represents in excess of R200 billion in assets under management through circa 180 members that form part of the private equity and venture capital ecosystem. SAVCA promotes the Southern Africa venture capital and private equity asset classes on a range of matters affecting the industry, providing relevant and insightful research, offering training on private equity and creating meaningful networking opportunities for industry players.
Copyright © 2022 FDOKUMEN