Private Equity Cross-border Investments Using the Gravity ... - OPUS
222
Private Equity Cross-border Investments Using the Gravity Model to Evaluate Transaction Patterns Across Countries and Years Dipl. Kfm. Christian Rosenberger New York Dissertation zur Erlangung des akademischen Grades eines Doktor rerum politicarum durch die Wirtschaftswissenschaftliche Fakultät der Universität Trier UNIVERSITY OF TRIER 2008
-
Upload
khangminh22 -
Category
Documents
-
view
2 -
download
0
Transcript of Private Equity Cross-border Investments Using the Gravity ... - OPUS

Private Equity Cross-border Investments Using the Gravity Model to Evaluate Transaction
Patterns Across Countries and Years
Dipl. Kfm. Christian Rosenberger
New York
Dissertation zur Erlangung des akademischen Grades
eines Doktor rerum politicarum
durch die Wirtschaftswissenschaftliche Fakultät
der Universität Trier
UNIVERSITY OF TRIER
2008

© 2008
Christian Rosenberger
All Rights Reserved

ABSTRACT Private Equity Cross-border Investments
Using the Gravity Model to Evaluate Transaction Patterns Across Countries and Years
International private equity development is highly volatile with increasing global
diversification. This thesis examines the transaction patterns of cross-border
private equity investment with a particular focus on the affinity of country pairs.
Analysis is based on a comprehensive dataset of 99 countries over 25 years. A
three-dimensional gravity model analysis covering source and host country over
time exposes the effects of the country determinants: economic mass, economic
distance, banking system, corporate endowment, as well as legal, political, and
institutional system on the transactions. A new method is developed to examine
countries in their dual roles as investor and target. This approach verifies their
global importance as source and host, and also makes possible an analysis of
overall private equity investment. For private equity-specific multi-investor deals,
a scheme is designed to measure cross-border activity with more precision by
participation, proportional deal participation, and deal flow. The analysis identifies
intense level of affinity between country pairs and reveals that no single country
is ideal for private equity activity. Instead, the findings show that the specific push
and pull factors within each country constellation define the optimal country as
trading partner. The results verify a correlation between cross-border deals and
economic masses and reduced economic distance of countries. Geographic
distance and cultural similarities, such as language and legal system, intensify
the likelihood of initiating transactions. International trade-oriented countries with
a high level of development lower the entrance barriers and increase the
chances of deal success. A well-funded financial system for the investor and an
efficient and competitive banking system of target countries enhance the
probability of investment between countries. Also relevant for the likelihood of
starting cross-border deals are low corporate tax burdens and advanced
scientific competitiveness, and a well-developed stock market in the investor
country. Fundamental to frequency and likelihood of success are well-
established, high standards of a country’s social, political, and legal systems with
widespread confidence in the rules of society. In particular, the reliability of
contract enforcement, with proven quality of regulations that promote private
sector development, proves to be crucial for deal success.

ABSTRACT Private Equity Cross-border Investments:
Using the Gravity Model to Evaluate Transaction Patterns Across Countries and Years
Die Entwicklungen der Private Equity Investitionen sind sehr volatil mit sich
verstärkender globaler Diversifikation. Die vorliegende Arbeit untersucht
internationale Private Equity Investitionsmuster für eine Grundgesamtheit von 99
Ländern über 25 Jahre. Eine dreidimensionale Gravity-Modell-Analyse mit
Quelle, Ziel und Zeitpunkt der Investitionen identifiziert die Effekte der
Länderdeterminanten Ökonomische Masse, Ökonomische Distanz, Güte des
Finanzsystems, unternehmerische Ausstattung des Landes als auch die Art des
Rechts-, Politik- und Sozialsystems. Hierzu wurde eine neue Methode entwickelt,
die Länder in ihrer dualen Rolle als Quell- und Zielland für Investitionen
untersucht. Dieser Ansatz ermöglicht es sowohl ihre Bedeutung als Investor und
Ziel als auch ihre kummulierte Private Equity Aktivität zu verifizieren. Für die
Private Equity spezifischen Multi-Investor-Transaktionen wurde ein Schema
entwickelt, das zur Erhöhung der Sensibilität der Messung von internationaler
Aktivität die Beteiligung und proportionale Beteiligung von Investoren sowie den
Betrag der Investitionen berücksichtigt. Die Analyse bestätigt eine starke Affinität
zwischen bestimmten Ländern und verifiziert, dass es das optimale Land für
grenzüberschreitende Private Equity Investitionen nicht geben kann. Sie zeigt
vielmehr, dass es spezifische Anziehungs- und Abstoßungskräfte zwischen den
Ländern gibt, die den optimalen Investitionspartner definieren. Die Ergebnisse
weisen auf einen Zusammenhang zwischen Investition und ökonomischer
Massen und ökonomischer Nähe der Länder hin. Besonders geographische
Distanz und kulturelle Gemeinsamkeiten wie Sprache und Rechtssystem
verstärken den Effekt. Starker Im- und Export und hohe ökonomische Standards
verringern die Eintrittsbarrieren und erhöhen die Wahrscheinlichkeit für
Investitionen. Ein kapitalkräftiges Finanzsystem des Investorlandes und ein
effizientes Bankensystem des Ziellandes begünstigen den Austausch zwischen
den Ländern. Weiter relevant sind niedrige Steuern, hohe wissenschaftliche
Konkurrenzfähigkeit und ein gut entwickeltes Börsensystem im Investorland.
Fundamental für den Erfolg sind hohe Standards des Sozial-, Staats- und
Rechtssystems mit Vertrauen in die Regeln des Gesellschaftssystems, vor allem
in das Vertragsrecht und in Regularien, die die Entwicklungen des Privatsektors
fördern.

Private Equity Cross-border Investments IV
Table of Contents
List of Figures .................................................................................VIII
List of Tables .................................................................................... X
List of Abbreviations & Acronyms ....................................................XII
A. Science of private equity investments .............. .......................................... 1
1. Introduction ................................................................................................ 1
2. Status quo in private equity research......................................................... 2
3. Goals and structure of thesis ..................................................................... 3
B. Concept for research of private equity investments. ................................. 6
1. Developing a theoretical framework........................................................... 6
1.1. Definition and specifics of the research ............................................. 7
1.1.1. Overall private equity investment market structure ................. 7
1.1.2. Private equity finance stages — the company life cycle........ 11
1.1.3. The private equity investment process.................................. 12
1.2. Relevant research studies and models............................................ 14
1.2.1. Topic-related private equity and venture capital studies ....... 14
1.2.2. Method-related studies: Time series and cross-section ........ 15
2. Design and method of analysis................................................................ 18
2.1. Design of the analysis...................................................................... 18
2.2. Statistical methods for analysis........................................................ 21
2.2.1. Panel data analysis ............................................................... 22
2.2.2. Gravity model analysis .......................................................... 29

Private Equity Cross-border Investments V
2.3. Conceptualization and definition of variables................................... 34
2.3.1. Conceptualization of private equity activity ........................... 34
2.3.1.1. Principles of measuring private equity activity ......... 34
2.3.1.2. In-depth measurement of private equity activity ...... 36
2.3.2. Conceptualization of indicators of private equity activity ....... 40
3. Data gathering for quantitative statistical analysis ................................... 52
3.1. Private equity investment data......................................................... 52
3.1.1. Database description ............................................................ 53
3.1.2. Data collection ...................................................................... 54
3.1.3. Data preparation ................................................................... 55
3.2. Indicator data ................................................................................... 58
3.2.1. Database description ............................................................ 58
3.2.2. Data collection ...................................................................... 60
3.2.3. Data preparation ................................................................... 62
3.2.3.1. Data selection and adjustment ................................ 62
3.2.3.2. Final explanatory variable derivation ....................... 64
4. Summary of methodology for statistical analysis ..................................... 66
C. Empirical analysis of private equity activity ...... ....................................... 68
1. Overview for empirical analysis ............................................................... 68
2. Pre-analysis of private equity activity ....................................................... 70
2.1. Investment activity over time............................................................ 70
2.2. Investment activity by country — cross-section ............................... 72
2.2.1. Overall country investment activity........................................ 73
2.2.2. Cross-border investment activity........................................... 74

Private Equity Cross-border Investments VI
3. Descriptive analysis of private equity activity ........................................... 74
3.1. Investments of a country over time — panel data............................ 74
3.2. Investments from source to host country — gravity model .............. 74
3.2.1. Overall investment activity .................................................... 74
3.2.2. Cross-border investment activity........................................... 74
3.3. Dynamics of cross-border activity — the gravity model over time.... 74
3.4. Dynamics of partnering and investment........................................... 74
3.5. Investment activity scaled by gross domestic product ..................... 74
3.5.1. Investment by source country over time................................ 74
3.5.2. Investment from source country to host country ................... 74
3.6. Descriptive analysis results.............................................................. 74
4. Explicative analysis — the gravity model analysis over time ................... 74
4.1. Configuration of statistical analysis.................................................. 74
4.1.1. Dataset for statistical analysis ............................................... 74
4.1.2. Data diagnostics for statistical analysis................................. 74
4.2. Analysis of main and interaction effects for countries over time ...... 74
4.2.1. ANOVA for overall cross-border deals .................................. 74
4.2.2. ANOVA applied to venture capital and private equity ........... 74
4.2.2.1. Venture capital......................................................... 74
4.2.2.2. Private equity........................................................... 74
4.2.3. Intermediate results of empirical analysis ............................. 74
4.3. The gravity model analysis with explanatory indicators ................... 74
4.3.1. Analysis of overall private equity investment......................... 74
4.3.1.1. Estimates from the gravity-model indicators ............ 74
4.3.1.2. Estimates from private equity indicators .................. 74
4.3.1.2.1. Banking and financial system variables ................ 74
4.3.1.2.2. Endowment variables............................................ 74

Private Equity Cross-border Investments VII
4.3.1.2.3. Institutional / legal / political system variables....... 74
4.3.2. Analysis applied to venture capital and private equity........... 74
4.3.2.1. Venture capital investment ...................................... 74
4.3.2.2. Private equity investment......................................... 74
4.3.3. Comparison and conclusion of analytic interpretation........... 74
D. Summary and implications........................... .............................................. 74
1. Summary of research results ................................................................... 74
2. Implications for private equity investment ................................................ 74
3. Further research ...................................................................................... 74
References ......................................................................................74
Appendix .........................................................................................74

Private Equity Cross-border Investments VIII
List of Figures
Figure 1: Structure of thesis ........................................................................... 5
Figure 2: Research approach......................................................................... 6
Figure 3: Private equity market structure........................................................ 8
Figure 4: The life cycle of a company........................................................... 11
Figure 5: Private equity investment process................................................. 12
Figure 6: Framework for research design..................................................... 19
Figure 7: Alignment of analytical methods with theoretical framework ......... 21
Figure 8: The gravity model (schematic) ...................................................... 30
Figure 9: Measurement of dependent variables ........................................... 35
Figure 10: Measurement of private equity activity involving more than one
investor ......................................................................................... 37
Figure 11: Dependent variable for analysis with investment round
consideration................................................................................. 39
Figure 12: Derivation of indicators for analysis............................................... 41
Figure 13: Combining information from empirical data................................... 54
Figure 14: Matrix of explanatory data availability for relevant years
by country ..................................................................................... 61
Figure 15: Overview of data selection (schematic)......................................... 63
Figure 16: Analytical steps, model structure, and model diversification ......... 68
Figure 17: Overview of investment development over time............................ 71
Figure 18: Panel of source countries — domestic and cross-border
deal flow........................................................................................ 74
Figure 19: Panel of source countries — domestic and cross-border
participation................................................................................... 74
Figure 20: Activity by country over time ......................................................... 74

Private Equity Cross-border Investments IX
Figure 21: Deal flow overview — source country to host country with
domestic deals .............................................................................. 74
Figure 22: Cross-border deals from 1980 through 2005 by deal flow............. 74
Figure 23: Cross-border deals from 1980 through 2005 by activity................ 74
Figure 24: Investment activity dynamics of source and host country for
1999 and 2000 .............................................................................. 74
Figure 25: Activity development over time for world and selected source
countries ....................................................................................... 74
Figure 26: Deal type development over time.................................................. 74
Figure 27: Panel data — deal flow to GDP..................................................... 74
Figure 28: Country pair activity by deal flow to GDP ...................................... 74
Figure 29: Geographic overview of private equity country activity.................. 74
Figure 30: Normality distribution of residuals (deal flow)................................ 74
Figure 31: Checking for normality of residuals for deal flow model after
transformation ............................................................................... 74

Private Equity Cross-border Investments X
List of Tables
Table 1: Derivation of deal type .................................................................. 39
Table 2: Final quantification of dependent variable with overall activity in
percentage .................................................................................... 40
Table 3: Overview of potential indicators for statistical analysis.................. 52
Table 4: Data matrix of source-to-host activity by number of years ............ 57
Table 5: Data sources for explanatory variables ......................................... 58
Table 6: Explanatory variable set for statistical analysis (I)......................... 65
Table 7: Explanatory variable set for statistical analysis (II)........................ 66
Table 8: Country activity overview of domestic and cross-border deals...... 74
Table 9: Country activity overview of cross-border deals............................ 74
Table 10: Top 20 country pairs — source country to host country
deal flow........................................................................................ 74
Table 11: Top 20 country pairs — source country to host country
participation................................................................................... 74
Table 12: Top 20 country pairs — source country to host country
activity in percentage .................................................................... 74
Table 13: Top 30 country pairs — cross-border activity................................ 74
Table 14: Top 40 cross-border country pairs excluding the United States
as source ...................................................................................... 74
Table 15: Overview of importance of host country for source country .......... 74
Table 16: Growth rates of the top 30 country pairs in 2000 for the years
1999 to 2001 ................................................................................. 74
Table 17: Top countries for deal flow / GDP ................................................. 74
Table 18: Top 20 cross-border deal country pairs......................................... 74
Table 19: Matrix overview of dependent variables ........................................ 74
Table 20: Overview of explanatory variables with transformation and
indication....................................................................................... 74

Private Equity Cross-border Investments XI
Table 21: Correlation of dependent variables for overall deals ..................... 74
Table 22: Analysis of variance of deal flow with main effects........................ 74
Table 23: Consolidated results of ANOVA with main and interaction
effects for deal flow ....................................................................... 74
Table 24: Consolidated results of ANOVA with main and interaction
effects ........................................................................................... 74
Table 25: Consolidated results of ANOVA with main and interaction
effects (VC) ................................................................................... 74
Table 26: Consolidated results of ANOVA with main and interaction
effects (PE) ................................................................................... 74
Table 27: Gravity model estimates for the gravity indicators......................... 74
Table 28: Gravity model estimates for the banking sector ............................ 74
Table 29: Gravity model estimates for endowment-related variables............ 74
Table 30: Gravity model analysis results....................................................... 74
Table 31: Results with gravity model indicators (VC).................................... 74
Table 32: Results with gravity model and private equity-related
indicators (VC) .............................................................................. 74
Table 33: Results with gravity model indicators (PE) .................................... 74
Table 34: Results of gravity model and private equity-related
indicators (PE)............................................................................... 74
Table 35: Comparison of analytic results ...................................................... 74

Private Equity Cross-border Investments XII
List of Abbreviations & Acronyms
ANOVA Analysis of Variance
BvK Bundesverband für Kapitalbeteiligungsgesellschaften
CIA Central Intelligence Agency
EIU Economic Intelligence Unit
EVCA European Venture Capital Association
FDI Foreign Direct Investment
GDP Gross Domestic Product
IFS International Financial Statistics
ILO International Labour Organization
IMF International Monetary Fund
IPO Initial Public Offering
OECD Organization for Economic and Co-operation and Development
PE Private Equity
PF Portfolio Company
R&D Research and Development
UN United Nations
VC Venture Capital
WIPO World Intellectual Property Organization
WTO World Trade Organization

A. Science of private equity investments 1
A. Science of private equity investments
1. Introduction
Over the past decades, private equity (PE) has experienced tremendous growth
worldwide.1 At the forefront of this growth have been mature economies, such as
those of the United States and the United Kingdom. In these countries, private
equity investors have not only invested heavily in their domestic markets, but
have also struck cross-border deals.
Given the rising level of globalization, the industry’s potential for expansion of
cross-border deals is vast. Due to pressure for new investments and high return,
more and more investors are branching beyond their traditional, local areas of
investment and are integrating themselves into the landscape of the global PE
market.
Of course, some countries are better than others for PE investment, particularly
those with maturing domestic markets. Also, the quality of the national PE
environment largely determines the size and success of that industry in any
country. Countries with similar levels of PE activity usually share similar
economic and legal characteristics. For example, the United States and the
United Kingdom, the two largest PE markets, both have stable regulatory
environments, liberal policies toward private enterprise, well-funded financial
systems, and an affinity for entrepreneurship.
However, when firms step out of their home country’s comfort zone to seek
opportunities in foreign markets, they are met with varying degrees of social,
cultural, legal, and economic challenges. Furthermore, entering the global market
inevitably means that investors will encounter global competition with firms in
other countries that may be vying for the same investments.
How do investors weigh foreign market conditions and investment opportunities?
To what degree do they try to exploit the similarities and differences of both the
source and the host countries? How can global market dynamics and interactions
1 See EVCA - European Venture Capital Association, EVCA - Yearbook, 2005-2007; NVCA
- National Venture Capital Association (USA), National Venture Capital Association Yearbook, Arlington, VA, 1990-2005.

A. Science of private equity investments 2
between different countries affect a single deal between the source and host
country?
Undeniably, in the cross-border deal history of both early adopter countries and
followers lies a wealth of information that reveals patterns and conventions that
may be applied to the global cross-border PE market at large. Can relationships
between certain countries be easily predicted or replicated? An understanding of
the drivers and determinants of transnational investment and their effects on the
level of affinity that countries share may shed much-needed light on how and
why deals are sourced abroad.
2. Status quo in private equity research
Despite the attention that PE has received in the financial press, the level of
analysis on cross-border activity has been rather limited in most academic
literature. Researchers often narrowly evaluate the propensity for PE investment
in multiple countries using economic and legal indicators, such as gross domestic
product (GDP), capital availability, and judicial regime.2 In many cases, research
tends to be financially oriented, with significant focus on microeconomic topics
like fund performance.3 Even country-specific studies, such as those analyzing
foreign direct investment (FDI), do not explicitly mention PE activity.4 Recent
business literature that discusses PE and venture capital (VC) activity cites
statistics and studies, the majority of which lack a scientific and comprehensive
2 See Kumar, V. and Orleck, S., Why Does Private Equity Vary Across Countries and Time?,
2002; Black, B. S.; Gilson, R. J.; McCahery, J. and Renne boog, L., Venture Capital and the Structure of Capital Markets: Banks Versus Stock Markets, Oxford and New York: Oxford University Press, 2003, pp. 29-59; Jeng, L. A. and Wells, P. C., The Determinants of Venture Capital Funding: Evidence Across Countries, Journal of Corporate Finance, 2000, 6(3), pp. 241-289.
3 Phalippou, L. and Zollo, M., What Drives Private Equity Fund Performance?, University of Amsterdam, Faculty of Economics and Econometrics, 2005; Ljungqvist, A. and Richardson, M. P., The Cash Flow, Return and Risk Characteristics of Private Equity, New York University Working Paper, 2003.
4 Blonigen, B. A., A Review of the Empirical Literature on FDI Determinants, Atlantic Economic Journal, 2005, 33(4), pp. 383-395; Sarisoy Guerin, S., The Role of Geography in Financial and Economic Integration: A Comparative Analysis of Foreign Direct Investment, Trade and Portfolio Investment Flows, World Economy, 2006, 29(2), pp. 189-209.

A. Science of private equity investments 3
approach.5 Inevitably, most of this work details only individual stages of VC or PE
investment or country-specific problems.
As cross-border PE activity intensifies, what seems to be severely lacking in the
bulk of academic research is a comprehensive picture of this cross-country
activity and of inter-country relationships. Finally, with PE markets converging
into one global playground, a greater understanding of the determinants driving
PE deals on a global basis, especially cross-border deals between particular
countries, seems mandatory.
3. Goals and structure of thesis
Given the relative lack of substantive research regarding cross-border PE
activity, the general goal of this dissertation is to further an understanding of this
area of inquiry by providing a structured and comprehensive approach by which
to discuss and assess inter-country PE investment. The research aims to take
into account a multitude of factors to identify and explain country-pair affinity.
Moreover, from the insights gained in this research, the specific goal is to provide
practical and sensible recommendations for the PE praxis.
The basic research question is: What drives countries to develop PE
relationships with each other?
To answer this question, the following major roadblocks must first be overcome:
• Limited transparency of cross-border transaction details
• Lack of aggregated PE transaction data on a country level
• Narrow perception of countries as isolated entities
• Lack of analysis that explains the multidimensional dependency of
interactions that can arise only between two countries
Scientific examination must be based on an all-encompassing theoretical
foundation from which a conceptual framework is developed to empirically
analyze cross-border activity. This thesis will develop a methodology that views
5 Apax Partners, Unlocking Global Value — Future Trends in Private Equity Investment
Worldwide, 2006.

A. Science of private equity investments 4
countries as interacting entities with dynamic relationships over time. More
specifically, countries will be placed in non-mutually exclusive pairs to recognize
their dual roles as investors and as targets.
Additionally, analyzing country pairs statically would be insufficient to understand
the market forces affecting cross-border relationships. Adding the element of
time to the analysis is essential in gaining insight into the evolution of country
relationships.
Finally, determinants will be derived from the conceptual framework to help
explain the affinity and strength of PE relations that certain countries have with
one another over time.
The general goal of this thesis requires the completion of three sub-goals:
description, explanation, and prognosis:
• Description: Develop PE conceptual research framework and describe
cross-border activity.
- Define the heterogeneous research subjects, e.g., the participants in the PE
market.
- Organize research subjects by their relation to each other to simplify real-
world complexities.
- Define cross-border activity and develop a method to structure and
aggregate deals from firm level to country level over time.
- Clarify the structure of cross-border deals through analysis of past deals.
- Derive universal determinants to analyze cross-border activity.
• Explanation: Explain why there is affinity between certain countries.
- Explore the influence (positive or negative) and impact (high or low) each
universal determinant has on cross-border activity over time.
• Prognosis: Interpret the analytical findings for practical application.
- Show the influence that country-level determinants have on company strategy.
- Determine the tendencies of country interaction on a global basis.
- Note limitations in research and recommend areas for future research in cross-border PE activity.

A. Science of private equity investments 5
With these goals clearly outlined, the structure of the thesis is mapped out below.
Figure 1: Structure of thesis
Chapter B begins with an overview of the PE market environment. In addition,
descriptions of the life cycle and finance stages of a company and of the
business process are provided to further explain the roles of the different PE
participants being researched. Previous studies and models are reviewed to
establish the theoretical framework on which a viable method of research and
statistical analysis must rest. Furthermore, cross-border activity (dependent
variable) and its determinants (independent variables) are conceptualized and
quantified to ensure the most sensible approach for analytical measurement.
Chapter B concludes with a summary of collected data to set the stage for
empirical analysis.
Chapter C focuses on the two-part empirical analysis of country activity and its
determinants. First, PE activity is systematically described and illustrated to
provide insight into cross-border investment patterns and to investigate their
underlying norms and rules. The second phase uses statistical analysis to
identify determinants that explain the affinity of country pairs in cross-border PE
initiatives.
Chapter D summarizes the findings and results of the analysis, and concludes
with recommendations for the PE praxis and for future areas of research.
Chapter A: Introduction
Chapter D: Summary and implications
Chapter B: Research concept
Development of theoretical framework
Design and methods for analysis
Data collection & preparation
Chapter C: Empirical analysis
Descriptive analysis
Statistical analysis
Statistical results
B. Concept for research of private equity investments 6
B. Concept for research of private equity investmen ts
1. Developing a theoretical framework
Comparison of previous research studies and heightened community interest in
PE reveal the need for a theory-based, empirically proven analysis of the
determinants of cross-border investments over time. A theoretical framework to
organize and simplify the complexities of reality can be achieved by arranging
observations of real phenomena in a statistical model. From this, an hypothesis
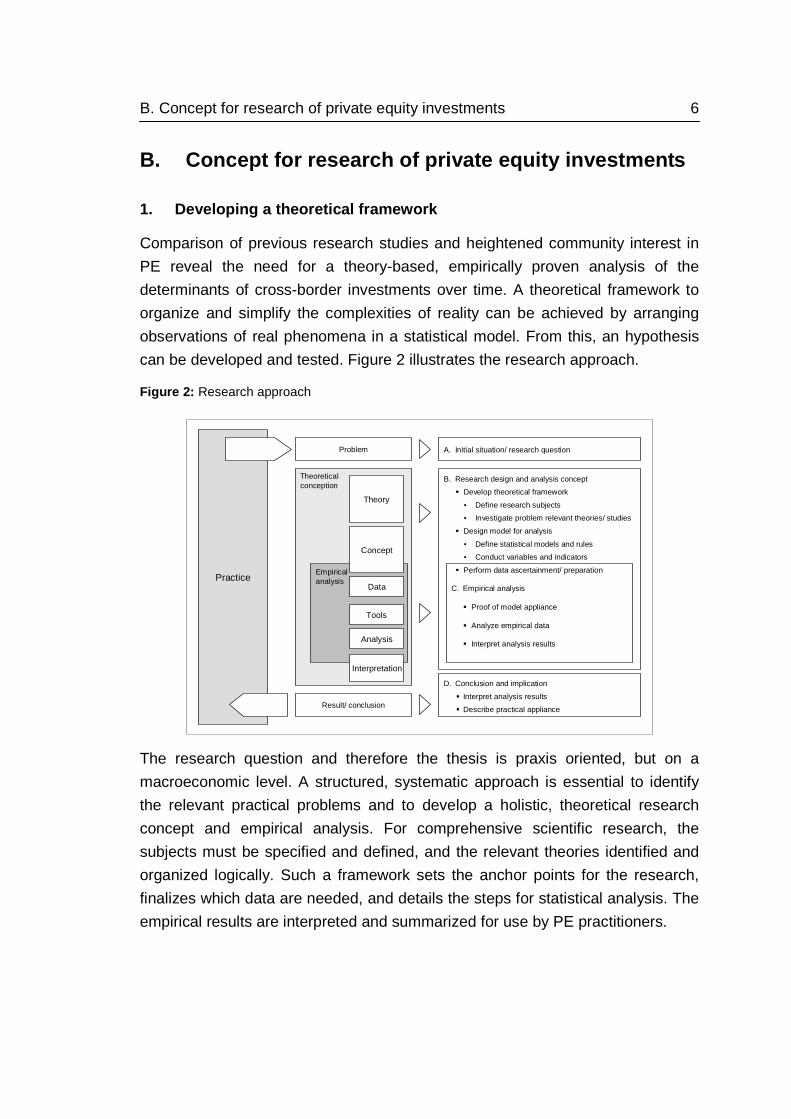
can be developed and tested. Figure 2 illustrates the research approach.
Figure 2: Research approach
The research question and therefore the thesis is praxis oriented, but on a
macroeconomic level. A structured, systematic approach is essential to identify
the relevant practical problems and to develop a holistic, theoretical research
concept and empirical analysis. For comprehensive scientific research, the
subjects must be specified and defined, and the relevant theories identified and
organized logically. Such a framework sets the anchor points for the research,
finalizes which data are needed, and details the steps for statistical analysis. The
empirical results are interpreted and summarized for use by PE practitioners.
Theoreticalconception
EmpiricalanalysisPractice
Theory
Tools
Data
Concept
Problem
Result/ conclusion
Analysis
Interpretation
A. Initial situation/ research question
B. Research design and analysis concept
� Develop theoretical framework
• Define research subjects
• Investigate problem relevant theories/ studies
� Design model for analysis
• Define statistical models and rules
• Conduct variables and indicators
� Perform data ascertainment/ preparation
C. Empirical analysis
� Proof of model appliance
� Analyze empirical data
� Interpret analysis results
D. Conclusion and implication
� Interpret analysis results
� Describe practical appliance

B. Concept for research of private equity investments 7
1.1. Definition and specifics of the research
The term private equity must first be defined because it is used differently in the
United States and Europe.6 Originally, PE investments were defined as
investments by institutions or wealthy individuals in companies. Now it is more
common that PE refers to a particular stage of development of a company
receiving investment. Currently, venture capital (VC) and management and
leveraged buyouts are the main types of PE financing. In the United States, PE
refers primarily to management and leveraged buyouts, and excludes VC. In the
United States, VC consists of three types of early stage financing — seed,
startup, and expansion investment — and excludes buyouts. In Europe, VC falls
under the umbrella category of PE investment.7 For the purposes of this
research, the following terms will be used in the analysis to accommodate both
the American and the European definitions of PE.
A. Venture capital: Seed, startup, and expansion investments (United States)
B. Private equity: All other stages that are not VC (United States)
C. Overall private equity investments: VC and PE (Europe)
To expand the definition of PE beyond an elementary level, it is necessary to
examine the economic foundations of the PE market and the institutional
structures that support it. First, it is important to describe the overall PE
investment market structure and its participants. Second, an overview of the
company stages will illustrate the purposes of the PE investment business.
Finally, a depiction of the investment process will clarify how PE is executed.
1.1.1. Overall private equity investment market str ucture
The PE market has three major players, as well as an assortment of minor ones,
that interact with each other. Investors, intermediaries (PE companies), and
issuers (portfolio (PF) companies) comprise the primary participants. PE firms
6 Bygrave, W. D. and Timmons, J. A., Venture Capital at the Crossroads, Boston, 1992;
EVCA - European Venture Capital Association, EVCA - 2007 Yearbook, 2007; Kumar and Orleck, Why Does Private Equity Vary Across Countries and Time?, p. 4; Jeng and Wells, The Determinants of Venture Capital Funding: Evidence Across Countries, p. 243.
7 BVCA - The British Private Equity and Venture Capit al Association, 2007, www.bvca.co.uk.

B. Concept for research of private equity investments 8
pool money from institutional and private investors for their funds to buy and
invest in companies. Such companies must generate returns that are higher than
the interest paid to the investors. The arrows in Figure 3 show the participation
and deal flow between these players. At the bottom are the agents and advisors
who help issuers and intermediaries raise money and advise investors.8
Figure 3: Private equity market structure
Investors include corporate and public pension funds, banks, wealthy families or
individuals, and other investors.
Most institutional investors in the PE market invest strictly to realize financial
gain. More specifically, they expect the risk-adjusted return on their PE
investments to exceed those that are possible in public equity markets.9 Bank
8 Prowse, S. D., The Economics of the Private Equity Market, Federal Reserve Bank of Dallas
Economic Review, 1998, pp. 21-34; Fenn, G. W. and Liang, N., The Economic of the Private Equity Market, Federal Reserve Bank of Dallas Economic Review, 1995; Phalippou and Zollo, What Drives Private Equity Fund Performance?, pp. 4 and 18.
9 For discussion of the role of investors, compare: Hellmann, F. T. and Puri, M., The Determinants of Venture Capital Funding: Evidence Across Countries, Journal of Corporate Finance, 2001, 6, pp. 241-289; Jelic, R.; Saadouni, B. and Wright, M., Performance of Private to Public MBOs: The Role of Venture Capital, Journal of Business Finance & Accounting, 2005, 32, pp. 643-682; Coval, J. and Thakor, A., Financial Intermediation as a Beliefs-Bridge Between Optimists and Pessimists, Journal of Financial Economics, 2004, 75, pp. 535-570; Hellmann, T. and Puri, M., The Interaction Between Product Market and
(cont)
Investment advisors Placement agents Investment brokers
Portfolio companies(Issuers)
Later Stage/Expansion
Early Stage
Establishedcompanies
Turnaround/Distressed
Private equity firms(Intermediaries/ general partner)
Limited partnership A
Support
Pension funds
Banks
Insurancecompanies
Privateinvestors
Companies
Investors(Limited partners)
Fund A
Limited partnership B
Fund B

B. Concept for research of private equity investments 9
holding companies, investment banks, and nonfinancial corporations remain
active in PE mostly to benefit from economies of scope between PE investing
and their core activities.10 For example, banks are large lenders to small and mid-
sized companies. As a result, they are in close contact with many potential PE
candidates, and generate opportunities for the firms in which a partnership
invests. Nonfinancial investors typically invest in early stage developmental
ventures that may fit with their strategic objectives.11
Private equity firms are specialized intermediaries, called general partners, that
raise money from institutional investors and invest it in publicly and privately held
companies. PE firms acquire stakes and take an active role in a company, often
exercising as much or more control as a company insider.12 Under the
partnership arrangement, institutional investors are the limited partners and
professional PE managers serve as the general partners, and are often
associated with a partnership management firm. Some management companies
are affiliated with a financial institution, such as an insurance company or
investment bank.
Limited partnerships are the major intermediary in the PE market. This is a result
of their success in mitigating the severe information problems that exist in the
market — both for institutional investors looking for appropriate partnerships in
which to invest and for partnerships looking for appropriate PF company
investment.13
Financial Strategy: The Role of Venture Capital, Review of Financial Studies, 2000, 13, pp. 959-984.
10 For restrictions and activity, compare: Hardymon, G. F.; De Nino, M. J. and Salter, M. S., When Corporate Venture Capital Doesn't Work., Harvard Business Review, 1983, 114; Edwards, J. and Fischer, K., Banks, Finance and Investment in Germany, Cambridge University Press, 1994; Roe, M. J., Political and Legal Restraints on Ownership and Control of Public Companies, Journal of Financial Economics, 1990, 27; Sahlman, W. A., Insights from the American Venture Capital Organizations, Working Paper, 1991; Siegel, R.; Siegel, E. and Mac Millan, I. C., Corporate Venture Capitalists: Autonomy, Obstacles, and Performance, Journal of Business Venturing, 1988, 3.
11 Prowse, The Economics of the Private Equity Market. 12 For a discussion of active investment, see: Jensen, M. C., Presidential Address: The Modern
Industrial Revolution, Exit, and the Failure of Internal Control Systems, Journal of Finance, 1993, 48.
13 For the impact of information problems, see: Toll, D. M., Private Equity Partnership Terms and Conditions, Wellesley, Mass., 1999; Gompers, P. and Lerner, J., An Analysis of Compensation in the US Venture Capital Partnership, Journal of Financial Economics, 1999,
(cont)

B. Concept for research of private equity investments 10
Portfolio companies in the PE market are very diverse, varying widely in size
and in their motives for raising capital, but they do share one common
characteristic. Because PE is one of the most expensive forms of finance, these
firms generally cannot raise financing from the public equity debt markets.14 A
company’s finance stages as a main differentiator of PF companies are
described in detail in the next chapter.
Supporters: In the PE market is a group of information producers, such as
agents, advisors, and brokers, whose role has increased significantly in recent
years. These supporters help to place private equity, raise funds for partnerships,
and evaluate potential PF companies. They exist because they reduce the costs
associated with the information problems that arise in PE investing, especially for
disclosure and due diligence.15
This description of the PE market structure shows that the initial set of
determinants governing the behavior of the PE market directly relate to the
financial environment.
Equally important are the determinants for the political or institutional frame, in
which the financial environment is of course embedded, that allows or hinders PE
activities. This is especially remarkable if there is an absence of PE markets, for
example, in heavily regulated securities markets where firms rely on bank
financing.16
51, pp. 3-44; Atje, R. and Jovanovic, B., Stock Markets and Development, European Economic Review, 1993, 37, pp. 632-640; Sahlman, W. A., The Structure and Governance of Venture Capital Organizations, Journal of Financial Economics, 1990, 27, pp. 473-524; Gorman, M. and Sahlman, W., What Do Venture Capitalists Do?, Journal of Business Venturing, 1989, 4, pp. 231-248.; Prowse, The Economics of the Private Equity Market.
14 Evans, D. S. and Jovanovich, B., An Estimated Model of Entrepreneurial Choice Under Liquidity Constraints, Journal of Political Economy, 1998, 97(4); Fama, E., What is Different about Banks?, Journal of Monetary Economics, 1985, 15; Mayer, C., New Issues in Corporate Finance, European Economic Review, 1988, 32; Myers, S. and Majluf, N., Corporate Financing and Investment Decisions When Firms Have Information That Investors Do Not Have, Journal of Financial Economics, 1984, 13; Prowse, The Economics of the Private Equity Market.
15 Prowse, The Economics of the Private Equity Market. 16 Prowse, The Economics of the Private Equity Market.

B. Concept for research of private equity investments 11
1.1.2. Private equity finance stages — the company life cycle
Private equity investments are closely related to the life cycle stages of a
company. PE firms seem to focus more on company stages than on the industry
or any other issuer criterion. The description of the company life cycle provides
fundamental insight into the PE finance stages.17
Figure 4: The life cycle of a company
Companies seeking venture capital are traditionally young firms. Most are
developing innovative technologies that are predicted to show high growth rates.
They may be early stage companies — those still in the research and
development stage, or later stage companies — those with several years of sales
but still trying to grow rapidly. Many such companies are profitable, established
businesses in manufacturing, distribution, and services. They use the PE market
to finance growth through new capital expenditures and acquisitions, and to
finance changes in capital structure and ownership. Public companies often look
17 Gompers, P. A., Optimal Investment, Monitoring, and the Staging of Venture Capital, Journal
of Finance, 1995, 50(5), pp. 1461-1489; Kaplan, S.; Sensoy, B. A. and Stromberg, P. J., What Are Firms? Evolution from Birth to Public Companies, CEPR Discussion Papers, 2005, 5224.
Pioneercompanies
Growingcompanies
Establishedcompanies
Early stage(seed/startup)
Later stage/(expansion)
Bridge/Pre-IPO
BuyoutDistressed/Turnaround
Venture Capital
Time
Value
Private Equity
Overall Private Equity investments

B. Concept for research of private equity investments 12
for a combination of debt and PE to finance their management or leveraged
buyout. Companies also use PE to help them through periods of financial
distress, or to avoid public disclosure.18
1.1.3. The private equity investment process
The PE investment process is very structured and can be separated
chronologically as shown below in Figure 5. The purpose of the process is to
balance the interests of money supply and money demand between investor and
PF company.19
Figure 5: Private equity investment process
18 For a discussion of stage investments, see: Holmes, T. J. and Schmitz, J. A., On the
Turnover of Business Firms and business Managers, Journal of Political Economy, 1995, 103(5); Kortum, S. and Lerner, J., Assessing the Contribution of Venture Capital to Innovation, 2000; Pratt, S. P., Guide to Venture Capital Sources, Wellesley, Mass.: Captial Publishing, 1981; Plummer, J. L., QED Report on Venture Capital Financial Analysis, Palo Alto: QED Research, 1987; Ruhnka, J. C. and Young, J. E., A Venture Capital Model of the Development Process for New Ventures, Journal of Business Venturing, 1987, 2, pp. 167-184; Sahlman, The Structure and Governance of Venture Capital Organizations; Kraft, V., Private Equity in Turnaround Investments, 2001.
19 Bygrave and Timmons, Venture Capital at the Crossroads, p. 14; Wright, M. and Robbie, K., Venture Capital and Private Equity: A Review and Synthesis, Journal of Business Finance & Accounting, 1998, 25(5/6), pp. 521-570; Fried, V. and Hisrich, R., Towards a Model of Venture Capital Investment Decision Making, Financial Management, 1994, 24(3), pp. 28-37; MacMillan, I. C.; Zemann, L. and Subba Narasimha, P . N., Criteria Distinguishing Successful from Unsuccessful Ventures in the Venture Screening Process., Journal of Business Venturing, 1987, 2, pp. 123-137; Gompers, P. A. and Lerner, J., Venture Capital and the Creation of Public Companies: Do Venture Capitalists Really Bring More than Money?, Journal of Private Equity, 1997, 1(1), pp. 15-32; Gorman and Sahlman, What Do Venture Capitalists Do?; Hart, O., Financial Contracting, Working Paper, Harvard University, 2000; Kaplan, S. N. and Strömberg, P., How Do Venture Capitalists Choose and Manage Their Investments?, Working Paper, University of Chicago, 2000; Kaplan, S. N. and
(cont)
Investment strategy
Fundraising
Dealsourcing
Duediligence
Acquisition ExitEnhancement
Legal involvementSearchLegal
involvement

B. Concept for research of private equity investments 13
The process starts with the formulation of an investment strategy that highlights
the PE firm’s preferences and guides its search for a potential PF company. This
strategy forms the entire investment process. Based on the investment strategy,
the PE company prepares an offering document outlining its legal structure, fund
size, management fees, performance fees, and track record. This documentation
is required for fundraising.
After defining the strategy and raising funds, the company identifies potential
targets.20 A PE company is usually embedded in a network of relationships that
leads to source deals. Potential target companies are run through a selection
process, and those on the short list go through due diligence. Due diligence is
essentially an analysis of the economic, operational, and legal facts. It ends with
a monetary proposal for value enhancement for the target company. For the
acquisition, the PE company enters a commitment to buy shares of the target
company. In the value enhancement phase, the PE company is actively involved
in the PF company’s business, with activities ranging from consulting to financial
engineering, and to managing the business operations. The exit phase realizes
the enhancement by taking the company public or by selling it to another
financial or strategic investor.21
The individual steps actually followed depend on the investment strategy. One of
the main problems is information asymmetry between the different parties. PE is
used in financing situations in which the sorting and incentive problems are
Strömberg, P., Venture Capitalists as Principals: Contracting, Screening, and Monitoring, NBER Working Paper Cambridge, Mass., 2001, 8202.
20 Gupta, A. K. and Sapienza, H., Determinants of Venture Capital Firms' Preferences Regarding the Industry Diversity and Geographic Scope of Their Investments., Journal of Business Venturing, 1992, 7(5), pp. 347-362; Tyebjee, T. and Bruno, A., A Model of Venture Capitalist Investment Activity, Management Science, 1984, 30(9), pp. 1051-1066.
21 Black; Gilson; McCahery and Renneboog, Venture Capital Contracting and the Valuation of High-technology Firms; Cumming, D. J. and MacIntosh, J. G., A Cross-Country Comparison of Full and Partial Venture Capital Exits, Journal of Banking & Finance, 2003, 27(3), pp. 511-515; Giot, P. and Schwienbacher, A., IPOs, Trade Sales and Liquidations: Modelling Venture Capital Exits Using Survival Analysis, Journal of Banking & Finance, 2007, 31(3), pp. 679-702; Schwienbacher, A., Innovation and Venture Capital Exits, Working Paper University of Amsterdam, 2003; Barry, C., New Directions in Research on Venture Capital Finance, Financial Management, 1994, 23(3), pp. 3-15; Bascha, A. and Walz, U., Convertible Securities and Optimal Exit Decisions in Venture Capital Finance, Journal of Corporate Finance, 2001, 7(3), pp. 285-306; Lerner, J., Venture Capitalists and the Decision to Go Public, Journal of Financial Economics, 1994, 35(3), pp. 293-316; Ritter, J., Initial Public Offerings, Contemporary Finance Digest, 1998, 2(1).
B. Concept for research of private equity investments 14
especially severe. Resolving these problems requires that investors engage in
intensive pre-investment due diligence and post-investment monitoring.22
1.2. Relevant research studies and models
To develop a suitable framework with which to analyze cross-border PE activity
over time, a variety of relevant scientific approaches must first be assessed.
These approaches can be found in both topic-related and method-related
studies. Topic-related studies are those that typically focus on the particular
subject of PE or VC. Method-related studies, which ideally confine analysis to
country investment flows, focus on cross-border activity and country time series.
1.2.1. Topic-related private equity and venture cap ital studies
The topic-related approach screens relevant PE investment studies to find those
PE and VC studies that are ideally confined to scientific country studies. The
focus of search is on academic literature and scientific research papers, and
universities with professorships supplemented by research topics on the
institutions, associations, and reports of PE investors. The most relevant and
recent ones are extracted.
Josh Lerner and Paul Gompers, of Harvard University, have done extensive
research on VC and PE. Some of their recent titles are “The Venture Capital
Revolution,” “Venture Capital and Private Equity: A Course Overview,” “Money
Chasing Deals?: The Impact of Fund Inflows on the Valuation of Private Equity
Investments.” Other scientific studies are “Why Does Private Equity Vary Across
Countries and Time?”23 and “Explaining Variations in Private Equity: A Panel
22 Myers and Majluf, Corporate Financing and Investment Decisions When Firms Have
Information That Investors Do Not Have; Levin, J., Structuring Venture Capital, Private Equity and Entrepreneurial Transactions, New York, 1998; Ljungqvist, A. and Richardson, M. P., The Investment Behavior of Private Equity Fund Managers, New York University Working Paper, 2003; Prowse, The Economics of the Private Equity Market, p. 28; Cumming, D. J., Agency Costs, Institutions, Learning, and Taxation in Venture Capital Contracting, Journal of Business Venturing, 2005, 20(5), pp. 573-578; Wright, M.; Thompson, S. and Robbie, K., Venture Capital and Management Led Leveraged Buyouts: A European Perspective, Journal of Business Venturing, 1992, 7, pp. 47-71.
23 Kumar and Orleck, Why Does Private Equity Vary Across Countries and Time?

B. Concept for research of private equity investments 15
Approach.”24 Most of the reviewed empirical studies25 have analyzed VC, PE
(and FDI) topics using economic time-series data or cross-sectional data
provided by economic databases. A few more practical studies use surveys as a
data set source.26 These studies are used as guidance for the criteria derived in
this paper.
1.2.2. Method-related studies: Time series and cros s-section
When analyzing countries over time and in relation to each other, the academic
literature employs two main methods. Panel data analysis 27 combines time
series and cross-sections to analyze repeated observations on fixed units. The
gravity model 28 has been used to investigate cross-border transactions of trade
flows29 and, more recently, investment flows.30
24 Leachman, L.; Kumar, V. and Orleck, S., Explaining Variations in Private Equity: A Panel
Approach, Duke University, Department of Economics, Working Papers, 2002, 02-14. 25 See also: Cumming, D. and Walz, U., Private Equity Returns and Disclosure Around the
World, University of Alberta and University of Frankfurt, 2004; Gao, T., Foreign Direct Investment in China: How Big Are the Roles of Culture and Geography?, Pacific Economic Review, 2005, 10(2), pp. 153-166; Baygan, G. and Freudenberg, M., The Internationalisation of Venture Capital Activity in OECD Countries: Implications for Measurement and Policy, STI Working Paper 2000/7 OECD, 2000; Helpmann, E., The Structure of Foreign Trade, Journal of Economic Perspectives, 1999, 13(2), pp. 121-144; Messica, A. and Agmon, T., Temporal Comparative Analysis of the US Venture Capital Industry Over 1980 to 2002, Holon Institute of Technology Working Paper Series, 2006; Schertler, A., Driving Forces of Venture Capital Investments in Europe - A Dynamic Panel Analysis, United Nations University, Institute for New Technologies, 2003, Technology and Finance Working Papers(23).
26 Kraft, Private Equity in Turnaround Investments; Bottazzi, L.; Da Rin, M. and Hellmann, T., The Changing Face of the European Venture Capital Industry: Facts and Analysis, Journal of Private Equity, 2004, 7(2), pp. 26-53.
27 Wooldridge, J. M., Econometric Analysis of Cross Section and Panel Data, Cambridge, Mass.: MIT Press, 2002; Greene, W. H., Econometric Analysis, Upper Saddle River, N.J.: Prentice Hall, 2003.
28 Tinbergen, J., Shaping the World Economy, International Executive, 1963, 5(1), pp. 27-30; Matyas, L., Proper Econometric Specification of the Gravity Model, World Economy, 1997, 20(3), pp. 363-369.
29 Josselin, D. and Nicot, B., A Geo-Economic Gravity of Trade for European Union, Gybergeo: Revue Europeenne de Geographie, 2003(237); Linnemann, H., An Econometric Study of International Trade Flows, Thesis, 1966, pp. 1-234; Rose, A., Which International Institutions Promote International Trade?, Review of International Economics, 2005, 13(4), pp. 682-685; Glick, R. and Rose, A. K., Does a Currency Union Affect trade? The Time-Series Evidence, European Economic Review, 2002, 46(6), pp. 1125-1130; SimTrade, A Gravity Model for the Calculation of Trade Potentials for Developing Countries and Countries in Transition, Discussion paper, UNCTAD/WTO, International Trade Center, 2003;
(cont)
B. Concept for research of private equity investments 16
The panel data analysis — also known as longitudinal data or cross-sectional
time series — is very common in economics and provides a rich environment for
the development of estimation techniques and theoretical results. Many studies
have analyzed panel data sets. Among the best known are the National
Longitudinal Survey of Income Dynamics31 and the Michigan Panel Study of
Income Dynamics.32 Other empirical studies have analyzed time-series data on
sets of states, countries, or industries simultaneously. Intensive theoretical
examination of the panel data analysis has been done, for example, by William
H. Greene33 and Jeffrey M. Wooldridge.34
Gravity models were originally used to explain bilateral trade flows between
countries using Newton’s law of gravitation as an analogy.35 Gravitation comes
from the attraction of two masses; distance reduces this effect. Applied to
bilateral trade flows of countries, the forces of attraction are represented by the
size of the economies, while distance is illustrated by the geographical and
economic distance — more generally, the transaction costs. The gravity model
has become one of the most successful tools for estimating the characteristics of
bilateral trade relations because the model has established its theoretical
Helpmann, The Structure of Foreign Trade; Harris, M. N. and Matyas, L., Modelling Export Flows in the APEC Region: Static and Dynamic Gravity Model Approaches, Asia Pacific Journal of Economics and Business, 2001, 5(1), pp. 97-118; Serlenga, L. and Shin, Y., Gravity Models of the Intra-EU Trade: Application of the Hausman-Taylor Estimation in Heterogeneous Panels with Common Time-Specific Factors, ESE Discussion Paper University of Edinburgh, School of Economics, 2004, 105.
30 Rose, A. K. and Spiegel, M. M., Offshore Financial Centers: Parasites or Symbionts?, The Economic Journal, 2007, 117(523), pp. 1310-1314; Di Mauro, F., The Impact of Economic Integration on FDI and Exports: A Gravity Approach, CEPS Working Document, 2000(156); Buch, C. and Piazolo, D., Capital Trade Flows in Europe and the Impact of Enlargement, Kiel University Working Paper, 2000, 1001; De Mello Sampayo, F., The Location of the United States' FDI under the Share Gravity Model, Discussion Paper University of Birmingham, 2000, 00-04.
31 U.S. Department of Labor- Bureau of Labor Statistic s National Longitudinal Survey of Income Dynamics.
32 University of Michigan, Michigan Panel Study of Income Dynamics. 33 Greene, Econometric Analysis, p. 283. 34 Wooldridge, Econometric Analysis of Cross Section and Panel Data. 35 Bergstrand, J., The Gravity Equation in International Trade: Some Microeconomic
Foundations and Empirical Evidence, The Review of Economics and Statistics, 1985, 67(3), pp. 474-481; Isard, W., Location Theory and Trade Theory: Short-Run Analysis, Quarterly Journal of Economics, 1954, 68, pp. 305- 322.

B. Concept for research of private equity investments 17
foundations, and recent specifications are in line with current econometric
literature.36
The model has been widely used by institutions like the World Bank, the World
Trade Organization (WTO), and central banks to model international relations,
test trade agreements, and evaluate investment flows. Recent academic
research37 has been done, for example, to model export potential,38 foreign direct
investment,39 and the impact of global financial centers.40 Intensive theoretical
research has been done on the model, for example, by Laszlo Matyas,41 Michael
Pfaffermayr and Peter Egger,42 and Badi H. Baltagi.43
36 Baltagi, B. H.; Egger, P. and Pfaffermayr, M., A Generalized Design for Bilateral Trade
Flow Models, Elsevier, 2003; Matyas, L., The Gravity Model: Some Econometric Considerations, World Economy, 1998, 21(3), pp. 397-402; Matyas, Proper Econometric Specification of the Gravity Model; Egger, P., An Econometric View on the Estimation of Gravity Models and the Calculation of Trade Potentials, The World Economy, 2002, 25(2), pp. 297-299; Greene, W.; Harris, M. N. and Matyas, L., Gravity Models, Zero Trade Flows and Fixed Effects, 2006; Ruiz, J. M. and Vilarrubia, J. M., The Wise Use of Dummies in Gravity Models: Export Potentials in the Euromed Region, Banco de Espana, Eurosistema, 2007.
37 For further research specific to the trade flow theories of Hekscher, Ohlin and Samuelson (HOS) and New Trade Theory (NTT), compare: Egger, P. and Pfaffermayr, M., The Proper Panel Econometric Specification of the Gravity Equation: A Three-Way Model with Bilateral Interaction Effects, Empirical Economics, 2003, 28(3), pp. 571-580; Bergstrand, J. H., The Heckscher-Ohlin-Samuelson Model, the Linder Hypothesis and the Determinants of Bilateral Intra-Industry Trade, The Economic Journal, 1990, 100(403), pp. 1216-1234; Ghosh, S. and Yamarik, S., Are Regional Trading Arrangements Trade Creating? An Application of Extreme Bounds Analysis, Journal of International Economics, 2004, 63(2), pp. 369-395; Helpmann, E. and Krugmann, P. R., Market Structure and Foreign Trade: Increasing Returns, Imperfect Competition and the International Economy, MIT Press, Cambridge, MA, 1985; Hummels, D. and Levinsohn, J., Monopolistic Competition and International Trade: Reconsidering the Evidence, Quarterly Journal of Economics, 1995, 110(3), pp. 799-837; Krugmann, P. R., Scale Economies, Product Differentiation, and the Pattern of Trade., American Economic Review, 1980, 70, pp. 950-959; Linder, S. B., An Essay OnTrade and Transformation, New York: John Wiley, 1961.
38 Baltagi; Egger and Pfaffermayr, A Generalized Design for Bilateral Trade Flow Models. 39 Borrmann, C.; Jungnickel, R. and Keller, D., What Gravity Models Can Tell Us About the
Position of German FDI in Central and Eastern Europe, HWWA DISCUSSION PAPER, 2005; Baltagi, B. H.; Peter, E. and Michael, P., Estimating Models of Complex FDI: Are There Third-Country Effects?, Journal of Econometrics, 2007, 140(1), pp. 260-265; Noguer, M. and Canals, C., The Determinants of Cross-Border Investment: A Value-Chain Analysis, La Caixa' Working Paper, 2007, No. 05/2006.
40 Rose and Spiegel, Offshore Financial Centers: Parasites or Symbionts? 41 Matyas, The Gravity Model: Some Econometric Considerations. 42 Egger and Pfaffermayr, The Proper Panel Econometric Specification of the Gravity
Equation: A Three-Way Model with Bilateral Interaction Effects. 43 Baltagi; Egger and Pfaffermayr, A Generalized Design for Bilateral Trade Flow Models.

B. Concept for research of private equity investments 18
Detailed explanation of the models appears in Chapter B.2.2. of this paper, in the
analysis design section.
2. Design and method of analysis
The previous section 1 described the research topic from a theoretical
standpoint. However, to answer the research question posed in the beginning,
the theoretical findings must be structured. A multidimensional framework is
developed to conceptualize the research goals and to set up an applicable
empirical framework to identify and explain PE investment patterns between
countries. Real-life information must be configured into defined observable
empirical objects. This determines the object’s position in the framework. Seeing
how the objects relate to each other helps to clarify, define, and quantify PE
activity. This conceptual frame supports the identification and derivation of
explanatory variables for statistical analysis.
Analyzing cross-border activity sets the foundation for research. The methods
(Chapter 1.2.2.) set the frame. The relevant research studies (Chapters 1.1. and
1.2.1.) support the design with key findings.
2.1. Design of the analysis
The analytic design strictly follows the research goals. The following graph shows
the initial research area (I) and visualizes reality expressed as an abstract
statistical model.

B. Concept for research of private equity investments 19
Figure 6: Framework for research design
The frame has essentially two dimensions — time and country — and is
arranged in layers with nested objects. The basic layer is the global environment
(A) with countries (C) for a fixed time period (T). Each layer (A) covers one time
period. The initial research outline (I) of cross-border activity shows the balance
of supply and demand between Countryi and Countryj, and spans further
dimensions within this layer by setting countries in relation to each other. This
three-dimensional model of a country pair — Countryi to Countryj over Yeart is
the basis of the theoretical model and reflects the starting point of the research.
Beneath the research model (I) is the schemed model of reality (II), which
illustrates the observable objects and the relations between PE firms and PF
companies to structure and quantify cross-border activity. The third frame (III)
illustrates country-related factors that determine country activity.
The core is the model of reality (II) that structures the investment of a PE firm to
a PF company. The physical objects are PE firm (Di) and portfolio company (Dj),
A: Global environment
CiS: Investing country CjH: Portfolio company country
External factors
B: Country pair
T: Time
Year 2
Year 3
Year t
PijSH : Country pair profileCriteria
QuantitativeQualitative
Activity
Supply
Demand
DiS: Private Equity firmCriteria:
Location…
DjH: Portfolio companyCriteria:
LocationIndustryStage…
F: DealCriteria:
TimeAmountE: Fund
Criteria:Country focusIndustry focusStage focus…
S H - Private EquitySecurities
S S - Money- Monitoring- Consulting
CountryjCountryi
PjH: Country profileCriteria
QuantitativeQualitative
PiS: Country profileCriteria
QuantitativeQualitative
I.
II.
III.

B. Concept for research of private equity investments 20
with fund (E) nested into the PE firm (Di). Deal (F) is a construct that relates the
funds of the PE firm to the PF company.
Each object has unique criteria, important for this specific analysis. The PE firm
is defined by location (country) and through its funds, with special focus on, e.g.,
company stage, industry, or particular region. The PF company is characterized
by industry, location (country), and current stage. So far, PE firm and PF
company are separate, static entities with no relation to each other. PE firms and
PF companies could be placed into the frame by country of origin. But anchoring
the objects by geographical location disturbs the analysis of supply and demand
between countries. The definition of country, therefore, has to be refined to
include its investment perspective, which is described in detail below.
In the global environment frame (A) the former static objects of countries, PE
firms, and companies are linked to each other through the construct Deal (F). In
this frame, the Deal (F) is designed as a separate observable entity with
consolidated criteria of the PE firm and the portfolio company, uniquely defining
an activity between companies. The deal in this case is characterized and
defined through the participants — the PE firm and the PF company — and a set
of goods and services for each participant (Ss, SH) that is transferred between
them at a certain point in time for a certain amount of money.
All the activity between the PE firm and PF company is described by the flow of
goods and services in both directions. To differentiate between the geographical
location and the location of investment, the country of the PE firm is defined as
the investing country (CiS), or the source country of investment, and the country
of the PF company is defined as PF company country (CjH) or host country. This
means that a geographical country can be both source (CS) and host (CH)
country of investment, for example, United StatesS and United StatesH. In other
words, if the source country is the same as the host country it is a domestic deal,
and if they are different it is a cross-border deal.
The source-host combination is a country pair (B), an independent observable
object at a certain point in time nested in the global environment (A). This shows
that neither the PE firm nor the PF company is a sufficient observable object. It is
the deal itself that comprises the three dimensions of source location, host
location, and time, and places all necessary objects into the frame to quantify PE
activity.

B. Concept for research of private equity investments 21
The third frame (III) illustrates how quantitative and qualitative data of the
geographical country align with the source and host country perspective through
the country pair combination. This is described in detail using actual data in
Chapter 2.3.2. External factors, e.g., the influence of third countries, are included
for methodological completeness.
2.2. Statistical methods for analysis
The modeling of the observations calls for some complex statistical calculations
to analyze the combined dimensions of source, host, and time. The analytical
methods must reflect the requirements of the data set. As described in Chapter
1.2., the two main methods — panel data analysis and gravity model analysis —
fill those requirements and can be linked to the framework.
Figure 7: Alignment of analytical methods with theoretical framework
Gravity model analysis
Panel dataanalysis
Cross-Section
(Country)
Timeseries
Source Host
Mass MassDistance
Cross-sectionTime series
Years Countries
Panel data
Country x years
Gravity data with years
Source x host x years
Gravity data
Source x host
Model combination
A: Global environment
CiS: Investing country CjH: Portfolio company country
External factors
B: Country pair
T: Time
Year 2
Year 3
Year t
PijSH : Country pair profileCriteria
QuantitativeQualitative
Activity
Supply
Demand
DiS: Private Equity firmCriteria:
Location…
DjH: Portfolio companyCriteria:
LocationIndustryStage…
F: DealCriteria:
TimeAmountE: Fund
Criteria:Country focusIndustry focusStage focus…
S H - Private EquitySecurities
S S - Money- Monitoring- Consulting
CountryjCountryi
PjH: Country profileCriteria
QuantitativeQualitative
PiS: Country profileCriteria
QuantitativeQualitative
I.
II.
III.

B. Concept for research of private equity investments 22
The graph shows the framework from Chapter 2.1. with the three dimensions of
source, host country, and time. To the left is the schematic of the panel data
analysis, with countries as cross-section and years as a time series. At the
bottom is the country pair combination translated into the gravity model with
source/host country. The model combination creates the analytical path to the
final data constellation for the statistical analysis — the gravity model analysis
with time dimensions.
2.2.1. Panel data analysis
The panel data analysis fills fundamental requirements for the gravity model.
Panel data analysis is one of the most active and innovative categories in
econometrics and provides a rich environment for estimation techniques and
theoretical results.44 Panel data combine cross-section and time series. Multiple
cases ( N ) are observed over time periods (T ) resulting in N x T observations.
The data set is a vector of observations with the form itx , with i for unit and t for
time. In this case, country i with a temporal reference t (here, the year). The
model predicts output y through subject-specific time variables x . Two types of
information are in this data: cross-sectional information, reflected in the
differences between subjects, and the time series, or within-subject information,
reflected in the change within subjects over time.
Panel data analysis allows using time-series cross-sectional data to examine
issues that could not be studied in either cross-sectional or time-series settings
alone.45 A general advantage of panel data analysis is that it is possible to
deconstruct the independent variable into two components — within-group and
between-group variances. The within-group estimator uses the time variation
within each cross-section, and the between-group estimator uses the variation
44 Baltagi, B. H., Econometric Analysis of Panel Data, Chichester; New York: Wiley, 1995;
Davidson, R. and MacKinnon, J. G., Estimation and Inference in Econometrics, Oxford University Press, 1993, pp. 320-323; Gujarat, D., Basic Econometrics, New York, 2003; Sayrs, L., Pooled Time Series Analysis, Newbury Park, CA, 1989; Wooldridge, Econometric Analysis of Cross Section and Panel Data Stata Corporation., Longitudinal/Panel data, College Station, Tex.: Stata Press, 2005.
45 Greene, Econometric Analysis, p. 284.

B. Concept for research of private equity investments 23
between the cross-section observations.46 The basic framework for the panel
data analysis is a regression model that takes the following form:
Equation 1: Basic panel data analysis model
εβα ititiit xy ++= Ni ,...,3,2,1= Tt ,...,3,2,1=
where: x = regressor or independent variables, y = regressand or dependent
variable, α = intercept, β = slope and ε = the residual or error term. The
variables ity and itx , and the residual itε have two dimensions; the intercept iα
has one dimension. The model predicts the output y through country-specific
variables ( x ) that vary over time, for example, population or gross domestic
product (GDP).
Several types of analytic panel data models exist. Pooled regression models,
fixed effects models, and random effects models. Among these are dynamic
panel, robust, and covariance structure models.47 Heterogeneity, also known as
individual effect48 across units, is integral to and often the central focus of such
analysis.
The panel data analysis models (pooled, fixed, or random effect) differ in their
assumptions of the individual effect (heterogeneity) of the subjects. Individual or
group-specific variables can either be observed, such as location, or unobserved,
such as country-specific characteristics. The variables can vary or be constant
over time.49 Substituting iα in the previous regression Equation 1 with αiz , the
heterogeneity is αiz , where iz contains a constant term and a set of individual or
group-specific variables. If the set of variables is constant over time t , this is a
classic regression model. If iz is observed for all individuals, then the entire
model can be treated as an ordinary linear model fit by least squares.50
Pooled regression model: If iz contains only a constant term with neither
significant individual country nor temporal effects, then the ordinary least squares
46 Wooldridge, Econometric Analysis of Cross Section and Panel Data, p. 268. 47 Mundlak, Y., On the Pooling of Time Series and Cross Section Data, Econometrica, 1978,
46(1), pp. 69-85; Greene, Econometric Analysis, p. 283. 48 Individual effect; the quality of being diverse and not comparable in kind; Greene,
Econometric Analysis, p. 285. 49 Greene, Econometric Analysis, p. 283. 50 Greene, Econometric Analysis, p. 285.

B. Concept for research of private equity investments 24
provides consistent and efficient estimates of α and β . This model has constant
coefficients referring to the intercepts and slopes.51
Fixed effects: The fixed effect approach takes iα to be a group-specific
constant term in the regression model, with iz unobserved but correlated to itx .
The model has constant slopes β , but intercepts iα differ according to the
cross-sectional group, in this case the country. This formulation assumes that
there are country-specific effects but no significant temporal effects, and that
differences across units can be captured in differences in the constant term.52
Random effects: If the unobserved individual heterogeneity can be assumed to
be uncorrelated with the included variables, then the model is a linear regression
with a compound disturbance that may be consistently estimated by least
squares.
Equation 2: Random effects model
The random effect specifies that iu is a group-specific random constant term that
enters the regression identically in each period. The random effect model allows
for time and country effects.
The crucial distinction between the models of fixed and random effects is
whether or not the unobserved individual effect embodies elements that are
correlated with the regressors in the model.53 The classic specification tests 54
— whether the fixed or random effects model should be used — are:
1. Hausman’s specification test for the random effects model55
2. Breusch-Pagan Lagrange multiplier test for random effects56
51 Greene, Econometric Analysis, p. 285. 52 Greene, Econometric Analysis, p. 285. 53 Greene, Econometric Analysis, p. 285; Wooldridge, Econometric Analysis of Cross Section
and Panel Data, p. 252. 54 Baltagi, B. H.; Bresson, G. and Pirotte, A., Fixed Effects, Random Effects or Hausman
Taylor?: A Pretest Estimator, Economics Letters, 2003, 79(3), pp. 361-369; Wooldridge, Econometric Analysis of Cross Section and Panel Data, p. 251.
55 Hausman, J. A., Specification Tests in Econometrics, Econometrica, 1978, 46, pp. 1251-1271; Greene, Econometric Analysis, p. 301.
εβα ititiiit xuy +++=

B. Concept for research of private equity investments 25
Statistically, the fixed effects model is reasonable for panel data analysis, but it
may not be the most efficient model to run. If there is no correlation between the
unobserved effects, the random effects model may be the more powerful model.
Otherwise, the random effects model would have inconsistent results and the
fixed effects model would be the model of choice.
In-depth fixed-effect model approach
The focus of this thesis is on the fixed model approach as the main technique for
panel data analysis, taking into account the gravity-model approach and after
testing for the most efficient model for the specific analysis of this paper.57
As described in the fixed model approach, each iα is treated as an unknown
parameter to be estimated. If differences across groups are of interest, the
hypothesis that the constant terms are all equal can be tested with an F-test.58
Without further assumptions, time-constant factors cannot be included in itx ,
because if iz can be correlated with each element of itx , there is no possibility to
distinguish the effects of time-constant observables from the time-constant
unobservable iα .59 In panel data analysis, the term “time-varying explanatory
variables” means that each element of itx varies over time for some cross-
section units.60
The fixed effect model is referred to as the least squares dummy variable
(LSDV) model, because the group effects can be estimated alternatively with a
constant term and 1−i dummy variables to designate a particular group, in this
case, country. All results will be unchanged, but rather than estimate iα , each
dummy variable coefficient will now be an estimate of 1αα −i , where group one is
the omitted group.61 The LSDV approach can be used to include a time-specific
56 Breusch, T. and Pagan, A., The LM Test and Its Applications to Model Specification in
Econometrics, Review of Economic Studies, 1980, 47, pp. 239-254; Greene, Econometric Analysis, p. 298; Wooldridge, Econometric Analysis of Cross Section and Panel Data, p. 264.
57 Greene, Econometric Analysis, p. 298. 58 Greene, Econometric Analysis, p. 289. 59 Wooldridge, Econometric Analysis of Cross Section and Panel Data, p. 266. 60 Wooldridge, Econometric Analysis of Cross Section and Panel Data, p. 266; Hausman, J.
A. and Taylor, W. E., Panel Data and Unobservable Individual Effects, Journal of Econometrics, 1981, 16(1), pp. 155-156; Hsiao, C., Analysis of Panel Data, Cambridge University Press, 1986.
61 Greene, Econometric Analysis, p. 289.

B. Concept for research of private equity investments 26
effect as well. A general specification to extend the model is to add the time
effect by 1−T dummy variables for the years.
Equation 3: Fixed effect model with time effect
εβγα itittiit xy +++=
The differences between units can be modeled as parametric shifts of the
regression function.62
Fixed effect hypothesis testing
Using the pooled regression model as a base, the results of the fixed effect
model can be tested for group, time, and interaction effects hierarchically. As
already pointed out, if there is no significant variation across countries, then there
is no need for a fixed effects model.
If the group effect is tested under the null hypothesis of equality of the constant
term, the efficient estimator is then pooled least squares. The significant test is
the F-test with the following F-ratio:
Equation 4: Group effect estimation
))(1(
)1/()(2
22
nKnTR
nRRF
LSDV
PooledLSDVtsgroupeffec −−
−−=
with F = total number of temporal observations, n = number of groups, and k =
number of regressors in the model. Pooled indicates the pooled restricted model,
with only a single overall constant term, and LSDV indicates the least squares
dummy variable model.63
The time effect can be tested by a contrast as comparison to a base period
using the one that is excluded as a reference.64 With the assumption that the
sum of the time effects is equal to zero, the contrast is paired t-test between the
reference and the rest value with the equation:
62 Greene, Econometric Analysis, p. 291; Wooldridge, Econometric Analysis of Cross Section
and Panel Data, p. 273; Baltagi, Econometric Analysis of Panel Data. 63 Wooldridge, Econometric Analysis of Cross Section and Panel Data; Greene, Econometric
Analysis, p. 289. 64 Greene, Econometric Analysis, p. 291.

B. Concept for research of private equity investments 27
Equation 5: Time effects
εβγα itittiit xy +++=
where the group effects are iα and time effects are tγ .
For fixed time and group effects , least squares estimates can be obtained by a
model in this form:
Equation 6: Fixed time and group effects
εβµγα itittiit xy ++++=
with full n and T effects included with µ as an overall constant term, and the
restriction that the sum of time effects and the sum of country effects of each
is zero, the least squares estimates of the slopes in the model can be obtained
by the regressions of:
Equation 7: Least squares estimates of slopes
yyyyy tiitit +−−= ..* on xxxxx tiitit +−−= ..*
where the period specific and the overall means are:
Equation 8: Period specific and overall means
∑=
=n
iitt y
ny
1.
1 and ∑∑
= =
=n
i
T
tity
nTy
1 1
1
for the regressand and likewise for the regressors tx. and x . Then the overall
constant and the dummy variable coefficients for country and time can be
recovered as:
Equation 9: Overall constant and dummy variable coefficients
Overall constant: bxy −=µ̂
Country effect: bxxyy iii )()(ˆ .. −−−=α
Year effect: bxxyyy ttt )()(ˆ .. −−−=
The equations describe the methods needed for the models used here.65
65 Greene, Econometric Analysis, p. 291.

B. Concept for research of private equity investments 28
For panel data analysis a number of restrictions that have to be considered if the
panels are unbalanced66 have autocorrelation, or heteroscedasticity. A panel is
unbalanced if the matrix N x T , with N cases and T periods, has gaps in the
observation, otherwise it is called balanced. Autocorrelation67 describes when
disturbances across the observations might not truly be independent.
Heteroscedasticity signifies inconsistency in the regression disturbance of the
variances across the observations. Heteroscedasticity68 arises in numerous
applications — in both cross-section and time series data — and poses
potentially severe problems for inferences based on least squares. To control for
the problem of heteroscedasticity it could be tested with:69
1. White’s general test70
2. Breusch-Pagan Lagrange multiplier test (for heteroscedasticity)71
The White test is extremely general. There are no specific assumptions about the
nature of the heteroscedasticity.72 The hypothesis to test is if the variance 2σ is: 22
0 : σσ =iH for all i and :1H Not 1H
66 Wansbeek, T. and Kapteyn, A., Estimation of the Error-Components Model with Incomplete
Panels, Journal of Econometrics, 1989, 41(3), pp. 341-361. 67 Autocorrelation — the dynamic panel models: The assumption that deviations of observations
from their expected values are uncorrelated is labeled non-autocorrelation. These autocorrelation, or dynamic, models allow past expressions of the dependent variable to affect its current level. If there is autocorrelation in the model, it can be tested for. Methods of handling autocorrelation in economic data occupy a large proportion of the literature. Durbin -Watson developed a test for first-order autocorrelation for residuals; modified by Bhargava to handle balanced panel data; and further by Baltagi and Wu to handle unbalanced panel data. Arellano and Bond developed a model to apply estimators to lagged dependant variables to account for dynamic effects. The lagged dependent variables can be introduced to either fixed or random effects models. The described models and tests are a selection of the different solutions for the dynamic model. There are several more specifications to deal with adjustments for panel data analysis; which can be derived in depth from the literature mentioned here. Greene, Econometric Analysis, Chapter 19.
68 Greene, Econometric Analysis, p. 215; Cook, D. R. and Weisberg, S., Diagnostics for Heteroskedasticity in Regression, Biometrika, 1983, 70(1), pp. 1–10.
69 Wooldridge, Econometric Analysis of Cross Section and Panel Data, p. 177. 70 White, H., A Heteroskedasticity-Consistent Covariance Matrix Estimator and a Direct Test for
Heteroskedasticity, Econometrica, 1980, 48(4), pp. 817-838; Greene, Econometric Analysis, p. 222.
71 Breusch, T. and Pagan, A., A Simple Test for Heteroscedasticity and Random Coefficient Variation, Econometrica, 1979, 47, pp. 1287-1294; Greene, Econometric Analysis, p. 223.
72 Greene, Econometric Analysis, p. 222.

B. Concept for research of private equity investments 29
Breusch and Pagan have devised a Lagrange multiplier test of the hypothesis )( 0
22ii zf αασσ += , where is z a vector of independent variables. The model is
homoscedastic if 0=α .
The White robust estimator is a classic way to correct for heteroscedasticity.73
This chapter has described the core models and tests: the panel data analysis
with pooled regression, fixed and random effects models, the effects of time and
country, and the test of heteroscedasticity.
Panel data analysis investigates multiple cases, in this instance, countries with
repeated observations over years. The weakness of this approach is that PE
activity is analyzed within countries seen as isolated entities. The propensity of a
country to invest in another country cannot be captured. The key to analyze
country interaction is to extend the cross-section from country to country pairs,
that is, to source country and host country combinations. The gravity model
focuses on analyzing country pair relations.
2.2.2. Gravity model analysis
The theory behind the gravity model is a supply and demand system that
quantifies the volume of trade between any two countries. The gravity model
equation models bilateral trade as a function of the characteristics of the
countries and the country pairs.74
73 White, A Heteroskedasticity-Consistent Covariance Matrix Estimator and a Direct Test for
Heteroskedasticity. 74 For further theoretical foundations see: Oguledo, V. I. and MacPhee, C. R., Gravity Models:
A Reformulation and an Application to Discriminatory Trade Arrangements, Applied Economics, 1994, 26(2), pp. 1007-1021; Egger, An Econometric View on the Estimation of Gravity Models and the Calculation of Trade Potentials; Egger and Pfaffermayr, The Proper Panel Econometric Specification of the Gravity Equation: A Three-Way Model with Bilateral Interaction Effects; Deardorff, A. V. and Frankel, J. A., Determinants of Bilateral Trade: Does Gravity Work in a Neoclassical World?, NBER Project Report series. Chicago and London: University of Chicago Press, 1998, pp. 7-22; Evenett, S. and Keller, W., On Theories Explaining the Success of the Gravity Equation, Working Paper NBER, 1998(6529).

B. Concept for research of private equity investments 30
Figure 8: The gravity model (schematic)
The model in general explains activities between two countries as being a
positive function of the economic masses of those countries, and a negative
function of the economic distance between them. Gravity models were first
applied to international trade by Tinbergen (1962).75 The theoretical foundations
were subsequently developed by Anderson (1978)76 and Bergstrand (1985).77
The basic specifications of the gravity model include supply factors of the export
country (e.g., population and GDP), demand factors of the import country (e.g.,
population and GDP), and trade-supporting determinants (such as proxies of
transport cost, and geographical and cultural measures of country proximity).78
The traditional gravity model, with source and host country, has evolved from a
two-dimensional model — source and host country — into a three-dimensional
model using panel data and including time-varying observations.79
In a three-dimensional model the affinity of countries can be explored by time-
invariant and time-variant determinants. Time-invariant determinants describe a
constant country pair affinity; time-variant determinants change the country pair
affinity itself and the relative affinity of the country pairs for each other compared
to the whole system.
75 Tinbergen, Shaping the World Economy. 76 Anderson, J. E., A Theoretical Foundation for the Gravity Equation, American Economic
Review, 1979, 69(1), pp. 106-116. 77 Bergstrand, The Gravity Equation in International Trade: Some Microeconomic Foundations
and Empirical Evidence. 78 Egger and Pfaffermayr, The Proper Panel Econometric Specification of the Gravity
Equation: A Three-Way Model with Bilateral Interaction Effects. 79 Matyas, Proper Econometric Specification of the Gravity Model; Matyas, The Gravity Model:
Some Econometric Considerations; Egger and Pfaffermayr, The Proper Panel Econometric Specification of the Gravity Equation: A Three-Way Model with Bilateral Interaction Effects.
Gravity model
Source Host
Mass MassDistance

B. Concept for research of private equity investments 31
The specification of the gravity model with time variation, usually in log-log80
form, takes the following form:
Equation 10: The basic gravity model
where ijty is the volume of transfer (exports) from country i to country j at time
t , ijtx is the vector of structural explanatory variables; in detail itx is the country
i (source) specific data at time t , and jtx is the country j (host) at time t . ijx is
country pair specific data between the countries i and j . iα , jγ , and tλ are the
unobserved specific effects.81 In detail:
iα is the source country effect, Ni ,...,1=
jγ is the host country effect Nj ,...,1=
tλ is the time (business cycle) effect Tt ,...,1=
ijtu is the usual white noise disturbance term and β is the unknown parameter
vector.82 The equation is sometimes augmented to include bilateral interaction
effects by inclusion of ijδ .83
Recognizing the underlying panel data nature of the gravity model, the
parameters iα , jγ , and tλ can be treated from an economic point of view as
random variables (random effect) or fixed variables (fixed effect).84 Given that in
this analysis these parameters are of special interest, they are formalized here as
80 Using logarithms, the equation can be converted to a linear form for econometric analysis.
Matyas, Proper Econometric Specification of the Gravity Model; Egger and Pfaffermayr, The Proper Panel Econometric Specification of the Gravity Equation: A Three-Way Model with Bilateral Interaction Effects.
81 Matyas, Proper Econometric Specification of the Gravity Model, p. 363. 82 Matyas, Proper Econometric Specification of the Gravity Model, p. 363; Matyas, The Gravity
Model: Some Econometric Considerations; Egger and Pfaffermayr, The Proper Panel Econometric Specification of the Gravity Equation: A Three-Way Model with Bilateral Interaction Effects; Baltagi; Egger and Pfaffermayr, A Generalized Design for Bilateral Trade Flow Models.
83 Egger, An Econometric View on the Estimation of Gravity Models and the Calculation of Trade Potentials; Egger and Pfaffermayr, The Proper Panel Econometric Specification of the Gravity Equation: A Three-Way Model with Bilateral Interaction Effects.
84 Matyas suggests the random and fixed approaches for different data sets (1997) (1998). See also: Cheng, I. H. and Wall, H. J., Controlling for Heterogeneity in Gravity Models of Trade and Integration, Review (00149187), 2005, 87(1), pp. 49-63.
,...,1,,,...,1,...321 TtjiNjiuxxxy ijtijjtittjiijt =≠=+++++++= βββλγα

B. Concept for research of private equity investments 32
fixed unknown parameters for a main and interaction effect analysis. The model
is then a generic form of a gravity model and a direct generalization of the two-
way panel data model.85 Many adjustments have been made in academic
literature to handle the complexity of the gravity model, especially for unbalanced
data sets with missing data or zero trade flows.86
With the above assumptions, the proper econometric expression of the gravity
model with time variation can be analyzed with fixed main time, source, and host
effects. The source and host effects control for all time-invariant country
characteristics, both observable and unobservable. Time effects capture cyclical
influences commonly shared by all involved countries, as described in the model
(Equation 10).87 Many solutions are considered to properly address the fixed-
effect approach when using panel data to estimate a gravity model.88
One problem with fixed-effect panel regressions is that time-invariant variables
are not considered. This means that a core variable of a gravity model, such as
distance, would be missing.89 To address this problem, empirical analysis follows
the broad specifications of Matyas, Egger, and Pfaffermayr by using a pooled
Ordinary Least Squares (OLS) regression as a basis that does not include fixed
effects.
85 Matyas, Proper Econometric Specification of the Gravity Model. 86 Greene; Harris and Matyas, Gravity Models, Zero Trade Flows and Fixed Effects; Linders,
G. T. and De Groot, H., Estimation of the Gravity Equation in the Presence of Zero Flow, Tinbergen Institute Discussion Paper, Tinbergen Institute, Free University Amsterdam, 2006, Ti 2006-073(3); Raballand, G., Determinants of the Negative Impact of Being Landlocked on Trade: An Empirical Investigation Through the Central Asian Case, Comparative Economic Studies, 2003, 45(4), pp. 520-536; Wang, Z. and Winters, L., The Trading Potential of Eastern Europe, CEPR Discussion Paper 610 London, 1991.
87 Egger and Pfaffermayr, The Proper Panel Econometric Specification of the Gravity Equation: A Three-Way Model with Bilateral Interaction Effects; Baltagi, Econometric Analysis of Panel Data; Pirotte, A., Convergence of the Static Estimation Toward the Long-Run Effects of Dynamic Panel Data Models: A Labour Demand Illustration, Applied Economics Letters, 2003, 10(13), pp. 843-847.
88 Baltagi; Egger and Pfaffermayr, A Generalized Design for Bilateral Trade Flow Models; Davies, R. B.; Ionascu, D. and Kristjansdottir, H., Estimating the Impact of Time-Invariant
Variables on FDI with Fixed Effects2005, pp. 37-37. 89 Borrmann; Jungnickel and Keller, What Gravity Models Can Tell Us About the Position of
German FDI in Central and Eastern Europe, p. 8; Egger and Pfaffermayr, The Proper Panel Econometric Specification of the Gravity Equation: A Three-Way Model with Bilateral Interaction Effects; Davies; Ionascu and Kristjansdottir, Estimating the Impact of Time-Invariant Variables on FDI with Fixed Effects.

B. Concept for research of private equity investments 33
Equation 11: The OLS regression of the gravity model without fixed effects
...6543210 ijtjiijjtitijtijt xxxxxxy εβββββββ +++++++=
,...,1,,,...,1, TtjiNji =≠=
where itx and jtx are the source’s and host’s time variables (e.g., GDP), ix and
jx include source and host’s time invariant characteristics (e.g., land area), ijx
are the time-invariant country pair characteristics (e.g., distance), and ijtx
includes country pair time-varying data (e.g., exchange rates). The specific
effects can be controlled for by including dummy variables for source id host jd
and time td in this OLS regression (see panel data analysis LSDV above).
Including the dummies for the specific source host or time effect has the
consequence that the related variables with the specific dimension cannot be
included in the model. The only dummy variable that can be considered — if all
the other variables are included in the model — is the time dummy. The equation
with OLS regression, including time dummies ( td ), is:
Equation 12: The OLS regression as gravity model with time dummies
... 16543210 ijttiiijjtitijtijt dxxxxxxy εβββββββ +++++++= −
,...,1,,,...,1, TtjiNji =≠=
This gravity model is the basic form used for this paper’s research. It analyzes
variables that affect the PE cross-border activity of source and host country over
time with relevant explanatory variables by testing the hypothesis:
effectnoHypothesisNullH =0 effectHypothesiseAlternativH =1
with the assumption of 0H for each variable, the 0H hypothesis is rejected if 0H
is unlikely. The F-test statistic is applied for the regression analysis with the
standard procedure, testing the hypothesis that the means of multiple, normally
distributed populations, all having the same standard deviation, are equal.90 The
simplest form of this test is the analysis of variance (ANOVA), which analyses the
main and interaction effects — in this case, of source, host, and year with the
following equation.91
90 Greene, Econometric Analysis, pp. 50 and 95. 91 Greene, Econometric Analysis, p. 95.

B. Concept for research of private equity investments 34
Equation 13: The OLS regression with dummy variables for the main and interaction effects
For the gravity model analysis, two different approaches are applied in this
research. First, a model with the fixed main and interactive effects of source,
host, and years with dummy variables, not including explanatory variables
(ANOVA, Equation 13), and second, the gravity model with the full set of derived
determinants, with time effects described schematically by Equation 12.
The developed theoretical gravity model will be further adjusted to the empirical
data after the derivation of the dependent and independent variables.
2.3. Conceptualization and definition of variables
2.3.1. Conceptualization of private equity activity
Before looking into which determinants influence cross-border PE activity, it must
be defined how to quantify PE activity in a country and between countries as a
dependent variable over time.
2.3.1.1. Principles of measuring private equity act ivity
As indicated by the theory, activity includes all deal sourcing by companies or
institutions that balances the supply and demand of goods and services between
each other. The intent to invest — a potential deal — is difficult to capture and
does not result in the balance of supply and demand between two parties.
Balance is achieved by the deal (defined in Chapter B.2.1.) that can be quantified
by the involvement of companies in a transaction of goods and / or services for
money at a certain time. For this analysis, the dependent variables of country
activity must be extrapolated from the deal level to the country level.
The activity of a deal can be measured in two ways: first, by simply counting
deals (participation in a deal) and second, as deal flow, here equivalent to the
amount of money transferred in exchange for equity. The actual deal count
reveals the frequency of investment — the number of deals in a country per year,
while deal flow measures the intensity of the investment — the amount invested
per country per year.
,...,1,,,...,1,111111 TtjiNjiddddddy ijtjtitijtjiijt =≠=++++++= −−−−−− ε

B. Concept for research of private equity investments 35
Both variables — participation and deal flow — are used for this analysis. The
variable participation assures sensitive and accurate measurement of country
activity unrelated to deal volume. The differentiation also allows the comparison
of deal flow and participation. It accounts for the different deal volumes in stage
financing and the availability of large investments in a country.
The character of PE deals implies that the quantity of deal activity can be
observed and captured at both the investor and target sites. The following figure
illustrates this in detail for two independent deals (x1 & x2) of PE firms (A & C)
investing in portfolio companies (B & D) with their sources (S1 & S2) and host
countries (H1 & H2) in single investor deals.
Figure 9: Measurement of dependent variables
In the deal perspective, the participation “1” and the amounts x1 and x2 for the
deals can be measured on both sides — the source and the host country.
Extending the perspective from the country deal view to the geographic country
(see Chapter B.2.1. for the definition) exemplifies two countries C1 (= S1) and C2
(= S2 = H1 = H2) with one cross-border deal (Deal1, x1) and one domestic deal
(Deal2, x2). The combination of deal perspective — with source and host of
1.Deal perspective(Source/ host)
2.Country perspective(geographical)
PE-Firm A
Source country S 1
1 Private Equity Firm
$ Amount x1
Portfolio company B
Host country H 1
1 Portfolio company
$ Amount x1
PE-Firm C
Source country S 2
1 Private Equity Firm
$ Amount x2
1
x1
1
x2
2
x1+x2
Participation
Money amount
DomesticCross border
Deal perspective Source activity Source activity Host activity
Overall
Country C 2Country C 1
3
x1+x2+x2
Overall activity
Host country H 2
Portfolio company D
$ Amount x2
1 Portfolio company
1$ x2
Deal 1
Deal 2
1$ x1
Country perspective Country 1 Country 2 Country 2 Country 2

B. Concept for research of private equity investments 36
investment — and geographic country perspective result in three different
perspectives for activity measurements (illustrated by the example for Country2):
1. Source country: source activity of country only (1 deal — amount x2)
2. Host country: host activity of country only (2 deals — amount x1 + x2)
3. Overall country activity: sum of source and host activity (3 deals
— amount x1 + x2 + x2)
Deals are double-counted from the country perspective in overall country activity.
It makes sense to compare countries by differentiating data into overall activity,
source, and host activity. Otherwise it is impossible to capture and compare the
distinct activity of a country in its double role as source and host country.
The three kinds of measurement describe typical cross-sectional data sets used
in combination with time series when using panel data analysis. For gravity
model analysis, the measurement described above is not exhaustive.
The gravity model uses a vector as the dependent variable ijy — besides, the
quantity a direction of deal is defined as being from the source to the host
country. The vector is:
Country pair combination with source1 to host1 country activity (1 deal)
with amount x1.
For the traditional gravity model analysis, this dependent variable definition of
country activity from one country to another country would be sufficient, but the
complex nature of PE deals requires further specification.
2.3.1.2. In-depth measurement of private equity act ivity
The definition of the traditional “single investor deal” used in trade flow
measurement does not exhaustively take into account the special characteristics
of PE deals and needs to be enhanced to measure deal activity accurately to
fulfill the requirements of this analysis. Difficulties in measuring cross-border
country activity arise if PE firms from different countries invest together in one PF
company at the same time (“multi investors deals”). In this case, the activity of a
country must be calculated in proportion to the deal participation of each firm.
The measurement is illustrated by one deal in the following graph:

B. Concept for research of private equity investments 37
Figure 10: Measurement of private equity activity involving more than one investor
The figure details the derivation of the dependent variable if more than one PE
firm (A and B) invest their funds (A1, A2, B1) in one PF company (C) with different
country locations. Three funds (A1, A2, B1) invest in company C with the amounts
A1 + A2 + A3 = C1. Fund participation in the deal is 1/3 for each fund. Two funds
(A1 & A2) belong to PE firmA located in countryA.92 The third fund, B1, belongs to
92 If a third firm from country A also invests in the company, the deal participation for countryA
would be 2/3, for countryB 1/3.
Fund A 1
Fund A 2
PE-Firma: A
PE-Firma: B
PE-Firms
Portfolio-Company: X
Portfolio-Company
Country: B
Country: A
FundInvestment
Weight
Funds
Fund B 1
1/2
1/2
FirmInvestment
1/3
1/3
1/3 1/2
1/4
1/4
Weight
2 Firms3 Funds1 Company
Venture Capital
$ Amount B1
Venture Capital
$ Amount A2
Venture Capital
$ Amount A1
Country: C
$ Amount B1
$ Amount A2
$ Amount A1
1
Source countriesHost country
A1+A2
B1
1/2
1/2
1
1
A1+A2+B1 1 2C1 = A1+A2+B1 1
A
B
?
$ Amount C1
1+1
1
3
C
C
C
T1
T1
A
B
C
Dependant variable sourceDependant variable host
Deal flow Deal participation
ParticipationDeal flow Deal participation
SourceFund participation
Host Time
I 2 1 II 3 4 5 6 III
Date
Early stage (VC)
ParticipationDeal
participationDeal flow
654Deal
Participation
1
Deal flow
2
A1+A2
B1
1/2
1/2
1
1
A1+A2+B1 1 2C1 = A1+A2+B1 1
A
B
?
Fundparticipation
3
1+1
1
3
Source
C
C
C
Host Time
T1
T1
Dependant variable sourceDependant variable host
I II III
Derivation of dependant variable assortment for ana lysis
Direction Time Quantity Stage
Source Host Year Participation Deal participation Deal flow
A C T1 1 0.5 A1+A2
B C T1 1 0.5 B1
VC/ PE
VC
VC
II 6 5 4B CIII I
1 Deal scheme
2
3
ParticipationDeal
participationDeal flow
654Deal
Participation
1
Deal flow
2
A1+A2
B1
1/2
1/2
1
1
A1+A2+B1 1 2C1 = A1+A2+B1 1
A
B
?
Fundparticipation
3
1+1
1
3
Source
C
C
C
Host Time
T1
T1
Dependent variable sourceDependent variable host
I II III
Derivation of dependent variable assortment for ana lysis
Direction Time Quantity Stage
Source Host Year Participation Deal participation Deal flow
A C T1 1 0.5 A1+A2
B C T1 1 0.5 B1
VC/ PE
VC
VC
II 6 5 4B CIII I
Activity measurement
Dependent variable arrangement for analysis

B. Concept for research of private equity investments 38
PE firmB located in countryB. The dependent variable for source and host country
can be measured in detail as follows:
Host country perspective
1. Portfolio company participation: count of participation in deal
2. Portfolio company deal flow: amount invested in PF company
Source country perspective
3. Fund participation: count of funds investing in PF companies
4. Deal flow: amount of money invested by each fund and by each PE firm
5. PE firm deal participation: sum of proportional participation of PE firms
6. PE firm participation: count of participation of firm
The differentiation of this information into the various activity measurements of
multiple investor countries for the gravity model can only be accomplished in the
source country perspective. The dependent variables are participation (6), deal
participation (5), and deal flow (4) of the source country. The host value is
understood as the sum of the corresponding activity variables of the source
country. The new analytical arrangement for the gravity model has the vector
direction: source to host, at a certain point of time (year), and three
measurements of quantity of activity: participation, deal participation, and deal
flow. The dependent variable derivation is so far confined to one observation at
one particular point in time. Observing and tracking the deal participants over
time opens an additional “multi investors over time” perspective. It adds a
reference to the past and connects the formerly independent time layers by
tracking the cycle of participation.93 The combination of company investment (first
deal for a PF company) and participation by an investor (first deal for an
investor), compounded by the number of investors, leads to different deal types.
93 Bengtsson, O., Relational Venture Capital Financing of Serial Founders, Cornell University
Working Paper Series, 2008.

B. Concept for research of private equity investments 39
Table 1: Derivation of deal type
Three main categories are derived from the PF company and PE firm
combination: (1) first deal: first-time investment in a PF company; (2) new deal:
new investor invests in particular company; (3) refinancing: previous investors
refinance the company. These categories are further broken down into single and
group investments, which lead to differentiation of the three categories into single
and multi-investor deals. Combining the categories with the number of
participants leads to a fourth category — deal mix: a previous investor
refinancing the company, but bringing in a new investor that is financing the
company for the first time. This differentiation exemplifies “true deals” — early
adopters and followers into different countries. Including the investment round
with the number of participants into the analysis results in the following variable
arrangement:
Figure 11: Dependent variable for analysis with investment round consideration
Finally, the proportion of activity in percent of the particular observations
compared to the total observations is calculated for each of the three activity
TInvestment round
Direction Time Quantity Deal type Stage
Source Host Year Participation Deal part. Deal lfow VC / PE
A C T2 1 0.5 $A1+$A2 Deal mix refinancing VC
B C T2 1 0.5 $B1 Deal mix first VC
Direction Time Quantity Deal type Stage
Source Host Year Participation Deal part. Deal lfow VC / PE
A C T1 1 1 $A0 First deal - single VC
Weight
1/21/2
1/21/2
1
1/21/2
1
1/3
1/31/3
1
Deal type
Deal mix - firstDeal mix - refinancing
Refinancing - multipleRefinancing - multipleRefinancing - single
New deal - multipleNew deal - multipleNew deal - single
First deal - multiple
First deal - multipleFirst deal - multipleFirst deal - single
PE-Firmparticipation
firstGrefinancingA
2refinancingrefinancing
refinancingCrefinancingB
2
refinancingA2
refinancingrefinancingrefinancing
firstFfirstE
2
firstE2
refinancingrefinancingrefinancing
firstD
firstCfirstB
1
firstA1
first
firstfirstfirst
PF-Company participation
PE-FirmDate(Round)
X
X
X
X
X
X
X
PF - Company
4
3.2
3.1
2.2
2.1
1.2
1.1
Scenario

B. Concept for research of private equity investments 40
variables to weigh the activity in relation to the global investment activity over all
years. For example the activity in percent for deal flow between country B to C is
B1/ (A0+A1+A2+B1) under the assumption that these deals represent the total of
global investments. Out of the particular activity a summarizing overall activity is
calculated for each observation by averaging the partial activities for each
observation.
Table 2: Final quantification of dependent variable with overall activity in percentage
The final observation unit utilizes criteria for the quantification of the dependent
variable: source, host, year, participation, deal participation, deal flow, overall
activity as a percentage, deal type (inherent investment round and number of
participants), and the finance stage of a company.
2.3.2. Conceptualization of indicators of private e quity activity
The complexity of the economics of PE on a global level requires a structured
approach to capture relevant indicators. The derivation of the explanatory
variables is based on the two concepts extracted from the theoretical framework.
First, the method-related approach of the three-dimensional gravity model
(Chapter B.1.2.2.), capturing cross-border relevant indicators, and second, the
economics of the PE market, focusing on PE-relevant indicators. To structure the
process further, the information from Chapter B.1.1. (definition and specifications
of the research object) is used; topic-related studies (Chapter B.1.2.1.) serve as
further support and guidance.94 The objective is to systematically explore
94 Blonigen, A Review of the Empirical Literature on FDI Determinants; Hofstede, G., Cultural
Constraints in Management Theories, International Review of Strategic Management, 1994, 5, pp. 27-37; Hofstede, G., Organizing for Cultural Diversity, European Management Review,
(cont)
Direction Time Quantity Activity % Deal type Stage
Source Host Year Participation Deal part. Deal lfow Parti cipation Deal part. Deal flow Overall VC / PE
A C T1 1 1 $10 17% 25% 11% 18% First deal - alone VC
A C T2 1 0.5 $18 17% 13% 20% 16% Deal mix refinancing VC
B C T2 1 0.5 $12 17% 13% 13% 14% Deal mix first VC
D E T3 1 0.5 $5 17% 13% 6% 12% First deal - mix PE
F E T3 1 0.5 $15 17% 13% 17% 15% First deal - mix PE
G H T4 1 1 $30 17% 25% 33% 25% First deal - alone VC
Total 6 4 $90 100% 100% 100% 100%

B. Concept for research of private equity investments 41
distinctive and exhaustive indicators that influence PE investment. Figure 12
illustrates the derivation of determinants.
Figure 12: Derivation of indicators for analysis
The graph shows a subsegment of the research frame (Chapter B.2.1.) in which
the country profiles Pi & Pj and the country pair profile Pij are embedded. The
relevant theoretical subframes of the gravity model and the PE market
environment indicate the derivation of the hypotheses and the explanatory
2001, 7(4), pp. 390-397; Hofstede, G. and Bond, M. H., The Confucius Connection: From Cultural Roots to Economic Growth, Organizational Dynamics, 1988, 16(4), pp. 4-7; Hofstede, G. H., Culture's Consequences: Comparing Values, Behaviors, Institutions, and Organizations Across Nations, Thousand Oaks, Calif.: Sage Publications, 2001; Portes, R. and Rey, H., The Determinants of Cross-Border Equity Flows, Journal of International Economics, 2005, 65(2), pp. 269-311; Deardorff and Frankel, Determinants of Bilateral Trade: Does Gravity Work in a Neoclassical World?; Helpmann, The Structure of Foreign Trade; Hummels and Levinsohn, Monopolistic Competition and International Trade: Reconsidering the Evidence; Gao, Foreign Direct Investment in China: How Big Are the Roles of Culture and Geography?; Chintrakarn, P., The Determinants of Cross-Border Equity Flows: A Dynamic Panel Data Reassessment, Applied Financial Economics Letters, 2007, 3(1-3), pp. 181-185.
Financial/ banking indicators
Legal/ politics/ institutional indicators
Endowmentindicators
1. Market structure
InvestorsPrivate equity
firms
2. Investment process
Fund raising Acquisition
3. CompanystagesPortfolio
companies
Exit
Startup
IPO
…
…
…
…
…
…
…
VC
PE
Pi & Pj: Country profile Pij: Country pair profile
Economic mass indicators
Economic distance indicators
Country pair specific
Relevant bilateral country criteria
Indicator derivation
Economic indicators 1
2
3
4
5
7
6
AB
Source Host
Distance
Gravity model analysis
Gravity Gravity
Research frame
CriteriaQuantitativeQualitative
CriteriaQuantitativeQualitative

B. Concept for research of private equity investments 42
analytic variables. The subframe country profile (Pi & Pj) shows how the
economics of the PE market relate to the investment process and the company
stages (Chapter B.1.1.). The three former independently illustrated schemes are
linked via the element PF companies in market structure, and the element exit of
the investment process in the company stages. The graph indicates, as shown in
Chapter B.1.1., how the economics of the PE market depend very much on the
economic conditions of a country (B4), the financial and banking sectors (B5), and
the legal regulations of a country (B7), all in relation to the global economic
environment.95
Endowment-related indicators (B6) are a subset of special indicators. They result
from the confluence of three categories: market structure, investment process,
and company stages. These indicators address relevant criteria for the company
life cycle, especially for the start-up and exit phases of a PE business.
The gravity model approach is embedded in the country pair profile (Pij), from
which, with support from the country profile, are derived the relevant gravity
model specific indicators for mass (A1) and distance (A2), and country pair
specific indicators resulting from the specific country pair constellation (A3).
For the cross-border analysis, relevant hypotheses with the explanatory
indicators are developed from the seven main categories.
A) Gravity model: Since the gravity model is a positive function of the economic
masses of two countries and a negative function of the economic distance
between them, two hypotheses for PE cross-border investments can be
formulated from it:
HGM 1EM: The larger the economic mass, the larger the cross-border PE
investment.
95 For a discussion on the effect of institutional, regulatory, and cultural factors, see; Jeng and
Wells, The Determinants of Venture Capital Funding: Evidence Across Countries; La Porta, R.; Lopez-de-Silanes, F.; Shleifer, A. and Vishny, R. W., Law and Finance, Journal of Finance, 1996; La Porta, R.; Lopez-de-Silanes, F.; Shleifer, A. an d Vishny, R., Legal Determinants of External Finance, Journal of Finance, 1997, 52, pp. 1131-1150; Tykvova, T.; Westerheide, P. and Zinser, B., Private Equity im internationalen Vergleich — Analyse der Rahmenbedingungen und Schlussfolgerungen für Deutschland, ZEW - Center for European Economic Research, 2005; Hitt, M. A.; Tihanyi, L.; Miller, T. and Connelly, B., International Diversification: Antecedents, Outcomes, and Moderators, Journal of Management, 2006, 32(6), pp. 831-841.

B. Concept for research of private equity investments 43
HGM 2ED: The nearer the economic distance, the larger the cross-border PE
investment.
According to various theoretical studies, to explain cross-border activity and,
more specifically, the regional distribution of PE investment, an empirical study
based upon the PE gravity model should include traditional indicators for mass
and distance:96
1. Economic mass indicators: The gross domestic product as an indicator of
market volume and economic productivity; population or area as an indicator of
country size.97
2. Economic distance indicators: 98 First, geographical distance between
capitals or economic centers; second, factors affecting the economic distance
between countries: for example, common language, common border, common
96 For the theoretical approach of the gravity model, see the previously mentioned studies of
Matyas; Eggers; Baltagi ; etc. and for practical use, compare: Sarisoy Guerin, The Role of Geography in Financial and Economic Integration: A Comparative Analysis of Foreign Direct Investment, Trade and Portfolio Investment Flows; Janeba, E., International Trade and Consumption Network Externalities, European Economic Review, 2007, 51(4), pp. 781-803.
97 For discussion of the impact of economic mass on trade flow, compare: Linnemann, An Econometric Study of International Trade Flows; Bergstrand, J. H., The Generalized Gravity Equation, Monopolistic Competition, and the Factor-Proportions Theory in International Trade, The Review of Economics and Statistics, 1989, 71(1), pp. 143-149; Baldwin, R., Towards an Integrated Europe CEPR Discussion Paper, 1994; Acs, S. J. and Audretsch, D. B., New-Firm Startups, Technology, and Macroeconomic Fluctuations, Small Business Economics, 1994, 6.
For discussion of the negative impact of population as an economic indicator, compare: Bergstrand (1989, p. 146); Linnemann, An Econometric Study of International Trade Flows; Aitken, N. D., The Effect of the EEC and EFTA on European Trade: A Temporal Cross-Section Analysis, American Economic Review, 1973, 63(5), pp. 881-893; Bikker, J. A., An International Trade Flow Model With Substitution: An Extension of the Gravity Model, Kyklos, 1987, 40(3), pp. 315-338; Sapir, A., Trade Benefits under EEC Generalized System of Preferences, European Economic Review, 1981, 15(3), pp. 339-335. For a postive impact of population on bilateral trade, compare: Oguledo and MacPhee, Gravity Models: A Reformulation and an Application to Discriminatory Trade Arrangements.
98 For the theoretical and practical use of the gravity model, especially for factors affecting cultural distance, compare: Egger, P., On the Role of Distance for Bilateral Trade, The World Economy, 2008, 31(5), pp. 653-658; Hofstede, Culture's Consequences: Comparing Values, Behaviors, Institutions, and Organizations Across Nations; Hofstede, Organizing for Cultural Diversity; Hofstede, Cultural Constraints in Management Theories; Ionascu, D.; Meyer, K. E. and Estrin, S., Institutional Distance and International Business Strategies in Emerging Economies, Working Papers (William Davidson Institute) - University of Michigan Business School, 2004, pp. 1-44.

B. Concept for research of private equity investments 44
history, common currency,99 common legal system, political dependency,
whether the country is landlocked or a member of a trade organization, and other
cultural indicators, such as religion, etc.
The economic mass and distance indicators may be regarded as elements of a
traditional gravity model, whereas the following additional indicators are
developed specifically to analyze PE investment.
3. Country pair specific indicators: The research frame provides a theoretical
foundation for taking into account further country pair determinants, derived from
the related theories of investment and PE.100 Factors affecting PE activity can be
assumed for general openness of a country toward international trade, its
economic maturity, and the value of its currency compared to other countries.
The hypotheses can be formulated thus:
HGM 3ER: The higher a country’s currency value, the greater its cross-border
activity as a source country and the lower its cross-border activity as a
host country.
HGM 3OP: The more open a country is toward international trade, the greater the
PE cross-border activity.
HGM 3DM: The more developed a country, the greater the PE cross-border
activity.
The country-specific indicators are: exchange rates,101 average openness toward
imports and exports,102 and development status.103 The exchange rate measures
99 For the impact on common currencies, compare: Frankel, J. A. and Rose, A. K., An
Estimate of the Effect of Common Currencies on Trade and Income, KSG Working Paper No. 01-013., 2001; Glick and Rose, Does a Currency Union Affect trade? The Time-Series Evidence.
100 Compare studies of: Rose and Spiegel, Offshore Financial Centers: Parasites or Symbionts?; Matyas, L.; Konya, L. and Harris, M. N., Modeling Export Activity in a Multicountry Economic Area: The APEC Case, Monash Econometrics and Business Statistics Working Papers, 1997, 1/97.
101 Compare studies of Bergstrand, The Gravity Equation in International Trade: Some Microeconomic Foundations and Empirical Evidence, p. 479, and Baier, S. L. and Bergstrand, J. H., The Growth of World Trade: Tariffs, Transport Costs, and Income Similarity, Journal of International Economics, 2001, 53(1), pp. 1-23 and 10 for a positive impact of a high real exchange rate index.
102 Egger, P.; Huber, P. and Pfaffermayr, M., A Note on Export Openness and Regional Wage Disparity in Central and Eastern Europe, The Annals of Regional Science, 2005, 39(1), pp. 63-64; Rose and Spiegel, Offshore Financial Centers: Parasites or Symbionts?
B. Concept for research of private equity investments 45
both the differences in currency value and the investment potential for investors.
The relationship of imports and exports to GDP is an indicator of any barriers into
or out of a country and indicates the general propensity of a country toward
cross-border activity. The development status of a country describes its relative
economic maturity compared to other countries.
These indicators are essential to the gravity model because they result from the
country pair constellation and describe conditions relative to other countries.
B) Private equity indicators: Views of the PE market and the investment
process indicate a correspondence between PE activity and the economic,
financial, institutional, and political environments.
4. Economic indicators: These are listed for completeness and have already
been included in the analytic model (via derivation from the gravity model) as
economic mass indicators. This category overlaps with the gravity model
indicators.
5. Financial/banking system indicator: 104 Institutions that specialize in the
finance sector, such as The World Bank or International Financial Statistics, and
the OECD105 recommend a variety of categories and indicators to describe the
103 Rose and Spiegel, Offshore Financial Centers: Parasites or Symbionts?; Lerner, J. and
Schoar, A., Transaction Structures in the Developing World, NBER Working Papers, 2004, 10348.
104 For the role of banks as financial intermediaries, compare: Fama, What is Different about Banks?; Mayer, New Issues in Corporate Finance; Myers and Majluf, Corporate Financing and Investment Decisions When Firms Have Information That Investors Do Not Have For bank competitiveness, see Berger, A. N., The Profit-Structure Relationship in Banking - Test of Market Power and Efficient Structure Hypothesis, Journal of Money, Credit & Banking, 1995, 27, pp. 404-431; Bikker, J. A. and Haaf, K., Competition and Concentration and Their Relationship: An Empirical Analysis of the Banking Industry, DNB Staff Report, De Nederlandsche Bank, 2001, 68; Claessens, S. and Laeven, L., What Drives Bank Competition? Some International Evidence, Journal of Money, Credit & Banking, 2004, 36(3), pp. 563-583; Demirguc-Kunt, A. and Levine, R., Financial Structure and Economic Growth, Cambridge MIT Press, 2001; Vives, X., Competition in the Changing World of Banking, Oxford Review of Economic Policy, 2001, 17, pp. 535-545; Greenwood, J. and Smith, B. D., Financial Markets in Development, and the Development of Financial Markets., Journal of Economic Dynamics and Control, 1997, 21(1), pp. 145-181; Maksimovic, V.; Beck, T.; Demirguc-Kunt, A. and Levine, R., Financial Structure and Economic Development: Firm, Industry, and Country Evidence, World Bank Policy Research Working Paper, 2000(2423).
105 Compare BankScope1, Datastream; Worldscope, International Financial Statistics (IMF) and Global Financial Stability Report (IMF) for indicators.

B. Concept for research of private equity investments 46
finance sector in depth. Common major categories to describe the finance sector
are size of the banking sector, efficiency, and competitiveness.106
The hypotheses for PE activity assume, as considered in Chapter B.1., a well-
funded financial system, and can be formulated thus for each category:
HPE 1FS: The larger the financial sector, the greater the cross-border PE activity.
HPE 1FE: The higher the efficiency of the banking system, the greater the cross-
border PE activity.
HPE 1FC: The more intense the competitiveness, the greater the PE cross-border
investment.
The relevant indicators per category for this analysis are aligned with academic
studies and key data sources, with main reference to The World Bank.107 The
three major categories with the complementary indicators are:
• Size of finance sector
1. M2108 to GDP, 2. private credit to GDP, 3. central bank assets to GDP, 4.
deposit money bank assets to GDP, 5. financial system deposits, 6. total bank
assets to GDP, 7. private credit to total domestic credit, 8. private credit to total
funding
The indicators for size and intermediation in detail description are: M2 (1) is a
measure of total money supply — in particular money that can be converted
within a short time period to be spent. Private credit to GDP (2) isolates the
106 For different measures of financial sector development, compare Levine, R. and Zervos, S.,
Stock Markets, Banks, and Economic Growth, American Economic Review 88, 1998, pp. 537-558; Rose and Spiegel, Offshore Financial Centers: Parasites or Symbionts?; Berger, The Profit-Structure Relationship in Banking - Test of Market Power and Efficient Structure Hypothesis; Bikker and Haaf, Competition and Concentration and Their Relationship: An Empirical Analysis of the Banking Industry; Claessens and Laeven, What Drives Bank Competition? Some International Evidence; Kim, S.-J. and Hooper, V. J., The Determinants of Capital Inflows: Does Opacity of Recipient Country Explain the Flows?, Economic Systems, 2007, Vol. 31(1); Lane, P. R. and Milesi-Ferretti, G. M., Examining Global Imbalances, Finance & Development, 2006, 43(1), pp. 38-45.
107 World Bank, Financing Growth — Financial & Private Sector Development, 2007. 108 Representative money indicator, which closely correlates with real economic activity. M2 is a
measure of total money supply: M1 plus savings and other time deposits. Economists use M2 when quantifying the amount of money in circulation to explain different monetary conditions. M1 is money that can be used for spending and M2 is money that can be quickly converted to M1. (Bank of Japan).

B. Concept for research of private equity investments 47
credit issued to the private sector as opposed to the credit issued to
governmental and public institutions. The indicator concentrates on the main
activity of financial intermediaries other than a central bank.109
The next three indicators — central bank assets (3), deposit money bank
assets to GDP (4), and financial system deposits (5) measure the size of
financial services performed by different financial sectors — central banks,
deposit money banks, and other financial institutions. Total bank assets (6)
include the total assets of the banking system.110
The last two indicators — private credit to total domestic credit (7), and private
credit to total funding (8) — concentrate (like the indicator private credit to
GDP) on claims to the private sector, measuring in detail the fraction of total
domestic credit in the economy covered by financial intermediaries and the
funding by the financial system’s deposits, foreign liabilities, bonds, and money
market instruments.111
• Efficiency of banking system
1. Return on assets, 2. operating costs to total assets, 3. net interest margin
The indicators for efficiency with return on assets (1) and the ratio of operating
costs to assets (2) show the profitability for the banking sector. Profitability is
typically related to bank efficiency. Net interest margin (3) is considered similar
to the gross margin of non-financial companies.112
• Competitiveness of banking system
1. Lending minus deposit rate spread, 2. bank concentration ratio (assets),
3. bank concentration ratio (deposits), 4. number of banks to GDP
Competitiveness in the banking sector is measured by lending minus deposit
interest rate spread113 (1), bank concentration ratio (by assets) (2), bank
concentration ratio (by deposits) (3), and number of banks to GDP (4). Higher
109 World Bank, Financing Growth — Financial & Private Sector Development. 110 Total assets of the banking system: Assets includes cash and balance with the central bank;
interbank deposits, loans, securities and other assets. World Bank, Financing Growth — Financial & Private Sector Development.
111 World Bank, Financing Growth — Financial & Private Sector Development. 112 World Bank, Financing Growth — Financial & Private Sector Development. 113 The difference between the rate charged by banks on loans to prime customers and the rate
paid by commercial or similar banks for demand, time, or savings deposits.

B. Concept for research of private equity investments 48
bank asset or deposit concentration — measured by industry share —
accounted for by the top five banks114 are used as indicators for less
competitive banking systems. Furthermore, examining large differences in
interest rate spread is another way to analyze competitiveness. The number of
banks to GDP indicates the general density of banks compared to overall
economic performance. 115
6. Endowment-related indicators 116 describe conditions of the PE market that
are effective in combining the phases of corporate development with the PE
investment cycle. The three main categories are a country’s scientific
competitiveness,117 its general corporate economic conditions, and the exit
possibilities118 for PE firms. The hypotheses for these categories are:
114 Demirguc-Kunt and Levine, Financial Structure and Economic Growth. 115 World Bank, Financing Growth — Financial & Private Sector Development. 116 Kumar and Orleck, Why Does Private Equity Vary Across Countries and Time? 117 Yeaple, S. R., The Role of Skill Endowments in the Structure of U.S. Outward Foreign Direct
Investment, Review of Economics and Statistics, 2003, 85(3), pp. 726-734; Saxenian, A. L., Regional Advantage: Culture and Competition in Silicon Valley and Route 128, Cambridge, Mass.: Harvard University Press, 1996; Kortum, S. S. and Lerner, J., Does Venture Capital Spur Innovation?, National Bureau of Economic Research (NBER) Working paper series, 1998; Gompers, P. A. and Lerner, J., The Venture Capital Cycle, Cambridge, Mass.: MIT Press, 2004; Park, W. and Ginarte, C., Intellectual Property Rights and Economic Growth, Contemporary Economic Policy, 1997, July 15(3), pp. 5-12; Bergstrand, J. H. and Egger, P., A Knowledge-And-Physical-Capital Model of International Trade Flows, Foreign Direct Investment, and Multinational Enterprises, Journal of International Economics, 2007, 73(2), pp. 278-288; Lerner, J., Boom and Bust in the Venture Capital Industry and the Impact on Innovation, Harvard NOM Working Paper, 2001(03-13).
118 Gompers, P. A.; Kovner, A.; Lerner, J. and Scharfst ein, D. S., Venture Capital Investment Cycles: The Impact of Public Markets, NBER Working Paper, 2005(W11385); Black, B. S. and Gilson, R. J., Does Venture Capital Require an Active Stock Market?, Journal of Applied Corporate Finance, 1999, pp. 36-48; Ranjan, D.; M., J. and A., S., Private Equity Returns: An Empirical Examination of the Exit of Venture Backed Companies, Journal of Investment Management, 2003, 11, pp. 152-177; Gompers, P. A. and Lerner, J., What Drives Venture Capital Fundraising?, National Bureau of Economic Research (NBER) Working paper series, 1999; Carlin, W. and Mayer, C., Finance, Investment and Growth, CEPR, Discussion Paper, 1999, 2223; Mayer, C., Financing the New Economy: Financial Institutions and Corporate Governance, Information Economics and Policy, 2001, 1; Cochrane, J. H., The Risk and Return of Venture Capital, Journal of Financial Economics, 2005, 75(3-52); Ljungqvist and Richardson, The Cash Flow, Return and Risk Characteristics of Private Equity. For a discussion of the effect of investment cycles on stock markets with the theoretical framework, see: Baker, M.; Stein, J. C. and Wurgler, J., When Does the Market Matter? Stock Prices and the Investment of Equity-Dependent Firms, Quarterly Journal of Economics, 2003, 118(3), pp. 969-1005; Hong, H. and Stein, J. C., A Unified Theory of Underreaction Momentum Trading, and Overreaction in Asset Markets, Journal of Finance, 1999, 54, pp.
(cont)

B. Concept for research of private equity investments 49
HPE 2SC: The higher the scientific competitiveness, the greater the cross-border
PE activity.
HPE 2EC: The better the corporate economic conditions, the greater the cross-
border PE activity.
HPE 2EP: The better the exit possibilities, the greater the cross-border PE
activity.
The above categories are associated with the following indicators:
• Scientific competitiveness, 119 as a measure of the skill value of a country’s
employees and knowledge base of a country: 1. concentration of R&D
engineers and scientists in the population, 2. frequency of residential patent
applications, and 3. frequency of nonresidential patent applications as a limiting
factor. These indicators generally describe the value conditions of a country,
and are especially related to the start-up phase with VC financing.
• Corporate economic conditions : 1. GDP per capita as a measure of a
country’s workforce productivity,120 2. labor cost measured in average wages,
indicating the qualification level of the workforce,121 3. corporate tax rates,122
measuring the highest corporate tax burden.
2143-2184; Cumming and MacIntosh, A Cross-Country Comparison of Full and Partial Venture Capital Exits.
119 Johnson, S.; McMillan, J. and Woodruff, C., Property Rights and Finance, NBER Working Paper, 2002(8852); Park and Ginarte, Intellectual Property Rights and Economic Growth
120 Hall, R. E. and Jones, C. I., Why Do Some Countries Produce So Much More Output per Worker than Others?, Quarterly Journal of Economics, 1999, 114(1), pp. 83-116.
121 Hall and Jones, Why Do Some Countries Produce So Much More Output per Worker than Others?; Belke, A.; Fehn, R. and Foster, N., Venture Capital Investment and Labor Market Performance: A Panel Data Analysis, CES ifo Working Paper, 2002(652(4)); Egger, H. and Egger, P., International Outsourcing and the Productivity of Low-Skilled Labor in the EU, Economic Inquiry, 2006, 44(1), pp. 98-105; Egger, H. and Egger, P., Labor Market Effects of Outsourcing Under Industrial Interdependence, International Review of Economics & Finance, 2005, 14(3), pp. 349-352; Borrmann; Jungnickel and Keller, What Gravity Models Can Tell Us About the Position of German FDI in Central and Eastern Europe.
122 Gilson, R. J. and Schizer, D., Venture Capital Structure: A Tax Explanation for Convertible Preferred Stock, Harvard Law Review, 2003, 116, pp. 875-916; Grubert, H. and Mutti, J., Empirical Asymmetries in Foreign Direct Investment and Taxation, Journal of International Economics, 2004, 62(2), pp. 337-358; Cullen, J. B. and Gordon, R. H., Taxes and Entrepreneurial Activity: Theory and Evidence for the U.S., NBER Working Paper W9015, 2002; Keuschnigg, C. and Nielsen, S. B., Tax Policy, Venture Capital and Entrepreneuership, Journal of Public Economics, 2003, 87, pp. 175-203; Poterba, J. M., Venture Capital and Capital Gain Taxation, Tax Policy and the Economy, 1989, 3, pp. 47-67.

B. Concept for research of private equity investments 50
• Exit possibility: Stock market capitalization123 measures the value of all stocks
listed on an exchange. This indicator examines the conditions and
attractiveness of a country’s IPOs.
7. Institutional / legal / political variables: 124 These indicators describe
general environmental conditions — opportunities for and threats to economic
activity — with special focus on the institutional, legal, and political environments.
HPE_3SQ: The better the institutional system, the greater the cross-border PE
activity.
HPE_3LO: The origin of the legal regime has an impact on cross-border activity.
HPE_3FR: The more freedom of activity, the greater the cross-border PE activity.
The sources used in academic research are primarily the governance indicators
from “Governance Matters” from The World Bank,125 and the freedom indicators
from Freedomhouse126 and the Heritage Foundation.127
123 Measure of the value of all stocks listed on an exchange. Worldbank, Financing Growth -
Financial & Private Sector Development, 2007. 124 Cumming, D. and Johan, S., Regulatory Harmonization and the Development of Private
Equity Markets, Journal of Banking & Finance, 2007, 31(10), pp. 3218-3221; Brada, J. C.; Kutan, A. M. and Yigit, T. M., The Effects of Transition and Political Instability on Foreign Direct Investment Inflows, Economics of Transition, 2006, 14(4), pp. 649-680; Demirguc-Kunt, A. and Maksimovic, V., Law, Finance and Growth, Journal of Finance, 1998, 53, pp. 2107-2137; Djankov, S.; LaPorta, R.; Lopez-de-Silanes, F. and Shleifer, A., The Regulation of Entry, Manuscript Harvard and the World Bank, 2000; Da Rin, M.; Nicodano, G. and Sembenelli, A., Public Policy and the Creation of Active Venture Capital Markets, University Torino, 2004; Lerner, J. and Schoar, A., Does Legal Enforcement Affect Financial Transactions? The Contractual Channel in Private Equity, Quarterly Journal of Economics, 2005, 120(1), pp. 223-246; Shleifer, A., Government in Transition, European Economic Review, 1997, 41, pp. 385-410; Sahlman, The Structure and Governance of Venture Capital Organizations; Kaplan, S. N. and Strömberg, P., Financial Contracting Theory Meets the Real World: An Empirical Analysis of Venture Capital Contracts, Working Paper, University of Chicago, 2001; La Porta; Lopez-de-Silanes; Shleifer and Vishny, Legal Determinants of External Finance.
125 Kaufmann, D.; Kraay, A. and Mastruzzi, M., Governance Matters 2007 Worldwide Governance Indicators, 1996-2006: 1. Political Stability (PS) measures perceptions of the likelihood that the government will be destabilized or overthrown by unconstitutional or violent means, including domestic violence and terrorism. 2. Regulatory Quality (RQ) measures the ability of a government to formulate and implement sound policies and regulations that permit and promote private sector development. 3. Rule of Law (RL) measures the extent to which agents have confidence in and abide by the rules of society, and in particular the quality of contract enforcement, the police, and the courts, as well as the likelihood of crime and violence. 4. Control of Corruption (CC) measures the extent to which public power is
(cont)

B. Concept for research of private equity investments 51
• Institutional stability and quality: 1. rule of law, 2. political stability, 3.
regulatory quality, 4. control of corruption128
• Freedom indicators: political rights, civil rights,129 economic freedom130
• Legal regimes and origin: 131 common law, civil law, French law, Islamic law,
mixed systems. The legal regime indicators are dummy variables for the origin
of a country’s legal system. They indicate if PE activity is fostered through
specific legal systems, where common law provides the best legal protection for
shareholder and creditor rights in various countries, followed by civil law and
French law.132
The list of factors outlined is not an exhaustive set of determinants of PE
investment activity. Rather, it distinguishes the core segments of macroeconomic
cross-border investment, which could be further developed. For the sake of
completeness, some additional variables that may affect PE activity but are not
included in this study could include indicators for maturity of different markets,
industry-specific variables, or microeconomic indicators. It must be said that
exercised for private gain, including both petty and grand forms of corruption, as well as “capture” of the state by elites and private interests.
The indicators are based on hundreds of specific and disaggregated individual variables measuring various dimensions of governance, taken from 33 data sources provided by 30 different organizations.
126 Freedom House (U.S.), Freedom in the World the Annual Survey of Political Rights and Civil Liberties, www.freedomhouse.org.
127 Heritage Foundation (Washington D.C.) and Wall Stre et Journal (Firm), Index of Economic Freedom.
128 Egger, P. and Winner, H., How Corruption Influences Foreign Direct Investment: A Panel Data Study, Economic Development and Cultural Change, 2006, 54(2), pp. 459-468.
129 Freedom House (U.S.), Freedom in the World the Annual Survey of Political Rights and Civil Liberties.
130 Heritage Foundation (Washington D.C.) and Wall Stre et Journal (Firm), Index of Economic Freedom.
131 Lerner and Schoar, Does Legal Enforcement Affect Financial Transactions? The Contractual Channel in Private Equity; La Porta, R.; Lopez-de-Silanes, F.; Shleifer, A. an d Vishny, R., Investor Protection and Corporate Governance, Journal of Financial Economics, 2000, 58, pp. 3-28; La Porta; Lopez-de-Silanes; Shleifer and Vishny, Legal Determinants of External Finance; Kaplan, S. N.; Martel, F. and Strömberg, P., How Do Legal Differences and Experience Affect Financial Contracts?, Journal of Financial Intermediation, 2007, 16(3), pp. 273-279.
132 Shleifer, A.; Hay, J. and Vishny, R., Towards a Theory of Legal Reform, European Economic Review, 1996; La Porta; Lopez-de-Silanes; Shleifer and Vishny, Law and Finance. According to Shleifer, civil law countries exhibit heavier regulations, weaker property right protection, and less political freedom than common law countries.

B. Concept for research of private equity investments 52
modeling a complete set of factors for a variety of countries and years is plagued
by lack of data availability, which greatly increases complexity. The explanatory
variables that were considered are the following:
Table 3: Overview of potential indicators for statistical analysis
3. Data gathering for quantitative statistical anal ysis
The different variable sets for PE activity and the explanatory variables require
multiple sources to gather specific data for analysis.
3.1. Private equity investment data
PE investment data are available from various sources. Numerous institutions
and associations133 track PE and VC deals. These vary in quantity and quality.
Professional online databases and intelligence tools designed for financial
institutions seem the most reliable. The available professional databases on PE
activity focus on different topics and each is therefore limited by its coverage of
countries, time, and deal detail.134 The most comprehensive database for this
research is Thomson VentureXpert. This database has been used in other
economic studies135 and the data quality has been validated.136 Thomson
133 EVCA - European Venture Capital Association, EVCA - Yearbook; NVCA - National
Venture Capital Association (USA), National Venture Capital Association Yearbook. 134 Compare Standard & Poor's, Capital IQ, 2007, www.capitaliq.com/main.asp; The Merger
Market Group, Merger Market, 2007, www.mergermarket.com; Thomson Financial, Venture Xpert, 2006, www.thomson.com/content/financial/brand_overviews/VentureXpert.
135 Kaplan, S. N. and Schoar, A., Private Equity Performance: Returns, Persistence, and Capital Flows, The Journal of Finance, 2005, 60(4), pp. 1791-1793; Lerner, J., Venture
(cont)
A) Gravity model indicators B) Private Equity indicator s
1) Economic mass related data: 1) Banking system 2) E ndowment-related variables 3) Institutional/ legal/ politicalGDP 1.1 Size 2.1 Scientific competitiveness 3.1 Institutional stability and qualityPopulation M2 to GDP Engineers and scientists per thousand Rule of lawArea Private credit to GDP Patents residential Political stability
Central bank assets to GDP Patents non residential Regulatory quality2) Economic distance related variables: Deposit money bank assets to GDP Control of corruption
Distance Financial system deposits to GDP 2.2 Corporate economic conditionsFactors affecting the economic distance: Bank assets to GDP GDP per capita 3.2 Legal regimes and origin
Common language Private credit to total domestic credit Wages in countries Common law Common border Private credit to total funding Corporate tax rates Civil lawCommon history French lawCommon currency 1.2 Efficiency 2.3 Exit possibility Islamic lawCommon legal system Return on assets Stock market capitalization Other
Operating costs to total assets3) Country pair specific data Net interest margin 3.3 Freedom
Exchanger rates Political rightsOpenness of im- and exports to GDP 1.2 Competitiveness Civil rightsDevelopment Lending minus deposit interest rate Economic freedom
Bank concentration ratio (assets)Bank concentration ratio (deposits)Number of banks to GDP

B. Concept for research of private equity investments 53
VentureXpert data is used in this study as basic data to calculate country PE
activity.
3.1.1. Database description
VentureXpert137 is a query and report database for the PE industry. It provides
comprehensive profiles of venture funds, private firms, venture-backed
companies, and limited partners. The database contains information on more
than 50,000 private equity-backed (PF) companies, and more than 16,000 VC
and buyout funds managed by more than 8,000 PE firms. More than 100,000 PE
transactions are listed, beginning with 1970,138 which include deal and fund
information from 100 countries. Several of the listed PF companies received
backing at different points in time by different PE funds, so that the total number
of investments amounts to approximately 250,000.
Data on investments include information about the PF company (location, status,
industry), the fund (investment focus, vintage year), the PE firm (location, firm
type, capital under management, firm status) and the particular investment (time
of investment, stage, co-investors, equity amount provided by each fund, exit
date).
The dataset is based on information Thomson obtains through its relationships
within the PE industry. Due to the confidential character of PE investment,
complete coverage of all investments by all funds remains difficult to achieve.
Thomson accommodates this gap with a 0 value for missing information on
confidential investments with an undisclosed equity amount.
Capitalists and the Oversight of Private Firms, The Journal of Finance, 1995, 50(1), pp. 301-307; Gompers and Lerner, The Venture Capital Cycle; Phalippou and Zollo, What Drives Private Equity Fund Performance?
136 Kaplan, S.; Sensoy, B. and Strömberg, P., How Well do Venture Capital Databases Reflect Actual Investments?, 2002.
137 Thomson Financial, Venture Xpert. 138 Previous deals are mentioned, but with less reliability of data coverage.

B. Concept for research of private equity investments 54
3.1.2. Data collection
The database provides profiles of PE firms, funds and PF companies. Available
investment data are listed in each profile. The deal information needed for
analysis is not explicitly contained in the database. It must be derived and
calculated by combining the profiles of the individual PE firms, funds and PF
companies. The Model II research design, developed in Chapter B.2.1., governs
the combining of these profiles and the necessary deal data as a single
observable unit. Figure 13 illustrates the layout:
Figure 13: Combining information from empirical data
Schematically displayed are the profiles of PF company, fund, and PE firm as
they appear in the Thomson database. Each profile lists entity and investment
data, which relate the entities to each other.139 The profiles relate to each other
through key attributes, namely the PF company name (yellow border), fund name
(red border), and management (PE) firm name (green border). PF company and
fund profiles include time-specific deal information (blue) that specifically link
these profiles. The paradigm deal contains core information for analyzing country
139 See Appendix 1 for excerpts of the database profiles.
Management firm• Firm Type• Founding Date• Capital under mgmt.• Last updated• Firm status• Firm country
Fund name 1• Management firm• Fund Type• Stage Focus• Vintage Year• Fund Size• Last updated• Fund country
Company name• Founding date• Company status• IPO date• Industry (4-digit code)• Last updated• Company country
Company name• Date• Fund name 1• Fund name x• Investment round• Company valuation• Number of investors (funds)• Round Amount for company
(total Round Amt($ Mil))• Stage
Fund name 1• Company name• Date• Round Amount (Amt ($ 000s))• Stage
Entityrelatedcriteria
Investmentrelatedcriteria
Deal ID
321
Fund name x• Company name• Date• Round Amount (Amt ($ 000s))• Stage
Portfolio company Fund Private Equity firm

B. Concept for research of private equity investments 55
activity: date, participants (PF company and fund), stage, and amount invested
by each fund (the crucial criteria are in italics). The smallest observation unit is
the data in Deal ID (orange border): investment data of one PF company to one
fund, which are part of one PF company deal (dashed border). The dependent
variables are derived from Deal ID observations (see Figure 13).
Country information joins deal information by linking Deal ID to the PF company
as well as via the funds to the PE firm country. Each deal is organized in a
relational database, out of which the relevant analytical data (red, blue, italics) is
aggregated with the information of PF company country, date, stage, investment
round amount, and PE firm country.
The extraction and arrangement of data leads to a total of 244,461 deals
between funds and PF companies.140 The end result is a clean dataset of deals
from 01/01/1946 to the last deal recorded on 05/15/2006, involving 7,475
management firms, 14,668 different funds, and 51,346 different PF companies,
all related to each other by the detailed information listed above. Observations
are missing if information has not been reported or the profile is not related to
any firm, fund, or company. Further, observations may be missing due to
dynamic database information changes during the long time period of the
collection process.141
3.1.3. Data preparation
The extracted dataset is adjusted to meet analytical requirements and to
calculate the PE-specific multi-investor country activity variables: participation,
deal participation, deal flow, and activities expressed as a percentage, described
in Chapter B.2.3.1. Due to concerns about the reliability of data quality,142 the
dataset is confined to the period from 1980 through 2005. Due to the relational
linkage of the profiles, missing investor profiles led to gaps in deal information. In
multi-investor deals, the specific information for the one particular missing
140 Only deal-relevant data is included; only those profiles with at least one related connection
are included. 141 Data has been collected through access to Thomson Financial. The data have been pulled
online in packages of 99 profiles over a period of 30 days. 142 See pre-analysis Chapter C.2.1 for time series and Kaplan; Sensoy and Strömberg, How
Well do Venture Capital Databases Reflect Actual Investments?

B. Concept for research of private equity investments 56
investor cannot be calculated, so that only the remaining investor information, as
a proportion of a total PF company deal, is included. A confidential, unreported
round amount is included in the dataset and marked with a zero. After
adjustments, the clean dataset has 207,131 deals between funds and PF
companies, and 190,319 deals between management and PF companies. The
dataset lists 6,963 different management firms, 13,708 different funds, and
37,461 different PF companies. The global reach is 99 countries with overall PE
activity, covering 70 source countries and 95 host countries over a 26-year span.
The data matrix has 3,474 source / host / year combinations, with 712 different
country pairs that are presented in the following deal activity matrix with 6,510
basic data fields.143
The matrix gives an overview of deal activity between countries over time by
outlining the 70 source countries in columns and the 95 host countries in rows.
The years are displayed as the sum of the years of deal activity between
countries. Activity of more than 10 years (out of 26 years) is highlighted yellow
and more than 20 years is in green. Domestic deals are framed and run
diagonally. The matrix highlights that deal activity is not evenly distributed. The
three main activity arrays are domestic deals and activity in the United States
and the United Kingdom. Especially noticeable are the blank spots indicating no
cross-border activity between countries.
143 The full matrix would have 70 x 95 x 26 = 172,900 data points.

B. Concept for research of private equity investments 57
Table 4: Data matrix of source-to-host activity by number of years Nr. 1 2 3 4 5 6 7 8 9 10 11 12 13 14 15 16 17 18 19 20 21 22 23 24 25 26 27 28 29 30 31 32 33 34 35 36 37 38 39 40 41 42 43 44 45 46 47 48 49 50 51 52 53 54 55 56 57 58 59 60 61 62 63 64 65 66 67 68 69 70
Source
Host
Arg
entin
aA
ustr
alia
Aus
tria
Bel
gium
Ber
mud
aB
razi
lB
ulga
riaC
amer
oon
Can
ada
Cay
man
Isla
nds
Chi
leC
hina
Cos
ta R
ica
Cyp
rus
Cze
ch R
epub
licD
enm
ark
Est
onia
Fin
land
Fra
nce
Ger
man
yG
hana
Gre
ece
Hon
g K
ong
Hun
gary
Icel
and
Indi
aIn
done
sia
Irel
and-
Rep
Isra
elIta
lyJa
pan
Kuw
ait
Lith
uani
aLu
xem
bour
gM
adag
asca
rM
alay
sia
Mau
ritiu
sM
exic
oM
oroc
coN
ethe
rland
sN
ethe
rland
s A
ntill
esN
ew Z
eala
ndN
iger
iaN
orw
ayP
akis
tan
Phi
lippi
nes
Pol
and
Por
tuga
lR
oman
iaR
ussi
an F
eder
atio
nS
audi
Ara
bia
Sen
egal
Sin
gapo
reS
lova
k R
epub
licS
love
nia
Sou
th A
fric
aS
outh
Kor
eaS
pain
Sri
Lank
aS
wed
enS
witz
erla
ndT
aiw
anT
haila
ndT
unis
iaT
urke
yU
krai
neU
nite
d A
rab
Em
irate
sU
nite
d K
ingd
omU
nite
d S
tate
s of
A.
Vie
tnam
1 Algeria 12 Argentina 2 5 1 1 1 2 83 Australia 19 1 1 2 1 2 10 1 1 2 7 11 4 2 8 194 Austria 9 1 1 3 9 1 3 2 1 4 9 85 Azerbaijan 26 Bangladesh 17 Belgium 1 14 9 4 1 3 1 2 8 1 2 3 11 138 Bermuda 1 1 1 3 159 Bolivia 1
10 Bosnia 111 Brazil 1 11 1 2 1 1 1112 British Virgin 1 113 Bulgaria 1 1 1 1 1 1 1 1 1 2 314 Cameroon 315 Canada 2 3 17 2 3 9 6 1 1 2 4 1 1 1 5 2 5 3 13 2216 Cayman Islands 317 Chile 1 818 China 1 5 13 1 1 5 12 1 6 1 10 2 3 7 7 1219 Colombia 220 Costa Rica 121 Croatia 1 1 4 322 Cyprus 1 2 123 Czech Republic 2 1 6 1 2 3 5 5 1124 Denmark 1 2 1 1 12 8 3 6 1 1 10 7 7 9 6 9 825 Dominica 126 Ecuador 127 Egypt 2 128 El Salvador 1 129 Estonia 1 3 1 1 330 Fiji 231 Finland 5 12 3 5 1 1 3 5 1 1 1 11 1 10 832 Fr Polynesia 233 France 1 8 6 4 1 22 10 2 1 5 6 5 11 10 1 1 1 1 7 1 7 11 5 21 1934 Germany 1 4 9 1 4 6 1 13 17 2 1 1 1 4 3 2 7 1 12 3 1 5 3 6 10 16 1635 Ghana 1 636 Greece 5 2 537 Hong Kong 5 4 1 1 2 19 1 5 2 1 8 1 1 3 7 1438 Hungary 5 4 3 9 1 1 7 1039 Iceland 1 1 2 240 India 1 1 3 1 11 16 2 6 9 1 1 9 1141 Indonesia 1 1 10 1 3 4 1142 Ireland-Rep 1 3 1 1 2 3 1 11 1 3 4 1 6 2 5 14 1643 Israel 5 4 4 7 11 1 1 12 5 4 5 1 5 3 1 6 5 9 1944 Italy 1 2 8 6 15 3 4 8 12 1245 Japan 1 2 7 2 10 2 1 2 2 5 2046 Jordan 1 147 Kazakhstan 1 148 Kenya 2 1 2 1 1 449 Latvia 1 1 150 Lithuania 3 3 151 Luxembourg 2 1 4 2 1 2 1 2 3 752 Macedonia 153 Malaysia 9 2 8 2 6 2 1254 Mauritius 155 Mexico 2 1256 Moldova 1 1 457 Monaco 1 2 158 Morocco 1 159 Mozambique 160 Netherlands 1 8 2 1 5 7 7 1 3 2 2 1 2 14 7 1 1 7 3 12 1561 Netherlands Ant. 1 2 162 New Zealand 11 1 10 2 1 1 1063 Nicaragua 164 Nigeria 3 3 265 Norway 1 1 1 4 1 1 1 3 8 8 3 7 766 Pakistan 1 3 1 167 Peru 168 Philippines 1 8 8 1 3 1169 Poland 1 9 1 4 3 2 11 1 5 1070 Portugal 3 3 15 1 2 4 2 971 Romania 2 4 2 3 3 3 672 Russian Federation 1 1 1 1 1 4 8 3 2 773 Sierra Leone 174 Singapore 9 3 1 2 16 2 1 1 4 1 4 1 1 13 2 1 1 8 2075 Slovak Republic 4 1 2 2 2 276 Slovenia 177 South Africa 1 1 1 1 10 7 778 South Korea 2 1 1 1 10 2 5 1 5 11 1 4 5 1179 Spain 4 7 3 1 3 5 3 3 13 1 1 10 1080 Sri Lanka 2 1 1 3 6 181 Sweden 3 2 2 6 8 6 8 1 1 4 2 7 7 1 15 7 10 1482 Switzerland 1 3 7 2 5 10 10 1 1 1 2 1 9 3 1 1 7 10 10 1483 Taiwan 2 1 1 1 13 1 5 18 4 1784 Tanzania 285 Thailand 2 1 9 2 5 1 7 1 1586 Tunisia 287 Turkey 4 288 Uganda 189 Ukraine 1 1 790 United Arab Emirates 2 1 191 United Kingdom 11 1 8 1 7 1 9 2 13 10 6 1 3 11 6 8 6 1 6 1 2 9 1 1 7 2 2 3 7 1 4 8 7 2 1 25 2492 United States of A. 2 18 1 13 4 9 26 5 1 9 6 10 2 12 26 25 3 21 7 2 10 1 14 12 13 25 18 5 22 6 19 5 12 7 4 2 12 1 21 2 4 11 4 1 14 22 16 1 26 2693 Venezuela 194 Vietnam 1 1 395 Zambia 1 1
Legend: < 10 10-20 >20 years

B. Concept for research of private equity investments 58
3.2. Indicator data
The variety of explanatory country variables required collecting and consolidating
information from different data sources. The main categories of variables and
their sources in the academic literature are summarized in Table 5.
Table 5: Data sources for explanatory variables
3.2.1. Database description
Institutions such as the OECD,144 the International Financial Monetary Fund,145
The World Bank,146 the United Nations, and Eurostat provide several main
databases with country-specific time series. These databases list a broad set of
144 OECD, OECD Factbook 2007, 2007; OECD, OECD Statistics of Foreign Trade, 2007. 145 International Monetary Fund, International Financial Statistics, 2008,
www.imfstatistics.org/imf. 146 World Bank Group, WDI online, Washington, DC: World Bank Group.
A) Gravity model Data sources
1) Economic mass related data: WDI/IFS/EIU2) Economic distance related variables: CIA factbook/MS Mappoint3) Country specific development related data EIU/Worldbank/WDI
B) Private Equity related data Data sources
1) Banking system1.1 Size EIU/WDI/IFS/OECD1.2 Efficiency EIU/WDI/IFS/OECD1.3 Stability IFS
2) Endowment-related variables1.1 Skill variables and knowledge based EIU/ World bank / WIPO2.2 Other EIU/WDI/IFS/OECD
3) Institutional/ legal/ political3.1 Institutional stability and quality The Worldbank/Governance matters 33.2 Legal regimes and origin CIA World factbook3.3 Freedom Freedomhouse/ The Heritage Foundation
Main sources for dataOrganisation Database/ ReportThe World Bank World Development Indicators (WDI)International Labour Organization (ILO)Organisation for Economic Co-operation and Developm ent (OECD) Bank Profitability StatisticsCentral Intelligence Agency (CIA) World fact bookInternational Monetary Fund (IMF) International Financial statistiscs (IFS)World Intellectual Property Organisation (WIPO) StatisticsUnited Nations (UN)Freedomhouse Freedom in the WorldThe Heritage Foundation Index of economic freedom
Economic Intelligence Unit (EIU) Professional database for country data

B. Concept for research of private equity investments 59
statistical data with both basic and specific information. They vary in their global
reach and time coverage. Basic variables, like population or GDP, are available
from several databases.
Besides the more comprehensive sources, specialized datasets of time series
exist to examine selected topics, such as freedom or governance indicators
provided by Freedomhouse147 and The Heritage Foundation,148 or Governance
Matters149 from The World Bank.150
An advanced approach for data collection is to use a comprehensive umbrella
database that consolidates data from several sources (OECD, World Bank, etc.)
and avoids discrepancies. Such datasets are provided by the Economic
Intelligence Unit (EIU), which composes information from more than a hundred
national and international sources,151 and verifies the information to ensure
accuracy and consistency. Main EIU databases are: world data,152 country
data,153 market indicators and forecasts,154 and world investment services.155
The CIA’s World Factbook156 lists informative country profiles (with time-invariant
country facts), which is especially useful for country pair indicators.
147 Freedom House (U.S.), Freedom in the World the Annual Survey of Political Rights and Civil
Liberties. 148 Heritage Foundation (Washington D.C.) and Wall Stre et Journal (Firm), Index of
Economic Freedom. 149 Kaufmann; Kraay and Mastruzzi, Governance Matters 2007 Worldwide Governance
Indicators, 1996-2006. 150 World Intellectual Property Organization, WIPO Industrial Property Statistics, 2007;
International Labour Organization, LABORSTAT, 2007. 151 OECD, Watson Wyatt, Zephyr, Eurostat, International Financial Statistics, UNCTAD. 152 Economic Intelligence Unit, World Data, 2007. Combines the following databases
(economic and industry forecasts of the EIU with updates from EcoWin): Comprehensive global database of economic and market figures, and forecasts on 150 countries with more than 120,000 series.
153 Economic Intelligence Unit, Country Data, 2007. Delivers more than 320 economic series for each country from 1980 to 2010, covering 150 countries.
154 Economic Intelligence Unit, Market indicators and forecast, 2007. Provides reliable data on market size and potential for the world’s 60 largest markets.
155 Economic Intelligence Unit, World Investment Service, 2007. Database containing flows of investment by country, industry, and by mergers and acquisitions.
156 Central Intelligence Agency, The World Factbook, Washington, DC: Central Intelligence Agency, 2007.

B. Concept for research of private equity investments 60
3.2.2. Data collection
The time-invariant economic mass and distance indicators for the gravity model
are taken from the CIA’s World Factbook. These include latitude and longitude
for distance measurement, land area as possible country mass measurement,
languages spoken, legal system, currency, and political history as economic and
cultural distance measurement. The bilateral indicators are derived by comparing
the particular variables and yield indicators such as common language, common
border, common history, etc.
The time-variant panel data are mainly taken from the EIU databases, with
additional indicators from Freedomhouse, The Heritage Foundation, and The
World Bank to establish the largest possible data coverage.
Equal availability for all relevant countries and years is hard to achieve. There
are several variations in data coverage: First, indicators are directly provided by
the database; second, they can be calculated from other indicators; and third,
data cannot be derived and the reference must be omitted. Further, some
indicators may be selected from different databases. The objective is to compose
a reliable and consistent dataset with full coverage of indicators.
The precise steps used to align the PE datasets of 99 countries and relevant
years of PE activity with the available data sources are:
1. Test if the needed indicator or basic data are provided by database
2. Verify that a country is listed in database
3. Check for relevant years (PE activity in a particular country in that year)
4. Assess if missing data for relevant years can be calculated (time series)
The result is a matrix of countries and indicators with gaps in the time series for
each database. The databases and indicators are further tested and compared
for maximum coverage and consistency.
Figure 14 illustrates the analytical results for selected variables from the EIU
database country and market indicators.

B. Concept for research of private equity investments 61
Figure 14: Matrix of explanatory data availability for relevant years by country
Nr. 0 1 2 3 4 5 6 7 8 9 10 11 12 13 14 15 16 17 18 19 20 21 22 23 24 25 26 27 28 29 30 31
Variable
Year coverageCountry R
elev
. Y
ears
AV
WG
BP
01
BP
04
BP
15
BP
17
BP
18
BP
22
CG
DP
CR
ER
EX
PS
FS
01
FS
09
GD
PD
GD
PL
IMP
S
IRS
P
MS
02
MS
13
NR
PA
PO
PN
RD
SP
RG
DP
RP
AP
SE
RD
SM
N2
SO
DC
ST
MC
TC
RP
XR
PD
XR
RE
YP
CP
Tot
al
Cov
erag
e
1 Algeria 1 1 1 1 1 1 1 1 1 1 1 0 0 1 1 1 1 1 1 1 1 0 1 1 0 1 1 0 0 1 1 1 25 81%2 Argentina 11 11 10 10 10 9 10 9 11 11 11 9 10 11 11 11 11 11 11 3 11 8 11 3 8 11 11 11 10 11 11 11 307 90%3 Australia 23 16 16 16 16 14 16 14 23 12 23 14 7 23 23 23 16 16 16 8 23 10 23 8 12 23 23 15 10 23 23 23 528 74%4 Austria 12 11 11 11 11 9 11 9 12 10 12 10 6 12 12 12 8 11 11 6 12 9 12 6 5 12 12 10 10 12 12 12 319 86%5 Azerbaijan 2 2 2 2 2 2 2 2 2 2 2 2 2 2 2 2 2 2 2 2 2 2 2 0 2 2 2 1 2 2 2 2 59 95%6 Bangladesh 1 0 0 0 0 0 0 0 1 0 1 0 0 1 1 1 0 0 0 0 1 0 1 0 0 1 1 0 0 1 1 1 12 39%7 Belgium 17 13 13 13 13 11 13 11 17 11 12 11 7 17 17 12 13 13 13 7 17 11 17 7 12 14 14 12 10 17 17 17 402 76%8 Bermuda 15 0 0 0 0 0 0 0 0 0 0 0 0 0 0 0 0 0 0 0 0 0 0 0 0 0 0 0 0 0 0 0 0 0%9 Bolivia 1 0 0 0 0 0 0 0 1 0 1 0 0 1 1 1 0 0 0 0 1 0 1 0 0 1 1 0 0 1 1 1 12 39%
10 Bosnia 1 0 0 0 0 0 0 0 1 0 1 0 0 1 1 1 0 0 0 0 1 0 1 0 0 1 1 0 0 1 1 1 12 39%11 Brazil 13 12 11 11 11 10 11 10 13 12 13 13 9 13 13 13 9 13 13 8 13 8 13 8 2 13 13 13 11 13 13 13 351 87%12 British Virgin 1 0 0 0 0 0 0 0 0 0 0 0 0 0 0 0 0 0 0 0 0 0 0 0 0 0 0 0 0 0 0 0 0 0%13 Bulgaria 4 4 4 4 4 3 4 3 4 4 4 4 4 4 4 4 4 4 4 2 4 2 4 2 3 4 4 4 4 4 4 4 115 93%14 Cameroon 3 0 0 0 0 0 0 0 3 0 3 0 0 3 3 3 0 0 0 0 3 0 3 0 0 3 3 0 0 3 3 3 36 39%15 Canada 26 16 16 16 16 14 16 14 26 12 26 10 8 26 26 26 16 16 16 8 26 14 26 8 13 26 26 15 6 26 26 26 562 70%16 Cayman Islands 6 0 0 0 0 0 0 0 0 0 0 0 0 0 0 0 0 0 0 0 0 0 0 0 0 0 0 0 0 0 0 0 0 0%17 Chile 9 9 9 9 9 8 9 8 9 9 9 9 6 9 9 9 9 9 9 2 9 7 9 3 7 9 9 9 9 9 9 9 257 92%
84 Sri Lanka 9 0 8 8 8 8 8 8 9 8 9 4 0 9 9 9 9 9 9 6 9 1 9 2 1 9 9 9 6 9 9 9 220 79%85 Sweden 21 15 15 15 15 13 15 13 21 12 21 11 0 21 21 21 15 6 15 8 21 9 21 8 13 12 21 14 10 21 21 21 465 71%86 Switzerland 25 15 15 15 15 13 15 13 25 12 25 10 0 25 25 25 13 15 15 8 25 7 25 8 8 25 25 14 10 25 25 25 521 67%87 Taiwan 20 16 11 11 11 11 11 11 20 12 20 12 7 20 20 20 16 16 16 0 16 0 20 0 0 20 19 0 10 20 19 16 401 65%88 Tanzania 2 0 0 0 0 0 0 0 2 0 2 0 0 2 2 2 0 0 0 0 2 0 2 0 0 2 2 0 0 2 2 2 24 39%89 Thailand 16 15 11 11 11 10 11 10 16 12 16 5 5 16 16 16 15 15 15 5 16 11 16 5 9 16 16 15 10 16 16 16 393 79%90 Tunisia 2 0 0 0 0 0 0 0 2 0 2 0 0 2 2 2 0 0 0 0 2 0 2 0 0 2 2 0 0 2 2 2 24 39%91 Turkey 5 5 5 5 5 4 5 4 5 5 5 5 4 5 5 5 5 5 5 2 5 3 5 2 3 5 5 5 5 5 5 5 142 92%92 Uganda 1 0 0 0 0 0 0 0 1 0 1 0 0 1 1 1 0 0 0 0 1 0 1 0 0 1 1 0 0 1 1 1 12 39%93 Ukraine 8 8 6 6 6 6 5 6 8 8 8 8 3 8 8 8 8 8 8 5 8 5 8 5 6 8 8 7 6 8 8 8 216 87%94 United Arab Emirates 3 0 0 0 0 0 0 0 3 0 3 0 0 3 3 3 0 0 0 0 3 0 3 0 0 3 3 0 0 3 3 3 36 39%95 United Kingdom 26 16 16 16 16 14 16 14 26 12 26 11 12 26 26 26 16 9 16 8 26 14 26 8 9 24 19 15 10 26 26 26 551 68%96 United States of A. 26 16 16 16 16 14 16 14 26 12 26 12 8 26 26 26 16 16 16 8 26 14 26 8 9 26 26 15 6 26 26 26 560 69%97 Venezuela 1 1 1 1 1 1 1 1 1 1 1 1 0 1 1 1 1 1 1 0 1 1 1 0 1 1 1 1 1 1 1 1 28 90%98 Vietnam 4 0 4 4 4 3 4 3 4 4 4 0 0 4 4 4 4 4 4 0 4 0 4 0 0 4 4 0 4 4 4 4 90 73%99 Zambia 1 0 0 0 0 0 0 0 1 0 1 0 0 1 1 1 0 0 0 0 1 0 1 0 0 1 1 0 0 1 1 1 12 39%
Total 953 627 584 583 582 490 576 508 910 539 875 472 271 907 907 875 617 623 636 315 899 426 910 300 421 870 890 591 459 911 908 887 #### 69%Coverage 66% 61% 61% 61% 51% 60% 53% 95% 57% 92% 50% 28% 95% 95% 92% 65% 65% 67% 33% 94% 45% 95% 31% 44% 91% 93% 62% 48% 96% 95% 93% ####
…… … …
Legend: Data not available Full data coverage for relevant yearsData missing
AVWG=Average wages (monthly, US$), BP01=Banking assets, BP04=Bank deposits, BP15=Loans/assets, BP17=Return on assets, BP18=Net interest margin (net interest inc/assets), BP22=Operating expenses/assets, CGDP=Real GDP (US$ at 1996 prices), CRER=Level of corruption (5=low), EXPS=Total exports fob, FS01=Number of banks, FS09=Concentration of top 10 banks by assets, GDPD=Nominal GDP (US$), GDPL=Nominal GDP, IMPS=Total imports cif, IRSP=Interest rate spread (lending minus deposit rate), MS02=Time and savings deposits, MS13=Total lending to the private sector, NRPA=Non-resident patents applications, POPN=Population, RDSP=R&D spending (% of GNP), RGDP=Real GDP, RPAP=Resident patents applications, SERD=Scientists & engineers in R&D (per m pop), SMN2=Stock of money M2, SODC=Stock of domestic credit, STMC=Stock market capitalisation (US$), TCRP=Top corporate tax rate (%), XRPD=Exchange rate LCU:US$ (av), XRRE=Real effective exchange rate (CPI-based), YPCP=GDP per head ($ at PPP)
This matrix shows a selection of country-specific panel data that are equivalent to
the PE activity data, and compares data availability for the relevant year for
source and host country. In column “0” are the number of years with PE activity
listed for the particular country. Columns 1 to 31 are the indicators, with the
available data points as the number of the relevant years available. “No data
available” is highlighted in yellow, “full coverage” is green. The columns and rows
Total and Coverage serve as quality indicators for data availability for the
countries and the variables. Total adds up the number of relevant years and
Coverage sets Total in relation to the required datapoints.
The matrix for a balanced dataset for all indicators without gaps, including all
years, requires 131,274157 data points; the reduced matrix, focusing only on the
relevant years, requires 48,603158 data points.
157 99 countries x 26 years x 51 variables = 131,274. 158 953 relevant country / year observations x 51 variables = 48,603.

B. Concept for research of private equity investments 62
3.2.3. Data preparation
The following chapter first describes the method of data selection and calculation
to get a full dataset of the required indicators. It then further describes the final
explanatory data derivation and calculation.
3.2.3.1. Data selection and adjustment
The analysis of the collected information (Figure 14) showed that some required
variables are either not fully available or not available at all. Hence, the reliability
of various indicators is inconsistent. The problem of one missing indicator is that
it affects the whole variable combination of source, host, time, and indicator, and
excludes each affected individual parameter from the regression due to zero
values in the equation. As a result, the particular country, the indicator, and the
year cannot be analyzed with the regression. Due to the complex three-
dimensional data structure and the comprehensive indicator compilation, the
analysis of the full set with the basic data (see gaps in matrix) is impossible.
The missing data points create a need for data enhancement and confinement.
The result will be a reduced but reliable subset of variables that fully cover the
explanatory variables to obtain a reliable analysis. To enhance the quantity of
data points in the explanatory variables, the missing time series is interpolated.
To ensure quality, the calculated data points are only considered if their number
is above a reliable percentage of the total required.159 The equation for
interpolation is:
Equation 14: Missing data calculation for explanatory time series
xbya −= And: ∑
∑−
−−=
2)(
))((
xx
yyxxb
Where x and y are the sample means of the known x ‘s and y ‘s, b is the slope
and a the variable of interest.160
159 The legal / political / environmental indicators would not have been included due to missing
data (reported years: 1996 through 2005). 160 Microsoft Excel Manual.

B. Concept for research of private equity investments 63
The confinement process optimizes the data by balancing the coverage of the
dependent variable with the explanatory variables at a maximum along all three
dimensions — country, year, and indicators.
For the selection process, the relevance of each country, year, and variable has
to be assessed to compare their relative importance to the data available for
each variable. The following graph illustrates the method of data confinement by
evaluating the importance of countries, years, and variables.
Figure 15: Overview of data selection (schematic)
For the dependent variables, pre-analysis (Chapter C.2.) identifies the relevance
of countries and years for both overall and cross-border activity. Countries are
ranked by their percentage of overall PE activity to global activity (see Chapters
B.2.3.1.2. and C.2.2.). Years are listed in a normal time series with the
percentage of overall activity (see Chapter C.2.1.).
Assessing the explanatory variables is a selection process supported by the
elbow criterion,161 which expresses the information each variable adds to the
analysis compared to the data available for each country and year. The
optimized dataset of overall deals results in coverage for the years 1990 through
2005 of 38 countries, out of the top 43, with minimum total activity of 0.02%. Top
countries not included due to lack of data are Taiwan, Bermuda, Luxembourg,
Indonesia, and the Philippines. The set comprises 163,970 deals between funds
and PF companies, and 152,088 (participation) deals between management and
PF companies. In the set are 6,144 different management firms, 12,424 different
161 Variables sorted after sum of missing data from highest to lowest. Curve with significant
“elbow”.
Country ranking
Indicatorranking
Years
Full matrix
Sub set
Importance
Availability
c
i
t
Availability

B. Concept for research of private equity investments 64
funds, and 33,073 different PF companies. The data matrix has 2,682 source /
host / year combinations with 490 different country pairs.162 The coverage of the
dependent variable is 80% of participation, 84% of deal participation, 93% of deal
flow, and 86% of activity compared to the full dataset. In absolute numbers —
participation: 152,088; deal participation: 77,645; and deal flow: $666,201
million . The cross-border set (excluding domestic deals) lists 38 source and
host countries. This set includes 22,591 deals between funds and PF companies,
21,260 (participation) deals between management and PF companies, as well as
2,363 different management firms, 4,188 different funds, and 9,109 different PF
companies. The data matrix spans 2,266 source / host / year combinations with
453 different cross-border country pairs. The dataset covers 11% (13%)163 of
participation, 13% (14%) of deal participation, 20% (22%) of deal flow, and 15%
(17%) of activity compared to the full dataset, with cross-border deals in all 99
countries over 26 years. In absolute numbers — participation: 21,260; deal
participation: 11,584; and deal flow: $141,429 million . The resulting explanatory
dataset is listed in the next chapter, in which the final variables are derived and
calculated.
3.2.3.2. Final explanatory variable derivation
The variables to be calculated that are not fully covered by databases are the
indicators derived from the gravity model: geographical and economic distance
measurements, and openness of imports and exports to GDP and development.
Within the PE-derived dataset, the banking indicators M2 to GDP, private credit
to GDP, bank assets to GDP, and lending minus deposit interest rates have to be
calculated. The geographic distance between countries is computed with
Equation 14 in nautical miles by using the countries’ latitude and longitude to
calculate the great circle distance between the capitals.164
Equation 15: Distance measurement between countries
))cos(*)cos(*)cos()sin(*)(arccos(sin* jijijiij longlonglatlatlatlatrdist −+=
162 The full matrix would have 70 x 95 x 26 = 172,900 data points. 163 Cross-border deals for overall data set are listed in parentheses. 164 where r is the earth radius (~3,444 nmi); lat and long correspond to the source and host
countries’ latitude and longitude.

B. Concept for research of private equity investments 65
The data, obtained from the CIA World Factbook correspond to the coordinates
of the capital city in each country.165 The economic distance variables are
derived by comparing country facts also provided by the CIA’s World Factbook.
Relevant variables are common language, common border, common history,
common currency, and common legal system.
The development indicator is derived from the “world development indicators”
income groups with low income = 1, middle income = 2, and high income = 3.
The following table shows the explanatory variables with their calculations and
original data source for the gravity model-derived indicators and the PE-derived
indicators.
Table 6: Explanatory variable set for statistical analysis (I)
165 Rose and Spiegel, Offshore Financial Centers: Parasites or Symbionts?
Model Indicator (calculation) Data source
A) Gravity model indicators
1) Economic mass related data:GDP GDP EIU/ WorldbankPopulation Population EIU/ Worldbank
2) Economic distance related variables:Distance Distance calculation CIA factbook/MS Mappoint
Factors affecting the economic distance:Common language Common language CIA factbookCommon border Common border CIA factbookCommon history Common history CIA factbookCommon currency Common currency CIA factbookCommon legal system Common legal system CIA factbook
3) Country specific development related dataExchanger rates Exchange rate (real CPI based) EIU/IMFOpenness of im- and exports to GDP (Exports + imports)/GDP EIU National statisticsDevelopment Country income groups clustered Worldbank

B. Concept for research of private equity investments 66
Table 7: Explanatory variable set for statistical analysis (II)
The final explanatory dataset is composed of two main categories: the gravity
model-derived indicators and PE-related indicators. These are each further
divided into three subcategories. The subcategory of the gravity model includes
11 indicators and the PE category — divided further into subcategories — has 24
explanatory variables. The datasets provide a total of 35 distinctive variables for
statistical analysis.
4. Summary of methodology for statistical analysis
A comprehensive theoretical foundation has been designed to empirically
analyze cross-border PE investment activity.
Model Indicator (calculation) Data source
B) Private Equity related indicators
1) Banking system1.1 Size
M2 to GDP M2/GDP EIU/IFSPrivate credit to GDP Private credit/GDP EIU/IFS
1.2 EfficiencyReturn on assets Return on assets EIU/ OECD Bank Proftability ReportOperating costs to total assets Operating costs/total assets EIU/ OECD Bank Proftability ReportNet interest margin Net interest margin EIU/ OECD Bank Proftability Report
1.3 CompetitivenessLending minus deposit interest rate spread Lending - deposit interest rate spread EIU/ OECD Bank Proftability ReportNumber of banks per GDP Number of banks/GDP EIU
2) Endowment-related variables2.1 Scientific competitiveness
Engineers and scientists per thousand Engineers and scientists per mln pop EIU/ World bankPatents residential Patents residential EIU/World Intellectual Property OrganisationPatents non residential Patents non residential EIU/World Intellectual Property Organisation
2.2 Corporate economic conditionsGDP per capita GDP/Population EIU/World bankWages in countries Avg wages in country EIU/ILOCorporate tax rates Corporate tax rates EIU/OECD
2.3 Exit possibilitiesStock market capitalization Stock market capitalization EIU/WDI/IFS
3) Institutional/ legal/ political3.1 Institutional stability and quality
Rule of law Rule of law Worldbank/Governance matters 3Political stability Political stability Worldbank/Governance matters 3Regulatory quality Regulatory quality Worldbank/Governance matters 3Control of corruption Control of corruption Worldbank/Governance matters 3
3.2 Legal regimes and originCommon law Common law CIA factbookCivil law Civil law CIA factbookOther Other CIA factbook
3.3 FreedomPolitical rights Political rights FreedomhouseCivil rights Civil rights FreedomhouseEconomic freedom Economic freedom The Heritage Foundation

B. Concept for research of private equity investments 67
First, the term private equity was clarified and defined due to different usages in
the United States and Europe. Also defined were venture capital, private equity,
and overall private equity investments.
To further strengthen the understanding of PE, its economic foundations have
been examined by investigating the PE market structure through its participants,
taking into account the life cycle of companies and the entire PE investment
process.
The research design applied a relational system of interacting entities with
reactive relationships over time. The countries are placed in a frame as non-
mutually exclusive pairs in their dual roles as investors and as targets.
Relevant statistical methods are applied to the framework, first with the structural
analyses of time series and cross-section, then panel data analysis and the
gravity model, and finally the three-dimensional gravity model over time.
Furthermore, the dependent variables of cross-border activity and its
determinants (independent variables) are conceptualized and quantified to
ensure a sensible approach for analytical measurement. Four different
dependent variables are derived: deal flow, participation, deal participation, and
activity as a percentage, which are further diversified by deal type, considering
the investment round, the number of participants, and the stage of the PF
company in a particular deal. The data collection process for dependent and
independent variables results in three basic datasets. First, the PE activity
dataset, with overall coverage of 99 countries from the year 1980 through 2005.
Second, the PE activity dataset aligned to the available explanatory dataset, with
38 countries and 2,266 source / host / year combinations for cross-border deals.
Third, the explanatory dataset, with the categories economic mass, economic
distance, country pair-specific indicators, banking system, endowment, and
institutional / legal / political indicators, with a total of 35 different variables.
Having fulfilled the requirement of complete data coverage, the dataset can now
be empirically analyzed.
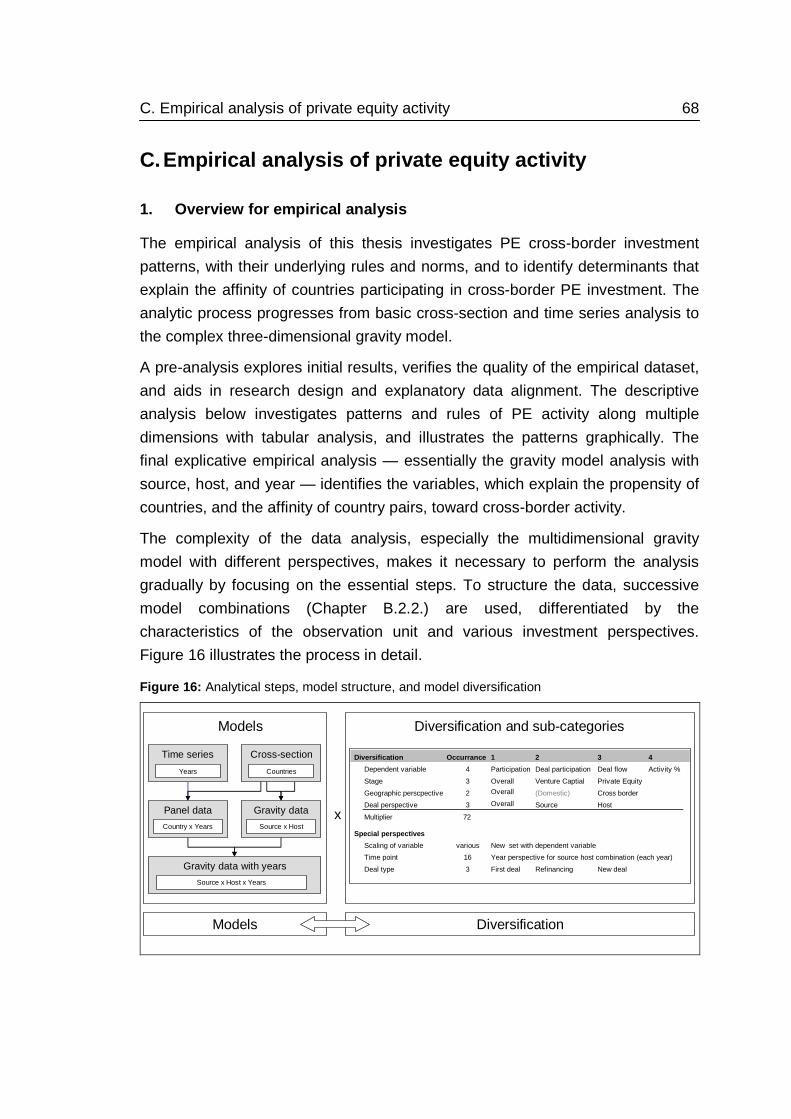
C. Empirical analysis of private equity activity 68
C. Empirical analysis of private equity activity
1. Overview for empirical analysis
The empirical analysis of this thesis investigates PE cross-border investment
patterns, with their underlying rules and norms, and to identify determinants that
explain the affinity of countries participating in cross-border PE investment. The
analytic process progresses from basic cross-section and time series analysis to
the complex three-dimensional gravity model.
A pre-analysis explores initial results, verifies the quality of the empirical dataset,
and aids in research design and explanatory data alignment. The descriptive
analysis below investigates patterns and rules of PE activity along multiple
dimensions with tabular analysis, and illustrates the patterns graphically. The
final explicative empirical analysis — essentially the gravity model analysis with
source, host, and year — identifies the variables, which explain the propensity of
countries, and the affinity of country pairs, toward cross-border activity.
The complexity of the data analysis, especially the multidimensional gravity
model with different perspectives, makes it necessary to perform the analysis
gradually by focusing on the essential steps. To structure the data, successive
model combinations (Chapter B.2.2.) are used, differentiated by the
characteristics of the observation unit and various investment perspectives.
Figure 16 illustrates the process in detail.
Figure 16: Analytical steps, model structure, and model diversification
Diversification and sub-categories
Cross-sectionTime series
Years Countries
Panel data
Country x Years
Gravity data with years
Source x Host x Years
Gravity data
Source x Host
Models
DiversificationModels
x
Diversification Occurrance 1 2 3 4
Dependent variable 4 Participation Deal participation Deal flow Activity %
Stage 3 Overall Venture Captial Private Equity
Geographic perscpective 2 Overall (Domestic) Cross border
Deal perspective 3 Overall Source Host
Multiplier 72
Special perspectives
Scaling of variable various New set with dependent variable
Time point 16 Year perspective for source host combination (each year)
Deal type 3 First deal Refinancing New deal

C. Empirical analysis of private equity activity 69
The models have a multidimensional structure, with the country cross-section
and time-series as a foundation. The analytical steps build on each other to
arrive at the final three-dimensional gravity model.
The pre-analysis , with time series and cross-sections, identifies source and host
activity patterns over time and across individual countries. The analysis confirms
the reliability of the collected empirical PE data in comparison with recent
literature,166 and ranks the countries and years by relevance to identify the
important PE countries and to align the database with the explanatory country
indicator data-sets for the explicative analysis.
The descriptive analysis investigates PE data along multiple dimensions. It is
built upon the two-dimensional panel data model and the two-dimensional gravity
model utilizing source and host country. The complexity of the gravity model, with
its basic dimensions of source, host, and year, cannot be visualized in one graph
while capturing all the dynamics of PE investment development. The basic panel
model and the two-dimensional gravity model serve in combination as a
foundation to analyze in depth the patterns of the three-dimensional gravity
model. The descriptive analysis of the three-dimensional gravity model focuses
on all dimensions (source, host, and time) and breaks down the data further to
capture the dynamics of PE activity. The data are presented in tables, selected
panel data series, and gravity models. Additionally, time series and cross-section
graphs address special topics, such as deal type with partnering in cross-border
activity.
The different models and the diversification into different dependent variables,
along with the subcategories of finance stage, investment, and geographical
perspective, etc., make it necessary to focus and confine the description to
selected illustrative stepping stones, since the variety of the dimensions reaches
more than 1,000 different possible combinations with tables and graphs. The
path funnels the descriptive multidimensional analysis from a comprehensive
overview of PE investments to detailed analysis. The illustrative graphs have
been chosen after exhaustive analysis of the results. The focus is on overall
investment (as the sum of VC and PE investment) without differentiating into the
166 EVCA - European Venture Capital Association, EVCA - Yearbook; NVCA - National
Venture Capital Association (USA), National Venture Capital Association Yearbook.

C. Empirical analysis of private equity activity 70
different company stages of investment. For the panel data, the source country
perspective is chosen to illustrate country activity. Further, the overall country
deals — comparing domestic to cross-border deals — are illustrated. Country
activity is shown, for deal flow, participation, and activity as a percentage.
The explicative analysis focuses on the three-dimensional gravity model with a
breakdown of main and interaction effects of source, host, and year, performing
first the analysis of variance (ANOVA) with dummy variables, and finally a gravity
model analysis with a study of the different categories of explanatory variables.
2. Pre-analysis of private equity activity
The pre-analysis investigates the dynamics of PE across time and the impact of
the individual countries for all PE-activity variables. The analysis examines the
dataset with 99 countries for the 26 years from 1980 through 2005 across the two
dimensions — countries and years — as time series and cross-section. The
matrix accounts for 190,319 participations, 92,198 deal participations, $719.95
billion of deal flow, and activity of 100%.
2.1. Investment activity over time
The time series is a fundamental analysis along the time dimension, investigating
the development of PE accumulated by all countries in the sample. The analysis
is diversified by the dependent variables of participation, deal participation, the
stages of venture capital financing, PE, and overall activity, and for overall and
cross-border activity. The following graph illustrates the analytic results of the
investment pattern from 1980 through 2005 for finance stages and for overall and
cross-border investments with the dependent variables. The y-axis has a
different scale to illustrate the patterns of investment in relative terms.

C. Empirical analysis of private equity activity 71
Figure 17: Overview of investment development over time
The comparison of country deals overall (Graph O1) to cross-border investments
(Graph O2) shows that domestic investments make up the largest portion of
deals; differentiated into finance stages, VC is the largest part. Generally, the
patterns indicate an exponential growth rate from the year 1990 on (in relative
numbers), with rapid growth reaching its peak between the years 1997 and 2000.
The rate of decline, though sharp, is not as dramatic as the rate of growth to the
peak. It levels out not lower, as in the year 1998 for the cross-border deals. The
patterns after the year 2000 indicate different dynamics for VC and PE, with both
further diversified into total and cross-border deals.
When focusing on overall deal activity and deal flow (Graph O1), the curve has
two peaks; with an absolute maximum in 2000 and a relative maximum in 2003.
The year with the largest growth is 1999. The differentiation of overall activity into
VC (VC1) and PE (PE1) reveals that the second peak is caused by PE activity
compared to VC, with only one peak in 2000.
0
5,000
10,000
15,000
20,000
25,000
30,000
35,000
198
0
198
1
198
2
198
3
198
4
198
5
198
6
198
7
198
8
198
9
199
0
199
1
199
2
199
3
199
4
199
5
199
6
199
7
199
8
199
9
200
0
200
1
200
2
200
3
200
4
200
5
0
5,000
10,000
15,000
20,000
25,000
1980
1981
1982
1983
1984
1985
1986
1987
1988
1989
1990
1991
1992
1993
1994
1995
1996
1997
1998
1999
2000
2001
2002
2003
2004
2005
0
1,000
2,000
3,000
4,000
5,000
6,000
7,000
8,000
9,000
10,000
198
0
198
1
198
2
198
3
198
4
198
5
198
6
198
7
198
8
198
9
199
0
199
1
199
2
199
3
199
4
199
5
199
6
199
7
199
8
199
9
200
0
200
1
200
2
200
3
200
4
200
5
Private EquityOverall Venture Capital
0
20,000
40,000
60,000
80,000
100,000
120,000
140,000
160,000
1980
1981
1982
1983
1984
1985
1986
1987
1988
1989
1990
1991
1992
1993
1994
1995
1996
1997
1998
1999
2000
2001
2002
2003
2004
2005
0
20,000
40,000
60,000
80,000
100,000
120,000
198
0
198
1
198
2
198
3
198
4
198
5
198
6
198
7
198
8
198
9
199
0
199
1
199
2
199
3
199
4
199
5
199
6
199
7
199
8
199
9
200
0
200
1
200
2
200
3
200
4
200
5
Year
0
5,000
10,000
15,000
20,000
25,000
30,000
35,000
40,000
45,000
50,000
198
0
198
1
198
2
198
3
198
4
198
5
198
6
198
7
198
8
198
9
199
0
199
1
199
2
199
3
199
4
199
5
199
6
199
7
199
8
199
9
200
0
200
1
200
2
200
3
200
4
200
5
Private EquityOverall Venture Capital
Country deals overall (domestic/cross border)
Cross border deals
1990
1995
2000
2005
1980
1985
1990
1995
2000
2005
1980
1985
1990
1995
2000
2005
1980
1985
1990
1995
2000
2005
1980
1985
1990
1995
2000
2005
1980
1985
1990
1995
2000
2005
1980
1985
50120160
000
102535
000
= Deal flow = Participation = Deal participation
$US bln#
Deal flow
Participation
Deal participation
$US bln#
O1
O2
VC1
VC2
PE1
PE2

C. Empirical analysis of private equity activity 72
The time-series amplitude of cross-border deals is less distinctive, caused by a
lower rate of decline. With a few cross-border deals from 1980 through 1992,
significant growth started in 1995 with the largest rates in 1999, reaching a peak
at 2000. The dependent variables participation and deal participation, with their
peak in 2000, have a distribution similar to deal flow across time. The relation of
the measurable variables participation and deal participation, calculated for
country deals overall, increases from 1.5 in 1995 to 1.9 in 2000, indicating a shift
toward mixed deals with partnering in the growth period.
The analysis of time series indicates a highly dynamic situation, with an
exponential growth rate until the year 2000 and volatile development for the
distinct segments in the following years. Volatile development provides evidence
of the necessity to diversify the research into the different finance stages of VC
and PE, and to investigate countries in relation to their domestic investment
behavior. The dynamics illustrate that the analysis should focus on the period
1990 through 2005 to compare the early phase (1990–1995) with the boom
(1995–1999), the peak (2000) and the downturn (2000–2005), each with a
different pattern of PE and VC activity. As proof of reliability, the time-series
patterns have been compared and correspond to results of deal flow
development in data sources (Merger Market, Zephyr) and statistics of
associations (EVCA, NVCA, BvK).167
2.2. Investment activity by country — cross-section
The cross-sectional analysis identifies the importance of each country by overall,
source, and host investments. The first table is a general analysis of domestic
and cross-border deals combined, while the second table focuses on cross-
border activity only (see Chapter B.2.3.1.). The tables for the differentiation into
VC and PE are listed in the appendix.
Analyzed are the 99 countries from 1980 through 2005 by the different
dependent variables of participation, deal participation, deal flow, and activity.
167 EVCA: European Venture Capital Association; NVCA: National Venture Capital Association;
BvK: Bundesverband Deutscher Kapitalbeteiligungsgesellschaften.

C. Empirical analysis of private equity activity 73
The countries are ranked by their overall activity expressed as a percentage,
which is calculated by proportional activity from participation, deal participation,
and deal flow (see Chapter B.2.3.1.). The ranking by activity as a percentage of
all dependent variables allows a comparison of countries with different
investment behaviors, such as less frequency (participation) and high intensity
(deal flow). The activity as a percentage signifies total PE activity over the last 26
years and over all countries. The tables additionally list the rank of source and
host country, illustrating the importance of a country as source and host from a
global perspective. Further, the tables display the difference between source and
host activity within a country, illustrating the country’ net balance of import to
export deals.
2.2.1. Overall country investment activity
The cross-section analyzes each country by overall country activity, accumulated
over the years 1980 through 2005, and ranked by total activity, with a total of 99
countries, 70 as source and 95 as host countries of investment. The following
table lists the countries in column 2 with the country selection for the explicative
analysis, which is highlighted in green. The rank of the country is displayed in
columns 3 and 4 for overall (O), source (S), and host country (H), followed by the
difference of global country rank between source and host (column 6).
The absolute dependent variables — participation, deal participation, and deal
flow — are listed in columns 7 to 15, broken down by investment perspectives of
overall, source, and host PE-country investment. Columns 16 to 18 display the
net ratio of source to host activity for each dependent variable, defining a country
as net importer or net exporter of PE investment: the number is negative for
inward flow and positive for outward flow.
Positive or negative signs for flows for one country occur because of the relation
of the number of investors to the deal size. The United States, for example, has a
negative ratio in source / host participation and a positive ratio of source / host
deal participation and deal flow, indicating that relatively few companies with
many deals and large capitalization invest abroad; whereas many companies
invest small amounts in the United States.

C. Empirical analysis of private equity activity 74
The activity as a percentage, and the proportional PE activity of each country to
global activity, are presented in columns 19 to 27 for each dependent variable by
overall, source, and host investment.
Table 8: Country activity overview of domestic and cross-border deals
1 2 3 4 5 6 7 8 9 10 11 12 13 14 15 16 17 18 19 20 21 22 23 24 25 26 27 28 29 30Difference source-host Percentage of total deals Activity %
Part. Dealp. Dflow Part. Dealp. Dflow Part. Dealp. Dflow Part. Dealp. Dflow Part. Dealp. Dflow Part. Dealp. Dflow Part. Dealp. Dflow Source Host Overall1 United States of A. 1 1 1 0 306,246 135,944 1,092,193 152,179 68,455 564,872 154,067 67,489 527,322 -1,888 966 37,550 80.5% 73.7% 75.9% 80.0% 74.2% 78.5% 81.0% 73.2% 73.2% 77.56% 75.80% 76.68%2 United Kingdom 2 2 2 0 18,188 12,114 126,645 10,582 6,816 74,240 7,606 5,298 52,405 2,976 1,518 21,835 4.8% 6.6% 8.8% 5.6% 7.4% 10.3% 4.0% 5.7% 7.3% 7.75% 5.67% 6.71%3 France 3 3 3 0 9,624 5,609 33,395 4,483 2,541 11,111 5,141 3,068 22,283 -658 -528 -11,172 2.5% 3.0% 2.3% 2.4% 2.8% 1.5% 2.7% 3.3% 3.1% 2.22% 3.04% 2.63%4 Germany 4 4 4 0 5,806 3,480 20,223 2,792 1,522 6,398 3,014 1,958 13,825 -222 -436 -7,427 1.5% 1.9% 1.4% 1.5% 1.7% 0.9% 1.6% 2.1% 1.9% 1.34% 1.88% 1.61%5 Canada 5 5 5 0 5,150 2,388 16,551 2,625 1,105 8,132 2,525 1,283 8,419 100 -178 -288 1.4% 1.3% 1.1% 1.4% 1.2% 1.1% 1.3% 1.4% 1.2% 1.24% 1.30% 1.27%6 Australia 6 6 6 0 3,893 3,156 10,156 1,978 1,589 4,904 1,915 1,567 5,252 63 22 -347 1.0% 1.7% 0.7% 1.0% 1.7% 0.7% 1.0% 1.7% 0.7% 1.15% 1.15% 1.15%7 South Korea 7 7 7 0 3,036 2,348 9,070 1,439 1,110 2,001 1,597 1,238 7,069 -158 -128 -5,068 0.8% 1.3% 0.6% 0.8% 1.2% 0.3% 0.8% 1.3% 1.0% 0.75% 1.05% 0.90%8 Sweden 8 8 8 0 2,716 1,863 9,709 1,239 835 4,827 1,477 1,028 4,882 -238 -193 -56 0.7% 1.0% 0.7% 0.7% 0.9% 0.7% 0.8% 1.1% 0.7% 0.74% 0.86% 0.80%9 Netherlands 9 9 10 1 2,258 1,430 12,925 1,215 755 5,391 1,043 675 7,533 172 79 -2,142 0.6% 0.8% 0.9% 0.6% 0.8% 0.7% 0.5% 0.7% 1.0% 0.74% 0.78% 0.76%
10 India 10 12 9 -3 2,151 1,928 6,758 954 857 1,757 1,197 1,071 5,001 -243 -213 -3,244 0.6% 1.0% 0.5% 0.5% 0.9% 0.2% 0.6% 1.2% 0.7% 0.56% 0.83% 0.69%11 Israel 11 10 12 2 2,595 1,213 6,101 1,358 586 3,193 1,237 627 2,907 121 -41 286 0.7% 0.7% 0.4% 0.7% 0.6% 0.4% 0.6% 0.7% 0.4% 0.60% 0.58% 0.59%12 Japan 12 13 11 -2 1,342 726 12,925 853 347 4,992 489 379 7,934 364 -32 -2,942 0.4% 0.4% 0.9% 0.4% 0.4% 0.7% 0.3% 0.4% 1.1% 0.51% 0.59% 0.55%13 Finland 13 14 13 -1 1,793 1,421 3,376 891 697 1,389 902 724 1,987 -11 -27 -599 0.5% 0.8% 0.2% 0.5% 0.8% 0.2% 0.5% 0.8% 0.3% 0.47% 0.51% 0.49%14 Hong Kong 14 11 23 12 1,021 715 9,472 625 432 6,693 396 283 2,779 229 149 3,914 0.3% 0.4% 0.7% 0.3% 0.5% 0.9% 0.2% 0.3% 0.4% 0.58% 0.30% 0.44%15 Switzerland 15 16 17 1 1,627 904 5,299 910 483 2,185 717 421 3,113 193 62 -928 0.4% 0.5% 0.4% 0.5% 0.5% 0.3% 0.4% 0.5% 0.4% 0.44% 0.42% 0.43%16 Denmark 16 18 14 -4 1,497 979 4,466 701 458 1,008 796 521 3,458 -95 -63 -2,450 0.4% 0.5% 0.3% 0.4% 0.5% 0.1% 0.4% 0.6% 0.5% 0.33% 0.49% 0.41%17 Singapore 17 15 21 6 1,196 694 7,154 790 383 4,022 406 311 3,132 384 73 891 0.3% 0.4% 0.5% 0.4% 0.4% 0.6% 0.2% 0.3% 0.4% 0.46% 0.33% 0.40%18 Belgium 18 17 18 1 1,358 816 4,162 745 420 1,481 613 396 2,681 132 24 -1,200 0.4% 0.4% 0.3% 0.4% 0.5% 0.2% 0.3% 0.4% 0.4% 0.35% 0.37% 0.36%19 Ireland-Rep 19 22 16 -6 1,045 694 4,622 428 296 575 617 399 4,047 -189 -103 -3,471 0.3% 0.4% 0.3% 0.2% 0.3% 0.1% 0.3% 0.4% 0.6% 0.21% 0.44% 0.32%20 Italy 20 21 19 -2 760 546 5,377 346 227 1,502 414 319 3,874 -68 -92 -2,372 0.2% 0.3% 0.4% 0.2% 0.2% 0.2% 0.2% 0.3% 0.5% 0.21% 0.37% 0.29%21 China 21 26 15 -11 803 482 4,786 182 116 365 621 366 4,421 -439 -250 -4,056 0.2% 0.3% 0.3% 0.1% 0.1% 0.1% 0.3% 0.4% 0.6% 0.09% 0.45% 0.27%22 Taiwan 22 19 25 6 996 636 2,748 671 363 1,716 325 273 1,032 346 91 684 0.3% 0.3% 0.2% 0.4% 0.4% 0.2% 0.2% 0.3% 0.1% 0.33% 0.20% 0.27%23 Brazil 23 20 24 4 661 561 4,439 289 254 1,819 372 307 2,620 -83 -54 -801 0.2% 0.3% 0.3% 0.2% 0.3% 0.3% 0.2% 0.3% 0.4% 0.23% 0.30% 0.26%24 Spain 24 24 22 -2 686 504 4,039 237 183 1,361 449 321 2,678 -212 -138 -1,317 0.2% 0.3% 0.3% 0.1% 0.2% 0.2% 0.2% 0.3% 0.4% 0.17% 0.32% 0.24%25 Norway 25 23 26 3 714 519 1,772 394 277 788 320 243 984 74 34 -196 0.2% 0.3% 0.1% 0.2% 0.3% 0.1% 0.2% 0.3% 0.1% 0.21% 0.19% 0.20%26 Bermuda 26 42 20 -22 132 57 6,412 15 10 62 117 47 6,350 -102 -36 -6,288 0.0% 0.0% 0.4% 0.0% 0.0% 0.0% 0.1% 0.1% 0.9% 0.01% 0.33% 0.17%27 Austria 27 25 28 3 486 350 723 198 151 208 288 199 515 -90 -48 -307 0.1% 0.2% 0.1% 0.1% 0.2% 0.0% 0.2% 0.2% 0.1% 0.10% 0.15% 0.12%28 Luxembourg 28 29 27 -2 184 100 3,487 133 68 538 51 32 2,949 82 36 -2,411 0.0% 0.1% 0.2% 0.1% 0.1% 0.1% 0.0% 0.0% 0.4% 0.07% 0.16% 0.11%29 New Zealand 29 27 29 2 297 259 1,020 135 116 233 162 143 786 -27 -27 -553 0.1% 0.1% 0.1% 0.1% 0.1% 0.0% 0.1% 0.2% 0.1% 0.08% 0.12% 0.10%30 Poland 30 30 30 0 270 245 627 116 105 232 154 140 395 -38 -35 -164 0.1% 0.1% 0.0% 0.1% 0.1% 0.0% 0.1% 0.2% 0.1% 0.07% 0.10% 0.08%31 Malaysia 31 28 32 4 272 212 523 151 106 186 121 106 337 30 0 -151 0.1% 0.1% 0.0% 0.1% 0.1% 0.0% 0.1% 0.1% 0.0% 0.07% 0.08% 0.07%32 Czech Republic 32 32 35 3 192 162 510 90 78 144 102 84 366 -12 -6 -222 0.1% 0.1% 0.0% 0.0% 0.1% 0.0% 0.1% 0.1% 0.1% 0.05% 0.07% 0.06%33 South Africa 33 31 37 6 143 110 1,021 65 54 487 78 57 534 -13 -3 -47 0.0% 0.1% 0.1% 0.0% 0.1% 0.1% 0.0% 0.1% 0.1% 0.05% 0.06% 0.06%34 Indonesia 34 37 33 -4 111 83 985 29 18 241 82 66 743 -53 -48 -502 0.0% 0.0% 0.1% 0.0% 0.0% 0.0% 0.0% 0.1% 0.1% 0.02% 0.07% 0.05%35 Portugal 35 33 38 5 153 125 438 66 57 98 87 68 339 -21 -11 -241 0.0% 0.1% 0.0% 0.0% 0.1% 0.0% 0.0% 0.1% 0.0% 0.04% 0.06% 0.05%36 Thailand 36 39 34 -5 131 127 457 33 32 65 98 95 392 -65 -63 -328 0.0% 0.1% 0.0% 0.0% 0.0% 0.0% 0.1% 0.1% 0.1% 0.02% 0.07% 0.05%37 Argentina 37 49 31 -18 96 58 1,115 8 6 8 88 52 1,107 -80 -46 -1,099 0.0% 0.0% 0.1% 0.0% 0.0% 0.0% 0.0% 0.1% 0.2% 0.00% 0.09% 0.04%38 Hungary 38 36 36 0 149 122 332 48 40 28 101 82 304 -53 -42 -276 0.0% 0.1% 0.0% 0.0% 0.0% 0.0% 0.1% 0.1% 0.0% 0.02% 0.06% 0.04%39 Russian Federation 39 34 41 7 118 97 295 65 48 131 53 49 163 12 -1 -32 0.0% 0.1% 0.0% 0.0% 0.1% 0.0% 0.0% 0.1% 0.0% 0.03% 0.03% 0.03%40 Philippines 40 40 39 -1 90 67 469 29 15 49 61 52 420 -32 -37 -371 0.0% 0.0% 0.0% 0.0% 0.0% 0.0% 0.0% 0.1% 0.1% 0.01% 0.05% 0.03%41 Mexico 41 70 40 -30 48 41 327 1 0 0 47 41 327 -46 -41 -327 0.0% 0.0% 0.0% 0.0% 0.0% 0.0% 0.0% 0.0% 0.0% 0.00% 0.04% 0.02%42 Romania 42 45 42 -3 50 44 263 10 10 30 40 34 232 -30 -24 -202 0.0% 0.0% 0.0% 0.0% 0.0% 0.0% 0.0% 0.0% 0.0% 0.01% 0.03% 0.02%43 Greece 43 38 47 9 48 39 305 28 23 182 20 16 122 8 7 60 0.0% 0.0% 0.0% 0.0% 0.0% 0.0% 0.0% 0.0% 0.0% 0.02% 0.01% 0.02%44 Mauritius 44 35 90 55 52 36 162 51 35 162 1 1 0 50 34 162 0.0% 0.0% 0.0% 0.0% 0.0% 0.0% 0.0% 0.0% 0.0% 0.03% 0.00% 0.01%45 Vietnam 45 41 50 9 40 40 42 19 19 19 21 21 23 -2 -2 -4 0.0% 0.0% 0.0% 0.0% 0.0% 0.0% 0.0% 0.0% 0.0% 0.01% 0.01% 0.01%46 Bulgaria 46 58 43 -15 24 15 227 3 3 0 21 12 227 -18 -9 -227 0.0% 0.0% 0.0% 0.0% 0.0% 0.0% 0.0% 0.0% 0.0% 0.00% 0.02% 0.01%47 Nigeria 47 48 46 -2 22 19 191 8 7 9 14 12 182 -6 -5 -173 0.0% 0.0% 0.0% 0.0% 0.0% 0.0% 0.0% 0.0% 0.0% 0.00% 0.02% 0.01%48 Iceland 48 44 51 7 35 26 72 13 12 19 22 14 54 -9 -2 -35 0.0% 0.0% 0.0% 0.0% 0.0% 0.0% 0.0% 0.0% 0.0% 0.01% 0.01% 0.01%49 Chile 49 63 44 -19 25 19 166 3 1 0 22 18 166 -19 -16 -166 0.0% 0.0% 0.0% 0.0% 0.0% 0.0% 0.0% 0.0% 0.0% 0.00% 0.02% 0.01%50 Cayman Islands 50 46 49 3 18 9 268 15 6 26 3 3 241 12 3 -215 0.0% 0.0% 0.0% 0.0% 0.0% 0.0% 0.0% 0.0% 0.0% 0.01% 0.01% 0.01%51 Slovak Republic 51 50 48 -2 32 29 35 6 6 3 26 23 32 -20 -17 -30 0.0% 0.0% 0.0% 0.0% 0.0% 0.0% 0.0% 0.0% 0.0% 0.00% 0.01% 0.01%52 Ukraine 52 43 55 12 29 29 20 16 16 6 13 13 14 3 3 -8 0.0% 0.0% 0.0% 0.0% 0.0% 0.0% 0.0% 0.0% 0.0% 0.01% 0.01% 0.01%53 Zambia 53 0 45 0 2 2 325 0 0 0 2 2 325 -2 -2 -325 0.0% 0.0% 0.0% 0.0% 0.0% 0.0% 0.0% 0.0% 0.0% 0.00% 0.02% 0.01%54 Sri Lanka 54 55 52 -3 21 21 38 4 4 0 17 17 37 -13 -13 -37 0.0% 0.0% 0.0% 0.0% 0.0% 0.0% 0.0% 0.0% 0.0% 0.00% 0.01% 0.01%55 Lithuania 55 56 56 0 15 13 51 4 4 0 11 9 51 -7 -5 -51 0.0% 0.0% 0.0% 0.0% 0.0% 0.0% 0.0% 0.0% 0.0% 0.00% 0.01% 0.00%56 Estonia 56 62 54 -8 13 11 58 3 1 3 10 10 56 -7 -9 -53 0.0% 0.0% 0.0% 0.0% 0.0% 0.0% 0.0% 0.0% 0.0% 0.00% 0.01% 0.00%57 Turkey 57 53 60 7 14 13 26 5 5 0 9 8 26 -4 -4 -26 0.0% 0.0% 0.0% 0.0% 0.0% 0.0% 0.0% 0.0% 0.0% 0.00% 0.01% 0.00%58 Kenya 58 0 53 0 15 10 42 0 0 0 15 10 42 -15 -10 -42 0.0% 0.0% 0.0% 0.0% 0.0% 0.0% 0.0% 0.0% 0.0% 0.00% 0.01% 0.00%59 Pakistan 59 54 59 5 11 10 52 4 4 0 7 6 52 -3 -2 -52 0.0% 0.0% 0.0% 0.0% 0.0% 0.0% 0.0% 0.0% 0.0% 0.00% 0.01% 0.00%60 Croatia 60 0 57 0 12 12 21 0 0 0 12 12 21 -12 -12 -21 0.0% 0.0% 0.0% 0.0% 0.0% 0.0% 0.0% 0.0% 0.0% 0.00% 0.01% 0.00%61 Netherlands Antilles 61 47 66 19 13 12 12 8 8 8 5 4 5 3 4 3 0.0% 0.0% 0.0% 0.0% 0.0% 0.0% 0.0% 0.0% 0.0% 0.00% 0.00% 0.00%62 Cyprus 62 67 58 -9 7 7 62 1 1 0 6 6 61 -5 -5 -61 0.0% 0.0% 0.0% 0.0% 0.0% 0.0% 0.0% 0.0% 0.0% 0.00% 0.01% 0.00%63 United Arab Emirates 63 51 65 14 8 8 39 4 4 23 4 4 17 0 0 6 0.0% 0.0% 0.0% 0.0% 0.0% 0.0% 0.0% 0.0% 0.0% 0.00% 0.00% 0.00%64 Ghana 64 66 62 -4 10 10 5 1 1 0 9 9 4 -8 -8 -4 0.0% 0.0% 0.0% 0.0% 0.0% 0.0% 0.0% 0.0% 0.0% 0.00% 0.01% 0.00%65 Tanzania 65 0 61 0 2 2 94 0 0 0 2 2 94 -2 -2 -94 0.0% 0.0% 0.0% 0.0% 0.0% 0.0% 0.0% 0.0% 0.0% 0.00% 0.01% 0.00%66 Morocco 66 59 67 8 7 5 21 3 2 5 4 3 15 -1 -1 -10 0.0% 0.0% 0.0% 0.0% 0.0% 0.0% 0.0% 0.0% 0.0% 0.00% 0.00% 0.00%67 Colombia 67 0 63 0 3 2 46 0 0 0 3 2 46 -3 -2 -46 0.0% 0.0% 0.0% 0.0% 0.0% 0.0% 0.0% 0.0% 0.0% 0.00% 0.00% 0.00%68 Cameroon 68 57 73 16 6 6 3 3 3 1 3 3 1 0 0 0 0.0% 0.0% 0.0% 0.0% 0.0% 0.0% 0.0% 0.0% 0.0% 0.00% 0.00% 0.00%69 Moldova 69 0 64 0 6 6 1 0 0 0 6 6 1 -6 -6 -1 0.0% 0.0% 0.0% 0.0% 0.0% 0.0% 0.0% 0.0% 0.0% 0.00% 0.00% 0.00%70 Madagascar 70 52 0 0 9 3 9 9 3 9 0 0 0 9 3 9 0.0% 0.0% 0.0% 0.0% 0.0% 0.0% 0.0% 0.0% 0.0% 0.00% 0.00% 0.00%71 British Virgin 71 0 68 0 3 2 25 0 0 0 3 2 25 -3 -2 -25 0.0% 0.0% 0.0% 0.0% 0.0% 0.0% 0.0% 0.0% 0.0% 0.00% 0.00% 0.00%72 Monaco 72 0 69 0 5 4 0 0 0 0 5 4 0 -5 -4 0 0.0% 0.0% 0.0% 0.0% 0.0% 0.0% 0.0% 0.0% 0.0% 0.00% 0.00% 0.00%73 Tunisia 73 61 79 18 4 4 2 2 2 1 2 2 1 0 0 0 0.0% 0.0% 0.0% 0.0% 0.0% 0.0% 0.0% 0.0% 0.0% 0.00% 0.00% 0.00%74 Jordan 74 0 70 0 3 3 11 0 0 0 3 3 11 -3 -3 -11 0.0% 0.0% 0.0% 0.0% 0.0% 0.0% 0.0% 0.0% 0.0% 0.00% 0.00% 0.00%75 Ecuador 75 0 71 0 1 1 28 0 0 0 1 1 28 -1 -1 -28 0.0% 0.0% 0.0% 0.0% 0.0% 0.0% 0.0% 0.0% 0.0% 0.00% 0.00% 0.00%76 Egypt 76 0 72 0 3 2 10 0 0 0 3 2 10 -3 -2 -10 0.0% 0.0% 0.0% 0.0% 0.0% 0.0% 0.0% 0.0% 0.0% 0.00% 0.00% 0.00%77 Latvia 77 0 74 0 3 3 0 0 0 0 3 3 0 -3 -3 0 0.0% 0.0% 0.0% 0.0% 0.0% 0.0% 0.0% 0.0% 0.0% 0.00% 0.00% 0.00%78 Fr Polynesia 78 0 75 0 3 3 0 0 0 0 3 3 0 -3 -3 0 0.0% 0.0% 0.0% 0.0% 0.0% 0.0% 0.0% 0.0% 0.0% 0.00% 0.00% 0.00%79 El Salvador 79 0 76 0 2 2 10 0 0 0 2 2 10 -2 -2 -10 0.0% 0.0% 0.0% 0.0% 0.0% 0.0% 0.0% 0.0% 0.0% 0.00% 0.00% 0.00%80 Slovenia 80 64 90 26 3 2 1 2 1 1 1 1 0 1 0 1 0.0% 0.0% 0.0% 0.0% 0.0% 0.0% 0.0% 0.0% 0.0% 0.00% 0.00% 0.00%81 Bangladesh 81 0 77 0 1 1 18 0 0 0 1 1 18 -1 -1 -18 0.0% 0.0% 0.0% 0.0% 0.0% 0.0% 0.0% 0.0% 0.0% 0.00% 0.00% 0.00%82 Kazakhstan 82 0 78 0 2 2 5 0 0 0 2 2 5 -2 -2 -5 0.0% 0.0% 0.0% 0.0% 0.0% 0.0% 0.0% 0.0% 0.0% 0.00% 0.00% 0.00%83 Senegal 83 60 0 0 2 2 2 2 2 2 0 0 0 2 2 2 0.0% 0.0% 0.0% 0.0% 0.0% 0.0% 0.0% 0.0% 0.0% 0.00% 0.00% 0.00%84 Azerbaijan 84 0 80 0 2 2 0 0 0 0 2 2 0 -2 -2 0 0.0% 0.0% 0.0% 0.0% 0.0% 0.0% 0.0% 0.0% 0.0% 0.00% 0.00% 0.00%85 Costa Rica 85 68 90 22 2 2 0 1 1 0 1 1 0 0 0 0 0.0% 0.0% 0.0% 0.0% 0.0% 0.0% 0.0% 0.0% 0.0% 0.00% 0.00% 0.00%86 Fiji 85 0 81 0 2 2 0 0 0 0 2 2 0 -2 -2 0 0.0% 0.0% 0.0% 0.0% 0.0% 0.0% 0.0% 0.0% 0.0% 0.00% 0.00% 0.00%87 Peru 87 0 82 0 1 1 10 0 0 0 1 1 10 -1 -1 -10 0.0% 0.0% 0.0% 0.0% 0.0% 0.0% 0.0% 0.0% 0.0% 0.00% 0.00% 0.00%88 Saudi Arabia 88 65 0 0 2 1 1 2 1 1 0 0 0 2 1 1 0.0% 0.0% 0.0% 0.0% 0.0% 0.0% 0.0% 0.0% 0.0% 0.00% 0.00% 0.00%89 Algeria 89 0 83 0 1 1 4 0 0 0 1 1 4 -1 -1 -4 0.0% 0.0% 0.0% 0.0% 0.0% 0.0% 0.0% 0.0% 0.0% 0.00% 0.00% 0.00%90 Bolivia 90 0 84 0 1 1 3 0 0 0 1 1 3 -1 -1 -3 0.0% 0.0% 0.0% 0.0% 0.0% 0.0% 0.0% 0.0% 0.0% 0.00% 0.00% 0.00%91 Macedonia 91 0 85 0 1 1 2 0 0 0 1 1 2 -1 -1 -2 0.0% 0.0% 0.0% 0.0% 0.0% 0.0% 0.0% 0.0% 0.0% 0.00% 0.00% 0.00%92 Mozambique 92 0 86 0 1 1 1 0 0 0 1 1 1 -1 -1 -1 0.0% 0.0% 0.0% 0.0% 0.0% 0.0% 0.0% 0.0% 0.0% 0.00% 0.00% 0.00%93 Sierra Leone 93 0 87 0 1 1 1 0 0 0 1 1 1 -1 -1 -1 0.0% 0.0% 0.0% 0.0% 0.0% 0.0% 0.0% 0.0% 0.0% 0.00% 0.00% 0.00%94 Venezuela 94 0 88 0 1 1 1 0 0 0 1 1 1 -1 -1 -1 0.0% 0.0% 0.0% 0.0% 0.0% 0.0% 0.0% 0.0% 0.0% 0.00% 0.00% 0.00%95 Bosnia 95 0 89 0 1 1 1 0 0 0 1 1 1 -1 -1 -1 0.0% 0.0% 0.0% 0.0% 0.0% 0.0% 0.0% 0.0% 0.0% 0.00% 0.00% 0.00%96 Dominica 96 0 90 0 1 1 0 0 0 0 1 1 0 -1 -1 0 0.0% 0.0% 0.0% 0.0% 0.0% 0.0% 0.0% 0.0% 0.0% 0.00% 0.00% 0.00%97 Kuwait 96 68 0 0 1 1 0 1 1 0 0 0 0 1 1 0 0.0% 0.0% 0.0% 0.0% 0.0% 0.0% 0.0% 0.0% 0.0% 0.00% 0.00% 0.00%98 Nicaragua 96 0 90 0 1 1 0 0 0 0 1 1 0 -1 -1 0 0.0% 0.0% 0.0% 0.0% 0.0% 0.0% 0.0% 0.0% 0.0% 0.00% 0.00% 0.00%99 Uganda 96 0 90 0 1 1 0 0 0 0 1 1 0 -1 -1 0 0.0% 0.0% 0.0% 0.0% 0.0% 0.0% 0.0% 0.0% 0.0% 0.00% 0.00% 0.00%
Grand Total ## ## ## ## 380,638 184,395 1,439,891 190,319 92,198 719,945 190,319 92,198 719,945 0 0 0 100% 100% 100% 100% 100% 100% 100% 100% 100% 100% 100% 100%
HostSourceOverall (Source+Host) Overall Source HostCountryNr.
O S H Dif.Rank Absolute volume of deals ($US mln)

C. Empirical analysis of private equity activity 75
Columns 28 to 30 present the average proportion of global activity as a
percentage of the dependent variable for each investment perspective.168 Overall
activity (column 30) expresses the general relevance of a country as source and
host combined — the indicator for the country ranking for the analysis.
The analysis covers 99 countries with 70 source and 95 host perspectives.
Comparing the range of the absolute dependent variables (columns 7–15)
between countries shows how widely countries differ in their absolute PE activity.
Countries also vary in their relevance as source and host of investment, indicated
by the country ranking (columns 4 and 5), the net ratio of investments (columns
16–18), and the activity as a percentage (columns 28 and 29). Comparing the
dependent variables as absolute (columns 7–15) or relative numbers (columns
19–27) in each country verifies that countries vary widely in the ratio of the
number of deals (frequency) to deal size (intensity), and the number of investors.
The six most important countries are the United States, United Kingdom, France,
Germany, Canada, and Australia. Their combined PE activity is highly
concentrated. The United States, with nearly 77% of all PE activity, is by far the
most active country, followed by the United Kingdom, with nearly 7%. France,
Germany, Canada, and Australia account for between 1% and 3% of overall
activity. Comparing the rankings of source and host activity, each of the top eight
countries, including South Korea and Sweden, assign their global rank position
for all investment perspectives. Other countries differ in their global rank as
source and host in a range from positive 55 for Mauritius and negative 30 for
Mexico. A country with only source or host activity is indicated by a zero.
Investigating the countries by different activity measures the United States,
United Kingdom, and France rank highest by all variables. Germany, Canada,
and Australia rank differently in the subcategories of activity variables, indicating
that an overall lower ranked country actually has greater activity in this
subsegment. The first two inverse rankings are highlighted in red for each activity
variable. The comparison of an activity by percentage for each variable (columns
19–27) illustrates the differences in the subsegment. The absolute numbers are
highlighted in the differences of source and host activity (columns 16–18).
168 Calculated by Average of Overall Participation (C19), Overall Deal participation (C20), and
Deal flow (C21).

C. Empirical analysis of private equity activity 76
For example, the United States accounts for 80.5% of total participation, with
80% as source and 81% as host country. Deal participation for the US is the
lowest segment, with 73.2% for host and 74.2% as source country. While the
difference in these variables is very close — less than 1% — the comparison of
deal flow, with 78.5% for source and 73.2% for host of total global deal flow,
shows a gap of more than 5%, indicating the dominance of the US as source
country for deal flow.
The United Kingdom has a different profile. The ratio of the dependent variable,
with deal flow 10.3% for source and 7.3% for host of global activity, is the largest
segment. For the UK, deal participation, with 7.4% for source and 5.7% for host,
is larger than 5.6% source and 4.0% host for participation. The table shows the
detailed results for each country. The results of the overall investment analysis
indicate a difference in country characteristics for PE investment along all activity
variables and across the source / host perspective, indicating differences in deal
flow and partnering. Further, overall PE is highly concentrated in the US. This
analysis confirms the research design that the diversification into different
dependent variables is necessary to capture factors in country activity not
recognized by deal flow analysis alone. The analysis further identifies the
relevant top 43 countries, with an absolute minimum of 0.02% activity for the
explicative data analysis, in which 38 countries (highlighted in green) are used,
with this subset of countries still covering a large proportion of total global country
activity.
2.2.2. Cross-border investment activity
The cross-section matrix on cross-border activity is similar to overall country
activity, covering 99 countries in the years 1980 through 2005. The table shows
only 97 countries diversified into 59 source and 93 host countries because
Cameroon and Tunisia are not listed with cross-border deals. The matrix
accounts for 24,807 participations, 13,231 deal participations, $158.28 billion of
deal flow, and 16.5% of global PE activity.
This table’s layout, identical to the previous overall country table, compares
overall investment activity to the cross-border activity of the relevant countries.

C. Empirical analysis of private equity activity 77
Table 9: Country activity overview of cross-border deals
Unlike the activity, expressed as a percentage in the previous analysis (defined
as a dependent variable), the percentage of cross-border activity here refers only
to the total of cross-border investments (columns 16–30) for precise analysis of
cross-border deals. The differences in source and host activity (columns 16–18)
are identical to the numbers from the previous table because they present the net
1 2 3 4 5 6 7 8 9 10 11 12 13 14 15 16 17 18 19 20 21 22 23 24 25 26 27 28 29 30Difference source-host Percentage of total deals (cross border as total) Cross border activity %
Part. Dealp. Dflow Part. Dealp. Dflow Part. Dealp. Dflow Part. Dealp. Dflow Part. Dealp. Dflow Part. Dealp. Dflow Part. Dealp. Dflow Source Host Overall1 United States of A. 1 1 1 0 18,042 8,790 113,213 8,077 4,878 75,381 9,965 3,912 37,831 -1,888 966 37,550 36.4% 33.2% 35.8% 32.6% 36.9% 47.6% 40.2% 29.6% 23.9% 39.02% 31.21% 35.12%2 United Kingdom 2 2 2 0 7,852 4,421 56,906 5,414 2,969 39,371 2,438 1,451 17,535 2,976 1,518 21,835 15.8% 16.7% 18.0% 21.8% 22.4% 24.9% 9.8% 11.0% 11.1% 23.05% 10.63% 16.84%4 Germany 3 3 4 1 2,866 1,521 15,127 1,322 543 3,850 1,544 978 11,277 -222 -436 -7,427 5.8% 5.7% 4.8% 5.3% 4.1% 2.4% 6.2% 7.4% 7.1% 3.95% 6.91% 5.43%3 France 4 5 3 -2 2,692 1,399 16,869 1,017 436 2,848 1,675 963 14,020 -658 -528 -11,172 5.4% 5.3% 5.3% 4.1% 3.3% 1.8% 6.8% 7.3% 8.9% 3.06% 7.63% 5.35%5 Canada 5 4 5 1 2,284 949 10,703 1,192 385 5,208 1,092 563 5,495 100 -178 -288 4.6% 3.6% 3.4% 4.8% 2.9% 3.3% 4.4% 4.3% 3.5% 3.67% 4.04% 3.86%9 Netherlands 6 6 6 0 1,314 723 11,338 743 401 4,598 571 322 6,740 172 79 -2,142 2.6% 2.7% 3.6% 3.0% 3.0% 2.9% 2.3% 2.4% 4.3% 2.98% 3.00% 2.99%
11 Israel 7 9 10 1 1,423 649 3,526 772 304 1,906 651 345 1,620 121 -41 286 2.9% 2.5% 1.1% 3.1% 2.3% 1.2% 2.6% 2.6% 1.0% 2.20% 2.08% 2.14%12 Japan 8 11 9 -2 1,046 501 7,591 705 235 2,325 341 266 5,267 364 -32 -2,942 2.1% 1.9% 2.4% 2.8% 1.8% 1.5% 1.4% 2.0% 3.3% 2.03% 2.24% 2.13%15 Switzerland 9 10 11 1 1,177 624 4,652 685 343 1,862 492 281 2,790 193 62 -928 2.4% 2.4% 1.5% 2.8% 2.6% 1.2% 2.0% 2.1% 1.8% 2.18% 1.96% 2.07%
8 Sweden 10 13 7 -6 1,032 650 4,951 397 229 2,448 635 422 2,503 -238 -193 -56 2.1% 2.5% 1.6% 1.6% 1.7% 1.5% 2.6% 3.2% 1.6% 1.62% 2.44% 2.03%14 Hong Kong 11 7 21 14 765 509 7,601 497 329 5,758 268 180 1,843 229 149 3,914 1.5% 1.9% 2.4% 2.0% 2.5% 3.6% 1.1% 1.4% 1.2% 2.71% 1.20% 1.96%17 Singapore 12 8 18 10 928 490 5,951 656 281 3,421 272 209 2,530 384 73 891 1.9% 1.9% 1.9% 2.6% 2.1% 2.2% 1.1% 1.6% 1.6% 2.31% 1.42% 1.87%
6 Australia 13 12 16 4 801 566 3,339 432 294 1,496 369 272 1,843 63 22 -347 1.6% 2.1% 1.1% 1.7% 2.2% 0.9% 1.5% 2.1% 1.2% 1.64% 1.57% 1.60%18 Belgium 14 15 20 5 706 352 3,454 419 188 1,127 287 164 2,327 132 24 -1,200 1.4% 1.3% 1.1% 1.7% 1.4% 0.7% 1.2% 1.2% 1.5% 1.27% 1.29% 1.28%21 China 15 26 8 -18 577 313 4,441 69 32 193 508 282 4,248 -439 -250 -4,056 1.2% 1.2% 1.4% 0.3% 0.2% 0.1% 2.0% 2.1% 2.7% 0.21% 2.29% 1.25%10 India 16 21 12 -9 443 347 3,991 100 67 373 343 280 3,618 -243 -213 -3,244 0.9% 1.3% 1.3% 0.4% 0.5% 0.2% 1.4% 2.1% 2.3% 0.38% 1.93% 1.15%
7 South Korea 17 24 13 -11 330 206 6,094 86 39 513 244 167 5,581 -158 -128 -5,068 0.7% 0.8% 1.9% 0.3% 0.3% 0.3% 1.0% 1.3% 3.5% 0.32% 1.92% 1.12%16 Denmark 18 17 17 0 535 321 3,382 220 129 466 315 192 2,916 -95 -63 -2,450 1.1% 1.2% 1.1% 0.9% 1.0% 0.3% 1.3% 1.5% 1.8% 0.72% 1.52% 1.12%22 Taiwan 19 14 25 11 658 346 2,280 502 219 1,482 156 128 798 346 91 684 1.3% 1.3% 0.7% 2.0% 1.7% 0.9% 0.6% 1.0% 0.5% 1.54% 0.70% 1.12%19 Ireland-Rep 20 22 14 -8 417 242 3,862 114 70 195 303 173 3,667 -189 -103 -3,471 0.8% 0.9% 1.2% 0.5% 0.5% 0.1% 1.2% 1.3% 2.3% 0.37% 1.61% 0.99%13 Finland 21 16 22 6 515 332 2,063 252 153 732 263 180 1,331 -11 -27 -599 1.0% 1.3% 0.7% 1.0% 1.2% 0.5% 1.1% 1.4% 0.8% 0.88% 1.09% 0.98%20 Italy 22 19 19 0 410 264 3,038 171 86 333 239 178 2,705 -68 -92 -2,372 0.8% 1.0% 1.0% 0.7% 0.6% 0.2% 1.0% 1.3% 1.7% 0.52% 1.34% 0.93%26 Bermuda 23 36 15 -21 132 57 6,412 15 10 62 117 47 6,350 -102 -36 -6,288 0.3% 0.2% 2.0% 0.1% 0.1% 0.0% 0.5% 0.4% 4.0% 0.06% 1.61% 0.84%28 Luxembourg 24 20 24 4 180 96 3,487 131 66 538 49 30 2,949 82 36 -2,411 0.4% 0.4% 1.1% 0.5% 0.5% 0.3% 0.2% 0.2% 1.9% 0.46% 0.76% 0.61%24 Spain 25 33 23 -10 252 162 1,790 20 12 237 232 150 1,554 -212 -138 -1,317 0.5% 0.6% 0.6% 0.1% 0.1% 0.1% 0.9% 1.1% 1.0% 0.11% 1.02% 0.56%25 Norway 26 18 29 11 278 169 877 176 102 341 102 67 537 74 34 -196 0.6% 0.6% 0.3% 0.7% 0.8% 0.2% 0.4% 0.5% 0.3% 0.56% 0.42% 0.49%31 Malaysia 27 23 31 8 196 146 466 113 73 157 83 73 308 30 0 -151 0.4% 0.6% 0.1% 0.5% 0.5% 0.1% 0.3% 0.6% 0.2% 0.37% 0.36% 0.36%23 Brazil 28 32 26 -6 165 96 1,013 41 21 106 124 75 907 -83 -54 -801 0.3% 0.4% 0.3% 0.2% 0.2% 0.1% 0.5% 0.6% 0.6% 0.13% 0.55% 0.34%27 Austria 29 30 28 -2 174 112 406 42 32 50 132 80 356 -90 -48 -307 0.4% 0.4% 0.1% 0.2% 0.2% 0.0% 0.5% 0.6% 0.2% 0.15% 0.45% 0.30%29 New Zealand 30 28 30 2 125 104 759 49 38 103 76 66 656 -27 -27 -553 0.3% 0.4% 0.2% 0.2% 0.3% 0.1% 0.3% 0.5% 0.4% 0.18% 0.41% 0.29%32 Czech Republic 31 25 35 10 136 109 442 62 52 110 74 57 332 -12 -6 -222 0.3% 0.4% 0.1% 0.2% 0.4% 0.1% 0.3% 0.4% 0.2% 0.24% 0.31% 0.28%30 Poland 32 29 33 4 126 106 432 44 35 134 82 71 298 -38 -35 -164 0.3% 0.4% 0.1% 0.2% 0.3% 0.1% 0.3% 0.5% 0.2% 0.18% 0.35% 0.26%37 Argentina 33 45 27 -18 92 55 1,113 6 4 7 86 51 1,106 -80 -46 -1,099 0.2% 0.2% 0.4% 0.0% 0.0% 0.0% 0.3% 0.4% 0.7% 0.02% 0.48% 0.25%34 Indonesia 34 38 32 -6 85 73 532 16 12 15 69 60 517 -53 -48 -502 0.2% 0.3% 0.2% 0.1% 0.1% 0.0% 0.3% 0.5% 0.3% 0.06% 0.35% 0.20%38 Hungary 35 39 36 -3 83 61 313 15 10 18 68 52 294 -53 -42 -276 0.2% 0.2% 0.1% 0.1% 0.1% 0.0% 0.3% 0.4% 0.2% 0.05% 0.28% 0.17%40 Philippines 36 37 37 0 74 53 469 21 8 49 53 45 420 -32 -37 -371 0.1% 0.2% 0.1% 0.1% 0.1% 0.0% 0.2% 0.3% 0.3% 0.06% 0.27% 0.17%36 Thailand 37 58 34 -24 67 64 338 1 1 5 66 64 333 -65 -63 -328 0.1% 0.2% 0.1% 0.0% 0.0% 0.0% 0.3% 0.5% 0.2% 0.00% 0.32% 0.16%39 Russian Federation 38 31 41 10 74 56 164 43 27 66 31 29 98 12 -1 -32 0.1% 0.2% 0.1% 0.2% 0.2% 0.0% 0.1% 0.2% 0.1% 0.14% 0.13% 0.14%41 Mexico 39 59 38 -21 48 41 327 1 0 0 47 41 327 -46 -41 -327 0.1% 0.2% 0.1% 0.0% 0.0% 0.0% 0.2% 0.3% 0.2% 0.00% 0.24% 0.12%42 Romania 40 43 39 -4 44 38 232 7 7 15 37 31 217 -30 -24 -202 0.1% 0.1% 0.1% 0.0% 0.1% 0.0% 0.1% 0.2% 0.1% 0.03% 0.17% 0.10%44 Mauritius 41 27 88 61 52 36 162 51 35 162 1 1 0 50 34 162 0.1% 0.1% 0.1% 0.2% 0.3% 0.1% 0.0% 0.0% 0.0% 0.19% 0.00% 0.10%35 Portugal 42 40 40 0 43 27 329 11 8 44 32 19 285 -21 -11 -241 0.1% 0.1% 0.1% 0.0% 0.1% 0.0% 0.1% 0.1% 0.2% 0.04% 0.15% 0.10%33 South Africa 43 35 44 9 45 26 129 16 12 41 29 14 88 -13 -3 -47 0.1% 0.1% 0.0% 0.1% 0.1% 0.0% 0.1% 0.1% 0.1% 0.06% 0.09% 0.08%43 Greece 44 34 53 19 36 28 64 22 18 62 14 11 2 8 7 60 0.1% 0.1% 0.0% 0.1% 0.1% 0.0% 0.1% 0.1% 0.0% 0.09% 0.05% 0.07%49 Chile 45 52 42 -10 25 19 166 3 1 0 22 18 166 -19 -16 -166 0.1% 0.1% 0.1% 0.0% 0.0% 0.0% 0.1% 0.1% 0.1% 0.01% 0.11% 0.06%50 Cayman Islands 46 41 48 7 18 9 268 15 6 26 3 3 241 12 3 -215 0.0% 0.0% 0.1% 0.1% 0.0% 0.0% 0.0% 0.0% 0.2% 0.04% 0.06% 0.05%46 Bulgaria 47 0 43 0 18 9 227 0 0 0 18 9 227 -18 -9 -227 0.0% 0.0% 0.1% 0.0% 0.0% 0.0% 0.1% 0.1% 0.1% 0.00% 0.09% 0.05%47 Nigeria 48 48 47 -1 12 9 185 3 2 6 9 7 179 -6 -5 -173 0.0% 0.0% 0.1% 0.0% 0.0% 0.0% 0.0% 0.1% 0.1% 0.01% 0.07% 0.04%53 Zambia 49 0 45 0 2 2 325 0 0 0 2 2 325 -2 -2 -325 0.0% 0.0% 0.1% 0.0% 0.0% 0.0% 0.0% 0.0% 0.2% 0.00% 0.08% 0.04%51 Slovak Republic 50 0 46 0 20 17 30 0 0 0 20 17 30 -20 -17 -30 0.0% 0.1% 0.0% 0.0% 0.0% 0.0% 0.1% 0.1% 0.0% 0.00% 0.08% 0.04%54 Sri Lanka 51 55 49 -6 15 15 37 1 1 0 14 14 37 -13 -13 -37 0.0% 0.1% 0.0% 0.0% 0.0% 0.0% 0.1% 0.1% 0.0% 0.00% 0.06% 0.03%48 Iceland 52 47 54 7 19 10 41 5 4 3 14 6 38 -9 -2 -35 0.0% 0.0% 0.0% 0.0% 0.0% 0.0% 0.1% 0.0% 0.0% 0.02% 0.04% 0.03%56 Estonia 53 51 52 1 13 11 58 3 1 3 10 10 56 -7 -9 -53 0.0% 0.0% 0.0% 0.0% 0.0% 0.0% 0.0% 0.1% 0.0% 0.01% 0.05% 0.03%58 Kenya 54 0 50 0 15 10 42 0 0 0 15 10 42 -15 -10 -42 0.0% 0.0% 0.0% 0.0% 0.0% 0.0% 0.1% 0.1% 0.0% 0.00% 0.05% 0.03%60 Croatia 55 0 51 0 12 12 21 0 0 0 12 12 21 -12 -12 -21 0.0% 0.0% 0.0% 0.0% 0.0% 0.0% 0.0% 0.1% 0.0% 0.00% 0.05% 0.03%61 Netherlands Antilles 56 42 63 21 13 12 12 8 8 8 5 4 5 3 4 3 0.0% 0.0% 0.0% 0.0% 0.1% 0.0% 0.0% 0.0% 0.0% 0.03% 0.02% 0.03%55 Lithuania 57 0 55 0 7 5 51 0 0 0 7 5 51 -7 -5 -51 0.0% 0.0% 0.0% 0.0% 0.0% 0.0% 0.0% 0.0% 0.0% 0.00% 0.03% 0.02%62 Cyprus 58 0 56 0 5 5 61 0 0 0 5 5 61 -5 -5 -61 0.0% 0.0% 0.0% 0.0% 0.0% 0.0% 0.0% 0.0% 0.0% 0.00% 0.03% 0.02%64 Ghana 59 0 57 0 8 8 4 0 0 0 8 8 4 -8 -8 -4 0.0% 0.0% 0.0% 0.0% 0.0% 0.0% 0.0% 0.1% 0.0% 0.00% 0.03% 0.02%52 Ukraine 60 46 72 26 7 7 10 5 5 1 2 2 9 3 3 -8 0.0% 0.0% 0.0% 0.0% 0.0% 0.0% 0.0% 0.0% 0.0% 0.02% 0.01% 0.01%65 Tanzania 61 0 58 0 2 2 94 0 0 0 2 2 94 -2 -2 -94 0.0% 0.0% 0.0% 0.0% 0.0% 0.0% 0.0% 0.0% 0.1% 0.00% 0.03% 0.01%69 Moldova 62 0 59 0 6 6 1 0 0 0 6 6 1 -6 -6 -1 0.0% 0.0% 0.0% 0.0% 0.0% 0.0% 0.0% 0.0% 0.0% 0.00% 0.02% 0.01%70 Madagascar 63 44 0 0 9 3 9 9 3 9 0 0 0 9 3 9 0.0% 0.0% 0.0% 0.0% 0.0% 0.0% 0.0% 0.0% 0.0% 0.02% 0.00% 0.01%59 Pakistan 64 0 60 0 3 2 52 0 0 0 3 2 52 -3 -2 -52 0.0% 0.0% 0.0% 0.0% 0.0% 0.0% 0.0% 0.0% 0.0% 0.00% 0.02% 0.01%57 Turkey 65 0 61 0 4 4 26 0 0 0 4 4 26 -4 -4 -26 0.0% 0.0% 0.0% 0.0% 0.0% 0.0% 0.0% 0.0% 0.0% 0.00% 0.02% 0.01%63 United Arab Emirates 66 49 73 24 4 4 19 2 2 13 2 2 7 0 0 6 0.0% 0.0% 0.0% 0.0% 0.0% 0.0% 0.0% 0.0% 0.0% 0.01% 0.01% 0.01%67 Colombia 67 0 62 0 3 2 46 0 0 0 3 2 46 -3 -2 -46 0.0% 0.0% 0.0% 0.0% 0.0% 0.0% 0.0% 0.0% 0.0% 0.00% 0.02% 0.01%72 Monaco 68 0 64 0 5 4 0 0 0 0 5 4 0 -5 -4 0 0.0% 0.0% 0.0% 0.0% 0.0% 0.0% 0.0% 0.0% 0.0% 0.00% 0.02% 0.01%71 British Virgin 69 0 65 0 3 2 25 0 0 0 3 2 25 -3 -2 -25 0.0% 0.0% 0.0% 0.0% 0.0% 0.0% 0.0% 0.0% 0.0% 0.00% 0.01% 0.01%74 Jordan 70 0 66 0 3 3 11 0 0 0 3 3 11 -3 -3 -11 0.0% 0.0% 0.0% 0.0% 0.0% 0.0% 0.0% 0.0% 0.0% 0.00% 0.01% 0.01%77 Latvia 71 0 67 0 3 3 0 0 0 0 3 3 0 -3 -3 0 0.0% 0.0% 0.0% 0.0% 0.0% 0.0% 0.0% 0.0% 0.0% 0.00% 0.01% 0.01%78 Fr Polynesia 72 0 68 0 3 3 0 0 0 0 3 3 0 -3 -3 0 0.0% 0.0% 0.0% 0.0% 0.0% 0.0% 0.0% 0.0% 0.0% 0.00% 0.01% 0.01%76 Egypt 73 0 69 0 3 2 10 0 0 0 3 2 10 -3 -2 -10 0.0% 0.0% 0.0% 0.0% 0.0% 0.0% 0.0% 0.0% 0.0% 0.00% 0.01% 0.01%80 Slovenia 74 53 88 35 3 2 1 2 1 1 1 1 0 1 0 1 0.0% 0.0% 0.0% 0.0% 0.0% 0.0% 0.0% 0.0% 0.0% 0.01% 0.00% 0.01%79 El Salvador 75 0 70 0 2 2 10 0 0 0 2 2 10 -2 -2 -10 0.0% 0.0% 0.0% 0.0% 0.0% 0.0% 0.0% 0.0% 0.0% 0.00% 0.01% 0.00%75 Ecuador 76 0 71 0 1 1 28 0 0 0 1 1 28 -1 -1 -28 0.0% 0.0% 0.0% 0.0% 0.0% 0.0% 0.0% 0.0% 0.0% 0.00% 0.01% 0.00%82 Kazakhstan 77 0 74 0 2 2 5 0 0 0 2 2 5 -2 -2 -5 0.0% 0.0% 0.0% 0.0% 0.0% 0.0% 0.0% 0.0% 0.0% 0.00% 0.01% 0.00%45 Vietnam 78 0 75 0 2 2 4 0 0 0 2 2 4 -2 -2 -4 0.0% 0.0% 0.0% 0.0% 0.0% 0.0% 0.0% 0.0% 0.0% 0.00% 0.01% 0.00%83 Senegal 79 50 0 0 2 2 2 2 2 2 0 0 0 2 2 2 0.0% 0.0% 0.0% 0.0% 0.0% 0.0% 0.0% 0.0% 0.0% 0.01% 0.00% 0.00%84 Azerbaijan 80 0 76 0 2 2 0 0 0 0 2 2 0 -2 -2 0 0.0% 0.0% 0.0% 0.0% 0.0% 0.0% 0.0% 0.0% 0.0% 0.00% 0.01% 0.00%85 Costa Rica 81 55 88 33 2 2 0 1 1 0 1 1 0 0 0 0 0.0% 0.0% 0.0% 0.0% 0.0% 0.0% 0.0% 0.0% 0.0% 0.00% 0.00% 0.00%86 Fiji 81 0 77 0 2 2 0 0 0 0 2 2 0 -2 -2 0 0.0% 0.0% 0.0% 0.0% 0.0% 0.0% 0.0% 0.0% 0.0% 0.00% 0.01% 0.00%81 Bangladesh 83 0 78 0 1 1 18 0 0 0 1 1 18 -1 -1 -18 0.0% 0.0% 0.0% 0.0% 0.0% 0.0% 0.0% 0.0% 0.0% 0.00% 0.01% 0.00%88 Saudi Arabia 84 54 0 0 2 1 1 2 1 1 0 0 0 2 1 1 0.0% 0.0% 0.0% 0.0% 0.0% 0.0% 0.0% 0.0% 0.0% 0.01% 0.00% 0.00%87 Peru 85 0 79 0 1 1 10 0 0 0 1 1 10 -1 -1 -10 0.0% 0.0% 0.0% 0.0% 0.0% 0.0% 0.0% 0.0% 0.0% 0.00% 0.01% 0.00%66 Morocco 86 0 80 0 1 1 10 0 0 0 1 1 10 -1 -1 -10 0.0% 0.0% 0.0% 0.0% 0.0% 0.0% 0.0% 0.0% 0.0% 0.00% 0.01% 0.00%89 Algeria 87 0 81 0 1 1 4 0 0 0 1 1 4 -1 -1 -4 0.0% 0.0% 0.0% 0.0% 0.0% 0.0% 0.0% 0.0% 0.0% 0.00% 0.00% 0.00%90 Bolivia 88 0 82 0 1 1 3 0 0 0 1 1 3 -1 -1 -3 0.0% 0.0% 0.0% 0.0% 0.0% 0.0% 0.0% 0.0% 0.0% 0.00% 0.00% 0.00%91 Macedonia 89 0 83 0 1 1 2 0 0 0 1 1 2 -1 -1 -2 0.0% 0.0% 0.0% 0.0% 0.0% 0.0% 0.0% 0.0% 0.0% 0.00% 0.00% 0.00%92 Mozambique 90 0 84 0 1 1 1 0 0 0 1 1 1 -1 -1 -1 0.0% 0.0% 0.0% 0.0% 0.0% 0.0% 0.0% 0.0% 0.0% 0.00% 0.00% 0.00%93 Sierra Leone 91 0 85 0 1 1 1 0 0 0 1 1 1 -1 -1 -1 0.0% 0.0% 0.0% 0.0% 0.0% 0.0% 0.0% 0.0% 0.0% 0.00% 0.00% 0.00%94 Venezuela 92 0 86 0 1 1 1 0 0 0 1 1 1 -1 -1 -1 0.0% 0.0% 0.0% 0.0% 0.0% 0.0% 0.0% 0.0% 0.0% 0.00% 0.00% 0.00%95 Bosnia 93 0 87 0 1 1 1 0 0 0 1 1 1 -1 -1 -1 0.0% 0.0% 0.0% 0.0% 0.0% 0.0% 0.0% 0.0% 0.0% 0.00% 0.00% 0.00%96 Dominica 94 0 88 0 1 1 0 0 0 0 1 1 0 -1 -1 0 0.0% 0.0% 0.0% 0.0% 0.0% 0.0% 0.0% 0.0% 0.0% 0.00% 0.00% 0.00%97 Kuwait 94 55 0 0 1 1 0 1 1 0 0 0 0 1 1 0 0.0% 0.0% 0.0% 0.0% 0.0% 0.0% 0.0% 0.0% 0.0% 0.00% 0.00% 0.00%98 Nicaragua 94 0 88 0 1 1 0 0 0 0 1 1 0 -1 -1 0 0.0% 0.0% 0.0% 0.0% 0.0% 0.0% 0.0% 0.0% 0.0% 0.00% 0.00% 0.00%99 Uganda 94 0 88 0 1 1 0 0 0 0 1 1 0 -1 -1 0 0.0% 0.0% 0.0% 0.0% 0.0% 0.0% 0.0% 0.0% 0.0% 0.00% 0.00% 0.00%
Grand Total ## ## ## ## 49,614 26,462 316,559 24,807 13,231 158,280 24,807 13,231 158,280 0 0 0 100% 100% 100% 100% 100% 100% 100% 100% 100% 100% 100% 100%
Nr.O S HRank
Overall Source HostCountry
Dif.Absolute volume of deals ($US mln)
HostSourceOverall (Source+Host)

C. Empirical analysis of private equity activity 78
ratio of source / host activity, which is essentially net cross-border activity. In
total, 97 countries are listed, with 59 source and 93 host countries. The ranking
identifies large differences in cross-border investment activity compared to the
overall deal activity from Table 8 (column 1 displays the rank of overall deal
activity from Table 8). With regard to the explicative analysis and the derived top
43 countries, the shifts are within the top 44 countries. Only Mauritius, with a high
cross-border ranking (but unavailable explanatory data and less than 0.02%
overall activity) is excluded. The comparison simultaneously confirms the
selection of top country overall and top country for cross-border activity in the
explicative analysis. It indicates that the largest PE countries are also the most
active cross-border deal countries.
In the country results, the arrangement in the cross-border table is more diverse.
The major countries are the United States, United Kingdom, Germany, France,
Canada, and the Netherlands. The US, with 35% of all PE activity, is still the
most active country, but only twice the size of the UK, which is second, with 17%.
In general, more countries account for a higher portion of cross-border deals.
The top 19 countries have more than 1% of global activity each compared to the
overall activity from Table 8, which shows only six countries accounting for more
than 1% each. Within the top countries, Germany and France have more than
5%. Canada, the Netherlands, Israel, Japan, Switzerland, and Sweden follow
with more than 2% of activity each. Comparing the ranking of source and host
activity, the US and UK still rank one and two globally, but Germany and
France’s global rankings for source and host have changed. Germany is third as
source country and fourth as host country relative to the rest of the world. France
is fifth as source and third as host country. The differences in the global ranking
of source and host, in combination with the net balance of countries, indicate
concentration shifts of PE activity between countries. Germany is a net importer
of PE activity (columns 16–18 and 28–29) and the third most important source
country, but only the fourth most important host country. This constellation of
ranking is possible because the US and UK share 62% of source activity (column
28) but account as top countries for only 41.8% of host activity (column 29). The
US and UK rank as top countries in all variables. Germany, France, Canada and
the other countries differ clearly in their ranking by activity variables. The US
accounts for 36.4% of total participation, with 32.6% as source and 40.2% as
host country. While deal participation was the lowest segment for the US in Table

C. Empirical analysis of private equity activity 79
8, here it is the largest segment, with participation as source being lower than
participation as host.
Deal flow for the US has a similar distribution, with an average of 35.8% but with
47.6% in source and 23.9% in host. This indicates that the US has relatively
fewer participations with high deal flow investing abroad, and many participations
with less deal flow investing inbound. The outflow of deal flow is double the
amount of inflow, while host participation is one third higher than source
participation. The UK has more evenly distributed variables, with 22% to 25% for
source and 10% to 11% for host. Source activity is twice as large as host activity.
The UK has a diverse investment profile compared to the US, indicated by the
concentration of dependent variables. Germany and France, with nearly the
same overall activity of 5.4% and 5.3%, show a completely diverse profile in the
subsegments. Both countries have more host than source activity, but with a
different ratio: Germany has 4.0% to 6.9% and France 3.1% to 7.6% (columns
28–29). Further breakdown indicates a difference in concentration of the source /
host deal flow ratio between Germany and France, with 2.4% to 7.1% and 1.8%
to 8.9% respectively (columns 24 and 27) — France has more overall deal flow
while Germany has more participations in deals. The table illustrates the ratio of
dependent variables for all countries as a percentage of total cross-border
activity as well as in absolute numbers. The shift in ranking is illustrated through
the red highlighted absolute numbers.
The analysis of country cross-sections identifies diverse country investment
behavior for domestic and cross-border, source and host, and the dependent
variables, expressing the need to understand exactly what affects different cross-
border behavior. The arrangement of overall, source, and host activity makes it
possible to comprehensively analyze the propensity of countries for PE activity,
but it is especially helpful to reveal country activity within the dual role of source
and host for cross-border investment.
This analyses display the time series and the cross-section as an initial picture of
growth and volume of activity over time and separately across countries, verifying
cross-border investment tendencies. The following analyses are rooted in this
foundation and analyze the data multidimensionally.

C. Empirical analysis of private equity activity 80
3. Descriptive analysis of private equity activity
The descriptive analyses investigate PE activity, with a focus on the three-
dimensional gravity model. The essential areas are investment activity evolution
by country, the affinity of countries toward each other, and country pair dynamics,
including investment rounds and partnering. The analysis follows the path
developed in Figure 16.
The panel data analysis evaluates the source countries by deal flow,
participation, and activity, with each diversified into overall and cross-border
deals to identify time-specific patterns within and between countries.
The static gravity model analysis verifies the affinity of country pairs for all
dependent variables accumulated over all years under consideration. Initial
comprehensive analysis includes deal flow and activity as a percentage of
domestic and cross-border deals. The built-on analyses focus in depth on cross-
border deals only.
The dynamic gravity model with time component is the expansion of the previous
analyses. The model is broken down into country pair combinations over years,
focusing especially on the dynamics of country affinity during the significant time
periods of boom, peak, and downturn.
The PE-specific instances of investment round and number of investors
participating in a deal — defined as deal type (Chapter B.2.3.1.) — is analyzed
with a time series to identify the different behaviors for domestic and cross-
border investments over time.
Finally, an analysis of deal flow, scaled by GDP of source country, accounts for
country size and identifies financial centers over time and by country pairs.
3.1. Investments of a country over time — panel dat a
The panel data analysis investigates each of the 70 source countries for the time
series from 1980 through 2005. The graphs show the variables by source country
over time in the top section, and for overall deals (domestic and cross-border)
and cross-border deals at the bottom. The y-axis is capped to enhance the
amplitude of country activity. The patterns for the US and UK are displayed in
detail on the right of the graphs. The top twelve cross-border countries are
highlighted.

C. Empirical analysis of private equity activity 81
Deal flow: The first analysis is on deal flow. The following figure displays
patterns of source country activity by visualizing the intercepts and the slope for
each country in a time series. Similar slopes identify similarity in country activity,
while the intercept displays the amplitude as a scale factor.169
Figure 18: Panel of source countries — domestic and cross-border deal flow
The time series shows highly volatile patterns both within and between the
country time series. Absolute deal flow and growth rate for each country differ
over time. Referring to the terms of panel data regression, the countries vary by
slope and intercept at a certain time point. Although the country patterns are
highly volatile with different curves, they show a common evolution, with a
significant growth rate in the late ‘90s and a distinctive peak in the year 2000.
Country development varies significantly once the global downturn set in.
169 See Chapter B.2.2. — panel data and fixed-effect models.
Deal flow($ mln)
1980
1985
1990
1995
2000
2005
---Argentina
AustraliaA
ustriaBelgium
Berm
udaB
razilB
ulgariaC
ameroon
Canada
Caym
an Islands
Chile
China
Costa R
icaC
yprusC
zech Republic
Denm
arkEstonia
FinlandFrance
Germ
anyG
hanaG
reeceH
ong Kong
Hungary
IcelandIndia
IndonesiaIreland-R
epIsrael
ItalyJapan
Kuw
aitLithuania
Luxembourg
Madagascar
Malaysia
Mauritius
Mexico
Morocco
Netherlands
Netherlands A
ntilles
New
Zealand
Nigeria
Norw
ayPakistan
Philippines
Poland
PortugalR
omania
Russian Federation
Saudi A
rabia
Senegal
Singapore
Slovak R
epublic
SloveniaSouth A
fricaS
outh Korea
Spain
Sri LankaS
weden
Sw
itzerlandTaiw
anThailand
TunisiaTurkey
Ukraine
United A
rab Emirates
United K
ingdom
United S
tates of America
Vietnam
0200400600800
1,0001,2001,4001,6001,8002,000
South Korea
SpainS
ri LankaSw
edenSw
itzerlandTaiw
anThailand
TunisiaTurkey
Ukraine
United A
rab Emirates
United K
ingdom
United S
tates of America
Vietnam
100
Dealflow
Overall
Investing countries(Source of investment)
Deal flow($ mln)
Years
Cross border
Years
1980
1985
1990
1995
2000
2005
---A
rgentinaA
ustraliaAustria
Belgium
Bermuda
Brazil
BulgariaC
ameroon
Canada
Caym
an Islands
Chile
China
Costa R
icaC
yprusC
zech Republic
Denm
arkE
stoniaFinland
FranceG
ermany
Ghana
Greece
Hong K
ongH
ungaryIceland
IndiaIndonesia
Ireland-Rep
IsraelItaly
JapanK
uwait
LithuaniaLuxem
bourgM
adagascarM
alaysiaM
auritiusM
exicoM
oroccoN
etherlandsN
etherlands Antilles
New
Zealand
Nigeria
Norw
ayP
akistanPhilippines
PolandP
ortugalR
omania
Russian Federation
Saudi Arabia
SenegalS
ingaporeS
lovak Republic
Slovenia
South AfricaS
outh Korea
Spain
Sri LankaS
weden
Sw
itzerlandTaiw
anThailand
TunisiaTurkey
Ukraine
United A
rab Em
irates
United K
ingdom
United S
tates of Am
erica
Vietnam
0
200
400
600
800
1,000
1,200
1,400
South Africa
South K
orea
Spain
Sri LankaSw
edenS
witzerland
Taiwan
ThailandTunisia
TurkeyU
kraineU
nited Arab E
mirates
United K
ingdom
United S
tates of America
Vietnam
16
1
2
34
5
6
7
8
910
1112
12
34
5
6
78
910
11
12

C. Empirical analysis of private equity activity 82
In the overall deal flow, for example, are countries like Canada (5) or Singapore
(12) with two distinctive peaks; other countries, like the United States (1) or
Sweden (10), have only one. Some countries, like Canada (5) or Australia, have
an even larger second peak in 2005.
Comparing the individual country series of overall and cross-border activity to
each other, it is significant that countries differ in the relative degree of amplitude
between overall and cross-border activity at a certain point in time. Brazil and
France (4) (yellow boxes), for example, indicate greater domestic activity relative
to cross-border activity. Further, countries differ among each other in their
cyclical or anticyclical cross-border behavior relative to their domestic deals, such
as Canada (5) compared to France (4).
For some countries the slopes stay the same, such as Canada (5), Hong Kong
(11), Israel (7), and Singapore (12), while countries like France (4), Japan (8),
and Brazil have different slopes. The difference in absolute height and slope
between the US (1) and the UK (2) is especially obvious. The US has significant
overall PE activity beginning in the early 1980s; the UK has significant activity in
the ‘90s, with a larger proportion of cross-border deals relative to the US.
When comparing the panel data analysis to the cross-section analyses (Tables 8
and 9) and to the consolidated deal flow, the country time series indicate a
variety of dynamics across countries and across overall and cross-border deals.
This pattern, with its growth rates shown in the time series, indicates an
intersection of both a global and a country-specific trend.
Participation: The next analysis focuses on the panel data for source countries
over time for participation, excluding the effect of different deal size. It is
significant that this series is even more volatile than the previous deal flow
results, which is indicated by dependent variable participation, again, with its
sensitivity not impacted by deal size. The patterns differ significantly within the
countries compared to the deal flow graph.

C. Empirical analysis of private equity activity 83
Figure 19: Panel of source countries — domestic and cross-border participation
There are countries that have a low amplitude in the deal flow illustration but a
significant curve in participation, and vice versa. The most significant countries
are Canada (5), with a shift from a two-peak curve to a one-peak curve
compared to deal flow. France (4) has a large second amplitude in overall
participation, while the two peaks in the cross-border section are at the same
height and even inverse to the cross-border deal flow series. One extreme is
South Korea (yellow frame), which has a rapid growth rate in 1999 and a high
peak in 2000 in overall participation.
The US and the UK, as the most active countries, have different patterns. The
US has a large portion of the overall participation, with significant participation in
the mid-1980s and a second large peak in 2000, but without a significant early
peak in the cross-border deal. The UK has less participation compared to the US,
but significant presence in cross-border deal activity. The cross-border pattern of
the UK shows much activity in 1983 and 1984, and has a similar pattern as the
US from the beginning of the boom phase on, but with less amplitude. The
Participation
Participation
Overall
Investing countries(Source of investment)
Years
Cross border
Years
1980
1985
1990
1995
2000
2005
---A
rgentinaA
ustraliaA
ustriaB
elgiumB
ermuda
Brazil
Bulgaria
Cam
eroonC
anadaC
ayman Islands
Chile
China
Costa R
icaC
yprusC
zech Republic
Denm
arkE
stoniaFinland
FranceG
ermany
Ghana
Greece
Hong K
ongH
ungaryIceland
IndiaIndonesia
Ireland-Rep
IsraelItaly
JapanK
uwait
LithuaniaLuxem
bourgM
adagascarM
alaysiaM
auritiusM
exicoM
oroccoN
etherlandsN
etherlands Antilles
New
Zealand
Nigeria
Norw
ayP
akistanP
hilippinesP
olandP
ortugalR
omania
Russian Federation
Saudi Arabia
SenegalS
ingaporeS
lovak Republic
Slovenia
South Africa
South Korea
Spain
Sri Lanka
Sw
edenSw
itzerlandTaiw
anThailand
TunisiaTurkey
Ukraine
United A
rab Em
irates
United K
ingdom
United S
tates of Am
erica
Vietnam
0100200300400500600700800900
1,000
20S
outh Africa
South K
orea
Spain
Sri Lanka
Sw
edenS
witzerland
Taiwan
ThailandTunisia
TurkeyU
kraineU
nited Arab E
mirates
United K
ingdom
United S
tates of Am
erica
Vietnam
Participation
1980
1985
1990
1995
2000
2005
---A
rgentinaA
ustraliaA
ustriaB
elgiumB
ermuda
Brazil
BulgariaC
ameroon
Canada
Caym
an Islands
Chile
China
Costa R
icaC
yprusC
zech Republic
Denm
arkEstonia
FinlandFrance
Germ
anyG
hanaG
reeceH
ong Kong
Hungary
IcelandIndia
IndonesiaIreland-R
epIsrael
ItalyJapan
Kuwait
LithuaniaLuxem
bourgM
adagascarM
alaysiaM
auritiusM
exicoM
oroccoN
etherlandsN
etherlands Antilles
New
Zealand
Nigeria
Norw
ayP
akistanPhilippines
Poland
PortugalR
omania
Russian Federation
Saudi A
rabia
Senegal
Singapore
Slovak Republic
Slovenia
South A
fricaS
outh Korea
SpainSri Lanka
Sw
edenS
witzerland
Taiwan
ThailandTunisia
TurkeyU
kraineU
nited Arab Em
irates
United K
ingdom
United S
tates of America
Vietnam
0
50
100
150
200
250
14
South Africa
South Korea
SpainSri Lanka
Sweden
Switzerland
Taiwan
ThailandTunisia
TurkeyU
kraineU
nited Arab Em
irates
United K
ingdom
United S
tates of America
Vietnam
1
2
34
5
67 8
910
11
12
12
34
5
6
7 8
9
10
11
12

C. Empirical analysis of private equity activity 84
analysis of deal flow and participation as time series indicates different dynamics
between the countries and within each country for domestic and cross-border,
but also across their dependent variables, indicating differences in deal size or
investment partnering.
Activity: The following graph shows the comprehensive variable activity,
expressed as a percentage, for cross-border investments over time. It is the main
result of the panel data analysis of source countries, summarizing differing
behavior by dependent variable participation, deal participation, and deal flow for
each country. The graph shows the previous results with a smoother curve for
the series (for example, Canada with two peaks of activity resulting from the
average of deal flow, participation and deal participation).
Figure 20: Activity by country over time
The panel data analysis for participation, deal participation, and deal flow
identified differing source country behavior as well as a similarity of patterns over
time for both domestic and cross-border activity. The next step focuses on the
propensity of cross-border investments toward potential host country trading
partners.
3.2. Investments from source to host country — grav ity model
The gravity model analysis identifies the affinity of countries to each other for
cross-border investment as source and host. The following analyses investigate
a matrix of 6,510 (Chapter B.3.1.3.) basis data points. It also displays the
different country activity measurements over all years from 1980 through 2005.
Activity in % 0.014
Cross border
Investing countries(Source of investment)
Year
%
South Korea
Sri LankaSw
edenSw
itzerlandTaiw
anThailand
TunisiaTurkey
Ukraine
United A
rab Em
irates
United K
ingdom
United S
tates of Am
erica
Vietnam
1980
1985
1990
1995
2000
2005
---Argentina
AustraliaAustria
BelgiumBerm
udaB
razilBulgaria
Cam
eroonC
anadaC
ayman Islands
Chile
China
Costa R
icaC
yprusC
zech Republic
Denm
arkE
stoniaFinland
FranceG
ermany
Ghana
Greece
Hong K
ongH
ungaryIceland
IndiaIndonesia
Ireland-Rep
IsraelItaly
JapanK
uwait
LithuaniaLuxem
bourgM
adagascarM
alaysiaM
auritiusM
exicoM
oroccoN
etherlandsN
etherlands Antilles
New
Zealand
Nigeria
Norw
ayPakistan
PhilippinesPoland
PortugalR
omania
Russian Federation
Saudi Arabia
SenegalS
ingaporeSlovak R
epublic
SloveniaSouth Africa
South Korea
SpainSri Lanka
Sweden
Switzerland
Taiwan
ThailandTunisia
TurkeyU
kraineU
nited Arab Em
irates
United K
ingdom
United States of Am
erica
Vietnam
0.0000
0.0002
0.0004
0.0006
0.0008
0.0010
0.0012
0.0014
1
2
3
4
5
6
78
910
11
12

C. Empirical analysis of private equity activity 85
The graphs and tables highlight the pattern of core concentration of activity by
country pair, which is then used to generate further data and refine the
hypothesis that countries tend to have core trading partners in the private equity
business.
3.2.1. Overall investment activity
Overall country pair affinity for PE investment is analyzed by deal flow,
participation, and activity as a percentage, following the sequence of the previous
chapter. In the first analysis, the domestic deals with identical source and host
country are included for comparison of specific country-pair activity to domestic
activity. Country-pair activity is presented graphically by source and host country,
and further represented by tabular analysis ranking the country pairs for each
dependent variable to determine country affinity accumulated over time.
Deal flow: The graph below shows deal flow from 1980 through 2005 for host
countries, with source countries on the right; domestic deal flow of the UK and
the US is capped by US$7 billion. Source countries are displayed in alphabetical
order. A is in front, placing the UK (green) and the US (red) in the back of the
chart. Host countries are displayed from left to right, with domestic deals running
diagonally from left to right. The top 20 source / host deal-flow combinations are
numbered and highlighted, and listed in detail in Table 10 below.
In general, the graph presents an irregular pattern of country-pair activity,
although three main arrays stand out.170 The first array is domestic activity on the
diagonal, the second is US (red) and UK (green) source activity in the back, and
third, US host activity on the right. Besides the main arrays, many country pairs
with little or no activity appear, but in between single spots with significant
country activity arise, indicating a large propensity of interest toward a particular
country.
170 Compare matrix in Chapter B.3.1.3.

C. Empirical analysis of private equity activity 86
Figure 21: Deal flow overview — source country to host country with domestic deals
Even within the main arrays, activity is irregularly distributed. Domestic deals
vary largely, with the greatest domestic activity in the US (1), the UK (2), France
(5), Australia (14), and Canada (17). With regard to source activity of the US
(red) and the UK (green), the US invests heavily in a variety of host countries and
accounts for nine of the top 20 country-pair activities, but the irregular pattern
indicates a propensity toward particular countries. The UK has a strong affinity
toward four main host countries, with a relatively high amplitude compared to its
other host countries — the US (3), Germany (8), France (12), and the
Netherlands (15). The pattern of host country activity of the US indicates that it is
a major host for many countries, and especially for some, like the UK (3),
Canada (11), and Germany (20).
The following table presents an excerpt of the top 20 country pairs ranked by
deal-flow activity, detailing the rules behind country affinity.
---
Alg
eri
aA
rgen
tina
Aus
tra
liaA
ust
ria
Aze
rba
ijan
Ba
ngla
des
hB
elg
ium
Be
rmud
aB
oliv
iaB
osn
iaB
razi
lB
ritis
h V
irgin
Bu
lga
riaC
ame
roon
Ca
nad
aC
aym
an I
sla
nds
Ch
ileC
hin
aC
olo
mbi
aC
ost
a R
ica
Cro
atia
Cyp
rus
Cze
ch R
ep
ublic
De
nm
ark
Do
min
ica
Ecu
ad
orE
gyp
tE
l Sa
lva
dor
Est
oni
aF
ijiF
inla
ndF
r P
oly
nes
iaF
ran
ceG
erm
any
Gh
ana
Gre
ece
Ho
ng
Ko
ng
Hu
nga
ryIc
ela
nd
Ind
iaIn
do
nesi
aIr
elan
d-R
ep
Isra
el
Ital
yJa
pan
Jord
anK
aza
khst
an
Ke
nya
Lat
via
Lith
uan
iaL
uxe
mbo
urg
Ma
ced
oni
aM
ala
ysia
Mau
ritiu
sM
exic
oM
old
ova
Mon
aco
Mo
rocc
oM
oza
mbi
que
Ne
the
rlan
ds
Ne
the
rland
s A
ntil
les
New
Ze
ala
ndN
ica
ragu
aN
ige
ria
No
rway
Pak
ista
nP
eru
Ph
ilipp
ine
sP
ola
nd
Por
tug
alR
om
ania
Ru
ssia
n F
ede
ratio
nS
ierr
a L
eon
eS
ing
apor
eS
lova
k R
epu
blic
Slo
ven
iaS
outh
Afr
ica
So
uth
Ko
rea
Spa
inS
ri L
ank
aS
we
den
Sw
itze
rlan
dT
aiw
anT
anza
nia
Th
aila
nd
Tu
nisi
aT
urke
yU
gan
daU
kra
ine
Un
ited
Ara
b E
mira
tes
Uni
ted
Kin
gdo
mU
nite
d S
tate
s of
Am
eric
aV
en
ezu
ela
Vie
tna
mZ
am
bia
---Argentina
AustraliaAustria
BelgiumBermuda
BrazilBulgaria
CameroonCanada
Cayman IslandsChile
ChinaCosta Rica
CyprusCzech Republic
DenmarkEstonia
FinlandFrance
GermanyGhana
GreeceHong Kong
HungaryIceland
IndiaIndonesia
Ireland-RepIsrael
ItalyJapan
KuwaitLithuania
LuxembourgMadagascar
MalaysiaMauritius
MexicoMorocco
NetherlandsNetherlands Antilles
New ZealandNigeria
NorwayPakistan
PhilippinesPoland
PortugalRomania
Russian FederationSaudi Arabia
SenegalSingapore
Slovak RepublicSlovenia
South AfricaSouth Korea
SpainSri Lanka
SwedenSwitzerland
TaiwanThailand
TunisiaTurkey
UkraineUnited Arab Emirates
United KingdomUnited States of America
Vietnam
0
1,000
2,000
3,000
4,000
5,000
6,000
7,000
Investingcountries(Source of
investment)
Portfolio c. countries(Host of investment)
3 4
2
5
76
910
13
11
12
14
16
17
1819
20
A
1Deal flow
($ mln)
Z
8
15

C. Empirical analysis of private equity activity 87
Table 10: Top 20 country pairs — source country to host country deal flow
The top 20 country pairs listed represent $626.7 billion, or 87%, of global deal
flow ($720 billion). Listed are five domestic deals of the US, UK, France,
Australia, and Canada, and 15 cross-border deals, with diverse source and host
countries.
The US and the UK dominate cross-border deal-flow activity as source countries,
with the US listed nine times and the UK listed four times. Canada comes in 11th
and Germany 20th. The top host country cross-border listing is less concentrated,
with certain countries appearing several times: the US is listed three times,
France, Canada, Germany, and the Netherlands two times, and the UK,
Bermuda, Japan, Luxembourg, and South Korea each listed once. Comparing
the country pairs, including domestic and cross-border deals, by amount of deal
flow, domestic US deals account for $490 billion or 68% of global PE investment
deal flow, followed by the domestic deals of the UK, with 5% of global deal flow,
worth $35 billion. The next two significant pairs are the cross-border deals
between the US and the UK. The UK / US is the largest cross-border country-pair
combination, with a deal flow of $16.4 billion. This is 10.4% larger than the
transfer from the US to the UK ($14.9 billion). French domestic deals are listed
next, with 1.2% of global deal flow. France to France is the fifth largest country
pair and is the third largest domestic market, just ahead of Australia (14) and
Canada (17). The following country pairs account for less than 1% of the global
deal flow, with the US investing in France, Bermuda, Canada, Germany, Japan,
Netherlands, South Korea, and Luxembourg, as well as other countries scattered
Rank D CB Source Host Part. DP DF % Part. % DP % DF Activity1 United States of America United States of America 144,102 63,577 489,490 75.72% 68.96% 67.99% 70.89%2 United Kingdom United Kingdom 5,168 3,847 34,869 2.72% 4.17% 4.84% 3.91%3 x United Kingdom United States of America 2,939 1,205 16,424 1.54% 1.31% 2.28% 1.71%4 x United States of America United Kingdom 1,677 1,026 14,857 0.88% 1.11% 2.06% 1.35%5 France France 3,466 2,105 8,263 1.82% 2.28% 1.15% 1.75%6 x United States of America France 687 355 6,758 0.36% 0.39% 0.94% 0.56%7 x United States of America Bermuda 105 44 5,798 0.06% 0.05% 0.81% 0.30%8 x United Kingdom Germany 552 413 5,256 0.29% 0.45% 0.73% 0.49%9 x United States of America Canada 949 489 5,102 0.50% 0.53% 0.71% 0.58%
10 x United States of America Germany 587 330 4,901 0.31% 0.36% 0.68% 0.45%11 x Canada United States of America 1,122 355 4,792 0.59% 0.39% 0.67% 0.55%12 x United Kingdom France 580 407 4,756 0.30% 0.44% 0.66% 0.47%13 x United States of America Japan 289 227 4,468 0.15% 0.25% 0.62% 0.34%14 Australia Australia 1,546 1,295 3,409 0.81% 1.40% 0.47% 0.90%15 x United Kingdom Netherlands 132 92 3,361 0.07% 0.10% 0.47% 0.21%16 x United States of America Netherlands 323 164 2,962 0.17% 0.18% 0.41% 0.25%17 Canada Canada 1,433 720 2,924 0.75% 0.78% 0.41% 0.65%18 x United States of America South Korea 152 105 2,858 0.08% 0.11% 0.40% 0.20%19 x United States of America Luxembourg 28 18 2,782 0.01% 0.02% 0.39% 0.14%20 x Germany United States of America 910 341 2,712 0.48% 0.37% 0.38% 0.41%
Total 166,747 77,115 626,742 87.61% 83.64% 87.05% 86.10%Legend: D= Rank Dealflow; CB= Cross-border; Part.= Participation; DP= Deal-participation; DF= Dealflow

C. Empirical analysis of private equity activity 88
over the globe, while the UK focuses on its neighboring European countries —
Germany, France, and the Netherlands, and, of course, the US.
The country pair listing shows the dominance of the US in general, and with the
UK for cross-border deal flow in particular. Both countries are involved in all of
the top twenty country-pair activities, except the domestic deals of France,
Australia, and Canada. The source countries’ sequence of investing in host
countries indicates the source countries’ preference for particular target
countries.
The sequence of preference of host countries for the US (UK, France, Bermuda,
Canada, and Germany) differs significantly from that of the UK (US, Germany,
France, and the Netherlands). Differences occur in the dual role of a country as
source or host. France, for example, with its large domestic market, is not listed
under the top countries as a cross-border source country, whereas it is an
attractive host country. Australia, the fourth largest domestic market, is listed
neither as source nor host, indicating an isolated position in PE investment.
Canada, the fifth largest domestic market, has more cross-border deals with the
US than deals within its own domestic market.
Participation: The next step in the analysis ranks country pairs by participation
to reveal country activity without considering deal size. The following table
presents the results in the same layout as the previous table (Table 10),
highlighting that prior table’s deal-flow pairs for comparison.
Table 11: Top 20 country pairs — source country to host country participation
P D CB Source Host Part. DP DF % Part. % DP % DF Activity1 1 United States of America United States of America 144,102 63,577 489,490 75.72% 68.96% 67.99% 70.89%2 2 United Kingdom United Kingdom 5,168 3,847 34,869 2.72% 4.17% 4.84% 3.91%3 5 France France 3,466 2,105 8,263 1.82% 2.28% 1.15% 1.75%4 3 x United Kingdom United States of America 2,939 1,205 16,424 1.54% 1.31% 2.28% 1.71%5 4 x United States of America United Kingdom 1,677 1,026 14,857 0.88% 1.11% 2.06% 1.35%6 14 Australia Australia 1,546 1,295 3,409 0.81% 1.40% 0.47% 0.90%7 23 Germany Germany 1,470 980 2,548 0.77% 1.06% 0.35% 0.73%8 17 Canada Canada 1,433 720 2,924 0.75% 0.78% 0.41% 0.65%9 33 South Korea South Korea 1,353 1,071 1,488 0.71% 1.16% 0.21% 0.69%
10 11 x Canada United States of America 1,122 355 4,792 0.59% 0.39% 0.67% 0.55%11 9 x United States of America Canada 949 489 5,102 0.50% 0.53% 0.71% 0.58%12 20 x Germany United States of America 910 341 2,712 0.48% 0.37% 0.38% 0.41%13 37 India India 854 791 1,383 0.45% 0.86% 0.19% 0.50%14 24 Sweden Sweden 842 606 2,379 0.44% 0.66% 0.33% 0.48%15 32 x Israel United States of America 709 280 1,612 0.37% 0.30% 0.22% 0.30%16 6 x United States of America France 687 355 6,758 0.36% 0.39% 0.94% 0.56%17 63 Finland Finland 639 544 656 0.34% 0.59% 0.09% 0.34%18 10 x United States of America Germany 587 330 4,901 0.31% 0.36% 0.68% 0.45%18 29 x Japan United States of America 587 179 1,845 0.31% 0.19% 0.26% 0.25%20 40 Israel Israel 586 282 1,287 0.31% 0.31% 0.18% 0.26%
Total 171,626 80,379 607,700 90.18% 87.18% 84.41% 87.26%Legend: P= Rank Participation; D= Rank Dealflow; CB= Cross-border; Part.= Participation; DP= Deal-participation; DF= Dealflow

C. Empirical analysis of private equity activity 89
Table 11, which lists the top 20 country pairs by participation (including domestic
deals) encompasses 90% of global deal participation, 171,626 observations, and
84% of global deal flow. Compared to the previous deal flow table, Table 11
contains more domestic deals with a ratio of domestic to cross-border of 11 to 9.
The 11 countries (domestic deal) in order of rank are the US, UK, France,
Australia, Germany, Canada, South Korea, India, Sweden, Finland, and Israel. In
this view, eight country pairs are newly listed: Germany, South Korea, India,
Sweden, Finland, and Israel as domestic country pairs, and Israel / United States
and Japan / United States as cross-border country pairs. Comparing the ranks of
country pairs for deal flow and participation, large differences occur from rank 6
(Australia domestic) on. For example, Finland, with its domestic deals, ranks 17
in participation and 63 in deal flow, whereas the cross-border country pairs with
the US as source country rank lower compared to deal-flow rank. Overall, the US
is the dominant source and host country by participation, but with a shift in the
ratio of source to host (4 to 5) compared to the deal-flow analysis (9 to 3),
excluding domestic deals. The UK is listed only twice, as country with domestic
deal activity and with the US in cross-border participation, indicating that the UK’s
participation is very confined to its domestic market and to the US.
The comparison of results between deal flow and participation indicate country
pair-specific deal structures, and confirm the findings of the cross-section
analysis (Chapter C.2.2.) in the net ratio of import and export for the dependent
variables and a particular country. Comparison of the results between deal flow
and the participation analysis reveals the different deal characteristics within
country pairs — either few investors and / or high dollar volume, or many
investors and / or small deal size.
Activity: The analysis of activity, expressed as percentages, consolidates the
results of dependent variable participation, deal participation, and deal flow for
country pairs.

C. Empirical analysis of private equity activity 90
Table 12: Top 20 country pairs — source country to host country activity in percentage
The table lists the top 20 country pairs by activity, covering 87% of global activity.
In total, 10 domestic country pairs exist — US, UK, France, Australia, Germany,
South Korea, Canada, India, Sweden, and Finland. Among the 10 cross-border
pairs are four different source countries: the US appears five times, the UK three
times, and Canada and Germany once each. The six different host countries are:
US (three times), France and Germany (twice each), and Canada, Japan, and
UK (once each). The overall comparison of absolute and relative numbers of the
activity variables by country pair verifies a change of affinity between countries,
depending on which variable is used. The three analyses of deal flow,
participation, and activity as a percentage for country pairs, with primary focus on
the top 20 country pairs (including domestic deals), lead to several conclusions.
Overall PE activity is highly concentrated, with US domestic deal activity
accounting for more than 71% of global PE activity. Further, the activity is
concentrated in three main arrays, with differing density: first, the domestic deal
activity of countries; second, US and UK source country activity; and third, the
host country activity of the US. Although the US is the largest cross-border
investor, the UK has the greatest investment activity in the US. The irregular host
country sequences by particular source country verify that countries have a
propensity toward particular trading partners. If they did not have such
preferences, the host country sequence, including domestic deals, would be
identical for all source countries, which is not the case. The irregular patterns
support the hypothesis that country affinity or even aversion is triggered by
country pair-specific determinants.
A P D CB Source Host Part. DP DF % Part. % DP % DF Activity1 1 1 United States of America United States of America 144,102 63,577 489,490 75.72% 68.96% 67.99% 70.8877%2 2 2 United Kingdom United Kingdom 5,168 3,847 34,869 2.72% 4.17% 4.84% 3.9103%3 5 3 France France 3,466 2,105 8,263 1.82% 2.28% 1.15% 1.7507%4 3 4 x United Kingdom United States of America 2,939 1,205 16,424 1.54% 1.31% 2.28% 1.7110%5 4 5 x United States of America United Kingdom 1,677 1,026 14,857 0.88% 1.11% 2.06% 1.3525%6 14 6 Australia Australia 1,546 1,295 3,409 0.81% 1.40% 0.47% 0.8967%7 23 7 Germany Germany 1,470 980 2,548 0.77% 1.06% 0.35% 0.7296%8 33 9 South Korea South Korea 1,353 1,071 1,488 0.71% 1.16% 0.21% 0.6932%9 17 8 Canada Canada 1,433 720 2,924 0.75% 0.78% 0.41% 0.6466%
10 9 11 x United States of America Canada 949 489 5,102 0.50% 0.53% 0.71% 0.5792%11 6 16 x United States of America France 687 355 6,758 0.36% 0.39% 0.94% 0.5616%12 11 10 x Canada United States of America 1,122 355 4,792 0.59% 0.39% 0.67% 0.5469%13 37 13 India India 854 791 1,383 0.45% 0.86% 0.19% 0.4995%14 8 23 x United Kingdom Germany 552 413 5,256 0.29% 0.45% 0.73% 0.4895%15 24 14 Sweden Sweden 842 606 2,379 0.44% 0.66% 0.33% 0.4768%16 12 21 x United Kingdom France 580 407 4,756 0.30% 0.44% 0.66% 0.4689%17 10 18 x United States of America Germany 587 330 4,901 0.31% 0.36% 0.68% 0.4491%18 20 12 x Germany United States of America 910 341 2,712 0.48% 0.37% 0.38% 0.4083%19 13 35 x United States of America Japan 289 227 4,468 0.15% 0.25% 0.62% 0.3394%20 63 17 Finland Finland 639 544 656 0.34% 0.59% 0.09% 0.3390%
Total 171,165 80,684 617,436 89.94% 87.51% 85.76% 87.74%Legend: A= Rank Activity; P= Rank Participation; D= Rank Dealflow; CB= Cross-border; Part.= Participation; DP= Deal-participation; DF= Dealflow

C. Empirical analysis of private equity activity 91
3.2.2. Cross-border investment activity
To investigate country affinity in depth by identifying underlying rules and norms
of country relations, the analysis focuses on cross-border deals only. Paying
attention to country pairs with less activity — while accounting for country size
and the accumulation of deals over time, indicating maturity of the PE market —
helps to refine the analytic process. The matrix comprises 59 source and 93 host
countries, covering deals from 1980 through 2005. Country pair activity is
presented graphically for deal flow and activity as a percentage, similar to the
previous graph, but with a reversed source country axis and excluding the
diagonal domestic array. The top 10 cross-border deals, and additionally the top
20 cross-border deals without the US and the UK, are listed by rank of activity as
a percentage. The top 10 cross-border deal country pairs are taken from the
previous listed results from the top 20 country pairs by activity as a percentage
(Table 12).
Deal flow: The graph shows the investment flow for host and source country
pairs from 1980 through 2005, with deal flow capped at US $5 billion to
emphasize patterns in the matrix and to identify underlying rules of affinity.

C. Empirical analysis of private equity activity 92
Figure 22: Cross-border deals from 1980 through 2005 by deal flow
The analysis accounts for the cross-border activity of the two main arrays: US /
UK source activity and US host activity, but it emphasizes the large array of
single spot country pair combinations with significant country activity apart from a
US presence. The top 10 cross-border deals by deal flow of country pairs are
dominated by three source countries (US (six times), the UK (three times), and
Canada (once)), and seven host countries (US, France, Germany, each listed
twice, and UK, Canada, Bermuda, and Japan, each listed once), verifying the
---
Alg
eria
Arg
entin
aA
ustr
alia
Aus
tria
Aze
rbai
jan
Ban
glad
esh
Bel
gium
Ber
mud
aB
oliv
iaB
osni
aB
razi
lB
ritis
h V
irgin
Bul
garia
Cam
eroo
nC
anad
aC
aym
an I
slan
ds
Chi
leC
hina
Col
ombi
aC
osta
Ric
aC
roat
iaC
ypru
sC
zech
Rep
ublic
Den
mar
kD
omin
ica
Ecu
ador
Egy
ptE
l Sal
vado
rE
ston
iaFiji
Fin
land
Fr
Pol
ynes
iaF
ranc
eG
erm
any
Gha
naG
reec
eH
ong
Kon
gH
unga
ryIc
elan
dIn
dia
Indo
nesi
aIr
elan
d-R
epIs
rael
Ital
yJa
pan
Jord
anK
azak
hsta
nK
enya
Latv
iaLi
thua
nia
Luxe
mbo
urg
Mac
edon
iaM
alay
sia
Mau
ritiu
sM
exic
oM
oldo
vaM
onac
oM
oroc
coM
ozam
biqu
eN
ethe
rlan
dsN
ethe
rlan
ds A
ntill
esN
ew Z
eala
ndN
icar
agua
Nig
eria
Nor
way
Pak
ista
nP
eru
Phi
lippi
nes
Pol
and
Por
tuga
lR
oman
iaR
ussi
an F
eder
atio
nS
ierr
a Le
one
Sin
gapo
reS
lova
k R
epub
licS
love
nia
Sou
th A
fric
aS
outh
Kor
eaS
pain
Sri
Lan
kaS
wed
enS
witz
erla
ndTa
iwan
Tan
zani
aT
haila
ndTu
nisi
aTu
rkey
Uga
nda
Ukr
aine
Uni
ted
Ara
b E
mira
tes
Uni
ted
Kin
gdom
Uni
ted
Sta
tes
of A
mer
ica
Ven
ezue
laV
ietn
amZa
mbi
a
---Argentina
AustraliaAustria
BelgiumBermuda
BrazilBulgaria
CameroonCanada
Cayman IslandsChile
ChinaCosta Rica
CyprusCzech Republic
DenmarkEstonia
FinlandFrance
GermanyGhana
GreeceHong Kong
HungaryIceland
IndiaIndonesia
Ireland-RepIsrael
ItalyJapan
KuwaitLithuania
LuxembourgMadagascar
MalaysiaMauritius
MexicoMorocco
NetherlandsNetherlands Antilles
New ZealandNigeria
NorwayPakistan
PhilippinesPoland
PortugalRomania
Russian FederationSaudi Arabia
SenegalSingapore
Slovak RepublicSlovenia
South AfricaSouth Korea
SpainSri Lanka
SwedenSwitzerland
TaiwanThailand
TunisiaTurkey
UkraineUnited Arab Emirates
United KingdomUnited States of America
Vietnam
0
500
1,000
1,500
2,000
2,500
3,000
3,500
4,000
4,500
5,000
Deal flow($ mln)
Investingcountries(Source of
investment)
Portfolio c. countries(Host of investment)
3
4
2
5
7
6
8
9
10
13
11
12
14
15
16
17
18
19
20
A
1
Germany/USA
Netherlands/USA
Top 10 Cross-border deals Top 20 Cross-border deals without US and UK
Nr. Source Host Nr. Source Host Nr. Source Host1 United Kingdom United States of America 1 Hong Kong South Korea 11 Hong Kong Singapore
2 United States of America United Kingdom 2 Singapore India 12 Sweden France
3 United States of America France 3 Hong Kong China 13 South Korea China
4 United States of America Bermuda 4 Netherlands France 14 Hong Kong Australia
5 United Kingdom Germany 5 Australia New Zealand 15 Switzerland France
6 United States of America Canada 6 Belgium France 16 Hong Kong India
7 United States of America Germany 7 Singapore China 17 Hong Kong Taiwan
8 Canada United States of America 8 Netherlands Denmark 18 Germany France
9 United Kingdom France 9 Sweden Finland 19 Singapore Australia
10 United States of America Japan 10 Hong Kong Japan 20 Hong Kong Indonesia
1 2 3 45
67
8
910

C. Empirical analysis of private equity activity 93
irregular pattern of deal activity of the top country pairs. The top 20 country pair
listing, excluding the US and UK, confirms the concentration of deals in nine
source countries, with Hong Kong, Singapore, the Netherlands, and Sweden
having multiple host countries, and Australia, Belgium, Germany, South Korea,
and Switzerland having one host country each in the top 20 list. The host deal
flow is less concentrated, having a total of 12 countries, with France, China,
Australia, and India being multiple hosts, and Denmark, Finland, Indonesia,
Japan, New Zealand, Singapore, South Korea, and Taiwan listed once each as
host.
Focusing on the pattern of country pair activity without the US and the UK, three
main categories are prominent in the array: first, empty spots that indicate no
country pair activity; second, single columns within a source and host country
series, like the country pairs Australia / New Zealand (5) and Belgium / France
(6), that indicate a strong affinity of one particular country pair; and third, a series
of columns, like the source series of Hong Kong with its eight host countries (1,
3, 10, 11, 14, 16, 17, 20), or Singapore with three host countries (2, 7, 19),
indicating countries with affinity toward several particular host countries. To
explore patterns of affinity further, the countries are arranged by trading partner.
Hong Kong as source country, for example, is listed with its nearby and bordering
countries — South Korea, China, Japan, Singapore, Australia, India, Taiwan, and
Indonesia. Singapore is listed with India, China, and Australia. The Netherlands
is listed with the hosts France and Sweden, and source country Sweden with
hosts Finland and France. Country pairs seem to be related by geographical and
economic distance, verified further through the single host pairs: Australia / New
Zealand, Belgium / France, Germany / France, South Korea / China, and
Switzerland / France. The findings support the assumptions of the gravity model
— that the closer the proximity and the larger the economy, the greater the
chances for cross-border activity.
Activity: This analysis evaluates country pairs by comprehensive variable
activity as a percentage. This is used as the core ranking parameter to further
explore country affinity patterns, with special attention to participation and deal
participation. The graphic analysis is refined by tabular analysis of absolute
numbers. The following graph shows the investment flow for host and source
country pairs of the previous graph (Figure 22) with variable activity capped at

C. Empirical analysis of private equity activity 94
0.005% of global deal activity, including both the top 10 and top 20 cross-border
pairs, but excluding the US and the UK.
Figure 23: Cross-border deals from 1980 through 2005 by activity
The graph illustrates an overall pattern similar to the previous deal flow analysis,
but with minor shifts in the major arrays as shown in the two country pair tables.
The top 10 cross-border deals by activity of country pairs are dominated by 4
source countries (the US (five times), the UK (three times) and Canada and
Alg
eria
Arg
entin
aA
ustr
alia
Aus
tria
Aze
rba
ijan
Ba
ngla
desh
Bel
giu
mB
erm
uda
Bo
livia
Bo
snia
Bra
zil
Brit
ish
Virg
inB
ulg
aria
Cam
ero
onC
ana
daC
aym
an Is
land
sC
hile
Ch
ina
Co
lom
bia
Cos
ta R
ica
Cro
atia
Cyp
rus
Cze
ch R
epu
blic
Den
mar
kD
omin
ica
Ecu
ador
Eg
ypt
El S
alv
ado
rE
ston
iaFiji
Fin
lan
dF
r P
oly
nesi
aF
ranc
eG
erm
any
Gha
naG
reec
eH
ong
Kon
gH
unga
ryIc
ela
ndIn
dia
Indo
nes
iaIr
elan
d-R
epIs
rael
Italy
Jap
anJo
rdan
Kaz
akhs
tan
Ken
yaLa
tvia
Lith
uan
iaLu
xem
bour
gM
aced
onia
Mal
aysi
aM
aurit
ius
Me
xico
Mol
dov
aM
ona
coM
oroc
coM
ozam
biq
ueN
eth
erla
nds
Net
herl
ands
Ant
illes
New
Zea
land
Nic
arag
ua
Nig
eria
Nor
wa
yP
akis
tan
Per
uP
hilip
pine
sP
ola
ndP
ortu
gal
Rom
ania
Rus
sian
Fed
era
tion
Sie
rra
Leon
eS
inga
pore
Slo
vak
Rep
ublic
Slo
veni
aS
outh
Afr
ica
Sou
th K
ore
aS
pain
Sri
Lan
kaS
wed
en
Sw
itze
rland
Ta
iwa
nT
anza
nia
Tha
iland
Tun
isia
Tur
key
Uga
nda
Ukr
aine
Un
ited
Ara
b E
mir
ates
Uni
ted
Kin
gdo
mU
nite
d S
tate
s o
f Am
eric
aV
ene
zuel
aV
ietn
amZ
am
bia---
---Argentina
AustraliaAustria
BelgiumBermuda
BrazilBulgaria
CameroonCanada
Cayman IslandsChile
ChinaCosta Rica
CyprusCzech Republic
DenmarkEstonia
FinlandFrance
GermanyGhana
GreeceHong Kong
HungaryIceland
IndiaIndonesia
Ireland-RepIsrael
ItalyJapan
KuwaitLithuania
LuxembourgMadagascar
MalaysiaMauritius
MexicoMorocco
NetherlandsNetherlands Antilles
New ZealandNigeriaNorwayPakistanPhilippines
PolandPortugalRomaniaRussian FederationSaudi ArabiaSenegalSingaporeSlovak RepublicSloveniaSouth Africa
South KoreaSpainSri LankaSwedenSwitzerlandTaiwanThailandTunisia
TurkeyUkraineUnited Arab EmiratesUnited KingdomUnited States of AmericaVietnam
0.000
0.001
0.001
0.002
0.002
0.003
0.003
0.004
0.004
0.005
0.005
Portfolio c. countries(Host of investment)
Activity%
Investingcountries(Source of
investment)
2
4
57
612
15
13
8
17
16
18
A
1 3
10
19149 20
11
Top 10 Cross-border deals Top 20 Cross-border deals without US and UK
Nr. Source Host Nr. Source Host Nr. Source Host1 United Kingdom United States of America 1 Hong Kong South Korea 11 France Germany
2 United States of America United Kingdom 2 Hong Kong China 12 Switzerland France
3 United States of America Canada 3 Netherlands France 13 Hong Kong Singapore
4 United States of America France 4 Singapore India 14 France Switzerland
5 Canada United States of America 5 Australia New Zealand 15 Netherlands Germany
6 United Kingdom Germany 6 Sweden Finland 16 Sweden Denmark
7 United Kingdom France 7 Belgium France 17 Hong Kong Australia
8 United States of America Germany 8 Switzerland Germany 18 Netherlands Belgium
9 Germany United States of America 9 Finland Sweden 19 Hong Kong Taiwan
10 United States of America Japan 10 Singapore China 20 Hong Kong India
12
34
5
6
78
9
10

C. Empirical analysis of private equity activity 95
Germany (once each)) and six host countries (the US (three times), France,
Germany (twice each) and the UK, Canada and Japan (once each)), verifying a
higher concentration of host countries compared to deal flow. The top 20 country
pair listing, excluding the US and the UK, shows nine source countries, with
Hong Kong, the Netherlands, France, Singapore, Sweden, and Switzerland
having multiple host countries, and Australia, Belgium, and Finland each having
one host country. The deal flow cross-border analysis (Figure 22) included
source countries Germany and South Korea. Here they are displaced by France
and Finland. The activity table of top 20 cross-border deals (Figure 23) lists a
total of 14 host countries. France, Germany, China, and India have multiple
hosts, and Australia, Belgium, Denmark, Finland, New Zealand, Singapore,
South Korea, Sweden, Switzerland, and Taiwan have a single host each.
Indonesia and Japan are no longer listed as top hosts compared to the previous
deal flow analysis table (Figure 22), while Germany, Belgium, Sweden, and
Switzerland are included, highlighting more participation-oriented countries. The
following tables refine the analysis of country affinity by including quantitative
data. To capture the differences in variables, this table shows the top 30 country
pairs.
Table 13: Top 30 country pairs — cross-border activity
CB Nr. Source Host Part. DP DF % Part. % DP %DF Activity1 4 United Kingdom United States of America 2,939 1,205 16,424 1.544% 1.307% 2.281% 1.711%2 5 United States of America United Kingdom 1,677 1,026 14,857 0.881% 1.113% 2.064% 1.352%3 10 United States of America Canada 949 489 5,102 0.499% 0.530% 0.709% 0.579%4 11 United States of America France 687 355 6,758 0.361% 0.385% 0.939% 0.562%5 12 Canada United States of America 1,122 355 4,792 0.590% 0.385% 0.666% 0.547%6 14 United Kingdom Germany 552 413 5,256 0.290% 0.448% 0.730% 0.489%7 16 United Kingdom France 580 407 4,756 0.305% 0.441% 0.661% 0.469%8 17 United States of America Germany 587 330 4,901 0.308% 0.358% 0.681% 0.449%9 18 Germany United States of America 910 341 2,712 0.478% 0.370% 0.377% 0.408%
10 19 United States of America Japan 289 227 4,468 0.152% 0.246% 0.621% 0.339%11 21 United States of America Bermuda 105 44 5,798 0.055% 0.047% 0.805% 0.303%12 22 Israel United States of America 709 280 1,612 0.373% 0.304% 0.224% 0.300%13 24 United States of America Netherlands 323 164 2,962 0.170% 0.178% 0.411% 0.253%14 25 Japan United States of America 587 179 1,845 0.308% 0.194% 0.256% 0.253%15 27 France United States of America 576 191 1,388 0.303% 0.207% 0.193% 0.234%16 29 United States of America China 306 169 2,317 0.161% 0.183% 0.322% 0.222%17 30 United Kingdom Netherlands 132 92 3,361 0.069% 0.100% 0.467% 0.212%18 31 United States of America Israel 422 225 1,132 0.222% 0.245% 0.157% 0.208%19 33 Taiwan United States of America 444 186 1,261 0.233% 0.202% 0.175% 0.203%20 34 United States of America South Korea 152 105 2,858 0.080% 0.114% 0.397% 0.197%21 36 United States of America India 202 164 2,035 0.106% 0.178% 0.283% 0.189%22 37 United States of America Ireland-Rep 152 85 2,621 0.080% 0.093% 0.364% 0.179%23 38 Netherlands United States of America 250 100 1,950 0.131% 0.108% 0.271% 0.170%24 39 Singapore United States of America 371 118 1,184 0.195% 0.128% 0.164% 0.162%25 42 United States of America Australia 241 177 996 0.127% 0.192% 0.138% 0.152%26 44 Switzerland United States of America 355 137 859 0.187% 0.148% 0.119% 0.151%27 45 United States of America Singapore 133 104 1,773 0.070% 0.113% 0.246% 0.143%28 46 United States of America Luxembourg 28 18 2,782 0.015% 0.019% 0.386% 0.140%29 47 United States of America Hong Kong 185 121 1,296 0.097% 0.132% 0.180% 0.136%30 49 Australia United States of America 297 183 379 0.156% 0.198% 0.053% 0.136%
Legend: CB= Rank Cross-border; O= Rank Overall (domestic+cross-border); Part.= Participation; DP= Deal-participation; DF= Dealflow

C. Empirical analysis of private equity activity 96
The US and the UK are part of each top 30-country pair, with the US 16 times as
source and 11 times as host. The UK is involved four times as source and only
once as host, but here it is the largest host country for the US. United Kingdom
activity is focused on neighboring countries Germany, France, and the
Netherlands, while US activity is more diverse geographically. The table lists nine
country pairs with investments in both directions, the US partnering with the
following countries: Australia, Canada, France, Germany, Israel, Japan, the
Netherlands, Singapore, and the UK. To sideline the impact of the US, the focus
here is on cross-border deals without the US as source country. The table covers
country pairs down to the rank of 65 and lists a total of 40 country pairs of cross-
border deals, showing the US as source country 25 times within the top 65
rankings.171
Table 14: Top 40 cross-border country pairs excluding the United States as source
CB Nr. Source Host Part. DP DF % Part. % DP %DF Activity1 4 United Kingdom United States of America 2,939 1,205 16,424 1.544% 1.307% 2.281% 1.711%5 12 Canada United States of America 1,122 355 4,792 0.590% 0.385% 0.666% 0.547%6 14 United Kingdom Germany 552 413 5,256 0.290% 0.448% 0.730% 0.489%7 16 United Kingdom France 580 407 4,756 0.305% 0.441% 0.661% 0.469%9 18 Germany United States of America 910 341 2,712 0.478% 0.370% 0.377% 0.408%
12 22 Israel United States of America 709 280 1,612 0.373% 0.304% 0.224% 0.300%14 25 Japan United States of America 587 179 1,845 0.308% 0.194% 0.256% 0.253%15 27 France United States of America 576 191 1,388 0.303% 0.207% 0.193% 0.234%17 30 United Kingdom Netherlands 132 92 3,361 0.069% 0.100% 0.467% 0.212%19 33 Taiwan United States of America 444 186 1,261 0.233% 0.202% 0.175% 0.203%23 38 Netherlands United States of America 250 100 1,950 0.131% 0.108% 0.271% 0.170%24 39 Singapore United States of America 371 118 1,184 0.195% 0.128% 0.164% 0.162%26 44 Switzerland United States of America 355 137 859 0.187% 0.148% 0.119% 0.151%30 49 Australia United States of America 297 183 379 0.156% 0.198% 0.053% 0.136%32 51 United Kingdom Sweden 186 137 991 0.098% 0.148% 0.138% 0.128%34 54 Hong Kong South Korea 44 30 2,034 0.023% 0.032% 0.283% 0.113%36 58 Netherlands United Kingdom 157 106 787 0.082% 0.115% 0.109% 0.102%38 60 United Kingdom Spain 96 69 1,138 0.050% 0.075% 0.158% 0.094%41 65 United Kingdom Ireland-Rep 102 64 904 0.054% 0.069% 0.126% 0.083%42 66 United Kingdom Italy 79 62 980 0.042% 0.068% 0.136% 0.082%44 69 Belgium United States of America 173 72 335 0.091% 0.078% 0.046% 0.072%45 70 United Kingdom Finland 101 78 551 0.053% 0.085% 0.076% 0.071%46 71 United Kingdom Switzerland 93 65 665 0.049% 0.070% 0.092% 0.071%47 72 Hong Kong United States of America 123 52 611 0.065% 0.056% 0.085% 0.069%48 73 Sweden United States of America 134 51 484 0.070% 0.055% 0.067% 0.064%50 76 Hong Kong China 62 36 722 0.033% 0.039% 0.100% 0.057%51 77 United Kingdom Belgium 51 34 748 0.027% 0.037% 0.104% 0.056%52 78 Netherlands France 64 32 621 0.034% 0.035% 0.086% 0.052%53 79 Singapore India 32 26 785 0.017% 0.028% 0.109% 0.051%54 81 United Kingdom Denmark 55 43 477 0.029% 0.046% 0.066% 0.047%55 82 Australia New Zealand 48 43 488 0.025% 0.046% 0.068% 0.046%56 83 Sweden Finland 60 45 409 0.032% 0.049% 0.057% 0.046%57 84 Belgium France 70 32 460 0.037% 0.034% 0.064% 0.045%58 85 Switzerland Germany 95 50 213 0.050% 0.055% 0.030% 0.045%59 87 Finland Sweden 86 65 124 0.045% 0.071% 0.017% 0.044%60 88 Singapore China 63 32 452 0.033% 0.035% 0.063% 0.044%61 89 Malaysia United States of America 95 59 107 0.050% 0.064% 0.015% 0.043%62 90 France Germany 98 49 168 0.051% 0.053% 0.023% 0.043%64 93 Finland United States of America 92 35 288 0.048% 0.038% 0.040% 0.042%65 94 France United Kingdom 75 40 305 0.039% 0.043% 0.042% 0.042%
Legend: CB= Rank Cross-border; O= Rank Overall (domestic+cross-border); Part.= Participation; DP= Deal-participation; DF= Dealflow
171 For an overview of the top 300 country-pair combinations, see Appendix.

C. Empirical analysis of private equity activity 97
The table demonstrates that the first 33 country pair activities are dominated by
the UK (five as source, one as host) and especially by the US (17 as source, 11
as host). The first country pair without participation of the US or UK is Hong Kong
to South Korea, ranked 34th, followed by 11 other country pairs, in a confined
range between rank 50 for Hong Kong / China to rank 62 for France / Germany.
The US is listed as host country 15 times, with a high ranking different to the UK,
with two listings of relatively low ranking (36, 65).
The results are combined to derive the sequences of host countries for each
source country to support the assumption of the underlying distance and mass
theory. The following table presents all 59 source countries ranked by most to
least country-pair activity, with the top 10 most important host countries listed in
descending order from left to right. Table 12 shows the largest concentration both
by country pair and host sequence.
Table 15: Overview of importance of host country for source country Source Host country by activity
1 2 3 4 5 6 7 8 9 101 United Kingdom 1.711% USA Germany France Netherlands Sweden Spain Ireland-Rep Italy Finland Switzerland2 USA 1.352% United Kingdom Canada Japan Bermuda China Israel South Korea India Ireland-Rep Australia3 Canada 0.547% USA Germany United Kingdom France China India Israel South Korea Brazil Sweden4 Germany 0.408% USA United Kingdom Israel France Switzerland Austria Sweden Netherlands Canada Italy5 Israel 0.300% USA France Japan United Kingdom Germany Singapore Netherlands Denmark Canada6 Japan 0.253% USA United Kingdom South Korea Hong Kong China Israel Singapore Malaysia France Sweden7 France 0.234% USA Germany United Kingdom Switzerland Belgium Sweden Netherlands Spain Italy Canada8 Taiwan 0.203% USA China South Korea Israel France Hong Kong Japan Canada Australia Singapore9 Netherlands 0.170% USA United Kingdom France Germany Belgium Denmark Switzerland Sweden Italy Israel
10 Singapore 0.162% USA India China Australia Hong Kong United Kingdom Indonesia South Korea France Taiwan11 Switzerland 0.151% USA Germany France Italy United Kingdom Sweden Denmark Canada Israel Austria12 Australia 0.136% USA New Zealand United Kingdom Singapore Hong Kong Italy South Korea Canada Indonesia Netherlands13 Hong Kong 0.113% South Korea USA China Singapore Australia Taiwan India Japan Indonesia Thailand14 Belgium 0.072% USA France United Kingdom Netherlands Germany Switzerland Spain Israel Ireland-Rep Canada15 Sweden 0.064% USA Finland Denmark France Norway Germany Switzerland United Kingdom Netherlands Belgium16 Finland 0.044% Sweden USA Denmark South Korea Norway Switzerland Netherlands Estonia Canada Lithuania17 Malaysia 0.043% USA Thailand Singapore India Australia United Kingdom Hong Kong South Korea Germany18 India 0.041% USA South Korea Singapore United Kingdom Indonesia Canada Sri Lanka Denmark Hong Kong Germany19 Denmark 0.037% USA United Kingdom Sweden Germany Finland France Switzerland Thailand China Croatia20 Ireland-Rep 0.035% United Kingdom USA Germany21 Italy 0.033% USA United Kingdom Israel France Spain Belgium Germany Netherlands Ireland-Rep China22 South Korea 0.032% USA China Hong Kong Israel Japan United Kingdom Austria Argentina23 Norway 0.029% USA Sweden Denmark United Kingdom Switzerland Finland Kenya Germany Canada Sri Lanka24 China 0.025% USA Hong Kong Japan New Zealand Philippines Taiwan25 Luxembourg 0.023% France USA Germany Sweden Finland United Kingdom Netherlands Italy Kenya Belgium26 Mauritius 0.018% India USA27 Russian Federation 0.018% USA United Kingdom Ukraine Switzerland France28 New Zealand 0.015% USA Australia United Kingdom29 Czech Republic 0.014% Poland Hungary Slovak Republic USA Bulgaria Sweden Estonia Bermuda Austria Denmark30 Austria 0.012% Germany Hungary Switzerland Czech Republic India Denmark Bosnia Russian FederationCroatia United Kingdom31 Brazil 0.012% USA Argentina Chile Denmark British Virgin32 South Africa 0.008% USA Netherlands33 Poland 0.008% Czech Republic Russian FederationRomania USA Croatia Slovak Republic Bulgaria Hungary Ireland-Rep Estonia34 Spain 0.008% USA United Kingdom Germany Portugal France Netherlands35 Indonesia 0.007% USA Singapore36 Philippines 0.005% USA Singapore China United Kingdom Malaysia Canada37 Bermuda 0.004% USA India Azerbaijan United Kingdom Kazakhstan Russian FederationGermany38 Greece 0.004% Romania Cyprus Bulgaria USA France Ireland-Rep Macedonia Moldova Switzerland39 Romania 0.004% Spain Canada40 Netherlands Antilles 0.004% France Finland41 Madagascar 0.003% USA United Kingdom42 Hungary 0.003% USA Netherlands Romania Russian FederationBelgium Germany43 Portugal 0.003% United Kingdom Spain USA Poland Germany44 Cayman Islands 0.003% USA Israel Australia United Kingdom45 Ukraine 0.002% Moldova USA46 Argentina 0.002% USA Brazil47 United Arab Emirates 0.001% India United Kingdom48 Iceland 0.001% United Kingdom USA Norway49 Slovenia 0.001% USA50 Saudi Arabia 0.001% USA51 Chile 0.001% Brazil USA52 Estonia 0.001% Russian FederationUSA53 Nigeria 0.001% United Kingdom South Africa Israel54 Senegal 0.001% Kenya Uganda55 Thailand 0.001% Singapore56 Costa Rica 0.001% El Salvador57 Kuwait 0.001% United Kingdom58 Sri Lanka 0.001% USA59 Mexico 0.000% Singapore
Largestactivity
Rank

C. Empirical analysis of private equity activity 98
The table ranks the percentage of global PE deal activity for each source country
with primary host deal activity. The ranking indicates the degree of global deal
concentration between a source country and its primary host. The UK is the
largest source with the US as host, accounting for global activity of 1.7%. The US
with host UK follows with 1.35%. The remaining source countries with their
primary sources account for global activity under 1%.
The irregular sequences of host countries indicate that no valid global sequence
of host countries exists for all source countries. Otherwise, each column by rank
would have to contain the identical host country. Although previous analysis
verified that the US is the primary host country with the expected large impact, 20
countries — one third — have different key trade partners. To identify patterns of
country pair affinity, source countries are analyzed individually for a country-
specific sequence. The UK focuses on the US and on European countries,
especially neighboring countries: Germany, France, the Netherlands, Sweden,
Spain, Ireland, Italy, Finland, Switzerland, Belgium, and Denmark. The US
invests globally, although a sequence of United Kingdom, Canada, Japan,
Bermuda, China, Israel, South Korea, India, Ireland, and Australia supports the
assumption of country affinity through geographic and economic distance.
Similar pattern arise by investigating other source countries with their hosts,
especially by source countries whose primary host is not the US, like Hong Kong
/ South Korea, Finland / Sweden, Ireland / United Kingdom, Luxembourg /
France, Mauritius / India, Czech Republic / Poland, Austria / Germany, etc. The
sequences emphasize which country is best adapted to niches in the global PE
market when competing against large players like the US and the UK. The
patterns indicate that the host selections are a mix of first-choice and next-best
opportunities to compete against other players.
The analysis of cross-border investments identifies rules and patterns inherent in
the country-pair combinations that are influenced by the role of large PE
countries, such as the US and the UK. The patterns further support the
assumption of the gravity model.
3.3. Dynamics of cross-border activity — the gravit y model over time
The analysis of dynamics combines the gravity model and the time series to
investigate the evolution of cross-border activity and the shifts of propensity of

C. Empirical analysis of private equity activity 99
source countries toward other host countries. The analysis breaks down the
observations into selected segments of country-pair combinations over time,
focusing on the dynamics of boom, peak, and downturn. The analytic steps are a
series of gravity model graphs by year, a tabular analysis of growth rate
development, and further, a time series analysis of the US, UK, and Hong Kong,
with their selection of first- and second-tier host countries compared to world
activity.
The following graph shows the activity for host and source country pair for the
years 1999 and 2000, and explores the dynamics for the year with the largest
growth rate to the year with the highest volume (Chapter C.3.1.). The graph
further lists the top 20 country pairs for each year and assigns growth rates for
the year 2000.
Figure 24: Investment activity dynamics of source and host country for 1999 and 2000
The graph shows the main patterns of activity for the US and the UK as source
countries, and the US as host country with irregular distribution. The comparison
of graphs validates not only large growth, but also relative shifts of activity,
especially in the main arrays of the US. That PE activity is globally more
---
Alg
eria
Arg
entin
aA
ustr
alia
Aus
tria
Aze
rbai
jan
Bang
lade
sh
Belg
ium
Ber
mud
a
Bol
ivia
Bos
nia
Bra
zil
Brit
ish
Virg
in
Bul
gari
a
Cam
eroo
nC
anad
aC
aym
an Is
land
s
Chi
leC
hina
Col
ombi
aC
osta
Ric
a
Cro
atia
Cyp
rus
Cze
ch R
epub
licD
enm
ark
Dom
inic
a
Ecu
ador
Egy
ptE
l Sal
vado
r
Esto
nia
Fiji
Finl
and
Fr P
olyn
esia
Fran
ceG
erm
any
Gha
na
Gre
ece
Hon
g K
ong
Hun
gary
Icel
and
Indi
aIn
done
sia
Irel
and-
Rep
Isra
elIta
lyJa
pan
Jord
anK
azak
hsta
nK
enya
Latv
iaLi
thua
nia
Luxe
mbo
urg
Mac
edon
ia
Mal
aysi
aM
aurit
ius
Mex
ico
Mol
dova
Mon
aco
Mor
occo
Moz
ambi
que
Net
herla
nds
Net
herla
nds
Antil
les
New
Zea
land
Nic
arag
uaN
iger
iaN
orw
ayP
akis
tan
Per
uP
hilip
pine
sP
olan
dP
ortu
gal
Rom
ania
Rus
sian
Fed
erat
ion
Sie
rra
Leon
eS
inga
pore
Slo
vak
Rep
ublic
Slo
veni
aS
outh
Afri
caSo
uth
Kor
eaS
pain
Sri
Lank
aSw
eden
Sw
itzer
land
Tai
wan
Tanz
ania
Thai
land
Tuni
sia
Turk
eyU
gand
aU
krai
neU
nite
d Ar
ab E
mira
tes
Uni
ted
Kin
gdom
Uni
ted
Sta
tes
of A
mer
ica
Ven
ezue
laV
ietn
amZ
ambi
a
---Argentina
AustraliaAustria
BelgiumBermuda
BrazilBulgaria
CameroonCanada
Cayman IslandsChile
ChinaCosta Rica
CyprusCzech Republic
DenmarkEstonia
FinlandFrance
GermanyGhana
GreeceHong Kong
HungaryIceland
IndiaIndonesia
I reland-RepIsrael
ItalyJapan
KuwaitLithuania
LuxembourgMadagascar
MalaysiaMauritius
MexicoMorocco
NetherlandsNetherlands Antilles
New ZealandNigeria
NorwayPakistan
PhilippinesPoland
PortugalRomania
Russian FederationSaudi Arabia
SenegalSingapore
Slovak RepublicSlovenia
South AfricaSouth Korea
SpainSri Lanka
SwedenSwitzerland
TaiwanThailand
TunisiaTurkey
UkraineUnited Arab Emirates
United KingdomUnited States of America
Vietnam
0.0000
0.0001
0.0002
0.0003
0.0004
0.0005
0.0006
0.0007
0.0008
0.0009
0.0010
Source--
-
Alg
eria
Arg
entin
a
Aus
tralia
Aust
ria
Aze
rbai
jan
Ban
glad
esh
Bel
gium
Ber
mud
aBo
livia
Bosn
iaB
razi
l
Brit
ish
Virg
inBu
lgar
ia
Cam
eroo
nC
anad
aC
aym
an Is
land
s
Chi
le
Chi
naC
olom
bia
Cos
ta R
ica
Cro
atia
Cyp
rus
Cze
ch R
epub
licD
enm
ark
Dom
inic
a
Ecu
ador
Egy
ptEl
Sal
vado
rE
ston
iaFiji
Finl
and
Fr P
olyn
esia
Fra
nce
Ger
man
yG
hana
Gre
ece
Hon
g K
ong
Hun
gary
Icel
and
Indi
aIn
done
sia
Irela
nd-R
epIs
rael
Italy
Japa
nJo
rdan
Kaz
akhs
tan
Ken
yaLa
tvia
Lith
uani
aLu
xem
bour
gM
aced
onia
Mal
aysi
aM
aurit
ius
Mex
ico
Mol
dova
Mon
aco
Mor
occo
Moz
ambi
que
Net
herla
nds
Net
herla
nds
Ant
illes
New
Zea
land
Nic
arag
uaN
iger
iaN
orw
ayP
akis
tan
Per
uP
hilip
pine
sP
olan
dP
ortu
gal
Rom
ania
Rus
sian
Fed
erat
ion
Sie
rra
Leon
eS
inga
pore
Slo
vak
Rep
ublic
Slo
veni
aS
outh
Afri
caSo
uth
Kor
eaS
pain
Sri
Lank
aSw
eden
Sw
itzer
land
Tai
wan
Tanz
ania
Thai
land
Tuni
sia
Turk
eyU
gand
aU
krai
neU
nite
d A
rab
Em
irate
sU
nite
d K
ingd
omU
nite
d S
tate
s of
Am
eric
aV
enez
uela
Vie
tnam
Zam
bia
---Argentina
AustraliaAustria
BelgiumBermuda
BrazilBulgaria
CameroonCanada
Cayman IslandsChile
ChinaCosta Rica
CyprusCzech Republic
DenmarkEstonia
FinlandFrance
GermanyGhana
GreeceHong Kong
HungaryIceland
IndiaIndonesia
I reland-RepIsrael
ItalyJapan
KuwaitLithuania
LuxembourgMadagascar
MalaysiaMauritius
MexicoMorocco
NetherlandsNetherlands Antilles
New ZealandNigeria
NorwayPakistan
PhilippinesPoland
PortugalRomania
Russian FederationSaudi Arabia
SenegalSingapore
Slovak RepublicSlovenia
South AfricaSouth Korea
SpainSri Lanka
SwedenSwitzerland
TaiwanThailand
TunisiaTurkey
UkraineUnited Arab Emirates
United KingdomUnited States of America
Vietnam
0.0000
0.0001
0.0002
0.0003
0.0004
0.0005
0.0006
0.0007
0.0008
0.0009
0.0010
Activity(%)
Activity(%)
1999 2000
Portfolio c. countries(Host of investment)
Portfolio c. countries(Host of investment)
Investingcountries(Source ofinvestment)
Investingcountries(Source ofinvestment)
3: 402%
5: 69%
1: 69%
2: 28%4: 96%
6: 118%7: 97%
8: 101%
9: 83%
10: 251%
11: 89%
12: 395%
13: 115%
14: 52%
15: 251%
16: 50%
17: 97%
18: 142%
19: 84%
20: 61%
1
2
3 45
6
7
8
9
1011
12
1314
15
16
17
18
1920
Nr. Source Host %P %DP %DF %all Part. Deal p. Dealflow1 United States of America United Kingdom 0.08% 0.11% 0.47% 0.216% 143 99 33602 United Kingdom United States of America 0.10% 0.08% 0.33% 0.167% 184 71 23823 United States of America France 0.04% 0.05% 0.09% 0.060% 75 44 6664 United States of America Canada 0.05% 0.06% 0.07% 0.059% 95 56 4805 United States of America Japan 0.01% 0.01% 0.16% 0.059% 14 7 11596 Canada United States of America 0.04% 0.03% 0.05% 0.041% 80 25 3867 United Kingdom France 0.03% 0.04% 0.06% 0.040% 56 33 4068 Germany United States of America 0.04% 0.03% 0.04% 0.039% 80 29 3079 United States of America South Korea 0.01% 0.01% 0.10% 0.038% 10 7 738
10 Japan United States of America 0.03% 0.02% 0.05% 0.034% 66 17 39211 Israel United States of America 0.04% 0.04% 0.02% 0.034% 79 35 16112 France United States of America 0.03% 0.02% 0.05% 0.032% 59 19 33213 United States of America Germany 0.02% 0.03% 0.04% 0.029% 42 26 27314 United States of America Netherlands 0.02% 0.01% 0.05% 0.026% 42 11 32715 United States of America Bermuda 0.01% 0.01% 0.06% 0.025% 18 6 42416 Hong Kong South Korea 0.00% 0.01% 0.06% 0.023% 8 7 41917 Singapore United States of America 0.03% 0.02% 0.02% 0.023% 52 18 15418 Australia United States of America 0.02% 0.04% 0.01% 0.023% 39 33 8319 United States of America Hong Kong 0.02% 0.02% 0.03% 0.022% 29 16 25020 United Kingdom Germany 0.02% 0.03% 0.01% 0.019% 35 24 100
Nr. R Source Host %P %DP %DF %all Part. Deal p. Dealflow1 2 United Kingdom United States of America 0.18% 0.15% 0.52% 0.279% 341 142 37362 1 United States of America United Kingdom 0.18% 0.21% 0.44% 0.277% 349 190 31943 13 United States of America Germany 0.08% 0.09% 0.27% 0.148% 159 87 19154 4 United States of America Canada 0.09% 0.09% 0.16% 0.113% 175 84 11705 3 United States of America France 0.07% 0.07% 0.16% 0.101% 134 65 11716 8 Germany United States of America 0.08% 0.05% 0.12% 0.084% 158 45 8777 7 United Kingdom France 0.05% 0.06% 0.13% 0.079% 96 58 9048 9 United States of America South Korea 0.04% 0.06% 0.14% 0.077% 70 51 10039 6 Canada United States of America 0.08% 0.05% 0.10% 0.075% 145 44 721
10 20 United Kingdom Germany 0.05% 0.07% 0.08% 0.068% 97 65 60011 11 Israel United States of America 0.07% 0.06% 0.06% 0.064% 141 58 39812 -- United States of America Israel 0.06% 0.07% 0.05% 0.058% 114 61 36013 14 United States of America Netherlands 0.04% 0.05% 0.08% 0.057% 80 44 59014 10 Japan United States of America 0.06% 0.04% 0.07% 0.053% 108 33 51215 -- United States of America India 0.03% 0.06% 0.07% 0.053% 63 51 50216 12 France United States of America 0.05% 0.03% 0.06% 0.049% 93 30 46517 19 United States of America Hong Kong 0.03% 0.03% 0.07% 0.044% 59 31 48918 -- Taiwan United States of America 0.05% 0.05% 0.03% 0.042% 92 43 21519 17 Singapore United States of America 0.05% 0.03% 0.05% 0.042% 86 31 33120 16 Hong Kong South Korea 0.01% 0.01% 0.09% 0.037% 13 9 683
Legend: R=Previous rank; %P=%participation; %DP=%deal participation; %DF=%deal flow; %all=%overall activity; Part.=Participation; Dealp.=Deal participation growth rate> 100%

C. Empirical analysis of private equity activity 100
diversified in the year 2000 is indicated by emerging spots of country pair activity.
Focusing on the top 20 country pairs for those two years (1999 and 2000), the
pairs have growth rates between a minimum of 28% for the US to UK, and a
maximum of 402% for the US to Germany. A growth rate larger than 100%
covers the following eight country combinations: the US as source country
investing in Germany, South Korea, Israel, India, and the Netherlands; Germany
and Taiwan as source countries investing in the US; and the UK investing in
Germany. The different growth rates indicate relative changes of supply and
demand between the countries, causing shifts within each country constellation.
Column R shows the change in rank for each country pair between 1999 and
2000. The major upward shifts are the new country pairs (US / Israel, US / India,
and Taiwan / US displacing the country pairs US / Bermuda, US / Japan, and
Australia / US) from the top 20 list. The top country pair in 2000 is UK / US,
changing rank with the country pair US / UK in 1999. Further significant upward
shifts are US / Germany and UK / Germany, improving by 10 ranks each. Major
downshifts are Japan / US, France / US, and Hong Kong / South Korea. The
relative transactions in the global system with the intersection of country pairs are
analyzed further in the next step. The list of the top 20 country pairs for the year
2000 is here expanded to 30 countries and focuses on the boom, peak, and
downturn for these countries as seen by the changes in their growth rates for the
years 1998 through 2001. The table lists the four dependent variables for four
years, illustrating positive growth rates in a green background, negative growth
rates in a yellow background; positive changes in growth rate are highlighted in
black letters while negative changes in growth rate are highlighted in red letters.
The minimum, maximum, and average growth rates of the 30 country pairs are
listed for comparison at the bottom. The country pairs account for 57.53% of
activity in 1998, 68.70% in 1999, 67.53% in 2000, and 55.11% in 2001.

C. Empirical analysis of private equity activity 101
Table 16: Growth rates of the top 30 country pairs in 2000 for the years 1999 to 2001
The overall comparison of the time series indicates a positive average growth
rate for the years 1998, 1999, and 2000, and a negative rate for the year 2001,
which is confirmed by the overall time series analysis of Chapter C.2.1. A
different pattern of growth rate occurs between the country pairs by year and
dependent variable. The year 1998 has an irregular pattern, with six to nine
negative growth rates for the dependent variables. The years 1999 through 2001
have a regular pattern, with one to two negative rates per year for participation
and activity, but excluding deal participation, with four negative rates in 1999, and
deal flow, with five positive rates in 2001. Even the growth rates that indicate the
same general orientation per year exhibit extreme volatility, especially for deal
flow, with -100% to 1,165% for 1998, -15% to 8,643% for 1999, -82% to 760% for
2000, and -100% to 278% for 2001.The growth rate analysis identifies the
intersection of a global trend and a country pair-specific trend. To focus precisely
on the relative shift in country affinity, the sensitive changes of growth rates172
are compared, with increasing or decreasing growth rates across country pairs.
In Table 16, black letters mark the speed-up in growth, red letters the slow-down
172 Second derivative of the function of private equity time series.
Growth rates of top 30 country pairs in the year 2000 from 1999 to 2001
Nr. Source Host1998 1999 2000 2001 1998 1999 2000 2001 1998 1999 2000 2001 1998 1999 2000 2001
1 United Kingdom United States of America 38% 50% 85% -29% 58% -2% 101% -23% 245% 122% 57% -64% 109% 73% 69% -49%2 United States of America United Kingdom 112% 64% 144% -37% 78% 74% 92% -27% 198% 344% -5% -52% 133% 205% 28% -43%3 United States of America Germany 5% 83% 279% -55% 55% 61% 234% -52% 95% 149% 601% -75% 46% 97% 402% -66%4 United States of America Canada 100% 138% 84% -11% 76% 99% 51% -6% 146% 84% 144% -49% 106% 102% 96% -27%5 United States of America France 25% 200% 79% -43% 48% 169% 48% -40% -48% 867% 76% -59% -1% 344% 69% -51%6 Germany United States of America 16% 116% 98% -31% 25% 122% 53% -2% 14% 366% 185% -63% 18% 171% 118% -41%7 United Kingdom France 19% 124% 71% -43% 8% 100% 77% -47% 88% 384% 123% -61% 26% 185% 97% -53%8 United States of America South Korea 43% 600% -61% 37% 652% -64% 293% 36% -42% 227% 101% -51%9 Canada United States of America 47% 82% 81% -11% 68% 43% 76% -4% 51% 160% 87% -19% 54% 96% 83% -13%
10 United Kingdom Germany 33% 75% 177% -23% 66% 51% 172% -26% 22% -15% 498% 29% 39% 32% 251% -3%11 Israel United States of America 164% 172% 78% -23% 244% 102% 65% -24% 42% 345% 147% -17% 164% 161% 89% -22%12 United States of America Israel -50% 167% 375% -45% -39% 74% 420% -55% -28% 274% 389% -48% -41% 141% 395% -50%13 United States of America Netherlands 146% 31% 90% -61% 141% -22% 296% -56% 844% 269% 80% -75% 207% 79% 115% -67%14 Japan United States of America -17% 175% 64% -39% -3% 96% 94% -46% 10% 790% 31% -63% -8% 282% 52% -51%15 United States of America India 43% 110% 200% -51% 18% 152% 166% -50% -45% 515% 427% -20% 7% 188% 251% -37%16 France United States of America 20% 146% 58% -42% -18% 175% 62% -34% 27% 707% 40% -78% 7% 279% 50% -56%17 United States of America Hong Kong 40% 314% 103% -51% 40% 129% 93% -31% 1060% 641% 96% -74% 89% 322% 97% -57%18 Taiwan United States of America 57% 14% 124% -25% 63% -23% 168% -32% 2% 29% 136% 9% 44% 0% 142% -20%19 Singapore United States of America -29% 247% 65% -40% 56% 112% 75% -54% -22% 386% 115% -42% -5% 218% 84% -44%20 Hong Kong South Korea 0% 700% 63% -38% 0% 583% 38% -57% 8643% 63% -80% 41% 2966% 61% -76%21 United States of America Brazil 20% 83% 318% -46% 33% -3% 294% -46% 61% 36% 217% -51% 45% 31% 255% -48%22 United States of America Japan -83% 600% 329% -67% -83% 244% 384% -58% -100% -- -82% 278% -84% -- -45% 38%23 United States of America Italy 33% 183% 97% -36% 24% 111% 71% -27% -49% 243% 146% -43% 0% 162% 99% -35%24 Switzerland United States of America 320% -52% -100% 335% -45% -100% -- -91% -100% -- -78%25 United States of America Luxembourg 50% -100% -43% -100% 514% -100% 308% -100%26 United States of America China -36% 189% 69% -52% -33% 58% 106% -46% -89% 2172% 95% 143% -47% 204% 90% 21%27 United Kingdom Sweden -41% -13% 105% -63% -35% -30% 61% -24% -21% 39% 429% 23% -36% -10% 188% -10%28 Netherlands United States of America 300% 200% -28% 255% 227% -38% 175% 321% -13% 241% 243% -27%29 Australia United States of America 225% 200% 23% -15% 158% 217% -8% -5% 1165% 252% -17% -44% 218% 217% 0% -14%30 Hong Kong United States of America 100% 350% 300% -47% -33% 279% 513% -45% 608% 760% -57% 39% 381% 495% -51%
maximum 225% 700% 600% -11% 244% 583% 652% -2% 1165% 8643% 760% 278% 218% 2966% 495% 38%minimum -83% -13% 23% -100% -100% -30% -43% -100% -100% -15% -82% -100% -100% -10% -45% -100%Average of 30 pairs 38% 197% 171% -44% 34% 134% 180% -41% 168% 1002% 218% -20% 35% 373% 160% -38%positive growth rate 20 27 30 0 19 23 28 0 16 26 26 5 18 26 28 2negative growth rate 6 1 0 30 8 5 2 30 9 1 3 25 9 1 1 28increasing growth rate 24 13 0 20 16 1 20 10 2 19 11 1decreasing growth rate 4 17 30 8 14 29 7 19 28 8 18 29
Participation Deal participation Deal flow Activity

C. Empirical analysis of private equity activity 102
in growth. The year 1999 is characterized by increased growth for 1/5 to 1/3 of
the country pairs, while growth slows down in the year 2000 for 1/2 to 1/3 of the
country pairs. In the downturn of 2001, almost all country pairs have a negative
growth rate, with the exception of US / Japan for deal flow activity and US / China
in deal flow.
Comparing growth rates and illustrating nuances by the change in growth rate
more easily identifies successful country-pair constellations by year. When
looking at source countries and their hosts, a shift in affinity can be observed.
The US is listed with its four main hosts for 2000 on ranks 2 through 5: the UK,
Germany, Canada, and France. Each of these four country pairs has a different
investment pattern. While the investments in Canada have a constant growth
rate of ~100% per year until 2000, growth rates in the UK and France reach their
peak of 204% and 344% in 1999, with less slowdown for France in 2000.
Germany has a different pattern. Compared to the other hosts, it reaches its peak
of 402% in 2000 from a moderate growth rate of 97% in 1999.
These patterns verify a shift in host country focus and changes in competition
through balancing of supply and demand within the whole system. The countries
compete for each others’ target companies, simultaneously competing against
the foreign investors in their own domestic market.
To investigate the dynamics of competition in domestic and cross-border
investments, the US, UK, and Hong Kong are selected as main cross-border
source countries of North America, Europe, and Asia. They are analyzed by total
investment, and by growth rate of their first-tier and second-tier hosts over time.
Their host country investments are analyzed to identify a cyclical or anticyclical
trend within the countries compared to the global PE trend: the US with hosts UK
(2)173 and Canada (4), the UK with hosts US (1) and Germany (10), and finally
Hong Kong with hosts South Korea (20) and the US (30). The following graph
presents these three countries and global development in a time series from
1980 through 2005. Each graph is split further into three sections: first, from 1991
through 1995 (1) with the beginning of cross-border activity; second, the boom
phase from 1996 through 2000 (2) with largest growth rate and global maximum;
173 The numbers present the rank of the country pairs of the previous table.

C. Empirical analysis of private equity activity 103
and third, the downturn from 2001 through 2005 (3). In each graph, the activity is
presented in a bar chart with H0 as domestic deals, H1 as tier-one host, H2 as tier-
two host, and HR as remaining host countries. The hosts H1, H2, and HR add up to
total cross-border activity, incorporating H0 results in the overall activity of the
source country. The growth rates are presented in a line chart with the same
colors as the bar chart.174
Figure 25: Activity development over time for world and selected source countries
The first graph (1) presents global activity with the pattern from the previous
time series (Chapter C.2.1.). The growth rates for overall and domestic deals
have a cyclical pattern, with little disturbance in the first section. The cross-border
deals have more volatility, with positive growth especially in 1994, with +39%
growth, while domestic deals decline in the 1993, with -14%. In section two,
174 To verify the cyclicality of growth rates within each section; the three correlations of growth
rates between domestic (HR) to cross-border (H1 + H2 + HR); H1 to H2 and H1 to HR; are calculated (see Appendix).
0.0%
0.2%
1980 1985 1990 1995 2000 2005
-350%
-250%
-150%
0.4%
0.6%
0.8%
-50%
50%
150%
3
1.0%
1.2%
1.4%
250%
350%
450%
H0: United Kingdom
H1: USA
H2: Germany
United KingdomActivity Growth
overallActivity cross-border H0/ domestic H1/Host 1 H2/Host 2 HR/Host other
Growth rate
0.00%
0.02%
0.04%
0.06%
0.08%
1980 1985 1990 1995 2000 2005
-2000%
-1500%
0%
2%
4%
1980 1985 1990 1995 2000 2005
-350%
-250%
-150%
-50%
0%
2%
4%
6%
8%
1980 1985 1990 1995 2000 2005
-100%
0%
4
Hong Kong
H0: Hong Kong
H1: South Korea
H2: USA
0.10%
0.12%
0.14%
0.16%
0.18%
1
Activity World
10%
12%
14%
16%
18%
50%
100%
150%
200%
United States of America
2
6%
8%
10%
12%
50%
150%
250%
350%
450%
-50%-1000%
-500%
0%
500%
1000%
1500%
2000%
2500%
3000%Growth
H0: United States
H1: UK
H2: Canada
1 2 31 2 3
Activity Growth
Activity Growth
1 2 31 2 3

C. Empirical analysis of private equity activity 104
cross-border growth rates have a first relative maximum in 1996, with 93%, and
an absolute maximum in 1999, with 116%. Domestic deals follow the same
pattern but with a slower growth rate of 56% and 72% for 1996 and 1999
respectively. The largest decline is for all investments in the year 2001. Cross-
border deals decline by 30% and domestic deals by 42%. Domestic deals
experience positive growth of 14% again in 2003, but the cross-border growth
rate is still negative at -4%, reaching positive growth of 1% in 2004.
The US has the largest domestic market relative to its cross-border market. The
correlation of growth rates for domestic to cross-border, and for domestic to host
UK, has a small positive medium correlation,175 whereas the pattern between the
hosts UK and Canada, and between the UK and the rest of the world, are
indifferent.
Focusing on section one first, the coefficient for domestic to cross-border is
positive medium, indicating an overall positive investment climate. The result for
investment in the UK and Canada is largely negative, with anticyclical investment
between the main host countries. The coefficient for the UK and the rest of the
world is medium negative, illustrated by anticyclical patterns in the graph.
Section two — focusing on the boom of PE activity — has overall positive, highly
correlated growth rates, indicating a cyclical trend with no limitation in host
selection in times of high supply and demand.
Section three describes the downturn in activity. The coefficients are positive for
domestic to cross-border deals. The pattern for section three is cyclical with little
disturbance. Domestic investment recovers early, while cross-border deals follow
after some time. The result for the UK to Canada is indifferent, while the highly
positive correlation coefficient for the UK and the rest of the world verifies a
similar reduction of investment in the downturn.
Overall, the analysis confirms an anticyclical selection — with substitution of host
countries — from 1991 through 1995; a cyclical selection during the boom,
balancing supply and demand on a high level; and a cyclical pattern during
downturn, when supply and demand vanishes.
175 The correlation of growth rates is calculated for the different hosts; cross-border; and domestic
deals (see Appendix).

C. Empirical analysis of private equity activity 105
The UK has a large proportion of cross-border deals. Cross-border investments
are diversified into the US, Germany, and the rest of the world. Investment
growth rates have volatile amplitudes without a distinctive pattern. The overall
correlation for domestic to cross-border, and the selection among the US,
Germany, and the rest of the world, are small to indifferent. In section one (1) the
domestic to cross-border curves illustrate a medium correlation. The investments
in the US and Germany are correlated, although with volatile growth in Germany.
Investment in the US and the rest of the world shows a negative relation. Section
two has constant positive and almost highly correlated growth development for
domestic cross-border and host development, with cyclical growth rates —
though with an increasing growth rate in Germany, while the remaining hosts
decline in growth. In section three the decline is highly correlated for domestic to
cross-border, whereas the pattern for the US and Germany illustrates indifferent
behavior, while the graph of investment in the rest of the world identifies a
negative correlation to the main host, the US.
The last country profile is Hong Kong, with dominant cross-border activity
compared to domestic deals, and with high amplitude of growth rates in the years
1999 and 2000. The correlation between domestic to cross-border, and between
host South Korea and the US, is very high, whereas investment relations
between those entities investing in the US and the rest of the world are
indifferent.
The graphs for section one (1) indicate a high correlation between domestic and
cross-border deals. Section two has constant large growth development with a
high correlation of domestic to cross-border, and medium correlation in
investment focus between the US and South Korea. In section three the decline
is negative-correlated for domestic to cross-border, with a large decrease in
domestic deals, and positive-correlated for the two main hosts.
The patterns are different from the profiles of the US and the UK. Hong Kong is
highly concentrated on cross-border deals, as shown by the high correlation of
host countries and the negative correlation between domestic and cross-border
activity. Even after the downturn, cross-border activity remains on a high level
compared to domestic deals.
The development of the top country pairs over time (Table 16) and the
investment series of the countries US, UK and Hong Kong (Figure 25) identify a

C. Empirical analysis of private equity activity 106
shift in propensity toward foreign target companies and simultaneously toward
their own domestic market over time.
The shifts further verify the application of the three-dimensional gravity model,
which breaks down the propensity in time constant into time-variant
determinants, which changes the country pair affinity relative to the global
system.
3.4. Dynamics of partnering and investment
The analysis explores the dynamics of partnering and investment in a PF
company by comparing domestic and cross-border investment. Changes are
investigated by the defined deal types (Chapter B.2.3.1.) in the four distinct
categories: first deal, deal mix, new deal, and refinance, with the subcategories
of single and multiple investors. The following graph illustrates the development
over time of deal flow for domestic deals and cross-border investment for the
period 1980 through 2005, with a focus on the boom phase and the downturn
phase of PE.
Figure 26: Deal type development over time
These two series show different patterns of domestic and cross-border PE
activity. In the domestic deal view, all categories increase until the year 2000 —
the boom phase. The largest group until the year 1998 is first-deal-single, relating
to single investor deals. In 1999, shifts take place within the groups, with a large
increase in deal-mix-first, referring to deals where a new co-investor joins
previous investors financing a company. This category has its maximum in 2000,
0
2,000
4,000
6,000
8,000
10,000
12,000
14,000
1980 1985 1990 1995 2000 2005
0
5,000
10,000
15,000
20,000
25,000
30,000
35,000
40,000
Cross borderDomestic
1980 1985 1990 1995 2000 2005
1.1 First deal single
1.2 First deal multiple
2.1 Deal mix first
2.2 Deal mix refinance
3.1 New deal single
4.1 Refinance single
4.2 Refinance multiple
Legend
Deal flow ($ mln) Deal flow ($ mln)

C. Empirical analysis of private equity activity 107
with twice the amplitude as the categories first-deal-single, first-deal-multiple and
deal-mix-refinance.
In the cross-border deal, the categories increase until 2000 except for first-deal-
single, which has a significant decline in 1999 after its relative maximum. The
largest group until 1999 — similar to domestic deals — is first-deal-single, which
was replaced by the large increase of first-deal-multiple. This had its maximum in
2000 at twice the size of first-deal-single and deal-mix-first. The downturn in
domestic investment shows a decrease in all deal types, with volatile shifts from
2001 on. First-deal-multiple investments have an early increase, outrun by first-
deal-single investments in 2003 reaching its maximum. The deal-mix-first group
has the largest decline, although it balances below first-deal and above new-
deal-single investments. New-deal investments have a relative increase in 2003,
verifying a selling-on from former PE investors.
During the downturn of cross-border deals, the first-deal-multiple investments
decline, but remain on a high level in 2001. While first-deal-multiple investments
rapidly decline in 2002, first-deal-single investments rise to their maximum. Deal-
mix-first slowly decreases after 2001, while new-deal rises steadily, with volatility
from 2000 on.
The time series indicate that investors are looking for single deals, except that in
boom times they tend to partner in domestic as well in cross-border deals. The
partnering differs: In domestic deals, investors’ participation increased as new
co-investors enter a deal arrangement with an established investor, while in the
cross-border segment, partnering in the first deal is the preferred arrangement.
3.5. Investment activity scaled by gross domestic p roduct
To compare country activity in proportion to country size, the activity has to be
scaled by country mass. The recommended variables for country size are
population, land area, GDP, etc., as listed in the overview of independent
variables for the explicative analysis (Chapter B.3.2.3.2.). With reference to
economic mass, the time-variable GDP of the source country is used to scale PE
activity.176 This analysis uses the design of the panel data and gravity model
176 Jeng and Wells, The Determinants of Venture Capital Funding: Evidence Across Countries.
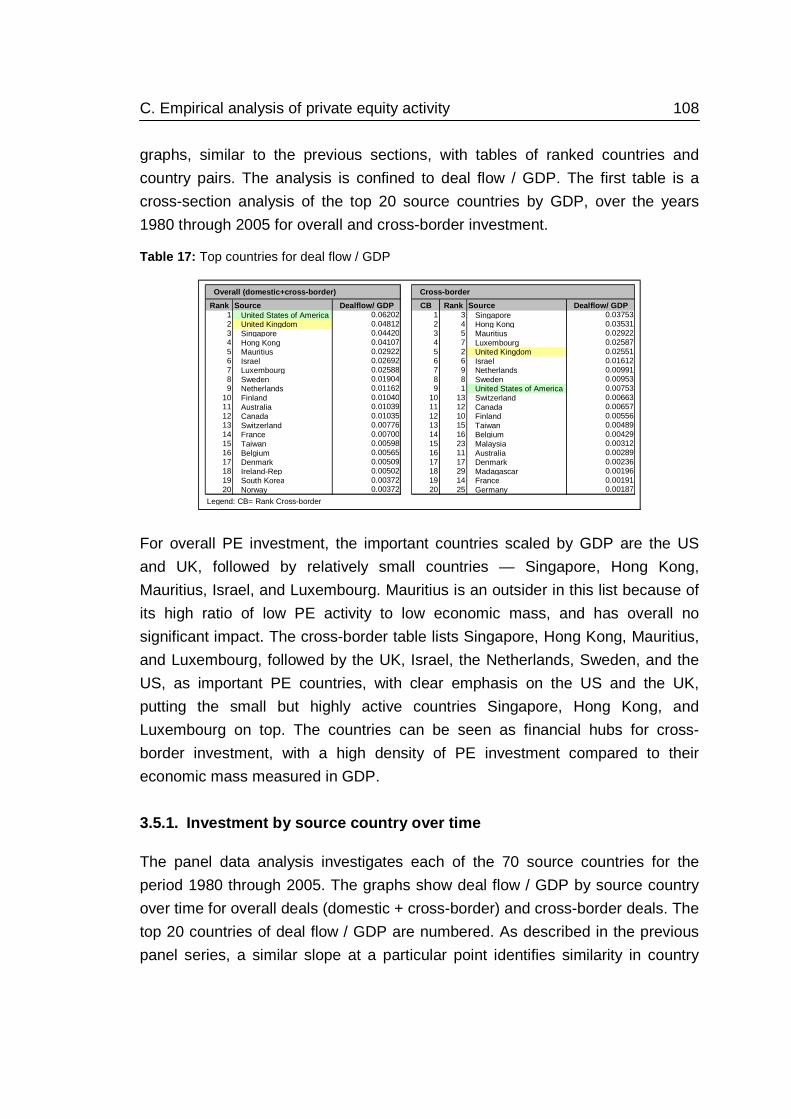
C. Empirical analysis of private equity activity 108
graphs, similar to the previous sections, with tables of ranked countries and
country pairs. The analysis is confined to deal flow / GDP. The first table is a
cross-section analysis of the top 20 source countries by GDP, over the years
1980 through 2005 for overall and cross-border investment.
Table 17: Top countries for deal flow / GDP
For overall PE investment, the important countries scaled by GDP are the US
and UK, followed by relatively small countries — Singapore, Hong Kong,
Mauritius, Israel, and Luxembourg. Mauritius is an outsider in this list because of
its high ratio of low PE activity to low economic mass, and has overall no
significant impact. The cross-border table lists Singapore, Hong Kong, Mauritius,
and Luxembourg, followed by the UK, Israel, the Netherlands, Sweden, and the
US, as important PE countries, with clear emphasis on the US and the UK,
putting the small but highly active countries Singapore, Hong Kong, and
Luxembourg on top. The countries can be seen as financial hubs for cross-
border investment, with a high density of PE investment compared to their
economic mass measured in GDP.
3.5.1. Investment by source country over time
The panel data analysis investigates each of the 70 source countries for the
period 1980 through 2005. The graphs show deal flow / GDP by source country
over time for overall deals (domestic + cross-border) and cross-border deals. The
top 20 countries of deal flow / GDP are numbered. As described in the previous
panel series, a similar slope at a particular point identifies similarity in country
Overall (domestic+cross-border) Cross-border
Rank Source Dealflow/ GDP CB Rank Source Dealflow/ GDP1 United States of America 0.06202 1 3 Singapore 0.037532 United Kingdom 0.04812 2 4 Hong Kong 0.035313 Singapore 0.04420 3 5 Mauritius 0.029224 Hong Kong 0.04107 4 7 Luxembourg 0.025875 Mauritius 0.02922 5 2 United Kingdom 0.025516 Israel 0.02692 6 6 Israel 0.016127 Luxembourg 0.02588 7 9 Netherlands 0.009918 Sweden 0.01904 8 8 Sweden 0.009539 Netherlands 0.01162 9 1 United States of America 0.00753
10 Finland 0.01040 10 13 Switzerland 0.0066311 Australia 0.01039 11 12 Canada 0.0065712 Canada 0.01035 12 10 Finland 0.0055613 Switzerland 0.00776 13 15 Taiwan 0.0048914 France 0.00700 14 16 Belgium 0.0042915 Taiwan 0.00598 15 23 Malaysia 0.0031216 Belgium 0.00565 16 11 Australia 0.0028917 Denmark 0.00509 17 17 Denmark 0.0023618 Ireland-Rep 0.00502 18 29 Madagascar 0.0019619 South Korea 0.00372 19 14 France 0.0019120 Norway 0.00372 20 25 Germany 0.00187
Legend: CB= Rank Cross-border

C. Empirical analysis of private equity activity 109
1980
1985
1990
1995
2000
2005
---A
rgentinaA
ustraliaA
ustriaB
elgiumB
ermuda
Brazil
Bulgaria
Cam
eroonC
anadaC
ayman Islands
Chile
China
Costa R
icaC
yprusC
zech Republic
Denm
arkE
stoniaFinland
FranceG
ermany
Ghana
Greece
Hong Kong
Hungary
IcelandIndia
IndonesiaIreland-R
epIsrael
ItalyJapan
Kuw
aitLithuania
Luxembourg
Madagascar
Malaysia
Mauritius
Mexico
Morocco
Netherlands
Netherlands Antilles
New
Zealand
Nigeria
Norw
ayP
akistanP
hilippinesP
olandP
ortugalR
omania
Russian Federation
Saudi A
rabia
Senegal
Singapore
Slovak R
epublic
Slovenia
South A
fricaS
outh Korea
Spain
Sri Lanka
Sw
edenS
witzerland
Taiwan
ThailandTunisia
TurkeyU
kraineU
nited Arab E
mirates
United S
tates of America
United K
ingdom
Vietnam
0.0000
0.0020
0.0040
0.0060
0.0080
0.0100
0.0120
0.0140
1980
1985
1990
1995
2000
2005
---A
rgentinaA
ustraliaA
ustriaB
elgiumB
ermuda
Brazil
Bulgaria
Cam
eroonC
anadaC
ayman Islands
Chile
China
Costa R
icaC
yprusC
zech Republic
Denm
arkE
stoniaFinland
FranceG
ermany
Ghana
Greece
Hong Kong
Hungary
IcelandIndia
IndonesiaIreland-R
epIsrael
ItalyJapan
Kuw
aitLithuania
Luxembourg
Madagascar
Malaysia
Mauritius
Mexico
Morocco
Netherlands
Netherlands Antilles
New
Zealand
Nigeria
Norw
ayP
akistanP
hilippinesP
olandP
ortugalR
omania
Russian Federation
Saudi A
rabia
Senegal
Singapore
Slovak R
epublic
Slovenia
South A
fricaS
outh Korea
Spain
Sri Lanka
Sw
edenS
witzerland
Taiwan
ThailandTunisia
TurkeyU
kraineU
nited Arab E
mirates
United K
ingdom
United S
tates of America
Vietnam
0.0000
0.0020
0.0040
0.0060
0.0080
0.0100
0.0120
0.0140
Deal flow/GDP
Source country deal flow scaled by GDP
Years
Cross border
Overall
Years
2
1
3
4
76 9
5
11
12
1410
1413
8
16
17
18
19
20
1
2
3
5
6
7
9108
11
13
14
15
16
17
184
1920
12
activity, while the intercept displays amplitude as a scale factor. With GDP as a
time variable, scaling affects the amplitude and shape of any particular country
curve. Comparing the scaled graph to the unscaled panel data set (Chapter
C.3.1.), the differences in shape are marginal compared to the shifts in
amplitude, which is where the focus is.
Figure 27: Panel data — deal flow to GDP
The time series patterns show high volatility of activity within and between the
country time series. The different patterns of the countries — especially top
countries like the US, UK, Hong Kong, and Singapore — were analyzed in the
previous unscaled panel data set. When comparing lesser PE density countries
with high PE density countries — Singapore, Hong Kong, Mauritius, and
Luxembourg — the time series patterns differ across countries. While Singapore,
Hong Kong, and Mauritius have large amplitudes in 2000 and 2003, Luxembourg
has more steady deal flow from the early ‘90s, with peaks in 1996 and 2001.
Comparing overall and cross-border deal flow, the absolute changes in amplitude
for Singapore, Hong Kong, Mauritius, and Luxembourg are minimal. This

C. Empirical analysis of private equity activity 110
indicates that the focus of these countries is on cross-border investment,
compared to the changing amplitudes between overall and cross-border activity
of the UK and the US.
The panel data analysis refers to different types of PE centers. The US and the
UK have large domestic and cross-border markets, whereas the smaller
countries are financial hubs with a high density of PE, especially for cross-border
investment.
3.5.2. Investment from source country to host count ry
The following analysis investigates country pair affinity scaled by the GDP of the
source country.177 The top 20 cross-border investments are highlighted.
Figure 28: Country pair activity by deal flow to GDP
177 See Cumming, D. J. and Macintosh, J. G., Boom, Bust and Litigation in Venture Capital
Finance, Willamette Law Review, 49(4), pp. 867-906.
---
Alg
eria
Arg
entin
a
Aus
tral
ia
Aus
tria
Aze
rbai
jan
Ban
glad
esh
Bel
gium
Ber
mud
a
Bol
ivia
Bosn
ia
Bra
zil
Bri
tish
Vir
gin
Bul
gari
a
Cam
eroo
n
Can
ada
Cay
man
Isla
nds
Chi
le
Chi
na
Col
ombi
a
Cos
ta R
ica
Cro
atia
Cyp
rus
Cze
ch R
epub
lic
Den
mar
k
Dom
inic
a
Ecu
ador
Egy
pt
El S
alva
dor
Est
oniaFiji
Fin
land
Fr P
olyn
esia
Fra
nce
Ger
man
y
Gha
na
Gre
ece
Hon
g K
ong
Hun
gary
Icel
and
Indi
a
Indo
nesi
aIr
elan
d-R
ep
Isra
elItaly
Japa
n
Jord
an
Kaz
akhs
tan
Ken
ya
Latv
ia
Lith
uani
a
Luxe
mbo
urg
Mac
edon
iaM
alay
sia
Mau
ritiu
s
Mex
ico
Mol
dova
Mon
aco
Mor
occo
Moz
ambi
que
Net
herl
ands
Net
herla
nds
Ant
illes
New
Zea
land
Nic
arag
ua
Nig
eria
Nor
way
Pak
ista
nP
eru
Phi
lippi
nes
Pol
and
Por
tuga
lR
oman
ia
Rus
sian
Fed
erat
ion
Sie
rra
Leon
eS
inga
pore
Slo
vak
Rep
ublic
Slo
veni
aS
outh
Afr
ica
Sou
th K
orea
Spa
inSr
i Lan
ka
Sw
eden
Sw
itzer
land
Tai
wan
Tan
zani
aT
haila
ndT
unis
ia
Tur
key
Uga
nda
Ukr
aine
Uni
ted
Ara
b Em
irat
esU
nite
d K
ingd
omU
nite
d S
tate
s of
Am
eric
aVe
nezu
ela
Vie
tnam
Zam
bia
-- -Argentina
AustraliaAustria
BelgiumBermuda
BrazilBulgaria
CameroonCanada
Cayman IslandsChile
ChinaCosta Rica
CyprusCzech Republic
DenmarkEstonia
FinlandFrance
GermanyGhana
GreeceHong Kong
HungaryIceland
IndiaIndonesia
Ireland-RepIsrael
ItalyJapan
KuwaitLithuania
LuxembourgMadagascar
MalaysiaMauritius
MexicoMorocco
NetherlandsNetherlands Antilles
New ZealandNigeria
NorwayPakistan
PhilippinesPoland
PortugalRomania
Russian FederationSaudi Arabia
SenegalSingapore
Slovak RepublicSlovenia
South Afr icaSouth Korea
SpainSri Lanka
SwedenSwitzer land
TaiwanThailand
TunisiaTurkey
UkraineUnited Arab Emirates
United KingdomUnited States of America
Vietnam
0.000
0.002
0.004
0.006
0.008
0.010
0.012
0.014
0.016
Sum of Fi_Dealflow_GDP
Dealflowto GDP
source country
Investingcountries(Source ofinvestment)
Portfolio c. countries(Host of investment) A
1
2
10
7 8
63
4
9
5
13
14
1512
1711
1816
19
20

C. Empirical analysis of private equity activity 111
This graph shows highly volatile amplitudes without the distinctive patterns
evident in previous graphs. Cross-border deals with the US and the UK as
source countries are reduced significantly, except for the UK into the US (6),
while cross-border deals into the US increased for several countries. Further,
several columns stand out, like the one for the greatest cross-border country pair
activity from Mauritius into India (1) and, as expected, the country series for Hong
Kong, Singapore, and Luxembourg are amplified. The 20 largest country pairs in
detail are:
Table 18: Top 20 cross-border deal country pairs
Figure 28 combined with Table 18 identify the largest cross-border country pairs
and the density of activity toward particular countries.
The top 20 country pair listing, in combination with the graph, verifies a
concentration into 11 source countries, with Singapore listed four times, Hong
Kong and the UK three times each, and Luxembourg and Mauritius listed twice
each as source countries. The host deal flow is highly concentrated into seven
countries, with the US listed 10 times. Other host countries are China, France,
Germany, and India (listed twice each), and Australia and South Korea (once
each).
The largest country pair is Mauritius / India. In absolute numbers, both are small
PE countries. Mauritius’s activity is highly concentrated into India and the US
only; no other trade partners are listed. The second largest country pair is Israel
investing into the US. Excluding the US, the sequence of smaller countries with
Country pair: Cross-border
Rank Source Host Dealflow_GDP1 Mauritius India 0.020132 Israel United States of America 0.013783 Singapore United States of America 0.013344 Hong Kong South Korea 0.012395 Luxembourg France 0.012346 United Kingdom United States of America 0.011377 Mauritius United States of America 0.009098 Singapore India 0.008389 Canada United States of America 0.00601
10 Singapore China 0.0047811 Hong Kong China 0.0043512 Taiwan United States of America 0.0041613 Hong Kong United States of America 0.0040814 Netherlands United States of America 0.0040715 Switzerland United States of America 0.0031116 United Kingdom Germany 0.0030817 Luxembourg Germany 0.0030318 United Kingdom France 0.0029819 Singapore Australia 0.0029720 Malaysia United States of America 0.00261

C. Empirical analysis of private equity activity 112
multiple host countries lists Singapore, with investments into India, China, and
Australia; Hong Kong, with investments into South Korea and China; and
Luxembourg, with investments into France and Germany. To investigate their
global diversification or even concentration, each source country is analyzed by
its number of host countries. Singapore with 28 hosts and Hong Kong with 22 are
highly diversified; Luxembourg with 11 hosts and Israel with 9 are more confined
in their selection of partnering countries; and Mauritius is highly concentrated on
India and the US exclusively. The countries’ high PE density and global reach
underscore these countries’ relevance as financial centers. The top five cross-
border financial centers are Singapore, Hong Kong, Luxembourg, the UK, and
Israel.
3.6. Descriptive analysis results
Prior chapters analyzed investment activity across countries and time, based on
the research models of time series, cross-section analysis, panel-data analysis,
and the gravity model approach. The measured variables are participation, deal
participation, deal flow, and activity expressed as a percentage.
The time-series approach was used to examine a boom and downturn of PE
investment within the short time period of 1995 through 2005, with the peak in
2000, the highest growth rate in 1999, and the decline in 2001. Different patterns
arise in the comparison of company stage investments (VC and PE) as well as in
the comparison of overall to cross-border deals. PE had a large second peak in
2003; VC saw a slow decline from 2001 on. Compared to overall deals, cross-
border deals experienced second peaks for VC in 2001 and a smaller peak for
PE in 2003. When comparing measurable variables, a shift toward higher
participation compared to deal participation is seen.
The cross-section analysis investigates the 99 countries studied here as source
and host country, and by country overall activity. Each of those was divided into
domestic and cross-border deals for the period 1980 through 2005. This analysis
further ranks each country by the measurable variables and identifies the
countries for explicative analysis. The overall analysis identifies 99 countries—
70 with source activity and 95 with host activity. The cross-border analysis
identifies 97 countries — 59 with source activity and 93 with host activity.

C. Empirical analysis of private equity activity 113
Significantly, the cross-section verifies a wide pattern of country activity,
especially for countries playing the dual roles of source and host, and in both
domestic and cross-border investment. This analysis is enhanced by extending it
to panel data and the gravity model to investigate underlying patterns.
The panel-data analysis compares the time series across countries to identify
similarity in PE behavior over time. The curves show high volatility across
countries, although a cyclical pattern between countries with similar growth rates
is seen, especially in the years 1999, 2000, and 2001, indicating the intersection
of a global trend with country-specific trends. The comparison of overall and
cross-border activity identifies countries with similar cross-border and overall
curves, like Hong Kong and Singapore. The analysis shows that countries differ
in their focus toward domestic or cross-border activity over time.
Diversification into the measurable variables shows countries with varying
amplitudes for each variable, indicating different country characteristics by
number of deals relative to deal size.
The gravity model shows first the country pair deal concentration as quantified
by different measurable variables. It identifies three main streams of activity: first,
the domestic deal concentration; second, the US and the UK as dominant source
countries; and third, the US as large host country. The gravity model further
reveals country propensity toward particular trading partners and different levels
of diversification, indicating patterns inherent in country-pair combinations that
are influenced by large PE countries, notably the US and the UK. The patterns
support the assumption of the gravity model, which states that the proximity
between countries and larger country mass increase cross-border activity.
The gravity model over time investigates the evolution of cross-border activity
and the shifts of propensity between the countries. The country pair snapshots of
the year with the largest growth rate (1999), and the year with the absolute global
maximum (2000) clearly illustrates shifts in country focus activity. Different
growth rates within country pairs demonstrate the intersection of a global trend
for growth rates in the years 1998 through 2000, a decline in 2001, and a country
pair-specific trend. The interaction of countries with their shift toward interest in
different host countries is presented for the US, UK, and Hong Kong, showing
cyclical and anticyclical behavior in the selection of host countries by a single
country as well as by different countries in different time periods. This indicates

C. Empirical analysis of private equity activity 114
that country pair-specific correlations exist at any given time that balance the
whole system. A disturbance in one country affects all dynamics in the system
due to relative shifts in other countries, and thus rearranges the constellation for
all countries.
The dynamics of the partnering and investment sequence captures shifts in
investment behavior over time by multi-investor deals or by refinancing a
company in several investment rounds. The time series indicate that investors
primarily invest in single deals. Changes occur in the boom and downturn,
beginning in 1997, with different behavior for domestic and cross-border deals.
Partnering in a cross-border deal as first investors is the preferred arrangement
when investing abroad, while in domestic deals investors participate increasingly
as new co-investors in a deal arrangement with an established investor.
Investment activity scaled by GDP accounts for country size by economic
mass and identifies high-density PE countries as financial centers for domestic
and cross-border activity across time and by country pairs. The top five cross-
border countries with extensive global diversification are Singapore, Hong Kong,
Luxembourg, the UK, and Israel.
The main results of the descriptive analysis are mapped to analyze the global
distribution of cumulative cross-border activity. Countries are classified by
geographical distance and by the amount of their cross-border PE activity as
source and host country from 1980 through 2005. The graph further summarizes
deal activity by continent with transcontinental activity. Two subgraphs highlight
Europe in detail and country activity by GDP, with source and host activity as
percentages, to evaluate their relative global importance as financial centers.
Country activity is expressed by concentric circles, and financial centers are
highlighted in red.
The circles (in the graph below) visualize cross-border activity of countries as
source, host, and overall, with the net balance being the difference between the
source and host circle area. Net importer countries — with less source activity
than host activity — have the smaller green source activity circle centered (like
Germany), while net exporter countries, with more source than host activity, have
the smaller yellow host activity circle centered, like the US or the UK. This view
shows countries in a relational global system — visualizing the gravity model
according to economic mass and distance.

C. Empirical analysis of private equity activity 115
The grouping of countries by region as source and host delineates the
competitive environment as density of cross-border activity measured in the level
of PE activity and geographic distance of countries to each other.
Figure 29: Geographic overview of private equity country activity
The maps above cover three main regions — North America, Europe, and Asia
— with their cumulative country deal activity: North America (10178 countries),
Europe (36179 countries), Asia (16180countries), and the rest of the world (36181
178 Bermuda, Canada, Cayman Islands, Costa Rica, Dominica, El Salvador, Mexico, Netherlands
Antilles, Nicaragua, United States of America. 179 Austria, Belgium, Bosnia, Bulgaria, Croatia, Cyprus, Czech Republic, Denmark, Estonia,
Finland, France, Germany, Greece, Hungary, Iceland, Ireland, Italy, Latvia, Lithuania,
(cont)
Cayman Islands
NetherlandsAntilles
Europe Cross border ranking
Cross-border activityby source and host
from year 1980 to 2005
Cross-border activityby source and host
United States of America
United Kingdom
Germany
Germany
France
France
Canada
Netherlands
Netherlands
Japan
Switzerland
Austral ia
Hong Kong
Singapore
China
India
South Korea
Sweden
Sweden
Luxembourg
Luxembourg
Spain
Spain
Belgium
United Kingdom
Finland
Finland
Italy
Italy
Bermuda
Denmark
Denmark
Switzerland
Ireland-Rep
Ireland-Rep
Taiwan
Norway
Norway
Malaysia
Brazil
Austria
Austria
New Zealand
Argentina
Indonesia
Hungary
Hungary
Russian Federation
Portugal
Portugal
Philippines
Mauritius
Thailand
AsiaAmericas Europe
Mexico
Poland
Poland
Czech Republic
Romania
Source activity
Legend:
Host activity
Top 5 financialcenters
deal flow/ GDPsource countries
0.00 0.02 0.04 0.06
SingaporeHong KongMauritius
LuxembourgUnited Kingdom
IsraelNetherlands
SwedenUSA
SwitzerlandCanadaFinlandTaiwanBelgiumMalaysiaAustraliaDenmark
MadagascarFrance
Germany
0.000.020.04
Source activity scaled by GDP Country activity in %
Israel
Source activity 45%Host activity 36%
36%
Source activity 42%Host activity 45%
Source activity 9%Host activity 14%
23%
9%
9%
5%
5% 19% 1%
21%
4%
9%
RoW 4%
RoW 1%
RoW 0%
RoW=Rest of World

C. Empirical analysis of private equity activity 116
countries). North America, principally the US and Canada, accounts for 45% of
global source activity and 36% of host activity. Europe, with three large countries
(the UK, Germany, and France) and two large PE financial centers (the UK and
Luxembourg) accounts for 42% of global source activity and 46% of global host
activity. Asia (principally Japan, China, India, and Taiwan, with the financial
centers Singapore and Hong Kong) accounts for 9% of source activity and 14%
of host activity. Analysis of the interaction of countries in a region demonstrates a
difference in global distribution of trade between and within regions. Europe has
the largest intracontinental investment with 21% of global source activity. North
America is responsible for 9% and Asia for 4%. The largest interaction among
continents occurs between North America and Europe in both directions, with
deal flow from North America to Europe at 23% activity and Europe to North
America at 19%. Europe’s focus is on North America and on intracontinental
deals; investments into Asia and the rest of the world account for only 1% each.
North America and Asia are more connected, with relatively large trades from
North America to Asia at 9% and Asia to North America at 5%. North America
invests 4% into the rest of the world and Asia invests 0%. Investment viewed on
a continental scale is highly concentrated in Europe, especially for global host
activity.
Luxembourg, Macedonia, Moldova, Monaco, Netherlands, Norway, Poland, Portugal, Romania, Slovak Republic, Slovenia, Spain, Sweden, Switzerland, Turkey, Ukraine, United Kingdom.
180 Bangladesh, China, Hong Kong, India, Indonesia, Japan, Kazakhstan, Malaysia, Philippines, Russian Federation, Singapore, South Korea, Sri Lanka, Taiwan, Thailand, Vietnam.
181 Algeria, Argentina, Australia, Azerbaijan, Bolivia, Brazil, British Virgin Islands, Cameroon, Chile, Colombia, Ecuador, Egypt, Fiji, French Polynesia, Ghana, Israel, Jordan, Kenya, Kuwait, Madagascar, Mauritius, Morocco, Mozambique, New Zealand, Nigeria, Pakistan, Peru, Senegal, Sierra Leone, South Africa, Tanzania, Tunisia, Uganda, United Arab Emirates, Venezuela, Zambia.

C. Empirical analysis of private equity activity 117
4. Explicative analysis — the gravity model analysi s over time
The gravity-model analysis identifies determinants that drive cross-border PE
activity, and further explains the nature of the affinity of countries participating in
cross-border deals. The first analyses verify the main and interaction effects of
source, host, and year of the three-dimensional gravity model with an analysis of
variance (ANOVA). The final gravity model analysis uses explanatory variables of
gravity indicators, banking system and endowment variables, and institutional,
legal, and political variables to illuminate activity (including VC and PE).
4.1. Configuration of statistical analysis
This chapter examines the empirical data to meet the requirements of the
specific empirical regression analysis of this paper. The theory of the gravity-
model analysis (Chapter B.2.2.2.) results in two essential regression equations
for the analysis of cross-border PE activity.
1. The gravity-model equation for the analyses of variance (ANOVA) is the
ordinary least squares (OLS) regression with dummy variables for the main
effects of source, host, and year, and the interaction effects of source / host,
source / year, and host / year.
Equation 16: The OLS regression with dummy variables for main and interaction effects
2. The equation for the gravity model with explanatory variables is the OLS
regression with multidimensional determinants and time dummy variables.
Equation 17: The OLS regression as gravity model with time dummies
The basic data sets for empirical analysis are described in detail for overall, VC,
and PE investment followed by the explanatory dataset with indicator orientation
and data transformation. The diagnostics focus on the screening of influential
data, normality assumption of residuals for hypothesis testing, normality testing
of dependent and independent variables, a heteroscedasticity test of residuals,
and the correlation of dependent variables. Required data transformation is
performed in each diagnostic step.
,...,1,,,...,1,111111 TtjiNjiddddddy ijtjtitijtjiijt =≠=++++++= −−−−−− ε
,...,1,,,...,1,... 16543210 TtjiNjidxxxxxxy ijttiiijjtitijtijt =≠=+++++++= − εβββββββ

C. Empirical analysis of private equity activity 118
4.1.1. Dataset for statistical analysis
The empirical analysis uses the optimized dataset with the selection of most
important countries (Chapter C.2.2.2.) aligned and adjusted to the independent
variables (Chapter B.3.2.3.1.), further broken down into VC and PE investment.
The optimized dataset covers the years 1990 through 2005 for 38182 countries
out of the top 43 (excluding Taiwan, Bermuda, Luxembourg, Indonesia, and the
Philippines).
The cross-border dataset contains information from 22,591 deals between funds
and PF companies, and 21,260 deals between PE investors and PF companies.
The dataset lists 2,363 different PE firms, 4,188 different funds, and 9,109
different PF companies. The set includes 38 source countries, 38 host countries,
considered in a time series of 16 years. The panel dataset (country / year
combination) has 399 different observations for source country and 475
observations for host country. The gravity-model dataset has 453 different cross-
border pairs and the final analysis spans a matrix of 2,266 source, host, and year
combinations. The dataset is unbalanced and includes four dependent variables:
participation, deal participation, deal flow, and the normative summarizing
variable activity expressed as a percentage. The absolute numbers for the
variables of activity are: participation, 21,260; deal participation: 11,584; deal
flow: $141.43 billion ; and activity 14.5%.
Distribution into VC and PE requires sub-datasets. These are:
Venture capital: The cross-border dataset gathers information from 16,782
deals between funds and PF companies, and 15,906 deals between PE firms
and PF companies. It contains 1,908 different PE firms, 3,130 different funds,
and 7,252 different PF companies. The set includes as cross-sections 38 source
countries and 38 host countries, and covers 16 years. The panel dataset for
source countries includes 381 observations, and for host countries 455
observations. The gravity-model dataset has 420 different cross-border pairs and
182 Argentina, Australia, Austria, Belgium, Brazil, Canada, China, Czech Republic, Denmark,
Finland, France, Germany, Greece, Hong Kong, Hungary, India, Ireland, Israel, Italy, Japan, Malaysia, Mexico, Netherlands, New Zealand, Norway, Poland, Portugal, Romania, Russian Federation, Singapore, South Africa, South Korea, Spain, Sweden, Switzerland, Thailand, United Kingdom, United States of America.

C. Empirical analysis of private equity activity 119
spans a matrix of 2,012 examples: participation, 15,748; deal participation,
8,481; deal flow, $99.37 billion and portion of total activity, 10.4%.
Private equity: The cross-border dataset contains 5,809 deals between funds
and PF companies, and 5,678 deals between PE firms and PF companies; listed
are 762 different PE firms, 1,058 different funds, and 3,505 different PF
companies. The set includes as cross-sections 34183 source countries and 38
host countries over 16 years. The panel dataset has 266 observations for source
countries and 397 observations for host countries. The gravity model dataset has
278 different cross-border pairs and spans a matrix of 1,167, with participation,
5,512; deal participation, 3,103; deal flow, $42.06 billion ; and activity, 4.1%.
The different datasets of overall deals, and VC and PE in combination with the
four different measurable variables, require 16 different analytical set-ups for
dependent variables as illustrated below:
Table 19: Matrix overview of dependent variables
Each analysis is further broken down into four successive areas: gravity
indicators, banking system, country endowment, and institutional / legal / political
indicators, which are listed in detail in the following table, with variable
transformation, source and host country, dimension, and time period.
183 Mexico, Romania, South Africa, and Thailand are not source countries for PE investment.
1. Participation 2.Deal participation 3. Deal flow 4. Activity
1. Deals total 1.1 2.1 3.1 4.1
2. Venture Capital 1.2 2.2 3.2 4.2
3. Private Equity 1.3 2.3 3.3 4.3

C. Empirical analysis of private equity activity 120
Table 20: Overview of explanatory variables with transformation and indication
The table above displays the explanatory variables with the indication of impact
on PE cross-border activity as formulated in the hypotheses of Chapter B.2.3.2.
The results are described in detail in the following section.
Model Transf. Period
A) Gravity model indicators Source Host Level Dimension
1) Economic mass related data: (+) (+)GDP log (+) (+) ratio continuous 1990-2005Population log (+) (+) ratio continuous 1990-2005
2) Economic distance related variables:Distance log ratio continuous Static
Factors affecting the economic distance:Common language nominal binary StaticCommon border nominal binary StaticCommon history nominal binary StaticCommon currency nominal binary StaticCommon legal system nominal binary Static
3) Country specific development related dataExchanger rates (+) (-) ratio index 1990-2005Openness of im- and exports to GDP (+) (+) ratio ratio 1990-2005Development (+) (+) ordinal rank 1990-2005
B) Private Equity related indicators Source Host Level Dimension
1) Banking system1.1 Size (+) (+)
M2 to GDP (+) (+) ratio ratio 1990-2005Private credit to GDP (+) (+) ratio ratio 1990-2005
1.2 Efficiency (+) (+)Return on assets (+) (+) ratio ratio 1990-2005Operating costs to total assets (-) (-) ratio ratio 1990-2005Net interest margin (+) (+) ratio ratio 1990-2005
1.3 Competitiveness (+) (+)Lending minus deposit interest rate spread (+) (+) ratio ratio 1990-2005Number of banks per GDP (+) (+) ratio ratio 1990-2005
2) Endowment-related variables2.1 Scientific competitiveness (+) (+)
Engineers and scientists per thousand (+) (+) ratio ratio 1990-2005Patents residential log (+) (+) ratio continuous 1990-2005Patents non residential log (-) (-) ratio continuous 1990-2005
2.2 Corporate economic conditions (+) (+)GDP per capita log (+) (+) ratio ratio 1990-2005Wages in countries log (+) (+) ratio continuous 1990-2005Corporate tax rates (-) (-) ratio ratio 1990-2005
2.3 Exit possibilities (+) (+)Stock market capitalization log (+) (+) ratio continuous 1990-2005
3) Institutional/ legal/ political3.1 Institutional stability and quality (+) (+)
Rule of law (+) (+) interval score 1990-2005Political stability (+) (+) interval score 1990-2005Regulatory quality (+) (+) interval score 1990-2005Control of corruption (+) (+) interval score 1990-2005
3.2 Legal regimes and originCommon law nominal binary StaticCivil law nominal binary StaticOther nominal binary Static
3.3 Freedom (+) (+)Political rights (+) (+) ordinal rank 1990-2005Civil rights (+) (+) ordinal rank 1990-2005Economic freedom (+) (+) interval score 1990-2005
MeasurementIndication
(+)(+)
(-)
(+)(+)(+)
(-)
C. Empirical analysis of private equity activity 121
4.1.2. Data diagnostics for statistical analysis
The data analysis, especially to perform the gravity model analysis, requires
some fundamental assumptions of linear regression. To use the model,
regression diagnostics focus on screening influential data, normality testing of the
residuals, and the test of heteroscedasticity (Chapter B.2.2.).184 Diagnostics are
required for each of the 16 regressions listed in the matrix and further for the VC
and PE datasets.
Screening of influential data
The screening of influential data identifies single observations that are
substantially different from all other observations and that manipulate the
regression analysis. The focus is the test for outliers and leverage of the
variables. Outliers are observations with large residuals. Leverage is an extreme
value of the explanatory variable.185 Outliers are examined with studentized
residuals with a value larger than ± 3.5.186 A critical value of the leverage is
larger than (2k + 2) / n.187 The data in the sample correspond to the data
derivation, and all observations are included.
The normality assumption of residuals for hypothesi s testing
The OLS regression requires that residuals are identically and independently
distributed. Normality of residuals is required for constructing statistics for valid
hypothesis testing.188 The normality assumption assures that the p-values for the
t-tests and F-tests are valid. Numerical tests189 determine if the residuals are
normally distributed and plots help visualize the distribution of the residuals. The
distribution of residuals is tested with D’Agostino’s K-squared test based on the
184 Greene, Econometric Analysis; Cook, R. D. and Weisberg, S., Residuals and Influence in
Regression, Monographs on statistics and applied probability, 1982, pp. 230-235; UCLA, Regression Diagnostics, 2008,
www.ats.ucla.edu/stat/stata/webbooks/reg/chapter2/statareg2.htm. 185 UCLA, Regression Diagnostics. 186 Different critical values are mentioned in literature, compare: Egger and Pfaffermayr, The
Proper Panel Econometric Specification of the Gravity Equation: A Three-Way Model with Bilateral Interaction Effects; UCLA, Regression Diagnostics.
187 k is the number of predictors and n is the number of observations: UCLA, Regression Diagnostics.
188 Greene, Econometric Analysis, pp. 17, 50 and 90. 189 Common tests for normality are: Shapiro-Wilk and Shapiro-Francia tests for normality, but the
tests have limitations in the number of observations.

C. Empirical analysis of private equity activity 122
combination of the tests for skewness and kurtosis.190 The following graphs plot
the residual distribution of the dependent variable deal flow against a normal
probability curve in a histogram and a kernel density plot.
Figure 30: Normality distribution of residuals (deal flow)
The plots clearly indicate that the residuals are not normally distributed and the
normality test verifies the result with a skewness of 0.000, a kurtosis of 0.000,
and a chi square of (.), rejecting the null hypothesis of normality.191
Normality of dependent and independent variables
A common cause of non-normally distributed residuals are non-normally
distributed dependent or explanatory variables. A transformation of the variables
helps to distribute the residuals more normally. The original econometric
representation of the gravity model takes the form of a triple-indexed model with
log-log transformation to fulfill the requirements of normality with the following
equation:192
Equation 18: Econometric representation of the gravity-model equation
lnlnlnlnlnlnln 6543210 ijtiiijjtitijtijt xxxxxxy εβββββββ +++++++=
with: ,...,1,,,...,1, TtjiNji =≠=
190 D'Agostino, R. B.; Balanger, A. and R. B. D'Agostin o, J., A Suggestion for Using Powerful
and Informative Tests of Normality, American Statistician, 1990, 44, pp. 316-321. 191 UCLA, Simple and Multiple Regression, 2008,
www.ats.ucla.edu/stat/Stata/webbooks/reg/chapter1/statareg1.htm. 192 Matyas, Proper Econometric Specification of the Gravity Model; Egger and Pfaffermayr,
The Proper Panel Econometric Specification of the Gravity Equation: A Three-Way Model with Bilateral Interaction Effects.
0.0
05.0
1.0
15D
ensi
ty
0 1000 2000 3000 4000
Residuals
Kernel density estimateNormal density
kernel = epanechnikov, bandwidth = 4.8633
Kernel density estimate for residuals
0.0
02.0
04.0
06.0
08D
ensi
ty
0 1000 2000 3000 4000Dealflow
Histogram

C. Empirical analysis of private equity activity 123
Log-log refers to the transformation of the dependent and the explanatory
variables by natural logarithm. The equation as it stands does not consider
specific variable types to be transformed. Different adjustments to the equations
are considered in literature without a definite method of variable
transformation.193
To obtain normality for empirical analysis, dependent and independent variables
are converted, with potential transformations of log, square root, or raising the
variable to a power, etc.,194 and the residuals are tested for normal distribution
with the skewness / kurtosis test.195 The result is shown for the dependent
variable deal flow.
Figure 31: Checking for normality of residuals for deal flow model after transformation
The histogram and kernel density graph verify the log transformation of the
dependent variable as a best fit for normality of residual distribution. The test
supports selection of the log transformation with a chi-square = 17.42 and a P
(chi-squared) for log (deal flow) = 0.000 having the smallest chi-square of all the
transformation possibilities.
Transformation of data in detail: Analyzing the variables for normality and
aligning the transformations with the gravity model set up in literature,196 the
193 Borrmann; Jungnickel and Keller, What Gravity Models Can Tell Us About the Position of
German FDI in Central and Eastern Europe; Rose and Spiegel, Offshore Financial Centers: Parasites or Symbionts?
194 Cubic, square, identity, square root, log, 1 / (square root), inverse, 1 / square, 1 / cubic. UCLA, Simple and Multiple Regression.
195 Using D’Agostino’s K-squared test. 196 Egger and Pfaffermayr, The Proper Panel Econometric Specification of the Gravity
Equation: A Three-Way Model with Bilateral Interaction Effects; Borrmann; Jungnickel and
(cont)
0.0
5.1
.15
.2D
ensi
ty
-10 -5 0 5 10
Residuals after log transformation of dependant variable
Kernel density estimateNormal densitykernel = epanechnikov, bandwidth = 0.3847
Kernel density estimate with log transformationcubic square identity
sqrt log 1/sqrt
inverse 1/square 1/cubic
Den
sity
Dealflow
Histograms by transformation of dependant variable

C. Empirical analysis of private equity activity 124
transformations are essentially applied to variables with a ratio scale of
measurement and not to quotients of numerical data. The transformed variables
are the dependent variables: participation, deal participation, deal flow, and the
activity percentage. The transformed independent variables of the gravity model
indicators of economic mass are GDP, population, and the geographic distance
in nautical miles. The transformed independent variables of PE are the
endowment indicators: patents residential and nonresidential, GDP per capita,197
wages in a country, and stock market capitalization.
Including the variables of population, GDP, and GDP per capita in the equation
with log transformation results in perfect colinearity of the three variables. To
avoid the problem of perfect colinearity, the variable GDP is excluded and GDP
per capita is understood as a measurement of economic mass and an
endowment indicator, and will be included in the analysis as representative of
both categories.198
The variables with nominal, ordinal, and interval scale — like the economic
distance indicators of common language, common border, etc., and the
institutional, legal, and political indicators — are not transformed due to their level
of measurement. The remaining ratio variables, like the banking sector
indicators, are unchanged because they are either scaled by a variable
accounting for country size, like GDP, or they are country size indifferent, like
lending minus deposit interest rate spread. The final variable set with
transformations is listed in Table 20 above.
Keller, What Gravity Models Can Tell Us About the Position of German FDI in Central and Eastern Europe, p. 7; Greene; Harris and Matyas, Gravity Models, Zero Trade Flows and Fixed Effects, p. 4; Matyas, Proper Econometric Specification of the Gravity Model.
197 Including GDP per capita requires some adjustments due to colinearity if the indicators GDP and population are included in the regression analysis. GDP per capita is used as an economic mass indicator in several studies with transformation: Rose and Spiegel, Offshore Financial Centers: Parasites or Symbionts?
198 Different variable combinations are used with the gravity model to avoid the problem of colinearity.
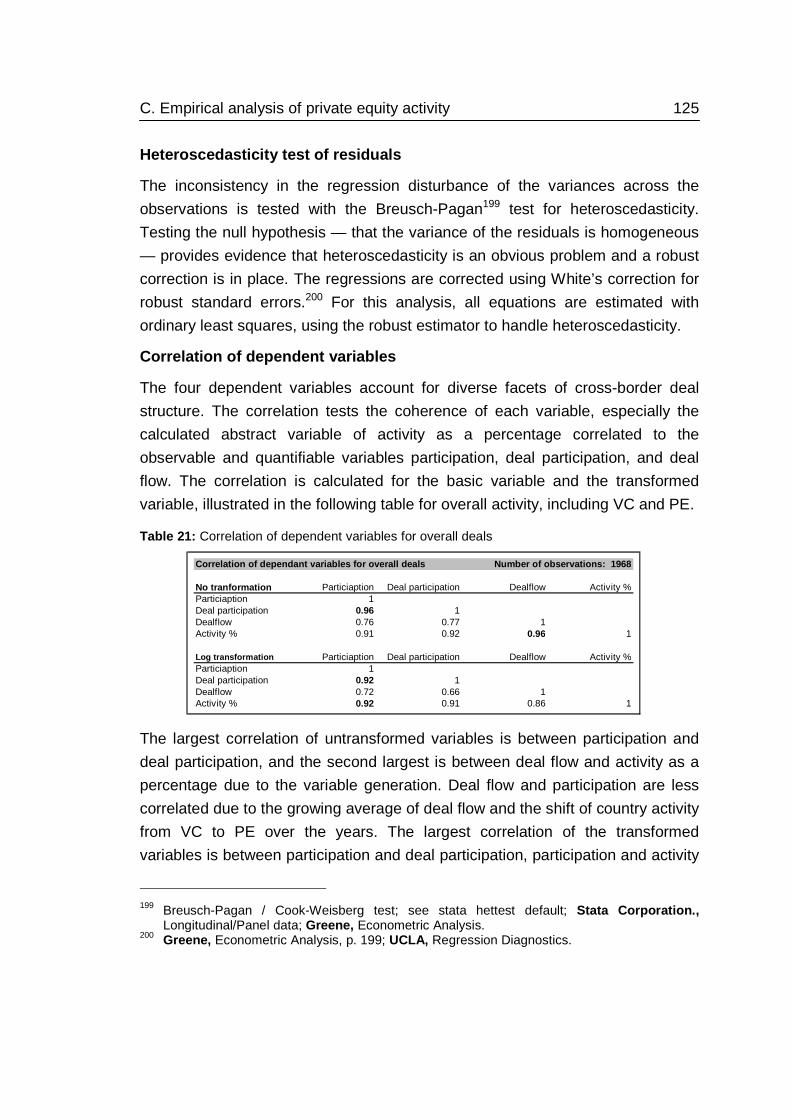
C. Empirical analysis of private equity activity 125
Heteroscedasticity test of residuals
The inconsistency in the regression disturbance of the variances across the
observations is tested with the Breusch-Pagan199 test for heteroscedasticity.
Testing the null hypothesis — that the variance of the residuals is homogeneous
— provides evidence that heteroscedasticity is an obvious problem and a robust
correction is in place. The regressions are corrected using White’s correction for
robust standard errors.200 For this analysis, all equations are estimated with
ordinary least squares, using the robust estimator to handle heteroscedasticity.
Correlation of dependent variables
The four dependent variables account for diverse facets of cross-border deal
structure. The correlation tests the coherence of each variable, especially the
calculated abstract variable of activity as a percentage correlated to the
observable and quantifiable variables participation, deal participation, and deal
flow. The correlation is calculated for the basic variable and the transformed
variable, illustrated in the following table for overall activity, including VC and PE.
Table 21: Correlation of dependent variables for overall deals
The largest correlation of untransformed variables is between participation and
deal participation, and the second largest is between deal flow and activity as a
percentage due to the variable generation. Deal flow and participation are less
correlated due to the growing average of deal flow and the shift of country activity
from VC to PE over the years. The largest correlation of the transformed
variables is between participation and deal participation, participation and activity
199 Breusch-Pagan / Cook-Weisberg test; see stata hettest default; Stata Corporation.,
Longitudinal/Panel data; Greene, Econometric Analysis. 200 Greene, Econometric Analysis, p. 199; UCLA, Regression Diagnostics.
Correlation of dependant variables for overall deal s Number of observations: 1968
No tranformation Particiaption Deal participation Dealflow Activity %Particiaption 1Deal participation 0.96 1Dealflow 0.76 0.77 1Activity % 0.91 0.92 0.96 1
Log transformation Particiaption Deal participation Dealflow Activity %Particiaption 1Deal participation 0.92 1Dealflow 0.72 0.66 1Activity % 0.92 0.91 0.86 1

C. Empirical analysis of private equity activity 126
as a percentage. Varying results can be expected due to the different
correlations of the variables.
The diagnostics with data transformation ensure reliable datasets of dependent
and independent variables for empirical analysis.
4.2. Analysis of main and interaction effects for c ountries over time
The analysis of main and interaction effects verifies the effect captured in the
three main dimensions — source, host, and year — and the effects inherent in
the particular constellation of source / host, source / year, and host / year.201 The
gravity-model equation for both main and interaction effects, as derived in
Chapter B.2.2.2. with dummy variables, is stated as follows:
Equation 19: Gravity equation with dummy variables
The verification of the main and interaction effects of source, host, and year is
accomplished by the analysis of variance (ANOVA)202 for each category. ANOVA
allows a breakdown of the variance into components of the main and interaction
effect. Analysis is performed for all dependent variables and for all company
investment stages; each effect is analyzed separately, resulting in 72
calculations.203 The following chapters detail the calculation steps for overall
investment. The results for VC and PE are listed in a summary table.
4.2.1. ANOVA for overall cross-border deals
The first analysis of variance investigates the main effects of source, host, and
year for the variable deal flow with the following results:
201 Egger and Pfaffermayr, The Proper Panel Econometric Specification of the Gravity
Equation: A Three-Way Model with Bilateral Interaction Effects. 202 Greene, Econometric Analysis, p. 33; ANOVA can be used to produce regression estimates
and the ANOVA output; Egger and Pfaffermayr, The Proper Panel Econometric Specification of the Gravity Equation: A Three-Way Model with Bilateral Interaction Effects, p. 575.
203 4 dependent variable x 3 investment stages x 6 ANOVA (3 for main effects, 3 interaction effects). The effects are estimated separately due to matrix size of interaction variables: source / host exceeds the maximum possible matrix size of the analysis program.
,...,1,,,...,1,ln 111111 TtjiNjiddddddy ijtjtitijtjiijt =≠=++++++= −−−−−− ε

C. Empirical analysis of private equity activity 127
Table 22: Analysis of variance of deal flow with main effects
The R-squared of 42% shows that the model explains approximately 42% of the
data variation. The main effects — source, host, and year — are all significant
with F<0.05. The source country effect is by far the largest main effect, with
31.1%, followed by host country, with 17.1%, and year, with 15.6% of variance.
The results indicate that the determinants inherent in the source country affect
cross-border investment activity most, followed by host country and year-inherent
determinants.
The next table presents the consolidated results of ANOVA with the three
separately analyzed main effects and the three separately analyzed interaction
effects:
Table 23: Consolidated results of ANOVA with main and interaction effects for deal flow
The analysis verifies that the largest part of cross-border investment is explained
by the interaction effects and not the main effects. The largest effect is inherent
in the country pair combination, expressed in the source / host interaction effect
with 44.2%, followed by the source / year effect with 34.6%, and the host / year
effect of 26.8%. The main effects verify the same relative importance as in the
Analysis of Variance of deal flow with main effects ANOVA Number of obs: 1968 R-squared: 0.4287Dealflow Root MSE: 1.55298 Adj R-squared: 0.4019 Source Partial SS % of total df MS F Prob > F
Model 3400.3842 42.9% 88 38.6407 16.02 0.0000
Year 1237.0990 15.6% 15 82.4733 34.20 0.0000Source 2464.2002 31.1% 36 68.4500 28.38 0.0000Host 1357.0484 17.1% 37 36.6770 15.21 0.0000
Residual 4531.6453 57.1% 1879 2.4117
Total 7932.0295 100.0% 1967 4.0326
Consolidated ANOVA tables of models with one effect
ANOVA Deal flow Number of obs: 1968
Source Partial SS % of total df MS F Prob > FTotal 7932.02953 100.0% 1967 4.0326
Year 419.8506 5.3% 15 27.9900 7.27 0.0000Source 1274.3920 16.1% 36 35.3998 10.27 0.0000Host 438.4014 5.5% 37 11.8487 3.05 0.0000Year*Source 2741.1682 34.6% 370 7.4086 2.28 0.0000Year*Host 2127.3350 26.8% 440 4.8349 1.27 0.0006Source*Host 3505.0077 44.2% 414 8.4662 2.97 0.0000

C. Empirical analysis of private equity activity 128
model, with all main effects included. The results prove the strong explanatory
power inherent in the country pair. To compare the main and interaction effects
for the dependent variable, the consolidated results of ANOVA performed for all
four dependent variables are summarized in Table 24 below. The number of
observations for participation, deal participation, and the activity percentage is
2,266, and for deal flow, 1,968. The R-squared of each model is the individual
effect for each category, since this is the only effect controlled for by the dummy
variable. Each table displays the partial sum of squares (Partial SS), the partial
sum of squares as a percentage, the F-statistic and the probability (Prob > F).
The first subtable contains the results of the previous consolidated deal flow
analysis. The largest effects overall are bolded.
Table 24: Consolidated results of ANOVA with main and interaction effects
The results are interpreted separately for each dependent variable and in
comparison to the four dependent variables.
Participation: The largest main effect for participation is the host country effect,
with 14.82%, which is different from the deal-flow analysis. The largest
interaction effect is the source / host effect, with 60.47%, validating the relevance
of the country pair combination. The second-largest effect is the year / host
effect, with 25.91%, almost identical with the year / source effect, with 25.85%,
which is also different compared to the deal-flow analysis. The effect of year
accounts only for 2.36%.
Consolidated ANOVA tables with models with one source Overall investements
ANOVA Deal flow Obs: 1968 ANOVA Participation Obs: 2266
Source Partial SS % of total F Prob > F Source Partial SS % of total F Prob > FTotal 7932.0295 100.00% Total 3530.5387 100.00%
Year 419.8506 5.29% 7.27 0.0000 Year 83.2365 2.36% 3.62 0.0000Source 1274.3920 16.07% 10.27 0.0000 Source 470.0724 13.31% 9.25 0.0000Host 438.4014 5.53% 3.05 0.0000 Host 523.3176 14.82% 10.48 0.0000Year*Source 2741.1682 34.56% 2.28 0.0000 Year*Source 912.6388 25.85% 1.64 0.0000Year*Host 2127.3350 26.82% 1.27 0.0006 Year*Host 914.8792 25.91% 1.32 0.0000Source*Host 3505.0077 44.19% 2.97 0.0000 Source*Host 2134.8717 60.47% 6.14 0.0000
ANOVA Deal participation Obs: 2266 ANOVA Activity Obs: 2266
Source Partial SS % of total F Prob > F Source Partial SS % of total F Prob > FTotal 4040.8082 100.00% Total 4324.7794 107.03%
Year 42.4441 1.05% 1.59 0.0681 Year 104.6269 2.59% 3.72 0.0000Source 720.1479 17.82% 13.06 0.0000 Source 756.2379 18.72% 12.76 0.0000Host 260.7237 6.45% 4.15 0.0000 Host 362.0694 8.96% 5.5 0.0000Year*Source 1225.5476 30.33% 2.04 0.0000 Year*Source 1320.8141 32.69% 2.06 0.0000Year*Host 746.7416 18.48% 0.86 0.9809 Year*Host 908.1724 22.48% 1 0.4706Source*Host 2413.3941 59.73% 5.95 0.0000 Source*Host 2448.3407 60.59% 5.23 0.0000

C. Empirical analysis of private equity activity 129
Deal-participation: The largest main effect in this analysis is by far the source
country effect, with 17.82%; the host country effect has only 6.45%, and the year
effect is not significant (p-value = 0.0681). The source / host interaction is the
dominant effect, with 59.73%, followed by the year / source effect, with 30.33%,
whereas the year / host effect is not significant.
Activity percent: The largest main effect is the source country effect, with
18.72%, followed by the host effect, with 8.96%, and the year effect, with 2.59%.
The largest interaction effect is source / host, with 60.59%, followed by year /
source, with 32.69%. The variable year / host is not significant. Comparison of
the ANOVA results reveals a variation in the main and interaction effects for each
of the four dependent variables, with different absolute explanatory values.
Further, the ratio of effects varies for each of the dependent variables. The
source / host combination explains the largest portion of cross-border activity.
The results for year / source and year / host vary in the analyses of the
dependent variables, caused by the result of participation with host country
effects larger than source country effects.
Comparing the ratio of main effects between the deal flow and participation
analysis, in the deal-flow analysis, source is the largest main effect, and the
effects of year and host are almost similar in proportion. In contrast, in the
participation analysis, the largest main effects are source and host with similar
values.
Comparing the interaction effects for deal flow and participation, the year / source
effect is significantly larger in the deal-flow analysis, whereas the year / source
and year / host effects are nearly similar in the participation analysis.
The comparison of the deal-participation analyses to the activity-percentage
analyses yields similar effect ratios, although on a higher level for the activity
percentage.
The results prove that it is not sufficient to investigate isolated countries to
explain PE activity. It is indispensable to explain cross-border activity with
country pairs in a system of entities with reactive relationships over time.
Further, analysis of the four dependent variables supports the fact that it can be
misleading to observe general activity by measuring deal flow only.

C. Empirical analysis of private equity activity 130
4.2.2. ANOVA applied to venture capital and private equity
ANOVA is applied to the finance stages of VC and PE investments to investigate
if country affinity varies between overall, VC, and PE investments. The results for
the four dependent variables are presented in the consolidated tables.
4.2.2.1. Venture capital
The ANOVA of VC cross-border investment focuses on the early stages of a
company, investigating the impact of the main and interaction effects. The
number of observations for deal flow is 1,744, and for participation, deal
participation, and activity percentage, 2,012.
Table 25: Consolidated results of ANOVA with main and interaction effects (VC)
The results show the same pattern of main and interaction effects as in overall
investment, although on a lower level of variance. The largest effect of the four
analyses is the source / host effect, with 59.41% for participation. The ratios vary
compared to overall investment, especially for participation. The host effect is
significantly larger than the source effect and the interaction effect of year / host
larger than year / source. The ANOVA for VC investment verifies the large impact
of the source / host effect and identifies a shift in ratio toward host country
effects, indicating that the destination country for early stage cross-border
investment is more important.
Consolidated ANOVA tables with models with one source Venture Capital
ANOVA Deal flow Obs: 1744 ANOVA Participation Obs: 2012
Source Partial SS % of total F Prob > F Source Partial SS % of total F Prob > FTotal 6606.0481 100.00% Total 2864.3509 100.00%
Year 326.5909 4.94% 5.99 0.0000 Year 50.9168 1.78% 2.41 0.0018Source 962.0351 14.56% 8.08 0.0000 Source 309.7270 10.81% 6.47 0.0000Host 425.0866 6.43% 3.26 0.0000 Host 449.3157 15.69% 9.93 0.0000Year* Source 2206.2515 33.40% 1.93 0.0000 Year* Source 660.9710 23.08% 1.29 0.0006Year*Host 1902.9870 28.81% 1.26 0.0013 Year*Host 767.2393 26.79% 1.25 0.0010Source*Host 2944.8870 44.58% 2.86 0.0000 Source*Host 1701.8446 59.41% 5.56 0.0000
ANOVA Deal participation Obs: 2012 ANOVA Activity Obs: 2012
Source Partial SS % of total F Prob > F Source Partial SS % of total F Prob > FTotal 3374.7679 100.00% Total 3549.1210 105.17%
Year 29.5814 0.88% 1.18 0.2826 Year 69.8299 2.07% 2.67 0.0005Source 541.6450 16.05% 10.2 0.0000 Source 526.6906 15.61% 9.3 0.0000Host 204.9636 6.07% 3.45 0.0000 Host 312.1674 9.25% 5.15 0.0000Year* Source 992.0067 29.39% 1.79 0.0000 Year* Source 995.4816 29.50% 1.67 0.0000Year*Host 618.7516 18.33% 0.77 0.9996 Year*Host 766.8292 22.72% 0.95 0.7670Source*Host 1941.1011 57.52% 5.14 0.0000 Source*Host 1956.5167 57.97% 4.67 0.0000

C. Empirical analysis of private equity activity 131
4.2.2.2. Private equity
The ANOVA for PE investment investigates the difference in buyouts and later-
stage investment compared to overall investment. The number of observations
for deal flow is 944 and for participation, deal participation, and activity
percentage, 1,167.
Table 26: Consolidated results of ANOVA with main and interaction effects (PE)
The analyses yield similar distributed results of the main and interaction effects,
although with a significant shift toward host effect, especially for participation and
deal participation. The largest effect is the source / host effect, with 59.15% for
the activity percentage. Compared to the previous ANOVAs, the main effect of
years in the deal-flow analysis is larger than the host effect. Although the host
country effect is very important, neither of the year / host interaction effects is
significant in the PE activity analyses.
4.2.3. Intermediate results of empirical analysis
Essential is the verification of the strong impact of country affinity expressed
through the large interaction effect of the source / host pair. It underscores the
importance of positive country relations for cross-border investment. Further,
ANOVA identifies the large impact of the source country effect for deal flow, deal
participation, and activity percentage. It verifies the focus on the source country
Consolidated ANOVA tables with models with one source Private Equity
ANOVA Deal flow Obs: 992 ANOVA Participation Obs: 1167
Source Partial SS % of total F Prob > F Source Partial SS % of total F Prob > FTotal 3767.8930 100.00% Total 1213.4517 100.00%
Year 234.7976 6.23% 4.32 0.0000 Year 26.6531 2.20% 1.72 0.0412Source 547.5399 14.53% 5.1 0.0000 Source 137.1030 11.30% 4.37 0.0000Host 197.1088 5.23% 1.42 0.0500 Host 211.4063 17.42% 6.44 0.0000Year* Source 1299.4979 34.49% 1.66 0.0000 Year* Source 300.7619 24.79% 1.12 0.1191Year*Host 1316.1563 34.93% 1 0.5119 Year*Host 401.2810 33.07% 0.96 0.6728Source*Host 1527.4550 40.54% 2.08 0.0000 Source*Host 715.5841 58.97% 4.61 0.0000
ANOVA Deal participation Obs: 1167 ANOVA Activity Obs: 1167
Source Partial SS % of total F Prob > F Source Partial SS % of total F Prob > FTotal 1472.9833 100.00% Total 1652.234 112.17%
Year 16.2998 1.11% 0.86 0.6116 Year 33.013 2.24% 1.56 0.0768Source 205.8984 13.98% 5.58 0.0000 Source 250.099 16.98% 6.12 0.0000Host 120.5076 8.18% 2.72 0.0000 Host 157.610 10.70% 3.22 0.0000Year* Source 423.8019 28.77% 1.37 0.0005 Year* Source 449.571 30.52% 1.27 0.0063Year*Host 374.0300 25.39% 0.66 1.0000 Year*Host 482.352 32.75% 0.8 0.9935Source*Host 825.9162 56.07% 4.1 0.0000 Source*Host 871.228 59.15% 3.58 0.0000
C. Empirical analysis of private equity activity 132
perspective, as done in the descriptive analysis, with the source perspective of
the graphic panel analysis and the scaling of countries by GDP of the source
country. Only for participation is the host country effect larger. The year effect is
less important for cross-border activity.
The breakdown into VC and PE financing confirms a shift toward the impact of
the host country compared to overall investment. The results of ANOVA support
the necessity of the gravity model analysis with differentiation into the four
dependent variables to capture cross-border PE activity in detail.
4.3. The gravity model analysis with explanatory in dicators
The gravity model analysis with explanatory variables identifies determinants that
explain PE cross-border activity. The analysis investigates especially the impact
of country affinity with the gravity indicators — mass and economic distance, and
the PE indicators — banking system, country endowment, and institutional, legal,
and political environments. The models diversify into the four dependent
variables. The analysis is further broken down into VC and PE activity. The
analytic steps are detailed for overall investment, with gravity indicators
discussed first, followed by the other sets of explanatory variables. Results of the
VC and PE analyses are disclosed for the gravity indicators and the full set of
determinants without presenting the intermediate steps of category analysis. The
final analyses compare the results for overall, VC, and PE investment.
4.3.1. Analysis of overall private equity investmen t
The analysis of overall PE investment explains cross-border activity with detailed
explanatory variables.
The equation for the gravity model with the full set of variables with log
transformation and year dummy variables is:

C. Empirical analysis of private equity activity 133
Equation 20: Gravity model with dummy variables and log for variables
with ,...,1,,,...,1, TtjiNji =≠=
The model is employed using the variables of the gravity model indicators —
economic mass, economic distance, country pair-specific data, and the overall
PE investment indicators — banking system, country endowment indicators and
the institutional / legal / political indicators. The variables of each step are listed
in the equation in parentheses. The focus of the analysis is on the indicators,
whether they are statistically significant and, if so, their direction and value. The
results are presented for all dependent variables in one table, including for each
model the number of observations in the regression analysis, the F and Prob > F
(F-value204 and p-value205), the R-squared,206 and the RootMSE207 in the top
columns. For each independent variable the coefficient, the p-value, and beta
coefficient208 are listed, whereas standard error, t- value, and the confidence
interval are hidden.
The tables list the variables with their transformation into logarithms, their source
(S) and host (H) abbreviation, and the expected positive (+) or negative (-)
indication. The statistically significant p-values are highlighted in green for easier
204 F-value is the Mean Square Model divided by the Mean Square Residual, yielding in F. 205 p-value associated with the F-value. 206 R-squared: Proportion of variance in the dependent variable that can be predicted from the
independent variable(s). 207 RootMSE: Standard deviation of the error term and square root of the Mean Square Residual
(Error). 208 The beta coefficient is the standardized regression coefficient that compares the strength of
the coefficients in standard deviations instead of the units of the variables.
...
)......
........
.....()...ln
..lnlnlnln
ln..ln..ln.ln.ln
..()....
....././...
..22()..
..
....ln.ln.ln(ln
20051991
605958575655
54535251504948
474645444342
414039383736
3534333231
302928272625
242322212019
18171615141312
1110987
6543210
ijt
ijtijtjtitjtit
jijijtitjt
itjtitjtitjt
itjtitjtitjt
itjtitjtit
jtitjtitjtit
jtitjtitjtit
jtitjtitjtitjt
itjtitijij
ijijijijjtitijt
dd
freeeconfreeeconrightscivrightscivrightspolrightspol
lawcivillawcivillawcomlawcomcorruptcorruptqualreg
qualregstabpolstabpollawrullawrulcapitalmstock
capitalmstocktaxratetaxratewageswagesGDPcapita
GDPcapitaresnpatentresnpatentrespatentrespatent
scientengscientengbanksnrbanksnrratespreadiratespreadi
marinetmarinetassetoperatassetoperatassetreturnassetreturn
creditprivcreditprivmmdevelopmdevelopmopenness
opennessteexchangerateexchangeralegalcomcurrencycom
historycombordercomlanguagecomdistpopulpopuly
εββββββ
βββββββββββββ
βββββββββββ
ββββββββββββ
ββββββββββββ
βββββββ
++++
++++++
+++++++
++++++
++++++
+++++
++++++
++++++
+++++++
+++++
++++++=

C. Empirical analysis of private equity activity 134
identification; the coefficients of the statistically significant variables are
highlighted in green if positive-related and in yellow if negative-related. The year
dummy variables are not listed as results in the table.
4.3.1.1. Estimates from the gravity-model indicator s
The first analysis focuses on the gravity model-derived indicators to investigate
the impact of country mass and country affinity. Indicators analyzed are
economic mass, economic distance, and country pair-specific data. Variable
GDP per capita is included in the gravity model indicator analysis because of its
dual role as mass indicator and country endowment indicator, after excluding
GDP from the analysis due to colinearity after log transformation.209 The equation
for gravity model indicators is:
Equation 21: Gravity-model equation with traditional gravity model indicators
with ,...,1,,,...,1, TtjiNji =≠=
The country mass and the country pair-specific variables are time-variant,
whereas the economic distance variables are time-invariant. The results for the
gravity model indicators are presented in the following table.
209 See “Rose and Spiegel, Offshore Financial Centers: Parasites or Symbionts?” to include
GDP per capita as an economic mass indicator.
...
)lnln()..
..
....ln.ln.ln(ln
20051991
3635141312
1110987
6543210
ijt
jtitjtitjt
itjtitijij
ijijijijjtitijt
dd
GDPcapitaGDPcapitadevelopmdevelopmopenness
opennessteexchangerateexchangeralegalcomcurrencycom
historycombordercomlanguagecomdistpopulpopuly
εβββββ
ββββββββββββ
++++
+++++
+++++
++++++=

C. Empirical analysis of private equity activity 135
Table 27: Gravity model estimates for the gravity indicators
Table 27 presents the four regression analysis results for the dependent
variables, with 11 different determinants specified in source (S) and host (H). In
total, 16 individual variables are analyzed, with 2,266 observations for model
participation, deal participation, and activity, and 1,968 observations for the deal
flow model.
The F-test (Prob > F = 0) for all four variables is statistically significant, indicating
that the models themselves are statistically significant. The R-squared of 0.4106
in the model participation shows that the model explains approximately 42% of
the data variation. For deal participation, R-squared is 0.2924 (29%), for deal
flow, 0.3164 (32%), and for activity percentage, 0.3661 (37%). The indicators
explain a considerable portion of the variation.
1) Economic mass indicator: Focusing on the economic mass indicator first,
the p-value (P > |t|) for population is statistically significant for source and host
country in all four models (p = 0.000),210 indicating that the coefficients for
population are significantly different from zero. The coefficients express the
relationship between dependent and independent variables and the increase in
PE investment by an increase of one of the independent variables. For the
210 The p-value is used to test the null hypothesis that the coefficient for log population is zero.
Gravity model analysis Participation Deal participation Dealflow Activity %Numberofobs=2266 Numberofobs=2266 Numberofobs=1968 Numberofobs=2266F(31,2234)=42.24 F(31,2234)=29.26 F(31,1936)=24.23 F(31,2234)=35.98
Indicators log Source Prob>F=0 Prob>F=0 Prob>F=0 Prob>F=0Host R-squared=0.4106 R-squared=0.2924 R-squared=0.3164 R-squared=0.3661
RootMSE=0.96513 RootMSE=1.1313 RootMSE=1.6736 RootMSE=1.1077
A) Gravity model indicators Coef. P>|t| Beta Coef. P>|t| Beta Coef. P>|t| Beta Coef. P>|t| Beta1) Economic mass (+)
Population log S (+) 0.3763 0.000 0.455 0.3696 0.000 0.418 0.6520 0.000 0.496 0.4422 0.000 0.483H (+) 0.3896 0.000 0.493 0.3350 0.000 0.396 0.5041 0.000 0.402 0.3945 0.000 0.451
2) Economic distance (-)Distance log (-) -0.1971 0.000 -0.187 -0.2102 0.000 -0.186 -0.3235 0.000 -0.191 -0.2543 0.000 -0.218
Factors eco. distance: (+)Common language (+) 0.6280 0.000 0.203 0.6771 0.000 0.205 0.7760 0.000 0.161 0.7254 0.000 0.212Common border (+) -0.0231 0.776 -0.007 -0.0541 0.565 -0.015 -0.4187 0.011 -0.075 -0.1817 0.053 -0.048Common history (+) 0.2316 0.055 0.036 0.2329 0.073 0.034 0.4585 0.019 0.046 0.2959 0.026 0.042Common currency (+) -0.6978 0.000 -0.120 -0.6837 0.000 -0.110 -1.0267 0.000 -0.100 -0.8067 0.000 -0.125Common legal system (+) -0.1694 0.002 -0.066 -0.0908 0.164 -0.033 -0.0806 0.456 -0.019 -0.1315 0.038 -0.046
3) Country pair specificExchange rates S (+) -0.0018 0.425 -0.016 -0.0015 0.570 -0.013 -0.0103 0.009 -0.057 -0.0044 0.082 -0.036
H (-) -0.0008 0.662 -0.008 0.0028 0.150 0.026 -0.0036 0.343 -0.021 -0.0022 0.282 -0.020Openness of im- and exports to GDP S (+) 0.1491 0.000 0.090 0.0713 0.123 0.040 0.4498 0.000 0.171 0.1976 0.000 0.108
H (+) 0.0191 0.614 0.009 0.0987 0.024 0.044 0.1268 0.100 0.038 0.0984 0.022 0.042Development S (+) -0.0419 0.805 -0.009 -0.0246 0.909 -0.005 0.6109 0.054 0.077 -0.0020 0.992 0.000
H (+) -0.0010 0.993 0.000 -0.1270 0.333 -0.036 -0.4202 0.067 -0.077 -0.1678 0.211 -0.046
2) Endowment-related variablesGDP per capita log S (+) 1.1340 0.000 0.376 1.0920 0.000 0.338 1.3713 0.000 0.277 1.2492 0.000 0.374
H (+) 0.9020 0.000 0.430 0.6654 0.000 0.297 1.0440 0.000 0.310 0.8535 0.000 0.368

C. Empirical analysis of private equity activity 136
variable population of source211 in the participation model, the coefficient is
0.3763, or approximately 0.4, expressing that, for a one-unit increase in log
population s, an increase of 0.4 units in log participation is expected.212 In detail,
the coefficients for source population are between 0.3696 and 0.6520, and for
host population between 0.3350 and 0.5041 for all four models. The positive sign
indicates that larger population is related to higher country performance, which is
expected from the gravity model theory. Differences arise in the importance of
the variable by source and host within the models. The coefficient is larger for
host in the participation model, but larger for source in the deal participation, deal
flow, and activity percentage models. The coefficients indicate the clear impact of
economic mass in general and especially of the source country for deal flow and
activity percentage.
The effect of GDP per capita for source (between 1.0920 and 1.3713), p =
0.000) and GDP per capita for host (between 0.6654 and 1.0440, p = 0.000) are
significant, and the coefficients indicate a positive relationship between PE
activity and GDP per capita.213 The coefficients support the theory that
economically massive and productive countries tend to have more PE cross-
border investments.
The beta coefficient indicates that the economic mass indicators — population
and GDP per capita — have the largest standardized coefficient in the analysis
and the largest impact in country PE activity. Overall, the mass indicators signify
that the larger the size of the economy, the greater the propensity for cross-
border PE activity.
2) Economic distance indicator: The elasticity of investment activity to
geographic distance is between -0.1971 and -0.3235, increasing the likelihood
of cross-border investment with lower distance. The economic distance indicator
common language is significant for all models, and indicates a rise in cross-
border investment by 0.6 to 0.8 units. A common border seems to be unrelated
211 Log transformed variable population of source country. 212 The numeric example is: a source country with 100 million (= 102) of population is expected
to have a log participation 0.4 units higher than a source country with 10 (= 101) million of population, with a correlation between the countries of 250 (= 102.4) to 100 (102) participants. UCLA, Simple and Multiple Regression.
213 Note, that it is not meant that GDP per capita causes higher country performance.

C. Empirical analysis of private equity activity 137
to country-pair performance, except for deal flow, where the impact is negative
with a coefficient of -0.42, which supports the fact of large money transfers
between the US and the UK. Common history is significant for deal flow and
activity percentage, with a positive impact of 0.45 for dollar amount and 0.30 for
activity — noticeable that for the deal flow-denominated investment the affinity
between countries has to be higher than for participation. The indicators
common currency and common legal system are significant with a negative
coefficient, with the exception, for the latter, of deal participation and deal flow.
The negative coefficients indicate that a common currency and legal system
does not increase the country-pair probability for cross-border investment.
Traditional gravity model indicators validate that the gravity model works well to
explain cross-border PE activity. The beta coefficients indicate that economic
mass, common language, and reduced distance are the best indicators for
increased cross-border activity. Common history supports this theory, especially
for the deal flow between countries, whereas common currency, common legal
system, and common border have a contrary effect on PE investment.
3) Country pair specific indicators: Investigating the country pair indicators,
the exchange rates of the source country in the deal flow model has negative
impact on cross-border activity, which is not expected. Openness of import-
export of the source country is, as expected, positive for participation, deal-flow,
and activity percentage, with the largest effect for deal flow of 0.4498. For the
host country, openness of import-export is significant for deal participation and
activity percentage. Indicator country development is not significant.
Of the sixteen specific cross-border activity indicators derived from the gravity
model, seven are significant for all models and five are significant for particular
cases.
4.3.1.2. Estimates from private equity indicators
The analysis then expands to look at indicators derived specifically from PE
economics. The three categories examined are banking indicators, country
endowment indicators, and institutional / legal / political indicators. The number of
observations is constant, assuring a consistent statistical population. The
regressions for the models are presented in the gravity model equation with the
full set of variables (Equation 20), with specific variables in parentheses.

C. Empirical analysis of private equity activity 138
4.3.1.2.1. Banking and financial system variables
The banking indicators clarify the effect of the financial environment of source
and host on cross-border activity. Analysis focuses on the impact of banking
system size, banking efficiency, and banking competitiveness of the countries.
Table 28: Gravity model estimates for the banking sector
The models are statistically significant, with an increase of R-squared to 49% for
participation, 39% for deal participation, 37% for deal flow, and 45% for activity
percentage.
The newly introduced banking indicators affect the significance of the mass,
distance, and country pair indicators. Focusing on the banking system variables
first, the results in detail are:
Banking size: The two traditional indicators for banking system size — M2 to
GDP and private credit to GDP — are statistically significant, except for M2 to
Gravity model analysis Participation Deal participation Dealflow Activity %Numberofobs=2266 Numberofobs=2266 Numberofobs=1968 Numberofobs=2266F(45,2220)=40.99 F(45,2220)=31.56 F(45,1922)=22.72 F(45,2220)=36.42
Indicators log Source Prob>F=0 Prob>F=0 Prob>F=0 Prob>F=0Host R-squared=0.4912 R-squared=0.3884 R-squared=0.3713 R-squared=0.4486
RootMSE=0.89952 RootMSE=1.0551 RootMSE=1.6107 RootMSE=1.0364
A) Gravity model indicators Coef. P>|t| Beta Coef. P>|t| Beta Coef. P>|t| Beta Coef. P>|t| Beta1) Economic mass (+)
Population log S (+) 0.2648 0.000 0.320 0.1876 0.000 0.212 0.5062 0.000 0.385 0.2820 0.000 0.308H (+) 0.2613 0.000 0.330 0.2630 0.000 0.311 0.3894 0.000 0.311 0.3023 0.000 0.345
2) Economic distance (-)Distance log (-) -0.3562 0.000 -0.338 -0.3822 0.000 -0.339 -0.5017 0.000 -0.295 -0.4209 0.000 -0.361
Factors eco. distance: (+)Common language (+) 0.6004 0.000 0.194 0.6406 0.000 0.194 0.7398 0.000 0.154 0.6832 0.000 0.200Common border (+) -0.0536 0.491 -0.016 -0.0939 0.299 -0.026 -0.4054 0.014 -0.072 -0.1934 0.033 -0.051Common history (+) 0.1491 0.142 0.023 0.1743 0.125 0.025 0.2252 0.244 0.023 0.1903 0.111 0.027Common currency (+) -0.5162 0.000 -0.088 -0.4484 0.000 -0.072 -0.7041 0.000 -0.069 -0.5954 0.000 -0.092Common legal system (+) -0.1315 0.009 -0.051 -0.0476 0.430 -0.017 0.0006 0.996 0.000 -0.0765 0.191 -0.027
3) Country pair specificExchange rates S (+) -0.0067 0.002 -0.061 -0.0065 0.013 -0.055 -0.0162 0.000 -0.089 -0.0090 0.000 -0.073
H (-) -0.0048 0.011 -0.048 -0.0025 0.211 -0.023 -0.0053 0.231 -0.031 -0.0050 0.024 -0.045Openness of im- and exports to GDP S (+) 0.1397 0.000 0.084 0.0160 0.738 0.009 0.3895 0.000 0.148 0.1499 0.001 0.082
H (+) 0.0361 0.398 0.017 0.1459 0.003 0.065 0.1183 0.194 0.035 0.1225 0.011 0.053Development S (+) 0.9409 0.000 0.192 1.0045 0.000 0.192 2.0453 0.000 0.258 1.2039 0.000 0.222
H (+) 0.5143 0.000 0.156 0.3914 0.013 0.111 0.7526 0.011 0.138 0.5349 0.001 0.147
B) Private Equity related indicators1) Banking system
1.1 Size (+)M2 to GDP S (+) -0.1140 0.042 -0.042 -0.1365 0.048 -0.047 -0.0934 0.397 -0.021 -0.1070 0.112 -0.035
H (+) -0.2325 0.000 -0.075 -0.2645 0.001 -0.079 -0.0721 0.617 -0.014 -0.1688 0.033 -0.049Private credit to GDP S (+) 0.5903 0.000 0.248 0.8080 0.000 0.318 1.1051 0.000 0.292 0.7965 0.000 0.303
H (+) 0.3613 0.000 0.159 0.3638 0.000 0.150 0.3961 0.003 0.109 0.3477 0.000 0.1381.2 Efficiency (+)
Return on assets S (+) 0.0005 0.478 0.010 -0.0002 0.832 -0.004 -0.0011 0.433 -0.016 -0.0001 0.909 -0.002H (+) 0.0000 0.960 -0.001 -0.0003 0.594 -0.011 0.0007 0.414 0.018 0.0004 0.468 0.015
Operating costs to total assets S (-) -0.0002 0.287 -0.023 -0.0005 0.049 -0.054 -0.0001 0.820 -0.007 -0.0002 0.461 -0.018H (-) -0.0001 0.476 -0.015 -0.0001 0.613 -0.012 0.0007 0.019 0.075 0.0003 0.185 0.037
Net interest margin S (+) 0.1518 0.000 0.121 0.1583 0.000 0.118 0.2706 0.001 0.130 0.2082 0.000 0.150H (+) 0.0558 0.049 0.055 0.0827 0.004 0.077 0.1187 0.008 0.075 0.0830 0.006 0.075
1.3 Competitiveness (+)Interest rate spread S (+) -0.0048 0.107 -0.029 -0.0034 0.322 -0.019 -0.0084 0.344 -0.026 -0.0043 0.178 -0.024
H (+) -0.0054 0.284 -0.018 -0.0100 0.126 -0.032 0.0005 0.959 0.001 -0.0058 0.367 -0.018Number of banks per GDP S (+) 0.0000 0.120 0.064 0.0000 0.026 0.099 0.0000 0.307 -0.057 0.0000 0.246 0.048
H (+) 0.0001 0.000 0.196 0.0000 0.012 0.103 0.0001 0.017 0.116 0.0001 0.000 0.1372) Endowment-related variables
2.2 Corporate eco. conditions (+)GDP per capita log S (+) 0.2625 0.064 0.087 -0.0363 0.827 -0.011 0.1054 0.681 0.021 0.1247 0.420 0.037
H (+) 0.2753 0.005 0.131 0.1714 0.129 0.076 0.1524 0.459 0.045 0.2222 0.052 0.096

C. Empirical analysis of private equity activity 139
GDP in the deal-flow model and for source in the activity percentage model. M2
to GDP, contrary to the assumption of banking size, has a negative coefficient for
the models (source between -0.1140 and -0.1365, and host between -0.1688 and
-0.2645), indicating that countries with less liquidity compared to GDP seem to
have more cross-border activity. The positive coefficients of private credit to GDP
confirm the assumption of the importance of banking size in the private credit
segment, especially for source (between 0.5903 and 1.1051) and host (between
0.3477 and 0.3961) for all variables. This indicates that countries with large
relative private credit tend to have more cross-border PE investment. The beta
coefficient is largest for source countries.
Banking efficiency: The indicator return on assets is not significant. Operating
costs to total assets is significant and negative-related for the source country in
deal participation, as expected. It is further significant but positive-related for host
in the deal flow model, indicating an investment flow into countries with less
efficiency. Net interest margin is significant and has positive coefficients for all
models, indicating that countries with an efficient banking system tend to have
more cross-border deals. The high-interest margins of source countries seem to
have an especially large impact on cross-border activity, verified by comparing
beta coefficients. The indicators, if significant, have the expected results, with
greater strength in the source country for net-interest margin compared to host
country, and a relatively low magnitude for operating costs.
Competitiveness: The indicators for competitiveness are interest rate spread
and number of banks per GDP . The number of banks indicator is significant for
source deal participation and for all host country models. The coefficients have
the expected positive sign, with beta coefficients for the host country between
0.103 and 0.196, indicating the high impact of competitiveness for cross-border
deals.
Incorporation of banking system variables into the model affects the previously
analyzed gravity model indicators. The economic mass indicator GDP per
capita is significant for the host in the participation model, with a decline in
magnitude compared to the previous model. Within the economic distance
indicators, common border becomes significant for the activity percentage with
a negative coefficient. The indicator common legal system is significant for the
participation model, and common history is not significant for any of the models.

C. Empirical analysis of private equity activity 140
Within the country pair specific indicators, exchange rate for source becomes
significant for all models, although with a negative sign.
Openness to import / export is similarly significant, as in the previous analysis,
for participation, deal flow, and activity percentage for source, and in deal
participation and activity percentage for host, supporting the assumption that
import / export-oriented countries have more cross-border PE investment. Most
changes affect variable development . Development is significant for all models,
with a coefficient for source between 0.94 and 2.05, and for host between 0.39
and 0.75, indicating that investors originate from highly developed countries and
focus on an equal level of country development for their cross-border
investments.
In this model, the most important variables by coefficient are population,
geographic distance , language, and private credit to GDP for the source
country, verifying the gravity model with mass and distance, and the large impact
of banking size in the source country.
The banking indicators help to analyze the impact on PE cross-border activity as
a proxy for a banking system’s size, efficiency, and competitiveness. Indicators
with large beta coefficients support the assumptions. The variable M2 to GDP
and the indicator operating costs to total assets for the deal-flow model have
an inverse direction. The negative M2 to GDP, although with a small beta
coefficient, could be interpreted that countries with less liquidity tend to have a
greater tendency to invest abroad. Operating cost may be interpreted as flow
from efficient to less efficient banking systems, but with a small magnitude.
4.3.1.2.2. Endowment variables
Endowment-related variables dissect the impact of the stage-specific economic
market environment by combining the company life-cycle with the PE investment
process, resulting in the three categories of scientific competitiveness, corporate
economic conditions, and exit possibilities.

C. Empirical analysis of private equity activity 141
Table 29: Gravity model estimates for endowment-related variables
For the models under consideration, the overall significance increased to 52% for
participation, 43% for deal participation, 41% for deal flow, and 49% for activity
percentage.
The endowment-related variables for scientific competitiveness are engineers
and scientists, and patents residential and nonresidential . They function as a
proxy for the skill and knowledge base in a country. Higher levels of engineers,
scientists, and patents residential are associated with higher skill endowment and
Gravity model analysis Participation Deal participation Dealflow Activity %Numberofobs=2266 Numberofobs=2266 Numberofobs=1968 Numberofobs=2266F(57,2208)=37.48 F(57,2208)=29.62 F(57,1910)=23.1 F(57,2208)=34.8
Indicators log Source Prob>F=0 Prob>F=0 Prob>F=0 Prob>F=0Host R-squared=0.5198 R-squared=0.4293 R-squared=0.413 R-squared=0.4883
RootMSE=0.87627 RootMSE=1.022 RootMSE=1.5613 RootMSE=1.0011
A) Gravity model indicators Coef. P>|t| Beta Coef. P>|t| Beta Coef. P>|t| Beta Coef. P>|t| Beta1) Economic mass (+)
Population log S (+) 0.1825 0.033 0.221 0.1872 0.055 0.212 0.3201 0.016 0.243 0.2599 0.017 0.284H (+) 0.2033 0.000 0.257 0.2355 0.000 0.278 0.6202 0.000 0.495 0.3621 0.000 0.414
2) Economic distance (-)Distance log (-) -0.3922 0.000 -0.372 -0.4353 0.000 -0.386 -0.5636 0.000 -0.332 -0.4790 0.000 -0.411
Factors eco. distance: (+)Common language (+) 0.5909 0.000 0.191 0.6468 0.000 0.196 0.7506 0.000 0.156 0.6893 0.000 0.201Common border (+) -0.0064 0.932 -0.002 -0.0448 0.608 -0.012 -0.3305 0.040 -0.059 -0.1515 0.080 -0.040Common history (+) 0.0797 0.422 0.012 0.0393 0.723 0.006 0.0565 0.760 0.006 0.0635 0.580 0.009Common currency (+) -0.4702 0.000 -0.081 -0.3916 0.000 -0.063 -0.6569 0.000 -0.064 -0.5410 0.000 -0.084Common legal system (+) -0.1179 0.017 -0.046 -0.0488 0.409 -0.018 0.0116 0.910 0.003 -0.0726 0.204 -0.026
3) Country pair specificExchange rates S (+) -0.0026 0.270 -0.024 -0.0013 0.645 -0.011 -0.0094 0.033 -0.052 -0.0031 0.253 -0.026
H (-) -0.0045 0.019 -0.044 -0.0020 0.332 -0.018 -0.0089 0.042 -0.052 -0.0054 0.013 -0.049Openness of im- and exports to GDP S (+) 0.1634 0.000 0.098 0.0152 0.788 0.009 0.3015 0.000 0.115 0.1395 0.008 0.076
H (+) 0.0579 0.207 0.027 0.1357 0.009 0.060 0.0969 0.317 0.029 0.1260 0.015 0.054Development S (+) 1.2696 0.000 0.259 1.4427 0.000 0.275 2.4272 0.000 0.306 1.6174 0.000 0.298
H (+) 0.8571 0.000 0.260 0.7778 0.000 0.221 1.2805 0.000 0.235 0.9195 0.000 0.252
B) Private Equity related indicators1) Banking system
1.1 Size (+)M2 to GDP S (+) -0.2130 0.000 -0.078 -0.2730 0.000 -0.093 -0.3508 0.002 -0.080 -0.2475 0.000 -0.081
H (+) -0.2829 0.000 -0.091 -0.2734 0.000 -0.082 -0.1085 0.471 -0.022 -0.1753 0.026 -0.051Private credit to GDP S (+) 0.3834 0.000 0.161 0.5316 0.000 0.209 0.6257 0.000 0.165 0.5089 0.000 0.194
H (+) 0.2114 0.001 0.093 0.1797 0.016 0.074 0.1519 0.247 0.042 0.1762 0.022 0.0701.2 Efficiency (+)
Return on assets S (+) 0.0002 0.834 0.004 -0.0005 0.655 -0.010 -0.0017 0.327 -0.025 -0.0004 0.660 -0.009H (+) -0.0001 0.889 -0.002 -0.0003 0.565 -0.011 0.0007 0.386 0.019 0.0004 0.433 0.015
Operating costs to total assets S (-) 0.0000 0.981 0.001 -0.0002 0.363 -0.027 0.0003 0.439 0.024 0.0001 0.641 0.013H (-) -0.0001 0.567 -0.012 0.0000 0.985 0.000 0.0007 0.020 0.072 0.0003 0.131 0.040
Net interest margin S (+) 0.1878 0.000 0.149 0.1903 0.000 0.142 0.2337 0.009 0.112 0.2357 0.000 0.169H (+) 0.0946 0.001 0.094 0.1133 0.000 0.105 0.1626 0.001 0.103 0.1182 0.000 0.106
1.3 Competitiveness (+)Interest rate spread S (+) -0.0040 0.177 -0.024 -0.0023 0.501 -0.013 -0.0059 0.464 -0.018 -0.0033 0.298 -0.018
H (+) -0.0057 0.247 -0.020 -0.0093 0.144 -0.030 -0.0023 0.801 -0.005 -0.0058 0.351 -0.018Number of banks per GDP S (+) 0.0000 0.042 0.099 0.0000 0.013 0.130 0.0000 0.830 -0.013 0.0000 0.155 0.070
H (+) 0.0001 0.000 0.266 0.0001 0.000 0.185 0.0001 0.000 0.195 0.0001 0.000 0.2082) Endowment-related variables
2.1 Scientific competitiveness (+)Engineers & scientists/('000) S (+) 0.0000 0.104 0.044 0.0000 0.503 0.021 0.0001 0.099 0.047 0.0001 0.058 0.053
H (+) 0.0000 0.274 0.029 0.0001 0.006 0.077 0.0000 0.745 0.011 0.0001 0.014 0.067Patents residential log S (+) 0.0437 0.059 0.082 0.0336 0.239 0.059 0.0208 0.587 0.024 0.0264 0.310 0.045
H (+) 0.0508 0.004 0.092 0.0413 0.049 0.070 -0.0076 0.835 -0.009 0.0261 0.210 0.043Patents non residential log S (-) -0.0739 0.001 -0.090 -0.0692 0.008 -0.078 -0.1303 0.017 -0.090 -0.0879 0.001 -0.096
H (-) -0.0796 0.000 -0.095 -0.1252 0.000 -0.140 -0.1570 0.003 -0.109 -0.1215 0.000 -0.1312.2 Corporate eco. conditions (+)
GDP per capita log S (+) -0.3007 0.164 -0.100 -0.4790 0.076 -0.148 -0.4620 0.279 -0.093 -0.3181 0.205 -0.095H (+) -0.4918 0.003 -0.235 -0.5187 0.005 -0.231 -0.5014 0.141 -0.149 -0.4307 0.021 -0.186
Wages in countries log S (+) 0.0550 0.634 0.029 0.0474 0.735 0.023 -0.1835 0.314 -0.059 -0.0072 0.958 -0.003H (+) 0.2751 0.001 0.209 0.2346 0.009 0.167 0.6042 0.000 0.282 0.3419 0.000 0.235
Corporate tax rates S (-) -0.0198 0.000 -0.120 -0.0360 0.000 -0.204 -0.0407 0.000 -0.152 -0.0335 0.000 -0.183H (-) -0.0143 0.000 -0.087 -0.0148 0.001 -0.084 -0.0350 0.000 -0.130 -0.0176 0.000 -0.097
2.3 Exit possibilities (+)Stock market capitalization log S (+) 0.1531 0.005 0.224 0.1449 0.020 0.199 0.3787 0.000 0.350 0.1783 0.017 0.236
H (+) 0.0646 0.004 0.102 0.0548 0.036 0.081 -0.0985 0.030 -0.098 -0.0027 0.918 -0.004

C. Empirical analysis of private equity activity 142
knowledge. Patents nonresidential are associated with barriers to scientific
competitiveness. The indicators for corporate economic conditions explain a level
of attractiveness of a country for PE investment with the variables GDP per
capita , average wages and corporate tax rates . The exit possibility is
determined by the stock market capitalization of a country.
In the scientific competitiveness category, engineers and scientists is
significant for deal participation and activity for host country, with a positive sign.
Patents residential is significant for the host in participation and deal
participation, with a positive sign, as expected. Patents nonresidential is
significant, with a negative sign for all models. The coefficients of patent
applications indicate that investors focus on the more scientifically competitive
countries, with less impact from foreign patent applicants. Scientific
competitiveness has a high positive impact on cross-border deals, especially for
host countries.
For the corporate economic indicators, it is noticeable that including the
endowment variables has the consequence that GDP per capita is negative for
the host countries in the significant models, with a high beta coefficient.
Wages are significant and, as expected, positive-related in the host country for
all models, indicating that host countries with higher average wages, and thus an
attractive and skilled labor force, are likely to be target countries.
Corporate tax rates are all significant, with negative coefficients of larger
magnitude for the source country. Lower corporate tax rates seem to support
cross-border transactions for both source and host countries.
As a proxy for exit possibilities, stock market capitalization in a source country
is significantly positive-related for all variables, with beta coefficients between
0.18 and 0.38. The large magnitude implies that countries with a large stock-
market capitalization are more likely to participate and invest cross-border. From
the host country perspective, the coefficients for participation and deal
participation are positive, signifying that source countries want to invest in host
countries with developed stock markets. The deal-flow model, with its negative
coefficient for the host county, indicates a different behavior, with investment
flows from well-developed stock markets to less-developed stock markets.
In the category of endowment-related variables, GDP per capita, wages for host
country, and stock market capitalization have the largest leverage.

C. Empirical analysis of private equity activity 143
4.3.1.2.3. Institutional / legal / political system variables
The institutional / legal / political category is the last segment in the gravity model
regression. The variables illuminate the general country-specific conditions for
PE cross-border investment. The three subcategories are institutional stability
and quality, legal regime, and freedom. The indicators for political rights and civil
rights are highlighted with negative indicators, because of the scaling of the
original data from low to high, with a low number indicating more freedom.

C. Empirical analysis of private equity activity 144
Table 30: Gravity model analysis results Gravity model analysis Participation Deal participation Dealflow Activity %
Numberofobs=2266 Numberofobs=2266 Numberofobs=1968 Numberofobs=2266F(75,2190)=35.15 F(75,2190)=27.37 F(75,1892)=22.85 F(75,2190)=31.91
Indicators log Source Prob>F=0 Prob>F=0 Prob>F=0 Prob>F=0Host R-squared=0.5714 R-squared=0.4791 R-squared=0.4468 R-squared=0.5362
RootMSE=0.83123 RootMSE=0.98035 RootMSE=1.5229 RootMSE=0.95707
A) Gravity model indicators Coef. P>|t| Beta Coef. P>|t| Beta Coef. P>|t| Beta Coef. P>|t| Beta1) Economic mass (+)
Population log S (+) 0.2376 0.002 0.287 0.1864 0.031 0.211 0.4340 0.001 0.330 0.2803 0.001 0.306H (+) 0.2824 0.000 0.357 0.2999 0.000 0.355 0.6662 0.000 0.532 0.4271 0.000 0.488
2) Economic distance (-)Distance log (-) -0.4739 0.000 -0.450 -0.5258 0.000 -0.467 -0.5940 0.000 -0.350 -0.5445 0.000 -0.467
Factors eco. distance: (+)Common language (+) 0.3640 0.000 0.118 0.3838 0.000 0.116 0.5635 0.000 0.117 0.4625 0.000 0.135Common border (+) 0.0060 0.936 0.002 -0.0272 0.757 -0.007 -0.2445 0.133 -0.044 -0.1158 0.180 -0.031Common history (+) -0.0671 0.493 -0.010 -0.1131 0.298 -0.016 -0.1214 0.511 -0.012 -0.0855 0.449 -0.012Common currency (+) -0.3777 0.000 -0.065 -0.2743 0.008 -0.044 -0.7340 0.000 -0.072 -0.4745 0.000 -0.073Common legal system (+) 0.0854 0.098 0.033 0.1505 0.014 0.055 0.1479 0.166 0.036 0.0972 0.109 0.034
3) Country pair specificExchange rates S (+) 0.0056 0.034 0.050 0.0053 0.094 0.045 0.0031 0.529 0.017 0.0059 0.051 0.048
H (-) -0.0001 0.941 -0.001 0.0025 0.248 0.023 -0.0054 0.262 -0.032 -0.0023 0.318 -0.021Openness of im- and exports to GDP S (+) 0.2616 0.004 0.158 0.1263 0.257 0.071 0.6456 0.000 0.245 0.3809 0.000 0.207
H (+) 0.0384 0.574 0.018 0.1542 0.042 0.068 0.0768 0.631 0.023 0.1000 0.210 0.043Development S (+) 0.3770 0.150 0.077 0.5456 0.073 0.104 0.8266 0.116 0.104 0.6438 0.021 0.119
H (+) 0.3013 0.053 0.091 0.3344 0.067 0.095 0.7868 0.034 0.144 0.4480 0.013 0.123
B) Private Equity related indicators1) Banking system
1.1 Size (+)M2 to GDP S (+) 0.0242 0.770 0.009 -0.1227 0.230 -0.042 0.2927 0.061 0.067 0.0649 0.492 0.021
H (+) -0.3356 0.000 -0.108 -0.3965 0.000 -0.119 -0.1353 0.447 -0.027 -0.2895 0.001 -0.084Private credit to GDP S (+) 0.2922 0.002 0.123 0.4175 0.000 0.164 0.4559 0.009 0.120 0.4416 0.000 0.168
H (+) 0.1101 0.137 0.049 0.0960 0.262 0.040 0.1408 0.364 0.039 0.0873 0.319 0.0351.2 Efficiency (+)
Return on assets S (+) 0.0000 0.947 -0.001 -0.0008 0.434 -0.015 -0.0020 0.252 -0.030 -0.0007 0.419 -0.014H (+) -0.0003 0.496 -0.011 -0.0006 0.291 -0.021 0.0007 0.335 0.019 0.0002 0.629 0.009
Operating costs to total assets S (-) 0.0000 0.820 -0.005 -0.0005 0.094 -0.051 0.0003 0.425 0.027 0.0001 0.818 0.006H (-) -0.0003 0.056 -0.043 -0.0003 0.078 -0.045 0.0005 0.132 0.054 -0.0001 0.719 -0.010
Net interest margin S (+) 0.1002 0.016 0.080 0.0850 0.114 0.063 0.0583 0.553 0.028 0.1376 0.001 0.099H (+) 0.0520 0.082 0.052 0.0649 0.033 0.060 0.1447 0.005 0.091 0.0792 0.015 0.071
1.3 Competitiveness (+)Interest rate spread S (+) -0.0026 0.332 -0.016 -0.0001 0.961 -0.001 -0.0027 0.555 -0.008 -0.0013 0.577 -0.007
H (+) 0.0010 0.846 0.003 -0.0028 0.665 -0.009 0.0030 0.764 0.006 0.0012 0.849 0.004Number of banks per GDP S (+) 0.0000 0.029 0.114 0.0000 0.012 0.146 0.0000 0.891 0.010 0.0000 0.134 0.078
H (+) 0.0001 0.000 0.215 0.0000 0.007 0.129 0.0001 0.024 0.134 0.0001 0.002 0.1402) Endowment-related variables
2.1 Scientific competitiveness (+)Engineers & scientists/('000) S (+) 0.0002 0.000 0.185 0.0002 0.000 0.155 0.0003 0.000 0.187 0.0002 0.000 0.200
H (+) 0.0001 0.001 0.117 0.0002 0.000 0.168 0.0001 0.289 0.048 0.0001 0.000 0.143Patents residential log S (+) 0.0491 0.068 0.093 0.0549 0.100 0.097 0.0424 0.322 0.049 0.0547 0.063 0.093
H (+) 0.0285 0.116 0.051 0.0285 0.186 0.048 -0.0120 0.756 -0.014 0.0153 0.482 0.025Patents non residential log S (-) -0.0517 0.036 -0.063 -0.0396 0.163 -0.045 -0.0798 0.173 -0.055 -0.0519 0.076 -0.057
H (-) -0.0106 0.639 -0.013 -0.0496 0.049 -0.055 -0.1101 0.062 -0.077 -0.0501 0.067 -0.0542.2 Corporate eco. conditions (+)
GDP per capita log S (+) 0.1598 0.513 0.053 -0.2981 0.331 -0.092 0.1984 0.703 0.040 -0.0205 0.941 -0.006H (+) -0.0052 0.978 -0.002 -0.1302 0.540 -0.058 -0.1136 0.783 -0.034 -0.0674 0.754 -0.029
Wages in countries log S (+) -0.1634 0.217 -0.086 -0.0577 0.715 -0.028 -0.6184 0.006 -0.198 -0.2415 0.105 -0.114H (+) 0.1954 0.039 0.148 0.2105 0.049 0.149 0.5237 0.014 0.245 0.3097 0.005 0.213
Corporate tax rates S (-) -0.0191 0.001 -0.116 -0.0275 0.000 -0.156 -0.0378 0.001 -0.141 -0.0285 0.000 -0.156H (-) -0.0124 0.005 -0.076 -0.0129 0.011 -0.074 -0.0316 0.006 -0.117 -0.0137 0.010 -0.076
2.3 Exit possibilities (+)Stock market capitalization log S (+) 0.1161 0.004 0.170 0.1025 0.011 0.140 0.2896 0.000 0.267 0.1293 0.007 0.171
H (+) 0.0247 0.297 0.039 0.0140 0.650 0.021 -0.1009 0.025 -0.100 -0.0348 0.211 -0.0493) Institutional/ legal/ political
3.1 Institut. stability & quality (+)Rule of law S (+) 0.2225 0.378 0.086 0.4231 0.194 0.154 -0.3630 0.445 -0.086 0.2550 0.375 0.089
H (+) 0.9410 0.000 0.496 0.9631 0.000 0.475 0.7419 0.074 0.239 1.0404 0.000 0.496Political stability S (+) -0.5215 0.000 -0.216 -0.4771 0.000 -0.185 -0.9500 0.000 -0.243 -0.5835 0.000 -0.219
H (+) -0.6675 0.000 -0.347 -0.6479 0.000 -0.315 -0.4115 0.003 -0.135 -0.6111 0.000 -0.287Regulatory quality S (+) 0.5146 0.000 0.180 0.5800 0.002 0.189 0.7582 0.016 0.165 0.5754 0.001 0.182
H (+) 0.0748 0.533 0.033 -0.0895 0.522 -0.037 0.5300 0.048 0.145 0.1801 0.209 0.072Control of corruption S (+) -0.0622 0.743 -0.031 -0.3222 0.179 -0.151 0.6318 0.085 0.194 -0.0596 0.782 -0.027
H (+) -0.3688 0.004 -0.246 -0.4575 0.001 -0.286 -0.5185 0.094 -0.212 -0.5967 0.000 -0.3603.2 Legal regimes and origin
Common law S 0.2164 0.052 0.086 0.4232 0.002 0.156 0.4252 0.031 0.105 0.4533 0.000 0.162H 0.0881 0.311 0.033 0.1139 0.254 0.040 -0.0110 0.955 -0.003 0.0185 0.855 0.006
Civil law S -0.1564 0.037 -0.060 -0.0733 0.442 -0.026 -0.0242 0.848 -0.006 -0.0724 0.389 -0.025H 0.0112 0.863 0.004 0.0174 0.818 0.006 -0.1547 0.294 -0.037 0.0072 0.926 0.003
3.3 Freedom (+)Political rights S (-) -0.1737 0.005 -0.189 -0.1430 0.068 -0.145 -0.2189 0.040 -0.148 -0.1828 0.007 -0.180
H (-) 0.1587 0.000 0.180 0.1537 0.002 0.163 0.1696 0.085 0.118 0.2011 0.000 0.207Civil rights S (-) 0.1453 0.005 0.130 0.1471 0.026 0.123 -0.0491 0.628 -0.027 0.0910 0.126 0.073
H (-) -0.0301 0.518 -0.030 -0.0386 0.475 -0.036 -0.0926 0.377 -0.057 -0.0867 0.117 -0.079Economic freedom S (+) -0.0036 0.603 -0.025 0.0017 0.836 0.011 -0.0187 0.178 -0.079 -0.0110 0.162 -0.069
H (+) 0.0079 0.174 0.056 0.0153 0.019 0.101 -0.0114 0.368 -0.050 0.0114 0.094 0.073

C. Empirical analysis of private equity activity 145
The analysis, with all variables included in the gravity regression, explains a high
proportion of variation in cross-border investment activity. The R-squared of the
models is 57% for participation, 48% for deal participation, 45% for deal flow, and
54% for activity. The institutional variables, with their aggregated indicators of
political stability, regulatory quality, rule of law, and control of corruption,
characterize the general stability and quality of the economic system in a country.
The rule of law is significant, as expected, for host country in terms of
participation, deal participation, and activity percentage, and implies that high
standards for social and judicial rules, especially the quality of contract
enforcement and the courts, is crucial for firms considering investment abroad.
Contrary to the assumption of the regression model, the political stability
coefficient is negative for all models. The reason for the negative indication is
high volatility for countries like the US and the UK, with low political stability
rankings due to threats of terrorism.
The indicator of regulatory quality is significant, with a positive coefficient for
the source country in all models, and for host in the deal-flow model. This
variable indicates that governmental permission and promotion of private sector
development is fundamental to support cross-border investment, especially for
high-dollar-amount investment.214
The coefficients for control of corruption are significant and negative-related for
host country for the models participation, deal participation, and activity. The
coefficient results are inverse to the assumption: investors tend to put money into
countries with a lack of control of corruption.
The indicators for legal regime identify if the origin of the legal system has an
influence on cross-border transactions. Common law in a source country is
significant for deal participation, deal flow, and activity. Civil law is significant for
source in the participation model, with a negative coefficient. Overall, the
variables signify that the type of legal system is important for the source country,
with the common law system supporting cross-border deals.
214 Kaufmann; Kraay and Mastruzzi, Governance Matters 2007 Worldwide Governance
Indicators, 1996-2006, p. 4.

C. Empirical analysis of private equity activity 146
The freedom variables indicate the state of freedom and civil liberties within a
country and describe the opportunity to act spontaneously outside the control of
the government and other centers of potential domination.
Freedom of political rights is important in the source country, where the variable
is positive-related for participation, deal participation, and activity percentage. For
host, the variable is negative-related for participation, deal participation, and
activity percentage. The variables verify that cross-border investment takes place
from countries with a high standard of political freedom toward low-standard
countries. The positive coefficient for the indicator of civil rights in the source
country, for participation and deal participation, signify a high participation in
cross-border deals by countries with a low standard of civil rights.
The last indicator, economic freedom, expresses the possibility of setting up
new businesses and acting in an economically beneficial way. Economic freedom
is significant for a host country in the deal participation model. The possibility to
act in an economically beneficial manner is important for cross-border deal
investment in the host country.
4.3.2. Analysis applied to venture capital and priv ate equity
The following section separates the analytical steps into the financing stages of a
company: VC and PE. Results are presented for a regression with gravity model
indicators and for the full set of variables. The intermediate steps (seen above in
Chapter 4.3.1.2.) are omitted here.
4.3.2.1. Venture capital investment
The analysis of VC cross-border deals investigates the determinants of early
company stages — seed, startup, and expansion. The equations of the
regressions are similar to the gravity model with overall investment; only the
dependent variable is confined to VC investment. In the models, the numbers of
observations for participation, deal participation, and activity are 2,012, and 1,744
for deal flow — fewer compared to overall investment. The details of the first
gravity model indicator analysis are:

C. Empirical analysis of private equity activity 147
Table 31: Results with gravity model indicators (VC)
The VC models for the gravity indicators are statistically significant, with R-
squared at 39% for participation, 27% for deal participation, 28% for deal flow,
and 34% for activity. Details explaining the variance of cross-border investment
for the dependent variables are:
1) Economic mass: The economic mass indicators population and GDP per
capita are significant for all models, verifying the gravity model theory, with
economic mass increasing the propensity toward activity. Population has the
largest beta coefficients, especially for the models of participation and activity
percentage.
2) Economic distance: The models indicate a similar pattern in economic
distance for VC as for the overall model. Increased geographic distance
negatively affects cross-border activity between countries. Common language
and common history increase the likelihood of cross-border investment,
whereas, contrary to the assumptions, common currency decreases the
likelihood of investment in all models. The common border indicator for the deal
flow and activity percentage models, and common legal system for
participation, have negative coefficients. The variables with the largest impact in
this category are geographic distance (beta: 0.187 to 0.221) and common
language (beta: 0.124 to 0.199).
Gravity model analysis Participation Deal participation Dealflow Activity %_l__fi_par~c _l__fi_cou~c _l__fi_dea~c _l__percen~c
Venture Capital Numberofobs=2012 Numberofobs=2012 Numberofobs=1744 Numberofobs=2012F(31,1980)=32.8 F(31,1980)=23.54 F(31,1712)=17.03 F(31,1980)=27.93
Indicators log Source Prob>F=0 Prob>F=0 Prob>F=0 Prob>F=0Host R-squared=0.3848 R-squared=0.2723 R-squared=0.2749 R-squared=0.3369
RootMSE=0.94335 RootMSE=1.1137 RootMSE=1.6727 RootMSE=1.0902
A) Gravity model indicators Coef. P>|t| Beta Coef. P>|t| Beta Coef. P>|t| Beta Coef. P>|t| Beta1) Economic mass (+)
Population log S (+) 0.3443 0.000 0.438 0.3628 0.000 0.426 0.5610 0.000 0.442 0.4150 0.000 0.475H (+) 0.3864 0.000 0.517 0.3314 0.000 0.409 0.4979 0.000 0.414 0.3876 0.000 0.466
2) Economic distance (-)Distance log (-) -0.1883 0.000 -0.187 -0.2050 0.000 -0.187 -0.3394 0.000 -0.204 -0.2479 0.000 -0.221
Factors eco. distance: (+)Common language (+) 0.5652 0.000 0.194 0.6175 0.000 0.195 0.5724 0.000 0.124 0.6479 0.000 0.199Common border (+) -0.0779 0.346 -0.024 -0.1346 0.172 -0.038 -0.4557 0.011 -0.084 -0.2312 0.019 -0.064Common history (+) 0.2671 0.037 0.044 0.2619 0.062 0.040 0.4966 0.025 0.052 0.3379 0.018 0.050Common currency (+) -0.6204 0.000 -0.111 -0.6379 0.000 -0.106 -0.8976 0.000 -0.088 -0.7588 0.000 -0.122Common legal system (+) -0.1374 0.014 -0.056 -0.0534 0.434 -0.020 -0.0773 0.503 -0.019 -0.1058 0.111 -0.039
3) Country pair specificExchange rates S (+) 0.0017 0.475 0.015 0.0030 0.287 0.025 -0.0135 0.002 -0.075 -0.0012 0.657 -0.010
H (-) -0.0040 0.027 -0.041 -0.0004 0.826 -0.004 -0.0055 0.176 -0.033 -0.0061 0.004 -0.056Openness of im- and exports to GDP S (+) 0.1341 0.001 0.085 0.0681 0.155 0.040 0.4084 0.000 0.162 0.1999 0.000 0.113
H (+) 0.0528 0.190 0.026 0.1289 0.006 0.058 0.1745 0.034 0.053 0.1175 0.009 0.052Development S (+) -0.0697 0.698 -0.015 0.0208 0.929 0.004 0.8977 0.010 0.119 0.0295 0.888 0.006
H (+) 0.0785 0.490 0.024 -0.0444 0.740 -0.013 -0.5054 0.041 -0.095 -0.1100 0.430 -0.031
2) Endowment-related variablesGDP per capita log S (+) 1.0562 0.000 0.370 0.9764 0.000 0.315 1.0550 0.000 0.222 1.1312 0.000 0.356
H (+) 0.8492 0.000 0.424 0.6163 0.000 0.283 0.9876 0.000 0.306 0.7972 0.000 0.357

C. Empirical analysis of private equity activity 148
3) Country pair: In the country pair indicator section, more variables are
significant compared to the overall investment models. Exchange rate of source
country in the deal flow model has negative impact, lowering the assumption of
positive impact, whereas for participation and activity percentage it supports the
assumption of investment toward low-exchange-rate countries. Openness of
import-export of the source country is positive for participation, deal flow, and
activity percentage, and positive for the host for deal participation, deal flow, and
activity percentage, indicating that export and import-oriented countries tend to
invest more abroad, as expected from the assumptions. Country development is
significant for deal flow of the source country, with a positive sign, and negative
for the host in the same model, which indicates a deal flow from highly developed
countries to less developed countries. The indicator of openness of imports and
exports for source in the deal flow model has the largest impact, with a beta
coefficient of 0.162.
Analysis of cross-border activity with the gravity model-derived indicators verifies
that, similar to the overall analysis, seven indicators are significant for all models,
and seven are significant for particular dependent variables for both source and
host countries. Overall, the regression analysis for VC deals confirms the gravity
model theory.
The gravity model analysis with the full set of determinants for VC deals is
presented in Table 32, having the constant number of observations listed in the
previous analyses.

C. Empirical analysis of private equity activity 149
Table 32: Results with gravity model and private equity-related indicators (VC) Gravity model analysis Participation Deal participation Dealflow Activity %
Venture Capital Numberofobs=2012 Numberofobs=2012 Numberofobs=1744 Numberofobs=2012F(75,1936)=26.91 F(75,1936)=22.91 F(75,1668)=18.28 F(75,1936)=25.75
Indicators log Source Prob>F=0 Prob>F=0 Prob>F=0 Prob>F=0Host R-squared=0.5396 R-squared=0.4518 R-squared=0.4027 R-squared=0.499
RootMSE=0.82533 RootMSE=0.97754 RootMSE=1.538 RootMSE=0.95838
A) Gravity model indicators Coef. P>|t| Beta Coef. P>|t| Beta Coef. P>|t| Beta Coef. P>|t| Beta1) Economic mass (+)
Population log S (+) 0.2177 0.003 0.277 0.2237 0.009 0.262 0.4158 0.001 0.327 0.3047 0.000 0.349H (+) 0.2438 0.000 0.327 0.2698 0.000 0.333 0.6978 0.000 0.581 0.4037 0.000 0.486
2) Economic distance (-)Distance log (-) -0.4453 0.000 -0.442 -0.4982 0.000 -0.455 -0.5272 0.000 -0.317 -0.5091 0.000 -0.454
Factors eco. distance: (+)Common language (+) 0.3744 0.000 0.128 0.4160 0.000 0.131 0.4654 0.000 0.101 0.4809 0.000 0.148Common border (+) -0.0689 0.376 -0.021 -0.1117 0.240 -0.032 -0.2376 0.171 -0.044 -0.1651 0.074 -0.046Common history (+) -0.0897 0.397 -0.015 -0.1532 0.216 -0.023 -0.2158 0.313 -0.023 -0.1095 0.385 -0.016Common currency (+) -0.3469 0.000 -0.062 -0.2695 0.016 -0.045 -0.6546 0.001 -0.064 -0.4772 0.000 -0.077Common legal system (+) 0.1129 0.041 0.046 0.1807 0.006 0.068 0.1909 0.094 0.047 0.1129 0.083 0.041
3) Country pair specificExchange rates S (+) 0.0050 0.067 0.046 0.0050 0.119 0.043 -0.0021 0.707 -0.011 0.0049 0.119 0.040
H (-) -0.0025 0.260 -0.025 -0.0003 0.911 -0.003 -0.0081 0.130 -0.048 -0.0059 0.025 -0.054Openness of im- and exports to GDP S (+) 0.1734 0.078 0.109 0.0476 0.690 0.028 0.6207 0.001 0.246 0.3153 0.004 0.179
H (+) 0.1426 0.061 0.070 0.2406 0.005 0.109 0.1960 0.274 0.059 0.1463 0.110 0.064Development S (+) 0.2423 0.370 0.052 0.4665 0.141 0.093 0.9544 0.090 0.126 0.5472 0.058 0.106
H (+) 0.3836 0.021 0.119 0.4361 0.023 0.125 0.5774 0.166 0.108 0.4586 0.021 0.128
B) Private Equity related indicators1) Banking system
1.1 Size (+)M2 to GDP S (+) 0.1215 0.160 0.046 -0.0100 0.924 -0.004 0.2596 0.132 0.061 0.1667 0.092 0.057
H (+) -0.3225 0.000 -0.108 -0.3636 0.000 -0.112 -0.1106 0.548 -0.023 -0.2313 0.017 -0.069Private credit to GDP S (+) 0.1565 0.102 0.069 0.3053 0.007 0.124 0.5342 0.003 0.146 0.3560 0.001 0.141
H (+) 0.1788 0.020 0.083 0.1857 0.034 0.080 0.1950 0.221 0.056 0.1464 0.109 0.0611.2 Efficiency (+)
Return on assets S (+) 0.0004 0.520 0.010 -0.0002 0.860 -0.003 -0.0016 0.322 -0.025 -0.0003 0.713 -0.007H (+) -0.0001 0.773 -0.004 -0.0005 0.295 -0.018 0.0012 0.140 0.029 0.0004 0.452 0.014
Operating costs to total assets S (-) -0.0002 0.341 -0.026 -0.0007 0.013 -0.081 0.0000 0.926 0.004 -0.0001 0.706 -0.012H (-) -0.0003 0.041 -0.048 -0.0004 0.058 -0.053 0.0003 0.471 0.028 -0.0002 0.411 -0.024
Net interest margin S (+) 0.1065 0.013 0.089 0.0994 0.079 0.077 0.0721 0.496 0.036 0.1370 0.003 0.103H (+) 0.0518 0.080 0.055 0.0716 0.015 0.070 0.1516 0.007 0.101 0.0863 0.008 0.082
1.3 Competitiveness (+)Interest rate spread S (+) -0.0032 0.268 -0.021 -0.0018 0.583 -0.010 -0.0012 0.761 -0.004 -0.0024 0.340 -0.014
H (+) 0.0027 0.619 0.010 0.0000 0.995 0.000 0.0013 0.903 0.003 0.0032 0.637 0.010Number of banks per GDP S (+) 0.0000 0.007 0.161 0.0000 0.017 0.155 0.0000 0.259 -0.088 0.0000 0.174 0.081
H (+) 0.0001 0.000 0.232 0.0000 0.019 0.127 0.0000 0.186 0.090 0.0001 0.007 0.1402) Endowment-related variables
2.1 Scientific competitiveness (+)Engineers & scientists/('000) S (+) 0.0001 0.000 0.155 0.0001 0.000 0.141 0.0003 0.000 0.184 0.0002 0.000 0.192
H (+) 0.0001 0.002 0.122 0.0001 0.000 0.167 0.0001 0.278 0.054 0.0001 0.000 0.146Patents residential log S (+) 0.0515 0.078 0.099 0.0465 0.195 0.083 0.0588 0.220 0.071 0.0444 0.162 0.077
H (+) 0.0414 0.027 0.078 0.0419 0.067 0.072 0.0005 0.991 0.001 0.0203 0.362 0.034Patents non residential log S (-) -0.0447 0.087 -0.053 -0.0421 0.161 -0.046 -0.0362 0.556 -0.026 -0.0604 0.056 -0.065
H (-) 0.0087 0.723 0.010 -0.0394 0.164 -0.042 -0.1250 0.047 -0.086 -0.0561 0.077 -0.0582.2 Corporate eco. conditions (+)
GDP per capita log S (+) 0.0570 0.824 0.020 -0.3305 0.306 -0.107 -0.0196 0.972 -0.004 -0.0177 0.952 -0.006H (+) -0.1520 0.446 -0.076 -0.2897 0.206 -0.133 -0.0789 0.858 -0.024 -0.2046 0.370 -0.092
Wages in countries log S (+) -0.0058 0.964 -0.003 0.0610 0.702 0.031 -0.5797 0.019 -0.191 -0.1517 0.303 -0.075H (+) 0.1684 0.104 0.134 0.1715 0.128 0.125 0.4798 0.035 0.231 0.3188 0.007 0.227
Corporate tax rates S (-) -0.0166 0.007 -0.104 -0.0267 0.000 -0.155 -0.0437 0.000 -0.170 -0.0279 0.000 -0.158H (-) -0.0121 0.010 -0.076 -0.0138 0.010 -0.080 -0.0351 0.005 -0.133 -0.0143 0.012 -0.081
2.3 Exit possibilities (+)Stock market capitalization log S (+) 0.0836 0.002 0.129 0.0654 0.031 0.093 0.2816 0.000 0.270 0.0912 0.006 0.127
H (+) 0.0471 0.068 0.079 0.0378 0.151 0.058 -0.0741 0.224 -0.077 -0.0128 0.651 -0.0193) Institutional/ legal/ political
3.1 Institut. stability & quality (+)Rule of law S (+) 0.1558 0.537 0.063 0.3611 0.276 0.135 -0.3408 0.488 -0.084 0.1003 0.729 0.037
H (+) 0.6967 0.001 0.380 0.7219 0.002 0.363 0.5558 0.200 0.183 0.8098 0.000 0.397Political stability S (+) -0.4835 0.000 -0.211 -0.4675 0.000 -0.188 -0.8893 0.000 -0.237 -0.5580 0.000 -0.218
H (+) -0.6512 0.000 -0.356 -0.6337 0.000 -0.319 -0.4155 0.005 -0.141 -0.5731 0.000 -0.281Regulatory quality S (+) 0.5254 0.001 0.194 0.6305 0.001 0.214 0.8101 0.020 0.182 0.6125 0.001 0.203
H (+) 0.0280 0.837 0.013 -0.1026 0.534 -0.044 0.6087 0.039 0.171 0.1866 0.261 0.077Control of corruption S (+) 0.0650 0.734 0.034 -0.2136 0.381 -0.103 0.6383 0.101 0.202 0.1117 0.613 0.053
H (+) -0.2517 0.068 -0.175 -0.3628 0.023 -0.232 -0.4733 0.141 -0.199 -0.5156 0.001 -0.3213.2 Legal regimes and origin
Common law S 0.3739 0.001 0.155 0.5640 0.000 0.215 0.4400 0.033 0.113 0.5838 0.000 0.218H 0.0091 0.926 0.004 -0.0006 0.995 0.000 -0.2231 0.314 -0.055 -0.0903 0.428 -0.032
Civil law S 0.0378 0.628 0.015 0.1415 0.160 0.053 0.1304 0.326 0.032 0.1411 0.110 0.051H 0.0297 0.671 0.012 0.0555 0.489 0.021 -0.1360 0.409 -0.033 0.0224 0.790 0.008
3.3 Freedom (+)Political rights S (-) -0.1267 0.055 -0.145 -0.1122 0.174 -0.118 -0.1890 0.105 -0.135 -0.1681 0.021 -0.172
H (-) 0.1264 0.008 0.149 0.1116 0.049 0.121 0.0676 0.521 0.048 0.1576 0.008 0.167Civil rights S (-) 0.2057 0.000 0.194 0.2115 0.003 0.183 -0.0397 0.721 -0.023 0.1566 0.017 0.132
H (-) -0.0613 0.218 -0.064 -0.0809 0.165 -0.078 -0.0672 0.555 -0.043 -0.1081 0.070 -0.102Economic freedom S (+) -0.0063 0.401 -0.045 -0.0007 0.938 -0.005 -0.0214 0.158 -0.094 -0.0143 0.093 -0.092
H (+) 0.0099 0.117 0.073 0.0198 0.004 0.134 -0.0079 0.555 -0.035 0.0140 0.064 0.092

C. Empirical analysis of private equity activity 150
The models are statistically significant, with an increase of R-squared to 52% for
participation, 43% for deal participation, 38% for deal flow, and 47% for activity.
A. The gravity model indicators are:
A.1) Economic mass: The economic mass indicator population is significant
and positive-related for all models. GDP per capita is not significant.
A.2) Economic distance: Variables that are significant for all models are
geographic distance and common language, with the indicated sign, whereas
common currency is significant for all models, although with inverse signs to
economic similarity. Partially significant is the variable common legal system for
participation and deal participation, with the indicated sign.
A.3) Country pair: There are several variables relevant in this section. First is
the exchange rate of host country in the deal flow model, verifying the
propensity of investment toward low-exchange-rate countries. Openness to
import-export of the source country is positive for deal flow and activity and
positive for host in the deal participation model. It indicates that export- and
import-oriented countries have increased deal activity. Country development is
important for the host country to attract foreign investors. The variable is
significant for participation, deal participation, and activity.
B. Private equity-related indicators
B.1) Banking system: The indicators for size of the banking system — M2 to
GDP and private credit to GDP — are, with exceptions, statistically significant
for VC investment. M2 to GDP has a negative impact for the host country in
participation, deal participation, and activity. The coefficients for private credit to
GDP are positive for deal participation, deal flow, and activity for source, and for
participation and deal participation for host, confirming the beneficial impact of
banking system size on VC cross-border deals.
Banking efficiency: The indicator return on assets is not significant. Operating
costs to total assets is significant and negative-related for source country in
deal participation and for host country in participation. The variable net interest
margin has positive coefficients for the models participation and activity in
source country and for host countries for deal participation, deal flow, and
activity. Both variables support the assumption that countries with efficient
banking systems have increased cross-border investment activity.

C. Empirical analysis of private equity activity 151
The indicators for bank competitiveness are interest rate spread and number
of banks per GDP . The variable interest rate spread is not significant. The
number of banks indicator covers participation and deal participation for source
and host, and in the activity model for host. It shows that increased competition in
the banking system supports cross-border investment.
B.2) Endowment-related variables: The indicators for scientific
competitiveness are engineers and scientists, and patents residential and
nonresidential. Engineers and scientists indicate positive impact of country
endowment for investment in all models for source, and for all models except
deal flow in host. The variable patents residential is significant for host in the
model participation. It indicates a focus on countries with a high level of patent
applications, which is a main stimulant for seed and startup investment. The
patents nonresidential variable is significant, with the expected negative
coefficient in the deal flow model. Corporate economic conditions are viewed
through the variables of GDP per capita (previously described as an economic
mass indicator), wages , and corporate tax rates .
Wages are significant and positive-related in the host country for deal flow and
activity, but negative-related for deal flow in the source country. This factor
verifies that host countries are more attractive if they have a skilled labor force.
Corporate tax rates are significant, with negative coefficients for all models and
a larger coefficient for source countries; high corporate tax rates seem to hinder
cross-border transactions.
In exit possibilities, stock market capitalization indicates the country
conditions for taking a company public. This variable demonstrates its
significance for all models in source, and the attracting influence of large stock
markets for investment abroad.
B.3) Institutional legal and political: The general environment is analyzed
according to a country’s institutional stability and quality, legal regime, and
freedom.
The rule of law is significant for host country for participation, deal participation,
and activity, and verifies the impact of high quality in the rules of society and the

C. Empirical analysis of private equity activity 152
judicial system for cross-border deals.215 The coefficients for political stability
are negative for all models, indicating the tendency of countries to invest into less
stable political countries.
Regulatory quality is significant for source country in all models, and for host in
the deal flow model, with a positive coefficient. The variable proves that
governmental permission and promotion of private sector development is
fundamental to healthy cross-border investment, especially for large investment.
The results for control of corruption verify a negative correlation between
investment abroad and the control of corruption for host country in deal
participation and activity, indicating that investment is made into countries with
less control of corruption. The indicators for legal regime prove the effect of the
origin of the legal system on cross-border transactions. Common law
coefficients for source country signify a positive correlation to cross-border
investment for all models. Civil law is not significant. Overall, the coefficients
verify that a common law system encourages VC investors to provide money for
cross-border transactions.
The freedom variables — civil rights, and political and economic freedom —
describe a country’s general liberties. Political rights is significant in source
country for activity with a positive impact on cross-border activity. It is negative-
related for participation, deal participation, and activity in source country. Civil
rights is significant, with negative impact for source in participation, deal
participation, and activity.
The last indicator, economic freedom is significant for host country in deal
participation.
The analysis with the full set of variables has much similarity with the overall
analysis, proving the effects of the gravity model assumptions.
215 Kaufmann; Kraay and Mastruzzi, Governance Matters 2007 Worldwide Governance
Indicators, 1996-2006, p. 4.

C. Empirical analysis of private equity activity 153
4.3.2.2. Private equity investment
The PE analysis investigates the determinants of advanced company stages,
especially buyouts. The general equations of the regressions are listed in the
overall analysis. The details of the gravity model indicator analysis are:
Table 33: Results with gravity model indicators (PE)
For PE investment, all models are statistically significant, with 1,167 observations
for participation, deal participation, and activity, and 992 observations for deal
flow. Participation explains 37% of the data variation; deal participation, 21%;
deal flow, 31%; and activity, 31%.
1) Economic mass: The economic mass indicators population and GDP per
capita are significant for all models, as in the previous gravity model-derived
indicator analysis. Population has the largest effect for source in deal flow,
indicated by a beta coefficient of 0.574.
2) Economic distance: The economic distance indicators are different
compared to the previous models. Conspicuously, geographic distance is
significant only for deal flow and activity. Common history and common legal
system are not significant at all. Common language is a dominant factor to
increase the propensity for cross-border investment. Common currency is
significant for all models, though with a negative coefficient. Common border
signifies a contrary impact for deal flow and activity percentage transactions.
Gravity model analysis Participation Deal participation Dealflow Activity %Private Equity Numberofobs=1167 Numberofobs=1167 Numberofobs=992 Numberofobs=1167
F(31,1135)=18.41 F(31,1135)=9.04 F(31,960)=13.53 F(31,1135)=13.99Indicators log Source Prob>F=0 Prob>F=0 Prob>F=0 Prob>F=0
Host R-squared=0.3681 R-squared=0.2045 R-squared=0.3136 R-squared=0.3078RootMSE=0.82193 RootMSE=1.016 RootMSE=1.6414 RootMSE=1.0038
A) Gravity model indicators Coef. P>|t| Beta Coef. P>|t| Beta Coef. P>|t| Beta Coef. P>|t| Beta1) Economic mass (+)
Population log S (+) 0.3173 0.000 0.477 0.2552 0.000 0.348 0.7213 0.000 0.574 0.3849 0.000 0.496H (+) 0.3099 0.000 0.477 0.2564 0.000 0.358 0.4322 0.000 0.349 0.3213 0.000 0.423
2) Economic distance (-)Distance log (-) -0.0481 0.148 -0.057 -0.0530 0.218 -0.057 -0.2134 0.005 -0.132 -0.1206 0.004 -0.123
Factors eco. distance: (+)Common language (+) 0.2176 0.003 0.092 0.2709 0.002 0.104 0.5312 0.001 0.120 0.3507 0.000 0.127Common border (+) -0.0401 0.697 -0.015 -0.0841 0.514 -0.028 -0.5764 0.009 -0.109 -0.2643 0.034 -0.084Common history (+) 0.1210 0.373 0.026 0.0941 0.554 0.018 0.2709 0.297 0.031 0.1575 0.335 0.029Common currency (+) -0.6047 0.000 -0.119 -0.6708 0.000 -0.120 -1.0448 0.000 -0.099 -0.7405 0.000 -0.125Common legal system (+) 0.0822 0.228 0.039 0.1214 0.142 0.053 0.2464 0.105 0.061 0.1117 0.171 0.046
3) Country pair specificExchange rates S (+) -0.0073 0.014 -0.074 -0.0086 0.025 -0.079 -0.0078 0.184 -0.040 -0.0082 0.022 -0.071
H (-) -0.0001 0.959 -0.001 0.0048 0.067 0.051 -0.0004 0.937 -0.002 0.0012 0.669 0.012Openness of im- and exports to GDP S (+) 0.2092 0.000 0.132 0.1232 0.060 0.071 0.5241 0.000 0.172 0.2302 0.000 0.125
H (+) -0.0412 0.374 -0.023 0.0416 0.462 0.021 0.1701 0.149 0.048 0.0723 0.262 0.034Development S (+) 0.5301 0.035 0.085 0.3103 0.369 0.045 0.8865 0.048 0.073 0.4951 0.095 0.068
H (+) 0.0995 0.497 0.035 -0.0026 0.989 -0.001 -0.6646 0.071 -0.118 -0.1260 0.508 -0.038
2) Endowment-related variablesGDP per capita log S (+) 0.5276 0.001 0.163 0.6003 0.002 0.169 1.0293 0.000 0.167 0.7401 0.000 0.196
H (+) 0.6650 0.000 0.372 0.4178 0.000 0.212 1.2492 0.000 0.353 0.7049 0.000 0.338

C. Empirical analysis of private equity activity 154
3) Country pair: The country pair section verifies the significance of the
variables for source country. Likewise, exchange rate is negative-related to
cross-border participation, deal participation, and activity in the source country.
Openness of imports-exports of the source country is positive for participation,
deal flow, and activity. Country development is significant for participation and
deal flow, with a positive coefficient. The regression analysis for PE investment
deals verifies the gravity model theory of country mass increasing cross-border
investment, whereas economic distance reducing the effect is limited to the
variable common language for all dependent variables, and geographic distance
for deal flow and activity.
The gravity model analysis with the full-set of determinants for PE deals is
presented in Table 34:

C. Empirical analysis of private equity activity 155
Table 34: Results of gravity model and private equity-related indicators (PE) Gravity model analysis Participation Deal participation Dealflow Activity %
Private Equity Numberofobs=1167 Numberofobs=1167 Numberofobs=992 Numberofobs=1167F(75,1091)=13.26 F(75,1091)=8.5 F(75,916)=8.86 F(75,1091)=10.22
Indicators log Source Prob>F=0 Prob>F=0 Prob>F=0 Prob>F=0Host R-squared=0.505 R-squared=0.3588 R-squared=0.3996 R-squared=0.4432
RootMSE=0.74196 RootMSE=0.93045 RootMSE=1.5716 RootMSE=0.91826
A) Gravity model indicators Coef. P>|t| Beta Coef. P>|t| Beta Coef. P>|t| Beta Coef. P>|t| Beta1) Economic mass (+)
Population log S (+) 0.0340 0.795 0.051 0.0287 0.871 0.039 0.5555 0.074 0.442 0.0472 0.771 0.061H (+) 0.2653 0.004 0.408 0.2975 0.011 0.415 0.8754 0.000 0.708 0.4278 0.000 0.564
2) Economic distance (-)Distance log (-) -0.2712 0.000 -0.322 -0.2993 0.000 -0.323 -0.6029 0.000 -0.373 -0.3638 0.000 -0.370
Factors eco. distance: (+)Common language (+) 0.0827 0.326 0.035 0.0234 0.830 0.009 0.1782 0.342 0.040 0.1377 0.176 0.050Common border (+) -0.1250 0.217 -0.046 -0.1704 0.196 -0.057 -0.6203 0.013 -0.117 -0.3177 0.012 -0.101Common history (+) 0.1469 0.254 0.031 0.1209 0.435 0.023 0.1226 0.655 0.014 0.1476 0.359 0.027Common currency (+) -0.3937 0.001 -0.077 -0.3511 0.052 -0.063 -0.7675 0.028 -0.073 -0.4650 0.006 -0.078Common legal system (+) 0.1588 0.028 0.076 0.2205 0.016 0.095 0.3980 0.024 0.098 0.2003 0.023 0.082
3) Country pair specificExchange rates S (+) -0.0009 0.812 -0.009 -0.0019 0.720 -0.017 0.0060 0.472 0.031 0.0017 0.716 0.015
H (-) -0.0008 0.762 -0.009 0.0010 0.730 0.011 0.0035 0.619 0.021 0.0004 0.902 0.004Openness of im- and exports to GDP S (+) 0.4077 0.001 0.257 0.2228 0.199 0.128 0.4886 0.065 0.161 0.3803 0.012 0.206
H (+) -0.0270 0.776 -0.015 0.1393 0.230 0.070 0.0356 0.878 0.010 0.1350 0.258 0.064Development S (+) 1.0632 0.010 0.170 1.0794 0.041 0.157 0.5777 0.492 0.047 1.0311 0.038 0.142
H (+) 0.2090 0.360 0.074 0.3081 0.272 0.099 0.3398 0.566 0.060 0.3741 0.182 0.114
B) Private Equity related indicators1) Banking system
1.1 Size (+)M2 to GDP S (+) -0.4082 0.000 -0.175 -0.5918 0.000 -0.230 -0.1671 0.500 -0.037 -0.3929 0.006 -0.144
H (+) -0.2816 0.005 -0.109 -0.3908 0.002 -0.138 -0.2525 0.357 -0.049 -0.3794 0.002 -0.126Private credit to GDP S (+) 0.2071 0.101 0.113 0.1907 0.262 0.095 -0.0285 0.921 -0.008 0.2048 0.183 0.096
H (+) 0.0861 0.419 0.049 0.0271 0.833 0.014 0.0308 0.898 0.009 0.1743 0.178 0.0841.2 Efficiency (+)
Return on assets S (+) -0.0007 0.026 -0.013 0.0004 0.372 0.008 -0.0004 0.643 -0.004 -0.0002 0.587 -0.004H (+) -0.0001 0.862 -0.004 0.0001 0.840 0.006 -0.0004 0.794 -0.011 0.0001 0.846 0.005
Operating costs to total assets S (-) -0.0001 0.838 -0.007 -0.0003 0.451 -0.035 0.0000 0.948 -0.003 -0.0001 0.728 -0.013H (-) -0.0002 0.340 -0.035 -0.0003 0.154 -0.056 0.0010 0.050 0.111 0.0000 0.883 0.007
Net interest margin S (+) 0.0730 0.309 0.068 0.0778 0.387 0.066 0.0825 0.645 0.039 0.0906 0.301 0.073H (+) -0.0707 0.092 -0.071 -0.0244 0.618 -0.022 0.1130 0.288 0.060 -0.0364 0.485 -0.031
1.3 Competitiveness (+)Interest rate spread S (+) 0.0174 0.016 0.062 0.0226 0.007 0.074 -0.0063 0.777 -0.008 0.0169 0.034 0.052
H (+) 0.0066 0.449 0.025 0.0036 0.741 0.012 0.0122 0.350 0.025 0.0087 0.266 0.028Number of banks per GDP S (+) 0.0000 0.664 0.042 0.0000 0.411 0.093 0.0000 0.772 -0.040 0.0000 0.620 0.052
H (+) 0.0001 0.006 0.206 0.0000 0.162 0.114 0.0000 0.969 0.004 0.0000 0.564 0.0432) Endowment-related variables
2.1 Scientific competitiveness (+)Engineers & scientists/('000) S (+) 0.0001 0.005 0.152 0.0001 0.028 0.137 0.0003 0.004 0.157 0.0001 0.006 0.147
H (+) 0.0001 0.112 0.081 0.0001 0.108 0.091 0.0000 0.696 0.026 0.0001 0.038 0.114Patents residential log S (+) 0.0418 0.332 0.095 0.0420 0.434 0.087 0.0441 0.625 0.050 0.0631 0.232 0.123
H (+) -0.0098 0.680 -0.022 0.0058 0.841 0.012 -0.0474 0.490 -0.054 -0.0007 0.980 -0.001Patents non residential log S (-) -0.1088 0.002 -0.138 -0.0851 0.070 -0.098 -0.0801 0.409 -0.039 -0.0676 0.095 -0.073
H (-) -0.0552 0.065 -0.079 -0.0542 0.123 -0.071 -0.0882 0.324 -0.058 -0.0451 0.209 -0.0562.2 Corporate eco. conditions (+)
GDP per capita log S (+) -0.3468 0.367 -0.107 -0.5677 0.253 -0.160 0.9540 0.309 0.155 -0.3803 0.442 -0.101H (+) 0.1070 0.684 0.060 -0.2155 0.503 -0.109 1.6205 0.032 0.457 0.1736 0.602 0.083
Wages in countries log S (+) -0.2850 0.212 -0.132 -0.2308 0.461 -0.097 -0.4828 0.337 -0.115 -0.3251 0.254 -0.129H (+) 0.1390 0.329 0.122 0.3539 0.038 0.281 0.0170 0.967 0.008 0.2304 0.197 0.173
Corporate tax rates S (-) -0.0133 0.105 -0.094 -0.0255 0.023 -0.163 -0.0180 0.318 -0.064 -0.0177 0.079 -0.107H (-) -0.0054 0.401 -0.039 -0.0003 0.967 -0.002 -0.0264 0.090 -0.098 -0.0029 0.704 -0.019
2.3 Exit possibilities (+)Stock market capitalization log S (+) 0.3077 0.000 0.533 0.2394 0.040 0.376 0.2134 0.274 0.196 0.3054 0.002 0.453
H (+) 0.0263 0.638 0.049 -0.0361 0.610 -0.061 -0.2398 0.114 -0.237 -0.0750 0.276 -0.1193) Institutional/ legal/ political
3.1 Institut. stability & quality (+)Rule of law S (+) 0.2124 0.577 0.074 0.3218 0.482 0.102 -0.8152 0.326 -0.140 0.1463 0.754 0.044
H (+) 0.9925 0.000 0.611 1.0760 0.000 0.601 1.7052 0.032 0.534 1.1904 0.000 0.628Political stability S (+) -0.2707 0.015 -0.133 -0.2362 0.104 -0.105 -0.7627 0.002 -0.195 -0.3560 0.008 -0.149
H (+) -0.4814 0.000 -0.295 -0.3975 0.000 -0.221 -0.7316 0.001 -0.236 -0.4922 0.000 -0.258Regulatory quality S (+) 0.3986 0.066 0.137 0.3170 0.271 0.099 0.9494 0.046 0.172 0.4288 0.099 0.126
H (+) -0.0290 0.834 -0.015 -0.1373 0.394 -0.064 0.0247 0.950 0.007 0.0808 0.639 0.035Control of corruption S (+) -0.5966 0.029 -0.283 -0.6397 0.062 -0.275 -0.0932 0.873 -0.023 -0.5570 0.091 -0.226
H (+) -0.3301 0.023 -0.255 -0.4721 0.005 -0.331 -0.5197 0.334 -0.205 -0.6343 0.000 -0.4203.2 Legal regimes and origin
Common law S -0.3548 0.036 -0.174 -0.2748 0.215 -0.122 -0.0746 0.849 -0.019 -0.1681 0.437 -0.071H 0.1906 0.117 0.090 0.3007 0.035 0.129 -0.0595 0.835 -0.015 0.2069 0.153 0.084
Civil law S -0.2765 0.018 -0.123 -0.2298 0.157 -0.093 -0.3881 0.103 -0.088 -0.2500 0.073 -0.095H 0.2019 0.016 0.097 0.2292 0.026 0.099 -0.1440 0.494 -0.036 0.2215 0.031 0.091
3.3 Freedom (+)Political rights S (-) -0.3152 0.000 -0.321 -0.2556 0.031 -0.237 -0.1047 0.576 -0.052 -0.2584 0.016 -0.226
H (-) 0.1012 0.093 0.135 0.1420 0.045 0.173 0.5075 0.001 0.348 0.2138 0.003 0.245Civil rights S (-) 0.0634 0.354 0.055 0.0851 0.345 0.066 -0.1433 0.358 -0.065 0.0104 0.901 0.008
H (-) 0.0496 0.410 0.058 0.0626 0.399 0.067 -0.2515 0.119 -0.152 -0.0397 0.592 -0.040Economic freedom S (+) 0.0240 0.016 0.177 0.0410 0.005 0.274 0.0247 0.291 0.092 0.0293 0.019 0.185
H (+) 0.0004 0.957 0.004 0.0060 0.510 0.046 -0.0056 0.754 -0.025 0.0039 0.666 0.028
C. Empirical analysis of private equity activity 156
The models are statistically significant, with an increase of explained variance of
50% for participation, 36% for deal participation, 40% for deal flow, and 44% for
activity.
A) Gravity model indicators:
A.1) Economic mass: The economic mass indicator population is significant
and positive-related for host in all models, indicating that the economic mass of
the host country attracts foreign PE investment, whereas mass is insignificant for
source. GDP per capita is significant and positive for host in deal flow, verifying
the mass assumption, especially for large-dollar-amount deals.
A.2) Economic distance: The variables that are significant, with the indicated
sign, are geographic distance and common legal system . Common currency
is significant for participation, deal flow, and activity, but with inverse signs to the
assumption of economic similarity. Common border is negative for deal flow and
activity. Common language and history are not significant.
A.3) Country pair: The significant variables are openness of import-export of
the source country and the development of the source country. The indicator
openness of import-export has positive coefficients for participation and activity
percentage. The development of the source country is significant, with a positive
effect for participation, deal participation, and activity.
B) Ptivate equity-related indicators:
B.1) Banking system: The indicators for size of the banking system M2 to GDP
are significant for source and host for participation, deal participation, and activity
percentage with negative coefficients. Private credit to GDP is not significant.
Banking efficiency: The indicator return on assets is significant for
participation with a negative sign. Operating costs to total assets and net
interest margin are not significant, indicating that banking efficiency does not
have a large impact on cross-border transactions. Bank competitiveness: The
indicators for bank competitiveness are interest rate spread and number of
banks per GDP , whereas the variable interest rate spread is not significant and
the number of banks per GDP indicator is significant only for the participation
model for host.
B.2) Endowment-related variables: The indicators for scientific
competitiveness are engineers and scientists, and patents residential and

C. Empirical analysis of private equity activity 157
nonresidential. Scientists and engineers relates to source in all models, and to
host country in activity, with positive effects for investment.
Patents residential is not significant, whereas patents nonresidential indicates
that source countries with fewer foreign patent applications tend toward
increased investment abroad.
Corporate economic conditions are investigated with the variables of GDP per
capita (which was mentioned as a mass indicator), wages , and corporate tax
rates . Wages are significant and positive-related in host country for deal
participation. Corporate tax rates are significant with negative coefficients for
source country for deal participation.
In the exit possibilities category, the variable stock market capitalization
shows a positive impact in participation, deal participation, and activity for source
in cross-border deals.
B.3) Institutional legal and political: The rule of law is significant for host
country for all models, and verifies the similarity of results in the VC investment
analysis. The coefficients for political stability are significant for host in all
models, and significant for source in participation, deal flow, and activity, with a
negative sign.
Regulatory quality is significant for source country in deal flow, with a positive
coefficient.
Control of corruption displays a negative correlation between cross-border
investment and for host country in participation, deal participation, and activity, as
well as for source in participation.
The legal regime indicator common law is significant for participation for
source, with a negative, and for host in deal participation, with a positive effect on
PE transactions. Civil law is significant for source for participation, with a
negative, and significant with a positive indication for host in participation, deal
participation, and activity.
Of the freedom variables, the indicator for political rights is significant for
participation, deal participation, and activity for host, with a positive impact, and
for host with a negative impact for deal participation, deal flow, and activity. The
indicator civil rights is not significant. Economic freedom is significant for
participation, deal participation, and activity for source.

C. Empirical analysis of private equity activity 158
The analysis with the full set of variables supports partially the traditional gravity
model indicators of mass and distance, whereas the economic mass of the
source country does not seem to have a major effect.
4.3.3. Comparison and conclusion of analytic interp retation
The gravity model analysis reveals the impact of country affinity, with the gravity
indicators and the PE indicators further broken down into VC and PE activity. The
results are compared with focus on the activity as a percentage for overall VC
and PE. See Table 35.

C. Empirical analysis of private equity activity 159
Table 35: Comparison of analytic results
Com
paris
on
Ove
rall
inve
stm
ent
Ven
ture
Cap
ital
Priv
ate
Equ
ityG
ravi
ty m
odel
ana
lysi
sP
artic
ipat
ion
Dea
l par
ticip
atio
nD
ealfl
owA
ctiv
ity %
Par
ticip
atio
nD
eal p
artic
ipat
ion
Dea
lflow
Act
ivity
%P
artic
ipat
ion
Dea
l par
ticip
atio
nD
ealfl
owA
ctiv
ity %
Num
bero
fobs
=22
66N
umbe
rofo
bs=
2266
Num
bero
fobs
=196
8N
umbe
rofo
bs=
2266
Num
bero
fobs
=201
2N
umbe
rofo
bs=2
012
Num
bero
fobs
=17
44N
umbe
rofo
bs=
2012
Num
bero
fobs
=116
7N
umbe
rofo
bs=
1167
Num
bero
fobs
=99
2N
umbe
rofo
bs=
1167
F(7
5,21
90)=
35.1
5F
(75,
2190
)=27
.37
F(7
5,18
92)=
22.8
5F
(75,
2190
)=31
.91
F(7
5,19
36)=
26.9
1F
(75,
1936
)=22
.91
F(7
5,16
68)=
18.2
8F
(75,
1936
)=25
.75
F(7
5,10
91)=
13.2
6F
(75,
1091
)=8.
5F
(75,
916)
=8.8
6F
(75,
1091
)=10
.22
Indi
cato
rsS
ourc
eP
rob>
F=0
Pro
b>F
=0
Pro
b>F
=0
Pro
b>F
=0
Pro
b>F
=0
Pro
b>F
=0
Pro
b>F
=0
Pro
b>F
=0P
rob>
F=
0P
rob>
F=
0P
rob>
F=
0P
rob>
F=0
Hos
tR
-squ
ared
=0.
5714
R-s
quar
ed=
0.47
91R
-squ
ared
=0.
4468
R-s
quar
ed=0
.536
2R
-squ
ared
=0.
5396
R-s
quar
ed=0
.451
8R
-squ
ared
=0.4
027
R-s
quar
ed=0
.499
R-s
quar
ed=
0.50
5R
-squ
ared
=0.3
588
R-s
quar
ed=0
.399
6R
-squ
ared
=0.
4432
Roo
tMS
E=0
.831
23R
ootM
SE
=0.9
8035
Roo
tMS
E=
1.52
29R
ootM
SE
=0.
9570
7R
ootM
SE
=0.
8253
3R
ootM
SE
=0.
9775
4R
ootM
SE
=1.
538
Roo
tMS
E=
0.95
838
Roo
tMS
E=
0.74
196
Roo
tMS
E=
0.93
045
Roo
tMS
E=
1.57
16R
ootM
SE
=0.
9182
6
A)
Gra
vity
mod
el in
dica
tors
Coe
f.P
>|t|
Coe
f.P
>|t|
Coe
f.P
>|t|
Coe
f.P
>|t|
Bet
aC
oef.
P>|
t|C
oef.
P>|
t|C
oef.
P>
|t|C
oef.
P>
|t|B
eta
Coe
f.P
>|t|
Coe
f.P
>|t|
Coe
f.P
>|t|
Coe
f.P
>|t|
Bet
a1)
Eco
nom
ic m
ass
(+)
Pop
ulat
ion
S(+
)0.
240.
000.
190.
030.
430.
000.
280.
000.
310.
220.
000.
220.
010.
420.
000.
300.
000.
350.
030.
800.
030.
870.
560.
070.
050.
770.
06H
(+)
0.28
0.00
0.30
0.00
0.67
0.00
0.43
0.00
0.49
0.24
0.00
0.27
0.00
0.70
0.00
0.40
0.00
0.49
0.27
0.00
0.30
0.01
0.88
0.00
0.43
0.00
0.56
2) E
cono
mic
dis
tanc
e(-
)D
ista
nce
(-)
-0.4
70.
00-0
.53
0.00
-0.5
90.
00-0
.54
0.00
-0.4
7-0
.45
0.00
-0.5
00.
00-0
.53
0.00
-0.5
10.
00-0
.45
-0.2
70.
00-0
.30
0.00
-0.6
00.
00-0
.36
0.00
-0.3
7F
acto
rs e
co. d
ista
nce:
(+)
Com
mon
lang
uage
(+)
0.36
0.00
0.38
0.00
0.56
0.00
0.46
0.00
0.14
0.37
0.00
0.42
0.00
0.47
0.00
0.48
0.00
0.15
0.08
0.33
0.02
0.83
0.18
0.34
0.14
0.18
0.05
Com
mon
bor
der
(+)
0.01
0.94
-0.0
30.
76-0
.24
0.13
-0.1
20.
18-0
.03
-0.0
70.
38-0
.11
0.24
-0.2
40.
17-0
.17
0.07
-0.0
5-0
.12
0.22
-0.1
70.
20-0
.62
0.01
-0.3
20.
01-0
.10
Com
mon
his
tory
(+)
-0.0
70.
49-0
.11
0.30
-0.1
20.
51-0
.09
0.45
-0.0
1-0
.09
0.40
-0.1
50.
22-0
.22
0.31
-0.1
10.
39-0
.02
0.15
0.25
0.12
0.44
0.12
0.66
0.15
0.36
0.03
Com
mon
cur
renc
y(+
)-0
.38
0.00
-0.2
70.
01-0
.73
0.00
-0.4
70.
00-0
.07
-0.3
50.
00-0
.27
0.02
-0.6
50.
00-0
.48
0.00
-0.0
8-0
.39
0.00
-0.3
50.
05-0
.77
0.03
-0.4
60.
01-0
.08
Com
mon
lega
l sys
tem
(+)
0.09
0.10
0.15
0.01
0.15
0.17
0.10
0.11
0.03
0.11
0.04
0.18
0.01
0.19
0.09
0.11
0.08
0.04
0.16
0.03
0.22
0.02
0.40
0.02
0.20
0.02
0.08
3) C
ount
ry p
air s
peci
ficE
xcha
nge
rate
sS
(+)
0.01
0.03
0.01
0.09
0.00
0.53
0.01
0.05
0.05
0.01
0.07
0.01
0.12
0.00
0.71
0.00
0.12
0.04
0.00
0.81
0.00
0.72
0.01
0.47
0.00
0.72
0.01
H(-
)0.
000.
940.
000.
25-0
.01
0.26
0.00
0.32
-0.0
20.
000.
260.
000.
91-0
.01
0.13
-0.0
10.
03-0
.05
0.00
0.76
0.00
0.73
0.00
0.62
0.00
0.90
0.00
Ope
nnes
s of
im-
and
expo
rts
to G
DPS
(+)
0.26
0.00
0.13
0.26
0.65
0.00
0.38
0.00
0.21
0.17
0.08
0.05
0.69
0.62
0.00
0.32
0.00
0.18
0.41
0.00
0.22
0.20
0.49
0.07
0.38
0.01
0.21
H(+
)0.
040.
570.
150.
040.
080.
630.
100.
210.
040.
140.
060.
240.
010.
200.
270.
150.
110.
06-0
.03
0.78
0.14
0.23
0.04
0.88
0.13
0.26
0.06
Dev
elop
men
tS
(+)
0.38
0.15
0.55
0.07
0.83
0.12
0.64
0.02
0.12
0.24
0.37
0.47
0.14
0.95
0.09
0.55
0.06
0.11
1.06
0.01
1.08
0.04
0.58
0.49
1.03
0.04
0.14
H(+
)0.
300.
050.
330.
070.
790.
030.
450.
010.
120.
380.
020.
440.
020.
580.
170.
460.
020.
130.
210.
360.
310.
270.
340.
570.
370.
180.
11
B)
Priv
ate
Equ
ity r
elat
ed in
dica
tors
1) B
anki
ng s
yste
m1.
1S
ize
(+)
M2
to G
DP
S(+
)0.
020.
77-0
.12
0.23
0.29
0.06
0.06
0.49
0.02
0.12
0.16
-0.0
10.
920.
260.
130.
170.
090.
06-0
.41
0.00
-0.5
90.
00-0
.17
0.50
-0.3
90.
01-0
.14
H(+
)-0
.34
0.00
-0.4
00.
00-0
.14
0.45
-0.2
90.
00-0
.08
-0.3
20.
00-0
.36
0.00
-0.1
10.
55-0
.23
0.02
-0.0
7-0
.28
0.01
-0.3
90.
00-0
.25
0.36
-0.3
80.
00-0
.13
Priv
ate
cred
it to
GD
PS
(+)
0.29
0.00
0.42
0.00
0.46
0.01
0.44
0.00
0.17
0.16
0.10
0.31
0.01
0.53
0.00
0.36
0.00
0.14
0.21
0.10
0.19
0.26
-0.0
30.
920.
200.
180.
10H
(+)
0.11
0.14
0.10
0.26
0.14
0.36
0.09
0.32
0.03
0.18
0.02
0.19
0.03
0.19
0.22
0.15
0.11
0.06
0.09
0.42
0.03
0.83
0.03
0.90
0.17
0.18
0.08
1.2
Effi
cien
cy(+
)R
etur
n on
ass
ets
S(+
)0.
000.
950.
000.
430.
000.
250.
000.
42-0
.01
0.00
0.52
0.00
0.86
0.00
0.32
0.00
0.71
-0.0
10.
000.
030.
000.
370.
000.
640.
000.
590.
00H
(+)
0.00
0.50
0.00
0.29
0.00
0.34
0.00
0.63
0.01
0.00
0.77
0.00
0.30
0.00
0.14
0.00
0.45
0.01
0.00
0.86
0.00
0.84
0.00
0.79
0.00
0.85
0.01
Ope
ratin
g co
sts
to to
tal a
sset
sS
(-)
0.00
0.82
0.00
0.09
0.00
0.43
0.00
0.82
0.01
0.00
0.34
0.00
0.01
0.00
0.93
0.00
0.71
-0.0
10.
000.
840.
000.
450.
000.
950.
000.
73-0
.01
H(-
)0.
000.
060.
000.
080.
000.
130.
000.
72-0
.01
0.00
0.04
0.00
0.06
0.00
0.47
0.00
0.41
-0.0
20.
000.
340.
000.
150.
000.
050.
000.
880.
01N
et in
tere
st m
argi
nS
(+)
0.10
0.02
0.09
0.11
0.06
0.55
0.14
0.00
0.10
0.11
0.01
0.10
0.08
0.07
0.50
0.14
0.00
0.10
0.07
0.31
0.08
0.39
0.08
0.65
0.09
0.30
0.07
H(+
)0.
050.
080.
060.
030.
140.
010.
080.
020.
070.
050.
080.
070.
020.
150.
010.
090.
010.
08-0
.07
0.09
-0.0
20.
620.
110.
29-0
.04
0.49
-0.0
31.
3C
ompe
titiv
enes
s(+
)In
tere
st r
ate
spre
adS
(+)
0.00
0.33
0.00
0.96
0.00
0.56
0.00
0.58
-0.0
10.
000.
270.
000.
580.
000.
760.
000.
34-0
.01
0.02
0.02
0.02
0.01
-0.0
10.
780.
020.
030.
05H
(+)
0.00
0.85
0.00
0.67
0.00
0.76
0.00
0.85
0.00
0.00
0.62
0.00
1.00
0.00
0.90
0.00
0.64
0.01
0.01
0.45
0.00
0.74
0.01
0.35
0.01
0.27
0.03
Num
ber
of b
anks
per
GD
PS
(+)
0.00
0.03
0.00
0.01
0.00
0.89
0.00
0.13
0.08
0.00
0.01
0.00
0.02
0.00
0.26
0.00
0.17
0.08
0.00
0.66
0.00
0.41
0.00
0.77
0.00
0.62
0.05
H(+
)0.
000.
000.
000.
010.
000.
020.
000.
000.
140.
000.
000.
000.
020.
000.
190.
000.
010.
140.
000.
010.
000.
160.
000.
970.
000.
560.
042)
End
owm
ent-
rela
ted
varia
bles
2.1
Sci
entif
ic c
ompe
titiv
enes
s(+
)E
ngin
eers
& s
cien
tists
/('0
00)
S(+
)0.
000.
000.
000.
000.
000.
000.
000.
000.
200.
000.
000.
000.
000.
000.
000.
000.
000.
190.
000.
010.
000.
030.
000.
000.
000.
010.
15H
(+)
0.00
0.00
0.00
0.00
0.00
0.29
0.00
0.00
0.14
0.00
0.00
0.00
0.00
0.00
0.28
0.00
0.00
0.15
0.00
0.11
0.00
0.11
0.00
0.70
0.00
0.04
0.11
Pat
ents
res
iden
tial
S(+
)0.
050.
070.
050.
100.
040.
320.
050.
060.
090.
050.
080.
050.
200.
060.
220.
040.
160.
080.
040.
330.
040.
430.
040.
630.
060.
230.
12H
(+)
0.03
0.12
0.03
0.19
-0.0
10.
760.
020.
480.
020.
040.
030.
040.
070.
000.
990.
020.
360.
03-0
.01
0.68
0.01
0.84
-0.0
50.
490.
000.
980.
00P
aten
ts n
on r
esid
entia
lS
(-)
-0.0
50.
04-0
.04
0.16
-0.0
80.
17-0
.05
0.08
-0.0
6-0
.04
0.09
-0.0
40.
16-0
.04
0.56
-0.0
60.
06-0
.06
-0.1
10.
00-0
.09
0.07
-0.0
80.
41-0
.07
0.10
-0.0
7H
(-)
-0.0
10.
64-0
.05
0.05
-0.1
10.
06-0
.05
0.07
-0.0
50.
010.
72-0
.04
0.16
-0.1
30.
05-0
.06
0.08
-0.0
6-0
.06
0.07
-0.0
50.
12-0
.09
0.32
-0.0
50.
21-0
.06
2.2
Cor
pora
te e
co. c
ondi
tions
(+)
GD
P p
er c
apita
S(+
)0.
160.
51-0
.30
0.33
0.20
0.70
-0.0
20.
94-0
.01
0.06
0.82
-0.3
30.
31-0
.02
0.97
-0.0
20.
95-0
.01
-0.3
50.
37-0
.57
0.25
0.95
0.31
-0.3
80.
44-0
.10
H(+
)-0
.01
0.98
-0.1
30.
54-0
.11
0.78
-0.0
70.
75-0
.03
-0.1
50.
45-0
.29
0.21
-0.0
80.
86-0
.20
0.37
-0.0
90.
110.
68-0
.22
0.50
1.62
0.03
0.17
0.60
0.08
Wag
es in
cou
ntrie
sS
(+)
-0.1
60.
22-0
.06
0.72
-0.6
20.
01-0
.24
0.11
-0.1
1-0
.01
0.96
0.06
0.70
-0.5
80.
02-0
.15
0.30
-0.0
7-0
.29
0.21
-0.2
30.
46-0
.48
0.34
-0.3
30.
25-0
.13
H(+
)0.
200.
040.
210.
050.
520.
010.
310.
010.
210.
170.
100.
170.
130.
480.
040.
320.
010.
230.
140.
330.
350.
040.
020.
970.
230.
200.
17C
orpo
rate
tax
rate
sS
(-)
-0.0
20.
00-0
.03
0.00
-0.0
40.
00-0
.03
0.00
-0.1
6-0
.02
0.01
-0.0
30.
00-0
.04
0.00
-0.0
30.
00-0
.16
-0.0
10.
11-0
.03
0.02
-0.0
20.
32-0
.02
0.08
-0.1
1H
(-)
-0.0
10.
01-0
.01
0.01
-0.0
30.
01-0
.01
0.01
-0.0
8-0
.01
0.01
-0.0
10.
01-0
.04
0.01
-0.0
10.
01-0
.08
-0.0
10.
400.
000.
97-0
.03
0.09
0.00
0.70
-0.0
22.
3E
xit p
ossi
bilit
ies
(+)
Sto
ck m
arke
t cap
italiz
atio
nS
(+)
0.12
0.00
0.10
0.01
0.29
0.00
0.13
0.01
0.17
0.08
0.00
0.07
0.03
0.28
0.00
0.09
0.01
0.13
0.31
0.00
0.24
0.04
0.21
0.27
0.31
0.00
0.45
H(+
)0.
020.
300.
010.
65-0
.10
0.03
-0.0
30.
21-0
.05
0.05
0.07
0.04
0.15
-0.0
70.
22-0
.01
0.65
-0.0
20.
030.
64-0
.04
0.61
-0.2
40.
11-0
.07
0.28
-0.1
23)
Inst
itutio
nal/
lega
l/ po
litic
al3.
1In
stitu
t. st
abili
ty &
qua
lity
(+)
Rul
e of
law
S(+
)0.
220.
380.
420.
19-0
.36
0.45
0.25
0.38
0.09
0.16
0.54
0.36
0.28
-0.3
40.
490.
100.
730.
040.
210.
580.
320.
48-0
.82
0.33
0.15
0.75
0.04
H(+
)0.
940.
000.
960.
000.
740.
071.
040.
000.
500.
700.
000.
720.
000.
560.
200.
810.
000.
400.
990.
001.
080.
001.
710.
031.
190.
000.
63P
oliti
cal s
tabi
lity
S(+
)-0
.52
0.00
-0.4
80.
00-0
.95
0.00
-0.5
80.
00-0
.22
-0.4
80.
00-0
.47
0.00
-0.8
90.
00-0
.56
0.00
-0.2
2-0
.27
0.02
-0.2
40.
10-0
.76
0.00
-0.3
60.
01-0
.15
H(+
)-0
.67
0.00
-0.6
50.
00-0
.41
0.00
-0.6
10.
00-0
.29
-0.6
50.
00-0
.63
0.00
-0.4
20.
01-0
.57
0.00
-0.2
8-0
.48
0.00
-0.4
00.
00-0
.73
0.00
-0.4
90.
00-0
.26
Reg
ulat
ory
qual
ityS
(+)
0.51
0.00
0.58
0.00
0.76
0.02
0.58
0.00
0.18
0.53
0.00
0.63
0.00
0.81
0.02
0.61
0.00
0.20
0.40
0.07
0.32
0.27
0.95
0.05
0.43
0.10
0.13
H(+
)0.
070.
53-0
.09
0.52
0.53
0.05
0.18
0.21
0.07
0.03
0.84
-0.1
00.
530.
610.
040.
190.
260.
08-0
.03
0.83
-0.1
40.
390.
020.
950.
080.
640.
04C
ontr
ol o
f cor
rupt
ion
S(+
)-0
.06
0.74
-0.3
20.
180.
630.
09-0
.06
0.78
-0.0
30.
070.
73-0
.21
0.38
0.64
0.10
0.11
0.61
0.05
-0.6
00.
03-0
.64
0.06
-0.0
90.
87-0
.56
0.09
-0.2
3H
(+)
-0.3
70.
00-0
.46
0.00
-0.5
20.
09-0
.60
0.00
-0.3
6-0
.25
0.07
-0.3
60.
02-0
.47
0.14
-0.5
20.
00-0
.32
-0.3
30.
02-0
.47
0.01
-0.5
20.
33-0
.63
0.00
-0.4
23.
2Le
gal r
egim
es a
nd o
rigin
Com
mon
law
S
0.22
0.05
0.42
0.00
0.43
0.03
0.45
0.00
0.16
0.37
0.00
0.56
0.00
0.44
0.03
0.58
0.00
0.22
-0.3
50.
04-0
.27
0.22
-0.0
70.
85-0
.17
0.44
-0.0
7H
0.09
0.31
0.11
0.25
-0.0
10.
960.
020.
860.
010.
010.
930.
001.
00-0
.22
0.31
-0.0
90.
43-0
.03
0.19
0.12
0.30
0.04
-0.0
60.
840.
210.
150.
08C
ivil
law
S-0
.16
0.04
-0.0
70.
44-0
.02
0.85
-0.0
70.
39-0
.03
0.04
0.63
0.14
0.16
0.13
0.33
0.14
0.11
0.05
-0.2
80.
02-0
.23
0.16
-0.3
90.
10-0
.25
0.07
-0.1
0H
0.01
0.86
0.02
0.82
-0.1
50.
290.
010.
930.
000.
030.
670.
060.
49-0
.14
0.41
0.02
0.79
0.01
0.20
0.02
0.23
0.03
-0.1
40.
490.
220.
030.
093.
3F
reed
om(+
)P
oliti
cal r
ight
sS
(-)
-0.1
70.
01-0
.14
0.07
-0.2
20.
04-0
.18
0.01
-0.1
8-0
.13
0.06
-0.1
10.
17-0
.19
0.11
-0.1
70.
02-0
.17
-0.3
20.
00-0
.26
0.03
-0.1
00.
58-0
.26
0.02
-0.2
3H
(-)
0.16
0.00
0.15
0.00
0.17
0.09
0.20
0.00
0.21
0.13
0.01
0.11
0.05
0.07
0.52
0.16
0.01
0.17
0.10
0.09
0.14
0.05
0.51
0.00
0.21
0.00
0.25
Civ
il rig
hts
S(-
)0.
150.
010.
150.
03-0
.05
0.63
0.09
0.13
0.07
0.21
0.00
0.21
0.00
-0.0
40.
720.
160.
020.
130.
060.
350.
090.
35-0
.14
0.36
0.01
0.90
0.01
H(-
)-0
.03
0.52
-0.0
40.
48-0
.09
0.38
-0.0
90.
12-0
.08
-0.0
60.
22-0
.08
0.17
-0.0
70.
56-0
.11
0.07
-0.1
00.
050.
410.
060.
40-0
.25
0.12
-0.0
40.
59-0
.04
Eco
nom
ic fr
eedo
mS
(+)
0.00
0.60
0.00
0.84
-0.0
20.
18-0
.01
0.16
-0.0
7-0
.01
0.40
0.00
0.94
-0.0
20.
16-0
.01
0.09
-0.0
90.
020.
020.
040.
010.
020.
290.
030.
020.
18H
(+)
0.01
0.17
0.02
0.02
-0.0
10.
370.
010.
090.
070.
010.
120.
020.
00-0
.01
0.56
0.01
0.06
0.09
0.00
0.96
0.01
0.51
-0.0
10.
750.
000.
670.
03

C. Empirical analysis of private equity activity 160
The results from the analysis imply that the impact of the environmental
indicators is predominantly valid and that the underlying gravity model functions
appropriately.
A) Gravity model indicators
1. Economic mass: Empirical analysis verifies the assumption that the
economic mass of countries intensifies the propensity for cross-border
investment and that the hypothesis HGM 1EM can be valid for overall investment
and VC investment. It can also be valid for the host in PE if population as mass
indicator is taken into account. The results show that for PE investment the mass
of the source country is not a crucial factor for cross-border activity, whereas for
VC investment, source country size is decisive, though with less impact than
host, as verified by the beta coefficients.
2. Economic distance: The empirical results prove the impact of economic
distance, with an inconsistent result for VC and PE investment. The hypothesis of
HGM_2ED can be proved for geographic distance, reducing the likelihood of
cross-border investment between countries for overall, VC, and PE investment,
with a relative high beta coefficient. This hypothesis further verifies the indicator
common language for overall and VC investment; for PE investment the
hypothesis must be rejected. The indicator common border is significant but
negative for PE, and common currency is significant but negative-related for all
models, resulting in a rejection of the hypothesis HGM_2ED. Common legal
system, however, is significant for PE investment. Overall, the beta coefficients
of the main indicators geographic distance and language verify that reduced
economic distance and cultural affinity enhance the propensity toward cross-
border transactions.
3. Country pair : Empirical analysis indicates an increase of cross-border activity
toward countries with lower exchange rates for VC, so that the hypothesis
HGM_3ER is proved for VC. The result indicates that investors consider differences
in currency value as additional investment incentive.
The openness of a country toward international trade explains a large portion of
the variance for source in all models. The hypothesis HGM_3OP is proved. The
results indicate that greater international trade increases the propensity for
countries to invest abroad and lowers entrance barriers.

C. Empirical analysis of private equity activity 161
The results of country development verify a significant positive coefficient for the
overall model, for host in VC, and for source in PE (generally, a proof of
HGM_3DM). The results indicate a positive coherence of the economic maturity of
countries and cross-border investment, where a high level of development is key
for VC into, and for PE from, those countries.
B) Private equity indicators
1. Banking system indicator: The hypothesis for cross-border activity assumes
a well-funded financial system. Empirical results document that private credit to
GDP provides a positive indication for size of the banking system for source
country for overall investment and VC, which results in the proof of HPE_1FS for
this indicator. However, the M2 to GDP for all host countries and for the source
in PE activity is significant, but negative, which leads to the rejection of the
hypothesis. Empirical results for efficiency of banking system verify that the
net interest margin of banks, considered similar to the gross margin of
nonfinancial companies, is significant for source and host countries in the overall
and VC models. The hypothesis HPE 1FE can be proved for this indicator, whereas
for the remaining indicators, and especially for PE activity, the hypothesis must
be rejected. It can thus be concluded that banking efficiency is relevant to VC
investment.
The results of the competitiveness of banking system have significant positive
coefficients for overall and VC investment for host country in the number of
banks per GDP, which leads to the proof of HPE 1FC, indicating increased cross-
border VC activity toward countries with a general high density of banks
compared to economic activity. The indicator interest rate spread in the source
of PE investment shows a larger gap between lending and deposit rates,
verifying HPE 1FC for PE investment.
2. Endowment-related indicators: The hypothesis for cross-border activity
assumes a high level of specified corporate conditions in a country.
The results confirm that scientific competitiveness has an impact on cross-
border deals, with the indicator engineers and scientists being significant for all
models, proving HPE 2SC. The indicators patents residential and nonresidential
are not significant in the activity models. Overall, it can be concluded that
scientific competitiveness is a crucial factor for both source and host country for
cross-border investment, as indicated in the models.

C. Empirical analysis of private equity activity 162
The analytic results for corporate economic conditions validate that the level
of qualification of the workforce measured in average wages is significant for
overall investment and the VC model in the host country, proving HPE_2EC. The
indicator of GDP per capita is not significant. The corporate tax burden,
indicated by highest corporate tax rate, has a significant impact on cross-border
activity for overall investment and VC models, which leads to the proof of
HPE_2EC. Corporate economic conditions are not significant for PE.
Empirical results for exit possibilities signify a large impact on the source
country for cross-border investment. Exit possibilities are represented by stock
market capitalization . It measures the value of all stocks listed on an exchange,
indicating the attractiveness for IPOs in a country. The hypothesis of HPE_2EP is
proved for the source countries with large coefficients, especially for PE
investment with a beta of 0.453.
3. Institutional / legal / political conditions: The assumption is that high
standards of environmental conditions foster cross-border transactions.
Institutional stability and quality has a crucial impact on cross-border
transactions. The rule of law — measuring the extent to which agents have
confidence in the rules of society, in particular the quality of courts and contract
enforcement — is significant for host countries for all models, with a high beta
coefficient, proving HPE_3SQ. The effect indicates that investors prefer target
companies in countries with high standards for the rule of law.
Political stability evaluates the likelihood that a government will be destabilized
or overthrown by unconstitutional or violent means, including domestic violence
and terrorism. The coefficient is significant but negative for all models, resulting
in the rejection of HPE_3SQ. The indicator has a large impact because of the
largest cross-border countries, the US and the UK, having a relatively volatile
level of political stability because of the terrorism threat.
Regulatory quality — measuring the ability of the government to formulate and
implement regulations that permit and promote private sector development —
has a great impact in source countries for overall investment and VC investment,
proving the hypothesis HPE_3SQ for the corresponding models. The result
identifies that high regulatory quality is crucial for investors going abroad.
Control of corruption measures the extent to which public power is exercised
for private gain. This indicator is significant but negative for host countries for all

C. Empirical analysis of private equity activity 163
models, which leads to the rejection of HPE_3SQ. The results indicate the attraction
of cross-border investment by countries with less control of corruption. The
interpretation must assume that the US, as major host country, has a relatively
high level of corruption control, although it is lower than that of the UK, France,
and Germany, for example, which are main investors into the US.
The empirical results for legal regimes and origin indicate that the common
law system in source countries explains a portion of the variance for overall and
VC investment. The coefficient demonstrates a positive effect for the civil law
system for PE cross-border deals in a host country. The hypothesis HPE_3LO is
therefore proved.
Freedom, as the opportunity to act spontaneously outside the control of the
government and other centers of potential domination, with the broad categories
of political rights, civil liberties, and economic freedom, is relevant for cross-
border investment. Political rights are significant for source countries in all
models, so HPE_3FR is proved. For host countries, the indicator is significant
though with a negative sign, which leads to the rejection of the hypothesis
HPE_3FR for host countries. The result verifies that cross-border transactions are
initiated from high standard countries that enable people to participate freely in
the political process, vote freely for distinct alternatives in legitimate elections,
and elect representatives who have a decisive impact on public policies toward
countries.
Civil rights measure the freedoms of expression and belief, and personal
autonomy, without interference from the state. The indicator is significant, but
negative-related in VC investment, so that HPE_3FR must be rejected.
Comparison of the results shows that the specific categories have different
impacts on the country pair affinity for overall, VC, and PE investment. For VC,
more indicators are relevant, and it can be concluded that PE is mainly affected
by the general country pair configuration, analyzed with the gravity model and the
environmental model of institutional, legal, and political indicators.

D. Summary and implications 164
D. Summary and implications
1. Summary of research results
The highly volatile private equity industry is home to thousands of firms all over
the world seeking to invest not only in their domestic markets, but increasingly in
countries abroad. As this global PE activity continues to intensify, so too will
competition between firms. Moreover, differences in social, cultural, legal, and
economic norms and values will impact the relative success of cross-border
deals.
Industry pressure to strike cross-border deals necessitate an understanding of
the patterns and conventions of transnational investment. This pressure also
increases the need to comprehend the forces driving the PE market and to
identify their effect on the affinity between countries for deal sourcing abroad.
The requirements for PE cross-border initiatives are only partly illuminated by
scientific discussion. Current studies either evaluate the propensity for PE
investment of specific countries or analyze foreign direct investment without
explicitly mentioning PE activity. Academic literature has shown a dearth in
coverage of several necessary areas, including explicit investigation of PE cross-
border activity and relevant intercountry relationships.
The goal of this dissertation is to provide a scientific analysis based on a
comprehensive theoretical foundation. Theory-guided hypotheses with
determinants of interaction between countries are derived and validated by the
quantitative application of the gravity model.
To evaluate the transaction patterns across countries, 244,461 deals between
funds and PF companies are analyzed from 99 different countries during the
years 1980 through 2005, covering 7,475 management firms, 14,668 different
funds, and 51,346 different PF companies with detailed deal information.
The heterogeneous research subjects of PE are defined by exploring the PE
market environment. Descriptions of the company life cycle, the finance stages of
a company, and the business process are provided to explain the roles of the
various PE participants and their relationships.
The next central element is the development of the PE research framework
which outlines the goal of analyzing intercountry effects over time, of defining

D. Summary and implications 165
activity between countries, and of deriving analytical determinants. The method-
related studies of the gravity model , which covers interaction between countries,
and the panel data model , which shows development over time, lay the
foundation for how countries interact over time and support the design of the
regression analyses with fixed effects. To simplify the complexity of PE for the
gravity model, economic foundations and institutional structures are used to
systematize the PE market and organize the participants in relationships,
structure the processes of PE deals, and assess the company life cycle by
finance stages for investment. Topic-related studies of PE investment, combined
with traditional cross-border trade flow analysis, support the generation of the
hypotheses and the derivation of determinants for empirical analysis.
Special attention was devoted to accurately conceptualize and quantify country
PE activity . This is necessary due to the immense complexity of PE investments
on a global basis. The construct activity is developed by arranging investor and
target company in relation to their particular engagement in a deal at a certain
point in time. To quantify activity, a new method is developed to structure and
aggregate deals from a firm-level to a country-level over time. The framework
then places countries in a defined relationship with the source and host of a deal
interacting over time.
The research framework confirms the need to examine four measurable
variables for PE–specific, multi-investor deals: participation, deal participation,
deal flow, and percent of activity. Comprehensive PE cross-border activity
analysis requires viewing countries through three investment perspectives as
source, as host, and as source and host combined in an overall view. This
perspective is expanded by the geographic view of domestic and cross-border
deals. The gravity model analyzes the deal flow as a vector with the direction of
investment going from source to host. Finally, the investment rounds recognize
prior participation of investor and target, and add the relevance of time to the
understanding of PE activity.
To discover and measure the determinants that influence PE activity, a
structured search of categories is developed from gravity model theories and
private equity-related studies. The use of three schemes — PE-market
environment, business process, and company stage — refines the relevant
categories. The main categories for the gravity model are economic mass,
economic distance, and country pair-specific indicators. For PE, the categories

D. Summary and implications 166
are finance / banking sector, corporate country endowment, and political / legal
country environment. For each category, relevant universal determinants are
derived and refined by subcategories, supported by relevant academic literature.
The research design for empirical analysis has three steps: 1. pre-analysis, 2.
descriptive analysis, and 3. explicative analysis. These are further divided into
analysis of variance and analysis with explanatory variables. The design follows
the pattern of the time series and cross-section analysis to the next level of panel
data model and gravity model, and then to the final level of the gravity model
over time.
The pre-analysis covers the development of investment over time from 1980
through 2005, concluding with a boom and downturn of PE within a short time
period — 1995 through 2005 — with its maximum in 2000 and highest growth
rate in 1999. The cross-section delineates the ranking of 99 countries by PE
activity, and breaks them down further into source and host countries. It further
identifies activity by the different measurable variables and establishes the net
importer and / or exporter role of a country. The cross-border analysis identifies
97 countries, 59 with source and 93 with host activity. The pre-analysis identifies
the most relevant PE countries and the most relevant PE cross-border countries
for the empirical analysis.
Significantly, the cross-section reveals a wide range of country activity, both for
the dual role of source and host and for their domestic and cross-border
investments. Particular focus is on the dominant investors, the US and the UK.
The descriptive analysis uses the three-dimensional gravity model with the
added dimension of time to illustrate and analyze PE activity more completely.
The panel-data analysis compares the time series across countries to identify
patterns in PE behavior over time. The curves show much volatility across
countries; however, a cyclical pattern is shared between countries with similar
growth rates of PE activity, especially in 1999, 2000, and 2001, indicating the
intersection of a global trend and country-specific trends.
The gravity model with country pair deals exposes the affinity between countries
for PE investment. It identifies three main streams of activity: the domestic deal
concentration, the US and UK as dominant source countries, and the US as
primary host country. Within these three main arrays, there is a diversified
pattern of source and host activity. The gravity model also verifies the intensity of

D. Summary and implications 167
country affinity toward particular trading partners and identifies the levels of
diversification into host countries. The model tests the hypothesis of the influence
of economic mass and geographic distance by sequencing the source and host
pattern by country.
The gravity model over time investigates the evolution of cross-border activity
and demonstrates shifts in cross-border investment. The different growth rates
among country pairs reveals an overall trend of an increasing growth rate from
1998 through 2000 and a decreasing growth rate in 2001. These growth rates
also expose a cyclical and anticyclical shift in source countries’ selection of host
countries. This occurs both within one country over time and also across
countries. Changes in one country affect the whole system and thus rearrange
the constellation of all countries.
The dynamics of partnering and investment sequence through partnering
with other investors or by refinancing a company in several investment rounds
capture shifts in investment behavior over time. The time series indicate that
investors are looking primarily for single deals. Changes occur in the boom and
downturn, beginning in 1997, with different behavior for domestic and cross-
border deals. For cross-border deals, partnering as first investor is generally
preferred. In domestic deals, however, investors participate increasingly as new
co-investors in a deal arrangement with an established investor.
Investment activity scaled by GDP accounts for country size by economic
mass and identifies high-density PE countries as financial centers. The top five
cross-border countries with large global diversification are Singapore, Hong
Kong, Luxembourg, the UK, and Israel.
Geographic analysis of countries as source and host verifies the global
distribution and accumulation of continental cross-border activity. This
arrangement presents the gravity model according to mass and distance, and
shows countries in an interrelated global system of reactive relationships. The
view by continent of source and host countries explains the competitive
environment by density of cross-border activity. Three main regions are
examined: North America, with two major countries, the US and Canada,
accounts for 45% of global source activity and 36% of host activity. Europe,
which is home to the large countries Germany, France, and the UK and which
holds two large PE financial centers (the UK and Luxembourg), comprises 42%

D. Summary and implications 168
of global source activity and 46% of global host activity. With Japan, China, India,
and Taiwan, and with the financial centers of Singapore and Hong Kong, Asia
accounts for 9% of source and 14% of host activity.
The analysis of country interaction shows a difference in global diversification of
trade between and within the continents. The most intracontinental deal
investment is in Europe with 21% of global source activity. North America
accounts for 9% and Asia, 4%. The largest interaction between continents is
between North America and Europe in both directions. Deal flow from North
America to Europe is 23% and from Europe to North America, 19%. Europe’s
investment focus is on North America and on intracontinental deals; investments
into Asia and the rest of the world account for only 1% each. North America and
Asia are more connected, with relatively large trades from North America to Asia
(9%) and from Asia to North America (5%). North America invests 4% into the
rest of the world and Asia, 0%.
Explicative analysis verifies the main and interactional effects of source, host,
and year, while the gravity model, with economic mass, economic distance,
financial system, country endowment, and general environment, explores the
influence and impact of each universal determinant on cross-border activity over
time.
The analysis of variance (ANOVA) confirms the strong impact of country affinity
on cross-border activity expressed through the significant interaction effect of the
source / host pair. Further, ANOVA identifies the large impact of the source
country effect for deal flow, deal participation, and activity.
The gravity model analysis with explanatory variables proves, with a
variance between 0.50 and 0.60 for the full dataset, the impact of the explanatory
categories and their determinants on cross-border activity. The analysis confirms
the gravity model in general, explaining the affinity of countries with the impact of
time-invariant (or less changeable) variables — such as economic mass, and
geographic and economic distance — expressed in common characteristics such
as language and legal system. Further, the gravity model verifies the impact of
time variation determinants, namely the finance sector, country endowment, and
institutional environment, especially on the PE environment,
Differentiation of country activity into the measurable variables of participation,
deal participation, deal flow, and the summarizing variable, activity (expressed as

D. Summary and implications 169
a percentage), verifies differing significance and elasticity for the determinants.
While the basic indicators for participation, like geographic distance, are relevant,
other crucial determinants such as host country development, corporate tax
rates, and regulatory quality are important for deal flow.
The differentiation of overall investments into company investment stages
shows differing effects for VC and PE. While determinants of language and
economic mass are important for venture capital, size is not relevant for the PE
source country. For PE cross-border investment, though, legal system and
economic freedom in the host country and stock market capitalization in the
source country are of great importance. Finally, it must be mentioned that cross-
border PE and VC markets have been subject to strong cyclicality over the years
with large growth rates. The experience has been similar for countries.
The research verifies that countries are defined by geographic distance and
economic mass, which affect their intercountry behavior in the highly interrelated
global system. The research also shows that country affinity is affected by
cultural affinity, and the standards of the economic, political, and legal
environment. Whereas time-fixed criteria (e.g., distance) define general affinity,
time-varying, stand-alone determinants (e.g., interest rate changes) can trigger a
shift in one country that then affects the relationships in the entire global system.
This has potential consequences for each particular country as a source and / or
host of investment.
2. Implications for private equity investment
The following implications can now be derived from country-level determinants
and applied on the firm level for successful cross-border deal investment. This
analysis provides a framework for the investor and the target company to
increase the likelihood of deal success by reducing information gaps and
lowering transaction costs.
The gravity model utilizes both bilateral and stand-alone variables of countries.
Country determinants are difficult to alter, although the following possibilities exist
to optimize the affinity between investor and target. Due to the nature of their
respective roles, investors can more easily adapt to such country determinants
than target companies:

D. Summary and implications 170
• Locate the investor firm in a globally optimal position for the targeted area
• Partner with investors experienced in similar deals
Along with gravity- and PE-related determinants, the model verifies the value of
the following categories:
• Economic mass: Focus on economically large target countries to
increase the likelihood of deal success. As a VC investor, relocation in a
massive country increases the likelihood of success; investor country size
is irrelevant for PE.
• Economic distance: Reduce the economic distance, especially by
geographic location, and overcome cultural barriers, like language. For PE
investment, a similar legal system enhances the likelihood of success.
• Country pair: Favor investment in trade-oriented countries with high
standards of development. This lowers entrance barriers and increases
the likelihood of deal success.
• Banking system: Aim for an established, well-funded financial system for
the investor country and an efficient, competitive banking system in a
target country. This enhances the probability of profitable PE investment.
• Corporate endowment: Find countries with a low corporate tax burden.
This has a significant impact on cross-border deal activity. Also relevant
are scientific competitiveness and a well-developed stock market in the
investor country.
• Institutional environment: Rely on established high standards of the
country system, which places confidence in the rules of society,
particularly the quality of courts and contract enforcement. A high level of
regulations that permit and promote private sector development also
increases the chance of deal success.
The optimal location of an investor depends on the specific target country or
countries included in the investment strategy, which means that an investor may
relocate to a country that is strategic but not necessarily a target country.
Because everything in the global system is interconnected, exploiting an
advantage in a target area will inherently affect the equilibrium of the whole
system of supply and demand of PE investment.

D. Summary and implications 171
The global expansion of established PE investors results in increased transaction
costs due to differences in language, culture, and geography. Once committed to
unfamiliar territory, investors may see some determinants, which were not
considered earlier, may gain in relevance. For example, investors may be
confronted with limiting factors, such as corruption, political instability, or reduced
economic freedom.
The value of this research rests in its ability to provide a method and a
comprehensive set of determinants to understand and optimize cross-border
investments.
Because no single country is ideal for private equity activity, the relative
advantage or disadvantage of entry in unfamiliar territory depends entirely on the
particular constellation of attributes of investor and of the target company. Each
combination is highly individual. The best chance for success depends on how
well an investor adapts to a particular target area.
3. Further research
Besides the important implications for cross-border investment, this study
indicates points for further research. Further questions emerge from the
theoretical concepts and the empirical results of the thesis.
• The core of the thesis is a quantitative empirical analysis of PE investment
from 1980 through 2005. Because of the market dynamics that
characterize the PE sector, it would be interesting to investigate if the
determinants remain significant in the future or, as globalization continues,
if new determinants emerge that have not yet been considered.
• The empirical analysis focuses on cross-border participation and
investment between countries. The analysis does not consider the
success of different funds within country pair constellations over time. The
data availability of fund success is limited compared to the corpus of data
that was considered in this dissertation. Future research could combine
the approach of this paper’s research with the success of deals between
different sets of countries.
• The explicative analysis covering a 15-year time period is quite
comprehensive. Based on the findings, further research could focus on

D. Summary and implications 172
how past investment can inform new investment between countries. The
investigation should focus on the impact of previous country environments
on PE cross-border investment. How previous PE investments affect
behavior could also be a fruitful area of investigation, because countries
gain maturity in cross-border PE investment.
• To enhance understanding of the dynamics of the global PE system, with
multiple interrelationships between countries, a rigorous inquiry could
extend the bilateral gravity model to a multirelational system. In such an
endeavor, it is conceivable to investigate the direct impact of certain
characteristics of other countries, such as the constellation of neighboring
countries or the distance to financial centers.
• This analysis differentiates the PE deal into specific measurable variables
— participation, deal participation, and deal flow, further divided into VC
and PE investment. Not yet differentiated are the various types of
investors, their experiences in the market and in global diversification, and
the deal sizes in which they operate.
Given the large impact of PE investment and the equally large expectations of
PE investments, this dissertation clearly points to a need for further research,
which would be necessary to enhance the knowledge and understanding of
cross-border PE deals.

References 173
References
Acs, S. J. and Audretsch, D. B., New-Firm Startups, Technology, and
Macroeconomic Fluctuations, Small Business Economics, 1994, 6.
Aitken, N. D., The Effect of the EEC and EFTA on European Trade: A Temporal
Cross-Section Analysis, American Economic Review, 1973, 63(5),
pp. 881-893.
Anderson, J. E., A Theoretical Foundation for the Gravity Equation, American
Economic Review, 1979, 69(1), pp. 106-116.
Apax Partners, Unlocking Global Value — Future Trends in Private Equity
Investment Worldwide, 2006.
Atje, R. and Jovanovic, B., Stock Markets and Development, European
Economic Review, 1993, 37, pp. 632-640.
Baier, S. L. and Bergstrand, J. H., The Growth of World Trade: Tariffs,
Transport Costs, and Income Similarity, Journal of International
Economics, 2001, 53(1), pp. 1-23.
Baker, M.; Stein, J. C. and Wurgler, J., When Does the Market Matter? Stock
Prices and the Investment of Equity-Dependent Firms, Quarterly
Journal of Economics, 2003, 118(3), pp. 969-1005.
Baldwin, R., Towards an Integrated Europe CEPR Discussion Paper, 1994.
Baltagi, B. H., Econometric Analysis of Panel Data, Chichester; New York:
Wiley, 1995.
Baltagi, B. H.; Bresson, G. and Pirotte, A., Fixed Effects, Random Effects or
Hausman Taylor?: A Pretest Estimator, Economics Letters, 2003,
79(3), pp. 361-369.
Baltagi, B. H.; Egger, P. and Pfaffermayr, M., A Generalized Design for
Bilateral Trade Flow Models, Elsevier, 2003.

References 174
Baltagi, B. H.; Peter, E. and Michael, P., Estimating Models of Complex FDI:
Are There Third-Country Effects?, Journal of Econometrics, 2007,
140(1), pp. 260-265.
Barry, C., New Directions in Research on Venture Capital Finance, Financial
Management, 1994, 23(3), pp. 3-15.
Bascha, A. and Walz, U., Convertible Securities and Optimal Exit Decisions in
Venture Capital Finance, Journal of Corporate Finance, 2001, 7(3),
pp. 285-306.
Baygan, G. and Freudenberg, M., The Internationalisation of Venture Capital
Activity in OECD Countries: Implications for Measurement and
Policy, STI Working Paper 2000/7 OECD, 2000.
Belke, A.; Fehn, R. and Foster, N., Venture Capital Investment and Labor
Market Performance: A Panel Data Analysis, CES ifo Working Paper,
2002(652(4)).
Bengtsson, O., Relational Venture Capital Financing of Serial Founders, Cornell
University Working Paper Series, 2008.
Berger, A. N., The Profit-Structure Relationship in Banking - Test of Market
Power and Efficient Structure Hypothesis, Journal of Money, Credit &
Banking, 1995, 27, pp. 404-431.
Bergstrand, J., The Gravity Equation in International Trade: Some
Microeconomic Foundations and Empirical Evidence, The Review of
Economics and Statistics, 1985, 67(3), pp. 474-481.
Bergstrand, J. H., The Generalized Gravity Equation, Monopolistic Competition,
and the Factor-Proportions Theory in International Trade, The
Review of Economics and Statistics, 1989, 71(1), pp. 143-149.
Bergstrand, J. H., The Heckscher-Ohlin-Samuelson Model, the Linder
Hypothesis and the Determinants of Bilateral Intra-Industry Trade,
The Economic Journal, 1990, 100(403), pp. 1216-1234.

References 175
Bergstrand, J. H. and Egger, P., A Knowledge-And-Physical-Capital Model of
International Trade Flows, Foreign Direct Investment, and
Multinational Enterprises, Journal of International Economics, 2007,
73(2), pp. 278-288.
Bikker, J. A., An International Trade Flow Model With Substitution: An Extension
of the Gravity Model, Kyklos, 1987, 40(3), pp. 315-338.
Bikker, J. A. and Haaf, K., Competition and Concentration and Their
Relationship: An Empirical Analysis of the Banking Industry, DNB
Staff Report, De Nederlandsche Bank, 2001, 68.
Black, B. S. and Gilson, R. J., Does Venture Capital Require an Active Stock
Market?, Journal of Applied Corporate Finance, 1999, pp. 36-48.
Black, B. S.; Gilson, R. J.; McCahery, J. and Renne boog, L., Venture Capital
and the Structure of Capital Markets: Banks Versus Stock Markets,
Oxford and New York: Oxford University Press, 2003, pp. 29-59.
Blonigen, B. A., A Review of the Empirical Literature on FDI Determinants,
Atlantic Economic Journal, 2005, 33(4), pp. 383-395.
Borrmann, C.; Jungnickel, R. and Keller, D., What Gravity Models Can Tell Us
About the Position of German FDI in Central and Eastern Europe,
HWWA DISCUSSION PAPER, 2005.
Bottazzi, L.; Da Rin, M. and Hellmann, T., The Changing Face of the European
Venture Capital Industry: Facts and Analysis, Journal of Private
Equity, 2004, 7(2), pp. 26-53.
Brada, J. C.; Kutan, A. M. and Yigit, T. M., The Effects of Transition and
Political Instability on Foreign Direct Investment Inflows, Economics
of Transition, 2006, 14(4), pp. 649-680.
Breusch, T. and Pagan, A., The LM Test and Its Applications to Model
Specification in Econometrics, Review of Economic Studies, 1980,
47, pp. 239-254.

References 176
Breusch, T. and Pagan, A., A Simple Test for Heteroscedasticity and Random
Coefficient Variation, Econometrica, 1979, 47, pp. 1287-1294.
Buch, C. and Piazolo, D., Capital Trade Flows in Europe and the Impact of
Enlargement, Kiel University Working Paper, 2000, 1001.
BVCA - The British Private Equity and Venture Capit al Association , 2007,
www.bvca.co.uk.
Bygrave, W. D. and Timmons, J. A., Venture Capital at the Crossroads,
Boston, 1992.
Carlin, W. and Mayer, C., Finance, Investment and Growth, CEPR, Discussion
Paper, 1999, 2223.
Central Intelligence Agency, The World Factbook, Washington, DC: Central
Intelligence Agency, 2007.
Cheng, I. H. and Wall, H. J., Controlling for Heterogeneity in Gravity Models of
Trade and Integration, Review (00149187), 2005, 87(1), pp. 49-63.
Chintrakarn, P., The Determinants of Cross-Border Equity Flows: A Dynamic
Panel Data Reassessment, Applied Financial Economics Letters,
2007, 3(1-3), pp. 181-185.
Claessens, S. and Laeven, L., What Drives Bank Competition? Some
International Evidence, Journal of Money, Credit & Banking, 2004,
36(3), pp. 563-583.
Cochrane, J. H., The Risk and Return of Venture Capital, Journal of Financial
Economics, 2005, 75(3-52).
Cook, D. R. and Weisberg, S., Diagnostics for Heteroskedasticity in Regression,
Biometrika, 1983, 70(1), pp. 1–10.
Cook, R. D. and Weisberg, S., Residuals and Influence in Regression,
Monographs on statistics and applied probability, 1982, pp. 230-235.

References 177
Coval, J. and Thakor, A., Financial Intermediation as a Beliefs-Bridge Between
Optimists and Pessimists, Journal of Financial Economics, 2004, 75,
pp. 535-570.
Cullen, J. B. and Gordon, R. H., Taxes and Entrepreneurial Activity: Theory and
Evidence for the U.S., NBER Working Paper W9015, 2002.
Cumming, D. and Johan, S., Regulatory Harmonization and the Development of
Private Equity Markets, Journal of Banking & Finance, 2007, 31(10),
pp. 3218-3221.
Cumming, D. and Walz, U., Private Equity Returns and Disclosure Around the
World, University of Alberta and University of Frankfurt, 2004.
Cumming, D. J., Agency Costs, Institutions, Learning, and Taxation in Venture
Capital Contracting, Journal of Business Venturing, 2005, 20(5), pp.
573-578.
Cumming, D. J. and Macintosh, J. G., Boom, Bust and Litigation in Venture
Capital Finance, Willamette Law Review, 49(4), pp. 867-906.
Cumming, D. J. and MacIntosh, J. G., A Cross-Country Comparison of Full and
Partial Venture Capital Exits, Journal of Banking & Finance, 2003,
27(3), pp. 511-515.
D'Agostino, R. B.; Balanger, A. and R. B. D'Agostin o, J., A Suggestion for
Using Powerful and Informative Tests of Normality, American
Statistician, 1990, 44, pp. 316-321.
Da Rin, M.; Nicodano, G. and Sembenelli, A., Public Policy and the Creation of
Active Venture Capital Markets, University Torino, 2004.
Davidson, R. and MacKinnon, J. G., Estimation and Inference in Econometrics,
Oxford University Press, 1993, pp. 320-323.
Davies, R. B.; Ionascu, D. and Kristjansdottir, H., Estimating the Impact of
Time-Invariant Variables on FDI with Fixed Effects2005, pp. 37-37.

References 178
De Mello Sampayo, F., The Location of the United States' FDI under the Share
Gravity Model, Discussion Paper University of Birmingham, 2000, 00-
04.
Deardorff, A. V. and Frankel, J. A., Determinants of Bilateral Trade: Does
Gravity Work in a Neoclassical World?, NBER Project Report series.
Chicago and London: University of Chicago Press, 1998, pp. 7-22.
Demirguc-Kunt, A. and Levine, R., Financial Structure and Economic Growth,
Cambridge MIT Press, 2001.
Demirguc-Kunt, A. and Maksimovic, V., Law, Finance and Growth, Journal of
Finance, 1998, 53, pp. 2107-2137.
Di Mauro, F., The Impact of Economic Integration on FDI and Exports: A Gravity
Approach, CEPS Working Document, 2000(156).
Djankov, S.; LaPorta, R.; Lopez-de-Silanes, F. and Shleifer, A., The
Regulation of Entry, Manuscript Harvard and the World Bank, 2000.
Economic Intelligence Unit, Country Data, 2007.
Economic Intelligence Unit, Market indicators and forecast, 2007.
Economic Intelligence Unit, World Data, 2007.
Economic Intelligence Unit, World Investment Service, 2007.
Edwards, J. and Fischer, K., Banks, Finance and Investment in Germany,
Cambridge University Press, 1994.
Egger, H. and Egger, P., International Outsourcing and the Productivity of Low-
Skilled Labor in the EU, Economic Inquiry, 2006, 44(1), pp. 98-105.
Egger, H. and Egger, P., Labor Market Effects of Outsourcing Under Industrial
Interdependence, International Review of Economics & Finance,
2005, 14(3), pp. 349-352.
References 179
Egger, P., An Econometric View on the Estimation of Gravity Models and the
Calculation of Trade Potentials, The World Economy, 2002, 25(2),
pp. 297-299.
Egger, P., On the Role of Distance for Bilateral Trade, The World Economy,
2008, 31(5), pp. 653-658.
Egger, P.; Huber, P. and Pfaffermayr, M., A Note on Export Openness and
Regional Wage Disparity in Central and Eastern Europe, The Annals
of Regional Science, 2005, 39(1), pp. 63-64.
Egger, P. and Pfaffermayr, M., The Proper Panel Econometric Specification of
the Gravity Equation: A Three-Way Model with Bilateral Interaction
Effects, Empirical Economics, 2003, 28(3), pp. 571-580.
Egger, P. and Winner, H., How Corruption Influences Foreign Direct Investment:
A Panel Data Study, Economic Development and Cultural Change,
2006, 54(2), pp. 459-468.
Evans, D. S. and Jovanovich, B., An Estimated Model of Entrepreneurial
Choice Under Liquidity Constraints, Journal of Political Economy,
1998, 97(4).
EVCA - European Venture Capital Association, EVCA - 2007 Yearbook, 2007.
EVCA - European Venture Capital Association, EVCA - Yearbook, 2005-2007.
Evenett, S. and Keller, W., On Theories Explaining the Success of the Gravity
Equation, Working Paper NBER, 1998(6529).
Fama, E., What is Different about Banks?, Journal of Monetary Economics,
1985, 15.
Fenn, G. W. and Liang, N., The Economic of the Private Equity Market, Federal
Reserve Bank of Dallas Economic Review, 1995.
Frankel, J. A. and Rose, A. K., An Estimate of the Effect of Common Currencies
on Trade and Income, KSG Working Paper No. 01-013., 2001.

References 180
Freedom House (U.S.), Freedom in the World the Annual Survey of Political
Rights and Civil Liberties, www.freedomhouse.org.
Fried, V. and Hisrich, R., Towards a Model of Venture Capital Investment
Decision Making, Financial Management, 1994, 24(3), pp. 28-37.
Gao, T., Foreign Direct Investment in China: How Big Are the Roles of Culture
and Geography?, Pacific Economic Review, 2005, 10(2), pp. 153-
166.
Ghosh, S. and Yamarik, S., Are Regional Trading Arrangements Trade
Creating? An Application of Extreme Bounds Analysis, Journal of
International Economics, 2004, 63(2), pp. 369-395.
Gilson, R. J. and Schizer, D., Venture Capital Structure: A Tax Explanation for
Convertible Preferred Stock, Harvard Law Review, 2003, 116, pp.
875-916.
Giot, P. and Schwienbacher, A., IPOs, Trade Sales and Liquidations: Modelling
Venture Capital Exits Using Survival Analysis, Journal of Banking &
Finance, 2007, 31(3), pp. 679-702.
Glick, R. and Rose, A. K., Does a Currency Union Affect trade? The Time-
Series Evidence, European Economic Review, 2002, 46(6), pp.
1125-1130.
Gompers, P. and Lerner, J., An Analysis of Compensation in the US Venture
Capital Partnership, Journal of Financial Economics, 1999, 51, pp. 3-
44.
Gompers, P. A., Optimal Investment, Monitoring, and the Staging of Venture
Capital, Journal of Finance, 1995, 50(5), pp. 1461-1489.
Gompers, P. A.; Kovner, A.; Lerner, J. and Scharfst ein, D. S., Venture Capital
Investment Cycles: The Impact of Public Markets, NBER Working
Paper, 2005(W11385).

References 181
Gompers, P. A. and Lerner, J., Venture Capital and the Creation of Public
Companies: Do Venture Capitalists Really Bring More than Money?,
Journal of Private Equity, 1997, 1(1), pp. 15-32.
Gompers, P. A. and Lerner, J., The Venture Capital Cycle, Cambridge, Mass.:
MIT Press, 2004.
Gompers, P. A. and Lerner, J., What Drives Venture Capital Fundraising?,
National Bureau of Economic Research (NBER) Working paper
series, 1999.
Gorman, M. and Sahlman, W., What Do Venture Capitalists Do?, Journal of
Business Venturing, 1989, 4, pp. 231-248..
Greene, W.; Harris, M. N. and Matyas, L., Gravity Models, Zero Trade Flows
and Fixed Effects, 2006.
Greene, W. H., Econometric Analysis, Upper Saddle River, N.J.: Prentice Hall,
2003.
Greenwood, J. and Smith, B. D., Financial Markets in Development, and the
Development of Financial Markets., Journal of Economic Dynamics
and Control, 1997, 21(1), pp. 145-181.
Grubert, H. and Mutti, J., Empirical Asymmetries in Foreign Direct Investment
and Taxation, Journal of International Economics, 2004, 62(2), pp.
337-358.
Gujarat, D., Basic Econometrics, New York, 2003.
Gupta, A. K. and Sapienza, H., Determinants of Venture Capital Firms'
Preferences Regarding the Industry Diversity and Geographic Scope
of Their Investments., Journal of Business Venturing, 1992, 7(5), pp.
347-362.
Hall, R. E. and Jones, C. I., Why Do Some Countries Produce So Much More
Output per Worker than Others?, Quarterly Journal of Economics,
1999, 114(1), pp. 83-116.

References 182
Hardymon, G. F.; De Nino, M. J. and Salter, M. S., When Corporate Venture
Capital Doesn't Work., Harvard Business Review, 1983, 114.
Harris, M. N. and Matyas, L., Modelling Export Flows in the APEC Region:
Static and Dynamic Gravity Model Approaches, Asia Pacific Journal
of Economics and Business, 2001, 5(1), pp. 97-118.
Hart, O., Financial Contracting, Working Paper, Harvard University, 2000.
Hausman, J. A., Specification Tests in Econometrics, Econometrica, 1978, 46,
pp. 1251-1271.
Hausman, J. A. and Taylor, W. E., Panel Data and Unobservable Individual
Effects, Journal of Econometrics, 1981, 16(1), pp. 155-156.
Hellmann, F. T. and Puri, M., The Determinants of Venture Capital Funding:
Evidence Across Countries, Journal of Corporate Finance, 2001, 6,
pp. 241-289.
Hellmann, T. and Puri, M., The Interaction Between Product Market and
Financial Strategy: The Role of Venture Capital, Review of Financial
Studies, 2000, 13, pp. 959-984.
Helpmann, E., The Structure of Foreign Trade, Journal of Economic
Perspectives, 1999, 13(2), pp. 121-144.
Helpmann, E. and Krugmann, P. R., Market Structure and Foreign Trade:
Increasing Returns, Imperfect Competition and the International
Economy, MIT Press, Cambridge, MA, 1985.
Heritage Foundation (Washington D.C.) and Wall Stre et Journal (Firm),
Index of Economic Freedom.
Hitt, M. A.; Tihanyi, L.; Miller, T. and Connelly, B., International Diversification:
Antecedents, Outcomes, and Moderators, Journal of Management,
2006, 32(6), pp. 831-841.
Hofstede, G., Cultural Constraints in Management Theories, International
Review of Strategic Management, 1994, 5, pp. 27-37.
References 183
Hofstede, G., Organizing for Cultural Diversity, European Management Review,
2001, 7(4), pp. 390-397.
Hofstede, G. and Bond, M. H., The Confucius Connection: From Cultural Roots
to Economic Growth, Organizational Dynamics, 1988, 16(4), pp. 4-7.
Hofstede, G. H., Culture's Consequences: Comparing Values, Behaviors,
Institutions, and Organizations Across Nations, Thousand Oaks,
Calif.: Sage Publications, 2001.
Holmes, T. J. and Schmitz, J. A., On the Turnover of Business Firms and
business Managers, Journal of Political Economy, 1995, 103(5).
Hong, H. and Stein, J. C., A Unified Theory of Underreaction Momentum
Trading, and Overreaction in Asset Markets, Journal of Finance,
1999, 54, pp. 2143-2184.
Hsiao, C., Analysis of Panel Data, Cambridge University Press, 1986.
Hummels, D. and Levinsohn, J., Monopolistic Competition and International
Trade: Reconsidering the Evidence, Quarterly Journal of Economics,
1995, 110(3), pp. 799-837.
International Labour Organization, LABORSTAT, 2007.
International Monetary Fund, International Financial Statistics, 2008,
www.imfstatistics.org/imf.
Ionascu, D.; Meyer, K. E. and Estrin, S., Institutional Distance and International
Business Strategies in Emerging Economies, Working Papers
(William Davidson Institute) - University of Michigan Business School,
2004, pp. 1-44.
Isard, W., Location Theory and Trade Theory: Short-Run Analysis, Quarterly
Journal of Economics, 1954, 68, pp. 305- 322.
Janeba, E., International Trade and Consumption Network Externalities,
European Economic Review, 2007, 51(4), pp. 781-803.

References 184
Jelic, R.; Saadouni, B. and Wright, M., Performance of Private to Public MBOs:
The Role of Venture Capital, Journal of Business Finance &
Accounting, 2005, 32, pp. 643-682.
Jeng, L. A. and Wells, P. C., The Determinants of Venture Capital Funding:
Evidence Across Countries, Journal of Corporate Finance, 2000,
6(3), pp. 241-289.
Jensen, M. C., Presidential Address: The Modern Industrial Revolution, Exit, and
the Failure of Internal Control Systems, Journal of Finance, 1993, 48.
Johnson, S.; McMillan, J. and Woodruff, C., Property Rights and Finance,
NBER Working Paper, 2002(8852).
Josselin, D. and Nicot, B., A Geo-Economic Gravity of Trade for European
Union, Gybergeo: Revue Europeenne de Geographie, 2003(237).
Kaplan, S.; Sensoy, B. and Strömberg, P., How Well do Venture Capital
Databases Reflect Actual Investments?, 2002.
Kaplan, S.; Sensoy, B. A. and Stromberg, P. J., What Are Firms? Evolution
from Birth to Public Companies, CEPR Discussion Papers, 2005,
5224.
Kaplan, S. N.; Martel, F. and Strömberg, P., How Do Legal Differences and
Experience Affect Financial Contracts?, Journal of Financial
Intermediation, 2007, 16(3), pp. 273-279.
Kaplan, S. N. and Schoar, A., Private Equity Performance: Returns,
Persistence, and Capital Flows, The Journal of Finance, 2005, 60(4),
pp. 1791-1793.
Kaplan, S. N. and Strömberg, P., Financial Contracting Theory Meets the Real
World: An Empirical Analysis of Venture Capital Contracts, Working
Paper, University of Chicago, 2001.
Kaplan, S. N. and Strömberg, P., How Do Venture Capitalists Choose and
Manage Their Investments?, Working Paper, University of Chicago,
2000.
References 185
Kaplan, S. N. and Strömberg, P., Venture Capitalists as Principals: Contracting,
Screening, and Monitoring, NBER Working Paper Cambridge, Mass.,
2001, 8202.
Kaufmann, D.; Kraay, A. and Mastruzzi, M., Governance Matters 2007
Worldwide Governance Indicators, 1996-2006.
Keuschnigg, C. and Nielsen, S. B., Tax Policy, Venture Capital and
Entrepreneuership, Journal of Public Economics, 2003, 87, pp. 175-
203.
Kim, S.-J. and Hooper, V. J., The Determinants of Capital Inflows: Does Opacity
of Recipient Country Explain the Flows?, Economic Systems, 2007,
Vol. 31(1).
Kortum, S. and Lerner, J., Assessing the Contribution of Venture Capital to
Innovation, 2000.
Kortum, S. S. and Lerner, J., Does Venture Capital Spur Innovation?, National
Bureau of Economic Research (NBER) Working paper series, 1998.
Kraft, V., Private Equity in Turnaround Investments, 2001.
Krugmann, P. R., Scale Economies, Product Differentiation, and the Pattern of
Trade., American Economic Review, 1980, 70, pp. 950-959.
Kumar, V. and Orleck, S., Why Does Private Equity Vary Across Countries and
Time?, 2002.
La Porta, R.; Lopez-de-Silanes, F.; Shleifer, A. an d Vishny, R., Investor
Protection and Corporate Governance, Journal of Financial
Economics, 2000, 58, pp. 3-28.
La Porta, R.; Lopez-de-Silanes, F.; Shleifer, A. an d Vishny, R., Legal
Determinants of External Finance, Journal of Finance, 1997, 52, pp.
1131-1150.
La Porta, R.; Lopez-de-Silanes, F.; Shleifer, A. an d Vishny, R. W., Law and
Finance, Journal of Finance, 1996.

References 186
Lane, P. R. and Milesi-Ferretti, G. M., Examining Global Imbalances, Finance &
Development, 2006, 43(1), pp. 38-45.
Leachman, L.; Kumar, V. and Orleck, S., Explaining Variations in Private
Equity: A Panel Approach, Duke University, Department of
Economics, Working Papers, 2002, 02-14.
Lerner, J., Boom and Bust in the Venture Capital Industry and the Impact on
Innovation, Harvard NOM Working Paper, 2001(03-13).
Lerner, J., Venture Capitalists and the Decision to Go Public, Journal of
Financial Economics, 1994, 35(3), pp. 293-316.
Lerner, J., Venture Capitalists and the Oversight of Private Firms, The Journal of
Finance, 1995, 50(1), pp. 301-307.
Lerner, J. and Schoar, A., Does Legal Enforcement Affect Financial
Transactions? The Contractual Channel in Private Equity, Quarterly
Journal of Economics, 2005, 120(1), pp. 223-246.
Lerner, J. and Schoar, A., Transaction Structures in the Developing World,
NBER Working Papers, 2004, 10348.
Levin, J., Structuring Venture Capital, Private Equity and Entrepreneurial
Transactions, New York, 1998.
Levine, R. and Zervos, S., Stock Markets, Banks, and Economic Growth,
American Economic Review 88, 1998, pp. 537-558.
Linder, S. B., An Essay OnTrade and Transformation, New York: John Wiley,
1961.
Linders, G. T. and De Groot, H., Estimation of the Gravity Equation in the
Presence of Zero Flow, Tinbergen Institute Discussion Paper,
Tinbergen Institute, Free University Amsterdam, 2006, Ti 2006-
073(3).
Linnemann, H., An Econometric Study of International Trade Flows, Thesis,
1966, pp. 1-234.

References 187
Ljungqvist, A. and Richardson, M. P., The Cash Flow, Return and Risk
Characteristics of Private Equity, New York University Working
Paper, 2003.
Ljungqvist, A. and Richardson, M. P., The Investment Behavior of Private
Equity Fund Managers, New York University Working Paper, 2003.
MacMillan, I. C.; Zemann, L. and Subba Narasimha, P . N., Criteria
Distinguishing Successful from Unsuccessful Ventures in the Venture
Screening Process., Journal of Business Venturing, 1987, 2, pp. 123-
137.
Maksimovic, V.; Beck, T.; Demirguc-Kunt, A. and Lev ine, R., Financial
Structure and Economic Development: Firm, Industry, and Country
Evidence, World Bank Policy Research Working Paper, 2000(2423).
Matyas, L., The Gravity Model: Some Econometric Considerations, World
Economy, 1998, 21(3), pp. 397-402.
Matyas, L., Proper Econometric Specification of the Gravity Model, World
Economy, 1997, 20(3), pp. 363-369.
Matyas, L.; Konya, L. and Harris, M. N., Modeling Export Activity in a
Multicountry Economic Area: The APEC Case, Monash
Econometrics and Business Statistics Working Papers, 1997, 1/97.
Mayer, C., Financing the New Economy: Financial Institutions and Corporate
Governance, Information Economics and Policy, 2001, 1.
Mayer, C., New Issues in Corporate Finance, European Economic Review, 1988,
32.
Messica, A. and Agmon, T., Temporal Comparative Analysis of the US Venture
Capital Industry Over 1980 to 2002, Holon Institute of Technology
Working Paper Series, 2006.
Mundlak, Y., On the Pooling of Time Series and Cross Section Data,
Econometrica, 1978, 46(1), pp. 69-85.

References 188
Myers, S. and Majluf, N., Corporate Financing and Investment Decisions When
Firms Have Information That Investors Do Not Have, Journal of
Financial Economics, 1984, 13.
Noguer, M. and Canals, C., The Determinants of Cross-Border Investment: A
Value-Chain Analysis, La Caixa' Working Paper, 2007, No. 05/2006.
NVCA - National Venture Capital Association (USA), National Venture Capital
Association Yearbook, Arlington, VA, 1990-2005.
OECD, OECD Factbook 2007, 2007.
OECD, OECD Statistics of Foreign Trade, 2007.
Oguledo, V. I. and MacPhee, C. R., Gravity Models: A Reformulation and an
Application to Discriminatory Trade Arrangements, Applied
Economics, 1994, 26(2), pp. 1007-1021.
Park, W. and Ginarte, C., Intellectual Property Rights and Economic Growth,
Contemporary Economic Policy, 1997, July 15(3), pp. 5-12.
Phalippou, L. and Zollo, M., What Drives Private Equity Fund Performance?,
University of Amsterdam, Faculty of Economics and Econometrics,
2005.
Pirotte, A., Convergence of the Static Estimation Toward the Long-Run Effects
of Dynamic Panel Data Models: A Labour Demand Illustration,
Applied Economics Letters, 2003, 10(13), pp. 843-847.
Plummer, J. L., QED Report on Venture Capital Financial Analysis, Palo Alto:
QED Research, 1987.
Portes, R. and Rey, H., The Determinants of Cross-Border Equity Flows,
Journal of International Economics, 2005, 65(2), pp. 269-311.
Poterba, J. M., Venture Capital and Capital Gain Taxation, Tax Policy and the
Economy, 1989, 3, pp. 47-67.
Pratt, S. P., Guide to Venture Capital Sources, Wellesley, Mass.: Captial
Publishing, 1981.

References 189
Prowse, S. D., The Economics of the Private Equity Market, Federal Reserve
Bank of Dallas Economic Review, 1998, pp. 21-34.
Raballand, G., Determinants of the Negative Impact of Being Landlocked on
Trade: An Empirical Investigation Through the Central Asian Case,
Comparative Economic Studies, 2003, 45(4), pp. 520-536.
Ranjan, D.; M., J. and A., S., Private Equity Returns: An Empirical Examination
of the Exit of Venture Backed Companies, Journal of Investment
Management, 2003, 11, pp. 152-177.
Ritter, J., Initial Public Offerings, Contemporary Finance Digest, 1998, 2(1).
Roe, M. J., Political and Legal Restraints on Ownership and Control of Public
Companies, Journal of Financial Economics, 1990, 27.
Rose, A., Which International Institutions Promote International Trade?, Review
of International Economics, 2005, 13(4), pp. 682-685.
Rose, A. K. and Spiegel, M. M., Offshore Financial Centers: Parasites or
Symbionts?, The Economic Journal, 2007, 117(523), pp. 1310-1314.
Ruhnka, J. C. and Young, J. E., A Venture Capital Model of the Development
Process for New Ventures, Journal of Business Venturing, 1987, 2,
pp. 167-184.
Ruiz, J. M. and Vilarrubia, J. M., The Wise Use of Dummies in Gravity Models:
Export Potentials in the Euromed Region, Banco de Espana,
Eurosistema, 2007.
Sahlman, W. A., Insights from the American Venture Capital Organizations,
Working Paper, 1991.
Sahlman, W. A., The Structure and Governance of Venture Capital
Organizations, Journal of Financial Economics, 1990, 27, pp. 473-
524.
Sapir, A., Trade Benefits under EEC Generalized System of Preferences,
European Economic Review, 1981, 15(3), pp. 339-335.

References 190
Sarisoy Guerin, S., The Role of Geography in Financial and Economic
Integration: A Comparative Analysis of Foreign Direct Investment,
Trade and Portfolio Investment Flows, World Economy, 2006, 29(2),
pp. 189-209.
Saxenian, A. L., Regional Advantage: Culture and Competition in Silicon Valley
and Route 128, Cambridge, Mass.: Harvard University Press, 1996.
Sayrs, L., Pooled Time Series Analysis, Newbury Park, CA, 1989.
Schertler, A., Driving Forces of Venture Capital Investments in Europe - A
Dynamic Panel Analysis, United Nations University, Institute for New
Technologies, 2003, Technology and Finance Working Papers(23).
Schwienbacher, A., Innovation and Venture Capital Exits, Working Paper
University of Amsterdam, 2003.
Serlenga, L. and Shin, Y., Gravity Models of the Intra-EU Trade: Application of
the Hausman-Taylor Estimation in Heterogeneous Panels with
Common Time-Specific Factors, ESE Discussion Paper University of
Edinburgh, School of Economics, 2004, 105.
Shleifer, A., Government in Transition, European Economic Review, 1997, 41,
pp. 385-410.
Shleifer, A.; Hay, J. and Vishny, R., Towards a Theory of Legal Reform,
European Economic Review, 1996.
Siegel, R.; Siegel, E. and Mac Millan, I. C., Corporate Venture Capitalists:
Autonomy, Obstacles, and Performance, Journal of Business
Venturing, 1988, 3.
SimTrade, A Gravity Model for the Calculation of Trade Potentials for Developing
Countries and Countries in Transition, Discussion paper,
UNCTAD/WTO, International Trade Center, 2003.
Standard & Poor's, Capital IQ, 2007, www.capitaliq.com/main.asp.

References 191
Stata Corporation., Longitudinal/Panel data, College Station, Tex.: Stata Press,
2005.
The Merger Market Group, Merger Market, 2007, www.mergermarket.com.
Thomson Financial, Venture Xpert, 2006,
www.thomson.com/content/financial/brand_overviews/VentureXpert.
Tinbergen, J., Shaping the World Economy, International Executive, 1963, 5(1),
pp. 27-30.
Toll, D. M., Private Equity Partnership Terms and Conditions, Wellesley, Mass.,
1999.
Tyebjee, T. and Bruno, A., A Model of Venture Capitalist Investment Activity,
Management Science, 1984, 30(9), pp. 1051-1066.
Tykvova, T.; Westerheide, P. and Zinser, B., Private Equity im internationalen
Vergleich — Analyse der Rahmenbedingungen und
Schlussfolgerungen für Deutschland, ZEW - Center for European
Economic Research, 2005.
U.S. Department of Labor- Bureau of Labor Statistic s National Longitudinal
Survey of Income Dynamics.
UCLA, Regression Diagnostics, 2008,
www.ats.ucla.edu/stat/stata/webbooks/reg/chapter2/statareg2.htm.
UCLA, Simple and Multiple Regression, 2008,
www.ats.ucla.edu/stat/Stata/webbooks/reg/chapter1/statareg1.htm.
University of Michigan, Michigan Panel Study of Income Dynamics.
Vives, X., Competition in the Changing World of Banking, Oxford Review of
Economic Policy, 2001, 17, pp. 535-545.
Wang, Z. and Winters, L., The Trading Potential of Eastern Europe, CEPR
Discussion Paper 610 London, 1991.

References 192
Wansbeek, T. and Kapteyn, A., Estimation of the Error-Components Model with
Incomplete Panels, Journal of Econometrics, 1989, 41(3), pp. 341-
361.
White, H., A Heteroskedasticity-Consistent Covariance Matrix Estimator and a
Direct Test for Heteroskedasticity, Econometrica, 1980, 48(4), pp.
817-838.
Wooldridge, J. M., Econometric Analysis of Cross Section and Panel Data,
Cambridge, Mass.: MIT Press, 2002.
World Bank, Financing Growth — Financial & Private Sector Development,
2007.
World Bank Group, WDI online, Washington, DC: World Bank Group.
World Intellectual Property Organization, WIPO Industrial Property Statistics,
2007.
Worldbank, Financing Growth - Financial & Private Sector Development, 2007.
Wright, M. and Robbie, K., Venture Capital and Private Equity: A Review and
Synthesis, Journal of Business Finance & Accounting, 1998, 25(5/6),
pp. 521-570.
Wright, M.; Thompson, S. and Robbie, K., Venture Capital and Management
Led Leveraged Buyouts: A European Perspective, Journal of
Business Venturing, 1992, 7, pp. 47-71.
Yeaple, S. R., The Role of Skill Endowments in the Structure of U.S. Outward
Foreign Direct Investment, Review of Economics and Statistics,
2003, 85(3), pp. 726-734.

Appendix 193
Appendix Appendix 1: Overview private equity data derivation...................................... 74
Appendix 2: Venture capital investments (cross-section analysis) ................. 74
Appendix 3: Venture Capital cross-border (cross-section analysis) ............... 74
Appendix 4: Private equity investments (cross-section analysis) ................... 74
Appendix 5: Private equity investments cross-border
(cross-section analysis) .............................................................. 74
Appendix 6: Correlation of host investment.................................................... 74
Appendix 7: Important country pairs (overall investment) 1-100 .................... 74
Appendix 8: Important country pairs (overall investment) 101-200 ................ 74
Appendix 9: Important country pairs (overall investment) 201-300 ................ 74
Appendix 10: Important country pairs (venture capital) 1-100 .......................... 74
Appendix 11: Important country pairs (venture capital) 101-200 ...................... 74
Appendix 12: Important country pairs (venture capital) 201-300 ...................... 74
Appendix 13: Important country pairs (private equity) 1-100 ............................ 74
Appendix 14: Important country pairs (private equity) 101-200 ........................ 74
Appendix 15: Important country pairs (private equity) 201-300 ........................ 74
Appendix 16: Venture Capital investment: Gravity model analysis with
gravity indicators ........................................................................ 74
Appendix 17: Venture Capital investment: Analysis with gravity and
banking indicators ...................................................................... 74
Appendix 18: Private Equity investment: Gravity model analysis with
gravity indicators ........................................................................ 74
Appendix 19: Private Equity investment: Analysis with gravity indicators
and banking indicators................................................................ 74

Appendix 194
Appendix 1: Overview private equity data derivation
Company Fund Investor
1 32

Appendix 195
Appendix 2: Venture capital investments (cross-section analysis) 1 2 3 4 5 6 7 8 9 10 11 12 13 14 15 16 17 18 19 20 21 22 23 24 25 26 27 28 29 30
Difference source-host Percentage of total deals Activity %
Part. Dealp. Dflow Part. Dealp. Dflow Part. Dealp. Dflow Part. Dealp. Dflow Part. Dealp. Dflow Part. Dealp. Dflow Part. Dealp. Dflow Source Host Overall1 United States of A. 1 1 1 0 229,028 101,338 732,822 113,213 50,766 375,987 115,815 50,572 356,834 -2,602 194 19,153 79.9% 73.0% 74.5% 79.0% 73.1% 76.5% 80.8% 72.9% 72.6% 76.20% 75.41% 75.80%2 United Kingdom 2 2 2 0 13,897 9,270 89,885 8,223 5,299 52,998 5,674 3,972 36,887 2,549 1,327 16,110 4.8% 6.7% 9.1% 5.7% 7.6% 10.8% 4.0% 5.7% 7.5% 8.05% 5.73% 6.89%3 France 3 3 3 0 7,254 4,213 24,011 3,533 1,987 8,365 3,721 2,227 15,645 -188 -240 -7,280 2.5% 3.0% 2.4% 2.5% 2.9% 1.7% 2.6% 3.2% 3.2% 2.34% 3.00% 2.67%4 Germany 4 4 4 0 4,767 2,834 13,652 2,369 1,281 4,736 2,398 1,553 8,916 -29 -272 -4,180 1.7% 2.0% 1.4% 1.7% 1.8% 1.0% 1.7% 2.2% 1.8% 1.49% 1.91% 1.70%5 Canada 5 5 5 0 4,381 2,021 12,894 2,303 974 6,473 2,078 1,048 6,420 225 -74 53 1.5% 1.5% 1.3% 1.6% 1.4% 1.3% 1.4% 1.5% 1.3% 1.44% 1.42% 1.43%6 Australia 6 6 7 1 2,865 2,330 7,465 1,488 1,184 3,868 1,377 1,145 3,597 111 39 271 1.0% 1.7% 0.8% 1.0% 1.7% 0.8% 1.0% 1.7% 0.7% 1.18% 1.11% 1.15%7 South Korea 7 7 6 -1 2,562 2,024 6,476 1,230 968 1,793 1,332 1,056 4,682 -102 -88 -2,889 0.9% 1.5% 0.7% 0.9% 1.4% 0.4% 0.9% 1.5% 1.0% 0.87% 1.13% 1.00%8 Sweden 8 8 9 1 2,143 1,424 8,083 987 638 4,282 1,156 786 3,801 -169 -147 481 0.7% 1.0% 0.8% 0.7% 0.9% 0.9% 0.8% 1.1% 0.8% 0.83% 0.90% 0.87%9 India 9 11 8 -3 1,829 1,656 5,707 822 748 1,498 1,007 908 4,209 -185 -160 -2,711 0.6% 1.2% 0.6% 0.6% 1.1% 0.3% 0.7% 1.3% 0.9% 0.65% 0.96% 0.80%
10 Netherlands 10 9 10 1 1,781 1,166 8,766 985 626 4,097 796 539 4,668 188 87 -571 0.6% 0.8% 0.9% 0.7% 0.9% 0.8% 0.6% 0.8% 0.9% 0.81% 0.76% 0.78%11 Israel 11 10 12 2 2,067 972 4,851 1,098 484 2,634 969 488 2,218 129 -5 416 0.7% 0.7% 0.5% 0.8% 0.7% 0.5% 0.7% 0.7% 0.5% 0.67% 0.61% 0.64%12 Japan 12 13 11 -2 1,056 592 10,326 654 272 4,123 402 320 6,203 252 -48 -2,080 0.4% 0.4% 1.1% 0.5% 0.4% 0.8% 0.3% 0.5% 1.3% 0.56% 0.67% 0.61%13 Finland 13 15 14 -1 1,432 1,139 2,614 705 547 1,050 727 591 1,564 -22 -44 -514 0.5% 0.8% 0.3% 0.5% 0.8% 0.2% 0.5% 0.9% 0.3% 0.50% 0.56% 0.53%14 Denmark 14 17 13 -4 1,291 835 3,806 601 386 856 690 449 2,951 -90 -62 -2,095 0.5% 0.6% 0.4% 0.4% 0.6% 0.2% 0.5% 0.6% 0.6% 0.38% 0.58% 0.48%15 Switzerland 15 16 16 0 1,319 719 4,301 744 386 1,837 576 333 2,464 168 53 -627 0.5% 0.5% 0.4% 0.5% 0.6% 0.4% 0.4% 0.5% 0.5% 0.48% 0.46% 0.47%16 Hong Kong 16 12 21 9 769 526 7,476 479 317 5,513 290 210 1,963 189 107 3,549 0.3% 0.4% 0.8% 0.3% 0.5% 1.1% 0.2% 0.3% 0.4% 0.64% 0.30% 0.47%17 Singapore 17 14 22 8 1,029 564 5,005 697 312 3,571 332 252 1,434 365 60 2,137 0.4% 0.4% 0.5% 0.5% 0.4% 0.7% 0.2% 0.4% 0.3% 0.55% 0.30% 0.42%18 Ireland-Rep 18 22 17 -5 732 475 3,264 275 183 353 458 292 2,912 -183 -109 -2,559 0.3% 0.3% 0.3% 0.2% 0.3% 0.1% 0.3% 0.4% 0.6% 0.18% 0.44% 0.31%19 Italy 19 19 18 -1 602 428 3,797 307 198 1,336 296 230 2,461 11 -31 -1,125 0.2% 0.3% 0.4% 0.2% 0.3% 0.3% 0.2% 0.3% 0.5% 0.26% 0.35% 0.30%20 China 20 25 15 -10 643 377 3,745 167 103 360 476 274 3,385 -309 -172 -3,025 0.2% 0.3% 0.4% 0.1% 0.1% 0.1% 0.3% 0.4% 0.7% 0.11% 0.47% 0.29%21 Belgium 21 20 20 0 720 452 2,424 342 206 550 378 245 1,874 -36 -39 -1,325 0.3% 0.3% 0.2% 0.2% 0.3% 0.1% 0.3% 0.4% 0.4% 0.22% 0.33% 0.27%22 Spain 22 23 19 -4 529 396 2,873 184 142 889 345 254 1,984 -161 -111 -1,095 0.2% 0.3% 0.3% 0.1% 0.2% 0.2% 0.2% 0.4% 0.4% 0.17% 0.34% 0.25%23 Taiwan 23 18 26 8 656 389 1,841 449 219 1,223 207 169 618 243 50 606 0.2% 0.3% 0.2% 0.3% 0.3% 0.2% 0.1% 0.2% 0.1% 0.29% 0.17% 0.23%24 Norway 24 21 25 4 514 376 1,338 292 206 574 222 170 763 71 35 -189 0.2% 0.3% 0.1% 0.2% 0.3% 0.1% 0.2% 0.2% 0.2% 0.21% 0.19% 0.20%25 Brazil 25 24 24 0 388 315 1,445 163 135 382 225 180 1,063 -63 -46 -681 0.1% 0.2% 0.1% 0.1% 0.2% 0.1% 0.2% 0.3% 0.2% 0.13% 0.21% 0.17%26 Bermuda 26 42 23 -19 94 45 3,765 12 10 42 82 36 3,722 -70 -26 -3,680 0.0% 0.0% 0.4% 0.0% 0.0% 0.0% 0.1% 0.1% 0.8% 0.01% 0.29% 0.15%27 Austria 27 26 28 2 380 275 490 167 126 170 214 148 320 -47 -22 -151 0.1% 0.2% 0.0% 0.1% 0.2% 0.0% 0.1% 0.2% 0.1% 0.11% 0.14% 0.13%28 Luxembourg 28 29 27 -2 88 70 2,643 58 48 481 30 21 2,162 28 27 -1,681 0.0% 0.1% 0.3% 0.0% 0.1% 0.1% 0.0% 0.0% 0.4% 0.07% 0.16% 0.12%29 New Zealand 29 28 29 1 223 195 688 110 94 135 113 101 553 -3 -6 -419 0.1% 0.1% 0.1% 0.1% 0.1% 0.0% 0.1% 0.1% 0.1% 0.08% 0.11% 0.10%30 Malaysia 30 27 32 5 217 161 459 130 87 170 87 75 289 43 12 -119 0.1% 0.1% 0.0% 0.1% 0.1% 0.0% 0.1% 0.1% 0.1% 0.08% 0.08% 0.08%31 Poland 31 30 35 5 153 135 470 81 71 199 72 64 270 10 7 -71 0.1% 0.1% 0.0% 0.1% 0.1% 0.0% 0.0% 0.1% 0.1% 0.07% 0.07% 0.07%32 Indonesia 32 36 31 -5 91 65 855 28 17 241 63 48 613 -35 -31 -372 0.0% 0.0% 0.1% 0.0% 0.0% 0.0% 0.0% 0.1% 0.1% 0.03% 0.08% 0.06%33 Argentina 33 49 30 -19 71 40 1,020 6 5 3 65 35 1,017 -59 -30 -1,015 0.0% 0.0% 0.1% 0.0% 0.0% 0.0% 0.0% 0.1% 0.2% 0.00% 0.10% 0.05%34 Czech Republic 34 35 36 1 120 96 370 48 38 103 73 58 268 -25 -21 -165 0.0% 0.1% 0.0% 0.0% 0.1% 0.0% 0.1% 0.1% 0.1% 0.04% 0.06% 0.05%35 Hungary 35 37 34 -3 121 102 239 41 34 23 80 68 216 -39 -34 -193 0.0% 0.1% 0.0% 0.0% 0.0% 0.0% 0.1% 0.1% 0.0% 0.03% 0.07% 0.05%36 Thailand 36 38 33 -5 102 99 319 26 26 16 76 74 303 -50 -48 -287 0.0% 0.1% 0.0% 0.0% 0.0% 0.0% 0.1% 0.1% 0.1% 0.02% 0.07% 0.05%37 Portugal 37 33 38 5 115 95 256 51 43 88 64 52 169 -13 -8 -81 0.0% 0.1% 0.0% 0.0% 0.1% 0.0% 0.0% 0.1% 0.0% 0.04% 0.05% 0.04%38 Russian Federation 38 31 41 10 102 83 234 60 43 128 42 40 106 18 3 22 0.0% 0.1% 0.0% 0.0% 0.1% 0.0% 0.0% 0.1% 0.0% 0.04% 0.04% 0.04%39 South Africa 39 34 40 6 99 79 233 49 40 114 50 38 119 -1 2 -5 0.0% 0.1% 0.0% 0.0% 0.1% 0.0% 0.0% 0.1% 0.0% 0.04% 0.04% 0.04%40 Philippines 40 39 37 -2 78 57 334 29 15 49 49 43 286 -20 -28 -237 0.0% 0.0% 0.0% 0.0% 0.0% 0.0% 0.0% 0.1% 0.1% 0.02% 0.05% 0.03%41 Mexico 41 66 39 -27 37 32 271 1 0 0 36 31 271 -35 -31 -271 0.0% 0.0% 0.0% 0.0% 0.0% 0.0% 0.0% 0.0% 0.1% 0.00% 0.04% 0.02%42 Romania 42 44 42 -2 43 37 197 10 10 30 33 27 166 -23 -17 -136 0.0% 0.0% 0.0% 0.0% 0.0% 0.0% 0.0% 0.0% 0.0% 0.01% 0.03% 0.02%43 Mauritius 43 32 88 56 52 36 162 51 35 162 1 1 0 50 34 162 0.0% 0.0% 0.0% 0.0% 0.1% 0.0% 0.0% 0.0% 0.0% 0.04% 0.00% 0.02%44 Zambia 44 0 43 0 2 2 325 0 0 0 2 2 325 -2 -2 -325 0.0% 0.0% 0.0% 0.0% 0.0% 0.0% 0.0% 0.0% 0.1% 0.00% 0.02% 0.01%45 Ukraine 45 40 49 9 29 29 20 16 16 6 13 13 14 3 3 -8 0.0% 0.0% 0.0% 0.0% 0.0% 0.0% 0.0% 0.0% 0.0% 0.01% 0.01% 0.01%46 Iceland 46 43 48 5 30 23 42 13 12 19 17 11 24 -4 2 -5 0.0% 0.0% 0.0% 0.0% 0.0% 0.0% 0.0% 0.0% 0.0% 0.01% 0.01% 0.01%47 Bulgaria 47 54 44 -10 15 10 167 3 3 0 12 7 167 -9 -4 -167 0.0% 0.0% 0.0% 0.0% 0.0% 0.0% 0.0% 0.0% 0.0% 0.00% 0.02% 0.01%48 Nigeria 48 46 46 0 18 16 101 8 7 9 10 9 92 -2 -2 -83 0.0% 0.0% 0.0% 0.0% 0.0% 0.0% 0.0% 0.0% 0.0% 0.01% 0.01% 0.01%49 Greece 49 41 59 18 23 20 19 15 13 14 8 7 4 7 7 10 0.0% 0.0% 0.0% 0.0% 0.0% 0.0% 0.0% 0.0% 0.0% 0.01% 0.01% 0.01%50 Chile 50 57 45 -12 15 11 84 3 1 0 12 10 84 -9 -8 -84 0.0% 0.0% 0.0% 0.0% 0.0% 0.0% 0.0% 0.0% 0.0% 0.00% 0.01% 0.01%51 Slovak Republic 51 0 47 0 14 12 24 0 0 0 14 12 24 -14 -12 -24 0.0% 0.0% 0.0% 0.0% 0.0% 0.0% 0.0% 0.0% 0.0% 0.00% 0.01% 0.01%52 Vietnam 52 47 56 9 14 14 7 6 6 2 8 8 6 -2 -2 -4 0.0% 0.0% 0.0% 0.0% 0.0% 0.0% 0.0% 0.0% 0.0% 0.00% 0.01% 0.01%53 Pakistan 53 52 52 0 10 10 51 4 4 0 6 6 51 -2 -2 -51 0.0% 0.0% 0.0% 0.0% 0.0% 0.0% 0.0% 0.0% 0.0% 0.00% 0.01% 0.01%54 Cayman Islands 54 45 75 30 17 8 28 15 6 26 2 2 1 13 4 25 0.0% 0.0% 0.0% 0.0% 0.0% 0.0% 0.0% 0.0% 0.0% 0.01% 0.00% 0.00%55 Croatia 55 0 50 0 11 11 15 0 0 0 11 11 15 -11 -11 -15 0.0% 0.0% 0.0% 0.0% 0.0% 0.0% 0.0% 0.0% 0.0% 0.00% 0.01% 0.00%56 Tanzania 56 0 51 0 2 2 94 0 0 0 2 2 94 -2 -2 -94 0.0% 0.0% 0.0% 0.0% 0.0% 0.0% 0.0% 0.0% 0.0% 0.00% 0.01% 0.00%57 Estonia 57 56 55 -1 7 5 53 3 1 3 4 4 51 -1 -3 -48 0.0% 0.0% 0.0% 0.0% 0.0% 0.0% 0.0% 0.0% 0.0% 0.00% 0.01% 0.00%58 Turkey 58 50 62 12 11 10 8 5 5 0 6 5 8 -1 -1 -8 0.0% 0.0% 0.0% 0.0% 0.0% 0.0% 0.0% 0.0% 0.0% 0.00% 0.00% 0.00%59 Ghana 59 60 54 -6 10 10 5 1 1 0 9 9 4 -8 -8 -4 0.0% 0.0% 0.0% 0.0% 0.0% 0.0% 0.0% 0.0% 0.0% 0.00% 0.01% 0.00%60 United Arab Emirates 60 48 64 16 7 7 33 4 4 23 3 3 10 1 1 13 0.0% 0.0% 0.0% 0.0% 0.0% 0.0% 0.0% 0.0% 0.0% 0.00% 0.00% 0.00%61 Kenya 61 0 53 0 9 5 31 0 0 0 9 5 31 -9 -5 -31 0.0% 0.0% 0.0% 0.0% 0.0% 0.0% 0.0% 0.0% 0.0% 0.00% 0.01% 0.00%62 Cyprus 62 61 57 -4 5 5 46 1 1 0 4 4 45 -3 -3 -45 0.0% 0.0% 0.0% 0.0% 0.0% 0.0% 0.0% 0.0% 0.0% 0.00% 0.01% 0.00%63 Lithuania 63 54 60 6 8 8 18 3 3 0 5 5 18 -2 -2 -18 0.0% 0.0% 0.0% 0.0% 0.0% 0.0% 0.0% 0.0% 0.0% 0.00% 0.00% 0.00%64 Sri Lanka 64 0 58 0 5 5 29 0 0 0 5 5 29 -5 -5 -29 0.0% 0.0% 0.0% 0.0% 0.0% 0.0% 0.0% 0.0% 0.0% 0.00% 0.01% 0.00%65 Cameroon 65 53 68 15 6 6 3 3 3 1 3 3 1 0 0 0 0.0% 0.0% 0.0% 0.0% 0.0% 0.0% 0.0% 0.0% 0.0% 0.00% 0.00% 0.00%66 Moldova 66 0 61 0 6 6 1 0 0 0 6 6 1 -6 -6 -1 0.0% 0.0% 0.0% 0.0% 0.0% 0.0% 0.0% 0.0% 0.0% 0.00% 0.00% 0.00%67 Madagascar 67 51 0 0 7 3 5 7 3 5 0 0 0 7 3 5 0.0% 0.0% 0.0% 0.0% 0.0% 0.0% 0.0% 0.0% 0.0% 0.00% 0.00% 0.00%68 Jordan 68 0 63 0 3 3 11 0 0 0 3 3 11 -3 -3 -11 0.0% 0.0% 0.0% 0.0% 0.0% 0.0% 0.0% 0.0% 0.0% 0.00% 0.00% 0.00%69 Monaco 69 0 65 0 4 4 0 0 0 0 4 4 0 -4 -4 0 0.0% 0.0% 0.0% 0.0% 0.0% 0.0% 0.0% 0.0% 0.0% 0.00% 0.00% 0.00%70 Ecuador 70 0 66 0 1 1 28 0 0 0 1 1 28 -1 -1 -28 0.0% 0.0% 0.0% 0.0% 0.0% 0.0% 0.0% 0.0% 0.0% 0.00% 0.00% 0.00%71 British Virgin 71 0 67 0 2 2 18 0 0 0 2 2 18 -2 -2 -18 0.0% 0.0% 0.0% 0.0% 0.0% 0.0% 0.0% 0.0% 0.0% 0.00% 0.00% 0.00%72 El Salvador 72 0 69 0 2 2 10 0 0 0 2 2 10 -2 -2 -10 0.0% 0.0% 0.0% 0.0% 0.0% 0.0% 0.0% 0.0% 0.0% 0.00% 0.00% 0.00%73 Colombia 73 0 70 0 1 1 24 0 0 0 1 1 24 -1 -1 -24 0.0% 0.0% 0.0% 0.0% 0.0% 0.0% 0.0% 0.0% 0.0% 0.00% 0.00% 0.00%74 Netherlands Antilles 74 0 71 0 3 3 1 0 0 0 3 3 1 -3 -3 -1 0.0% 0.0% 0.0% 0.0% 0.0% 0.0% 0.0% 0.0% 0.0% 0.00% 0.00% 0.00%75 Bangladesh 75 0 72 0 1 1 18 0 0 0 1 1 18 -1 -1 -18 0.0% 0.0% 0.0% 0.0% 0.0% 0.0% 0.0% 0.0% 0.0% 0.00% 0.00% 0.00%76 Slovenia 76 58 88 30 3 2 1 2 1 1 1 1 0 1 0 1 0.0% 0.0% 0.0% 0.0% 0.0% 0.0% 0.0% 0.0% 0.0% 0.00% 0.00% 0.00%77 Kazakhstan 77 0 73 0 2 2 5 0 0 0 2 2 5 -2 -2 -5 0.0% 0.0% 0.0% 0.0% 0.0% 0.0% 0.0% 0.0% 0.0% 0.00% 0.00% 0.00%78 Egypt 78 0 74 0 2 2 9 0 0 0 2 2 9 -2 -2 -9 0.0% 0.0% 0.0% 0.0% 0.0% 0.0% 0.0% 0.0% 0.0% 0.00% 0.00% 0.00%79 Latvia 79 0 76 0 2 2 0 0 0 0 2 2 0 -2 -2 0 0.0% 0.0% 0.0% 0.0% 0.0% 0.0% 0.0% 0.0% 0.0% 0.00% 0.00% 0.00%80 Tunisia 80 62 87 25 2 2 0 1 1 0 1 1 0 0 0 0 0.0% 0.0% 0.0% 0.0% 0.0% 0.0% 0.0% 0.0% 0.0% 0.00% 0.00% 0.00%81 Fr Polynesia 81 0 77 0 2 2 0 0 0 0 2 2 0 -2 -2 0 0.0% 0.0% 0.0% 0.0% 0.0% 0.0% 0.0% 0.0% 0.0% 0.00% 0.00% 0.00%82 Azerbaijan 82 0 78 0 2 2 0 0 0 0 2 2 0 -2 -2 0 0.0% 0.0% 0.0% 0.0% 0.0% 0.0% 0.0% 0.0% 0.0% 0.00% 0.00% 0.00%83 Fiji 83 0 79 0 2 2 0 0 0 0 2 2 0 -2 -2 0 0.0% 0.0% 0.0% 0.0% 0.0% 0.0% 0.0% 0.0% 0.0% 0.00% 0.00% 0.00%84 Peru 84 0 80 0 1 1 10 0 0 0 1 1 10 -1 -1 -10 0.0% 0.0% 0.0% 0.0% 0.0% 0.0% 0.0% 0.0% 0.0% 0.00% 0.00% 0.00%85 Saudi Arabia 85 59 0 0 2 1 1 2 1 1 0 0 0 2 1 1 0.0% 0.0% 0.0% 0.0% 0.0% 0.0% 0.0% 0.0% 0.0% 0.00% 0.00% 0.00%86 Morocco 86 65 90 25 2 1 2 1 1 1 1 1 1 0 0 0 0.0% 0.0% 0.0% 0.0% 0.0% 0.0% 0.0% 0.0% 0.0% 0.00% 0.00% 0.00%87 Bolivia 87 0 81 0 1 1 3 0 0 0 1 1 3 -1 -1 -3 0.0% 0.0% 0.0% 0.0% 0.0% 0.0% 0.0% 0.0% 0.0% 0.00% 0.00% 0.00%88 Macedonia 88 0 82 0 1 1 2 0 0 0 1 1 2 -1 -1 -2 0.0% 0.0% 0.0% 0.0% 0.0% 0.0% 0.0% 0.0% 0.0% 0.00% 0.00% 0.00%89 Mozambique 89 0 83 0 1 1 1 0 0 0 1 1 1 -1 -1 -1 0.0% 0.0% 0.0% 0.0% 0.0% 0.0% 0.0% 0.0% 0.0% 0.00% 0.00% 0.00%90 Sierra Leone 90 0 84 0 1 1 1 0 0 0 1 1 1 -1 -1 -1 0.0% 0.0% 0.0% 0.0% 0.0% 0.0% 0.0% 0.0% 0.0% 0.00% 0.00% 0.00%91 Venezuela 91 0 85 0 1 1 1 0 0 0 1 1 1 -1 -1 -1 0.0% 0.0% 0.0% 0.0% 0.0% 0.0% 0.0% 0.0% 0.0% 0.00% 0.00% 0.00%92 Bosnia 92 0 86 0 1 1 1 0 0 0 1 1 1 -1 -1 -1 0.0% 0.0% 0.0% 0.0% 0.0% 0.0% 0.0% 0.0% 0.0% 0.00% 0.00% 0.00%93 Costa Rica 93 63 0 0 1 1 0 1 1 0 0 0 0 1 1 0 0.0% 0.0% 0.0% 0.0% 0.0% 0.0% 0.0% 0.0% 0.0% 0.00% 0.00% 0.00%94 Kuwait 93 63 0 0 1 1 0 1 1 0 0 0 0 1 1 0 0.0% 0.0% 0.0% 0.0% 0.0% 0.0% 0.0% 0.0% 0.0% 0.00% 0.00% 0.00%
Grand Total ## ## ## ## 286,761 138,809 983,228 143,381 69,404 491,614 143,381 69,404 491,614 0 0 0 100% 100% 100% 100% 100% 100% 100% 100% 100% 100% 100% 100%
HostSourceOverall (Source+Host) Overall Source HostCountryNr.
O S H Dif.Rank Absolute volume of deals ($US mln)

Appendix 196
Appendix 3: Venture Capital cross-border (cross-section analysis) 1 2 3 4 5 6 7 8 9 10 11 12 13 14 15 16 17 18 19 20 21 22 23 24 25 26 27 28 29 30
Difference source-host Percentage of total deals Activity %
Part. Dealp. Dflow Part. Dealp. Dflow Part. Dealp. Dflow Part. Dealp. Dflow Part. Dealp. Dflow Part. Dealp. Dflow Part. Dealp. Dflow Source Host Overall1 United States of A. 1 1 1 0 13,091 6,261 75,511 5,245 3,228 47,332 7,847 3,033 28,179 -2,602 194 19,153 35.7% 32.4% 34.1% 28.6% 33.4% 42.8% 42.8% 31.4% 25.5% 34.94% 33.23% 34.08%2 United Kingdom 2 2 2 0 5,764 3,241 40,511 4,157 2,284 28,311 1,608 957 12,200 2,549 1,327 16,110 15.7% 16.8% 18.3% 22.7% 23.6% 25.6% 8.8% 9.9% 11.0% 23.97% 9.90% 16.94%3 Germany 3 3 4 1 2,276 1,186 10,156 1,124 457 2,988 1,153 729 7,168 -29 -272 -4,180 6.2% 6.1% 4.6% 6.1% 4.7% 2.7% 6.3% 7.5% 6.5% 4.52% 6.77% 5.65%4 France 4 5 3 -2 1,897 958 12,032 855 359 2,376 1,042 599 9,656 -188 -240 -7,280 5.2% 5.0% 5.4% 4.7% 3.7% 2.1% 5.7% 6.2% 8.7% 3.51% 6.87% 5.19%5 Canada 5 4 5 1 1,840 736 7,635 1,033 331 3,844 808 405 3,791 225 -74 53 5.0% 3.8% 3.5% 5.6% 3.4% 3.5% 4.4% 4.2% 3.4% 4.18% 4.01% 4.09%6 Netherlands 6 6 6 0 959 539 7,856 574 313 3,642 385 226 4,213 188 87 -571 2.6% 2.8% 3.6% 3.1% 3.2% 3.3% 2.1% 2.3% 3.8% 3.22% 2.75% 2.99%7 Israel 7 9 11 2 1,102 497 2,742 616 246 1,579 487 251 1,163 129 -5 416 3.0% 2.6% 1.2% 3.4% 2.5% 1.4% 2.7% 2.6% 1.1% 2.44% 2.10% 2.27%8 Japan 8 11 8 -3 804 399 5,380 528 175 1,650 276 223 3,730 252 -48 -2,080 2.2% 2.1% 2.4% 2.9% 1.8% 1.5% 1.5% 2.3% 3.4% 2.06% 2.40% 2.23%9 Sweden 9 12 7 -5 813 508 3,977 322 180 2,229 491 328 1,748 -169 -147 481 2.2% 2.6% 1.8% 1.8% 1.9% 2.0% 2.7% 3.4% 1.6% 1.88% 2.55% 2.22%
10 Switzerland 10 10 12 2 913 469 3,714 541 261 1,543 373 208 2,170 168 53 -627 2.5% 2.4% 1.7% 2.9% 2.7% 1.4% 2.0% 2.2% 2.0% 2.35% 2.05% 2.20%11 Hong Kong 11 7 21 14 569 367 6,036 379 237 4,793 190 130 1,243 189 107 3,549 1.6% 1.9% 2.7% 2.1% 2.5% 4.3% 1.0% 1.3% 1.1% 2.95% 1.17% 2.06%12 Singapore 12 8 19 11 784 382 4,175 574 221 3,156 210 161 1,019 365 60 2,137 2.1% 2.0% 1.9% 3.1% 2.3% 2.9% 1.1% 1.7% 0.9% 2.76% 1.24% 2.00%13 Australia 13 13 16 3 592 426 2,383 351 233 1,327 241 194 1,056 111 39 271 1.6% 2.2% 1.1% 1.9% 2.4% 1.2% 1.3% 2.0% 1.0% 1.84% 1.42% 1.63%14 China 14 24 9 -15 445 235 3,405 68 32 190 377 203 3,215 -309 -172 -3,025 1.2% 1.2% 1.5% 0.4% 0.3% 0.2% 2.1% 2.1% 2.9% 0.29% 2.36% 1.32%15 India 15 22 10 -12 327 267 3,339 71 53 314 256 213 3,025 -185 -160 -2,711 0.9% 1.4% 1.5% 0.4% 0.6% 0.3% 1.4% 2.2% 2.7% 0.41% 2.11% 1.26%16 Denmark 16 16 14 -2 414 246 2,805 162 92 355 252 154 2,450 -90 -62 -2,095 1.1% 1.3% 1.3% 0.9% 0.9% 0.3% 1.4% 1.6% 2.2% 0.72% 1.73% 1.22%17 South Korea 17 23 15 -8 234 148 3,825 66 30 468 168 118 3,357 -102 -88 -2,889 0.6% 0.8% 1.7% 0.4% 0.3% 0.4% 0.9% 1.2% 3.0% 0.37% 1.73% 1.05%18 Finland 18 15 20 5 382 240 1,757 180 98 622 202 142 1,136 -22 -44 -514 1.0% 1.2% 0.8% 1.0% 1.0% 0.6% 1.1% 1.5% 1.0% 0.85% 1.20% 1.03%19 Ireland-Rep 19 25 13 -12 313 179 2,764 65 35 102 248 144 2,662 -183 -109 -2,559 0.9% 0.9% 1.2% 0.4% 0.4% 0.1% 1.4% 1.5% 2.4% 0.27% 1.75% 1.01%20 Belgium 20 17 18 1 372 194 2,192 168 78 434 204 117 1,759 -36 -39 -1,325 1.0% 1.0% 1.0% 0.9% 0.8% 0.4% 1.1% 1.2% 1.6% 0.70% 1.30% 1.00%21 Taiwan 21 14 26 12 446 212 1,505 344 131 1,055 102 81 450 243 50 606 1.2% 1.1% 0.7% 1.9% 1.4% 1.0% 0.6% 0.8% 0.4% 1.40% 0.60% 1.00%22 Italy 22 18 23 5 307 189 1,689 159 79 282 148 110 1,407 11 -31 -1,125 0.8% 1.0% 0.8% 0.9% 0.8% 0.3% 0.8% 1.1% 1.3% 0.65% 1.07% 0.86%23 Bermuda 23 37 17 -20 94 45 3,765 12 10 42 82 36 3,722 -70 -26 -3,680 0.3% 0.2% 1.7% 0.1% 0.1% 0.0% 0.4% 0.4% 3.4% 0.07% 1.39% 0.73%24 Spain 24 33 22 -11 192 131 1,506 16 10 205 177 121 1,300 -161 -111 -1,095 0.5% 0.7% 0.7% 0.1% 0.1% 0.2% 1.0% 1.3% 1.2% 0.12% 1.13% 0.63%25 Luxembourg 25 21 24 3 86 68 2,643 57 47 481 29 20 2,162 28 27 -1,681 0.2% 0.4% 1.2% 0.3% 0.5% 0.4% 0.2% 0.2% 2.0% 0.41% 0.77% 0.59%26 Norway 26 19 29 10 199 119 650 135 77 231 64 42 420 71 35 -189 0.5% 0.6% 0.3% 0.7% 0.8% 0.2% 0.3% 0.4% 0.4% 0.58% 0.39% 0.48%27 Malaysia 27 20 28 8 178 128 428 110 70 155 68 58 273 43 12 -119 0.5% 0.7% 0.2% 0.6% 0.7% 0.1% 0.4% 0.6% 0.2% 0.49% 0.41% 0.45%28 Brazil 28 32 25 -7 125 70 854 31 12 86 94 58 767 -63 -46 -681 0.3% 0.4% 0.4% 0.2% 0.1% 0.1% 0.5% 0.6% 0.7% 0.12% 0.60% 0.36%29 New Zealand 29 28 31 3 93 79 467 45 36 24 48 43 443 -3 -6 -419 0.3% 0.4% 0.2% 0.2% 0.4% 0.0% 0.3% 0.4% 0.4% 0.21% 0.37% 0.29%30 Argentina 30 46 27 -19 67 37 1,018 4 4 2 63 34 1,016 -59 -30 -1,015 0.2% 0.2% 0.5% 0.0% 0.0% 0.0% 0.3% 0.3% 0.9% 0.02% 0.54% 0.28%31 Austria 31 31 30 -1 115 75 235 34 27 42 81 49 193 -47 -22 -151 0.3% 0.4% 0.1% 0.2% 0.3% 0.0% 0.4% 0.5% 0.2% 0.17% 0.37% 0.27%32 Czech Republic 32 30 34 4 94 71 354 35 25 95 60 46 260 -25 -21 -165 0.3% 0.4% 0.2% 0.2% 0.3% 0.1% 0.3% 0.5% 0.2% 0.18% 0.35% 0.26%33 Poland 33 27 38 11 75 60 329 42 33 129 33 27 200 10 7 -71 0.2% 0.3% 0.1% 0.2% 0.3% 0.1% 0.2% 0.3% 0.2% 0.23% 0.21% 0.22%34 Indonesia 34 36 32 -4 67 56 402 16 12 15 51 44 387 -35 -31 -372 0.2% 0.3% 0.2% 0.1% 0.1% 0.0% 0.3% 0.5% 0.3% 0.08% 0.36% 0.22%35 Philippines 35 35 36 1 62 44 334 21 8 49 41 36 286 -20 -28 -237 0.2% 0.2% 0.2% 0.1% 0.1% 0.0% 0.2% 0.4% 0.3% 0.08% 0.28% 0.18%36 Hungary 36 40 35 -5 65 50 227 13 8 17 52 42 210 -39 -34 -193 0.2% 0.3% 0.1% 0.1% 0.1% 0.0% 0.3% 0.4% 0.2% 0.06% 0.30% 0.18%37 Thailand 37 55 33 -22 52 49 297 1 1 5 51 49 292 -50 -48 -287 0.1% 0.3% 0.1% 0.0% 0.0% 0.0% 0.3% 0.5% 0.3% 0.01% 0.35% 0.18%38 Russian Federation 38 29 41 12 64 48 103 41 26 63 23 23 41 18 3 22 0.2% 0.3% 0.0% 0.2% 0.3% 0.1% 0.1% 0.2% 0.0% 0.18% 0.13% 0.16%39 Mauritius 39 26 84 58 52 36 162 51 35 162 1 1 0 50 34 162 0.1% 0.2% 0.1% 0.3% 0.4% 0.1% 0.0% 0.0% 0.0% 0.26% 0.01% 0.13%40 Mexico 40 56 37 -19 37 32 271 1 0 0 36 31 271 -35 -31 -271 0.1% 0.2% 0.1% 0.0% 0.0% 0.0% 0.2% 0.3% 0.2% 0.00% 0.25% 0.13%41 Romania 41 42 39 -3 37 31 166 7 7 15 30 24 151 -23 -17 -136 0.1% 0.2% 0.1% 0.0% 0.1% 0.0% 0.2% 0.2% 0.1% 0.04% 0.18% 0.11%42 Portugal 42 41 40 -1 33 22 169 10 7 44 23 15 125 -13 -8 -81 0.1% 0.1% 0.1% 0.1% 0.1% 0.0% 0.1% 0.2% 0.1% 0.06% 0.13% 0.09%43 South Africa 43 34 45 11 33 21 88 16 12 41 17 9 46 -1 2 -5 0.1% 0.1% 0.0% 0.1% 0.1% 0.0% 0.1% 0.1% 0.0% 0.08% 0.08% 0.08%44 Zambia 44 0 42 0 2 2 325 0 0 0 2 2 325 -2 -2 -325 0.0% 0.0% 0.1% 0.0% 0.0% 0.0% 0.0% 0.0% 0.3% 0.00% 0.11% 0.05%45 Greece 45 38 56 18 19 17 10 13 12 10 6 5 0 7 7 10 0.1% 0.1% 0.0% 0.1% 0.1% 0.0% 0.0% 0.1% 0.0% 0.07% 0.03% 0.05%46 Chile 46 50 44 -6 15 11 84 3 1 0 12 10 84 -9 -8 -84 0.0% 0.1% 0.0% 0.0% 0.0% 0.0% 0.1% 0.1% 0.1% 0.01% 0.08% 0.04%47 Bulgaria 47 0 43 0 9 4 167 0 0 0 9 4 167 -9 -4 -167 0.0% 0.0% 0.1% 0.0% 0.0% 0.0% 0.0% 0.0% 0.2% 0.00% 0.08% 0.04%48 Slovak Republic 48 0 46 0 14 12 24 0 0 0 14 12 24 -14 -12 -24 0.0% 0.1% 0.0% 0.0% 0.0% 0.0% 0.1% 0.1% 0.0% 0.00% 0.07% 0.04%49 Cayman Islands 49 39 70 31 17 8 28 15 6 26 2 2 1 13 4 25 0.0% 0.0% 0.0% 0.1% 0.1% 0.0% 0.0% 0.0% 0.0% 0.06% 0.01% 0.03%50 Nigeria 50 47 48 1 8 6 96 3 2 6 5 4 89 -2 -2 -83 0.0% 0.0% 0.0% 0.0% 0.0% 0.0% 0.0% 0.0% 0.1% 0.01% 0.05% 0.03%51 Croatia 51 0 47 0 11 11 15 0 0 0 11 11 15 -11 -11 -15 0.0% 0.1% 0.0% 0.0% 0.0% 0.0% 0.1% 0.1% 0.0% 0.00% 0.06% 0.03%52 Iceland 52 44 57 13 14 7 11 5 4 3 9 3 8 -4 2 -5 0.0% 0.0% 0.0% 0.0% 0.0% 0.0% 0.0% 0.0% 0.0% 0.02% 0.03% 0.03%53 Estonia 53 49 52 3 7 5 53 3 1 3 4 4 51 -1 -3 -48 0.0% 0.0% 0.0% 0.0% 0.0% 0.0% 0.0% 0.0% 0.0% 0.01% 0.04% 0.02%54 Kenya 54 0 49 0 9 5 31 0 0 0 9 5 31 -9 -5 -31 0.0% 0.0% 0.0% 0.0% 0.0% 0.0% 0.0% 0.1% 0.0% 0.00% 0.04% 0.02%55 Ghana 55 0 50 0 8 8 4 0 0 0 8 8 4 -8 -8 -4 0.0% 0.0% 0.0% 0.0% 0.0% 0.0% 0.0% 0.1% 0.0% 0.00% 0.04% 0.02%56 Ukraine 56 43 66 23 7 7 10 5 5 1 2 2 9 3 3 -8 0.0% 0.0% 0.0% 0.0% 0.1% 0.0% 0.0% 0.0% 0.0% 0.03% 0.01% 0.02%57 Tanzania 57 0 51 0 2 2 94 0 0 0 2 2 94 -2 -2 -94 0.0% 0.0% 0.0% 0.0% 0.0% 0.0% 0.0% 0.0% 0.1% 0.00% 0.04% 0.02%58 Sri Lanka 58 0 53 0 5 5 29 0 0 0 5 5 29 -5 -5 -29 0.0% 0.0% 0.0% 0.0% 0.0% 0.0% 0.0% 0.1% 0.0% 0.00% 0.03% 0.02%59 Moldova 59 0 54 0 6 6 1 0 0 0 6 6 1 -6 -6 -1 0.0% 0.0% 0.0% 0.0% 0.0% 0.0% 0.0% 0.1% 0.0% 0.00% 0.03% 0.02%60 Cyprus 60 0 55 0 3 3 45 0 0 0 3 3 45 -3 -3 -45 0.0% 0.0% 0.0% 0.0% 0.0% 0.0% 0.0% 0.0% 0.0% 0.00% 0.03% 0.01%61 Pakistan 61 0 58 0 2 2 51 0 0 0 2 2 51 -2 -2 -51 0.0% 0.0% 0.0% 0.0% 0.0% 0.0% 0.0% 0.0% 0.0% 0.00% 0.02% 0.01%62 Madagascar 62 45 0 0 7 3 5 7 3 5 0 0 0 7 3 5 0.0% 0.0% 0.0% 0.0% 0.0% 0.0% 0.0% 0.0% 0.0% 0.02% 0.00% 0.01%63 United Arab Emirates 63 48 84 36 3 3 13 2 2 13 1 1 0 1 1 13 0.0% 0.0% 0.0% 0.0% 0.0% 0.0% 0.0% 0.0% 0.0% 0.01% 0.01% 0.01%64 Monaco 64 0 59 0 4 4 0 0 0 0 4 4 0 -4 -4 0 0.0% 0.0% 0.0% 0.0% 0.0% 0.0% 0.0% 0.0% 0.0% 0.00% 0.02% 0.01%65 Jordan 65 0 60 0 3 3 11 0 0 0 3 3 11 -3 -3 -11 0.0% 0.0% 0.0% 0.0% 0.0% 0.0% 0.0% 0.0% 0.0% 0.00% 0.02% 0.01%66 Netherlands Antilles 66 0 61 0 3 3 1 0 0 0 3 3 1 -3 -3 -1 0.0% 0.0% 0.0% 0.0% 0.0% 0.0% 0.0% 0.0% 0.0% 0.00% 0.01% 0.01%67 British Virgin 67 0 62 0 2 2 18 0 0 0 2 2 18 -2 -2 -18 0.0% 0.0% 0.0% 0.0% 0.0% 0.0% 0.0% 0.0% 0.0% 0.00% 0.01% 0.01%68 Lithuania 68 0 63 0 2 2 18 0 0 0 2 2 18 -2 -2 -18 0.0% 0.0% 0.0% 0.0% 0.0% 0.0% 0.0% 0.0% 0.0% 0.00% 0.01% 0.01%69 Slovenia 69 51 84 33 3 2 1 2 1 1 1 1 0 1 0 1 0.0% 0.0% 0.0% 0.0% 0.0% 0.0% 0.0% 0.0% 0.0% 0.01% 0.01% 0.01%70 Ecuador 70 0 64 0 1 1 28 0 0 0 1 1 28 -1 -1 -28 0.0% 0.0% 0.0% 0.0% 0.0% 0.0% 0.0% 0.0% 0.0% 0.00% 0.01% 0.01%71 El Salvador 71 0 65 0 2 2 10 0 0 0 2 2 10 -2 -2 -10 0.0% 0.0% 0.0% 0.0% 0.0% 0.0% 0.0% 0.0% 0.0% 0.00% 0.01% 0.01%72 Kazakhstan 72 0 67 0 2 2 5 0 0 0 2 2 5 -2 -2 -5 0.0% 0.0% 0.0% 0.0% 0.0% 0.0% 0.0% 0.0% 0.0% 0.00% 0.01% 0.01%73 Vietnam 73 0 68 0 2 2 4 0 0 0 2 2 4 -2 -2 -4 0.0% 0.0% 0.0% 0.0% 0.0% 0.0% 0.0% 0.0% 0.0% 0.00% 0.01% 0.01%74 Egypt 74 0 69 0 2 2 9 0 0 0 2 2 9 -2 -2 -9 0.0% 0.0% 0.0% 0.0% 0.0% 0.0% 0.0% 0.0% 0.0% 0.00% 0.01% 0.01%75 Colombia 75 0 71 0 1 1 24 0 0 0 1 1 24 -1 -1 -24 0.0% 0.0% 0.0% 0.0% 0.0% 0.0% 0.0% 0.0% 0.0% 0.00% 0.01% 0.01%76 Bangladesh 76 0 72 0 1 1 18 0 0 0 1 1 18 -1 -1 -18 0.0% 0.0% 0.0% 0.0% 0.0% 0.0% 0.0% 0.0% 0.0% 0.00% 0.01% 0.01%77 Latvia 77 0 73 0 2 2 0 0 0 0 2 2 0 -2 -2 0 0.0% 0.0% 0.0% 0.0% 0.0% 0.0% 0.0% 0.0% 0.0% 0.00% 0.01% 0.01%78 Fr Polynesia 78 0 74 0 2 2 0 0 0 0 2 2 0 -2 -2 0 0.0% 0.0% 0.0% 0.0% 0.0% 0.0% 0.0% 0.0% 0.0% 0.00% 0.01% 0.01%79 Azerbaijan 79 0 75 0 2 2 0 0 0 0 2 2 0 -2 -2 0 0.0% 0.0% 0.0% 0.0% 0.0% 0.0% 0.0% 0.0% 0.0% 0.00% 0.01% 0.01%80 Fiji 80 0 76 0 2 2 0 0 0 0 2 2 0 -2 -2 0 0.0% 0.0% 0.0% 0.0% 0.0% 0.0% 0.0% 0.0% 0.0% 0.00% 0.01% 0.01%81 Peru 81 0 77 0 1 1 10 0 0 0 1 1 10 -1 -1 -10 0.0% 0.0% 0.0% 0.0% 0.0% 0.0% 0.0% 0.0% 0.0% 0.00% 0.01% 0.00%82 Saudi Arabia 82 52 0 0 2 1 1 2 1 1 0 0 0 2 1 1 0.0% 0.0% 0.0% 0.0% 0.0% 0.0% 0.0% 0.0% 0.0% 0.01% 0.00% 0.00%83 Bolivia 83 0 78 0 1 1 3 0 0 0 1 1 3 -1 -1 -3 0.0% 0.0% 0.0% 0.0% 0.0% 0.0% 0.0% 0.0% 0.0% 0.00% 0.01% 0.00%84 Macedonia 84 0 79 0 1 1 2 0 0 0 1 1 2 -1 -1 -2 0.0% 0.0% 0.0% 0.0% 0.0% 0.0% 0.0% 0.0% 0.0% 0.00% 0.01% 0.00%85 Mozambique 85 0 80 0 1 1 1 0 0 0 1 1 1 -1 -1 -1 0.0% 0.0% 0.0% 0.0% 0.0% 0.0% 0.0% 0.0% 0.0% 0.00% 0.01% 0.00%86 Sierra Leone 86 0 81 0 1 1 1 0 0 0 1 1 1 -1 -1 -1 0.0% 0.0% 0.0% 0.0% 0.0% 0.0% 0.0% 0.0% 0.0% 0.00% 0.01% 0.00%87 Venezuela 87 0 82 0 1 1 1 0 0 0 1 1 1 -1 -1 -1 0.0% 0.0% 0.0% 0.0% 0.0% 0.0% 0.0% 0.0% 0.0% 0.00% 0.01% 0.00%88 Bosnia 88 0 83 0 1 1 1 0 0 0 1 1 1 -1 -1 -1 0.0% 0.0% 0.0% 0.0% 0.0% 0.0% 0.0% 0.0% 0.0% 0.00% 0.01% 0.00%89 Costa Rica 89 53 0 0 1 1 0 1 1 0 0 0 0 1 1 0 0.0% 0.0% 0.0% 0.0% 0.0% 0.0% 0.0% 0.0% 0.0% 0.01% 0.00% 0.00%90 Kuwait 89 53 0 0 1 1 0 1 1 0 0 0 0 1 1 0 0.0% 0.0% 0.0% 0.0% 0.0% 0.0% 0.0% 0.0% 0.0% 0.01% 0.00% 0.00%91 Turkey 91 0 87 0 1 1 8 0 0 0 1 1 8 -1 -1 -8 0.0% 0.0% 0.0% 0.0% 0.0% 0.0% 0.0% 0.0% 0.0% 0.00% 0.01% 0.00%
Grand Total ## ## ## ## 36,674 19,321 221,127 18,337 9,661 110,564 18,337 9,661 110,564 0 0 0 100% 100% 100% 100% 100% 100% 100% 100% 100% 100% 100% 100%
Source HostCountryNr.
O S H Dif.Rank Absolute volume of deals ($US mln)
HostSourceOverall (Source+Host) Overall

Appendix 197
Appendix 4: Private equity investments (cross-section analysis) 1 2 3 4 5 6 7 8 9 10 11 12 13 14 15 16 17 18 19 20 21 22 23 24 25 26 27 28 29 30
Difference source-host Percentage of total deals Activity %
Part. Dealp. Dflow Part. Dealp. Dflow Part. Dealp. Dflow Part. Dealp. Dflow Part. Dealp. Dflow Part. Dealp. Dflow Part. Dealp. Dflow Source Host Overall1 United States of A. 1 1 1 0 77,218 34,606 359,371 38,966 17,689 188,884 38,252 16,917 170,487 714 772 18,397 82.3% 75.9% 78.7% 83.0% 77.6% 82.7% 81.5% 74.2% 74.7% 81.11% 76.79% 78.95%2 United Kingdom 2 2 2 0 4,291 2,844 36,760 2,359 1,517 21,243 1,932 1,327 15,518 427 191 5,725 4.6% 6.2% 8.0% 5.0% 6.7% 9.3% 4.1% 5.8% 6.8% 7.00% 5.58% 6.29%3 France 3 3 3 0 2,370 1,396 9,384 950 554 2,746 1,420 842 6,638 -471 -287 -3,892 2.5% 3.1% 2.1% 2.0% 2.4% 1.2% 3.0% 3.7% 2.9% 1.89% 3.21% 2.55%4 Germany 4 5 4 -1 1,039 646 6,571 423 241 1,662 616 405 4,909 -193 -164 -3,247 1.1% 1.4% 1.4% 0.9% 1.1% 0.7% 1.3% 1.8% 2.1% 0.90% 1.75% 1.32%5 Australia 5 4 5 1 1,029 826 2,691 491 404 1,036 538 422 1,655 -48 -17 -619 1.1% 1.8% 0.6% 1.0% 1.8% 0.5% 1.1% 1.8% 0.7% 1.09% 1.24% 1.17%6 Canada 6 7 6 -1 769 367 3,657 322 132 1,658 447 235 1,999 -125 -104 -341 0.8% 0.8% 0.8% 0.7% 0.6% 0.7% 1.0% 1.0% 0.9% 0.66% 0.95% 0.81%7 Netherlands 7 9 8 -1 477 264 4,159 231 128 1,294 247 136 2,865 -16 -8 -1,571 0.5% 0.6% 0.9% 0.5% 0.6% 0.6% 0.5% 0.6% 1.3% 0.54% 0.79% 0.67%8 Sweden 8 8 9 1 573 439 1,626 252 197 545 321 242 1,081 -69 -46 -536 0.6% 1.0% 0.4% 0.5% 0.9% 0.2% 0.7% 1.1% 0.5% 0.55% 0.74% 0.64%9 Belgium 9 6 11 5 638 364 1,738 403 214 932 235 151 807 168 63 125 0.7% 0.8% 0.4% 0.9% 0.9% 0.4% 0.5% 0.7% 0.4% 0.73% 0.50% 0.62%
10 South Korea 10 15 7 -8 474 325 2,594 209 142 208 265 182 2,386 -56 -40 -2,179 0.5% 0.7% 0.6% 0.4% 0.6% 0.1% 0.6% 0.8% 1.0% 0.39% 0.80% 0.60%11 Brazil 11 10 10 0 274 246 2,995 127 119 1,437 147 127 1,557 -21 -8 -120 0.3% 0.5% 0.7% 0.3% 0.5% 0.6% 0.3% 0.6% 0.7% 0.47% 0.52% 0.50%12 Israel 12 13 12 -1 528 242 1,249 260 103 559 268 139 690 -8 -36 -130 0.6% 0.5% 0.3% 0.6% 0.5% 0.2% 0.6% 0.6% 0.3% 0.42% 0.49% 0.46%13 Finland 13 14 20 6 361 282 762 186 149 339 175 133 424 11 16 -85 0.4% 0.6% 0.2% 0.4% 0.7% 0.1% 0.4% 0.6% 0.2% 0.40% 0.38% 0.39%14 India 14 19 13 -6 322 272 1,051 132 109 259 190 163 792 -58 -54 -533 0.3% 0.6% 0.2% 0.3% 0.5% 0.1% 0.4% 0.7% 0.3% 0.29% 0.49% 0.39%15 Japan 15 16 17 1 286 135 2,599 199 76 868 87 59 1,731 112 16 -862 0.3% 0.3% 0.6% 0.4% 0.3% 0.4% 0.2% 0.3% 0.8% 0.38% 0.40% 0.39%16 Hong Kong 16 11 22 11 252 189 1,995 146 116 1,180 106 73 815 40 42 365 0.3% 0.4% 0.4% 0.3% 0.5% 0.5% 0.2% 0.3% 0.4% 0.44% 0.30% 0.37%17 Ireland-Rep 17 18 14 -4 313 219 1,358 153 112 223 159 107 1,135 -6 6 -912 0.3% 0.5% 0.3% 0.3% 0.5% 0.1% 0.3% 0.5% 0.5% 0.31% 0.44% 0.37%18 Taiwan 18 12 23 11 340 247 907 222 144 493 118 103 414 103 41 79 0.4% 0.5% 0.2% 0.5% 0.6% 0.2% 0.3% 0.5% 0.2% 0.44% 0.30% 0.37%19 Switzerland 19 17 21 4 308 184 998 167 97 348 141 88 649 25 9 -301 0.3% 0.4% 0.2% 0.4% 0.4% 0.2% 0.3% 0.4% 0.3% 0.31% 0.32% 0.32%20 Singapore 20 20 19 -1 168 130 2,149 94 72 451 74 59 1,698 20 13 -1,246 0.2% 0.3% 0.5% 0.2% 0.3% 0.2% 0.2% 0.3% 0.7% 0.24% 0.39% 0.31%21 Italy 21 25 16 -9 158 118 1,580 40 29 166 119 89 1,413 -79 -61 -1,247 0.2% 0.3% 0.3% 0.1% 0.1% 0.1% 0.3% 0.4% 0.6% 0.09% 0.42% 0.26%22 Denmark 22 22 25 3 206 143 659 100 71 152 106 72 507 -5 -1 -355 0.2% 0.3% 0.1% 0.2% 0.3% 0.1% 0.2% 0.3% 0.2% 0.20% 0.25% 0.23%23 Spain 23 23 24 1 157 108 1,166 53 41 472 104 67 694 -51 -27 -222 0.2% 0.2% 0.3% 0.1% 0.2% 0.2% 0.2% 0.3% 0.3% 0.17% 0.27% 0.22%24 Bermuda 24 42 15 -27 38 12 2,647 3 1 20 35 11 2,627 -32 -10 -2,608 0.0% 0.0% 0.6% 0.0% 0.0% 0.0% 0.1% 0.0% 1.2% 0.01% 0.42% 0.22%25 China 25 34 18 -16 161 105 1,041 15 14 5 146 92 1,036 -131 -78 -1,031 0.2% 0.2% 0.2% 0.0% 0.1% 0.0% 0.3% 0.4% 0.5% 0.03% 0.39% 0.21%26 Norway 26 21 26 5 201 143 434 102 71 214 99 72 221 4 -1 -7 0.2% 0.3% 0.1% 0.2% 0.3% 0.1% 0.2% 0.3% 0.1% 0.21% 0.21% 0.21%27 Poland 27 28 27 -1 118 110 157 35 34 32 83 76 125 -48 -42 -93 0.1% 0.2% 0.0% 0.1% 0.1% 0.0% 0.2% 0.3% 0.1% 0.08% 0.19% 0.13%28 Luxembourg 28 26 29 3 96 31 845 75 20 57 21 11 787 54 9 -730 0.1% 0.1% 0.2% 0.2% 0.1% 0.0% 0.0% 0.0% 0.3% 0.09% 0.15% 0.12%29 Austria 29 29 28 -1 106 75 233 32 25 38 75 51 194 -43 -26 -156 0.1% 0.2% 0.1% 0.1% 0.1% 0.0% 0.2% 0.2% 0.1% 0.06% 0.16% 0.11%30 New Zealand 30 30 30 0 75 64 331 25 21 99 50 43 233 -25 -21 -134 0.1% 0.1% 0.1% 0.1% 0.1% 0.0% 0.1% 0.2% 0.1% 0.06% 0.13% 0.10%31 South Africa 31 27 31 4 44 32 788 16 13 373 28 19 415 -12 -5 -42 0.0% 0.1% 0.2% 0.0% 0.1% 0.2% 0.1% 0.1% 0.2% 0.09% 0.11% 0.10%32 Czech Republic 32 24 33 9 72 66 140 43 40 41 30 26 99 13 15 -57 0.1% 0.1% 0.0% 0.1% 0.2% 0.0% 0.1% 0.1% 0.0% 0.10% 0.07% 0.08%33 Malaysia 33 32 32 0 56 50 64 22 19 16 34 32 48 -13 -13 -33 0.1% 0.1% 0.0% 0.0% 0.1% 0.0% 0.1% 0.1% 0.0% 0.05% 0.08% 0.06%34 Portugal 34 33 34 1 38 30 181 15 14 11 23 16 171 -8 -3 -160 0.0% 0.1% 0.0% 0.0% 0.1% 0.0% 0.0% 0.1% 0.1% 0.03% 0.07% 0.05%35 Greece 35 31 40 9 25 19 286 13 10 168 12 10 118 1 0 51 0.0% 0.0% 0.1% 0.0% 0.0% 0.1% 0.0% 0.0% 0.1% 0.05% 0.04% 0.04%36 Thailand 36 36 35 -1 29 28 138 7 7 49 22 22 89 -15 -15 -41 0.0% 0.1% 0.0% 0.0% 0.0% 0.0% 0.0% 0.1% 0.0% 0.02% 0.06% 0.04%37 Hungary 37 38 38 0 28 21 93 7 7 5 21 14 88 -14 -8 -83 0.0% 0.0% 0.0% 0.0% 0.0% 0.0% 0.0% 0.1% 0.0% 0.02% 0.05% 0.03%38 Vietnam 38 35 42 7 26 26 35 13 13 17 13 13 17 0 0 0 0.0% 0.1% 0.0% 0.0% 0.1% 0.0% 0.0% 0.1% 0.0% 0.03% 0.03% 0.03%39 Indonesia 39 48 36 -12 20 18 130 1 1 0 19 17 130 -18 -16 -130 0.0% 0.0% 0.0% 0.0% 0.0% 0.0% 0.0% 0.1% 0.1% 0.00% 0.06% 0.03%40 Argentina 40 45 37 -8 26 18 96 2 1 5 24 17 90 -22 -16 -85 0.0% 0.0% 0.0% 0.0% 0.0% 0.0% 0.1% 0.1% 0.0% 0.00% 0.05% 0.03%41 Philippines 41 0 39 0 13 9 134 0 0 0 13 9 134 -13 -9 -134 0.0% 0.0% 0.0% 0.0% 0.0% 0.0% 0.0% 0.0% 0.1% 0.00% 0.04% 0.02%42 Russian Federation 42 40 45 5 16 13 61 5 4 4 11 9 58 -6 -5 -54 0.0% 0.0% 0.0% 0.0% 0.0% 0.0% 0.0% 0.0% 0.0% 0.01% 0.03% 0.02%43 Slovak Republic 43 39 47 8 18 17 10 6 6 3 12 11 8 -6 -5 -5 0.0% 0.0% 0.0% 0.0% 0.0% 0.0% 0.0% 0.0% 0.0% 0.01% 0.03% 0.02%44 Cayman Islands 44 0 41 0 1 1 240 0 0 0 1 1 240 -1 -1 -240 0.0% 0.0% 0.1% 0.0% 0.0% 0.0% 0.0% 0.0% 0.1% 0.00% 0.04% 0.02%45 Sri Lanka 45 41 46 5 16 16 9 4 4 0 12 12 9 -8 -8 -8 0.0% 0.0% 0.0% 0.0% 0.0% 0.0% 0.0% 0.1% 0.0% 0.01% 0.03% 0.02%46 Chile 46 0 43 0 10 8 82 0 0 0 10 8 82 -10 -8 -82 0.0% 0.0% 0.0% 0.0% 0.0% 0.0% 0.0% 0.0% 0.0% 0.00% 0.03% 0.02%47 Mexico 47 0 44 0 12 10 56 0 0 0 12 10 56 -12 -10 -56 0.0% 0.0% 0.0% 0.0% 0.0% 0.0% 0.0% 0.0% 0.0% 0.00% 0.03% 0.02%48 Romania 48 0 48 0 8 7 66 0 0 0 8 7 66 -8 -7 -66 0.0% 0.0% 0.0% 0.0% 0.0% 0.0% 0.0% 0.0% 0.0% 0.00% 0.03% 0.01%49 Netherlands Antilles 49 37 59 22 10 10 11 8 8 8 2 2 3 6 7 5 0.0% 0.0% 0.0% 0.0% 0.0% 0.0% 0.0% 0.0% 0.0% 0.02% 0.00% 0.01%50 Bulgaria 50 0 49 0 9 5 59 0 0 0 9 5 59 -9 -5 -59 0.0% 0.0% 0.0% 0.0% 0.0% 0.0% 0.0% 0.0% 0.0% 0.00% 0.02% 0.01%51 Nigeria 51 0 50 0 4 3 90 0 0 0 4 3 90 -4 -3 -90 0.0% 0.0% 0.0% 0.0% 0.0% 0.0% 0.0% 0.0% 0.0% 0.00% 0.02% 0.01%52 Lithuania 52 48 51 3 7 6 33 1 1 0 6 5 33 -5 -4 -33 0.0% 0.0% 0.0% 0.0% 0.0% 0.0% 0.0% 0.0% 0.0% 0.00% 0.02% 0.01%53 Estonia 53 0 52 0 6 6 5 0 0 0 6 6 5 -6 -6 -5 0.0% 0.0% 0.0% 0.0% 0.0% 0.0% 0.0% 0.0% 0.0% 0.00% 0.01% 0.01%54 Iceland 54 0 53 0 5 3 30 0 0 0 5 3 30 -5 -3 -30 0.0% 0.0% 0.0% 0.0% 0.0% 0.0% 0.0% 0.0% 0.0% 0.00% 0.01% 0.01%55 Kenya 55 0 54 0 6 5 11 0 0 0 6 5 11 -6 -5 -11 0.0% 0.0% 0.0% 0.0% 0.0% 0.0% 0.0% 0.0% 0.0% 0.00% 0.01% 0.01%56 Morocco 56 44 56 12 5 4 19 2 2 4 3 3 14 -1 -1 -10 0.0% 0.0% 0.0% 0.0% 0.0% 0.0% 0.0% 0.0% 0.0% 0.00% 0.01% 0.01%57 Turkey 57 0 55 0 4 3 18 0 0 0 4 3 18 -4 -3 -18 0.0% 0.0% 0.0% 0.0% 0.0% 0.0% 0.0% 0.0% 0.0% 0.00% 0.01% 0.00%58 Colombia 58 0 57 0 2 2 22 0 0 0 2 2 22 -2 -2 -22 0.0% 0.0% 0.0% 0.0% 0.0% 0.0% 0.0% 0.0% 0.0% 0.00% 0.01% 0.00%59 Cyprus 59 0 58 0 2 2 16 0 0 0 2 2 16 -2 -2 -16 0.0% 0.0% 0.0% 0.0% 0.0% 0.0% 0.0% 0.0% 0.0% 0.00% 0.01% 0.00%60 Senegal 60 43 0 0 2 2 2 2 2 2 0 0 0 2 2 2 0.0% 0.0% 0.0% 0.0% 0.0% 0.0% 0.0% 0.0% 0.0% 0.00% 0.00% 0.00%61 Tunisia 61 47 64 17 2 2 1 1 1 1 1 1 1 0 0 0 0.0% 0.0% 0.0% 0.0% 0.0% 0.0% 0.0% 0.0% 0.0% 0.00% 0.00% 0.00%62 United Arab Emirates 62 0 60 0 1 1 7 0 0 0 1 1 7 -1 -1 -7 0.0% 0.0% 0.0% 0.0% 0.0% 0.0% 0.0% 0.0% 0.0% 0.00% 0.00% 0.00%63 Croatia 63 0 61 0 1 1 6 0 0 0 1 1 6 -1 -1 -6 0.0% 0.0% 0.0% 0.0% 0.0% 0.0% 0.0% 0.0% 0.0% 0.00% 0.00% 0.00%64 Madagascar 64 46 0 0 2 1 4 2 1 4 0 0 0 2 1 4 0.0% 0.0% 0.0% 0.0% 0.0% 0.0% 0.0% 0.0% 0.0% 0.00% 0.00% 0.00%65 Algeria 65 0 62 0 1 1 4 0 0 0 1 1 4 -1 -1 -4 0.0% 0.0% 0.0% 0.0% 0.0% 0.0% 0.0% 0.0% 0.0% 0.00% 0.00% 0.00%66 British Virgin 66 0 63 0 1 1 7 0 0 0 1 1 7 -1 -1 -7 0.0% 0.0% 0.0% 0.0% 0.0% 0.0% 0.0% 0.0% 0.0% 0.00% 0.00% 0.00%67 Latvia 67 0 65 0 1 1 0 0 0 0 1 1 0 -1 -1 0 0.0% 0.0% 0.0% 0.0% 0.0% 0.0% 0.0% 0.0% 0.0% 0.00% 0.00% 0.00%68 Fr Polynesia 67 0 65 0 1 1 0 0 0 0 1 1 0 -1 -1 0 0.0% 0.0% 0.0% 0.0% 0.0% 0.0% 0.0% 0.0% 0.0% 0.00% 0.00% 0.00%69 Costa Rica 67 0 65 0 1 1 0 0 0 0 1 1 0 -1 -1 0 0.0% 0.0% 0.0% 0.0% 0.0% 0.0% 0.0% 0.0% 0.0% 0.00% 0.00% 0.00%70 Dominica 67 0 65 0 1 1 0 0 0 0 1 1 0 -1 -1 0 0.0% 0.0% 0.0% 0.0% 0.0% 0.0% 0.0% 0.0% 0.0% 0.00% 0.00% 0.00%71 Nicaragua 67 0 65 0 1 1 0 0 0 0 1 1 0 -1 -1 0 0.0% 0.0% 0.0% 0.0% 0.0% 0.0% 0.0% 0.0% 0.0% 0.00% 0.00% 0.00%72 Uganda 67 0 65 0 1 1 0 0 0 0 1 1 0 -1 -1 0 0.0% 0.0% 0.0% 0.0% 0.0% 0.0% 0.0% 0.0% 0.0% 0.00% 0.00% 0.00%73 Pakistan 73 0 71 0 1 1 1 0 0 0 1 1 1 -1 -1 -1 0.0% 0.0% 0.0% 0.0% 0.0% 0.0% 0.0% 0.0% 0.0% 0.00% 0.00% 0.00%74 Egypt 73 0 71 0 1 1 1 0 0 0 1 1 1 -1 -1 -1 0.0% 0.0% 0.0% 0.0% 0.0% 0.0% 0.0% 0.0% 0.0% 0.00% 0.00% 0.00%75 Monaco 75 0 73 0 1 1 0 0 0 0 1 1 0 -1 -1 0 0.0% 0.0% 0.0% 0.0% 0.0% 0.0% 0.0% 0.0% 0.0% 0.00% 0.00% 0.00%
Grand Total ## ## ## 56 93,877 45,586 456,663 46,938 22,793 228,331 46,938 22,793 228,331 0 0 0 100% 100% 100% 100% 100% 100% 100% 100% 100% 100% 100% 100%
Source HostCountryNr.
O S H Dif.Rank Absolute volume of deals ($US mln)
HostSourceOverall (Source+Host) Overall

Appendix 198
Appendix 5: Private equity investments cross-border (cross-section analysis) 1 2 3 4 5 6 7 8 9 10 11 12 13 14 15 16 17 18 19 20 21 22 23 24 25 26 27 28 29 30
Difference source-host Percentage of total deals Activity %
Part. Dealp. Dflow Part. Dealp. Dflow Part. Dealp. Dflow Part. Dealp. Dflow Part. Dealp. Dflow Part. Dealp. Dflow Part. Dealp. Dflow Source Host Overall1 United States of A. 1 1 1 0 4,951 2,529 37,701 2,832 1,651 28,049 2,118 879 9,652 714 772 18,397 38.3% 35.4% 39.5% 43.8% 46.2% 58.8% 32.7% 24.6% 20.2% 49.60% 25.86% 37.73%2 United Kingdom 2 2 2 0 2,088 1,180 16,395 1,257 685 11,060 830 494 5,335 427 191 5,725 16.1% 16.5% 17.2% 19.4% 19.2% 23.2% 12.8% 13.8% 11.2% 20.60% 12.62% 16.61%3 France 3 10 3 -7 796 441 4,836 163 77 472 633 364 4,364 -471 -287 -3,892 6.1% 6.2% 5.1% 2.5% 2.1% 1.0% 9.8% 10.2% 9.1% 1.88% 9.71% 5.80%4 Germany 4 4 4 0 590 335 4,972 198 85 862 391 249 4,109 -193 -164 -3,247 4.6% 4.7% 5.2% 3.1% 2.4% 1.8% 6.0% 7.0% 8.6% 2.42% 7.22% 4.82%5 Canada 5 6 5 -1 444 212 3,068 160 54 1,364 285 158 1,704 -125 -104 -341 3.4% 3.0% 3.2% 2.5% 1.5% 2.9% 4.4% 4.4% 3.6% 2.28% 4.13% 3.21%6 Netherlands 6 5 6 1 355 184 3,482 170 88 955 186 96 2,526 -16 -8 -1,571 2.7% 2.6% 3.6% 2.6% 2.5% 2.0% 2.9% 2.7% 5.3% 2.36% 3.62% 2.99%7 Belgium 7 3 19 16 334 158 1,262 251 111 694 83 47 569 168 63 125 2.6% 2.2% 1.3% 3.9% 3.1% 1.5% 1.3% 1.3% 1.2% 2.81% 1.27% 2.04%8 Japan 8 8 15 7 242 102 2,212 177 59 675 65 43 1,537 112 16 -862 1.9% 1.4% 2.3% 2.7% 1.7% 1.4% 1.0% 1.2% 3.2% 1.94% 1.81% 1.87%9 Israel 9 12 11 -1 321 152 784 156 58 327 164 94 457 -8 -36 -130 2.5% 2.1% 0.8% 2.4% 1.6% 0.7% 2.5% 2.6% 1.0% 1.58% 2.04% 1.81%
10 Switzerland 10 11 16 5 264 155 938 145 82 318 119 73 620 25 9 -301 2.0% 2.2% 1.0% 2.2% 2.3% 0.7% 1.8% 2.1% 1.3% 1.73% 1.73% 1.73%11 Hong Kong 11 7 18 11 196 142 1,565 118 92 965 78 50 600 40 42 365 1.5% 2.0% 1.6% 1.8% 2.6% 2.0% 1.2% 1.4% 1.3% 2.14% 1.28% 1.71%12 Sweden 12 15 8 -7 219 142 974 75 48 219 144 94 755 -69 -46 -536 1.7% 2.0% 1.0% 1.2% 1.3% 0.5% 2.2% 2.6% 1.6% 0.99% 2.15% 1.57%13 Australia 13 14 13 -1 210 140 956 81 61 169 129 79 787 -48 -17 -619 1.6% 2.0% 1.0% 1.3% 1.7% 0.4% 2.0% 2.2% 1.6% 1.11% 1.95% 1.53%14 Singapore 14 13 14 1 145 108 1,776 82 60 265 63 47 1,511 20 13 -1,246 1.1% 1.5% 1.9% 1.3% 1.7% 0.6% 1.0% 1.3% 3.2% 1.17% 1.82% 1.50%15 Taiwan 15 9 22 13 212 135 775 158 88 427 55 47 348 103 41 79 1.6% 1.9% 0.8% 2.4% 2.5% 0.9% 0.8% 1.3% 0.7% 1.93% 0.96% 1.45%16 South Korea 16 23 7 -16 96 57 2,268 20 9 45 76 48 2,224 -56 -40 -2,179 0.7% 0.8% 2.4% 0.3% 0.2% 0.1% 1.2% 1.4% 4.7% 0.22% 2.40% 1.31%17 Italy 17 24 12 -12 103 75 1,349 12 7 51 91 68 1,298 -79 -61 -1,247 0.8% 1.0% 1.4% 0.2% 0.2% 0.1% 1.4% 1.9% 2.7% 0.16% 2.01% 1.09%18 Bermuda 18 32 10 -22 38 12 2,647 3 1 20 35 11 2,627 -32 -10 -2,608 0.3% 0.2% 2.8% 0.0% 0.0% 0.0% 0.5% 0.3% 5.5% 0.04% 2.12% 1.08%19 China 19 41 9 -32 133 78 1,036 1 0 3 132 78 1,033 -131 -78 -1,031 1.0% 1.1% 1.1% 0.0% 0.0% 0.0% 2.0% 2.2% 2.2% 0.01% 2.13% 1.07%20 Ireland-Rep 20 18 20 2 104 63 1,098 49 34 93 55 29 1,005 -6 6 -912 0.8% 0.9% 1.2% 0.8% 1.0% 0.2% 0.9% 0.8% 2.1% 0.64% 1.25% 0.94%21 India 21 22 17 -5 116 80 652 29 13 59 87 67 592 -58 -54 -533 0.9% 1.1% 0.7% 0.4% 0.4% 0.1% 1.3% 1.9% 1.2% 0.31% 1.49% 0.90%22 Finland 22 16 23 7 133 93 306 72 54 111 61 38 195 11 16 -85 1.0% 1.3% 0.3% 1.1% 1.5% 0.2% 0.9% 1.1% 0.4% 0.96% 0.81% 0.88%23 Denmark 23 17 21 4 121 75 577 58 37 111 63 38 466 -5 -1 -355 0.9% 1.1% 0.6% 0.9% 1.0% 0.2% 1.0% 1.1% 1.0% 0.72% 1.01% 0.86%24 Luxembourg 24 19 24 5 94 29 844 74 19 57 20 10 787 54 9 -730 0.7% 0.4% 0.9% 1.1% 0.5% 0.1% 0.3% 0.3% 1.6% 0.60% 0.74% 0.67%25 Norway 25 20 28 8 80 50 227 42 25 110 38 25 117 4 -1 -7 0.6% 0.7% 0.2% 0.6% 0.7% 0.2% 0.6% 0.7% 0.2% 0.52% 0.52% 0.52%26 Spain 26 30 26 -4 60 31 285 5 2 31 56 29 254 -51 -27 -222 0.5% 0.4% 0.3% 0.1% 0.1% 0.1% 0.9% 0.8% 0.5% 0.07% 0.73% 0.40%27 Austria 27 28 27 -1 59 37 171 8 6 8 51 32 164 -43 -26 -156 0.5% 0.5% 0.2% 0.1% 0.2% 0.0% 0.8% 0.9% 0.3% 0.10% 0.67% 0.39%28 Poland 28 33 25 -8 52 46 103 2 2 5 50 44 98 -48 -42 -93 0.4% 0.6% 0.1% 0.0% 0.1% 0.0% 0.8% 1.2% 0.2% 0.03% 0.73% 0.38%29 Czech Republic 29 21 36 15 42 38 88 28 26 15 15 11 72 13 15 -57 0.3% 0.5% 0.1% 0.4% 0.7% 0.0% 0.2% 0.3% 0.2% 0.40% 0.23% 0.31%30 New Zealand 30 29 29 0 33 25 292 4 2 79 29 23 213 -25 -21 -134 0.3% 0.3% 0.3% 0.1% 0.1% 0.2% 0.4% 0.6% 0.4% 0.09% 0.51% 0.30%31 Brazil 31 25 30 5 41 26 159 10 9 20 31 17 140 -21 -8 -120 0.3% 0.4% 0.2% 0.2% 0.3% 0.0% 0.5% 0.5% 0.3% 0.15% 0.41% 0.28%32 Argentina 32 37 31 -6 26 18 96 2 1 5 24 17 90 -22 -16 -85 0.2% 0.2% 0.1% 0.0% 0.0% 0.0% 0.4% 0.5% 0.2% 0.02% 0.34% 0.18%33 Indonesia 33 0 32 0 18 16 130 0 0 0 18 16 130 -18 -16 -130 0.1% 0.2% 0.1% 0.0% 0.0% 0.0% 0.3% 0.5% 0.3% 0.00% 0.34% 0.17%34 Malaysia 34 31 35 4 19 17 38 3 2 2 16 15 35 -13 -13 -33 0.1% 0.2% 0.0% 0.0% 0.1% 0.0% 0.2% 0.4% 0.1% 0.04% 0.24% 0.14%35 Hungary 35 35 37 2 18 12 85 2 2 1 16 10 84 -14 -8 -83 0.1% 0.2% 0.1% 0.0% 0.1% 0.0% 0.2% 0.3% 0.2% 0.03% 0.23% 0.13%36 Thailand 36 0 33 0 15 15 41 0 0 0 15 15 41 -15 -15 -41 0.1% 0.2% 0.0% 0.0% 0.0% 0.0% 0.2% 0.4% 0.1% 0.00% 0.25% 0.12%37 Philippines 37 0 34 0 13 9 134 0 0 0 13 9 134 -13 -9 -134 0.1% 0.1% 0.1% 0.0% 0.0% 0.0% 0.2% 0.3% 0.3% 0.00% 0.24% 0.12%38 Greece 38 26 48 22 17 11 55 9 6 53 8 6 2 1 0 51 0.1% 0.2% 0.1% 0.1% 0.2% 0.1% 0.1% 0.2% 0.0% 0.14% 0.09% 0.12%39 Portugal 39 39 38 -1 10 5 160 1 1 0 9 4 160 -8 -3 -160 0.1% 0.1% 0.2% 0.0% 0.0% 0.0% 0.1% 0.1% 0.3% 0.01% 0.19% 0.10%40 Mexico 40 0 39 0 12 10 56 0 0 0 12 10 56 -12 -10 -56 0.1% 0.1% 0.1% 0.0% 0.0% 0.0% 0.2% 0.3% 0.1% 0.00% 0.19% 0.09%41 Chile 41 0 40 0 10 8 82 0 0 0 10 8 82 -10 -8 -82 0.1% 0.1% 0.1% 0.0% 0.0% 0.0% 0.2% 0.2% 0.2% 0.00% 0.18% 0.09%42 Cayman Islands 42 0 41 0 1 1 240 0 0 0 1 1 240 -1 -1 -240 0.0% 0.0% 0.3% 0.0% 0.0% 0.0% 0.0% 0.0% 0.5% 0.00% 0.18% 0.09%43 Russian Federation 43 36 44 8 10 7 61 2 1 4 8 6 58 -6 -5 -54 0.1% 0.1% 0.1% 0.0% 0.0% 0.0% 0.1% 0.2% 0.1% 0.03% 0.14% 0.08%44 Sri Lanka 44 39 45 6 10 10 8 1 1 0 9 9 8 -8 -8 -8 0.1% 0.1% 0.0% 0.0% 0.0% 0.0% 0.1% 0.3% 0.0% 0.01% 0.14% 0.08%45 Romania 45 0 42 0 8 7 66 0 0 0 8 7 66 -8 -7 -66 0.1% 0.1% 0.1% 0.0% 0.0% 0.0% 0.1% 0.2% 0.1% 0.00% 0.15% 0.08%46 Netherlands Antilles 46 27 57 30 10 10 11 8 8 8 2 2 3 6 7 5 0.1% 0.1% 0.0% 0.1% 0.2% 0.0% 0.0% 0.0% 0.0% 0.12% 0.03% 0.07%47 South Africa 47 0 43 0 12 5 42 0 0 0 12 5 42 -12 -5 -42 0.1% 0.1% 0.0% 0.0% 0.0% 0.0% 0.2% 0.1% 0.1% 0.00% 0.14% 0.07%48 Bulgaria 48 0 46 0 9 5 59 0 0 0 9 5 59 -9 -5 -59 0.1% 0.1% 0.1% 0.0% 0.0% 0.0% 0.1% 0.1% 0.1% 0.00% 0.13% 0.07%49 Nigeria 49 0 47 0 4 3 90 0 0 0 4 3 90 -4 -3 -90 0.0% 0.0% 0.1% 0.0% 0.0% 0.0% 0.1% 0.1% 0.2% 0.00% 0.11% 0.06%50 Estonia 50 0 49 0 6 6 5 0 0 0 6 6 5 -6 -6 -5 0.0% 0.1% 0.0% 0.0% 0.0% 0.0% 0.1% 0.2% 0.0% 0.00% 0.09% 0.05%51 Kenya 51 0 50 0 6 5 11 0 0 0 6 5 11 -6 -5 -11 0.0% 0.1% 0.0% 0.0% 0.0% 0.0% 0.1% 0.1% 0.0% 0.00% 0.08% 0.04%52 Lithuania 52 0 51 0 5 4 33 0 0 0 5 4 33 -5 -4 -33 0.0% 0.0% 0.0% 0.0% 0.0% 0.0% 0.1% 0.1% 0.1% 0.00% 0.08% 0.04%53 Slovak Republic 53 0 52 0 6 5 5 0 0 0 6 5 5 -6 -5 -5 0.0% 0.1% 0.0% 0.0% 0.0% 0.0% 0.1% 0.1% 0.0% 0.00% 0.08% 0.04%54 Iceland 54 0 53 0 5 3 30 0 0 0 5 3 30 -5 -3 -30 0.0% 0.0% 0.0% 0.0% 0.0% 0.0% 0.1% 0.1% 0.1% 0.00% 0.08% 0.04%55 Turkey 55 0 54 0 4 3 18 0 0 0 4 3 18 -4 -3 -18 0.0% 0.0% 0.0% 0.0% 0.0% 0.0% 0.1% 0.1% 0.0% 0.00% 0.06% 0.03%56 Cyprus 56 0 55 0 2 2 16 0 0 0 2 2 16 -2 -2 -16 0.0% 0.0% 0.0% 0.0% 0.0% 0.0% 0.0% 0.1% 0.0% 0.00% 0.04% 0.02%57 Colombia 57 0 56 0 2 2 22 0 0 0 2 2 22 -2 -2 -22 0.0% 0.0% 0.0% 0.0% 0.0% 0.0% 0.0% 0.0% 0.0% 0.00% 0.04% 0.02%58 Senegal 58 34 0 0 2 2 2 2 2 2 0 0 0 2 2 2 0.0% 0.0% 0.0% 0.0% 0.1% 0.0% 0.0% 0.0% 0.0% 0.03% 0.00% 0.02%59 Morocco 59 0 58 0 1 1 10 0 0 0 1 1 10 -1 -1 -10 0.0% 0.0% 0.0% 0.0% 0.0% 0.0% 0.0% 0.0% 0.0% 0.00% 0.02% 0.01%60 Madagascar 60 38 0 0 2 1 4 2 1 4 0 0 0 2 1 4 0.0% 0.0% 0.0% 0.0% 0.0% 0.0% 0.0% 0.0% 0.0% 0.02% 0.00% 0.01%61 United Arab Emirates 61 0 59 0 1 1 7 0 0 0 1 1 7 -1 -1 -7 0.0% 0.0% 0.0% 0.0% 0.0% 0.0% 0.0% 0.0% 0.0% 0.00% 0.02% 0.01%62 Croatia 62 0 60 0 1 1 6 0 0 0 1 1 6 -1 -1 -6 0.0% 0.0% 0.0% 0.0% 0.0% 0.0% 0.0% 0.0% 0.0% 0.00% 0.02% 0.01%63 Algeria 63 0 61 0 1 1 4 0 0 0 1 1 4 -1 -1 -4 0.0% 0.0% 0.0% 0.0% 0.0% 0.0% 0.0% 0.0% 0.0% 0.00% 0.02% 0.01%64 British Virgin 64 0 62 0 1 1 7 0 0 0 1 1 7 -1 -1 -7 0.0% 0.0% 0.0% 0.0% 0.0% 0.0% 0.0% 0.0% 0.0% 0.00% 0.01% 0.01%65 Latvia 65 0 63 0 1 1 0 0 0 0 1 1 0 -1 -1 0 0.0% 0.0% 0.0% 0.0% 0.0% 0.0% 0.0% 0.0% 0.0% 0.00% 0.01% 0.01%66 Fr Polynesia 65 0 63 0 1 1 0 0 0 0 1 1 0 -1 -1 0 0.0% 0.0% 0.0% 0.0% 0.0% 0.0% 0.0% 0.0% 0.0% 0.00% 0.01% 0.01%67 Costa Rica 65 0 63 0 1 1 0 0 0 0 1 1 0 -1 -1 0 0.0% 0.0% 0.0% 0.0% 0.0% 0.0% 0.0% 0.0% 0.0% 0.00% 0.01% 0.01%68 Dominica 65 0 63 0 1 1 0 0 0 0 1 1 0 -1 -1 0 0.0% 0.0% 0.0% 0.0% 0.0% 0.0% 0.0% 0.0% 0.0% 0.00% 0.01% 0.01%69 Nicaragua 65 0 63 0 1 1 0 0 0 0 1 1 0 -1 -1 0 0.0% 0.0% 0.0% 0.0% 0.0% 0.0% 0.0% 0.0% 0.0% 0.00% 0.01% 0.01%70 Uganda 65 0 63 0 1 1 0 0 0 0 1 1 0 -1 -1 0 0.0% 0.0% 0.0% 0.0% 0.0% 0.0% 0.0% 0.0% 0.0% 0.00% 0.01% 0.01%71 Pakistan 71 0 69 0 1 1 1 0 0 0 1 1 1 -1 -1 -1 0.0% 0.0% 0.0% 0.0% 0.0% 0.0% 0.0% 0.0% 0.0% 0.00% 0.01% 0.01%72 Egypt 71 0 69 0 1 1 1 0 0 0 1 1 1 -1 -1 -1 0.0% 0.0% 0.0% 0.0% 0.0% 0.0% 0.0% 0.0% 0.0% 0.00% 0.01% 0.01%73 Monaco 73 0 71 0 1 1 0 0 0 0 1 1 0 -1 -1 0 0.0% 0.0% 0.0% 0.0% 0.0% 0.0% 0.0% 0.0% 0.0% 0.00% 0.01% 0.00%
Grand Total ## ## ## 48 12,940 7,141 95,432 6,470 3,571 47,716 6,470 3,571 47,716 0 0 0 100% 100% 100% 100% 100% 100% 100% 100% 100% 100% 100% 100%
HostSourceOverall (Source+Host) Overall Source HostCountryNr.
O S H Dif.Rank Absolute volume of deals ($US mln)
Appendix 6: Correlation of host investment
Country
CorrelationOver
all1991-1995
1996-2000
2001-2005
Overall
1991-1995
1996-2000
2001-2005
Overall
1991-1995
1996-2000
2001-2005
H0 to CB 0.43 0.39 0.85 0.55 -0.09 0.31 0.48 0.66 0.53 0.92 0.86 -0.42
H1 to H0 0.27 -0.55 0.77 0.41 -0.11 0.78 0.68 0.23 0.36 0.00 1.00 -0.26
H1 to H2 0.08 -0.89 0.46 -0.02 0.14 0.38 -0.02 0.04 0.57 0.00 0.28 0.87H1 to HR 0.00 -0.38 0.70 0.75 -0.02 -0.37 -0.22 -0.60 0.18 0.00 0.81 -0.03
H0 to CB: Domestic to cross-border investment
H1 to H0: Tier one host country to domestic investment
H1 to H2 Tier one host country to tier two host country investment
H1 to HR Tier one host country to rest of host country investment
United States Hong KongUnited Kingdom

Appendix 199
Appendix 7: Country pairs (overall investment) 1-100
Investment country pairs: Cross-border and domestic for all investments (1980-2005) 1/3
CB Nr. Source Host Participation Deal part. Deal flow % Participation % Deal particip. %Deal flow Activity1 United States of America United States of America 144,102 63,577 489,490 75.716% 68.957% 67.990% 70.888%2 United Kingdom United Kingdom 5,168 3,847 34,869 2.715% 4.172% 4.843% 3.910%3 France France 3,466 2,105 8,263 1.821% 2.283% 1.148% 1.751%
1 4 United Kingdom United States of America 2,939 1,205 16,424 1.544% 1.307% 2.281% 1.711%2 5 United States of America United Kingdom 1,677 1,026 14,857 0.881% 1.113% 2.064% 1.352%
6 Australia Australia 1,546 1,295 3,409 0.812% 1.404% 0.473% 0.897%7 Germany Germany 1,470 980 2,548 0.772% 1.063% 0.354% 0.730%8 South Korea South Korea 1,353 1,071 1,488 0.711% 1.162% 0.207% 0.693%9 Canada Canada 1,433 720 2,924 0.753% 0.781% 0.406% 0.647%
3 10 United States of America Canada 949 489 5,102 0.499% 0.530% 0.709% 0.579%4 11 United States of America France 687 355 6,758 0.361% 0.385% 0.939% 0.562%5 12 Canada United States of America 1,122 355 4,792 0.590% 0.385% 0.666% 0.547%
13 India India 854 791 1,383 0.449% 0.858% 0.192% 0.499%6 14 United Kingdom Germany 552 413 5,256 0.290% 0.448% 0.730% 0.489%
15 Sweden Sweden 842 606 2,379 0.442% 0.658% 0.330% 0.477%7 16 United Kingdom France 580 407 4,756 0.305% 0.441% 0.661% 0.469%8 17 United States of America Germany 587 330 4,901 0.308% 0.358% 0.681% 0.449%9 18 Germany United States of America 910 341 2,712 0.478% 0.370% 0.377% 0.408%
10 19 United States of America Japan 289 227 4,468 0.152% 0.246% 0.621% 0.339%20 Finland Finland 639 544 656 0.336% 0.590% 0.091% 0.339%
11 21 United States of America Bermuda 105 44 5,798 0.055% 0.047% 0.805% 0.303%12 22 Israel United States of America 709 280 1,612 0.373% 0.304% 0.224% 0.300%
23 Israel Israel 586 282 1,287 0.308% 0.306% 0.179% 0.264%13 24 United States of America Netherlands 323 164 2,962 0.170% 0.178% 0.411% 0.253%14 25 Japan United States of America 587 179 1,845 0.308% 0.194% 0.256% 0.253%
26 Netherlands Netherlands 472 354 794 0.248% 0.383% 0.110% 0.247%15 27 France United States of America 576 191 1,388 0.303% 0.207% 0.193% 0.234%
28 Denmark Denmark 481 329 542 0.253% 0.357% 0.075% 0.228%16 29 United States of America China 306 169 2,317 0.161% 0.183% 0.322% 0.222%17 30 United Kingdom Netherlands 132 92 3,361 0.069% 0.100% 0.467% 0.212%18 31 United States of America Israel 422 225 1,132 0.222% 0.245% 0.157% 0.208%
32 Brazil Brazil 248 232 1,713 0.130% 0.252% 0.238% 0.207%19 33 Taiwan United States of America 444 186 1,261 0.233% 0.202% 0.175% 0.203%20 34 United States of America South Korea 152 105 2,858 0.080% 0.114% 0.397% 0.197%
35 Japan Japan 148 113 2,667 0.078% 0.122% 0.370% 0.190%21 36 United States of America India 202 164 2,035 0.106% 0.178% 0.283% 0.189%22 37 United States of America Ireland-Rep 152 85 2,621 0.080% 0.093% 0.364% 0.179%23 38 Netherlands United States of America 250 100 1,950 0.131% 0.108% 0.271% 0.170%24 39 Singapore United States of America 371 118 1,184 0.195% 0.128% 0.164% 0.162%
40 Belgium Belgium 326 232 354 0.171% 0.252% 0.049% 0.157%41 Ireland-Rep Ireland-Rep 314 226 380 0.165% 0.245% 0.053% 0.154%
25 42 United States of America Australia 241 177 996 0.127% 0.192% 0.138% 0.152%43 Spain Spain 217 171 1,124 0.114% 0.185% 0.156% 0.152%
26 44 Switzerland United States of America 355 137 859 0.187% 0.148% 0.119% 0.151%27 45 United States of America Singapore 133 104 1,773 0.070% 0.113% 0.246% 0.143%28 46 United States of America Luxembourg 28 18 2,782 0.015% 0.019% 0.386% 0.140%29 47 United States of America Hong Kong 185 121 1,296 0.097% 0.132% 0.180% 0.136%
48 Italy Italy 175 141 1,169 0.092% 0.153% 0.162% 0.136%30 49 Australia United States of America 297 183 379 0.156% 0.198% 0.053% 0.136%31 50 United States of America Switzerland 189 101 1,334 0.099% 0.110% 0.185% 0.132%32 51 United Kingdom Sweden 186 137 991 0.098% 0.148% 0.138% 0.128%
52 Norway Norway 218 175 447 0.115% 0.190% 0.062% 0.122%33 53 United States of America Sweden 181 102 962 0.095% 0.111% 0.134% 0.113%34 54 Hong Kong South Korea 44 30 2,034 0.023% 0.032% 0.283% 0.113%35 55 United States of America Italy 96 62 1,418 0.050% 0.068% 0.197% 0.105%
56 Switzerland Switzerland 225 140 324 0.118% 0.152% 0.045% 0.105%57 Hong Kong Hong Kong 128 103 935 0.067% 0.112% 0.130% 0.103%
36 58 Netherlands United Kingdom 157 106 787 0.082% 0.115% 0.109% 0.102%37 59 United States of America Denmark 75 39 1,478 0.039% 0.043% 0.205% 0.096%38 60 United Kingdom Spain 96 69 1,138 0.050% 0.075% 0.158% 0.094%
61 Taiwan Taiwan 169 145 234 0.089% 0.157% 0.033% 0.093%39 62 United States of America Belgium 114 63 1,016 0.060% 0.068% 0.141% 0.090%
63 Singapore Singapore 134 102 601 0.070% 0.111% 0.084% 0.088%40 64 United States of America Brazil 117 71 864 0.061% 0.078% 0.120% 0.086%41 65 United Kingdom Ireland-Rep 102 64 904 0.054% 0.069% 0.126% 0.083%42 66 United Kingdom Italy 79 62 980 0.042% 0.068% 0.136% 0.082%
67 Austria Austria 156 119 158 0.082% 0.129% 0.022% 0.078%43 68 United States of America Argentina 67 34 1,050 0.035% 0.037% 0.146% 0.073%44 69 Belgium United States of America 173 72 335 0.091% 0.078% 0.046% 0.072%45 70 United Kingdom Finland 101 78 551 0.053% 0.085% 0.076% 0.071%46 71 United Kingdom Switzerland 93 65 665 0.049% 0.070% 0.092% 0.071%47 72 Hong Kong United States of America 123 52 611 0.065% 0.056% 0.085% 0.069%48 73 Sweden United States of America 134 51 484 0.070% 0.055% 0.067% 0.064%49 74 United States of America Taiwan 97 80 385 0.051% 0.087% 0.053% 0.064%
75 China China 113 84 173 0.059% 0.092% 0.024% 0.058%50 76 Hong Kong China 62 36 722 0.033% 0.039% 0.100% 0.057%51 77 United Kingdom Belgium 51 34 748 0.027% 0.037% 0.104% 0.056%52 78 Netherlands France 64 32 621 0.034% 0.035% 0.086% 0.052%53 79 Singapore India 32 26 785 0.017% 0.028% 0.109% 0.051%
80 New Zealand New Zealand 86 78 130 0.045% 0.084% 0.018% 0.049%54 81 United Kingdom Denmark 55 43 477 0.029% 0.046% 0.066% 0.047%55 82 Australia New Zealand 48 43 488 0.025% 0.046% 0.068% 0.046%56 83 Sweden Finland 60 45 409 0.032% 0.049% 0.057% 0.046%57 84 Belgium France 70 32 460 0.037% 0.034% 0.064% 0.045%58 85 Switzerland Germany 95 50 213 0.050% 0.055% 0.030% 0.045%
86 South Africa South Africa 49 42 446 0.026% 0.046% 0.062% 0.044%59 87 Finland Sweden 86 65 124 0.045% 0.071% 0.017% 0.044%60 88 Singapore China 63 32 452 0.033% 0.035% 0.063% 0.044%61 89 Malaysia United States of America 95 59 107 0.050% 0.064% 0.015% 0.043%62 90 France Germany 98 49 168 0.051% 0.053% 0.023% 0.043%63 91 United States of America Spain 76 44 284 0.040% 0.048% 0.039% 0.042%
92 Poland Poland 72 70 97 0.038% 0.075% 0.014% 0.042%64 93 Finland United States of America 92 35 288 0.048% 0.038% 0.040% 0.042%65 94 France United Kingdom 75 40 305 0.039% 0.043% 0.042% 0.042%66 95 India United States of America 81 51 185 0.043% 0.056% 0.026% 0.041%67 96 Switzerland France 63 40 332 0.033% 0.044% 0.046% 0.041%68 97 Hong Kong Singapore 45 33 394 0.024% 0.035% 0.055% 0.038%69 98 France Switzerland 65 40 258 0.034% 0.043% 0.036% 0.038%70 99 Australia United Kingdom 37 26 469 0.019% 0.028% 0.065% 0.038%71 100 Netherlands Germany 74 53 109 0.039% 0.058% 0.015% 0.037%

Appendix 200
Appendix 8: Country pairs (overall investment) 101-200
Investment country pairs: cross-border and domestic for all investments (1980-2005) 2/3
CB Nr. Source Host Participation Deal part. Deal flow % Part. % DP %DF Activity72 101 Sweden Denmark 70 44 188 0.037% 0.048% 0.026% 0.037%73 102 Denmark United States of America 82 33 229 0.043% 0.036% 0.032% 0.037%74 103 United States of America Mexico 45 40 311 0.024% 0.043% 0.043% 0.037%75 104 Hong Kong Australia 45 35 332 0.024% 0.038% 0.046% 0.036%76 105 Ireland-Rep United Kingdom 74 49 97 0.039% 0.053% 0.013% 0.035%77 106 Netherlands Belgium 61 35 246 0.032% 0.038% 0.034% 0.035%78 107 Germany United Kingdom 84 30 177 0.044% 0.032% 0.025% 0.034%79 108 Italy United States of America 83 33 148 0.044% 0.036% 0.021% 0.033%80 109 United States of America Malaysia 49 46 176 0.026% 0.050% 0.024% 0.033%81 110 Hong Kong Taiwan 38 34 300 0.020% 0.037% 0.042% 0.033%82 111 South Korea United States of America 75 33 147 0.039% 0.036% 0.020% 0.032%83 112 United Kingdom India 36 31 303 0.019% 0.034% 0.042% 0.032%84 113 United States of America Philippines 37 32 283 0.019% 0.035% 0.039% 0.031%85 114 United States of America Finland 59 32 204 0.031% 0.034% 0.028% 0.031%86 115 Hong Kong India 34 26 322 0.018% 0.029% 0.045% 0.030%87 116 Germany Israel 61 34 154 0.032% 0.037% 0.021% 0.030%
117 Portugal Portugal 55 49 54 0.029% 0.053% 0.008% 0.030%88 118 United Kingdom Canada 50 28 230 0.026% 0.030% 0.032% 0.029%89 119 United States of America Czech Republic 42 34 213 0.022% 0.036% 0.030% 0.029%90 120 Norway United States of America 70 31 112 0.037% 0.034% 0.016% 0.029%91 121 Germany France 50 16 292 0.026% 0.018% 0.041% 0.028%92 122 United Kingdom Israel 57 27 170 0.030% 0.030% 0.024% 0.028%93 123 Germany Switzerland 64 33 97 0.034% 0.036% 0.014% 0.028%94 124 United States of America Thailand 35 34 195 0.018% 0.036% 0.027% 0.027%95 125 Netherlands Denmark 15 9 437 0.008% 0.010% 0.061% 0.026%96 126 United States of America Poland 36 30 185 0.019% 0.033% 0.026% 0.026%97 127 Hong Kong Japan 15 12 406 0.008% 0.013% 0.056% 0.026%98 128 Hong Kong Indonesia 28 23 261 0.015% 0.025% 0.036% 0.025%99 129 China United States of America 58 25 126 0.030% 0.027% 0.018% 0.025%
100 130 Sweden France 22 11 366 0.012% 0.012% 0.051% 0.025%101 131 United Kingdom Singapore 33 25 214 0.017% 0.027% 0.030% 0.025%102 132 Belgium United Kingdom 57 23 131 0.030% 0.025% 0.018% 0.024%103 133 United States of America Hungary 31 21 238 0.016% 0.023% 0.033% 0.024%104 134 Singapore Australia 22 18 270 0.012% 0.020% 0.038% 0.023%105 135 Luxembourg France 27 20 226 0.014% 0.022% 0.031% 0.023%106 136 United States of America Norway 31 21 196 0.016% 0.023% 0.027% 0.022%107 137 United States of America Austria 43 24 125 0.023% 0.026% 0.017% 0.022%108 138 France Belgium 40 17 190 0.021% 0.018% 0.026% 0.022%109 139 United States of America Indonesia 34 31 100 0.018% 0.034% 0.014% 0.022%110 140 Norway Sweden 45 32 30 0.024% 0.035% 0.004% 0.021%111 141 Singapore Hong Kong 27 18 196 0.014% 0.020% 0.027% 0.020%
142 Malaysia Malaysia 38 33 29 0.020% 0.036% 0.004% 0.020%143 Thailand Thailand 32 32 60 0.017% 0.034% 0.008% 0.020%
112 144 United Kingdom Bermuda 9 2 379 0.005% 0.002% 0.053% 0.020%113 145 Sweden Norway 24 18 194 0.013% 0.019% 0.027% 0.020%114 146 Switzerland Italy 28 23 134 0.015% 0.025% 0.019% 0.019%115 147 Switzerland United Kingdom 40 23 86 0.021% 0.024% 0.012% 0.019%116 148 Ireland-Rep United States of America 39 19 98 0.020% 0.021% 0.014% 0.018%117 149 Denmark United Kingdom 34 27 56 0.018% 0.029% 0.008% 0.018%118 150 Mauritius India 27 23 113 0.014% 0.025% 0.016% 0.018%119 151 United States of America New Zealand 23 19 159 0.012% 0.020% 0.022% 0.018%120 152 Luxembourg United States of America 67 14 23 0.035% 0.016% 0.003% 0.018%121 153 Finland Denmark 27 22 119 0.014% 0.023% 0.016% 0.018%122 154 United Kingdom Japan 20 17 177 0.011% 0.019% 0.025% 0.018%123 155 Russian Federation United States of America 37 24 56 0.019% 0.026% 0.008% 0.018%
156 Hungary Hungary 33 30 9 0.017% 0.033% 0.001% 0.017%124 157 South Korea China 3 1 340 0.002% 0.001% 0.047% 0.017%125 158 United Kingdom Austria 32 21 74 0.017% 0.023% 0.010% 0.017%126 159 United States of America Chile 20 16 157 0.011% 0.017% 0.022% 0.016%
160 Czech Republic Czech Republic 28 27 34 0.015% 0.029% 0.005% 0.016%127 161 Germany Austria 31 17 84 0.016% 0.019% 0.012% 0.016%128 162 United States of America Zambia 1 1 325 0.001% 0.001% 0.045% 0.016%129 163 United States of America Romania 17 15 153 0.009% 0.016% 0.021% 0.015%130 164 United Kingdom China 19 11 168 0.010% 0.012% 0.023% 0.015%131 165 Australia Singapore 24 23 55 0.013% 0.025% 0.008% 0.015%132 166 New Zealand United States of America 33 23 16 0.017% 0.025% 0.002% 0.015%
167 Indonesia Indonesia 13 5 227 0.007% 0.006% 0.031% 0.015%133 168 Sweden Germany 21 14 131 0.011% 0.015% 0.018% 0.015%134 169 France Sweden 29 17 73 0.015% 0.018% 0.010% 0.014%135 170 United Kingdom Australia 25 13 112 0.013% 0.014% 0.016% 0.014%
171 Russian Federation Russian Federation 22 21 65 0.012% 0.022% 0.009% 0.014%136 172 Denmark Sweden 31 19 38 0.016% 0.021% 0.005% 0.014%137 173 Sweden Switzerland 13 8 188 0.007% 0.009% 0.026% 0.014%138 174 Netherlands Switzerland 22 10 140 0.012% 0.011% 0.019% 0.014%139 175 Czech Republic Poland 25 25 12 0.013% 0.027% 0.002% 0.014%140 176 France Netherlands 16 9 153 0.008% 0.010% 0.021% 0.013%141 177 Belgium Netherlands 32 14 50 0.017% 0.016% 0.007% 0.013%142 178 Taiwan China 17 10 140 0.009% 0.010% 0.019% 0.013%143 179 United States of America Cayman Islands 3 3 241 0.002% 0.003% 0.034% 0.013%144 180 Norway Denmark 23 14 77 0.012% 0.015% 0.011% 0.013%145 181 Germany Sweden 16 10 129 0.008% 0.011% 0.018% 0.012%146 182 Austria Germany 24 19 26 0.013% 0.021% 0.004% 0.012%147 183 United Kingdom South Korea 10 3 204 0.005% 0.003% 0.028% 0.012%148 184 Japan United Kingdom 24 10 90 0.013% 0.011% 0.013% 0.012%149 185 New Zealand Australia 15 14 86 0.008% 0.016% 0.012% 0.012%150 186 Brazil United States of America 27 9 79 0.014% 0.010% 0.011% 0.012%151 187 Netherlands Sweden 23 13 60 0.012% 0.014% 0.008% 0.012%152 188 United Kingdom Norway 17 13 83 0.009% 0.014% 0.012% 0.011%153 189 Israel France 29 11 50 0.015% 0.011% 0.007% 0.011%154 190 Italy United Kingdom 28 10 57 0.015% 0.011% 0.008% 0.011%155 191 Mauritius United States of America 24 13 49 0.013% 0.014% 0.007% 0.011%
192 Vietnam Vietnam 19 19 19 0.010% 0.021% 0.003% 0.011%156 193 Germany Netherlands 24 13 42 0.013% 0.014% 0.006% 0.011%157 194 United States of America Portugal 16 10 102 0.008% 0.010% 0.014% 0.011%158 195 Canada Germany 5 2 197 0.003% 0.002% 0.027% 0.011%159 196 United Kingdom Hong Kong 15 11 86 0.008% 0.012% 0.012% 0.011%160 197 Sweden United Kingdom 20 13 52 0.011% 0.014% 0.007% 0.011%161 198 Hong Kong Thailand 14 14 63 0.007% 0.015% 0.009% 0.010%162 199 Italy Israel 21 17 13 0.011% 0.018% 0.002% 0.010%163 200 Belgium Germany 22 9 66 0.012% 0.010% 0.009% 0.010%

Appendix 201
Appendix 9: Country pairs (overall investment) 201-300
Investment country pairs: cross-border and domestic for all investments (1980-2005) 3/3
CB Nr. Source Host Participation Deal part. Deal flow % Part. % DP %DF Activity164 201 France Spain 19 13 42 0.010% 0.014% 0.006% 0.010%165 202 Hong Kong Philippines 11 9 103 0.006% 0.009% 0.014% 0.010%166 203 Hong Kong Malaysia 17 13 42 0.009% 0.014% 0.006% 0.010%167 204 Denmark Germany 20 14 21 0.011% 0.015% 0.003% 0.010%168 205 United States of America Russian Federation 14 12 63 0.007% 0.012% 0.009% 0.010%169 206 Japan South Korea 14 11 66 0.007% 0.011% 0.009% 0.009%170 207 Japan Hong Kong 10 6 108 0.005% 0.006% 0.015% 0.009%171 208 Norway United Kingdom 19 12 25 0.010% 0.013% 0.003% 0.009%172 209 Israel Japan 3 1 170 0.002% 0.001% 0.024% 0.009%
210 Greece Greece 6 6 120 0.003% 0.006% 0.017% 0.009%173 211 South Africa United States of America 15 11 40 0.008% 0.012% 0.006% 0.008%174 212 Poland Czech Republic 15 13 27 0.008% 0.014% 0.004% 0.008%175 213 France Italy 13 11 48 0.007% 0.012% 0.007% 0.008%176 214 Luxembourg Germany 10 9 73 0.005% 0.010% 0.010% 0.008%177 215 Canada United Kingdom 20 6 55 0.011% 0.006% 0.008% 0.008%178 216 United Kingdom Nigeria 6 5 114 0.003% 0.005% 0.016% 0.008%179 217 Spain United States of America 4 2 138 0.002% 0.002% 0.019% 0.008%180 218 Singapore United Kingdom 18 7 46 0.009% 0.008% 0.006% 0.008%181 219 Canada France 17 8 38 0.009% 0.009% 0.005% 0.008%182 220 Switzerland Sweden 15 12 14 0.008% 0.013% 0.002% 0.008%183 221 Germany Canada 16 10 31 0.008% 0.010% 0.004% 0.008%184 222 Israel United Kingdom 18 8 37 0.009% 0.008% 0.005% 0.008%185 223 France Canada 20 9 18 0.011% 0.010% 0.003% 0.008%186 224 Indonesia United States of America 15 12 10 0.008% 0.013% 0.001% 0.007%187 225 United States of America South Africa 16 5 58 0.008% 0.006% 0.008% 0.007%188 226 Sweden Netherlands 8 6 79 0.004% 0.007% 0.011% 0.007%189 227 Singapore Indonesia 4 3 115 0.002% 0.004% 0.016% 0.007%190 228 Czech Republic Hungary 13 11 11 0.007% 0.012% 0.001% 0.007%191 229 United Kingdom Hungary 13 9 23 0.007% 0.010% 0.003% 0.007%192 230 Switzerland Denmark 12 5 59 0.006% 0.005% 0.008% 0.007%193 231 Hong Kong United Kingdom 10 7 53 0.005% 0.007% 0.007% 0.007%194 232 Finland South Korea 1 1 130 0.001% 0.001% 0.018% 0.007%195 233 India South Korea 2 1 117 0.001% 0.001% 0.016% 0.006%196 234 Singapore South Korea 10 7 39 0.005% 0.008% 0.005% 0.006%197 235 Singapore France 16 5 32 0.008% 0.006% 0.004% 0.006%
236 Ukraine Ukraine 11 11 5 0.006% 0.012% 0.001% 0.006%198 237 Switzerland Canada 12 7 28 0.006% 0.008% 0.004% 0.006%199 238 United Kingdom Portugal 2 1 114 0.001% 0.001% 0.016% 0.006%200 239 United Kingdom Sri Lanka 9 9 21 0.005% 0.010% 0.003% 0.006%201 240 Japan China 13 4 41 0.007% 0.005% 0.006% 0.006%202 241 Australia Hong Kong 10 9 18 0.005% 0.009% 0.003% 0.006%203 242 France Israel 14 7 18 0.007% 0.007% 0.002% 0.006%204 243 Singapore Taiwan 10 7 30 0.005% 0.008% 0.004% 0.006%205 244 Switzerland Israel 12 8 14 0.006% 0.009% 0.002% 0.006%206 245 Belgium Switzerland 14 7 19 0.007% 0.007% 0.003% 0.006%207 246 United Kingdom Taiwan 5 4 74 0.003% 0.004% 0.010% 0.006%208 247 Italy France 13 8 8 0.007% 0.009% 0.001% 0.006%209 248 Singapore Malaysia 10 8 19 0.005% 0.009% 0.003% 0.006%210 249 Spain United Kingdom 7 5 54 0.004% 0.005% 0.008% 0.006%211 250 Switzerland Austria 8 7 37 0.004% 0.007% 0.005% 0.006%212 251 Netherlands Italy 6 4 60 0.003% 0.005% 0.008% 0.005%213 252 United Kingdom Tanzania 2 2 94 0.001% 0.002% 0.013% 0.005%214 253 France Luxembourg 5 3 72 0.003% 0.004% 0.010% 0.005%215 254 China Hong Kong 7 4 54 0.004% 0.005% 0.008% 0.005%216 255 Sweden Belgium 2 2 91 0.001% 0.002% 0.013% 0.005%217 256 United States of America Greece 11 9 2 0.006% 0.009% 0.000% 0.005%218 257 Brazil Argentina 10 8 7 0.005% 0.009% 0.001% 0.005%219 258 Denmark Finland 12 7 14 0.006% 0.007% 0.002% 0.005%220 259 United Kingdom Czech Republic 8 5 38 0.004% 0.006% 0.005% 0.005%
260 Iceland Iceland 8 8 16 0.004% 0.009% 0.002% 0.005%221 261 Singapore Denmark 12 4 34 0.006% 0.004% 0.005% 0.005%222 262 United Kingdom South Africa 9 6 28 0.005% 0.006% 0.004% 0.005%223 263 United Kingdom Poland 8 4 45 0.004% 0.005% 0.006% 0.005%224 264 United States of America Bulgaria 6 3 59 0.003% 0.003% 0.008% 0.005%225 265 Netherlands Israel 12 5 15 0.006% 0.006% 0.002% 0.005%226 266 Philippines United States of America 13 4 25 0.007% 0.004% 0.003% 0.005%227 267 Finland Norway 9 6 21 0.005% 0.006% 0.003% 0.005%228 268 Germany Italy 8 7 18 0.004% 0.007% 0.002% 0.005%229 269 United Kingdom Luxembourg 3 2 75 0.002% 0.002% 0.010% 0.005%230 270 Netherlands Ireland-Rep 10 5 22 0.005% 0.005% 0.003% 0.005%231 271 United Kingdom Ghana 8 8 4 0.004% 0.009% 0.001% 0.004%232 272 Netherlands Spain 10 7 6 0.005% 0.007% 0.001% 0.004%233 273 Singapore Thailand 7 6 23 0.004% 0.007% 0.003% 0.004%234 274 Luxembourg Sweden 3 3 61 0.002% 0.003% 0.009% 0.004%235 275 Japan Israel 10 4 27 0.005% 0.004% 0.004% 0.004%236 276 Luxembourg Finland 4 4 49 0.002% 0.004% 0.007% 0.004%237 277 Luxembourg United Kingdom 8 6 17 0.004% 0.007% 0.002% 0.004%238 278 Czech Republic Slovak Republic 8 7 9 0.004% 0.008% 0.001% 0.004%239 279 Singapore Ireland-Rep 10 3 28 0.005% 0.004% 0.004% 0.004%240 280 Japan Singapore 10 4 21 0.005% 0.005% 0.003% 0.004%241 281 United Kingdom Kenya 7 6 17 0.004% 0.007% 0.002% 0.004%242 282 United States of America Nigeria 3 2 65 0.002% 0.002% 0.009% 0.004%243 283 Singapore Bermuda 1 0 86 0.001% 0.000% 0.012% 0.004%244 284 Sweden Bermuda 1 0 86 0.001% 0.000% 0.012% 0.004%245 285 Czech Republic United States of America 9 5 19 0.005% 0.005% 0.003% 0.004%246 286 France Denmark 10 5 16 0.005% 0.005% 0.002% 0.004%247 287 Taiwan South Korea 5 5 31 0.003% 0.005% 0.004% 0.004%248 288 Bermuda United States of America 8 3 32 0.004% 0.004% 0.004% 0.004%249 289 Belgium Spain 10 5 12 0.005% 0.005% 0.002% 0.004%250 290 Greece Romania 7 7 6 0.004% 0.008% 0.001% 0.004%251 291 Italy Spain 5 2 51 0.003% 0.002% 0.007% 0.004%252 292 United States of America Estonia 3 3 50 0.002% 0.003% 0.007% 0.004%253 293 Romania Spain 6 6 15 0.003% 0.007% 0.002% 0.004%
294 Philippines Philippines 8 7 0 0.004% 0.007% 0.000% 0.004%254 295 United Kingdom Argentina 3 3 46 0.002% 0.003% 0.006% 0.004%255 296 Germany Denmark 9 3 20 0.005% 0.004% 0.003% 0.004%256 297 Taiwan Israel 9 4 13 0.005% 0.005% 0.002% 0.004%257 298 Canada China 7 5 10 0.004% 0.006% 0.001% 0.004%258 299 Belgium Israel 7 5 11 0.004% 0.005% 0.002% 0.004%259 300 Netherlands Antilles France 6 6 6 0.003% 0.007% 0.001% 0.004%

Appendix 202
Appendix 10: Country pairs (venture capital) 1-100
Investment country pairs: Venture capital cross-bor der and domestic (1980-2005) 1/3
CB Nr. Source Host Participation Deal part. Deal flow % Part. % DP %DF Activity1 United States of America United States of America 107,968 47,538 328,655 56.730% 51.562% 45.650% 51.314%2 United Kingdom United Kingdom 4,066 3,015 24,687 2.137% 3.270% 3.429% 2.945%3 France France 2,679 1,627 5,989 1.407% 1.765% 0.832% 1.335%
1 4 United Kingdom United States of America 2,189 887 11,663 1.150% 0.962% 1.620% 1.244%2 5 United States of America United Kingdom 1,030 638 10,115 0.541% 0.692% 1.405% 0.879%
6 Australia Australia 1,137 952 2,541 0.597% 1.032% 0.353% 0.661%7 South Korea South Korea 1,164 938 1,325 0.612% 1.017% 0.184% 0.604%8 Germany Germany 1,245 824 1,748 0.654% 0.894% 0.243% 0.597%9 Canada Canada 1,271 643 2,629 0.668% 0.697% 0.365% 0.577%
3 10 Canada United States of America 974 306 3,475 0.512% 0.332% 0.483% 0.442%11 India India 751 695 1,184 0.395% 0.753% 0.164% 0.437%
4 12 United States of America Canada 691 348 3,474 0.363% 0.377% 0.483% 0.408%13 Sweden Sweden 665 458 2,053 0.349% 0.497% 0.285% 0.377%
5 14 United Kingdom Germany 448 332 3,594 0.236% 0.360% 0.499% 0.365%6 15 Germany United States of America 787 296 2,108 0.414% 0.321% 0.293% 0.343%7 16 United Kingdom France 447 306 3,292 0.235% 0.331% 0.457% 0.341%8 17 United States of America France 299 150 4,270 0.157% 0.163% 0.593% 0.304%
18 Finland Finland 525 449 428 0.276% 0.487% 0.059% 0.274%9 19 United States of America Germany 379 207 2,601 0.199% 0.224% 0.361% 0.262%
10 20 United States of America Japan 236 193 2,978 0.124% 0.209% 0.414% 0.249%11 21 Israel United States of America 561 226 1,312 0.295% 0.245% 0.182% 0.241%
22 Israel Israel 482 237 1,055 0.253% 0.258% 0.146% 0.219%23 Denmark Denmark 439 295 501 0.230% 0.320% 0.070% 0.207%24 Netherlands Netherlands 411 313 455 0.216% 0.340% 0.063% 0.206%
12 25 France United States of America 489 156 1,195 0.257% 0.170% 0.166% 0.197%13 26 Japan United States of America 445 136 1,275 0.234% 0.148% 0.177% 0.186%
27 Japan Japan 126 96 2,473 0.066% 0.105% 0.344% 0.171%14 28 United States of America Bermuda 70 33 3,170 0.037% 0.036% 0.440% 0.171%15 29 United Kingdom Netherlands 109 77 2,399 0.057% 0.083% 0.333% 0.158%16 30 United States of America China 208 116 1,507 0.109% 0.126% 0.209% 0.148%17 31 Singapore United States of America 339 100 1,075 0.178% 0.109% 0.149% 0.145%18 32 United States of America Israel 298 155 743 0.156% 0.168% 0.103% 0.143%19 33 United States of America Netherlands 190 96 1,561 0.100% 0.105% 0.217% 0.140%20 34 United States of America Ireland-Rep 125 73 1,922 0.066% 0.079% 0.267% 0.137%21 35 United States of America India 133 111 1,570 0.070% 0.121% 0.218% 0.136%22 36 Taiwan United States of America 303 108 867 0.159% 0.117% 0.120% 0.132%23 37 Switzerland United States of America 293 112 785 0.154% 0.122% 0.109% 0.128%24 38 Netherlands United States of America 177 65 1,451 0.093% 0.071% 0.202% 0.122%
39 Italy Italy 148 120 1,054 0.078% 0.130% 0.146% 0.118%25 40 United Kingdom Sweden 169 125 854 0.089% 0.136% 0.119% 0.114%26 41 Australia United States of America 247 148 331 0.130% 0.160% 0.046% 0.112%
42 Spain Spain 169 132 684 0.089% 0.144% 0.095% 0.109%27 43 United States of America Luxembourg 18 13 2,073 0.009% 0.014% 0.288% 0.104%
44 Ireland-Rep Ireland-Rep 210 148 250 0.110% 0.160% 0.035% 0.102%28 45 Hong Kong South Korea 35 25 1,741 0.018% 0.027% 0.242% 0.096%
46 Switzerland Switzerland 203 125 294 0.107% 0.136% 0.041% 0.094%29 47 United States of America South Korea 99 69 1,116 0.052% 0.075% 0.155% 0.094%30 48 United States of America Australia 158 127 422 0.083% 0.138% 0.059% 0.093%31 49 United States of America Hong Kong 133 90 782 0.070% 0.098% 0.109% 0.092%32 50 United States of America Switzerland 136 69 900 0.071% 0.075% 0.125% 0.091%
51 Norway Norway 158 129 344 0.083% 0.140% 0.048% 0.090%52 Belgium Belgium 174 129 116 0.091% 0.140% 0.016% 0.082%53 Brazil Brazil 132 123 296 0.069% 0.133% 0.041% 0.081%
33 54 Netherlands United Kingdom 132 91 534 0.069% 0.099% 0.074% 0.081%55 Hong Kong Hong Kong 100 79 720 0.053% 0.086% 0.100% 0.080%
34 56 United Kingdom Spain 77 58 972 0.040% 0.063% 0.135% 0.079%35 57 United States of America Denmark 51 28 1,226 0.027% 0.030% 0.170% 0.076%36 58 United States of America Sweden 130 77 532 0.068% 0.084% 0.074% 0.075%
59 Singapore Singapore 123 91 415 0.064% 0.098% 0.058% 0.073%37 60 United States of America Brazil 87 54 724 0.045% 0.059% 0.101% 0.068%38 61 United States of America Singapore 102 82 426 0.053% 0.089% 0.059% 0.067%39 62 United Kingdom Finland 92 72 507 0.048% 0.078% 0.070% 0.066%
63 Austria Austria 133 100 128 0.070% 0.108% 0.018% 0.065%40 64 United Kingdom Ireland-Rep 87 54 639 0.046% 0.059% 0.089% 0.064%41 65 United States of America Argentina 53 26 960 0.028% 0.028% 0.133% 0.063%
66 Taiwan Taiwan 105 88 168 0.055% 0.096% 0.023% 0.058%42 67 United States of America Italy 47 32 808 0.025% 0.035% 0.112% 0.057%43 68 Hong Kong United States of America 105 41 485 0.055% 0.044% 0.067% 0.056%44 69 United Kingdom Switzerland 69 46 531 0.036% 0.050% 0.074% 0.053%45 70 Sweden United States of America 105 40 396 0.055% 0.043% 0.055% 0.051%
71 China China 99 71 170 0.052% 0.077% 0.024% 0.051%46 72 United Kingdom Belgium 38 26 742 0.020% 0.028% 0.103% 0.050%47 73 Singapore India 30 25 777 0.016% 0.027% 0.108% 0.050%48 74 United States of America Belgium 66 37 506 0.034% 0.040% 0.070% 0.048%49 75 Hong Kong China 49 26 636 0.026% 0.028% 0.088% 0.047%50 76 Netherlands France 52 27 584 0.027% 0.029% 0.081% 0.046%51 77 United Kingdom Italy 57 43 409 0.030% 0.046% 0.057% 0.044%52 78 Malaysia United States of America 95 59 107 0.050% 0.064% 0.015% 0.043%53 79 Sweden Finland 50 37 405 0.026% 0.041% 0.056% 0.041%54 80 United States of America Taiwan 66 53 212 0.034% 0.057% 0.029% 0.040%55 81 Switzerland Germany 86 45 193 0.045% 0.049% 0.027% 0.040%56 82 United Kingdom Denmark 45 36 413 0.024% 0.039% 0.057% 0.040%57 83 France Germany 86 44 153 0.045% 0.048% 0.021% 0.038%
84 New Zealand New Zealand 65 58 110 0.034% 0.063% 0.015% 0.037%58 85 Singapore China 54 24 414 0.028% 0.026% 0.058% 0.037%59 86 Finland United States of America 77 28 262 0.040% 0.031% 0.036% 0.036%60 87 Australia United Kingdom 33 23 466 0.017% 0.025% 0.065% 0.036%61 88 Australia New Zealand 32 28 411 0.017% 0.030% 0.057% 0.035%62 89 France Switzerland 58 35 255 0.030% 0.038% 0.035% 0.034%63 90 Sweden Denmark 65 41 174 0.034% 0.044% 0.024% 0.034%64 91 France United Kingdom 58 30 281 0.030% 0.033% 0.039% 0.034%65 92 Italy United States of America 83 33 148 0.044% 0.036% 0.021% 0.033%66 93 Hong Kong Australia 40 31 328 0.021% 0.033% 0.046% 0.033%67 94 Netherlands Belgium 52 31 234 0.027% 0.033% 0.033% 0.031%68 95 United States of America Malaysia 45 42 172 0.023% 0.045% 0.024% 0.031%69 96 India United States of America 54 40 141 0.028% 0.043% 0.020% 0.030%70 97 United States of America Mexico 35 30 256 0.018% 0.033% 0.036% 0.029%71 98 Germany United Kingdom 73 25 152 0.038% 0.027% 0.021% 0.029%72 99 United States of America Spain 46 29 198 0.024% 0.031% 0.027% 0.028%73 100 Germany Israel 54 30 144 0.028% 0.033% 0.020% 0.027%

Appendix 203
Appendix 11: Country pairs (venture capital) 101-200
Investment country pairs: Venture capital cross-bor der and domestic (1980-2005) 2/3
CB Nr. Source Host Participation Deal part. Deal flow % Part. % DP %DF Activity74 101 Netherlands Germany 52 39 85 0.027% 0.042% 0.012% 0.027%75 102 Hong Kong Singapore 31 21 302 0.016% 0.022% 0.042% 0.027%76 103 United States of America Thailand 32 31 193 0.017% 0.033% 0.027% 0.026%77 104 United Kingdom India 29 25 247 0.015% 0.027% 0.034% 0.026%78 105 Belgium United States of America 64 27 94 0.034% 0.030% 0.013% 0.026%79 106 Finland Sweden 50 34 90 0.026% 0.037% 0.013% 0.025%80 107 Germany France 42 14 275 0.022% 0.015% 0.038% 0.025%81 108 Netherlands Denmark 13 7 431 0.007% 0.008% 0.060% 0.025%82 109 Denmark United States of America 58 20 162 0.030% 0.022% 0.022% 0.025%83 110 Switzerland France 32 19 264 0.017% 0.021% 0.037% 0.025%84 111 China United States of America 57 25 124 0.030% 0.027% 0.017% 0.025%85 112 Sweden France 21 10 366 0.011% 0.011% 0.051% 0.024%86 113 Hong Kong India 27 21 258 0.014% 0.023% 0.036% 0.024%87 114 South Korea United States of America 57 26 106 0.030% 0.028% 0.015% 0.024%88 115 United States of America Philippines 31 28 193 0.016% 0.030% 0.027% 0.024%89 116 United Kingdom Canada 42 22 188 0.022% 0.024% 0.026% 0.024%
117 Poland Poland 39 38 70 0.020% 0.041% 0.010% 0.024%90 118 Belgium France 38 18 224 0.020% 0.019% 0.031% 0.023%91 119 United States of America Czech Republic 33 25 188 0.017% 0.027% 0.026% 0.023%92 120 Hong Kong Japan 11 8 393 0.006% 0.009% 0.055% 0.023%
121 Portugal Portugal 41 36 44 0.022% 0.039% 0.006% 0.022%93 122 Hong Kong Taiwan 25 22 213 0.013% 0.024% 0.030% 0.022%94 123 Germany Switzerland 50 26 87 0.026% 0.028% 0.012% 0.022%95 124 United Kingdom Singapore 30 22 188 0.016% 0.024% 0.026% 0.022%96 125 Norway United States of America 53 23 89 0.028% 0.025% 0.012% 0.022%97 126 Luxembourg France 24 19 220 0.013% 0.021% 0.031% 0.021%98 127 Ireland-Rep United Kingdom 47 27 66 0.025% 0.030% 0.009% 0.021%99 128 United Kingdom Israel 43 18 146 0.023% 0.019% 0.020% 0.021%
100 129 United Kingdom Bermuda 9 2 379 0.005% 0.002% 0.053% 0.020%130 South Africa South Africa 33 29 73 0.017% 0.031% 0.010% 0.020%
101 131 Mauritius India 27 23 113 0.014% 0.025% 0.016% 0.018%102 132 United States of America Indonesia 27 24 97 0.014% 0.026% 0.013% 0.018%103 133 France Belgium 32 12 169 0.017% 0.013% 0.023% 0.018%104 134 Norway Sweden 38 28 15 0.020% 0.031% 0.002% 0.018%105 135 Russian Federation United States of America 36 23 56 0.019% 0.025% 0.008% 0.017%106 136 Switzerland United Kingdom 35 21 69 0.018% 0.022% 0.010% 0.017%107 137 United Kingdom Japan 19 17 162 0.010% 0.018% 0.023% 0.017%108 138 South Korea China 3 1 340 0.002% 0.001% 0.047% 0.017%109 139 Hong Kong Indonesia 19 16 158 0.010% 0.017% 0.022% 0.016%110 140 United States of America Norway 19 14 158 0.010% 0.015% 0.022% 0.016%111 141 United States of America Zambia 1 1 325 0.001% 0.001% 0.045% 0.016%112 142 Singapore Australia 9 6 250 0.005% 0.007% 0.035% 0.015%113 143 United States of America Hungary 18 13 155 0.009% 0.014% 0.022% 0.015%114 144 Switzerland Italy 21 17 113 0.011% 0.018% 0.016% 0.015%115 145 Sweden Germany 21 14 131 0.011% 0.015% 0.018% 0.015%
146 Hungary Hungary 28 26 6 0.015% 0.028% 0.001% 0.015%147 Indonesia Indonesia 12 4 227 0.006% 0.005% 0.031% 0.014%
116 148 New Zealand United States of America 30 22 15 0.016% 0.024% 0.002% 0.014%149 Thailand Thailand 25 25 11 0.013% 0.027% 0.002% 0.014%
117 150 Australia Singapore 22 21 53 0.012% 0.023% 0.007% 0.014%118 151 Singapore Hong Kong 16 9 159 0.008% 0.010% 0.022% 0.014%119 152 Sweden Norway 15 10 162 0.008% 0.010% 0.022% 0.014%120 153 Finland Denmark 20 15 97 0.010% 0.016% 0.013% 0.013%121 154 United States of America Finland 27 15 61 0.014% 0.017% 0.008% 0.013%122 155 Denmark United Kingdom 25 19 34 0.013% 0.020% 0.005% 0.013%
156 Russian Federation Russian Federation 19 18 65 0.010% 0.019% 0.009% 0.013%123 157 France Sweden 24 15 67 0.013% 0.016% 0.009% 0.013%124 158 Netherlands Switzerland 18 9 136 0.009% 0.010% 0.019% 0.013%125 159 United States of America Poland 15 12 121 0.008% 0.013% 0.017% 0.013%126 160 United Kingdom Austria 25 17 41 0.013% 0.018% 0.006% 0.012%127 161 Denmark Sweden 26 16 35 0.014% 0.017% 0.005% 0.012%128 162 Sweden Switzerland 9 6 175 0.005% 0.006% 0.024% 0.012%129 163 Mauritius United States of America 24 13 49 0.013% 0.014% 0.007% 0.011%130 164 Taiwan China 14 7 128 0.007% 0.007% 0.018% 0.011%131 165 Brazil United States of America 25 8 75 0.013% 0.008% 0.010% 0.011%132 166 Netherlands Sweden 21 12 56 0.011% 0.013% 0.008% 0.011%133 167 Italy Israel 21 17 13 0.011% 0.018% 0.002% 0.010%134 168 United Kingdom Norway 15 11 78 0.008% 0.012% 0.011% 0.010%135 169 Israel France 28 10 36 0.015% 0.011% 0.005% 0.010%
170 Malaysia Malaysia 20 17 16 0.010% 0.018% 0.002% 0.010%136 171 Canada Germany 3 1 195 0.002% 0.001% 0.027% 0.010%137 172 Germany Netherlands 21 13 32 0.011% 0.014% 0.005% 0.010%138 173 United States of America Romania 12 10 89 0.006% 0.011% 0.012% 0.010%139 174 Italy United Kingdom 24 9 44 0.013% 0.010% 0.006% 0.010%140 175 United States of America Chile 12 10 84 0.006% 0.010% 0.012% 0.009%141 176 Japan United Kingdom 18 8 72 0.009% 0.009% 0.010% 0.009%142 177 United Kingdom China 13 7 100 0.007% 0.007% 0.014% 0.009%143 178 Germany Austria 19 10 52 0.010% 0.011% 0.007% 0.009%144 179 France Spain 18 12 42 0.009% 0.012% 0.006% 0.009%145 180 Belgium United Kingdom 21 8 57 0.011% 0.009% 0.008% 0.009%146 181 United States of America Portugal 12 8 85 0.006% 0.009% 0.012% 0.009%147 182 Austria Germany 17 14 19 0.009% 0.015% 0.003% 0.009%148 183 United States of America Austria 16 9 60 0.008% 0.010% 0.008% 0.009%149 184 Israel Japan 3 1 170 0.002% 0.001% 0.024% 0.009%150 185 South Africa United States of America 15 11 40 0.008% 0.012% 0.006% 0.008%151 186 Poland Czech Republic 15 13 27 0.008% 0.014% 0.004% 0.008%152 187 Luxembourg Germany 10 9 73 0.005% 0.010% 0.010% 0.008%153 188 Spain United States of America 4 2 138 0.002% 0.002% 0.019% 0.008%154 189 Singapore United Kingdom 18 7 46 0.009% 0.008% 0.006% 0.008%155 190 Japan Hong Kong 8 4 108 0.004% 0.004% 0.015% 0.008%156 191 Canada France 17 8 38 0.009% 0.009% 0.005% 0.008%157 192 Germany Canada 16 10 31 0.008% 0.010% 0.004% 0.008%158 193 Ireland-Rep United States of America 18 8 36 0.009% 0.009% 0.005% 0.008%159 194 New Zealand Australia 14 13 8 0.007% 0.014% 0.001% 0.008%160 195 Norway Denmark 17 10 21 0.009% 0.011% 0.003% 0.008%161 196 Indonesia United States of America 15 12 10 0.008% 0.013% 0.001% 0.007%
197 Czech Republic Czech Republic 13 13 8 0.007% 0.014% 0.001% 0.007%162 198 Sweden Netherlands 7 6 79 0.004% 0.006% 0.011% 0.007%163 199 France Italy 10 8 47 0.005% 0.009% 0.007% 0.007%164 200 Belgium Netherlands 15 8 25 0.008% 0.009% 0.003% 0.007%

Appendix 204
Appendix 12: Country pairs (venture capital) 201-300
Investment country pairs: Venture capital cross-bor der and domestic (1980-2005) 3/3
CB Nr. Source Host Participation Deal part. Deal flow % Part. % DP %DF Activity165 201 Czech Republic Hungary 13 11 11 0.007% 0.012% 0.001% 0.007%166 202 Norway United Kingdom 15 9 18 0.008% 0.010% 0.002% 0.007%167 203 France Canada 18 8 17 0.009% 0.008% 0.002% 0.007%168 204 Canada United Kingdom 17 4 48 0.009% 0.005% 0.007% 0.007%169 205 United States of America New Zealand 11 10 23 0.006% 0.011% 0.003% 0.007%170 206 Hong Kong Philippines 6 5 80 0.003% 0.005% 0.011% 0.007%171 207 Finland South Korea 1 1 130 0.001% 0.001% 0.018% 0.007%172 208 United Kingdom Nigeria 5 4 89 0.003% 0.004% 0.012% 0.006%173 209 United Kingdom Hong Kong 9 7 51 0.004% 0.008% 0.007% 0.006%174 210 India South Korea 2 1 117 0.001% 0.001% 0.016% 0.006%175 211 Singapore France 16 5 32 0.008% 0.006% 0.004% 0.006%
212 Ukraine Ukraine 11 11 5 0.006% 0.012% 0.001% 0.006%176 213 Singapore Indonesia 3 2 101 0.002% 0.002% 0.014% 0.006%177 214 Denmark Germany 13 8 14 0.007% 0.009% 0.002% 0.006%178 215 Japan South Korea 8 7 42 0.004% 0.007% 0.006% 0.006%179 216 United Kingdom Hungary 10 8 22 0.005% 0.008% 0.003% 0.006%180 217 France Netherlands 11 7 27 0.006% 0.007% 0.004% 0.006%181 218 United Kingdom Tanzania 2 2 94 0.001% 0.002% 0.013% 0.005%182 219 United States of America Russian Federation 9 9 14 0.005% 0.009% 0.002% 0.005%183 220 Hong Kong Thailand 7 7 33 0.004% 0.008% 0.005% 0.005%184 221 China Hong Kong 7 4 54 0.004% 0.005% 0.008% 0.005%185 222 Sweden Belgium 2 2 91 0.001% 0.002% 0.013% 0.005%186 223 Singapore South Korea 8 6 36 0.004% 0.007% 0.005% 0.005%187 224 Australia Hong Kong 9 9 10 0.005% 0.009% 0.001% 0.005%188 225 Israel United Kingdom 12 5 27 0.006% 0.005% 0.004% 0.005%
226 Iceland Iceland 8 8 16 0.004% 0.009% 0.002% 0.005%189 227 Singapore Denmark 12 4 34 0.006% 0.004% 0.005% 0.005%190 228 Switzerland Sweden 10 7 13 0.005% 0.008% 0.002% 0.005%191 229 Switzerland Canada 10 5 28 0.005% 0.006% 0.004% 0.005%192 230 Philippines United States of America 13 4 25 0.007% 0.004% 0.003% 0.005%193 231 United Kingdom South Korea 5 2 70 0.003% 0.002% 0.010% 0.005%194 232 France Israel 11 5 15 0.006% 0.006% 0.002% 0.005%195 233 United Kingdom Ghana 8 8 4 0.004% 0.009% 0.001% 0.004%196 234 Netherlands Spain 10 7 6 0.005% 0.007% 0.001% 0.004%197 235 Luxembourg Finland 4 4 49 0.002% 0.004% 0.007% 0.004%198 236 Singapore Malaysia 8 6 15 0.004% 0.007% 0.002% 0.004%199 237 Singapore Ireland-Rep 10 3 28 0.005% 0.004% 0.004% 0.004%200 238 Sweden United Kingdom 10 4 22 0.005% 0.005% 0.003% 0.004%201 239 Switzerland Israel 9 6 14 0.005% 0.006% 0.002% 0.004%202 240 Singapore Bermuda 1 0 86 0.001% 0.000% 0.012% 0.004%203 241 Sweden Bermuda 1 0 86 0.001% 0.000% 0.012% 0.004%204 242 Czech Republic United States of America 9 5 19 0.005% 0.005% 0.003% 0.004%205 243 Netherlands Ireland-Rep 9 5 21 0.005% 0.005% 0.003% 0.004%206 244 United Kingdom Luxembourg 2 1 72 0.001% 0.001% 0.010% 0.004%207 245 Japan China 11 3 21 0.006% 0.004% 0.003% 0.004%208 246 Taiwan South Korea 5 5 31 0.003% 0.005% 0.004% 0.004%209 247 United Kingdom South Africa 6 5 28 0.003% 0.005% 0.004% 0.004%210 248 Italy Spain 5 2 51 0.003% 0.002% 0.007% 0.004%211 249 Hong Kong United Kingdom 6 3 39 0.003% 0.003% 0.005% 0.004%212 250 Japan Israel 9 4 23 0.005% 0.004% 0.003% 0.004%213 251 Romania Spain 6 6 15 0.003% 0.007% 0.002% 0.004%214 252 Luxembourg Sweden 2 2 61 0.001% 0.002% 0.009% 0.004%215 253 France Denmark 9 4 16 0.005% 0.005% 0.002% 0.004%
254 Philippines Philippines 8 7 0 0.004% 0.007% 0.000% 0.004%216 255 Hong Kong Malaysia 8 5 14 0.004% 0.005% 0.002% 0.004%217 256 United Kingdom Argentina 3 3 46 0.002% 0.003% 0.006% 0.004%218 257 Belgium Spain 9 5 10 0.005% 0.005% 0.001% 0.004%219 258 Canada China 7 5 10 0.004% 0.006% 0.001% 0.004%220 259 Switzerland Austria 7 6 6 0.004% 0.006% 0.001% 0.004%221 260 Norway Switzerland 6 3 26 0.003% 0.004% 0.004% 0.004%222 261 Germany China 7 4 15 0.004% 0.005% 0.002% 0.003%223 262 Japan Malaysia 2 2 51 0.001% 0.002% 0.007% 0.003%224 263 Greece Romania 6 6 3 0.003% 0.007% 0.000% 0.003%225 264 United Kingdom Australia 6 4 16 0.003% 0.005% 0.002% 0.003%226 265 Hong Kong Germany 2 1 60 0.001% 0.001% 0.008% 0.003%227 266 Germany Sweden 9 4 9 0.005% 0.004% 0.001% 0.003%
267 Vietnam Vietnam 6 6 2 0.003% 0.007% 0.000% 0.003%228 268 Germany Denmark 8 3 16 0.004% 0.003% 0.002% 0.003%229 269 Taiwan Israel 8 4 9 0.004% 0.004% 0.001% 0.003%230 270 Netherlands Israel 8 4 10 0.004% 0.004% 0.001% 0.003%231 271 Sweden Hong Kong 1 1 60 0.001% 0.001% 0.008% 0.003%232 272 United Kingdom Poland 5 3 23 0.003% 0.003% 0.003% 0.003%233 273 Finland Switzerland 7 4 9 0.004% 0.004% 0.001% 0.003%234 274 Norway Finland 1 1 55 0.001% 0.001% 0.008% 0.003%235 275 Poland Russian Federation 5 5 8 0.003% 0.005% 0.001% 0.003%236 276 Luxembourg Netherlands 2 1 48 0.001% 0.001% 0.007% 0.003%237 277 Luxembourg United Kingdom 5 5 7 0.003% 0.005% 0.001% 0.003%238 278 Spain United Kingdom 4 3 27 0.002% 0.003% 0.004% 0.003%239 279 Italy France 8 4 4 0.004% 0.004% 0.001% 0.003%240 280 Singapore Netherlands 7 3 11 0.004% 0.004% 0.001% 0.003%241 281 United Kingdom Czech Republic 5 4 15 0.003% 0.004% 0.002% 0.003%242 282 United States of America South Africa 8 2 16 0.004% 0.002% 0.002% 0.003%243 283 Switzerland Denmark 7 3 12 0.004% 0.003% 0.002% 0.003%244 284 France Austria 6 3 14 0.003% 0.004% 0.002% 0.003%245 285 United States of America Estonia 1 1 50 0.001% 0.001% 0.007% 0.003%
286 Nigeria Nigeria 5 5 3 0.003% 0.005% 0.000% 0.003%246 287 Czech Republic Slovak Republic 5 5 6 0.003% 0.005% 0.001% 0.003%247 288 Austria Hungary 5 4 8 0.003% 0.005% 0.001% 0.003%248 289 Denmark France 5 3 17 0.003% 0.003% 0.002% 0.003%249 290 Czech Republic Bulgaria 1 0 55 0.001% 0.000% 0.008% 0.003%250 291 Singapore Thailand 4 3 20 0.002% 0.003% 0.003% 0.003%251 292 United Kingdom Romania 4 2 29 0.002% 0.002% 0.004% 0.003%252 293 Poland Romania 4 2 24 0.002% 0.003% 0.003% 0.003%253 294 United Kingdom Kenya 4 3 17 0.002% 0.003% 0.002% 0.003%254 295 United States of America Cyprus 1 1 45 0.001% 0.001% 0.006% 0.003%255 296 Singapore Canada 8 2 14 0.004% 0.002% 0.002% 0.003%256 297 Finland Netherlands 7 3 5 0.004% 0.003% 0.001% 0.003%257 298 Portugal United Kingdom 3 2 31 0.002% 0.002% 0.004% 0.003%258 299 Cayman Islands United States of America 7 2 16 0.004% 0.002% 0.002% 0.003%259 300 Germany Belgium 5 4 7 0.003% 0.004% 0.001% 0.003%

Appendix 205
Appendix 13: Country pairs (private equity) 1-100
Investment country pairs: Venture capital cross-bor der and domestic (1980-2005)Investment country pairs: Private Equity cross-bord er and domestic (1980-2005) 1/3
CB Nr. Source Host Participation Deal part. Deal flow % Part. % DP %DF Activity1 United States of America United States of America 36,134 16,038 160,835 18.986% 17.396% 22.340% 19.574%2 United Kingdom United Kingdom 1,102 832 10,183 0.579% 0.903% 1.414% 0.965%
1 3 United States of America United Kingdom 647 388 4,742 0.340% 0.421% 0.659% 0.473%2 4 United Kingdom United States of America 750 318 4,762 0.394% 0.345% 0.661% 0.467%
5 France France 787 478 2,274 0.414% 0.518% 0.316% 0.416%3 6 United States of America France 389 205 2,488 0.204% 0.222% 0.346% 0.257%
7 Australia Australia 410 343 868 0.215% 0.372% 0.121% 0.236%4 8 United States of America Germany 208 123 2,300 0.109% 0.134% 0.320% 0.188%5 9 United States of America Canada 258 141 1,628 0.136% 0.153% 0.226% 0.172%
10 Germany Germany 225 156 800 0.118% 0.169% 0.111% 0.133%6 11 United States of America Bermuda 35 11 2,627 0.018% 0.012% 0.365% 0.132%7 12 United Kingdom France 134 101 1,464 0.070% 0.110% 0.203% 0.128%
13 Brazil Brazil 117 110 1,418 0.061% 0.119% 0.197% 0.126%8 14 United Kingdom Germany 104 82 1,662 0.054% 0.089% 0.231% 0.125%9 15 United States of America Netherlands 133 68 1,402 0.070% 0.073% 0.195% 0.113%
10 16 Canada United States of America 149 49 1,317 0.078% 0.053% 0.183% 0.105%11 17 United States of America South Korea 53 36 1,742 0.028% 0.039% 0.242% 0.103%
18 Sweden Sweden 177 148 326 0.093% 0.161% 0.045% 0.100%12 19 United States of America Japan 53 34 1,490 0.028% 0.036% 0.207% 0.090%
20 South Korea South Korea 189 134 163 0.099% 0.145% 0.023% 0.089%13 21 United States of America Singapore 32 22 1,348 0.017% 0.024% 0.187% 0.076%
22 Belgium Belgium 152 103 238 0.080% 0.112% 0.033% 0.075%14 23 United States of America China 98 53 810 0.051% 0.057% 0.112% 0.074%15 24 Taiwan United States of America 141 78 394 0.074% 0.084% 0.055% 0.071%
25 Canada Canada 163 77 295 0.085% 0.084% 0.041% 0.070%16 26 Japan United States of America 142 43 570 0.075% 0.046% 0.079% 0.067%17 27 Germany United States of America 123 45 603 0.065% 0.049% 0.084% 0.066%18 28 United States of America Israel 124 70 389 0.065% 0.076% 0.054% 0.065%
29 Finland Finland 114 95 228 0.060% 0.103% 0.032% 0.065%30 India India 103 96 200 0.054% 0.104% 0.028% 0.062%
19 31 Israel United States of America 148 54 300 0.078% 0.059% 0.042% 0.060%20 32 United States of America Australia 84 50 574 0.044% 0.054% 0.080% 0.059%21 33 United Kingdom Netherlands 23 15 962 0.012% 0.017% 0.134% 0.054%
34 Ireland-Rep Ireland-Rep 104 78 130 0.055% 0.085% 0.018% 0.053%22 35 United States of America India 69 52 464 0.036% 0.057% 0.064% 0.052%23 36 Netherlands United States of America 74 34 499 0.039% 0.037% 0.069% 0.048%24 37 United States of America Italy 49 30 610 0.026% 0.033% 0.085% 0.048%25 38 Belgium United States of America 109 45 240 0.057% 0.049% 0.033% 0.046%
39 Israel Israel 104 45 233 0.055% 0.049% 0.032% 0.045%26 40 United States of America Hong Kong 52 31 514 0.027% 0.034% 0.071% 0.044%
41 Spain Spain 49 38 441 0.025% 0.041% 0.061% 0.043%27 42 United States of America Belgium 49 26 510 0.025% 0.029% 0.071% 0.042%28 43 United States of America Ireland-Rep 27 13 699 0.014% 0.014% 0.097% 0.042%29 44 United States of America Switzerland 53 32 434 0.028% 0.035% 0.060% 0.041%
45 Netherlands Netherlands 61 40 339 0.032% 0.044% 0.047% 0.041%30 46 United States of America Sweden 51 25 430 0.027% 0.027% 0.060% 0.038%31 47 United Kingdom Italy 22 20 571 0.012% 0.022% 0.079% 0.037%32 48 France United States of America 87 34 194 0.046% 0.037% 0.027% 0.037%33 49 United States of America Luxembourg 11 5 709 0.006% 0.005% 0.099% 0.036%
50 Taiwan Taiwan 64 56 66 0.033% 0.061% 0.009% 0.035%51 Norway Norway 61 47 104 0.032% 0.051% 0.014% 0.032%52 South Africa South Africa 16 13 373 0.008% 0.015% 0.052% 0.025%
34 53 Australia United States of America 51 35 48 0.027% 0.038% 0.007% 0.024%54 Hong Kong Hong Kong 28 24 215 0.015% 0.026% 0.030% 0.023%
35 55 United States of America Taiwan 32 27 173 0.017% 0.030% 0.024% 0.023%36 56 Switzerland United States of America 63 25 74 0.033% 0.027% 0.010% 0.023%
57 Denmark Denmark 42 34 41 0.022% 0.037% 0.006% 0.022%37 58 Belgium France 32 14 236 0.017% 0.015% 0.033% 0.022%38 59 Netherlands United Kingdom 25 15 253 0.013% 0.016% 0.035% 0.021%39 60 United States of America Denmark 24 12 252 0.013% 0.013% 0.035% 0.020%40 61 Finland Sweden 36 31 34 0.019% 0.034% 0.005% 0.019%
62 Japan Japan 22 16 194 0.012% 0.018% 0.027% 0.019%63 Poland Poland 33 32 27 0.017% 0.035% 0.004% 0.019%
41 64 United Kingdom Ireland-Rep 15 10 265 0.008% 0.010% 0.037% 0.018%42 65 United States of America Finland 32 16 144 0.017% 0.018% 0.020% 0.018%43 66 United States of America Brazil 31 17 140 0.016% 0.019% 0.019% 0.018%
67 Italy Italy 28 22 115 0.014% 0.023% 0.016% 0.018%44 68 United Kingdom Switzerland 24 19 134 0.013% 0.021% 0.019% 0.017%45 69 Hong Kong South Korea 9 5 294 0.005% 0.006% 0.041% 0.017%46 70 Singapore United States of America 32 18 109 0.017% 0.019% 0.015% 0.017%47 71 Luxembourg United States of America 64 13 21 0.034% 0.014% 0.003% 0.017%48 72 Switzerland France 31 21 67 0.016% 0.023% 0.009% 0.016%49 73 Belgium United Kingdom 36 15 75 0.019% 0.017% 0.010% 0.015%50 74 United Kingdom Spain 20 11 166 0.010% 0.012% 0.023% 0.015%
75 Singapore Singapore 12 11 186 0.006% 0.012% 0.026% 0.015%51 76 United States of America Spain 31 15 86 0.016% 0.016% 0.012% 0.015%52 77 Ireland-Rep United Kingdom 27 22 31 0.014% 0.024% 0.004% 0.014%53 78 United Kingdom Sweden 17 11 137 0.009% 0.012% 0.019% 0.014%54 79 United States of America Poland 22 18 64 0.011% 0.020% 0.009% 0.013%55 80 United States of America Austria 27 15 65 0.014% 0.016% 0.009% 0.013%56 81 Czech Republic Poland 24 24 12 0.012% 0.025% 0.002% 0.013%57 82 Sweden United States of America 29 11 89 0.015% 0.012% 0.012% 0.013%58 83 Hong Kong United States of America 18 11 126 0.009% 0.012% 0.018% 0.013%
84 Austria Austria 24 19 31 0.012% 0.020% 0.004% 0.012%59 85 Denmark United States of America 25 13 68 0.013% 0.014% 0.009% 0.012%60 86 Australia New Zealand 17 15 76 0.009% 0.016% 0.011% 0.012%61 87 United States of America Cayman Islands 1 1 240 0.001% 0.001% 0.033% 0.012%
88 New Zealand New Zealand 21 20 20 0.011% 0.021% 0.003% 0.012%62 89 United States of America New Zealand 12 9 137 0.006% 0.009% 0.019% 0.011%63 90 India United States of America 27 12 44 0.014% 0.013% 0.006% 0.011%64 91 Hong Kong Singapore 14 12 92 0.007% 0.013% 0.013% 0.011%65 92 United Kingdom Australia 19 9 96 0.010% 0.010% 0.013% 0.011%66 93 Ireland-Rep United States of America 21 12 62 0.011% 0.012% 0.009% 0.011%
94 Switzerland Switzerland 22 15 30 0.012% 0.016% 0.004% 0.010%67 95 Hong Kong Taiwan 13 12 87 0.007% 0.012% 0.012% 0.010%68 96 Netherlands Germany 22 15 25 0.012% 0.016% 0.003% 0.010%
97 Malaysia Malaysia 19 17 13 0.010% 0.018% 0.002% 0.010%69 98 Hong Kong China 13 10 86 0.007% 0.010% 0.012% 0.010%70 99 United States of America Argentina 15 8 90 0.008% 0.009% 0.013% 0.010%71 100 Germany Sweden 7 7 120 0.004% 0.007% 0.017% 0.009%

Appendix 206
Appendix 14: Country pairs (private equity) 101-200
Investment country pairs: Venture capital cross-bor der and domestic (1980-2005)Investment country pairs: Private Equity cross-bord er and domestic (1980-2005) 2/3
CB Nr. Source Host Participation Deal part. Deal flow % Part. % DP %DF Activity72 101 United States of America Hungary 13 8 83 0.007% 0.009% 0.012% 0.009%
102 Czech Republic Czech Republic 15 14 26 0.008% 0.015% 0.004% 0.009%73 103 Hong Kong Indonesia 9 7 102 0.005% 0.008% 0.014% 0.009%74 104 France United Kingdom 18 10 25 0.009% 0.011% 0.003% 0.008%
105 Vietnam Vietnam 13 13 17 0.007% 0.014% 0.002% 0.008%75 106 Belgium Germany 16 6 64 0.008% 0.006% 0.009% 0.008%76 107 South Korea United States of America 18 7 41 0.009% 0.008% 0.006% 0.008%77 108 United States of America Mexico 11 9 55 0.006% 0.010% 0.008% 0.008%78 109 France Netherlands 5 3 126 0.003% 0.003% 0.018% 0.008%79 110 United Kingdom South Korea 5 1 134 0.003% 0.002% 0.019% 0.008%
111 Portugal Portugal 14 13 11 0.007% 0.014% 0.001% 0.008%112 Greece Greece 4 4 116 0.002% 0.004% 0.016% 0.008%
80 113 Singapore Australia 13 12 20 0.007% 0.013% 0.003% 0.007%114 China China 14 13 3 0.007% 0.014% 0.000% 0.007%
81 115 Norway United States of America 18 8 24 0.009% 0.009% 0.003% 0.007%82 116 United Kingdom Denmark 10 7 64 0.005% 0.007% 0.009% 0.007%83 117 United States of America Philippines 7 5 90 0.003% 0.005% 0.013% 0.007%84 118 United Kingdom Israel 14 10 24 0.007% 0.010% 0.003% 0.007%85 119 United States of America Chile 8 6 72 0.004% 0.007% 0.010% 0.007%86 120 Singapore Hong Kong 11 9 37 0.006% 0.010% 0.005% 0.007%87 121 United States of America Norway 12 7 38 0.006% 0.008% 0.005% 0.006%88 122 Germany Austria 12 8 32 0.006% 0.008% 0.004% 0.006%89 123 Belgium Netherlands 17 6 26 0.009% 0.006% 0.004% 0.006%90 124 Sweden United Kingdom 10 9 30 0.005% 0.009% 0.004% 0.006%91 125 Singapore China 9 8 37 0.005% 0.009% 0.005% 0.006%92 126 Finland United States of America 15 6 27 0.008% 0.007% 0.004% 0.006%93 127 Hong Kong India 7 5 64 0.004% 0.006% 0.009% 0.006%94 128 United States of America Czech Republic 10 9 25 0.005% 0.010% 0.003% 0.006%95 129 United Kingdom India 7 6 56 0.004% 0.007% 0.008% 0.006%96 130 Hong Kong Malaysia 9 9 28 0.005% 0.009% 0.004% 0.006%97 131 Sweden Norway 9 8 32 0.005% 0.009% 0.004% 0.006%
132 Thailand Thailand 7 7 49 0.004% 0.007% 0.007% 0.006%98 133 United Kingdom Finland 9 6 43 0.005% 0.007% 0.006% 0.006%99 134 United States of America Romania 6 5 64 0.003% 0.005% 0.009% 0.006%
100 135 United Kingdom China 6 4 68 0.003% 0.005% 0.009% 0.006%101 136 United Kingdom Belgium 13 9 6 0.007% 0.009% 0.001% 0.006%102 137 Netherlands France 12 5 37 0.006% 0.005% 0.005% 0.006%103 138 United Kingdom Portugal 1 1 110 0.001% 0.001% 0.015% 0.005%104 139 Germany Switzerland 14 7 10 0.007% 0.007% 0.001% 0.005%105 140 Denmark United Kingdom 9 8 22 0.005% 0.008% 0.003% 0.005%106 141 United Kingdom Canada 9 5 41 0.004% 0.006% 0.006% 0.005%107 142 Hong Kong Thailand 7 7 30 0.004% 0.008% 0.004% 0.005%108 143 Norway Denmark 6 4 55 0.003% 0.004% 0.008% 0.005%109 144 Germany United Kingdom 11 5 25 0.006% 0.005% 0.004% 0.005%110 145 Sweden Finland 10 8 4 0.005% 0.008% 0.001% 0.005%111 146 Finland Denmark 7 7 22 0.004% 0.007% 0.003% 0.005%112 147 United Kingdom Sri Lanka 8 8 8 0.004% 0.009% 0.001% 0.005%113 148 Switzerland Germany 9 6 19 0.005% 0.006% 0.003% 0.005%114 149 United States of America South Africa 8 3 42 0.004% 0.003% 0.006% 0.004%115 150 United Kingdom Austria 7 5 33 0.004% 0.005% 0.005% 0.004%116 151 Switzerland Italy 7 6 21 0.004% 0.007% 0.003% 0.004%117 152 France Germany 12 5 15 0.006% 0.005% 0.002% 0.004%118 153 United States of America Nigeria 3 2 65 0.002% 0.002% 0.009% 0.004%119 154 France Belgium 9 5 21 0.004% 0.005% 0.003% 0.004%120 155 United Kingdom Hong Kong 7 4 35 0.003% 0.004% 0.005% 0.004%121 156 United States of America Russian Federation 5 3 49 0.003% 0.003% 0.007% 0.004%122 157 Singapore Taiwan 6 5 28 0.003% 0.005% 0.004% 0.004%123 158 New Zealand Australia 1 1 77 0.001% 0.001% 0.011% 0.004%124 159 United Kingdom Taiwan 3 2 59 0.002% 0.002% 0.008% 0.004%125 160 United States of America Indonesia 7 7 4 0.004% 0.008% 0.000% 0.004%126 161 France Luxembourg 2 1 68 0.001% 0.001% 0.009% 0.004%127 162 Netherlands Belgium 9 5 12 0.005% 0.005% 0.002% 0.004%128 163 Switzerland Denmark 5 2 48 0.003% 0.002% 0.007% 0.004%129 164 Belgium Switzerland 9 4 15 0.005% 0.004% 0.002% 0.004%130 165 Denmark Germany 8 6 7 0.004% 0.006% 0.001% 0.004%131 166 Japan South Korea 6 4 24 0.003% 0.004% 0.003% 0.004%132 167 Netherlands Antilles France 6 6 6 0.003% 0.007% 0.001% 0.004%133 168 Austria Germany 7 5 8 0.004% 0.006% 0.001% 0.004%134 169 Finland Norway 6 4 21 0.003% 0.004% 0.003% 0.003%135 170 Netherlands Italy 2 1 56 0.001% 0.001% 0.008% 0.003%
171 Slovak Republic Slovak Republic 6 6 3 0.003% 0.007% 0.000% 0.003%136 172 Norway Sweden 7 4 15 0.004% 0.004% 0.002% 0.003%137 173 Hong Kong Philippines 5 4 23 0.003% 0.004% 0.003% 0.003%138 174 France Switzerland 7 5 3 0.004% 0.006% 0.000% 0.003%139 175 Germany France 8 3 18 0.004% 0.003% 0.002% 0.003%140 176 United States of America Greece 7 5 2 0.004% 0.005% 0.000% 0.003%141 177 Germany Israel 7 4 10 0.004% 0.004% 0.001% 0.003%142 178 Japan Singapore 6 3 17 0.003% 0.003% 0.002% 0.003%143 179 United States of America Bulgaria 4 2 31 0.002% 0.002% 0.004% 0.003%144 180 United Kingdom Singapore 3 3 26 0.002% 0.003% 0.004% 0.003%145 181 Sweden Denmark 5 4 14 0.003% 0.004% 0.002% 0.003%146 182 Denmark Finland 6 4 3 0.003% 0.005% 0.000% 0.003%147 183 Switzerland Sweden 5 5 1 0.003% 0.005% 0.000% 0.003%148 184 Japan United Kingdom 6 2 18 0.003% 0.002% 0.003% 0.003%149 185 Brazil Argentina 5 5 0 0.003% 0.005% 0.000% 0.003%
186 Hungary Hungary 5 5 4 0.003% 0.005% 0.001% 0.003%150 187 Hong Kong Australia 5 4 4 0.003% 0.005% 0.001% 0.003%151 188 Belgium Ireland-Rep 6 3 11 0.003% 0.003% 0.002% 0.003%152 189 Italy France 5 4 4 0.003% 0.005% 0.001% 0.003%153 190 Israel United Kingdom 6 3 10 0.003% 0.003% 0.001% 0.003%154 191 Hong Kong United Kingdom 4 4 14 0.002% 0.004% 0.002% 0.003%155 192 Germany Italy 4 4 10 0.002% 0.004% 0.001% 0.003%156 193 United States of America Malaysia 5 5 4 0.002% 0.005% 0.001% 0.003%157 194 Spain United Kingdom 4 2 27 0.002% 0.002% 0.004% 0.003%158 195 United States of America Turkey 4 3 18 0.002% 0.003% 0.002% 0.003%159 196 Hong Kong Japan 4 3 13 0.002% 0.004% 0.002% 0.003%160 197 Sweden Iceland 2 2 29 0.001% 0.002% 0.004% 0.002%161 198 Switzerland United Kingdom 5 2 17 0.003% 0.002% 0.002% 0.002%162 199 Netherlands Canada 4 2 20 0.002% 0.002% 0.003% 0.002%163 200 Belgium Canada 4 4 3 0.002% 0.004% 0.000% 0.002%

Appendix 207
Appendix 15: Country pairs (private equity) 201-300
Investment country pairs: Venture capital cross-bor der and domestic (1980-2005)Investment country pairs: Private Equity cross-bord er and domestic (1980-2005) 3/3
CB Nr. Source Host Participation Deal part. Deal flow % Part. % DP %DF Activity164 201 United States of America Lithuania 2 2 30 0.001% 0.002% 0.004% 0.002%165 202 Sweden Switzerland 4 2 12 0.002% 0.003% 0.002% 0.002%166 203 Taiwan China 4 3 12 0.002% 0.003% 0.002% 0.002%167 204 Switzerland Argentina 4 4 0 0.002% 0.004% 0.000% 0.002%168 205 United Kingdom Czech Republic 3 1 24 0.002% 0.002% 0.003% 0.002%169 206 Denmark Sweden 5 3 3 0.003% 0.003% 0.000% 0.002%170 207 Greece Bulgaria 2 1 29 0.001% 0.001% 0.004% 0.002%171 208 Taiwan France 6 2 7 0.003% 0.002% 0.001% 0.002%172 209 Switzerland Austria 1 1 31 0.001% 0.001% 0.004% 0.002%173 210 Switzerland Portugal 2 2 23 0.001% 0.002% 0.003% 0.002%174 211 Norway United Kingdom 4 3 7 0.002% 0.003% 0.001% 0.002%175 212 United States of America Portugal 4 1 17 0.002% 0.001% 0.002% 0.002%176 213 Netherlands Norway 4 2 7 0.002% 0.003% 0.001% 0.002%177 214 Taiwan Japan 3 3 6 0.002% 0.003% 0.001% 0.002%178 215 United States of America Colombia 2 2 22 0.001% 0.002% 0.003% 0.002%179 216 Belgium Israel 3 3 6 0.002% 0.003% 0.001% 0.002%180 217 United Kingdom Poland 3 1 21 0.002% 0.001% 0.003% 0.002%181 218 Australia United Kingdom 4 3 3 0.002% 0.003% 0.000% 0.002%182 219 France Sweden 5 2 6 0.003% 0.002% 0.001% 0.002%183 220 Greece Cyprus 2 2 16 0.001% 0.002% 0.002% 0.002%184 221 Belgium Luxembourg 4 2 5 0.002% 0.003% 0.001% 0.002%185 222 Singapore Thailand 3 3 3 0.002% 0.003% 0.000% 0.002%186 223 Belgium Singapore 3 3 3 0.002% 0.003% 0.000% 0.002%187 224 Bermuda United States of America 3 1 20 0.002% 0.001% 0.003% 0.002%188 225 United States of America Thailand 3 3 2 0.002% 0.003% 0.000% 0.002%189 226 United Kingdom Nigeria 1 1 25 0.001% 0.001% 0.003% 0.002%190 227 Japan France 4 1 12 0.002% 0.001% 0.002% 0.002%
228 Sri Lanka Sri Lanka 3 3 0 0.002% 0.003% 0.000% 0.002%191 229 United Kingdom Kenya 3 3 0 0.002% 0.003% 0.000% 0.002%
230 Russian Federation Russian Federation 3 3 0 0.002% 0.003% 0.000% 0.002%192 231 Japan China 2 1 19 0.001% 0.001% 0.003% 0.002%193 232 Belgium Sweden 5 1 5 0.003% 0.001% 0.001% 0.002%194 233 Italy United Kingdom 4 1 13 0.002% 0.001% 0.002% 0.002%195 234 Luxembourg Italy 2 2 11 0.001% 0.002% 0.001% 0.002%196 235 Netherlands Israel 4 2 6 0.002% 0.002% 0.001% 0.002%197 236 Czech Republic Slovak Republic 3 3 2 0.002% 0.003% 0.000% 0.002%198 237 Canada South Korea 1 0 27 0.001% 0.000% 0.004% 0.002%199 238 United Kingdom Philippines 1 1 21 0.001% 0.001% 0.003% 0.002%200 239 Brazil Chile 2 2 9 0.001% 0.002% 0.001% 0.002%201 240 Sweden Japan 2 2 9 0.001% 0.002% 0.001% 0.001%202 241 Canada United Kingdom 3 2 8 0.002% 0.002% 0.001% 0.001%203 242 France Italy 3 3 1 0.002% 0.003% 0.000% 0.001%204 243 Italy Belgium 2 2 12 0.001% 0.002% 0.002% 0.001%205 244 United Kingdom Russian Federation 2 2 8 0.001% 0.002% 0.001% 0.001%206 245 Switzerland Israel 3 3 1 0.002% 0.003% 0.000% 0.001%207 246 Finland Lithuania 3 2 4 0.002% 0.002% 0.001% 0.001%208 247 Netherlands Denmark 2 2 7 0.001% 0.002% 0.001% 0.001%209 248 Australia Italy 1 1 18 0.001% 0.001% 0.003% 0.001%210 249 Italy Ireland-Rep 1 1 22 0.001% 0.001% 0.003% 0.001%211 250 Netherlands Switzerland 4 1 4 0.002% 0.001% 0.001% 0.001%212 251 Luxembourg United Kingdom 3 1 10 0.002% 0.001% 0.001% 0.001%213 252 Netherlands Czech Republic 1 0 24 0.001% 0.000% 0.003% 0.001%214 253 Singapore India 2 2 8 0.001% 0.002% 0.001% 0.001%215 254 Singapore Malaysia 2 2 3 0.001% 0.002% 0.000% 0.001%216 255 Germany Netherlands 3 1 10 0.002% 0.001% 0.001% 0.001%217 256 Singapore Indonesia 1 1 14 0.001% 0.001% 0.002% 0.001%218 257 Australia Canada 2 2 2 0.001% 0.002% 0.000% 0.001%219 258 United Kingdom Japan 1 1 14 0.001% 0.001% 0.002% 0.001%220 259 Australia Singapore 2 2 2 0.001% 0.002% 0.000% 0.001%221 260 France Israel 3 1 3 0.002% 0.002% 0.000% 0.001%222 261 Luxembourg France 3 1 6 0.002% 0.001% 0.001% 0.001%223 262 Netherlands Antilles Finland 2 2 2 0.001% 0.002% 0.000% 0.001%224 263 Switzerland Norway 2 1 11 0.001% 0.001% 0.002% 0.001%225 264 United Kingdom Hungary 3 2 1 0.002% 0.002% 0.000% 0.001%226 265 Finland Estonia 2 2 0 0.001% 0.002% 0.000% 0.001%
266 Morocco Morocco 2 2 4 0.001% 0.002% 0.001% 0.001%227 267 Switzerland Netherlands 2 2 0 0.001% 0.002% 0.000% 0.001%228 268 Switzerland Canada 2 2 0 0.001% 0.002% 0.000% 0.001%229 269 United States of America Estonia 2 2 0 0.001% 0.002% 0.000% 0.001%230 270 Japan Hong Kong 2 2 0 0.001% 0.002% 0.000% 0.001%231 271 United States of America Iceland 3 1 1 0.002% 0.002% 0.000% 0.001%232 272 Brazil United States of America 2 2 3 0.001% 0.002% 0.000% 0.001%233 273 Norway Kenya 2 1 9 0.001% 0.001% 0.001% 0.001%234 274 United States of America Slovak Republic 2 2 3 0.001% 0.002% 0.000% 0.001%235 275 United Kingdom Norway 2 1 5 0.001% 0.001% 0.001% 0.001%236 276 United States of America Morocco 1 1 10 0.001% 0.001% 0.001% 0.001%237 277 Luxembourg Singapore 1 1 10 0.001% 0.001% 0.001% 0.001%238 278 Australia Indonesia 1 1 10 0.001% 0.001% 0.001% 0.001%239 279 Netherlands Sweden 2 1 3 0.001% 0.001% 0.000% 0.001%240 280 Japan Canada 3 1 5 0.002% 0.001% 0.001% 0.001%241 281 Singapore South Korea 2 1 3 0.001% 0.001% 0.000% 0.001%242 282 New Zealand United States of America 3 1 2 0.002% 0.001% 0.000% 0.001%243 283 Israel France 1 0 14 0.001% 0.000% 0.002% 0.001%244 284 France Portugal 2 0 9 0.001% 0.001% 0.001% 0.001%245 285 United Kingdom South Africa 3 1 0 0.002% 0.001% 0.000% 0.001%246 286 France Canada 2 1 2 0.001% 0.001% 0.000% 0.001%247 287 India Singapore 1 0 12 0.001% 0.000% 0.002% 0.001%248 288 Denmark Australia 2 1 1 0.001% 0.001% 0.000% 0.001%249 289 Argentina United States of America 2 1 5 0.001% 0.001% 0.001% 0.001%250 290 United States of America United Arab Emirates 1 1 7 0.001% 0.001% 0.001% 0.001%251 291 Canada Germany 2 1 1 0.001% 0.001% 0.000% 0.001%252 292 United States of America Croatia 1 1 6 0.001% 0.001% 0.001% 0.001%253 293 France Spain 2 2 0 0.001% 0.002% 0.000% 0.001%254 294 Germany Hong Kong 2 1 5 0.001% 0.001% 0.001% 0.001%255 295 United Kingdom Thailand 1 1 5 0.001% 0.001% 0.001% 0.001%256 296 United States of America Algeria 1 1 4 0.001% 0.001% 0.001% 0.001%257 297 Greece United States of America 2 1 3 0.001% 0.001% 0.000% 0.001%258 298 Taiwan Hong Kong 1 1 0 0.001% 0.001% 0.000% 0.001%259 299 United States of America Netherlands Antilles 1 1 3 0.001% 0.001% 0.000% 0.001%260 300 Brazil British Virgin 1 1 7 0.001% 0.001% 0.001% 0.001%

Appendix 208
Appendix 16: Venture Capital investment: Gravity model analysis with gravity indicators Gravity model analysis Participation Deal participation Dealflow Activity %
Venture Capital Numberofobs=2012 Numberofobs=2012 Numberofobs=1744 Numberofobs=2012F(31,1980)=32.8 F(31,1980)=23.54 F(31,1712)=17.03 F(31,1980)=27.93
Indicators log Source Prob>F=0 Prob>F=0 Prob>F=0 Prob>F=0Host R-squared=0.3848 R-squared=0.2723 R-squared=0.2749 R-squared=0.3369
RootMSE=0.94335 RootMSE=1.1137 RootMSE=1.6727 RootMSE=1.0902
A) Gravity model indicators Coef. P>|t| Beta Coef. P>|t| Beta Coef. P>|t| Beta Coef. P>|t| Beta1) Economic mass (+)
Population log S (+) 0.3443 0.000 0.438 0.3628 0.000 0.426 0.5610 0.000 0.442 0.4150 0.000 0.475H (+) 0.3864 0.000 0.517 0.3314 0.000 0.409 0.4979 0.000 0.414 0.3876 0.000 0.466
2) Economic distance (-)Distance log (-) -0.1883 0.000 -0.187 -0.2050 0.000 -0.187 -0.3394 0.000 -0.204 -0.2479 0.000 -0.221
Factors eco. distance: (+)Common language (+) 0.5652 0.000 0.194 0.6175 0.000 0.195 0.5724 0.000 0.124 0.6479 0.000 0.199Common border (+) -0.0779 0.346 -0.024 -0.1346 0.172 -0.038 -0.4557 0.011 -0.084 -0.2312 0.019 -0.064Common history (+) 0.2671 0.037 0.044 0.2619 0.062 0.040 0.4966 0.025 0.052 0.3379 0.018 0.050Common currency (+) -0.6204 0.000 -0.111 -0.6379 0.000 -0.106 -0.8976 0.000 -0.088 -0.7588 0.000 -0.122Common legal system (+) -0.1374 0.014 -0.056 -0.0534 0.434 -0.020 -0.0773 0.503 -0.019 -0.1058 0.111 -0.039
3) Country pair specificExchange rates S (+) 0.0017 0.475 0.015 0.0030 0.287 0.025 -0.0135 0.002 -0.075 -0.0012 0.657 -0.010
H (-) -0.0040 0.027 -0.041 -0.0004 0.826 -0.004 -0.0055 0.176 -0.033 -0.0061 0.004 -0.056Openness of im- and exports to GDP S (+) 0.1341 0.001 0.085 0.0681 0.155 0.040 0.4084 0.000 0.162 0.1999 0.000 0.113
H (+) 0.0528 0.190 0.026 0.1289 0.006 0.058 0.1745 0.034 0.053 0.1175 0.009 0.052Development S (+) -0.0697 0.698 -0.015 0.0208 0.929 0.004 0.8977 0.010 0.119 0.0295 0.888 0.006
H (+) 0.0785 0.490 0.024 -0.0444 0.740 -0.013 -0.5054 0.041 -0.095 -0.1100 0.430 -0.031
2) Endowment-related variablesGDP per capita log S (+) 1.0562 0.000 0.370 0.9764 0.000 0.315 1.0550 0.000 0.222 1.1312 0.000 0.356
H (+) 0.8492 0.000 0.424 0.6163 0.000 0.283 0.9876 0.000 0.306 0.7972 0.000 0.357
Appendix 17: Venture Capital investment: Analysis with gravity and banking indicators
Gravity model analysis Participation Deal participation Dealflow Activity %Venture Capital Numberofobs=2012 Numberofobs=2012 Numberofobs=1744 Numberofobs=2012
F(45,1966)=31.17 F(45,1966)=24.88 F(45,1698)=16.05 F(45,1966)=27.18Indicators log Source Prob>F=0 Prob>F=0 Prob>F=0 Prob>F=0
Host R-squared=0.4611 R-squared=0.3624 R-squared=0.3233 R-squared=0.4112RootMSE=0.88607 RootMSE=1.0462 RootMSE=1.6225 RootMSE=1.031
A) Gravity model indicators Coef. P>|t| Beta Coef. P>|t| Beta Coef. P>|t| Beta Coef. P>|t| Beta1) Economic mass (+)
Population log S (+) 0.2669 0.000 0.340 0.2169 0.000 0.254 0.4682 0.000 0.369 0.2907 0.000 0.333H (+) 0.2553 0.000 0.342 0.2543 0.000 0.314 0.4178 0.000 0.348 0.2937 0.000 0.353
2) Economic distance (-)Distance log (-) -0.3486 0.000 -0.346 -0.3811 0.000 -0.348 -0.4802 0.000 -0.288 -0.4119 0.000 -0.367
Factors eco. distance: (+)Common language (+) 0.5422 0.000 0.186 0.5860 0.000 0.185 0.5301 0.000 0.115 0.6095 0.000 0.187Common border (+) -0.1197 0.137 -0.037 -0.1739 0.072 -0.049 -0.4106 0.021 -0.075 -0.2432 0.011 -0.067Common history (+) 0.1601 0.145 0.026 0.1723 0.175 0.026 0.1982 0.366 0.021 0.2135 0.102 0.032Common currency (+) -0.4647 0.000 -0.083 -0.4212 0.000 -0.070 -0.5897 0.002 -0.058 -0.5725 0.000 -0.092Common legal system (+) -0.0931 0.076 -0.038 -0.0036 0.955 -0.001 0.0357 0.750 0.009 -0.0466 0.455 -0.017
3) Country pair specificExchange rates S (+) -0.0037 0.112 -0.034 -0.0030 0.271 -0.025 -0.0204 0.000 -0.113 -0.0064 0.016 -0.053
H (-) -0.0079 0.000 -0.081 -0.0055 0.011 -0.051 -0.0079 0.112 -0.047 -0.0086 0.000 -0.078Openness of im- and exports to GDP S (+) 0.1403 0.001 0.089 0.0260 0.600 0.015 0.3674 0.000 0.146 0.1693 0.000 0.096
H (+) 0.0711 0.122 0.035 0.1669 0.002 0.075 0.1795 0.073 0.054 0.1286 0.014 0.057Development S (+) 0.7412 0.002 0.160 0.8577 0.002 0.171 1.9563 0.000 0.258 1.0561 0.000 0.205
H (+) 0.5991 0.000 0.187 0.4857 0.003 0.139 0.4829 0.141 0.090 0.5453 0.001 0.153
B) Private Equity related indicators1) Banking system
1.1 Size (+)M2 to GDP S (+) -0.0672 0.243 -0.026 -0.0776 0.274 -0.027 -0.1661 0.162 -0.039 -0.0735 0.301 -0.025
H (+) -0.2433 0.000 -0.081 -0.2544 0.001 -0.078 -0.1096 0.467 -0.023 -0.1360 0.098 -0.041Private credit to GDP S (+) 0.4780 0.000 0.211 0.7069 0.000 0.288 1.1202 0.000 0.305 0.7001 0.000 0.278
H (+) 0.3917 0.000 0.182 0.4146 0.000 0.178 0.4028 0.004 0.116 0.3731 0.000 0.1561.2 Efficiency (+)
Return on assets S (+) 0.0009 0.217 0.021 0.0004 0.702 0.008 -0.0007 0.600 -0.010 0.0003 0.707 0.007H (+) 0.0000 0.969 -0.001 -0.0005 0.377 -0.017 0.0008 0.372 0.021 0.0004 0.549 0.013
Operating costs to total assets S (-) -0.0003 0.101 -0.042 -0.0007 0.011 -0.081 -0.0004 0.296 -0.035 -0.0003 0.207 -0.037H (-) -0.0001 0.420 -0.016 -0.0001 0.728 -0.009 0.0005 0.109 0.053 0.0002 0.272 0.031
Net interest margin S (+) 0.1398 0.000 0.117 0.1594 0.000 0.123 0.2093 0.014 0.105 0.1954 0.000 0.147H (+) 0.0523 0.058 0.055 0.0868 0.002 0.085 0.1156 0.012 0.077 0.0821 0.006 0.078
1.3 Competitiveness (+)Interest rate spread S (+) -0.0062 0.072 -0.040 -0.0056 0.190 -0.033 -0.0076 0.384 -0.025 -0.0059 0.118 -0.034
H (+) -0.0010 0.841 -0.004 -0.0047 0.490 -0.016 -0.0002 0.984 0.000 -0.0010 0.874 -0.003Number of banks per GDP S (+) 0.0000 0.262 0.051 0.0000 0.135 0.074 -0.0001 0.046 -0.123 0.0000 0.621 0.023
H (+) 0.0001 0.000 0.208 0.0000 0.020 0.105 0.0000 0.203 0.070 0.0001 0.001 0.1402) Endowment-related variables
2.2 Corporate eco. conditions (+)GDP per capita log S (+) 0.3777 0.013 0.132 0.0636 0.717 0.021 0.0636 0.825 0.013 0.2060 0.211 0.065
H (+) 0.1889 0.061 0.094 0.0809 0.490 0.037 0.2422 0.291 0.075 0.1696 0.169 0.076

Appendix 209
Appendix 18: Private Equity investment: Gravity model analysis with gravity indicators Gravity model analysis Participation Deal participation Dealflow Activity %
Private Equity Numberofobs=1167 Numberofobs=1167 Numberofobs=992 Numberofobs=1167F(31,1135)=18.41 F(31,1135)=9.04 F(31,960)=13.53 F(31,1135)=13.99
Indicators log Source Prob>F=0 Prob>F=0 Prob>F=0 Prob>F=0Host R-squared=0.3681 R-squared=0.2045 R-squared=0.3136 R-squared=0.3078
RootMSE=0.82193 RootMSE=1.016 RootMSE=1.6414 RootMSE=1.0038
A) Gravity model indicators Coef. P>|t| Beta Coef. P>|t| Beta Coef. P>|t| Beta Coef. P>|t| Beta1) Economic mass (+)
Population log S (+) 0.3173 0.000 0.477 0.2552 0.000 0.348 0.7213 0.000 0.574 0.3849 0.000 0.496H (+) 0.3099 0.000 0.477 0.2564 0.000 0.358 0.4322 0.000 0.349 0.3213 0.000 0.423
2) Economic distance (-)Distance log (-) -0.0481 0.148 -0.057 -0.0530 0.218 -0.057 -0.2134 0.005 -0.132 -0.1206 0.004 -0.123
Factors eco. distance: (+)Common language (+) 0.2176 0.003 0.092 0.2709 0.002 0.104 0.5312 0.001 0.120 0.3507 0.000 0.127Common border (+) -0.0401 0.697 -0.015 -0.0841 0.514 -0.028 -0.5764 0.009 -0.109 -0.2643 0.034 -0.084Common history (+) 0.1210 0.373 0.026 0.0941 0.554 0.018 0.2709 0.297 0.031 0.1575 0.335 0.029Common currency (+) -0.6047 0.000 -0.119 -0.6708 0.000 -0.120 -1.0448 0.000 -0.099 -0.7405 0.000 -0.125Common legal system (+) 0.0822 0.228 0.039 0.1214 0.142 0.053 0.2464 0.105 0.061 0.1117 0.171 0.046
3) Country pair specificExchange rates S (+) -0.0073 0.014 -0.074 -0.0086 0.025 -0.079 -0.0078 0.184 -0.040 -0.0082 0.022 -0.071
H (-) -0.0001 0.959 -0.001 0.0048 0.067 0.051 -0.0004 0.937 -0.002 0.0012 0.669 0.012Openness of im- and exports to GDP S (+) 0.2092 0.000 0.132 0.1232 0.060 0.071 0.5241 0.000 0.172 0.2302 0.000 0.125
H (+) -0.0412 0.374 -0.023 0.0416 0.462 0.021 0.1701 0.149 0.048 0.0723 0.262 0.034Development S (+) 0.5301 0.035 0.085 0.3103 0.369 0.045 0.8865 0.048 0.073 0.4951 0.095 0.068
H (+) 0.0995 0.497 0.035 -0.0026 0.989 -0.001 -0.6646 0.071 -0.118 -0.1260 0.508 -0.038
2) Endowment-related variablesGDP per capita log S (+) 0.5276 0.001 0.163 0.6003 0.002 0.169 1.0293 0.000 0.167 0.7401 0.000 0.196
H (+) 0.6650 0.000 0.372 0.4178 0.000 0.212 1.2492 0.000 0.353 0.7049 0.000 0.338
Appendix 19: Private Equity investment: Analysis with gravity indicators and banking indicators
Gravity model analysis Participation Deal participation Dealflow Activity %Private Equity Numberofobs=1167 Numberofobs=1167 Numberofobs=992 Numberofobs=1167
F(45,1121)=16.07 F(45,1121)=10.43 F(45,946)=11 F(45,1121)=13.16Indicators log Source Prob>F=0 Prob>F=0 Prob>F=0 Prob>F=0
Host R-squared=0.4296 R-squared=0.2864 R-squared=0.3458 R-squared=0.3761RootMSE=0.78576 RootMSE=0.96833 RootMSE=1.6142 RootMSE=0.95896
A) Gravity model indicators Coef. P>|t| Beta Coef. P>|t| Beta Coef. P>|t| Beta Coef. P>|t| Beta1) Economic mass (+)
Population log S (+) 0.2146 0.000 0.322 0.0795 0.115 0.108 0.6253 0.000 0.498 0.2364 0.000 0.304H (+) 0.2621 0.000 0.403 0.2777 0.000 0.388 0.4055 0.000 0.328 0.3201 0.000 0.422
2) Economic distance (-)Distance log (-) -0.1530 0.000 -0.182 -0.1636 0.000 -0.176 -0.3586 0.000 -0.222 -0.2231 0.000 -0.227
Factors eco. distance: (+)Common language (+) 0.1301 0.075 0.055 0.1628 0.063 0.062 0.3476 0.034 0.078 0.2267 0.009 0.082Common border (+) -0.0616 0.543 -0.023 -0.1294 0.311 -0.044 -0.4691 0.045 -0.089 -0.2472 0.046 -0.079Common history (+) 0.1995 0.111 0.042 0.2120 0.167 0.041 0.2745 0.320 0.031 0.2328 0.145 0.042Common currency (+) -0.4302 0.000 -0.085 -0.4541 0.004 -0.081 -0.7338 0.022 -0.069 -0.5125 0.001 -0.086Common legal system (+) 0.0801 0.236 0.038 0.1247 0.130 0.054 0.2628 0.082 0.065 0.1257 0.115 0.051
3) Country pair specificExchange rates S (+) -0.0115 0.000 -0.117 -0.0136 0.001 -0.125 -0.0133 0.038 -0.067 -0.0121 0.001 -0.105
H (-) -0.0027 0.272 -0.031 0.0010 0.716 0.011 0.0004 0.945 0.002 0.0000 0.989 0.000Openness of im- and exports to GDP S (+) 0.2369 0.000 0.150 0.1411 0.059 0.081 0.6012 0.000 0.198 0.2332 0.001 0.126
H (+) 0.0018 0.973 0.001 0.1408 0.036 0.071 0.2127 0.112 0.061 0.1511 0.039 0.072Development S (+) 1.9368 0.000 0.310 2.0406 0.000 0.297 2.6679 0.000 0.219 2.1845 0.000 0.300
H (+) 0.3915 0.047 0.139 0.3347 0.163 0.108 0.4624 0.347 0.082 0.4464 0.056 0.136
B) Private Equity related indicators1) Banking system
1.1 Size (+)M2 to GDP S (+) -0.1911 0.007 -0.082 -0.2495 0.006 -0.097 -0.1150 0.506 -0.026 -0.1773 0.045 -0.065
H (+) -0.2684 0.001 -0.104 -0.3119 0.003 -0.110 -0.0703 0.715 -0.014 -0.3146 0.002 -0.105Private credit to GDP S (+) 0.5061 0.000 0.277 0.6990 0.000 0.347 0.5331 0.011 0.155 0.6899 0.000 0.323
H (+) 0.2450 0.004 0.138 0.1831 0.077 0.094 0.3235 0.105 0.097 0.3062 0.004 0.1481.2 Efficiency (+)
Return on assets S (+) -0.0005 0.057 -0.011 0.0007 0.109 0.012 0.0004 0.606 0.004 0.0001 0.873 0.001H (+) 0.0002 0.740 0.008 0.0003 0.596 0.015 0.0001 0.918 0.004 0.0004 0.609 0.015
Operating costs to total assets S (-) 0.0003 0.272 0.035 0.0001 0.703 0.015 0.0005 0.431 0.029 0.0003 0.373 0.030H (-) -0.0001 0.587 -0.017 -0.0001 0.674 -0.015 0.0009 0.030 0.101 0.0003 0.223 0.054
Net interest margin S (+) 0.1734 0.003 0.162 0.2321 0.000 0.197 0.5372 0.000 0.257 0.2609 0.000 0.209H (+) -0.0806 0.036 -0.081 -0.0605 0.181 -0.055 0.0552 0.506 0.029 -0.0583 0.214 -0.050
1.3 Competitiveness (+)Interest rate spread S (+) 0.0169 0.012 0.061 0.0189 0.016 0.062 -0.0110 0.770 -0.014 0.0159 0.046 0.049
H (+) -0.0040 0.580 -0.015 -0.0041 0.683 -0.014 0.0037 0.779 0.007 -0.0015 0.841 -0.005Number of banks per GDP S (+) 0.0000 0.589 0.042 0.0000 0.508 0.056 0.0000 0.295 -0.110 0.0000 0.989 -0.001
H (+) 0.0000 0.029 0.137 0.0000 0.625 0.034 0.0000 0.577 0.043 0.0000 0.638 0.0292) Endowment-related variables
2.2 Corporate eco. conditions (+)GDP per capita log S (+) -0.5201 0.025 -0.161 -0.8473 0.002 -0.238 -0.0540 0.890 -0.009 -0.6155 0.022 -0.163
H (+) 0.2963 0.024 0.166 0.2153 0.186 0.109 0.5717 0.099 0.161 0.2958 0.064 0.142