BORDER PETROLEUM LIMITED
23
BORDER PETROLEUM LIMITED (Formerly Border Petroleum Corp.) MANAGEMENT’S DISCUSSION AND ANALYSIS July 16, 2014 SUITE 2000, 840 – 7 AVENUE S.W. CALGARY, ALBERTA T2P 3G2
-
Upload
khangminh22 -
Category
Documents
-
view
0 -
download
0
Transcript of BORDER PETROLEUM LIMITED

BORDER PETROLEUM LIMITED (Formerly Border Petroleum Corp.)
MANAGEMENT’S DISCUSSION AND
ANALYSIS
July 16, 2014
SUITE 2000, 840 – 7 AVENUE S.W. CALGARY, ALBERTA T2P 3G2
Border Petroleum Ltd.
Management's Discussion & Analysis
- 2 -
MANAGEMENT'S DISCUSSION AND ANALYSIS
The following discussion and analysis of financial results and related data has been prepared by management, is
reported in Canadian dollars and should be read in conjunction with the audited financial statements for the year
ended March 31, 2014. The accompanying financial statements were approved by the Corporation’s Audit
Committee on behalf of the Board of Directors. The financial information presented herein has been prepared in
accordance with International Financial Reporting Standards (“IFRS”). Additional information relating to Border is
filed at www.sedar.com. This Management’s Discussion and Analysis is dated as of July 16, 2014.
BOE presentation – For the purposes of calculating unit costs, natural gas is converted to a barrel of oil equivalent (boe) using six thousand cubic feet equal to one boe unless otherwise stated. A boe is a very approximate comparative measure that, in some cases, could be misleading, particularly if used in isolation.
FORWARD-LOOKING STATEMENTS The information herein contains forward-looking statements and assumptions. All statements other than statements of historical fact may be forward-looking statements. Forward-looking statements are often, but not always, identified by the use of words such as “seek”, “anticipate”, “plan”, continue”, “estimate”, “expect”, “may”, “will”, “project”, “predict”, “potential, “targeting”, “intend”, “could”, “might”, “should”, “believe” and other similar expressions. Such statements and assumptions also include those relating to guidance, results of operations and financial condition, capital spending, financing sources, commodity prices, cost of production and the magnitude of oil and gas reserves. By their nature, forward-looking statements are subject to numerous known and unknown risks and uncertainties that could significantly affect anticipated results in the future and, accordingly, actual results may differ materially from those predicted. Border Petroleum Corp. is exposed to numerous operation, technical, financial and regulatory risks and uncertainties, many of which are beyond its control and may significantly affect anticipated future results. Operations may be unsuccessful or delayed as a result of competition for services, supplies and equipment, mechanical and technical difficulties, ability to attract and retain employees on a cost-effective basis, commodity and marketing risk and seasonality. Border Petroleum Corp. is subject to significant drill risks and uncertainties including the ability to find oil and natural gas reserves on an economic basis and the potential for technical problems that could lead to well blowouts and environmental damage. Border Petroleum Ltd. is also exposed to risks relating to the inability to obtain timely regulatory approvals, surface access, access to third party gathering and processing facilities, transportation and other third party related operation risks. Furthermore, there are numerous uncertainties in estimating Border Petroleum Ltd.’s reserve base due to the complexities in estimated future production, costs and timing of expenses and future capital. The financial risks Border Petroleum Ltd. is exposed to include, but not limited to, access to debt or equity markets and fluctuations in commodity prices, interest rates and the Canadian/US dollar exchange rate. Border Petroleum Ltd. is subject to regulatory legislation, the compliance with which may require significant expenditures and non-compliance with which may result in fines, penalties or production restrictions. Readers are cautioned that the assumptions used in the preparation of such information, although considered reasonable at the time preparation of, may prove to be imprecise and, as such, undue reliance should not be placed on forward-looking statements. Border Petroleum Corp. does not undertake any obligation to update publicly or to revise any of the included forward-looking statements, whether as a result of new information, future events or otherwise, except as may be required by applicable securities laws.
NON-IFRS MEASURES This MD&A includes references to financial measures commonly used in the oil and gas industry. The terms “net petroleum and natural gas revenue” (petroleum and natural gas sales less royalties, production expenses and transportation costs) and “funds from operations” (net loss for the period adjusted for non-cash items in the statement of operations) have no standardized meanings, are not defined by IFRS, and accordingly are referred to as non-IFRS measures.
Border Petroleum Ltd. also uses “operating netbacks” as a key performance indicator of field results by commodity. “Operating netbacks” do not have a standardized meaning prescribed by IFRS and therefore may not be comparable with the calculation of similar measures by other companies. Operating netbacks are determined by deducting royalties, operating, processing and transportation expenses from petroleum and natural gas sales.

Border Petroleum Ltd.
Management's Discussion & Analysis
Funds from operations and operating netbacks are not intended to represent operating profits, nor should they be viewed as an alternative to cash flow provided by operating activities, net loss or other measures of financial performance calculated in accordance with IFRS.
CORPORATION OVERVIEW
The primary business of Border Petroleum Ltd. (“Border” or the “Corporation”) is the acquisition, development and
production of crude oil, natural gas and natural gas liquids from properties located in the province of Alberta. The
Corporation’s shares are posted on the TSX Venture Exchange (the “TSXV”) under the symbol “BOR”. The
Corporation changed its name from Border Petroleum Corp. to Border Petroleum Ltd. on March 21, 2014.
HIGHLIGHTS On March 27, 2014, Border dissolved its Special Committee and terminated its advisors. Border continues to evaluate properties and companies to enhance shareholder value.
OPERATIONS The Corporation’s average net daily production was 137 boe/d for the year ended March 31, 2014 compared to 216 boe/d for the last year. Average net daily production was 130 boe/d for the three months ended March 31, 2014 compared to 232 boe/d for the last year. In Red Earth and in Norris, several wells were down for pump changes, some work was completed this quarter and other work is now waiting for dry conditions to complete this work. Producing Properties Red Earth/Dawson, Alberta The Corporation has a working interest in 22,160 gross acres (22,117 net) in the Red Earth and Dawson area of northwestern Alberta (“Non-Reserve Lands”). Of this the largest component is the Loon block which is 18,482 acres gross/net acres. The Corporation has a single well in the Dawson field located at 6-23-80-17W5M. All of the wells operate as single well batteries with effluent trucked to local processing facilities. With respect to Border’s horizontal wells on the Loon Block, the long-leg Slave Point horizontal well located at 10-15-85-10W5M has been shut in since April 12, 2013 and remains shut in due to high operating costs in effluent trucking. The two short-leg horizontal wells on the Loon Block have been shut in due to maintenance issues and the freeze on capital spending. The Red Earth/Dawson production during the three and twelve months ended March 31, 2014, averaged 3 bbls/d and 9 bbls/d respectively. Last year, the three and twelve months ended March 31, 2013, averaged 39 bbls/d and 41 bbls/d, respectively. Leduc, Alberta The Corporation has an interest in 4,820 gross acres (4,564 net) in the Leduc area of central Alberta. The Corporation has a 100% working interest in the wells 15-19-49-26W4M, 10-29-49-26W4M, 8-32-49-26W4M, 14-32-49-26W4M and 13-33-49-26W4M and 60% in 11-33-49-26W4M. The Leduc production during the three and twelve months ended March 31, 2014, averaged 119 boe/d and 117 boe/d, respectively. Last year, the Leduc production for the three and twelve months ended March 31, 2013, averaged 147 boe/d and 129 boe/d, respectively. Norris, Alberta The Corporation has various working interests varying from 57.5% to 100% in 520 gross acres (452 net acres) in the Norris area of central Alberta which also consists of five producing oil wells and one water disposal well. The Corporation has a 57.5% working interest in the well 100/16-21-53-18W4M and 100.0% working interest in wells 102/16-21-53-18W4M, 00/01-28-53-18W4M, 102/01-28-53-18W4M and 100/04-27-053-18W4M which all produce from the Mannville formation. Norris wells have continued to experience mechanical issues and several Norris wells had further pump optimization performed during the reporting period. The Norris production during the three and twelve months ended March 31, 2014, averaged nil bbls/d and 2 bbls/d, respectively. Last year, the Norris production for the three and twelve months ended March 31, 2013, averaged 16 bbls/d and 12 bbls/d, respectively. Cherhill/Majeau, Alberta Border has a 37.5% to 100% working interest in 3,170 acres (2,770 net acres) in the Cherhill area of southwestern Alberta. The wells, 100/03-25-56-04W5 and the 6-26-56-04W5M, produce from the Glauconite formation. The

Border Petroleum Corp.
Management's Discussion & Analysis
2
Cherhill/Majeau production during the three and twelve months ended March 31, 2014, averaged 8 bbls/d and 6 bbls/d, respectively. Last year, the Cherhill/Majeau production for the three and twelve months ended March 31, 2013, averaged 9 bbls/d and 9 bbls/d, respectively. Non-Producing Properties Pembina/Brazeau, Alberta
The Pembina production for the three and nine months ended March 31, 2014, averaged nil boe/d and 4 boe/d, respectively. Last year, the Pembina production for the three and nine months ended March 31, 2013, averaged 21 boe/d and 25 boe/d, respectively. The properties in the Pembina area are comprised of shallow natural gas wells that are not Operated by Border. Due to low natural gas prices for the past few years, the wells were not economically viable and were primarily shut-in and the Operator filed bankruptcy. For these reasons the Pembina reserves were not included in the March 31, 2014 independent engineering report. Cardiff, Alberta No production. Tomahawk, Central Alberta Border incurred 100% of the cost to complete the Wilrich zone in a vertical well located at LSD 1-20-52-7W5 in the Tomahawk area of Central Alberta. Results exceeded expectations in that during 130 hours of clean-up after fracture stimulation, flow increased to a relatively stable rate of 30.5 M3/d (1,080 mcf/d).Border earned a 60% working interest in the section of land (640 acres) on which the well is located. Conrad, Southeastern Alberta Border incurred 100% of the drilling costs of a well located at LSD 3-32-5-15W4 in the Conrad area of south eastern Alberta. The well was drilled as a vertical strat test that was subsequently sidetracked for use as a future Sawtooth horizontal well. Border earned a 60% working interest in the target zone on the quarter section of land on which the well was drilled. Montgomery, Southwestern Alberta Border incurred 30% of the cost to complete the Cutbank zone in a vertical well located at LSD 1-16-12-29 W4 in the Montgomery area of south western Alberta. The well stabilized at a rate of approximately 13.0 M3/d (450mcf/d). Border earned a 30% working interest in the completed well.
PRODUCTION SUMMARY
% %
2014 2013 CHANGE 2014 2013 CHANGE
Total Production
Oil - bbls 2,579 7,386 (65) 10,414 28,028 (63)
Natural gas liquids - bbls 1,472 3,127 (53) 7,646 7,215 6
Natural Gas - Mcf 45,981 62,366 (26) 192,678 261,998 (26)
Total boe 11,715 20,907 (44) 50,173 78,909 (36)
Daily Production
Oil - bbls per day 29 82 (65) 29 77 (62)
Natural gas liquids - bbls per day 16 35 (54) 21 20 5
Natural Gas - Mcf per day 511 693 (26) 528 718 (26)
Total boe per day 130 232 (44) 137 216 (37)
TWELVE MONTHS ENDEDTHREE MONTHS ENDED
MARCH 31MARCH 31

Border Petroleum Corp.
Management's Discussion & Analysis
3
For the year ended March 31, 2014, oil production decreased 63% to 10,414 bbls compared to 28,028 bbls last year. Some of this decrease can be attributed to the high processing fees at the NEP facility where Borders solution gas is processed so oil production was shut in. Natural gas production for the year ended March 31, 2014, decreased 26% to 192,678 mcf compared to 261,998 mcf last year due to shutting in of gas wells as a result of low pricing. Natural gas liquids (“NGLs”) increased 6% to 7,646 bbls during the year ended March 31, 2014 compared to 7,215 bbls last year. Total production expressed in boe for the year ended March 31, 2014, decreased 36% to 50,173 boe compared to 78,909 boe last year as Border was producing a higher weighted gas stream. Border has five key producing areas; Majeau, Norris, Red Earth Leduc and Pembina. For the three months ended March 31, 2014, oil production decreased 65% to 2,579 bbls compared to 7,386 bbls for the comparable period last year. This was mainly due to capital conservation as part of the strategic process. Natural gas production for the three months ended March 31, 2014, decreased 26% to 45,981 mcf compared to 62,366 mcf for the comparable period last year due to continued shutting in of gas wells due to poor pricing. Natural gas liquids (“NGLs”) decreased 53% to 1,472 bbls during the three months ended March 31, 2014 compared to 3,127 bbls for the same period last year. Total production expressed in boe for the three months ended March 31, 2014, decreased 44% to 11,715 boe compared to 20,907 boe last year due to the gas weighting of total production.
PRICING SUMMARY
% %
2014 2013 CHANGE 2014 2013 CHANGE
Oil - $ per bbl 103.88$ 75.24$ 38 94.76$ 72.79$ 30
Natural gas liquids - $ per bbl 72.33$ 52.02$ 39 55.81$ 50.94$ 10
Natural Gas - $ per Mcf 6.41$ 3.13$ 105 3.98$ 2.68$ 48
$ per boe 57.13$ 43.70$ 31 43.46$ 39.42$ 10
MARCH 31
THREE MONTHS ENDED TWELVE MONTHS ENDED
MARCH 31
During the year ended March 31, 2014, and the comparable period last year, Border sold all its oil, natural gas and natural gas liquids at spot prices and did not enter into any long-term, fixed price marketing contracts or derivative financial instruments. The Corporation’s oil production is currently comprised of three different densities, classified as light, medium and heavy (844.2 to 949.1 kg/m3) and as such receives average prices that are lower than the light WTI spot price that is the most common oil reference price. During the year ended March 31, 2014, the average realized boe price was $43.46 compared to $39.42 last year. Oil prices increased by 30%, to average $94.76 per barrel from $72.79 per barrel last year. Natural gas prices increased 48% to average $3.98 per mcf compared to $2.68 per mcf last year. Natural gas liquid prices increased 10% to average $55.81 per barrel from $50.94 per barrel last year. The percentage of natural gas production to oil and liquids production was 64% compared to 55% last year. The boe price will vary due to two key components, the first is the current market price of the products and the second is the Corporation’s mix of products. During the three months ended March 31, 2014, the average boe price was $57.13 compared to $43.70 last year. Oil prices increased by 38% to average $103.88 per barrel from $75.24 per barrel last year. Natural gas prices increased 105% to average $6.41 per mcf compared to $3.13 per mcf last year. Natural gas liquid prices increased 39% to average $72.33 per barrel from $52.02 per barrel last year. The percentage of natural gas production to oil and liquids production was 65% compared to 50% last year.
REVENUE
% %
2014 2013 CHANGE 2014 2013 CHANGE
Oil 267,902$ 555,709$ (52) 986,782$ 2,040,190$ (52)
Natural gas liquids 106,477 162,670 (35) 426,748 367,517 16
Natural Gas 294,882 195,215 51 767,004 702,802 9
Total Working Interest Revenue 669,261$ 913,594$ (27) 2,180,534$ 3,110,509$ (30)
$ per boe 57.13$ 43.70$ 31 43.46$ 39.42$ 10
THREE MONTHS ENDED
MARCH 31 MARCH 31
TWELVE MONTHS ENDED
Total revenue for the year ended March 31, 2014, decreased 30% or $929,975 totaling $2,180,534 compared to $3,110,509 last year due primarily to lower oil and natural gas sales volumes. Oil revenue fell by $1,053,408 or 52%, to total $986,782 from $2,040,190 due primarily to a 63% decrease in oil sales volumes which more than offset the
Border Petroleum Corp.
Management's Discussion & Analysis
4
30% increase in this year’s oil prices compared to last year. Natural gas revenue increased by $64,202 or 9% over last year, due primarily to a 48% increase in natural gas prices which more than offset the 27% decline in natural gas sales volumes. Natural gas liquids increased by $59,231 or 16% over last year due primarily to a 6% increase in sales volume and a 10% increase due to higher prices. Total revenue for the year ended March 31, 2014 when expressed as dollars per boe, increased 10% to average $43.46 per boe compared to $39.42 per boe last year. Total revenue for the three months ended March 31, 2014, decreased 27% or $244,333 totaling $669,261 compared to $913,594 last year, due primarily to lower sales volumes of oil, natural gas and natural gas liquids. Oil revenues decreased by 52% or $287,807 from the comparable quarter last year due primarily to a 65% drop in sales volumes. Natural gas revenue increased by 51% or $99,667 from the comparable quarter last year due primarily to a significant price increase of 105% during the quarter. During February 2014 natural gas prices averaged $8.11 per mcf. Natural gas liquids revenues decreased 35% or $56,193 from the comparable quarter last year primarily due to a 53% decrease in sales volumes. Total revenue for the three months ended March 31, 2014 when expressed as dollars per boe, increased 31% to average $57.13 per boe compared to $43.70 per boe last year.
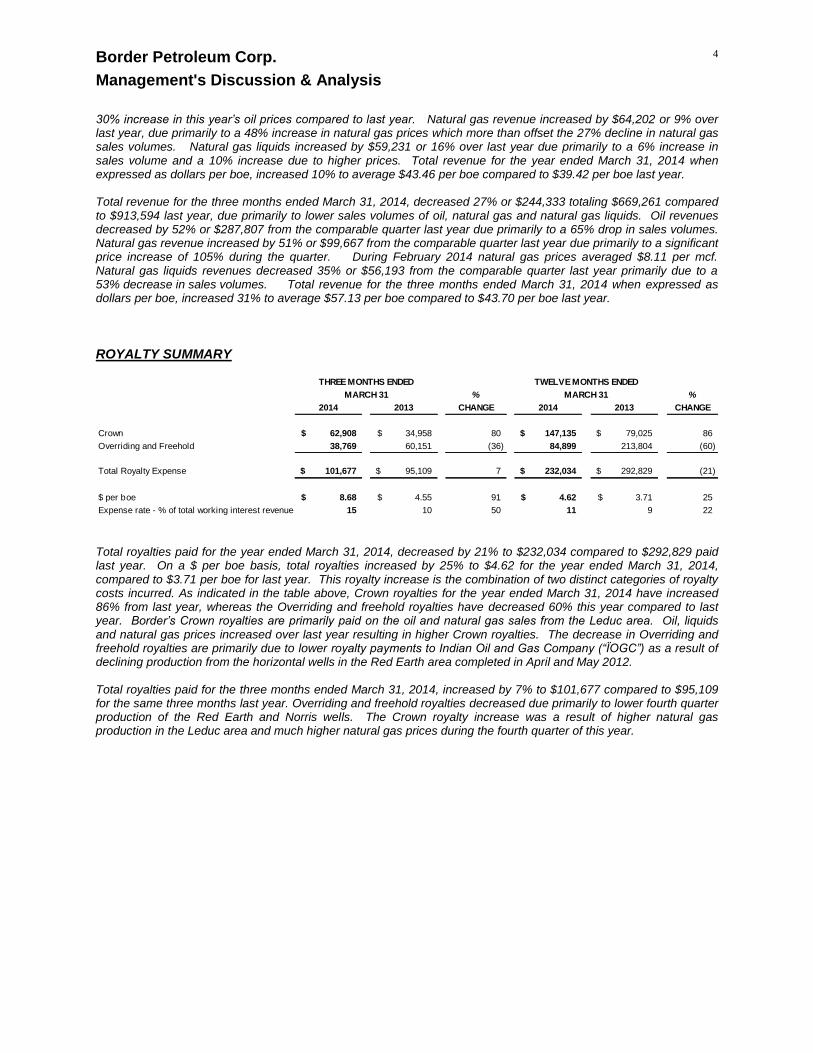
ROYALTY SUMMARY
% %
2014 2013 CHANGE 2014 2013 CHANGE
Crown 62,908$ 34,958$ 80 147,135$ 79,025$ 86
Overriding and Freehold 38,769 60,151 (36) 84,899 213,804 (60)
Total Royalty Expense 101,677$ 95,109$ 7 232,034$ 292,829$ (21)
$ per boe 8.68$ 4.55$ 91 4.62$ 3.71$ 25
Expense rate - % of total working interest revenue 15 10 50 11 9 22
MARCH 31
TWELVE MONTHS ENDEDTHREE MONTHS ENDED
MARCH 31
Total royalties paid for the year ended March 31, 2014, decreased by 21% to $232,034 compared to $292,829 paid last year. On a $ per boe basis, total royalties increased by 25% to $4.62 for the year ended March 31, 2014, compared to $3.71 per boe for last year. This royalty increase is the combination of two distinct categories of royalty costs incurred. As indicated in the table above, Crown royalties for the year ended March 31, 2014 have increased 86% from last year, whereas the Overriding and freehold royalties have decreased 60% this year compared to last year. Border’s Crown royalties are primarily paid on the oil and natural gas sales from the Leduc area. Oil, liquids and natural gas prices increased over last year resulting in higher Crown royalties. The decrease in Overriding and freehold royalties are primarily due to lower royalty payments to Indian Oil and Gas Company (“ÏOGC”) as a result of declining production from the horizontal wells in the Red Earth area completed in April and May 2012. Total royalties paid for the three months ended March 31, 2014, increased by 7% to $101,677 compared to $95,109 for the same three months last year. Overriding and freehold royalties decreased due primarily to lower fourth quarter production of the Red Earth and Norris wells. The Crown royalty increase was a result of higher natural gas production in the Leduc area and much higher natural gas prices during the fourth quarter of this year.

Border Petroleum Corp.
Management's Discussion & Analysis
5
OPERATING AND TRANSPORTATION EXPENSES
% %
2014 2013 CHANGE 2014 2013 CHANGE
Production expenses 166,597$ 400,112$ (58) 1,120,057$ 1,720,890$ (35)
Transportation and gathering 204,284 360,366 (43) 836,308 1,153,888 (28)
370,881 760,478 (51) 1,956,365 2,874,778 (32)
Workover expenses 82 180,097 na 66,497 210,165 (68)
Total Production Expenses 370,963$ 940,575$ (61) 2,022,862$ 3,084,943$ (34)
$ per boe Total production expenses 31.67$ 44.99$ (30) 40.32$ 39.09$ 3
Production expenses 14.22$ 19.14$ (26) 22.32$ 21.81$ 2
Transportation & gathering 17.44$ 17.24$ 1 16.67$ 14.62$ 14
Workover expenses 0.01$ 8.61$ na 1.33$ 2.66$ (50)
Expense rate - % of total working interest revenue 55 103 (47) 93 99 (6)
TWELVE MONTHS ENDEDTHREE MONTHS ENDED
MARCH 31 MARCH 31
Total production expenses are comprised of three cost categories; day-to-day production expenses, transportation and gathering costs and work-over expenses. Production, transportation and gathering costs for the year ended March 31, 2014, decreased 32% to total $1,956,365 compared to $2,874,778 last year. The transportation and gathering expense component of the production costs for the year ended March 31, 2014, fell 28% to $836,308 compared to $1,153,888 last year, due to declining production from the Red Earth and Leduc areas. Total production expenses for the year ended March 31, 2014, decreased 34% to $2,022,862 compared to $3,084,943 last year. When expressed as a $ per boe, total production expenses increased by 3% due primarily to the decrease in production volumes. Day-to-day production, transportation and gathering costs for the quarter ended March 31, 2014, decreased 58% to $166,597 compared to $400,112 for the same quarter last year. The transportation and gathering expense component of the production costs for the three months ended March 31, 2014, decreased 43% to $204,284 compared to $360,366 for the same three months last year, due to declining production in the Leduc and Red Earth areas. Total production expenses for the three months ended March 31, 2014, decreased 61% to $370,963 from $940,575 for the same three months last year due primarily to declining production volumes.
GENERAL AND ADMINISTRATIVE EXPENSES
% %
2014 2013 CHANGE 2014 2013 CHANGE
General and administration 566,504$ 550,754$ 3 1,645,915$ 1,937,269$ (15)
Strategic process costs 97,164 - na 308,884 - na
663,668$ 550,754$ 21 1,954,799$ 1,937,269$ 1
$ per boe 56.65$ 26.34$ 115 38.96$ 24.55$ 59
Expense rate - % of total working interest revenue 99 60 64 90 62 44
MARCH 31
THREE MONTHS ENDED TWELVE MONTHS ENDED
MARCH 31
General and administrative expenses for the year ended March 31, 2014, decreased by 15% totaling $1,645,915 compared to $1,937,269 last year. The additional “transaction costs” this year were management consulting fees, executive severance and data room costs totaling $308,884 that were incurred during the strategic process review by the Special Committee of independent directors including Dundee Securities and Macquarie Capital Markets Canada Ltd. as co-financial advisors. General and administrative expenses for the quarter ended March 31, 2014, increased by 3% totaling $566,504 compared to $550,754 for the same quarter last year. Additional costs of $97,164 were incurred during the fourth quarter this year associated to the strategic process review.

Border Petroleum Corp.
Management's Discussion & Analysis
6
FINANCE INCOME AND EXPENSES Finance income, consisting of interest income, is recognized as it accrues in the statement of income, using the effective interest method. Finance expense comprises interest expense on convertible debentures and note payable and accretion on the convertible note payable and of decommissioning provisions.
% %
2014 2013 CHANGE 2014 2013 CHANGE
Finance income
Interest income 4,218$ 96,018$ (96) 126,714$ 229,327$ (45)
Finance expenses
Interest expense 26,709 13,756 94 34,352 28,074 22
Interest expense on note payable - - na - 63,594 (100)
Accretion & gain/loss on redemption of
convertible note payable - 7,747 (100) - 74,135
Accretion of decommissioning provisions 2,661 6,645 (60) 14,685 24,522 (40)
Asset retirement expense (220) 18,655 na (220) 18,716 (101)
29,150 46,803 (38) 48,817 209,041 (77)
Net finance income (expense) (24,932) 49,215 (151) 77,897 20,286 284
Finance income (expense) cash items (22,491) 48,694 (146) 92,362 65,115 42
Finance expense non-cash items (2,441) 521 (569) (14,465) (44,829) (68)
Net finance income (expense) (24,932) 49,215 (151) 77,897 20,286 284
$ per boe - finance income (expense) cash items (1.92)$ 2.33$ (182) 1.84$ 0.83$ 122
$ per boe - finance expense non-cash items (0.21)$ 0.02$ (1,150) (0.29)$ (0.57)$ (49)
MARCH 31
TWELVE MONTHS ENDEDTHREE MONTHS ENDED
MARCH 31
DEPLETION AND DEPRECIATION
% %
2014 2013 CHANGE 2014 2013 CHANGE
Depletion & depreciation 30,843$ 436,766$ (93) 879,750$ 1,584,493$ (44)
Impairment 13,497,366 - na 13,497,366 13,480,946 -
13,528,209$ 436,766$ 2,997 14,377,116$ 15,065,439$ (5)
$ per boe - Depletion, depreciation 2.63$ 20.89$ (87) 17.53$ 20.08$ (13)
Expense rate - % of working interest revenue 2,021 47 4,201 659 484 36
MARCH 31
THREE MONTHS ENDED TWELVE MONTHS ENDED
MARCH 31
Depletion and depreciation expense for the year ended March 31, 2014, totaled $879,750 or $17.53 per boe compared to $1,584,493 or $20.08 per boe for the same period last year. The depletion cost decreased 44% from the comparable period last year due primarily to the 36% drop in barrels of equivalent (“boe”) production volumes. Depletion and depreciation expense for the three months ended March 31, 2014, totaled $30,843 or $2.63 per boe compared to $436,766 or $20.89 per boe for the same period last year. The significant decrease in depletion cost in the fourth quarter this year is a direct result of the write-down or impairment loss of the reserve value of the Red Earth and Leduc areas as reflected in the independent engineering evaluation as at March 31, 2014. During the year ended March 31, 2014, the Corporation recorded impairment losses of $13,497,366 (2013 - $13,480,946); $5,102,959 (2013 - $nil) attributable to the Leduc CG; $7,875 (2013 - $6,060) to the Cardiff Area CGU, and $8,386,532 (2013 - $13,474,886) to the Red Earth CGU. During 2014 and 2013, the Red Earth impairment was caused mainly due to drilling results that did not yield commercially viable volumes of oil and therefore the reserve values prepared by an independent engineering consulting firm at March 31, 2014 and 2013 were not sufficient to cover the costs incurred. Effective April 1, 2014 the Corporation sold the majority of its Leduc properties for $1.8 million and has an offer to sell the remaining Leduc

Border Petroleum Corp.
Management's Discussion & Analysis
7
properties for an additional $500,000. At March 31, 2014 the Leduc properties were written-down to $2.3 million based on this fair market value, and recorded as available for sale. At March 31, 2014, $3,006,000 (March 2013 - $28,164,000) of future development costs related to proved and probable reserves were included in costs subject to depletion. The recoverable amounts of the Corporation's CGUs were estimated as the fair value less costs to sell based on the net present value of the before tax net cash flows from oil and natural gas proved plus probable reserves estimated by the Corporation's external reserve evaluators discounted at a rate of 10% (2013 – 10%) per annum.
EXPLORATION AND EVALUATION EXPENDITURES
% %
2014 2013 CHANGE 2014 2013 CHANGE
Exploration and evaluation expense 5,243,842$ 941,790$ - 5,243,842$ 941,790$ 457
$ per boe 447.62$ 45.05$ - 104.52$ 11.94$ 775
Expense rate - % of working interest revenue 784 103 - 240 30 694
THREE MONTHS ENDED TWELVE MONTHS ENDED
MARCH 31 MARCH 31
Exploration and evaluation assets include undeveloped lands and assets that management has not fully evaluated for technical feasibility and commercial viability. Additions represent the Corporation's share of costs incurred on exploration and evaluation assets during the year. Transfers to property and equipment represent successful drilling and related land costs to which technical feasibility and commercial viability are determined to exist. During the year ended March 31, 2014, the Corporation expensed $5,243,842 previously capitalized as exploration and evaluation asset. The Corporation has no plans to further develop the Red Earth Loon Block and therefore has expensed $5,009,440 of land permit costs, seismic costs and preliminary expenditures associated with prospective drilling locations in the Red Earth area. An additional $234,402 has also been expensed as a result of the sale of the Corporation’s Leduc properties as the Corporation no longer plans to develop this area. These amounts have been included as exploration and evaluation expenditures in the statement of income (loss). During the year ended March 31, 2013, the Corporation expensed certain costs previously capitalized as exploration and evaluation assets as the lease term of undeveloped lands expired in the amount of $26,000 (2012 - $Nil) as well as $915,790 (2012 -$Nil) relating to its Montana, USA, assets as the Corporation had no plans to pursue these assets.
DEFERRED TAX RECOVERY Deferred tax recovery was $341,626 for the year ended March 31, 2014 and $1,393,304 for the year ended March 31, 2013 relating to the income tax recovery of flow-through share expenditures.
SHARE CAPITAL Issued and Outstanding Common Shares
March 31, 2014 March 31, 2013
Number Stated Value Number Stated Value
Balance, beginning of period 332,978,953 65,354,339$ 224,537,953 50,352,276$
Reduced by 10:1 consolidation (294,224,843) - - -
Cancelled (ii) (6,062,446) - - -
Issuance of common shares (i) 1,000,000 50,000 - -
Issuance of common shares (iii) 48,335,000 7,250,250
Issuance of flow-through shares (iii) 60,106,000 10,750,830
Flow-through share premium (iii) - (1,734,930)
Share issue costs - (1,264,087)
33,691,664 65,404,339$ 332,978,953 65,354,339$

Border Petroleum Corp.
Management's Discussion & Analysis
8
(i) On March 27, 2014, the Corporation issued 1,000,000 common shares at a price of $0.05 per common share to a former employee as part of their severance payment.
(ii) On November 14, 2014, 6,062,446 common shares (pre-consolidation) were cancelled.
(iii) On September 28, 2012, the Corporation closed a bought deal offering with a syndicate of Underwriters for the issuance of 48,335,000 common shares of the Corporation at a price of $0.15 per common share and 55,556,000 Canadian Exploration Expense (“CEE”) flow-through shares of the Corporation at a price of $0.18 per flow-through share and 4,550,000 Canadian Development Expense (“CDE”) flow-through shares of the Corporation at a price of $0.165 per flow-through share for aggregate gross proceeds of $18,001,080. The Underwriters were paid a cash commission of 6% of the gross proceeds of the offering.
Of the total proceeds from the flow-through shares issued, the premium paid for the flow-through shares of $1,734,930 was recorded as flow-through share premium. At December 31, 2012, the Corporation had incurred all of the CDE qualifying expenditures related to this issuance and accordingly, the flow-through share premium has been reversed through deferred income tax recovery. At March 31, 2013, the Corporation has incurred $8.0 million of the CEE qualifying expenditures related to this issuance and accordingly, the flow-through share premium related to expenditures incurred has been reversed through deferred income tax recovery. An additional $2.0 million of CEE qualifying expenditures is required to be spent by December 31, 2013 (note 18(a)).
STOCK BASED COMPENSATION The Corporation has established a stock option plan (the "Plan") which is administered by the Board of Directors, allowing the Board of Directors to grant stock options. The Corporation adopted a 10% Rolling Stock Option Plan, which allows for the granting of stock options for the purchase of up to 10% of the outstanding common shares of the Corporation. Additionally, options may not be granted to any one person, any one consultant or any persons performing investor relations duties in any twelve month period which could, when exercised, result in the issuance of shares exceeding 5%, 2% or 2%, respectively, of the issued and outstanding common shares of the Corporation. All options granted under the Plan shall expire as determined by the Board of Directors not later than the tenth anniversary of the date the options were granted. The exercise price of the options is to be determined by the Board of Directors, but shall not be less than the market price of the common shares of the Corporation on the TSXV on the last business day before the date on which the options are granted, less any discount permitted by the rules of the TSXV. Vesting of the options is at the discretion of the Board of Directors but generally will occur over a two to three year period following the grant date. The following options have been awarded under the stock option plan:
Number Number
Outstanding, beginning of period 14,625,000 $0.23 14,936,250 $0.23
Cancelled or expired (8,725,000) $0.23 (311,250) $0.23
5,900,000 $0.23 14,625,000 $0.23
Reduced by 10:1 consolidation (5,310,000) - - -
Outstanding, end of period 590,000 $2.30 14,625,000 $0.23
Exercisable, end of period 422,500 $2.31 6,408,334 $0.23
March 31, 2014 March 31, 2013
Weighted Average
Exercise Price
Weighted Average
Exercise Price

Border Petroleum Corp.
Management's Discussion & Analysis
9
% %
2014 2013 CHANGE 2014 2013 CHANGE
Stock based compensation 174,822$ 105,495$ 66 442,529$ 885,719$ (50)
$ per boe 14.92$ 5.05$ 195 8.82$ 11.22$ (21)
Expense rate - % of working interest revenue 26 12 125 20 28 (30)
THREE MONTHS ENDED TWELVE MONTHS ENDED
MARCH 31 MARCH 31
Stock-based compensation for the year ended March 31, 2014 was $442,529 or $8.82 per boe, compared to $885,719 or $11.22 per boe for last year. These costs have been expensed and have resulted in a corresponding increase in contributed surplus. The Corporation calculates stock-based compensation using the Black-Scholes option-pricing model. For the year ended March 31, 2014, no new options were granted and 8,725,000 options (872,500 after 10:1 consolidation) were cancelled or expired. At March 31, 2014, there were 422,500 options that were exercisable.
AVERAGE SHARES OUTSTANDING The weighted average number of shares outstanding for the year ended March 31, 2014, totaled 33,081,310 compared to 27,920,410 ( 279,204,101 prior to the 10:1 consolidation) for the year ended March 31, 2013. Common shares and other equity instruments outstanding as at the date of this MD&A is as follows: Common shares 34,297,895 Stock options 590,000
NET LOSS AND COMPREHENSIVE LOSS
% %
2014 2013 CHANGE 2014 2013 CHANGE
Net income (loss) for period (19,093,309)$ (15,419,907)$ 24 (21,327,582)$ (17,683,890)$ 21
Income (Loss) per share (0.57)$ (0.06)$ 938 (0.64)$ (0.06)$ 911
THREE MONTHS ENDED
MARCH 31 MARCH 31
TWELVE MONTHS ENDED
A net loss and comprehensive loss of ($21,327,582) was recorded for the year ended March 31, 2014, compared to a net loss and comprehensive loss of ($17,683,890) last year. This was due primarily to the $13.5 million impairment loss, the $5.2 million exploration and evaluation expense and the significant decrease in oil and natural gas sales volumes.
NET PETROLEUM AND NATURAL GAS REVENUE
% %
2014 2013 CHANGE 2014 2013 CHANGE
Petroleum & Natural Gas Revenue 669,261$ 913,594$ (27) 2,180,534$ 3,110,509$ (30)
Less:
Royalties 101,677 95,109 7 232,034 292,829 (21)
Production expenses 370,881 760,478 (51) 1,956,365 2,874,778 (32)
Workover expenses 82 180,097 (100) 66,497 210,165 (68)
Net Petroleum & Natural Gas Revenue 196,621$ (122,090)$ (261) (74,362)$ (267,263)$ (72)
$ per boe 16.78$ (5.84)$ (387) (1.48)$ (3.38)$ (56)
MARCH 31
THREE MONTHS ENDED
MARCH 31
TWELVE MONTHS ENDED
Gross revenue from petroleum and natural gas decreased 30% to total $2,180,534 for the year ended March 31, 2014, compared to $3,110,509 last year. The net petroleum and natural gas losses after royalties, production and
Border Petroleum Corp.
Management's Discussion & Analysis
10
workover expenses for the year ended March 31, 2014 was ($74,362) compared to net petroleum and natural gas losses of ($267,263) last year. Gross revenue from petroleum and natural gas decreased 27% to total $669,261 for the three months ended March 31, 2014, compared to $913,594 last year. Net petroleum and natural gas losses after royalties, production and workover expenses for the three months ended March 31, 2013 decreased 24% to ($122,090) compared to net petroleum and natural gas losses of ($159,621) last year.
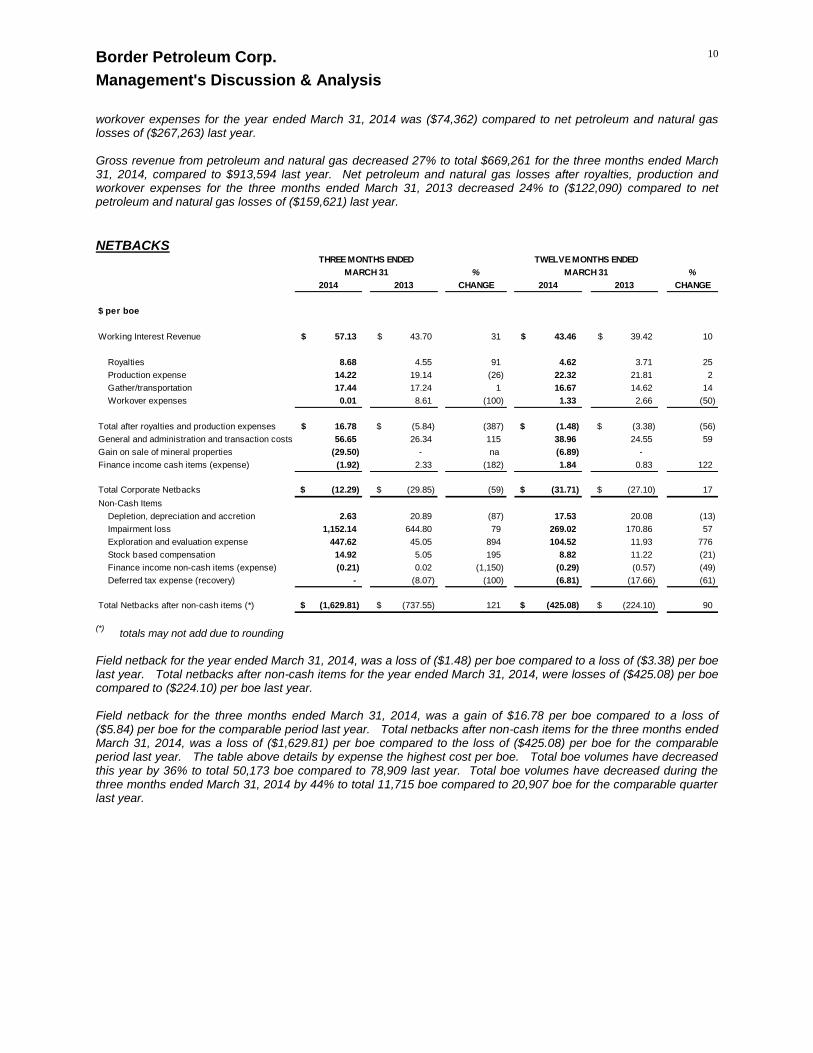
NETBACKS
% %
2014 2013 CHANGE 2014 2013 CHANGE
$ per boe
Working Interest Revenue 57.13$ 43.70$ 31 43.46$ 39.42$ 10
Royalties 8.68 4.55 91 4.62 3.71 25
Production expense 14.22 19.14 (26) 22.32 21.81 2
Gather/transportation 17.44 17.24 1 16.67 14.62 14
Workover expenses 0.01 8.61 (100) 1.33 2.66 (50)
Total after royalties and production expenses 16.78$ (5.84)$ (387) (1.48)$ (3.38)$ (56)
General and administration and transaction costs 56.65 26.34 115 38.96 24.55 59
Gain on sale of mineral properties (29.50) - na (6.89) -
Finance income cash items (expense) (1.92) 2.33 (182) 1.84 0.83 122
Total Corporate Netbacks (12.29)$ (29.85)$ (59) (31.71)$ (27.10)$ 17
Non-Cash Items
Depletion, depreciation and accretion 2.63 20.89 (87) 17.53 20.08 (13)
Impairment loss 1,152.14 644.80 79 269.02 170.86 57
Exploration and evaluation expense 447.62 45.05 894 104.52 11.93 776
Stock based compensation 14.92 5.05 195 8.82 11.22 (21)
Finance income non-cash items (expense) (0.21) 0.02 (1,150) (0.29) (0.57) (49)
Deferred tax expense (recovery) - (8.07) (100) (6.81) (17.66) (61)
Total Netbacks after non-cash items (*) (1,629.81)$ (737.55)$ 121 (425.08)$ (224.10)$ 90
MARCH 31
TWELVE MONTHS ENDEDTHREE MONTHS ENDED
MARCH 31
(*) totals may not add due to rounding
Field netback for the year ended March 31, 2014, was a loss of ($1.48) per boe compared to a loss of ($3.38) per boe last year. Total netbacks after non-cash items for the year ended March 31, 2014, were losses of ($425.08) per boe compared to ($224.10) per boe last year. Field netback for the three months ended March 31, 2014, was a gain of $16.78 per boe compared to a loss of ($5.84) per boe for the comparable period last year. Total netbacks after non-cash items for the three months ended March 31, 2014, was a loss of ($1,629.81) per boe compared to the loss of ($425.08) per boe for the comparable period last year. The table above details by expense the highest cost per boe. Total boe volumes have decreased this year by 36% to total 50,173 boe compared to 78,909 last year. Total boe volumes have decreased during the three months ended March 31, 2014 by 44% to total 11,715 boe compared to 20,907 boe for the comparable quarter last year.

Border Petroleum Corp.
Management's Discussion & Analysis
11
CAPITAL ADDITIONS
% %
2014 2013 CHANGE 2014 2013 CHANGE
Exploration and evaluation assets (5,502,509) (6,924,781)$ (21) (3,290,953)$ 572,533$ (675)
Property and equipment
Land and lease costs 18,128 (134,060) (114) 18,128 323,705 (94)
Geophysical and seismic - 197,439 (100) 2,400 197,439 (99)
Drilling and completions 490,531 7,672,559 (94) 796,699 9,413,919 (92)
Production equipment and facilities 56,923 (64,091) (189) 95,277 1,001,751 (90)
Property acquisitions 934,805 - na 988,880 54,907 1,701
Property dispositions (1,956,865) - na (2,704,457) - na
Asset retirement 165,185 300,234 (45) (35,496) 411,405 (109)
Furniture & computers - - na - 8,581 (100)
Total (5,793,802)$ 1,047,300$ (653) (4,129,522)$ 11,984,240$ (134)
MARCH 31
THREE MONTHS ENDED
MARCH 31
TWELVE MONTHS ENDED
For the year ended March 31, 2014, asset dispositions and the reclassification of exploration and evaluation assets to expense resulted in a reduction of assets of ($4,129,522). Asset dispositions were comprised of the sale of certain Red Earth properties for $750,000 and Leduc properties for $1.8 million. These dispositions also reduced the non-cash asset retirement account by $35,496. The additions to capital expenditures during the year ended March 31, 2013 relate primarily to the drilling, completion and equipping of the long-leg horizontal Red Earth well drilled during December 2012 and the completion and equipping of the two short-leg Red Earth horizontal wells drilled in March 2012.
LIQUIDITY AND CAPITAL RESOURCES At March 31, 2014, Border had working capital (current assets minus current liabilities) of $4,649,505 (excluding flow-through share premium) compared to working capital of $7,519,842 at March 31, 2013.
MARCH 31 MARCH 31 %
2014 2013 CHANGE
Cash 3,122,067$ 8,266,710$ (62)
Accounts receivable and prepaid expenses 1,085,225 1,496,577 (27)
Investment in secured debt - 899,067 (100)
Assets held for sale 2,300,000 -
Accounts payable and accrued liablities (1,857,787) (3,142,512) (41)
4,649,505$ 7,519,842$ (38)
OFF-BALANCE SHEET ARRANGEMENTS The Corporation has no off-balance sheet arrangements.
TRANSACTIONS WITH RELATED PARTIES The Corporation utilizes the services of a law firm in which a Director of the Corporation is a Partner. During the year ended March 31, 2014, the Corporation incurred $68,113 (2013 - $129,160) on legal services, of which $68,113 (2013 - $50,581) is included in general and administrative expense or transaction costs and $nil (2013 - $78,759) is included in share issue costs. At March 31, 2014 $7,747 (2013 - $2,151) is included in accounts payable and accrued liabilities.

Border Petroleum Corp.
Management's Discussion & Analysis
12
COMMITMENTS AND CONTINGENCIES (a) Flow-through share commitment
Pursuant to the Corporation's flow-through financing in September 2012, the Corporation is required to spend $750,750 of qualifying oil and natural gas development costs (“CDE” ) by December 31, 2012, and $10,000,080 of qualifying oil and natural gas exploration costs ( “CEE” ) by December 31, 2013. At December 31, 2012, the Corporation had incurred $750,750 on qualifying CDE expenditures, fulfilling the CDE commitment. At March 31, 2014, the Corporation had incurred $10,000,080 CEE expenditures thereby fulfilling the CEE flow-through share spending commitment.
(b) Contingent acquisition costs
For the year ended March 31, 2014, total cash payments of $18,859 (2013 - $32,250) have been paid and an additional $15,527 (2013 - $34,386) has been accrued for the year ending March 31, 2014 based on management's estimate of the amount that will ultimately be paid under the Termination Agreement.
During the year ended March 31, 2011, the Corporation entered into a termination agreement pertaining to an Area of Mutual Interest ("AMI") and Farm-in Agreement dated July 1, 2009 (the “Termination Agreement”). By Termination Agreement dated November 1, 2010, the parties terminated the Area of Mutual Interest Agreement and set out terms for payment by Border. Border is required to pay twenty percent of net monthly revenue (net of royalties, overriding royalties, transportation and processing fees) received from the current and future re-entries conducted by Border on the lands previously covered by the "AMI" at the end of each month to a total maximum payment of all payments under the agreement of $550,000.
(c) Legal matters
Canflame, now amalgamated with the wholly-owned subsidiary of the Corporation, has been named as a defendant in a lawsuit on behalf of a joint venture partner seeking to recover damages allegedly sustained by them as a result of a breach of agreement pertaining to the drilling of shallow natural gas wells in the Pembina area of Alberta and their associated costs. Canflame has filed a counterclaim in this matter. On November 26, 2013, that joint venture partner filed a voluntary assignment in bankruptcy pursuant to the provisions of the Bankruptcy and Insolvency Act such that the matter is now being handled by the appointed Receiver.
(d) Office Lease
The Corporation entered into a commitment related to the leasing of office premises. The payments due, including estimated operating costs, from April 1, 2014 to November 30, 2014 total $150,528.
SUBSEQUENT EVENTS Effective April 1, 2014, the Corporation closed the sale of certain of its Leduc assets for proceeds of $1,800,000 which was paid in cash. In connection with that transaction, the Corporation granted an option (“Option”) to the private limited partnership (“Purchaser”) that acquired those Leduc assets. Effective July 1, 2014, the Purchaser exercised their Option and additional Leduc properties were sold for $500,000. To facilitate the sale of the Leduc properties, Border increased their Liability Management Rating (“LMR”) security deposit held in trust by the Royal Bank of Canada to $1.35 million.
RISK FACTORS The following are certain risk factors that relate to Border that the reader should consider. If any event arising from these factors occurs, the Corporation’s business could be materially affected.
Fluctuations in the prices of oil and gas will affect Border’s revenue, cash flows and earnings and the value of the Corporation’s oil and gas properties. These fluctuations could also affect the Corporation’s ability to raise capital. These fluctuations in prices could be due to global economic and market conditions, weather conditions, the level of consumer and industrial demand, and governmental regulations.
Border Petroleum Corp.
Management's Discussion & Analysis
13
Drilling activities are subject to risks such as the possibility that commercially productive reservoirs will not be encountered, weather conditions, the ability to obtain regulatory approvals and shortages or delays in equipment and services.
Estimates of oil and natural gas reserves involve a great measure of uncertainty as they depend on the reliability of available data, the costs to recover said reserves, and the ability to transport the product to market.
There are operating risks that could affect the business of the Corporation. These include blowouts, equipment failures, spills or leaks, accidents and weather conditions.
Compliance with and changes to environmental laws and regulations.
The oil and gas industry is extremely competitive.
The value of the Corporation’s oil and gas properties.
FINANCIAL INSTRUMENTS AND RISK MANAGEMENT The Corporation has not entered into any marketing arrangements related to the selling of oil or natural gas production. Fair Values The fair values of cash, accounts receivable, deposits, investment in secured debt, bank debt and accounts payable and accrued liabilities approximate their carrying value. At March 31, 2014, the Corporation does not have any financial derivatives, including commodity contracts. Consequently, the Corporation's financial instruments were recorded at fair value on the balance sheet with changes to fair value being reported in the statement of loss and comprehensive loss. The fair value of transactions are classified according to the following hierarchy based on the amount of observable inputs used to value the instrument.
Level 1 – Quoted prices (unadjusted) in active markets for identical assets or liabilities.
Level 2 – Inputs are other than quoted prices in Level 1 that are either directly or indirectly observable for the asset or liability.
Level 3 – Inputs for the asset or liability that are not based on observable market data. Assessment of the significance of a particular input to the fair value measurement requires judgment and may affect the placement within the fair value hierarchy level. The Corporation’s cash has been valued using Level 1 inputs. The Corporation is exposed to financial risks arising from its financial assets and liabilities. The Corporation manages its exposure to financial risks by operating in a manner that minimizes its exposure to the extent practical. The main financial risks affecting the Corporation are as follows: Credit Risk Credit risk is primarily related to the Corporation's receivables from oil and natural gas marketers and joint interest partners and the risk of financial loss if a customer, partner, or counterparty to a financial instrument fails to meet its contractual obligations. Receivables from oil and natural gas marketers are normally collected on the 25th day of the month following production. Currently the Corporation sells the majority of its production to an oil and gas marketer. The Corporation historically has not experienced any collection issues with its oil and natural gas marketers. Joint interest partner receivables are typically collected within one to three-months of the joint venture bill being issued to the partner. The Corporation attempts to mitigate the risk from joint interest partners' receivables by obtaining partner approval of

Border Petroleum Corp.
Management's Discussion & Analysis
14
significant capital expenditures prior to expenditure. The Corporation does not typically obtain collateral from joint interest partners; however, in certain circumstances, it may cash-call a partner in advance of the work and as well the Corporation has the ability in most cases to withhold production from joint interest partners in the event of non-payment. The Corporation establishes an allowance for doubtful accounts as determined by management based on their assessed collectability; therefore, the carrying amount of accounts receivable generally represents the maximum credit exposure. The Corporation believes that its counterparties currently have the financial capacity to settle outstanding obligations in the normal course of business. There were no receivables allowed for or written off during the year ended March 31, 2014 and there is $623,125 (2013 - $469,308) in accounts receivable outstanding greater than 90 days at March 31, 2014, which the Corporation would consider past due under normal conditions. Of this balance, $422,481 (2013 - $401,836) is due from one joint venture partner. Cash balances consist of amounts on deposit with banks and term deposits. The Corporation manages the credit exposure of cash by selecting financial institutions with high credit ratings. Total credit risk at March 31, 2014, is comprised of $1,026,529 in accounts receivable, $58,696 in deposits and prepaid expenses, $289,151 in lease reclamation deposits, $2,300,000 in assets held for sale and $3,122,067 in cash and cash equivalents. Market Risk Market risk consists of commodity price, foreign exchange and interest rate risk, that may affect the value of the Corporation's financial instruments. Commodity Price Risk Commodity price risk is the risk that the future cash flows will fluctuate as a result of changes in commodity prices. Commodity prices for oil and natural gas are impacted by the world and continental/regional economy and other events that dictate the levels of supply and demand. The Corporation has not attempted to mitigate commodity price risk through the use of financial derivative contracts. The Corporation had no financial derivative sales contracts or working capital items denominated in foreign currencies as at or during the year ended March 31, 2014. Foreign Currency Exchange Risk Foreign currency exchange risk is the risk that future cash flows will fluctuate as a result of changes in foreign exchange rates. Although all the Corporation's oil and natural gas sales are denominated in Canadian dollars, the underlying market prices in Canada for oil and natural gas are impacted by changes in the exchange rate between the Canadian dollar and the United States dollars. The Corporation had no forward exchange rate contracts in place as at or during the year ended March 31, 2014. Interest Rate Risk Interest rate risk is the risk that future cash flows will fluctuate as a result of changes in market interest rates. The Corporation is exposed to interest rate price risk to the extent that the investment in secured debt and term deposits both bear interest at a fixed rate and interest rate cash flow risk to the extent that bank debt, if any, bears interest at a floating rate. Operational Risks Border’s operational activities are focused in the Western Canadian Sedimentary Basin, a competitive environment with a number of companies exploring for hydrocarbons. Other operational risks include weather delays, mechanical or technical difficulties, and exploration risks associated with finding economically viable hydrocarbons reserves. Border attempts to manage these risks by maintaining an inventory of certain critical equipment; conducting advance planning to manage its drilling programs in an efficient and cost effective manner; and hiring experienced technical staff and personnel to conduct its exploration programs. Border’s field operations are also subject to health, safety and environmental risks. The Corporation maintains a Health, Safety and Environmental Policy and an Emergency Response Plan which are updated bi-annually or as needed to comply with current legislation. Both are designed to protect the health and safety of all concerned property, drilling, pollution, and commercial general liability. Liquidity Risk

Border Petroleum Corp.
Management's Discussion & Analysis
15
Liquidity risk is the risk that the Corporation will not be able to meet its financial obligations as they are due. The Corporation's approach to managing liquidity is to ensure, as far as possible, that it will have sufficient liquidity to meet its liabilities when due without incurring unacceptable losses or risking harm to the Corporation's reputation. The Corporation prepares capital expenditure budgets which are regularly monitored and updated as considered necessary. As well, the Corporation utilizes authorizations for expenditures on both operated and non-operated projects to further manage capital expenditures. Also see below for a discussion on the Corporation's capital management policy. Capital Management The Corporation’s policy is to maintain a strong capital base with the following objectives:
Maintaining financial flexibility
Maintaining creditor and investor confidence, and
Sustaining the future development of the business. The Corporation manages its capital structure and makes adjustments to it in light of changes in economic conditions and the risk characteristics of the underlying oil and natural gas assets. Working capital (excluding flow-through share premium) and debt instruments (if any) are the components of the Corporation’s capital structure to be managed. The most significant alternatives available for the management of the capital structure include adjusting capital spending to manage projected debt levels or to issue common shares or debentures when management and the Board of Directors feel the timing is appropriate. Management continually monitors the Corporation’s projected capital spending and its net debt to maintain a sound capital position. Refer to the above section “Liquidity and Capital Resources”.
APPLICATION OF CRITICAL ACCOUNTING ESTIMATES The significant accounting policies used by Border are disclosed in notes 2 and 3 to the financial statements for the year ended March 31, 2014. Certain accounting policies require that management make appropriate decisions with respect to the formulation of estimates and assumptions that affect the reported amounts of assets, liabilities, revenues and expenses. Management reviews its estimates on a regular basis. The emergence of new information and changed circumstance may result in actual results or changes to estimate amounts that differ materially from current estimates. The following discussion helps to assess the critical accounting policies and practices of the Corporation and the likelihood of materially different results from those reported. Proved Reserves Under National Instrument 51-101 “Proved” reserves are defined as those reserves that can be estimated with a high degree of certainty to be recoverable. The level of certainty should result in at least a 90 percent probability that the quantities actually recovered will equal or exceed the estimated Proved reserves. It does not mean that there is a 90 percent probability that the Proved reserves will be recovered – it means there must be at least a 90 percent probability that the given amount or more will be recovered. “Proved plus Probable” reserves are the most likely case and are based on a 50 percent certainty that they will equal or exceed the reserves estimated. The standard provides for a conservative evaluation of proved and probable reserves, particularly on new wells where production history has not yet been established. These oil and gas reserve estimates are made using all available geological and reservoir data, as well as historical production data. Estimates are reviewed on a quarterly basis and revised as appropriate. Revisions occur as a result of various factors including: actual reservoir performance, changes in price and cost forecasts or a change in the Corporation’s plans. Reserve changes will impact the financial results as reserves are used in the calculation of depletion and are used to assess whether asset impairment occurs. Reserve changes also affect other Non-IFRS measures such as finding and development costs; recycle ratios and net asset value calculations. Use of estimates and judgments The preparation of financial statements in conformity with IFRS requires management to make judgments, estimates and assumptions that affect the application of accounting policies and the reported amounts of assets, liabilities, income and expenses. Actual results may differ from these estimates.

Border Petroleum Corp.
Management's Discussion & Analysis
16
Estimates and judgments are continually evaluated and are based on historical experience and other factors, including expectations of future events that are believed to be reasonable under the circumstances. Accounting estimates will, by definition, seldom equal the actual results. Revisions to accounting estimates are recognized in the periods in which the estimates are revised and in any future years affected. The following discussion sets forth management’s most critical estimates and assumptions in determining the value of assets, liabilities and equity: Depletion and depreciation and valuation of property and equipment and exploration and evaluation assets
The amounts recorded for depletion and depreciation of property and equipment and the valuation of property and equipment are based on estimates. These estimates include proved and probable reserves, production rates, future oil and natural gas prices, future development costs, remaining lives and periods of future benefits of the related assets and other relevant assumptions.
The Corporation’s reserve estimates are evaluated annually pursuant to the parameters and guidelines stipulated under National Instrument 51-101 - Standards of Disclosure for Oil and Gas Activities.
The valuation of exploration and evaluation assets is dependent upon the discovery of economically recoverable reserves which in turn is dependent on future oil and natural gas prices, future capital expenditures and environmental and regulatory restrictions.
The decision to transfer assets from exploration and evaluation assets to property and equipment is based on the estimated proved and probable reserves which are in part used to determine a project's technical feasibility and commercial viability.
For impairment testing, property and equipment and exploration and evaluation assets are aggregated into cash generating units ("CGUs"), based on management's judgment in defining the smallest identifiable group of assets that generate cash inflows that are largely independent of the cash flows from other assets or groups of assets. CGUs are determined by similar geological structure, shared infrastructure, geographical proximity, commodity type, similar exposure to market risks and materiality.
Decommissioning provisions
The value of decommissioning provisions depends on estimates of current risk-free interest rates, future restoration and reclamation expenditures and the timing of those expenditures.
Valuation of accounts receivable
The valuation of accounts receivable is based on management's best estimate of the provision for doubtful accounts.
Income taxes
The amounts recorded for deferred income taxes are based on estimates as to the timing of the reversal of temporary differences and tax rates currently substantively enacted. They are also based on estimates of the probability of the Corporation utilizing certain tax pools and assets which, in turn, is dependent on estimates of proved and probable reserves, production rates, future petroleum and natural gas prices and changes in legislation, tax rates and interpretations by taxation authorities. The availability of tax pools is subject to audit and interpretation by taxation authorities.
Stock-based compensation
The amounts recorded relating to the fair value of stock options and warrants granted are based on estimates of the future volatility of the Corporation’s share price, expected lives of the options and warrants, expected forfeiture rates, expected dividends and other relevant assumptions.
Investment in secured debt
The amount recorded for investment in secured debt and the valuation thereof is based on management’s assessment of the value of the underlying assets held as security. The classification of investment in secured debt as a current or non-current asset is based on management's estimate on timing of collection of amounts outstanding.
Border Petroleum Corp.
Management's Discussion & Analysis
17
Contingent acquisition costs
The amount accrued for contingent consideration payable under a land acquisition (note 20(b)) is based upon estimates of proved reserves and future oil and natural gas prices and related transportation and processing costs.
Business combination
The values assigned to the common shares issued in the corporate acquisition completed in fiscal 2012 and the allocation of the purchase price to the net assets in the acquisition are based on numerous estimates that affect the valuation of certain assets and liabilities acquired including discount rates, estimates of proved and probable reserves, estimates of fair values of exploration and evaluation assets, future oil and natural gas prices and other factors.
The number of common shares issued on the business combination and the associated consideration paid are dependent upon management's best estimate of the resolution of the pre-existing legal action.
Convertible note payable
The allocation between the debt and equity components of the convertible note payable is based on estimates of the interest rate the Corporation would pay on a non-convertible note payable with similar terms.
CHANGES IN ACCOUNTING POLICIES AND NEW ACCOUNTING PRONOUNCEMENTS Recent Accounting Pronouncements Accounting standards and amendments to existing standards not yet affective
The Corporation has reviewed new and revised accounting standards that have been issued but are not yet effective, and determined that the following may have an impact on the Corporation:
For the annual periods beginning on or after January 1, 2013, the Corporation will be required to adopt the following:
IFRS 7, "Financial Instruments" provides additional information about offsetting of financial assets and liabilities. Additional disclosures will be required to enable users of financial statements to evaluate the effect or potential effect of netting arrangements on the entity’s financial position.
IFRS 10, "Consolidated Financial Statements" provides a single model to be applied in control analysis for all investees including special purpose entities.
IFRS 11, "Joint Arrangements" redefines joint arrangements into two types, joint operations and joint ventures, each with their own accounting model. All joint operations will need to be proportionately consolidated and joint ventures to be equity accounted.
IFRS 12, "Disclosure of Interests in Other Entities" combines in a single standard the disclosure requirements for subsidiaries, associates and joint arrangements as well as unconsolidated structured entities.
IFRS 13, "Fair Value Measurement" defines the fair value, establishes a framework for measuring fair value and sets out disclosure requirements for fair value measurements. This standard defines fair value as the price that would be received to sell an asset or paid to transfer a liability in an orderly transaction between market participants at the measurement date.
In addition to the issuance of new standards as detailed above, there have also been amendments to existing standards, which are also effective January 1, 2013, including:
IAS 1, "Presentation of Financial Statements" amended to require presentation of an additional opening balance sheet when an entity applies an accounting policy retrospectively or makes a retrospective restatement or reclassification and to clarify the disclosure requirements.
IAS 32, "Financial Instruments: Presentation" amended to clarify the criteria that should be considered in determining whether an entity has a legally enforceable right of offset in respect of its financial instruments and clarifying the treatment of income taxes related to distributions and transaction costs.
Border Petroleum Corp.
Management's Discussion & Analysis
18
For annual periods beginning on or after January 1, 2015, the Corporation will be required to adopt:
IFRS 9, "Financial Instruments" - the new standard replaces the current multiple classification and measurement models for financial assets and liabilities with a single model that has only two classification categories: amortized cost and fair value.
The Corporation has not yet completed its assessment and evaluation of the effect of adopting the new and amended standards and the impact it may have on its financial statements.
BUSINESS RISKS AND UNCERTAINTIES Border advises readers that this Report may contain a number of forward-looking statements that involve a number of risks and uncertainties. Such information, although considered reasonable by Border at the time, may ultimately prove incorrect, too optimistic or too pessimistic, and actual results may differ materially from those anticipated in the statements. For this purpose, any statements contained within this Report that are not statements of historical fact may be deemed forward looking. In common with all public oil and gas companies, and especially smaller companies, Border is subject to considerable market volatility affecting the prices received for its production, foreign exchange and interest rates, the availability and cost of capital financing, and market liquidity for its common shares. Furthermore, high energy prices can lead to increased energy supplies, reduced economic activity, and increased conservation efforts, which then sow the seeds for lower energy prices. Border does not participate in hedging of oil and gas prices, foreign exchange or interest rates, as it considers such activities to be highly risky and a distraction from its primary areas of focus. The oil and gas business is also subject to a number of operational risks and uncertainties relating to such matters as exploration and development success, technical drilling and production performance and equipment failure including blowouts and fires, reserve recovery rates and timing, availability of third-party natural gas transportation, environmental damage and competition with much larger and better-financed companies for scarce land, people and financial resources. To manage these risks and uncertainties, Border relies upon the expertise and creativity of its human resources, the development of strategic relationships with industry partners, modern exploration, engineering and business technology, professional environmental sensitivity assessments, and public liability, property damage and business interruption insurance. Furthermore, the oil and gas industry is subject to extensive regulatory environments and fiscal regimes, both in Canada and internationally, which are subject to changes and beyond the control of the Corporation. The Corporation takes a proactive approach with respect to environment and safety. An operational emergency and response plan and safety policy are in place and the Corporation is in compliance with current environmental legislation.
DATE This Management Discussion and Analysis is dated as of July 16, 2014.
ADDITIONAL INFORMATION Additional information regarding Border is available on SEDAR at www.sedar.com.
ABBREVIATIONS
Oil and Natural Gas Liquids Natural Gas
bbls Barrels Mcf thousand cubic feet
Mbbls thousand barrels MMcf million cubic feet
bbls/d barrels of oil per day Mcf/d thousand cubic feet per day
boe/d barrels of oil equivalent per day m3 cubic meters
NGLs natural gas liquids (consisting of any one
or more of propane, butane and
condensate thousand stock tank barrels of oil
bpd barrels of production per day

Border Petroleum Corp.
Management's Discussion & Analysis
19
Other boe means barrels of oil equivalent. A barrel of oil equivalent is determined by converting a volume of natural
gas to barrels using the ration of six (6) mcf to one (1) barrel. “boe” may be misleading, particularly if used in isolation the boe conversion ration of six (6) mcf: one (1) bbl is based on an energy equivalency methods primarily applicable at the burner tip and does not represent a value equivalency at the wellhead.
GORR means gross overriding royalty
CONVERSION
The following table sets forth certain standard conversions between Standard Imperial Units and the International System of Units (or metric units).
To Convert From To Multiply By Mcf Cubic meters 28.174
cubic meters Cubic feet 35.494
bbls Cubic meters 0.159
feet meters 0.305
acres hectares 0.405
Border Petroleum Corp.
Management's Discussion & Analysis
20
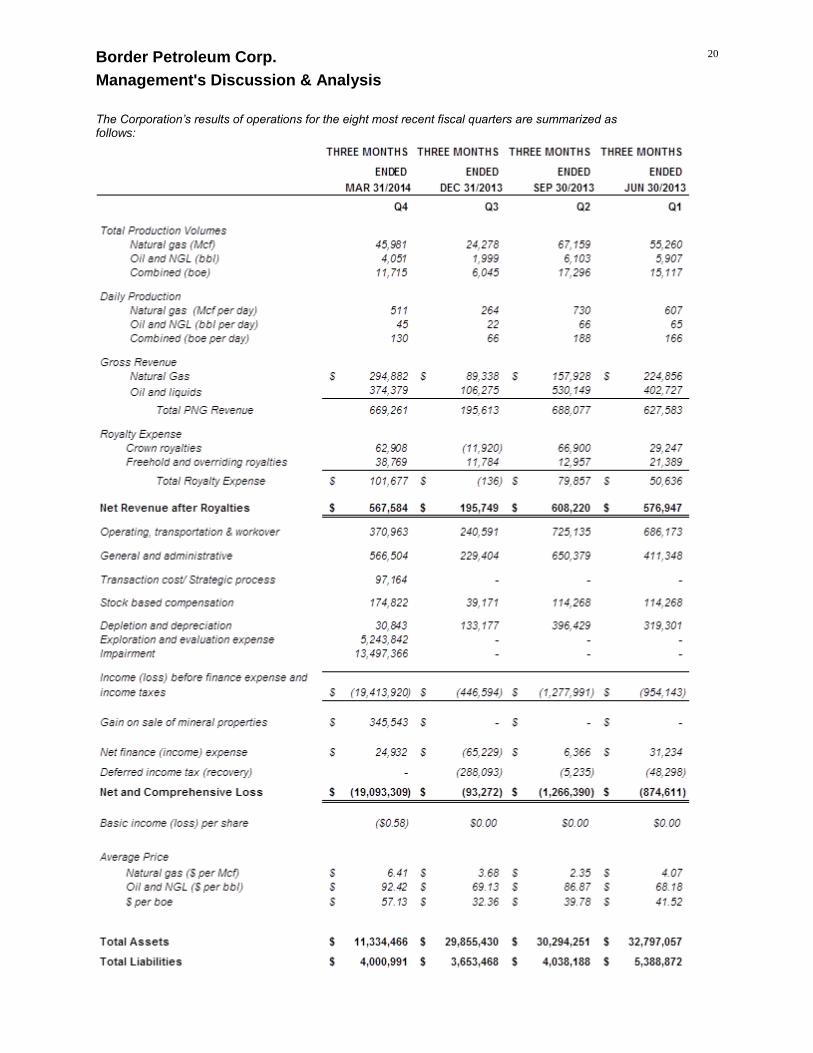
The Corporation’s results of operations for the eight most recent fiscal quarters are summarized as follows:
Border Petroleum Corp.
Management's Discussion & Analysis
21
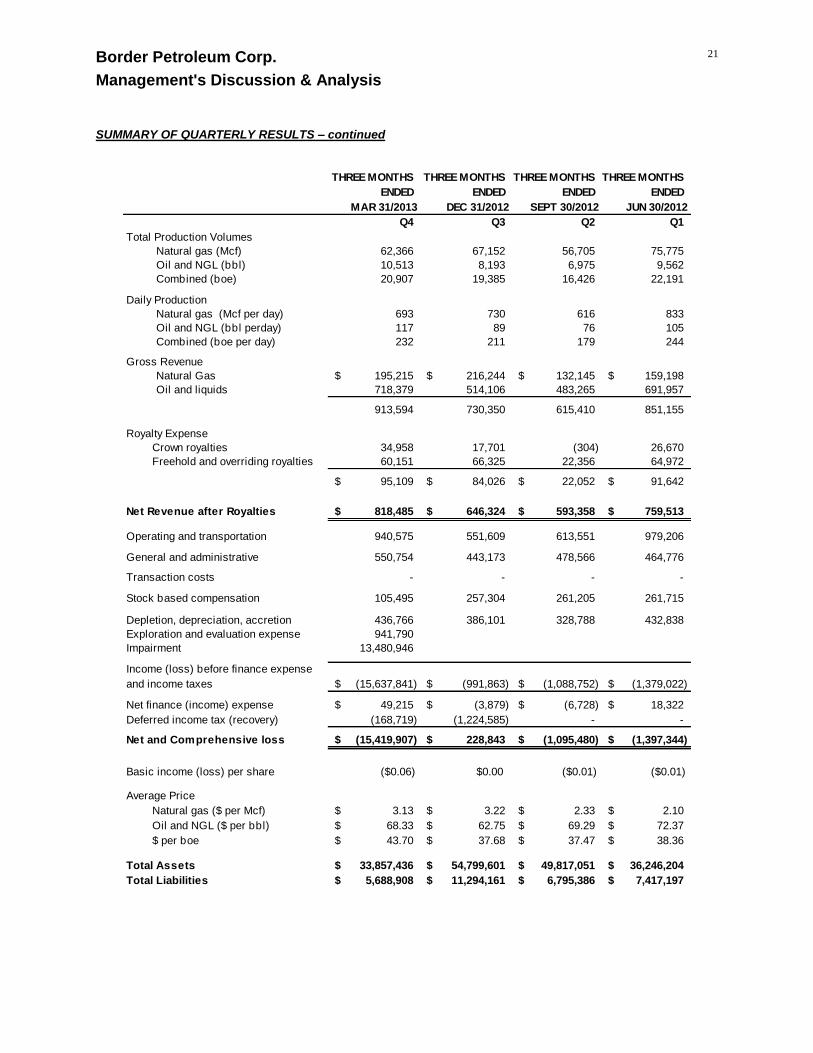
SUMMARY OF QUARTERLY RESULTS – continued
THREE MONTHS THREE MONTHS THREE MONTHS THREE MONTHS
ENDED ENDED ENDED ENDED
MAR 31/2013 DEC 31/2012 SEPT 30/2012 JUN 30/2012
Q4 Q3 Q2 Q1
Total Production Volumes
Natural gas (Mcf) 62,366 67,152 56,705 75,775
Oil and NGL (bbl) 10,513 8,193 6,975 9,562
Combined (boe) 20,907 19,385 16,426 22,191
Daily Production
Natural gas (Mcf per day) 693 730 616 833
Oil and NGL (bbl perday) 117 89 76 105
Combined (boe per day) 232 211 179 244
Gross Revenue
Natural Gas 195,215$ 216,244$ 132,145$ 159,198$
Oil and liquids 718,379 514,106 483,265 691,957
913,594 730,350 615,410 851,155
Royalty Expense
Crown royalties 34,958 17,701 (304) 26,670
Freehold and overriding royalties 60,151 66,325 22,356 64,972
95,109$ 84,026$ 22,052$ 91,642$
Net Revenue after Royalties 818,485$ 646,324$ 593,358$ 759,513$
Operating and transportation 940,575 551,609 613,551 979,206
General and administrative 550,754 443,173 478,566 464,776
Transaction costs - - - -
Stock based compensation 105,495 257,304 261,205 261,715
Depletion, depreciation, accretion 436,766 386,101 328,788 432,838
Exploration and evaluation expense 941,790
Impairment 13,480,946
(15,637,841)$ (991,863)$ (1,088,752)$ (1,379,022)$
Net finance (income) expense 49,215$ (3,879)$ (6,728)$ 18,322$
Deferred income tax (recovery) (168,719) (1,224,585) - -
Net and Comprehensive loss (15,419,907)$ 228,843$ (1,095,480)$ (1,397,344)$
Basic income (loss) per share ($0.06) $0.00 ($0.01) ($0.01)
Average Price
Natural gas ($ per Mcf) 3.13$ 3.22$ 2.33$ 2.10$
Oil and NGL ($ per bbl) 68.33$ 62.75$ 69.29$ 72.37$
$ per boe 43.70$ 37.68$ 37.47$ 38.36$
Total Assets 33,857,436$ 54,799,601$ 49,817,051$ 36,246,204$
Total Liabilities 5,688,908$ 11,294,161$ 6,795,386$ 7,417,197$
Income (loss) before finance expense
and income taxes