How management decides investments:
99
How management decides investments: The diagnosis of the business case practices in Portugal Cláudia Sofia Bento Teixeira Dissertation submitted as partial requirement for the conferral of Master in Management Supervisor: Prof. Doutor Leandro Pereira, ISCTE Business School June 2015
-
Upload
khangminh22 -
Category
Documents
-
view
1 -
download
0
Transcript of How management decides investments:

How management decides investments: The diagnosis of the business case practices in Portugal
Cláudia Sofia Bento Teixeira
Dissertation submitted as partial requirement for the conferral of Master in
Management
Supervisor:
Prof. Doutor Leandro Pereira, ISCTE Business School
June 2015

Abstract
The current economic context faced by organizations is addressing the manager role on creating
value through the right management and investment decisions. Investments projects are a
vehicle for business growth as it is the act of converting strategies into innovative projects
within the time-to-market that drives a business sustainability in today’s competitive market.
Business Cases were born to justify the investment required to deliver a proposed solution,
while following an accurate, impartial and rational process. Although several business case
practices have been developed worldwide, most project’s success measurement still rely on the
process efficiency (time, budget and scope) rather than project effectiveness (i.e benefits
realization).
This dissertation aims to provide a deeper understanding about how management teams make
investment decisions, or in other words, analyse the business case processes used in
organizations according to the best practices and also propose recommendations to improve the
gaps identified.
In terms of conclusion, organizations still lack a standardized process for projects strategic
alignment analysis, estimated benefits are often presented qualitatively rather than
quantitatively whereas costs quantification is already a more common practice. The research
also suggests a big lack of practice on cash flows and economic indicators’ sensitive and risk
analysis and unawareness about how much return the initiatives’ investments are estimated to
bring to the business.
In conclusion, although most organizations attempt to present a project (investment)
justification, there are several steps missing or not using the appropriate techniques for a reliable
and predictable output for the right investment decision.
Keywords: Benefits, Project, Business Case, Investment, Strategy
JEL Classification System: M10, M19
Resumo
O atual contexto económico enfrentado pelas organizações, tem destacado o papel do gestor na
criação de valor através da tomada de decisões de gestão e de investimento corretas. Os projetos
de investimentos são um veículo para o crescimento de um negócio pois é a ação de converter
estratégias em projetos inovadores no time-to-market que garantirá a sustentabilidade de um
negócio.
Assim, os Business Cases nasceram para justificar o investimento necessário à entrega de uma
proposta de solução, assente num processo rigoroso, imparcial e racional. Apesar de várias
práticas de business case terem sido desenvolvidas a nível mundial, a maioria do sucesso dos
projetos é ainda medido pela eficiência do processo (tempo, orçamento, âmbito) em vez da
eficácia (concretização dos benefícios).
Esta dissertação visa um maior entendimento de como a Gestão faz as decisões de investimento
à luz das melhores práticas e propor recomendações.
Em termos de conclusão, as organizações ainda falham na adoção de um processo normalizado
na análise de alinhamento estratégico, os benefícios estimados são apresentados
qualitativamente em vez de quantitativamente, enquanto que a apresentação dos custos
quantificados é já uma prática frequente. A investigação também sugere uma grande falha na
prática de análise de sensibilidade dos cash flows e dos indicadores económicos e a falta de
conhecimento de qual o retorno estimado para o negócio pelas iniciativas propostas.
Em conclusão, apesar de muitas organizações tentarem apresentar a justificação de um projeto
(investimento), ainda falham alguns passos ou a utilização de técnicas adequadas para a
obtenção de um output mais confiável e previsível para a correta tomada de decisão de
investimento.
Keywords: Benefícios, Projeto, Business Case, Investimento, Estratégia
JEL Classification System: M10, M19
Acknowledgments
I would like to start from thanking my thesis supervisor, Professor Leandro Pereira, for his
support, encouragement and availability on assisting me towards this research project. Besides
all the guidance during this journey, Prof. Leandro became a strong reference for myself,
especially from his valuable knowledge, entrepreneurial drive and inspiring leadership.
A very special thank you to my parents, who have always supported me along my academic
and career journey and who have always given me the strengths and joy to complete this
research project.
A thank you to INDEG-IUL for the support and conditions provided to allow this investigation.
Last but not lost least, a thank you to all the professionals who spent some time while
collaborating in this research.
I Thank you all.

I
Contents
LIST OF FIGURES ................................................................................................................ V
LIST OF ABBREVIATIONS .............................................................................................. VII
Chapter 1 - Introduction - …………………………………………………………………...1
1.1. Introduction ……………………………………………………………………………….1
Chapter 2 - Literature Review ................................................................................................ 3
2.1.Investment Projects .............................................................................................................. 3
2.1.1. What is an Investment and an Investment Project.................................................... 3
2.1.2. Project Life cycle ..................................................................................................... 4
2.2. Business Case ...................................................................................................................... 5
2.2.1. Business Case Purpose ............................................................................................. 5
2.2.2. Business Case Process .............................................................................................. 6
2.2.3. Business Case Steps ................................................................................................. 6
2.2.3.1. Step 1 – Project Request .................................................................................... 6
2.2.3.2. Step 2 – Strategic Alignment ............................................................................ 8
2.2.3.3. Step 3 – Benefits Estimation ............................................................................. 8
2.2.3.4. Step 4 – Costs Estimation ................................................................................ 11
2.2.3.5. Step 5 – Economic Evaluation ........................................................................ 12
2.2.3.5.1 The principle of the time value for money ............................................... 13
2.2.3.5.2 WACC (Weighted average cost of capital) .............................................. 13
2.2.3.5.3 CAPM ....................................................................................................... 14
2.2.3.5.4 Interest Rate – inflation rate, opportunity cost and risk............................ 15
2.2.3.5.5 Sensitive and Risk Analysis...................................................................... 17
2.2.3.6. Step 6 – Context Readiness ............................................................................. 20
2.2.3.7. Step 7 – Decision Making ............................................................................... 21
2.2.3.8. Step 8 – Benefits Tracking .............................................................................. 21
2.3. Benefits Management ........................................................................................................ 22
2.3.1. Understanding the Benefits Rationale .................................................................... 22
2.3.2. The Budgeting Concept: Capital Expenditure vs Operational Expenditure .......... 23
2.4. Change Management ......................................................................................................... 25
2.5. Resources and Capacities .................................................................................................. 26
2.6. Statistics / Surveys ............................................................................................................ 26
II
Chapter 3 - Methodology ....................................................................................................... 31
3.1.Identification of type of thesis ............................................................................................ 31
3.2. Research Problem .............................................................................................................. 31
3.3. Research questions ............................................................................................................ 33
3.4. Research Objectives .......................................................................................................... 33
3.5. Research Approach ........................................................................................................... 33
3.5.1. Research Type ........................................................................................................ 33
3.6.Target Population ............................................................................................................... 34
3.7. Sampling Method .............................................................................................................. 34
3.8. Data Collection Methods: Instruments and Procedures .................................................... 35
3.8.1. Primary Data ........................................................................................................... 35
3.8.1.1. Questionnaire Building Procedures .............................................................. 36
3.8.1.2. Response Strategy ........................................................................................ 36
3.8.2. Questionnaire Validation Procedures: Pre-Test ..................................................... 37
3.8.2.1. Questionnaire Data Analysis ........................................................................ 38
3.8.3.Secondary Data ....................................................................................................... 38
Chapter 4 - Questionnaire Results ........................................................................................ 39
4.1. Research role and experience ............................................................................................ 39
4.2. General Considerations ..................................................................................................... 39
4.3. Research Findings ............................................................................................................. 40
4.3.1.Sample Profile ......................................................................................................... 40
4.3.2. CAPEX Budget ...................................................................................................... 43
4.3.2.1 CAPEX Budgeting Process .............................................................................. 43
4.3.2.2 Main Goal of the budgeting process ................................................................ 44
4.3.2.3 Criteria for portfolio selection .......................................................................... 45
4.3.2.4 Budgeting – Start and Last Month ................................................................... 47
4.3.3.2.5 ROI Awareness .................................................................................................. 48
4.3.2.6. Income boosted by the budget ......................................................................... 49
4.3.3 Initiatives Application ............................................................................................. 50
4.3.4 Strategic Alignment ................................................................................................. 51
4.3.5 Benefits Estimation ................................................................................................. 52
4.3.5.1 Benefits Presentation ........................................................................................ 52
4.3.5.2 Benefits Collection Techniques ....................................................................... 54
4.3.5.3 Benefits Sensitive and Risk Analysis ............................................................... 56
4.3.6 Cost Estimation ....................................................................................................... 58
III
4.3.6.1 Costs Presentation ............................................................................................ 58
4.3.6.2 Costs collection techniques .............................................................................. 59
4.3.6.3 Costs Sensitive and Risk Analysis ................................................................... 61
4.3.7 Economic/Financial Analysis .................................................................................. 62
4.3.7.1 Economic criteria ............................................................................................. 62
4.3.7.2 Discount Rate Methods .................................................................................... 63
4.3.8 Organization Readiness ........................................................................................... 64
4.3.9 Sensitive and Risk Analysis for the Business Case Cash Flows ............................. 65
4.3.10 Benefits Measurement ........................................................................................... 66
Chapter 5 - Conclusions ......................................................................................................... 67
5.1. Main Conclusions .............................................................................................................. 67
5.2 Research Limitations .......................................................................................................... 70
5.3 Future Research .................................................................................................................. 70
Bibliography ........................................................................................................................... 71
Appendix ................................................................................................................................. 77

IV
V
LIST OF FIGURES
Figure 1- POLDAT .................................................................................................................... 7
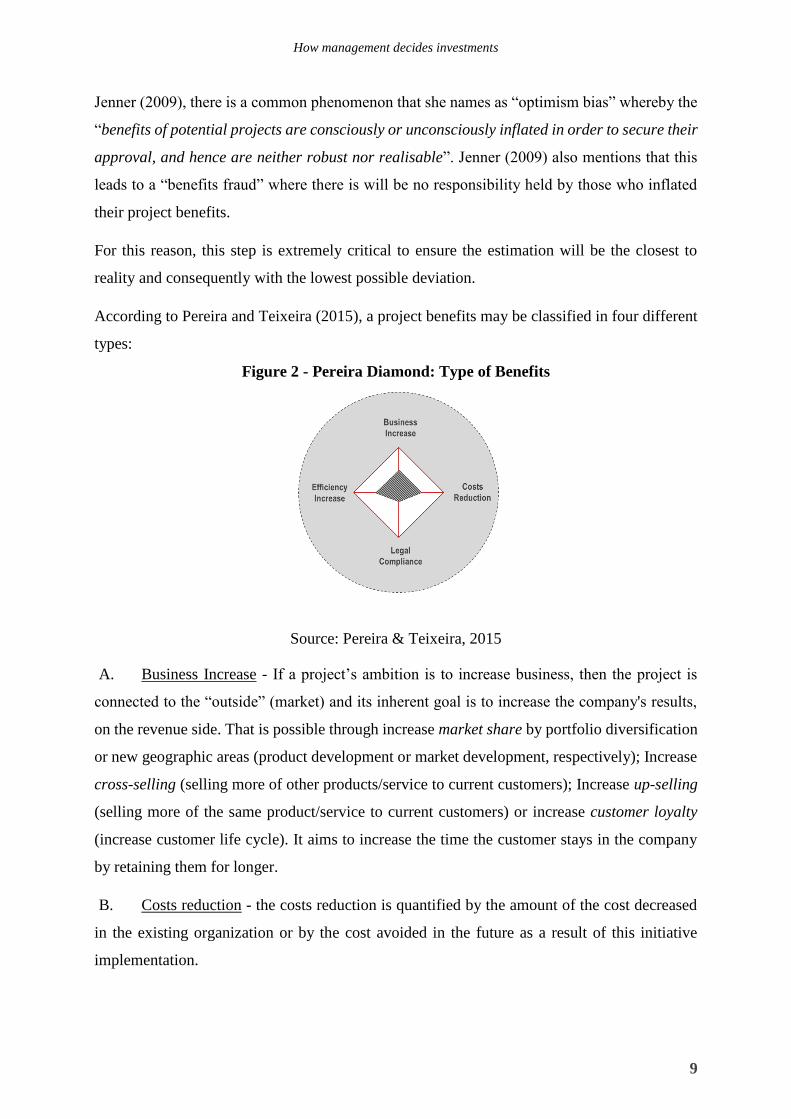
Figure 2 - Pereira Diamond: Type of Benefits ........................................................................... 9
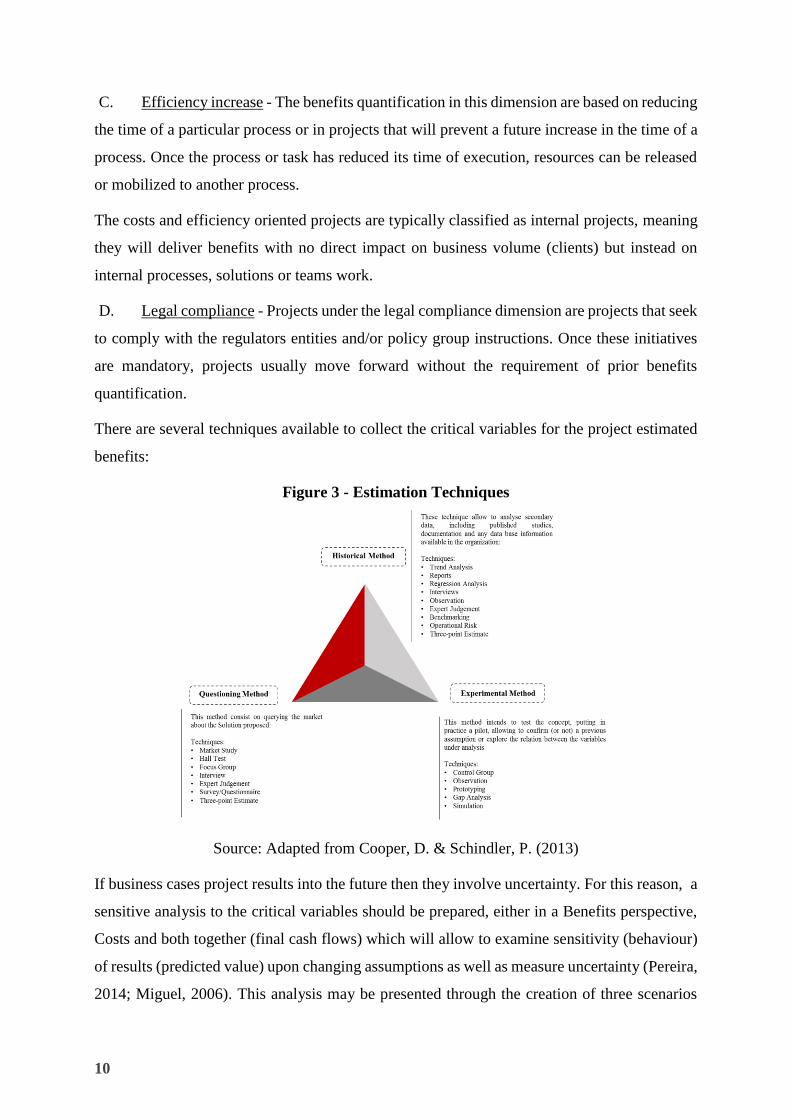
Figure 3 - Estimation Techniques ............................................................................................ 10
Figure 4 - Benefits S Curve - Example .................................................................................... 11
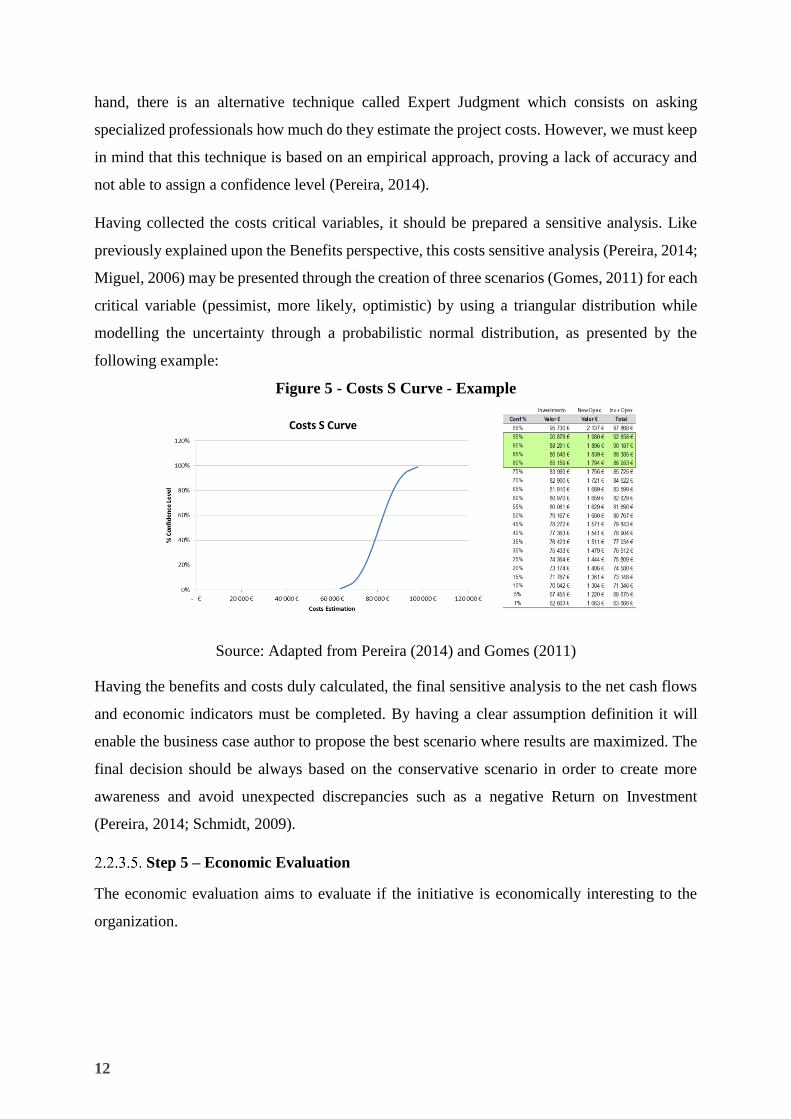
Figure 5 - Costs S Curve - Example ......................................................................................... 12
Figure 6 - Causes of Optimism bias ......................................................................................... 17
Figure 7 - Examples of Critical Variables ................................................................................ 19
Figure 8 - Conceptual model of TimeBudget Box ................................................................... 24
Figure 9 - Seven Generic Project Success Criteria .................................................................. 29
Figure 10 - Key BRM Practices ............................................................................................... 29
Figure 11 - Research Methodology .......................................................................................... 31
Figure 12 - Research Method ................................................................................................... 35
Figure 13 - Role ........................................................................................................................ 40
Figure 14 - Sector ..................................................................................................................... 41
Figure 15 - Core Area ............................................................................................................... 42
Figure 16 - Years involved in budgeting .................................................................................. 42
Figure 17 - Organizations with CAPEX .................................................................................. 43
Figure 18 - Main goal of budgeting process ............................................................................ 44
Figure 19 - Main criteria for projects portfolio selection ......................................................... 46
Figure 20 - Budget - Starting Month ........................................................................................ 47
Figure 21 - Budget - Last Month .............................................................................................. 47
Figure 22 - ROI Awareness of projects .................................................................................... 48
Figure 23 - Awareness about the income boosted by the last budget ...................................... 49
Figure 24 - Process to submit initiatives .................................................................................. 50
Figure 25 - Criteria for strategic alignment .............................................................................. 52
Figure 26 - Benefits Format ..................................................................................................... 53
Figure 27 - Methods and techniques for benefits estimation ................................................... 54
Figure 28 - Methods and Techniques for benefits estimation
Figure 29 - Benefits' Sensitive and Risk Analysis ................................................................... 56
Figure 30 - Costs Presentation ................................................................................................. 58
Figure 31 - Methods and techniques for costs estimation ........................................................ 59
Figure 32 - Example Product Breakdown Structure ................................................................ 60
Figure 33 - Costs Sensitive and Risk Analysis ........................................................................ 61
Figure 34 – Index ..................................................................................................................... 62
Figure 35 - Discount rate method ............................................................................................. 63
Figure 36 - Organization Readiness ......................................................................................... 64
Figure 37 - Business Case Sensitive Analysis ......................................................................... 65
Figure 38 - Benefits Measurement ........................................................................................... 66

VI
VII
LIST OF ABBREVIATIONS
BABOK – Business Analysis Body of Knowledge
BRM – Benefits Realization Management
CAPM – Capital Asset Pricing Model
CAPEX – Capital Expenditure
IRR – Internal Rate of Return
NPV – Net Present Value
OPEX – Operational Expenditure
PMBOK – Project Management Body of Knowledge
ROI – Return on Investment
UK – United Kingdom
WACC – Weight Average Cost of Capital

VIII
How management decides investments
1
Chapter 1 - Introduction
The Introduction
Nowadays, organizations are challenged daily to keep their business running on a sustainable
way. The crisis context together with the huge speed of technology advancements, the power
of social networking and markets globalization are triggering organizations to rationalize and
optimize their resources. These resources include time, human labour and capital which need
to be invested day by day while a business is running and especially when a new project is
implemented (Greenberg, 1982; Pereira, 2014).
According to the authors Teece et al. (1997), the ability to create dynamism is part of a
manager’s role, which consists on having the capacity to renew skills aligned with the business
environment which is constantly subject to change, as well as being able to respond with
innovative proposals specially when time-to-market and time management to “respond” are
critical, in such an unpredictable market. The term “capacities” emphasizes the key role of
strategic management on adapting, integrating and reconfiguring the internal and external
organization abilities, resources (financial, humans, knowledge) and functional competencies
in order to respond and combine with the demand and market environment changes (and
creating competitive advantages).
With this being said, the investment becomes the vehicle for a business growth and wealth when
applied in the right projects, those which increase value to the organization’s stakeholders. It is
the act of converting strategies into innovative projects in a time-to-market manner that may
drive a business sustainability in today fast growing market. However, project success
measurement is a subject which still requires a few improvements since the efficiency of the
process (time, budget and scope) is still dominant by mainly focusing on project deliveries
(Ashurst et al., 2008) rather than effectiveness of the project investment through organizational
benefits generation (O. Zwikael & J. Smyrk, 2012).
Having this said, business cases play a helpful role on facilitating top management on deciding
where to or not to invest their resources, in order to add continuously value by providing the
ability on making the right investment decision within the time-to-market. For this reason,
managers need to know what, when, how and where to invest which by default generates the
need to create reliable and trustful estimations in order to support their decisions (Pereira &
Teixeira, 2015). With this being said, if the level of competition is high then wrong decisions
may seriously compromise a company success. Due to all the economic factors previously
2
explained, it led several academic and business experts to develop business case methodologies
(eg. The GreenBook, ROI Methodology, Gateway Review process) to support organizations on
making the right investment decisions.
Following the organizations current challenges on this topic, the research objectives are to
assess the current scenario and evaluate their maturity level followed by the main gaps
identification in companies regarding each main stage of the business case process and propose
recommendations based on the current best practices of business cases, which will allow to
boost the company’s return on investments, minimize financial wastes and promote the
company growth and sustainability.
The research approach relies on an explanatory research where a convenience sample was
considered. In order to complete my dissertation, my research was based on a quantitative
method as a primary data source, complemented by a qualitative and quantitative data as a
secondary data source. The research started from collecting literature information available to
date, followed by a quantitative analysis from a survey based on a convenience sample followed
by a data analysis and a recommendations proposal.
The target population are business manager’s professionals operating in Portugal, where
investments decisions are taken place and who are directly or indirectly involved either in
investment appraisals or investments decisions. Since the need of investing in new solutions is
a reality across every sector, this research covers different sectors (such as Energy,
Telecommunications, Insurance & Banking, Construction and others) and business areas (IT,
Project Management, Sales, Human Resources and others).
According to the final conclusions gathered, this dissertation aims to generate awareness, help
mitigating the main gaps detected and contribute as a basis for future researches on this matter
to assist on creating sustainable solutions.
How management decides investments
3
Chapter 2 - Literature Review
Although this research aims to analyse the business case process and practices currently used
in organizations, this chapter aims to support this investigation in terms of theoretical concepts
related to this subject.
Investment Projects
What is an Investment and an Investment Project
There are several concepts developed to better describe what an investment is.
Whether it is an individual, a public organization or a private company an investment usually
consists on the application of funds in real or financial assets in order to obtain a surplus which
will payoff the expenses on a medium-long term (Esperança & Matias, 2009).
Completing an investment project means there is an idea and simultaneously a projected
business plan which consists on affecting several resources (usually scarce) for a particular
application with the end goal to obtain a return or income during a certain period of time
(Miguel, 2006). While applying this concept into a business perspective, investments should
generate additional revenue, maximizing wealth to shareholder and assisting on achieving
business objectives towards meeting a strategic goal(s). As per Kelly et al. (2008), a project is
intrinsically related to change, organizational evolution and transitions, therefore it constitutes
the vehicle to a business progress by implementing the future steps. So, it will be through
projects implementation that the organizational strategies are put in place towards the
continuous improvement and differentiation in the current global market. As mentioned by
Pereira (2006) the success of projects will determine the success of an organization.
According to Johnson & Scholes (2002) good business strategies are those that deliver
stakeholder value representing the organisation's long-term cash generation capability or in
other words, a valued services delivery. These business strategies are then set on strategic
objectives (targets for future value). Considering that objectives should be measurable, then the
difference between the current situation and the intended future situation will define the value
gap, which in order to be achieved, it will require a portfolio of initiatives which should be
defined in the organizations strategic plan (Kaplan & Norton, 2008). So, projects require
resource employment organised on a new and unique way, for a specific time period, in order
to create positive changes (transformation) in the business (Turner & Müller, 2003) and
consequently contribute to the organizational objectives. These strategic improvements in the
business are called ‘benefits’, which consist on business value increments from not only a
4
shareholders' perspective but also customers’, suppliers’, or even societal perspectives (Zwikael
& Smyrk, 2011).
Throughout the business case and in particular during the problem definition and benefits
quantification, it must be clear that the business requirement is composed by the business need
of the enterprise plus the impact generated (BABOK, 2009). When proposing a solution for the
identified business need, this must create a positive impact which is able to be quantified and
represented on a financial basis (Pereira, 2014).
Project Life cycle
To better understand the basis from business case methodologies it is essential to have in mind
the different steps which compose a project lifecycle (Esperança & Matias, 2009; Mota &
Custódio, 2008)
There are hree phases on a project lifecycle:
Phase 1 - Pre-investment
Before a project is actually implemented, its embryo takes origin from the moment when several
ideas or opportunities are identified and formulated. It also includes the steps of its evaluation
such as market studies, investment analysis, funding, technology, in order to make a final
decision on whether to go or not go ahead with the project implementation. As highlighted by
Esperança & Matias (2009), the investment idea should consider a market need as well as the
competencies and skills of the entrepreneur or the company.
Phase 2 – Investment
In this phase there is a deep insight on the outcomes from the previous technical and financial
studies (phase) and where company gives the first steps on their legal commitments. The
investment period is critical and requires specially attention in terms of the several project
management techniques which assist on the effective project implementation under the planned
time, budget and scope. According to the PMBOK Guide there are five main processes
categories: initiation, Planning, Executing, Monitoring & Controlling and Closing Processes
(Miguel, 2013).
Phase 3- Exploitation
The phase of exploitation, as the name states, is the moment when the project is launched and
is running, as a consequence of the investment expenses (Gonçalves, 2009). In other words,
when we start collecting the project benefits during a certain period of time.
How management decides investments
5
Business Case
Business Case Purpose
The business case was born mainly to provide a decision support to the business managers,
assist on planning resources (eg. Funding), management and control queries and for
accountability purposes (measurement of results; commit managers) (Schmidt, 2009).
In a context where resources are scarce and face several constrains, companies ought to decide
as to which investments they should invest that maximize the most value to their business.
Considering these two aspect of the amount of return the project is able to provide plus the
added value to the business, companies need to prioritize the various projects available “on the
table” (Capital investment, 2014). To assist in this process, there are several economic measures
commonly used such as Payback, NPV (Net Present Value), ROI (return on investment), IRR
methods and many others. So, business cases arise as the methodology to analyse and support
investment decisions, especially in an uncertainty period towards the future, composed by a set
of techniques which will allow the cost and benefits analysis associated in an investment project
(Couto, G., et al., 2013).
According to the BABOK Guide (A Guide to the Business Analysis Body of Knowledge), a
“case justifies the investment required to deliver a proposed solution and Mcvey (2014:1) states
that “a business case is part of the due diligence the business case represents, measuring
benefits, costs, and risks associated with the investment. The business case assesses and
evaluates the available options to solve the business issue. The business case provides an
opportunity for the business to determine if a project is needed and if the solution options are
beneficial to the organization”. The author also says this may be accomplished through both
qualitative and quantitative analysis techniques, by describing if the solution is feasible and
financially viable while meeting business goals. Mcvey (2014) also mentions that business case
is more than just a financial justification, such as:
Why the project should be undertaken and includes a problem statement
How will the business issue be solved
Recommended solutions
What are the benefits to the organization, customer, and staff
How much money, resources and time will be needed to deliver the solution
Risk, Assumptions and Constraints
Financial impacts
6
Business Case Process
Having in mind the groups of processes required to do project management, the business case
activities for the project evaluation are organized as following:
According to (Pereira, 2014), the three essential business case steps are composed by:
Project justification
Execution
Benefits tracking
In an operational level, these steps are composed by:
Tasks to justify the business requirement
Business analysis, functional and non-functional requirements definition, scope
delimitation
Project management, plan, tests
Exploitation
Business Case Steps
Since my investigation consists on making a diagnosis about the business case practices
currently used in organizations, my data collection (market research) will follow the main
critical steps of a business case process to be successfully prepared. Based on several business
case best-practices worldwide (eg. ROI methodology, Green Book, Gateway Review Process)
the author (Pereira, 2014) presents the following main business case’s steps:
Step 1 – Project Request
This step aims to present the project request in a formal and standard procedure internally but
in order to do it accurately it is crucial that the stakeholder (client) requesting for this initiative
has a deep understanding of the business need, problem or opportunity which drives him to
request for an investment. The formal document should also state a brief description on the
main expected impacts in the company architecture: on the company stakeholders, processes
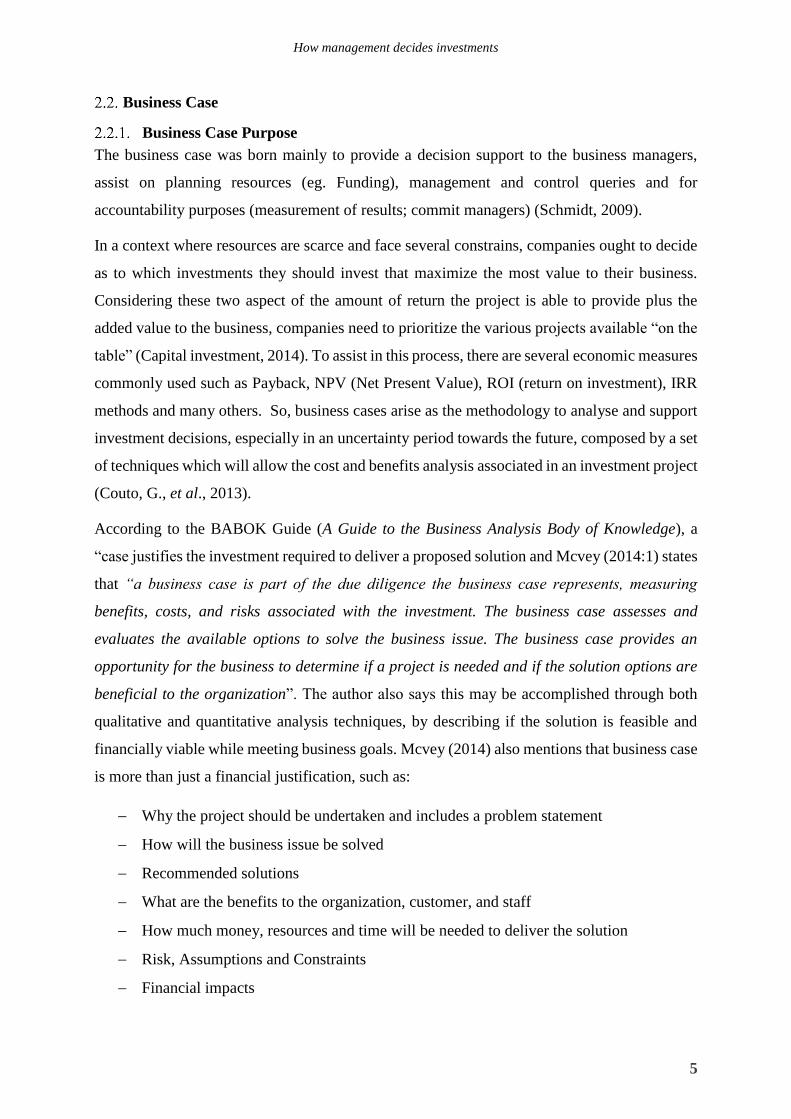
and systems. The main technique that supports this impact analysis is named POLDAT
(Karney, J. 2009), requiring the clear understanding of the current scenario (as is) and the goal
to be achieved (to be).
How management decides investments
7
Source: Adapted from Karney, J. (2009)
This step should also state why the initiative should be done during that period and state the
impacts of not pursuing it or of postponing it.
In order to provide an accurate, structured and consistent Project Request it is essential that the
individual is capable to do a problem-solving analysis. Briefly, it consists on a qualitative
analysis where the main problem/need/opportunity is described, followed by the identification
of its main impacts in the business and their behaviour on a certain time period (trend analysis).
As the solution should fit on the problem’s causes, it is of high importance to identify up to the
three main benefits that origin this initiative (investment) request.
The recommendation on identifying up to three main benefits is based on the principle of Pareto
Law. Vilfredo Pareto was an Italian economist and sociologist (1848-1923) who demonstrated
that 80 per cent of the wealth of the nation was distributed among 20 per cent of the population
("the vital few") and the remaining 20 per cent of the wealth was distributed among the other
80 per cent of the population ("the trivial many") (La Rooy, 1999). Pareto’s theory became
known as the “80/20” rule, which states that 20% of the known variables will account 80% of
the results (Basile, 1996), which was the result of the observations and writings of Joseph M.
Juran, a "pioneer in the development of principles and methods for managing quality control
programs" (Juran, 2001). Juran admitted that the linkage of the principle with Pareto was wrong
and gave the name “Pareto” to this principle of the `vital few and trivial many' which is a
shorthand name for the phenomenon that in any population which contributes to a common
effect, a relative few of the contributors account for the bulk of the effect" (Juran, 2001). Since
then, the Pareto principle has become generally accepted in management sciences. According
to Juran (1954), this principle is "universal" for planning and controlling and as per Drucker
Figure 1- POLDAT
8
(1996) also confirmed the importance of the "vital few" by noting that effective executives do
not make a great many decisions, they concentrate on the important ones.
Step 2 – Strategic Alignment
Having the initiative presented to the Sponsor (decision-maker), signed and approved to move
on to the next stage, it must be evaluated on a strategic perspective. Frequently organizations
waste time on predicting, planning and even implementing initiatives that do not fit the
organization strategic goals set for the short-medium term. For this reason, before proceeding
to a cost-benefit analysis the solution proposed should be analysed carefully on a qualitative
level.
The scoring model (a type of multi criteria analysis) consists on classifying the initiatives on
each criteria (in this case on strategic objectives), in a numeric scale, which score will be
multiplied by a weight and sum in order to obtain a final scoring. The initiatives with the best
classification (score) should get priority (Milosevic, 2003).
Step 2 requires a clear goal-setting meaning the ability of each organization on establishing a
standard or objective for performance at various organizational levels such as strategic, tactical
and operational goals (Gunasekaran et al., 2001). At the business case level, the initiative
benefits are analysed towards the strategic goals which refer to organizational-level business
objectives. However, it is important to highlight that strategic goals direct the formulation of
tactical goals at project-level (project target benefits), which consequently are supported by the
operational goals (e.g. budget and schedule for output delivery).
Step 3 – Benefits Estimation
If the initiative meets the strategic requirements, the next step is to evaluate the benefits in a
quantitative basis. In order to prevent stakeholders from taking different interpretations about
the target benefits, these ones should be specifically defined so there will be a clear resources
allocation as well as assigning responsibility for managing their realization (Breese, 2012;
Norris, 1996).
Considering that tight budgets are one of biggest barriers in current organizations, the estimated
benefits should be the main reference for the budget definition avoiding that a project with high
potential return will be immediately excluded due to a budget constraint. In order to estimate
the benefits there are several techniques to collect the current situation and evaluate the future
scenario. Identifying the right sources of information and the evaluation techniques will
determine the accuracy and the veracity of the business case (Pereira, 2014). According to
How management decides investments
9
Jenner (2009), there is a common phenomenon that she names as “optimism bias” whereby the
“benefits of potential projects are consciously or unconsciously inflated in order to secure their
approval, and hence are neither robust nor realisable”. Jenner (2009) also mentions that this
leads to a “benefits fraud” where there is will be no responsibility held by those who inflated
their project benefits.
For this reason, this step is extremely critical to ensure the estimation will be the closest to
reality and consequently with the lowest possible deviation.
According to Pereira and Teixeira (2015), a project benefits may be classified in four different
types:
Figure 2 - Pereira Diamond: Type of Benefits
Source: Pereira & Teixeira, 2015
A. Business Increase - If a project’s ambition is to increase business, then the project is
connected to the “outside” (market) and its inherent goal is to increase the company's results,
on the revenue side. That is possible through increase market share by portfolio diversification
or new geographic areas (product development or market development, respectively); Increase
cross-selling (selling more of other products/service to current customers); Increase up-selling
(selling more of the same product/service to current customers) or increase customer loyalty
(increase customer life cycle). It aims to increase the time the customer stays in the company
by retaining them for longer.
B. Costs reduction - the costs reduction is quantified by the amount of the cost decreased
in the existing organization or by the cost avoided in the future as a result of this initiative
implementation.
10
C. Efficiency increase - The benefits quantification in this dimension are based on reducing
the time of a particular process or in projects that will prevent a future increase in the time of a
process. Once the process or task has reduced its time of execution, resources can be released
or mobilized to another process.
The costs and efficiency oriented projects are typically classified as internal projects, meaning
they will deliver benefits with no direct impact on business volume (clients) but instead on
internal processes, solutions or teams work.
D. Legal compliance - Projects under the legal compliance dimension are projects that seek
to comply with the regulators entities and/or policy group instructions. Once these initiatives
are mandatory, projects usually move forward without the requirement of prior benefits
quantification.
There are several techniques available to collect the critical variables for the project estimated
benefits:
Figure 3 - Estimation Techniques
Source: Adapted from Cooper, D. & Schindler, P. (2013)
If business cases project results into the future then they involve uncertainty. For this reason, a
sensitive analysis to the critical variables should be prepared, either in a Benefits perspective,
Costs and both together (final cash flows) which will allow to examine sensitivity (behaviour)
of results (predicted value) upon changing assumptions as well as measure uncertainty (Pereira,
2014; Miguel, 2006). This analysis may be presented through the creation of three scenarios
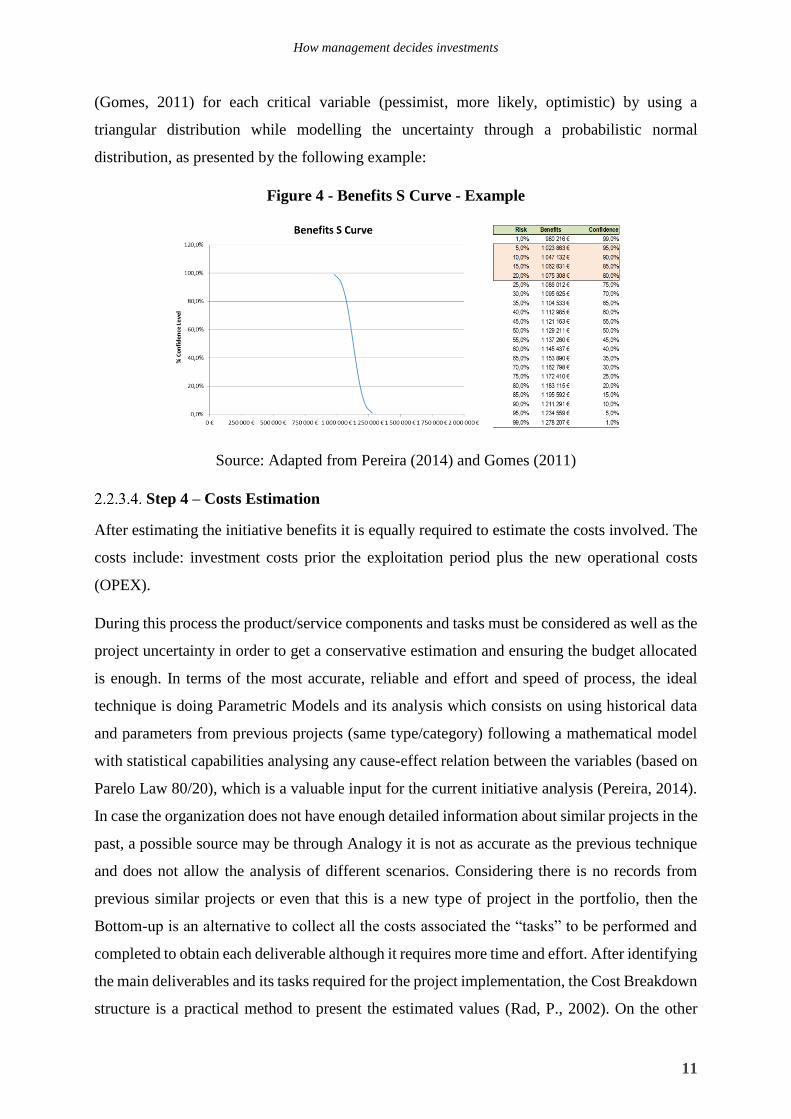
How management decides investments
11
(Gomes, 2011) for each critical variable (pessimist, more likely, optimistic) by using a
triangular distribution while modelling the uncertainty through a probabilistic normal
distribution, as presented by the following example:
Figure 4 - Benefits S Curve - Example
Source: Adapted from Pereira (2014) and Gomes (2011)
Step 4 – Costs Estimation
After estimating the initiative benefits it is equally required to estimate the costs involved. The
costs include: investment costs prior the exploitation period plus the new operational costs
(OPEX).
During this process the product/service components and tasks must be considered as well as the
project uncertainty in order to get a conservative estimation and ensuring the budget allocated
is enough. In terms of the most accurate, reliable and effort and speed of process, the ideal
technique is doing Parametric Models and its analysis which consists on using historical data
and parameters from previous projects (same type/category) following a mathematical model
with statistical capabilities analysing any cause-effect relation between the variables (based on
Parelo Law 80/20), which is a valuable input for the current initiative analysis (Pereira, 2014).
In case the organization does not have enough detailed information about similar projects in the
past, a possible source may be through Analogy it is not as accurate as the previous technique
and does not allow the analysis of different scenarios. Considering there is no records from
previous similar projects or even that this is a new type of project in the portfolio, then the
Bottom-up is an alternative to collect all the costs associated the “tasks” to be performed and
completed to obtain each deliverable although it requires more time and effort. After identifying
the main deliverables and its tasks required for the project implementation, the Cost Breakdown
structure is a practical method to present the estimated values (Rad, P., 2002). On the other
12
hand, there is an alternative technique called Expert Judgment which consists on asking
specialized professionals how much do they estimate the project costs. However, we must keep
in mind that this technique is based on an empirical approach, proving a lack of accuracy and
not able to assign a confidence level (Pereira, 2014).
Having collected the costs critical variables, it should be prepared a sensitive analysis. Like
previously explained upon the Benefits perspective, this costs sensitive analysis (Pereira, 2014;
Miguel, 2006) may be presented through the creation of three scenarios (Gomes, 2011) for each
critical variable (pessimist, more likely, optimistic) by using a triangular distribution while
modelling the uncertainty through a probabilistic normal distribution, as presented by the
following example:
Figure 5 - Costs S Curve - Example
Source: Adapted from Pereira (2014) and Gomes (2011)
Having the benefits and costs duly calculated, the final sensitive analysis to the net cash flows
and economic indicators must be completed. By having a clear assumption definition it will
enable the business case author to propose the best scenario where results are maximized. The
final decision should be always based on the conservative scenario in order to create more
awareness and avoid unexpected discrepancies such as a negative Return on Investment
(Pereira, 2014; Schmidt, 2009).
Step 5 – Economic Evaluation
The economic evaluation aims to evaluate if the initiative is economically interesting to the
organization.
How management decides investments
13
2.2.3.5.1 The principle of the time value for money
Having the project benefits and cost estimated, it is possible to calculate the estimated project’s
cash flows generated during its lifecycle period.
As per Kaplan Financial Knowledge bank (2015), the money received today is worth more than
the same sum received in the future – time value effect – which may occur for three main
reasons: potential for earning interest/cost of finance, impact of inflation and effect of risk.
Therefore, upon an investment appraisal, it comes the need to evaluate whether it is
economically viable for which is required to bunch all the cash flows to a specific moment
(period) of time. In order to complete that, it is required to calculate a discount rate to update
all the cash flows to the same moment of time (Mota & Custódio, 2008) which represent the
minimum rate required to create value for the firm and shareholders.
In order to determine the discounted cash flows there are several possible methods:
2.2.3.5.2 WACC (Weighted average cost of capital)
According to the authors (Clayman, M. et al., 2012) the cost of capital for a company is
estimated for the entire company, meaning it is calculated based on the average riskiness of the
company’s assets as well as its financial structure. The required rates of return of debt and
equity are used to estimate the weighted (overall) average cost of capital (WACC) for the
company. However if the project under consideration is more risky or less risky than the
company, the WACC should not be used as the project required rate of return.
The rate obtained through this method, considers the effect of the debt cost assuming the use of
both equity and debt capital as funding sources to all the projects. So, the rate of the cost of
capital results on a weighted average of the debt and equity costs (net of income taxes) (Caetano,
2009), according to the market value of each source of finance (Kaplan Financial Knowledge
bank – WACC, 2015).
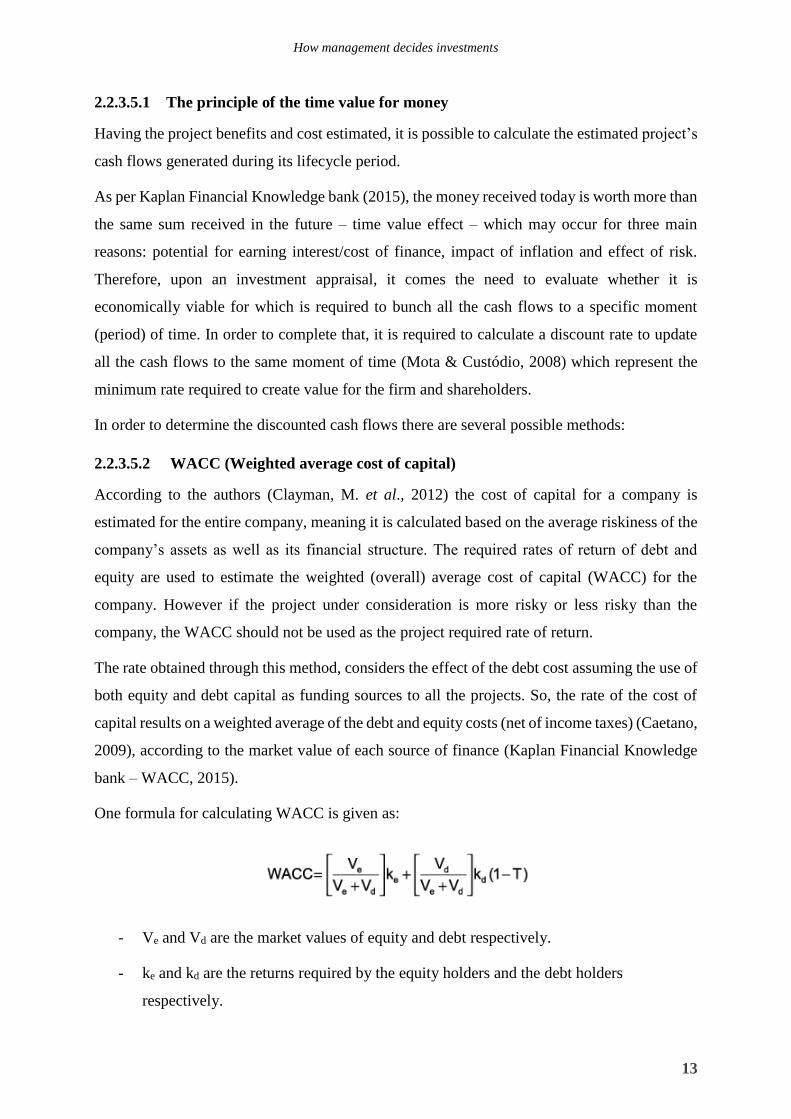
One formula for calculating WACC is given as:
- Ve and Vd are the market values of equity and debt respectively.
- ke and kd are the returns required by the equity holders and the debt holders
respectively.
14
- T is the corporation tax rate.
- ke is the cost of equity.
- kd(1-T) is the cost of debt.
However, WACC methods presents some limitations such as the assumption that all the projects
undertaken by the company are of same risk profile and the source and mix of financing (for
new projects) is the same as the current capital mix of the company (Kaplan Financial
Knowledge Bank, 2015). Having this said, the WACC should only be used as a discount rate
for a new investment project if the business risk and the capital structure (financial risk) are
likely to stay constant (Gomes, 2011). If these conditions do not hold then a different approach
is needed.
On an investment appraisal perspective, the WACC might not be the most appropriate technique
as each project may not represent a “miniature” of the company hence not representing the most
accurate discount rate associated to the project under analysis.
2.2.3.5.3 CAPM
According to the CAPM method, the risk faced by a shareholder is in large part due to the
volatility of the company's earnings. This volatility can occur because of a systematic risk (from
market wide factors i.e the state of the economy) which cannot be diversified away (Clayman,
M. et al., 2012) and a non-systematic risk (from company/industry specific factors).
Considering the different natures of each risk type, the systematic risk usually affect all
companies in the same way and non-systematic risk factors may impact each firm differently,
depending on the circumstances. In order to eliminate unsystematic risks, shareholders may do
a portfolio diversification, but since all investments are affected in the same way by macro-
economic factors, the systematic risk of the portfolio will always remain (Kaplan Financial
Knowledge – CAPM, 2015). Having this said, diversified investors may demand a premium
risk for taking systematic risk, although not for unsystematic risk (Clayman, M. et al, 2012).
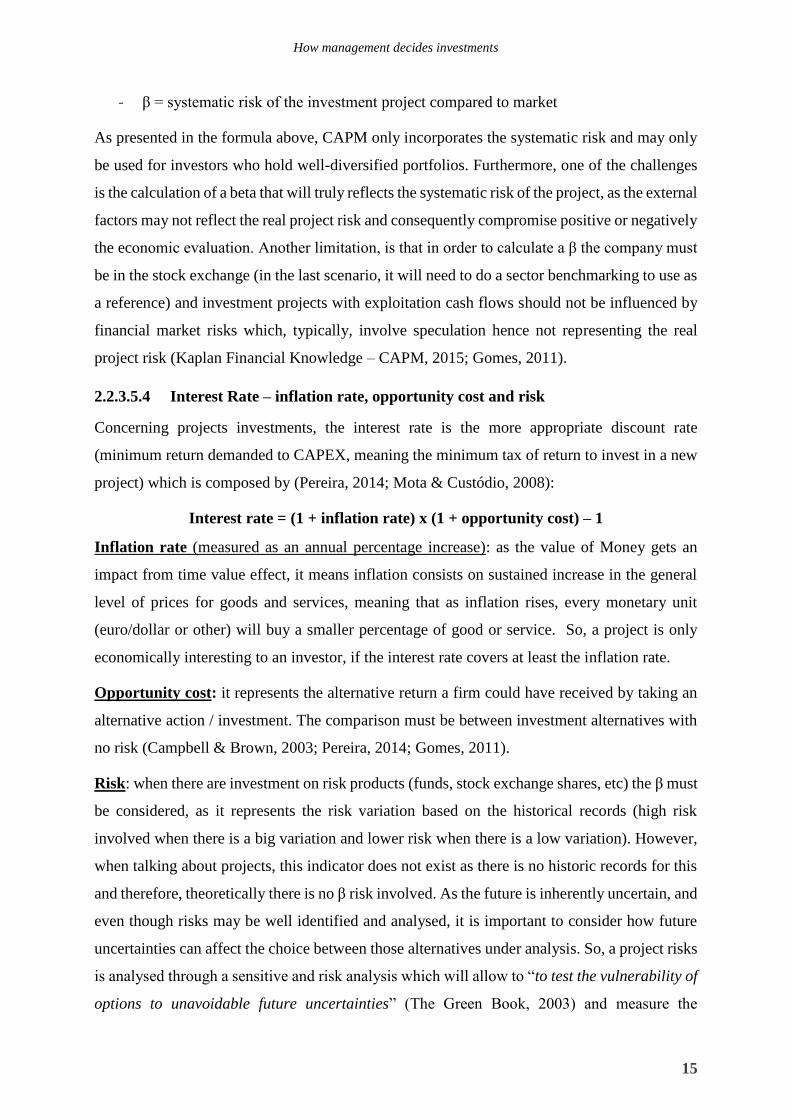
The project’s required rate of return is equal to the risk-free rate plus a risk premium, where the
risk premium is the product of the project beta and the market risk premium.
Required return = Rf + β × (Rm - Rf)
- Rf = risk-free rate of return
- Rm = average return on the market
- (Rm - Rf) = equity risk premium
How management decides investments
15
- β = systematic risk of the investment project compared to market
As presented in the formula above, CAPM only incorporates the systematic risk and may only
be used for investors who hold well-diversified portfolios. Furthermore, one of the challenges
is the calculation of a beta that will truly reflects the systematic risk of the project, as the external
factors may not reflect the real project risk and consequently compromise positive or negatively
the economic evaluation. Another limitation, is that in order to calculate a β the company must
be in the stock exchange (in the last scenario, it will need to do a sector benchmarking to use as
a reference) and investment projects with exploitation cash flows should not be influenced by
financial market risks which, typically, involve speculation hence not representing the real
project risk (Kaplan Financial Knowledge – CAPM, 2015; Gomes, 2011).
2.2.3.5.4 Interest Rate – inflation rate, opportunity cost and risk
Concerning projects investments, the interest rate is the more appropriate discount rate
(minimum return demanded to CAPEX, meaning the minimum tax of return to invest in a new
project) which is composed by (Pereira, 2014; Mota & Custódio, 2008):
Interest rate = (1 + inflation rate) x (1 + opportunity cost) – 1
Inflation rate (measured as an annual percentage increase): as the value of Money gets an
impact from time value effect, it means inflation consists on sustained increase in the general
level of prices for goods and services, meaning that as inflation rises, every monetary unit
(euro/dollar or other) will buy a smaller percentage of good or service. So, a project is only
economically interesting to an investor, if the interest rate covers at least the inflation rate.
Opportunity cost: it represents the alternative return a firm could have received by taking an
alternative action / investment. The comparison must be between investment alternatives with
no risk (Campbell & Brown, 2003; Pereira, 2014; Gomes, 2011).
Risk: when there are investment on risk products (funds, stock exchange shares, etc) the β must
be considered, as it represents the risk variation based on the historical records (high risk
involved when there is a big variation and lower risk when there is a low variation). However,
when talking about projects, this indicator does not exist as there is no historic records for this
and therefore, theoretically there is no β risk involved. As the future is inherently uncertain, and
even though risks may be well identified and analysed, it is important to consider how future
uncertainties can affect the choice between those alternatives under analysis. So, a project risks
is analysed through a sensitive and risk analysis which will allow to “to test the vulnerability of
options to unavoidable future uncertainties” (The Green Book, 2003) and measure the
16
probabilities of different results to occur under a given set of assumptions, for instance, when
making a decision with a 95% confidence level (or probability) it is been considered a 5% risk
(Pereira, 2014).
Besides the importance on calculating the discount rate, there are other relevant metrics which
should also be considered such as Pereira (2014), Miguel (2006) and Schmidt (2009):
- Payback – is the period of time required to pay the investment. According to The Green
Book (2003), the payback period is sometimes put forward as a decision criterion. However
it is an indicator which ignores the differences in values over time and the wider impacts
of proposals and for these reasons it should not generally be used as a decision criterion.
- External Rate of Return - the project rate of return and avoid assuming that income
received from the project can earn interest at unrealistically high rates.
- BCR (Benefit Cost Ratio). Which conceptually presents how much the project returns for
each euro (or other currency unit) invested.
BCR = Program Benefits / Program Costs
- ROI (Return on Investment. It presents, under a percentage, how much relative value is
generated from an investment. According to the ROI Institute authors Phillips, J. &
Phillips, P., (2007) financial ROI is defined as “earning over investment” which is
calculated by:
ROI (%) = (Net Program Benefits / Program Costs) × 100
ROI is the financial return on investment calculated by comparing meeting costs to the
benefits. First, the data must be converted into money and secondly compare the cost
benefits to the fully loaded costs of the initiative. (Phillips, J & Phillips, P., 2007)
- IRR (internal rate of return) – according to The Green Book (2003), IRR should be
avoided as a decision criterion, which although is very similar to NPV, there are some
circumstances in which it will provide different and consequently incorrect answers, such
as ranking projects that are mutually exclusive differently from NPV
- NPV - Net Present Value - the sum of present values of the future project cash flows
According to The Green Book (2003), if a full cost benefit analysis has been undertaken “the
best option is likely to be the one with the highest risk adjusted net present value.” Having all
costs, benefits and risks robustly valued, this guideline can be applied with more certainty. In
How management decides investments
17
cost effectiveness analysis while assuming the cost estimates are as accurate and reliable, the
option with the lowest net present cost should be the best. In organizations where a budget
ceiling is previously established, the combination of proposals chosen should be the ones that
maximise the value of benefits.
2.2.3.5.5 Sensitive and Risk Analysis
Optimism bias is a common tendency from project appraisers with in private and public sectors
worldwide, in a demonstrated and systematic way (The Green Book, 2003). Optimism bias
turns several project parameters affected by optimism, where appraisers tend to overstate
benefits and understate timings and costs, both capital and operational. In order to redress this
phenomenon, appraisers should make explicit adjustments for this bias, taking the form of
increasing estimates of the costs and decreasing or/and delaying the receipt of estimated
benefits.
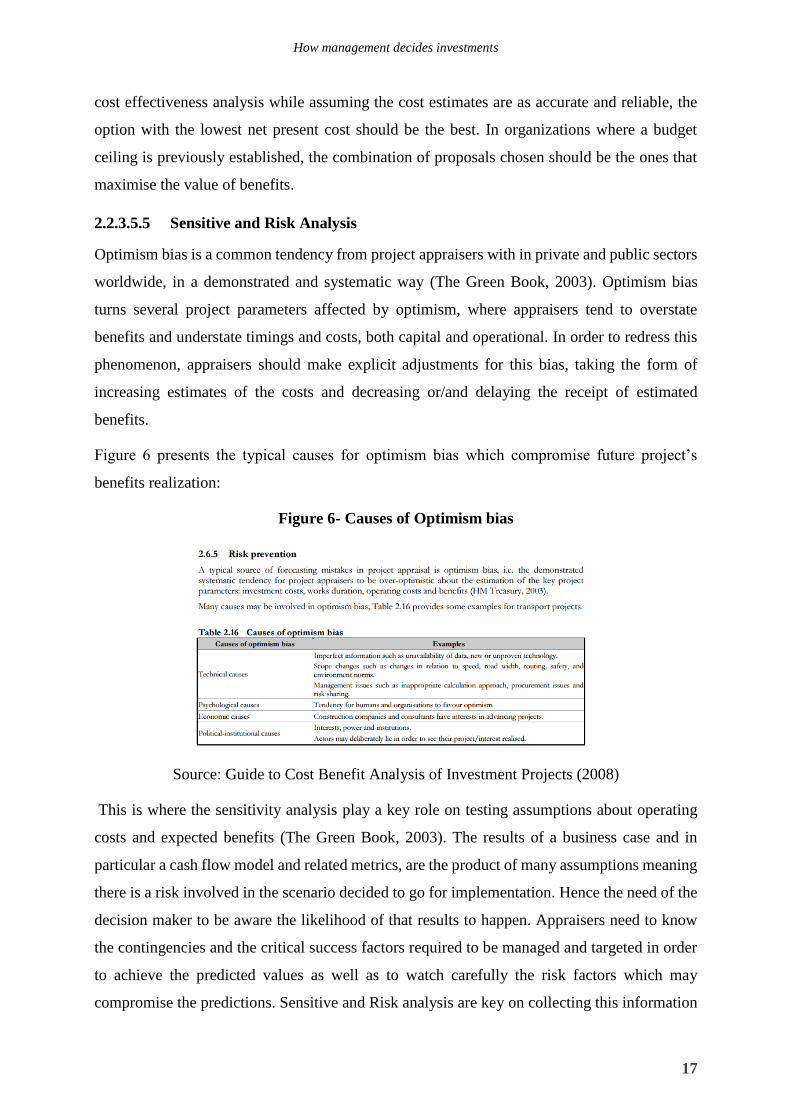
Figure 6 presents the typical causes for optimism bias which compromise future project’s
benefits realization:
Figure 6- Causes of Optimism bias
Source: Guide to Cost Benefit Analysis of Investment Projects (2008)
This is where the sensitivity analysis play a key role on testing assumptions about operating
costs and expected benefits (The Green Book, 2003). The results of a business case and in
particular a cash flow model and related metrics, are the product of many assumptions meaning
there is a risk involved in the scenario decided to go for implementation. Hence the need of the
decision maker to be aware the likelihood of that results to happen. Appraisers need to know
the contingencies and the critical success factors required to be managed and targeted in order
to achieve the predicted values as well as to watch carefully the risk factors which may
compromise the predictions. Sensitive and Risk analysis are key on collecting this information
18
(Schmidt, 2009). Also, according to the Guide to Cost Benefit Analysis for Investment Projects
(2008:60), sensitivity analysis “allows the determination of the critical variables or parameters
of the model, which variations (either positive or negative), will have the greatest impact on a
project’s financial and economic performance”. That analysis is carried out by varying one
element at a time and determining the effect of that change on IRR or NPV or other economic
indicators.
According to Kelliher & Mahoney (2000), the sensitive analysis may be used to answer
different type of “what-if” questions which usually considers different possible scenarios.
Sensitive analysis allows to answer the following questions (Schmidt, 2009):
- What happens if these assumptions (variables) change?
- Which assumptions are most important in controlling results?
- Which variables have less impact in the results?
By answering these questions and knowing which assumptions are important in achieving and
controlling financial results (eg. NPV, ROI, Payback), it enables the appraiser to make more
specific recommendations on how to manage the proposed actions to maximize results.
According to the Guide to Cost Benefit Analysis for Investment (2008), scenario analysis is a
specific form of sensitivity analysis, where it is studied the combined impact of determined sets
of values, with a combination of optimist and pessimistic values for each critical variables
which may be useful to build different realistic scenarios. In order to define the optimistic and
pessimistic scenarios it is necessary to choose for each critical variable the extreme values in
the range defined by the distributional probability. Regarding the critical variables, their choice
varies according to the project under analysis and according to the Guide to Cost Benefit
Analysis for Investment (2008:60), the criteria of choice recommended is “for which an
absolute variation of 1% around the best estimate gives rise to a corresponding variation of
not less than 1% (one percentage point) in the NPV (i.e. elasticity is unity or greater)”.
How management decides investments
19
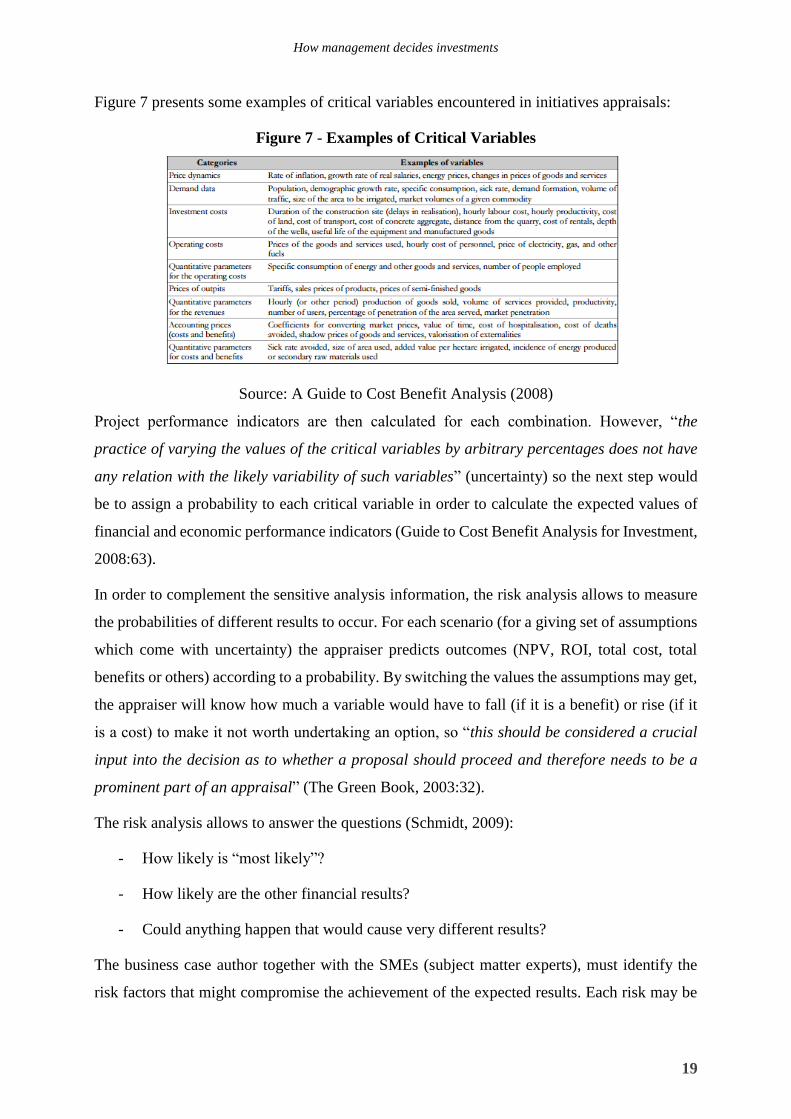
Figure 7 presents some examples of critical variables encountered in initiatives appraisals:
Figure 7 - Examples of Critical Variables
Source: A Guide to Cost Benefit Analysis (2008)
Project performance indicators are then calculated for each combination. However, “the
practice of varying the values of the critical variables by arbitrary percentages does not have
any relation with the likely variability of such variables” (uncertainty) so the next step would
be to assign a probability to each critical variable in order to calculate the expected values of
financial and economic performance indicators (Guide to Cost Benefit Analysis for Investment,
2008:63).
In order to complement the sensitive analysis information, the risk analysis allows to measure
the probabilities of different results to occur. For each scenario (for a giving set of assumptions
which come with uncertainty) the appraiser predicts outcomes (NPV, ROI, total cost, total
benefits or others) according to a probability. By switching the values the assumptions may get,
the appraiser will know how much a variable would have to fall (if it is a benefit) or rise (if it
is a cost) to make it not worth undertaking an option, so “this should be considered a crucial
input into the decision as to whether a proposal should proceed and therefore needs to be a
prominent part of an appraisal” (The Green Book, 2003:32).
The risk analysis allows to answer the questions (Schmidt, 2009):
- How likely is “most likely”?
- How likely are the other financial results?
- Could anything happen that would cause very different results?
The business case author together with the SMEs (subject matter experts), must identify the
risk factors that might compromise the achievement of the expected results. Each risk may be
20
rated according to its probability of occurring and impact importance (high/medium/low).
(Schmidt, 2009):
Monte Carlo analysis is one of the well-known techniques for risk modelling which is useful
when there are many variables with significant uncertainties, by presenting the range and the
expected value, of the collective impact of various risks (The Green Book, 2003) which through
a software simulation, completes a “process of changing all assumptions and recording the
output value repeated a thousands of times until a picture emerges showing the full range of
possible outputs and its probabilities together with the weigh/contribution of each assumption
to the output result” (Schmidt, 2009). The sensitivity analysis with Monte Carlo simulation
measures the statistical correlation between each assumption and the output, measured over
thousands of trials and the most relevant assumptions are identified by their high correlation
with changes in output results (Schmidt, 2009; Guide to Cost Benefit Analysis of Investment
Projects, 2008).
Having this said, the ‘maximum-return’ option is the most important to consider, with the most
risk averse option, as it is the option that provides the least bad outcome if the worst possible
conditions prevail (The Green Book, 2003).
Step 6 – Context Readiness
After the financial metrics analysis it is important to have a perception of the market and
organization’s preparation to embrace a new project. As specified on Step 2 (project Request),
there should be an evaluation on stakeholders maturity state who will suffer an impact.
Stakeholder Matrix represents each stakeholder profile in terms of decision power versus
impact, in order to prepare a communication plan to ensure a smooth transition and project
implementation. This analysis is important to support project and programme managers who
have to influence, work with or consider the views of other people (Welch & Jackson, 2007).
Another technique, is the Force Field Analysis developed by Kurt Lewin in 1951, which allows
a comprehensive overview of the different forces (driving and restraining forces) acting on a
potential organizational change issue as well assessing their source and strength by scoring each
identified force from one (weak) to five (strong). This information provides a good input for
the decision-making in particular when planning and implementing change management
programmes in organizations (Hovland, I., 2005).
How management decides investments
21
Very often, organizations have a business case which is economically very interesting although
their organization’s culture, maturity or interests are not aligned, placing barriers upon the
project implementation.
The findings of a recent survey, conducted in Summer 2013 amongst project professionals,
highlight the perception that stakeholder engagement is an under-developed discipline within
the project management industry and warrants further research, greater investment in training
and greater prominence within individual organisations. 80% of the survey’s respondents did
not believe that their organisation had a tailored stakeholder engagement training and
development programme that suited their needs, so work needs to be done (MacNicol, 2014).
Step 7 – Decision Making
In order to assist the top management on making a decision (GO or NO GO), all the information
on the previous steps should be collected, analysed and presented in a decision-matrix format.
This matrix may be represented by one of the following tools: the SWOT matrix or the Business
Case Canvas. The SWOT analysis is an helpful technique to present the required information
for the final decision-making with the end goal of maximizing the identified strengths, minimize
weaknesses and take advantage of opportunities and overcome threats (Lawrence, F., 2009).
In regards to the financial results, these should be presented under the most conservative
scenario (ideally the 80%-95% confidence). The Business Case Canvas is another
recommended tool which presents the business case information in a structured and logical way
and should include the strategic alignment, the benefits, the investment costs and the
organizational environment. Besides the data presented in the Swot analysis, it also includes
the key stakeholders involved and the potential risks (qualitative basis).
By following these 7 steps based on reliable sources, information and assumptions together
with financial models which show sensitivity and scenarios interaction, the board members may
take a more confident and evidenced-based decision on whether the potential gain is worth the
risk.
Step 8 – Benefits Tracking
The Benefits Tracking phase is as equally high-valued as the previous ones. However, the
measurement of the actual results is ignored very often in most of the organizations.
After making a decision and an implementation plan and in order that evaluations may be
completed satisfactorily later on, it is important that during implementation, the project
22
performance is tracked and measured, and data captured for later analysis. This performance
management consists on tracking the success of an initiative appraisal, in achieving its
objectives and in securing the expected benefits (The Green Book, 2003).
The benefits tracking and monitoring should be done during the project exploitation in order to
measure the quality of the investment decision-making process as well as identify new
investment opportunities to add continuous value to the organization. In fact the business case
report should be a living document where new updates and improvements may be submitted
for review and judgment (Schmidt, 2009).
Following the continuous improvement mindset, the best practices also recommend to bring
together any insights gained during a project that can be usefully applied on future projects.
Having the main stakeholders involved for a brainstorming and open communication is
essential (Eskerod & Jepsen, 2013) while compiling and documenting the information
regarding the successes, failures and recommendations for improving the performance of future
projects (Pereira, 2014; Welch, M. & Jackson, P. 2007).
Ex-post evaluation examines the outturn of a project against what was expected and its purpose
is to ensure the lessons learned are fed back into the decision-making process (The Green Book,
2003).
Benefits Management
Understanding the Benefits Rationale
One of the concepts behind a business case is the ability to identify and capture the benefits
levered by the project proposal. The business case aims to “translate” into financial terms, either
the financial and non-financial business impacts. For several people, their understanding for
benefits and costs is based on their common sense: benefits is the money coming in and costs
is the act of spending money Schmidt (2009). However, the author Schmidt (2009), defends
that either benefits or costs should always be aligned to business objectives:
Benefit: “A result that contributes towards meeting a business objective” Schmidt (2009),
Cost: “A result that works against meeting a business objective” Schmidt (2009)
In order to complete the diagnosis of the current business case practices, my research will be
based on the best practices such as ROI Institute Methodology, The Green Book (2003) and A
Guide to Cost Benefit Analysis of Investment Projects (2008). The ROI Methodology ™ (ROI)
is a North American methodology and international reference in this field, whose mission is to
help managers evaluate the contribution of each decision for the creation of wealth, value and
How management decides investments
23
business sustainability through implementation of key techniques of business analysis and
evaluation of investment projects (Pereira, 2013). This methodology is a compilation of
practices, techniques, procedures and rules used in public or private business context in logical
assessment of the economic benefits generated by projects. It is important to be aware that this
methodology do not evaluate the social benefits’ analysis. One of the guiding principles of the
ROI methodology is that two different people, teams or entities achieve very similar
conclusions in regards to the expected results of a project (ROI Institute) such as NPV, IRR,
Payback, ROI and Breakeven. According to Phillips (2011), Chairman of the ROI Institute,
“When the business model focuses on results that are measured clearly, it works much better.
When a culture of measurement and accountability is in place, ROI is easily implemented.” The
author also says this tends to occur more in private businesses, as it has been subject to greater
accountability than public sector organizations, non-profit’s, and non-governmental
organizations. Although there is an increase on the level of accountability, we may conclude
there is still a big space for improvement on implementing a ROI culture and consequently on
the ROI best practices. Regarding The Green Book, this is a methodology for Appraisal and
Evaluation in Central Government used by the Ministry of Finance in UK and the A Guide to
Cost Benefit Analysis of Investment Projects (2008) edited by the European Commission, both
recommending a set of steps, principles and techniques that a project assessment should pursue.
The Budgeting Concept: Capital Expenditure vs Operational Expenditure
During the process of any project appraisals and selection, it is important to understand the
budget concept and distinguish two types of budgeting available: the operational expenditure
(OPEX) and the capital expenditure (CAPEX) (Donnely, R., 2006).
The OPEX is the capital available essential for the daily business activity, meaning, the use of
resources to put processes in practice, to do the daily operations and selling the products and
services portfolio. On the other hand, the CAPEX is the budgeted capital used for the
investments, innovation and the continuous business change, in other words, it is through capex
that firms may put projects in practice and fulfil its strategic “movement” (Donnely, R. 2006;
Pereira, 2014; Gallinger 1980). According to Gallinger (1980), capital expenditure decisions
are critical for the success in organizations, especially for large businesses which must be
aligned and consistent to long term strategic goals. The author concludes that although there
are plenty of financial techniques available to appraise proposals, the capital expenditure system
goes beyond that. It is a matter of company culture and mindset, where employees must be
motivated to generate proposals within an impartial and rigorous evaluation process and making
24
decisions consistent to the firm’s strategy (Gallinger, 1980). Having decisions done and
resources allocated, there are several procedures available to put in place in order to monitor
the projects. So, capital expenditure administration will be the vehicle to implement a firm’s
strategy (Gallinger, 1980) and therefore projects should be selected and approved based on the
return and added value (estimated benefits) and consequently the budget definition for new
projects (capex) defined according to that (certainly not exceeding the debt ratios) (Pereira,
2014).
One of the most popular indicators used to evaluate a project return, is the Return on Investment
(ROI). In order to obtain a high ROI, it is crucial to start from capturing the project economic
value, disregarding its financial value (i.e. financial benefits, depreciations). If benefits are not
previously estimated then there is no limits for the project scope and costs, which easily leads
an excellent idea to an economic failure as the project dimension tends to be many times bigger
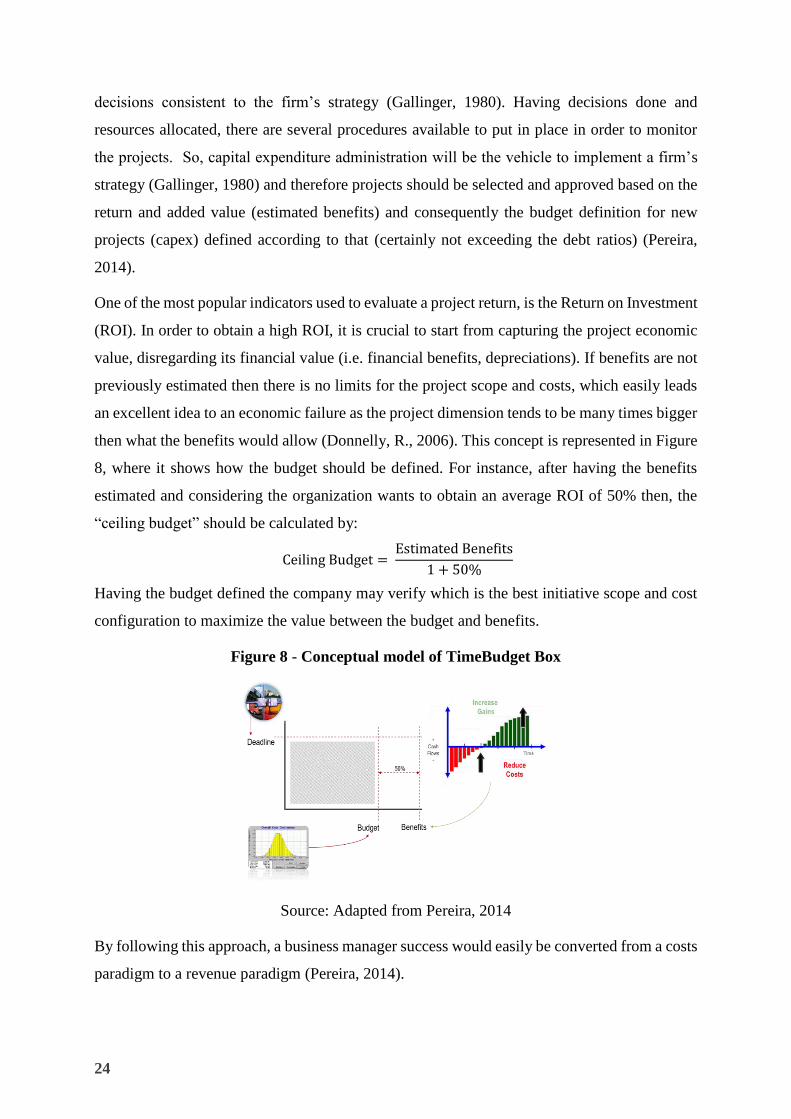
then what the benefits would allow (Donnelly, R., 2006). This concept is represented in Figure
8, where it shows how the budget should be defined. For instance, after having the benefits
estimated and considering the organization wants to obtain an average ROI of 50% then, the
“ceiling budget” should be calculated by:
Ceiling Budget = Estimated Benefits
1 + 50%
Having the budget defined the company may verify which is the best initiative scope and cost
configuration to maximize the value between the budget and benefits.
Figure 8 - Conceptual model of TimeBudget Box
Source: Adapted from Pereira, 2014
By following this approach, a business manager success would easily be converted from a costs
paradigm to a revenue paradigm (Pereira, 2014).
How management decides investments
25
Change Management
Following my research about benefits tracking, I found an interesting article from Gartner
regarding the art of change management during the benefits realization. Although the paper
emphasizes the healthcare sector, the benefits realization management and mindset may be
applied to others economic sectors (Zafar, C. et al., 2013). According to this paper in order to
have a benefits realization and a constant concert about the benefits control during the project
exploitation, the benefits realization framework must be driven by the organization’s strategic
planning and portfolio management processes (Zafar, C. et al., 2013). The authors also
concluded that in order for the benefits realization to be effective it is crucial that it becomes a
standard management practice throughout the business change lifecycle, in particular during
programme and project definition. The first step is to establish a framework that defines how
benefits should be identified, structured, planned and realized. This framework should also
consider and classify types of benefits of value to the business as well make reference to the
organization’s current strategic goals and objectives (e.g., service/process;
quality/productivity/improvements; cost avoidance/reduction; staff morale/motivation; revenue
generation/customer retention). The article (Zafar, C. et al., 2013) also highlights how
important it is to identify dependencies in order to better understand where the achievement of
one benefit is dependent on the realization of another and once they have been identified,
analysed and structured, the following task will be to create the realization plan. This plan
should also include the management actions required to support and execute that plan. Very
often, the implementation of projects require people to adapt the way they work, their daily
processes, the way they interact, their tasks, etc. So, this article also addresses how change
management is becoming a more popular matter as organisations and their employees attempt
to deal with more complexity in achieving their work objectives and life goals. It also highlights
that accomplishing organisational change is dependent on a group of people adapting the way
that they work.
In order to have an effective process-based transformation, it is required three main elements
which complement each other: Process, People and Technology. According to the article author
(Zafar, C. et al., 2013:4) companies should “develop a technology and process improvement
model that demands executive leadership and sponsorship; involves key stakeholders, captures
people’s hearts and minds to avoid alienation, depersonalisation, and staff turnover”. The
author also addresses that in order to get successful benefits realisation, firstly a current state
assessment should be pursued followed by the determination of the metrics which will be
changed, as a result of the project (capturing the current scenario and define the future one);
26
developing a framework to define, agree, measure and report on the expected benefits;
stakeholder involvement (identify stakeholders and develop communication strategies to
involve them and get their buy-in), executive leadership and sponsorship; change management,
continual training and good communication for the duration.
Resources and Capacities
According to Barney (1995), the creation of competitive advantages also depends on
discovering the right resources and capacities inside the organizations (resources which are rare,
valuable, irreplaceable and difficult to be imitate) as it will contribute to the business
sustainability. Generating this “intelligence” culture inside the organization, allowing a
systematic transformation of information or random parts of information, into strategic
knowledge and actions, it is classified as Competitive Intelligence (Tyson, 2002).
These are important principles behind the business case purpose, as they promote the creative
and innovative ideas which commonly requires to make an investment and consequently require
managers analyse whether they generate value to the organization.
Statistics / Surveys
“The economic climate is driving the requirement for greater value for money, including cost
reduction, across both public and private sectors” (Glynne, P. & Williams, Rod. 2009).
On this report the authors explain that most business organizations in the UK are experiencing
a tightening of financial spending, particularly those in the public sector, but also that the private
sector is facing difficult choices in order to minimize costs in challenging market conditions.
The main results from the national UK survey taken by APM, 54% of respondents indicated
that “cost reduction is a primary driver of projects and programmes in their organization”
(Glynne, P. & Williams, Rod, 2009). This number seems very concerning since, on a
sustainable perspective, projects should be able to create value by generating wealth. Indeed,
become cost effective is a starting point, but on a long term run, the company may start
compromising their business if their main focus is on reducing costs. According to another
source (Gartner EXP Premier, 2005) “Controlling costs is still a major business pressure. But
cost cutting alone doesn’t foster growth, energize employees, or attract new customers.
Investments do—if they’re well-conceived, solid and deliver results. Brilliant business cases
can facilitate that”. In the same survey it was asked respondents to describe the approach to
benefits management within their organization and 60% described the approach as informal or
incidental. This conclusion shows how the benefits management field is still developing and is
far from achieving a maturity level. The same report states the main reasons for this high
How management decides investments
27
percentage: “Senior executives becoming dissatisfied with process-led project and programme
management not delivering the expected business outcomes; benefits management is often
wrongly seen as a specialist discipline requiring deep expertise; benefits management is often
misperceived as only a financial skill-set; a misperception that benefits management is benefits
tracking which provides monitoring of metrics only after the change has occurred. Change is
almost continual for business organisations and many people are impacted. “
According to John Kotter’s article at the Harvard Business Review, Professor of Leadership at
Harvard Business School in Boston “Up to 70% of change initiatives fail to deliver on the
benefits that they set out to achieve” (Kotter, 1995). Kotter, emphasises that realising benefits
cannot be the responsibility of only the project or programme manager but instead, it needs to
be a partnership approach between the managers delivering change and those in ‘business as
usual’ (Kotter, 1995). He reminds that often “when a programme closes, the changes are still
being embedded and significant benefits are yet to be realized” (Kotter, 1995). So, in order to
ensure success, all managers involved in change must understand their roles and responsibilities
in this partnership approach. Benefits management is emerging as a core business skill for all
managers engaged in leading and implementing change; the report also mentions that a change
to be successful, requires that management information on benefits should be aligned to the
corporate performance framework, which ensures ownership and accountability for the
outcomes of change. On the survey taken by APM (Glynne, P. & Williams, R., 2009) 60% of
respondents indicated that their organization had a standard set of key performance indicators
to measure corporate business performance. However, only 12% of respondents used a software
application to support management information on benefits. This results also express the
existent lack of maturity in the software market for benefits management.
According to (Williams, 2014), an Australian Managing Director of the Connection Systems,
defends that in order to maximize the value from project/programme delivery, a company
should initially focus on People (having both the right organizational structure - such as the
creation of a Value Management Office to work alongside a PMO - and the right mindset), then
a Process (a consistent approach taken to benefits/value management across all
projects/programmes) before considering Tools (ones appropriate for both the size and maturity
of the organization).
A more recent study conducted by APM Benefits Management SIG (Specific Interest Group)
(APM, 2014), undertook a questionnaire survey to find out how benefits management is viewed
in the organizations that its members work for. The respondents were almost all based in the
28
UK, and worked in a wide spread of industrial sectors. One of the questions was: “ By widening
the focus to the whole organization, to what extent is benefits thinking integral to the wider
approach to management, from strategy to operations?”, to which 40,5% answered it is “weak
benefits focus” plus 23,8% as a “very weak benefits focus”. The survey also suggests “there is
a need for guidance and best practice examples on how benefits management might fit within
the overall approach to organizational change and project/programme/portfolio management”
(APM, 2014). They also concluded that due to the different nature of the business (different
types of organizations and industrial sectors) the benefits practices cannot be a “one size fits
all” approach, but instead needs to be tailored to different contexts.
Another research was conducted by Serra, C. & Kunc, M. (2014) with the end goal of evaluating
the use of Benefits Realisation Management among the project management communities of
three countries (United Kingdom, United States and Brasil) in order to understand its impact
on project success rates and evaluate the impact of projects on the creation of organisational
value. One of the relevant findings from the research, is the “practice adherence of actual
outcomes to the ones planned in the business case being consistently relevant to predict two
dimensions of success across the three countries: the return on the investment and the business
case success. According to the authors Serra, C. & Kunc, M. (2014:11), the results obtained
evidence “business cases being effective tools for the comparison of the results between project
evaluations, performed at project closure stages, to the results of project appraisals, done at
project start for the approval of business cases and updated throughout project execution”.
The results also allowed the authors to conclude the relevance of financial appraisals on
business cases clear, as they are key elements to support return on investment’s success.
Based on the literature review pursued by this paper’s authors, since 1960s that project
performance was mostly evaluated based on one criteria: how much the project has met the
triple constraint (Levine, 2005; Ika, 2009), iron triangle or golden triangle (Zwikael & Smyrk,
2011). However, nowadays the trend is changing, as organizations found the need to evaluate
whether the projects implemented were actually contributing to the business strategy and
consequently, creating shareholder value (Levine, 2005; Ika, 2009).
One of the authors (Serra, 2012) presents a set of criteria by assessing seven dimensions of
project success:
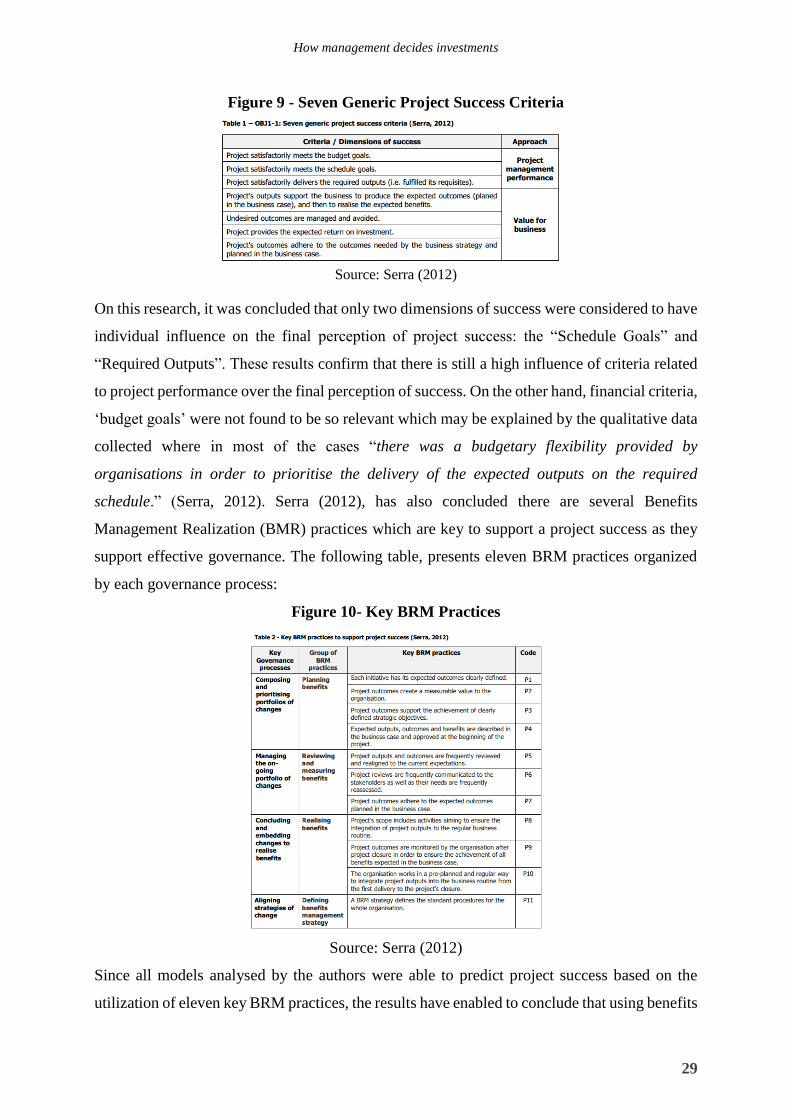
How management decides investments
29
Figure 9 - Seven Generic Project Success Criteria
Source: Serra (2012)
On this research, it was concluded that only two dimensions of success were considered to have
individual influence on the final perception of project success: the “Schedule Goals” and
“Required Outputs”. These results confirm that there is still a high influence of criteria related
to project performance over the final perception of success. On the other hand, financial criteria,
‘budget goals’ were not found to be so relevant which may be explained by the qualitative data
collected where in most of the cases “there was a budgetary flexibility provided by
organisations in order to prioritise the delivery of the expected outputs on the required
schedule.” (Serra, 2012). Serra (2012), has also concluded there are several Benefits
Management Realization (BMR) practices which are key to support a project success as they
support effective governance. The following table, presents eleven BRM practices organized
by each governance process:
Figure 10- Key BRM Practices
Source: Serra (2012)
Since all models analysed by the authors were able to predict project success based on the
utilization of eleven key BRM practices, the results have enabled to conclude that using benefits
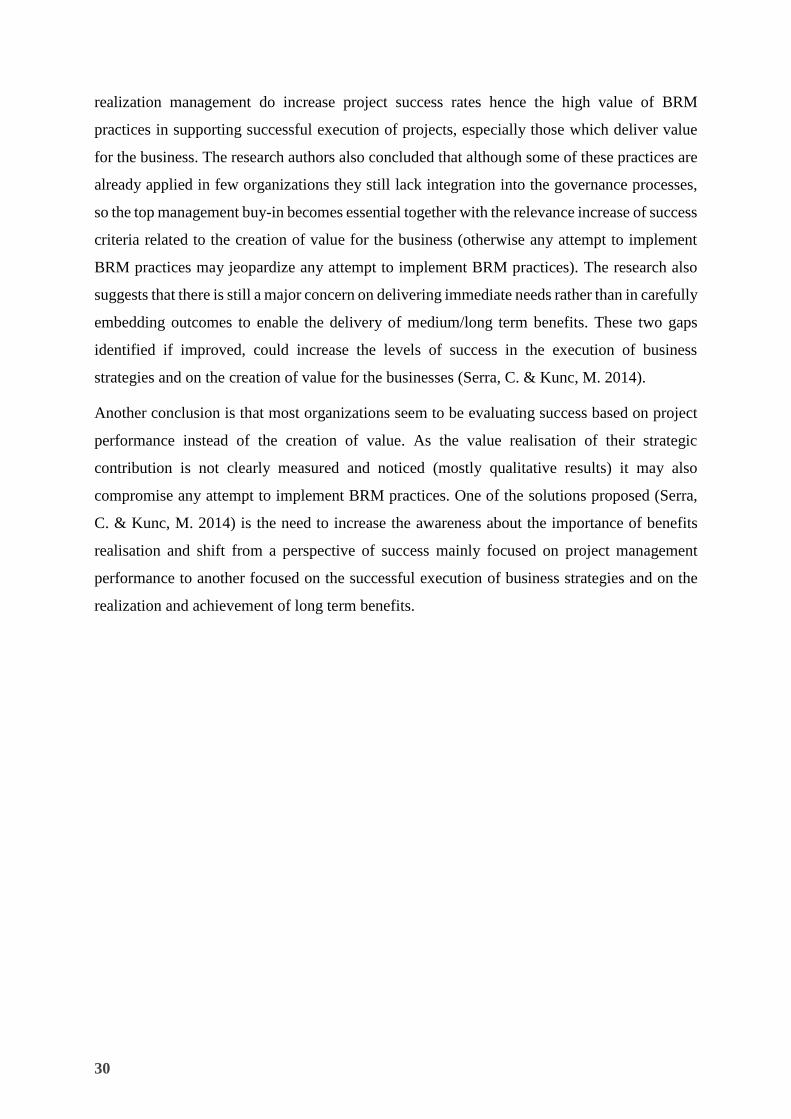
30
realization management do increase project success rates hence the high value of BRM
practices in supporting successful execution of projects, especially those which deliver value
for the business. The research authors also concluded that although some of these practices are
already applied in few organizations they still lack integration into the governance processes,
so the top management buy-in becomes essential together with the relevance increase of success
criteria related to the creation of value for the business (otherwise any attempt to implement
BRM practices may jeopardize any attempt to implement BRM practices). The research also
suggests that there is still a major concern on delivering immediate needs rather than in carefully
embedding outcomes to enable the delivery of medium/long term benefits. These two gaps
identified if improved, could increase the levels of success in the execution of business
strategies and on the creation of value for the businesses (Serra, C. & Kunc, M. 2014).
Another conclusion is that most organizations seem to be evaluating success based on project
performance instead of the creation of value. As the value realisation of their strategic
contribution is not clearly measured and noticed (mostly qualitative results) it may also
compromise any attempt to implement BRM practices. One of the solutions proposed (Serra,
C. & Kunc, M. 2014) is the need to increase the awareness about the importance of benefits
realisation and shift from a perspective of success mainly focused on project management
performance to another focused on the successful execution of business strategies and on the
realization and achievement of long term benefits.
How management decides investments
31
Chapter 3 - Methodology
Identification of type of thesis
The purpose of this thesis is to gain a deep understanding about the business case practices
currently applied in Portuguese organizations with economic purposes. Once this research will
not be regarding a concrete problem within an organization neither a case-study approach but
instead, a general approach in organizations across different sectors never analysed and
addressed at this level before, this thesis requires a form of dissertation.
Figure 11 presents the methodology followed by the investigation:
Figure 11 - Research Methodology
Source: Self-constructed table
Research Problem
As previously mentioned the main purpose of this thesis is to gain a deep understanding about
the business case practices currently applied in the organizations or in another words to make a
diagnosis on the “as is” situation and whether there is a space for improvement on this practices
gaps, based on the existent methodologies and good practice developed to date.
The last few years, the debt crisis, political and economic instability together with financial
constraints have held back the business investments, in private companies (ROI Institute, 2014).
At the same time, the economic recession worldwide has particularly addressed the relevance
of the manager role within an organization, on creating value through the right management
decisions. Now, more than ever, managers have a huge pressure to think, plan, implement and
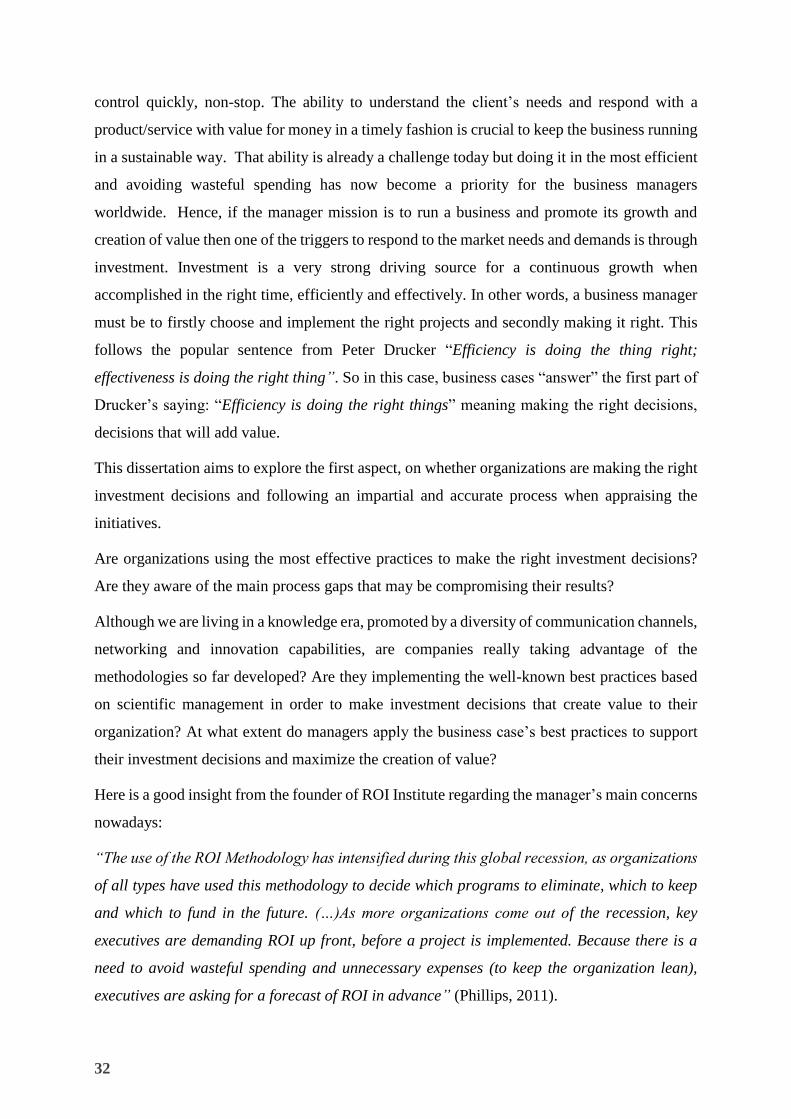
32
control quickly, non-stop. The ability to understand the client’s needs and respond with a
product/service with value for money in a timely fashion is crucial to keep the business running
in a sustainable way. That ability is already a challenge today but doing it in the most efficient
and avoiding wasteful spending has now become a priority for the business managers
worldwide. Hence, if the manager mission is to run a business and promote its growth and
creation of value then one of the triggers to respond to the market needs and demands is through
investment. Investment is a very strong driving source for a continuous growth when
accomplished in the right time, efficiently and effectively. In other words, a business manager
must be to firstly choose and implement the right projects and secondly making it right. This
follows the popular sentence from Peter Drucker “Efficiency is doing the thing right;
effectiveness is doing the right thing”. So in this case, business cases “answer” the first part of
Drucker’s saying: “Efficiency is doing the right things” meaning making the right decisions,
decisions that will add value.
This dissertation aims to explore the first aspect, on whether organizations are making the right
investment decisions and following an impartial and accurate process when appraising the
initiatives.
Are organizations using the most effective practices to make the right investment decisions?
Are they aware of the main process gaps that may be compromising their results?
Although we are living in a knowledge era, promoted by a diversity of communication channels,
networking and innovation capabilities, are companies really taking advantage of the
methodologies so far developed? Are they implementing the well-known best practices based
on scientific management in order to make investment decisions that create value to their
organization? At what extent do managers apply the business case’s best practices to support
their investment decisions and maximize the creation of value?
Here is a good insight from the founder of ROI Institute regarding the manager’s main concerns
nowadays:
“The use of the ROI Methodology has intensified during this global recession, as organizations
of all types have used this methodology to decide which programs to eliminate, which to keep
and which to fund in the future. (…)As more organizations come out of the recession, key
executives are demanding ROI up front, before a project is implemented. Because there is a
need to avoid wasteful spending and unnecessary expenses (to keep the organization lean),
executives are asking for a forecast of ROI in advance” (Phillips, 2011).
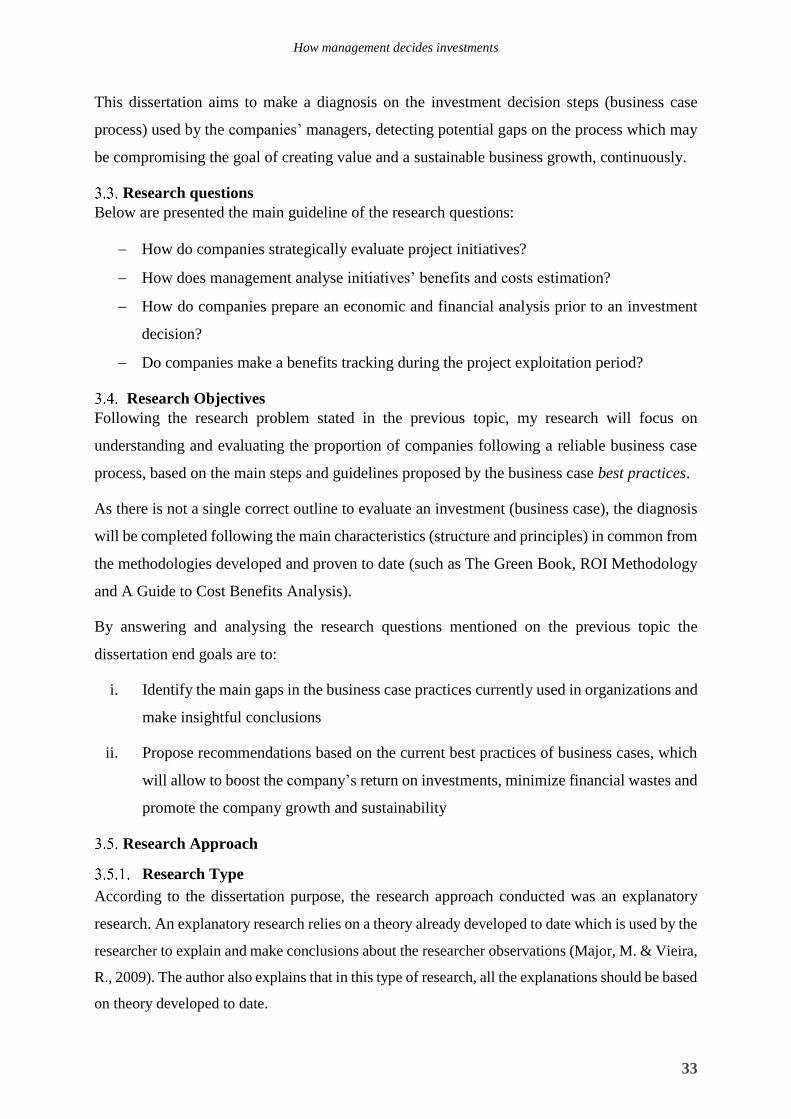
How management decides investments
33
This dissertation aims to make a diagnosis on the investment decision steps (business case
process) used by the companies’ managers, detecting potential gaps on the process which may
be compromising the goal of creating value and a sustainable business growth, continuously.
Research questions
Below are presented the main guideline of the research questions:
How do companies strategically evaluate project initiatives?
How does management analyse initiatives’ benefits and costs estimation?
How do companies prepare an economic and financial analysis prior to an investment
decision?
Do companies make a benefits tracking during the project exploitation period?
Research Objectives
Following the research problem stated in the previous topic, my research will focus on
understanding and evaluating the proportion of companies following a reliable business case
process, based on the main steps and guidelines proposed by the business case best practices.
As there is not a single correct outline to evaluate an investment (business case), the diagnosis
will be completed following the main characteristics (structure and principles) in common from
the methodologies developed and proven to date (such as The Green Book, ROI Methodology
and A Guide to Cost Benefits Analysis).
By answering and analysing the research questions mentioned on the previous topic the
dissertation end goals are to:
i. Identify the main gaps in the business case practices currently used in organizations and
make insightful conclusions
ii. Propose recommendations based on the current best practices of business cases, which
will allow to boost the company’s return on investments, minimize financial wastes and
promote the company growth and sustainability
Research Approach
Research Type
According to the dissertation purpose, the research approach conducted was an explanatory
research. An explanatory research relies on a theory already developed to date which is used by the
researcher to explain and make conclusions about the researcher observations (Major, M. & Vieira,
R., 2009). The author also explains that in this type of research, all the explanations should be based
on theory developed to date.

34
Having this said, the most appropriate research approach is the explanatory research, where the
researcher intends to identify the gaps based in the business case methodologies and best
practices developed to date, make conclusions and propose recommendations.
Target Population
This research intends to analyse whether organizations follow an accurate business case process
to appraise their investment projects and identify the main gaps (based on the international
business case methodology and best practices) that may be compromising the successful
portfolio selection of initiatives and consequently the creation of value to the organization.
Since the need of investing in new solutions is a reality across every sector, this research covers
different sectors (such as Energy, Telecommunications, Insurance & Banking, Construction
and others) and business areas (IT, Project Management, Sales, Human Resources and others).
The target population intended in this study, is business manager’s professionals operating in
Portugal, where investments decisions are taken place and who are directly or indirectly
involved either in investment appraisals or investments decisions.
Sampling Method
In order to reach the target population, this dissertation is based on a convenience sampling
which consists in a non-probability sampling technique where those selected are chosen based
on the accessibility and proximity to the researcher and because they meet the general parameter
of a study’s objectives (Clark, M. et al., 2000). The convenience sampling technique is usually
used when the population is too large and impossible to include every individual, while also
being a fast, inexpensive way of collecting data with subject readily available and appropriate
in cases where no sampling frame or list exists (Lowe et al., 2007). Therefore, convenience
sampling is a nonprobability sampling type because members are selected from the population
in some nonrandom manner, according to the convenient sources of data for researchers and
where the degree to which the sample differs from the population remains unknown (Battaglia,
2011). It is important to be aware of this sampling disadvantages: firstly it may lead to the
under-representation or over-representation of particular groups (bias) and since the sampling
frame is not known and the sample is not chosen randomly, the inherent bias in convenience
sampling means that the sample is unlikely to be representative of the population under
research. This undermines the researcher ability to make generalizations from the sample to the
population (Battaglia, 2011).
How management decides investments
35
Data Collection Methods: Instruments and Procedures
Figure 12- Research Method
Source: Self-constructed table
In order to complete my dissertation, I have completed two research methods: quantitative
analysis as a primary data source and qualitative and quantitative data as a secondary data
source.
Primary Data
In order to collect primary data about the current practices in the respondents’ organizations,
the most appropriate method chosen was a survey as it presents several advantages. Having a
survey well-structured, properly designed and having it answered by a representative sample,
it will allow to gather quantitative and qualitative information from a large amount of people
which will be able to reflect facts close to reality and making conclusions representing the entire
population. In addition, a survey allows the respondent to take “her/his” time to comfortably
think about each question queried and provide an answer in a thoughtful manner (Fowler, 1993).
Some limitations include the inability of the respondent to clarify any doubts that for example,
a face-to-face interview would facilitate.
According to Quivy & Campenhoudt (2005) a questionnaire may also fell to provide deep
answers with all the necessary elements that will allow to deeply understand the subject under
36
investigation. The instruments used for primary data collection, allow to obtain three general
classes of information (Coopler & Schindler, 2013):
Administrative questions which allow to identify the participant, interviewer and
conditions
Classification questions regarding participant characteristics which will help on
grouping the answer for analysis
Target questions which are the most important ones as they address the investigative
questions
In order to easily reach the target population, to use a cost effective tool and simultaneously
easily prepare data treatment, all questionnaires were sent online to the recipients.
Questionnaire Building Procedures
In order to have the most quality of information collected through the use of the questionnaire
instrument there were several procedures I have followed based on a thorough literature review
related to this instrument research method (Babbie, 1998; Foddy, 1996; Fowler, 1993;
Ghiglione and Matalon, 2001; Hill and Hill, 2002; Quivy & Campenhoudt, 2005; Sudman &
Bradburn, 1982):
Having the investigation’s objectives clearly defined and construct clear questions
Avoid negative or abstract terms and avoid too long descriptions
Ensure the survey is addressed and answered by the people knowledgeable and aware
of the subject object in order to provide a reliable answer
Provide a logical sequence in regards to questions order, ideally starting from soft
questions and progressively increase the complexity and scope
An easy and attractive design
Response Strategy
The questionnaire pursued was mostly based on close-ended questions. As stated by the author
Cooper & Schindler (2013), free-response questions survey researchers tend to reduce this type
of questions as they are too broad and tend to bring significant challenges in terms of
compilation, interpretation and data analysis. Closed-ended questions will facilitate the
comparison between all sample answers which according to Aaker et al. (2004), is essential to
How management decides investments
37
any analytical method and allows respondents spending less time and effort to answer (reducing
the probability of giving up half way of the answering process).
So the response strategy was based on closed responses which may be categorized as
dichotomous, multiple-choice, checklist, rating, or ranking response. In this research, I found
the following the most appropriate types (Cooper & Schindler (2013):
Dichotomous questions: they typically suggest opposing choices (dichotomous choices).
Multiple choice questions: most of the questions provide more than two alternatives,
although it is required a single choice. According to the author, these questions may bring
two problems which I have considered and solved based on his recommendations. The first
one, is that one or more responses may have not been anticipated and the second one, the
list of choices is not detailed leading respondents to give an answered not offered as an
alternative, such as, when the participant wants to combine more than one of the
alternatives presented. As highlighted by the authors, I have considered to add the category
Other (please specify) as a safeguard to provide the participant with an acceptable
alternative for all other options which was also considered during the pre-testing phases.
Questionnaire Validation Procedures: Pre-Test
As recommended by several research specialists such as Cooper & Schindler (2013), the final
step to improve survey results is to conduct a pretesting, which consists on doing an assessment
of questions and instruments before pursuing with the study in order to: discover ways to
captivate and keep the participant’s interest, increase the likelihood of them remaining engaged
until the final completion of the survey, discover any possible question content, wording or
sequencing problems, discover any target questions which require deeper research and find out
ways to improve the overall quality of the questionnaire data.
Based on the author recommendations and before proceeding with the main survey, I have done
a pre-test to a group of 6 people of the same sample target (2 Head of Departments, 2 Directors,
2 Top Executives). In order to collect the feedback instantaneously and in a timely manner, the
participants were physically present giving them the chance to expose their doubts. All the
doubts, questions or suggestions received were taken in consideration giving me the opportunity
to improve the formulation of some questions and provide more alternatives of answers in the
multiple choice options. After proceeding with the survey changes, a second pre-test was
carried, to another 5 people, which allowed to conclude that the survey was clearer and ready
to be sent to the final respondents.
38
The final version of survey used is presented in Appendix I. As mentioned along the survey,
some questions may have not been answered by all the respondents as some questions would
only be applied according to the previous answers. The filtered questions are mentioned in the
survey attached.
Questionnaire Data Analysis
Since the main goals was to make a thorough research regarding the business case practices
used (tools and techniques), it was used a descriptive statistics which were drawn in a graphical
form in order to easily identify patterns and take conclusions about the professionals tools’
choices and process used in the business cases process.
Data analysis allows to edit the data collected in order to reduce any errors, improve legibility
and clarify any unclear or invalid (inappropriate) responses, putting them in a way that makes
analysis possible. As stated by Cooper & Schindler (2013), raw data needs to be translated in
alphanumeric codes in order to reduce accumulated content to a manageable size, assisting on
all the work of preparation, finding patterns and applying statistical techniques. It also assists
on transferring the data into a manageable system either for storage and future processing.
Secondary Data
I have started from analysing the current information available in articles, reviews, books and
scientific articles in specialized sources such as Organizations/Institutes, Scientific Magazines
about Management/Economics and Past Master/Doctorate thesis. It is crucial to collect the
information and research available to date as a starting point for a new research, contributing
to portray the topic under analysis. For this reason, in order to contribute the utmost with my
dissertation on this topic, a thorough research was completed before planning and collecting
any primary data. The qualitative analysis was essential to assist on providing insightful data
in topics such as management tools, concerns or business practices in current organizations,
which will strongly assist on introducing my thesis topic in the current context.
How management decides investments
39
Chapter 4 - Questionnaire Results
This sections aims to present the conclusions gathered after a thorough data analysis collected
from the surveys in order to provide insightful and valuable information enabling to answer the
proposed research questions on this dissertation.
Research role and experience
In regards to this dissertation’s subject, the researcher has a solid knowledge and professional
experience in the use of several business case practices and techniques in organizations. This is
an advantage as it will facilitate the analysis and provide a deeper comprehension about the
organizations’ maturity level and therefore better ability to make practical insights.
It is also important to note, that there is no personal connection between the researcher and the
companies surveyed.
General Considerations
It was sent 350 questionnaires between the periods of July 2014 to January 2015, through social
networks: by enrolling in LinkedIn groups discussions, I have directed my survey to Linked In
groups discussions related to Budgeting, Benefits Management and Investment topics as well
as by emailing current clients’ contacts from the organization I am currently working for
(consulting company), covering different sectors and organizations departments.
From the first mailing sent, it was possible to collect 145 responses, however only 138 were
considered valid answers since 7 were incomplete or abandoned which represents a final
response rate of 39%.
In order to better understand whether this response rate is “acceptable” I have prepared a small
benchmark where it is possible to compare to other similar researches related to the benefits
management and business case overall practices. In September 2014 APM Benefits
Management SIG conducted a questionnaire survey with the majority respondents from UK,
sent over to 1300 from which they have obtained only 44 responses which is equivalent to a
response rate of 3,3% (APM, 2014). Another research taken place in Portugal about a similar
thematic (strategy and management tools), the response rate got was 22% with 218 valid
responses out of 993 mailings sent (Oliveira, 2008). Regarding a more recent research about
benefits management practices in three countries, the authors have sent 900 invitations to
project management practitioners through the social network LinkedIn (300 per country) which
was advertised at electronic social networks and the websites of organization’s specialized in
project management. In a 6 month period 331 responses were received, presenting a response
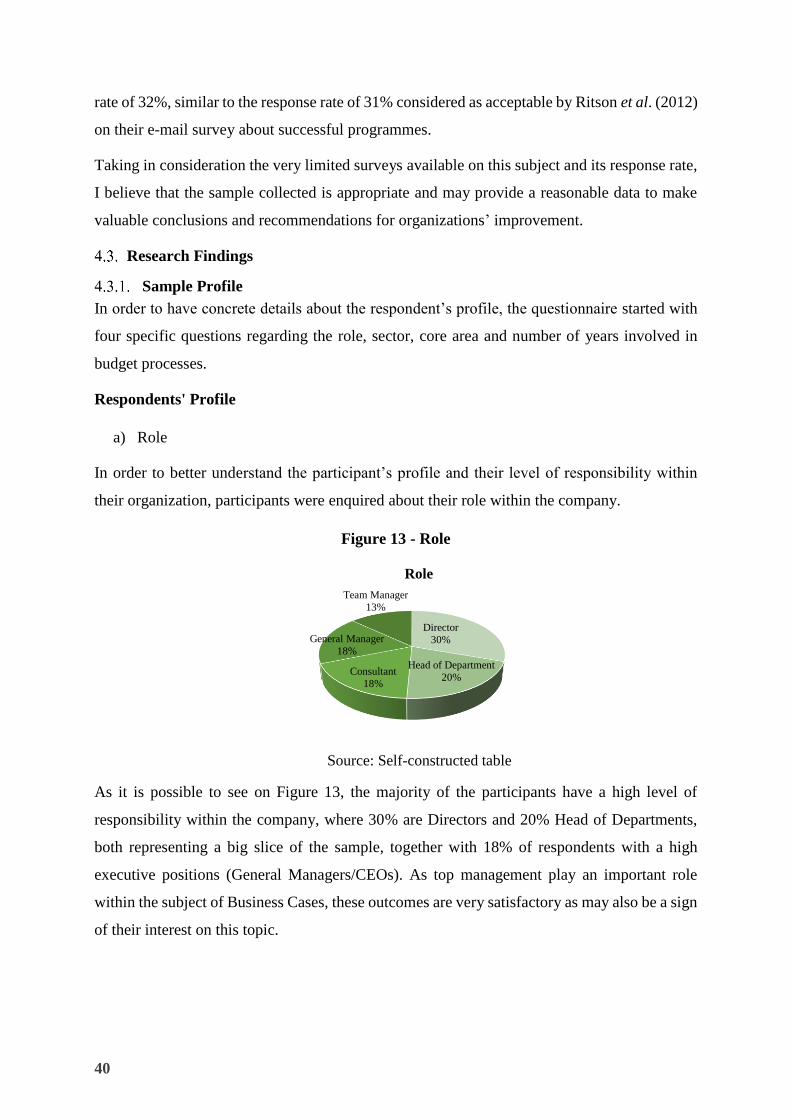
40
rate of 32%, similar to the response rate of 31% considered as acceptable by Ritson et al. (2012)
on their e-mail survey about successful programmes.
Taking in consideration the very limited surveys available on this subject and its response rate,
I believe that the sample collected is appropriate and may provide a reasonable data to make
valuable conclusions and recommendations for organizations’ improvement.
Research Findings
Sample Profile
In order to have concrete details about the respondent’s profile, the questionnaire started with
four specific questions regarding the role, sector, core area and number of years involved in
budget processes.
Respondents' Profile
a) Role
In order to better understand the participant’s profile and their level of responsibility within
their organization, participants were enquired about their role within the company.
Figure 13 - Role
Source: Self-constructed table
As it is possible to see on Figure 13, the majority of the participants have a high level of
responsibility within the company, where 30% are Directors and 20% Head of Departments,
both representing a big slice of the sample, together with 18% of respondents with a high
executive positions (General Managers/CEOs). As top management play an important role
within the subject of Business Cases, these outcomes are very satisfactory as may also be a sign
of their interest on this topic.
Director
30%
Head of Department
20%Consultant
18%
General Manager
18%
Team Manager
13%
Role
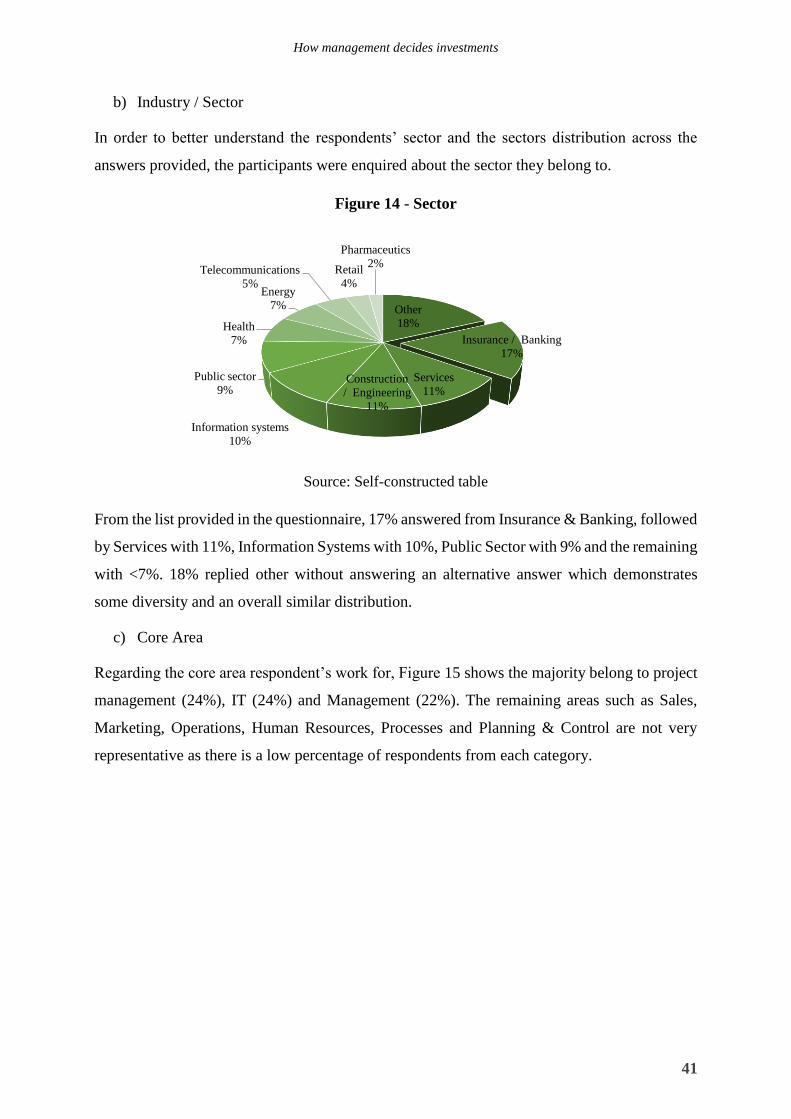
How management decides investments
41
b) Industry / Sector
In order to better understand the respondents’ sector and the sectors distribution across the
answers provided, the participants were enquired about the sector they belong to.
Figure 14 - Sector
Source: Self-constructed table
From the list provided in the questionnaire, 17% answered from Insurance & Banking, followed
by Services with 11%, Information Systems with 10%, Public Sector with 9% and the remaining
with <7%. 18% replied other without answering an alternative answer which demonstrates
some diversity and an overall similar distribution.
c) Core Area
Regarding the core area respondent’s work for, Figure 15 shows the majority belong to project
management (24%), IT (24%) and Management (22%). The remaining areas such as Sales,
Marketing, Operations, Human Resources, Processes and Planning & Control are not very
representative as there is a low percentage of respondents from each category.
Other
18%
Insurance / Banking
17%
Services
11%Construction
/ Engineering
11%
Information systems
10%
Public sector
9%
Health
7%
Energy
7%
Telecommunications
5%
Retail
4%
Pharmaceutics
2%
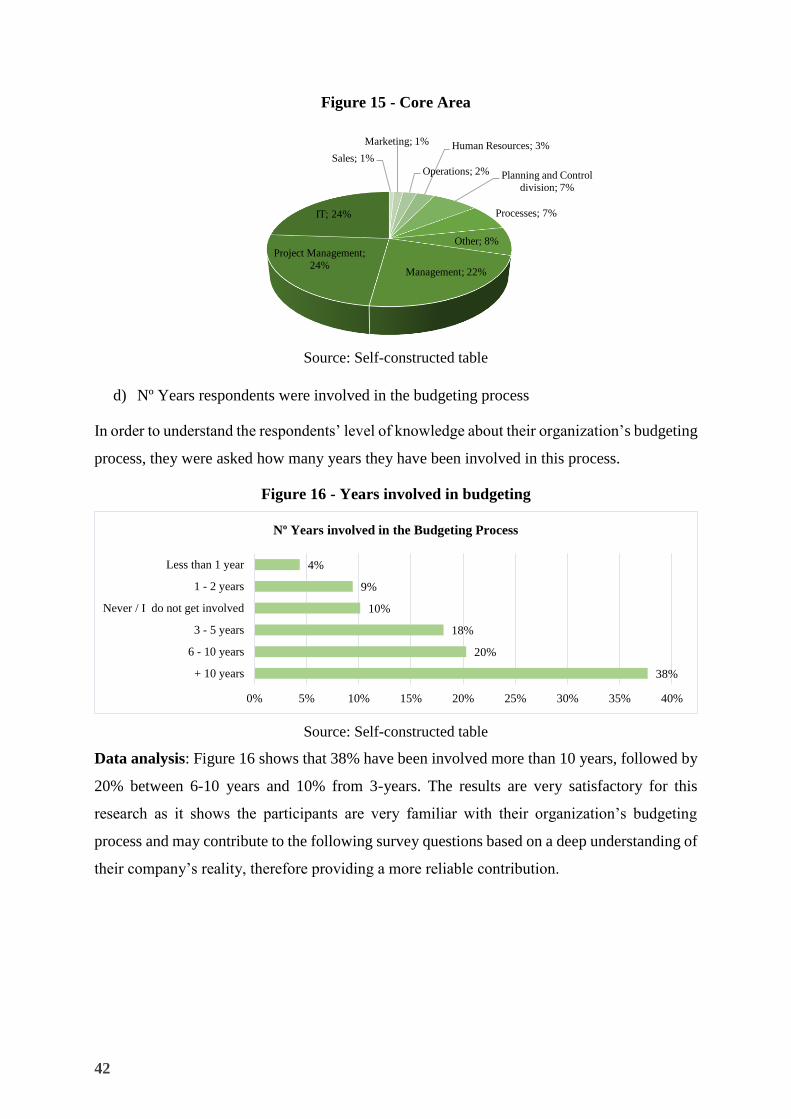
42
Figure 15 - Core Area
Source: Self-constructed table
d) Nº Years respondents were involved in the budgeting process
In order to understand the respondents’ level of knowledge about their organization’s budgeting
process, they were asked how many years they have been involved in this process.
Figure 16 - Years involved in budgeting
Source: Self-constructed table
Data analysis: Figure 16 shows that 38% have been involved more than 10 years, followed by
20% between 6-10 years and 10% from 3-years. The results are very satisfactory for this
research as it shows the participants are very familiar with their organization’s budgeting
process and may contribute to the following survey questions based on a deep understanding of
their company’s reality, therefore providing a more reliable contribution.
38%
20%
18%
10%
9%
4%
0% 5% 10% 15% 20% 25% 30% 35% 40%
+ 10 years
6 - 10 years
3 - 5 years
Never / I do not get involved
1 - 2 years
Less than 1 year
Nº Years involved in the Budgeting Process
Sales; 1%
Marketing; 1%
Operations; 2%
Human Resources; 3%
Planning and Control
division; 7%
Processes; 7%
Other; 8%
Management; 22%
Project Management;
24%
IT; 24%
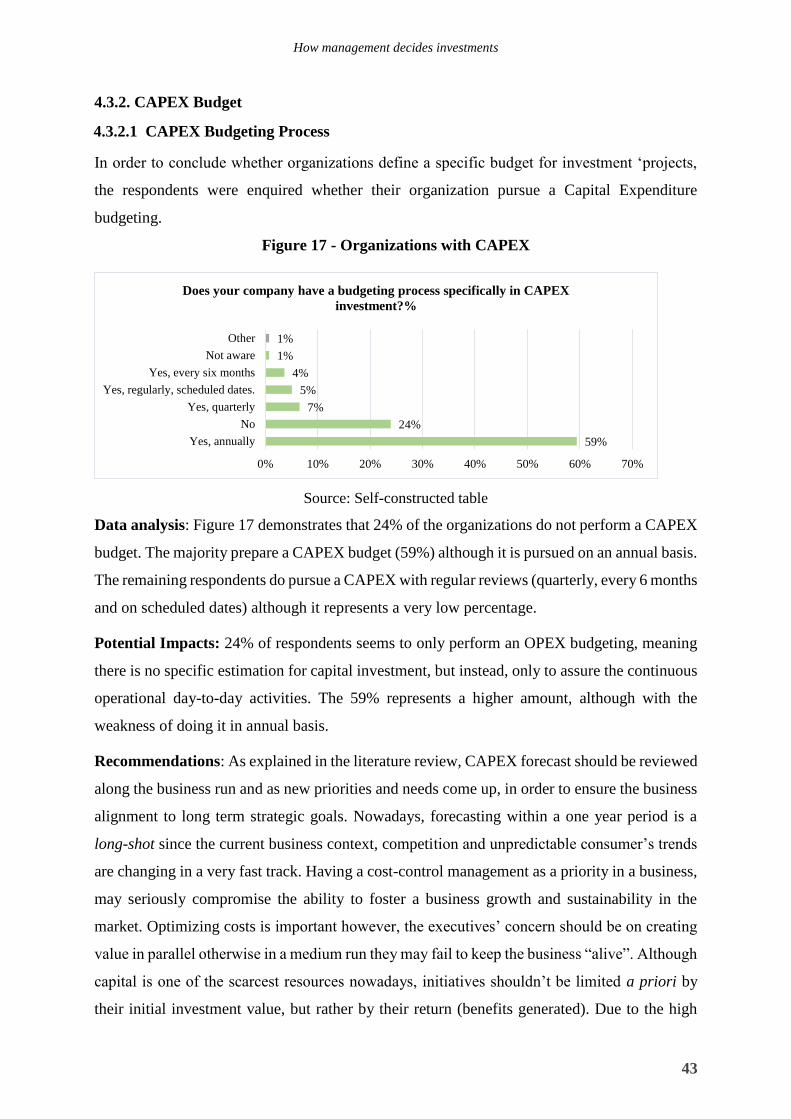
How management decides investments
43
4.3.2. CAPEX Budget
4.3.2.1 CAPEX Budgeting Process
In order to conclude whether organizations define a specific budget for investment ‘projects,
the respondents were enquired whether their organization pursue a Capital Expenditure
budgeting.
Figure 17 - Organizations with CAPEX
Source: Self-constructed table
Data analysis: Figure 17 demonstrates that 24% of the organizations do not perform a CAPEX
budget. The majority prepare a CAPEX budget (59%) although it is pursued on an annual basis.
The remaining respondents do pursue a CAPEX with regular reviews (quarterly, every 6 months
and on scheduled dates) although it represents a very low percentage.
Potential Impacts: 24% of respondents seems to only perform an OPEX budgeting, meaning
there is no specific estimation for capital investment, but instead, only to assure the continuous
operational day-to-day activities. The 59% represents a higher amount, although with the
weakness of doing it in annual basis.
Recommendations: As explained in the literature review, CAPEX forecast should be reviewed
along the business run and as new priorities and needs come up, in order to ensure the business
alignment to long term strategic goals. Nowadays, forecasting within a one year period is a
long-shot since the current business context, competition and unpredictable consumer’s trends
are changing in a very fast track. Having a cost-control management as a priority in a business,
may seriously compromise the ability to foster a business growth and sustainability in the
market. Optimizing costs is important however, the executives’ concern should be on creating
value in parallel otherwise in a medium run they may fail to keep the business “alive”. Although
capital is one of the scarcest resources nowadays, initiatives shouldn’t be limited a priori by
their initial investment value, but rather by their return (benefits generated). Due to the high
59%
24%
7%
5%
4%
1%
1%
0% 10% 20% 30% 40% 50% 60% 70%
Yes, annually
No
Yes, quarterly
Yes, regularly, scheduled dates.
Yes, every six months
Not aware
Other
Does your company have a budgeting process specifically in CAPEX
investment?%
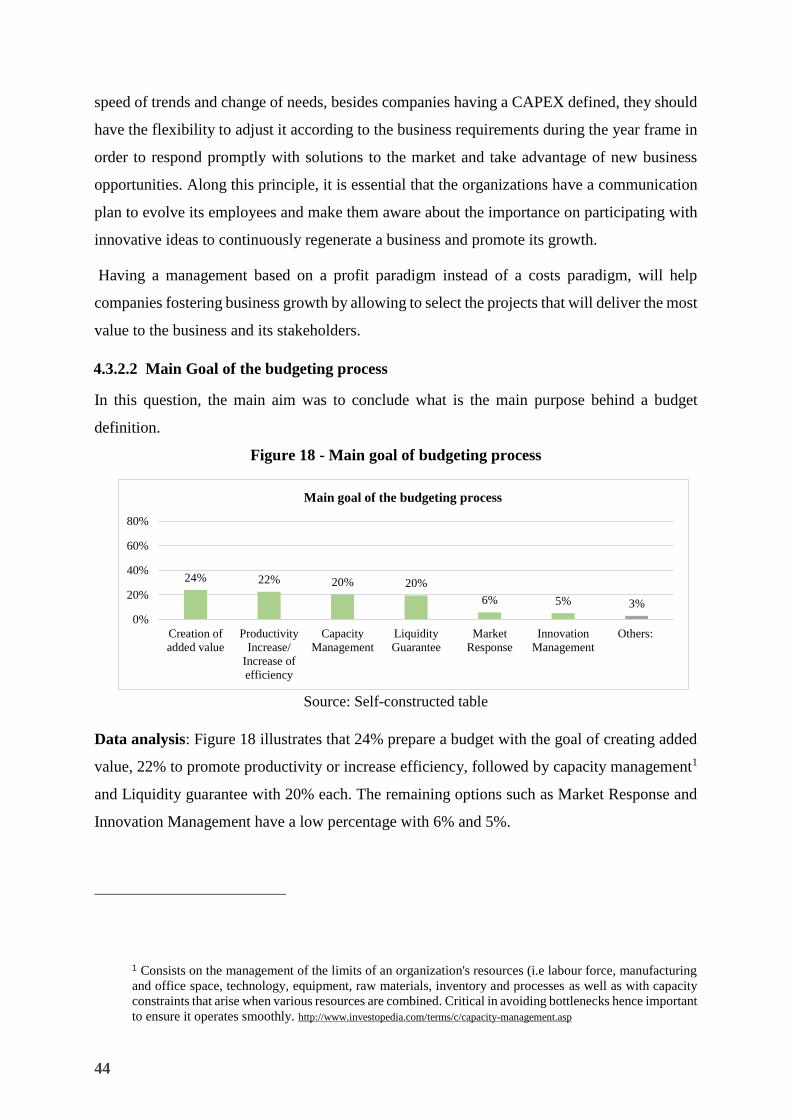
44
speed of trends and change of needs, besides companies having a CAPEX defined, they should
have the flexibility to adjust it according to the business requirements during the year frame in
order to respond promptly with solutions to the market and take advantage of new business
opportunities. Along this principle, it is essential that the organizations have a communication
plan to evolve its employees and make them aware about the importance on participating with
innovative ideas to continuously regenerate a business and promote its growth.
Having a management based on a profit paradigm instead of a costs paradigm, will help
companies fostering business growth by allowing to select the projects that will deliver the most
value to the business and its stakeholders.
4.3.2.2 Main Goal of the budgeting process
In this question, the main aim was to conclude what is the main purpose behind a budget
definition.
Figure 18 - Main goal of budgeting process
Source: Self-constructed table
Data analysis: Figure 18 illustrates that 24% prepare a budget with the goal of creating added
value, 22% to promote productivity or increase efficiency, followed by capacity management1
and Liquidity guarantee with 20% each. The remaining options such as Market Response and
Innovation Management have a low percentage with 6% and 5%.
1 Consists on the management of the limits of an organization's resources (i.e labour force, manufacturing
and office space, technology, equipment, raw materials, inventory and processes as well as with capacity
constraints that arise when various resources are combined. Critical in avoiding bottlenecks hence important
to ensure it operates smoothly. http://www.investopedia.com/terms/c/capacity-management.asp
24% 22% 20% 20%
6% 5% 3%
0%
20%
40%
60%
80%
Creation of
added value
Productivity
Increase/
Increase of
efficiency
Capacity
Management
Liquidity
Guarantee
Market
Response
Innovation
Management
Others:
Main goal of the budgeting process
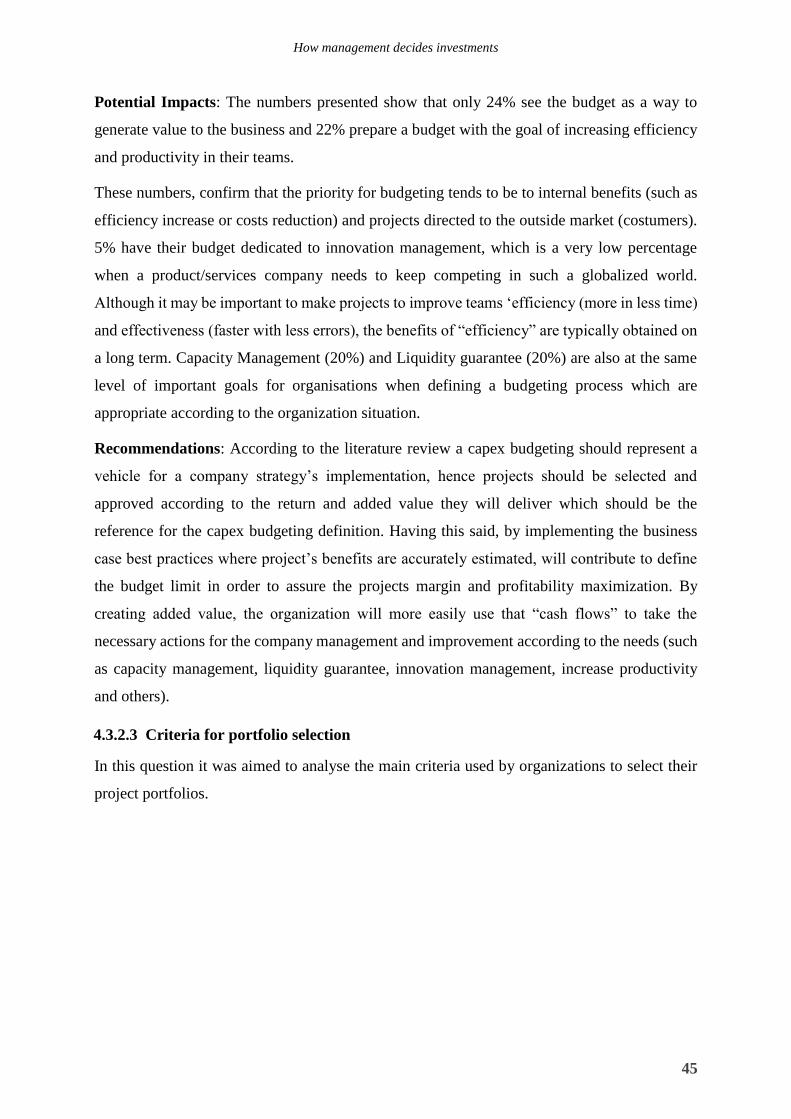
How management decides investments
45
Potential Impacts: The numbers presented show that only 24% see the budget as a way to
generate value to the business and 22% prepare a budget with the goal of increasing efficiency
and productivity in their teams.
These numbers, confirm that the priority for budgeting tends to be to internal benefits (such as
efficiency increase or costs reduction) and projects directed to the outside market (costumers).
5% have their budget dedicated to innovation management, which is a very low percentage
when a product/services company needs to keep competing in such a globalized world.
Although it may be important to make projects to improve teams ‘efficiency (more in less time)
and effectiveness (faster with less errors), the benefits of “efficiency” are typically obtained on
a long term. Capacity Management (20%) and Liquidity guarantee (20%) are also at the same
level of important goals for organisations when defining a budgeting process which are
appropriate according to the organization situation.
Recommendations: According to the literature review a capex budgeting should represent a
vehicle for a company strategy’s implementation, hence projects should be selected and
approved according to the return and added value they will deliver which should be the
reference for the capex budgeting definition. Having this said, by implementing the business
case best practices where project’s benefits are accurately estimated, will contribute to define
the budget limit in order to assure the projects margin and profitability maximization. By
creating added value, the organization will more easily use that “cash flows” to take the
necessary actions for the company management and improvement according to the needs (such
as capacity management, liquidity guarantee, innovation management, increase productivity
and others).
4.3.2.3 Criteria for portfolio selection
In this question it was aimed to analyse the main criteria used by organizations to select their
project portfolios.
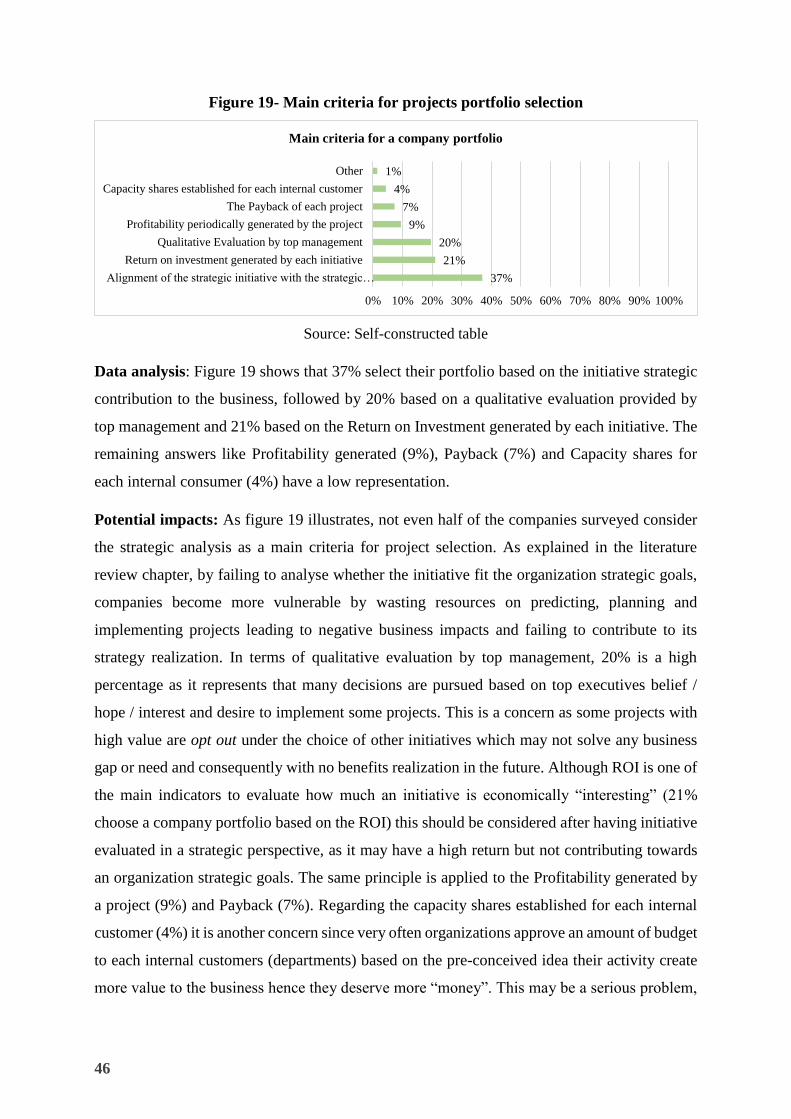
46
Figure 19- Main criteria for projects portfolio selection
Source: Self-constructed table
Data analysis: Figure 19 shows that 37% select their portfolio based on the initiative strategic
contribution to the business, followed by 20% based on a qualitative evaluation provided by
top management and 21% based on the Return on Investment generated by each initiative. The
remaining answers like Profitability generated (9%), Payback (7%) and Capacity shares for
each internal consumer (4%) have a low representation.
Potential impacts: As figure 19 illustrates, not even half of the companies surveyed consider
the strategic analysis as a main criteria for project selection. As explained in the literature
review chapter, by failing to analyse whether the initiative fit the organization strategic goals,
companies become more vulnerable by wasting resources on predicting, planning and
implementing projects leading to negative business impacts and failing to contribute to its
strategy realization. In terms of qualitative evaluation by top management, 20% is a high
percentage as it represents that many decisions are pursued based on top executives belief /
hope / interest and desire to implement some projects. This is a concern as some projects with
high value are opt out under the choice of other initiatives which may not solve any business
gap or need and consequently with no benefits realization in the future. Although ROI is one of
the main indicators to evaluate how much an initiative is economically “interesting” (21%
choose a company portfolio based on the ROI) this should be considered after having initiative
evaluated in a strategic perspective, as it may have a high return but not contributing towards
an organization strategic goals. The same principle is applied to the Profitability generated by
a project (9%) and Payback (7%). Regarding the capacity shares established for each internal
customer (4%) it is another concern since very often organizations approve an amount of budget
to each internal customers (departments) based on the pre-conceived idea their activity create
more value to the business hence they deserve more “money”. This may be a serious problem,
37%
21%
20%
9%
7%
4%
1%
0% 10% 20% 30% 40% 50% 60% 70% 80% 90% 100%
Alignment of the strategic initiative with the strategic…
Return on investment generated by each initiative
Qualitative Evaluation by top management
Profitability periodically generated by the project
The Payback of each project
Capacity shares established for each internal customer
Other
Main criteria for a company portfolio
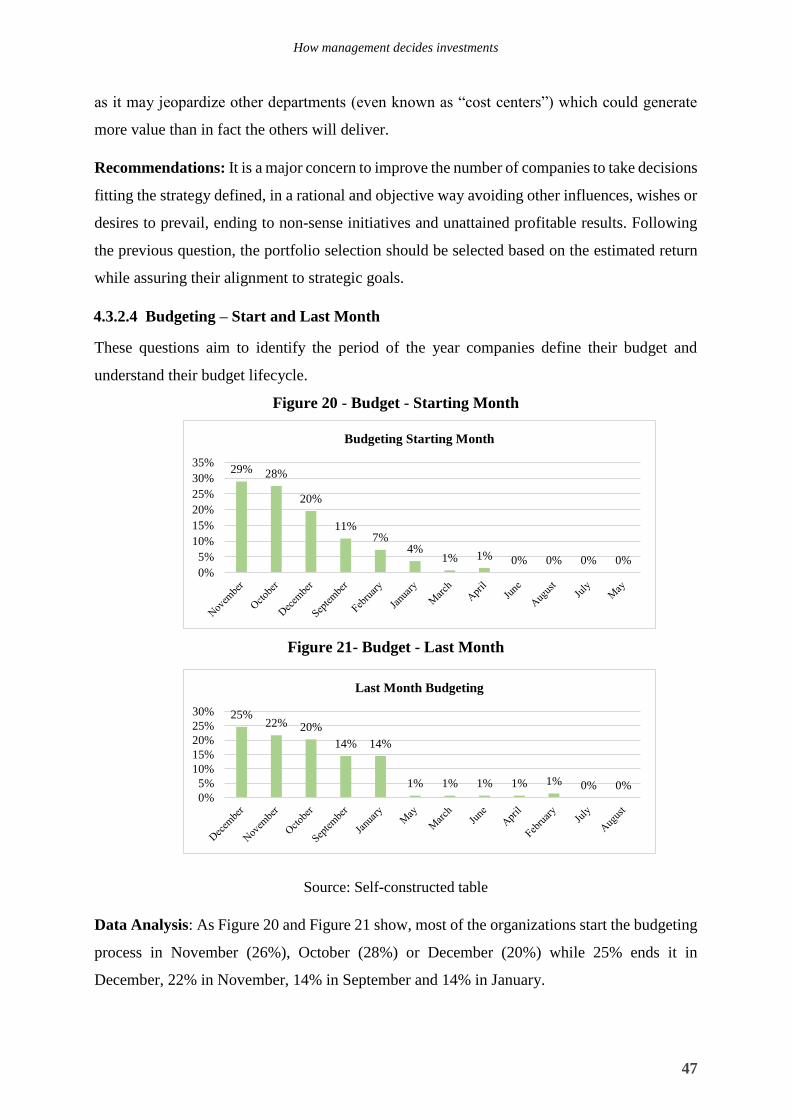
How management decides investments
47
as it may jeopardize other departments (even known as “cost centers”) which could generate
more value than in fact the others will deliver.
Recommendations: It is a major concern to improve the number of companies to take decisions
fitting the strategy defined, in a rational and objective way avoiding other influences, wishes or
desires to prevail, ending to non-sense initiatives and unattained profitable results. Following
the previous question, the portfolio selection should be selected based on the estimated return
while assuring their alignment to strategic goals.
4.3.2.4 Budgeting – Start and Last Month
These questions aim to identify the period of the year companies define their budget and
understand their budget lifecycle.
Figure 20 - Budget - Starting Month
Figure 21- Budget - Last Month
Source: Self-constructed table
Data Analysis: As Figure 20 and Figure 21 show, most of the organizations start the budgeting
process in November (26%), October (28%) or December (20%) while 25% ends it in
December, 22% in November, 14% in September and 14% in January.
29% 28%
20%
11%7%
4%1% 1% 0% 0% 0% 0%
0%
5%
10%
15%
20%
25%
30%
35%
Budgeting Starting Month
25%22% 20%
14% 14%
1% 1% 1% 1% 1% 0% 0%0%
5%
10%
15%
20%
25%
30%
Last Month Budgeting
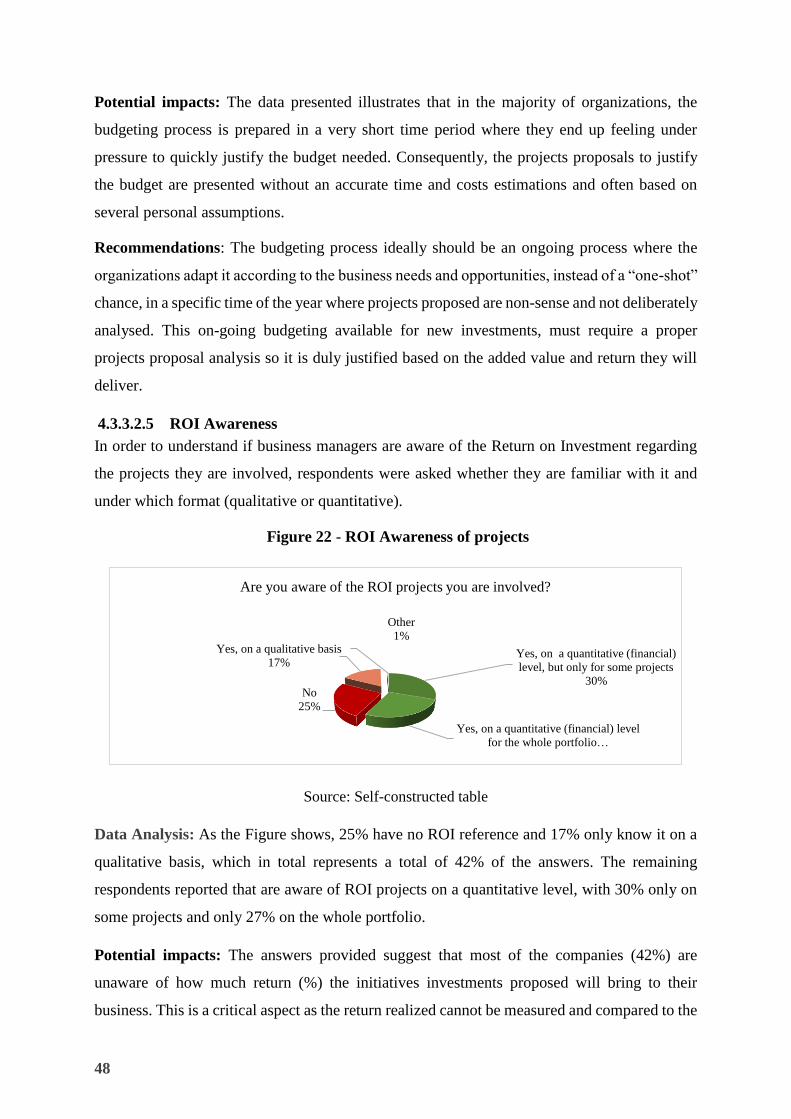
48
Potential impacts: The data presented illustrates that in the majority of organizations, the
budgeting process is prepared in a very short time period where they end up feeling under
pressure to quickly justify the budget needed. Consequently, the projects proposals to justify
the budget are presented without an accurate time and costs estimations and often based on
several personal assumptions.
Recommendations: The budgeting process ideally should be an ongoing process where the
organizations adapt it according to the business needs and opportunities, instead of a “one-shot”
chance, in a specific time of the year where projects proposed are non-sense and not deliberately
analysed. This on-going budgeting available for new investments, must require a proper
projects proposal analysis so it is duly justified based on the added value and return they will
deliver.
4.3.3.2.5 ROI Awareness
In order to understand if business managers are aware of the Return on Investment regarding
the projects they are involved, respondents were asked whether they are familiar with it and
under which format (qualitative or quantitative).
Figure 22 - ROI Awareness of projects
Source: Self-constructed table
Data Analysis: As the Figure shows, 25% have no ROI reference and 17% only know it on a
qualitative basis, which in total represents a total of 42% of the answers. The remaining
respondents reported that are aware of ROI projects on a quantitative level, with 30% only on
some projects and only 27% on the whole portfolio.
Potential impacts: The answers provided suggest that most of the companies (42%) are
unaware of how much return (%) the initiatives investments proposed will bring to their
business. This is a critical aspect as the return realized cannot be measured and compared to the
Yes, on a quantitative (financial)
level, but only for some projects
30%
Yes, on a quantitative (financial) level
for the whole portfolio…
No
25%
Yes, on a qualitative basis
17%
Other
1%
Are you aware of the ROI projects you are involved?
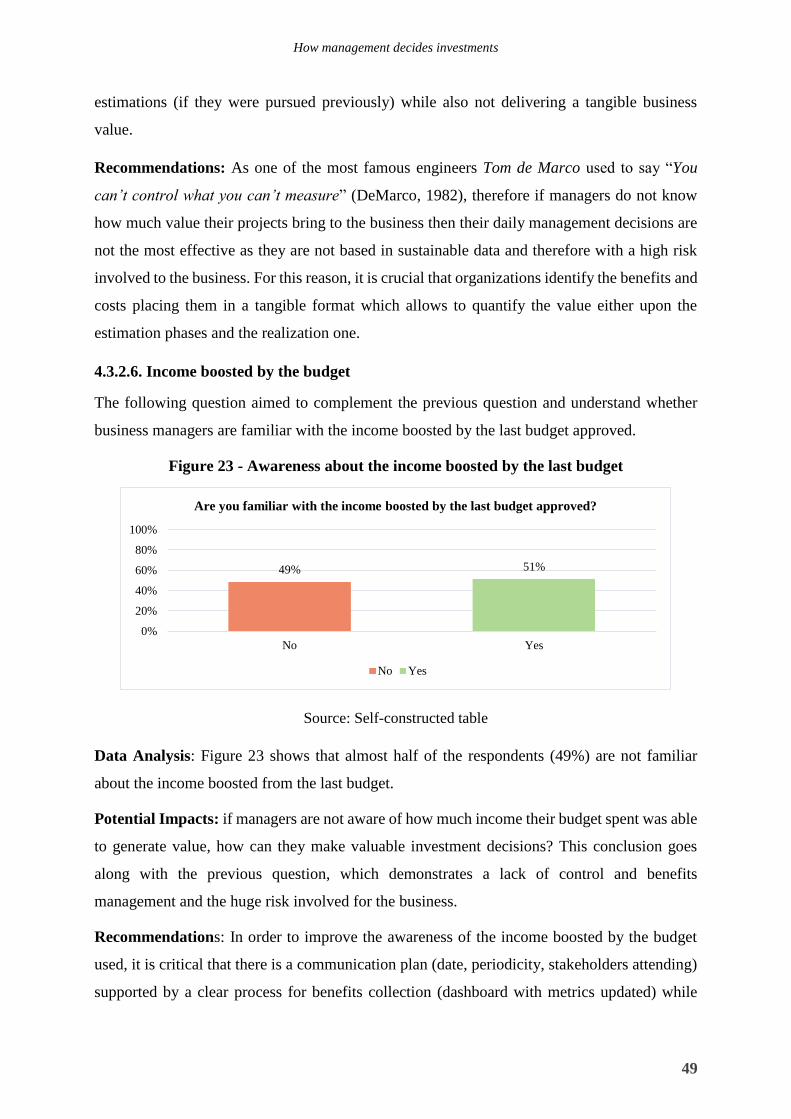
How management decides investments
49
estimations (if they were pursued previously) while also not delivering a tangible business
value.
Recommendations: As one of the most famous engineers Tom de Marco used to say “You
can’t control what you can’t measure” (DeMarco, 1982), therefore if managers do not know
how much value their projects bring to the business then their daily management decisions are
not the most effective as they are not based in sustainable data and therefore with a high risk
involved to the business. For this reason, it is crucial that organizations identify the benefits and
costs placing them in a tangible format which allows to quantify the value either upon the
estimation phases and the realization one.
4.3.2.6. Income boosted by the budget
The following question aimed to complement the previous question and understand whether
business managers are familiar with the income boosted by the last budget approved.
Figure 23 - Awareness about the income boosted by the last budget
Source: Self-constructed table
Data Analysis: Figure 23 shows that almost half of the respondents (49%) are not familiar
about the income boosted from the last budget.
Potential Impacts: if managers are not aware of how much income their budget spent was able
to generate value, how can they make valuable investment decisions? This conclusion goes
along with the previous question, which demonstrates a lack of control and benefits
management and the huge risk involved for the business.
Recommendations: In order to improve the awareness of the income boosted by the budget
used, it is critical that there is a communication plan (date, periodicity, stakeholders attending)
supported by a clear process for benefits collection (dashboard with metrics updated) while
49% 51%
No Yes
0%
20%
40%
60%
80%
100%
Are you familiar with the income boosted by the last budget approved?
No Yes
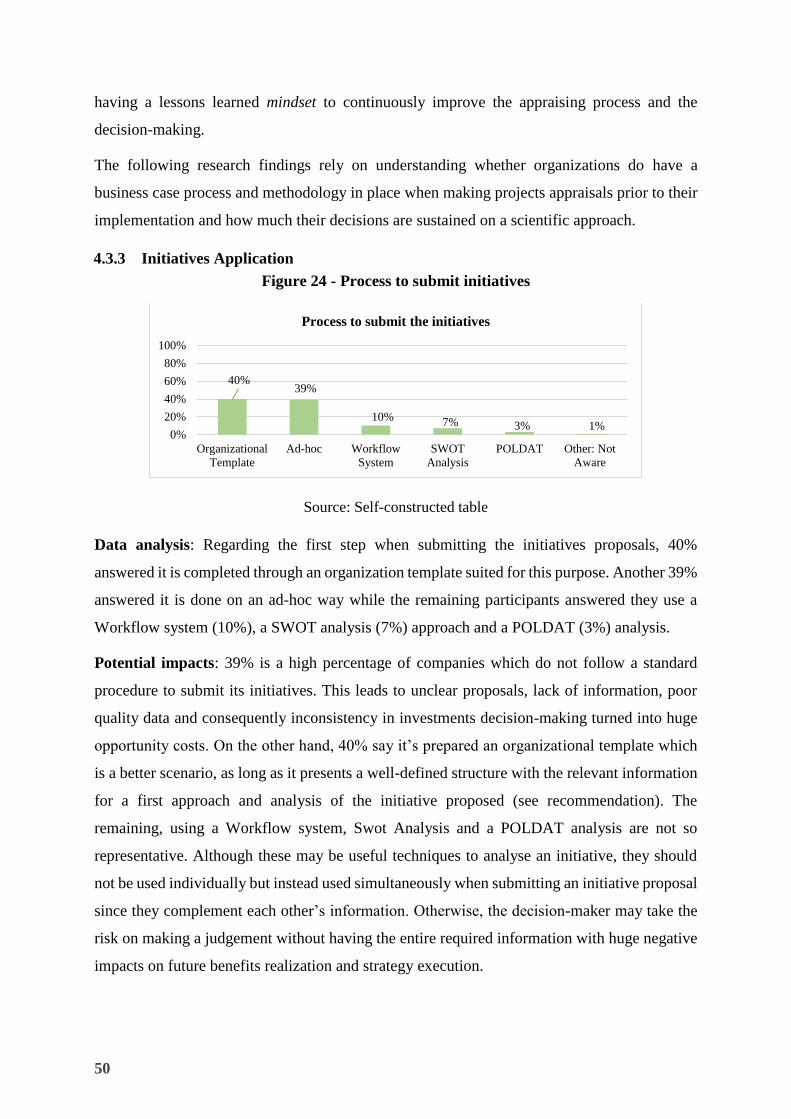
50
having a lessons learned mindset to continuously improve the appraising process and the
decision-making.
The following research findings rely on understanding whether organizations do have a
business case process and methodology in place when making projects appraisals prior to their
implementation and how much their decisions are sustained on a scientific approach.
4.3.3 Initiatives Application
Figure 24 - Process to submit initiatives
Source: Self-constructed table
Data analysis: Regarding the first step when submitting the initiatives proposals, 40%
answered it is completed through an organization template suited for this purpose. Another 39%
answered it is done on an ad-hoc way while the remaining participants answered they use a
Workflow system (10%), a SWOT analysis (7%) approach and a POLDAT (3%) analysis.
Potential impacts: 39% is a high percentage of companies which do not follow a standard
procedure to submit its initiatives. This leads to unclear proposals, lack of information, poor
quality data and consequently inconsistency in investments decision-making turned into huge
opportunity costs. On the other hand, 40% say it’s prepared an organizational template which
is a better scenario, as long as it presents a well-defined structure with the relevant information
for a first approach and analysis of the initiative proposed (see recommendation). The
remaining, using a Workflow system, Swot Analysis and a POLDAT analysis are not so
representative. Although these may be useful techniques to analyse an initiative, they should
not be used individually but instead used simultaneously when submitting an initiative proposal
since they complement each other’s information. Otherwise, the decision-maker may take the
risk on making a judgement without having the entire required information with huge negative
impacts on future benefits realization and strategy execution.
40%39%
10% 7% 3% 1%0%
20%
40%
60%
80%
100%
Organizational
Template
Ad-hoc Workflow
System
SWOT
Analysis
POLDAT Other: Not
Aware
Process to submit the initiatives
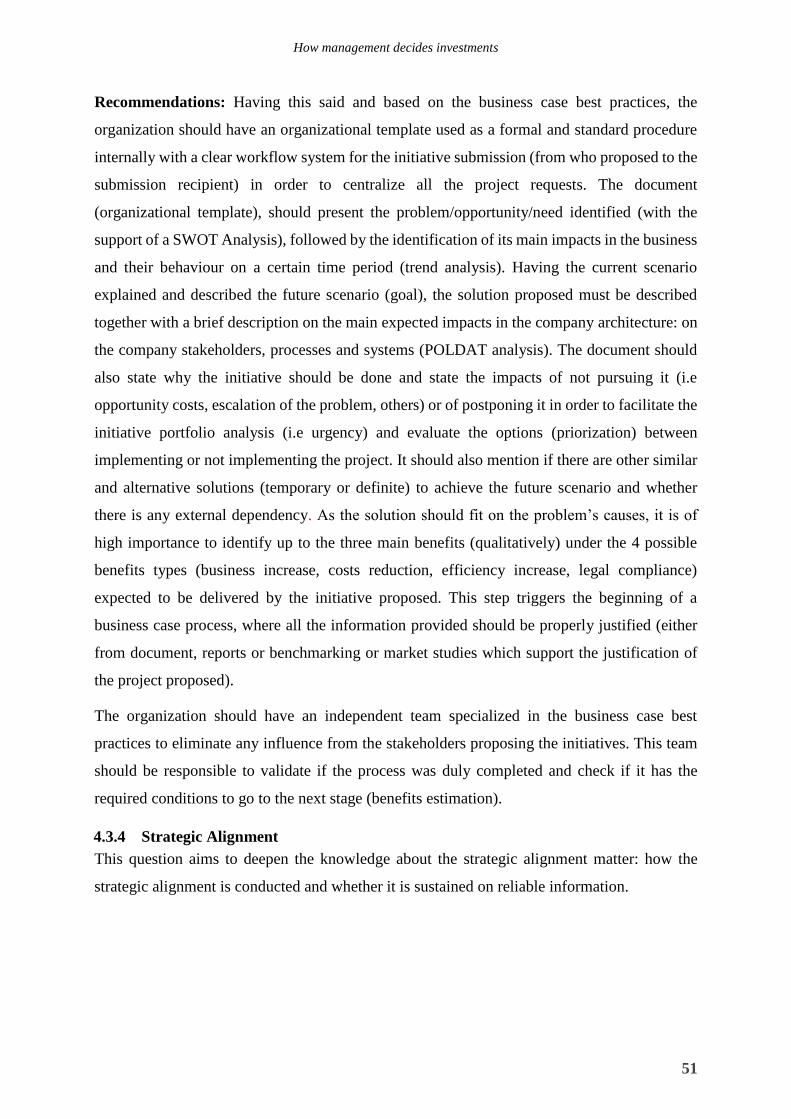
How management decides investments
51
Recommendations: Having this said and based on the business case best practices, the
organization should have an organizational template used as a formal and standard procedure
internally with a clear workflow system for the initiative submission (from who proposed to the
submission recipient) in order to centralize all the project requests. The document
(organizational template), should present the problem/opportunity/need identified (with the
support of a SWOT Analysis), followed by the identification of its main impacts in the business
and their behaviour on a certain time period (trend analysis). Having the current scenario
explained and described the future scenario (goal), the solution proposed must be described
together with a brief description on the main expected impacts in the company architecture: on
the company stakeholders, processes and systems (POLDAT analysis). The document should
also state why the initiative should be done and state the impacts of not pursuing it (i.e
opportunity costs, escalation of the problem, others) or of postponing it in order to facilitate the
initiative portfolio analysis (i.e urgency) and evaluate the options (priorization) between
implementing or not implementing the project. It should also mention if there are other similar
and alternative solutions (temporary or definite) to achieve the future scenario and whether
there is any external dependency. As the solution should fit on the problem’s causes, it is of
high importance to identify up to the three main benefits (qualitatively) under the 4 possible
benefits types (business increase, costs reduction, efficiency increase, legal compliance)
expected to be delivered by the initiative proposed. This step triggers the beginning of a
business case process, where all the information provided should be properly justified (either
from document, reports or benchmarking or market studies which support the justification of
the project proposed).
The organization should have an independent team specialized in the business case best
practices to eliminate any influence from the stakeholders proposing the initiatives. This team
should be responsible to validate if the process was duly completed and check if it has the
required conditions to go to the next stage (benefits estimation).
4.3.4 Strategic Alignment
This question aims to deepen the knowledge about the strategic alignment matter: how the
strategic alignment is conducted and whether it is sustained on reliable information.
52
Figure 25 - Criteria for strategic alignment
Source: Self-constructed table
The results shown on Figure 25 reflect that 12% do not evaluate the strategic alignment at all
while 46% is based on Top Management perception. Regarding the remaining respondents,
20% used a Scoring Model, 15% evaluate it according to the request source (which submitted
the proposal) and 5% by a voting process.
Potential impacts: the results presented suggest that decisions about initiatives’ strategic
analysis are usually based on a common sense way with no reliable methods or information
behind decision-making. If initiatives are not accurately evaluated in a strategic perspective,
the strategic goals may be compromised and will hardly be achieved through these projects
proposals, leading to a waste of resources, teams demotivation and consequently destruction of
value.
Recommendations: As explained in the literature review chapter, any initiative proposed
should carefully follow a strategy analysis in order to decide whether to proceed with the
remaining business case steps. Besides the ability to evaluate how the initiative benefits
contribute to each strategic goal on a qualitative level, a multi criteria analysis (such as the
scoring model technique) should be used in organizations to complement the analysis as it
provides an objective and quantifiable scoring, assisting on comparing and prioritizing the
initiatives proposed. In order to do it consistently and efficiently, the top management must
start from establishing clear and tangible strategic goals towards which the initiative’s estimated
benefits will be evaluated.
4.3.5 Benefits Estimation
4.3.5.1 Benefits Presentation
In regards to benefits formulation, respondents were enquired about how these are presented
during a projects appraisal.
46%
20% 15% 12%5% 3%
0%
20%
40%
60%
80%
100%
Top management
perception
By a scoring
model
According to the
request source
It is not rated A voting process Other
The Criteria used to evaluate the initiative's strategic alignment is by:
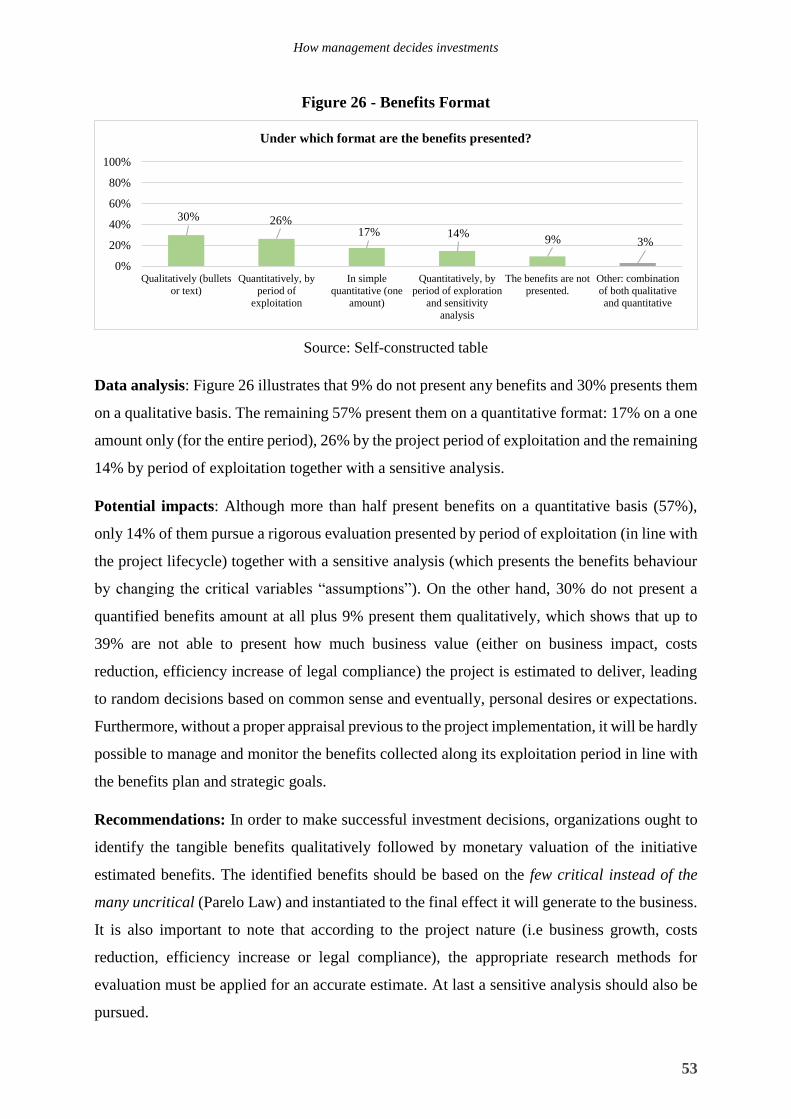
How management decides investments
53
Figure 26 - Benefits Format
Source: Self-constructed table
Data analysis: Figure 26 illustrates that 9% do not present any benefits and 30% presents them
on a qualitative basis. The remaining 57% present them on a quantitative format: 17% on a one
amount only (for the entire period), 26% by the project period of exploitation and the remaining
14% by period of exploitation together with a sensitive analysis.
Potential impacts: Although more than half present benefits on a quantitative basis (57%),
only 14% of them pursue a rigorous evaluation presented by period of exploitation (in line with
the project lifecycle) together with a sensitive analysis (which presents the benefits behaviour
by changing the critical variables “assumptions”). On the other hand, 30% do not present a
quantified benefits amount at all plus 9% present them qualitatively, which shows that up to
39% are not able to present how much business value (either on business impact, costs
reduction, efficiency increase of legal compliance) the project is estimated to deliver, leading
to random decisions based on common sense and eventually, personal desires or expectations.
Furthermore, without a proper appraisal previous to the project implementation, it will be hardly
possible to manage and monitor the benefits collected along its exploitation period in line with
the benefits plan and strategic goals.
Recommendations: In order to make successful investment decisions, organizations ought to
identify the tangible benefits qualitatively followed by monetary valuation of the initiative
estimated benefits. The identified benefits should be based on the few critical instead of the
many uncritical (Parelo Law) and instantiated to the final effect it will generate to the business.
It is also important to note that according to the project nature (i.e business growth, costs
reduction, efficiency increase or legal compliance), the appropriate research methods for
evaluation must be applied for an accurate estimate. At last a sensitive analysis should also be
pursued.
30% 26%17% 14%
9% 3%
0%
20%
40%
60%
80%
100%
Qualitatively (bullets
or text)
Quantitatively, by
period of
exploitation
In simple
quantitative (one
amount)
Quantitatively, by
period of exploration
and sensitivity
analysis
The benefits are not
presented.
Other: combination
of both qualitative
and quantitative
Under which format are the benefits presented?
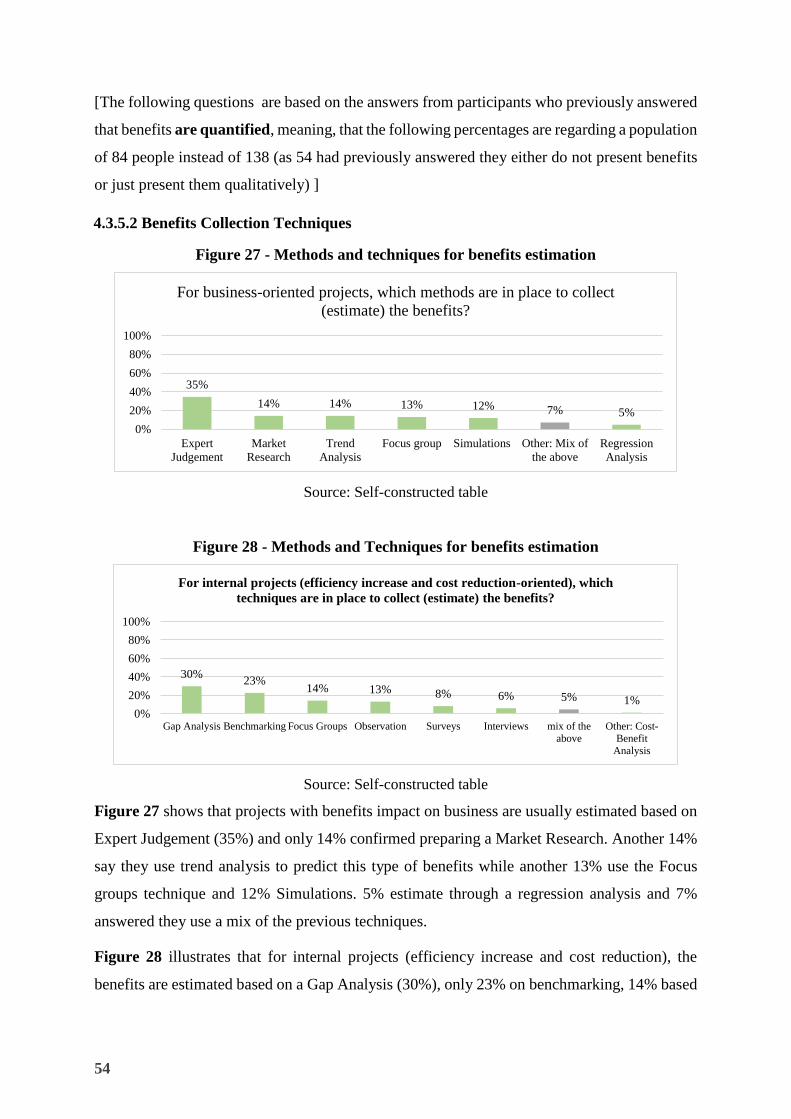
54
[The following questions are based on the answers from participants who previously answered
that benefits are quantified, meaning, that the following percentages are regarding a population
of 84 people instead of 138 (as 54 had previously answered they either do not present benefits
or just present them qualitatively) ]
4.3.5.2 Benefits Collection Techniques
Figure 27 - Methods and techniques for benefits estimation
Source: Self-constructed table
Figure 28 - Methods and Techniques for benefits estimation
Source: Self-constructed table
Figure 27 shows that projects with benefits impact on business are usually estimated based on
Expert Judgement (35%) and only 14% confirmed preparing a Market Research. Another 14%
say they use trend analysis to predict this type of benefits while another 13% use the Focus
groups technique and 12% Simulations. 5% estimate through a regression analysis and 7%
answered they use a mix of the previous techniques.
Figure 28 illustrates that for internal projects (efficiency increase and cost reduction), the
benefits are estimated based on a Gap Analysis (30%), only 23% on benchmarking, 14% based
35%
14% 14% 13% 12% 7% 5%
0%
20%
40%
60%
80%
100%
Expert
Judgement
Market
Research
Trend
Analysis
Focus group Simulations Other: Mix of
the above
Regression
Analysis
For business-oriented projects, which methods are in place to collect
(estimate) the benefits?
30%23%
14% 13% 8% 6% 5% 1%0%
20%
40%
60%
80%
100%
Gap Analysis Benchmarking Focus Groups Observation Surveys Interviews mix of the
above
Other: Cost-
Benefit
Analysis
For internal projects (efficiency increase and cost reduction-oriented), which
techniques are in place to collect (estimate) the benefits?
How management decides investments
55
on focus groups, 13% on observation, 8% based on surveys , 6% through interviews and 5%
with a mix of the above.
Potential Impacts: Regarding business-oriented projects the numbers presented are very
concerning as the majority of respondents (35%) confirmed estimating benefits through an
expert judgment process, which technically is the less reliable technique for business benefits
estimation. Projects which impact the market (external clients) require testing the solution
(product / service) proposed directly with the potential clients not only to get advice,
recommendations and feedback for improvement but specially at the final stage to verify how
much demand and return it will be leveraged. Regarding internal projects (typically efficiency
or costs related) depending on the project under analysis and the historical data recorded to date,
any of the techniques listed may be used if used appropriately.
Recommendations: Before proceeding to any benefits estimation, it is essential to have a deep
comprehension about the processes and techniques in a project development.
In order to increase the quality of the collection process and the results accuracy, there should
be conducted a benefits planning to identify the metrics, sources and which techniques are
meant to be used, followed by the parametric equations to support the benefits estimations, and
finally conduct the data collection. There are several techniques duly tested to collect the current
situation and evaluate the future scenario, therefore it is critical to have the knowledge and
ability to identify the right sources of information and the evaluation techniques in order to
assure the accuracy and the veracity of the business case. As presented in the literature review
chapter there are several techniques developed to collect data both to internal or external
oriented projects, which should be used according to the type of benefit under analysis. If a
solution proposed (initiative) aims to fulfil a market need, then the most accurate way to validate
whether it will be “welcomed” and get buyers in the future is contacting and querying potential
clients. For example, market research (surveys), hall testing with potential clients or even focus
groups (with experts on the matter) may be a valuable way to collect reliable opinions and
insights about the product/service. But firstly, before pursuing any investment appraisal, it is
essential to evaluate whether the market has the capacity to absorb (or not) the product/service
proposed, which exceeds the minimum required for a project profitability. It is important to
mention that while making the data collection, managers cannot involve their personal
judgment or personal opinions from who will manufacture the potential product (impartial and
rational).
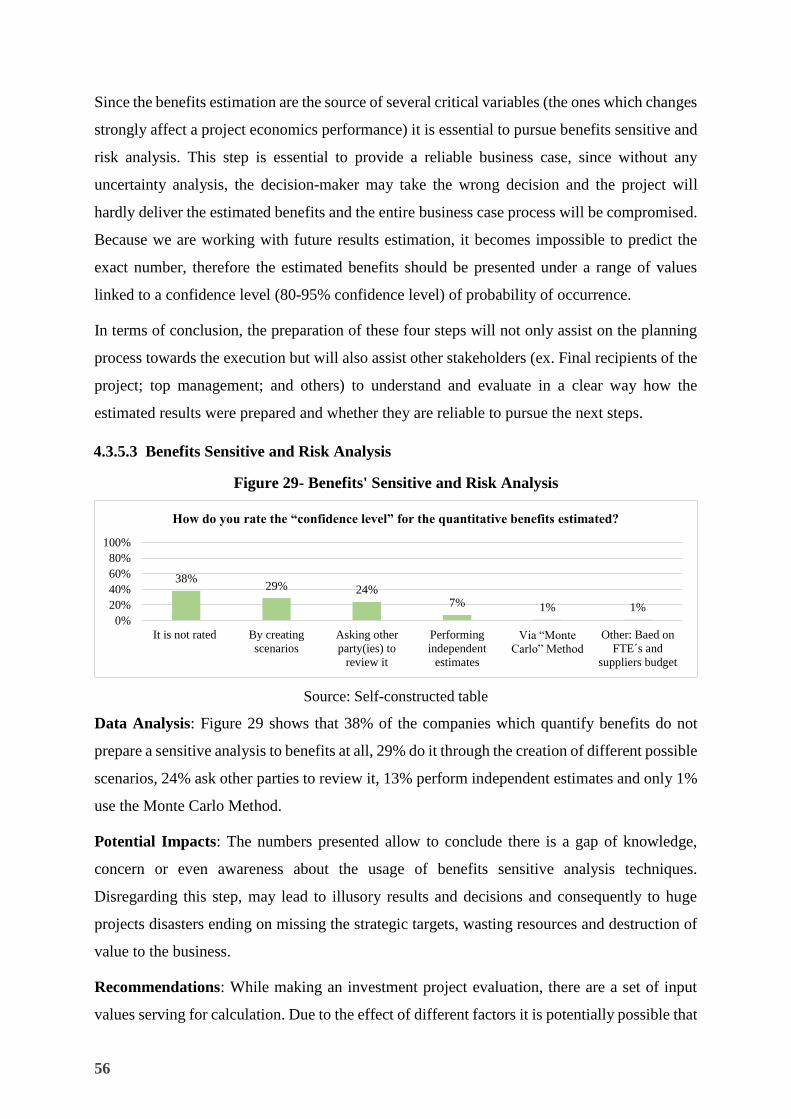
56
Since the benefits estimation are the source of several critical variables (the ones which changes
strongly affect a project economics performance) it is essential to pursue benefits sensitive and
risk analysis. This step is essential to provide a reliable business case, since without any
uncertainty analysis, the decision-maker may take the wrong decision and the project will
hardly deliver the estimated benefits and the entire business case process will be compromised.
Because we are working with future results estimation, it becomes impossible to predict the
exact number, therefore the estimated benefits should be presented under a range of values
linked to a confidence level (80-95% confidence level) of probability of occurrence.
In terms of conclusion, the preparation of these four steps will not only assist on the planning
process towards the execution but will also assist other stakeholders (ex. Final recipients of the
project; top management; and others) to understand and evaluate in a clear way how the
estimated results were prepared and whether they are reliable to pursue the next steps.
4.3.5.3 Benefits Sensitive and Risk Analysis
Figure 29- Benefits' Sensitive and Risk Analysis
Source: Self-constructed table
Data Analysis: Figure 29 shows that 38% of the companies which quantify benefits do not
prepare a sensitive analysis to benefits at all, 29% do it through the creation of different possible
scenarios, 24% ask other parties to review it, 13% perform independent estimates and only 1%
use the Monte Carlo Method.
Potential Impacts: The numbers presented allow to conclude there is a gap of knowledge,
concern or even awareness about the usage of benefits sensitive analysis techniques.
Disregarding this step, may lead to illusory results and decisions and consequently to huge
projects disasters ending on missing the strategic targets, wasting resources and destruction of
value to the business.
Recommendations: While making an investment project evaluation, there are a set of input
values serving for calculation. Due to the effect of different factors it is potentially possible that
38%29% 24%
7% 1% 1%0%
20%
40%
60%
80%
100%
It is not rated By creating
scenarios
Asking other
party(ies) to
review it
Performing
independent
estimates
Via “Monte
Carlo” Method
Other: Baed on
FTE´s and
suppliers budget
How do you rate the “confidence level” for the quantitative benefits estimated?
How management decides investments
57
these input values are not realized in the future, which may compromise the final evaluation
scores. If we want to take into consideration all possible consequences, we must analyse, in
advance the effect of potential changes (of the input value – critical values) which is performed
through procedures of the Sensitivity Analysis. Therefore, it is recommended to make a
sensitive analysis to benefits, which will be further completed by the costs sensitivity analysis.
Appraisers need to know the contingencies and the critical success factors required to achieve
the future scenario (goal) so, when presenting a benefits plan they should be able to answer the
following guideline questions:
What happens if these assumptions change?
Which assumptions are most important in controlling results?
How likely is “most likely”?
How likely are the other financial results?
Could anything happen that would cause very different results?
Since the ability to estimate depends on the quantity and quality of the information available,
on the reliability and the independency of the sources and specialists consulted, these are critical
factors upon the initiative decision-making as they may influence it either positively or
negatively. Having this said, the business case experts/appraiser team must present all the
sources used and how the information and data was collected. After doing a sensitive analysis,
there will be more substance to guide us on how to define the necessary steps and actions to
influence certain factors and avoid possible unwanted changes of some input values and of
investment project evaluation. The sensitive and risk analysis is a critical step to provide a
reliable business case process as this uncertainty and risk analysis to a benefits plan may
identify the range of benefits amount that may occur in a given project, essential to the decision
maker. The final sensitive analysis to the net cash flows, will not only provide an insight into
the impact of changes of different parameters on changes of certain criteria values (eg. ROI,
NPV; Breakeven, IRR or other) but will also allow to understand the impact of such changes
on the total evaluation of a certain investment project validity. Using different scenarios (eg.
triangular distributions) is a common technique used to evaluate the worst and best possible
results as long as the metrics and assumptions considered are duly validated and based on
reliable facts. However, this technique is not rigorous enough if used by itself so instead, it
should be used to complement other techniques which better provide the information about the
behaviour and output estimated from a different set of possible inputs under a given set of
assumptions. For this purpose, organizations should be skilled and have the required tools to
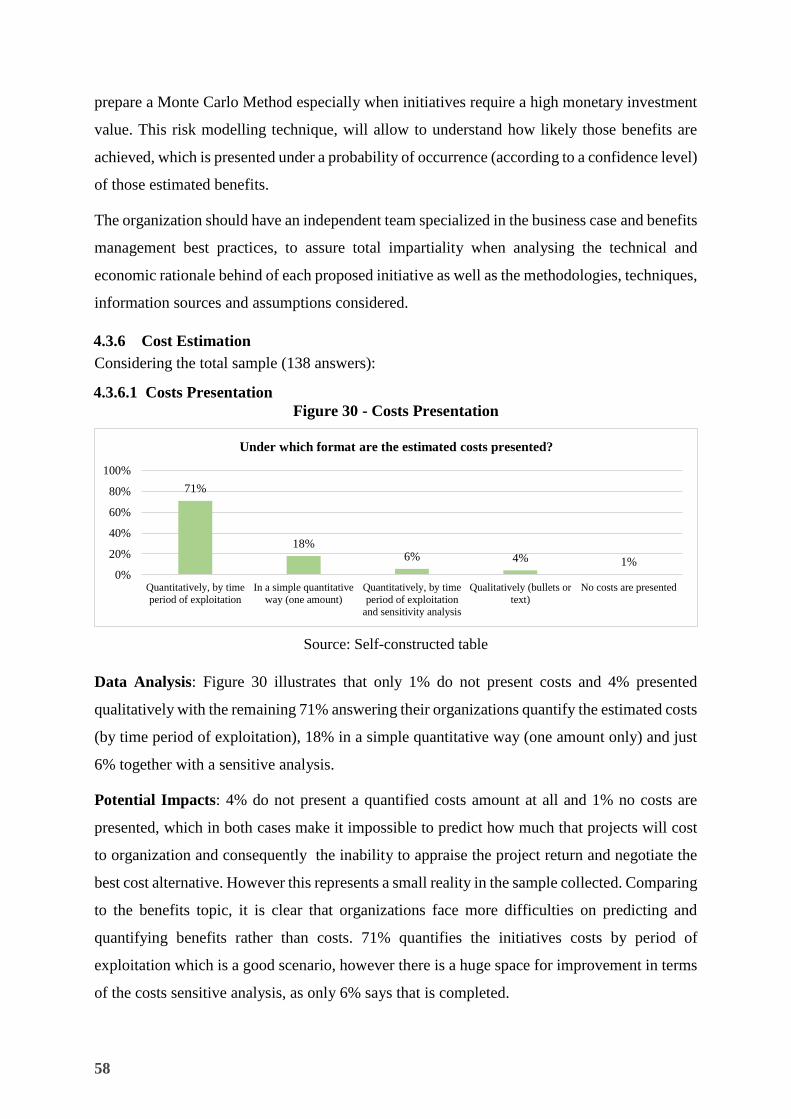
58
prepare a Monte Carlo Method especially when initiatives require a high monetary investment
value. This risk modelling technique, will allow to understand how likely those benefits are
achieved, which is presented under a probability of occurrence (according to a confidence level)
of those estimated benefits.
The organization should have an independent team specialized in the business case and benefits
management best practices, to assure total impartiality when analysing the technical and
economic rationale behind of each proposed initiative as well as the methodologies, techniques,
information sources and assumptions considered.
4.3.6 Cost Estimation
Considering the total sample (138 answers):
4.3.6.1 Costs Presentation
Figure 30 - Costs Presentation
Source: Self-constructed table
Data Analysis: Figure 30 illustrates that only 1% do not present costs and 4% presented
qualitatively with the remaining 71% answering their organizations quantify the estimated costs
(by time period of exploitation), 18% in a simple quantitative way (one amount only) and just
6% together with a sensitive analysis.
Potential Impacts: 4% do not present a quantified costs amount at all and 1% no costs are
presented, which in both cases make it impossible to predict how much that projects will cost
to organization and consequently the inability to appraise the project return and negotiate the
best cost alternative. However this represents a small reality in the sample collected. Comparing
to the benefits topic, it is clear that organizations face more difficulties on predicting and
quantifying benefits rather than costs. 71% quantifies the initiatives costs by period of
exploitation which is a good scenario, however there is a huge space for improvement in terms
of the costs sensitive analysis, as only 6% says that is completed.
71%
18%6% 4% 1%
0%
20%
40%
60%
80%
100%
Quantitatively, by time
period of exploitation
In a simple quantitative
way (one amount)
Quantitatively, by time
period of exploitation
and sensitivity analysis
Qualitatively (bullets or
text)
No costs are presented
Under which format are the estimated costs presented?
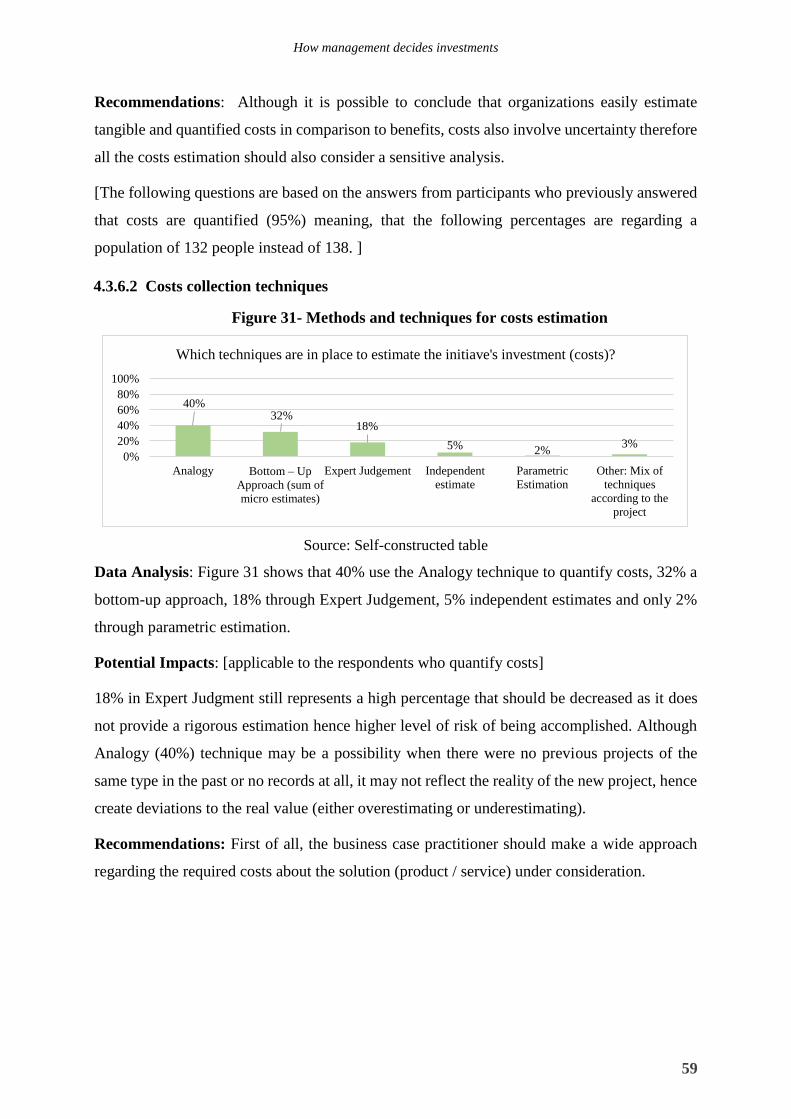
How management decides investments
59
Recommendations: Although it is possible to conclude that organizations easily estimate
tangible and quantified costs in comparison to benefits, costs also involve uncertainty therefore
all the costs estimation should also consider a sensitive analysis.
[The following questions are based on the answers from participants who previously answered
that costs are quantified (95%) meaning, that the following percentages are regarding a
population of 132 people instead of 138. ]
4.3.6.2 Costs collection techniques
Figure 31- Methods and techniques for costs estimation
Source: Self-constructed table
Data Analysis: Figure 31 shows that 40% use the Analogy technique to quantify costs, 32% a
bottom-up approach, 18% through Expert Judgement, 5% independent estimates and only 2%
through parametric estimation.
Potential Impacts: [applicable to the respondents who quantify costs]
18% in Expert Judgment still represents a high percentage that should be decreased as it does
not provide a rigorous estimation hence higher level of risk of being accomplished. Although
Analogy (40%) technique may be a possibility when there were no previous projects of the
same type in the past or no records at all, it may not reflect the reality of the new project, hence
create deviations to the real value (either overestimating or underestimating).
Recommendations: First of all, the business case practitioner should make a wide approach
regarding the required costs about the solution (product / service) under consideration.
40%32%
18%
5% 2%3%
0%
20%
40%
60%
80%
100%
Analogy Bottom – Up
Approach (sum of
micro estimates)
Expert Judgement Independent
estimate
Parametric
Estimation
Other: Mix of
techniques
according to the
project
Which techniques are in place to estimate the initiave's investment (costs)?
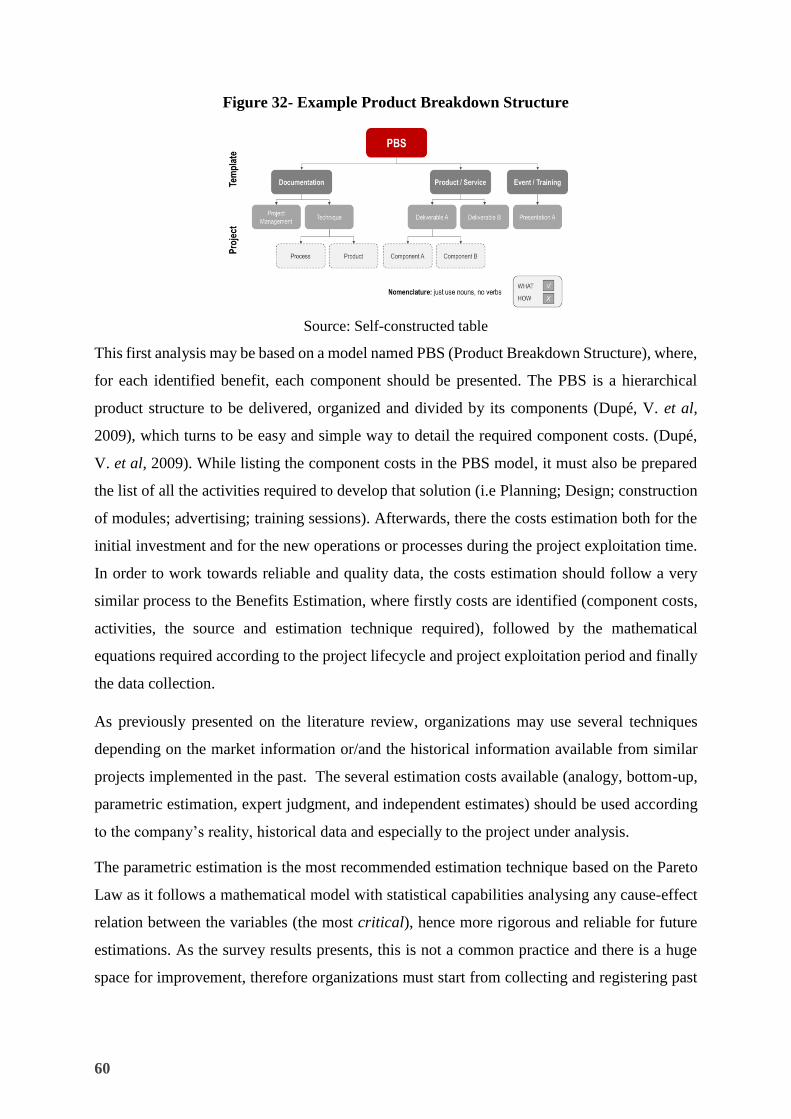
60
Figure 32- Example Product Breakdown Structure
Source: Self-constructed table
This first analysis may be based on a model named PBS (Product Breakdown Structure), where,
for each identified benefit, each component should be presented. The PBS is a hierarchical
product structure to be delivered, organized and divided by its components (Dupé, V. et al,
2009), which turns to be easy and simple way to detail the required component costs. (Dupé,
V. et al, 2009). While listing the component costs in the PBS model, it must also be prepared
the list of all the activities required to develop that solution (i.e Planning; Design; construction
of modules; advertising; training sessions). Afterwards, there the costs estimation both for the
initial investment and for the new operations or processes during the project exploitation time.
In order to work towards reliable and quality data, the costs estimation should follow a very
similar process to the Benefits Estimation, where firstly costs are identified (component costs,
activities, the source and estimation technique required), followed by the mathematical
equations required according to the project lifecycle and project exploitation period and finally
the data collection.
As previously presented on the literature review, organizations may use several techniques
depending on the market information or/and the historical information available from similar
projects implemented in the past. The several estimation costs available (analogy, bottom-up,
parametric estimation, expert judgment, and independent estimates) should be used according
to the company’s reality, historical data and especially to the project under analysis.
The parametric estimation is the most recommended estimation technique based on the Pareto
Law as it follows a mathematical model with statistical capabilities analysing any cause-effect
relation between the variables (the most critical), hence more rigorous and reliable for future
estimations. As the survey results presents, this is not a common practice and there is a huge
space for improvement, therefore organizations must start from collecting and registering past
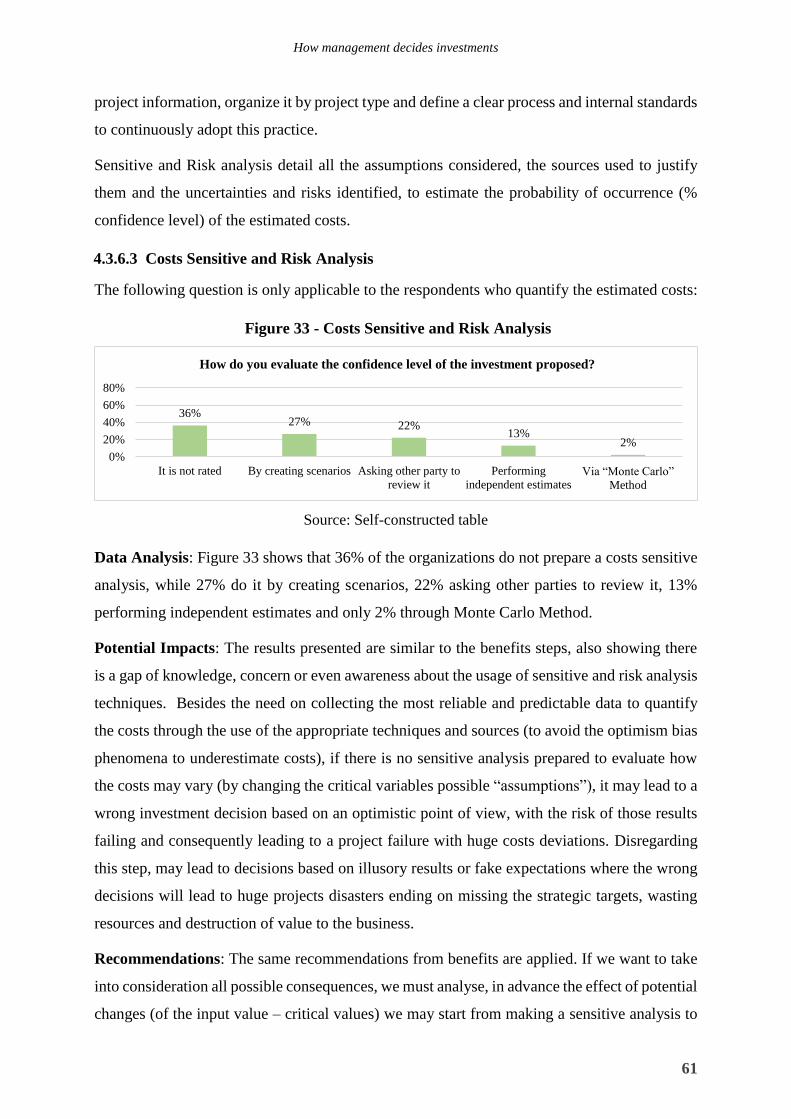
How management decides investments
61
project information, organize it by project type and define a clear process and internal standards
to continuously adopt this practice.
Sensitive and Risk analysis detail all the assumptions considered, the sources used to justify
them and the uncertainties and risks identified, to estimate the probability of occurrence (%
confidence level) of the estimated costs.
4.3.6.3 Costs Sensitive and Risk Analysis
The following question is only applicable to the respondents who quantify the estimated costs:
Figure 33 - Costs Sensitive and Risk Analysis
Source: Self-constructed table
Data Analysis: Figure 33 shows that 36% of the organizations do not prepare a costs sensitive
analysis, while 27% do it by creating scenarios, 22% asking other parties to review it, 13%
performing independent estimates and only 2% through Monte Carlo Method.
Potential Impacts: The results presented are similar to the benefits steps, also showing there
is a gap of knowledge, concern or even awareness about the usage of sensitive and risk analysis
techniques. Besides the need on collecting the most reliable and predictable data to quantify
the costs through the use of the appropriate techniques and sources (to avoid the optimism bias
phenomena to underestimate costs), if there is no sensitive analysis prepared to evaluate how
the costs may vary (by changing the critical variables possible “assumptions”), it may lead to a
wrong investment decision based on an optimistic point of view, with the risk of those results
failing and consequently leading to a project failure with huge costs deviations. Disregarding
this step, may lead to decisions based on illusory results or fake expectations where the wrong
decisions will lead to huge projects disasters ending on missing the strategic targets, wasting
resources and destruction of value to the business.
Recommendations: The same recommendations from benefits are applied. If we want to take
into consideration all possible consequences, we must analyse, in advance the effect of potential
changes (of the input value – critical values) we may start from making a sensitive analysis to
36%27% 22%
13%2%
0%
20%
40%
60%
80%
It is not rated By creating scenarios Asking other party to
review it
Performing
independent estimatesVia “Monte Carlo”
Method
How do you evaluate the confidence level of the investment proposed?
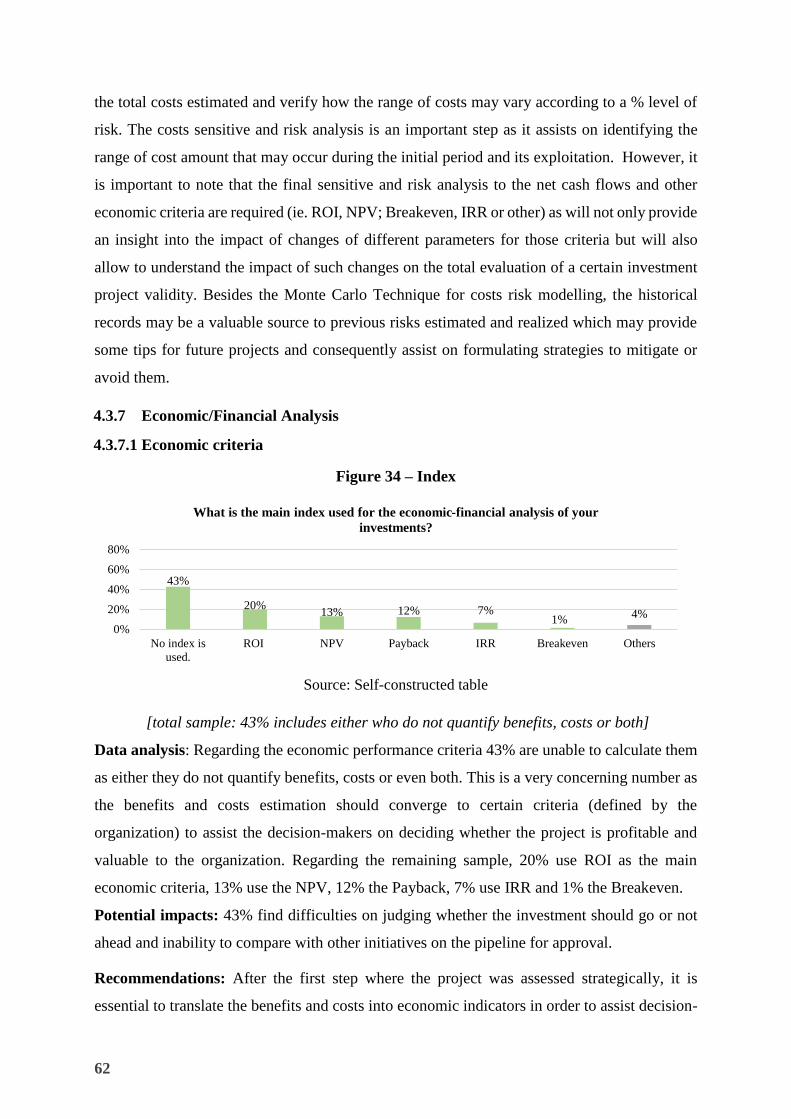
62
the total costs estimated and verify how the range of costs may vary according to a % level of
risk. The costs sensitive and risk analysis is an important step as it assists on identifying the
range of cost amount that may occur during the initial period and its exploitation. However, it
is important to note that the final sensitive and risk analysis to the net cash flows and other
economic criteria are required (ie. ROI, NPV; Breakeven, IRR or other) as will not only provide
an insight into the impact of changes of different parameters for those criteria but will also
allow to understand the impact of such changes on the total evaluation of a certain investment
project validity. Besides the Monte Carlo Technique for costs risk modelling, the historical
records may be a valuable source to previous risks estimated and realized which may provide
some tips for future projects and consequently assist on formulating strategies to mitigate or
avoid them.
4.3.7 Economic/Financial Analysis
4.3.7.1 Economic criteria
Figure 34 – Index
Source: Self-constructed table
[total sample: 43% includes either who do not quantify benefits, costs or both]
Data analysis: Regarding the economic performance criteria 43% are unable to calculate them
as either they do not quantify benefits, costs or even both. This is a very concerning number as
the benefits and costs estimation should converge to certain criteria (defined by the
organization) to assist the decision-makers on deciding whether the project is profitable and
valuable to the organization. Regarding the remaining sample, 20% use ROI as the main
economic criteria, 13% use the NPV, 12% the Payback, 7% use IRR and 1% the Breakeven.
Potential impacts: 43% find difficulties on judging whether the investment should go or not
ahead and inability to compare with other initiatives on the pipeline for approval.
Recommendations: After the first step where the project was assessed strategically, it is
essential to translate the benefits and costs into economic indicators in order to assist decision-
43%
20%13% 12% 7%
1%4%
0%
20%
40%
60%
80%
No index is
used.
ROI NPV Payback IRR Breakeven Others
What is the main index used for the economic-financial analysis of your
investments?
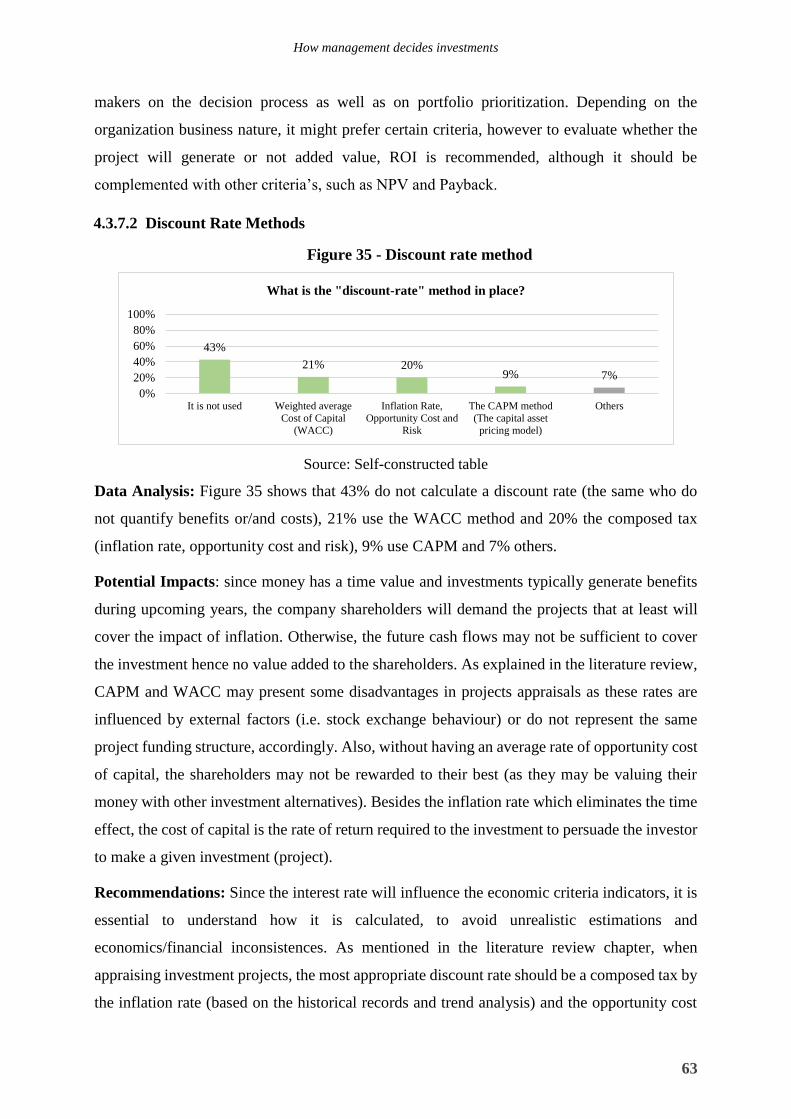
How management decides investments
63
makers on the decision process as well as on portfolio prioritization. Depending on the
organization business nature, it might prefer certain criteria, however to evaluate whether the
project will generate or not added value, ROI is recommended, although it should be
complemented with other criteria’s, such as NPV and Payback.
4.3.7.2 Discount Rate Methods
Figure 35 - Discount rate method
Source: Self-constructed table
Data Analysis: Figure 35 shows that 43% do not calculate a discount rate (the same who do
not quantify benefits or/and costs), 21% use the WACC method and 20% the composed tax
(inflation rate, opportunity cost and risk), 9% use CAPM and 7% others.
Potential Impacts: since money has a time value and investments typically generate benefits
during upcoming years, the company shareholders will demand the projects that at least will
cover the impact of inflation. Otherwise, the future cash flows may not be sufficient to cover
the investment hence no value added to the shareholders. As explained in the literature review,
CAPM and WACC may present some disadvantages in projects appraisals as these rates are
influenced by external factors (i.e. stock exchange behaviour) or do not represent the same
project funding structure, accordingly. Also, without having an average rate of opportunity cost
of capital, the shareholders may not be rewarded to their best (as they may be valuing their
money with other investment alternatives). Besides the inflation rate which eliminates the time
effect, the cost of capital is the rate of return required to the investment to persuade the investor
to make a given investment (project).
Recommendations: Since the interest rate will influence the economic criteria indicators, it is
essential to understand how it is calculated, to avoid unrealistic estimations and
economics/financial inconsistences. As mentioned in the literature review chapter, when
appraising investment projects, the most appropriate discount rate should be a composed tax by
the inflation rate (based on the historical records and trend analysis) and the opportunity cost
43%
21% 20%9% 7%
0%
20%
40%
60%
80%
100%
It is not used Weighted average
Cost of Capital
(WACC)
Inflation Rate,
Opportunity Cost and
Risk
The CAPM method
(The capital asset
pricing model)
Others
What is the "discount-rate" method in place?
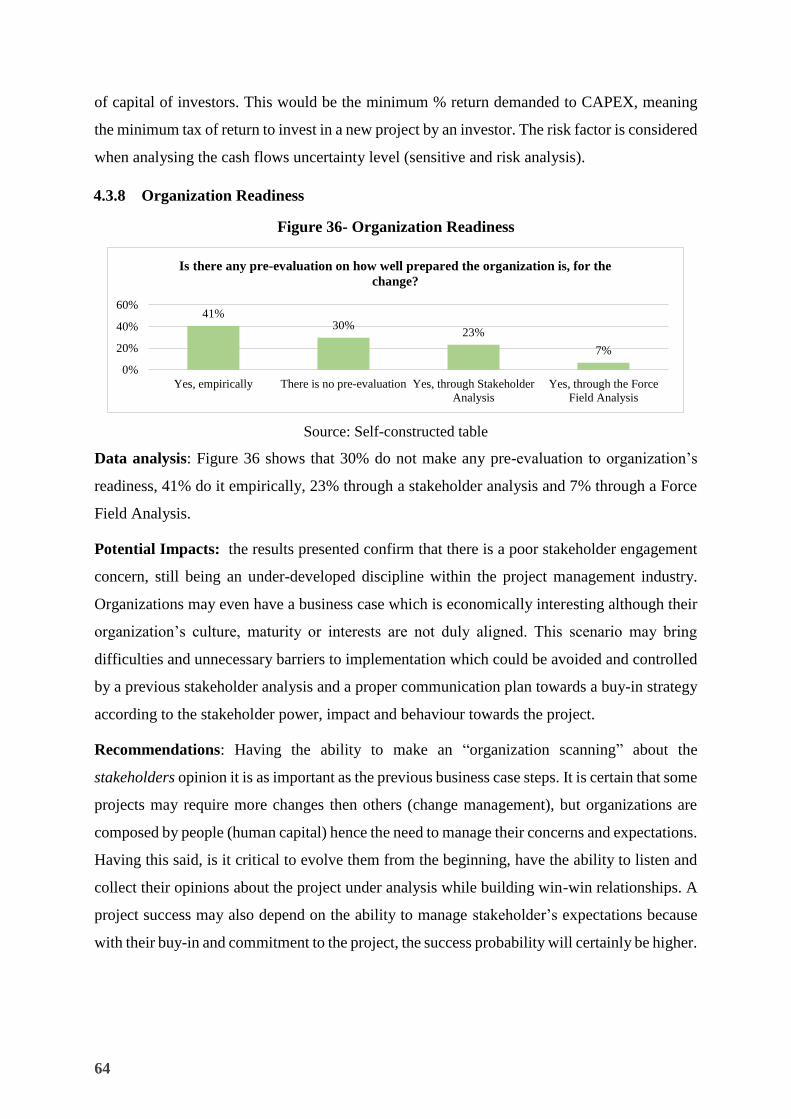
64
of capital of investors. This would be the minimum % return demanded to CAPEX, meaning
the minimum tax of return to invest in a new project by an investor. The risk factor is considered
when analysing the cash flows uncertainty level (sensitive and risk analysis).
4.3.8 Organization Readiness
Figure 36- Organization Readiness
Source: Self-constructed table
Data analysis: Figure 36 shows that 30% do not make any pre-evaluation to organization’s
readiness, 41% do it empirically, 23% through a stakeholder analysis and 7% through a Force
Field Analysis.
Potential Impacts: the results presented confirm that there is a poor stakeholder engagement
concern, still being an under-developed discipline within the project management industry.
Organizations may even have a business case which is economically interesting although their
organization’s culture, maturity or interests are not duly aligned. This scenario may bring
difficulties and unnecessary barriers to implementation which could be avoided and controlled
by a previous stakeholder analysis and a proper communication plan towards a buy-in strategy
according to the stakeholder power, impact and behaviour towards the project.
Recommendations: Having the ability to make an “organization scanning” about the
stakeholders opinion it is as important as the previous business case steps. It is certain that some
projects may require more changes then others (change management), but organizations are
composed by people (human capital) hence the need to manage their concerns and expectations.
Having this said, is it critical to evolve them from the beginning, have the ability to listen and
collect their opinions about the project under analysis while building win-win relationships. A
project success may also depend on the ability to manage stakeholder’s expectations because
with their buy-in and commitment to the project, the success probability will certainly be higher.
41%30%
23%
7%
0%
20%
40%
60%
Yes, empirically There is no pre-evaluation Yes, through Stakeholder
Analysis
Yes, through the Force
Field Analysis
Is there any pre-evaluation on how well prepared the organization is, for the
change?
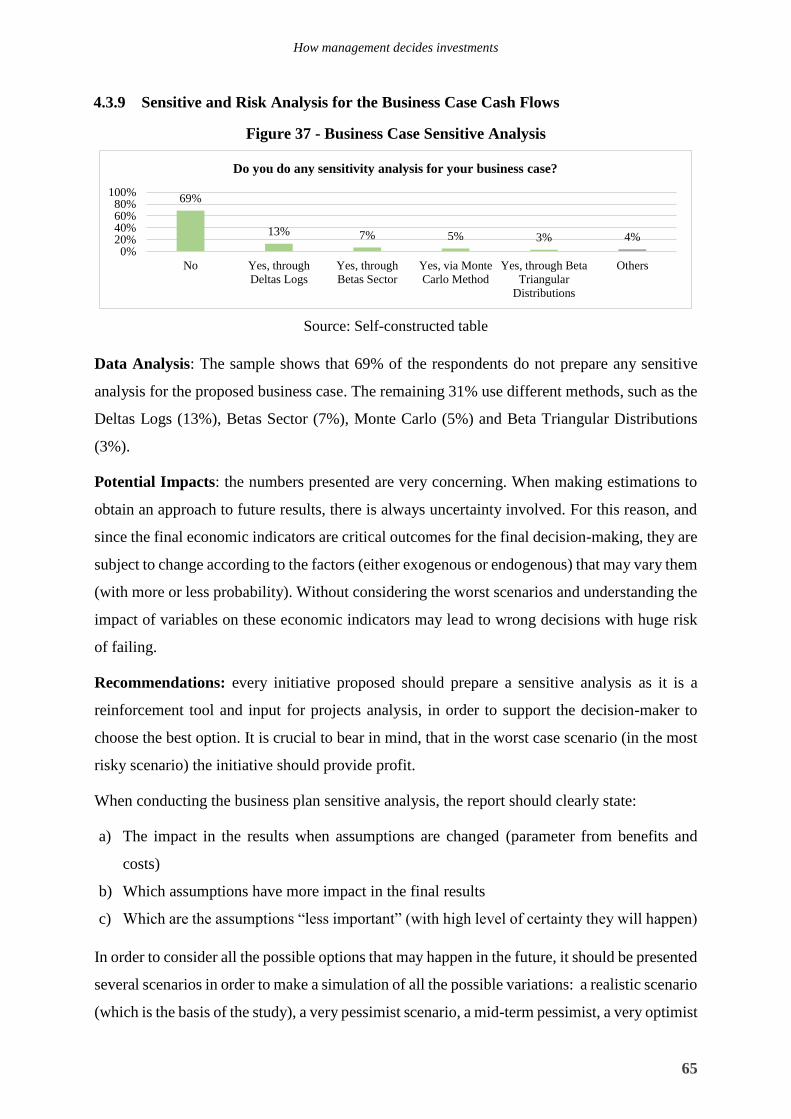
How management decides investments
65
4.3.9 Sensitive and Risk Analysis for the Business Case Cash Flows
Figure 37 - Business Case Sensitive Analysis
Source: Self-constructed table
Data Analysis: The sample shows that 69% of the respondents do not prepare any sensitive
analysis for the proposed business case. The remaining 31% use different methods, such as the
Deltas Logs (13%), Betas Sector (7%), Monte Carlo (5%) and Beta Triangular Distributions
(3%).
Potential Impacts: the numbers presented are very concerning. When making estimations to
obtain an approach to future results, there is always uncertainty involved. For this reason, and
since the final economic indicators are critical outcomes for the final decision-making, they are
subject to change according to the factors (either exogenous or endogenous) that may vary them
(with more or less probability). Without considering the worst scenarios and understanding the
impact of variables on these economic indicators may lead to wrong decisions with huge risk
of failing.
Recommendations: every initiative proposed should prepare a sensitive analysis as it is a
reinforcement tool and input for projects analysis, in order to support the decision-maker to
choose the best option. It is crucial to bear in mind, that in the worst case scenario (in the most
risky scenario) the initiative should provide profit.
When conducting the business plan sensitive analysis, the report should clearly state:
a) The impact in the results when assumptions are changed (parameter from benefits and
costs)
b) Which assumptions have more impact in the final results
c) Which are the assumptions “less important” (with high level of certainty they will happen)
In order to consider all the possible options that may happen in the future, it should be presented
several scenarios in order to make a simulation of all the possible variations: a realistic scenario
(which is the basis of the study), a very pessimist scenario, a mid-term pessimist, a very optimist
69%
13% 7% 5% 3% 4%
0%20%40%60%80%
100%
No Yes, through
Deltas Logs
Yes, through
Betas Sector
Yes, via Monte
Carlo Method
Yes, through Beta
Triangular
Distributions
Others
Do you do any sensitivity analysis for your business case?
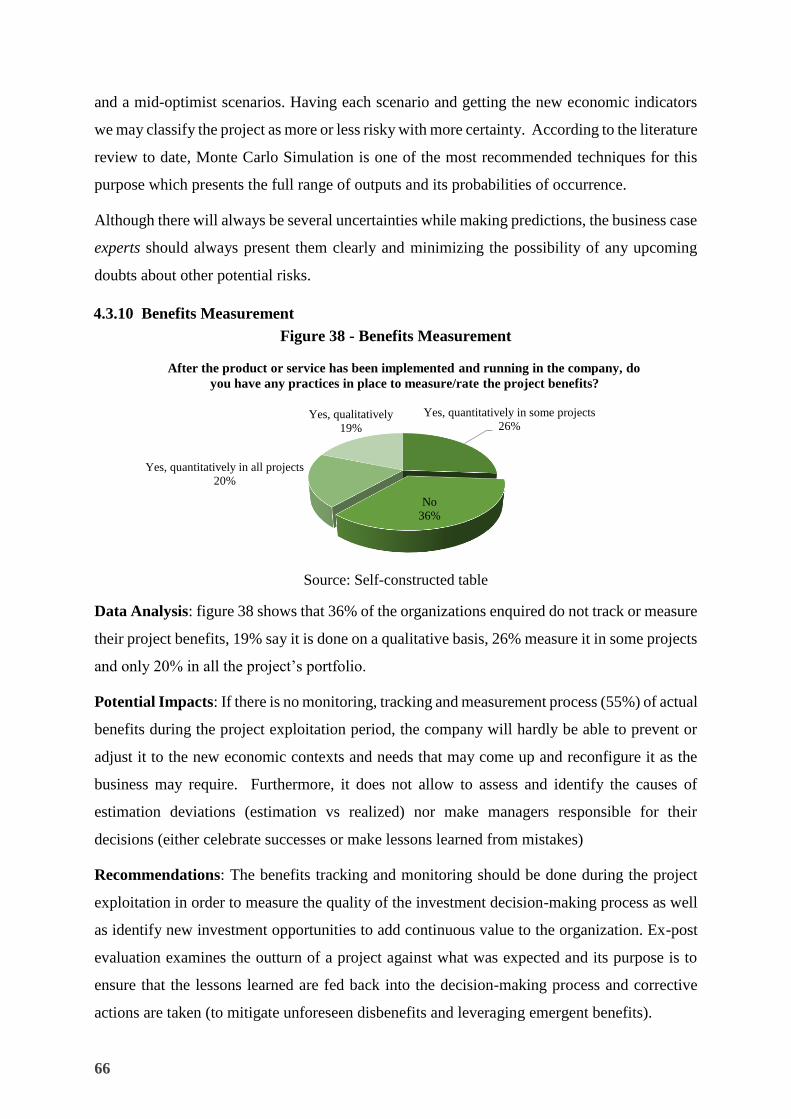
66
and a mid-optimist scenarios. Having each scenario and getting the new economic indicators
we may classify the project as more or less risky with more certainty. According to the literature
review to date, Monte Carlo Simulation is one of the most recommended techniques for this
purpose which presents the full range of outputs and its probabilities of occurrence.
Although there will always be several uncertainties while making predictions, the business case
experts should always present them clearly and minimizing the possibility of any upcoming
doubts about other potential risks.
4.3.10 Benefits Measurement
Figure 38 - Benefits Measurement
Source: Self-constructed table
Data Analysis: figure 38 shows that 36% of the organizations enquired do not track or measure
their project benefits, 19% say it is done on a qualitative basis, 26% measure it in some projects
and only 20% in all the project’s portfolio.
Potential Impacts: If there is no monitoring, tracking and measurement process (55%) of actual
benefits during the project exploitation period, the company will hardly be able to prevent or
adjust it to the new economic contexts and needs that may come up and reconfigure it as the
business may require. Furthermore, it does not allow to assess and identify the causes of
estimation deviations (estimation vs realized) nor make managers responsible for their
decisions (either celebrate successes or make lessons learned from mistakes)
Recommendations: The benefits tracking and monitoring should be done during the project
exploitation in order to measure the quality of the investment decision-making process as well
as identify new investment opportunities to add continuous value to the organization. Ex-post
evaluation examines the outturn of a project against what was expected and its purpose is to
ensure that the lessons learned are fed back into the decision-making process and corrective
actions are taken (to mitigate unforeseen disbenefits and leveraging emergent benefits).
Yes, quantitatively in some projects
26%
No
36%
Yes, quantitatively in all projects
20%
Yes, qualitatively
19%
After the product or service has been implemented and running in the company, do
you have any practices in place to measure/rate the project benefits?
How management decides investments
67
Chapter 5 - Conclusions
5.1. Main Conclusions
The dissertation aimed to provide a deeper understanding about how management makes
investment decisions, or in other words, which are the business case processes used in
organizations according to the worldwide best practices and propose recommendations to
improve the gaps identified. By putting the research findings together, I present the following
responses to my initial research questions:
How do companies strategically evaluate project initiatives?
24% of respondents perform only an OPEX budgeting, meaning a budget definition for
continuous operational day-to-day activities, disregarding a specific budget estimation for
capital investment. The majority (59%) conduct a Capex budgeting although on an annual basis.
Regarding the initiatives proposals application, 39% pursue it on an ad-hoc way, while the
strategic alignment analysis relies on a top management perception on 46% of the companies
surveyed. This suggests that decisions are usually based on a common sense way with a lack
on reliable methods or information behind decision-making. By identifying these issues it gets
critical to adopt a benefits management culture, not only focused on optimizing costs but also
on proposing projects which will leverage the business growth and create wealth to meet the
strategic axes defined. Therefore, an ongoing CAPEX budgeting process is required, to
continuously encourage the organization teams to propose innovative projects aligned to the
new trends and market needs, along the year, which will assist on keeping the business
regenerated aligned to its vision and strategic goals, stay competitive and promoting its growth.
While defining the CAPEX for new projects, collect the estimated benefits leveraged by the
projects’ proposed, and based on the return and estimated value, decide how much budget
should be available for the investments.
To face the current project application process, a business case methodology should be
implemented (tailored to the business) as an organization standard for any new project request.
This should include a clear and mandatory project request form filled for the application,
followed by the strategic alignment analysis.
How does management analyse initiatives’ benefits and costs estimation?
The benefits estimation is a critical step on the business case process, where benefits must be
quantified (in monetary units) with a clear justification about the metrics, sources, techniques
used followed by a sensitive analysis. As presented in the literature review chapter, the costs
68
estimation step tends to be “easier” to collect. This is confirmed in this research: 39% do not
present benefits or do it qualitatively versus only 5% that do not present costs or just present
them qualitatively. The lack of knowledge and usage of the appropriate techniques to estimate
the benefits and costs of each initiative proposed, leads several professionals to use assumptions
with very subjective numbers and no validation at all. According to this research, one of the
most common methods to estimate benefits (with business impact) is the Expert Judgement
which is the less accurate and scientific estimation technique. For these type of projects, it is
critical to validate and test the potential market by asking them (eg. Through focus groups,
market researches, control groups or other techniques). By neglecting the accuracy required on
this step, organizations face several negative impacts in benefits realization leading to complete
projects in failure. Regarding the costs, only 1% do not present costs and 4% presented
qualitatively with the remaining 71% answering their organizations quantify the estimated
costs. These numbers are not so concerning as the benefits, however there may be done some
improvements in terms of the techniques used. 40% use the Analogy technique to quantify
costs, 32% a bottom-up approach, 18% through Expert Judgement, 5% independent estimates
and only 2% through parametric estimation. For a cost estimation improvement, in terms of
better accuracy and a more efficient effort dedicated in this task, the Parametric Estimation
Model is recommended due to its effectiveness in the costs estimation.
It was also possible to conclude, 38% of the companies which quantify the benefits amount
(57% of the total sample do benefits quantification) do not prepare any sensitive and risk
analysis to benefits at all and from the companies which quantify the estimated costs (71% of
the total sample), 36% do not prepare any costs sensitive and risk analysis. At last, 69% do not
make a Business Case (cash flows) sensitive and risk analysis where the critical variables are
identified and analysed, together with a probability of the outcome occurrence. By failing this
step, it may leads to investment decisions with high risk of failing due to a lack of analysis of
the critical (uncertain) variables. Monte Carlo method is a risk modelling technique which is a
good solution to assist on this concern (only 5% use this technique).
How do companies prepare an economic and financial analysis prior to an investment
decision?
From the sample collected, since some organizations do not quantify either the estimated
benefits or costs or both (just qualitatively), 43% do not make any economic analysis, which
disable them to make an appropriate judgement on whether the initiative is economically
interesting to implement, suggesting a decision-making based on the “business feeling”, desires
How management decides investments
69
or expectations. Regarding the remaining companies, 20% use ROI indicator, 13% NPV, 12%
Payback, 7% IRR and 1% breakeven point as decision criteria. Another gap identified was the
lack of a proper organizational impact analysis for a communication plan to obtain the
stakeholder buy-in, or in other words, to prepare them for a change and engage them towards
the project’s commitment and success. 30% do not make analyse the organization readiness to
welcome the project and 41% do it empirically.
Do companies make a benefits tracking during the project exploitation period?
The last business case step, typically disregarded, is the benefits tracking where the projects
results are collected. This research shows that 55% do not do not track or measure their project
benefits (where 19% say it is done on a qualitative basis), 26% measure it in some projects and
only 20% in all the project’s portfolio. These are concerning numbers since benefits tracking is
an important step to identify any deviations from what was initially estimated versus what is
getting realized (eg. Estimated ROI vs Realized ROI) and avoid committing the same mistake
in the future while taking corrective actions during its exploitation period.
According to the topics under research I present other recommendations which may assist
organizations to improve their business case quality:
- Creation of a specialized unit (department) composed by an independent specialized team to
assist on supporting and auditing the business cases submitted by the organization’s
departments to assure total impartiality, when assessing the quality of the results presented
as well as the related techniques and sources used, the calculations accuracy and the
assumptions in order to get a consistent and reliable business case process in place.
- Having a clear communication policy and workflow defined, to assure realized benefits are
duly shared and managers become aware about the return on invested boosted by the
implemented projects. Adopt a lessons learned culture and managers accountability for their
decisions.
- Similarly to other institutes specialized in the field of Business Analysis (IIBA) and Project
Management (PMI) it could be useful to have an Institute specialized on the Business Case
field proving a body of knowledge, a professional certification scheme and updated articles
about the subject, while promoting a community for knowledge sharing at a worldwide level.
In conclusion, although most organizations attempt to present a project (investment)
justification, there are several steps missing or without using appropriate techniques for a
quality and reliable output for a decision making. This research aimed to help on detecting those
70
gaps and assisting on creating awareness about the relevance on implementing accurate
business case processes. I also hope that this research may serve as a starting point for future
researches.
5.2 Research Limitations
Due to time and geographic limitations this study was based on a convenience sampling. Since
the goal of this dissertation is to get a better understanding about how management makes
investment decisions (business case practices), the previous limitation could be avoided by
having a bigger and more diversified sample since statistically wise, the more participants we
have, the more representative of the population will be. Another limitation detected arise from
the multiple choices answers listed in the survey, as it could limit the most common
tools/techniques used to the ones listed (although it was created the Other option for the
respondent add information).
5.3 Future Research
Although organizations care about project management and measure their performance, the
business case standards tools are still neglected in most management practices. This research
allowed to understand where the main issues and gaps are and where organizations, in general,
should improve their project appraisals in order to maximize the creation of value and projects’
return on investment.
This investigation allowed to collect a “picture” of the business case process “state of the art”
in organizations, so below I present more suggestions about what could be interesting to explore
and advance in the near future:
- Consider a larger survey in other regions in the world to enable to compare the business case
maturity levels on a global scale;
- Filter results and data analysis comparing different business sectors (energy,
telecommunications, insurance & banking, Construction and others);
- Quantify the impacts (moneywise) of failing to complete each Business Case Step (example:
strategic alignment, benefits estimation, costs estimation and others)
- Collect a sample of projects from different companies (business areas/ sectors/geographies),
collect the estimated ROI (one with BC practices and another without) versus the Realized
ROI and check the percentage of deviations. This would allow to evaluate the Business Case
effectiveness on quantifiable terms: by determining how much (%) deviation the Business
Case practices would avoid compared to the current scenario.
How management decides investments
71
Bibliography
Aaker, D. A., V. Kummar, George S. Day, 2004. Pesquisa de Marketing. Second Edition,
Editora Atlas.
APM, 2014. Survey: Benefits Management 2014 Survey Results. Retrieved from
http://www.apm.org.uk/news/benefits-management-2014-survey-results. Consulted on
January 2014.
APM Association of Project Management, 2014. Retrieved from
http://www.apm.org.uk/news/benefits-management-2014-survey-results. Consulted on
January, 13, 2014.
Ashurst, C., N. F. Doherty, & J. Peppard 2008. Improving the impact of IT development
projects: the benefits realization capability model, European Journal of Information Systems,
17: 352–370
Babbie, E. 1998. The Practice of Social Research. Belmont: Wadsworth.
BABOK, 2009. A Guide to the Business Analysis Body of Knowledge. IIBA (International
Institute of Business Analysis): 5.
Barney, J. B. 1995. Looking inside for competitive advantage: 49. The Academy of
Management Executive.
Basile, F. 1996. Great management ideas can work for you. Indianapolis Business Journal,
vol.16: 53-54
Battaglia, Michael P. 2011. Non-probability sampling. Encyclopedia of Survey Research
Methods. SAGE Publications.
Breese, R. 2012. Benefit realisation management: panacea or false dawn? International
Journal of Project Management, 30: 341-351.
Brown RB. 2006. Doing Your Dissertation in Business and Management: The Reality of
Research and Writing. Sage Publications.
Campbell & Brown. 2003. Benefit-Cost Analysis: Financial and Economic Appraisal using
Spreadsheets. Cambridge University Press.
Capital Investment Decisions. http://www.capital-investment.co.uk/capital-investment-
decisions.php. Consulted on September, 01, 2014
Caetano, N. 2009. Análise da Viabilidade Económica - Financeira de uma Unidade de
Resíduos Industriais não Perigosos em Portugal. Master Thesis in Management, ISCTE
Business School.
Clark,M., Riley, M. Szivas E, Wilkie E & Wood, R. 2000. Researching and Writing
dissertations in Business and Management. London: Thomson Learning
Clayman, M; Fridson & M. Throughton G., March 2012. Corporate Finance: A Practical
Practice (2nd ed.). John Wiley & Sons.
Cooper, D. & Schindler,P. 2013. Business Research Methods (12th ed.). New York:
McGraw-Hill.
Couto G. Crispim J Lopes M.M, P. 2013. Avaliação de Investimentos. Áreas Editora.
72
DeMarco. 1982. Controlling Software Projects, Management Measurement & Estimation,
3. Yourdon Press.
Donald R. Cooper & Pamela S. Schindler. 2013. Business Research Methods, 12th edition.
Mc-Graw Hill Irwin.
Donnelly, R. 2006. Guide Book to Planning: Strategic Planning and Budgeting Basics for
the growing firm. New York: Van Nostrand Reinhold Publishing.
Drucker, P. 1996. The Effective Executive, Harper and Row. New York, NY: 116.
Dupé, Valérie; Briand, Renaud; Fischer, Xavier. 2009. Component Based Modelling for
Structuring Measurement. IEEE.
Eskerod, Pernille & Jepsen, Anna. 2013. Project Stakeholder Management. Surrey: Gower.
Esperança, J., & Matias. 2009. Finanças Empresariais. Texto Editora.
European Commission, 2008. Guide to Cost Benefit Analysis of Investment Projects.
Structural Funds, Cohesion Fund and Instrument for Pre-Accession.
Foddy, W. 1996. Como Perguntar: Teoria e Prática da Construção de Perguntas em
Entrevistas e Questionários. Oeiras: Celta Editora.
Fowler, F. J. 1993, Survey Research Methods. Newbury Park: Sage Publications.
Gallinger, G.W.1980. Capital Expenditure Administration. Sloan Management Review, 22:1,
13.
Gartner EXP Premier, (2005). http://www.iiba.org/ba-connect/2011/March/The-Importance-
of-the-BusinessCase-A-Vehicle-for-S.aspx Consulted October 2014.
Ghiglione, R. & B. Matalon. 2001. O Inquérito: Teoria e Prática. Oeiras: Celta Editora.
Glynne, Peter & Williams, Rod. 2009. A strategic business skill for all reasons. Association
for project managers. Published on July 2010.
Gomes, V. 2011. Elaboração de um estudo de viabilidade Económico-Financeira. Tese de
Mestrado em Gestão, Universidade de Coimbra.
Gonçalves, C. 2009. Gestão Financeira – A Decisão de Investimento. ISCTE Business
School.
Grantt, R. M. 1991. The resource-based theory of competitive advantage: Implications for
Strategy Formulation. California Management Review.
Greenberg, Ellen. 1982. Competing for scarce resources. Journal of Business Strategy (pre-
1986), 2: 81-82.
Gunasekaran, A., Love, P.E, Rahimi, F., Miele, R. 2001, A model for investment justification
in information technology projects. International Journal of Information Management, 21
(5): 349–364.
Hill, M. M. & A. Hill.2002. Investigação por Questionário. Lisboa: Sílabo.
Hovland, I. (2005). Successful Communication: A Toolkit for Researchers and Civil Society
Organisations, ODI Working Paper 227, London: ODI. Retrieved from:
http://www.odi.org/sites/odi.org.uk/files/odi-assets/publications-opinion-files/192.pdf.
Consulted on May, 5, 2015.
How management decides investments
73
Ika, L. A., 2009. Project success as a topic in project management journals. Project
Management Journal, 40(4): 6-19.
Jenner, S., 2009. Realising Benefits from Government ICT Investment—A Fool's Errand?,
Academic Publishing, Reading.
Johnson, G. & Scholes, K., 2002. Exploring Corporate Strategy, Sixth ed. Prentice Hall,
London.
Juran, J. 2001. The non-Pareto principle; mea culpa. Retrieved from The Juran Institute:
www.juran.com/research/articles/ sp7515.html. Consulted on September,10, 2014.
Kaplan Financial Knowledge Bank, 2015.
(http://kfknowledgebank.kaplan.co.uk/KFKB/Wiki%20Pages/Cost%20of%20Capital.aspx?ta
gName=WACC&weburl=http://kfknowledgebank.kaplan.co.uk&listid=1d06790a-eef1-4037-
8b41-f862a89ff68e) Consulted on March, 9, 2015.
Kaplan Financial Knowledge Bank – CAPM, 2015.
http://kfknowledgebank.kaplan.co.uk/KFKB/Wiki%20Pages/The%20Capital%20Asset%20Pr
icing%20Model%20(CAPM).aspx. Consulted on March, 9, 2015
Kaplan Financial Knowledge bank – WACC, 2015.
http://kfknowledgebank.kaplan.co.uk/KFKB/Wiki%20Pages/Cost%20of%20Capital.aspx?tag
Name=WACC&weburl=http://kfknowledgebank.kaplan.co.uk&listid=1d06790a-eef1-4037-
8b41-f862a89ff68e. Consulted on March, 9, 2015.
Kaplan, R.S. & Norton, D.P., 2008. The Execution Premium: Linking Strategy to Operations
for Competitive Advantage, First ed. Harvard Business School Publishing Corporation,
Boston.
Kaplan Financial Knowledge Bank, 2015.
http://kfknowledgebank.kaplan.co.uk/KFKB/Wiki%20Pages/Further%20aspects%20of%20in
vestment%20appraisal.aspx?mode=none. Consulted on March, 9, 2015
Karney, J. 2009. Introduction to Business Architecture. Boston: Cengage Learning
Kelliher, C. & Mahoney, L. (2000). The Appraisal Journal: 44-56.
Kelly, J., Male, S. & Graham, D. 2008. Value Management of Construction Projects: 98-
100. Willey Online Library.
Kotter, J.,1995. Leading Change: Why Transformation Efforts Fail. Harvard Press Review.
La Rooy, G. 1999. Know what counts. NZ Business, 13: 28-31.
Lawrence, F., 2009. The Swot Analysis: Using Your Strength to Overcome Weaknesses,
Using Opportunities to Overcome Threats. CreateSpace Independent Publishing Platform
Levine, H. A., 2005. Project portfolio management: a practical guide to selecting
projects, managing portfolios, and maximizing benefits. First ed. Jossey-Bass. San
Francisco, USA.
Lowe, B., Ward, S., Winzar, H., & Zikmund, W. G. 2007. Marketing Research: Asia Pacific
Edition. Cengage Learing Australia.
MacNicol, D. 2014. http://www.apm.org.uk/blog/art-successful-stakeholder-
engagement#.VEVc6vnF-VM.APM Association for Project Management. Consulted on
19/08/2014.
74
Major, M., & Vieira, R., 2009. Contabilidade e Controlo de Gestão. Escolar Editora.
Mcvey, M. 2014. Head of Learning and Development. BABOK Guide.
http://www.iiba.org/ba-connect/2013/march/how-to-define-business-case-babok-guide.aspx.
Consulted on May 2015.
Miguel, A. 2006. Avaliação de Projetos - Construção do Business Case. 3rd Edition, FCA-
Editora de Informática.
Miguel, A. 2013. Gestão Moderna de Projetos. FCA, Editora de Informática Ltd, 7th Edition.
Milosevic, D. Z. 2003. Project Management ToolBox: Tools and Techniques for the Practicing
Project Manager. New Jersey: JohnWiley & Sons, Inc.
Mota, A. G., & Custódio 2008. Finanças da Empresa. Deplano Network.
Norris, G. and D.,Willcocks L., 1996. Post-investment appraisal. Investing in Information
Systems: Evaluation and Management: 193-223. Chapman & Hall.
Oliveira, B. 2008, Strategy Tools' use in the largest companies in Portugal. Tese de Mestrado
em Gestão, ISCTE Business School.
Pereira, 2006. Phd Thesis: Un modelo de gestión de conocimiento para la gestión de proyectos
conforme con PMBoK® 2004. Madrid.
Pereira, L. 2013. Manual de Formação do Auditor do Tribunal de Contas.
Pereira, L. 2014. Como Criar Riqueza. Bnomics.
Pereira, L., & Teixeira, C. 2015. Pereira Diamond: Benefits Management Framework.
International Journal of Business & Management: 47-55. Volume III, Issue III.
Phillips, J. & Phillips, P. 2007 ROI: Results Enhancer, Value Adder. ROI Institute.
http://www.roiinstitute.net/wp-content/uploads/2014/12/ROI-Results-Enhancer-Value-
Adder.pdf. Consulted on March, 9, 2015.
Phillips, J. 2011. Questions about ROI in today's climate. Magazine HR Poland: ROI Institute
publications and articles.
Quivy, R., & L. Campenhoudt. 2005. Manual de Investigação em Ciências Sociais. Paris:
Gradiva.
Rad, Parviz. 2002. Project Estimating and Cost Management. Virginia: Management
concepts Inc.
Schmidt, M. J. 2009. Business Case Essentials, A Guide to Structure and Content. Boston:
Solution Matrix ltd.
Serra, C., 2012. Benefits Realisation Management and its influence on project
success, project governance, and execution of business strategy - Analysis of Brazil,
the United Kingdom, and the United States of America. University of Warwick.
Coventry, UK.
Serra, C & Kunc, M. 2014. Benefits Realisation Management and its influence on project
success and on the execution of business strategies, International Journal of Project
Management: 5-13 (http://dx.doi.org/10.1016/j.ijproman.2014.03.011).
Sudman, S., & N. M. Bradburn. 1982. Asking Questions. San Francisco: Jossey-Bass.
How management decides investments
75
Teece, D., Pisano, G., & Schuen. 1997. A Dynamic capabilities and strategic management.
Strategic Management Journal, V. 18: 509-533.
The Green Book. 2003. Appraisal and Evaluation in Central Government.
https://www.gov.uk/government/uploads/system/uploads/attachment_data/file/220541/green_
book_complete.pdf . Consulted on March, 09, 2015.
Turner, J.R. & Müller, R. 2003. On the nature of the project as a temporary organization. Int.
Journal of Project Management. 21: 1–8.
Tyson, K. 2002. The complete guide to competitive intelligence. Chicago: Leading Edge
Publications.
Williams, M., 2014. Value destruction: Why most projects fail to realize the benefits used to
make the business case for change (and how to address it). APM Association for project
management. Retrieved from http://www.apm.org.uk/news/value-destruction-why-most-
projects-fail-realise-benefits-used-make-business-case-change-and-ho#.VEVby_nF-VM.
Consulted on September, 23, 2014
Welch, M. & Jackson, P. 2007. Rethinking internal communication: a stakeholder approach.
Emerald Group Publishing, 12: 177.
Zafar Chaudry, Koehler, M., & Roberts, J. April 2013. Benefits Realization Paper:
Measuring Benefits Realisation Should be Integral to Any Healthcare System Should be
Integral to Any Healthcare System. Gartner.
Zwikael, O. & Smyrk, J. 2011. Project Management for the Creation of Organisational
Value, First ed. Springer-Verlag London Limited, London.
Zwikael,O & J. Smyrk 2012. A General Framework for Gauging the Performance of Initiatives
to Enhance Organizational Value, British Journal of Management, 23: 6–22.

76
How management decides investments
77
Appendix
Appendix 1 – Questionnaire Presentation Letter (translated from the original Portuguese
version)
“Dear XX,
I am currently on a research project regarding the modern practices of the budgeting process
and business cases worldwide. The aim is to understand how organizations plan their budget
(CAPEX – Capital Expenditure), whether they follow a business case process and how benefits
get managed.
Your participation is extremely valuable and would be very much appreciated. You just need
to complete my online survey which should take you about 8 minutes. I would like to assure
you that all responses will remain confidential, therefore no personal or company information
will be made available in the final report.
Please access it here: (survey link)
Should you have questions or doubts please do not hesitate to contact me.
Thank you very much for your time.
Kind Regards,
Cláudia Teixeira
Student at ISCTE Business School”
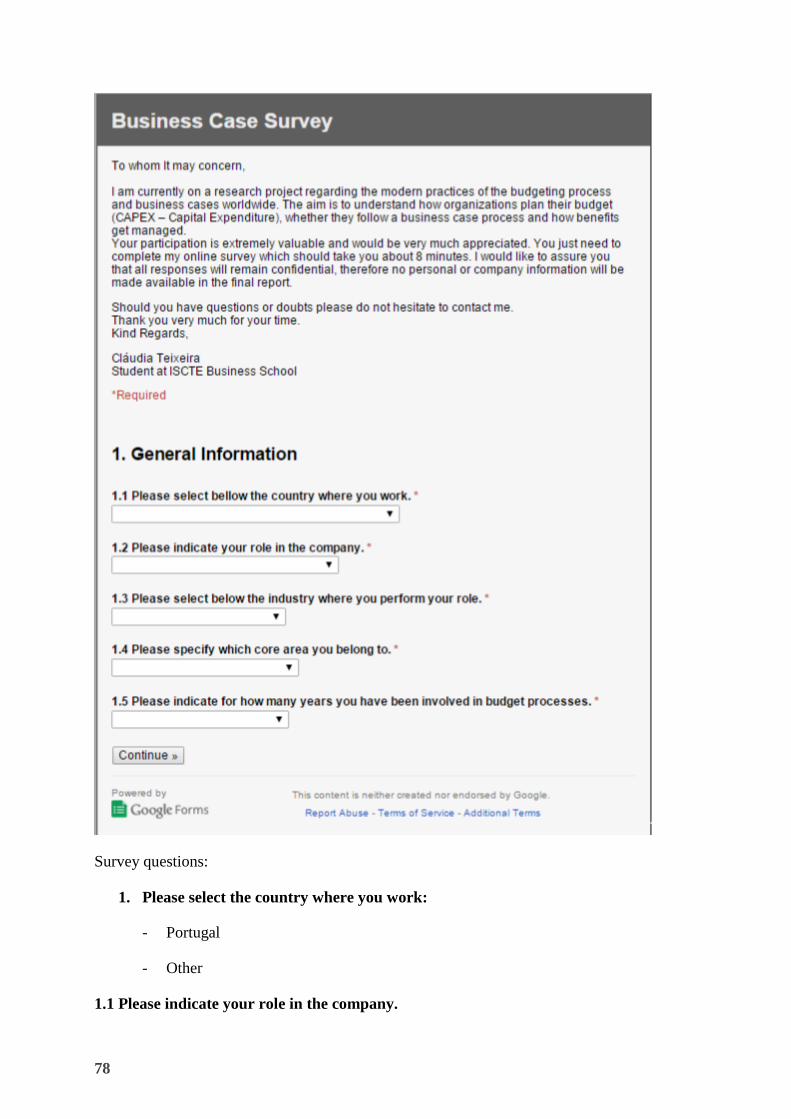
78
Survey questions:
1. Please select the country where you work:
- Portugal
- Other
1.1 Please indicate your role in the company.
How management decides investments
79
- General Manager
- Director
- Head of Department
- Team Manager
- Consultant
- Other
1.2 Please select below the industry where you perform your role.
- Insurance / Banking
- Energy
- Construction / Engineering
- Health
- Pharmaceutics
- Public sector
- Retail
- Services
- Telecommunications
- Information systems
- Other
1.3 Please specify which core area you belong to.
- Management
- Human Resources
- IT
- Marketing
- Operations
- Project Management
- Processes
- Sales
- Other
1.4 Please indicate for how many years you have been involved on budget processes.
- Never/ I do not get involved.
- Less than 1 year
- 1-2 years
- 3-5 years
80
- 6-10 years
- + 10 years
2.1 Does your company have a budgeting process specifically on CAPEX investment?
- No
- Yes, annually
- Yes, semiannual
- Yes, quarterly
- Yes, regularly, scheduled dates.
- Other
2.2 Please indicate what the main goal is on the current budgeting process in place.
- Capacity Management
- Innovation Management
- Liquidity Guarantee
- Efficiency Increase
- Market response
- Creation of added value
- Other
2.3 What is the main selection criteria used for the company portfolio?
- Qualitative Evaluation by top management
- Capacity shares established for each internal customer
- Alignment of the strategic initiative with the strategic plan
- Profitability periodically generated by the project
- The Payback of each project
- Return on investment generated by each initiative
2.4 Regarding the budget process, please select the starting month.
- January
- February
- March
- April
- May
- June
How management decides investments
81
- July
- August
- September
- October
- November
- December
2.5 Please select the last month of the budget process.
- February
- March
- April
- May
- June
- July
- August
- September
- October
- November
- December
2.6 Are you aware of the ROI, on the projects you are currently involved?
a. No
b. Yes, on a qualitative basis (Text)
c. Yes, on a quantitative (financial) level, but only for some projects
d. Yes, on a quantitative (financial) level for the whole portfolio
2.7 On a financial perspective ($$), are you familiar with the total income boosted by the
last approved budget?
a. Yes
b. No
3. In order to submit the initiatives, please select the process in use:
a. Ad-hoc
b. Organizational Template
c. Workflow System
d. POLDAT
82
e. SWOT Analysis
f. Other
4. Strategic Alignment
What is the evaluation criteria concerning the strategic alignment of each
initiative/project?
a. It is not rated
b. It is evaluated according to the request source
c. It is evaluate by the top management perception
d. It is evaluate by a voting process
e. It is evaluated by a scoring model
f. Other:
5. Benefits forecast
5.1 Under which format are the benefits of each initiative/project presented?
a. The benefits are not presented.
b. These are presented qualitatively (bullets or text)
c. These are presented in a simple quantitative (one amount)
d. These are presented quantitatively, by period of exploitation
e. These are presented quantitatively, by period of exploration and sensitivity analysis
5.2 Regarding business projects, which are the methods in practice to analyse the
quantitative benefits?
a. Expert judgment
b. Focus group
c. Market Research
d. Trend Analysis
e. Regression Analysis
f. Simulations with the sensitivity analysis
g. Other:
5.3 Which techniques do you use to forecast/predict the quantitative benefits, for the
internal projects of optimization and cost reduction?
(*only applicable if answered either 5.1 c), d) or e) previously)
How management decides investments
83
a. The Gap Analysis
b. Interviews
c. Benchmarking
d. Observation
e. Focus Groups
f. Surveys
5.4 How do you rate the “confidence level” for the quantitative benefits estimated?
(*only applicable if answered either 5.1 c), d) or e) previously)
a. It is not rated
b. Yes, asking other party to review it
c. Yes, performing independent estimates
d. Yes, by creating scenarios
e. Yes, via “monte carlo” Method
6. Investment Forecast
6.1 Under which format are the costs of each project/initiative presented?
a. No costs are presented
b. These are presented qualitatively (bullets or text)
c. These are presented on a simple quantitative way (a value)
d. These are presented quantitatively, by time period of exploitation
e. are presented quantitatively, by time period of exploration and sensitivity analysis
6.2 Which techniques do you sue to calculate/obtain your investment forecast?
(*only applicable if answered either 6.1 c), d) or e) previously)
a. Expert Judgment
b. Estimation by Analogy
c. Bottom – Up Approach (sum of micro estimates)
d. Independent estimation
e. Parametric Estimation
6.3 How do you evaluate the confidence level of the investment proposed?
(*only applicable if answered either 6.1 c), d) or e) previously)
a. It is not rated
84
b. Asking other party to review it
c. Performing independent estimates
d. By creating scenarios
e. Via “monte carlo” Method
7. Economic and Financial Analysis
What is the main index used for the economic and financial analysis of your
investments?
(*only applicable to respondents who previously answered they quantify benefits and costs:
5.1 c), d) or e) and 6.1 c), d) or e))
a. No index is used.
b. Payback
c. NPV
d. BCR
e. ROI
f. IRR
g. Breakeven
h. Other
7.2 In order to get the “discount rate” what is the method in place?
a. It is not used
b. Empiric decision
c. Weighted average Cost of Capital (WACC)
d. Inflation Rate, Opportunity Cost and Risk
e. The CAPM method (The capital asset pricing model)
f. Other
8. Organization readiness Analysis:
Is there any pre-evaluation on how prepared the organization is for the change, before
any final investment decision?
a. There is no pre-evaluation
b. Yes, empirically
c. Yes, through the Force Field Analysis
d. Yes, through Stakeholder Analysis
How management decides investments
85
e. Other
9. Sensitivity Analysis
Do you do any sensitivity analysis for your business case?
a. No.
b. Yes, through Deltas Logs
c. Yes, through Betas Sector
d. Yes, through Beta Triangular Distributions
e. Yes, via Monte Carlo Method
f. Other:
10. After the product or service has been implemented and running in the company, do
you have any practices in place to measure/rate the project benefits?
a. No.
b. Yes, qualitatively
c. Yes, quantitatively in some projects
d. Yes, quantitatively in all projects