How Chinese SOE Foreign Investments Affect Recipient ...
92
Shifting Landscapes: How Chinese SOE Foreign Investments Affect Recipient Country Market Concentration Jessica Zhang HMN 679B Special Honors in the Department of Humanities The University of Texas at Austin May 2021 _____________________________ Dr. Rachel L. Wellhausen Department of Government Supervising Professor _____________________________ Dr. Sheena C. Greitens Department of Public Affairs Second Reader
-
Upload
khangminh22 -
Category
Documents
-
view
3 -
download
0
Transcript of How Chinese SOE Foreign Investments Affect Recipient ...

Shifting Landscapes: How Chinese SOE Foreign Investments Affect Recipient Country
Market Concentration
Jessica Zhang
HMN 679B
Special Honors in the Department of Humanities
The University of Texas at Austin
May 2021
_____________________________
Dr. Rachel L. Wellhausen
Department of Government
Supervising Professor
_____________________________
Dr. Sheena C. Greitens
Department of Public Affairs
Second Reader

Shifting Landscapes: How Chinese SOE Foreign Investments Affect Recipient Country
Market Concentration
Jessica Zhang, B.A
The University of Texas at Austin, 2021
Supervisor: Dr. Rachel L. Wellhausen
Abstract
This project analyzes the 514 foreign investments made by Chinese SOEs between
January 2005 and December 2015 and considers their effects on market competitiveness as
measured by country-and-industry-level HHI. The results describe how the investment volume
and Chinese government stake in an SOE significantly affect HHI, but the other tested measures
of Chinese state influence do not. These findings reflect the confirmed legal advantages and
prevalent M&A behavior adopted by SOEs in virtue of them being vessels for CCP foreign
policy. Prospective recipient countries may extrapolate conclusions to limit the type or size of
Chinese SOE investments given this information. To further confirm the validity of these results,
alternative indicators for market competitiveness and state control over SOEs ought to be
explored. Additional exploration into this subject area could investigate the effects of Chinese
SOE investments from other lenses, for instance, considering if the investments are justified
based on their expected rates of return.

Table of Contents
Acknowledgements ....................................................................................................................... 1
Introduction ................................................................................................................................... 2
Background ................................................................................................................................... 3
SOEs Explained .......................................................................................................................... 3
The History of Chinese SOEs ...................................................................................................... 4
Modern CCP Influence Over Chinese SOEs .............................................................................. 7
Mixed Conclusions Around International Treatment of Chinese SOEs ................................... 11
Defining Project Scope ............................................................................................................. 13
Hypotheses ................................................................................................................................... 15
Hypothesis 1 .............................................................................................................................. 15
Hypothesis 2 .............................................................................................................................. 16
Hypothesis 3 .............................................................................................................................. 18
Methods ........................................................................................................................................ 19
Competitiveness ........................................................................................................................ 19
Investment Volume .................................................................................................................... 21
State Control Factors ................................................................................................................ 22
Additional Variables ................................................................................................................. 23
Data Compilation...................................................................................................................... 24
Results .......................................................................................................................................... 25
Hypothesis 1 .............................................................................................................................. 25
Hypothesis 2 .............................................................................................................................. 28
Hypothesis 3 .............................................................................................................................. 31
Discussion..................................................................................................................................... 35
Congruence with Prior Literature ............................................................................................ 35
Limitations of Findings ............................................................................................................. 36
Robustness Tests for Competition ............................................................................................. 37
Robustness Tests for State Control ........................................................................................... 40
Continuations ............................................................................................................................ 41
Potential Applications of Findings ........................................................................................... 42
Conclusion ................................................................................................................................... 43

References .................................................................................................................................... 45
Appendices ................................................................................................................................... 55
Appendix 1: Glossary of Acronyms........................................................................................... 55
Appendix 2: Glossary of Terms................................................................................................. 56
Appendix 3: Complete Explanation of Source Data ................................................................. 57
Appendix 4: Complete Explanation of Data Cleaning and Analysis ........................................ 58
Appendix 5: Compilation of Figures......................................................................................... 81

1
Acknowledgements
I would like to thank my thesis advisors, Dr. Rachel L. Wellhausen and Dr. Sheena C.
Greitens, for the guidance they provided me throughout this process. I am grateful beyond words
that they were willing to take a chance on me and honored to have had the opportunity to work
with such distinguished scholars and incredible people.
I would like to thank Dr. Linda Mayhew for organizing everything in the Humanities
Honors program. It is a massive feat to simultaneously manage advising, two thesis classes, the
thesis symposium, Humanities activities and announcements, and Humanities admissions. Every
year I also become more impressed with her ability to connect personally with students and
encourage them to find their own paths. With her advising and thesis course, I felt empowered to
explore any topic that piqued my interest.
I would like to thank my friends in the Humanities Honors program for constantly
enduring the same struggles as me. The obstacles we encountered seemed smaller because we
faced them together. Through this program, I found a community that I will forever cherish. I am
continuously inspired by the passion and achievement of my peers and am excited to keep in
touch with them after graduation.
I would like to thank my family for supporting me throughout college and motivating me
to work harder every day. The silver lining to this extraordinarily difficult year was that I spent
more time than ever with them. I am endlessly stunned by their strength and resilience in painful
situations.

2
Introduction
Despite numerous predictions that state-owned enterprises (SOEs) would not survive,
Chinese SOEs continued to rise globally with a business strategy predicated on outward
investments and reliance on Chinese Communist Party (CCP) resources. What originated as
entities offering public services to Chinese citizens evolved into multinational mega-corporations
dominating core industries, including energy and construction, globally. Theoretically, deals
entered by these companies should be beneficial for both China and recipient countries;
otherwise, there would be no reason for both parties to continue entering these transactions.
Despite this ideal, international concern about ulterior geostrategic and economic motives has
accompanied the rapid global emergence of Chinese SOEs in recent years. Scholars have argued
that CCP influence has had overwhelming positive effects on efficiency within the state-owned
companies and the Chinese economy overall, but it is unclear if these benefits extend beyond
China.
Much literature has analyzed the investment patterns of Chinese SOEs and how they
fueled China’s modern economic growth. However, an underexplored aspect of these companies
and their investments is how they affect markets of recipient countries. This dimension is
particularly relevant for understanding the broader effects of China’s ongoing foreign policy
endeavors. As China embarks on the Belt and Road Initiative (BRI)—arguably its most
ambitious and far-reaching investment project in history—with SOEs leading the charge,
potential economic effects on industries in different countries ought to be examined in greater
detail. This project analyzes the foreign investments of Chinese SOEs to understand the effect
these transactions have on market competitiveness globally. A comprehensive examination of
3
these companies from a diversified set of industries assists in dissecting the incremental results
of Chinese SOE behavior.
Background1
SOEs Explained
SOEs, also referred to as government-owned corporations (GOCs), are companies that
are partially or fully owned or operated by a national, regional, or local government. They
originated in Europe to create natural monopolies that promoted societal wellbeing (International
Monetary Fund, 2020). The free market could not effectively provide services like utilities or
healthcare, but there also was not sufficient public funding to guarantee them in the long-term, so
a middle ground needed to be found. An SOE offered a solution for both issues. They could be
started with the public funding that was available, but they would be operated with profitability
as a core goal, like that of a private business. In struggling years, they could be assisted by the
government, and in profitable years, they would increase government revenue and SOE
shareholder wealth (Peng et al., 2016).
The emergence of these companies came with an emergence of critics. Leading the
charge, János Kornai argued that these companies and “market socialism” more generally—
where markets exist but state-owned firms comprise a large share of a state’s economy—were
untenable. To him, a society that sat halfway between socialism and capitalism would reap the
benefits of neither system and eventually implode on itself (Kornai, 2007). Other scholars joined
in his line of logic, arguing that the line between public and private should not be traversed.
SOEs tended to be less efficiently run due to the nature of bureaucratic governmental systems
1 For reference, a glossary of acronyms and initialisms defined and used throughout this paper can be found in
Appendix 1. A glossary of terms can be found in Appendix 2.

4
and the presence of a cushion if the company underperformed (Milhaupt and Pargendler, 2017).
However, because they were fundamentally for-profit, they needed to charge higher than
expected prices to stay afloat. They could offer neither the profitability and operational
excellence of a private company nor the expansiveness and affordability of a government service
(Kornai, 2007).
This corporate structure remains prevalent today, with over 2,197 being reported in
OECD countries alone as of 2012 (OECD.org, n.d.). Collectively, these companies are valued at
over $2 trillion USD, have over 6 million employees, and contribute to around 10% of global
GDP (OECD.org, n.d.; Bruton et al., 2015). With subsidies and legal exemptions, SOEs fly
above market principles that ground purely private businesses. They are given exclusive
financing rates, subsidies, resources, and tax advantages which help them outcompete other
companies in the acquisition bidding process (Grimsditch, 2015; Heng 2014). Additionally, they
have the financial backing of the state to support them through unprofitable years and protect
them from the complications of bankruptcy (Grimsditch, 2015). Operationally, they are also
easier to scale given the expansive networks and geographical locations that state agencies have
access to and are familiar with (International Monetary Fund, 2020).
The History of Chinese SOEs
Chinese SOEs were formed in 1949 in conjunction with the People’s Republic of China
to provide essential services and rebuild the disaster-torn country (Gang and Hope, 2013). As
predicted by Kornai, these companies faced a series of problems due to their corporate structure.
They struggled with to produce steady income after accounting for a laundry list of expenses but
continued to be propped up by state resources. The SOEs also harmed the private business
5
landscape within China. Private businesses did not have the advantage of government backing to
support them in times of unprofitability. Until 1978, SOEs were the predominant corporate
structure of Chinese companies (Grimsditch et al., 2015).
Beginning in 1978, the Deng Xiaoping regime introduced free market principles,
requiring them to undergo a series of sweeping reforms (Lin et al., 2020; Heng, 2014). The
common business ways of SOEs shifted during this period. The focus on profitability took a
front seat as the companies embarked on lucrative opportunities abroad. SOEs undertook
unprecedented amounts of debt, increasing average leverage ratios from a reasonable 18.7% to
an alarming 79% between 1980 and 1994 (Wu, 1999). The support of the Chinese government
initially allowed them to take greater risks to realize greater returns. Former SASAC Chairman,
Li Rongrong analogized that state funding was the blood pumping through the “vital arteries” of
the Chinese economy (Dobson, 2014). However, managers in these companies lacked
accountability. They were granted autonomy with no supervisors to report to, allowing
corruption and mismanagement to run rampant (Heng, 2014; Chen, 2013). Resultantly, over
238,000 of the SOEs, more than two-thirds of all in operation, recorded net losses in 1998
(Ralston et al., 2006).
In 2003, the State Assets Supervision and Advisory Committee (SASAC) of the State
Council had been established to oversee the functions of the SOEs deemed central to China (The
World Bank and Development Research Center of the People’s Republic China State Council,
2012). The least profitable SOEs were either permanently closed, merged, or acquired by local
municipalities or more profitable SOEs (Heng, 2014; Lin et al., 2020). These consolidations and
restructurings significantly reduced the average amount of debt held by these companies and
increased the percentage of profitability across them (Heng, 2014). The corporatization of these

6
entities also furthered their involvement in China’s internationalization plan that began in 2000
(OECD.org, 2009).
Chinese SOEs became unique in their reliance on foreign business. In 2020, over 60% of
Chinese SOE revenue was obtained overseas, as opposed to 0% in 1949 (Wang, 2021). In 2013
alone, the combined value of all Chinese overseas investments surpassed $107.84 billion USD
(Ministry of Commerce, National Bureau of Statistics and State Administration of Foreign
Exchange, 2014). In all other countries, the vast majority of outward investments are made by
completely private companies (Huang and Wang, 2011). Meanwhile, beginning in 2009, SOE
investments comprised over 70% of all outward investments from China (Huang and Wang,
2011). Mergers and acquisitions (M&A) were a common deployment of these investments.
China arose as a “national strategic buyer”, completing over $96 billion in M&A transactions in
2016 alone (Gordon and Milhaupt, 2018).
Between their inception and the current day, the goal of many SOEs transformed from
providing accessible, essential services for the Chinese public to maximizing profit and
furthering state interests internationally. This strategy is responsible for Chinese SOEs’ rise to
prominence. Of the 204 largest SOEs listed in the 2012 Forbes Global 2000 list, 70 were
Chinese, with India at 30 being the next largest player (Kowalski et al., 2013). All four Chinese
state-owned banks ranked within the ten largest public companies in the 2020 Forbes Global
2000 list, and for the eighth consecutive year, the Industrial and Commercial Bank of China
(ICBC) ranked first (Murphy et al., 2020).

7
Modern CCP Influence Over Chinese SOEs
Embedded in the functioning of SOEs is allegiance to the CCP. The reform of SOEs was
partially driven by domestic economic motives like achieving operational excellence, but, in
part, it was also motivated by the desire to align companies with CCP goals. SOE reform remains
a continuous process of blurring lines between the CCP and Chinese businesses. In 2015, the
CCP General Committee and the State Council released a guidance for SOEs which explains
that:
“…adhering to the [CCP]’s leadership over SOEs is the political direction
and principle when deepening the reform of SOEs. It is necessary to
implement the principle about overall strict governance of the Party, to
[fully] play to the political core role of the Party organization in companies,
to strengthen the construction of the leading group in companies, to
innovate the work of [Party] building at the primary level, to deepen the
construction of a clean and honest Party, to wholeheartedly rely on the
working class, to safeguard the legitimate rights and interests of employees,
and to provide a strong political and organizational guarantee and human
resource support for the reform and development in SOEs.”2
The covered topics were focused on domestic issues such as fostering patriotism and
support for employees. These tactics emphasize employee identification with the CCP,
strengthening its influence from within companies themselves. Wording like “to wholeheartedly
rely on the working class” puts the onus on employees to fulfill CCP goals like “implement[ing]
2 This translation was copied from Lu and Zhu (2020). Brackets were added for clarity and consistency.

8
the principle about overall strict governance of the Party”. However, the guidance deployed
wording like “innovate the work of [Party] building” that can be construed ambiguously to
maintain the guise of autonomy within SOEs (Lu and Zhu, 2020). It does not explicitly give
direct instructions for how these goals will be achieved or allude to the nature of SOE expansion
over the previous decades.
In the following years, SOEs were more openly utilized to further geostrategic moves for
the CCP, following themes of how the CCP deploys authoritarian control over most crucial
aspects of China. However, these efforts have never been as brazen. A 2017 guidance read:
“…it is the unique advantage of SOEs to insist on the [CCP]’s leadership
and to strengthen the Party building. It is necessary to clarify the legal status
of the Party organization in the corporate governance structure of SOEs, to
incorporate the general requirements of the Party building in the regulations
of SOEs, and to clarify the rights, responsibilities and working methods of
the Party organization in the decision-making, implementation and
supervision processes, so as to make the Party organization an integral part
of the corporate governance structure. In addition, it is essential to [give]
full play to the [leading political role] of the Party, to lead the ideological
and political work of the companies, to support board of directors, board of
supervisors and management to perform their duties in accordance with the
law, and to ensure the implementation of the [Party’s] national policies” 3
It continues:
3 This translation was copied from Lu and Zhu (2020). Brackets were added for clarity and consistency.

9
“…the Party members among directors, supervisors, and management team
of SOEs shall regularly report to the Party group (Party committee) about
the performance of their duties, integrity and self-discipline every year…
[and] actively explore the ways and methods of the organic combination
between the principle of the Party’s managing cadres and board’s selection
and appointment of management personnel. By insist on and improving the
leadership system of two-way entry and cross appointment, qualified
members of the Party group (Party committee) in SOEs can be a member of
the board of directors, board of supervisors and management through legal
procedures. Qualified members of board of directors, board of supervisors
and management are able to enter the Party group (Party committee)
according to relevant regulations and procedures; the position of secretary
of the Party group (Party committee) and chairman of board of directors
should be taken by the same person generally and promote the project about
appointing the Deputy Secretary of the Party group (Party committee) as a
member of board of directors in centrally-administered SOEs.” 4
The first passage describes the general structures the CCP expects SOEs to implement while the
second passage clarifies specific directives for their goals. These passages establish a strong
allegiance to the party that is reinforced with both supervision and weight on “self-discipline.” In
addition to securing profit, SOEs must allow “full play to the [leading political role] of the
party,” “ensure the implementation of the [Party’s] national policies,” and create a CCP
committee that is “an integral part of [its] corporate governance structure.” From the laws and
4 This translation was copied from Lu and Zhu (2020). Ellipses and brackets were added for efficiency.

10
regulations to the boards of companies themselves, the CCP has been gradually expanding its
circle of influence over SOEs and the goals of SOEs themselves. In exchange for compliance
with these guidances, the CCP offers even more preferential treatment for the most loyal
companies. SOEs are already given advantages from the Chinese government, for instance, a
functionally unlimited line of credit and exclusive access to governmental resources (Dorn,
2015). These guidelines further increase the gap between private businesses and SOEs, allowing
them to deploy their capital even more effectively in comparison.
Recently, in the face of international critics, President Xi Jinping has also shamelessly
embraced SOEs under the condition that they would continue to allow the expansion of CCP
control over them (Buckley and Bradsher, 2020). He approved a three-year plan, effective July
2020, that would even further augment the role SOEs play in the global economy (Tang, 2020).
The action plan, with endorsement from the Central Comprehensively Deepening Reforms
Commission, argued that the coronavirus underscored the reliability of SOEs and sustainability
of a “socialist market economy” (Tang, 2020). Despite numerous analyst predictions that the
plan will be ineffectual, Xi continues to defend it. The report from the commission states:
“State-owned enterprises are an important material and political foundation
for socialism with Chinese characteristics. They are the key pillar and force
for the party’s rule and the country’s revitalization… We will improve their
economic competitiveness, innovation capabilities, their ability to control
the economy, their influence as well as their capability for control of and
resistance to risks.”

11
Mixed Conclusions Around International Treatment of Chinese SOEs
Within China, the perceived business effects of these types of guidances are largely
positive, especially from a corporate governance perspective. One study found that the
impression of CCP surveillance reduced excess compensation of executives and resulted in
greater efficiency in managing salary expenses (Ma et al., 2013). However, the effects on
China’s neighbors and recipient countries are less clear. The blatant promotion of CCP goals by
these companies in the vast majority of cases does not align with the wants of other countries.
Many states have attempted to limit the activities and influence of wholly private companies due
to perceived state ties,5 so they are even more wary of SOEs for this reason.
For instance, the United States-China Economic and Security Review Commission
published a report recommending Congress to “amend the statute authorizing the Committee on
Foreign Investment in the United States to bar Chinese state-owned enterprises from acquiring or
otherwise gaining effective control of U.S. companies.” The recommendation was justified by
the suspicion that such transactions would allow the SOEs to use “technology, intelligence, and
market power…in the service of the Chinese state to the detriment of U.S. national security”
(United States-China Economic and Security Review Commission, 2016). If adopted, this
proposal would shift the way the Committee on Foreign Investment in the United States
(CFIUS)6 reviews Chinese SOE transactions. CFIUS approved the $43 billion acquisition of
Syngenta by ChemChina, giving the 100% state-owned company control over major portions of
the agrichemical supply chain (Copeland, 2016). Historically, CFIUS has also been particularly
lax with minority-stake SOEs, even if they were acquiring a controlling stake in an American
5 For instance, the Trump administration released announcements of a ban against TikTok earlier in 2020 (Buckley
and Bradsher, 2020). 6 CFIUS

12
company (Copeland, 2016). Another instance of hesitancy to deal with CCP-affiliated
organizations occurred in April 2021. Australia cancelled a multi-billion-dollar infrastructure
agreement with China’s National Development and Reform Commission (Westcott, 2021;
Premier of Victoria, 2019). Australia’s foreign affairs minister, Marise Payne, then called the
deal “inconsistent with Australia’s foreign policy or adverse to [their] foreign relations”
(Westcott, 2021).
Not all scholars follow this line of reasoning though. Dr. Wendy Dobson, a Professor
Emerita of Economic Analysis and Policy at the University of Toronto argues that concerns
about CCP political and economic influence are “overblown.” She argues that, unexpectedly,
Chinese SOEs are more transparent than some from other countries, including Canada, so if any,
more scrutiny should be directed to those countries. By rejecting Chinese SOE investments,
Canada misses out on opportunities to grow its economy and drive innovation in its energy
sector especially. Chinese SOEs face no shortage of investment opportunities, so by barring them
from certain transactions, Canada would be allowing other countries to surpass it. Dobson also
explains that even if worries of CCP influence are true, they should be weighed against the net
benefits of the investments and other possible remedies.
For instance, the activities of the China Ocean Shipping Company (COSCO) serve as a
case study with favorable results of Chinese SOE involvement in the United States. After Maersk
Line, a Danish shipping company ended their relationship with the Massachusetts Port Authority,
COSCO invested in the Port of Boston (Yan, 2012). David Mackey, then-CEO of the
Massachusetts estimated that this investment saved over 34,000 jobs through the ten-year
relationship and recognized COSCO for its contribution to the American economy (Yan, 2012).

13
Benefits like these should be weighed against potential consequences before uniformly
restricting Chinese SOEs from certain transactions (Dobson, 2014).
Defining Project Scope
For the purposes of this project, the Chinese government will have an ownership stake in
all the SOEs considered. Roughly, SOEs can be divided into for-profit entities and those that
provide public services (Guluzade, 2019; Gang and Hope 2013). Only for-profit SOEs with
international operations and investments from 2005 to 2015—a period that is representative of
modern Chinese SOEs and their projected growth patterns over the next decade —will be
considered (Lin et al., 2020). Many Chinese SOEs limit themselves to domestic operations and
pose interesting questions about the mixing of business and government, however, these entities
are external to the topic of this project.
The focus of this project lies within the broader context of considering the overall impact
of Chinese SOE foreign investment activity. The effects of these actions by Chinese SOEs have
been analyzed from geopolitical, humanitarian, economic perspectives, and more. This project
will specifically consider a crucial dimension of economic effects on recipient countries:
competitiveness. Competitiveness encapsulates many of the concerns from international critics
described previously, including unfair advantages for SOEs and restrained access to resources
following transactions.
Competitiveness in this paper will refer to market competitiveness in the context of
general equilibrium theory.7 In a perfectly competitive market, all buyers and sellers face the
7 To avoid confusion, the term “economic competitiveness”, although facially equivalent, will not be used in this
paper. The phrase is widely used as a term of art describing how successful a country or region of the world is at
competing in the global economy (see Metropolitan Council (n.d.). Economic Competitiveness.
https://metrocouncil.org/Handbook/Plan-Elements/Economic-
14
same price determined by supply and demand. There exists a seller for every buyer interested in
a good or service. Sellers cannot charger higher prices because buyers have a plethora of other
sellers offering virtually indistinguishable items to choose from. No rational buyer would pay
more for a good when an equal one is available for less. At the same time, sellers cannot charger
lower prices because that would entail incurring major losses and having to leave the market.
There is free entry and exit from the market which allows for price adjustments in the long run.
These theoretical markets are characterized by the availability of choices for interested buyers
and the lack of price-setting power for sellers. In sum, this equilibrium state “coordinates
productive effort, balances supply and demand, and leads to an efficient allocation of goods and
services in the economy” (Levin, 2006).
The structure of actual markets strays from this ideal in meaningful ways. On the most
extreme end, a monopoly is the opposite of a perfectly competitive market; there is one producer
who controls the supply and price of a particular product. A well-known real-world example of a
monopoly was the De Beers corporation until the early 2000’s. The company owned an
expansive network of global mines and artificially induced diamond scarcity to increase buyers’
willingness to pay for the gems. Following regulatory pressures, the company released its
monopoly status and has not been able to rebound profits since (Biesheuvel, 2020). Less
competitive markets facilitate augmented profits for sellers at the expense of buyers. This
example concerns a non-essential luxury good, but markets for necessities can also stray in this
Competitiveness.aspx#:~:text=Economic%20competitiveness%20i%20n%20the%20context%20of%20comprehensi
ve,that%20bring%20wealth%20into%20a%20community%20or%20region.). The economic competitiveness of the
United States, for example, would be determined by how efficiently it innovates and produces products that are
preferred above similar ones made elsewhere. Meanwhile, market competitiveness in this paper is concerned with
industry level analyses and seller market power dynamics.

15
direction. As markets become less competitive, they move towards these unjust situations where
corporations wield power over buyers.
Hypotheses
Hypothesis 1
Hypothesis 1: The change in an industry’s competitiveness is positively correlated with
the volume of total investments from Chinese SOEs. Let a low “competitiveness” statistic
represent a perfectly competitive market and a high one represent a more fragmented,
concentrated one. Figure 1 depicts the model being tested with this hypothesis.
Figure 1: Hypothesis 1 Model8
∆𝐶𝑜𝑚𝑝𝑒𝑡𝑖𝑡𝑖𝑣𝑒𝑛𝑒𝑠𝑠 = 𝑇𝑜𝑡𝑎𝑙 𝐼𝑛𝑣𝑒𝑠𝑡𝑚𝑒𝑛𝑡𝑠 + 𝐶
Investment volume has the potential to drastically shape the competitive landscapes of
recipient industries in a few ways. First, investments can be directed toward M&A transactions.
When companies in the same industry combine, they automatically control a larger portion of
their market. The consumers for the pre-M&A companies are now consumers of one
amalgamated company, and the new company’s share of the market is greater than each of the
pre-M&A companies’ shares individually. These transactions can thus result in less competitive
markets because the large company has fewer competitors and can have more power in setting
prices, especially if it provides an essential good or service.
Second, investments can fuel the growth of companies that, willfully or not, create
anticompetitive environments as a byproduct of their success. For instance, a once common
strategy used by newly formed companies was to undercut competitors and sustain losses until
8 Let C equal some constant.

16
the new company becomes the dominant player in a market. The incumbent companies may not
be able to withstand this heightened price competition, allowing the new company to gain market
share. Although this practice called predatory pricing is regulated against in most developed
countries, it arguably is still pursued in various sectors including retail and entertainment (Bolton
et al., 2000; Lecher, 2019). Given the propensity for SOEs to engage in M&A activity and their
ability to weather significant losses, both explanations for competitive landscape shifts may be at
play.
Hypothesis 2
Hypothesis 2: The change in an industry’s competitiveness is positively correlated with
each Chinese state control variable of SOEs that invested in it. Figure X depicts the model being
tested with this hypothesis.
Figure 2: Hypothesis 2 Model
∆𝐶𝑜𝑚𝑝𝑒𝑡𝑖𝑡𝑖𝑣𝑒𝑛𝑒𝑠𝑠 = ∑ 𝑆𝑡𝑎𝑡𝑒 𝐶𝑜𝑛𝑡𝑟𝑜𝑙 𝐹𝑎𝑐𝑡𝑜𝑟𝑠 + 𝐶
The ownership structure of an SOE can affect how decisions are made within the firm. In
traditional corporations with “control-minority” situations,9 agency problems may arise due to
misalignment between controlling and minority shareholders (Bebchuk et al., 2000). In SOEs,
the difference in priorities between the state and private, individual stakeholders is even greater
(Milhaupt and Pargendler, 2017). Without a majority economic interest in a company, the state
has fewer incentives to pursue financial goals but equivalent power to pursue political ones
9 Control-minority situations occur when minority economic shareholders possess the majority of voting equity in a
company. This status is also sometimes referred to as “working control.”

17
(Milhaupt and Pargendler, 2017). Most countries have attempted to avoid this issue by requiring
equal share ownership to voting rights or by proactively restricting the government’s voting
rights (Milhaupt and Pargendler, 2017). A higher government percentage ownership stake in a
Chinese SOE results in higher economic stakes with their investment decisions and thus could
result in a greater incentive to promote financial interests which are magnified when the
remainder of an industry is not competitive.
Although SOEs face some tension between political and financial motives, political
motives in many cases are largely driven by financial ones. Dr. Ritika Passi of the Observer
Research Foundations analyzed BRI plans and argued that the distinction between economic and
non-economic motives for SOEs foreign investments can become tenuous. The two cannot be
disentangled in many cases. She uses infrastructure, the “OBOR’s foundational and most visible
element as an example (Passi, 2019). Although China arguably has an interest in political
domination through control of trade routes along the original Silk Road path, these aims are
fundamentally rooted in its desire for economic growth (Passi, 2019). In cases like these, it is
reasonable to predict that the state control factors will concurrently result in stronger economic
effects; the greater the influence of the state, the lower the influence of outside individuals and
the higher the drive for both profit and power in international politics.
The composition and role of boards at SOEs can also influence how investment activity
occurs in the firm. A strong principle in international SOE governance is maintaining an
independent board of directors from the government (Milhaupt and Pargendler, 2017). The
reasoning behind this principle is separating financial motives from political ones. As a result,
some countries have instituted measures that prevent politicians and regulators from serving on
boards or limiting the power of board members should government officials be allowed on them.
18
For instance, Norway bans all civil servants and Brazil bans regulators, politicians, and union
leaders from serving on the boards of SOEs (Milhaupt and Pargendler, 2017). Chinese SOEs had
similar regulations prior to the passage of the 2015 guidance, which may have allowed financial
interests to take precedence in matters of foreign investment (Lu and Zhu, 2020).
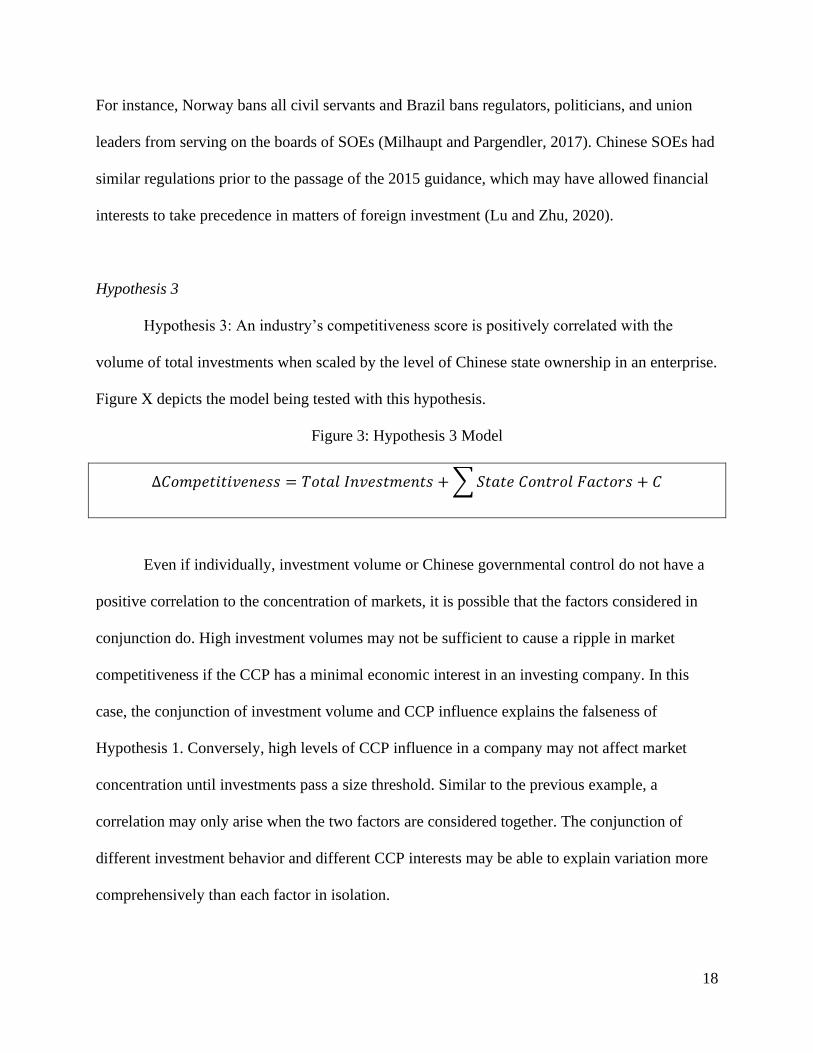
Hypothesis 3
Hypothesis 3: An industry’s competitiveness score is positively correlated with the
volume of total investments when scaled by the level of Chinese state ownership in an enterprise.
Figure X depicts the model being tested with this hypothesis.
Figure 3: Hypothesis 3 Model
∆𝐶𝑜𝑚𝑝𝑒𝑡𝑖𝑡𝑖𝑣𝑒𝑛𝑒𝑠𝑠 = 𝑇𝑜𝑡𝑎𝑙 𝐼𝑛𝑣𝑒𝑠𝑡𝑚𝑒𝑛𝑡𝑠 + ∑ 𝑆𝑡𝑎𝑡𝑒 𝐶𝑜𝑛𝑡𝑟𝑜𝑙 𝐹𝑎𝑐𝑡𝑜𝑟𝑠 + 𝐶
Even if individually, investment volume or Chinese governmental control do not have a
positive correlation to the concentration of markets, it is possible that the factors considered in
conjunction do. High investment volumes may not be sufficient to cause a ripple in market
competitiveness if the CCP has a minimal economic interest in an investing company. In this
case, the conjunction of investment volume and CCP influence explains the falseness of
Hypothesis 1. Conversely, high levels of CCP influence in a company may not affect market
concentration until investments pass a size threshold. Similar to the previous example, a
correlation may only arise when the two factors are considered together. The conjunction of
different investment behavior and different CCP interests may be able to explain variation more
comprehensively than each factor in isolation.
19
Methods
Competitiveness
The Herfindahl-Hirschman Index (HHI) measures how concentrated an industry is and
will be used as a proxy for market competitiveness. Market concentration describes how spread-
out market share is among all the firms in an industry. Low market concentration indicates that
the percentage of revenue generated by each firm is low and approximately equal to the share of
all other firms. Factors that shift market concentration and market competitiveness include
corporate consolidation, the regulatory environment, and the ease at which a company can enter
a market.
The HHI is the most widely accepted indicator for competitiveness and has been proven
to be theoretically robust (Rhodes, 1993; Herfindahl, 1950). Countries deploy the HHI
differently in their considerations, but it is generally considered a standard variable for antitrust
cases around the world (Rhodes, 1993). For instance, the United States considers M&A activity
that raises the HHI by two basis points, or 20 points on a scale of 10,000, “likely to enhance
market power” and thus worthy of thorough investigation prior to approval (The United States
Department of Justice, 2018). Alternatively, the European Commission merger assessment
guidelines mainly considers the end size of industries, reading:
“The Commission is unlikely to identify horizontal competition concerns in
a market with a post-merger HHI below 1000. Such markets normally do
not require extensive analysis. 20. The Commission is also unlikely to
identify horizontal competition concerns in a merger with a post-merger
HHI between 1000 and 2000 and a delta below 250, or a merger with a post-
merger HHI above 2000 and a delta below 150, except where special
20
circumstances such as, for instance, one or more of the following factors are
present: (a) a merger involves a potential entrant or a recent entrant with a
small market share; (b) one or more merging parties are important
innovators in ways not reflected in market shares; (c) there are significant
cross-shareholdings among the market [participants]; (d) one of the merging
firms is a maverick firm with a high likelihood of disrupting coordinated
conduct; (e) indications of past or ongoing coordination, or facilitating
practices, are present; (f) one of the merging parties has a pre-merger market
share of 50% [or more].”
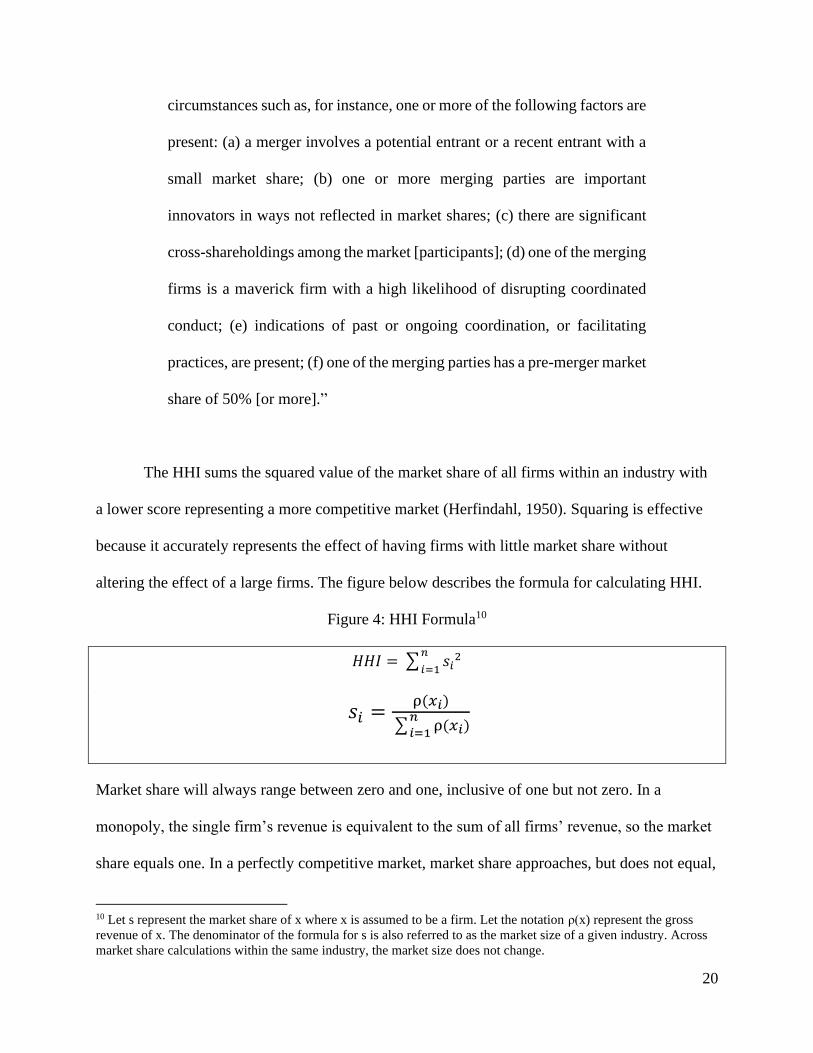
The HHI sums the squared value of the market share of all firms within an industry with
a lower score representing a more competitive market (Herfindahl, 1950). Squaring is effective
because it accurately represents the effect of having firms with little market share without
altering the effect of a large firms. The figure below describes the formula for calculating HHI.
Figure 4: HHI Formula10
𝐻𝐻𝐼 = ∑ 𝑠𝑖2𝑛
𝑖=1
𝑠𝑖 =ρ(𝑥𝑖)
∑ ρ(𝑥𝑖)𝑛
𝑖=1
Market share will always range between zero and one, inclusive of one but not zero. In a
monopoly, the single firm’s revenue is equivalent to the sum of all firms’ revenue, so the market
share equals one. In a perfectly competitive market, market share approaches, but does not equal,
10 Let s represent the market share of x where x is assumed to be a firm. Let the notation ρ(x) represent the gross
revenue of x. The denominator of the formula for s is also referred to as the market size of a given industry. Across
market share calculations within the same industry, the market size does not change.

21
zero. Each firm has a negligibly small share of the market that will continue to decrease as more
firms enter the market. However, the numerator, revenue, definitionally cannot equal zero;
otherwise, the firm would not be in the industry at all. Because market share never exceeds one
and neither does the sum of all market shares, HHI will also never exceed one. Intuitively, this
calculation also reflects shifts in market landscapes. For instance, M&A activity results in one
company’s original share vanishing and another one’s being augmented, which will result in a
higher HHI due to the new formula inputs. To show the magnitude of changes more effectively,
HHI will frequently be scaled by 10,000.11 This scaling will also be adopted for analyses in this
paper.
Investment Volume
Investment volume will be evaluated on a yearly industry-and-country-level basis with
USD as its unit. Investment amounts will only include completed deals and be counted in the
year that the capital was deployed. Because the evaluation period 2005 through 2015 is relatively
short, investment values will not be adjusted to account for the time value of money. They will
be presented as the value of the capital at the time of investment. If a transaction had multiple
investors, it will be assumed that the investors contributed an equal percentage unless otherwise
indicated in reporting on the deal. Oftentimes when SOEs invest alongside each other or pursue
joint ventures, they share the burden of capital investment (Grimsditch, 2015). They also tend to
use same funding sources, so assuming the money was distributed evenly is roughly in
accordance with this fact (Lin et al., 2020).
11 Much literature also begins with the premise of HHI ranging from 0 to 10,000 where the share of a firm
comprising 20% of an industry would be computed as 20 rather than .2.

22
State Control Factors
State control factors will reflect the degree to which the CCP has influence over a
company. The first factor is the Chinese government’s percentage ownership stake in an SOE.
Ownership stake affects an SOEs capital structure and the availability of state resources for it
(Huang et al., 2018; Gang and Hope, 2013). It also directly reflects the level of financial interest
the government has in an SOE. This metric is a reliable gauge for state control but other factors
could be relevant as well.
Even if the government does not own a large stake in an SOE, it can still heavily
influence the company’s projects and business dealings (Bruton et al., 2015). The second factor,
supervision over the SASAC, reflects these cases. The main SOEs are operated by the SASAC,
but the Chinese government does not necessarily hold large stakes in them (Gang and Hope,
2013; State-owned Assets Supervision and Administration Commission of the State Council,
n.d.; Scissors, 2020). The SASAC ensures that SOE actions are in alignment with CCP goals,
and it can play a role in strategizing expansive projects and facilitating engagement with private
firms (Shen and Galbraith, 2020). The SASAC also provides SOEs additional dividends through
heightened investments and support through restructuring, allowing them to mirror the strategies
of global investment banks (Dobson, 2014).
Lastly, the third factor will be involvement with the BRI. The Xi administration
characterizes the BRI as “new round of opening to the world” and indicates that they plan to
heavily direct companies through this globalization effort to best ensure their desired results
(Cheng et al, 2019). Some companies possess resources, leadership, and networks that are
valuable for the BRI but otherwise are not of specific interest to the CCP (Cheng et al., 2019).
Even if a company has a low government ownership stake and is not under SASAC supervision,

23
entrance into a BRI contract entails that for the duration of the project, the company is
responsible for promoting Beijing’s aims. This variable—whether an investment is associated
with the BRI—and the presence of SASAC supervision will be treated as indicator variables
while ownership stake will be treated as numerical or categorical, between majority or minority,
depending on the model. Additionally, this variable will be evaluated on a transaction-level basis
while the others are at the company-level.
Additional Variables
There is conflicting evidence about how greenfield and brownfield investments affect
economic growth and market composition. An article published in the Review of International
Economics studied 127 countries over the period 1990 to 2010 and found that greenfield
investments enhance economic growth while brownfield investments, at best, have no effect on it
(Harms and Méon, 2017). Conversely, an article from Usak University researchers found that
both greenfield and brownfield investments enhance economic growth, but greenfield
investments had a significantly stronger effect (Bayar, 2017). Another study concludes that
greenfield investments cause a type of “crowding out” effect that deters domestic private
investment while brownfield investments do not (Ashraf and Herzer, 2014). Regardless, there is
consensus that greenfield and brownfield investments affect recipient countries in meaningfully
different ways, so that factor could potentially be relevant in this project and is thus accounted
for in certain models below. Like the last two variables above, whether an investment is
greenfield or brownfield will be treated as an indicator variable.
24
Data Compilation
Investment data was sourced from the American Enterprise Institute’s (AEI) China
Global Investment Tracker (Scissors, 2020). This dataset includes the individual investments
made by companies over the period January 2005 through June 2020. Only objective information
like the company name, government ownership stake, investment volume, and industry of
operation are included. Derek Scissors, the think tank’s Chief Asia Economist, records the
completed deals on an approximately quarterly basis. Investments after December 2015 were not
included for analysis, because there lacks sufficient data about more recent changes in HHI
globally.
Industry boundaries were determined by four-digit codes from the 2017 North American
Industry Classification System (NAICS), the most recently published manual (Office of
Management and Budget, 2017). For less disaggregation, three-digit and two-digit NAICS codes
were also used. NAICS codes divide industries using their production processes and are updated
every five years to reflect technological advancements and sector-wide shifts (Office of
Management and Budget, 2017). The manual demarcates 20 industries with two-digit codes and
then subclassifications within it using three, four, five, and six-digit codes signaling increased
specificity (Office of Management and Budget, 2017).
For each investing company, two measures of state control were recorded: the
government’s ownership stake in the company and supervision from the SASAC. Government
ownership stake was listed in the China Global Investment Tracker. Recorded companies were
crosschecked against the SASAC’s published list of central SOEs to determine the second state
control factor (State-owned Assets Supervision and Administration Commission of the State
Council, n.d.). The transaction-level measure, contract involvement with the BRI, was also
25
pulled from the China Global Investment Tracker and updated, if needed, using reports from
various media outlets.
HHI by country was sourced from The World Bank’s TCdata360 initiative HHI Market
Concentration Index database (The World Bank, 2015). HHI by country was also sourced from
The World Bank’s World Integrated Trade Solution (WITS) HHI Market Concentration Index
database. HHI by industry was sourced from the US Census Bureau. Every spreadsheet in which
data was pulled from was compiled into the attached sheet called “intsheets.xlsx”. Then, relevant
data was cleaned and extracted into the attached final dataset used for analysis, “thesisdata.csv”.
More detailed explanation of the source data and its analysis can be found in Appendices 3 and
4.12
Results
Hypothesis 1
As depicted in Figure 5, there was a significant relationship between the total investment
volume and the change in HHI. However, the effect size was minimal, and the R2 value was very
small for this model. With the ordinary least squares (OLS) regression, it was estimated that for
every $1 million increase in investments, HHI on the 0 to 10,000 scale increases by .021. This
increase would represent only .12% of the average one-year HHI change observed and .11% and
.09% of the two and three-year changes, respectively (Figure 1). Considering the relationships
under a logistic model revealed an odds ratio (OR) of .0001 (Figure 1). On average, every $1
million increase in total investment volume increases the probability of a positive HHI change by
12 Appendix 3 contains a complete guide of the types of source data that were compiled to product the final dataset
for analysis. In the final sheet, formulas for calculating cell values were removed in the interest of reducing storage
space, so Appendix 4 also contains a detailed replication guide covering the exact steps needed to reproduce the
attached csv files and results described in this paper.

26
.0001. The low R2 and adjusted R2 indicate that describing the total investments alone does not
account for much variation in the data, and more variables are needed to fully describe the cause
for HHI changes.
Figure 5: Hypothesis 1 Model Results13
These conclusions are supported by the difference in means for one-year, two-year, and
three-year HHI changes. Total investments tend to be higher in cases when HHI increased but
not by much. In the two-year time frame, the average difference in total investments between
13 Tables were formatted using the R package “stargazer” (see Hlavac, M. (2018). stargazer: Well-Formatted
Regression and Summary Statistics Tables. R package version 5.2.2. https://CRAN.R-
project.org/package=stargazer.).
27
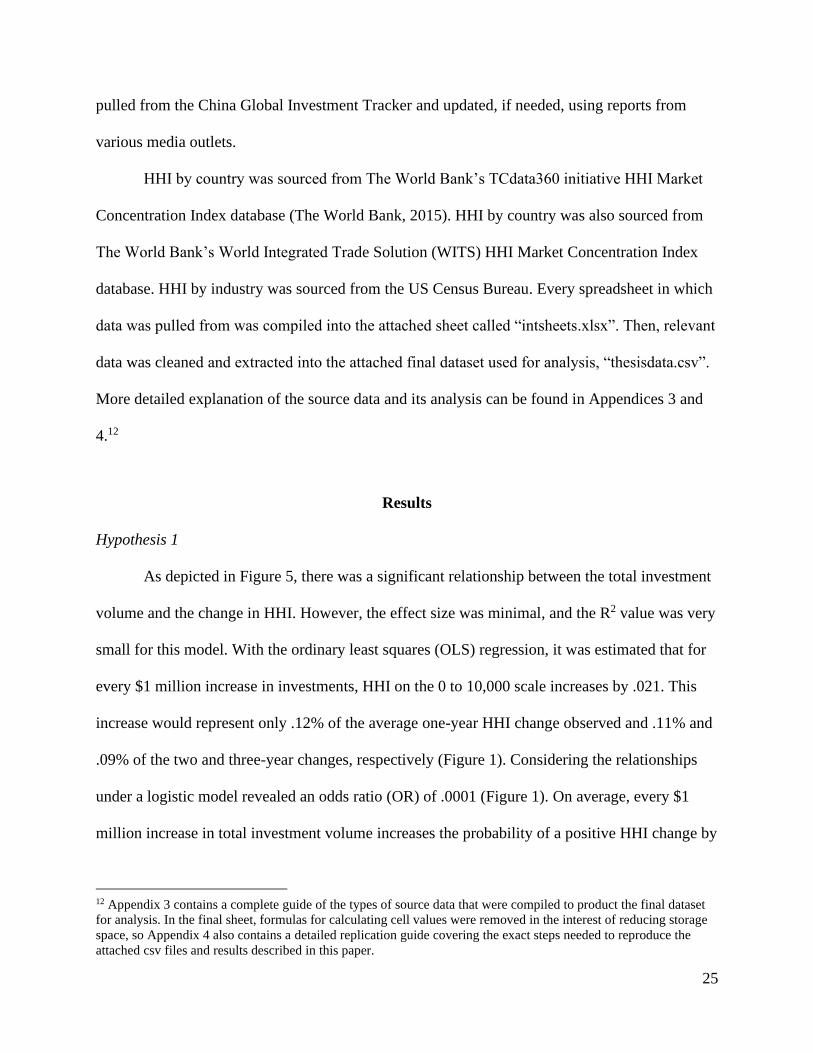
cases where HHI increased and cases where HHI decreased was less than $3 million, a small
fraction of the total outward investment in any given year (Figure 6).
Figure 6: Yearly Average Total Investments by Time Period and HHI Change
Given overall average total investments of 954.6012 and a standard deviation of 1393.2550, a Z-
test for the difference in means revealed that the differences are not significant under typical
norms for p-values.14 Although a difference is depicted in Figure 6, it cannot be solely
attributable to different investment volumes.
14 The number of observations was 514. One-sided tests were assumed. The results of the Z-Test were calculated as
follows:
1. 1 Year HHI Increase (279 observations, standard deviation of 1566.829): 1005.3760 – 954.6012
√1393.2552
514+
1566.8292
279
= .45.
1- Z(.45) = .3264.
2. 1 Year HHI Decrease (235 observations, standard deviation of 1157.853): 901.2195 – 954.6012
√1393.2552
514+
1157.8532
235
= -.54.
Z(-.54) = .2946.
3. 2 Year HHI Increase (247 observations, standard deviation of 1561.480): 956.9636 – 954.6012
√1393.2552
514+
1561.4802
247
= .02. 1-
Z(.02) = .4920.
4. 2 Year HHI Decrease (267 observations, standard deviation of 1223.135): 954.7210 – 954.6012
√1393.2552
514+
1223.1352
267
= .001.
Z(.001) = .5000.
28
Hypothesis 2
The average ownership stake in a Chinese SOE proved to be a significant predictor of
HHI changes, but none of the other variables describing state influence were not. Adding the
SASAC and BRI variables did not improve the R2 values from Model 1 in Figure 7 on the next
page, meaning the additional state control factors did not assist in explaining the variation in the
data. SASAC supervision had a negative coefficient, which would have indicated that the
investments of SOEs under SASAC supervision had a beneficial effect on market concentration.
This finding would have been completely contrary to the predictions in Hypothesis 2, but the
variable was not significant.
5. 3 Year HHI Increase (254 observations, standard deviation of 1582.493): 986.8898 – 954.6012
√1393.2552
514+
1582.4932
254
= .28. 1-
Z(.28) = .3897.
6. 3 Year HHI Decrease (260 observations, standard deviation of 1184.926): 917.4091 – 954.6012
√1393.2552
514+
1184.9262
260
= -.39
Z(-.39) = .3483.

29
Figure 7: Hypothesis 2 Model Results
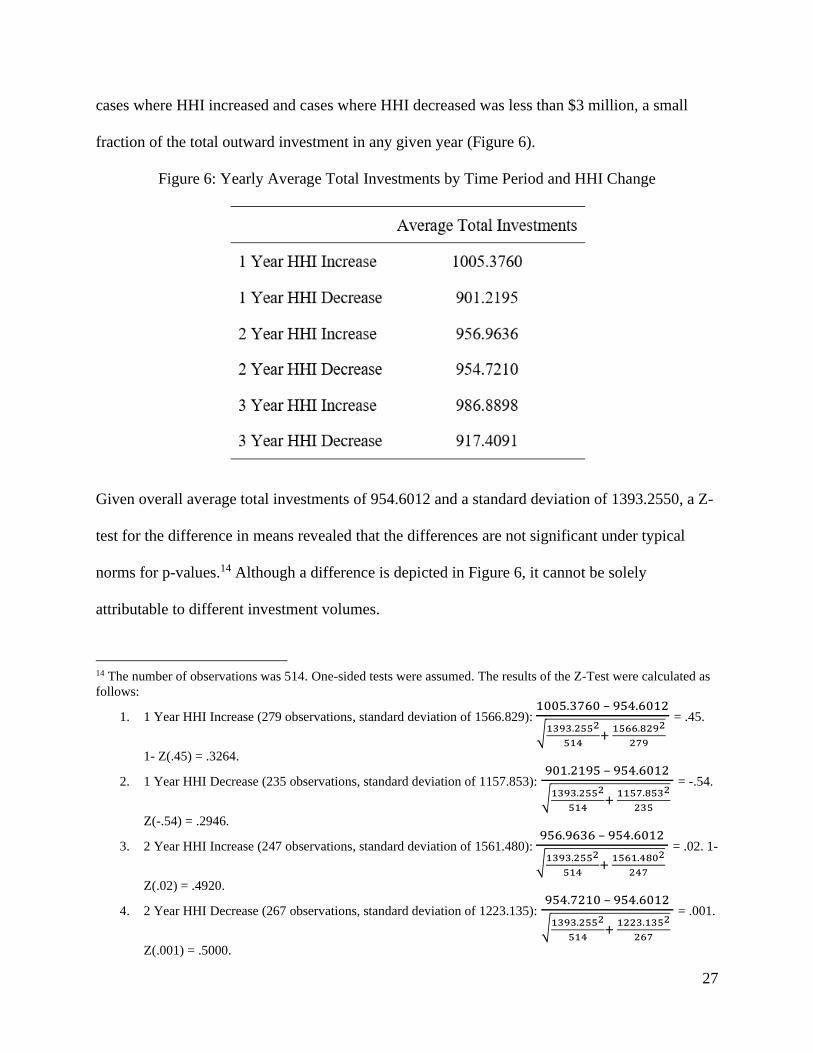
It was then explored if separating the average stake variable into minority and majority
would yield important results. Reconsidering the average Chinese government stake as a
categorical variable—minority if it was less than or equal to 50% and majority if it was greater
than 50%—revealed noticeable differences (Figure 8, Figure 9, Figure 10). The majority stake
transactions, on average, resulted in larger changes in HHI than the remainder of the population,
and the minority stake transactions, on average, resulted in smaller HHI changes.
30
Figure 8: Overall Change in HHI
Figure 9: Change in HHI for Majority Stake Transactions
Figure 10: Change in HHI for Minority Stake Transactions
Using a Z-Test to examine if the difference in means between these three samples is significant,
it was found that the significance levels ranged between .1170 and .3483.15 There was a larger
15 One-sided tests were assumed. The results of the Z-Test were calculated as follows:
1. Majority stake transactions with a one-year timeframe:26.534 – 17.085
√253.0992
484+
306.4142
290
= .44. 1- Z(.44) = .3300.
2. Majority stake transactions with a two-year timeframe: 27.447 – 18.270
√281.6002
480+
330.8922
287
= .39. 1- Z(.39) = .3483.
3. Majority stake transactions with a three-year timeframe: 38.809 – 23.493
√248.0242
474+
271.0352
281
= .77. 1- Z(.77) = .2206.

31
normalized difference between the minority stake sample and the overall sample, as compared to
with the majority stake sample. The p-values from these statistics are not small enough to
definitively conclude that the majority or minority stake transactions are significantly different
from the holistic average.
Hypothesis 3
The models tested for Hypothesis 3 follow the Hypothesis 2 findings that state control
factors besides average stake are not significant predictors of HHI changes (Figure 11). In each
model with the additional features added, they were not significant and did not improve both the
R2 and adjusted R2 values. Although R2 and adjusted R2 values were higher than in the previous
models, they were still very small, so another model factoring in the starting HHI was tested.
4. Minority stake transactions with a one-year timeframe: 2.960− 17.085
√253.0992
484+
139.2412
194
= -.93. Z(-.67) = .1762.
5. Minority stake transactions with a two-year timeframe: 4.623 – 18.270
√281.6002
480+
185.5442
193
= -.73. Z(-.73) = .2327.
6. Minority stake transactions with a three-year timeframe: 1.194 – 23.493
√248.0242
474+
208.7452
193
= -1.19. Z(-1.19) = .1170.

32
Figure 11: Hypothesis 3 Model Results

33
Figure 12 depicts the revised model being tested for Hypothesis 3.
Figure 12: Revised Hypothesis 3 Model
𝐻𝐻𝐼𝑡 = 𝐻𝐻𝐼0 + 𝑇𝑜𝑡𝑎𝑙 𝐼𝑛𝑣𝑒𝑠𝑡𝑚𝑒𝑛𝑡𝑠 + ∑ 𝑆𝑡𝑎𝑡𝑒 𝐶𝑜𝑛𝑡𝑟𝑜𝑙 𝐹𝑎𝑐𝑡𝑜𝑟𝑠 + 𝐶
This model tests the same variables as before but attempts to remove some of the fluctuations
based on starting HHI and is instead attempting to predict the ending HHI. Starting HHI may
affect how much HHI can change within the period. A more concentrated market may be capable
of larger shifts in HHI because a single merger or acquisition would sweep a larger share of the
industry’s existing firms. Figure 13 on the next page depicts the results from testing this model.

34
Figure 13: Hypothesis 3 Revised Model Results

35
The revised model produced substantially higher R2 and adjusted R2 values without
reaching the point of overspecification (Figure 13). The overall R2 values in these models
increased substantially after considering starting HHI. Starting HHI, total investment volume,
and average stake were significant predictors at the .1 confidence level. However, the state
control factors besides average stake remained non-significant. These results mirror the
Hypothesis 2 findings that state control factors besides average stake are not significant
predictors of HHI changes (Figure 13). None of the cases with the additional features showed
improvement for both R2 and adjusted R2 values, indicating that changes in R2 were offset by
adjusted R2 penalties for incorporating additional variables. Of the tested models, this one proved
the most effective but parsimonious at predicting HHI changes (Figure 13).
Discussion
Congruence with Prior Literature
The findings from this project are consistent with journalistic descriptions of the
investment strategies deployed by Chinese SOEs. Chinese companies in general historically tend
to prefer inorganic growth through the acquisition of strategic assets, both physical and
intangible (Deng, 2009). SOEs adopted this disposition, resulting in high profile deals that raised
the suspicion of antitrust governance bodies. For instance, Zoomlion, the six largest construction
machinery company in the world and the largest in China, acquired Compagnia Italiana Forme
Acciaio (CIFA) and Powermole in 2008 and 2000, outbidding other interested companies (High,
2008). These companies were Zoomlion’s rivals in Italy and the United Kingdom, respectively,
and each was a dominant player on the global scale (High, 2008). Instead of attempting to
outcompete them, Zoomlion relied on highly leveraged transactions to eliminate its challengers

36
and continues to pursue that approach today (O’Connor, 2018). In 2016, the company submitted
a bid to purchase its US-based rival, Terex, despite already having debt over 43 times its
earnings for the year (O’Connor, 2018). The bid was ultimately unsuccessful, but the sheer
volume of transactions should continue to give pause to regulatory officials considering future
SOE deals.
The negative coefficients for SASAC supervision could be explained by the additional
levels of supervision from provincial and local governments that some SOEs must abide under
(Heng, 2014). Provincial and local governments are significantly less concerned with
international geopolitics and significantly more concerned with SOEs ability to provide local
services (Heng, 2014). Furthermore, the extensive reporting guidelines and additional layers of
middle management for SASAC SOEs may reduce their operational efficiency (Lu and Zhu,
2020). These superfluous instances of bureaucracy, among others, could result in SASAC SOEs
being less agile in executing the investment strategies of other SOEs (Milhaupt and Pargendler,
2017).
Limitations of Findings
Like all indicators, the HHI is not always a perfect reflection of what it was designed to
measure. The “relevant market fallacy” can occur when evaluating any transaction (Young,
2009). HHI computations can be based upon both infinitely specified industries to meaninglessly
broad ones and still be valid mathematically (Young, 2009). For instance, a soft drink company
could be considered in its specific flavored beverage industry within its town and nutritional
classification, i.e. zero-sugar orange sodas in Round Rock, Texas. On the other side of the
spectrum, the company could be considered within the industry of all liquids. Both conceptions
are nonsensical and render the indicator useless. If the company were considering a merger, the

37
first classification would yield an astronomically large post-transaction HHI, even if both the
buyer and target were small companies. The latter grouping would produce a very modest HHI
figure, even if the two companies were multinational corporations. No specific guidelines exist
for drawing industry boundaries for HHI calculations, so good-faith mistakes can also occur.
Because of the leeway here, HHI will also vary naturally depending on the person examining it.
Considering multiple sources and using a tiebreaker, if necessary, may be an effective way to
reduce the impact of individual biases.
Additionally, critics argue that the HHI does not sufficiently weight consumer utility, for
instance, when handling exceptions where one large company is better able to provide services
for their needs (Roberts, 2014). If a credit card company can only reach nationwide acceptance
by merchants after a series of mergers, consumers would clearly prefer that to having multiple
credit cards even if it entailed higher fees (Roberts, 2014). In a situation where one company
services half of all merchants and another services the other half, their merger may significantly
enhance the proforma company’s market power. The United States Federal Trade Commission
would likely cancel this deal even though would it provide an enhanced service and contribute to
consumer welfare. Toby Roberts, a staff attorney at the California Court of Appeals, proposes
incorporating network effects and other drivers of customer satisfaction into a more holistic
M&A evaluation framework.
Robustness Tests for Competition
For additional robustness checks on these findings, results could be measured in terms of
changes in average price-cost margins (PCMs) and augmented relative profit differences
(ARPDs) across industries. All are alternative measures of market competitiveness with

38
significant economic and mathematic backings. Each one captures aspects of competition absent
from the HHI formula but, on their own, are not rigorous enough justify complete conclusions.
With the HHI, they can paint a more comprehensive picture of an industry’s competitive
landscape.
The PCM represents the difference between the price and marginal cost of an item, and it
can be calculated by reviewing line items on balance sheets and income statements (Amador et
al., 2015). In congruence with the theory of perfectly competitive markets, lower PCM and lower
overall profitability is characteristic of more competitive markets. An upward trend in the
average PCM reflects an increase in market power wielded by the average player in an industry
(Amador et al., 2015). A declining average PCM reflects a market becoming more competitive
(Amador et al., 2015). In addition to describing shifts in market competition, research has shown
that changes in average PCMs can also predict sensitivity to market shocks and financial crises
(Görg and Warzynski, 2006; Amador et al., 2015). However, the PCM has not been proven
theoretically robust. Contrary to predictions, in certain cases,16 increasing competition can result
in an industry’s PCM increasing (Amir, 2003).
The ARPD is a modified version of the Boone Indicator or relative profit difference
(RPD), which was proven to be more robust measure for market competition than the PCM
(Schiersch and Schmidt-Ehmcke, 2010; Ansari, 2012; Boone, 2008). The RPD formula is as
follows (Boone, 2008):
16 The case described in this study was a simulated Cournot industry with increasing entrants that had different cost
structures. A Cournot industry is a duopolistic one where firms produce homogenous products and choose quantity
to produce simultaneously (see Cournot, A. A. & Fisher, Irving. (1929). Researches Into the Mathematical
Principles of the Theory of Wealth. New York: Macmillan Company).

39
Figure 14: RPD Formula17
RPD =π(typical firm) − π(least efficient firm)
π(most efficient firm) − π(least efficient firm)
Under this logic, the higher the RPD, the more competitive a market; in a perfectly competitive
market there are minimal differences between the profit of the most efficient and least efficient
firms. Boone analyzed the banking industry and rationalized that competition boosts the profits
of more efficient banks while destroying those of less efficient ones, thus causing them to exit
(Boone, 2008).
However, the RPD does not account for firm size and thus the volume of innovation,
which can lead to a misleadingly small RPD in broad sectors like manufacturing (Leuvensteijn et
al., 2007; Schiersch and Schmidt-Ehmcke, 2010). The ARPD resolves that problem by dividing
the profit terms in the original RPD equation by the gross revenue for a given period (Schiersch
and Schmidt-Ehmcke, 2010):
Figure 15: ARPD Formula18
ARPD =
π(typical firm)ρ(typical firm)
−π(least efficient firm)ρ(least efficient firm)
π(most efficient firm)ρ(most efficient firm)
−π(least efficient firm)ρ(least efficient firm)
Although the ARPD has been proven theoretically robust, there have been minimal explorations
or tests of it outside of Schiersch and Schmidt-Ehmcke’s work (Ansari, 2012). Until further
applications of this indicator are explored, it should not be used authoritatively but rather in
comparison or conjunction with other indicators.
17 Let the notation π(x) represent the profit of x where x is assumed to be a firm. 18 Let the notation ρ(x) represent the gross revenue of x where x is assumed to be a firm.

40
Should the results from either additional test not reinforce the HHI findings, a
reevaluation of the conclusions from this project may the necessary. The mismatch between
HHI, PCM, and ARPD could stem from differences in the measures themselves. Although the
factors are attempting to reflect the same concept, their calculations are vastly different. One
factor might be including metrics not relevant to the others or vice versa. Nonetheless, a
mismatch could also indicate reasonable conflicting conclusions about the overall effect on
market concentration. In such cases, the data and analyses would need to be reexamined to
pinpoint the drivers of the inconsistencies between the statistics. Afterward, it would be
worthwhile to discuss what these drivers reveal about different dimensions of market
competition.
Robustness Tests for State Control
Different variables measuring the depth of CCP state influence could also be explored to
test the validity of this paper’s results. Additional factors could include the use of government
resources, historical minimum Chinese government ownership stake, and the proportion of debt
owed to Chinese government-affiliated entities versus wholly private ones. These variables,
although not publicly available and difficult to compile, would explore different dimensions of
influence that the CCP has on companies. A company that relies on conditional subsidies and
uses SASAC directors as management consultants is retrained in its ability to pursue interests
independent of the CCP. A company where the Chinese government has always held a majority
stake has always had operations framed around state interests. Conversely, companies where that
condition does not hold have had operations pursuing independent financial goals. A company
that holds looming debt obligations to the Chinese government has a greater interest in

41
maximizing its cash flows to pay it off. It also has incentives to cater to CCP directors in hopes
of receiving favorable refinancing rates or debt forgiveness. These companies may act in
meaningfully different ways from those that do not rely on governmental support, did not
originate with a large government ownership stake, and do not hold outstanding debts to the
Chinese government adjacent lenders. Two of the three state control factors proved insignificant
in this paper, but that result does not preclude the possibility of other ones being more useful for
similar analyses.
Continuations
Continuations of this line of research could include investigating other financial metrics
that reflect the health of an industry. Possible dependent variables could include average leverage
ratios, capital intensity, multiples in M&A transactions, and the average return on assets. These
metrics reflect themes in general equilibrium theory, like the ease of entry and exit into a market.
If an industry’s average leverage ratio is trending upwards, it likely is becoming more difficult to
enter, as newcomers would likely need to assume more debt to survive. Conversely, if an
industry’s capital intensity is trending upwards, it likely is becoming more difficult to exit, as
fixed assets tend to be attached to longer-term contracts.
Additionally, specific transactions completed by Chinese SOEs could be evaluated to see
if they were worthwhile. SOEs’ access to higher amounts of capital and capacity to hold debt
allow them to pay otherwise absurd prices for acquisitions. Many bids and deals closed are
arguably attempts for China to strengthen its claim to strategic resources or territories, like the
South China Sea. The value of these potential geopolitical gains could be calculated with
42
consideration of contingent scenarios and compared to the expenses incurred with associated
transactions.
Potential Applications of Findings
This paper’s findings and analogous ones could be used for recommendations to
investment promotion agencies against supporting Chinese SOE transactions. However, they
could also be used for regulatory bodies, like the Federal Trade Commission, to create
environments that minimize the harms of SOE investments and allow for recipient countries to
enjoy the economic growth associated with them. Dobson, who encourages China SOE
investments into Canada, reasons that any negative effects of these transactions could be
resolved with increased regulatory oversight and devising consequences for noncompliance.
Instead of outright restricting SOEs, their activities could be monitored from various standpoints
including transparency and security (Dobson, 2014). Decisions to halt mergers could also not be
bound to company size thresholds or other related metrics, so specific cautionary measures can
be applied to SOEs (Young, 2009; Cheng et al., 2019).
One example of a targeted rule is the antitrust-related standard for Chinese SOEs that was
devised by the European Commission19 in 2016. Upon announcement of the potential joint
venture between China General Nuclear Power (CGN) and Électricité de France (EDF), the
Commission deemed it necessary to examine Chinese energy sector SOEs as a collective (Price,
2016). Instead of considering SOE transactions on the basis of individual companies, they can
consider all SOEs in the same country and industry together. The sentiments of this move
underly the results of this project. Because Chinese SOEs in the same sector jointly promote the
19 The European Commission is the governing body that oversees antitrust issues within the EU.

43
same interests and benefit many of the same actors, they ought to be treated as one entity when
considering antitrust issues. The shifts in market concentration are not dependent on the size or
capabilities of each company individually but rather the combined presence of all Chinese SOEs
in a given industry. At the very least, this regulatory change presents another obstacle for SOEs
considering M&A transactions. Viewing Chinese SOEs as a class rather than individuals disarms
the previously effective strategy of spreading investments across multiple CCP-controlled
corporations. Although the CGN-EDF deal was eventually approved, Dr. Alan Riley of the
Institute for Statecraft and Nicholas French, head of the China antitrust practice at Freshfields
Bruckhaus Deringer, predict that this framework shift foreshadows tightening rules to come
(Price, 2016).
Conclusion
Chinese SOEs rely on foreign operations and investments to secure income and promote
Beijing’s policy goals. Encoded in their functioning is allegiance to the CCP, and as such, the
companies act collectively to maximize its profits and international influence. Over six decades,
the companies shifted their focus from domestic services to foreign opportunities under market
reforms implemented by different administrations. The current SOE expansion strategy uniquely
utilizes M&A transactions instead of organic growth to expedite their rise to dominance and
preemptively remove rivals within an industry. As China embarks on the BRI, with SOEs
primarily leading the way, the historical economic effects of SOE investments should not be
overlooked.
This project quantitatively tested one aspect of the notion that Chinese SOEs and the
government entities behind them cause problematic results when they expand internationally.

44
The results of this paper support initiatives to further regulate the M&A activity of Chinese
SOEs and limit their presence in the global economy. It found that foreign investments of
Chinese SOEs tend to significantly increase market concentration in recipient industries based on
the size of their commitments and the strength of CCP influence on a company. Both numerical
figures and descriptive accounts illustrate how the investment strategies of Chinese SOEs can
create less competitive markets. The structure of markets reflects dynamics between consumers,
corporations, and governments, and it is crucial to protect for the promotion of societal wellbeing
and innovative progress.

45
References
Amador, J., Di Comite, F., Fuss, C., Hagemejer, J., Montero, J. M., Soares, A. C. (2015, July).
Price-cost Margin Dynamics and Heterogeneity: Evidence from European Firm-Level
Data. European Central Bank: Competitiveness Research Network. https://www.comp-
net.org/index.php?eID=dumpFile&t=f&f=6973&token=161f29c75f66c5e686782764b12
82259bb27afa8&download=.20
Amir, R. (2003). Market Structure, Scale Economies and Industry Performance. CORE
Discussion Paper Series 2003/65.21
Ansari, J. (2012): A New Measure of Competition in Indian Loan Market. Munich Personal
RePEc Archive. https://mpra.ub.uni-muenchen.de/50108/.22
Ashraf, A., & Herzer, D. (2014). The effects of greenfield investment and M&As on domestic
investment in developing countries. Applied Economics Letters, 21(14), 997-1000.
doi:10.1080/13504851.2014.904482.
Bayar, Y. (2017). Greenfield and Brownfield Investments and Economic Growth: Evidence from
Central and Eastern European Union Countries. Naše Gospodarstvo/Our Economy, 63(3),
19-26. doi:10.1515/ngoe-2017-0015.
20 This project analyzes 2001-2012 European Union firm-level differences in PCM between like industries. It
concludes that firm-level data can be effectively translated into country-level data and that changes in PCM correlate
with how severely a firm was impacted by previous financial crises. 21 CORE is the “world’s largest collection of open access research papers” (see CORE (n.d.), core.ac.uk). This paper
was featured in the 2003 Discussion Papers Series they hosted. 22 The author is affiliated with the Center for Advanced Financial Research and Learning (CAFRAL), an
independent research organization formed by the Reserve Bank of India (RBI) (see Center for Advanced Financial
Research and Learning (n.d.). About CAFRAL. https://www.cafral.org.in/).

46
Bebchuk, L. A., Kraakman, R. H., and Triantis, G. G. (2000). Stock Pyramids, Cross-Ownership,
and Dual Class Equity: The Creation and Agency Costs of Separating Control from Cash
Flow Rights. Concentrated Corporate Ownership (Randall Morck ed.), 445-60.23
Biesheuvel, T. (2020, February 20). De Beers Posts Lowest Profit Since End of Diamond
Monopoly. https://www.bloomberg.com/news/articles/2020-02-20/de-beers-posts-lowest-
profit-since-end-of-diamond-monopoly.
Bolton, P., Brodley, J. F., and Riordan, M. H. (1999, September 29). Predatory Pricing: Strategic
Theory and Legal Policy. https://papers.ssrn.com/sol3/papers.cfm?abstract_id=211689.
Boone, J., 2008, A new way to measure competition. The Economic Journal 188: 1245-61.
doi:10.1111/j.1468-0297.2008.02168.x.24
Bruton, G. D., Peng, M. W., Ahlstrom, D., Stan, C. V., and Xu, K. (2015). State-owned
enterprises around the world as hybrid organizations. Academy of Management
Perspectives. 29(1), 92-114.
Buckley, C. and Bradsher, K. (2020, September 17). China's Communists to Private Business:
You Heed Us, We'll Help You. New York Times.
https://www.nytimes.com/2020/09/17/business/china-communist-private-business.html.25
23 The authors describe common structures for separating cash flow rights, i.e. for dividends because of equity
ownership, and control rights, i.e. voting rights. They focus on situations where the majority of control shareholders
do not possess a majority of the cash flow rights in a company. The paper highlights the consequences and agency
costs that arise from this potential misalignment of priorities between shareholders, showing cases where there are
significant disadvantages to the aforementioned situations. They argue that these agency costs are also likely to be
higher than those of capital structures with high amounts of debt. 24 This paper founded the Boone Indicator or RPD. 25 This article describes how the Chinese Communist Party currently aims to secure control over private businesses
by offering supporting resources not available otherwise. Xi argues that success in this goal will also lead to
“healthy development of the private economy”. For decades, the government has attempted a balancing act between
ensuring loyalty from private companies and “allowing sufficient autonomy to develop a competitive economy”.
Amid COVID-19 the administration released a new economic growth strategy that involves Party officials
establishing more lines of communication for more frequent contact with business owners.

47
Chen, F. (2013, June 26). Law Weekend. Hexun. http://opinion.hexun.com/2013-06-
26/155516455.html
Cheng, Y., Song, L., Huang, L., Mitrovic, D., Qiqi, Z., Szunomar, A., … Jian, J. (2019). The Belt
& Road Initiative in the Global Arena: Chinese and European perspectives. Basingstoke,
Hampshire: Palgrave Macmillan.26
Copeland, Z. (2019, October 31). Foreign investment, China, and Trump.
https://www.lawfareblog.com/foreign-investment-china-and-trump
Cournot, A. A. & Fisher, I. (1929). Researches Into the Mathematical Principles of the Theory of
Wealth. New York: Macmillan Company.27
Deng, P. (2009). Why do Chinese firms tend to acquire strategic assets in international
expansion? Journal of World Business, 44(1), 74–84. doi: 10.1016/j.jwb.2008.03.014.28
Dobson, W. (2014). China’s State-Owned Enterprises and Canada’s FDI Policy. University of
Calgary School of Public Policy SPP Research Papers, 7(10), 1–26.
26 This book provides a comprehensive look into how the BRI falls into China’s larger globalization plans and
political motives using four sections: 1) “Comprehension and Communication on the ‘Belt and Road’ Initiative”, 2)
“Regional Cooperation in the ‘Belt and Road’ Initiative”, 3) “Economic Cooperation in the ‘Belt and Road’
Initiative”, and 4) “Geopolitical Challenge in the ‘Belt and Road’ Initiative”. Each section comprises articles and
case studies written by post-doctoral researchers, lecturers, professors, and graduate students at various universities.
This book is a fantastic starting point for research on the BRI, because it covers practically every topic of
significance, including global public opinion, international stakeholders, diplomacy, and more. Not all the book is
publicly available online, but one of the uncovered sections discussed how China attempts to manipulate media in
nearby areas to promote positive coverage of the BRI. Control of the internet infrastructure could thus be a lever
China uses to continuously further those projects and their long-term goals with media. 27 This book founded crucial economic concepts including Cournot competition and Nash equilibrium. 28 This paper attempts to answer why Chinese firms, especially those in the technology industry, tend to use
inorganic growth—through mergers and acquisitions (M&A)—instead of organic growth—through research and
development or marketing—when expanding globally. The author, Ping Deng is a Professor of Business
Administration at the John E. Simon School of Business at Maryville University of St. Louis. Deng uses case studies
of TCL, BOE, and Lenovo to argue that companies are resource-driven and that Chinese companies in particular are
in a unique institutional environment that facilitates M&A activity. In considering different scenarios and
trajectories that companies may take, Deng uses analytical models to support his reasoning.

48
Dorn, J. A. (2015, October 7). China's Financial System: The Tension Between State and market.
Retrieved May 15, 2021, from https://www.cato.org/commentary/chinas-financial-
system-tension-between-state-market.
Forbes (n.d.). BlueFocus Communication Group. https://www.forbes.com/companies/bluefocus-
communication-group/?sh=774ddd6f4737.
Gang, F., and Hope, N. C. (2013). Chapter 16: The Role of State-Owned Enterprises in the
Chinese Economy. In US-China 2022: Economic Relations in the Next 10 Years. Hong
Kong: China-United States Exchange Foundation.
Görg, H. and Warzynski, F. (2006). The Dynamics of Price Cost Margins: Evidence from UK
Manufacturing. Revue de l'OFCE. 97 bis. doi: 10.3917/reof.073.0303.
Grimsditch, M. (2015, June). The Role and Characteristics of Chinese State-owned and Private
Enterprises in Overseas Investment. Friends of Earth US.
Guluzade, A. (2019, May 7). The role of China’s state-owned enterprises explained. World
Economic Forum. https://www.weforum.org/agenda/2019/05/why-chinas-state-owned-
companies-still-have-a-key-role-to-play/.
Harms, P., and Méon, P. (2017). Good and useless FDI: The growth effects of greenfield
investment and mergers and acquisitions. Review of International Economics, 26(1), 37-
59. doi:10.1111/roie.12302.
Heng, J. (2014). An Evolving Framework for Outward Investment: A Chinese Approach to
Conflict Sensitive Business. American Friends Service Committee.
Herfindahl, O. C. (1950). Concentration in the Steel Industry. Columbia University.
High, R. (2008, June 26). China's Zoomlion Acquires CIFA. https://www.khl.com/news/China-s-
Zoomlion-acquires-Cifa/1025898.article.

49
Hlavac, M. (2018). stargazer: Well-Formatted Regression and Summary Statistics Tables. R
package version 5.2.2. https://CRAN.R-project.org/package=stargazer.
Huang, X., Kabir, R., and Zhang, L. (2018, September). Government ownership and the capital
structure of firms: Analysis of an institutional context from China. China Journal of
Accounting Research. doi:10.1016/c.jar.2018.07.001.
Huang, Y. and Wang, B. (2011). Chinese Outward Direct Investment: Is There a Chinese
Model? China and World Economy, 19, 4-6.
International Monetary Fund. (2020, April). Chapter 3: State-Owned Enterprises: The Other
Government. In Fiscal Monitor: Policies to Support People During the COVID-19
Pandemic (pp. 47-74). Washington DC, USA: International Monetary Fund Publication
Services.
Kornai, J. (2007). The Socialist System: The Political Economy of Communism.
Kowalski, P., Büge M., Sztajerowska, M., and Egeland, M. (2013). “State-Owned Enterprises:
Trade Effects and Policy Implications”, OECD Trade Policy Papers, No. 147, OECD
Publishing. doi:http://dx.doi.org/10.1787/5k4869ckqk7l-en.
Lecher, C. (2019, May 13). How low prices could make for an antitrust case against Amazon.
https://www.theverge.com/2019/5/13/18563379/amazon-predatory-pricing-antitrust-law
Leuvensteijn, V, M., J.A. Bikker, A. van Rixtel, and C. Kok Sorensen (2007, June). A new
approach to measure competition in the loan markets of the euro area. ECB Working
Paper Series, No. 768.
Levin, J. (2006, November). General Equilibrium.
https://web.stanford.edu/~jdlevin/Econ%20202/General%20Equilibrium.pdf.29
29 Dr. Jonathan Levin holds a BS in Mathematics and a BA in English from Stanford University, an M. Phil in
Economics from Oxford University, and a Ph.D. in Economics from the Massachusetts Institute of Technology.

50
Lin, K. J., Lu, X., Zhang, J., and Zheng, Y. (2020, February 15). State-owned enterprises in
China: A review of 40 years of research and practice. China Journal of Accounting
Research, 13(1), 31-55.
Lu, Z., and Zhu, J. (2020, June). Tracing back to the source: Understanding the corporate
governance of boards of directors in Chinese SOEs. China Journal of Accounting
Research, 13(2).
Ma, L., Wang, Y., and Shen, X. (2013). Party Organization Governance, Redundant Employees
and Executive Compensation Contract in SOEs. World Journal of Management, 100-115.
Milhaupt, C. J. and Pargendler, M. (2017). Governance Challenges of Listed State- Owned
Enterprises Around the World: National Experiences and a Framework for Reform.
Cornell International Law Journal, 50(3), 474-542.
https://scholarship.law.cornell.edu/cilj/vol50/iss3/3.30
Ministry of Commerce, National Bureau of Statistics and State Administration of Foreign
Exchange (2014). 2013 Statistics Bulletin of China’s Outward Foreign Direct Investment.
Beijing, China: China Statistics Press, 81.
Murphy, A., Tucker, H., Coyne, M., and Touryalai, H. (2020, May 13 6:00 am). Global 2000 -
the world's largest public Companies 2020,
https://www.forbes.com/global2000/#4d2422d3335d.
Currently, he serves as the Dean of the Stanford Graduate School of Business (see Stanford Graduate School of
Business. (n.d.) “Jonathan Levin.” https://www.gsb.stanford.edu/faculty-research/faculty/jonathan-levin). 30 The authors describe the history of SOEs and how they operate in various countries, comparing the companies and
noting similarities in how they are regulated. In China, a mixed ownership strategy where shares are owned by both
the state and private stakeholders is prevalent. Through the corporatization of SOEs and a 1997 privatization
program, companies shifted away from being wholly owned by the Chinese government. The SASAC plays a broad
role in investing, regulating, governing, and disseminating industrial policy from the government into these
companies. Although there are few similarities in how SOEs are governed internationally, each policy framework
holds the same goals: to avoid entangling geopolitical motives with a company’s commercial but public missions.
51
O’Connor, S. (2018, May 24). SOE Megamergers Signal New Direction in China’s Economic
Policy. US-China Economic and Security Review Commission Staff Research Report.
https://www.uscc.gov/sites/default/files/Research/SOE%20Megamergers.pdf.
OECD.org. (n.d.) “OECD dataset on the size and composition of national state-owned enterprise
sectors.” Organisation for Economic Co-operation and Development,
https://www.oecd.org/corporate/oecd-dataset-size-composition-soe-sectors.htm
OECD.org (2009, January 26). “Occasional Paper: State Owned Enterprises in China: Reviewing
the Evidence.” OECD Working Group on Privatisation and Corporate Governance of
State Owned Assets, https://www.oecd.org/corporate/ca/corporategovernanceofstate-
ownedenterprises/42095493.pdf
Office of Management and Budget, Executive Office of the President. “North American Industry
Classification System: United States, 2017.” United States Census Bureau, U.S.
Department of Commerce, 2017,
www.census.gov/eos/www/naics/2017NAICS/2017_NAICS_Manual.pdf.
Passi, R.,(2019). Unpacking Economic Motivations and Non-economic Consequences of
Connectivity Infrastructure Under OBOR. In Mapping China’s "One Belt One Road"
Initiative. Cham, Switzerland: Palgrave Macmillan. doi:10.1007/978-3-319-92201-0_7.31
Peng, M. W., Bruton, G. D., Stan, C. V., and Huang, Y. (2016, May 3). Theories of the (state-
owned) firm. Asia Pacific Journal of Management. doi:10.1007/s10490-016-9462-3.
31 This book focuses more on future projections about the BRI and less on history. The authors are all professors,
lecturers, and post-doctoral researchers from various universities across the world. One article, “Unpacking
Economic Motivations and Non-Economic Consequences of Connectivity Infrastructure Under OBOR” by Ritika
Passi, in part, argues that the “non-economic” considerations that go into planning this project are ultimately rooted
in economic considerations. For instance, increasing the span of political power is for increasing wealth for China in
the future.
52
Price, M. (2016, June 13). Chinese state-owned companies face greater scrutiny of EU deals after
ruling. https://www.reuters.com/article/us-china-eu-m-a-idUSKCN0YZ00U
Ralston, D. A., Terpstra-Tong, J., Terpstra, R. H., Wang, X., and Egri, C. (2006, September).
Today's state‐owned enterprises of China: are they dying dinosaurs or dynamic dynamos?
Strategic Management Journal. 27(9). 825-43. doi:10.1002/smj.545.
Rhodes, S. A. (1993, March). The Herfindahl-Hirschman Index. Federal Reserve Bank of St.
Louis. p. 188. https://fraser.stlouisfed.org/files/docs/publications/FRB/pages/1990-
1994/33101_1990-1994.pdf
Roberts, T. (2014). When Bigger is Better: A Critique of the Herfindahl-Hirschman Index’s Use
to Evaluate Mergers in Network Industries. Pace Law Review. 34. p. 894.
Schiersch, A. and Schmidt-Ehmcke, J. (2010, July). Empiricism Meets Theory: Is the Boone-
Indicator Applicable? DIW Berlin Discussion Paper No. 1030.
https://ssrn.com/abstract=1641034 or http://dx.doi.org/10.2139/ssrn.1641034.32
Scissors, D. “China Global Investment Tracker.” American Enterprise Institute, 2020.
www.aei.org/china-global-investment-tracker/.33
Shen, S., and Galbraith, A. (2020, October 12). Chinese state firms to work with private capital
to boost competitiveness. https://www.reuters.com/article/us-china-state-reform/chinese-
state-firms-to-work-with-private-capital-to-boost-competitiveness-idUSKBN26X1KT
State-owned Assets Supervision and Administration Commission of the State Council. (n.d.).
Directory. http://en.sasac.gov.cn/directory.html.
32 This paper coins the augmented relative price difference metric based on the “Boone Indicator” or relative price
difference which was introduced by Dr. Jan Boone in 2008. 33 Derek Scissors holds a Ph.D. from Stanford University, an M.A. from the University of Chicago, and an A.B.
from the University of Michigan. He is the leading economist covering Asia at the American Enterprise Institute and
has had previous experience as a business consultant in China and a university professor in Hong Kong and the
United States (see Scissors, D. “Derek Scissors.” LinkedIn, n.d., https://www.linkedin.com/in/derek-scissors-
6265a587/).

53
Tang, F. (2020, July 08). China to enhance influence of SOEs, Despite trade partners'
complaints. https://www.scmp.com/economy/china-economy/article/3092339/china-
approves-plan-boost-prominence-state-firms-despite.
The United States Department of Justice. (2018, July 31). “Herfindahl-Hirschman Index.”
https://www.justice.gov/atr/herfindahl-hirschman-index
The World Bank and Development Research Center of the People’s Republic China State
Council. (2012). “China 2030: Building a Modern, Harmonious, and Creative High-
Income Society.”
The World Bank. “HH Market Concentration Index.” TCdata360, The World Bank Group, 2015,
tcdata360.worldbank.org/indicators/hh.mkt?country=BRA.
United States Census Bureau. (n.d.). Selected Sectors: Concentration of Largest Firms for the
U.S.: 2017.
https://data.census.gov/cedsci/table?q=concentration&n=N0000.00&tid=ECNS
IZE2017.EC1700SIZECONCEN&hidePreview=true.34
United States-China Economic and Security Review Commission. (2016, November). 2016
Annual Report to Congress. https://www.uscc.gov/annual-report/2016-annual-report-
congress
United States Department of Agriculture, Grain Inspection, Packers and Stockyards
Administration (2003). Assessment of the Cattle, Hog, Poultry, and Sheep Industries.
https://www.gipsa.usda.gov/psp/publication/asses/assessment02-03.pdf.
34 The US Census Bureau Table ID for this data compilation is EC1700SIZECONCEN. The Dataset ID for all the
source data is ECNSIZE2017/

54
Wang, W. (2021, February 23). Overseas revenues of Chinese central SOEs exceed 24 trillion
yuan in 2016-2020. The State Council Information Office of The People’s Republic of
China. http://english.scio.gov.cn/pressroom/2021-02/23/content_77241827.htm.
Westcott, B. (2021, April 22). Australian Government Tears Up State's Belt and Road
Agreement with China. https://www.cnn.com/2021/04/22/business/australia-china-belt-
and-road-initiative-intl-hnk/index.html.
Wu, H. (1999). Reasons and Solutions for the High Debt in SOEs. DocIn.
https://www.docin.com/p-573043471.html
Yan, P. (2012, March 6). COSCO forms Strong anchor for Boston port. China Daily.
http://www.china.org.cn/business/2012-03/06/content_24817255.htm.
Young, R. (2009, July 1). Antitrust basics: Misleading Herfindahl-Hirschman Index.
Competitive Enterprise Institute. https://cei.org/blog/antitrust-basics-misleading-
herfindahl-hirschman-index/.

55
Appendices
Appendix 1: Glossary of Acronyms
a. ARPD – Augmented relative profit difference. The ARPD is a weighted measure of
market competition that adjusts the RPD of an industry based on the gross revenue of
relevant firms (Schiersch and Schmidt-Ehmcke, 2010). See Appendix 1g for explanation
of the RPD. Refer to Figure 15 and its associated paragraphs for more details and
calculations about the ARPD.
b. BRI – Belt and Road Initiative. The Belt and Road Initiative is a multi-trillion-dollar
global infrastructure project that the Chinese government announced in 2013.
c. CCP – Chinese Communist Party. The Chinese Communist Party is the governing
political party in China and faces no significant institutional opposition.
d. HHI – Herfindahl-Hirschman Index. Refer to Figure 3 and its associated paragraphs for
more details and calculations about the HHI.
e. M&A – Mergers and acquisitions. Mergers occur when two companies decide to
combine into one. Acquisitions occur when one company wants to purchase another
company either to subsume it or to establish it as a subsidiary.
f. NAICS – North American Industry Classification System. NAICS is the industry
classification system used by the United States, Canada, and Mexico (Office of
Management and Budget, 2017). It groups like businesses together based on their
production processes and assigns codes to each group with increasing specificity as more
digits are added (Office of Management and Budget, 2017).
g. OBOR – One Belt One Road. See Appendix 1b; OBOR is an alternative abbreviation for
the BRI.
56
h. PCM – Price-cost margin. The PCM is the difference between the price and marginal cost
of a good or service (Amador et al., 2015). Changes in the average PCM of an industry
are used to describe changes in its competitive landscape. A lower PCM represents higher
competition while a higher PCM represents the opposite.
i. RPD – Relative profit difference. The RPD is a measure of how competitive a market is
based on the profits of the least, average, and most efficient companies within an industry
(Boone, 2008). Refer to Figure 14 and its associated paragraph for more details and
calculations.
j. SASAC – State-Owned Assets Supervision and Administration Commission. The State-
Owned Assets Supervision and Administration Commission is an agency within China’s
State Council that oversees the operations of 97 most central SOEs.
k. SOE – State-owned enterprise. State-owned enterprises are companies that are partially
or wholly operated or owned by a national, provincial, or local government.
Appendix 2: Glossary of Terms
a. Brownfield – For brownfield investments, a company purchases access to existing
facilities in a foreign country to launch its expansion into it.
b. Greenfield – For greenfield investments, a company builds its facilities from the ground
up without using on preexisting fixed assets of other companies.
c. Market competitiveness – Market competitiveness in general equilibrium theory refers to
the quality of a market to 1) naturally produce one prevailing price that constrains all
sellers of a product and 2) satisfy all buyer demand at that prevailing price. Market
57
concentration is associated with market competitiveness, because it relates to the amount
of companies competing in an industry.
Appendix 3: Complete Explanation of Source Data
The file titled “intsheets” was created to centralize all the sheets the final dataset would
reference.35 The following sheets in order were added to this file in individual tabs:
• naics: Contains four-digit, three-digit, and two-digit NAICS codes for relevant
industries (Office of Management and Budget, 2017). The four-digit codes were
manually entered, but the three-digit and two-digit ones were calculated using the
formulas LEFT(B2, 3) and LEFT(C2, 3), respectively.
• cmpnycode: Contains an ascending numeric code for relevant companies.
Companies were copied from the invdata sheet, duplicates were removed, and the
remaining cells were sorted alphabetically and given incrementing codes
beginning with 1. This sheet also contains data for the government ownership
stake at the time of investment and the presence of SASAC supervision. This data
accumulated from multiple sources with the latter two columns being filled in
manually.
• sasac: Contains a list of central SOEs that are supervised by SASAC, including
both the Chinese names and the English translation (State-owned Assets
Supervision and Administration Commission of the State Council, n.d.).
• invdata: Contains a copy of the China Global Investment Tracker (Scissors,
2020). The columns with multiple stakes or companies were divided into multiple
35 The title was intended to be a shorthand for “Intermediate Sheets.”

58
rows, and their collective investment was assumed to be split equally unless
available information stated otherwise. Additionally, the blank subsector sells
were populated with the sector in the column directly to the left. Lastly, one edit
was made to further specify the industries being invested in. In 2014, one
investment into Canada was categorized as “Other” in its industry subsector. For
accuracy, the industry was changed to “Advertising” because the investing
company was BlueFocus Communication Group, one of the top public relations
companies in Asia (Forbes, n.d.).
• hhi-tc: Contains a copy of the HH Market Concentration Index created by
TCdata360 (The World Bank, n.d.).36
• hhi-wits: Contains a copy of the HHI data compiled for the WITS database (The
World Bank, n.d.).
• ctrycode: Contains an ascending numeric code for relevant countries. Countries
were copied from the invdata sheet, duplicates were removed, and the remaining
cells were sorted alphabetically and given incrementing codes beginning with 1.
Appendix 4: Complete Explanation of Data Cleaning and Analysis
Coding for R with comments can be found in the attached files. Formulas in each csv file
were removed and replaced with the text of their values to reduce file sizes. The instructions
below describe how to recreate the final csv file used for analysis.
36 This HHI data was eventually replaced with the data from WITS. As such, it is not necessary to include in the
intsheets file if desired.

59
To replicate the “thesisdata” csv file, first, filter out the blank cells in Column E (“Share
Size”), and copy the country, subsector,37 and year columns from the invdata tabs in intsheets.
Delete values where the year is greater than 2015. Use the following formulas to then add the
four-digit, three-digit, and two-digit NAICS codes, respectively, for the industries:
• naics4: INDEX ( [intsheets.xlsx] NAICS! $B$2 : $B$36, MATCH (B2, [intsheets.xlsx]
NAICS! $A$2: $A$36, 0) )38
• naics3: INDEX ( [intsheets.xlsx] NAICS! $C$2 : $C$36, MATCH (B2, [intsheets.xlsx]
NAICS! $A$2: $A$36, 0) )
• naics2: INDEX ( [intsheets.xlsx] NAICS! $D$2 : $D$36, MATCH (B2, [intsheets.xlsx]
NAICS! $A$2: $A$36, 0) )
Highlight the country, industry, and four-digit NAICS code columns, and use the remove
duplicates Excel function to keep only the unique combinations. At this point, there should 515
rows, including the title row, remaining.
The following table describes the thesisdata column names and the remaining steps for
replicating it using intsheets and Excel formulas. Columns are listed in the left-to-right order
they appear in the final sheet.
Figure 16: Replication Table for thesisdata.csv
37 This value was used instead of sector to describe an industry because it allowed for a higher level of
disaggregation that could be reversed if needed. 38 Remove the spaces when entering this text into Excel. Spaces were added to improve the readability of long
formulas.

60
Column Name (Letter) Data Stored Excel Formula
id The unique value that
represents the row being
used. It is created from the
concatenation of a four-digit
industry code, country code,
and year.39
CONCATENATE(C2,"_",F2,
"_",E2)40
ctrycode The corresponding country
code from the ctrycode page
in the intsheets file.
INDEX ( ' [intsheets.xlsx]
ctrycode'! $B$2: $B$125,
MATCH(B2,'[intsheets.xlsx]c
trycode'!$A$2:$A$125,0))41
naics4 Explained above. Explained above.
naics3 Explained above. Explained above.
naics2 Explained above. Explained above.
39 This process can be replaced with concatenating the industry name, country, and year. Codes were used to
minimize the influence of preconceptions when initially interpreting the data. 40 For this formula, “ctrycode” was in Column C, “naics4” was in Column F, and “year” was in column E of
thesisdata. 41 For this formula, Column B of thesisdata had the list of countries created at the beginning.

61
Column Name (Letter) Data Stored Excel Formula
num_cmpny The number of companies
that invested in a given
country, industry, and year
COUNTIFS('[intsheets.xlsx]
invdata'! $A$5: $A$1701,
"="&E2, '[intsheets.xlsx]
invdata'!$I$5:$I$1701,"="&B
2,'[intsheets.xlsx]invdata'!
$H$5: $H$1701, "="&D2,
'[intsheets.xlsx] invdata'!
$E$5: $E$1701, ">"&0)

62
Column Name (Letter) Data Stored Excel Formula
cmpny1 The company code of the first
company listed in the invdata
table that invested in the
corresponding country and
industry during the
corresponding year.
The “id” column is first
added as the first column in
the invdata sheet in intsheets
using the following formula:
IF(AND(NOT(F5=0),B5<
2016), CONCATENATE
(VLOOKUP(J5,ctrycode!
$A$2:$B$125,2,FALSE),"_",
VLOOKUP(I5,naics!$A$2:
$B$36,2,FALSE),"_",B5),"").
Then in the thesisdata file,
cmpny1 is found using this
formula: INDEX([intsheets.
xlsx]cmpnycode!$A$2:
$A$661,MATCH(
VLOOKUP(A2,[intsheets.
xlsx]invdata!$A$5:$D$1701,
4,FALSE),[intsheets.xlsx]
cmpnycode!$B$2:$B$661,0))
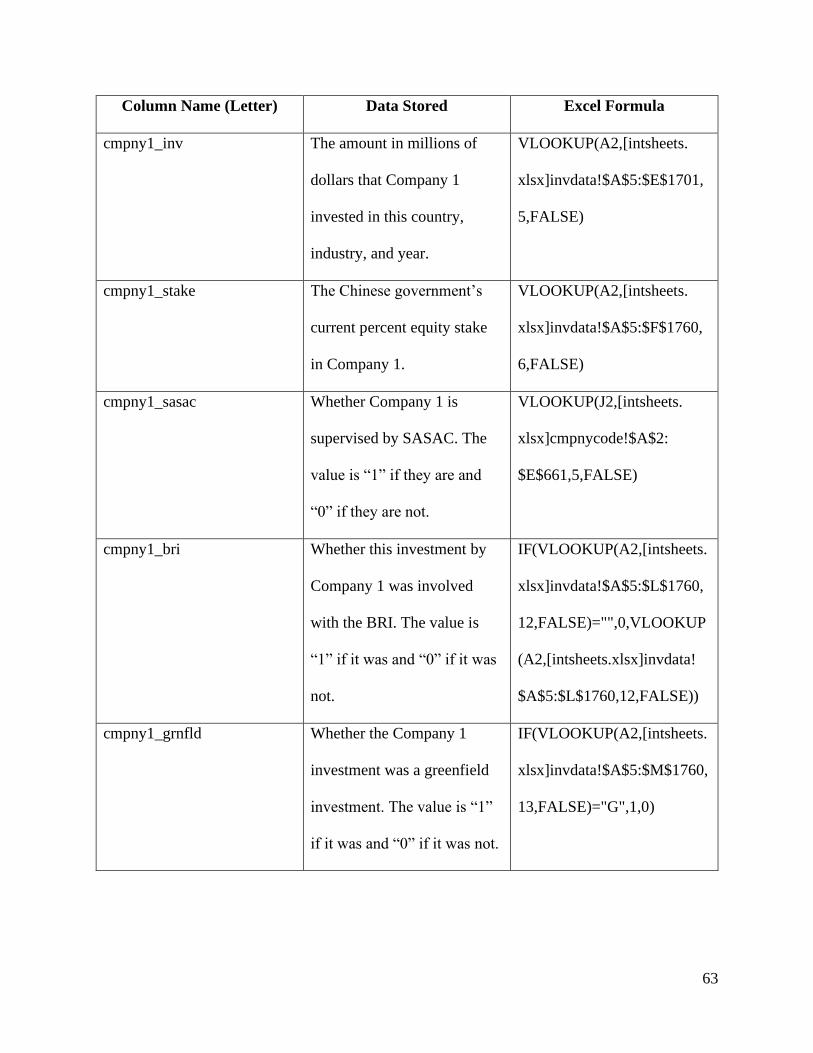
63
Column Name (Letter) Data Stored Excel Formula
cmpny1_inv The amount in millions of
dollars that Company 1
invested in this country,
industry, and year.
VLOOKUP(A2,[intsheets.
xlsx]invdata!$A$5:$E$1701,
5,FALSE)
cmpny1_stake The Chinese government’s
current percent equity stake
in Company 1.
VLOOKUP(A2,[intsheets.
xlsx]invdata!$A$5:$F$1760,
6,FALSE)
cmpny1_sasac Whether Company 1 is
supervised by SASAC. The
value is “1” if they are and
“0” if they are not.
VLOOKUP(J2,[intsheets.
xlsx]cmpnycode!$A$2:
$E$661,5,FALSE)
cmpny1_bri Whether this investment by
Company 1 was involved
with the BRI. The value is
“1” if it was and “0” if it was
not.
IF(VLOOKUP(A2,[intsheets.
xlsx]invdata!$A$5:$L$1760,
12,FALSE)="",0,VLOOKUP
(A2,[intsheets.xlsx]invdata!
$A$5:$L$1760,12,FALSE))
cmpny1_grnfld Whether the Company 1
investment was a greenfield
investment. The value is “1”
if it was and “0” if it was not.
IF(VLOOKUP(A2,[intsheets.
xlsx]invdata!$A$5:$M$1760,
13,FALSE)="G",1,0)

64
Column Name (Letter) Data Stored Excel Formula
cmpny2 The second company listed in
the invdata table that invested
in the corresponding country
and industry during the
corresponding year. Cells are
blank if there is no second
company.
Filter out rows where
num_cmpny equals 1. Use the
following formula beginning
with the first entry, which
should be on the third row:
INDEX([intsheets.xlsx]
cmpnycode!$A$2:$A$661,
MATCH(INDEX([intsheets.
xlsx] invdata!$D$5:$D$1760,
SMALL(IF([intsheets.xlsx]
invdata!$A$5:$A$1760=A3,
ROW([intsheets.xlsx]invdata!
$A$5:$A$1760)-MIN(ROW(
[intsheets.xlsx]invdata!$A$5:
$A$1760))+1),2)),[intsheets.
xlsx]cmpnycode!$B$2:
$B$661,0),)

65
Column Name (Letter) Data Stored Excel Formula
cmpny2_inv The amount in millions of
dollars that Company 2
invested in this country,
industry, and year. Cells are
blank if there is no second
company.
{INDEX([intsheets.
xlsx]invdata!$E$5:$E$1760,
MATCH(1,(A3=[intsheets.
xlsx]invdata!$A$5:$A$1760)
*(VLOOKUP(P3,[intsheets.
xlsx]cmpnycode!$A$2:
$B$661,2,FALSE)=
[intsheets.xlsx]invdata!$D$5:
$D$1760),0))}42
cmpny2_stake The Chinese government’s
current percent equity stake
in Company 2. Cells are
blank if there is no second
company.
{INDEX([intsheets.xlsx]
invdata!$F$5:$F$1760,
MATCH(1,(A3=[intsheets.
xlsx]invdata!$A$5:$A$1760)
*(VLOOKUP(P3,[intsheets.
xlsx]cmpnycode!$A$2:
$B$661,2,FALSE)=
[intsheets.xlsx]invdata!$D$5:
$D$1760),0))}
42 The brackets indicate an array formula. Array formulas must be applied using Ctrl+Shift+Enter. The “+” used in
commands here indicates a need to hold down the two keys simultaneously. Meanwhile, the “-“, if used, indicates
that the buttons should be pressed in succession, not at the same time.

66
Column Name (Letter) Data Stored Excel Formula
cmpny2_sasac Whether Company 2 is
supervised by SASAC. The
value is “1” if they are and
“0” if they are not.
VLOOKUP(P3,[intsheets.
xlsx]cmpnycode!$A$2:
$E$661,5,FALSE)
cmpny2_bri Whether this investment by
Company 2 was involved
with the BRI. The value is
“1” if it was and “0” if it was
not. Cells are blank if there is
no second company.
{INDEX([intsheets.xlsx]
invdata!$L$5:$L$1760,
MATCH(1,(A3=[intsheets.
xlsx]invdata!$A$5:$A$1760)
*(VLOOKUP(P3,[intsheets.
xlsx]cmpnycode!$A$2:
$B$661,2,FALSE)=
[intsheets.xlsx]invdata!$D$5:
$D$1760),0))}
cmpny2_grnfld Whether the Company 2
investment was a greenfield
investment. The value is “1”
if it was and “0” if it was not.
Cells are blank if there is no
second company.
IF(INDEX([intsheets.xlsx]
invdata!$M$5:$M$1760,
MATCH(1,(A3=[intsheets.
xlsx]invdata!$A$5:$A$1760)
*(VLOOKUP(P3,[intsheets.
xlsx]cmpnycode!$A$2:
$B$661,2,FALSE)=
[intsheets.xlsx]invdata!$D$5:
$D$1760),0))="G",1,0)

67
Column Name (Letter) Data Stored Excel Formula
cmpny3 The third company listed in
the invdata table that invested
in the corresponding country
and industry during the
corresponding year. Cells are
blank if there is no third
company.
Filter out rows where
num_cmpny equals 1 or 2.
Use the following formula
beginning with the first entry,
which should be on the 28th
row: INDEX([intsheets.
xlsx]cmpnycode!$A$2:
$A$661,MATCH(INDEX(
[intsheets.xlsx]invdata!$D$5:
$D$1760,SMALL(IF(
[intsheets.xlsx]invdata!$A$5:
$A$1760=A28,ROW(
[intsheets.xlsx]invdata!$A$5:
$A$1760)-MIN(ROW(
[intsheets.xlsx]invdata!$A$5:
$A$1760))+1),3)),[intsheets.
xlsx]cmpnycode!$B$2:
$B$661,0),)
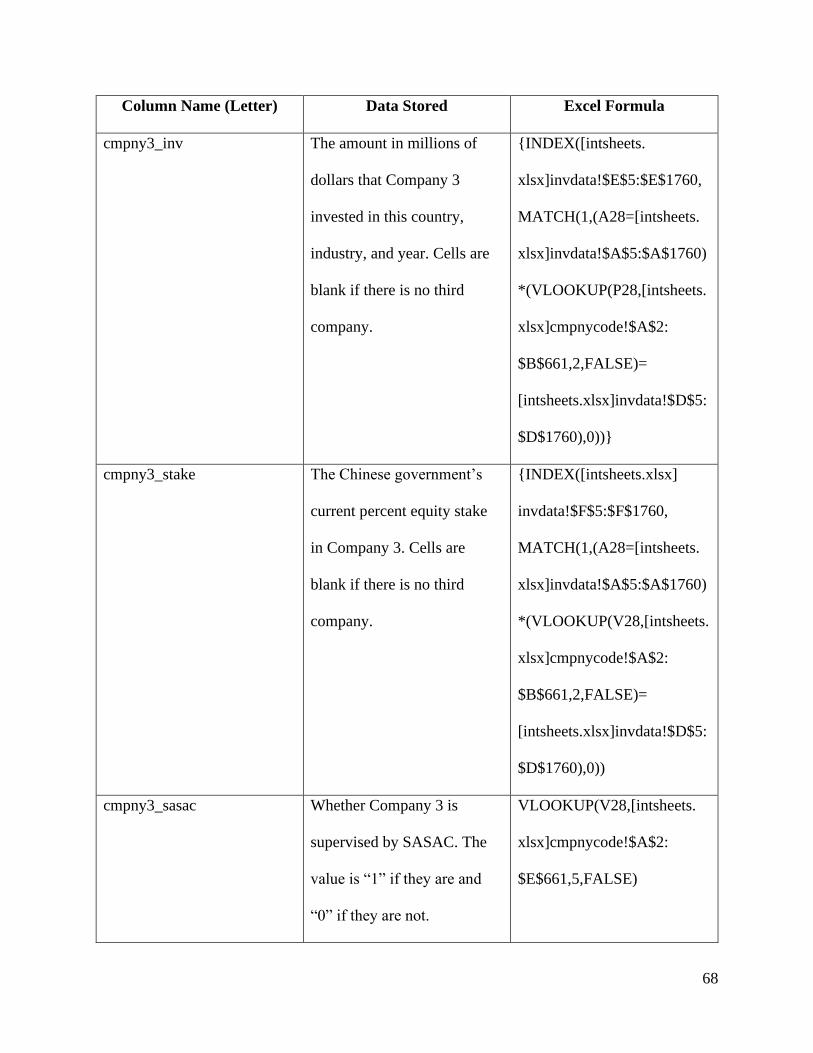
68
Column Name (Letter) Data Stored Excel Formula
cmpny3_inv The amount in millions of
dollars that Company 3
invested in this country,
industry, and year. Cells are
blank if there is no third
company.
{INDEX([intsheets.
xlsx]invdata!$E$5:$E$1760,
MATCH(1,(A28=[intsheets.
xlsx]invdata!$A$5:$A$1760)
*(VLOOKUP(P28,[intsheets.
xlsx]cmpnycode!$A$2:
$B$661,2,FALSE)=
[intsheets.xlsx]invdata!$D$5:
$D$1760),0))}
cmpny3_stake The Chinese government’s
current percent equity stake
in Company 3. Cells are
blank if there is no third
company.
{INDEX([intsheets.xlsx]
invdata!$F$5:$F$1760,
MATCH(1,(A28=[intsheets.
xlsx]invdata!$A$5:$A$1760)
*(VLOOKUP(V28,[intsheets.
xlsx]cmpnycode!$A$2:
$B$661,2,FALSE)=
[intsheets.xlsx]invdata!$D$5:
$D$1760),0))
cmpny3_sasac Whether Company 3 is
supervised by SASAC. The
value is “1” if they are and
“0” if they are not.
VLOOKUP(V28,[intsheets.
xlsx]cmpnycode!$A$2:
$E$661,5,FALSE)

69
Column Name (Letter) Data Stored Excel Formula
cmpny3_bri Whether this investment by
Company 3 was involved
with the BRI. The value is
“1” if it was and “0” if it was
not. Cells are blank if there is
no third company.
{INDEX([intsheets.xlsx]
invdata!$L$5:$L$1760,
MATCH(1,(A28=[intsheets.
xlsx]invdata!$A$5:$A$1760)
*(VLOOKUP(V28,[intsheets.
xlsx]cmpnycode!$A$2:
$B$661,2,FALSE)=
[intsheets.xlsx]invdata!$D$5:
$D$1760),0))}
cmpny3_grnfld Whether the Company 3
investment was a greenfield
investment. The value is “1”
if it was and “0” if it was not.
Cells are blank if there is no
third company.
IF(INDEX([intsheets.xlsx]
invdata!$M$5:$M$1760,
MATCH(1,(A28=[intsheets.
xlsx]invdata!$A$5:$A$1760)
*(VLOOKUP(V28,[intsheets.
xlsx]cmpnycode!$A$2:
$B$661,2,FALSE)=
[intsheets.xlsx]invdata!$D$5:
$D$1760),0))="G",1,0)

70
Column Name (Letter) Data Stored Excel Formula
cmpny4 The fourth company listed in
the invdata table that invested
in the corresponding country
and industry during the
corresponding year. Cells are
blank if there is no fourth
company.
Filter out rows where
num_cmpny equals 1, 2, or 3.
Use the following formula
beginning with the first entry,
which should be on the 28th
row: INDEX([intsheets.
xlsx]cmpnycode!$A$2:
$A$661,MATCH(INDEX(
[intsheets.xlsx]invdata!$D$5:
$D$1760,SMALL(IF(
[intsheets.xlsx]invdata!$A$5:
$A$1760=A28,ROW(
[intsheets.xlsx]invdata!$A$5:
$A$1760)-MIN(ROW(
[intsheets.xlsx]invdata!$A$5:
$A$1760))+1),4)),[intsheets.
xlsx]cmpnycode!$B$2:
$B$661,0),)

71
Column Name (Letter) Data Stored Excel Formula
cmpny4_inv The amount in millions of
dollars that Company 4
invested in this country,
industry, and year. Cells are
blank if there is no fourth
company.
{INDEX([intsheets.
xlsx]invdata!$E$5:$E$1760,
MATCH(1,(A28=[intsheets.
xlsx]invdata!$A$5:$A$1760)
*(VLOOKUP(A28,
[intsheets.xlsx]cmpnycode!
$A$2: $B$661,2,FALSE)=
[intsheets.xlsx]invdata!$D$5:
$D$1760),0))}
cmpny4_stake The Chinese government’s
current percent equity stake
in Company 4. Cells are
blank if there is no fourth
company.
{ INDEX([intsheets.xlsx]
invdata!$F$5:$F$1760,
MATCH(1,(A28=[intsheets.
xlsx]invdata!$A$5:$A$1760)
*(VLOOKUP(AB28,
[intsheets.xlsx]cmpnycode!
$A$2:$B$661,2,FALSE)=
[intsheets.xlsx]invdata!$D$5:
$D$1760),0))}
cmpny4_sasac Whether Company 4 is
supervised by SASAC. The
value is “1” if they are and
“0” if they are not.
=VLOOKUP(AB28,
[intsheets.xlsx]cmpnycode!
$A$2:$E$661,5,FALSE)
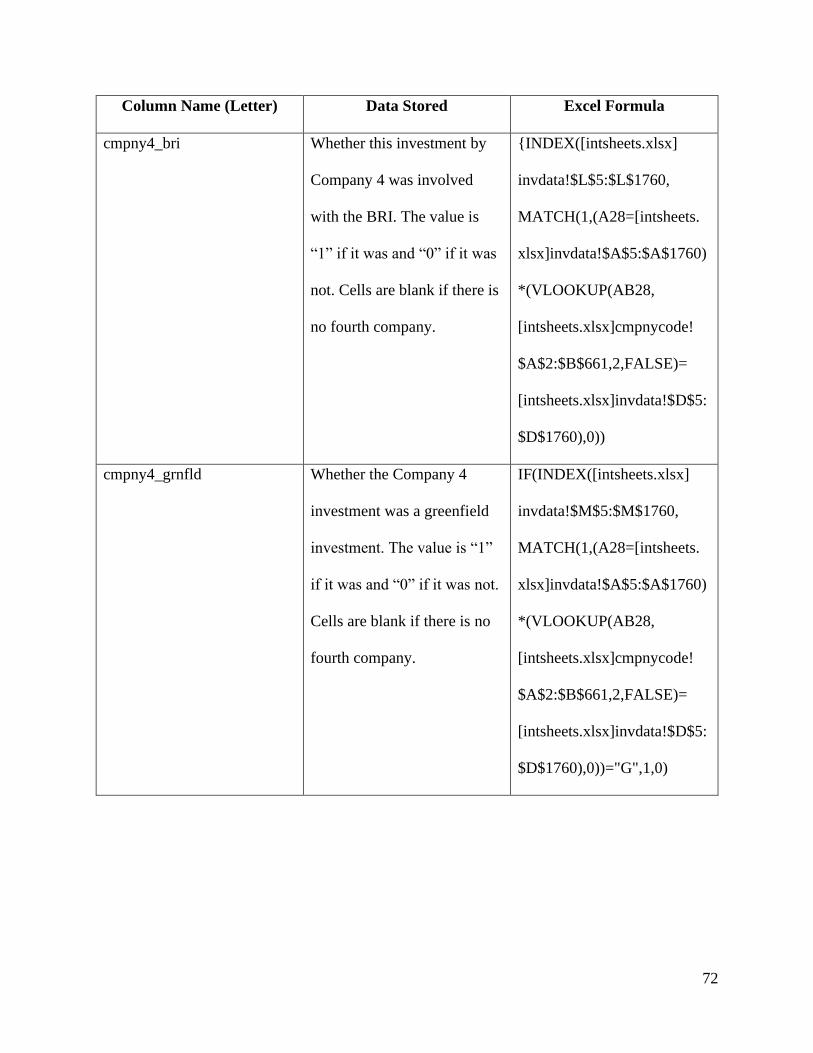
72
Column Name (Letter) Data Stored Excel Formula
cmpny4_bri Whether this investment by
Company 4 was involved
with the BRI. The value is
“1” if it was and “0” if it was
not. Cells are blank if there is
no fourth company.
{INDEX([intsheets.xlsx]
invdata!$L$5:$L$1760,
MATCH(1,(A28=[intsheets.
xlsx]invdata!$A$5:$A$1760)
*(VLOOKUP(AB28,
[intsheets.xlsx]cmpnycode!
$A$2:$B$661,2,FALSE)=
[intsheets.xlsx]invdata!$D$5:
$D$1760),0))
cmpny4_grnfld Whether the Company 4
investment was a greenfield
investment. The value is “1”
if it was and “0” if it was not.
Cells are blank if there is no
fourth company.
IF(INDEX([intsheets.xlsx]
invdata!$M$5:$M$1760,
MATCH(1,(A28=[intsheets.
xlsx]invdata!$A$5:$A$1760)
*(VLOOKUP(AB28,
[intsheets.xlsx]cmpnycode!
$A$2:$B$661,2,FALSE)=
[intsheets.xlsx]invdata!$D$5:
$D$1760),0))="G",1,0)

73
Column Name (Letter) Data Stored Excel Formula
cmpny5 The fifth company listed in
the invdata table that invested
in the corresponding country
and industry during the
corresponding year. Cells are
blank if there is no fifth
company.
Filter out rows where
num_cmpny equals 1, 2, 3, or
4. Use the following formula
beginning with the first entry,
which should be on the 28th
row: INDEX([intsheets.
xlsx]cmpnycode!$A$2:
$A$661,MATCH(INDEX(
[intsheets.xlsx]invdata!$D$5:
$D$1760,SMALL(IF(
[intsheets.xlsx]invdata!$A$5:
$A$1760=A28,ROW(
[intsheets.xlsx]invdata!$A$5:
$A$1760)-MIN(ROW(
[intsheets.xlsx]invdata!$A$5:
$A$1760))+1),5)),[intsheets.
xlsx]cmpnycode!$B$2:
$B$661,0),)

74
Column Name (Letter) Data Stored Excel Formula
cmpny5_inv The amount in millions of
dollars that Company 5
invested in this country,
industry, and year. Cells are
blank if there is no fifth
company.
{INDEX([intsheets.
xlsx]invdata!$E$5:$E$1760,
MATCH(1,(A28=[intsheets.
xlsx]invdata!$A$5:$A$1760)
*(VLOOKUP(AH28,
[intsheets.xlsx]cmpnycode!
$A$2: $B$661,2,FALSE)=
[intsheets.xlsx]invdata!$D$5:
$D$1760),0))}
cmpny5_stake The Chinese government’s
current percent equity stake
in Company 5. Cells are
blank if there is no fifth
company.
{INDEX([intsheets.xlsx]
invdata!$F$5:$F$1760,
MATCH(1,(A28=[intsheets.
xlsx]invdata!$A$5:$A$1760)
*(VLOOKUP(AH28,
[intsheets.xlsx]cmpnycode!
$A$2:$B$661,2,FALSE)=
[intsheets.xlsx]invdata!$D$5:
$D$1760),0))}
cmpny5_sasac Whether Company 5 is
supervised by SASAC. The
value is “1” if they are and
“0” if they are not.
VLOOKUP(AH28,[intsheets.
xlsx]cmpnycode!$A$2:
$E$661,5,FALSE)

75
Column Name (Letter) Data Stored Excel Formula
cmpny5_bri Whether this investment by
Company 5 was involved
with the BRI. The value is
“1” if it was and “0” if it was
not. Cells are blank if there is
no fifth company.
{INDEX([intsheets.xlsx]
invdata!$L$5:$L$1760,
MATCH(1,(A28=[intsheets.
xlsx]invdata!$A$5:$A$1760)
*(VLOOKUP(AH28,
[intsheets.xlsx]cmpnycode!
$A$2:$B$661,2,FALSE)=
[intsheets.xlsx]invdata!$D$5:
$D$1760),0))}
cmpny5_grnfld Whether the Company 5
investment was a greenfield
investment. The value is “1”
if it was and “0” if it was not.
Cells are blank if there is no
fifth company.
IF(INDEX([intsheets.xlsx]
invdata!$M$5:$M$1760,
MATCH(1,(A28=[intsheets.
xlsx]invdata!$A$5:$A$1760)
*(VLOOKUP(AH28,
[intsheets.xlsx]cmpnycode!
$A$2:$B$661,2,FALSE)=
[intsheets.xlsx]invdata!$D$5:
$D$1760),0))="G",1,0)

76
Column Name (Letter) Data Stored Excel Formula
cmpny6 The sixth company listed in
the invdata table that invested
in the corresponding country
and industry during the
corresponding year. Cells are
blank if there is no sixth
company.
Filter out rows where
num_cmpny equals 1, 2, 3, or
4.43 Use the following
formula beginning with the
first entry, which should be
on the 28th row:
INDEX([intsheets.
xlsx]cmpnycode!$A$2:
$A$661,MATCH(INDEX(
[intsheets.xlsx]invdata!$D$5:
$D$1760,SMALL(IF(
[intsheets.xlsx]invdata!$A$5:
$A$1760=A28,ROW(
[intsheets.xlsx]invdata!$A$5:
$A$1760)-MIN(ROW(
[intsheets.xlsx]invdata!$A$5:
$A$1760))+1),6)),[intsheets.
xlsx]cmpnycode!$B$2:$B$66
1,0),)
43 No rows have exactly five companies.

77
Column Name (Letter) Data Stored Excel Formula
cmpny6_inv The amount in millions of
dollars that Company 6
invested in this country,
industry, and year. Cells are
blank if there is no sixth
company.
{INDEX([intsheets.
xlsx]invdata!$E$5:$E$1760,
MATCH(1,(A28=[intsheets.
xlsx]invdata!$A$5:$A$1760)
*(VLOOKUP(AN28,
[intsheets.xlsx]cmpnycode!
$A$2: $B$661,2,FALSE)=
[intsheets.xlsx]invdata!$D$5:
$D$1760),0))}
cmpny6_stake The Chinese government’s
current percent equity stake
in Company 6. Cells are
blank if there is no sixth
company.
{ =INDEX([intsheets.xlsx]
invdata!$F$5:$F$1760,
MATCH(1,(A28=[intsheets.
xlsx]invdata!$A$5:$A$1760)
*(VLOOKUP(AN28,
[intsheets.xlsx]cmpnycode!
$A$2:$B$661,2,FALSE)=
[intsheets.xlsx]invdata!$D$5:
$D$1760),0))}
cmpny6_sasac Whether Company 6 is
supervised by SASAC. The
value is “1” if they are and
“0” if they are not.
VLOOKUP(AN28,[intsheets.
xlsx]cmpnycode!$A$2:
$E$661,5,FALSE)

78
Column Name (Letter) Data Stored Excel Formula
cmpny6_bri Whether this investment by
Company 6 was involved
with the BRI. The value is
“1” if it was and “0” if it was
not. Cells are blank if there is
no sixth company.
{INDEX([intsheets.xlsx]
invdata!$L$5:$L$1760,
MATCH(1,(A28=[intsheets.
xlsx]invdata!$A$5:$A$1760)
*(VLOOKUP(AN28,
[intsheets.xlsx]cmpnycode!
$A$2:$B$661,2,FALSE)=
[intsheets.xlsx]invdata!$D$5:
$D$1760),0))}
cmpny6_grnfld Whether the Company 6
investment was a greenfield
investment. The value is “1”
if it was and “0” if it was not.
Cells are blank if there is no
sixth company.
IF(INDEX([intsheets.xlsx]
invdata!$M$5:$M$1760,
MATCH(1,(A230=[intsheets.
xlsx]invdata!$A$5:$A$1760)
*(VLOOKUP(AN230,
[intsheets.xlsx]cmpnycode!
$A$2:$B$661,2,FALSE)=
[intsheets.xlsx]invdata!$D$5:
$D$1760),0))="G",1,0)
total_inv The total amount of
investments in millions that
were received in an industry
over one year.
SUM(N2,T2,Z2,AF2,AL2,
AQ2)

79
Column Name (Letter) Data Stored Excel Formula
avgstake Simple average of the
government ownership stakes
in the investing companies
for the evaluation period
AVERAGE(O2,U2,AA2,
AG2,AM2,AS2)
w_avgstake Weighted average of the
government ownership stakes
based on the investment sizes
of companies for the
evaluation period
SUM(N2*O2/AW2,T2*U2/
AW2,Z2*AA2/AW2,AF2*
AG2/AW2,AL2*AM2/AW2,
AR2*AS2/AW2)
hhi_0 HHI in the year of investment 10000*VLOOKUP(B2,[intsh
eets.xlsx]hhi!$A$2:$Q$207,
E2-[intsheets.xlsx]hhi!$D$1
+3,FALSE)
hhi_1 HHI one year after
investment
10000*VLOOKUP(B2,[intsh
eets.xlsx]hhi!$A$2:$Q$207,
E2- [intsheets.xlsx]hhi!$D$1
+4,FALSE)
1yr_hhichange HHI change over one year BD2-BC2
1yr_hhichange_bin Whether HHI increased in
one year. The value is “1” if
it did and “0” if it did not.
IF(AND(BE2<>””,BE2>0),1,
IF(AND(BE2<>””,BE2<0,0,”
”))
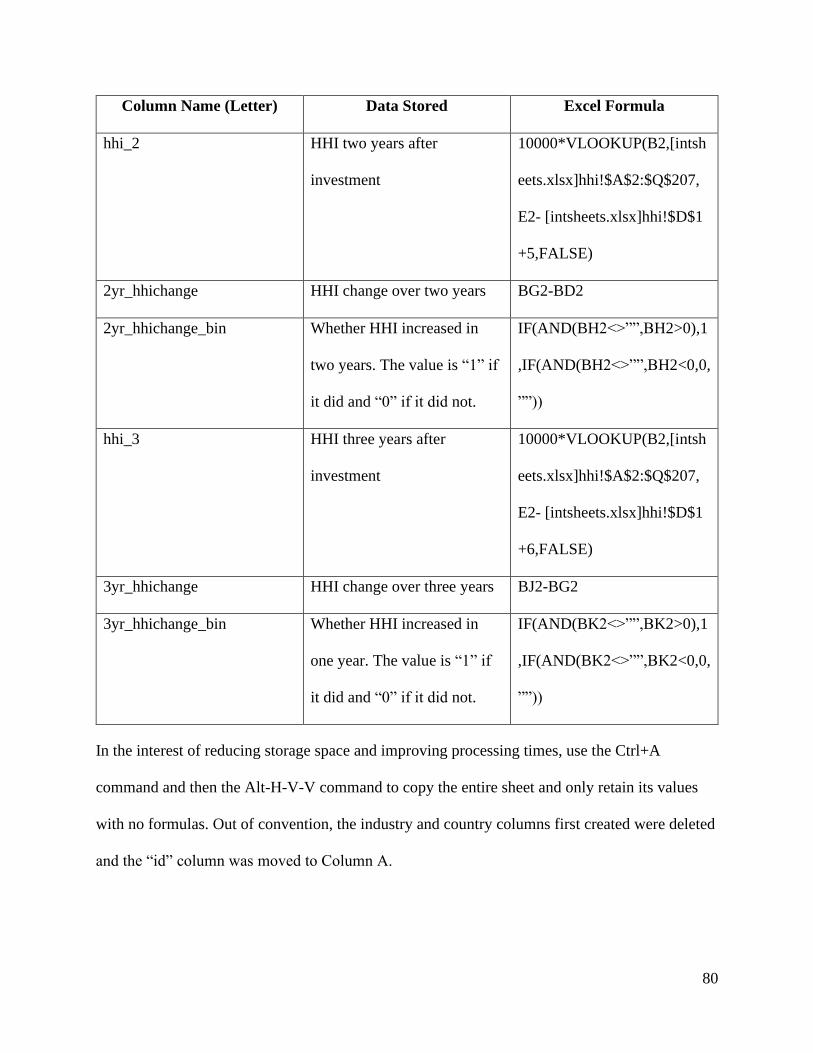
80
Column Name (Letter) Data Stored Excel Formula
hhi_2 HHI two years after
investment
10000*VLOOKUP(B2,[intsh
eets.xlsx]hhi!$A$2:$Q$207,
E2- [intsheets.xlsx]hhi!$D$1
+5,FALSE)
2yr_hhichange HHI change over two years BG2-BD2
2yr_hhichange_bin Whether HHI increased in
two years. The value is “1” if
it did and “0” if it did not.
IF(AND(BH2<>””,BH2>0),1
,IF(AND(BH2<>””,BH2<0,0,
””))
hhi_3 HHI three years after
investment
10000*VLOOKUP(B2,[intsh
eets.xlsx]hhi!$A$2:$Q$207,
E2- [intsheets.xlsx]hhi!$D$1
+6,FALSE)
3yr_hhichange HHI change over three years BJ2-BG2
3yr_hhichange_bin Whether HHI increased in
one year. The value is “1” if
it did and “0” if it did not.
IF(AND(BK2<>””,BK2>0),1
,IF(AND(BK2<>””,BK2<0,0,
””))
In the interest of reducing storage space and improving processing times, use the Ctrl+A
command and then the Alt-H-V-V command to copy the entire sheet and only retain its values
with no formulas. Out of convention, the industry and country columns first created were deleted
and the “id” column was moved to Column A.

81
Appendix 5: Compilation of Figures
a. Figure 1: Hypothesis 1 Model
∆𝐶𝑜𝑚𝑝𝑒𝑡𝑖𝑡𝑣𝑒𝑛𝑒𝑠𝑠 = 𝑇𝑜𝑡𝑎𝑙 𝐼𝑛𝑣𝑒𝑠𝑡𝑚𝑒𝑛𝑡𝑠 + 𝐶
b. Figure 2: Hypothesis 2 Model
∆𝐶𝑜𝑚𝑝𝑒𝑡𝑖𝑡𝑖𝑣𝑒𝑛𝑒𝑠𝑠 = ∑ 𝑆𝑡𝑎𝑡𝑒 𝐶𝑜𝑛𝑡𝑟𝑜𝑙 𝐹𝑎𝑐𝑡𝑜𝑟𝑠 + 𝐶
c. Figure 3: Hypothesis 3 Model
∆𝐶𝑜𝑚𝑝𝑒𝑡𝑖𝑡𝑖𝑣𝑒𝑛𝑒𝑠𝑠 = 𝑇𝑜𝑡𝑎𝑙 𝐼𝑛𝑣𝑒𝑠𝑡𝑚𝑒𝑛𝑡𝑠 + ∑ 𝑆𝑡𝑎𝑡𝑒 𝐶𝑜𝑛𝑡𝑟𝑜𝑙 𝐹𝑎𝑐𝑡𝑜𝑟𝑠 + 𝐶
d. Figure 4: HHI Formula
𝐻𝐻𝐼 = ∑ 𝑠𝑖2
𝑛
𝑖=1
𝑠𝑖 =ρ(𝑥𝑖)
∑ 𝑥𝑖𝑛𝑖=1
e. Figure 5: Hypothesis 1 Model Results
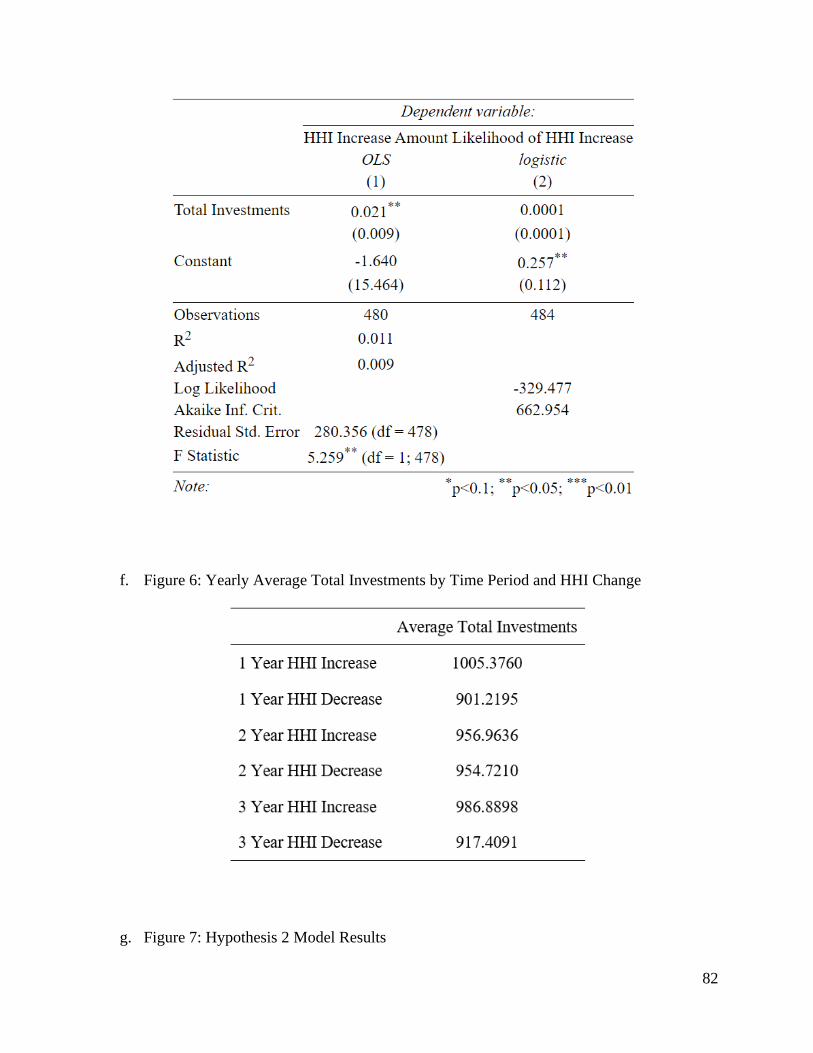
82
f. Figure 6: Yearly Average Total Investments by Time Period and HHI Change
g. Figure 7: Hypothesis 2 Model Results

83
h. Figure 8: Overall Change in HHI
i. Figure 9: Change in HHI for Majority Stake Transactions

84
j. Figure 10: Change in HHI for Minority Stake Transactions
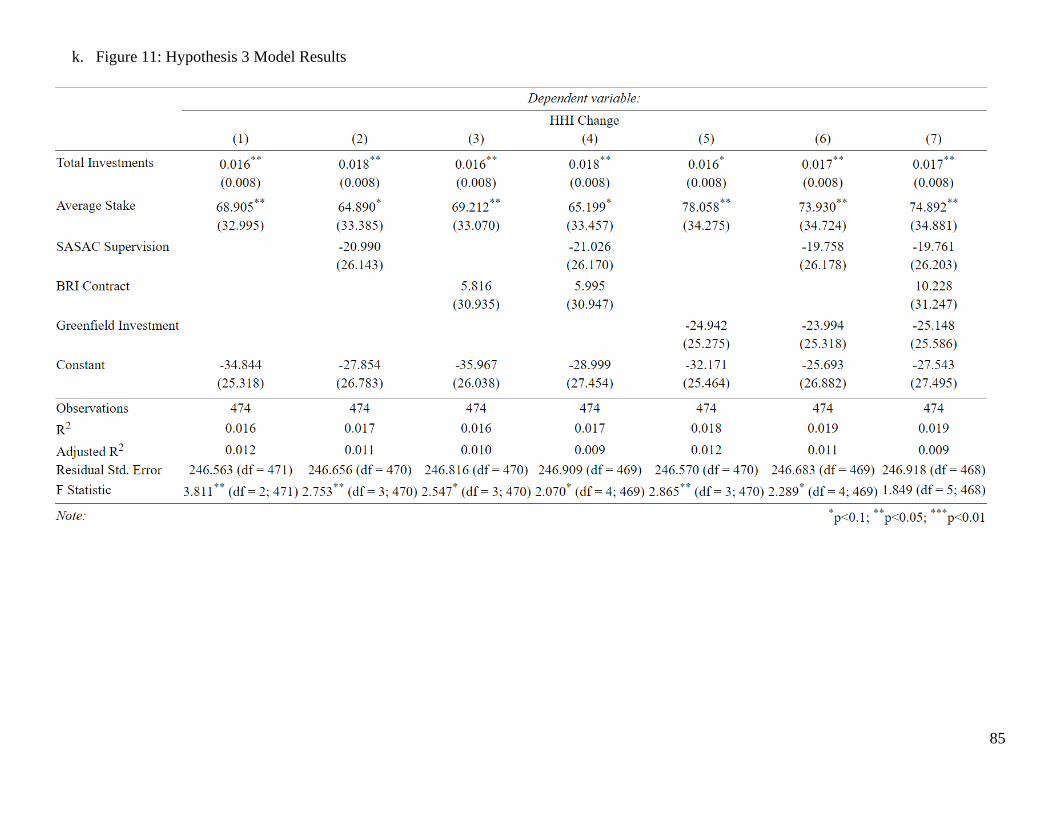
85
k. Figure 11: Hypothesis 3 Model Results

86
l. Figure 12: Revised Hypothesis 3 Model
𝐻𝐻𝐼𝑡 = 𝐻𝐻𝐼0 + 𝑇𝑜𝑡𝑎𝑙 𝐼𝑛𝑣𝑒𝑠𝑡𝑚𝑒𝑛𝑡𝑠 + ∑ 𝑆𝑡𝑎𝑡𝑒 𝐶𝑜𝑛𝑡𝑟𝑜𝑙 𝐹𝑎𝑐𝑡𝑜𝑟𝑠 + 𝐶

87
m. Figure 13: Hypothesis 3 Models Continued
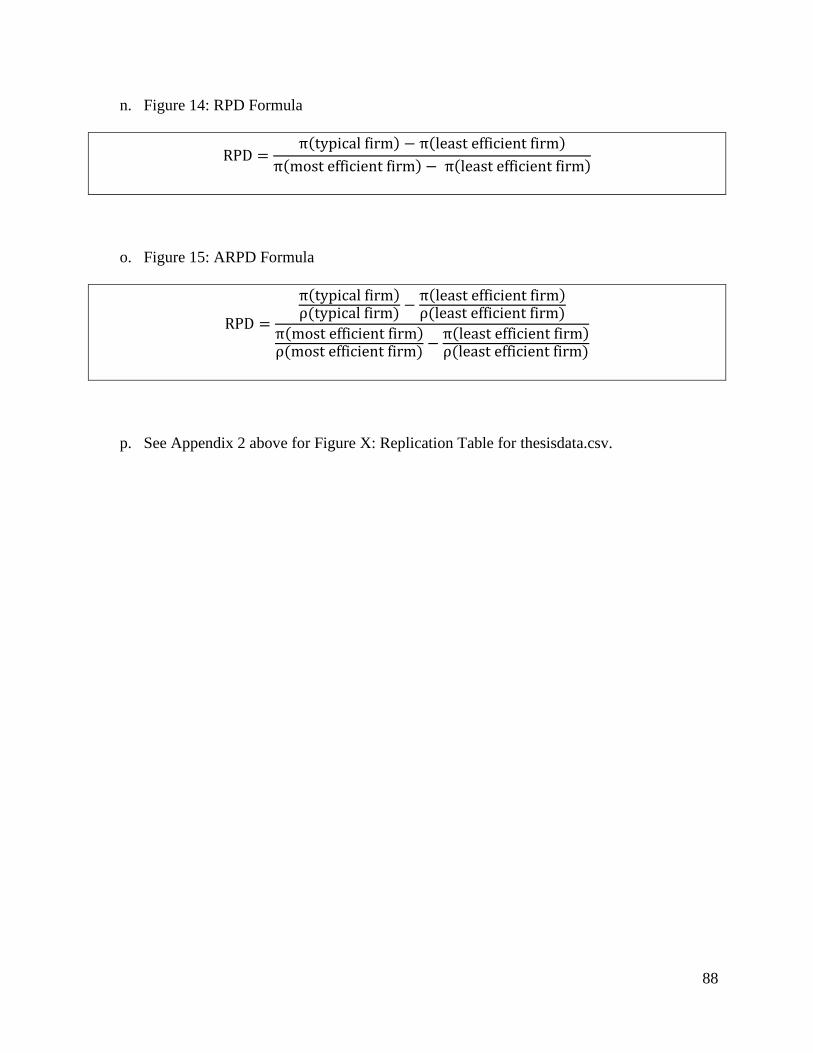
88
n. Figure 14: RPD Formula
RPD =π(typical firm) − π(least efficient firm)
π(most efficient firm) − π(least efficient firm)
o. Figure 15: ARPD Formula
RPD =
π(typical firm)ρ(typical firm)
−π(least efficient firm)ρ(least efficient firm)
π(most efficient firm)ρ(most efficient firm)
−π(least efficient firm)ρ(least efficient firm)
p. See Appendix 2 above for Figure X: Replication Table for thesisdata.csv.