Investments to End Poverty Chapter 1
17
15 1 • Extreme poverty can and must be eradicated by 2030. The UN Secretary- General’s High-Level Panel and subsequent reports have all called for eradicating extreme poverty from the face of the earth by 2030. • Poverty has many dimensions – it is not just about income. Ending poverty means ensuring that everyone has access to adequate nutrition, basic health, education and housing as well as the information and freedom from discrimination that enable people to participate in society. • No one should live on less than $1.25 a day in any country. This is an important first step on the road towards ending all poverty. • Economic growth alone will not get us there fast enough. It will play a critical role in reducing poverty, but growth alone is not fast and inclusive enough to get to zero – no one anywhere living in extreme poverty. Even current best-case scenarios leave more than 100 million living in extreme poverty in 2030. • Targeted interventions are needed. In 2010 there were 400 million people in extreme poverty in sub-Saharan Africa. Many of them are so deep in poverty that only interventions beyond broader growth benefits can overcome the risks and structural barriers they face. • Poverty eradication demands an international backstop. To prevent people falling back into poverty, the international aid architecture must act as a backstop, providing a basic minimum when domestic governments are unable to do so. Ending poverty by 2030 E nding poverty requires permanently lifting every person in the world out of extreme poverty, to above an income of $1.25 a day. This is both a giant leap and a minimum milestone towards ending multidimensional poverty, which blights the lives of hundreds of millions of people. It is also an essential step towards future expectations that ending $2 a day poverty should become the global minimum standard by 2030. The report of the UN High-Level Panel of Eminent Persons on the Post-2015 Development Agenda has crystallised an emerging consensus that the number of poor people could almost get to zero by 2030. 9 This is supported by scenarios based on rapid economic growth and ensuring that poor people benefit from that growth. This will take resources and effective governance of those resources.
-
Upload
independent -
Category
Documents
-
view
10 -
download
0
Transcript of Investments to End Poverty Chapter 1

15
1
• Extreme poverty can and must be eradicated by 2030. The UN Secretary-General’s High-Level Panel and subsequent reports have all called for eradicating extreme poverty from the face of the earth by 2030.
• Poverty has many dimensions – it is not just about income. Ending poverty means ensuring that everyone has access to adequate nutrition, basic health, education and housing as well as the information and freedom from discrimination that enable people to participate in society.
• No one should live on less than $1.25 a day in any country. This is an important first step on the road towards ending all poverty.
• Economic growth alone will not get us there fast enough. It will play a critical role in reducing poverty, but growth alone is not fast and inclusive enough to get to zero – no one anywhere living in extreme poverty. Even current best-case scenarios leave more than 100 million living in extreme poverty in 2030.
• Targeted interventions are needed. In 2010 there were 400 million people in extreme poverty in sub-Saharan Africa. Many of them are so deep in poverty that only interventions beyond broader growth benefits can overcome the risks and structural barriers they face.
• Poverty eradication demands an international backstop. To prevent people falling back into poverty, the international aid architecture must act as a backstop, providing a basic minimum when domestic governments are unable to do so.
Ending poverty by 2030
E nding poverty requires permanently lifting every person in the world out
of extreme poverty, to above an income of $1.25 a day. This is both a giant leap and a minimum milestone towards ending multidimensional poverty, which blights the lives of hundreds of
millions of people. it is also an essential step towards future expectations that ending $2 a day poverty should become the global minimum standard by 2030.
The report of the UN High-Level Panel of Eminent Persons on the Post-2015 Development Agenda has
crystallised an emerging consensus that the number of poor people could almost get to zero by 2030.9 This is supported by scenarios based on rapid economic growth and ensuring that poor people benefit from that growth. This will take resources and effective governance of those resources.

16 PART 1 FRoM v IS IoN To PL AN: INvESTMENTS To END E x TREME PovERT y By 2030
But even in the best-case scenarios growth will fail to lift millions of people out of extreme poverty by 2030 unless growth rates are implausibly high or growth becomes far more inclusive. And if growth slows, inequality rises, or climate change or increased conflict and insecurity affect their country’s economy, poverty could be much more prevalent.
Neither growth nor the resources that drive it are well targeted at poor people. This must change. People who have a very low living standard or who are at high risk of personal, national or global crises must be the focus of future development policy.
Targeting poor people requires understanding and then harnessing all the resources available – both private and public flows, including aid. It also requires knowing who the poor are, where they are and how deep their poverty is. By bringing this information together we can expedite the end of
poverty and ensure that all people attain the most basic living standard by 2030. Better information on poverty and resources flows, as advocated in the High-Level Panel’s proposed ‘Data Revolution,’ fundamentally underpins all efforts to end poverty.
Ending extreme poverty: the first step
Millennium Development Goal (MDG) Target 1A – to halve the proportion of the world’s population living in extreme poverty – was probably met in 2010, five years ahead of schedule, with great progress in East Asia, though much less in South Asia and sub-Saharan Africa. The success should be celebrated. But it leaves more than 1.2 billion people in extreme poverty in developing countries.10 Lifting everyone above this most basic level should be the minimum goal – a first step towards improving living standards for all (Box 1.1).
The UN High-Level Panel, one of the bodies appointed by the UN Secretary-General in 2012 to look at development goals beyond 2015, has proposed a new goal of ending extreme poverty by 2030. The threshold for extreme poverty that it has proposed is an individual having an income equivalent to what $1.25 a day – less than $500 a year – could buy in the United States in 2005.11 Revised over the years, this extreme poverty line was based on the average national poverty lines of the world’s 15 poorest countries.12 The High-Level Panel also expressed the hope that the higher $2 a day threshold could become the global standard by 2030.
The $1.25 a day threshold is a bare minimum baseline. Many more people live on an income slightly above it and are vulnerable to falling back into extreme poverty. Some 2.4 billion people, the ‘moderately poor,’13 live on less than $2 a day, twice as many as live in extreme poverty. Including
Box 1.1
Getting to zero poor people: the first milestone for ending poverty must be no one living on less than $1.25 a day by 2030
Some studies have interpreted ending poverty as reaching low poverty rates. But ending poverty must be about getting to zero, so that no one anywhere is living below the basic poverty line and all are prevented from falling back below that line. To get to zero, it is necessary to focus not on rates but on the absolute numbers of people in poverty.
Many countries have made real progress in reducing their poverty rate. Burkina Faso’s extreme poverty rate fell from 71% in 1994 to 45% in 2009, but the number of people in poverty remained broadly unchanged, at more than 7 million. Ethiopia, often seen as an MDG ‘trailblazer,’ almost halved its poverty rate over 1995–2011, from 61% to 31%. While this took 8.6 million people out of extreme poverty, population growth means that
around 26 million Ethiopians still live on less than $1.25 a day.1
World Bank President Jim yong Kim has outlined what he called a “highly ambitious” vision for ending poverty by 2030 – bringing extreme poverty rates to 3% or less.2 This would require faster and more-inclusive growth translated into poverty reduction to an extent not seen before in many low-income countries, as well as adding resources and addressing major shocks.3
But a 3% target would still leave more than 200 million people in developing countries in poverty in 2030.4 Kim has said that below this level the poverty challenge will change fundamentally in most parts of the world – from broad structural measures to tackling sporadic poverty among specific vulnerable groups.5 The World Bank states, “The
fight against poverty in its current form thus may need to continue well beyond a generation.”6 It highlights that fragile states and those affected by conflict may continue to experience poverty rates much higher than 3% after 2030.7 Ending poverty by 2030 should mean ending poverty in these countries as well.
notes1. World Bank DataBank (http://data.worldbank.
org).
2. Kim 2013b; World Bank 2013a,d.
3. World Bank 2013e.
4. Some 213.9 million, based on United
Nations, Department of Economic and Social
Affairs, Population Division (2013) estimate
of 7.13 billion in 2030 for less developed
countries (medium variant).
5. Kim 2013b.
6. World Bank 2013d, p. 16.
7. World Bank 2013d.

CHAP TER 1 ENDING PovERT y By 2030 17
‘vulnerable’ populations with incomes of PPP$4–10 a day brings the total to 5.2 billion people, or 88% of the 5.9 billion people in developing countries (Figure 1.1). While these are the best available figures today, the data to calculate them must be much more robust for poverty to be verifiably ended by 2030 (see Chapter 6).
The most common measures used to assess poverty are income and
consumption, which identify people whose well-being, or command over financial resources, meets a minimum standard. People whose income is above that standard are expected to have enough to secure the goods and services needed for that minimum. A monthly income of PPP$38 may not be enough for a decent life, but it can be seen as an absolute global minimum for basic existence.
This approach has its limitations, because poverty clearly is about more than income. While low consumption and low living standards are often at its core, poverty for most people also means lacking other assets: human, social, cultural, political and natural. Powerlessness, marginalisation and exclusion result in profound insecurity, prevent people from taking up opportunities and often force them into short-term choices that run counter to their longer term well-being.14
Multidimensional poverty seeks to capture these wider deprivations,15 including health, education, empowerment, quality of work and security. While income and multidimensional poverty are correlated, their association is complex (Figure 1.2). They can be mutually reinforcing: better health and education can lead to higher income, while higher income offers personal control so that poor people can prioritise and address their needs. But there are instances where progress on income poverty has not been reflected in other dimensions of poverty, such as Uganda’s lack of progress on wider goals even after meeting MDG Target 1A.
The escape from poverty is stepwise. For example, research has found that in Western Kenya, the sequence of being lifted out of poverty was having food, then clothes, shelter and money (to fund education of children) and finally animals. It was “only after households had crossed this particular stage that they were no longer considered to be poor.”16
Different policies will therefore be required to support these transitional steps out of poverty. Three sets of policies and programmes can be complementary. one set would promote the escape from poverty, such as social assistance that builds human capital and enables people to
FIGURE 1.2
Extreme poverty and multidimensional poverty are correlated but different
0
25
50
75
100
0 25 50 75 100
Share of population in multidimensional poverty, %, most recent year available
Share of population in extreme poverty, %, most recent year available
DEMOCRATIC REPUBLIC OF CONGO
NIGERIA
CHINA
BANGLADESH
INDIA
Note: Size of bubble shows number of people in extreme poverty in each country.
Source: oxford Poverty and Human Development Initiative Multidimensional Poverty Index Data Bank (www.
ophi.org.uk/multidimensional-poverty-index).
FIGURE 1.1
The extent of poverty depends on the income threshold
Incomethreshold,
PPP$ a day
People in poverty, billions
5.2 billion peopleliving on less than$10 a day
$1.25
$4
$2
$10
1.2billion
2.4billion
4.0billion
5.2billion
Source: Development Initiatives calculations based on data from World Bank Development Research Group’s
PovcalNet database (http://iresearch.worldbank.org/PovcalNet/).

18 PART 1 FRoM v IS IoN To PL AN: INvESTMENTS To END E x TREME PovERT y By 2030
take up opportunities. Another set would prevent households from falling into poverty, such as risk management and social insurance. A final set would help households graduate to higher levels of well-being once basic security negates the need for low-risk, low-return behaviour, such as investment in livelihoods and jobs.
Some developing countries have begun to monitor multidimensional poverty. Mexico included it in its official poverty measure in 2009,17 while Colombia’s 2011 poverty reduction plan has binding targets using a multidimensional poverty index.18
Assessing the prospects for an end to extreme poverty by 2030
Global poverty, once about scarce resources, is now about distributing sufficient resources among countries and people. For example, in 2010 the richest tenth of the population received 54.6% of global income, compared with 5.6% for the poorest two-fifths.19
Recent scenario modelling indicates that getting close to ending poverty by 2030 is a realistic prospect if the benefits of economic growth – the most powerful weapon against poverty – are shared more equally. But
if existing patterns continue, growth alone will not be enough.
The Brookings Institution has analysed possible trajectories for future levels of global poverty. Its baseline scenario has 342 million people still in extreme poverty by 2030, down two-thirds from 2010.20 This is based on current projections of individuals’ consumption, which generally rises with growth in the wider economy, and assumes that the current distribution of consumption across the population does not change. Consumption growth and how it is shared between richer and poorer people could both differ – in either direction – from this baseline scenario.
Box 1.2
How many people will be living in extreme poverty in 2030? The poverty prediction conundrum
Forecasts attempt to predict the unpredictable. Near-term forecasts are likely to be somewhat more accurate than those for the longer term. And while near-term growth forecasts can be extrapolated far into the future, rapid rates of economic growth in developing countries are difficult to sustain over time. The Commission on Growth and Development found that this was possible but rare, identifying only 13 cases of sustained growth since the Second World War.1 The recent economic crisis also showed the sudden, dramatic, life-changing effects when risks are realised.
Poverty modelling develops possible scenarios for the future. This approach has real value for understanding the conditions needed to end poverty, providing the context for strategic policymaking.
Models rest by necessity on a range of simplifying assumptions and focus on the growth of either economies or private consumption and on possible income distribution trends that determine whether poor people benefit from growth.
While most models focus on central or ‘baseline’ scenarios, they also recognise the full range of potential futures.
The Brookings Institution’s consumption-based scenarios suggest that the number of people in poverty in 2030 could range from around 100 million to more than 1 billion, reflecting the inherent uncertainty. For growth, the scenarios use a 2 percentage point margin of error on each side of a baseline consumption growth projection, in line with differences observed between past forecasts and actual outcomes. The scenarios use different outlooks for inequality based on the shares of national consumption among the poorest 40% and the richest 10%. The analysis sees these shares moving up or down by 0.25 percentage points annually.
Much will need to be done to encourage growth that is both rapid and shared. But the Brookings Institution’s research finds that even this is not enough in isolation to ensure that the number of people in extreme poverty gets to zero by 2030.
A 2012 World Bank study painted a broadly similar picture. It found that maintaining progress over the last two decades would bring the extreme poverty rate down to 9% by 2022, while an ambitious target could see 3% reached, requiring either slightly faster economic growth or the proceeds of growth shared more
widely with the poorest.2 More recent World Bank analysis suggests that the number of people in extreme poverty globally will fall below 1 billion by 2015, to 970 million – or 15.5% of the population, down from 20.6% in 2010. The Bank is committing to monitoring the incomes of the poorest 40% every year and to reporting progress in reducing extreme poverty in all developing countries.3
People living in extreme poverty are a diverse group. It is far easier to bring those immediately below a poverty line above it than to raise the incomes of all those much deeper in poverty. So, projecting poverty trends as a ‘straight line’ into the future is overly optimistic: The rate of poverty reduction – based on economic growth alone – is likely to slow as different policies and investments are needed to reach people far below the poverty line.
notes1. Botswana; Brazil; China; Hong Kong, China;
Indonesia; Japan; Korea; Malaysia; Malta;
oman; Singapore; Chinese Taipei; and
Thailand. India and viet Nam were identified
as potentially on course to join this group
(Commission on Growth and Development
2008).
2. Ravallion 2012a.
3. Kim 2013a.

CHAP TER 1 ENDING PovERT y By 2030 19
Applying optimistic and pessimistic outlooks for growth and inequality – based on differences between past predictions and observed growth trends and historical distribution trends – shows a breadth of possible outcomes (Box 1.2).
When the more optimistic scenarios are combined – faster growth more equally distributed – some 1.1 billion people could be lifted out of extreme poverty between 2010 and 2030, leaving around 100 million behind. By contrast, the pessimistic scenario – slower growth more unequally distributed – leaves more than 1 billion behind, with fewer than 200 million lifted from extreme poverty (Figure 1.3).
The global picture from Brookings’ analysis will not be replicated across every region (Figure 1.4). None looks likely to end extreme poverty in any of these scenarios, though Europe and Central Asia and the Middle East and North Africa come close. Sub-Saharan Africa looks most likely to be farthest
from zero, even though some countries in the region may see some of the biggest improvements.21 The region was alone in seeing extreme poverty increase between 1990 and 2010, from 290 million to 414 million. Home to 15% of the world’s extreme poor in 1990, it now accounts for more than 34%. But the region’s prospects are improving: The World Bank projects that between 2010 and 2015 the number of poor people could fall to 408 million, with the poverty rate falling from 48.5% to 42.3%.22
The baseline scenario suggests that some 275 million people in sub-Saharan Africa could remain in extreme
poverty in 2030, making it home to more than 80% of the world’s extreme poor (Table 1.1). Faster and more-equitable growth could reduce this to around 100 million. Slower and less-equitable growth could lead to an increase, leaving more than half a billion people in extreme poverty in 2030. As other regions make faster progress, the pessimistic outlook shows almost half (49%) the world’s population in extreme poverty living in sub-Saharan Africa – while under the optimistic scenario almost all would be.
South Asia had more people in extreme poverty in 2010 (507 million) than sub-Saharan Africa (414 million).
FIGURE 1.3
The number of people in extreme poverty in 2030 could be anywhere between 100 million and more than 1 billionPeople in extreme poverty (billions), 1990–2030
0.0
0.5
1.0
1.5
2.0
20302020201020001990
Worst case:1.04 billion
Best case: 107.9 million
Baseline:342 million
Source: Chandy, Ledlie and Penciakova 2013c.
FIGURE 1.4
Extreme poverty levels are likely to fall by 2030 but the regional distribution will change radically
Latin America & Caribbean Middle East& North Africa
Europe &Central Asia
India
Sub-Saharan Africa other
Burkina Faso, Mali, Malawi, Uganda
South Asia other
IndonesiaEast Asia &Pacific other China
IndiaSub-Saharan Africa other
Burkina Faso, Mali, Malawi, UgandaSouth Asia other
East Asia & Pacific other
Latin America & Caribbean Middle East & North Africa
Europe & Central Asia
China
2010:1.2 billion
2030:342 million
Source: Development Initiatives calculations based on Chandy, Ledlie and Penciakova (2013c).

20 PART 1 FRoM v IS IoN To PL AN: INvESTMENTS To END E x TREME PovERT y By 2030
But South Asia is likely to see much faster progress, overtaking sub-Saharan Africa well within this decade under the range of scenarios. The number of people in extreme poverty in South Asia could fall below 50 million by 2030.
This is largely because poor people in South Asia are not as poor as those in sub-Saharan Africa, with a large number of poor people just below the poverty line and more ready to cross it (see below).
Indeed, as Brookings summarises, the 40 years from 1990 to 2030 “resemble a relay race in which responsibility for leading the charge on global poverty reduction passes from China to India to sub-Saharan Africa. China has driven progress over the last 20 years, but with its poverty rate now in the single digits, the baton is being passed to India (Figure 1.5). India has the capacity to deliver sustained progress on global poverty reduction over the next decade, based on modest assumptions of equitable growth.”23
Indeed, recently released poverty data suggests that rapid progress has been made since 2004/2005.24 Brookings notes that it will then be left to sub-Saharan Africa “to run the final relay leg and bring the baton home.”25 This is because so many of the region’s extreme poor are starting a long way below the $1.25 a day poverty line.26
Minding the poverty gap
Ending poverty is more than a purely economic equation. The poorest people face structural barriers to escaping poverty that growth alone cannot overcome. Targeted interventions to ‘bend the curve’ down to zero poor people by 2030 are required on two fronts. First, poor people will need assistance to plug them into engines of growth. They are the greatest agents of change and can make the greatest advances if conditions are right and opportunities exist. Second, resources are required to provide basic services and incomes, both for those on trajectories out of poverty and for those who do not stand to benefit from the opportunities that growth can bring.
The depth of poverty, a key factor in driving poverty eradication trajectories, indicates the relative effort and resources needed to raise the poor from poverty. It is the sheer depth of poverty in sub-Saharan Africa and some countries in other regions that makes ending poverty by 2030 so challenging.27
one measure of poverty’s depth is the average consumption of people below the poverty line, expressed in dollars or as a proportion of the poverty line. The average daily income of people in extreme poverty has been mostly flat in sub-Saharan Africa since 1981, while in the rest of the developing world it has risen 20 cents (Figure 1.6).
The PPP$0.71 regional average is low by developing countries standards, and
FIGURE 1.5
india passes the baton for ending poverty to sub-saharan Africa by 2030Change in number of people in extreme poverty, millions, 1990–2030
Other Sub-Saharan AfricaChinaIndia
–100
–75
–50
–25
0
25
50
203020282026202420222020201820162014201220102008200520021999199619931990
Global
Note: Three-year periods up to 2008, then two-year periods.
Source: Chandy, Ledlie and Penciakova 2013c.
TABLE 1.1
south Asia’s prospects in reducing the number of people in extreme poverty far outstrip those of sub-saharan Africa
Number of people in extreme poverty in 2030, millions
optimistic Baseline pessimistic
Sub-Saharan Africa 103.5 275.1 508.6
South Asia 1.1 46.3 365.6
Share of global extreme poor in 2030, %
optimistic Baseline pessimistic
Sub-Saharan Africa 95.9 80.5 48.9
South Asia 1.0 13.5 35.2
Source: Development Initiatives calculations based on Chandy, Ledlie and Penciakova (2013c).

Chap ter 1 Ending povErt y by 2030 21
beneath this are several countries with much lower average incomes: ppp$0.53 in democratic republic of Congo and ppp$0.55 in Zambia (Map 1.1).
india has seen consumption below the $1.25 a day threshold increase, such
that there is now a ‘bulge’ of poor people just below the line. the average poor person’s daily consumption is ppp$0.97 in rural areas and ppp$0.93 in urban areas. Current patterns of growth and inequality could move millions above the $1.25 a day line,
leaving about 37 million people in extreme poverty by 2030 (Figure 1.7). An optimistic scenario would see fewer than 1 million there.
but the depth of poverty in sub-Saharan Africa means that its extreme
FigurE 1.6
average incomes of the extreme poor in sub-Saharan africa have remained unchanged over three decadesAverage daily consumption of individuals living on less
than $1.25 a day, 2005 ppp$, 1981–2010
$0.00
$0.25
$0.50
$0.75
$1.00
2010200520001995199019851981
Sub-Saharan Africa2010: $0.71
2010: $0.96Developing world, excluding sub-Saharan Africa
Source: World bank 2013c.
FigurE 1.7
ending extreme poverty will be more challenging in sub-Saharan africa than in Indiapeople in extreme poverty, millions, 1990–2030
0
100
200
300
400
500
203020252020201520102005200019951990
Baseline:37.0 million
Best case:103.5 million
Worst case:244.9 million
Best case:0.9 million
Sub-Saharan Africa India
0
100
200
300
400
500
203020252020201520102005200019951990
Worst case:508.6 million
Baseline:275.1 million
Source: Chandy, Ledlie and penciakova 2013c.
MAp 1.1
average incomes of the extreme poor in africa are often far below the $1.25 a day poverty lineAverage daily consumption of individuals living on less
than $1.25 a day, 2005 ppp$, 2010
$0.53–0.71$0.72–0.84$0.85–0.88$0.89–1.10No data
MALI$0.84
BURKINAFASO$0.84
DEMOCRATICREPUBLIC
OF CONGO$0.53
ZAMBIA$0.55
MALAWI$0.53
UGANDA$0.87
Source: Chandy, Ledlie and penciakova 2013c.
22 PART 1 FRoM v IS IoN To PL AN: INvESTMENTS To END E x TREME PovERT y By 2030
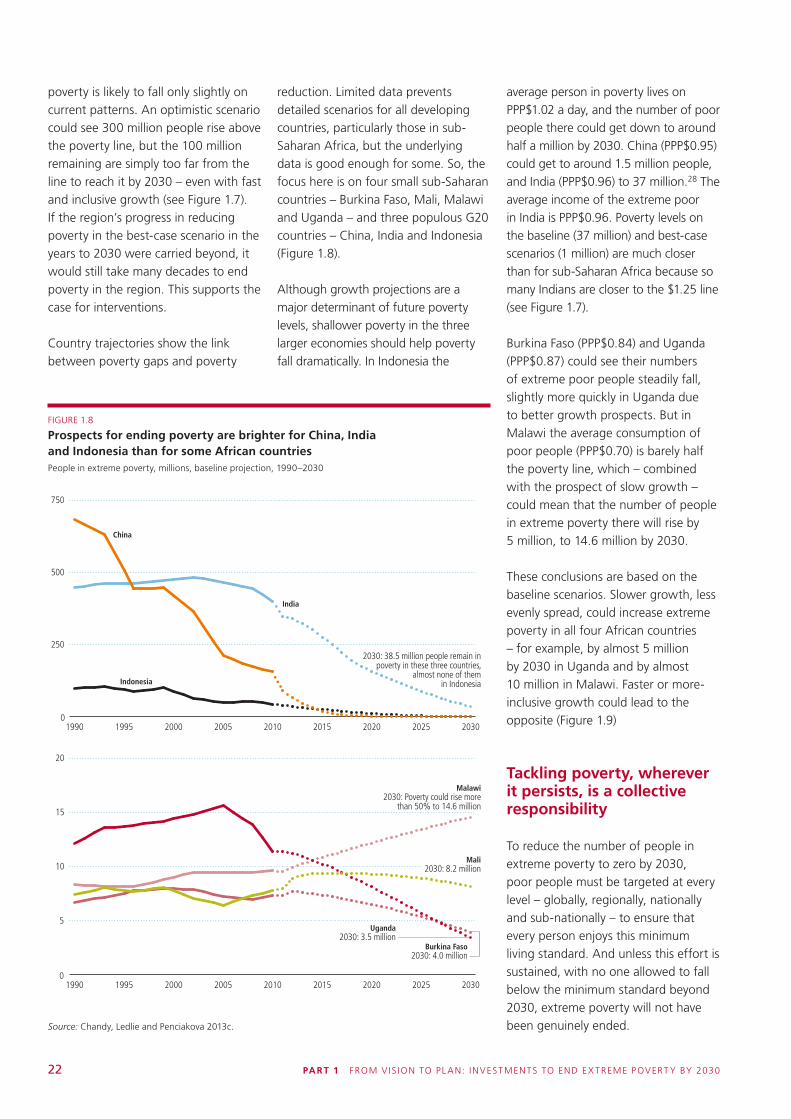
poverty is likely to fall only slightly on current patterns. An optimistic scenario could see 300 million people rise above the poverty line, but the 100 million remaining are simply too far from the line to reach it by 2030 – even with fast and inclusive growth (see Figure 1.7). If the region’s progress in reducing poverty in the best-case scenario in the years to 2030 were carried beyond, it would still take many decades to end poverty in the region. This supports the case for interventions.
Country trajectories show the link between poverty gaps and poverty
reduction. Limited data prevents detailed scenarios for all developing countries, particularly those in sub-Saharan Africa, but the underlying data is good enough for some. So, the focus here is on four small sub-Saharan countries – Burkina Faso, Mali, Malawi and Uganda – and three populous G20 countries – China, India and Indonesia (Figure 1.8).
Although growth projections are a major determinant of future poverty levels, shallower poverty in the three larger economies should help poverty fall dramatically. In Indonesia the
average person in poverty lives on PPP$1.02 a day, and the number of poor people there could get down to around half a million by 2030. China (PPP$0.95) could get to around 1.5 million people, and India (PPP$0.96) to 37 million.28 The average income of the extreme poor in India is PPP$0.96. Poverty levels on the baseline (37 million) and best-case scenarios (1 million) are much closer than for sub-Saharan Africa because so many Indians are closer to the $1.25 line (see Figure 1.7).
Burkina Faso (PPP$0.84) and Uganda (PPP$0.87) could see their numbers of extreme poor people steadily fall, slightly more quickly in Uganda due to better growth prospects. But in Malawi the average consumption of poor people (PPP$0.70) is barely half the poverty line, which – combined with the prospect of slow growth – could mean that the number of people in extreme poverty there will rise by 5 million, to 14.6 million by 2030.
These conclusions are based on the baseline scenarios. Slower growth, less evenly spread, could increase extreme poverty in all four African countries – for example, by almost 5 million by 2030 in Uganda and by almost 10 million in Malawi. Faster or more-inclusive growth could lead to the opposite (Figure 1.9)
Tackling poverty, wherever it persists, is a collective responsibility
To reduce the number of people in extreme poverty to zero by 2030, poor people must be targeted at every level – globally, regionally, nationally and sub-nationally – to ensure that every person enjoys this minimum living standard. And unless this effort is sustained, with no one allowed to fall below the minimum standard beyond 2030, extreme poverty will not have been genuinely ended.
FIGURE 1.8
Prospects for ending poverty are brighter for China, india and indonesia than for some African countriesPeople in extreme poverty, millions, baseline projection, 1990–2030
0
250
500
750
203020252020201520102005200019951990
0
5
10
15
20
203020252020201520102005200019951990
Indonesia
India
2030: 38.5 million people remain inpoverty in these three countries,
almost none of themin Indonesia
Malawi2030: Poverty could rise more
than 50% to 14.6 million
China
Uganda2030: 3.5 million
Burkina Faso2030: 4.0 million
Mali2030: 8.2 million
Source: Chandy, Ledlie and Penciakova 2013c.

CHAP TER 1 ENDING PovERT y By 2030 23
Because current growth patterns will not get the world to zero, developing countries at every level of economic development will need to lead additional efforts, underpinned financially and politically by the global community.
Addressing extreme poverty in middle-income countries too
Ending poverty by 2030 must apply to poor people wherever they live, including people in middle-income countries.
India illustrates the fallacy of classifying countries by average income, an oversimplification that masks vastly different incomes within those classifications.
Since 2007 India has been considered a middle-income country.29 This is an internal World Bank classification originally linked to civil works preference, which granted poor country–based contractors preference over others in international bids for projects. The middle-income threshold has stayed
broadly the same in real terms over its 40 years of use, updated only for inflation since 1988.30 It is also based on market exchange rates, which are not adjusted for relative purchasing power (as the $1.25 a day threshold is).31 As a simple per capita figure, it takes no account of the distribution of national income or the domestic or international resources available for targeting poverty.
Despite India’s economic success, it remains home to more than a third of the world’s extreme poor. With gross national income (GNI) per capita of US$1,530 in 2012, it is barely in the middle- income range (Figure 1.10). Fast-growing China has seen GNI per capita rise rapidly in recent years to reach US$5,740, putting it well within the upper middle- income range, and almost halfway to upper middle- income status. Despite this, China still had 157 million people in extreme poverty in 2010.
In addition, many developing countries are not yet able to raise sufficient domestic resources to tackle poverty. Government expenditure per person
was PPP$864 in 2010, compared with a developing county average of PPP$1,360 (see Chapter 2 for more on domestic resources).
The taxation needed to raise resources domestically to bring all the extreme poor up to the extreme poverty line can be impracticably high. In most cases countries with average consumption below PPP$2,000 (including India) require tax rates above 100% – or more than the income available to be taxed.32 Such analysis is based on surveys that do not always accurately capture the highest incomes, but this indicates that, while there is broad correlation between higher incomes and the ability to close poverty gaps domestically, great variability remains in developing countries’ abilities to pursue the end of poverty without international support.
Knowing who is poor and where they live
Targeting the poorest in every country will require accurate information
FIGURE 1.9
Best- and worst-case scenarios for ending extreme poverty in African countries vary widelyPeople in extreme poverty, millions, 1990–2030
0
5
10
15
20
203020252020201520102005200019951990
Uganda
Mali
Burkina Faso
Malawi
0
5
10
15
20
203020252020201520102005200019951990
0
5
10
15
20
203020252020201520102005200019951990
Best case:0.3 million
Best case:0.2 million
Best case:0.2 million
0
5
10
15
20
203020252020201520102005200019951990
Worst case:19.5 million
Best case:7.0 million
Worst case:14.6 million
Worst case:11.1 million
Baseline:4.0 million
Worst case:16.2 million
Baseline:3.5 million
Baseline:8.2 million
Baseline:14.6 million
Source: Chandy, Ledlie and Penciakova 2013c.

24 PART 1 FRoM v IS IoN To PL AN: INvESTMENTS To END E x TREME PovERT y By 2030
on the distribution and depth of poverty – in every district and every village. Average incomes mask widely varying distributions of poverty within countries, but available data does not allow the tracking of $1.25 a day poverty below the national level in most countries. However, comparisons across and within developing countries are possible using wider multidimensional poverty measures.
India has one of the widest ranges between its most and least deprived regions (based on 2005/2006 household survey data). While the country’s average multidimensional poverty rate is 53.7%, the rate in Bihar in the northeast is 79.3%, and Delhi capital territory has the lowest rate (12.4%, followed closely by Kerala in the south at 12.7%; Figure 1.11).
Uttar Pradesh alone has 136 million people in multidimensional poverty, second only to China and more than all of Bangladesh.33 Uttar Pradesh, Bihar, West Bengal and Madhya Pradesh would all rank among the world’s 10 poorest countries, and 11 Indian states would be among the 20 poorest countries (Figure 1.12). other poorer developing countries show similar within-country variation (Figure 1.13).
Information on the location and depth of extreme poverty within countries will be a central requirement for ending poverty by 2030. National statistics on $1.25 a day are weak for many countries and non-existent for some. Analysing extreme poverty and multidimensional poverty sub-nationally is essential to be able to accurately target resources to need (Box 1.3; see also Chapter 5). Bringing together sub-national poverty data and details of finance (such as domestic investments or aid projects) that are geographically coded allows targeting and monitoring resources for poverty reduction at a local scale (Map 1.2).
A global backstop to an enduring end to poverty
Today’s growth patterns alone will not end extreme poverty by 2030. Nor will domestic resources be sufficient
in all countries, at least in the near future. So domestic efforts need to be backstopped by international commitments to ensure that no one is left behind. The end of poverty must also be sustained, lasting far
FIGURE 1.11
Differences between the least and most deprived parts of emerging economies vary widelyMultidimensional poverty rate, %, most recent year available
Most deprived region
Least deprived region
National deprivation estimate
0
25
50
75
100
ThailandViet NamMexicoColombiaPhilippinesIndonesiaNigeriaIndia
Source: oxford Poverty and Human Development Initiative Multidimensional Poverty Index Data Bank (www.
ophi.org.uk/multidimensional-poverty-index).
FIGURE 1.10
india is just above the lower middle-income threshold, China far aboveGNI per capita and World Bank income classifications, US$, 1990–2012
201220102008200620042002200019981996199419921990
Uppermiddle income
(US$4,036–12,475)
Lowermiddle income
(US$1,026–4,035)
Low income(US$1,025 or less)
China
India
0
1,000
2,000
3,000
4,000
5,000
6,000
Source: World Bank DataBank (http://data.worldbank.org/indicator/Ny.GNP.PCAP.CD).

CHAP TER 1 ENDING PovERT y By 2030 25
beyond 2030. International efforts can build resilience and establish global mechanisms that help poor people and poor countries manage risk, protect them from shocks and prevent the most vulnerable from falling back into poverty.
internationally backstopped commitments
National poverty lines are based on country values, circumstances and available resources.
Just as developed countries accept a moral imperative to support the most vulnerable in their own societies, so the global poverty agenda must recognise the groups marginalised from growth if extreme poverty is to be eliminated by 2030.
The $1.25 a day poverty line is based on the average of the very poorest countries, so the majority of developing countries’ national poverty lines are already above it. The small number of countries with national lines below $1.25 a day will be critical to ending poverty (Figure 1.14). They are likely to lack the domestic resources to achieve this minimum living standard, and they should be able to call on external assistance to do so.
The UN High- Level Panel’s report argued for supplementing the goal to end extreme poverty by 2030 with a target to reduce the proportions of people below national poverty lines in 2015. It also expressed hope and expectation that countries will continually raise the bar on the living standards they deem minimally acceptable for their own citizens and adjust their poverty line upwards over time. The High-Level Panel proposed a target for the proportion of people living below national poverty lines in 2015 in order to facilitate the adoption of a $2 a day global minimum threshold by 2030.34
FIGURE 1.12
Eleven indian states would be among the world’s 20 countries with the highest levels of multidimensional povertyPeople in multidimensional poverty, millions, most recent year available
0 25 50 75 100 125 150 175
Uganda (2011)
Gujarat (2005/2006)
Jharkhand (2005/2006)
Orissa (2005/2006)
Karnataka (2005/2006)
Tanzania (2010)
Andhra Pradesh (2005/2006)
Maharashtra (2005/2006)
Rajasthan (2005/2006)
Congo, Dem. Rep. (2010)
Indonesia (2007)
Madhya Pradesh (2005/2006)
West Bengal (2005/2006)
Ethiopia (2011)
Bihar (2005/2006)
Nigeria (2008)
Pakistan (2006/2007)
Bangladesh (2007)
Uttar Pradesh (2005/2006)
China (2002)
Note: Total for India (2005/2006) is 658 million. Data is multidimensional poverty rates from various survey
years applied to 2010 population data to enable cross-country comparison.
Source: oxford Poverty and Human Development Initiative Multidimensional Poverty Index Data Bank (www.
ophi.org.uk/multidimensional-poverty-index).
FIGURE 1.13
There are widely variable poverty levels within poorer developing countries tooMultidimensional poverty rate, %, most recent year available
Least deprived region
Most deprived region
National deprivation estimate
0
25
50
75
100
Malawi
Buru
ndi
Bang
lades
h
Liberi
a
Rwan
daMali
Mozam
bique
Haiti
Burki
na Fa
so
Tanz
ania
Cong
o, Dem
. Rep
.
Ethiop
ia
Ugand
aKe
nya
Source: oxford Poverty and Human Development Initiative Multidimensional Poverty Index Data Bank (www.
ophi.org.uk/multidimensional-poverty-index).

26 PART 1 FRoM v IS IoN To PL AN: INvESTMENTS To END E x TREME PovERT y By 2030
Box 1.3
Brazil’s cash transfers and political will
Brazil had around 11.9 million people at or below the $1.25 a day poverty line in 2009.
Its poverty reduction strategy builds on past political and economic reform, with a single system for social assistance that has several intertwined programmes, including Bolsa Família (introduced in 2003), Brasil Sem Miséria (introduced in 2011) and Brasil Carinhoso (introduced in 2012).
Perhaps the best known, Bolsa Família transfers cash directly to poor households.1 The minimum transfer is R$70 a month (around US$35) for households with no children, but households with children receive more if they meet additional conditions (such as school attendance and health checks). In 2009 the average payment was R$95 (US$47.50). Brasil Sem Miséria targets poor people not already reached by Bolsa Família.2 Brasil Carinhoso extends Bolsa Família by focusing on households with young children in extreme poverty, guaranteeing the R$70 minimum income, but with payments linked to
the depth of poverty rather than to household composition.
In February 2013 President Dilma Rousseff declared the government’s poverty target almost met. Some 28 million people have been raised from extreme poverty (based on the national poverty line) since 2003. The Instituto de Pesquisa Econômica Aplicada found Bolsa Família to be very effective, reducing poverty rates by 40% (Box Figure 1) and increasing the number of households that obtained enough food by 52%. It is also believed to have reduced under-five mortality.3
Brazil’s focus on the poorest parts of society has reduced its high income inequality: The commonly used Gini index fell from 55.3% in 2002 to 50% in 2011, a fairly rapid drop.4 The organisation for Economic Co-operation and Development noted that without the income redistribution, Brazil’s economy would need to have grown faster – 4 more percentage points a year – to achieve the same poverty reduction.5
Box FIGURE 1
Extreme poverty in Brazil has fallen quickly in recent yearsPeople in extreme poverty, millions, 1990–2009
0
10
20
30
2009200620042002200019981996199419921990
Source: World Bank DataBank (http://data.worldbank.org).
Economic growth has provided increased domestic resources – total government expenditure per person increased to around PPP$4,000 in 2011 from PPP$2,730 in 2000 (see Chapter 2) – to invest in social programmes, which have given a boost to the economy as payments have been spent. Every R$1 invested in Bolsa Família returned R$1.44 to GDP.6 Although the scheme contributed to poverty reduction in 2004–2009, the most important factor was economic growth’s generating formal employment, together with the strengthening of minimum salary policies.7 Fundaçao Getulio vargas estimated that around one-sixth of the poverty reduction from 2003 to 2009 could be attributed directly to Bolsa Família alone, with a similar share to (more expensive) state pensions.
Bolsa Família also operates at relatively low cost: Its R$24 billion (around US$12 billion) budget accounted for less than 1% of the 2013 federal budget, while spending was 0.46% of national income in 2012.
More than 48 million people, a quarter of Brazil’s population, are now registered for government social programmes. Brazil’s Cadastro Único, or single registry, gives detailed information on who the majority of poor people are and where they live. Census records suggest that up to 700,000 households, by some estimates 2.5 million people, are still in poverty, though not yet officially registered as such.
notes1. The Economist 2010.
2. Boadle 2013.
3. See Rasella and others (2013).
4. Studart 2013 (see World Bank n.d. b for
information on the Gini coefficient).
5. Arnold 2011; oECD 2011.
6. Brazil Ministry of Social Development 2012.
7. IPEA 2012b.
Source: Brazil Ministry of Social Development
2012; UNDP International Policy Centre for
Inclusive Growth 2013; The Economist 2013; IPEA
2010; Soares 2012; Burton 2013; IPEA 2012a;
Rodrigues de oliveira and Kassouf 2013.

CHAP TER 1 ENDING PovERT y By 2030 27
A shared global responsibility for the world’s poorest people also means that developing-country governments must commit to lift their citizens above their own national poverty lines. And it means
that this effort is backstopped by an international aid architecture committed to providing a basic minimum when domestic governments are unable to do so – wherever that need may be.
An enduring end to poverty, not just in 2030
People move in and out of poverty. Some 30% of the non-poor in Senegal fell into poverty between 2006 and 2008, based on national poverty definitions. Kenya saw similar movements into poverty between 1997 and 2007, as did 22% of rural Indians between 1994 and 2005.35 There are also substantial fluctuations in well-being within single years, as hundreds of millions of poor people with rural livelihoods cope with the impact of seasons on their income and consumption. For them, it is not conflict or disaster that most commonly drives hunger, disease and cycles of poverty – it is annually recurring periods when harvest stocks have been depleted and local food prices soar. And as weather patterns become more unpredictable with a changing climate, ‘normal’ vulnerabilities – of unequal access to resources – will instigate tip-overs into more entrenched crises.
FIGURE 1.14
Aid can support countries with national poverty lines below $1.25 a day to attain this basic standard; several countries’ national poverty lines are already above $2 a dayNational poverty line, 2005 PPP$ a day, various years
0.0
2.5
5.0
7.5
10.0
0.0
0.5
1.0
1.5
2.0
$1.25 a day international poverty line
$2 a day international poverty line
China (
new)
Niger
(199
3)
Viet N
am (2
002)
Indones
ia (1
999)
Lao PD
R (199
7/19
98)
Niger
ia (1
985)
Banglad
esh (2
000)
Rwan
da (19
99/2
001)
Moza
mbiq
ue (20
02/2
003)
India
(200
4/20
05)
Nepal
(200
3/20
04)
Chad (1
995/
96)
Mala
wi (
2004
/200
5)
Burkin
a Fas
o (200
3)
Benin
(199
9/20
00)
Seneg
al (1
991)
Tanza
nia (2
000/
2001
)
Colom
bia (1
999)
Mex
ico (2
002)
Argen
tina (
1999
)
Brazil
(200
2/20
03)
Russia
(200
2)
Turk
ey (2
002)
Kenya
(199
7)
China (
new)
$1.25 a day international poverty line
$2 a day international poverty line
Note: Reflects the revised national poverty line for China but does not include revised national poverty lines for India and viet Nam.
Source: Ravallion, Chen and Sangraula 2008.
MAP 1.2
Geocoded aid projects can be linked to deprivation data to improve targetingInfant mortality rate (deaths per 1,000 live births) and number of projects active as of 28 March 2012
19–23
15–18
10–14
6–9
1–5
Project counts
17.7–30.830.8–43.843.8–56.956.9–69.969.9–83.0
Infant mortality rate
Source: World Bank Mapping for Results database (http://maps.worldbank.org).

28 PART 1 FRoM v IS IoN To PL AN: INvESTMENTS To END E x TREME PovERT y By 2030
Poor people face a wide range of risks, from the personal, or idiosyncratic, such as losing a job or being unable to work because of illness – to the wider, or covariant, such as conflict, natural disasters, or food or economic crises. Each can strike at any time and undermine years or even decades of progress. The Haiti earthquake in 2010 drove poverty back to levels witnessed a decade earlier, wiping out an 8 percentage point gain over 2001–2010. And following the 2011 drought in Djibouti, poverty rates rose again to the 2002 level of 42%.36
Just as ending extreme poverty means more than ‘most people,’ so it means more than ‘most years.’ A single setback can have long-term effects. Unable to draw on savings or private insurance, the poorest face a different set of choices in the face of shocks – taking children out of school, reducing meals or selling assets vital for recovery. Poverty traps can result from such setbacks, which reduce employment prospects and economic progress.
vulnerable people, districts and countries must build resilience at all levels to protect themselves from falling into extreme poverty. Building local, national, regional and international structures can prepare and protect poor people, with governments helping manage their risk and respond to crises and changing circumstances. These structures must have the requisite funding to mitigate risk. They must also have the flexibility to manage and adapt to the changing risks that the future will inevitably bring.
These structures should not be focused exclusively on the currently poor. Protecting the assets and capabilities of the 3.9 billion acutely vulnerable people who live on less than PPP$4 a day – and possibly higher thresholds, such as the PPP$10 a day threshold the
World Bank has used to separate the global ‘vulnerable’ and ‘middle’ classes – will also be vital to sustain progress towards ending extreme poverty and beyond.37
Harnessing all resources for ending poverty
The September 2013 UN General Assembly will be a turning point in defining post-2015 development goals. As other processes take centre stage, attention will turn to how to achieve them and how to finance the investments needed to end poverty by 2030.
Some international resources are vital for growth; others, combined with good policy, can encourage this growth to be inclusive of poor people. But even this is not likely to be sufficient to end extreme poverty by 2030. Therefore, direct, targeted interventions will be needed.
Aid will remain an indispensable intervention. While it may seem small compared with other international flows, it can and should be focused on directly helping those in extreme poverty. Aid also has real potential to catalyse and leverage the best of those other flows, to help countries lead their own fight against poverty. This suggests a strong agenda of policy coherence for development.
notes1. High-Level Panel of Eminent
Persons on the Post-2015 Development Agenda 2013.
2. Cameron 2013.3. oNE 2013.4. Krishna 2004.5. The Economist 2013.6. Sirleaf 2012.7. Green 2013.8. Government of Brazil 2013.9. UN 2013.
10. World Bank Development Research Group’s PovcalNet database (http://iresearch.worldbank.org/PovcalNet/). World Bank (2013f) gives a 2010 provisional figure of 1.215 billion people.
11. The $1.25 a day and $2 a day income thresholds are measured in 2005 purchasing power parity (PPP) international dollars, in practice a mixture of income- and consumption-based measures. Throughout the report, all instances of $1.25 a day and $2 a day refer to PPP rates; other dollar values that use PPP rates are indicated by PPP$ and dollar values that use market-based exchange rates are indicated by US$.
12. The $1.25 a day (2005 PPP) international poverty line replaced the previous $1.08 a day (1993 PPP) line. It was the average of poverty lines for a reference group of 15 countries: Malawi, Mali, Ethiopia, Sierra Leone, Niger, Uganda, Gambia, Rwanda, Guinea-Bissau, Tanzania, Tajikistan, Mozambique, Chad, Nepal and Ghana.
13. See Kapsos and Bourmpoula (2013): extreme poor (below $1.25 a day), moderately poor ($1.25 to under $2), near poor ($2 to under PPP$4), the developing middle class (PPP$4 to under PPP$13), and the developed middle class and above (PPP$13 and above).
14. See, for example, Mehta and others (2011).
15. Thorbecke 2005.16. Krishna and others 2004, p. 216.17. See oPHI (2013b).18. oPHI 2013a.19. Watkins 201320. Chandy, Ledlie and Penciakova
(2013c) based on their methodology and including 40 updated surveys.
21. Poverty data and projections are for World Bank regions, which do not match the oECD regions used elsewhere in this report. The

CHAP TER 1 ENDING PovERT y By 2030 29
sub-Saharan Africa region is similar for the two organisations, but the oECD includes Djibouti, which the World Bank classes as Middle East and North Africa. (http://data.worldbank.org/about/country -classifications/country-and -lending-groups). The countries in the World Bank South Asia region are a subset of those in the oECD South and Central Asia region (which also includes Myanmar and the five Central Asian republics of the former Soviet Union). The World Bank combines Central Asia and Europe into a single region.
22. World Bank 2013b.23. Chandy, Ledlie and Penciakova
2013d.24. New estimates of poverty in India
were published in July 2013. While based on national poverty lines, rather than the $1.25 a day measure, these suggest that rapid progress has been made in reducing poverty (Government of India, Planning Commission 2013).
25. Chandy, Ledlie and Penciakova 2013d.
26. Chandy, Ledlie and Penciakova 2013a.
27. See also Chandy, Ledlie and Penciakova 2013a.
28. Averages weighted by poverty headcounts in rural and urban areas: China, PPP$0.95 rural and PPP$0.84 urban; India, PPP$0.97 rural and PPP$0.93 urban; Indonesia, PPP$1.04 rural and PPP$1.00 urban (based on data from Chandy, Ledlie and Penciakova 2013b).
29. World Bank historical classification spreadsheet from World Bank (n.d. a).
30. Ravallion (2012b) suggests that this threshold was set at a GNI per capita of US$200 in 1971.
31. The Economist 2012.32. A marginal tax rate of 25% means
a tax set at US$1 for each US$4 of income above PPP$13 a day would generate enough revenue
to close the $1.25 a day poverty gap. PPP$13 a day in 2005 is the US poverty line (assuming that it is unreasonable to tax those considered poor in developed countries). Marginal tax rates to end poverty average 1% of countries’ consumption above PPP$4,000 per capita (Ravallion 2010, 2012b).
33. World Bank President Jim yong Kim has stated that Uttar Pradesh accounts for 8% of the world’s extreme poor (Kim 2013b).
34. High-Level Panel of Eminent Persons on the Post-2015 Development Agenda 2013.
35. Shepherd and Lenhardt (2012); see also the update Lenhardt and Shepherd (2013).
36. Government of the Republic of Haiti 2010; Government of the Republic of Djibouti 2011. Cited in Mitchell and others (2013). The Djibouti figure of 42% is based on a national government figure of US$1.80 a day poverty.
37. World Bank 2012; López-Calva and ortiz-Juarez 2013.
ReferencesArnold, Jens. 2011. “Tackling Poverty
and Inequality.” OECD Observer 287. www.oecdobserver.org/news/fullstory.php/aid/3715.
Boadle, Anthony. 2013. “Brazil’s Rousseff Says Extreme Poverty Almost Eradicated.” Reuters, 19 February. www.reuters.com/article/2013/02/19/us-brazil-poverty -idUSBRE91I14F20130219.
Brazil Ministry of Social Development. 2012. Brazil without Extreme Poverty Plan. Brasilia.
Burton, Guy. 2013. “An End to Poverty in Brazil? An Assessment of the Lula and Rousseff Governments’ Poverty Reduction and Elimination Strategies.” Journal of Policy Practice 12(3): 194–215.
Cameron, David. 2013. “Prime Minister David Cameron’s speech to the World Economic Forum in Davos.”
24 January, Davos, Switzerland. www.gov.uk/government/speeches/prime-minister-david-camerons -speech-to-the-world-economic -forum-in-davos.
Chandy, Laurence, Natasha Ledlie, and veronika Penciakova. 2013a. “Africa’s Challenge to End Extreme Poverty by 2030: Too Slow or Too Far Behind?” 29 May. www.brookings.edu/blogs/up-front/posts/2013/05/29-africa-challenge-end-extreme-poverty-2030-chandy.
———. 2013b. “The Final Countdown: Prospects for Ending Extreme Poverty by 2030.” The Brookings Institution, Washington, DC.
———. 2013c. Unpublished update to “The Final Countdown: Prospects for Ending Extreme Poverty by 2030.” The Brookings Institution, Washington, DC.
———. 2013d. “The Final Countdown: Prospects for Ending Extreme Poverty by 2030 (Report).” www.brookings.edu/research/reports/2013/04/ending-extreme-poverty-chandy.
Commission on Growth and Development. 2008. The Growth Report: Strategies for Sustained Growth and Inclusive Development. Washington, DC.
The Economist. 2010. “How to Get Children out of Jobs and into School.” 29 July. www.economist.com/node/16690887.
———. 2012. “Self Insufficient.” 14 November. www.economist.com/blogs/feastandfamine/2012/11/middle-income-countries-and-fighting-poverty.
———. 2013. “The End of Poverty?” 28 February. www.economist.com/blogs/americasview/2013/02/social-spending-brazil.
———. 2013. “Not Always with Us.” 1 June. www.economist.com/news/briefing/21578643-world-has-astonishing-chance-take-billion-people-out-extreme-poverty-2030-not.

30 PART 1 FRoM v IS IoN To PL AN: INvESTMENTS To END E x TREME PovERT y By 2030
Government of Brazil. 2013. “o fim da miséria é só um começo.” 19 February. www.dilma.com.br/site/noticias/view/o-fim-da-miseria-e-so -um-comeco.
Government of India, Planning Commission. 2013. “Press Note on Poverty Estimates, 2011–12.” New Delhi. http://planningcommission.nic.in/news/pre_pov2307.pdf.
Government of the Republic of Djibouti. 2011. “Evaluation des dommages, pertes et besoins suite à la sécheresse.” Djibouti.
Government of the Republic of Haiti. 2010. “Haiti Earthquake PDNA: Assessment of Damage, Losses, General and Sectoral Needs.” Port-au-Prince.
Green, Duncan. 2013. “A Selection of Letters on our Article.” 10 June. www.economist.com/blogs/feastandfamine/2013/06/poverty-reduction.
The Guardian. 2012. “The Radical Nature of Development in the Near Future Is Already Assured.” 12 March. www.theguardian.com/global-development/poverty-matters/2013/mar/12/radical-nature-development-future-assured.
High-Level Panel of Eminent Persons on the Post-2015 Development Agenda. 2013. “Communiqué.” 1 February, Monrovia. http://www.post2015hlp.org/wp-content/uploads/2013/02/Monrovia -Communique-1-February-2013.pdf.
IPEA (Instituto de Pesquisa Econômica Aplicada). 2010. Bolsa Família 2003–2010: avanços e desafios. Brasilia.
———. 2012a. “’Brasil Carinhoso’ Can Reduce Extreme Poverty among Children to 0.6%.” 28 December. http://pressroom.ipc-undp.org/?p=13497.
———. 2012b. “Social Policies.” Monitoring and Analysis 20. Brasilia.
Kapsos, Steven, and Evangelia Bourmpoula. 2013. Employment and Economic Class in the Developing World. Research Paper
6. Geneva: International Labour office.
Kim, Jim yong. 2013a. “Statement at the Spring Meetings 2013 Closing Press Conference.” 20 April, Washington, DC.
———. 2013b. “Within our Grasp: A World Free of Poverty.” Speech presented at Georgetown University, 2 April, Washington, DC.
Krishna, Anirudh. 2004. “Escaping Poverty and Becoming Poor: Who Gains, Who Loses, and Why?” World Development 32(1): 121–136.
Krishna, Anirudh, Patti Kristjanson, Maren Redeny, and Wilson Nindo. 2004. “Escaping Poverty and Becoming Poor in 20 Kenyan villages.” Journal of Human Development 5(2): 211–226.
A. Lenhardt, and A. Shepherd. 2013. “What Has Happened to the Poorest 50%?” Working Paper 184. University of Manchester, Brooks World Poverty Institute.
López-Calva, Luis F., and Eduardo ortiz-Juarez. 2013. “A vulnerability Approach to the Definition of the Middle Class?” Journal of Economic Inequality 1−25.
Mehta, A., A. Shepherd, S. Bhide, A. Shah, and A. Kumar. 2011. India Chronic Poverty Report: Towards Solutions and New Compacts in a Dynamic Context. New Delhi: Indian Institute of Public Administration.
Mitchell, Tom, Lindsey Jones, Emma Lovell, and Eva Comba, eds. 2013. Disaster Risk Management in Post 2015 Development Goals: Potential Targets and Indicators. London: overseas Development Institute.
oECD (organisation for Economic Co-operation and Development). 2011. OECD Economic Surveys: Brazil. Paris.
oNE. 2013. “Bono at TED 2013: Eradicating Extreme Poverty Doesn’t Have To Be a Dream.” www.one.org/us/shareworthy/bono-at-ted/
oPHI (oxford Poverty and Human Development Initiative). 2013a.
“Colombia’s Multidimensional Poverty Index.” www.ophi.org.uk/policy/national-policy/colombia-mpi/.
———. 2013b. “Launch of Mexico’s New Poverty Measure.” www.ophi.org.uk/launch-of-mexico%E2%80%99s-new-poverty-measure/.
Palma, Jose Gabriel. 2006. “Globalizing Inequality: ‘Centrifugal’ and ‘Centripetal’ Forces at Work.” DESA Working Paper 35. United Nations, Department of Economic and Social Affairs, New york.
Rasella, Davide, Rosana Aquino, Carlos AT Santos, Rômulo Paes-Sousa, and Mauricio L Barreto. 2013. “Effect of a Conditional Cash Transfer Programme on Childhood Mortality: A Nationwide Analysis of Brazilian Municipalities.” Lancet 382(9886): 57−64.
Ravallion, Martin. 2010. “Do Poorer Countries Have Less Capacity for Redistribution.” Journal of Globalization and Development 1(2): 1−31.
———. 2012a. “Benchmarking Global Poverty Reduction.” Policy Research Working Paper 6205. World Bank, Washington, DC.
———. 2012b. “Should We Care Equally about Poor People Wherever They May Live?” 8 November. http://blogs.worldbank.org/developmenttalk/should-we-care -equally-about-poor-people -wherever-they-may-live.
Ravallion, Martin, Shaohua Chen, and Prem Sangraula. 2008. “Dollar a Day Revisited.” World Bank Economic Review 23(2): 163–184.
Rodrigues de oliveira, Pedro, and Ana Lucia Kassouf. 2013. “Impacts of the Continuous Cash Benefit Programme on Family Welfare.” one pager 192. United Nations Development Programme, International Policy Centre for Inclusive Growth, Brasilia.
Shepherd, A., and A. Lenhardt. 2012. “What Has Happened to the Poorest 50%?” Chronic Poverty Advisory Network, overseas

CHAP TER 1 ENDING PovERT y By 2030 31
Development Institute, London. www.worldwewant2015.org/node/291329.
Sirleaf, Ellen Johnson. 2012. “opening Remarks.” 16th Mid-Term Review Meeting of the International Development Association, 12 November, Abidjan.
Studart, Rogerio. 2013. “Brazil and the Global Battle to Eliminate Extreme Poverty.” 26 March. The Globalist. http://theglobalist.com/storyid.aspx?storyid=9944.
Soares, Sergei. 2012. “Bolsa Família, Its Design, Its Impacts and Possibilities for the Future.” Working Paper 89. United Nations Development Programme, International Policy Centre for Inclusive Growth, Brasilia.
Thorbecke, Erik. 2005. “Multi-dimensional Poverty: Conceptual and Measurement Issues.” Paper prepared for the Many Dimensions of Poverty International Conference, 29–31 August, UNDP International Poverty Centre, Brasilia.
UNDP (United Nations Development Programme) International Policy Centre for Inclusive Growth. 2013. “Bolsa Família Budget Expected
to Increase by $2.1 Billion USD in 2013.” 20 March. http://pressroom.ipc-undp.org/?p=14026.
United Nations. 2008. Achieving the Millennium Development Goals in Africa: Recommendations of the MDG Africa Steering Group. New york.
———. 2013. A New Global Partnership: Eradicate Poverty and Transform Economies through Sustainable Development: The Report of the High-Level Panel of Eminent Persons on the Post-2015 Development Agenda. New york.
United Nations, Department of Economic and Social Affairs, Population Division. 2013. World Population Prospects: 2012 Revision. New york.
Watkins, Kevin. 2013.“Inequality as a Barrier to Human Development.” Ryszard Kapuscinski Lecture, 5 March, Stockholm School of Economics. http://kapuscinskilectures.eu/lectures/inequality-as-barrier-to-human-development/
World Bank. 2012. “New World Bank Report Finds 50 Percent Increase in
Middle Class in Latin America and the Caribbean over Last Decade.” Press Release, 13 November. Washington, DC.
———. 2013a. “A Common vision for the World Bank Group.” Washington, DC.
———. 2013b. Global Monitoring Report 2013. Washington, DC.
———. 2013c. “The State of the Poor: Where Are the Poor and Where Are They Poorest?” Washington, DC.
———. 2013d. “The World Bank Group Goals: End Extreme Poverty and Promote Shared Prosperity.” Washington, DC.
———. 2013e. “World Bank/IMF Spring Meetings 2013: Development Committee Communiqué.” 20 April. Washington, DC.
———. 2013f. World Development Indicators 2013. Washington, DC.
———. n.d. a. “A Short History.” http://data.worldbank.org/about/country-classifications/a-short-history.
———. n.d. b. “Measuring Inequality.” http://go.worldbank.org/3SLyUTvy00.