Flagship Investments Limited - AnnualReports.com
48
Flagship Investments Limited ABN 99 080 135 913 ANNUAL REPORT 2015
-
Upload
khangminh22 -
Category
Documents
-
view
0 -
download
0
Transcript of Flagship Investments Limited - AnnualReports.com

Flagship Investments LimitedABN 99 080 135 913
AnnuAl report 2015
flagship investments limited directors (from left to right)Dominic McGann, Sophie Mitchell, Patrick Corrigan AM, Henry Smerdon AM and Dr Manny Pohl (Managing Director)
financial calendar financial Year end30 June 2015
dividend BooKs close26 August 2015
dividend paYment11 September 2015
notice of annUal general meetingThe Annual General Meeting of Flagship Investments Limited.
Will Be held at:The office of McCullough Robertson LawyersLevel 11, Central Plaza Two66 Eagle StreetBRISBANE Qld 4000
time:4.00pm (Qld Time)
date:Friday 6 November 2015
investing in flagship investments limitedInvestors can purchase shares in Flagship Investments Limited through the Australian Securities Exchange.
ASX code: FSI
Flagship Investments LimitedABN 99 080 135 913Registered in Queensland 23 September 1997

Chairman’s Report 7
Operating and Financial Review and Managing Director’s Report 8
Directors’ Report 10
Auditor’s Independence Declaration 15
Corporate Governance Statement 16
Financial Report 21
Directors’ Declaration 41
Independent Auditor’s Report 42
Shareholder Information 43
Investments 44
Corporate Directory 47
Table of Contents

Flagship Investments Limited Annual Report 2015
Highlights for 2015
4
Highlights for the year ending June 2015
INVESTMENTSFLAGSHIP The portfolio before fees and tax increased by 6.6% versus a 1.3% increase in the All Ordinaries Index over the twelve month period.
INVESTMENTSFLAGSHIP The Net Tangible Assets (NTA) per share decreased by 1.4% after tax (on realised gains only).
INVESTMENTSFLAGSHIP Dividends of 7.5 cents comprising a 3.5 cent final dividend (2014), a 0.5 cent special dividend (2014) and a 3.5 cent interim dividend (2015) were paid during the year.
INVESTMENTSFLAGSHIP 717,154 shares were issued at $1.51 per share under the Share Purchase Plan.
INVESTMENTSFLAGSHIP
INVESTMENTSFLAGSHIP
Total return since inception to June 2015
INVESTMENTSFLAGSHIP
NAV (cents) Share Price (cents)
Capital GrowthDividends
180
160
200
140
120
100
80
60
40
20
0
TOTAL ReTuRn SInce IncepTIOn (neT OF TAx)
Relative Performance History Portfolio Return Pre Fees
Portfolio Return After FeesPortfolio Return After ExpensesNAV Accumulation with DPS reinvested in DRPNAVAll Ordinaries Index
Jun98
Jun99
Jun00
Jun01
Jun03
Jun02
Jun04
Jun05
Jun06
Jun07
Jun08
Jun12
Jun13
Jun14
Jun15
Jun11
Jun10
Jun09
0
100
200
300
400
500
600
700
800 InVeSTMenT peRFORMAnce

Flagship Investments Limited Annual Report 2015
Flagship Investments Performance vs. the All Ordinaries Index
AnnuAL peRcenTAge gAIn
Year toPortfolio Return
Pre Fees
Portfolio Return
After Fees
NTA (on Realised
Gains Only)
All Ordinaries
Index
June-99 16.4% 14.4% 14.6% 10.1%
June-00 33.6% 30.4% 25.3% 12.9%
June-01 20.0% 15.2% 8.8% 5.1%
June-02 -5.0% -6.3% -9.3% -7.6%
June-03 -9.4% -10.2% -14.6% -5.2%
June-04 20.5% 19.0% 14.4% 17.7%
June-05 35.1% 31.0% 24.1% 19.8%
June-06 34.7% 31.6% 19.8% 19.0%
June-07 35.9% 32.8% 21.6% 25.4%
June-08 -24.1% -25.8% -31.3% -15.5%
June-09 -4.2% -4.2% -8.0% -26.0%
June-10 21.4% 19.6% 6.7% 9.5%
June-11 4.6% 4.6% -1.7% 7.7%
June-12 -4.9% -4.9% -8.2% -11.3%
June-13 32.9% 29.5% 15.7% 15.5%
June-14 26.2% 23.5% 15.8% 12.7%
June-15 6.6% 6.2% -1.4% 1.3%
Note: Fees include Performance Fees and Under-writing Fees.
INVESTMENTSFLAGSHIP
5
Major InvestmentsJune 2015
MAJOR InVeSTMenTS % OF pORTFOLIO
June 15 June 14
Telstra 9.3% 6.9%
Macquarie group 9.3% 5.4%
commonwealth Bank 7.8% 8.4%
Westpac 6.2% 4.8%
Rio Tinto 5.3% 5.5%
SeeK 5.0% 7.2%
TOTAl 42.9% 38.2%
INVESTMENTSFLAGSHIP
Note: Investments greater than 5% of Portfolio.
INVESTMENTSFLAGSHIP
Dividends per share
0.00001.11112.22223.33334.44445.55556.66667.77778.88889.9999
1999
cent
s
2000 2001 2002 2003 2004 2005 2006 2007 2008 2009 2010 2013 2014 201520122011
Interim Dividend Final DividendSpecial Dividend
9.00 –8.00 –7.00 –6.00 –5.00 –4.00 –3.00 –2.00 –1.00 –0.00 –
cents
cOMpOund AnnuAL gROWTh RATe 5.9%** (includes Special dividend)
Flagship Investments Limited Annual Report 20156
Overview
cOMpAnY pROFILeFlagship Investments Limited (the “Company”) is a listed investment company providing investors with access to a diversified Australian investment portfolio.The composition and performance of the investment portfolio is monitored by the Board of Directors, which comprises business people with many years of experience in the business, investment and funds management.The Manager’s investment strategy centres on the view that investing in high quality business franchises with the ability to grow sales and earnings at rates above Gross Domestic Product (GDP) growth will produce superior investment returns over the long-term. The Company’s portfolio of investments comprises companies whose operations cover a wide spectrum of business activities. The portfolio is constructed from the perspective of a business owner by investing in well managed companies and not simply by tracking the index weighting of various component stocks.There is no fixed management fee. The Manager receives a fee which is performance based and payable annually in arrears if the Company’s investments outperform the returns on a cash investment. If the Company’s net performance is less than the returns on a cash investment, no performance fee is payable.
OBJecTIVeSThe investment objectives of Flagship Investments Limited are:
INVESTMENTSFLAGSHIP To achieve medium to long-term capital growth and income through investing in a diversified portfolio of Australian companies;
INVESTMENTSFLAGSHIP To preserve and enhance the NTA per share after allowing for inflation; and
INVESTMENTSFLAGSHIP To p r o v i d e C o m p a n y S h a r e h o l d e r s (“Shareholders”) with a fully franked dividend which, over time, will grow at a rate in excess of the rate of inflation.
InVeSTOR BeneFITSThe benefits for investors in Flagship Investments Limited are:
INVESTMENTSFLAGSHIP Reduced share investment risk through a diversified investment portfolio;
INVESTMENTSFLAGSHIP Professional, disciplined management of an investment portfolio;
INVESTMENTSFLAGSHIP Fully franked dividend income;INVESTMENTSFLAGSHIP Access to tax advantages of Listed Investment Company Capital Gains when available;
INVESTMENTSFLAGSHIP Access to a Dividend Reinvestment Plan;INVESTMENTSFLAGSHIP No fixed management fees - the Fund Manager is remunerated on a performance basis;
INVESTMENTSFLAGSHIP No entry or exit charges made by the Company; and
INVESTMENTSFLAGSHIP Easy access to information via the Company’s head office or website www.flagshipinvestments.com.au
InVeSTMenT MAnAgeRThe management of the Company’s investment portfolio is undertaken by EC Pohl & Co Pty Ltd which provides administration support even when a performance fee is not paid.Dr Manny Pohl is the Managing Director and major shareholder of EC Pohl & Co Pty Ltd.Information on the Manager is available from www.ecpohl.com

Flagship Investments Limited Annual Report 2015 7
Chairman’s Report
Dear Investor,
I am pleased to present the 18th Annual Chairman’s Report of Flagship Investments Limited for the 2014/15 financial year.
The Year in Review:
In many respects 2014/15 has been a difficult year. Markets around the world experienced periods of volatility in part driven by the Greek debt crisis, problems in China and general softening in emerging markets. Share market returns have been lacklustre and a far cry from the heady returns experienced in the previous couple of years. Globally the MSCI (measured in US dollar terms) declined by 0.4% while US share market returns reflected the more positive outlook for the US economy generally.
Our portfolio return net of fees in 2014/15 was 6.2% compared with the increase in the broad All Ordinaries Index of 1.3% in the same period. It is a relatively modest result compared with the after fee returns of 23.5% in 2013/14 and 29.5% in 2012/13. However, the portfolio has consistently returned well above the broader market and the result for the year is consistent with our long term objective for our Shareholders of providing a return on their investment that is in excess of the returns they might otherwise receive investing on their own account.
The Net Tangible Asset (NTA) decreased by 1.4% in 2014/15 compared with a 15.8% increase in the previous year.
Consistent with previous years, our Managing Director, Dr Manny Pohl, has provided a detailed report on one of our newer holdings, Catapult Sports, and I commend it to Shareholders.
In terms of the financials, After Tax Profit for the Company increased from $0.326m in 2013/14 to $1.032m in 2014/15 while Total Comprehensive Income in the same period decreased from $5.64m to $1.888m, largely due to smaller gains during the year in the fair value of assets.
The Market Outlook
We remain cautiously positive about the outlook for markets generally but it is not without risks. The Australian economy is still dealing with a depressed commodity market but should see some benefits from the lower dollar and low interest rates.
In our view, companies with strong market positions, strong balance sheets and good management, will continue to perform well and reward patient investors although we expect market returns to be modest again in the coming year.
dividend
The Board has approved a final dividend for the year of 3.75 cents per share. It represents an overall dividend of 7.5 cents per share, fully franked.
There is no LIC attributable capital gains tax deduction available again this year.
Share Buy-Back Scheme
The share buy-back scheme again operated in 2014/15 although no shares were bought back during the year. The scheme will be available again in the 2015/16 year.
Share purchase plan
The Company implemented a Share Purchase Plan in 2014/15. 717,154 shares were issued at a price of $1.51. The Company was pleased with the outcome.
The Board
I particularly want to thank my fellow Board members for their support and input in the past year. Special thanks must go to Dr Manny Pohl and his small but brilliant team of investment professionals at E C Pohl &Co. Our success would not be possible without the outstanding contribution of these very committed individuals.
Sadly one of our long-standing Directors, Patrick Corrigan AM, has decided not to seek re-election as a Director. Patrick’s wise counsel has been greatly valued by the Board. We sincerely thank Patrick for his contribution to our success and we wish him well in the future.
I thank Shareholders for their on-going support and look forward to another good year ahead.
Yours sincerely,
henry R Smerdon AM
Chairman

Flagship Investments Limited Annual Report 20158
After a few years of reasonable returns, global market performance has been lacklustre across most asset classes. The economies of the developed world have performed better than those in emerging markets with the US and European economic data suggesting that they are mid-cycle while the economies of the emerging markets, particularly China, are under pressure. Low interest rates are the norm for most of the developed world, while quantitative easing is still in place in Europe and Japan. Volatility in the markets has been largely driven by both Greece, who are continuing to battle their economic woes, and, China who are facing cyclical headwinds as they struggle to deal with slowing economic growth. Australia is faced with a tougher economic environment as the commodities cycle remains depressed, causing a decline in national income. However, the depreciating dollar and likelihood of an interest rate cut could provide some relief in the future.
As an indicator of global market performance, the MSCI (as measured in US dollar terms) closed at 1735.6 which was an overall decline of 0.4% for the twelve months to 30 June 2015. In Australian dollar terms, the MSCI increased by 21.8% over the same period, reflecting the continued decline of the Australian dollar compared to the US dollar over most of the year. The US market performed slightly better than the other major markets with the S&P 500 increasing by 5.2% in US dollar terms for the twelve months to the end of June 2015. During the same twelve month period, the Australian share market, as represented by the All Ordinaries Index, increased by 1.3%.
When compared to the overall market, our portfolio did particularly well increasing by 6.6% over the twelve months to June 2015. The NTA (tax on realised gains only) declined marginally by 1.4% after paying a dividend of 7.5 cents per share to Shareholders during the year.
This performance was due to the fact that high quality businesses were recognized as such by the market and marked up, while the speculative resource companies remained under pressure.
chART 1: dISTRIBuTIOn OF ASSeTS AS AT 30 June 2015
The overall portfolio distribution of assets is shown in Chart 1. In keeping with our intention of providing Shareholders with information on a few of the investments in the portfolio each year, we have included a comment on Catapult Sports, a recent addition to the portfolio.
COMPANY COMMENTARY: CATAPULT SPORTSASX Code: CAT
Catapult Sports provides professional sports teams with granular data that can be used to track and monitor player performance, understand the risk that players may be overworked or under worked, their readiness to play, and ability to return to the field. This data is sourced during training sessions and in live play to help the coaches and medical teams leverage this information to improve the outcomes for the teams through player optimisation, strategy and player health.
Sustainable Competitive AdvantageCatapult’s sustainable competitive advantage is mainly derived from their dataset. The more players and teams they have on their system, the more data they collect. This allows them to provide more accurate and interesting analytics across their offering and provide more value to their current clients and future clients. This growing dataset sets the foundation for the virtuous circle, the more teams the better the data, the more teams sign up, the more they are able to monetise their data and so on.
Growth OptionsThe investment thesis is centred around the assumption that professional sports teams are always focused on getting an edge over their competition. Elite and professional teams usually have large budgets (salary costs etc) and will look to maintain a competitive edge. The main drivers of the investment hypothesis are:
• Product Reach
While Catapult are the market leading wearable device and analytics provider to professional sports teams globally, market penetration is extremely low. They have approximately 2% penetration in their target market, and the investment thesis is that this penetration could grow significantly over the next few years as professional teams begin to leverage big data to improve their strategies and optimise player performance. Catapult is looking to dominate the elite leagues first, and then use those “influencers” to trickle down into the professional and semi professional leagues as well. The further down the chain you go, the bigger the market size and the greater the competition. Furthermore, Catapult are not in the consumable tracking device market.
Operating and Financial Review and Managing Director’s Report
8
Financials 36.1%
Consumer Discretionary 12.1%
Industrials 10.8%
Telecommunication Services 10.7%
Materials 8.6%
Information Technology 6.7%
Energy 4.7%
Consumer Staples 4.2%
Healthcare 3.7%
Cash and Equivalent 2.4%

Flagship Investments Limited Annual Report 2015 9
• Data Leverage
Catapult retains the rights to utilise client’s data on a de-identified basis for a range of commercial applications. These include providing athlete performance benchmarks to peers, creating new algorithms and analytical tools and potential media and consumer applications such as live statistics for broadcasting, fantasy sports leagues etc.
cLOSIng cOMMenTSOur investment horizon of three to five years is sufficiently long to give us a long-term perspective, but short enough to ensure that we are mindful of current market forces. This combination of having a long-term thought process with an overlay of market sensitivity we believe will provide Investors with better overall returns.
The cash rate is unlikely to be changed from the current level of 2.0%, based on our view that the RBA will need to keep rates where they are to ensure rebalancing of growth towards the non-mining sectors. We do not expect inflation to be a barrier. Indicators of inflation – unit labour costs, GDP growth and capacity utilisation – are all well-behaved. At the current time, household income growth remains reasonable, but there has been a shift in household spending patterns. Households continue to save more, are investing more conservatively, paying down debt and shifting consumption from discretionary items to ‘essentials’.
We have maintained our fully invested position during the year with a marginal increase in our cash holding to 2.4% at the end of June. In our portfolio modelling we have factored in an improvement in P/E ratings from current levels. Furthermore, the short-term financial metrics for the companies in the portfolio, including organic sales growth, earnings and dividend growth, should provide an additional impetus for an improvement in valuations.
The portfolio return profile remains attractive in historical terms and the complete details of all the investments that were held at the end of the financial year are detailed later in the Annual Report. Suffice to say that Telstra (9.3%), Macquarie Bank (9.3%) and Commonwealth Bank (7.8%) were the three largest investments held at the June 2015 year-end and it is these three investments that we believe have the best risk adjusted return profiles.
dr emmanuel (Manny) c pohl
Managing Director

Flagship Investments Limited Annual Report 201510
1. dIRecTORS The following persons were Directors of Flagship Investments Limited from the beginning of the financial year until the date of this report, unless otherwise stated: H Smerdon AM, Dr E Pohl, S Mitchell, P Corrigan AM and D McGann.
2. InFORMATIOn On dIRecTORS
henry R Smerdon AM B.Com, B.Econ, FCPA, MAICD, Fdn DFP, HonD (Griffith University)
Non-Executive ChairmanChairman of Remuneration and Nomination CommitteeMember of Audit and Risk Committee
Experience and expertiseDirector since 2000.Extensive experience as a previous board member/CEO of Queensland Investment Corporation, Chairman of Q-Invest Ltd, member of various private and Government boards and as Under Treasurer of the Queensland Treasury.
Other Current directorshipsChairman of AustSafe SuperDirector of National Trust of Australia (Qld) Limited and Chairman of Currumbin Wildlife Sanctuary CommitteeChair of Queensland Education Leadership Institute LtdChancellor of Griffith UniversityMember of Public Trust Investment BoardPrincipal of Strategic and Financial Consulting Services
Former Listed Company directorships in last 3 yearsNone.
Interest in Shares63,229 ordinary shares
dr emmanuel (Manny) c pohl Pr Eng, B.Sc (Eng), MBA, DBA, FAICD, MSAA, F Fin
Managing DirectorMember of Remuneration and Nomination Committee
Experience and expertiseManaging Director since the inception of the Company in 1997.Extensive experience in the funds management industry.
Other current directorshipsManaging Director of Global Masters Fund Limited Executive Director of Barrack Street Investments LimitedChair of Athelney Trust PlcChairman of EC Pohl & Co Pty Ltd Chairman of ECP Asset Management Pty Ltd Chairman of EC Pohl & Co Private Equity LimitedChairman of Astuce Group LimitedChairman of Pohl Pty LtdChairman & President of Bond University Rugby ClubDirector of Huysamer International Holdings (Pty) LtdMember of Bond University, Institute of Sustainable Development & Architecture Academic Advisory Panel Trustee of Currumbin Wildlife Hospital Foundation
Former Listed Company directorships in last 3 yearsNone.
Interest in Shares8,409,413 ordinary shares
Has a relevant interest in shares in the Company over which he holds a Power of Attorney arrangement with a number of Shareholders.
Directors’ Report
Your Directors present their report on Flagship Investments Limited for the financial year ended 30 June 2015.
10

Flagship Investments Limited Annual Report 2015 11
dominic M McgannSolicitor of the Supreme Court of Queensland, LLB (QUT), LLM (Sydney University), LLM (Bond University) Non-Executive DirectorMember of Audit and Risk Committee
Experience and expertiseAppointed Non-Executive Director on 8 October 2009. Extensive experience as a Partner with McCullough Robertson Lawyers and a Solicitor with the Supreme Court of Queensland.
Other current directorshipsDirector of Australian National Development Index Limited Chairman of Partners of McCullough Robertson Lawyers Chair of the Brisbane Writers Festival
Former Listed Company directorships in last 3 yearsNone.
Interest in SharesNil ordinary shares
patrick corrigan AM HonD (Bond University)
Non-Executive Director
Experience and expertiseAppointed a Non-Executive Director on 1 May 2009. Extensive business experience having founded, run and sold two international freight forwarding businesses and subsequently taken on Non-Executive Directorships with a number of leading Australian corporations and arts bodies, made a Member in the Order of Australia (2000) and awarded an Honorary Doctorate of Bond University (2007).
Other current directorshipsNon-Executive Chairman of UBI Logistics (Australia) Pty LtdChairman of Qantas Art Scholarship CommitteeChairman of Gold Coast Regional Art GalleryDeputy Chair of Air Freight Export Council of NSW IncDirector of Global Masters Fund LimitedDirector of Better Read Pty LtdDirector of Gold Coast Art CentreDirector of Aboriginal Benefits Foundation LimitedDirector of National Portrait Gallery
Former Listed Company directorships in last 3 yearsNone.
Interest in Shares1,135,223 ordinary shares
Sophie A Mitchell B.Econ, GAICD, SF Fin
Non-Executive DirectorChair of Audit and Risk CommitteeMember of Remuneration and Nomination Committee
Experience and expertiseAppointed a Non-Executive Director on 11 June 2008.Management and industry experience as an Executive Director of Morgans, former portfolio manager Seymour Funds Management (2007), and Head of Research Morgans (1996-2007).
Other current directorshipsChair of Norna Limited Director of Silver Chef LimitedDirector of Morgans Director of Morgans Foundation Trustee of the Queensland Performing Arts TrustMember of the Takeovers Panel Board Member of the Australia Council
Former Listed Company directorships in last 3 yearsNone.
Interest in Shares30,000 ordinary shares

Flagship Investments Limited Annual Report 201512
3. pRIncIpAL AcTIVITIeSThe principal activity of the Company is investing in securities listed on the Australian Securities Exchange. There have been no significant changes in the nature of this activity during the year.
4. ReVIeW OF OpeRATIOnSOur portfolio outperformed the market, increasing by 6.6% over the twelve months, while the NTA decreased by 1.4% after paying a dividend of 7.5 cents per share to Shareholders during the year.
The Australian equity market continued to perform with overall equity performance driven by investors seeking yield. The Australian share market, as represented by the All Ordinaries Index, increased by 1.3%.
Once again high quality businesses were recognized as such by the market and marked up, while the speculative resource companies remain under pressure.
As our investment horizon is three to five years, we believe there is significant capital appreciation potential for the portfolio.
A detailed review of the operations for the year can be obtained from the Operating and Financial Review and Managing Director’s Report on page 8 of this Annual Report.
5. SIgnIFIcAnT chAngeS In The STATe OF AFFAIRS
Significant changes in the state of affairs of the Company during the financial year were as follows:
INVESTMENTSFLAGSHIP The value of the portfolio before fees and taxes increased by 6.6%.
INVESTMENTSFLAGSHIP The on-market buy-back programme was reinstated on 16 July 2014 and ceased on 10 July 2015. No shares were bought back during the period. The programme was reinstated effective from 22 July 2015.
INVESTMENTSFLAGSHIP A Share Purchase Plan was offered during the year which resulted in 717,154 shares being issued @ $1.51 per share.
6. MATTeRS SuBSequenT TO The end OF The FInAncIAL YeAR
Apart from the dividend declared as per item 9, no other matter or circumstance not otherwise dealt with in the Director’s Report or Financial Report, which has arisen since the end of the year that has significantly affected, or may significantly affect the operations of the Company, the results of those operations or the state of affairs of the Company in future financial years.
7. LIKeLY deVeLOpMenTS And expecTed ReSuLTS OF OpeRATIOnS
There are no planned changes to principal activities. Any general decline in equity markets may have an adverse effect on results in future years.
8. enVIROnMenTAL ISSueSThe Company’s operations are not regulated by any significant environmental regulation under a law of the Commonwealth or of a State or Territory.
9. dIVIdendS pAId Type Cents per
shareTotal amount
$’000’sDate of payment
Dividends paid to Shareholders during the financial year were as follows:
Final (Inc Special)Interim
4.003.507.50
969853
1,822
September 2014April 2015
Dividends paid by the Company during the preceding year were:
FinalInterim
3.503.256.75
843783
1,626
September 2013April 2014
The final and special dividend paid in September 2014 and the interim dividend paid in April 2015, were fully franked.
In addition to the above dividends, since the end of the financial year the Directors have recommended the payment of a franked final dividend of $914,000 (3.75 cents per share) to be paid on 11 September 2015. There is no LIC attributable amount attached to these dividends.
10. eARnIngS peR ShAReBased on profit after income tax.
2015 cents 2014 cents
Basic earnings per share 4.2 1.35Diluted earnings per share 4.2 1.35
As a result of moving to AASB 9 Total Comprehensive Income is a more appropriate base for detailing earnings per share.
2015 cents 2014 cents
Basic earnings per share 7.7 23.35Diluted earnings per share 7.7 23.35
See Note 21 of the Financial Report.
11. cOMpAnY SecReTARYIan W harrison B.Bus (Acc), FcpA, cSA (Affiliate)Company Secretary since inception of the Company in 1997. Ian has 37 years experience in the accounting and finance industries. He is the Company Secretary for Hyperion Asset Management Limited and was previously the Company Secretary for Wilson Group Ltd and its associated entities.
12. MeeTIngS OF dIRecTORSThe number of Directors’ meetings attended by each of the Directors of the Company during the financial year are:
Board Audit and Risk Committee
Remunerationand
Nomination Committee
DirectorEligible
toattend
AttendEligible
toattend
AttendEligible
toattend
Attend
h R Smerdon AM 4 4 4 4 1 1
dr e c pohl 4 4 - - 1 1
S A Mitchell 4 4 4 4 1 1
p corrigan AM 4 4 - - - -
d M Mcgann 4 4 4 3 - -
Directors’ Report (Continued)
12

Flagship Investments Limited Annual Report 2015 13
The remuneration report is set out under the following main headings:
(A) Principles used to determine the nature and amount of remuneration
(B) Details of remuneration
(c) Service agreements
(d) Share-based compensation
(e) Related Party Transactions
(F) Equity Instrument Disclosure relating to Key Management Personnel
(A) Principles used to determine the nature and amount of remuneration
Fees and payments to Directors reflect the demands which are made
on, and the responsibilities of, the Directors. The Remuneration
and Nomination Committee reviews the remuneration of Directors
annually. No remuneration consultants were engaged during the year.
The per annum remuneration of the Directors increased on 1 July 2014 to:
INVESTMENTSFLAGSHIP Chairman $45,000
INVESTMENTSFLAGSHIP Chairman – Audit Committee $35,000
INVESTMENTSFLAGSHIP Other Directors $30,000
Remuneration of Directors is determined by the Board within the maximum amount of $200,000 previously approved by the Shareholders.
The Director fees paid to Manny Pohl were paid to his previous employer in accordance with that employer’s policies.
There is no performance based remuneration for Directors.
(B) Details of remunerationDetai ls of the remunerat ion of each Director of F lagship Investments Limited and the executives of the Company are set out in the following table.
(C) Service agreementsAs the Company does not employ any employment service agreements entered into by the Company. The Company Secretary is employed by Hyperion Asset Management Limited, the previous Investment Manager and the Managing Director is employed by the Investment Manager – EC Pohl & Co Pty Ltd.
(D) Share-based compensationNo share-based compensation exists.
(E) Related Party Transactions
the following transactions occurred with other related parties: 2015$’000
2014$’000
expenses paid or payable by the Company to:
– eC pohl & Co pty ltd for performance Fee A performance Fee was payable in accordance with the Management Services Agreement as detailed in note 22. Dr e C pohl has an interest in the transaction as during the year Dr e C pohl was a Director, employee and Shareholder of eC pohl & Co pty ltd.
178 1,176
– McCullough robertson lawyers for the provision of legal services. D M McGann is a partner of McCullough robertson lawyers.
4 1
All related party transactions are made on an arm’s length basis using the standard terms and conditions.
deTAILS OF ReMuneRATIOn
Year Short-term Benefits Post-Employment Equity
Director
Fees
$
Performace Fees
$
Non-monetary benefits
$
Super
$
Shares
$
Options
$
Total
$
h R Smerdon AMNon-Executive Chairman
2015 45,000 - - - - - 45,0002014 40,000 - - - - - 40,000
dr e c pohlManaging Director
2015 30,000 - - - - - 30,0002014 25,000 - - - - - 25,000
S A MitchellNon-Executive Director
2015 35,000 - - - - - 35,0002014 30,000 - - - - - 30,000
p corrigan AMNon-Executive Director
2015 30,000 - - - - - 30,0002014 25,000 - - - - - 25,000
dominic M McgannNon-Executive Director
2015 30,000 - - - - - 30,0002014 25,000 - - - - - 25,000
Total directors Rumuneration
2015 170,000 - - - - - 170,0002014 145,000 - - - - - 145,000
13. ReMuneRATIOn RepORT (AudITed)
Flagship Investments Limited Annual Report 201514
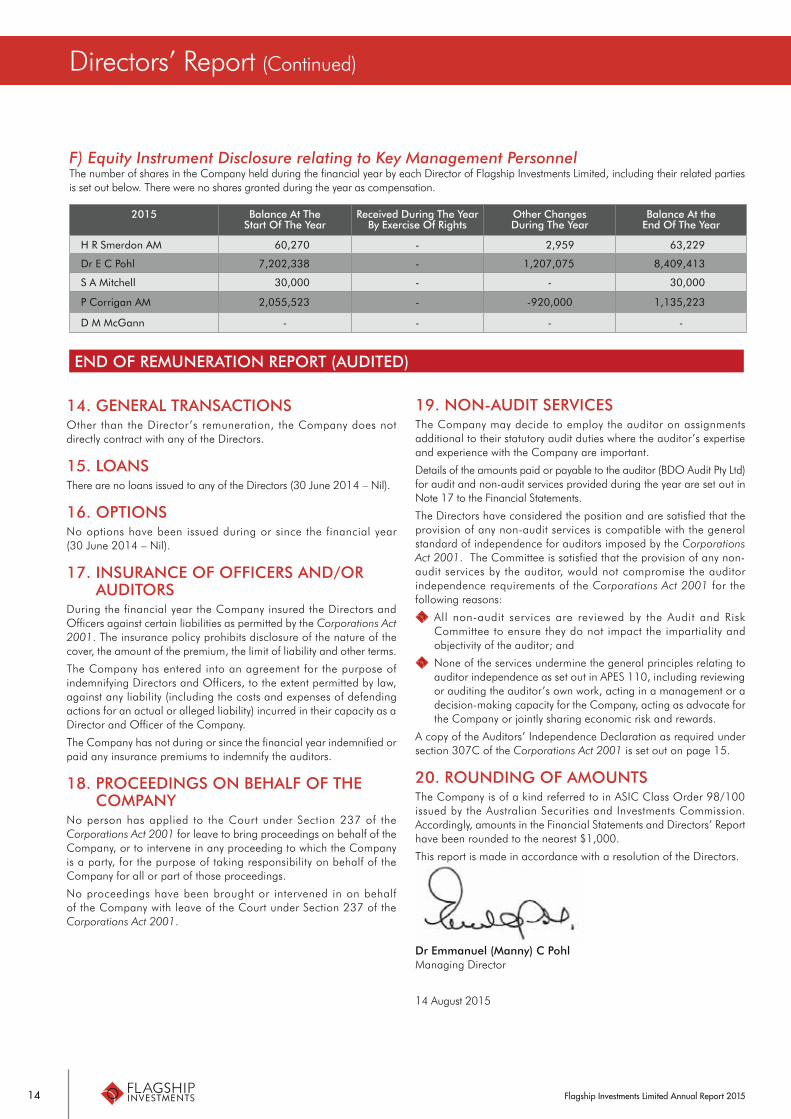
F) Equity Instrument Disclosure relating to Key Management PersonnelThe number of shares in the Company held during the financial year by each Director of Flagship Investments Limited, including their related parties is set out below. There were no shares granted during the year as compensation.
2015 Balance At The Start Of The Year
Received during The Year By exercise Of Rights
Other changes during The Year
Balance At the end Of The Year
H r Smerdon AM 60,270 - 2,959 63,229
Dr e C pohl 7,202,338 - 1,207,075 8,409,413
S A Mitchell 30,000 - - 30,000
p Corrigan AM 2,055,523 - -920,000 1,135,223
D M McGann - - - -
end OF ReMuneRATIOn RepORT (AudITed)
Directors’ Report (Continued)
14. geneRAL TRAnSAcTIOnSOther than the Director’s remuneration, the Company does not directly contract with any of the Directors.
15. LOAnSThere are no loans issued to any of the Directors (30 June 2014 – Nil).
16. OpTIOnS No options have been issued during or since the financial year (30 June 2014 – Nil).
17. InSuRAnce OF OFFIceRS And/OR AudITORS
During the financial year the Company insured the Directors and Officers against certain liabilities as permitted by the Corporations Act 2001. The insurance policy prohibits disclosure of the nature of the cover, the amount of the premium, the limit of liability and other terms.
The Company has entered into an agreement for the purpose of indemnifying Directors and Officers, to the extent permitted by law, against any liability (including the costs and expenses of defending actions for an actual or alleged liability) incurred in their capacity as a Director and Officer of the Company.
The Company has not during or since the financial year indemnified or paid any insurance premiums to indemnify the auditors.
18. pROceedIngS On BehALF OF The cOMpAnY
No person has applied to the Court under Section 237 of the Corporations Act 2001 for leave to bring proceedings on behalf of the Company, or to intervene in any proceeding to which the Company is a party, for the purpose of taking responsibility on behalf of the Company for all or part of those proceedings.
No proceedings have been brought or intervened in on behalf of the Company with leave of the Court under Section 237 of the Corporations Act 2001.
19. nOn-AudIT SeRVIceSThe Company may decide to employ the auditor on assignments additional to their statutory audit duties where the auditor’s expertise and experience with the Company are important.
Details of the amounts paid or payable to the auditor (BDO Audit Pty Ltd) for audit and non-audit services provided during the year are set out in Note 17 to the Financial Statements.
The Directors have considered the position and are satisfied that the provision of any non-audit services is compatible with the general standard of independence for auditors imposed by the Corporations Act 2001. The Committee is satisfied that the provision of any non-audit services by the auditor, would not compromise the auditor independence requirements of the Corporations Act 2001 for the following reasons:
INVESTMENTSFLAGSHIP All non-audit services are reviewed by the Audit and Risk Committee to ensure they do not impact the impartiality and objectivity of the auditor; and
INVESTMENTSFLAGSHIP None of the services undermine the general principles relating to auditor independence as set out in APES 110, including reviewing or auditing the auditor’s own work, acting in a management or a decision-making capacity for the Company, acting as advocate for the Company or jointly sharing economic risk and rewards.
A copy of the Auditors’ Independence Declaration as required under section 307C of the Corporations Act 2001 is set out on page 15.
20. ROundIng OF AMOunTSThe Company is of a kind referred to in ASIC Class Order 98/100 issued by the Australian Securities and Investments Commission. Accordingly, amounts in the Financial Statements and Directors’ Report have been rounded to the nearest $1,000.
This report is made in accordance with a resolution of the Directors.
dr emmanuel (Manny) c pohlManaging Director
14 August 2015

BDO Audit Pty Ltd ABN 33 134 022 870 is a member of a national association of independent entities which are all members of BDO Australia Ltd ABN 77 050 110 275, an Australian company limited by guarantee. BDO Audit Pty Ltd and BDO Australia Ltd are members of BDO International Ltd, a UK company limited by guarantee, and form part of the international BDO network of independent member firms. Liability limited by a scheme approved under Professional Standards Legislation, other than for the acts or omissions of financial services licensees.
Auditor’s Independence Declaration
Mr H Smerdon AMChairmanFlagship Investments Limited Level 12Corporate Centre One2 Corporate CourtBUNDALL QLD 4217
Dear Henry
decLARATIOn OF Independence BY T J KendALL TO The dIRecTORS OF FLAgShIp InVeSTMenTS LIMITed
As lead auditor of Flagship Investments Limited for the year ended 30 June 2015, I declare that, to the best of my knowledge and belief, there have been:
1. No contraventions of the auditor independence requirements of the Corporations Act 2001 in relation to the audit; and
2. No contraventions of any applicable code of professional conduct in relation to the audit.
T J Kendall
Director
BDO Audit Pty Ltd
Brisbane, 14 August 2015
Level 10, 12 Creek StreetBrisbane QLD 4000GPO Box 457 Brisbane QLD 4001Australia
Phone: +61 7 3237 5999Fax: +61 7 3221 9227www.bdo.com.au
15

Flagship Investments Limited Annual Report 201516
This statement outlines the main corporate governance practices that were in place for the year ended 30 June 2015. The statement explains the extent to which the Company complies with the ASX Corporate Governance Principles and Recommendations, including explanations of why certain recommendations have not been followed. For ease of comparison with the Principles and Recommendations, this section summarises the Company’s compliance with each of the specific recommendations as follows.
pRIncIpLe 1:
Lay solid foundations for management and oversight
Recommendation 1.1: Respective roles and responsibilities of its Board and Management
compliant
The Board is responsible for the overall corporate governance of the entity and its overriding objective is to protect and increase Shareholder value. The Board guides and monitors the business to ensure that the Company is properly managed in the best interest of Shareholders. The Board is accountable to its Shareholders.
It is responsible for a broad range of matters including:
INVESTMENTSFLAGSHIP monitoring the Investment Manager and the composition and performance of the investment portfolio;
INVESTMENTSFLAGSHIP monitoring and assessing the performance of the Managing Director;
INVESTMENTSFLAGSHIP undertaking Director nomination matters including succession planning for the Board to ensure an appropriate mix of skills, experience, expertise and diversity is maintained;
INVESTMENTSFLAGSHIP ensuring the Managing Director has an adequate management succession plan;
INVESTMENTSFLAGSHIP approving and maintaining appropriate risk management and internal control systems to identify, assess, monitor and manage the Company’s business risks on an ongoing basis;
INVESTMENTSFLAGSHIP overseeing the Company ’s process for disclosure and communications; and
INVESTMENTSFLAGSHIP developing and approving appropriate Company policies, procedures and codes of behaviour as required to maintain a culture of integrity and a strong framework of corporate governance.
The Board has adopted a formal Board Charter that details the Board’s role, authority, responsibilities, membership and operations, and is available on the Company’s website http://www.flagship investments.com.au/documents/FSIBoardcharterVer4nov12-FInAL.pdf.
The Charter sets out the matters specifically reserved for the Board and the powers delegated to its Committees and to the Managing Director.
The Board has determined the responsibilities of the Chairman and the Managing Director. A summary of these responsibilities are:
chairman
The Chairman’s responsibilities are:
INVESTMENTSFLAGSHIP The overall leadership of the Board.
INVESTMENTSFLAGSHIP Communication with Shareholders.
INVESTMENTSFLAGSHIP Keeping Directors informed with accurate, timely and relevant information.
INVESTMENTSFLAGSHIP Evaluating the performance of the Board and individual Directors, including the Managing Director.
INVESTMENTSFLAGSHIP Managing the business of the Board.
INVESTMENTSFLAGSHIP Ensuring the effective operation of Board Committees.
INVESTMENTSFLAGSHIP Ensuring appropriate standards for corporate governance are in place and complied with.
INVESTMENTSFLAGSHIP Monitoring conflicts of interest.
INVESTMENTSFLAGSHIP Ensuring effective communication with the Managing Director.
In particular, the chairman will:
INVESTMENTSFLAGSHIP Be responsible for the efficient organization and conduct of Board business, including chairing meetings, briefing Directors on issues relevant to the Board, establishing appropriate agendas for meetings.
INVESTMENTSFLAGSHIP Facilitate the effective contribution of all Directors to, at and between meetings.
INVESTMENTSFLAGSHIP Be the spokesperson for the Company at the Annual General Meeting particularly in regard to policy and strategic issues.
INVESTMENTSFLAGSHIP Chair the Remuneration and Nomination Committee.
INVESTMENTSFLAGSHIP Ensure that the performance of the Investment Manager/service provider is formally reviewed by the Audit and Risk Committee at least once per year.
INVESTMENTSFLAGSHIP Ensure, in conjunction with the Managing Director, that corporate and strategic priorities and objectives for the Company are developed and considered by the Board on an annual basis.
Managing director
The responsibility of the Managing Director is broadly to work with the Board and the Chairman to achieve the Company’s corporate and strategic objectives and to undertake those duties not specifically assigned to the Board or the Chairman and generally are:
INVESTMENTSFLAGSHIP Day to day management of the business.
INVESTMENTSFLAGSHIP Implementing decisions of the Board and reporting to the Board on progress/outcomes.
INVESTMENTSFLAGSHIP Providing the Chairman and other Board members with accurate and timely information on all matters relevant to the business and operations of the Company.
INVESTMENTSFLAGSHIP Ensuring that there is effective communication between himself, the Chairman and other Directors.
INVESTMENTSFLAGSHIP Ensuring that the services provided to the Company are consistent with the needs of the Company as assessed by the Board and that the service provided is regularly evaluated for efficiency and value for money.
INVESTMENTSFLAGSHIP Reporting to the Board regularly on the performance of the business against strategic priorities and objectives.
Corporate Governance Statement: FOR The YeAR endIng 30 June 2015
16
pRIncIpLe 1:
Lay solid foundations for management and oversight

Flagship Investments Limited Annual Report 2015 17
Recommendation 1.2: Information prior to director election/re-election
compliant
The Remuneration and Nominations Committee assists the Board with the selection and appointment of Directors. Before the Board appoints a new Director or puts forward a candidate for election, the Committee will ensure that appropriate background checks are undertaken. Shareholders are provided with all material information in our possession that is relevant to their decision on whether or not to elect or re-elect a Director through a number of channels, including via the Notice of Meeting, the Director Resumés and other information contained in the Annual Report.
Recommendation 1.3: Written agreement with each director and senior executive setting out the terms of their appointment
compliant
Upon appointment, each Director receives a letter of appointment which sets out the formal terms of their appointment, along with a deed of indemnity, insurance and access.
Recommendation 1.4: The company Secretary of a listed entity should be accountable directly to the Board, through the chair, on all matters to do with the proper functioning of the Board.
compliant
The Company Secretary is employed by a third party as disclosed in the Directors’ Report and is directly accountable to the Board on matters relating to the proper functioning of the Board.
Details regarding the Company Secretary, including experience and qualifications, are set out in the Directors’ Report.
Recommendation 1.5: gender diversity
non compliant
The Company has a Diversity Policy which is available on the website: www.flagshipinvestments.com.au/documents/FSI diversity policynov12-FInAL.pdf.
The policy includes measureable diversity objectives of 1/3 of the independent Directors. Refer Recommendation 2.3 for details on the independent Directors. There is currently one female Director (25% of the independent Directors).
Recommendations 1.6 and 1.7: Board and Senior executive evaluation
compliant
The Board is committed to formally evaluating its performance and the performance of the Audit and Risk Committee and individual Directors, as well as the governance processes supporting the Board. The Board does this through an annual assessment process. Any issues identified are addressed at subsequent Board meetings.
pRIncIpLe 2:
Structure the Board to add value
Recommendation 2.1: establish a nomination committee
compliant
The Company has a Remuneration and Nomination Committee comprising two independent Directors, Henry Smerdon AM (Chair of the Committee) and Sophie Mitchell and the Managing Director Dr Manny Pohl. The Charter for the Committee is available on the Company’s website http://www.flagshipinvestments.com.au/ documents/FSIRemunnomcteecharterAugust14FInAL.pdf
A record of its meetings is set out in the Directors Report.
Recommendation 2.2: have and disclose a Board skills matrix
compliant
Our objective is to have an appropriate mix of expertise and experience on our Board and its Committees so that the Board can effectively discharge its corporate governance and oversight responsibilities. This mix is described in the Board skills matrix below.
expertise experience
INVESTMENTSFLAGSHIP Financial knowledge and experience
INVESTMENTSFLAGSHIP Legal, governance and compliance
INVESTMENTSFLAGSHIP Commercial acumen
INVESTMENTSFLAGSHIP Risk management
INVESTMENTSFLAGSHIP Remuneration and nominations
IndustryFinanceSuperannuation
MarketAustralian Listed Securities
geographicAustralia
Recommendation 2.3: Independent directors
compliant
The Board has accepted that an independent Director is as defined in Box 2.3 of the ASX Corporate Governance Principles and Recommendations (3rd Edition).
Of the current Board members, Mr Henry Smerdon AM, Ms Sophie Mitchell, Mr Dominic McGann and Patrick Corrigan AM are considered to be independent Directors. The Board has determined that even though:
1. Henry Smerdon AM has been a Director for 15 years, his length of service has not compromised his independence as he has no relationship with the Investment Manager or Company Management; and
pRIncIpLe 1:
Lay solid foundations for management and oversight
Flagship Investments Limited Annual Report 201518
2. Patrick Corrigan AM is a substantial Shareholder, his substantial interest has not compromised his independence as he has no relationship with the Investment Manager or Company Management.
The length of service of each Director is set out in the Directors Report.
Recommendation 2.4: A majority of the Board of a listed entity should be independent directors
compliant
The structure of the Board does comply with this recommendation in that a majority of the Directors are independent (refer recommendation 2.3)
Recommendation 2.5: The chair of the Board of a listed entity should be an independent director and, in particular, should not be the same person as the ceO of the entity.
compliant
The Company’s Chairman is Mr Henry Smerdon AM an independent Director.
Recommendation 2.6: director induction and professional development
compliant
New Directors are inducted into the Company’s processes and policies in a suite of ways, including the provision of a ‘Board manual’, interviews with senior management of the Investment Manager and out of session meetings with other Directors. All Directors are encouraged to undertake ongoing professional development both in their area of technical expertise and in the skills required to effectively execute the role of Director.
pRIncIpLe 3:
Act ethically and responsibly
Recommendation 3.1: code of conduct
compliant
The Company has developed a Code of Conduct (the Code) which has been fully endorsed by the Board and applies to all Directors and employees. The Code is reviewed annually and updated as necessary to ensure it reflects the highest standards of behaviour and professionalism and the practices necessary to maintain confidence in the Company’s integrity. A summary of the Code is available on the Company’s website http://www.flagshipinvestments.com.au/ documents/FSIcodeOfconductnov12-FInAL.pdf
The Code sets out the Company’s commitment to conducting its business in accordance with all applicable laws and regulations while demonstrating and promoting the highest ethical standards.
pRIncIpLe 4:
Safeguard integrity in corporate reporting
Recommendation 4.1: Audit committee
compliant
The Company has an Audit and Risk Committee which comprises three independent Directors.
The composition of the Committee, a record of its meetings, and the relevant experience of each member of the Committee is set out in the Directors Report.
The Audit and Risk Committee charter is available on the Company’s website http://www.flagshipinvestments.com.au/documents/FSI AuditRiskcteecharter-Feb14-FInAL.pdf
Recommendation 4.2: ceO and cFO declaration on the financial records
compliant
The Board has received a declaration from the CEO and CFO that the Company’s financial records have been properly maintained and that the financial statements comply with the appropriate accounting standards and give a true and fair view of the financial position and performance of the Company and that the opinion has been formed on the basis of a sound system of risk management and internal control which is operating effectively.
Recommendation 4.3: The external auditor should attend the AgM and be available to answer questions from security holders relevant to the audit
compliant
A partner of BDO, the Company’s auditor during the year, was available at the most recent AGM and will be available at the next AGM to answer questions from Shareholders. It is the policy of the Board to always request auditor presence at AGMs.
pRIncIpLe 5:
Make timely and balanced disclosure
Recommendation 5.1: continuous disclosure policy
compliant
The Company has a Continuous Disclosure Policy which sets out the obligations of the Company’s Directors and officers in relation to continuous disclosure as well as the Company’s obligations under the Corporations Act and the ASX Listing Rules. The policy also
Corporate Governance Statement: FOR The YeAR endIng 30 June 2015 (Continued)

Flagship Investments Limited Annual Report 2015 19
contains procedures for internal notification and external disclosure, as well as procedures for promoting understanding of compliance with the disclosure requirements and for the monitoring of Company compliance.
The Disclosure Policy is available on the Company ’s website h t tp://www.f lagship investments .com.au/documents/FSIdisclosurepolicyJun13-FInAL.pdf
pRIncIpLe 6:
Respect the rights of security holders
Recommendation 6.1: A listed entity should provide information about itself and its governance to investors via its website
compliant
Investors and other stakeholders can find information about the Company on its website http://www.flagshipinvestments.com.au Information on the Company’s corporate governance practices can be found at http://www.flagshipinvestments.com.au/corporate
Recommendation 6.2: A listed entity should design and implement an investor relations program to facilitate effective two-way communication with investors
compliant
The Company’s Communications Policy sets out how the Company will communicate with Shareholders.
Information is communicated to Shareholders through the distribution of a quarterly report, annual and half yearly financial reports, announcements through the ASX and the media, on the Company’s website and through the Chairman’s address at the Annual General Meeting.
If requested, the Company will provide general information by email, facsimile or post.
Through the Company’s information email address and phone number, and at AGMs, the Company encourages two-way communication with Shareholders.
The Communication Policy is available on the Company ’s website http://www.flagshipinvestments.com.au/documents/FSIcommunicationpolicynov12-FInAL.pdf
Recommendation 6.3: disclose the policies and processes it has in place to facilitate and encourage participation at meetings of security holders
compliant
The Company facilitates and encourages participation at meetings of security holders by having sections of each meeting dedicated to
questions from the floor. Shareholders are given at least 30 days’ notice of security holder meetings and those that are unable to attend in person may email or fax questions they would like answered. The Company provides a direct voting facility to allow security holders to vote ahead of AGMs without having to attend or appoint a proxy.
Recommendation 6.4: give security holders the option to receive communications from, and send communications to, the entity and its security registry electronically
compliant
Quarterly reports and other information required to be sent to Shareholders are sent by email to all persons who have requested their name to be added to the Company’s email list. If requested, the Company will provide general information by email, facsimile or post.
pRIncIpLe 7:
Recognise and manage risk
Recommendation 7.1: Risk committee
compliant
The Audit and Risk Committee monitors the Company’s business risks.
A third party compliance consultant monitors risk in accordance with the risk management framework and reports directly to the Audit and Risk Committee.
The composition of the Committee and a record of its meetings is set out in the Directors Report. The Audit and Risk Committee charter is available on the Company’s website http://www.flagshipinvestments.com.au/documents/FSIAuditRiskcteecharter-Feb14-FInAL.pdf
Recommendation 7.2: Annual risk management framework review
compliant
Each year, the Audit and Risk Committee, reviews the Company’s risk management framework. Ad hoc reviews may also be conducted when the Board perceives that the risk environment has shifted significantly. A review was conducted during the year.
Recommendation 7.3: Internal audit function
non compliant
The Company does not have an internal audit function as the Board has deemed it is not necessary giving consideration to the size and nature of the Company. Instead, the full Board through the Audit and Risk Committee liaises closely with the Company’s external auditor to identify potential improvements to the risk management and internal control processes.

Flagship Investments Limited Annual Report 201520
Recommendation 7.4: exposure to economic, environmental and social sustainability risks
compliant
The Board monitors the business risk and guides the affairs of the Company in the discharge of its stewardship responsibilities.
The Board meeting agendas and reports advise the Board of current and forthcoming issues relevant to the Company’s operations and performance. The Board reviews the investment portfolio at their regular meetings.
Management has designed and implemented a risk management and internal control system through a Risk Management Framework. The Framework is monitored by the Audit & Risk Committee with regular reporting to Committee meetings. The Framework is reviewed yearly by the Committee.
The identified risks are grouped within the Framework under the following headings:
INVESTMENTSFLAGSHIP Strategic
INVESTMENTSFLAGSHIP Operational
INVESTMENTSFLAGSHIP External Macro
INVESTMENTSFLAGSHIP Environmental
pRIncIpLe 8:
Remunerate fairly and responsibly
Recommendation 8.1: Remuneration committee
compliant
The Board has a Remuneration and Nomination Committee which monitors the Company’s Remuneration matters.
The Committee comprises two independent Directors and the Managing Director. The composition of the Committee and a record of its meetings are set out in the Directors Report.
A Charter setting out the Committees’ role, responsibilit ies and composi t ion is avai lable on the Company ’s websi te ht tp://www.f lagship investments .com.au/documents/FSIRemunnomcteecharterAugust14FInAL.pdf
The role of the Committee is to assess the skills required on the Board and review remuneration matters. All matters determined by the Committee are submitted to the full Board as recommendations for Board decision.
Recommendation 8.2: disclose its policies and practices regarding the remuneration of non-executive directors and the remuneration of executive directors and other senior executives
compliant
The maximum amount of Directors’ fees is fixed by Shareholders at the Annual General Meeting and can only be varied by Shareholders in a similar manner. In determining the allocation of fees, the Board takes into account the time demands on each Director, together with the responsibilities undertaken by them and market practices of similar sized businesses in the Listed Investment Company sector.
It is the policy of the Board not to issue Directors incentive shares or options.
The details of the remuneration received by Directors in the 2014/2015 year are included in the Remuneration Report contained within the Directors’ Report.
Recommendation 8.3: equity-based remuneration
non compliant
As the Company does not have an equity-based remuneration scheme, Recommendation 8.3 is not applicable.
Corporate Governance Statement: FOR The YeAR endIng 30 June 2015 (Continued)
Flagship Investments Limited Annual Report 2015 21
page
cOnTenTS OF FInAncIAL RepORT: Financial Report
– Statement of Profit or Loss and Other Comprehensive Income 22
– Statement of Financial Position 23
– Statement of Changes in Equity 24
– Statement of Cash Flows 25
– Notes to the Financial Statements 26
– Directors’ Declaration 41
Independent Auditor’s Report 42
Shareholder Information 43
Investments 44
Corporate Directory 47
Financial Report
This financial report covers Flagship Investments Limited as an individual entity. There are no controlled entities.
Flagship Investments Limited is a company limited by shares, incorporated and domiciled in Australia. Its registered office and principal place of business is:
Flagship Investments Limited Level 12 Corporate Centre One 2 Corporate Court BUNDALL QLD 4217
The financial report was authorised for issue by the Directors on 14 August 2015.
A description of the nature of the entity’s operations and its principal activities is included in the Operating and Financial Review and Managing Director’s report on page 8.
Through the use of the internet, we have ensured that our corporate reporting is timely, complete and available globally at minimum cost to the Company. All media releases, financial reports and other information are available from the Company at the above address or from our website:
www.flagshipinvestments.com.au

Flagship Investments Limited Annual Report 201522
FLAGSHIP INVESTMENTS LIMITEDSTATeMenT OF pROFIT OR LOSS And OTheR cOMpRehenSIVe IncOMe FOR THE YEAR ENDED 30 JUNE 2015
2015 2014 Notes $’000 $’000
Other Income 4 1,743 1,570
Change in fair value of Financial Assets at fair value through Profit & Loss 10 (275) -
Performance Fee 22 (178) (1,176)
Other Expenses 5 (445) (490)
profit/(Loss) before income tax 845 (96)
Income tax (Expense)/Benefit 6 187 422
profit after income tax for the year 1,032 326
Other comprehensive Income
Items that will not be reclassified subsequently to profit & loss
Changes in fair value of Financial Assets at fair value through Other Comprehensive Income 1,223 7,592
Income Tax (Expense)/Benefit relating to components of Other Comprehensive Income (367) (2,278)
Other comprehensive Income/(Loss) for the year, net of tax 856 5,314
Total comprehensive Income/(Loss) for the year 1,888 5,640
earnings per share:
cents Cents
Basic earnings per share 21 4.2 1.35
Diluted earnings per share 21 4.2 1.35
The above statement of financial position should be read in conjunction with the notes to the financial statements.
Financial Report

Flagship Investments Limited Annual Report 2015 23
FLAGSHIP INVESTMENTS LIMITEDSTATeMenT OF FInAncIAL pOSITIOn AS AT 30 JUNE 2015
2015 2014 Notes $’000 $’000
ASSeTS Cash and Cash Equivalents 7 872 427 Trade and Other Receivables 8 211 148 Financial Assets at fair value through Other Comprehensive Income 9 42,208 41,798 Financial Assets at fair value through Profit or Loss 10 - 250
Total Assets 43,291 42,623
LIABILITIeS Trade and Other Payables 12 235 1,322 Deferred Tax Liability 11 1,588 1,409
Total Liabilities 1,823 2,731
net Assets 41,468 39,892
equITY Contributed Equity 13 35,176 33,666 Other Reserves 14 4,977 5,943 Retained Earnings 1,315 283
Total equity 41,468 39,892
The above statement of financial position should be read in conjunction with the notes to the financial statements.

Flagship Investments Limited Annual Report 201524
FLAGSHIP INVESTMENTS LIMITEDSTATeMenT OF chAngeS In equITY FOR THE YEAR ENDED 30 JUNE 2015
Notes Contributed Retained Asset Asset TOTAL Equity Earnings Revaluation Realisation Reserve Reserve $’000 $’000 $’000 $’000 $’000
Balance at 1 July 2013 33,657 (15) 1,806 421 35,869
Total comprehensive Income
Profit for Year - 326 - - 326
Other Comprehensive Income - - 5,314 - 5,314
Total comprehensive Income - 326 5,314 - 5,640
Transfers between ReservesTransfer to Asset Realisation Reserve - - (1,638) 1,638 -
Total Transfers between Reserves - - (1,638) 1,638 -
Transactions with Owners in their capacity as owners
Shares issued during period 13(b) 462 - - - 462
Shares bought back on market 13(b) (453) - - - (453)
Dividends paid or provided for 15(a) - (28) - (1,598) (1,626)
9 (28) - (1,598) (1,617)
Balance at 30 June 2014 33,666 283 5,482 461 39,892
Balance at 1 July 2014 33,666 283 5,482 461 39,892
Total comprehensive Income
Profit for Year - 1,032 - - 1,032
Other Comprehensive Income - - 856 - 856
Total comprehensive Income - 1,032 856 - 1,888
Transfers between ReservesTransfer to Asset Realisation Reserve - - (1,678) 1,678 -Total Transfers betweenReserves
- - (1,678) 1,678 -
Transactions with Owners in their capacity as owners
Shares issued during period 13(b) 1,510 - - - 1,510
Dividends paid or provided for 15(a) - - - (1,822) (1,822)
1,510 - - (1,822) (312)
Balance at 30 June 2015 35,176 1,315 4,660 317 41,468
The above statement of changes in equity should be read in conjunction with the notes to the financial statements.
Financial Report

Flagship Investments Limited Annual Report 2015 25
FLAGSHIP INVESTMENTS LIMITEDSTATeMenT OF cASh FLOWS FOR THE YEAR ENDED 30 JUNE 2015
Notes 2015 2014 $’000 $’000
cash flows from operating activities Dividends received 1,634 1,617
Interest received 50 15
Other payments (inclusive of GST) (1,744) (1,765)
net cash inflow/(outflow) from operating activities 20 (60) (133)
cash flows from investing activities
Proceeds from sale of investments 9,199 11,802
Payment for investments (8,410) (12,156)
net cash inflow/(outflow) from investing activities 789 (354)
cash flows from financing activities
Share Purchase Plan 1,083 -
Dividends paid 15(a) (1,367) (1,164)
Buy-back of shares - (453)
net cash inflow/(outflow) from financing activities (284) (1,617)
net increase/(decrease) in cash and cash equivalents 445 (2,104)
Cash and cash equivalents at the beginning of the year 427 2,531
cash and cash equivalents at end of period 7 872 427
The above statement of cash flows should be read in conjunction with the notes to the financial statements.

Flagship Investments Limited Annual Report 201526
FLAGSHIP INVESTMENTS LIMITEDnOTeS TO FInAncIAL STATeMenTS FOR THE YEAR ENDED 30 JUNE 2015
1. SuMMARY OF SIgnIFIcAnT AccOunTIng pOLIcIeS
The principal accounting policies adopted in the preparation of these financial statements are set out below. These policies have been consistently applied to all the years presented, unless otherwise stated.
(A) BASIS OF pRepARATIOnThese general purpose financial statements have been prepared in accordance with Australian Accounting Standards, other authoritative pronouncements of the Australian Accounting Standards Board, Australian Accounting Interpretations and the Corporations Act 2001.
Australian Accounting Standards include Australian Equivalents to International Financial Reporting Standards (AIFRS). Compliance with AIFRS ensures that the financial report of Flagship Investments Limited complies with International Financial Reporting Standards (IFRS).
These financial statements have been prepared under the historical cost convention, except for Financial Assets at fair value through Other Comprehensive Income or profit and loss, which are measured at fair value.
Unless otherwise stated, all amounts are presented in Australian dollars. Flagship Investments Limited is a for-profit entity for the purpose of preparing these financial statements.
(B) BALAnce SheeT FORMATThe Statement of Financial Position is in a liquidity format. The adoption of a liquidity format results in the removal of the terms “current asset” and “non current asset” from the Statement of Financial Position, in favour of the general term “assets”.
(c) ReVenue RecOgnITIOnRevenue is measured at the fair value of the consideration received or receivable net of the amount of Goods and Services Tax (GST). The Company recognises revenue when the amount of revenue can be reliably measured, it is probable that future economic benefits will flow to the entity and specific criteria have been met for each of the Company’s activities as described below. The amount of revenue is not considered to be reliably measurable until all contingencies relating to the sale have been resolved. The Company bases its estimates on historical results, taking into consideration the type of customer, the type of transaction and the specifics of each arrangement.
Revenue is recognised for the major business activities as follows:
(i) dividend Revenue Dividend revenue is recognised when the right to receive the
dividend has been established.
(ii) Interest Revenue Interest revenue is recognised on a time proportion basis using
the effective interest method. When a receivable is impaired, the Company reduces the carrying amount to its recoverable amount, being the estimated future cash flow discounted at the original effective interest rate of the instrument, and continues unwinding the discount as interest revenue. Interest revenue on impaired loans is recognised using the original effective interest rate.
(d) IncOMe TAxThe income tax expense or benefit for the period is the tax payable on the current period’s taxable income based on the income tax rate adjusted by changes in deferred tax assets and tax liabilities attributable to temporary differences and to unused tax losses.
Deferred income tax is provided in full, using the liability method, on temporary differences arising between the tax bases of assets and liabilities and their carrying amounts in the financial statements. However, the deferred income tax is not accounted for if it arises from initial recognition of an asset or liability in a transaction other than a business combination that at the time of the transaction affects neither accounting, nor taxable profit or loss. Deferred income tax is determined using tax rates (and laws) that have been enacted or substantially enacted by the Statement of Financial Position date and are expected to apply when the related deferred income tax asset is realised or the deferred income tax liability is settled.
Deferred tax assets are recognised for deductible temporary differences and unused tax losses only if it is probable that future taxable amounts will be available to utilise those temporary differences and losses.
Deferred tax assets and liabilities are offset when there is a legally enforceable right to offset current tax assets and liabilities and when the deferred tax balances relate to the same taxation authority. Current tax assets and tax liabilities are offset where the entity has a legally enforceable right to offset and intends either to settle on a net basis, or to realise the asset and settle the liability simultaneously.
(e) FInAncIAL InSTRuMenTSFinancial Assets At Fair Value Through profit Or Loss
Financial assets at fair value through Profit or Loss are Financial Instruments convertible into Equity Instruments. A financial asset is classified in this category if it is so designated by management and within the requirement of AASB 9 Financial Instruments. Realised and unrealised gains and losses arising from changes in the fair value of these assets are included in the profit or loss in the period in which they arise.
Financial Assets At Fair Value Through Other comprehensive Income
The Company is a long-term investor in equity instruments. Under AASB 9, these investments are classified as fair value through Other Comprehensive Income. After initial recognition at fair value (being cost), the Company has elected to present in Other Comprehensive Income changes in the fair value of equity instrument investments.
Unrealised gains and losses on investments are recognised in the Asset Revaluation Reserve until the investment is sold or otherwise disposed of, at which time the cumulative gain or loss is transferred to the Asset Realisation Reserve.
The Company derecognises an investment when it is sold or it transfers the investment and the transfer qualifies for derecognition in accordance with AASB 9. Upon derecognition, unrealised gains/losses net of tax relating to the investment are transferred from the revaluation reserve to the realisation reserve.
Financial Report

Flagship Investments Limited Annual Report 2015 27
Available-For-Sale Financial Assets
These investments are measured at fair value.
Unrealised gains and losses arising from changes in the fair value of these assets are taken directly to Other Comprehensive Income and accumulated in Equity.
When these financial Assets are sold, the accumulated fair value adjustments are reclassified from Equity to the profit or loss as gains and losses on sale.
Available-For-Sale-Financial assets are assessed at each reporting date to determine whether there is any objective evidence that it is impaired. In the case of Available-For-Sale Financial Instruments, a significant or prolonged decline in the value of the instrument below cost is considered to be evidence of whether or not impairment has arisen.
Any cumulative impairment loss in respect of an Available-For-Sale Financial Assets previously recognised in equity is reclassified to profit or loss.
An impairment loss is reversed if the reversal can be related objectively to an event occurring after the impairment loss was recognised. For Available- For-Sale Financial Assets that are debt securities, the reversal is recognised in profit or loss. For equity securities, the reversal is recognised in Other Comprehensive Income.
Loans and Receivables
Loans and receivables are recognised initially at fair value and subsequently measured at amortised cost, less provision for doubtful debts. Trade receivables are due for settlement no more than 30 days from the date of recognition.
Collectability of loans and receivables is reviewed on an ongoing basis. Debts which are known to be uncollectible are written off. A provision for impairment of trade receivables is established when there is objective evidence that the Company will not be able to collect all amounts due according to the original terms of the receivables. Significant financial difficulties of the debtor, probability that the debtor will enter bankruptcy or financial reorganisation, and default or delinquency in payments (more than 30 days overdue) are considered indicators that the trade receivable is impaired. The amount of the provision is the difference between the asset’s carrying amount and the present value of estimated future cash flows, discounted at the original effective interest rate. Cash flows relating to short-term receivables are not discounted if the effect of discounting is immaterial. The amount of the provision is recognised in the profit or loss in other expenses.
Fair Value estimation
The fair value of financial instruments traded in active markets (such as publicly traded derivatives and securities) is based on quoted market prices at the Statement of Financial Position date. The quoted market price used for financial assets held by the Company is the current bid price. The appropriate quoted market price for financial liabilities is the current bid price.
The nominal value less estimated credit adjustments of trade receivables and payables are assumed to approximate their fair values. The fair value of financial liabilities for disclosure purposes is estimated by discounting the future contractual cash flows at the current market interest rate that is available to the Company for similar financial instruments.
(F) cASh And cASh equIVALenTSFor Statement of Cash Flows purposes, cash and cash equivalents includes cash on hand, deposits held at call with financial institutions, other short-term, highly liquid investments with original maturities of three months or less that are readily convertible to known amounts of cash and which are subject to an insignificant risk of changes in value, and bank overdrafts.
(g) TRAde And OTheR pAYABLeSThese amounts represent liabilities for goods and services provided to the Company prior to the end of the financial year which are unpaid. The amounts are unsecured and are usually paid within 30 days of recognition.
Other liabilities are measured at amortised cost using the effective interest method.
(h) cOnTRIBuTed equITYOrdinary shares are classified as Equity.
Incremental costs directly attributable to the issue of new shares or options are shown in Equity as a deduction, net of tax, from the proceeds.
(I) dIVIdendSProvision is made for the amount of any dividend declared, being appropriately authorised and no longer at the discretion of the Company, on or before the end of the reporting period but not distributed at the end of the reporting period.
(J) gOOdS And SeRVIceS TAx (gST)Revenues, expenses and assets are recognised net of the amount of associated GST, unless the GST incurred is not recoverable from the taxation authority. In this case it is recognised as part of the cost of acquisition of the asset or as part of the expense.
Receivables and payables are stated inclusive of the amount of GST receivable or payable. The net amount of GST recoverable from, or payable to, the taxation authority is included with other receivables or payables in the Statement of Financial Position.
Cash flows are presented on a gross basis. The GST components of cash flows arising from investing or financing activities which are recoverable from, or payable to the taxation authority, are presented as operating cash flow.
(K) ROundIng OF AMOunTSThe Company is of a kind referred to in Class order 98/0100, issued by the Australian Securities and Investments Commission, relating to the “rounding off” of amounts in the financial report. Amounts in the financial report have been rounded off in accordance with that Class Order to the nearest thousand dollars, unless otherwise stated.
FLAGSHIP INVESTMENTS LIMITEDnOTeS TO FInAncIAL STATeMenTS FOR THE YEAR ENDED 30 JUNE 2015

Flagship Investments Limited Annual Report 201528
(L) KeY JudgeMenTSThe preparation of financial reports in conformity with Australian Accounting Standards requires the use of certain critical accounting estimates. This requires the Board to exercise their judgement in the process of applying the Company’s accounting policies.
The carrying amounts of certain assets and liabilities are often determined based on estimates and assumptions of future events. In accordance with AASB 112 Income Taxes, deferred tax liabilities and deferred tax assets have been recognised for Capital Gains Tax (CGT) on the unrealised gains/losses in the investment portfolio at current tax rates.
As the Directors do not intend to dispose of the portfolio, this tax liability/benefit may not be crystallised at the amount disclosed in Note 11. In addition, the tax liability/benefit that arises on disposal of these securities may be impacted by changes in tax legislation relating to treatment of capital gains and the rate of taxation applicable to such gains/losses at the time of disposal.
The Company has an investment process (see below for explanation) which is anticipated will deliver medium to long-term capital growth – minimum investment period is three to five years. The deferred tax asset has been carried forward as it believed that this process will deliver growth over this period to utilise the deferred tax asset.
The Company does not hold any securities for short term trading purposes. Therefore the investment portfolio is classified as Financial Assets at fair value through Other Comprehensive Income.
(M) KeY ASSuMpTIOnS And SOuRceS OF eSTIMATIOn unceRTAInTY
There are no key assumptions or sources of estimation uncertainty that have a risk of causing material adjustment to the carrying amounts of certain assets and liabilities within the next annual reporting period as investments are carried at their market value.
(n) neW AccOunTIng STAndARdS And InTeRpReTATIOnS nOT YeT MAndATORY OR eARLY AdOpTed
Australian Accounting Standards and Interpretations that have recently been issued or amended, but are not yet mandatory, have not been early adopted by the Company for the annual reporting period ended 30 June 2015. The Company’s assessment of the impact of these new or amended Accounting Standards and Interpretations, most relevant to the Company, are set out below.
Annual Improvements to IFRSs 2010-2012 Cycle
These amendments are applicable to annual reporting periods beginning on or after 1 July 2014 and affects several Accounting Standards as follows: Clarifies that the issuance of AASB 13 ‘Fair Value Measurement’ and the amending of the AASB 139 ‘Financial Instruments: Recognition and Measurement’ and the AASB 9 ‘Financial Instruments’ did not remove the ability to measure short-term receivables and payables with no stated interest rate at their invoice amount, if the effect of discounting is immaterial. The adoption of these amendments from 1 July 2014 did not have a material impact on the Company.
2. FInAncIAL RISK MAnAgeMenTThe activities of the Company expose it to a variety of financial risks as discussed below:
The Company’s overall risk management program focuses on the volatility of the financial markets and seeks to minimise potential adverse effects on the financial performance of the Company. Risk governance is managed through the Board which provides direct oversight on the Company’s risk management framework and overall risk management performance. The Board provides written principles for risk management covering investment portfolio composition. Risk is managed by the professional, disciplined management of the investment portfolio by EC Pohl & Co Pty Ltd (the Manager).
The Company held the following financial instruments:
(a) marKet risK(i) Foreign exchange riskThe Company operates entirely within Australia and is not exposed to material foreign exchange risk.
(ii) Equity market risk The Company is exposed to risk of market price movement through its investments in Australian listed equity securities. Equity investments held by the Company are classified on the Statement of Financial Position as Financial Assets at fair value through Other Comprehensive Income and any movement in the listed equity securities is reflected in Other Comprehensive Income.
The risk to Shareholders is that adverse equity securities market movements have the potential to cause losses in Company earnings or the value of its holdings of financial instruments. The Manager’s investment strategy centres on the view that investing in proven high quality businesses with growth opportunities arising from their sustainable competitive advantage will outperform over the longer-term. Consistent with this approach, the Manager has an established risk management framework that includes procedures, policies and functions to ensure constant monitoring of the quality of the investee companies. The objective of the risk management framework is to manage and control risk exposures within acceptable parameters while optimising returns.
Equity market risk is measured as a percentage change in the value of equity instruments held in the portfolio, as compared to the total market index for the same period.
FLAGSHIP INVESTMENTS LIMITEDnOTeS TO FInAncIAL STATeMenTS FOR THE YEAR ENDED 30 JUNE 2015
Financial Report
30 June2015
$’000
30 June2014
$’000
Financial assetsCash and cash equivalents 872 427Trade and Other Receivables 211 148Financial Assets at fair value through Other Comprehensive Income 42,208 41,798 Financial Assets at fair value throughProfit or Loss - 250
Total 43,291 42,623
Financial liabilitiesTrade and Other Payables 235 1,322
Total 235 1,322

Flagship Investments Limited Annual Report 2015 29
The Company’s exposure to equity market risk over the Manager’s investment horizon at the end of the reporting period is:
2015 2014
Portfolio five year return 12.2% 15.2%All Ordinaries Index five year return 4.7% 6.4%
Sensitivity Analysis
Increases/decreases in an equity securities price, affect the Company’s asset revaluation reserve and Other Comprehensive Income for the year. The analysis is based on the assumption that the Financial Assets at fair value through Other Comprehensive Income had increased/decreased by 5% (2014 – 5%) with all other variables held constant.
Impact on Equity and Other Comprehensive Income for the year:-
2015 +/- $2,110,000
2014 +/- $2,090,000
Impact on profit or loss is nil.
(iii) cashflow interest rate risk
The Company is exposed to cash flow interest rate risk from holding cash and cash equivalents at variable rates. The objective of the Company is to minimise the potential adverse effects of interest rate risk.
In order to minimise the potential adverse effects of this risk, the Manager reviews the interest rate exposure as part of cash flow management and takes into consideration liquidity and yields as part of cash flow management. The cash and cash equivalents held are subject to an insignificant level of risk of changes in value.
As at the reporting date, the Company had the following cash and cash equivalents:
30 June 2015: Balance $872,000 Weighted average interest rate 2.26%
30 June 2014: Balance $427,000 Weighted average interest rate 1.49%
(B) relative performance risKThe Manager aims to outperform the risk free cash rate over the long-term. However, as the portfolio consists of equity investments these will tend to be more volatile than cash, so there will likely be periods of relative under and over performance compared to the benchmark risk free rate.
Over the long-term the Manager is confident that the portfolio can achieve outperformance through an investment selection process that invests in companies that have a sound business model, display a sustainable competitive advantage and have proven quality management.
(c) credit risKCredit risk is the risk of a counterparty defaulting on their financial obligations resulting in a loss to the Company. The objective of the Company is to minimise credit risk exposure. Credit risk arises from cash and cash equivalents and Financial Assets at fair value through Other Comprehensive Income. Credit risk is managed by the Manager.
Credit risk arising from cash and cash equivalents is managed by only transacting with counterparties independently rated with a minimum rating of A. The providers of financial services to the Company are rated as AA by Standard and Poor’s. Credit risk on cash and cash equivalents is deemed to be low.
Credit risk arising from Financial Assets at fair value through Other Comprehensive Income relates to the risk of counterparties on the ASX defaulting on their financial obligations on transactions for Australian listed equity securities. The credit risk for these transactions is deemed to be low.
The maximum credit risk exposure of the Company at year end is the carrying value of the assets in the Statement of Financial Position.
There is no concentration of credit risk with respect to financial assets in the Statement of Financial Position.
(d) liqUiditY risKLiquidity risk is the risk that the Company will not be able to meet its financial obligations as they fall due.
The objective of the Company is to ensure as far as possible that it will always have sufficient liquidity to meet its liabilities when due, under both normal and distressed conditions.
Prudent liquidity risk management implies maintaining sufficient cash and marketable Australian listed equity securities.
The Manager controls liquidity risk by continuously monitoring the balance between equity securities and cash or cash equivalents and the maturity profiles of assets and liabilities to ensure this risk is minimal.
FLAGSHIP INVESTMENTS LIMITEDnOTeS TO FInAncIAL STATeMenTS FOR THE YEAR ENDED 30 JUNE 2015

Flagship Investments Limited Annual Report 201530
(e) fair valUe measUrementsThe following assets and liabilities are recognised and measured at fair value on a recurring basis:
- Financial Assets at fair value through Other Comprehensive Income.
- Financial Assets at fair value through Profit or Loss.
- Available-for-sale Financial Assets.
Assets classified as held for sale are measured at fair value on a non recurring basis.
Assets and liabilities are measured and disclosed using the three level hierarchy:
Level 1: Quoted prices (unadjusted) in active markets for identical assets or liabilities;
Level 2: Inputs other than quoted prices included with level 1 that are observable for the asset or liability, either directly (as prices) or indirectly (derived from prices); and
Level 3: Inputs for the asset or liability that are not based on observable market data (unobservable inputs).
The following table sets out the Company’s assets and liabilities that are measured and recognised at fair value in the financial statements.
company – at 30 June 2015 Level 1
Level 2
Level 3 TOTAL
Assets $’000 $’000 $’000 $’000
Recurring fair value measurements.Financial AssetsFinancial Assets at fair value through Other Comprehensive Income- Listed Equity Securities 42,208 - - 42,208Financial Assets at fair value through Profit or Loss- Convertible Notes - - - -
Total Financial Assets 42,208 - - 42,208
company – at 30 June 2014
Level 1
Level 2
Level 3 TOTAL
Assets $’000 $’000 $’000 $’000
Recurring fair value measurements.Financial AssetsFinancial Assets at fair value through Other Comprehensive Income- Listed Equity Securities 41,798 - - 41,798Financial Assets at fair value through Profit or Loss- Convertible Notes - 250 - 250
Total Financial Assets 41,798 250 - 42,048
There were no transfers during the year between Level 1 and Level 2 for recurring fair value measurements.
The Company’s policy is to recognise transfers into and out of the different fair value hierarchy levels at the date the event or change in circumstances that caused the transfer occurred.
disclosed fair values
The Company also has assets and liabilities which are not measured at fair value, but for which fair values are disclosed in the notes to the financial statements.
Valuation techniques used to derive Level 2 and Level 3 fair values recognised in the financial statements.
description Valuation approach and inputs used
Convertible Notes Unquoted investments have been valued using a discounted cash flow model.
Due to their short-term nature, the carrying amount of trade receivables and payables are assumed to approximate their fair values.
The carrying amount of current trade and other payables disclosed in Note 12 are assumed to approximate their fair values because the impact of discounting is not significant.
(f) capital managementThe Board’s policy is to maintain a strong capital base so as to maintain investor, creditor and market confidence and to sustain future development of the business. The capital structure of the Company consists of equity attributable to members of the Company. The Board monitors the return on capital, which is defined as net operating income divided by total Shareholders’ Equity. The Board also monitors the level of dividends to Shareholders.
The capital of the Company is invested by the Investment Manager in accordance with the investment policy established by the Board. The Company has no borrowings. It is not subject to any externally imposed capital requirements.
The Company has continued the on-market buy-back of its own shares during the year. This assists in maintaining the alignment between the market price and the Net Asset Value of the Company.
There were no changes in the Company’s approach to capital management during the year.
3. SegMenT InFORMATIOn
operating segmentThe Company operates in the investment industry. Its core business focuses on investing in Australian equities to achieve medium to long-term capital growth and income.
Operating segments have been determined on the basis of reports reviewed by the Managing Director. The Managing Director is considered to be the chief operating decision maker of the Company. The Managing Director considers the business from both a product and geographic perspective and assesses performance and allocates resources on this basis. The Managing Director considers the business to consist of just one reportable segment.
FLAGSHIP INVESTMENTS LIMITEDnOTeS TO FInAncIAL STATeMenTS FOR THE YEAR ENDED 30 JUNE 2015
Financial Report

Flagship Investments Limited Annual Report 2015 31
FLAGSHIP INVESTMENTS LIMITEDnOTeS TO The FInAncIAL STATeMenTS FOR THE YEAR ENDED 30 JUNE 2015
Notes 2015 2014 $’000 $’000
4. ReVenue Dividends 1,693 1,554 Interest 50 16
1,743 1,570
5. OTheR expenSeSprofit/(Loss) before income tax includes the following specific expenses:ASX listing and other fees 45 35 Audit fees 27 24 Directors fees 170 145 Insurance 28 29 Share registry 34 31Other 141 226
445 490
6. IncOMe TAx expenSe(a) Income tax expense Deferred tax (179) (422) Under/(over) provided in prior years (8) -
Total income tax expense in profit or loss (187) (422)
Deferred income tax (benefit)/expense included in income tax expense comprises: Decrease (increase) in deferred tax assets 11 (112) (421) (Decrease) increase in deferred tax liabilities 11 (75) (1)
(187) (422)
(b) Reconciliation of income tax expense to prima facie tax payable
Profit/(Loss) before income tax expense 845 (96)
Tax at the Australian tax rate of 30% (2014 – 30%) 253 (29)Tax effect of amounts which are not deductible (taxable) in calculating taxable income: Dividend franking credits (417) (413) Other (15) 20
(179) (422)
Under/(over) provision in prior years (8) -
Total income tax expense (benefit) (187) (422)
(c) Amounts recognised in Other comprehensive Income Aggregate current and deferred tax arising in the reporting period and not recognised in net profit or loss but directly debited or credited to Other Comprehensive Income.Net deferred tax – debited/(credited) directly to Other Comprehensive Income 11 367 2,278
367 2,278

Flagship Investments Limited Annual Report 201532
FLAGSHIP INVESTMENTS LIMITEDnOTeS TO The FInAncIAL STATeMenTS FOR THE YEAR ENDED 30 JUNE 2015
2015 2014 $’000 $’000
7. cASh And cASh equIVALenTSCash at bank and on hand 872 427
872 427
8. TRAde And OTheR ReceIVABLeSOther receivables 211 148
211 148
9. FInAncIAL ASSeTS AT FAIR VALue ThROughOTheR cOMpRehenSIVe IncOMe
Listed Securities, at fair value At beginning of year 41,798 34,102 Additions (at cost) 8,410 11,906 Revaluation (1,450) 5,252 Disposals (at fair value) (6,550) (9,462)
closing Balance at 30 June 42,208 41,798
Australian listed equity securities 42,208 41,798
For listed equity securities, fair value is determined by reference to closing bid prices on the Australian Securities Exchange.
10. FInAncIAL ASSeTS AT FAIR VALue ThROugh pROFIT OR LOSS
At beginning of year 250 - Additions (at cost) 25 250 Revaluation (275) - closing Balance at 30 June - 250
Australian Convertible Notes - 250
Financial Report

Flagship Investments Limited Annual Report 2015 33
FLAGSHIP INVESTMENTS LIMITEDnOTeS TO The FInAncIAL STATeMenTS FOR THE YEAR ENDED 30 JUNE 2015
2015 2014 $’000 $’000
11. deFeRRed TAx ASSeTS/LIABILITIeSThe deferred tax assets balance comprises temporary differences attributable to: Amounts recognised in profit or loss Accruals 7 7 Tax losses - revenue 338 945 Tax losses - capital - -
345 952Reconciliations gross Movements:The overall movement in deferred tax asset accounts is as follows: Opening balance 952 1,233 (Charged)/credited directly to the profit or loss 112 421 (Charged)/credited to Other Comprehensive Income (719) (702)
closing Balance 345 952
The movement in deferred tax assets for each temporary difference during the year is as follows:i Accruals Opening balance 7 8 (Charged)/credited directly to the profit or loss - (1)
closing Balance 7 7
ii Tax losses - revenue Opening balance 945 1,064 (Charged)/credited directly to the profit or loss 112 422 (Charged)/credited directly to Other Comprehensive Income (719) (541)
closing Balance 338 945 iii Tax losses - capital Opening balance - 161 (Charged)/credited directly to Other Comprehensive Income - (161)
closing Balance - -
iv Unrealised loss on Financial Assets at fair value through Other Comprehensive Income Opening balance - - (Charged)/credited directly to Other Comprehensive Income - -
closing Balance - -

Flagship Investments Limited Annual Report 201534
FLAGSHIP INVESTMENTS LIMITEDnOTeS TO The FInAncIAL STATeMenTS FOR THE YEAR ENDED 30 JUNE 2015
2015 2014 $’000 $’000
11. deFeRRed TAx ASSeTS/LIABILITIeS (continued) The deferred tax liability balance comprises temporary differences attributable to:Amounts recognised in Profit or Loss Unfranked dividend and interest receivable 18 11 Unrealised loss on Financial Assets at fair value (82) -
Net deferred tax liabilities (64) 11
Amounts recognised in Other Comprehensive Income Unrealised gain on Financial Assets on fair value 1,997 2,350
1,997 2,350
1,933 2,361
Reconciliations gross Movements: The Overall movement in the deferred tax liability account is as follows: Opening balance 2,361 786 Charged/(credited) directly to profit or loss (75) (1) Charged/(credited) directly to other comprehensive income (353) 1,576
closing balance 1,933 2,361
The movement in deferred tax liability for each temporary difference during the year is as follows: i Unrealised gain on Financial Assets on fair value Opening balance 2,350 774 Charged/(credited) directly to profit or loss (82) - Charged/(credited) directly to other comprehensive income (353) 1,576
closing balance 1,915 2,350
ii Unfranked dividend and interest receivable Opening balance 11 12 Charged/(credited) directly to profit and loss 7 (1)
closing balance 18 11
net deferred tax asset adjusted for deferred tax liabilities - -
net deferred tax liabilities adjusted for deferred tax assets 1,588 1,409
12. TRAde And OTheR pAYABLeSAccured expenses 235 1,322
235 1,322
Contractual cash flows from trade and other payables approximate their carrying amount. Trade and other payables are all contractually due within six months of reporting date.
Financial Report

Flagship Investments Limited Annual Report 2015 35
FLAGSHIP INVESTMENTS LIMITEDnOTeS TO The FInAncIAL STATeMenTS FOR THE YEAR ENDED 30 JUNE 2015
2015 2014 2015 2014 Shares Shares $’000 $’000
13. cOnTRIBuTed equITY(a) Share capital
Ordinary shares Fully paid 25,230,455 24,219,484 35,176 33,666
Total Share capital 25,230,455 24,219,484 35,176 33,666
The Company does not have an authorised capital value or par value in respect of its issued shares.
(b) Movements in ordinary share capital:
date details number price $’000 of Shares
30 June 2013 Balance 24,226,573 33,657
15 July 2013 to Cancellation of shares under (318,288) $1.42 (453)30 June 2014 the buy-back scheme (average price)
27 September 2013 Dividend Reinvestment Plan issues 172,502 $1.38 238
11 April 2014 Dividend Reinvestment Plan issues 138,697 $1.62 224
30 June 2014 Balance 24,219,484 33,666
26 September 2014 Dividend Reinvestment Plan issues 158,714 $1.585 251
24 March 2015 Share Purchase Plan 717,154 $1.51 1,083
Costs of Share Purchase Plan - - (28)
2 April 2015 Dividend Reinvestment Plan issues 135,103 $1.507 204
30 June 2015 Balance 25,230,455 35,176
(c) Ordinary shares
Ordinary shares entitle the holder to participate in dividends and the proceeds on winding up of the Company in proportion to the number of shares held.
On a show of hands every holder of ordinary shares present at a meeting in person or by proxy, is entitled to one vote, and upon a poll each share is entitled to one vote.
(d) Share buy-back
On 16 July 2014 the Company announced to the Australian Securities Exchange that it intended to buy-back up to a maximum of 10% of its issued capital within one year, subject to market conditions. The buy-backs reflect the Company’s focus on maintaining an efficient balance sheet through active capital management. This buy-back ceased 10 July 2015.
The Company announced on 6 July 2015 to the Australian Securities Exchange that the buy-back program had been extended and that it intended to buy-back up to a maximum of 10% of its issued capital during the period 22 July 2015 to 15 July 2016 subject to market conditions.
Flagship Investments Limited Annual Report 201536
FLAGSHIP INVESTMENTS LIMITEDnOTeS TO The FInAncIAL STATeMenTS FOR THE YEAR ENDED 30 JUNE 2015
2015 2014 $’000 $’000
15. dIVIdendS(a) dividends paid
Final dividend of 4.00 cents (2014 – 3.50 cents) per fully paid share paid on 26 September 2014 (2013 – 27 September 2013)
Fully franked based on tax paid @ 30% – 4.00 cents per share 969 843
Interim dividend of 3.50 cents (2014 – 3.25 cents) per fully paid share paid on 2 April 2015 (2014 – 11 April 2014)
Fully franked based on tax paid @ 30% – 3.50 cents per share 853 783
Total dividends provided for or paid 1,822 1,626
Dividends paid in cash or satisfied by the issue of shares under the dividend reinvestment plan during the years ended 30 June 2015 and 2014 were as follows: Paid in cash 1,367 1,164 Satisfied by issue of shares 455 462
1,822 1,626
(b) Listed Investment company capital gain account
Balance of the Listed Investment Company (LIC) capital gain account - -
LIC capital gains available for distribution are dependent upon:(i) The disposal of investment portfolio holdings which qualify for LIC capital gains; or(ii) The receipt of LIC distributions from LIC securities held in the portfolio.
(c) Franked dividends
The franked portions of the final dividends recommended after 30 June 2015 will be franked out of existing franking credits or out of franking credits arising from the payment of income tax or franking credits received on dividends in the year ending 30 June 2016.
Balance as at 30 June 2015 on the franking account after allowing for tax payable in respect of the current year’s profits, the receipt of dividends recognised as receivablesand the payment of dividends recognised as a liability at the reporting date. 1,149 1,333
14. OTheR ReSeRVeSAsset Revaluation Reserve
Increments or decrements on the revaluation of long-term investments after provision for deferred tax are recorded in the Asset Revaluation Reserve. When an investment has been sold or de-recognised, the realised gains and losses (after tax) are transferred from the revaluation reserve to the Asset Realisation Reserve.
Asset Realisation Reserve
The Asset Realisation Reserve records realised gains and losses from the sale of investments which are transferred from the Asset Revaluation Reserve.
Financial Report

Flagship Investments Limited Annual Report 2015 37
(d) dividends not recognised at year end
In addition to the above dividends, since year end the Directors have recommended the payments of a:
- final dividend of 3.75 cents per fully paid ordinary share, (2014 – 3.50 cents) fully franked based on tax paid at 30%.
- special dividend of Nil cents per fully paid ordinary share, (2014 – 0.50) fully franked based on tax paid at 30%.
The amount of the proposed dividends to be paid on 25 September 2015, but not recognised as a liability at year end.
- final dividend 914 843- special dividend - 120
914 963
The impact on the franking account of dividends recommended after year end but before the financial statements were authorised for issue and not recognised as aliability at year end will be a reduction on the franking account. 392 415
16. KeY MAnAgeMenT peRSOnneL dIScLOSuReS (a) Other Key Management personnel
The Company’s Secretary and Chief Financial Officer (Ian Harrison) is employed by Hyperion Asset Management Limited. Ian has not received any form of direct remuneration from the Company. Hyperion Asset Management Limited was the Investment Manager until Shareholders approved a novation of the Management Services Agreement to EC Pohl & Co Pty Ltd at the AGM on 18 October 2012. Hyperion Asset Management Limited is remunerated by EC Pohl & Co Pty Ltd for the provision of these services only if a performance fee has been paid in accordance with the Management Services Agreement.
The Company has no other staff and therefore has no Key Management Personnel other than the Directors.
No member of Key Management Personnel held options over shares in the Company during the year.
There have been no other transactions with Key Management Personnel or their related entities other than those disclosed in Note 19.
(b) Key Management personnel (directors) compensation
Short-term Employment benefits 170,000 145,000Post-Employment Benefits - -Long-term Benefits - -
Total remuneration 170,000 145,000
Detailed remuneration disclosures are provided in sections (A) – (F) of the remuneration report on pages 13 and 14.
2015 2014 $’000 $’000
2015 2014 $ $
FLAGSHIP INVESTMENTS LIMITEDnOTeS TO The FInAncIAL STATeMenTS FOR THE YEAR ENDED 30 JUNE 2015

Flagship Investments Limited Annual Report 201538
2015 2014 $’000 $’000
17. ReMuneRATIOn OF AudITORSDuring the year the following fees were paid or payable for services provided by the auditor: Provision of accounting advice - -Audit and review of financial reports and other audit work under the Corporations Act 2001 27 24
Total remuneration of auditors 27 24
18. cOMMITMenTSLease commitments: company as lessee: Commitments in relation to leases contracted for at the reporting date but not recognised asliabilities, payable:Within one year 43 43Later than one year but not later than five years 26 69Later than five years - -
69 112
Representing: Non-cancellable operating leases 69 112
Total lease commitments 69 112
The lease relates to premises at Level 12 Corporate Centre One, 2 Corporate Court, Bundall QLD 4217. A separate Deed of Lease Arrangements & Indemnity has been entered into with EC Pohl & Co Pty Ltd, where EC Pohl & Co Pty Ltd is responsible for the lease arrangements of the Company and must indemnify the Company if the terms of the lease arrangements are not complied with.
19. ReLATed pARTY TRAnSAcTIOnSThe following transactions occurred with other related parties:
Expenses paid or payable by the Company to: Amounts remaining payable at balance date: – EC Pohl & Co Pty Ltd for Performance Fee. 178 1,176
A Performance Fee was payable in accordance with the Management Services Agreement as detailed in Note 22.
Dr E C Pohl has an interest in the transaction as during the year Dr E C Pohl was a Director, employee and Shareholder of EC Pohl & Co Pty Ltd.
– McCullough Robertson Lawyers for the provision of legal services. D M McGann is a partner of McCullough Robertson Lawyers. 4 1
All related party transactions are made on an arm’s length basis using the standard terms and conditions.
FLAGSHIP INVESTMENTS LIMITEDnOTeS TO The FInAncIAL STATeMenTS FOR THE YEAR ENDED 30 JUNE 2015
Financial Report

Flagship Investments Limited Annual Report 2015 39
20. RecOncILIATIOn OF pROFIT AFTeR IncOMe TAx TO neT cASh InFLOW FROM OpeRATIng AcTIVITIeS
Profit/(Loss) for the year 1,032 326 Unrealised (Gain)/loss on Financial Assets at fair value through Profit or Loss 275 -Changes in Operating Assets/Liabilities (Increase)/Decrease in trade and other receivables (59) 62 (Increase)/Decrease in prepayment (4) (9) (Increase)/Decrease in deferred tax assets (187) (422) Increase/(Decrease) in trade and other payables (1,117) (90)
Net cash inflow/(outflow) from operating activities (60) (133)
21. eARnIngS peR ShARe(a) earnings used in the calculation of basic and diluted earnings per share.
(i) Profit/(loss) from continuing operations attributable to the owners of the Company 1,032 326 (ii) TotalComprehensiveIncome 1,888 5,640
cents Cents (b) Basic and diluted earnings per share
(i) Profit/(loss) from continuing operations attributable to the owners of the Company 4.2 1.35 (ii) Total Comprehensive Income 7.7 23.35
number Number(c) Weighted average number of ordinary shares used in the calculation of earnings per share 24,565,427 24,151,612
Total Comprehensive Income is a more appropriate base for determining earnings per share as it includes profit after income tax and changes in fair value of financial assets.
22. MAnAgeMenT SeRVIceS AgReeMenTIn accordance with a Management Services Agreement approved by Shareholders at the AGM on 12 November 2010, the Company has agreed to engage the Manager to provide primary and secondary management services, including:
1) managing the investment of the Company’s portfolio, including keeping it under review;2) ensuring investments by the Company are only made in authorised investments;3) complying with the investment policy of the Company;4) identifying, evaluating and implementing the acquisition and disposal of authorised investments;5) provide the Company with monthly investment performance reporting;6) manage the company’s public and regulatory announcements and notices;7) promoting investment in the Company by the general investment community;8) providing investor relationship services; and 9) provision of accounting, human resources, corporate and information technology services support.
2015 2014 $’000 $’000
FLAGSHIP INVESTMENTS LIMITED nOTeS TO The FInAncIAL STATeMenTS FOR THE YEAR ENDED 30 JUNE 2015

Flagship Investments Limited Annual Report 201540
Financial Report
FLAGSHIP INVESTMENTS LIMITEDnOTeS TO The FInAncIAL STATeMenTS FOR THE YEAR ENDED 30 JUNE 2015
22. MAnAgeMenT SeRVIceS AgReeMenT (continued)The agreement has a term of five years from the agreement date of 12 November 2010.
The agreement may be terminated if:a) either party ceases to carry on business, orb) either party enters into liquidation voluntarily or otherwise, orc) either party passes any resolution for voluntary winding-up, ord) a receiver of the property of either party, or any part thereof, is appointed, ore) the Shareholders of the Company at an abnormal meeting called in for that purpose, resolve by binding resolution to
terminate the operations, orf) if the Company provides written notes to the Manager in the event of any material and substantial breach of the agreement
by the Manager or if the Manager fails to remedy a breach of this agreement within 14 days following written notice of the breach
g) if the Manager provides written notice to the Company in the event of any material and substantial breach of the agreement by the Company or if the Company fails to remedy a breach of this agreement within 14 days following written notice of the breach.
h) In recognition of the roles and personal expertise of senior executives retained by the Manager for the purpose of providing the primary services described in clause 3 of the Agreement, the parties agree that the agreement may be terminated, at the option of the Company, if there are major changes to senior executives (or their roles) providing the primary services. The Company shall be entitled to give the Manager a written termination notice upon or after the occurrence of a major change of the kind mentioned and such notice, if given, shall be effective at the end of the calendar month next following the giving of such notice unless the Company and the Manager mutually agree upon another date at which this agreement will terminate.
Under the agreement the Manager will receive a performance fee, payable annually in arrears, equal to 15% of the amount by which the Company’s net performance before tax (that is, after all costs and outlays but before the calculation of the performance fee) exceeds the interest rate payable on bank bills as represented by the UBS Bank Bill Index for that year. If the Company’s net performance in the year is less than the interest rate payable on bank bills as represented by the UBS Bank Bill Index for that year, then no performance fee will be payable.
Under the terms of this agreement a performance fee of $178,000 (excl GST) was paid or payable during the year ended 30 June 2015 (2014 – $1,176,000).
23. SuBSequenT eVenTSNo events have arisen, subsequent to balance date that would require amendment of, or disclosure of, in the financial statements.
24. cOnTIngenT ASSeTS And LIABILITIeSThe Company has no known contingent assets or liabilities.

Flagship Investments Limited Annual Report 2015 41
Directors’ Declaration
The Directors of the Company declare that:
(a) the Financial Statements and Notes set out on pages 21 to 40 are in accordance with the Corporations Act 2001, including:
(i) complying with Accounting Standards, which, as stated in accounting policy Note 1 to the financial statements, constitutes compliance with International Financial Reporting Standards (IFRS); and
(ii) give a true and fair view of the financial position as at 30 June 2015 and of the performance for the year ended on that date; and
in the Directors’ opinion,
(b) there are reasonable grounds to believe that the Company will be able to pay its debts as and when they become due and payable; and
(c) the remuneration disclosures set out on pages 13 and 14 of the Directors’ Report (as part of the audited remuneration report) for the year ended 30 June 2015 comply with section 300A of the Corporations Act 2001.
The Directors have been given the declarations by the Chief Executive Officer and Chief Financial Officer required by section 295A of the Corporations Act 2001.
This declaration is made in accordance with a resolution of the Directors and is signed for and on behalf of the Directors by:
dr emmanuel (Manny) c pohlManaging Director
14 August 2015

42
To the members of Flagship Investments Limited
Report on the Financial ReportWe have audited the accompanying financial report of Flagship Investments Limited, which comprises the statement of financial position as at 30 June 2015, the statement of profit or loss and comprehensive income, statement of changes in equity and statement of cash flows for the year then ended, notes comprising a summary of significant accounting policies and other explanatory information, and the directors’ declaration.
directors’ Responsibility for the Financial ReportThe directors of the company are responsible for the preparation of the financial report that gives a true and fair view in accordance with Australian Accounting Standards and the Corporations Act 2001 and for such internal control as the directors determine is necessary to enable the preparation of the financial report that gives a true and fair view and is free from material misstatement, whether due to fraud or error. In Note 1, the directors also state, in accordance with Accounting Standard AASB 101 Presentation of Financial Statements, that the financial statements comply with International Financial Reporting Standards.
Auditor’s Responsibility Our responsibility is to express an opinion on the financial report based on our audit. We conducted our audit in accordance with Australian Auditing Standards. Those standards require that we comply with relevant ethical requirements relating to audit engagements and plan and perform the audit to obtain reasonable assurance about whether the financial report is free from material misstatement.
An audit involves performing procedures to obtain audit evidence about the amounts and disclosures in the financial report. The procedures selected depend on the auditor’s judgement, including the assessment of the risks of material misstatement of the financial report, whether due to fraud or error. In making those risk assessments, the auditor considers internal control relevant to the company’s preparation of the financial report that gives a true and fair view in order to design audit procedures that are appropriate in the circumstances, but not for the purpose of expressing an opinion on the effectiveness of the company’s internal control. An audit also includes evaluating the appropriateness of accounting policies used and the reasonableness of accounting estimates made by the directors, as well as evaluating the overall presentation of the financial report.
We believe that the audit evidence we have obtained is sufficient and appropriate to provide a basis for our audit opinion.
IndependenceIn conducting our audit, we have complied with the independence requirements of the Corporations Act 2001. We confirm that the independence declaration required by the Corporations Act 2001, which has been given to the directors of Flagship Investments Limited, would be in the same terms if given to the directors as at the time of this auditor’s report.
OpinionIn our opinion:(a) the financial report of Flagship Investments Limited is in accordance
with the Corporations Act 2001, including:
(i) giving a true and fair view of the company’s financial position as at 30 June 2015 and of its performance for the year ended on that date; and
(ii) complying with Australian Accounting Standards and the Corporations Regulations 2001; and
(b) the financial report also complies with International Financial Reporting Standards as disclosed in Note 1.
Report on the Remuneration ReportWe have audited the Remuneration Report included on pages 13 and 14 in the directors’ report for the year ended 30 June 2015. The directors of the company are responsible for the preparation and presentation of the Remuneration Report in accordance with section 300A of the Corporations Act 2001. Our responsibility is to express an opinion on the Remuneration Report, based on our audit conducted in accordance with Australian Auditing Standards.
Opinion
In our opinion, the Remuneration Report of Flagship Investments Limited for the year ended 30 June 2015 complies with section 300A of the Corporations Act 2001.
BDO Audit Pty Ltd
T J KendallDirector
Brisbane, 14 August 2015
IndependenT AudITOR’S RepORT
Level 10, 12 Creek StreetBrisbane QLD 4000GPO Box 457 Brisbane QLD 4001Australia
Phone: +61 7 3237 5999Fax: +61 7 3221 9227www.bdo.com.au
BDO Audit Pty Ltd ABN 33 134 022 870 is a member of a national association of independent entities which are all members of BDO Australia Ltd ABN 77 050 110 275, an Australian company limited by guarantee. BDO Audit Pty Ltd and BDO Australia Ltd are members of BDO International Ltd, a UK company limited by guarantee, and form part of the international BDO network of independent member firms. Liability limited by a scheme approved under Professional Standards Legislation, other than for the acts or omissions of financial services licensees.
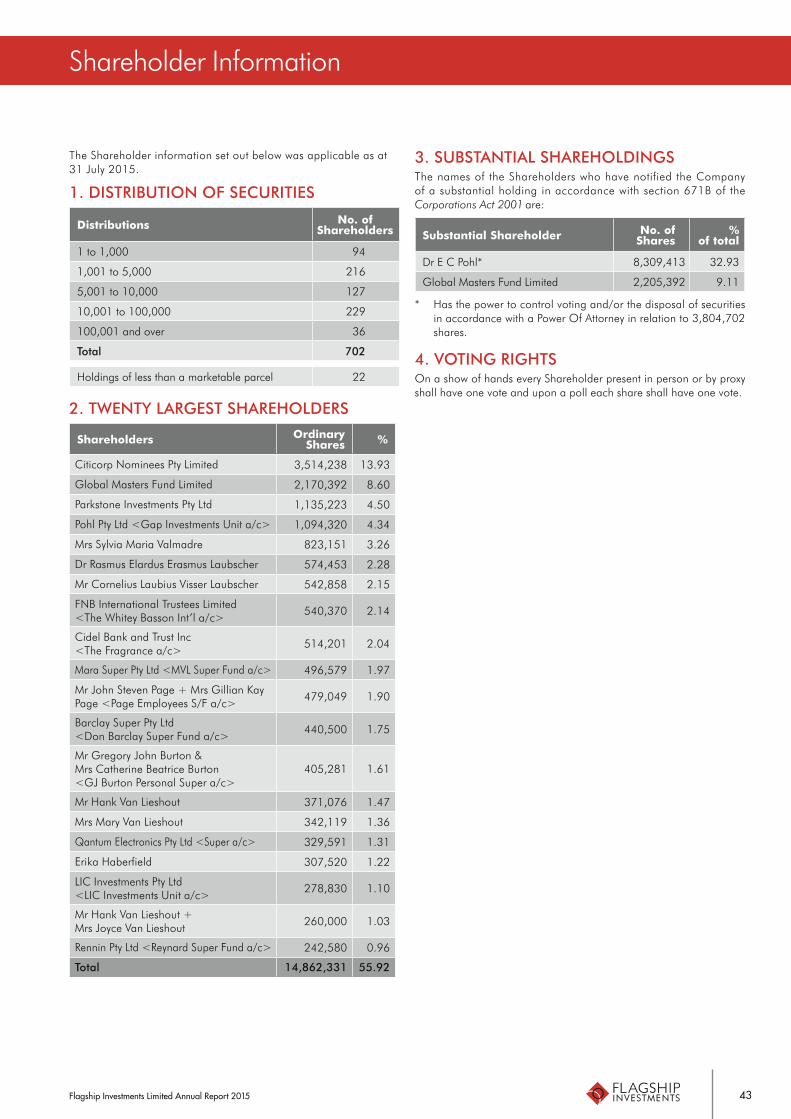
Flagship Investments Limited Annual Report 2015 43
Shareholder Information
The Shareholder information set out below was applicable as at 31 July 2015.
1. dISTRIBuTIOn OF SecuRITIeS
Distributions No. of Shareholders
1 to 1,000 94
1,001 to 5,000 216
5,001 to 10,000 127
10,001 to 100,000 229
100,001 and over 36
Total 702
Holdings of less than a marketable parcel 22
2. TWenTY LARgeST ShARehOLdeRS
Shareholders Ordinary Shares %
Citicorp Nominees Pty Limited 3,514,238 13.93
Global Masters Fund Limited 2,170,392 8.60
Parkstone Investments Pty Ltd 1,135,223 4.50
Pohl Pty Ltd <Gap Investments Unit a/c> 1,094,320 4.34
Mrs Sylvia Maria Valmadre 823,151 3.26
Dr Rasmus Elardus Erasmus Laubscher 574,453 2.28
Mr Cornelius Laubius Visser Laubscher 542,858 2.15
FNB International Trustees Limited <The Whitey Basson Int’l a/c>
540,370 2.14
Cidel Bank and Trust Inc <The Fragrance a/c>
514,201 2.04
Mara Super Pty Ltd <MVL Super Fund a/c> 496,579 1.97
Mr John Steven Page + Mrs Gillian Kay Page <Page Employees S/F a/c>
479,049 1.90
Barclay Super Pty Ltd <Don Barclay Super Fund a/c>
440,500 1.75
Mr Gregory John Burton & Mrs Catherine Beatrice Burton <GJ Burton Personal Super a/c>
405,281 1.61
Mr Hank Van Lieshout 371,076 1.47
Mrs Mary Van Lieshout 342,119 1.36
Qantum Electronics Pty Ltd <Super a/c> 329,591 1.31
Erika Haberfield 307,520 1.22
LIC Investments Pty Ltd <LIC Investments Unit a/c>
278,830 1.10
Mr Hank Van Lieshout + Mrs Joyce Van Lieshout
260,000 1.03
Rennin Pty Ltd <Reynard Super Fund a/c> 242,580 0.96
Total 14,862,331 55.92
3. SuBSTAnTIAL ShARehOLdIngSThe names of the Shareholders who have notified the Company of a substantial holding in accordance with section 671B of the Corporations Act 2001 are:
Substantial Shareholder No. of Shares
%of total
Dr E C Pohl* 8,309,413 32.93
Global Masters Fund Limited 2,205,392 9.11
* Has the power to control voting and/or the disposal of securities in accordance with a Power Of Attorney in relation to 3,804,702 shares.
4. VOTIng RIghTSOn a show of hands every Shareholder present in person or by proxy shall have one vote and upon a poll each share shall have one vote.

Flagship Investments Limited Annual Report 201544
Investments
1. hOLdIngS OF SecuRITIeS AS AT 30 June 2015Individual investments at 30 June 2015 are listed below. The list should not, however, be used to evaluate portfolio performance or to determine the net asset backing per share at other dates. Individual holdings in the portfolio may change during the course of the year.
Company SharesMarket Value
$’000%
ORdInARY ShAReS
AMP AMP Limited 347,963 2,094.7 4.9
ARP ARB Corporation Limited 62,913 819.8 1.9
AUB Austbrokers Holdings Limited 40,110 361.0 0.8
BEN Bendigo and Adelaide Bank Limited 105,033 1,287.7 3.0
BGL Bigair Group Limited 932,619 573.6 1.3
BHP BHP Billiton Limited 52,789 1,427.9 3.3
BLA Blue Sky Alternative Investments Limited 228,678 939.9 2.2
BXB Brambles Limited 180,000 1,908.0 4.4
CAT Catapult Group Int Ltd 1,160,899 1,207.3 2.8
CBA Commonwealth Bank of Australia Limited 39,831 3,390.8 7.9
CRZ Carsales.com Limited 165,468 1,686.1 3.9
CSL CSL Limited 8,110 701.3 1.6
DMP Domino’s Pizza Enterprises Limited 42,572 1,519.4 3.5
IPH IPH Limited 182,501 857.8 2.0
MQG Macquarie Group Limited 49,159 4,001.5 9.3
NVT Navitas Limited 159,286 683.3 1.6
PTM Platinum Asset Management Limited 118,000 882.6 2.0
REA REA Group Ltd 47,982 1,881.4 4.4
RIO Rio Tinto Limited 42,880 2,304.8 5.3
SEK SEEK Limited 136,525 1,919.5 4.5
SRX Sirtex Medical Limited 30,962 899.5 2.1
TLS Telstra Corporation Limited 657,198 4,035.2 9.4
TME Trade Me Group Limited 104,000 314.1 0.7
WBC Westpac Banking Corporation Limited 82,749 2,660.4 6.2
WOR WorleyParsons Limited 80,000 832.8 1.9
WOW Woolworths Limited 67,945 1,831.8 4.3
WPL Woodside Petroleum Limited 34,630 1,185.4 2.8
42,207.6 98.0
cOnVeRTIBLe nOTeS
Exergen Pty Ltd 274,999 0.0 0.0
cASh
Cash 872.4 2.0
TOTAL 43,080.0 100.0
2. TRAnSAcTIOnS And BROKeRAgeThere were 70 (2014: 76) transactions in securities during the year on which brokerage of $51,710 (2014: $65,518) was paid.

Flagship Investments Limited Annual Report 2015 45
Notes

Flagship Investments Limited Annual Report 201546
Notes

Flagship Investments Limited Annual Report 2015 47
Corporate Directory
FLAGSHIP INVESTMENTS LIMITED ABN 99 080 135 913 REGISTERED IN QUEENSLAND ON 23 SEPTEMBER 1997.
BOARd OF dIRecTORSHenry R Smerdon AMNon-Executive Chairman
Dr Emmanuel (Manny) C PohlManaging Director
Sophie A MitchellNon-Executive Director
Patrick Corrigan AMNon-Executive Director
Dominic M McGannNon-Executive Director
SecReTARYIan W Harrison
pRIncIpAL pLAce OF BuSIneSSLevel 12Corporate Centre One2 Corporate CourtBUNDALL QLD 4217
MAnAgeREC Pohl & Co Pty LtdACN 154 399 916Level 12Corporate Centre One2 Corporate Court BUNDALL QLD 4217Tel: +61 (0) 7 5644 4405 Fax: +61 (0) 7 5574 1457 Toll Free: 1800 FLAGSHIP 1800 352 474
SOLIcITORSMcCullough Robertson LawyersLevel 11Central Plaza Two66 Eagle StreetBRISBANE QLD 4000Tel: +61 (0) 7 3233 8888Fax: +61 (0) 7 3229 9949
AudITORSBDO Audit Pty Ltd Level 10 12 Creek Street BRISBANE QLD 4000
ShARe RegISTRYComputershare Investor Services Pty LimitedGPO Box 2975 MELBOURNE VIC 3001 Toll Free: 1300 850 505International: +61 (0) 3 9415 4000Fax: +61 (0) 3 9473 2500
RegISTeRed OFFIceLevel 12Corporate Centre One2 Corporate Court BUNDALL QLD 4217Tel: +61 (0) 7 5644 4405 Fax: +61 (0) 7 5574 1457 Toll Free: 1800 FLAGSHIP 1800 352 474
WeBSITe AddReSSwww.flagshipinvestments.com.au

Flagship Investments limitedABN 99 080 135 913
Level 12Corporate Centre One2 Corporate Court BUNDALL QLD 4217Tel: +61 (0) 7 5644 4405 Fax: +61 (0) 7 5574 1457 www.flagshipinvestments.com.au