2006 - AnnualReports.com
66
2006 2006
-
Upload
khangminh22 -
Category
Documents
-
view
1 -
download
0
Transcript of 2006 - AnnualReports.com

20062006

OPERATING RESULTS ($000) 2006 2005
Operating revenue $1,528,270 $1,556,888
EBITDA (1) 202,134 253,491
Operating profit 123,332 194,549
Net income 79,141 118,843
Cash from operating activities 111,591 124,140
OPERATING RESULTS
Operating profit – 8.1% 12.5%percentage of revenue
Cash from operating activities – 13.0% 15.2%percentage of average shareholders’ equity
PER CL ASS A AND CL ASS B SHARES
Net income $1.01 $1.52
Dividends $0.74 $0.74
Price range (high/low) $23.66/16.90 $26.91/21.39
FINANCIAL POSITION ($000)
Long-term debt $724,193 $334,317
Shareholders’ equity $872,746 $841,652
The Annual Meeting of shareholders will be held Wed., May 2, 2007 at the Toronto Star building, 3rd Floor Auditorium, One Yonge Street,
Toronto beginning at 10 a.m. It will also be webcast live on the internet by Torstar Media Group Television with interactive capabilities.
FINANCIALHIGHLIGHTS
This annual report contains forward-looking statements within the meaning of certain securities laws, including the “safe harbour“ prorisions of the Securities Act (Ontario). We caution read-ers not to place undue reliance on these statements as a number of factors could cause our results to differ materially from the beliefs, plans, objectives, expectations, anticipations, esti-mates and intentions expressed in such forward-looking statements. Additional information about these factors is contained on page 22 under the heading “Forward-Looking Statements“.
02
03
04
05
06
OPERATING REVENUE ($MILLIONS)
1,475
1,488
1,542
1,556
1,528
02
03
04
05
06
INCOME FROM CONTINUING OPERATIONS PER SHARE
1.64
1.59
1.42
1.52
1.01
02
03
04
05
06
OPERATING PROFIT ($MILLIONS)
212
209
201
195
123
02
03
04
05
06
EBITDA ($MILLIONS) (1)
269
276
266
202
253
(1) Operating profit before depreciation, amortization and restructuring provisions. Please see “Non-GAAP Measures” on page 22.

As Marcus Aurelius said centuries ago, the universe is change and our life is what our thoughts make it.Last year Torstar effected numerous changes to strengthen the company in challenging times.
More specifically, Torstar made a number of leadership and structural changes to its businesses to bemore responsive to the challenges facing the company. These changes demonstrate the Board’s andmanagement’s resolve to continue to focus on our long-term success and to create shareholder value.
In a highly competitive media environment, Torstar is not only setting attainable financial goals, but alsobeing mindful of the values that are foundational to the mission of Torstar. Here I refer to the AtkinsonPrinciples which in reference to the Toronto Star provide a set of beliefs that guide the Board and management in the operation of our flagship newspaper.
Of particular challenge to our newspapers is the rapidly evolving new technology. I am pleased at the waysin which Torstar, Star Media Group, Torstar Digital, and Metroland Media Group are seeking to convert a challenge into an opportunity to provide increased services to our readers and added value to our shareholders.
This year marks the retirement of two of our long-serving directors, Martin Connell and Christina Gold.Martin is our senior director having served with distinction for seventeen years. His own record of business leadership, progressive values and community involvement is a model for the values we prize.We are very grateful for his long service and many contributions.
Christina Gold has served on the Board for nine years. She is the Chief Executive Officer of Western Unionand with the recent public listing of the company on the NYSE and her world-wide travel obligations, herschedule has made it too difficult for her to maintain her directorship with us. We will miss her valuedcontributions and continue to take pride in her as a Canadian woman providing leadership to an importantglobal company.
Hon. Roy Romanow is standing for election to the Board this year. He is a Canadian of great distinctionwho has contributed richly to building a strong and progressive Canada. His experience, wisdom and judgment will be welcome additions to our deliberations.
This past year of challenge and change reinforces the importance of the remarkable people who work inthe businesses of the Torstar family. Much was asked of them during the past year and they answeredwith their typical loyalty and inexorable commitment to further the interests of the businesses. I also wishto thank my colleagues on the Board and management for their collaborative stewardship in 2006.
F R A N K I A C O B U C C I
MESSAGE FROM
THE CHAIRMAN
F R A N K I A C O B U C C IChairman, Board of Directors
3

2006 was a challenging year for Torstar, but we finished theyear with improving results and are well positioned forstronger results in 2007.
In 2006 we faced both difficult business conditions and asubstantial negative foreign exchange impact on our earnings. As a result, we reported lower earnings throughoutthe year and our share price declined 11.5 percent. Our reported results in 2006, should not, however, be allowed todisguise numerous achievements and the steps we havetaken to strengthen Torstar for the future. Adversity facesmost businesses at some point and the true test of a company is how it responds. In this respect, I am proud ofour work at Torstar this year.
Reviewing our results in 2006, the pattern is uneven, including both strengths and weaknesses. First, thestrengths:
• Metroland, our community newspaper franchise andlargest business, performed strongly and reported record revenues and profits. It was a very good year forMetroland. Metroland has an enviable record of innovation and growth and we remain confident that thecommunity newspaper business is a good one with goodprospects for growth.
• Harlequin, our book publishing franchise and secondlargest business, stabilized unit sales and – excluding foreign exchange – delivered earnings that were close tolast year’s. Absent the bankruptcy of a logistics supplierearly in the year, profits would have been flat to last year.And in the final quarter of the year, Harlequin reportedincreased unit sales and, excluding foreign exchange,increased revenues and profits.
• Torstar Digital also performed well led by our onlineemployment and careers business, Workopolis. We areinvesting in growing audiences and revenue for TorstarDigital and were encouraged by our progress in 2006.
These considerable strengths were more than offset by threeareas of weakness. In particular:
• Foreign exchange reduced our reported profits by almost$37 million in 2006. As our 2003 to 2005 US dollar
hedge ended, we faced the full impact of the rise in theCanadian dollar on our US dollar earnings from Harlequin.This impact reduced our profits by about $9 million everyquarter and swamped any financial progress in our underlying operating businesses. It is important to remember that this reduction in reported profits was not areflection of reduced strength in Harlequin’s business.
• The Toronto Star had a tough year and reported lower profits on lower linage and advertising revenue. The combined forces of headwinds for large city daily newspapers and the very competitive Toronto newspapermarket hurt our results as did our celebrity magazine,Weekly Scoop.
• Transit TV did not meet our revenue expectations andcontinued to put a drag on Torstar’s overall earnings.
Faced with these mixed results, we took action to build onour strengths and reverse the negative trends. The principalsteps were the following:
• In June, we closed down Weekly Scoop and stopped thelosses when it was clear the path to profitability was toolong and murky.
• In September, we simplified our newspaper business, integrating the CityMedia Group into Metroland to createthe Metroland Media Group. This injected Metroland’s culture of innovation and growth into the CityMedia properties and expanded the footprint of our best performing business.
• Later in September, we took a restructuring charge atHarlequin to reduce costs and improve profitability. We didnot, however, reduce Harlequin’s capacity to innovate,launch new products, expand geographically and embracethe digital space as we grow Harlequin’s business.
• In October, we put new leadership in place at the TorontoStar and created the Star Media Group. In Jagoda Pike, thenew Publisher, we have a highly experienced and effective business leader with a clear determination toarrest any further decline in the profitability of the TorontoStar.
TO OUR SHAREHOLDERS
J . R O B E R T S . P R I C H A R DPresident and Chief Executive Officer
4

• In December, we took restructuring charges at both the StarMedia Group and the Metroland Media Group to reduce costsin our daily newspapers. Rigorous cost controls and focusedreductions are essential to the long-term health of daily newspapers and these restructurings have allowed us tomake progress on this agenda while maintaining our commitment to excellent journalism.
• In late December, we initiated a strategic review of our optionsfor our Transit TV business and are actively considering various alternative scenarios. Whatever choice we make andexecute, we expect to have lower operating losses for TransitTV in 2007 than 2006.
• Throughout the year we moved aggressively to reduce corporate costs, reducing the activities of the corporate centre and relying instead on simplification and decentralization of various functions. The cost reductions willallow us to absorb inflationary pressures without increasingoverall corporate costs.
The changes we have made are the right choices for Torstar andthey will strengthen our performance in 2007 and beyond. Theywere not easy choices and they were particularly tough foremployees who lost their positions as a result. We are grateful toall of them for their contributions to Torstar and wish them well.
With these changes in place, we have strengthened our corebusinesses and set the stage for stronger financial performancefor Torstar as a whole. We expect to deliver better results in2007 than we did in 2006 and, with the negative foreignexchange impact behind us, this improvement will drop directlyto our bottom line.
Improving the performance of our core businesses is the firststep in strengthening Torstar but it is not our only step. We arealso investing in our future by building our digital businesses andextending our portfolio of businesses more broadly into themulti-media space.
The digital revolution compels us to transform our existing businesses and we are working hard to do so. It also createsnew opportunities for us and we are working equally hard toseize them. Our newspaper websites allow us to extend thereach and penetration of our newspapers and to create newopportunities for our advertisers. We intend to be leaders in thisrespect. The Internet also allows us to build new businesses notbounded by the location of our printing presses. In Workopolis,in partnership with Gesca Ltd., we have a great national franchise which is one of Canada’s best Internet businesses.We have also built the Olive Canada Network which is emergingas a national leader in the online advertising market in Canadaand launched LiveDeal.ca as our national online classified solution. These national initiatives, boosted by partnerships,take us beyond our traditional regional footprint to reach moreconsumers and serve more advertisers.
In 2006 we also increased our investment in CTVglobemedia(formerly Bell Globemedia) as CTVglobemedia acquired CHUM.The acquisition of CHUM adds strength in conventional TV, specialty TV and radio and was CTVglobemedia’s top strategicpriority. The combined businesses will form a preeminentCanadian media company and we are very pleased to havejoined with excellent partners in owning it. We invested on thesame terms as two of Canada’s most respected investors –Woodbridge and Teachers’. In addition to the solid financialfoundation to this investment, we have broadened our exposureas a media company to include television and radio, increasedthe strategic options available to Torstar and expanded ourrange of corporate development opportunities, particularly inthe digital space.
We are also invested in Black Press, expanding our communitynewspaper exposure to British Columbia and Alberta. Thisinvestment has performed strongly for Torstar over the past fouryears and, like CTVglobemedia, has expanded our strategicoptions for the longer term.
In 2007, we must both deliver better results than we did in2006 and continue to build a stronger future for Torstar throughimproved performance in our core franchises, the growth of ourdigital initiatives and the success of our investments inCTVglobemedia and Black Press. We believe we are well positioned to do just this. A combination of the changes madein 2006 and a relentless focus on operations and execution in2007 should allow us to deliver on our goal.
Fortunately, however, as we pursue our goals, we have a lot ofadvantages: market leading franchises, fine leaders, a strongBoard and a heavily invested controlling shareholder group witha long-term perspective. We also have confidence, borne of ourlong history, that we will prevail just as we have in earlier challenging times.
Our most significant advantage is the talent, creativity and commitment of my colleagues throughout Torstar. We are fortunate to attract and keep very fine people throughout ourbusinesses. They are drawn to Torstar to be part of a worthycompany that does important work. They share in our commitments: a commitment to the Atkinson Principles at theToronto Star; a commitment to editorial excellence in all wepublish; a commitment to serve and support our communities;and a commitment to make Torstar a great place to work. Theycare about our company and are committed to our future. Byharnessing all their talent, we will succeed.
I thank all of the more than 7,000 employees at Torstar for allthey do to advance our cause. We all thank our Board ofDirectors for their wise counsel and we thank you, our shareholders, for vesting your confidence in us. We will do ourutmost to vindicate it with our work.
R O B E R T P R I C H A R D
5

NEWSPAPERSAND
DIGITAL
6
N E W S P A P E R S
O T H E R P U B L I C A T I O N S

7
W E B S I T E S
Torstar’s Newspapers and Digital business operation islargely concentrated in the Golden Horseshoe region ofOntario, the largest and most attractive media market inCanada. In 2006, revenues of the division were $1.06billion, up 2% versus prior year. This represents 69% ofTorstar’s revenue.
Through its numerous media properties within the divi-sion, Torstar is committed to delivering editorial excel-lence and innovative approaches to serve readers andadvertisers with relevant, local content and servicesacross all of its properties.
As the media environment continues to evolve, specialemphasis is being placed on digital initiatives to ensurewe seize the opportunity to broaden our offerings to bet-ter serve our readers and advertisers.
Newspapers and Digital is comprised of the Star MediaGroup which includes the flagship newspaper, theToronto Star, and Torstar Digital; Metroland Media Group,built on a foundation of community papers and focusedon serving local needs; and Transit Television Network, aUS based operation that delivers broadcast quality infor-mation to passengers on buses via screens mounted inthe vehicles.

Created in 2006, Star Media Group includes Torstar’s flagshipnewspaper, the Toronto Star, thestar.com, Shop TV, EyeWeekly, Sway Magazine, Real Estate News, The CanadianImmigrant magazine and Torstar Syndication Services. It hasan interest in the Metro free daily newspapers in Toronto,Ottawa, Calgary and Vancouver and Sing Tao Daily in Toronto,Calgary and Vancouver. In addition, for financial reporting pur-poses, Star Media Group includes Torstar Digital.
2006 was a difficult year for large urban dailies in North Amer-ica and the Toronto Star was no exception. While readership and circulation remained stable, revenue was under substant-ial pressure due to structural impacts including that of the weband the increasingly competitive Toronto media market. A number of growth and cost reduction initiatives were underta-ken during the year in response to these challenges.
With more than 2.7 millionreaders Monday to Sunday,the Toronto Star once againretained its position asCanada’s leading daily news-paper by a wide margin.
The Toronto Star’s editorialteam provided outstandingcoverage in several areasincluding extensive, leadingcoverage of Canada’s efforts inAfghanistan, breaking compre-hensive coverage of the arrestof 17 Toronto area residentson terrorism charges in Juneand, in the spirit of its founder,Joseph E. Atkinson, in-depthcoverage of the ongoing issues
of poverty and the working poor. The Toronto Star also pub-lished a number of investigative seriesincluding: Collision Course (an eye-openeron the state of air traffic safety), Brothelsin the Sky (an examination of Toronto’sgrowing blight of high rise brothels with alook at how to fix the problem) andMethadone (a three part series on OntarioAddiction Methadone Clinics andPrograms, which are fraught with fraudand abuse).
The Toronto Star continued to be recog-nized for its outstanding journalism win-ning 25 Society of Newspaper DesignAwards for excellence in design and pho-tography, which placed the Toronto Starfirst in Canada and 7th in the world. Otherawards included a Michener nomination,
two investigative journalism awards by the CanadianAssociation of Journalists and six Inland Press awards for spe-cial sections created jointly by Editorial and Advertisingteams.
The Toronto Star continues to boast the most NationalNewspaper Awards (NNAs) of any newspaper, with nine nom-inations and two wins in 2006. Most recently, Toronto Starphotographers won first and second place in the EasternCanada News Photographers Association Photographer of theYear Awards, and nine Star photographers placed in the toptwenty.
The Toronto Star continued to invest in the products and serv-ices most important to its readers and advertisers. In recogni-tion of the importance of retail marketplaces, the Toronto Starexpanded its zoning initiative in 2006 from the Wheels sectionto the GTA section on Thursday and Shopping section onSaturday. 2006 also saw the launch of glossy new Wheels,Fashion, and Décor Extra sections. These initiatives haveattracted many new advertisers to the Toronto Star.
In September, the Toronto Star introduced a new advertisingcampaign with the tagline “ask why” to reinforce the uniquestrengths of newspapers as compared to other forms ofmedia, and of the Toronto Star as compared to other news-papers. This significant multi-media campaign represents theToronto Star’s largest marketing effort in several years. Theresponse from readers and advertisers has exceeded expec-tations.
The Toronto Star launched Star P.M., North America’s firstdownloadable newspaper available for free every afternoon atwww.thestar.com/starpm.
thestar.com recorded its highest ever readership with almost51 million monthly page views in November 2006 and 2.7million monthly unique visitors (individual readers) inSeptember 2006.
STARMEDIAGROUP
8

In December, thestar.com was relaunched in a new dynamicformat with even better content and more features for ourreaders. Winning in the digital space is a strategic imperativefor the Toronto Star and the re-launch is a critical foundationfor the next phase of thestar.com’s growth.
The new website is powered by a completely new contentmanagement system developed by Torstar Digital calledTOPS, or Torstar Open Source Publishing System. This power-ful publishing system permits faster handling of breakingnews, greater innovation in presentation and content sharingand supports a wide array of advertising formats.
SHOP TV is a shopping channel catering to the GTA. It airsboth short and long form advertising with commercial lengthsranging from 30 seconds to 30 minutes. A basic cable offer-ing, SHOP TV is available in approximately 1.5 million homesin Southern Ontario with a potential reach of over 4 millionpeople. It also boasts an award-winning full service video pro-duction and post-production facility, including a 3D virtual setstudio.
Eye Weekly is the largest circulation urban weekly in Canada.This exciting, informative entertainment resource now reach-es over 280,000 readers every Thursday.
Toronto is Canada’s most ethnically diverse community andSway is a new quarterly magazine launched that celebratesthe power and influence of Canada's black community.Canadian Immigrant magazine, launched three years ago inVancouver and now also published in Toronto, is Canada's firstmagazine for all immigrants.
Real Estate News has been around for nearly four decades.Published online and in print every other Friday, Real EstateNews is Toronto's only real estate book endorsed by TheToronto Real Estate Board.
Torstar Syndication Services provides value-added services topublishers, companies, governments and consumers by col-lecting, packaging, marketing, licensing and distributing con-tent (text, photos and graphics). From an archive of almostone million images, covering local, national and internationalevents for the past 100 years, Torstar Syndication Servicesoffers reprints of more than 30,000 Toronto Star photographs
and full-pages for commercial and personal use. Registeredusers may also license and download images for commercialand editorial use.
Metro, Toronto’s largest reach free daily newspaper, launchedthree new successful weekly features in 2006, includingMetro Carguide and Metro dreamhomes, which are co-brand-ed with Star Media Group properties. In April, Sing Tao, themost widely read Chinese newspaper in Canada, introducedthe Sing Tao Gourmet Guide. This free weekly supplement,which is distributed with Sing Tao, helped to increase thenewspaper's circulation during 2006.
Star Media Group is committed to providing readers andadvertisers with innovative solutions and services. In 2007,we will remain dedicated to building our products and ourbrands in print or online and to arresting any further decline infinancial performance at our flagship paper, the Toronto Star.
J A G O D A P I K EPublisher, Toronto Star and President,
Star Media Group
9

TORSTAR DIGITAL
http://www.torstardigital.com
Torstar Digital, created in 2005 to plan and manage online
strategy for Torstar, continued in 2006 its mission to deliver
technology and strategic leadership to our online-only prop-
erties and to create winning online businesses that can lever-
age Torstar’s wealth of media assets.
In 2006, Torstar Digital achieved its most important goal of
building audience and made excellent progress in all of our
priority areas.
AUDIENCE
Torstar Digital’s main goal in 2006 was to implement strate-
gies to build audience and traffic and set the stage for mean-
ingful revenue growth. The Torstar Digital audience grew
from 1.7 million unique visitors in 2005 to 9.2 million in
2006. This growth was primarily due to the launch of our
Olive Canada Network business and we expect to continue
growth in this area in 2007.
WORKOPOLIS.COM
http://www.workopolis.com
Torstar increased its ownership share in Workopolis
(workopolis.com) from 40% to 50% in October of 2006 with
Gesca Ltd. now owning the remaining 50%. As Canada’s
leading careers website, workopolis.com continued to reach
record revenue, earnings and unique visitor levels.
Workopolis successfully bid for and won the rights to be an
official sponsor for the 2010 Olympics in Vancouver.
OLIVE CANADA NETWORK
http://www.olivecanadanetwork.com
Launched in July of 2006, the Olive Canada Network was a
key driver of audience growth and revenue for Torstar Digital
in 2006. The Olive Canada Network provides an unparalleled
opportunity for national advertisers to reach a Canadian audi-
ence of more than 9.2 million unique visitors via 18 premi-
um branded websites, including among others: CNET,
ArtistDirect, Maxim and Billboard. In a very short time, Olive
Canada Network has obtained a high level of brand recogni-
tion from media buying agencies and national advertisers.
Olive expects to add more sites and increase its audience
numbers during 2007.
TOPS 2.0
A key initiative for Torstar Digital in 2006 was the development
of an integrated online publishing platform for all of Torstar’s
newspaper properties. During 2006, thestar.com,
toronto.com and several Metroland divisions migrated to this
new platform. All remaining Torstar newspaper sites are
expected to be migrated during the first half of 2007.
10
TORSTARDIGITALT O M E R S T R O L I G H T
President, Torstar Digital

Transit Television Network (Transit TV) develops, installs,services and manages digital out-of-home advertising net-works on buses, rail and other modes of mass transitthrough LCD screens mounted inside the vehicles. It deliv-ers full motion, broadcast quality information and entertain-ment programming to its audience, including audio andvisual “next stop” announcements, local and national news,weather and sports, advertising and lifestyle programming.In 2006, Transit TV completed the installation of its largestmarket, the Metro transit system in Los Angeles, California.
Together with its systems in Orlando, Florida; Milwaukee,Wisconsin; Chicago, Illinois; Atlanta, Georgia; and VirginiaBeach, Virginia, Transit TV now reaches a daily audience of1.7 million riders through 8,900 screens in the fast growingdigital out-of-home advertising market. Transit TV has alsobeen awarded the right to negotiate a contract to install itssystem on the San Diego, California transit system. Otherproposals are at various stages for several North Americancities.
TORONTO.COM
http;//www.toronto.com
In 2006, toronto.com was redesigned and relaunched on
the new TOPS 2.0 platform, offering users a much improved
user experience with increased functionality and search
engine refinements. The relaunch resulted in record traffic
and unique visitor levels; additionally, the increased value
proposition created by the redesign attributed to significant
growth in toronto.com’s audience.
LIVEDEAL.CA
http://www.livedeal.ca
In January 2006, Torstar Digital and Livedeal.com launched
Livedeal.ca, which provides Canadians with an online mar-
ketplace for buying and selling goods at both the local and
national level. Later in 2006, Gesca Digital Ltd joined the
Livedeal.ca partnership. By the end of 2006, LiveDeal.ca
was averaging more than 300,000 unique visitors per month
and carrying on average 45,000 listings. To increase audi-
ence distribution, agreements to host online classified sec-
tions powered by Livedeal.ca have been signed with CTV,
TELUS, Aliant, Standard Radio, AOL and Lycos.
G E R R Y N O B L EPresident and CEO,
Transit Television Network
TRANSITTELEVISION
NETWORK
11
2

METROLANDMEDIAGROUP
12
2006 was a year of significant growth and change in theMetroland Media Group.
It was Metroland’s first full year operating acquired newspa-pers in the expanded territories of Muskoka and Ottawa.During 2006, the company continued its growth in theseregions through the acquisitions of the Almaguin News(Burks Falls), Nepean This Week and the Perth Courier.Metroland also launched two new publications, Smiths FallsThis Week and Perth Weekender.
Later in 2006, Torstar announced a realignment of newspa-per properties. Operations of the former CityMedia Group,including its three daily newspapers (The HamiltonSpectator, The Record (Waterloo Region) and the GuelphMercury), plus two community newspaper groups (HamiltonCommunity News and the Fairway Group), became a part ofMetroland while Torstar’s interest in the Chinese languagedaily Sing Tao, Metro commuter dailies, and other specialtypublications, including Eye Weekly and Real Estate News,transferred to Star Media Group.
This realignment resulted in a name change to MetrolandMedia Group Ltd., a reflection of the broad geographic cov-erage and depth of media offerings provided by the compa-ny. Metroland’s newspaper properties now occupy a broadterritory stretching from Niagara to Muskoka, from south-western Ontario to the Kawartha Lakes, plus the OttawaValley region. This vast territory encompasses 3.1 millionhouseholds and makes up two-thirds of Ontario. Metroland’snewspapers reach 4.3 million readers, and associated websites attract 1.5 million monthly unique visitors.
All of Metroland’s more than 100 newspapers are deeplyinvolved in the communities they serve. Local news and con-tent makes each paper the leading source of communityinformation in its respective market. Editorial excellencethroughout Metroland was recognized again in 2006 withsignificant editorial awards. For the second year in a row,The Hamilton Spectator won the prestigious NationalNewspaper Award for investigative journalism for its “BlindFaith” series on the ties between university researchers andpharmaceutical companies. As well, Guelph Mercuryreporter Deirdre Healey received the Canadian Associationof Journalists award for investigative journalism for her seriescovering crack cocaine use in Guelph.
2 0 0 6 A C Q U I S I T I O N S A N D S T A R T - U P S
G O L D B O O K D I R E C T O R I E S
g o l d b o o k . c a

Metroland’s community newspapers again dominated the OntarioCommunity Newspaper Awards, the Canadian Community NewspaperAwards and were recognized by the Suburban Newspapers of Americawith the second-most awards won by any group in North America.
Metroland newspapers serve thousands of local, regional and nationaladvertisers. During 2006, Metroland newspapers carried more than 350million lines of advertising and delivered more than 3.2 billion pre-printedinserts. Metroland concluded 2006 with a solid financial performanceincluding 6% growth in EBITDA.
During 2006, Metroland aggressively expanded its Gold Book phone direc-tories in both print editions and online. A significant investment in staff andinfrastructure will result in 25 print directories to be published in 2007.
Also during 2006, Metroland installed the first phase of new mechanicalinserting machines in seven locations. These machines were fully opera-tional by year-end and will assist in maintaining a strong youth carrier forcewhile providing significant cost savings.
At the end of 2006, Metroland undertook a staff reduction programincluding a voluntary severance program at the dailies.
With year-end restructuring complete, including new publishers Ian Oliverin Hamilton and Dana Robbins in Kitchener, Metroland looks forward tocontinued growth in 2007.
M U R R A Y S K I N N E RPresident,
Metroland Media Group
13
C O M M U N I T Y P A P E R S
M A G A Z I N E S
D A I L Y P A P E R S

Harlequin is unique in the publishing industry. Building onstrong brands and its dominance of series romance pub-lishing, Harlequin publishes books for women in a variety ofgenres. In addition, Harlequin complements these strengthswith longstanding Retail channel partner relationships andits unique Direct-To-Consumer and Overseas channels.
Harlequin remains committed to being a leading publisherof great reading entertainment for women. Pursuit of thisvision is built upon four strategic themes:1. Relevant portfolio of reading for women2. Optimal channel and market management3. Cost reduction and execution4. Engaging the right people
In 2006, Harlequin made progress against these themesand positioned itself for further success in the future.
INDUSTRYConsumer book publishing remains a relatively stable, mod-est growth industry. After a difficult year for the industry in2004, the mass market paperback format stabilized in2005 and showed moderate growth in 2006.
The direct-to-consumer environment in which Harlequinoperates continues to prove challenging. Sales in the tradi-tional U.S. direct mail industry continue to decline, with sim-ilar weakness in certain Overseas direct-to-consumer busi-nesses. As with other industries, however, consumers’migration to the Internet opens new opportunities for pub-lishers to reach readers directly. Harlequin has responded to
consumer demand for online sales and social community,seeing double-digit sales growth via retail partners’ websitesand eHarlequin.com.
In addition, publishers are driving technological advances inthe creation, promotion, and distribution of their content.Digital presence is increasing, as audiobooks and eBooksgain traction. Publishers are executing integrated onlinestrategies and Harlequin made very good progress on this in2006.
OPERATING REVIEWIn 2006, Harlequin earned EBITDA of $63.4 million, down$39.7 million from $103.1 million in 2005. The strength-ening of the Canadian dollar and the non-recurrence of theU.S. dollar hedge contracts in place in 2005 accounted for$36.6 million of the decline. Excluding the effect of foreignexchange, were it not for the bankruptcy of a major suppli-
er, Harlequin earnings would have been stable in 2006.Books sold were stable in 2006 at 131 million. Total rev-enue for the year was $471.8 million. After excluding theimpact of foreign exchange, revenue increased by $9.4 mil-lion or 2% over 2005.
HARLEQUIN’S STRATEGYIn 2006, Harlequin focused on four strategic themes.
1. Relevant Portfolio of Reading for Women
Stabilizing the series business continues to be Harlequin’snumber one priority. Investing in product development,
HARLEQUIN
14

and promotion are the keys to delivering a relevant series read-ing experience. Outside of series, Harlequin continues to servea broader group of women with entertaining content across avariety of single title genres and imprints.
2006 Progress• In 2006, Harlequin launched several successful product lines
– Silhouette Nocturne, a paranormal romance series– Kimani Romance, the only African-American romance series– Spice, an erotic fiction imprint
• Supporting the continued success of one of Harlequin’slongest running series, title output in the HarlequinPresents line increased
• As a result of evolving editorial content and effective pro-motion, research revealed significant improvement in therelevance of Harlequin editorial for consumers
• Top selling authors under Harlequin imprints reached newlevels of achievement– Collectively, Harlequin authors enjoyed 181 weeks on the New York Times Bestseller Lists; 45 titles reached the lists in 2006, up from 42 in 2005– Debbie Macomber reached a larger audience than ever before, generating a 29% increase in the number of weeks her titles spent on the New York Times Bestseller Lists– Susan Wiggs, Heather Graham and Carla Neggers also
had their best years to date• One year after launching a North American eBook program,Harlequin has the largest offering of romance eBooks in themarket and 6,000 titles in its global digital warehouse
2007 Initiatives• Drive product innovation by building on consumer expertise• Continue to improve the relevance and appeal of series
romance books• Launch Harlequin Everlasting Love, a new sweeping epic
romance series• Launch Kimani TRU, a new fiction line for African-American
teens• Broaden the range of content Harlequin publishes
– Increase emphasis on thriller and paranormal fiction– Expand into nonfiction, a segment representing 60% of the U.S. consumer book publishing market
• Maintain focus on developing and promoting Harlequin’stop authors to higher levels of performance
2. Optimal Channel and Market Management
Serving existing channels more effectively and identifyingnew channels through which to sell books remain top priori-ties for Harlequin.
D O N N A H A Y E SPublisher and Chief
Executive Officer
15

2006 Progress• Retail North America significantly improved the efficiency
of series book sales – distributing fewer books and sell-ing more
• In partnership with key North American retailers,Harlequin conducted a large scale series sampling pro-gram to drive awareness and trial
• Key Overseas markets performed well, particularlyAustralia, Japan, and the Nordic region
• Harlequin’s Brazil joint venture ended its first full fiscalyear on track to profitability
• eHarlequin.com delivered double-digit sales growth andexpanded to support eBook sales
2007 Initiatives• Continue to optimize sales of series books in the Retail
North America channel• Continue to introduce Harlequin titles to new distribution
channels, particularly in Overseas markets• Grow online sales via Harlequin’s Internet partners and
eHarlequin.com in all markets• Continue to grow sales of digital products, including
audiobooks, eBooks and mobile content in the U.S. andJapan
• Sign new license deals in eastern Europe and conductresearch and build relationships in potential expansionmarkets, such as India, Taiwan, and China
3. Cost Reduction and Execution
While Harlequin has stabilized net units and grown revenuebefore the effect of foreign exchange, costs have grown ata faster pace in recent years. In response to this marginpressure, Harlequin undertook a significant cost reductioninitiative in 2006.
2006 Progress• Reduced overheads globally• Focused advertising and promotion budgets on the most
effective activities in Retail North America and Direct-To-Consumer
• Streamlined processes and created efficiencies in man-aging resources and assets, such as cover art and paperusage
• Invested in short-run printing capabilities that will reduceinventory costs and improve availability of top authors’titles
2007 InitiativesGoing forward, Harlequin will continue to identify ways toreduce costs and improve workflow.
4. Engaging the Right People
The foundation of Harlequin’s business lies in the talent ofits author base and employees. Accordingly, Harlequinworks to align the organization with its strategies, developand retain talent, and reward performance. Balanced withthese activities is Harlequin’s need to maintain an efficientcost structure.
FUTURE OUTLOOKBy continuing to publish books that women want to read,Harlequin maintains its unique position in an increasinglycompetitive market. Publishing editorial in diverse genresallows Harlequin to reach new readers, while remainingfresh and relevant to its loyal base.
Looking ahead, Harlequin will continue to deliver relevanteditorial in innovative formats. Expanding and optimizingchannels will make Harlequin books more widely availableat attractive margins. Reducing costs and improving exe-cution are expected to grow Harlequin’s profitability, whilefacilitating continued investment in brands and authors.
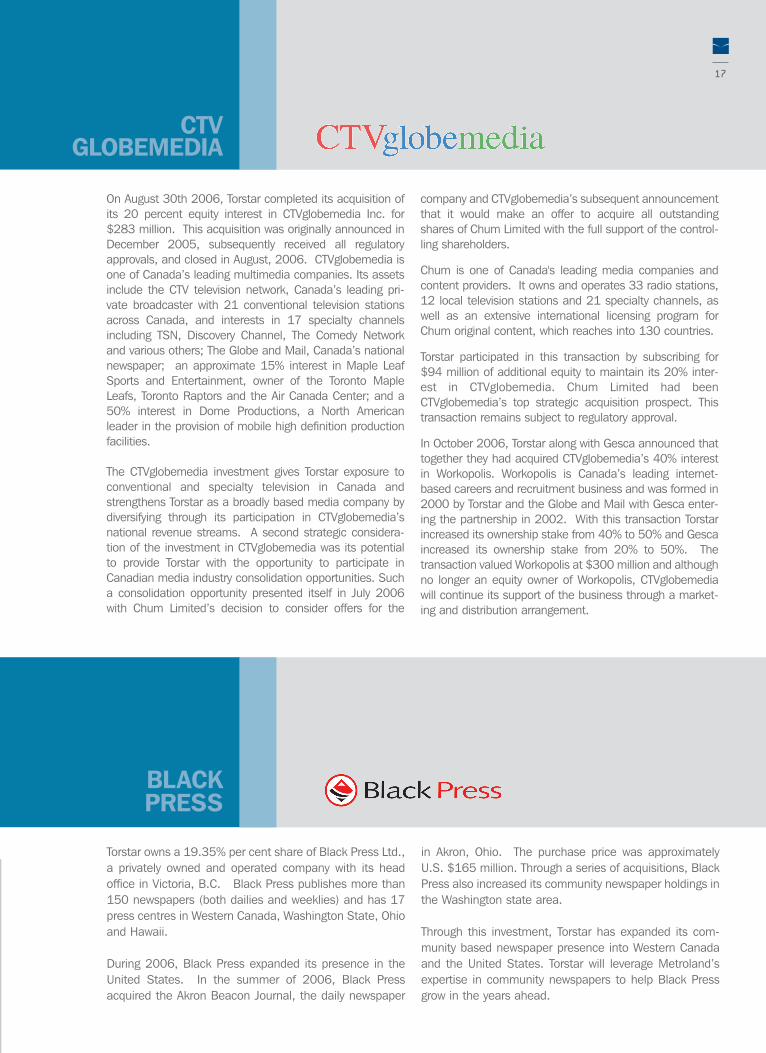
Torstar owns a 19.35% per cent share of Black Press Ltd.,a privately owned and operated company with its headoffice in Victoria, B.C. Black Press publishes more than150 newspapers (both dailies and weeklies) and has 17press centres in Western Canada, Washington State, Ohioand Hawaii.
During 2006, Black Press expanded its presence in theUnited States. In the summer of 2006, Black Pressacquired the Akron Beacon Journal, the daily newspaper
in Akron, Ohio. The purchase price was approximatelyU.S. $165 million. Through a series of acquisitions, BlackPress also increased its community newspaper holdings inthe Washington state area.
Through this investment, Torstar has expanded its com-munity based newspaper presence into Western Canadaand the United States. Torstar will leverage Metroland’sexpertise in community newspapers to help Black Pressgrow in the years ahead.
CTVGLOBEMEDIA
BLACKPRESS
17
On August 30th 2006, Torstar completed its acquisition ofits 20 percent equity interest in CTVglobemedia Inc. for$283 million. This acquisition was originally announced inDecember 2005, subsequently received all regulatoryapprovals, and closed in August, 2006. CTVglobemedia isone of Canada’s leading multimedia companies. Its assetsinclude the CTV television network, Canada’s leading pri-vate broadcaster with 21 conventional television stationsacross Canada, and interests in 17 specialty channelsincluding TSN, Discovery Channel, The Comedy Networkand various others; The Globe and Mail, Canada’s nationalnewspaper; an approximate 15% interest in Maple LeafSports and Entertainment, owner of the Toronto MapleLeafs, Toronto Raptors and the Air Canada Center; and a50% interest in Dome Productions, a North Americanleader in the provision of mobile high definition productionfacilities.
The CTVglobemedia investment gives Torstar exposure toconventional and specialty television in Canada andstrengthens Torstar as a broadly based media company bydiversifying through its participation in CTVglobemedia’snational revenue streams. A second strategic considera-tion of the investment in CTVglobemedia was its potentialto provide Torstar with the opportunity to participate inCanadian media industry consolidation opportunities. Sucha consolidation opportunity presented itself in July 2006with Chum Limited’s decision to consider offers for the
company and CTVglobemedia’s subsequent announcementthat it would make an offer to acquire all outstandingshares of Chum Limited with the full support of the control-ling shareholders.
Chum is one of Canada's leading media companies andcontent providers. It owns and operates 33 radio stations,12 local television stations and 21 specialty channels, aswell as an extensive international licensing program forChum original content, which reaches into 130 countries.
Torstar participated in this transaction by subscribing for$94 million of additional equity to maintain its 20% inter-est in CTVglobemedia. Chum Limited had beenCTVglobemedia’s top strategic acquisition prospect. Thistransaction remains subject to regulatory approval.
In October 2006, Torstar along with Gesca announced thattogether they had acquired CTVglobemedia’s 40% interestin Workopolis. Workopolis is Canada’s leading internet-based careers and recruitment business and was formed in2000 by Torstar and the Globe and Mail with Gesca enter-ing the partnership in 2002. With this transaction Torstarincreased its ownership stake from 40% to 50% and Gescaincreased its ownership stake from 20% to 50%. Thetransaction valued Workopolis at $300 million and althoughno longer an equity owner of Workopolis, CTVglobemediawill continue its support of the business through a market-ing and distribution arrangement.

Former Toronto Star publisher, Joseph E. Atkinson, was relent-less in pressing for social and economic programs to help theless advantaged members of our city. His strong values andbeliefs formed what are now called The Atkinson Principles andare the leading force behind the Toronto Star’s editorial andcharitable endeavours. For more than one hundred years, theAtkinson Principles have echoed Mr. Atkinson’s words andhave been the guidelines for future generations of Toronto Starstaff and readers to follow. His passion for the youngest andmost needy in our community resulted in the establishment oftwo separate children’s charities. Mr. Atkinson’s goal was toensure that underprivileged children were given a memorablecamp experience in the summer, and were not forgotten atChristmas. This legacy is now ours to continue in the com-munity, well into the next century.
The Toronto Star covers all administrative expenses of TheToronto Star Children’s Charities. This tradition has ensuredthat 100 per cent of public donations are spent directly on theyoung and vulnerable. In 2006, more than 75,000 childrenand teens were supported by the Funds.
The Toronto Star Fresh Air Fund was launched in1901. Joseph Atkinson appealed to TorontoStar readers to help underprivileged childrenescape the sweltering heat wave that summer.His message did not go unnoticed or forgotten.Today, children with a multitude of debilitating ill-nesses, mental and physical handicaps andchildren from low-income families are given the
opportunity to explore the fun and lessons of camp each sum-mer. In 2006, The Toronto Star Fresh Air Fund once againhelped alleviate the daily stresses for more than 25,000 chil-dren by providing them with lasting, memorable summer campexperiences. The Fund raised $591,452 to support 98 dayand residential camps.
2006 proved to be another stellar fundraising year for TheToronto Star Santa Claus Fund. The fund celebrated its 101styear and ensured that 45,000 children received a gift atChristmas. Surpassing its $1.4 million goal, the fund raised inexcess of $1.5 million by December 23, 2006 from TorontoStar readers as well as supporters of our sister papers, TheMississauga News, The Brampton Guardian and Ajax-PickeringNews Advertiser. The gift boxes, delivered directly to children’shomes by thousands of volunteers, contained the traditionalwarm sweater, hat, mittens, socks, candy, book and small toy.In 2005, a dental hygiene kit was included in gift boxes for chil-dren aged 4 to 12. This item was continued in 2006 as wasthe youth program for 5,500 teens, age 13 to 17. Each youth
received movie passes and a gift certificateto the theatre’s concession stand.
The Toronto Star continues to extend a help-ing hand in the community by supporting theToronto Public Library literacy programs,Children’s Aid Foundation and journalismeducation with scholarships to RyersonUniversity, Loyalist College, Humber Collegeand Sheridan College.
COMMITMENTTOOUR COMMUNITIES
At Torstar, we believe that serving andbeing a part of our many communities areboth our responsibility and our privilege.

HARLEQUINNow in its fourth year of operation, the Harlequin More ThanWords program honours ordinary women who make extraordinarycontributions to their communities. Each year nominations arereceived from across North America and Harlequin presents fivewomen with the More Than Words award. Harlequin is proud tomake a $10,000 donation to each of the award winners’ asso-ciated charities and to promote the charities online and througha North America-wide publicity campaign. In addition, five ofHarlequin’s leading authors donate their time and creative tal-ents to a collection of short stories inspired by the award winners’dedication and compassion. Proceeds from the book are rein-vested in Harlequin’s charitable initiatives. For more informationabout this program and the award winners, please visitwww.HarlequinMoreThanWords.com.
METROL AND MEDIA GROUPMetroland Media Group’s newspapers provide support and lead-ership to literally hundreds of charitable efforts throughout thecommunities they serve. In 2006, Metroland properties donatedin-paper space worth more than $4.6 million to a variety of wor-thy causes. Each newspaper selects suitable local charities andprovides support by donating promotional space in the newspa-pers. Here are just a few examples:
The Hamilton Spectator has a long tradition of providing camp-ing experiences for disadvantaged children, through fundingraised in the Summer Camp Fund. In 2006, more than 1,300children spent a week at camp. Also in 2006, The HamiltonSpectator launched an exciting new initiative stemming from itstrailblazing editorial initiative, The Poverty Project, launched in2005. Kids Unlimited is an outreach program by employees todirectly support poverty reduction in the Hamilton community.The first initiative is the ‘adoption’ of a local elementary school in
the inner city, in which nearly half of the families live in poverty.Kids Unlimited is putting corporate and human resourcestowards helping the students reach their full potential.
Since 1996, The Record has held its annual Books for Kids bookdrive, providing new books for children of need in WaterlooRegion. In 2001, the Guelph Mercury joined forces with TheRecord and the campaign grew to service Guelph and WellingtonCounty. Since 1996, over 50,000 books have been collected byBooks for Kids and distributed to area children through theSalvation Army’s Christmas Bureau program.
The Annual Scarborough Walk of Fame, launched in 2006,showcases Scarborough citizens whose accomplishments bringpride to the community. The Scarborough Mirror played a key rolein the planning and implementation of the annual event. TheWalk of Fame committee, of which The Mirror was one of threekey sponsors, also presented three charitable organizations thatserve at-risk youth with cheques for $10,000 each.
In 2006, Mississauga News staff organized and served the firstannual community thanksgiving dinner to more than 100 fami-lies, including seniors, who experience hunger and rely on localfood banks for nutrition. The dinner is an extension of the sum-mer breakfast program organized and staffed by The MississaugaNews. The program runs during July and August to bridge thegap between school-based programs that end in June.
The Mississauga News was recognized with an award fromHeritage Mississauga for a significant contribution for the preser-vation and conservation of the Port Credit Log Cabin. In additionto the preservation of local heritage, the cabin will be used as arelaxed meeting place for older children who have fled from abu-sive homes.

Results from underlying operations were mixed in 2006 with growth experienced in MetrolandMedia Group, continuing stability in results at Harlequin and a decline in earnings in the StarMedia Group. Revenues were $1.53 billion, down 1.8% versus prior year. Excluding foreigncurrency related impacts, revenues were up 2% in the year. Earning before interest, taxes,depreciation and amortization (“EBITDA”) before restructuring charges declined to $202.1million in 2006 from $253.5 million in 2005. The decline in EBITDA was primarily due to$36.6 million in foreign currency related year over year impact, the majority of which was dueto the non-recurrence of a 2005 gain from hedging U.S. dollars.
• The Metroland Media Group, focused on serving its local communities, had a strong year.Revenue grew by 5.2% to $558.2 million and EBITDA grew by 6.3% to $113.5 million.
• Harlequin had a solid year in 2006, experiencing a modest decline of 4.5% in underlyingEBITDA to $63.4 million excluding foreign currency related impact. Results in the year werenegatively affected by the bankruptcy of a supplier to the Direct to Consumer business. TheNorth America Retail business continued to maintain its positive momentum.
• The Star Media Group’s results were $52.8 million, down $18.9 million versus prior year.The Toronto Star continued to face revenue challenges similar to many large urban newspapers in North America.
Looking ahead to 2007, we will remain focused on execution of our plans and at the sametime will be disciplined about making the investments necessary to enhance value over thelong term.
D A V I D H O L L A N D
FINANCIALRESULTS
D A V I D H O L L A N DExecutive Vice-President and
Chief Financial Officer
20

MANAGEMENT’S DISCUSSION & ANALYSIS 22
MANAGEMENT’S STATEMENT OF RESPONSIBILITY 43
INDEPENDENT AUDITOR’S REPORT TO SHAREHOLDERS 43
CONSOLIDATED BALANCE SHEETS 44
CONSOLIDATED STATEMENTS OF INCOME 45
CONSOLIDATED STATEMENTS OF CASH FLOWS 46
NOTES TO CONSOLIDATED FINANCIAL STATEMENTS 47
SUMMARY OF BUSINESS & GEOGRAPHIC SEGMENTS 61
ANNUAL OPERATING HIGHLIGHTS, SEVEN-YEAR-SUMMARY 62
CORPORATE INFORMATION 63
FINANCIAL TABLEOF CONTENTS

For the year ended December 31, 2006
Dated: February 28, 2007
The following review and analysis of Torstar Corporation’s (“Torstar”) operations and financial position is supplementaryto, and should be read in conjunction with the audited consolidated financial statements of Torstar Corporation for theyear ended December 31, 2006.
Torstar reports its financial results under Canadian generally accepted accounting principles (“GAAP”) in Canadian dollars.Per share amounts are calculated using the weighted average number of shares outstanding for the applicable period.
Non-GAAP Measures
Management uses both operating profit, as presented in the consolidated statements of income, and EBITDA as measuresto assess the performance of the reporting units and business segments. EBITDA is a measure that is also used by manyof Torstar’s shareholders, creditors, other stakeholders and analysts as a proxy for the amount of cash generated by thereporting unit or segment. EBITDA is not the actual cash provided by operating activities and is not a recognized measureof financial performance under GAAP. Torstar calculates EBITDA as the reporting unit or segment’s operating profit beforerestructuring provisions, interest, gains on sale of properties, taxes, depreciation and amortization of intangible assets.Torstar’s method of calculating EBITDA may differ from other companies and accordingly, may not be comparable tomeasures used by other companies.
Forward-looking statements
Certain statements in this report may constitute forward-looking statements that reflect management’s expectationsregarding the Company’s future growth, results of operations, performance and business prospects and opportunities asof the date of this report. Generally, these forward-looking statements can be identified by the use of forward-lookingterminology such as “anticipate”, “believe”, “plan”, “forecast”, “expect”, “intend”, “would”, “could”, “if”, “may” and similarexpressions. All such statements are made pursuant to the “safe harbour” provisions of applicable Canadian securitieslegislation. These statements reflect current expectations of management regarding future events and operating performance, and speak only as of the date of this report. The Company does not intend, and disclaims any obligationto, update any forward-looking statements whether as a result of new information or otherwise.
By their very nature, forward-looking statements require management to make assumptions and are subject to inherentrisks and uncertainties. There is a significant risk that predictions, forecasts, conclusions or projections will not prove to beaccurate, that management’s assumptions may not be accurate and that actual results, performance or achievements maydiffer significantly from such predictions, forecasts, conclusions or projections expressed or implied by such forward-lookingstatements. We caution readers to not place undue reliance on the forward-looking statements in this MD&A as a numberof factors could cause actual future results, conditions, actions or events to differ materially from the targets, outlooks,expectations, goals, estimates or intentions expressed in the forward-looking statements.
These factors include, but are not limited to: general economic conditions in the principal markets in which the Companyoperates, the Company’s ability to operate in highly competitive industries, the Company’s ability to compete with otherforms of media, the Company’s ability to attract advertisers, cyclical and seasonal variations in the Company’s revenues,newsprint costs, labour disruptions, foreign exchange fluctuations, restrictions imposed on existing credit facilities, litigation,and uncertainties associated with critical accounting estimates.
We caution that the foregoing list is not exhaustive of all possible factors, as other factors could adversely affect ourresults. For more information, please see the discussion starting on page 24 concerning the effect certain risk factorscould have on actual results, as well as the discussion in the Company’s current Annual Information Form, which is incorporated herein by reference.
In addition, a number of assumptions, including those assumptions specifically identified throughout this MD&A, wereapplied in making the forward-looking statements set forth in this MD&A, some or all of which may prove to be incorrect.
22
MANAGEMENT’S DISCUSSION & ANALYSIS

OVERVIEW
Torstar Corporation is a broadly based media company listed on the
Toronto Stock Exchange (TS.B). Torstar reports its operations in two
segments: Newspapers and Digital; and Book Publishing. Its
Newspapers and Digital Segment includes the Star Media Group
led by the Toronto Star, Canada’s largest daily newspaper and
digital properties including thestar.com, toronto.com, LiveDeal.ca,
Workopolis, and Olive Canada Network; and Metroland Media
Group, publishers of community and daily newspapers in Ontario.
Its Book Publishing Segment represents Harlequin Enterprises,
a leading global publisher of women’s fiction. Torstar also has
investments in CTVglobemedia Inc. (“CTVgm”) and Black Press
Limited which are accounted for as Associated Businesses, using
the equity method. In 2006, Torstar had revenues of $1.5 billion
and net income of $79.1 million.
NEWSPAPERS AND DIGITAL SEGMENT
The Newspapers and Digital Segment includes the Star Media
Group; Metroland Media Group (“Metroland”); and Transit Television
Network (“Transit TV”).
The Star Media Group and Metroland Media Group reporting units
have been aggregated into one segment due to their similar
economic factors, geography, customers, distribution channels and
the level of interaction between the reporting units. Transit TV has
been included in the Newspapers and Digital Segment as it, like the
other businesses in this segment, is a platform providing news
content and generates advertising revenue. However, this reporting
unit is small relative to the other reporting units in the segment.
Each of the reporting units is discussed separately in the MD&A in
order to provide more specific information about their operations.
During the fall of 2006 and early 2007, Torstar announced restruc-
turings of its newspaper and digital operations. These restructurings
resulted in the realignment of Torstar’s various newspaper and
digital businesses into the Star Media Group and Metroland Media
Group reporting units. The financial results presented in this report
have been restated to reflect this change in the reporting units.
Star Media Group includes the Toronto Star, with the largest
circulation and readership of any daily newspaper in Canada;
Torstar’s interests in Sing Tao Daily and the Toronto, Ottawa and
Vancouver editions of Metro; thestar.com; Toronto.com; LiveDeal.ca;
and Torstar Media Group Television (“TMG TV”). Recognizing the level
of interaction between the Star Media Group digital businesses and
Torstar Digital, including common systems and strategic planning,
Star Media Group also includes the Torstar Digital corporate group,
Workopolis and Olive Canada Network.
Torstar owns 100% of Toronto.com, a local search site offering
business, event and entertainment listings and information.
LiveDeal.ca is a web classified site with a broad selection of free
listings that is ideal for trading hard-to-ship items such as automobiles,
furniture, appliances, real estate and other “try before you buy”
items. Torstar owns 40% of LiveDeal.ca in partnership with Gesca
Ltd. and LiveDeal, Inc. Torstar owns 50% of Workopolis, Canada’s
leading provider of Internet recruitment and job search solutions, in
partnership with Gesca Ltd. Olive Canada Network is a premium
content network that reaches over 13 million unique Canadian visitors
monthly on its network of top-tier sites including CNET.com,
ArtistDirect.com, thestar.com, LiveDeal.ca, toronto.com, cyberpresse.ca
and tetesaclaques.tv. Torstar owns 75%1 of Olive Canada Network in
partnership with Gesca Ltd.
The Toronto Star’s Vaughan Press Centre primarily supports the
Toronto Star’s printing needs but is also engaged in commercial
printing, including printing the National Post. TMG TV is a 24–hour
direct response television business operating the SHOP TV Canada
channel and TMG TV Productions.
Metroland Media Group (the combination of the former Metroland
and CityMedia Group Inc.) publishes in print and on-line more than
100 community newspapers and three daily newspapers – The
Hamilton Spectator, The Record (Kitchener, Cambridge and
Waterloo) and the Guelph Mercury. It is also the publisher of
Goldbook Directories, a number of specialty publications, and operates
several consumer shows throughout Ontario through its Premier
Consumer Shows division. Metroland Media Group has nine web
press facilities which print the Metroland newspapers but also
engage in commercial printing.
Transit TV is a U.S. based operation that delivers full motion, broad-
cast–quality information and entertainment to passengers on
buses, rail and other modes of mass transit on screens mounted in
the vehicle. Torstar is currently reviewing its strategic options for
Transit TV.
23
MANAGEMENT’S DISCUSSION & ANALYSIS
1 Effective January 1, 2007.

BOOK PUBLISHING SEGMENT
The Book Publishing Segment reports the results of Harlequin
Enterprises Limited, a leading global publisher of women’s fiction.
Harlequin publishes women’s fiction around the world, selling
books through the retail channel and directly to the consumer
by mail and the Internet. Harlequin’s women’s fiction publishing
operations are comprised of three divisions: North America Retail,
North America Direct-To-Consumer and Overseas. In 2006
Harlequin published books in 26 languages in 109 international
markets. Harlequin reported a total of 131 million books sold in
2006, consistent with 2005.
Harlequin sells books under several imprints including Harlequin,
Silhouette, MIRA, Red Dress Ink, Steeple Hill, LUNA, HQN and
Kimani Press. Different genres of women’s fiction are published
under the various imprints.
Harlequin publishes books in both series and single title formats.
Harlequin publishes series titles primarily under the Harlequin and
Silhouette brands. Series titles are published monthly in mass-market
paperback format under an imprint that identifies the type of story
to the reader. Each series typically has a preset number of titles that
will be published each month. The single title publishing program
provides a broader spectrum of content in a variety of formats
(mass-market paperback, trade paperback, hardcover) and generally
a longer book. New single title books are published each month
and the individual titles have a longer shelf life.
ASSOCIATED BUSINESSES
On August 30, 2006, Torstar acquired a 20% equity interest in Bell
Globemedia Inc. for $283 million. In January, 2007, Bell
Globemedia changed its name to CTVglobemedia Inc. (“CTVgm”).
CTVgm is a Canadian multi-media company with ownership
interests in Canada’s leading media properties including: CTV Inc.,
the number-one private broadcaster, and The Globe and Mail, the
leading national daily newspaper. CTV operates 21 conventional
television stations across Canada and offers a wide-range of
quality news, sports, information and entertainment programming.
Additionally, CTV has interests in 17 specialty channels. The Globe
and Mail also publishes Report on Business magazine and also
owns many interactive properties including globeandmail.com.
Other CTVgm investments include: an approximate 15 percent interest
in Maple Leaf Sports and Entertainment Ltd., which owns the
Toronto Maple Leafs, Toronto Raptors and the Air Canada Centre;
and a 50 percent interest in Dome Productions, a North American
leader in the provision of mobile high definition production facilities.
During September and October 2006 CTVgm acquired the issued
and outstanding shares of CHUM. The common shares of CHUM have
been placed in trust pending regulatory approval of the transaction.
CHUM owns and operates 33 radio stations, 12 local television stations
and 21 specialty channels. Torstar made an additional investment
of $94 million in CTVgm in September 2006 in order to provide its
pro-rata share of the equity contribution in respect of the CHUM
purchase price, maintaining its 20% interest.
Torstar has a 19.35% equity investment in Black Press Ltd. and a
30% equity interest in Q-ponz Inc. Black Press Ltd. is a privately
held company that publishes more than 150 newspapers (both
dailies and weeklies) and has 17 press centres in Western Canada,
Washington State, Ohio and Hawaii. In 2006, Black Press acquired
the Akron Beacon Journal, the daily newspaper in Akron, Ohio.
Torstar may make additional investments in Black Press under certain
circumstances. Black Press faces many of the same risks as
Torstar’s community newspapers, but in a different geography which
may have a different impact on revenues and operating income.
Qponz Inc. is a coupon envelope business based in Toronto.
KEY FACTORS AND RELATED RISKS AFFECTING REVENUES AND OPERATING INCOME
Torstar is subject to a number of risks and uncertainties, including
those set forth below. A risk is the possibility that an event might
happen in the future that could have a negative effect on the financial
condition, results of operations or business of Torstar. The actual
effect of any event on Torstar’s business could be materially different
from what is anticipated. A further discussion of risks affecting
Torstar and its businesses is set forth in Torstar’s current Annual
Information Form, which is incorporated herein by reference.
Revenues
Torstar’s newspapers generate revenue primarily from advertising
and from paid circulation for the daily newspapers. Advertising
revenue includes in-paper advertising, inserts/flyers, specialty
publications as well as on-line ads. Competition for advertising
revenue comes from local and regional newspapers, radio, broadcast
and cable television, direct mail, Internet and other communications
and advertising media that operate in Torstar’s markets. The extent
and nature of such competition is, in large part, determined by the
location and demographics of each market and the number of
media alternatives available. For example, just considering the
competition from other daily newspapers, the Toronto Star is part of
an intense battle with five other daily newspapers in the Greater
Toronto Area (“GTA”), including two free daily papers.
Advertising revenue is sensitive to prevailing economic conditions,
including changes in local and regional economic conditions, and the
level of consumer confidence. A large portion of Torstar’s advertising
revenue is derived from the automotive, technology, retail, telecom-
munications, travel and entertainment sectors. These sectors have
24
MANAGEMENT’S DISCUSSION & ANALYSIS

historically been sensitive to changes in economic conditions.
Advertising revenue tends to be cyclical with the second and fourth
quarters being stronger than the first and third.
Advertising revenues are sensitive to changes in linage and rate.
A 1% shift in either advertising linage or the average line rate at the
combined daily newspapers impacts Torstar’s revenues by approxi-
mately $3.6 million over a full year. A 1% shift at the community
newspapers impacts revenues by approximately $2.4 million over a
full year.
Readership levels are an important factor in the ability of a newspaper
to generate advertising revenues. Changes in everyday lifestyle may
mean that people choose not to devote as much time to reading
newspapers as often as they used to. In addition, increased usage
of the Internet over the past decade has changed how people
receive news and other information which may also reduce their
newspaper reading and purchasing habits.
In response to this trend, Torstar’s newspapers have established
electronic versions which are updated regularly during the day for
breaking news and which have various interactive features. These
sites complement the printed product and provide both readership
and advertising opportunities. In addition, Torstar has made
investments in digital operations including classified websites
where revenues have migrated over the past few years. In 2006,
digital revenues represented 3.2% of Torstar’s Newspaper and
Digital Segment revenues. However, digital revenues tend to be
lower than traditional media, due in part to the lower cost structure
and, in some cases, low barriers to entry. Generating a significant
level of digital revenues may require a large volume of transactions
at relatively low rates. To get the volume of transactions, a critical mass
of relevant content and brand recognition and effective technology
are key requirements. A challenge for Torstar in the digital space is
that the playing field continues to change at a rapid pace, there are
lower barriers to entry and the competitors include global players
with access to greater financial and other resources than Torstar.
TMG TV generates revenues primarily by selling time for direct
response advertising on the SHOP TV Canada channel. The direct
response television business in Canada has been challenging for
several years. Federal regulations on products and a shift to digital
tuning (reducing channel surfing) have negatively affected the
Canadian direct response television business. Channel placement
with the cable networks is an important selling feature for this business.
TMG TV’s contract with Rogers for access to their cable network in the
Toronto area expired on December 31, 2006.A new contract has not
been negotiated but the current access arrangements have continued.
The Transit TV model is to generate revenues by selling advertising
space on programming broadcast on buses. The medium enjoys the
advantage of a relatively “captive” audience, is less expensive for
advertisers than television and may provide better access to key
demographics. However, as a new product, there is no guarantee
of commercial success and Torstar’s experience to date is that
advertisers have been slow to embrace it.
A key risk for book publishing revenue is to be able to publish books
that consumers want to read and to have them available where and
when consumers are making their purchasing decision. Given the
large percentage of its sales in the U.S., Harlequin has considerable
exposure to trends occurring in the U.S. book market. Harlequin
regularly introduces new product lines in order to attract new readers
and discontinues products where consumer interest has declined.
Harlequin also continues to expand its distribution network through
retail stores, by direct mail and through the Internet.
Books sold through the retail channel are sold to wholesalers and
retailers with a right of return leaving the ultimate sales risk with
Harlequin. In order to reflect the ability of the retailers to return
books that they don’t sell, a provision for returns is made when revenue
is recognized. (See additional information in the Critical Accounting
Policies and Estimates section of this MD&A.) The provision is then
adjusted as actual returns are received over time. Series books are
on sale for approximately one month. Returns for these books are
normally received within one year, with more than 95% received
within the first six months. Single title books are on sale for several
months and, as a result, experience a longer return period. The
difference between the initial estimate of returns and the actual
returns realized has an impact on Harlequin’s results during
subsequent periods as the returns are received. Single title books
tend to have a higher variability in return rates than series books,
increasing the related risk in the provision for returns estimate.
A key revenue risk for Harlequin’s direct-to-consumer business is
maintaining the customer base. This is done through a combination of
acquiring new customers and keeping the existing ones.A significant
source of new customers has historically been through promotional
direct mailings. The direct marketing industry continues to face
considerable challenges from a lack of available mailing lists,
regulation and competitive pressure from alternate channels.
This makes the acquisition of new customers through promotional
mailings difficult. Harlequin has responded to these challenges in a
number of ways including the use of its Internet site, eharlequin.com,
to attract new customers.
25
MANAGEMENT’S DISCUSSION & ANALYSIS

Employees
Torstar has a number of collective agreements at its newspaper
operations that have historically tied annual wage increases to cost
of living. The newspapers face the risk of future labour negotiations
and the potential for business interruption should a strike, lockout or
other labour disruption occur. Such an interruption could materially
adversely affect Torstar’s revenue. The level of unionization at the
newspapers also impacts the ability of Torstar to respond quickly to
downturns in the economy that negatively impact revenue.
Five of the Toronto Star’s collective agreements covering approximately
770 employees at One Yonge Street and 80 employees at the
Vaughan Press Centre will expire at the end of 2007. Three additional
agreements covering approximately 400 employees at the Vaughan
Press Centre will expire at the end of 2011. Sing Tao’s two collective
agreements covering 125 employees expired at the end of 2006. A
tentative settlement of both contracts was reached subsequent to
year end and both are scheduled for a ratification vote the first
week of March. In February 2007, approximately 50 employees at
Metro Toronto voted in favour of unionization. Negotiations for a first
contract are expected to be scheduled during 2007.
Metroland Media Group has a number of collective agreements
throughout their operations covering approximately 900 employees.
Five agreements were settled at the end of 2006 and negotiations
are being scheduled for six agreements covering approximately 400
employees that expired at the end of 2006. Five other agreements
covering approximately 175 employees will expire during 2007.
During the second quarter of 2006, a settlement was reached for
the 18-month strike at the Hamilton Web facility.
Newsprint Costs
Newsprint costs are the single largest raw material expense for
Torstar’s newspapers and are one of the Newspapers and Digital
Segment’s most significant operating costs. Newsprint is priced as
a commodity with price increases or decreases implemented at regular
intervals. In 2006, Torstar’s newsprint price was on average 3.5%
higher than in 2005. Based on pricing trends, the average newsprint
price is expected to decline in 2007. Torstar’s newspapers consume
approximately 150,000 tonnes of newsprint each year. A $10
change in the price per tonne affects operating profits by $1.5 million.
Distribution
Distribution of newspapers is made through independent contractors
with adults primarily used for the daily newspapers and local youth
used for many of the community newspapers. For the community
newspapers, the ability to attract and retain a youth carrier force is
a key business concern. For all of the newspapers, distribution
costs are negatively impacted by higher fuel prices.
Technology
The media industry is experiencing rapid and significant technological
changes. This requires Torstar to be able to attract and retain appropri-
ately skilled staff to manage the changes and may require capital
investments in the future.
Foreign Exchange
As an international publisher, approximately 95% of Harlequin’s
revenues are earned in currencies other than the Canadian dollar.
As a result, Harlequin’s reported revenues and operating profits are
affected by changes in foreign exchange rates relative to the
Canadian dollar. The most significant risk is from changes in the
U.S.$/Cdn.$ exchange rate. Harlequin also has exposure to many
other currencies, the most significant of which are the Euro, Yen and
British Pound. From 2005 to 2006, the Canadian dollar strengthened
by 6% relative to the U.S. dollar, Euro and the British Pound and by
12% to the Yen. The total impact of Harlequin’s exposure to foreign
currencies in 2006 as compared to 2005 was a decrease of
$7.9 million in Harlequin’s reported operating income.
To offset some of this exposure, Torstar enters into forward foreign
exchange and option contracts, primarily for U.S. dollars. (See
additional information on foreign exchange risks in the Financial
Instruments section of this MD&A.) In 2006, Torstar realized gains
of $0.8 million related to $30.0 million of U.S. dollar contracts at an
average exchange rate of $1.16. (In 2005, gains of $29.5 million
related to U.S. $76.0 million of U.S. dollar contracts at an average
rate of $1.59.) These gains were included in Harlequin’s reported
revenue and operating income. The U.S. dollar contracts that
matured in 2005 were entered into in 2002 when the Canadian
dollar was much weaker. The level of gains realized in 2005 on U.S.
dollar contracts is not expected to recur in the future.
26
MANAGEMENT’S DISCUSSION & ANALYSIS

Interest Expense
Torstar may be exposed to fluctuations in interest rates under its
borrowing arrangements. With the increased levels of long-term
debt arising from Torstar’s investment in CTVgm in 2006, Torstar has
entered into interest rate swap agreements to fix the rate of interest
on $250 million of Canadian dollar borrowings at 4.3% (plus the
interest rate spread based on Torstar’s long-term credit rating,
currently 0.6%) for the next five years. Torstar also has a U.S.
interest rate swap arrangement that fixes the interest rate on U.S.
$80 million of borrowings at approximately 3.5% (plus the interest
rate spread based on Torstar’s long-term credit rating, currently
0.6%) through December 2007.
OPERATING RESULTS – YEAR ENDED DECEMBER 31, 2006
Overall Performance
Total revenue was $1,528.3 million in 2006, down $28.6 million
from $1,556.9 million in 2005. Newspaper and Digital revenue
grew $20.7 million to $1,056.5 million including $14.3 million
from acquisitions. Reported Book Publishing revenue was $471.8
million in 2006, down $49.3 million from $521.1 million in 2005.
Underlying revenue growth of $9.4 million was more than offset by
a $30.0 million decline from the strengthening of the Canadian
dollar during the year and $28.7 million from lower gains on U.S.
dollar hedges year over year.
Operating profit was $123.3 million in 2006, down $71.2 million
from $194.5 million in 2005. The decrease included $20.2 million
of higher restructuring provisions in 2006. Newspaper and Digital
Segment operating profit was $107.8 million in 2006, down
$12.5 million from $120.3 million in 2005 as lower revenue at the
Toronto Star and the investment in Torstar Digital more than offset
improved results at Metroland Media Group’s community newspapers.
Book Publishing reported operating profit was $56.3 million in
2006, down $39.1 million from $95.4 million in 2005. Underlying
operating profit was down only $2.5 million in the year while the
strengthening Canadian dollar decreased profits by $7.9 million
and lower gains on the U.S. dollar hedges decreased profits by
$28.7 million year over year. Underlying results were up for North
America Retail and Overseas but were more than offset by lower
North America Direct-To-Consumer results.
Corporate costs were $18.5 million in 2006, down $0.5 million
from $19.0 million in 2005. EBITDA, excluding restructuring provisions
was $202.1 million in 2006, down $51.4 million from $253.5 million
in 2005. Excluding the impact of foreign exchange and restructuring
provisions, EBITDA was down $14.8 million in the year.
Restructuring provisions of $22.3 million were incurred in 2006.
Star Media Group undertook several initiatives, including the
renegotiation of its labour contracts at the Vaughan Press Centre
which resulted in a workforce reduction, the outsourcing of its
circulation call centre and a fourth quarter targeted separation
program for a total cost of $13.6 million. Restructuring provisions
of $6.0 million were recorded by Metroland Media Group from
restructuring of operations triggered by the combination of the
CityMedia and Metroland operations. Harlequin reduced its global
workforce by 4% in the third quarter of 2006 at a cost of $2.7 million.
In 2005, the Toronto Star recorded a restructuring provision of
$2.1 million for a voluntary severance program at the Vaughan
Press Centre.
Interest expense was $20.8 million in 2006, up $10.3 million from
$10.5 million in 2005. This almost doubling of the expense was
from the higher level of debt outstanding during 2006, primarily
from the investment in CTVgm, and higher interest rates. The average
net debt (long-term debt and bank overdraft net of cash and cash
equivalents) was $446.2 million in 2006, up from $290.2 million
in 2005. Torstar’s effective interest rate was 4.7% in 2006 and
3.6% in 2005.
Torstar has U.S. dollar denominated debt which provides a hedge
against its U.S. dollar assets. However the offset is not exact as the
U.S. dollar assets are primarily working capital with amounts fluctuating
daily. As a result of the inexact offset and changes in the relative
strength of the Canadian dollar, Torstar reports a non-cash foreign
exchange gain or loss each year on the translation of its net U.S.
dollar asset position. The Canadian dollar strengthened relative to
the U.S. dollar by approximately 6% in 2006 and 7% in 2005. In
2006, there was a non-cash translation gain of $0.1 million on the
translation of Torstar’s net U.S. dollar asset position compared with
a loss of $2.7 million reported in 2005.
Income from associated businesses was $16.0 million in 2006
compared with $0.6 million in 2005. The income in 2006 includes
$14.0 million from CTVgm’s results for the quarter ended November
30, 2006 (its first quarter of fiscal 2007) adjusted for the impact
of the allocation of Torstar’s purchase price to CTVgm’s underlying
assets and liabilities. (As Torstar and CTVgm do not have coterminous
quarter-ends, Torstar reflects CTVgm’s operations with a one-month
lag.) CTVgm had a strong first quarter with revenues and EBITDA up
in both its broadcast and print operations. During the quarter
CTVgm acquired 100% of CHUM, completed a refinancing and sold
its 40% interest in Workopolis. CTVgm is equity accounting for
CHUM while the common shares are being held in a trust pending
regulatory approval of the transaction. Torstar’s income from Black
Press was $1.8 million in 2006 compared with $0.6 million in
27
MANAGEMENT’S DISCUSSION & ANALYSIS

2005. Black Press had a strong 2006, with EBITDA up from
acquisitions and improved operations. Black Press’ results were
negatively impacted during 2006 by a non-cash mark-to-market
loss on foreign exchange and interest rate derivatives.
Torstar reported a gain on the sale of properties of $12.4 million in
2005 from the sale of the land and building in Kitchener that had
previously been occupied by The Record and the sale of surplus
land at 7 Queen’s Quay East in Toronto. On an after-tax basis the
2005 gain was $0.13 per share.
Torstar’s effective tax rate was 33.3% in 2006 compared with
38.8% in 2005. During 2006, the Canadian federal government
enacted corporate income tax decreases for future years. Under
Canadian generally accepted accounting principles the impact of
these changes on Torstar’s future income tax assets and liabilities
is to be recorded during the period the tax changes are substantially
enacted. The impact was to reduce Torstar’s tax expense by
$4.6 million and its effective tax rate by 3.9%. Excluding this
adjustment, Torstar’s effective tax rate was 37.2%. The effective tax
rate was lower in 2006 from the impact of the significant increase
in income of associated businesses which is tax effected at a
capital gains rate.
Net income was $79.1 million in 2006, down $39.7 million from
$118.8 million in 2005. Net income per share was $1.01 in 2006,
down $0.51 from $1.52 in 2005. The average number of Class B
non-voting shares outstanding in both 2006 and 2005 was
78.2 million.
The following chart provides a continuity of earnings per share from
2005 to 2006:
Net income per share 2005 $1.52
Changes
• Operations (0.12)
• Currency impact on operations (0.30)
• Restructuring provisions (0.17)
• Gain on sale of properties in 2005 (0.13)
• Non-cash foreign exchange 0.04
• Income from associated businesses 0.16
• Interest on CTVgm investment (0.05)
• Change in statutory tax rates 0.06
Net income per share 2006 $1.01
28
MANAGEMENT’S DISCUSSION & ANALYSIS
2 Metroland’s 2005 revenue has been restated as a result of the January 1, 2006 adoption, with retroactive restatement, of EIC–156 – “Accounting by a vendor for consideration given to
a customer”. The effect was to decrease both revenues and operating expenses by $5.3 million in 2005. The 2005 profit and EBITDA margin percentages increased as a result of the
restatement but there was no impact on operating profit or EBITDA.3 EBITDA is calculated as reporting unit or segment operating profit plus depreciation and amortization. It excludes restructuring provisions.
Segment Operating Results – Newspapers and Digital
The following tables set out, in $000’s, the results for the reporting units within the Newspapers and Digital Segment for the years ended
December 31, 2006 and 2005.
Operating Revenue Operating Profit (Loss) Profit Margin2006 20052 2006 2005 2006 2005
Star Media $496,518 $501,627 $20,474 $37,806 4.1% 7.5%
Metroland Media 558,156 530,694 99,911 94,251 17.9% 17.8%
Transit TV 1,788 3,495 (12,536) (11,769) n/a n/a
Segment Total $1,056,462 $1,035,816 $107,849 $120,288 10.2% 11.6%
Depreciationand Amortization EBITDA3 EBITDA Margin2006 2005 2006 2005 2006 2005
Star Media $32,297 $33,894 $52,771 $71,700 10.6% 14.3%
Metroland Media 13,624 12,574 113,535 106,825 20.3% 20.1%
Transit TV 3,342 2,574 (9,194) (9,195) n/a n/a
Segment Total $49,263 $49,042 $157,112 $169,330 14.9% 16.3%
Total revenue of the Newspaper and Digital Segment was $1,056.5
million in 2006, up $20.7 million from $1,035.8 million in 2005,
including $14.3 million from acquisitions. Digital revenues were
3.2% of the total in 2006, up from 2.6% in 2005.
Star Media Group
The Star Media Group reported revenues of $496.5 million in
2006, a decline of $5.1 million from $501.6 million in 2005
primarily from lower advertising revenue at the Toronto Star offset
partially by higher digital revenues. Star Media Group’s EBITDA was
$52.8 million in 2006, down $18.9 million from $71.7 million
in 2005. $1.3 million of the decline in EBITDA was from higher losses
related to Weekly Scoop in 2006. The Star Media Group had an
operating profit of $20.5 million in 2006, down $17.3 million from
$37.8 million in 2005.
Advertising revenue continued to be a significant challenge for the
Toronto Star throughout 2006. Advertising linage was down 7.2% in
the year with declines across all major categories. National, travel
and classified linage were each down approximately 10%. Retail
linage was relatively stable as this category benefited from the new
zoned advertising sections. The effective average line rate was up
2.4% in 2006.The jointly-owned Sing Tao Daily and Metro newspapers
grew revenues by $4.6 million in 2006 from a combination of market
expansion, increased advertising volumes and higher effective average
rates. Workopolis continued its trend of increasing revenues and
Olive Canada Network contributed to the Torstar Digital revenue
growth in its first year of operations.
Higher newsprint pricing and promotional costs were mitigated by
savings in labour and pension expenses for the Toronto Star in
2006. During 2006, the Toronto Star undertook several initiatives to
reduce costs, including the renegotiation of its labour contracts at
the Vaughan Press Centre, the outsourcing of its circulation call centre
and a targeted separation program. The cost savings from these
programs will be realized in 2007.
Torstar Digital payroll and operating costs were higher in 2006 from
the investment in building the LiveDeal.ca and Olive Canada
Network businesses as well as developing TOPS (an online publishing
system that will power all of Torstar’s newspaper web sites and
Toronto.com). Promotional costs were higher as Workopolis undertook
a significant marketing program.
Weekly Scoop incurred operating losses of $4.5 million in the first
six months of 2006, prior to ceasing publication in June. Operating
losses were $3.2 million in 2005. TMG TV’s revenue and operating
profit were down year over year as the direct response advertising
market continued to be challenging.
Metroland Media Group
Revenues were up $27.5 million in 2006 at Metroland Media
Group including $14.3 million from the impact of acquisitions.
Advertising and distribution revenues were up at the community
newspapers while the daily newspapers had a decline in advertising
revenues. EBITDA was $113.5 million in 2006, up $6.7 million from
$106.8 million in 2005. Operating profit was $99.9 million in the
year, up $5.6 million from $94.3 million in 2005.
During 2006, Metroland made several smaller acquisitions of
community newspapers and magazines as well as realizing the full-year
benefits of the acquisitions made during 2005. Metroland continued
its trend of new publications and market expansion during 2006
including expansion of the Gold Book Directories.
Advertising linage was up 3.1% at the community newspapers,
excluding acquisitions, and down 1.1% at the daily newspapers.
Distribution volumes grew 6.0% in 2006 with just over 3.2 billion
pieces distributed by the community and daily newspapers.
Excluding the impact of acquisitions, distribution volumes grew by
4.5% in the year.
Newsprint costs were higher in 2006 as a result of higher prices
and increased consumption from acquisitions and market expansions.
Payroll and department costs were up in 2006, commensurate with
the increase in revenue at the community newspapers and general
wage increases. Costs related to the strike at the Hamilton Web
facility, which was settled during the second quarter of 2006, were
$1.4 million lower in 2006. Metroland Media Group undertook a
restructuring of its operations in the fourth quarter of 2006 in order
to realize cost savings resulting from the combination of the
CityMedia and Metroland operations.
Transit TV
Transit TV 2006 revenues of $1.8 million were down from $3.5 million
in 2005. In 2005, the revenue base was primarily from local
advertisers. In 2006, Transit TV changed its sales emphasis from
local to national advertisers. The national advertisers have been
slower than expected to adopt this new advertising media resulting
in lower revenues year over year. During 2006, Transit TV completed
the Los Angeles Metro (MTA) installation. Transit TV reported an
EBITDA loss of $9.2 million in 2006 consistent with the loss in
2005. Transit TV’s operating loss was $12.5 million in 2006, up
$0.7 million from $11.8 million in 2005 with higher depreciation
from the completion of the Los Angeles installation.
29
MANAGEMENT’S DISCUSSION & ANALYSIS

30
MANAGEMENT’S DISCUSSION & ANALYSIS
4 Harlequin’s 2005 revenue has been restated as a result of the January 1, 2006 adoption, with retroactive restatement, of EIC–156 – “Accounting by a vendor for consideration given to
a customer”. The effect was to decrease both revenues and operating expenses by $4.8 million in 2005. The 2005 profit and EBITDA margin percentages increased as a result of the
restatement but there was no impact on operating profit or EBITDA.5 EBITDA is calculated as segment operating profit plus depreciation and amortization. It excludes restructuring provisions.
Segment Operating Results – Book Publishing
The following tables set out, in $000’s, the results for the
Book Publishing Segment, including the impact of foreign currency
movements and foreign currency contracts, for the years ended
December 31, 2006 and 2005.
2006 20054
Reported revenue, prior year $521,072 $534,448
Impact of currency movements (29,960) (32,904)
Impact of U.S. dollar hedges (28,666) 8,072
Change in underlying
operating revenue 9,362 11,456
Reported revenue, current year $471,808 $521,072
U.S. dollar hedge gains 802 29,468
Revenue before hedges,
current year $471,006 $491,604
2006 2005
Reported operating profit, prior year $95,381 $97,182
Impact of currency movements (7,264) (8,146)
Impact of U.S. dollar hedges (28,666) 8,072
Impact of other currency
foreign exchange contracts (687) 214
Change in operating profit (2,487) (1,941)
Reported operating profit,
current year $56,277 $95,381
Gains from U.S. dollar
and other currency
foreign exchange contracts 958 30,311
Operating profit before foreign
exchange contract gains,
current year $55,319 $65,070
Reported operating profit margin 11.9% 18.3%
Operating profit margin, before
foreign exchange contract gains 11.7% 13.2%
Reported operating profit,
current year $56,277 $95,381
Depreciation and amortization 7,162 7,719
EBITDA5, current year $63,439 $103,100
Book Publishing revenues were up $9.4 million in 2006 excluding
the impact of foreign exchange. North America Retail was up
$9.9 million, North America Direct-To-Consumer was down
$5.7 million and Overseas was up $5.2 million.
Book Publishing operating profits were down $2.5 million in 2006
excluding the impact of foreign exchange. North America Retail was
up $2.7 million, North America Direct-To-Consumer was down
$6.5 million and Overseas was up $1.3 million. Harlequin reduced
its global workforce by 4% through a restructuring completed during
the second half of 2006.
North America Retail increased book sales in 2006 after stabilizing
in 2005. Significant efficiency improvements were made to the
series business in 2006 as fewer books were printed and distributed
and more books were sold. Sales of single title books also increased
in 2006. Lower promotional and sales support costs were partially
offset by increased product and distribution costs.
The North America Direct-To-Consumer revenue decline in 2006
was due to both fewer shipments of a children’s direct-to-home
continuity program and from shipping disruptions experienced early
in the year associated with the bankruptcy of a key supplier. While
the lower revenue in the children’s direct-to-home continuity program
did not impact operating profit, the shipping disruptions, in conjunction
with the long-term decline in the customer base and higher product
costs contributed to the year over year decline in earnings. Improved
sales through the Internet channel partially offset this decline.
The Overseas markets had mixed results in 2006 with improvements
in the United Kingdom and the Nordic Group offset by lower results
in Germany. In the United Kingdom improved retail results, primarily
from adjustments to prior period returns provisions, more than
offset lower direct-to-consumer volumes. The Nordic Group was up
significantly with growth in both the single title and series lines.
Germany’s results were lower in 2006 with lower sales in its single
title business primarily from the level of success in 2005 from a
unique publishing program that did not continue in 2006. Brazil,
a joint venture launched in 2005, showed improvement in 2006
selling more books and making progress towards break-even.

LIQUIDITY AND CAPITAL RESOURCES
Overview
Funds are generally used for capital expenditures, debt repayment
and distributions to shareholders. Long-term debt is used to
supplement funds from operations and as required for acquisitions.
It is expected that future cash flows from operating activities,
combined with the credit facilities available will be adequate to
cover forecasted financing requirements.
In 2006, $111.6 million of cash was generated by operations,
$449.4 million was used for investing activities and $338.0 million
was generated by financing activities. Cash and cash equivalents
net of bank overdraft increased by $2.9 million in the year from
$41.0 million to $43.9 million.
Operating activities
Operating activities provided cash of $111.6 million in 2006, down
$12.5 million from $124.1 million in 2005. The lower level of
cash provided in 2006 reflected the lower operating profits offset
partially by lower pension funding and a smaller increase in non-cash
working capital.
Other adjustments to operating cash flows were $2.4 million in
2006 and $17.6 million in 2005. In 2006, the adjustments included
pension contributions in excess of pension expense partially offset
by the non-cash stock-based compensation expense. In 2005, pension
contributions in excess of pension expense and the gain from the
sale of land were partially offset by the non-cash foreign exchange
loss and the non-cash stock-based compensation expense.
Non-cash working capital investments increased $8.4 million in
2006. Receivables increased $16.3 million in 2006 primarily from
improved fourth quarter revenues in Book Publishing as the
Newspaper and Digital receivables were flat year over year. Prepaid
and recoverable income taxes increased $13.5 million year over
year primarily due to the timing of installments in 2006. Accounts
payable and accrued liabilities increased $22.3 million in 2006
from a combination of higher restructuring provisions and the timing
of payments for trade payables. In 2005, non-cash working capital
increased $42.7 million from increases in receivable and prepaid
balances and reductions in payables.
Investing activities
During 2006, $449.4 million was used for investments, up from
$74.6 million in 2005.
In 2006, $378.0 million was used for the initial purchase of
20% of CTVgm and the additional investment related to CTVgm’s
acquisition of CHUM. In the fourth quarter of 2006, Torstar acquired
an additional 10% of Workopolis for $28.8 million. Torstar also
completed a number of other acquisitions during 2006 primarily of
community newspapers and magazines for a total purchase price of
$4.7 million and made an additional investment in Vocel, Inc. for
$1.1 million.
During 2005, $59.4 million was used for acquisitions and investments,
including community newspapers in the Muskoka, Huntsville, Parry
Sound and Ottawa areas. Metroland Media Group also acquired the
Toronto Wine and Cheese Show and Paton Publishing (a contract
publisher and producer of focused marketing campaigns aimed
principally at youth audiences). The Metroland Media Group 2005
acquisitions had a total purchase price of $48.4 million. Harlequin
completed the $5.0 million acquisition of BET Books from Black
Entertainment Television during 2005 and Torstar made $6.0 million
of portfolio investments in Vocel, Inc. and LiveDeal, Inc.
Additions to property plant and equipment were $38.3 million in
2006, up slightly from $35.3 million in 2005. The 2006 additions
included general capital replacement across all the operations,
$8.5 million for inserting machines at Metroland Media Group’s
community newspapers and $4.1 million for the completion of
Transit TV’s Los Angeles installation.
During 2005, total proceeds of $17.7 million were received from
the sale of the property in Kitchener that had previously been occupied
by The Record and the surplus land at 7 Queen’s Quay East in
Toronto. There were no comparable transactions in 2006.
2007 Capital expenditures
Capital expenditures in 2007 are expected to be approximately
$45.0 million, $6.7 million higher than the $38.3 million spent in
2006. The 2007 capital expenditures are anticipated to include the
purchase of additional inserting equipment at Metroland Media
Group’s community newspapers and continuing investment in
technology to improve the utilization of information across the
Newspaper and Digital Segment both in print and on the Internet.
31
MANAGEMENT’S DISCUSSION & ANALYSIS

Financing activities
Cash of $338.0 million was generated by financing activities during
2006, compared with a use of $45.3 million in 2005.
Torstar increased its long-term debt by $390.2 million in 2006
primarily to fund its investment in CTVgm. During 2006, Torstar
issued $618.8 million of bankers’ acceptances under a new banking
facility and repaid $228.6 million of commercial paper. No medium
term notes were issued or matured during 2006.
Cash dividends paid to shareholders were $57.2 million in 2006,
up $0.3 million from $56.9 million in 2005. $3.1 million of cash
was received from the exercise of stock options in 2006, down from
$8.4 million received in 2005.
Torstar had two normal course issuer bids outstanding during the
period May 7, 2004 to May 5, 2006. In 2005, 904,100 Class B
shares were repurchased for a total price of $20.9 million. There
were no shares purchased in 2006.
Long–term debt
At December 31, 2006, Torstar had long-term debt of $724.2 million
outstanding. The debt consisted of U.S. dollar bankers’ acceptance
of $132.3 million, Canadian dollar bankers’ acceptance of $491.9
million and Canadian dollar medium term notes of $100.0 million.
During the third quarter of 2006, Torstar renegotiated its long-term
bank credit facilities as part of the funding for its equity investment
in CTVgm. The new facilities consist of a $425 million revolving loan
that will mature on January 4, 2012 and a $425 million revolving
operating loan. The operating loan matures on January 11, 2008
and can be extended with the consent of all parties for up to four
additional 364-day periods or can be converted to a 364-day term
loan at Torstar’s option. Amounts may be drawn under the facility in
either Canadian or U.S. dollars. With the change in the long-term
bank credit facilities and the new borrowings for the CTVgm investment,
Torstar has changed from borrowing through the commercial paper
program supported by the long-term credit facility to bank borrowings
primarily in the form of bankers’ acceptances.The bankers’ acceptances
normally mature over periods of 30 to 180 days but are classified
as long-term as they are issued under the long-term credit facility.
Bankers’ acceptances (and prior to mid 2006, commercial paper)
are generally issued for a term of less than one year in order to provide
for flexibility in borrowing. However, the bankers’ acceptance and
commercial paper program has been and is intended to continue
to be an ongoing source of financing for Torstar. Recognizing this
intent, to the extent that the long-term credit facility has sufficient
credit available that it could be used to replace the outstanding
bankers’ acceptance and commercial paper, the bankers’ acceptance
and commercial paper is classified as long-term debt on Torstar’s
balance sheet.
The long-term credit facility for $850 million is also designated as
a standby line in support of letters of credit. At December 31, 2006,
$630.8 million was drawn under the facility and a $25.2 million
letter of credit was outstanding relating to the executive retirement
plan. The remaining credit of $194.0 million is considered to be
adequate to cover forecasted financing requirements.
Torstar has a policy of maintaining a sufficient level of U.S. dollar
denominated debt in order to provide a hedge against its U.S. dollar
assets. It is expected that the level of U.S. dollar debt will remain
relatively constant during 2007.
32
MANAGEMENT’S DISCUSSION & ANALYSIS
6 This chart does not include Torstar’s obligations for Employee future benefits as detailed in Note 12 of the consolidated financial statements.7 All foreign denominated obligations were translated at the December 31, 2006 spot rates.
Contractual obligations
Torstar has the following significant contractual obligations6 (in $000’s7):
Less than1 Year 1 – 3 Years 4 – 5 Years After 5 Years
Nature of the obligation Total (2007) (2008 – 2009) (2010 – 2011) (2012 +)
Office leases $149,605 $14,262 $25,098 $21,671 $88,574
Services 20,943 7,642 8,312 3,326 1,663
Equipment leases 4,403 1,395 1,968 1,040
Revenue share 2,498 368 765 500 865
Capital purchases 3,098 2,357 741
Long-term debt 724,193 25,000 75,000 624,193
Total $904,740 $26,024 $61,884 $101,537 $715,295

Office leases include the offices at One Yonge Street, in Toronto for
Torstar and the Toronto Star, Harlequin’s Toronto head office and The
Record in Kitchener. The One Yonge Street and Kitchener leases
extend until the year 2020. Harlequin’s lease will expire in 2009.
Equipment leases include office equipment and company vehicles.
The services obligations include content for Transit TV, the outsourced
Toronto Star circulation call centre and the acquisition by Olive
Canada Network of ad impressions on third party websites.The revenue
share obligations are the guaranteed minimum revenue share
commitments to various transit commissions in connection with
Transit TV’s operations.
Torstar has a guarantee outstanding in relation to an operating
lease for a warehouse in New Hampshire that was entered into by
one of the businesses in its former Children’s Supplementary
Education Publishing segment. Lease payments are under U.S. $1.0
million per year and the lease runs through December 2018. The
warehouse has been subleased, on identical terms and conditions,
to the purchaser of that business. The sublease is secured by a U.S.
$0.7 million letter of credit.
2007 OUTLOOK
The outlook for the Newspapers and Digital Segment is mixed. The
community newspapers have been able to maintain linage and
revenue growth over the past few years and continue to perform
well. However, the daily newspaper businesses continue to face
significant revenue challenges. The Toronto Star has realized linage
declines of 7% and 8% for 2006 and 2005 respectively, with higher
effective average line rates unable to offset the revenue loss. The
level of competition for advertising dollars in Toronto, both in print
and from other forms of media, remains high. New products and
pricing strategies will continue to be introduced by the newspapers
to meet the changing needs of advertisers. In addition, provision of
services to our readers and advertisers leveraging the Internet will
remain a priority. Cost savings of approximately $6.5 million are
expected to be realized in 2007 from the various restructuring
provisions undertaken in 2006. The focus in 2007 for Torstar
Digital, led by Workopolis, is to grow revenue after building audience
and market share in 2006. While some of the individual properties
are expected to improve EBITDA results in 2007, overall costs for
Torstar Digital, including marketing spending, are expected to offset
most of the growth resulting in stable EBITDA in 2007 for Torstar Digital.
For Book Publishing, following the modest decline in profit experienced
in 2006, the outlook for 2007 is for stability. Harlequin has stabilized
the total number of books sold over the past three years despite
difficult trends in its direct-to-consumer operations. Investment will
continue in innovation and new products including digital initiatives
in 2007. Cost savings of approximately $3.0 million are expected
from the restructuring undertaken in late 2006. Harlequin will continue
to be subject to the impact of changes in the value of the Canadian
dollar relative to the U.S. dollar and other currencies. Torstar has
reduced a portion of this exposure by entering into forward foreign
exchange contracts to sell $27.5 million U.S. dollars during 2007
at a rate of $1.14.
Torstar’s investment in CTVgm will have an uncertain impact on
Torstar’s earnings in 2007. The results reported by Torstar for CTVgm
in the fourth quarter of 2006 are not indicative of what is expected
to be reported in the next three quarters. This is due to the seasonal
nature of CTVgm’s businesses with the fall being the strongest quarter.
Torstar will have increased interest expense in 2007 from the higher
levels of debt and higher interest rates. This interest expense will be
funded by Torstar’s other operations as there currently is no expectation
of cash distributions from CTVgm.
OPERATING RESULTS – THREE MONTHS ENDEDDECEMBER 31, 2006
Overall Performance
Total revenue was $414.6 million in the fourth quarter, down
$2.6 million from $417.2 million in the fourth quarter of 2005.
Newspaper and Digital revenue was up $2.0 million to $294.6 million
including $1.5 million from acquisitions. Reported Book Publishing
revenues were $120.0 million in the fourth quarter of 2006, down
$4.6 million from $124.6 million in the same period last year.
Excluding the impact of $8.1 million from lower gains on U.S. dollar
hedges year over year, underlying revenues were up $3.6 million in
the quarter.
Operating profit was $42.7 million in the fourth quarter, down
$22.4 million from $65.1 million in the fourth quarter of 2005. The
decrease included $11.7 million of restructuring provisions in
2006. Newspaper and Digital Segment operating profit was $42.5
million in 2006, down $5.3 million from $47.8 million in 2005, as
improved results at Metroland Media Group were more than offset
by the earnings impact of the revenue decline at the Toronto Star
and the investment spending at Torstar Digital. Book Publishing
Segment reported operating profits were $16.6 million in the fourth
quarter, down $5.8 million from $22.4 million in the same period
last year. Excluding the impact of $8.1 million from lower gains on
U.S. dollar hedges year over year, underlying operating profits were
up $2.4 million in the fourth quarter.
33
MANAGEMENT’S DISCUSSION & ANALYSIS

Corporate costs were $4.7 million in the fourth quarter of 2006,
down $0.5 million from $5.2 million in 2005. The decrease in
costs in the fourth quarter is related to the timing of expenses year
over year. EBITDA, excluding restructuring provisions, was
$68.4 million in the fourth quarter, down $10.2 million from
$78.6 million in the same period last year. Excluding the impact of
foreign exchange and restructuring provisions, EBITDA was down
$2.0 million in the fourth quarter.
Restructuring provisions of $11.7 million were incurred in the fourth
quarter of 2006. This included a targeted separation program at the
Toronto Star and a restructuring at Metroland Media Group in order
to realize cost savings from the combination of the CityMedia and
Metroland operations.
Interest expense was $8.8 million in the fourth quarter of 2006, up
$5.9 million from $2.9 million in the fourth quarter of 2005. This
significant increase was from the higher level of debt outstanding
during the fourth quarter of 2006, primarily from the CTVgm acquisition,
and higher interest rates. The average net debt (long-term debt and
bank overdraft net of cash and cash equivalents) was $667.4 million
in the fourth quarter of 2006, up from $284.2 million in 2005.
Torstar’s effective interest rate was 5.3% in the fourth quarter of
2006 and 4.1% in 2005.
Torstar has U.S. dollar denominated debt which provides a hedge
against its U.S. dollar assets. However the offset is not exact as the
U.S. dollar assets are primarily working capital with amounts fluctuating
daily. As a result of the inexact offset and changes in the relative
strength of the Canadian dollar, Torstar reports a non-cash foreign
exchange gain or loss each year on the translation of its net
U.S. dollar asset position. In the fourth quarter of 2006, there was
a non-cash translation gain of $1.1 million on the translation of
Torstar’s net U.S. dollar asset position compared with a gain of
$0.1 million reported in 2005.
Income from associated businesses was $14.8 million in the fourth
quarter of 2006 compared with $0.3 million in 2005. The income
in 2006 includes $14.0 million from CTVgm’s results for the quarter
ended November 30, 2006 (its first quarter of fiscal 2007) adjusted
for the impact of the allocation of Torstar’s purchase price to
CTVgm’s underlying assets and liabilities. (As Torstar and CTVgm do not
have coterminous quarter-ends, Torstar reflects CTVgm’s operations
with a one-month lag.) CTVgm had a strong first quarter with revenues
and EBITDA up in both its broadcast and print operations. During
the quarter CTVgm acquired 100% of CHUM, completed a refinancing
and sold its 40% interest in Workopolis. CTVgm is equity accounting
for CHUM while the common shares are being held in a trust pending
regulatory approval of the transaction. Torstar’s income from Black
Press was $0.9 million in the fourth quarter of 2006. Black Press
had a strong quarter, with EBITDA up from acquisitions and
improved operations. Black Press’ results were negatively impacted
during the quarter by a non-cash mark-to-market loss on foreign
exchange and interest rate derivatives.
Torstar’s effective tax rate was 27.5% in the fourth quarter of 2006,
down from 39.5% in the same period in 2005. The effective tax rate
was lower in the fourth quarter of 2006 from the impact of the
significant increase in income of associated businesses which is tax
effected at a capital gains rate, the changes in future Canadian federal
corporate income tax rates, the mix of income during the quarter
and the timing of the recording of permanent differences in the
fourth quarter of 2005.
Net income was $36.1 million in the fourth quarter of 2006, down
$1.8 million from $37.9 million in the fourth quarter of 2005. Net
income per share was $0.46 in 2006, down $0.02 from $0.48 in
2005. The average number of Class B non-voting shares outstanding
in the fourth quarter of 2006 was 78.4 million, consistent with
78.3 million in 2005.
The following chart provides a continuity of earnings per share from
2005 to 2006:
Net income per share fourth quarter 2005 $0.48
Changes
• Operations (0.02)
• Currency impact on operations (0.07)
• Restructuring provisions (0.10)
• Non-cash foreign exchange 0.01
• Income from associated businesses 0.16
• Interest on CTVgm investment (0.04)
• Tax rate 0.02
• Change in statutory tax rates 0.02
Net income per share fourth quarter 2006 $0.46
34
MANAGEMENT’S DISCUSSION & ANALYSIS

35
MANAGEMENT’S DISCUSSION & ANALYSIS
Newspaper and Digital revenues were up $2.0 million in the fourth
quarter of 2006, including $1.5 million from acquisitions. Higher
revenues at Metroland Media Group’s community newspapers and
Torstar Digital were reduced by lower advertising revenues at the
Toronto Star. Digital revenues were 3.4% of the total in the fourth
quarter of 2006, up from 2.5% in the fourth quarter of 2005.
Linage was down 9.3% in the fourth quarter of 2006 at the Toronto
Star with national, travel and classified linage all having a difficult
quarter. Retail linage was relatively stable. The lower linage included
the impact of one less publishing Saturday compared with the
fourth quarter of 2005. Both Workopolis and Olive Canada Network
contributed to the revenue growth in the fourth quarter. At Metroland
Media Group, community newspaper advertising revenues were up
$5.0 million in the quarter with a 7.3% increase in linage, excluding
the impact of acquisitions. Linage was down 4.6% at Metroland
Media Group’s daily newspapers in the fourth quarter with
weakness in the national and multi-market retail categories.
Distribution volumes were up 7.4% in the fourth quarter for the
community and daily newspapers, increasing revenue by $2.8 million,
excluding the impact of acquisitions.
EBITDA for the Newspaper and Digital Segment was $54.7 million
in the fourth quarter, down $4.7 million from $59.4 million in
2005. Improved results at Metroland Media Group were more than
offset by the earnings impact from the revenue declines and
increased promotional expenses at the Toronto Star and the investment
spending at Torstar Digital. In the fourth quarter of 2005, Weekly
Scoop had EBITDA losses of $2.6 million. Operating profit was
$42.5 million in the fourth quarter of 2006, down $5.3 million from
$47.8 million in 2005.
8 Metroland’s 2005 revenue has been restated as a result of the January 1, 2006 adoption, with retroactive restatement, of EIC–156 – “Accounting by a vendor for consideration given to
a customer”. The effect was to decrease both revenues and operating expenses by $1.5 million in the fourth quarter of 2005. The 2005 profit and EBITDA margin percentages increased
as a result of the restatement but there was no impact on operating profit or EBITDA.9 EBITDA is calculated as reporting unit or segment operating profit plus depreciation and amortization. It excludes restructuring provisions.
Segment Results – Newspapers and Digital
The following tables set out, in $000’s, the results for the reporting units within the Newspapers and Digital Segment for the fourth quarters
ended December 31, 2006 and 2005.
Operating Revenue Operating Profit (Loss) Profit Margin2006 20058 2006 2005 2006 2005
Star Media $135,858 $140,202 $12,984 $21,081 9.6% 15.0%
Metroland Media 158,154 151,849 32,710 29,634 20.7% 19.5%
Transit TV 564 545 (3,203) (2,892) n/a n/a
Segment Total $294,576 $292,596 $42,491 $47,823 14.4% 16.3%
Depreciation and Amortization EBITDA9 EBITDA Margin
2006 2005 2006 2005 2006 2005
Star Media $7,867 $7,833 $20,851 $28,914 15.3% 20.6%
Metroland Media 3,328 3,150 36,038 32,784 22.8% 21.6%
Transit TV 971 636 (2,232) (2,256) n/a n/a
Segment Total $12,166 $11,619 $54,657 $59,442 18.6% 20.3%

36
MANAGEMENT’S DISCUSSION & ANALYSIS
Segment Results – Book Publishing
The following tables set out, in $000’s, the results for the Book
Publishing Segment, including the impact of foreign currency
movements and foreign currency contracts, for the fourth quarters
ended December 31, 2006 and 2005.
2006 200510
Reported revenue,fourth quarter prior year $124,631 $128,873
Impact of currency movements (137) (7,849)
Impact of U.S. dollar hedges (8,065) 567
Change in underlying operating revenue 3,605 3,040
Reported revenue,fourth quarter current year $120,034 $124,631
U.S. dollar hedge gains 47 8,112
Revenue before hedges,fourth quarter current year $119,987 $116,519
2006 2005
Reported operating profit,fourth quarter prior year $22,438 $24,865
Impact of currency movements (92) (1,510)
Impact of U.S. dollar hedges (8,065) 567
Impact of other currency foreign exchange contracts (63) 686
Change in operating profit 2,357 (2,170)
Reported operating profit,fourth quarter current year $16,575 $22,438
Gains from U.S. dollar and other currency foreign exchange contracts 91 8,219
Operating profit before foreign exchange contract gains, fourth quarter current year $16,484 $14,219
Reported operating profit margin 13.8% 18.0%
Operating profit margin,before foreign exchange contract gains 13.7% 12.2%
Reported operating profit,fourth quarter current year $16,575 $22,438
Depreciation and amortization 1,847 1,875
EBITDA11, fourth quarter current year $18,422 $24,313
Book Publishing revenues were up $3.6 million in the fourth quarter
of 2006 excluding the impact of foreign exchange. North America
Retail was up $5.6 million, North America Direct-To-Consumer was
down $4.2 million and Overseas was up $2.2 million.
Book Publishing operating profits were up $2.4 million in the fourth
quarter of 2006 excluding the impact of foreign exchange. North
America Retail was up $3.3 million, North America Direct-To-Consumer
was down $2.1 million and Overseas was up $1.2 million.
North America Retail revenues and operating profits were up in the
fourth quarter with higher series and single title net unit sales and
lower promotional expenses. North America Direct-To-Consumer
revenues were lower in the fourth quarter from the lower sales of the
children’s direct-to-home continuity program and the lower
customer base including the impact of the shipping disruption earlier
in the year. Overseas gains included continued strong results from
the Nordic Group and improved results in the United Kingdom.
Liquidity
In the fourth quarter of 2006, $28.8 million of cash was generated
by operations, $39.4 million was used for investing activities and
$6.6 million was generated by financing activities. Cash and cash
equivalents net of bank overdraft decreased by $1.1 million in the
quarter from $45.0 million to $43.9 million.
Operating activities provided $28.8 million of cash in the quarter,
down from $34.8 million in 2005.The decrease reflected the lower level
of operating income, lower pension funding and a smaller increase
in non-cash working capital in the fourth quarter year over year.
During the fourth quarter of 2006, $30.5 million was used for
acquisitions, primarily for the incremental 10% of Workopolis.
During the fourth quarter of 2005, $24.5 million was spent on
acquisitions and investments including the community newspapers
in Ottawa, BET Books and the portfolio investment in LiveDeal, Inc.
Fixed asset additions were $9.0 million in the quarter down slightly
from $10.2 million in 2005.
Torstar issued $19.2 million of bankers’ acceptances during the
fourth quarter of 2006 and paid dividends of $14.1 million. Torstar
issued $13.2 million of commercial paper during the fourth quarter
of 2005 and paid dividends of $14.3 million. During the fourth
quarter of 2005, Torstar purchased 314,900 shares for a total price
of $7.0 million under the normal course issuer bid that opened on
May 6, 2005.
10 Harlequin’s 2005 revenue has been restated as a result of the January 1, 2006 adoption, with retroactive restatement, of EIC–156 – “Accounting by a vendor for consideration given to a
customer”. The effect was to decrease both revenues and operating expenses by $1.0 million in the fourth quarter of 2005. The 2005 profit and EBITDA margin percentages increased as
a result of the restatement but there was no impact on operating profit or EBITDA.11 EBITDA is calculated as segment operating profit plus depreciation and amortization. It excludes restructuring provisions.

37
MANAGEMENT’S DISCUSSION & ANALYSIS
FINANCIAL INSTRUMENTS
Foreign Exchange
Harlequin’s international operations provide Torstar with approximately
30% of its operating revenues. As a result, fluctuations in exchange
rates can have a significant impact on Torstar’s reported profitability.
To manage the exchange risk in its operating results, Torstar enters
into forward foreign exchange and currency option contracts.
Torstar’s most significant exposure is to the movements in the
U.S.$/Cdn.$ exchange rate. Torstar’s current practice is to hedge,
one year in advance on a quarterly basis, U.S. dollar revenues
equivalent to approximately 50% of its expected U.S. dollar operating
profit. Torstar has entered into forward foreign exchange contracts to
sell $27.5 million U.S. dollars during 2007 at a rate of $1.14 and
$3.0 million in 2008 at a rate of $1.17. These contracts are designated
as revenue hedges for accounting purposes and any resulting gains
or losses are recognized in Book Publishing revenues as realized.
The counterparties to the foreign currency contracts are all major
financial institutions with high credit ratings. Further details are
contained in Note 13 of the consolidated financial statements.
In order to offset the exchange risk on its balance sheet from net
U.S. dollar denominated assets, Torstar maintains a certain level of
U.S. dollar denominated debt. These net assets are primarily current
in nature, and to the extent that the amount of net U.S. dollar assets
differs from the amount of the U.S. dollar debt, a foreign exchange
gain or loss is recognized in earnings.
Interest rates
Torstar has long-term debt in the form of medium-term notes and
bankers’ acceptances issued under a bank loan facility. Torstar
issues debt in both Canadian and U.S. dollars with the U.S. dollar
debt used as a hedge against the U.S. dollar denominated assets
in the Book Publishing Segment. Torstar issues bankers’ acceptances
at floating rates and medium term notes with either fixed or floating
interest rates.
Torstar is party to a U.S. interest rate swap arrangement that fixes
the interest rate on U.S. $80 million of borrowings at approximately
3.5% (plus the interest rate spread based on Torstar’s long-term
credit rating, currently 0.6%) through December 2007. The U.S. $80
million was based on the expectation that Torstar will hold at least
that level of U.S. dollar debt as an economic hedge against
Harlequin’s U.S. operations over the long term.
With the increased borrowings for the CTVgm investment, Torstar
decided to fix the interest rate on a portion of the incremental
Canadian dollar debt. In the third quarter of 2006, Torstar entered
into interest rate swap agreements to fix the rate of interest on
$250 million of Canadian dollar borrowings at 4.3% (plus the interest
rate spread based on Torstar’s long-term credit rating, currently
0.6%) for the next five years.
Torstar has decided to have floating interest rates on the remainder
of its Canadian dollar debt. Torstar has entered into swap agreements
that effectively convert the $100 million of Canadian dollar fixed
rate medium term notes that were issued in 2005 into floating rate
debt based on a spread over 90-day bankers’ acceptance rates.
All of the interest rate swap arrangements have been designated as
hedges. The fair value of the interest rate swap arrangements was
$1.8 million unfavourable at December 31, 2006.
Torstar’s exposure to credit related losses in the event of
non-performance by counterparties to the interest rate swaps and
derivatives is mitigated by accepting only major financial
institutions with high credit ratings as counterparties. Further details
are contained in Note 6 of the consolidated financial statements.
PENSION OBLIGATIONS
Torstar maintains a number of defined benefit plans which provide
pension benefits to its employees in Canada and the U.S. Torstar
also maintains defined contribution plans in Canada, the U.S. and
in certain of Harlequin’s overseas operations.
The accounting for defined benefit plans requires the use of actuarial
estimates for pension expense and pension plan obligations.
In making the estimates, certain assumptions must be made.
The significant assumptions made by Torstar in 2006 and 2005 for
determining the pension plan obligations and expenses were:
2006 2005
Discount rate – year end obligation 5.0% 5.0%
Discount rate – annual expense 5.0% 5.75%
Rate of future compensation
increase 3.0% to 3.5% 3.0% to 3.5%
Expected long-term rate
of return on plan assets 7.0% 7.0%
Average remaining service life
of active employees (years) 7 to 17 7 to 17
The discount rate of 5.0% is the yield at December 31, 2006 on
high quality fixed income investments with maturities that match
the expected maturity of the pension obligations (as prescribed by
the Canadian Institute of Chartered Accountants (“CICA”)). A one
percent increase in the discount rate would result in a decrease in
the total pension plan obligation of $92.9 million and a decrease
in the current year expense of $6.8 million. A one percent decrease
in the discount rate would increase the total pension plan
obligation by $106.8 million and increase current year expense by
$11.0 million.

The rate of future compensation increases has been assumed to be
between 3.0% and 3.5%. This rate is consistent with the level of
increases over the past few years and is management’s best estimate
of future compensation increases.
Torstar has maintained its expected long-term rate of return on plan
assets at 7%, as management believes it to be a reasonable estimate.
The return on plan assets has exceeded this rate for the past three
years. A one percent increase (decrease) in the expected return on
plan assets would decrease (increase) the current year expense by
$6.8 million.
The average remaining service life of active employees is used to
amortize past service costs from plan improvements and net actuarial
gains or losses. Torstar’s estimate of this time period is 7–17 years.
This range reflects the current composition of Torstar’s workforce
and expectations for staff turnover. The estimate of the average
remaining service life is generally reviewed every three years.
Torstar’s total pension expense was $14.9 million in 2006, down
from $16.4 million in 2005. Total pension funding was $19.5 million
in 2006, down from $36.7 million in 2005.
Torstar’s pension plans are in a net funded position of $0.3 million
at December 31, 2006 compared with a net unfunded position
of $42.6 million at the end of 2005. This balance includes
$26.1 million ($25.6 million in 2005) for an executive retirement
plan, which is not funded until payments are made to the executives
upon retirement, but is supported by a letter of credit. Excluding the
executive retirement plan, Torstar’s pension plans are in a net funded
position of $26.4 million compared with a net unfunded position of
$17.0 million in 2005.
Torstar also provides post-employment benefits including health
and life insurance benefits for certain grandfathered employees,
primarily in the Canadian newspaper operations. This obligation is
being funded as payments are made to retirees. Torstar has recorded
a liability of $54.6 million on its December 31, 2006 balance sheet
and an annual expense of $5.0 million ($52.0 million and
$3.9 million respectively in 2005). At December 31, 2006 the
unfunded obligation for these benefits was $60.0 million, down
from $67.8 million at December 31, 2005. The key assumptions for
this obligation are the discount rate and the health care cost
trends. The discount rate is the same as the prescribed rate for the
pension obligation. For health care costs, the estimated trend was
for a 9.5% increase for the 2006 expense. For 2007, health care
costs are estimated to increase by 10.0% with a 0.5% decrease
each year until 2017. A 1% increase in the estimated increase in
health care costs would increase the obligation by $3.3 million. The
increase in the annual expense would be less than $0.5 million.
DISCLOSURE CONTROLS AND PROCEDURES ANDINTERNAL CONTROLS OVER FINANCIAL REPORTING
As required by Multilateral Instrument 52–109 issued by the
Canadian Securities Administrators, Torstar’s Chief Executive Officer
(“CEO”) and Chief Financial Officer (“CFO”) will be making
certifications related to the information in Torstar’s annual filings
(as defined in Multilateral Instrument 52–109) with the securities
regulatory authorities. As part of the certification, the CEO and CFO
must certify that they are responsible for establishing and maintaining
disclosure controls and procedures and have designed such disclosure
controls and procedures (or caused such disclosure controls and
procedures to be designed under their supervision) to ensure that
the material information with respect to Torstar, including its
consolidated subsidiaries, is made known to them and that they
have evaluated the effectiveness of Torstar’s disclosure controls and
procedures as of the end of the period covered by these annual
filings. The CEO and CFO must also certify that they have designed
a system of internal control over financial reporting to provide
reasonable assurance regarding the reliability of financial reporting
and the preparation of financial statements for external purposes in
accordance with Canadian GAAP.
Disclosure controls and procedures are designed to ensure that
information required to be disclosed by Torstar in reports filed with
securities regulatory authorities is recorded, processed, summarized
and reported on a timely basis, and is accumulated and communicated
to Torstar’s management, including the CEO and CFO, as appropriate,
to allow timely decisions regarding required disclosure. Torstar’s
management, including the CEO and CFO, does not expect that
Torstar’s disclosure controls will prevent or detect all misstatements
due to error or fraud. Because of the inherent limitations in all control
systems, an evaluation of control can provide only reasonable, not
absolute assurance, that all control issues and instances of fraud
or error, if any, within Torstar have been detected. Torstar has adopted
or formalized such controls and procedures as it believes are
necessary and consistent with its business and internal management
and supervisory practices. Torstar is continually improving its systems
of controls and procedures.
38
MANAGEMENT’S DISCUSSION & ANALYSIS

Evaluation of disclosure controls and procedures
As of December 31, 2006, under the supervision of, and with the
participation of the CEO and CFO, Torstar’s management evaluated
the effectiveness of the design and operation of its disclosure controls
and procedures. Based on this evaluation, Torstar’s CEO and CFO
have concluded that, as at December 31, 2006, the Company’s
disclosure controls and procedures were effective.
Evaluation of internal controls over financial reporting
As of December 31, 2006, under the supervision of, and with the
participation of the CEO and CFO, Torstar’s management also
evaluated the effectiveness of the design of its internal controls over
financial reporting. Based on this evaluation, Torstar’s CEO and CFO
have concluded that, as at December 31, 2006, the Company’s
internal controls over financial reporting were designed effectively.
There have been no changes in Torstar’s internal controls over
financial reporting that occurred during the fourth quarter of 2006,
the most recent interim period, that have materially affected, or are
reasonably likely to materially affect, Torstar’s internal controls over
financial reporting.
CRITICAL ACCOUNTING POLICIES AND ESTIMATES
Torstar prepares its consolidated financial statements in Canadian
dollars and in accordance with Canadian GAAP. A summary of
Torstar’s significant accounting policies is presented in Note 1 of
the consolidated financial statements. Some of Torstar’s accounting
policies require subjective, complex judgments and estimates as
they relate to matters that are inherently uncertain. Changes in
these judgments or estimates could have a significant impact on
Torstar’s financial statements. Critical accounting estimates that
require management’s judgments include the provision for book
returns, valuation of goodwill, accounting for employee future benefits
and accounting for income taxes.
Provision for book returns
Revenue from the sale of books, net of provisions for estimated
returns, is recognized for retail sales based on the publication date
and for sales made directly to the consumer when the books are
shipped and title has transferred.
The provision for estimated returns is significant for retail sales
where books are sold with a right of return. As revenue is recognized,
a provision is recorded for returns. This provision is estimated by
management, based primarily on historic sales performance of that
type of book and the author. Books are returned over time and are
adjusted against the returns provision. On a quarterly basis the actual
returns experience is used to assess the adequacy of the provision.
The impact of the variance between the original estimate for returns
and the actual experience is reported in a period subsequent to the
original sale. This can have either a positive (if the actual experience
is better than estimated) or negative (if the actual experience is
worse) impact on reported results. A change in market conditions
can therefore have a compounded effect on the book publishing
results. If the market sales are declining, the estimate being made
for returns on current period sales will generally be higher and the
adjustment to the returns provision for prior period sales is likely to
be negative (i.e. the market has softened since the original estimate
was made).
Series books are on sale for approximately one month and returns
are normally received within one year, with more than 95% received
within the first six months. Harlequin has been publishing series
books for more than 20 years and has significant experience in
projecting returns for this business. Single title books are on sale
for several months and, as a result, experience a longer return period.
The single title publishing program has grown over the past decade.
Harlequin’s experience with the returns patterns and methodology
used by management to project returns for single title books has
also evolved over that time period. For these books, there is more
variation in net sale rates between titles, even for the same author.
As a result, the estimate for returns on these titles has more variability
than that for the series titles.
At December 31, 2006, the returns provision deducted from accounts
receivable on the consolidated balance sheets was $104 million
($109 million in 2005). A one percent change in the average net
sale rate used in calculating the global retail returns provision on sales
from July to December 2006 would have resulted in a $4.0 million
change in reported 2006 revenue.
Valuation of goodwill
Under Canadian GAAP, goodwill is not amortized but is assessed for
impairment at the reporting unit level at least on an annual basis.
Goodwill is assessed for impairment using a two-step approach.
The first step is to assess whether the fair value of the reporting unit
to which the goodwill is associated is less than its carrying value. If
the fair value of the reporting unit is less than the carrying value,
the second step is required. The second step is a comparison of the
fair value of goodwill to its carrying amount. If the fair value of goodwill
is less than its carrying value, goodwill is considered impaired and
a charge for impairment must be recognized immediately.
Reporting units are identified based on the nature of the business
and the level of integration between operations. Torstar uses a market
approach to determine the fair value of its reporting units. This
approach uses several factors including normalized or projected
39
MANAGEMENT’S DISCUSSION & ANALYSIS

earnings and price earnings multiples. Comparable transactions are
reviewed for appropriate price earnings multiples. The fair value of an
asset is defined as the amount at which it could be bought or sold
in a current transaction between willing parties.
Torstar has completed its annual impairment test and no adjustment
for impairment was required.
Accounting for employee future benefits
The cost of defined benefit pension and other retirement benefits
earned by employees is actuarially determined each year based on
management’s estimates of the long-term rate of investment return
on plan assets and future compensation and health care costs.
Management applies judgment in the selection of these estimates,
based on regular reviews of historical investment returns, salary
increases and health care costs. Expectations regarding future
economic trends and business conditions, including inflation rates
are also considered.
The discount rate used in measuring the liability and expected
healthcare costs is prescribed to be equal to the current yield on
long-term, high-quality corporate bonds with a duration similar to
the duration of the benefit obligation.
Management’s estimates, along with a sensitivity analysis of
changes in these estimates on both the benefit obligation and the
benefit expense are further discussed under “Pension Obligations”
in the MD&A and are disclosed in Note 12 of the consolidated
financial statements.
Accounting for income taxes
Future income taxes are recorded to account for the effects of
future taxes on transactions occurring in the current period.
Management uses judgment and estimates in determining the
appropriate rates and amounts to record for future taxes, giving
consideration to timing and probability. Previously recorded tax
assets and liabilities are adjusted if the expected tax rate is revised
based on current information.
The recording of future tax assets also requires an assessment of
recoverability. A valuation allowance is recorded when Torstar does
not believe, based on all available evidence, that it is more likely
than not that all of the future tax assets recognized will be realized
prior to their expiration. This assessment includes a projection of
future year earnings based on historical results and known changes
in operations.
More information on Torstar’s income taxes is provided in Note 10
of the consolidated financial statements.
CHANGES IN ACCOUNTING POLICIES
Accounting by a Vendor for Consideration Given to aCustomer (EIC–156)
This EIC was effective for Torstar’s 2006 fiscal year with retroactive
restatement. EIC–156 provides guidance on the classification in the
vendor’s financial statements of consideration given to its customers.
The guidance determines whether a consideration is to be treated
as an adjustment of the selling price or as a cost incurred by the
vendor to sell goods or services and the timing of when such
amounts should be recorded. The impact of the change for the year
ended 2005 was to decrease revenue and operating expenses by
$10.1 million for advertiser volume rebates and trade incentives.
There was no impact on operating profit or net income.
Financial Instruments (Sections 3855, 3861, 3865and 1530)
The CICA has issued four new standards which will be effective
prospectively for the company beginning January 1, 2007. Section
3855, “Financial Instruments – Recognition and Measurement”,
determines when and at what value a financial instrument is to be
recognized on the balance sheet and how gains or losses are to be
recorded. Section 3861, “Financial Instruments – Disclosures and
Presentation”, provides standards for disclosures and presentation
of financial instruments. Section 3865, “Hedges”, specifies how
hedge accounting is applied and related disclosure.
Section 1530, “Comprehensive Income”, introduces new standards
for the presentation and disclosure of comprehensive income and
its components. Certain unrealized gains or losses which would
otherwise be excluded from the calculation of net income and
unrealized foreign currency translation amounts arising from
self-sustaining foreign operations will be recorded in a Statement
of Other Comprehensive Income. Other comprehensive income will
form part of shareholders’ equity.
40
MANAGEMENT’S DISCUSSION & ANALYSIS

41
MANAGEMENT’S DISCUSSION & ANALYSIS
Torstar has interest rate swaps and foreign exchange forward
contracts which are accounted for as hedges. Under these new
sections, Torstar will be required to recognize changes in their fair
values to the extent of hedge effectiveness, as defined by accounting
standards, in comprehensive income. Any ineffective portion, as
defined by accounting standards, will be recognized in net income.
For certain other financial instruments, Torstar will be required to
recognize the asset or liability on the balance sheet at its fair
values on January 1, 2007 with subsequent changes in fair
value recorded in net income for held-for-trading items and in
comprehensive income for available-for-sale items. Changes in
unrealized foreign exchange gains or losses which arise from the
translation of self-sustaining operations subsequent to January 1, 2007
will also be recorded in comprehensive income. Net income is not
expected to change significantly as a result of the new accounting
standards. However, there may be significant fluctuations in
comprehensive income from period to period as financial
instruments are adjusted to market value.
ANNUAL INFORMATION – 3 YEAR SUMMARY
The following table presents, in $000’s (except for per share
amounts) selected key information for the past three years:
2006 2005 2004
Revenue12 $1,528,270 $1,556,888 $1,541,849
Net income $79,141 $118,843 $112,703
Per share (basic) $1.01 $1.52 $1.42
Per share (diluted) $1.01 $1.51 $1.41
Average number of
shares outstanding
during the year (in 000’s)
Basic 78,250 78,214 79,168
Diluted 78,414 78,621 79,813
Cash dividends per share $0.74 $0.74 $0.70
Total assets $2,001,473 $1,561,682 $1,510,027
Total long-term debt 724,193 334,317 317,829
Total revenues have been steady over the past three years. The daily
newspapers have experienced declining revenues while the community
newspapers have continued to see growth. The Book Publishing
revenues have declined significantly in 2005 and 2006 as a result
of the strengthening Canadian dollar and lower gains from U.S. dollar
hedge contracts. Underlying revenues were down significantly in
2004 but have improved versus prior year in 2005 and 2006.
Net income increased between 2004 and 2005 from the impact of
a $12.4 million unusual gain in 2005 compared with an unusual
loss in 2004. Operating profits for both Newspapers and Digital and
Book Publishing were down in 2005 and corporate costs were up.
In 2006, net income was negatively impacted by foreign exchange
in the Book Publishing Segment; the Newspaper and Digital
Segment had lower revenues in its daily newspapers and
investment spending for Torstar Digital; and restructuring provisions
of $22.3 million were recorded.
The increase in total assets in 2006 reflected the $378.0 million
investment in CTVgm.
RECENT DEVELOPMENTS
In February 2007, Torstar and Metro International announced
the launch of Metro Calgary on March 5th and Metro Edmonton on
April 2nd. The new editions will be distributed through a combination
of promoters, street boxes and strategic locations ramping up to a
total daily circulation of 60,000 copies per city.
12 Torstar’s 2005 revenue has been restated as a result of the January 1, 2006 adoption, with retroactive restatement, of EIC–156 – “Accounting by a vendor for consideration
given to a customer”. The effect was to decrease both revenues and operating expenses by $10.1 million in 2005. There was no impact on net income.

42
MANAGEMENT’S DISCUSSION & ANALYSIS
13 Torstar’s 2005 revenue has been restated as a result of the January 1, 2006 adoption, with retroactive restatement, of EIC–156 – “Accounting by a vendor for consideration given to a
customer”. The effect was to decrease both revenues and operating expenses by $2.3 million, $2.6 million, $2.6 million and $ 2.5 million in each of the first, second third and fourth
quarters respectively. There was no impact on net income.
The summary of quarterly results illustrates the cyclical nature of
revenues and operating profit in the Newspapers and Digital
Segment. The fourth and second quarters are generally the
strongest for the newspapers.
Gains from the sale of properties and restructuring provisions have
impacted the level of net income in several quarters. In 2006, the
first, third and fourth quarters had restructuring provisions of
$3.7 million, $7.0 million and $11.7 million respectively. In 2005,
the third quarter had a restructuring provision of $2.1 million and
the first and third quarters had gains from the sale of properties of
$1.3 million and $11.1 million respectively.
OTHER
At January 31, 2007, Torstar had 9,909,402 Class A voting shares
and 68,564,397 Class B non-voting shares outstanding. More
information on Torstar share capital is provided in Note 8 of the
consolidated financial statements.
At January 31, 2007, Torstar had 5,841,942 options to purchase
Class B non-voting shares outstanding to executives and non-executive
directors. More information on Torstar’s stock option plan is provided
in Note 9 of the consolidated financial statements.
Additional information relating to Torstar including the Annual
Information Form is available on SEDAR at www.sedar.com.
2005 Quarter Ended
Dec. 31 Sept. 30 June 30 March 31
Revenue13 $417,227 $378,002 $402,851 $358,808
Net income $37,894 $23,698 $36,112 $21,139
Net income per Class A voting and Class B non-voting share
Basic $0.48 $0.30 $0.46 $0.27
Diluted $0.48 $0.30 $0.46 $0.27
SUMMARY OF QUARTERLY RESULTS(In thousands of dollars except for per share amounts)
2006 Quarter Ended
Dec. 31 Sept. 30 June 30 March 31
Revenue $414,610 $366,216 $390,331 $357,113
Net income $36,068 $7,667 $25,631 $9,775
Net income per Class A voting and Class B non-voting share
Basic $0.46 $0.10 $0.33 $0.13
Diluted $0.46 $0.10 $0.33 $0.12

MANAGEMENT’S REPORT ON RESPONSIBILITY FOR FINANCIAL REPORTINGManagement is responsible for preparation of the consolidated financial statements, notes hereto and other financial information contained
in this annual report. The financial statements have been prepared in conformity with Canadian generally accepted accounting principles
using the best estimates and judgments of management, where appropriate. Information presented elsewhere in this annual report is consistent
with that in the financial statements.
Management is also responsible for maintaining a system of internal control designed to provide reasonable assurance that assets are
safeguarded and that accounting systems provide timely, accurate and reliable information.
The Board of Directors is responsible for ensuring that management fulfills its responsibilities for financial reporting and internal control.
The Board is assisted in exercising its responsibilities by the Audit Committee of the Board. The Committee meets quarterly with
management and the internal and external auditors, and separately with the internal and external auditors, to satisfy itself that management’s
responsibilities are properly discharged, and to discuss accounting and auditing matters. The Committee reviews the consolidated financial
statements and recommends approval of the consolidated financial statements to the Board.
The internal and external auditors have full and unrestricted access to the Audit Committee to discuss their audits and their related
findings as to the integrity of the financial reporting process.
J. Robert S. Prichard David P. Holland
President and Chief Executive Officer Executive Vice-President and Chief Financial Officer
February 26, 2007
AUDITORS’ REPORT TO THE SHAREHOLDERS OF TORSTAR CORPORATIONWe have audited the consolidated balance sheets of Torstar Corporation as at December 31, 2006 and 2005 and the consolidated statements
of income, retained earnings and cash flows for the years then ended. These financial statements are the responsibility of the company’s
management. Our responsibility is to express an opinion on these financial statements based on our audits.
We conducted our audits in accordance with Canadian generally accepted auditing standards. Those standards require that we plan and perform
an audit to obtain reasonable assurance whether the financial statements are free of material misstatement. An audit includes examining,
on a test basis, evidence supporting the amounts and disclosures in the financial statements. An audit also includes assessing the
accounting principles used and significant estimates made by management, as well as evaluating the overall financial statement presentation.
In our opinion, these consolidated financial statements present fairly, in all material respects, the financial position of the company as at
December 31, 2006 and 2005 and the results of its operations and its cash flows for the years then ended in accordance with Canadian
generally accepted accounting principles.
Toronto, Ontario, Ernst & Young LLP
February 26, 2007 Chartered Accountants
43
CONSOLIDATED FINANCIAL STATEMENTS

CONSOLIDATED BALANCE SHEETS
DECEMBER 31, 2006 AND 2005
(thousands of dollars)
Assets 2006 2005Current:
Cash and cash equivalents $46,037 $47,783
Receivables (note 2) 269,977 253,718
Inventories 38,208 35,568
Prepaid expenses 72,665 77,211
Prepaid and recoverable income taxes 16,665 3,130
Future income tax assets (note 10) 23,002 21,630
Total current assets 466,554 439,040
Property, plant and equipment (net) (note 3) 349,842 365,665
Investment in associated businesses (note 4) 416,320 23,618
Goodwill 552,928 537,545
Other assets (note 5) 171,547 145,712
Future income tax assets (note 10) 44,282 50,102
Total assets $2,001,473 $1,561,682
Liabilities and Shareholders’ Equity
Current:
Bank overdraft $2,173 $6,738
Accounts payable and accrued liabilities 227,001 204,710
Income taxes payable 14,174 15,047
Total current liabilities 243,348 226,495
Long–term debt (note 6) 724,193 334,317
Other liabilities (note 7) 88,313 85,689
Future income tax liabilities (note 10) 72,873 73,529
Shareholders’ equity:
Share capital (note 8) 382,397 376,925
Contributed surplus 7,466 4,883
Retained earnings 491,999 470,783
Foreign currency translation adjustment (9,116) (10,939)
Total shareholders’ equity 872,746 841,652
Total liabilities and shareholders’ equity $2,001,473 $1,561,682
Commitments and contingencies (note 16)
(See accompanying notes)
ON BEHALF OF THE BOARD
The Hon. Frank Iacobucci J. Spencer Lanthier
Director Director
44
TORSTAR CORPORATION(Incorporated under the laws of Ontario)

45
TORSTAR CORPORATION
CONSOLIDATED STATEMENTS OF INCOME
YEARS ENDED DECEMBER 31, 2006 AND 2005
(thousands of dollars except per share amounts)
2006 2005
Operating revenue
Newspapers and digital $1,056,462 $1,035,816
Book publishing 471,808 521,072
$1,528,270 $1,556,888
Operating profit
Newspapers and digital $107,849 $120,288
Book publishing 56,277 95,381
Corporate (18,475) (19,001)
Restructuring provisions (note 14(a)) (22,319) (2,119)
123,332 194,549
Interest (note 6(f)) (20,761) (10,463)
Foreign exchange 70 (2,723)
Income of associated businesses 16,000 565
Gain on sale of properties (note 14(b)) 12,415
Income before taxes 118,641 194,343
Income and other taxes (note 10) (39,500) (75,500)
Net income $79,141 $118,843
Earnings per Class A and Class B share (note 8(d))
Net income – Basic $1.01 $1.52
Net income – Diluted $1.01 $1.51
(See accompanying notes)
CONSOLIDATED STATEMENTS OF RETAINED EARNINGS
YEARS ENDED DECEMBER 31, 2006 AND 2005
(thousands of dollars)
2006 2005
Retained earnings, beginning of year $470,783 $425,787
Net income 79,141 118,843
Dividends (57,925) (57,869)
Premium paid on repurchase of shares for cancellation
(note 8(c)) (15,978)
Retained earnings, end of year $491,999 $470,783
(See accompanying notes)

CONSOLIDATED STATEMENTS OF CASH FLOWS
YEARS ENDED DECEMBER 31, 2006 AND 2005
(thousands of dollars)
2006 2005Cash was provided by (used in)
Operating activities $111,591 $124,140Investing activities (449,394) (74,630)Financing activities 337,997 (45,335)
Increase in cash 194 4,175Effect of exchange rate changes 2,625 (3,945)Cash, beginning of year 41,045 40,815Cash, end of year $43,864 $41,045
Operating activities:
Net income $79,141 $118,843Depreciation 53,496 54,274Amortization 2,987 2,549Future income taxes 2,752 9,309Income of associated businesses (16,000) (565)Other (note 15) (2,354) (17,563)
120,022 166,847Increase in non-cash working capital (8,431) (42,707)Cash provided by operating activities $111,591 $124,140
Investing activities:
Additions to property, plant and equipment ($38,317) ($35,260)Investment in associated business (note 4) (377,982)Acquisitions and investments (note 11) (34,647) (59,358)Proceeds on sale of properties (note 14) 17,744Other 1,552 2,244Cash used in investing activities ($449,394) ($74,630)
Financing activities:
Issuance of banker’s acceptance $618,763Repayment of commercial paper (255,114) ($92,150)Issuance of commercial paper 26,519 58,390Repayment of medium term notes (45,000)Issuance of medium term notes 100,000Dividends paid (57,237) (56,869)Exercise of stock options (note 8(b)) 3,054 8,390Purchase of shares for cancellation (note 8(c)) (20,858)Other 2,012 2,762Cash provided by (used in) financing activities $337,997 ($45,335)
Cash represented by:
Cash and cash equivalents $46,037 $47,783Bank overdraft (2,173) (6,738)
$43,864 $41,045
(See accompanying notes)
46
TORSTAR CORPORATION

NOTES TO CONSOLIDATED FINANCIAL STATEMENTS
December 31, 2006 and 2005
(Tabular amounts in thousands of dollars)
1. ACCOUNTING POLICIES
The consolidated financial statements are prepared in accordance
with Canadian generally accepted accounting principles (“GAAP”).
The following is a summary of significant accounting policies.
(a) Principles of consolidation
The consolidated financial statements include the accounts of the
company and all its subsidiaries and joint ventures. The major
subsidiaries are: Toronto Star Newspapers Limited; Harlequin
Enterprises Limited (“Harlequin”); Metroland Printing, Publishing
& Distributing Ltd. (“Metroland”); and CityMedia Group Inc. The
company proportionately consolidates its joint ventures.
(b) Foreign currency translation
Assets and liabilities denominated in foreign currencies have
been translated to Canadian dollars primarily at exchange rates
prevailing at the year end. Revenues and expenses are translated
at average rates for the year. Translation gains or losses relating
to self-sustaining foreign operations, principally in Europe and
Asia, are deferred and included in shareholders’ equity as
foreign currency translation adjustments. A proportionate
amount of these deferred gains or losses are recognized in
income when there is a reduction in the company’s net investment
in the foreign operation.
(c) Financial instruments
The fair value of the company’s financial instruments approximates
their carrying value unless otherwise stated.
The company manages its exposure to currency fluctuations,
primarily U.S. dollars, through the use of derivative financial
instruments. Foreign exchange contracts and options to sell
U.S. dollars have been designated as hedges against future
Book publishing revenue. Gains and losses on these instruments
are accounted for as a component of the related hedged
transaction. Foreign exchange contracts which do not qualify for
hedge accounting are reported on a mark to market basis in
Book publishing earnings.
The company uses interest rate swap contracts to manage interest
rate risks and has designated all interest rate swap contracts as
hedges. Payments and receipts under interest rate swap
contracts are recognized as adjustments to interest expense on
an accrual basis. Any resulting carrying amounts are included
in receivables in the case of favourable contracts and accounts
payable in the case of unfavourable contracts.
The company manages its exposure associated with changes in
the fair value of its Deferred Share Unit Plan through the use of
a derivative instrument. Changes in the fair value of this instrument
are recorded as compensation expense.
The company does not engage in trading or other speculative
activities with respect to derivative financial instruments.
Hedge accounting is applied when the derivative instrument is
designated as a hedge and is expected to be effective throughout
the life of the hedged item. When such derivative instrument
ceases to exist as a hedge, or when designation of a hedging
relationship is terminated, any associated deferred gains or
losses are carried forward to be recognized in income in the
same period as the corresponding gains or losses associated
with the hedged item. When a hedged item ceases to exist, any
associated deferred gains or losses are recognized in the current
period’s consolidated statement of income.
The fair value of derivative financial instruments reflects the
estimated amount that the company would have been required
to pay if forced to settle all unfavourable outstanding contracts
or the amount that would be received if forced to settle all
favourable contracts at year end. The fair value represents a
point-in-time estimate that may not be relevant in predicting the
company’s future earnings or cash flows.
(d) Cash and cash equivalents
Cash and cash equivalents consists of cash in bank and short-term
investments with maturities on acquisition of 90 days or less.
(e) Receivables
Receivables are reduced by provisions for anticipated book
returns and estimated bad debts which are determined by
reference to past experience and expectations.
(f) Inventories
Inventories are valued at the lower of cost and net realizable value.
(g) Prepaid expenses
Prepaid expenses include advance royalty payments to authors
which are deferred until the related works are published and are
reduced by estimated provisions for advances that may exceed
royalties earned.
47
TORSTAR CORPORATION

48
TORSTAR CORPORATION
(h) Property, plant and equipment
These assets are recorded at cost and depreciated over their
estimated useful lives. The rates and methods used for the
major depreciable assets are:
Buildings:
— straight-line over 25 years or 5% diminishing balance
Leasehold Improvements:
— straight-line over the life of the lease
Machinery and Equipment:
— straight-line over 10 to 20 years or 20% diminishing balance
(i) Impairment of long-lived assets
Long-lived assets are tested for recoverability whenever events
or changes in circumstances indicate that their carrying amount
may not be recoverable. An impairment loss is recognized when
their carrying value exceeds the total undiscounted cash flows
expected from their use and eventual disposition.Any impairment
loss would be determined as the excess of the carrying value of
the assets over their fair value.
(j) Investments in associated businesses
Investments in associated businesses are accounted for using
the equity method.
(k) Intangible assets
Intangible assets are recorded at their fair value on the date of
acquisition. Intangible assets with finite lives are amortized over
their useful lives and consist primarily of customer relationships
which are being amortized on a straight line basis over 10 years.
The company’s intangible assets, which include trade and
domain names and newspaper mastheads, have an indefinite
life and accordingly are not amortized. Intangibles with indefinite
lives are tested for impairment annually or when indicated by
events or changes in circumstances.
(l) Goodwill
Goodwill represents the cost of acquired businesses in excess
of the fair value of net identifiable assets acquired. Goodwill is
tested for impairment on an annual basis. Goodwill is allocated
to reporting units and any potential impairment is identified by
comparing the carrying value of the reporting unit with its fair
value. Any impairment loss would be charged against current
period earnings and shown as a separate item in the
Consolidated Statement of Income.
(m) Other assets
The cost of a distribution services agreement is amortized on a
straight-line basis over the 10-year term of the agreement and
was fully amortized by December 31, 2006. Portfolio investments
are accounted for by the cost method.
(n) Employee future benefits
Details with respect to accounting for employee future benefits
are as follows:
• The cost and obligations of pensions and post employment
benefits earned by employees are actuarially determined
using the projected benefit method prorated on service
and management’s best estimate of assumptions of
future investment returns for funded plans, salary
changes, retirement ages of employees and expected
health care costs.
• For the purpose of calculating the expected return on
plan assets, those assets are valued at fair value.
• As prescribed by the Canadian Institute of Chartered
Accountants (“CICA”), the discount rate used for
determining the benefit obligation is the current interest
rate at the balance sheet date on high quality fixed
income investments with maturities that match the
expected maturity of the obligations.
• Past service costs resulting from plan amendments are
amortized on a straight-line basis over the average
remaining service life of employees active at the date of
amendment.
• The excess of the net actuarial gain (loss) over 10% of
the greater of the benefit obligation and the fair value of
plan assets is amortized over the average remaining
service life of active employees. The average remaining
service life of the active employees covered by the plans
ranges from 7 to 17 years.
Company pension contributions in excess of the amounts
expensed in the statements of income are recorded as accrued
benefit assets in other assets in the balance sheet. Liabilities
related to unfunded post employment benefits and an executive
retirement plan are included as post employment benefits in
other long-term liabilities.
(o) Stock-based compensation plans
The company has a stock option plan, an employee share purchase
plan and two deferred share unit plans. In addition, during 2006
the company introduced a Restricted Share Unit (“RSU”) Plan.

The company uses the fair value method of accounting for stock
options granted subsequent to December 31, 2002. Under this
method, the fair value of the stock options is determined at the
date of grant using an option pricing model. Over the vesting
period, this fair value is recognized as compensation expense
and a related credit to contributed surplus.The contributed surplus
balance is reduced as options are exercised through a credit to
share capital. No compensation expense has been recorded for
stock options awarded and outstanding prior to January 1, 2003.
The consideration paid by option holders is credited to share
capital when the options are exercised.
The fair value method of accounting is utilized for the company’s
annual employee share purchase plans. Under this method, the
company recognizes a compensation expense and a related
credit to contributed surplus each period, based on the excess
of the current share price over the opening price, in accordance
with the terms that would apply if the plan had matured at the
current share price. Upon maturity of the plan, contributed surplus
is eliminated and share capital is credited. No compensation
expense has been recorded for plans originating prior to
January 1, 2003. The consideration paid by the plan members
is credited to share capital when the plan matures.
Eligible executives and non-employee directors may receive or
elect to receive deferred share units equivalent in value to Class
B non-voting shares of the company. A compensation expense
is recorded in the year of granting of the deferred share units
and changes in the intrinsic value of outstanding deferred share
units, including deemed dividend equivalents, are recorded as
an expense in the period that they occur. Outstanding deferred
share units are recorded as long-term liabilities.
For the new RSU plan, compensation expense equal to the
grant date value of the RSU is recognized over the applicable
vesting period subsequent to the date of grant.
(p) Income taxes
The company follows the liability method of accounting for
income taxes. Under the liability method of tax allocation, future
tax assets and liabilities are determined based on differences
between the financial reporting and tax bases of assets and
liabilities and are measured using substantively enacted tax
rates and laws that will be in effect when the differences are
expected to reverse.
(q) Revenue recognition
Advertising revenue is recognized when publications are
delivered or advertisements are broadcast or placed on the
company’s Web sites. Newspaper circulation is recognized when
the publication is delivered. Subscription revenue for newspapers
is recognized as the publications are delivered over the term of
the subscription. Revenue from the sale of books is recognized
for the Retail distribution channel based on the book’s publication
date (books are shipped prior to the publication date so
that they are in stores by the publication date) and for the
Direct-to-Consumer distribution channel when the books are
shipped. Book publishing revenue is recorded net of provisions
for estimated returns and direct-to-consumer bad debts, which
are primarily based on past experience. Other revenue is recognized
when the related service or product has been delivered.
Amounts received in advance are included in the balance sheet
in Accounts payable and accrued liabilities until the revenue is
recognized in accordance with the policies noted above.
(r) Use of estimates
The preparation of financial statements in conformity with
Canadian generally accepted accounting principles requires
management to make estimates and assumptions that
affect the reported amounts of assets and liabilities, the
disclosure of contingent assets and liabilities at the date of the
financial statements and the reported amounts of revenues and
expenses during the reporting year. Actual results could differ
from those estimates.
(s) Changes in accounting policies
Accounting by a Vendor for Consideration Given to a Customer
(including a Reseller of the Vendor’s Products)
The CICA’s Emerging Issues Committee issued EIC–156
“Accounting by a Vendor for Consideration Given to a Customer
(including a Reseller of the Vendor’s Products)” which provides
guidance on the classification in the vendor’s financial statements
of consideration given to its customers. The guidance determines
whether such consideration is to be treated as an adjustment
of the selling price or as a cost incurred by the vendor to sell
goods or services and the timing of when such amounts should
be recorded. The company has applied EIC–156 effective
January 1, 2006 with restatement of prior periods. As a result
of the change, revenue and operating expenses for the year
ended December 31, 2005 have been reduced by $10.1 million
for advertiser volume rebates and trade incentives, with no
impact on operating profit or net income.
49
TORSTAR CORPORATION

50
TORSTAR CORPORATION
Future accounting changes include the following items.
Financial Instruments
The CICA has issued four new standards which will be effective
prospectively for the company beginning January 1, 2007.
These standards are: Section 3855 “Financial Instruments –
Recognition and Measurement”, Section 3861 “Financial
Instruments – Disclosure and Presentation”, Section 3865
“Hedges” and Section 1530 “Comprehensive Income”. Section
3855 determines when and at what value a financial instrument
is to be recognized on the balance sheet and how gains or losses
are to be recorded. Section 3865 specifies how hedge accounting
is applied and related disclosure. Section 1530 introduces new
standards for the presentation and disclosure of comprehensive
income and its components. Certain unrealized gains or losses
which would be excluded from the calculation of net income
and unrealized foreign currency translation amounts arising
from self-sustaining foreign operations will be recorded in a
Statement of Other Comprehensive Income. Other comprehensive
income will form part of shareholders’ equity.
The company has swaps and forward contracts which are
accounted for as hedges but will be required to recognize
changes in their fair values to the extent of hedge effectiveness
in comprehensive income. Any ineffective portion, as defined by
the accounting standards, will be recognized in net income. For
certain other financial instruments, the company will be
required to recognize them on the balance sheet at their fair
values with the changes in their fair values recorded in net
income for held-for-trading items and in comprehensive income
for available-for-sale items. Changes in unrealized foreign
exchange gains or losses which arise from the translation of
self-sustaining operations will also be recorded in comprehensive
income. Net income is not expected to change significantly as
a result of the new accounting standards. However, there may
be significant fluctuations in comprehensive income from period
to period as financial instruments are adjusted to market value.
2. Receivables
The provisions for anticipated book and magazine returns and
bad debts deducted from receivables at December 31, 2006
amounted to $126 million (December 31, 2005 – $135 million).
Under a billing and collection agreement with a third party, the
Book publishing segment has a net receivable of $40 million
at December 31, 2006 (December 31, 2005 – $32 million).
The company believes that the credit risk associated with this
balance is mitigated by the financial stability and payment
history of the third party.
3. Property, plant and equipment
AccumulatedCost Depreciation Net
2006
Land $7,451 $7,451
Buildings and leasehold
improvements 228,799 $121,728 107,071
Machinery and equipment 763,921 528,601 235,320
Total $1,000,171 $650,329 $349,842
2005
Land $7,451 $7,451
Buildings and leasehold
improvements 227,832 $113,519 114,313
Machinery and equipment 732,384 488,483 243,901
Total $967,667 $602,002 $365,665
4. Investment in associated businesses
The company’s Investment in associated businesses includes a
20% equity interest in CTVglobemedia Inc. (“CTVgm”), a
19.35% equity interest in Black Press Ltd. and a 30% equity
interest in Q-ponz Inc. The Investment in associated businesses
is comprised of the following:
2006 2005
Balance, beginning of year $23,618 $22,954
Income of associated businesses 16,000 565
Investment in CTVgm 377,982
Change in investee foreign currency
translation adjustment (1,280) 99
Balance, end of year $416,320 $23,618

The $20.7 million initial investment in Black Press included
$17.9 million of goodwill.
On August 30, 2006, the company acquired a 20% equity
interest in CTVgm. On September 7, 2006, the company made
an additional investment in CTVgm to provide its pro-rata share
of the equity contribution in respect of CTVgm’s acquisition of
all of the common shares of CHUM Limited (“CHUM”). The total
purchase price, including transaction costs, was $378.0 million.
The CTVgm investment is accounted for using the equity method.
Torstar and CTVgm do not have coterminous quarter-ends and
these financial statements reflect the company’s share of
CTVgm’s results for the three months ended November 30, 2006.
A summary of the company’s share of the fair values of
the assets and liabilities acquired in CTVgm, excluding its
$94.2 million share of CTVgm’s investment in CHUM, is as follows:
Current assets $112,212
Property, plant and equipment 65,656
Goodwill and other intangible assets 441,596
Other assets 46,488
$665,952
Current liabilities $57,199
Long-term debt 278,473
Other liabilities and non-controlling interests 46,522
$382,194
Net assets acquired at fair value $283,758
Intangible assets include the company’s share of broadcast
licenses of $209.6 million, newspaper mastheads of $20.0 million
and other intangibles of $2.4 million which are indefinite life
assets. Fair value adjustments included above include an
increase in other liabilities of $19.8 million for pension and
post-retirement benefits, an after tax gain related to the subsequent
sale of the careers web site “Workopolis” of $16.1 million, an
increase in property values of $6.0 million and other adjustments,
primarily related to debt, of $5.0 million which increase
liabilities. Future income tax liabilities related to the above total
$23.4 million. The fair value adjustments will be amortized over
the next 5 to 15 years. None of the $209.1 million of goodwill
included above is deductible for tax purposes. The above
allocation of the fair values is subject to change upon the final
determination of the valuation of certain of the intangible assets.
CTVgm’s common share holdings of CHUM have been placed in
trust under the terms of a voting trust agreement between
CTVgm and the Trustee. Under this agreement, voting control of
CHUM resides with the Trustee pending regulatory approval of
the CHUM acquisition by the Canadian and Radio-television
and Telecommunications Commission. The Competition Bureau
is also reviewing the CHUM acquisition. As a consequence, the
results of CHUM will be accounted for on an equity basis by
CTVgm and the allocations of the CHUM purchase price have
not been finalized by CTVgm pending regulatory approvals.
The company’s income from associated businesses includes
net income of $14.0 million from its investment in CTVgm for
the three months ended November 30, 2006. Although the
completion of the CTVgm purchase price allocation with respect
to CHUM has not been finalized, the company has allocated on
a preliminary basis the purchase price discrepancy to indefinite
life intangibles and goodwill and therefore no amortization has
been included for the three months ended November 30, 2006.
The allocation is subject to change pending regulatory approval
and CTVgm’s finalization of the CHUM purchase price allocation.
Outlined below is summarized financial information for 100% of
CTVgm, including fair value adjustments, for the three months
and period ended November 30, 2006.
Balance Sheet
Current assets $580,008
Property, plant and equipment 323,660
Investment in CHUM 1,388,960
Goodwill and other intangible assets 2,201,964
Other assets 233,216
$4,727,808
Current liabilities $341,836
Long-term debt 2,185,765
Other liabilities and non-controlling interests 246,078
Shareholders’ equity 1,954,129
$4,727,808
Statement of Income
Revenues $487,402
Net income $70,160
51
TORSTAR CORPORATION

52
TORSTAR CORPORATION
5. Other assets
2006 2005
Accrued benefit assets (note 12) $122,620 $116,728
Intangible assets 35,415 15,199
Distribution Services Agreement 2,126
Portfolio investments (note 11) 7,054 5,948
Other 6,458 5,711
$171,547 $145,712
6. Long-term debt
2006 2005
Bankers’ acceptance:
Cdn. dollar denominated $491,885
U.S. dollar denominated 132,308
624,193
Commercial paper:
Cdn. dollar denominated $93,663
U.S. dollar denominated 140,654
234,317
Medium Term Notes:
Cdn. dollar denominated 100,000 100,000
$724,193 $334,317
(a) Bank debt
(i) On October 19,2006, the company finalized the renegotiation
of its long-term credit facilities with its bankers. The new
facilities consist of a $425 million revolving loan that
matures on January 4, 2012 and a $425 million revolving
operating loan. The operating loan, which matures January
11, 2008, can be extended with the consent of all parties
for up to four additional 364-day periods or can be converted
to a 364-day term loan at the company’s option. The credit
facilities may be drawn in Canadian or U.S. dollars.
(ii) Amounts borrowed under the bank credit facilities would
primarily be in the form of bankers’ acceptances (or an
equivalent) at varying interest rates and would normally
mature over periods of 30 to 180 days. The interest rate
spread above the bankers’ acceptance rate if in Canadian
dollars, or LIBOR rate if in U.S. dollars, at December 31, 2006
was 0.6% and varies based on the company’s long-term
credit rating (December 31, 2005 – 0.4%).
(iii) In September 2006, the company entered into three interest
rate swap agreements with major Canadian chartered
banks that will fix the interest rate on $250 million of
Canadian dollar borrowings. As a result, the company will
pay quarterly a fixed rate of 4.3% per annum (plus the
interest rate spread referred to in 6(a)(ii)) for the next five
years and will receive quarterly floating rate payments
based on 90 day bankers’ acceptance rates. These swap
contracts have been designated as hedges. The fair value
of these swap agreements was $0.8 million unfavourable
at December 31, 2006.
(iv) The average rate on Canadian dollar bank borrowings
outstanding at December 31, 2006 was 4.9%. Including
the effect of the interest rate swap noted in 6(a)(iii) the
effective rate was 4.9% at December 31, 2006.
(v) Bank debt outstanding at December 31, 2006 included
U.S. dollar borrowings of U.S. $113.5 million at an average
rate of 6.1%. Including the effect of the interest rate
swap noted in 6(d) the effective rate was 4.8% at
December 31, 2006.
(b) Commercial paper
A facility exists for the company to issue short-term notes in the
form of commercial paper. These notes may be issued in
Canadian or U.S. dollars to an authorized aggregate principal
amount of Canadian $550 million outstanding at any one time.
No commercial paper was outstanding at December 31, 2006
and the company has suspended the program. All commercial
paper outstanding at December 31, 2005 with a term of less
than one year was classified as long-term debt as the compa-
ny had the ability to refinance these amounts under its existing
long-term credit facilities. The average rate on Canadian dollar
commercial paper outstanding at December 31, 2005 was
3.3%. Commercial paper outstanding at December 31, 2005
included U.S. dollar borrowings of U.S. $120.6 million at an
average rate of 4.4%. Including the effect of the interest rate swap
noted in 6(d) the effective rate was 3.8% at December 31, 2005.
(c) Medium Term Notes
The company issued in September 2005 $75 million 3.85%
medium term notes which mature on September 8, 2010. The
company has entered into swap agreements effectively converting
this debt into floating rate debt based on 90-day bankers’
acceptance rates plus 0.39%. The company also issued in
September 2005 $25 million 3.7% medium term notes which
mature on September 9, 2009. The company has entered into
a swap agreement effectively converting this debt into floating
rate debt based on 90-day bankers’ acceptance rates plus
0.36%. Interest on the medium term notes as well as the payments
under the swap agreements is paid semi-annually. The swap
agreements have been designated as hedges and mature on
the due dates of the respective notes. The effective interest rate
on the medium term notes outstanding at December 31, 2006,
including the above noted swaps, was 4.9% (December 31, 2005

53
TORSTAR CORPORATION
– 4.0%).The fair value of the medium term notes at December 31,
2006 was $3.6 million favourable (December 31, 2005 – $2.6
million favourable). The fair value of the interest rate swap
agreements at December 31, 2006 was $2.7 million
unfavourable (December 31, 2005 – $2.8 million unfavourable).
(d) The company is party to an interest rate swap arrangement that
will fix the interest rate on U.S. $80 million of borrowings at
approximately 3.5% (plus the interest rate spread referred to in
6(a)(ii)) through December 2007. The swap has been designated
as a hedge. The fair value of the U.S. interest rate swap arrangement
at December 31, 2006 was $1.7 million favourable (December
31, 2005 – $2.4 million favourable).
(e) The company is exposed to credit related losses in the event of
non-performance by counterparties to the above described
derivative instruments, but it does not anticipate any counter-
parties to fail to meet their obligations given their high credit
ratings. The company has a policy of only accepting major
financial institutions, as approved by the Board of Directors,
as counterparties.
(f) Interest expense includes interest on long-term debt of $21.8
million (2005 – $11.1 million).
(g) Interest of $22.7 million was paid during the year (2005 –
$10.8 million).
7. Other liabilities
2006 2005
Post employment benefits (note 12) $70,654 $69,801
Employees’ shares subscribed (note 9(c)) 6,547 8,031
Deferred share unit plan (note 9(f)) 5,233 3,549
Other 5,879 4,308
$88,313 $85,689
8. Share capital
(a) Rights attaching to the company’s share capital:
(i) Class A (voting) and Class B (non-voting) shares
Class A and Class B shareholders may elect to receive
dividends in cash or stock dividends in the form of Class
B shares. Class A shares are convertible at any time at the
option of the holder into Class B shares.
(ii) Voting provisions
Class B shares are non-voting unless eight consecutive
quarterly dividends have not been paid.
(iii) Restrictions on transfer
Registration of the transfer of any of the company’s shares
may be refused if such transfer could jeopardize either the
ability of the company to engage in broadcasting or its
status as a Canadian newspaper publisher.
(b) Summary of changes in the company’s share capital:
Class A (voting) and Class B (non-voting) shares
Class A shares
The only changes in the Class A shares were the conversion to
Class B shares of 1,650 shares (with a stated value of $448)
in 2006 and 2,033 shares (with a stated value of $1,000) in
2005. Total Class A shares outstanding at December 31 were:
Shares Amount
2005 9,916,442 $2,694
2006 9,914,792 $2,694
Class B shares
The changes in the Class B shares were:
Shares Amount
January 1, 2005 68,533,752 $366,445
Converted from Class A 2,033 1
Issued under Employee
Share Purchase Plan 129,395 3,235
Stock options exercised 421,850 8,390
Purchased for cancellation (904,100) (4,880)
Dividend reinvestment plan 40,840 1,000
Other 1,665 40
December 31, 2005 68,225,435 374,231
Converted from Class A 1,650
Issued under Employee
Share Purchase Plan 126,956 2,894
Stock options exercised 166,800 3,071
Dividend reinvestment plan 35,416 688
Other 2,675 55
68,558,932 380,939
Reduction for RSU Trust
shares (note 9(g)) (1,236)
December 31, 2006 68,558,932 $379,703

54
TORSTAR CORPORATION
Totals
The total Class A and Class B shares outstanding at December
31 were:
Shares Amount
2005 78,141,877 $376,925
2006 78,473,724 $382,397
An unlimited number of Class B shares is authorized. While the
number of authorized Class A shares is unlimited, the issuance of
further Class A shares, may under certain circumstances, require
unanimous board approval.
(c) Under normal course issuer bids, the company has not
repurchased any Class B shares during 2006 and the most
recent issuer bid expired May 5, 2006. Under normal course
issuer bids the company repurchased in 2005 904,100 Class
B shares for cancellation at an average price of $23.07 per
share for total consideration of $20,858,000. Retained earnings
were reduced by $15,978,000 representing the excess of the
cost of the shares repurchased over their stated value.
(d) Earnings per share
Basic earnings per share amounts have been determined by
dividing income by the weighted average number of Class A and
Class B shares outstanding during the year after deducting the
unvested shares held by the RSU Trust.
The treasury stock method is used for the calculation of the
dilutive effect of stock options and other dilutive securities. In
calculating diluted per share amounts under the treasury stock
method, the numerator remains unchanged from the basic per
share calculation as the assumed exercise of the company’s
stock options and employee share purchase plan does not
result in an adjustment to income. The reconciliation of the
denominator in calculating diluted per share amounts is as follows:
(thousands of shares) 2006 2005Weighted average number of
shares outstanding, basic 78,250 78,214
Effect of dilutive securities
– stock options 105 407
– unvested RSU shares 59
Weighted average number of
shares outstanding, diluted 78,414 78,621
Outstanding stock options totalling 4,063,545 (2005–1,798,662),
which are out of the money, have been excluded from the above
calculation of dilutive securities.
9. Stock-based compensation plans
(a) Stock option plan
Eligible senior executives may be granted options to purchase
Class B shares at an option price which shall not be less than
the closing market price of the shares on the last trading day
before the grant. Prior to January 1, 2003, non-executive directors
were also eligible to be granted options.
The maximum number of shares that may be issued under the
stock option plan is 12,500,000, and the number of shares
reserved for issuance to insiders cannot exceed 10% of the
outstanding shares. The term of the options shall not exceed
ten years from the date the option is granted. Up to 25% of an
option grant may be exercised twelve months after the date
granted, and a further 25% after each subsequent anniversary.
Options to purchase 10,993,304 shares have been granted as
of December 31, 2006.
(b) A summary of changes in the stock option plan is as follows:
Weighted average
Options exercise price
January 1, 2005 4,936,962 22.63
Granted 643,531 22.00
Exercised (421,850) (19.89)
Forfeited or expired (20,175) (24.85)
December 31, 2005 5,138,468 $22.77
Granted 583,956 22.14
Exercised (166,800) (18.30)
Forfeited or expired (167,479) (24.22)
December 31, 2006 5,388,145 $22.80
As at December 31, 2006, outstanding stock options were as follows:
Options Outstanding
Weighted WeightedRange of Number average averageexercise outstanding remaining exercise
price December 31, 2006 contractual life price
$15.75–18.05 341,100 2.2 years $17.35
$18.50–22.20 3,315,408 5.3 years $21.36
$25.00–29.01 1,731,657 4.1 years $26.61
$15.75–29.01 5,388,145 4.7 years $22.80

55
TORSTAR CORPORATION
Options Exercisable
WeightedRange of Number averageexercise exercisable exercise
price December 31, 2006 price
$15.75–18.05 341,100 $17.35
$18.50–22.20 2,333,720 $21.07
$25.00–29.01 1,355,967 $26.26
$15.75–29.01 4,030,787 $22.50
Subsequent to year-end, 502,797 stock options were granted
at an exercise price of $19.61 per share.
(c) Under the company’s annual employee share purchase plans,
employees may subscribe for Class B shares to be paid for
through payroll deductions over two-year periods at a purchase
price which is the lower of the market price on the entry date or
the market price at the end of the payment period. The value of
the shares that an employee may subscribe for is restricted to
a maximum of 20% of salary at the beginning of the two year
period. As at December 31, outstanding employee subscriptions
were as follows:
22006 2005
Maturing 2007 2008 2006 2007
Subscription price
at entry date $24.99 $21.86 $28.01 $24.99
Number of shares 126,563 154,801 148,392 155,028
(d) The company has recognized in 2006, compensation expense
totalling $3.2 million (2005 – $2.3 million) for the stock
options granted in 2003 to 2006, RSUs granted in 2006 and
the employee share purchase plans originating in 2004 to 2006.
In estimating the compensation expense for stock options
granted in 2003 to 2006, the company uses the Black-Scholes
options pricing model. The weighted average fair value of
the options on the date of grant and the assumptions used are
as follows:
2006 2005 2004 2003
Fair Value $3.08 $3.48 $5.52 $5.28
Risk-free interest rate 4.2% 3.7% 4.1% 4.1%
Expected dividend yield 3.3% 3.4% 2.4% 2.5%
Expected share price volatility 16.8% 20.7% 20.6% 23.2%
Expected time until
exercise (years) 5 5 5 5
(e) No compensation expense has been recognized for the grants
under the company’s stock-based compensation plans in 2002
and prior. Had compensation cost been determined for these
grants based on the fair value method of accounting for
stock-based compensation, the company’s 2005 net income
and earnings per share would have been reduced to the pro
forma amounts indicated below:
2005
Net income - as reported $118,843
- Pro forma $117,135
Earnings per share – Basic - as reported $1.52
- Pro forma $1.50
Earnings per share – Diluted - As reported $1.51
- Pro forma $1.49
The fair value of the executive stock options granted in 2002
was estimated to be $4.98 per option at the date of grant using
the Black-Scholes option pricing model with the assumptions of
a risk free interest rate of 4.7%, expected dividend yield of
2.6%, expected volatility of 24.7% and an expected time until
exercise of 5 years.
(f) The company has a Deferred Share Unit Plan (“DSU”), for
executives and non-employee directors.
An executive may elect to receive certain cash incentive
compensation in the form of DSU units. Each unit is equal in
value to one Class B non-voting share of the company. The units
are issued on the basis of the closing market price per share of
Torstar Class B non-voting shares on the Toronto Stock
Exchange on the date of issue. The units also accrue dividend
equivalents payable in additional units in an amount equal to
dividends paid on Torstar Class B non-voting shares. DSU units
mature upon termination of employment, whereupon an executive
is entitled to receive the fair market value of the equivalent
number of Class B non-voting shares, net of withholdings, in cash.
The company has also adopted a DSU for non-employee directors.
Each non-employee director receives an award of DSU units as part
of his or her annual Board retainer. In addition, a non-employee
director holding less than 8,000 Class B non-voting shares,
Class A voting shares, DSU units, or a combination thereof,
receives the cash portion of his or her annual Board retainer in
the form of DSU units. Any non-employee director may elect to
participate in the DSU in respect of part or all of his or her
retainer and attendance fees. The terms of the director DSU are
substantially the same as the executive DSU.

56
TORSTAR CORPORATION
As at December 31, 2006, 264,076 units were outstanding at
a value of $5.2 million (December 31, 2005 – 160,316 units,
value $3.5 million). There were 14,994 units redeemed during
2006 at an average price of $21.25 per unit (December 31,
2005 – 14,947 units, average price $23.39 per unit).
The company has entered into a derivative instrument in
order to offset its exposure to changes in the fair value of units
issued under its DSU Plan. As at December 31, 2006, the
derivative instrument offset 252,813 units (December 31,
2005 – 149,880 units).
(g) During 2006, the company introduced an RSU Plan. Under the
plan, eligible senior executives are granted RSU awards to
receive Torstar Class B non-voting shares as part of their long-
term incentive compensation. The value of an RSU is equal in
value to a Torstar Class B non-voting share. RSUs vest after
three years at which time Torstar Class B non-voting shares will
be distributed to the participants. There were 105,187 RSUs
granted in January 2006 of which 91,570 remain outstanding
at December 31, 2006. Subsequent to year-end, 98,493
RSUs have been granted.
An employee benefit trust (“Trust”) has been established to
purchase the necessary Torstar Class B non-voting shares in
the open market. For accounting purposes, the Trust is treated
as a Variable Interest Entity and consolidated in the accounts
of the company. As a result, unamortized compensation
expense representing the related shares held by the RSU Trust
is presented as a reduction of the company’s share capital.
10. Income and other taxes
A reconciliation of income taxes at the average statutory tax
rate to actual income taxes is as follows:
2006 2005
Income before taxes $118,641 $194,343
Provision for income taxes based on
Canadian statutory rate of
36.1% (2005 – 36.1%) ($42,800) ($70,200)
(Increase) decrease in taxes resulting from:
Foreign income taxed at lower rates 3,900 5,500
Foreign losses not tax effected (4,500) (4,300)
Manufacturing and processing
profits allowance 900 1,800
Large Corporations tax and other taxes (1,800) (3,000)
Permanent differences 200 (5,300)
Reduction in future tax rates 4,600
($39,500) ($75,500)
Effective income tax rate 33.3% 38.8%
Income taxes of $54.6 million were paid during the year
(2005 – $75.5 million).
The components of the provision for income taxes are as follows:
2006 2005
Current tax provision $42,500 $63,600
Future tax provision (3,000) 11,900
Total tax provision $39,500 $75,500
Future income taxes reflect the net tax effects of temporary
differences between the carrying amounts of assets and
liabilities for financial reporting purposes and the amounts
used for income tax purposes. Significant components of the
company’s future income tax assets and liabilities as of
December 31 are as follows:
2006 2005
Current future income tax assets:
Receivables $16,549 $17,052
Other 6,453 4,578
$23,002 $21,630
Non-current future income tax assets:
Tax losses carried forward $39,763 $47,820
Post employment benefits 813 837
Other 3,706 1,445
$44,282 $50,102
Non-current future income tax liabilities:
Property, plant and equipment $39,187 $45,176
Post employment benefits 18,356 17,468
Goodwill and other 15,330 10,885
$72,873 $73,529
At December 31, 2006, the company had net operating loss
carryforwards of approximately U.S. $66.3 million for income
tax purposes for which no future tax asset has been recognized.
U.S. $35.0 million of the U.S. carryforward will expire in 2021
while U.S. $31.3 million will expire between 2023 and 2026.

57
TORSTAR CORPORATION
11. Acquisitions and investments
In the fourth quarter of 2006, the company acquired an
additional 10% of Workopolis from CTVgm which increases its
interest in Workopolis to 50%. The purchase has been
accounted for under the purchase method. The total purchase
price was $28.8 million and included intangible assets of
$20.7 million, future income tax liabilities of $2.4 million,
other assets of $0.2 million, current liabilities of $0.2 million
and $10.5 million allocated to goodwill. The intangible assets
identified included trade and domain names of $13.6 million,
customer relationships of $6.9 million and a non-compete
agreement of $0.2 million. The customer relationships and
non-compete agreement will be amortized on a straight-line
basis over 10 and 3 years respectively.
The company also completed a number of other acquisitions
during 2006 primarily of community newspapers and magazines
for a total purchase price of $4.7 million. These acquisitions
were accounted for under the purchase method and $4.7 million
has been allocated to goodwill. The company also made an
additional investment in Vocel, Inc. for $1.1 million which was
accounted for by the cost method.
Within the newspaper and digital segment, a number of
community newspaper acquisitions were completed during
2005. The acquisitions included newspapers in the Muskoka,
Huntsville, Parry Sound and Ottawa areas as well as the
purchase of Paton Publishing and the Toronto Wine and
Cheese Show. The total purchase price for these acquisitions
was $48.4 million and included $2.3 million of tangible
assets including $2.0 million of property, plant and equipment,
$11.3 million of intangible assets and $34.8 million allocated
to goodwill. These acquisitions were accounted for under the
purchase method and also include $2.5 million of contingent
purchase consideration based on future operating results. The
intangible assets identified consist of mastheads of $8.3 million
which have an indefinite life and other intangibles of $3.0 million
which primarily relate to advertiser relationships and have an
amortization period of 10 years.
Harlequin purchased in 2005 the assets of BET Books, the
publishing arm of Black Entertainment Television for a total
purchase price $5.0 million which included $1.5 million of
tangible assets, $0.2 million of intangible assets and
$3.3 million allocated to goodwill. This acquisition was
accounted for under the purchase method.
The company also made portfolio investments in 2005 of
$2.4 million in Vocel, Inc. and $3.6 million in LiveDeal Inc.
(LiveDeal.com). Vocel, Inc. is a wireless application publisher
with whom Harlequin has signed a licensing agreement.
LiveDeal.com is a growing localized online classifieds provider
that has been operating in the U.S. since 2003. These portfolio
investments were accounted for by the cost method.
With respect to the 2003 purchase of the remaining 49%
interest in Transit Television Network, the purchase included a
contingent purchase price based on future operating results.
The consideration for each acquisition was cash. The amount
of goodwill that is expected to be deductible for tax purposes
is $2.0 million (2005 – $3.9 million).
12. Employee future benefits
The company maintains a number of defined benefit plans
which provide pension benefits to its employees in Canada
and the United States. The company also maintains defined
contribution plans in Canada, the United States and in certain
overseas operations of Harlequin. Post employment benefits
other than pensions are also available to employees, primarily
in the Canadian newspaper operations, which provide for various
health and life insurance benefits.

58
TORSTAR CORPORATION
Information concerning the company’s post employment benefit plans as at December 31 is as follows:
Pension Plans Post Employment Benefit Plans
2006 2005 2006 2005
Accrued benefit obligations
Balance, beginning of year $714,136 $599,644 $67,839 $60,082
Current service cost 19,000 14,904 986 752
Interest cost 36,035 35,366 3,370 3,416
Benefits paid (34,670) (24,717) (2,394) (2,374)
Actuarial losses (gains) 3,529 65,372 (9,813) 5,754
Participant contributions 7,675 7,404
Past service costs 2,683 16,553
Foreign exchange (7) (390)
Special termination benefits 867
Acquisitions 209
Balance, end of year $749,248 $714,136 $59,988 $67,839
Plans’ assets
Fair value, beginning of year $671,495 $569,299
Return on plan assets 82,659 90,511
Benefits paid (24,072) (24,717)
Contributions to plan 19,513 36,662
Foreign exchange (5) (260)
Fair value, end of year $749,590 $671,495
Funded status – surplus (deficit) $342 ($42,641) ($59,988) ($67,839)
Unamortized losses 82,036 117,678 5,192 15,642
Unrecognized prior service costs 24,191 23,878 193 209
Accrued benefit asset (liability) $106,569 $98,915 ($54,603) ($51,988)
Recorded in:
Other assets $122,620 $116,728
Other liabilities (16,051) (17,813) ($54,603) ($51,988)
Accrued benefit asset (liability) $106,569 $98,915 ($54,603) ($51,988)
Net benefit expense for the year
Current service cost $19,000 $14,904 $986 $752
Interest cost on benefit obligation 36,035 35,366 3,370 3,416
Actual return on plan assets (82,659) (90,511)
Actuarial loss (gain) on benefit obligation 3,529 65,372 (9,813) 5,754
Past service costs 2,683 16,691
Excess of actual return on plan
assets over expected return 35,156 50,495
Difference between net actuarial loss
recognized and actual actuarial
loss on benefit obligation 568 (61,247) 10,398 (6,039)
Difference between recognized and
actual past service costs (311) (14,718) 16
Special termination benefits 867
Net benefit expense $14,868 $16,352 $4,957 $3,883

59
TORSTAR CORPORATION
Long-term liabilities includes $14.3 million related to an unfunded executive retirement plan which is supported by an outstanding letter
of credit of $25.2 million at December 31, 2006.
The effect of a one percent increase or decrease in significant assumptions used for the company’s pension and post employment benefit
plans would result in an increase (decrease) in the net benefit expense and accrued benefit obligation at December 31, 2006:
Pension Plans Post Employment Benefit Plans
2006 2005 2006 2005
Significant assumptions used
To determine benefit obligation at end of year:
Discount rate 5.0% 5.0% 5.0% 5.0%
Rate of future compensation increase 3.0% to 3.5% 3.0% to 3.5% N/A N/A
To determine benefit expense:
Discount rate 5.0% 5.75% 5.0% 5.75%
Expected long-term rate of
return on plan assets 7.0% 7.0% N/A N/A
Rate of future compensation increase 3.0% to 3.5% 3.0% to 3.5% N/A N/A
Health care cost trend rates at end of year:
Initial rate N/A N/A 10.0% 9.5%
Ultimate rate N/A N/A 5.0% 5.0%
Year ultimate rate reached N/A N/A 2017 2014
Average remaining service life
of active employees 7 to 17 years 7 to 17 years 15 years 15 years
Net Benefit Expense Accrued Benefit Obligation
1% Increase 1% Decrease 1% Increase 1% Decrease
Pension plans:
Discount rate ($6,797) $11,047 ($92,908) $106,806
Expected long-term rate of
return on plan assets (6,773) 6,777
Rate of compensation increase 2,798 (2,615) 12,520 (11,938)
Post employment benefits plans:
Discount rate (443) 435 (6,684) 7,547
Per capita cost of health care 473 (441) 3,329 (3,149)
Pension plan assets, measured as at December 31, are as follows:
2006 2005
Equity investments 68% 65%
Fixed income investments 32% 35%
Total 100% 100%
The company measures the accrued benefit obligations and the fair value of the Plans’ assets for accounting purposes as at December 31
of each year. The most recent actuarial valuation of the Plans’ for funding purposes was performed as at December 31, 2005 and the next
required valuation will be as at December 31, 2008.
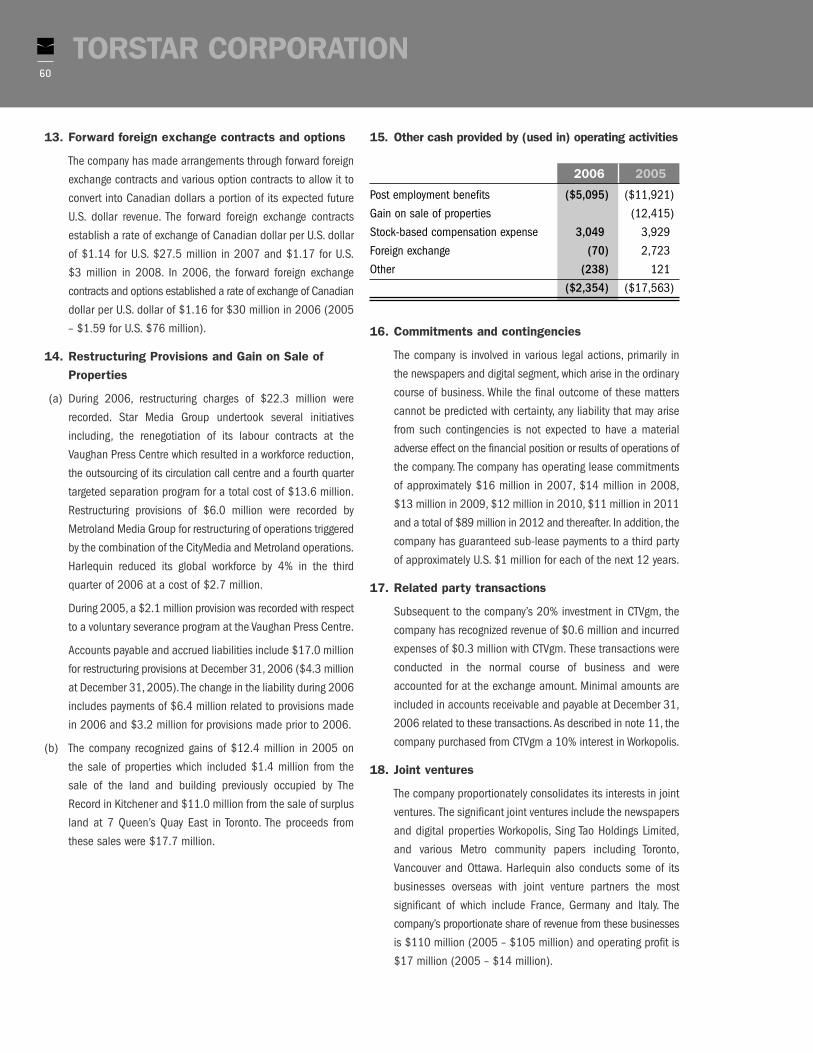
60
TORSTAR CORPORATION
13. Forward foreign exchange contracts and options
The company has made arrangements through forward foreign
exchange contracts and various option contracts to allow it to
convert into Canadian dollars a portion of its expected future
U.S. dollar revenue. The forward foreign exchange contracts
establish a rate of exchange of Canadian dollar per U.S. dollar
of $1.14 for U.S. $27.5 million in 2007 and $1.17 for U.S.
$3 million in 2008. In 2006, the forward foreign exchange
contracts and options established a rate of exchange of Canadian
dollar per U.S. dollar of $1.16 for $30 million in 2006 (2005
– $1.59 for U.S. $76 million).
14. Restructuring Provisions and Gain on Sale ofProperties
(a) During 2006, restructuring charges of $22.3 million were
recorded. Star Media Group undertook several initiatives
including, the renegotiation of its labour contracts at the
Vaughan Press Centre which resulted in a workforce reduction,
the outsourcing of its circulation call centre and a fourth quarter
targeted separation program for a total cost of $13.6 million.
Restructuring provisions of $6.0 million were recorded by
Metroland Media Group for restructuring of operations triggered
by the combination of the CityMedia and Metroland operations.
Harlequin reduced its global workforce by 4% in the third
quarter of 2006 at a cost of $2.7 million.
During 2005, a $2.1 million provision was recorded with respect
to a voluntary severance program at the Vaughan Press Centre.
Accounts payable and accrued liabilities include $17.0 million
for restructuring provisions at December 31, 2006 ($4.3 million
at December 31, 2005). The change in the liability during 2006
includes payments of $6.4 million related to provisions made
in 2006 and $3.2 million for provisions made prior to 2006.
(b) The company recognized gains of $12.4 million in 2005 on
the sale of properties which included $1.4 million from the
sale of the land and building previously occupied by The
Record in Kitchener and $11.0 million from the sale of surplus
land at 7 Queen’s Quay East in Toronto. The proceeds from
these sales were $17.7 million.
15. Other cash provided by (used in) operating activities
2006 2005
Post employment benefits ($5,095) ($11,921)
Gain on sale of properties (12,415)
Stock-based compensation expense 3,049 3,929
Foreign exchange (70) 2,723
Other (238) 121
($2,354) ($17,563)
16. Commitments and contingencies
The company is involved in various legal actions, primarily in
the newspapers and digital segment, which arise in the ordinary
course of business. While the final outcome of these matters
cannot be predicted with certainty, any liability that may arise
from such contingencies is not expected to have a material
adverse effect on the financial position or results of operations of
the company. The company has operating lease commitments
of approximately $16 million in 2007, $14 million in 2008,
$13 million in 2009, $12 million in 2010, $11 million in 2011
and a total of $89 million in 2012 and thereafter. In addition, the
company has guaranteed sub-lease payments to a third party
of approximately U.S. $1 million for each of the next 12 years.
17. Related party transactions
Subsequent to the company’s 20% investment in CTVgm, the
company has recognized revenue of $0.6 million and incurred
expenses of $0.3 million with CTVgm. These transactions were
conducted in the normal course of business and were
accounted for at the exchange amount. Minimal amounts are
included in accounts receivable and payable at December 31,
2006 related to these transactions.As described in note 11, the
company purchased from CTVgm a 10% interest in Workopolis.
18. Joint ventures
The company proportionately consolidates its interests in joint
ventures. The significant joint ventures include the newspapers
and digital properties Workopolis, Sing Tao Holdings Limited,
and various Metro community papers including Toronto,
Vancouver and Ottawa. Harlequin also conducts some of its
businesses overseas with joint venture partners the most
significant of which include France, Germany and Italy. The
company’s proportionate share of revenue from these businesses
is $110 million (2005 – $105 million) and operating profit is
$17 million (2005 – $14 million).

61
TORSTAR CORPORATION
19. Comparative financial statements
The comparative financial statements have been reclassified
from statements previously presented to conform to the
presentation of the 2006 financial statements.
20. Segmented information
The company operates two business segments: Newspapers
and Digital, and Book Publishing, which are described below.
Newspapers and Digital – Publishing of daily and community
newspapers including the Toronto Star, The Hamilton
Spectator, The Record (Kitchener, Cambridge and Waterloo)
and Metroland’s publications. This segment also includes the
related Internet, specialty publications (including magazines)
and commercial printing businesses of the newspapers as well
as the operations of Transit Television Network;
Book Publishing – Publishing and distribution of women’s fiction
through retail outlets, by direct mail and through the Internet.
Segment profit or loss has been defined as operating profit which
corresponds to operating profit as presented in the Consolidated
Statements of Income but before restructuring provisions.
SUMMARY OF BUSINESS AND GEOGRAPHIC SEGMENTS OF THE COMPANY:
Business Segments Operating Revenue Depreciation and Amortization Operating Profit
2006 2005 2006 2005 2006 2005
Newspapers and Digital $1,056,462 $1,035,816 $49,263 $49,042 $107,849 $120,288
Book publishing 471,808 521,072 7,162 7,719 56,277 95,381
1,528,270 1,556,888 56,425 56,761 164,126 215,669
Corporate 58 62 (18,475) (19,001)
Restructuring provisions (22,319) (2,119)
Consolidated $1,528,270 $1,556,888 $56,483 $56,823 $123,332 $194,549
Additions to Additions to GoodwillIdentifiable Assets Capital Assets & Intangible Assets
2006 2005 2006 2005 2006 2005Newspapers and Digital $1,159,390 $1,119,806 $34,186 $34,537 $35,711 $46,068
Book publishing 410,352 401,098 4,539 2,632 236 3,579
1,569,742 1,520,904 38,725 37,169 35,947 49,647
Corporate 15,411 17,160 32 51
Investment in associated businesses 416,320 23,618
Consolidated $2,001,473 $1,561,682 $38,757 $37,220 $35,947 $49,647
Geographic SegmentsCapital Assets
Operating Revenue and Goodwill
2006 2005 2006 2005Canada $1,079,363 $1,055,202 $774,067 $778,388
United States 251,971 297,000 101,358 100,100
Other (a) 196,936 204,686 27,762 27,652
Segment Totals $1,528,270 $1,556,888 $903,187 $906,140
(a) Principally – United Kingdom, Japan, Germany, Australia, Italy and France.

62
TORSTAR CORPORATION
ANNUAL OPERATING HIGHLIGHTS CONTINUING OPERATIONS
2 2006 2005 2004 2003 2002 2001 2000Operating revenue(thousands of dollars)Newspapers and Digital $1,056,462 $1,035,816 $1,003,473 $903,385 $856,956 $825,765 $857,989Book publishing 471,808 521,072 538,376 584,924 618,093 596,898 587,085Total $1,528,270 $1,556,888 $1,541,849 $1,488,309 $1,475,049 $1,422,663 $1,445,074
Operating profit & Income from continuing operations(thousands of dollars)Newspapers and Digital $107,849 $120,288 $127,601 $110,116 $105,495 $54,300 $98,814Book publishing 56,277 95,381 97,182 124,121 119,168 99,643 83,831Corporate (18,475) (19,001) (15,555) (14,166) (12,764) (10,773) (9,804)Restructuring provisions (22,319) (2,119) (8,399) (11,015) (13,000) (30,400)Operating profit 123,332 194,549 200,829 209,056 211,899 130,170 142,441Interest (20,761) (10,463) (10,916) (12,806) (12,751) (29,143) (41,283)Foreign exchange 70 (2,723) (1,723) (4,011) 973 392 (1,395)Income (losses) of associated businesses 16,000 565 496 134 504 (8,022) (6,202)
Gain (loss) on sale of assets 12,415 (3,883) 10,342 (5,924) (28,744) 54,815Unusual items 2,624 (28,800)Income before taxes 118,641 194,343 184,803 202,715 197,325 35,853 148,376Income and other taxes (39,500) (75,500) (72,100) (79,200) (72,000) (14,900) (47,200)Income from continuing operations before amortization of goodwill 79,141 118,843 112,703 123,515 125,325 20,953 101,176
Amortization of goodwill (net of tax) (17,973) (17,461)
Income from continuing operations $79,141 $118,843 $112,703 $123,515 $125,325 $2,980 $83,715
Cash from continuing operating activities $111,591 $124,140 $178,598 $162,976 $167,732 $91,711 $184,802
Average number of shares outstanding (thousands) 78,250 78,214 79,168 77,645 76,329 75,292 74,695
Per share DataIncome from continuing operations $1.01 $1.52 $1.42 $1.59 $1.64 $0.04 $1.12
Dividends – Class A and Class B shares 0.74 0.74 0.70 0.64 0.58 $0.58 $0.58
Rate of Return on RevenueOperating profit 8.1% 12.5% 13.0% 14.0% 14.4% 9.1% 9.9%
Return on equityCash from operating activities as a percentage of average shareholders’ equity 13.0% 15.2% 23.2% 23.5% 28.5% 15.4% 27.5%
Financial positionTotal Assets $2,001,473 $1,561,682 $1,510,027 $1,511,767 $1,480,721 $1,490,154 $1,755,764Long–term debt 724,193 334,317 317,829 387,800 448,390 508,848 494,477Shareholders’ equity 872,746 841,652 793,661 745,055 643,506 534,398 660,001Property, plant and equipment (net) 349,842 365,665 392,141 401,172 391,521 410,427 425,380

DAILY NEWSPAPERS DIGITAL
www.thestar.com
2
COMMUNITY NEWSPAPERSMetroland Media Group is Ontario’s leading publisher ofcommunity newspapers, publishing more than 100 commu-nity newspapers. Some of the larger publications include:
Ajax/Pickering News AdvertiserAurora/Newmarket Era-BannerBarrie AdvanceBracebridge ExaminerBrampton GuardianBurlington PostEtobicoke GuardianMarkham Economist & SunMississauga NewsNiagara This WeekOakville BeaverOshawa/Whitby This WeekPeterborough This WeekRenfrew MercuryRichmond Hill LiberalScarborough Mirror
SPECIALTY PRODUCTSEye WeeklyForever YoungReal Estate NewsCar GuideBoat GuideCity ParentPremier Consumer ShowsGold Book Directories10 Metroland Regional Internet Portals
INVESTMENTS
HARLEQUIN ENTERPRISESHarlequin is a leading publisher
of women’s fiction.
Harlequin Mills & Boon U.K.
Harlequin Australia
Harlequin Holland
Harlequin Japan
Harlequin Poland
Harlequin Scandinavia
Harlequin Spain
JOINT VENTURESHarlequin Brazil
Harlequin France
Harlequin Germany
Harlequin Greece
Harlequin Hungary
Harlequin Italy
TELEVISION INITIATIVES
Free Local Classifieds
TM
Project Direction: Don Blair
Creative Director: Lorne Silver
Art Director: Joan Blastorah
Graphic Design: Rudy Hurtado
Production Art Director: Darlene Dewell
Printing: Metroland Media Group
Photography: Ken Faught/Star Photography Team
Central Imaging: Maria Doyle
20062006

MARTIN E. THALLPresident and Chief Executive Officer,Thall Group of CompaniesDirector since 2002
J. SPENCER L ANTHIERCorporate DirectorDirector since 2002
JACK FULLERPast President,Tribute Publishing CompanyCorporate DirectorDirector since 2004
THE HONOURABLEFRANK IACOBUCCIChairman, Torstar Corporation,Former Justice of the Supreme Court of Canada Director since 2004
TRANSFER AGENT & REGISTRAR
CIBC Mellon Trust CompanyP.O. Box 7010 Adelaide Street Postal Station Toronto, Ontario M5C 2W9AnswerLine (416) 643-5500 or 1-800-387-0825 (toll-free in North America)
www.cibcmellon.com/[email protected]
Torstar Class B non-voting shares are tradedon the Toronto Stock Exchange under the symbol TS.B
CORPORATE OFFICE
One Yonge StreetToronto, Ontario Canada M5E 1P9Telephone: (416) 869-4010Fax: (416) 869-4183e-mail: [email protected]: www.torstar.com
BOARDOF DIRECTORS
MARTIN P. CONNELLPrivate InvestorDirector since 1990
CHRISTINA A.GOLDPresident and Chief Executive Officer, The Western Union CompanyDirector since 1998
CAMPBELL R. HARVEYProfessor,Fuqua School of Business,Duke UniversityDirector since 1992
SARABJIT S. MARWAHVice-Chairman andChief Administrative Officer,The Bank of Nova ScotiaDirector since 2003
DONALD BABICKPast President,Southam PublicationsCorporate DirectorDirector since 2004
JOHN A. HONDERICHSpecial Advisor to the Premier of Ontario on the Fiscal ImbalanceDirector since 2004

LORENZO DEMARCHIManaging Director,Corporate Development
GAIL MARTINVice-President of Finance
D. TODD SMITHTreasurer
RONALD W. OSBOURNEChairman,Sun Life Financial Inc. Director since 2003
JACK FULLERPast President,Tribune Publishing CompanyCorporate DirectorDirector since 2004
J. ROBERT S. PRICHARDPresident and Chief Executive Officer,Torstar CorporationDirector since 2002
L ANCE R. PRIMISManaging Partner,Lance R Primis & Partners LLCDirector since 1997
PETER ARMSTRONGCorporate DirectorDirector since 2006
EL AINE BERGERCorporate DirectorDirector since 2006
OFFICERSTHE HONOURABLE FRANK IACOBUCCIChairman
J. ROBERT S. PRICHARDPresident andChief Executive Officer
DAVID P. HOLLANDExecutive Vice-Presidentand Chief Financial Officer
MARIE E. BEYETTEVice-President, GeneralCounsel and CorporateSecretary

Torstar Corporation is a broadly based media company. It was built on the foun-
dation of its flagship newspaper, the Toronto Star, which remains firmly commit-
ted to being a great metropolitan newspaper dedicated to observing and promot-
ing the principles of its long-time Publisher, Joseph Atkinson.
From this foundation, Torstar’s media presence has expanded through Metroland
Media Group, Star Media Group, and Torstar Digital, which together include more
than 100 newspapers, web-based businesses and related services, principally
based in southern Ontario. Torstar has also built a major presence in book publish-
ing through Harlequin, which is a leading global publisher of romance and woman’s
fiction, selling books in 26 languages in more than 100 international markets.
Torstar strives to be one of Canada’s premier media companies. Torstar and all of
its businesses are committed to outstanding corporate performance in the areas
of maximizing long-term shareholder value and returns, advancing editorial excel-
lence, creating a great place to work and having a positive impact in the commu-
nities we serve.
OURGOAL
20062006