
COMPANY - AnnualReports.com
133
John Fairfax Holdings Limited ABN 15 008 663 161 www.fxj.com.au > Diversification of publishing business > Circulation growth in major mastheads > Growth of Fairfax Digital > Acquisition of Trade Me Fairfax Media is being successfully reshaped for stronger earnings growth JOHN FAIRFAX HOLDINGS LIMITED ANNUAL REPORT 2006 BUILDING A DIGITAL MEDIA COMPANY
-
Upload
khangminh22 -
Category
Documents
-
view
3 -
download
0
Transcript of COMPANY - AnnualReports.com

John Fairfax Holdings Limited ABN 15 008 663 161 www.fxj.com.au
> Diversifi cation of publishing business
> Circulation growth in major mastheads
> Growth of Fairfax Digital
> Acquisition of Trade Me
Fairfax Media is being successfully reshaped for stronger earnings growth
JOHN FAIRFAX HOLDINGS LIMITED ANNUAL REPORT 2006
BUILDING A DIGITAL MEDIA COMPANY
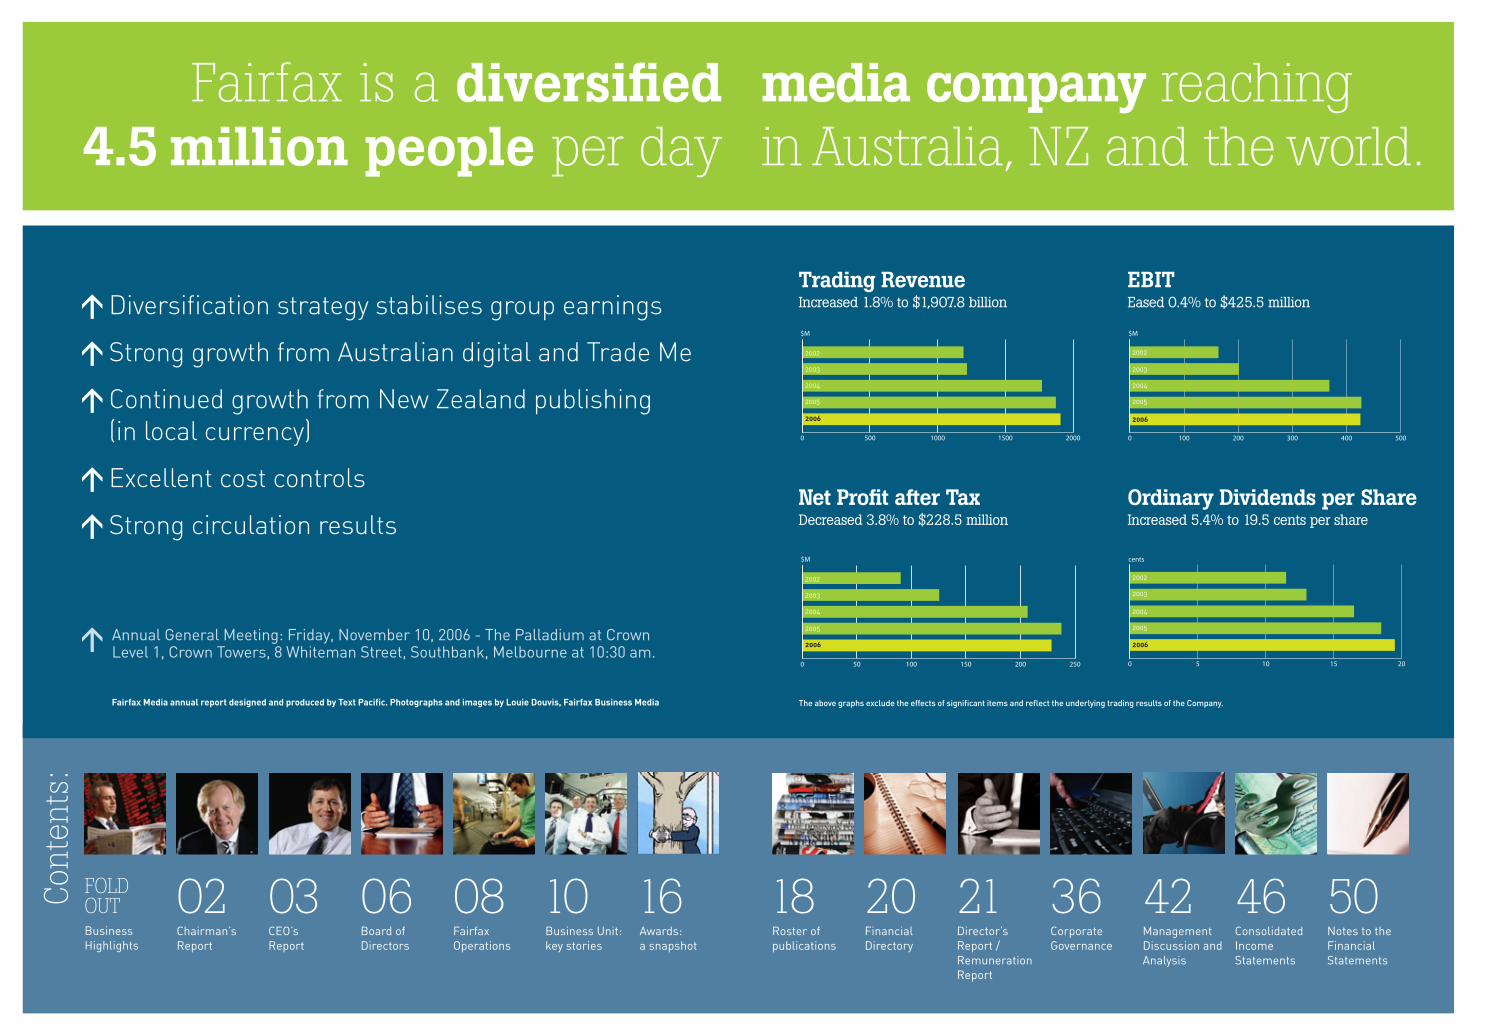
> Diversifi cation strategy stabilises group earnings
> Strong growth from Australian digital and Trade Me
> Continued growth from New Zealand publishing
(in local currency)
> Excellent cost controls
> Strong circulation results
Trading RevenueIncreased 1.8% to $1,907.8 billion
EBITEased 0.4% to $425.5 million
Net Profi t after TaxDecreased 3.8% to $228.5 million
Ordinary Dividends per ShareIncreased 5.4% to 19.5 cents per share
The above graphs exclude the effects of signifi cant items and refl ect the underlying trading results of the Company.
Cont
ents
:
FOLD OUT Business Highlights
02Chairman’sReport
03 CEO’s Report
08Fairfax Operations
10Business Unit: key stories
16Awards: a snapshot
06 Board of Directors
media company reaching in Australia, NZ and the world.
18Roster of publications
20Financial Directory
21Director’s Report / Remuneration Report
36Corporate Governance
42Management Discussion and Analysis
46Consolidated Income Statements
50Notes to the Financial Statements
Fairfax is a diversifi ed4.5 million people per day
0 100 200 300 400 500
2002
2003
2004
2005
2006
$M
0 50 100 150 200 250
2002
2003
2004
2005
2006
$M
0 5 10 15 20
2002
2003
2004
2005
2006
cents
0 500 1000
$M
1500 2000
2002
2003
2004
2005
2006
Annual General Meeting: Friday, November 10, 2006 - The Palladium at CrownLevel 1, Crown Towers, 8 Whiteman Street, Southbank, Melbourne at 10:30 am.
Fairfax Media annual report designed and produced by Text Pacifi c. Photographs and images by Louie Douvis, Fairfax Business Media
>

AFR268,000 readers every business day, and 180,000 on Saturdays: the most powerful and affl uent audience in newspapers in Australia.
268,000 readers
every business day
drive.com.auContesting the #1 position online with nearly 1 million users per month.
Verging on
1 MILLIONusers/month
Sydney Morning Herald12 months of circulation growth across all editions weekdays, Saturdays and Sundays
GROWTH in circulation across
all editions
smh.com.au and theage.com.auAustralia’s #1 news sites online, with over 3.5 million unique browsers per month
#1 news sites
online
Cuisine Magazine (NZ) Gold winner in Cannes as Best Media Food Magazine in the world
GOLD WINNER IN
CANNES
TradeMeIn a nation of 4 million people, 700,000 active users. 675,000 items for sale. Over 65% of domestic page views on the internet in New Zealand are on TradeMe.co.nz
65%of domestic pages
views in NZ
The Border Mail103 years of publication, the community leader in Albury-Wodonga.
OVER 100 YEARS
OF HISTORY
Sunday Star Times (NZ) Over 200,000 sales each Sunday – the biggest selling newspaper in New Zealand.
200,000 Sales each
Sunday
HIGHESTCIRCULATION
GROWTH
The AgeBest circulation growth of any metropolitan newspaper in Australia.
1.8 MILLIONreaders every
weekend
Good WeekendWith 1.8 million readers every weekend, the most successful weekly magazine in Australia

2 Fairfax Annual Report 2006
I am pleased to report to you, our
shareholders, that Fairfax Media is a
stronger, more dynamic and more
modern media company than at any
time in its history, and that we have an
extremely bright future as a leading
and growing media company.
We are a different company today,
embracing the technological drivers of the
21st century and harnessing them to the
quality, independent journalism for which
we are known and respected worldwide.
Fairfax Media is evolving into a truly digital
media company, with our content available
in print and online, on mobile devices and,
given the contours of future development
of our industry, Fairfax Media will lead the
way on other information, entertainment,
and commercial platforms.
This has been a year of challenge and
achievement. Notwithstanding diffi cult
economic conditions in the principal
geographies where we operate, we
have still been able to deliver to our
shareholders the highest dividend in
the history of this company.
Over the past year, your Board, together
with our excellent and capable
management, led by our CEO, David Kirk,
has engaged in a concerted strategy of
strategic expansion in new and traditional
media. David’s fi rst year with us has been
one of strong success.
Trade Me, founded and developed by an
exceptional entrepreneur, Sam Morgan,
is an outstanding acquisition. Trade Me
has a position in the market that is
unreplicated in any other country,
and it will be a generator of signifi cant
revenues and profi ts in the years ahead.
We purchased The Border Mail, one of
the most successful and distinguished
regional newspapers in the country.
We are moving forward aggressively with
our Fairfax Digital businesses in new
areas of opportunity.
Fairfax Media will continue to expand
its information, commercial and
entertainment services.
Our publications across Australia and New
Zealand are stronger than ever, and are
authoritative, lively and more entertaining
publications that are closely connected
with the communities they serve.
Our Board is totally focused on
shareholder wealth and return on
investment. The Fairfax Media Board
is working as one, cognisant always of
our strategic direction and the role
Fairfax Media will play in the future.
With shareholder value paramount,
the Board is especially pleased to have
declared a fi nal dividend of 11.5 cents
per share, fully franked, bringing the total
dividends for the year to 19.5 cents, fully
franked. This is an increase of 5% over
the ordinary dividends paid last year,
and represents a payout ratio of 80%,
notwithstanding the cyclical downturn
in trading conditions that the company
experienced.
I am proud to say that Fairfax Media’s
future is extremely bright, given the
unlimited horizons of the digital world
of the 21st century.
Last year, I pledged that, during my watch
as Chairman, I was committed to enhancing
Fairfax’s leading position in the industry
by building on our achievements over the
past several years in which we strengthened
our business in Australia and extended it
to New Zealand. I said that we want to
pursue options for future growth consistent
with our commitment to shareholder value.
Over this past year, we have taken
important steps along that road.
In this challenging world of information
and entertainment services, we face a
very exciting future with confi dence.
I look forward to seeing you and speaking
with you at the Annual General Meeting.
> Chairman’s Report
Looking ahead to growthChairman Ronald Walker shares his view on the dynamic approach Fairfax Media has taken to the market.

Fairfax Annual Report 2006 3
Reading between the linesThe past year has seen signifi cant change within Fairfax Media, new CEO David Kirk talks strategy and answers your questions – where to from here?
Chief Executive Offi cer’s Report >
Q. Based on this past year, what is the road ahead?
We have performed well in a challenging
environment. What is clear is that Fairfax
Media is being successfully reshaped for
stronger earnings growth in the medium
term. Our aim is steady growth in
publishing and rapid growth in our
internet businesses.
Growth in publishing will be achieved by
continued diversifi cation into regional,
business and magazine publishing;
further alignment of the cost base; and
strong circulation and readership that
help drive advertising revenues.
We made excellent progress against
these objectives over the past year.
In Publishing:
> We have defi nitely led the news in
print and online in Melbourne and
Sydney, and often nationally in both
Australia and New Zealand.
> We acquired The Border Mail, The
Rodney Times, The Independent
Financial Review, and launched Travel
+ Leisure and AFR Smart Investor.
> Growth in publishing costs was fi rmly
under control.
> We had signifi cant circulation and
readership gains in all our major
mastheads.
And in Digital:
> The rapid growth of our internet
businesses is changing the overall
growth and earnings profi le of the
company.
> We have leading positions in news and
information, in online personals and
holiday accommodation, cars, and we
are a strong second in employment
and real estate.
> Trade Me is already showing itself
to be an excellent acquisition for the
company. Trade Me Jobs was just
launched and it is already beating
our expectations.

4 Fairfax Annual Report 2006
Q. What are Fairfax Media’s key strengths?
There are several. First our values, and
what we stand for in terms of our role of
promoting a free and independent press
in a democratic society. Second, our
heritage, which has built reservoirs of
enormous trust over 175 years. Third,
our mastheads and brands, which are
renowned for journalism that stands for
accuracy, excellence, quality, and
integrity. Fourth, our online position,
which is one of the strongest of any
publishing group in the world. We have
digital newsrooms that enable us to
leverage our superb journalism over
multiple distribution channels.
Fairfax Media also has very strong
cash fl ows, which allows us to pay
high dividends and reinvest for growth.
Q. What do you worry about?
Let me tell you fi rst what I don’t worry
about. I don’t lose sleep over the current
economic cycles in NSW or New Zealand
where the conditions are currently soft.
I have faith in the long term growth
prospects of both economies. I don’t
worry about Trade Me and the price we
paid for it and how it is performing.
It’s doing great.
What concerns me most is how we
adapt the business – how we move
quickly enough – to understand the
evolution of our customers’ needs,
and then adapting our publications
and products to those needs.
I also want to be as effective as
I can in communicating with the
whole organisation, and providing
a clear path for us all to move
forward together.
> Chief Executive Offi cer’s Report
“ our values... are the key to the success
of our enterprise: integrity, independence,
honesty, and commitment to quality
journalism.” David Kirk
Expansion for Fairfax Media NZ
The Warkworth-based Rodney group is strategically situated in the New Zealand
media scene, based in a burgeoning growth area just north of Auckland. It was
owned for three generations by the Cook family.
The Independent was a privately-owned weekly business newspaper and since
acquisition has been renamed the Independent Financial Review.
Its acquisition demonstrates Fairfax Media’s commitment to, and competency in,
quality business journalism. The newspaper has been relaunched and now includes
content sourced from the Australian Financial Review. It operates alongside the
Fairfax Media BusinessDay daily newspaper publications in New Zealand, and utilises
synergies which draw on the best of Australasian business journalism.
Highlights for Fairfax Media in New Zealand have been two acquisitions, the Rodney Times community newspaper group and the Independent, both previously owned by independent publishers.

Fairfax Annual Report 2006 5
Fairfax Business Media Launches AFR Access
Chief Executive Offi cer’s Report >
In June this year The Australian Financial Review launched AFR Access (www.afraccess.com) – a new digital toolkit for the retail investor.
Q. And what about the year ahead?
I have consistently stated that the fi rst
two objectives of our strategy are to
defend and grow our newspaper
businesses, and to build the leading
portfolio of internet businesses.
There is also a third major objective:
developing Fairfax into a genuinely
integrated digital media company. How
we diversify and build the business is
one part of it.
But we are also now referring to ourselves
as Fairfax Media.
Fairfax Media is a better name that better
refl ects not only what we do, but how we
conceive of our company and our mission
in the 21st century.
Q. Has Fairfax Media been what you expected so far?
There have been no major surprises. I
have followed the company for years, and
long admired what it stands for and the
role it plays in democratic society in
Australia and New Zealand. I have had to
learn a lot – about the media, the markets,
and the guts of the operating businesses,
but there have been no major surprises.
We have an excellent management team,
and we work well together. The Board has
been fully supportive, and is focused on
the prime longterm issues of growth and
shareholder returns.
Q. Why will Fairfax Media be successful?
We will be successful, fi rst, because we
have a clear strategy; second, because
we have the will and capability to
execute it; and third, because we are
aligned and committed as an organisation
to succeed. We know we have to adapt
ourselves to consumer and technological
changes, but also that the fundamentals
of good journalism and editing, and
the integrity that stands behind them,
are timeless. We understand that the
liveliness and the connectedness of our
newspapers with the communities we
serve is critical.
Q. Where will the Fairfax Media be in fi ve years?
I’m often asked that question. I believe
newspapers will be with us for decades
to come. Five years from now, Fairfax will
still be a very successful newspaper
company, with strong brands and
mastheads. It will also be a signifi cantly
bigger internet company. We will be
distributing our content over more media.
But our values will be unchanged, and they
are the key to the success of our enterprise
integrity, independence, honesty, and
commitment to quality journalism.
As a company, we will be more innovative
and risk-taking, and more collaborative.
We will think of ourselves more as a digital
media company. I believe we will have
more scale, and be more diversifi ed.
So, when people ask if I am optimistic
about Fairfax Media’s future, I certainly
am, and you can see why.
“AFR Access is unique. The fi rst of
its kind in the world, AFR Access
combines a range of renowned
information and data sources with
unprecedented search technology
and portfolio management tools to
deliver an incredibly powerful
resource for investors across
equities, commodities, property
and managed funds,” says Fairfax
Business Media’s Publisher,
Michael Gill.
The product is the result of over 18
months of development and extensive
research by Fairfax
Business Media on how
it could truly harness
the potential of digital
technology and deliver an innovative
new resource for investors.
AFR Access is a research application
rather than a website and has
been designed to serve a different
purpose to The Australian Financial
Review. Our web-based product will
complement the strengths and
reputation of the newspaper, while
offering readers new fl exible options
of tailoring and interacting with
the digital content.
With access to over 20 different
sources, including the The Australian
Financial Review, Australian Stock
Exchange, The Wall Street Journal®,
Reuters, IBISWorld, Aspect Huntley,
Morningstar and more, AFR Access
allows the investor to easily receive the
information they want in the one place.

6 Fairfax Annual Report 2006
Mr Ronald Walker AC CBE
Non-Executive Chairman[Joined the Board 4 February 2003]
Mr Walker has been a prominent
businessman in Australia for more than
30 years and was Lord Mayor of
Melbourne from 1974 to 1976, having
served two terms. He was founder and
chairman of one of Australia’s largest
private chemical companies between
1963 and 1976, was co-founder, director
and major shareholder of Hudson
Conway Limited, and co-founder and
major shareholder of Crown Casino
Limited. Mr Walker is an alternate
Director of Scarborough Minerals plc.
He is Chairman of the Australian Grand
Prix Corporation, a Director of the
Football Federation Australia Limited,
and is a Member of the Formula One
Commission in the UK. Mr Walker was
Chairman of the Melbourne 2006
Commonwealth Games. He is Chairman
of the Microsurgery Foundation and
Chairman of the Australian Tissue
Engineering Centre.
Mr Mark BurrowsNon-Executive Deputy Chairman[Joined the Board 22 January 1996]
Mr Burrows is an investment banker,
a Managing Director of Lazard LLC
and Chairman of Lazard Australia,
Deputy Chairman of Brambles
Industries Limited, a Director of
Burns Philp & Company Limited
and Carter Holt Harvey Limited (NZ).
Mr Burrows chaired the Companies
and Securities Advisory Committee
from 1989 to 1994 and was one of the
principal participants in the creation
of the Australian Securities
Commission (now ASIC).
Mr Roger Corbett AM
Non-Executive Director[Joined the Board 4 February 2003]
Mr Corbett has been involved in the
retail industry for more than 40 years.
In 1984 Mr Corbett joined the Board
of David Jones Australia as Director of
Operations. In 1990 he was appointed to
the Board of Woolworths Limited and to
the position of Managing Director of BIG
W. Mr Corbett was appointed Chief
Executive Offi cer of Woolworths Limited
in 1999. He is a Member of the Board of
the Reserve Bank of Australia.
Mr David EvansNon-Executive Director[Joined the Board 22 June 2005]
Mr Evans has over three decades of
experience in the television industry
in Australia, the US and the UK. He was
> Board of Directors

Fairfax Annual Report 2006 7
recently appointed to the senior
executive team at RHI Entertainment,
in charge of New Media and Channel
Development. Prior to taking up his
position at RHI Entertainment, he was
President and CEO of Crown Media
Holdings, Inc, the owner of Hallmark
Channels in the USA. Mr Evans has
also served as President and CEO of
Tele-Communications International,
Inc. and as Executive Vice President
of News Corporation, responsible for
establishing its DTH service in Latin
America. In the 1990s, Mr Evans was
President and Chief Operating Offi cer
of Fox Television after working for
British Sky Broadcasting. In the 1980s,
Mr Evans served seven years as the
Chief Executive Offi cer of GTV Channel
Nine in Melbourne.
Mrs Julia KingNon-Executive Director[Joined the Board 17 July 1995]
Mrs King has had more than 30 years’
experience in media marketing and
advertising. She was Chief Executive of
the LVMH fashion group in Oceania and
developed the businesses in this area.
Prior to joining LVMH she was the
Managing Director of Lintas Advertising.
She has been on the Australian
Government’s Task Force for the
restructure of the Wool Industry, the
Council of the National Library and the
Heide Museum of Modern Art. Mrs King
is a director of Servcorp Australian
Holdings Pty Limited, Opera Australia,
Carla Zampatti Limited and is the
Executive Chairman of Retail Cube
Limited.
Mr David KirkExecutive Director and Chief Executive Offi cer[Joined the Board 18 November 2005]
Mr Kirk commenced as CEO of John
Fairfax Holdings Limited in October
2005. Prior to joining Fairfax, Mr Kirk
was the CEO and Managing Director of
PMP Limited, the largest magazine and
commercial printing and media services
company in Australia. Before this, he
was Regional President, Australasia for
Norske Skog, the world’s largest
manufacturer of newsprint and magazine
grades of paper. Mr Kirk previously
worked for Fletcher Challenge Paper
and Fletcher Challenge Energy in senior
executive roles in New Zealand and
Australia.
Prior to joining Fletcher Challenge,
Mr Kirk worked for three years as fi rst
Executive Assistant and then Chief
Policy Advisor to the Rt. Hon. Jim Bolger,
Prime Minister of New Zealand. Apart
from the business arena, he represented
New Zealand in rugby union from 1983-
1987 and captained the All Blacks in 1986
and 1987. In 1987, under his leadership
the All Blacks won the inaugural Rugby
World Cup. In 1987 he was awarded an
MBE for services to rugby. In 1987 he
took up a Rhodes Scholarship at Oxford
University, studying Philosophy, Politics
and Economics. His fi rst degree was
in Medicine.
Mr Peter YoungNon-Executive Director[Joined the Board 16 September 2005]
Mr Young has until recently served
as Chairman of Investment Banking
for ABN AMRO in Australia and New
Zealand. From 1998 to 2002, Mr Young
was Executive Vice Chairman, ABN AMRO
Group (Australia and New Zealand) and
Head of Telecommunications, Media &
Technology Client Management for Asia
Pacifi c. He is the Chair of EFIC, the
Federal Government’s Export Agency,
and is Chairman of Delta Electricity. He
is involved in several other community,
environmental and artistic activities.
Caption from left to right: Mr Peter Young, Mr David Evans, Mr David Kirk, Mrs Julia King, Mr Ronald Walker, Mr Mark Burrows, Mr Roger Corbett.
Board of Directors >

8 Fairfax Annual Report 2006
Fairfax Business MediaCirculation gains for the AFR
Profi t growth through editorial innovation
AFR Smart Investor relaunched with circulation growth
AFR Access launched.
> Fairfax Operations
Fairfax NSW Across the board newspaper circulation gains
SMH celebrates 175 years, and the Illawarra Mercury marks its 150th
Strong growth in regional newspapers
Upgrade at Beresfi eld printing plant.
Fairfax VICRevitalised editorial that sets the agenda
Best circulation and readership performance in Victoria
Outstanding fi nancial result for the community newspapers.
Key Information
> The major metropolitan mastheads, The Sydney Morning Herald and The Sun-Herald; regional newspapers The Herald in Newcastle and the Illawarra Mercury in Wollongong
> 22 community titles
> Fairfax General Magazine titles including GoodWeekend, SundayLife, the(sydneymagazine)
Key Information
> The major metropolitan mastheads The Age and The Sunday Age; regional newspapers The Border Mail in Albury-Wodonga and the Warrnambool Standard;
> 36 community titles
> Fairfax General Magazine titles including GoodWeekend, SundayLife, and theage(melbourne)magazine
Key Information
> Publishes the pre-eminent business and fi nance titles in Australia, including The Australian Financial Review, BRW, CFO, MIS, BOSS, AFR Smart Investor, inserted magazines AFR Magazine and AFR Sophisticated Traveller, and afr.com and the new premium afr.access investment tool. Fairfax Business Media readers are the most elite and infl uential in the country.

Fairfax Annual Report 2006 9
Fairfax Digital Revenue up 76%, and EBIT up 360%
Implementation of digital newsrooms
News and information sites, RSVP and Stayz all #1 in their categories.
Trademe.co.nz65% of all internet traffi c in NZ traverses Trademe.co.nz
1.3 million members – a third of the NZ population
#1 web business in New Zealand.
Key Information
> New Zealand’s largest media company.
> These assets include nine daily newspapers including The Dominion Post and The Press; two national Sunday papers, The Sunday Star-Times and the Sunday News; a stable of magazines, including Cuisine and NZ House and Garden, with particular strength in the lifestyle category; and a news and classifi eds internet operation, stuff.co.nz.
> Fairfax New Zealand Ltd also publishes over 60 community newspapers throughout the country.
Key Information
> Fairfax Digital is Australia’s leading provider of online news and classifi eds. Comprising around 30 interactive sites which reach over 3.5 million visitors each month, Fairfax Digital provides incisive and constantly updated information on news, fi nance, business, IT, sport and entertainment – and features the online presence of some of Australia’s most prominent media brands such as smh.com.au and theage.com.au.
Key Information
> Trade Me Jobs launched in August 2006
> The Trade Me auctions and advertising site in New Zealand is expected to host over 35 million auctions this year.
> Trade Me has the leading motors and property classifi ed sites, as well as sites for dating, community and rental accommodation.
Fairfax Media (NZ)Acquisition of Rodney Times and The Independent
Sunday Star-Times largest selling newspaper in NZ
Revenue and profi t growth in diffi cult environment.

10 Fairfax Annual Report 2006
Trade Me Jobs gives employers and
recruiters the ability to list their jobs on
New Zealand’s most visited website.
Trade Me’s strategy is to reach more
people at a fraction of the price of the
other online employment services.
The Wellington based team used their
skill in website design to create an easy to
use site, meeting the needs of the New
Zealand market. They then integrated it
with the proven Trade Me platform that
over 1.3 million Kiwis already belong to.
Recruiters and job seekers have been
quick to arrive. In its fi rst week, Trade Me
Jobs received more unique visitors than
any other New Zealand jobs site.
This success draws on Trade Me’s
tremendous share of the Kiwi internet
market – Trade Me serves over 65% of all
domestic pages viewed in New Zealand.
Feedback from the recruitment industry
was immediate and overwhelmingly
supportive. On day one, Trade Me Jobs
already had supply agreements in place
with over 40 of the country’s leading
recruitment fi rms as well as several leading
corporates. Employers have also been
quick to list on Trade Me Jobs directly.
Trade Me expects to grow the online job
market in two ways – removing price
barriers for casual advertisers and
bringing passive job seekers to the site.
Lower casual pricing – around a third of
the price of the market leaders – is
making online advertising affordable for
smaller businesses. There is no charge
for jobseekers.
Importantly, with more traffi c than any
other New Zealand website, Trade Me
Jobs can connect employers and recruiters
with people who aren’t actively looking. In
a labour market where unemployment is
at near record lows, this creates
signifi cant opportunities for employers.
This is the third specialist website Trade
Me has launched in the past three years –
the other two (Motors and Property) –
both lead their respective markets.
Trade Me Jobs has steep growth targets,
but soon showed its potency, passing
5000 listings within its fi rst three weeks of
operation. This is in accord with the
remarkable success of Trade Me Motors
and Trade Me Property.
In its fi rst 12 months Trade Me Property
grew from 1,000 to 25,000 listings and is
now consistently the most visited real
estate website in New Zealand.
Trade Me Motors, launched in 2004, has
more automotive listings than any other
New Zealand website, and around 90% of
all New Zealand’s automotive web traffi c.
Trade Me Jobs Goes LiveTrade Me Jobs launched on 8 August 2006 right on target as had been promised when Fairfax Media acquired the online marketplace earlier in the year.
> Acquisitions: Trade Me
3,500
3,000
2,500
2,000
1,500
1,000
500
0
Apr
03
July
03
Oct
03
Jan
04
Apr
04
July
04
Oct
04
Jan
05
Apr
05
July
05
Oct
05
Jan
06
Apr
06
July
06
Trade Me Unique visitors per month up 23% (July 05 - July 06)
000’s

Fairfax Annual Report 2006 11
In July, Fairfax Media completed its
acquisition of The Border Morning Mail
Limited, publisher of leading regional
newspaper The Border Mail, by acquiring
100% of the shares of the company, for a
net consideration of $155 million.
David Kirk, CEO of Fairfax Media, said:
“Our acquisition of The Border Morning
Mail Limited represents further strategic
growth for Fairfax Media’s regional
publishing businesses in Australia. We
welcome its staff into our company, and
we will work together to continue The
Border Mail’s vigorous local news
reporting and participation in, and
commitment to, the greater Albury-
Wodonga region and its citizens.”
Don Churchill, Managing Director,
Victoria, who will have responsibility
for The Border Mail, said:
“The Border Mail is a great paper with
a proud 103-year history of serving
its communities. The business is well
managed, has a great team of people
and an excellent reputation for
independent reporting.
“The Border Mail publishes six days
a week with a circulation of 26,500
copies and is distributed throughout a
130 kilometre radius of Albury-Wodonga.
“As one of the most highly awarded
regional papers in Australia, it is
respected for its contribution to the
fi nancial well-being and growth of
the greater Albury-Wodonga region.
“This acquisition will signifi cantly
strengthen Fairfax Media’s regional
publishing presence in Victoria. It is part
of our growth strategy which has seen
acquisitions such as Text Media and the
growth of our 36 community papers in
Victoria, which now command a weekly
readership in excess of 2 million.
“This is a vote of confi dence in the future
of print and newspapers’ unique ability to
connect with their communities and is
consistent with our strategic plans for
ongoing readership and revenue growth.”
In a separate transaction, Fairfax Media
also acquired 100% of the shares in two
Melbourne based companies, The
Independent News Pty Limited and its
associate Melbourne Community
Newspapers Pty Limited, for a total
consideration of $15.1 million
Together, these two companies own 5
free weekly community publications with
a combined weekly circulation of around
190,000 plus tourism publications and an
additional 24.5% equity stake in Border
Mail Printing Pty Ltd (BMP) which,
together with the 51% share in BMP
previously held by BMM, lifts the Fairfax
Media stake in BMP to 75.5%.
Acquisitions: Border Mail >
Building on Over 100 Years of SuccessWith the acquisition of the Border Mail we have further enhanced our position as the publisher of the most successful and respected media outlets in Australia and New Zealand.
David Kirk (centre) with Cameron Thompson, Tony Whiting and Robert Mott of The Border Mail.

12 Fairfax Annual Report 2006
With this transaction, Fairfax becomes
the #1 IT publisher in the Pacifi c and
South East Asian region.
The relationship involves Fairfax licensing
IDG’s global IT content and mastheads for
the Singapore, Malaysia and New Zealand
markets and acquiring IDG’s publishing
assets in those markets. In the UK Fairfax
sold IDG its UK publishing assets
including MIS UK and the Market Base
database.
“With this transaction and through our
ongoing relationship with IDG, Fairfax
Media will continue to develop the world
class information service regional CIO’s
and IT professionals already receive from
the two companies,” said Michael Gill,
publisher and editor in chief, FBM.
“Likewise in New Zealand, Fairfax Media
will publish Computerworld, CIO, PC
World and NZ Reseller, giving it the most
comprehensive suite of products in the
local market. We will continue to invest in
the dedicated focus on New Zealand’s IT
sector which IDG has developed over
more than two decades.”
Fairfax Business Media Now the #1 IT Publisher in Asia-Pacifi cFairfax Business Media (FBM) recently concluded an extensive IT publishing relationship in
the Asia Pacifi c with International Data Group, the world’s largest technology media company.
> Business Unit: Fairfax Business Media
Fairfax Media moves to One Darling Island Pyrmont and will sell its Melbourne HQ
Fairfax Media will relocate its Sydney headquarters to a new building at
One Darling Island, Pyrmont. Fairfax will also sell its property at Spencer
Street, Melbourne and is assessing alternative premises for The Age and
its operations.
Ronald Walker, Chairman of Fairfax Media, said, “One Darling Island is a
new high-tech building for the new diversifi ed Fairfax of the 21st century.
We want our staff to have a fi rst class facility in which we can work together
as Australasia’s leading media company. Similarly, there are also exciting
developments ahead for The Age and our headquarters in Melbourne.”

Fairfax Annual Report 2006 13
Business Unit: Fairfax Digital >
Fairfax Digital Wins Website of the Year at PANPAFairfax Digital beat a fi eld of online
contenders to win website of the year,
based on the success of its “FIFA World
Cup Germany 2006” site section, a stand-
alone extension of news websites smh.
com.au and theage.com.au which ran
during the World Cup period.
The site incorporated a broad range of
compelling and engaging content such as
instant match results, interactive charts,
expert commentary direct from Germany,
photo galleries, a dedicated blog and an
interactive citizen journalism page for fans
to post comments, video and photographs
of their World Cup experiences.
It exceeded all set targets and
expectations to deliver a total of over 19
million page impressions, 695,000 unique
browsers a week and 690,000 video
streams. The sections that proved most
popular with users were the Aussie
Updates with a total of 8.4 million page
impressions and the photo galleries with
4.2 million page impressions.
PANPA judges praised the FIFA World
Cup Germany 2006 site section’s
technical effi ciencies, including ease of
use and application speed. They further
commended the creativity surrounding
the site’s Citizen Journalism section.
The Creatures campaign showcases
the interesting lifestyles and opinions
that best defi ne those people who read
The Sydney Morning Herald.
The campaign features the lives of
six ‘interesting creatures’ – Noteboom,
Wilhelmina, Mifamwe, Finbaar,
Persephone and Barnaby – all of whom
have very different lifestyles and
opinions, yet read The Sydney Morning
Herald because of the daily inspiration
it feeds them.
The campaign is aimed to engage its
target audience of key media agencies
and staff, with the thematic line:
“All Kinds Of Interesting Creatures
Read The Sydney Morning Herald.”
Work on the campaign began in late
2005 when readership fi gures confi rmed
that the audience of The Sydney Morning
Herald, which had predominantly
been categorised as an AB publication,
spanned wider than this core. It was felt
that Sydney Morning Herald readers were
more completely defi ned by their opinions
and attitudes as well as the traditional
demographic measure. They read The
Sydney Morning Herald because they
enjoy the varied and intelligent content
across its sections and magazines.
The Creatures have a lively home in
cyberspace www.interestingcreatures.
com.au, complete with profi les,
their interests and passions, networking
and blogs.
“All Kinds Of Interesting Creatures Read The Sydney Morning Herald”
A new campaign has been launched informing advertisers and media agencies that there’s more to the readers of The Sydney Morning Herald than they might have once thought.

14 Fairfax Annual Report 2006
> Business Unit: RSVP / The Illawarra Mercury
Mercury Named Paper of the YearThe Illawarra Mercury has been crowned the 2006 PANPA Newspaper of the Year It is the fi rst time the Mercury has won
the award, which attracts entries from
newspapers in Australia, New Zealand
and Asia.
A stunning achievement for the Mercury,
the paper also won two marketing
awards: for best branding campaign (its
150th anniversary campaign), and best
classifi ed advertising (for its Babies of
2005 publication).
The Mercury also was highly commended
in the best circulation strategy category.
Editor Simon Dulhunty said it was a
special moment in the history of the
Illawarra Mercury as the newspaper
celebrated its 150th anniversary.
“It takes a superior newspaper to win
the Newspaper Of The Year award – a
newspaper that is big, bold and brave,
but one that also listens to, and is in
touch with, its community.
“The people of the Illawarra are fortunate
to have an outstanding newspaper that is
produced by highly skilled and dedicated
staff at our Wollongong and Shellharbour
offi ces.”
Connecting PeopleRSVP is Australia’s most popular dating site.
Launched on St. Valentine’s Day 1997,
RSVP provides a fun, modern, safe and
personal way for singles to meet.
RSVP is committed to helping individuals
meet others for friendship and as
potential compatible partners, and is
proud of the part it has played in many
stories of romance. To date, the site has
resulted in 943 weddings and 157 babies…
and that’s just the ones we know of!
RSVP currently has 855,000 member
profi les on the site. The site is attracting
an average of 950 new members every
day. RSVP receives over 100 million page
impressions a month, with 30 million
RSVP profi le pages accessed monthly.
RSVP will celebrate its 10th anniversary
on Valentine’s Day next year.
RSVP will celebrate its 10th anniversary on Valentine’s Day next year.
Fairfax Annual Report 2006 15
Business Unit: Fairfax Digital >
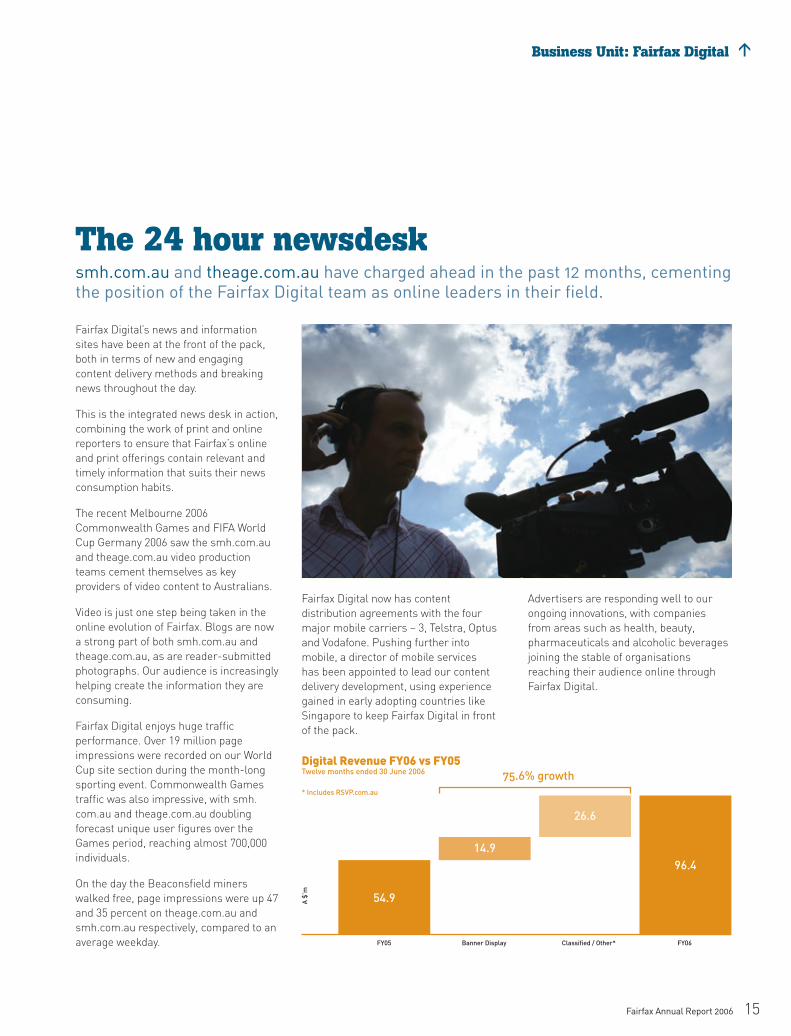
The 24 hour newsdesksmh.com.au and theage.com.au have charged ahead in the past 12 months, cementing the position of the Fairfax Digital team as online leaders in their fi eld.
Fairfax Digital’s news and information
sites have been at the front of the pack,
both in terms of new and engaging
content delivery methods and breaking
news throughout the day.
This is the integrated news desk in action,
combining the work of print and online
reporters to ensure that Fairfax’s online
and print offerings contain relevant and
timely information that suits their news
consumption habits.
The recent Melbourne 2006
Commonwealth Games and FIFA World
Cup Germany 2006 saw the smh.com.au
and theage.com.au video production
teams cement themselves as key
providers of video content to Australians.
Video is just one step being taken in the
online evolution of Fairfax. Blogs are now
a strong part of both smh.com.au and
theage.com.au, as are reader-submitted
photographs. Our audience is increasingly
helping create the information they are
consuming.
Fairfax Digital enjoys huge traffi c
performance. Over 19 million page
impressions were recorded on our World
Cup site section during the month-long
sporting event. Commonwealth Games
traffi c was also impressive, with smh.
com.au and theage.com.au doubling
forecast unique user fi gures over the
Games period, reaching almost 700,000
individuals.
On the day the Beaconsfi eld miners
walked free, page impressions were up 47
and 35 percent on theage.com.au and
smh.com.au respectively, compared to an
average weekday.
Fairfax Digital now has content
distribution agreements with the four
major mobile carriers – 3, Telstra, Optus
and Vodafone. Pushing further into
mobile, a director of mobile services
has been appointed to lead our content
delivery development, using experience
gained in early adopting countries like
Singapore to keep Fairfax Digital in front
of the pack.
Advertisers are responding well to our
ongoing innovations, with companies
from areas such as health, beauty,
pharmaceuticals and alcoholic beverages
joining the stable of organisations
reaching their audience online through
Fairfax Digital.
Digital Revenue FY06 vs FY05Twelve months ended 30 June 2006
* Includes RSVP.com.au
FY05
54.9
14.9
26.6
96.4
FY06Classifi ed / Other*Banner Display
75.6% growth
A $
’m

16 Fairfax Annual Report 2006
> Awards: a snapshot
Walkley Awards
> Hamish McDonald, The Sydney Morning Herald
Best Newspaper Feature Writing
> Andrew Dyson, The Age Best Cartoon
> Joe Armao, The Age Best Sports Photograph
> Amanda Hooton, Good Weekend Best Coverage of Sport
> Sahlan Hayes, Sydney Morning Herald
Nikon Walkley Photographic Portrait Award for 2005
Media Federation Awards 2005
> The Good Weekend, Best Media Owner Proposal
Cream of the CropFairfax Media, journalists, photographers, illustrators, online editors, and sales and advertising teams are recognised for excellence by their peers in Australia, New Zealand and internationally. Some of Fairfax Media’s leading award winners in 2006 are listed below.
Caxton Awards 2005
> The Good Weekend, Most Innovative Use of Newspaper
Magazines
Melbourne Press Club Quill Awards
> Christian Catalano, The Age Young Journalist of the Year
> Dan Silkstone and Royce Millar, The Age RACV Transport Quill
> Sushi Das, The Age Best Columnist
> Sandy Scheltema, The Age Best Features Photograph
> Mark Baker, The Age Best Headlines
> Bill Farr, The Age Best Page Layout
> Ron Tandberg, The Age Best Illustration
> The Age Online
Best Online Report
> Andra Jackson, The Age Best News Report in Print
> Gary Tippet, The Age Best Feature in Print
Media Connect Award for Best Communications Journalist 2006
> David Crowe, The Australian Financial Review
United Nations Media Peace Awards
> Jason South, The Age Best Photojournalist
> Karen Kissane, The Age Best Print Award
> The Sunday Age, Promoting Multicultural Issues, Australian Society of Travel Writers Award
> Lisa Allen, The Australian Financial Review

Fairfax Annual Report 2006 17
Trade Industry Award 2005
> Lisa Allen, The Australian Financial Review
European Union Qantas Journalism Award
> Tony Boyd, The Australian Financial Review
Women’s Electoral Lobby Award
> Catherine Fox, The Australian Financial Review
MediaConnect IT Journalism Awards 2006
> Emma Connors, The Australian Financial ReviewBest Feature Writer Award
> Helen Dancer
Best Consumer Technology Journalist
National Press Club of Australia 2006
> Jill Margo
Health Journalist of the Year, and Best Documentary Series in Health
> Adele Ferguson, Business Review Weekly, Quill Award for best business story in any medium
Sun Microsystems IT Journalism Awards 2006
> MIS Australia, Best Production Team
2005 WebAwards
> smh.com.au, Fairfax Digital Outstanding Achievement in Website Development (Standard of Excellence)
PANPA
> smh.com.au
website of the year
> Illawarra Mercury
Newspaper of the Year (15,000–50,000 circulation)
FAIRFAX MEDIA NEW ZEALAND
Qantas Print Media Awards
> THE PRESS Best NZ Newspaper, Best Daily Newspaper over 25,000, Best Newspaper Investigation
> SUNDAY STAR-TIMES
Best Weekly Newspaper
> Steve Braunias, Sunday Star-Times Qantas Fellow to Wolfsan College, Cambridge
> Tim Hume, Sunday Star-Times Junior and Senior Newspaper Feature Writer of the Year
> Tony Wall, Sunday Star-TimesBest Reporter
NZ Magazine Publishers Awards
> Rebecca Hayter, NZ Boating Supreme Award for Editor of the Year
People’s Choice NetGuide Web Awards
> TRADE ME
Best Trading Site, Best Online Shopping Site, Site of the Year
> STUFF
Best Media Site
Awards: a snapshot >

> Roster of Publications
Australian Publications
FAIRFAX METROPOLITAN, REGIONAL AND COMMUNITY NEWSPAPERS
Metropolitan Newspapers
> The Sydney Morning Herald> The Sun-Herald> The Age> The Sunday Age
Fairfax Regional Newspapers
– New South Wales
> The Newcastle Herald
> Illawarra Mercury
> Hunter Post > Newcastle/Lake Macquarie Post > Central Coast Sun Weekly> Port Stephens Examiner> Port Stephens Pink Pages> Maitland Pink Pages
> Wollongong Advertiser> Shellharbour Advertiser
Fairfax Regional Newspapers
– Victoria
> The Border Mail> The Warrnambool Standard
Fairfax Community Newspapers
– New South Wales
> The St George & Sutherland Shire Leader
> Cooks River Valley Times
> Camden Advertiser > Wollondilly Advertiser > Fairfi eld City Champion
> Liverpool City Champion > Bankstown-Canterbury Torch> Blacktown City Sun
> Parramatta Sun
> Penrith City Star
> St Mary’s Mt Druitt Star> Hills News> Northern News> Northern Beaches Weekender> South Western Rural Advertiser
> Auburn Review Pictorial> Western Rural Weekly (Bringelly)> Homes Pictorial> Property Focus> Property Showcase> Central Coast Homes Pictorial
Fairfax Community Newspapers – Victoria
> Melbourne Weekly Magazine> Melbourne Weekly Bayside> Emerald Hill Weekly> City Weekly> The Melbourne Times> Melbourne Times Northern Edition> Heidelberg Weekly> Knox Journal

Roster of Publications >
> Maroondah Journal > Yarra Ranges Journal > The Journal> Berwick & District Journal/Pakenham
Journal > Monash Journal > Whitehorse Weekly
> Macedon Ranges/Sunbury Telegraph> Werribee Banner > Moreland Community News> Moonee Valley Community News> The Altona Laverton Mail> The Mail> Williamstown Advertiser
> North-West Advocate> The Advocate
> Melton Express Telegraph
> Bacchus Marsh Express Telegraph> Whittlesea Weekly
> Valley Weekly
> Manningham Weekly
> Peninsular Journal Weekender> Hume Weekly (Inc. Broadmeadows/
Tullamarine edition)> Colac & Corangamite Extra> Frankston/Hastings Independent> Mornington and Southern
Peninsula Mail> Cranbourne Independent> Dandenong Independent> Chelsea, Mordialloc, Mentone
Independent
Fairfax General Magazines
> Good Weekend> Television> Sunday Life> the(sydney)magazine> theage(melbourne)magazine> Travel + Leisure> Uncorked> Drive
FAIRFAX BUSINESS MEDIA
> The Australian Financial Review> The Australian Financial Review –
Weekend Edition> AFR Access> afr.com> AFR Magazine> AFR Smart Investor> AFR Sophisticated Traveller> Asset> AFR Boss> BRW> CFO Australia> MIS Australia> MIS NZ> MIS Asia> Computerworld
> CIO> PC World> NZ Reseller
Fairfax Digital > smh.com.au> theage.com.au> rugbyheaven.com> realfooty.com.au> monyemanager.com.au> tradingroom.com.au> domain.com.au> mycareer.com.au> RSVP.com.au> stayz.com.au> drive.com.au> tradingroom.com.au> cracker.com.au
New Zealand Publications
Metropolitan Newspapers
> The Dominion Post> The Christchurch Press
> Waikato Times
Provincial Newspapers
> The Manawatu Standard> The Marlborough Express> The Nelson Mail> The Southland Times> Taranaki Daily News> Timaru Herald
National
> Sunday Star-Times> Independent Financial Review> Sunday News> Turf Digest, Best Bets> New Zealand Truth
Community Newspapers
> Wellingtonian> Hutt News> Kapi-Mana News> Kapiti Observer> Horowhenua Mail> Upper Hutt Leader> Wairarapa News> Christchurch Mail> The Northern Outlook> Central Canterbury News> Central Districts Farmer> Feilding Herald> Rangitikei Mail> The Tribune> Kaikoura Star> Motueka Golden Bay News> The Nelson Leader> The Richmond-Waimea Edition> The Mirror
> Clutha Leader> Newslink> Taieri Herald> Otago Southland Farmer> The Bay Chronicle> Central Leader> Auckland City Harbour News> Eastern Courier> East & Bays Courier> Manukau Courier> Papakura Courier> Northern News> North Harbour News> North Shore Times> Norwest Newsbrief> Western Leader> Whangarei Leader> South Taranaki Star> North Taranaki Midweek> High Country Herald> Cambridge Edition> Franklin County News> North Waikato News> Hauraki Herald> Matamata Chronicle> East Waikato Country> Rural Delivery> Piako Post> Rotorua Review> South Waikato News> Ruapehu Press> Taupo Times> Rodney Times> The Coaster
Fairfax Magazines
> Autocar> Cuisine> New Zealand Gardener> NZ House & Garden> TV Guide> Boating New Zealand> New Zealand Fishing News> Fish & Game New Zealand> New Zealand Growing Today> New Zealand Horse & Pony> New Zealand Trucking> Truck & Machinery Trader
New Zealand Digital> trademe.co.nz> trademeproperty.co.nz> tradememotors.co.nz> trademejobs.co.nz> smaps.co.nz> fi ndsomeone.co.nz> oldfriends.co.nz> stuff.co.nz
Fairfax Annual Report 2006 19

21Directors’ Report/RemunerationReport
36Corporate Governance
42Management Discussion & Analysis Report
46Consolidated Income Statements
50Notes to the Financial Statements
47Consolidated Balance Sheets
48Consolidated Statements of Recognised Income and Expense
49Consolidated Cash Flow Statements
Notes to the Financial Statements1. Summary of Signifi cant Accounting Policies 502. Revenues 633. Expenses 644. Signifi cant Items 655. Income Tax Expense 656. Dividends Paid and Proposed and Finance Costs 667. Receivables 678. Inventories 679. Investments Accounted for using the Equity Method 6810. Available for Sale Investments 7011. Held to Maturity Investments 7012. Intangible Assets 7013. Property, Plant and Equipment 7314. Derivative Financial Instruments 76 15. Pension Assets 78 16. Deferred Tax Assets and Liabilities 8117. Other Financial Assets 8318. Payables 8319. Interest-bearing Liabilities 84 20. Provisions 86 21. Contributed Equity 87 22. Reserves 90 23. Retained Profi ts 91 24. Minority Interest 91 25. Earnings per Share 92 26. Commitments 93 27. Contingencies 94 28. Controlled Entities 95 29. Acquisition and Disposal of Controlled Entities 98 30. Business Combinations 9831. Employee Benefi ts 101 32. Remuneration of Auditors 103 33. Director and Executive Disclosures 104 34. Related Party Transactions 109 35. Notes to the Statement of Cashfl ows 110 36. Financial Risk Management and Financial Instruments Disclosures 111 37. Segment Reporting 11438. Events Subsequent to Balance Sheet Date 116 39. Transition to Australian Equivalents of IFRS 117
> Financial Directory
123Independent audit report
125Shareholder information
122Directors’ declaration
128Five Year Performance summary

Directors’ Report >
DirectorsThe directors of the Company at any time during the fi nancial
year or up to the date of this report are as follows. Directors held
offi ce for the entire period unless otherwise stated:
Mr Ronald Walker, AC, CBE
Non-Executive Chairman
Mr Mark Burrows
Non-Executive Deputy Chairman
Mr David Kirk
Executive Director and Chief Executive Offi cer
Appointed to the Board on 18 November 2005
Mr Roger Corbett, AM
Non-Executive Director
Mr David Evans
Non-Executive Director
Mrs Julia King
Non-Executive Director
Mr Peter Young
Non-Executive Director
Appointed to the Board on 16 September 2005
Mr Dean Wills, AO
Resigned from the Board on 26 August 2005
Mr Frederick Hilmer, AO
Resigned from the Board on 18 November 2005
A profi le of each director at the date of this report is included
on page 6 and 7 of this report.
Company SecretaryThe company secretary, Ms Gail Hambly, was appointed to the
position of Group General Counsel and Company Secretary in
1993. Before joining John Fairfax Holdings Limited she practised
as a solicitor at a major law fi rm. She has extensive experience
in commercial, media and communication law. Ms Hambly is
a member of the Media and Communications Committee for
the Law Council of Australia and a member of the Institute
of Chartered Secretaries and Administrators and Chartered
Secretaries Australia. She holds degrees in Law, Economics,
Science and Arts.
Corporate structureJohn Fairfax Holdings Limited is a company limited by shares
that is incorporated and domiciled in Australia.
Principal activitiesThe principal activities of the consolidated entity during the course
of the fi nancial year were news, information and entertainment
publishing and advertising sales in newspaper, magazine and
electronic formats.
There were no signifi cant changes in the nature of the
consolidated entity during the year.
Consolidated resultThe consolidated profi t attributable to the consolidated entity
for the fi nancial year was $227,453,000 (2005: $263,249,000).
DividendsA fi nal fully franked dividend of 11.0 cents and a special fully
franked dividend of 5.0 cents per ordinary share and debenture
in respect of the year ended 30 June 2005 was paid on 11 October
2005. This dividend was shown as approved in the previous
annual report.
An interim fully franked dividend of 8 cents per ordinary share
and debenture in respect of the year ended 30 June 2006 was
paid on 12 April 2006.
The directors present their report together with the fi nancial report of John Fairfax Holdings Limited (the Company) and of the consolidated entity, being the Company and its controlled entities for the year ended 30 June 2006 and the auditor’s report thereon.
Fairfax Annual Report 2006 21

> Directors’ Report
22 Fairfax Annual Report 2006
Dividends (continued)Since the end of the fi nancial year, the Board has declared a fi nal fully franked dividend of 11.5 cents per ordinary share and
debenture in respect of the year ended 30 June 2006 to be paid on 6 October 2006.
Fully franked PRESSES dividends of $3.7304 and $3.7101 per PRESSES were paid on 13 June 2006 and 12 December 2005 respectively.
Review of operationsA review of the operations of the consolidated entity for the fi nancial year is set out on pages 8 to 15 of this report.
Signifi cant changes in the state of affairsSignifi cant changes in the state of affairs of the consolidated entity during the fi nancial year were as follows:
a) issue of 3,000,000 stapled preference shares on 23 March 2006 to partially fund the acquisition of Trade Me Limited
in New Zealand which occurred on 3 April 2006, for a purchase price of NZ$700 million.
b) issue of $200 million in medium term notes on 27 June 2006. Funds raised were used to repay existing debt.
Likely developments and expected resultsThe Company’s prospects and strategic direction are discussed in the Chairman’s and Chief Executive Offi cer’s reports on page 2
and 4 of this report.
Further information about likely developments in the operations of the consolidated entity and the expected results of those operations
in future fi nancial years has not been included in this report because disclosure of the information would be likely to result in
unreasonable prejudice to the consolidated entity.
Environmental regulation and performanceThe Company maintains its established practice of commissioning an independent expert to audit and report annually in respect of
environmental compliance. Recommendations resulting from these annual audits and reports have been, or are being, implemented.
No material non-compliance with environmental regulation has been identifi ed relating to the current year.
Events after balance date
CONVERSION OF PRESSESPRESSES were converted into 66,348,490 ordinary shares on 27 July 2006 in accordance with the terms of the PRESSES issue. The fi nal
fully franked PRESSES dividend of $0.8921 per share for the period 12 June 2006 to 26 July 2006 was paid on 4 August 2006. The dividend
paid totalled $2,230,250.
The PRESSES (FXJPA) were suspended from quotation on the Australian Stock Exchange on 19 July 2006.
ACQUISITION OF ENTITIES INCLUDING THE BORDER MORNING MAILThe consolidated entity has also gained control over the following entities:
Entity or business acquired Principal activity Date of Acquisition Ownership interest
The Border Morning Mail Limited Newspaper publishing 25 July 2006 100.0%
Border Mail Printing Pty Limited Printing facility 25 July 2006 75.5%
Melbourne Community Newspapers Pty Ltd Newspaper publishing 25 July 2006 100.0%
The Independent News Pty Limited Newspaper publishing 25 July 2006 100.0%
Consideration paid for the acquisition of Border Morning Mail Limited, including 51% of Border Mail Printing Pty Limited, consisted
of $135 million in cash and 4,858,517 ordinary shares at a price of $4.10 per share, for a net consideration of $155 million.
The Independent News Pty Limited, including 24.5% of Border Mail Printing Pty Limited held by Melbourne Community Newspapers
Pty Limited, were acquired for a total consideration of $15.1 million.

Directors’ Report >
Fairfax Annual Report 2006 23
Events after balance date (continued)
RELOCATION OF THE SYDNEY HEADQUARTERS AND SALE OF SPENCER STREET PREMISESOn 7 September 2006, the Company entered into a lease agreement to relocate the headquarters of the Company from Darling Park
to One Darling Island Pyrmont by mid 2007.
The Company also intends to sell its Spencer Street premises in Melbourne during the 2007 fi nancial year.
Remuneration ReportA remuneration report is set out on pages 27 and 35 and forms part of this Directors’ Report.
Directors’ InterestsThe relevant interest of each director in the equity of the Company, as at the date of this report is:
ORDINARY SHARES Opening Closing Post Year End Post Year End Post Year End Balance Acquisitions Disposals Balance Acquisitions Disposals Balance
MD Burrows 24,205 9,347 – 33,552 3,379 – 36,931
RC Corbett 13,748 7,305 – 21,053 2,365 – 23,418
D Evans – 6,456 – 6,456 2,028 – 8,484
FG Hilmer* 148,653 – – 148,653 – – n/a
JM King 32,230 7,106 – 39,336 2,196 – 41,532
DE Kirk – 100,000 – 100,000 108,108 – 208,108
RJ Walker 312,605 112,186 – 424,791 576,068 – 1,000,859
P Young – 4,369 – 4,369 2,365 – 6,734
DR Wills* 62,237 3,268 – 65,505 – – n/a
TOTAL 593,678 250,037 – 843,715 696,509 – 1,326,066
OPTIONS
PressesFG Hilmer* 180 – – 180 – (180) –
TOTAL 180 – – 180 – (180) –
* In the case of retired directors, the closing balance represents the number of shares at the date the director retired from the board.
All equity transactions with directors and specifi ed senior executives other than those arising from the exercise of remuneration options
have been entered into under terms and conditions no more favourable than those the Company would have adopted if dealing at
arm’s length.

> Directors’ Report
24 Fairfax Annual Report 2006
Director’s meetingsThe following table shows the number of Board and Committee meetings held during the fi nancial year ended 30 June 2006 and the
number attended by each director or Committee member.
MEETINGS OF COMMITTEES***
Directors’ Meetings*** Audit & Risk NominationsPersonnel Policy and
Remuneration
No. Held No. Attended No. Held No. Attended No. Held No. Attended No. Held No. Attended
MD Burrows 13 13 5 5 – – 2 1
RC Corbett 13 13 3 3 – – 3 3
D Evans 13 12 4 3 – – 1 1
FG Hilmer* 6 6 2 2 – – 1 1
JM King 13 13 – – – – 3 3
DE Kirk* 8 8 3 3 – – 2 2
RJ Walker 13 13 – – – – 3 3
DR Wills** 2 2 2 0 – – 1 1
P Young 10 9 3 3 – – 1 1
* FG Hilmer and DE Kirk attended Audit & Risk and Personnel Policy and Remuneration Committee meetings as an invitee of the Committees.
** Mr Wills, up until his retirement, was an ex-offi cio member of the Audit & Risk and the Personnel Policy and Remuneration Committees.
*** Relating to meetings held, the numbers in the columns refer to the number of meetings held while the director was a member of the Board or the relevant
Committee.
Options
The employee share option plan ceased in March 2006 and no options over ordinary shares were granted or unissued ordinary shares
under option grants were on issue at 30 June 2006. No options have been granted since the end of the fi nancial year. Details of options
issues and movements in options during the fi nancial year are included in Notes 31 and 33 to the fi nancial statements.
Indemnifi cation and insurance of offi cers and auditorsThe directors of the Company and such other offi cers as the directors determine, are entitled to receive the benefi t of an indemnity
contained in the Constitution of the Company to the extent allowed by the Corporations Act 2001, including against liabilities incurred
by them in their respective capacities in successfully defending proceedings against them.
During or since the end of the fi nancial year, the Company has paid premiums under contracts insuring the directors and offi cers of
the Company and its controlled entities against liability incurred in that capacity to the extent allowed by the Corporations Act 2001.
The terms of the policies prohibit disclosure of the details of the liability and the premium paid.
Each director has entered into a Deed of Indemnity and Access which provides for indemnity against liability as a director to the extent
allowed by the law.
There are no indemnities given or insurance premiums paid during or since the end of the fi nancial year for the auditors.
No offi cers are former auditorsNo offi cer of the Fairfax Group has been a partner of an audit fi rm or a director of an audit company that is or was an auditor of any
entity in the Fairfax Group during the year ended 30 June 2006.

Directors’ Report >
Fairfax Annual Report 2006 25
Non-audit servicesUnder its Charter of Audit Independence the Company may employ the auditor on assignments additional to statutory audit duties
where the type of work performed and the fee for service does not impact on the actual or perceived independence of the auditor.
Details of the amounts paid or payable to the auditor, Ernst & Young for non-audit services provided during the fi nancial year are set
out below. Details of amounts paid or payable for audit services are set out in Note 32 to the fi nancial statements.
The Board of Directors has received advice from the Audit & Risk Committee and is satisfi ed that the provision of the non-audit services
did not compromise the auditor independence requirements of the Corporations Act 2001 because none of the services undermine
the general principles relating to auditor independence as set out in Professional Statement F1, including reviewing or auditing the
auditor’s own work, acting in a management or a decision-making capacity for the Company, acting as advocate for the Company or
jointly sharing economic risk and rewards.
A copy of the auditor’s independence declaration as required under section 307C of the Corporations Act 2001 is set out on page 26
of this report.
During the year Ernst & Young received or are due to receive the following amounts for the provision of non-audit services:
Subsidiary company and other contractually required audits required by regulatory or other bodies
Australia $126,000
Overseas $151,000
Due diligence services
Australia $34,000
RoundingThe Company is of a kind referred to in Class Order 98/100, issued by the Australian Securities and Investments Commission,
relating to the “rounding off” of amounts in the directors’ report. Amounts contained in the directors’ report have been rounded off in
accordance with that Class Order to the nearest thousand dollars, or in certain cases, to the nearest dollar.
Signed on behalf of the directors in accordance with a resolution of the directors.
Mark BurrowsChairman, Audit and Risk Committee
David KirkChief Executive Offi cer and Director
Sydney, 26 September 2005
•
•
•

> Directors’ Report
26 Fairfax Annual Report 2006
> Auditor’s Independence Declaration
Auditor’s Independence Declaration to the Directors Of John Fairfax Holdings LimitedIn relation to our audit of the fi nancial report of John Fairfax Holdings Limited for the fi nancial year ended 30 June 2006, to the best
of my knowledge and belief, there have been no contraventions of the auditor independence requirement of the Corporations Act 2001
or any applicable code of professional conduct.
Ernst & Young
David SimmondsPartner
26 September 2006
Directors’ Report >
Fairfax Annual Report 2006 27
Remuneration Report >
1. IntroductionThis report forms part of the Company’s 2006 Directors’ Report and describes the Fairfax remuneration arrangements for directors
and prescribed senior executives. It has been prepared to comply with section 300A of the Corporations Act 2001 and accounting
standard AASB 124.
Except for sections 1, 2 and the table in section 5.2, the narrative descriptions and tables contain information required by AASB 124
‘Related Party Disclosures’. This information has been audited by Ernst & Young and is included within the scope of the audit report
on page 123.
The report also contains details of the equity interests of Fairfax directors and certain senior executives.
2. Personnel Policy and Remuneration Committee (PPRC)The current members of the PPRC are Julia King (Chairman), Ronald Walker, Roger Corbett, Mark Burrows and David Evans. All are
independent directors. The PPRC met three times during the year.
The Committee’s primary responsibilities are to:
(a) review and approve Fairfax employee remuneration strategies and frameworks and to oversee the development and
implementation of employee remuneration programs, performance management processes and succession planning with the
goal of attracting, motivating and retaining high quality people;
(b) review and recommend to the Board for approval the goals and objectives relevant to the remuneration of the CEO, assist the
Board to evaluate the performance of the CEO in light of those goals and objectives, and to recommend to the Board the CEO’s
remuneration based on this evaluation;
(c) review the principles to apply to contractual terms of employment for direct reports to the CEO including base pay, incentives,
superannuation arrangements, retention arrangements, termination payments, performance goals and performance based
evaluation procedures and succession plans;
(d) make recommendations to the Board regarding directors’ fees and review and recommend the aggregate remuneration of non-
executive directors to be approved by shareholders.
The CEO, the Director of Organisation Development and the Employment Practices Director regularly attend PPRC meetings but not
when their own remuneration arrangements are being discussed.
The Committee commissions reports from independent remuneration experts on market relativities and other matters relating to
remuneration practices to assist it with setting appropriate remuneration levels and processes.
3. Remuneration of Non-Executive DirectorsUnder the Company’s Constitution, the aggregate remuneration of non-executive directors is set by resolution of shareholders. The
aggregate was last reviewed by shareholders at the 2004 Annual General Meeting and set at $1,500,000 per annum. Within this limit,
the Board annually reviews directors’ remuneration with advice from the PPRC. The Board also considers survey data on directors’
fees paid by comparable companies, and expert advice commissioned from time to time.
Fees to non-executive directors refl ect the demands and the responsibilities of each director including service on Board Committees.
By resolution of the Board, each non-executive director sacrifi ces at least 25% per annum of his or her director’s fees to the
Company’s Employee Share Acquisition Plan. Under this Plan, shares are purchased on-market by an independent trustee on behalf
of directors, as well as employees who have salary sacrifi ced to participate in the Plan. Share acquisition dates are pre-set and
determined by the trustee.

> Remuneration Report
28 Fairfax Annual Report 2006
3. Remuneration of Non-Executive Directors (continued)At the date of this report the Board has set fees as follows:
$
Chairman 280,000
Deputy Chairman 150,000
Other Non-Executive Director 100,000
Additional fees:
Chairman of Audit & Risk Committee 30,000
Member of Audit & Risk Committee 20,000
Chairman of Personnel Policy & Remuneration Committee 30,000
Members of Personnel Policy & Remuneration Committee 20,000
The above fees do not include 9% superannuation payments.
3.1 RETIREMENT BENEFITS FOR NON-EXECUTIVE DIRECTORS
The Company makes superannuation contributions on behalf of non-executive directors equivalent to 9% of directors’ fees.
The Company has discontinued its previous retirement benefi ts scheme for non-executive directors. Other than superannuation
contributions as outlined above, non-executive directors who did not have fi ve years service on the Board as at 30 June 2004 are
not eligible for retirement benefi ts. Non-executive directors who had served on the Board for at least fi ve years as at 30 June 2004
and who therefore had already qualifi ed for benefi ts under the previous scheme are, on retirement, entitled to a retirement benefi t
equivalent to the lesser of:
(a) three times the relevant director’s annual directors’ fee as at 30 June 2004: or
(b) the maximum allowable without shareholder approval under the Corporations Act and the ASX Listing Rules.
During the fi nancial year, one director, Mr Dean Wills, retired and became eligible for payment of a retirement benefi t. Details of the
benefi t paid to Mr Wills is set out in Section 5.7 of this report.
4. Remuneration of the Chief Executive Offi cerThe remuneration details for the CEO, are set out in section 5.7 of this report.
Mr David Kirk commenced as CEO on 17 October 2005 and was appointed to the Board on 18 November 2005.
The key terms of Mr Kirk’s Executive Services Agreement with the Company include a base salary of $1.2 million per year, and
performance bonus of up to 150% of base salary depending on achievement of defi ned performance criteria set at the beginning of each
fi nancial year. As approved by shareholders at the 2005 AGM, one third of the bonus earned by the CEO will be paid in Company shares
purchased on market by the Trustee of the Employee Share Plan. These shares vest three years from their issue. In addition, under his
employment agreement Mr Kirk is entitled to a one-off special payment of $1.2 million in lieu of benefi ts forgone from previous employment.
Of this amount $400,000 was paid on commencement of employment, a further instalment of $400,000 was paid on 1 July 2006 and the
fi nal $400,000 is payable on 1 July 2007. Mr Kirk has salary sacrifi ced each of the instalments so far paid to him into the Fairfax
Employee Share Plan for the purchase of Fairfax shares.
Mr Kirk’s employment contract has been posted with the Australian Stock Exchange.
As disclosed in the 2005 Annual Report the former CEO, Mr Hilmer, was paid a retirement allowance of $4.5 million consistent with
his employment arrangements and the timing and circumstances of his departure.

Remuneration Report >
Fairfax Annual Report 2006 29
5. Remuneration of Senior ExecutivesThe objective of the Company’s executive remuneration framework is to align remuneration with the achievement of strategic
objectives, the creation of value for shareholders, and to be consistent with market standards.
The PPRC aims to ensure that executive remuneration addresses the following criteria:
Attract, retain and motivate talented, qualifi ed and experienced people in light of competitive employment markets.
Align remuneration with achievement of business strategy.
Align interests of executives and Fairfax shareholders.
Deliver competitive cost outcomes.
Comply with regulatory requirements.
Be transparent and fair.
The framework provides a mix of fi xed salary and performance-based incentives. Payment of performance-based incentives is determined
by the fi nancial performance of the Company, the fi nancial performance of the business unit relevant to the executive and the performance
of the individual executive against objectives set at the beginning of the year.
The PPRC discusses and approves the remuneration packages and any bonus payments to the direct reports of the CEO annually in
August. On the recommendation of the CEO it also approves key performance indicators for these executives for the following year.
The executive remuneration framework has the following components:
A fi xed remuneration package which includes base pay, superannuation and other benefi ts.
Performance incentives.
The combination comprises the executive’s total remuneration.
The fi xed component of the remuneration package represents the total cost to the Company and includes all employee benefi ts and
related Fringe Benefi ts Tax (FBT), for example, motor vehicle, parking and superannuation.
5.1 PERFORMANCE BASED INCENTIVES (BONUS) FOR SENIOR EXECUTIVES
Annual bonus payments for senior executives depend on achievement of annual fi nancial performance criteria for the Group as well
as specifi c strategic and operational criteria. The bonus criteria for the CEO are set each year by the Board.
Each senior executive has a target bonus opportunity depending on the accountabilities of the role and impact on Company or business
unit performance. For most senior executives reporting directly to the CEO the on-target bonus opportunity for 2006 was 30% of the
executive’s fi xed pay and the maximum bonus opportunity was 60% of the fi xed remuneration package. Generally, the bonus opportunity
consists of three components: 30% of the bonus opportunity is based on EBITDA and earnings per share, 30% is based on business
unit profi t and 40% is based on other KPIs. For corporate executives whose duties are not confi ned to one business unit, 60% of the
bonus opportunity is based on corporate profi t.
For the year ended 30 June 2006, the key performance indicators (KPIs) linked to the incentive plans for senior executives were
based on Company performance, individual business unit performance and personal objectives. The KPIs required performance in
increasing revenue, reducing operating costs and achieving specifi c targets relating to other key strategic non-fi nancial measures
linked to drivers of the Company’s performance, including circulation, readership and market position. Specifi c measures for individuals
include EPS, EBITDA, revenue and circulation and readership targets.
The Board sets Company profi t targets annually as part of the budget and strategic planning process. Using a profi t target ensures
reward is linked to achievement of the business plan and value creation for shareholders. The incentive pool is leveraged for
performance above the threshold to provide an incentive for executive over performance.
•
•
•
•
•
•
•
•
> Remuneration Report
30 Fairfax Annual Report 2006
5. Remuneration of Senior Executives (continued)
5.2 EQUITY-BASED INCENTIVES (EBIs)
(a) Pre 2006 Financial Year EBI
Senior executives reporting to the CEO whose roles and skills are critical to the strategy of the Company participate in an EBI scheme.
Under the EBI in place prior to the 2006 fi nancial year, EBIs were payable according to the total shareholder return (TSR) of the
Company over a three year period against a comparator group of companies. The maximum reward was 25% of fi xed pay plus
Bonus payable in shares.
Each year a target EBI amount was determined for each participating executive (the “Allocation”). At the end of three years from
the Allocation date the Allocation becomes available to the executive (“Vests”) if performance hurdles have been met. If the
performance hurdles are not met at the end of the third year the executive loses the Allocation.
The comparator group is the ASX 300 Industrial Accumulation Index (“Comparator”). For each Allocation to vest the Company’s
TSR over the relevant three year period must outperform the Comparator (the “Hurdle”). Allocations in the EBI Scheme were
made in each July 2001, 2002, 2003, 2004 and 2005. Over the performance periods, July 2001–July 2004, July 2002–July 2005 and
July 2003–July 2006, the Hurdle was not met and as a result, 2001, 2002 and 2003 Allocations have now been lost.
From 2006, the above plan has been replaced by the new EBI as described below.
(b) New EBI
The PPRC has reviewed the equity incentive scheme and has introduced a new plan to replace the previous EBI. The Company has
worked with expert external consultants to review the pre-2006 scheme and propose a new scheme that will more closely align
shareholders’ interests with the Company’s remuneration principles. External consultants have noted limitations of the current
scheme due to the cyclical nature of media companies and their market-based measurements and the lack of a comparable
Australian peer index.
Under the new EBI, which will apply for the fi rst time for bonuses earned in the 2006 fi nancial year, one third of the annual bonus
earned on the achievements of KPIs as detailed in Section 5.1 above will be deferred. The deferred amount will then be remitted
to the Trustee of the Employee Share Trust who will purchase shares and allocate the shares inside the Trust to the relevant
executive. Each executive’s allocated shares will then vest three years after the allocation date.
The fi nancial performance of the Company in key shareholder value measures over the past fi ve years is shown below:
AIFRS AIFRS AGAAP AGAAP AGAAP Restated 2006 2005 2004 2003 2002
Underlying operating revenue $m 1,907.8 1,873.4 1,767.7 1,208.9 1,174.8
Net profi t before signifi cant items $m 234.3 237.6 207.6 125.5 90.2
Earnings per share before signifi cant items Cents 24.5 25.8 21.4 14.4 11.2
Dividends per share Cents 19.5 23.5 16.5 13.0 11.5
*Total Shareholder Returns (TSR) % (5.70) 23.20 36.64 (7.71) (14.34)
* Total shareholder returns comprises share price appreciation and dividends, gross of franking credits, reinvested in the shares (source: Bloomberg)
5.3 RETENTION ARRANGEMENTSAs disclosed in the 2005 Annual Report retention arrangements are in place for two key executives to ensure their retention and
successful contribution during the transition to the new CEO. The two key executives and the amounts of the retention are:
G Hambly $300,000
S Narayan $300,000
To facilitate this arrangement, ordinary John Fairfax Holdings shares have been purchased for the employee and held in the Employee
Share Trust until they vest. The shares will vest over a three year period. Vesting is contingent on the executive continuing to be employed
by Fairfax on the date of vesting and also subject to the achievement of pre-set personal KPIs related to each individuals area of
responsibility. These KPIs are set by the CEO and PPRC each year. The KPIs are chosen as the most appropriate to drive the
successful delivery of business outcomes. The fi rst tranche of 25% of the shares is due to vest on 1 October 2006, the second tranche
of 25% is due to vest on 1 October 2007 and the fi nal tranche of 50% is due to vest on 1 October 2008.
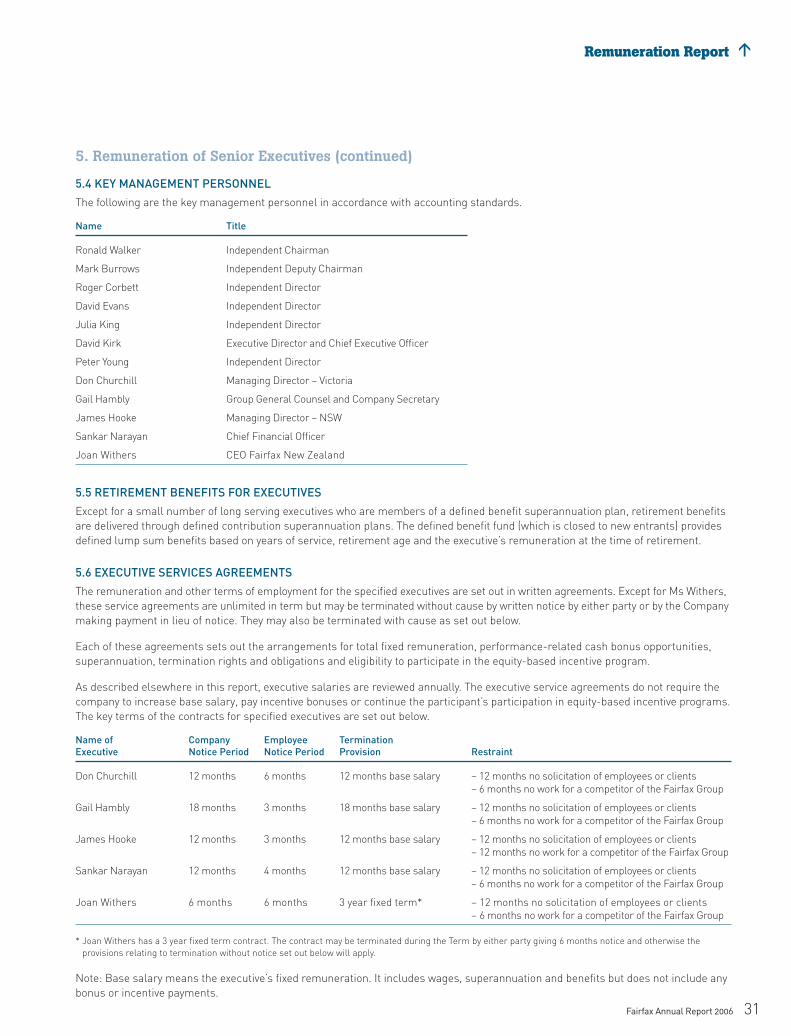
Remuneration Report >
Fairfax Annual Report 2006 31
5. Remuneration of Senior Executives (continued)
5.4 KEY MANAGEMENT PERSONNEL
The following are the key management personnel in accordance with accounting standards.
Name Title
Ronald Walker Independent Chairman
Mark Burrows Independent Deputy Chairman
Roger Corbett Independent Director
David Evans Independent Director
Julia King Independent Director
David Kirk Executive Director and Chief Executive Offi cer
Peter Young Independent Director
Don Churchill Managing Director – Victoria
Gail Hambly Group General Counsel and Company Secretary
James Hooke Managing Director – NSW
Sankar Narayan Chief Financial Offi cer
Joan Withers CEO Fairfax New Zealand
5.5 RETIREMENT BENEFITS FOR EXECUTIVES
Except for a small number of long serving executives who are members of a defi ned benefi t superannuation plan, retirement benefi ts
are delivered through defi ned contribution superannuation plans. The defi ned benefi t fund (which is closed to new entrants) provides
defi ned lump sum benefi ts based on years of service, retirement age and the executive’s remuneration at the time of retirement.
5.6 EXECUTIVE SERVICES AGREEMENTS
The remuneration and other terms of employment for the specifi ed executives are set out in written agreements. Except for Ms Withers,
these service agreements are unlimited in term but may be terminated without cause by written notice by either party or by the Company
making payment in lieu of notice. They may also be terminated with cause as set out below.
Each of these agreements sets out the arrangements for total fi xed remuneration, performance-related cash bonus opportunities,
superannuation, termination rights and obligations and eligibility to participate in the equity-based incentive program.
As described elsewhere in this report, executive salaries are reviewed annually. The executive service agreements do not require the
company to increase base salary, pay incentive bonuses or continue the participant’s participation in equity-based incentive programs.
The key terms of the contracts for specifi ed executives are set out below.
Name of Company Employee TerminationExecutive Notice Period Notice Period Provision Restraint
Don Churchill 12 months 6 months 12 months base salary – 12 months no solicitation of employees or clients
– 6 months no work for a competitor of the Fairfax Group
Gail Hambly 18 months 3 months 18 months base salary – 12 months no solicitation of employees or clients
– 6 months no work for a competitor of the Fairfax Group
James Hooke 12 months 3 months 12 months base salary – 12 months no solicitation of employees or clients
– 12 months no work for a competitor of the Fairfax Group
Sankar Narayan 12 months 4 months 12 months base salary – 12 months no solicitation of employees or clients
– 6 months no work for a competitor of the Fairfax Group
Joan Withers 6 months 6 months 3 year fi xed term* – 12 months no solicitation of employees or clients
– 6 months no work for a competitor of the Fairfax Group
* Joan Withers has a 3 year fi xed term contract. The contract may be terminated during the Term by either party giving 6 months notice and otherwise the
provisions relating to termination without notice set out below will apply.
Note: Base salary means the executive’s fi xed remuneration. It includes wages, superannuation and benefi ts but does not include any
bonus or incentive payments.

> Remuneration Report
32 Fairfax Annual Report 2006
5. Remuneration of Senior Executives (continued)
Termination of employment without notice and without payment in lieu of notice
The Company may terminate the employment of the executive without notice and without payment in lieu of notice in some
circumstances. Generally this includes if the executive:
(a) commits an act of serious misconduct;
(b) commits a material breach of the executive service agreement;
(c) is charged with any criminal offence which, in the reasonable opinion of the Company, may embarrass or bring the Fairfax Group
into disrepute; or
(d) unreasonably refuses to carry out his or her duties including complying with reasonable, material and lawful directions from the Company.
Termination of employment with notice or with payment in lieu of notice.
The Company may terminate the employment of the executive at any time by giving the executive notice of termination or payment in lieu
of such notice. The amount of notice or payment in lieu required from the Company in these circumstances is set out in the above table.
5.7 REMUNERATION OF DIRECTORS AND KEY MANAGEMENT PERSONNEL
Remuneration of directors
SHORT-TERM POST EMPLOYMENT LONG-TERM
SHARE-BASED
PAYMENT
Base Salary Performance Directors’ & Other Cash Super- Retirement Cash Related Fees Benefi ts Bonus annuation Benefi ts Benefi ts Shares* Total Total
MD Burrows 2006 173,334 – – 15,600 – – – 188,934
2005 90,002 – – 8,100 – – – 98,102
RC Corbett 2006 128,000 – – 11,520 – – – 139,520
2005 84,502 – – 7,605 – – – 92,107
D Evans 2006 125,833 – – 11,325 – – – 137,158
2005 – – – – – – – –
FG Hilmer (i) 2006 – 590,106 – 47,443 4,500,000 – – 5,137,549
2005 – 1,377,513 – 123,351 – – – 1,500,864
DE Kirk (ii) 2006 – 1,584,957 933,333 70,143 – 171,429 81,897 2,841,759 5%
2005 – – – – – – – –
JM King 2006 122,667 – – 11,040 – – – 133,707
2005 86,502 – – 7,785 – – – 94,287
RJ Walker 2006 270,152 – – 24,314 – – – 294,466
2005 82,502 – – 7,425 – – – 89,927
DR Wills (iii) 2006 62,501 – – 5,625 495,043 – – 563,169
2005 207,505 – – 18,675 – – – 226,180
P Young (iv) 2006 110,000 – – 9,900 – – – 119,900
2005 – – – – – – – –
Total remuneration:Directors 2006 992,487 2,175,063 933,333 206,910 4,995,043 171,429 81,897 9,556,162 2005 551,013 1,377,513 – 172,941 – – – 2,101,467
* Remuneration includes the fair value of rights to shares, amortised consistent with their vesting period.(i) FG Hilmer retired on 18 November 2005 from the Board.(ii) DE Kirk commenced as CEO on 17 October 2005. A bonus of $1.4 million was awarded for the year ended 2006. Mr Kirk’s employment agreement provides
that in his fi rst year only he is guaranteed a bonus of 100% of base salary. This bonus was paid as 2/3 cash and 1/3 shares (with a 3 year vesting period). In addition, Mr Kirk is entitled to a one-off special compensation of $1.2 million in respect of benefi ts foregone from previous employment. Of this amount, $400,000 was paid on commencement of employment, a further instalment of $400,000 was paid on 1 July 2006 and the fi nal $400,000 is payable on 1 July 2007 if Mr Kirk is still employed by the company up to that date.
(iii) DR Wills retired from the board on 26 August 2005.(iv) P Young was appointed to the board on 16 September 2005.
Group totals for 2005 are not the same as disclosed in the 2005 report, as different individuals and different components of remuneration were disclosed in the 2005 fi nancial year.

Remuneration Report >
Fairfax Annual Report 2006 33
5. Remuneration of Senior Executives (continued)
5.7 REMUNERATION OF DIRECTORS AND KEY MANAGEMENT PERSONNEL (CONTINUED)
Remuneration of the 5 Company & Group executives who received the highest remuneration for the year ended 30 June 2006
SHORT-TERM POST EMPLOYMENTSHARE-BASED
PAYMENT
Base Salary Termin- Performance & Other Cash Super- ation Related Company Group Benefi ts Bonus annuation Benefi ts Options* Shares** Total Total
R Antulov (i) 2006 ✓ 197,369 – 17,752 352,500 – 14,703 582,324 3%
2005 – – – – – – –
G Hambly 2006 ✓ ✓ 370,898 100,000 44,648 – 2,901 168,689 687,136 39%
2005 361,215 150,000 43,066 – 16,699 48,097 619,077 32%
J Hooke 2006 ✓ ✓ 398,270 84,000 33,938 – – 37,450 553,658 22%
2005*** – – – – – – –
S Narayan 2006 ✓ ✓ 529,824 200,000 46,974 – – 180,592 957,390 40%
2005 459,534 200,000 40,782 – – 31,465 731,781 32%
A Revell (ii) 2006 ✓ ✓ 263,055 – 34,071 640,000 – – 937,126 0%
2005 646,486 160,000 56,312 – 3,554 54,208 920,560 23%
J Withers 2006 ✓ 491,810 114,828 – – – – 606,638 19%
2005*** – – – – – – –
Total remuneration: Company & Group 2006 2,251,226 498,828 177,384 992,500 2,901 401,434 4,324,272highest paid executives 2005*** 1,467,235 510,000 140,160 – 20,253 133,770 2,271,418
Remuneration of the key management personnel for the year ended 30 June 2006
SHORT-TERM POST EMPLOYMENTSHARE-BASED
PAYMENT
Base Salary Termin- Performance & Other Cash Super- ation Related Benefi ts Bonus annuation Benefi ts Options* Shares** Total Total
D Churchill 2006 403,426 90,667 33,683 – – 6,044 533,820 17%
Managing Director – Victoria 2005*** – – – – – – –
G Hambly 2006 370,898 100,000 44,648 – 2,901 168,689 687,136 39%
Group General Counsel 2005 361,215 150,000 43,066 – 16,699 48,097 619,077 32%
and Company Secretary
J Hooke 2006 398,270 84,000 33,938 – – 37,450 553,658 22%
Managing Director – NSW 2005*** – – – – – – –
S Narayan 2006 529,824 200,000 46,974 – – 180,592 957,390 40%
Chief Financial Offi cer 2005 459,534 200,000 40,782 – – 31,465 731,781 32%
J Withers 2006 491,810 114,828 – – – – 606,638 19%
CEO Fairfax New Zealand 2005*** – – – – – – –
Total remuneration: key management personnel 2006 2,194,228 589,495 159,243 – 2,901 392,776 3,338,643 2005*** 820,749 350,000 83,848 – 16,699 79,562 1,350,858
* Remuneration includes the fair value of options granted in a previous period, amortised on a consistent basis to vesting period.
** Remuneration includes the fair value of rights to shares, amortised consistent with their vesting period.
*** Prior year comparative numbers are not applicable for executives who are new to their positions: Don Churchill (29 August 2005); James Hooke (29 August
2005); Joan Withers (11July 2005).
(i) R Antulov ceased employment on 31 March 2006.
(ii) A Revell ceased employment on 2 February 2006.
Group totals for 2005 are not the same as disclosed in the 2005 report, as different individuals and different components of remuneration were disclosed in the
2005 fi nancial year.

> Remuneration Report
34 Fairfax Annual Report 2006
5. Remuneration of Senior Executives (continued)
5.8 REMUNERATION OPTIONS: GRANTED AND VESTED DURING THE YEAR
During the year there were no options granted (2005: nil). The number of options that vested during the year ended 30 June 2006 is
set out in the following table:
Key Management Personnel Number Vested
G Hambly 300,000
No Directors had options that vested during the year ended 30 June 2006.
5.9 SHARES ISSUED ON EXERCISE OF REMUNERATION OPTIONSKey Management Personnel Number of shares issued Value per share $ Total share value $
G Hambly 300,000 4.36 1,308,000
5.10 OPTION HOLDINGS OF DIRECTORS AND OTHER KEY MANAGEMENT PERSONNEL
Directors
During the year ended 30 June 2006, there were no options granted to or exercised by directors, nor were there any options held
by directors that lapsed during the fi nancial year.
Key Management Personnel
The following table displays options granted, exercised or lapsed during the current year:
VESTED AT 30 JUNE 2006
Balance at Granted as Balance at beginning of period remuner- Options Options end of period Not 1 July 2005 ation exercised expired 30 June 2006 Total exercisable Exercisable
Key Management Personnel
G Hambly 300,000 – (300,000) – – – – –
Total 300,000 – (300,000) – – – – –
5.11 OPTION VALUES OF KEY MANAGEMENT PERSONNEL Total value [$] Value per share [$] Options Exercised
Value of options granted – – –
Value of options exercised (at exercised date) 33,000 0.11 300,000
Value of options lapsed – – –
Total 33,000 0.11 300,000

Remuneration Report >
Fairfax Annual Report 2006 35
5. Remuneration of Senior Executives (continued)
5.12 LOANS TO DIRECTORS AND OTHER KEY MANAGEMENT PERSONNEL
Directors
During the year ended 30 June 2006 there were no loans to directors (2005: nil).
Key Management Personnel Balance at Interest not Balance at endPeriod beginning of period charged of period
2006 – – –
2005 100,000 2,747 –
Details of individuals with loans above $100,000 in the reporting period are as follows:
Directors
During the year ended 30 June 2006 there are no loans to directors (2005: nil).
Key Management Personnel Balance at Interest Balance at Highest Owing Period beginning of period not charged end of period in Period
n/a 2006 – – – –
A Revell 2005 100,000 2,747 – 100,000
There are no outstanding loans above $100,000 for the year ended 30 June 2006.

> Corporate Governance
36 Fairfax Annual Report 2006
> Corporate Governance
The Company has considered the best practice recommendations established in the ASX Corporate Governance Council “Principles of Good Corporate Governance and Best Practice Recommendations” (ASX Principle) and recorded its compliance with the recommendations in the following table. 2006 Annual Report Compliance Page Reference
Principle 1: Lay solid foundations for management oversight
1.1 Formalise and disclose the functions reserved to the Board and those delegated
to management ✓ 38
Principle 2: Structure the board to add value
2.1 A majority of the board should be independent directors ✓
2.2 The Chairperson should be an independent director ✓
2.3 The roles of Chairperson and Chief Executive Offi cer should not be exercised by the
same individual ✓
2.4 The board should establish a nomination committee ✓
2.5 Provide the information indicated in Guide to reporting on Principle 2 ✓ 38,39
Principle 3: Ethical and responsible decision making
3.1 Establish a code of conduct to guide the directors, the Chief Executive Offi cer (or equivalent),
the Chief Financial Offi cer (or equivalent) and any other key executives as to:
3.1.1 The practices necessary to maintain confi dence in the Company’s integrity
3.1.2 The responsibility and accountability of individuals for reporting and investigating
reports of unethical practices ✓
3.2 Disclose the policy concerning trading in company securities by directors, offi cers
and employees ✓
3.3 Provide the information indicated in Guide to reporting on Principle 3 ✓ 39,41
Principle 4: Integrity and fi nancial reporting ✓
4.1 Require the Chief Executive Offi cer (or equivalent) to state in writing to the board that the
Company’s fi nancial reports present a true and fair view, in all material respects, of the
Company’s fi nancial condition and operational results and are in accordance with relevant
accounting standards ✓
4.2 The Board should establish an audit committee ✓
4.3 Structure the audit committee so that it consists of:
• only non-executive directors ✓
• a majority of independent directors ✓
• an independent chairperson, who is not Chairperson of the Board ✓
• at least three members ✓
4.4 The audit committee should have a formal charter ✓
4.5 Provide the information indicated in Guide to reporting on Principle 4 ✓ 37,39,40

Corporate Governance >
Fairfax Annual Report 2006 37
2006 Annual Report Compliance Page Reference
Principle 5: Timely and balanced disclosure
5.1 Establish written policies and procedures designed to ensure compliance with ASX Listing
Rule disclosure requirements and to ensure accountability at a senior management level
for that compliance ✓
5.2 Provide the information indicated in Guide to reporting on Principle 5 ✓ 40,41
Principle 6: Respect for the rights of shareholders
6.1 Design and disclose a communications strategy to promote effective communication with
shareholders and encourage effective participation at general meetings ✓
6.2 Request the external auditor to attend the annual general meeting and be available to
answer shareholder questions about the conduct of the audit and the preparation and
content of the auditor’s report ✓ 40,41
Principle 7: Recognise and manage risk
7.1 The Board or appropriate Board committee should establish policies on risk oversight
and management ✓
7.2 The Chief Executive Offi cer (or equivalent) and the Chief Financial Offi cer (or equivalent)
should state to the Board in writing that: ✓
7.2.1 the statement given in accordance with best practice recommendation 4.1
(the integrity of fi nancial statements) is founded on a sound system of risk
management and internal compliance and control which implements the policies
adopted by the Board ✓
7.2.2 the Company’s risk management and internal compliance and control system is
operating effi ciently and effectively in all material aspects 1
7.3 Provide the information indicated in Guide to reporting on Principle 7 ✓ 37,41
Principle 8: Encourage enhanced performance
8.1 Disclose the process for performance evaluation of the Board, its committees and
individual directors, and key executives. ✓ 41
Principle 9: Remunerate fairly and responsibly
9.1 Provide disclosure in relation to the Company’s remuneration policies to enable investors
to understand (i) the costs and benefi ts of those policies and (ii) the link between
remuneration paid to directors and key executives and corporate performance. 2
9.2 The Board should establish a remuneration committee. ✓
9.3 Clearly distinguish the structure of non-executive directors’ remuneration from that
of executives. ✓
9.4 Ensure that payment of equity-based executives’ remuneration is made in accordance
with thresholds set in plans approved by shareholders. 3
9.5 Provide the information indicated in Guide to reporting on Principle 9 ✓ 27-35
Principle 10: Recognise the legitimate interest of stakeholders
10.1 Establish and disclose a code of conduct to guide compliance with legal and other
obligations to legitimate stakeholders. ✓ 39
The above disclosure should be read in conjunction with the following:
1) the Company has complied with the Guide to Compliance with the ASX Principle 7: Recognise and Manage Risk prepared by the
Group of 100 and endorsed by the ASX Corporate Governance Council;
2) disclosure of remuneration policy and procedures are set out in Remuneration Report on pages [xx-xx] of the Annual Report; and
3) equity-based remuneration is not paid to directors other than the CEO. The terms of the CEO’s equity based incentive were
approved by shareholders at the 2005 Annual General Meeting. Equity-based remuneration paid to non-director key executives
under the Equity Based Incentive Scheme has not been approved by shareholders, as the Board considers it to be part of the total
compensation package for those executives and should not be individually segregated for separate approval.
Set out on the following pages are the key corporate governance principles of the Company.
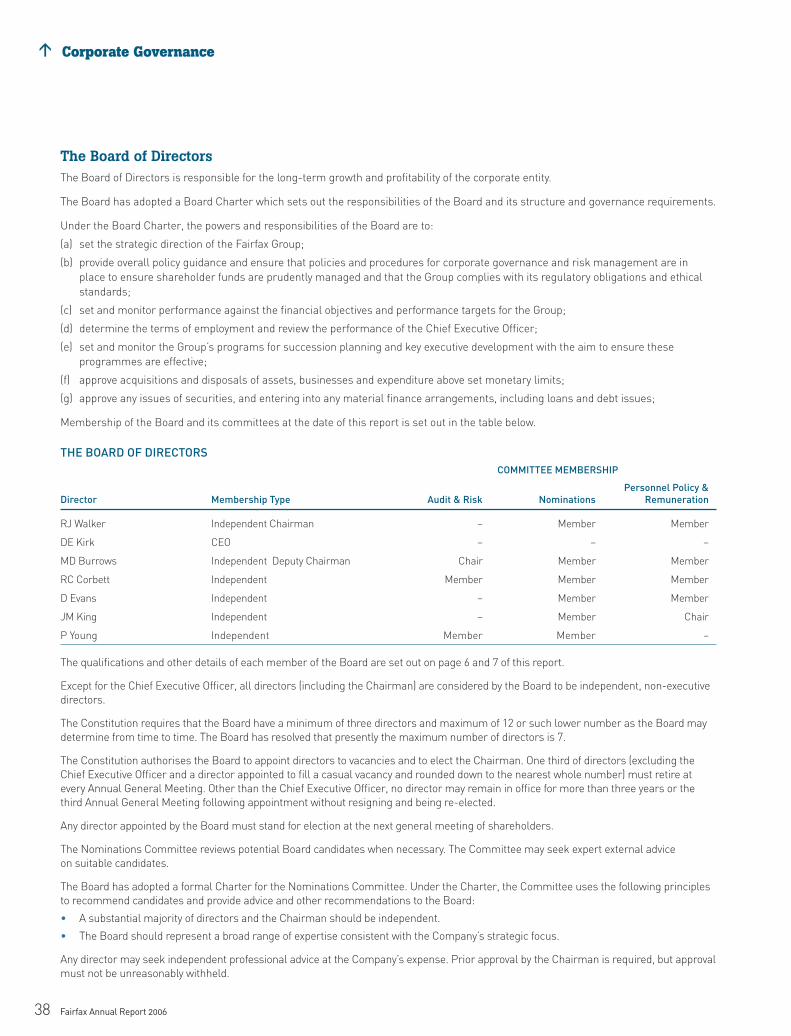
> Corporate Governance
38 Fairfax Annual Report 2006
The Board of DirectorsThe Board of Directors is responsible for the long-term growth and profi tability of the corporate entity.
The Board has adopted a Board Charter which sets out the responsibilities of the Board and its structure and governance requirements.
Under the Board Charter, the powers and responsibilities of the Board are to:
(a) set the strategic direction of the Fairfax Group;
(b) provide overall policy guidance and ensure that policies and procedures for corporate governance and risk management are in
place to ensure shareholder funds are prudently managed and that the Group complies with its regulatory obligations and ethical
standards;
(c) set and monitor performance against the fi nancial objectives and performance targets for the Group;
(d) determine the terms of employment and review the performance of the Chief Executive Offi cer;
(e) set and monitor the Group’s programs for succession planning and key executive development with the aim to ensure these
programmes are effective;
(f) approve acquisitions and disposals of assets, businesses and expenditure above set monetary limits;
(g) approve any issues of securities, and entering into any material fi nance arrangements, including loans and debt issues;
Membership of the Board and its committees at the date of this report is set out in the table below.
THE BOARD OF DIRECTORS COMMITTEE MEMBERSHIP
Personnel Policy &Director Membership Type Audit & Risk Nominations Remuneration
RJ Walker Independent Chairman – Member Member
DE Kirk CEO – – –
MD Burrows Independent Deputy Chairman Chair Member Member
RC Corbett Independent Member Member Member
D Evans Independent – Member Member
JM King Independent – Member Chair
P Young Independent Member Member –
The qualifi cations and other details of each member of the Board are set out on page 6 and 7 of this report.
Except for the Chief Executive Offi cer, all directors (including the Chairman) are considered by the Board to be independent, non-executive
directors.
The Constitution requires that the Board have a minimum of three directors and maximum of 12 or such lower number as the Board may
determine from time to time. The Board has resolved that presently the maximum number of directors is 7.
The Constitution authorises the Board to appoint directors to vacancies and to elect the Chairman. One third of directors (excluding the
Chief Executive Offi cer and a director appointed to fi ll a casual vacancy and rounded down to the nearest whole number) must retire at
every Annual General Meeting. Other than the Chief Executive Offi cer, no director may remain in offi ce for more than three years or the
third Annual General Meeting following appointment without resigning and being re-elected.
Any director appointed by the Board must stand for election at the next general meeting of shareholders.
The Nominations Committee reviews potential Board candidates when necessary. The Committee may seek expert external advice
on suitable candidates.
The Board has adopted a formal Charter for the Nominations Committee. Under the Charter, the Committee uses the following principles
to recommend candidates and provide advice and other recommendations to the Board:
A substantial majority of directors and the Chairman should be independent.
The Board should represent a broad range of expertise consistent with the Company’s strategic focus.
Any director may seek independent professional advice at the Company’s expense. Prior approval by the Chairman is required, but approval
must not be unreasonably withheld.
•
•

Corporate Governance >
Fairfax Annual Report 2006 39
INDEPENDENT DIRECTORSUnder the Board Charter the majority of the Board and the Chairman must be independent.
Directors have determined that all directors except the Chief Executive Offi cer are independent on the basis of the following criteria:
a) the director has no material relationship with Fairfax (either directly, or as a partner, shareholder, or executive offi cer of an
organisation that has a material relationship with Fairfax except as a director of the Company);
b) the director is not, and has not been within the previous three years:
(i) employed by, or a partner in, any fi rm that in the past three years has been Fairfax’s external auditor; or
(ii) been employed by Fairfax, or a company in the Fairfax Group
c) no immediate family member of the director is, or has in the past three years, been an executive offi cer of Fairfax or employed by,
or a partner of, any fi rm that has been Fairfax’s external auditor within the past three years; and
(d) the director has no interest or other relationship which could or could be reasonably perceived to materially interfere with the director’s
ability to act in the best interest of the Company.
CODES OF CONDUCTAll directors, managers and employees are required to act honestly and with integrity.
The Company has developed and communicated to all employees, directors and consultants the Fairfax Codes of Conduct. The Codes assist
in upholding ethical standards and conducting business in accordance with applicable laws. The Codes also set out the responsibility of
individuals for reporting Code breaches.
The Fairfax Code of Conduct aims to:
provide clear guidance on the Company’s values and expectations while acting as a representative of Fairfax;
promote a common minimum standard of ethical behaviour standards and expectations across the group, all business units and locations;
offer guidance for shareholders, customers, readers, suppliers and the wider community on our values, standards and expectations,
and what it means to work for Fairfax;
raise employees awareness of acceptable and unacceptable behaviour and provide a means to assist in avoiding any real or perceived
misconduct.
Supporting the Codes of Conduct is the Company’s range of documented policies. These policies are posted on the Company intranet,
are communicated to employees at the time of employment and are reinforced by training programmes.
AUDIT & RISK COMMITTEEThe Board has had an Audit & Risk committee since 1992. The committee operates in accordance with a written charter which sets out its
role and functions which are, in summary, to advise and assist the Board on the establishment and maintenance of a framework of risk
management, internal controls and ethical standards for the management of the economic entity and to monitor the quality and reliability
of fi nancial information for the Group. To carry out this role the committee:
appoints the external auditor, reviews its performance independence and effectiveness, approves the auditor’s fee arrangements and
enforces the Company’s Charter of Audit Independence;
ensures that appropriate systems of control are in place to effectively safeguard the value of assets;
ensures accounting records are maintained in accordance with statutory and accounting requirements;
monitors systems designed to ensure fi nancial statements and other information provided to shareholders is timely, reliable
and accurate;
formulates policy and oversees key fi nance and treasury functions;
seeks to ensure there is an appropriate framework for compliance with all legal and regulatory requirements and monitors
performance against these requirements;
reviews the audit process with the external auditor, including in the absence of management to ensure full and frank discussion
of audit issues;
recommends to the Board the appointment and tenure of the Internal Audit Manager, reviews the Internal Audit Manager’s performance,
approves the internal audit plan, receives summaries of signifi cant reports prepared by internal audit and meets with the Internal Audit
Manager (including in the absence of management if considered necessary).
All Audit & Risk Committee members must be non executive directors. Executives may attend on invitation. The Chairman of the Committee
is required to have relevant fi nancial expertise and not be the Chairman of the Board.
The Chairman of the Committee may, at the Company’s expense, obtain such external expert advice and obtain assistance and information
from offi cers of the Group as is reasonably required from time to time.
•
•
•
•
•
•
•
•
•
•
•
•

> Corporate Governance
40 Fairfax Annual Report 2006
CHARTER OF AUDIT INDEPENDENCEThe Board has also adopted a Charter of Audit Independence, a copy of which is available on the Corporate website.
The purpose of this Charter is to provide a framework for the Board and management to aim to ensure that the statutory auditor is both
independent and seen to be independent. The purpose of an independent statutory audit is to provide shareholders with reliable and clear
fi nancial reports on which to base investment decisions. The Charter sets out key commitments by the Board and procedures to be
followed by the Audit & Risk Committee and management aimed to set proper framework of audit independence.
To promote audit quality, and effective audit service by suitably qualifi ed professionals, the Board ensures that the auditor is fairly rewarded
for the agreed scope of the statutory audit and audit-related services.
Restrictions are placed on non audit work performed by the auditor. Non audit fees above a fi xed minimum level may not be incurred
without the approval of the Chairman of the Audit and Risk Committee.
The Company requires rotation of the senior audit partner for the Company at least every fi ve years. The Company’s audit partner was last
changed for the 2002 year end audit.
The Audit & Risk Committee requires the auditor to confi rm annually that it has complied with all professional regulations and guidelines
issued by the Australian accounting profession relating to auditor independence and to confi rm that the auditor has no fi nancial or
material business interests in the Company outside of the supply of professional services.
INTEGRITY IN FINANCIAL REPORTINGAs well as the principles set out in the Audit and Risk Committee Charter and the Charter of Audit Independence, the Company has
implemented a structure to verify and safeguard the integrity of its fi nancial reporting.
The Chief Executive Offi cer and the Chief Financial Offi cer provide a written statement to the Board that to the best of their knowledge and
belief, the Company’s published fi nancial reports present a true and fair view, in all material respects, of the Company’s fi nancial condition
and that the operational results are in accordance with relevant accounting standards.
This statement to the Board is underpinned by the requirement for appropriate senior executives to provide a signed letter of representation
addressed to the Chief Executive Offi cer and Chief Financial Offi cer verifying material issues relating to the executive’s areas of responsibility
and disclosing factors that may have a material effect on the fi nancial results or operations of the Group.
DISCLOSURE POLICYThe Company has a Market Disclosure Policy which sets out requirements aimed to ensure full and timely disclosure to the market
of material issues relating to the Group to ensure that all stakeholders have an equal opportunity to access information.
The policy refl ects the ASX Listing Rules and Corporations Act continuous disclosure requirements.
The Market Disclosure Policy requires that the Company notify the market, via the ASX, of any price sensitive information (subject to exceptions
to disclosure under the Listing Rules). Information is price sensitive if a reasonable person would expect the information to have a material
effect on the price or value of the Company’s securities.
The Chief Executive Offi cer, the Chief Financial Offi cer, the Director, Corporate Affairs, General Manager Investor Relations and Group
General Counsel and Company Secretary are designated as Disclosure Offi cers who are responsible for reviewing potential disclosures
and deciding what information should be disclosed.
Only the Disclosure Offi cers may authorise communication on behalf of the Company to the media, analysts and investors. This safeguards
the premature exposure of confi dential information and aims to ensure proper disclosure is made in accordance with the law. The Disclosure
Offi cers are also authorised to determine whether a trading halt will be requested from the ASX to prevent trading in an uninformed market.
The onus is on all staff to inform a Disclosure Offi cer of any price sensitive information as soon as becoming aware of it. The Executive
Leadership Team is responsible for ensuring staff understand and comply with the policy.
All ASX and press releases containing important material information must be approved by a Disclosure Offi cer and either the Chairman
of the Board or the Audit & Risk Committee before release to the market.
As well as its statutory reporting obligations, the Company actively encourages timely and ongoing shareholder communications.
Company announcements, Annual Reports, Notices of Meetings, analyst and investor briefi ngs, fi nancial results and other information
useful to investors such as press releases are placed on the Company’s website as soon as practical after release to the ASX.

Corporate Governance >
Fairfax Annual Report 2006 41
The Chairman’s and the Chief Executive Offi cer’s addresses and the results of resolutions of meetings of shareholders, are also posted on
the Corporate Governance section of the Fairfax website.
The external auditor attends the Annual General Meeting and is available to answer shareholder questions about the audit and the audit report.
RISK MANAGEMENTThe Board has set a risk management program (including internal control and compliance).
This policy draws upon guidance endorsed by the ASX Corporate Governance Council and seeks to provide a consistent approach to
identifying, assessing, and reporting risks, whether they be related to company performance, reputation, safety, environment, internal
control, compliance or other risk areas.
Key aspects of the Company’s risk management system are summarised as follows:
Risk is assessed at least annually and revised periodically for each division through the business planning, budgeting, forecasting,
reporting and performance management processes.
The Board, through the Audit & Risk Committee, receives regular reports from management (and independent advisers where appropriate)
on key risk areas such as treasury, health safety and environment, regulatory compliance, taxation, fi nance and internal audit.
The process for assessing and reporting on risks, internal controls and internal compliance is being standardised, enhanced and
formalised across the Group in accordance with available best practice guidance. This is an ongoing process.
An Executive Risk Committee has been established to oversee the implementation of the Board’s risk management policy, including
oversight and coordination of risk assessment activities, and coordination of risk reporting.
The Company has engaged external experts to conduct a regular review of the Fairfax risk management framework (including the
process for the identifi cation of key risks across the Company) against better market practice. Improvements to the existing process
will be implemented as required after consideration of the outcomes of this review.
Formal risk assessments are required as part of business case approvals for one-off projects or initiatives of a signifi cant nature.
Project teams are responsible for managing the risks identifi ed.
Under the direction of the Audit and Risk Committee, Internal Audit conducts a program of internal control reviews over key areas based on
their importance to the Company, and provides independent assurance over the internal control assessments undertaken by management.
REMUNERATIONDetails of the Company’s remuneration policies are set out in the Remuneration Report beginning on page 27.
DIRECTORS’ DEALINGS IN COMPANY SHARESBy resolution of the Board, each non-executive director sacrifi ces at least 25% per annum of his or her director’s fees to the Company’s
Employee Share Acquisition Scheme. Under this Scheme, shares are purchased on-market by an independent trustee on behalf of directors
and employees who have salary sacrifi ced to participate in the Scheme. Share acquisition dates are pre-set and determined by the trustee.
Consistent with the law, directors must not trade directly or indirectly in Fairfax securities while in possession of unpublished price
sensitive information.
Price sensitive information is information, usually about the Company or its intentions, which a reasonable person would expect to have
a material effect on the price or value of Fairfax securities.
A director must not trade in Fairfax securities without fi rst reviewing the matter with the Company Secretary and notifying the Chairman.
Notwithstanding the above, it is the responsibility of the individual director to reasonably consider whether he or she is in possession of price
sensitive information and, when in doubt, the director should not trade, thus minimising the possibility of a perception of improper trading.
A director must notify the Company Secretary of any change in the director’s legal or benefi cial interest in Company securities so as
to ensure compliance with the disclosure requirements of the ASX Listing Rules.
REVIEW OF THE BOARD’S EFFECTIVENESSThe Board conducts a review of its structure, composition and performance annually. The initial formal review was carried out with the
assistance of Cameron Ralph Pty Limited and resulted in an ongoing programme of Board renewal and review.
•
•
•
•
•
•
•

42 Fairfax Annual Report 2006
OVERVIEWThe operating results for the 2006 fi nancial year refl ect
the success of our diversifi cation strategy and strong
cost controls.
Excellent profi t growth from our Australian digital businesses
and Trade Me in New Zealand have offset lower earnings from
our traditional publishing businesses which were affected by
cyclically weaker advertising markets in Sydney and Melbourne
and the weakening New Zealand dollar. Underlying earnings
before interest and tax of $425.5 million were in-line with the
2005 result.
Excluding signifi cant items, the underlying net profi t attributable
to ordinary shareholders (including a notional dividend payable
on the Stapled Preference Shares issued in March 2006 of $5.8
million) was $228.5 million, a decrease of 3.8% compared to last
year. Underlying earnings per share decreased 5.2% to 24.5
cents.
Including signifi cant items, profi t after tax was $227.5 million,
down 7.1% and earnings per share decreased 8.3% to
24.4 cents.
In summary, the 2006 result is refl ective of how the Company is
being reshaped. Previously, in weaker advertising markets,
earnings reduced substantially. With the diversifi cation and
growth now being experienced by our digital businesses, the
Company has a broader revenue base where weakness in a
particular business can usually be offset by growth in another.
GROUP TRADING(For comparison purposes, all references exclude signifi cant items and
are on an underlying trading basis. The 2005 results have been adjusted
for adoption of International Financial Reporting Standards)
RevenuesGroup revenues from continuing operations increased 1.8%
to $1.91 billion. Revenues from newspapers fell 2.7%, however
this was more than offset by growth from sales in the digital
and magazines businesses which reported revenue increases
of 31%.
Australian publishing revenues fell 1.3% for the year. While the
Magazine, Regional and Business Media operations increased
revenues, the Metropolitan and Community publications were
signifi cantly affected by the weak economies and advertising
markets in New South Wales and Victoria.
The Australian Digital businesses increased revenues by a very
strong 76% – higher than the overall growth of the internet
industry’s total advertising revenues – driven by increases across
the entire network of classifi ed and news and information sites.
Revenues also increased with the acquisition of RSVP and Stayz
during the fi nancial year.
In local currency, the New Zealand publishing business
increased advertising revenues by 2.0% and circulation revenues
were 2.7% higher. Although the economy weakened during the
year, the business was successful in increasing advertising
revenues across all categories with the exception of Motor
Vehicle advertising which was down 4.0%.
> Management Discussion & Analysis Report
Sankar Narayan, Chief Financial Offi cer
The operating results for
the 2006 fi nancial year
refl ect the success of our
diversifi cation strategy and
strong cost controls.

Fairfax Annual Report 2006 43
Management Discussion & Analysis Report >
Costs Cost controls across the Group were a highlight of these results.
Australian publishing costs were very well controlled and
increased only 0.9% during the year. Excluding amounts
expensed as part of the development of new initiatives such as
Travel & Leisure magazine and AFR Access, costs were in-line
with last year. Cost increases in newsprint, production/
distribution, promotions and other costs were offset by
reductions in staff costs, refl ecting the restructuring initiatives
undertaken during the year.
Australian digital costs increased 49%, driven by acquisitions
and the additional investment being made in staff and
promotional activities to further improve its competitive position
in this fast growing segment.
Excluding the impact of acquisitions, New Zealand publishing
cost growth was 1.3% (in New Zealand dollars). This is a good
outcome considering the infl ationary pressures on labour costs
being experienced in that market and is indicative of the very
strong cost disciplines that are in place.
In total, costs for the Group increased 2.8%.
The Company is currently undertaking a number of business
process simplifi cation and streamlining projects to better align
the cost base in our publishing business with revenue growth.
These projects will improve the operating platform in publishing
and result in further cost savings.
EarningsAs highlighted earlier, our diversifi cation strategy and
the continued focus on the alignment of the cost base has
reduced the earnings volatility of the Group. During a period
when our traditional metropolitan markets faced weakened ad
market conditions, the Group reported EBITDA of $505.2 million,
a reduction of 0.4% compared to the previous year. In previous
cyclical downturns, the earnings decline was signifi cant.
Another strong aspect of this year’s results is the earnings
contribution from the digital business in Australia and Trade Me
in New Zealand.
Our Australian digital business increased EBITDA by 270%
to $24.3 million (compared to $6.6 million in 2005) with all
the web-based businesses increasing in profi tability.
2006 2005 Variance A$m A$m %
Profi t and Loss
Group: Reported Trading
Trading Revenue 1907.8 1873.4 1.8%
Associate Profi ts & Other* 6.9 5.4 28.2%
Costs 1421.2 1367.4 (3.9%)
EBITDA* 493.5 511.4 (3.5%)
Depreciation 79.8 80.1 0.4%
EBIT* 413.8 431.3 (4.1%)
Group: Underlying Trading
Trading Revenue 1907.8 1873.4 1.8%
Associate Profi ts & Other 2.5 1.4 86.8%
Costs 1405.1 1367.4 (2.6%)
EBITDA 505.2 507.4 (0.4%)
Depreciation 79.8 80.1 0.4%
EBIT 425.5 427.3 (0.4%)
Balance Sheet
Total assets 4,087.2 3,592.8
Total liabilities 1,950.4 1,424.1
Total equity 2,136.8 2,168.7
Free Cashfl ow
Cash fl ows from
operating activities 288.2 343.8
Capital Expenditure (52.6) (48.2)
PRESSES Dividend – (18.6)
Operating cashfl ow
post Capital Expenditure
and PRESSES (Free cashfl ow) 235.6 277.1
*excludes interest income as per Note 2(b) to the fi nancial statements.
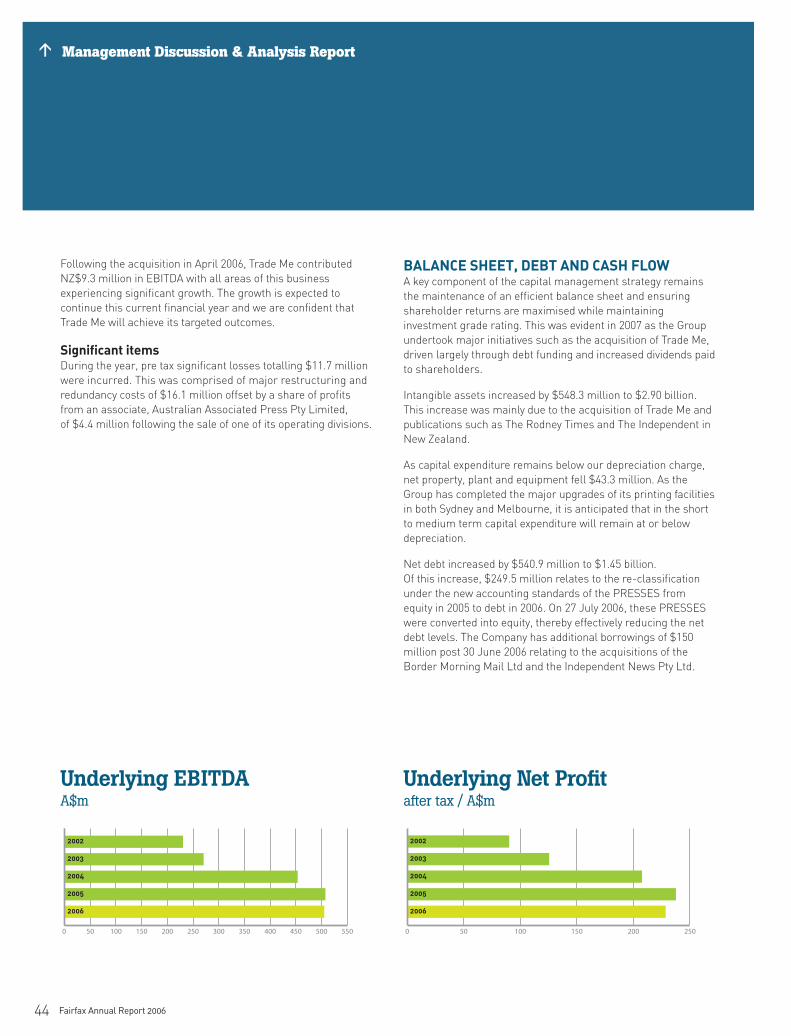
44 Fairfax Annual Report 2006
> Management Discussion & Analysis Report
Following the acquisition in April 2006, Trade Me contributed
NZ$9.3 million in EBITDA with all areas of this business
experiencing signifi cant growth. The growth is expected to
continue this current fi nancial year and we are confi dent that
Trade Me will achieve its targeted outcomes.
Signifi cant itemsDuring the year, pre tax signifi cant losses totalling $11.7 million
were incurred. This was comprised of major restructuring and
redundancy costs of $16.1 million offset by a share of profi ts
from an associate, Australian Associated Press Pty Limited,
of $4.4 million following the sale of one of its operating divisions.
BALANCE SHEET, DEBT AND CASH FLOW A key component of the capital management strategy remains
the maintenance of an effi cient balance sheet and ensuring
shareholder returns are maximised while maintaining
investment grade rating. This was evident in 2007 as the Group
undertook major initiatives such as the acquisition of Trade Me,
driven largely through debt funding and increased dividends paid
to shareholders.
Intangible assets increased by $548.3 million to $2.90 billion.
This increase was mainly due to the acquisition of Trade Me and
publications such as The Rodney Times and The Independent in
New Zealand.
As capital expenditure remains below our depreciation charge,
net property, plant and equipment fell $43.3 million. As the
Group has completed the major upgrades of its printing facilities
in both Sydney and Melbourne, it is anticipated that in the short
to medium term capital expenditure will remain at or below
depreciation.
Net debt increased by $540.9 million to $1.45 billion.
Of this increase, $249.5 million relates to the re-classifi cation
under the new accounting standards of the PRESSES from
equity in 2005 to debt in 2006. On 27 July 2006, these PRESSES
were converted into equity, thereby effectively reducing the net
debt levels. The Company has additional borrowings of $150
million post 30 June 2006 relating to the acquisitions of the
Border Morning Mail Ltd and the Independent News Pty Ltd.
Underlying EBITDA A$m
0 50 100 150 200 250 300 350 400 450 500 550
2006
2005
2004
2003
2002
Underlying Net Profi tafter tax / A$m
0 50 100 150 200 250
2006
2005
2004
2003
2002

Fairfax Annual Report 2006 45
Management Discussion & Analysis Report >
In March 2006, the Company issued 3 million Stapled Preference
Shares with a total value of $293.2 million. The proceeds from
the issue were used to partially fund the NZ$700 million
acquisition of Trade Me. Under International Financial Reporting
Standards the issue is treated as equity.
We have optimised the balance sheet with higher debt levels to
improve shareholder returns. Key debt ratios such as interest
cover at 5.1 times and debt to EBITDA (including PRESSES) at
2.93 are well within investment grade ratings.
The cash fl ow position of the Group remains strong with cash
fl ow per share of 25.4 cents exceeding reported earnings per
share of 24.4 cents. This is a refl ection of the benefi ts arising to
the Group from our investment in plant and equipment as well
as the continuing tight control on working capital. Overall free
cash fl ow was $235.6 million during the year.
DIVIDENDSDividends of $222.6 million were proposed and paid during the
year, an increase of $53.8 million from last year and an
indication of the fi nancial strength of the Group. Dividends were
comprised of ordinary dividends of $176.4 million and a special
dividend of $46.2 million. A Dividend Reinvestment Plan (DRP)
was in operation with the Company issuing 14,137,642 shares
under the DRP in 2006.
A fully franked fi nal dividend of 11.5 cents per share has been
declared taking the total ordinary dividends per share for 2006 to
19.5 cents per share or 5.4% higher than the previous year. The
DRP was in operation for the fi nal dividend with a 2.5% discount
applied. There was no discount applied to the interim dividend.
INTERNATIONAL FINANCIAL REPORTING STANDARDS As advised last year, the Company transitioned accounting
policies and fi nancial reporting from Australian Accounting
Standards (AGAAP) to Australian equivalents to International
Financial Reporting Standards (AIFRS) for the fi nancial year
ended 30 June 2006. The effects on both the restated 2005
fi nancial year Consolidated Income Statement and Balance
Sheet are minimal. Note 39 to the Financial Statements sets
out in detail the adjustments made.
Group Capital ExpenditureA$m
0 50 100 150 200 250
2006
2005
2004
2003
2002
Ordinary Dividendscents per share
00 5 10 15 20
2006
2005
2004
2003
2002

46 Fairfax Annual Report 2006
Consolidated Company Consolidated Restated Company Restated
2006 2005 2006 2005 Note $’000 $’000 $’000 $’000
Revenue from operations 2(a) 1,907,842 1,873,407 346,195 482,093
Other revenue 2(b) 2,122 6,840 26,490 158,549
Total revenue 1,909,964 1,880,247 372,685 640,642
Share of net profi ts of associates and joint ventures 9(c) 6,919 2,907 – –
Expenses from continuing operations excluding depreciation,
amortisation and fi nance costs 3(a) (1,421,216) (1,367,406) (84,766) (105,121)
Depreciation and amortisation 3(b) (79,775) (80,083) (13,814) (9,991)
Finance costs – PRESSES 3(d) (18,893) – (18,893) –
Finance costs – other 3(d) (80,416) (80,974) – (210,694)
Net profi t from continuing operations before income tax expense 316,583 354,691 255,212 314,836
Income tax (expense)/benefi t 5 (88,512) (90,808) 19,056 (36,495)
Net profi t from continuing operations after income tax expense 228,071 263,883 274,268 278,341
Net profi t attributable to minority interest (618) (634) – –
Net profi t attributable to members of the Company * 227,453 263,249 274,268 278,341
Earnings per share (cents per share)
Basic earnings per share (cents per share) 25 24.41 26.63
Diluted earnings per share (cents per share) 25 23.84 26.63
The basic and diluted earnings per share (cents per share)
before signifi cant and non-recurring items are shown at note 25.
Net profi t attributable to members of the Company* 227,453 263,249
Less dividend paid on PRESSES – (18,551)
Net profi t after signifi cant and non-recurring items 227,453 244,698
Signifi cant and non-recurring items, net of tax 4 6,876 (7,069)
Net profi t before signifi cant and non-recurring items, net of tax 234,329 237,629
Less notional SPS dividend 25 (5,844) –
Net profi t before signifi cant and non-recurring items and including notional SPS dividend 228,485 237,629
The above Income Statements should be read in conjunction with the accompanying notes.
Consolidated Income StatementsJohn Fairfax Holdings Limited and Controlled EntitiesFor the year ended 30 June 2006

Fairfax Annual Report 2006 47
Consolidated Company Consolidated Restated Company Restated
2006 2005 2006 2005 Note $’000 $’000 $’000 $’000
CURRENT ASSETSCash and cash equivalents 35(b) 52,748 134,154 954 23,813
Trade and other receivables 7 281,852 284,061 6,664 4,525
Inventories 8 35,663 30,195 – –
Derivative assets 14 15,305 411 – –
Total current assets 385,568 448,821 7,618 28,338
NON-CURRENT ASSETSReceivables 7 217 8,739 1,578,340 1,429,258
Investments accounted for using the equity method 9 16,333 10,661 3,046 –
Available for sale investments 10 3,175 – – –
Held to maturity investments 11 16,949 – – –
Intangible assets 12 2,899,648 2,351,357 25,821 20,851
Property, plant and equipment 13 654,257 697,539 26,696 29,618
Derivative assets 14 15,999 6,830 – –
Pension asset 15(a) 10,676 6,816 – –
Deferred tax assets 16(a) 78,253 55,699 6,646 4,211
Other fi nancial assets 17 6,119 6,321 409,570 155,570
Total non-current assets 3,701,626 3,143,962 2,050,119 1,639,508
Total assets 4,087,194 3,592,783 2,057,737 1,667,846
CURRENT LIABILITIESPayables 18 201,730 204,676 15,616 22,917
Interest bearing liabilities 19 610,175 163,420 249,536 –
Derivatives 14 246 – – –
Provisions 20 79,465 78,452 5,234 8,463
Current tax liabilities 7,656 25,805 7,486 25,521
Total current liabilities 899,272 472,353 277,872 56,901
NON-CURRENT LIABILITIESInterest bearing liabilities 19 897,757 885,019 – –
Derivatives 14 51,712 – – –
Deferred tax liabilities 16(a) 81,634 44,718 2,934 97
Provisions 20 17,635 21,115 1,137 154
Other 2,375 867 – –
Total non-current liabilities 1,051,113 951,719 4,071 251
Total liabilities 1,950,385 1,424,072 281,943 57,152
Net assets 2,136,809 2,168,711 1,775,794 1,610,694
EQUITYContributed equity 21 1,541,501 1,425,547 1,547,616 1,425,547
Reserves 22 (126,824) 28,089 595 595
Retained profi ts 23 717,414 710,975 227,583 184,552
Total parent entity interest 2,132,091 2,164,611 1,775,794 1,610,694
Minority interest 24 4,718 4,100 – –
Total equity 2,136,809 2,168,711 1,775,794 1,610,694
The above Balance Sheets should be read in conjunction with the accompanying notes.
Consolidated Balance SheetsJohn Fairfax Holdings Limited and Controlled Entities
For the year ended 30 June 2006

48 Fairfax Annual Report 2006
Consolidated Company Consolidated Restated Company Restated
2006 2005 2006 2005 $’000 $’000 $’000 $’000
Net profi t from continuing operations after income tax expense 227,453 263,249 274,268 278,341
Amounts recognised directly in equity
Adjustments on adoption of AIFRS, net of tax
Retained earnings (580) – (8,615) (179)
Foreign currency translation reserve (3,059) 15 – –
Cashfl ow hedge reserve, net of tax (648) – – –
Cashfl ow hedge reserve, net of tax (666) – – –
Net investment hedge reserve, net of tax (4,494) – – –
Foreign currency translation reserve, net of tax (146,386) 1,077 – –
Changes in fair value of available for sale assets, net of tax (667) – – –
Actuarial gain/(loss) on defi ned benefi t plans, net of tax 2,911 (384) – –
Total 73,864 263,957 265,653 278,162
Attributable to minority interest (618) (634) – –
Total recognised income and expense for the fi nancial year 73,246 263,323 265,653 278,162
The above Statements of Recognised Income and Expense should be read in conjunction with the accompanying notes.
Consolidated Statements ofRecognised Income and ExpenseJohn Fairfax Holdings Limited and Controlled EntitiesFor the year ended 30 June 2006

Fairfax Annual Report 2006 49
Consolidated Company Consolidated Restated Company Restated
2006 2005 2006 2005 Note $’000 $’000 $’000 $’000
Cash fl ows from operating activities
Receipts from customers (inclusive of GST) 2,114,427 2,068,565 4,264 292,093
Payments to suppliers and employees (inclusive of GST) (1,618,203) (1,574,643) (93,104) (129,336)
Redundancy and severance payments (20,264) (11,526) (2,620) –
Interest received 10,795 7,432 26,490 158,549
Dividends and distributions received 4,972 2,360 344,700 190,000
Finance costs paid – other (86,887) (85,440) – (210,694)
Finance costs paid – PRESSES ** (18,601) – (18,601) –
Net income taxes paid (98,054) (62,947) (55,437) (21,502)
Net cash infl ows from operating activities 35(a) 288,185 343,801 205,692 279,110
Cash fl ows from investing activities
Payment for purchase of controlled entities, associates
and joint ventures (net of cash acquired) (663,045) (13,563) (303,046) –
Payment for purchase of businesses, including mastheads (14,216) (9,697) – (2)
Proceeds from sale of controlled entities, associates and joint ventures – 7,699 – –
Payment for property, plant and equipment and other assets (52,554) (48,181) (16,099) (14,292)
Proceeds from sale of property, plant and equipment 141 3,167 38 –
Payment for available for sale investments (4,128) – – –
Payment for held to maturity investments (16,949) – – –
Proceeds from sale/liquidation of other fi nancial assets 47 95 – –
Loans advanced to controlled entities – – (49,477) (114,101)
Other – 680 – 170
Net cash outfl ow from investing activities (750,704) (59,800) (368,584) (128,225)
Cash fl ows from fi nancing activities
Proceeds from issue of shares 21(a) 1,913 441 1,913 441
Refund of transaction costs – share issue 21(a) – 1,117 – 1,117
Proceeds from issue of SPS (net of costs) 21(b) 293,167 – 299,282 –
Proceeds from borrowings and other fi nancial liabilities 735,765 182,091 – –
Repayment of borrowings and other fi nancial liabilities (488,046) (233,769) – –
Transaction costs – debt securities (375) (6,705) – –
Dividends paid to shareholders* (161,162) (102,576) (161,162) (102,576)
Dividends paid – PRESSES ** – (18,551) – (18,551)
Net cash infl ows/(outfl ows) from fi nancing activities 381,262 (177,952) 140,033 (119,569)
Net (decrease)/increase in cash and cash equivalents held (81,257) 106,049 (22,859) 31,316
Cash and cash equivalents at beginning of the fi nancial year 134,154 28,105 23,813 (7,503)
Effect of exchange rate changes on cash and cash equivalents (149) – – –
Cash and cash equivalents at end of the fi nancial year 35(b) 52,748 134,154 954 23,813
* Under the terms of the DRP, $61.460 million (2005: $66.321 million) of dividends were paid via the issue of 14,137,642 ordinary shares (2005: 17,494,932 ordinary
shares). A cash dividend payment of $161.162 million (2005: $102.576 million) was made to ordinary shareholders that did not elect to participate in the DRP.
** Under AIFRS, the PRESSES were reclassifi ed as a fi nancial liability and the dividends on the PRESSES reclassifi ed as an interest expense (refer to note 39).
The above Cash Flow Statements should be read in conjunction with the accompanying notes.
Consolidated Cash Flow StatementsJohn Fairfax Holdings Limited and Controlled Entities
For the year ended 30 June 2006

Notes to the Financial StatementsJohn Fairfax Holdings Limited and Controlled EntitiesFor the year ended 30 June 2006
50 Fairfax Annual Report 2006
1. Summary of signifi cant accounting policiesThe principal accounting policies adopted in the preparation of the fi nancial report are set out below. These policies have been
consistently applied to all the years presented, unless otherwise stated. The fi nancial report includes separate fi nancial statements
for John Fairfax Holdings Limited as an individual entity and the consolidated entity consisting of John Fairfax Holdings Limited and its
subsidiaries.
(A) BASIS OF PREPARATION
This general purpose fi nancial report for the fi nancial year ended 30 June 2006 has been prepared in accordance with Australian
equivalents to International Financial Reporting Standards (AIFRSs), other authoritative pronouncements of the Australian Accounting
Standards Board, Urgent Issues Group Interpretations and the Corporations Act 2001.
Application of AASB 1 First-time Adoption of Australian Equivalents to International Financial Reporting Standards.
The consolidated entity changed its accounting policies on 1 July 2005 to comply with AIFRS. The transition to AIFRS is accounted for
in accordance with Accounting Standard AASB 1 First-time Adoption of Australian Equivalents to International Financial Reporting
Standards, with 1 July 2004 as the date of transition.
The fi nancial statements of John Fairfax Holdings Limited and the Group until 30 June 2005 had been prepared in accordance with
previous Australian Generally Accepted Accounting Principles (previous AGAAP). Previous AGAAP differs in certain respects from
AIFRS. When preparing the fi nancial report for the fi nancial year ended 30 June 2006, management has amended certain accounting
and valuation methods applied in previous AGAAP fi nancial statements to comply with AIFRS. The comparative information has been
restated to refl ect these adjustments, with the exception of fi nancial instruments (AASB 132 and AASB 139), including derivatives,
as permitted under the fi rst time adoption transitional provisions. The accounting policies for fi nancial instruments applicable to
the comparative information are consistent with those adopted and disclosed in the 2005 annual fi nancial report. Accordingly, the
comparative columns have been presented as restated.
Compliance with AIFRS ensures that the fi nancial report, comprising the fi nancial statements and notes thereto, complies with
International Financial Reporting Standards (IFRS). The parent entity fi nancial statements and notes also comply with IFRS except
that it has elected to apply the relief provided to parent entities in respect of certain disclosure requirements contained in AASB 132
Financial Instruments: Presentation and Disclosure.
Early adoption of standard
The Group has elected to apply AASB 119 Employee Benefi ts (issued in December 2004) to the annual reporting period beginning
1 July 2004.
Transitional elections
The Group has not taken advantage of any fi rst time transition elections available under AASB 1 apart from the following:
to apply AASB 132 Financial Instruments: Disclosure and Presentation and AASB 139 Financial Instruments: Recognition and
Measurement from 1 July 2005
to not apply AASB 3 Business Combinations retrospectively to business combinations that occurred before the transition date of
1 July 2004
to recognise all cumulative defi ned benefi t superannuation plan actuarial gains and losses directly in retained earnings; and
to apply AASB 2 Share Based Payment only to shares and options granted after 7 November 2002 that had not vested on or before
1 January 2005.
The impact of the transition from previous AGAAP to AIFRS on the Group’s equity and net profi t are reconciled and described in
note 39.
Historical cost convention
These fi nancial statements have been prepared on a going concern basis and on the basis of historical cost principles except for
derivative fi nancial instruments and certain fi nancial assets which are measured at fair value. The carrying values of recognised
assets and liabilities that are hedged with fair value hedges are adjusted to record changes in the fair values attributable to the risks
that are being hedged.
•
•
•
•
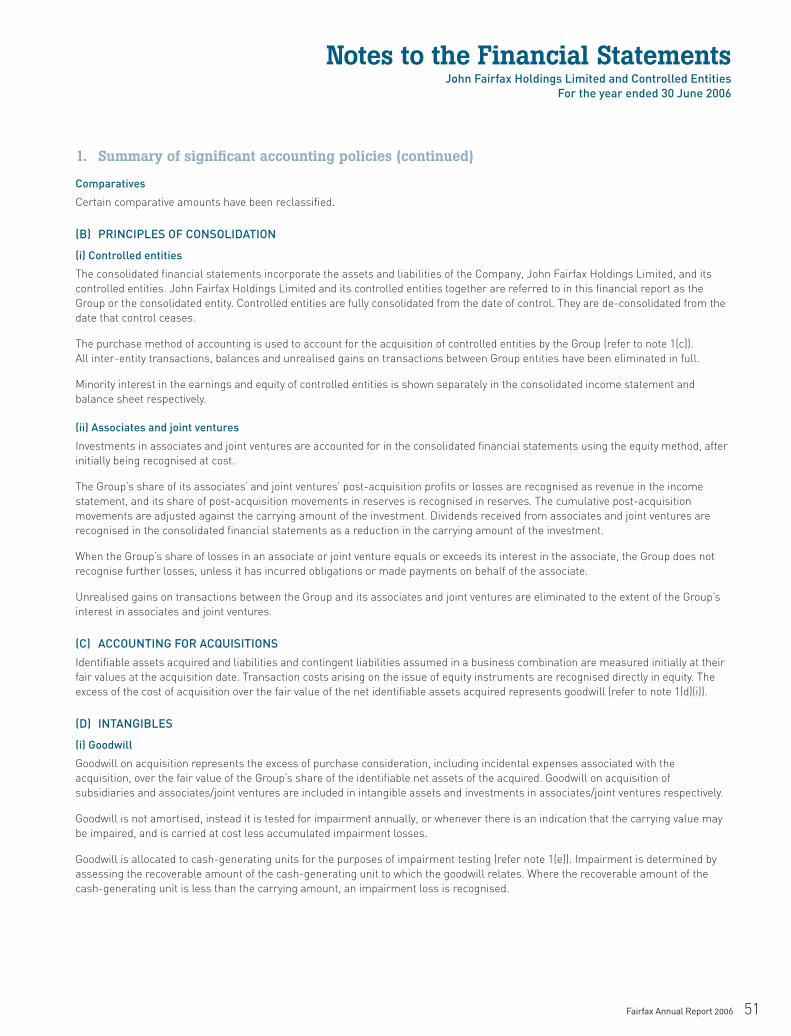
Notes to the Financial StatementsJohn Fairfax Holdings Limited and Controlled Entities
For the year ended 30 June 2006
Fairfax Annual Report 2006 51
Comparatives
Certain comparative amounts have been reclassifi ed.
(B) PRINCIPLES OF CONSOLIDATION
(i) Controlled entities
The consolidated fi nancial statements incorporate the assets and liabilities of the Company, John Fairfax Holdings Limited, and its
controlled entities. John Fairfax Holdings Limited and its controlled entities together are referred to in this fi nancial report as the
Group or the consolidated entity. Controlled entities are fully consolidated from the date of control. They are de-consolidated from the
date that control ceases.
The purchase method of accounting is used to account for the acquisition of controlled entities by the Group (refer to note 1(c)).
All inter-entity transactions, balances and unrealised gains on transactions between Group entities have been eliminated in full.
Minority interest in the earnings and equity of controlled entities is shown separately in the consolidated income statement and
balance sheet respectively.
(ii) Associates and joint ventures
Investments in associates and joint ventures are accounted for in the consolidated fi nancial statements using the equity method, after
initially being recognised at cost.
The Group’s share of its associates’ and joint ventures’ post-acquisition profi ts or losses are recognised as revenue in the income
statement, and its share of post-acquisition movements in reserves is recognised in reserves. The cumulative post-acquisition
movements are adjusted against the carrying amount of the investment. Dividends received from associates and joint ventures are
recognised in the consolidated fi nancial statements as a reduction in the carrying amount of the investment.
When the Group’s share of losses in an associate or joint venture equals or exceeds its interest in the associate, the Group does not
recognise further losses, unless it has incurred obligations or made payments on behalf of the associate.
Unrealised gains on transactions between the Group and its associates and joint ventures are eliminated to the extent of the Group’s
interest in associates and joint ventures.
(C) ACCOUNTING FOR ACQUISITIONS
Identifi able assets acquired and liabilities and contingent liabilities assumed in a business combination are measured initially at their
fair values at the acquisition date. Transaction costs arising on the issue of equity instruments are recognised directly in equity. The
excess of the cost of acquisition over the fair value of the net identifi able assets acquired represents goodwill (refer to note 1(d)(i)).
(D) INTANGIBLES
(i) Goodwill
Goodwill on acquisition represents the excess of purchase consideration, including incidental expenses associated with the
acquisition, over the fair value of the Group’s share of the identifi able net assets of the acquired. Goodwill on acquisition of
subsidiaries and associates/joint ventures are included in intangible assets and investments in associates/joint ventures respectively.
Goodwill is not amortised, instead it is tested for impairment annually, or whenever there is an indication that the carrying value may
be impaired, and is carried at cost less accumulated impairment losses.
Goodwill is allocated to cash-generating units for the purposes of impairment testing (refer note 1(e)). Impairment is determined by
assessing the recoverable amount of the cash-generating unit to which the goodwill relates. Where the recoverable amount of the
cash-generating unit is less than the carrying amount, an impairment loss is recognised.
1. Summary of signifi cant accounting policies (continued)

Notes to the Financial StatementsJohn Fairfax Holdings Limited and Controlled EntitiesFor the year ended 30 June 2006
52 Fairfax Annual Report 2006
(ii) Other intangible assets
Mastheads and tradenames
The newspaper mastheads and tradenames have been assessed to have indefi nite useful lives. Accordingly, they are not amortised,
instead they are tested for impairment annually, or whenever there is an indication that the carrying value may be impaired, and are
carried at cost less accumulated impairment losses.
The Group’s mastheads and tradenames operate in established markets with limited licence conditions and are expected to continue
to complement the Group’s new media initiatives. On this basis, the directors have determined that mastheads and tradenames
have indefi nite lives as there is no foreseeable limit to the period over which the assets are expected to generate net cash infl ows for
the Group.
Computer software
Acquired computer software licences are capitalised as an intangible as are internal and external costs directly incurred in the
purchase or development of computer software, including subsequent upgrades and enhancements when it is probable that they will
generate future economic benefi ts attributable to the consolidated entity. These costs are amortised using the straight-line method
over 3 years.
Intangible assets created within the business are not capitalised and are expensed in the income statement in the period the
expenditure is incurred.
Intangible assets are tested for impairment annually (refer to note 1(e)).
(E) IMPAIRMENT
Assets that have an indefi nite useful life are not subject to amortisation and are tested annually for impairment or whenever there
is an indication that it may be impaired. Assets that are subject to amortisation are reviewed for impairment whenever events or
changes in circumstances indicate that the carrying value may not be recoverable. An impairment loss is recognised for the amount by
which the asset’s carrying amount exceeds its recoverable amount. The recoverable amount is the higher of an asset’s fair value less
costs to sell and value in use. In assessing value in use, the estimated future cash fl ows are discounted to their present value using a
pre-tax discount rate that refl ects current market assessments of the time value of money and the risks specifi c to the asset. Where
an asset does not generate largely independent cash infl ows, the recoverable amount is determined for the cash-generating unit to
which the asset belongs. A cash generating unit is the grouping of assets at the lowest level for which there are separately identifi able
cash fl ows.
At each balance date, the consolidated entity assesses whether there is any indication that an asset may be impaired. Where an
indicator of impairment exists, the Group makes a formal estimate of recoverable amount. Where the carrying amount of an asset
exceeds its recoverable amount the asset is considered impaired and is written down to its recoverable amount.
(F) FOREIGN CURRENCY
Currency of presentation
All amounts are expressed in Australian dollars, which is the consolidated entity’s presentation currency.
Items included in the fi nancial statements of each of the Group’s entities are measured using the currency of the primary economic
environment in which the entity operates (the functional currency).
Transactions and balances
Foreign currency transactions are translated into the functional currency using the exchange rates prevailing at the dates of the
transactions. Foreign exchange gains and losses resulting from the settlement of such transactions and from the translation at
reporting date exchange rates of monetary assets and liabilities denominated in foreign currencies are recognised in the income
statement, with the exception of differences on foreign currency borrowings that provide a hedge against a net investment in a
foreign operation and qualifying cash fl ow hedges, which are deferred in equity until disposal. Tax charges and credits attributable to
exchange differences on borrowings are also recognised in equity.
1. Summary of signifi cant accounting policies (continued)
(D) INTANGIBLES (CONTINUED)

Notes to the Financial StatementsJohn Fairfax Holdings Limited and Controlled Entities
For the year ended 30 June 2006
Fairfax Annual Report 2006 53
Translation differences on non-monetary items that are measured in terms of historical cost in a foreign currency are translated using
the exchange rate as at the date of the initial transaction. Translation differences on non-monetary items, such as available for sale
fi nancial assets, are translated using the exchange rates at the date when the fair value was determined and included in the fair value
reserve in equity.
Group entities
The results and fi nancial position of all the Group entities that have a functional currency different from the presentation currency
are translated into the presentation currency as follows:
assets and liabilities for each balance sheet presented are translated at closing rate at the date of that balance sheet;
income and expenses for each income statement are translated at average exchange rates; and
all resulting exchange differences are recognised as a separate component of equity.
On consolidation, exchange differences arising from the translation on any net investment in foreign entities are taken directly to a
separate component of equity, the foreign currency translation reserve.
On disposal of a foreign entity, or borrowings that form part of the net investment are repaid, the deferred cumulative amount of
the exchange differences in the foreign currency translation reserve relating to that foreign operation is recognised in the income
statement as part of the gain or loss on sale. Goodwill and fair value adjustments arising on the acquisition of a foreign entity are
treated as assets and liabilities of the foreign entity and translated at the closing rate.
(G) REVENUE RECOGNITION
Revenue is recognised to the extent that it is probable that the economic benefi ts will fl ow to the entity and the amount of the revenue
can be reliably measured. Advertising and circulation revenue from the sale of newspapers, magazines and other publications is
recognised on publication net of expected returns and pricing adjustments. Revenue from rendering of services is recognised when
control of a right to be compensated for the services has been attained and the stage of completion of the service contract can be
reliably measured. Stage of completion is measured by reference to the services performed to date as a percentage of total estimated
services to be performed for each contract. If a contract outcome cannot be reliably measured, revenue is recognised only to the
extent that costs have been incurred. Online revenue from the sale of advertising is recognised on publication of the advertisement
on the website. Revenue from other internet sales depends on the nature of the service and is recognised on a basis that refl ects the
timing, nature and value of the benefi ts provided.
Revenue from dividends and distributions from controlled entities are recognised by the Company when they are declared by the
controlled entities.
Interest is recognised as it accrues, taking into account the effective yield on the fi nancial asset.
(H) INCOME TAX
Current tax assets and liabilities for the current and prior periods are measured at the amount expected to be recovered from or paid
to the taxation authorities. The tax rates and tax laws used to calculate the amount are those that are enacted or substantively enacted
at balance date.
The income tax expense or revenue for the period is the tax payable on the current period’s taxable income based on the national
income tax rate for each jurisdiction adjusted by changes in deferred tax assets and liabilities attributed to temporary differences
between the tax bases of assets and liabilities and their carrying amounts in the fi nancial statements, and to unused tax losses.
Deferred tax assets and liabilities are recognised for temporary differences at the balance date between the tax bases of assets and
liabilities and their carrying amounts for fi nancial reporting purposes. Income taxes relating to equity items are recognised directly in
equity and not in the income statement.
•
•
•
1. Summary of signifi cant accounting policies (continued)
(F) FOREIGN CURRENCY (CONTINUED)
Transactions and balances (continued)

Notes to the Financial StatementsJohn Fairfax Holdings Limited and Controlled EntitiesFor the year ended 30 June 2006
54 Fairfax Annual Report 2006
Deferred income tax liabilities are recognised for all taxable temporary differences:
except where the deferred income tax liability arises from the initial recognition of an asset or liability in a transaction that is not
a business combination and, at the time of the transaction, affects neither the accounting profi t nor taxable profi t or loss; and
in respect of taxable temporary differences associated with investments in subsidiaries, associates and interests in joint ventures,
except where the timing of the reversal of the temporary differences can be controlled and it is probable that the temporary
differences will not reverse in the foreseeable future.
Deferred income tax assets are recognised for all deductible temporary differences, carry-forward of unused tax assets and unused
tax losses, to the extent that it is probable that taxable profi t will be available against which the deductible temporary differences,
and the carry-forward of unused tax assets and unused tax losses can be utilised:
except where the deferred income tax asset relating to the deductible temporary difference arises from the initial recognition
of an asset or liability in a transaction that is not a business combination and, at the time of the transaction, affects neither the
accounting profi t nor taxable profi t or loss; and
in respect of deductible temporary differences associated with investments in subsidiaries, associates and interests in joint
ventures, deferred tax assets are only recognised to the extent that it is probable that the temporary differences will reverse in the
foreseeable future and taxable profi t will be available against which the temporary differences can be utilised.
The carrying amount of deferred income tax assets is reviewed at each reporting date and reduced to the extent that it is no longer
probable that suffi cient taxable profi t will be available to allow all or part of the deferred income tax asset to be utilised.
Income taxes relating to items recognised directly in equity are recognised in equity and not in profi t and loss.
Deferred tax assets and deferred tax liabilities are offset only if a legally enforceable right exists to set off current
assets against current tax liabilities and the deferred tax assets and liabilities relate to the same taxable entity and the same
taxation authority.
Goods and Services Tax (GST)
Revenues, expenses and assets are recognised net of the amount of GST except:
(i) where the GST incurred on a purchase of goods and services is not recoverable from the taxation authority, in which case the
GST is recognised as part of the cost of acquisition of the asset or as part of the cost of acquisition of the asset or as part of the
expense item as applicable; and
(ii) receivables and payables are stated with the amount of GST included.
This net amount of GST recoverable from, or payable to, the taxation authority is included as part of receivables or payables in the
balance sheet.
Cashfl ows are included in the statement of cashfl ow on a gross basis and the GST component of cashfl ows arising from investing and
fi nancing activities, which are recoverable from, or payable to the taxation authority are classifi ed as operating cashfl ows.
Commitments and contingencies are disclosed net of the amount of GST recoverable from, or payable to, the taxation authority.
Tax consolidation – Australia
John Fairfax Holdings Limited (the head entity) and its wholly-owned Australian entities have implemented the tax consolidation
legislation as of 1 July 2003. Each member in the tax consolidated group continues to account for their own current and deferred tax
amounts as if they continued to be a stand alone taxpayer in its own right.
On adoption of the tax consolidation legislation, the entities in the tax consolidated group entered into a tax sharing agreement which,
in the opinion of the directors, limits the joint and several liability of the wholly-owned entities in the case of a default of the head
entity, John Fairfax Holdings Limited.
The entities have also entered into a tax funding agreement under which the wholly-owned entities fully compensate John Fairfax
Holdings Limited for any current tax payable assumed and are compensated by the Company for any current tax receivable and
deferred tax assets relating to unused tax losses or unused tax credits transferred to John Fairfax Holdings Limited under the tax
•
•
•
•
1. Summary of signifi cant accounting policies (continued)
(H) INCOME TAX (CONTINUED)

Notes to the Financial StatementsJohn Fairfax Holdings Limited and Controlled Entities
For the year ended 30 June 2006
Fairfax Annual Report 2006 55
consolidation legislation. Assets or liabilities arising under tax funding arrangements with the tax consolidated entities are recognised
as amounts receivable from or payable to other entities in the group. The amounts receivable/payable under the tax funding
arrangements are due upon demand from the head entity. The head entity may also require payment of interim funding amounts to
assist with its obligations to pay tax instalments.
(I) LEASES
Finance leases
Assets acquired under fi nance leases which result in the consolidated entity receiving substantially all the risks and rewards of
ownership of the asset (fi nance leases) are capitalised at the lease’s inception at the lower of the fair value of the leased property or
the estimated present value of the minimum lease payments. The corresponding fi nance lease obligation, net of fi nance charges, is
included within interest bearing liabilities. The interest element is allocated to accounting periods during the lease term to refl ect a
constant rate of interest on the remaining balance of the liability for each accounting period. The leased asset is included in property,
plant and equipment and is depreciated over the shorter of the estimated useful life of the asset or the lease term.
Operating leases
Leases where the lessor retains substantially all the risks and benefi ts of ownership of the asset are classifi ed as operating leases.
Net rental payments, excluding contingent payments, are recognised as an expense in the income statement on a straight-line basis
over the period of the lease.
(J) CASH AND CASH EQUIVALENTS
Cash and cash equivalents includes cash on hand, deposits held at call with fi nancial institutions and other short term investments
with original maturities of three months or less that are readily convertible to cash and subject to insignifi cant risk of changes in
value. Bank overdrafts are shown within interest bearing liabilities in current liabilities on the balance sheet.
(K) TRADE AND OTHER RECEIVABLES
For the fi nancial year ended 30 June 2005, trade receivables were recognised at original invoice amount less provision for doubtful
debts. Debts which were known to be uncollectible were written off. A provision for doubtful debts was established where there was
objective evidence that the Group will not be able to collect all amounts due. From 1 July 2005, trade receivables are recognised
at amortised cost, which in the case of the Group, is the original invoice amount less an allowance for any uncollectable amount.
Collectability of trade receivables is reviewed on an ongoing basis and a provision for doubtful debts is made when there is objective
evidence that the Group will not be able to collect the debts.
Interest receivable on related party loans is recognised on an accruals basis.
(L) INVENTORIES
Inventories including work in progress are stated at the lower of cost and net realisable value. The methods used to determine cost
for the main items of inventory are:
raw materials (comprising mainly newsprint and paper on hand) are assessed at average cost and newsprint and paper in transit
by specifi c identifi cation cost.
fi nished goods and work-in-progress are assessed as the cost of direct material and labour and a proportion of manufacturing
overheads based on normal operating capacity
in the case of other inventories, cost is assigned by the weighted average cost method.
A provision for diminution in value of inventories exists to cover the estimated decline in value from the effects of storage hazards.
(M) AVAILABLE-FOR-SALE INVESTMENTS
Available-for-sale fi nancial assets are investments in listed equity securities in which the Group does not have signifi cant infl uence
or control. They are stated at fair value based on current bid prices and unrealised gains and losses arising from changes in the fair
value are recognised in the asset revaluation reserve. The assets are included in non-current assets unless management intends to
dispose of the investment within 12 months of the balance sheet date.
•
•
•
1. Summary of signifi cant accounting policies (continued)
(H) INCOME TAX (CONTINUED)

Notes to the Financial StatementsJohn Fairfax Holdings Limited and Controlled EntitiesFor the year ended 30 June 2006
56 Fairfax Annual Report 2006
(N) INVESTMENTS AND OTHER FINANCIAL ASSETS
The consolidated entity adopted AASB 139 Financial Instruments: Recognition and Measurement from 1 July 2005. Adjustments have
been made to the opening balance sheet at 1 July 2005 to refl ect this change in accounting policy for the adoption of AASB 139 and
these are shown separately in note 39.
From 1 July 2005, the consolidated entity classifi ed its investments in the following categories: fi nancial assets at fair value through
profi t or loss, loans and receivables, held-to-maturity investments and available for sale fi nancial assets. The classifi cation depends
on the purpose for which the investments were acquired. Management determines the classifi cation of its investments at initial
recognition and re-evaluates this designation at each reporting date.
The consolidated entity classifi es and measures its investments as follows:
(i) Financial assets at fair value through profi t and loss
This category has two sub-categories: fi nancial assets held for trading and those designated at fair value through profi t and loss on
initial recognition. The policy of management is to designate a fi nancial asset at fair value through profi t and loss if there exists the
possibility it will be sold in the short term and the asset is subject to frequent changes in fair value. These assets are measured at
fair value and realised and unrealised gains and losses arising from changes in fair value are included in the income statement in the
period in which they arise.
(ii) Loans and receivables
Loans and receivables are non-derivative fi nancial assets with fi xed or determinable payments that are not quoted in an active market
and are included in receivables in the balance sheet and measured at amortised cost using the effective interest method.
(iii) Available for sale fi nancial assets
These assets are non-derivatives that are either designated or not classifi ed in any of the other categories and measured at fair value.
Any unrealised gains and losses arising from changes in fair value are included in equity.
(iv) Held-to-maturity investments
Held-to-maturity investments are non-derivative fi nancial assets with fi xed or determinable payments and fi xed maturities that the
Group’s management has the positive intention and ability to hold to maturity. These assets are measured at amortised cost using the
effective interest method.
Financial assets other than derivatives are recognised at fair value or amortised cost in accordance with the requirements of AASB
139. Where they are carried at fair value, gains and losses on remeasurement are recognised directly in equity unless the fi nancial
assets have been designated as being held at fair value through profi t and loss, in which case the gains and losses are recognised
directly in the income statement.
All fi nancial liabilities other than derivatives are carried at amortised cost.
The Group uses derivative fi nancial instruments such as forward foreign currency contracts, foreign currency and interest rate swaps
to hedge its risks associated with interest rate and foreign currency fl uctuations. Derivatives, including those embedded in other
contractual arrangements, are initially recognised at fair value on the date a derivative contract is entered into and are subsequently
remeasured to their fair value. The method of recognising the resulting gain or loss depends on whether the derivative is designated
as a hedging instrument, and if so, the nature of the item being hedged.
The measurement of the fair value of forward exchange contracts is calculated by reference to current forward exchange rates for
contracts with similar maturity profi les. The fair value of interest rate swap contracts is determined by reference to market values for
similar instruments.
Hedge accounting
For the purposes of hedge accounting, hedges are classifi ed as either fair value hedges (hedges of the fair value of recognised assets
or liabilities or a fi rm commitment) or cash fl ow hedges (hedges of highly probable forecast transactions).
1. Summary of signifi cant accounting policies (continued)

Notes to the Financial StatementsJohn Fairfax Holdings Limited and Controlled Entities
For the year ended 30 June 2006
Fairfax Annual Report 2006 57
Fair value hedge
Changes in the fair value of derivatives that are designated and qualify as fair value hedges are recorded in the income statement,
together with any changes in the fair value of the hedged asset or liability that are attributable to the hedged risk. Any gain or loss
attributable to the hedged risk on remeasurement of the hedged item is adjusted against the carrying amount of the hedged item
and recognised in the income statement. Where the adjustment is to the carrying amount of a hedged interest-bearing fi nancial
instrument, the adjustment is amortised to the income statement such that it is fully amortised by maturity.
When the hedged fi rm commitment results in the recognition of an asset or a liability, then, at the time the asset or liability is
recognised, the associated gains or losses that had previously been recognised in equity are included in the initial measurement
of the acquisition cost or other carrying amount of the asset or liability.
Cash fl ow hedge
The effective portion of changes in the fair value of derivatives that are designated and qualify as cash fl ow hedges is recognised in
equity in the hedging reserve. The gain or loss relating to the ineffective portion is recognised immediately in the income statement.
Gains or losses that are recognised in equity are transferred to the income statement in the same year in which the hedged fi rm
commitment affects the net profi t and loss, for example when the future sale actually occurs.
The consolidated entity’s interest rate swaps and cross currency swaps held for hedging purposes are generally accounted for as cash
fl ow hedges. At 30 June 2006, the consolidated entity had closed out all forward foreign currency contracts held for hedging purposes.
Hedge accounting is discontinued when the hedging instrument expires or is sold, terminated or exercised, or no longer qualifi es
for hedge accounting. At that point in time, any cumulative gain or loss on the hedging instrument recognised in equity is retained in
equity until the forecasted transaction occurs. If a hedged transaction is no longer expected to occur, the net cumulative gain or loss
recognised in equity is transferred to the income statement.
Derivatives that do not qualify for hedge accounting
For derivatives that do not qualify for hedge accounting, any gains or losses arising from changes in fair value are taken directly to the
income statement.
Financial instrument transaction costs
Under previous AGAAP transaction costs were excluded from the amounts disclosed in the fi nancial instruments. Under AIFRS such
costs are included in the carrying amounts.
(O) PROPERTY, PLANT AND EQUIPMENT
Property, plant and equipment is recorded at cost less accumulated depreciation. Directly attributable costs arising from the
acquisition or construction of fi xed assets, including internal labour and interest, are also capitalised as part of the cost.
Recoverable amount
All items of property, plant and equipment are reviewed annually to ensure carrying values are not in excess of recoverable amounts.
Recoverable amounts are based upon the present value of expected future cashfl ows.
Depreciation and amortisation
Land is not depreciated. Depreciation on other assets is calculated using the straight line method to allocate their cost, net of their
residual values, over their estimated useful lives, as follows:
Buildings up to 60 years
Printing presses up to 20 years
Other production equipment up to 15 years
Other equipment up to 40 years
The assets’ residual values and useful lives are reviewed and adjusted, if appropriate, at each balance sheet date. An asset’s carrying
amount is written down immediately to its recoverable amount if the asset’s carrying amount is greater than its estimated recoverable
amount. Gains and losses on disposals are determined by comparing the proceeds with carrying amount. These are included in the
income statement.
1. Summary of signifi cant accounting policies (continued)
(N) INVESTMENTS AND OTHER FINANCIAL ASSETS (CONTINUED)

Notes to the Financial StatementsJohn Fairfax Holdings Limited and Controlled EntitiesFor the year ended 30 June 2006
58 Fairfax Annual Report 2006
(P) TRADE AND OTHER PAYABLES
For the fi nancial year ended 30 June 2005, trade payables were carried at cost which was the fair value of consideration to be paid in
the future for goods and services received. From 1 July 2005, liabilities for trade payables and other amounts are carried at amortised
cost which, in the case of the Group, is the fair value of the consideration to be paid in the future for goods and services received.
Loans payable to related parties are carried at amortised cost and interest payable is recognised on an accruals basis.
(Q) PROVISIONS
Provisions are recognised when an entity has a legal, equitable or constructive obligation to make a future sacrifi ce of economic
benefi ts to others as a result of past transactions, or past events, it is probable that a future sacrifi ce of economic benefi ts will be
required and a reliable estimate can be made of the amount of the obligation.
A provision for dividends is not recognised as a liability unless the dividends are declared, determined or publicly recommended on or
before balance date.
(R) INTEREST-BEARING LIABILITIES
Subsequent to initial recognition at fair value, net of transaction costs incurred, interest bearing liabilities are measured at amortised
cost. Any difference between the proceeds (net of transaction costs) and the redemption amount is recognised in the income
statement over the period of the borrowings using the effective interest method.
Preferred reset securities exchangeable for shares are classifi ed as liabilities (refer to note 19, 21(c)). The dividends on these shares
are recognised in the income statement as a fi nance cost.
Finance lease liabilities are determined in accordance with the requirements of AASB 117 Leases (refer to note 1(i)).
Borrowing costs
Borrowing costs include interest, amortisation of discounts or premiums relating to borrowings, amortisation or ancillary costs
incurred in connection with arrangement of borrowings and foreign exchange losses net of hedged amounts on borrowings, including
trade creditors and lease fi nance charges.
Borrowing costs are expensed as incurred unless they relate to qualifying assets. Qualifying assets are assets which take more than
12 months to get ready for their intended use or sale. In these circumstances, borrowing costs are capitalised to the cost of the asset.
Where funds are borrowed generally, borrowing costs are capitalised using a weighted average capitalisation rate.
(S) EMPLOYEE BENEFITS
(i) Wages, salaries, annual leave and long service leave
Liabilities for wages and salaries, holiday pay, annual leave are recognised in the provision for employee benefi ts and measured at the
amounts expected to be paid when the liabilities are settled.
The employee benefi t liability expected to be settled within 12 months from balance date is recognised in current liabilities. The
non-current provision relates to entitlements, including long service leave, which are expected to be payable after twelve months
from balance date and are measured as the present value of expected future payments to be made in respect of services provided by
employees up to balance date. Consideration is given to expected future wage and salary levels, experience of employee departures
and periods of service. Expected future payments are discounted using market yields at balance date on national government bonds
with terms to maturity and currency that match, as closely as possible, the estimated future cash outfl ows.
Employee benefi t on-costs are recognised and included in employee benefi t liabilities and costs when the employee benefi ts to which
they relate are recognised as liabilities.
(ii) Share-based payment transactions
Share based compensation benefi ts can be provided to employees in the form of shares and options.
There are currently two plans in place to provide these benefi ts. Information relating to these schemes is set out in note 31.
1. Summary of signifi cant accounting policies (continued)

Notes to the Financial StatementsJohn Fairfax Holdings Limited and Controlled Entities
For the year ended 30 June 2006
Fairfax Annual Report 2006 59
Shares options granted before 7 November 2002 and/or vested before 1 January 2005
No expense is recognised in the income statement in respect of these options. The shares are recognised when the options are
exercised and the proceeds received allocated to share capital.
Shares options granted after 7 November 2002 and vested after 1 January 2005
The fair value of options granted under the share plans is recognised as an employee benefi t expense with a corresponding increase
in equity. The fair value is measured at grant date and recognised over the period during which the employees become unconditionally
entitled to the options.
The fair value at grant date is independently determined using a Monte Carlo option pricing model that takes into account the exercise
price, the term of the option, the vesting and performance criteria, the impact of dilution, the non-tradeable nature of the option, the
share price at grant date and expected price volatility of the underlying share, the expected dividend yield and the risk-free interest
rate for the term of the option.
The fair value of the options granted excludes the impact of any non-market vesting conditions (for example, profi tability and sales
growth targets). Non-market vesting conditions are included in assumptions about the number of options that are expected to become
exercisable. At each reporting date, the entity revises its estimate of the number of options that are expected to vest. The employee
benefi t expense recognised each period takes into account the most recent estimate.
Upon the exercise of options, the balance of the share based payments reserve relating to those options is transferred to share capital.
The market value of shares issued to employees for no cash consideration under the Long Term Incentive Share Plan is recognised as
an employee benefi ts expense with a corresponding increase in equity when the employees become entitled to the shares.
The dilutive effect, if any, of outstanding options is refl ected as additional share dilution in earnings per share.
(iii) Defi ned benefi t superannuation plans
John Fairfax Holdings Limited and certain controlled entities participate in a number of superannuation plans.
An asset in respect of defi ned benefi t superannuation plans is recognised in the balance sheet, and is measured as the present value
of the defi ned benefi t obligation at the reporting date plus unrecognised actuarial gains (less unrecognised actuarial losses), less the
fair value of the superannuation fund’s assets at that date and any unrecognised past service cost. The present value of the defi ned
benefi t obligation is based on expected future payments which arise from membership of the fund to the balance date, calculated
annually by independent actuaries using the projected unit credit method. Consideration is given to expected future wage and salary
levels, experience of employee departures and periods of service. Actuarial gains and losses are recognised in retained earnings in
the periods in which they arise.
Contributions made by the Company to defi ned contribution superannuation funds are charged to the income statement in the period
the employee’s service is provided.
(iv) Termination benefi ts
Termination benefi ts are payable when employment is terminated before the normal retirement date, or when an employee accepts
voluntary redundancy in exchange for these benefi ts. The Group recognises termination benefi ts when it is demonstrably committed
to either terminating the employment of current employees according to a detailed formal plan without possibility of withdrawal or
providing termination benefi ts as a result of an offer made to encourage voluntary redundancy.
1. Summary of signifi cant accounting policies (continued)
(S) EMPLOYEE BENEFITS (CONTINUED)

Notes to the Financial StatementsJohn Fairfax Holdings Limited and Controlled EntitiesFor the year ended 30 June 2006
60 Fairfax Annual Report 2006
(T) CONTRIBUTED EQUITY
Ordinary shares are classifi ed as equity. Preferred reset securities exchangeable for shares are classifi ed as liabilities (refer note 1(r)).
Stapled preference shares are classifi ed as equity (refer note 21(b)).
Incremental costs directly attributable to the issue of new shares or options are recognised in equity as a reduction from the proceeds.
Incremental costs directly attributable to the issue of new shares for the acquisition of a business are not included in the cost of the
acquisition as part of the purchase consideration.
Debentures
Debentures have been included as equity as the rights attaching to them are in all material respects comparable to those attaching to
the ordinary shares. Such debentures are unsecured non-voting securities that have interest entitlements equivalent to the dividend
entitlements attaching to the ordinary voting shares and rank equally with such shares on any liquidation or winding up. These interest
entitlements are treated as dividends.
The debentures are convertible into shares on a one-for-one basis at the option of the holder provided that conversion will not result
in a breach of any of the following:
(i) any provision of the Foreign Acquisitions and Takeovers Act 1975;
(ii) any undertaking given by the Company to the Foreign Investment Review Board or at the request of the Foreign Investment Review
Board from time to time; or
(iii) any other applicable law including, without limitation the Broadcasting Act 1942.
(U) EARNINGS PER SHARE
Basic earnings per share
Basic earnings per share (EPS) is calculated by dividing the net profi t attributable to members, adjusted to exclude costs of servicing
equity other than ordinary shares, by the weighted average number of ordinary shares outstanding during the fi nancial year, adjusted
for any bonus elements in ordinary shares issued during the fi nancial year.
Diluted earnings per share
Diluted earnings per share is calculated by dividing the basic EPS earnings adjusted by the after tax effect of interest and other
fi nancing costs associated with dilutive potential ordinary shares and the effect on revenues and expenses of conversion to ordinary
shares associated with dilutive potential ordinary shares by the weighted average number of ordinary shares and dilutive potential
ordinary shares adjusted for any bonus issue.
(V) SEGMENT REPORTING
A business segment is a group of assets and operations engaged in providing products or services that are subject to risks and
returns that are different to those of other business segments. A geographical segment is engaged in providing products or services
within a particular economic environment and is subject to risks and returns that are different from those of segments operating in
other economic environments. Geographical segments are the consolidated entity’s primary reporting format.
1. Summary of signifi cant accounting policies (continued)

Notes to the Financial StatementsJohn Fairfax Holdings Limited and Controlled Entities
For the year ended 30 June 2006
Fairfax Annual Report 2006 61
(W) SIGNIFICANT ACCOUNTING ESTIMATES AND JUDGEMENTS
The carrying amounts of certain assets and liabilities are often determined based on estimates and assumptions of future events. The
key estimates and assumptions that have a signifi cant risk of causing a material adjustment to the carrying amounts of certain assets
and liabilities within the next fi nancial year are:
(i) Impairment of goodwill and intangibles with indefi nite useful lives
The Group tests annually whether goodwill and intangibles with indefi nite useful lives are impaired. This requires an estimation of the
recoverable amount of the cash-generating units to which the goodwill and intangibles with indefi nite useful lives are allocated. The
assumptions used in this estimation of recoverable amount and the carrying amount of goodwill and intangibles with indefi nite useful
lives are detailed in note 12.
(ii) Income taxes
The Group is subject to income taxes in Australia and jurisdictions where it has foreign operations. Signifi cant judgement is required in
determining the worldwide provision for income taxes. There are many transactions and calculations undertaken during the ordinary
course of business for which the ultimate tax determination is uncertain.
(iii) Share-based payment transactions
The Group measures the cost of equity-settled transactions with employees by reference to the fair value of equity instruments at
the date at which they are granted. The fair value is determined by an external valuer using a binomial model, using the assumptions
detailed in note 31.
The Group measures the cost of share-based payments at fair value at the grant date using the Monte Carlo formula taking into
account the terms and conditions upon which the instruments were granted, as discussed in note 31.
(iv) Defi ned benefi t plans
Various actuarial assumptions are required when determining the Group’s superannuation plan obligations. These assumptions and
the related carrying amounts are disclosed in note 15.
(v) Held-to-maturity investments
The Group follows the AASB 139 guidance on classifying non-derivative fi nancial assets with fi xed or determinable payments and fi xed
maturity as held-to-maturity. This classifi cation requires signifi cant judgement. In making this judgement, the Group evaluates its
intention and ability to hold such investments to maturity.
If the Group fails to keep these investments to maturity other than for specifi c circumstances explained in AASB 139, it will be required
to reclassify the whole class as available-for-sale. The investments would therefore be measured at fair value not amortised cost
which would result in a corresponding entry in the fair value reserve in shareholders’ equity. Furthermore, the entity would not be able
to classify any fi nancial assets as held-to-maturity for the following two fi nancial years.
(X) ROUNDING OF AMOUNTS
The consolidated entity is of a kind referred to in Class Order 98/0100, as amended by Class Order 04/667, issued by the Australian
Securities and Investments Commission relating to the “rounding off” of amounts in the fi nancial report. Amounts in this report have
been rounded to the nearest thousand dollars in accordance with that Class Order, unless otherwise indicated.
1. Summary of signifi cant accounting policies (continued)

Notes to the Financial StatementsJohn Fairfax Holdings Limited and Controlled EntitiesFor the year ended 30 June 2006
62 Fairfax Annual Report 2006
(Y) NEW ACCOUNTING STANDARDS AND UIG INTERPRETATIONS
As at 30 June 2006, the following new Accounting standards or amendments have been published which are not mandatory for
30 June 2006 reporting periods:
UIG 4 Determining whether an arrangement contains a lease
Implementation of UIG 4 is not expected to change the accounting for any of the Group’s current arrangements.
UIG 8 Scope of AASB 2
Implementation of UIG 8 is not expected to change the accounting for any of the Group’s current arrangements.
UIG 9 Reassessment of embedded derivatives
Implementation of UIG 9 is not expected to change the accounting for any of the Group’s current arrangements.
AASB 2005-1 Amendments to Australian Accounting Standards AASB 139 – Cashflow hedge accounting of forecast intra-group
transactions
Application of AASB 2005-1 is not expected to change the accounting for any of the Group’s current arrangements.
AASB 2005-4 Amendments to Australian Accounting Standards (AASB 139, AASB 132, AASB 1, AASB 1023 & AASB 1038) – Fair
value option
Application of AASB 2005-4 is not expected to change the accounting for any of the Group’s current arrangements.
AASB 2005-6 Amendments to Australian Accounting Standards AASB 3 – Business combinations involving entities under
common control
Application of AASB 2005-6 is not expected to change the accounting for any of the Group’s current arrangements.
AASB 2005-9 Amendments to Australian Accounting Standards (AASB 4, AASB 1023, AASB 139 & AASB 132) – Consequential
amendments arising as a result of proposed amendments to IAS 39 and IFRS 4
Application of the revised rules may result in the recognition of fi nancial liabilities in the fi nancial statements of
John Fairfax Holdings Limited, under guarantees given pursuant to the deed of cross guarantee (refer note 28) in
respect of amounts payable by wholly owned subsidiaries. As assessment of the fair value of these guarantees has
not yet been performed.
AASB 2005-10 Amendments to Australian Accounting Standards (AASB 132, AASB 101, AASB 114, AASB 117, AASB 133, AASB
139, AASB 1, AASB 4, AASB 1023 & AASB 1038) – Consequential amendments arising as a result of the release
of AASB 7
Application of AASB 2005-10 is not expected to change the accounting for any of the Group’s current
arrangements.
AASB 2006-1 Amendments to Australian Accounting Standards (AASB 121)– Consequential amendments arising as a result of
the amendments to AASB 121.
Application of AASB 2006-1 is not expected to change the accounting for any of the Group’s current arrangements.
AASB 7 Financial Instruments: Disclosures
AASB 7 and AASB 2005-10 are applicable to annual reporting periods beginning on or after 1 January 2007.
The Group has not adopted the standards early. Application of the standards will not affect any of the amounts
recognised in the fi nancial statements, but will impact the type of information disclosed in relation to the Group’s
fi nancial instruments.
In addition to the above UIG 5, 6 and 7 are not expected to affect the Group’s fi nancial statements.
1. Summary of signifi cant accounting policies (continued)

Notes to the Financial StatementsJohn Fairfax Holdings Limited and Controlled Entities
For the year ended 30 June 2006
Fairfax Annual Report 2006 63
Consolidated Company Consolidated Restated Company Restated
2006 2005 2006 2005 $’000 $’000 $’000 $’000
2. Revenue
(A) REVENUE FROM OPERATIONSRevenue generated from sales of:
Newspapers 1,560,592 1,603,274 – –
Magazines 195,064 177,532 – –
Online and other 134,908 74,303 1,495 –
Total revenue from sales 1,890,564 1,855,109 1,495 –
Revenue from rendering of services 16,254 17,174 – 292,093
Dividend/distribution revenue
Wholly owned controlled entities – – 344,700 190,000
Other corporations 1,024 1,124 – –
Total revenue from operations 1,907,842 1,873,407 346,195 482,093
(B) OTHER REVENUEInterest income
Wholly owned controlled entities – – 23,846 158,532
Other corporations 2,122 4,349 8 17
Other income – wholly owned controlled entities – – 2,636 –
Net gain on sale of property, plant and equipment – 2,261 – –
Net gain on sale of other assets – 230 – –
Total other revenue 2,122 6,840 26,490 158,549
Total revenue 1,909,964 1,880,247 372,685 640,642
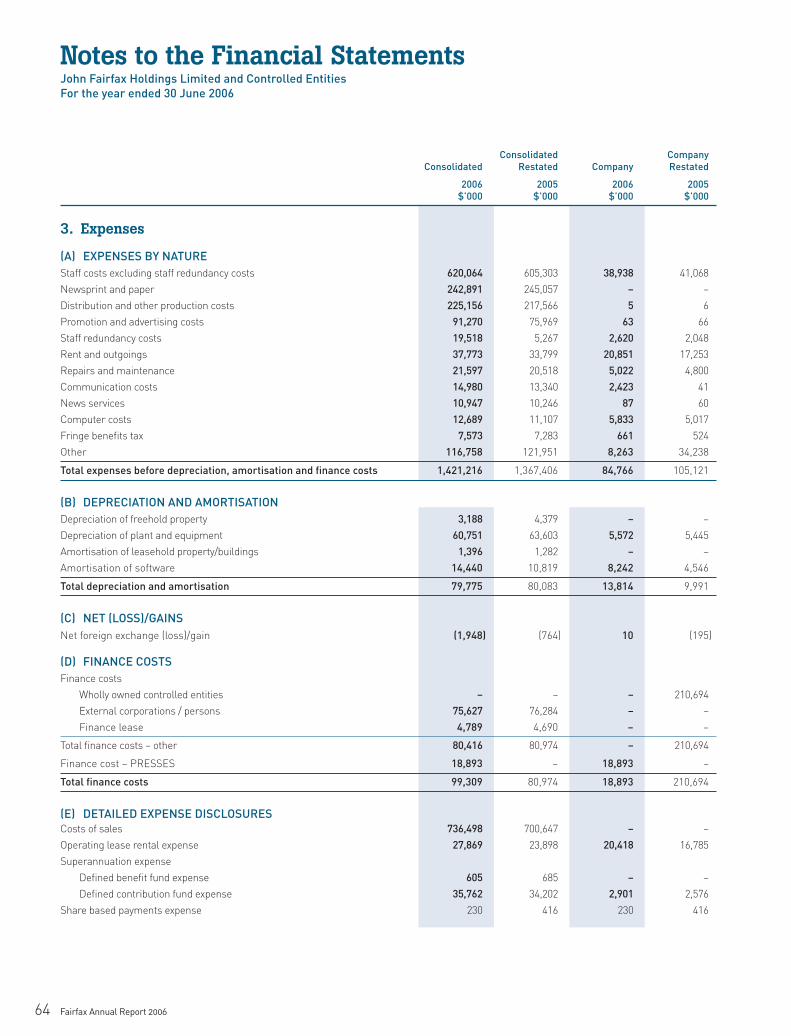
Notes to the Financial StatementsJohn Fairfax Holdings Limited and Controlled EntitiesFor the year ended 30 June 2006
64 Fairfax Annual Report 2006
Consolidated Company Consolidated Restated Company Restated
2006 2005 2006 2005 $’000 $’000 $’000 $’000
3. Expenses
(A) EXPENSES BY NATUREStaff costs excluding staff redundancy costs 620,064 605,303 38,938 41,068
Newsprint and paper 242,891 245,057 – –
Distribution and other production costs 225,156 217,566 5 6
Promotion and advertising costs 91,270 75,969 63 66
Staff redundancy costs 19,518 5,267 2,620 2,048
Rent and outgoings 37,773 33,799 20,851 17,253
Repairs and maintenance 21,597 20,518 5,022 4,800
Communication costs 14,980 13,340 2,423 41
News services 10,947 10,246 87 60
Computer costs 12,689 11,107 5,833 5,017
Fringe benefi ts tax 7,573 7,283 661 524
Other 116,758 121,951 8,263 34,238
Total expenses before depreciation, amortisation and fi nance costs 1,421,216 1,367,406 84,766 105,121
(B) DEPRECIATION AND AMORTISATIONDepreciation of freehold property 3,188 4,379 – –
Depreciation of plant and equipment 60,751 63,603 5,572 5,445
Amortisation of leasehold property/buildings 1,396 1,282 – –
Amortisation of software 14,440 10,819 8,242 4,546
Total depreciation and amortisation 79,775 80,083 13,814 9,991
(C) NET (LOSS)/GAINSNet foreign exchange (loss)/gain (1,948) (764) 10 (195)
(D) FINANCE COSTSFinance costs
Wholly owned controlled entities – – – 210,694
External corporations / persons 75,627 76,284 – –
Finance lease 4,789 4,690 – –
Total fi nance costs – other 80,416 80,974 – 210,694
Finance cost – PRESSES 18,893 – 18,893 –
Total fi nance costs 99,309 80,974 18,893 210,694
(E) DETAILED EXPENSE DISCLOSURESCosts of sales 736,498 700,647 – –
Operating lease rental expense 27,869 23,898 20,418 16,785
Superannuation expense
Defi ned benefi t fund expense 605 685 – –
Defi ned contribution fund expense 35,762 34,202 2,901 2,576
Share based payments expense 230 416 230 416
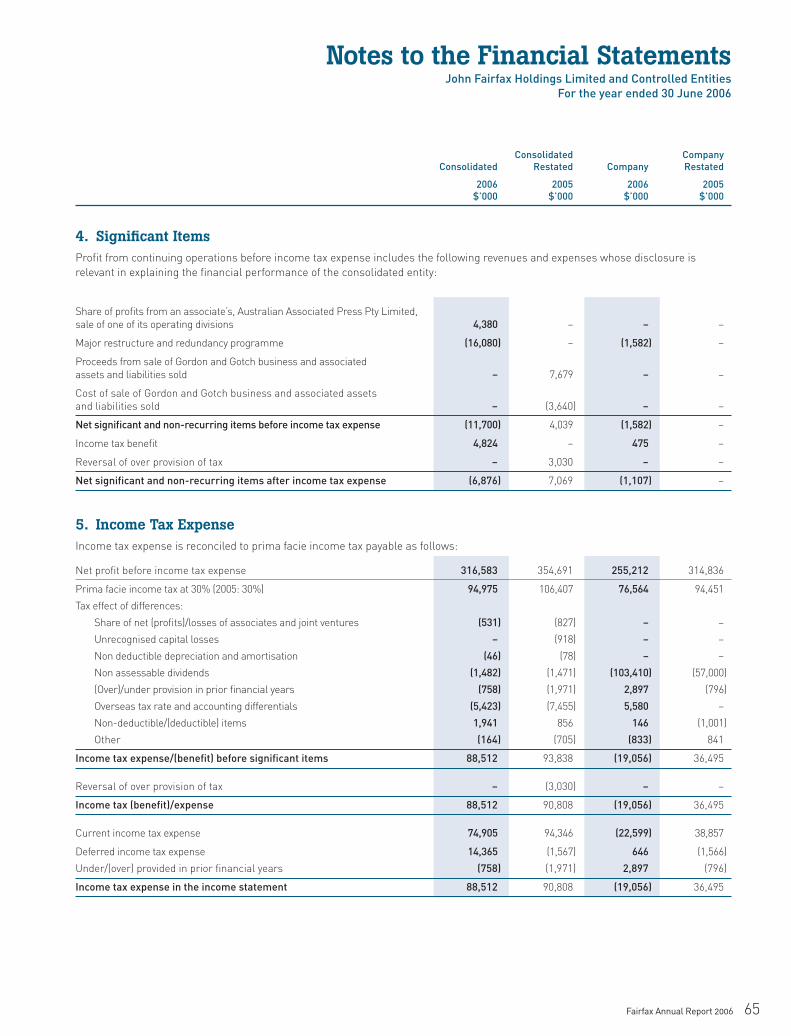
Notes to the Financial StatementsJohn Fairfax Holdings Limited and Controlled Entities
For the year ended 30 June 2006
Fairfax Annual Report 2006 65
Consolidated Company Consolidated Restated Company Restated
2006 2005 2006 2005 $’000 $’000 $’000 $’000
4. Signifi cant ItemsProfi t from continuing operations before income tax expense includes the following revenues and expenses whose disclosure is
relevant in explaining the fi nancial performance of the consolidated entity:
Share of profi ts from an associate’s, Australian Associated Press Pty Limited,
sale of one of its operating divisions 4,380 – – –
Major restructure and redundancy programme (16,080) – (1,582) –
Proceeds from sale of Gordon and Gotch business and associated
assets and liabilities sold – 7,679 – –
Cost of sale of Gordon and Gotch business and associated assets
and liabilities sold – (3,640) – –
Net signifi cant and non-recurring items before income tax expense (11,700) 4,039 (1,582) –
Income tax benefi t 4,824 – 475 –
Reversal of over provision of tax – 3,030 – –
Net signifi cant and non-recurring items after income tax expense (6,876) 7,069 (1,107) –
5. Income Tax ExpenseIncome tax expense is reconciled to prima facie income tax payable as follows:
Net profi t before income tax expense 316,583 354,691 255,212 314,836
Prima facie income tax at 30% (2005: 30%) 94,975 106,407 76,564 94,451
Tax effect of differences:
Share of net (profi ts)/losses of associates and joint ventures (531) (827) – –
Unrecognised capital losses – (918) – –
Non deductible depreciation and amortisation (46) (78) – –
Non assessable dividends (1,482) (1,471) (103,410) (57,000)
(Over)/under provision in prior fi nancial years (758) (1,971) 2,897 (796)
Overseas tax rate and accounting differentials (5,423) (7,455) 5,580 –
Non-deductible/(deductible) items 1,941 856 146 (1,001)
Other (164) (705) (833) 841
Income tax expense/(benefi t) before signifi cant items 88,512 93,838 (19,056) 36,495
Reversal of over provision of tax – (3,030) – –
Income tax (benefi t)/expense 88,512 90,808 (19,056) 36,495
Current income tax expense 74,905 94,346 (22,599) 38,857
Deferred income tax expense 14,365 (1,567) 646 (1,566)
Under/(over) provided in prior fi nancial years (758) (1,971) 2,897 (796)
Income tax expense in the income statement 88,512 90,808 (19,056) 36,495

Notes to the Financial StatementsJohn Fairfax Holdings Limited and Controlled EntitiesFor the year ended 30 June 2006
66 Fairfax Annual Report 2006
Consolidated Company Consolidated Restated Company Restated
2006 2005 2006 2005 $’000 $’000 $’000 $’000
6. Dividends paid and proposed and fi nance costs
(A) ORDINARY SHARESInterim fully franked dividend:
2006: 8 cents – paid 12 April 2006 (2005: 7.5 cents – paid 31 March 2005) 74,669 69,143 74,669 69,143
Final fully franked dividend and special dividend:
2006: 11 cents (fi nal) – paid 11 October 2005 (2005: 11 cents –
paid 21 October 2004) 101,718 99,754 101,718 99,754
2006: 5 cents (special) – paid 11 October 2005 (2005: nil) 46,235 – 46,235 –
(B) PREFERRED RESET SECURITIES EXCHANGEABLE FOR SHARES (PRESSES) Fully franked PRESSES dividend:
2006: $3.7304 per share – paid 13 June 2006* 9,326 – 9,326 –
2006: $3.7101 per share – paid 12 December 2005* 9,275 – 9,275 –
2005: $3.6493 per share – paid 10 June 2005 – 9,123 – 9,123
2005: $3.7710 per share – paid 13 December 2004 – 9,428 – 9,428
Total fully franked dividends paid and fi nance costs 241,223 187,448 241,223 187,448
* Under AIFRS, the PRESSES were reclassifi ed as a fi nancial liability and the dividends on the PRESSES reclassifi ed as interest expense from 1 July 2005 under
AASB 132 Financial Instruments: Presentation and Disclosure. At 30 June 2006, fully franked dividends paid amounted to $222,622,000 and interest expense on
PRESSES totalled $18,601,000.
(C) DIVIDENDS PROPOSED AND NOT RECOGNISED AS A LIABILITY
Since balance date the directors have declared a fi nal dividend of 11.5 cents per fully paid ordinary share fully franked to the corporate
tax rate of 30%. The aggregate amount of the fi nal dividend to be paid on 6 October 2006 out of the retained profi ts at 30 June 2006,
but not recognised as a liability at the end of the year is expected to be $116 million.
(D) FRANKED DIVIDENDSFranking account balance as at balance date at 30% (2005: 30%) 66,167 110,977
Franking credits that will arise from the payment of income tax
payables as at the end of the fi nancial year 7,486 25,805
Franking debits that will arise from tax receivable as at balance date – –
Total franking credits available for subsequent fi nancial years based on a tax rate of 30% 73,653 136,782
On a tax-paid basis, the Company’s franking account balance is approximately $66 million (2005: $111 million). The impact on
the franking account of the dividend declared by the directors since balance date, will be a reduction in the franking account of
approximately $50 million.

Notes to the Financial StatementsJohn Fairfax Holdings Limited and Controlled Entities
For the year ended 30 June 2006
Fairfax Annual Report 2006 67
Consolidated Company Consolidated Restated Company Restated
2006 2005 2006 2005 $’000 $’000 $’000 $’000
7. ReceivablesCurrent
Trade debtors 258,488 261,081 294 316
Provision for doubtful debts (3,572) (6,359) – –
254,916 254,722 294 316
Loans and deposits 248 (134) (59) (70)
Prepayments 15,593 13,886 3,924 2,542
Other 11,095 15,587 2,505 1,737
Total current receivables 281,852 284,061 6,664 4,525
Non-current
Loans to related parties – – 1,578,340 1,427,578
Deposits 199 6,717 – 648
Prepayments 12 2,022 – 1,032
Other 6 – – –
Total non-current receivables 217 8,739 1,578,340 1,429,258
8. InventoriesRaw materials and stores – at cost 35,434 30,326 – –
Provision for diminution in value (104) (261) – –
Total raw materials and stores 35,330 30,065 –
Finished goods – at cost 132 27 – –
Work in progress – at cost 201 103 – –
Total inventories 35,663 30,195 – –

Notes to the Financial StatementsJohn Fairfax Holdings Limited and Controlled EntitiesFor the year ended 30 June 2006
68 Fairfax Annual Report 2006
Consolidated Company Consolidated Restated Company Restated
2006 2005 2006 2005 Note $’000 $’000 $’000 $’000
9. Investments accounted for using the equity method
Shares in associates (a) 15,553 9,796 3,046 –
Shares in joint ventures (b) 780 865 – –
Total investments accounted for using the equity method 16,333 10,661 3,046 –
(A) INTERESTS IN ASSOCIATES Place of Ownership interestName of Company Principal Activity Incorporation 2006 2005
Executive Publishing Network Magazine Publishing Australia 30.0% –
Australian Associated Press Pty Limited News agency business and Australia 44.7% 44.7%
information service
NGA.net.au E-commerce: recruitment software Australia 30.0% 30.0%
Newspaper House Limited Property ownership New Zealand 45.5% 45.5%
New Zealand Press Association Limited News agency business and fi nancial New Zealand 49.2% 49.2%
information service
Times Newspapers Limited Newspaper Publishing New Zealand 50.0% 50.0%
Ashburton Guardian Co Limited Printing facility New Zealand 25.0% 25.0%
Autobase Limited E-commerce: online vehicle dealer New Zealand 24.7% –
automotive website
Consolidated Consolidated Restated
2006 2005 $’000 $’000
(i) Carrying amount of investment in associatesBalance at 1 July 2005 9,796 6,931
Investments in associates acquired during the fi nancial year 3,269 887
Adjustment for foreign exchange revaluation (82) 2
Share of associates’ net profi t after income tax expense 6,079 2,005
Share of increment in associates’ reserves – –
Dividends received/receivable from associates (3,509) (29)
Balance at 30 June 2006 15,553 9,796
(ii) Share of associates’ profi tsProfi t before income tax expense 7,193 2,880
Income tax expense (1,114) (875)
Net profi t after income tax expense 6,079 2,005
(iii) Share of associates’ assets and liabilities Current assets 13,074 19,129
Non-current assets 15,259 12,452
Total assets 28,333 31,581
Current liabilities 6,435 12,346
Non-current liabilities 1,484 973
Total liabilities 7,919 13,319

Notes to the Financial StatementsJohn Fairfax Holdings Limited and Controlled Entities
For the year ended 30 June 2006
Fairfax Annual Report 2006 69
(B) INTEREST IN JOINT VENTURE Place of Ownership interestName of Company Principal Activity Incorporation 2006 2005
Text Pacifi c Pty Limited Publishing Australia 50.0% 50.0%
Consolidated Consolidated Restated
2006 2005 $’000 $’000
(i) Carrying amount of investment in joint ventureBalance at 1 July 2005 865 1,198
Share of joint venture’s net profi t after income tax expense 840 902
Dividends received/receivable from joint venture (925) (1,235)
Balance at 30 June 2006 780 865
(ii) Share of joint ventures’ profi tsRevenues 9,130 9,765
Expenses (7,946) (8,485)
Profi t before income tax expense 1,184 1,280
Income tax expense (344) (378)
Net profi t after income tax expense 840 902
(iii) Share of joint ventures’ assets and liabilitiesCurrent assets 2,782 2,069
Non-current assets – 161
Total assets 2,782 2,230
Current liabilities 2,039 1,365
Non-current liabilities – –
Total liabilities 2,039 1,365
There were no impairment losses relating to the investment in associates or joint venture and no capital commitments or other
commitments relating to the associates or joint ventures.
(C) SHARE OF NET PROFITS OF ASSOCIATES AND JOINT VENTURESProfi t before income tax expense 8,377 4,160
Income tax expense (1,458) (1,253)
Net profi t after income tax expense 6,919 2,907
9. Investments accounted for using the equity method (continued)

Notes to the Financial StatementsJohn Fairfax Holdings Limited and Controlled EntitiesFor the year ended 30 June 2006
70 Fairfax Annual Report 2006
Consolidated Company Consolidated Restated Company Restated
2006 2005 2006 2005 $’000 $’000 $’000 $’000
10. Available for sale investmentsListed equity securities – at fair value 3,175 – – –
Total available for sale investments 3,175 – – –
Available for sale investments consist of investments in ordinary shares and have no fi xed maturity date. During the fi nancial year, a
devaluation of $952,500 was recognised directly in equity.
11. Held to maturity investmentsBonds 16,949 – – –
Total held to maturity investments 16,949 – – –
The annuity bonds issued by Paperbonds Limited, which were acquired on 8 March 2006 and are to be held to maturity in September
2015, have a face value of $20,000,000. They are indexed to the consumer price index (CPI) and have an effective interest rate for the
fi nancial year ended 30 June 2006 of 5.64%.
12. Intangible assetsMastheads and tradenames – at cost 2,200,270 2,258,305 – 201
Software – at cost 45,236 36,806 25,821 20,650
Goodwill 654,142 56,246 – –
Total intangible assets 2,899,648 2,351,357 25,821 20,851
RECONCILIATIONS
Reconciliations of the carrying amount of each class of intangible at the beginning and end of the current fi nancial year are set
out below:
Mastheads & tradenames Software Goodwill Total Note $’000 $’000 $’000 $’000
(i) Consolidated
At 1 July 2004
Cost 2,233,964 93,034 56,005 2,383,003
Accumulated amortisation and impairment – (57,821) – (57,821)
Net carrying amount 2,233,964 35,213 56,005 2,325,182
Year ended 30 June 2005
Balance at beginning of the fi nancial year 2,233,964 35,213 56,005 2,325,182
Additions 9,608 12,412 241 22,261
Acquisition of controlled entities 9,538 – – 9,538
Impairment charge – – – –
Amortisation charge 3(b) – (10,819) – (10,819)
Exchange differences 5,195 – – 5,195
At 30 June 2005, net of accumulated amortisation and impairment 2,258,305 36,806 56,246 2,351,357

Notes to the Financial StatementsJohn Fairfax Holdings Limited and Controlled Entities
For the year ended 30 June 2006
Fairfax Annual Report 2006 71
12. Intangible assets (continued) Mastheads & tradenames Software Goodwill Total Note $’000 $’000 $’000 $’000
At 30 June 2005
Cost 2,258,305 105,446 56,246 2,419,997
Accumulated amortisation and impairment – (68,640) – (68,640)
Net carrying amount 2,258,305 36,806 56,246 2,351,357
Year ended 30 June 2006
Balance at beginning of the fi nancial year 2,258,305 36,806 56,246 2,351,357
Additions 9,622 22,492 3,724 35,838
Acquisition of controlled entities 35,263 4,598 623,142 663,003
Impairment charge – – – –
Amortisation charge 3(b) – (14,440) – (14,440)
Exchange differences (102,920) (4,220) (28,970) (136,078)
At 30 June 2006, net of accumulated amortisation and impairment 2,200,270 45,236 654,142 2,899,648
At 30 June 2006
Cost 2,200,270 128,316 654,142 2,982,728
Accumulated amortisation and impairment – (83,080) – (83,080)
Net carrying amount 2,200,270 45,236 654,142 2,899,648
(ii) Company
At 1 July 2004
Cost 199 27,867 – 28,066
Accumulated amortisation and impairment – (14,741) – (14,741)
Net carrying amount 199 13,126 – 13,325
Year ended 30 June 2005
Balance at beginning of the fi nancial year 199 13,126 – 13,325
Additions 2 12,070 – 12,072
Acquisition of controlled entities – – – –
Impairment charge – – – –
Amortisation charge 3(b) – (4,546) – (4,546)
Exchange differences – – – –
At 30 June 2005, net of accumulated amortisation and impairment 201 20,650 – 20,851
At 30 June 2005
Cost 201 39,937 – 40,138
Accumulated amortisation and impairment – (19,287) – (19,287)
Net carrying amount 201 20,650 – 20,851

Notes to the Financial StatementsJohn Fairfax Holdings Limited and Controlled EntitiesFor the year ended 30 June 2006
72 Fairfax Annual Report 2006
Mastheads & tradenames Software Goodwill Total Note $’000 $’000 $’000 $’000
Year ended 30 June 2006
Balance at beginning of the fi nancial year 201 20,650 – 20,851
Additions – 13,413 – 13,413
Acquisition of controlled entities – – – –
Impairment charge – – – –
Amortisation charge 3(b) – – – –
Exchange differences – (8,242) – (8,242)
Disposal (201) – – (201)
At 30 June 2006, net of accumulated amortisation and impairment – 25,821 – 25,821
At 30 June 2006
Cost – 53,350 – 53,350
Accumulated amortisation and impairment – (27,529) – (27,529)
Net carrying amount – 25,821 – 25,821
(iii) Impairment of cash generating units (CGU) including goodwill and indefi nite life assets
The recoverable amount of each CGU which includes goodwill or indefi nite life intangibles has been reviewed.
The recoverable amount of each CGU is determined based on fair value less costs to sell. These calculations use cashfl ow projections
based on fi nancial budgets approved by the Directors for the twelve months to 30 June 2007, after an adjustment for central overheads
and synergy benefi ts. Management then apply a masthead multiple, based on recent market transactions, independent valuations or
directors’ assessment, to the CGU’s resulting cashfl ow projection.
(iv) Allocation of goodwill and non-amortising intangibles to CGUs Consolidated Consolidated
2006 2005CGU Group $’000 $’000
New South Wales General Publications 652,753 651,352
Victoria General Publications 489,472 489,681
Fairfax Business Media 177,317 176,895
Australian Digital and other 58,486 758
New Zealand Publishing 902,584 995,865
New Zealand Digital 573,800 –
Total goodwill and indefi nite life intangibles 2,854,412 2,314,551
General publications excludes national and specialist publishing.
No goodwill or intangibles are allocated to a CGU in the company.
12. Intangible assets (continued)

Notes to the Financial StatementsJohn Fairfax Holdings Limited and Controlled Entities
For the year ended 30 June 2006
Fairfax Annual Report 2006 73
(v) Key assumptions used for fair value less costs to sell calculations
The key assumptions on which management has based its cashfl ow projections when determining the fair value less costs to sell of
the CGUs are as follows:
no signifi cant increase in budgeted gross margin or growth rate from the 30 June 2006 fi nancial year for non-digital CGUs. This is
based on past performance and expected effi ciency improvements.
growth rates of between 40% to 55% for digital CGUs.
masthead multiples ranging between 5 to 12, excluding NZ digital which has applied a 26 multiple based on a recent independent
valuation.
the spot exchange rate prevailing at balance date is used when converting foreign cashfl ows on foreign mastheads. The exchange
rate of .8202 has been applied to New Zealand mastheads for the current fi nancial year.
Due to the fact that Trade Me Limited, which comprises the NZ Digital CGU, was recently acquired (refer note 30(a)) and is a relatively
new and emerging business, the recoverable amount of the NZ Digital CGU is also its carrying value at 30 June 2006. If there any are
adverse movements in the assumptions applying to digital CGUs, this may result in the CGU’s recoverable amount being less than its
carrying value.
(vi) Impairment charge
No class of asset or goodwill was impaired and no impairment losses have been reversed during the fi nancial year.
13. Property, plant and equipment Consolidated Company Consolidated Restated Company Restated
2006 2005 2006 2005 $’000 $’000 $’000 $’000
Freehold land and buildings
At cost 184,784 183,685 – –
Provision for depreciation (14,220) (11,032) – –
Total freehold land and buildings 170,564 172,653 – –
Leasehold buildings
At cost 57,015 53,654 473 –
Provision for depreciation (13,643) (12,247) – –
Total leasehold buildings 43,372 41,407 473 –
Plant and equipment
At cost 1,026,976 998,682 43,808 35,080
Provision for depreciation (610,144) (549,393) (23,484) (17,912)
Total plant and equipment 416,832 449,289 20,324 17,168
Capital works in progress – at cost 23,489 34,190 5,899 12,450
Total property, plant and equipment 654,257 697,539 26,696 29,618
•
•
•
•
12. Intangible assets (continued)

Notes to the Financial StatementsJohn Fairfax Holdings Limited and Controlled EntitiesFor the year ended 30 June 2006
74 Fairfax Annual Report 2006
ReconciliationsReconciliations of the carrying amount of each class of property, plant and equipment during the fi nancial year are set out below:
(i) Consolidated Capital Freehold works in land & Leasehold Plant and progress buildings buildings equipment Total Note $’000 $’000 $’000 $’000 $’000
At 1 July 2004
Cost 27,415 189,563 53,373 978,565 1,248,916
Accumulated depreciation and impairment – (6,957) (10,965) (485,790) (503,712)
Net carrying amount 27,415 182,606 42,408 492,775 745,204
Year ended 30 June 2005
Balance at beginning of fi nancial year 27,415 182,606 42,408 492,775 745,204
Additions/capitalisations 6,814 1,455 281 16,986 25,536
Disposals – (7,481) – (2,842) (10,323)
Impairment – – – – –
Depreciation charge 3(b) – (4,379) (1,282) (63,603) (69,264)
Exchange differences (39) 452 – 5,973 6,386
At 30 June 2005, net of accumulated depreciation and impairment 34,190 172,653 41,407 449,289 697,539
At 30 June 2005
Cost 34,190 183,685 53,654 998,682 1,270,211
Accumulated depreciation and impairment – (11,032) (12,247) (549,393) (572,672)
Net carrying amount 34,190 172,653 41,407 449,289 697,539
Year ended 30 June 2006
Balance at beginning of fi nancial year 34,190 172,653 41,407 449,289 697,539
Additions/capitalisations (9,323) 1,099 3,816 31,309 26,901
Disposals (630) – – (262) (892)
Acquisition of controlled entities – – – 1,530 1,530
Impairment – – – – –
Depreciation charge 3(b) – (3,188) (1,396) (60,751) (65,335)
Exchange differences (748) – (455) (4,283) (5,486)
At 30 June 2006, net of accumulated depreciation and impairment 23,489 170,564 43,372 416,832 654,257
At 30 June 2006
Cost 23,489 184,784 57,015 1,026,976 1,292,264
Accumulated depreciation and impairment – (14,220) (13,643) (610,144) (638,007)
Net carrying amount 23,489 170,564 43,372 416,832 654,257
13. Property, plant and equipment (continued)

Notes to the Financial StatementsJohn Fairfax Holdings Limited and Controlled Entities
For the year ended 30 June 2006
Fairfax Annual Report 2006 75
Capital Freehold works in land & Leasehold Plant and progress buildings buildings equipment Total Note $’000 $’000 $’000 $’000 $’000
(ii) Company
At 1 July 2004
Cost 15,570 – – 31,770 47,340
Accumulated depreciation and impairment – – – (12,467) (12,467)
Net carrying amount 15,570 – – 19,303 34,873
Year ended 30 June 2005
At 1 July 2004, net of accumulated depreciation and impairment 15,570 – – 19,303 34,873
Additions/capitalisations (3,120) – – 3,310 190
Disposals – – – – –
Impairment – – – – –
Depreciation charge 3(b) – – – (5,445) (5,445)
At 30 June 2005, net of accumulated depreciation and impairment 12,450 – – 17,168 29,618
At 30 June 2005
Cost 12,450 – – 35,080 47,530
Accumulated depreciation and impairment – – – (17,912) (17,912)
Net carrying amount 12,450 – – 17,168 29,618
Year ended 30 June 2006
At 1 July 2005, net of accumulated depreciation and impairment 12,450 – – 17,168 29,618
Additions/capitalisations (6,551) – 473 8,728 2,650
Disposals – – – – –
Acquisition of controlled entities – – – – –
Impairment – – – – –
Depreciation charge 3(b) – – – (5,572) (5,572)
At 30 June 2006, net of accumulated depreciation and impairment 5,899 – 473 20,324 26,696
At 30 June 2006
Cost 5,899 – 473 43,808 50,180
Accumulated depreciation and impairment – – – (23,484) (23,484)
Net carrying amount 5,899 – 473 20,324 26,696
13. Property, plant and equipment (continued)

Notes to the Financial StatementsJohn Fairfax Holdings Limited and Controlled EntitiesFor the year ended 30 June 2006
76 Fairfax Annual Report 2006
Consolidated Company Consolidated Restated* Company Restated
2006 2005 2006 2005 $’000 $’000 $’000 $’000
14. Derivative fi nancial instruments
Current assets
Cross currency swap – fair value hedge 14,642 411 – –
Interest rate swap – fair value to profi t and loss 393 – – –
Forward contracts – fair value to profi t and loss 270 – – –
Total current derivative assets 15,305 411 – –
Non-current assets
Interest rate swap – cashfl ow hedge 134 6,830 – –
Cross currency swap – net investment hedge 15,865 – – –
Total non-current derivative assets 15,999 6,830 – –
Current liabilities
Interest rate swap – cashfl ow hedge 9 – – –
Interest rate swap – fair value to profi t and loss 236 – – –
Forward contracts – fair value to profi t and loss 1 – – –
Total current derivative liabilities 246 – – –
Non-current liabilities
Cross currency swap – fair value hedge 31,059 – – –
Cross currency swap – fair value hedge 20,653 – – –
Total non-current derivative liabilities 51,712 – – –
* The 2005 derivative balances have not been restated to comply with AASB 132 Financial Instruments: Disclosure and Presentation and AASB 139 Financial
Instruments: Recognition and Measurement as disclosed in note 1(a).
The Group uses derivative fi nancial instruments to reduce its exposure to fl uctuations in interest rates and foreign currency rates.
The Group formally designates hedging instruments to an underlying exposure and details the risk management objectives and
strategies for undertaking hedge transactions. The Group assesses at inception and on a quarterly basis thereafter, as to whether the
derivative fi nancial instruments used in the hedging transactions are effective at offsetting the risks they are designed to hedge. Due
to the high effectiveness between the hedging instrument and underlying exposure being hedged, value changes in the derivatives are
generally offset by changes in the fair value or cash fl ows of the underlying exposure. Any derivatives not formally designated as part
of a hedging relationship are fair valued with changes in fair value recognised in the profi t and loss.
The derivatives entered into are vanilla over-the-counter instruments with liquid markets.

Notes to the Financial StatementsJohn Fairfax Holdings Limited and Controlled Entities
For the year ended 30 June 2006
Fairfax Annual Report 2006 77
(A) HEDGING ACTIVITIES
(i) Cashfl ow hedges
At 30 June 2006, the Group held two interest rate swaps designated as hedges of future contracted interest payments on a long term
AUD denominated loan. The interest rate swaps are used to hedge unfavourable movements in interest rates.
The terms of these interest rate swaps are as follows:
Maturity date Interest rate
Pay fi xed receive fl oating – AUD $75m 12 September 2007 6.00%
Pay fi xed receive fl oating – AUD $20m 19 December 2006 6.09%
At 30 June 2006, the hedges were assessed to be highly effective with an unrealised gain in fair value of $124,000 recognised in equity.
(ii) Fair value hedges
At 30 June 2006, the Group held fi ve cross currency swap agreements designated to changes in the underlying value of USD
denominated Senior Notes (refer note 19). The terms of certain cross currency swap agreements exchange USD obligations into AUD
obligations and other agreements exchange USD obligations into NZD obligations. The latter are also designated to hedge value
changes in the Group’s New Zealand controlled entities (excluding Trade Me Limited), as discussed in note (iii) below.
At 30 June 2006, the cross currency swap agreements had a combined value of $16.4 million.
The cross currency swaps are designated based on matched terms to the debt and also have the same maturity profi le as the USD
denominated senior notes.
The terms of these cross currency swaps are as follows:
Maturity date
Pay fl oating AUD receive fi xed USD – USD $120m 19 December 2006
Pay fl oating AUD receive fi xed USD – USD $50m 15 January 2011
Pay fl oating NZD receive fi xed USD – USD $40m 15 January 2011
Pay fl oating NZD receive fi xed USD – USD $90m 15 January 2014
Pay fl oating NZD receive fi xed USD – USD $50m 15 January 2019
(iii) Net investment hedges
The NZD/USD cross currency swap agreements have also been designated to hedge the net investment in New Zealand controlled
entities acquired as part of Independent News Limited in June 2003.
At 30 June 2006, the hedges were assessed to be highly effective with an unrealised gain of $15.9 million recognised in equity.
14. Derivative fi nancial instruments (continued)

Notes to the Financial StatementsJohn Fairfax Holdings Limited and Controlled EntitiesFor the year ended 30 June 2006
78 Fairfax Annual Report 2006
15. Pension asset
SUPERANNUATION PLAN
The Company and certain controlled entities contribute to defi ned contribution and defi ned benefi t plans, which provide benefi ts to
employees and their dependants on retirement, disability or death.
The superannuation arrangements in Australia are managed in a sub-plan of the Mercer Super Trust, called Fairfax Super. The
Trustee of the Trust is Mercer Investment Nominees Limited. The superannuation arrangements in New Zealand are managed in
three funds – Fairfax NZ Retirement Fund (formerly Gordon and Gotch (N.Z.) Limited Superannuation Fund) Fairfax New Zealand
Superannuation Fund and Fairfax NZ Senior Executive Superannuation Scheme. The Trustees of the Trusts are executives and staff
of Fairfax New Zealand Limited. The defi ned benefi t section of the plans is closed to new members and all new members receive
accumulation only benefi ts.
The defi ned contribution plans receive fi xed contributions from Group companies and the Group’s legally enforceable obligation is
limited to these contributions. The defi ned benefi t plans receive employee contributions and the Group also contributes to the defi ned
benefi t plans at rates recommended by the plans’ actuaries, which is generally twice the employees’ contributions, such that the
funds will be adequate to provide for the benefi ts payable to members on their retirement.
The following sets out details in respect of the defi ned benefi t section only.
Consolidated Company Consolidated Restated Company Restated
2006 2005 2006 2005 $’000 $’000 $’000 $’000
(A) BALANCE SHEET
The amounts recognised in the balance sheet are determined as follows:
Present value of the defi ned benefi t obligation (19,424) (21,836) – –
Fair value of defi ned benefi t plan assets 30,100 28,652 – –
Net pension asset 10,676 6,816 – –
Unrecognised actuarial (losses)/gains – – – –
Unrecognised past service costs – – – –
Net pension asset in the balance sheet 10,676 6,816 – –
The Group companies may at any time, by notice to the Trustees terminate its contributions. The Group companies have a liability to pay the monthly
contributions due prior to the effective date of notice, but there is no current requirement for the Group companies to pay any further contributions, irrespective
of the fi nancial condition of the plans.
(B) RECONCILIATION OF THE PRESENT VALUE OF DEFINED BENEFIT OBLIGATION
Balance at the beginning of the fi nancial year 21,836 19,420 – –
Current service cost 1,079 935 – –
Interest cost 929 959 – –
Contributions by employees 824 541 – –
Actuarial (gains) and losses (1,796) 1,934 – –
Benefi ts paid (2,120) (1,701) – –
Taxes, premiums and expenses paid (458) (305)
Transfers (out)/in (870) 53
Balance at the end of the fi nancial year 19,424 21,836 – –
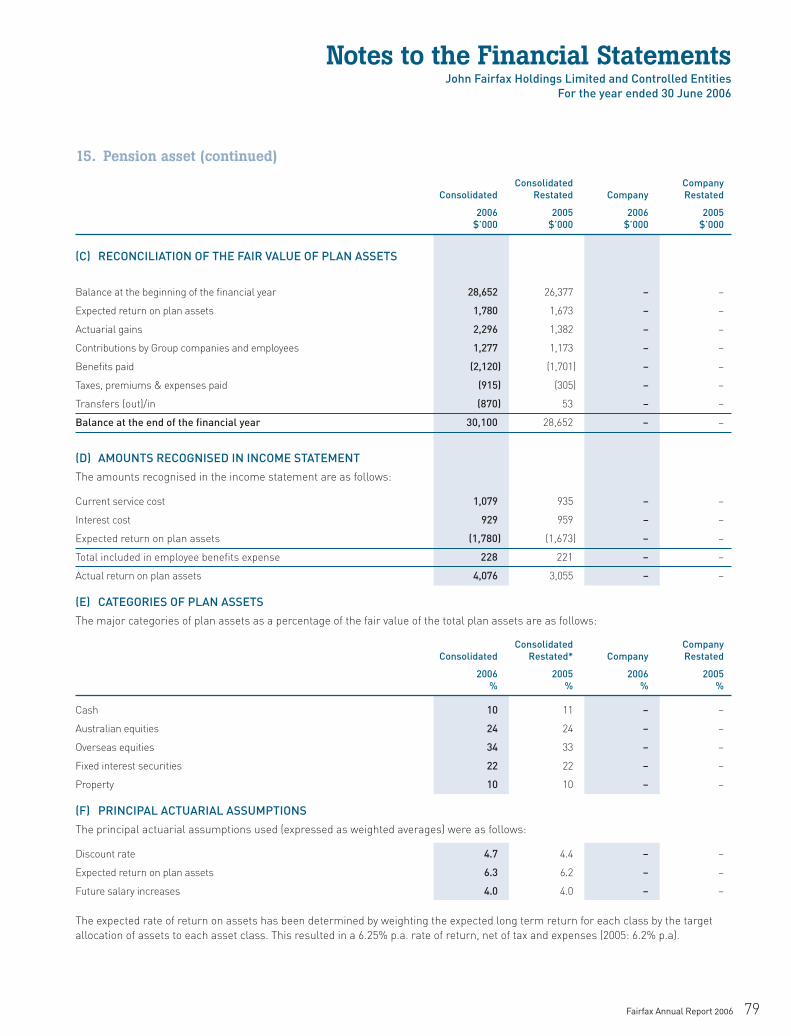
Notes to the Financial StatementsJohn Fairfax Holdings Limited and Controlled Entities
For the year ended 30 June 2006
Fairfax Annual Report 2006 79
Consolidated Company Consolidated Restated Company Restated
2006 2005 2006 2005 $’000 $’000 $’000 $’000
(C) RECONCILIATION OF THE FAIR VALUE OF PLAN ASSETS
Balance at the beginning of the fi nancial year 28,652 26,377 – –
Expected return on plan assets 1,780 1,673 – –
Actuarial gains 2,296 1,382 – –
Contributions by Group companies and employees 1,277 1,173 – –
Benefi ts paid (2,120) (1,701) – –
Taxes, premiums & expenses paid (915) (305) – –
Transfers (out)/in (870) 53 – –
Balance at the end of the fi nancial year 30,100 28,652 – –
(D) AMOUNTS RECOGNISED IN INCOME STATEMENT
The amounts recognised in the income statement are as follows:
Current service cost 1,079 935 – –
Interest cost 929 959 – –
Expected return on plan assets (1,780) (1,673) – –
Total included in employee benefi ts expense 228 221 – –
Actual return on plan assets 4,076 3,055 – –
(E) CATEGORIES OF PLAN ASSETS
The major categories of plan assets as a percentage of the fair value of the total plan assets are as follows:
Consolidated Company Consolidated Restated* Company Restated
2006 2005 2006 2005 % % % %
Cash 10 11 – –
Australian equities 24 24 – –
Overseas equities 34 33 – –
Fixed interest securities 22 22 – –
Property 10 10 – –
(F) PRINCIPAL ACTUARIAL ASSUMPTIONS
The principal actuarial assumptions used (expressed as weighted averages) were as follows:
Discount rate 4.7 4.4 – –
Expected return on plan assets 6.3 6.2 – –
Future salary increases 4.0 4.0 – –
The expected rate of return on assets has been determined by weighting the expected long term return for each class by the target
allocation of assets to each asset class. This resulted in a 6.25% p.a. rate of return, net of tax and expenses (2005: 6.2% p.a).
15. Pension asset (continued)

Notes to the Financial StatementsJohn Fairfax Holdings Limited and Controlled EntitiesFor the year ended 30 June 2006
80 Fairfax Annual Report 2006
(G) EMPLOYER CONTRIBUTIONS
Employer contributions to the defi ned benefi t section of the plans are based on recommendations by the plans’ actuaries. Actuarial
assessments are made at no more than three yearly intervals and the last actuarial assessment of Fairfax Super was carried out as
at 1 July 2004 by Ian Manners, BMath FIAA, of Mercer Human Resource Consulting Pty Ltd. The last actuarial assessments of Fairfax
NZ Retirement Fund, Fairfax NZ Senior Executive Superannuation Scheme and Fairfax NZ Senior Executive Superannuation Scheme
were carried out as at 31 March 2004, 1 April 2002 and 1 April 2005 respectively by Aon Consulting New Zealand Limited. Fairfax New
Zealand Superannuation Fund is a defi ned contribution fund and does not require an actuarial assessment.
The objective of funding is to ensure that the benefi t entitlements of members and other benefi ciaries are fully funded by the time
they become payable. To achieve this objective, the actuary has adopted a method of funding benefi ts known as the aggregate funding
method. This funding method seeks to have benefi ts funded by means of a total contribution which is expected to be a constant
percentage of members’ salaries over their working lifetimes.
Using the funding method described above and particular actuarial assumptions as to the plan’s future experience (as detailed
below), the actuary recommended in the actuarial review as at 1 July 2004, the payment of employer contributions to the fund of 6%
of salaries for employees who are members of the defi ned benefi t section. These contribution rates have been adopted by the Group
from 1 July 2004.
Total employer contributions expected to be paid by Group companies for the year ending 30 June 2007 are $407,000 (parent entity: $nil).
The economic assumptions used by the actuary to make the funding recommendations for the Australian plans were a long-term
investment earning rate of 6.5%p.a. (net of fees and taxes), a salary increase rate of 4% together with an age related promotional
scale, and an infl ation rate of 4% p.a.
(H) NET FINANCIAL POSITION OF PLAN
In accordance with AAS 25 Financial Reporting by Superannuation Plans the plans’ net fi nancial position is determined as the
difference between the present value of the accrued benefi ts and the net market value of plan assets. This has been determined as
a surplus of $7,914,756 at the most recent fi nancial position of the plans, being 1 July 2004. As such, the assets of each of the plans
are suffi cient to satisfy all benefi ts that would have vested under the plans in the event of termination of the plans and voluntary or
compulsory termination of employment of each employee.
The directors, based on the advice of the trustees of the plan, are not aware of any changes in circumstances since the date of the
most recent fi nancial statements of the plans (30 June 2005), which would have a material impact on the overall fi nancial position of
the defi ned benefi t plan.
(I) HISTORIC SUMMARY 2006 2005 $’000 $’000
Defi ned benefi t plan obligation (19,424) (21,836)
Plan assets 30,100 28,652
Surplus 10,676 6,816
Experience adjustments arising on plan liabilities (2,152) (1,457)
Experience adjustments arising on plan assets (892) 644
15. Pension asset (continued)

Notes to the Financial StatementsJohn Fairfax Holdings Limited and Controlled Entities
For the year ended 30 June 2006
Fairfax Annual Report 2006 81
Assets Liabilities Net
Restated Restated Restated 2006 2005 2006 2005 2006 2005 $’000 $’000 $’000 $’000 $’000 $’000
16. Deferred tax assets and liabilities
(A) RECOGNISED DEFERRED TAX ASSETS AND LIABILITIES
Deferred tax assets and liabilities are attributable to the following:
(i) ConsolidatedProperty, plant and equipment 9,470 668 13,086 (588) (3,616) 1,256
Inventories – – 2,535 2,425 (2,535) (2,425)
Investments 286 – 677 677 (391) (677)
Intangible assets 5,853 2,919 31,667 29,660 (25,814) (26,741)
Other fi nancial assets 16,200 16,832 17,357 12,759 (1,157) 4,073
Provisions 29,157 29,285 – – 29,157 29,285
Payables 3,568 4,383 – – 3,568 4,383
Other liabilities 12,990 201 12,587 – 403 201
Other 729 1,411 3,725 (215) (2,996) 1,626
Net deferred tax assets/liabilities 78,253 55,699 81,634 44,718 (3,381) 10,981
(ii) CompanyProperty, plant and equipment – – 2,729 3,175 (2,729) (3,175)
Intangible assets 3,692 – – (2,919) 3,692 2,919
Other assets 3 8 205 (5) (202) 13
Employee provisions 1,911 2,234 – – 1,911 2,234
Accruals 550 1,757 – – 550 1,757
Other liabilities – – – (59) – 59
Other 490 212 – (95) 490 307
Net deferred tax assets/liabilities 6,646 4,211 2,934 97 3,712 4,114
There are no unrecognised deferred tax assets or liabilities and no unused income tax losses for which no deferred tax asset has been
recognised.

Notes to the Financial StatementsJohn Fairfax Holdings Limited and Controlled EntitiesFor the year ended 30 June 2006
82 Fairfax Annual Report 2006
(B) MOVEMENT IN TEMPORARY DIFFERENCES DURING THE FINANCIAL YEAR
(i) Consolidated Balance Recognised Recognised Balance Recognised Recognised Balance 2004 in income in equity 2005 in income in equity 2006
Property, plant and equipment 4,917 (3,661) – 1,256 (4,872) – (3,616)
Inventories (2,439) 14 – (2,425) (110) – (2,535)
Investments (677) – – (677) – 286 (391)
Intangible assets (27,988) 1,247 – (26,741) 927 – (25,814)
Other fi nancial assets (1,973) 6,504 (458) 4,073 (5,084) (146) (1,157)
Provisions 26,799 2,486 – 29,285 (128) – 29,157
Payables 3,565 818 – 4,383 (815) – 3,568
Other liabilities 10,086 (9,885) – 201 202 – 403
Other 716 910 – 1,626 (4,485) (137) (2,996)
13,006 (1,567) (458) 10,981 (14,365) 3 (3,381)
(ii) CompanyProperty, plant and equipment (2,692) (483) – (3,175) 446 – (2,729)
Intangible assets 2,276 643 – 2,919 773 – 3,692
Other fi nancial assets (65) 78 – 13 (459) 244 (202)
Provisions 1,886 348 – 2,234 (323) – 1,911
Payables 1,143 614 – 1,757 (1,207) – 550
Other liabilities – 59 – 59 (59) – –
Other – 307 – 307 183 – 490
2,548 1,566 – 4,114 (646) 244 3,712
16. Deferred tax assets and liabilities (continued)

Notes to the Financial StatementsJohn Fairfax Holdings Limited and Controlled Entities
For the year ended 30 June 2006
Fairfax Annual Report 2006 83
Consolidated Company Consolidated Restated Company Restated
2006 2005 2006 2005 $’000 $’000 $’000 $’000
17. Other fi nancial assetsNon-current
Shares in controlled entities – at cost – – 409,570 155,570
Shares in unlisted entities 6,119 6,321 – –
Total non-current other fi nancial assets 6,119 6,321 409,570 155,570
18. PayablesTrade and other creditors 148,956 147,344 15,616 22,917
Interest payable 6,174 11,577 – –
Income in advance 46,600 45,755 – –
Total current payables 201,730 204,676 15,616 22,917

Notes to the Financial StatementsJohn Fairfax Holdings Limited and Controlled EntitiesFor the year ended 30 June 2006
84 Fairfax Annual Report 2006
Consolidated Company Consolidated Restated Company Restated
2006 2005 2006 2005 Note $’000 $’000 $’000 $’000
19. Interest bearing liabilitiesCurrent – unsecured
Bank borrowings (e) 185,732 7,043 – –
Preferred Reset Securities Exchangeable for Shares 21(c) 249,536 – 249,536 –
Other loans
Senior notes (a) 165,331 – – –
Medium term notes (b) – 150,000 – –
Other (c) 6,889 5,399 – –
Current – secured
Finance lease liability (c) 2,687 978 – –
Total current interest bearing liabilities 610,175 163,420 249,536 –
Non-current – unsecured
Bank borrowings (e) 145,000 95,000 – –
Redeemable Preference Shares (d) 148,395 173,615 – –
Other loans
Senior notes (a) 295,635 497,789 – –
Medium term notes (b) 199,765 – – –
Other (c) 77,644 83,218 – –
Non-current – secured
Finance lease liability (c) 31,318 35,397 – –
Total non-current interest bearing liabilities 897,757 885,019 – –
(A) SENIOR NOTES
Senior Notes issued in the US private placement market in December 1996 with a principal of USD$120 million (A$165.3 million)
mature on 19 December 2006. As a result, the Senior Notes have been classifi ed as a current fi nancial liability.
The Senior Notes were issued at par with a fi xed interest coupon of 7.43% p.a. payable semi-annually in arrears. Interest and principal
on the Senior Notes is payable in USD and was swapped into fl oating rate AUD via a cross-currency swap.
The Company also issued Senior Notes in the US private placement market with a principal value of USD$230 million (A$295.6
million) in January 2004 with a fi xed coupon of between 4.74% p.a. and 5.85% p.a payable semi-annually in arrears. The interest and
principal on the Senior Notes are payable in USD and were swapped into fl oating rate NZD and fl oating rate AUD via a cross-currency
swap. This issue of Senior Notes comprises maturities ranging from January 2011 to January 2019. The weighted average maturity of
the issue is approximately 8.5 years. The applicable cross-currency swap credit margin includes the cost of hedging all currency risk
and future interest and principal repayments on a quarterly basis.

Notes to the Financial StatementsJohn Fairfax Holdings Limited and Controlled Entities
For the year ended 30 June 2006
Fairfax Annual Report 2006 85
(B) MEDIUM TERM NOTES
A Medium Term Note (MTN) program was established in November 1998. MTNs to the value of $150 million were repaid on 15 July
2005. On 27 June 2006, the Company issued $200 million of MTNs with a maturity date of 27 June 2011 and have been classifi ed as a
non-current interest bearing liability. The MTNs were issued at a fi xed rate of 6.865% p.a.
(C) OTHER LOANS AND FINANCE LEASE LIABILITY
The Chullora printing facility in Sydney is partially fi nanced by a fi nance lease facility and loans with a fi nal maturity date of September
2015. There is a CPI indexed annuity loan with principal and interest outstanding of $52.2 million (2005: $53.5 million) and a fi nance
lease of $34 million (2005: A$36.3 million), which was entered into in February 1996. There is also principal and interest outstanding of
$32.3 million (2005: A$35.1 million) in the form of a fi xed rate loan with an established drawdown and repayment schedule.
Lease liabilities are effectively secured, as the rights to the leased assets recognised in the fi nancial statements revert to the lessor in
the event of default.
(D) REDEEMABLE PREFERENCE SHARES (RPS)
The Company issued Redeemable Preference Shares in New Zealand in May 2005 with a principal value of NZD$186.5 million
(A$148.3 million) with a fi xed one year coupon of 8.43%p.a. payable quarterly in arrears at a margin of 1% over the applicable one
year swap rate. The Redeemable Preference Shares mature in June 2010. The interest and principal on the Redeemable Preference
Shares are payable in NZD and were swapped into one year fi xed rate AUD via a cross-currency swap and were partially used to repay
the MTNs on 15 July 2005. The applicable cross-currency swap credit margin includes the cost of hedging all currency risk and future
interest and principal repayments on a quarterly basis.
(E) BANK BORROWINGS
A bank loan of $95 million established in September 2001 matures on 19 December 2006 and accordingly has been reclassifi ed as a
current interest bearing liability. During the fi nancial year, the Company also entered into a bridge facility for $300 million to partially
fund the acquisition of Trade Me Limited. This facility is currently drawn to $100 million and matures on 22 March 2007. The interest
rate for this facility is the applicable bank bill rate plus a credit margin.
Non-current bank borrowings are detailed at note (f) below.
(F) FINANCING ARRANGEMENTS
A $550 million syndicated bank facility is available to the Group companies until May 2009. At 30 June 2006, $145 million has been
drawn (2005: nil) and included in non-current bank borrowings. The interest rate for drawings under this facility is the applicable bank
bill rate plus a credit margin.
A NZD$50 million revolving committed cash advance facility is also available to the Group companies until 10 July 2007. At 30 June
2006, this facility was not drawn down (2005: nil).
The Group has suffi cient unused committed facilities at balance date to fi nance maturing current interest bearing liabilities.
The Group has a number of fi nancing facilities which are guaranteed by John Fairfax Holdings Limited and are covered by Deeds of
negative pledge.
19. Interest bearing liabilities (continued)

Notes to the Financial StatementsJohn Fairfax Holdings Limited and Controlled EntitiesFor the year ended 30 June 2006
86 Fairfax Annual Report 2006
Consolidated Company Consolidated Restated Company Restated
2006 2005 2006 2005 $’000 $’000 $’000 $’000
20. ProvisionsCurrent
Employee benefi ts 75,439 73,948 5,179 7,174
Defamation 2,482 2,250 – –
Other 1,544 2,254 55 1,289
Total current provisions 79,465 78,452 5,234 8,463
Non-current
Employee benefi ts 10,496 15,888 1,137 154
Other 7,139 5,227 – –
Total non-current provisions 17,635 21,115 1,137 154
Reconciliations
Reconciliations of the carrying amount of each class of provision, other than employee benefi ts, during the fi nancial year are set
out below:
Consolidated Consolidated Company Company Defamation Other Defamation Other
2006 2005 2006 2005 $’000 $’000 $’000 $’000
Current
Carrying amount at beginning of the fi nancial year 2,250 2,254 – 1,289
Acquisition of controlled entities – 35 – –
Additional provision 3,345 17,253 – 2,620
Utilised (3,113) (17,953) – (3,854)
Unused amounts reversed – (45) – –
Carrying amount at end of the fi nancial year 2,482 1,544 – 55
Non-current
Carrying amount at beginning of the fi nancial year – 5,227 – –
Acquisition of controlled entities – – – –
Additional provision – 2,161 – –
Utilised – (249) – –
Carrying amount at end of the fi nancial year – 7,139 – –

Notes to the Financial StatementsJohn Fairfax Holdings Limited and Controlled Entities
For the year ended 30 June 2006
Fairfax Annual Report 2006 87
Consolidated Company Consolidated Restated Company Restated
2006 2005 2006 2005 Note $’000 $’000 $’000 $’000
21. Contributed EquityOrdinary shares
939,067,152 ordinary shares fully paid (2005: 924,463,510) (a) 1,248,334 1,183,596 1,248,334 1,183,596
Preferred Reset Securities Exchangeable for Shares (PRESSES)
2,500,000 shares (2005: 2,500,000) (c), 39(v)(b) – 241,951 – 241,951
Stapled Preference Shares (SPS)
3,000,000 stapled preference shares (2005: nil) (b) 293,167 – 299,282 –
Debentures
281 debentures fully paid (2005: 281) (d) * * * *
Total contributed equity 1,541,501 1,425,547 1,547,616 1,425,547
* Amount is less than $1,000.
RECONCILIATIONS
Reconciliations of each class of contributed equity at the beginning and end of the current fi nancial year are set out below:
Consolidated Consolidated Restated
2006 2005 2006 2005 Note No. of shares No. of shares $’000 $’000
Consolidated
(A) ORDINARY SHARESBalance at beginning of the fi nancial year 924,463,510 906,856,578 1,183,596 1,115,717
Dividend reinvestment plan issue – 12 April 2006 5,535,530 – 21,977 –
Dividend reinvestment plan issue – 11 October 2005 8,602,112 – 39,483 –
Dividend reinvestment plan issue – 31 March 2005 – 2,439,660 – 10,466
Dividend reinvestment plan issue – 21 October 2004 – 15,055,272 – 55,855
Exercise of options – 30 March 2006 31(c)(ii) 66,000 – 236 –
Exercise of options – 12 March 2006 31(c)(ii) 100,000 – 369 –
Exercise of options – 19 September 2005 31(c)(ii) 60,000 – 262 –
Exercise of options – 19 September 2005 31(c)(ii) 240,000 – 1,046 –
Exercise of options – 21 June 2005 31(c)(ii) – 48,000 – 212
Exercise of options – 7 June 2005 31(c)(ii) – 64,000 – 229
Refund of share issue costs – – – 1,117
Reclassifi cation of share issue costs from equity to debt 39(v)(b) – – 1,365 –
Balance at end of the fi nancial year 939,067,152 924,463,510 1,248,334 1,183,596
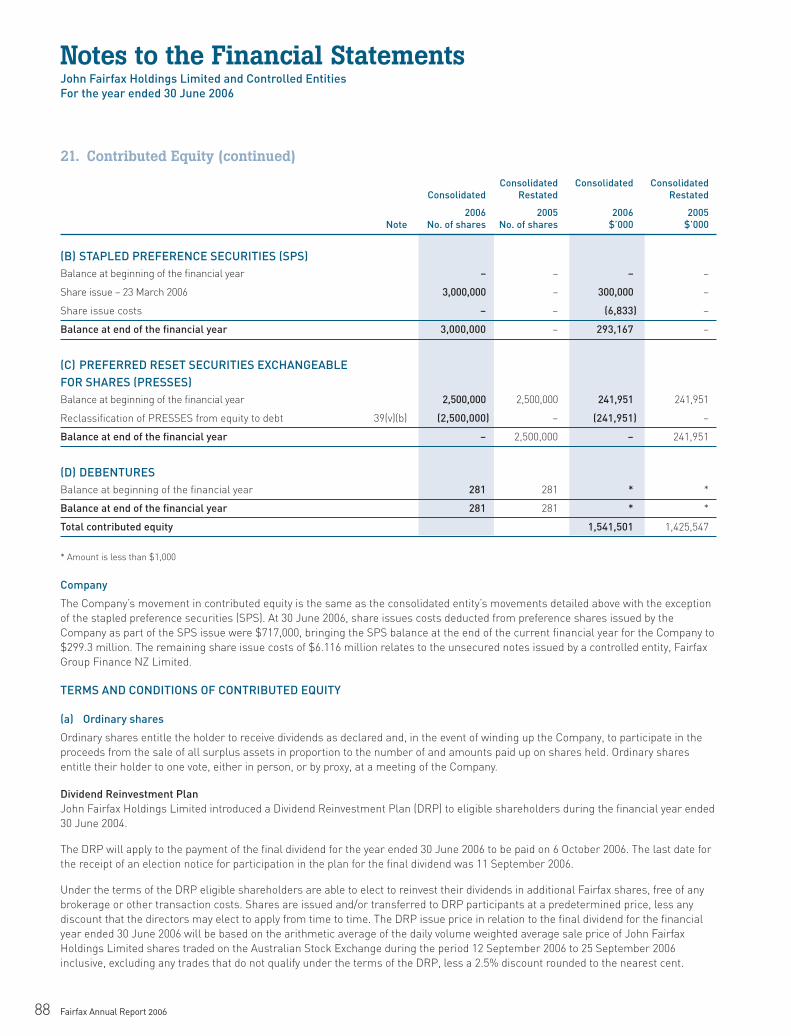
Notes to the Financial StatementsJohn Fairfax Holdings Limited and Controlled EntitiesFor the year ended 30 June 2006
88 Fairfax Annual Report 2006
Consolidated Consolidated Consolidated Consolidated Restated Restated
2006 2005 2006 2005 Note No. of shares No. of shares $’000 $’000
(B) STAPLED PREFERENCE SECURITIES (SPS)Balance at beginning of the fi nancial year – – – –
Share issue – 23 March 2006 3,000,000 – 300,000 –
Share issue costs – – (6,833) –
Balance at end of the fi nancial year 3,000,000 – 293,167 –
(C) PREFERRED RESET SECURITIES EXCHANGEABLE FOR SHARES (PRESSES)Balance at beginning of the fi nancial year 2,500,000 2,500,000 241,951 241,951
Reclassifi cation of PRESSES from equity to debt 39(v)(b) (2,500,000) – (241,951) –
Balance at end of the fi nancial year – 2,500,000 – 241,951
(D) DEBENTURESBalance at beginning of the fi nancial year 281 281 * *
Balance at end of the fi nancial year 281 281 * *
Total contributed equity 1,541,501 1,425,547
* Amount is less than $1,000
Company
The Company’s movement in contributed equity is the same as the consolidated entity’s movements detailed above with the exception
of the stapled preference securities (SPS). At 30 June 2006, share issues costs deducted from preference shares issued by the
Company as part of the SPS issue were $717,000, bringing the SPS balance at the end of the current fi nancial year for the Company to
$299.3 million. The remaining share issue costs of $6.116 million relates to the unsecured notes issued by a controlled entity, Fairfax
Group Finance NZ Limited.
TERMS AND CONDITIONS OF CONTRIBUTED EQUITY
(a) Ordinary shares
Ordinary shares entitle the holder to receive dividends as declared and, in the event of winding up the Company, to participate in the
proceeds from the sale of all surplus assets in proportion to the number of and amounts paid up on shares held. Ordinary shares
entitle their holder to one vote, either in person, or by proxy, at a meeting of the Company.
Dividend Reinvestment PlanJohn Fairfax Holdings Limited introduced a Dividend Reinvestment Plan (DRP) to eligible shareholders during the fi nancial year ended
30 June 2004.
The DRP will apply to the payment of the fi nal dividend for the year ended 30 June 2006 to be paid on 6 October 2006. The last date for
the receipt of an election notice for participation in the plan for the fi nal dividend was 11 September 2006.
Under the terms of the DRP eligible shareholders are able to elect to reinvest their dividends in additional Fairfax shares, free of any
brokerage or other transaction costs. Shares are issued and/or transferred to DRP participants at a predetermined price, less any
discount that the directors may elect to apply from time to time. The DRP issue price in relation to the fi nal dividend for the fi nancial
year ended 30 June 2006 will be based on the arithmetic average of the daily volume weighted average sale price of John Fairfax
Holdings Limited shares traded on the Australian Stock Exchange during the period 12 September 2006 to 25 September 2006
inclusive, excluding any trades that do not qualify under the terms of the DRP, less a 2.5% discount rounded to the nearest cent.
21. Contributed Equity (continued)
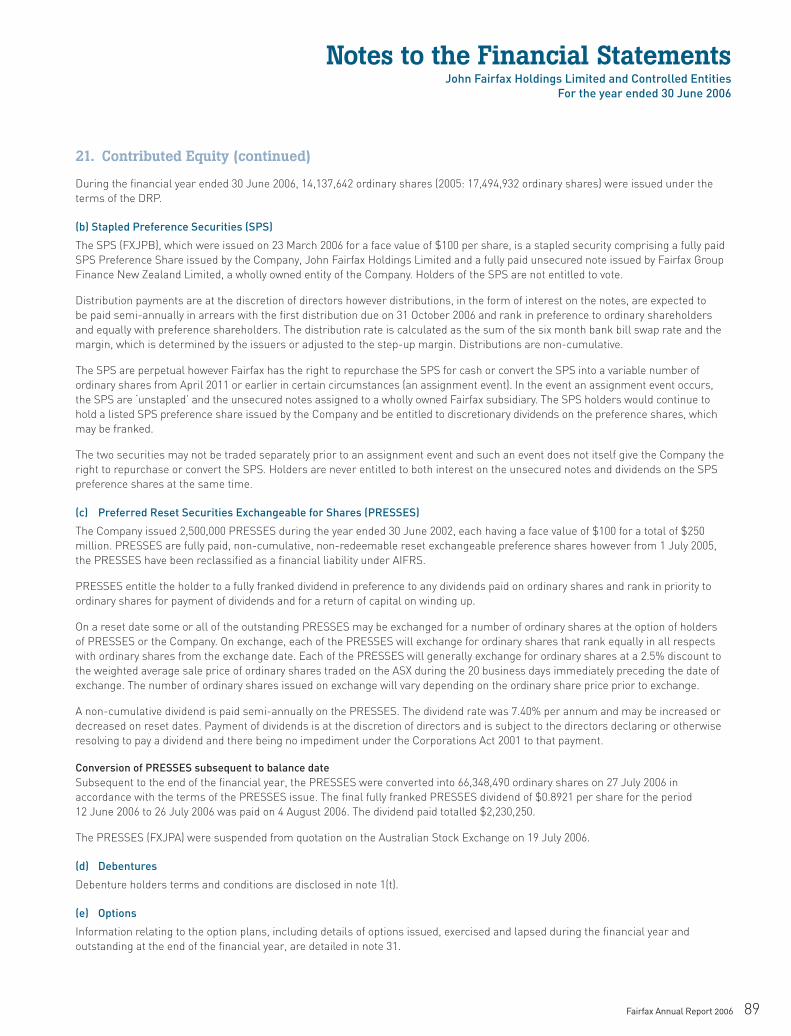
Notes to the Financial StatementsJohn Fairfax Holdings Limited and Controlled Entities
For the year ended 30 June 2006
Fairfax Annual Report 2006 89
During the fi nancial year ended 30 June 2006, 14,137,642 ordinary shares (2005: 17,494,932 ordinary shares) were issued under the
terms of the DRP.
(b) Stapled Preference Securities (SPS)
The SPS (FXJPB), which were issued on 23 March 2006 for a face value of $100 per share, is a stapled security comprising a fully paid
SPS Preference Share issued by the Company, John Fairfax Holdings Limited and a fully paid unsecured note issued by Fairfax Group
Finance New Zealand Limited, a wholly owned entity of the Company. Holders of the SPS are not entitled to vote.
Distribution payments are at the discretion of directors however distributions, in the form of interest on the notes, are expected to
be paid semi-annually in arrears with the fi rst distribution due on 31 October 2006 and rank in preference to ordinary shareholders
and equally with preference shareholders. The distribution rate is calculated as the sum of the six month bank bill swap rate and the
margin, which is determined by the issuers or adjusted to the step-up margin. Distributions are non-cumulative.
The SPS are perpetual however Fairfax has the right to repurchase the SPS for cash or convert the SPS into a variable number of
ordinary shares from April 2011 or earlier in certain circumstances (an assignment event). In the event an assignment event occurs,
the SPS are ‘unstapled’ and the unsecured notes assigned to a wholly owned Fairfax subsidiary. The SPS holders would continue to
hold a listed SPS preference share issued by the Company and be entitled to discretionary dividends on the preference shares, which
may be franked.
The two securities may not be traded separately prior to an assignment event and such an event does not itself give the Company the
right to repurchase or convert the SPS. Holders are never entitled to both interest on the unsecured notes and dividends on the SPS
preference shares at the same time.
(c) Preferred Reset Securities Exchangeable for Shares (PRESSES)
The Company issued 2,500,000 PRESSES during the year ended 30 June 2002, each having a face value of $100 for a total of $250
million. PRESSES are fully paid, non-cumulative, non-redeemable reset exchangeable preference shares however from 1 July 2005,
the PRESSES have been reclassifi ed as a fi nancial liability under AIFRS.
PRESSES entitle the holder to a fully franked dividend in preference to any dividends paid on ordinary shares and rank in priority to
ordinary shares for payment of dividends and for a return of capital on winding up.
On a reset date some or all of the outstanding PRESSES may be exchanged for a number of ordinary shares at the option of holders
of PRESSES or the Company. On exchange, each of the PRESSES will exchange for ordinary shares that rank equally in all respects
with ordinary shares from the exchange date. Each of the PRESSES will generally exchange for ordinary shares at a 2.5% discount to
the weighted average sale price of ordinary shares traded on the ASX during the 20 business days immediately preceding the date of
exchange. The number of ordinary shares issued on exchange will vary depending on the ordinary share price prior to exchange.
A non-cumulative dividend is paid semi-annually on the PRESSES. The dividend rate was 7.40% per annum and may be increased or
decreased on reset dates. Payment of dividends is at the discretion of directors and is subject to the directors declaring or otherwise
resolving to pay a dividend and there being no impediment under the Corporations Act 2001 to that payment.
Conversion of PRESSES subsequent to balance dateSubsequent to the end of the fi nancial year, the PRESSES were converted into 66,348,490 ordinary shares on 27 July 2006 in
accordance with the terms of the PRESSES issue. The fi nal fully franked PRESSES dividend of $0.8921 per share for the period
12 June 2006 to 26 July 2006 was paid on 4 August 2006. The dividend paid totalled $2,230,250.
The PRESSES (FXJPA) were suspended from quotation on the Australian Stock Exchange on 19 July 2006.
(d) Debentures
Debenture holders terms and conditions are disclosed in note 1(t).
(e) Options
Information relating to the option plans, including details of options issued, exercised and lapsed during the fi nancial year and
outstanding at the end of the fi nancial year, are detailed in note 31.
21. Contributed Equity (continued)

Notes to the Financial StatementsJohn Fairfax Holdings Limited and Controlled EntitiesFor the year ended 30 June 2006
90 Fairfax Annual Report 2006
Consolidated Company Consolidated Restated Company Restated
2006 2005 2006 2005 Note $’000 $’000 $’000 $’000
22. ReservesAsset revaluation reserve, net of tax (a) 7,676 7,336 – –
Foreign currency translation reserve, net of tax (b) (129,287) 20,158 – –
Cashfl ow hedge reserve, net of tax (c) (1,314) – – –
Net investment hedge reserve, net of tax (d) (4,494) – – –
Share-based payment reserve, net of tax (e) 595 595 595 595
Total reserves (126,824) 28,089 595 595
(a) Asset revaluation reserve Balance at beginning of the fi nancial year 7,336 7,336 – –
Net unrealised (losses) on available for sale investment (953) – – –
Transfer to retained earnings (723) – – –
Other 1,730 – – –
Tax effect of net loss on available for sale investment 286 – – –
Balance at end of the fi nancial year 7,676 7,336 – –
(b) Foreign currency translation reserve Balance at beginning of the fi nancial year 20,158 19,066 – –
Net exchange differences on currency translation, net of tax (149,445) 1,092 – –
Balance at end of the fi nancial year (129,287) 20,158 – –
(c) Cashfl ow hedge reserve Balance at beginning of the fi nancial year – – – –
Application of AASB 132 and 139 at 1 July 2005, net of tax (648) – – –
Effective portion of changes in value of cashfl ow hedges (65) – – –
Tax effect of net changes on cashfl ow hedges (601) – – –
Balance at end of the fi nancial year (1,314) – – –
(d) Net investment hedge reserve Balance at beginning of the fi nancial year – – – –
Application of AASB 132 and 139 at 1 July 2005, net of tax (13,599) – – –
Effective portion of changes in value of net investment hedges 7,179 – – –
Tax effect on net investment hedges 1,926 – – –
Balance at end of the fi nancial year (4,494) – – –
(e) Share-based payment reserve Balance at beginning of the fi nancial year 595 179 595 179
Option expense – 416 – 416
Balance at end of the fi nancial year 595 595 595 595

Notes to the Financial StatementsJohn Fairfax Holdings Limited and Controlled Entities
For the year ended 30 June 2006
Fairfax Annual Report 2006 91
NATURE AND PURPOSE OF RESERVES
(a) Asset revaluation reserve
The asset revaluation reserve is used to record increments and decrements on the revaluation of non-current assets. From 1 July
2004, changes in the fair value of investments classifi ed as available for sale investments are recognised in the asset revaluation
reserve, as described in note 1(n)(iii).
(b) Foreign currency translation reserve
The foreign currency translation reserve is used to record exchange differences arising on translation of foreign controlled entities and
associated funding of foreign controlled entities, as described in note 1(f).
(c) Cash fl ow hedge reserve
The hedging reserve is used to record the portion of gains and losses on a hedging instrument in a cash fl ow hedge that is determined
to be an effective hedge, as described in note 1(n).
(d) Net investment hedge reserve
The net investment hedge reserve is used to record gains and losses on a hedging instruments in a fair value hedge, as described in
note 1(n).
(e) Share-based payment reserve
The share-based payments reserve is used to recognise the fair value of options issued but not exercised, as described in note 1(s)(ii).
Consolidated Company Consolidated Restated Company Restated
2006 2005 2006 2005 Note $’000 $’000 $’000 $’000
23. Retained Profi tsBalance at beginning of the fi nancial year 710,975 679,817 184,552 93,838
Adoption adjustment of AIFRS (balance sheet), net of tax – (44,259) – (179)
Application of AASB 132 and AASB 139, net of tax (580) _ (8,615) –
Transfer to/(from) reserves (723) – – –
Net profi t for the fi nancial year 227,453 263,249 274,268 278,341
Actuarial gain/(loss) on defi ned benefi t plans, net of tax 2,911 (384) – –
Total available for appropriation 940,036 898,423 450,205 372,000
Dividends paid 6 (222,622) (187,448) (222,622) (187,448)
Balance at end of the fi nancial year 717,414 710,975 227,583 184,552
24. Minority InterestInterest in:
Contributed equity 3,195 3,195 – –
Reserves 905 905 – –
Retained profi ts 618 – – –
Balance at end of the fi nancial year 4,718 4,100 – –
22. Reserves (continued)

Notes to the Financial StatementsJohn Fairfax Holdings Limited and Controlled EntitiesFor the year ended 30 June 2006
92 Fairfax Annual Report 2006
Consolidated Consolidated Restated
2006 2005 Note ¢ per share ¢ per share
25. Earnings per shareBasic earnings per share
After signifi cant and non-recurring items 24.41 26.63
Before signifi cant and non-recurring items and including notional SPS * 24.52 25.86
Diluted earnings per share
After signifi cant and non-recurring items 23.84 26.63
Before signifi cant and non-recurring items 24.56 25.86
Consolidated Consolidated Restated
2006 2005 $’000 $’000
Earnings reconciliation – basic
Net profi t attributable to members of the Company 227,453 263,249
Less dividend paid on PRESSES 6(b) – (18,551)
Basic earnings after signifi cant and non-recurring items 227,453 244,698
Signifi cant and non-recurring items, net of tax 4 6,876 (7,069)
Basic earnings before signifi cant and non-recurring items, net of tax 234,329 237,629
Less notional SPS dividend * (5,844) –
Basic earnings before signifi cant and non-recurring items and including notional SPS dividend * 228,485 237,629
Earnings reconciliation – diluted
Net profi t attributable to members of the Company 227,453 263,249
Less dividend paid on PRESSES 6(b) – (18,551)
Diluted earnings after signifi cant and non-recurring items 227,453 244,698
Signifi cant and non-recurring items, net of tax 4 6,876 (7,069)
Diluted earnings before signifi cant and non-recurring items, net of tax 234,329 237,629
Less notional SPS dividend * – –
Diluted earnings before signifi cant and non-recurring items 234,329 237,629

Notes to the Financial StatementsJohn Fairfax Holdings Limited and Controlled Entities
For the year ended 30 June 2006
Fairfax Annual Report 2006 93
Consolidated Consolidated
2006 2005 Number Number ’000s ’000s
Weighted average number of ordinary shares used in calculating basis EPS before and after signifi cant and non-recurring items 931,650 918,979
Weighted average number of ordinary shares used in calculating diluted EPS before signifi cant and non-recurring items 931,650 918,979
SPS 22,498 –
PRESSES – –
Options – 58
Weighted average number of ordinary shares used in calculating diluted EPS after signifi cant and non-recurring items 954,148 919,037
As at 30 June 2006, there are no options on issue at balance date (refer note 31) and the PRESSES are not dilutive. As such they are not
included in the diluted EPS calculation before or after signifi cant items.
* The notional SPS dividend represents the dividend to be paid to the SPS holders once the Company declares the dividend.
The fi rst dividend is due to be paid on 31 October 2006 (refer note 21(b)).
At 30 June 2006, the dividend is not a present obligation of the Company and accordingly has not been provided for.
The notional SPS dividend has been calculated by applying the interest rate of 7.1883% to the SPS on issue pro-rated for the period to 30 June 2006.
26. Commitments
OPERATING LEASE COMMITMENTS – GROUP AS LESSEE
The Group has entered into commercial leases on offi ce and warehouse premises, motor vehicles and offi ce equipment. These leases
have an average life of 8.2 years (2005: 8.4 years) and a weighted average interest rate of 3.9% (2005: 3.8%).
Future minimum rentals payable under non-cancellable operating leases as at 30 June are as follows:
Consolidated Company Consolidated Restated Company Restated
2006 2005 2006 2005 $’000 $’000 $’000 $’000
Within one year 26,050 23,155 – –
Later than one year and not later than fi ve years 95,160 82,284 – –
Later than fi ve years 130,152 123,188 – –
Total operating lease commitments 251,362 228,627 – –
25. Earnings per share (continued)

Notes to the Financial StatementsJohn Fairfax Holdings Limited and Controlled EntitiesFor the year ended 30 June 2006
94 Fairfax Annual Report 2006
FINANCE LEASE COMMITMENTS – GROUP AS LESSEE
The Group has a fi nance lease for plant and machinery. The lease has an average lease term of 9 years (2005: 10 years) and a
weighted average interest rate of 12.5% (2005: 13.7%).
Future minimum lease payments under the fi nance lease together with the present value of the net minimum lease payments are
as follows:
Consolidated Company Consolidated Restated Company Restated
2006 2005 2006 2005 Note $’000 $’000 $’000 $’000
Within one year 5,076 5,076 – –
Later than one year and not later than fi ve years 30,454 20,303 – –
Later than fi ve years 11,420 26,647 – –
Minimum lease payments 46,950 52,026 – –
Less future fi nance charges (12,945) (15,651) – –
Total fi nance lease liability 34,005 36,375 – –
Classifi ed as:
Current interest bearing liabilties 2,687 978 – –
Non-current interest bearing liabilities 31,318 35,397 – –
Total fi nance lease liability 19(c) 34,005 36,375 – –
Contingent rentals under fi nance lease
A component of the fi nance lease payments are contingent on movements in the consumer price index. At balance date, the
contingent rent payable over the remaining lease term of 9 years is $35.0 million (2005: $37.2 million).
Capital commitments
At 30 June 2006, the Group has commitments principally relating to the purchase of property, plant and equipment. Commitments
contracted for at reporting date but not recognised as liabilities are as follows:
Within one year 12,407 7,658 357 2,170
Later than one year and not later than fi ve years 1,232 – – –
Later than fi ve years 2,275 – – –
Total capital commitments 15,914 7,658 357 2,170
27. Contingencies
EARN OUT AGREEMENT – TRADE ME LIMITED
The consolidated entity has entered into an earn out agreement as part of the condition of purchase of Trade Me Limited. Additional
cash consideration of up to NZD$50 million (A$41.01 million) will be payable by the consolidated entity if Trade Me Limited achieve
specifi ed fi nancial performance criteria.
The amount of the earn-out is based on the Trade Me Group’s earnings before interest, tax, depreciation and amortisation (EBITDA)
for the 12 months ended 31 March 2007 and, should that fi nancial target not be fully met in that period, the 12 months ended
31 March 2008.
A liability for earn-out has not been recognised at 30 June 2006 as it is subject to a variety of factors including market behaviour,
competition, auction volumes and activity and cannot be reliably determined at this stage.
26. Commitments (continued)

Notes to the Financial StatementsJohn Fairfax Holdings Limited and Controlled Entities
For the year ended 30 June 2006
Fairfax Annual Report 2006 95
Should the performance criteria be achieved and the earn out paid, the payment will be accounted for as an additional acquisition cost
and added to the carrying amount of the investment in Trade Me Limited as goodwill.
GUARANTEES
Under the terms of ASIC Class Order 98/1418 (as amended), the Company and certain controlled entities (refer note 28), have
guaranteed any defi ciency of funds if any entity to the class order is wound-up. No such defi ciency exists at balance date.
DEFAMATION
From time to time, entities in the consolidated entity are sued for defamation and similar matters in the ordinary course of business.
At the date of this report, there were no legal actions against the consolidated entity that are expected to result in a material impact.
28. Controlled entitiesThe following entities were controlled as at the end of the fi nancial year:
Note Note
John Fairfax Holdings Limited (a),(c)
CONTROLLED ENTITIESAIPD Pty LtdAssociated Newspapers Ltd (a)ACN 108 417 036 Pty Limited Australian Property Monitors Pty Limited (g)David Syme & Co Pty Limited (a)Debt Retrieval Agency Limited (b)Fairfax Business Media Pte Limited (b)Fairfax Business Media (South Asia) Pte Limited (b)Fairfax Business Information Solutions Pty Limited (a)Fairfax Community Newspapers Pty Limited (a)Fairfax Corporation Pty Limited (a)Fairfax Digital Australia & New Zealand Pty Limited (a)Fairfax Digital Limited (a)Fairfax EEC Limited (b)Fairfax Group Finance New Zealand Limited (b)Fairfax New Zealand Finance Limited (b)Fairfax New Zealand Holdings Limited Fairfax New Zealand Limited (b)Fairfax Print Holdings Pty Limited (a)Fairfax Printers Pty Limited (a)Fairfax Properties Pty Limited (a)Fairfax Regional Printers Pty Limited (a)Freesurf Publishing Pty Ltd Illawarra Newspaper Holdings Pty Limited (a)John Fairfax & Sons Ltd (a)John Fairfax (UK) Limited (b)John Fairfax (US) Limited (b)John Fairfax Group Finance Pty Limited (a)John Fairfax Limited (a)
John Fairfax Publications Pty Limited (a)Large Publications Pty Ltd (f)Lime Digital Pty LimitedMistcue Pty LimitedMetropolis Media Pty Ltd (a)Online Services International Limited (b)Old Friends Limited (b)Newcastle Newspapers Pty Ltd (a)Personal Investment Direct Access Pty LimitedPort Stephens Publishers Pty LtdPort Stephens Publishers TrustPropaganda Print Pty LtdReal Estate Publications Australasia Pty Limited (d)Real Estate Publications Australasia Trust (e)Rydge Publications Pty LtdSouth Australian Real Estate Press Pty Limited (a)Suzannenic Pty LimitedStays Pty Limited Stays Pty LimitedStays Pty Limited (b)The Age Company Ltd (a)The Age Print Company Pty Ltd (a)The Text City Newspaper Company Pty Ltd The Text Magazine Company Pty Ltd The Text Media Group Limited (a)The Text Newspaper Company Pty Ltd (a)The Warrnambool Standard Pty Ltd (a)Trade Me Limited (b)
Victorian Lifestyle Property Pty Limited
(a) The Company and the controlled entities incorporated within Australia are party to Class Order 98/1418 (as amended) issued by
the Australian Securities & Investment Commission. These entities have entered into a Deed of Cross Guarantee dated August
2001 under which each entity guarantees the debts of the others. These companies represent a ‘Closed Group’ for the purposes of
the Class Order and there are no other members of the ‘Extended Closed Group’. Under the Class Order, these entities have been
relieved from the requirements of the Corporations Act 2001 with regard to the preparation, audit and publication of accounts.
27. Contingencies (continued)

Notes to the Financial StatementsJohn Fairfax Holdings Limited and Controlled EntitiesFor the year ended 30 June 2006
96 Fairfax Annual Report 2006
(b) All controlled entities are incorporated in Australia except for:
Country of formation or incorporation Functional Currency
Debt Retrieval Agency Limited New Zealand NZD
Fairfax Business Media Pte Limited Singapore SGD
Fairfax Business Media (South Asia) Pte Limited Singapore SGD
Fairfax EEC Limited United Kingdom GBP
Fairfax Group Finance New Zealand Limited New Zealand AUD
Fairfax New Zealand Holdings Limited New Zealand NZD
Fairfax New Zealand Limited New Zealand NZD
John Fairfax Publications Limited (NZ Branch) New Zealand NZD
John Fairfax (UK) Limited United Kingdom GBP
John Fairfax (US) Limited United States USD
Online Services International Limited New Zealand NZD
Old Friends Limited New Zealand NZD
Stayz Limited New Zealand NZD
Trade Me Limited New Zealand NZD
(c) The consolidated entity holds a 100% equity interest (2005: 100% equity interest) in all controlled entities except (e),(f),(g) and (h).
(d) This entity is the trustee company of the Real Estate Publications Trust which the consolidated entity holds a 100% equity interest
(2005: 100% equity interest).
(e) The consolidated entity holds a 55% equity interest (2005: 55% equity interest).
(f) The consolidated entity holds a 79% equity interest (2005: 79% equity interest).
(g) The consolidated entity holds a 100% equity interest (2005: 50% equity interest) – refer note 29.
The functional currency of all controlled entities is AUD except for those entities specifi ed in note (b) above.
DEED OF CROSS GUARANTEE
John Fairfax Holdings Limited and certain wholly-owned entities (the “Closed Group”) identifi ed at (a) above are parties to a Deed of
Cross Guarantee under ASIC Class Order 98/1418 (as amended). Pursuant to the requirements of that Class Order, a summarised
consolidated income statement for the year ended 30 June 2006 and consolidated balance sheet as at 30 June 2006, comprising the
members of the Closed Group after eliminating all transaction between members are set out opposite:
28. Controlled entities (continued)
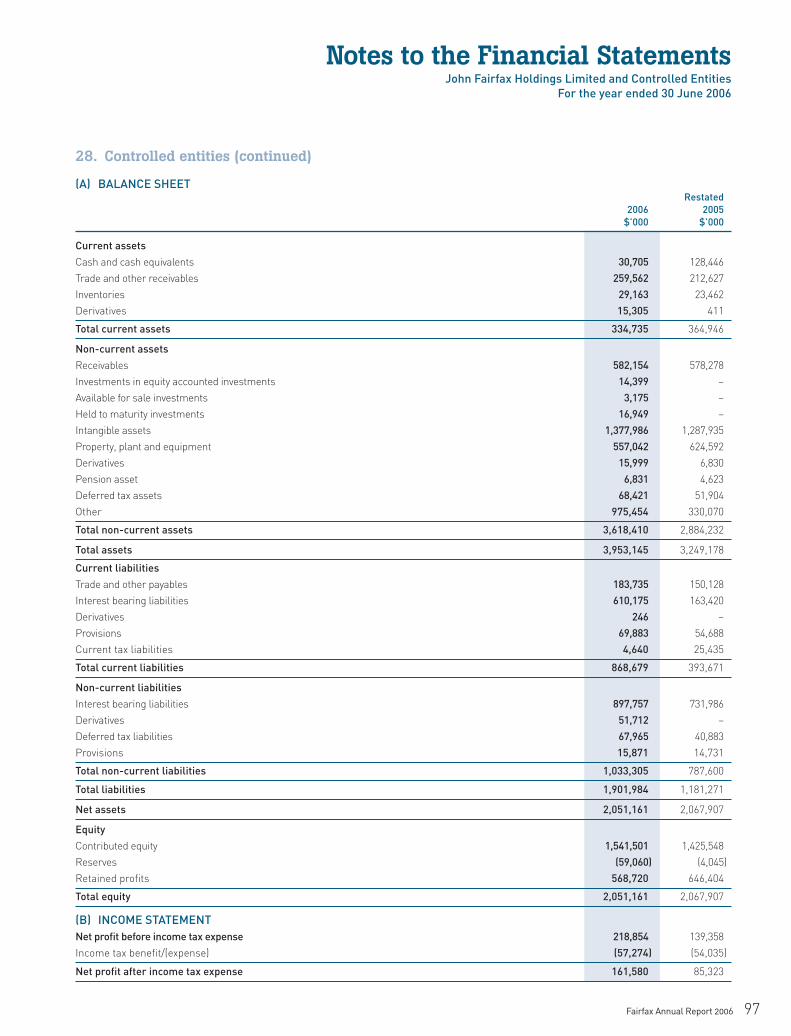
Notes to the Financial StatementsJohn Fairfax Holdings Limited and Controlled Entities
For the year ended 30 June 2006
Fairfax Annual Report 2006 97
(A) BALANCE SHEET Restated 2006 2005 $’000 $’000
Current assets
Cash and cash equivalents 30,705 128,446
Trade and other receivables 259,562 212,627
Inventories 29,163 23,462
Derivatives 15,305 411
Total current assets 334,735 364,946
Non-current assets
Receivables 582,154 578,278
Investments in equity accounted investments 14,399 –
Available for sale investments 3,175 –
Held to maturity investments 16,949 –
Intangible assets 1,377,986 1,287,935
Property, plant and equipment 557,042 624,592
Derivatives 15,999 6,830
Pension asset 6,831 4,623
Deferred tax assets 68,421 51,904
Other 975,454 330,070
Total non-current assets 3,618,410 2,884,232
Total assets 3,953,145 3,249,178
Current liabilities
Trade and other payables 183,735 150,128
Interest bearing liabilities 610,175 163,420
Derivatives 246 –
Provisions 69,883 54,688
Current tax liabilities 4,640 25,435
Total current liabilities 868,679 393,671
Non-current liabilities
Interest bearing liabilities 897,757 731,986
Derivatives 51,712 –
Deferred tax liabilities 67,965 40,883
Provisions 15,871 14,731
Total non-current liabilities 1,033,305 787,600
Total liabilities 1,901,984 1,181,271
Net assets 2,051,161 2,067,907
Equity
Contributed equity 1,541,501 1,425,548
Reserves (59,060) (4,045)
Retained profi ts 568,720 646,404
Total equity 2,051,161 2,067,907
(B) INCOME STATEMENTNet profi t before income tax expense 218,854 139,358
Income tax benefi t/(expense) (57,274) (54,035)
Net profi t after income tax expense 161,580 85,323
28. Controlled entities (continued)

Notes to the Financial StatementsJohn Fairfax Holdings Limited and Controlled EntitiesFor the year ended 30 June 2006
98 Fairfax Annual Report 2006
29. Acquisition and disposal of controlled entitiesThe consolidated entity gained control over the following entities in Australia and New Zealand during the fi nancial year:
Entity or business acquired Principal activity Date of Acquisition Ownership Interest
RSVP.com.au Pty Limited Online dating 8 July 2005 100%
Rodney Times Newspaper publishing 24 October 2005 *
Stayz Pty Limited Online holiday accommodation advertising 3 January 2006 100%
Australian Property Monitors Pty Limited Property sales and auction data specialist 3 January 2006 100%^
The Independent Newspaper publishing 23 February 2006 **
Trade Me Limited Online auction site 3 April 2006 100%
Commercial Real Estate.com.au Online commercial and industrial real 4 May 2006 ***
estate advertising
* The publishing assets of the Times Media Group were acquired, which included the Rodney Times masthead.
** The publishing assets of The Independent were acquired, including The Independent masthead.
*** The business assets of Commercial Real Estate.com.au were acquired.
^ During the fi nancial year, the consolidated entity acquired the remaining 50% of equity in Australian Property Monitors Pty Limited (APM) which resulted in full
control of APM from 3 January 2006. The consolidated entity previously held a 50% ownership.
For additional information refer to note 30.
The consolidated entity did not lose control over any entity (or group of entities) during the fi nancial year.
30. Business Combinations
(A) TRADE ME LIMITED
On 3 April 2006, Fairfax New Zealand Holdings Limited, a wholly-owned subsidiary of John Fairfax Holdings Limited, acquired 100% of
the issued capital of Trade Me Limited, a company based in New Zealand which operates an online auction website.
The fair value of the identifi able assets and liabilities of Trade Me Limited as at the date of acquisition were:
Carrying amounts recognised by Recognised on consolidated acquisition entity $’000 $’000
Fair value of net assets acquired
Cash and cash equivalents 1,585 1,585
Receivables 591 591
Investments – equity accounted 235 235
Property plant and equipment 888 888
Intangible assets 28,568 513
Total assets 31,867 3,812
Payables 5,100 5,100
Current tax liabilities (447) (447)
Provisions 102 102
Total liabilities 4,755 4,755
Fair value of identifi able net assets 27,111 (943)
Goodwill arising on acquisition ** 575,960 –
Total identifi able net assets and goodwill 603,071 (943)

Notes to the Financial StatementsJohn Fairfax Holdings Limited and Controlled Entities
For the year ended 30 June 2006
Fairfax Annual Report 2006 99
Recognised on acquisition $’000
Consideration
Purchase consideration 601,845
Costs directly attributable to the acquisition 1,226
Total consideration 603,071
Net cash outfl ow on acquisition
Net cash acquired with subsidiary 1,585
Cash paid (603,071)
Net cash outfl ow (601,486)
** Included in the $575.960 million of goodwill are certain intangible assets that cannot be individually separated and reliably measured from the acquiree due
to their nature, or which do not have a material value. Assets included in this balance consist of customer relationships, order backlog, workforce in place
and fi rst mover advantage.
Since acquisition, Trade Me Limited has contributed net profi t after income tax expense of $5,103,000.
If the acquisition had occurred on 1 July 2005, consolidated net profi t after income tax expense would have been $12,434,000 based on
management records.
(B) OTHER ACQUISITIONS DURING THE FINANCIAL YEAR
The consolidated entity gained control over the following entities in Australia and New Zealand during the fi nancial year, none of which
were individually signifi cant to the consolidated entity:
Entity or business acquired Principal activity Date of Acquisition Ownership Interest
RSVP.com.au Pty Limited Online dating 8 July 2005 100%
Rodney Times Newspaper publishing 24 October 2005 *
Stayz Pty Limited Online holiday accommodation advertising 3 January 2006 100%
Australian Property Monitors Pty Limited Property sales and auction data specialist 3 January 2006 100%
The Independent Newspaper publishing 23 February 2006 **
Commercial Real Estate.com.au Online commercial and industrial real 4 May 2006 ***
estate advertising
* The publishing assets of the Times Media Group in New Zealand were acquired, which included the Rodney Times masthead.
** The publishing assets of The Independent in New Zealand were acquired, including The Independent masthead.
*** The business assets of Commercial Real Estate.com.au were acquired.
30. Business Combinations (continued)
(A) TRADE ME LIMITED (CONTINUED)
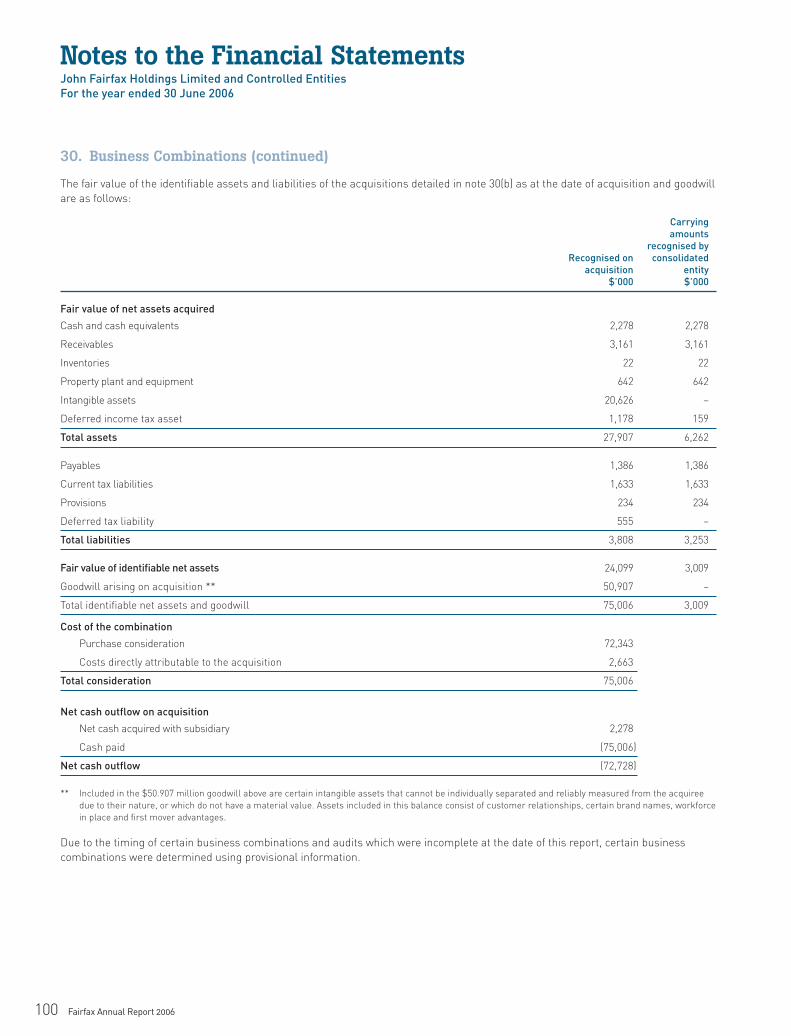
Notes to the Financial StatementsJohn Fairfax Holdings Limited and Controlled EntitiesFor the year ended 30 June 2006
100 Fairfax Annual Report 2006
The fair value of the identifi able assets and liabilities of the acquisitions detailed in note 30(b) as at the date of acquisition and goodwill
are as follows:
Carrying amounts recognised by Recognised on consolidated acquisition entity $’000 $’000
Fair value of net assets acquired
Cash and cash equivalents 2,278 2,278
Receivables 3,161 3,161
Inventories 22 22
Property plant and equipment 642 642
Intangible assets 20,626 –
Deferred income tax asset 1,178 159
Total assets 27,907 6,262
Payables 1,386 1,386
Current tax liabilities 1,633 1,633
Provisions 234 234
Deferred tax liability 555 –
Total liabilities 3,808 3,253
Fair value of identifi able net assets 24,099 3,009
Goodwill arising on acquisition ** 50,907 –
Total identifi able net assets and goodwill 75,006 3,009
Cost of the combination
Purchase consideration 72,343
Costs directly attributable to the acquisition 2,663
Total consideration 75,006
Net cash outfl ow on acquisition
Net cash acquired with subsidiary 2,278
Cash paid (75,006)
Net cash outfl ow (72,728)
** Included in the $50.907 million goodwill above are certain intangible assets that cannot be individually separated and reliably measured from the acquiree
due to their nature, or which do not have a material value. Assets included in this balance consist of customer relationships, certain brand names, workforce
in place and fi rst mover advantages.
Due to the timing of certain business combinations and audits which were incomplete at the date of this report, certain business
combinations were determined using provisional information.
30. Business Combinations (continued)

Notes to the Financial StatementsJohn Fairfax Holdings Limited and Controlled Entities
For the year ended 30 June 2006
Fairfax Annual Report 2006 101
31. Employee Benefi ts
(A) NUMBER OF EMPLOYEES
As at 30 June 2006 the consolidated entity employed 6,468 full time employees (2005: 6,377) and 2,168 part-time and casual
employees (2005: 2,249). This includes 2,363 (2005: 2,373) full-time employees and 286 (2004: 275) part-time and casual employees in
New Zealand.
(B) EMPLOYEE SHARE/SHARE OPTION PLANS
The Company has four employee share/share option plans at balance date. Information relating to each plan is set out below:
1. Fairfax Exempt Employee Share PlanThis plan is open to all permanent full-time and part-time Australian employees with more than 12 months service with the
consolidated entity in Australia. Under this Plan, participants may salary sacrifi ce up to $1,000 of pre tax salary per annum for
purchase of issued Fairfax shares at the market price on the open market of the ASX. The shares are purchased by an independent
trustee company on pre-fi xed dates.
2. Fairfax Deferred Employee Share PlanThis plan is open to all permanent full-time and part-time Australian employees with more than 12 months service with the
consolidated entity in Australia. Under this Plan, participants may salary sacrifi ce a minimum of $3,000 and up to a maximum of
25% of salary per annum for purchase of issued Fairfax shares at the market price on the open market of the ASX. The shares are
purchased by an independent trustee company on pre-fi xed dates.
3. Long Term Deferred Incentive PlanDuring the fi nancial year, the long term incentive share plan was replaced with a long term deferred incentive plan which is
available to certain permanent full-time and part-time employees of the consolidated entity who are not directors of the Company
effective 30 June 2006.
Under the revised plan, one third of the cash value of each participating employee’s annual incentive payment will be allocated in
the form of rights to Fairfax shares.The shares will be purchased on market by the Trustee of the Employee Share Plan, allocated
to the relevant employee and held in the Trust until they either vest to the employee or are forfeited. The shares will vest if the
eligible employee remains employed by the Fairfax Group for three calendar years from the date the rights are allocated. There is
no cash settlement alternative. Dividends on the allocated shares are paid directly to the eligible employee and the Company does
not have any recourse to dividends paid.
4. Employee Share Option Plan During the fi nancial year, full-time and part-time employees of the consolidated entity are eligible to participate on invitation from
the Company. On and after two years from the date of issue, 40% of options will become conditionally exercisable. On and after the
passing of each subsequent year, a further 20% of the options will become conditionally exercisable. Options not exercised within
fi ve years of issue will lapse. On exercise, each option is convertible to one ordinary share. The maximum number of employee
scheme options approved by shareholders at a general meeting which may be issued at any one time is 4 per cent of the number
of ordinary shares of the Company on issue at that date. The number of employee scheme options outstanding, which were issued
under the employee option incentive scheme, is equivalent to 0.05% of the ordinary shares on issue at 30 June 2005.
The Employee Share Option Plan ceased in March 2006 and there were no options held by employees at 30 June 2006
(2005: 5 employees).

Notes to the Financial StatementsJohn Fairfax Holdings Limited and Controlled EntitiesFor the year ended 30 June 2006
102 Fairfax Annual Report 2006
(C) MOVEMENT IN SHARE OPTIONS DURING THE FINANCIAL YEAR 2006 2005 Weighted Weighted 2006 average 2005 average Number exercise Number exercise Note of options price of options price
Balance at the beginning of the fi nancial year 496,000 4.08 5,325,000 4.10
Granted – – – –
Exercised 31(c)(ii) (466,000) 4.11 (112,000) 3.94
Forfeited 31(c)(ii) (30,000) 3.69 (4,717,000) 4.10
Expired – – – –
Balance at the end of the fi nancial year – – 496,000 4.08
Exercisable at the end of the fi nancial year – – 496,000 4.08
The consolidated entity did not grant any share options during
the fi nancial years ended 2006 or 2005.
(i) Options held at the beginning of the fi nancial year
Number of options Grant date Expiry date Exercise price
300,000 19 September 2001 19 September 2005 $4.36
130,000 12 March 2001 12 March 2006 $3.69
66,000 30 March 2001 30 March 2006 $3.58
(ii) Options exercised or forfeited during the fi nancial year Number Proceeds Exercise of shares from sharesOption details and issue date Grant date price issued issued
$
Exercised and converted to ordinary shares
Exercise of options – 30 March 2006 30 March 2001 $3.58 66,000 236,280
Exercise of options – 12 March 2006 12 March 2001 $3.69 100,000 369,000
Exercise of options – 19 September 2005 19 September 2001 $4.36 300,000 1,308,000
Total options exercised 466,000 1,913,280
Forfeited during the fi nancial year
Forfeiture of options – 12 March 2006 12 March 2001 $3.69 30,000 –
31. Employee Benefi ts (continued)

Notes to the Financial StatementsJohn Fairfax Holdings Limited and Controlled Entities
For the year ended 30 June 2006
Fairfax Annual Report 2006 103
The exercise price of options granted in previous years was equivalent to the Company’s average market share price on the ASX, at the
date the options were issued. At balance date, the Company’s closing share price was $3.75 (2005: $4.30).
(iii) Fair values of options and rights over shares
The fair value of options and rights over shares are estimated on grant date using the Black-Scholes and Monte Carlo option pricing
models respectively taking into account the terms and conditions upon which they were granted.The inputs to these models used for
the fi nancial years are as below: 2006 Range 2005 Range
Dividend yield 1.92 – 3.47% 1.92 – 3.47%
Expected volatility 10% 2 – 3.4%
Risk-free discount rate 4.5 – 5.5% 4.8 – 6.3%
Expected life of option 3 yrs 5 yrs
Option exercise price $3.88 $2.90
Weighted average share price at grant date $1.79 $1.83
The dividend yield refl ects the assumption that the current dividend payout will continue with no material anticipated increases. The expected
life of the options is based on historical data and is not necessarily indicative of exercise patterns that may occur. The expected volatility
refl ects the assumption that the historical volatility is indicative of future trends, which may also not necessarily be the actual outcome.
32. Remuneration of auditorsDuring the fi nancial year the following amounts were paid or payable for services provided by the auditor of the Company and its
related parties: Consolidated Company Consolidated Restated Consolidated Restated
2006 2005 2006 2005 $’000 $’000 $’000 $’000
Audit services
Ernst & Young Australia
Audit and review of fi nancial reports 785 695 785 695
Affi liates of Ernst & Young Australia
Audit and review of fi nancial reports 371 338 – –
Total audit services 1,156 1,033 785 695
Other assurance services
Ernst & Young Australia
Regulatory and contractually required audits 126 184 – 35
Affi liates of Ernst & Young Australia
Regulatory and contractually required audits 151 171 – –
Total other assurance services 277 355 – 35
Total remuneration for assurance services 1,433 1,388 785 730
Non assurance services
Ernst & Young Australia
Accounting advice – 17 – –
Due diligence 34 – 8 –
Affi liates of Ernst & Young Australia
Taxation services – 29 – –
Total non assurance services 34 46 8 –
Total remuneration of auditors 1,467 1,434 793 730
31. Employee Benefi ts (continued)
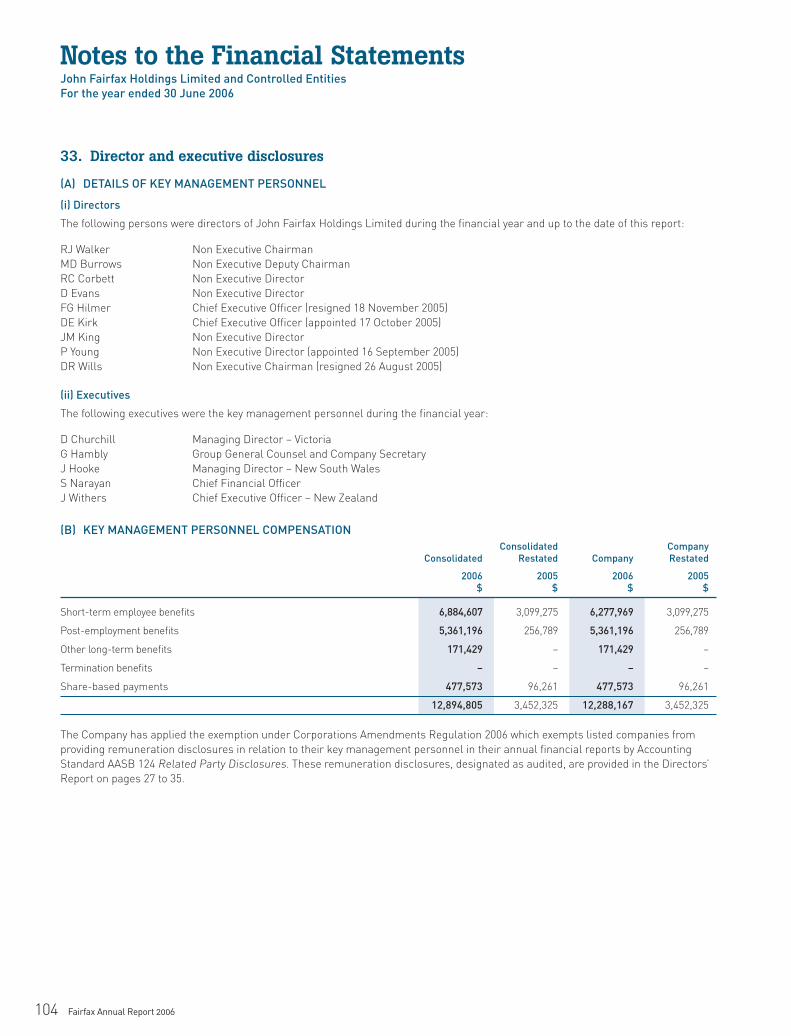
Notes to the Financial StatementsJohn Fairfax Holdings Limited and Controlled EntitiesFor the year ended 30 June 2006
104 Fairfax Annual Report 2006
33. Director and executive disclosures
(A) DETAILS OF KEY MANAGEMENT PERSONNEL
(i) Directors
The following persons were directors of John Fairfax Holdings Limited during the fi nancial year and up to the date of this report:
RJ Walker Non Executive Chairman
MD Burrows Non Executive Deputy Chairman
RC Corbett Non Executive Director
D Evans Non Executive Director
FG Hilmer Chief Executive Offi cer (resigned 18 November 2005)
DE Kirk Chief Executive Offi cer (appointed 17 October 2005)
JM King Non Executive Director
P Young Non Executive Director (appointed 16 September 2005)
DR Wills Non Executive Chairman (resigned 26 August 2005)
(ii) Executives
The following executives were the key management personnel during the fi nancial year:
D Churchill Managing Director – Victoria
G Hambly Group General Counsel and Company Secretary
J Hooke Managing Director – New South Wales
S Narayan Chief Financial Offi cer
J Withers Chief Executive Offi cer – New Zealand
(B) KEY MANAGEMENT PERSONNEL COMPENSATION Consolidated Company Consolidated Restated Company Restated
2006 2005 2006 2005 $ $ $ $
Short-term employee benefi ts 6,884,607 3,099,275 6,277,969 3,099,275
Post-employment benefi ts 5,361,196 256,789 5,361,196 256,789
Other long-term benefi ts 171,429 – 171,429 –
Termination benefi ts – – – –
Share-based payments 477,573 96,261 477,573 96,261
12,894,805 3,452,325 12,288,167 3,452,325
The Company has applied the exemption under Corporations Amendments Regulation 2006 which exempts listed companies from
providing remuneration disclosures in relation to their key management personnel in their annual fi nancial reports by Accounting
Standard AASB 124 Related Party Disclosures. These remuneration disclosures, designated as audited, are provided in the Directors’
Report on pages 27 to 35.

Notes to the Financial StatementsJohn Fairfax Holdings Limited and Controlled Entities
For the year ended 30 June 2006
Fairfax Annual Report 2006 105
(C) EQUITY INSTRUMENT DISCLOSURES RELATING TO KEY MANAGEMENT PERSONNEL
(i) Options provided as remuneration and shares issued on exercise of such options
Details of options provided as remuneration and shares issued on the exercise of such options, together with terms and conditions of
the options, can be found in section 5.2 of the remuneration report on pages 27 to 35.
(ii) Option holdings
Remuneration options: granted and vested during the fi nancial year
During the year there were no options granted (2005: nil). The number of options that vested during the fi nancial year ended
30 June 2006 (2005: nil) is set out in the following table:
Number of options vested
G Hambly 300,000
Ordinary shares issued on exercise of remuneration options
Number of Value Total share shares issued per share value $ $
G Hambly 300,000 4.36 1,308,000
Option holdings of directors and key management personnel
Directors
During the fi nancial year ended 30 June 2006, there were no options issued to or exercised by directors, nor were there any options
held by directors that lapsed during the fi nancial year (2005: nil).
Key management personnel
The following table details options granted, exercised or lapsed during the current fi nancial year relating to the key management
personnel:
Balance at beginning Balance at of period Granted as Options Options end of period Not 1 July 2005 remuneration exercised expired 30 June 2006 Total Exercisable Exercisable
G Hambly 300,000 – (300,000) – – – – –
Total 300,000 – (300,000) – – – – –
Option values of key management personnel
Value Total options Total value per share exercised $ $
Value of options granted – – –
Value of options exercised (at exercise date) 33,000 0.11 300,000
Value of options lapsed – – –
Total 33,000 0.11 300,000
33. Director and executive disclosures (continued)

106 Fairfax Annual Report 2006
(iii) Shareholdings
Balance Granted as On exercise Net change Balance Post year-end Post year-end Post year-end 2005 remuneration of option Other 2006* acquisitions disposals balance
Directors
RJ Walker 312,605 – – 112,186 424,791 576,068 – 1,000,859
MD Burrows 24,205 – – 9,347 33,552 3,379 – 36,931
RC Corbett 13,748 – – 7,305 21,053 2,365 – 23,418
D Evans – – – 6,456 6,456 2,028 – 8,484
FG Hilmer* 148,653 – – – 148,653 – – n/a
JM King 32,230 – – 7,106 39,336 2,196 – 41,532
DE Kirk – – – 100,000 100,000 108,108 – 208,108
P Young – – – 4,368 4,369 2,365 – 6,734
DR Wills* 62,237 – – 3,268 65,505 – – n/a
Key management personnel
D Churchill – – – – – – – –
G Hambly 96,415 – 300,000 (300,000) 96,415 – – 96,415
J Hooke – – – – – – – –
S Narayan – – – 2,247 2,247 – – 2,247
J Withers 3,296 – – – 3,296 – – 3,296
Total 693,389 – 300,000 (47,716) 945,673 696,509 – 1,428,024
Balance Granted as On exercise Net change Balance 2004 remuneration of option Other 2005*
Directors
RJ Walker 307,316 – – 5,289 312,605
MD Burrows 19,298 – – 4,907 24,205
RC Corbett 8,399 – – 5,349 13,748
FG Hilmer 2,948,653 – – (2,800,000) 148,653
JM King 27,590 – – 4,640 32,230
P Young – – – – –
R Carnegie* 24,495 – – 931 25,426
DM Gonski* 29,298 – – 5,056 34,354
MA Jackson* 17,672 – – 1,017 18,689
DR Wills 50,903 – – 11,334 62,237
J Withers* – – – 3,296 3,296
Specifi ed executivesB Evans 341 – – – 341
P Graham 2,366 – – – 2,366
A Revell 12,201 – – – 12,201
G Hambly – – – 96,415 96,415
S Narayan – – – – –
Total 3,448,532 – – (2,661,766) 786,766
* In the case of retired directors, the closing balance represents the number of shares at the date the director retired from the Board
33. Director and executive disclosures (continued)
Notes to the Financial StatementsJohn Fairfax Holdings Limited and Controlled EntitiesFor the year ended 30 June 2006

Notes to the Financial StatementsJohn Fairfax Holdings Limited and Controlled Entities
For the year ended 30 June 2006
Fairfax Annual Report 2006 107
Balance Granted as On exercise Net change Balance Post year-end Post year-end Post year-end 2005 remuneration of option Other 2006* acquisitions disposals balance
PRESSES
Directors
FG Hilmer* 180 – – – 180 – (180) –
Total 180 – – – 180 – (180) –
There were no PRESSES held, acquired or disposed of by key management personnel in the fi nancial year ended 30 June 2006.
Balance Granted as On exercise Net change Balance 2004 remuneration of option Other 2005*
PRESSES
Directors
JM King 128 – (128) – –
DR Wills 180 – (180) – –
FG Hilmer 180 – – – 180
Total 488 – (308) – 180
There were no PRESSES held, acquired or disposed of in the fi nancial year ended 30 June 2005 by specifi ed executives.
* In the case of retired directors, the closing balance represents the number of shares at the date the director retired from the Board
Stapled Preference Shares (SPS)There were no SPS held, acquired or disposed of in the fi nancial year ended 30 June 2006 by directors or key management personnel.
(D) RIGHTS OVER SHARE HOLDINGS OF DIRECTORS AND KEY MANAGEMENT PERSONNEL
Details of shares provided as remuneration is in section 5.2 of the remuneration report on page 30.
Opening Closing balance Granted as Net change balance 2005 remuneration Other** 2006
Directors
DE Kirk* – – – –
Key management personnel
Don Churchill* – – – –
Gail Hambly 80,431 105,190 (45,706) 139,915
James Hooke 53,986 26,129 (26,760) 53,355
Sankar Narayan 48,638 113,896 (12,633) 149,901
Joan Withers* – – – –
Total 183,055 245,215 (85,099) 343,171
* Executives who had no participation in the equity-based incentives (EBI) pre 2006 fi nancial year.
** includes forfeitures
33. Director and executive disclosures (continued)

Notes to the Financial StatementsJohn Fairfax Holdings Limited and Controlled EntitiesFor the year ended 30 June 2006
108 Fairfax Annual Report 2006
Opening Closing balance Granted as Net change balance 2004 remuneration Other** 2005
Directors
No directors had rights over shares in the fi nancial year ended 2005.
Specifi ed executives
Brian Evans* 38,704 50,357 – 89,061
Peter Graham* 51,594 42,259 – 93,853
Gail Hambly 45,706 34,725 – 80,431
Sankar Narayan 12,633 36,005 48,638
Alan Revell* 48,357 41,566 – 89,923
Total 196,994 204,912 – 401,906
* The following specifi ed executives ceased employment during the fi nancial year ended 2006 and forfeited rights to share holdings
depending on their contracts: Brian Evans (4 November 2005); Peter Graham (1 August 2005); Alan Revell (2 February 2006).
** includes forfeitures
(E) LOANS TO KEY MANAGEMENT PERSONNEL
Details of loans made to directors of John Fairfax Holdings Limited and other key management personnel of the Group, including their
personally related parties, are set out below.
(i) Aggregate for key management personnel Balance at Balance Highest beginning Interest not at end owing Year of year charged of year in year
A Revell 2005 100,000 2,747 – 100,000
There were no loans issued to directors or key management personnel during the fi nancial year ended 30 June 2006.
(ii) Individuals with loans above $100,000 during the fi nancial year
There are no outstanding loans above $100,000 for the fi nancial years ended 30 June 2006 and 30 June 2005.
(F) OTHER TRANSACTIONS WITH KEY MANAGEMENT PERSONNEL
A number of directors of John Fairfax Holdings Limited also hold directorships with other corporations which provide and receive
goods or services to and from the Fairfax Group in the ordinary course of business on normal terms and conditions and are considered
to be minor in nature. None of these directors derive any direct personal benefi t from the transactions between the Fairfax Group and
these corporations.
Transactions were entered into during the fi nancial year with the directors of John Fairfax Holdings Limited and its controlled
entities or with director-related entities, which:
occurred within a normal employee, customer or supplier relationship on terms and conditions no more favourable than those
which it is reasonable to expect would have been adopted if dealing with the director or director-related entity at arm’s length in
the same circumstances;
do not have the potential to adversely affect decisions about the allocation of scarce resources or discharge the responsibility of
the directors; or
are minor or domestic in nature.
•
•
•
33. Director and executive disclosures (continued)

Notes to the Financial StatementsJohn Fairfax Holdings Limited and Controlled Entities
For the year ended 30 June 2006
Fairfax Annual Report 2006 109
34. Related party transactions
(A) ULTIMATE PARENT
John Fairfax Holdings Limited is the ultimate parent company.
(B) CONTROLLED ENTITIES
Interests in controlled entities are set out in note 28 and note 9.
(C) KEY MANAGEMENT PERSONNEL
Disclosures relating to key management personnel are set out in note 33.
(D) TRANSACTIONS WITH RELATED PARTIES
The following transactions occurred with related parties on normal market terms and conditions:
Sales to Purchases Amount owed Amount owed related from related by related to related parties parties parties parties Year $’000 $’000 $’000 $’000
Consolidated
Associates and joint ventures 2006 12 10,340 15 399
2005 2 7,436 – 831
Company
Associates and joint ventures 2006 – 201 – 3
2005 – 129 – –
John Fairfax Holdings Limited has undertaken transactions with its controlled entities including the issue and receipt of loans and management
fees. On consolidation, all such transactions have been eliminated in full.

Notes to the Financial StatementsJohn Fairfax Holdings Limited and Controlled EntitiesFor the year ended 30 June 2006
110 Fairfax Annual Report 2006
35. Notes to the Statement of Cash Flows
(A) RECONCILIATION OF NET PROFIT AFTER INCOME TAX EXPENSE TO NET CASH INFLOW FROM OPERATING ACTIVITIES
Consolidated Company Consolidated Restated Company Restated
2006 2005 2006 2005 $’000 $’000 $’000 $’000
Net profi t for the fi nancial year 227,453 263,249 274,268 278,341
Non-cash items
Depreciation and amortisation 79,775 80,083 13,814 9,991
Amortisation of PRESSES issue costs 292 – 292 –
Share of profi ts of associates and joint ventures not
received as dividends or distributions (2,924) (1,642) – –
Straight-line rent adjustment 3,920 (1,411) – –
Net loss/(gain) on disposal of property, plant and equipment 168 (2,261) (3) –
Net (gain)/loss) on disposal of other assets – (230) – –
(Gain)/loss on disposal of derivatives 4,120 – – –
Fair value adjustment to derivatives 188 – – –
Net foreign currency (gain)/loss (860) 764 – –
Share based payments 230 416 230 416
Non-cash superannuation (income)/expense (226) (282) – –
Changes in operating assets and liabilities, net of effects from acquisitions
(Increase)/decrease in trade receivables 3,315 (8,889) 22 (316)
Decrease in other receivables 4,502 21,026 (53,860) (9,519)
(Increase)/decrease in inventories (6,066) 11,884 – –
(Decrease) in payables (9,083) (55,734) (7,377) 1,238
(Decrease)/increase in provisions (6,106) 3,924 (2,247) 3,395
(Decrease)/increase in tax balances (10,513) 32,904 (19,447) (4,436)
Net cash infl ow from operating activities 288,185 343,801 205,692 279,110
(B) RECONCILIATION OF CASH AND CASH EQUIVALENTS
Reconciliation of cash at end of the fi nancial year (as shown in the Statement of Cash Flows) to the related items in the fi nancial
statements is as follows:
Cash on hand and at bank 52,748 134,154 954 23,813
Total cash at end of the fi nancial year 52,748 134,154 954 23,813
(C) NON-CASH INVESTING AND FINANCING ACTIVITIES
Dividends satisfi ed by the issue of shares under the dividend reinvestment plan are shown in note 21(a) and options issued to
employees under the Employee Share Option Plan for no cash consideration are shown in note 31(b).

Notes to the Financial StatementsJohn Fairfax Holdings Limited and Controlled Entities
For the year ended 30 June 2006
Fairfax Annual Report 2006 111
36. Financial risk management and fi nancial instrument disclosuresHedging transactions and derivative fi nancial instruments
The consolidated entity’s principal fi nancial instruments, other than derivatives, comprise bank loans, senior notes, preference
shares, fi nance leases, cash and short term deposits.
The main purpose of these fi nancial instruments is to raise fi nance for the Group’s operations. The Group has various other fi nancial
assets and liabilities such as trade receivables and payables, which arise directly from its operations. The consolidated entity also
enters into derivative transactions to manage principally interest rate and currency risks arising from their operations and its
sources of fi nance (refer to note 14) in accordance with a Treasury Policy approved by the Board of John Fairfax Holdings Limited.
The consolidated entity does not use derivative instruments for speculative or trading purposes.
Details of the signifi cant accounting policies and methods adopted, including the criteria for recognition, the basis of measurement
and the basis on which income and expenses are recognised, in respect of each class of fi nancial asset, fi nancial liability and equity
instrument are disclosed in note 1.
(A) INTEREST RATE RISK
Interest rate risk arises on the consolidated entity’s long term borrowings which are denominated in various currencies as well
as fl oating and fi xed rates of interest. The consolidated entity manages its interest rate risk through a range of derivative fi nancial
instruments, primarily interest rate swaps and cross currency swaps. The objective of entering into these derivatives is to reduce
the risk of profi tability and cashfl ow being effected by interest rate risk. The Treasury Policy requires the portion of fi xed and variable
interest rate risk as well as the maturity of fi xed interest rate risk to be maintained within defi ned limits.
The following table summarises the consolidated entity’s exposure to interest rate risks:
Consolidated30 June 2006 Fixed interest maturing in
Weighted average Floating 1 year 1 to 5 More than Non-interest effective interest rate or less years 5 years bearing Total interest rate
$’000 $’000 $’000 $’000 $’000 $’000 %
Financial assets
Cash and cash equivalents 52,748 – – – – 52,748 5.7
Trade and other receivables* – – – – 266,463 266,463 –
Available for sale investments – – – – 3,175 3,175 –
Held to maturity investments 16,949 – – – – 16,949 5.6
Other fi nancial assets – – – – 6,119 6,119 –
Derivatives 30,777 393 134 – – 31,304 5.9
Total fi nancial assets 100,474 393 134 – 275,757 376,758
Financial liabilities
Payables – – – – 201,730 201,730
Bank borrowings and loans 383,002 3,719 16,910 11,634 – 415,265 7.4
Senior notes – 165,331 66,838 228,797 – 460,966 7.3
Medium term notes – – 199,765 – – 199,765 6.9
Finance lease liability 34,005 – – – – 34,005 7.2
PRESSES – 249,536 – – – 249,536 7.4
Redeemable preference shares (RPS) – – 148,395 – – 148,395 4.4
Derivatives 51,949 9 – – – 51,958 6.2
Total fi nancial liabilities 468,956 418,595 431,908 240,431 201,730 1,761,620

Notes to the Financial StatementsJohn Fairfax Holdings Limited and Controlled EntitiesFor the year ended 30 June 2006
112 Fairfax Annual Report 2006
30 June 2005 Fixed interest maturing in
Weighted average Floating 1 year 1 to 5 More than Non-interest effective interest rate or less years 5 years bearing Total interest rate
$’000 $’000 $’000 $’000 $’000 $’000 %
Financial assets
Cash and cash equivalents 134,154 – – – – 134,154 5.4
Trade and other receivables – – – – 276,892 276,892 –
Other fi nancial assets – – – – 6,321 6,321 –
Derivatives – – – – 7,241 7,241 –
Total fi nancial assets 134,154 – – – 290,454 424,608
Financial liabilities
Payables – – – – 204,676 204,676 –
Bank borrowings and loans 102,043 5,399 – 83,218 – 190,660 6.2
Senior notes – – 157,584 340,205 – 497,789 7.1
Medium term notes – 150,000 – – – 150,000 6.4
Finance lease liability 36,375 – – – – 36,375 7.2
Redeemable preference shares (RPS) – – 173,615 – – 173,615 4.4
Derivatives 308,263 100,000 (138,969) (269,294) – – –
Total fi nancial liabilities 446,681 255,399 192,230 154,129 204,676 1,253,115
(B) FOREIGN CURRENCY RISK
The consolidated entity enters into a range of derivative fi nancial instruments to manage foreign exchange risk with the objectives of
reducing the risk to profi tability and cashfl ow and removing uncertainty in valuation of the income statement. The principal balance
sheet risk arises from the issue of senior notes denominated in USD (refer note 19) and the underlying assets and liabilities of the
New Zealand business. The exposure to USD payments for principal and interest under this transaction was fully hedged into AUD and
NZD by cross currency and interest rate swap transactions.
The consolidated entity also enters into forward foreign exchange contracts to hedge foreign currency denominated payments
(principally USD, NZD and EUR) mainly for purchases of capital equipment, newsprint, paper, other materials, and hedging of loan
receivables and dividend payments from overseas controlled entities.
The consolidated entity has hedged a NZD loan receivable from its New Zealand controlled entity.
The following table sets out the gross value to be received under foreign currency contracts, the weighted average contracted
exchange rates and the settlement periods of outstanding contracts for the consolidated entity at balance date:
Weighted average Less than 1 year 1 to 5 years exchange rate
2006 2005 2006 2005 2006 2005 $’000 $’000 $’000 $’000 % %
USD 6,184 97 – 350,000 0.7610 0.7378
EUR 2,977 – – – 0.5942 –
NZD – – – (602,426) – 1.0812
36. Financial risk management and fi nancial instrument disclosures (continued)

Notes to the Financial StatementsJohn Fairfax Holdings Limited and Controlled Entities
For the year ended 30 June 2006
Fairfax Annual Report 2006 113
(C) CREDIT RISK
The consolidated entity is exposed to credit risk representing the loss in the event of non-performance by the fi nancial instrument
counterparties which are investment grade rated fi nancial institutions. Credit risk is managed through the use of credit ratings and
monitoring the usage of predetermined credit limits.
Credit risk arising on receivable balances are monitored on an ongoing basis with the result that the Group’s exposure to bad debts
is not signifi cant. With respect to credit risk arising from the other fi nancial assets of the Group, which comprise cash and cash
equivalents, available-for-sale fi nancial assets and certain derivative instruments, the Group’s exposure to credit risk arises from
default of the counterparty, with a maximum exposure equal to the carrying amount of these instruments.
As at 30 June 2006, the consolidated entity had no signifi cant concentration of credit risk with any single counterparty or group of counterparties.
(D) LIQUIDITY RISK
The Group’s objective is to maintain adequate liquidity to meet its fi nancial obligations as and when they fall due through the use of
bank overdrafts, bank loans and facilities, preference shares, fi nance leases and the issue of notes. The consolidated entity’s policy is
that no more than 30% of the borrowings should mature in any twelve month period.
(E) FAIR VALUE
The carrying amounts and fair values of fi nancial assets and fi nancial liabilities at balance date are:
Consolidated Consolidated Consolidated Consolidated Carrying value Fair value Carrying value Fair value 2006 2006 2005 2005 $’000 $’000 $’000 $’000
Financial assets
Cash and cash equivalents 52,748 52,748 134,154 134,154
Receivables 266,464 266,464 276,892 276,892
Derivative assets 31,304 31,304 7,241 7,241
Available for sale investments 3,175 3,175 – –
Held to maturity investments 16,949 16,949 – –
Other fi nancial assets 6,119 6,119 6,321 6,321
376,759 376,759 424,608 424,608
Financial liabilities
Payables 201,730 201,730 204,676 204,676
Interest bearing liabilities
- bank borrowings 235,731 235,731 - -
- bank loans 179,534 177,526 190,660 190,660
- senior notes 460,966 460,966 497,789 497,789
- medium term notes 199,765 200,000 150,000 150,000
- lease liability 34,005 48,134 36,375 52,921
- PRESSES 249,536 250,000 – –
- Redeemable Preference Shares (RPS) 148,395 152,189 173,615 173,615
Derivatives 51,958 51,958 – –
1,761,620 1,778,234 1,253,115 1,269,661
Market values have been used to determine the fair value of listed available for sale investments
The fair value of interest bearing liabilities (excluding PRESSES and RPS) have been calculated by discounting the expected future
cashfl ows by interest rates for liabilities with similar risk profi les. The discount rates applied range from 8.57% to 11.7%. The fair
value of PRESSES have been calculated using the face value upon redemption and the fair value of held to maturity investments and
RPS have been determined by adjusting for the transaction costs.
The carrying value of all other balances approximate the fair value.

Notes to the Financial StatementsJohn Fairfax Holdings Limited and Controlled EntitiesFor the year ended 30 June 2006
114 Fairfax Annual Report 2006
37. Segment ReportingThe economic entity operates predominantly in two geographic segments, Australia and New Zealand.
The economic entity operates in one business segment, publishing. The publishing business comprises news, information and
entertainment publishing and advertising sales in newspaper, magazine and electronic formats.
(A) RESULTS BY GEOGRAPHIC SEGMENT
30 June 2006 Consolidated Australia New Zealand Unallocated entity
$’000 $’000 $’000 $’000
Sales to external customers 1,363,026 527,538 – 1,890,564
Total sales revenue 1,363,026 527,538 – 1,890,564
Share of net profi ts of associates and joint ventures 6,769 150 – 6,919
Other revenues 10,611 6,667 2,122 19,400
Total segment revenue 1,380,406 534,355 2,122 1,916,883
Segment profi t from continuing operations before income tax expense 240,443 173,327 2,122 415,892
Unallocated expenses (including PRESSES) – – (99,309) (99,309)
Net profi t from continuing operations before tax 240,443 173,327 (97,187) 316,583
Income tax expense – – (88,512) (88,512)
Net profi t after income tax expense 240,443 173,327 (185,699) 228,071
30 June 2005 (Restated)Sales to external customers 1,339,225 515,884 – 1,855,109
Total sales revenue 1,339,225 515,884 – 1,855,109
Share of net profi ts of associates and joint ventures 2,792 115 – 2,907
Other revenues 9,350 11,439 4,349 25,138
Total segment revenue 1,351,367 527,438 4,349 1,883,154
Segment profi t from continuing operations before income tax expense 260,668 170,648 4,349 435,665
Unallocated expenses – – (80,974) (80,974)
Net profi t from continuing operations before tax 260,668 170,648 (76,625) 354,691
Income tax expense – – (90,808) (90,808)
Net profi t after income tax expense 260,668 170,648 (167,433) 263,883

Notes to the Financial StatementsJohn Fairfax Holdings Limited and Controlled Entities
For the year ended 30 June 2006
Fairfax Annual Report 2006 115
(B) ASSETS AND LIABILITIES BY GEOGRAPHIC SEGMENT
30 June 2006 Consolidated Australia New Zealand entity
$’000 $’000 $’000
Assets
Segment assets 2,367,903 1,641,038 4,008,941
Unallocated assets – – 78,253
Total assets 4,087,194
Liabilities
Segment liabilities 287,318 65,845 353,163
Unallocated liabilities – – 1,597,222
Total liabilities 1,950,385
Net assets 2,136,809
30 June 2005 (Restated)
Assets
Segment assets 2,355,134 1,181,950 3,537,084
Unallocated assets – – 55,699
Total assets 3,592,783
Liabilities
Segment liabilities 242,811 62,299 305,110
Unallocated liabilities – – 1,118,962
Total liabilities 1,424,072
Net assets 2,168,711
(C) OTHER DETAILED SEGMENT DISCLOSURES
2006 2006 2005 2005 Australia New Zealand Australia New Zealand
$’000 $’000 $’000 $’000
Equity method investments included in segment assets 14,399 8,953 1,953 1,708
Acquisition of property, plant and equipment, intangible
assets and other non-current assets 129,787 48,987 625,893 21,822
Depreciation 54,249 68,805 8,619 9,997
Amortisation 15,579 3,640 1,328 –
Non-cash expenses other than depreciation and amortisation 45,162 47,077 10,795 5,112

Notes to the Financial StatementsJohn Fairfax Holdings Limited and Controlled EntitiesFor the year ended 30 June 2006
116 Fairfax Annual Report 2006
38. Events subsequent to balance sheet date
CONVERSION OF PRESSES
Refer to note 21(c) for further details.
The fi nancial effects of the above transactions have not been brought to account in the fi nancial statements for the year ended 30 June
2006, no other events have occurred since balance date.
ACQUISITION OF ENTITIES
Since the end of the fi nancial year, the consolidated entity also gained control over the following entities in two separate transactions:
Entity or business acquired Principal activity Date of Acquisition Ownership Interest
The Border Morning Mail Limited Newspaper Publishing 25 July 2006 100%
Border Mail Printing Pty Limited Printing facility 25 July 2006 75.5%
Melbourne Community Newspapers Pty Ltd Newspaper Publishing 25 July 2006 100%
The Independent News Pty Limited Newspaper Publishing 25 July 2006 100%
Consideration paid for the acquisition of Border Morning Mail Limited, including 51% of Border Mail Printing Pty Limited, consisted
of $135 million in cash and 4,858,517 ordinary shares at a price of $4.10 per share pursuant to the Scheme of Arrangement, for a net
consideration of $155 million.
The Independent News Pty Limited, including 24.5% of Border Mail Printing Pty Limited held by Melbourne Community Newspapers
Pty Limited, were acquired for a total cash consideration of $15.1 million.
Due to the short timeframe between the completion of the acquisition and date of this report, additional disclosures are considered
impractical by management.
RELOCATION OF SYDNEY HEADQUARTERS TO ONE DARLING ISLAND AND SALE OF SPENCER STREET PREMISES
On 7 September 2006, the Company entered into a lease agreement to relocate the headquarters from Darling Park to One Darling
Island, Pyrmont by the middle of 2007. The Company has also decided to sell the Spencer Street building in Melbourne.
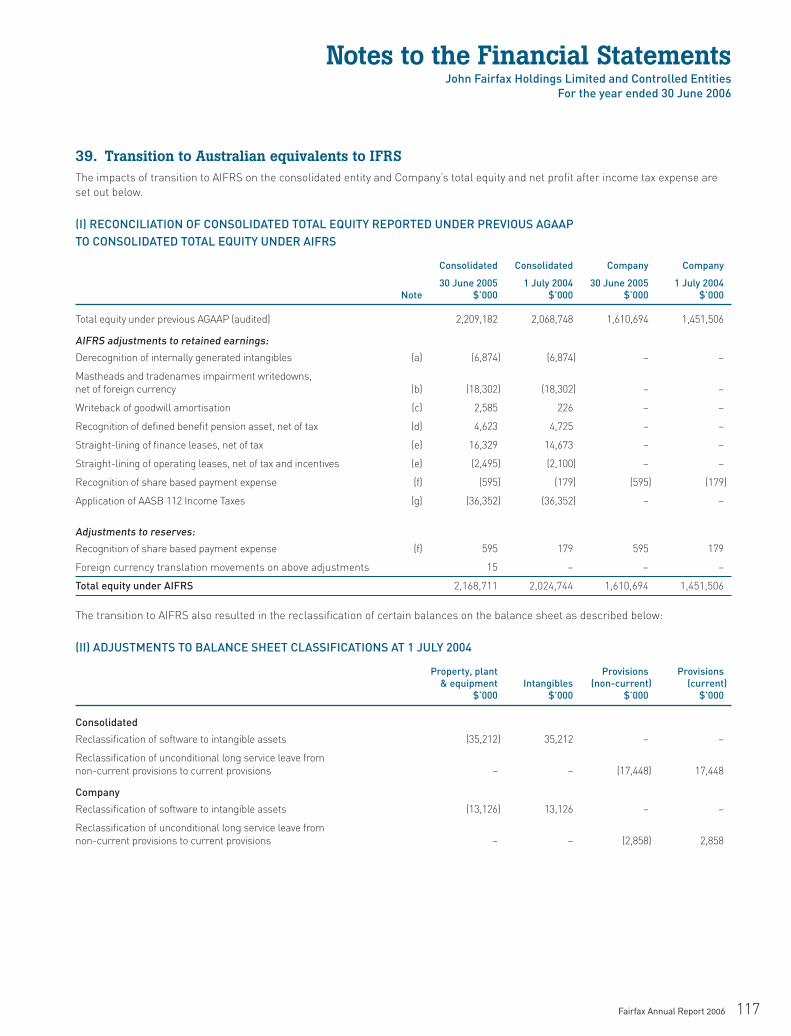
Notes to the Financial StatementsJohn Fairfax Holdings Limited and Controlled Entities
For the year ended 30 June 2006
Fairfax Annual Report 2006 117
39. Transition to Australian equivalents to IFRSThe impacts of transition to AIFRS on the consolidated entity and Company’s total equity and net profi t after income tax expense are
set out below.
(I) RECONCILIATION OF CONSOLIDATED TOTAL EQUITY REPORTED UNDER PREVIOUS AGAAP TO CONSOLIDATED TOTAL EQUITY UNDER AIFRS
Consolidated Consolidated Company Company
30 June 2005 1 July 2004 30 June 2005 1 July 2004 Note $’000 $’000 $’000 $’000
Total equity under previous AGAAP (audited) 2,209,182 2,068,748 1,610,694 1,451,506
AIFRS adjustments to retained earnings:
Derecognition of internally generated intangibles (a) (6,874) (6,874) – –
Mastheads and tradenames impairment writedowns,
net of foreign currency (b) (18,302) (18,302) – –
Writeback of goodwill amortisation (c) 2,585 226 – –
Recognition of defi ned benefi t pension asset, net of tax (d) 4,623 4,725 – –
Straight-lining of fi nance leases, net of tax (e) 16,329 14,673 – –
Straight-lining of operating leases, net of tax and incentives (e) (2,495) (2,100) – –
Recognition of share based payment expense (f) (595) (179) (595) (179)
Application of AASB 112 Income Taxes (g) (36,352) (36,352) – –
Adjustments to reserves:
Recognition of share based payment expense (f) 595 179 595 179
Foreign currency translation movements on above adjustments 15 – – –
Total equity under AIFRS 2,168,711 2,024,744 1,610,694 1,451,506
The transition to AIFRS also resulted in the reclassifi cation of certain balances on the balance sheet as described below:
(II) ADJUSTMENTS TO BALANCE SHEET CLASSIFICATIONS AT 1 JULY 2004
Property, plant Provisions Provisions & equipment Intangibles (non-current) (current) $’000 $’000 $’000 $’000
Consolidated
Reclassifi cation of software to intangible assets (35,212) 35,212 – –
Reclassifi cation of unconditional long service leave from
non-current provisions to current provisions – – (17,448) 17,448
Company
Reclassifi cation of software to intangible assets (13,126) 13,126 – –
Reclassifi cation of unconditional long service leave from
non-current provisions to current provisions – – (2,858) 2,858

Notes to the Financial StatementsJohn Fairfax Holdings Limited and Controlled EntitiesFor the year ended 30 June 2006
118 Fairfax Annual Report 2006
(III) RECONCILIATION OF CONSOLIDATED NET PROFIT UNDER PREVIOUS AGAAP TO CONSOLIDATED NET PROFIT UNDER AIFRS
Consolidated Company
30 June 2005 30 June 2005 Note $’000 $’000
Net profi t from continuing operations after income tax expense under previous AGAAP (audited) 260,321 278,757
AIFRS adjustments to retained earnings:
Write back of goodwill amortisation (c) 2,358 –
Straight-lining of leases (e) 1,806 –
Straight-lining of operating leases, net of incentives (e) (395) –
Expense of share based payments (f) (416) (416)
Movement in defi ned benefi t plan asset (d) 282 –
Other (73) –
Net profi t under AIFRS 263,883 278,341
Reconciliation of cashfl ow statementThe transition to AIFRS has not resulted in any material adjustments between the cashfl ow statement presented under AIFRS and
previous AGAAP.
NOTES TO THE ABOVE RECONCILIATIONS
(a) De-recognition of internally generated intangible assets
Under previous AGAAP, recognition of internally generated intangible assets on balance sheet was permitted whereas under AIFRS,
internally generated intangible assets must meet strict criteria in order to be recognised.
At the date of transition and in accordance with AASB 138 Intangible Assets, certain mastheads and trade names have been
derecognised. The effect of this is a decrease in intangibles by $6.9m and corresponding decrease in retained earnings at 1 July 2004.
(b) Impairment of non-fi nancial assets
Under AIFRS, the recoverable amount of a non-fi nancial asset is determined as the higher of its net selling price and value in use.
Following an assessment of the recoverable amount of the consolidated entity’s individual mastheads in accordance with AASB 136
Impairment of Assets compared with the impairment testing for groups of assets basis used previously, an impairment write-down
adjustment is required. The effect of this is a decrease in intangible assets by $18.3 million and corresponding decrease in retained
earnings at 1 July 2004.
(c) Goodwill
Under previous AGAAP, goodwill was amortised over a maximum of 20 years. Under AIFRS, goodwill is no longer amortised but
instead is tested for impairment annually to ensure that the carrying amount is not greater than the recoverable amount. As a result,
accumulated goodwill amortisation is written back to goodwill.
During the year ended 30 June 2005, additional goodwill was amortised under previous AGAAP. Accordingly, intangible assets
increased by $2.6 million representing the write-back of accumulated goodwill amortisation and there was a corresponding decrease
in amortisation expense for the year ended 30 June 2005.
(d) Defi ned benefi t plan pension asset
The company and certain controlled entities currently sponsor defi ned benefi t superannuation plans in Australia and New Zealand.
Under previous AGAAP, surpluses and/or defi cits on the defi ned benefi t superannuation plans were not recognised on the balance
sheet and contributions to the plans were recognised as an expense when due and payable. Under AASB 119 Employee Benefits, a
pension asset (surplus) or liability (defi cit) is recognised on the balance sheet and any actuarial gains or losses in the movement of the
asset or liability is recognised in retained earnings, as elected by the Company in accordance with AASB 1.
39. Transition to Australian equivalents to IFRS (continued)

Notes to the Financial StatementsJohn Fairfax Holdings Limited and Controlled Entities
For the year ended 30 June 2006
Fairfax Annual Report 2006 119
The effect of this is the recognition of a new defi ned benefi t plan pension asset on the balance sheet at 1 July 2004 for $6.9 million,
which represents the cumulative actuarial gains existing at transition date, an increase in retained earnings of $4.7 million and
increase in deferred tax liabilities of $2.2 million.
At 30 June 2005, an actuarial loss on the defi ned benefi t plans resulted in a net decrease in the defi ned benefi t pension asset by
$0.1 million and a decrease in retained earnings of $0.4 million. The decrease in the asset was offset by a net increase (including
foreign exchange translation loss for the New Zealand pension asset) to refl ect the write back of the net contributions and service
costs based on actuarial valuations for the period to 30 June 2005. The tax-effect of this adjustment decreased deferred tax liabilities
and increased income tax expense for the year to 30 June 2005.
(e) Leases
(i) Finance lease liabilityUnder previous AGAAP, the minimum lease payments of a fi nance lease were determined using an implicit interest rate, whereas
under AIFRS, a constant periodic interest rate must be applied.
The effect in the consolidated entity is:
a decrease in the lease liability by $14.6 million and corresponding increase in retained earnings at 1 July 2004. Due to the nature
of the fi nance lease, deferred tax assets have immaterially increased.
a decrease in the lease liability by $1.7 million and increase in deferred tax assets at 30 June 2005. Interest expense for the year
ended 30 June 2005 decreased by $1.7 million.
(ii) Operating leasesUnder previous AGAAP, lease payments were recognised in the income statement on an accruals basis refl ecting the payment terms
of the underlying lease. Under AIFRS, lease payments under leases which contain fi xed increases are recognised on a straight line
basis over the lease term. Lease incentives are also required to be amortised over the lease term.
The effect in the consolidated entity is:
an increase in deferred lease liability, net of tax of $2.1 million for lease incentives at 1 July 2004: and
an increase in the deferred lease liability, net of tax and incentives of $0.4 million and corresponding increase in lease expense at
30 June 2005.
(f) Shared based payments
Under previous AGAAP the Group did not account for performance options or shares issued to employees or directors of the Group.
Under AIFRS, the consolidated entity is required to recognise an expense for all share based remuneration, including shares or
options issued to employees or directors after 7 November 2002 which had not vested by 1 January 2005. The Company has elected
not to apply AASB 2 Share Based Payments to its share based payment arrangements granted before 7 November 2002 in accordance
with AASB 1.
The effect in the consolidated entity and Company of accounting for share based payment transactions is:
a decrease in retained earnings of $0.2 million and corresponding increase in the share options reserves at 1 July 2004; and
an increase in the share options reserve of $0.4 million, a corresponding decrease in retained earnings and increase in the
employee benefi ts expense by $0.4 million for the year ended 30 June 2005.
(g) Deferred tax
The adoption of AIFRS has resulted in a change in accounting policy. Under previous AGAAP, income tax expense was calculated
by reference to the accounting profi t after allowing for permanent balances (‘the income statement approach’). Deferred tax was
not recognised in relation to amounts recognised directly in equity. The application of AASB 112 Income Taxes has resulted in the
recognition of additional deferred tax assets of $0.8 million and deferred tax liabilities of $37.1 million and a decrease to retained
earnings of $36.3 million at 1 July 2004.
•
•
•
•
•
•
39. Transition to Australian equivalents to IFRS (continued)

120 Fairfax Annual Report 2006
(h) Software classifi ed as intangible assets
Under previous AGAAP, capitalised software and software developments costs were included in, and accounted for, as property,
plant and equipment. At the date of transition, capitalised software and software development costs were reclassifi ed in the balance
sheet as intangible assets in accordance with AASB 138 Intangible Assets. The effect of this in the consolidated entity was to reduce
property, plant and equipment by:
$35.2 million and increase intangible assets by $35.2 million at 1 July 2004; and
$6.7 million and increase intangible assets by $6.7 million at 30 June 2005.
The effect of this change in the Company was to reduce property, plant and equipment by $13.1 million and increase intangible assets
by $13.1 million at 1 July 2004.
There was no effect on total or net assets and in all other respects, the accounting for the asset remains unchanged.
(i) Long service leave classifi ed as current employee benefi ts provision
Under previous AGAAP, long service leave was classifi ed according to when the benefi ts were expected to be paid. Under AIFRS, the
portion of long service leave which the Company does not have an unconditional right to defer settlement on has been reclassifi ed as
a current provision. The effect of this change in the consolidated entity has been to increase current provisions by $17.4 million and
decrease non-current provisions by $17.4 million.
The effect of this change in the Company has been to increase current provisions by $2.8 million and decrease non-current provisions
by $2.8 million.
(IV) ADOPTION OF AASB 132 AND AASB 139 ON 1 JULY 2005
John Fairfax Holdings Limited has taken the exemption available under AASB 1 First Time Adoption of Australian International
Financial Reporting Standards to apply AASB 132 Financial Instruments: Disclosure and Presentation and AASB 139 Financial
Instruments: Recognition and Measurement from 1 July 2005. The adoption by the Group of AASB 132 and AASB 139 on 1 July 2005
had the following effects:
Consolidated Company
1 July 2005 1 July 2005 Note $’000 $’000
Total equity under AIFRS (excluding AASB 132 and AASB 139) 2,168,711 1,610,694
AIFRS adjustments to retained earnings:
Fair value of derivative assets and liabilities (a) (13,334) –
Fair value movement of hedged fi nancial liabilities (c) 26,184 –
Amortisation of transaction costs on PRESSES (b) (8,615) (8,615)
Tax-effect of AASB 139 adjustments above (4,815) –
AIFRS adjustments to cashfl ow hedge reserve:
Fair value of derivatives, net of tax (a) (648) –
AIFRS adjustments to foreign currency translation reserve:
Fair value of derivatives, net of tax (a) (3,059) –
AIFRS adjustments to contributed equity:
Reclassifi cation of PRESSES from equity to debt (b), 21(c) (241,951) (241,951)
Reallocation of share issue costs relating to PRESSES from equity to debt (b), 21(c) 1,365 1,365
Total equity under AIFRS 1,923,838 1,361,493
The transition to AIFRS also resulted in the reclassifi cation of certain balances on the balance sheet as described on the next page:
•
•
39. Transition to Australian equivalents to IFRS (continued)
Notes to the Financial StatementsJohn Fairfax Holdings Limited and Controlled EntitiesFor the year ended 30 June 2006

Notes to the Financial StatementsJohn Fairfax Holdings Limited and Controlled Entities
For the year ended 30 June 2006
Fairfax Annual Report 2006 121
(V) ADJUSTMENTS TO BALANCE SHEET CLASSIFICATIONS AT 1 JULY 2005
Interest Contributed Bearing equity Liabilities $’000 $’000
Reclassifi cation of PRESSES from equity to debt (241,951) 241,951
Reallocation of share issue costs relating to PRESSES from equity to debt 1,365 (1,365)
The above classifi cation adjustment applies equally to both the consolidated entity and Company.
NOTES TO THE ABOVE RECONCILIATIONS
(A) DERIVATIVES AND HEDGING
Under previous AGAAP, derivatives were not recorded on the balance sheet and unrealised gains or losses from re-measurement of
derivatives used to hedge foreign exchange or interest rate exposures were excluded from the income statement but disclosed in the
notes to the fi nancial statements. In accordance with AASB 139 Financial Instruments: Recognition and Measurement, derivatives are
now recognised on balance sheet at fair value and derivatives held for hedging purposes are accounted for as fair value or cash fl ow
hedges with changes in the fair value recognised directly in the income statement or equity respectively until the hedged transaction
occurs.
The effect of this is to increase derivative assets and derivative liabilities by $20.0 million and $37.7 million respectively at 1 July 2005
with a corresponding decrease in retained earnings of $13.3 million, cashfl ow hedge reserve of $0.7 million and foreign currency
translation reserve of $3.1 million, net of tax. The adjustment is net of previously recognised hedge receivables and payables under
AGAAP, which amounted to $3.7 million at 30 June 2005.
(B) RECLASSIFICATION OF PRESSES
Under AGAAP, PRESSES were classifi ed in the balance sheet as an equity instrument. Under AASB 132 Financial Instruments:
Presentation and Disclosure, PRESSES were reclassifi ed from equity to debt. $1.3 million of transaction costs relating to PRESSES
were reallocated at the time of reclassifi cation of the PRESSES to debt (refer note 21(c)). The effect of this was a net decrease from
contributed equity by $240.6 million and a corresponding increase in non-current interest bearing liabilities.
Under AASB 139, the PRESSES are measured at amortised cost and transaction costs totalling $9.4 million are amortised over 5
years. At 1 July 2005, $8.6 million of transaction costs were amortised and the effect of this was to increase the PRESSES in non-
current interest bearing liabilities of $8.6 million and decrease retained earnings. As such at 1 July 2005, PRESSES (inclusive of
amortised transactions costs) were carried at $249.2 million.
As a result of the PRESSES conversion on 27 July 2006 (refer to Note 21(c)), the PRESSES have been reclassifi ed from non-current
interest bearing liabilities to current interest bearing liabilities at 1 July 2005.
(C) INTEREST BEARING LIABILITIES – US DEBT NOTES AND REDEEMABLE PREFERENCE SHARES
Under AGAAP, notes and redeemable preference shares (RPS) were recognised at cost and transaction costs capitalised and
amortised over the life of those liabilities. Under AASB 139, interest bearing liabilities are recognised at amortised cost and fair valued
to the extent the liability is hedged.
The effect of this is a $26.2 million decrease in non-current interest bearing liabilities and increase in retained earnings at 1 July 2005
for the fair value changes in the hedged component of the US debt notes and RPS.
39. Transition to Australian equivalents to IFRS (continued)

122 Fairfax Annual Report 2006
In accordance with a resolution of the directors of John Fairfax Holdings Limited, we state that:
1. In the opinion of the directors:
(a) the fi nancial report and the additional disclosures included in the Directors’ Report designated as audited, of the Company
and of the consolidated entity are in accordance with the Corporations Act 2001, including:
(i) giving a true and fair view of the Company’s and consolidated entity’s fi nancial position as at 30 June 2006 and of
their performance for the year ended on the date; and
(ii) complying with Accounting Standards and Corporations Regulations 2001; and
(b) there are reasonable grounds to believe that the Company will be able to pay its debts as and when they become due and
payable.
2. This declaration has been made after receiving the declarations required to be made to the directors in accordance with section
295A of the Corporations Act 2001 for the fi nancial period ended 30 June 2006.
3. In the opinion of the directors, as at the date of this declaration, there are reasonable grounds to believe that the members of the
closed group identifi ed in Note 28 will be able to meet any obligations or liabilities to which they are or may become subject to, by
virtue of the Deed of Cross Guarantee.
On behalf of the Board
Mark BurrowsChairman, Audit and Risk Committee
David KirkChief Executive Offi cer and Director
Sydney26 September 2006
Directors’ Declaration

Fairfax Annual Report 2006 123
Scope
THE FINANCIAL REPORT, REMUNERATION DISCLOSURES AND DIRECTORS’ RESPONSIBILITY
The fi nancial report comprises the balance sheet, income statement, statement of changes in equity, cash fl ow statement,
accompanying notes to the fi nancial statements, and the directors’ declaration for John Fairfax Holdings Limited (the company) and
the consolidated entity, for the year ended 30 June 2006. The consolidated entity comprises both the company and the entities it
controlled during that year.
The company has disclosed information as required by paragraphs Aus 25.4 to Aus 25.7.2 of Accounting Standard AASB 124 Related
Party Disclosures (“remuneration disclosures”), under the heading “Remuneration Report” in the directors’ report, as permitted by
Corporations Regulation 2M.6.04 .
The directors of the company are responsible for preparing a fi nancial report that gives a true and fair view of the fi nancial position
and performance of the company and the consolidated entity, and that complies with Accounting Standards in Australia, in accordance
with the Corporations Act 2001. This includes responsibility for the maintenance of adequate accounting records and internal controls
that are designed to prevent and detect fraud and error, and for the accounting policies and accounting estimates inherent in the
fi nancial report. The directors are also responsible for the remuneration disclosures contained in the directors’ report.
AUDIT APPROACH
We conducted an independent audit of the fi nancial report in order to express an opinion to the members of the company. Our audit
was conducted in accordance with Australian Auditing Standards in order to provide reasonable assurance as to whether the fi nancial
report is free of material misstatement and the remuneration disclosures comply with Accounting Standard AASB 124 Related Party
Disclosures. The nature of an audit is infl uenced by factors such as the use of professional judgement, selective testing, the inherent
limitations of internal control, and the availability of persuasive rather than conclusive evidence. Therefore, an audit cannot guarantee
that all material misstatements have been detected.
We performed procedures to assess whether in all material respects the fi nancial report presents fairly, in accordance with the
Corporations Act 2001, including compliance with Accounting Standards in Australia, and other mandatory fi nancial reporting
requirements in Australia, a view which is consistent with our understanding of the company’s and the consolidated entity’s fi nancial
position, and of their performance as represented by the results of their operations and cash fl ows and whether the remuneration
disclosures comply with Accounting Standard AASB 124 Related Party Disclosures.
We formed our audit opinion on the basis of these procedures, which included:
examining, on a test basis, information to provide evidence supporting the amounts and disclosures in the fi nancial report and the
remuneration disclosures; and
assessing the appropriateness of the accounting policies and disclosures used and the reasonableness of signifi cant accounting
estimates made by the directors.
While we considered the effectiveness of management’s internal controls over fi nancial reporting when determining the nature and
extent of our procedures, our audit was not designed to provide assurance on internal controls.
We performed procedures to assess whether the substance of business transactions was accurately refl ected in the fi nancial
report and the remuneration disclosures. These and our other procedures did not include consideration or judgement of the
appropriateness or reasonableness of the business plans or strategies adopted by the directors and management of the company.
•
•
Independent audit report to the members of John Fairfax Holdings Limited

124 Fairfax Annual Report 2006
INDEPENDENCE
We are independent of the company and the consolidated entity and have met the independence requirements of Australian
professional ethical pronouncements and the Corporations Act 2001. We have given to the directors of the company a written Auditor’s
Independence Declaration, a copy of which is included in the Directors’ Report. In addition to our audit of the fi nancial report and
the remuneration disclosures, we were engaged to undertake the services disclosed in the notes to the fi nancial statements. The
provision of these services has not impaired our independence.
AUDIT OPINION
In our opinion:
1. the fi nancial report of John Fairfax Holdings Limited is in accordance with:
(a) the Corporations Act 2001, including:
(i) giving a true and fair view of the fi nancial position of John Fairfax Holdings Limited and the consolidated entity at 30 June
2006 and of their performance for the year ended on that date; and
(ii) complying with Accounting Standards in Australia and the Corporations Regulations 2001; and
(b) other mandatory fi nancial reporting requirements in Australia.
2. the remuneration disclosures that are contained in the directors’ report and are identifi ed as being subject to audit, comply with
Accounting Standard AASB 124 Related Party Disclosures.
Ernst & Young
D J SimmondsPartner
Sydney26 September 2006
Independent audit report to the members of John Fairfax Holdings Limited

Fairfax Annual Report 2006 125
TWENTY LARGEST HOLDERS OF SECURITIES AT 31 AUGUST 2006
Number of securities %
ORDINARY SHARES (FXJ)
National Nominees Limited 178,806,499 17.70
JP Morgan Nominees Australia Ltd 153,013,719 15.15
Westpac Custodian Nominees Ltd 126,887,579 12.56
RBC Dexia Investor Services Australia Nominees Pty Ltd 85,110,760 8.42
Citicorp Nominees Pty Ltd 75,757,029 7.50
Cogent Nominees Pty Ltd 38,589,586 3.82
ANZ Nominees Ltd 25,947,828 2.57
UBS Nominees Pty Ltd 22,044,315 2.18
Queensland Investment Corporation 9,243,339 0.91
Australian Reward Investment Alliance 9,155,076 0.91
AMP Life Ltd 8,563,197 0.85
Tasman Asset Management Ltd 7,644,613 0.76
Westpac Financial Services Ltd 6,257,369 0.62
Victorian Workcover Authority 4,706,699 0.47
UBS Wealth Management Australia Nominees Pty Ltd 4,676,414 0.46
Australian Foundation Investment Company Ltd 4,610,308 0.46
Fairfax Employee Share Plans P/L 3,751,772 0.37
Bond Street Custodians Limited 3,468,852 0.34
Cambooya Pty Ltd 3,443,262 0.34
Promina Equities Ltd 3,301,605 0.33
774,979,821 76.72
Shareholder InformationJohn Fairfax Holdings Limited

126 Fairfax Annual Report 2006
TWENTY LARGEST HOLDERS OF SECURITIES AT 31 AUGUST 2006 (CONTINUED)
Number of securities %
STAPLED PREFERENCE SECURITIES (SPS) (FXJPB)
JP Morgan Nominees Australia Ltd 691,650 23.06
ANZ Nominees Ltd 373,250 12.44
Share Direct Nominess Pty Ltd 203,500 6.78
Westpac Custodian Nominees Ltd 161,760 5.39
National Nominees Ltd 150,522 5.02
Goldman Sachs JB Were Pty Ltd 150,000 5.00
Citicorp Nominees Pty Ltd 143,570 4.79
MLEQ Nominees Pty Ltd 125,000 4.17
RBC Dexia Investor Services Australia Nominees Pty Ltd 123,000 4.10
Invia Custodian Pty Ltd 99,341 3.31
Elise Nominees Pty Ltd 64,303 2.14
Irrewarra Investments Pty Ltd 61,258 2.04
Questor Financial Services Ltd 56,078 1.87
Kaplan Equity Ltd 51,450 1.72
ANZ Executors & Trustee Company Ltd 40,579 1.35
UBS Nominees Pty Ltd 28,761 0.96
Fortis Clearing Nominees P/L 26,861 0.90
Equity Trustees Ltd 25,000 0.83
OHJ Holdings Pty Ltd 23,500 0.78
Merrill Lynch (Australia) Nominees Pty Ltd 22,409 0.75
2,621,792 87.40
DEBENTURES National Financial Services Corp. 281 100
OPTIONS All options were issued to employees of the Company (or its related entities) and are not listed separately.
SUBSTANTIAL SHAREHOLDERS Substantial shareholders as shown in substantial shareholder notices received by the Company as at 31 August 2006 are:
Ordinary Shares
Maple Brown-Abbott Ltd 104,346,432
UBS Nominees Pty Ltd 87,684,432
Perpetual Limited 93,498,969
Commonwealth Bank of Australia 89,463,693
Lazard Asset Management Pacifi c Co. 59,152,708
National Australia Bank Limited Group 57,915,868
452 Capital Pty Limited 47,689,625
Portfolio Partners Limited 47,144,759
Perennial Value Management Limited 47,596,409
Shareholder InformationJohn Fairfax Holdings Limited

Fairfax Annual Report 2006 127
DISTRIBUTION SCHEDULE OF HOLDINGS AT 31 AUGUST 2006
No. of No. of No. of No. of ordinary SPS debenture optionNo. of securities shareholders holders holders holders
1 – 1,000 8,494 460 1 –
1,001 – 5,000 22,039 65 – –
5,001 – 10,000 6,087 12 – –
10,001 – 100,000 3,496 19 – –
100,001 and over 185 8 – –
Total number of holders 40,301 564 1 –
Number of holders holding less than a marketable parcel 730 – – –
VOTING RIGHTS
Voting rights of shareholders are governed by Articles 5.8 and 5.9 of the Company’s Articles of Association which provide that every
member present personally or by proxy, attorney or representative shall on a show of hands have one vote and on a poll, shall have
one vote for every share held. Debentures and options do not carry any voting rights.
Shareholder InformationJohn Fairfax Holdings Limited

128 Fairfax Annual Report 2006
AIFRS AIFRS Restated AGAAP AGAAP AGAAP 2006 2005 2004 2003 2002
Total revenue $m 1,909.9 1,880.2 1,783.0 1,226.0 1,197.8
Revenue from operations $m 1,907.8 1,873.4 1,767.7 1,208.9 1,174.8
Earnings before depreciation, interest and tax (EBITDA) $m 495.7 515.7 433.0 270.5 188.6
Depreciation $m 79.8 80.1 85.3 69.2 67.1
Earning before interest and tax $m 415.9 435.6 347.7 201.3 121.6
Net interest expense $m 97.1 76.6 71.9 23.5 29.7
Profi t before tax $m 316.6 354.7 275.8 177.8 91.8
Income tax (benefi t) / expense $m 88.5 90.8 (1.0) 52.0 38.2
Net profi t attributable to members of the Company $m 227.5 263.2 276.0 125.5 53.7
Net profi t before signifi cant items $m 234.3 237.6 207.6 125.5 90.2
Total equity $m 2,136.8 2,168.7 2,068.7 1,781.8 1,344.5
Total assets $m 4,087.1 3,592.8 3,531.2 3,426.2 2,314.7
Total borrowings $m 1,507.9 1,048.4 1,117.6 1,219.8 593.4
Number of shares and debentures m 939.1 924.5 906.9 867.5 735.1
Number of shareholders 40,301 38,089 37,899 45,455 44,731
Number of PRESSES holders – 5,835 5,984 6,285 6,201
Number of SPS holders 564 – – – –
EBITDA to operating revenue % 26.0 27.5 24.5 22.4 16.1
Basic earnings per share cents 24.4 26.6 29.1 14.4 6.2
Basic earnings per share before signifi cant items cents 24.5 25.8 21.4 14.4 11.2
Operating cash fl ow per share cents 30.7 37.2 24.1 29.3 18.5
Dividend per share cents 19.5 23.5 16.5 13.0 11.5
Dividend payout ratio % 79.9 88.3 56.7 90.3 185.5
Interest cover based on EBITDA before
signifi cant items Times 5.1 6.5 6.3 11.5 7.8
Gearing % 70.6 42.2 52.7 67.4 43.6
Return on equity % 11.0 11.0 13.3 7.0 4.0
Five year performance summaryJohn Fairfax Holdings Limited and Controlled Entities

Fairfax Annual Report 2006 129
ANNUAL GENERAL MEETINGThe annual general meeting will be held at 10.30am on Friday, 10 November 2006 at the Crown Towers, Southbank, Melbourne.
FINANCIAL CALENDAR
For Financial Year 2005-2006
Books close for fi nal dividends 10 September 2006
Final dividend mailed 6 October 2006
Stapled Preference Share dividend 31 October 2006
Annual General Meeting 10 November 2006
Estimated for Financial Year 2006-2007
Interim result and dividend announcement February 2007
Books close for interim dividend April 2007
Interim dividend mailed April 2007
Stapled preference share dividend April 2007
Preliminary fi nal result and dividend announcement August 2007
Final dividend mailed October 2007
Stapled preference share dividend October 2007
Annual general meeting November 2007
COMPANY SECRETARY
Gail Hambly
REGISTERED OFFICE
Level 19
Darling Park
201 Sussex Street
Sydney NSW 2000
Ph: 1300 888 062 (toll free within Australia)
Ph: (02) 9282 3046
Ph: (02) 92823065
SHARE REGISTRY
LINK Market Services Limited
Level 12
680 George Street
Sydney NSW 2000
Ph: 1300 888 062 (toll free within Australia)
Ph: (02) 8280 7670
Fax: (02) 9287 0303
Email: [email protected]
Website: www.linkmarketservices.com.au
DirectoryJohn Fairfax Holdings Limited

130 Fairfax Annual Report 2006
STOCK EXCHANGE LISTING
The Company’s ordinary shares are listed on the Australian Stock Exchange Limited – “FXJ”. The Stapled Preference Securities
(Fairfax SPS) are listed on the Australian Stock Exchange Limited – “FXJPB”.
The NZ redeemable preference shares are listed on the New Zealand Debt Exchange – “FXFFA”.
WEBSITE
Corporate information and the Fairfax Annual Report can be found via the Company’s website at www.fxj.com.au. The Company’s
family of websites can also be accessed through www.fairfax.com.au.
IMPORTANT INFORMATION ABOUT THE FAIRFAX ANNUAL REPORT
To obtain a free copy of this report, contact Link Market Services – see contact details on opposite page.
REMOVAL FROM ANNUAL REPORT MAILING LIST
Shareholders who do not wish to receive a copy of the annual report should advise Link Market Services Limited in writing, fax or
email to the address, fax or email address set out on the opposite page.
CONSOLIDATION OF SHAREHOLDINGS
Shareholders who wish to consolidate their separate shareholdings into one account should advise the Share Registry in writing.
DIRECT PAYMENT TO SHAREHOLDERS’ ACCOUNTS
We encourage shareholders to have their dividends paid directly into their bank accounts in Australia. A Direct Credit form can be
downloaded from the Fairfax website:
www.fxj.com.au or obtained from the Share Registry.
To download a Direct Credit form from www.fxj.com.au please click on Shareholders Information Services and follow the prompts.
Payments are electronically credited on the dividend date and confi rmed by a mailed payment advice. Shareholders are advised to
notify the Share Registry (although it is not obligatory) of their tax fi le number so that dividends can be paid without tax being withheld.
DirectoryJohn Fairfax Holdings Limited

www.fxj.com.au