2002 - AnnualReports.com
176
2002 Annual Report Inter-American Development Bank Annual Report 2002
-
Upload
khangminh22 -
Category
Documents
-
view
2 -
download
0
Transcript of 2002 - AnnualReports.com
INTER-AMERICAN DEVELOPMENT BANK1300 New York Avenue, N.W.
Washington, D.C. 20577
Tel. (202) 623-1000 Fax (202) 623-3096
www.iadb.org
ISSN 0074-087X
INT
ER
-AM
ER
ICA
N D
EV
EL
OP
ME
NT
BA
NK 2002
Annual ReportInter-American Development Bank
An
nu
al Re
po
rt 2002

The Inter-American Development Bank, the oldest and
largest regional multilateral development institution,
was established in 1959 to help accelerate economic
and social development in Latin America and the
Caribbean.
Efforts to create a development institution to
focus on pressing problems in the region date to the
First Inter-American Conference in 1890. A specific
proposal toward that end by President Juscelino
Kubitschek of Brazil in 1958 received support through-
out the hemisphere. Shortly thereafter, the Organi-
zation of American States drafted the Articles of
Agreement establishing the Inter-American
Development Bank.
Today, the Bank’s membership totals 46 nations,
including 26 Latin American and Caribbean countries,
the United States, Canada, and 18 nonregional
countries.
The Bank has become a major catalyst in mobi-
lizing resources for the region. Its principal functions
are to utilize its own capital, funds raised in financial
markets, and other available resources to finance the
development of its borrowing member countries; to
supplement private investment when private capital is
not available on reasonable terms and conditions; and
to provide technical assistance for the preparation,
financing and implementation of development
projects.
In carrying out its mission, the Bank has
approved $118 billion for projects that represent a
total investment of $282 billion.
The Bank’s operations cover the entire spec-
trum of economic and social development, with an
emphasis on programs that benefit low-income popu-
lations. In the past, Bank lending focused on the pro-
ductive sectors of agriculture and industry, the physi-
cal infrastructure sectors of energy and transportation,
and the social sectors of environmental and public
health, education and urban development. In 1995, the
IDB began lending up to 5 percent of its ordinary capi-
tal resources directly to the private sector, without
government guarantees. Current lending priorities
include poverty reduction and social equity, modern-
ization of the State, competitiveness, and integration.
The IDB group also includes the Inter-American
Investment Corporation (IIC), an autonomous affiliate
that promotes economic development by financing
small and medium-scale private enterprises, and the
Multilateral Investment Fund (MIF), which supports
investment reforms and private sector development.
The financial resources of the Bank consist of
the ordinary capital account—comprised of subscribed
capital, reserves and funds raised through borrow-
ings—and Funds in Administration, comprised of con-
tributions made by member countries. The Bank also
has a Fund for Special Operations for lending on con-
cessional terms in countries classified as economically
less developed.
Member country subscriptions to the Bank's
ordinary capital consist of both paid-in and callable
capital. Paid-in capital in the form of cash or notes
represents 4.3 percent of total subscriptions. The
major part of member subscriptions is for callable cap-
ital, which may be drawn only to service the Bank's
borrowings and guarantees.
The Bank has borrowed funds for its operations
from the capital markets of Europe, Japan, Latin
America, the Caribbean and the United States. The
Bank’s debt is AAA rated by the three major rating
services in the United States, and is accorded equiva-
lent status in the other major capital markets.
The Bank’s highest authority is the Board of
Governors, on which each member country is repre-
sented. Governors are usually Ministers of Finance,
Presidents of Central Banks or officers of comparable
rank. The Board of Governors has delegated many of
its operational powers to the Board of Executive
Directors, which is responsible for the conduct of the
Bank’s operations.
The Bank, whose headquarters are in
Washington, D.C., has Country Offices in each of its
borrowing member countries and in Paris and Tokyo.
THE INTER-AMERICAN DEVELOPMENT BANK COUNTRY OFFICES AND REPRESENTATIVES
ARGENTINA, Jorge ElenaCalle Esmeralda 130, pisos 19 y 20(Casilla de correo N 181, Sucursal 1)Buenos Aires Tel: 4320-1800
BAHAMAS, Frank J. MarescaIDB House, East Bay Street(P.O. Box N-3743)Nassau Tel: 393-7159
BARBADOS, Jeremy S. GouldMaple Manor, Hastings(P.O. Box 402)Christ Church Tel: 427-3612
BELIZE, Hugo Souza1024 Newtown Barracks101 1st FloorMarina Towers Building(P.O. Box 1853)Belize City Tel: 223-3900
BOLIVIA, Carlos MeloEdificio “BISA”, 5 pisoAvda. 16 de Julio, N 1628(Casilla N 5872)La Paz Tel: 235-1221
BRAZIL, Waldemar F. WirsigSetor de Embaixadas NorteQuadra 802 Conjunto FLote 39 - Asa Norte70.800-400 Brasília, D.F. Tel: 317-4200
CHILE, Julio AngelAvda. Pedro de Valdivia 0193, 11 piso(Casilla N 16611)Correo 9 (Providencia)Santiago Tel: 431-3700
COLOMBIA, Fernando CossioCarrera 7a N 71-21Torre B, 19 pisoEdificio BancafeBogotá Tel: 325-7000
COSTA RICA, Bertus J. MeinsEdificio Centro Colón, piso 12Paseo Colón, entre calles 38 y 40San José Tel: 233-3244
DOMINICAN REPUBLIC Moisés A. PinedaAvda. Winston Churchill esquinacalle Luis F. Thomen, Torre BHD(Apartado postal N 1386)Santo Domingo Tel: 562-6400
ECUADOR, Dora P. CurreaAvda. 12 de Octubre 1830 y CorderoEd. World Trade Center - Torre II, piso 9(Apartado postal N 17-07-9041)Quito Tel: 256-3453
EL SALVADOR, Luis VergaraEdificio World Trade Center, 4 piso89 Avda. Norte y Calle El MiradorColonia EscalónSan Salvador Tel: 233-8900
GUATEMALA, Carlos BarberyEdificio Géminis 1012 Calle 1-25, Zona 10, Nivel 19(Apartado postal N 935)Guatemala Tel: 335-2650
GUYANA, Sergio Varas-Olea47 High Street, Kingston(P.O. Box 10867)Georgetown Tel: 225-7950
HAITI, Gerard S. JohnsonBanque interaméricaine de
développementBourdon 389(Boîte postale 1321)Port-au-Prince Tel: 45-5711
HONDURAS, Helge SembBoulevard MorazánEdificio Los Castaños, 5 y 6 pisosColonia Los Castaños(Apartado postal N 3180)Tegucigalpa Tel: 232-4838
JAMAICA, Keith Evans40-46 Knutsford Blvd., 6th floor(P.O. Box 429)Kingston 10 Tel: 926-2342
JAPAN, Toshio KobayashiFukoku Seimei Bldg. 16F2-2-2 Uchisaiwaicho, Chiyoda-kuTokyo 100 Tel: 3591-0461
MEXICO, David B. AtkinsonAvda. Horacio N 18556 piso (Esquina Periférico)Los Morales-Polanco11510 México, D.F. Tel: 5580-2122
NICARAGUA, Eduardo BalcarcelEdificio BIDKm. 4-1/2 Carretera a Masaya(Apartado postal 2512)Managua Tel: 67-0831
PANAMA, John J. HastingsAvda. Samuel LewisEdificio Banco Unión, piso 14(Apartado postal 7297)Panamá 5 Tel: 263-6944
PARAGUAY, Alvaro CubillosEdificio Aurora I, pisos 2 y 3Calle Caballero esquinaEligio Ayala (Casilla N 1209)Asunción Tel: 49-2061
PERU, Vladimir RadovicPaseo de la República 3245, piso 14(Apartado postal N 270154)San Isidro, Lima 27 Tel: 215-7800
SURINAME, Pablo AdamPeter Bruneslaan 2-4Paramaribo Tel: 46-2903
TRINIDAD AND TOBAGOWilliam Robinson19 St. Clair Avenue(P.O. Box 68)Port of Spain Tel: 622-8367
URUGUAY, Martin StabileAndes 1365, piso 13(Casilla de correo 5029)Sucursal 1Montevideo Tel: 902-0444
VENEZUELA, Román MayorgaEdificio Centro Federal, piso 3Avda. Venezuela, El RosalCaracas 1060 Tel: 951-5533
INSTITUTE FOR THE INTEGRATIONOF LATIN AMERICA AND THE CARIBBEAN
Juan José TacconeCalle Esmeralda 130, pisos 16 y 17(Casilla de correo N 39)Sucursal 1Buenos Aires Tel: 4320-1850
SPECIAL REPRESENTATIVE IN EUROPE
Carlo BinettiBanque interaméricaine de
développement66, Avenue d’Iéna75116 Paris France Tel: 40 69 31 00

i
CONTENTS
INTER-AMERICAN DEVELOPMENT BANK
Latin America and the Caribbean in 2002 . . 1
Part I: THE BANK IN 2002
Key AreasOverview . . . . . . . . . . . . . . . . . . . . . . . 11Board of Governors . . . . . . . . . . . . . . . 16Board of Executive Directors . . . . . . . . 17Poverty Reduction and Social Equity . . 20Sustainable Economic Growth . . . . . . . . 22Modernization of the State . . . . . . . . . . 24Competitiveness . . . . . . . . . . . . . . . . . . . 25Social Sectors . . . . . . . . . . . . . . . . . . . . 27Integration . . . . . . . . . . . . . . . . . . . . . . 31The Environment . . . . . . . . . . . . . . . . . 36Private Sector . . . . . . . . . . . . . . . . . . . . . 37Portfolio Management . . . . . . . . . . . . . . 43Development Effectiveness . . . . . . . . . . . 47
The Year’s LendingSummary . . . . . . . . . . . . . . . . . . . . . . . 51Argentina . . . . . . . . . . . . . . . . . . . . . . . 55Bahamas . . . . . . . . . . . . . . . . . . . . . . . . 55Barbados . . . . . . . . . . . . . . . . . . . . . . . . 56Belize . . . . . . . . . . . . . . . . . . . . . . . . . . 56Bolivia . . . . . . . . . . . . . . . . . . . . . . . . . 57Brazil . . . . . . . . . . . . . . . . . . . . . . . . . . 59Chile . . . . . . . . . . . . . . . . . . . . . . . . . . . 62Colombia . . . . . . . . . . . . . . . . . . . . . . . 63Costa Rica . . . . . . . . . . . . . . . . . . . . . . 65Dominican Republic . . . . . . . . . . . . . . . 65Ecuador . . . . . . . . . . . . . . . . . . . . . . . . 67El Salvador . . . . . . . . . . . . . . . . . . . . . . 68Guatemala . . . . . . . . . . . . . . . . . . . . . . 68Guyana . . . . . . . . . . . . . . . . . . . . . . . . . 70Haiti . . . . . . . . . . . . . . . . . . . . . . . . . . 71
Honduras . . . . . . . . . . . . . . . . . . . . . . . 71Jamaica . . . . . . . . . . . . . . . . . . . . . . . . . 73Mexico . . . . . . . . . . . . . . . . . . . . . . . . 73Nicaragua . . . . . . . . . . . . . . . . . . . . . . . 75Panama . . . . . . . . . . . . . . . . . . . . . . . . 77Paraguay . . . . . . . . . . . . . . . . . . . . . . . . 78Peru . . . . . . . . . . . . . . . . . . . . . . . . . . . 78Suriname . . . . . . . . . . . . . . . . . . . . . . . 80Trinidad and Tobago . . . . . . . . . . . . . . . 80Uruguay . . . . . . . . . . . . . . . . . . . . . . . . 81Venezuela . . . . . . . . . . . . . . . . . . . . . . . 82Regional . . . . . . . . . . . . . . . . . . . . . . . . 83Technical Cooperation . . . . . . . . . . . . . . 86Cofinancing . . . . . . . . . . . . . . . . . . . . . 87Funds in Administration . . . . . . . . . . . . 89Procurement . . . . . . . . . . . . . . . . . . . . . 92Statement of Approved Loans
and Guarantees . . . . . . . . . . . . . . . . 97
Institutional AspectsEvaluation and Internal Audit . . . . . . . . 100Country Offices . . . . . . . . . . . . . . . . . . 102Special Office in Europe . . . . . . . . . . . . . 103Office in Japan . . . . . . . . . . . . . . . . . . . . 105Administration . . . . . . . . . . . . . . . . . . . 106
Financial MattersHighlights . . . . . . . . . . . . . . . . . . . . . . . 109Borrowings . . . . . . . . . . . . . . . . . . . . . . 111
Part II: FINANCIAL STATEMENTS
Ordinary Capital . . . . . . . . . . . . . . . . . . . 115Fund for Special Operations . . . . . . . . . . 143Intermediate Financing Facility Account . 157
Annual Report 2002

ii
APPENDICES
Governors and Alternate Governors . . . . . 163Executive Directors and Alternates . . . . . . 164Channels of Communication
and Depositories . . . . . . . . . . . . . . . . . 165Principal Officers . . . . . . . . . . . . . . . . . . . 166
BOXES
1. Colpatria: First Private Sector Mortgage Bond Guarantee . . . . . . . . . 14
2 Poverty Reduction Initiatives in Belize . . . 213. MECOVI Program . . . . . . . . . . . . . . . . . 234. Regional Security . . . . . . . . . . . . . . . . . . 255. Advancing Social Inclusion . . . . . . . . . . . 296. The New Regionalism in the Americas . . 327. The Follow-up to the Summit
of the Americas . . . . . . . . . . . . . . . . . . 358. Reconstruction of the Coffee-Growing
Region in Colombia . . . . . . . . . . . . . . . 389. Corporate Social Responsibility . . . . . . . 4010. Microenterprise Forum . . . . . . . . . . . . . . 4111. Participatory Project Design:
Brazil’s Favela/Bairro . . . . . . . . . . . . . . . . 46
TABLES
I. Ten Years of Operations, 1993-2002 . . vII. The External Environment . . . . . . . . 1
III. Distribution of Loans by Sector . . . . . 51IV. Yearly (2002) and Cumulative Loans
and Guarantees (1961-2002) . . . . . . . . 52V. Yearly (2002) and Cumulative
Disbursements (1961-2002) . . . . . . . . 53VI. Yearly (2002) and Cumulative (1961-2002)
Total Cost of Projects . . . . . . . . . . . . . 54VII. Nonreimbursable and Contingent-
Recovery Technical Cooperation . . . . . 86VIII. Cofinancing . . . . . . . . . . . . . . . . . . . . . 88
IX. Funds in Administration . . . . . . . . . . . 90X-XII. Disbursements for Purchase
of Goods and Services by Country of Origin . . . . . . . . . . . . . . . 94-96
XIII. Consolidated Administrative Expenses . . . . . . . . . . . . . . . . . . . . . . . 107
XIV. Capital of the Bank . . . . . . . . . . . . . . . 109XV. Contribution Quotas to the Fund
for Special Operations . . . . . . . . . . . . . 110XVI. Outstanding Borrowings by Currency 110
XVII. Borrowings, Fiscal Year 2002 . . . . . . . 111
CONTENTS
ArgentinaAustriaBahamasBarbadosBelgiumBelizeBoliviaBrazilCanadaChileColombiaCosta Rica
CroatiaDenmarkDominican RepublicEcuadorEl SalvadorFinlandFranceGermanyGuatemalaGuyanaHaitiHonduras
IsraelItalyJamaicaJapanMexicoNetherlandsNicaraguaNorway PanamaParaguayPeruPortugal
SloveniaSpainSurinameSwedenSwitzerlandTrinidad and TobagoUnited KingdomUnited StatesUruguayVenezuela
MEMBER COUNTRIES

iii
Inter-American Development BankWashington, D.C.
January 31, 2003
Mr. Chairman:
Pursuant to Section 2 of the By-Laws of the Inter-American Development Bank, I trans-mit to you the Annual Report of the Bank for 2002, which the Board of ExecutiveDirectors submits to the Board of Governors.
The Report contains a brief summary of the economic situation of Latin Americaand the Caribbean and a review of the Bank’s operations in 2002.
In addition, the Report contains a description on a country-by-country basis and aregional basis of the Bank’s various operations—loans, guarantees, financings for smallprojects and technical cooperation—on behalf of Latin America’s development; a summarystatement of the loans approved in 2002; the financial statements of the Bank, and its gen-eral appendices.
Complying with Article III, Section 3(a), of the Agreement Establishing the Bank,the Report contains separate audited financial statements for its various sources of funds.For the ordinary capital resources, these are presented pursuant to the provisions of ArticleVIII, Section 6(a) of the Agreement; for the Fund for Special Operations, in accordancewith the provisions of Article IV, Section 8(d), of the Agreement; and for the IntermediateFinancing Facility Account, complying with Section 5(d) of Resolution AG-12/83 of theBoard of Governors.
Sincerely yours,
Enrique V. Iglesias
Chairman, Board of GovernorsInter-American Development Bank

iv
Editor John Ferriter, Office of External Relations
Design by Valkiria Amaro Peizer, Office of External Relations
Photographers Text photos: Willie Heinz, Office of External Relations
Cover photo: Willie Heinz and Diana Lesbines
This report can be obtained online in PDF format at www.iadb.org
This report is printed on recycled paper.
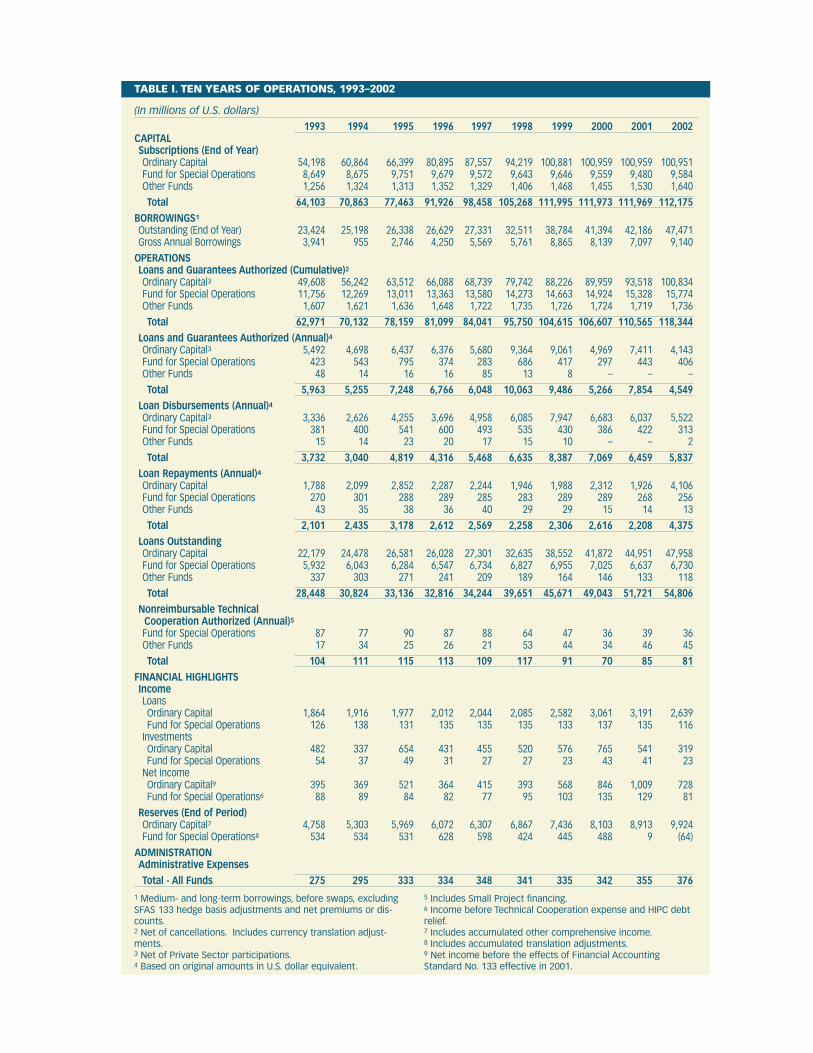
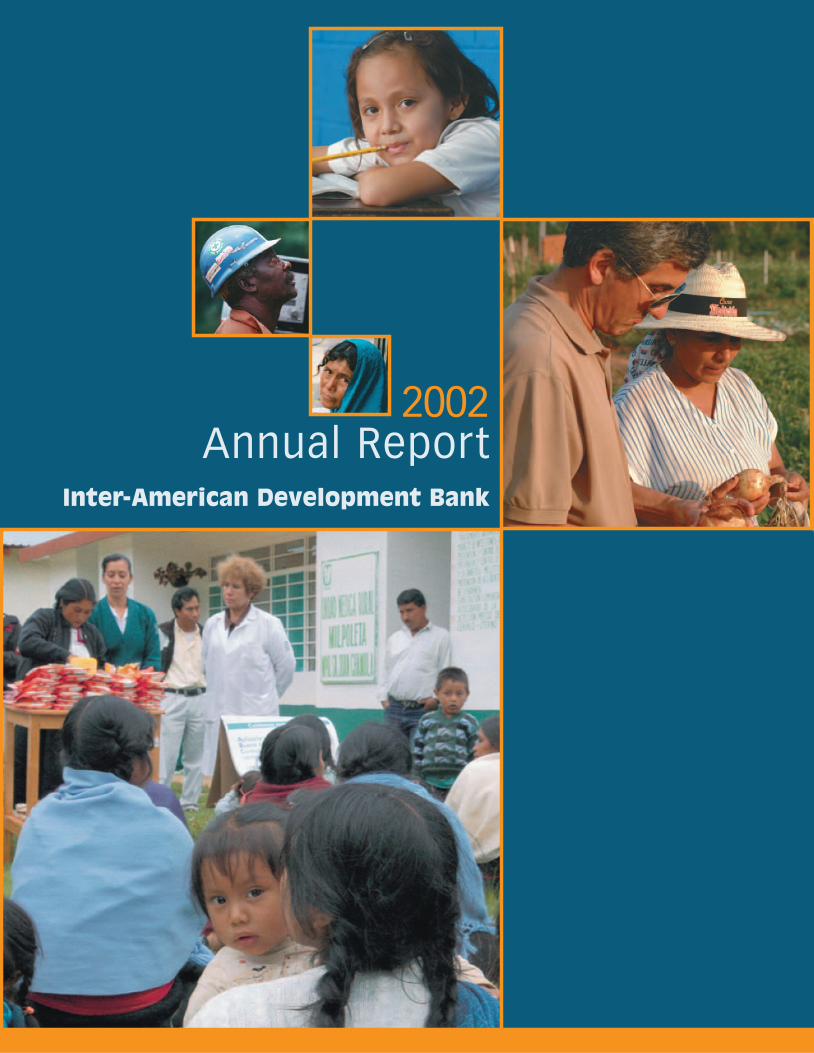
TABLE I. TEN YEARS OF OPERATIONS, 1993–2002
(In millions of U.S. dollars)
1993 1994 1995 1996 1997 1998 1999 2000 2001 2002CAPITALSubscriptions (End of Year)Ordinary Capital 54,198 60,864 66,399 80,895 87,557 94,219 100,881 100,959 100,959 100,951Fund for Special Operations 8,649 8,675 9,751 9,679 9,572 9,643 9,646 9,559 9,480 9,584Other Funds 1,256 1,324 1,313 1,352 1,329 1,406 1,468 1,455 1,530 1,640
Total 64,103 70,863 77,463 91,926 98,458 105,268 111,995 111,973 111,969 112,175BORROWINGS1
Outstanding (End of Year) 23,424 25,198 26,338 26,629 27,331 32,511 38,784 41,394 42,186 47,471Gross Annual Borrowings 3,941 955 2,746 4,250 5,569 5,761 8,865 8,139 7,097 9,140
OPERATIONSLoans and Guarantees Authorized (Cumulative)2Ordinary Capital3 49,608 56,242 63,512 66,088 68,739 79,742 88,226 89,959 93,518 100,834Fund for Special Operations 11,756 12,269 13,011 13,363 13,580 14,273 14,663 14,924 15,328 15,774Other Funds 1,607 1,621 1,636 1,648 1,722 1,735 1,726 1,724 1,719 1,736
Total 62,971 70,132 78,159 81,099 84,041 95,750 104,615 106,607 110,565 118,344Loans and Guarantees Authorized (Annual)4Ordinary Capital3 5,492 4,698 6,437 6,376 5,680 9,364 9,061 4,969 7,411 4,143Fund for Special Operations 423 543 795 374 283 686 417 297 443 406Other Funds 48 14 16 16 85 13 8 – – –
Total 5,963 5,255 7,248 6,766 6,048 10,063 9,486 5,266 7,854 4,549 Loan Disbursements (Annual)4Ordinary Capital3 3,336 2,626 4,255 3,696 4,958 6,085 7,947 6,683 6,037 5,522Fund for Special Operations 381 400 541 600 493 535 430 386 422 313Other Funds 15 14 23 20 17 15 10 – – 2
Total 3,732 3,040 4,819 4,316 5,468 6,635 8,387 7,069 6,459 5,837Loan Repayments (Annual)4Ordinary Capital 1,788 2,099 2,852 2,287 2,244 1,946 1,988 2,312 1,926 4,106Fund for Special Operations 270 301 288 289 285 283 289 289 268 256Other Funds 43 35 38 36 40 29 29 15 14 13
Total 2,101 2,435 3,178 2,612 2,569 2,258 2,306 2,616 2,208 4,375Loans OutstandingOrdinary Capital 22,179 24,478 26,581 26,028 27,301 32,635 38,552 41,872 44,951 47,958Fund for Special Operations 5,932 6,043 6,284 6,547 6,734 6,827 6,955 7,025 6,637 6,730Other Funds 337 303 271 241 209 189 164 146 133 118
Total 28,448 30,824 33,136 32,816 34,244 39,651 45,671 49,043 51,721 54,806 Nonreimbursable Technical
Cooperation Authorized (Annual)5Fund for Special Operations 87 77 90 87 88 64 47 36 39 36Other Funds 17 34 25 26 21 53 44 34 46 45
Total 104 111 115 113 109 117 91 70 85 81FINANCIAL HIGHLIGHTSIncomeLoansOrdinary Capital 1,864 1,916 1,977 2,012 2,044 2,085 2,582 3,061 3,191 2,639Fund for Special Operations 126 138 131 135 135 135 133 137 135 116
InvestmentsOrdinary Capital 482 337 654 431 455 520 576 765 541 319Fund for Special Operations 54 37 49 31 27 27 23 43 41 23
Net IncomeOrdinary Capital9 395 369 521 364 415 393 568 846 1,009 728Fund for Special Operations6 88 89 84 82 77 95 103 135 129 81
Reserves (End of Period)Ordinary Capital7 4,758 5,303 5,969 6,072 6,307 6,867 7,436 8,103 8,913 9,924Fund for Special Operations8 534 534 531 628 598 424 445 488 9 (64)
ADMINISTRATIONAdministrative ExpensesTotal - All Funds 275 295 333 334 348 341 335 342 355 376
1 Medium- and long-term borrowings, before swaps, excludingSFAS 133 hedge basis adjustments and net premiums or dis-counts.2 Net of cancellations. Includes currency translation adjust-ments.3 Net of Private Sector participations.4 Based on original amounts in U.S. dollar equivalent.
5 Includes Small Project financing.6 Income before Technical Cooperation expense and HIPC debtrelief.7 Includes accumulated other comprehensive income.8 Includes accumulated translation adjustments.9 Net income before the effects of Financial AccountingStandard No. 133 effective in 2001.

Latin America and the Caribbean in 2002

LATIN AMERICA AND THE CARIBBEAN IN 2002 1
TABLE II. THE EXTERNAL ENVIRONMENT
(In percent)
2001 2002eOutput growthDeveloped countries 0.7 1.5Developing countries 2.9 2.8
Growth — World trade volume –0.5 2.9
Short-term interest ratesU.S. Dollar 3.6 1.8Euro 4.2 3.4
Commodity prices(% change)Petroleum –13.8 2.7Agricultural Products –9.1 8.5Minerals and Metals –9.5 –3.6
Developed country (G-7) manufactured goods –1.4 0.5
e = EstimatesSource: World Bank, Global Economic Prospects, 2003.
Economic performance in Latin America andthe Caribbean remained sluggish in 2002.Although the United States emerged from itsrecession, fear of risk dominated the interna-tional environment. The region continued tobe affected by the severe crisis in Argentina,which had repercussions on trade and finan-cial stability in neighboring countries and con-tributed to weakening capital inflows to theregion.
Latin America is now experiencing one ofits most critical periods in several decades.While some economies experienced modestgrowth, not a single country has escaped thedownturn, and at least five economies are inthe midst of an outright recession. Per capitaincome in Latin America is now less than itwas five years ago, consumption is stagnant,and investment has slid back to its lowestpoint in the past decade. After almost half a
decade of external financial constraints andlow domestic growth, any maneuvering roomto offset the effects of the cycle has all but dis-appeared in most countries.
Many factors are contributing to theuncertainty about the future of the region. Theinternational economic scenario continues tobe clouded by the fragile recovery of growth inthe United States. Argentina has not yetfound a way out of its protracted economiccrisis. In Brazil, fears of macroeconomic insta-bility have not fully dissipated, due to the fis-cal pressure exerted by the heavy debt burden.In several countries, economic uncertainty iscompounded by social unrest.
Nevertheless, in the midst of the currentproblems the region has shown its commit-ment to macroeconomic stability, internationaleconomic integration and democracy. Thesefoundations, absent from the scene two

decades ago, must now be strengthened inorder to foster sustained recovery throughoutthe region.
International Scenario
The international environment for LatinAmerican economies was highly adverse in2002, due to slow growth in developed coun-tries, deterioration in the terms of trade for theregion as a whole, greater aversion to risk onthe part of international investors, and thereverberations from the severe crisis inArgentina.
Thanks to interest rate reductions by theFederal Reserve and an expansionary fiscalpolicy, the recession in the United Statesproved less pronounced and more short-livedthan was initially feared after the events ofSeptember 11, 2001.The U.S. economy grew2.3 percent in 2002. However, growth in theEuropean Union was a mere 0.8 percent and inJapan was completely stagnant.The recovery inthe United States had a healthy effect on worldtrade, as the country’s imports rose 4.4 percent.As a result, world trade, which had fallenslightly in 2001, rose 2.9 percent in 2002.
2
Raw material and commodity pricesaround the world recovered somewhat, afterdeclining for several years. Agricultural prod-uct prices rose by over 8 percent on average,although metals and minerals fell by 3.6 per-cent while the price of petroleum rose 2.7 per-cent. Nevertheless, several major LatinAmerican commodities declined significantly:sugar dropped 26.5 percent, coffee 8.8 per-cent, bananas 7.4 percent, aluminum 6.5 per-cent and copper 0.2 percent. Hence, the termsof trade for the region as a whole were onceagain weakened. Various factors also weakenedtrade for some groups of countries. The crisisin Argentina had adverse effects on tradewithin the MERCOSUR countries, and alsoaffected the tourism industry in Uruguay andParaguay, as well as family remittances toBolivia and Paraguay. The tourism industry inCaribbean countries remained depressed as aresult of the events of September 11.However, contrary to what had been feared,family remittances from the United States toMexico, Central America and other countriesdid not decline.
Despite the return of positive growthrates in the United States, the risk-averse cli-mate in 2002 deterred capital inflows to LatinAmerica and the Caribbean, especially afterthe second quarter of the year, due in largepart to domestic factors in the United States.The accounting fraud scandals sharpened theperception of risk in the capital market to pro-portions even greater than those noted in theweeks following September 11. The spread onU.S. high-yield corporate bonds jumped from650 basis points (above the yield on U.S.Treasury bonds) at the end of April to over1,000 basis points in October, when it peaked(a year earlier, just after the terrorist attacks, ithad reached 950 basis points). This increase inperceived risk was reflected in investments inemerging markets, compounded in certaincases by domestic or regional situations. Thiswas the case in Brazil, affected by the uncer-tainty surrounding the presidential election,and by the crisis in neighboring Argentina: thecost of international debt issues rose from 700
75
85
95
105
115
125
135
COMPONENTS OF DEMAND(Index: 1998.II = 100)
Note: Includes Argentina, Brazil, Chile, Colombia, Peru andVenezuela.
Consumption Exports Investment
1998
.II
1998
.III
1998
.IV
1999
.I
1999
.II
1999
.III
1999
.IV
2000
.I
2000
.II
2000
.III
2000
.IV
2001
.I
2001
.II
2001
.III
2001
.IV
2002
.I
2002
.II

basis points in the first quarter of 2002 to over2,000 basis points in October before beginningto decline. There were also sharp increases inthe cost of securities in Uruguay, because of itsclose ties to Argentina. The cost of internation-al financial resources rose for other countriesas well, although to a lesser degree. InArgentina, the spreads remained above 4,000basis points after the country defaulted on itsdebt at the end of 2001.
The adverse international financial envi-ronment for Latin America has translated intoa substantial decrease in capital inflows. In theseven largest economies in Latin America (rep-resenting 90 percent of regional GDP), capitalinflows in mid-2002 plummeted to one-thirdof the amount recorded four years earlier. Forthe full year, total capital inflows to the regiontotaled an estimated $50 billion, well below theannual average of $74 billion posted from 1996to 1998. Discounting the emergency fundingdisbursed to alleviate crisis situations, inde-pendent capital inflows added up to less then$40 billion. Since 1999, foreign direct invest-ment has been the only source of net inflowsto the region. The figure for 2002 represents a
sharp decline, from over $60 billion in 2001and a peak of $72 billion in 1999. Foreigndirect investment concentrated in only twocountries, Mexico and Brazil, which are receiv-ing over 80 percent of such funds.
Capital other than foreign investment hasbeen fleeing the region since the Russian crisisin mid-1998, and the situation worsened dur-ing some months in 2002. The outflow offunds from the region has now exceeded thecapital flight that occurred from 1983 to 1989during the debt crisis (in amounts adjusted forinflation). In the past two years alone, theregion has foregone funds amounting toroughly 5 percent of its GDP.
The reduction in capital inflows hasspread to virtually all the countries in theregion that had gained access to the interna-tional financial markets in the second half ofthe 1990s. Mexico and some of the CentralAmerican countries have been the least affect-ed. In the final months of the year, Colombiaand Peru were able to return to the marketwith successful bond offerings at rates thatwere relatively moderate, given the generalconditions of the market. While various inter-
LATIN AMERICA AND THE CARIBBEAN IN 2002 3
0
20
40
60
80
100
120
CAPITAL FLOWS(In billions of U.S. dollars)
Note: Includes Argentina, Brazil, Chile, Colombia, Mexico, Peruand Venezuela. Data refer to the cumulative value for the last 12months.
1997
-I
1997
-III
1998
-I
1998
-III
1999
-I
1999
-III
2000
-I
2000
-III
2001
-I
2001
-III
2002
-I20
02-II
10
8
6
4
2
0
-2
-4
-6
GDP GROWTH IN LATIN AMERICA (In percent)
Note: Includes Argentina, Brazil, Chile, Colombia, Mexico, Peruand Venezuela.
Decline Recession Recovery Stagnation Recession
1997
.II
1997
.IV
1998
.II
1998
.IV
1999
.II
1999
.IV
2000
.II
2000
.IV
2001
.II
2001
.IV
2002
.II

national events have influenced the behavior ofinvestors, the bond market has shown greatability to distinguish between countries. Infact, there have never been such differences inthe debt margins of the various countries inthe region, from the extremely high level ofArgentina to the very low levels of Chile andMexico, with Brazil and Uruguay occupyingpositions in between.
In short, despite a measured recovery inthe United States and lower U.S. interest rates,external conditions for Latin America becamemore difficult in 2002, thereby aggravating atrend that began in 1998. The terms of tradehave been unfavorable since then, and on thewhole changed little in 2002. Aversion to riskon the part of international investors increaseddue to domestic factors in the United States,and when combined with the crisis inArgentina and political uncertainty in Brazil,caused a new reduction in net capital inflowsin the region.
Macroeconomic Results andAdjustment Policies
Economic growth in the region over the pastfew years has been closely associated with the
behavior of external capital inflows other thanforeign investment, which, as noted above, hasbeen very unstable. As a result of the Asian cri-sis in mid-1997 and the Russian debt moratori-um a year later, capital inflows to the regionbecame negative. A partial recovery of inflowsin mid-1999 coincided with a period of robustbut very short-lived growth, which ended ayear later. Since then growth rates in the regionhave been modest and in 2002 were negative.Overall GDP for the region is estimated tohave fallen by 0.5 percent, thereby cancelingout the modest 0.4 percent increase that hadbeen achieved in 2001. As ECLAC has report-ed, the region has now accrued half a decade oflost growth, inasmuch as per capita income hasfallen 0.3 percent per year since 1998.
The decrease in GDP in 2002 was due inparticular to the collapse of production inArgentina. Although in mid-2002 there weresome signs of a modest recovery in demandand certain sectors of production, the year wasexpected to close with a 12 percent drop in thecountry’s GDP. Haiti, Paraguay, Uruguay andVenezuela also saw declines in their GDP.Although Peru and Ecuador achieved thehighest growth rates in South America, thoserates were only around 4 percent. Growth
4
75
80
85
90
95
100
105
CREDIT TO THE PRIVATE SECTOR(Index: June 1998 = 100)
Note: Loans in constant value, three-month moving average.Includes Argentina, Brazil, Chile, Colombia, Mexico, Peru andVenezuela.
Jan
1998
July
199
8
Jan
1999
July
199
9
Jan
2000
July
200
0
Jan
2001
July
200
1
Jan
2002
July
200
2
PUBLIC SECTOR BALANCE(Percent of GDP)
Source: International Monetary Fund, World Economic Outlook.Note: Includes 33 Latin American and Caribbean countries.
1991
1992
1993
1994
1995
1996
1997
1998
1999
2000
2001
2002
0.0
-0.5
-1.0
-1.5
-2.0
-2.5
-3.0
-3.5
-4.0
-4.5

rates in Bolivia, Chile and Colombia, althoughpositive, were even more modest. Spurred bythe United States, Mexico emerged fromrecession, but grew less than 2 percent. Thegrowth rate of the Central American countriesas a whole was slightly higher than 2 percent,while Caribbean economies, despite problemsin tourism, grew by an estimated 3.6 percent.Given that virtually no country experiencedhigh growth, it can be said for the first time inover a decade that the region was in a situationof widespread stagnation.
Investment has been the component ofaggregate demand that has been most sensitiveto the fluctuations in capital inflows and thedownturn in productive activity. In 2002 itdropped again, to at least 20 percent below itspeak in 1997, representing the lowest point inthe past ten years. Mexico is the only one ofthe larger countries in the region to escapethese tendencies. Over the past four years,investment is estimated to have fallen 60 per-cent in Argentina, 15 percent in Chile, and 10percent in Brazil. Consumption has beenmuch more stable, but without any upwardtrend, entailing gradual erosion of per capitaconsumption over the past few years for theregion as a whole. There was a sudden drop in
consumption in Argentina. Decreases were alsonoted in the other countries in recession.
Exports have been the only component ofaggregate demand consistently contributing togrowth in the region in recent years. Thistrend was reversed in 2002, as the region’sexports as a whole fell 3 percent. Exportsfrom the MERCOSUR countries fell 4 per-cent, particularly due to the crisis in Argentina,whose imports from neighboring countries fellto a third of their 2001 level. Uruguay is esti-mated to have suffered a two percentage pointdrop in its growth rate for this reason.Exports from the Andean countries as a groupare estimated to have fallen by 4 percent.Mexico and the Central American countrieswere helped by the recovery in the UnitedStates, but likewise did not make great gains inexport growth. The lack of growth in exportsis one of the most worrisome features of theregion’s current situation, especially in view ofthe fact that several countries received thestimulus of significant exchange rate devalua-tions, described below.
Given the protracted deterioration of theinternational economic environment for LatinAmerica, governments have had less and lesslatitude for domestic policy measures. Fiscal
LATIN AMERICA AND THE CARIBBEAN IN 2002 5
60
50
40
1990
30
20
10
0
1997 1999 2000/e 2001/e
POVERTY(Percent of the population)
Source: ECLAC.
1995
1996
1997
1998
1999
2000
2001
2002
UNEMPLOYMENT(In percent)
Source: ECLAC.
9.5
9.0
8.5
8.0
7.5
7.0
Indigent Non-indigent poor
25.8
24.5 25.324.3 24.4
22.519 18.5 17.8 18.6

deficits increased, especially between 1997 and1999, leading to major increases in public sec-tor debt ratios. For example, in six of thelargest economies of Latin America, the aver-age fiscal deficit rose from 0.9 percent of GDPin the second quarter of 1997 to 3.7 percent inthe last quarter of 1999, and public debtincreased from 27 percent to 35 percent ofGDP. Since then, despite slow economicgrowth, governments have tightened fiscalpolicies in an effort to limit the fiscal deficit.However, two factors have worked againstthem. First, fiscal income suffered from thestagnation or recession, and was in someinstances weakened by the very same austeritymeasures. Argentina and Uruguay have bothexperienced this problem. Second, the cost ofpublic debt increased, due to both the increasein domestic interest rates and the devaluationof the local currencies. Brazil was particularlyhard hit by this problem, which was exacerbat-ed by the fact that the cost of a large part of itsdomestic debt is also directly or indirectlylinked to the exchange rate. Despite the imple-mentation of fiscal austerity measures, theaverage fiscal deficit in the region as a wholefell from 3.9 percent of GDP in 2001 to 3.1percent in 2002, still well above the levels ofaround 2 percent that were the norm until1997.
Because fiscal policy has not been suffi-cient to reduce the excess of spending overrevenue (or to compensate for the lessenedavailability of external savings since the 1998Russian crisis), the burden of adjustment hasfallen on the private sector. In the sevenlargest economies in the region, the averagecurrent account deficit (external savings) fellfrom 5 percent of GDP in 1998 to less than 1percent four years later. However, the averagefiscal deficit in these economies fell onlyaround 1 percent on average. Thus, the adjust-ment was made through a reduction in net pri-vate sector spending of around 3 percent ofGDP, which occurred essentially through asharp drop in investment. Within this average,however, the modalities of adjustment havediffered sharply from country to country.
Brazil and Venezuela have sharply reducedtheir fiscal deficits, making room for the pri-vate sector (which in Venezuela has translatedinto capital outflow and a massive surplus inthe current account, given the depression ofprivate investment for reasons other than theavailability of external savings). In Argentinaand Colombia, attempts at fiscal adjustmenthave ultimately not succeeded in reducing thefiscal deficit, and so sharp reductions in theavailability of external savings have been com-pletely absorbed by cutbacks in private sectorspending. In Chile and Peru, initially morefavorable fiscal positions have allowed forrelaxation of the fiscal deficit, thereby moder-ating the social cost of the adjustment.However, the private sectors in these countrieshave experienced significant changes in theirinvestment and financing patterns in order toadjust to the change in external conditions.
Exchange rates have been a central vari-able in recent adjustment processes in a num-ber of economies in the region. Faced withreduced external financing, a number of coun-tries have loosened the exchange rate as a toolfor strengthening the current account positionabroad. Argentina and Venezuela in particularhave allowed a (managed) float of their curren-cies. In Argentina, the convertibility that hadbeen in place for almost ten years wasdropped, and in Venezuela, the system of con-trolled devaluation was abandoned. Brazil,Colombia and Uruguay also devalued theircurrency by over 20 percent over the past 12months. Increasingly since mid-1998, whenrestrictions on foreign financing began, realexchange rates have risen on average byaround 70 percent in the seven largest coun-tries in the region. In Argentina and Brazil,rates had risen by the end of 2002 by over 150percent; in Chile and Colombia by close to 50percent, and in Venezuela and Peru by around25 percent. Mexico is the only one of the largeeconomies whose currency has appreciated inreal terms since 1998.
The devaluations have been a necessarystep, although in many cases not a trouble-freeone. While devaluing the currency is a com-
6

mon response to externally-generated disrup-tions, such as those experienced by most coun-tries in the region in recent years, it can alsohave a painful impact when the government,the financial sector or private firms have majormismatches between their assets and liabilitiesin foreign exchange. Several countries initiallysought to avoid adjustments in the exchangerate, only to be forced to yield to persistent,deepening external turbulence. In some cases,the devaluations have had devastating effectson the financial sector and the sustainability ofthe fiscal situation. The countries that havebeen best able to address these problems, suchas Chile, are the ones that are more open tointernational trade, with lower ratios of publicsector debt and smaller foreign exchange mis-matches in the balances of the public sector,the financial sector and private firms.
The desire to retain international reserveshas been among the reasons for looseningexchange rates. Contrary to what happened inperiods of external constraints in previousdecades, virtually all countries have avoidedsignificant reductions of their internationalreserves. With the exception of Paraguay,international reserves in South Americancountries at the end of 2002 in all instances aregreater than six months’ worth of imports, andnot substantially less than in 1998, when theconstraints on external financing began.
Given the limited latitude for fiscal policymeasures, several countries have turned moreactively to monetary policy to stimulatedomestic demand. This was the case in thefirst few months of 2002, when internationalfinancial conditions were less unfavorable andthe risks of losing international reserves wereconsequently lower. Several central banks inthe region substantially increased the basicmoney supply, at least until May, and somereduced their intervention rates. However,these trends were later reversed. For example,in Brazil, after a period of decline, the refer-ence rate rose to 24 percent by the end of2002, over eight points higher than the rate ofa year earlier. Although the rate also increasedin Mexico, the level remained far below where
it had stood until 2000. On the other hand,Colombia, Chile and Peru achieved more last-ing reductions in interest rates in comparisonwith the previous two years. These recent dif-ferences in behavior notwithstanding, wheninterest rates for 2002 are compared with thoseimmediately after the Russian crisis, it is clearthat recent levels are substantially lower inmost countries, with the notable exceptions ofArgentina and Uruguay.
Attempts to stimulate aggregate demandthrough monetary policy were limited by thecautious attitude on the part of the financialsector and investors in general. Domestic cred-it grew at very modest rates in most countries,in many cases at rates below the basic moneysupply. In the seven largest countries in theregion, bank credit for the private sector hasfallen by 20 percent in real terms since mid-1998. Rather than a situation of tight credit,which would be reflected in pressures for rais-ing bank lending rates, most countries are in astate of financial paralysis, in which demandfor credit has fallen and banks are hesitant tolend due to slow economic growth and theincreased risk associated with possible devalu-ations and other macroeconomic adjustmentpolicies.
For the first time since 1991, averageinflation in the region increased in 2002, from6 percent in 2001 to 8 percent. Although anumber of countries implemented expansion-ary monetary policies at some point in 2002,higher inflation was actually due to the sharpdevaluations in the exchange rates of a fewcountries, particularly Argentina andVenezuela, and to a lesser extent, Brazil andUruguay. By contrast, inflation declined con-siderably in Ecuador, and also in Colombia,Costa Rica and Nicaragua. Higher inflationrates are not yet a threat to macroeconomicstability in any country in the region.Nevertheless, rising inflation does reflect thelimitations of monetary policies, because fiscalproblems are so great that they limit themaneuvering room of monetary authorities.In a number of countries the level and struc-ture of government debt limits the room for
LATIN AMERICA AND THE CARIBBEAN IN 2002 7

raising interest rates and creates a preconditionfor inflation.
Social Situation
Due to the stagnation and recession in LatinAmerica, the labor market has weakened. Theaverage unemployment rate is estimated tohave risen to 9.1 percent in 2002, almost onepercentage point higher than in the past twoyears and the highest on record. Argentina,Colombia, the Dominican Republic, Panama,Uruguay and Venezuela had unemploymentrates of over 15 percent. In addition, there isevidence that real wages have deteriorated inArgentina, Brazil, Paraguay, Uruguay andVenezuela. In Chile and Colombia, real wagestended to increase despite unemployment, sus-tained by the effectiveness of the minimumwage. Real wages also rose in Bolivia, Mexico,Nicaragua and Peru.
The weakening of the labor market in thelast few years has had a worrisome effect ontrends in poverty. During the 1990s, thepoverty rate (defined as the number of personsliving on less than $2 daily income) had fallenfrom 48.3 percent to around 42 percent, andextreme poverty (less than $1 a day) haddeclined from 22.6 percent to 17.8 percent.Because of slow growth in the past two years,these trends have reversed. According toECLAC calculations, the poverty rate rose to43 percent in 2001, and extreme poverty roseto 18.6 percent. Thus, by 2001 the total num-ber of poor people had risen from 207 millionto 214 million (and those in extreme povertyfrom 88 million in 2000 to 93 million).Although estimates for 2002 are provisional,the poverty index is believed to have risen to44 percent and the figure for extreme povertymay have reached 20 percent. Argentina,Paraguay, Uruguay and Venezuela suffered anincrease in poverty, whereas rates may havefallen slightly in Peru and the DominicanRepublic. ECLAC projections for 2002 indi-cate a rise in poverty by around seven millionpeople, six million of whom are in dire need.
ECLAC has reconsidered the feasibility of
Latin America and the Caribbean meeting theobjective proposed in the United Nations’Millennium Development Goals of reducingextreme poverty by half between 1990 and2015. The progress achieved thus far by thevarious countries in the region is uneven, inas-much as some have already reached the goal,while others have receded from it. The situa-tion is best in Chile and Panama, which in2000 achieved the goal of lowering extremepoverty by half. Brazil, the DominicanRepublic and Uruguay have advanced partiallybut significantly toward the goal: 95 percent inthe first two countries and 82 percent in thethird. Costa Rica, El Salvador, Guatemala,Mexico and Nicaragua have advanced byabout 40 percent. Bolivia, Honduras and Perualso showed advances toward meeting the goal,although at their current pace, they would notbe able to reach it. A more critical picture canbe seen in Colombia, Ecuador, Paraguay andVenezuela, where levels of extreme poverty in2000 were higher than they were in 1990.
According to ECLAC calculations, ifextreme poverty is to be cut in half by 2015,total GDP would have to grow by 2.7 percenta year for 15 years: 5.7 percent for countrieswith the greatest poverty, 2.7 percent for coun-tries in the middle and 2.5 percent for coun-tries with the least poverty. With regard tocutting total poverty by half, a goal that is inprinciple more in tune with the region’s levelof development, some of poorest countries havepractically no chance of doing so, because theywould have to reach levels of growth consider-ably higher than their historic performance.
Prospects for 2003 and PolicyChallenges
The prospects for the region in 2003 areuncertain. In the international environment,perceived risk remains very high, particularlybecause of various fears about the U.S. econo-my. Although growth recovered in the thirdquarter of 2002, there are still doubts aboutvarious parts of the corporate sector, and thehigh current account deficit of the United
8

States with the rest of the world may be asource of instability for the world economy.The implications of a possible armed conflictadd to uncertainty, and in certain circles, thereis speculation about possible deflation, whichcould mire the U.S. economy in more perma-nent problems, similar to what Japan experi-enced in the 1990s.
There are also serious causes for concernin Latin America. The Argentine crisis remainsunresolved, despite signs of recovering produc-tion and a gradual renewal of financial confi-dence. The goal of reaching a full agreementwith the International Monetary Fund, whichis crucial for reestablishing relations with theinternational financial markets, has proven tobe particularly troublesome. Brazil alsoemerged as a focus of concern in 2002, due tothe increase in the spread on its public debt,increased domestic interest rates, and devalua-tion of the currency. However, these concernshave subsided, improving prospects for debtsustainability.
Against this difficult political and eco-nomic backdrop, the region has nonethelessreaffirmed its commitments to democracy andinternational integration. Democracy is theregion’s best asset in terms of responding to
the current crisis, together with participatoryand inclusive policies aimed at resolving notonly macroeconomic problems, but also thelarge-scale social challenges.
The new processes of international inte-gration are the region’s best opportunity forimproving its medium-range prospects forgrowth.The challenge facing Latin Americaand the Caribbean is to combine the varioussubregional integration initiatives with themore ambitious objective of achieving integra-tion with other groups of countries, especiallyfrom the developed world. The countries ofCentral America and the Caribbean haverecently revitalized their subregional integra-tion programs, and are now aiming at the U.S.market. Chile has opted for a strategy of bilat-eral agreements and signed a free trade agree-ment with the United States in late 2002. TheAndean countries and the members of MER-COSUR are exploring what their best optionsmay be. The experiences of the region and ofother regions of the world show that there is nosingle path for advancing toward internationalintegration. In any case, the region now has arange of possibilities that must be seized inorder to open up new possibilities for invest-ment, trade and international cooperation.
LATIN AMERICA AND THE CARIBBEAN IN 2002 9

Part I:The Bank in 2002

THE BANK IN 2002 11
Key Areas
Overview
For the ninth year in a row, the Inter-American Development Bank was the largestsource of multilateral financing for LatinAmerica and the Caribbean in 2002. Includedin the lending program were loans and guaran-tees to finance public and private sector invest-ment programs, an emergency operation, andsector loans supporting policy reformprograms.
The Bank’s operational program for theyear responded to the needs of the borrowingmember countries and reflected the use of agreater variety of instruments and productsthan ever before. These included innovationloans, multi-phase loans and sector facility
loans—three product lines that, taken together,make up the flexible lending instrumentsestablished by the Bank’s Board of Governorsin 2001.
Over the course of 2002, the IDB com-mitted $4.55 billion in 86 loan operations tofund projects totaling an estimated $7.6 bil-lion. Of these, seven loans and guarantees tothe private sector without government guaran-tees totaled $316.4 million. The Bank alsofinanced 336 technical cooperation projectstotaling $65.4 million. In addition, theMultilateral Investment Fund approved 67projects, most of them technical assistanceoperations, for a total of $98.6 million.
Distributed among the principal areas ofconcentration of activity as defined in theBank’s Institutional Strategy, social sectorprojects accounted for $2.13 billion, or 46.8percent of the year’s non-emergency loanapprovals; projects for modernization of thestate and reform totaled $667.2 million, or 14.7percent of new commitments; and projects toimprove the competitiveness of the region’seconomies reached $1.26 billion, or 27.6 per-cent of the portfolio. A single emergency loanof $500 million, not included in the distribu-tion above, was approved for Uruguay to shoreup social expenditures at a time of severe fiscalconstraint. When this operation is included asa social sector program, the total of the year’slending in that sphere rises to 57.6 percent of2002 approvals.
The Bank’s Board of Governors stipulatedin the Eighth General Replenishment ofResources in 1994 that lending for povertyreduction and social equity should reach 40percent in terms of volume of resources and 50percent in terms of the number of operationsin succeeding years. Investments in povertyreduction and social equity are cross-sectoraland include financings in the social sectors as

well as other sectors. In 2002, 69 percent ofthe total lending volume ($2.8 billion) and 58percent of the number of operations (42) wereclassified under these headings.
Sorted by country group, the Bankapproved $2.52 billion for Group I countries,whose 1997 per capita income was above$3,200 (Argentina, Bahamas, Barbados, Brazil,Chile, Mexico, Trinidad and Tobago, Uruguayand Venezuela) and $2.01 billion for Group IIcountries, with incomes below $3,200 per capi-ta (Belize, Bolivia, Colombia, Costa Rica, theDominican Republic, Ecuador, El Salvador,Guatemala, Guyana, Haiti, Honduras, Jamaica,Nicaragua, Panama, Paraguay, Peru andSuriname).
As part of the Heavily Indebted PoorCountries (HIPC) Initiative, the Bank in 2002delivered debt relief to each of the four eligiblemember countries: Bolivia, $47 million;Guyana, $10 million; Honduras, $20 million;and Nicaragua, $46 million, for a total ofapproximately $123 million.
The Bank provided financing for policy-based reform programs in 2002 in Guatemala,Peru and Nicaragua, with funding of $500 mil-lion from the ordinary capital and $30 millionfrom the Fund for Special Operations. Thetotal of $530 million was well below the Bank’slending authority for policy-based lending. Itis expected that total approvals for this instru-ment will be higher in the coming year.
In the social sectors taken as a whole, theleading areas of concentration were socialinvestment (10 projects representing over 13percent of the total number of approvals and42 percent of all loan commitments) and theenvironment and natural disaster preventionand mitigation (11 projects totaling over $146million). Oportunidades in Mexico was a par-ticularly noteworthy social investment project.By targeting resources to indigent families andimplementing measures to continuously moni-tor key project components—incentives toencourage children to remain in school and forparents to make better use of health care andnutrition services—the operation will build onsuccess already achieved by the government of
Mexico in the social sectors, while looking forways to strengthen the replicability and evalu-ability of expenditures in these vital sectors.
In the area of the environment and natu-ral disasters, projects in Bolivia and Peru willminimize, control and compensate for thedirect and indirect social and environmentalimpacts of construction and operation ofmajor infrastructure investments. InBarbados, Ecuador, Guatemala, Honduras andPanama, the Bank helped underwrite programsfor the management and conservation of eco-logically fragile areas.
Seven urban development projects werefinanced during the year. One key effort wasto modernize local governments to make thembetter able to mobilize investment, more agileand transparent in the administration of publicfunds, and more attractive as future investmentdestinations. In terms of meeting more imme-diate needs, the Bank financed housing andsettlement projects in Ecuador, Nicaragua andTrinidad and Tobago.
Five projects were approved in the watersupply and sanitation sector, including one forthe city of Goiânia in Brazil that will con-tribute directly to achieving the MillenniumDevelopment Goal of halving by 2015 thenumber of people lacking access to safe drink-ing water or an adequate wastewater disposalsystem.
In education, the Bank supported threeprojects, including an $80 million loan toimprove the achievement of primary schoolstudents in rural and marginal urban areas inthe Dominican Republic. A $30 million loanto the Ministry of Education in Guyana willimprove literacy and numeracy at the primaryschool level while improving attendance ratesfor pupils and training for teachers. In health,the Bank approved another project for Guyanathat will improve nutrition for infants by usingthe flexible sector facility instrument.
A global microenterprise credit programfor the northeast of Brazil will add 120,000new clients to CrediAmigo, tripling the num-ber of participants in this program initiated bythe Banco do Nordeste do Brasil in 1997.
12

In the second major category of lending,modernization of the state, there was anemphasis on projects for reform and decentral-ization of public sector administration. In all,eight such projects were approved in 2002 fora total of $105 million. Examples included anoperation in Chile to modernize theComptroller’s Office and a program inColombia to decentralize government serviceadministration. In terms of lending volume,an even greater amount of resources wasdirected toward projects in the realm of fiscalpolicy and the management of fiscal institutions.The single largest operation in the moderniza-tion of the state category was for fiscal reformin Peru, to be disbursed in two tranches total-ing $300 million. The project focuses on rev-enue enhancement and improved budget man-agement; social expenditure policy (gearingprograms to serve the country’s poorest popu-lations); and curbing public pension costs.Stand-alone projects included programs tostrengthen national foreign trade departmentsin Bolivia, Nicaragua and Peru; a fiscal reformprogram in Guatemala that will institute keybenchmarks for measuring the efficacy andpace of legal reforms and new regulations; andan innovative project to modernize the admin-istration of justice in Honduras.
In the third and final area of major activi-ty for the year—competitiveness—projectsinclude the subsectors of energy and trans-portation (including loans to both public andprivate sector borrowers), telecommunications(one loan to a private sector borrower inBolivia), agriculture and rural development,science and technology, tourism, industry andcredit and capital markets. In addition, a proj-ect approved for Panama addresses “competi-tiveness development” in general by financingdiagnostic studies that include inputs fromcivil society organizations, the public sectorand businesses, as well as preinvestment activi-ties for projects in the productive sectors.There were six transportation projectsapproved for highways, ports and airports inBolivia, Brazil, Colombia, the DominicanRepublic, Honduras and Uruguay. Energy sec-
tor projects included electricity transmissionand distribution in Guatemala and Guyana,and partial financing by the Bank’s PrivateSector Department for the Transredes, S.A. gaspipeline project in Bolivia, a major initiative toexpand the country’s capacity to export gas toBrazil.
In 2002, the Bank provided $242 millionin support for multisector credit programs. Aloan of $42 million to El Salvador’s BancoMultisectorial de Inversiones (BMI) will channelresources to start-up businesses as well asexisting firms in manufacturing, trade andservices. A $180 million loan for the thirdphase of a program administered by theCentral Bank of Uruguay will make up part ofthe shortfall in the domestic market of bothshort- and long-term savings needed byUruguayan businesses to invest in the produc-tive sectors. A particularly innovative projectin local capital market development was theColpatria partial credit guarantee on a mort-gage-based bond issue by a Colombian finan-cial institution (see Box 1). The Colpatriaproject will address a serious impediment togrowth for the entire region: the lack of a deepand efficient financial intermediation systemthat can stimulate private savings to enablesmaller and medium-sized businesses, in par-ticular, to make the investments they need tocompete with their counterparts in other partsof the world.
Projects in the productive sectors of agri-culture and agribusiness totaled $156 million,roughly 4 percent of the total lending volumefor the year. Resources were provided forprograms in Costa Rica, the DominicanRepublic, Nicaragua and Panama. In additionto concentrating on efforts to integrate nation-al and international markets, increase produc-tivity and combat rural poverty, each projectcontained a component to make more effectiveuse of technology in the area of plant and ani-mal health and food safety. The Bank financedtourism projects in Bolivia and Brazil. A rela-tively small but significant flexible-instrumentcredit of $500,000 was provided for Jamaica touse information and communications technol-
THE BANK IN 2002 13

BOX 1
ogy to foster greater competitiveness by localbusinesses.
A credit to the Caribbean DevelopmentBank (CDB) will continue the IDB’s ongoingefforts, as outlined in the Bank’s Charter, toassist non-IDB member countries from theCaribbean. The IDB and the CDB haveenjoyed a close and constructive relationship.The current loan, building upon the achieve-ments of past credits, will make concessionalresources available to qualifying countries(Dominica, Grenada, St. Lucia and St.Vincent) at a time when these countries havebeen forced to undertake broad and deep eco-nomic reconstruction programs in the after-math of September 11.
The Bank’s private sector operations in2002 amounted to $316.4 million. Six of theseven operations approved were for projects inthe region’s relatively poorer and smaller coun-tries, including the first private sector loan toGuatemala. Despite an unfavorable interna-tional context, the Bank was able through useof direct loan resources and an additional$63 million in syndicated cofinancing throughB loans, to marshal a total of more than
$1.15 billion for infrastructure investment.This is the equivalent of roughly three dollarsfor each dollar of funding approved by theBoard of Executive Directors.
The IDB’s 336 national and regionaltechnical cooperation programs totaled$65.4 million. National technical cooperationaccounted for the lion’s share (278 operationsfor $49.1 million), but regional projects(58 operations for $16.3 million) were also sig-nificant. The portfolio includes projects tocollect census data on the ethnic compositionof national populations so as to combat socialexclusion; promote corporate social responsi-bility; prevent the transmission of HIV/AIDS;improve educational opportunities for girls inprimary and secondary school; and reducechild labor.
The Bank’s Social EntrepreneurshipProgram continued to provide financing forsmall productive and commercial enterprisesand to support community-based projectsaimed at the poor and the excluded through-out Latin America and the Caribbean. In2002, 18 projects were approved totaling$8.1 million. They ranged from efforts to
14
In November 2002, the Bank backed the introduction
of a new securitization instrument into the Colombian
capital market by approving its first private sector
mortgage bond guarantee in support of the equiva-
lent of $50 million in mortgage bonds to be issued by
Banco Colpatria to local institutional investors.
The IDB partial credit guarantee will backstop
up to $5 million, or 10 percent of the total face value,
of the mortgage bond obligation, thereby leveraging
the Bank's participation tenfold.
The guarantee is designed to support
Colombia’s pioneering effort to establish the mort-
gage bond as a new instrument in the country’s cap-
ital markets, with Colpatria as the first issuer of such
a security, as permitted by new financial regulations
in 1999. This transaction may provide a demonstra-
tion effect for other private issuers as well as for
investors in Colombia, increasing the volume of secu-
ritization instruments locally and benefiting the
depth and diversity of the Colombian capital market.
The guarantee operation advances the IDB strategy
for Colombia of promoting private sector growth,
modernizing capital markets and developing housing
for less advantaged segments of the population.
Colombia’s once flourishing mortgage sector
suffered a setback in 1998 due to the unfavorable
macroeconomic climate and increasing interest
rates. The IDB support for a mortgage-backed bond
issue in national currency will improve Colpatria’s
capacity to provide residential mortgages, especially
for the low-income sector, and thus help resume
housing finance activity and raise the level of home
ownership in Colombia.
COLPATRIA: FIRST PRIVATE SECTOR MORTGAGE BOND GUARANTEE

develop sheep farms in Nicaragua to supportfor growers of sugar cane in the province ofTucumán in Argentina, honey producers inSan Bernardino, Guatemala and cashew farm-ers in El Salvador.
In October 2002, the Bank and theGovernment of Italy established the ItalianTrust Fund for Microenterprise Developmentwith an initial endowment of 5 million eurosto promote microcredit and social entrepre-neurship in the region.
The Multilateral Investment Fund(MIF), administered by the Bank, continuedas the major source of technical assistancegrants for microenterprise and small businessdevelopment, testing new approaches to devel-opment and reaching out to involve a broaderspectrum of populations. MIF approvals in2002 amounted to $98.6 million. Since itsinception in 1993, the MIF has providedalmost $800 million to finance more than 500projects to strengthen workforce capabilities,skills and standards, broaden the economicparticipation of smaller enterprises, and bolsterthe overall environment for entrepreneurialactivities in the region.
The Inter-American InvestmentCorporation (IIC) approved 20 projectstotaling $123.3 million in 2002. Anautonomous affiliate of the Bank, the IIC pro-motes the establishment, expansion and mod-ernization of the region’s small and medium-sized enterprises.
In terms of financial performance, theBank showed continued profitability duringthe year, with strong financial ratios. Amid aturbulent and uncertain climate, the Bankdelivered its borrowing program for 2002 andagain received a AAA credit rating from themajor credit-rating agencies, as it has everyyear since the founding of the institution.The Bank’s bond issues for the year totaled aface amount of $9.1 billion equivalent, with anaverage maturity of six years (two years longerthan the comparable figure for 2001) and aver-age adjustable-rate cost of 22 basis pointsbelow U.S. dollar LIBOR (five basis pointsbelow the previous year).
As described in greater detail in ensuingsections, the Bank’s Board of Governorsadopted on the occasion of the Bank’s AnnualMeeting in March a resolution implementingan Agreement of Measures for Enhancing theResponse Capacity of the Bank, thereby creat-ing a new lending framework for 2002-2004.The framework consists of three permanentlending categories: investment loans, policy-based loans (PBL) and emergency loans. Inaddition, the Governors established severalparameters for the lending program including:a) a numerical cap of $4.5 billion (an averageof $1.5 billion per annum) on policy-basedloans for 2002-2004 and subsequent three-yearperiods; b) minimum disbursement periods of36 months for investment loans and 18 monthsfor policy-based loans; c) an increase in themaximum percentage of IDB financing forinvestment loans of 10 percent for all countrygroups; and d) creation of a permanent win-dow for emergency loans with amounts anddisbursement profiles of operations to be con-sidered in any given year subject to maintain-ing the financial soundness of the Bank andwith floors to ensure availability of theseemergency resources for the smaller and lesserdeveloped countries.
Efforts to implement the Bank’sInstitutional Strategy continued on severalfronts, including:
Adoption of the MillenniumDevelopment Goals, within the context of theparticular circumstances and priorities of IDBmember countries;
Presentation by the Board ofExecutive Directors to the Board of Governorsof a Progress Report on the New LendingInstruments;
Completion of a risk-assessment studyfor private sector operations; and
Preparation of a work plan for a reviewof the entire set of the Bank’s operational poli-cies.
The backdrop for the definition of thenew lending framework and the follow-up onrecommendations contained in the InstitutionalStrategy—in fact for virtually all areas of Bank
THE BANK IN 2002 15
activity during 2002—was the focus ondevelopment effectiveness. Together with theGovernors’ instructions to Management toadopt a series of measures to improve both thequality at entry and quality of the portfolio,the focus on this broad topic engendered avariety of concrete alternatives for improvingthe design, monitoring and evaluation of Bankinterventions.
In its second full year of operations fol-lowing a substantial overhaul, the Bank’sOffice of Evaluation and Oversight (OVE)produced a major report on the broad topic ofeffectiveness and issued a number of CountryProgram Evaluations (CPEs). The CPEs wereintended to serve as important inputs for theBank’s Country Strategy documents, them-selves a product reformulated according tonew guidelines adopted during the year. Forthe first time, performance-based criteria wereestablished for the allocation of the conces-sional resources of the Fund for SpecialOperations and Intermediate FinancingFacility.
As reported in the Annual Report onProjects in Execution prepared in 2002 basedon the portfolio as of the end of 2001, 91 per-cent of projects were classified as likely toachieve their development objectives asdefined in the Bank’s Portfolio PerformanceMonitoring and Reporting (PPMR) system.This compared with the figure of 88 percentestimated for the portfolio as of December 31,2000. The full deployment of a new ProjectAlert Identification System (PAIS) and thelaunching of a Lessons Learned RetrievalNetwork (LERN), both part of the ongoingredesign of the Project and OperationsInformation System (POIS), were evidence ofthe Bank’s efforts to improve accountabilitythroughout the project cycle and in all of theBank’s line departments.
The need to increase transparency in allaspects of Bank operations was felt keenly in2002. The Oversight Committee on Fraud andCorruption (OCFC) began its first full year ofoperations and instituted a toll-free hotline forthe anonymous reporting of allegations to a
permanent secretariat of the high-level bodychaired by the Executive Vice President. Inaddition, Management initiated a series ofactions aimed at making available to the publica greatly expanded amount of informationabout the Bank and its activities, includingprocurement, projects in implementation, and,in particular, areas of finance and institutionalprocedures and structure. A draft of a broadrevision of the Bank’s seven year-old informa-tion disclosure policy was prepared and dis-tributed to the Board of Executive Directorsfor consideration early in the new year.
Mechanisms to enhance consultation withcivil society groups and other stakeholdersinvolved in Bank operations continued to bedeveloped and used throughout the year. AStrategy for Promoting Citizen Participationin Bank Activities was prepared and sent to theBoard for consideration. Numerous consulta-tions were held by Civil Society AdvisoryCouncils (CASC) in the IDB Country Offices,many of them focused on discussions of theBank’s draft strategies on poverty, sustainablegrowth, social sector reform, competitiveness,integration and modernization of the state. TheBank’s Office of Learning concluded a two-year program of 20 workshops on IncorporatingCivil Society Participation in IDB Activities.Throughout the year, the Bank continued itsdialogue with the Inter-American RegionalOrganization of Workers (ORIT).
Board of Governors
The highest authority of the Bank is vested inthe Board of Governors, composed of oneGovernor and an Alternate Governor appoint-ed by each member country. Governors areusually Ministers of Finance, Presidents ofCentral Banks or officials in positions of com-parable rank in their respective governments.
The Forty-third Annual Meeting of theBoard of Governors took place in Fortaleza,Brazil from March 11-13, 2002. On that occa-sion, the Board approved the financial state-ments of the ordinary capital, the Fund forSpecial Operations (FSO), and the
16

Intermediate Financing Facility (IFF) accountfor 2001. The Board also approved the trans-fer of $70,200,000 equivalent in convertiblecurrencies to the IFF account, drawn from theFSO.
During its deliberations, the Board ofGovernors considered a range of topics includ-ing matters related to the international finan-cial scenario, the impact of external agents onthe stability of the region’s economies, thefight against poverty, and the role of the pri-vate sector in the development of the region.
The Board approved a resolution to rein-force the Bank’s ability to offer new productsand improve some of its current instruments;to respond more efficiently and effectively tocrisis; and to pay special attention to specificaspects such as mitigating social impacts andreducing poverty. By passing this resolution,the Board approved a new financing frame-work consisting of three types of loans: invest-ment, support of policy reform, and emer-gency. The Board of Executive Directors wasinstructed to analyze the outcome of imple-menting this financing framework, and tosubmit a report to the Governors during the2005 Annual Meeting.
In addition, the Governors stressed theneed to combat corruption and money laun-dering in the region, reinforce judicial systems,and foster private sector development. TheBoard emphasized the need to increase privatesector operations for the smaller countries inthe region, and to draft and implement a planof action to tend to the needs of the smallerand less developed countries. The Governorsrequested that the Bank assist in draftingnational strategies and planning for increasingcompetitiveness, take an active role in formu-lating strategies to reduce poverty, and providesupport to improve efficiency and transparen-cy in public expenditures. Lastly, the Boardrecommended improving supervision andevaluation systems in order to assess the effec-tiveness of Bank operations.
In addition to the Fortaleza meeting, theCommittee of the Board of Governors alsomet in Washington, on January 17-18. During
this meeting, the Committee worked on theproposals submitted by Management toincrease the Bank’s ability to respond to thenew requirements of the borrowing countriesand to engage in financing in foreignexchange. At its second meeting, theCommittee examined the report submitted tothe President entitled “The Challenge of BeingRelevant: The Future Role of the IDB,” pre-pared by the External Advisory Group, andanalyzed the topic of effectiveness in develop-ment.
As for effectiveness in development, theCommittee acknowledged the inherent diffi-culty in questions of measurement, particularlyin social sector projects, and suggested thatefforts be made to develop an assessment sys-tem that would take into account the specificsituation in each country. The Committeeunderscored the importance of reinforcing thesense of project ownership in each country inorder to strengthen sustainability. In addition,it stressed that Millennium DevelopmentGoals should be considered during the processof approving operations. Lastly, the Committeeagreed to the creation of a unit that will reportto the Executive Vice President and be incharge of assessing the impact of developmentand the “evaluability” of all Bank operations.
On November 8, 2002, the Board held anextraordinary meeting to elect the President ofthe Bank. On that occasion, it approved a res-olution electing Mr. Enrique V. Iglesias for afive-year term, starting April 1, 2003.
Board of Executive Directors
The IDB has 14 Executive Directors whorepresent the Bank’s 46 member countries.Directors serve full-time for a period of threeyears. In the absence of a Director, the Bank’sAlternate Executive Directors, appointed bytheir respective Directors, have full authorityto represent their constituencies.
During 2002, the Board of ExecutiveDirectors approved loan and technical cooper-ation operations as detailed below in the sec-tion on the year’s lending. The principal corpo-
THE BANK IN 2002 17

rate issues resolved by the Board are describedin the following section detailing the activitiesof Board Committees.
During early 2002, the Board, in an AdHoc Committee created for this purpose, heldintensive discussions on means for increasingthe Bank’s capacity to respond to evolvingregional needs.
Permanent Committees of the Board of Executive Directors
Steering Committee
The Steering Committee of the Board coordi-nates the work of the Board StandingCommittees and deals with administrativeissues related to Board management. TheCommittee is made up of the Chairs of thefour Standing Committees, Dean and ViceDean. In 2002, the Board approved expandingits membership to include the Director repre-senting the Bank’s largest shareholder, theUnited States.
Throughout 2002, the SteeringCommittee worked closely with the Office ofthe Executive Vice President to coordinate themanagement of the Board’s work program. Toshape the development of the 2003 work pro-gram, the Committee coordinated a series ofmeetings to review Management’s proposalsand allow Directors to set priorities for thecoming year. To that same end, the Committeehelped set the agenda for a Board retreat inNovember that focused on equipping theBank with the instruments needed to respondefficiently to the challenges facing its borrow-ing members. In addition, the Committee con-sidered issues concerning management of theBoard budget and the travel program of Boardvisits to borrowing countries.
Organization, Human Resources and Board Matters Committee
This Committee deals with Bank organization-al issues such as adjustments to the structureof the institution, human resources topics
including those related to the new humanresources strategy, and matters related toBoard functioning and efficiency.
During the course of the year, theCommittee reviewed Management’s progressin implementing the human resources strategyas well as Management’s progress in using thecontingency reserve for mutually agreed sepa-rations.
In the area of personnel policy, theCommittee recommended approval of a newsecondment policy for the Bank.
The Committee also initiated discussionsof the first case under the IndependentInvestigation Mechanism since new proce-dures were approved in 2000. This case high-lighted a need to modify some of these proce-dures.
The Committee reviewed a report on thenew staffing plan and received documentationfrom Management that will assist in the estab-lishment of a new headcount for the Bank for2004.
Finally, late in the year the Committeediscussed the organizational aspects for the2003 annual meeting of the Board ofGovernors and recommended to the Board aseries of measures to simplify the meeting byincreasing its efficiency and reducing its scale.
Budget, Financial Policies and AuditCommittee
This Committee oversees the Bank’s adminis-trative and capital budgets, reviews the Bank’sfinancial policies, and supervises the externaland internal auditing of the Bank’s affairs.
Responding to heightened concerns inthe corporate world, the Committee gave pri-ority throughout the year to ensuring that theBank’s control environment and auditing func-tions continue to meet the most rigorous stan-dards. Working in close coordination withManagement, the Committee supervised theselection of Ernst & Young LLP as externalauditor, in place of Arthur Andersen LLP,without any disruption of the Bank’s financialactivities or of the timetable for auditing its
18

annual financial statements. The Committeehas worked closely with the Office of theAuditor General (AUG) to review how theOffice defines its work program and reports itsresults. The Committee has supervised thestartup of Management’s OversightCommittee on Fraud and Corruption,approved in 2001. In response to a report fromthe AUG, the Committee has agreed on anaction plan to improve compliance with audit-ing requirements of disbursements and pro-curement in lending projects that adopted anex-post modality for these transactions.
The Committee also adopted an actionplan to further simplify the Bank’s procure-ment procedures and to ensure their respon-siveness to client needs. Finally, in consultationwith the Finance Department, the AUG andthe new external auditors, the Committeebegan to develop a work program to review,and if necessary modify, the way it performs itsoversight of auditing and financial manage-ment functions.
In the area of financial policies, theCommittee began consideration of a newframework for the calculation of the Bank’sloan loss provisioning and economic capital.The adoption of this new framework wouldrequire a review of financial policies related tocapital adequacy, in particular the net incometarget policy and the loan loss provisioningpolicy. After an initial discussion, theCommittee requested additional informationand analysis to help Directors evaluate themodel’s parameters and assumptions. TheCommittee hopes to conclude its analysis ofthese issues during the first semester of 2003.
The procedures used to determine theBank’s annual budgets and salary increaseshave been progressively standardized over thepast four years. To conclude this process, theCommittee adopted documents that formalizethese new procedures. After an extended peri-od of appraising the costs and benefits of dif-ferent alternatives, the Committee recom-mended approval of a plan to equip the Bankwith additional conference and auditoriumfacilities. For the Bank’s administrative expen-
ditures, the Committee recommendedapproval of a 2003 budget that supports awork program responsive to the needs of theregion, with a nominal increase of 3.2 percent.In 2003, the Committee plans to discuss fur-ther the adoption of a system of “managementby results” that would allow closer tracking ofthe link between resources and institutionalpriorities and a multiyear budget.
Programming Committee
This Committee considers country and region-al programming documents, reviews reports onthe loan and technical cooperation pipelines,evaluates proposals for the allocation of con-cessional resources, oversees the activities ofthe Office of Evaluation and Oversight inareas related to country programming, andconsiders new initiatives that relate to theBank’s programming function.
In the area of country programming for2002, the Committee reviewed and recom-mended for Board approval the country strate-gies for Mexico, Peru, Guyana and Honduras.After substantial discussions on both contentand procedures, the Committee also took noteof country program evaluations for Mexico,Peru, Guyana and Honduras. The Committeenoted an improvement in the quality of coun-try strategies over previous years, in partattributable to the new guidelines approvedduring the year. The Committee also observedthat lessons learned from the evaluations werebeing increasingly included in the new countrystrategies.
For the first time, the Committee met toconsider country strategy updates. Theseupdates, which are required under the newcountry strategy guidelines, are less formalpresentations that afford Directors a currentlook at the status of each of the Bank’s countryprograms. The Committee considered theinnovation successful and will continue withthe practice next year.
In the area of concessional financing, theCommittee recommended approval of a newperformance-based formula for the annual
THE BANK IN 2002 19

allocation of resources from the Fund forSpecial Operations (FSO) and theIntermediate Financing Facility (IFF).Discussions on this issue had been underwayin the Committee since early 2001.
Policy and Evaluation Committee
This Committee considers the policies andstrategies that guide the Bank’s operations inthe region, reviews the instruments andreports that assess their success in promotingsocial and economic development, and over-sees the work of the Office of Evaluation andOversight (OVE).
Following a mandate from the Governors,the Committee devoted considerable attentionto proposals designed to strengthen the Bank’sability to measure, and hence enhance, thedevelopment effectiveness of its activities. TheCommittee began with a detailed discussion ofOVE’s assessment of the Bank’s currentarrangements. Subsequent consultationsbetween Management and members of theCommittee led to Board approval of a set ofactions, including immediate initiation of apilot program to assess the quality at entry ofBank loans, and the hiring of a high-levelexpert on development effectiveness. As aresult, the Board will deliver a progress reporton strengthening the Bank’s self-evaluationcapacity to the Governors at the 2003 AnnualMeeting. After considering the annual reporton the performance of the Bank’s portfolio ofloans in execution, the Committee recom-mended that Management prepare an actionplan to improve portfolio quality. TheCommittee also considered reports from OVEthat analyzed the effectiveness of Bank opera-tions in specific fields such as potable waterand reconstruction in the wake of naturaldisasters.
The Committee made substantialprogress in supporting the redrafting of theBank’s development strategies. The Committeereviewed an integrated set of profiles forstrategies covering the Bank’s two overarchinggoals—the reduction of poverty and the pro-
motion of sustainable economic growth—andits four areas of operational priority—competi-tiveness, regional integration, social develop-ment and modernization of the state. Indeveloping these strategies, Management wasto conduct extensive consultations with gov-ernment officials, technical experts and civilsociety. Consideration of the resulting strate-gies, including one for the environment, beganin the fall and will continue into the new year.
The Committee was active in reviewingBank policies and instruments promoting andprotecting financial development in the region.Responding to a mandate from the Board ofGovernors, the Committee recommendedapproval of guidelines for Bank lending inresponse to financial crises. It discussed pro-posals for a new policy on operations withfinancial intermediaries in borrowing coun-tries. To diversify the instruments available tothe Bank’s private sector operations, theCommittee recommended approval of aproposal to expand the scope of partial creditguarantees to allow Bank support of bondissues in local currencies and establishment ofa Trade Finance Reactivation program.
Poverty Reduction and Social Equity
The reduction of poverty and the promotionof social equity in Latin America and theCaribbean is one of the Bank’s overarchingobjectives. During 2002, the Bank undertooknumerous lending and non-lending activitiesin pursuit of this goal.
In the course of the year, the Bank’s newPoverty Reduction and Social EquityPromotion Strategy was developed and deliv-ered to the Policy and Evaluation Committeeof the Board. This strategy provides guidelinesto be followed in this area, highlights the needfor specific goals and targets for povertyreduction and equity promotion in the regionin line with the Millennium DevelopmentGoals, and underscores specific policy actions
For further information, see
http://www.iadb.org/goto.cfm?povertyred
20
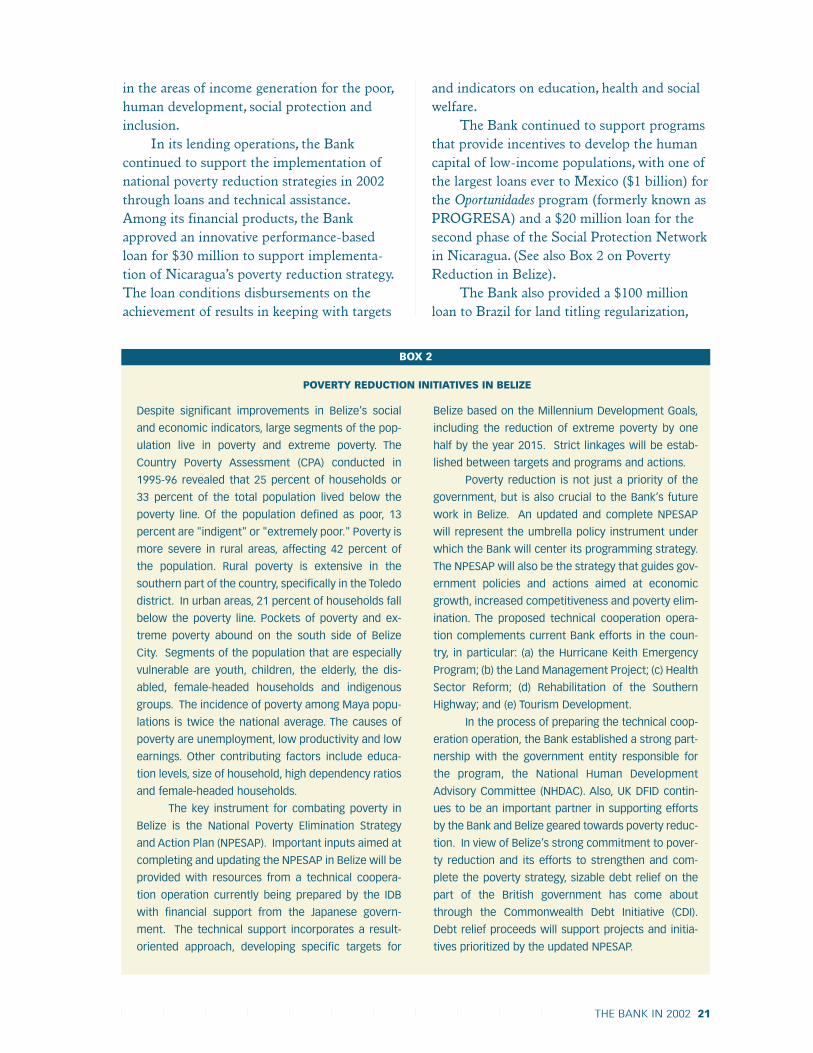
THE BANK IN 2002 21
BOX 2
Despite significant improvements in Belize’s social
and economic indicators, large segments of the pop-
ulation live in poverty and extreme poverty. The
Country Poverty Assessment (CPA) conducted in
1995-96 revealed that 25 percent of households or
33 percent of the total population lived below the
poverty line. Of the population defined as poor, 13
percent are "indigent" or "extremely poor." Poverty is
more severe in rural areas, affecting 42 percent of
the population. Rural poverty is extensive in the
southern part of the country, specifically in the Toledo
district. In urban areas, 21 percent of households fall
below the poverty line. Pockets of poverty and ex-
treme poverty abound on the south side of Belize
City. Segments of the population that are especially
vulnerable are youth, children, the elderly, the dis-
abled, female-headed households and indigenous
groups. The incidence of poverty among Maya popu-
lations is twice the national average. The causes of
poverty are unemployment, low productivity and low
earnings. Other contributing factors include educa-
tion levels, size of household, high dependency ratios
and female-headed households.
The key instrument for combating poverty in
Belize is the National Poverty Elimination Strategy
and Action Plan (NPESAP). Important inputs aimed at
completing and updating the NPESAP in Belize will be
provided with resources from a technical coopera-
tion operation currently being prepared by the IDB
with financial support from the Japanese govern-
ment. The technical support incorporates a result-
oriented approach, developing specific targets for
Belize based on the Millennium Development Goals,
including the reduction of extreme poverty by one
half by the year 2015. Strict linkages will be estab-
lished between targets and programs and actions.
Poverty reduction is not just a priority of the
government, but is also crucial to the Bank’s future
work in Belize. An updated and complete NPESAP
will represent the umbrella policy instrument under
which the Bank will center its programming strategy.
The NPESAP will also be the strategy that guides gov-
ernment policies and actions aimed at economic
growth, increased competitiveness and poverty elim-
ination. The proposed technical cooperation opera-
tion complements current Bank efforts in the coun-
try, in particular: (a) the Hurricane Keith Emergency
Program; (b) the Land Management Project; (c) Health
Sector Reform; (d) Rehabilitation of the Southern
Highway; and (e) Tourism Development.
In the process of preparing the technical coop-
eration operation, the Bank established a strong part-
nership with the government entity responsible for
the program, the National Human Development
Advisory Committee (NHDAC). Also, UK DFID contin-
ues to be an important partner in supporting efforts
by the Bank and Belize geared towards poverty reduc-
tion. In view of Belize’s strong commitment to pover-
ty reduction and its efforts to strengthen and com-
plete the poverty strategy, sizable debt relief on the
part of the British government has come about
through the Commonwealth Debt Initiative (CDI).
Debt relief proceeds will support projects and initia-
tives prioritized by the updated NPESAP.
POVERTY REDUCTION INITIATIVES IN BELIZE
in the areas of income generation for the poor,human development, social protection andinclusion.
In its lending operations, the Bankcontinued to support the implementation ofnational poverty reduction strategies in 2002through loans and technical assistance.Among its financial products, the Bankapproved an innovative performance-basedloan for $30 million to support implementa-tion of Nicaragua’s poverty reduction strategy.The loan conditions disbursements on theachievement of results in keeping with targets
and indicators on education, health and socialwelfare.
The Bank continued to support programsthat provide incentives to develop the humancapital of low-income populations, with one ofthe largest loans ever to Mexico ($1 billion) forthe Oportunidades program (formerly known asPROGRESA) and a $20 million loan for thesecond phase of the Social Protection Networkin Nicaragua. (See also Box 2 on PovertyReduction in Belize).
The Bank also provided a $100 millionloan to Brazil for land titling regularization,

basic infrastructure, training, and support forindigenous communities in the state of Acre.A $21 million loan to Bolivia will address thesocioeconomic impact of the Santa Cruz-Puerto Suárez corridor highway and supportland titling, development of human capital(including indigenous groups), and repaymentof resettlement losses. The Bank also approveda $27.4 million loan to provide electricity topoor segments of the population in Guyana.
Among its non-financial services, theBank continued activities geared toward gener-ating knowledge on poverty and inequality.Three technical cooperation operations aimedat identifying financial products for the poorwere initiated, generating outcome indicatorsfor monitoring of the Millennium Develop-ment Goals, and supporting the evaluation ofpoverty reduction programs. The Bankpublished a study on poverty reduction andeconomic growth and produced studies onsocial investment funds and institutionaldevelopment for the delivery of social services.
The Bank also contributed to the dissemi-nation of experiences, best practices andknowledge through workshops and seminars.The Bank held international seminars on socialprotection and the challenges of meeting theMillennium Development Goals in LatinAmerica and the Caribbean. Also held werethe third and fourth meetings of the RegionalPolicy Dialogue on Poverty and Inequality,discussing issues such as micro-finance pro-grams targeted to the poor and experiences inimplementing national poverty reductionstrategies. The final report and evaluation ofthe Social Equity Forum was completed, andplans are underway to launch its second phase.The Bank also continued to support theNetwork on Inequality and Poverty (see Box 3on MECOVI).
Sustainable Economic Growth
During the past five decades, the region hasshown disappointing growth rates. All otherregions in the world, with the exception ofAfrica, achieved stronger growth and develop-
ment. While per capita income recoveredthroughout the 1990s following the previous“lost decade,” the average annual growth rateonly reached 1.5 percent during the ten yearsending in 1999. The reasons for this slowgrowth are mainly poor quality services pro-vided by public institutions, inadequatemacroeconomic policies, a weak financial sys-tem, poor quality physical infrastructure, poor-ly trained human capital, and an adverse inter-national environment.
The main goal of the draft IDB Strategyfor Sustainable Economic Growth is toincrease income and per capita output in theregion, fostering an environment for a betterquality of life for the population, thus reducingpoverty rates and preserving or improving themanagement of natural resources.
Governments and international organiza-tions have geared efforts towards increasingeconomic growth in the region. These effortshave generated valuable lessons. The mostnotable and important lesson is to understandthat there is no given recipe for guaranteedgrowth. Even during periods of macroeco-nomic stability and properly functioning mar-kets, the growth rate may be disappointing forreasons varying from the quality of the politi-cal and social environment to the ability of thepopulation to sort out mixed signals regardingopportunities for investing.
The Bank recognizes that the countries inthe region face significant barriers for sustain-able growth. Consequently, it has developed astrategy—flexible yet containing a series ofcommon core elements—to be adapted to theneeds and priorities of each country. Thisstrategy aims to make full use of the advan-tages and possibilities offered by the institu-tion. Activities are organized based on the fol-lowing priorities, which are fully detailed inindividual sector strategies:
To improve the competitiveness ofproductive activities, especially in the institu-tional and economic spheres, in order to
22
For further information, see
http://www.iadb.org/goto.cfm?econgrowth

upgrade the operations of financial markets,human resources, infrastructure services,knowledge, and technology;
To increase the quality and coverage ofeducation and health services within a devel-opment and social integration framework;
To strengthen public institutions andfoster a conducive political environment
within a framework for modernization of thestate;
To promote regional integration tobetter position the countries of the region tocompete internationally; and
To strengthen environmental manage-ment and natural resource management, toensure sustainable economic growth.
THE BANK IN 2002 23
BOX 3
One important restriction faced by policymakers and
researchers working on poverty reduction has been
the lack or poor quality of information at the micro
level. The development of good quality household
surveys and the institutional strengthening associat-
ed with data collection and processing are essential
for enhancing the potential of public policies to
reduce poverty.
The Program for the Improvement of Surveys
and Measurement of Living Conditions in Latin
America and the Caribbean (better known by its
Spanish acronym MECOVI) was established in 1996
by the IDB, the World Bank and the United Nations
Economic Commission for Latin America and the
Caribbean (ECLAC). The objective of the program is to
support countries’ efforts to develop prompt, compa-
rable and easily accessible micro data, and to
improve the quality of those data and their geo-
graphic and thematic coverage. To this end, the pro-
gram focuses on strengthening the institutional and
technical capacity of statistics offices and institutions
throughout the region.
The program operates at different levels, con-
centrating on the survey design side, improvement of
questionnaires, fieldwork logistics, data entry, and
the inclusion of original modules that explore impor-
tant developmental themes such as ethnicity, family
remittances, access to social programs, and house-
hold response to adverse shocks.
At the country level, the program strengthens
institutional capacity to train and educate technical
staff on the execution, analysis and research of
household surveys, provide financing for technical
studies, and support institutional reforms. The focus
is on the producers and the users of statistical data,
in order to contribute to the generation of a statisti-
cal culture that values the importance of information
for policymaking. MECOVI has country-specific pro-
grams in Argentina, Bolivia, El Salvador, Guatemala,
Nicaragua, Paraguay and Peru. Ecuador, the Domini-
can Republic and Honduras are in the process of join-
ing the program. Funding for country-specific activi-
ties has come from the IDB’s Fund for Special
Operations (FSO), the World Bank’s Institutional
Development Fund (IDF) and Trust Fund for Statistical
Capacity Building (TFSCB), and from bilateral donors
(Canada, Denmark, Germany, Japan, Norway and
Sweden). In some recently incorporated countries,
resources have been part of IDB lending operations.
At the regional level, activities provide a mech-
anism to disseminate research and information on
best practices on issues such as measurement,
methodologies and data collection and organization.
These activities also stimulate country-to-country
cooperation. In cooperation with the Instituto Nacio-
nal de Estadística, Geografía e Informática de México
(INEGI), and the Instituto Nacional de Estadística y
Censos de Argentina (INDEC), MECOVI has organized
ten regional workshops and eight regional training
courses for producers and users of household sur-
veys. To date, more than 400 technical staff from
most countries in the region have participated in
these activities. Resources to fund these activities
have come from the FSO.
The program has been successful on many
fronts, such as improving the quality of household
survey data, promoting the use of data for policy-
making, playing a role in the creation of a statistical
culture in the region, and underlining the importance
of data production.
MECOVI PROGRAM
For further information, see http://www.iadb.org/goto.cfm?mecovi

Concerning the final priority, Managementin 2002 prepared an environmental strategydesigned to establish systemic links with eachof the other four areas of emphasis. The strat-egy thereby seeks to embed environmentalconcerns and sound natural resource manage-ment as goals underlying the fundamentalobjectives of poverty reduction and sustainableeconomic growth.
Modernization of the State
In 2002, 16 projects were categorized as havingprimary components of reform and modern-ization, totaling $667.2 million. These projectsencompass a broad range of categories, includ-ing reform of the judicial system, public man-agement, decentralization and fiscal reform.They were financed using traditional, sector-based and flexible lending instruments andcovered most of the countries in LatinAmerica and the Caribbean.
The Bank concentrated during the yearon the lines of activity identified within thearea of democratic governance. This focus isconsistent with the Eighth CapitalReplenishment, the Institutional Strategy ofthe Bank, and the countries’ demand for sup-port to economic, social and institutionaldevelopment. The emphasis on democraticgovernance stems from the recognition that itis a fundamental condition for countries of theregion to develop in an equitable and environ-mentally sustainable way.
The attention the Bank and membercountries have given to modernization of thestate continued in 2002.The three new Stateand Civil Society Divisions established in eachRegional Department in 2001 permit the Bankto accommodate the rising demand from bor-rowing countries to modernize the state andstrengthen ties with civil society organizations.An updated modernization of the state strategy,as well as a strategy for citizen participation inBank activities, were delivered to the Policy andEvaluation Committee of the Board in 2002.These strategies were formulated to identifycurrent priorities for Bank action and provide
the basis for new operations, technical workand resource allocation. Input for the strategiescame from a range of sources, including aca-demics, government officials, civil societyorganizations and international developmentagencies.The strategies were adjusted to fitwith the requirements of the sustainable eco-nomic growth and poverty reduction frame-work strategies described above, and weredrawn up as complements to the sector strate-gies related to social development, competitive-ness, regional integration, and the environment.
Projects approved in this area in 2002included a $28 million Modernization of theState and Decentralization Program in Peruthat will redefine key institutional rules thatregulate national and subnational governmentactivities. During project preparation, theBank assisted the Peruvian government indesigning a constitutional amendment andother legal reforms that will enable the countryto launch the decentralization process. A farsmaller project, a $100,000 grant from theFund for Special Operations, will support thedesign of an integrated system of data collec-tion and processing that will generate justicestatistics and indicators in Latin America andthe Caribbean. The operation will be carriedout by the Justice Studies Center of theAmericas (JSCA).
In 2002, the Bank approved 97 technicalcooperation projects for reform and moderniza-tion of the state, totaling $27.3 million.Through these projects, which include nationalas well as regional programs, the Bank is intro-ducing innovative issues into its loan pipeline.The issues include public safety, civil societyparticipation, electronic government and decen-tralization. These technical cooperation projectsfinanced workshops, seminars, training sessions,publications, and other activities designed tobuild consensus among all relevant parties.
The year was a difficult one for theregion, with the weak economy in the industri-alized nations, the economic crises in South
24
For further information, see
http://www.iadb.org/goto.cfm?modstate

America, and concern over regional securityissues (see Box 4). However, the demand formore effective, efficient and transparent gov-ernment systems has not lessened, and theBank has continued to offer its support to itsmembers’ efforts in this task.
Competitiveness
Differences in productivity constitute the mainreason for the enormous differences in percapita income throughout the world.Thus, thelow productivity levels of the Latin American
THE BANK IN 2002 25
BOX 4
International experts analyzed the economic, social
and political impact of security issues on the develop-
ment of Latin America and the Caribbean at a seminar
held by the IDB and the Organization of American
States in September 2002.
The seminar, entitled "Security and Develop-
ment: Challenges for Latin America and the
Caribbean," brought together more than 150 dele-
gates from government, academia and civil society.
Speakers underscored the need to strengthen region-
al cooperation in order to reduce the vulnerability of
countries to risks ranging from economic crises to
natural disasters, crime and terrorism. IDB President
Enrique Iglesias pointed out that security, an issue
with deep and complex roots, has become a key con-
cern among citizens, and a "tax on progress" for many
countries in the region. Security must be based both
on democracy and development.
Countries of the region have come to recognize
that security threats are a shared burden. None-
theless, there is also a domestic dimension to the
issue. Speakers agreed, for instance, that individual
nations should strive to improve their justice systems
in order to deal with the problems caused by crime.
Many critical instruments needed to confront the
challenges represented by drug trafficking, terrorism
and corruption are lacking or need improvement in
many countries. There was a consensus that the
effort to meet these challenges must not be left sole-
ly to the armed forces or the police, but that they
demand greater participation from civil society.
The seminar consisted of panel discussions on
economic, social, political and diplomatic aspects of
security. The first panel analyzed the volatility of Latin
American economies as a source of insecurity, and
proposed policies to address the problem. The panel
on social issues discussed the importance of social
safety networks for stability and development in the
region. The panel on political issues highlighted the
role played by democratic institutions, while the panel
on hemispheric security examined lessons learned
from the terrorist attacks of September 11, 2001.
Towards the end of 2001, the Bank approved a
MIF line of activity for $10 million for security and
safety upgrades at airports in Latin America and the
Caribbean. The goal of the financing is to enhance civil
aviation policies and regulatory frameworks, improve
administrative services, and train personnel in charge
of surveillance and enforcement of new regulations,
and therefore strengthen airport security. By the end
of 2002, almost all the countries of the region had
applied or were in the process of applying for MIF
support in this area.
In addition, the Bank convened an inter-institu-
tional working group whose members reviewed
questions related to the design and utility of terror-
ism insurance and its impact on infrastructure
finance. Representatives of the private sector (such
as insurance underwriters and contractors) as well
as officials of other international and bilateral organ-
izations (including the International Finance Cor-
poration and the U.S. Overseas Private Investment
Corporation) will continue to confer periodically on
this and related topics.
In the area of natural disasters, the Bank has
continued to work on various fronts, including the
issue of risk management and risk transfer. A study is
under way to review the impact of natural disasters
on infrastructure and the incentives to mitigate that
risk and obtain coverage. In mid-2002, the Bank con-
cluded a Memorandum of Understanding with FIDES
(Federación Interamericana de Empresas de Seguros),
the Latin American association of insurance compa-
nies, to strengthen work in the industry in many coun-
tries in the region, including, in particular, transfer of
risk associated with natural disasters.
REGIONAL SECURITY
For further information, see http://www.iadb.org/goto.cfm?security

countries imply a potential for growth thatmust be activated.The main goal of the Bank’sCompetitiveness Strategy, prepared during2002, is to help improve the economic andinstitutional environment for private sectordevelopment and enhanced productivity. Themain activities included in the strategy focuson correcting or counterbalancing defects inmarket activities regarding private sector com-petitiveness, and involve the following:
1. Policies and institutions for the efficientmobilization and use of financial and capitalresources.The biggest obstacle to strongercompetitiveness by private sector firms in theregion is the scarcity of financial resources andthe difficulty in accessing credit. This is espe-cially true for small enterprises and independ-ent producers. Given the Bank’s experience inthis area, the Competitiveness Strategy stressesthat the IDB support national efforts to:
Modernize legislation and regulationsgoverning financial systems in order to fostercompetitiveness within the sector, improveefficiency in intermediation procedures,reduce and manage risks that may arise fromfinancial service activities, and adopt non-dis-torting regulation and control mechanisms;
Develop capital markets and comple-mentary regulatory and supervisory institu-tions;
Strengthen investors’ property rights,especially those of small and institutionalinvestors;
Improve property rights related toassets such as land and housing, particularlyfor low-income individuals;
Make sustainable and productive useof natural resource capital;
Develop micro-credit systems andother alternative institutions that broadenaccess to credit; and
Transform pension regimes into finan-cially sustainable systems, including thosebased on individual financial capitalizationschemes.
2. Policies and institutions for more efficientuse of human resources. This includes educationand training, hiring of labor, and negotiation.
The Bank has a longstanding tradition of sup-porting the education and training sectors,including:
Reforming the education sector toincrease effectiveness, broaden coverage, andimprove the equality of basic education sys-tems, taking training methodologies intoaccount;
Reforming labor training systems toincrease competitiveness, foster private sectorparticipation, and increase the relevance oftraining;
Formulating mechanisms for thetraining of entrepreneurs and the workforce, inorder to strengthen microenterprise andsmall- and medium-size businesses andincrease their productivity and trade opportu-nities; and
Modernizing labor and collectivenegotiation legislation to facilitate hiring prac-tices in the formal sectors, reduce labor costsdue to unnecessary regulation, facilitate dia-logue between industry and the workforce, andenforce legislation and measures protecting theworkforce.
3. Policies and institutions for the supply ofinfrastructure services, including electricity,telecommunications, water and sanitation,roads, ports and airports. The Bank has consis-tently been at the forefront of efforts to sup-port the modernization and privatization ofthese sectors. Thus, the CompetitivenessStrategy focuses on:
Consolidating the reform processes inprivatized sectors;
Adjusting regulatory frameworks tofoster competitiveness in delivering services,promoting efficiency and modernization, andbroadening both the quality and coverage ofservices, especially in rural and low-incomeareas; and
Financing infrastructure investments,including the design and implementation ofnew modalities to access national and interna-tional capital markets.
26
For further information, see
http://www.iadb.org/goto.cfm?competitiveness

4. Policies and institutions for the assimila-tion and development of knowledge and new pro-ductive technologies. In this area, essential to thecompetitiveness of the countries, the Bank hasconsistently attempted to benefit the leastdeveloped nations in particular, as well asmedium-sized and small enterprise. TheStrategy proposes Bank support for:
The forecast and identification of pos-sible deficiencies in science and technologysystems;
Strengthening science and technologyinstitutions;
Technical training and scientificresearch in those areas critical for sectors withknown potential; and
Fostering technological advances with-in small enterprises and low-income producers.
Social Sectors
A new Social Development Strategy wasdeveloped and delivered to the Policy andEvaluation Committee of the Board to guidethe Bank’s actions in social development forthe next five to 10 years. The objective of thestrategy is to help countries accelerate socialprogress by fostering human and social envi-ronments conducive to the well being of all,with special emphasis on poverty reductionand equal opportunity. The preparation of thestrategy included research, consultation andconsensus building. Background studies andsurveys were commissioned on the region’ssocial indicators, trends in social expenditures,and challenges for crafting sustainable socialcontracts.
To stress the importance of social policydialogue and civil participation, a seminar ledby former Chilean President Patricio Aylwinwas held during the Bank’s Annual Meeting inFortaleza. The seminar emphasized theimportance of identifying principal social pri-orities and fostering national consensus on themost effective policies for addressing them. Inparticular, it examined the successful 20-yearexperience of the Environmental Councils inBrazil. A follow-up seminar in Santiago, hosted
by ECLAC, expanded this review to includeexperiences from national governments (e.g.,Bolivia, Honduras and Peru) and internationalagencies (UNDP, the World Bank and theInternational Institute for Democracy andElectoral Assistance, among others).
The Millennium Development Goalsconstitute a commitment made by all coun-tries to achieve specific levels of human andsocial development by 2015 in the areas ofpoverty, health, education, gender, environmentand trade. In cooperation with UNDP,ECLAC and the World Bank, the IDB isexploring ways to help countries in the regionachieve these development targets. A jointinternational seminar was held in June at IDBheadquarters to review the best practices ofinterventions aimed at reaching these goals.
The Bank approved a program focusedon improving the quality of life of the elderlypoor in Latin America and the Caribbean. A$750,000 grant from the Japan Special Fundwill strengthen organizations that support theelderly in Argentina, Chile, Peru and Uruguay,as well as improve the capability of a regionalnetwork and seven national networks to sup-port these organizations. The resources willfinance leadership courses for 2,380 elderlypersons and strengthen more than 3,000organizations that benefit older people. TheBank also published the book Más vale porviejo,which analyzes regional statistics andpossible policy interventions.
Following the approval of the SubnationalDevelopment Strategy the year before, theBank in 2002 approved loans totaling $276million in the area of urban development. Inaddition, the Bank supported the establish-ment of two Social Investment Funds, impor-tant tools for supporting local development,totaling $178.4 million. The Bank continued toassist borrowing countries in reforming thehousing sector to enhance efficiency and targetpublic sector expenditures to low-income fam-ilies. Loans totaling $79.5 million benefited
THE BANK IN 2002 27
For further information, see
http://www.iadb.org/goto.cfm?social

Ecuador, Trinidad and Tobago and Nicaragua.Sustained demand for Bank support for
integrated settlement upgrading programs ledto the publication of Cities for All, describinglessons learned from Bank-sponsored projects.The book responds to the need to transferknowledge from successful experiences tocountries in the early stages of implementingprograms that are increasingly complex anddecentralized. A loan to Guatemala for$46.8 million for settlement upgrading wasapproved in 2002, the first of several opera-tions being prepared for Central America.
The Bank expanded its technical coopera-tion activities that support rehabilitation pro-grams for deteriorated areas and the preserva-tion of urban heritage areas. Operationsfunded by the Italian, French and SpanishTrust Funds benefited projects in Brazil,Colombia, Panama and Peru. Responding tothe growing interest in heritage preservation,an Italian Trust Fund grant of 2.5 millioneuros was established to assist local govern-ments in preserving their cultural heritage,supporting the preservation and developmentof heritage assets, new heritage-based econom-ic activities, cultural tourism, and communitydevelopment.
The Bank continued to mainstream issuesconcerning indigenous peoples into its regularlending program. Several highway and energyinfrastructure programs included comprehen-sive measures to mitigate and compensateindigenous communities for possible negativeimpacts on their lands, resources and socio-cultural conditions. Examples included theSanta Cruz-Puerto Suárez Highway project inBolivia and the Camisea energy project inPeru. Operations involving tourism and natu-ral resource management incorporated specificcomponents, targeting mechanisms or designmeasures to ensure the participation of indige-nous groups. Examples included FONCODESIII in Peru, the Guatemala Upper WatershedNatural Resource Management Program, theEcuador Northern Amazon Program, theBolivia Sustainable Tourism Program, theNicaragua Social Protection Program II, and
the Panama Employment and TrainingProgram. Several of these projects that benefitethnic minority groups are adopting an inte-grated participatory community developmentfocus.
To prepare the guidelines for 2003 regard-ing support for indigenous groups, studieswere undertaken during the year on bilingualand intercultural education at the primarylevel, technical and vocational and tertiaryeducation, and the incorporation of traditionalmedicine in public health programs and poli-cies. Reflecting the Bank’s new strategy forthe participatory and integral development ofrural areas, lessons learned were systematizedand incorporated into new projects designedespecially for the indigenous and African-descendant populations. Progress has beenmade in developing an application for incorpo-rating the interests of native populations intogeographical information systems (GIS), andfor land use planning, taking into considera-tion the different categories used by the differ-ent cultural or ethnic groups (see Box 5).
Continuing with its work on violenceprevention, the Bank approved a $27.9 millionloan to support El Salvador’s Social PeaceProgram, which aims to improve public safetythrough the prevention of crime and violence,and by involving national agencies, localgovernments and civil society groups. Thisproject broadens the IDB’s involvement in thefield of public safety, building on previousexperiences in Colombia, Jamaica andUruguay. A $63 million loan to Colombia willsupport the building and rehabilitation ofsocial infrastructure and services in small,low-income communities that have sufferedfrom violence and civil strife. The resourceswill support investments to enhance commu-nity management capacity, build public works,and improve health, education and socialdevelopment in 252 municipalities of less than10,000 inhabitants.
Technical cooperation operations wereapproved to support violence prevention pro-grams in Guatemala, Honduras, Nicaragua andChile. Other innovative programs included a
28

THE BANK IN 2002 29
BOX 5
Social exclusion is defined as the chronic scarcity of
opportunities and lack of access to basic services,
labor markets and credit; exposure to unhealthful
physical conditions; and lack of recourse to adequate
infrastructure and judicial and political systems.
The Bank adopted its first Action Plan for
Combating Social Exclusion Due to Race or Ethnic
Background in May 2001. The aim of the plan is to
promote and govern Bank activities that advance the
social inclusion of racial and ethnic populations in the
region in Bank policies, projects and practices.
Race and ethnicity are among the most impor-
tant factors in such exclusion in Latin America and the
Caribbean. Because specific racial and ethnic popula-
tions are over-represented among the poor, attacking
the dynamics of social exclusion in the region is criti-
cal to achieving the key Bank goals of reducing pover-
ty and inequality and implementing sustainable devel-
opment in socio-culturally appropriate ways.
The 2001 Action Plan has been an important
tool in organizing and targeting the Bank’s activities to
address social inclusion. Accomplishments include:
• Exceeding the goal of having two new social
inclusion operations in each of the Bank’s Regional
Departments approved in 2001;
• New and expanded technical support to
national statistics institutes for data gathering and
data analysis on ethnic groups;
• Development of new INDES training courses
for indigenous peoples and afro-descendents, the
results of which will be incorporated into the broad-
er Bank training program and offered to all regional
leaders trained by the IDB;
• Approval of an internal plan to promote
diversity among Bank staff.
In June 2002, based on the results of the plan,
a follow-on Action Plan was adopted, constituting a
"second phase" of the IDB’s efforts to advance social
inclusion. The extended action plan sets specific
goals to cover the June 2002-December 2003 period,
and defines activities and commitments in this next
phase. Identified priorities under this second plan
are: (i) capacity-building, both within the Bank and in
the region; (ii) knowledge-building and research to
better identify and understand how to address social
inclusion; and (iii) an expanded project pipeline that
tests new approaches to addressing social inclusion.
New and ongoing Bank social inclusion activities
include the following:
• Targeted operations. More than 15 opera-
tions directed toward afro-descendents have been
approved since May 2001. More than 10 percent of
IDB operations in the social sectors have had indige-
nous peoples as direct or indirect beneficiaries. An
Inter-Departmental Technical Group on Social Inclu-
sion has continued to work toward greater main-
streaming of social inclusion in Bank operations.
• Internal Diversity Plan. The Action Plan to
Promote Diversity at the IDB was endorsed by the
Board of Executive Directors in November 2001. As
part of this plan, the Bank’s Human Resources
Department will conduct an internal census on staff
demographics, including race and ethnicity, and a
survey of the organizational climate for promoting,
valuing and working with diversity.
• Technical Support, Research and Dissemina-
tion. A seminar entitled Todos Contamos II, during
which mechanisms to accelerate processing and dis-
semination of data on ethnic groups were discussed,
was held in Lima, Peru with the World Bank and the
National Institute of Statistics of Peru. The Bank has
also given technical support to statistics authorities
in Honduras for the analysis of household survey data
on afro-descendents and indigenous peoples. A book
compiling key findings from diagnostic studies and
data-gathering efforts carried out to identify the caus-
es and consequences of social exclusion due to race
or ethnic background will be published next year.
• New tools for project development. The
Bank has developed rosters of potential consultants
for work on development programs involving afro-
descendents and indigenous peoples, and databases
that monitor and record the development of new
projects benefiting these populations. Operational
guidelines on sociocultural analysis have been pre-
pared, as has a GIS-based software tool for including
sociocultural factors in land use planning, project
design and targeting. Research on socioculturally
appropriate indicators, which measure indigenous
poverty and other aspects of human development
based on local values, was commissioned and will be
ready in 2003.
ADVANCING SOCIAL INCLUSION
For further information, see http://www.iadb.org/goto.cfm?socialincl

$750,000 regional TC from the JapaneseSpecial Fund to strengthen and evaluateschool-based violence prevention programs,and a grant of $150,000 from the UnitedKingdom Fund for Strengthening LocalInstitutions in Central America (CABILICA),which will improve local capacity for domesticviolence prevention in Panama.
The Bank published Domestic Violence:Interventions for its Prevention and Treatment. Incollaboration with ICRW and UNIFEM, theIDB produced a background study, Making theLaw Work:Analysis of Budget Allocations forImplementing Domestic Violence Law, with data,policy suggestions and budgetary implicationsfor the implementation of domestic violencelaws approved in the region since the UnitedNations’ Fourth World Conference on Women.
The Bank is promoting an extensive con-sultation process to obtain feedback from keystakeholders on labor market issues. This isimportant input for the preparation of theSocial Development Strategy. Two seminarswere held on labor market and employmentpolicies, one for the Andean Region in Peruand one for the Southern Cone in Argentina.In 2002, the Bank approved an $8.4 millionloan to Panama to implement a job trainingand placement system that will improveemployment prospects for youth and enhanceworker skills in the microenterprise and smalland medium-sized business sector. Child laborprevention initiatives advanced in 2002 withthe support of Special Funds for EuropeanTechnical Assistance in Latin America, whichwill raise awareness on child labor issues, withan emphasis on eliminating the worst forms ofchild labor, and financing and disseminatingbest prevention practices.
In the health sector, the expansion of theOportunidades anti-poverty program in Mexicowill improve access to basic health servicesand nutritional services. The program pro-vides free food supplements to expectant andbreast-feeding mothers and to infants up totwo years old in order to prevent undernour-ishment. The program also awards cash grantsto families to help them improve the quantity,
quality and variety of their diet, as long asbeneficiaries go for medical consultations andattend courses on health and nutrition. TheBank also approved an urban developmentproject for the state of Pará, in Brazil, thatincludes strong support to enhance health sys-tems at the municipal level.
One of the challenges in health is toachieve an equitable, efficient and sustainablehealth system in federative countries likeBrazil. In response to this challenge, the Bankpublished El Desafío de la Descentralización:Financiamiento Público de la Salud en Brasil,which details an agenda to improve the organi-zation and financing of the Brazilian healthsystem. To help Argentina in the health sector,the Bank approved a reformulation of projectsin execution, to include new components thatprovide free generic pharmaceuticals for thepoorest population. The REMEDIAR pro-gram, supported by the Bank, is a key elementin the effort to provide services to Argentinesliving in poverty.
The Bank paid special attention to raisingawareness on HIV/AIDS. A high-level semi-nar at the IDB Annual Meeting in Fortalezagave policymakers an opportunity to discussthe best approaches for HIV/AIDS preventionand treatment. Norway, Finland, Denmark andSweden supported Bank-led HIV initiativesaimed at raising awareness and implementinginnovative pilot programs to prevent AIDS.
Over the course of 2002, the Bank’s port-folio in education continued to expand intonew areas. Loans were approved to enhancecultural awareness in Brazil and for sectoralreforms in the Dominican Republic andGuyana. In addition, several efforts wereundertaken to increase understanding of pre-school, accreditation, certification at the uni-versity level, diversification of options at thetertiary, non-university level, and the use oftechnology and distance education. Otheractivities were launched to raise the profile ofeducation as a regional issue. The Bank spon-sored several international technical meetingsto discuss the Millennium Development Goalsin education across the region, the promotion
30

of regional public goods in education (such aseducational software), and the use of educa-tional assessment and evaluation. Best practicepapers were prepared and disseminated on thetopics of private education and public policy,preschool, and the state of education reformsthroughout the region. Five books were pub-lished on topics ranging from teachers’ careersand incentives, to the applicability of the com-munity college model to the region, privateeducation, secondary education, and a compar-ison between innovation and performance inAsia and Latin America.
A technical cooperation was approved tocarry out studies on the education of girls inArgentina, Bolivia, Guatemala and Peru. Thestudies will produce information to assist poli-cymakers in developing new policies andstrategies to improve girls’ education at the pri-mary level, as well as to improve the relevanceof secondary education to the labor markets.
In 2002, the Inter-American Institutefor Social Development (INDES) expandedand diversified its training activities in socialpolicy design and social program managementfor professionals from diverse governmentaland nongovernmental organizations.
Some 300 persons were trained in 16regional events, including the four-week coreINDES courses, seminars for parliamentari-ans, youth leaders, journalists, and directors ofsocial investment funds, as well as training forLatin Americans of Asian and African descent.A distance training course on hospital man-agement and a seminar in Japan on citizenparticipation were also held. National pro-grams in Nicaragua, the Dominican Republic,and Honduras trained almost 1,000 partici-pants in a variety of social management skills.
INDES also strengthened a network withLatin American university centers engaged intraining social managers to discuss technicalissues and course content and coordinateactivities to ensure the sustainability of train-ing programs. The Institute is also imple-menting innovative technology-based strate-gies for training, such as web-based videotransmission and communication via Internet.
In activities related to gender, studies werecoordinated as part of the preparation of theSocial Development Strategy to identify chal-lenges for afro-descendent and indigenouswomen. To support the strengthening of com-petencies to analyze gender issues both inter-nally and externally, the Gender AnalysisTraining Facilitator’s Manual was published. Themanual draws on Bank experience with gendertraining and will be disseminated throughoutthe region. Follow-up activities with the par-ticipants of the “training of trainers” courseprovided technical support to trainers replicat-ing courses nationally. Courses were given inEcuador, Bolivia and Nicaragua.
Within the Program to Support Women’sLeadership and Representation (PROLEAD),the Sustainable Development Department metwith the Indigenous Initiative for Peace andthe Rigoberta Menchú Foundation to developa plan of action for the Summit of IndigenousWomen of the Americas, held in Oaxaca. INDESoffered a course in Managua on “DemocraticValues for Central American Young WomenLeaders” in collaboration with the OAS.Technical cooperation funds were used to sup-port civil society initiatives geared to strength-en women’s political leadership and contribu-tions to democratic governance in the AndeanRegion.
Integration
Support for integration, one of the four pillarsof the Bank’s Institutional Strategy, was evi-dent in the preparation of a strategy docu-ment, in participation in various subregional,hemispheric and extra-regional initiatives, andin a concerted program of technical assistanceoperations.
The momentum of regional integrationremained strong throughout 2002 as subre-gional, hemispheric and extra-regional initia-tives advanced steadily. Negotiations for theFree Trade Area of the Americas (FTAA), the
THE BANK IN 2002 31
For further information, see
http://www.iadb.org/goto.cfm?integrate

most ambitious integration project ever under-taken in the Western Hemisphere, are oncourse for completion by the end of 2004. Theseventh meeting of hemispheric trade minis-ters in Ecuador in November was an impor-tant step forward. A second draft treaty wasagreed upon and the United States and Brazilassumed the joint chair of the negotiations. All34 participating countries approved atimetable for completion of the talks by thedeadline and decided that initial offers of pro-posed tariff reductions should be presented by
mid-February 2003. They also agreed to set upa Hemispheric Cooperation Program to sup-port capacity-building that will help LatinAmerican and Caribbean countries engage innegotiations, implement the agreement, andconfront the adjustments that will be required(see Box 6).
The Andean Community continued tocomplete its free trade area as Peru made fur-ther progress on its tariff liberalization pro-gram for trading with the other members ofthe group. Peru’s full integration into the free
32
BOX 6
Since independence, regional integration has repeat-
edly emerged in one form or another on the agendas
of Latin American and Caribbean countries. Initiatives
have varied in terms of their objectives, ranging from
monumental political unions to simple agreements
for the free trade of goods. However, regional initia-
tives have repeatedly fallen victim to factors such as
political and military conflict, skewed distribution of
benefits among partners, inappropriate design and
implementation, macroeconomic instability and eco-
nomic crisis, or the physical obstacles of nature.
After the disappointing performance of the
early post-war economic integration initiatives, the
near collapse of regional trade during the crisis of the
1980s, and the shift to a more open market-based
development strategy, regional economic integration
appeared to have become a relic of the past. To the
surprise of many, however, integration initiatives
reappeared in the 1990s and in new robust forms.
The "new regionalism" of the 1990s emerged
as an integral component of the structural reform
process in Latin America, complementing and rein-
forcing the modernizing policies pursued unilaterally
and adopted as part of the region’s participation in
the multilateral liberalization emerging from the
Uruguay Round. It has emerged as a result of more
favorable conditions on different fronts. The move to
more external openness and market-based activity
has unleashed new trade and investment opportuni-
ties with the world and provided incentives for new
regional approaches to commercial relations.
Democracy has helped to pacify borders and
increased the disposition to cooperate and integrate
with other countries, including the industrialized
democracies of the North that also are increasingly
looking South for regional partners. Meanwhile, the
launch in Doha of new World Trade Organization
(WTO) negotiations promises that regional initiatives
will be accompanied by stronger multilateral rules.
In this new setting, regional integration can create an
enabling environment for furthering reforms, encour-
aging productive transformations and fostering the
cooperation that will more readily generate net ben-
efits for all countries.
During the 1990s, regional integration made
progress on several fronts. Market access for goods
traded within the subregions has been substantially
liberalized. Functional cooperation in areas such as
regional infrastructure, security and protection of
democracy are also without historical precedent.
Moreover, regional economic integration and cooper-
ation with Northern industrialized countries—politi-
cally inconceivable only 15 years ago—is now
advancing on multiple fronts that encompass the
major regional markets of the world.
Yet many challenges remain. Parallel initiatives
for deepening integration in the subregions, widening
the scope of subregional accords to include integra-
tion with industrialized countries, and creating syner-
gies with the multilateral negotiations in Geneva
raise important strategic issues for the countries of
Latin America and their potential industrialized coun-
try partners. Efforts will be redoubled to move exist-
ing subregional agreements that enjoy political lead-
THE NEW REGIONALISM IN THE AMERICAS

trade area is envisaged for 2005, when themember states have agreed to establish a com-mon market. A Presidential Summit in January2002 marked an advance in that directionwhen the heads of state agreed to adopt acommon agricultural policy, further harmonizemacroeconomic policies, and fully apply theCommunity’s new common external tariff(CET) by the end of December 2003.
The integration process in the CaribbeanCommunity (CARICOM) widened anddeepened in 2002. Haiti became the
Community’s fifteenth full member in July,while Bermuda and the Cayman Islandsacceded as associate members. The memberstates are modifying CARICOM’s constitutivetreaty with a view to completing theCaribbean Single Market and Economy(CSME), which entails the removal of allobstacles to intra-regional trade, the free move-ment of skilled workers and capital, a CET andcommon trade policy, and greater coordinationin other areas of economic policy. Intra-region-al goods trade is virtually free: all tariff restric-
THE BANK IN 2002 33
ership and economic relevance toward their com-
mon market objectives. In the absence of these con-
ditions, other more limited but still valuable alterna-
tives, such as preserving and perfecting free trade
areas, should be considered. At the same time, the
region should exploit new opportunities to support
structural reform and development by integrating
with major industrialized regions, and with the world
as a whole under the umbrella of the Doha
Development Agenda. In pursuing these goals, coun-
tries need to take into account the increased
demand for participation on the part of civil society,
and develop mechanisms to ensure that the fruits of
regionalism, and the globalization of which it is part,
are more equally distributed. Meanwhile, industrial-
ized countries have a responsibility to provide mar-
ket access to overly protected sectors where Latin
American producers have a comparative advantage,
facilitate sustainable agreements by supporting
trade-related capacity-building, and recognize the
special problems that smaller economies encounter
in regional and multilateral liberalization.
Since its founding, the Inter-American Deve-
lopment Bank has been, in the words of its first
President Felipe Herrera, the "Integration Bank."
That vocation remains strong today. It is expressed in
the Bank's Institutional Strategy, where regional inte-
gration is one of the four central pillars for achieving
the goals of sustainable economic growth and pover-
ty reduction. Integration clearly can contribute to the
overarching objective of development.
Beyond Borders, the 2002 edition of the
Economic and Social Progress Report, explores the
emergence of this "new regionalism." It examines the
advances and shortcomings of the process of region-
al integration and proposes an agenda for the region
by focusing on the interaction between current sub-
regional integration schemes, the new agenda
launched in Doha for multilateral trade talks, North-
South initiatives such as the FTAA, and inter-regional
agreements with the European Union or Asia.
The first part of the report focuses on different
dimensions of regional integration. While integration
in trade and related market access issues have been
the object of much attention, the report looks at
other dimensions that may be equally important: the
institutional requirements that are crucial for the
smooth functioning of regional integration agree-
ments, financial integration, and the integration of
physical infrastructure. In each of these dimensions,
the focus is on how much has been achieved, what
are the main effects, and what remains to be done.
Part Two of the report discusses issues of macroeco-
nomic coordination, with particular emphasis on the
coordination of exchange rate policies and the scope
for the formation of currency unions. Special atten-
tion is given to the problems that may arise among
partners in regional trade agreements when they fol-
low divergent exchange rate policies.
Part Three focuses on the effects of regional
integration on productivity, inequality and foreign
direct investment.
For further information, see http://www.iadb.org/goto.cfm?regionalism

tions and most unauthorized quantitativerestrictions have been removed, and the CETis being applied in 10 member states. TheCSME process advanced substantially at ameeting of the heads of government inFebruary, when the member states agreed onprograms for the elimination of restrictions onthe right of establishment, services supply andcapital flows. The programs became effectivein March 2002.
In February 2002 the presidents of thecountries of Central America met with theexpress purpose of reinforcing integration inthe Central American Common Market(CACM). They instructed their ministers tomake further efforts to establish the free tradearea and complete the customs union, andagreed to create a flexible dispute settlementmechanism. They also decided to negotiate afree trade accord with the United States. It isenvisaged that the agreement, which theCentral American countries will negotiate as agroup, will be concluded during 2003. InMarch, the presidents adopted an Action Planfor Economic Integration, which fixed a seriesof deadlines for completing negotiations onissues such as common standards, tariff har-monization, removal of the remaining obstaclesto intra-subregional trade, and streamliningcustoms procedures. The customs unionshould be completed by 2003. Much progresshas been made at border crossings, with ElSalvador, Honduras and Guatemala havingalready set up joint customs facilities.
The integration process in MERCOSURhas faced substantial difficulties in recentyears. Economic conditions in Argentina havespurred a contraction in trade among membercountries, while the greater competitiveness ofArgentine exports—the result of the sharpdevaluation of the currency—has promptedother members to introduce protective meas-ures. Convergence of the CET has stalled andin some cases reversed. Nonetheless, some pos-itive developments have been evident. Despitethe current difficulties, at the PresidentialSummit in July the heads of state called forfurther work on macroeconomic policy coordi-
nation and decided to begin transformingMERCOSUR’s Administrative Secretariatinto a full Technical Secretariat. Later, a deci-sion was made to facilitate immigration amongMERCOSUR partners, including associatemembers Chile and Bolivia.
In terms of Bank operations, regionaltechnical cooperation in the AndeanCommunity during 2002 centered on the pos-sible harmonization of customs regimes andindirect taxation. One project will support theAndean countries in their efforts to promoteexports and attract investment by evaluatingthe effectiveness of special customs regimes ineach country, and by proposing a means ofharmonizing those regimes among all memberstates. Another operation analyzes the Andeancountries’ policies on taxation, including thevalue-added tax, and defines policy options.The aim is to harmonize and improve the cli-mate for business and investment in the con-text of greater trade liberalization.
IDB support for the CARICOM integra-tion process advanced throughout the year onvarious fronts. One operation approved in 2002will provide further backing for CARICOM’sRegional Negotiating Machinery (RNM) inpreparing for and conducting the subregion’sexternal trade negotiations. The program willassist regional negotiators in specific areas oftrade negotiations and facilitate the delibera-tions of the Technical Working Groups. Thisoperation complements a number of currentprojects designed to support the completion ofthe CSME and the deepening of integration inareas such as the harmonization of investmentand government procurement frameworks,finalizing the subregional CET, compliancewith WTO commitments, and the creation ofthe Caribbean Court of Justice.
Tax reform was also an important part ofthe Bank’s regional technical cooperation forCentral America. One program supports thecountries of the subregion, Belize, and theDominican Republic in assessing their tax pol-icy regimes in the light of greater trade liberal-ization, and in defining tax policy options tomaintain and increase public revenue. The
34

Multilateral Investment Fund (MIF) is alsosupporting integration in Central America.One MIF project will facilitate trade in agri-cultural goods in the isthmus by contributingto the design and implementation of a regionalsystem for applying sanitary and phytosanitarymeasures, strengthening coordination betweenthe agencies active in this field, and promotingfood safety. Another MIF operation aims toboost trade in Central America and reduce thecosts of transporting goods by creating a com-puterized systems for monitoring internationalgoods transit and a common procedure forborder posts. Additionally, the Bank remainedactive in providing technical and logisticalsupport to the Puebla-Panama Plan, whichinvolves the Central American countries,Mexico, Panama and Belize. In this endeavor,the IDB is collaborating with the CentralAmerican Bank for Economic Integration(CABEI) and the United Nations EconomicCommission for Latin America and theCaribbean (ECLAC), with a view to coordinat-ing and financing regional projects in sustain-
able development, human development, energyinter-connection, trade facilitation, the preven-tion and mitigation of disasters, and the inte-gration of roads and telecommunicationssystems.
Regarding MERCOSUR, the Bank isaiming to deepen integration with a projectthat will complete the norms for a regulationon protection against dumping from non-MERCOSUR countries, and which will trans-fer expertise from the North American FreeTrade Agreement (NAFTA) on the applicationof such instruments. In South America gener-ally, work continued on the Initiative for theIntegration of Regional Infrastructure inSouth America (IIRSA). In collaboration withthe Andean Development Corporation (CAF)and the Financial Fund for the Developmentof the River Plate Basin (FONPLATA), theIDB is providing technical and logistical sup-port to this 12-country initiative to coordinateand finance regional infrastructure projects intransport, telecommunications and energy. TheIDB’s Institute for the Integration of Latin
THE BANK IN 2002 35
BOX 7
During 2002, many activities, programs and projects
contributed to meeting the goals of the Action Plan of
the 2001 Summit of the Americas. In particular, a
series of strategic programs that the Bank presented
at the Quebec Summit in public governance and
political development, integration and economic
development, ecology and sustainable development,
equity and social development, and connectivity and
technological development were advanced during
the year. The Bank presented two reports to the
Summit Implementation Review Group (SIRG)
describing the many activities to fulfill the mandates.
As an example, to fulfill the mandates that fall
under the headings "Making Democracy Work
Better" and "Justice, Rule of Law and Security of the
Individual," the Bank approved several major loans
and technical cooperation operations. Activities have
also been initiated to combat money laundering, for
electoral and political reform, and to promote a civic
democratic culture. Strategic programs underway in
2002 included support for the Hemispheric Network
of Legislative Information, which assists the coun-
tries of the region in connecting to the Global
Legislative Information Network; the Program for the
Support of Democratic Governance, which includes
national and regional actions to promote institution-
al and democratic development; the Program to Train
Young Democratic Leaders, whose aim is to instill
democratic values and respect for human rights in
the region’s youth; the Program to Support the
Justice Studies Center for the Americas, a regional
network for the exchange of experiences in judicial
reform; and the Violence Prevention Program, which
provides financing and technical assistance for activ-
ities to reduce and prevent violence.
THE FOLLOW-UP TO THE SUMMIT OF THE AMERICAS

36
America and the Caribbean (INTAL) serves asthe site for the IIRSA Secretariat.
As a member of the Tripartite Committee,along with ECLAC and the OAS, the Bankprovides substantial technical support toFTAA negotiating groups and committees inthe areas of market access, agriculture, govern-ment procurement, investment, institutionalissues, smaller economies, civil society, and theadministrative budget committee. The Bankis also supporting the development of aHemispheric Cooperation Program and theexploration of more efficient hemisphericmechanisms to deliver trade-related technicalassistance. Additionally, the IDB providestechnical and financial support to the FTAASecretariat, and has designed and maintainsthe Hemispheric Database on Trade andTariffs.
Trade and integration is one of the sevenareas in which the Bank has established aRegional Policy Dialogue among vice-minis-ters to promote best practices, facilitateregional cooperation, and support integrationprocesses. Meetings are held twice a year; fivehave been held thus far, including two in 2002.The last meeting, in September, addressed theimplications for the FTAA of the WTOnegotiations on agriculture and services, con-sultation with civil society in trade negotia-tions, and the fiscal implications of tradeliberalization.
Finally, in 2002 the Bank instituted athree-year Special Initiative on Trade andIntegration. This is designed to help countriesprepare for deepening subregional integration,as well as to negotiate and implement tradeagreements, including those being pursued inthe FTAA process, and with the EuropeanUnion and the WTO. In 2002, the specialinitiative gave rise to a wide range of projectsoffering direct support to governments intrade-related capacity-building, as well as aseries of conferences, workshops, official meet-ings and studies to support integration inLatin America and the Caribbean.
In 2002, the Bank’s Institute for theIntegration of Latin America and the
Caribbean (INTAL) intensified its efforts tostrengthen the institutional capacity of govern-ments in the region to meet challenges in thenegotiation of trade and integration agree-ments at the bilateral, subregional, hemispher-ic, interregional and multilateral levels.
Under an expanded Memorandum ofUnderstanding signed in 2002 by the IDB andWTO, INTAL increased the number and vari-ety of training workshops for trade negotiatorsaddressing specific issues of the DohaDevelopment Agenda and their relevance forongoing subregional and hemispheric integra-tion processes. These capacity-building effortsare serving as a potential model for otherregional and multilateral organizations in otherparts of the world.
Policy research supported by INTAL in2002 focused on trade and direct foreigninvestment. A second round of the REDINTintegration research network directed at for-eign direct investment was initiated withresearch centers in Latin America and theCaribbean. Toward the end of the year, theBank launched a new Euro-Latin AmericanResearch Network on Integration and Tradewith the incorporation of three EuropeanResearch Centers into the network’s SteeringCommittee. Public outreach activities includednumerous publications, databases, the INTALDocumentation Center, policy fora, and specialevents. INTAL also supported a joint projectbetween the IDB, the Inter-AmericanDialogue, and the University of Toronto tohelp strengthen governments’ capacity to con-sult with civil society in the formulation andexecution of trade policy. At the end of theyear, INTAL sponsored a conference withHarvard University on the impacts and policyimplications of the FTAA.
The Environment
Bank activities in 2002 in the area of the envi-ronment and natural resources managementincluded the development of strategic and poli-cy initiatives, the Bank’s participation in theWorld Summit on Sustainable Development,

and several innovative loan operations preparedby the Regional Operations Departments.Throughout the year, efforts were made toprepare the Bank’s Environment Strategy,including a broad consultation process and pol-icy dialogues.The strategy will be presented tothe Board in 2003. The Bank’s role during thepast ten years, as well as the strategic vision forthe future, are reflected in the document Facingthe Challenges of Sustainable Development:TheIDB and the Environment 1992-2002, which wasdistributed at the Johannesburg World Summiton Sustainable Development. The Bank com-mitted to continuing to support the principlesof sustainable development set forth at thesummit.
Among the innovative operations in natu-ral resources management, environmental pro-tection and regional sustainable developmentwere the Sustainable Development Program ofthe Northern Amazon Border Zone ofEcuador, an especially fragile and conflictedarea of the country; the SustainableDevelopment Program of Bocas del ToroProvince in Panama, which focuses onstrengthening local governance to promoteproper management of natural resources; andthe Bay Islands Environmental ManagementProgram in Honduras, a loan that will inte-grate environmental objectives directly intolocal economic policy for this critical area. Astatewide approach to the sustainable develop-ment of the state of Acre was initiated with aloan to Brazil. In Bolivia, the Program forSustainable Tourism Development seeks newapproaches to eco-tourism. In the critical areaof water and sanitation, the Bank has movedforward with a poverty-targeted program toprovide services to small rural population cen-ters in Venezuela. The Bank’s capacity toinnovate in the water sector has been greatlyenhanced by the newly establishedIDB/Netherlands Water Partnership.
In addition, the Bank continued advanc-ing in the area of regional policy dialogues onthe environment and on risk management fornatural disasters. Several risk managementinstruments were analyzed as a response to a
mandate given to the Bank at the QuebecSummit of 2001. Important regional technicalcooperation projects with funding from theJapanese government were approved toimprove disaster-related information and indi-cators, and to reduce desertification. The firstIDB loans were approved through the newDisaster Prevention Sector Facility. The Bankcarried out an evaluation and initiated aredesign of the Emergency ReconstructionFacility to include “non-natural, non-marketrelated” disasters, based on the recommenda-tions of the Board of Governors (see Box 8).
The Bank continued to strengthen itsinternal environmental and social reviewprocess through the Committee on Environ-ment and Social Impact (CESI). The yearmarked a significant turning point for CESI,with the revision of the requirements and pro-cedures to facilitate improved environmentalmainstreaming.
Private Sector
The Bank’s private sector activities in 2002were affected by the general decline in invest-ments by foreign sponsors in the region due tothe Argentina debt default and other factorsthat slowed economic growth in many coun-tries. In addition to continuing its support forbasic infrastructure projects in the region, thePrivate Sector Department also increased itscommitment to the development of local capi-tal markets. The Bank also approved its firstlocal currency mortgage-backed security(Colpatria, in Colombia, see Box 1) and under-took a number of initiatives that should payoff in the coming years by expanding access tofinancial instruments, increasing liquidity, andcreating new financing tools in Ecuador, Peruand Venezuela, in the relatively stable anddeveloped market of Chile, and in the largeeconomies of Brazil and Mexico. The Bank iscommitted to enhancing the capacity of localcapital markets to finance developmental needs
THE BANK IN 2002 37
For further information, see
http://www.iadb.org/goto.cfm?environment

with local currency, thereby eliminating one ofthe greatest risk factors faced by lenders andinvestors in long-term projects in the region,that of foreign currency devaluation.
The current downturn in economic activi-ty has resulted in a substantial drop in interna-
tional trade in the region, as traditional sourcesof trade finance have withdrawn. In response,Management in 2002 proposed the creation ofan International Trade Finance Reactivationprogram. The initiative would expand theBank’s mandate to finance international trade-
38
BOX 8
It was the most destructive natural disaster in
Colombia’s history. On January 25, 1999, two earth-
quakes, measuring 6.2 and 5.8 on the Richter Scale,
destroyed more than 100,000 buildings in 28 munici-
palities in the heart of Colombia’s economically
strategic coffee-producing region, killing 1,185 per-
sons and leaving more than 550,000 homeless in a
1,360-square-kilometer mountainous region that lies
between the Pacific Ocean and Bogota.
The shock of the disaster, which had an eco-
nomic cost estimated at 2.2 percent of Colombia’s
gross domestic product, was made even worse by
the fact that it came during a period of economic
recession.
Thanks to the extraordinary efforts of the gov-
ernment and people of Colombia, and aided in part
by the redirection of several prior IDB loans in a new
package channeled to the Fondo para la Reconstruc-
ción y Desarrollo Social del Eje Cafetero, FOREC
(Fund for the Reconstruction and Social Development
of the Coffee-Growing Region), recovery has been
better than it otherwise might have been.
Homes belonging to some 130,000 families
have been repaired or rebuilt. Another 16,700 new
homes have been built for persons who had previ-
ously rented property in areas at high risk of seismic
damage. These families were relocated and given
permanent titles to new homes, creating a new class
of low-income homeowners. Some 649 schools and
52 health centers were repaired or rebuilt in the 28
affected municipalities.
Although the official goal of reconstruction
was to rebuild infrastructure that was damaged or
destroyed, in some instances the region ended up
better off after the earthquake than before. Armenia,
a city of 300,000 inhabitants that was 60 percent
destroyed in the quake, now has a gleaming new sky-
line, a new airport, a new police station, a new
administrative center, and new hotels. Several new
schools were concentrated in one area called the
Ciudadela Educativa del Sur, as part of an adminis-
trative reorganization that had been previously con-
templated but was suddenly made a reality during
the reconstruction process. Perhaps most remark-
ably, all this was accomplished in just three-and-a-
half years.
How did the government do it? Ironically, the
answer is that the government did not directly do it.
Convinced that traditional bureaucratic channels
would be too slow and inefficient, Colombian author-
ities devised a plan to mobilize nongovernmental
organizations and put them in charge of the relief
and reconstruction efforts.
The government selected 28 universities,
cooperatives, civic groups and professional associa-
tions to administer the 32 operational zones set up
for the reconstruction program. These NGOs were
responsible for identifying recovery projects and fam-
ilies that needed relocation and new homes. They
were also in charge of applying proper administrative
practices, mechanisms for participation of the affect-
ed population in the reconstruction process, and
environmental safeguards. Finally, the NGOs called
for competitive bids from construction firms that
were subsequently awarded contracts to do the
actual construction.
The government’s role was confined to provid-
ing overall supervision to the process and assigning
resources from FOREC. Only 120 government officials
were permanently assigned to the reconstruction
program. In keeping with the goal of limiting bureau-
cratic intervention, the government officially dis-
solved FOREC in July 2002, declaring that it had com-
pleted its mission.
RECONSTRUCTION OF THE COFFEE-GROWING REGION IN COLOMBIA

related activities through the private sector,without government guarantees, for a period oftwo years. At year’s end, the measure was for-warded by the Board of Executive Directors tothe Board of Governors for the latter’s consid-eration in early 2003. Under the initiative, theBank would be able to provide A/B loans tofinancial institutions for the financing ofimports and exports and to apply its variousguarantee capabilities to confirm letters ofcredit and back the issuance of other instru-ments supporting trade finance.
In 2002, the Bank approved five loans andtwo guarantees to the private sector to providebasic infrastructure and to support other activ-ities. Loans in Bolivia will help finance con-struction of a state-of-the-art nationwidetelecommunications network and expansion ofthe country’s natural gas pipeline network. InUruguay, a private sector loan will facilitateconstruction of a port to serve the forestindustry, servicing bulk cargo and agriculturalexports aimed primarily at European markets.In Honduras, an expansion of the potablewater supply and improved sewerage service inSan Pedro Sula will be financed through aninvestment program to a privately owned con-cessionaire. Participation in an investment pro-gram for two electricity distribution companiesin Guatemala will improve the quality andreliability of electricity service. A political riskguarantee in the Dominican Republic willenhance the issuance of project bonds tofinance six airports. For Colombia, the Bankapproved a partial risk guarantee for theissuance of five-, seven- and ten-year bonds tofund mortgage lending in the local housingmarket.
Throughout the year the Bank continuedto support private sector development throughpublications, workshops and conferencesaimed at disseminating best practices and poli-cies and strategies to guide Bank action in thesector. Four major research projects were com-pleted, leading to the publication of CapitalMarket Development:A New Focus; CompetitionPolicy in Regulated Industries:Approaches forEmerging Economies; and Entrepreneurship in
Emerging Economies:The Creation andDevelopment of New Firms in Latin America andEast Asia. The Sustainable DevelopmentDepartment also coordinated preparation ofthree handbooks on regulation and supervisionof microfinance institutions; reduction of theimpact of natural disasters on microfinanceinstitutions; and guidelines for analysis ofhousing markets.
Two major conferences for the privatesector were organized by the Bank, the“Americas Conference on Corporate SocialResponsibility” (see Box 9) and the “FifthForum on Microenterprise” (see Box 10).
The conferences and workshops held dur-ing 2002 included programs on Sustainabilityof Reform in the Electric Sector; a Program ofTransnational Projects, organized to establishcriteria for screening, governance and financ-ing of cross-border projects; a workshop onthe development of bond markets in LatinAmerica and the Caribbean; a meeting onAccess to Financing by Small and Medium-size Enterprises (SMEs) to discuss obstaclesthese companies face in accessing long-termfinance; and an event focused on a Line ofActivity for the Strengthening of MicrofinanceInstitutions to discuss lessons learned and theimpact evaluation of projects funded by theMultilateral Investment Fund in this areasince 1998.
A financial intermediation policy wasprepared and sent forward to the Board ofExecutive Directors for review. Also during2002, the Private Sector CoordinationCommittee was formalized as a permanentcommittee of the IDB Group (including theIDB, IIC and MIF) in order to enhance itseffectiveness as a tool to support concertedactions in support of the private sector.
Multilateral Investment Fund
The Multilateral Investment Fund (MIF) isthe major source of technical assistance grants
THE BANK IN 2002 39
For further information, see
http://www.iadb.org/goto.cfm?privatesect

for micro and small business development inLatin America and the Caribbean and hasbecome a key mechanism of the IDB Groupin promoting inclusive economic growth. Itwas established in 1993 as a special mechanismto help countries of Latin America and theCaribbean bridge the gap between the theoryand the realities of transition to a global mar-ket economy.
The MIF’s technical assistance andinvestment projects test new developmentapproaches and reach out to involve a broaderspectrum of populations in the developmentprocess. Over 75 percent of its grant initia-tives, which average between $1 million and$1.5 million, are with partners new to the
IDB. The MIF’s goal is to improve economicprospects for those less equipped to benefitfrom market reforms, focusing on micro andsmall businesses, building worker skills, andhelping markets work better. The significantmajority of MIF grant financing has been tar-geted to the smaller and less developed coun-tries in the region.
In addition, through its investment pro-gram, (one quarter of the total portfolio), theMIF is pioneering the use of equity as a devel-opment tool for micro and small business.
40
BOX 9
The Americas Conference on Corporate Social
Responsibility (CSR Americas) took place in
September 2002 in Miami. The conference was
organized by the IDB with the support of the World
Bank and the Organization of American States, and
with sponsorship by the Government of Canada and
the Inter-American Foundation.
The conference brought together some 500
professionals from 30 countries, including represen-
tatives from governments, civil society and the busi-
ness community, to engage in a dialogue on corpo-
rate social responsibility in the Western Hemisphere.
The aim was to raise awareness of key issues and
discuss ways to promote the development, adoption
and implementation by the business community of
principles of good conduct that will advance corpo-
rate social and environmental responsibility.
The overall theme for the conference—
"alliances for development"—emphasized the need
for the three sectors (business, government and civil
society) to work together towards the integrated
improvement of communities and the environment,
and to complement each other’s capacities to
address and overcome societal challenges. CSR
Americas sought to involve medium-sized companies,
in particular, by creating a forum in which they could
interact, exchange views, share experiences and build
trust with representatives of the other sectors.
Participants had the opportunity to listen to
representatives from large and medium-sized com-
panies, governments, academia, multilateral organi-
zations and civil society organizations from through-
out the Americas. The conference showcased CSR
business practices of multinational and local compa-
nies and highlighted successful cases of how larger
businesses have incorporated CSR strategies and
reached the "triple bottom line" by obtaining busi-
ness and social benefits and addressing environmen-
tal concerns. Session themes included Examples of
Successful Partnerships; Demand Side: Investors and
Consumers; Creating an Enabling Environment for
CSR; Role of the Media; Role of Accountability Institu-
tions; and the Role of Supranational Institutions.
CSR Americas was the first hemispheric initia-
tive to bring together leaders from throughout the
Americas, as well as a diverse audience from the
three sectors, to discuss corporate social responsibil-
ity in a single event. Bank officials hope that the con-
cept of CSR is something that they will be able to
explore and formally incorporate into Bank Group
activities in the near future.
CORPORATE SOCIAL RESPONSIBILITY
For further information, see
http://www.iadb.org/goto.cfm?mif
For further information, see http://www.iadb.org/goto.cfm?csr

By the end of 2002, the MIF hadapproved over 500 projects with a commit-ment of almost $800 million. Combined withthe counterpart financing from its partners,this has directed over $1.5 billion in technicalassistance and investment projects to developthe private sector throughout the region.Projects are building the capabilities and skillsstandards of the workforce, broadening theeconomic participation of smaller enterprises,and strengthening the business environment.
During 2002, 65 projects and two specialprograms were approved by the MIF Donors
Committee, for a total of $98.6 million. Ofthese approvals, 22 were via short procedure(financing under $500,000). This increase ismainly due to a greater volume of projectsunder the MIF Lines of Activity facility.
The year’s approvals included seven newinvestment funds totaling $36.5 million. As inrecent years, investment projects compriseabout one-third of the total approved amountof MIF resources.
Excluding the investment funds and theLines of Activity, MIF financing per projectaveraged $1.3 million in 2002. Local counter-
THE BANK IN 2002 41
BOX 10
The IDB’s Fifth Inter-American Forum on Micro-
enterprise focused on how countries in the region
can create favorable political, economic and financial
environments to foster the development of microen-
terprise and micro-finance. The microenterprise sec-
tor generates nearly half the jobs in Latin America
and the Caribbean.
The three-day meeting, held in September
2002 in Rio de Janeiro, was organized by the Bank
and co-sponsored by Brazil’s Banco Nacional de De-
senvolvimento Econômico e Social (BNDES), Serviço
Brasileiro de Apoio às Micro e Pequenas Empresas
(SEBRAE) and Banco do Nordeste.
The forum brought together more than 1,000
delegates from nongovernmental organizations,
commercial banks, credit cooperatives, community
groups, consulting firms, philanthropic foundations,
investment funds, bilateral and multilateral institu-
tions and government agencies from Latin America
and the Caribbean as well as other parts of the
world. As in past years, the gathering provided an
opportunity for public and private sector organiza-
tions that are interested and active in the develop-
ment of the microenterprise sector to share experi-
ences and gather information on the latest
developments in financial and nonfinancial services.
The event also afforded an occasion to share best
practices in policy and regulatory and institutional
frameworks conducive to microenterprise and small
business development in the region.
The event had three plenary sessions and 30
workshops. Topics included New Developments in
Microfinance Regulation; Savings Alternatives for
Microfinance; Assessing Government Programs for
Micro and Small Enterprises; Simplified Business Tax
Regimes; Linking Microfinance to Capital Markets;
Incorporating Microenterprises in Local Development
Initiatives; E-business; Facing Globalization: How
Micro and Small Enterprises Can Begin to Export; and
Stages and Challenges of Microfinance Development.
As part of the forum, IDB President Enrique V.
Iglesias awarded the Bank’s annual prizes to institu-
tions and people who stood out for their support for
the region’s microenterprise and community develop-
ment. Peru’s Caja Municipal de Ahorro y Crédito de
Arequipa won the Award for Excellence in Micro-
finance for Regulated Institutions. Nicaragua’s Fun-
dación para el Apoyo a la Microempresa (FAMA) won
the Award for Excellence in Microfinance for Non-
Regulated Institutions. The Brazilian NGO Visão Mun-
dial won the Award for Excellence in Business
Development Services. Oded Grajew, president and
founder of the Instituto Ethos de Responsabilidade So-
cial do Brasil, won the Social Entrepreneurship Award.
The next Inter-American Forum on Micro-
enterprise will be held in 2003 in Guatemala.
MICROENTERPRISE FORUM
For further information, see http://www.iadb.org/goto.cfm?microforum

parts during the year accounted for $102 mil-lion, meaning that on average, MIF partnersare contributing 53 percent of the total projectcost.
The MIF’s “project cluster” approach toproject development and implementationhelps ensure a strategic focus in an operationalsense for promising development approaches.Projects are launched according to a strategythat is presented to the Donors Committee forinformation and discussion, and then specificprojects are developed for Donors Committeeapproval. The special feature of this approachis that these projects are treated as members ofa group throughout the project cycle—fromidentification to evaluation—enabling bettersupport during implementation and increasingthe effectiveness of lessons learned.
During 2002, five new clusters werelaunched, bringing the total number of projectclusters to eight. Cluster topics are identifiedbased on demand from the region, and on theexperience gained with promising pilot initia-tives. Clusters currently in implementation arequality and environmental management; cleanproduction standards for small business;remittances as a development tool; reductionof regulatory burdens on small business; facili-tating international trade and investment;small business networks and supply chains;accounting and auditing standards; and infor-mation and communications technology.
Remittances play a key social and eco-nomic role in many countries of the region,with the total amount transferred over the nextdecade projected to reach $300 billion, anamount far outstripping the flows of officialdevelopment assistance. Remittances equalone-third of the region’s foreign direct invest-ment and account for at least 10 percent ofGDP in five countries. Over the past year, theMIF held a series of conferences inWashington, DC, El Salvador, the DominicanRepublic, Jamaica, and Japan to raise awarenessof the development potential of these flows.The MIF also supported research to deepenunderstanding of the dynamics of this impor-tant issue, and approved three projects to test
innovative models to reduce transmittal costsand explore alternatives for channeling a por-tion of these flows into productive investments.
Learning from project experience is acentral MIF objective. Every project has fundsallocated for evaluation, and there is an activeprogram of ongoing information exchange.Each project cluster has a specific plan tofacilitate the exchange of ongoing experiencesamong executing agencies, and as projectsmove through implementation, events areorganized to support information sharing andidentify good practices. Over the past year, theIDB Office of Oversight and Evaluationundertook a special independent evaluation ofover 130 MIF projects in financial reform,capital market development, alternative disputeresolution (ADR) and microfinance. The studyfound that MIF projects have addressedimportant private sector development issues,introducing new concepts and enablingreforms that otherwise would not have hap-pened. In the area of microfinance and ADR,the findings make it clear that MIF interven-tions were central to the progress achieved inthe region.
Inter-American Investment Corporation
The Inter-American Investment Corporation(IIC) began operations in 1989. As an affiliateof the IDB, the IIC promotes the economicdevelopment of its 26 Latin American andCaribbean member countries by providingfinancing for small and medium-size privateenterprises in the region. In all, the IIC has 41member countries.
The IIC is unique among developmentfinance organizations in its exclusive focus onsmall and medium-size companies. The IICprovides financing to companies that lackaccess to other suitable sources of equity capi-tal or long-term loans. It lends to and invests
42
For further information, see
http://www.iadb.org/goto.cfm?iic

in these companies directly or provides financ-ing indirectly through financial intermediariesor private equity funds. It does not requiresovereign guarantees. To be eligible for IICfunding, projects must further sustainabledevelopment by creating jobs, broadening cap-ital ownership, generating net foreign currencyincome, facilitating the transfer of resourcesand technology, utilizing local resources in anenvironmentally responsible manner, fosteringlocal savings, or promoting economic integra-tion in the region.
In 2002, the IIC approved $123.3 millionfor 20 direct loan and equity transactions.Indirect transactions totaled $28.8 million.Examplary projects included a loan toExportadora Subsole,S.A., a Chilean company,to achieve a multiplier effect by providing 100small fruit growers with new technology,advice on agricultural and business matters,and, for some, financing for planting or har-vesting their crops. A second operation, a loanto UNIVA (the Instituto Superior Autónomo deOccidente,A.C.) a Mexican educational insti-tution, underscores the IIC’s role as lender oflast resort. By providing long-term funding onappropriate terms to a sector—education—inwhich private banking in the region has histor-ically shown little interest, the Corporation isfilling an important niche and helping to bringneeded services and infrastructure to studentsin the cities of Puerto Vallarta, Lagos andLeón.
Portfolio Management
The Bank intensified efforts in 2002 torespond to the difficult challenges faced byborrowing member countries. Factors beyondthe project level, including worsening macro-economic and fiscal environments, coupledwith elections and shifts in governments inmany countries, often resulted in changes innational priorities. Some countries experienceda reduction in the availability of counterpartresources needed to execute projects, as theytightened fiscal and monetary policies tomaintain macroeconomic stability. Weaknesses
in legal and regulatory frameworks also affect-ed the timely enactment of reforms in key sec-tors. Limitations in institutional capacitythroughout the region continued to be a majorbottleneck in project implementation. Theseweaknesses were manifested in limited absorp-tive capacity of borrowers, high levels of staffturnover, and overload in executing agencies.
Against this backdrop, the Bank height-ened actions to enhance the quality of itsinterventions by further refining products andapplying lessons learned from operationalexperiences. Support to borrowers in theachievement of better results was given priori-ty in efforts to improve the effectiveness ofboth lending and non-financial activities.While substantial progress has been made inthe area of portfolio management, the Bankhas identified a number of areas that requiregreater attention by Management, and will beaddressed in a corporate Portfolio Improve-ment Action Plan aimed at consolidating andachieving further gains in portfolio quality.
The Bank’s Annual Report on Projects inExecution (ARPE) summarizes information onthe performance of the Bank’s lending portfo-lio, discusses trends and challenges in theregion, reports on activities carried out by theBank to address issues affecting the portfolio,and provides recommendations for futureactions. Key issues, initiatives and recommen-dations of the report are placed within thecontext of the Bank’s overall efforts tostrengthen a results-based focus in its strate-gies, products and systems to enhance thedevelopment effectiveness of its interventions.As of December 31, 2001, the Bank’s activeportfolio included 537 projects representing atotal commitment of $40.9 billion. Investmentprojects continued to represent the Bank’s pri-mary lending modality with 86 percent ofcommitments, followed by policy-based loansand private sector operations with 10 and 4percent, respectively.
THE BANK IN 2002 43
For further information, see
http://www.iadb.org/goto.cfm?portfoliomngt

In terms of sector composition of theportfolio, the report noted that 49 percent ofcommitments as of the end of 2001 were dedi-cated to the social sectors, in keeping withEighth Replenishment mandates, followed byprojects in the infrastructure, reform and mod-ernization of the state and productive sectors.Private sector lending continued to increase asspending in public sector infrastructuredeclined due to the privatization of state enter-prises. Reform and modernization of the stateprojects continued to make up around one-fifth of the number of projects, but declined to16 percent in terms of commitments by vol-ume. The smaller Group II countries contin-ued to account for the largest share of projectsin the portfolio (63 percent), representingmore than 36 percent of commitments.
The performance of the public sectorportfolio is reported in the ARPE and basedon project ratings assigned by each CountryOffice. Projects are rated on the extent towhich they are making progress in their imple-mentation, and the likelihood that they willachieve their development objectives in thefuture. Despite a difficult year in the region,the ARPE reported that 91 percent of projectsin the reporting portfolio and 93 percent ofcommitments were judged to be on track toachieve their development objectives. Ninepercent of reported projects were classified asproblem projects, those judged unlikely toachieve their development objectives. Overall,81 percent of projects were reported as beingimplemented without any significant delays, aslight improvement over 2000 levels.
While the report noted an improvementin 2001 in the number and volume of projectsin problem-project status from the year before,the ARPE reported a slight increase in alertstatus projects in terms of number and com-mitment values. The Bank’s Project AlertIdentification System (PAIS) placed 28 per-cent of the reported portfolio on alert status,compared to 26 percent in 2000. Alert statusprojects are classified as being expected toachieve their development objectives, but hav-ing attributes that signal the possibility of
developing problems in the future. Theseinclude projects with poor implementationprogress and those whose key assumptions arerated as having a low probability of holdingtrue. Projects placed on alert status may notnecessarily become problem projects. However,they have a greater propensity toward becom-ing problematic in the future if timely meas-ures are not taken to address difficultiesthrough more rigorous project monitoring.
In this regard, the Bank heightenedefforts to proactively address bottlenecks inproject execution and to close operationsshowing little progress toward improvement.As a result of actions taken in close collabora-tion with borrowers, the number of problemprojects reported at the end of 2000 wasreduced through upgrading or cancellations.However, concentrations of problem projectsand key areas of concern for Managementwere noted in social sector investment loanslocated primarily in Argentina, Brazil andVenezuela, with smaller clusters in theDominican Republic and Paraguay. The reportalso highlighted clusters of multi-year problemprojects in Argentina, Colombia, theDominican Republic and Trinidad andTobago. These areas will continue to be closelymonitored through Management’s PortfolioImprovement Action Plan.
The ARPE also identified a number ofinternal IDB-specific areas that need to beaddressed to improve the effectiveness of theBank’s portfolio management activities and itsproactive approach in supporting borrowersand executing agencies. These includeenhancements in project design, the need forbetter stakeholder analysis at early stages ofproject preparation, improvements in perform-ance indicators to measure and monitorprogress, more realistic dimensioning of proj-ects and execution periods, more streamlinedproject management procedures, and a moreproactive approach in portfolio monitoring.(For an example of participatory projectdesign, see Box 11).
The report also emphasizes that contin-ued efforts to tackle the pervasive institutional
44
weaknesses that erode potential gains in devel-opment interventions must be sustained. Inaddition to specific interventions to strengthenthe institutional capacity of borrowing institu-tions, further measures are also needed to pro-mote more effective donor coordination by theBank and borrowers, particularly in a numberof smaller countries that have received signifi-cant amounts of international assistance due toemergency situations and natural disasters. Inthese countries, special attention should begeared towards not overloading already weak-ened or incipient executing agencies. While theBank can continue to provide support forlonger-term institutional capacity building,these efforts cannot substitute for far-reachingreforms that must be undertaken by countriesin the region.
The report highlighted the need for theBank to focus more on enhancing the moni-toring and evaluation capacity of borrowers, intandem with initiatives to revamp its ownmonitoring and evaluation systems. In thisregard, Management has continued to hone itsmonitoring and reporting systems in an effortto improve portfolio quality and reporting. Theproject alert system has been fully deployed,and the on-line project performance monitor-ing system (PPMR) was fully revamped in2002 to capture recommendations of mid-termevaluations, report on financial issues, institu-tional development and sustainability issues,and record lessons learned. Projects financedwith resources from the MultilateralInvestment Fund were incorporated in thesystem, and final preparations were undertakento expand coverage to selected non-reim-bursable technical cooperation operations.
Headway has also been made in therevamping of the Project Completion Report(PCR), which will be more focused on measur-ing results. The new report will facilitate theanalysis of project results vis-à-vis originalexpectations and performance indicators, focuson difficulties in project execution and theeffectiveness of corrective measures, andemphasize lessons learned in the process thatcan be fed back into the design and execution
of future projects. The new, streamlined PCRwill comply with OECD/DAC guidelines forMDBs and include an evaluation of both Bankand borrower performance, an assessment ofthe project’s contribution to institutionaldevelopment, and an outlook on expectationsregarding the project’s ability to continue todeliver benefits in the medium and long term.To make the PCR process more participatoryand results-oriented, a “project exit meeting”with borrowers will be organized by theCountry Offices to discuss the report and tojointly prepare an action plan for any opera-tional follow-up as needed. This plan, alongwith the borrower’s contribution, will hence-forth represent an integral part of the finalPCR to be considered by Management. Fulldeployment of the revamped PCR format andcontent is expected by mid-2003.
Efforts within the Bank have alsoadvanced in terms of developing an on-linemonitoring and reporting system for privatesector projects. This system will complementthe Bank’s existing reporting system for publicsector projects, and will address the uniqueand confidential aspects of private sector oper-ations and incorporate OECD/DAC standardsfor evaluations for such operations.Performance reporting of private sector opera-tions is conducted through semi-annualreviews (SARs), and quarterly portfolio statusreports are presented to the Board. The PrivateSector Department has already completed thefirst phase of its project management informa-tion system (PRIS). A second phase willinclude the SARs and eventual PCRs, as wellas a report based on the analysis of theachievement of key performance indicatorsand lessons learned.
Two additional operational tools werelaunched during the year: a new help deskfacility to assist project teams in the prepara-tion of logical frameworks and related indica-tors, and a centralized on-line lessons learnedretrieval network. The latter will provide sup-port to staff in the storage and retrieval ofoperational lessons learned classified by sector,country or particular theme. It is expected that
THE BANK IN 2002 45

both of these tools will contribute to improv-ing the design of new projects.
Finally, the report noted the importanceof strengthening the Bank’s entire resultsframework, beginning with the programmingprocess and continuing throughout the projectcycle. The articulation of the linkages betweennational, sectoral and project-level interven-tions is key to this process. Management hastaken on this challenge by developing newcountry strategy guidelines that emphasizecountry-level performance indicators to bettermeasure results obtained during a specific pro-
gramming period. In addition, future sectorstrategies will contain sector performance indi-cators, which will enhance the consistency ofmonitoring and measuring results across lend-ing instruments and Regional Departments. Atthe project level, the report indicated thatimprovements are also warranted in perform-ance reporting systems and in improving port-folio monitoring and management practices toenable corrective action and better tracking ofprogress towards outcomes.
A key challenge for Management is topromote a results-oriented operational frame-
46
BOX 11
For decades, Rio de Janeiro’s favelas, the teeming
slums that house nearly one-fifth of the city’s inhabi-
tants, appeared as blank areas on city maps. At best,
these communities clinging to the city’s steep hill-
sides, crowding its riverbanks and tidal basins and
strewn around its suburbs, were ignored by their rich-
er neighbors and abandoned by local authorities. At
worst, favelas were vilified as social pockmarks mar-
ring one of the world’s most beautiful urban settings.
However, after Brazil returned to democratic
rule in the mid-1980s, a new attitude towards the
favelas began to take shape in Rio de Janeiro, blend-
ing the hopes of its poorest citizens and the ideals of
architects, urban planners, engineers, anthropolo-
gists, sociologists, economists and grassroots
activists. Starting with a pilot program of small self-
help community projects, the municipal government
crafted an innovative strategy by the end of the
decade to deal with favelas. Rather than razing these
settlements and cramming their inhabitants into pub-
lic housing, the city would seek to improve the living
standards in poor neighborhoods by upgrading their
basic infrastructure and providing much-needed
social services.
In 1995, with the support of the Bank, Rio de
Janeiro launched Programa Favela/Bairro, an initiative
that seeks to turn forlorn shantytowns, home to more
than one million people, into proud neighborhoods,
and knit them into the formal city's fabric. Under the
program, the municipal government and the IDB have
committed more than $600 million to this project, the
bulk of which will be spent on public works in some
120 of the city’s 600 favelas. These investments
include opening streets and creating parks, play-
grounds and other public spaces, as well as bringing
essential services such as potable water, sewerage
systems, storm drainage, garbage removal and public
lighting to places lacking even mail delivery.
The second of the Bank’s two loans for
Favela/Bairro will benefit up to 230,000 residents,
14,000 of them children. Execution of the program
was classified in the Bank’s monitoring as "satisfacto-
ry" during 2002. In addition to working with their
counterparts in the city’s Housing Secretariat on the
infrastructure, nutrition and income-generation
aspects of the project, IDB Country Office personnel
focused on the establishment of an ongoing monitor-
ing and evaluation program.
In addition to public works, Favela/Bairro also
offers beneficiary communities a menu of social serv-
ices, which are supplied by civil society organizations.
During the program’s first phase, Bank financing was
used to build daycare centers, which are indispensa-
ble to accommodate working mothers. In response to
demand from residents, the second phase added
other services such as school retention and rein-
forcement programs, youth leadership activities, and
counseling on domestic violence, sexual abuse,
PARTICIPATORY PROJECT DESIGN: BRAZIL'S FAVELA/BAIRRO

work in a holistic manner throughout theBank. It will also be crucial for the Bank toengage the borrowers in dialogue and partner-ship on these matters. Throughout the processof improving portfolio quality, the Bank willcontinue to maintain contact with borrowers,MDBs, bilateral agencies and cofinancingpartners to exchange experiences on portfoliomanagement, results-tracking methodologies,and practices to gauge outcomes.
Development Effectiveness
The Bank’s response to the changing andpressing needs of borrowers and beneficiarieshas been shaped by both internal mandatesand the development challenges in the regionin which the Bank operates. To maintain itscompetitiveness as a regional developmentinstitution, the Bank has continuously adaptedand fine-tuned its organizational strategy, aswell as its financial and non-financial instru-ments, with the goal of becoming better posi-tioned to provide relevant, timely and effective
THE BANK IN 2002 47
teenage pregnancy and drug and alcohol addiction.
An income-generation component offering adult edu-
cation and job training was also included in the menu
of options.
From the start, Favela/Bairro shunned one-size-
fits-all solutions. During the first phase, the city held
design competitions for proposals to upgrade favelas
containing between 500 and 2,500 homes. The con-
tests drew creative entries from established architec-
tural firms as well as from young professionals eager
to make a difference. In subsequent stages, competi-
tions were replaced with public tenders.
Under the program’s participative methodolo-
gy, proposals are discussed in detail with each com-
munity’s residents, who decide on the location of
infrastructure projects and what social services will
be provided, based on the program's limits for how
much can be spent per beneficiary family. Community
involvement helps administrators to make tough deci-
sions, such as relocating families to make room for
wider roads or removing homes from high-risk areas.
In Ana Gonzaga, a low-income subdivision with
some 3,700 residents in Rio de Janeiro's western
zone, Favela/Bairro helped turn around a neighbor-
hood that had no water service, paved streets, public
lighting or sewers. By providing the infrastructure that
the original developers failed to build, the program
will allow Ana Gonzaga residents to apply for legal
title to their properties.
As Favela/Bairro matures, the program faces
increasing challenges. It began in settlements where
it was most likely to succeed, in order to gain experi-
ence and build momentum. As it goes forward, every
new community presents more complex problems
than the previous ones. Plus, neighborhoods that
have been upgraded require maintenance. Physical
infrastructure can deteriorate, community-based pro-
grams can bog down, high-risk areas can be resettled.
And then there is crime, a major and growing concern
for citizens across Rio de Janeiro.
Favela/Bairro officials place great hope in the
program's income-generation component, which is
aimed at raising productivity levels and creating more
economic opportunities for the poor. While most
adults in these communities work, their income levels
are far short of those of their wealthier neighbors.
According to data from Brazil’s 2000 census, the
average monthly income for a head of household in
Barra de Tijuca, one of Rio de Janeiro’s better-off dis-
tricts, was 5,175 reais. In the nearby Favela do Angu
Duro, it was just 382 reais. In contrast, drug gangs
reportedly pay youngsters around 600 reais a month
to act as lookouts at their sales points.
For further information, see http://www.iadb.org/goto.cfm?favela

assistance to its borrowing member countriesin their social and economic development.
The past year marked a turning point inthe history of the Bank, as the internal debateon development effectiveness stimulatedManagement and the Board to rethink the waythey operate, and to find a better balancebetween the traditional approvals culture and aculture of results. A major report prepared bythe Office of Evaluation and Oversight (OVE)and a note prepared by Management on thesame topic sparked discussion and proposedconcrete alternatives for improving the design,monitoring and evaluation of Bank interven-tions to sharpen focus on achieving measura-ble results.
The following sections highlight majoradvancements made during the year to addressdevelopment effectiveness in five key areas.
Country and Sectoral Programming
Given the importance of the country environ-ment for the effectiveness of the Bank’s inter-ventions, country programming and countrystrategies are central to helping partnersachieve development gains. The new countrystrategy guidelines adopted in 2002 requireprecise monitoring and results indicators.When considered together with the conclu-sions arising from the outcome-based CountryProgram Evaluations (CPE) performed byOVE, these two activities represent an impor-tant step towards promoting evaluation capaci-ty building within and outside the Bank, andimproving the measurement and quality ofcountry-level interventions. The Bank’sResearch Department is complementing suchefforts through its periodic policy seminarswith counterparts and a macroeconomic coun-try watch system to enhance and help tracklong-term effectiveness of the Bank’s policyand sectoral work.
Performance-based criteria for the alloca-tion of concessional resources were approvedin 2002, and the Bank is developing new per-formance-based instruments that would focuson establishing and monitoring predetermined
goals. Finally, the new guidelines for emer-gency lending approved by the Board ofDirectors in 2002 and objectives for policy-based loans (PBL) both require the introduc-tion of measurable indicators.
Project Preparation and Execution
The Bank is placing heightened attention onoverall project quality during project prepara-tion and execution. Focus in Managementcommittees is on project quality at entry,including a clear definition of program or spe-cific project goals; the relevance and strategiccontext of interventions; and the building in ofsolid performance indicators at the outset thatare conducive to measuring outputs associatedwith ongoing project implementation, out-comes at project completion and eventualimpacts. Central to this effort is the establish-ment and maintenance of an appropriate mon-itoring and evaluation system for the project.
In-house skills-building at the Bank hasincreased, complementing its regular trainingcourses. The Bank has already employed theuse of Internet technology to establish web-based training modules on use of the logicalframework, available to all Bank staff and bor-rowers. Increased participation of CountryOffices in project design and in the reviewprocess, and the increased involvement of staffin real-time monitoring and assessment ofresults, is leading to a better understanding ofthe evaluability and implementability issues ofproject design. There is increased emphasis onupgrading the skills of Country Office staff inportfolio management, including the provisionof methodologies to enhance performance anddialogue with borrowers. Activities such as theorganization of project start-up workshops andthe execution of mid-term project reviewswith borrowers have contributed favorably tothis process.
48
For further information, see
http://www.iadb.org/goto.cfm?effect

At the request of the Board, Managementdeveloped a Portfolio Improvement ActionPlan to respond to portfolio quality issueshighlighted in the 2001 ARPE, and to propose,among other things, measures to improvedevelopment effectiveness in the Bank’s port-folio. These measures include new portfolioquality indices; actions to address specificportfolio problem areas; and studies related tothe benchmarking of IDB performance againstthat of comparable institutions.
An example of the Bank’s actions tostrengthen results-based monitoring and eval-uation systems is evident in the governanceprojects prepared during the year. Of theseven modernization of the state operationsapproved during 2002, three proposed thepreparation of ex-post evaluations, and anotherthree included explicit components aimed atstrengthening monitoring and evaluationcapacity. It is anticipated that these evaluationswill provide rich operational lessons learnedthat could contribute to the improvement ofnew project designs in this sector.
Internal Organization and ApprovalProcedures for Operations
The Bank is committed to move the develop-ment effectiveness agenda forward and hastaken specific actions in this direction, includ-ing the decision to contract a ChiefDevelopment Effectiveness Officer who willreport directly to the Executive Vice President;the formation of an internal working group toconduct a study on quality at entry of projects;and the creation of a task force comprised ofrepresentatives from Management and theBoard to develop an action plan for develop-ment effectiveness to be presented to theBoard of Governors at the Annual Meeting in2003.
In addition, under the direction of theExecutive Vice President, a proposal aimed atstreamlining the Bank’s loan approval processwas prepared and has been reviewed byManagement. The Regional Departments haveconvened a task force to prepare a detailed
action plan to implement the recommenda-tions of the proposal, including the preparationof a model project conceptual paper; the selec-tion of a small group of project teams for bothpublic and private sector operations to pilotthe problem-solving and institutional learningexercise beginning in January 2003; and thedevelopment of a methodology for trackingproblems encountered by the project teamsduring the process of implementing the pilotinitiative.
Monitoring and Evaluation Systems
Management and the Board are explicitlyattempting to correct the imbalance that cur-rently prevails within the Bank that privilegesan intervention focus, as opposed to theresults-focus required by development effec-tiveness. This is being done through the pro-motion of evaluation capacity building insidethe Bank and in the region. As describedabove, the Bank has completed a major step inenhancing project monitoring and reportingtools with the complete revamping of the proj-ect performance monitoring system and thefull deployment of a Project Alert Identifica-tion System (PAIS). To complement this newperformance reporting system, Management isalso working on a prototype to revise theBank’s project completion reporting system.
Coordination and Harmonization with Other Bilateral and MultilateralFinancial Institutions
The global agenda on development effective-ness was further consolidated this year at theInternational Conference on Financing forDevelopment held in Monterrey, Mexico. TheBank and other multilateral developmentbanks issued a joint note of commitment tomeasure, monitor and manage for developmentresults. This collaboration continued inWashington at the International Roundtable ofMDBs on Better Measuring, Monitoring andManaging for Results, which highlighted theneed to focus on country-specific results man-
THE BANK IN 2002 49

agement, knowledge management and dissemi-nation, inter-agency coordination, and capacitybuilding at the country level. The harmoniza-tion of definitions used by the MDBs shouldhelp improve development effectiveness.
Within this context, Management willcarry out a study on cofinanced and parallel-
financed projects in the IDB and WorldBank/LAC portfolios, including the identifica-tion of portfolio similarities (in terms of com-position of subsectors, project types, lendinginstruments, etc.) and of common issues andmethodologies.
50

Summary
This chapter includes summaries by countrywith brief descriptions of loans, technicalcooperation operations ($1 million and above),small projects, and Multilateral InvestmentFund (MIF) operations ($1 million and above)authorized by the Bank in 2002. The intro-ductory paragraph for each country includesthe number of TCs and MIF operationsapproved by the Bank in 2002 for $500,000and above, but only those operations over$1 million are subsequently described. Thechapter concludes with information related tothe Bank’s lending and technical cooperationprogram and the Statement of ApprovedLoans and Guarantees.
The loans and guarantees authorized bythe Bank in 2002 came from the followingsources:
Ordinary capital resources: 60 loansfor $3,988 million and two guarantees for $155million brought the cumulative total of loans,less cancellations, to 1,590 for $100,834 millionand the cumulative numbers of guarantees toseven totaling $611 million as of December 31,2002.
Fund for Special Operations: 24loans totaling $406 million brought the cumu-lative total of loans, less cancellations, to 1,110for $15,774 million as of December 31, 2002.
Other funds: There were no loansapproved in 2002. Cumulative total loans, lesscancellations, were 209 for $1,736 million as ofDecember 31, 2002.
The Bank agreed to partially defray up tofive percentage points of the interest on fiveloans approved in 2002 from the ordinary cap-ital resources for $81.6 million, with fundsfrom the Intermediate Financing Facility(IFF) created under the Sixth Replenishment.
THE YEAR’S LENDING 51
The Year’s Lending
TABLE III. DISTRIBUTION OF LOANS BY SECTOR OF ACTIVITY
(In millions of U.S. dollars)
Sector 20021 % 1961–02 %Productive Sectors
Agriculture and Fisheries $ 156.9 3.4 $12,950.4 10.9
Industry, Mining and Tourism 497.6 10.9 12,336.9 10.4
Science and Technology 18.0 0.4 1,688.4 1.4
Physical InfrastructureEnergy 127.6 2.8 16,912.2 14.3
Transportation and Communications 451.8 10.0 13,665.6 11.6
Social SectorsSanitation 133.8 2.9 9,218.5 7.8
Urban Development 284.1 6.2 7,086.4 6.0
Education 115.0 2.5 5,108.7 4.3
Social Investment 1,912.5 42.0 10,971.0 9.3
Health 5.0 0.1 2,157.7 1.8
Environment 146.4 3.2 1,669.0 1.4
Microenterprise 30.0 0.7 418.6 0.4
OthersReform and Modernization of the State 667.2 14.7 20,296.3 17.2
Export Financing 0.0 0.0 1,564.1 1.3
Preinvestment and Other 7.0 0.2 2,299.8 1.9
TOTAL $4,552.9 $118,343.71 Includes increase to 997/SF-HO of $4.5 million.

Total Cost of Projects
The $4.5 billion in Bank loans and guaranteeshelps finance projects involving a total invest-ment of more than $7.6 billion. The Bank’sloans cover only a part of the total cost of theprojects being carried out by the borrowingcountries. The balance over and above theBank’s contributions comes principally fromthe Latin American and Caribbean countries.
Disbursements
The Bank’s disbursements on authorized loansamounted to $5,837 million in 2002, comparedwith $6,459 million in 2001. As of December31, 2002, cumulative disbursements, includingexchange adjustments, totaled $97,160 million,or 82 percent of the loans authorized by theBank. The 2002 disbursements and cumula-tive totals by funds include:
52
TABLE IV. YEARLY (2002) AND CUMULATIVE LOANS AND GUARANTEES (1961–2002) 1
(In millions of U.S. dollars)
Detail by Funds
Fund for Funds inTotal Amount Ordinary Capital2 Special Operations Administration
Country 2002 1961–02 2002 1961–02 2002 1961–02 2002 1961–02
Argentina $ - $ 17,098.6 $ - $ 16,404.7 $ - $ 644.9 - $ 49.0
Bahamas - 344.2 - 342.2 - - - 2.0
Barbados 17.0 407.3 17.0 345.5 - 42.8 - 19.0
Belize - 92.2 - 92.2 - - - -
Bolivia 229.2 3,138.4 112.0 1,148.0 117.2 1,918.7 - 71.7
Brazil 690.4 25,050.9 690.4 23,362.8 - 1,558.5 - 129.6
Chile 15.4 4,872.7 15.4 4,627.5 - 203.3 - 41.9
Colombia 105.9 8,864.3 105.9 8,049.3 - 754.7 - 60.3
Costa Rica 14.4 2,196.3 14.4 1,704.7 - 351.8 - 139.8
Dominican Republic 290.0 2,564.5 290.0 1,773.8 - 705.3 - 85.4
Ecuador 75.0 3,791.5 75.0 2,770.9 - 933.3 - 87.3
El Salvador 70.3 2,908.9 70.3 2,015.2 - 747.8 - 145.9
Guatemala 321.8 2,539.3 321.8 1,838.0 - 629.4 - 71.9
Guyana 62.9 819.9 - 109.5 62.9 703.5 - 6.9
Haiti - 749.4 - - - 743.1 - 6.3
Honduras 76.3 2,300.5 13.7 530.4 62.6 1,702.0 - 68.1
Jamaica 34.0 1,704.0 34.0 1,341.3 - 163.8 - 198.9
Mexico 1,000.0 16,015.0 1,000.0 15,403.0 - 559.0 - 53.0
Nicaragua 142.9 2,009.5 - 259.3 142.9 1,682.1 - 68.1
Panama 67.6 1,988.0 67.6 1,663.6 - 280.0 - 44.4
Paraguay 29.4 1,769.9 29.4 1,181.7 - 576.1 - 12.1
Peru 488.8 6,045.7 488.8 5,406.6 - 418.1 - 221.0
Suriname 3.4 76.6 3.4 74.6 - 2.0 - -
Trinidad and Tobago 32.0 1,018.0 32.0 962.2 - 30.6 - 25.2
Uruguay 733.7 3,391.2 733.7 3,245.3 - 104.1 - 41.8
Venezuela 28.0 3,854.7 28.0 3,680.4 - 101.4 - 72.9
Regional 20.0 2,731.7 - 2,501.4 20.0 217.2 - 13.1
TOTAL $4,548.3 $118,343.7 $4,142.7 $100,834.2 $405.6 $15,773.6 $1,735.91 After cancellations and exchange adjustments. Totals may not add up due to rounding.2 Detail includes private sector loans, net of participations.

Ordinary capital resources: $5,522million, bringing the cumulative total to$81,653 million as of December 31, 2002.
Fund for Special Operations: $313million, bringing the cumulative total to$13,854 million as of December 31, 2002.
Other funds: $1.8 million, bringing thecumulative total from funds administered bythe Bank to $1,653 million as of December 31,2002.
Repayments
Loan repayments amounted to $4,375 millionin 2002. Cumulative payments as ofDecember 31, 2002, were $41,558 million.Repayments received by the Bank during theyear, and cumulative as of December 31, 2002were:
Ordinary capital resources: $4,106million, bringing the cumulative total, before
THE YEAR’S LENDING 53
TABLE V. YEARLY (2002) AND CUMULATIVE DISBURSEMENTS (1961–2002)1
(In millions of U.S. dollars)
Detail by Funds
Fund for Funds inTotal Amount Ordinary Capital2 Special Operations Administration
Country 2002 1961–02 2002 1961–02 2002 1961–02 2002 1961–02
Argentina $ 413.0 $13,757.6 $ 408.0 $13,075.0 $ 5.0 $ 633.6 - $ 49.0
Bahamas 13.8 276.0 13.8 274.0 - - - 2.0
Barbados 15.8 284.5 15.8 222.7 - 42.8 - 19.0
Belize 14.3 48.6 14.3 48.6 - - - -
Bolivia 99.5 2,530.9 4.9 1,031.1 94.7 1,428.1 - 71.7
Brazil 1,792.1 20,244.4 1,782.7 18,583.5 9.5 1,531.3 - 129.6
Chile 100.3 4,381.7 100.3 4,136.5 - 203.3 - 41.9
Colombia 159.2 7,906.9 151.9 7,108.3 7.3 738.3 - 60.3
Costa Rica 45.1 1,813.6 45.1 1,333.8 - 351.8 - 128.0
Dominican Republic 184.1 1,698.0 184.1 907.3 - 705.3 - 85.4
Ecuador 94.5 3,560.8 85.5 2,542.6 9.0 930.9 - 87.3
El Salvador 144.0 2,362.5 143.6 1,481.4 0.4 747.0 - 134.1
Guatemala 195.3 1,982.6 187.5 1,295.7 7.9 626.8 - 60.1
Guyana 24.6 583.5 - 109.5 24.6 467.1 - 6.9
Haiti 2.6 548.9 - - 2.6 542.6 - 6.3
Honduras 47.6 1,859.3 0.1 516.7 47.5 1,292.2 - 50.4
Jamaica 133.0 1,447.6 133.0 1,084.9 - 163.8 - 198.9
Mexico 993.2 13,222.7 991.4 12,610.7 - 559.0 $1.8 53.0
Nicaragua 104.2 1,489.9 - 259.3 104.2 1,180.2 - 50.4
Panama 72.6 1,512.5 72.6 1,199.9 - 280.0 - 32.6
Paraguay 52.0 1,364.7 52.0 776.5 - 576.1 - 12.1
Peru 307.8 5,210.5 307.8 4,571.4 - 418.1 - 221.0
Suriname 0.8 37.3 0.8 35.3 - 2.0 - -
Trinidad and Tobago 24.5 702.9 24.5 647.1 - 30.6 - 25.2
Uruguay 558.6 2,712.3 558.6 2,566.4 - 104.1 - 41.8
Venezuela 176.9 3,419.7 176.9 3,245.4 - 101.4 - 72.9
Regional 67.1 2,199.8 66.8 1,989.5 0.3 197.2 - 13.1
TOTAL $5,836.5 $97,160.1 $5,521.8 $81,653.1 $312.9 $13,853.7 $1.8 $1,653.31 After cancellations and exchange adjustments. Totals may not add up due to rounding.2 Detail includes private sector loans, net of participations.

repayments to participants, to $33,683 millionas of December 31, 2002.
Fund for Special Operations: $256million, for a cumulative total of $6,311 mil-lion as of December 31, 2002.
Other funds: $13 million, bringing thecumulative total to $1,587 million as ofDecember 31, 2002.
54
TABLE VI. YEARLY (2002) AND CUMULATIVE (1961–2002) TOTAL COST OF PROJECTS1
(In millions of U.S. dollars)
Bank Loans Latin America’sTotal Cost and Guarantees2 Contributions
Country 2002 1961–02 20023 1961–02 2002 1961–02
Argentina $ 0.0 $ 40,105.0 $ 0.0 $ 17,098.5 $ 0.0 $ 23,006.5
Bahamas 0.0 555.7 0.0 344.3 0.0 211.5
Barbados 24.2 717.6 17.0 407.3 7.2 310.2
Belize 0.0 139.9 0.0 92.2 0.0 47.7
Bolivia 680.9 5,381.8 229.2 3,138.4 451.7 2,243.4
Brazil 1,228.9 71,185.5 690.4 25,050.9 538.5 46,134.6
Chile 25.4 12,281.6 15.4 4,872.8 10.0 7,408.9
Colombia 199.7 20,517.6 105.9 8,864.2 93.8 11,653.3
Costa Rica 17.6 3,709.7 14.4 2,196.3 3.2 1,513.3
Dominican Republic 494.8 3,812.0 290.0 2,564.5 204.8 1,247.5
Ecuador 102.5 6,979.0 75.0 3,791.6 27.5 3,187.4
El Salvador 88.4 4,366.0 70.3 2,909.0 18.1 1,457.1
Guatemala 401.7 4,190.6 321.8 2,539.3 79.9 1,651.3
Guyana 74.8 1,018.6 62.9 819.9 11.9 198.7
Haiti 0.0 1,055.7 0.0 749.5 0.0 306.2
Honduras 125.1 4,085.7 80.8 2,300.5 44.3 1,785.2
Jamaica 44.0 2,516.5 34.0 1,704.0 10.0 812.5
Mexico 2,377.0 44,447.5 1,000.0 16,015.0 1,377.0 28,432.5
Nicaragua 156.8 3,148.4 142.9 2,009.5 13.9 1,138.9
Panama 82.8 3,821.6 67.6 1,988.0 15.2 1,833.6
Paraguay 34.0 2,591.4 29.4 1,769.9 4.6 821.5
Peru 505.1 10,572.5 488.8 6,045.7 16.4 4,526.8
Suriname 4.5 97.4 3.4 76.7 1.1 20.7
Trinidad and Tobago 40.0 1,591.8 32.0 1,018.0 8.0 573.8
Uruguay 809.1 5,049.8 733.7 3,391.3 75.4 1,658.5
Venezuela 40.0 13,257.0 28.0 3,854.6 12.0 9,402.4
Regional 22.2 14,521.7 20.0 2,731.8 2.2 11,789.9
TOTAL $7,579.4 $281,717.6 $4,552.9 $118,343.7 $3,026.6 $163,373.91 Cumulative loans after cancellations and exchange adjustments. Totals may not add up due to rounding.2 Excludes private sector participations.3 Includes increase to 997/SF-HO of $4.5 million.

For further information on the projectsapproved by the IDB in 2002, please refer tothe Inter-American Development Bank’sInternet site at www.iadb.org/goto.cfm?projects
ARGENTINA
In 2002, the Bank approved two MIF financ-ings to Argentina. On a cumulative basis, theBank has made 218 loans totaling $17,099 mil-lion and disbursements have totaled $13,758million.
Small Business Competitiveness($1.9 million MIF grant)
This program will generate new job opportu-nities by promoting entrepreneurial develop-ment projects in three localities: Olavarría inBuenos Aires Province, Esquel and the north-west of Chubut Province, and the San Justo-San Javier microregion in Santa Fe Province.Each subprogram features specific activities topromote the development of productive sec-tors with competitive advantages, such asstrengthening production chains in Olavarría,diversifying regional products in Esquel, anddeveloping agro industry and ethnic crafts inSan Justo-San Javier.
Supply Chain Development in the Province of Cordoba($1 million MIF grant)
This project will support the competitivenessand growth of strategic small and medium-sized businesses. The focus will be on support-ing business clusters in information and com-munications technology, furniture and otherwood products, and regional agricultural prod-
ucts, particularly organic agriculture and live-stock production. The program will strengthencooperation among businesses and institu-tions, improve access to technology for pro-duction and organization, and improve accessto markets.
BAHAMAS
In 2002, no new loans were approved to theBahamas. On a cumulative basis, the Bank hasmade 17 loans totaling $344 million and dis-bursements have totaled $276 million.
The Bank’s focus in the Bahamas during 2002was on reviewing the current portfolio of loanand technical cooperation operations, mappingout a program to support the government thattook office in May, and setting the stage for thepreparation of a new country strategy for2003-2005. In close collaboration with nation-al authorities, this effort involved the earlyidentification of implementation issues andcorrective actions, and follow-up to ensure thatprojects meet their intended developmentobjectives.
There are demonstrable benefits fromthe Bank’s support for a variety of projects inthe Bahamas in recent years. A loan toincrease the generation, transmission and dis-tribution of power in New Providence hashelped increase efficiency and lower produc-tion costs. Other Bank interventions in infra-structure have repaired roads, docks and sea-walls in the Family Islands and upgradedroads in New Providence. In the social sec-tors, Bank projects have expanded access topotable water and improved primary and sec-ondary education.
A notable initiative during 2002 was the
Project Descriptions
THE YEAR’S LENDING 55

establishment by the IDB Country Office inNassau of a Civil Society Advisory Group.Representatives of such organizations as tradeunions, youth groups and environmental andsocial advocacy groups were brought togetheron a regular basis to provide the Bank and itsgovernment counterparts with input on IDBactivity throughout the country. An effort wasalso made during the year to refine the qualityof data obtained from the Bahamas LivingConditions Survey, estimating the cost of afood basket and examining indices of povertyand inequality.
BARBADOS
In 2002, the Bank approved one loan toBarbados. On a cumulative basis, the Bank hasmade 39 loans totaling $407 million and dis-bursements have totaled $285 million.
Coastal Infrastructure Program($17 million loan from the OC)
Coastline beaches are central to the Barbadiantourism economy, but encroaching develop-ment increasingly has limited access to beachareas and damaged the environment. Thisoperation will support coastal managementand sustainable development by financingprojects for shoreline stabilization, erosioncontrol, restoration of coastal habitats, and bet-ter beach access for both local and tourismuse. The works include waterfront improve-ments from Rockley Beach to Drill Hall; head-land protection between Little Bay andWomen’s Bay; restoration of Crane Beach;improvements to the Welch and HoletownBeaches and installation of a lagoon aerationsystem along the latter; dune restoration atWalker’s Savannah; and improvements inwaterfront access at the Bay Street OldHospital Jetty and the Tent Bay boat launch.
BELIZE
In 2002, the Bank approved one technicalcooperation operation and one MIF financingto Belize. On a cumulative basis, the Bank hasmade nine loans totaling $92 million and dis-bursements have totaled $49 million.
Preservation of Garífuna Culture($140,000 TC grant from the Danish Fund forConsulting Services)
This financing will develop income-generatingprojects for Garífuna communities that takeinto account their unique culture and history.The Garífuna incorporate elements of popula-tions of African origin as well as indigenousCaribbean groups. A business plan will bedesigned to promote community developmentinitiatives and a study will identify viable pro-ductive projects as well as potential investors.Area communities will receive training in howto implement and sustain those projects.Training will also be provided to the NationalGarífuna Council in planning, negotiationskills, organizational expertise and institutionalanalysis. The program will also establish net-work contacts and alliances with Afro descen-dent groups in other countries and promoteculturally appropriate investments.
Trade and Investment Promotion($490,000 TC grant from the MIF)
This operation aims to increase foreign invest-ment in Belizean firms as well as promoteexports of the country’s products and services.Technical assistance and consultants will beprovided to identify priority exports and desti-nation markets, develop a marketing campaignfor ecological food products, strengthenBelizean participation in international exportpromotion events, and develop the capability tosupply market information.To attract invest-ment, particularly in small and medium-sizedfirms, an investment plan will target foreign
56

corporations in priority sectors. Support to theBelize Trade and Development Service will cre-ate a consultative export and investment pro-motion forum, strengthen information tech-nologies, and train staff in the application ofinternational trade and investment regulationsto Belizean industry, agriculture and services.
BOLIVIA
In 2002, the Bank approved eight loans toBolivia. On a cumulative basis, the Bank hasmade 160 loans totaling $3,138 million anddisbursements have totaled $2,531 million.
Santa Cruz-Puerto Suárez Corridor Project(Phase One)($75 million loan from the FSO)
The Santa Cruz-Puerto Suárez Corridorextends some 632 kms from Bolivia’s fastestgrowing area to the Brazilian border. The high-way is a critical link to large consumer centersand export markets. This operation will pavethe 346 km Paraíso-San José de Chiquitos-Roboré section, repair the 139 km section fromRoboré to El Carmen, and carry out mainte-nance work on another 88 kms of various grav-el sections of the highway. The improvementswill reduce transport costs and travel times,improve highway conditions and traffic safety,and promote integration with regional andinternational markets. An accompanying loan(see next page) will address the socio-environ-mental impacts of the highway construction bysupporting conservation and social and eco-nomic development projects in affected areas.
Transredes S.A.($75 million loan from the OC and a “B”loan of$57 million,with $88 million in cofinancing fromthe Andean Development Corporation)
This private sector operation will expandTransredes’ natural gas and liquids pipelinenetwork in order to meet growing national
demand and increase exports to Brazil.Transredes is Bolivia’s main gas transportationcompany. The gas expansion—which willincrease gas transport capacity from 670 to1,060 million cubic feet per day—will add par-allel looped pipe sections and expand andrefurbish compression stations between theproduction fields in the south and RíoGrande, where the system connects to theBolivia-Brazil pipeline. The liquids expansionwill extend to Santa Cruz and Cochabamba aswell as Arica, Chile, and will take the systemfrom 55,000 to 71,000 barrels per day. Toimprove the safety and reliability of the trans-port network, the program will replacepipelines, put lines underground, overhaulequipment, and install station protection sys-tems, shutdowns and alarms, fire systems,cathodic protections, liquid measurement sys-tems, pluvial and industrial drainage systems,fuel tanks and control rooms.
REDIBOL Project($37 million loan from the OC and a “B”loan of$3 million)
This operation will finance installation andoperation of a state-of-the-art telecommunica-tions network across Bolivia that will improvethe quality and coverage of telephone service,including better national and internationallong distance service, and open access to theInternet and other data transmission services.The project will be carried out by the AESCorporation, a private firm that is one of theworld’s leading independent power producers.AES has already completed about 70 percentof its capital expenditure program. This opera-tion will partially finance the rollout of thecompany’s fiber optic network and relatedinfrastructure across the country. Networkarchitecture will be based on new generationmulti-service technology that fully supportsvoice, data, Internet and video on transmissionequipment.
THE YEAR’S LENDING 57

Environmental and Social Protection in the Santa Cruz-Puerto Suárez Corridor($21 million loan from the FSO with cofinancingfrom the Nordic Development Fund)
Improvements to the Santa Cruz-PuertoSuárez corridor are critical to link Bolivia toexport markets, but completion of a modernhighway will have an environmental and socialimpact on surrounding areas. This operationwill mitigate those effects by creating a landtitling program for some 8,800 families thatlive near the highway; providing technical assis-tance, training and financing to strengthenindigenous organizations; developing microcre-dit projects; improving regulation and manage-ment of protected areas; and establishing acompensation fund for families displaced orotherwise affected by the construction. Fundingwill also be used to protect and preserve cultur-al and archeological sites.Technical assistance tomunicipalities in urban planning and zoningwill help local governments cope with the socialand environmental demands likely to resultfrom development of the corridor.
Sustainable Tourism Development Program($10 million loan from the FSO)
Bolivia enjoys a wealth of natural and culturalresources with potential to attract increasedtourism. This program will enhance the coun-try’s image as a tourist destination by improv-ing the quality of tourism services and byfinancing joint public-private pilot projects insustainable tourism. Technical assistance andtraining will help establish an accreditationand certification system to ensure that tourismproviders meet international quality standards;develop regulations regarding conservation ofcultural heritage, safety and environmentalprotection; and design promotional campaigns.The program will finance at least a dozen pilotprojects for environmental infrastructure suchas educational trails, clean energy systems andsewage treatment. Small-scale communityprojects will improve tourist attractions by
building overlooks, on-site museums andinformation booths.
Strengthening the Foreign Trade Sector Facility($5 million loan from the FSO)
This operation will modernize and strengthenthe government’s capacity to formulate andimplement effective trade policy and attractinvestment. An International TradeNegotiation Unit will be created and trainingprovided for trade officials. Technical assis-tance to the Ministry of Foreign Trade andInvestment will support reforms that facilitateimplementation and monitoring of tradeagreements. Specific objectives will includeconsolidating the Single Export WindowFacility by including ISO 9000 certificationand other technical requirements, establishingexport business clusters, and developingexport products with competitive advantagesand promoting their access to internationalmarkets. An information system componentwill develop a master technology plan, imple-ment e-trade for export firms, and establishnetworks to ensure timely access to informa-tion on trade flows.
Disaster Prevention Program($2.7 million loan from the FSO)
By strengthening disaster prevention andassistance capabilities, this program will lay thegroundwork for an effective national risk man-agement system. Technical assistance andtraining will help several key ministries imple-ment and coordinate emergency assistance andrisk management plans. A disaster preventionplan developed for the La Paz area will serveas a pilot for subsequent municipal risk man-agement plans, and an information manage-ment model for the government’s disaster pre-vention and risk reduction agency willfacilitate the sharing of information essentialto decision-making. The program will alsodesign and disseminate a public informationcampaign to heighten awareness of the dangers
58

of natural disasters and the mechanisms avail-able to prevent them or mitigate their effects.
Water Production at the Sama MountainBiological Reserve($2.5 million loan from the FSO)
A fire in the Sama reserve in the department ofTarija in August 2002 destroyed some 30,000hectares of forest and grasslands, causing mil-lions of dollars in damage. Runoff and erosioncaused by the deforestation have severelyreduced water levels in areas that serve as areservoir for neighboring communities, includ-ing the city of Tarija.This emergency operationwill restore the potable water supply throughconstruction of an infiltration galley, ditchesand dikes, and soil stabilization barriers.Chemicals and equipment will be provided tocontrol and treat ash-polluted water. Plantingof forage and issuance of feed vouchers for live-stock will help local farmers who sufferedheavy losses from the blaze.The program willalso finance studies to further assess the envi-ronmental damage, as well as preparation of adisaster prevention plan for the area.
BRAZIL
In 2002, the Bank approved nine loans and sixMIF financings to Brazil. On a cumulativebasis, the Bank has made 296 loans totaling$25,051 million and disbursements havetotaled $20,244 million.
Northeast Tourism Development (Stage 2)($240 million loan from the OC)
This program will help states and municipali-ties implement integrated tourism develop-ment plans that provide basic infrastructure,promote private investment, and ensure sus-tainable tourism that benefits local residents.Building on lessons learned from the firststage of the program, this operation willemphasize a participatory planning process
and adequate environmental, administrativeand fiscal management at local levels.Technical assistance and training willstrengthen state and municipal capacity intourism planning and management, protectionof natural and cultural resources, and solidwaste management. Consulting services willhelp prepare marketing plans and publicitycampaigns to promote area tourist attractions.The program will finance investments intransportation infrastructure such as roadsand airports, water and sewerage facilities, jobtraining services, and the development oftourism areas such as waterfronts, coastlinesand boardwalks.
Santa Catarina State Highway Program (Phase Four)($150 million loan from the OC)
A series of transportation investments throughthis program will improve road conditions bypaving or repairing heavily traveled highways,installing traffic safety features, and strength-ening the state highway patrol. Some 450 kmsof dirt or gravel roads will be paved and anoth-er 700 kms of already paved highways will berepaired. Other works will include road widen-ing and construction or improvements ofshoulders and drainage systems. To offset anincrease in traffic accidents in the state inrecent years, the program will place particularemphasis on safety features, such as civil worksinvolving intersections and urban access routesand construction of pedestrian and bicyclepaths. The program will also finance construc-tion of 10 new patrol stations and procurementof patrol and rescue vehicles. Finally, a masterplan will be developed for transportation ofhazardous materials.
Paraná Urbano II Program($100 million loan from the OC)
This program will improve the coverage andquality of municipal services in the state ofParaná by financing economically viable proj-
THE YEAR’S LENDING 59

ects to repair and expand social infrastructure.The operation will also strengthen municipalmanagement, financing, and auditing capacity.Works to be funded include roads, water sup-ply and sewerage systems, solid waste manage-ment, street lighting, markets, terminals, parks,cultural and recreational facilities, and erosionand flood control structures. The program willalso fund social services in health and educa-tion, and support small business developmentas well as a number of cultural initiatives.Technical assistance will examine ways toattract private capital for municipal funding,implement a results-based managementapproach for the state’s municipal reportingsystem, and promote civil society participationin prioritizing municipal investments.
Acre Sustainable Development Program($64.8 million loan from the OC)
Per capita GDP has steadily declined over thepast decade in the western Brazilian state ofAcre, due in part to less demand for naturalrubber. Deforestation has increased as inhabi-tants increasingly turn to low productivityagricultural activities. This loan will supportmore sustainable development through invest-ments in conservation, infrastructure and pro-ductive projects. The program includes a prop-erty titling component, and technicalassistance, training, infrastructure and equip-ment will be provided to rehabilitate degradedland, foster organic livestock production, pro-mote sustainable extraction of forestresources, improve marketing of local prod-ucts, upgrade river transportation, and pre-serve indigenous cultures. Protected areas willbe established covering 220,000 hectaresaround the Serra do Divisor National Park. Tofacilitate the marketing of certified forestproducts, 70 kms of the Rio Liberdade-RioTauri-Iguarapé Sante Fe subsection ofHighway BR-364 will be paved.
Pará Urbe Support Program (Phase One)($48 million loan from the OC)
This operation will expand and improve thequality of services that local governmentsdeliver to their communities in the state ofPará. The program will finance construction orrepair of social infrastructure under municipaljurisdiction, including roads, water supply andsewerage systems, solid waste management,street lighting, markets, terminals, parks andrecreational facilities, and erosion and floodcontrol structures. To support small business-es, the program will build and equip basiccommercial and industrial premises and pro-vide technical assistance to foster businessalliances and promote better marketing andexport operations. Technical assistance willsupport more efficient and transparent use ofmunicipal resources by revising the state taxdistribution formula, using cost recoverymethods, developing a more rational statetransfer system, promoting private investment,strengthening municipal management capacity,and promoting civil society participation ininvestment decisions.
Goiânia Water and Sanitation Program($47.6 million loan from the OC)
Only a third of households in this state capitalhave sewerage connections, and although mosthouseholds have potable water, the city’s rapidgrowth has led to serious water shortages. Thisoperation will ensure a more reliable and sus-tainable water supply system, expand seweragecoverage and in so doing improve the qualityof local rivers, and make service delivery moreefficient. To boost water supply, a storage damwill be built along the João Leite River with awater intake and conveyance system. Plants,pumping stations and storage tanks for treatedwater will be upgraded along with the city’sdistribution network. In all, 268 kms of sewagecollection networks and 21 kms of sewer inter-ceptors will be built, allowing for expansion ofthe sewerage system to nearly 20,000 primarily
60

low-income households. Consulting serviceswill help the state water and sanitation compa-ny improve efficiency by adopting a modernmanagement model with the participation of aprivate sector operator.
Northeast Global Microenterprise CreditProgram($30 million loan from the OC with parallelfinancing from the World Bank)
An estimated 90 percent of businesses inNortheast Brazil are microenterprises, yet only2 percent of these small firms has access tobank credit. This financing will expand thesupply of formal microcredit in this low-income region by enabling CrediAmigo, themicroenterprise arm of the Banco do Nordestedo Brasil, to extend credit to 120,000 new cus-tomers for working and fixed capital. This willtriple the number of borrowers compared withyear-end 2000. CrediAmigo uses a solidaritylending approach in which groups of borrow-ers cross-guarantee each other’s loans, whichaverage $500. Technical assistance will be pro-vided to train CrediAmigo loan officers, devel-op promotional strategies and a risk ratingunit, identify new savings and loan products,and review loan management procedures.
Modernization of the Federal Court of Accounts($5 million loan from the OC)
The Federal Court of Accounts is the legisla-tive agency responsible for carrying out thenation’s accounting, financial, budgetary, oper-ational and accrual accounting audits. Thisoperation will support modernization andinstitutional strengthening of the agency inorder to make it more effective and efficient inmonitoring the use of public resources.Technical assistance will improve the timeli-ness and quality of control processes by mod-ernizing auditing methods, tools and tech-niques. The agency’s functions will beexpanded to include control of utilities regula-tions and to ensure compliance with Brazil’s
new Fiscal Responsibility Act. The programwill implement a management-outcomesmodel based on the principles of total qualitymanagement, strategic planning and results-based management. Investments will be madein staff development and in initiativesdesigned to improve coordination and dialoguebetween the auditing agency and the NationalCongress and civil society.
Diversity in Access to Higher Education($5 million loan from the OC)
As in most Latin American countries, educa-tional indicators for Afro-Brazilians andindigenous peoples are low compared to therest of the population. This program will pro-mote access to higher education and improvesecondary school performance by black andindigenous students. Aimed specifically atimproving minority student results in thenational secondary school examination, theprogram will provide entrance grants, livingallowances, and special courses of study andtraining, as well as arrange visits to universitiesand establish networks. Studies, workshopsand curricular and media materials will bedirected towards building a consensus on poli-cies and strategies that promote social inclu-sion and cultural diversity and combat racialand ethnic discrimination in secondary andhigher education. The program will be carriedout in nine states selected on the basis of rep-resentative socioeconomic status of Afro-Brazilian and indigenous peoples nationwide.
LatinTech Investment Fund for EmergingTechnology-based Companies($4 million MIF investment and $60,000 grant)
This project will help capitalize approximatelya dozen newly or recently created small andmedium-sized companies with high growthpotential that provide software solution servic-es in finance and banking, business intelligenceand productivity enhancement. Emphasis willbe placed on supporting companies that
THE YEAR’S LENDING 61
adhere to disclosure requisites and other cor-porate governance standards necessary tobecome listed on the Novo Mercado, a stockexchange listing firms that voluntarily accepthigh standards. The project will contribute tothe development of the venture capital indus-try in Brazil and support the improvement ofthe regulatory environment.
Investment Fund for Emerging Technology-Based Companies (Rio Bravo-Investech II)($3 million MIF investment and $60,000 grant)
This fund will invest in 12 to 15 small andmedium-sized companies in south and south-east Brazil in sectors related to biotechnologyand bio-informatics (representing a maximumof 30 percent of the portfolio), and in solutionproviders in software and hardware fortelecommunications and information technolo-gy, including software (representing up to 80percent of the portfolio). Up to a third of theportfolio is expected to comprise companies inearly stages of development, while the rest ofthe funds will be invested in companiesalready established.
Development of Industrial Districts($2.1 million MIF grant)
Small and medium-sized enterprises accountfor approximately 98 percent of total domesticbusiness activity in Brazil. This program willtarget small enterprises that produce goodsand services in selected industrial districts,helping strengthen their competitive capacity.The project will establish incentives for indus-trial cooperation and increase the efficiencyand productivity of the enterprises, applyinglessons derived from international experience.
Modernization of the Securities ExchangeCommission (CVM)($2 million MIF grant)
This project will help the Securities ExchangeCommission improve market transparency and
the legal framework covering regulated finan-cial entities. The program will finance studiesto provide the commission with a road map todeepen its knowledge of international bestpractices to achieve competitiveness. Theobjective is to strengthen the country’s capitalmarkets, which are operating below potentialand are in the process of being modernized.The project will streamline and develop regu-latory frameworks, design data managementinformation systems, and train brokers andother agents in security exchange practices.
Sustainable Tourism Certification System($1.7 million MIF grant)
This project will establish a certification sys-tem to improve the quality and competitive-ness of small and medium-sized enterprises inthe tourism sector. The first phase of the proj-ect aims to certify 400 enterprises. Some 400professionals will be trained to carry out certi-fication and provide technical assistance to par-ticipating companies. By 2010, more than 5,000small firms in the tourism sector are expectedto pursue certification.The project will developa system of internationally recognized qualitystandards, evaluations and audits, and certifica-tions. Other productive sectors will also benefitfrom the project, since it will promote start-upsin goods and services in the environmental,social and economic sustainability areas.
CHILE
In 2002, the Bank approved one loan to Chile.On a cumulative basis, the Bank has made126 loans totaling $4,873 million anddisbursements have totaled $4,382 million.
Modernization of the Comptroller General’sOffice($15 million loan from the OC)
The Comptroller General’s Office (CGR)monitors the legality of state administration,
62
maintains the nation’s general accounts, andaudits the revenue and investment flows ofpublic funds. By supporting CGR moderniza-tion and reform, this project will improve thefinancial management, transparency and pro-tection of state assets. A new results-basedorganizational structure will help the institu-tion better adapt to its mission and objectives,break down outputs and performance indica-tors by functional area, and calculate the cost-benefit ratio of activities. Improved informa-tion systems and technologies will allow for amore efficient communications network bothwith external actors as well as between CGRheadquarters and its 12 regional offices.Innovative audit, control and monitoring ini-tiatives will include development of a compre-hensive audit manual, new audit techniques,and a financial information system.
Hydrological Modeling and Pollution ControlStudy of the Concepción and San Vicente Bays($1.2 million grant from the Japanese Trust Fundfor Consultancy Services)
This program will develop operational tools tocontrol water pollution in two key Chileanports that have long been subjected to runofffrom heavy industries, discharges from ship-building and fisheries, and domestic sewage.The studies will use mathematical models todefine the load capacity of the two bays andevaluate the environmental changes that resultwhen different measures for controlling waste-water are applied. Among the factors measuredwill be hydrodynamics, currents and disper-sion, and water quality. Using these data as afoundation, a pollution control plan will bedeveloped in accordance with Chilean environ-mental regulations. The program will alsotransfer technology and expertise in the fieldsof hydrodynamics, water quality modeling, andclean-up of industrial and domestic wastewaterdisposal facilities.
COLOMBIA
In 2002, the Bank approved four loans andfour MIF financings to Colombia. On acumulative basis, the Bank has made 192 loanstotaling $8,864 million and disbursementshave totaled $7,907 million.
Social Infrastructure and CommunityManagement for Peace($63 million loan from the OC)
This program will repair, equip and build newschools, health clinics and recreational andother community facilities in impoverishedareas affected by Colombia’s ongoing armedconflict. An estimated 1,260 social infrastruc-ture works will be financed in 252 smallmunicipalities. To qualify for assistance, com-munities must comply with fiscal reform legis-lation and have democratically elected leaders.Nearly a third of the beneficiaries will be blackor indigenous. Technical assistance and train-ing provided to municipal governments andcommunity organizations will ensure local par-ticipation in project identification, manage-ment and maintenance. The aim is not only toimprove living conditions, but also to restorethe social fabric through community participa-tion, and to strengthen local government aswell as the presence of the state.
Highway Development and InstitutionalStrengthening in Cundinamarca($21.7 million loan from the OC)
Cundinamarca surrounds the Capital District ofBogota and is the third largest producer amongthe country’s 32 departments.This operationwill lay the groundwork for a comprehensivedepartmental development plan by improvingthe road system and strengthening the depart-ment’s management capacity.The financing willbe used to upgrade and pave 240 kms of high-ways that will complete a beltway around thecapital, an external highway ring around the
THE YEAR’S LENDING 63

64
department, and seven regional trunk lines. Interms of institutional strengthening, the pro-gram will provide training, technical assistanceand equipment to bolster planning, financialadministration and information systems.Management support systems will be imple-mented to inventory departmental documents,update and valuate property records, evaluatepersonnel performance and carry out internalauditing. Finally, the program will strengthenmunicipal fiscal, financial and land use planningby providing advisory services and modernizingtechnical and administrative functions.
Institutional Strengthening of the Bogota District($16 million loan from the OC)
This program will improve the delivery ofpublic services by strengthening managementof district level planning and budgeting, prop-erty registration and land use planning, and byimproving management efficiency in capitalarea municipalities. The program will reorgan-ize key district institutions using a sectoralapproach; implement a performance-basedbudget methodology and information systemsto support it; develop 10-year plans and train-ing systems for land use planning; and updateproperty registration systems. Technical assis-tance and training will improve municipalmanagement skills by better defining the divi-sion of services and functions between centraland local administrations, and by examiningresource allocation measures. The program willpromote more public participation in budget-ary decisions of local government by strength-ening community action groups and improv-ing public access to information. Three publicservice centers will be built and an interactiveon-line services system will be installed.
Colpatria Mortgage Bond Project($5.2 million guarantee from the OC)
Colombia’s mortgage market historically hasbeen among the most successful in Latin
America, but an unfavorable macroeconomicclimate and rising interest rates have set thesector back in recent years. This operation—the IDB’s first private sector mortgage bondguarantee—will strengthen the capacity ofBanco Colpatria, one of the country’s leadingmortgage banks, to provide residential mort-gages, especially for low-income households.The guarantee is issued in support of $50 mil-lion in mortgage bonds to be issued byColpatria to local institutional investors. Thispioneering effort to establish the mortgagebond as a new instrument in Colombia’s capi-tal markets is permitted by new financial regu-lations passed in 1999.
Business Linkages in the Garment Industry($1.1 million MIF grant)
This program will encourage investments inthe clothing industry, particularly in thedepartments of Caldas, Risaralda and Quindío,areas severely affected by the earthquake ofJanuary 1999. The program will establish acoordinated and sustainable process for pro-viding training and technical assistance forgarment firms and workers. Approximately3,000 workers and 1,000 trainers will receivetraining, and smaller firms will be encouragedto link with larger companies to standardizeproductive processes, increase productivity, andstrengthen the industry’s ability to competeinternationally.
Information and Communications Technologiesto Support Business Performance ($1 million MIF grant)
In the past five years, Internet use inColombia has tripled, from less than 500,000users to more than 1.5 million. All companiesin Colombia with more than 100 employeesare now connected to the Internet, and nineout of ten have a website. This project willmake small and medium-sized companiesmore competitive through the use of informa-tion and communications technology (ICT),

THE YEAR’S LENDING 65
and will also stimulate the national market forICT. The firms will be encouraged to form andstrengthen business communities through theuse of information technologies and electroniccommerce, particularly business-to-businesselectronic commerce (B2B) on the Internet,which reduces transaction costs and increasesefficiency.
Strengthening Capital Markets($1 million MIF grant)
This project will help strengthen Colombiancapital markets in order to bring them up tothe country’s level of economic development.Funds will be used to create a data warehousecontaining financial and individual firm datafor the use of investors. It will also support theefforts of the Bolsa de Valores de Colombia(BVC) to protect investor interests, particularlyminority investors, by disseminating corporategovernance requirements based on interna-tional standards. The data warehouse willinclude historical information from the threestock exchanges that merged to form the BVC,as well as current information regarding tradedinstruments.
Promoting Cooperative Business Ventures ($1 million MIF grant)
This project will enhance the competitivenessof small and medium-sized enterprises byencouraging and strengthening cooperativeventures among firms linked either horizontal-ly in industrial clusters or vertically in produc-tion chains. The project will demonstrate theeffectiveness of such ventures in terms of shar-ing technology, building economies of scale,and training. It will also encourage shared ven-tures and build greater trust and confidenceamong firms. International experience hasshown that by working together, firms in oneindustry (preferably located in the same geo-graphical area) can pool assets to obtaineconomies of scale and lower costs.
COSTA RICA
In 2002, the Bank approved one loan to CostaRica. On a cumulative basis, the Bank hasmade 98 loans totaling $2,196 million and dis-bursements have totaled $1,814 million.
Sustainable Agricultural Production($14.4 million loan from the OC)
This program will help small and medium-scale farmers increase production using envi-ronmentally sustainable agricultural practices.The operation will finance technical assistanceand investment projects that apply new tech-nologies, adapt productive systems to changesin local or international markets, make moreefficient use of soil resources to free up sur-plus land for forestry or conservation, reducethe use of agrochemicals by applying naturalresource management techniques, and imple-ment product grading and certification.Activities will focus on Chorotega, Brunca andHuetar Norte, where rural poverty is mostsevere. Training will strengthen the businessskills of producer organizations as well aswomen’s and youth groups. The InfoAgro net-work will be expanded to include all agricul-tural service agencies, and extension agentswill be trained to help improve competitive-ness in nontraditional areas.
DOMINICAN REPUBLIC
In 2002, the Bank approved four loans to theDominican Republic. On a cumulative basis,the Bank has made 80 loans totaling $2,565million and disbursements have totaled $1,698million.
AERODOM Airports($150 million guarantee from the OC)
Tourists represent 75 percent of passengerarrivals in the Dominican Republic, so

improving airport infrastructure is vital tothe nation’s economy. This operation willfinance construction of two new airports andrepairs and expansion of two others. Theproject is being carried out by a private firm,Aeropuertos Dominicanos Siglo XXI(AERODOM), under a 20-year concessionawarded by the government to build andoperate the airports. The financing will beused to complete construction of the LaIsabela Airport north of Santo Domingo andbuild a new airport in Catey on the Samanapeninsula. Upgrades to the Gregorio LupónAirport in Puerto Plata and Las AméricasAirport in Santo Domingo will include con-struction of new buildings, repairs to runwaysand aprons, expansion of parking lots, andimprovements to utilities and service-relatedinfrastructure. The financing will take theform of project bonds for which the IDB willprovide a guarantee of certain AERODOMobligations.
Multiphase Program for Equity in Basic Education($80 million loan from the OC with an IFF interest rate subsidy)
This program will raise educational achieve-ment in rural and marginal urban areas byexpanding access to primary schools andimproving students’ basic skills. Training andeducational equipment and materials will sup-port implementation of a pedagogical modeltailored to the needs of disadvantaged studentsin multigrade rural schools.The program willalso refurbish classrooms and build water andsanitation facilities for schools in need. Inschools in low-income areas of Santo Domingo,Santiago and La Vega, the focus will be onreducing dropout rates by providing specialremedial courses for students falling behind,training teachers, implementing specific meas-ures for over-age students, and expandinglibraries and other school facilities.The pro-gram will also extend an educational manage-ment system to networks of rural schools, install
information systems, and establish a competi-tive fund for innovative educational initiatives.
Support for Competitive Agriculture($55 million loan from the OC)
Although agriculture is a key productive sectorin the Dominican Republic, its share of GDPhas declined steadily over the past decade, inpart because small farmers have not adoptedmodern technologies to boost efficiency. Theproject will provide partial cash rebates to pro-ducers who purchase new technologies thatsustainably reduce production costs throughground leveling, irrigation, zero or minimaltilling, vitroplants, greenhouses, rehabilitationor conservation of pastures, and forestation oragro-forestry. The project will also promotefood and health safety regulations and upgradelaboratories and quarantine stations.Consulting services and other technical assis-tance will support commercial and institution-al reforms, including design of a consolidatedcustoms tariff and a direct compensatory sup-port system, and organizational improvementsin agri-food regulation and credit.
Disaster Prevention and Risk Management Program($5 million loan from the OC)
The overall goal of this program is to help thegovernment implement key elements of itsnational risk management strategy and to pro-vide the technical analysis to eventuallyexpand public investment in risk reduction. Apilot risk management program in eightmunicipalities will train local environmentalunits, conduct a public awareness campaign,prepare risk reduction action plans, upgradeinformation systems, and provide emergencypreparedness equipment. To protect schoolsand students from natural disasters, the pro-gram will work in 540 schools to train 5,000teachers in risk reduction and managementtechniques, develop school emergency plans,and provide equipment. Technical teams, stud-
66

THE YEAR’S LENDING 67
ies and instruments will strengthen nationalrisk management policy and administration bythe executing agency, the Technical Secretariatof the Presidency.
ECUADOR
In 2002, the Bank approved three loans andone technical cooperation operation toEcuador. On a cumulative basis, the Bank hasmade 167 loans totaling $3,792 million anddisbursements have totaled $3,561 million.
Metropolitan Quito Environmental SanitationProgram (Phase I)($40 million loan from the OC)
As Quito has expanded onto the steep slopesthat surround it, those areas have been defor-ested, increasing surface water and erosion,overloading the sewer system, and puttinglives at risk. This operation will reduce thedanger of flooding, landslides and mudslidesby building slope stabilization works andrepairs and expanding the sewer system in thecentral and southern parts of the city. Waterconveyance systems, distribution lines andresidential connections will also be installed toexpand the water supply to low-income areas.Green areas will be built in slope managementintervention zones, and community enterpris-es will be established for trash collection. Toimprove efficiency, consulting services will beused to help privatize part of the local waterutility, and measures will be put in place tocontrol unbilled water and expand hydro-meteorological monitoring.
Housing Sector Support Program II($25 million loan from the OC with an IFF interest rate subsidy)
The formal housing sector currently can meetonly half of Ecuador’s growing demand forurban housing, which often results in low-income families turning to the informal sector
to solve their housing needs. This program willprovide subsidies in the form of vouchers thatwill enable poor households to afford a newhome or improve their current dwelling.Financing extended to municipalities willencourage them to target low-income areas forimprovements in basic infrastructure and serv-ices, including water supply, day care, propertytitling, parks and community centers. The sub-sidy portion of the program also aims to stim-ulate the private financial and constructionsectors, since the vouchers will enable house-holds to qualify for a mortgage. Subsidies forhome improvements will give priority to con-nections to basic utilities and construction orexpansion of kitchens, bathrooms and roofs. Inall, an estimated 136,000 people will benefitfrom the program.
Sustainable Development of the NorthernAmazon Border Zone($10 million loan from the OC and $500,000technical cooperation grant from the FSO)
The Northern Amazon Region accounts for 80percent of Ecuador’s biodiversity, but extrac-tive industries and growing settlements arecausing damage to the environment. This pro-gram will strengthen protection of theCuyabeno Wildlife Preserve and its bufferareas while also supporting sustainable pro-ductive projects for impoverished farmers inthe area. An estimated 4,000 cacao and coffeeproducers in the border provinces ofSucumbíos, Orellana and Napo will receivetechnical assistance, training and equipmentthat promote agri-ecological practices.Surveying and titling will delineate protectedareas and regularize indigenous ancestrallands and property belonging to settlers. Acontrol and supervision program will beestablished for the preserve, and pilot projectswill explore the market potential for biodiver-sity products such as medicinal plants, eco-tourism and natural foods.

EL SALVADOR
In 2002, the Bank approved two loans and oneMIF financing to El Salvador. On a cumula-tive basis, the Bank has made 105 loans total-ing $2,909 million and disbursements havetotaled $2,363 million.
Global Multisector Credit Program($42.4 million loan from the OC)
The ability of El Salvador’s financial system tomeet growing demand from small and medi-um-sized firms for loans is constrained by thelimited availability of long-term resources.This operation will provide a stable supply ofsuch financing in order to help these privatefirms boost productivity and competitiveness.Funds extended to the country’s MultisectorInvestment Bank (BMI) will finance lendingby eligible intermediary financial institutions(IFIs). The subloans will be available to start-up and existing manufacturing, trade and serv-ices companies that need credit for procure-ment of fixed assets, working capital forexpansion, restructuring or modernization ofproduction, and hiring of technical and mana-gerial services. Technical assistance willstrengthen the institutional capacity of theBMI to access domestic and international cap-ital markets and help IFIs conduct risk analy-sis and expand financial services in rural areas.
Support for the Social Peace Program($27.9 million loan from the OC)
This program will improve public safety bysupporting social services for young people inareas with high levels of crime and violence. Tobuild safer neighborhoods and address the fac-tors underlying delinquency, the program willpromote community-based social organiza-tions, upgrade recreational facilities such assports fields and meeting halls, establishemployment and job training programs, andsupport interventions in schools such as lead-
ership training, dispute settlement and anti-drug programs. The financing will also sup-port projects to improve police-communityrelations, prevent and treat domestic violence,and rehabilitate young offenders. New infor-mation technology will be brought in to sys-temize crime statistics data, expand the child-hood information system to protect minors,and implement a computerized prison registry.
Financial and Family Remittance Services for Low-income Groups($1.5 million MIF grant)
This project will improve access to financialservices for low-income groups, especially inrural areas. It will help strengthen the manage-ment and financial capacity of the 29 membersof the Federation of Credit Unions of ElSalvador (FEDECACES), which operate in 13of the country’s 14 departments. FEDE-CACES and the credit unions will receive sup-port to integrate their remittances services andautomate their information and operationalsystems in order to cut costs and increase effi-ciency. FEDECACES and credit union staffwill receive training in managing and promot-ing these services.
GUATEMALA
In 2002, the Bank approved five loans and oneMIF financing to Guatemala. On a cumula-tive basis, the Bank has made 109 loans total-ing $2,539 million and disbursements havetotaled $1,983 million.
Financial Sector Reform Program II($200 million loan from the OC with an IFFinterest rate subsidy)
This program will modernize the legal frame-work of the banking sector and strengthen theagencies that regulate it. Legal reforms willenable the Central Bank and theSuperintendency of Banks to fully exercise
68

their functions in implementing monetary,exchange and credit policies and supervisingand regulating financial institutions. The loanwill be released in tranches based on adoptionof a macroeconomic stabilization program andimplementation of a series of legal reforms,including measures that clarify the functionsof the Central Bank, ensure its independenceand restore its capital; eliminate restrictions onownership of foreign exchange; implement anew system of risk management; consolidatesupervision of financial groups; and establishnew accounting and auditing norms.
Urban Poverty Reduction Program($46.8 million loan from the OC)
This program will provide basic infrastructureand social services for slum settlements in andaround Guatemala City. Living conditions willbe improved for an estimated 85,000 peopleliving in 32 shantytowns in the metropolitanarea. The operation will finance constructionof water supply and sewerage works, marketsand recreational facilities, road improvements,street lighting, and waste disposal services.Land titling will legalize family properties, andslope stabilization, reforestation and construc-tion of retention walls will protect residentsfrom natural disasters. Social services willfocus on at-risk groups and will include provi-sion of community daycare, school enrichmentprograms, preventive health, family counseling,and job training and placement.
Natural Resource Management in Upper Watersheds($40 million loan from the OC)
This project will promote environmentally andfinancially sustainable productive activities as away to reconcile the need to preserve soil andwater resources with the economic needs ofpeople who live in upper watershed areas.Financial and technical assistance will be pro-vided for initiatives that transform land usepatterns and convert productive systems that
degrade the natural resource base into onesthat are environmentally friendly. Projects eligi-ble for support will include agroforestry, con-struction of basic infrastructure such as irriga-tion systems and warehouses, small-scaleprocessing of forest products, and productionof organic coffee. Small and medium-size pro-ducer organizations in 94 municipalities inimpoverished areas of central and westernGuatemala with largely indigenous populationswill be eligible to participate in the program.
Capital Expenditures for ElectricityDistribution($25 million loan from the OC)
This program will expand electricity coverageand improve the reliability and efficiency ofservice delivery. New connections will beinstalled in rural areas where most customerslive below the poverty line. The program willreduce service interruptions, technical andnontechnical losses, and operating mainte-nance costs. Investments will upgrade techni-cal installations and add safety devices anddigital protection to the distribution network;bring energy control, quality and environmen-tal requirements up to international standards;and upgrade the commercial network. Theoperation will be carried out by two privateelectricity distribution firms operating underthe direction of Unión Fenosa Internacional, aSpanish company that was awarded an elec-tricity distribution concession in Guatemala.
Labor Market Program($10 million loan from the OC)
The dual objectives of Guatemala’s labor poli-cies are to get more of the working-age popu-lation gainfully employed and improve theproductivity of those who are working orunderemployed. This program will enhancelabor market participation by providing train-ing for vulnerable rural populations and bybetter matching training with employmentneeds. Training programs targeted to impover-
THE YEAR’S LENDING 69

ished areas as well as at-risk groups such asfemale heads of households will benefit anestimated 25,000 unemployed or underem-ployed rural residents. In urban areas, on-the-job training and special courses to developcore job skills will help the job search or per-formance of 4,000 young people between theages of 18 and 29. The program also will createan electronic job bank and employment servic-es network, sponsor job fairs, and strengthenthe national labor statistics system.
Banking Regulation and Supervision($1 million MIF grant)
This project will improve the solvency, effi-ciency and transparency of the Guatemalanbanking system. A major objective is tostrengthen the Superintendency of Banks toenable it to implement and enforce the newlegal framework as well as consolidate itssupervision of all entities in the financial sys-tem. Project components include drafting reg-ulations for new laws, upgrading inspectionand account manuals, and improving informa-tion systems.
GUYANA
In 2002, the Bank approved three loans toGuyana. On a cumulative basis, the Bank hasmade 44 loans totaling $820 million and dis-bursements have totaled $584 million.
Basic Education Access and ManagementSupport Program (Phase One)($30 million loan from the FSO)
This program will finance construction andrepairs of secondary schools in underservedareas and strengthen primary educationthrough a series of curricular and pedagogicalreforms in literacy and numeracy. To expandeducational access, five new secondary schoolswill be built and seven others expanded orrepaired in targeted low-income areas.
Equipment, supplies and furnishings will beprovided for five schools in remote areas. Toimprove student performance in primaryschools, the program will finance results-ori-ented literacy programs, core numeracyinstruction via interactive radio, community-based initiatives to increase attendance, intro-duction of modern technologies into teaching,learning and school administration, teachertraining, and a comprehensive student assess-ment system.
Electrification Program for Unserved Areas($27.4 million loan from the FSO)
An estimated 40,000 new households inGeorgetown and other coastal regions will getelectricity connections through this operation.Many of the new customers will be low-income families in township developments andsquatter settlements in the process of beingrepaired or regularized. The connections willbe made possible by extension of 13.8kV dis-tribution lines totaling about 200 kms andtheir linkage to the 69kV transmission system.The program will also finance pilot projects totest the viability of applying representativetechnologies and locally available energysources in isolated areas where extension ofexisting grids is not feasible. Finally, trainingand technical assistance will support ongoingstructural reforms of the electricity sector bystrengthening the legal, regulatory and institu-tional framework, particularly in support ofefforts to extend service to remote areas.
Basic Nutrition Program($5 million loan from the FSO)
This program will reduce malnutrition amongmothers and young children through a series ofhealth, nutrition and education interventions.Food vouchers for children up to 24 months oldwill be issued in poor districts contingent onfamily participation in health education pro-grams at local clinics. Iron supplements alsowill be available at the clinics for children and
70

lactating and pregnant mothers in order tocombat anemia.A national information, educa-tion and communication strategy will be devel-oped to promote breastfeeding and child nutri-tion, and health workers will receive training onthose topics.An evaluation will assess the pro-ject’s impact on children’s nutritional status.
HAITI
In 2002, the Bank approved one technicalcooperation operation to Haiti. On a cumula-tive basis, the Bank has made 47 loans totaling$750 million and disbursements have totaled$549 million.
Institutional Strengthening Initiatives($950,000 TC grant from the FSO)
This program will improve public financialmanagement by strengthening the Ministry ofEconomy and Finance (MEF) as well as othercentral government agencies. Training andtechnical assistance will bolster MEF capacityto undertake strategic planning for economicpolicies, expenditures, investment, aid anddebt; prepare and execute the national budget;collect and analyze information on resourceflows; manage internal and external debt; andverify accounting information and consolidatefinancial statements. Support for other agen-cies will focus on introducing a centrally man-aged institutional strengthening program toimprove efficiency and effectiveness in allaspects of managing public resources. Theprogram will also provide consultancy servicesand install computer hardware and software.
HONDURAS
In 2002, the Bank approved seven loans toHonduras. On a cumulative basis, the Bank hasmade 135 loans totaling $2,300 million and dis-bursements have totaled $1,859 million.
Modernization of the Administration of Justice (Stage II)($30 million loan from the FSO)
Honduras is strengthening its legal and judi-cial institutions in order to consolidate the ruleof law and ensure the transparency and ethicalstandards of its justice system. This programwill finance construction of 10 new judicialfacilities across the country that will housesectional lower courts, specialized courts, andjustices of the peace. Existing facilities will bemodernized to include new special criminalcourts and sentencing tribunals. The programwill provide technical assistance, training andequipment for penal reforms, clearing up casebacklogs, and strengthening Public DefenderOffices. To promote professionalism in crimi-nal procedures, the investigative capacity of thePublic Prosecutor’s Office and law enforce-ment will be strengthened. Information systemnetworks will be installed to improve inter-agency coordination, and the program willsupport legislation, as well as enforcement of anew Code of Criminal Procedure, to institu-tionalize an ongoing and participative legalreform process.
Aguas de San Pedro Sula Water and Sewerage Project($13.7 million loan from the OC)
This loan will finance a comprehensive five-year investment program to expand andupgrade water and sewerage services in SanPedro Sula, an industrial center and the secondlargest city in Honduras.The program will becarried out by a private firm, Aguas de SanPedro Sula de C.V, which was awarded the con-cession by the city to provide these services.The loan will finance construction of fourwater treatment plants and improvements toexisting plants; construction of a collector net-work and storage tanks; installation of watermeters, pumping equipment and fire hydrants;laying of pipelines to incorporate isolated sys-tems and in future growth areas; and repairs or
THE YEAR’S LENDING 71

replacement of equipment throughout the sys-tem.The project company includes investorsfrom a number of leading Italian water andsewerage firms.
Bay Islands Environmental ManagementProgram II($12 million loan from the FSO)
The Bay Islands include three main islandsand more than 60 smaller keys about 50 kmseast of the Honduran mainland. The archipela-go provides a base for the country’s industrialfishing fleet, and its surrounding coral reefsare a major tourist attraction. This operationwill strengthen management of coastal andmarine resources, expand environmental sani-tation services, and improve local land useplanning. A fee system will be established tofinance the protection and restoration of criti-cal ecosystems. Potable water supply, waste-water treatment and solid waste managementservices will be expanded for 20,000 residentson the islands of Utila, Guanja and Roatán.Technical assistance will strengthen municipalcapacity to operate and maintain the services.The program will also secure property rightsfor 5,800 low-income households and establisha modern property registry linked to fourmunicipal cadastres.
San Pedro Sula Municipal DevelopmentProgram (Phase II)($9 million loan from the FSO)
This ongoing reform program will restructuremunicipal financial management to improveefficiency and modernize service delivery.Covering an array of municipal services, the pro-gram will build on institutional reforms imple-mented during the first phase.Technical assis-tance will help plan transportation investmentsand develop road maintenance and traffic man-agement programs.A sanitary landfill will bebuilt and a private firm hired for solid wastemanagement. Housing will be built for some2,000 low-income beneficiaries and resettlement
models will be developed for at-risk popula-tions.To improve administration, an integratedfinancial management system will be imple-mented along with electronic services. Finally,environmental reforms include developing amanagement plan for the Merendón watershedand intensifying efforts to manage growth, withan emphasis on public participation.
Sustainable Institutional Strengthening of the Road Sector($7.6 million loan from the FSO)
This operation will implement a pilot roadsafety project and support improvements inroad planning, design, construction and main-tenance. The pilot project involves installingroad safety measures and building 10 pedestri-an bridges along the Northern Highway (CA-5) between Tegucigalpa and San Pedro Sula.Training and equipment will be provided fortraffic officers. Road safety management enti-ties such as a national Road Safety Council,safety units and an accident information sys-tem will be institutionalized. The program willcreate a new agency to specifically manage andexecute road projects, develop a multiyeartransportation investment plan, and providetraining in planning, engineering, and environ-mental, legal and procedural issues. Finally, aroad concession feasibility study will be car-ried out and the performance of road mainte-nance firms monitored through a new evalua-tion system.
Puerto Cortés Sewerage Project($4.5 million loan from the FSO)
This operation will finance completion of acomprehensive sanitation program that themunicipality has been working on since 1997.The operation is in the form of amendment toan earlier IDB loan that financed the develop-ment of sustainable potable water and waste-water disposal services. That operation sup-ported construction of a sewage collectionnetwork and implemented a series of institu-
72

tional changes that improved the efficiency ofsanitation services. But increased constructioncosts require the loan amendment to completeconstruction of the treatment plant, which iscritical to reducing pollution in the receivingwaters from the collection network.
Modernization of the National Statistics System($4 million loan from the FSO)
This project will support the collection, pro-cessing and analysis of timely and reliable sur-vey information that is vital to governmentdecision-making. Technical assistance willsupport the design and implementation ofsocial and economic surveys to provide pri-mary statistical data in such areas as employ-ment, living standards and business and agri-cultural activity. A permanent trainingprogram will be established for staff at theNational Statistics Institute (INE), withcourses covering basic analysis of statisticaldata, fieldwork organization and logistics, datacapturing and purging, and sample design andupdating. The program will strengthen theINE by upgrading statistical tools, technolo-gies and procedures, and by improving super-vision, coordination, regulation and auditing ofdata throughout the national statistics system.
JAMAICA
In 2002, the Bank approved two loans toJamaica. On a cumulative basis, the Bank hasmade 86 loans totaling $1,704 million and dis-bursements have totaled $1,448 million.
Information and Communications Technology($17 million loan from the OC with an IFF interest rate subsidy)
This program will enhance Jamaica’s “e-readi-ness” by promoting the use of informationcommunications technology (ICT) in the pub-lic and private sectors and throughout society.Technical assistance will help put a number of
government fiscal and trade agencies on line,enabling citizens to pay taxes and obtainimport and export permits electronically. Theprogram will also strengthen the legal and reg-ulatory framework for telecommunications andlay the groundwork for installation of an e-procurement system. To reach out to low-income areas without Internet access, training,equipment and software will be provided toset up 60 “community access points” wherecitizens can access online information andservices about employment, markets, distancelearning and other topics. Scholarships forICT training will also be provided.
Emergency Reconstruction Facility($16 million loan from the OC)
Two weeks of torrential rains across Jamaica inthe spring of 2002 brought heavy flooding,landslides and mudslides that caused extensivedamage. This emergency operation will sup-port immediate repairs to basic infrastructurein five parishes that were declared disasterareas: Clarendon, Manchester, St. Catherine,St. Elizabeth, and St. Thomas. The programwill finance removal of debris from roads,clean-up of blocked canals and flooded wellfields and stations, and repairs of roads,drainage systems, water supply and health carefacilities, and electrical equipment. To preventdisease outbreaks in the aftermath of the dis-aster, the program will support water qualitymonitoring, vector control and health educa-tion. Technical assistance will also be providedto strengthen institutions involved with emer-gency preparedness.
MEXICO
In 2002, the Bank approved one loan and fourMIF financings to Mexico. On a cumulativebasis, the Bank has made 174 loans totaling$16,015 million and disbursements havetotaled $13,223 million.
THE YEAR’S LENDING 73

Consolidation and Expansion of the Health,Education and Nutrition Program(Oportunidades)($1 billion loan from the OC)
Created in 1997, Oportunidades (originallynamed Progresa) is the centerpiece of Mexico’sefforts to help those living in extreme poverty.The program is often cited as one of theregion’s most innovative anti-poverty initia-tives because of its targeting and design, andbecause it elicits co-responsibility from benefi-ciaries. Oportunidades provides families witheducational grants and basic health and nutri-tional services, but beneficiaries must meetsuch counterpart obligations as school atten-dance and participation in health educationprograms. This operation—the largest IDBloan ever made to Mexico—will provide tech-nical assistance, training, materials and equip-ment to assist Oportunidades in selecting locali-ties, identifying and incorporating newfamilies, and strengthening processes that re-certify current beneficiaries. Initially focusedon rural areas, Oportunidades will be expandedto semi-urban and urban locales, where anestimated one million new families are expect-ed to benefit from this first program phase.Educational support will be expanded toinclude students in upper secondary school.To ensure efficiency and long-term projectimpact, this operation will strengthen monitor-ing, auditing, social communications, and coor-dination with other social programs.
Tourism Sector Ancillary Industry Fund($7 million MIF investment and $45,000 grant)
This fund will provide small and medium-sized enterprises with resources for financial orbusiness restructuring, expansion, develop-ment of new products and technologies, andmanagement improvement. The fund willinvest in up to 18 Mexican businesses withstrong growth potential and skilled manage-ment. To qualify, firms must have sales andassets of under $5 million and less than 100
employees. The firms will have access to medi-um- and long-term financing, as well as sup-port for their management and productivity.
Chihuahua Venture Fund ($4 million MIF investment and $110,000 grant)
This project will help finance a venture capitalfund in the state of Chihuahua that promotessmall business start-ups, new technologies, andexpansion projects for existing businesses toenhance competitiveness. The fund will investin approximately 20 small and medium-sizedfirms, all with sales and assets under $5 mil-lion and fewer than 100 employees. Prioritywill be given to investments made by means ofquasi-equity instruments such as convertibleloans and debt with a share of profit or sales.By introducing a risk capital instrument to themarket, the fund aims to help build a moreentrepreneurial culture.
Strengthening Institutions in the Low-incomeSavings and Loan Sector($3.5 million MIF grant)
This project will promote orderly developmentof Mexico’s savings and loans institutions, pro-tect domestic savings, and foster the introduc-tion of new financial services for small andmedium-sized enterprises. The grant will beused to upgrade the technological capabilitiesof the National Bank of Savings and FinancialServices (BANSEFI), which has a network of1,000 branches throughout the country. Theseimprovements will help BANSEFI adapt to anew legal framework and compete in theremittance market, offering services to nation-als living abroad who regularly send moneyback to their family members in Mexico.
Water Sector Reform and Establishment of aRegulatory Agency in Veracruz($1 million MIF grant)
This project will support efforts by the gov-ernment of Veracruz to modernize the potable
74

water and sanitation sector. Private sector par-ticipation will be encouraged in the adminis-tration of services and the financing ofrequired investments. The project will reviseand reform the regulatory framework, establisha strategic development plan, and create andstrengthen an autonomous regulatory agency.
NICARAGUA
In 2002, the Bank approved six loans and oneMIF financing to Nicaragua. On a cumulativebasis, the Bank has made 120 loans totaling$2,010 million and disbursements have totaled$1,490 million.
Rural Production Revitalization Program($60 million loan from the FSO)
This financing will increase productivity inrural areas by providing grants for projectsthat improve competitiveness and upgradeproductive infrastructure. Resources and othersupport will be provided to an estimated35,000 low-income farmers in 120 municipali-ties nationwide to convert toward higher-valuecrops. Technical assistance will introduce spe-cialized technologies to diversify production,and management training will help producerorganizations with marketing, environmentallysustainable productive practices, and droughtreduction techniques. Investment projects willfinance construction and repairs of roads andcivil works for irrigation, electrification, ero-sion, flood and slope control, and marketing,storage and other productive infrastructure.The program will strengthen environmentaland accounting management by the RuralDevelopment Institute and help the Ministryof Agriculture and Forestry prepare an actionplan for rural productive development.
Social Policy Reforms for the Poverty ReductionStrategy($30 million loan from the FSO)
This operation will support social policyreforms aimed at reducing poverty. Funds willbe disbursed in tranches based on progress inimplementing key social sector reforms andmeeting poverty reduction targets related tohealth, education and social welfare. Prioritybudget expenditures will be monitored toensure that they are consistent with the coun-try’s poverty reduction strategy. Educationreforms will address school autonomy, educa-tional incentives and adult education, whilehealth priorities will include funding for drugsand pharmaceuticals, hospital equipment andrepairs, strengthening rural primary healthcare, and providing surgical instruments tohealth units. Social welfare reforms will ensuresufficient resources for programs to help thecountry’s most vulnerable groups, such ashigh-risk children and adolescents. Thereforms supported through this program willenable Nicaragua to secure the full benefits ofdebt relief under the Heavily Indebted PoorCountries (HIPC) initiative.
Low-income Housing Program (Phase One)($22.5 million loan from the FSO and a$300,000 grant from the Austrian HurricaneMitch Trust Fund)
Nicaragua has the fastest urbanization rate inLatin America, and the country’s incipienthousing industry has been unable to meet theneeds of these new urban households, the vastmajority of which are poor. Destruction ofsome 41,000 homes by Hurricane Mitch exac-erbated the housing shortage. This programwill provide subsidies to help 17,500 house-holds build a home or repair or expand anexisting dwelling. Most of the financing will bein the form of group subsidies provided topoor communities that apply collectively to anewly established housing entity, the Institutefor Urban and Rural Housing (INVUR).
THE YEAR’S LENDING 75

Technical assistance and training will helpinstall the management information systemneeded to connect INVUR with the NGOs andmunicipalities through which it will provide thesubsidies. The program will also provideassistance and incentives for mortgages andland titling aimed at stimulating developmentof a private sector housing microfinanceindustry.
Social Safety Net Program (Phase II)($20 million loan from the FSO)
This comprehensive program provides familiesliving in extreme poverty with subsidies forfood, health and education. Beneficiaries areselected based on rigorous targeting proce-dures and must meet certain counterpart obli-gations, such as regular visits to health clinics,participation in health education programs,and consistent school attendance. Phase II willexpand the program to 12,500 new householdswhile providing ongoing support for the10,000 households already enrolled. An evalua-tion of Phase I found significant improve-ments in participating households in terms ofschool enrollment, attendance and retention,child growth and development, immunizationcoverage and nutrition. Implementation of thepoverty reduction strategy supported by thisprogram has enabled Nicaragua to benefitfrom the Heavily Indebted Poor Countries(HIPC) initiative supported by the IDB andother multilateral institutions.
Modernization of the Comptroller General’sOffice ($5.4 million loan from the FSO)
This operation will ensure timely, efficient andtransparent oversight of state resources bymodernizing and strengthening the organiza-tion, management and technical capacity of thecountry’s supreme audit institution. Technicalassistance will help the Comptroller General’sOffice establish a new organizational structure,prepare strategic and management plans,
design and implement guidelines and proce-dures, and formulate a human resources policy.Technology infrastructure will be developed toexpand networks, implement a data manage-ment reporting system, and establish anagency-wide communications network. Atraining program will be put in place to helpstaff upgrade technical skills in the use ofinformation systems for management proce-dures, control systems and office tasks.
Strengthening Foreign Trade Management($5 million loan from the FSO)
This operation will strengthen Nicaragua’sposition in international trade negotiations as aprelude to opening new business opportunitiesfor its goods and services. Technical assistancewill boost administrative and managementcapacity to carry out existing trade agreementsand take part in negotiations on a free tradeagreement between Central America and theUnited States, the Doha Development Round,and the Free Trade Area of the Americas. Tostrengthen export promotion, the program willdraft a national export development plan,develop a trade information system, andfinance studies on exportable supply, productmarket profiles, and participation in tradefairs. Technical training plans will be devel-oped on export facilitation for entrepreneursand public sector officials and on trade pro-motion for foreign service personnel. Finally,consultative mechanisms will be established tofacilitate dialogue between the public and pri-vate sectors and civil society on the full rangeof trade issues.
Support to the Superintendency of Banks($1.2 million MIF grant)
This project will support the development ofan efficient capital market in Nicaragua bystrengthening the Superintendency of Banksand Financial Institutions (SBIF). The capac-ity of the SBIF to regulate, supervise, andinspect bank and nonbank financial intermedi-
76

aries will be improved, leading to greater tech-nical and administrative efficiency. The projectaims to reduce the vulnerability of the coun-try’s financial system and give a broad segmentof the population access to credit withoutjeopardizing public deposits.
PANAMA
In 2002, the Bank approved five loans toPanama. On a cumulative basis, the Bank hasmade 119 loans totaling $1,988 million anddisbursements have totaled $1,513 million.
Land Administration and Regularization($27 million loan from the OC)
This program, which also has received financialsupport from the World Bank, will provide thetechnical and legal support necessary for acomprehensive land regularization program inthe provinces of Herrera, Los Santos, Veraguas,Cocle and Colón. An estimated 120,000 newtitles will be issued through the operation, inturn facilitating access by homeowners tocredit and promoting community investments.Regularization services will include legalcadastre, titling or certification, registry ofproperties, and dispute resolution programs.Technical assistance will strengthen and mod-ernize the institutional and technical capacityof the entities responsible for land titling andadministration at the municipal, provincial andnational levels. To bolster the long-term eco-nomic impact of land regularization, the pro-gram will strengthen land use managementand promote measures to improve local accessto information, services and infrastructure.
Sustainable Development of Bocas del Toro($15.2 million loan from the OC)
The Bocas del Toro region along Panama’snorthwest Atlantic coast includes extensiveforests, farming and fishing resources, as wellas scenic areas with potential for tourism.
However, settlement patterns and uncontrolledresource exploitation pose a growing threat tothe region. This multiphase program willstrengthen natural resource management,encourage economic diversification and pro-vide basic infrastructure. The operation willfinance construction of a bridge over theChanguinola River, wastewater treatment forChiriquí Grande, and solid waste collectionand disposal for Isla Colón. Technical assis-tance will improve the delivery of utility andtransport services and promote civil societyparticipation in decision making. Studies willexamine coastal management, ecotourism andland use planning, and advisory services willhelp reduce the risk of natural disasters andstrengthen business management by smallfarmers and fishermen.
Strengthening and Modernization of Economicand Fiscal Management (Phase II)($10 million loan from the OC)
This program will improve public sector fiscalmanagement by streamlining and modernizingexpenditure, investment and borrowingprocesses, making the tax system more effi-cient, and strengthening customs and land useprocedures. Budget planning, programmingand control will be reviewed to ensure thatinvestment options yield the highest returnwhile conforming to public macroeconomictargets. A series of reforms will better integrateand consolidate financial management compo-nents of the budget, general treasury, publicdebt and national accounting directorates.Measures to modernize and professionalize taxadministration will combat evasion andincrease revenues. Training and technical assis-tance for the customs administration willreduce transaction costs for international busi-ness by upgrading human resources and tech-nology and by streamlining regulatory, admin-istrative and management procedures. Theproperty registry system will be strengthenedthrough property tax reforms and support fornew information technology.
THE YEAR’S LENDING 77

Training and Employment System($8.4 million loan from the OC)
This operation will strengthen training andemployment programs for youth, small busi-ness workers and disadvantaged groups. Anestimated 7,000 unemployed low-incomeyouths will benefit from demand-driven train-ing and job counseling and placement servicesprovided by private firms contracted throughthe program. School-to work transition assis-tance will provide career path counseling andjob hunting tools for another 4,400 youngpeople. An in-service training program willprovide matching funds to small businessesthat invest in workforce training, and special-ized training will meet the employment needsof disadvantaged groups such as indigenouspeoples, blacks, female heads of households,and the disabled. At the institutional level,technical assistance will establish aConsultative Job and Workforce DevelopmentCouncil and strengthen employment interme-diation services.
Program to Foster Competitiveness($7 million loan from the OC)
This program looks to build a public and pri-vate sector consensus on policies and programsto enhance business competitiveness in agroin-dustry, logistics, technology services andtourism. The program will fund national andsector-specific diagnostic assessments thatidentify barriers to competitiveness. It will alsosupport the start-up of a national team to leada participatory planning process that decideson the objectives, instruments and actions tobest meet the challenge of making businessesmore competitive. A national competitivenessstrategy will be developed to improve the busi-ness climate and provide matching grants tofirms for projects that advance productivity interms of better products, services and produc-tion chains.
PARAGUAY
In 2002, the Bank approved one loan toParaguay. On a cumulative basis, the Bank hasmade 110 loans totaling $1,770 million anddisbursements have totaled $1,365 million.
Social Investment Program (PROPAIS II)($28.4 million loan from the OC)
This operation will fund social investments toimprove the living conditions of the poor, par-ticularly vulnerable groups such as children,female heads of households, indigenous com-munities, street children, the disabled and theelderly. Beneficiaries will design comprehensivesocial development plans in cooperation withlocal authorities for projects for water and sani-tation facilities, food production, job training,income generation, health and nutrition servic-es, and construction of community, daycare andspecial education centers. Neighborhoodimprovement projects for marginalized urbanareas will focus on titling of property as well asbuilding social infrastructure, including roadrepairs and waste disposal and environmentalprotection works. An estimated 12,500 familieswill benefit from these projects, while another25,000 will benefit from a separate portion ofthe operation that will specifically target vul-nerable groups living in poverty.
PERU
In 2002, the Bank approved five loans to Peru.On a cumulative basis, the Bank has made 161loans totaling $6,046 million and disburse-ments have totaled $5,211 million.
Fiscal Reform Program ($300 million loan from the OC)
This operation will support reforms in themanagement of tax, pension and social pro-grams in order to make them more efficient
78

and equitable. The resources from this policy-based loan will be released in tranches basedon progress in increasing tax collection byreducing exemptions and consolidating recentreforms; improving coordination betweenbudgetary, treasury, debt management, publicinvestment and accounting systems; enhancingfiscal decentralization; improving the targetingof social programs to ensure that they benefitthose most in need; and reducing the fiscalcost of the public pension system by imple-menting legislation to limit payments to heavi-ly subsidized pensioners while increasing ben-efits for low-income pensioners.
Compensation and Social Development Fund(FONCODES III)($150 million loan from the OC)
Since it was created in 1991 under a nationalinitiative to mitigate the impact of macroeco-nomic adjustments, FONCODES hasfinanced thousands of poverty alleviation proj-ects across the country. This loan will enableFONCODES to expand basic social infrastruc-ture, develop productive projects, and strength-en project participation by local governments.The program will finance construction orrepairs of schools, health centers, water and san-itation facilities, roads, electrical systems, irriga-tion works, and marketing facilities, as well asland improvements and reforestation. Creditand technical assistance will help small busi-nesses diversify production and incorporatenew technologies. Rural communities and theregional and local entities linked to their devel-opment will be trained in project planning andexecution. FONCODES staff will be trained insuch areas as social management, and the insti-tution’s information systems will be upgradedas part of an equipment modernization plan.
State Modernization and Decentralization($28 million loan from the OC)
This operation will support efforts to build amodern, efficient and decentralized state that
can deliver quality services and is accessibleand accountable to all citizens. The programwill promote the policies and regulations need-ed to develop e-government and will imple-ment online services—including an electronicprocurement and contracting system—as wellas a state intranet. Reforms to human resourcemanagement—including changes to the legalframework, unification of payrolls and designof new remuneration policies—will improvethe efficiency of public service delivery. Theprogram will help set up 25 regional govern-ments scheduled to begin operations in 2003according to Peru’s decentralization law.Technical assistance, training and equipmentwill be provided to establish regional adminis-trative and management systems and to trans-fer the competencies needed to make thosesystems functional. A nationwide system willalso be put in place to strengthen municipalinstitutions impacted by the decentralizationprocess.
Foreign Trade Policy Development Program($5 million loan from the OC)
This program will support institutionalreforms that improve trade policy managementas a means to increase and diversify the coun-try’s exports and markets. The financing willbe used to establish an integrated foreign tradeinformation system and to update a technicaland analytical database for designing strategiesfor trade negotiations and export development.Training will strengthen the capacity of insti-tutions involved in policy formulation, tradepromotion and the administration of tradeagreements. The program will support restruc-turing of the Vice Ministry of Trade in orderto strengthen the interagency external tradesystem, and will work to develop an institu-tional network to better coordinate trade pro-motion and national foreign trade policies.Finally, consultative mechanisms will be put inplace to ensure dialogue on trade issuesbetween government, the private sector andcivil society.
THE YEAR’S LENDING 79

Institutional Strengthening and Environmentaland Social Management for the Camisea GasProject($5 million loan from the OC)
The Peruvian government’s Camisea gas proj-ect will drill natural gas fields in the depart-ment of Cuzco and then build a 700 kmpipeline to transport the gas for eventual dis-tribution in Lima and Callao. This operationwill support measures to monitor the gas pro-ject’s environmental and social impact toensure that any resulting development is sus-tainable and balanced. Technical assistance,staff training and laboratory and computerequipment will be provided to strengthen theagencies involved in monitoring projectimpact. Specialists will be enlisted to examineproject effects in terms of hydrocarbons,forestry, ecology, anthropology and sociology.Preinvestment studies will explore projectsthat might be eligible for financing from anenvironmental and social development fund.The program will also prepare final manage-ment plans and provide basic infrastructurefor national parks, sanctuaries and tribalreserves in the gas project’s area of influence.
SURINAME
In 2002, the Bank approved one loan toSuriname. On a cumulative basis, the Bankhas made 12 loans totaling $77 million anddisbursements have totaled $37 million.
National Population and Housing Census($3.4 million loan from the OC with an IFF interest rate subsidy)
This operation will help carry out a compre-hensive census that will provide up-to-dateand accurate demographic, social and econom-ic data for national and regional planning. Tolay the technical and organizational ground-work for the census, the program will financestaffing, equipment and supplies and provide
technical support and training. For the censusperiod itself, scheduled for April 2003, supportwill include printing census forms and provid-ing transport and stipends for enumerators.Computer hardware and software as well asconsulting services will support post-censusactivities such as data processing, evaluationand analysis, and publication and dissemina-tion of results. The program will help establisha permanent Census Office and introducetechnological advances such as geographicalpositioning and information system techniquesthat will build national capacity for future censuses.
TRINIDAD AND TOBAGO
In 2002, the Bank approved one loan toTrinidad and Tobago. On a cumulative basis,the Bank has made 33 loans totaling $1,018million and disbursements have totaled $703million.
National Settlements Program (Second Stage)($32 million loan from the OC)
Despite Trinidad and Tobago’s growing econo-my, the number of informal settlements hasincreased in recent years because many poorfamilies cannot afford formal housing con-struction or a lot on which to incrementallybuild a home. This financing will support amore equitable, transparent, sustainable andaffordable national housing program by pro-viding demand-side subsidies for families,improving targeting mechanisms, and extend-ing basic services and titling to families livingin informal settlements. An estimated 4,100families will benefit from the housing subsidyprogram, which will stimulate private housingmarkets and foster competition, mobilize pri-vate resources such as family savings andcommercial bank loans, and improve the costeffectiveness of public investments. Another5,400 families living in informal settlementswill benefit from land regularization or
80

upgraded sewerage, waste disposal and elec-tricity services.
URUGUAY
In 2002, the Bank approved five loans and oneMIF financing to Uruguay. On a cumulativebasis, the Bank has made 117 loans totaling$3,391 million and disbursements have totaled$2,712 million.
Social Protection and Sustainability Program($500 million loan from the OC)
This emergency loan will mitigate the effectsof Uruguay’s economic crisis on the poor byprotecting priority health and educationspending and by ensuring that programs tomodernize and improve the efficiency of socialprograms are not scaled back. The fast-dis-bursing loan forms part of a global financialsupport package, in conjunction with theInternational Monetary Fund and the WorldBank, designed to maintain the country’smacroeconomic stability. The financing will bereleased in tranches over a period of 12months based on compliance with budgetingtargets for social protection, including socialsecurity, as well as with benchmarks for mod-ernization efforts. The latter include a range ofprograms aimed at improving the targeting ofsocial programs through such initiatives asestablishing standards for the identificationand classification of users and authorizing anational height-for-weight census for children.
Multisector Global Financing Program III($180 million loan from the OC)
This program will promote private investmentby Uruguayan businesses by expanding thesupply of credit on market terms and provid-ing the liquid resources needed to spur the useof available financial products. The objective isto make up the shortfall in the domestic finan-cial market, which is not mobilizing sufficient
savings to fund private sector productiveinvestments. The operation will provide fund-ing to enlarge the Central Bank’s medium- andlong-term loan discount window supportedthrough previous IDB-financed multisectorcredit programs. This will bolster the CentralBank’s efforts to provide intermediary finan-cial institutions (IFIs) with lines of credit forsubloans to finance capital investments, termmismatch insurance cover for IFI lendingportfolios, medium-term financial and operat-ing leasing, securitization of bank loans forproductive investments, and export creditoperations.
Comprehensive Program for At-Risk Children,Adolescents and Families($40 million loan from the OC)
Nearly half of children under five and a thirdof adolescents in Uruguay live in poor house-holds. This program will expand and improvethe quality of social services for vulnerablechildren and their families in order tostrengthen academic performance and mitigatesuch problems as malnutrition, juvenile delin-quency, school attrition, child labor, teenagepregnancy, drug abuse and violence. The pro-gram will target intervention zones identifiedas having the greatest unmet needs, and theprogram design will include participation bygovernment, civil society organizations andeducational institutions. Training and equip-ment will be provided for early education cen-ters, and counseling services will strengthenlinks between schools and families. Other serv-ices will include recreational and sports activi-ties, job training, and a learning accreditationprogram to enable dropouts to continue theireducation. Public information campaigns onsexual and reproductive health will aim to pre-vent teen pregnancy, and services for streetchildren will strengthen their ties with theirfamilies, schools and communities.
THE YEAR’S LENDING 81

Port of M’Bopicua($10.5 million loan from the OC with a “B”loanof $10.5 million)
This financing will support construction andoperation of a privately owned port facility toexport sustainable forestry and agriculturalproducts as well as other bulk cargoes. Locatedon the Uruguay River east of Fray Bentos, theport will have separate receiving, processingand loading facilities. The terminal will includea docking area and berth with loading equip-ment to service large ocean vessels; storage andreceiving areas; a wood processing facility; con-veyer belt systems to transport products with-in the port; and maintenance and administra-tive facilities, including a control tower andcustoms area. A seven km access road will bebuilt to connect the port with a nearby nation-al highway. Bank participation is expected toattract participation by commercial financialinstitutions in support of the investment pro-gram of the project sponsor, Grupo EmpresarialENCE of Spain, operating under a concessionfrom the Uruguayan government.
Montevideo Municipal Modernization Program($3 million loan from the OC)
This program will improve the quality andefficiency of municipal services by moderniz-ing administrative, fiscal and technologicalprocesses. Strategic management systems andperformance indicators will be put in place,information technology upgraded, and admin-istrative processes and service delivery decen-tralized. New technologies will be introducedfor key municipal sanitation services such astrash collection, and regulations for land usewill be reformed. Training will be provided inmanagerial leadership, application of a per-formance-based pay system, and in openingdialogues with social actors such as organizedlabor. Staff retraining will prepare personnelfor new tasks. The program will create andrestructure systems for management and con-trol of municipal revenues. To strengthen the
financial area, the program will support adjust-ments in the accrual accounting system, con-trol of fixed assets, and installation of animport-based procurement system.
Venture Capital Fund for Small Enterprises($5 million MIF grant)
This project will introduce a new tool intoUruguay’s capital market—a risk capitalfund—to support the expansion and develop-ment strategies of small and medium-sizedbusinesses. The fund will invest in firmsselected on the basis of anticipated growthprospects. Resources will facilitate manage-ment improvements, capital upgrades, andstrengthening of financial structures.
VENEZUELA
In 2002, the Bank approved one loan toVenezuela. On a cumulative basis, the Bankhas made 74 loans totaling $3,855 million anddisbursements have totaled $3,420 million.
Rural and Small Town Water Supply Systems($28 million loan from the OC)
By decentralizing rural water supply to thelocal level, this operation aims to improve serv-ice delivery and water quality, in turn reducingthe incidence of water-borne diseases. Waterand sanitation projects will be financed inpoor rural communities willing to form a localorganization to manage, operate and maintainthe system. Loan resources will be used tocarry out engineering works, procure andinstall equipment, and provide assistance dur-ing start-up of the system, which will thenoperate on a payment-for-service basis.Training and technical assistance will alsostrengthen the communities and theautonomous management units that theyestablish to run the water and sanitation sys-tems. Some 100,000 rural inhabitants in 50different communities are expected to benefit
82

from the operation. Studies on the projectscarried out will be used to measure effective-ness and to prepare designs for system repairsor expansion.
REGIONAL
In 2002, the Bank approved one loan, threetechnical cooperation operations and six MIFfinancings at the regional level. On a cumula-tive basis, the Bank has made 61 loans totaling$2,732 million and disbursements have totaled$2,200 million.
Global Credit for Small Caribbean States($20 million loan from the FSO)
The IDB charter enables the Bank to fostereconomic and social development in non-member Caribbean states by providing loansto the Caribbean Development Bank (CDB) tobe onlent to small and lower-income nations. Asharp decline in tourism in these countriessince the events of September 11, 2001 hashad a particularly negative impact on theireconomies. This loan will be used to financeno less than four CDB operations for socialand infrastructure projects, poverty reduction,mitigation of the effects of natural disasters,and economic policy and institutionalstrengthening measures. CDB countries cur-rently eligible for such FSO funding includeDominica, Grenada, St. Lucia, and St. Vincentand the Grenadines.
Consolidating the Integration Process($2 million TC grant from the FSO)
This program will finance training, policyresearch and technical assistance to promoteregional integration. The Institute for theIntegration of Latin America and theCaribbean (INTAL) will carry out the pro-gram in collaboration with the World TradeOrganization., Government officials will betrained in negotiating skills in such areas as
market access, competition policy, anti-dump-ing and customs valuation. Research will helpdecision-makers formulate policies on such keytrade and integration issues as agriculture, gov-ernment procurement and investment.Technical assistance will support greater par-ticipation by civil society in formulating andimplementing trade and integration policies.
Research Network($1.3 million TC grant from the FSO)
The Research Network has provided grantssince 1995 to Latin American and Caribbeanresearch centers to carry out studies on devel-opment issues. This new network round willfocus on priority issues for both the IDB andthe region. In the process, it will strengthenregional research capacity and generate usefulpolicy lessons for the structural reform agenda,in particular. Studies are expected to focus onsuch issues as economic growth and competi-tiveness of the productive sectors, the socialimpact of unemployment, poverty, macroeco-nomic stability, financial systems, and globaleconomic integration. The operation alsofinances seminars, publication and dissemina-tion of the studies, and meetings with nationalauthorities on policy lessons.
Program to Combat Desertification in SouthAmerica($1 million grant from the Japan Special Fund)
This program will provide technical assistanceand training to address the environmental andsocioeconomic problems caused by the deteri-oration of arid and drought-ridden areas. Thesix participating nations—Argentina, Bolivia,Brazil, Chile, Ecuador and Peru—have ratifiedthe United Nations Agreement to CombatDesertification. Most of the degradation ofarid areas is caused by poor land use practicesthat turn useful soil into marginal and eventu-ally sterile land. This program will refine amethodology to identify and evaluate desertifi-cation processes and recommend policies to
THE YEAR’S LENDING 83

control and monitor them. Public officials willbe trained in analysis of the data so that theycan develop appropriate programs and poli-cies. Specialized university and post-graduateprograms on desertification will be developedand a public awareness campaign will bedirected at farmers, NGOs, regional and localofficials and the media.
Innovation Program for E-Business and SMEDevelopment($5 million MIF grant)
Through a competitive selection process, thisprogram will support between 10 and 15 proj-ects that present innovative applications ofinformation and communication technologiesfor targeted users. Non-profit organizations,small and medium-sized enterprises (SMEs)and networks all qualify for participation.Using selected pilot initiatives, the programaims to demonstrate the technical feasibilityand commercial viability of proposed applica-tions and services.
Modernization of Customs and Border Crossings($2 million MIF grant)
This project will promote greater trade andhigher productivity in Mesoamerica bystreamlining border control procedures forgoods in transit. The goal is to reduce theoperating costs of international freight trans-portation in the region. The project will designand implement a standard computerized pro-cedure for international transit of goods in theform of a single declaration for all controlagencies and a common operating procedure atthe borders of the eight countries involved:Mexico, Guatemala, Belize, El Salvador,Honduras, Nicaragua, Costa Rica and Panama.
Improving Competitiveness of SMEs in theForestry Sector($1.7 million MIF grant)
This project will improve the efficiency andcompetitiveness of small and medium-sized(SME) forestry enterprises in Guatemala,Honduras and Nicaragua. The aim is tostrengthen the firms’ administrative and tech-nical skills as well as increase long-termopportunities for marketing forestry products.The project will develop training modules,establish a website for SME forestry services,identify products with potential, and developinnovative marketing strategies. Local commu-nities will benefit from enhanced cooperationbetween government, private producers, andthe general public.
Application of Sanitary and PhytosanitaryMeasures($1.5 million MIF grant)
This program will improve trade in agricultur-al products in the countries of the Pueblo-Panama Plan by coordinating and improving aregional system to apply sanitary and phy-tosanitary measures and strengthen regionalcoordination of each country’s agrosanitaryoperating structures.
Labor Market and Training InformationSystems($1.4 million MIF grant)
Part of the Pueblo-Panama Plan, this projectwill create a network for information exchangethat facilitates market demand for and supplyof training services and best practices andtraining models. The information system willbe Internet-accessible to the private sector andother interested parties. The system will iden-tify private sector demand for job training aswell as appropriate training services.Entrepreneurs will be helped in identifyingtheir training needs and then connected withthe service providers most qualified to respond
84

to those needs. Because system coverage willbe regional, service alternatives for entrepre-neurs will be broader and more varied.
Creation and Development of FinancialIntelligence Units in South America($1.3 million MIF grant)
This program will create, develop and consoli-date Financial Intelligence Units in order tominimize money-laundering practices in eightcountries: Argentina, Bolivia, Brazil, Chile,Ecuador, Peru, Uruguay and Venezuela. The
program will support development of legal andregulatory frameworks; organization, manage-ment and human resource development; andinformation and communication technology,including interagency information systems,data banks, and programs for analysis of data.The ability to detect suspicious transactionswill allow the countries to increase bankingtransparency, decrease market volatility associ-ated with sudden capital inflows and outflows,and improve conditions for successful privatesector participation.
THE YEAR’S LENDING 85

TABLE VII. NONREIMBURSABLE ANDCONTINGENT-RECOVERY TECHNICALCOOPERATION1
(In thousands of U.S. dollars)
Country 2002 1961–02
Argentina $ 323 $ 68,372Bahamas 22 18,036Barbados 33 20,907Belize 334 6,563Bolivia 1,367 74,363Brazil 1,307 158,086Chile 3,121 13,156Colombia 1,221 54,624Costa Rica 665 42,984Dominican Republic 2,295 52,307Ecuador 2,842 63,618El Salvador 2,950 49,992Guatemala 3,409 52,173Guyana 1,400 50,107Haiti 1,580 50,433Honduras 3,704 58,326Jamaica 2,100 36,388Mexico 4,063 21,810Nicaragua 2,481 70,214Panama 575 34,187Paraguay 2,395 58,962Peru 1,691 82,004Suriname 1,245 23,549Trinidad and Tobago 59 19,533Uruguay 57 31,222Venezuela 58 11,954Regional 24,092 665,373
TOTAL $65,391 $1,889,2451 Does not include Small Project financings.
Technical Cooperation
The IDB’s technical cooperation program hastraditionally been an effective instrument forfacilitating project design, preparing theBank’s lending program and sharing knowl-edge and experience among the countries ofthe region. In recent years, the program haschanneled valuable technical assistance toregional initiatives to strengthen dialogue onpoverty, integration and trade, and the envi-ronment.
Implementation of the technical coopera-tion program is based on the EighthReplenishment mandates, the Board ofGovernors’ lending program framework, coun-try strategies, and the Bank’s InstitutionalStrategy. Those documents set out medium-term priorities for the technical cooperationprogram to support the borrowing membercountries by (i) improving the quality andefficacy of services for the social sectors; (ii)expanding efforts to alleviate poverty; (iii)intensifying efforts to modernize public agen-cies; (iv) strengthening environmental man-agement programs; and (v) promoting smallbusiness and microenterprise development.The Bank is also committed to respondingquickly to emergencies resulting from naturaldisasters.
In 2002, the Bank approved 336 technicalcooperation projects totaling $65.4 million.National technical cooperation operationsaccounted for 278 of these projects totaling$49.1 million. Examples include programs tosupport environmental management ofKingston harbor in Jamaica, improve the man-agement of public finance in Haiti, promoteopportunities for women living in rural partsof Mexico, and prepare environmental riskmaps in Nicaragua.
The regional technical cooperation pro-gram financed 58 operations for a total of$16.3 million. Throughout 2002, and consis-tent with the priorities determined within theBank’s institutional strategy, regional technicalcooperation activities centered on programssupporting the generation of public goods, as
86
well as the dissemination of topics newlyincorporated in the agendas of the Bank andits borrowing member countries. By means ofthe regional technical cooperation grant pro-gram, the Bank contributes to the transfer ofknowledge to the countries of the region andpilots strategic operations at a regional levelthat complement activities carried out in eachcountry.
In the area of social sector reform, sup-port was provided for updating census datashowing ethnic groups, with the intention ofproviding accurate information to formulatepublic policies to ameliorate poverty and fos-ter social equity. Financing was provided forpublic officials and civil society groups toattend courses, seminars and workshopsoffered by the Bank’s Inter-American Institutefor Social Development (INDES), as well as
For further information, see
http://www.iadb.org/goto.cfm?rtc

for activities for reducing child labor; for com-pliance with international mandates and agree-ments on the rights of immigrants; and fornutrition programs in Central America.
Additional financing went to activities toimprove the quality of education, includingtraining in distance learning; expand child andyouth education programs in low-income com-munities; develop quality standards for tertiarydistance education; analyze unequal access toeducation in the region; and develop new poli-cies and strategies to strengthen basic and sec-ondary education for girls.
Throughout 2002, financing was also pro-vided for activities to reduce vulnerability toHIV/AIDS, and to promote social inclusion ofsegments of the population traditionallyexcluded because of race, ethnic background,gender or disability.
To support modernization of the state,initiatives helped to implement a program onethics in development, promote good corporatecitizenship in the region (see Box 9), traindecision-makers in public finance, andimprove the quality of statistical data onpoverty and social equity. Other grants fundedan examination of the new challenges inregional security arising from the events ofSeptember 11, 2001, and alternatives forincreasing leadership effectiveness for women.
Under the heading of competitiveness,financing was provided for services and train-ing for microentrepreneurs, and for implemen-tation of a macroeconomic and financial policyframework that promotes private sectoractivities.
In the area of regional integration, fundswill help promote and consolidate the integra-tion process at the subregional and hemispher-ic levels. Grants will support both the internalintegration process and external trade negotia-tions of the Andean Community; assist CARI-COM member countries in participating inand negotiating multilateral, regional and bilat-eral trade agreements; and set up a humanresource development and training program inregional integration, strengthening the techni-cal negotiating skills of civil society profession-
als in the Bank’s borrowing member countries.Financing was also approved for improving aforeign trade information system in order tobetter the quality and accuracy of the statisti-cal information available to Latin Americanand Caribbean governments, and for strength-ening the statistical systems of the MERCO-SUR member countries in particular. Regionaltechnical cooperation funds will help a num-ber of countries develop subregional physicalinfrastructure for the transportation, telecom-munications and energy sectors, enabling themto improve and harmonize their regulatoryframeworks through the Initiative for theIntegration of Regional Infrastructure inSouth America (IIRSA).
Cofinancing
Cofinancing of IDB-supported projectsreached $990.6 million through 19 operationsby 20 partners, representing approximately 22percent of the Bank’s $4.5 billion total lendingprogram for the year. Of this amount, fourbilateral agencies contributed $29.5 millionand four multilateral organizations funded$946 million, respectively, for nine operations.The World Bank participated in four of theseprograms for a total of $843 million. Eightcofinancing grants administered by the Bank(COFABs) were approved for a total of $1.05million. This instrument, officially introducedin October 2001, has proven to be an effectiveand flexible mechanism, opening doors toinnovative operations and nontraditionalcofinanciers.
The IDB continues to strengthen its rela-tionships with donors by more closely adher-ing to the partnership approach. Throughoutthe year, it emphasized the importance ofstrategic partnerships and new cooperativeagreements. As such, it finalized Memorandaof Understanding (MOU) with the FederalRepublic of Germany and the EuropeanCommission and signed other arrangements
THE YEAR’S LENDING 87
For further information, see
http://www.iadb.org/goto.cfm?cofinance
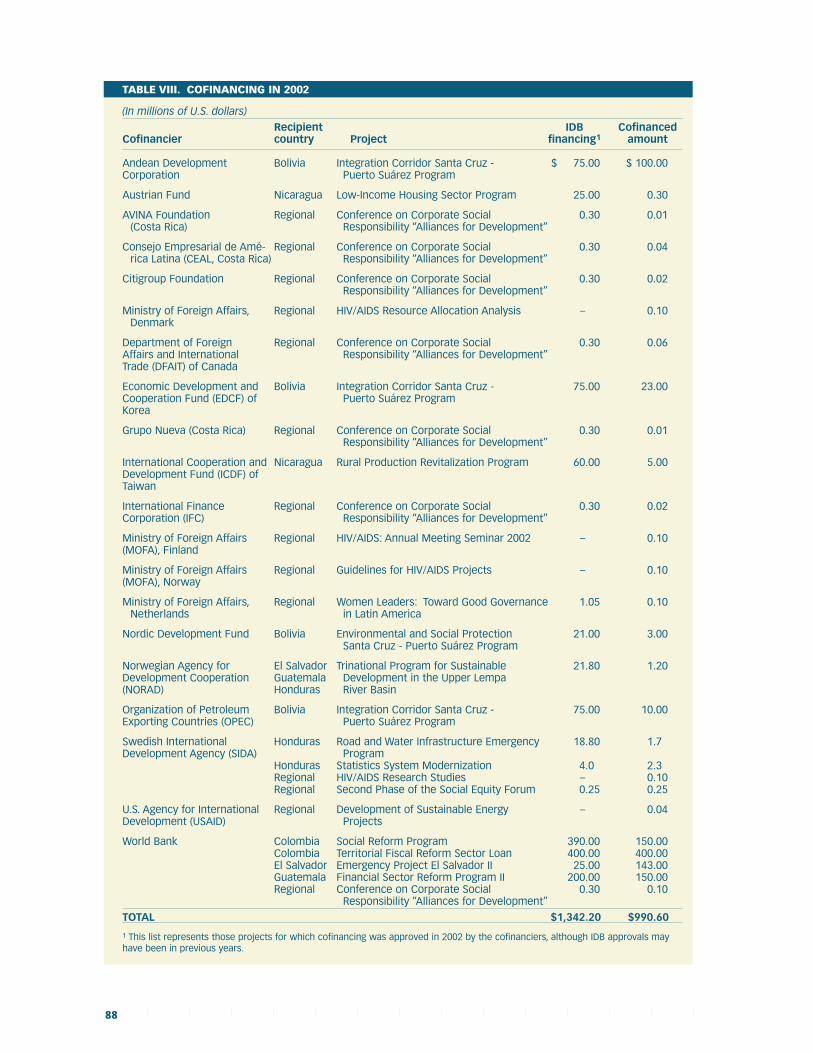
88
TABLE VIII. COFINANCING IN 2002
(In millions of U.S. dollars)
Recipient IDB CofinancedCofinancier country Project financing1 amount
Andean Development Bolivia Integration Corridor Santa Cruz - $ 75.00 $ 100.00Corporation Puerto Suárez Program
Austrian Fund Nicaragua Low-Income Housing Sector Program 25.00 0.30
AVINA Foundation Regional Conference on Corporate Social 0.30 0.01(Costa Rica) Responsibility “Alliances for Development”
Consejo Empresarial de Amé- Regional Conference on Corporate Social 0.30 0.04rica Latina (CEAL, Costa Rica) Responsibility “Alliances for Development”
Citigroup Foundation Regional Conference on Corporate Social 0.30 0.02Responsibility “Alliances for Development”
Ministry of Foreign Affairs, Regional HIV/AIDS Resource Allocation Analysis – 0.10Denmark
Department of Foreign Regional Conference on Corporate Social 0.30 0.06Affairs and International Responsibility “Alliances for Development”Trade (DFAIT) of Canada
Economic Development and Bolivia Integration Corridor Santa Cruz - 75.00 23.00Cooperation Fund (EDCF) of Puerto Suárez ProgramKorea
Grupo Nueva (Costa Rica) Regional Conference on Corporate Social 0.30 0.01Responsibility “Alliances for Development”
International Cooperation and Nicaragua Rural Production Revitalization Program 60.00 5.00Development Fund (ICDF) ofTaiwan
International Finance Regional Conference on Corporate Social 0.30 0.02Corporation (IFC) Responsibility “Alliances for Development”
Ministry of Foreign Affairs Regional HIV/AIDS: Annual Meeting Seminar 2002 – 0.10(MOFA), Finland
Ministry of Foreign Affairs Regional Guidelines for HIV/AIDS Projects – 0.10(MOFA), Norway
Ministry of Foreign Affairs, Regional Women Leaders: Toward Good Governance 1.05 0.10Netherlands in Latin America
Nordic Development Fund Bolivia Environmental and Social Protection 21.00 3.00Santa Cruz - Puerto Suárez Program
Norwegian Agency for El Salvador Trinational Program for Sustainable 21.80 1.20Development Cooperation Guatemala Development in the Upper Lempa(NORAD) Honduras River Basin
Organization of Petroleum Bolivia Integration Corridor Santa Cruz - 75.00 10.00Exporting Countries (OPEC) Puerto Suárez Program
Swedish International Honduras Road and Water Infrastructure Emergency 18.80 1.7Development Agency (SIDA) Program
Honduras Statistics System Modernization 4.0 2.3Regional HIV/AIDS Research Studies – 0.10Regional Second Phase of the Social Equity Forum 0.25 0.25
U.S. Agency for International Regional Development of Sustainable Energy – 0.04Development (USAID) Projects
World Bank Colombia Social Reform Program 390.00 150.00Colombia Territorial Fiscal Reform Sector Loan 400.00 400.00El Salvador Emergency Project El Salvador II 25.00 143.00Guatemala Financial Sector Reform Program II 200.00 150.00Regional Conference on Corporate Social 0.30 0.10
Responsibility “Alliances for Development”
TOTAL $1,342.20 $990.60
1 This list represents those projects for which cofinancing was approved in 2002 by the cofinanciers, although IDB approvals mayhave been in previous years.

such as the Canadian Framework Agreement.In addition, the Bank organized 20 coordina-tion and consultation meetings with variouscofinanciers and hosted technical meetingsbetween donors and Bank staff such as theworkshop on water and sanitation with theJapan Bank for International Cooperation(JBIC). Through this collaboration, the IDBpromotes understanding of the Bank’s strate-gies, policies, priorities and procedures with itspartners while encouraging more effectiveproject design, execution and evaluation.
The Bank successfully rekindled relationswith former contributors while incorporatingnew multilateral, bilateral and private sectororganizations into its donor corps. Themobilization of external funds extended IDBresources, allowing for participation in newareas such as HIV/AIDS, corporate socialresponsibility and women’s leadership in goodgovernance. Furthermore, through use of acomprehensive donor matrix for selected bene-ficiary countries, the Bank continues to fortifydonor coordination.
In support of private sector operations,the Bank continued to act as a catalyst for theinvolvement of private sector commerciallenders through its successful B loan program.In recognition of the growing difficulty in mar-ket conditions for Latin America as a whole,the Bank also teamed up with other co-lendersto ensure that projects had sufficient financialresources to meet their objectives. Co-lendersinclude other official agencies as well asdomestic financial institutions. The total num-ber of participants in the program grew to 73financial institutions (commercial and invest-ment banks, insurance companies, and otherinstitutional investors) in 13 countries.
Funds in Administration
The Bank currently administers 44 trust fundsfor technical cooperation activities. This num-ber includes the Fund for AgricultureTechnology (FONTAGRO), the IndigenousPeoples Fund, three trust funds for microen-terprise, eleven independent funds established
by Austria, Canada, Korea, Spain, the UnitedStates and Venezuela, and 28 funds of theProgram for Development of TechnicalCooperation among Member Countries of theBank (TC/Funds Program).
The TC/Funds Program was establishedto finance short- and medium-term consultan-cies and training activities. Since 1991, 37funds have been established under theTC/Funds umbrella, with total contributionsof $167.2 million, as well as five agreements in-kind for the provision of services.Contributions have been donated by all butthree of the nonborrowing member countriesof the Bank. Funds have been established byAustria, Belgium, Canada, Denmark, theEuropean Union, Finland, France, Israel, Italy,Japan, the Netherlands, Norway, Portugal,Spain, Sweden, Switzerland, the UnitedKingdom and the United States.Contributions by these donor countries in2002 amounted to $16.4 million.
In 2002, the Italian Ministry of ForeignAffairs established three new trust funds at theBank for Cultural Heritage and SustainableDevelopment, the Sustainable Development ofArgentina, and Microenterprise Development,with total commitments equivalent to $18.2million.
The Netherlands Ministry forDevelopment Cooperation and the Bankestablished the IDB-Netherlands WaterPartnership Program with a pledge of $10 mil-lion. Another new fund, outside the TC/FundsProgram, was established by the Governmentof Korea and the Bank: the Korean Trust Fundfor Technical Cooperation for the Republic ofColombia.
In 2002, resources from the trust fundsconstituted the largest source of financing ofthe Bank’s nonreimbursable technical coopera-tion program. Of the total of $65.4 millionapproved by the Bank’s non-reimbursabletechnical cooperation program, $38 million wasfinanced with resources from the trust funds.
THE YEAR’S LENDING 89
For further information, see
http://www.iadb.org/goto.cfm?tcfunds

90
TABLE IX. FUNDS IN ADMINISTRATION
Contributions1
Date Entrusted (US$ millions Name Established by Currency equivalent) Sector Concentration or Purpose
Social Progress Trust Fund 1961 USA USD 525 Agriculture, sanitation, education, social
Canadian Fund 1964 Canada CAD 47.2 Physical infrastructure and other sectors
Venezuelan Trust Fund 1975 Venezuela USD 400 Integration, natural resources, industry,VBO 100 exports
Norwegian Development Fund 1987 Norway USD 2.0 Low-income groups, health, education,for Latin America agriculture, small-scale industry
Japan Special Fund 1988 Japan JPY 204 Technical assistance, small projects,emergency assistance
Spanish Quincentennial Fund 1990 Spain EUR 83.8 Technical education, agriculture, health,communications, urban development
Trust Fund for Belgian Consultants 1991 Belgium EUR 3.1 Technical assistance for the preparationof projects
IDB Graduate Scholarship Program 1991 Japan JPY 21.2 Scholarship for advanced studies
Portuguese Technical Cooperation 1991 Portugal EUR 2.7 Technical assistance, scholarships andFund training
Swedish Fund for Small Projects and 1991 Sweden USD 5.3 Small projects financing for low-Technical Assistance for Latin America income groups
Austrian Technical Cooperation 1992 Austria USD 0.6 Preparation, execution and supervisionTrust Fund of projects
Israeli Consultant Trust Fund 1992 Israel USD 0.7 Preparation and appraisal of economic(Bank of Israel) and social development projects
Italian Consulting Firms and 1992 Italy USD 9.0 Sector studies and special programsSpecialized Institutions
Italian Individual Consultant 1992 Italy USD 3.5 Short-term consultancy forTrust Fund development projects
Norwegian Fund for Women 1993 Norway USD 7.5 Technical assistance, studies, trainingin Development and seminars under the Women in
Development Program
Danish Consultants Fund 1994 Denmark USD 10.0 Prefeasibility and feasibility studies ininfrastructure, environment, healthand education
Norwegian Technical Cooperation 1994 Norway USD 7.7 Prefeasibility and feasibility studies inTrust Fund for Consulting Services infrastructure, environment, health
and education
Spanish Fund for Consultants (ICEX) 1994 Spain EUR 13.8 All sectors, preferably in agroindustryand industrial restructuring
Swiss Consultants Fund 1994 Switzerland USD 4.6 Activities sponsored by the Bank andthe Bolívar Program
United Kingdom Fund for 1994 United Kingdom GBP 0.8 All sectors of activities, particularly forConsulting Services project assessment and technical
support studies
Japanese Trust Fund for 1995 Japan JPY 26.1 All sectors of activities for projectConsultancy Services preparation and implementation
USTDA-IDB Evergreen Fund for 1995 USA USD 4.6 All sectors, preferably in support ofTechnical Assistance infrastructure and industrial projects
European Special Fund for 1997 European EUR 3.9 Improve preparation of projects,Technical Assistance in Latin America Union transfer of technology and
development of human resources

THE YEAR’S LENDING 91
Contributions1
Date Entrusted (US$ millions Name Established by Currency equivalent) Sector Concentration or Purpose
European Special Fund for the 1997 European EUR 12.5 Small projects and technical assistanceFinancing of Small Productive Projects Union
Finnish Technical Cooperation 1997 Finland USD 2.0 Project identification, preparation andTrust Fund for Consulting Services implementation, training, sector studies
French Technical Cooperation Fund for 1997 France EUR 10.1 Consultancy services and trainingConsultancy and Training Activities activities
Norwegian Fund for Innovation 1997 Norway USD 4.8 Technical cooperation for social sectorin Social Programs programs in the poorest countries of
IDB Region 2
Indigenous Peoples Fund 1998 Regional USD 11.8 Endowment fund for assistance toindigenous peoples
Norwegian Fund for Microenterprise 1998 Norway USD 1.6 Technical cooperation forDevelopment microenterprise projects in the
poorest countries
Regional Fund for Agricultural 1998 Regional USD 31.9 Endowment fund for assistance inTechnology (FONTAGRO) agricultural projects
United Kingdom Capacity Building 1999 United Kingdom USD 3.1 Capacity building of local institutionsFund for Local Institutions in in Central AmericaCentral America
IDB Disaster Assistance and 1999 Austria USD 4.1 Disaster assistance and reconstructionReconstruction Fund of countries affected by Hurricane Mitch
Italian Trust Fund for 2000 Italy USD 1.6 Support the preparation of MIF projectsMIF Project Preparation
Swedish Framework-SIDA 2000 Sweden USD 1.5 Social sectors of the poorest countriesIDB Partnership Program in Central America affected by
Hurricane Mitch
U.S. Department of Energy- 2000 USA USD 1.3 Support clean energy technologyHemispheric Sustainable Energy Fund projects in all energy-consuming sectors
Partnership Program in Environment 2000 The Netherlands USD 3.0 Support environmental projects
The Netherlands Framework- 2000 The Netherlands USD 0.7 Support women’s leadership in civicProgram for Women’s Leadership and public lifefor Good Governance
Korean Trust Fund 2000 Korea USD 0.6 Assistance to Central Americancountries and social projects in Colombia
Global Environment Facility 2000 GEF/World Bank USD 1.9 Project development facility for the Trust Fund environment
Spanish Framework-General 2001 Spain EUR 44.4 Support projects in modernization ofCooperation Fund the state and governance, regional
integration and competitiveness
Canadian Technical Cooperation 2001 Canada CAD 11.6 Consultancy services in all sectors withProgram emphasis on social reform
Swedish Trust Fund for Consulting 2001 Sweden USD 1.2 Consulting and training in areas ofServices and Training Activities social and economic development
Korean Trust Fund for the 2002 Korea USD 0.4 Assistance for social projects in Republic of Colombia Colombia
Netherlands Water Management 2002 The Netherlands USD 2.7 Preparation of projects in water Partnership management
1 Amounts reflect historical exchange rates.

The TC/Funds financed 33 percent of thetotal approvals and the Japan Special Fundfinanced 19 percent. In 2002, the TC/Fundsfinanced 143 operations for $21.7 million, inaddition to $1 million from the Austria MitchFund for the rehabilitation of bridges dam-aged by Hurricane Mitch.
Japanese Funds
Since its establishment in 1988, the JapanSpecial Fund (JSF) has acquired majorimportance in providing untied resources forthe Bank’s technical cooperation activities. Oneof the oldest and largest funds administered bythe Bank, the JSF approved 17 projects in2002 totaling $9.2 million, of which 56 percentwas directed toward the environment andsocial sectors. New contributions from theGovernment of Japan to the JSF in 2002 wereapproximately $3.6 million, raising the aggre-gate contribution to approximately $204million.
In 2001, the Government of Japan setaside $30 million from JSF for the PovertyReduction Program (JPO). The program wasestablished for a period of five years (2001-2005) to finance activities related to povertyreduction. During 2002, the JPO approvedseven projects for $3.5 million.
In 2002, the Japan Program approvedtechnical cooperation projects for a total of$2.9 million. The Japan Program was createdin 1999 with funds mainly from the Govern-ment of Japan to facilitate knowledge transferand exchange of best practices between theregion and Asia.
The largest of the Bank’s TC/Funds , theJapanese Trust Fund for Consultancy Services(JCF), was created in 1995. In 2002, the JCFapproved nine projects for $3.7 million. Fiftypercent of the JCF funding is tied to thefinancing of Japanese consultants or consult-ing firms. Any Bank sectors in which there isrecognized Japanese expertise— such as infra-structure, the environment and informationtechnology—are eligible for financing. In2002, Japan contributed approximately $1.6
million, bringing cumulative contributions toapproximately $26.1 million.
Procurement
Bank policies mandate that the procurementof goods, works and consulting services forIDB-funded projects must comply with theprinciples of economy, efficiency, competition,transparency and due process. Procurementmust be done based on a process of openselection and competitiveness, and there mustbe international public bidding for contractsabove specific thresholds. Only firms fromIDB member countries may participate in bid-ding for IDB-financed projects.
Borrowers are responsible for the execu-tion and management of the projects, includ-ing the bidding process, from the drafting ofbidding documentation to the adjudicationand administration of contracts. IDB CountryOffices are responsible for monitoring thisprocess and cooperating with the executingagencies to ensure full compliance with Bankprocedures.
The Procurement Policy andCoordination Office at IDB headquarters isresponsible for drafting procurement policiesand overseeing their application in Bank-financed projects. The office also providesassistance, training and dissemination of infor-mation regarding interpretation and applica-tion of regulations and procedures. The officeperiodically offers seminars and workshops onprocurement procedures for staff from theexecuting agencies.
During the year, the Bank continuedefforts to harmonize its procurement regula-tions and procedures with those of the othermultilateral development institutions, workingto adopt substantially similar procurementdocuments and policies and facilitating theactivities of executing agencies, bidders andothers involved in the procurement process
92
For further information, see
http://www.iadb.org/goto.cfm?procure

The Bank also continued working on aproject to disseminate regional experiences onthe execution of procurement procedures viathe Internet. The objective is to incorporatethe use of electronic media into Bank procure-ment procedures, which will result in a signifi-cant increase in efficiency and transparency.
The Bank’s Procurement Committee is amanagement-level interdepartmental groupthat reviews and oversees procurement policiesand procedures. The committee is alsoresponsible for reviewing requests for waiversto competitive bidding requirements and allprotests submitted by bidders or potential bid-ders at any stage of the procurement process.In 2002, synopses of decisions taken by theCommittee in prior years were posted on theBank’s website, at www.iadb.org/ros/prm/com-mittee.htm.
Disbursements of convertible currenciesfor the purchase of goods, works and consult-ing services under investment and sector loanstotaled $5.7 billion in 2002. Borrowing mem-ber countries received $4.4 billion, or 77.6 per-cent of the value. Local purchase of goods,works and consulting services for projects inthe borrowing countries totaled $3.5 billion,
while nonborrowing countries provided a totalof $1.3 billion. The accompanying tables(Disbursements for Purchase of Goods andServices by Country of Origin, Tables X, XI,and XII) break out disbursements for all Banklending, sector loans, and investment loans.Where applicable, the tables include a detailedbreakdown of local purchases and exports ofgoods, works and consulting services.
In 2002, Management took a number ofsteps to promote transparency in procurementfor the projects it finances, including the pub-lication on the Bank’s website, for informationpurposes, of Specific Procurement Notices(SPNs) and General Procurement Notices(GPNs). In addition, a working group com-prised of several departments prepared andsubmitted to the Board of Executive Directorsan action plan for expanding the amount ofprocurement information available to thepublic free of charge. As part of a program ofoutreach to the business community, the Officeof External Relations organizes (and helpsother Bank units to organize) regular seminarsfor suppliers, contractors and consultants inWashington and in many of its borrowing andnonborrowing member countries.
THE YEAR’S LENDING 93

94
TABLE X. DISBURSEMENTS FOR PURCHASE OF GOODS AND SERVICES BY COUNTRY OF ORIGIN (INVESTMENT AND SECTOR LOANS)
(In millions of U.S. dollars)
1961–01 2002 1961–02Local Purchases Exports Total Local Purchases Exports Total Local Purchases Exports Total
Amount % Amount % Amount % Amount % Amount % Amount % Amount % Amount % Amount %
BORROWING COUNTRIESArgentina $ 3,397.2 9.9 $ 1,571.7 3.9 $ 4,968.9 6.7 $ 154.1 4.4 $ 209.1 9.6 $ 363.2 6.3 $ 3,551.3 9.4 $ 1,780.8 4.2 $ 5,332.1 6.7Bahamas 23.7 0.1 91.2 0.2 114.9 0.2 10.0 0.3 0.0 0.0 10.0 0.2 33.7 0.1 91.2 0.2 124.9 0.2Barbados 59.9 0.2 6.7 0.0 66.6 0.1 17.3 0.5 0.8 0.0 18.1 0.3 77.2 0.2 7.5 0.0 84.7 0.1Belize 28.9 0.1 30.1 0.1 59.0 0.1 11.3 0.3 0.0 0.0 11.3 0.2 40.2 0.1 30.1 0.1 70.3 0.1Bolivia 817.6 2.4 92.9 0.2 910.5 1.2 61.7 1.7 8.7 0.4 70.4 1.2 879.3 2.3 101.6 0.2 980.9 1.2Brazil 10,226.9 29.7 3,721.9 9.3 13,948.8 18.8 1,108.2 31.3 289.7 13.2 1,397.9 24.4 11,335.1 29.9 4,011.6 9.5 15,346.7 19.2Chile 2,198.8 6.4 357.3 0.9 2,556.1 3.4 90.8 2.6 63.1 2.9 153.9 2.7 2,289.6 6.0 420.4 1.0 2,710.0 3.4Colombia 1,914.8 5.6 389.2 1.0 2,304.0 3.1 166.2 4.7 29.6 1.3 195.8 3.4 2,081.0 5.5 418.8 1.0 2,499.8 3.1Costa Rica 380.9 1.1 242.5 0.6 623.4 0.8 11.0 0.3 16.7 0.8 27.7 0.5 391.9 1.0 259.2 0.6 651.1 0.8Dominican Republic 463.5 1.3 37.2 0.1 500.7 0.7 35.6 1.0 0.0 0.0 35.6 0.6 499.1 1.3 37.2 0.1 536.3 0.7Ecuador 1,555.8 4.5 288.2 0.7 1,844.0 2.5 96.1 2.7 17.3 0.8 113.4 2.0 1,651.9 4.4 305.5 0.7 1,957.4 2.4El Salvador 680.8 2.0 62.1 0.2 742.9 1.0 75.6 2.1 16.4 0.8 92.0 1.6 756.4 2.0 78.5 0.2 834.9 1.0Guatemala 515.9 1.5 100.8 0.3 616.7 0.8 65.6 1.9 15.9 0.7 81.5 1.4 581.5 1.5 116.7 0.3 698.2 0.9Guyana 88.2 0.3 2.4 0.0 90.6 0.1 10.0 0.3 0.0 0.0 10.0 0.2 98.2 0.3 2.4 0.0 100.6 0.1Haiti 250.8 0.7 9.6 0.0 260.4 0.4 2.0 0.1 0.0 0.0 2.0 0.0 252.8 0.7 9.6 0.0 262.4 0.3Honduras 415.5 1.2 40.9 0.1 456.4 0.6 72.5 2.0 3.9 0.2 76.4 1.3 488.0 1.3 44.8 0.1 532.8 0.7Jamaica 238.6 0.7 86.8 0.2 325.4 0.4 9.8 0.3 0.1 0.0 9.9 0.2 248.4 0.7 86.9 0.2 335.3 0.4Mexico 5,510.2 16.0 1,200.2 3.0 6,710.4 9.0 946.8 26.8 90.9 4.1 1,037.7 18.1 6,457.0 17.0 1,291.1 3.1 7,748.1 9.7Nicaragua 385.0 1.1 25.2 0.1 410.2 0.6 31.6 0.9 1.7 0.1 33.3 0.6 416.6 1.1 26.9 0.1 443.5 0.6Panama 508.1 1.5 105.4 0.3 613.5 0.8 63.5 1.7 3.5 0.2 67.0 1.2 571.6 1.5 108.9 0.3 680.5 0.9Paraguay 639.9 1.9 98.6 0.2 738.5 1.0 46.8 1.3 24.1 1.1 70.9 1.2 686.7 1.8 122.7 0.3 809.4 1.0Peru 1,624.7 4.7 167.0 0.4 1,791.7 2.4 100.8 2.8 22.5 1.0 123.3 2.2 1,725.5 4.5 189.5 0.5 1,915.0 2.4Suriname 0.7 0.0 1.0 0.0 1.7 0.0 0.0 0.0 0.2 0.0 0.2 0.0 0.7 0.0 1.2 0.0 1.9 0.0Trinidad and Tobago 251.8 0.7 108.9 0.3 360.7 0.5 18.0 0.5 21.3 1.0 39.3 0.7 269.8 0.7 130.2 0.3 400.0 0.5Uruguay 947.6 2.7 221.8 0.6 1,169.4 1.6 139.8 4.0 10.6 0.5 150.4 2.6 1,087.4 2.9 232.4 0.6 1,319.8 1.7Venezuela 1,294.6 3.7 854.3 2.2 2,148.9 2.9 192.9 5.5 63.5 2.9 256.4 4.5 1,487.5 3.8 917.8 2.2 2,405.3 3.0
Total Borrowers $34,420.4 100.0 $9,913.9 24.9 $44,334.3 59.7 $3,538.0 100.0 $ 909.6 41.6 $4,447.6 77.6 $37,958.4 100.0 $10,823.5 25.8 $48,781.9 61.1
NONBORROWING COUNTRIESAustria $119.1 0.3 $119.1 0.2 $8.5 0.4 $8.5 0.1 $127.6 0.3 $127.6 0.2Belgium 245.8 0.6 245.8 0.3 22.7 1.0 22.7 0.4 268.5 0.6 268.5 0.3Canada 703.8 1.8 703.8 0.9 26.7 1.2 26.7 0.5 730.5 1.7 730.5 0.9Croatia 4.4 0.0 4.4 0.0 0.1 0.0 0.1 0.0 4.5 0.0 4.5 0.0Denmark 151.6 0.4 151.6 0.2 6.1 0.3 6.1 0.1 157.7 0.4 157.7 0.2Finland 112.0 0.3 112.0 0.2 9.2 0.4 9.2 0.2 121.2 0.3 121.2 0.2France 1,910.8 4.8 1,910.8 2.6 82.7 3.7 82.7 1.4 1,993.5 4.8 1,993.5 2.5Germany 2,616.8 6.6 2,616.8 3.5 120.1 5.4 120.1 2.1 2,736.9 6.5 2,736.9 3.4Israel 152.8 0.4 152.8 0.2 6.2 0.3 6.2 0.1 159.0 0.4 159.0 0.2Italy 2,755.2 6.9 2,755.2 3.7 82.5 3.8 82.5 1.4 2,837.7 6.8 2,837.7 3.5Japan 2,100.9 5.3 2,100.9 2.8 85.4 3.9 85.4 1.5 2,186.3 5.2 2,186.3 2.7Netherlands 596.0 1.5 596.0 0.8 17.0 0.8 17.0 0.3 613.0 1.5 613.0 0.8Norway 50.0 0.1 50.0 0.1 3.5 0.2 3.5 0.1 53.5 0.1 53.5 0.1Portugal 57.3 0.1 57.3 0.1 3.3 0.2 3.3 0.1 60.6 0.1 60.6 0.1Slovenia 40.5 0.1 40.5 0.1 3.0 0.1 3.0 0.1 43.5 0.1 43.5 0.1Spain 1,326.6 3.3 1,326.6 1.8 86.4 4.0 86.4 1.5 1,413.0 3.4 1,413.0 1.7Sweden 579.3 1.5 579.3 0.8 16.1 0.7 16.1 0.3 595.4 1.4 595.4 0.7Switzerland 757.1 1.9 757.1 1.0 31.8 1.5 31.8 0.6 788.9 1.9 788.9 1.0United Kingdom 973.3 2.4 973.3 1.3 40.7 1.9 40.7 0.7 1,014.0 2.4 1,014.0 1.3United States 14,640.8 36.8 14,640.8 19.7 624.8 28.6 624.8 10.9 15,265.6 36.3 15,265.6 19.0Yugoslavia 14.3 0.0 14.3 0.0 0.0 0.0 0.0 0.0 14.3 0.0 14.3 0.0
Total Nonborrowers $29,908.4 75.1 $29,908.4 40.3 $1,276.8 58.4 $1,276.8 22.4 $31,185.2 74.2 $31,185.2 38.9
TOTAL $34,420.4 100.0 $39,822.3 100.0 $74,242.7 100.0 $3,538.0 100.0 $2,186.3 100.0 $5,724.3 100.0 $37,958.4 100.0 $42,008.6 100.0 $79,967.0 100.0

THE Y
EAR
’SLEN
DIN
G95
TABLE XI. DISBURSEMENTS FOR PURCHASE OF GOODS AND SERVICES BY COUNTRY OF ORIGIN (SECTOR LOANS) 1
(In millions of U.S. dollars)
1990–01 2002 1990–02Local Purchases Exports Total Local Purchases Exports2 Total Local Purchases Exports Total
Amount % Amount % Amount % Amount % Amount % Amount % Amount % Amount % Amount %
BORROWING COUNTRIESArgentina $30.0 40.2 $ 727.4 3.9 $ 757.4 4.0 $190.3 11.4 $190.3 11.4 $30.0 40.2 $ 917.7 4.5 $ 947.7 4.6Bahamas 6.4 0.0 6.4 0.0 6.4 0.0 6.4 0.0Barbados 4.7 0.0 4.7 0.0 0.8 0.0 0.8 0.0 5.5 0.0 5.5 0.0Belize 29.9 0.2 29.9 0.2 29.9 0.1 29.9 0.1Bolivia 54.5 0.3 54.5 0.3 8.2 0.5 8.2 0.5 62.7 0.3 62.7 0.3Brazil 1,948.2 10.3 1,948.2 10.3 173.0 10.3 173.0 10.3 2,121.2 10.3 2,121.2 10.3Chile 282.3 1.5 282.3 1.5 56.4 3.4 56.4 3.4 338.7 1.6 338.7 1.6Colombia 253.8 1.3 253.8 1.3 19.6 1.2 19.6 1.2 273.4 1.3 273.4 1.3Costa Rica 79.5 0.4 79.5 0.4 14.5 0.9 14.5 0.9 94.0 0.5 94.0 0.5Dominican Republic 0.6 0.0 0.6 0.0 0.6 0.0 0.6 0.0Ecuador 230.4 1.2 230.4 1.2 16.9 1.0 16.9 1.0 247.3 1.2 247.3 1.2El Salvador 30.1 0.2 30.1 0.2 12.6 0.8 12.6 0.8 42.7 0.2 42.7 0.2Guatemala 45.9 0.2 45.9 0.2 8.9 0.5 8.9 0.5 54.8 0.3 54.8 0.3Guyana 1.7 0.0 1.7 0.0 1.7 0.0 1.7 0.0Haiti 14.6 19.5 0.0 0.0 14.6 0.1 14.6 19.5 0.0 0.0 14.6 0.1Honduras 9.6 0.1 9.6 0.1 3.6 0.2 3.6 0.2 13.2 0.1 13.2 0.1Jamaica 3.4 0.0 3.4 0.0 3.4 0.0 3.4 0.0Mexico 488.3 2.6 488.3 2.5 58.5 3.5 58.5 3.5 546.8 2.7 546.8 2.7Nicaragua 0.4 0.5 2.8 0.0 3.2 0.0 1.4 0.1 1.4 0.1 0.4 0.5 4.2 0.0 4.6 0.0Panama 29.7 39.8 64.1 0.3 93.8 0.4 1.9 0.1 1.9 0.1 29.7 39.8 66.0 0.3 95.7 0.5Paraguay 53.3 0.3 53.3 0.3 23.6 1.4 23.6 1.4 76.9 0.4 76.9 0.4Peru 72.7 0.4 72.7 0.4 5.8 0.3 5.8 0.3 78.5 0.4 78.5 0.4Suriname 1.0 0.0 1.0 0.0 1.0 0.0 1.0 0.0Trinidad and Tobago 55.7 0.3 55.7 0.3 20.1 1.2 20.1 1.2 75.8 0.4 75.8 0.4Uruguay 182.3 1.0 182.3 1.0 10.0 0.6 10.0 0.6 192.3 0.9 192.3 0.9Venezuela 659.0 3.5 659.0 3.5 59.1 3.5 59.1 3.5 718.1 3.5 718.1 3.5
Total Borrowers $74.7 100.0 $5,287.6 28.0 $5,362.3 28.2 $685.2 40.9 $685.2 40.9 $74.7 100.0 $5,972.8 29.0 $6,047.5 29.4
NONBORROWING COUNTRIESAustria $ 49.4 0.3 $ 49.4 0.3 $ 6.1 0.4 $ 6.1 0.4 $ 55.5 0.3 $ 55.5 0.3Belgium 155.6 0.8 155.6 0.8 20.7 1.2 20.7 1.2 176.3 0.9 176.3 0.9Canada 362.9 1.9 362.9 1.9 20.0 1.2 20.0 1.2 382.9 1.8 382.9 1.8Croatia 2.0 0.0 2.0 0.0 0.1 0.0 0.1 0.0 2.1 0.0 2.1 0.0Denmark 50.9 0.3 50.9 0.3 5.0 0.3 5.0 0.3 55.9 0.3 55.9 0.3Finland 62.1 0.3 62.1 0.3 8.8 0.5 8.8 0.5 70.9 0.3 70.9 0.3France 573.6 3.0 573.6 3.0 75.6 4.5 75.6 4.5 649.2 3.2 649.2 3.1Germany 1,265.5 6.7 1,265.5 6.7 101.1 6.0 101.1 6.0 1,366.6 6.6 1,366.6 6.6Israel 50.0 0.3 50.0 0.3 50.0 0.2 50.0 0.2Italy 750.9 4.0 750.9 4.0 65.8 3.9 65.8 3.9 816.7 4.0 816.7 4.0Japan 890.4 4.7 890.4 4.7 66.2 4.0 66.2 4.0 956.6 4.7 956.6 4.6Netherlands 398.7 2.1 398.7 2.0 16.6 1.0 16.6 1.0 415.3 2.0 415.3 2.0Norway 36.7 0.2 36.7 0.2 3.5 0.2 3.5 0.2 40.2 0.2 40.2 0.2Portugal 15.0 0.1 15.0 0.1 15.0 0.1 15.0 0.1Slovenia 5.2 0.0 5.2 0.0 0.4 0.0 0.4 0.0 5.6 0.0 5.6 0.0Spain 546.1 2.9 546.1 2.9 53.0 3.2 53.0 3.2 599.1 2.9 599.1 2.9Sweden 204.7 1.1 204.7 1.1 15.2 0.9 15.2 0.9 219.9 1.1 219.9 1.1Switzerland 244.6 1.3 244.6 1.3 19.3 1.2 19.3 1.2 263.9 1.3 263.9 1.3United Kingdom 370.7 2.0 370.7 2.0 31.7 1.9 31.7 1.9 402.4 2.0 402.4 2.0United States 7,557.4 40.0 7,557.4 39.9 479.5 28.7 479.5 28.7 8,036.9 39.1 8,036.9 38.9Yugoslavia 0.8 0.0 0.8 0.0 0.8 0.0 0.8 0.0
Total Nonborrowers $ 0.0 0.0 $13,593.2 72.0 $13,593.2 71.8 $ 988.6 59.1 $ 988.6 59.1 $ 0.0 0.0 $14,581.8 71.0 $14,581.8 70.6
TOTAL $74.7 100.0 $18,880.8 100.0 $18,955.5 100.0 $1,673.7 100.0 $1,673.7 100.0 $74.7 100.0 $20,554.5 100.0 $20,629.2 100.01 Sector lending began in 1990.2 Since 1998, the information in this table has reflected adjustment loan disbursements to each borrower as pro rata shares of that borrower’s eligible imports from supplying countries, using the latestavailable import data drawn from United Nations trade statistics.

96
TABLE XII. DISBURSEMENTS FOR PURCHASE OF GOODS AND SERVICES BY COUNTRY OF ORIGIN (INVESTMENT LOANS)
(In millions of U.S. dollars)
1961–01 2002 1961–02Local Purchases Exports Total Local Purchases Exports Total Local Purchases Exports Total
Amount % Amount % Amount % Amount % Amount % Amount % Amount % Amount % Amount %
BORROWING COUNTRIESArgentina $ 3,367.2 9.8 $ 844.3 4.0 $ 4,211.5 7.6 $ 154.1 4.4 $ 18.8 3.7 $ 172.9 4.3 $ 3,521.3 9.3 $ 863.1 4.0 $ 4,384.4 7.4Bahamas 23.7 0.1 84.8 0.4 108.5 0.2 10.0 0.3 10.0 0.2 33.7 0.1 84.8 0.4 118.5 0.2Barbados 59.9 0.2 2.0 0.0 61.9 0.1 17.3 0.5 17.3 0.4 77.2 0.2 2.0 0.0 79.2 0.1Belize 28.9 0.1 0.2 0.0 29.1 0.1 11.3 0.3 11.3 0.3 40.2 0.1 0.2 0.0 40.4 0.1Bolivia 817.6 2.4 38.4 0.2 856.0 1.6 61.7 1.7 0.5 0.1 62.2 1.5 879.3 2.3 38.9 0.2 918.2 1.5Brazil 10,226.9 29.8 1,773.7 8.4 12,000.6 21.7 1,108.2 31.3 116.7 22.8 1,224.9 30.2 11,335.1 29.9 1,890.4 8.8 13,225.5 22.3Chile 2,198.8 6.4 75.0 0.4 2,273.8 4.1 90.8 2.6 6.7 1.3 97.5 2.4 2,289.6 6.0 81.7 0.4 2,371.3 4.0Colombia 1,914.8 5.6 135.4 0.7 2,050.2 3.7 166.2 4.7 10.0 2.0 176.2 4.3 2,081.0 5.5 145.4 0.7 2,226.4 3.8Costa Rica 380.9 1.1 163.0 0.8 543.9 1.0 11.0 0.3 2.2 0.4 13.2 0.3 391.9 1.0 165.2 0.8 557.1 0.9Dominican Republic 463.5 1.4 36.6 0.2 500.1 0.9 35.6 1.0 0.0 35.6 0.9 499.1 1.3 36.6 0.2 535.7 0.9Ecuador 1,555.8 4.5 57.8 0.3 1,613.6 2.9 96.1 2.7 0.4 0.1 96.5 2.4 1,651.9 4.4 58.2 0.3 1,710.1 2.9El Salvador 680.8 2.0 32.0 0.2 712.8 1.3 75.6 2.1 3.8 0.7 79.4 2.0 756.4 2.0 35.8 0.2 792.2 1.3Guatemala 515.9 1.5 54.9 0.3 570.8 1.0 65.6 1.9 7.0 1.4 72.6 1.8 581.5 1.5 61.9 0.3 643.4 1.1Guyana 88.2 0.3 0.7 0.0 88.9 0.2 10.0 0.3 0.0 10.0 0.2 98.2 0.3 0.7 0.0 98.9 0.2Haiti 236.2 0.7 9.6 0.1 245.8 0.4 2.0 0.1 0.0 2.0 0.0 238.2 0.6 9.6 0.0 247.8 0.4Honduras 415.5 1.2 31.3 0.2 446.8 0.8 72.5 2.0 0.3 0.1 72.8 1.8 488.0 1.3 31.6 0.1 519.6 0.9Jamaica 238.6 0.6 83.4 0.4 322.0 0.6 9.8 0.3 0.1 0.0 9.9 0.2 248.4 0.7 83.5 0.4 331.9 0.6Mexico 5,510.2 16.0 711.9 3.3 6,222.1 11.3 946.8 26.8 32.4 6.3 979.2 24.2 6,457.0 17.0 744.3 3.5 7,201.3 12.1Nicaragua 384.6 1.1 22.4 0.1 407.0 0.7 31.6 0.9 0.3 0.1 31.9 0.8 416.2 1.1 22.7 0.1 438.9 0.7Panama 478.4 1.4 41.3 0.2 519.7 0.9 63.5 1.7 1.6 0.3 65.1 1.6 541.9 1.4 42.9 0.2 584.8 1.0Paraguay 639.9 1.9 45.3 0.2 685.2 1.2 46.8 1.3 0.5 0.1 47.3 1.2 686.7 1.8 45.8 0.2 732.5 1.2Peru 1,624.7 4.7 94.3 0.5 1,719.0 3.1 100.8 2.8 16.7 3.3 117.5 2.9 1,725.5 4.7 111.0 0.5 1,836.5 3.1Suriname 0.7 0.0 0.0 0.0 0.7 0.0 0.0 0.2 0.0 0.2 0.0 0.7 0.0 0.2 0.0 0.9 0.0Trinidad and Tobago 251.8 0.7 53.2 0.3 305.0 0.6 18.0 0.5 1.2 0.2 19.2 0.5 269.8 0.7 54.4 0.3 324.2 0.5Uruguay 947.6 2.8 39.5 0.2 987.1 1.8 139.8 4.0 0.6 0.1 140.4 3.5 1,087.4 2.9 40.1 0.2 1,127.5 1.9Venezuela 1,294.6 3.7 195.3 0.8 1,489.9 2.7 192.9 5.5 4.4 0.8 197.3 4.9 1,487.5 3.9 199.7 0.9 1,687.2 2.8
Total Borrowers $34,345.7 100.0 $4,626.3 22.2 $38,972.0 70.5 $3,538.0 100.0 $224.4 43.8 $3,762.4 92.8 $37,883.7 100.0 $4,850.7 22.7 $42,734.4 71.9
NONBORROWING COUNTRIESAustria $ 69.7 0.3 $ 69.7 0.1 $ 2.4 0.5 $ 2.4 0.1 $ 72.1 0.3 $ 72.1 0.1Belgium 90.2 0.4 90.2 0.2 2.0 0.4 2.0 0.0 92.2 0.4 92.2 0.2Canada 340.9 1.5 340.9 0.6 6.7 1.3 6.7 0.2 347.6 1.6 347.6 0.6Croatia 2.4 0.0 2.4 0.0 2.4 0.0 2.4 0.0Denmark 100.7 0.5 100.7 0.2 1.1 0.2 1.1 0.0 101.8 0.5 101.8 0.2Finland 49.9 0.2 49.9 0.1 0.4 0.1 0.4 0.0 50.3 0.2 50.3 0.1France 1,337.2 6.4 1,337.2 2.4 7.1 1.4 7.1 0.2 1,344.3 6.3 1,344.3 2.3Germany 1,351.3 6.5 1,351.3 2.4 19.0 3.7 19.0 0.5 1,370.3 6.4 1,370.3 2.3Israel 102.8 0.5 102.8 0.2 6.2 1.2 6.2 0.2 109.0 0.5 109.0 0.2Italy 2,004.3 9.6 2,004.3 3.6 16.7 3.3 16.7 0.4 2,021.0 9.4 2,021.0 3.4Japan 1,210.5 5.8 1,210.5 2.2 19.2 3.7 19.2 0.5 1,229.7 5.6 1,229.7 2.1Netherlands 197.3 0.8 197.3 0.4 0.4 0.1 0.4 0.0 197.7 0.9 197.7 0.3Norway 13.3 0.1 13.3 0.0 13.3 0.1 13.3 0.0Portugal 42.3 0.2 42.3 0.1 3.3 0.6 3.3 0.1 45.6 0.2 45.6 0.1Slovenia 35.3 0.2 35.3 0.1 2.6 0.5 2.6 0.1 37.9 0.2 37.9 0.1Spain 780.5 3.7 780.5 1.4 33.4 6.5 33.4 0.8 813.9 3.8 813.9 1.4Sweden 374.6 1.8 374.6 0.7 0.9 0.2 0.9 0.0 375.5 1.8 375.5 0.6Switzerland 512.5 2.6 512.5 0.9 12.5 2.4 12.5 0.3 525.0 2.4 525.0 0.9United Kingdom 602.6 2.8 602.6 1.1 9.0 1.8 9.0 0.2 611.6 2.9 611.6 1.0United States 7,083.4 33.8 7,083.4 12.8 145.3 28.3 145.3 3.6 7,228.7 33.7 7,228.7 12.2Yugoslavia 13.5 0.1 13.5 0.0 13.5 0.1 13.5 0.0
Total Nonborrowers $0.0 0.0 $16,315.2 77.8 $16,315.2 29.5 $ 0.0 0.0 $288.2 56.2 $ 288.2 7.2 $ 0.0 0.0 $16,603.4 77.3 $16,603.4 28.1
TOTAL $34,345.7 100.0 $20,941.5 100.0 $55,287.2 100.0 $3,538.0 100.0 $512.6 100.0 $4,050.6 100.0 $37,883.7 100.0 $21,454.1 100.0 $59,337.8 100.0

THE YEAR’S LENDING 97
STATEMENT OF APPROVED LOANS AND GUARANTEES, 2002
Ordinary Capital
LOAN AMOUNTCOUNTRY PROJECT NUMBER (Millions of US$)
Barbados Coastal Infrastructure Program 1386/OC-BA 17.0
Bolivia Transredes S.A. 1444A/OC-BO1 75.0
Redibol 1431A/OC-BO2 37.0
Brazil Northeast Tourism Development (Stage II) 1392/OC-BR 240.0
Santa Catarina State Highway Program (Phase IV) 1390/OC-BR 150.0
Paraná Urbano II Program 1405/OC-BR 100.0
Acre Sustainable Development Program 1399/OC-BR 64.8
Pará Urbe Support Program (Phase I) 1404/OC-BR 48.0
Goiâna Water and Sanitation Program 1414/OC-BR 47.6
Northeast Global Microenterprise Credit Program 1387/OC-BR 30.0
Modernization of the Federal Court of Accounts 1423/OC-BR 5.0
Diversity in Access to Higher Education 1406/OC-BR 5.0
Chile Modernization of the Comptroller General's Office 1391/OC-CH 15.0
Colombia Social Infrastructure and Community Management 1393/OC-CO 63.0
for Peace
Highway Development and Institutional Strengthening 1443/OC-CO 21.7
in Cundinamarca
Institutional Strengthening of the Bogota District 1385/OC-CO 16.0
Colpatria Mortgage Bond Project 1433/OC-CO 5.2
Costa Rica Sustainable Agricultural Production 1436/OC-CR 14.4
Dominican Republic Aerodom Airports 1418/OC-DR 150.0
Multiphase Program for Equity in Basic Education 1429/OC-DR3 80.0
Support for Competitive Agriculture 1397/OC-DR 55.0
Disaster Prevention and Risk Management Program 1408/OC-DR 5.0
Ecuador Metropolitan Quito Environmental Sanitation Program 1424/OC-EC 40.0
(Phase I)
Housing Sector Support Program II 1416/OC-EC3 25.0
Sustainable Development of the Northern Amazon 1420/OC-EC 10.0
Border Zone
El Salvador Global Multisector Credit Program 1396/OC-ES 42.4
Support for the Social Peace Program 1389/OC-ES 27.9
Guatemala Financial Sector Reform Program II 1400/OC-GU3 200.0
Urban Poverty Reduction Program 1409/OC-GU 46.8
Natural Resource Management in Upper Watersheds 1398/OC-GU 40.0
Capital Expenditures for Electricity Distribution 1440/OC-GU 25.0
Labor Market Program 1401/OC-GU 10.0
Honduras Aguas de San Pedro Sula Water and Sewerage 1435/OC-HO 13.7
1 Complemented by a "B" loan syndication up to $57 million.2 Complemented by a "B" loan syndication up to $3 million.3 Interest rate partially subsidized by the Intermediate Financing Facility.

98
Jamaica Information and Communications Technology 1438/OC-JA3 17.0
Emergency Reconstruction Facility 1419/OC-JA 16.0
Mexico Consolidation and Expansion of the Health, Education 1388/OC-ME 1,000.0
and Nutrition Program (Oportunidades)
Panama Land Administration and Regularization 1427/OC-PN 27.0
Sustainable Development of Bocas del Toro 1439/OC-PN 15.2
Strengthening and Modernization of Economic and 1430/OC-PN 10.0
Fiscal Management (Phase II)
Training and Employment System 1403/OC-PN 8.4
Program to Foster Competitiveness 1410/OC-PN 7.0
Paraguay Social Investment Program (PROPAIS II) 1422/OC-PR 28.4
Peru Fiscal Reform Program 1412/OC-PE 300.0
Compensation and Social Development Fund (Foncodes III) 1421/OC-PE 150.0
State Modernization and Decentralization 1437/OC-PE 28.0
Foreign Trade Policy Development Program 1442/OC-PE 5.0
Institutional Strengthening and Environmental and 1441/OC-PE 5.0
Social Management for the Camisea Gas Project
Suriname National Population and Housing Census 1446/OC-SU 4 3.4
Trinidad and Tobago National Settlements Program (Stage II) 1402/OC-TT 32.0
Uruguay Social Protection and Sustainability Program 1417/OC-UR 500.0
Multisector Global Financing Program III 1407/OC-UR 180.0
Comprehensive Program for At-Risk Children, 1434/OC-UR 40.0
Adolescents and Families
Port of M'Bopicua 1432A/OC-UR4 10.5
Montevideo Municipal Modernization Program 1425/OC-UR 3.0
Venezuela Rural and Small Town Water Supply Systems 1445/OC-VE 28.0
4 Complemented by a "B" loan syndication up to $10.5 million.
STATEMENT OF APPROVED LOANS AND GUARANTEES, 2002 (CONTINUED)
Ordinary Capital
LOAN AMOUNTCOUNTRY PROJECT NUMBER (Millions of US$)

THE YEAR’S LENDING 99
STATEMENT OF APPROVED LOANS AND GUARANTEES, 2002 (CONTINUED)
Fund for Special Operations
LOAN AMOUNTCOUNTRY PROJECT NUMBER (Millions of US$)
Bolivia Santa Cruz-Puerto Suárez Corridor Project (Phase I) 1101/SF-BO 75.0
Environmental and Social Protection in the Santa 1099/SF-BO 21.0
Cruz-Puerto Suárez Corridor
Sustainable Tourism Development Program 1098/SF-BO 10.0
Strengthening the Foreign Trade Sector Facility 1118/SF-BO 5.0
Disaster Prevention Program 1121/SF-BO 2.7
Water Production at the Sama Mountain Biological 1116/SF-BO 2.5
Reserve
Guyana Basic Education Access and Management Support 1107/SF-GY 30.0
Program (Phase I)
Electrification Program for Unserved Areas 1103/SF-GY 27.4
Basic Nutrition Program 1120/SF-GY 5.0
Honduras Modernization of the Administration of Justice (Stage 2) 1115/SF-HO 30.0
Bay Islands Environmental Management Program II 1113/SF-HO 12.0
San Pedro Sula Municipal Development Program (Phase II) 1104/SF-HO 9.0
Sustainable Institutional Strengthening of the Road Sector 1106/SF-HO 7.6
Puerto Cortés Sewerage Project5 – 4.5
Modernization of the National Statistics System 1112/SF-HO 4.0
Nicaragua Rural Production Revitalization Program 1110/SF-NI 60.0
Social Policy Reforms for the Poverty Reduction Strategy 1114/SF-NI 30.0
Low-Income Housing Program (Phase I) 1111/SF-NI 22.5
Social Safety Net Program (Phase II) 1109/SF-NI 20.0
Modernization of the Comptroller General's Office 1100/SF-NI 5.4
Strengthening Foreign Trade Management 1117/SF-NI 5.0
Regional Global Credit for Small Caribbean States 1108/SF-RG 20.0
5 Increase to a $13.8 million loan (997/SF-Ho) approved in 1997.

Evaluation and Internal Audit
The year 2002 was the second full year ofoperation of the Office of Evaluation andOversight (OVE) under the new mandatedefined by the Board of Executive Directors.OVE’s main activity during the year focusedon initiatives to implement the recommenda-tions contained in its “DevelopmentEffectiveness Report.” The report showed thatwhile development effectiveness requiresresults-based management, the organization ofthe Bank still focuses on interventions, i.e., oninputs and outputs, not outcomes and impacts.
In 2002, OVE produced its own evaluationstudies on country programs, strategic direc-tions pursued by the Bank, and Bank policiesand instruments. These activities can begrouped into five areas: i) oversight of evalua-tion activities; ii) country program evaluation;iii) evaluation capacity development; iv) strategyevaluation; v) policy and instrument evaluation.
In the broad area of oversight, a numberof reports were released to the Board ofExecutive Directors, including OVE’s annualreport, a memorandum on resource allocation,a project evaluability report and a report ontools for project supervision. Country programevaluations are aimed at assessing Bank sup-port and constitute an important element instrengthening the development effectiveness ofBank actions in a given country. In 2002, aprotocol for the conduct and content of coun-try program evaluation was developed andevaluations were produced for the Bahamas,Costa Rica, Guyana and Nicaragua.
Under the rubric of evaluation capacitydevelopment, OVE administered a series ofseminars, training programs and cooperativeevaluation agreements with subregional finan-cial institutions. The Office also sponsoredfour seminars on evaluation methods (private
sector country risk assessment, jointly withStandard and Poor’s), evaluation capacitybuilding (jointly with the World Bank), coun-try program evaluation methodology, and eval-uation of social investment funds (jointly withthe World Bank).
Strategy evaluations were carried out inthe areas of agriculture, poverty, decentraliza-tion, water and sanitation, justice, small andmedium-sized enterprises and integration.
Two other products completed during theyear were a summary of evaluation findings of10 projects that include indigenous people asbeneficiaries and a report on service deliverythrough NGOs, a study of the Bank’s experi-ence in working in partnership with civil socie-ty in the execution of social programs.
Policy and instrument evaluations wereconducted to assess the MIF, the IIC, largetechnical cooperation projects, and theEmergency Reconstruction Facility. The Officeconducted 23 studies of individual projects aspart of larger thematic or country level reviewsduring 2002 (five relating to the EmergencyRecovery Facility, 11 relating to the policyevaluation of the water sector, and seven relat-ing to justice), as well as written project evalu-ation summaries on 140 MIF projects.
During 2002, the Auditor General’s Officecontinued to coordinate all internal audits withthe IDB’s external auditors to provide maxi-mum audit coverage of Bank activities and toeffectively transition to the Bank’s new exter-nal auditors, Ernst & Young. At headquarters,the Office continued to monitor and reviewthe selection, implementation and upgrade ofsignificant computer applications, includingthe web-enabled version of PeopleSoft (theHuman Resources Information System); the
100
Institutional Aspects
For further information, see
http://www.iadb.org/goto.cfm?evaleng

new Budget and Financial ManagementSystem, which replaced the prior system forbudgeting, general ledger, accounts payable,purchasing, Country Office accounting andproject accounting; the replacement of theBank’s Investment Management System; theenhancements to the Loan ManagementSystem, which is the system for the Bank’slending, guarantee and technical cooperationprograms; and the Borrowing ManagementSystem, focusing on the enhancementsrequired for reporting financial derivativesunder the new accounting standard.
The Office also reviewed test plans andfollowed up on improvements to the Bank’sbusiness continuity plan and disaster recoveryplan for mission critical Bank functions andcomputer systems; continued monitoring thedeployment of Windows 2000 Bank-wide; andreviewed the Remote Access Strategy and theWindows 2000 Security for the servers in thePrivate Sector Department. In addition, theOffice reviewed the proposed capital adequacymodel. The Office also completed severalreviews in the areas of personnel policies andprocedures, administrative procurement, con-tributions and life insurance reserves.Additionally the Office continued a review ofthe Bank’s trust fund activities and coordinat-ed an external review of the risk managementprocess of the Bank’s private sector lendingprogram.
In the Regional Operations Departmentsand Country Offices, the Auditor General’sOffice focused on the Management OversightSystem as well as all key operational controlfeatures in Country Offices pertaining to proj-ect supervision, procurement, disbursement,reporting and resource management. In addi-tion to its ongoing audit of Country Officeoperations, the Office continued reviewing theeffectiveness of key control features for highlydecentralized projects, including the eligibilityrequirements for the performance of ex-postreviews of procurement and disbursements; theadequacy and timeliness of Bank supervision;the responsibilities of external auditors andconsultants regarding projects; and the adequa-
cy of existing reporting requirements. In addi-tion, the Office worked on the development ofthe Bank’s anti-corruption strategy and revi-sion of the Code of Ethics, and supported thereviews by Regional Operations Departmentsof certain executing agencies to strengthentheir transparency and overall control environ-ment. The Office continued reviewing theinvolvement of national audit institutions inauditing Bank-financed projects.
The Office of the Auditor General alsocontinued to perform inquiries and investiga-tions, including those referred to the Officefrom the Ethics Committee and from theOversight Committee on Fraud andCorruption.
Following up on the important stepstaken in 2001 to strengthen the Bank’s ongo-ing fight against fraud and corruption, moresignificant progress was made in 2002 in car-rying out the anti-corruption agenda. Theparameters of that agenda were established inthe 2001 Board-approved document“Strengthening a Systemic Framework againstCorruption.”
Within the Bank, the OversightCommittee on Fraud and Corruption spear-heads efforts to head off these potential prob-lems. The Oversight Committee is composedof four members of senior management of theBank and reports directly to the President. Itis chaired by the Executive Vice President, andincludes the Vice President for Planning andAdministration, the General Counsel and theAuditor General. The Oversight Committeeoversees all allegations of fraud and corruptionin connection with any Bank activities or oper-ations; oversees investigations; imposes appro-priate sanctions and coordinates their imple-mentation; and determines when matters needto be referred to national authorities for civilor criminal prosecution.
The executive arm of the OversightCommittee is its Secretariat, which beganoperations in 2002. The Secretariat receivesand classifies all allegations of fraud and cor-ruption. Throughout 2002, the Secretariatfocused attention on promoting and dissemi-
INSTITUTIONAL ASPECTS 101

nating the new policies related to fraud andcorruption. As a result of the emphasis placedon disseminating information on the anti-cor-ruption efforts of the Bank, the number ofallegations received by the Secretariat hassteadily increased.
The Oversight Committee created a seriesof mechanisms to report allegations of fraudand corruption.The Secretariat manages themechanisms, including a direct telephone num-ber that is available toll-free from all the Bank’smember countries for anyone wishing to reportallegations of fraud and corruption.TheSecretariat also provides a secure e-mailaddress, a secure facsimile, and will receive alle-gations in person at the Bank’s headquarters.
A new website, www.iadb.org/ocfc, pro-vides information to the general public on theBank’s policies against fraud and corruptionand also offers secure and confidential mecha-nisms to report suspected cases.
Country Offices
In 2002, the Bank’s Country Offices continuedthe important task of assisting borrowers andexecuting agencies in monitoring and imple-menting Bank-approved projects. Overall ini-tiatives were oriented toward improving thequality of Bank interventions and respondingto the challenges faced by countries in theregion. At the same time, Country Officesstreamlined their internal operations so thatthey could enhance technical support to bor-rowers aimed at achieving better developmentresults. Country Offices also undertook effortsto provide feedback from lessons learned frompast operations into new project design.
The monitoring of the portfolio contin-ued to be a prime responsibility of theCountry Offices. Dialogue with borrowers andexecuting agencies was intensified, and high-level discussions with national authorities onportfolio issues and project performanceoccurred on a monthly or quarterly basis. Thistype of proactive portfolio monitoring wascritical in many countries experiencing fiscalconstraints, where there was a reduction of the
amount of local counterpart resources availablefor project implementation. These meetingswere complemented by the annual countryportfolio reviews, during which action planswere agreed upon with national counterpartsto resolve bottlenecks in projectimplementation.
Country Offices also played a critical rolein responding to natural disasters and emer-gency situations, including an outbreak ofdengue fever in El Salvador and Honduras,flooding in Bolivia, Jamaica and Venezuela, andhurricanes in Mexico. Reconstruction effortsalso continued in many Central American coun-tries following hurricanes and earthquakes.
In general, Country Offices more activelyengaged the national liaison ministries in theoverall monitoring of national portfolios. InJamaica, for example, the Planning Institutehas effectively taken on the role of overall port-folio monitoring with support from theCountry Office. In Uruguay, the CountryOffice frequently organizes meetings with rep-resentatives from the Ministry of Economyand Finance and the Office of Planning andBudget to discuss individual projects encoun-tering budgetary restrictions and shortfalls incounterpart resources. This type of problem-solving approach has resulted in reinvigoratingstagnant portfolios and has contributed to theredirection of resources to projects withgreater national priority.
One noteworthy Country Office initiativein support of project monitoring was in theDominican Republic, where a ProjectManagement Monitoring System (Sistema deSeguimiento Gerencial,SISEG) has been devel-oped. The system is being used by nine projectimplementation units to monitor actual andplanned progress for project activities in termsof cost, and uses a color-coded, real-time report-ing system to rate project performance.Thisrating system has encouraged project managersto manage for results, and enhances their abilityto identify the source of any problem and takethe necessary remedial action opportunely.
As a result of the positive feedbackreceived from the executing agencies, an
102
INSTITUTIONAL ASPECTS 103
enhanced version of SISEG is being developedthat will allow executing agencies to automati-cally generate progress and mid-term evalua-tion reports with updated information.TheSISEG progress reports to be submitted to theBank’s Country Office will represent a keyinput for monitoring project implementationand updating the Bank’s Project Performanceand Monitoring Reporting system.
In 2002, Country Offices continued toprovide training to executing agencies andrelated ministry staff on the Bank’s policies andprocedures, procurement, disbursements, finan-cial management and controls.This was com-plemented with training in the logical frame-work, project management, institutionalanalysis and monitoring and evaluation.Theeffect of this training has been an improvementby executing agencies in the implementationand monitoring of projects in execution.Thedevelopment by the Bank of a CD-ROM onthe logical framework for borrowers and exe-cuting agencies has also responded to the addi-tional demand for training needs in this area.
The Country Offices continued to beactively involved in the preparation of newprojects, particularly the institutional analysisof the borrower and project execution mecha-nisms, as well as participation in the prepara-tion of the logical framework. Leadership ofproject teams by Country Office specialistsincreased during the year, and in almost allcases, Country Offices participated in the inter-nal review of new projects. Once projects wereapproved, the Country Offices were instrumen-tal in supporting borrowers and executingagencies in compliance with contractual condi-tions and eligibility for first disbursement.
All Country Offices in 2002 held projectstart-up workshops with borrowers and execut-ing agencies.These events were seen as beingcritical in promoting national ownership ofprojects and an overall commitment to successduring execution. Another measure to addressthe institutional weaknesses of borrowers andexecuting agencies in implementing projectshas been the preparation of studies to analyzefactors that hamper the ability of executing
units to move forward with Bank-funded proj-ects in a timely manner. The Country Office inEcuador, for example, developed questionnairesfor both Bank specialists and executing agen-cies to determine the root causes of problemsaffecting project implementation.The results ofthese questionnaires were presented in a work-shop to each group, and subsequently an actionplan was developed with borrowers to seek amutual resolution of problems. Other CountryOffices have initiated similar analyses.
Finally, Country Offices continued toenhance the participation of civil society organ-izations in the Bank’s projects and activities.The Bank’s Country Offices in Belize,Barbados, Guyana, Haiti, Jamaica, Surinameand Trinidad and Tobago, along with CARI-COM, co-hosted the “Forward Together CivilSociety Conference.” The event broughttogether representatives of nongovernmentalorganizations, private sector groups and othercivil society actors to discuss issues related totheir roles in the development of the Caribbeanregion. Participants included representatives oflabor, youth, women’s groups, the media, reli-gious bodies, the academic community andother civil society interests.The draft Strategyfor Promoting Participation in the Activities ofthe Bank was circulated to all participants,along with the results of national consultationson the same document.
Country Office staff in the Caribbean alsomet in Trinidad with representatives of govern-ment and staff of executing units of Bank-funded projects to discuss interaction with civilsociety.The objectives of this meeting includedincreasing awareness of the relevance andimpact of civil society participation in thesocial and economic development of countries,and providing tools and methods to facilitatethe incorporation of civil society in Bank proj-ects and activities.
Special Office in Europe
The role of the Special Office in Europe (SOE)is to contribute to the strengthening of rela-tions and cooperation between the Bank and

the IDB’s regional and 17 nonregional mem-ber countries (16 European countries andIsrael), the European Union and internationalorganizations based in Europe (OECD, WTO,UNDP, UNCTAD, UNESCO and the ParisClub). The key elements of its mission are topromote a greater awareness of the IDB inEurope, strengthen the Bank’s cooperationwith European countries and institutionsbased there, and create activities to encouragethe exchange of information and the genera-tion of informed opinions among those inter-ested in Latin America and the Caribbean.SOE’s main activities in 2002 reflected thosepriorities:
To increase the Bank’s presence amongthe European member countries and Israel,SOE facilitated a consultative meeting betweenthe President of the Bank and the nonregionalmember countries in Berlin and subsequentvisits by the President to Switzerland,Germany, Spain, Italy, France, Finland, theNetherlands and the UK, featuring meetingswith government officials and participation invarious conferences.The President also signedagreements with the governments of Spain andItaly and an accord to strengthen cooperationwith the European Commission.
As part of its efforts to disseminateinformation about the Bank and the region,SOE participated in and helped to coordinatevarious meetings, including the ConsultativeGroup Meetings for Guatemala, Honduras andNicaragua; a promotional mission to France andSpain by the Bank’s Private Sector Department;and missions linked to the preparation of the2003 Bank’s Annual Meeting to be held inMilan. In the latter connection, meetings wereorganized with Italian civil society organiza-tions, the private sector and universities. Inaddition—in cooperation with the SustainableDevelopment Department—SOE organizeddiscussions on key areas of the Bank’sInstitutional Strategy, inviting representatives ofthe nonregional member country governments,civil society and academic circles. Topicsincluded poverty reduction and gender issues(Paris and London), and the Bank’s proposed
strategies for the social sectors, competitivenessand the environment (Paris).
In coordination with the Office ofExternal Relations, the IIC and the MIF, SOEorganized a series of seminars and missions forEuropean entrepreneurs on business opportu-nities generated by the Bank group’s projectsand programs. Presentations were made inScandinavia, Milan, Munich and Zurich. SOEregularly participated in meetings organized bythe French Enterprises Association (MEDEF)and the French Center of Foreign Trade. Italso organized meetings in Paris, Milan, Romeand London to present and promote the publi-cation it edited on European foreign directinvestment in Latin America.
SOE participated with the Presidentof the Bank at the summit meeting of heads ofstate and government of the European Unionand Latin America, which took place inMadrid in May. The meeting resulted in aMemorandum of Understanding (MoU)between the Bank and the EuropeanCommission to strengthen future cooperationin the pursuit of common goals.
In view of the MoU and the follow-upto the Madrid Summit—and in collaborationwith the Integration and Regional ProgramsDepartment, Financial ServicesSubdepartment and Sustainable DevelopmentDepartment—SOE promoted collaborationwith the European Commission in areas suchas cooperation with Central America, socialequity and poverty reduction, governance andcivil society, and planning for natural disasters.
The Office created a forum for thestudy of the Latin American economy and anetwork of centers whose purpose will be totrack and study current economic topics inLatin American countries. Joint effortsbetween the Bank’s Research Department andSOE led to the constitution in October of theIDB Euro-Latin Research Network, which willdefine topics for forthcoming studies andconferences.
104
For further information, see
http://www.iadb.org/goto.cfm?europe

SOE contributed to the creation of theEuro-Latin Study Network on Integration andTrade, the main objective of which is to fosterresearch and debate on these topics amongLatin American and European experts. Thenetwork is directed by a steering committeemade up of representatives from the IDB, theEuropean Commission and three rotatingEuropean research centers. The network willdefine the topics to be discussed within thecontext of an annual conference. Additionally,SOE has continued supporting the activities ofthe Working Group on EU-MERCOSURNegotiations of the Institute of PoliticalScience (Paris).
To promote alliances with internation-al organizations based in Europe, the SpecialOffice in Europe participated in meetings onterritorial development (OECD’s LEEDProgram), small and medium-sized enterprises(OECD), corruption and money laundering(OECD/FATF and UN), rural poverty(IFAD), and competition policy and trade(OECD and WTO), as well as fora on educa-tion, cultural enterprises, scientific cooperation(Institute Pasteur), the information society(ITU), statistical support for monitoringdevelopment goals (UN - Paris21) and thedevelopment of the Millennium DevelopmentGoals for education (UNESCO).
Office in Japan
During 2002, the IDB Office in Japan cele-brated its seventh anniversary of buildingdevelopment partnerships in Japan and EastAsia. The Office implemented a broad pro-gram of outreach and knowledge dissemina-tion activities with three main objectives: (i) toinform the Japanese community of the socialand economic situation of Latin America andthe Caribbean and of the business opportuni-ties created by Bank-financed operations inthe region; (ii) to promote trade and invest-ment opportunities in Latin America and theCaribbean; and (iii) to foster an exchange ofbest practices and experiences in differentdevelopment fields between Japan and East
Asia and the Bank’s borrowing membercountries.
In coordination with the Bank’s Inter-American Institute for Social Development(INDES) and the Japan Program, the Officeorganized workshops on “Citizen Participationin the Context of Fiscal Decentralization inTokyo and Kobe.”The workshops broughttogether a distinguished group of researchersand practitioners from East Asia (Japan,Indonesia, Malaysia, Philippines and Thailand)and Latin America (Brazil, Colombia andPeru), as well as from the Asian DevelopmentBank and the IDB. Participants exchangedexperiences, best practices and lessons learnedfrom programs featuring citizen participationin municipal management. The workshopassessed programs that have effectivelyincreased public participation in the designand implementation of policies and projects atthe local government level, and which haveconsequently improved social equity in bothregions.
In collaboration with the MIF, the Officeorganized a seminar for Peruvian and Braziliantemporary workers residing in Japan. Duringthe meeting, creation of a “Dekasegui Fund”by the Bank was discussed. The Fund wouldserve as a means to help workers reduce thetransaction costs of remittances to their homecountries and to channel important resourcesto more productive uses.
In the area of promotion of trade andinvestment for Latin American and Caribbeancountries, the Office sponsored seminars on theoccasion of the visit to Japan of the Presidentsof Ecuador and Dominican Republic and ofthe Vice Minister of Finance of Peru and ViceMinister of Foreign Affairs of Paraguay. Anadditional event, on the occasion of the visit toJapan of Chile’s Minister of Foreign Affairs,focused on the ongoing negotiations of a possi-ble free trade agreement between Japan andChile, and was held in cooperation with theJapan and Tokyo Chambers of Commerce and
INSTITUTIONAL ASPECTS 105
For further information, see
http://www.iadb.org/goto.cfm?japan
Industry, the Japan-Chile BusinessCooperation Committee, the Japan ExternalTrade Organization (JETRO) and the JapanInstitute for Overseas Investment (JOI).
In the field of private sector development,in coordination with the Development Bank ofJapan (DBJ), the Office conducted an outreachseminar on “Entrepreneurship in EmergingEconomies: The Creation and Development ofNew Firms in Latin America and East Asia.” Itfocused on the results of a large-scale compara-tive study undertaken by the IDB on the entre-preneurial process of nine countries: four fromEast Asia (Japan, Korea, Singapore and Taiwan)and five from Latin America (Argentina, Brazil,Costa Rica, Mexico and Peru). A separate semi-nar on “Challenges in Private InfrastructureFinance in Latin America,” at which the recentand ongoing efforts of the Latin Americancountries in fostering private infrastructuredevelopment were discussed, highlighted therole played by the Bank in attracting privateinvestment to the region.
Activities undertaken in conjunction withthe Bank’s Private Sector Department includ-ed seminars and working sessions to informinterested Japanese commercial banks, invest-ment groups and consulting firms on the busi-ness opportunities created by the Bank-financed operations in the region and on theBank’s policy for the procurement of goodsand services. With the support of staff fromthe three Regional Operations Departments,the Office led a public outreach seminar inTokyo on the investment opportunities forJapanese investors in two ongoing regionalintegration initiatives—the Puebla-PanamaPlan (PPP) and the Initiative for theIntegration of Regional Infrastructure inSouth America (IIRSA).
The Office also sought to support regionalintegration initiatives in Latin America and theCaribbean through the Japan-Central AmericanInformation Encounter.The aim was tostrengthen mutual understanding and economicrelations between Japan and Central America.The encounter proposed a new framework forcooperation to increase trade, investment and
tourism flows from Japan to the region as awhole and to enhance cultural exchanges.
A key aspect of the work of the Office isto focus attention on the economies of LatinAmerica and the Caribbean. To that effect, itconducted a seminar on the “RecentPerformance and Prospects of the ArgentineRepublic,” which examined the external anddomestic factors accounting for that country’sdifficulties, as well as the policy measures thatthe country has been implementing to begin asustainable recovery. Another program,“Ecuador: Dollarization, Competitiveness andInvestment Opportunities,” held on the occa-sion of the visit to Japan of Ecuador’s Ministerof Foreign Trade, Industry, Fisheries andCompetitiveness, reviewed impacts of dollar-ization of the Ecuadorian economy.
In collaboration with the Integration andRegional Programs Department, the Officepromoted the first meeting in Tokyo of theLatin America/Caribbean and Asia/PacificEconomics and Business Association(LAEBA). This association is an initiativelaunched under the umbrella of the Bank’sPartnership Agreement with the AsianDevelopment Bank. The Tokyo panel focusedon “Regional Monetary and FinancialArrangements for Emerging Economies: LatinAmerica and the Caribbean and Asia-Pacific”and was part of the annual meeting of theAsia-Pacific Finance Association (APFA).
Together with the Financial ServicesSubdepartment, the Office was instrumental insetting up the IDB-JBIC CoordinationMeeting in Tokyo to discuss strategies and proj-ects for possible cofinancing between the twoorganizations. A second meeting helped defineareas of possible cooperation between the IDBand Japan International Cooperation Agency(JICA) in the area of technical assistance forLatin American and Caribbean countries.
Administration
In addition to core activities (administrationof the IDB’s human resources and the corre-sponding policies and rules), the Bank’s focus
106

during 2002 was on consolidating critical com-ponents of the Human Resources Strategy(including the Leadership Assessment Develo-pment Program, Management DevelopmentProgram, staffing plan, and plans and strate-gies in the areas of performance management,compensation, diversity, and mobility andcommunications).
The Leadership Assessment and Develop-ment Program, designed to identify, assess anddevelop staff with high potential to performleadership roles at the Bank, completed threesessions during 2002. The ManagementDevelopment Program, which is intended toimprove the skills of newly-appointed supervi-sors, current supervisors and senior manage-ment, conducted workshops, forums and semi-nars and continued with an individualcoaching program.
A compensation strategy was approved bythe Board in May, following completion of astudy on benefits in comparator organizations.In addition, management sent forward aDiversity Action Plan, containing a methodol-ogy to conduct a Bank-wide survey to identifystaff perceptions of opportunities and obsta-cles for promoting diversity. A census to obtaindata on race and ethnicity was also developed.
The Office of Learning, responsible forbasic training and orientation workshops for
the Country Offices, gave priority to develop-ing additional expertise in the areas of com-petitiveness, civil society, development effec-tiveness, ethics and corruption, violenceprevention and judicial reform.
During 2002, Management implementedseveral programs to enhance security at Bankheadquarters and the Country Offices. TheSecurity Advisory Committee chaired by theVice President for Planning and Administrationreviewed and coordinated all aspects of securitypolicies, physical security, the protection of dataand other information assets, disaster recoveryand business continuity.
A net administrative budget of $378.6 mil-lion and a Capital Improvement Program of$31.7 million have been authorized for 2003.Table XIII shows total expenditures for 2000,2001 and 2002. In 2002, total administrativeexpenditures of $360.2 million represented98.2 percent of the net approved budget.
At year-end 2002, Bank staff funded bythe administrative budget, excluding the Boardof Executive Directors and the Office ofEvaluation and Oversight totaled 1,912, ofwhom 1,396 were professionals and 516 admin-istrative. Of this total, 543 staff were assignedto Country Offices. At year’s end, there were516 professional women at the Bank, compris-ing 37 percent of all professional staff.
INSTITUTIONAL ASPECTS 107
TABLE XIII. CONSOLIDATED ADMINISTRATIVE EXPENSES
(In thousands of U.S. dollars)
2000 2001 2002Category Actual Actual Actual
Board of Governors $ 2,095.9 $ 2,885.0 $ 3,232.4
Board of Executive Directors 14,751.1 14,918.1 15,598.8
Evaluation Office 3,633.8 4,581.5 4,730.5
Headquarters and Country Offices 292,102.2 305,159.1 338,559.5
Post-Retirement Benefits 1,200.0 – –
Total before Reimbursement1,2,3 313,783.1 327,543.8 362,121.2Reimbursement from Funds in Administration and IIC (2,526.9) (2,333.9) (1,885.4)
Total Administrative 311,256.2 325,209.9 360,235.8Capital 10,750.0 20,206.2 26,059.9
TOTAL ADMINISTRATIVE AND CAPITAL $ 322,006.2 $ 345,416.1 $ 386,295.71 Excludes depreciation amounting to $15.7 million in 2000, $15.3 million in 2001 and $9.6 million in 2002.2 Net of certain income items in the amount of $13.1 million, $11.6 million, and $11.8 million in 2000, 2001, and 2002, respectively.3 Includes $7.8 million of prepaid pension costs in 2002.


Financial Matters
Highlights
As of December 31, 2002, all ordinary capitalloans were performing except for certain loansto private sector borrowers without sovereignguarantee that were classified as impaired andwere in nonaccrual. Ordinary capital operationsgenerated operating income of $728 million,compared with $1 billion in 2001. Operatingincome decreased, due largely to a reduction inloan charges approved by the Board ofExecutive Directors. Investment incomedeclined due to a general fall in short-terminterest rates, which affects a large part of theliquidity that is invested in floating rate securi-ties. However, the reduction in yield did notaffect operating income because a large part ofthe liquidity is financed with matching floatingrate debt.The interest coverage ratio was 1.40 in2002. Ordinary capital equity grew to $14.3 bil-lion as of December 31, 2002 from $13.3 billionat the end of the previous year, including totalreserves of $9.9 billion in 2002, up from $8.9billion in 2001.The reserves to net loans andguarantees ratio at the end of 2002 was 21.4percent. These ratios, which are calculatedexcluding the effects of the implementation ofFAS 133, are consistent with Bank policy andreflect the institution’s financial soundness.
The Bank was again rated AAA by themajor credit agencies in 2002, as it has eversince it was first rated.
The Bank applied minimum loan chargesto ordinary capital loans during the first andsecond semesters of 2002.That is, full waiversof both the supervision and inspection fee andthe credit commission were granted, and a min-imum lending spread of 0.1 percent was
FINANCIAL MATTERS 109
TABLE XIV. CAPITAL OF THE BANK
(In thousands of U.S. dollars)1
Subscriptions as of December 31, 2002
Country Paid-in Callable Total
Argentina $ 465,118 $10,393,829 $ 10,858,947Austria 6,900 153,688 160,588Bahamas 11,533 198,347 209,880Barbados 5,634 124,253 129,887Belgium 14,235 316,762 330,997
Belize 7,202 103,516 110,718Bolivia 37,324 834,355 871,680Brazil 465,118 10,393,829 10,858,947Canada 173,677 3,866,209 4,039,887Chile 127,716 2,853,919 2,981,634
Colombia 127,716 2,853,919 2,981,634Costa Rica 18,662 417,081 435,743Croatia 2,087 46,384 48,471Denmark 7,347 163,435 170,782Dominican
Republic 24,911 556,788 581,699
Ecuador 24,911 556,788 581,699El Salvador 18,662 417,081 435,743Finland 6,900 153,688 160,588France 82,273 1,831,446 1,913,719Germany 82,273 1,831,446 1,913,719
Guatemala 24,911 556,788 581,699Guyana 7,793 153,773 161,566Haiti 18,662 417,081 435,743Honduras 18,662 417,081 435,743Israel 6,804 151,541 158,345
Italy 82,273 1,831,446 1,913,719Jamaica 24,911 556,788 581,699Japan 217,106 4,833,154 5,050,260Mexico 298,980 6,681,308 6,980,288Netherlands 14,633 325,640 340,273
Nicaragua 18,662 417,081 435,743Norway 7,347 163,435 170,782Panama 18,662 417,081 435,743Paraguay 18,662 417,081 435,743Peru 62,235 1,390,745 1,452,980
Portugal 2,316 51,656 53,972Slovenia 1,267 28,096 29,362Spain 82,273 1,831,446 1,913,719Suriname 5,718 82,852 88,570Sweden 14,139 314,807 328,946
Switzerland 20,411 454,249 474,660Trinidad and
Tobago 18,662 417,081 435,743United Kingdom 41,776 929,946 971,722United States 1,303,020 29,006,704 30,309,724Uruguay 49,870 1,114,335 1,164,206Venezuela 249,339 5,568,456 5,817,795
Subtotal 4,339,289 96,596,415 100,935,704Unallocated 905 14,765 15,670
TOTAL $4,340,194 $96,611,180 $100,951,3741 Data are rounded to the nearest one thousand: detail maynot add up to subtotals and totals because of rounding.2 Total unallocated amount consists of 1,299 shares (75 paid-in and 1,224 callable) pertaining to the remainder of theformer Social Federal Republic of Yugoslavia.
2

charged. Minimum loan charges were appliedin 2002 in accordance with the Bank’s policy oftargeting only as much operating income as isrequired to meet its financial ratio targets.For a detailed description of the terms andconditions that apply to the Bank’s variousloan products, refer to the Bank’s Web site atwww.iadb.org/fin/capmar.htm.
At December 31, 2002, the loan portfolioof the Fund for Special Operations (FSO) wasfully performing, except for loans to Haiti inthe amount of $436 million. FSO operationsgenerated net income before technical cooper-ation expense and HIPC debt relief in anamount of $81 million, compared to $129 mil-lion in 2001.
In 2002, the amount of $70.2 million wasallocated from the FSO to the IntermediateFinancing Facility (IFF), for its standardoperations, for the Heavily Indebted PoorCountries (HIPC) initiative, and in connectionwith the agreement on concessional resourcesapproved by the Board of Governors in 1999.
In 2001, Bolivia reached the HIPCcompletion point, thereby becoming eligiblefor net present value (NPV) $307 million indebt relief. The Board of Directors approved
110
TABLE XVI. OUTSTANDING BORROWINGS BYCURRENCY AS OF DECEMBER 31, 2002
(In millions of U.S. dollars)
Currency1 Amount
Australian dollars $ 1,504
British pounds sterling 3,118
Canadian dollars 538
Euro 4,910
Hong Kong dollars 1,042
Japanese yen 3,555
New Taiwan dollars 1,052
New Zealand dollars 259
Polish zlotys 117
South African rand 18
Swedish kronor 57
Swiss francs 2,439
United States dollars 28,862
Total $47,4711 Medium- and long-term borrowings before swaps, SFAS133 bond hedge basis adjustments and net unamortizeddiscounts.
TABLE XV. CONTRIBUTION QUOTAS TO THEFUND FOR SPECIAL OPERATIONS1
(In thousands of U.S. dollars)
As ofCountry December 31, 2002
Argentina $ 493,789Austria 18,500 Bahamas 10,440 Barbados 1,751 Belgium 42,597 Belize 7,502
Bolivia 48,193 Brazil 538,561 Canada 292,055 Chile 156,062 Colombia 152,065
Costa Rica 23,129 Croatia 5,398 Denmark 19,718 Dominican Republic 33,588 Ecuador 29,978
El Salvador 21,154 Finland 18,183 France 218,592 Germany 232,318 Guatemala 32,522
Guyana 8,244 Haiti 21,535 Honduras 26,291 Israel 18,237 Italy 208,645
Jamaica 28,470 Japan 570,748 Mexico 325,254 Netherlands 36,160 Nicaragua 23,925 Norway 19,848
Panama 25,121 Paraguay 27,679 Peru 78,967 Portugal 7,307 Slovenia 3,278
Spain 207,347 Suriname 6,219 Sweden 37,169 Switzerland 62,579 Trinidad and Tobago 20,707
United Kingdom 174,175 United States 4,822,778 Uruguay 55,246 Venezuela 312,194
Subtotal 9,524,218 Unallocated 59,546
TOTAL $9,583,7641 After exchange adjustments.

TABLE XVII. BORROWINGS, FISCAL YEAR 20021,6
(Amounts in millions)
AmountType Issue Amount (US$ equiv.)
Australian 5.02%, due 2005 178 $ 99dollars 5.12%, due 2007 100 55
4.53%, due 2005 150 824.77%, due 2007 265 1491.00%, due 20125 1,300 736
Euro 3.79%, due 2005 45 393.70%, due 2005 10 94.00%, due 2006 60 59Step up, due 20082,4 200 1973.62%, due 2007 10 100.50%, due 20125 400 3951.00%, due 20145 200 2043.52%, due 2008 200 205
New Taiwan 2.74%, due 20054 500 14dollars 2.72%, due 20053 500 14
2.70%, due 2005 1,000 293.00%, due 20064 500 152.96%, due 20063 500 142.95%, due 2006 1,000 293.15%, due 20074 500 143.08%, due 20073 500 153.07%, due 2007 1,000 293.13%, due 20083 500 143.15%, due 20083 500 143.16%, due 20083 500 143.12%, due 2008 1,000 293.21%, due 20093 500 143.22%, due 20093 500 143.25%, due 20093 500 14
Polish zlotys 8.25%, due 2005 150 36
Swiss francs 3.00%, due 2007 700 410
United States 4.25%, due 2003 50 50dollars 4.00%, due 2005 2,500 2,500
Variable, due 2009 61 61Variable, due 2008 25 253.44%, due 2005 59 593.85%, due 2006 300 3003.62%, due 2005 35 353.53%, due 2005 81 813.25%, due 2007 15 154.375%, due 2012 2,000 2,0000.50%, due 20125 300 3003.00%, due 2005 500 5000.50%, due 20125 137 1370.50%, due 20125 106 106
TOTAL BORROWINGS $ 9,1401 Medium- and long-term borrowings before swaps.2 Year 1 - 4.125% with annual increases of 0.125%.3 The issuer has a single call option.4 The issuer has multiple call options.5 Deep discount issues. Proceeds approximate 68% of face value.6 This table excludes a US$200 million issue (1%, due 2015) launched onDecember 5, 2002, with settlement on January 7, 2003.
interim HIPC financing for debt relief forHonduras and Nicaragua in 2001 in the nomi-nal amounts of $43.8 million and $56.3million, respectively. Guyana became eligiblefor interim relief in 2002 of $11.2 million innominal terms. As a result of these decisions,the FSO recognized HIPC debt relief totaling$540.8 million and $37.5 million during 2001and 2002, respectively, following its accountingpolicy for these transactions.
The audited financial statements of theordinary capital, the Fund for SpecialOperations and the Intermediate FinancingFacility, appear on pages 113-161 of this report.
Borrowings
In 2002, the Bank issued bonds for a total faceamount of $9.1 billion equivalent and net pro-ceeds of $8.6 billion with an average life of sixyears. The funding continued within a strate-gy of combining a few very large benchmarkbonds in the Bank’s core currency with small-er transactions in a series of currencies asopportunities arose. Accordingly, the Bankmarketed two U.S. dollar denominated globalbond issues of $2 billion, carrying maturitiesof three and ten years. The three-year issuewas subsequently increased by $500 million.In addition, the Bank diversified the marketaccess by selling bonds in five other currenciesthan U.S. dollars. The institutional marketcontinued to absorb a significant part of the2002 borrowing program (67 percent).However, the Japanese retail market, the“Uridashi market,” was also an important partof the placement of Bank’s bond issues (30percent). As interest rates came down during2002, an unusually high volume of call optionsattached to outstanding bonds of the Bankwas exercised ($813 million). The Bank main-tained a broad geographical distribution of itsbond sales with 57 percent placed in Asia, 26percent in Europe and the Middle East, and17 percent in North and South America.
FINANCIAL MATTERS 111


Part II:Financial Statements


ORDINARY
CAPITAL
REPORT OF INDEPENDENT AUDITORS
Board of Governors
Inter-American Development Bank
We have audited the accompanying balance sheet of the Inter-American Development Bank (Bank)—Ordinary Capital as of
December 31, 2002, and the related statements of income and general reserve, comprehensive income, and cash flows for the year then
ended. These financial statements are the responsibility of the Bank’s management. Our responsibility is to express an opinion on these
financial statements based on our audit. The financial statements of the Inter-American Development Bank—Ordinary Capital as of
December 31, 2001, were audited by other auditors who have ceased operations and whose report dated February 13, 2002, expressed an
unqualified opinion on those statements and included an explanatory paragraph that disclosed the change in the Bank’s method of
accounting for derivative instruments and hedging activities discussed in Note B to these financial statements.
We conducted our audit in accordance with auditing standards generally accepted in the United States. Those standards require that we
plan and perform the audit to obtain reasonable assurance about whether the financial statements are free of material misstatement. An
audit includes examining, on a test basis, evidence supporting the amounts and disclosures in the financial statements. An audit also
includes assessing the accounting principles used and significant estimates made by management, as well as evaluating the overall
financial statement presentation. We believe that our audit provides a reasonable basis for our opinion.
In our opinion, the financial statements referred to above present fairly, in all material respects, the financial position of the
Inter-American Development Bank—Ordinary Capital as of December 31, 2002, and the results of its operations and its cash flows for
the year then ended in conformity with accounting principles generally accepted in the United States.
Washington, D.C.
February 12, 2003

116
ORDINARY CAPITALINTER-AMERICAN DEVELOPMENT BANK
BALANCE SHEETExpressed in thousands of United States dollars
The accompanying notes are an integral part of these financial statements.
December 31,
2002 2001
ASSETS
Cash and investmentsCash . . . . . . . . . . . . . . . . . . . . . . . . . . . . . . . . . . . . . . . . . . . . . . . . . $ 208,909 $ 267,477Investments
Trading . . . . . . . . . . . . . . . . . . . . . . . . . . . . . . . . . . . . . . . . . . . . 11,298,628 8,384,364Held-to-maturity . . . . . . . . . . . . . . . . . . . . . . . . . . . . . . . . . . . . 3,542,249 $15,049,786 3,370,235 $12,022,076
Loans outstanding . . . . . . . . . . . . . . . . . . . . . . . . . . . . . . . . . . . . . . 47,957,857 44,950,977Allowance for loan losses . . . . . . . . . . . . . . . . . . . . . . . . . . . . . . . . (1,560,885) 46,396,972 (1,423,849) 43,527,128
Accrued interest and other chargesOn investments . . . . . . . . . . . . . . . . . . . . . . . . . . . . . . . . . . . . . . . . 113,688 103,954On loans . . . . . . . . . . . . . . . . . . . . . . . . . . . . . . . . . . . . . . . . . . . . . 694,037 805,086On swaps, net . . . . . . . . . . . . . . . . . . . . . . . . . . . . . . . . . . . . . . . . . 181,719 989,444 150,364 1,059,404
Receivable from membersCapital subscriptions . . . . . . . . . . . . . . . . . . . . . . . . . . . . . . . . . . . 6,191 11,617Non-negotiable, non-interest bearing demand obligations . . . . 499,506 578,831Amounts required to maintain value of currency holdings . . . . 57,868 563,565 56,991 647,439
Currency and interest rate swapsInvestments—trading . . . . . . . . . . . . . . . . . . . . . . . . . . . . . . . . . . . 18,860 41,688Borrowings . . . . . . . . . . . . . . . . . . . . . . . . . . . . . . . . . . . . . . . . . . . 1,293,803 1,312,663 739,277 780,965
Other assetsProperty, net . . . . . . . . . . . . . . . . . . . . . . . . . . . . . . . . . . . . . . . . . . 287,152 271,405Unamortized borrowing costs . . . . . . . . . . . . . . . . . . . . . . . . . . . . 143,972 113,216Miscellaneous . . . . . . . . . . . . . . . . . . . . . . . . . . . . . . . . . . . . . . . . . 254,386 685,510 159,499 544,120
Total assets . . . . . . . . . . . . . . . . . . . . . . . . . . . . . . . . . . . . . . . . $64,997,940 $58,581,132
LIABILITIES AND CAPITAL
LiabilitiesBorrowings
Short-term . . . . . . . . . . . . . . . . . . . . . . . . . . . . . . . . . . . . . . . . . $ 729,434 $ 490,361Medium- and long-term . . . . . . . . . . . . . . . . . . . . . . . . . . . . . . 48,129,872 $48,859,306 42,676,726 $43,167,087
Currency and interest rate swapsInvestments—trading . . . . . . . . . . . . . . . . . . . . . . . . . . . . . . . . 288,829 132,102Loans . . . . . . . . . . . . . . . . . . . . . . . . . . . . . . . . . . . . . . . . . . . . . . 64,932 8,709Borrowings . . . . . . . . . . . . . . . . . . . . . . . . . . . . . . . . . . . . . . . . . 613,362 967,123 1,159,904 1,300,715
Accrued interest on borrowings . . . . . . . . . . . . . . . . . . . . . . . . . . 781,735 749,387Accounts payable and accrued expenses . . . . . . . . . . . . . . . . . . . . 121,014 110,295
Total liabilities . . . . . . . . . . . . . . . . . . . . . . . . . . . . . . . . . . . . . . 50,729,178 45,327,484
CapitalCapital stock
Subscribed—8,368,379 shares (2001—8,369,043) . . . . . . . . . 100,951,374 100,959,384Less callable portion . . . . . . . . . . . . . . . . . . . . . . . . . . . . . . . . . . (96,611,180) (96,618,732)
4,340,194 4,340,652
General reserve . . . . . . . . . . . . . . . . . . . . . . . . . . . . . . . . . . . . . . . . 7,217,356 6,535,821Special reserve . . . . . . . . . . . . . . . . . . . . . . . . . . . . . . . . . . . . . . . . . 2,665,500 2,665,500Accumulated other comprehensive income (loss) . . . . . . . . . . . . 45,712 14,268,762 (288,325) 13,253,648
Total liabilities and capital . . . . . . . . . . . . . . . . . . . . . . . . . . . $64,997,940 $58,581,132

FINANCIAL STATEMENTS 117
The accompanying notes are an integral part of these financial statements.
Years ended December 31,
2002 2001
IncomeLoans
Interest . . . . . . . . . . . . . . . . . . . . . . . . . . . . . . . . . . . . . . . . . . . . . . . . . . . . . . . . . . . . . . . . . . . . $2,615,576 $2,994,938Credit commissions . . . . . . . . . . . . . . . . . . . . . . . . . . . . . . . . . . . . . . . . . . . . . . . . . . . . . . . . . 564 114,687Supervision and inspection and other fees . . . . . . . . . . . . . . . . . . . . . . . . . . . . . . . . . . . . . . 22,731 81,344
. . . . . . . . . . . . . . . . . . . . . . . . . . . . . . . . . . . . . . . . . . . . . . . . . . . . . . . . . . . . . . . . . . . . . . . . . . 2,638,871 3,190,969Investments . . . . . . . . . . . . . . . . . . . . . . . . . . . . . . . . . . . . . . . . . . . . . . . . . . . . . . . . . . . . . . . . . . 318,596 540,917Other . . . . . . . . . . . . . . . . . . . . . . . . . . . . . . . . . . . . . . . . . . . . . . . . . . . . . . . . . . . . . . . . . . . . . . . 27,384 45,162
Total income . . . . . . . . . . . . . . . . . . . . . . . . . . . . . . . . . . . . . . . . . . . . . . . . . . . . . . . . . . . . . . . 2,984,851 3,777,048
ExpensesBorrowing expenses
Interest . . . . . . . . . . . . . . . . . . . . . . . . . . . . . . . . . . . . . . . . . . . . . . . . . . . . . . . . . . . . . . . . . . . . 1,801,147 2,269,439Amortization of borrowing costs . . . . . . . . . . . . . . . . . . . . . . . . . . . . . . . . . . . . . . . . . . . . . . 37,520 40,116Debt repurchase costs . . . . . . . . . . . . . . . . . . . . . . . . . . . . . . . . . . . . . . . . . . . . . . . . . . . . . . . 2,694 10,955
. . . . . . . . . . . . . . . . . . . . . . . . . . . . . . . . . . . . . . . . . . . . . . . . . . . . . . . . . . . . . . . . . . . . . . . . . . 1,841,361 2,320,510Provision for loan losses . . . . . . . . . . . . . . . . . . . . . . . . . . . . . . . . . . . . . . . . . . . . . . . . . . . . . . . . 99,884 147,303Administrative expenses . . . . . . . . . . . . . . . . . . . . . . . . . . . . . . . . . . . . . . . . . . . . . . . . . . . . . . . 315,972 299,777
Total expenses . . . . . . . . . . . . . . . . . . . . . . . . . . . . . . . . . . . . . . . . . . . . . . . . . . . . . . . . . . . . . . 2,257,217 2,767,590
Operating income . . . . . . . . . . . . . . . . . . . . . . . . . . . . . . . . . . . . . . . . . . . . . . . . . . . . . . . . . . . . . . 727,634 1,009,458Net loss from hedging activities under SFAS 133 . . . . . . . . . . . . . . . . . . . . . . . . . . . . . . . . . . (18,899) (39,697)
Income before cumulative effect of change in accounting principle . . . . . . . . . . . . . . . . . 708,735 969,761Cumulative effect of change in accounting principle . . . . . . . . . . . . . . . . . . . . . . . . . . . . . . — 50,839
Net income . . . . . . . . . . . . . . . . . . . . . . . . . . . . . . . . . . . . . . . . . . . . . . . . . . . . . . . . . . . . . . . . . . . . 708,735 1,020,600Allocation to the Fund for Special Operations . . . . . . . . . . . . . . . . . . . . . . . . . . . . . . . . . . . . . (27,200) (27,200)
Addition to general reserve for the year . . . . . . . . . . . . . . . . . . . . . . . . . . . . . . . . . . . . . . . . . 681,535 993,400General reserve, beginning of year . . . . . . . . . . . . . . . . . . . . . . . . . . . . . . . . . . . . . . . . . . . . . . 6,535,821 5,542,421
General reserve, end of year . . . . . . . . . . . . . . . . . . . . . . . . . . . . . . . . . . . . . . . . . . . . . . . . . . . . $7,217,356 $6,535,821
STATEMENT OF COMPREHENSIVE INCOMEExpressed in thousands of United States dollars
Years ended December 31,
2002 2001
Net income . . . . . . . . . . . . . . . . . . . . . . . . . . . . . . . . . . . . . . . . . . . . . . . . . . . . . . . . . . . . . . . . . . . . $ 708,735 $1,020,600
Other comprehensive income (loss)Translation adjustments . . . . . . . . . . . . . . . . . . . . . . . . . . . . . . . . . . . . . . . . . . . . . . . . . . . . . . . . 372,928 (207,049)Net loss on cash flow hedges under SFAS 133 . . . . . . . . . . . . . . . . . . . . . . . . . . . . . . . . . . . . . . (38,891) (21,155)Cumulative effect of change in accounting principle . . . . . . . . . . . . . . . . . . . . . . . . . . . . . . . . — 44,760
Total other comprehensive income (loss) . . . . . . . . . . . . . . . . . . . . . . . . . . . . . . . . . . . . . . . 334,037 (183,444)
Comprehensive income . . . . . . . . . . . . . . . . . . . . . . . . . . . . . . . . . . . . . . . . . . . . . . . . . . . . . . . . $1,042,772 $ 837,156
ORDINARY CAPITALINTER-AMERICAN DEVELOPMENT BANK
STATEMENT OF INCOME AND GENERAL RESERVEExpressed in thousands of United States dollars

118
The accompanying notes are an integral part of these financial statements.
Years ended December 31,
2002 2001
Cash flows from lending and investing activitiesLending:
Loan disbursements (net of participations) . . . . . . . . . . . . . . . . . . . . . . . . . . . . . . . . . . . . . . $ (5,521,825) $ (6,037,233)Loan collections (net of participations) . . . . . . . . . . . . . . . . . . . . . . . . . . . . . . . . . . . . . . . . . 4,106,227 1,925,760
Net cash used in lending activities . . . . . . . . . . . . . . . . . . . . . . . . . . . . . . . . . . . . . . . . . . . . . . . (1,415,598) (4,111,473)Gross purchases of held-to-maturity investments . . . . . . . . . . . . . . . . . . . . . . . . . . . . . . . . . . . (17,017,449) (15,159,919)Gross proceeds from maturities of held-to-maturity investments . . . . . . . . . . . . . . . . . . . . . 16,961,698 14,801,386Purchase of property . . . . . . . . . . . . . . . . . . . . . . . . . . . . . . . . . . . . . . . . . . . . . . . . . . . . . . . . . . (25,328) (20,220)Miscellaneous assets and liabilities . . . . . . . . . . . . . . . . . . . . . . . . . . . . . . . . . . . . . . . . . . . . . . . (21,608) 5,683
Net cash used in lending and investing activities . . . . . . . . . . . . . . . . . . . . . . . . . . . . . . . . . . . . (1,518,285) (4,484,543)
Cash flows from financing activitiesMedium- and long-term borrowings:
Gross proceeds . . . . . . . . . . . . . . . . . . . . . . . . . . . . . . . . . . . . . . . . . . . . . . . . . . . . . . . . . . . . . 8,575,159 7,081,689Repayments . . . . . . . . . . . . . . . . . . . . . . . . . . . . . . . . . . . . . . . . . . . . . . . . . . . . . . . . . . . . . . . . (6,058,863) (5,399,508)
Short-term borrowings:Gross proceeds . . . . . . . . . . . . . . . . . . . . . . . . . . . . . . . . . . . . . . . . . . . . . . . . . . . . . . . . . . . . . 897,801 2,900,790Repayments . . . . . . . . . . . . . . . . . . . . . . . . . . . . . . . . . . . . . . . . . . . . . . . . . . . . . . . . . . . . . . . . (655,814) (3,479,867)
Capital:Collections of receivables from members . . . . . . . . . . . . . . . . . . . . . . . . . . . . . . . . . . . . . . . 83,415 164,148
Net cash provided by financing activities . . . . . . . . . . . . . . . . . . . . . . . . . . . . . . . . . . . . . . . . . . 2,841,698 1,267,252
Cash flows from operating activitiesLoan income collections . . . . . . . . . . . . . . . . . . . . . . . . . . . . . . . . . . . . . . . . . . . . . . . . . . . . . . . 2,785,447 3,028,763Interest and other costs of borrowings . . . . . . . . . . . . . . . . . . . . . . . . . . . . . . . . . . . . . . . . . . . . (1,708,692) (2,366,599)Income from investments . . . . . . . . . . . . . . . . . . . . . . . . . . . . . . . . . . . . . . . . . . . . . . . . . . . . . . 309,070 577,643Other income . . . . . . . . . . . . . . . . . . . . . . . . . . . . . . . . . . . . . . . . . . . . . . . . . . . . . . . . . . . . . . . . 14,677 14,862Administrative expenses . . . . . . . . . . . . . . . . . . . . . . . . . . . . . . . . . . . . . . . . . . . . . . . . . . . . . . . (326,031) (318,481)
Net cash provided by operating activities . . . . . . . . . . . . . . . . . . . . . . . . . . . . . . . . . . . . . . . . . . 1,074,471 936,188
Adjustments to receivable from members . . . . . . . . . . . . . . . . . . . . . . . . . . . . . . . . . . . . . . . . — (1,639)
Change in market value of trading investments . . . . . . . . . . . . . . . . . . . . . . . . . . . . . . . . . . . (1,097) 4,612
Effect of exchange rate fluctuations on cash and trading investments . . . . . . . . . . . . . . 306,554 (154,903)
Allocation to the Fund for Special Operations . . . . . . . . . . . . . . . . . . . . . . . . . . . . . . . . . . . . . (27,200) (27,200)
Net increase (decrease) in cash and trading investments . . . . . . . . . . . . . . . . . . . . . . . . . . 2,676,141 (2,460,233)
Cash and trading investments, beginning of year . . . . . . . . . . . . . . . . . . . . . . . . . . . . . . . . . 8,561,427 11,021,660
Cash and trading investments, end of year . . . . . . . . . . . . . . . . . . . . . . . . . . . . . . . . . . . . . . . $11,237,568 $ (8,561,427
Composition of cash and trading investments:Cash . . . . . . . . . . . . . . . . . . . . . . . . . . . . . . . . . . . . . . . . . . . . . . . . . . . . . . . . . . . . . . . . . . . . . . . . $ 208,909 $( 267,477Investments held in trading portfolio . . . . . . . . . . . . . . . . . . . . . . . . . . . . . . . . . . . . . . . . . . . . . 11,298,628 8,384,364Currency and interest rate
swaps—Investments-trading, net . . . . . . . . . . . . . . . . . . . . . . . . . . . . . . . . . . . . . . . . . . . . . . (269,969) (90,414)
$11,237,568 $ (8,561,427
ORDINARY CAPITALINTER-AMERICAN DEVELOPMENT BANK
STATEMENT OF CASH FLOWSExpressed in thousands of United States dollars

ORDINARY CAPITALINTER-AMERICAN DEVELOPMENT BANK
NOTES TO FINANCIAL STATEMENTS (continued)
December 31, 2002 and 2001
FINANCIAL STATEMENTS 119
Note A – OriginThe Inter-American Development Bank (Bank) is an interna-
tional organization which was established in December 1959. The
principal purpose of the Bank is to promote the economic and
social development of Latin America and the Caribbean, prima-
rily by providing loans and related technical assistance for spe-
cific projects and for programs of economic reform. The primary
activities of the Bank are conducted through the Ordinary Capi-
tal with such operations supplemented by those of the Fund for
Special Operations (FSO) and the Intermediate Financing Facil-
ity Account (IFF). The FSO was established for the purpose of
making loans in the less developed member countries in Latin
America and the Caribbean by providing financing on terms
which are highly concessional. The IFF’s purpose is to subsidize
part of the interest payments for which certain borrowers are
liable on loans from the Ordinary Capital.
Note B – Summary of Significant Accounting PoliciesThe Bank’s financial statements are prepared in conformity with
United States generally accepted accounting principles. The prepa-
ration of financial statements in conformity with generally ac-
cepted accounting principles requires management to make
estimates and assumptions that affect the reported amounts of
assets and liabilities, the disclosure of contingent assets and li-
abilities at the date of the financial statements, and the reported
amounts of revenues and expenses during the reporting period.
Actual results could differ from these estimates.
New accounting pronouncementsIn November 2002, the Financial Accounting Standards Board
(FASB) issued FASB Interpretation No. 45, “Guarantor’s Account-
ing and Disclosure Requirements for Guarantees, Including In-
direct Guarantees of Indebtedness of Others”. This interpretation
clarifies the requirements for a guarantor’s accounting for and
disclosures of certain guarantees issued and outstanding. The
initial recognition and measurement provisions of this interpre-
tation are applicable to guarantees issued or modified after
December 31, 2002, while the disclosure requirements are effec-
tive for the Bank’s 2002 financial statements. Management is in
the process of reviewing the initial recognition and measurement
provisions of the interpretation and expects that they will not
have a material impact on the Bank’s financial statements.
Adoption of Statement of Financial Accounting Standards(SFAS) No. 133On January 1, 2001, the Bank adopted SFAS No. 133, “Account-
ing for Derivative Instruments and Hedging Activities”, as
amended by SFAS No. 138, “Accounting for Certain Derivative
Instruments and Certain Hedging Activities” (herein after referred
to as SFAS 133). SFAS 133 establishes accounting and reporting
standards requiring that every derivative instrument (including
certain derivative instruments embedded in other contracts) be
recorded on the Balance Sheet as either an asset or liability mea-
sured at its fair value. Changes in the fair value of the derivatives
are recorded each period in current earnings or other compre-
hensive income, depending on whether a derivative is designated
as part of a hedge transaction and, if it is, the type of the hedge
transaction. In accordance with the transition provisions of SFAS
133 the Bank recorded a cumulative effect adjustment of
$96,101,000 (gain) in earnings to recognize at fair value all de-
rivatives that were designated as fair value hedge instruments at
December 31, 2000. The Bank also recorded a cumulative effect
adjustment of $45,262,000 (loss) in earnings to adjust the carry-
ing values of related hedged assets, liabilities and firm commit-
ments. In addition, the Bank recorded a cumulative effect
adjustment of $44,760,000 (gain) in other comprehensive income
to recognize at fair value all derivatives that were designated as
cash flow hedging instruments. Investment derivative instruments
were already recorded at market value as part of the trading port-
folio; therefore, they were not affected by SFAS 133.
ReclassificationsCertain reclassifications of the prior year’s information have been
made to conform to the current year’s presentation.
Translation of currenciesThe Bank’s financial statements are expressed in United States
dollars; however, the Bank conducts its operations in the curren-
cies of all of its members, which are considered functional cur-
rencies. The Bank’s resources are derived from capital, borrowings
and accumulated earnings in those various currencies. The Bank
has a number of general policies aimed at minimizing exchange-
rate risk in a multicurrency environment. The Bank generally
follows the policy of investing and lending the proceeds of bor-
rowings (after swaps) and paid-in capital in the currencies re-
ceived. In addition, the Bank periodically undertakes currency
conversions to match more closely the currencies underlying its
general and special reserves with those of the outstanding loans.
Assets and liabilities in functional currencies derived from
borrowings are translated into United States dollars at approxi-
mate market exchange rates prevailing at the dates of the finan-
cial statements. Net adjustments resulting from the translation
of functional currencies are charged or credited to translation
adjustments and are presented as a separate component of other
comprehensive income in the Statement of Comprehensive In-
come. Exchange rate fluctuations do not have any effect on the
United States dollar equivalent of currencies from paid-in capi-
tal because of the maintenance of value described below. Income

ORDINARY CAPITALINTER-AMERICAN DEVELOPMENT BANK
NOTES TO FINANCIAL STATEMENTS (continued)
December 31, 2002 and 2001
120
and expenses are translated at approximate market exchange rates
prevailing during each month.
Valuation of capital stockThe Agreement Establishing the Bank (Agreement) provides that
the Ordinary Capital be expressed in terms of the United States
dollar of the weight and fineness in effect on January 1, 1959.
The Second Amendment to the Articles of Agreement of the In-
ternational Monetary Fund eliminated par values of currencies
in terms of gold effective April 1, 1978, and consequently the
General Counsel of the Bank has rendered an opinion that the
Special Drawing Right (SDR) has become the successor to the
1959 United States dollar as the standard of value of the Bank’s
capital stock and for the purpose of maintaining the value of the
Bank’s currency holdings. The SDR has a value equal to the sum
of the values of specific amounts of stated currencies, including
the United States dollar. Pending a decision by the Bank’s gov-
erning boards and as suggested in the General Counsel’s opin-
ion, the Bank is continuing its practice of using the 1959 United
States dollar, which pursuant to the devaluations of the United
States dollar in 1972 and 1973 is equal to approximately 1.2063
current United States dollars, as the basis of valuation. If the 1959
United States dollar were to have been substituted with the SDR
on December 31, 2002, the financial position and the results of
operations of the Bank would not have been materially affected.
Maintenance of valueIn accordance with the Agreement, each member is required to
maintain the value of its currency held in the Ordinary Capital,
except for currency derived from borrowings. Likewise, the Bank
is required to return to a member an amount of its currency equal
to any significant increase in value of such member’s currency
which is held in the Ordinary Capital, except for currency de-
rived from borrowings. The standard of value for these purposes
is the United States dollar of the weight and fineness in effect on
January 1, 1959.
General and special reservesIn accordance with resolutions of the Board of Governors, the
net income from the Ordinary Capital resources of the Bank is
generally added to the general reserve to provide for possible
annual excess of expenses over income.
The special reserve consists of loan commissions set aside
from the Bank’s inception to 1998 pursuant to Article III, Sec-
tion 13 of the Agreement, which are held in investments. These
investments may be used only for the purpose of meeting liabili-
ties of the Bank on its borrowings and guarantees in the event of
defaults on loans made, participated in, or guaranteed by the
Bank.
InvestmentsInvestment securities are classified based on management’s in-
tention on the date of purchase. Securities which management
has the intent and ability to hold until maturity are included in
the held-to-maturity portfolio and reported at amortized cost.
All other securities are held in a trading portfolio. Securities and
related derivative instruments (mostly currency and interest rate
swaps) held in the trading portfolio are carried and reported at
market value, with realized and unrealized gains and losses in-
cluded in income from investments. These securities and related
derivative instruments are included in the Statement of Cash
Flows as cash equivalents due to their nature and the Bank’s policy
governing the level and use of such investments.
LoansThe Bank makes loans to its developing member countries, agen-
cies or political subdivisions of such members or to private en-
terprises carrying out projects in their territories. In the case of
loans to borrowers other than national governments, central
banks or other governmental or inter-governmental entities, the
Bank follows the general policy of requiring a guarantee engag-
ing the full faith and credit of the government. Up to 10% of the
Bank’s outstanding loans and guarantees, not including emer-
gency lending, may be made directly to private sector entities
without a government guarantee on the basis of market-based
pricing and provisioning (Private Sector Program). These
financings are subject to a number of restrictions, including a
ceiling on financing the lesser of 25% of the total costs of an in-
dividual project or $75 million, although in the case of certain
specified countries the Bank may finance up to the lesser of 40%
of the total costs of an individual project or $75 million. There is
also a ceiling on partial risk guarantees of the lesser of 50% of the
total costs of an individual project or $150 million.
Loans representing approximately 48% of the outstand-
ing balances have repayment obligations in various currencies
determined on the basis of a currency pooling system (Currency
Pooling System). The principal amount of Currency Pooling Sys-
tem loans is repayable, in aggregate, in the currencies lent.
Multicurrency loans approved prior to January 1, 1983 and single
currency loans are repayable in the specific currencies disbursed.
Incremental direct costs associated with originating loans
are expensed as incurred as such amounts are considered imma-
terial to the financial results of the Bank. Front-end fees on emer-
gency loans are deferred and amortized over the first four years
of the loan on a straight-line basis, which approximates the ef-
fective interest method.
It is the policy of the Bank to place on nonaccrual status
all loans made to or guaranteed by a member of the Bank if prin-
cipal, interest or other charges with respect to any such loan are

ORDINARY CAPITALINTER-AMERICAN DEVELOPMENT BANK
NOTES TO FINANCIAL STATEMENTS (continued)
December 31, 2002 and 2001
FINANCIAL STATEMENTS 121
overdue by more than 180 days. In addition, if loans made to a
member country by the FSO or any fund owned or administered
by the Bank are placed on nonaccrual status, all loans made to or
guaranteed by that member government will also be placed on
nonaccrual status by the Bank. On the date a member’s loans are
placed on nonaccrual status, unpaid interest and other charges
accrued on loans outstanding to the member are deducted from
the income of the current period. Interest and other charges on
nonaccruing loans are included in income only to the extent that
payments have actually been received by the Bank. On the date a
member pays in full all overdue amounts, the member’s loans
emerge from nonaccrual status, its eligibility for new loans is re-
stored and all overdue charges (including those from prior years)
are recognized as income from loans in the current period.
For Private Sector Program loans, it is the policy of the
Bank to place on nonaccrual status loans made to a borrower
when interest or other charges are past due by more than 90 days,
or earlier when management has doubts about the future
collectibility of principal or interest. Income is recorded thereaf-
ter on a cash-basis or a combination of cash-basis and cost-
recovery methods, until loan service is current and management’s
doubts about future collectibility cease to exist. If the collectibility
risk is considered to be particularly high at the time of arrears
clearance, the borrower’s loans will not automatically emerge from
nonaccrual status.
The Bank’s Ordinary Capital has a policy of not resched-
uling public sector loan repayments and has never had a write-
off on any of its loans. The Bank reviews the collectibility of loans
on a continuous basis and records, as an expense, provisions for
loan losses in accordance with its determination of the
collectibility risk of the total loan and guarantees portfolio. Such
reviews consider the potential for delay in the scheduled loan
repayments.
The Bank considers a Private Sector Program loan as impaired
when, based on current information and events, it is probable that
the Bank will be unable to collect all amounts due according to the
loan’s original contractual terms. Specific allowance for losses on
impaired loans are set aside based on management’s judgment of
the present value of expected future cash flows discounted at the
loan’s effective interest rate or based on the fair value of the collat-
eral. Income on impaired loans is generally recognized following a
combination of cash-basis and cost-recovery methods.
GuaranteesThe Bank may make partial guarantees either without a govern-
ment counter-guarantee under the 10% limit for the Private Sec-
tor Program operations mentioned above or for public sector
operations with a member government counter-guarantee. To
date, the Bank has issued partial guarantees designed to encour-
age private sector investments and local capital market develop-
ment. The partial risk guarantees and partial credit guarantees
are provided mostly for infrastructure projects and may be of-
fered on a stand-alone basis or in conjunction with a Bank loan.
Partial risk guarantees cover specific risk events related to non-
commercial factors (e.g.: currency convertibility, transferability
of currencies outside the host country, government contract frus-
tration) and partial credit guarantees cover payment risks for
selected project borrowings or debt issuances. The terms of all
guarantees are specifically set in each guarantee agreement and
are primarily tied to a project or the terms of debt issuances. On
a case-by-case basis, depending upon the risks covered and the
nature of each individual project, the Bank may reinsure certain
guarantees to reduce its exposure. Guarantee fees, net of reinsur-
ance premiums, are charged and recognized as income from loans
over the term of the guarantee.
Guarantees are regarded as outstanding when the borrower
incurs the underlying financial obligation and are called when a
guaranteed party demands payment under the guarantee. The
outstanding amount represents the maximum potential risk if
the payments guaranteed for these entities are not made. Guar-
antee exposure is measured as the future guaranteed cash flows,
net of reinsurance, when applicable, discounted to the current
period. Guarantees are not included in reported loan balances.
Receivable from membersReceivable from members includes non-negotiable, non-interest
bearing demand obligations that have been accepted in lieu of
the immediate payment of all or any part of a member’s sub-
scribed paid-in capital stock.
PropertyProperty is recorded at cost. Major improvements are capitalized
while routine replacements, maintenance and repairs are charged
to expense. Depreciation is computed on the straight-line method
over estimated useful lives (30 to 40 years for buildings, 10 years
for building improvements and capitalized software, and 4 to 15
years for equipment).
BorrowingsTo ensure funds are available for lending and liquidity purposes,
the Bank borrows in the international capital markets, offering its
securities to private and public investors. The Bank issues medium-
and long-term debt instruments denominated in various curren-
cies with both fixed and adjustable interest rates. The Bank also
issues short-term discount notes for liquidity management pur-
poses. Borrowings are carried on the Balance Sheet at their par
value (face value) adjusted for changes in fair value attributable to
the hedged risk, when part of a hedging relationship (basis adjust-

ORDINARY CAPITALINTER-AMERICAN DEVELOPMENT BANK
NOTES TO FINANCIAL STATEMENTS (continued)
December 31, 2002 and 2001
122
ment), and for any unamortized premiums or discounts. Basis
adjustments on hedged borrowings are recorded in net gain (loss)
from hedging activities under SFAS 133 on the Statement of In-
come and General Reserve. The Bank starts amortizing basis ad-
justments when the related hedge is terminated. Basis adjustments
and premiums or discounts are amortized on a straight-line basis,
which approximates the effective interest method. Amortization
of premiums and discounts is included in interest under borrow-
ing expenses, on the Statement of Income and General Reserve.
Borrowing costs associated with a bond offering are deferred and
amortized on a straight-line basis, which approximates the effec-
tive interest method, over the period during which the related in-
debtedness is outstanding. The unamortized balance of the
borrowing costs is presented separately under other assets on the
Balance Sheet and the amortization of the borrowing costs is pre-
sented as a separate element under borrowing expenses in the State-
ment of Income and General Reserve.
DerivativesAs part of its asset and liability management, the Bank uses de-
rivatives, mostly currency and interest rate swaps, in its invest-
ment, loan and borrowing operations. These derivatives modify
the interest rate and/or currency characteristics of the respective
operation to produce the desired interest and/or currency type.
Effective January 1, 2001, all derivatives are recognized in
the Balance Sheet at their fair value and are classified as either
assets or liabilities, depending on the nature (debit or credit) of
their net fair value amount. On the date the derivative contract is
entered into, the Bank designates the derivative as a hedge of the
fair value of a recognized asset or liability or of an unrecognized
firm commitment (fair value hedge), a hedge of the variability of
cash flows to be received or paid related to a recognized asset or
liability (cash flow hedge) or as held in the trading portfolio (in-
vestment derivatives). Changes in the fair value of a derivative
that is highly effective, and that is designated and qualifies as a
fair-value hedge, along with the gain or loss on the hedged asset
or liability that is attributable to the hedged risk (including gains
or losses on firm commitments) are recorded in net gain (loss)
from hedging activities under SFAS 133 in the Statement of In-
come and General Reserve. The effective portion of the changes
in fair value of a derivative that is highly effective and that is des-
ignated and qualifies as a cash-flow hedge is recorded in other
comprehensive income, until earnings are affected by the vari-
ability of cash flows. The ineffective portion, resulting from ex-
cess expected cash flows on the derivative, is recorded in net gain
(loss) from hedging activities under SFAS 133 in the Statement
of Income and General Reserve. Changes in the market value of
investment derivatives are recorded in income from investments.
The interest component of derivatives is recognized as an adjust-
ment to the investment yield, the loan return, or the borrowing
cost, as applicable, over the life of the derivative contract and is
included in the corresponding income or expense category on
the Statement of Income and General Reserve.
The Bank occasionally issues debt instruments that con-
tain an embedded derivative. The Bank assesses whether the eco-
nomic characteristics of the embedded derivative are clearly and
closely related to the economic characteristics of the debt instru-
ment (i.e., the host contract), excluding the embedded derivative
features. If the embedded derivative possesses economic charac-
teristics that are not clearly and closely related to the economic
characteristics of the host contract, not already marked to mar-
ket through earnings, and would separately meet the definition
of a derivative, then the embedded derivative is separated from
the host contract, carried at fair value, and designated as a fair
value or cash flow hedge.
Administrative expensesSubstantially all administrative expenses of the Bank, including
depreciation, are allocated between the Ordinary Capital and the
FSO pursuant to an allocation method approved by the Board of
Executive Directors. Following this allocation method, during
2002 the effective ratio of administrative expenses charged to the
Ordinary Capital was 83.6% and 16.4% to the FSO (2001—84.0%
and 16.0%).
Fair values of financial instrumentsThe following methods and assumptions were used by the Bank
in estimating the fair value for its financial instruments:
Cash: The carrying amount reported in the Balance Sheet for
cash approximates fair value.
Investments: Fair values for investment securities are based on
quoted market prices, where available. If quoted market prices
are not available, fair values are based on quoted market prices of
comparable instruments.
Loans: The Bank is one of very few lenders of development
loans to Latin American and Caribbean countries. There is no
secondary market for development loans. For all loans and re-
lated commitments, the Bank is of the opinion that, due to its
unique position in lending operations and the absence of a sec-
ondary market, it is not practicable to estimate a fair value for
the Bank’s lending portfolio.
Swaps: Fair values for the Bank’s interest rate and currency
swaps are based on quoted market prices or pricing models and
represent the estimated cost of replacing these contracts.

ORDINARY CAPITALINTER-AMERICAN DEVELOPMENT BANK
NOTES TO FINANCIAL STATEMENTS (continued)
December 31, 2002 and 2001
FINANCIAL STATEMENTS 123
Borrowings: The fair values of the Bank’s borrowings are based
on quoted market prices, where available. If quoted market prices
are not available, fair values are based on quoted market prices of
comparable instruments.
Note C – Restricted CurrenciesAt December 31, 2002, cash includes $118,557,000 (2001—
$112,749,000) in non-convertible currencies of regional borrow-
ing members, of which $23,356,000 (2001—$22,612,000) has
been restricted by one of the members, in accordance with the
provisions of the Agreement, to be used for making payments
for goods and services produced in its territory.
Note D – InvestmentsAs part of its overall portfolio management strategy, the Bank
invests in government, agency, bank and corporate obligations,
time deposits, asset- and mortgage-backed securities, and related
derivative instruments, in particular currency and interest rate
swaps.
Government and agency obligations: These obligations include
unsubordinated and marketable bonds, notes and other obliga-
tions issued or unconditionally guaranteed by a government of a
country, an agency or instrumentality of a government of a coun-
try, a multilateral organization, or any other official entity. The
Bank invests only in (i) obligations of or guaranteed by the gov-
ernment of the member country whose currency is being invested,
(ii) obligations issued or unconditionally guaranteed by an agency
or instrumentality of the government of certain countries or any
other official entity, in any currency, with credit quality equiva-
lent to a AA– or better rating (residential mortgage-backed secu-
rities require a AAA rating), (iii) obligations of multilateral
organizations, in any currency, with credit quality equivalent to a
AAA rating, and (iv) non-local currency obligations of or guar-
anteed by certain governments with credit quality equivalent to
a AA– or better rating.
Bank obligations and time deposits: These obligations include
certificates of deposit, bankers’ acceptances, and other obligations
issued or unconditionally guaranteed by banks or other financial
institutions. The Bank invests in these types of obligations if the
entity issuing or guaranteeing them has a senior debt securities
rating of at least A+.
Corporate securities: These obligations include publicly issued,
unsubordinated and marketable bonds, notes or other debt obli-
gations issued or unconditionally guaranteed by non-bank cor-
porate entities or trusts. The Bank invests only in these types of
securities with credit ratings of AAA.
Asset- and mortgage-backed securities: Asset- and mortgage-
backed securities include unsubordinated, marketable asset-
backed and residential mortgage-backed obligations issued or
unconditionally guaranteed by corporate entities or trusts. The
cash flow of these instruments is based on the cash flows of the
pool of underlying assets managed by a special purpose vehicle,
or trust, which provides credit enhancements to ensure higher
credit ratings. The Bank invests only in these types of securities
with credit ratings of AAA. In addition, the Bank invests in
short-term asset-backed securities and short-term asset-backed
commercial paper carrying only the highest short-term credit
ratings.
Currency swaps: Currency swaps are agreements to exchange
cash flows denominated in different currencies at one or more
certain times in the future. Cash flows are based on a predeter-
mined exchange rate and a formula, which reflects fixed or float-
ing rates of interest and an exchange of principal.
Interest rate swaps: Interest rate swaps are agreements involv-
ing the exchange of periodic interest payments of differing char-
acter, based on an underlying notional principal amount for a
specified time.
Trading portfolio: A summary of the Bank’s position in trad-
ing portfolio instruments at December 31, 2002 and 2001 is shown
in the Summary Statement of Trading Investments and Swaps in
Appendix I-1.
Net unrealized gains (losses) on trading portfolio instru-
ments, held at December 31, 2002, of ($3,118,000) (2001—
$3,333,000), were included in income from investments. The
average return on trading investments, after swaps, including re-
alized and unrealized gains and losses, during 2002 and 2001 was
1.79% and 4.18%, respectively.
Held-to-maturity portfolio: A summary of the Bank’s held-
to-maturity portfolio and the portfolio’s maturity structure at
December 31, 2002 and 2001 are shown in the Summary State-
ment of Held-to-Maturity Investments in Appendix I-2. The
average return on held-to-maturity investments for the years
ended December 31, 2002 and 2001 was 3.87% and 3.97%,
respectively.
Note E – Loans and Guarantees OutstandingApproved loans are disbursed to borrowers in accordance with
the requirements of the project being financed; however, disburse-
ments do not begin until the borrower and guarantor, if any,
take certain actions and furnish certain documents to the Bank.
Of the undisbursed balances, the Bank has entered into irrevo-

ORDINARY CAPITALINTER-AMERICAN DEVELOPMENT BANK
NOTES TO FINANCIAL STATEMENTS (continued)
December 31, 2002 and 2001
124
cable commitments to disburse approximately $31,630,000 at
December 31, 2002.
The average interest rate earned on loans outstanding was
5.68% in 2002 and 7.02% in 2001. The average total return on
loans outstanding was 5.73% in 2002 and 7.48% in 2001.
A summary statement of loans is presented in Appendix I-
3 and a summary of the Bank’s outstanding loans by currency and
product type and their maturity structure at December 31, 2002
and 2001 is shown in Appendix I-4.
Multicurrency loans – With a government guaranteeFixed rate loans: Prior to January 1, 1983, the interest rate due
on all amounts disbursed under each loan was the interest rate
prevailing at the time that the loan was approved. In 1982, the
Bank established the Currency Pooling System to equalize ex-
change risk among the borrowers in determining their repay-
ment obligations. The interest rate due for Currency Pooling System
loans approved from January 1, 1983 to December 31, 1989 is fixed
at the time of each disbursement, for the life of the loan, at a rate
which represents the cost of the funds borrowed by the Bank for
such loans over the two calendar semesters prior to the date of
disbursement, plus a spread which, including loan fees, is esti-
mated to cover administrative and other costs.
Adjustable rate loans: On January 1, 1990, the Bank mitigated
its interest rate risk by moving from fixed rate to adjustable rate
lending for all Currency Pooling System loans made after that
date. This rate, which resets twice a year, represents the effective
cost during the previous six months of a pool of borrowings al-
located to fund such loans, plus a spread which, including loan
fees, is estimated to cover administrative and other costs and to
meet desired operating income targets.
Average maturity: The Bank maintains a targeted currency
composition in its Currency Pooling System. The present target
ratio is 50% United States dollars, 25% Japanese yen and 25%
European currencies (primarily Swiss francs and euro). The com-
position of the multicurrency loans is affected by the selection of
currencies for disbursements on those loans and by the curren-
cies selected for the billing of the principal repayments, both of
which are managed so as to maintain the alignment of the
multicurrency loans’ composition with the target ratio. The se-
lection of currencies by the Bank for billing purposes does not
permit the determination of average maturity information for
multicurrency loans by individual currency. Accordingly, the Bank
discloses the maturity periods for its multicurrency loans and
the average maturity for the total multicurrency loan portfolio
on a combined United States dollar equivalent basis.
Single currency loans – With a government guaranteeAdjustable rate loans: In 1996, the Single Currency Facility
was approved, pursuant to which borrowers have the option to
choose to denominate each loan in the Currency Pooling Sys-
tem, in one of four currencies (United States dollars, euro, Japa-
nese yen and Swiss francs) or in a combination of the Currency
Pooling System and such currencies. The rates charged on Single
Currency Facility loans are reset semi-annually to reflect the
effective cost during the previous six months of each of the
single-currency pools of borrowings allocated to fund such
loans, plus a spread which, including loan fees, is estimated to
cover administrative and other costs and to meet desired oper-
ating income targets.
LIBOR-based loans: In 1994, a lending program (U.S. Dollar
Window Program) aimed for private sector borrowers was ap-
proved under which loans are denominated and disbursed only
in United States dollars and are guaranteed by a government. The
amount approved for this program is currently $500,000,000 per
calendar year. Borrowers under the U.S. Dollar Window Program
have the option of electing either a LIBOR-based fixed or float-
ing-rate loan. For fixed rate loans, the interest rate is fixed for
each disbursement, for the life of the loan, at a rate based on a
LIBOR funding cost. For floating-rate loans, the interest rate re-
sets every six months based on a LIBOR rate. In either case, the
borrower pays the Bank’s spread and fees.
In December 1998, guidelines were approved for emer-
gency lending to participate in concerted international emergency
financial assistance to the Bank’s borrowing member countries
in response to the global liquidity crisis. These loans are for a
term not to exceed five years, with a three-year grace period, and
carry a six-month LIBOR interest rate plus a spread of 400 basis
points, a front-end fee of 1% on the total amount of the loan,
and a commitment fee of 0.75% per annum on the undisbursed
balance. Under the guidelines approved, these loans are currently
not eligible for the standard fee waivers described below. During
1998 and 1999, the Bank approved $7,239,501,000, net of can-
cellations amounting to $370,499,000, under a temporary emer-
gency lending program. Outstanding emergency loans under this
program amounted to $5,235,951,000 at December 31, 2002
(2001—$6,999,011,000).
In March 2002, the Bank approved a new emergency lend-
ing facility in a revolving aggregate amount of up to $6 billion
under essentially the same terms and conditions of the tempo-
rary emergency lending program in effect in 1998 and 1999 de-
scribed in the preceding paragraph. As of December 31, 2002,
emergency loans approved under this facility amounted to
$500,000,000, of which $340,000,000 were outstanding.

ORDINARY CAPITALINTER-AMERICAN DEVELOPMENT BANK
NOTES TO FINANCIAL STATEMENTS (continued)
December 31, 2002 and 2001
FINANCIAL STATEMENTS 125
Charges on loans with a government guarantee (excludingemergency lending)In addition to the interest rate, for loans made under the Currency
Pooling System, the U.S. Dollar Window Program and the Single
Currency Facility, the Bank charges a credit commission of 0.75%
(1.25% on loans approved prior to January 1, 1989) per annum on
the undisbursed convertible currency portion of a loan and a one-
time supervision and inspection fee of 1% on the principal amount
of a loan which is capitalized into the loan balance in quarterly
installments during the disbursement period of the loan. Waivers
of loan charges and a portion of the lending spread, down to a
minimum spread of 0.10%, are granted at the discretion of the
Board of Executive Directors when their collection is not needed
to meet desired operating income targets. During 2002, the Board
of Executive Directors approved full waivers of loan charges and a
reduction in lending spread of 0.40%. The effect of these waivers
and reduction in lending spread was to decrease income from loans
by approximately $307,952,000. Lending spreads, credit commis-
sions and one-time supervision and inspection fees prevailing dur-
ing 2002 and 2001 were as follows:
Inter-American Investment Corporation (IIC)Currently, the Bank has an approved loan to the IIC, an affiliated
entity, in the amount of $300,000,000. Disbursements under this
loan are to be denominated in United States dollars and carry a
LIBOR-based interest rate. There were no amounts outstanding
as of December 31, 2002 and 2001.
Loan participations and guaranteesUnder the loan contracts with the borrowers, the Bank may sell
participations in the loans to commercial banks or other public
or private organizations, but it reserves to itself the administra-
tion of the loans. As of December 31, 2002, there were
$2,156,068,000 (2001—$1,725,023,000) in outstanding partici-
pations in Private Sector Program loans not included in the Bal-
ance Sheet.
As of December 31, 2002, the Bank had approved, net of
cancellations, guarantees without government counter-guaran-
tees in the amount of $611,450,000 (2001—$531,250,000) of
which $335,420,000 (2001—$337,104,000) was outstanding and
subject to call. As of December 31, 2002, no guarantees provided
by the Bank have been called. The net present value of guarantee
exposure, net of reinsurance, which is the amount counted un-
der the Private Sector Program’s limit, was $193,600,000 at
December 31, 2002 (2001—$188,900,000).
IFF subsidyThe IFF was established in 1983 by the Board of Governors of
the Bank for the purpose of subsidizing part of the interest pay-
ments for which certain borrowers are liable on loans from the
Ordinary Capital resources of the Bank. In addition, under the
enhanced Heavily Indebted Poor Countries (HIPC) Initiative,
which is a concerted, international initiative for addressing the
debt problems of a group of countries identified as heavily in-
debted poor countries in which the Bank is participating, the IFF
will subsidize 100% of certain principal and interest payments
on Ordinary Capital loans. During 2002, the IFF paid $68,917,000
(2001—$73,328,000) of interest and $10,525,000 (2001—
$1,243,000) of principal on behalf of the borrowers. The IFF is
funded primarily from the general reserve of the Bank’s FSO.
Nonaccrual and impaired loans and allowance for loan lossesAt December 31, 2002, all loans were performing except for cer-
tain Private Sector Program loans which were classified as im-
paired and were in nonaccrual. The Bank’s recorded investment
in impaired Private Sector Program loans at December 31, 2002
was $315,561,000 (2001—$185,004,000). The average recorded in-
vestment in impaired Private Sector Program loans during 2002
was $256,722,000 (2001—$60,439,000). Income recognized on
impaired Private Sector Program loans while impaired was
One-time
supervision &Lending Credit inspectionspread commission fee
% % %
2001: First six months . . . . . 0.50 Full 1.00Second six months . . . 0.50 Full 1.00
2002: First six months . . . . . 0.10 — —Second six months . . . 0.10 — —
Single currency loans – Without a government guaranteeUnder the terms of the Eighth General Increase in the Resources
of the Bank and subsequent agreements, the Bank is authorized
to lend under the Private Sector Program up to 10% of outstand-
ing loans and guarantees, not including emergency lending, di-
rectly to private sector entities without a government guarantee
on the basis of market-based pricing and provisioning, subject
to a number of restrictions. Disbursements are denominated in
United States dollars and borrowers have the option of either a
LIBOR-based fixed or floating-rate loan. For fixed rate loans, the
interest rate is fixed upon approval or for each disbursement, for
the life of the loan, at a rate based on a LIBOR funding cost plus
a credit spread. For floating-rate loans, the interest rate resets every
one, three or six months based on a LIBOR rate plus a credit
spread. The credit spreads and fees for Private Sector Program
loans are set on a case by case basis.
As of December 31, 2002, cumulative Private Sector Pro-
gram loans approved, net of cancellations and participations,
amounted to $1,814,759,000 (2001—$1,765,230,000). Outstand-
ing loans, net of participations, under this Program amounted to
$1,254,353,000 at December 31, 2002 (2001—$1,059,428,000).

ORDINARY CAPITALINTER-AMERICAN DEVELOPMENT BANK
NOTES TO FINANCIAL STATEMENTS (continued)
December 31, 2002 and 2001
126
$7,129,000 in 2002 and $3,676,000 in 2001. Income that would
have been recognized on a cash basis for the period of impair-
ment was $14,308,000 in 2002 and $7,599,000 in 2001. All im-
paired loans have specific allowances for loan losses amounting
to $98,687,000 at December 31, 2002 (2001—$66,887,000).
The changes in the allowance for loan losses for the
years ended December 31, 2002 and 2001 were as follows (in
thousands):
cludes establishing and maintaining financial practices consistent
with its risk preference primarily by implementing, updating, and
monitoring its interrelated set of financial policies and guidelines
and by utilizing appropriate financial instruments and organizational
structures. Financial derivative instruments are an important com-
ponent of the set of financial instruments used by the Bank to facili-
tate increasing its financial efficiency while achieving its risk
management objectives. The Bank uses financial derivative instru-
ments, mostly currency and interest rate swaps, exclusively for hedg-
ing purposes as part of its asset and liability management. This
approach enables the Bank to lower funding costs and enhance in-
vestment returns without increasing the Bank’s exposure to market
risk. Consequently, whenever it enters into a derivative contract, the
Bank identifies the specific hedging relationship and, when desig-
nated in accordance with SFAS 133, documents the hedge transac-
tion and evaluates its hedge effectiveness to determine whether or
not the transaction qualifies for hedge accounting.
The majority of the Bank’s current borrowing operations
include swaps to hedge a specific underlying liability, producing
the funding required (i.e., the appropriate currency and rate type).
The Bank’s operations also include interest rate swaps to hedge
private sector fixed rate loans and investment swaps that hedge a
particular underlying investment security and produce the appro-
priate vehicle to invest existing cash. Investment swaps are held in
the trading portfolio which is carried and reported at market value.
Effective January 1, 2001, the Bank follows hedge accounting un-
der SFAS 133 for all currency and interest rate swaps, except for a
small number of basis swaps and the investment swaps already
reported at market value, as described below:
Fair-value hedgesTo hedge the change in fair value of fixed rate debt resulting from
changes in the benchmark interest rates and currencies, while
obtaining the currencies and interest rate types required, the Bank
enters into currency and/or interest rate swap agreements. In
aligning its private sector loans with the funding obtained for
such loans, the Bank also enters into interest rate swap agree-
ments to hedge the changes in fair value of fixed rate loans and
loan commitments resulting from changes in the benchmark
interest rate. During 2002, the Bank recognized a net loss of
$9,749,000 (2001—$26,698,000) (included in Net loss from hedg-
ing activities under SFAS 133 on the Statement of Income and
General Reserve), which represented the ineffective portion of
all fair value hedges.
Cash-flow hedgesThe Bank enters into currency swap agreements to convert debt
into the currencies required while hedging foreign currency fixed-
rate medium- and long-term debt against the variability of cash
Note F – PropertyAs of December 31, 2002 and 2001, the property of the Bank—
Ordinary Capital—consists of the following (in thousands):
Note G – BorrowingsThe primary objective of the Bank’s borrowing policy is to ob-
tain the necessary resources to finance its lending program at the
lowest possible cost for borrowers. The medium- and long-term
borrowings of the Bank consist of loans, notes and bonds issued
in various currencies at contracted interest rates ranging from
0.50% to 15.00%, before swaps, and from (0.54%) to 12.77%,
after swaps, with various maturity dates through 2027. A sum-
mary of the Bank’s medium- and long-term borrowing portfolio
and its maturity structure at December 31, 2002 and 2001 is
shown in Appendix I-5.
The Bank has a short-term borrowing facility under which
discount notes are issued in amounts not less than $100,000 and
maturities of up to 360 days.
The average cost of total borrowings during 2002 and
2001 was 5.79% and 6.18%, respectively, before swaps, and
3.97% and 5.34%, respectively, after swaps.
The estimated fair values of borrowings as of
December 31, 2002 and 2001 amounted to $51,413,000,000
and $44,872,000,000, respectively.
Note H – Derivatives and Hedging ActivitiesRisk management strategy and use of derivativesThe Bank’s financial risk management strategy is designed to
strengthen the Bank’s ability to fulfill its purpose. Such strategy in-
2002 2001
Balance at January 1, . . . . . . . . . . . . . . $1,423,849 $1,308,146Provision for loan losses . . . . . . . . . . . . 99,884 147,303Translation adjustments . . . . . . . . . . . . 37,152 (31,600)
Balance at December 31, . . . . . . . . . . . $1,560,885 $1,423,849
2002 2001
Land, buildings, improvements,capitalized software andequipment, at cost . . . . . . . . . . . . . . . $ 491,863 $(466,546
Less: accumulated depreciation . . . . . . (204,711) (195,141)
$ 287,152 $(271,405

ORDINARY CAPITALINTER-AMERICAN DEVELOPMENT BANK
NOTES TO FINANCIAL STATEMENTS (continued)
December 31, 2002 and 2001
FINANCIAL STATEMENTS 127
flows resulting from changes in exchange rates. The ineffective-
ness of cash-flow hedges for the years ended December 31, 2002
and 2001 was not significant. All components of each derivative’s
gain or loss are included in the assessment of hedge effectiveness.
During 2001, the year of initial application of SFAS 133, an
amount of approximately $8,400,000 associated with the transi-
tion adjustment originated upon adoption of SFAS 133 was
reclassified to earnings. The estimated amount, included in ac-
cumulated other comprehensive income as of December 31, 2002,
expected to be reclassified into earnings within the next 12 months
to offset the variability of cash flows during this period is not
material. As of December 31, 2002, the maximum term over which
the Bank is hedging its exposure to the variability of future cash
flows was 8.3 years (2001—9.3 years).
Hedge effectiveness assessmentThe Bank formally documents all relationships between hedging
instruments and hedged items, as well as its risk-management
objective and strategy for undertaking various hedge transactions.
This process includes linking all derivatives that are designated
as fair value or cash flow hedges to specific assets and liabilities
on the Balance Sheet or to specific firm commitments. The Bank
formally assesses, both at the hedge’s inception and on an ongo-
ing basis, whether the derivatives that are used in hedging trans-
actions are highly effective in offsetting changes in fair values or
cash flows of hedged items and whether they are expected to con-
tinue to be highly effective in the future.
Discontinuation of hedge accountingThe Bank discontinues hedge accounting when the derivative is
no longer highly effective in offsetting changes in the fair value
or cash flows of a hedged item or when management determines
that designation of the derivative as a hedging instrument is no
longer appropriate. In general, when hedge accounting is discon-
tinued, the derivative designated in a fair value hedge continues
to be carried on the Balance Sheet at its fair value, the hedged
asset or liability no longer is adjusted for changes in fair value
and the related basis adjustment is amortized over the remaining
life of the asset or liability. Similarly, the derivative designated in
a cash flow hedge continues to be carried on the Balance Sheet at
its fair value, and the gains and losses that were accumulated in
other comprehensive income are reclassified to earnings in the
same period or periods in which the hedged transaction affects
earnings. Also, the Bank discontinues hedge accounting when the
derivative expires, is sold, terminated, or exercised.
Note I – Commercial Credit RiskCommercial credit risk is the potential loss that could result from
either the default or the downgrade by a credit rating agency of
one of the Bank’s investment, trading or swap counterparties.
The main sources of commercial credit risk are the debt instru-
ments in which the Bank invests its liquid holdings. The primary
objective in the management of the Bank’s liquid assets is the
maintenance of a conservative exposure to market, credit and
liquidity risks. Consequently, the Bank will only invest in high
quality debt instruments issued by sovereigns, agencies, banks
and corporate entities.
In addition, as part of its regular investment, funding and
asset and liability management activities, the Bank uses deriva-
tive instruments, primarily swaps, exclusively for hedging pur-
poses without incurring additional market risk. To manage the
credit risk of its investment, funding and asset and liability man-
agement activities, the Bank limits these activities to authorized
dealers and counterparties selected on the basis of conservative
risk management policies. The Bank also establishes strict credit
limits for each counterparty and, for swap counterparties, has
entered into master swap agreements which contain enforceable
close-out netting provisions and has agreements in place provid-
ing for collateralization in the event that the mark-to-market
exposure exceeds certain contractual limits, which are a function
of the counterparty’s credit rating. Monitoring the Bank’s expo-
sures and managing such risks are continuous processes. The Bank
does not expect nonperformance by any of its counterparties. As
of December 31, 2002, the Bank had received collateral of
$456,600,000 (2001—$244,700,000) in connection with swap
agreements. None of this collateral has been included in the as-
sets of the Bank.
The credit risk exposures below represent the maximum
potential loss, based on the gross fair value of the financial in-
strument, the Bank would incur if the parties to the derivative
financial instruments referred to in the preceding paragraphs
failed completely to perform according to the terms of the con-
tracts and the collateral or other security, if any, for the amount
due proved to be of no value. As of December 31, 2002 and 2001,
such credit risk exposures, prior to considering any master swap
or collateral agreements, are as follows (in thousands):
2002 2001
Investments – Trading PortfolioCurrency swaps . . . . . . . . . . . . . . . . . . . . $ 18,120 $ 33,191Interest rate swaps . . . . . . . . . . . . . . . . . 1,170 3,061
Borrowing PortfolioCurrency swaps . . . . . . . . . . . . . . . . . . . . 493,460 318,860Interest rate swaps . . . . . . . . . . . . . . . . . 1,007,796 587,452
Note J – Capital StockCompositionThe capital of the Bank consists of “paid-in” and “callable” shares.
The subscribed “paid-in” capital has been or is to be paid in gold

ORDINARY CAPITALINTER-AMERICAN DEVELOPMENT BANK
NOTES TO FINANCIAL STATEMENTS (continued)
December 31, 2002 and 2001
128
and/or United States dollars and in the currency of the respective
member, which in some cases must be made freely convertible,
in accordance with the terms for the respective increase in capi-
tal. Non-negotiable, non-interest bearing demand obligations
have been or will be accepted in lieu of the immediate payment
of all or any part of the member’s subscribed “paid-in” capital
stock. The subscribed “callable” portion of capital may only be
called when required to meet obligations of the Bank created by
borrowings of funds for inclusion in the Bank’s Ordinary Capi-
tal resources or guarantees chargeable to such resources and is
payable at the option of the member either in gold, in United
States dollars, in fully convertible currency of the member coun-
try, or in the currency required to discharge the obligations of
the Bank for the purpose for which the call is made. For a State-
ment of Subscriptions to Capital Stock at December 31, 2002 and
2001, see Appendix I-6.
The composition of the receivable from members as of
December 31, 2002 and 2001 is as follows (in thousands):
Bosnia and Herzegovina, the Republic of Croatia, the former
Yugoslav Republic of Macedonia, the Republic of Slovenia and
the Federal Republic of Yugoslavia (Serbia and Montenegro) were
authorized to succeed to the SFRY’s membership. Accordingly,
the shares representing SFRY’s membership in the Ordinary Capi-
tal of the Bank were classified as unallocated until each successor
republic succeeded to the membership of the SFRY. The Repub-
lics of Croatia and Slovenia have since become members of the
Bank and have subscribed to the 1,142 and 655 shares, respec-
tively, allocated to them. The Governments of the former Yugoslav
Republic of Macedonia and the Republic of Bosnia and Herze-
govina declined the offer to succeed to the membership of the
SFRY in the Bank. Membership of the Federal Republic of Yugo-
slavia (Serbia and Montenegro) is still pending.
Note K – Allocation of Net IncomeThe agreement for the Eighth General Increase in the Resources
of the Bank provides for up to $136,000,000 of unallocated spe-
cial contributions to the FSO to be paid by contributions from
members. Any unpaid portion is to be paid to the FSO by peri-
odic transfers from the net income of the Ordinary Capital, consis-
tent with prudent financial management, between January 1, 2000
and December 31, 2004. As of December 31, 2002, no such con-
tributions had been paid by members. Accordingly, the Bank
has transferred $27,200,000, representing one fifth of the
unallocated special contributions, from the net income of the
Ordinary Capital to the FSO in each of the years 2000 through
2002.
Note L – General ReserveThe following is a summary of changes in the General Reserve
for the years ended December 31, 2002 and 2001 (in thousands):
Voting powerUnder the Agreement, each member country shall have 135 votes
plus one vote for each share of Ordinary Capital stock held by
that country. The Agreement, as amended by the Eighth General
Increase in the Resources of the Bank, also provides that no in-
crease in the subscription of any member to the Ordinary Capi-
tal stock shall have the effect of reducing the voting power of the
regional developing members below 50.005%, of the United States
below 30%, and of Canada below 4% of the total voting power,
leaving the voting power available for nonregional members at
up to 15.995%, including approximately 5% for Japan.
In making decisions concerning operations of the FSO and
the IFF, the number of votes and percent of total voting power
for each member country are the same as determined by the pro-
visions of the Agreement referred to above.
Total subscriptions to shares of Ordinary Capital stock and
the voting power of the member countries as of December 31, 2002
are shown in the Statement of Subscriptions to Capital Stock and
Voting Power in Appendix I-7.
MembershipOn April 21, 1993, the Bank’s Board of Executive Directors de-
cided that the Socialist Federal Republic of Yugoslavia (SFRY)
had ceased to be a member of the Bank and that the Republic of
2002 2001
Regional developing members . . . . . . . . . . $500,890 $525,891United States . . . . . . . . . . . . . . . . . . . . . . . . 15,366 30,733Canada . . . . . . . . . . . . . . . . . . . . . . . . . . . . . 3,039 5,468Non-regional members . . . . . . . . . . . . . . . 44,270 85,347
Total . . . . . . . . . . . . . . . . . . . . . . . . . . . . . $563,565 $647,439
Operating SFAS 133Income Adjustments Total
Balance at January 1, 2001 . . . . . . . $5,542,421 $( — $5,542,421
Operating income . . . . . . . . . . . 1,009,458 — 1,009,458
Allocation to the FSO . . . . . . . . . (27,200) — (27,200)
Cumulative effect of
change in accounting
principle . . . . . . . . . . . . . . . . . — 50,839 50,839
Net loss from hedging
activities under SFAS 133 . . . — (39,697) (39,697)
Balance at December 31, 2001 . . . . 6,524,679 11,142 6,535,821
Operating income . . . . . . . . . . . 727,634 — 727,634
Allocation to the FSO . . . . . . . . . (27,200) — (27,200)
Net loss from hedging
activities under SFAS 133 . . . — (18,899) (18,899)
Balance at December 31, 2002 . . . . $7,225,113 $ (7,757) $7,217,356

ORDINARY CAPITALINTER-AMERICAN DEVELOPMENT BANK
NOTES TO FINANCIAL STATEMENTS (continued)
December 31, 2002 and 2001
FINANCIAL STATEMENTS 129
Note M – Accumulated Other Comprehensive Income (Loss)Other comprehensive income (loss) comprises the effects of the
implementation of SFAS 133 and currency translation adjust-
ments. These items are presented on the Statement of Compre-
hensive Income.
The following is a summary of changes in accumu-
lated other comprehensive income (loss) for the years ended
December 31, 2002 and 2001 (in thousands):
The following table summarizes the change in benefit ob-
ligation, change in plan assets, and funded status of the Plans
and the PRF and amounts recognized in the Balance Sheet for
the years ended December 31, 2002 and 2001 (in thousands):
Note N – Pension and Postretirement Benefit PlansThe Bank has two defined benefit retirement plans (Plans), the
Staff Retirement Plan (SRP) for the pension benefit of its inter-
national employees and the employees of the IIC and the Local
Retirement Plan (LRP) for the pension benefit of local employ-
ees in the country offices. The Plans are funded by employee and
Bank contributions in accordance with the provisions of the Plans.
Any and all contributions to the Plans by the Bank are irrevo-
cable and are held separately in retirement funds solely for the
payment of benefits under the Plans.
The Bank also provides certain health care and other ben-
efits to retirees. All current staff of the Bank and the IIC who
contribute to the SRP and LRP while in active service and who
meet certain requirements are eligible for postretirement ben-
efits under the Postretirement Benefits Plan (PRF). Retirees con-
tribute toward the Bank’s health care program based on a
premium schedule established by the Bank. The Bank contrib-
utes the remainder of the actuarially determined cost of future
health and other benefits. While all contributions made by the
Bank and all other assets and income of the PRF remain the prop-
erty of the Bank, they are held and administered separately and
apart from the other property and assets of the Bank solely for
the purpose of payment of benefits under the plan.
The actuarial assumptions used are based on financial
market interest rates, past experience, and management’s best
estimate of future benefit changes and economic conditions.
Changes in these assumptions will impact future benefit costs
and obligations. Actuarial gains and losses occur when actual re-
sults are different from expected results. Unrecognized actuarial
gains and losses which exceed 10% of the greater of the benefit
obligation or market-related value of plan assets at the begin-
ning of the period are amortized over the average remaining ser-
vice period of active employees expected to receive benefits under
the SRP and LRP plans, which approximates 10.8 and 13.0 years,
respectively. Excess unrecognized actuarial gains and losses for
the PRF are amortized over the average remaining life of active
participants, which approximates 11.8 years.
PostretirementPension Benefits Benefits
2002 2001 2002 2001
Change in benefit obligationBenefit obligation,
beginning of year . . . . . . . $1,567,003 $1,444,637 $624,126 $695,781Service cost . . . . . . . . . . . . . . 46,512 40,161 18,929 18,099Interest cost . . . . . . . . . . . . . . 80,003 83,724 32,439 33,419Plan participants’
contributions . . . . . . . . . . 17,251 15,550 — —Actuarial (gain) loss . . . . . . . (68,248) 26,048 (18,721) (112,231)Benefits paid . . . . . . . . . . . . . (47,940) (43,117) (11,508) (10,942)
Benefit obligation,end of year . . . . . . . . . . . . . 1,594,581 1,567,003 645,265 624,126
Change in plan assetsFair value of plan assets,
beginning of year . . . . . . . 1,842,893 1,949,616 754,841 813,842Actual return on plan assets . (150,395) (81,094) (80,446) (48,059)Employer contribution . . . . . 18,119 1,881 — —Plan participants’
contributions . . . . . . . . . . 17,251 15,550 — —Benefits paid . . . . . . . . . . . . . (47,940) (43,117) (11,508) (10,942)Net payments from
other plans . . . . . . . . . . . . . — 57 — —
Fair value of plan assets,end of year . . . . . . . . . . . . . 1,679,928 1,842,893 662,887 754,841
Funded status . . . . . . . . . . . . 85,347 275,890 17,622 130,715Unrecognized:
Net actuarial loss (gain) . . 25,037 (174,700) 32,139 (94,751)Prior service cost . . . . . . . . 5,761 7,214 (3,249) (5,023)
Prepaid benefit cost . . . . . . . $ 116,145 $ 108,404 $ 46,512 $ 30,941
Amounts recognized in theBalance Sheet consist of:Prepaid benefit cost . . . . . $ 116,145 $ 108,404 $ 46,716 $ 31,077Accrued benefit liability . . — — (204) (136)
Net amount recognized . . . . $ 116,145 $ 108,404 $ 46,512 $ 30,941
Translation Adjustments
General Special SFAS 133Reserve Reserve Adjustments Total
Balance atJanuary 1, 2001 . . . . . . $(167,946 $(272,827) $( — $(104,881)
Translationadjustments . . . . . . . . . (150,976) (56,073) — (207,049)
Cumulative effect ofchange in accountingprinciple . . . . . . . . . . . — — 44,760 44,760
Net loss on cash flowhedges . . . . . . . . . . . . . — — (21,155) (21,155)
Balance atDecember 31, 2001 . . . 16,970 (328,900) 23,605 (288,325)
Translationadjustments . . . . . . . . . 290,772 82,156 — 372,928
Net loss on cash flowhedges . . . . . . . . . . . . . — — (38,891) (38,891)
Balance atDecember 31, 2002 . . . $(307,742 $(246,744) $(15,286) $( 45,712
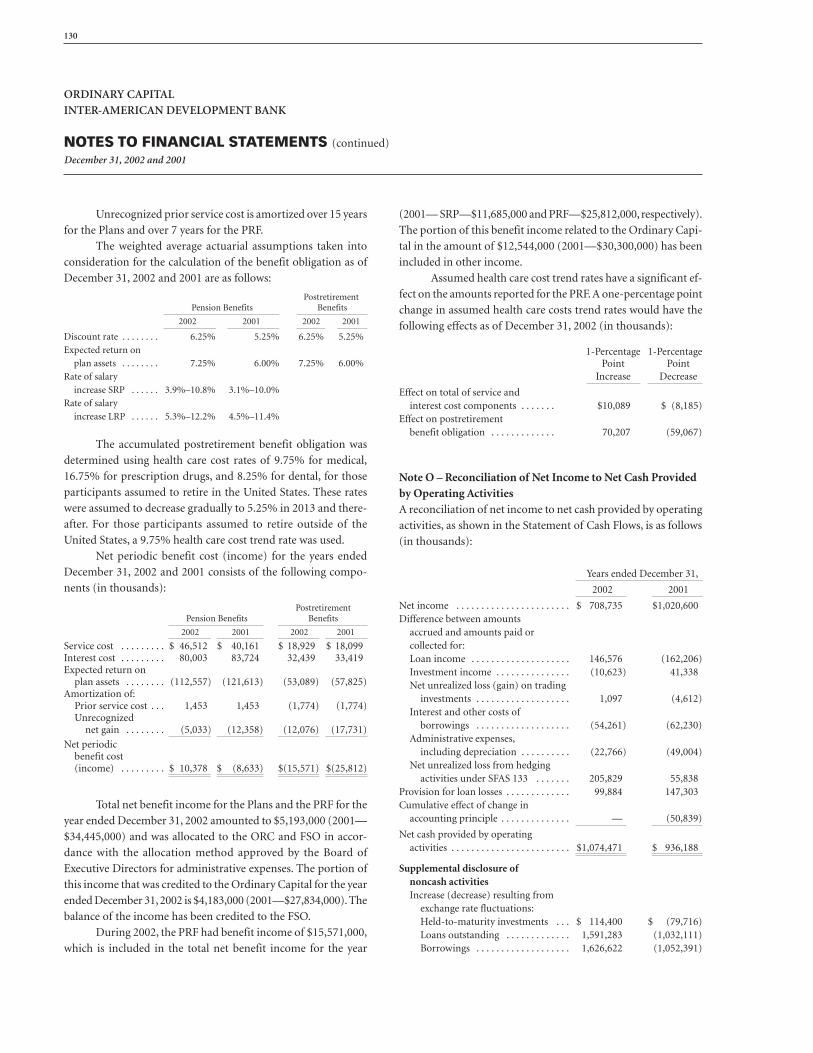
ORDINARY CAPITALINTER-AMERICAN DEVELOPMENT BANK
NOTES TO FINANCIAL STATEMENTS (continued)
December 31, 2002 and 2001
130
Unrecognized prior service cost is amortized over 15 years
for the Plans and over 7 years for the PRF.
The weighted average actuarial assumptions taken into
consideration for the calculation of the benefit obligation as of
December 31, 2002 and 2001 are as follows:
Total net benefit income for the Plans and the PRF for the
year ended December 31, 2002 amounted to $5,193,000 (2001—
$34,445,000) and was allocated to the ORC and FSO in accor-
dance with the allocation method approved by the Board of
Executive Directors for administrative expenses. The portion of
this income that was credited to the Ordinary Capital for the year
ended December 31, 2002 is $4,183,000 (2001—$27,834,000). The
balance of the income has been credited to the FSO.
During 2002, the PRF had benefit income of $15,571,000,
which is included in the total net benefit income for the year
The accumulated postretirement benefit obligation was
determined using health care cost rates of 9.75% for medical,
16.75% for prescription drugs, and 8.25% for dental, for those
participants assumed to retire in the United States. These rates
were assumed to decrease gradually to 5.25% in 2013 and there-
after. For those participants assumed to retire outside of the
United States, a 9.75% health care cost trend rate was used.
Net periodic benefit cost (income) for the years ended
December 31, 2002 and 2001 consists of the following compo-
nents (in thousands):
1-Percentage 1-PercentagePoint Point
Increase Decrease
Effect on total of service andinterest cost components . . . . . . . $10,089 $ (8,185)
Effect on postretirementbenefit obligation . . . . . . . . . . . . . 70,207 (59,067)
(2001— SRP—$11,685,000 and PRF—$25,812,000, respectively).
The portion of this benefit income related to the Ordinary Capi-
tal in the amount of $12,544,000 (2001—$30,300,000) has been
included in other income.
Assumed health care cost trend rates have a significant ef-
fect on the amounts reported for the PRF. A one-percentage point
change in assumed health care costs trend rates would have the
following effects as of December 31, 2002 (in thousands):
Note O – Reconciliation of Net Income to Net Cash Providedby Operating ActivitiesA reconciliation of net income to net cash provided by operating
activities, as shown in the Statement of Cash Flows, is as follows
(in thousands):
PostretirementPension Benefits Benefits
2002 2001 2002 2001
Service cost . . . . . . . . . $ 46,512 $( 40,161 $(18,929 $(18,099Interest cost . . . . . . . . . 80,003 83,724 32,439 33,419Expected return on
plan assets . . . . . . . . (112,557) (121,613) (53,089) (57,825)Amortization of:
Prior service cost . . . 1,453 1,453 (1,774) (1,774)Unrecognized
net gain . . . . . . . . (5,033) (12,358) (12,076) (17,731)
Net periodicbenefit cost(income) . . . . . . . . . $ 10,378 $ (8,633) $(15,571) $(25,812)
PostretirementPension Benefits Benefits
2002 2001 2002 2001
Discount rate . . . . . . . . 6.25% 5.25% 6.25% 5.25%
Expected return on
plan assets . . . . . . . . 7.25% 6.00% 7.25% 6.00%
Rate of salary
increase SRP . . . . . . 3.9%–10.8% 3.1%–10.0%
Rate of salary
increase LRP . . . . . . 5.3%–12.2% 4.5%–11.4%
Years ended December 31,
2002 2001
Net income . . . . . . . . . . . . . . . . . . . . . . . $ 708,735 $1,020,600Difference between amounts
accrued and amounts paid orcollected for:Loan income . . . . . . . . . . . . . . . . . . . . 146,576 (162,206)Investment income . . . . . . . . . . . . . . . (10,623) 41,338Net unrealized loss (gain) on trading
investments . . . . . . . . . . . . . . . . . . . 1,097 (4,612)Interest and other costs of
borrowings . . . . . . . . . . . . . . . . . . . (54,261) (62,230)Administrative expenses,
including depreciation . . . . . . . . . . (22,766) (49,004)Net unrealized loss from hedging
activities under SFAS 133 . . . . . . . 205,829 55,838Provision for loan losses . . . . . . . . . . . . . 99,884 147,303Cumulative effect of change in
accounting principle . . . . . . . . . . . . . . — (50,839)
Net cash provided by operatingactivities . . . . . . . . . . . . . . . . . . . . . . . . $1,074,471 $ 936,188
Supplemental disclosure ofnoncash activitiesIncrease (decrease) resulting from
exchange rate fluctuations:Held-to-maturity investments . . . $ 114,400 $ (79,716)Loans outstanding . . . . . . . . . . . . . 1,591,283 (1,032,111)Borrowings . . . . . . . . . . . . . . . . . . . 1,626,622 (1,052,391)

ORDINARY CAPITALINTER-AMERICAN DEVELOPMENT BANK
NOTES TO FINANCIAL STATEMENTS (continued)
December 31, 2002 and 2001
FINANCIAL STATEMENTS 131
Note P – Segment ReportingManagement has determined that the Bank has only one re-
portable segment since the Bank does not manage its opera-
tions by allocating resources based on a determination of the
contributions to net income of individual operations. The Bank
does not differentiate between the nature of the products or
services provided, the preparation process, or the method for
providing the services among individual countries. For the year
2002, loans made to or guaranteed by three countries individu-
ally generated in excess of 10 percent of loan income. Loan in-
come from these three countries was $675,928,000, $466,901,000
and $345,855,000, respectively.

132
ORDINARY CAPITAL APPENDIX I-1INTER-AMERICAN DEVELOPMENT BANK
SUMMARY STATEMENT OF TRADING INVESTMENTS AND SWAPS – NOTE DDecember 31, 2002Expressed in thousands of United States dollars
Japanese Swiss United States Other AllEuro yen francs dollars currencies currencies
Obligations of the United States Government and itscorporations and agencies:Carrying value . . . . . . . . . . . . . . . . . . . . . . . . . . . . . . . . . . . 93,017 — — 307,329 — 400,346Average balance during year . . . . . . . . . . . . . . . . . . . . . . . 113,018 — — 171,531 — 284,549Net gains (losses) for the year . . . . . . . . . . . . . . . . . . . . . . 6,938 — — (484) — 6,454
Obligations of other governments and agencies:Carrying value . . . . . . . . . . . . . . . . . . . . . . . . . . . . . . . . . . . 474,644 136,221 — 423,598 9,586 1,044,049Average balance during year . . . . . . . . . . . . . . . . . . . . . . . 501,624 284,603 — 410,128 10,021 1,206,376Net gains (losses) for the year . . . . . . . . . . . . . . . . . . . . . . (7,145) (1,865) — 16,015 (554) 6,451
Bank obligations and time deposits:Carrying value . . . . . . . . . . . . . . . . . . . . . . . . . . . . . . . . . . . 1,460,743 — 298,792 2,004,240 6,007 3,769,782Average balance during year . . . . . . . . . . . . . . . . . . . . . . . 1,478,400 168,134 448,031 1,686,128 3,019 3,783,712Net gains (losses) for the year . . . . . . . . . . . . . . . . . . . . . . 240 — — (209) — 31
Corporate securities:Carrying value . . . . . . . . . . . . . . . . . . . . . . . . . . . . . . . . . . . 31,196 133,279 — 1,454,443 32,326 1,651,244Average balance during year . . . . . . . . . . . . . . . . . . . . . . . 14,248 99,115 — 1,391,694 48,232 1,553,289Net gains (losses) for the year . . . . . . . . . . . . . . . . . . . . . . (30) (98) — 19,908 356 20,136
Asset- and mortgage-backed securities:Carrying value . . . . . . . . . . . . . . . . . . . . . . . . . . . . . . . . . . . 582,034 121,357 — 3,729,816 — 4,433,207Average balance during year . . . . . . . . . . . . . . . . . . . . . . . 246,691 95,198 — 3,648,433 — 3,990,322Net gains (losses) for the year . . . . . . . . . . . . . . . . . . . . . . (421) 22 — (2,837) — (3,236)
Total trading investments:Carrying value . . . . . . . . . . . . . . . . . . . . . . . . . . . . . . . . . . . 2,641,634 390,857 298,792 7,919,426 47,919 11,298,628Average balance during year . . . . . . . . . . . . . . . . . . . . . . . 2,353,981 647,050 448,031 7,307,914 61,272 10,818,248Net gains (losses) for the year . . . . . . . . . . . . . . . . . . . . . . (418) (1,941) — 32,393 (198) 29,836
Currency swaps receivable:Carrying value (2) . . . . . . . . . . . . . . . . . . . . . . . . . . . . . . . . . — 221,539 — 1,338,548 — 1,560,087Average balance during year . . . . . . . . . . . . . . . . . . . . . . . — 448,609 — 1,905,505 — 2,354,114Net gains for the year . . . . . . . . . . . . . . . . . . . . . . . . . . . . . — 330 — 687 — 1,017
Currency swaps payable:Carrying value (2) . . . . . . . . . . . . . . . . . . . . . . . . . . . . . . . . . (1,521,610) (33,571) — (182,080) (41,913) (1,779,174)Average balance during year . . . . . . . . . . . . . . . . . . . . . . . (2,015,199) (58,231) — (397,032) (59,751) (2,530,213)Net gains for the year . . . . . . . . . . . . . . . . . . . . . . . . . . . . . 238 142 — 1,441 199 2,020
Net interest rate swaps:Carrying value (2) . . . . . . . . . . . . . . . . . . . . . . . . . . . . . . . . . (13) (1,192) — (49,677) — (50,882)Average balance during year . . . . . . . . . . . . . . . . . . . . . . . (1) 119 — (34,162) — (34,044)Net gains (losses) for the year . . . . . . . . . . . . . . . . . . . . . . (13) 1,360 — (17,748) — (16,401)
Total trading investments and swaps:Carrying value . . . . . . . . . . . . . . . . . . . . . . . . . . . . . . . . . . . 1,120,011 577,633 298,792 9,026,217 6,006 11,028,659Average balance during year . . . . . . . . . . . . . . . . . . . . . . . 338,781 1,037,547 448,031 8,782,225 1,521 10,608,105Net gains (losses) for the year . . . . . . . . . . . . . . . . . . . . . . (193) (109) — 16,773 1 16,472Return for the year (%) . . . . . . . . . . . . . . . . . . . . . . . . . . . 3.31 0.14 1.07 1.96 3.99 1.79
(1) The carrying value of total trading investments and swaps held in other currencies consists of British pound sterling.(2) Carrying value of currency swaps represents the fair value of each individual receivable or (payable) leg, classified by their currency. As explained in Note B to the financial
statements, currency and interest rate swap agreements are stated in the Balance Sheet as assets or liabilities, depending on the nature (debit or credit) of the net fair valueamount of these agreements.
(1)

FINANCIAL STATEMENTS 133
Japanese Swiss United States Other AllEuro yen francs dollars currencies currencies
Obligations of the United States Government and itscorporations and agencies:
Carrying value . . . . . . . . . . . . . . . . . . . . . . . . . . . . . . . . 344,634 — — 117,549 — 462,183Average balance during year . . . . . . . . . . . . . . . . . . . . . 207,322 — — 122,672 — 329,994Net gains for the year . . . . . . . . . . . . . . . . . . . . . . . . . . . 5,014 — — 1,429 — 6,443
Obligations of other governments and agencies:Carrying value . . . . . . . . . . . . . . . . . . . . . . . . . . . . . . . . 314,844 692,420 — 384,090 10,016 1,401,370Average balance during year . . . . . . . . . . . . . . . . . . . . . 284,275 341,233 — 557,956 31,282 1,214,746Net gains (losses) for the year . . . . . . . . . . . . . . . . . . . . (3,316) (1,706) — 18,690 98 13,766
Bank obligations and time deposits:Carrying value . . . . . . . . . . . . . . . . . . . . . . . . . . . . . . . . 1,525,009 44,917 278,722 566,682 5,071 2,420,401Average balance during year . . . . . . . . . . . . . . . . . . . . . 2,063,180 240,060 139,668 2,211,755 1,689 4,656,352Net gains (losses) for the year . . . . . . . . . . . . . . . . . . . . (216) (114) — 5,570 1 5,241
Corporate securities:Carrying value . . . . . . . . . . . . . . . . . . . . . . . . . . . . . . . . — 7,648 — 296,552 105,707 409,907Average balance during year . . . . . . . . . . . . . . . . . . . . . — 8,260 — 554,977 73,697 636,934Net gains for the year . . . . . . . . . . . . . . . . . . . . . . . . . . . — 52 — 20,378 183 20,613
Asset- and mortgage-backed securities:Carrying value . . . . . . . . . . . . . . . . . . . . . . . . . . . . . . . . 159,002 34,143 — 3,497,358 — 3,690,503Average balance during year . . . . . . . . . . . . . . . . . . . . . 165,183 5,697 — 3,415,657 — 3,586,537Net gains for the year . . . . . . . . . . . . . . . . . . . . . . . . . . . 427 — — 10,750 — 11,177
Total trading investments:Carrying value . . . . . . . . . . . . . . . . . . . . . . . . . . . . . . . . 2,343,489 779,128 278,722 4,862,231 120,794 8,384,364Average balance during year . . . . . . . . . . . . . . . . . . . . . 2,719,960 595,250 139,668 6,863,017 106,668 10,424,563Net gains (losses) for the year . . . . . . . . . . . . . . . . . . . . 1,909 (1,768) — 56,817 282 57,240
Currency swaps receivable:Carrying value (2) . . . . . . . . . . . . . . . . . . . . . . . . . . . . . . — 357,085 — 2,279,425 — 2,636,510Average balance during year . . . . . . . . . . . . . . . . . . . . . — 648,345 — 2,309,037 — 2,957,382Net losses for the year . . . . . . . . . . . . . . . . . . . . . . . . . . — (33) — (5) — (38)
Currency swaps payable:Carrying value (2) . . . . . . . . . . . . . . . . . . . . . . . . . . . . . . (2,180,072) (68,611) — (333,067) (115,723) (2,697,473)Average balance during year . . . . . . . . . . . . . . . . . . . . . (2,507,268) (118,322) — (356,973) (105,041) (3,087,604)Net gains (losses) for the year . . . . . . . . . . . . . . . . . . . . (1,909) 504 — (134) (281) (1,820)
Net interest rate swaps:Carrying value (2) . . . . . . . . . . . . . . . . . . . . . . . . . . . . . . — (2,397) — (27,054) — (29,451)Average balance during year . . . . . . . . . . . . . . . . . . . . . — (3,176) — (17,989) — (21,165)Net losses for the year . . . . . . . . . . . . . . . . . . . . . . . . . . — (242) — (24,938) — (25,180)
Total trading investments and swaps:Carrying value . . . . . . . . . . . . . . . . . . . . . . . . . . . . . . . . 163,417 1,065,205 278,722 6,781,535 5,071(1) 8,293,950Average balance during year . . . . . . . . . . . . . . . . . . . . . 212,692 1,122,097 139,668 8,797,092 1,627 10,273,176Net gains (losses) for the year . . . . . . . . . . . . . . . . . . . . — (1,539) — 31,740 1 30,202Return for the year (%) . . . . . . . . . . . . . . . . . . . . . . . . . 4.43 0.27 2.74 4.66 5.02 4.18
(1) The carrying value of total trading investments and swaps held in other currencies consists of British pound sterling.(2) Carrying value of currency swaps represents the fair value of each individual receivable or (payable) leg, classified by their currency. As explained in Note B to the financial
statements, currency and interest rate swap agreements are stated in the Balance Sheet as assets or liabilities, depending on the nature (debit or credit) of the net fair valueamount of these agreements.
ORDINARY CAPITAL APPENDIX I-1INTER-AMERICAN DEVELOPMENT BANK
SUMMARY STATEMENT OF TRADING INVESTMENTS AND SWAPS – NOTE DDecember 31, 2001Expressed in thousands of United States dollars

134
ORDINARY CAPITAL APPENDIX I-2INTER-AMERICAN DEVELOPMENT BANK
SUMMARY STATEMENT OF HELD-TO-MATURITY INVESTMENTS – NOTE DDecember 31, 2002Expressed in thousands of United States dollars
MATURITY STRUCTURE OF HELD-TO-MATURITY INVESTMENTSDecember 31, 2002Expressed in thousands of United States dollars
Net Carrying MarketYear of Maturity Amount Value
2003 . . . . . . . . . . . . . . . . . . . . . . . . . . . . . . $1,214,608 $1,221,2422004 . . . . . . . . . . . . . . . . . . . . . . . . . . . . . . 734,410 749,5122005 . . . . . . . . . . . . . . . . . . . . . . . . . . . . . . 646,008 667,0262006 . . . . . . . . . . . . . . . . . . . . . . . . . . . . . . 418,809 436,6052007 . . . . . . . . . . . . . . . . . . . . . . . . . . . . . . 374,019 389,7212008 . . . . . . . . . . . . . . . . . . . . . . . . . . . . . . 90,154 94,0842009 . . . . . . . . . . . . . . . . . . . . . . . . . . . . . . 30,021 31,8472010 . . . . . . . . . . . . . . . . . . . . . . . . . . . . . . 34,220 37,769
Total . . . . . . . . . . . . . . . . . . . . . . . . . . . $3,542,249 $3,627,806
Japanese Swiss United States Other AllEuro yen francs dollars currencies currencies
Obligations of the United States Government and itscorporations and agencies:
Net carrying amount . . . . . . . . . . . . . . . . . . . . . . . . . . . 166,240 — — — 16,043 182,283Gross unrealized gains . . . . . . . . . . . . . . . . . . . . . . . . . . 4,683 — — — 104 4,787Gross unrealized losses . . . . . . . . . . . . . . . . . . . . . . . . . — — — — — —Market value . . . . . . . . . . . . . . . . . . . . . . . . . . . . . . . . . . 170,923 — — — 16,147 187,070
Obligations of other governments and agencies:Net carrying amount . . . . . . . . . . . . . . . . . . . . . . . . . . . 417,166 482,650 160,156 300,073 671,100 2,031,145Gross unrealized gains . . . . . . . . . . . . . . . . . . . . . . . . . . 3,425 1,114 5,913 14,363 20,574 45,389Gross unrealized losses . . . . . . . . . . . . . . . . . . . . . . . . . — 31 — — — 31Market value . . . . . . . . . . . . . . . . . . . . . . . . . . . . . . . . . . 420,591 483,733 166,069 314,436 691,674 2,076,503
Bank obligations and time deposits:Net carrying amount . . . . . . . . . . . . . . . . . . . . . . . . . . . 1,015 — 10,039 34,322 320,780 366,156Gross unrealized gains . . . . . . . . . . . . . . . . . . . . . . . . . . — — — — — —Gross unrealized losses . . . . . . . . . . . . . . . . . . . . . . . . . — — — — — —Market value . . . . . . . . . . . . . . . . . . . . . . . . . . . . . . . . . . 1,015 — 10,039 34,322 320,780 366,156
Corporate securities:Net carrying amount . . . . . . . . . . . . . . . . . . . . . . . . . . . — 15,393 — 67,244 31,319 113,956Gross unrealized gains . . . . . . . . . . . . . . . . . . . . . . . . . . — 18 — 1,966 433 2,417Gross unrealized losses . . . . . . . . . . . . . . . . . . . . . . . . . — 25 — — — 25Market value . . . . . . . . . . . . . . . . . . . . . . . . . . . . . . . . . . — 15,386 — 69,210 31,752 116,348
Asset- and mortgage-backed securities:Net carrying amount . . . . . . . . . . . . . . . . . . . . . . . . . . . 435,554 19,315 10,726 187,512 195,602 848,709Gross unrealized gains . . . . . . . . . . . . . . . . . . . . . . . . . . 12,790 — 260 13,106 6,873 33,029Gross unrealized losses . . . . . . . . . . . . . . . . . . . . . . . . . — 9 — — — 9Market value . . . . . . . . . . . . . . . . . . . . . . . . . . . . . . . . . . 448,344 19,306 10,986 200,618 202,475 881,729
Total held-to-maturity investments:Net carrying amount . . . . . . . . . . . . . . . . . . . . . . . . . . . 1,019,975 517,358 180,921 589,151 1,234,844 3,542,249Gross unrealized gains . . . . . . . . . . . . . . . . . . . . . . . . . . 20,898 1,132 6,173 29,435 27,984 85,622Gross unrealized losses . . . . . . . . . . . . . . . . . . . . . . . . . — 65 — — — 65Market value . . . . . . . . . . . . . . . . . . . . . . . . . . . . . . . . . . 1,040,873 518,425 187,094 618,586 1,262,828 3,627,806Return for the year (%) . . . . . . . . . . . . . . . . . . . . . . . . . 4.00 0.30 2.83 5.22 5.15 3.87
(1) The net carrying amount of held-to-maturity investments held in other currencies consists of the following:Canadian dollars . . . . . . . . . . . . . . . . . . . . . . . . . . . . . . . . . . . . . . . $ 652,808British pounds sterling . . . . . . . . . . . . . . . . . . . . . . . . . . . . . . . . . . 515,356Other . . . . . . . . . . . . . . . . . . . . . . . . . . . . . . . . . . . . . . . . . . . . . . . . 66,680
Total . . . . . . . . . . . . . . . . . . . . . . . . . . . . . . . . . . . . . . . . . . . . . . . $1,234,844
(1)

FINANCIAL STATEMENTS 135
ORDINARY CAPITAL APPENDIX I-2INTER-AMERICAN DEVELOPMENT BANK
SUMMARY STATEMENT OF HELD-TO-MATURITY INVESTMENTS – NOTE DDecember 31, 2001Expressed in thousands of United States dollars
MATURITY STRUCTURE OF HELD-TO-MATURITY INVESTMENTSDecember 31, 2001Expressed in thousands of United States dollars
Net Carrying MarketYear of Maturity Amount Value
2002 . . . . . . . . . . . . . . . . . . . . . . . . . . . . . . $ 905,583 $ 910,0142003 . . . . . . . . . . . . . . . . . . . . . . . . . . . . . . 822,300 834,4982004 . . . . . . . . . . . . . . . . . . . . . . . . . . . . . . 709,360 717,8382005 . . . . . . . . . . . . . . . . . . . . . . . . . . . . . . 427,259 434,5182006 . . . . . . . . . . . . . . . . . . . . . . . . . . . . . . 350,604 351,1782007 . . . . . . . . . . . . . . . . . . . . . . . . . . . . . . 69,746 70,3342008 . . . . . . . . . . . . . . . . . . . . . . . . . . . . . . 70,422 70,1652009 . . . . . . . . . . . . . . . . . . . . . . . . . . . . . . 14,961 15,042
Total . . . . . . . . . . . . . . . . . . . . . . . . . . . $3,370,235 $3,403,587
Japanese Swiss United States Other AllEuro yen francs dollars currencies currencies
Obligations of the United States Government and itscorporations and agencies:
Net carrying amount . . . . . . . . . . . . . . . . . . . . . . . . . . . 118,970 — — 75,048 16,166 210,184Gross unrealized gains . . . . . . . . . . . . . . . . . . . . . . . . . . 557 — — 783 123 1,463Gross unrealized losses . . . . . . . . . . . . . . . . . . . . . . . . . 706 — — — — 706Market value . . . . . . . . . . . . . . . . . . . . . . . . . . . . . . . . . . 118,821 — — 75,831 16,289 210,941
Obligations of other governments and agencies:Net carrying amount . . . . . . . . . . . . . . . . . . . . . . . . . . . 405,498 491,816 162,734 213,586 655,031 1,928,665Gross unrealized gains . . . . . . . . . . . . . . . . . . . . . . . . . . 800 1,156 1,042 4,934 12,976 20,908Gross unrealized losses . . . . . . . . . . . . . . . . . . . . . . . . . 457 101 427 2,042 290 3,317Market value . . . . . . . . . . . . . . . . . . . . . . . . . . . . . . . . . . 405,841 492,871 163,349 216,478 667,717 1,946,256
Bank obligations and time deposits:Net carrying amount . . . . . . . . . . . . . . . . . . . . . . . . . . . 6,319 34,203 2,822 700 205,942 249,986Gross unrealized gains . . . . . . . . . . . . . . . . . . . . . . . . . . — 46 — — 19 65Gross unrealized losses . . . . . . . . . . . . . . . . . . . . . . . . . — — — — — —Market value . . . . . . . . . . . . . . . . . . . . . . . . . . . . . . . . . . 6,319 34,249 2,822 700 205,961 250,051
Corporate securities:Net carrying amount . . . . . . . . . . . . . . . . . . . . . . . . . . . — 14,598 — 60,488 30,048 105,134Gross unrealized gains . . . . . . . . . . . . . . . . . . . . . . . . . . — 44 — 1,030 569 1,643Gross unrealized losses . . . . . . . . . . . . . . . . . . . . . . . . . — — — 133 — 133Market value . . . . . . . . . . . . . . . . . . . . . . . . . . . . . . . . . . — 14,642 — 61,385 30,617 106,644
Asset- and mortgage-backed securities:Net carrying amount . . . . . . . . . . . . . . . . . . . . . . . . . . . 402,707 — 8,900 210,838 253,821 876,266Gross unrealized gains . . . . . . . . . . . . . . . . . . . . . . . . . . 2,706 — — 7,081 7,622 17,409Gross unrealized losses . . . . . . . . . . . . . . . . . . . . . . . . . 3,576 — 82 220 102 3,980Market value . . . . . . . . . . . . . . . . . . . . . . . . . . . . . . . . . . 401,837 — 8,818 217,699 261,341 889,695
Total held-to-maturity investments:Net carrying amount . . . . . . . . . . . . . . . . . . . . . . . . . . . 933,494 540,617 174,456 560,660 1,161,008(1) 3,370,235Gross unrealized gains . . . . . . . . . . . . . . . . . . . . . . . . . . 4,063 1,246 1,042 13,828 21,309 41,488Gross unrealized losses . . . . . . . . . . . . . . . . . . . . . . . . . 4,739 101 509 2,395 392 8,136Market value . . . . . . . . . . . . . . . . . . . . . . . . . . . . . . . . . . 932,818 541,762 174,989 572,093 1,181,925 3,403,587Return for the year (%) . . . . . . . . . . . . . . . . . . . . . . . . . 4.04 0.34 2.87 5.87 5.56 3.97
(1) The net carrying amount of held-to-maturity investments held in other currencies consists of the following:Canadian dollars . . . . . . . . . . . . . . . . . . . . . . . . . . . . . . . . . . . . . . . $ 621,927British pounds sterling . . . . . . . . . . . . . . . . . . . . . . . . . . . . . . . . . . 473,823Other . . . . . . . . . . . . . . . . . . . . . . . . . . . . . . . . . . . . . . . . . . . . . . . . . 65,258
Total . . . . . . . . . . . . . . . . . . . . . . . . . . . . . . . . . . . . . . . . . . . . . . . $1,161,008

136
ORDINARY CAPITAL APPENDIX I-3INTER-AMERICAN DEVELOPMENT BANK
SUMMARY STATEMENT OF LOANS – NOTE EDecember 31, 2002 and 2001Expressed in thousands of United States dollars
The Bank has Private Sector Program loans outstanding in the following countries (in thousands):
December 31,
2002 2001
Argentina . . . . . . . . . . . . . . . . . . . . . . . . . $ 266,480 $ 309,282Brazil . . . . . . . . . . . . . . . . . . . . . . . . . . . . . 326,728 222,131Chile . . . . . . . . . . . . . . . . . . . . . . . . . . . . . 24,312 22,500Colombia . . . . . . . . . . . . . . . . . . . . . . . . . 22,218 25,215Dominican Republic . . . . . . . . . . . . . . . . 69,375 —Mexico . . . . . . . . . . . . . . . . . . . . . . . . . . . 344,827 300,892Peru . . . . . . . . . . . . . . . . . . . . . . . . . . . . . . 51,540 41,017Regional . . . . . . . . . . . . . . . . . . . . . . . . . . 89,636 73,693Other . . . . . . . . . . . . . . . . . . . . . . . . . . . . . 59,237 64,698
$1,254,353 $1,059,428
Currency in which
outstanding portion ofapproved loans is
collectible
Member in whose Loans Freelyterritory loans have approved, less Principal Outstanding convertible Other Outstanding
been made cancellations(1) collected(2) Undisbursed 2002 currencies currencies 2001
Argentina . . . . . . . . . . . . . . . . . . . . . . $ 16,009,391 $ 4,637,317 $ 3,329,680 $ 8,042,394 $ 7,950,469 $ 91,925 $ 8,269,741Bahamas . . . . . . . . . . . . . . . . . . . . . . . 342,208 79,144 68,220 194,844 194,844 — 186,144Barbados . . . . . . . . . . . . . . . . . . . . . . 345,419 73,275 122,768 149,376 149,376 — 131,557Belize . . . . . . . . . . . . . . . . . . . . . . . . . 92,215 — 43,614 48,601 48,601 — 34,347Bolivia . . . . . . . . . . . . . . . . . . . . . . . . 1,029,535 568,265 4,888 456,382 455,592 790 479,659Brazil . . . . . . . . . . . . . . . . . . . . . . . . . 22,752,887 6,094,217 4,519,762 12,138,908 12,093,616 45,292 11,146,839Chile . . . . . . . . . . . . . . . . . . . . . . . . . . 4,501,303 3,581,317 395,397 524,589 521,032 3,557 579,977Colombia . . . . . . . . . . . . . . . . . . . . . . 7,980,577 3,607,989 904,522 3,468,066 3,436,453 31,613 3,762,806Costa Rica . . . . . . . . . . . . . . . . . . . . . 1,687,880 625,371 370,878 691,631 691,631 — 668,715Dominican Republic . . . . . . . . . . . . . 1,398,733 263,538 566,547 568,648 568,648 — 473,108Ecuador . . . . . . . . . . . . . . . . . . . . . . . 2,770,194 1,163,215 228,321 1,378,658 1,378,599 59 1,338,601El Salvador . . . . . . . . . . . . . . . . . . . . . 2,015,093 431,775 533,849 1,049,469 1,049,282 187 921,601Guatemala . . . . . . . . . . . . . . . . . . . . . 1,812,893 491,571 517,306 804,016 804,016 — 631,326Guyana . . . . . . . . . . . . . . . . . . . . . . . . 109,436 87,060 — 22,376 22,376 — 25,212Honduras . . . . . . . . . . . . . . . . . . . . . . 506,891 329,329 — 177,562 177,562 — 184,348Jamaica . . . . . . . . . . . . . . . . . . . . . . . . 1,341,136 452,499 256,421 632,216 632,216 — 513,736Mexico . . . . . . . . . . . . . . . . . . . . . . . . 15,005,814 5,526,832 2,768,277 6,710,705 6,709,360 1,345 5,929,419Nicaragua . . . . . . . . . . . . . . . . . . . . . . 248,476 130,874 — 117,602 117,602 — 120,260Panama . . . . . . . . . . . . . . . . . . . . . . . 1,642,921 462,328 463,690 716,903 716,903 — 639,957Paraguay . . . . . . . . . . . . . . . . . . . . . . . 1,181,164 220,189 405,232 555,743 555,699 44 507,066Peru . . . . . . . . . . . . . . . . . . . . . . . . . . 5,339,347 1,590,857 835,173 2,913,317 2,911,909 1,408 2,663,000Suriname . . . . . . . . . . . . . . . . . . . . . . 74,645 8,158 39,341 27,146 27,146 — 26,505Trinidad and Tobago . . . . . . . . . . . . 962,096 208,502 315,160 438,434 438,434 — 434,673Uruguay . . . . . . . . . . . . . . . . . . . . . . . 3,222,549 583,902 668,412 1,970,235 1,970,234 1 1,436,233Venezuela . . . . . . . . . . . . . . . . . . . . . . 3,679,882 1,081,043 434,970 2,163,869 2,156,765 7,104 2,037,133Regional . . . . . . . . . . . . . . . . . . . . . . . 1,967,782 1,079,083 146,885 741,814 741,814 — 749,586Private Sector Program . . . . . . . . . . . 1,814,759 230,046 330,360 1,254,353 1,254,353 — 1,059,428Inter-American Investment
Corporation . . . . . . . . . . . . . . . . . 375,000 75,000 300,000 — — — —Total 2002 . . . . . . . . . . . . . . . . . $100,210,226 $33,682,696 $18,569,673 $47,957,857 $47,774,532 $183,325
Total 2001 . . . . . . . . . . . . . . . . . $ 92,976,191 $27,518,903 $20,506,311 $44,761,853 $189,124 $44,950,977
(1) This table excludes participated Private Sector Program loans which amounted to $2,785,118 at December 31, 2002 (2001—$2,792,605). This table also excludes guaranteeswithout government counter-guarantees approved in the amount of $611,450 at December 31, 2002 (2001—$531,250).
(2) Includes full principal repayments of loans previously sold.

FINANCIAL STATEMENTS 137
ORDINARY CAPITAL APPENDIX I-4INTER-AMERICAN DEVELOPMENT BANK
SUMMARY STATEMENT OF LOANS OUTSTANDING BY CURRENCY AND PRODUCT –NOTE EDecember 31, 2002Expressed in thousands of United States dollars
MATURITY STRUCTURE OF LOANS OUTSTANDINGDecember 31, 2002Expressed in thousands of United States dollars
Multicurrency loans Single currency loans All loans
Year of Maturity Fixed Adjustable Fixed(1) Adjustable(1) Fixed Adjustable Total
2003 . . . . . . . . . . . . . . . . . . $ 722,910 $ 1,395,986 $ 82,448 $ 4,364,813 $ 805,358 $ 5,760,799 $ 6,566,1572004 . . . . . . . . . . . . . . . . . . 673,900 1,656,800 108,200 2,127,000 782,100 3,783,800 4,565,9002005 . . . . . . . . . . . . . . . . . . 581,700 1,716,500 114,100 1,038,000 695,800 2,754,500 3,450,3002006 . . . . . . . . . . . . . . . . . . 454,500 1,726,000 106,200 1,237,900 560,700 2,963,900 3,524,6002007 . . . . . . . . . . . . . . . . . . 357,400 1,710,100 101,700 1,351,900 459,100 3,062,000 3,521,1002008 through 2012 . . . . . . 774,700 7,623,300 343,800 6,148,300 1,118,500 13,771,600 14,890,1002013 through 2017 . . . . . . 138,300 3,018,000 62,900 4,814,800 201,200 7,832,800 8,034,0002018 through 2022 . . . . . . 12,200 730,300 8,600 2,231,700 20,800 2,962,000 2,982,8002023 through 2027 . . . . . . 700 44,800 — 366,200 700 411,000 411,7002028 through 2032 . . . . . . — — — 11,200 — 11,200 11,200
Total . . . . . . . . . . . . . . . . $3,716,310 $19,621,786 $927,948 $23,691,813 $4,644,258 $43,313,599 $47,957,857
Average Maturity (years) . . 3.46 6.46 4.99 7.20 3.77 6.86 6.56
(1) Includes LIBOR-based loans.
Multicurrency loans Single currency loans Total loans
Weighted Weighted Weightedaverage average Average average
rate rate maturity rateCurrency/Rate type Amount (%) Amount (%) (years) Amount (%)
EuroFixed . . . . . . . . . . . . . . . . . . . . . . . . . $ 501,545 7.48 $ — — — $ 501,545 7.48Adjustable . . . . . . . . . . . . . . . . . . . . 2,766,682 5.27 7,435 5.35 9.23 2,774,117 5.27
Japanese yenFixed . . . . . . . . . . . . . . . . . . . . . . . . . 829,997 7.46 — — — 829,997 7.46Adjustable . . . . . . . . . . . . . . . . . . . . 4,661,413 5.27 1,907 1.46 8.63 4,663,320 5.27
Swiss francsFixed . . . . . . . . . . . . . . . . . . . . . . . . . 499,632 7.50 — — — 499,632 7.50Adjustable . . . . . . . . . . . . . . . . . . . . 2,717,328 5.27 — — — 2,717,328 5.27
United States dollarsFixed . . . . . . . . . . . . . . . . . . . . . . . . . 1,700,468 7.47 — — — 1,700,468 7.47Adjustable . . . . . . . . . . . . . . . . . . . . 9,476,363 5.27 17,048,109 5.39 9.29 26,524,472 5.35LIBOR-based fixed . . . . . . . . . . . . . — — 927,948 7.35 4.99 927,948 7.35LIBOR-based floating . . . . . . . . . . . — — 6,634,362 5.10 1.81 6,634,362 5.10
OthersFixed . . . . . . . . . . . . . . . . . . . . . . . . . 184,668 4.04 — — — 184,668 4.04
Loans outstandingFixed . . . . . . . . . . . . . . . . . . . . . . . . . 3,716,310 7.30 — — — 3,716,310 7.30Adjustable . . . . . . . . . . . . . . . . . . . . 19,621,786 5.27 17,057,451 5.39 9.29 36,679,237 5.33LIBOR-based fixed . . . . . . . . . . . . . — — 927,948 7.35 4.99 927,948 7.35LIBOR-based floating . . . . . . . . . . . — — 6,634,362 5.10 1.81 6,634,362 5.10
Total . . . . . . . . . . . . . . . . . . . . . . . $23,338,096 5.59 $24,619,761 5.39 7.11 $47,957,857 5.49

138
ORDINARY CAPITAL APPENDIX I-4INTER-AMERICAN DEVELOPMENT BANK
SUMMARY STATEMENT OF LOANS OUTSTANDING BY CURRENCY AND PRODUCT –NOTE EDecember 31, 2001Expressed in thousands of United States dollars
Multicurrency loans Single currency loans All loans
Year of Maturity Fixed Adjustable Fixed(1) Adjustable(1) Fixed Adjustable Total
2002 . . . . . . . . . . . . . . . . . . $ 764,349 $ 1,128,355 $ 53,505 $ 2,717,168 $ 817,854 $ 3,845,523 $ 4,663,3772003 . . . . . . . . . . . . . . . . . . 721,500 1,450,400 58,400 3,899,000 779,900 5,349,400 6,129,3002004 . . . . . . . . . . . . . . . . . . 673,400 1,541,100 67,000 2,158,000 740,400 3,699,100 4,439,5002005 . . . . . . . . . . . . . . . . . . 564,500 1,548,900 65,300 873,400 629,800 2,422,300 3,052,1002006 . . . . . . . . . . . . . . . . . . 424,500 1,550,500 53,400 928,600 477,900 2,479,100 2,957,0002007 through 2011 . . . . . . 973,700 7,288,100 167,200 4,949,400 1,140,900 12,237,500 13,378,4002012 through 2016 . . . . . . 206,900 3,328,100 49,000 3,789,000 255,900 7,117,100 7,373,0002017 through 2021 . . . . . . 12,600 833,300 10,600 1,812,900 23,200 2,646,200 2,669,4002022 through 2026 . . . . . . 800 44,600 1,900 229,100 2,700 273,700 276,4002027 through 2029 . . . . . . — — — 12,500 — 12,500 12,500
Total . . . . . . . . . . . . . . . . $4,342,249 $18,713,355 $526,305 $21,369,068 $4,868,554 $40,082,423 $44,950,977
Average Maturity (years) . . 3.68 6.86 4.61 6.60 3.78 6.72 6.40
(1) Includes LIBOR-based loans.
MATURITY STRUCTURE OF LOANS OUTSTANDINGDecember 31, 2001Expressed in thousands of United States dollars
Multicurrency loans Single currency loans Total loans
Weighted Weighted Weightedaverage average Average average
rate rate maturity rateCurrency/Rate type Amount (%) Amount (%) (years) Amount (%)
EuroFixed . . . . . . . . . . . . . . . . . . . . . . . . . $ 540,079 7.53 $ — — — $ 540,079 7.53Adjustable . . . . . . . . . . . . . . . . . . . . 2,404,599 6.29 4,836 6.09 10.11 2,409,435 6.29
Japanese yenFixed . . . . . . . . . . . . . . . . . . . . . . . . . 961,468 7.50 — — — 961,468 7.50Adjustable . . . . . . . . . . . . . . . . . . . . 4,374,072 6.29 516 2.07 8.86 4,374,588 6.29
Swiss francsFixed . . . . . . . . . . . . . . . . . . . . . . . . . 527,100 7.54 — — — 527,100 7.54Adjustable . . . . . . . . . . . . . . . . . . . . 2,320,435 6.29 — — — 2,320,435 6.29
United States dollarsFixed . . . . . . . . . . . . . . . . . . . . . . . . . 2,122,350 7.50 — — — 2,122,350 7.50Adjustable . . . . . . . . . . . . . . . . . . . . 9,614,249 6.29 13,258,740 6.97 9.36 22,872,989 6.68LIBOR-based fixed . . . . . . . . . . . . . — — 526,305 8.61 4.61 526,305 8.61LIBOR-based floating . . . . . . . . . . . — — 8,104,976 5.79 2.08 8,104,976 5.79
OthersFixed . . . . . . . . . . . . . . . . . . . . . . . . . 191,252 4.07 — — — 191,252 4.07
Loans outstandingFixed . . . . . . . . . . . . . . . . . . . . . . . . . 4,342,249 7.36 — — — 4,342,249 7.36Adjustable . . . . . . . . . . . . . . . . . . . . 18,713,355 6.29 13,264,092 6.97 9.36 31,977,447 6.57LIBOR-based fixed . . . . . . . . . . . . . — — 526,305 8.61 4.61 526,305 8.61LIBOR-based floating . . . . . . . . . . . — — 8,104,976 5.79 2.08 8,104,976 5.79
Total . . . . . . . . . . . . . . . . . . . . . . . $23,055,604 6.49 $21,895,373 6.57 6.55 $44,950,977 6.53

FINANCIAL STATEMENTS 139
ORDINARY CAPITAL APPENDIX I-5INTER-AMERICAN DEVELOPMENT BANK
STATEMENT OF MEDIUM- AND LONG-TERM BORROWINGS AND SWAPS – NOTES G AND HDecember 31, 2002Expressed in thousands of United States dollars
Year of Maturity
2003 . . . . . . . . . . . . . . . . . . . . . . . . . . . . . . . . . . $ 7,701,2692004 . . . . . . . . . . . . . . . . . . . . . . . . . . . . . . . . . . 7,298,7032005 . . . . . . . . . . . . . . . . . . . . . . . . . . . . . . . . . . 5,428,9972006 . . . . . . . . . . . . . . . . . . . . . . . . . . . . . . . . . . 4,737,7692007 . . . . . . . . . . . . . . . . . . . . . . . . . . . . . . . . . . 3,807,114
MATURITY STRUCTURE OF MEDIUM- AND LONG-TERM BORROWINGS OUTSTANDINGDecember 31, 2002Expressed in thousands of United States dollars
Year of Maturity
2008 through 2012 . . . . . . . . . . . . . . . . . . . . . . $15,074,7532013 through 2017 . . . . . . . . . . . . . . . . . . . . . . 1,262,7282018 through 2022 . . . . . . . . . . . . . . . . . . . . . . 610,0402023 through 2027 . . . . . . . . . . . . . . . . . . . . . . 1,550,000
Total . . . . . . . . . . . . . . . . . . . . . . . . . . . . . . . . $47,471,373
Currency Interest rateDirect borrowings swap agreements swap agreements Net currency obligations
Wgtd. Wgtd. Notional Wgtd. Wgtd.avg. Average Amount(2) avg. Average amount(2) avg. Average Amount avg. Averagecost maturity payable cost maturity payable cost maturity payable cost maturity
Currency/Rate type Amount (%) (years) (receivable) (%) (years) (receivable) (%) (years) (receivable) (%) (years) (1)
EuroFixed . . . . . . . . . . . . $ 3,959,851 5.62 5.30 $ — — — $ 363,387 4.22 4.31 $( 4,323,238 5.50 5.21
. . . . . . . . . . . . . . . — — — (744,340) 5.48 3.51 (1,173,159) 3.98 7.77 (1,917,499) 4.56 6.12Adjustable . . . . . . . . 950,134 5.83 12.10 825,547 2.80 3.76 1,173,159 3.40 7.77 2,948,840 4.02 8.04
. . . . . . . . . . . . . . . — — — (1,020,874) 5.61 11.53 (363,387) 2.77 4.31 (1,384,261) 4.86 9.63Japanese yen
Fixed . . . . . . . . . . . . 3,463,319 3.80 5.85 752,762 0.93 5.82 293,544 0.01 1.09 4,509,625 3.07 5.54 . . . . . . . . . . . . . . . — — — (502,519) 3.53 5.25 (1,024,187) 1.85 6.52 (1,526,706) 2.40 6.10
Adjustable . . . . . . . . 91,743 3.23 8.61 1,219,160 (0.25) 3.12 1,007,506 (0.20) 6.79 2,318,409 (0.09) 4.94 . . . . . . . . . . . . . . . — — — (66,722) 3.84 5.90 (276,863) (0.21) 1.78 (343,585) 0.58 2.58
Swiss francsFixed . . . . . . . . . . . . 2,438,849 4.00 2.30 486,134 4.61 1.40 255,183 2.23 1.74 3,180,166 3.95 2.12
. . . . . . . . . . . . . . . — — — (358,654) 2.17 1.39 (143,462) 3.33 1.83 (502,116) 2.50 1.51Adjustable . . . . . . . . — — — 255,183 0.60 1.74 143,462 0.58 1.83 398,645 0.59 1.77
. . . . . . . . . . . . . . . — — — — — — (255,183) 0.60 1.74 (255,183) 0.60 1.74United States dollars
Fixed . . . . . . . . . . . . 28,776,000 5.79 4.88 888,383 6.51 3.55 319,129 5.54 5.70 29,983,512 5.81 4.85 . . . . . . . . . . . . . . . — — — (15,000) 3.60 4.68 (12,243,910) 5.04 3.49 (12,258,910) 5.04 3.49
Adjustable . . . . . . . . 86,000 5.04 5.82 8,012,468 1.28 5.33 13,739,710 1.44 3.26 21,838,178 1.40 4.03 . . . . . . . . . . . . . . . — — — (2,089,878) 1.31 4.19 (1,814,929) 1.74 2.15 (3,904,807) 1.51 3.24
OthersFixed . . . . . . . . . . . . 7,647,978 6.14 4.40 — — — — — — 7,647,978 6.14 4.40
. . . . . . . . . . . . . . . — — — (7,252,734) 5.64 4.16 — — — (7,252,734) 5.64 4.16Adjustable . . . . . . . . 57,499 1.58 0.38 — — — — — — 57,499 1.58 0.38
. . . . . . . . . . . . . . . — — — (57,499) 1.58 0.38 — — — (57,499) 1.58 0.38
TotalFixed . . . . . . . . . . . . 46,285,997 5.59 4.77 2,127,279 1,231,243 49,644,519 5.47 4.70
. . . . . . . . . . . . . . . — — — (8,873,247) (14,584,718) (23,457,965) 4.96 4.04Adjustable . . . . . . . . 1,185,376 5.37 10.81 10,312,358 16,063,837 27,561,571 1.54 4.49
. . . . . . . . . . . . . . . — — — (3,234,973) (2,710,362) (5,945,335) 2.20 4.60
Principal at face value . 47,471,373 5.59 4.92 331,417 — 47,802,790 3.86 4.92SFAS 133 —
Basis adjustment . . . 1,270,177 1,270,177Market value
adjustment (2) . . . (227,341) (784,517) (1,011,858)Net unamortized
discount . . . . . . . . . . (611,678) (611,678)
Total . . . . . . . . . . . $48,129,872 5.59 4.92 $ 104,076 $ (784,517) $(47,449,431 3.86 4.92
(1) As of December 31, 2002, the average repricing period of the net currency obligations for adjustable rate borrowings was four months.(2) Currency swaps are shown at face value and interest rate swaps are shown at the notional amount of each individual payable or (receivable) leg, classified by their currency.
Both currency and interest rate swaps are adjusted, in total, to fair value as indicated. The net fair value amount payable from currency swaps of $104,076 and the net fairvalue amount receivable from interest rate swaps of $784,517 as of December 31, 2002, shown in the above table, are represented by currency and interest rate swap assets atfair value of $1,293,803 and currency and interest rate swap liabilities at fair value of $613,362, included in the Balance Sheet.

140
ORDINARY CAPITAL APPENDIX I-5INTER-AMERICAN DEVELOPMENT BANK
STATEMENT OF MEDIUM- AND LONG-TERM BORROWINGS AND SWAPS – NOTES G AND HDecember 31, 2001Expressed in thousands of United States dollars
Currency Interest rateDirect borrowings swap agreements swap agreements Net currency obligations
Wgtd. Wgtd. Notional Wgtd. Wgtd.avg. Average Amount(2) avg. Average amount(2) avg. Average Amount avg. Averagecost maturity payable cost maturity payable cost maturity payable cost maturity
Currency/Rate type Amount (%) (years) (receivable) (%) (years) (receivable) (%) (years) (receivable) (%) (years) (1)
EuroFixed . . . . . . . . . . . . . $ 2,769,560 6.45 4.15 $ — — — $( 176,258 4.64 4.88 $( 2,945,818 6.34 4.19
. . . . . . . . . . . . . . . . — — — (366,657) 6.13 1.50 (225,298) 6.22 4.79 (591,955) 6.16 2.75Adjustable . . . . . . . . . 983,669 5.93 11.71 324,205 3.04 4.88 225,298 3.49 4.79 1,533,172 4.96 9.25
. . . . . . . . . . . . . . . . — — — (1,043,487) 5.79 11.31 (176,258) 3.04 4.88 (1,219,745) 5.39 10.38Japanese yen
Fixed . . . . . . . . . . . . . 4,250,774 4.16 5.93 684,796 0.93 6.82 267,040 0.01 2.08 5,202,610 3.52 5.85 . . . . . . . . . . . . . . . . — — — (495,083) 3.59 6.03 (969,651) 1.94 7.63 (1,464,734) 2.50 7.09
Adjustable . . . . . . . . . 83,460 1.46 10.97 1,109,084 (0.23) 4.12 992,413 (0.19) 7.84 2,184,957 (0.15) 6.07 . . . . . . . . . . . . . . . . — — — (22,762) 3.37 12.76 (289,802) (0.44) 3.25 (312,564) (0.16) 3.94
Swiss francsFixed . . . . . . . . . . . . . 2,220,831 4.90 2.08 480,489 4.96 2.04 50,677 2.74 2.74 2,751,997 4.87 2.09
. . . . . . . . . . . . . . . . — — — (298,098) 2.17 2.39 (119,239) 3.33 2.83 (417,337) 2.50 2.52Adjustable . . . . . . . . . — — — 212,097 1.70 2.78 119,239 2.03 2.83 331,336 1.82 2.80
. . . . . . . . . . . . . . . . — — — — — — (50,677) 1.72 2.74 (50,677) 1.72 2.74United States dollars
Fixed . . . . . . . . . . . . . 24,463,000 6.26 5.41 888,383 6.45 4.55 503,973 6.70 3.46 25,855,356 6.28 5.34 . . . . . . . . . . . . . . . . — — — — — — (11,698,000) 5.66 3.51 (11,698,000) 5.66 3.51
Adjustable . . . . . . . . . — — — 8,405,510 1.89 4.84 13,107,800 2.03 3.36 21,513,310 1.98 3.94 . . . . . . . . . . . . . . . . — — — (1,903,817) 1.96 5.36 (1,913,773) 2.10 2.48 (3,817,590) 2.03 3.92
OthersFixed . . . . . . . . . . . . . 7,357,843 6.60 3.94 — — — — — — 7,357,843 6.60 3.94
. . . . . . . . . . . . . . . . — — — (7,000,338) 6.35 3.64 — — — (7,000,338) 6.35 3.64Adjustable . . . . . . . . . 57,013 4.36 1.39 — — — — — — 57,013 4.36 1.39
. . . . . . . . . . . . . . . . — — — (57,013) 2.05 1.39 — — — (57,013) 2.05 1.39
TotalFixed . . . . . . . . . . . . . 41,062,008 6.04 4.94 2,053,668 997,948 44,113,624 5.92 4.89
. . . . . . . . . . . . . . . . — — — (8,160,176) (13,012,188) (21,172,364) 5.62 3.76Adjustable . . . . . . . . . 1,124,142 5.52 11.13 10,050,896 14,444,750 25,619,788 1.98 4.42
. . . . . . . . . . . . . . . . — — — (3,027,079) (2,430,510) (5,457,589) 2.64 5.30
Principal at face value . . . 42,186,150 6.03 5.10 917,309 — 43,103,459 4.14 5.11SFAS 133 —
Basis adjustment . . . . 515,414 515,414Market value
adjustment (2) . . . . (78,849) (417,833) (496,682)Net unamortized
discount . . . . . . . . . . . (24,838) (24,838)
Total . . . . . . . . . . . $42,676,726 6.03 5.10 $ (838,460 $ (417,833) $(43,097,353 4.14 5.11
(1) As of December 31, 2001, the average repricing period of the net currency obligations for adjustable rate borrowings was four months.(2) Currency swaps are shown at face value and interest rate swaps are shown at the notional amount of each individual payable or (receivable) leg, classified by their currency.
Both currency and interest rate swaps are adjusted, in total, to fair value as indicated. The net fair value amount payable from currency swaps of $838,460 and the net fairvalue amount receivable from interest rate swaps of $417,833 as of December 31, 2001, shown in the above table, are represented by currency and interest rate swap assets atfair value of $739,277 and currency and interest rate swap liabilities at fair value of $1,159,904, included in the Balance Sheet.
MATURITY STRUCTURE OF MEDIUM- AND LONG-TERM BORROWINGS OUTSTANDINGDecember 31, 2001Expressed in thousands of United States dollars
Year of Maturity Year of Maturity
2002 . . . . . . . . . . . . . . . . . . . . . . . . . . . . . . . . . . . $ 4,877,789 2007 through 2011 . . . . . . . . . . . . . . . . . . . . . . . $13,803,0082003 . . . . . . . . . . . . . . . . . . . . . . . . . . . . . . . . . . . 7,478,513 2012 through 2016 . . . . . . . . . . . . . . . . . . . . . . . 757,4802004 . . . . . . . . . . . . . . . . . . . . . . . . . . . . . . . . . . . 7,019,293 2017 through 2021 . . . . . . . . . . . . . . . . . . . . . . . 721,8262005 . . . . . . . . . . . . . . . . . . . . . . . . . . . . . . . . . . . 1,775,926 2022 through 2026 . . . . . . . . . . . . . . . . . . . . . . . 950,0002006 . . . . . . . . . . . . . . . . . . . . . . . . . . . . . . . . . . . 4,202,315 2027 . . . . . . . . . . . . . . . . . . . . . . . . . . . . . . . . . . . 600,000
Total . . . . . . . . . . . . . . . . . . . . . . . . . . . . . . . . . $42,186,150

FINANCIAL STATEMENTS 141
Paid-in portion ofsubscribed capital
Freely Callableconvertible Other portion of Total Total
Members Shares currencies currencies subscribed capital 2002 2001
Argentina . . . . . . . . . . . . . . . . . . . 900,154 $ 361,059 $104,059 $10,393,829 $ 10,858,947 $ 10,858,947Austria . . . . . . . . . . . . . . . . . . . . . 13,312 6,900 — 153,688 160,588 160,588Bahamas . . . . . . . . . . . . . . . . . . . . 17,398 7,479 4,054 198,347 209,880 209,880Barbados . . . . . . . . . . . . . . . . . . . 10,767 3,879 1,755 124,253 129,887 129,887Belgium . . . . . . . . . . . . . . . . . . . . 27,438 14,235 — 316,762 330,997 330,997Belize . . . . . . . . . . . . . . . . . . . . . . 9,178 3,601 3,601 103,516 110,718 110,718Bolivia . . . . . . . . . . . . . . . . . . . . . 72,258 28,964 8,360 834,355 871,680 871,680Brazil . . . . . . . . . . . . . . . . . . . . . . 900,154 361,059 104,059 10,393,829 10,858,947 10,858,947Canada . . . . . . . . . . . . . . . . . . . . . 334,887 173,677 — 3,866,209 4,039,887 4,039,887Chile . . . . . . . . . . . . . . . . . . . . . . . 247,163 99,149 28,566 2,853,919 2,981,634 2,981,634Colombia . . . . . . . . . . . . . . . . . . . 247,163 99,161 28,554 2,853,919 2,981,634 2,981,634Costa Rica . . . . . . . . . . . . . . . . . . 36,121 14,500 4,162 417,081 435,743 435,743Croatia . . . . . . . . . . . . . . . . . . . . . 4,018 2,087 — 46,384 48,471 48,471Denmark . . . . . . . . . . . . . . . . . . . 14,157 7,347 — 163,435 170,782 170,782Dominican Republic . . . . . . . . . . 48,220 19,338 5,573 556,788 581,699 581,699Ecuador . . . . . . . . . . . . . . . . . . . . 48,220 19,338 5,573 556,788 581,699 581,699El Salvador . . . . . . . . . . . . . . . . . . 36,121 14,500 4,162 417,081 435,743 435,743Finland . . . . . . . . . . . . . . . . . . . . . 13,312 6,900 — 153,688 160,588 160,588France . . . . . . . . . . . . . . . . . . . . . . 158,638 82,273 — 1,831,446 1,913,719 1,913,719Germany . . . . . . . . . . . . . . . . . . . 158,638 82,273 — 1,831,446 1,913,719 1,913,719Guatemala . . . . . . . . . . . . . . . . . . 48,220 19,338 5,573 556,788 581,699 581,699Guyana . . . . . . . . . . . . . . . . . . . . . 13,393 5,223 2,570 153,773 161,566 161,566Haiti . . . . . . . . . . . . . . . . . . . . . . . 36,121 14,500 4,162 417,081 435,743 435,743Honduras . . . . . . . . . . . . . . . . . . . 36,121 14,500 4,162 417,081 435,743 435,743Israel . . . . . . . . . . . . . . . . . . . . . . . 13,126 6,804 — 151,541 158,345 158,345Italy . . . . . . . . . . . . . . . . . . . . . . . 158,638 82,273 — 1,831,446 1,913,719 1,913,719Jamaica . . . . . . . . . . . . . . . . . . . . . 48,220 19,338 5,573 556,788 581,699 581,699Japan . . . . . . . . . . . . . . . . . . . . . . 418,642 217,106 — 4,833,154 5,050,260 5,050,260Mexico . . . . . . . . . . . . . . . . . . . . . 578,632 232,076 66,904 6,681,308 6,980,288 6,980,288Netherlands . . . . . . . . . . . . . . . . . 28,207 14,633 — 325,640 340,273 340,273Nicaragua . . . . . . . . . . . . . . . . . . . 36,121 14,500 4,162 417,081 435,743 435,743Norway . . . . . . . . . . . . . . . . . . . . . 14,157 7,347 — 163,435 170,782 170,782Panama . . . . . . . . . . . . . . . . . . . . 36,121 14,500 4,162 417,081 435,743 435,743Paraguay . . . . . . . . . . . . . . . . . . . . 36,121 14,500 4,162 417,081 435,743 435,743Peru . . . . . . . . . . . . . . . . . . . . . . . 120,445 48,278 13,957 1,390,745 1,452,980 1,452,980Portugal . . . . . . . . . . . . . . . . . . . . 4,474 2,316 — 51,656 53,972 53,972Slovenia . . . . . . . . . . . . . . . . . . . . 2,434 1,267 — 28,096 29,362 29,362Spain . . . . . . . . . . . . . . . . . . . . . . 158,638 82,273 — 1,831,446 1,913,719 1,913,719Suriname . . . . . . . . . . . . . . . . . . . 7,342 3,486 2,232 82,852 88,570 88,570Sweden . . . . . . . . . . . . . . . . . . . . . 27,268 14,139 — 314,807 328,946 328,946Switzerland . . . . . . . . . . . . . . . . . 39,347 20,411 — 454,249 474,660 474,660Trinidad and Tobago . . . . . . . . . 36,121 14,500 4,162 417,081 435,743 435,743United Kingdom . . . . . . . . . . . . . 80,551 41,776 — 929,946 971,722 971,722United States . . . . . . . . . . . . . . . . 2,512,529 1,303,020 — 29,006,704 30,309,724 30,309,724Uruguay . . . . . . . . . . . . . . . . . . . . 96,507 38,699 11,171 1,114,335 1,164,206 1,164,206Venezuela . . . . . . . . . . . . . . . . . . . 482,267 216,008 33,331 5,568,456 5,817,795 5,817,795
Total before unallocated amount . 8,367,080 3,870,529 468,760 96,596,415 100,935,704 100,935,704Unallocated (see Note J) . . . . . . . 1,299 905 — 14,765 15,670 23,680
Total 2002 . . . . . . . . . . . . . . . . 8,368,379 $3,871,434 $468,760 $96,611,180 $100,951,374
Total 2001 . . . . . . . . . . . . . . . . 8,369,043 $3,871,892 $468,760 $96,618,732 $100,959,384
(1) Data are rounded; detail may not add up to subtotals and totals because of rounding.
ORDINARY CAPITAL APPENDIX I-6INTER-AMERICAN DEVELOPMENT BANK
STATEMENT OF SUBSCRIPTIONS TO CAPITAL STOCK – NOTE JDecember 31, 2002 and 2001Expressed in thousands of United States dollars(1)

142
ORDINARY CAPITAL APPENDIX I-7INTER-AMERICAN DEVELOPMENT BANK
STATEMENT OF SUBSCRIPTIONS TO CAPITAL STOCK AND VOTING POWERDecember 31, 2002
% of totalSubscribed Number number of
Member countries shares of votes votes (1)
Regional developing membersArgentina . . . . . . . . . . . . . . . . . . . . . . . . . . . . . . . . . . 900,154 900,289 10.752Bahamas . . . . . . . . . . . . . . . . . . . . . . . . . . . . . . . . . . 17,398 17,533 0.209Barbados . . . . . . . . . . . . . . . . . . . . . . . . . . . . . . . . . . 10,767 10,902 0.130Belize . . . . . . . . . . . . . . . . . . . . . . . . . . . . . . . . . . . . . 9,178 9,313 0.111Bolivia . . . . . . . . . . . . . . . . . . . . . . . . . . . . . . . . . . . . 72,258 72,393 0.865Brazil . . . . . . . . . . . . . . . . . . . . . . . . . . . . . . . . . . . . . 900,154 900,289 10.752Chile . . . . . . . . . . . . . . . . . . . . . . . . . . . . . . . . . . . . . . 247,163 247,298 2.953Colombia . . . . . . . . . . . . . . . . . . . . . . . . . . . . . . . . . . 247,163 247,298 2.953Costa Rica . . . . . . . . . . . . . . . . . . . . . . . . . . . . . . . . . 36,121 36,256 0.433Dominican Republic . . . . . . . . . . . . . . . . . . . . . . . . 48,220 48,355 0.577Ecuador . . . . . . . . . . . . . . . . . . . . . . . . . . . . . . . . . . . 48,220 48,355 0.577El Salvador . . . . . . . . . . . . . . . . . . . . . . . . . . . . . . . . . 36,121 36,256 0.433Guatemala . . . . . . . . . . . . . . . . . . . . . . . . . . . . . . . . . 48,220 48,355 0.577Guyana . . . . . . . . . . . . . . . . . . . . . . . . . . . . . . . . . . . . 13,393 13,528 0.162Haiti . . . . . . . . . . . . . . . . . . . . . . . . . . . . . . . . . . . . . . 36,121 36,256 0.433Honduras . . . . . . . . . . . . . . . . . . . . . . . . . . . . . . . . . . 36,121 36,256 0.433Jamaica . . . . . . . . . . . . . . . . . . . . . . . . . . . . . . . . . . . 48,220 48,355 0.577Mexico . . . . . . . . . . . . . . . . . . . . . . . . . . . . . . . . . . . . 578,632 578,767 6.912Nicaragua . . . . . . . . . . . . . . . . . . . . . . . . . . . . . . . . . 36,121 36,256 0.433Panama . . . . . . . . . . . . . . . . . . . . . . . . . . . . . . . . . . . 36,121 36,256 0.433Paraguay . . . . . . . . . . . . . . . . . . . . . . . . . . . . . . . . . . 36,121 36,256 0.433Peru . . . . . . . . . . . . . . . . . . . . . . . . . . . . . . . . . . . . . . 120,445 120,580 1.440Suriname . . . . . . . . . . . . . . . . . . . . . . . . . . . . . . . . . . 7,342 7,477 0.089Trinidad and Tobago . . . . . . . . . . . . . . . . . . . . . . . . 36,121 36,256 0.433Uruguay . . . . . . . . . . . . . . . . . . . . . . . . . . . . . . . . . . . 96,507 96,642 1.154Venezuela . . . . . . . . . . . . . . . . . . . . . . . . . . . . . . . . . . 482,267 482,402 5.761
Total regional developing members . . . . . . . . . . . . 4,184,669 4,188,179 50.018
Canada . . . . . . . . . . . . . . . . . . . . . . . . . . . . . . . . . . . . . 334,887 335,022 4.001United States . . . . . . . . . . . . . . . . . . . . . . . . . . . . . . . . 2,512,529 2,512,664 30.008
Nonregional membersAustria . . . . . . . . . . . . . . . . . . . . . . . . . . . . . . . . . . . . 13,312 13,447 0.161Belgium . . . . . . . . . . . . . . . . . . . . . . . . . . . . . . . . . . . 27,438 27,573 0.329Croatia . . . . . . . . . . . . . . . . . . . . . . . . . . . . . . . . . . . . 4,018 4,153 0.050Denmark. . . . . . . . . . . . . . . . . . . . . . . . . . . . . . . . . . . 14,157 14,292 0.171Finland . . . . . . . . . . . . . . . . . . . . . . . . . . . . . . . . . . . . 13,312 13,447 0.161France . . . . . . . . . . . . . . . . . . . . . . . . . . . . . . . . . . . . 158,638 158,773 1.896Germany . . . . . . . . . . . . . . . . . . . . . . . . . . . . . . . . . . 158,638 158,773 1.896Israel . . . . . . . . . . . . . . . . . . . . . . . . . . . . . . . . . . . . . . 13,126 13,261 0.158Italy . . . . . . . . . . . . . . . . . . . . . . . . . . . . . . . . . . . . . . 158,638 158,773 1.896Japan . . . . . . . . . . . . . . . . . . . . . . . . . . . . . . . . . . . . . 418,642 418,777 5.001Netherlands . . . . . . . . . . . . . . . . . . . . . . . . . . . . . . . . 28,207 28,342 0.338Norway . . . . . . . . . . . . . . . . . . . . . . . . . . . . . . . . . . . 14,157 14,292 0.171Portugal . . . . . . . . . . . . . . . . . . . . . . . . . . . . . . . . . . . 4,474 4,609 0.055Slovenia . . . . . . . . . . . . . . . . . . . . . . . . . . . . . . . . . . . 2,434 2,569 0.031Spain . . . . . . . . . . . . . . . . . . . . . . . . . . . . . . . . . . . . . 158,638 158,773 1.896Sweden . . . . . . . . . . . . . . . . . . . . . . . . . . . . . . . . . . . . 27,268 27,403 0.327Switzerland . . . . . . . . . . . . . . . . . . . . . . . . . . . . . . . . 39,347 39,482 0.472United Kingdom . . . . . . . . . . . . . . . . . . . . . . . . . . . . 80,551 80,686 0.964
Total nonregional members . . . . . . . . . . . . . . . . . . . 1,334,995 1,337,425 15.973
Total before unallocated amount . . . . . . . . . . . . . . 8,367,080 8,373,290 100.000
Unallocated (see Note J) . . . . . . . . . . . . . . . . . . . . . 1,299 1,434
GRAND TOTAL . . . . . . . . . . . . . . . . . . . . . . . . . . . 8,368,379 8,374,724
(1) Data are rounded; detail may not add to subtotals and grand total because of rounding.

FUND FOR
SPECIAL OPERATIONS
REPORT OF INDEPENDENT AUDITORS
Board of Governors
Inter-American Development Bank
We have audited the accompanying special purpose statement of assets, liabilities and fund balance of the Inter-American Development
Bank (Bank)—Fund for Special Operations as of December 31, 2002, and the related special purpose statements of changes in general
reserve, comprehensive income, and cash flows for the year then ended. These financial statements are the responsibility of the Bank’s
management. Our responsibility is to express an opinion on these financial statements based on our audit. The special purpose financial
statements of the Inter-American Development Bank—Fund for Special Operations as of December 31, 2001, were audited by other
auditors who have ceased operations and whose report dated February 13, 2002, expressed an unqualified opinion on those special
purpose financial statements prepared on the basis of accounting described in Note B to these financial statements.
We conducted our audit in accordance with auditing standards generally accepted in the United States. Those standards require that we
plan and perform an audit to obtain reasonable assurance about whether the financial statements are free of material misstatement. An
audit includes examining, on a test basis, evidence supporting the amounts and disclosures in the financial statements. An audit also
includes assessing the accounting principles used and significant estimates made by management, as well as evaluating the overall
financial statement presentation. We believe that our audit provides a reasonable basis for our opinion.
As described in Note B, the accompanying special purpose financial statements have been prepared for the purpose of complying with
Article IV, Section 8(d) of the Agreement Establishing the Inter-American Development Bank, and are not intended to be a presentation
in conformity with generally accepted accounting principles.
In our opinion, the accompanying special purpose financial statements of the Inter-American Development Bank—Fund for Special
Operations as of December 31, 2002 and for the year then ended present fairly, in all material respects, the information set forth therein
on the basis of accounting described in Note B.
This report was prepared solely for the information and use of the Board of Governors, Board of Executive Directors, and management
of the Bank. However, under the Agreement Establishing the Inter-American Development Bank, this report is included in the Annual
Report of the Bank and is therefore a matter of public record and its distribution is not limited.
Washington, D.C.
February 12, 2003

144
The accompanying notes are an integral part of these special purpose financial statements.
FUND FOR SPECIAL OPERATIONSINTER-AMERICAN DEVELOPMENT BANK
SPECIAL PURPOSE STATEMENT OF ASSETS, LIABILITIES AND FUND BALANCEExpressed in thousands of United States dollars
December 31,
2002 2001
ASSETS
Cash and investmentsCash . . . . . . . . . . . . . . . . . . . . . . . . . . . . . . . . . . . . . . . . . . . . . . . . . . . . $ 487,232 $ 517,527Investments . . . . . . . . . . . . . . . . . . . . . . . . . . . . . . . . . . . . . . . . . . . . . . 1,133,919 $1,621,151 1,041,679 $1,559,206
Loans outstanding . . . . . . . . . . . . . . . . . . . . . . . . . . . . . . . . . . . . . . . . . 6,730,320 6,636,835
Accrued interest and other chargesOn investments . . . . . . . . . . . . . . . . . . . . . . . . . . . . . . . . . . . . . . . . . . . 2,464 2,338On loans . . . . . . . . . . . . . . . . . . . . . . . . . . . . . . . . . . . . . . . . . . . . . . . . 35,485 37,949 48,149 50,487
Receivable from membersContribution quotas . . . . . . . . . . . . . . . . . . . . . . . . . . . . . . . . . . . . . . . 57,019 85,380Non-negotiable, non-interest bearing
demand obligations . . . . . . . . . . . . . . . . . . . . . . . . . . . . . . . . . . . . . 944,183 999,843Amounts required to maintain value
of currency holdings . . . . . . . . . . . . . . . . . . . . . . . . . . . . . . . . . . . . 250,200 1,251,402 279,787 1,365,010
Other assets . . . . . . . . . . . . . . . . . . . . . . . . . . . . . . . . . . . . . . . . . . 7,411 12,340
Total assets . . . . . . . . . . . . . . . . . . . . . . . . . . . . . . . . . . . . . . . . . . . . . $9,648,233 $9,623,878
LIABILITIES AND FUND BALANCE
LiabilitiesAccounts payable and accrued expenses . . . . . . . . . . . . . . . . . . . . . . . $ 9,704 $ 2,349Undisbursed technical cooperation
projects and other financings . . . . . . . . . . . . . . . . . . . . . . . . . . . . . 118,628 $ 128,332 132,023 $ 134,372
Fund balanceContribution quotas authorized and subscribed . . . . . . . . . . . . . . . . 9,583,764 9,480,313General reserve . . . . . . . . . . . . . . . . . . . . . . . . . . . . . . . . . . . . . . . . . . . (53,604) 4,124Accumulated translation adjustments . . . . . . . . . . . . . . . . . . . . . . . . (10,259) 9,519,901 5,069 9,489,506
Total liabilities and fund balance . . . . . . . . . . . . . . . . . . . . . . . . $9,648,233 $9,623,878

FINANCIAL STATEMENTS 145
FUND FOR SPECIAL OPERATIONSINTER-AMERICAN DEVELOPMENT BANK
SPECIAL PURPOSE STATEMENT OF CHANGES IN GENERAL RESERVEExpressed in thousands of United States dollars
The accompanying notes are an integral part of these special purpose financial statements.
Years ended December 31,
2002 2001
IncomeLoans
Interest . . . . . . . . . . . . . . . . . . . . . . . . . . . . . . . . . . . . . . . . . . . . . . . . . . . . . . . . . . . . . . . . $106,706 $ 126,459Credit commissions . . . . . . . . . . . . . . . . . . . . . . . . . . . . . . . . . . . . . . . . . . . . . . . . . . . . . 4,504 4,704Service charges . . . . . . . . . . . . . . . . . . . . . . . . . . . . . . . . . . . . . . . . . . . . . . . . . . . . . . . . . 408 513Supervision and inspection fees . . . . . . . . . . . . . . . . . . . . . . . . . . . . . . . . . . . . . . . . . . . 3,929 3,220
115,547 134,896
Investments . . . . . . . . . . . . . . . . . . . . . . . . . . . . . . . . . . . . . . . . . . . . . . . . . . . . . . . . . . . . . . 22,791 41,376Other . . . . . . . . . . . . . . . . . . . . . . . . . . . . . . . . . . . . . . . . . . . . . . . . . . . . . . . . . . . . . . . . . . . 2,931 7,863
Total income . . . . . . . . . . . . . . . . . . . . . . . . . . . . . . . . . . . . . . . . . . . . . . . . . . . . . . . . . . . 141,269 184,135
ExpensesAdministrative expenses . . . . . . . . . . . . . . . . . . . . . . . . . . . . . . . . . . . . . . . . . . . . . . . . . . . 60,247 55,604
Total expenses . . . . . . . . . . . . . . . . . . . . . . . . . . . . . . . . . . . . . . . . . . . . . . . . . . . . . . . . . . 60,247 55,604
Excess of income over expenses before technicalcooperation expense and HIPC debt initiative . . . . . . . . . . . . . . . . . . . . . . . . . . . . . . 81,022 128,531
Technical cooperation expense . . . . . . . . . . . . . . . . . . . . . . . . . . . . . . . . . . . . . . . . . . . . . . 31,056 27,424HIPC debt relief . . . . . . . . . . . . . . . . . . . . . . . . . . . . . . . . . . . . . . . . . . . . . . . . . . . . . . . . . . . . 37,494 540,828
Excess of income over expenses (expenses over income) . . . . . . . . . . . . . . . . . . . . . . 12,472 (439,721)
General reserve, beginning of year . . . . . . . . . . . . . . . . . . . . . . . . . . . . . . . . . . . . . . . . . . 4,124 498,345Allocations to Intermediate Financing Facility Account . . . . . . . . . . . . . . . . . . . . . . . . . . (70,200) (54,500)
General reserve, end of year . . . . . . . . . . . . . . . . . . . . . . . . . . . . . . . . . . . . . . . . . . . . . . . . $ (53,604) $ 4,124
SPECIAL PURPOSE STATEMENT OF COMPREHENSIVE INCOMEExpressed in thousands of United States dollars
Years ended December 31,
2002 2001
Excess of income over expenses (expenses over income) . . . . . . . . . . . . . . . . . . . . . . $ 12,472 $ (439,721)Translation adjustments on assets and liabilities . . . . . . . . . . . . . . . . . . . . . . . . . . . . . . 88,892 (64,086)
Comprehensive income (loss) . . . . . . . . . . . . . . . . . . . . . . . . . . . . . . . . . . . . . . . . . . . . . . . $101,364 $ (503,807)

146
The accompanying notes are an integral part of these special purpose financial statements.
FUND FOR SPECIAL OPERATIONSINTER-AMERICAN DEVELOPMENT BANK
SPECIAL PURPOSE STATEMENT OF CASH FLOWSExpressed in thousands of United States dollars
Years ended December 31,
2002 2001
Cash flows from lending and investing activitiesLending:
Loan disbursements . . . . . . . . . . . . . . . . . . . . . . . . . . . . . . . . . . . . . . . . . . . . . . . . . . . . . $ (312,910) $ (422,033)Loan collections . . . . . . . . . . . . . . . . . . . . . . . . . . . . . . . . . . . . . . . . . . . . . . . . . . . . . . . . 255,611 265,732Loan participations, net . . . . . . . . . . . . . . . . . . . . . . . . . . . . . . . . . . . . . . . . . . . . . . . . . . (6,567) 1,992
Net cash used in lending activities . . . . . . . . . . . . . . . . . . . . . . . . . . . . . . . . . . . . . . . . . . . (63,866) (154,309)Miscellaneous assets and liabilities . . . . . . . . . . . . . . . . . . . . . . . . . . . . . . . . . . . . . . . . . . . 2,518 (1,096)
Net cash used in lending and investing activities . . . . . . . . . . . . . . . . . . . . . . . . . . . . . . . . (61,348) (155,405)
Cash flows from financing activitiesCapital:
Collections of receivables from members . . . . . . . . . . . . . . . . . . . . . . . . . . . . . . . . . . . 132,142 277,357
Net cash provided by financing activities . . . . . . . . . . . . . . . . . . . . . . . . . . . . . . . . . . . . . . 132,142 277,357
Cash flows from operating activitiesLoan income collections . . . . . . . . . . . . . . . . . . . . . . . . . . . . . . . . . . . . . . . . . . . . . . . . . . . 115,895 117,021Income from investments . . . . . . . . . . . . . . . . . . . . . . . . . . . . . . . . . . . . . . . . . . . . . . . . . . 23,159 43,641Other income . . . . . . . . . . . . . . . . . . . . . . . . . . . . . . . . . . . . . . . . . . . . . . . . . . . . . . . . . . . . 2,931 7,863Administrative expenses . . . . . . . . . . . . . . . . . . . . . . . . . . . . . . . . . . . . . . . . . . . . . . . . . . . (52,042) (57,403)Technical cooperation and other financings . . . . . . . . . . . . . . . . . . . . . . . . . . . . . . . . . . . (44,450) (51,299)
Net cash provided by operating activities . . . . . . . . . . . . . . . . . . . . . . . . . . . . . . . . . . . . . . 45,493 59,823
Adjustments to receivable from members . . . . . . . . . . . . . . . . . . . . . . . . . . . . . . . . . . . . — (55,379)
Change in market value of investments . . . . . . . . . . . . . . . . . . . . . . . . . . . . . . . . . . . . . . (482) 301
Allocations to the Intermediate Financing Facility Account . . . . . . . . . . . . . . . . . . . . . (70,200) (54,500)
Effect of exchange rate fluctuations on cash and investments . . . . . . . . . . . . . . . . . 16,340 (25,735)
Net increase in cash and investments . . . . . . . . . . . . . . . . . . . . . . . . . . . . . . . . . . . . . . . 61,945 46,462
Cash and investments, beginning of year . . . . . . . . . . . . . . . . . . . . . . . . . . . . . . . . . . . . 1,559,206 1,512,744
Cash and investments, end of year . . . . . . . . . . . . . . . . . . . . . . . . . . . . . . . . . . . . . . . . . . $1,621,151 $1,559,206

FUND FOR SPECIAL OPERATIONSINTER-AMERICAN DEVELOPMENT BANK
NOTES TO SPECIAL PURPOSE FINANCIAL STATEMENTS (continued)
December 31, 2002 and 2001
FINANCIAL STATEMENTS 147
Note A – OriginThe Inter-American Development Bank (Bank) is an international
organization which was established in December 1959. The prin-
cipal purpose of the Bank is to promote the economic and social
development of Latin America and the Caribbean, primarily by
providing loans and related technical assistance for specific projects
and for programs of economic reform. The Fund for Special Op-
erations (FSO) was established under the Agreement Establishing
the Bank (Agreement) for the purpose of making loans in the less
developed member countries in Latin America and the Caribbean
by providing financing on terms which are highly concessional.
The FSO also provides technical assistance both related to projects
and not connected to specific loans. The FSO complements the
activities of the Ordinary Capital and the Intermediate Financing
Facility Account (IFF). The IFF’s purpose is to subsidize part of
the interest payments for which certain borrowers are liable on
loans from the Ordinary Capital. The FSO makes annual general
reserve allocations to the IFF, as indicated in Note H.
Note B – Summary of Significant Accounting PoliciesDue to the nature and organization of the FSO, the accompany-
ing financial statements have been prepared on a special account-
ing basis. As described below, this special accounting basis is not
consistent with United States generally accepted accounting prin-
ciples (GAAP) with respect to certain items. These special pur-
pose financial statements have been prepared to comply with
Article IV, Section 8(d) of the Agreement.
Basis of accountingThe FSO’s special purpose financial statements are prepared on
the accrual basis of accounting for loan income, investment in-
come and administrative expenses. That is, the effect of transac-
tions and other events is recognized when they occur (not as cash
is received or paid) and they are recorded in the accounting
records and reported in the annual financial statements of the
period to which they relate. The FSO follows a special account-
ing basis for loans and contribution quotas as described below.
Use of estimatesThe preparation of financial statements requires management to
make estimates and assumptions that affect the reported amounts
of assets and liabilities, the disclosure of contingent assets and
liabilities at the date of the financial statements, and the reported
amounts of revenues and expenses during the reporting period.
Actual results could differ from these estimates.
Translation of currenciesThe FSO’s financial statements are expressed in United States
dollars; however, the Bank conducts the operations of the FSO in
the currencies of all of its members. Assets and liabilities denomi-
nated in currencies other than the United States dollar are gener-
ally translated at approximate market rates of exchange prevailing
at the dates of the financial statements. Income and expenses in
such currencies are translated at approximate market rates of
exchange prevailing during each month. Exchange rate fluctua-
tions generally do not have any effect on the United States dollar
equivalents of such currencies because of the maintenance of
value provisions described below. The adjustments resulting from
the translation into United States dollars of assets and liabilities
are presented as a component of comprehensive income in the
Special Purpose Statement of Comprehensive Income. The ad-
justments resulting from the translation of contribution quotas
authorized and subscribed that do not have maintenance of value
protection, which are derived from the 1983, 1990 and 1995 in-
creases in contribution quotas, are charged or credited directly
to accumulated translation adjustments. Under United States
GAAP, the contribution quotas authorized and subscribed should
be reported at historical rates of exchange prevailing at the date
of the relevant replenishment’s approval.
InvestmentsAll of the FSO’s investment securities are held in a trading port-
folio carried at market value, with realized and unrealized gains
and losses included in income from investments. The investments
are included in the Special Purpose Statement of Cash Flows as
cash equivalents due to their nature and the Bank’s policy gov-
erning the level and use of such investments.
LoansThe FSO makes highly concessional loans in convertible curren-
cies to the Bank’s least-developed borrowing members, agencies
or political subdivisions of such members, or to private enterprises
located in their territories. In previous years, the FSO also made
concessional loans in local currencies to borrowing members. In
the case of loans to borrowers other than national governments,
central banks or other governmental or inter-governmental enti-
ties, the FSO follows the general policy of requiring a guarantee
engaging the full faith and credit of the government. Under the
loan contracts with the borrowers, the FSO sells participations in
certain loans to the Social Progress Trust Fund (SPTF), reserving
to itself the administration of those loans.
Loans generally have up to 40 years final maturity and up
to a 10 year grace period for principal payments and generally
carry an interest rate of 1% during the grace period and 2% there-
after. The principal amount of loans and accrued interest are re-
payable in the currencies lent.
It is the policy of the FSO to place on nonaccrual status all
loans to a member government if service under any loan to or
FUND FOR SPECIAL OPERATIONSINTER-AMERICAN DEVELOPMENT BANK
NOTES TO SPECIAL PURPOSE FINANCIAL STATEMENTS (continued)
December 31, 2002 and 2001
148
guaranteed by the member government, made from any fund
owned or administered by the Bank, is overdue more than 180
days. On the date that a member’s loan is placed on nonaccrual
status, all loans to that member country are also placed on
nonaccrual status. When a loan is placed on nonaccrual status,
charges that had been accrued and remain unpaid are deducted
from the income of the current period. Charges on nonaccruing
loans are included in income only to the extent that payments
have actually been received by the FSO. On the date a member
pays in full all overdue amounts, the member’s loans emerge from
nonaccrual status, its eligibility for new loans is restored, and all
overdue charges (including those from prior years) are recog-
nized as income from loans in the current period. Except for the
debt relief loan write-offs resulting from the implementation of
the Heavily Indebted Poor Countries (HIPC) Initiative discussed
in Note M, the FSO has never had a write-off on any of its loans
and has a policy of not rescheduling loan repayments.
Incremental direct costs associated with originating loans
are expensed as incurred as such amounts are immaterial to the
financial results of the FSO.
Under United States GAAP, loans are recorded at their net
realizable value, including an allowance for amounts estimated
to be uncollectible. Management has elected to present loans
under a special accounting basis to provide for recording loans
and accrued income at the full face amount of the borrowers’
outstanding obligations. Any loan losses that might occur would
be charged to income of the current period.
The principal component of FSO loans affected by the
enhanced HIPC Initiative is recognized as HIPC debt relief in
the Special Purpose Statement of Changes in General Reserve
and as a reduction in loans in the Special Purpose Statement of
Assets, Liabilities and Fund Balance when the Board of Executive
Directors determines that a country has reached completion
point. Interim debt relief, which is revocable, during the period
between decision and completion points (as defined in Note M)
is recognized when relief is delivered to the country. HIPC loans
continue to accrue interest and other charges until principal debt
relief is delivered. The interest and other charges component of
debt relief, if any, is recognized as HIPC debt relief in the period
it is forgiven.
Contribution quotasRecognition: Under United States GAAP, contribution quotas
authorized and subscribed should not be recorded until the Bank
receives a promissory demand note, which is guaranteed by the
member country, as payment of the amount due. To present the
full amount of the member country’s commitment, management
has elected to report contribution quotas under a special account-
ing basis that provides for the recording of member’s contribu-
tion quotas, for each FSO replenishment, in full as contribution
quotas receivable upon approval of the relevant replenishment
by the Board of Governors.
Contribution quotas come due as a receivable throughout
the replenishment period in accordance with an agreed subscrip-
tion and encashment schedule. The actual subscription and pay-
ment of receivables when they become due from certain members
is conditional upon the respective member’s budgetary appro-
priation processes. Contribution quotas are settled through pay-
ment of cash or non-negotiable, non-interest bearing demand
notes. If the receivable is settled in cash, the cash is recorded in
cash and investments. The notes are encashed by the FSO as pro-
vided in the relevant replenishment resolution.
Valuation: The Agreement provides that the FSO be expressed
in terms of the United States dollar of the weight and fineness in
effect on January 1, 1959. The Second Amendment to the Ar-
ticles of Agreement of the International Monetary Fund elimi-
nated par values of currencies in terms of gold effective April 1,
1978, and consequently the General Counsel of the Bank has ren-
dered an opinion that the Special Drawing Right (SDR) has be-
come the successor to the 1959 United States dollar as the standard
of value of the FSO’s member contributions and for the purpose
of maintaining the value of the FSO’s currency holdings. The SDR
has a value equal to the sum of the values of specific amounts of
stated currencies, including the United States dollar. Pending a
decision by the Bank’s governing board and as suggested in the
General Counsel’s opinion, the Bank is continuing its practice of
using the 1959 United States dollar, which, pursuant to the de-
valuations of the United States dollar in 1972 and 1973, is equal
to approximately 1.2063 current United States dollars, as the ba-
sis of valuation. If the 1959 United States dollar were to have been
substituted with the SDR on December 31, 2002, the financial
position and the results of operations of the FSO would not have
been materially affected.
Maintenance of valueIn accordance with the Agreement, each member is required to
maintain the value of its currency held in the FSO to the extent
established by the terms for the respective increases in contribu-
tion quotas. Likewise, and subject to the same terms of the con-
tribution quota increases, the Bank is required to return to a
member an amount of its currency equal to any significant in-
crease in value of such member’s currency which is held in the
FSO. The standard of value for these purposes is the United States
dollar of the weight and fineness in effect on January 1, 1959, as
provided in the Agreement. Currency holdings derived from the
1983, 1990 and 1995 increases in contribution quotas do not have
maintenance of value protection.

FUND FOR SPECIAL OPERATIONSINTER-AMERICAN DEVELOPMENT BANK
NOTES TO SPECIAL PURPOSE FINANCIAL STATEMENTS (continued)
December 31, 2002 and 2001
FINANCIAL STATEMENTS 149
Administrative expensesSubstantially all administrative expenses of the Bank, including
depreciation, are allocated between the Ordinary Capital and the
FSO pursuant to an allocation method approved by the Board of
Executive Directors. Following this allocation method, during
2002, the effective ratio of administrative expenses charged to
the FSO was 16.4% and 83.6% to the Ordinary Capital (2001—
16.0% and 84.0%, respectively).
Technical cooperationNon-reimbursable technical cooperation projects, as well as cer-
tain financings whose recovery is explicitly contingent on events
that may not occur, are recorded as technical cooperation ex-
pense at the time of approval.
Cancellations of undisbursed balances and recuperations
of contingently recoverable financings are recognized as an off-
set to technical cooperation expense in the period in which they
occur.
Fair values of financial instrumentsThe following methods and assumptions were used by the FSO in
estimating the fair value for its financial instruments:
Cash: The carrying amount reported in the Special Purpose
Statement of Assets, Liabilities and Fund Balance for cash ap-
proximates fair value.
Investments: Fair values for investment securities are based on
quoted market prices, where available. If quoted market prices
are not available, fair values are based on quoted market prices of
comparable instruments.
Loans: The FSO is one of very few sources of development loans
to Latin American and Caribbean countries. There is no second-
ary market for development loans. Interest on all loans within
the FSO is accrued at fixed rates. For all loans and related com-
mitments, the FSO is of the opinion that, due to its unique posi-
tion in lending operations and the absence of a secondary market,
it is not practicable to estimate a fair market value for the FSO’s
lending portfolio.
Note C – Restricted CurrenciesAs of December 31, 2002, cash includes $461,697,000 (2001—
$500,584,000) in non-convertible currencies of regional borrow-
ing members, of which $38,478,000 (2001—$53,212,000) has
been restricted by one of the members in accordance with provi-
sions of the Agreement, to be used for making payments for goods
and services produced in its territory.
Note D – InvestmentsAs part of its overall portfolio management strategy, the Bank
invests FSO resources in government, agency, bank and corpo-
rate obligations, time deposits and asset- and mortgage-backed
securities. The Bank limits FSO activities of investing in securi-
ties to a list of authorized dealers and counterparties. Strict credit
limits have been established for each counterparty.
Government and agency obligations: These obligations include
unsubordinated and marketable bonds, notes and other obliga-
tions issued or unconditionally guaranteed by a government of a
country, an agency or instrumentality of a government of a coun-
try, a multilateral organization, or any other official entity. The
Bank invests only in (i) obligations of or guaranteed by the gov-
ernment of the member country whose currency is being invested,
(ii) obligations issued or unconditionally guaranteed by an agency
or instrumentality of the government of certain countries or any
other official entity, in any currency, with credit quality equiva-
lent to a AA– or better rating (residential mortgage-backed secu-
rities require a AAA rating), (iii) obligations of multilateral
organizations, in any currency, with credit quality equivalent to a
AAA rating, and (iv) non-local currency obligations of or guar-
anteed by certain governments with credit quality equivalent to
a AA– or better rating.
Bank obligations and time deposits: These obligations include
certificates of deposit, bankers’ acceptances, and other obligations
issued or unconditionally guaranteed by banks or other financial
institutions. The Bank invests in these types of obligations if the
entity issuing or guaranteeing them has a senior debt securities
rating of at least A+.
Corporate securities: These obligations include publicly issued,
unsubordinated and marketable bonds, notes or other debt obli-
gations issued or unconditionally guaranteed by non-bank cor-
porate entities or trusts. The Bank invests only in these types of
securities with credit ratings of AAA.
Asset- and mortgage-backed securities: Asset- and mortgage-
backed securities include unsubordinated, marketable asset-
backed and residential mortgage-backed obligations issued or
unconditionally guaranteed by corporate entities or trusts. The
cash flow of these instruments is based on the cash flows of the
pool of underlying assets managed by a special purpose vehicle,
or trust, which provides credit enhancements to ensure higher
credit ratings. The Bank invests only in these types of securities
with credit ratings of AAA. In addition, the Bank invests in short-
term asset-backed securities and short-term asset-backed com-
mercial paper carrying only the highest short-term credit ratings.

FUND FOR SPECIAL OPERATIONSINTER-AMERICAN DEVELOPMENT BANK
NOTES TO SPECIAL PURPOSE FINANCIAL STATEMENTS (continued)
December 31, 2002 and 2001
150
Trading portfolio: A summary of the FSO’s position in trading
portfolio securities at December 31, 2002 and 2001 is shown in
the Summary Statement of Investments in Appendix II-1.
Net unrealized gains on trading securities, held at
December 31, 2002, of $259,000 (2001—$320,000) were included
in income from investments. The average return on investments,
including realized and unrealized gains and losses, during 2002
and 2001 was 2.05% and 3.88%, respectively.
Note E – Loans OutstandingApproved loans are disbursed to borrowers in accordance with
the requirements of the project being financed; however, disburse-
ments do not begin until the borrower and guarantor, if any, take
certain actions and furnish certain documents to the Bank. Of
the undisbursed balances, the FSO has entered into irrevocable
commitments to disburse approximately $5,863,000 at
December 31, 2002. The loans outstanding of the FSO are shown
in the Summary Statement of Loans in Appendix II-2. At
December 31, 2002, loans made to or guaranteed by Haiti with
an outstanding balance of $435,625,000 were on nonaccrual sta-
tus, pursuant to the policy described in Note B. If these loans had
not been on nonaccrual status, income from loans for 2002 would
have been higher by $11,454,000.
The average maturity for loans outstanding at December 31, 2002
and 2001 was 13.45 years and 13.52 years, respectively, and the
average interest rate was 1.75% and 1.74%, respectively.
Note F – Contribution Quotas Authorized and SubscribedNon-negotiable, non-interest bearing demand obligations have
been or will be accepted in lieu of the immediate payment of all
or any part of a member’s contribution quotas. The payment of
contribution quotas is conditional on the members’ budgetary
and, in some cases, legislative processes. The Canadian contribu-
tion quota is being increased by collections of principal, interest
and service charges on loans extended from the Canadian Trust
Fund administered by the Bank. For a Statement of Contribu-
tion Quotas at December 31, 2002 and 2001, see Appendix II-3.
Voting powerThe number of votes and percent of voting power of the Ordi-
nary Capital for each member country form the basis of decision
making concerning the operations of the FSO.
Changes for the periodThe following table summarizes the changes in contribution
Contribution quotas
authorized andsubscribed
Balance at January 1, 2001 . . . . . . . . . . . . . . . . . . . . . . . . $9,559,010Contribution by Canada—
Trust Fund collections . . . . . . . . . . . . . . . . . . . . . . . . . 828Contribution by Switzerland—
Additional contribution fromterminated trust fund . . . . . . . . . . . . . . . . . . . . . . . . . . 321
Translation adjustment of contributionsapproved in 1983, 1990 and 1995due to exchange rate fluctuations . . . . . . . . . . . . . . . . (79,713)
Other . . . . . . . . . . . . . . . . . . . . . . . . . . . . . . . . . . . . . . . . . (133)
Balance at December 31, 2001 . . . . . . . . . . . . . . . . . . . . . 9,480,313Contribution by Canada—
Trust Fund collections . . . . . . . . . . . . . . . . . . . . . . . . . 739Contribution by Switzerland—
Additional contribution fromterminated trust fund . . . . . . . . . . . . . . . . . . . . . . . . . . 310
Translation adjustment of contributionsapproved in 1983, 1990 and 1995due to exchange rate fluctuations . . . . . . . . . . . . . . . . 104,220
Withdrawal of Bosnia and Herzegovina . . . . . . . . . . . . . (1,818)
Balance at December 31, 2002 . . . . . . . . . . . . . . . . . . . . . $9,583,764
As of December 31, 2002, the cumulative decrease in
the United States dollar equivalents of contribution quotas be-
cause of exchange rate fluctuations was $196,497,000 (2001—
$300,717,000).
The composition of the receivable from members as of
December 31, 2002 and 2001 is as follows (in thousands):
2002 2001
Regional developing members . . . . . . . . $1,020,880 $1,033,258Canada . . . . . . . . . . . . . . . . . . . . . . . . . . . — 2,508Non-regional members . . . . . . . . . . . . . 176,122 247,644Unallocated . . . . . . . . . . . . . . . . . . . . . . . 54,400 81,600
Total . . . . . . . . . . . . . . . . . . . . . . . . . . . $1,251,402 $1,365,010
In 2001, the FSO reclassified $55,379,000 from cash to
receivable from members—amounts required to maintain the
value of currency holdings relating to its regional developing
members.
On July 31, 1995, the Board of Governors of the Bank ap-
proved the Eighth General Increase in the Resources of the Bank
which provided for an increase in the authorized contribution
quotas for the FSO of approximately $1,000,000,000. Encash-
quotas authorized and subscribed for the years ended
December 31, 2002 and 2001 (in thousands):

FUND FOR SPECIAL OPERATIONSINTER-AMERICAN DEVELOPMENT BANK
NOTES TO SPECIAL PURPOSE FINANCIAL STATEMENTS (continued)
December 31, 2002 and 2001
FINANCIAL STATEMENTS 151
ments of contributions under this increase are due annually
through 2005. Under the increase, up to $136,000,000 of
unallocated special contributions to the FSO are to be paid by
contributions from members. Any unpaid portion is to be paid
to the FSO by periodic transfers from the net income of the Or-
dinary Capital, consistent with prudent financial management,
between January 1, 2000 and December 31, 2004. As of
December 31, 2002, no such contributions had been paid by
members. Accordingly, the Bank has transferred $27,200,000, rep-
resenting one fifth of the unallocated special contributions, from
the net income of the Ordinary Capital to the FSO in each of the
years 2000 through 2002. In accordance with the Agreement, these
transfers are credited to the total contribution quotas of each
member in the FSO in proportion to the number of Ordinary
Capital shares held by each member. At December 31, 2002,
unallocated special contributions not covered by net income
transfers from the Ordinary Capital amounted to $54,400,000
(2001—$81,600,000).
MembershipOn April 21, 1993, the Bank’s Board of Executive Directors de-
cided that the Socialist Federal Republic of Yugoslavia (SFRY)
had ceased to be a member of the Bank and that the Republic of
Bosnia and Herzegovina, the Republic of Croatia, the former
Yugoslav Republic of Macedonia, the Republic of Slovenia and
the Federal Republic of Yugoslavia (Serbia and Montenegro) were
authorized to succeed to the SFRY’s membership. Accordingly,
the contribution quotas representing SFRY’s membership in the
FSO of the Bank were classified as unallocated until each succes-
sor republic succeeded to the membership of the SFRY. Subse-
quently, the Republics of Croatia and Slovenia became members
of the Bank and subscribed to their allocated share of the contri-
bution quotas. The Governments of the former Yugoslav Repub-
lic of Macedonia and the Republic of Bosnia and Herzegovina
declined the offer to succeed to the membership of the SFRY in
the Bank. Membership of the Federal Republic of Yugoslavia
(Serbia and Montenegro) is still pending.
Note G –Maintenance of Value ReceivableAt December 31, 2002, amounts required to maintain value of
currency holdings, included on the Special Purpose Statement of
Assets, Liabilities and Fund Balance as a component of receiv-
able from members, includes $20,535,000 (2001—$47,302,000)
of amounts due from member countries for maintenance of value
adjustments resulting from the changes in the values of curren-
cies in 1972 and 1973 due to the devaluation of the United States
dollar in those years and $224,749,000 (2001—$227,570,000)
relating to reclassifications from cash to receivable from members.
Note H – General ReserveIn accordance with resolutions of the Board of Governors, the
excess of income over expenses of the FSO is to be added to the
general reserve.
In 2002, the Board of Governors allocated the equivalent
of $70,200,000 (2001—$54,500,000) in convertible currencies
from the general reserve of the FSO to the IFF for the purpose of
subsidizing part of the interest and principal for which certain
borrowers are liable on loans from the Ordinary Capital. Pro-
jected allocations from the general reserve of the FSO to the IFF
in accordance with various agreements of the Board of Gover-
nors are shown in the following table (in thousands):
Concessional
Capital HIPC resourcesYear increases(1) initiative (2) agreement (3) Total
2003 $ 30,000 $ 25,200 $ 20,000 $ 75,2002004 30,000 22,600 20,000 72,6002005 30,000 12,300 20,000 62,3002006 30,000 11,000 20,000 61,0002007 30,000 11,000 20,000 61,000
2008 to 2012 120,000 28,000 165,000 313,0002013 to 2017 — — 340,000 340,0002018 to 2019 — — 130,000 130,000
Total $270,000 $110,100 $735,000 $1,115,100
(1) Under the terms of the Sixth and Seventh General Capital Increases in the Re-sources of the Bank.
(2) Transfers to fund additional subsidy payments on Ordinary Capital loans to Bo-livia, Guyana and Nicaragua. See Note M for a description of the HIPC Initiative.
(3) Mandated allocations under the Concessional resources agreement approved bythe Board of Governors in 1999 amount to $20 million annually from 2000 to2012 and $15 million in 2013. Additional transfers of approximately $65 millionannually from 2012 to 2019 will be necessary to fund the 2000–2008 IFF lendingmandated under the Concessional resources agreement of 1999. The level of theseadditional transfers may change as assumptions are revised in future years.
These allocations are subject to annual approvals by the
Board of Governors and to adjustment for appropriate reasons
related to the availability of funding for the IFF.
The following is a summary of changes in the general reserve
for the years ended December 31, 2002 and 2001 (in thousands):
Income, TotalHIPC Other General
Initiative than HIPC Reserve
Balance at January 1, 2001 . . . . . $(177,077) $675,422 $(498,345Allocation to IFF . . . . . . . . . . . — (54,500) (54,500)HIPC debt relief . . . . . . . . . . . (540,828) — (540,828)Income, excluding HIPC . . . . — 101,107 101,107
Balance at December 31, 2001 . . (717,905) 722,029 4,124Allocation to IFF . . . . . . . . . . . (15,700) (54,500) (70,200)HIPC debt relief . . . . . . . . . . . (37,494) — (37,494)Income, excluding HIPC . . . . — 49,966 49,966
Balance at December 31, 2002 . . $(771,099) $717,495 $((53,604)

FUND FOR SPECIAL OPERATIONSINTER-AMERICAN DEVELOPMENT BANK
NOTES TO SPECIAL PURPOSE FINANCIAL STATEMENTS (continued)
December 31, 2002 and 2001
152
Note I – Accumulated Translation AdjustmentsThe following is a summary of changes in the accumulated trans-
lation adjustments for the years ended December 31, 2002 and
2001 (in thousands):
the Special Purpose Statement of Cash Flows, is as follows (in
thousands):
Note J – Administrative ExpensesPursuant to the policy described in Note B, the FSO shares in all
of the expenses incurred by the Bank in the Ordinary Capital
including those related to the pension and postretirement ben-
efit plans. During 2002, the Bank’s Postretirement Benefit Plan
had benefit income of $15,571,000 while during 2001 the Bank’s
Staff Retirement Plan and the Postretirement Benefit Plan had
benefit income aggregating $37,497,000. The FSO’s share of such
income, which is included in other income, amounted to
$3,027,000 (2001—$7,200,000).
Note K – Undisbursed Technical Cooperation Projects andOther FinancingsThe following is a summary of changes in undisbursed technical
cooperation projects and other financings for the years ended
December 31, 2002 and 2001 (in thousands):
Note M – Heavily Indebted Poor Countries (HIPC) InitiativeThe Bank is participating in the HIPC Initiative, a concerted, in-
ternational initiative endorsed by the Group of Seven Countries
(G-7), the World Bank and the International Monetary Fund for
addressing the debt problems of a group of countries identified
as heavily indebted poor countries to ensure that reform efforts
of these countries will not be put at risk by continued high exter-
nal debt burdens. Under the HIPC Initiative, all bilateral and
multilateral creditors are providing debt relief for countries that
demonstrate good policy performance over an extended period
in order to bring their debt service burdens to sustainable levels.
For the Bank, HIPC debt relief comprises HIPC I of 1998
and the enhanced HIPC Initiative approved in 2001. Eligible
member countries are Bolivia, Guyana, Honduras and Nicara-
gua and debt relief is expected to total a net present value of ap-
proximately $1.1 billion, to be delivered from 1998 through 2019.
This debt relief is being implemented through a combination of
2002 2001
Balance at January 1, . . . . . . . . . . . . . $132,023 $155,782Approvals . . . . . . . . . . . . . . . . . . . . . . 35,930 39,412Cancellations . . . . . . . . . . . . . . . . . . . (3,434) (9,814)Disbursements . . . . . . . . . . . . . . . . . . (45,891) (53,357)
Balance at December 31, . . . . . . . . . $118,628 $132,023
ContributionAssets quotasand authorized and
liabilities subscribed Total
Balance at January 1, 2001 . . . . . $(231,562) $221,004 $(10,558)Translation adjustments . . . . . (64,086) 79,713 15,627
Balance at December 31, 2001 . . (295,648) 300,717 5,069Translation adjustments . . . . . 88,892 (104,220) (15,328)
Balance at December 31, 2002 . . $(206,756) $196,497 $(10,259)
Years ended December 31,
2002 2001
Excess of income over expenses(expenses over income) . . . . . . . . . . . . . . . $ 12,472 $(439,721)
Difference between amounts accrued andamounts paid or collected for:Loan income . . . . . . . . . . . . . . . . . . . . . . . . 348 (17,875)Income from investments . . . . . . . . . . . . . (114) 2,566Net unrealized loss (gain) on
investments . . . . . . . . . . . . . . . . . . . . . . . 482 (301)Administrative expenses . . . . . . . . . . . . . . 8,205 (1,799)Technical cooperation and other
financings . . . . . . . . . . . . . . . . . . . . . . . . (13,394) (23,875)HIPC debt relief . . . . . . . . . . . . . . . . . . . . . . . 37,494 540,828
Net cash provided by operatingactivities . . . . . . . . . . . . . . . . . . . . . . . . . . . . $ 45,493 $ (59,823
Supplemental disclosure of noncashactivitiesIncrease (decrease) resulting from
exchange rate fluctuations:Loans outstanding . . . . . . . . . . . . . . . . . . . $ 54,586 $ (14,843)Receivable from members . . . . . . . . . . . . . 17,798 (23,063)Contribution quotas authorized and
subscribed . . . . . . . . . . . . . . . . . . . . . . . . 104,220 (79,713)
Note L – Reconciliation of Excess of Income over Expenses(Expenses over Income) to Net Cash Provided by OperatingActivitiesA reconciliation of excess of income over expenses (expenses over
income) to net cash provided by operating activities, as shown in

FUND FOR SPECIAL OPERATIONSINTER-AMERICAN DEVELOPMENT BANK
NOTES TO SPECIAL PURPOSE FINANCIAL STATEMENTS (continued)
December 31, 2002 and 2001
FINANCIAL STATEMENTS 153
write-offs of FSO loans, transfers from the FSO general reserve
to the IFF, conversion of Bank-held FSO local currencies to con-
vertible currencies, and grants of member countries through the
World Bank HIPC Trust Fund.
As part of HIPC I, in 1998 the FSO charged off loans to
Bolivia and Guyana in the amount of $177.1 million. In addi-
tion, the FSO will transfer the equivalent of $138 million in con-
vertible currencies during the period 1998 to 2010 from its general
reserve to the IFF to provide for increased IFF subsidy payments
during the period 1998 to 2015 on Ordinary Capital loans. Of
this amount $55,000,000 had already been transferred as of
December 31, 2002 (2001—$44,000,000).
Enhanced HIPC InitiativeAs part of the enhanced HIPC, the FSO will deliver debt service
relief by forgiving a portion of an eligible country’s FSO debt
service obligations as they become due. Additional debt service
relief to be delivered from 2001 to 2008 will be funded by amounts
received from the World Bank HIPC Trust Fund which, includ-
ing any investment income thereon, are kept separately from the
resources of the FSO in the HIPC Account to be used solely for
the specific purpose of meeting debt service obligations of eli-
gible countries with the FSO. These resources are not included
in the financial statements and do not affect the operations of
the FSO.
Under the enhanced HIPC, decision point is reached once
the country has established an adequate policy track record. The
completion point is achieved once the country has demonstrated
continued strong policy performance. During the period between
decision point and completion point, referred to as the interim
period, partial debt relief, not to exceed one-third of the total
relief amount, may be granted to a country. Such interim debt
relief is revocable and is contingent upon the country making
satisfactory progress towards a strong policy performance. Once
a country reaches completion point, the debt relief to the coun-
try becomes irrevocable.
Because of its revocable nature, interim debt relief is rec-
ognized only when actual relief is delivered to the country. Once
the Board of Executive Directors determines that a country has
reached completion point, the remaining nominal value of the
principal component of the total debt relief to be provided from
the FSO resources to the country is recorded as a reduction in
loans in the Special Purpose Statement of Assets, Liabilities and
Fund Balance and as HIPC debt relief in the Special Purpose State-
ment of Changes in General Reserve. The interest and other
charges component of debt relief to be provided from the FSO
resources, if any, is recognized as HIPC debt relief in the period
the debt relief is delivered.
During 2002, the Board of Executive Directors determined
that Guyana had reached decision point. In 2001, the Board of
Executive Directors determined that Bolivia had reached comple-
tion point and that Honduras and Nicaragua had reached de-
cision point. As a result of these determinations, the FSO recog-
nized as HIPC debt relief a total amount of $37,494,000 and
$540,828,000 during 2002 and 2001, respectively, following the
accounting policy described above.

154
FUND FOR SPECIAL OPERATIONS APPENDIX II-1INTER-AMERICAN DEVELOPMENT BANK
SUMMARY STATEMENT OF INVESTMENTS – NOTE DDecember 31, 2002 and 2001Expressed in thousands of United States dollars
The freely convertible currencies of the above investments are as follows:
Currencies 2002 2001
British pounds sterling . . . . . . . . . . . . $ 58,144 $ 43,647Canadian dollars . . . . . . . . . . . . . . . . . 10,027 —Euro . . . . . . . . . . . . . . . . . . . . . . . . . . . 31,557 1,868Japanese yen . . . . . . . . . . . . . . . . . . . . — 37,936Swedish kronor . . . . . . . . . . . . . . . . . . 1,316 3,352Swiss francs . . . . . . . . . . . . . . . . . . . . . 5,049 1,013United States dollars . . . . . . . . . . . . . . 1,027,826 953,863
$1,133,919 $1,041,679
2002 2001
Market MarketInvestments Cost value Cost value
Obligations of governmentsand agencies . . . . . . . . . . . . . . . . . . . . . . . . . . . . . . . $ 18,440 $ 18,437 $ 99,606 $ 99,830
Bank obligations and time deposits . . . . . . . . . . . . . . 404,947 404,966 337,029 337,029Corporate Securities . . . . . . . . . . . . . . . . . . . . . . . . . . . 50,000 49,833 — —Asset- and mortgage-backed securities . . . . . . . . . . . . 660,699 660,683 604,724 604,820
$1,134,086 $1,133,919 $1,041,359 $1,041,679

FINANCIAL STATEMENTS 155
FUND FOR SPECIAL OPERATIONS APPENDIX II-2INTER-AMERICAN DEVELOPMENT BANK
SUMMARY STATEMENT OF LOANS – NOTE EDecember 31, 2002 and 2001Expressed in thousands of United States dollars
The freely convertible currency in which the outstanding portion of approved loans is collectible are as follows:
Currency in which
outstanding portion ofapproved loans is
collectible
Loans FreelyMember in whose territory approved, less Principal HIPC debt Outstanding convertible Other Outstandingloans have been made cancellations collected(1) relief Undisbursed 2002 currencies currencies 2001
Argentina . . . . . . . . . . . . . . . . $ 644,904 $ 481,617 $ — $ 11,307 $ 151,980 $ 61 $ 151,919 $ 167,478Barbados . . . . . . . . . . . . . . . . 40,797 22,710 — — 18,087 17,921 166 18,700Bolivia . . . . . . . . . . . . . . . . . . 1,911,287 304,950 612,852 490,539 502,946 448,774 54,172 402,061Brazil . . . . . . . . . . . . . . . . . . . 1,558,305 1,134,592 — 27,244 396,469 1,642 394,827 423,494Chile . . . . . . . . . . . . . . . . . . . . 202,991 196,558 — — 6,433 2,669 3,764 8,553Colombia . . . . . . . . . . . . . . . . 754,845 534,382 — 16,344 204,119 61,659 142,460 222,910Costa Rica . . . . . . . . . . . . . . . 347,161 234,715 — — 112,446 103,391 9,055 124,002Dominican Republic . . . . . . . 705,117 291,896 — — 413,221 390,688 22,533 422,762Ecuador . . . . . . . . . . . . . . . . . 929,833 337,291 — 2,418 590,124 528,760 61,364 605,838El Salvador . . . . . . . . . . . . . . . 739,833 219,870 — 834 519,129 493,737 25,392 536,216Guatemala . . . . . . . . . . . . . . . 617,168 233,614 — 2,528 381,026 326,093 54,933 384,869Guyana . . . . . . . . . . . . . . . . . . 700,843 48,477 81,465 236,356 334,545 332,941 1,604 314,545Haiti . . . . . . . . . . . . . . . . . . . . 740,736 104,588 — 200,523 435,625 420,508 15,117 427,049Honduras . . . . . . . . . . . . . . . . 1,683,751 265,725 21,194 409,831 987,001 940,195 46,806 950,002Jamaica . . . . . . . . . . . . . . . . . . 161,656 99,243 — — 62,413 52,317 10,096 67,749Mexico . . . . . . . . . . . . . . . . . . 558,986 528,537 — — 30,449 — 30,449 34,216Nicaragua . . . . . . . . . . . . . . . . 1,657,091 170,635 15,303 501,897 969,256 936,642 32,614 874,738Panama . . . . . . . . . . . . . . . . . 280,891 208,644 — — 72,247 63,179 9,068 82,007Paraguay . . . . . . . . . . . . . . . . . 577,794 233,260 — — 344,534 314,195 30,339 351,988Peru . . . . . . . . . . . . . . . . . . . . 419,075 322,428 — — 96,647 45,864 50,783 106,932Suriname . . . . . . . . . . . . . . . . 2,036 591 — — 1,445 — 1,445 1,544Trinidad and Tobago . . . . . . 30,607 20,110 — — 10,497 131 10,366 11,408Uruguay . . . . . . . . . . . . . . . . . 103,934 73,292 — — 30,642 15,516 15,126 33,663Venezuela . . . . . . . . . . . . . . . . 101,393 101,393 — — — — — —Regional . . . . . . . . . . . . . . . . . 221,285 142,246 — 20,000 59,039 54,791 4,248 64,111
Total 2002 . . . . . . . . . . . . . $15,692,319 $6,311,364 $730,814 $1,919,821 $6,730,320 $5,551,674 $1,178,646
Total 2001 . . . . . . . . . . . . . $15,245,916 $6,060,346 $704,763 $1,843,972 $5,393,832 $1,243,003 $6,636,835
(1) Includes full principal repayment of loans previously sold.(2) Includes $489,168 of debt relief to be delivered in future years.
(2)
Currencies 2002 2001
British pounds sterling . . . . . . . . . . . . . . . . $ 99,612 $ 100,689Canadian dollars . . . . . . . . . . . . . . . . . . . . . 373,686 378,408Danish kroner . . . . . . . . . . . . . . . . . . . . . . . 28,615 26,815Euro . . . . . . . . . . . . . . . . . . . . . . . . . . . . . . . 757,771 720,449Japanese yen . . . . . . . . . . . . . . . . . . . . . . . . 218,243 203,301Norwegian kroner . . . . . . . . . . . . . . . . . . . . 24,062 23,030Swedish kronor . . . . . . . . . . . . . . . . . . . . . . 43,096 40,056Swiss francs . . . . . . . . . . . . . . . . . . . . . . . . . 47,731 45,756United States dollars . . . . . . . . . . . . . . . . . . 4,422,324 4,333,333Venezuelan bolivars . . . . . . . . . . . . . . . . . . 25,702 27,587
6,040,842 5,899,424Less: HIPC debt relief not delivered yet (1) 489,168 505,592
$5,551,674 $5,393,832
(1) Represents the principal component of loans recognized as HIPC debt relief in the Special Purpose Statement of Changes in General Reserve, and as a reduction of loansoutstanding in the Special Purpose Statement of Assets, Liabilities and Fund Balance for which debt service relief has not yet been delivered and, accordingly, the relatedcurrency of the debt service to be forgiven has not been determined.

156
FUND FOR SPECIAL OPERATIONS APPENDIX II-3INTER-AMERICAN DEVELOPMENT BANK
STATEMENT OF CONTRIBUTION QUOTAS – NOTE FDecember 31, 2002 and 2001Expressed in thousands of United States dollars
Contribution quotas authorized and subscribed
Subject to maintenance of value Not subject toBefore maintenance
Members adjustments Adjustments(1) of value Total 2002 Total 2001
Argentina . . . . . . . . . . . . . . . . . . . . . . . . . $ 402,819 $ 29,491 $ 61,479 $ 493,789 $ 486,094Austria . . . . . . . . . . . . . . . . . . . . . . . . . . . 10,955 — 7,545 18,500 17,312Bahamas . . . . . . . . . . . . . . . . . . . . . . . . . . 8,800 — 1,640 10,440 10,383Barbados . . . . . . . . . . . . . . . . . . . . . . . . . 1,403 42 306 1,751 1,716Belgium . . . . . . . . . . . . . . . . . . . . . . . . . . 27,098 — 15,499 42,597 40,156Belize . . . . . . . . . . . . . . . . . . . . . . . . . . . . — — 7,502 7,502 7,472Bolivia . . . . . . . . . . . . . . . . . . . . . . . . . . . 32,535 9,671 5,987 48,193 47,958Brazil . . . . . . . . . . . . . . . . . . . . . . . . . . . . 402,819 62,220 73,522 538,561 535,635Canada . . . . . . . . . . . . . . . . . . . . . . . . . . . 220,530 12,577 58,948 292,055 289,572Chile . . . . . . . . . . . . . . . . . . . . . . . . . . . . . 111,440 24,019 20,603 156,062 155,259Colombia . . . . . . . . . . . . . . . . . . . . . . . . . 111,385 20,077 20,603 152,065 151,262Costa Rica . . . . . . . . . . . . . . . . . . . . . . . . 16,215 3,954 2,960 23,129 23,012Croatia . . . . . . . . . . . . . . . . . . . . . . . . . . . 3,121 — 2,277 5,398 5,064Denmark . . . . . . . . . . . . . . . . . . . . . . . . . 11,692 — 8,026 19,718 18,454Dominican Republic . . . . . . . . . . . . . . . . 21,721 7,854 4,013 33,588 33,431Ecuador . . . . . . . . . . . . . . . . . . . . . . . . . . 21,721 4,246 4,011 29,978 29,821El Salvador . . . . . . . . . . . . . . . . . . . . . . . . 16,215 1,979 2,960 21,154 21,036Finland . . . . . . . . . . . . . . . . . . . . . . . . . . . 10,955 — 7,228 18,183 17,352France . . . . . . . . . . . . . . . . . . . . . . . . . . . . 133,396 — 85,196 218,592 205,161Germany . . . . . . . . . . . . . . . . . . . . . . . . . 136,692 — 95,626 232,318 226,856Guatemala . . . . . . . . . . . . . . . . . . . . . . . . 21,721 6,790 4,011 32,522 32,366Guyana . . . . . . . . . . . . . . . . . . . . . . . . . . . 6,980 — 1,264 8,244 8,201Haiti . . . . . . . . . . . . . . . . . . . . . . . . . . . . . 16,215 2,359 2,961 21,535 21,417Honduras . . . . . . . . . . . . . . . . . . . . . . . . . 16,215 7,116 2,960 26,291 26,174Israel . . . . . . . . . . . . . . . . . . . . . . . . . . . . . 10,794 — 7,443 18,237 17,813Italy . . . . . . . . . . . . . . . . . . . . . . . . . . . . . 133,396 — 75,249 208,645 196,749Jamaica . . . . . . . . . . . . . . . . . . . . . . . . . . . 21,721 2,737 4,012 28,470 28,313Japan . . . . . . . . . . . . . . . . . . . . . . . . . . . . 148,825 — 421,923 570,748 531,661Mexico . . . . . . . . . . . . . . . . . . . . . . . . . . . 259,249 15,041 50,964 325,254 323,373Netherlands . . . . . . . . . . . . . . . . . . . . . . . 20,261 — 15,899 36,160 33,656Nicaragua . . . . . . . . . . . . . . . . . . . . . . . . . 16,215 4,758 2,952 23,925 23,808Norway . . . . . . . . . . . . . . . . . . . . . . . . . . . 11,692 — 8,156 19,848 18,467Panama . . . . . . . . . . . . . . . . . . . . . . . . . . 16,215 5,946 2,960 25,121 25,004Paraguay . . . . . . . . . . . . . . . . . . . . . . . . . . 16,215 8,504 2,960 27,679 27,562Peru . . . . . . . . . . . . . . . . . . . . . . . . . . . . . 54,492 14,340 10,135 78,967 78,575Portugal . . . . . . . . . . . . . . . . . . . . . . . . . . 4,994 — 2,313 7,307 7,041Slovenia . . . . . . . . . . . . . . . . . . . . . . . . . . 1,795 — 1,483 3,278 3,206Spain . . . . . . . . . . . . . . . . . . . . . . . . . . . . 133,396 — 73,951 207,347 195,652Suriname . . . . . . . . . . . . . . . . . . . . . . . . . 5,280 — 939 6,219 6,195Sweden . . . . . . . . . . . . . . . . . . . . . . . . . . . 23,729 — 13,440 37,169 34,805Switzerland . . . . . . . . . . . . . . . . . . . . . . . 37,035 — 25,544 62,579 57,893Trinidad and Tobago . . . . . . . . . . . . . . . 16,215 1,532 2,960 20,707 20,590United Kingdom . . . . . . . . . . . . . . . . . . . 133,396 — 40,779 174,175 170,095United States . . . . . . . . . . . . . . . . . . . . . . 4,100,000 243,666 479,112 4,822,778 4,814,697Uruguay . . . . . . . . . . . . . . . . . . . . . . . . . . 43,502 3,714 8,030 55,246 54,930Venezuela . . . . . . . . . . . . . . . . . . . . . . . . . 250,060 12,109 50,025 312,194 310,539
Total before unallocated amount . . . . . . 7,221,120 504,742 1,798,356 9,524,218 9,391,788Unallocated (see Note F) . . . . . . . . . . . . 4,001 3 55,542 59,546 88,525
Total 2002 . . . . . . . . . . . . . . . . . . . . . . $7,225,121 $504,745 $1,853,898 $9,583,764
Total 2001 . . . . . . . . . . . . . . . . . . . . . . $7,225,518 $504,745 $1,750,050 $9,480,313
(1) Represent maintenance of value adjustments resulting from the changes in the values of currencies in 1972 and 1973 due to the devaluation of the United States dollar inthose years.

INTERMEDIATE FINANCING
FACILITY ACCOUNT
REPORT OF INDEPENDENT AUDITORS
Board of Governors
Inter-American Development Bank
We have audited the accompanying balance sheet of the Inter-American Development Bank (Bank)—Intermediate Financing Facility
Account as of December 31, 2002, and the related statement of changes in fund balance for the year then ended. These financial state-
ments are the responsibility of the Bank’s management. Our responsibility is to express an opinion on these financial statements based
on our audit. The financial statements of the Inter-American Development Bank—Intermediate Financing Facility Account as of
December 31, 2001, were audited by other auditors who have ceased operations and whose report dated February 13, 2002, expressed
an unqualified opinion on those statements.
We conducted our audit in accordance with auditing standards generally accepted in the United States. Those standards require that we
plan and perform the audit to obtain reasonable assurance about whether the financial statements are free of material misstatement. An
audit includes examining, on a test basis, evidence supporting the amounts and disclosures in the financial statements. An audit also
includes assessing the accounting principles used and significant estimates made by management, as well as evaluating the overall
financial statement presentation. We believe that our audit provides a reasonable basis for our opinion.
In our opinion, the financial statements referred to above present fairly, in all material respects, the financial position of the Inter-
American Development Bank—Intermediate Financing Facility Account as of December 31, 2002, and the results of its operations for
the year then ended in conformity with accounting principles generally accepted in the United States.
Washington, D.C.
February 12, 2003

158
INTERMEDIATE FINANCING FACILITY ACCOUNTINTER-AMERICAN DEVELOPMENT BANK
BALANCE SHEETExpressed in thousands of United States dollars
December 31,
2002 2001
ASSETS
Cash and investmentsCash . . . . . . . . . . . . . . . . . . . . . . . . . . . . . . . . . . . . . . . . $ 1,719 $ 5,664Investments . . . . . . . . . . . . . . . . . . . . . . . . . . . . . . . . . . 244,650 $246,369 237,704 $243,368
Accrued interest on investments . . . . . . . . . . . . . . . . 19 40
Total assets . . . . . . . . . . . . . . . . . . . . . . . . . . . . . . . . . $246,388 $243,408
LIABILITIES AND FUND BALANCE
LiabilitiesAccounts payable and accrued expenses . . . . . . . . . . . $ 896 $ 3,720
Fund balanceAccumulated translation adjustments . . . . . . . . . . . . $ 37,488 $ 26,855Other changes in fund balance . . . . . . . . . . . . . . . . . . 208,004 245,492 212,833 239,688
Total liabilities and fund balance . . . . . . . . . . . . $246,388 $243,408
The accompanying notes are an integral part of these financial statements.
STATEMENT OF CHANGES IN FUND BALANCEExpressed in thousands of United States dollars
Years ended December 31,
2002 2001
AdditionsAllocations from Fund for Special Operations . . . . . . . . . . . . . . . . . . . . . . . . . . . . . . . . . . . . . $ 70,200 $ 54,500Income from investments . . . . . . . . . . . . . . . . . . . . . . . . . . . . . . . . . . . . . . . . . . . . . . . . . . . . . . 4,413 8,872
Total additions . . . . . . . . . . . . . . . . . . . . . . . . . . . . . . . . . . . . . . . . . . . . . . . . . . . . . . . . . . . . . 74,613 63,372
DeductionsInterest and principal paid on behalf of
Ordinary Capital borrowers . . . . . . . . . . . . . . . . . . . . . . . . . . . . . . . . . . . . . . . . . . . . . . . . . . 79,442 74,571
Decrease for the year . . . . . . . . . . . . . . . . . . . . . . . . . . . . . . . . . . . . . . . . . . . . . . . . . . . . . . . . . . (4,829) (11,199)Translation adjustments . . . . . . . . . . . . . . . . . . . . . . . . . . . . . . . . . . . . . . . . . . . . . . . . . . . . . . . . . . . . . . . 10,633 (8,032)
Increase (decrease) for the year, after translation adjustments . . . . . . . . . . . . . . . . . . . . . . . . 5,804 (19,231)Fund balance, beginning of year . . . . . . . . . . . . . . . . . . . . . . . . . . . . . . . . . . . . . . . . . . . . . . . . . 239,688 258,919
Fund balance, end of year . . . . . . . . . . . . . . . . . . . . . . . . . . . . . . . . . . . . . . . . . . . . . . . . . . . . . . $245,492 $239,688

INTERMEDIATE FINANCING FACILITY ACCOUNTINTER-AMERICAN DEVELOPMENT BANK
NOTES TO FINANCIAL STATEMENTS (continued)
December 31, 2002 and 2001
FINANCIAL STATEMENTS 159
Note A – OriginThe Inter-American Development Bank (Bank) is an interna-
tional organization which was established in December 1959. The
principal purpose of the Bank is to promote economic and social
development in Latin America and the Caribbean, primarily by
providing loans and related technical assistance for specific
projects and for programs of economic reform. The Agreement
Establishing the Bank (Agreement) provides for operations of
the Bank to be conducted through the Fund for Special Opera-
tions (FSO) and the Ordinary Capital. In 1983, the Board of Gov-
ernors of the Bank established the Intermediate Financing Facility
Account (IFF) for the purpose of subsidizing part of the interest
payments for which certain borrowers are liable on loans from
the Ordinary Capital. The IFF receives annual allocations from
the FSO, as indicated in Note D.
In making decisions concerning operations of the IFF, the
number of votes and percent of voting power for each member
country are the same as determined for the Ordinary Capital.
Note B – Summary of Significant Accounting PoliciesThe IFF’s financial statements are prepared in conformity with
United States generally accepted accounting principles. The prepa-
ration of financial statements in conformity with generally ac-
cepted accounting principles requires management to make
estimates and assumptions that affect the reported amounts of
assets and liabilities, the disclosure of contingent assets and li-
abilities at the date of the financial statements, and the reported
amounts of revenues and expenses during the reporting period.
Actual results could differ from these estimates.
Translation of currenciesThe IFF’s financial statements are expressed in United States dol-
lars; however, the IFF conducts its operations in various convert-
ible currencies, including the United States dollar. Assets and
liabilities denominated in currencies other than the United States
dollar are translated at approximate market rates of exchange
prevailing at the dates of the financial statements. Income and
expenses in such currencies are translated at the approximate
market rates of exchange prevailing during each month. The ad-
justments resulting from the translation of assets and liabilities
are shown in the Statement of Changes in Fund Balance as trans-
lation adjustments.
InvestmentsAll of the IFF’s investment securities are in the trading portfolio
carried at market value, with realized and unrealized gains and
losses included in income from investments in the Statement of
Changes in Fund Balance.
Administrative expensesAdministrative expenses of the IFF are paid by the Ordinary Capi-
tal and are allocated between the Ordinary Capital and the FSO
pursuant to an allocation method approved by the Board of Ex-
ecutive Directors.
Fair values of financial instrumentsThe following methods and assumptions were used by the IFF in
estimating the fair value for its financial instruments:
Cash: The carrying amount reported in the Balance Sheet for
cash approximates fair value.
Investments: Fair values for investment securities are based on
quoted market prices, where available. If quoted market prices
are not available, fair values are based on quoted market prices of
comparable instruments.
Note C – InvestmentsAs part of its overall portfolio management strategy, the Bank
invests IFF resources, both directly and indirectly through an in-
vestment pool managed by the Bank, in high quality securities.
The Bank manages these resources in the same manner as its
own investments. IFF investments include government, agency,
bank and corporate obligations, time deposits and asset- and
mortgage-backed securities with credit ratings ranging from A+
to AAA.
The Bank limits IFF activities of investing in securities to
a list of authorized dealers and counterparties. Strict credit lim-
its have been established for each counterparty.
Trading portfolio: Investment securities held in the trading
portfolio are carried at market value as shown in the Summary
Statement of Investments in Appendix III-1. Net unrealized gains
on trading securities, held at December 31, 2002, of $8,291,000
(2001—$5,563,000) were included in income from investments.
The average return on investments during 2002 and 2001, in-
cluding realized and unrealized gains and losses, was 1.70% and
3.38%, respectively.
Note D – Fund ContributionsThe IFF is funded primarily through transfers from the FSO. The
IFF is also authorized to receive additional contributions from
any member country.
For initial funding purposes, the equivalent of $61,000,000
in convertible currencies of the general reserve of the FSO was
transferred to the IFF on December 15, 1983. Actual and pro-
jected allocations from the general reserve of the FSO to the IFF

INTERMEDIATE FINANCING FACILITY ACCOUNTINTER-AMERICAN DEVELOPMENT BANK
NOTES TO FINANCIAL STATEMENTS (continued)
December 31, 2002 and 2001
160
in accordance with various agreements of the Board of Gover-
nors are shown in the following table (in thousands):
Future allocations are subject to annual approvals by the
Board of Governors and to adjustment for appropriate reasons
related to the availability of funding for the IFF.
Note E – Accumulated Translation AdjustmentsThe following is a summary of changes in the accumulated trans-
lation adjustments for the years ended December 31, 2002 and
2001 (in thousands):
Note F – CommitmentsThe payment by the IFF of part of the interest due from bor-
rowers is contingent on the availability of resources. At
December 31, 2002, the amounts disbursed and outstanding and
undisbursed, classified by country, under loans on which the IFF
would pay part of the interest are as follows (in thousands):
2002 2001
Balance at January 1 . . . . . . . . . . . . . . . $26,855 $34,887Translation adjustments . . . . . . . . . . . . 10,633 (8,032)
Balance at December 31, . . . . . . . . . . . $37,488 $26,855
The rate of IFF subsidy of interest due from certain bor-
rowers on Ordinary Capital loans is set twice annually by the
Board of Executive Directors. The amount of subsidy of the lend-
ing rate of IFF subsidized loans can be no more than 5% of eli-
gible loans outstanding, subject to the effective rate paid by the
borrowers being at least 1.5% above the convertible currency FSO
average interest rate. For certain loans with increased subsidy
under the HIPC I , the effective rate paid by the borrowers can be
as low as the convertible currency FSO average interest rate. Un-
der the enhanced HIPC, the IFF will subsidize 100% of certain
debt service payments (both principal and interest) on Ordinary
Capital loans to Nicaragua. Over time, the IFF intends to distrib-
ute all of its fund balance to subsidize part of the interest and
principal payments for which certain Ordinary Capital borrow-
ers are liable.
ConcessionalCapital HIPC resources
Year increases(1) initiative (2) agreement (3) Total
Through 2000 $348,500 $ 33,000 $ 32,000 $ 413,5002001 23,500 11,000 20,000 54,5002002 23,500 26,700 20,000 70,2002003 30,000 25,200 20,000 75,2002004 30,000 22,600 20,000 72,6002005 30,000 12,300 20,000 62,3002006 30,000 11,000 20,000 61,0002007 30,000 11,000 20,000 61,000
2008 to 2012 120,000 28,000 165,000 313,0002013 to 2017 — — 340,000 340,0002018 to 2019 — — 130,000 130,000
Total $665,500 $180,800 $807,000 $1,653,300
(1) Under the terms of the Sixth and Seventh General Capital Increases in the Re-sources of the Bank.
(2) As part of the Heavily Indebted Poor Countries Initiative (HIPC), the IFF isincreasing subsidy payments on Ordinary Capital loans to Bolivia, Guyana andNicaragua. In order to fund these additional subsidy payments, the FSO is mak-ing additional annual transfers in convertible currencies from its general reserveto the IFF.
(3) Mandated allocations under the Concessional resources agreement approved bythe Board of Governors in 1999 amount to $20 million annually from 2000 to2012 and $15 million in 2013. Additional transfers of approximately $65 millionannually from 2012 to 2019 will be necessary to fund the 2000–2008 IFF lendingmandated under the Concessional resources agreement of 1999. The level of theseadditional transfers may change as assumptions are revised in future years.
Disbursedand
Country outstanding Undisbursed
Bahamas . . . . . . . . . . . . . . . . . . . . . . . . . . . . . . $ 19,369 $ —Barbados . . . . . . . . . . . . . . . . . . . . . . . . . . . . . 54,666 6,241Bolivia . . . . . . . . . . . . . . . . . . . . . . . . . . . . . . . 264,824 —Costa Rica . . . . . . . . . . . . . . . . . . . . . . . . . . . . 128,383 13,353Dominican Republic . . . . . . . . . . . . . . . . . . . . 182,124 201,474Ecuador . . . . . . . . . . . . . . . . . . . . . . . . . . . . . . 215,357 167,871El Salvador . . . . . . . . . . . . . . . . . . . . . . . . . . . . 246,292 81,964Guatemala . . . . . . . . . . . . . . . . . . . . . . . . . . . . 265,489 109,877Guyana . . . . . . . . . . . . . . . . . . . . . . . . . . . . . . . 22,375 —Honduras . . . . . . . . . . . . . . . . . . . . . . . . . . . . . 3,258 —Jamaica . . . . . . . . . . . . . . . . . . . . . . . . . . . . . . . 250,613 154,510Nicaragua . . . . . . . . . . . . . . . . . . . . . . . . . . . . . 115,285 —Panama . . . . . . . . . . . . . . . . . . . . . . . . . . . . . . 114,312 —Paraguay . . . . . . . . . . . . . . . . . . . . . . . . . . . . . . 141,125 51,862Suriname . . . . . . . . . . . . . . . . . . . . . . . . . . . . . 26,077 39,310Trinidad and Tobago . . . . . . . . . . . . . . . . . . . 120,255 7,939Uruguay . . . . . . . . . . . . . . . . . . . . . . . . . . . . . . 96,272 —Regional . . . . . . . . . . . . . . . . . . . . . . . . . . . . . . 47,616 —
$2,313,692 $834,401

FINANCIAL STATEMENTS 161
The freely convertible currencies of the above investments are as follows:
INTERMEDIATE FINANCING FACILITY ACCOUNT APPENDIX III-1INTER-AMERICAN DEVELOPMENT BANK
SUMMARY STATEMENT OF INVESTMENTS – NOTE CDecember 31, 2002 and 2001Expressed in thousands of United States dollars
Currencies 2002 2001
Euro . . . . . . . . . . . . . . . . . . . . . . . . . . . $ 22,738 $ 27,588Japanese yen . . . . . . . . . . . . . . . . . . . . 31,219 40,212Swiss francs . . . . . . . . . . . . . . . . . . . . . 12,419 17,907United States dollars . . . . . . . . . . . . . . 178,274 151,997
$244,650 $237,704
2002 2001
Market MarketInvestments Cost value Cost value
Investment Pool . . . . . . . . . . . . . . . . . . . . . . . . . . . . . . $169,983 $178,274 $146,434 $151,997Obligations of governments . . . . . . . . . . . . . . . . . . . . . — — 40,212 40,212Time deposits . . . . . . . . . . . . . . . . . . . . . . . . . . . . . . . . 66,376 66,376 45,495 45,495
$236,359 $244,650 $232,141 $237,704

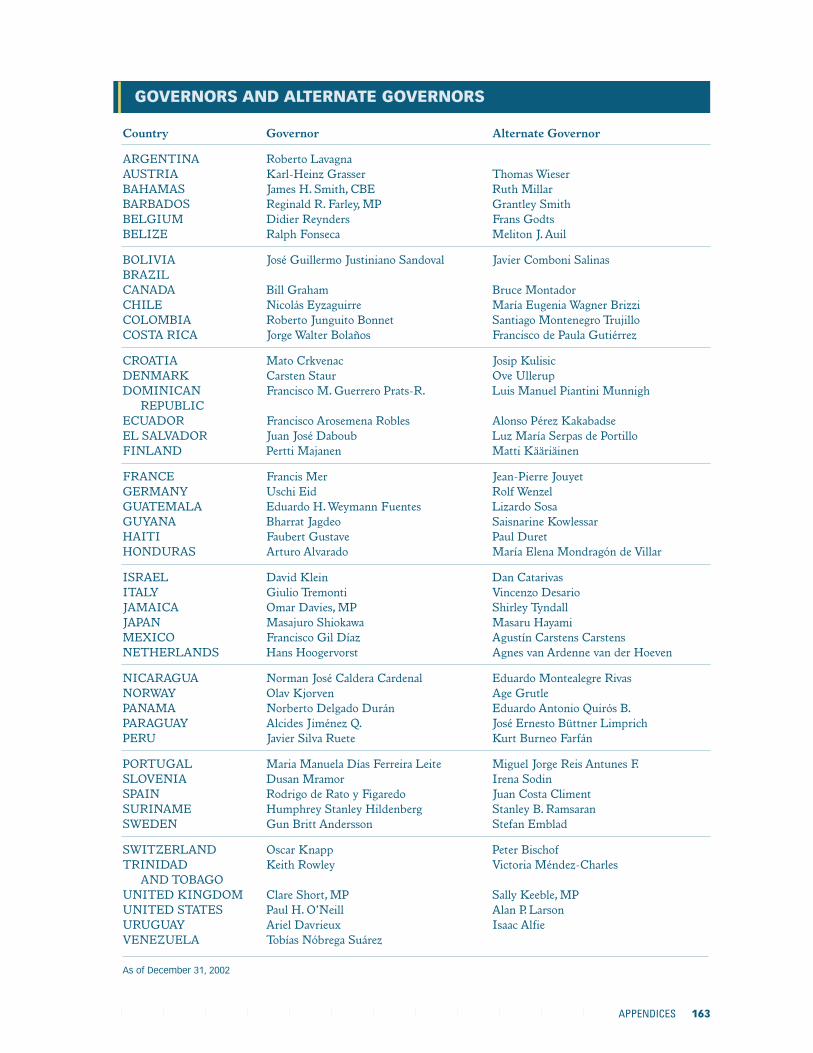
Country Governor Alternate Governor
ARGENTINA Roberto LavagnaAUSTRIA Karl-Heinz Grasser Thomas WieserBAHAMAS James H. Smith, CBE Ruth MillarBARBADOS Reginald R. Farley, MP Grantley SmithBELGIUM Didier Reynders Frans GodtsBELIZE Ralph Fonseca Meliton J. Auil
BOLIVIA José Guillermo Justiniano Sandoval Javier Comboni SalinasBRAZILCANADA Bill Graham Bruce MontadorCHILE Nicolás Eyzaguirre María Eugenia Wagner BrizziCOLOMBIA Roberto Junguito Bonnet Santiago Montenegro TrujilloCOSTA RICA Jorge Walter Bolaños Francisco de Paula Gutiérrez
CROATIA Mato Crkvenac Josip KulisicDENMARK Carsten Staur Ove UllerupDOMINICAN Francisco M. Guerrero Prats-R. Luis Manuel Piantini Munnigh
REPUBLICECUADOR Francisco Arosemena Robles Alonso Pérez KakabadseEL SALVADOR Juan José Daboub Luz María Serpas de PortilloFINLAND Pertti Majanen Matti Kääriäinen
FRANCE Francis Mer Jean-Pierre JouyetGERMANY Uschi Eid Rolf WenzelGUATEMALA Eduardo H. Weymann Fuentes Lizardo SosaGUYANA Bharrat Jagdeo Saisnarine KowlessarHAITI Faubert Gustave Paul DuretHONDURAS Arturo Alvarado María Elena Mondragón de Villar
ISRAEL David Klein Dan CatarivasITALY Giulio Tremonti Vincenzo DesarioJAMAICA Omar Davies, MP Shirley TyndallJAPAN Masajuro Shiokawa Masaru HayamiMEXICO Francisco Gil Díaz Agustín Carstens CarstensNETHERLANDS Hans Hoogervorst Agnes van Ardenne van der Hoeven
NICARAGUA Norman José Caldera Cardenal Eduardo Montealegre RivasNORWAY Olav Kjorven Age GrutlePANAMA Norberto Delgado Durán Eduardo Antonio Quirós B.PARAGUAY Alcides Jiménez Q. José Ernesto Büttner LimprichPERU Javier Silva Ruete Kurt Burneo Farfán
PORTUGAL Maria Manuela Días Ferreira Leite Miguel Jorge Reis Antunes F.SLOVENIA Dusan Mramor Irena SodinSPAIN Rodrigo de Rato y Figaredo Juan Costa ClimentSURINAME Humphrey Stanley Hildenberg Stanley B. RamsaranSWEDEN Gun Britt Andersson Stefan Emblad
SWITZERLAND Oscar Knapp Peter BischofTRINIDAD Keith Rowley Victoria Méndez-Charles
AND TOBAGOUNITED KINGDOM Clare Short, MP Sally Keeble, MPUNITED STATES Paul H. O’Neill Alan P. LarsonURUGUAY Ariel Davrieux Isaac AlfieVENEZUELA Tobías Nóbrega Suárez
As of December 31, 2002
APPENDICES 163
GOVERNORS AND ALTERNATE GOVERNORS

164
Number Percentage ofof votes voting power
Ricardo R. Carciofi, ARGENTINA Elected by:Martín Bès (Alternate), ARGENTINA Argentina
Haiti 936,545 11.185
Luis Guillermo Echeverri, COLOMBIA Elected by:Jaime Pinto Tabini (Alternate), PERU Colombia
Peru 367,878 4.393
José A. Fourquet, UNITED STATES Appointed by:Jorge Luis Arrizurieta (Alternate) United States 2,512,664 30.008UNITED STATES
Agustín García-López, MEXICO Elected by:Héctor J. Santos (Alternate) Dominican RepublicDOMINICAN REPUBLIC Mexico 627,122 7.489
(Vacant), CANADA Elected by:Alan F. Gill (Alternate), CANADA Canada 335,022 4.001
Juan E. Notaro, URUGUAY Elected by:Jorge Crespo-Velasco (Alternate) BoliviaBOLIVIA Paraguay
Uruguay 205,291 2.452
Michel Planque, FRANCE Elected by:Pekka J. Hukka (Alternate), FINLAND Austria Norway
Denmark SpainFinland SwedenFrance 400,427 4.783
Germán Quintana, CHILE Elected by:César Coronel (Alternate), ECUADOR Chile
Ecuador 295,653 3.530
José Carlos Quirce, COSTA RICA Elected by:José Carlos Castañeda (Alternate) Belize GuatemalaGUATEMALA Costa Rica Honduras
El Salvador Nicaragua 202,692 2.420
Luis Alberto Rodriguez Elected by:TRINIDAD AND TOBAGO Bahamas JamaicaHavelock Brewster (Alternate), GUYANA Barbados Trinidad and Tobago
Guyana 126,574 1.511
José Alejandro Rojas, VENEZUELA Elected by:Eduardo Linares (Alternate), PANAMA Panama
Venezuela 518,658 6.194
Martus Tavares, BRAZIL Elected by:Frederico Álvares (Alternate), BRAZIL Brazil
Suriname 907,766 10.841
Yoshihisa Ueda, JAPAN Elected by:Toshitake Kurosawa (Alternate), JAPAN Croatia Slovenia
Japan United KingdomPortugal 510,794 6.101
Michaela Zintl, GERMANY Elected by:Paolo Cappellacci (Alternate), ITALY Belgium Italy
Germany NetherlandsIsrael Switzerland 426,204 5.089
TOTAL: 8,373,290 100.00*
Office of Evaluation and OversightStephen A. Quick, Director
Sixto Felipe Aquino, Deputy Director
As of December 31, 2002
* The figures listed represent the sum of the individual countries’ voting percentages, rounded to the nearest one-hundredth of one per-cent. Consequently, the total of 100% shown may not be identical to the sum of the individual percentages listed.
EXECUTIVE DIRECTORS AND ALTERNATE EXECUTIVE DIRECTORS

APPENDICES 165
Member Country Channels of Communication Depository
ARGENTINA Ministerio de Economía Banco Central de la República ArgentinaAUSTRIA Federal Ministry of Finance Österreichische NationalbankBAHAMAS Ministry of Finance Central Bank of the BahamasBARBADOS Ministry of Economic Development Central Bank of BarbadosBELGIUM Administration de la trésorerie, Banque Nationale de Belgique
Service des relations internationalesBELIZE Financial Secretary, Ministry of Finance Central Bank of BelizeBOLIVIA Banco Central de Bolivia Banco Central de BoliviaBRAZIL Ministério do Planejamento, Orçamento e Gestão, Banco Central do Brasil
Secretaria de Assuntos Internacionais—SEAINCANADA International Financial Institution, Multilateral Bank of Canada
Programs Branch, Canadian InternationalDevelopment Agency
CHILE Ministerio de Hacienda Banco Central de ChileCOLOMBIA Ministerio de Hacienda y Crédito Público Banco de la RepúblicaCOSTA RICA Ministerio de Hacienda Banco Central de Costa RicaCROATIA Ministry of Finance National Bank of CroatiaDENMARK Danish International Development Agency Danmarks Nationalbank
(DANIDA)DOMINICAN Banco Central de la República Dominicana Banco Central de la República
REPUBLIC DominicanaECUADOR Ministerio de Economía y Finanzas Banco Central del EcuadorEL SALVADOR Secretaría Técnica de la Presidencia Banco Central de Reserva de El SalvadorFINLAND Ministry for Foreign Affairs Bank of FinlandFRANCE Ministère de l’Économie, des Finances Banque de France
et de l’IndustrieGERMANY Federal Ministry for Economic Cooperation Deutsche Bundesbank
and DevelopmentGUATEMALA Banco de Guatemala Banco de GuatemalaGUYANA Ministry of Finance Bank of GuyanaHAITI Banque de la République d’Haïti Banque de la République d’HaïtiHONDURAS Banco Central de Honduras Banco Central de HondurasISRAEL Bank of Israel Bank of IsraelITALY Ministry of the Economy and Finance Banca d’ItaliaJAMAICA Ministry of Finance and Planning Bank of JamaicaJAPAN Ministry of Finance Bank of JapanMEXICO Secretaría de Hacienda y Crédito Público Banco de MéxicoNETHERLANDS Ministry of Finance De Nederlandsche Bank N.V.NICARAGUA Ministerio de Hacienda y Crédito Público Banco Central de NicaraguaNORWAY Royal Norwegian Ministry of Foreign Affairs Bank of NorwayPANAMA Ministerio de Economía y Finanzas Banco Nacional de PanamáPARAGUAY Banco Central del Paraguay Banco Central de ParaguayPERU Banco Central de Reserva del Perú Banco Central de Reserva del PerúPORTUGAL Ministério das Finanças Banco de PortugalSLOVENIA Ministry of Finance Bank of SloveniaSPAIN Subdirección General de Instituciones Banco de España
Financieras Multilaterales, Ministerio deEconomía
SURINAME Ministry of Finance Central Bank van SurinameSWEDEN Ministry for Foreign Affairs, Department Sveriges Riksbank
for International Development Co-operationSWITZERLAND Office fédéral des affaires économiques Banque Nationale Suisse
extérieuresTRINIDAD Central Bank of Trinidad and Tobago Central Bank of Trinidad and Tobago
AND TOBAGOUNITED KINGDOM Department for International Development Bank of EnglandUNITED STATES Treasury Department Federal Reserve Bank of New YorkURUGUAY Ministerio de Economía y Finanzas Banco Central del UruguayVENEZUELA Ministerio de Planificación y Desarrollo Banco Central de VenezuelaAs of December 31, 2002
CHANNELS OF COMMUNICATION AND DEPOSITORIES

166
President Enrique V. IglesiasExecutive Vice-President Dennis E. FlanneryVice-President for Planning and Administration Paulo Paiva
Chief, Office of the Presidency Euric A. BobbChief Advisor, Office of the Executive Vice-President Joel A. Riley
Office of the Secretary of the BankSecretary Carlos Ferdinand
Deputy Secretary Armando Chuecos P.
Auditor General William L. Taylor
External Relations Advisor Mirna Liévano de Marques
Office of the Multilateral Investment FundManager Donald F. Terry
Deputy Manager Noriaki Kishimoto
Regional Operations Department 1Manager Ricardo L. Santiago
Deputy Manager Luisa C. Rains
Regional Operations Department 2Manager Miguel E. Martínez
Deputy Manager Jairo Sánchez
Regional Operations Department 3Manager Ciro De Falco
Deputy Manager Máximo Jeria-Figueroa
Regional Operations Support OfficeChief Rosa Olivia Villa-Lawson
Finance DepartmentManager Charles O. Sethness
Senior Deputy Manager-Treasurer Eloy B. GarcíaDeputy Manager Ira J. KaylinDeputy Manager Shigeki Kimura
Legal DepartmentGeneral Counsel J. James Spinner
Deputy General Counsel José Roberto NolascoDeputy General Counsel Ana-Mita Betancourt
Strategic Planning and Budget DepartmentManager Manuel Rapoport
Integration and Regional Programs DepartmentManager Nohra Rey de Marulanda
Deputy Manager Robert Devlin
Private Sector DepartmentManager Hiroshi Toyoda
Deputy Manager Bernardo Frydman
Sustainable Development DepartmentManager Carlos M. Jarque
Deputy Manager Christof KuechemannDeputy Manager Antonio Vives
Research DepartmentChief Economist Guillermo Calvo
Information Technology and General Services DepartmentManager Richard J. Herring
Deputy Manager and Chief Information Officer Erico de Oliveira E. Silva
Human Resources DepartmentManager Manuel Labrado
Deputy Manager
As of December 31, 2002
PRINCIPAL OFFICERS OF THE BANK

The Inter-American Development Bank, the oldest and
largest regional multilateral development institution,
was established in 1959 to help accelerate economic
and social development in Latin America and the
Caribbean.
Efforts to create a development institution to
focus on pressing problems in the region date to the
First Inter-American Conference in 1890. A specific
proposal toward that end by President Juscelino
Kubitschek of Brazil in 1958 received support through-
out the hemisphere. Shortly thereafter, the Organi-
zation of American States drafted the Articles of
Agreement establishing the Inter-American
Development Bank.
Today, the Bank’s membership totals 46 nations,
including 26 Latin American and Caribbean countries,
the United States, Canada, and 18 nonregional
countries.
The Bank has become a major catalyst in mobi-
lizing resources for the region. Its principal functions
are to utilize its own capital, funds raised in financial
markets, and other available resources to finance the
development of its borrowing member countries; to
supplement private investment when private capital is
not available on reasonable terms and conditions; and
to provide technical assistance for the preparation,
financing and implementation of development
projects.
In carrying out its mission, the Bank has
approved $118 billion for projects that represent a
total investment of $282 billion.
The Bank’s operations cover the entire spec-
trum of economic and social development, with an
emphasis on programs that benefit low-income popu-
lations. In the past, Bank lending focused on the pro-
ductive sectors of agriculture and industry, the physi-
cal infrastructure sectors of energy and transportation,
and the social sectors of environmental and public
health, education and urban development. In 1995, the
IDB began lending up to 5 percent of its ordinary capi-
tal resources directly to the private sector, without
government guarantees. Current lending priorities
include poverty reduction and social equity, modern-
ization of the State, competitiveness, and integration.
The IDB group also includes the Inter-American
Investment Corporation (IIC), an autonomous affiliate
that promotes economic development by financing
small and medium-scale private enterprises, and the
Multilateral Investment Fund (MIF), which supports
investment reforms and private sector development.
The financial resources of the Bank consist of
the ordinary capital account—comprised of subscribed
capital, reserves and funds raised through borrow-
ings—and Funds in Administration, comprised of con-
tributions made by member countries. The Bank also
has a Fund for Special Operations for lending on con-
cessional terms in countries classified as economically
less developed.
Member country subscriptions to the Bank's
ordinary capital consist of both paid-in and callable
capital. Paid-in capital in the form of cash or notes
represents 4.3 percent of total subscriptions. The
major part of member subscriptions is for callable cap-
ital, which may be drawn only to service the Bank's
borrowings and guarantees.
The Bank has borrowed funds for its operations
from the capital markets of Europe, Japan, Latin
America, the Caribbean and the United States. The
Bank’s debt is AAA rated by the three major rating
services in the United States, and is accorded equiva-
lent status in the other major capital markets.
The Bank’s highest authority is the Board of
Governors, on which each member country is repre-
sented. Governors are usually Ministers of Finance,
Presidents of Central Banks or officers of comparable
rank. The Board of Governors has delegated many of
its operational powers to the Board of Executive
Directors, which is responsible for the conduct of the
Bank’s operations.
The Bank, whose headquarters are in
Washington, D.C., has Country Offices in each of its
borrowing member countries and in Paris and Tokyo.
THE INTER-AMERICAN DEVELOPMENT BANK COUNTRY OFFICES AND REPRESENTATIVES
ARGENTINA, Jorge ElenaCalle Esmeralda 130, pisos 19 y 20(Casilla de correo N 181, Sucursal 1)Buenos Aires Tel: 4320-1800
BAHAMAS, Frank J. MarescaIDB House, East Bay Street(P.O. Box N-3743)Nassau Tel: 393-7159
BARBADOS, Jeremy S. GouldMaple Manor, Hastings(P.O. Box 402)Christ Church Tel: 427-3612
BELIZE, Hugo Souza1024 Newtown Barracks101 1st FloorMarina Towers Building(P.O. Box 1853)Belize City Tel: 223-3900
BOLIVIA, Carlos MeloEdificio “BISA”, 5 pisoAvda. 16 de Julio, N 1628(Casilla N 5872)La Paz Tel: 235-1221
BRAZIL, Waldemar F. WirsigSetor de Embaixadas NorteQuadra 802 Conjunto FLote 39 - Asa Norte70.800-400 Brasília, D.F. Tel: 317-4200
CHILE, Julio AngelAvda. Pedro de Valdivia 0193, 11 piso(Casilla N 16611)Correo 9 (Providencia)Santiago Tel: 431-3700
COLOMBIA, Fernando CossioCarrera 7a N 71-21Torre B, 19 pisoEdificio BancafeBogotá Tel: 325-7000
COSTA RICA, Bertus J. MeinsEdificio Centro Colón, piso 12Paseo Colón, entre calles 38 y 40San José Tel: 233-3244
DOMINICAN REPUBLIC Moisés A. PinedaAvda. Winston Churchill esquinacalle Luis F. Thomen, Torre BHD(Apartado postal N 1386)Santo Domingo Tel: 562-6400
ECUADOR, Dora P. CurreaAvda. 12 de Octubre 1830 y CorderoEd. World Trade Center - Torre II, piso 9(Apartado postal N 17-07-9041)Quito Tel: 256-3453
EL SALVADOR, Luis VergaraEdificio World Trade Center, 4 piso89 Avda. Norte y Calle El MiradorColonia EscalónSan Salvador Tel: 233-8900
GUATEMALA, Carlos BarberyEdificio Géminis 1012 Calle 1-25, Zona 10, Nivel 19(Apartado postal N 935)Guatemala Tel: 335-2650
GUYANA, Sergio Varas-Olea47 High Street, Kingston(P.O. Box 10867)Georgetown Tel: 225-7950
HAITI, Gerard S. JohnsonBanque interaméricaine de
développementBourdon 389(Boîte postale 1321)Port-au-Prince Tel: 45-5711
HONDURAS, Helge SembBoulevard MorazánEdificio Los Castaños, 5 y 6 pisosColonia Los Castaños(Apartado postal N 3180)Tegucigalpa Tel: 232-4838
JAMAICA, Keith Evans40-46 Knutsford Blvd., 6th floor(P.O. Box 429)Kingston 10 Tel: 926-2342
JAPAN, Toshio KobayashiFukoku Seimei Bldg. 16F2-2-2 Uchisaiwaicho, Chiyoda-kuTokyo 100 Tel: 3591-0461
MEXICO, David B. AtkinsonAvda. Horacio N 18556 piso (Esquina Periférico)Los Morales-Polanco11510 México, D.F. Tel: 5580-2122
NICARAGUA, Eduardo BalcarcelEdificio BIDKm. 4-1/2 Carretera a Masaya(Apartado postal 2512)Managua Tel: 67-0831
PANAMA, John J. HastingsAvda. Samuel LewisEdificio Banco Unión, piso 14(Apartado postal 7297)Panamá 5 Tel: 263-6944
PARAGUAY, Alvaro CubillosEdificio Aurora I, pisos 2 y 3Calle Caballero esquinaEligio Ayala (Casilla N 1209)Asunción Tel: 49-2061
PERU, Vladimir RadovicPaseo de la República 3245, piso 14(Apartado postal N 270154)San Isidro, Lima 27 Tel: 215-7800
SURINAME, Pablo AdamPeter Bruneslaan 2-4Paramaribo Tel: 46-2903
TRINIDAD AND TOBAGOWilliam Robinson19 St. Clair Avenue(P.O. Box 68)Port of Spain Tel: 622-8367
URUGUAY, Martin StabileAndes 1365, piso 13(Casilla de correo 5029)Sucursal 1Montevideo Tel: 902-0444
VENEZUELA, Román MayorgaEdificio Centro Federal, piso 3Avda. Venezuela, El RosalCaracas 1060 Tel: 951-5533
INSTITUTE FOR THE INTEGRATIONOF LATIN AMERICA AND THE CARIBBEAN
Juan José TacconeCalle Esmeralda 130, pisos 16 y 17(Casilla de correo N 39)Sucursal 1Buenos Aires Tel: 4320-1850
SPECIAL REPRESENTATIVE IN EUROPE
Carlo BinettiBanque interaméricaine de
développement66, Avenue d’Iéna75116 Paris France Tel: 40 69 31 00

INTER-AMERICAN DEVELOPMENT BANK1300 New York Avenue, N.W.
Washington, D.C. 20577
Tel. (202) 623-1000 Fax (202) 623-3096
www.iadb.org
ISSN 0074-087X
INT
ER
-AM
ER
ICA
N D
EV
EL
OP
ME
NT
BA
NK 2002
Annual ReportInter-American Development Bank
An
nu
al Re
po
rt 2002