3376_Book Hennigan.indd - AnnualReports.com
122
JOLLY GOOD SHOW A Message from Brian Walker, CEO, Herman Miller, Inc. Fiscal Year 2007
-
Upload
khangminh22 -
Category
Documents
-
view
0 -
download
0
Transcript of 3376_Book Hennigan.indd - AnnualReports.com

JOLLY GOOD SHOW
A Message from Brian Walker, CEO, Herman Miller, Inc. Fiscal Year 2007

This year we attached Pep Nagelkirk’s name to our employee awards. Pep worked for Herman Miller 42 years and retired in 1988 as a modelmaker. His quiet leadership and competence are still models for all of us. This page lists our Pep winners for 2007.
48 people this year won Pep Awards, aligned with our corporate values Curiosity and Exploration, Performance, Engagement, and A Better World
Melinda Adams Annette AllenKevin BaldusRandall BraaksmaTia BuchananDavid ChourbTim CollisonCindy DeGraaf
Brian DickenMartha FordJeff GeurinkCharlie JonesMary KelloggMary KellyWillie KendrickJim Kraushar
Judi KruisSteve KupferGordon LantingaEva LaurettiRobert LawsDawn LowrieSharon LukasJohn McManus
Mike MezeskeEric MooreCathy NewbergerVicki NuiverJohn PeckJohn PierTheresa ProloFred Renker
Robin RobinsonRosetta RockJim RodgersTom RogersHeather RoseMarv SchwartzJoel SnellerSteve Teays
Carol ThompsonSherry TrippLavonne Van KampenTodd VenemaDavid “Duffy” WaltersMargaret Washington Isaac WendtKenneth Wright

Dear members of the Herman Miller community
This marks my third year of writing an annual letter to you, and I’m beginning to sound like a broken record—thanks for another very good year. It’s the kind of message I’m sure you don’t mind hearing and one I never mind writing.
We defi ne a great year at Herman Miller as generating great business performance, having a great impact on society, and creating a great place to work. I would like to give you a progress report on these goals, but fi rst I’d like to talk with you about our future.
Setting goals helps shape the future, acknowledging reality is also necessary
Our future is directed at an overarching purpose: We are determined to improve the performance of human habitats. We do this largely through our designs, and design at Herman Miller, as designer George Nelson told us years ago, is a response to social change. The best and most lasting designs at Herman Miller account for and then respond to current and future realities.
We are currently thinking about fi ve dominant new realities. I believe the following fi ve social changes will greatly infl uence our future; I don’t believe they are debatable. They are shaping our thinking about how to improve the performance of human habitats. They present Herman Miller with both challenges and opportunities.
The global shift from West to East
The movement of economic growth from West to East should be apparent to everyone. Herman Miller has been present in Asia for many years, and we have a thriving distribution channel throughout the region. Two years ago, we established a commercial presence in India. This past year, we hosted a group of design leaders from China in West Michigan and are conducting design research in China and India. We established a manufacturing facility in Ningbo, China, opened our commercial headquarters in nearby Shanghai, and are expanding our distribution network.
Herman Miller global network—then and now
2002 2006

The infi nite mobility of workers and work
The ability of knowledge workers to work almost anywhere (thanks to technology and their own desires to balance life and work) has been growing for several years. Over the past few years, as the boundaries between the places where people work, learn, and live have become less distinct, we have developed distribution capabilities and new designs to meet them wherever they are. Our newly launched accessories line—The Be Collection™—is an example of our increased focus on designs targeted at highly mobile and autonomous individuals. While still a modest part of our overall business, our revenue from the Herman Miller for the Home™ retail channel has increased signifi cantly, and we believe this represents an excellent future opportunity for Herman Miller.
Emerging playlist generation
A playlist generation is emerging—people who have grown up with and expect to create their own collections of music, games, clothing—even to watch television shows according to their own schedules. In sync with this trend is Convia,™ our newly launched sustainable, intelligent, electrical infrastructure. Convia embeds lighting, power, audiovisual control, and energy management and reporting capabilities into the wiring system of a building—all of which saves money and expands capabilities for building owners. In an experimental installation in a retail store, one Herman Miller researcher noticed that halfway through his brief training session with
Packaging for The Be Collection aimed at consumers

31 children of Herman Miller employees win company scholarships—that makes 193 in all
Ten years ago, Mike and Valerie Volkema (our chairman of the board and his wife) started a scholarship fund for children of Herman Miller employees. The scholarships are funded by contributions from offi cers and directors and matched by the Herman Miller Foundation. I can’t think of a better investment in our future.
Carolyn AffholterMichelle AffholterMarti AlderinkAmanda BaronKate BehrensElizabeth Boeve
Melissa BoschAmber ChildressAshley DoaneRachel EvelethJacqueline Ferguson
Alyssa GeertsKatie GeertsAimee GerritsCasey HolstegeJoshua Jubenville
Rachel KoteckiGrace KrolKerstine LundyAnne MehrtensLogan Oonk
Ashley PotgeterSteven PohlerDanielle RichardsSamanth RichardsKaren Van Dyke
Lindsey VanDenBrinkJay Vanden BrinkAshley ZondlakBritney ZondlakHeidi Zandstra

Our environmental advocacy is centered in our Environmental Quality Action Teams, a grass-roots effort begun in the early 1990s and involving hundreds of employees representing all parts of the company. The people listed above lead our nine environmental action teams.
SustainableBusiness.com listed Herman Miller as one of its “top 20 sustainable stocks” worldwide
Jerry AkersRudy Bartels Willie BeattieDaniel BroersmaSteve Bullock Diane Bunse Bruce Buursma
Scott Charon Larry Dykhuis Suzanne Fisher Kent Gawart Ken Goodson Fred GordonSteve Griffore
Mike Gummere Lori Heinz Dan Kinney John Knoll Julie LamerJudy Leese Matt Long
Todd MillerPaul MurrayRay Muscat Ed Nagelkirk Michael RamirezJane ReardonDrew Schramm
Mark SchurmanTed StojakKevin Tibbetts Martine Vanden Ende-Harvey Barry Volkers Sheila Warfi eld
Gabe WingGreg Wrona

a customer, the young staff had already begun to play with Convia. Such at-will modifi cations to the environment made perfect and immediate sense.
Tipping point of sustainability movement
Herman Miller has been involved in sustainable business practices, environmental advocacy—call it what you like—for over 50 years. Today, environmental concerns are a global issue. The environment fi gures into every decision we make and into every product we design. Of our 10 strategic goals, 2 have specifi cally to do with environmental practices. Though we haven’t moved as fast as we’d like, and we still have a ways to go before we reach our goal of zero footprint on the environment, we are constantly moving toward that destination. Convia’s programming and monitoring features will most certainly help customers reduce energy consumption by allowing them to control and monitor energy use in new ways.
I’m happy to report that as we were writing this message, Sustainable Business (in its publication Progressive Investor) has named Herman Miller one of its 20 top “World Sustainability Stocks.” It’s a sign of progress.
Environmental Quality Action Teams
Convia’s wide range of capabilities
EQAT
Personal Environmental Control• Task lighting levels• Ambient lighting levels• Temperature• Occupancy sensor
Zone Level Control• Daylighting controls Dimming Switching• Daylight harvesting• Dual-level switching• Manual dimming• Occupancy sensor control
Building Energy Management Control• Adaptation compensation• Load shedding• Centralized power shutdown• Energy trending and reporting• Space utilization reporting
ISO 14001
Indoor Air
Communications
Packaging/Transportation
Energy Reduction Environmental Affairs
Environmental Low-Impact Process
Green Buildings
Design for Environment

Infusion of technology into all environments
Everyone knows that technology has become part and parcel of life and work. Of course, all our products are designed to help people use technology more easily, but Convia, which I’ve already mentioned, is a great example of integrating technology into architecture. This product also illustrates our strategy of expanding into new types of environments by serving individuals (with The Be Collection), interior space (with furniture and systems), and habitat infrastructure (with Convia). This is what we mean by “improving human habitats.”
Great performance, great impact, and a great place for winners
All in all, as the cover to this message says, we had a jolly good show in 2007 (more about John Portlock and Queen Elizabeth in a minute). Most of the credit for a great year goes, as usual, to Herman Miller employees and our extended community—our creative network, dealers, and suppliers. They made it happen. They are the ones who produce the products and services that improve the performance of human habitats worldwide. They are the ones who have a great and good impact on our communities. They make Herman Miller what it is. Let me go through in more detail some of their highlights.
Great Business Performance
Financial factsOne of our 2010 goals is to reach sales of $2.6 billion. Our fi nancial performance in 2007 puts us right on track. Sales last year grew 10.5 percent, from $1.7 billion to $1.9 billion. Operating earnings increased from 9.1 percent of sales to 10.3 percent
The scope of our strategy to improve human habitats.
M
Habitat Infrastructure (Convia)
Interior Space (My Studio and Vivo)
Individual (The Be Collection)
Herman Miller’sProblem-Solving Design

of sales. Net earnings rose 30.1 percent to $129.1 million. Earnings per share rose 36.6 percent to $1.98.
Selected Financial Data FY05 FY06 FY07(In Millions Except Per Share Data)
Net Sales $1,516 $1,737 $1,919Operating Earnings 122 158 198Net Earnings 68 99 129Earnings Per Share—Diluted 0.96 1.45 1.98
End of Period Balances: Cash and Cash Equivalents 154 107 76Total Assets 708 668 666
Interest-Bearing Debt 194 179 176Total Liabilities 537 529 511Total Equity $171 $139 $155
Net sales(In Millions)
$1,
516
F Y05
$1,
737
F Y06
$1,
919
F Y07
North American net sales(In Millions)
$1,
324
F Y05
$1,
520
F Y06
$1,
640
F Y07
Non-North Americannet sales(In Millions)
$19
2
F Y05
$21
7
F Y06$
279
F Y07
* Defi ned as cash dividends paid plus share repurchases.
Cash returned to shareholders*(In Millions)
$15
2
F Y05
$17
5
F Y06
$18
6
F Y07
Operating Income as a percent of sales
8.0
F Y05
9.1
F Y06
10.3
F Y07
Earnings per share—diluted
$0.
96
F Y05
$1.
45
F Y06
$ 1
.98
F Y07

When I suggested to my work team that we list all 206 salesperson winners of Cube Awards, several objected. “Those are some of the most valuable people in the company,” they said. “That’s classifi ed information.” But at least I can thank them publicly for their great performance. And thanks also to Northern Texas, the top performing region.
Sales last year grew 10.5 percent, from $1.7 billion to $1.9 billion

Our Certifi ed Dealer Network grew to 52 last year in 120 locations
As our new CFO Curt Pullen likes to say, “The largest asset we have isn’t on our balance sheet—it’s our dealer network.” Our dealers have always been a central part of our business—and they always will be. 143 North American and 69 International dealers earned awards by meeting or exceeding their sales goals last year.
Market Share Leadership AwardOffi ce Pavilion/Contract Furnishers of Hawaii Pigott Herman Miller MexicoJohn A. Marshall Company Millington LockwoodIntereum Creative Offi ce PavilionTrope Group, Workplace Resource of Austin—San Antonio Continental Offi ce FurnitureHerman Miller Canada
Supply Source Workplace Resource of Southern CaliforniaGoodmans Interior Structures Pivot Interiors Business Interiors NorthwestKlingman WilliamsContemporary Offi ce Interiors Offi ce Pavilion—HoustonCarithers-Wallace-Courtenay Building ServiceWorkplace Resource of ColoradoMiles Treaster and Associates
Sales Volume Leadership AwardCreative Offi ce Pavilion Interior Investments Goodmans Interior StructuresWorkplace Resource of Southern California Continental Offi ce Furniture
Certifi ed Network Leadership AwardWPR Florida SpectrumAPG Offi ce Furnishings

Growth in new marketsAnother of our goals is to drive 50 percent of our annual growth from markets outside the North American offi ce furniture business by the year 2010. This year we saw outstanding performance in two areas—International and Healthcare. Our International group continued its superior performance, increasing sales by 28.4 percent to $278.5 million. While a good portion of this growth has been driven by entering new markets and expanding distribution, we also had very good results in established markets.
Which leads me to explain the cover photo—a great story. Our U.K. subsidiary, Herman Miller Limited, has won a Queen’s Award for Enterprise, the U.K.’s most prestigious award for business. What a way to round off a great year in International! Executive Vice President John Portlock and a team from International accepted the award (in the International Trade category) in a ceremony at Buckingham Palace—and gave us a great cover for this year’s message.
Healthcare had a great year, with sales increasing 20.7 percent over last year—this was the biggest year ever for our Healthcare group. Healthcare is the largest industry in the U.S., $2.17 trillion, representing 15 percent of GDP (expected to rise to 18.7 percent by 2014). The rate at which Americans are aging ensures that this market will grow rapidly in coming years, and we have allocated more R&D budget to problem areas in this fi eld. The quality of healthcare will surely have a great impact on our world and on Herman Miller’s future.
The research and development group Herman Miller Creative Offi ce continues its work to move us into new and adjacent markets. The most exciting result so far is Convia. Convia is both a product and a new business. As previously mentioned, at its heart Convia is a building infrastructure product that allows the user and building owner to adapt, modify, and program their habitat in new and profound ways. This product leads us into the fi eld of modular electrical building systems. To reach this market of building owners and tenants, the Convia business team has developed an entirely new distribution channel focused on electrical contractors.

New ProductsNew product innovations are Herman Miller’s lifeblood, at the heart of our culture and strategy. Three years ago, we set a goal of launching 10 new product platforms by 2010. Last June we launched two new systems—My Studio Environments™ and Vivo® interiors—and the Foray™ chair. This past November at GREENBUILD, we introduced Convia, and in June of 2007, we introduced The Be Collection. These introductions put us on track to meet this goal. We also have a broad and deep portfolio of new designs in the process of development.
My Studio Environments has captured the imagination of many customers who wanted an environment they could fall in love with. Vivo has exceeded our already high expectations in gaining sales and attracting new customers. Start-up costs of the new products did adversely affect margins this year, but we expect that to reverse in fi scal 2008. Subsidiary Geiger’s Foray chair is an important addition to our seating portfolio and an entry into the executive seating segment of the market.
My Studio Environments
Vivo interiors

Great impact
The environmentThree years ago, we restated our corporate values in a piece we call “Things that Matter.” One value we titled “A Better World,” and one way we work to live up to this value is to “pursue sustainability and environmental wisdom.” This value led us to another measurable goal—to reduce our environmental footprint by 80 percent by 2010 and to 0 by 2020. We certainly don’t have this all fi gured out. Progress is slow, and—as with many corporations—we constantly make tough calls in an attempt to balance environmental goals and business goals. Nevertheless, we do make constant progress.
Last year we made improvements in water usage, energy usage, and the use of green power. We published our fi rst Sustainability Report (available online at HermanMiller.com). We have also enlisted the help of our suppliers. I might also add that this year’s annual report contributes in a small way toward these efforts. For the fi rst time, our fi nancials and proxy materials will be entirely online (at HermanMiller.com).
Another strategic goal—have 50 percent of our sales come from products that meet the Design for the Environment (DfE) protocol by 2010. At present we stand at 17.4 percent. I can also report that two new products—My Studio and the Foray chair—have both been Cradle-to-Cradle Certifi ed. To be frank, we are behind on this goal. To achieve it we must increase our efforts at redesigning the material structures of existing products.
Community service and doing goodAnother goal: Among our employees, donate 50,000 hours of volunteer time by 2010. To follow through, we allow employees paid time off to volunteer to nonprofi t organizations of their choice. I always laugh at myself when I talk about this goal. We have fi nished our third year and stand at 58,260 hours. Herman Miller employees have donated time to causes from Katrina relief to breast cancer walks to Habitat for Humanity. The number of hours volunteered tells a lot about what kind of community Herman Miller aspires to be.
The Foray chair, designed by Eric Chan for Geiger

Three years ago, we set a goal of 50,000 hours of volunteer time by 2010—and people at Herman Miller have already showed me how easily they zoomed past it. In this photo, Matthew Warfi eld is smiling over the fi rst Herman Miller scholarship set aside for college-bound members of the Holland, Michigan, Boys and Girls Club.
Over the past three years, Herman Miller employees have given 58,260 hours in volunteer time to nonprofi t groups

Seniority doesn’t guarantee wisdom, but it sure ups the odds. We value the accumulated knowledge and experience of long-term employees. Since 1987, we have recognized them as Watercarriers—which also obliges them to mentor and inform new employees.
Last year, 193 employees reached a real milestone—20 years with Herman Miller—and became Watercarriers
James AielloMoses AlexanderElizabeth AndersonDavid BairPatricia BartholomewWillie BeattieDave BeckmanWaltraud BeckmannDarla Billey-QuinnLyndon BlauwkampMarlin BoerRobert BolhuisJonathon BongaSusan BosMary BossThomas BotbylJames BranderSonia BrittonScott BrownDiane BunseHenry CaliffTerri ChambersSusan ChildressCatherine CollinsJanice CookKenneth CooperJane CooperAnthony Corona
Donna CulverMarcia DaleySusan DalmanShirley DePreeJulie DeShawDavid DetamoreRaChel DeurPaula DeVriesLinda DiepenLoraine DoerrKen DowdyDaniel DreeseTroy DugginsDoris DunnWilliam DykehouseClifford EastlingBettie EldridgeDeborah EllisonMarcia EmmertGlenn EngelPatricia EssenburgMavis FootmanMary FouphtDonald FowlerDean FrickeMari FrisSteven GetzMark Goldsberry
Marie GonsarKeith GoodrichKen GoodsonGeorge GrecoJeffrey GreenslatePamela GudasRobert GustavsonTony HammondMilburn HanksRobin HarrisonNancy HarwellWesley HeikkilaSusan HertelHarris HofChristopher HoltzKathy HornackMarne HoughtalingMark HylbakNancy JagerMary JobeChristine JohnsonJoseph JohnsonMichael JorgensenMary KellyJacqueline KellyDaniel KingBrent KingshottSharon Kolker
Lawrence KooistraDan KoviakMichael KrakerMado KreutzScott KubonJay KuiperRandall KuiteRaymond LacrosseJack LandstraTiep LeTimothy LemieuxJeffrey LieffersJonathon LoomanLeonila LundyDavid LutzJami MarshallAllen MayTheodore MayJames McElfi shAisling McEvoyTimothy McKeeJulie McKeeverDiana McManameyWalter McNamaraThomas McSaubySusan McVayBernard MesbergenPheth Moksouvanh
Mark MollJoseph MoranKathleen MoyerArthur NessenDung NguyenSheldon NienhuisJoseph OhrlingGodwin OkonkwoMichael O’TooleNancy PeckDean PelkeyCraig PetersenPamela PeweKaren PitcherDennis PitzKimberly PlunkettJonathan PlylerLaura PotterClarence PowellCathy PtacekBrian QuillianAndrew RaffaeleTerri RedderScott ReedMargaret ReillyValerie RenkemaJeffrey RhodaTimothy Richards
Cathy RickettsDean RitterGregory RobarStephen RobertsDanial RobinsonJames RockwellSheila RodgersHelen RodriguezL SamuelsWilliam SchultzEric SheggrudPhongsak SichandengKim SkuttPatricia SlamkowskiRandel SlyTimothy SoperMichael SouthDavid SpiraKeven StaffordRosemary SzejnTsehaie TemnewoBette TerpstraJacqueline TerrellKathy ThomasLesley ThompsonConstance TimmerDana TokarczykDaniel Tooker
Janelle TravisKevin TrycAdriane TurnerJames ValleeSharon Van Den BeldtTerry VandenbergRyan Vander HaarKenneth VanderkolkDonald VandykenPhouxanh VannouvongMark Van StaverenDavid WagnerVincent WallaceClarence WallisRoger WalstraBruce WaltersMaryln WaltonPhab WattanasinthamTodd WellsDavid WheelerLynda WiggerDaniel WilkinsKimberly WilksDaniel ZawlockiMatt Zondlak

The Board of Directors also donates a portion of our profi ts each year to nonprofi t organizations. Like many companies, we believe the stronger our communities are, the healthier Herman Miller will be.
A great place for winnersMy team and I really believe that Herman Miller is full of great people. And it follows that they deserve a great place to work. Another of our strategic goals is to be included on Fortune’s list of 100 Best Places to Work. We didn’t make it last year, but we’re still going after this recognition and have applied again this year. Of course there are other recognitions we’re proud of—Industry Week named us one of the top 50 manufacturing companies; we lead our industry in Fortune’s “Most Admired” rankings; and we have been named one of “West Michigan’s 101 Best and Brightest Companies to Work For.”
Inclusiveness is another goal (and corporate value) we have in front of us. This year we established Inclusiveness Resource Teams to involve as many employees as possible in understanding the special needs of people at Herman Miller—and to implement programs that benefi t us all. We were also named, for the second year in a row, minority supplier program of the year by the Michigan Minority Business Council. As with environmental programs, we have a long way to go—and perhaps we should talk about the pursuit of inclusiveness as an important fact of life and not a destination.

What’s next?
I can’t tell you for certain. I can tell you for certain that my team and I are thrilled with what we have and are putting into place. We believe we have all the elements that will allow us to reach our strategic vision for Herman Miller. I’m looking forward to the results of some great work in research and design; our queue of future products is full. I’m looking forward to the expanding and inventive ways people at Herman Miller fi nd to help communities around the world.
I intend for our customers to have long-lived, innovative, and high-performing environments. Herman Miller will continue to be a place where employees can fi nd fulfi llment along many dimensions. Our stockholders will always have our attention; a high level of fi nancial performance is absolutely essential to our ability to perform in other ways. Finally, we will fi nd ways to help our communities grow to become inclusive, creative, welcoming places for people of all abilities and talent.
Sincerely,
© 2007 Herman Miller, Inc., Zeeland, Michigan Printed in U.S.A. on 100 percent post-consumer waste recycled paper with soy-based inks. P.MS2843® L, Y, and Vivo are among the registered trademarks of Herman Miller, Inc.™ Convia, Foray, Herman Miller for the Home, My Studio Environments, and The Be Collection are among the trademarks of Herman Miller, Inc. Cover Photography: BCA Films

Max continues to inspire us at Herman Miller through his books and ideas. As Mike Volkema said in introducing Max at the award ceremony, “Max’s beliefs and worldview have established the architecture for Herman Miller’s beliefs about community.” Not only does Max have yet another honor, but he continues to have our thanks for all he’s done for Herman Miller.
The Community Leadership Association gave retired chairman Max De Pree its International Leadership Award in May.

y
Z

Notice of 2007
Annual Meeting of Shareholders
Proxy Statement
Y
44941HMProxy 8/15/07 6:41 AM Page 1

August 22, 2007
Dear Shareholder
You are cordially invited to attend the Annual Meeting of Shareholders of Herman Miller, Inc., which will be held onOctober 2, 2007, commencing at 9 a.m. (EDT). This year our meeting will be held through the Internet only.
The accompanying Notice of Annual Meeting of Shareholders and Proxy Statement describe in detail the actions weexpect to take at this meeting, as well as the means by which you may vote your shares and attend the meeting throughthe Internet.
Whether or not you plan to attend the Internet meeting, please vote electronically via the Internet, and if you requestpaper materials you can also vote by telephone or by mail. For more details on how to vote your shares please see theProxy Statement under the caption “Solicitation of Proxies and Voting”.
Sincerely,
Brian WalkerPresident and Chief Executive Officer
Notice of Annual Meeting of Shareholders
The annual meeting of the shareholders of Herman Miller, Inc. (the “company”), will be held on October 2, 2007 bymeans of remote communication on the Internet at the Company’s web site, www.hermanmiller.com at 9:00 a.m. (EDT) forthe following purposes:
1. To elect three directors, one for a term of one year and two for a term of three years2. To consider and vote upon a proposal to ratify the appointment of Ernst & Young LLP as our independent registered
public accounting firm3. To transact such other business as may properly come before the meeting or any adjournment thereof
Shareholders of record at the close of business on August 3, 2007, will be entitled to vote at the meeting.Please note that this year’s Annual Meeting will be held via the Internet only. The accompanying proxy materials include
instructions on how to participate in the meeting and the means by which you may vote your shares of Company stock.
We encourage you to vote your Proxy, at your earliest convenience, by one of the following means:
By visiting www.proxyvote.com on the Internet;
And if you request paper materialsBy calling (within the U.S. or Canada) toll free at 1-800-690-6903; orBy signing and returning your Proxy card.
You may also vote at the meeting by faxing your Proxy to (616) 654-7221 before the polls are closed during the meeting. Regardless of whether you expect to attend the meeting through the Internet, please vote your shares in theone of the ways listed above.
By order of the Board of DirectorsDaniel C. Molhoek, Secretary to the Board August 22, 2007
2 2007 Proxy Statement
44941HMProxy 8/15/07 6:41 AM Page 2

3 Herman Miller, Inc., and Subsidiaries
4 Solicitation of Proxies and Voting5 Election of Directors5 Ratification of Appointment of Independent Registered Public Accounting Firm6 Voting Securities and Principal Shareholders6 Director and Executive Officer Information9 Corporate Governance and Board Matters
11 Board Committees12 Report of the Audit Committee13 Compensation Discussion and Analysis21 Executive Compensation Committee Report22 Summary Compensation Table23 Grants of Plan-Based Awards24 Outstanding Equity Awards at Fiscal Year-End25 Option Exercises and Stock Vested25 Pension Benefits26 Nonqualified Deferred Compensation26 Potential Payments upon Termination, Death, Disability, Retirement or Change in Control30 Director Compensation32 Equity Compensation Plan Information33 Section 16(a) Beneficial Ownership Reporting Compliance33 Certain Relationships and Related Party Transactions34 Submission of Shareholder Proposals for the 2008 Annual Meeting34 Miscellaneous
Table of Contents
44941HMProxy 8/15/07 6:41 AM Page 3

4 2007 Proxy Statement
855 East Main AvenuePO Box 302Zeeland, Michigan 49464-0302
Proxy Statement Dated August 22, 2007
This Proxy Statement and the accompanying Proxy, which are being made available to shareholders on or about August22, 2007, are furnished to the shareholders of Herman Miller, Inc., in connection with the solicitation by the Board of Directors of proxies to be used at the Annual Meeting of Shareholders. This meeting will be held on October 2, 2007 at 9:00 a.m. (EDT). Please note that this year’s Annual Meeting will be held via the Internet rather than in person.
How to Participate in the Electronic Meeting
In order to participate in this year’s Annual Meeting, please log on to www.hermanmiller.com and click on the“Investors” section and the “Annual Meeting Webcast” link at least 15 minutes prior to the start of the 9:00 a.m.meeting to provide time to register and download the required audio software if needed. All shareholders will need toregister by entering your name and, if you would like to ask a question during the meeting, you will also need to enterthe 12-digit control number received with your Notice or Proxy. Questions that would be appropriate to raise in personand that relate to the purpose of the meeting will be accepted during the meeting. To submit questions, please accessthe Annual Meeting Webcast and select “Ask a Question.”
Solicitation of Proxies and Voting
Each shareholder, as an owner of the company, is entitled to vote on matters scheduled to come before the annualmeeting. The use of proxies allows a shareholder to be represented at the annual meeting if he or she is unable to attendthe meeting via the Internet.
You can vote by any of the following methods
• Vote by Internet Before the Annual Meeting Use your computer to access the website listed on the Proxy (or thewritten Notice mailed to you) and, with the Proxy or Notice in hand, record your vote. The deadline for internet voting is11:59 p.m., EDT, on October 1, 2007.
If you request paper materials you may also
• Vote by Telephone Call the toll free telephone number provided with your Proxy and, with the Proxy in hand, followthe instructions. The deadline for telephone voting is 11:59 p.m. EDT on October 1, 2007.
• Vote by Mail Complete, date, and sign your Proxy. Mail it in the prepaid envelope provided so that it reaches usbefore October 2, 2007.
• Vote by Facsimile During the Annual Meeting You may vote by facsimile during the Annual Meeting priorto the announcement that the polls are closed. You may do so by faxing a marked and signed copy of your Proxy to1-616-654-7221.
If your Proxy is properly executed, the shares represented by the Proxy will be voted at the Annual Meeting of Shareholders and at any adjournment of that meeting. Where shareholders specify a choice, the Proxy will be voted as specified. If no choice is specified, the shares represented by the Proxy will be voted for the election of all nomineesnamed in the Proxy and for the proposal described in this Proxy Statement.
A Proxy may be revoked prior to its exercise by (i) delivering a written notice of revocation to the Secretary of thecompany, (ii) executing and delivering a Proxy at a later date, or (iii) attending the meeting via the Internet and voting viafax. However, attendance at the meeting does not automatically serve to revoke a Proxy.
Herman Miller, Inc.
44941HMProxy 8/15/07 6:41 AM Page 4

5 Herman Miller, Inc., and Subsidiaries
The Board of Directors has nominated C. William Pollard, Dorothy A. Terrell, and David O. Ulrich for election as directors;Mr. Pollard to serve until the 2008 annual meeting, and Ms. Terrell and Mr. Ulrich to serve until the 2010 annual meeting.Our Bylaws provide that a person may not be elected as a director for a term that expires later than the annualstockholders meeting after attaining age 70. Accordingly, Mr. Pollard, who is currently 69, is being nominated for a one-year term only. Each of the nominees previously has been elected as a director by our shareholders.
The latter portion of this Proxy Statement contains more information about the nominees. Unless otherwise directed bya shareholder’s proxy, each person named as proxy voters in the accompanying proxy will vote for the nominees namedabove. If any of the nominees become unavailable, which is not anticipated, the Board of Directors, at its discretion, maydesignate substitute nominees, in which event the enclosed proxy will be voted for such substituted nominees. Proxiescannot be voted for a greater number of people than the number of nominees named.
A plurality of the votes cast at the meeting is required to elect the nominees as our directors. Accordingly, the three peoplewho receive the largest number of votes cast at the meeting will be elected as directors. Shares not voted at the meeting,whether by abstention, broker non-vote, or otherwise, will not be treated as votes cast at the meeting.
The Board of Directors recommends a vote FOR the election of each person nominated by the Board.
Ratification of Appointment of Independent Registered Public Accounting Firm
Our Audit Committee has appointed Ernst & Young LLP (Ernst & Young) as our independent registered public accountingfirm for the fiscal year ending May 31, 2008. Representatives of Ernst & Young will be present at the annual meeting ofshareholders and available to respond to appropriate questions submitted in advance. The Ernst & Young representativeswill have the opportunity to make a statement if they so desire.
Although the submission of this matter for approval by shareholders is not legally required, our Board of Directorsbelieves that such submission follows sound corporate business practice and is in the best interests of our shareholders.If our shareholders do not approve the selection of Ernst & Young, the selection of this firm as our independent registeredpublic accounting firm will be reconsidered by the Audit Committee.
The Board of Directors recommends a vote FOR the ratification of the appointment of Ernst & Young LLP as ourindependent registered public accounting firm.
Disclosure of Fees Paid to Independent Auditors
Aggregate fees billed to us for the fiscal years ended June 3, 2006, and June 2, 2007 by our independent registeredpublic accounting firm, Ernst & Young, were as follows:Fiscal Year Ended June 3, 2006 June 2, 2007
Audit Fees(1) 1,197,000 1,227,000
Audit Related Fees(2) 30,000 24,000
Tax Fees(3) 17,000 15,000
All Other Fees 0 0
Total $1,244,000 $1,266,000
(1) Includes fees billed for the audit of and accounting consultations related to our consolidated financial statements included in Form 10-K, including theassociated audit of our internal controls, the review of our financial statements included in our quarterly reports in Form 10-Qs, and services in connection with statutory and regulatory filings.
(2) Includes fees billed for audits of employees benefits plans and accounting consultations that are unrelated to the audit or review of financial statements.(3) Includes fees billed for tax compliance, tax advice and, tax planning.
Our Audit Committee has adopted a policy for pre-approving all permissible services performed by Ernst & Young andother firms. This policy requires the Committee’s pre-approval of all services that may be provided by our independentregistered public accounting firm and audit services provided by other firms. The policy authorizes the committee todelegate to one or more of its members pre-approval authority with respect to permitted services. All of the servicesprovided by Ernst & Young under the captions “Audit Fees,” “Audit Related Fees,” “Tax Fees,” and “All Other Fees” wereapproved by the Audit Committee under this policy.
Election of Directors
44941HMProxy 8/15/07 6:41 AM Page 5

6 2007 Proxy Statement
On August 3, 2007, we had 61,235,442 shares of common stock issued and outstanding, par value $.20 per share.Shareholders are entitled to one vote for each share of common stock registered in their names at the close of businesson August 3, 2007, the record date fixed by our Board of Directors. Votes cast at the meeting and submitted by proxy willbe tabulated by our transfer agent. As of August 3, 2007, no person was known by management to be the beneficialowner of more than five percent of our common stock, except as follows.Name and Address of Beneficial Owner Amount and Nature Percent of Class
of Beneficial Ownership
Ariel Capital Management, Inc. 6,954,066(1) 11.36200 East Randolph Dr., Ste. 2900Chicago, Illinois 60601
Barclays Global Fund Advisors 6,094,978(2) 9.9545 Fremont StreetSan Francisco, CA 94105
Columbia Wanger Asset Management, L.P. 4,131,000(3) 6.75227 West Monroe StreetSuite 3000Chicago, IL 60606
Rainier Investment Management, Inc. 3,475,217(4) 5.68601 Union Street, Ste. 2801Seattle, WA 98101
(1) This information is based solely upon information as of December 31, 2006 contained in the 13G/A filed on February 13, 2007 by Ariel Capital Managementwith the Securities and Exchange Commission, “SEC”, including notice that it has sole voting power as to 5,539,896 shares and sole dispositive power as to6,953,236 shares.
(2) This information is based solely upon information as of December 31, 2006 contained in the 13G filed on January 23, 2007 by Barclays Global Fund Advisorswith the SEC, including notice that it has sole voting power as to 5,207,526 shares and sole dispositive power as to 6,094,978 shares.
(3) This information is based solely upon information as of June 30, 2007 contained in the 13F filed on August 7, 2007 by Columbia Wanger Asset Management,LLP. with the SEC.
(4) This information is based solely upon information as of March 31, 2007 contained in the 13F filed on May 11, 2007 by Rainier Investment Management, Inc.,with the SEC.
Director and Executive Officer Information
Security Ownership of Management
The following table shows, as of August 3, 2007, the number of shares beneficially owned by each of the NamedExecutives identified in the executive compensation tables of this Proxy Statement and by all directors and executiveofficers as a group. Except as described in the notes following the table, the following persons have sole voting anddispositive power as to all of their respective shares.Named Executive Amount and Nature Percent of Class(2)
of Beneficial Ownership(1)
Brian C. Walker 313,043 .50Elizabeth A. Nickels 233,938 .38John Portlock 92,406 .15Andrew J. Lock 46,426 .07Gary S. Miller 287,019 .46All executive officers and directors as a group (21 persons) 2,129,839(3) 3.42
(1) Includes the following number of shares with respect to which the Named Executives have the right to acquire beneficial ownership under stock optionsexercisable in 60 days: Mr. Walker—19,160; Ms. Nickels—176,637; Mr. Portlock—66,425; Mr. Lock—12,774; and Mr. Miller—196,654.
(2) Calculated based on the number of shares outstanding plus the option shares referred to in footnote (3) below.(3) Included in this number are 1,074,005 shares with respect to which executive officers and directors have the right to acquire beneficial ownership under
options exercisable within 60 days.
Voting Securities and Principal Shareholders
44941HMProxy 8/15/07 6:41 AM Page 6

The Board of Directors
The information in the following table relating to each nominee’s and director’s age, principal occupation or employmentfor the past five years, and beneficial ownership of shares of common stock as of August 3, 2007, has been furnished tous by the respective nominees and directors. Except as described in the notes following the table, the following nomineesand directors have sole voting and dispositive power as to all of the shares set forth in the following table.Name and Principal Occupation Age Year First Shares Percent of
Became a Owned(1) Class(2)
Director
Nominee for Election as Director for Term to Expire in 2008
C. William Pollard 69 1985 68,298(3) .11Since April 2002—Chairman Emeritus, The ServiceMaster CompanyJanuary 2005 to December 2006—Chairman of the Board, UnumProvident CorporationMarch 2003 to January 2005—Co-Chairman of the Board, UnumProvident CorporationApril 2002 to January 2003—Chairman of Executive Committee, The ServiceMaster Company
Nominees for Election as Directors for Terms to Expire in 2010
Dorothy A. Terrell 62 1997 42,469 .07Since April 2003—Venture Partner, First Light CapitalApril 2005 to June 2007—President and Chief Executive Officer, Initiative for a Competitive Inner CityFebruary 1998 to August 2002—President, Platform Service Group, and Senior Vice President, Worldwide Sales, NMS Communications Corporation
David O. Ulrich 53 2001 67,782 .11Since 1982—Professor, University of Michigan Business School
Directors Whose Terms Expire in 2009
Douglas D. French 53 2002 34,707 .06Since June 2007—Managing Director, Santé Health VenturesMay 2004 to May 2007—Principal, JD Resources, LLCJanuary 2000 to May 2004—President and Chief Executive Officer, Ascension Health
John R. Hoke III 42 2005 3,160 .01Since July 2003—Vice President, Global Footwear Design, NIKE, Inc.January 2002 to July 2003—Global Creative Director, Footwear Design, NIKE, Inc.
James R. Kackley 65 2003 30,519 .05Since May 2002—Private Investor
7 Herman Miller, Inc., and Subsidiaries
Director and Executive Officer Information (Continued)
44941HMProxy 8/15/07 6:41 AM Page 7

8 2007 Proxy Statement
Name and Principal Occupation Age Year First Shares Percent ofBecame a Owned(1) Class(2)
Director
Michael A. Volkema 51 1995 218,950 .35Since 2000—Chairman of the Board, Herman Miller, Inc.July 1995 to July 2004Chief Executive Officer, Herman Miller, Inc.From May 1995 to March 2003President, Herman Miller, Inc.
Directors Whose Terms Expire in 2008
Mary Vermeer Andringa 57 1999 35,209 .06Since February 2003—President and Chief Executive Officer, Vermeer Manufacturing CompanyFrom 1989 to February 2003Chief Operating Officer, Vermeer ManufacturingSince 1989—President, Vermeer Manufacturing
Lord Brian Griffiths of Fforestfach 65 1991 83,572 .13Since 1991—International Advisor, Goldman Sachs International Limited and House of Lords, United Kingdom
J. Barry Griswell 58 2004 10,000 .02Since June 2006—Chairman of the Board, Principal LifeSince January 2002— Chairman of the Board and Chief Executive Officer, Principal Financial Group, Inc.Since January 2000—Chief Executive Officer, Principal LifeApril 2001 to June 2006President, Principal Financial Group, Inc.March 1998 to June 2006President, Principal Life
Brian C. Walker 45 2003 313,043 .50Since July 2004—President and Chief Executive Officer, Herman Miller, Inc.March 2003 to July 2004President and Chief Operating Officer, Herman Miller, Inc.From December 1999 to March 2003President, Herman Miller North America
1) Shares shown for each director include the following number of shares which that director has the right to acquire beneficial ownership under stock options exercisable within 60 days: 39,573 shares for Mr. Pollard; 32,775 shares for Ms. Terrell; 67,782 shares for Mr. Ulrich; 31,037 shares for Mr. French; 24,096 shares for Mr. Kackley; 8,602 shares for Ms. Andringa; 31,605 shares for Lord Griffiths; 19,160 shares for Mr. Walker;.
(2) Percentages are calculated based upon shares outstanding plus shares that the director has the right to acquire under stock options exercisable within 60 days.
(3) Includes 1,612 shares owned of record and beneficially by Mr. Pollard’s wife. Mr. Pollard disclaims beneficial ownership of these shares. Additionally, 19,500 shares are owned by a family partnership.
Ms. Terrell also is a director of General Mills, Inc. Mr. French also is a director of Emageon. Mr. Kackley also is a directorof PepsiAmericas, Inc. and Ryerson, Inc. Mr. Volkema also is a director of Applebee’s International, Inc. and WolverineWorldwide, Inc. Brian Griffiths, Lord Griffiths of Fforestfach, also is a director of The ServiceMaster Company. Mr. Griswellalso is a director of Principal Financial Group, Inc. and Principal Life. Mr. Walker also is a director of Briggs & StrattonCorporation. There are no family relationships between or among our directors, nominees, or any of our executive officers.
Director and Executive Officer InformationThe Board of Directors (Continued)
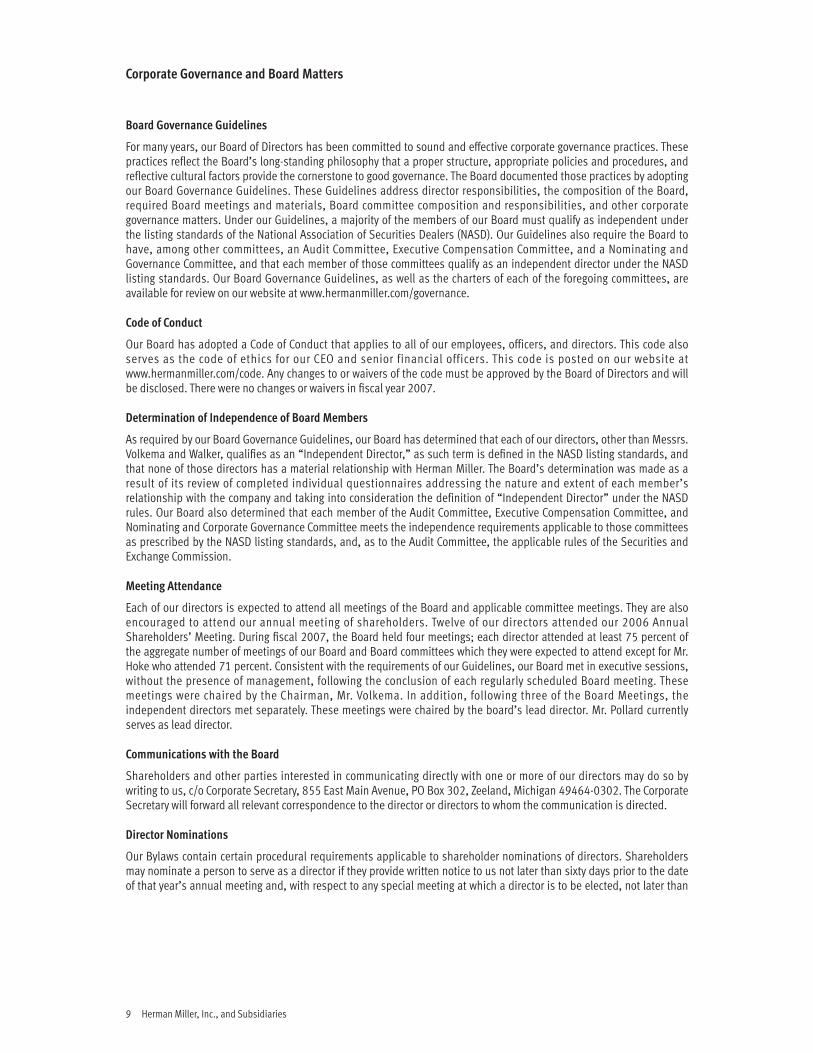
9 Herman Miller, Inc., and Subsidiaries
Board Governance Guidelines
For many years, our Board of Directors has been committed to sound and effective corporate governance practices. Thesepractices reflect the Board’s long-standing philosophy that a proper structure, appropriate policies and procedures, andreflective cultural factors provide the cornerstone to good governance. The Board documented those practices by adoptingour Board Governance Guidelines. These Guidelines address director responsibilities, the composition of the Board,required Board meetings and materials, Board committee composition and responsibilities, and other corporategovernance matters. Under our Guidelines, a majority of the members of our Board must qualify as independent underthe listing standards of the National Association of Securities Dealers (NASD). Our Guidelines also require the Board tohave, among other committees, an Audit Committee, Executive Compensation Committee, and a Nominating andGovernance Committee, and that each member of those committees qualify as an independent director under the NASDlisting standards. Our Board Governance Guidelines, as well as the charters of each of the foregoing committees, areavailable for review on our website at www.hermanmiller.com/governance.
Code of Conduct
Our Board has adopted a Code of Conduct that applies to all of our employees, officers, and directors. This code alsoserves as the code of ethics for our CEO and senior financial officers. This code is posted on our website atwww.hermanmiller.com/code. Any changes to or waivers of the code must be approved by the Board of Directors and willbe disclosed. There were no changes or waivers in fiscal year 2007.
Determination of Independence of Board Members
As required by our Board Governance Guidelines, our Board has determined that each of our directors, other than Messrs.Volkema and Walker, qualifies as an “Independent Director,” as such term is defined in the NASD listing standards, andthat none of those directors has a material relationship with Herman Miller. The Board’s determination was made as aresult of its review of completed individual questionnaires addressing the nature and extent of each member’srelationship with the company and taking into consideration the definition of “Independent Director” under the NASDrules. Our Board also determined that each member of the Audit Committee, Executive Compensation Committee, andNominating and Corporate Governance Committee meets the independence requirements applicable to those committeesas prescribed by the NASD listing standards, and, as to the Audit Committee, the applicable rules of the Securities andExchange Commission.
Meeting Attendance
Each of our directors is expected to attend all meetings of the Board and applicable committee meetings. They are alsoencouraged to attend our annual meeting of shareholders. Twelve of our directors attended our 2006 AnnualShareholders’ Meeting. During fiscal 2007, the Board held four meetings; each director attended at least 75 percent ofthe aggregate number of meetings of our Board and Board committees which they were expected to attend except for Mr.Hoke who attended 71 percent. Consistent with the requirements of our Guidelines, our Board met in executive sessions,without the presence of management, following the conclusion of each regularly scheduled Board meeting. Thesemeetings were chaired by the Chairman, Mr. Volkema. In addition, following three of the Board Meetings, theindependent directors met separately. These meetings were chaired by the board’s lead director. Mr. Pollard currentlyserves as lead director.
Communications with the Board
Shareholders and other parties interested in communicating directly with one or more of our directors may do so bywriting to us, c/o Corporate Secretary, 855 East Main Avenue, PO Box 302, Zeeland, Michigan 49464-0302. The CorporateSecretary will forward all relevant correspondence to the director or directors to whom the communication is directed.
Director Nominations
Our Bylaws contain certain procedural requirements applicable to shareholder nominations of directors. Shareholdersmay nominate a person to serve as a director if they provide written notice to us not later than sixty days prior to the dateof that year’s annual meeting and, with respect to any special meeting at which a director is to be elected, not later than
Corporate Governance and Board Matters
44941HMProxy 8/15/07 6:41 AM Page 9

10 2007 Proxy Statement
10 days after the date of notice of that meeting. The notice must include (1) the name and address of the shareholderwho intends to make the nomination and of the person or persons nominated, (2) a representation that the shareholder isa current record holder and will continue to hold those shares through the date of the meeting and intends to attend the meeting in person or by proxy, (3) a description of all arrangements between the shareholder and each nominee, (4) theinformation regarding each nominee as would be required to be included in a proxy statement filed under Regulations14A of the Exchange Act had the nominee been nominated by the Board of Directors, and (5) the consent of each nomineeto serve as director.
Our Nominating and Governance Committee is responsible for reviewing the qualifications and independence of themembers of the Board. However, it has not established specific, minimum qualifications for director nominees. Thiscommittee does assess the experience and background of prospective candidates, including his or her independence.The committee’s charter authorizes the committee to consider all factors it considers appropriate, including the candidate’s experience and knowledge of our history and culture, as well as his or her experience and background in manufacturing, design, marketing, technology, finance, management structure and philosophy, including his or herexperience as a senior executive officer of a public company. In light of these general requirements, our governancecommittee reviews the suitability of each person nominated to our Board. In the past, through the board evaluationprocess, the committee has determined whether there were any skills or experience that needed to be added to the Boardand used that information to help establish criteria for Board member searches and candidate evaluation. Other than the procedural requirements described above, the Board has not adopted a policy with regard to the consideration ofdirector candidates nominated by shareholders. All candidates, by whomever nominated, are evaluated in the samemanner and under the same standards.
The Nominating and Governance Committee has not received any recommended nominations from any of ourshareholders in connection with our 2007 annual meeting. The nominees who are standing for election as directorsat the 2007 annual meeting are incumbent directors recommended by the committee and nominated by the Board.Our Nominating and Governance Committee is currently utilizing the services of a third party search firm to assistin the identification and evaluation of board member candidates.
Corporate Governance and Board MattersDirector Nominations (Continued)
44941HMProxy 8/15/07 6:41 AM Page 10

11 Herman Miller, Inc., and Subsidiaries
Our Board has four standing committees. Committee responsibilities are detailed in written charters. These charters areavailable on our Internet website at www.hermanmiller.com/charters . The committees are as follows:
Executive Compensation Committee
We have an Executive Compensation Committee comprised of David O. Ulrich (chair), J. Barry Griswell, and John R. Hoke III.The Executive Compensation Committee recommends to the Board the annual executive incentive plan and the annualremuneration of our Chief Executive Officer and President, approves the annual remuneration and executive incentive planfor the other executive officers, grants employee stock options and other equity awards, and acts as the administrativecommittee for our employee stock option and long-term incentive plans. The committee met five times during the last fiscalyear. A description of the Committee's processes and procedures for the consideration and determination of executive anddirector compensation is set forth under the caption "Compensation Disclosure and Analysis - The Executive CompensationCommittee" below in this Proxy Statement.
Executive Compensation Committee Interlocks and Insider Participation
No member of the Executive Compensation Committee is or has been an officer or employee of the company or had anyrelationship that is required to be disclosed as a transaction with a related party. In addition, no current executive officer ofthe Company has ever served as a member of the Board of Directors or Compensation Committee of any other entity thathas or has had one or more executive officers serving as a member of our Board of Directors or Compensation Committee.
Nominating and Governance Committee
We have a Nominating and Governance Committee comprised of C. William Pollard (chair), Lord Brian Griffiths ofFforestfach, and Dorothy A. Terrell. The Nominating and Governance Committee develops and recommends to the Boardgovernance standards and policies and board compensation including that of the chairman of the board. In addition, thecommittee identifies and recommends to the Board candidates for election to fill vacancies on the Board. The committeemet four times during the last fiscal year.
Executive Committee
We have an Executive Committee comprised of Michael A. Volkema (chair), James R. Kackley, C. William Pollard, and DavidO. Ulrich. The Executive Committee acts from time to time on behalf of the Board in managing our business and affairs(except as limited by law or our Bylaws) and is delegated certain assignments and functions by the Board of Directors. Thecommittee met four times during the last fiscal year.
Audit Committee
We have an Audit Committee comprised and James R. Kackley (chair), Mary V. Andringa, and Douglas D. French. Mr. Kackley is qualified as and serves as the “Audit Committee financial expert” within the meaning of the applicable SEC regulations. This Committee, composed entirely of independent directors under the applicable listing standardsof the National Association of Securities Dealers (NASD), as well as the requirements of the Sarbanes-Oxley Act of 2002,is responsible for overseeing management’s reporting practices and internal controls on behalf of the Board of Directors.The Committee is also responsible for appointing, approving the compensation of, and overseeing our independentregistered public accounting firm. The Audit Committee met eight times during the past fiscal year. The March 2007meeting included an annual review of the Committee’s written charter.
Board Committees
44941HMProxy 8/15/07 6:41 AM Page 11

12 2007 Proxy Statement
The Audit Committee’s purpose is to oversee the accounting and financial reporting processes of the company, the audits ofthe company’s financial statements and management’s assessment of the company’s internal controls, the qualificationsof the public accounting firm engaged as the company’s independent registered public accounting firm, and theperformance of the company’s internal auditors and independent registered public accounting firm. The Committee’sfunction is more fully described in its charter, which the Board has adopted. The Committee reviews the charter on anannual basis. The Board annually reviews the NASDAQ listing standards definition of independence for audit committeemembers and has determined that each member of the Committee meets that standard.
Management is responsible for the preparation, presentation, and integrity of the company’s financial statements,accounting and financial reporting principles, internal controls, and procedures designed to ensure compliance withaccounting standards, applicable laws, and regulations. The company’s independent registered public accounting firm,Ernst & Young, LLP, is responsible for performing an independent audit of the consolidated financial statements andexpressing an opinion on the conformity of those financial statements with U.S. generally accepted accounting principles.Ernst & Young, LLP is also responsible for providing an opinion on the effectiveness of the company’s internal control overfinancial reporting as well as management’s assessment thereof.
We have reviewed—and discussed with management and Ernst & Young, LLP—the company’s audited financial statementsfor the year ended June 2, 2007, management’s assessment of the effectiveness of the company’s internal controls overfinancial reporting, and Ernst & Young, LLP’s evaluation of the company’s internal controls over financial reporting.
We have discussed with Ernst & Young, LLP the matters required to be discussed by Statement on AccountingStandards No. 61, Communication with Audit Committees, as amended, by the Auditing Standards Board of the AmericanInstitute of Certified Public Accountants.
We have received and reviewed the written disclosures and the letter from Ernst & Young, LLP required by IndependenceStandard No. 1, Independence Discussions with Audit Committees, as amended, by the Independence Standards Board,and have discussed with Ernst & Young, LLP their independence including a consideration of the compatibility of non-auditservices with their independence.
Based on the reviews and discussions referred to above, we recommended to the Board of Directors that the financialstatements referred to above be included in the company’s Form 10-K Report for the year ended June 2, 2007, and weselected Ernst & Young LLP as the independent auditor for fiscal year 2008. The Board is recommending thatshareholders ratify that selection at the annual meeting.
James R. Kackley (chair) Douglas D. French Mary VerMeer Andringa
Report of the Audit Committee
44941HMProxy 8/15/07 6:41 AM Page 12

13 Herman Miller, Inc., and Subsidiaries
Overview of Compensation Program
The Executive Compensation Committee of the Board (the “Committee”) is responsible for establishing the executivecompensation programs at Herman Miller, Inc. (the “Company,” “us” or similar pronouns). The Committee insures thatthe compensation paid to the Company’s corporate officers is fair, reasonable, competitive and consistent with ourcompensation philosophy.
The Company is required to provide information regarding our compensation policies and decisions for our CEO, CFOand the three other most highly compensated executive officers. We refer to our CEO, CFO and the other three most highlycompensated executive officers collectively as our “Named Executive Officers” or “NEOs.” This Compensation Discussionand Analysis is intended to provide information regarding, among other things, the overall objectives of ourcompensation program and each element of compensation provided to the NEOs.
The Executive Compensation Committee
The Committee is comprised of three directors, each qualifying as an independent director under NASDAQ’s listingrequirements. The Board has determined that each member of the Committee meets the definition of independenceunder Herman Miller’s corporate governance guidelines and further each member qualifies as a non-employee Directorfor purposes of Rule 16b-3 under the Securities Exchange Act of 1934.
The Committee’s primary functions are to oversee the compensation philosophy and strategy of the Company, todetermine or recommend the compensation of company officers, including the NEOs, and to act as the AdministrativeCommittee for the Company’s key executive compensation plans. During fiscal year 2007 (ended June 2, 2007), theCommittee met five times.
The Committee is responsible for recommendations to the full Board with respect to the annual compensation of theCompany’s President and Chief Executive Officer. These recommendations cover all aspects of the President and ChiefExecutive Officer’s compensation including base salary, incentive pay, and equity-based compensation. The Committee,based upon recommendations from our CEO, approves the annual compensation for all other corporate officers coveredby Section 16 of the Securities Exchange Act of 1934 including the NEOs (Corporate Officers). Our President and ChiefExecutive Officer establishes the base salary of all other company executives. The Committee establishes the performanceobjectives for the EVA Incentive Cash Bonus Plan and the equity-based compensation plans, which cover the Presidentand Chief Executive Officer, Corporate Officers, and executive employees of the company.
The Committee does not set compensation for the Board of Directors. The Nominating and Governance Committee isresponsible for reviewing, and recommending to the Board of Directors, the amount and form of payment of directorcompensation.
Compensation Philosophy and Objectives
Our compensation philosophy, as formulated by Management and endorsed by the Committee and by our Board ofDirectors, is to allow for an appropriate level of risk and a corresponding compensation reward within a range that bears arelationship to the competitive market, to the responsibilities of the employee and to the performance of the employeeand Company. Consistent with this philosophy, the key objectives of our executive compensation program are to:
• Link a material portion of executives’ total annual compensation directly to the Company’s performance• Reinforce our values, build corporate community, and focus employees on common goals• Align the interests of executives with the long-term interests of shareholders• Attract, motivate, and retain executives of outstanding ability.
The compensation program, through its use of base salary, annual incentive pay and long-term incentives is intendedto reward performance that generates both consistent and long-term enhancement of shareholder value.
Compensation Discussion and Analysis
44941HMProxy 8/15/07 6:41 AM Page 13
14 2007 Proxy Statement
External Consultants
During fiscal year 2007, the Committee retained Towers Perrin to provide consulting services to it concerning certainaspects of executive compensation. The services included reviewing the elements of compensation of the Chairman, thePresident and Chief Executive Officer, and the Corporate Officers and comparing those elements to the Company’scompensation philosophy and objectives and to the market practices for such compensation. Towers Perrin concludedthat the compensation program established for those officers is consistent with the Company’s compensation philosophyand objectives including with respect to market practices. The Company from time to time retains separate independentexternal consultants for other specialized work as may be required, such as recommending Board of Directors’compensation, conducting a review of retirement or other benefit programs, and establishing change in controlprovisions. The Company in 2007 did not use the services of such separate independent consultants. With the approval ofthe Committee, Towers Perrin in 2007 did provide consulting services to the Company other than those provided to theCommittee. For 2007 Towers Perrin charged the Company approximately $106,000 for services provided to the Committeeand an additional approximate $48,000 for other compensation related consulting services provided to the Company.
Benchmarking of Compensation
To ensure that executive compensation is competitive in the marketplace, the Committee benchmarks our compensationprograms relative to general industry pay practices. The Committee chooses to benchmark compensation levels againstindustrial companies in general as it minimizes the potential volatility of market pay data due to changes indatabase/survey participation or mergers/acquisitions; lessens the impact that a single entity can have on the overall data;provides a more consistent result; and better reflects the market in which the Company competes for executive talent.
Towers Perrin annually presents the Committee with benchmarking data, market practices and trends to provideappropriate context for the Committee’s deliberations. The CEO makes recommendations to the Committee regarding thecompensation package for each of the Corporate Officers (other than himself). The CEO’s recommendations are based onthe Towers Perrin information, his evaluation of the individual’s performance and other factors. Based on theCommittee’s review of the information from Towers Perrin, the recommendations of the CEO and their own judgment ofthe relative performance of both the Company and its executives and of the market practices, the Committee determinesthe appropriate compensation for Corporate Officers (other than the CEO) and makes a recommendation to the full boardfor the CEO compensation. The Board of Directors determines the compensation of the CEO.
Towers Perrin in 2007 used the following survey sources when analyzing the market competitiveness pay levels ofCorporate Officers; Towers Perrin Executive Compensation Database, Watson Wyatt Top Management CompensationReport, and the Mercer Executive Database (collectively these are referred to as “Published Survey Data”). Towers Perrinuses a regression analysis and aging to make allowances for time differences in the data and to align the data so that itcan be compared both with companies with $2 billion in revenue and with companies having revenues equivalent to theoperations managed by individual NEOs. In addition, in setting the 2007 compensation of Corporate Officers, includingthe NEOs, the Committee used a specifically selected comparator group of companies to confirm the Published SurveyData supplied by Towers Perrin. The companies in this comparator group were: Whirlpool, Kellogg, Stryker, Steelcase,Universal Forest Products, HNI, Furniture Brands International, La-Z-Boy, Spartan Stores, Hillenbrand Industries, KimballInternational, Wolverine World Wide, Perrigo, Ethan Allen Interiors, Tempur Pedic International, Knoll and Select Comfort.
Each NEO position has its base salary, target total cash and target total direct compensation compared relative to the 25th, 50th (market median) and 75th percentile of the survey data of a comparable benchmark position. Each ofthe compensation elements is explained in more detail below. Positions are benchmarked based upon comparabilityof responsibilities and the annual revenues of the operations managed. The Committee uses the Published Survey Datafor benchmarking purposes because it believes the competitive market for executive talent in which the Companyoperates is the general corporate talent market, not just the office furniture or West Michigan talent markets.
The Committee annually reviews executive pay tally sheets prepared by Towers Perrin for Corporate Officers. The tallysheets reflect the total compensation to the NEOs from all sources of compensation, including payments under severanceor change in control scenarios. The Committee uses the tally sheets to help it determine that the Company’scompensation program is consistent with market norms and with our compensation philosophy and corporate values.
The Committee has determined that total compensation for each NEO in fiscal 2007 was appropriate and reasonable.The Committee has also determined that the Company’s compensation program operates in a manner that is consistentwith the Company’s overall compensation philosophy.
Compensation Discussion and Analysis (Continued)
44941HMProxy 8/15/07 6:41 AM Page 14

15 Herman Miller, Inc., and Subsidiaries
Elements of the Compensation Program
Our Corporate Officer compensation package includes five distinct elements:
1. Base Salary2. Annual Executive Incentive Cash Bonus3. Long-Term Equity Incentives4. Retirement and Health Benefits5. Perquisites and other executive compensation plans
These five elements together form an executive’s total compensation package. The first two elements form anexecutive’s total cash compensation and the first three elements form an executive’s total direct compensation package.It is the Company’s goal to align the compensation packages with prevailing market rates. The alignment is accomplishedprimarily through adjustments to each Corporate Officer’s total direct compensation. The compensation program helps usto attract and retain the talent we need to grow and sustain our business.
Our goal is to compensate executives for their level of responsibility, development and individual performance. The Committee believes that as the responsibility and authority of a Corporate Officer increases, the portion of his or hercompensation determined by the Company’s performance should also increase. Each Corporate Officer’s currentresponsibility, development and individual performance is assessed by the Committee to determine the appropriatecompensation given performance in their position. The compensation program is intended to provide executives who arejudged to perform their duties at a proficient level with a total direct compensation package that approximates the marketmedian compensation for such position based upon the data provided by Towers Perrin. Each element of total directcompensation is benchmarked to the prevailing market, however, in certain circumstances local practices related to long-term incentives and bonuses may be significantly different than those applicable to the Company as a whole. In thosecircumstances, the Company emphasizes consistency in the application of its long-term incentive programs and adjustsbase and bonus so as to maintain total direct compensation in an amount that is consistent with the Company’scompensation philosophy.
Base Salary
The CEO evaluates each of the Corporate Officers annually and makes recommendations to the Committee for base salary.The base salary of the CEO is set by the Board of Directors. In general, but subject to individual circumstances, basesalaries reflect market rates for comparative positions and the NEO’s level of proficiency and performance. The basesalary of NEOs assessed by the CEO and the Committee to be proficient is generally targeted around the market median ofthe survey market compensation data. The base compensation of NEOs who are assessed to still be developing in theirrole in general would be below the market median and those judged to be performing at a significantly higher level wouldbe above the market median. The Committee in each circumstance uses its judgment and experience in setting thespecific level of base salary relative to the general market median data.
Executive Incentive Cash Bonus
The annual executive incentive cash bonus for the Corporate Officers is paid pursuant to the Executive Incentive CashBonus Plan. This plan is intended to link annual incentive compensation to the creation of shareholder value. TheExecutive Incentive Cash Bonus Plan provides for the annual payment of a cash bonus (Incentive Cash Bonus) to selectedexecutives based upon the performance of the Company during the fiscal year. The annual Incentive Cash Bonusis reported in the Summary Compensation Table under the column titled “Non-equity Incentive Plan Compensation” as required by SEC regulation.
The measure of performance for the Incentive Cash Bonus is Economic Value Added (EVA). EVA in general terms is equalto the Company’s net operating income after subtraction of taxes and a charge for capital. The Committee believes thatthe utilization of the EVA measurement system, with its focus on maximizing the Company’s return on capital investmentsrelative to its cost of capital, is an effective means of evaluating and rewarding executive performance. The cash bonus forNEOs in fiscal 2007 was based upon consolidated EVA for the entire Company.
Compensation Discussion and Analysis (Continued)
44941HMProxy 8/15/07 6:42 AM Page 15

16 2007 Proxy Statement
Under the Executive Incentive Cash Bonus Plan a participant is assigned an Incentive Cash Bonus target expressed as apercentage of his or her base pay, and the actual bonus payment is determined by comparing the actual improvement inEVA achieved by the Company against expected improvement. The expected improvement is the dollar amount of EVAimprovement necessary to earn the targeted EVA bonus. The interval is the dollar amount of EVA change, either above orbelow the expected improvement, necessary to either double the EVA bonus amount or reduce it to zero.
The actual Incentive Cash Bonus amount paid with respect to any year may range from 0 to 2 times of the target basedupon the relative achievement of our EVA targets described below. The Committee sets the EVA targets for 3 year periods.The Incentive Cash Bonus earned by participants is expected over time to equal 100 percent of his or her individualtarget. The target Incentive Cash Bonus payment for the NEOs generally is set at 100 percent of the market median bonusamount for comparable positions as shown in the Published Survey Data , although as explained earlier base pay andbonus may be adjusted in order to maintain total compensation in an amount that is consistent with our compensationphilosophy. The Committee believes that this use of Incentive Cash Bonus is consistent with the objective of makingcompensation for senior corporate officers more variable with the Company’s performance.
The Incentive Cash Bonus payment target percentages for NEOs in fiscal 2007 ranged from 85 percent of base salary forthe CEO to 60 percent of base salary for other NEOs. For fiscal 2008, the payment target percentage for our CEO wasincreased to 100 percent of base salary. This increase was based upon the CEO’s greater experience in his role, hisimproved performance and the market information provided by the Published Survey Data.
The Committee is responsible for administering all elements of the Executive Incentive Cash Bonus Plan, except thatthose elements of the plan relating to the CEO (including target percentage payment) are approved by the Board. TheCommittee approves participants in the plan, the target payment percentage, the EVA improvement goals and the cost ofcapital. The Audit Committee at the end of each fiscal year approves the calculation of EVA results for the year and the EVAchange from the previous year and the resulting bonus factor. The Committee certifies the use of the bonus factor for usein the Incentive Cash Bonus calculation. For fiscal 2007 participants in the Executive Incentive Cash Bonus Plan receivedIncentive Cash Bonus payments amounting to 1.563 times their individual targets. The EVA targets for 2007 were anexpected improvement of $11 million and an interval of $29 million. The EVA targets beginning in 2008 are an expectedimprovement of $9 million and an interval of $32 million. The cost of capital in both 2007 and 2008 is 9 percent.
Long-Term Incentives
Our shareholders in 2004 approved our Long-Term Incentive Plan (LTI Plan). The plan authorizes the Company to issuestock, restricted stock, options, restricted stock units, and other forms of equity-based compensation (Long-Term IncentiveGrants). The key objectives of making Long-Term Incentive Grants under the LTI Plan are:
• To provide an appropriate level of equity reward to Corporate Officers that ties a meaningful part of their compensationto the long-term returns generated for shareholders.
• To provide an appropriate equity award to the next level of executives where market data would support their inclusionin an annual equity award plan.
• To assist the achievement of our share ownership requirements.• To attract, retain and reward key employees.
We believe that a significant portion of executive pay should be aligned with long-term shareholder returns and thatencouraging long-term strategic thinking and decision-making requires that executives have a significant stake in thelong-term success of Herman Miller. The Committee is responsible for administering all elements of the LTI Plan and formaking all Long-Term Incentive Grants under the LTI Plan, except that the Board approves the grants to the CEO.
The LTI Plan provides for the issuance of options with a reload feature. A reload feature permits an option holder whoexercises an option to receive an additional (reload) option in connection with the exercise. The reload option has anexercise price equal to the price at which the existing option was exercised and represents a number of shares equal tothe number of shares traded in to exercise the option and to pay the taxes on the exercise of the option. The reloadfeature exists in option grants made before fiscal year 2007. The Committee, beginning in fiscal year 2007, discontinuedthe practice of issuing new options with reload features.
Compensation Discussion and AnalysisElements of the Compensation Program (Continued)
44941HMProxy 8/15/07 6:42 AM Page 16

17 Herman Miller, Inc., and Subsidiaries
LTI Grants in 2007In fiscal 2007, we awarded both stock options and restricted stock units to our NEOs relating to fiscal 2006 performance.The target value of the grants was divided equally between options and restricted stock units. The Committee (and theBoard in the case of the CEO) at the beginning of fiscal 2006 established target values of the Long-Term Incentive Grantsto be awarded in connection with the Company’s performance for that fiscal year. The actual grants were made in fiscal2007 after the financial results were reported for the year and therefore the value of grants with respect to 2006 appearsin this year’s proxy information. The actual value of the restricted stock units granted was subject to adjustment fromtarget because of the Company’s EVA performance for fiscal 2006, as explained below, while the actual value of theoptions was not subject to such adjustment.
The target values established in 2006 for the Long-Term Incentive Grants (including options and restricted stock units)awarded in fiscal 2007 was 80 percent of base salary for Ms. Nickels, 73 percent for Mr. Miller, 69 percent for Mr. Lock,and 28 percent for Mr. Portlock. The target value of the Long-Term Incentive Grants to Brian Walker was set at $300,000.The target value of these awards was matched against Published Survey Data with the understanding that the awardswere less than market median data and with the understanding that subsequent adjustments would be needed to reachmarket median. The Committee in setting the target award for Brian Walker also took into account the value of a 100,000share stock grant made to Mr. Walker July 27, 2004.
Stock Options The options granted in fiscal 2007 were priced at 10 percent above the closing price of our stock onthe date of grant, have a 10-year life and vest equally over 3 years. An employee who leaves the Company for any reasonwill forfeit all unvested options. The vesting of all options is accelerated on a change of control of the Company. The valueof the options granted in fiscal 2007 was not subject to adjustment on account of our Company’s EVA performance. The actual number of options granted was determined using the Black-Scholes valuation method and the closing price forthe Company’s stock on the date of grant. The Black-Scholes assumptions used in connection with these grants can befound in footnote 14 to our annual financial statements included in this years Form 10K.
Restricted Stock Units The total value of restricted stock units actually granted to NEO’s in fiscal 2007 was subject toadjustment with respect to the Company’s EVA improvement in fiscal year 2006 as compared to fiscal year 2005. If the EVAresults in fiscal 2006 varied from the Expected Improvement, the total value of the restricted stock units would beincreased or decreased but such increase or decrease could not change the total value of the restricted stock units grantedby more than 50 percent of the targeted grant value. The Company achieved a 1.8272 EVA bonus factor for fiscal year 2006,which exceeded the 50 percent cap for the year, resulting in a 50 percent increase above target in the total value of therestricted stock units granted to the NEOs. The number of restricted stock units actually granted was determined by dividingthe adjusted dollar value of the award amount by the closing price of our stock on the date of grant.
The restricted stock units are units that convert into shares of the Company’s common stock after they vest. Therestricted stock units granted in 2007 cliff vest at the end of 5 years. An employee who leaves the Company for anyreason, except for death, disability, retirement or termination for other than cause will forfeit all of the unvested restrictedstock units. An employee who retires, dies, leaves the Company because of a disability or is discharged for other thancause, will receive a portion of the restricted stock units equal to that proportion of time he or she is employed by theCompany after the grant of the restricted stock units. If an employee retires, the vesting of restricted stock unitsis conditioned upon his or her providing 10 hours per quarter of consulting services. The vesting of all restricted stockunits is accelerated on a change of control of the Company. Dividends accrue on the restricted stock units and are addedto the total value of the units.
LTI Grants for 2008The Committee, in consultation with Towers Perrin, revisited our practice of granting awards under the LTI Plan for grantsmade beginning in fiscal 2008 with three goals in mind; 1) better aligning the expense of the plan with the actual resultsof the business in any fiscal year, 2) establishing a longer-term time horizon over which to evaluate performance whenmaking long-term incentive awards, 3) modifying the mix between options and shares. The Committee made significantchanges to the awards that will be granted in July 2007. Beginning with the grants made in July 2007, awards will bemade in the form of performance shares and stock options (one-third performance shares, one-third market priced stockoptions, and one-third to be selected by the participant between the two forms of equity awards). The grants of
Compensation Discussion and AnalysisElements of the Compensation Program (Continued)
44941HMProxy 8/15/07 6:42 AM Page 17

18 2007 Proxy Statement
performance shares will not be based upon the prior year’s EVA performance but upon the Company’s future EVAperformance. The Committee believes this revised grant structure retains the key elements of EVA measurement andemployee ownership and aligns the interests of shareholders and executives while better matching the expense in anygiven year to the performance of the business in that year. The Long-Term Incentive Grants to be granted in fiscal 2008have a target value ranging from 225 percent of base salary for our CEO to 100 percent of base salary for Andrew Lock andGary Miller, 60 percent for Beth Nickels and 50 percent for John Portlock. The increase in the target value of the Long-TermIncentive Grants to the CEO and most of the other NEOs in both absolute amount and relative to the increase in basecompensation reflects the decision of the Committee to bring the value of the LTI grants closer to the market medianvalues of such grants reflected by the Published Survey Data. The decrease in target value for Ms Nickels reflects her newrole, for fiscal year 2008, as President, Herman Miller for Healthcare as discussed in the most recent 10K. In the case ofthe CEO it also reflects the fact that the Company is no longer amortizing the cost of the 100,000 share grant made to himJuly 27, 2004.
Stock Options The options will vest equally over three years, have a ten year life and are priced at fair market valueon the date of grant.
Performance Shares The performance shares will represent shares of the Company’s common stock and are to beissued to participants at the end of a future 3-year measurement period beginning in the year that performance sharesare granted. The value of the performance shares is initially based upon a target grant to each participant. The actualpayout of shares can vary between 0 percent and 200 percent of target shares depending upon the cumulative averageEVA performance over the three-year measurement period. There will be no payment of dividends during the performanceperiod and the shares will not actually be issued until the end of the three-year measurement period.
Practices Concerning Grant DatesGrants under the LTI Plan are typically made in connection with the Board of Directors meeting in July of each year. Thenumber of performance shares is determined using the closing price for the Company’s common stock on the date ofgrant and the number of options is based on the Black-Scholes valuation method described as a footnote to the Long-Term Incentive Grants table. The Company does not attempt to influence the amount of executive compensation by timingequity grants in connection with the disclosure of material information to the public. The Company’s year end financialinformation is normally disclosed through a press release in the third week of June. The backdating of equity award datesis specifically prohibited under policies adopted by the Board of Directors.
Retirement and Health Plans
Health Plans
The Company maintains a broad base of health insurance plans available to all full-time and most part-time employees. TheNEOs participate in such health insurance plans on the same terms as all other employees within the geographic region.
Retirement Plans
The Company maintains broad based retirement plans available to all non-union employees in the United States. Ouremployees in England and who are union members are covered by separate defined benefit retirement plans. Our retirement plans are designed to provide an appropriate level of replacement income upon retirement. The benefitsavailable to NEOs are the same as available to other non-executive employees in the geographic region subject tolimitations provided by law or regulation. The NEOs participate in the full range of benefits and are covered by the sameplans (with exceptions noted) on the same terms as provided to all U.S. employees. John Portlock, an NEO, is covered bythe retirement income plan in effect in England. The Company targets its overall benefits to be competitive withcompanies with which we compete for executive talent.
The retirement plans include:
• The Herman Miller, Inc. Retirement Income Plan• The Herman Miller, Inc. Profit Sharing and 401(k) Plan• The Herman Miller, Inc. Non-qualified Deferred Compensation Plan• The Herman Miller Limited Retirement Benefits Plan
Compensation Discussion and AnalysisElements of the Compensation Program (Continued)
44941HMProxy 8/15/07 6:42 AM Page 18

19 Herman Miller, Inc., and Subsidiaries
Retirement Income Plan The Herman Miller, Inc. Retirement Income Plan (Cash Balance Plan) is what is known as ahybrid plan. Under the Plan the Company accrues a benefit for the participant which is expressed as a fixed dollar amount(cash balance). The Company credits each employee’s account with an amount equal to 4 percent of his or her salary, upto the maximum salary level permitted by the Internal Revenue Service (currently $220,000). Each account is alsocredited with hypothetical interest earning pegged to a predetermined benchmark. For fiscal 2007 interest was creditedat 5.06 percent.
Profit Sharing Plan The Herman Miller, Inc. Profit Sharing and 401(k) Plan consists of two parts. The Company annuallymakes a contribution to the profit sharing portion based upon the Company’s EVA results for the year that may range from 0 percent to 6 percent of base salaries, with a target contribution of 4 percent of base salary. Based upon our EVA results,the actual percentage contributed for fiscal year 2007 was 4.69 percent. The amount of salary included in the base for thecalculation is limited to the maximum salary level permitted by the IRS. The 401(k) portion of the plan is a salary deferralplan. Each employee may elect to defer up to the maximum amount permitted. The Company matches up to half ofthe amount deferred by the employee up to the first 6 percent of the employee’s compensation contributed.
Herman Miller Limited Retirement Plan Herman Miller Limited, the Company’s, wholly owned UK subsidiarymaintains an average final pay pension plan for all of its retirees. Under the plan each employee is entitled to a normalbasic pension equal to an equivalent of 1/70th of final pensionable salary for each complete year of service. The pensionis subject to a maximum of 40/70ths of final pensionable salary,
Perquisites and Other Executive Compensation Plans
Perquisites
The Company has historically been conservative in its approach to executive perquisite benefits. Our approach has beento provide a limited number of perquisites to corporate officers. The Company normally provides each NEO with aspecified dollar amount which can be used for a range of perquisites. These perquisites include financial planning, lifeinsurance, spousal travel and other benefits. In 2007 the dollar amount of these benefits used was $25,000 for the CEOand between $10,000 and $32,000 for each of the other NEOs.
The Company does not normally provide non-business-related use of chartered aircraft for Corporate Officers. During2007 there were two occasions on which the Company did provide chartered aircraft to NEOs for non-business use. Thetotal cost to the Company for this usage was less than $10,000.
The Company in 2007 did provide the NEOs and all other Corporate Officers with the opportunity to purchase certainadditional disability insurance and to obtain comprehensive physicals paid for by the Company.
Deferred Compensation Plan
The Non-qualified Deferred Compensation Plan allows selected employees to defer part or all of their Executive IncentiveCash Bonus payment each year. The Company will match any such deferral, up to 50 percent of the incentive cash bonuspayment. The matching payment vests over 3 years and vesting is dependent upon the executive remaining employedwith the Company. During 2007 only two executives, Brian Walker and Beth Nickels, elected to participate in the deferredcompensation plan. Amounts deferred are converted into units having the same value as the Company’s stock and arecredited with amounts at the same rate as the Company’s dividend on its common stock. Units are converted into sharesof the Company’s common stock at the time of distribution. The Company, after 2007, will discontinue use of this plan.Company match contributions with respect to amounts deferred during 2007 will appear on the 2008 SummaryCompensation Table. The vesting on the Company matching contribution is shown on the Perquisites and OtherCompensation table.
The Committee has approved a supplemental deferred compensation plan for salary deferrals beginning in January2008. The plan will allow all United States employees who have compensation above the statutory ceiling to defer incomein the same proportion as if the statutory ceiling did not exist. The Company will make contributions to the plan such thatthe amounts in the plan “mirror” the amounts the Company would have contributed had the employee’s compensationnot been above the statutory ceiling, subject to a limit of 9.9 percent of compensation. Investment options under thisplan will be the same as those available under the 401(k) Plan.
Compensation Discussion and AnalysisRetirement and Health Plans (Continued)
44941HMProxy 8/15/07 6:42 AM Page 19

20 2007 Proxy Statement
Key Executive Stock Purchase Assistance Plan
In 1994 the Company established the Key Executive Stock Purchase Assistance Plan. The plan provided that the Companywould make loans to certain key executives to allow them to purchase shares of Company stock. The executives areobligated to repay the loans together with interest over an 8 year period. The executive could earn repayment of up to 80percent of the total loan principal and 100 percent of the annual interest through Company performance as measured bythe Company meeting its annual EVA expected improvement target. The Committee closed the plan to further participantsin 2004 and there is only one remaining loan outstanding, that being to Beth Nickels. In 2006 and 2007 she earnedrepayment of the full amount of the interest and principal due on the loan for those years. The earned repayment for fiscalyear 2007 is shown on the Perquisites and Other Income table.
Executive Long Term Disability Plan
The plan covers 60% of the rolling two year average of executive incentive compensation. Executives are eligible to participate when they have earned over $6,000 in annual executive incentive comp. This benefit continues as long as the executive is disabled until age 65. The monthly benefit is capped at $10,000. The executive can maintain the planby paying Unum, the provider, directly when they leave Herman Miller.
Deductibility of Compensation
The income tax laws of the United States limit the amount the company may deduct for compensation paid to thecompany’s CEO, CFO and the other three most highly paid executives. Certain compensation that qualifies as“performance based” under IRS guidelines is not subject to this limit. All compensation paid by the company during fiscal2007 meets the requirements for deductibility.
Ownership Guidelines
The Committee believes that significant stock ownership by top management is of critical importance to the ongoingsuccess of the Company, since it closely links the interests of senior management and company shareholders. Stockownership requirements apply to the nine members of the Executive Leadership Team for the Company. Under theserequirements, the President and Chief Executive Officer must own shares of company stock with an aggregate marketvalue of at least six (6) times base salary, Corporate Officers having a Long-Term Incentive Plan target equal to 100 percentof base salary must own shares of Company stock with an aggregate market value of four (4) times their respective basesalaries and all other direct reports to the CEO must own shares with an aggregate market value of three (3) times theirrespective base salaries.
All participants must achieve their ownership requirement over a five-year period from the date of their appointment tothe position. Ownership for the purpose of the guidelines is defined to include shares owned by the executives, as well asshares held in profit sharing, 401(k), restricted stock and restricted stock units (both vested and unvested), and deferredaccounts for his or her benefit. Stock options and unissued performance shares are not included in the calculation of anexecutive’s total ownership. If a participant fails to meet the ownership guidelines within the specified period half of hisor her Incentive Cash Bonus will be paid in the form of Company stock until the guideline is met.
In fiscal 2007, all NEOs had achieved their ownership guidelines.
Impact of Prior Compensation in Setting Elements of Compensation
Prior compensation of the NEOs does not normally impact how the Committee sets the current elements of compensation.The Committee believes the current competitive environment mandates the current total level of compensation. Asdescribed earlier the Committee uses tally sheets to track all of the elements of current compensation to enable theCommittee to determine whether the compensation which the NEO is currently receiving is consistent with marketpractices. The Committee, however, has the ability to consider the impact of any special equity grants upon the value offuture grants made to Corporate Officers under the LTI plan. In 2007, the Committee adjusted the value of the grantsmade to the CEO under the LTI plan to reflect a portion of the value of a 100,000 share equity grant made July 27, 2004.
Compensation Discussion and AnalysisPerquisites and Other Executive Compensation Plans (Continued)
44941HMProxy 8/15/07 6:42 AM Page 20

Impact of Restatements Retroactively Impacting Financial Goals
The Company has not had any material restatement of prior financial results. If such restatements were to occur, the Committee would review the matter and determine what, if any, adjustment to current compensation mightbe appropriate.
Post-Employment Compensation
Change in control and discharge for other than cause can result in additional compensation being paid to or for certainNEOs. In addition, as described above, certain of the Long-Term Incentive Bonus payments continue if the NEO leavesemployment as the result of death, disability or retirement.
Termination Payments
All of the NEOs are “at will” employees. This means that they can be discharged at any time and for no reason. TheCompany has agreed to pay Corporate Officers and other executives severance if they are terminated for reasons otherthan cause. In 2007 the severance payments would have been equal to 12 months of base salary and in 2008 the severance payments would be equal to 18 months of base salary for each of the NEOs. The change in the amount ofseverance payments is the result of benchmarking our practices to the Published Survey Data. In addition, the Companymaintains the health insurance on such employee during the salary continuation period. In exchange for such paymentsthe employee provides the Company with a mutual release of all claims and agrees not to work for a competitor during thesalary continuation period.
Change in Control Agreements
Each NEO is party to a change in control agreement with the Company. In 2006 the Committee retained Frederic W. Cookto review the existing change in control agreements and to advise it on whether the continued use of such agreementswas appropriate and if so whether the agreements were consistent with competitive practices. Frederic W. Cook advisedthe Committee that the continued use of change in control agreements is appropriate and recommended certain changesto the form of the agreements. In 2006 the Company entered into new change in control agreements with the NEOs andcertain other Corporate Officers and executives. The new form of change in control agreement is found under Exhibit 10 in the Company’s consolidated financial statements for the fiscal year ended June 2, 2007, included in our Annual Reporton Form 10-K.
The Committee believes that the use of change in control agreements is appropriate as they help insure a continuityof management during a threatened take-over and help insure that management remains focused on completing atransaction that is likely to maximize shareholder value. Potential payments under the change in control agreementsare included in the tally sheets provided annually to the Committee.
The narrative and footnotes to the tables entitled Potential Payments upon Termination in Connection with a Change inControl describe the change in control payments in greater detail.
Executive Compensation Committee Report
The Committee has reviewed and discussed the Compensation Discussion and Analysis required by Item 402(b) ofRegulation S-K with Management and, based on such review and discussions, the Committee recommended to the Boardthat the Compensation Discussion and Analysis be included in the Proxy Statement.
David Ulrich (chair) Barry Griswell John Hoke
21 Herman Miller, Inc., and Subsidiaries
Compensation Discussion and Analysis (Continued)
44941HMProxy 8/15/07 6:42 AM Page 21

The summary compensation table below shows the compensation for the Named Executive Officers for the fiscal yearended June 2, 2007 (“Fiscal 2007”). The details of the Company’s executive compensation programs are found in theCD&A.Name and Principal Position Year Salary Bonus Stock Option Non-Equity Change in All Other Total
($) ($) Awards Awards Incentive Pension Compensation ($)($)(1) ($)(1) Plan Value and ($)(4)
Compensation Nonqualified($)(2) Deferred
CompensationEarnings
($)(3)
Brian C. WalkerPresident and Chief Executive Officer 2007 625,961 — 651,052 358,045 829,981 11,957 105,433 2,582,429
Elizabeth A. NickelsChief Financial Officer 2007 349,327 — 128,038 170,390 327,377 8,869 169,917 1,153,918
John Portlock(5)
President, Herman Miller, International 2007 315,232 — 173,680 47,444 297,088 51,840 58,377 943,661
Andrew LockChief Administration Officer, 2007 302,981 — 119,610 61,771 283,558 8,970 40,818 817,708
Gary MillerChief Development Officer 2007 275,000 — 171,596 61,771 257,862 33,944 27,004 827,177
(1) Amounts set forth in the stock award and option award columns represent the amounts recognized as compensation expense in fiscal 2007 for financialreporting purposes with respect to stock awards and options in accordance with FAS 123R except that the amounts do not reflect a reduction for estimatedforfeitures. The assumptions used in calculating these amounts are set forth in Note 14, in the Company’s consolidated financial statements for the fiscal yearended June 2, 2007, included in our Annual Report on Form 10-K.
(2) Includes the amounts earned in fiscal 2007 and paid in fiscal 2008 under the Executive Incentive Cash Bonus Plan as described in the CD&A. Certain executiveshave elected to defer a part of the Executive Incentive Cash Bonus under the Key Executive Deferred Compensation Plan. The amount of the deferrals and thecorresponding Company contributions will be shown in next year’s Nonqualified Deferred Compensation Table.
(3) Amounts represent the aggregate change in the actuarial present value of the accumulated benefits under the Company’s Retirement Plans.(4) The amounts in this column for all other compensation are described in the following table:
Bundled Car Key Dividends Company Air Retirement Group Vesting of TotalBenefits(a) Allowance Executive on Sponsored Travel Plan Term Life Registrants Other
(UK only) Loan restricked Physicals Contribution Insurance contributions CompensationAssistance(b) stock and (c) (d) to Deferred
Healthcare CompensationPlan
Brian Walker 25,856 32,000 2,892 1,083 16,918 991 25,693 105,433Elizabeth Nickels 9,336 95,637 800 6,524 416 16,918 814 39,472 169,917John Portlock 32,072 21,318 4,987 58,377Andrew Lock 14,717 7,858 16,918 1,325 40,818Gary Miller 7,859 16,918 2,227 27,004
(a) Bundled Benefits includes accounting fees, cell phone fees, club dues, family travel, financial planning, home office expenses, vehicle expenses, lifeinsurance, and tax gross-ups. None of these benefits exceeded $10,000 except for tax gross-ups for Mr. Portlock in the amounts of $12,829.
(b) Represents amount earned under our Key Executive Stock Purchase Assistance Plan and applied to the repayment of loans made thereunder. No new loansmay be extended under this plan. At June 2, 2007, the outstanding loan was $115,303.
(c) Each executive, except for Mr. Portlock, received contributions of $16,918 pursuant to our defined contribution retirement plans. (d) Group Term Life Insurance is available to all US employees.
(5) Mr. Portlock serves the company through its United Kingdom subsidiary. As such, his benefits are paid according to the benefits paid in the United Kingdom,which are different from the benefits in the United States. His benefits include medical insurance, car allowance, spouse travel, and contributions to a pensionplan. All amounts are converted from pounds to dollars using an annual average exchange rate of 1.92.
22 2007 Proxy Statement
Summary Compensation Table
44941HMProxy 8/15/07 6:42 AM Page 22

The Grant of Plan-Based Awards table below sets forth information on equity awards granted by the Company to the NEOsduring fiscal 2007 under the Long Term Incentive Plan (LTI Plan) and the possible payouts to the NEOs under the ExecutiveIncentive Cash Bonus Plan (Annual Cash Bonus Plan) for fiscal 2007. Payments under the Incentive Cash Bonus Plan areshown in the Estimated Possible Payouts Under Non-Equity Incentive Plan Awards column. The CD&A provides furtherdetails of grants under the LTI Plan, including the vesting information for the options and restricted stock units as well asthe performance criteria under the Annual Cash Bonus Plan. Name Grant Date Estimated Possible Payouts Under Estimated Future Payouts Under All Other All Other Exercise or Grant Date
Non-Equity Incentive Plan Awards(1) Equity Incentive Plan Awards Stock Option Base Price Fair ValueThreshold Target Maximum Threshold Target Maximum Awards: Awards: of Option of Stock
($) ($) ($) (#) (#) (#) Number Number of Awards and of Shares Securities ($/Sh)(4) Option
of Stock Underlying Awardsof Units(2) Options(3) ($)(5)
(#) (#)
Brian C. Walker 07/24/06 8,105 224,99507/24/06 20,066 30.536 149,99710/30/06(6) 45,635 34.51 450,548
0 532,067 1,064,134
Elizabeth A. Nickels 07/24/06 7,430 206,25707/24/06 18,394 30.536 137,499
0 209,596 419,192
John Portlock 07/24/06 2,161 59,98907/24/06 5,351 30.536 40,000
0 189,139 378,278
Andrew Lock 07/24/06 5,403 149,98707/24/06 13,378 30.536 100,003
0 181,789 363,577
Gary Miller 07/24/06 5,403 149,98707/24/06 13.378 30.536 100,003
0 165,000 330,000
(1) Under the Annual Cash Bonus Plan executives can earn incentive compensation based on the achievement of certain company performance goals. The actualCash Bonus amount paid with respect to any year may range from 0 to 2 times of the target based upon the relative achievement of our EVA targets.
(2) Represent units that convert into an equivalent number of shares of common stock and are subject to time-based cliff vesting in five years.(3) Except as noted in footnote (6), each option has a term of ten years and vests pro rata over three years.(4) Stock options are awarded at an option price not less than the market value of the Company’s common stock at the grant date in accordance with the LTI Plan.(5) Aggregate grant date values are computed in accordance with FAS 123R.(6) Reflects options granted pursuant to stock option reload rights contained in certain option agreements. The rights permit employees to receive new options
if an employee exercises options by trading in shares. Reload options allow for the purchase of shares of Company stock equal to the number of shares thatwere exchanged upon exercise of the underlying option. The reload options retain the expiration date of the original option, but the exercise price equals thefair market value of the company’s stock on the date of grant of the reload option.
23 Herman Miller, Inc., and Subsidiaries
Grants of Plan-Based Awards
44941HMProxy 8/15/07 6:42 AM Page 23

24 2007 Proxy Statement
The Outstanding Equity Awards at Fiscal Year-End table below shows the option awards and stock awards that wereoutstanding as of June 2, 2007. The table shows both exercisable and unexercisable options. The table also shows shareunits and equity plan awards that have not vested.Name Grant Number of Number of Option Option Number of Market Equity Equity
Date Securities Securities Exercise Expiration of Shares or Value of Incentive IncentiveUnderlying Underlying Price Date Units of Stock Shares or Plan Awards: Plan Awards
Unexercised Unexercised ($) That Have Units of Number of Market orOptions(#)(1) Options(#)(1) Not Vested Stock That Unearned Payout Value
Exercisable Unexerciable (#)(2) Have Note Shares, Units of UnearnedVested ($)(3) or Other Shares, Units
Rights That or OtherHave Not Rights That
Vested (#) Have NotVested ($)
Brian C. Walker 07/27/04 100,000 3,653,00006/27/05 6,236 12,473 33.517 06/27/15 6,202 226,55907/24/06 20,066 30.536 07/24/16 8,159 298,04810/30/06 8,589 34.510 07/05/1010/30/06 3,616 34.510 06/29/1110/30/06 33,430 34.510 04/23/12
Elizabeth A. Nickels 07/05/00 9,800 27.359 07/05/1004/25/01 3,115 25.230 02/07/1004/23/02 25,313 25.000 04/23/1206/30/03 25,000 20.060 06/30/1305/19/04 50,000 23.870 05/19/0907/20/04 17,931 26.950 02/07/1006/27/05 5,717 11,433 33.517 06/27/15 5,685 207,67310/18/05 3,706 27.990 02/07/1010/18/05 10,194 27.990 02/07/1010/18/05 8,740 27.990 02/07/1010/18/05 2,788 27.990 06/29/1110/18/05 2,486 27.990 04/23/1207/24/06 18,394 30.536 07/24/16 7,480 273,244
John Portlock 07/05/00 3,853 27.359 07/05/1004/23/01 20,000 25.100 04/23/1106/29/01 3,500 24.200 06/29/1104/23/02 23,962 25.000 04/23/1206/30/03 10,000 20.060 06/30/1306/27/05 1,663 3,326 33.517 06/27/15 1,653 60,38407/24/06 0 5,351 30.536 07/24/16 2,175 79,453
Andrew Lock 06/27/05 4,158 8,315 33.517 06/27/15 4,134 151,01507/24/06 13,378 30.536 07/24/16 5,439 198,687
Gary Miller 07/08/97 5,030 19.875 07/08/0707/06/98 40,000 29.750 07/06/0807/02/99 28,000 23.313 07/02/0907/05/00 9,800 27.359 07/05/1006/29/01 3,080 24.200 06/29/1104/23/02 28,000 25.000 04/23/0206/30/03 25,000 20.060 06/30/1305/19/04 50,000 23.870 05/19/1406/27/05 4,158 8,315 33.517 06/27/15 4,134 151,01507/24/06 13,378 30.536 07/24/16 5,439 198,687
(1) Options granted on 06/27/05 and 07/24/06 vest in three equal annual installments beginning on the first anniversary of the grant date. Options granted priorto 06/27/05 or in connection with a reload vest 100 percent on the one year anniversary date of the award.
(2) All awards vest 100 percent on the five year anniversary date of the award. Assumes a stock price of $36.53 per share, which was the closing price of a shareof Common Stock on the last trading day of the fiscal year, June 1, 2007.
(3) Options granted on 10/30/06, 10/18/05, 7/20/04, 4/25/01 reflects options granted pursuant to stock option reload rights contained in certain optionagreements. The rights permit employees to receive new options if an employee exercises options by trading in shares. Reload options allow for the purchaseof shares of Company stock equal to the number of shares that were exchanged upon exercise of the underlying option. The reload options retain the expirationdate of the original option, but the exercise price equals the fair market value of the company’s stock on the date of grant of the reload option.
Outstanding Equity Awards at Fiscal Year-End
44941HMProxy 8/15/07 6:42 AM Page 24

25 Herman Miller, Inc., and Subsidiaries
This table provides information on the number and value of (1) options exercised in Fiscal 2007, and (2) the vesting ofrestricted stock (on an aggregate basis).
Option Awards Stock AwardsName Number of Value Realized Number of Value Realized
Shares on Exercise Shares on VestingAcquired ($)(1) Acquired ($)(2)
on Exercise on Vesting(#) (#)
Brian C. Walker 54,200 495,844 5,000 169,850
Elizabeth A. Nickels — — 5,000 169,850
John Portlock 97,145 1,152,090 2,000 70,800
Andrew Lock 95,051 826,502 1,107 37,262
Gary Miller — — — —
(1) Represents the difference between the exercise price and the fair market value of our common stock on the date of exercise.(2) Value based on the closing market price of the Company’s common stock on the vesting date.
Pension Benefits
The Pension Benefit table which is below provides certain information on the retirement benefits available under eachretirement plan to each NEO at the end of fiscal 2007. The retirement plans are described in the CD&A.Name Plan Name Number of Present Value of Payments During
Years Credited Accumulated Last FiscalService Benefit Year
(#) ($) ($)
Brian C. Walker Herman Miller, Inc. Retirement Income Plan 18 103,670 —
Elizabeth A. Nickels Herman Miller, Inc. Retirement Income Plan 7 50,365 —
John Portlock(1) Herman Miller, UK Pension Plan 27 2,133,120 —
Andrew Lock(2) Herman Miller, Inc. Retirement Income Plan 5 38,872 —Herman Miller, UK Pension Plan 12 529,920 —
Gary Miller Herman Miller, Inc. Retirement Income Plan 31 476,338 —
(1) John Portlock is covered by the UK Pension Plan which is unlike the Herman Miller Cash Balance Plan described above. Under the UK Pension Plan benefits aredetermined by salary and years of service.
(2) Andy Lock was covered from 1990-2002 under the UK Pension Plan and from 2002-2007 under the Retirement Income Plan.
Option Exercises and Stock Vested
44941HMProxy 8/15/07 6:42 AM Page 25

26 2007 Proxy Statement
The Nonqualified Deferred Compensation table below provides certain information relating to each defined contributionplan that provides for the deferral of compensation on a basis that is not tax-qualified. Name Executive Contributions Registrant Contributions Aggregate Earnings Aggregate Withdrawals/ Aggregate Balance
in Last Fiscal Year in Last Fiscal Year in Last Fiscal Year Distributions at Last Fiscal Year End($)(1) ($)(2) ($)(3) ($) ($)
Brian C. Walker — — 334,629 305,214 1,528,323
Elizabeth A. Nickels 186,872 56,061 114,304 — 555,935
Andrew Lock — — — — —
Gary Miller — — — — —
John Portlock — — — — —
(1) Amounts in this column represent the amounts deferred by the participant relating to the Executive Incentive Cash Bonus Plan earned in fiscal 2006 but paid in fiscal 2007.
(2) Amounts in this column represent the Company’s match of 30 percent of the employee’s contribution.(3) Amounts reflect increase in value of the Company’s common stock during the year, based upon deemed investment of deferred amounts.
The Company’s Non-qualified Deferred Compensation Plan allows certain employees to defer part or all of his or herExecutive Incentive Cash Bonus payment each year. The Company will match any such deferral, up to 50 percent ofthe incentive cash bonus payment. The matching payment vests over 3 years and vesting is dependent upon the executiveremaining employed with the Company. During 2007 only two executives, Brian Walker and Beth Nickels, elected to participate in the deferred compensation plan. The amounts deferred with respect to 2007 income will be reflected in the 2008 proxy information. Amounts deferred are converted into units having the same value as the Company’sstock and are credited with amounts at the same rate as the Company’s dividend on its common stock. Units are convertedinto shares of the Company’s common stock at the time of distribution. After 2007, the Company will discontinue use of this plan.
The Committee has approved a supplemental deferred compensation plan for salary deferrals beginning in January2008. The plan will allow all United States employees who have compensation above the statutory ceiling to defer incomein the same proportion as if the statutory ceiling did not exist. The Company will make contributions to the plan such thatthe amounts in the plan “mirror” the amounts the Company would have contributed had the employee’s compensationnot be above the statutory ceiling, subject to a limit of 9.9 percent of compensation.
Potential Payments upon Termination, Death, Disability, Retirement or Change in Control
The following tables quantify both the estimated payments that would be made to each NEO in the event of his/hertermination by the Company without cause, and in the event of his/her termination under circumstances that wouldtrigger payments under the change in control agreements. The tables also provide information regarding the incrementalamounts that would have vested and become payable on June 2, 2007 if a change in control occurred on that date or ifthe NEO’s employment had terminated on that date because of death, disability or retirement. The amounts potentiallypayable to each NEO in the event of separation without cause, death, disability, retirement or in connection with a changein control in which a termination occurs is illustrated below. The narrative that follows the tables gives more detailsconcerning the plans and the circumstances under which either accelerated payment or vesting would occur.
Nonqualified Deferred Compensation
44941HMProxy 8/15/07 6:42 AM Page 26

27 Herman Miller, Inc., and Subsidiaries
Assumes termination occurs at end of Fiscal Year 2007 (June 2, 2007)
Brian Walker—Chief Executive Officer
Benefit Death Disability Retirement Without Cause Change in Control
Cash Severance $ — $ — $ — $ 630,000 $ 3,496,500Prorated Annual Incentive $ 829,981 $ 829,981 $ — $ — $ 829,981Equity
Restricted Stock $ 1,461,200 $ 1,461,200 $ — $ 1,461,200 $ 3,653,000Restricted Stock Units $ 138,473 $ 138,473 $ — $ 138,473 $ 524,606Unexercisable Options $ — $ — $ — $ — $ 250,039Total $ 1,599,673 $ 1,599,673 $ — $ 1,599,673 $ 4,427,645
Retirement Benefits(1)
Unvested Deferred Stock Units $ 26,140 $ 26,140 $ — $ — $ 26,140Other Benefits
Health and Welfare $ — $ — $ — $ 16,093 $ 48,279Outplacement $ — $ — $ — $ 20,000 $ 20,000Tax Gross-Ups $ — $ — $ — $ — $ 1,739,984Total $ — $ — $ — $ 36,093 $ 1,808,262
Total $ 2,455,794 $ 2,455,794 $ — $ 2,265,766 $10,588,528
Elizabeth Nickels—EVP, Chief Financial Officer
Benefit Death Disability Retirement Without Cause Change in Control
Cash Severance $ — $ — $ — $ 350,000 $ 1,120,000Prorated Annual Incentive $ 327,377 $ 327,377 $ — $ — $ 327,377Equity
Restricted Stock $ — $ — $ — $ — $ —Restricted Stock Units $ 126,937 $ 126,937 $ — $ 126,937 $ 480,904Unexercisable Options $ — $ — $ — $ — $ 144,701Total $ 126,937 $ 126,937 $ — $ 126,937 $ 625,605
Retirement Benefits(1)
Unvested Deferred Stock Units $ 58,682 $ 58,682 $ — $ — $ 58,682Other Benefits
Health and Welfare $ — $ — $ — $ 14,277 $ 28,553 Outplacement $ — $ — $ — $ 20,000 $ 20,000Tax Gross-Ups $ — $ — $ — $ — $ —Total $ — $ — $ — $ 34,277 $ 48,553
Total $ 512,996 $ 512,996 $ — $ 511,214 $ 2,180,217
John Portlock - President, International
Benefit Death Disability Retirement Without Cause Change in Control
Cash Severance $ — $ — $ — $ 316,800 $ 1,013,760Prorated Annual Incentive $ 297,088 $ 297,088 $297,088 $ — $ 297,088Equity
Restricted Stock $ — $ — $ — $ — $ —Restricted Stock Units $ 36,916 $ 36,916 $ — $ 36,916 $ 139,860
Unexercisable Options $ — $ — $ — $ — $ 42,095Total $ 36,916 $ 36,916 $ — $ 36,916 $ 181,955
Retirement Benefits(1)
Unvested Deferred Stock Units $ — $ — $ — $ — $ —Other Benefits
Health and Welfare $ — $ — $ — $ 32,085 $ 64,170Outplacement $ — $ — $ — $ 20,000 $ 20,000Tax Gross-Ups $ — $ — $ — $ — $ —Total $ — $ — $ — $ 52,085 $ 84,170
Total $ 334,004 $ 334,004 $297,088 $ 405,801 $ 1,576,973
Potential Payments upon Termination, Death, Disability, Retirement or Change in Control (Continued)
44941HMProxy 8/15/07 6:42 AM Page 27

28 2007 Proxy Statement
Andrew Lock—EVP, Chief Administrative Officer
Benefit Death Disability Retirement Without Cause Change in Control
Cash Severance $ — $ — $ — $ 305,000 $ 976,000Prorated Annual Incentive $ 283,558 $ 283,558 $ — $ — $ 283,558Equity
Restricted Stock $ — $ — $ — $ — $ —Restricted Stock Units $ 92,314 $ 92,314 $ — $ 92,314 $ 349,725Unexercisable Options $ — $ — $ — $ — $ 105,241Total $ 92,314 $ 92,314 $ — $ 92,314 $ 454,966
Retirement Benefits(1)
Unvested Deferred Stock Units $ — $ — $ — $ — $ —Other Benefits
Health and Welfare $ — $ — $ — $ 16,317 $ 32,634Outplacement $ — $ — $ — $ 20,000 $ 20,000Tax Gross-Ups $ — $ — $ — $ — $ —Total $ — $ — $ — $ 36,317 $ 52,634
Total $ 375,872 $ 375,872 $ — $ 433,631 $ 1,767,158
Gary Miller—EVP, Creative Office
Benefit Death Disability Retirement Without Cause Change in Control
Cash Severance $ — $ — $ — $ 275,000 $ 884,664Prorated Annual Incentive $ 257,862 $ 257,862 $257,862 $ — $ 257,862Equity
Restricted Stock $ — $ — $ — $ — $ —Restricted Stock Units $ 92,314 $ 92,314 $ — $ 92,314 $ 349,725Unexercisable Options $ — $ — $ — $ — $ 105,241Total $ 92,314 $ 92,314 $ — $ 92,314 $ 454,966
Retirement Benefits(1)
Unvested Deferred Stock Units $ — $ — $ — $ — $ —Other Benefits
Health and Welfare $ — $ — $ — $ 14,343 $ 28,685Outplacement $ — $ — $ — $ 20,000 $ 20,000Tax Gross-Ups $ — $ — $ — $ — $ —Total $ — $ — $ — $ 34,343 $ 48,685
Total $ 350,176 $ 350,176 $257,862 $ 401,657 $ 1,646,177
(1) The retirement benefits available to the Named Executive Officers are the same as those available to all salaried employees.
Potential Payments upon Termination without Change in Control
The Company under its salary continuation plan has agreed to pay Corporate Officers and other executives severance ifthey are terminated for reasons other than cause. The payments in 2007 would have been equal to 12 months basesalary while in 2008 the payments will be equal to 18 months base salary continuation for the NEOs. In addition theCompany maintains the health insurance on such employee during the salary continuation period. In exchange for suchpayments the employee provides the Company with a mutual release of all claims and agrees not to work for a competitorduring the salary continuation period. In the event of a termination covered by the change in control agreementsdescribed below, the payments under those agreements is reduced by any amounts received under the salarycontinuation plan.
The Executive Long Term Disability Plan provides a monthly benefit to an executive of 60% of their 2 year averageexecutive incentive up to a monthly maximum of 10,000. Each of the NEOs, except Mr. Portlock, would be entitled to a$10,000 monthly benefit if they became disabled as of June 2, 2007 as long as they are disabled or until age 65.
Potential Payments upon Termination, Death, Disability, Retirement or Change in Control (Continued)
44941HMProxy 8/15/07 6:42 AM Page 28
29 Herman Miller, Inc., and Subsidiaries
Potential Payments upon Termination in Connection with Change in Control
In Fiscal 2007 each NEO is party to a change in control agreement with the Company. The change in control agreementsare all “two trigger” agreements. This means there both must be a change in control and the employee must lose his orher job for a reason covered by the change in control agreement in order to be entitled to a payment.
The agreements define change in control as having occurred (1) when a third party becomes the owner of more than 35 percent of the Company’s stock, (2) when a majority of the Board of directors is composed of persons who are notrecommended by the existing Board, (3) when a third party acquires a majority of the assets of the Companyin a transaction not approved by the continuing directors, (4) when the Company is a party to a merger or reorganizationin which the existing shareholders do not control 60 percent of the shares of the surviving company or (5) when there is a liquidation of the Company.
An employee is entitled to a payment under the change in control agreement if within 2 years after a change in controlhe (1) loses his or her employment with the Company for reasons other than cause, (2) the responsibilities of his or herjob are significantly reduced, (3) the base salary or bonus he or she receives is reduced, (4) the benefits he or shereceives are reduced by more than 5 percent, (5) the location of his or her job is relocated more than 50 miles from itscurrent location, or (6) the obligations of the change in control agreement is not assumed by any successor company.
If both triggering events occur, then the NEO is entitled to a change in control payment. The change in control paymentconsists of three elements (1) amounts owed for current year base salary, on target bonus prorated to the date oftermination and all amounts of deferred income, (2) medical and other insurance benefits, and (3) a separation payment.In addition, all existing unvested options and other equity units become immediately vested and exercisable. Theseparation payment in the case of the CEO is to be equal to 3 times the amount described below and in the case of allother NEOs the payment is equal to 2 times the amount described below. The separation payment is a lump sum equal toeither two or three times the sum of (a) the executive’s base salary plus (b) the greater of the executive’s actual bonus forthe preceding year or his or her on-target bonus for the current year. This amount is reduced by any severance paymentthat executive receives under the severance program described above.
The Company has the obligation to make a “gross up” payment to the executive if the amount of the payments underthe change in control agreements is subject to an excise tax under Section 4999 of the Internal Revenue Code of 1986.However, if a reduction of 5 percent in the separation payments to the executive would prevent them from being subjectto the excise tax, the Company may reduce the payments up to 5 percent but only to the extent necessary to avoid theimposition of the excise tax.
In order to receive the payments the NEO would be required to sign a non-competition agreement, committing to refrainfrom competing with the Company for a period equal to the number of years of compensation received by the NEO underthe agreement.
Accelerated Vesting upon Death, Disability, Retirement or Change in Control
Various compensation plans contain provisions that permit accelerated vesting upon death, disability or change in control. In the event of a change in control, the Key Executive Deferred Compensation Plan, the Long-Term IncentivePlan, and the Executive Incentive Cash Bonus Plan provide for the acceleration of vesting and/or payment even if the NEOhas not been terminated. These are so called single trigger payment provisions. The Long-Term Incentive Plan, ExecutiveIncentive Cash Bonus Plan and Key Executive Deferred Compensation Plan each has provisions dealing with vesting upondeath, disability or retirement. The definition of change in control for these plans after December 31, 2005 is thedefinition contained in Treasury Regulations for Section 409A of the American Jobs Creation Act of 2004.
Key Executive Deferred Compensation Plan
The Key executive Deferred Compensation Plan permits a participant to elect to have his or her account distributedimmediately upon his death, disability, or termination of employment in addition to change in control. The plan alsopermits the Committee to distribute to the employee amounts deferred before December 31, 2005 in the event of hisdeath, disability or termination of employment.
Long-Term Incentive Plan
The Long-Term Incentive Plan provides that all unvested options and restricted stock units vest and become immediatelyexercisable in the event of a change in control. Options granted under the LTI Plan to the extent vested at the date ofdeath, disability or retirement, remain exercisable for the lesser of 60 months or the balance of their original term. In allother cases the options terminate 90 days after a termination of employment. Restricted stock units granted in 2007cliff vest 5 years after the date of grant. If an employee dies, becomes disabled or is terminated by the Company forreasons other than cause, his or her restricted stock units vest ratably determined by the number of months he or shehas been with the Company after grant. If an employee retires the grant of restricted stock units will continue to vestover the original vesting period, provided the employee is available to provide 10 hours per quarter of consultingservices and does not work for a competitor.
Potential Payments upon Termination, Death, Disability, Retirement or Change in Control (Continued)
44941HMProxy 8/15/07 6:42 AM Page 29

30 2007 Proxy Statement
The Executive Incentive Cash Bonus Plan
The Executive Incentive Cash Bonus Plan requires that an employee be employed by the Company on the last day of afiscal year in order to be eligible to receive the Incentive Cash Bonus, with certain exceptions noted below. The planprovides that in the events of death, disability or retirement an employee does not need to be employed on the last day ofthe fiscal year in order to receive a bonus. The employee’s bonus will be reduced to reflect the portion of the year that heor she was employed by the Company. In the event of a change in control, the Incentive Cash Bonus is immediately vested(based upon EVA results achieved through the date of the change in control) and payable and is not reduced by virtue ofthe fact that it is calculated upon a partial year. The same provisions governing payment in the event of death, disability,retirement or change in control are also found in the bonus plan applicable to all other employees.
Director Compensation
The following Director Compensation table provides information on the compensation of each director for fiscal year2007. The standard compensation of each director is $105,000. The audit committee chair receives an additional$10,000. All other committee chairs receive an additional $5,000. The chairman of the Board of Directors receivesadditional annual compensation of $305,000 and is eligible to participate in the Company’s health insurance plan. BrianWalker, the Company’s CEO, does not receive any additional compensation for serving on the Board of Directors.
The annual retainer and chairperson fee (if appropriate) is payable by one or more of the following means, as selectedby each director: (1) in cash; (2) in shares of our stock valued as of January 15 of each year; (3) credit under the DirectorDeferred Compensation Plan described below, with company common stock units valued as of January 15 of each year; (4)stock options valued as of January 15 of each year under the Black-Scholes Valuation Model; or (5) as a contribution to ourcompany employee scholarship fund. Any director who does not meet the stock ownership guideline must take at least 50percent of his or her fee in one of the permissible forms of equity.
Stock Compensation Plan
We have in effect a Stock Compensation Plan, approved and adopted by our shareholders, under which nonemployeeofficers and directors may be granted options to purchase shares of our stock if they elect to receive their compensation instock options. Subject to certain exceptions, the options are not exercisable until 12 months after the date of grant andexpire 10 years after the date of the grant. The option price is payable upon exercise in cash or, subject to certainlimitations, in shares of our stock already owned by the optionee, or a combination of shares and cash.
Deferred Compensation Plan
We also maintain a Nonemployee Officer and Director Deferred Compensation Stock Purchase Plan. The Plan permitsparticipants to defer receipt of all or a portion of the total annual retainer and Chairman of the Board and committee chairfees to his or her account under the plan expressed in stock units equivalent to shares of our stock.
Stock Ownership Guidelines
Director stock ownership guidelines have been in effect since 1997. These guidelines, like those of the managementteam, are intended to reinforce the importance of linking shareholder and director interests. Under these guidelines,beginning in 2000, each director is encouraged to reach a minimum level of share ownership having a value of at leastthree times the annual director retainer over a five-year period after first becoming a director.
Other
Directors are reimbursed for travel and other necessary business expenses incurred in the performance of their servicesfor the Company, and they are covered under the Company’s business travel insurance policies and under the Directorand Officer liability insurance policy.
Potential Payments upon Termination, Death, Disability, Retirement or Change in ControlAccelerated Vesting upon Death, Disability, Retirement or Change in Control (Continued)
44941HMProxy 8/15/07 6:42 AM Page 30

31 Herman Miller, Inc., and Subsidiaries
Perquisites
Some Directors’ spouses accompany them to Board meetings. The Company pays for their expenses and for someamenities for the Directors and their spouses, including some meals and social events. The total of these perquisites isless than $10,000 per Director.
Director Compensation TableName Fees Earned Stock Option Non-Equity Change in All Other Total
or Paid Awards Awards Incentive Plan Pension Compensation ($)in Cash ($)(2) ($)(2) Compensation Value and ($)(3)
($)(1) ($) NonqualifiedDeferred
CompensationEarnings
Mary Vermeer Andringa 100,000 70,800(4) 5,000 175,800
Douglas D. French 100,000 30,954 5,000 135,954
Lord Brian Griffiths of Fforestfach 105,000 5,000 110,000
J. Barry Griswell 100,000 5,000 105,000
John R. Hoke III 47,500 52,500 5,000 105,000
James R. Kackley 50,000 62,500 30,954 2,500 145,954
C. William Pollard 105,000 5,000 110,000
Dorothy A. Terrell 104,000 1,000 105,000
David O. Ulrich 107,317 3,000 110,317
Michael A. Volkema(5) 570,192 2,938 9,657 13,798 596,585
(1) The amounts shown in the “Fees Earned or Paid in Cash” column include amounts which may be deferred under the Non-Employee Director DeferredCompensation Plan. Amounts deferred are retained as units equal to shares of stock under the plan. The plan permits non-employee directors to elect to deferamounts which they would otherwise receive as director fees. Amounts deferred are credited with earnings at the same rate as the dividend on the Company’sstock. Directors at the time of deferral elect the deferral period. The units together with the earnings on the units are converted to shares of the Company’scommon stock at the end of the deferral period and are distributed to the director at the end of the deferral period.
(2) These amounts reflect the expense recognized as compensation expense in fiscal 2007 for financial reporting purposes with respect to stock awards andoptions, granted in fiscal 2007 and/or the prior year, in accordance with FAS 123R except that the amounts do not reflect a reduction for estimated forfeitures.The assumptions used in calculating these amounts are set forth in Note 14 in the Company’s consolidated financial statements for the fiscal year ended June 2,2007, included in our Annual Report on Form 10-K.
(3) The Michael Volkema Scholarship fund awards college scholarships to children of employees. All directors contributed a portion of their fees to the fund. Mr. Volkema’s Other Compensation includes $10,000 for the Scholarship fund, $694 for group life insurance and $3,104 for the Company 401K match duringthe time Mr. Volkema was an employee, see note (5) below.
(4) Ms. Andringa during the year received reload options as a result of her exercise of options granted under the Non-employee Officer and DirectorStock Option Plan.
(5) Mr. Volkema was an employee of the Company until December 31, 2006. The amount of compensation shown for him includes $170,192 received as anemployee. Beginning January 1, 2007 he is no longer an employee and receives only his director’s fees from the Company.
As of June 2, 2007, each Director had the following aggregate number of outstanding options:Name Aggregate Number of Outstanding Options
Mary Vermeer Andringa 16,948Douglas D. French 31,037Lord Brian Griffiths of Fforestfach 31,605J. Barry Griswell 0John R. Hoke III 0James R. Kackley 24,096C. William Pollard 39,573Dorothy A. Terrell 32,775David O. Ulrich 77,276Michael A. Volkema 0
Director Compensation (Continued)
44941HMProxy 8/15/07 6:42 AM Page 31

32 2007 Proxy Statement
As noted in the Compensation Discussion and Analysis, we maintain certain equity compensation plans under whichcommon stock is authorized for issuance to employees and directors in exchange for services. In addition, we maintainthe Nonemployee Officer and Director Stock Option Plan, Long Term Incentive Plan, 2000 Employee Stock Option Plan,Employees’ Stock Purchase Plan, and various employee ownership and profit sharing plans under which common stock isauthorized for issuance to employees and directors in exchange for services.
The 2000 Employee Stock Option Plan is our only equity compensation plan under which common stock is authorized forissuance that has not been approved by our shareholders. Under the 2000 Employee Stock Option Plan, each full- or part-time employee of the company, or any U.S. or Canadian subsidiary, and certain foreign subsidiaries who was not eligible toparticipate in the Long-Term Incentive Plan, received a one-time, nontransferable grant of a nonqualified stock option to purchase 100 shares of our common stock, at fair market value of the shares on the grant date. The options were notexercisable until after one year of continuous employment from the grant date and remain exercisable until the earlier of 10years after the grant date or three months after termination of employment (other than termination due to of retirement,disability, or death, which events allow for a longer exercise period). The Board is sensitive to dilution of shareholderinterests resulting from the granting of stock options and therefore has allocated the options granted under this planagainst the authorized shares available under the Long-term Incentive Plan.
The following table sets forth certain information regarding the above referenced equity compensation plans as ofJune 2, 2007. Plan category Number of securities Weighted-average Number of securities
to be issued upon exercise exercise price of remaining available forof outstanding options outstanding options, future issuance under
warrants and rights(1) warrants and rights equity compensationplans (excluding securities
reflected in column(a))
(a) (b) (c)
Equity compensation plans approved by security holders 2,655,052 $27.17 6,204,214(2)
Equity compensation plans not approved by security holders 205,070 $27.24 —Total 2,860,122 $27.18 6,204,214
(1) We have not granted warrants or rights applicable to this chart.(2) The number of shares remaining available for future issuance under our plans for awards other than options is limited to 12 percent of the shares authorized
by shareholders. There are 620,660 shares remaining available for future issuance for awards other than options.
Equity Compensation Plan Information
44941HMProxy 8/15/07 6:42 AM Page 32

33 Herman Miller, Inc., and Subsidiaries
Our directors and officers, as well as any person holding more than 10 percent of our common stock, are required toreport initial statements of ownership of our securities and changes in such ownership to the Securities and ExchangeCommission. Based upon written representations by each director and officer, all the reports were filed by such personsduring the last fiscal year, except C. William Pollard who filed one late Form 4 that reported one transaction involving afractional share.
Certain Relationships and Related Party Transactions
During the past fiscal year, the Board of Directors adopted a Policy on Related Party Transactions. Under that Policy, withcertain limited exceptions, all proposed transactions between the Company and one of its directors or officers or theirrespective affiliates are required to be reported to the Nominating and Governance Committee prior to entering into such atransaction. Management is obligated to provide that Committee with information relating to the terms and conditions ofthe proposed transaction, how it complies with the Policy, and if the proposed transaction is with a director, advise theCommittee if the transaction would impact that director's status as an independent director. The Nominating andGovernance Committee has the authority to determine whether the proposed transaction is exempt from approval or, if not,approve the transaction as compliant with the Policy or refer the matter to the Board of Directors. All approved or exemptedtransactions must be reported by the Committee to the full Board of Directors.
In order to approve a transaction under the Policy, the Nominating and Governance Committee must determine that either (1) the dollar amount of the transaction and other transactions with the director during that year is less than$100,000, and, for any director that is a member of the Audit Committee, does not constitute a proscribed consulting,advisory, or other compensated fee, or (2) if the proposed transaction is for the acquisition of products or services and is either less than $100,000 or is subject to a bid process involving three or more competing parties, and the transactionis in the best interest of the Company and its shareholders, provided that (a) management determined that the proposedtransaction will provide the best value for the Company, (b) the compensation is consistent with the proposals submittedby the other bidders, and (c) the director did not directly participate in the proposal process.
J. Barry Griswell is the Chairman of the Board of Directors and Chief Executive Officer of Principal Financial Group, Inc.During fiscal 2007, management submitted a request to the Nominating and Governance Committee to approve aproposed transaction under which the Principal Financial Group would provide Family Medical Leave Act and short-termand long-term disability management work on behalf of the Company. Management, with the assistance of a third-partyconsultant, sent a request for a proposal to nine different companies to provide these services, formerly provided bymanagement. Following the evaluation of bids submitted by a variety of vendors, management recommended that thework be performed by the Principal Financial Group due to its competitive advantages, including pricing. Mr. Griswell didnot participate in the bid process or discuss the proposal with management of the Company. Based upon management’srecommendation, the Committee determined that the proposed transaction was in the best interest of the Company andits shareholders and approved the proposed transaction. Under the terms of the transaction, Principal Financial Groupwill provide FMLA administration, short-term disability and long-term disability for a period of three years at an annualrate of approximately $1.5 million for each of the three years of the contract.
Section 16(a) Beneficial Ownership Reporting Compliance
44941HMProxy 8/15/07 6:42 AM Page 33

34 2007 Proxy Statement
Shareholders wishing to submit proposals on matters appropriate for shareholder action to be presented at our 2008annual meeting of shareholders may do so in accordance with Rule 14a-8 promulgated under the Exchange Act. For suchproposals to be included in our proxy materials relating to our 2008 annual meeting of shareholders, all applicablerequirements of Rule 14a-8 must be satisfied and such proposals must be received by us at our principal executive officesat 855 East Main Avenue, PO Box 302, Zeeland, Michigan 49464-0302, no later than April 24, 2008.
For any proposal that is not submitted for inclusion in next year’s Proxy Statement, but is instead sought to bepresented directly at the 2008 Annual Meeting, SEC rules permit management to vote proxies at its discretion if we: (1)receive notice of the proposal before the close of business on July 8, 2008, and advise shareholders in the 2008 ProxyStatement about the nature of the matter and how management intends to vote on such matter, or (2) do not receivenotice of the proposal prior to the close of business on July 8, 2008. Notices of intention to present proposals at the 2008annual meeting should be addressed to our Corporate Secretary, at our principal executive offices at 855 East MainAvenue, PO Box 302, Zeeland, Michigan 49464-0302.
As of August 22, 2007, no proposals to be presented at the 2007 annual meeting had been received by us.Under our Bylaws, no business may be brought before an annual shareholder meeting unless it is specified in the
notice of the meeting and included in the accompanying proxy materials, or as otherwise brought before the meeting by or at the direction of the Board or by a shareholder entitled to vote who has delivered written notice to us (containingcertain information specified in the Bylaws about the shareholder and the proposed action) not less than thirty (30) daysprior to the date of the originally scheduled meeting. If less than forty (40) days advance notice of the meeting is given,the notice must be received by us no later than the close of business on the tenth day following the date on which the notice of the scheduled meeting was first mailed to our shareholders.
Miscellaneous
The cost of the solicitation of proxies will be borne by us. In addition to the use of the mails, proxies may be solicitedpersonally or by telephone or electronic means by a few of our regular employees. We may reimburse brokers and otherpeople holding stock in their names or in the names of nominees for their expenses in sending proxy materials to theprincipals and obtaining their proxies.
Our mailing for the fiscal year ended June 2, 2007, includes the Notice Regarding the Availability of Proxy Materials. Acopy of the Notice of 2007 Annual Meeting of Shareholders and the 2007 Annual Financial Statements as well as the ProxyStatement and our Report on Form 10-K both filed with the Securities and Exchange Commission are available, withoutcharge, upon written request from the Secretary of the company, 855 East Main Avenue, PO Box 302, Zeeland, Michigan49464-0302.
Shareholders are urged to vote promptly. Questions related to your holdings can be directed as follows:
Computershare Investor Services, LLC, 250 Royall Street, Canton, Massachusetts 02021Phone: 1 800 446 2617 inside the United StatesPhone: 1 781 575 2723 outside the United Stateshttp://www.computershare.com
By Order of the Board of DirectorsDaniel C. Molhoek, Secretary to the Board August 22, 2007
Submission of Shareholder Proposals for the 2008 Annual Meeting
44941HMProxy 8/15/07 6:42 AM Page 34

© 2007 Herman Miller, Inc., Zeeland, Michigan Printed in U.S.A. on recycled paper P.MS2843-01® L and Y are among the registered trademarks of Herman Miller, Inc.
44941HMProxy 8/15/07 6:42 AM Page 35

Y
44941HMProxy 8/15/07 6:42 AM Page 36

THIS PROXY CARD IS VALID ONLY WHEN SIGNED AND DATED.
KEEP THIS PORTION FOR YOUR RECORDSDETACH AND RETURN THIS PORTION ONLY
TO VOTE, MARK BLOCKS BELOW IN BLUE OR BLACK INK AS FOLLOWS:
Signature (Joint Owners)Signature [PLEASE SIGN WITHIN BOX] DateDate
Vote On Proposals
For address changes and/or comments, please check this boxand write them on the back where indicated.
3. To transact such other business as may properly come before the meeting or any adjournment thereof.
2. To consider and vote upon a proposal to ratify the appointment of Ernst & Young LLP as our independent registered publicaccounting firm.
For Against Abstain
0 0 0
To withhold authority to vote for any individualnominee(s), mark “For All Except” and write thenumber(s) of the nominee(s) on the line below.
0 0 0
0 0 0
ForAll
WithholdAll
For AllExcept
VOTE BY INTERNET - www.proxyvote.comUse the Internet to transmit your voting instructions and for electronicdelivery of information up until 11:59 P.M. Eastern Time the day before thecut-off date or meeting date. Have your proxy card in hand when youaccess the web site and follow the instructions to obtain your records andto create an electronic voting instruction form.ELECTRONIC DELIVERY OF FUTURE SHAREHOLDERCOMMUNICATIONSIf you would like to reduce the costs incurred by Herman Miller, Inc. inmailing proxy materials, you can consent to receiving all future proxystatements, proxy cards and annual reports electronically via e-mail or theInternet. To sign up for electronic delivery, please follow the instructionsabove to vote using the Internet and, when prompted, indicate that youagree to receive or access shareholder communications electronically infuture years.VOTE BY PHONE - 1-800-690-6903Use any touch-tone telephone to transmit your voting instructions up until11:59 P.M. Eastern Time the day before the cut-off date or meeting date.Have your proxy card in hand when you call and then follow the instructions.VOTE BY MAILMark, sign and date your proxy card and return it in the postage-paidenvelope we have provided or return it to Herman Miller, Inc., c/o Broadridge,51 Mercedes Way, Edgewood, NY 11717.VOTE BY FAX DURING THE MEETINGMark, sign and date your proxy card and return it to Herman Miller byfaxing it to 1-616-654-7221.
HERMAN MILLER, INC.C/O SHAREHOLDER SERVICES855 EAST MAIN AVENUEZEELAND, MI 49464-0302
0
HERMAN MILLER, INC.
HERML1
1. Director VoteTo elect one director to serve until 2008
Vote On Directors
01) C. William Pollard
To elect two directors to serve until 201002) Dorothy A. Terrell03) David O. Ulrich
The Board of Directors recommends a voteFOR the listed nominees.
The Board of Directors recommends a vote FOR the proposal.
The proxies will vote the shares in accordance with the direction on this card. If a choice is not indicated, the proxies will vote the shares "FOR" thenominees and "FOR" the proposal.

Address Changes/Comments: ___________________________________________________________________________
________________________________________________________________________________________________________
(If you noted any Address Changes/Comments above, please mark corresponding box on the reverse side.)
Herman Miller, Inc.
By signing this card, voting by telephone or voting by Internet, the shareholder appoints James E. Christensonand Michael A. Volkema, and each of them, proxies, with full power of substitution, to vote all of theundersigned's shares of Herman Miller, Inc. Common Stock (Common Stock) at the Annual Meeting ofShareholders to be held on Tuesday, October 2, 2007, at 9:00 a.m. (EDT) at www.hermanmiller.com, and atany adjournments or postponements thereof, upon all subjects that may properly come before the meeting,including the matters described in the proxy statement furnished herewith, subject to any directions indicatedon the reverse side of this card.

2007 Annual Financial Statements
Herman Miller, Inc., and Subsidiaries
Y
44940HMFinancialStatement 8/15/07 6:12 AM Page 1

2 2007 Annual Financial Statements
The company’s annual report on Form 10-K, quarterly reports on Form 10-Q, current reports on Form 8-K, and allamendments to those reports are made available free of charge through the “Investors” section of the company’s internetwebsite at www.hermanmiller.com, as soon as practicable after such material is electronically filed with or furnished tothe Securities and Exchange Commission (SEC). The company’s filings with the SEC are also available for the public to readand copy in person at the SEC’s Public Reference Room at 100 F Street NE, Room 1024, Washington, DC 20549, by phoneat 1-800-SEC-0330, or via their internet website at www.sec.gov.
Changes in and Disagreements with Accountants on Accounting and Financial Disclosures
As defined in Item 304 of Regulation S-K, there have been no changes in, or disagreements with, accountants during the24-month period ended June 2, 2007.
Table of Contents
3 Share Price, Earnings, and Dividends Summary4 Review of Operations6 Management’s Discussion and Analysis of Financial Condition and Results of Operations
23 Quantitative and Qualitative Disclosures About Market Risk25 Quarterly Financial Data26 Consolidated Statements of Operations27 Consolidated Balance Sheets28 Consolidated Statements of Shareholders’ Equity29 Consolidated Statements of Cash Flows30 Notes to the Consolidated Financial Statements56 Management’s Report on Internal Control Over Financial Reporting57 Report of Independent Registered Public Accounting Firm on Internal Control over Financial Reporting58 Report of Independent Registered Public Accounting Firm on Consolidated Financial Statements59 Board of Directors60 Leadership Team61 Shareholder Reference Information
Available Information
44940HMFinancialStatement 8/15/07 6:12 AM Page 2

Herman Miller, Inc., common stock is traded on the NASDAQ-Global Select Market System (Symbol: MLHR). As of July 30, 2007,there were approximately 24,200 shareholders of record of the company’s common stock.
Per Share and Unaudited Market Price Market Price Market Price Earnings DividendsHigh Low Close Per Declared Per
(at close) (at close) Share-Diluted(1) Share
Year Ended June 2, 2007
First quarter $ 29.87 $ 25.77 $ 28.45 $ 0.43 $0.08000
Second quarter 36.83 27.67 35.40 0.56 0.08000
Third quarter 40.61 34.14 37.19 0.50 0.08000
Fourth quarter 37.84 33.27 36.53 0.50 0.08800
Year $ 40.61 $ 25.77 $ 36.53 $ 1.98 $0.32800
Year Ended June 3, 2006
First quarter $ 32.91 $ 28.68 $ 29.25 $ 0.34 $0.07250
Second quarter 30.83 26.88 30.71 0.40 0.07250
Third quarter 31.44 28.19 30.61 0.33 0.08000
Fourth quarter 32.54 29.14 30.34 0.38 0.08000
Year $ 32.91 $ 26.88 $ 30.34 $ 1.45 $0.30500
(1) Sum of the quarters may not equal the annual balance due to rounding associated with the calculation of earnings per share on an individual quarter basis.
Dividends were declared and paid quarterly during fiscal 2007 and 2006 as approved by the Board of Directors. Whileit is anticipated that the company will continue to pay quarterly cash dividends, the amount and timing of such dividendsis subject to the discretion of the Board depending on the company’s future results of operations, financial condition,capital requirements, and other relevant factors.
Shareholder Return Performance Graph
Set forth below is a line graph comparing the yearly percentage change in the cumulative total shareholder return on theCompany’s common stock with that of the cumulative total return of the Standard & Poor’s 500 Stock Index and the NASDNon-Financial Index for the five-year period ended June 2, 2007. The graph assumes an investment of $100 on June 1,2002 in the company’s common stock, the Standard & Poor’s 500 Stock Index and the NASD Non-Financial Index, withdividends reinvested.
2002 2003 2004 2005 2006 2007
Herman Miller, Inc. $100 $83 $104 $129 $133 $162S&P 500 Index $100 $92 $109 $118 $130 $142NASD Non-Financial $100 $99 $124 $129 $136 $165
Information required by this item is also contained in the Company’s Proxy Statement for the Company’s 2007 AnnualMeeting of Shareholders under the heading “Equity Compensation Plan Information,” which information is incorporatedherein by reference.
3 Herman Miller, Inc., and Subsidiaries
Share Price, Earnings, And Dividends Summary
44940HMFinancialStatement 8/15/07 6:12 AM Page 3

(In Millions, Except Key Ratios and Per Share Data) 2007 2006 2005 2004 2003
Operating Results
Net Sales(3) $1,918.9 $1,737.2 $1,515.6 $1,338.3 $1,336.5Gross Margin(3) 645.9 574.8 489.8 415.6 423.6Selling, General, and Administrative(3, 10) 395.8 371.7 327.7 304.1 319.8Design and Research(11) 52.0 45.4 40.2 40.0 39.1Operating Earnings 198.1 157.7 121.9 61.2 48.3Earnings Before Income Taxes 187.0 147.6 112.8 51.6 35.8Net Earnings 129.1 99.2 68.0 42.3 23.3Cash Flow from Operating Activities 137.7 150.4 109.3 82.7 144.7Depreciation and Amortization 41.2 41.6 46.9 59.3 69.4Capital Expenditures 41.3 50.8 34.9 26.7 29.0Common Stock Repurchased plus Cash Dividends Paid 185.6 175.4 152.0 72.6 72.7
Key Ratios
Sales Growth (Decline)(3) 10.5% 14.6% 13.2% 0.1% (9.0)%Gross Margin(1, 3) 33.7 33.1 32.3 31.1 31.7Selling, General, and Administrative(1, 3, 10) 20.6 21.4 21.6 22.7 23.9Design and Research Expense(1, 3, 11) 2.7 2.6 2.7 3.0 2.9Operating Earnings(1, 3) 10.3 9.1 8.0 4.6 3.6Net Earnings Growth (Decline) 30.1 45.9 60.8 81.5 141.6After-Tax Return on Net Sales(3, 5) 6.7 5.7 4.5 3.2 1.7After-Tax Return on Average Assets(6) 19.4 14.4 9.6 5.7 3.0After-Tax Return on Average Equity(7) 87.9 64.2 37.3 21.9 10.3
Share and Per Share Data(2)
Earnings per Share-Diluted $1.98 $1.45 $0.96 $0.58 $0.31Cash Dividends Declared per Share 0.33 0.31 0.29 0.18 0.15Book Value per Share at Year End 2.47 2.10 2.45 2.71 2.62Market Price per Share at Year End 36.53 30.34 29.80 24.08 19.34Weighted Average Shares Outstanding-Diluted 65.1 68.5 70.8 73.1 74.5
Financial Condition
Total Assets(9) $666.2 $668.0 $707.8 $714.7 $757.3Working Capital(4) 103.2 93.8 162.3 207.8 189.9Current Ratio 1.4 1.3 1.5 1.8 1.7Interest-Bearing Debt and Related Swap Agreements 176.2 178.8 194.0 207.2 223.0Shareholders’ Equity 155.3 138.4 170.5 194.6 191.0Total Capital(8) 331.5 317.2 364.5 401.8 414.0
(1) Shown as a percent of net sales.(2) Retroactively adjusted to reflect a two-for-one stock split occurring in 1998.(3) Amounts for 1997-2000 were restated in 2001 to reflect reclassification of certain expenses.(4) Calculated using current assets less non-interest bearing current liabilities.(5) Calculated as net earnings divided by net sales.(6) Calculated as net earnings divided by average assets.(7) Calculated as net earnings divided by average equity.(8) Calculated as interest-bearing debt plus shareholders’ equity.(9) Amount for 2005 was restated in 2006 to reflect reclassifications between current assets and current liabilities.
(10) Amount for 2005 and 2006 were restated to reflect 2007 classification.(11) Amount for 2006 was restated to reflect 2007 classification.
4 2007 Annual Financial Statements
Review of Operations
44940HMFinancialStatement 8/15/07 6:12 AM Page 4

2002 2001 2000 1999 1998 1997
$1,468.7 $2,236.2 $2,010.2 $1,828.4 $1,773.0 $1,543.8440.3 755.7 680.4 641.6 613.0 509.5399.7 475.4 404.4 379.3 370.9 335.2
38.9 44.3 41.3 38.0 33.8 29.1(79.9) 236.0 234.7 224.3 208.3 130.7(91.0) 225.1 221.8 229.9 209.5 125.9(56.0) 140.6 139.7 141.8 128.3 74.4
54.6 211.8 202.1 205.6 268.7 218.2112.9 92.6 77.1 62.1 50.7 48.0
52.4 105.0 135.7 103.4 73.6 54.530.3 105.3 101.6 179.7 215.5 110.4
(34.3)% 11.2% 9.9% 3.1% 14.8% 16.5%30.0 33.8 33.8 35.1 34.6 33.027.3 21.3 20.1 20.7 20.9 21.7
2.6 2.0 2.1 2.1 1.9 1.9(5.4) 10.6 11.7 12.3 11.7 8.5
(139.8) 0.6 (1.5) 10.5 72.4 62.1(3.8) 6.3 6.9 7.8 7.2 4.8(6.3) 14.5 16.5 18.5 16.7 10.3
(18.2) 43.5 55.5 64.4 49.5 25.0
$(0.74) $1.81 $1.74 $1.67 $1.39 $0.770.15 0.15 0.15 0.15 0.15 0.133.45 4.63 3.76 2.63 2.66 3.12
23.46 26.90 29.75 20.19 27.69 17.8875.9 77.6 80.5 84.8 92.0 96.1
$788.0 $996.5 $941.2 $751.5 $784.3 $755.6188.7 191.6 99.1 55.5 77.2 135.7
1.8 1.5 0.9 1.0 1.1 1.4235.1 259.3 225.6 147.6 130.7 127.4263.0 351.5 294.5 209.1 231.0 287.1498.1 610.8 520.1 356.7 361.7 414.5
5 Herman Miller, Inc., and Subsidiaries
44940HMFinancialStatement 8/15/07 6:12 AM Page 5

6 2007 Annual Financial Statements
You should read the issues discussed in Management’s Discussion and Analysis in conjunction with the company’sConsolidated Financial Statements and the Notes to the Consolidated Financial Statements included in this Form 10-K.
Executive Overview
We use problem-solving design and innovation to enhance the performance of human habitats worldwide, making ourcustomers’ lives more productive, rewarding, delightful, and meaningful. We do this by providing high quality productsand related knowledge services. At present, most of our customers come to us for work environments. Our primaryproducts include furniture systems, seating, storage and material handling solutions, freestanding furniture, andcasegoods. Our services extend from workplace and real estate strategy to furniture asset management. We recentlylaunched two new ventures aimed at extending the Herman Miller brand into new market opportunities. The first of theseis ConviaTM, a business which provides programmable electrical and data infrastructure for building interiors. We alsointroduced The Be CollectionTM; a suite of new products intended to further our reach into the work accessories market.
Our primary domestic manufacturing operations are located in Michigan and Georgia. We also have a significantmanufacturing presence in the United Kingdom, our largest marketplace outside the United States. In fiscal year 2007,we opened a new manufacturing operation in China.
Our products are sold internationally through wholly-owned subsidiaries or branches in various countries includingCanada, France, Germany, Italy, Japan, Mexico, Australia, Singapore, China, India, and the Netherlands. Our products areoffered elsewhere in the world primarily through independent dealerships.
We manufacture our products using a system of lean manufacturing techniques collectively referred to as the HermanMiller Production System (HMPS). We strive to maintain efficiencies and cost savings by minimizing the amountof inventory on hand. Accordingly, production is order-driven with direct materials and components purchased as neededto meet demand. The standard lead time for the majority of our products is 10 to 20 days. As a result, the rate of ourinventory turns is high. These combined factors could cause our inventory levels to appear relatively low in relation to sales volume.
A key element of our manufacturing strategy is to limit fixed production costs by sourcing component parts fromstrategic suppliers. This strategy has allowed us to increase the variable nature of our cost structure while retainingproprietary control over those production processes that we believe provide us a competitive advantage. As a resultof this strategy, our manufacturing operations are largely assembly based.
Our business comprises various operating segments as defined by generally accepted accounting principles. Theseoperating segments are determined on the basis of how we internally report and evaluate financial information used tomake operating decisions and are organized by the various markets we serve. For external reporting purposes, weaggregate these operating segments as follows.
• North American Furniture Solutions Includes the business associated with the design, manufacture, and sale offurniture products for office and healthcare environments throughout the United States, Canada, and Mexico.
• Non-North American Furniture Solutions Includes the business associated with the design, manufacture, and saleof furniture products primarily for work-related settings outside North America.
• Other Includes our North American residential furniture business as well as other business activities such as Conviaand startup businesses associated with the Herman Miller Creative Office and unallocated corporate expenses.
Core Strengths
We rely on the following core strengths in delivering workplace solutions to our customers.
• Problem-Solving Design and Innovation We are committed to developing aesthetically and functionally innovativenew products and have a history of doing so. We believe our skills and experience in matching problem-solving designwith the workplace needs of our customers provide us with a competitive advantage in the marketplace. An importantcomponent of our business strategy is to actively pursue a program of new product research, design, and development.We accomplish this through the use of an internal research and design staff as well as external design resourcesgenerally compensated on a royalty basis.
• Operational Excellence We were among the first in our industry to embrace the concepts of lean manufacturing.HMPS provides the foundation for all of our manufacturing operations. We are committed to continuously improvingboth product quality and production and operational efficiency.
• Building and Leading Networks We value relationships in all areas of our business. We consider our networks ofinnovative designers, owned and independent dealers, and suppliers to be among the most important competitivefactors vital to the long-term success of our business.
Management’s Discussion and Analysis of Financial Condition and Results of Operations
44940HMFinancialStatement 8/15/07 6:12 AM Page 6
7 Herman Miller, Inc., and Subsidiaries
Channels of Distribution
Our products and services are offered to most of our customers under standard trade credit terms between 30 and 45 daysand are sold through the following distribution channels.
• Independent Contract Furniture Dealers and Licensees Most of our product sales are made to a network ofindependently owned and operated contract furniture dealerships doing business in many countries around the world.These dealers purchase our products and distribute them to end customers. We recognize revenue on product salesthrough this channel once our products are shipped and title passes to the dealer. Many of these dealers also offerfurniture-related services, including product installation.
• Owned Contract Furniture Dealers At June 2, 2007, we owned 9 contract furniture dealerships, some of which haveoperations in multiple locations. The financial results of these owned dealers are included in our ConsolidatedFinancial Statements. Product sales to these dealerships are eliminated as inter-company transactions from ourconsolidated financial results. We recognize revenue on these sales once products are shipped to the end customerand installation is substantially complete. We believe independent ownership of contract furniture dealers is generally,the best model for a financially strong distribution network. With this in mind, our strategy is to continue to pursueopportunities to transition our owned dealerships to independent owners. Where possible, our goal is to involve localmanagers in these ownership transitions.
• Direct Customer Sales We sometimes sell products and services directly to end customers without an intermediary(e.g. sales to the U.S. federal government). In most of these instances, we contract separately with a dealership orthird-party installation company to provide sales-related services. We recognize revenue on these sales once productsare shipped and installation is substantially complete.
• Independent Retailers Certain products are sold to end customers through independent retail operations. Revenue isrecognized on these sales once products are shipped and title passes to the independent retailer.
Challenges Ahead
Like all businesses, we are faced with a host of challenges and risks. We believe our core strengths and values, whichprovide the foundation for our strategic direction, have us well prepared to respond to the inevitable challenges we willface in the future. While we are confident in our direction, we acknowledge the risks specific to our business and industry.Refer to Item 1A of our Annual Report on Form 10-K for discussion of certain of these risk factors.
Future Avenues of Growth
We believe we are well positioned to successfully pursue our mission despite the risks and challenges we face. That is, webelieve we can continue to improve the performance of human habitats worldwide. In pursuing our mission, we haveidentified the following as key avenues for our future growth.
• Primary Markets Capturing additional market share within our existing primary markets by offering superiorsolutions to customers who value space as a strategic tool
• Adjacent Markets Further applying our core skills in environments such as healthcare, higher education, and residential
• Developing Economies Expanding our geographic reach in areas of the world with significant growth potential• New Markets Developing new products and technologies that serve new markets
Industry Analysis
The Business and Institutional Furniture Manufacturer’s Association (BIFMA) is the trade association for the U.S. domesticoffice furniture industry. We closely monitor the trade statistics reported by BIFMA and consider them among the keyindicators of industry-wide sales and order performance. We also analyze BIFMA statistical information over severalquarters as a benchmark comparison against the performance of our domestic U.S. business. Finally, BIFMA regularlyprovides its members with industry forecast information, which we use internally as one of many considerations in ourshort- and long-range planning process.
Discussion of Business Conditions
Our fiscal year ended June 2, 2007 included 52 weeks of operations. By comparison, the year ended June 3, 2006included 53 weeks of operations; the extra week was required to bring our fiscal reporting dates in line with the actualcalendar months. We report an additional week of operations in our fiscal calendar approximately every six years for thisreason. The fiscal year ended May 28, 2005 included a standard 52 weeks of operations.
Management’s Discussion and Analysis of Financial Condition and Results of OperationsExecutive Overview (Continued)
44940HMFinancialStatement 8/15/07 6:12 AM Page 7

8 2007 Annual Financial Statements
Fiscal 2007 marked our third consecutive year of double-digit sales and net earnings growth. During the year we madecontinued progress toward many of our long-term strategic goals. While sales growth was seen across virtually all areas ofour business in fiscal 2007, our Non-North American Furniture Solutions segment once again outpaced our business inNorth America. Our business outside North America has continued to become a larger proportion of our consolidated netsales, a fact we believe makes us a stronger, more deeply diversified company. This international growth has been drivenby the expansion of our distribution footprint and investments in new products. In February of this year we opened a newmanufacturing plant in China. This operation, combined with our fast growing network of independent dealers in theregion, will serve customers within China and throughout Asia.
Our strategic progress in fiscal 2007 was not limited to international sales growth. Market acceptance of our mostrecent systems product introductions, My Studio EnvironmentsTM and Vivo® Interiors, has exceeded our expectations,although we did incur higher than expected start-up costs related to these products. Our pursuit of new marketopportunities led us to introduce The Be Collection, a suite of work accessories aimed at offering users morepersonalization and control within their work environments. We also launched Convia, a new building infrastructuretechnology which we believe offers significant potential for growth in an entirely new market.
Direct material cost increases remained a challenge during much of fiscal 2007. While in some cases, these costsmoderated during the second half of the year, particularly in the case of steel components, for the most part theyremained above the levels in fiscal 2006. In response to these higher costs, we implemented a general price increaseeffective in February 2007. The price adjustment varied by product line and increased our commercial product list pricesan average of 5 percent. This price change followed similar increases in each of the past two fiscal years, each of whichaveraged approximately 4 percent of list price. We have been successful in capturing a portion of general price increasesin recent years. However, we expect the intense price competition in our industry to continue. Accordingly, our pastsuccess in capturing benefit from our price changes is not necessarily indicative of our ability to do so in the future.
The general economic environment for our industry was positive throughout most of fiscal 2007, with office furnitureconsumption being bolstered by strong corporate profits, service sector employment, and non-residential constructionrates. The outlook for the industry, however, looks somewhat mixed given current economic conditions. In its May 2007domestic industry forecast, BIFMA noted that these key economic indicators are expected to moderate in the near-term.The forecast, which extends through calendar year 2008, indicates an expectation that industry sales and orders willcontinue to grow, though at a slower pace than in recent years.
Financial Results
The following is a comparison of our annual results of operations and year-over-year percentage changes for the periodsindicated.(Dollars in Millions) Fiscal 2007 % Chg Fiscal 2006 % Chg Fiscal 2005
from 2006 from 2005
Net Sales $1,918.9 10.5% $1,737.2 14.6% $1,515.6Cost of Sales 1,273.0 9.5% 1,162.4 13.3% 1,025.8
Gross Margin 645.9 12.4% 574.8 17.4% 489.8Operating Expenses 447.8 7.4% 417.1 13.4% 367.9
Operating Earnings 198.1 25.6% 157.7 29.4% 121.9Net Other Expenses 11.1 9.9% 10.1 11.0% 9.1
Earnings Before Income Taxes 187.0 26.7% 147.6 30.9% 112.8Income Tax Expense 57.9 21.4% 47.7 6.7% 44.7Minority Interest, net of tax — N/A 0.7 600.0% 0.1
Net Earnings $ 129.1 30.1% $ 99.2 45.9% $ 68.0
Net Sales, Orders, and Backlog
Fiscal 2007 Compared to Fiscal 2006Consolidated net sales of $1,918.9 million in fiscal year 2007 increased $181.7 million from the prior year. This increaseof 10.5 percent was driven by growth within both of our primary reportable business segments. The additional week infiscal 2006 added approximately $31 million in net sales to that period. Excluding the impact of this additional week, theyear-over-year growth in net sales between fiscal years 2006 and 2007 totaled approximately 12.5 percent.
Despite intense price competition in all of our major market areas, we were able to capture some benefit in the currentyear from our recent price increases. We estimate between $24 million to $26 million of our fiscal 2007 sales growth is
Management’s Discussion and Analysis of Financial Condition and Results of OperationsDiscussion of Business Conditions (Continued)
44940HMFinancialStatement 8/15/07 6:12 AM Page 8

9 Herman Miller, Inc., and Subsidiaries
attributable to these pricing actions. The most recent of these general price increases became effective in February 2007and we didn’t begin to feel its positive impact on net sales until late in the fiscal year.
Consolidated net trade orders in fiscal 2007 totaled $1,967.0 million. This compares to orders of $1,765.7 million infiscal 2006 and represents year-over-year growth of 11.4 percent. Excluding the extra week of operations in the prior year,order growth was 13.7 percent between periods.
Average weekly order pacing was higher in the first half of fiscal 2007 than in the second half of the year. This trendreflects moderating demand in the North American contract furniture market, combined with the seasonality we typicallyexperience in our order patterns. The seasonality is largely driven by the timing of the federal government fiscal year andthe December holiday season. The backlog of unfilled orders at the end of fiscal 2007 totaled $288.0 million, an increaseof 20.9 percent from the prior year of $238.2 million.
During the first quarter of fiscal 2006, we completed the sale of two wholly-owned contract furniture dealerships–onebased in New York City, New York, and another in Cleveland, Ohio. Another development in the first quarter of fiscal 2006involved an independently-owned dealership we had previously consolidated as a Variable Interest Entity (VIE) underFinancial Accounting Standards Board Interpretation No. 46, “Consolidation of Variable Interest Entities” (FIN 46(R)). Dueto this dealership’s improved financial condition, the owners were successful in obtaining outside bank financing. As aresult, we were no longer required to include this VIE in our Consolidated Financial Statements.
These dealership transitions affect our year-over-year comparisons. Net sales and trade orders from these dealersincluded in our fiscal 2006 financial results totaled approximately $10.7 million and $14.4 million, respectively. Thefinancial results of these dealerships were not included in our Consolidated Financial Statements during fiscal 2007.
BIFMA reported an estimated year-over-year increase in U.S. office furniture shipments of approximately 5.9 percentand orders of 5.0 percent for the twelve-month period ended May 2007. By comparison, net sales and order growth forour domestic U.S. business totaled approximately 7.8 percent and 8.5 percent, respectively. It is important to note thatthese growth percentages, both for our domestic U.S. business as well as the BIFMA amounts, include the impact of ourextra week of operations in fiscal 2006. Taking this factor into consideration and the fact that 2006 dealer sales andorders were higher than 2007 because of VIEs included in 2006 as described above, we believe our net sales and orderperformance in fiscal 2007 indicates that we have been successful in capturing domestic U.S. market share.
While the sales and order data for our U.S. operations provide a relative comparison to BIFMA, it is not intended to bean exact comparison. The actual data we report to BIFMA is done so in a manner consistent with the BIFMA definition ofoffice furniture “consumption.” This definition differs slightly from the categorization we have presented in this report.Notwithstanding this difference, we believe our presentation provides the reader with a more relevant comparison.
Fiscal 2006 Compared to Fiscal 2005Net sales of $1,737.2 million in fiscal 2006 were 14.6 percent higher than our fiscal 2005 level. Excluding the impactof the extra week of operations in fiscal 2006, the year-over-year growth in net sales totaled approximately 12.6 percent.Similar to our performance in the most recent year (fiscal 2007), sales growth in fiscal 2006 varied across the majorityof the markets we serve.
Year-over-year increases in the level of price discounting occurred throughout fiscal 2006; however, this market pricingpressure was more than offset by benefits from our previously instituted general price increases. Our best estimate is thatwe were able to capture approximately 25 to 35 percent of the price increases, net of discounting, in both fiscal years2006 and 2005.
Trade orders in fiscal 2006 increased 15.1 percent over the fiscal 2005 level of $1,534.7 million. Excluding the extra weekof operations, order growth between fiscal 2005 and 2006 was 12.8 percent. The backlog of unfilled orders at the end offiscal 2006 was $238.2 million. This was an increase of 4.2 percent from the fiscal 2005 ending level of $228.6 million.
The dealership transitions discussed above also affect the comparison of our fiscal 2006 and fiscal 2005 results. Netsales from these dealers included in our fiscal 2005 results totaled approximately $42.7 million and net trade orders inthat year were approximately $47.6 million. The ending backlog for fiscal 2005 included approximately $16.4 millionrelated to these dealers.
Discussion of Business Segments
Fiscal 2007 Compared to Fiscal 2006Net sales within our North American Furniture Solutions segment increased 8.0 percent from $1,448.0 million in fiscal2006 to $1,563.6 million in the current year. On a weekly-average basis (which adjusts for the extra week of operations infiscal 2006) net sales in this segment were 10.1 percent higher than the prior year level. To varying degrees, this growthwas experienced throughout the majority of our North American business operations. Of particular note is our businesswithin the healthcare industry, which has continued to drive significant year-over-year percentage increases. This remainsa key growth area within the segment, and we feel it presents a tremendous opportunity to capitalize on the boom in newconstruction within the healthcare industry. Sales at our Mexican subsidiary again reached double-digit growth over the
Management’s Discussion and Analysis of Financial Condition and Results of OperationsFinancial Results (Continued)
44940HMFinancialStatement 8/15/07 6:12 AM Page 9

10 2007 Annual Financial Statements
prior year. Canadian sales, which increased over the prior year level during the first half of fiscal 2007, ended the full yearapproximately flat with 2006. Operating earnings in fiscal 2007 were $161.7 million, or 10.3 percent of net sales. Thiscompares to $139.9 million or 9.7 percent in the prior year.
The most significant net sales increases within our consolidated business operations came, once again, from ourNon-North American Furniture Solutions segment. We had year-over-year increases in net sales across all geographicregions except South America. Total net sales in the year of $278.5 million were up 28.4 percent from $216.9 million infiscal year 2006. On a weekly-average basis, net sales in fiscal 2007 were 30.9 percent higher than the prior year. TheNon-North American Furniture Solutions segment generated 14.5 percent of our consolidated net sales in fiscal 2007,compared to 12.5 percent in fiscal 2006. Our operations in the United Kingdom, the segment’s largest contributor to netsales and operating earnings, generated sales growth of 23.7 percent from the prior year. We also saw continued salesgrowth in continental Europe and are beginning to experience more activity in Eastern Europe as we expand our dealernetwork. Our results in the Asia Pacific region were particularly strong in fiscal 2007, with net sales increasing 61.6percent from the prior year. As do many in our industry, we see a compelling business opportunity for further growth inAsia. We are extremely pleased with the progress we made this year in executing our Asian business strategy, includingthe startup of our new Chinese manufacturing facility, and the expansion of our independent dealer network in China andJapan. Operating earnings in fiscal 2007 within our Non-North American segment totaled $28.9 million, or 10.4 percentof net sales. This compares to $14.1 million or 6.5 percent last year.
Net sales within the “Other” segment category were $76.8 million in fiscal 2007 compared to $72.3 million in the prioryear. The increase was driven by the growth of our North American Home business. Sales in fiscal 2006 included net salesof $6.8 million from a VIE we had previously consolidated under the accounting provisions of FIN 46(R).
Changes in currency exchange rates from the prior year affected the U.S. dollar value of net sales within both primaryoperating segments. We estimate these changes effectively increased our fiscal 2007 net sales within the North AmericanFurniture Solutions segment by approximately $2 million. This was largely driven by the general weakening in the averageU.S. dollar / Canadian dollar exchange rate during the current year. As for our Non-North American Furniture Solutionssegment, exchange rate changes increased fiscal 2007 net sales by approximately $11 million. This increase was driven byfavorable movements in the U.S. dollar / British Pound Sterling and U.S. dollar / Euro exchange rates as compared to lastyear. It is important to note that period-to-period changes in currency exchange rates have a directionally similar impact onour international cost structures. Operating earnings within our Non-North American business segment increased anestimated $2 million in fiscal 2007 due to changes in currency exchange rates relative to the prior year level. The estimatedimpact on operating earnings of our North American business segment was not significant in the current year.
Fiscal 2006 Compared to Fiscal 2005Business in our North American Furniture Solutions segment remained strong throughout fiscal 2006. Net sales for thissegment totaled $1,448.0 million, compared to $1,262.8 million in fiscal 2005. This represents a 14.7 percent increasein net sales. On a weekly-average basis (adjusting for the extra week of operations in fiscal 2006) net sales in fiscal 2006were 12.5 percent higher than the prior year. We experienced varying degrees of growth across the entire segment, withthe largest gains coming from our core office environment and healthcare businesses.
We posted net sales in our Non-North American Furniture Solutions segment of $216.9 million in fiscal 2006. The year-over-year increase in net sales within this segment totaled 13.3 percent, much of it driven by business in the UnitedKingdom, continental Europe, Australia, and Brazil. On a weekly-average basis, net sales in fiscal 2006 were 11.1 percenthigher than the prior year. We achieved these increases despite downward pressure from currency exchange rates relativeto fiscal 2005 levels. In particular, our year-over-year net sales comparison in this segment was affected by thestrengthening of the U.S. dollar relative to the British Pound Sterling, Euro, and Japanese Yen. We estimate the change in currency exchange rates between fiscal years 2005 and 2006 effectively decreased the U.S. dollar-value of net salesin our Non-North American Furniture Solutions segment by approximately $8 million in fiscal 2006.
On a consolidated basis, changes in foreign currency exchange rates relative to the U.S. dollar had a minimal effect onour net sales in fiscal 2006 relative to fiscal 2005. This is because the adverse exchange rate movements within our Non-North American markets were offset, in large part, by the weakening of the U.S. dollar against the Canadian dollar. Weestimate the year-over-year change in exchange rates effectively decreased the U.S. dollar-value of our consolidated netsales by approximately $0.1 million for fiscal 2006.
The remainder of our report within Management’s Discussion and Analysis focuses on what we believe to be the mostsignificant factors affecting our consolidated financial results, without specific reference to the impact within individual
Management’s Discussion and Analysis of Financial Condition and Results of OperationsFinancial Results (Continued)
44940HMFinancialStatement 8/15/07 6:12 AM Page 10

11 Herman Miller, Inc., and Subsidiaries
business segments. We believe discussion at this level provides the most meaningful basis for understanding the keydrivers of our business performance. Refer to Note 20 for further information regarding the financial performance of ourbusiness segments in fiscal years 2007, 2006, and 2005.
Percent of Net Sales Analysis
The following table presents, for the periods indicated, the components of the company’s Consolidated Statements ofOperations as a percentage of net sales.
Fiscal Year EndedJune 2, 2007 June 3, 2006 May 28, 2005
Net Sales 100.0% 100.0% 100.0%Cost of Sales 66.3 66.9 67.7Gross Margin 33.7 33.1 32.3Selling, General, and Administrative Expenses 20.6 21.4 21.6Design and Research Expenses 2.7 2.6 2.7Total Operating Expenses 23.3 24.0 24.3Operating Earnings 10.3 9.1 8.0Net Other Expenses 0.6 0.6 0.6Earnings Before Income Taxes 9.7 8.5 7.4Income Tax Expense 3.0 2.7 2.9Net Earnings 6.7% 5.7% 4.5%
Gross Margin
Fiscal 2007 Compared to Fiscal 2006Our fiscal 2007 gross margin improved 60 basis points from the prior year level. The leveraging of overhead expensesagainst higher net sales in the current year significantly contributed to this improvement. During fiscal 2007, directmaterial costs continued to pressure gross margin performance. These cost increases were, however, more than offset bythe benefit captured through our recent general price increases. This market pricing, combined with continuedmanufacturing process improvements, drove a reduction in direct labor expenses on a percent-of-sales basis. Theimprovement in direct labor was achieved despite the implementation of wage increases in the current year first quarterand inefficiencies associated with the start-up of our most recent product introductions.
As a percent-of-sales, direct material expenses increased 140 basis points from the fiscal 2006 level. The directmaterial content associated with the launch of one of our newest lines of systems furniture drove a significant amount ofthis increase. While these excess costs are typical in the initial years following product launch, the impact wasexacerbated by customer demand that far outpaced our business plan for the year. Our efforts to keep pace with thisdemand drove additional cost into the supply chain.
Market price inflation for key manufacturing inputs also contributed to the year-over-year increase in direct materialcosts. While the costs of these key commodities, particularly steel, plastics, aluminum, and wood particleboard,stabilized in the second half of fiscal 2007, they remain above the average price-points we experienced in 2006. Intotal, we estimate commodity cost increases added between $14 million and $16 million to our consolidated directmaterial expenses in fiscal 2007 compared to the prior year. We were able to offset some of this negative impactthrough efficiencies gained in connection with our engineering and supply management efforts under HMPS. Our pricingstrategy, combined with our commitment to lean manufacturing principles, continue to be our primary means ofaddressing the financial impact of rising material costs.
Despite an increase in manufacturing overhead expenses, we improved significantly on a percent-of-sales basis infiscal 2007 versus the prior year. The expense increase was driven in part by the increase in net sales. We also incurredhigher expenses in the current year for employee benefits such as retirement programs, medical and prescription drugcoverage, and annual wage increases for indirect labor employees. Partially offsetting these year-over-year expenseincreases were lower incentive bonus expenses in the current year. Our incentive bonus program is based on a measureof improvement in economic profit from year-to-year as opposed to an absolute level of earnings in any one period. Based
Management’s Discussion and Analysis of Financial Condition and Results of OperationsFinancial Results (Continued)
44940HMFinancialStatement 8/15/07 6:12 AM Page 11

12 2007 Annual Financial Statements
on our relative performance between periods, incentive bonus expenses recorded within Cost of Sales in fiscal 2007 were$2 million lower than the prior year.
Freight expenses, as a percentage of sales, decreased in relation to the prior year. We have continued to benefit fromthe efforts of our distribution team to consolidate shipments, increase trailer utilization, and engage the services of lowercost carriers. Additionally, our freight percentage was reduced due to the additional net sales captured as a result of theprice increases.
Fiscal 2006 Compared to Fiscal 2005On a percent-of-sales basis, our fiscal 2006 gross margin improved 80 basis-points from the fiscal 2005 level. Benefitsfrom the realization of price increases and improvements in overhead and direct labor drove much of the increase.However, these favorable factors were partially offset by higher material and freight costs.
While actual dollar spending increased in fiscal 2006, manufacturing overhead, as a percentage of sales, improvedsignificantly between periods. This was due to leverage gained against higher net sales. The higher expenses wereprimarily related to medical benefits, pension, incentive compensation, utilities, and other items that vary with salesvolume. The combined expenses related to pension and incentive compensation alone for fiscal 2006 increased $10.2million over the fiscal 2005 level.
Direct labor, as a percentage of sales, improved between fiscal 2005 and 2006 as a result of increased operationalefficiencies and leverage gained on higher production levels.
Direct material expenses increased sharply between fiscal 2005 and 2006. The key commodities which drove the bulk ofthe increase were aluminum, plastics, and particleboard. Despite these increases, material costs as a percentage of net salesincreased only slightly in fiscal 2006. This was mainly due to the net benefit realized during the year from price increases.
Freight costs, as a percentage of sales, increased approximately 50 basis-points in fiscal 2006 due to higher fuel pricesand the mix of shipments to higher-cost freight zones.
Operating Expenses
Fiscal 2007 Compared to Fiscal 2006Operating expenses in fiscal 2007 were $447.8 million, or 23.3 percent of net sales, compared to $417.1 million, or 24.0percent of net sales in the prior fiscal year. This represents a year-over-year increase of $30.7 million or 7.4 percent. Ourfiscal 2006 operating expenses included approximately $3.5 million in additional compensation costs associated withthe extra week of operations. We also incurred expenses totaling approximately $2.4 million in the prior year first quarterrelating to the three dealerships that were transitioned in that period. Excluding these amounts, the comparable year-over-year increase in operating expenses was $37.1 million or 9.0 percent.
A significant proportion of this increase is attributed to expenses such as designer royalties and selling-related costs,which vary with net sales. Our portfolio of new product launches at the start of fiscal 2007 drove an increase in programmarketing expenses relative to the prior year. We estimate that approximately $18 million of the year-over-year increase inoperating expenses resulted from higher spending on incremental employee compensation (including stock-basedcompensation programs), retirement, and health benefits. Increased expenses related to charitable contributionsaccount for $2.9 million of the year-over-year increase. We also incurred higher operating expenses during fiscal 2007related to our new market expansion efforts. Specifically, the opening of our manufacturing operation in China and thelaunch of two new business ventures, Convia and The Be CollectionTM, contributed to the increase.
Year-over-year changes in currency exchange rates had an inflationary impact on the operating expenses associatedwith our international operations, as measured in U.S. dollars. We estimate these changes increased our consolidatedoperating expenses in fiscal 2007 by approximately $3.1 million relative to the prior year.
Fiscal 2006 operating expenses included a pre-tax charge totaling $1.4 million related to a long-term leasearrangement in the United Kingdom. Additional information on this lease arrangement can be found in Note 19.
Pretax compensation expenses associated with our stock-based compensation programs, the majority of which isclassified within operating expenses, totaled $4.9 million in fiscal 2007. This compares to $2.6 million in fiscal 2006.The increase over the prior year is the result of our adoption of SFAS No. 123, “Share-Based Payment” (SFAS 123(R)) inthe first quarter of fiscal 2007. Additional information on this accounting standard, including our method of transitionand prior accounting practice, can be found in Note 14.
Design and research costs included in total operating expenses were $52.0 million and $45.4 million in fiscal 2007 and2006, respectively. These expenses include royalty payments to the designers of our products. We consider such royaltypayments, which totaled $9.9 million and $8.7 million in fiscal years 2007 and 2006, respectively, to be variable costs ofthe products being sold. Accordingly, we do not include them in research and development costs as discussed in Note 1.
Management’s Discussion and Analysis of Financial Condition and Results of OperationsFinancial Results (Continued)
44940HMFinancialStatement 8/15/07 6:12 AM Page 12

13 Herman Miller, Inc., and Subsidiaries
Fiscal 2006 Compared to Fiscal 2005As a percentage of net sales, operating expenses in fiscal 2006 declined 30 basis-points from the fiscal 2005 level due toimproved operating leverage against higher sales dollars. Total dollar spending in fiscal 2006 was, however, $49.2 millionhigher than the fiscal 2005 level.
During the fourth quarter of fiscal 2005 we recorded a significant reserve adjustment, which resulted in a reduction toour fiscal 2005 operating expenses. In April 2005, we reported that we had reached a settlement with the GeneralServices Administration (GSA) concerning a prior audit of the 1988 to 1991 multiple award schedule contract. In light ofthe settlement, which required us to pay the GSA $0.5 million, we reevaluated our balance sheet reserves related to all GSA contract periods. As a result of this evaluation, we made the determination that these reserves should be reduced.Accordingly, during the fourth quarter of fiscal 2005, we recorded an adjustment to the reserves, which reduced our pre-tax operating expenses by approximately $13.0 million. Approximately $7.0 million of this adjustment related to theelimination of the remaining reserves, beyond the amount of the settlement, allocable to the 1988 to 1991 contractperiod. The remainder of the adjustment related to our reevaluation of required reserves for open contract periods thathad not yet been subject to audit.
The dealership transitions that occurred in the first quarter of fiscal 2006 had a significant impact on the year-over-year operating expense comparison. Our fiscal 2006 results reflect approximately $2.4 million in operating expensesassociated with these dealers. By comparison, our fiscal 2005 operating expenses included $14.7 million related tothese transitioned dealers.
Excluding the comparative impact of the dealership transitions and fiscal 2005 GSA reserve adjustment, operatingexpenses in fiscal 2006 were approximately $48.5 million higher than in fiscal 2005.
The majority of the increased operating expenses between fiscal 2005 and 2006 resulted from higher variable sellingcosts tied to the increase in sales volume. Incentive compensation, product warranty, pension, medical insurance, legal,marketing, new product development, and charitable donation expenses also contributed to the increase. Specifically,combined expenses in fiscal 2006 related to incentive compensation, pension, and donations increased $14.5 millionover the fiscal 2005 level.
The increase in warranty expenses between fiscal 2005 and 2006 was mainly driven by the increase in net sales forthe period. In addition, a portion of the increase was due to the establishment of liabilities for specific warranty mattersthat became known during the year. The majority of these matters related to products manufactured prior to theimplementation of our current quality testing protocol. Refer to Note 19 for further information regarding product warranty.
The increase in legal expenses between fiscal 2005 and 2006 was partially due to costs incurred in defending ourintellectual property assets. We also incurred expenses during fiscal 2006 in establishing our legal trading structure inmainland China. Additionally, during the fourth quarter of fiscal 2006, we established an estimated liability associatedwith the previously disclosed New York Attorney General investigation regarding the minimum advertised price programmaintained by our Herman Miller for the Home division. For further information regarding pending legal contingencies,refer to Note 19.
We estimate the year-over-year change in exchange rates effectively decreased the U.S. dollar value of our internationaloperating expenses by $0.8 million in fiscal 2006 relative to fiscal 2005.
Design and research costs included in operating expenses totaled $40.2 million in fiscal 2005. This amount includesdesigner royalty expenses of $7.5 million.
As discussed above, our fiscal 2006 operating expenses included a pre-tax charge totaling $1.4 million related to along-term lease arrangement in the United Kingdom.
Operating Earnings
Fiscal 2007 operating earnings were $198.1 million. This is an increase of 25.6% from our fiscal 2006 level of $157.7million. As a percentage of net sales, operating earnings in fiscal 2007 totaled 10.3 percent, representing a 120 basis-point improvement over the prior year. In fiscal year 2005, we reported operating earnings of $121.9 million or 8.0percent of net sales.
Other Expenses and Income
Net other expenses totaled $11.1 million in fiscal 2007 compared to $10.1 million in the prior year and $9.1 million in fiscal2005. The increase in expense between fiscal 2006 and 2007 was principally driven by lower interest income in the current
Management’s Discussion and Analysis of Financial Condition and Results of OperationsFinancial Results (Continued)
44940HMFinancialStatement 8/15/07 6:12 AM Page 13

14 2007 Annual Financial Statements
year due to a reduction in our average cash and cash equivalents balance between periods. Additionally, the net foreigncurrency transaction gain in fiscal 2007 was less than $0.1 million compared to a net gain of $0.3 million last year.
The year-over-year increase in net other expenses between fiscal years 2005 and 2006 resulted primarily from twodealership transactions in fiscal 2005. During the first quarter of that year, we recorded a pre-tax gain of $0.5 millionrelated to the ownership transition of a previously consolidated VIE. Also during the first quarter of fiscal 2005, weacquired certain assets and liabilities of an independent contract furniture dealership. In doing so, we recognized a pre-taxgain of $0.4 million due to the reversal of a financial guarantee liability. These gains were reflected as a reduction to netother expenses in fiscal 2005.
Foreign currency transactions recorded during fiscal 2005 resulted in a net gain of $0.2 million.
Income Taxes
Our effective tax rate was 31.0 percent in fiscal 2007 versus 32.3 percent in fiscal 2006. The current year effective ratewas below the statutory rate of 35 percent primarily due to $4.3 million in tax credits for foreign taxes, other credits forR&D activities, and tax incentives for export sales and domestic manufacturing. The effective rate in fiscal 2006 was lowerthan the statutory rate due mainly to tax benefits from R&D activities, tax incentives for export sales and domesticmanufacturing, and certain adjustments to recognize certain foreign deferred tax assets.
Our effective tax rate in fiscal 2005 was 39.6 percent. The fiscal 2005 effective rate was higher than the statutory ratedue primarily to a $4.4 million tax charge, recorded in the fourth quarter of that year, related to our planned cashrepatriation under the American Jobs Creations Act of 2004 (AJCA). During the fourth quarter of fiscal 2005, we alsorecorded tax adjustments driven by tax law changes, as well as other federal, state, and international accrualadjustments.
We expect our effective tax rate for fiscal 2008 to be between 32 and 34 percent. For further information regardingincome taxes, refer to Note 15.
Net Earnings
Net earnings and diluted earnings per share in fiscal 2007 were $129.1 million and $1.98, respectively. This compares toour fiscal 2006 net earnings and diluted earnings per share of $99.2 million and $1.45, respectively. In fiscal 2005, wegenerated net earnings of $68.0 million or $0.96 per diluted share. Earnings per share in fiscal 2005 included income ofapproximately $0.12 per share, net of taxes, from the adjustment to GSA reserves as previously discussed. In addition,net earnings in fiscal 2005 were reduced by approximately $0.06 per diluted share from taxes related to our thenanticipated cash repatriation under the AJCA.
Liquidity and Capital Resources
The table below presents certain key cash flow and capital highlights for the fiscal years indicated.(In Millions) 2007 2006 2005
Cash and cash equivalents, end of period $ 76.4 $ 106.8 $ 154.4
Short term investments, end of period $ 15.9 $ 15.2 $ 13.9
Cash generated from operating activities $ 137.7 $ 150.4 $ 109.3
Cash used for investing activities $ (37.4) $ (47.6) $ (40.1)
Cash used for financing activities $(131.5) $ (151.4) $(106.6)
Pension and post-retirement benefit plan contributions $ (7.6) $ (26.3) $ (27.3)
Capital expenditures $ (41.3) $ (50.8) $ (34.9)
Stock repurchased and retired $ (164.9) $ (155.1) $(131.6)
Interest-bearing debt, end of period(1) $ 176.2 $ 178.8 $ 194.0
Available unsecured credit facility, end of period(2) $ 136.9 $ 136.8 $ 137.2
(1) Amounts shown include the fair market value of the company’s interest rate swap arrangements. The net fair value of these arrangements was $(1.8) million atJune 2, 2007, $(2.2) million at June 3, 2006, and negligible at May 28, 2005.
(2) Amounts shown are net of outstanding letters of credit, which are applied against the company’s unsecured credit facility, excluding the $50 million accordionfeature disclosed in Note 9.
Management’s Discussion and Analysis of Financial Condition and Results of OperationsFinancial Results (Continued)
44940HMFinancialStatement 8/15/07 6:12 AM Page 14

15 Herman Miller, Inc., and Subsidiaries
Cash Flow—Operating Activities
Cash generated from operating activities in fiscal 2007 totaled $137.7 million compared to $150.4 million in the prioryear. Changes in working capital balances resulted in a $37.0 million use of cash in the current fiscal year compared to a$20.4 million source of cash in the prior year.
The majority of the working capital investment in fiscal 2007 related to increases in inventory and accounts receivable.The significant growth within our Non-North American Furniture Solutions segment resulted in a substantial increase inboth inventory and accounts receivable over the past year. The opening of our manufacturing operation in China was acontributing factor to the inventory increase as was the general growth in sales activity across our international regions.The accounts receivable balances within this segment tend to have a longer cash collection cycle than we experience inNorth America. As sales within this segment grow in proportion to the total business, we expect to see a correspondingincrease in the absolute aging of our receivable balances.
Another contributing factor to the working capital investment during fiscal 2007 relates to our business with the U.S.federal government. Order activity with the federal government increased significantly during the year, particularly duringthe first and second quarters. These sales generally require a longer cash collection cycle than do sales to independentcontract furniture dealers. Accordingly, we experienced a related increase in accounts receivable. Inventory levels havealso been affected by this growth in federal government business, since we are generally required to hold product ininventory longer than with non-government business. This extended inventory holding period is necessary to beconsistent with our revenue recognition policy for direct customer sales.
The source of working capital cash flow in fiscal 2006 resulted principally from an increase in accounts payable and accrued liabilities, namely employee compensation and warranty accruals. This was partially offset by volume-relatedincreases in accounts receivable and inventory levels.
In fiscal year 2005, cash flows from operating activities totaled $109.3 million. Changes in working capital balances inthat fiscal year resulted in a net source of cash of $21.4 million. This was driven by increases in accounts payable andaccrued liabilities for employee compensation, other employee benefits, and income taxes. Partially offsetting thesefavorable balance changes were volume-related increases during the year in inventory and accounts receivable.
Collections of accounts receivable remained strong throughout the year, and we believe our recorded accountsreceivable valuation allowances at the end of fiscal 2007 are adequate to cover the risk of potential bad debts.Allowances for non-collectible accounts receivable, as a percent of gross accounts receivable, totaled 2.5, 2.8, and 3.2percent at the end of fiscal years 2007, 2006, and 2005, respectively. The reduction in these percentages over this timeperiod was driven by a general improvement in the quality of our aged receivable balances.
Included in operating cash flows are cash contributions made to our employee pension and post-retirement benefitplans which totaled $7.6 million, $26.3 million, and $27.3 million in fiscal years 2007, 2006, and 2005, respectively.For further information regarding the company’s pension and post-retirement benefit plans, including information relativeto the funded status of these plans, refer to Note 12.
Cash Flow—Investing Activities
Capital expenditures totaled $41.3 million in fiscal 2007 and $50.8 million in the prior fiscal year. The higher spendinglast year was driven by the large number of new product introductions and the construction of an office and showroomfacility in the United Kingdom. Cash outflows for investing activities in fiscal 2005 included capital expenditures of $34.9million. At the end of fiscal 2007, we had outstanding commitments for future capital purchases of approximately $7.7million. We expect capital spending in fiscal 2008 to be between $55 million and $65 million.
During the fourth quarter of fiscal 2007, we completed the sale of a facility located in Canton, Georgia. This facility wasexited during fiscal 2004 and, since that time, has been listed for sale. At the end of fiscal 2006, the related assets wereclassified in the Consolidated Balance Sheet under the caption, “Net Property and Equipment,” at a net carrying value of$7.5 million. Proceeds received in connection with the sale of this facility during fiscal 2007 totaled $7.5 million and arereflected in the Consolidated Statement of Cash Flows as “Proceeds from sales of property and equipment.”
Included in our fiscal 2007 investing activities is a $3.5 million outflow related to the acquisition of a technologycompany. The purchase of this company is intended to provide enhanced functionality to the existing product portfoliounder our recently launched Convia subsidiary. In the first quarter of fiscal 2005, cash flows from investing activitiesincluded a payment of $0.7 million related to the acquisition of certain assets and liabilities of a contract furnituredealership based in Oklahoma. These acquisitions are discussed further in Note 2.
As previously discussed, we sold two wholly-owned contract furniture dealerships during the first quarter of fiscal2006. Proceeds received in connection with these sales, which had the effect of increasing cash flows from investingactivities, totaled $2.1 million.
Management’s Discussion and Analysis of Financial Condition and Results of OperationsFinancial Results (Continued)
44940HMFinancialStatement 8/15/07 6:12 AM Page 15

16 2007 Annual Financial Statements
Net cash received from the repayment of notes receivable in fiscal 2006 related primarily to a payment received from a contract dealership previously consolidated under FIN 46(R). As mentioned earlier in this report, this VIE was able to obtain financing with an outside bank and, therefore, was able to repay a large portion of its debt owed to us duringthe first quarter of fiscal 2006.
Cash Flow—Financing Activities(In Millions, Except Share and Per Share Data) 2007 2006 2005
Shares acquired 5,116,375 5,124,306 4,877,832
Cost of shares acquired $ 164.9 $ 155.1 $ 131.6
Average cost per share acquired $ 32.23 $ 30.27 $ 26.98
Shares issued 2,001,348 1,572,769 2,712,842
Average price per share issued $ 25.19 $ 23.50 $ 23.91
Cash dividends paid $ 20.7 $ 20.3 $ 20.4
Share repurchases were the most significant factor affecting cash outflows from financing activities during the pastthree fiscal years. Our Board of Directors approved a new share repurchase authorization of $100 million in the fourthquarter of fiscal 2007. Including this most recent approval, the amount remaining under our share repurchaseauthorizations at the end of fiscal 2007 totaled $138.1 million.
Our Board of Directors also increased the rate of our quarterly cash dividend in each of the last two fiscal years. The firstof these increases was in the third quarter of fiscal 2006 and allowed for an approximate 10 percent increase in thequarterly rate. The second Board approval, which provided for a 10 percent rate increase, was granted in the fourth quarterof fiscal 2007. This most recent increase brought our quarterly cash dividend to $0.088 per share.
Interest-bearing debt at the end of fiscal 2007 of $176.2 million decreased $2.6 million from $178.8 million at the endof fiscal 2006. The decrease related primarily to a scheduled $3.0 million payment we made during the fourth quarter offiscal 2007 on our private placement notes. This payment was partially offset by a $0.4 million increase in the fair valueof our interest rate swap instruments. Debt repayments made during fiscal 2006 totaled $13.0 million. Our nextscheduled repayment is for $3.0 million to be made in the fourth quarter of fiscal 2008.
The combined fair values of our interest rate swap arrangements, as further described in Note 17, was negative $1.8million at the end of fiscal 2007 compared to negative $2.2 million at the end of fiscal 2006. The fair values of theseswap arrangements change based on fluctuations in market interest rates. Such changes are not included in net earningsof the related period. Instead, they are reflected as adjustments to our consolidated assets and/or liabilities. At the endof fiscal 2007, the portion of our total interest-bearing debt that was effectively converted to a variable-rate basis throughour swap arrangements was $53.0 million. These interest rate swaps had the effect of increasing total interest expense by$0.6 million and $0.3 million in fiscal years 2007 and 2006, respectively. Conversely, during fiscal 2005, the swapsresulted in a net interest expense reduction of approximately $1.1 million.
During the first quarter of fiscal 2005, we paid off $1.5 million of notes payable associated with one of the VIE’sinitially consolidated under FIN 46(R) as further described in Note 3.
The only usage against our unsecured revolving credit facility at the end of fiscal years 2007 and 2006 representedoutstanding standby letters of credit totaling $13.1 million and $13.2 million, respectively. The provisions of our privateplacement notes and unsecured credit facility require that we adhere to certain covenant restrictions and maintain certainperformance ratios. We were in compliance with all such restrictions and performance ratios during fiscal 2007 andexpect to remain in compliance in the future.
Partially offsetting the effects of our share repurchases, dividend payments, and debt payments was cash received relatedto stock-based benefit plans. During fiscal 2007, we received $50.4 million from the issuance of shares in connection with
Management’s Discussion and Analysis of Financial Condition and Results of OperationsFinancial Results (Continued)
44940HMFinancialStatement 8/15/07 6:12 AM Page 16

17 Herman Miller, Inc., and Subsidiaries
these plans. By comparison, we received $37.0 million and $59.9 million from the issuance of shares in fiscal 2006 andfiscal 2005, respectively.
At the end of fiscal year 2005, we reported our plan to take advantage of the one-time tax deduction related to therepatriation of undistributed foreign earnings under the AJCA. During the first quarter of fiscal 2006, we repatriatedapproximately $35 million of undistributed earnings from certain of our foreign entities. An additional $9 million ofundistributed foreign earnings was repatriated during the second quarter of fiscal 2006. Our dividend reinvestment planrequired these funds to be used for capital purchases and investment in research and development.
We believe cash on hand, cash generated from operations, and our borrowing capacity will provide adequate liquidityto fund near term and future business operations and capital needs.
Contingencies
As previously reported, the company has received a subpoena from the New York Attorney General’s office requestingcertain information relating to the minimum advertised price program maintained by the Herman Miller for the Homedivision. In connection with this matter, the New York Attorney General’s office has taken depositions of current andformer employees of the company and certain dealers. The company and the New York Attorney General’s office havehad preliminary discussions regarding possible methods of resolving the matter. The company has reserved its bestestimate of a potential amount to resolve this matter. The accrued amount is not material to the company’s consolidatedfinancial position.
The company leases a facility in the UK under an agreement that expires in March 2008. Under the terms of the lease,the company is required to perform the maintenance and repairs necessary to address the general dilapidation of thefacility over the lease term. The ultimate cost of this provision to the company is dependent on a number of factorsincluding, but not limited to, the future use of the facility by the lessor and whether the company chooses and is permittedto renew the lease term. The company has estimated the cost of these maintenance and repairs to be between $0 and $3million, depending on the outcome of future plans and negotiations. Based on existing circumstances, it is estimated thatthese costs will most likely approximate $0.5 million. As a result, this amount has been recorded as a liability reflectedunder the caption “Other Liabilities” in the Consolidated Balance Sheets as of June 2, 2007, and June 3, 2006.
In May 1996, the company assigned its rights as lessee of a UK facility to a third party under an agreement thatcontained a provision granting the third party the right to re-assign the lease to the company after 10 years, at itselection. During fiscal 2006, the company was notified by the third party that it is no longer using the space and intendsto exercise the re-assignment option. The original lease term expires in May 2014. The company believes it will be able toassign or sublet the lease for the majority of the remaining lease term to another tenant at current market rates. However,current market rates for comparable office space are lower than the rental payments owed under the lease agreement. Assuch, the company would remain liable to pay the difference. As a result, the company recorded a pre-tax charge of $1.4million in fiscal 2006 for the expected loss under the arrangement. The corresponding impact of this charge on fiscal2006 net earnings was $0.9 million, net of a $0.5 million tax benefit, or approximately $0.01 per diluted share. As ofJune 2, 2007 and June 3, 2006, the future cost of this arrangement was estimated to be $1.4 million. Accordingly thisamount is reflected within “Other Liabilities” on the Consolidated Balance Sheets as of these dates.
The company is also involved in legal proceedings and litigation arising in the ordinary course of business. It is thecompany’s opinion that the outcome of such proceedings and litigation currently pending will not materially affect itsConsolidated Financial Statements.
Basis of Presentation
The company’s fiscal year ends on the Saturday closest to May 31. The year ended June 2, 2007 (Fiscal year 2007)included 52 weeks of operations. In contrast, fiscal year 2006, which ended on June 3, 2006, included 53 weeks ofoperations. The year ended May 28, 2005 was comprised of 52 weeks. This is the basis upon which all of the aboveweekly-average data is presented. The extra week in fiscal 2006 was required to realign our fiscal calendar with the actualcalendar months. This is required approximately every six years.
Management’s Discussion and Analysis of Financial Condition and Results of OperationsFinancial Results (Continued)
44940HMFinancialStatement 8/15/07 6:12 AM Page 17

18 2007 Annual Financial Statements
Contractual Obligations
Contractual obligations associated with our ongoing business and financing activities will result in cash payments infuture periods. The following table summarizes the amounts and estimated timing of these future cash payments. Furtherinformation regarding debt obligations can be found in Note 10 to the Consolidated Financial Statements. Likewise,further information related to operating leases can be found in Note 11.(In Millions) Payments due by fiscal year
Total 2008 2009-2010 2011-2012 Thereafter
Long-Term Debt(1, 7) $ 178.0 $ 3.0 $ — $ 175.0 $ —Estimated Interest on Debt Obligations(2) 49.2 13.1 25.9 10.2 —Operating Leases 64.7 18.8 24.1 12.6 9.2Purchase Obligations(3) 39.2 38.4 0.7 0.1 —Pension Plan Funding(4) 4.8 4.8 — — —Shareholder Dividends(5, 7) 5.5 5.5 — — —Other(6, 7) 11.4 1.9 2.1 2.4 5.0
Total $ 352.8 $ 85.5 $ 52.8 $ 200.3 $ 14.2
(1) Amounts indicated do not include the recorded fair value of interest rate swap instruments.(2) Estimated future interest payments on our outstanding debt obligations are based on interest rates as of June 2, 2007. Actual cash outflows may differ
significantly due to changes in underlying interest rates and timing of principal payments.(3) Purchase obligations consist of non-cancelable purchase orders and commitments for goods, services, and capital assets.(4) Pension funding commitments are defined as the estimated minimum funding requirements to be made in the following 12-month period. As of June 2, 2007,
the total accumulated benefit obligation for our domestic and international employee pension benefit plans was $344.0 million.(5) Represents the recorded dividend payable as of June 2, 2007. Future dividend payments are not considered contractual obligations until declared.(6) Other contractual obligations represent long-term commitments related to deferred and supplemental employee compensation benefits, minimum designer
royalty payments, and scheduled commitments related to the acquisition of intellectual property rights.(7) Total balance is reflected as a liability in the Consolidated Balance Sheet at June 2, 2007.
Off-Balance Sheet Arrangements
Guarantees
We provide certain guarantees to third parties under various arrangements in the form of product warranties, loan guarantees, standby letters of credit, lease guarantees, performance bonds, and indemnification provisions. These arrangements are accounted for and disclosed in accordance with FIN 45, “Guarantor’s Accounting and Disclosure Requirement for Guarantees, Including Indirect Guarantees of Indebtedness of Others” as described in Note19 to the Consolidated Financial Statements.
Variable Interest Entities
On occasion, we provide financial support to certain independent dealers in the form of term loans, lines of credit, andloan guarantees. At June 2, 2007 and June 3, 2006, we were not considered the primary beneficiary of any such dealerrelationships as defined by FASB Interpretation No. 46, “Consolidation of Variable Interest Entities” (FIN 46(R)) andtherefore, no entities were included as VIEs as of these dates.
The risks and rewards associated with our interests in these dealerships are primarily limited to our outstandingloans and guarantee amounts. As of June 2, 2007 and June 3, 2006, our maximum exposure to potential losses relatedto outstanding loans to these dealerships totaled $4.0 million and $4.6 million, respectively. Information on ourexposure related to outstanding loan guarantees provided to such entities is included in Note 19 to the ConsolidatedFinancial Statements.
During fiscal 2006, a qualifying triggering event occurred with a previously consolidated VIE which resulted inreconsideration under FIN 46(R). Based on this reconsideration, it was determined we were no longer considered theprimary beneficiary. As such, we ceased consolidation of the independent dealership in the first quarter of fiscal 2006.Net earnings in the first quarter of fiscal 2006 were not significantly affected by the consolidation of this VIE. This isbecause the net earnings of the VIE were primarily attributed to, and therefore offset by, minority interest of $0.7 million.
During fiscal 2005, a qualifying triggering event occurred with a previously consolidated VIE which resulted in reconsideration under FIN 46(R). Based on this reconsideration, it was determined that we were no longer consideredthe primary beneficiary. As such, we recorded the ownership transition and ceased consolidation of the dealership in thefirst quarter of fiscal 2005. This resulted in a pre-tax gain of $0.5 million, which we recorded as “Other Expenses(Income)” in the Consolidated Statement of Operations. Refer to Note 3 to the Consolidated Financial Statements foradditional information on FIN 46(R).
Management’s Discussion and Analysis of Financial Condition and Results of Operations (Continued)
44940HMFinancialStatement 8/15/07 6:12 AM Page 18

19 Herman Miller, Inc., and Subsidiaries
Critical Accounting Policies and Estimates
Our goal is to report financial results clearly and understandably. We follow U.S. generally accepted accounting principlesin preparing our Consolidated Financial Statements, which require us to make certain estimates and apply judgmentsthat affect our financial position and results of operations. We continually review our accounting policies and financialinformation disclosures. These policies and disclosures are reviewed at least annually with the Audit Committee of theBoard of Directors. Following is a summary of our more significant accounting policies that require the use of estimatesand judgments in preparing the financial statements.
Revenue Recognition
As described in the “Executive Overview,” the majority of our products and services are sold through one of fourchannels: Independent contract furniture dealers and licensees, owned contract furniture dealers, direct to endcustomers, and independent retailers. We recognize revenue on sales to independent dealers, licensees, and retailersonce the product is shipped and title passes to the buyer. When we sell product directly to the end customer or to owneddealers, we recognize revenue once the product and services are delivered and installation is substantially complete.
Amounts recorded as net sales generally include freight charged to customers, with the related freight expensesrecognized within cost of sales. Items such as discounts off list price, rebates, and other sale-related marketing programexpenses are recorded as reductions to net sales. We record accruals for rebates and other marketing programs, whichrequire us to make estimates about future customer buying patterns and market conditions. Customer sales that reach (orfail to reach) certain levels can affect the amount of such estimates, and actual results could differ from our estimates.
Receivable Allowances
We base our allowances related to receivables on known customer exposures, historical credit experience, and the specificidentification of other potential problems, including the economic climate. These methods are applied to all majorreceivables, including trade, lease, and notes receivable. In addition, we follow a policy that consistently applies reserverates based on the age of outstanding accounts receivable. Actual collections can differ from our historical experience, andif economic or business conditions deteriorate significantly, adjustments to these reserves may be required.
The accounts receivable allowance totaled $4.9 million and $5.0 million at June 2, 2007 and June 3, 2006,respectively. As a percentage of gross accounts receivable, these allowances totaled 2.5 percent and 2.8 percent,respectively. The year-over-year reduction in the allowance percentage is attributable to a general improvement in thequality of our accounts receivable aging.
Goodwill
The carrying value of our goodwill assets as of June 2, 2007 and June 3, 2006, totaled $39.1 million. We account for ourgoodwill assets in accordance with Statement of Financial Accounting Standards (SFAS) No. 142. Under this accountingguidance, we are required to perform an annual test on our goodwill assets by reporting unit to determine whether theasset values are impaired. If impairment is determined, we are required to reduce the net carrying value of the assets totheir estimated fair market value.
Our impairment-testing model is based on the present value of projected cash flows and a residual value. In completingthe test under this approach, we assume that the value of a business today is derived from the cash flows it will generate inthe future. We also assume that such future cash flows can be reasonably estimated. While these projected cash flowsreflect our best estimate of future reporting unit performance, actual cash flows could differ significantly.
The results of this test, performed in the fourth quarter of fiscal 2007, indicated that our net goodwill asset valueswere not impaired. We employed a market-based approach in selecting the discount rates used in our analysis. By this,we mean the discount rates selected represent market rates of return equal to what we believe a reasonable investorwould expect to achieve on investments of similar size to our reporting units. We believe the discount rates selected inour testing are conservative in that, in all cases, they exceed the estimated weighted average cost of capital for ourbusiness as a whole. The results of the impairment test are sensitive to changes in the discount rates. Our testingperformed in fiscal 2007 indicated that a substantial increase in the discount rates utilized would be required before theresults would indicate a potential impairment issue.
Warranty Reserve
We stand behind our products and keep our promises to customers. From time to time, quality issues arise resulting in theneed to incur costs to correct problems with products or services. We have established warranty reserves for the variouscosts associated with these guarantees. General warranty reserves are based on historical claims experience andperiodically adjusted for business levels. Specific reserves are established once an issue is identified. The valuation of suchreserves is based on the estimated costs to correct the problem. Actual costs may vary and may result in an adjustmentto our reserves.
Management’s Discussion and Analysis of Financial Condition and Results of Operations (Continued)
44940HMFinancialStatement 8/15/07 6:12 AM Page 19

20 2007 Annual Financial Statements
Inventory Reserves
Inventories are valued at the lower of cost or market. The inventories at the majority of our manufacturing operations arevalued using the last-in, first-out (LIFO) method, whereas inventories of certain other subsidiaries are valued using the first-in, first-out (FIFO) method. We establish reserves for excess and obsolete inventory, based on material movement andjudgment for consideration of current events, such as economic conditions, that may affect inventory. The amountof reserve required to record inventory at lower of cost or market may be adjusted as conditions change.
Income Taxes
Deferred tax assets and liabilities are recognized for the expected future tax consequences attributable to differencesbetween the financial statement carrying amounts of existing assets and liabilities, and their respective tax bases.Deferred tax assets and liabilities are measured using the enacted tax rates expected to apply to taxable income in theyears in which those temporary differences are expected to reverse.
We have net operating loss (NOL) carryforwards available in certain jurisdictions to reduce future taxable income. Wealso have foreign tax credits available in certain jurisdictions to reduce future tax due. Future tax benefits for NOLcarryforwards and foreign tax credits are recognized to the extent that realization of these benefits is considered morelikely than not. We base this determination on the expectation that related operations will be sufficiently profitable orvarious tax planning strategies available to us will enable us to utilize the NOL carryforwards and/or foreign tax credits.When information becomes available that raises doubts about the realization of a deferred income tax asset, a valuationallowance is established.
Self-Insurance Reserves
With the assistance of independent actuaries, we establish reserves for workers’ compensation and general liabilityexposures. The reserves are established based on expected future claims for incurred losses. We also establish reservesfor health benefit exposures based on historical claims information along with certain assumptions about future trends.The methods and assumptions used to determine the liabilities are applied consistently, although actual claimsexperience can vary. We also maintain insurance coverage for certain risk exposures through traditional premium-basedinsurance policies.
Pension and other Post-Retirement Benefits
The determination of the obligation and expense for pension and other post-retirement benefits depends on certainactuarial assumptions. Among the most significant of these assumptions are the discount rate, interest-crediting rate,and expected long-term rate of return on plan assets. We determine these assumptions as follows.
• Discount Rate This assumption is established at the end of the fiscal year based on high-quality corporate bondyields. We utilize the services of an independent actuarial firm to analyze and recommend an appropriate rate. For ourdomestic pension and other post-retirement benefit plans, the actuary uses a “cash flow matching” technique, whichcompares the estimated future cash flows of the plan to a published discount curve showing the relationship betweeninterest rates and duration for hypothetical zero-coupon fixed income investments. We set the discount rate for ourinternational pension plan based on the yield level of a commonly used corporate bond index. Because the averageduration of the bonds underlying this index is less than that of our international pension plan liabilities, the indexyield is used as a reference point. The final discount rate, which takes into consideration the index yield and thedifference in comparative durations, is based on a recommendation from our independent actuarial consultant.
The discount rates selected for our domestic pension and post-retirement benefit plans at the end of fiscal 2007were lower than those established at the end of fiscal 2006. With all other assumptions and values held constant, thischange would result in an increase in our pension and post-retirement benefit plan expenses for our 2008 fiscal year,which began on June 3, 2007. Conversely, the discount rate selected for our international pension plan at the end ofthe current year was higher than the rate established at the end of fiscal 2006. This change would result in a decreasein our international pension plan expense for fiscal 2008 if all other assumptions were held constant.
• Interest Crediting Rate We use this assumption in accounting for our primary domestic pension plan, which is a cashbalance-type plan. The rate, which represents the annual rate of interest applied to each plan participant’s accountbalance, is established at an assumed level, or spread, below the discount rate. We base this methodology on thehistorical spread between the 30-year U.S. Treasury and high-quality corporate bond yields. This relationship isexamined annually to determine whether the methodology is appropriate.
• Expected Long-Term Rate of Return We base this assumption on our long-term assumed rates of return for equitiesand fixed income securities, weighted by the allocation of the invested assets of the pension plan. We consider riskfactors specific to the various classes of investments and advice from independent actuaries in establishing this rate.Changes in the investment allocation of plan assets would impact this assumption. A shift to a higher relativepercentage of fixed income securities, for example, would result in a lower assumed rate.
Management’s Discussion and Analysis of Financial Condition and Results of OperationsCritical Accounting Policies and Estimates (Continued)
44940HMFinancialStatement 8/15/07 6:12 AM Page 20

21 Herman Miller, Inc., and Subsidiaries
While this assumption represents our long-term market return expectation, actual asset returns can differ from year-to-year. Such differences give rise to actuarial gains and losses. In years where actual market returns are lower than the assumedrate, an actuarial loss is generated. Conversely, an actuarial gain results when actual market returns exceed the assumed ratein a given year. As of June 2, 2007, and June 3, 2006, the net actuarial loss associated with our employee pension and post-retirement benefit plans totaled approximately $92.4 million and $123.9 million, respectively. At both dates, the majority ofthis unrecognized loss was associated with lower than expected plan asset returns.
For purposes of determining annual net pension expense, we use a calculated method for determining the market-related value of plan assets. Under this method, we recognize the change in fair value of plan assets systematically over afive-year period. Accordingly, a portion of our net actuarial loss is deferred. The remaining portion of the net actuarial lossis subject to amortization expense each year. The amortization period used in determining this expense is the estimatedremaining working life of active pension plan participants. We currently estimate this period to be approximately 13 years.As of the beginning of fiscal year 2007, the deferred net actuarial loss (i.e., the portion of the total net actuarial loss notsubject to amortization) was approximately $4.7 million.
Refer to Note 12 to the Consolidated Financial Statements for more information regarding costs and assumptionsused for employee benefit plans.
Long-Lived Assets
We evaluate long-lived assets and acquired businesses for indicators of impairment when events or circumstancesindicate that a risk may be present. Our judgments regarding the existence of impairment are based on marketconditions, operational performance, and estimated future cash flows. If the carrying value of a long-lived asset isconsidered impaired, an impairment charge is recorded to adjust the asset to its estimated fair value.
Stock-Based Compensation
We view stock-based compensation as a key component of total compensation for certain of our employees, non-employee directors and officers. We account for these programs, which include grants of restricted stock, restricted stockunits, employee stock purchase, and stock options, in accordance with SFAS 123(R). Under this guidance we recognizecompensation expense related to each of these share-based arrangements. We utilize the Black-Scholes option pricingmodel in estimating the fair value of stock options issued in connection with our compensation program. This pricingmodel requires the use of several input assumptions. Among the most significant of these assumptions are the expectedvolatility of our common stock price, and the expected timing of future stock option exercises.
• Expected Volatility This represents a measure, expressed as a percentage, of the expected fluctuation in the marketprice of our common stock. As a point of reference, a high volatility percentage would assume a wider expected rangeof market returns for a particular security. All other assumptions held constant, this would yield a higher stock optionvaluation than a calculation using a lower measure of volatility. In measuring the fair value of stock options issuedduring fiscal year 2007, we utilized an expected volatility of 28 percent.
• Expected Term of Options This assumption represents the expected length of time between the grant date of a stockoption and the date at which it is exercised (option life). We assumed an average expected term of 5 years incalculating the fair values of the majority of stock options issued during fiscal 2007.
Refer to Note 14 for further discussion on our stock-based compensation plans.
Contingencies
In the ordinary course of business, we encounter matters which raise the potential for contingent liabilities. In evaluatingthese matters for accounting treatment and disclosure, we are required to apply judgment in order to determine the probability that a liability has been incurred. We are also required to measure, if possible, the dollar value of such liabilities in determining whether or not recognition in our financial statements is required. This process involvesthe use of estimates which may differ from actual outcomes. Refer to Note 19 to the Consolidated Financial Statements formore information relating to contingencies.
New Accounting Standards
In November 2004, the FASB issued SFAS No. 151, “Inventory Costs” (SFAS 151). This Statement amends the guidance inARB No. 43, Chapter 4, “Inventory Pricing,” to clarify the accounting for abnormal amounts of idle facility expense, freight,handling costs, and wasted material (spoilage). SFAS 151 requires those items to be recognized as current-periodcharges. In addition, this Statement requires fixed production overhead expenses to be allocated to inventory based onthe “normal capacity” of the production facilities. We adopted SFAS 151 in the first quarter of fiscal 2007, and theresulting impact on our Consolidated Financial Statements was not material.
Management’s Discussion and Analysis of Financial Condition and Results of OperationsCritical Accounting Policies and Estimates (Continued)
44940HMFinancialStatement 8/15/07 6:13 AM Page 21

22 2007 Annual Financial Statements
In December 2004, the FASB issued a revision of SFAS No. 123, “Share-Based Payment” (SFAS 123(R)), whichsupersedes APB Opinion No. 25, “Accounting for Stock Issued to Employees.” This statement focuses primarily ontransactions in which an entity obtains employee services in exchange for share-based payments. Under SFAS 123(R), apublic entity generally is required to measure the cost of employee services received in exchange for an award of equityinstruments based on the grant-date fair value of the award, with such cost recognized over the requisite service period.This new accounting treatment is also required for any share-based payments to our Board of Directors. SFAS 123(R) alsorequires an entity to provide certain disclosures in order to assist in understanding the nature of share-based paymenttransactions and the effects of those transactions on the financial statements. We adopted the provisions of SFAS 123(R)in the first quarter of fiscal 2007. Further information regarding the method of adoption and the resulting impact on netearnings and earnings per share is provided in Note 14.
In June 2006, the FASB issued Interpretation No. 48, “Accounting for Uncertainty in Income Taxes, an Interpretation ofFASB Statement No. 109” (FIN 48). This Interpretation clarifies the accounting for income taxes by prescribing theminimum recognition threshold a tax position is required to meet before being recognized in the Consolidated FinancialStatements. The Interpretation also provides guidance for the measurement and classification of tax positions, interestand penalties, and requires additional disclosure on an annual basis. We plan to adopt the provisions FIN 48 effectiveJune 3, 2007, as required. We have not yet determined the effect the adoption of the Interpretation will have on ourConsolidated Financial Statements; however, we do not anticipate a material impact. Any difference between the amountsrecognized in our Consolidated Financial Statements prior to the adoption of the Interpretation and the amounts reportedafter the adoption will be accounted for as a cumulative-effect adjustment recorded in the beginning balance of retainedearnings on June 3, 2007 and will not require restatement of prior periods.
In September 2006, the FASB issued SFAS No. 157, “Fair Value Measurements” (SFAS 157). This new standardestablishes a framework for measuring the fair value of assets and liabilities. This framework is intended to provideincreased consistency in how fair value determinations are made under various existing accounting standards thatpermit, or in some cases require, estimates of fair market value. SFAS 157 also expands financial statement disclosurerequirements about a company’s use of fair value measurements, including the effect of such measures on earnings. Weare required to adopt this new accounting guidance at the beginning of fiscal 2009. While we are currently evaluating theprovisions of SFAS 157, the adoption is not expected to have a material impact on our Consolidated Financial Statements.
In September 2006, the FASB issued SFAS No. 158 “Employers’ Accounting for Defined Benefit Pension and OtherPostretirement Plans” (SFAS 158). SFAS 158 amends SFAS No. 87 “Employers’ Accounting for Pensions,” SFAS No. 88“Employers’ Accounting for Settlements and Curtailments of Defined Benefit Pension Plans and for Termination Benefits,”SFAS No. 106 “Employers’ Accounting for Postretirement Benefits Other than Pensions” and SFAS 132 “Employers’Disclosures about Pensions and Other Postretirement Benefits.” The amendments retain most of the existing measurementand disclosure guidance and will not change the amounts recognized in our Consolidated Statements of Operations. SFAS158 requires companies to recognize a net asset or liability with an offset to equity, by which the defined-benefitpostretirement obligation is over-funded or under-funded. SFAS 158 requires prospective application, and the recognitionand disclosure requirements are effective for our fiscal year ending June 2, 2007. Further information regarding our methodof adoption and the resulting impact on our Consolidated Financial Statements is provided in Note 12.
In February 2007, the FASB issued SFAS No. 159 “The Fair Value Option for Financial Assets and Financial Liabilities”(SFAS 159). SFAS 159 expands the use of fair value measurement by permitting entities to choose to measure manyfinancial instruments and certain other items at fair value that are not currently required to be measured at fair value. Weare required to adopt SFAS 159 at the beginning of fiscal 2009 and are currently in the process of evaluating theapplicability and potential impact on our Consolidated Financial Statements.
Forward Looking Statements
Certain statements in this filing are not historical facts but are “forward-looking statements” as defined under Section 27Aof the Securities Act of 1933, as amended, and Section 21E of the Securities Exchange Act, as amended. Such statementsare based on management’s belief, assumptions, current expectations, estimates and projections about the officefurniture industry, the economy and the company itself. Words like “anticipates,” “believes,” “confident,” “estimates,”“expects,” “forecast,” “likely,” “plans,” “projects,” and “should,” and variations of such words and similar expressionsidentify forward looking statements. These statements do not guarantee future performance and involve certain risks,uncertainties, and assumptions that are difficult to predict with regard to timing, expense, likelihood and degree ofoccurrence. These risks include, without limitation, employment and general economic conditions in the U.S. and in ourinternational markets, the increase in white collar employment, the willingness of customers to undertake capitalexpenditures, the types of products purchased by customers, the possibility of order cancellations or deferrals by
Management’s Discussion and Analysis of Financial Condition and Results of OperationsNew Accounting Standards (Continued)
44940HMFinancialStatement 8/15/07 6:13 AM Page 22

23 Herman Miller, Inc., and Subsidiaries
customers, competitive pricing pressures, the availability and pricing of direct materials, our reliance on a limited numberof suppliers, currency fluctuations, the ability to increase prices to absorb the additional costs of direct materials, thefinancial strength of our dealers, the financial strength of our customers, the mix of our products purchased by customers,our ability to attract and retain key executives and other qualified employees, our ability to continue to make productinnovations, the strength of the intellectual property relating to our products, the success of newly introduced products, ourability to serve all of our markets, possible acquisitions, divestitures or alliances, the outcome of pending litigation orgovernmental audits or investigations, and other risks identified in this Form 10-K and our other filings with the Securitiesand Exchange Commission. Therefore, actual results and outcomes may materially differ from what we express or forecast.Furthermore, Herman Miller, Inc., takes no obligation to update, amend, or clarify forward-looking statements.
Quantitative and Qualitative Disclosures about Market Risk
The company manufactures, markets, and sells its products throughout the world and, as a result, is subject to changingeconomic conditions, which could reduce the demand for its products.
Direct Material Costs
The company is exposed to risks arising from price changes for certain direct materials and assembly componentsused in its operations. The largest such costs incurred by the company are for steel, plastic/textiles, wood particleboard,and aluminum components. Commodity prices increased relative to the prior year during fiscal 2007, particularly duringthe first half of the year. This was followed by a period of price stabilization, and in the case steel, improvement, duringthe second half of the fiscal year. For the full year, the company estimates rising commodity prices added between $14million and $16 million to its consolidated cost of sales compared to fiscal 2006. The market price of steel, in particular,was relatively stable during fiscal 2006 and, in fact, improved slightly relative to the prior year. Consequently, it did nothave a significant impact on the year-over-year gross margin comparison between fiscal years 2005 and 2006. However,the company did experience price increases for other key manufacturing inputs during fiscal 2006. During fiscal 2005,the price of steel increased significantly. As a result, the company estimates its direct material costs for steelcomponents in fiscal 2005 increased between $18 million and $20 million in comparison to fiscal 2004.
The market price of plastics and textiles are sensitive to the cost of oil and natural gas. Oil and natural gas pricesincreased sharply during the latter half of fiscal 2005 and throughout fiscal 2006. In fiscal 2007, petroleum pricesdeclined somewhat, however, showed continued volatility. As a result, the cost of plastics and textiles increased duringfiscal years 2005 and 2006. In fiscal 2007, these market prices moderated somewhat. In addition to the marketdynamics of supply and demand, the cost of wood particleboard has been impacted by continual downsizing ofproduction capacity in the wood market as well as increased costs in transportation related to oil increases. Aluminumcomponent prices have risen in part due to high market demand and increased energy costs associated with theconversion of raw materials to aluminum ingots.
The company believes future market price increases on its key direct materials and assembly components are likely.Consequently, it views the prospect of such increases as an outlook risk to the business.
Foreign Exchange Risk
The company manufactures its products in the United States, United Kingdom, and China. It also sources completedproducts and product components from outside the United States. The company’s completed products are sold innumerous countries around the world. Sales in foreign countries as well as certain expenses related to those sales aretransacted in currencies other than the company’s reporting currency, the U.S. Dollar. Accordingly, production costs andprofit margins related to these sales are affected by the currency exchange relationship between the countries where thesales take place and the countries where the products are sourced or manufactured. These currency exchangerelationships can also affect the company’s competitive positions within these markets.
In the normal course of business, the company enters into contracts denominated in foreign currencies. The principalforeign currencies in which the company conducts its business are the British Pound, Euro, Canadian Dollar, JapaneseYen, Mexican Peso, and Chinese Renminbi. During the fourth quarter of fiscal 2007, the company entered into threeseparate forward currency contracts in order to offset €4.0 million of its Euro net asset exposure denominated in a non-functional currency. Similarly, in the fourth quarter of fiscal 2006, the company entered into a single forward currency
Management’s Discussion and Analysis of Financial Condition and Results of OperationsNew Accounting Standards (Continued)
44940HMFinancialStatement 8/15/07 6:13 AM Page 23

24 2007 Annual Financial Statements
contract to offset €1.5 million of its Euro net asset exposure. In both years, the instruments were marked to market at theend of the period, with changes in fair value reflected in net earnings. At June 2, 2007 and June 3, 2006, the fair values ofthe instruments were negligible.
Net gains arising from remeasuring all foreign currency transactions into the appropriate functional currency, whichwere included in net earnings, totaled $0.3 million, and $0.2 million for the years ended June 3, 2006 and May 28,2005, respectively. The net currency transaction gain in the year ended June 2, 2007 was negligible. Additionally, the cumulative effect of translating the balance sheet and income statement accounts from the functional currency intothe United States dollar reduced the accumulated comprehensive loss component of total shareholders’ equity by $3.3million, $1.2 million, and $3.9 million for the years ended June 2, 2007, June 3, 2006, and May 28, 2005, respectively.
Interest Rate Risk
The company maintains fixed-rate debt. For fixed-rate debt, changes in interest rates generally affect fair market value butnot earnings or cash flows. The company does not have an incentive to prepay fixed rate debt prior to maturity, and asa result, interest rate risk and changes in fair market value should not have a significant impact on such debt until the company would be required to refinance it. The company has two separate interest rate swap instruments that, as ofthe end of fiscal year 2007, effectively convert $53 million in total of fixed-rate debt to a variable-rate basis. This debtis subject to changes in interest rates, which, if significant, could have a material impact on the company’s financialresults. The interest rate swap derivative instruments are held and used by the company as a tool for managing interestrate risk. They are not used for trading or speculative purposes. The counterparties to these swap instruments are largefinancial institutions that the company believes are of high-quality creditworthiness. While the company may be exposedto potential losses due to the credit risk of non-performance by these counterparties, such losses are not anticipated.
The combined fair market value of effective swap instruments was negative $1.8 million at June 2, 2007, incomparison to negative $2.2 million at June 3, 2006. The impact of these swap instruments on total interest expense wasan addition to interest expense of approximately $0.6 million and $0.3 million in fiscal 2007 and 2006, respectively. Infiscal 2005, the swap instruments reduced total interest expense by approximately $1.1 million. All cash flows related tothe company’s interest rate swap instruments are denominated in U.S. dollars. For further information, refer to Notes 16and 17 to the Consolidated Financial Statements.
As of June 2, 2007, the weighted-average interest rate on the company’s variable-rate debt was approximately8.1 percent. Based on the level of variable-rate debt outstanding as of that date, a 1 percentage-point increase in theweighted-average interest rate would increase the company’s annual pre-tax interest expense by approximately $0.5 million.
Expected cash flows (notional amounts) over the next five years and thereafter related to debt instruments are as follows.(In Millions) 2008 2009 2010 2011 2012 Thereafter Total(1)
Long-term Debt:Fixed Rate $ 3.0 $ — $ — $ 175.0 $ — $ — $ 178.0Weighted Average Interest Rate = 7.11%
Derivative Financial Instruments Related to Debt—Interest Rate Swaps:Pay Variable/Receive Fixed $ 3.0 $ — $ — $ — $ — $ — $ 3.0Pay Interest Rate = 8.65% (at June 2, 2007)Received Interest Rate = 6.52%
Pay Variable/Receive Fixed $ — $ — $ — $ 50.0 $ — $ — $ 50.0Pay Interest Rate = 8.03% (at June 2, 2007)Receive Interest Rate = 7.125%
(1) Amount does not include the recorded fair value of the swap instruments, which totaled negative $1.8 million at the end of fiscal 2007.
Quantitative and Qualitative Disclosures about Market RiskForeign Exchange Risk (Continued)
44940HMFinancialStatement 8/15/07 6:13 AM Page 24

25 Herman Miller, Inc., and Subsidiaries
Set forth below is a summary of the quarterly operating results on a consolidated basis for the years ended June 2, 2007,June 3, 2006, and May 28, 2005. Refer to Management’s Discussion and Analysis provided in Item 7 and the Notes to theConsolidated Financial Statements for further disclosure of significant accounting transactions that may have affected thequarterly operating results for each of the periods presented.(In Millions, Except Per Share Data) First Second Third Fourth
Quarter(3) Quarter Quarter Quarter
Fiscal 2007
Net Sales $ 449.7 $ 499.1 $ 484.8 $ 485.3Gross margin(1) 152.3 170.4 160.0 163.1Net earnings(2) 28.5 36.6 32.3 31.7Earnings per share-basic .44 .57 .50 .50Earnings per share-diluted(1, 2) .43 .56 .50 .50
Fiscal 2006
Net sales $ 430.9 $ 438.2 $424.0 $ 444.1Gross margin(1) 141.7 143.9 137.9 151.2Net earnings(1) 23.7 27.9 22.4 25.0Earnings per share-basic .34 .41 .33 .38Earnings per share-diluted .34 .40 .33 .38
Fiscal 2005
Net sales $ 357.3 $ 368.4 $ 382.4 $ 407.5Gross margin(1) 112.1 120.0 122.9 134.9Net earnings(1, 4, 5) 14.3 15.4 16.8 21.6Earnings per share-basic .20 .22 .24 .31Earnings per share-diluted(1, 4, 5) .20 .22 .24 .31
(1) Sum of the quarters does not equal the annual balance reflected in the Consolidated Statements of Operations due to rounding associated with the calculationson an individual quarter basis.
(2) The fourth quarter of fiscal year 2007 includes adjustments to various tax accruals resulting in a reduction of income taxes of $3.4 million or $0.05 dilutedearnings per share in the quarter.
(3) The first quarter of fiscal year 2006 included 14 weeks of operations. (4) The fourth quarter of fiscal year 2005 includes an increase to income tax expense related to cash repatriation, resulting in a decrease to net earnings of $4.4
million or $0.06 diluted earnings per share in the quarter. (5) The fourth quarter of fiscal year 2005 includes an adjustment to operating expenses of $13.0 million before taxes, related to the company’s GSA reserves.
This adjustment reduced operating expenses and increased diluted earnings per share by $0.12 in the quarter.
Quarterly Financial Data (Unaudited)
44940HMFinancialStatement 8/15/07 6:13 AM Page 25

26 2007 Annual Financial Statements
(In Millions, Except Per Share Data) June 2, 2007 June 3, 2006 May 28, 2005
Net Sales $1,918.9 $1,737.2 $1,515.6Cost of Sales 1,273.0 1,162.4 1,025.8
Gross Margin 645.9 574.8 489.8Operating Expenses:
Selling, general, and administrative (Note 19) 395.8 371.7 327.7Design and research (Note 1) 52.0 45.4 40.2
Total Operating Expenses 447.8 417.1 367.9
Operating Earnings 198.1 157.7 121.9Other Expenses (Income):
Interest expense 13.7 14.0 14.0Interest and other investment income (4.1) (4.9) (4.6)Other, net 1.5 1.0 (0.3)
Net Other Expenses 11.1 10.1 9.1
Earnings Before Income Taxes and Minority Interest 187.0 147.6 112.8Income Tax Expense (Note 15) 57.9 47.7 44.7Minority Interest, net of income tax expense (Note 3) — 0.7 0.1
Net Earnings $ 129.1 $ 99.2 $ 68.0
Earnings Per Share—Basic $ 2.01 $ 1.46 $ 0.97Earnings Per Share—Diluted $ 1.98 $ 1.45 $ 0.96
Consolidated Statements of Operations
44940HMFinancialStatement 8/15/07 6:13 AM Page 26

27 Herman Miller, Inc., and Subsidiaries
(In Millions, Except Share and Per Share Data) June 2, 2007 June 3, 2006
AssetsCurrent Assets:
Cash and cash equivalents $ 76.4 $ 106.8Short-term investments (Note 1) 15.9 15.2Accounts receivable, less allowances of $4.9 in 2007 and $5.0 in 2006 188.1 173.2Inventories (Note 4) 56.0 47.1Prepaid expenses and other (Note 5) 48.3 47.9
Total Current Assets 384.7 390.2
Property and Equipment:Land and improvements 18.9 20.9Buildings and improvements 137.2 139.1Machinery and equipment 543.3 523.8Construction in progress 17.6 23.5
717.0 707.3Less: accumulated depreciation (520.4) (504.0)
Net Property and Equipment 196.6 203.3
Goodwill 39.1 39.1Other Assets (Note 6) 45.8 35.4
Total Assets $ 666.2 $ 668.0
Liabilities and Shareholders’ EquityCurrent Liabilities:
Unfunded checks $ 7.4 $ 6.5Current maturities of long-term debt (Note 10) 3.0 3.0Accounts payable 110.5 112.3Accrued liabilities (Note 7) 163.6 177.6
Total Current Liabilities 284.5 299.4
Long-term Debt, less current maturities (Note 10) 173.2 175.8Other Liabilities (Note 8) 52.9 54.2
Total Liabilities 510.6 529.4
Minority Interest 0.3 0.2
Shareholders’ Equity:Preferred stock, no par value (10,000,000 shares authorized, none issued) — —Common stock, $0.20 par value (240,000,000 shares authorized, 62,919,425 and 66,034,452 shares issued and outstanding in 2007 and 2006, respectively) 12.6 13.2Additional paid-in capital — —Retained earnings 197.8 192.2Accumulated other comprehensive loss (Note 1) (51.6) (63.3)Key executive deferred compensation (3.5) (3.7)
Total Shareholders’ Equity 155.3 138.4
Total Liabilities and Shareholders’ Equity $ 666.2 $ 668.0
Consolidated Balance Sheets
44940HMFinancialStatement 8/15/07 6:13 AM Page 27

28 2007 Annual Financial Statements
(In Millions, Except Share Data) Accumulated KeyShares of Additional Other Executive TotalCommon Common Paid-In Retained Comprehensive Deferred Shareholders’
Stock Stock Capital Earnings Loss Compensation Equity
Balance, May 29, 2004 71,750,979 $ 14.4 $ — $246.1 $(57.6) $ (8.3) $ 194.6
Net earnings — — — 68.0 — — 68.0Foreign currency translation adjustment — — — — 3.9 — 3.9Minimum pension liability (net of tax of $4.3 million) — — — — (10.4) — (10.4)Unrealized holding loss (net of tax of $0.1 million) — — — — (0.3) — (0.3)Total comprehensive income 61.2Cash dividends declared ($.29 per share) — — — (20.3) — — (20.3)Exercise of stock options 2,478,810 0.5 56.4 — — — 56.9Employee stock purchase plan 125,845 — 2.9 — — — 2.9Tax benefit relating to stock options — — 4.8 — — — 4.8Repurchase and retirement of common stock (4,877,832) (1.0) (64.1) (66.5) — — (131.6)Directors’ fees 8,187 — 0.2 — — — 0.2Stock grants earned — — — — — 1.8 1.8Stock grants issued 100,000 — 2.6 — — (2.6) —Deferred compensation plan — — (2.8) — — 2.8 —
Balance, May 28, 2005 69,585,989 $ 13.9 $ — $227.3 $(64.4) $ (6.3) $ 170.5
Net earnings — — — 99.2 — — 99.2Foreign currency translation adjustment — — — — 1.2 — 1.2Minimum pension liability (net of tax of $0.4 million) — — — — 0.3 — 0.3Unrealized holding loss (net of tax of $0.2 million) — — — — (0.4) — (0.4)Total comprehensive income 100.3Cash dividends declared ($.305 per share) — — — (20.6) — — (20.6)Exercise of stock options 1,451,143 0.3 33.5 — — — 33.8Employee stock purchase plan 114,659 — 3.0 — — — 3.0Tax benefit relating to stock options — — 3.7 — — — 3.7Repurchase and retirement of common stock (5,124,306) (1.0) (40.4) (113.7) — — (155.1)Directors’ fees 6,967 — 0.2 — — — 0.2Restricted stock units earned — — — — — 1.1 1.1Stock grants earned — — — — — 1.5 1.5
Balance, June 3, 2006 66,034,452 $ 13.2 $ — $192.2 $(63.3) $ (3.7) $ 138.4
Net earnings — — — 129.1 — — 129.1Foreign currency translation adjustment — — — — 3.3 — 3.3Pension and post-retirement liabilityadjustments (net of tax of $33.5 million) — — — — 58.3 — 58.3Unrealized holding gain (net of negligible tax) — — — — 0.1 — 0.1Total comprehensive income 190.8Cash dividends declared ($0.328 per share) — — — (21.0) — — (21.0)Exercise of stock options 1,886,326 0.4 46.9 — — — 47.3Employee stock purchase plan 102,808 — 3.4 — — — 3.4Tax benefit relating to stock-based compensation — — 6.7 — — — 6.7Repurchase and retirement of common stock (5,116,375) (1.0) (61.4) (102.5) — — (164.9)Directors’ fees 5,637 — 0.2 — — — 0.2Restricted stock units compensation expense — — 2.4 — — (1.3) 1.1Restricted stock units released 1,527 — 0.1 — — — 0.1Stock grants compensation expense — — (1.1) — — 1.8 0.7Stock grants issued 5,050 — — — — — —Stock option compensation expense — — 2.5 — — — 2.5Deferred compensation plan — — 0.3 — — (0.3) 0.0Adjustment to adopt SFAS 158
(net of tax of $28.2 million) — — — — (50.0) — (50.0)
Balance, June 2, 2007 62,919,425 $ 12.6 $ — $197.8 $(51.6) $ (3.5) $ 155.3
Consolidated Statements of Shareholders’ Equity
44940HMFinancialStatement 8/15/07 6:13 AM Page 28

29 Herman Miller, Inc., and Subsidiaries
(In Millions) June 2, 2007 June 3, 2006 May 28, 2005
Cash Flows from Operating Activities:Net earnings $ 129.1 $ 99.2 $ 68.0Adjustments to reconcile net earnings to net cash provided by operating activities (Note 18) 8.6 51.2 41.3
Net Cash Provided by Operating Activities 137.7 150.4 109.3
Cash Flows from Investing Activities:Notes receivable repayments 67.4 67.8 27.9Notes receivable issued (66.8) (65.6) (27.4)Short-term investment purchases (11.5) (11.6) (18.7)Short-term investment sales 11.0 9.8 15.2Capital expenditures (41.3) (50.8) (34.9)Proceeds from sales of property and equipment (Note 1) 7.9 1.6 0.4Proceeds from disposal of owned dealers (Note 2) — 2.1 —Net cash paid for acquisitions (Note 2) (3.5) — (0.7)Other, net (0.6) (0.9) (1.9)
Net Cash Used for Investing Activities (37.4) (47.6) (40.1)
Cash Flows from Financing Activities:Short-term debt repayments (Note 3) — — (1.5)Long-term debt repayments (3.0) (13.0) (13.0)Dividends paid (20.7) (20.3) (20.4)Common stock issued 50.4 37.0 59.9Common stock repurchased and retired (164.9) (155.1) (131.6)Excess tax benefits from stock-based compensation (Note 14) 6.7 — —
Net Cash Used for Financing Activities (131.5) (151.4) (106.6)
Effect of Exchange Rate Changes on Cash and Cash Equivalents 0.8 1.0 2.6
Net Decrease in Cash and Cash Equivalents (30.4) (47.6) (34.8)Cash and Cash Equivalents, Beginning of Year 106.8 154.4 189.2
Cash and Cash Equivalents, End of Year $ 76.4 $ 106.8 $ 154.4
Consolidated Statements of Cash Flows
44940HMFinancialStatement 8/15/07 6:13 AM Page 29
30 2007 Annual Financial Statements
1 Significant Accounting and Reporting Policies
The following is a summary of significant accounting and reporting policies not reflected elsewhere in the accompanyingfinancial statements.
Principles of Consolidation
The Consolidated Financial Statements include the accounts of Herman Miller, Inc., and its majority-owned domestic andforeign subsidiaries. The consolidated entities are collectively referred to as the “company.” All intercompany accountsand transactions, including any involving VIEs, have been eliminated in the Consolidated Financial Statements.
Description of Business
The company researches, designs, manufactures and distributes interior furnishings, for use in various environmentsincluding office, healthcare, educational, and residential settings, and provides related services that supportcompanies all over the world. The company’s products are sold primarily through independent contract office furnituredealers. Accordingly, accounts and notes receivable in the accompanying balance sheets are principally amountsdue from the dealers.
Fiscal Year
The company’s fiscal year ends on the Saturday closest to May 31. Fiscal 2007, the year ending June 2, 2007, contained52 weeks while the fiscal years ended June 3, 2006 and May 28, 2005, contained 53 and 52 weeks, respectively. Thesefiscal periods are the basis upon which weekly-average data is presented. An extra week in the company’s fiscal year isrequired approximately every six years in order to realign its fiscal calendar-end dates with the actual calendar months.
Foreign Currency Translation
The functional currency for foreign subsidiaries is the local currency. The cumulative effect of translating the balance sheetaccounts from the functional currency into the United States dollar at fiscal year-end exchange rates, and revenue andexpense accounts using average exchange rates for the period, is reflected as a component of accumulated comprehensiveincome (loss) in the Consolidated Statements of Shareholders’ Equity. The financial statement impact resulting fromremeasuring all foreign currency transactions into the appropriate functional currency, which was included in “OtherExpenses (Income)” in the Consolidated Statement of Operations, was a negligible gain for the year ended June 2, 2007and a gain of $0.3 million and $0.2 million for the years ended June 3, 2006, and May 28, 2005, respectively.
Cash Equivalents
The company holds cash equivalents as part of its cash management function. Cash equivalents include money marketfunds, time deposit investments, and treasury bills with original maturities of less than three months. The carrying valueof cash equivalents, which approximates fair value, totaled $22.0 million and $68.3 million as of June 2, 2007, and June3, 2006, respectively. All cash and cash equivalents are high-credit quality financial instruments, and the amount ofcredit exposure to any one financial institution or instrument is limited.
Short-Term Investments
The company maintains a portfolio of short-term investments comprised of investment grade fixed-income securities.These investments are held by the company’s wholly owned insurance captive and are considered “available-for-sale” asdefined in Statement of Financial Accounting Standards (SFAS) No. 115, “Accounting for Certain Investments in Debt andEquity Securities.” Accordingly, they have been recorded at fair market value based on quoted market prices, with theresulting net unrealized holding gains or losses reflected net of tax as a component of “Accumulated OtherComprehensive Loss” in the Consolidated Statements of Shareholders’ Equity.
All marketable security transactions are recognized on the trade date. Realized gains and losses on disposal of available-for-sale investments are included in “Interest and other investment income” in the Consolidated Statementsof Operations. Net investment income recognized in the Consolidated Statements of Operations for available-for-saleinvestments totaled $0.8 million, $0.7 million, and $0.7 million for the years ended June 2, 2007, June 3, 2006, and May28, 2005, respectively.
Notes to the Consolidated Financial Statements
44940HMFinancialStatement 8/15/07 6:13 AM Page 30

31 Herman Miller, Inc., and Subsidiaries
The following is a summary of the carrying and market values of the company’s short-term investments as of thedates indicated.(In Millions) June 2, 2007
Cost Unrealized Gain Unrealized Loss Market Value
U.S. Government and Agency Debt $ 3.9 $ — $ (0.1) $ 3.8 Corporate Bonds 6.0 — (0.1) 5.9Mortgage-Backed 5.5 — (0.1) 5.4Other Debt 0.8 — — 0.8
Total $ 16.2 $ — $ (0.3) $ 15.9
(In Millions) June 3, 2006Cost Unrealized Gain Unrealized Loss Market Value
U.S. Government and Agency Debt $ 2.5 $ — $ (0.1) $ 2.4 Corporate Bonds 7.8 — (0.2) 7.6Mortgage-Backed 4.6 — (0.1) 4.5Other Debt 0.7 — — 0.7
Total $ 15.6 $ — $ (0.4) $ 15.2
Maturities of short-term investments as of June 2, 2007, are as follows.(In Millions) Cost Market Value
Due within one year $ 1.4 $ 1.4Due after one year through five years 8.0 7.9Due after five years 6.8 6.6
Total $ 16.2 $ 15.9
Accounts Receivable Allowances
Reserves for uncollectible accounts receivable balances are based on known customer exposures, historical creditexperience, and the specific identification of other potential problems, including the economic climate. Fully reservedbalances are written off against the reserve once the company determines the probability of collection to be remote. Thecompany generally does not require collateral or other security on trade accounts receivable.
Inventories
Inventories are valued at the lower of cost or market. The inventories at the majority of the company’s manufacturingoperations are valued using the last-in, first-out (LIFO) method, whereas inventories of certain other of the company’ssubsidiaries are valued using the first-in, first-out (FIFO) method. The company establishes reserves for excess and obsoleteinventory, based its material movement and judgment for consideration of current events, such as economic conditions,that may affect inventory. Further information on the company’s recorded inventory balances can be found in Note 4.
Property, Equipment, and Depreciation
Property and equipment are stated at cost. The cost is depreciated over the estimated useful lives of the assets, using the straight-line method. Estimated useful lives range from 3 to 10 years for machinery and equipment and do not exceed40 years for buildings. Leasehold improvements are depreciated over the lesser of the lease term or the useful life ofthe asset, not to exceed 10 years. The company capitalizes certain external and internal costs incurred in connection withthe development, testing, and installation of software for internal use. Software for internal use is included in propertyand equipment and is depreciated over an estimated useful life not exceeding 5 years.
During the first quarter of fiscal 2006, the company finalized the sale of a warehouse/storage facility in West Michiganthat the company previously exited. As a result of the sale, the company received proceeds of $0.7 million and recognizeda gain on sale of $0.2 million. During the fourth quarter of fiscal 2007, the company completed the sale of its Canton,Georgia facility which was exited in fiscal 2004. The company received net cash consideration of $7.5 million, for assetswith a carrying value of $7.5 million. This resulted in a negligible pre-tax gain. As of the end of fiscal 2007, outstandingcommitments for future capital purchases approximated $7.7 million.
Notes to the Consolidated Financial Statements1 Significant Accounting and Reporting Policies (Continued)
44940HMFinancialStatement 8/15/07 6:13 AM Page 31

32 2007 Annual Financial Statements
Long-Lived Assets
The company assesses the recoverability of its long-lived assets in accordance with the provisions of SFAS No. 144,“Accounting for the Impairment or Disposal of Long-Lived Assets.” This assessment is performed whenever events orcircumstances such as current and projected future operating losses or changes in the business climate indicate that thecarrying amount may not be recoverable. Assets are grouped and evaluated at the lowest level for which there areindependent and identifiable cash flows. The company considers historical performance and future estimated results inits evaluation of potential impairment and then compares the carrying amount of the asset to the estimated futureundiscounted cash flows (without interest charges) expected to result from the use of the asset. If the carrying amount ofthe asset exceeds the expected future cash flows, the company measures and records an impairment loss for the excessof the carrying value of the asset over its fair value. The estimation of fair value is made by discounting the expectedfuture cash flows at the rate the company uses to evaluate similar potential investments based on the best informationavailable at that time.
Goodwill and Other Intangible Assets
The company’s recorded goodwill at June 2, 2007 and June 3, 2006, is associated with the North American FurnitureSolutions segment, which is described in further detail in Note 20. The company is required to test the carrying value ofgoodwill for impairment at the “reporting unit” level annually or more frequently if a triggering event occurs under theprovisions of SFAS No. 142, “Goodwill and Other Intangible Assets” (SFAS 142). As a matter of practice, the companyperforms the required annual impairment testing of goodwill during the fourth quarter of each fiscal year. The annualtesting performed each year indicated the present value of discounted cash flows of the reporting unit exceeded the recorded carrying value of the company’s goodwill assets, and accordingly no impairment charge was required for theyears ending June 2, 2007, June 3, 2006, and May 28, 2005. In addition, the carrying amount of goodwill during fiscalyears 2007 and 2006 did not change.
SFAS 142 also requires the company to evaluate its acquired intangible assets to determine whether any have“indefinite useful lives.” Under this accounting standard, intangible assets with indefinite useful lives, if any, are notsubject to amortization. The company has not classified any of its other intangible assets as having indefinite useful livesand, accordingly, amortizes them over their remaining useful lives. The company amortizes its other intangible assetsusing the straight-line method over periods ranging from 5 to 17 years.
Other intangible assets are comprised of patents, trademarks, and intellectual property rights with a combined grosscarrying value and accumulated amortization of $14.9 million and $5.5 million, respectively as of June 2, 2007. As ofJune 3, 2006, these amounts totaled $10.9 million and $4.8 million, respectively.
Estimated amortization expense for existing intangible assets as of June 2, 2007, for each of the succeeding five fiscalyears is as follows.(In Millions)
2008 $ 1.82009 $ 1.72010 $ 1.32011 $ 1.32012 $ 1.2
Notes Receivable
The notes receivable are primarily from certain independent contract office furniture dealers. These notes are the result ofdealers in transition either through a change in ownership or general financial difficulty. The notes generally arecollateralized by the assets of the dealers and bear interest based on the prevailing prime rate. Recorded reserves arebased on historical credit experience, collateralization levels, and the specific identification of other potential collectionproblems. Interest income relating to these notes in fiscal years 2007, 2006, and 2005 totaled $0.4 million for each year.
Unfunded Checks
As a result of maintaining a consolidated cash management system, the company utilizes controlled disbursement bankaccounts. These accounts are funded as checks are presented for payment, not when checks are issued. Any resultingbook overdraft position is included in current liabilities as unfunded checks.
Notes to the Consolidated Financial Statements1 Significant Accounting and Reporting Policies (Continued)
44940HMFinancialStatement 8/15/07 6:13 AM Page 32

33 Herman Miller, Inc., and Subsidiaries
Self-Insurance
The company is partially self-insured for general liability, workers’ compensation, and certain employee health benefitsunder insurance arrangements that provide for third-party coverage of claims exceeding the company’s loss retention levels.The company’s retention levels designated within significant insurance arrangements as of June 2, 2007, are as follows.
Retention Level
General Liability and Auto Liability/Physical Damage $1.00 million per occurrenceWorkers’ Compensation and Property $0.75 million per occurrenceHealth Benefits $0.20 million per employee
The company’s policy is to accrue amounts equal to the actuarially determined liabilities for loss and loss adjustmentexpenses, which are included in “Other Liabilities” in the Consolidated Balance Sheets. The actuarial valuations arebased on historical information along with certain assumptions about future events. Changes in assumptions for suchmatters as legal actions, medical costs, and changes in actual experience could cause these estimates to change in thenear term. The general and workers’ compensation liabilities are managed through the company’s wholly-ownedinsurance captive.
Research, Development, and Other Related Costs
Research, development, pre-production, and start-up costs are expensed as incurred. Research and development (R&D)costs consist of expenditures incurred during the course of planned search and investigation aimed at discovery of newknowledge useful in developing new products or processes. R&D costs also include the significant enhancement of existingproducts or production processes and the implementation of such through design, testing of product alternatives, orconstruction of prototypes. Royalty payments made to designers of the company’s products as the products are sold are notincluded in research and development costs, as they are a variable cost based on product sales. Research anddevelopment costs included in “Design and Research” expense in the accompanying Consolidated Statements ofOperations were $42.1 million, $36.7 million, and $32.7 million, in fiscal 2007, 2006, and 2005, respectively.
Advertising Costs
Advertising costs are expensed as incurred and are included in “Selling, general, and administrative” expense in theaccompanying Consolidated Statements of Operations. Advertising costs were $3.2 million, $3.2 million, and $2.7million, in fiscal 2007, 2006, and 2005, respectively.
Income Taxes
Deferred tax assets and liabilities are recognized for the expected future tax consequences attributable to differencesbetween the financial statement carrying amounts of existing assets and liabilities, and their respective tax bases.Deferred tax assets and liabilities are measured using the enacted tax rates expected to apply to taxable income in theyears in which those temporary differences are expected to reverse.
Stock-Based Compensation
The company has several stock-based compensation plans, which are described fully in Note 14. In December 2004, theFASB issued a revision of SFAS No. 123, “Share-Based Payment” (SFAS 123(R)), which supersedes APB Opinion No. 25,“Accounting for Stock Issued to Employees.” The company adopted the provisions of SFAS 123(R) in the first quarter offiscal 2007. Refer to the New Accounting Standards section of this Note, for further information regarding this newaccounting standard and its application to the company.
Prior to the adoption of SFAS 123(R), the company accounted for its stock-based compensation plans under therecognition and measurement principles of APB 25 and related Interpretations. Under this method, compensationexpense related to stock options was recognized only if the market price of the stock, underlying an award on the date ofgrant, exceeded the related exercise price. Expense attributable to certain stock-based awards, such as restricted stockgrants and restricted stock units, was recognized in the company’s reported results under APB 25.
Earnings per Share
Basic earnings per share (EPS) excludes the dilutive effect of common shares that could potentially be issued, due to theexercise of stock options or the vesting of restricted shares, and is computed by dividing net earnings by the weighted-average number of common shares outstanding for the period. Diluted EPS for fiscal years 2007, 2006, and 2005, wascomputed by dividing net earnings by the sum of the weighted-average number of shares outstanding, plus all dilutiveshares that could potentially be issued. Refer to Note 13, for further information regarding the computation of EPS.
Notes to the Consolidated Financial Statements1 Significant Accounting and Reporting Policies (Continued)
44940HMFinancialStatement 8/15/07 6:13 AM Page 33

34 2007 Annual Financial Statements
Revenue Recognition
The company recognizes revenue on sales through its network of independent contract furniture dealers and independentretailers once the related product is shipped and title passes to the dealer. In situations where products are sold throughsubsidiary dealers or directly to the end customer, revenue is recognized once the related product is shipped to the endcustomer and installation is substantially complete. Offers such as rebates and discounts are recorded as reductions tonet sales. Unearned revenue arises as a normal part of business from advance payments from customers for futuredelivery of product and service.
Shipping and Handling Expenses
The company records shipping and handling related expenses under the caption “Cost of Sales” in the ConsolidatedStatements of Operations.
Comprehensive Income/(Loss)
The company’s comprehensive income (loss) consists of net earnings, foreign currency translation adjustments, pensionand post-retirement liability adjustments, and unrealized holding gains (losses) on “available-for-sale” investments. Thecomponents of “Accumulated Other Comprehensive Loss” in each of the last three fiscal years are as follows.(In Millions) Foreign Currency Pension and Unrealized Total
Translation Post-Retirement Holding AccumulatedAdjustments Liability Period Other
Adjustments Gains (Losses) Comprehensive(net of tax) (net of tax) Income (Loss)
Balance, May 29, 2004 $ (7.9) $ (50.1) $ 0.4 $ (57.6)
Other comprehensive gain/(loss) in fiscal 2005 3.9 (10.4) (0.3) (6.8)
Balance, May 28, 2005 (4.0) (60.5) 0.1 (64.4)
Other comprehensive gain/(loss) in fiscal 2006 1.2 0.3 (0.4) 1.1
Balance, June 3, 2006 (2.8) (60.2) (0.3) (63.3)
Other comprehensive gain in fiscal 2007 3.3 58.3 0.1 61.7
Adjustments to adopt SFAS No. 158(1) — (50.0) — (50.0)
Balance, June 2, 2007 $ 0.5 $ (51.9) $ (0.2) $ (51.6)
(1) See discussion relative to the adoption of SFAS 158 below under New Accounting Standards in this footnote.
Use of Estimates in the Preparation of Financial Statements
The preparation of financial statements in conformity with accounting principles generally accepted in the United Statesrequires management to make estimates and assumptions that affect the reported amounts of assets and liabilities anddisclosure of contingent assets and liabilities at the date of the financial statements and the reported amounts ofrevenues and expenses during the reporting period. Actual results could differ from those estimates.
Change in Accounting Estimate
In fiscal 2005, pretax operating expenses were reduced by $13.0 million due to reserve reductions resulting from aninternal evaluation of reserves on open contract years with the General Services Administration (GSA). This evaluationwas prompted by a settlement reached with the GSA during the fourth quarter of fiscal 2005 concerning a prior contractaudit. The effect of this adjustment on fiscal 2005 Earnings Per Share–Diluted was an increase of approximately $0.12.Refer to Note 19 for further discussion regarding this settlement.
Variable Interest Entities
The company has provided subordinated debt to and/or guarantees on behalf of certain independent contract furnituredealerships. These relationships constitute variable interests under the provisions of FASB Interpretation No. 46,“Consolidation of Variable Interest Entities” (FIN 46(R)). At June 2, 2007 and June 3, 2006, the company was notconsidered the primary beneficiary of any such dealer relationships as defined by FIN 46(R) and therefore, no entitieswere included as Variable Interest Entities (VIEs) as of these dates. Refer to Note 3 for further discussion regarding VIEs.
The risks and rewards associated with the company’s interests in these dealerships are primarily limited to its outstandingloans and guarantee amounts. As of June 2, 2007 and June 3, 2006, the company’s maximum exposure to potential lossesrelated to outstanding loans to these dealerships totaled $4.0 million and $4.6 million, respectively. Information on thecompany’s exposure related to outstanding loan guarantees provided to such entities is included in Note 19.
Notes to the Consolidated Financial Statements1 Significant Accounting and Reporting Policies (Continued)
44940HMFinancialStatement 8/15/07 6:13 AM Page 34

35 Herman Miller, Inc., and Subsidiaries
New Accounting Standards
In November 2004, the FASB issued SFAS No. 151, “Inventory Costs.” This Statement amends the guidance in ARB No. 43,Chapter 4, “Inventory Pricing,” to clarify the accounting for abnormal amounts of idle facility expense, freight, handlingcosts, and wasted material (spoilage). SFAS 151 requires that those items be recognized as current-period charges. Inaddition, this Statement requires that fixed production overhead expenses be allocated to inventory based on the “normalcapacity” of the production facilities. The company adopted SFAS 151 in the first quarter of fiscal 2007, and the resultingimpact on its Consolidated Financial Statements was not material.
In December 2004, the FASB issued a revision of SFAS No. 123, “Share-Based Payment” (SFAS 123(R)), whichsupersedes APB Opinion No. 25, “Accounting for Stock Issued to Employees.” This statement focuses primarily ontransactions in which an entity obtains employee services in exchange for share-based payments. Under SFAS 123(R), apublic entity generally is required to measure the cost of employee services received in exchange for an award of equityinstruments based on the grant-date fair value of the award, with such cost recognized over the requisite service period.This new accounting treatment is also required for any share-based payments to the company’s Board of Directors. SFAS123(R) also requires an entity to provide certain disclosures in order to assist in understanding the nature of share-basedpayment transactions and the effects of those transactions on the financial statements. The company adopted theprovisions of SFAS 123(R) in the first quarter of fiscal 2007. Further information regarding the company’s method ofadoption and the resulting impact on net earnings and earnings per share is provided in Note 14.
In June 2006, the FASB issued Interpretation No. 48, “Accounting for Uncertainty in Income Taxes, an Interpretation of FASB Statement No. 109” (FIN 48). This Interpretation clarifies the accounting for income taxes by prescribing theminimum recognition threshold a tax position is required to meet before being recognized in the company’s ConsolidatedFinancial Statements. The Interpretation also provides guidance for the measurement and classification of tax positions,interest and penalties, and requires additional disclosure on an annual basis. The company plans to adopt the provisionsof the Interpretation effective June 3, 2007, as required. The company has not yet determined the effect the adoption of the Interpretation will have on the financial position of the company but does not anticipate a material impact. Anydifference between the amounts recognized in the company’s Consolidated Financial Statements prior to the adoption ofthe Interpretation and the amounts reported after the adoption will be accounted for as a cumulative-effect adjustmentrecorded in the beginning balance of retained earnings on June 3, 2007 and will not require restatement of prior periods.
In September 2006, the FASB issued SFAS No. 157, “Fair Value Measurements” (SFAS 157). This new standardestablishes a framework for measuring the fair value of assets and liabilities. This framework is intended to provideincreased consistency in how fair value determinations are made under various existing accounting standards thatpermit, or in some cases require, estimates of fair market value. SFAS 157 also expands financial statement disclosurerequirements about a company’s use of fair value measurements, including the effect of such measures on earnings.The company is required to adopt this new accounting guidance at the beginning of fiscal 2009. While the companyis currently evaluating the provisions of SFAS 157, the adoption is not expected to have a material impact on itsConsolidated Financial Statements.
In September 2006, the FASB issued SFAS No. 158 “Employers’ Accounting for Defined Benefit Pension and OtherPostretirement Plans” (SFAS 158). SFAS 158 amends SFAS No. 87 “Employers’ Accounting for Pensions,” SFAS No. 88“Employers’ Accounting for Settlements and Curtailments of Defined Benefit Pension Plans and for Termination Benefits,”SFAS No. 106 “Employers’ Accounting for Postretirement Benefits Other than Pensions” and SFAS 132 “Employers’Disclosures about Pensions and Other Postretirement Benefits.” The amendments retain most of the existingmeasurement and disclosure guidance and will not change the amounts recognized in the company’s ConsolidatedStatement of Operations. SFAS 158 requires companies to recognize a net asset or liability with an offset to equity, bywhich the defined-benefit postretirement obligation is over-funded or under-funded. SFAS 158 requires prospectiveapplication, and the recognition and disclosure requirements are effective for the company’s annual financial statementsfor the fiscal year ending June 2, 2007. Further information regarding the company’s method of adoption and theresulting impact to its financial statements is provided in Note 12.
In February 2007, the FASB issued SFAS No. 159 “The Fair Value Option for Financial Assets and Financial Liabilities”(SFAS 159). SFAS 159 expands the use of fair value measurement by permitting entities to choose to measure manyfinancial instruments and certain other items at fair value that are not currently required to be measured at fair value. The company is required to adopt SFAS 159 at the beginning of fiscal 2009 and is in the process of evaluating theapplicability and potential impact to its financial statements.
Reclassifications
Certain prior year information has been reclassified to conform to the current year presentation.
Notes to the Consolidated Financial Statements1 Significant Accounting and Reporting Policies (Continued)
44940HMFinancialStatement 8/15/07 6:13 AM Page 35

36 2007 Annual Financial Statements
2 Acquisitions and Divestitures
During the first quarter of fiscal 2005, the company acquired certain assets and liabilities of Office Interiors, Inc., acontract furniture dealership primarily based in Oklahoma City, Oklahoma, for $0.7 million. This resulted in therecognition of pre-tax income of $0.4 million due to the reversal of a financial guarantee liability because the companywas released from the guarantee by the third-party as part of this transaction. The gain is reflected in “Other Expenses(Income)” in the Consolidated Statements of Operations.
During the first quarter of fiscal 2006, the company completed the sale of two wholly owned contract furnituredealerships: Workplace Resource based in Cleveland, Ohio, and WB Wood based in New York, New York. The sale of thesedealerships corresponds with the company’s strategy to continue pursuing opportunities to transition its owneddealerships to independent owners, as it is believed that independent ownership of contract furniture dealers isgenerally the best model for a strong distribution network. The company ceased consolidation of the dealerships’ balancesheets and results of operations since the respective dates of sale. In connection with these sale transactions, thecompany received total consideration of $5.7 million, of which $2.1 million represented cash proceeds, for net assetswith a carrying value of $5.4 million. This resulted in a pre-tax gain on sale of $0.3 million, which is reflected as an offsetto “Selling, general, and administrative” expenses in the Consolidated Statements of Operations.
During the fourth quarter of fiscal 2007, Convia, a subsidiary of Herman Miller, Inc. acquired a technology companyfor $3.5 million in cash. The intellectual property acquired in connection with this transaction is intended to enhance the functionality of Convia’s product offering.
3 Variable Interest Entities
At the end of fiscal year 2004, when the company adopted FIN 46(R), the company qualified as the “primary beneficiary”in certain of these relationships. This required the company to include the financial statements of these qualifying VIEs inits Consolidated Financial Statements. Since that time, triggering events occurred which allowed the company to ceasethe consolidation of these VIE financial statements. At June 2, 2007, the company was not considered the primarybeneficiary in any of its independent dealer financing relationships.
During the first quarter of fiscal 2005, a qualifying triggering event occurred with one of the VIEs, which resulted in reconsideration under FIN 46(R). Based on this reconsideration, it was determined that the company was no longerconsidered the primary beneficiary. As such, the company recorded the ownership transition and ceased consolidation of the independent dealership in the first quarter of fiscal 2005. This resulted in a pre-tax gain of $0.5 million, which isreflected in “Other Expenses (Income)” in the Consolidated Statements of Operations. In connection with this ownershiptransition, the company incurred a $1.5 million cash outflow in the first quarter of fiscal 2005 related to the paymentof the outstanding bank debt of the VIE.
During the first quarter of fiscal 2006, a qualifying triggering event occurred with a VIE which resulted inreconsideration under FIN 46(R). Based on this reconsideration, it was determined that the company was no longerconsidered the primary beneficiary. Accordingly, the company ceased consolidation of the independent dealership’sfinancial statements. This resulted in a pre-tax loss of $0.1 million which is reflected in “Other Expenses (Income)” in theConsolidated Statement of Operations in fiscal 2006.
Consolidation of the VIE during the first quarter of fiscal 2006 increased the company’s net sales by $6.8 million. Netearnings for the same period were not significantly affected, excluding the loss on ceasing consolidation, as the resultingearnings were primarily attributed to minority interest of $0.7 million.
4 Inventories(In Millions) June 2, 2007 June 3, 2006
Finished goods $ 27.6 $ 22.5Work in process 14.3 12.7Raw materials 14.1 11.9
Total $ 56.0 $ 47.1
Inventories are valued at the lower of cost or market and include material, labor, and overhead. The inventories of themajority of domestic manufacturing subsidiaries are valued using the last-in, first-out method (LIFO). The inventories of allother subsidiaries are valued using the first-in, first-out method. Inventories valued using LIFO amounted to $21.6 millionand $18.2 million as of June 2, 2007 and June 3, 2006, respectively. If all inventories had been valued using the first-in,first-out method, inventories would have been $12.1 million and $11.1 million higher than reported at June 2, 2007 andJune 3, 2006, respectively.
Notes to the Consolidated Financial Statements (Continued)
44940HMFinancialStatement 8/15/07 6:13 AM Page 36

37 Herman Miller, Inc., and Subsidiaries
5 Prepaid Expenses and Other(In Millions) June 2, 2007 June 3, 2006
Deferred income taxes (Note15) $ 10.4 $ 16.3Taxes 5.2 2.3Other 32.7 29.3
Total $ 48.3 $ 47.9
6 Other Assets(In Millions) June 2, 2007 June 3, 2006
Notes receivable, less allowance of $1.9 in 2007 and $2.6 in 2006 $ 2.0 $ 2.0Pension intangible (Note 12) — 1.4Prepaid pension benefits (Note 12) 9.8 —Other intangibles, net (Note 1) 9.4 6.1Deferred income taxes (Note15) 3.2 4.8Other 21.4 21.1
Total $ 45.8 $ 35.4
7 Accrued Liabilities(In Millions) June 2, 2007 June 3, 2006
Compensation and employee benefits $ 95.0 $ 97.4Income taxes (Note 15) 2.0 10.6Other taxes 7.6 8.4Unearned revenue 13.3 15.3Warranty reserves (Note 19) 14.6 14.9Charitable contributions 2.2 1.6Customer advances 4.1 3.2Other 24.8 26.2
Total $ 163.6 $ 177.6
8 Other Liabilities(In Millions) June 2, 2007 June 3, 2006
Pension benefits (Note 12) $ 5.1 $ 15.2Post-retirement benefits (Note 12) 17.3 8.4Other 30.5 30.6
Total $ 52.9 $ 54.2
9 Notes Payable
The company has available an unsecured revolving credit facility that provides for $150 million of borrowings and expires inOctober 2009. The agreement has an accordion feature enabling the credit facility to be increased by an additional $50million, subject to certain conditions. Outstanding borrowings under the agreement bear interest at rates based on theprime, certificates of deposit, LIBOR, or negotiated rates as outlined in the agreement. Interest is payable periodicallythroughout the period a borrowing is outstanding. As of June 2, 2007, and June 3, 2006, the only usage against this facility isrelated to outstanding standby letters of credit totaling approximately $13.1 million and $13.2 million, respectively.
Notes to the Consolidated Financial Statements (Continued)
44940HMFinancialStatement 8/15/07 6:13 AM Page 37

38 2007 Annual Financial Statements
10 Long-Term Debt(In Millions) June 2, 2007 June 3, 2006
Series C senior notes, 6.52%, due March 5, 2008 $ 3.0 $ 6.0Debt securities, 7.125%, due March 15, 2011 175.0 175.0Fair value of interest rate swap arrangements (1.8) (2.2)
Subtotal 176.2 178.8Less: current portion 3.0 3.0
Total $ 173.2 $ 175.8
The company previously issued $100.0 million of senior notes in a private placement to seven insurance companies ofwhich $3.0 million and $6.0 million was outstanding at June 2, 2007, and June 3, 2006, respectively.
Provisions of the senior notes and the unsecured senior revolving credit facility restrict, without prior consent, the company’s borrowings, long-term leases, and sale of certain assets. In addition, the company has agreed tomaintain certain financial performance ratios, which are based on earnings before taxes, interest expense, depreciationand amortization. At June 2, 2007 and June 3, 2006, the company was in compliance with all of these restrictions andperformance ratios.
On March 6, 2001, the company sold publicly registered debt securities totaling $175 million. These notes mature onMarch 15, 2011, and bear an annual interest rate of 7.125 percent, with interest payments due semi-annually.
Annual maturities of long-term debt for the five fiscal years subsequent to June 2, 2007, are as follows.(In Millions)
2008 $ 3.02009 $ —2010 $ —2011 $ 175.02012 $ —Thereafter $ —
The above amounts exclude the recorded fair value of the company’s interest rate swap arrangements, which had a combined fair value of negative $1.8 million as of June 2, 2007. Additional information regarding interest rate swapsis provided in Note 17.
11 Operating Leases
The company leases real property and equipment under agreements that expire on various dates. Certain leases containrenewal provisions and generally require the company to pay utilities, insurance, taxes, and other operating expenses.
Future minimum rental payments required under operating leases that have non-cancelable lease terms as ofJune 2, 2007, are as follows.(In Millions)
2008 $ 18.82009 $ 14.02010 $ 10.22011 $ 7.72012 $ 4.9Thereafter $ 9.2
Total rental expense charged to operations was $24.8 million, $25.6 million, and $26.3 million, in fiscal 2007, 2006, and2005, respectively. Substantially all such rental expense represented the minimum rental payments under operating leases.
Notes to the Consolidated Financial Statements (Continued)
44940HMFinancialStatement 8/15/07 6:13 AM Page 38

39 Herman Miller, Inc., and Subsidiaries
12 Employee Benefit Plans
The company maintains plans that provide retirement benefits for substantially all employees.
Pension Plans and Post-Retirement Medical and Life Insurance
The principal domestic retirement plan is a defined-benefit plan with benefits determined by a cash balance calculation.Benefits under this plan are based upon an employee’s years of service and earnings. The company also offers certainemployees retirement benefits under other domestic defined benefit plans, one of which covers employees subject to acollective bargaining arrangement. The company provides healthcare and life insurance benefits to employees who retiredfrom service on or before a qualifying date in 1998. As of the qualifying date, the company discontinued offering post-retirement medical and life insurance benefits to future retirees. Benefits to qualifying retirees under this plan are basedon the employee’s years of service and age at the date of retirement.
In addition to the domestic pension and retiree healthcare and life insurance plans, one of the company’s whollyowned foreign subsidiaries has a defined-benefit pension plan based upon an average final pay benefit calculation.
The measurement date for the company’s principal domestic and international pension plans as well as its post-retirement medical and life insurance plan is the last day of the fiscal year.
As discussed in Note 1 under New Accounting Standards, the Company adopted the provisions of SFAS No. 158 as of June2, 2007. SFAS No. 158 requires recognition of the overfunded or underfunded status of defined benefit plans as an asset orliability. As a result of the adoption, the company recognized in its June 2, 2007 consolidated balance sheet, an additional$78.2 million liability with corresponding changes in accumulated other comprehensive income and deferred taxes of $50.0million and $28.2 million, respectively. The adoption of SFAS No. 158 did not require a restatement of prior periods
Benefit Obligations and Funded Status
The following table presents, for the fiscal years noted, a summary of the changes in the projected benefit obligation, planassets, and funded status of the company’s domestic and international pension plans and post-retirement plan. (In Millions) Pension Benefits Post-Retirement Benefits
2007 2006 2007 2006Domestic International Domestic International
Change in benefit obligation:Benefit obligation at beginning of year $ 255.9 $ 73.4 $ 255.7 $ 58.3 $ 16.1 $ 17.8Service cost 8.8 2.2 8.3 1.7 — —Interest cost 16.0 3.7 14.3 3.1 1.0 1.0Foreign exchange impact — 3.9 — 2.2 — —Actuarial (gain)/loss 7.5 (4.8) (5.1) 8.5 1.4 (1.1)Employee contributions — 0.5 — 0.4 — —Benefits paid (13.7) (1.0) (17.3) (0.8) (1.2) (1.6)
Benefit obligation at end of year $ 274.5 $ 77.9 $ 255.9 $ 73.4 $ 17.3 $ 16.1
Change in plan assets:Fair value of plan assets at beginning of year $ 252.1 $ 54.5 $ 231.8 $ 41.9 $ — $ —Actual return on plan assets 44.3 10.7 17.4 6.8 — —Foreign exchange impact — 3.3 — 1.7 — —Employer contributions 1.6 4.8 20.2 4.5 1.2 1.6Employee contributions — 0.5 — 0.4 — —Benefits paid (13.7) (1.0) (17.3) (0.8) (1.2) (1.6)
Fair value of plan assets at end of year 284.3 72.8 252.1 54.5 — —
Over (under) funded status at end of year $ 9.8 $ (5.1) $ (3.8) $ (18.9) $ (17.3) $ (16.1)
Unrecognized transition amount $ — $ 0.1 $ —Unrecognized net actuarial loss 92.0 24.6 7.3Unrecognized prior service cost (14.0) — 0.4
Prepaid (accrued) benefit cost $ 74.2 $ 5.8 $ (8.4)
Notes to the Consolidated Financial Statements (Continued)
44940HMFinancialStatement 8/15/07 6:13 AM Page 39

40 2007 Annual Financial Statements
The components of the amounts recognized in the Consolidated Balance Sheets are as follows.(In Millions) Pension Benefits Post-Retirement Benefits
2007 2006 2007 2006Domestic International Domestic International
Non-current assets $ 9.8 $ — $ 1.3 $ 0.1 $ — $ —Non-current liabilities — (5.1) (3.8) (11.4) (17.3) (8.4)
$ 9.8 $ (5.1) $ (2.5) $ (11.3) $ (17.3) $ (8.4)
The accumulated benefit obligation for the company’s domestic employee benefit plans totaled $274.5 million and$255.9 million as of the end of fiscal years 2007 and 2006, respectively. For its international plans, these amountstotaled $69.5 million and $65.8 million as of the same dates, respectively.
The components of the amounts recognized in accumulated other comprehensive loss before the effect of income taxesare as follows.(In Millions) Pension Benefits Post-Retirement Benefits
2007 2006 2007 2006Domestic International Domestic International
Unrecognized net actuarial loss $ 2.9 $ — $ 76.7 $ 17.1 $ — $ —Adjustments to adopt SFAS 158:
Additional unrecognized net actuarial loss 68.6 12.9 — — 8.0 —Unrecognized prior service cost (11.7) — — — 0.3 —Unrecognized transition amount — 0.1 — — — —
$ 59.8 $ 13.0 $ 76.7 $ 17.1 $ 8.3 $ —
Components of Net Periodic Benefit Costs
The following table is a summary of the annual cost of the company’s pension and post-retirement plans.(In Millions) Pension Benefits Post-Retirement Benefits
2007 2006 2005 2007 2006 2005
Domestic:Service cost $ 8.8 $ 8.3 $ 8.0 $ — $ — $ —Interest cost 16.0 14.3 14.9 1.0 1.0 1.0Expected return on plan assets (21.2) (21.1) (22.3) — — —Net amortization (gain)/loss 2.5 2.0 (1.0) 0.8 0.6 0.6
Net periodic benefit cost (credit) $ 6.1 $ 3.5 $ (0.4) $ 1.8 $ 1.6 $ 1.6
International:Service cost $ 2.2 $ 1.7 $ 1.6Interest cost 3.7 3.1 2.7Expected return on plan assets (4.3) (3.4) (3.4)Net amortization 1.6 1.0 0.3
Net periodic benefit cost $ 3.2 $ 2.4 $ 1.2
Total net periodic benefit cost $ 9.3 $ 5.9 $ 0.8 $ 1.8 $ 1.6 $ 1.6
The net prior service credit and actuarial loss included in accumulated other comprehensive income expected to berecognized in net periodic benefit cost during fiscal 2008 is $(2.1) million ($(1.3) million, net of tax) and $6.2 million($4.0 million, net of tax), respectively.
In connection with the initial adoption of FASB Staff Position 106-2 “Accounting and Disclosure Requirements Relatedto the Medicare Prescription Drug Improvement and Modernization Act of 2003,” (FSP 106-2) on August 29, 2004, and the finalization of the Medicare Part D Prescription Drug Rules on January 28, 2005, the company determined that itsretiree healthcare plan provides a benefit that is actuarially equivalent to that provided in Medicare Part D coverage andremeasured its plans’ accumulated post-retirement benefit obligation (APBO) to incorporate applicable effects of the Actsince its date of enactment. The remeasurements were taken in the second quarter and third quarter of fiscal 2005,which resulted in a reduction to the APBO for the subsidy related to benefits attributed to past service. This reduction inthe APBO was accounted for as an actuarial experience gain. As permitted under FSP 106-2, the company elected to apply
Notes to the Consolidated Financial Statements12 Employee Benefit Plans (Continued)
44940HMFinancialStatement 8/15/07 6:13 AM Page 40

41 Herman Miller, Inc., and Subsidiaries
the results of the remeasurements prospectively. As such, the gain has been included in the total unrecognized netactuarial loss for the plan and will be accounted for through amortization in future periods as a reduction of net periodicbenefit cost.
As of May 28, 2005, the recognition of the Medicare Act subsidy reduced the APBO by $3.3 million. The followingsummarizes the effects of the Medicare Act subsidy on net periodic post-retirement benefit cost in fiscal year 2005 sincethe adoption of FSP 106-2 in the second quarter.(In Millions) 2005
Amortization of the actuarial experience gain $ (0.2)Reduction in interest costs (0.2)
Total reduction in net periodic benefit cost $ (0.4)
Actuarial Assumptions
The weighted-average actuarial assumptions used to determine the benefit obligation amounts as of the end of the fiscalyear for our pension plans and post-retirement plans are as follows.
2007 2006 2005U.S. International U.S. International U.S. International
Discount rate 6.00 5.50 6.50 5.00 5.75 5.25Compensation increase rate 4.50 4.50 4.50 4.25 4.50 4.25
The weighted-average actuarial assumptions used to determine the net periodic benefit cost are established at the endof the previous fiscal year for the subsequent fiscal years as follows.
2007 2006 2005U.S. International U.S. International U.S. International
Discount rate 6.50 5.00 5.75 5.25 6.50 5.75Compensation increase rate 4.50 4.25 4.50 4.25 4.50 4.25Expected return on plan assets 8.50 7.75 8.50 8.00 8.50 8.00
In calculating post-retirement benefit obligations, a 10 percent annual rate of increase in the per capita cost of coveredhealthcare benefits was assumed for 2007, decreasing gradually to 5.0 percent by 2014 and remaining at that levelthereafter. For purposes of calculating post-retirement benefit costs, a 9.0 percent annual rate of increase in the percapita cost of covered healthcare benefits was assumed for 2007, decreasing gradually to 5.0 percent by 2010 andremaining at that level thereafter.
Assumed health care cost-trend rates have a significant effect on the amounts reported for retiree health care costs. A one-percentage-point change in the assumed health care cost-trend rates would have the following effects:(In Millions) 1 Percent 1 Percent
Increase Decrease
Effect on total fiscal 2007 service and interest cost components $ 0.1 $ (0.1)Effect on post-retirement benefit obligation at June 2, 2007 $ 1.3 $ (1.1)
Plan Assets and Investment Strategies
The company’s primary domestic and international plan assets consist mainly of listed common stocks, mutual funds,and fixed income obligations. The company’s primary objective for invested pension plan assets is to provide for sufficientlong-term growth and liquidity to satisfy all of its benefit obligations over time. Accordingly, the company has developedan investment strategy that it believes maximizes the probability of meeting this overall objective. This strategy includesthe development of a target investment allocation by asset category in order to provide guidelines for making investmentdecisions. This target allocation emphasizes the long-term characteristics of individual asset classes as well as thediversification among multiple asset classes. In developing its strategy, the company considered the need to balance thevarying risks associated with each asset class with the long-term nature of its benefit obligations. The company’s strategyplaces an emphasis on the philosophy that, over the long-term, equities will outperform fixed income investments.Accordingly, the majority of plan assets are managed within various forms of equity investments.
Notes to the Consolidated Financial Statements12 Employee Benefit Plans (Continued)
44940HMFinancialStatement 8/15/07 6:13 AM Page 41

42 2007 Annual Financial Statements
The company utilizes independent investment managers to assist with investment decisions within the overallguidelines of the strategy.
The asset allocation for the company’s primary pension plans at the end of fiscal 2007 and 2006 and the targetallocation by asset category are as follows:
Primary Domestic Plan(Percentages) Targeted Actual Percentage of Plan
Asset Assets at Year-EndAllocation 2007 2006
Asset CategoryEquities 59—80 77.7 72.9Fixed Income 20—28 21.7 24.3Other(1) 0—5 0.6 2.8
Total 100.0 100.0
Primary International Plan(Percentages) Targeted Actual Percentage of Plan
Asset Assets at Year-EndAllocation(2) 2007 2006
Asset CategoryEquities 60—90 83.9 86.7Fixed Income 10—30 8.8 8.6Other(1) 0—10 3.5 1.7Real Estate 0 3.8 3.0
Total 100.0 100.0
(1) Primarily includes cash and equivalents.(2) Represents a newly established target. Actual asset allocation will continue to be adjusted during fiscal 2008.
Cash Flows
The company is currently determining what voluntary pension plan contributions, if any, will be made in fiscal 2008.Actual contributions will be dependent upon investment returns, changes in pension obligations, and other economicand regulatory factors.
The following represents a summary of the benefits expected to be paid by the company in future fiscal years. Theseexpected benefits were estimated based on the same actuarial valuation assumptions that were used to determinebenefit obligations at year-end.(In Millions) Post-Retirement Benefits
Pension Before Effects of AfterBenefits Medicare Medicare Medicare
Act Subsidy Act Subsidy Act Subsidy
Domestic:2008 $ 20.7 $ 1.9 $ (0.3) $ 1.62009 21.7 1.9 (0.3) 1.62010 23.1 1.9 (0.3) 1.62011 23.3 2.0 (0.4) 1.62012 19.6 2.0 (0.4) 1.62013-2017 114.7 9.1 (1.8) 7.3
International:2008 $ 1.02009 1.12010 1.22011 1.32012 1.42013-2017 8.7
Notes to the Consolidated Financial Statements12 Employee Benefit Plans (Continued)
44940HMFinancialStatement 8/15/07 6:13 AM Page 42

43 Herman Miller, Inc., and Subsidiaries
Profit Sharing and 401(k) Plan
Herman Miller, Inc. has a trusteed profit sharing plan that includes substantially all domestic employees. Theseemployees are eligible to begin participating on their date of hire. The plan provides for discretionary contributions(payable in the company’s common stock) of not more than 6.0 percent of employees’ wages based on the company’sfinancial performance. The cost of the company’s profit sharing contributions charged against operations in fiscal 2007,2006, and 2005, was $12.2 million, $13.9 million, and $8.8 million, respectively.
The company matches 50 percent of employee contributions to their 401(k) accounts up to 6.0 percent of their pay. Thecost of the company’s matching contributions charged against operations was approximately $6.6 million, $6.7 million,and $6.0 million, in fiscal 2007, 2006, and 2005, respectively.
13 Common Stock and Per Share Information
The following table reconciles the numerators and denominators used in the calculations of basic and diluted EPS foreach of the last three fiscal years. (In Millions, Except Shares) 2007 2006 2005
Numerators:Numerators for both basic and diluted EPS, net earnings $ 129.1 $ 99.2 $ 68.0
Denominators: Denominators for basic EPS, weighted-average common shares outstanding 64,318,034 67,861,900 70,174,618Potentially dilutive shares resulting from stock plans 743,236 639,239 654,409
Denominator for diluted EPS 65,061,270 68,501,139 70,829,027
Options to purchase 710,516 shares, 369,817 shares, and 676,170 shares of common stock have not been includedin the denominator for the computation of diluted earnings per share for the fiscal years ended June 2, 2007, June 3,2006, and May 28, 2005, respectively, because they were anti-dilutive.
14 Stock-Based Compensation
The company utilizes equity-based compensation incentives as a component of its employee and non-employee directorand officer compensation philosophy. Currently, these incentives consist principally of stock options, restricted stock andrestricted stock units. The company also offers a discounted stock purchase plan for its domestic and internationalemployees. The Company issues shares in connection with its share-based compensation plans from authorized, butunissued, shares.
Valuation and Expense Information
In December 2004, the FASB issued a revision of SFAS No. 123, “Share-Based Payment” (SFAS 123(R)), whichsupersedes Accounting Principles Board Opinion No. 25, “Accounting for Stock Issued to Employees” (APB 25). SFAS123(R) generally requires companies to measure the cost of employee services received in exchange for an award ofequity instruments based on their grant-date fair market value and to recognize this cost over the requisite serviceperiod. The company adopted SFAS 123(R) as of the beginning of its 2007 fiscal year, using the modified prospectivemethod. Under this method, compensation expense recognized by the company in fiscal 2007, included: (a)compensation cost for all stock-based payments granted prior to, but not yet vested as of June 3, 2006, based on thegrant-date fair value estimate in accordance with the original provisions of SFAS 123, “Accounting for Stock-BasedCompensation,” and (b) compensation cost for all stock-based payments granted subsequent to June 3, 2006, based onthe grant-date fair value estimated in accordance with SFAS 123(R). Results of prior periods have not been restated.
Prior to the adoption of SFAS 123(R), the company accounted for its stock-based compensation plans under therecognition and measurement principles of APB 25 and related Interpretations. Under this method, compensationexpense related to stock options was recognized only if the market price of the stock underlying an award on the date ofgrant exceeded the related exercise price. Expense attributable to other types of stock-based awards, such as restrictedstock grants and restricted stock units, was recognized in the company’s reported results under APB 25.
Certain of the company’s equity-based compensation awards contain provisions that allow for continued vesting intoretirement. Prior to adoption of SFAS 123(R), when following the provisions of APB 25, the company recognizedcompensation expense related to these awards over the vesting period plus any required performance period, withoutregard to when an employee became eligible for retirement. Under SFAS 123(R), a stock-based award is considered fullyvested for expense attribution purposes when the employee’s retention of the award is no longer contingent on providingsubsequent service.
Notes to the Consolidated Financial Statements12 Employee Benefit Plans (Continued)
44940HMFinancialStatement 8/15/07 6:13 AM Page 43

44 2007 Annual Financial Statements
The company classifies pre-tax stock-based compensation expense primarily within “Operating Expenses” in theConsolidated Statements of Operations. Related expenses charged to “Cost of Sales” are not material. For the year endedJune 2, 2007, pre-tax compensation expense for all types of stock-based programs and the related income tax benefitrecognized was $4.9 million and $1.6 million, respectively. As a result of adopting SFAS 123(R) at the beginning of fiscal2007, the company’s reported pre-tax stock-based compensation expense for the year ended June 2, 2007, wasapproximately $3.0 million higher than it would have been under APB 25. The incremental stock-based compensationexpense effectively reduced basic and diluted earnings per share in fiscal 2007, by $0.03 each.
The following table reconciles reported net earnings and per share information to pro forma net earnings and per shareinformation that would have been reported if the fair value method had been used to account for stock-based employeecompensation in fiscal years 2006 and 2005.(In Millions, Except Per Share Data) 2006 2005
Net earnings, as reported $ 99.2 $ 68.0Addback:
Total stock-based employee compensation expense included in net earnings, as reported, net of related tax effects 1.6 1.1
Less: Total stock-based employee compensation expense determined under fair value based method for all awards, net of related tax effects (3.4) (7.2)
Pro forma net earnings $ 97.4 $ 61.9
Earnings per share:Basic, as reported $ 1.46 $ 0.97Basic, pro forma $ 1.44 $ 0.88Diluted, as reported $ 1.45 $ 0.96Diluted, pro forma $ 1.42 $ 0.87
As of June 2, 2007, total pre-tax stock-based compensation cost not yet recognized related to non-vested awards wasapproximately $7.1 million. The weighted-average period over which this amount is expected to be recognized is 2.29years.
The company estimated the fair value of employee stock options on the date of grant using the Black-Scholes model. Indetermining these values, the following weighted-average assumptions were used for the periods indicated.
2007 2006(5) 2005(5)
Risk-free interest rates(1) 4.33-4.95% 3.72-4.38% 2.04-3.42%Expected term of options(2) 1.7-5.0 years 1.6-5.0 years 1.2-4.0 yearsExpected volatility(3) 28% 30% 28-31%Dividend yield(4) 1.0% 1.0% 1.0%Weighted-average grant-date fair value of stock options:
Granted with exercise prices equal to the fair market value of the stock on the date of grant $ 9.38 $ 7.68 $ 5.68Granted with exercise prices greater than the fair market value of the stock on the date of grant $ 7.48 $ 8.02 N/A
(1) Represents the U.S. Treasury yield over the same period as the expected option term.(2) Represents the period of time that options granted are expected to be outstanding. Based on analysis of historical option exercise activity, the company has
determined that all employee groups exhibit similar exercise and post-vesting termination behavior. (3) Amount is determined based on analysis of historical price volatility of the company’s common stock over a period equal to the expected term of the options.
The company also utilizes a market-based or “implied volatility” measure, on exchange-traded options in the company’s common stock, as a reference indetermining this assumption.
(4) Represents the company’s estimated cash dividend yield over the expected term of options.(5) Assumptions used for pro forma purposes.
Stock-based compensation expense recognized in the Consolidated Statements of Operations for the year ended June 2, 2007, has been reduced for estimated forfeitures, as it is based on awards ultimately expected to vest. SFAS123(R) requires forfeitures to be estimated at the time of grant and revised, if necessary, in subsequent periods if actualforfeitures differ from those estimates. Forfeitures were estimated based on historical experience. In the company’s proforma information, which was required under SFAS No. 123 for the periods prior to fiscal 2007, the company accountedfor forfeitures as they occurred. The cumulative effect of the change in accounting for forfeitures was not material.
Notes to the Consolidated Financial Statements14 Stock-Based Compensation (Continued)
44940HMFinancialStatement 8/15/07 6:13 AM Page 44

45 Herman Miller, Inc., and Subsidiaries
Adoption of SFAS 123(R) also affected the presentation of cash flows. The change is related to tax benefits arising fromtax deductions that exceed the amount of compensation expense recognized (excess tax benefits) in the financialstatements. For the year ended June 2, 2007, cash flows from operating activities were reduced by $6.7 million and cashflows from financing activities were increased by $6.7 million from amounts that would have been reported if thecompany had not adopted SFAS 123(R). For the years ended June 3, 2006 and May 28, 2005, the amount of tax benefitsarising from tax deductions exceeding the amount of compensation expense included in cash flows from operatingactivities was $3.7 million and $4.8 million, respectively.
Employee Stock Purchase Program
Under the terms of the company’s Employee Stock Purchase Plan, 4 million shares of authorized common stock werereserved for purchase by plan participants at 85.0 percent of the market price. The company recognized $0.5 million ofpre-tax compensation expense related to employee stock purchases for the fiscal year ended June 2, 2007.
Stock Option Plans
The company has stock option plans under which options to purchase the company’s stock are granted to employees andnon-employee directors and officers at a price not less than the market price of the company’s common stock on the date ofgrant. All options become exercisable between one year and three years from date of grant and expire two to ten years fromdate of grant. The options are subject to graded vesting with the related compensation expense recognized on a straight-line basis over the requisite service period. At June 2, 2007, there were 6.2 million shares available for future options.
The following is a summary of the transactions under the company’s stock option plans.Weighted-
Weighted- Average- AggregateShares Average Remaining IntrinsicUnder Exercise Contractual Value
Option Prices Term (Years) (In Millions)
Outstanding at May 29, 2004 7,857,838 $ 24.14 4.29 $ 9.7
Granted at Market 249,761 $ 26.34Granted>Market — —Exercised (2,478,810) $ 22.94Forfeited (245,777) $ 27.55
Outstanding at May 28, 2005 5,383,012 $ 24.64 3.93 $ 27.9
Granted at Market 110,010 $ 28.36Granted>Market 356,713 $ 33.51Exercised (1,451,143) $ 23.30Forfeited (67,884) $ 31.56
Outstanding at June 3, 2006 4,330,708 $ 25.80 3.88 $ 20.8
Granted at Market 94,205 $ 34.87Granted>Market 385,286 $ 30.54Exercised (1,886,326) $ 25.01Forfeited (63,751) $ 29.72
Outstanding at June 2, 2007 2,860,122 $ 27.18 4.82 $ 26.8
Ending vested + Expected to vest 2,814,562 $ 27.10 4.76 $ 26.6Exercisable at end of period 2,184,029 $ 25.65 3.79 $ 23.8
Pre-tax compensation expense related to these options totaled $2.5 million for fiscal 2007. On a pro forma basis,compensation expense related to these options totaled $1.6 million and $8.8 million, for fiscal 2006 and 2005, respectively.
The total pre-tax intrinsic value of options exercised during fiscal 2007, 2006 and 2005 was $19.8 million, $11.5 million and $14.4 million, respectively. The aggregate intrinsic value in the preceding table represents the totalpre-tax intrinsic value, based on the company’s closing stock price as of the end of the period presented, which wouldhave been received by the option holders had all option holders exercised in-the-money options as of that date.
Notes to the Consolidated Financial Statements14 Stock-Based Compensation (Continued)
44940HMFinancialStatement 8/15/07 6:13 AM Page 45

46 2007 Annual Financial Statements
The following is a summary of stock options outstanding at June 2, 2007.Range of Exercise Price Outstanding Stock Options Exercisable Stock Options
Shares Weighted- Weighted- Shares Weighted-Average Average Average
Remaining Exercise ExerciseContractual Prices Prices
Term (Years)
$16.29-25.00 1,122,542 4.04 $ 23.36 1,122,542 $ 23.36$25.06-29.75 957,289 3.06 $ 27.48 957,289 $ 27.48$30.54-38.13 780,291 8.12 $ 32.29 104,198 $ 33.52
Total 2,860,122 4.82 $ 27.18 2,184,029 $ 25.65
Restricted Stock Grants
The company grants restricted common stock to certain key employees. Shares are granted in the name of the employee,who has all rights of a shareholder, subject to certain restrictions on transferability and a risk of forfeiture. The grants aresubject to either cliff-based or graded vesting over a period not to exceed five years, subject to forfeiture if the employeeceases to be employed by the company for certain reasons. After the vesting period, the restrictions on transferabilitylapse. The company recognizes the related compensation expense on a straight-line basis over the requisite serviceperiod. A summary of shares subject to restrictions follows.
2007 2006 2005Shares Weighted- Shares Weighted- Shares Weighted-
Average Average AverageGrant-Date Grant-Date Grant-Date
Fair Value Fair Value Fair Value
Outstanding, at beginning of year 140,484 $ 25.12 184,221 $ 24.89 148,780 $ 23.81Granted 5,050 33.68 — — 100,000 25.80Forfeited — — — — — —Vested (39,533) 23.87 (43,737) 24.13 (64,559) 23.82
Outstanding, at end of year 106,001 $ 26.00 140,484 $ 25.12 184,221 $ 24.89
Pre-tax compensation expense related to these awards totaled $0.7 million, $1.5 million and $1.6 million, for theyears ended June 2, 2007, June, 3, 2006 and May 28, 2005, respectively. The weighted-average remaining recognitionperiod of the outstanding restricted shares at June 2, 2007, was 2.18 years. The fair value on the dates of vesting forshares that vested during the twelve months ended June 2, 2007, was $1.3 million.
Restricted Stock Units
The company grants restricted stock units to certain key employees. This program provides that the actual numberof restricted stock units awarded is tied in part to the company’s annual financial performance for the year on which thegrant is based. The awards generally cliff-vest after a five-year service period, with prorated vesting under certaincircumstances and continued vesting into retirement. Each restricted stock unit represents one equivalent share of thecompany’s common stock to be awarded, free of restrictions, after the vesting period. Compensation expense related to these awards is recognized over the requisite service period, which includes any applicable performance period.Dividend equivalent awards are granted quarterly. The following is a summary of restricted stock unit transactions for theyears ended June 2, 2007 and June 3, 2006.
2007 2006Share Aggregate Weighted- Share Aggregate Weighted-Units Intrinsic Average Units Intrinsic Average
Value Remaining Value Remainingin Millions Contractual in Millions Contractual
Term (Years) Term (Years)
Outstanding, at beginning of year 80,062 $ 2.4 4.07 — — —Granted 109,318 83,120Forfeited (10,379) (2,882)Released (1,527) (176)
Outstanding, at end of year 177,474 $ 6.5 3.68 80,062 $ 2.4 4.07
Ending vested and expected to vest 154,808 $ 5.7 3.68 70,105 $ 2.1 4.07
Notes to the Consolidated Financial Statements14 Stock-Based Compensation (Continued)
44940HMFinancialStatement 8/15/07 6:13 AM Page 46

47 Herman Miller, Inc., and Subsidiaries
The company recognized pre-tax compensation expense related to restricted stock units of $1.1 million in fiscal 2007,$1.1 million in fiscal 2006 and $0.2 million in fiscal 2005.
Key Executive Deferred Compensation Plan
The company established the Herman Miller, Inc., Key Executive Deferred Compensation Plan, which allows certainexecutives to defer receipt of all or a portion of their cash incentive bonus. The company may make a matchingcontribution of 30 percent of the executive’s contribution up to 50 percent of the deferred cash incentive bonus. The company’s matching contribution vests at the rate of 33 1/3 percent annually. In accordance with the terms of theplan, the executive deferral and company matching contribution have been placed in a “Rabbi” trust, which invests solelyin the company’s common stock. These Rabbi trust arrangements offer the executive a degree of assurance for ultimatepayment of benefits without causing constructive receipt for income tax purposes. Distributions to the executive from the Rabbi trust can only be made in the form of the company’s common stock. The assets in the Rabbi trust remainsubject to the claims of creditors of the company and are not the property of the executive and are, therefore, included asa separate component of shareholders’ equity under the caption Key Executive Stock Programs.
Director Fees
During fiscal 2000, the Board of Directors approved a plan that allows the Board members to elect to receive their directorfees in one or more of the following forms: cash, deferred compensation in the form of shares, unrestricted company stockat the market value at the date of election, or stock options that vest in one year and expire in ten years. The exercise priceof the stock options granted may not be less than the market price of the company’s common stock on the date of grant.Under the plan, the Board members received the following in the fiscal years indicated.
2007 2006 2005
Options 9,494 28,369 23,603Shares of common stock 5,637 6,967 8,187Shares through the deferred compensation program 6,529 8,633 3,903
15 Income Taxes
The components of earnings before income taxes are as follows. (In Millions) 2007 2006 2005
Domestic $ 149.9 $ 124.4 $ 96.2Foreign 37.1 23.2 16.6
Total $ 187.0 $ 147.6 $ 112.8
The provision (benefit) for income taxes consists of the following.(In Millions) 2007 2006 2005
Current: Domestic – Federal $ 38.7 $ 35.7 $ 29.3Domestic – State 3.7 3.3 3.2Foreign 12.3 8.3 4.9
Subtotal 54.7 47.3 37.4
Deferred: Domestic – Federal 1.6 1.6 5.3Domestic – State 0.9 0.3 0.2Foreign 0.7 (1.5) 1.8
Subtotal 3.2 0.4 7.3
Total income tax provision $ 57.9 $ 47.7 $ 44.7
Notes to the Consolidated Financial Statements14 Stock-Based Compensation (Continued)
44940HMFinancialStatement 8/15/07 6:13 AM Page 47

48 2007 Annual Financial Statements
The following table represents a reconciliation of income taxes at the United States statutory rate with the effective taxrate as follows.(In Millions) 2007 2006 2005
Income taxes computed at the United StatesStatutory rate of 35% $ 65.5 $ 51.7 $ 39.5
Increase (decrease) in taxes resulting from:Dividend planned under the American Jobs Creation Act of 2004 — — 4.4Foreign tax credits (1.4) (0.4) (7.0)Valuation allowance adjustments (2.8) (1.5) 8.0Tax reserve adjustments 0.2 2.1 0.3Other, net (3.6) (4.2) (0.5)
Income tax expense $ 57.9 $ 47.7 $ 44.7
Effective tax rate 31.0% 32.3% 39.6%
During fiscal 2007, the company had higher than anticipated foreign tax credits. Because of these increased creditsand the company’s anticipated future foreign source income, the company determined that its existing foreign tax creditcarryforward no longer required a $2.9 million valuation allowance.
Also in fiscal 2007, the company was granted a tax holiday from the Ningbo Economic and Technological DevelopmentCommission in China. This agreement provides, starting with the first year of cumulative profits, for the company to betaxed at reduced rate for five years. For fiscal year 2007, the company’s Ningbo, China operations incurred a loss,therefore, it did not use any benefits of the tax holiday.
In the fourth quarter of fiscal 2005, the company recorded tax expense of $4.4 million on a repatriation dividend of$45 million the company planned under the American Jobs Creation Act of 2004, as further discussed below. Also in thefourth quarter of fiscal 2005, the company recorded foreign tax credits of $7.0 million associated with the repatriationdividend declared under the American Jobs Creation Act of 2004 and an additional valuation allowance of $8.0 million,primarily due to those foreign tax credits.
FSP 109-1 and FSP 109-2 became effective in December 2004. This guidance was issued in response to the AmericanJobs Creation Act of 2004 (the Act). This Act includes a tax deduction up to 9 percent (when fully phased-in) of the lesserof (a) “qualified production activities income,” as defined in the Act, or (b) taxable income (after the deduction for theutilization of any net operating loss carryforwards). According to FSP 109-1, this deduction should be accounted for as aspecial deduction, rather than as a rate reduction, in accordance with Statement 109. The tax benefit of the specialdeduction is recognized under Statement 109 as it is earned. As such, FSP 109-1 did not have an effect on the company’sConsolidated Financial Statements upon adoption in fiscal 2005. Rather, the company began recognizing the benefit ofthis special deduction starting in the first quarter of fiscal year 2006, which reduced the company’s effective tax rate.
The Act also provides for a one-time tax deduction of 85 percent of certain foreign earnings that are repatriated within aspecified time frame. In order to qualify for the deduction, the earnings must be reinvested in the United States pursuantto a domestic reinvestment plan established by the company’s Chief Executive Officer and approved by its Board ofDirectors. Certain other criteria in the Act must be satisfied as well. On May 10, 2005, the Internal Revenue Service andDepartment of Treasury issued guidance concerning the calculation of tax on distributions under Section 965 of theInternal Revenue Code. Based on this guidance, the company repatriated approximately $45 million of undistributedforeign earnings under the American Jobs Creation Act of 2004, which resulted in related income tax expense of $4.4million in fiscal year 2005. During the first quarter of fiscal 2006, the company repatriated approximately $35 million ofundistributed foreign earnings under the Act. The company repatriated an additional $9 million of undistributed foreignearnings in the second quarter of fiscal 2006. Based on the taxes accrued, no additional taxes were recorded on theactual dividends paid. These dividends were fully reinvested in fiscal 2006 pursuant to the domestic reinvestment plansigned by the company’s Chief Executive Officer and approved by its Board of Directors.
Notes to the Consolidated Financial Statements15 Income Taxes (Continued)
44940HMFinancialStatement 8/15/07 6:13 AM Page 48

49 Herman Miller, Inc., and Subsidiaries
The tax effects and types of temporary differences that give rise to significant components of the deferred tax assetsand liabilities at June 2, 2007 and June 3, 2006, are as follows.(In Millions) 2007 2006
Deferred tax assets:Compensation-related accruals $ 6.8 $ 6.4Accrued pension and post-retirement benefit obligations 8.2 10.8Reserves for inventory 1.6 2.0Reserves for uncollectible accounts and notes receivable 1.9 2.9Restructuring and asset impairments 0.1 3.9Warranty 4.6 4.5State and local tax net operating loss carryforwards 4.4 5.6Tax basis in property in excess of book basis 3.7 2.9State credits 1.8 1.8Foreign tax net operating loss carryforwards 5.2 4.6Foreign tax credits 2.8 6.7Other 7.7 8.0
Subtotal 48.8 60.1Valuation allowance (9.2) (13.6)
Total $ 39.6 $ 46.5
Deferred tax liabilities:Capitalized software costs $ (18.3) $ (17.9)Prepaid employee benefits (5.6) (5.2)Other (2.1) (2.3)
Total $ (26.0) $ (25.4)
The future tax benefits of net operating loss (NOL) carryforwards and foreign tax credits are recognized to the extent thatrealization of these benefits is considered more likely than not. The company bases this determination on the expectationthat related operations will be sufficiently profitable or various tax planning strategies will enable the company to utilizethe NOL carryforwards and/or foreign tax credits. To the extent that available evidence about the future raises doubt aboutthe realization of these tax benefits, a valuation allowance is established.
At June 2, 2007, the company had state and local tax NOL carryforwards of $67.3 million, the tax benefit of which is$4.4 million, which have various expiration periods from one to twenty years. The company also had state credits witha tax benefit of $1.8 million that expire in one to ten years. For financial statement purposes, the NOL carryforwardsand state tax credits have been recognized as deferred tax assets, subject to a valuation allowance of $4.0 million.
At June 2, 2007, the company had foreign net operating loss carryforwards of $16.9 million, the tax benefit of which is$5.2 million, which have expiration periods from three years to unlimited in term. The company also had foreign taxcredits with a tax benefit of $2.8 million that expire in ten years. For financial statement purposes, NOL carryforwards andforeign tax credits have been recognized as deferred tax assets, subject to a valuation allowance of $5.2 million.
The company has not provided for United States income taxes on undistributed earnings of foreign subsidiariestotaling approximately $77.0 million. Recording deferred income taxes on these undistributed earnings is not required,because these earnings have been deemed to be permanently reinvested. These amounts would be subject to possibleU.S. taxation only if remitted as dividends. The determination of the hypothetical amount of unrecognized deferred U.S.taxes on undistributed earnings of foreign entities is not practicable.
16 Fair Value of Financial Instruments
The carrying amount of the company’s financial instruments included in current assets and current liabilitiesapproximates fair value due to their short-term nature. As of June 2, 2007, and June 3, 2006, the company estimates thatthe fair value of notes receivable approximates the related carrying values. The company intends to hold these notes tomaturity and has recorded allowances to reflect the expected net realizable value. As of June 2, 2007, the carrying valueof the company’s long-term debt, including both current maturities and the fair value of the company’s interest rate swaparrangements, was $176.2 million with a corresponding fair market value of $181.2 million. At June 3, 2006, the carryingvalue and fair market value was $178.8 million and $184.7 million, respectively.
Notes to the Consolidated Financial Statements15 Income Taxes (Continued)
44940HMFinancialStatement 8/15/07 6:13 AM Page 49

50 2007 Annual Financial Statements
17 Financial Instruments with Off-Balance Sheet Risk
The company has periodically utilized financial instruments to manage its foreign currency volatility at the transactionallevel as well as its exposure to interest rate fluctuations.
Foreign Currency Contracts
In the normal course of business, the company enters into contracts denominated in foreign currencies. The principal foreigncurrencies in which the company conducts its business are the British Pound Sterling, Euro, Canadian dollar, Japanese Yen,Mexican Peso, and Chinese Renminbi. The market risk exposure is limited to currency rate movements. During the fourthquarter of fiscal 2007, the company entered into three forward currency instruments to offset ?4.0 million of its net assetexposure, denominated in a non-functional currency. The forward currency instruments are marked to market at the end ofthe period, with changes in fair value reflected in the Consolidated Statements of Operations. At June 2, 2007, the fair valueof the forward currency instruments was negligible. At June 3, 2006, the company had one outstanding forward currencyinstrument to offset ?1.5 million of its net asset exposure, denominated in a non-functional currency.
Interest Rate Swaps
In November 2003, the company entered into two fixed-to-floating interest rate swap agreements. The first which expiresMarch 15, 2011, effectively converts $50.0 million of fixed-rate debt securities to a floating-rate basis. The fair value ofthis swap instrument, which is based upon expected LIBOR rates over the remaining term of the instrument, wasapproximately $(1.7) million at June 2, 2007, and is reflected as a reduction to long-term debt and an offsetting additionto other long-term liabilities in the Consolidated Balance Sheets. As of June 3, 2006, the fair value of approximately $(2.0)million is reflected as a reduction to long-term debt and an offsetting addition to other long-term liabilities. The floatinginterest rate for this agreement is based on the six-month LIBOR, set in-arrears at the end of each semi-annual period,which is estimated to be approximately 8.0 percent and 8.1 percent at June 2, 2007, and June 3, 2006, respectively. Thenext scheduled interest rate reset date is in September 2007.
The second agreement, which expires March 5, 2008, effectively converts $3.0 million of fixed-rate private placementdebt to a floating-rate basis. The fair value of this swap instrument, which is based upon expected LIBOR rates overthe remaining term of the instrument, was approximately $(0.1) million at June 2, 2007, and is reflected as a reduction to long-term debt and an offsetting addition to other long-term liabilities in the Consolidated Balance Sheets. As ofJune 3, 2006, the fair value of approximately $(0.2) million is reflected as a reduction to long-term debt and an offsettingaddition to other long-term liabilities. The floating interest rate for this agreement is based on the six-month LIBOR, setin-arrears at the end of each semi-annual period, which is estimated to be approximately 8.7 percent at June 2, 2007,and June 3, 2006, respectively. The next scheduled interest rate reset date is in September 2007.
As of June 2, 2007, a total of $53.0 million of the company’s outstanding debt was effectively converted to a variable-rate basis as a result of these interest rate swap arrangements. These swaps are fair-value hedges and qualify forhedge-accounting treatment using the “short-cut” method under the provisions of SFAS No. 133, “Accounting for DerivativeInstruments and Hedging Activities.” Under this accounting treatment, the change in the fair value of the interest rate swapis equal to the change in value of the related hedged debt and, as a result, there is no net effect on earnings. Theseagreements require the company to pay floating-rate interest payments in return for receiving fixed-rate interest paymentsthat coincide with the semi-annual payments to the debt holders at the same date.
The counterparties to these swap instruments are large financial institutions which the company believes are of high-quality creditworthiness. While the company may be exposed to potential losses due to the credit risk of non-performanceby these counterparties, such losses are not anticipated. These swap arrangements effectively increased interest expenseby $0.6 million and $0.3 million in fiscal years 2007 and 2006, respectively, and reduced interest expense by$1.1 million in fiscal 2005.
Notes to the Consolidated Financial Statements (Continued)
44940HMFinancialStatement 8/15/07 6:13 AM Page 50

51 Herman Miller, Inc., and Subsidiaries
18 Supplemental Disclosures of Cash Flow Information
The following table presents the adjustments to reconcile net earnings to net cash provided by operating activities.(In Millions) 2007 2006 2005
Depreciation $ 39.7 $ 40.5 $ 45.7Amortization 1.5 1.1 1.2Provision for losses on accounts receivable and notes receivable (0.6) 0.5 (0.6)Provision for losses on financial guarantees (0.2) 0.1 0.2Minority interest — 0.7 0.1Loss on sales of property and equipment 1.5 1.3 0.9Gain on disposal of owned dealers (Note 2) — (0.3) —Deferred taxes 3.2 0.4 7.3Pension and other post-retirement benefits 3.9 (18.5) (24.8)Stock-based compensation 4.9 2.6 1.8Excess tax benefits from stock-based compensation (6.7) — —Other liabilities 0.3 2.9 (11.1)Other (1.9) (0.5) (0.8)Changes in current assets and liabilities:
Decrease (increase) in assets:Accounts receivable (14.8) (7.6) (25.5)Inventories (9.0) (8.7) (9.6)Prepaid expenses and other (6.3) 3.0 (2.4)
Increase (decrease) in liabilities:Accounts payable (1.8) 7.5 16.5Accrued liabilities (5.1) 26.2 42.4
Total changes in current assets and liabilities (37.0) 20.4 21.4
Total adjustments $ 8.6 $ 51.2 $ 41.3
Cash payments for interest and income taxes were as follows.(In Millions) 2007 2006 2005
Interest paid $ 13.5 $ 13.8 $ 13.1Income taxes paid, net of cash received $ 57.6 $ 45.0 $ 16.1
19 Guarantees, Indemnifications, and Contingencies
Product Warranties
The company provides warranty coverage to the end-user for parts and labor on products sold. The standard length of warranty is 12 years, however, this varies depending on the product classification. The company does not sell orotherwise issue warranties or warranty extensions as stand-alone products. Reserves have been established for variouscosts associated with the company’s warranty program. General warranty reserves are based on historical claimsexperience and other currently available information and are periodically adjusted for business levels and other factors.Specific reserves are established once an issue is identified with the amounts for such reserves based on the estimatedcost of correction. Changes in the warranty reserve for the stated periods were as follows.(In Millions) 2007 2006
Accrual Balance, beginning $ 14.9 $ 13.0Accrual for warranty matters 12.3 9.5Settlements and adjustments (12.6) (7.6)
Accrual Balance, ending $ 14.6 $ 14.9
Notes to the Consolidated Financial Statements (Continued)
44940HMFinancialStatement 8/15/07 6:13 AM Page 51

52 2007 Annual Financial Statements
Other Guarantees
The company has entered into separate agreements to guarantee the debt of two independent contract furnituredealerships. In accordance with the provisions of FASB Interpretation No. 45, “Guarantor’s Accounting and DisclosureRequirements for Guarantees, Including Indirect Guarantees of the Indebtedness of Others” (FIN 45), the companyinitially recorded an expense equal to the estimated fair values of these guarantees. The maximum financial exposureassumed by the company as a result of these arrangements totaled $0.5 million as of June 2, 2007. Guarantees of$0.4 million are reflected under the caption “Other Liabilities” in the Consolidated Balance Sheets as of June 2, 2007.At June 3, 2006, the recorded liability for such guarantees totaled $0.5 million.
The company previously entered into an agreement with a third-party leasing company to guarantee a contractual leaseterm, including the lessee payment obligation and/or residual value of Herman Miller product. This lease expired inMarch 2007. As of June 3, 2006, the maximum financial exposure assumed by the company in connection with thisguarantee totaled approximately $2.0 million. A guarantee of $0.6 million was reflected in “Other Liabilities” in theConsolidated Balance Sheet as of June 3, 2006 which approximated the estimated fair value at that date. As of June 2,2007, the estimated fair value is zero, and accordingly, is not reflected on the company’s Consolidated Balance Sheet atthat date.
The company is periodically required to provide performance bonds in order to conduct business with certaincustomers. These arrangements are common and generally have terms ranging between one and three years. The bondsare required to provide assurances to customers that the products and services they have purchased will be installedand/or provided properly and without damage to their facilities. The performance bonds are provided by various bondingagencies and the company is ultimately liable for claims that may occur against them. As of June 2, 2007, the companyhad a maximum financial exposure related to performance bonds of approximately $3.9 million. The company hasno history of claims, nor is it aware of circumstances that would require it to perform under any of these arrangementsand believes that the resolution of any claims that might arise in the future, either individually or in the aggregate, wouldnot materially affect the company’s financial statements. Accordingly, no liability has been recorded as of June 2, 2007,and June 3, 2006.
The company periodically enters into agreements in the normal course of business, which may include indemnificationclauses regarding patent/trademark infringement and service losses. Service losses represent all direct or consequentialloss, liability, damages, costs and expenses incurred by the customer or others resulting from services rendered by thecompany, the dealer, or certain sub-contractors due to a proven negligent act. The company has no history of claims, noris it aware of circumstances that would require it to perform under these arrangements and believes that the resolution ofany claims that might arise in the future, either individually or in the aggregate, would not materially affect the company’sfinancial statements. Accordingly, no liability has been recorded as of June 2, 2007, and June 3, 2006.
The company has entered into standby letter of credit arrangements for the purpose of protecting various insurancecompanies against default on the payment of certain premiums and claims. A majority of these arrangements are related tothe company’s wholly-owned captive insurance company. As of June 2, 2007, the company had a maximum financialexposure from these insurance-related standby letters of credit of approximately $13.1 million. The company has no historyof claims, nor is it aware of circumstances that would require it to perform under any of these arrangements and believesthat the resolution of any claims that might arise in the future, either individually or in the aggregate, would not materiallyaffect the company’s financial statements. Accordingly, no liability has been recorded as of June 2, 2007, and June 3, 2006.
Contingencies
As previously reported, the company has received a subpoena from the New York Attorney General’s office requesting certaininformation relating to the minimum advertised price program maintained by the Herman Miller for the Home division. In connection with this matter, the New York Attorney General’s office has taken depositions of current and former employeesof the company and certain dealers. The company and the New York Attorney General’s office have had preliminarydiscussions regarding possible methods of resolving the matter. The company has reserved its best estimate of a potentialamount to resolve this matter. The accrued amount is not material to the company’s consolidated financial position.
The company leases a facility in the United Kingdom under an agreement that expires in March 2008. Under the termsof the lease, the company is required to perform the maintenance and repairs necessary to address the generaldilapidation of the facility over the lease term. The ultimate cost of this provision to the company is dependent on a number of factors including, but not limited to, the future use of the facility by the lessor and whether the companychooses and is permitted to renew the lease term. The company has estimated the cost of these maintenance and repairsto be between $0 and $3 million, depending on the outcome of future plans and negotiations. Based on existingcircumstances, it is estimated that these costs will most likely approximate $0.5 million. As a result, this amount hasbeen recorded as a liability reflected under the caption “Other Liabilities” in the Consolidated Balance Sheets as of June2, 2007, and June 3, 2006.
Notes to the Consolidated Financial Statements19 Guarantees, Indemnifications, and Contingencies (Continued)
44940HMFinancialStatement 8/15/07 6:13 AM Page 52

53 Herman Miller, Inc., and Subsidiaries
In May 1996, the company assigned its rights as lessee of a facility in the United Kingdom to a third party under anagreement that contained a provision granting the third party the right to re-assign the lease to the company after 10years, at its election. During the first quarter of 2006, the company was notified by the third party that it is no longerusing the space and intends to exercise the re-assignment option. The original lease term expires in May 2014. Thecompany believes it will be able to assign the lease or sublet this facility for the majority of the remaining lease term toanother tenant at current market rates. However, current market rates for comparable office space are lower than therental payments owed under the lease agreement. As such, the company would remain liable to pay the difference. As aresult, the company recorded a pre-tax charge of $1.4 million to “Operating Expenses” in fiscal 2006 for the expectedloss under the arrangement based on the best information available at the time. During its second fiscal quarter of 2007,the company revised its estimate and recorded an additional pre-tax charge of $0.4 million. The estimated liability of$1.4 million is reflected under the caption “Other Liabilities” in the Consolidated Balance Sheets at June 2, 2007 andJune 3, 2006.
The company, for a number of years, has sold various products to the United States Government under General ServicesAdministration (“GSA”) multiple award schedule contracts. Under the terms of these contracts, the GSA is permitted toaudit the company’s compliance with the GSA contracts. The company has occasionally noted errors in complying withcontract provisions. From time to time the company has notified the GSA of known instances of non-compliance (whetherfavorable or unfavorable to the GSA) once such circumstances are identified and investigated. The company does notbelieve that any of the errors brought to the GSA’s attention will adversely affect its relationship with the GSA. Currentlythere are no GSA post-award audits either scheduled or in process. Management does not expect resolution of potentialfuture audits to have a material adverse effect on the company’s Consolidated Financial Statements.
On April 6, 2005, the company reported that it had reached a settlement with the General Services Administration(GSA) concerning a prior audit of the 1988 to 1991 multiple award schedule contract. In light of the settlement, whichrequired the company to pay the GSA $0.5 million, the balance sheet reserves related to all GSA contract periods were re-evaluated. As a result of this evaluation, it was determined that these reserves should be reduced. Accordingly, duringthe fourth quarter of fiscal 2005, the company reduced such reserves by $13.0 million during the fourth quarter of fiscal2005, which was reflected as a corresponding reduction in pretax “Selling, general, and administrative” expenses in the Consolidated Statement of Operations. Approximately $7.0 million of this adjustment related to the elimination of theremaining reserves, beyond the amount of the settlement, allocable to the 1988 to 1991 contract period. The remainderof the adjustment related to our re-evaluation of required reserves for open contract periods which had not yet beensubject to audit.
The company has been made aware of a potential issue related to the actuarial valuation of liabilities under its primaryinternational pension plan and the definition of eligible compensation. The company is currently in the process ofcorrecting and clarifying the definition and believes any resulting adjustments would be immaterial to its financialstatements.
The company is also involved in legal proceedings and litigation arising in the ordinary course of business. In the opinionof management, the outcome of such proceedings and litigation currently pending will not materially affect the company’sConsolidated Financial Statements.
20 Operating Segments
The company is comprised of two primary operating segments as defined in SFAS No. 131, “Disclosures about Segmentsof an Enterprise and Related Information;” North American Furniture Solutions and Non-North American Furniture Solutions.
The North American Furniture Solutions segment includes the operations associated with the design, manufacture,and sale of furniture products for work-related settings, including office and healthcare environments, throughout theUnited States, Canada, and Mexico. The business associated with the company’s owned contract furniture dealers is alsoincluded in the North American Furniture Solutions segment. The Non-North American Furniture Solutions segmentincludes the operations associated with the design, manufacture, and sale of furniture products primarily for work-relatedsettings outside of North America.
Notes to the Consolidated Financial Statements19 Guarantees, Indemnifications, and Contingencies (Continued)
44940HMFinancialStatement 8/15/07 6:13 AM Page 53

54 2007 Annual Financial Statements
The company also reports an “Other” category consisting primarily of its North American Home and start-up businesses,Variable Interest Entities (VIEs), and certain unallocated corporate expenses. North American Home includes the operationsassociated with the design, manufacture and sale of furniture products for residential settings in the United States,Canada, and Mexico. The start-up businesses are aimed at developing innovative products to serve current and newmarkets. VIEs, which are discussed further in Note 3, represent independent contract furniture dealerships whoseoperations are included in the consolidated results of the company due to financial arrangements with such entities.
The performance of the operating segments is evaluated by the company’s management using various financialmeasures. The following is a summary of certain key financial measures for the respective fiscal years indicated. (In Millions) 2007 2006 2005
Net Sales:North American Furniture Solutions $1,563.6 $1,448.0 $1,262.8Non-North American Furniture Solutions 278.5 216.9 191.5Other 76.8 72.3 61.3
Total $1,918.9 $1,737.2 $1,515.6
Depreciation and Amortization:North American Furniture Solutions $ 35.7 $ 36.5 $ 41.7Non-North American Furniture Solutions 4.4 4.0 4.5Other 1.1 1.1 0.7
Total $ 41.2 $ 41.6 $ 46.9
Operating Earnings:North American Furniture Solutions $ 161.7 $ 139.9 $ 109.5Non-North American Furniture Solutions 28.9 14.1 11.0Other 7.5 3.7 1.4
Total $ 198.1 $ 157.7 $ 121.9
Capital Expenditures:North American Furniture Solutions $ 34.1 $ 39.0 $ 27.4Non-North American Furniture Solutions 4.8 9.1 6.8Other 2.4 2.7 0.7
Total $ 41.3 $ 50.8 $ 34.9
Total Assets:North American Furniture Solutions $ 507.0 $ 512.2 $ 546.5Non-North American Furniture Solutions 133.1 130.1 135.8Other 26.1 25.7 25.5
Total $ 666.2 $ 668.0 $ 707.8
The accounting policies of the reportable operating segments are the same as those of the company, which aredisclosed in further detail within Note 1. Additionally, the company employs a methodology for allocating corporate costs and assets to the operating segments. The underlying objective of this methodology is to allocate corporate costsaccording to the relative “usage” of the underlying resources and to allocate corporate assets according to the relativeexpected benefit. The company has determined that allocation based on relative net sales is most appropriate. The majority of corporate costs are allocated to the operating segments, however, certain costs that are generallyconsidered the result of isolated business decisions are not subject to allocation and are evaluated separately from therest of the regular ongoing business operations.
Notes to the Consolidated Financial Statements20 Operating Segments (Continued)
44940HMFinancialStatement 8/15/07 6:13 AM Page 54

55 Herman Miller, Inc., and Subsidiaries
The company’s product offerings consist primarily of office furniture systems, seating, freestanding furniture, storageand casegoods. These product offerings are marketed, distributed, and managed primarily as a group of similar productson an overall portfolio basis. The following is a summary of net sales by product category for the respective fiscal yearsindicated. Given that formal product line information is not available for the company as a whole, this summaryis intended to represent a reasonable estimate of net sales by product category based on the best information available.(In Millions) 2007 2006 2005
Net sales:Systems $ 565.2 $ 530.6 $ 489.3Seating 481.7 421.1 348.7Freestanding and Storage 288.0 277.1 239.7International(1) 408.9 336.1 272.9Other(2) 175.1 172.3 165.0
Total $1,918.9 $1,737.2 $1,515.6
(1) The company has determined that the disclosure of international product line information is not practicable.(2) “Other” primarily consists of miscellaneous or otherwise uncategorized product sales and service sales.
Sales by geographic area are based on the location of the customer. Long-lived assets consist of long-term assets of thecompany, excluding financial instruments and deferred tax assets. The following is a summary of geographic informationfor the respective fiscal years indicated. Individual foreign country information is not provided as none of the individualforeign countries in which we operate are considered material for separate disclosure based on quantitative andqualitative considerations.(In Millions) 2007 2006 2005
Net sales:United States $1,510.0 $1,401.1 $1,242.7International 408.9 336.1 272.9
Total $1,918.9 $1,737.2 $1,515.6
Long-lived assets:United States $ 238.4 $ 241.4 $ 245.5International 37.9 29.6 17.9
Total $ 276.3 $ 271.0 $ 263.4
It is estimated that no single dealer accounted for more than 4 percent of the company’s net sales in the fiscal yearended June 2, 2007. It is also estimated that the largest single end user customer accounted for approximately 8 percentof the company’s net sales with the 10 largest customers accounting for approximately 18 percent of net sales.
Approximately 7 percent of the company’s employees are covered by collective bargaining agreements, most of whomare employees of its Integrated Metal Technology, Inc., and Herman Miller Limited (U.K.) subsidiaries.
Notes to the Consolidated Financial Statements20 Operating Segments (Continued)
44940HMFinancialStatement 8/15/07 6:13 AM Page 55

56 2007 Annual Financial Statements
To the Shareholders and Board of Directors of Herman Miller, Inc.
Our management is responsible for establishing and maintaining adequate internal control over financial reporting, as defined in Exchange Act Rule 13a-15(f). The internal control over financial reporting at Herman Miller, Inc., is designedto provide reasonable assurance to our stakeholders that the financial statements of the Company fairly represent itsfinancial condition and results of operations.
Under the supervision and with the participation of management, including our Chief Executive Officer and ChiefFinancial Officer, we conducted an assessment of the effectiveness of our internal control over financial reporting as of June2, 2007, based on the framework in Internal Control—Integrated Framework issued by the Committee of SponsoringOrganizations of the Treadway Commission. Based on this assessment, our management believes the Company’s internalcontrol over financial reporting was effective as of June 2, 2007.
This assessment by management has been audited by Ernst & Young LLP, an independent registered public accountingfirm, as stated in their report, which appears on page 80.
Brian C. WalkerChief Executive Officer
Elizabeth A. NickelsChief Financial Officer
Management’s Report on Internal Control Over Financial Reporting
44940HMFinancialStatement 8/15/07 6:13 AM Page 56

57 Herman Miller, Inc., and Subsidiaries
The Board of Directors and Shareholders of Herman Miller, Inc.
We have audited management’s assessment, included in the accompanying Management’s Report on Internal Controlover Financial Reporting, that Herman Miller, Inc. maintained effective internal control over financial reporting as of June2, 2007, based on criteria established in Internal Control–Integrated Framework issued by the Committee of SponsoringOrganizations of the Treadway Commission (the COSO criteria). The Company’s management is responsible formaintaining effective internal control over financial reporting and for its assessment of the effectiveness of internalcontrol over financial reporting. Our responsibility is to express an opinion on management’s assessment and an opinionon the effectiveness of the company’s internal control over financial reporting based on our audit.
We conducted our audit in accordance with the standards of the Public Company Accounting Oversight Board (UnitedStates). Those standards require that we plan and perform the audit to obtain reasonable assurance about whethereffective internal control over financial reporting was maintained in all material respects. Our audit included obtaining anunderstanding of internal control over financial reporting, evaluating management’s assessment, testing and evaluatingthe design and operating effectiveness of internal control, and performing such other procedures as we considerednecessary in the circumstances. We believe that our audit provides a reasonable basis for our opinion.
A company’s internal control over financial reporting is a process designed to provide reasonable assurance regardingthe reliability of financial reporting and the preparation of financial statements for external purposes in accordance withgenerally accepted accounting principles. A company’s internal control over financial reporting includes those policiesand procedures that (1) pertain to the maintenance of records that, in reasonable detail, accurately and fairly reflectthe transactions and dispositions of the assets of the company; (2) provide reasonable assurance that transactions arerecorded as necessary to permit preparation of financial statements in accordance with generally accepted accountingprinciples, and that receipts and expenditures of the company are being made only in accordance with authorizationsof management and directors of the company; and (3) provide reasonable assurance regarding prevention or timelydetection of unauthorized acquisition, use, or disposition of the company’s assets that could have a material effecton the financial statements.
Because of its inherent limitations, internal control over financial reporting may not prevent or detect misstatements.Also, projections of any evaluation of effectiveness to future periods are subject to the risk that controls may becomeinadequate because of changes in conditions, or that the degree of compliance with the policies or procedures maydeteriorate.
In our opinion, management’s assessment that Herman Miller, Inc. maintained effective internal control over financialreporting as of June 2, 2007, is fairly stated, in all material respects, based on the COSO criteria. Also, in our opinion, theCompany maintained, in all material respects, effective internal control over financial reporting as of June 2, 2007, basedon the COSO criteria.
We also have audited, in accordance with the standards of the Public Company Accounting Oversight Board (UnitedStates), the fiscal 2007 consolidated financial statements of Herman Miller, Inc. and our report dated July 17, 2007expressed an unqualified opinion thereon.
Grand Rapids, MichiganJuly 17, 2007
Report of Independent Registered Public Accounting Firm on Internal Control over Financial Reporting
44940HMFinancialStatement 8/15/07 6:13 AM Page 57

58 2007 Annual Financial Statements
To the Shareholders and Board of Directors of Herman Miller, Inc.
We have audited the accompanying consolidated balance sheets of Herman Miller, Inc. and subsidiaries (the Company) asof June 2, 2007 and June 3, 2006, and the related consolidated statements of operations, shareholders’ equity, and cashflows for each of the three fiscal years in the period ended June 2, 2007. These financial statements are the responsibilityof the Company’s management. Our responsibility is to express an opinion on these financial statements based on ouraudits.
We conducted our audits in accordance with the standards of the Public Company Accounting Oversight Board (UnitedStates). Those standards require that we plan and perform the audit to obtain reasonable assurance about whether thefinancial statements are free of material misstatement. An audit includes examining, on a test basis, evidence supportingthe amounts and disclosures in the financial statements. An audit also includes assessing the accounting principles usedand significant estimates made by management, as well as evaluating the overall financial statement presentation. Webelieve that our audits provide a reasonable basis for our opinion.
In our opinion, the financial statements referred to above present fairly, in all material respects, the consolidatedfinancial position of Herman Miller, Inc. and subsidiaries at June 2, 2007 and June 3, 2006, and the consolidated resultsof their operations and their cash flows for each of the three fiscal years in the period ended June 2, 2007, in conformitywith U.S. generally accepted accounting principles.
As discussed in Notes 12 and 14 to the consolidated financial statements, in 2007 the Company changed its method of accounting for pension and post-retirement benefits and stock-based payments as a result of the required adoption of Statements of Financial Accounting Standard Nos. 158 and 123(R), respectively.
We also have audited, in accordance with the standards of the Public Company Accounting Oversight Board (UnitedStates), the effectiveness of Herman Miller, Inc.’s internal control over financial reporting as of June 2, 2007, based oncriteria established in Internal Control-Integrated Framework issued by the Committee of Sponsoring Organizations of theTreadway Commission and our report dated July 17, 2007 expressed an unqualified opinion thereon.
Grand Rapids, MichiganJuly 17, 2007
Report of Independent Registered Public Accounting Firm on Financial Statements
44940HMFinancialStatement 8/15/07 6:13 AM Page 58

59 Herman Miller, Inc., and Subsidiaries
Mary Vermeer Andringa(2)
President and Chief Executive Officer, Vermeer Manufacturing CompanyAgricultural and industrial equipment manufacturer
Lord Brian Griffiths of Fforestfach(4)
International Advisor, Goldman Sachs International Limited International investment banking firm and House of Lords, United Kingdom
Douglas D. French(2)
Managing Director, Santé Health VenturesHealthcare venture capital
J. Barry Griswell(1)
Chairman, President and Chief Executive OfficerPrincipal Financial Group, Inc.Financial services organization
John R. Hoke III(1)
Vice President, Global Footwear Design, NIKE, Inc.Footwear, apparel, equipment, and accessories
James R. Kackley(2, 3)
Private investor
C. William Pollard(3, 4)
Chairman Emeritus, The ServiceMaster CompanyManagement and consumer services for healthcare, industrial, and educational facilities
Dorothy A. Terrell(4)
Venture Partner, First Light Capital
David O. Ulrich(1, 3)
Professor, University of Michigan Business School
Michael A. Volkema(3)
Chairman of the Board, Herman Miller, Inc.
Brian C. WalkerPresident and Chief Executive Officer, Herman Miller, Inc.
Daniel C. MolhoekSecretary to the Board, Partner, Varnum, Riddering, Schmidt & Howlett LLPAttorneys at law
(1) Executive Compensation Committee(2) Audit Committees(3) Executive Committee(4) Nominating and Governance Committee
Board of Directors
44940HMFinancialStatement 8/15/07 6:13 AM Page 59
60 2007 Annual Financial Statements
Brian WalkerPresident and Chief Executive Officer
Don GoemanExecutive Vice President, Research, Design, and Development
Ken GoodsonExecutive Vice President, Operations
Andy LockExecutive Vice President, Chief Administrative Officer
Kris ManosExecutive Vice President, North American Office and Learning Environments
Gary MillerExecutive Vice President, Chief Development Officer
Beth NickelsExecutive Vice President, Chief Financial Officer
John PortlockExecutive Vice President, Herman Miller International
Charley VranianExecutive Vice President, North American Emerging Markets
Leadership Team
44940HMFinancialStatement 8/15/07 6:13 AM Page 60

61 Herman Miller, Inc., and Subsidiaries
Line of Business
Herman Miller uses problem-solving design and innovation to create great places to work, heal, live, and learn. Thecompany’s award-winning products are complemented by primary furniture-management services, which are providedcorporately and through a network of owned and independent dealers. Herman Miller is widely recognized both for itsproducts and business practices, including the use of industry-leading, customer-focused technology.
Common StockHerman Miller, Inc., common stock is traded on the NASDAQ-Global Select Market System (Symbol: MLHR). As of July 30,2007, there were approximately 24,200 shareholders of record of the company’s common stock.
Affirmative ActionHerman Miller, Inc., is an equal opportunity employer and supports affirmative action programs for minorities andwomen, including the recruitment, education and training, and economic development of businesses.
Investor RelationsQuestions regarding earnings, releases, financial information, and other investor data should be addressed to:
Investor Relations, Herman Miller, Inc., 855 East Main Avenue, PO Box 302, Zeeland, MI 49464-0302, USAOr call: 616 654 3305Or e-mail: [email protected]
Transfer Agent and RegistrarComputershare Trust Company, N.A., 250 Royall Street, Canton, Massachusetts 02021Attention: Herman Miller, Inc.,Shareholder Relations800 446 2617
Independent Registered Public AccountantsErnst & Young LLP, Grand Rapids, Michigan
Contact Herman MillerHerman Miller has a physical presence through showrooms, dealers, customer centers, retailers, and manufacturingfacilities around the world. No matter how you would like to do business with us, you can begin connecting with us at:www.hermanmiller.comOr call: 616 654 3000Or write: Herman Miller, Inc., 855 East Main Avenue, PO Box 302, Zeeland, MI 49464-0302, USA
Shareholder Reference Information
44940HMFinancialStatement 8/15/07 6:13 AM Page 61

62 2007 Annual Financial Statements
44940HMFinancialStatement 8/15/07 6:13 AM Page 62

© 2007 Herman Miller, Inc., Zeeland, Michigan Printed in U.S.A. on recycled paper P.MS2843-02® L, Y, and Vivo are among the registered trademarks of Herman Miller, Inc.™ Convia, My Studio Environments, and The Be Collection are among the trademarks of Herman Miller, Inc.
44940HMFinancialStatement 8/15/07 6:13 AM Page 63

Y
44940HMFinancialStatement 8/15/07 6:13 AM Page 64