Report - AnnualReports.com
161
1 9 Report
-
Upload
khangminh22 -
Category
Documents
-
view
1 -
download
0
Transcript of Report - AnnualReports.com

19Report
Akzo
No
bel R
epo
rt 2019

2019 PROGRESS
Target (set in 2017):
2019 PROGRESS
2019 SUMMARY
1 Excluding unallocated corporate center costs; assumes no signifi cant market disruption.
2 Excluding unallocated corporate center costs and invested capital; assumes no signifi cant market disruption.
12.0% 17.2% 22%
15% >25% 20%Return on sales (ROS)1
Achieve return on sales (adjusted operating income/revenue) of 15% by 2020
Return on investment (ROI)2
Achieve return on investment (adjusted operating income/average invested capital) of more than 25% by 2020
Eco-premium solutionsMaintain at least 20% of revenue from eco-premium solutions by 2020
2019 PROGRESS

Return on sales development Adjusted operating income as % of revenue
2020201820192018
12.010.6
14.5 - 15.5
202020192018
>20.0
16.6 17.2
Return on investment development Adjusted operating income/average invested capital in %
1 Excluding unallocated corporate center costs; assumes no significant market disruption.
2 Excluding unallocated corporate center costs and invested capital; assumes no significant market disruption.
Return on sales (ROS)1
We use return on sales (ROS) as a performance indicator to reflect profitability relative to revenue. ROS as a financial guidance aims to focus management on delivery and quality of profits. ROS is defined as adjusted operating income as percentage of revenue.
• Revenue was flat, with positive price/mix of 4% and acquisitions contributing 1%, offset by 5% lower volumes due to our value over volume strategy
• Adjusted operating income up 24% at €991 million driven by pricing initiatives and cost savings
• Progress towards delivering €200 million of savings planned for 2020: €80 million delivered in 2019
• Progress towards delivering our Winning together: 15 by 20 ambition and continue creating a fit-for-purpose organization for a focused paints and coatings company
Return on investment (ROI)2
We use return on investment (ROI) as a performance indicator to reflect profit relative to invested capital. ROI as a financial guidance aims to focus management on delivering value through returns in excess of our cost of capital. ROI is defined as adjusted operating income of the last 12 months as percentage of average invested capital.
• Adjusted operating income up 24% at €991 million, driven by pricing initiatives and cost savings
• Invested capital totaled €7.0 billion, up €0.8 billion from year-end 2018, mainly due to higher operating working capital, the impact of the adoption of IFRS 16 and increased goodwill and other intangible assets due to acquisitions
Eco-premium solutions development in % of revenue
20202019201820172016201520142013
2022 2221202019
21
Eco-premium solutions
We use eco-premium solutions to track our performance in creating shared value for our business, our customers and society. We aim to maintain at least 20% of revenue from eco-premium solutions by constantly innovating, based on insights into evolving environmental concerns and societal needs. Eco-premium solutions need to exceed the reference in each market in terms of sustain-ability performance. It is therefore a moving target, as the reference is constantly improving.
• In 2019, we achieved 22% of our sales from eco-premium solutions for the second year running
• Initial assessments indicate that another estimated 20% of sales were from eco-performers, which offer clear sustainability features and are overall on a par with mainstream alternatives. Total sales of sustainable solutions was therefore around 42%

1
ReportOur Report 2019 is also available online.To read the digital version (and view all the case study videos) please visit:https://report.akzonobel.com/2019
Other regions
4%1 Mature Europe
Western, Northern and Southern Europe, including Austria. 2 Emerging Europe
Central and Eastern Europe (excluding Austria), Baltic States and Turkey.
€9.28 bln revenue€991 mln adjusted operating income€841 mln operating income€2.53 earnings per share 33,800 employees
North America
12%Mature Europe1
35%Emerging Europe2
10%Asia Pacifi c
30%
South America
9%
2019 facts and fi gures

1
ReportOur Report 2019 is also available online.To read the digital version (and view all the case study videos) please visit:https://report.akzonobel.com/2019

2
FEATURED CONTENT
AkzoNobel Report 2019
7
6
”We sent a strong message about our ability to achieve our fi nancial ambitionCEO statement
4
8
“

3
CONTENTS
2019 facts and figures Cover flap
2019 summary Cover flap
CEO statement 4
Our strategy 11
How we created value in 2019 14
Business overview 19
Our leadership 31
Governance and compliance 45
Financial information 69
Sustainability statements 129
Index 154
AkzoNobel Report 2019
22
138

4 CEO statement | AkzoNobel Report 20194
CEO STATEMENT
watch video on akzo.no/CEO2019

5AkzoNobel Report 2019 | CEO statement
From the start, 2019 was all about delivering a powerful performance to help propel the company towards its Winning together: 15 by 20 ambition. It was impressive to experience our internal momentum during the course of the year as we intensified our focus on dramatically stepping up our return on sales by 2020.
Right across the organization – from salespeople in Brazil, to operators in France and researchers in China – everyone has been fully focused on delivering for our customers, while helping the company to become the reference in paints and coatings.
We’re rightfully proud of our results, especially because we received little help from a sluggish growth environment and uncertain global economy. Our value over volume strategy helped us improve our bottom line performance, and we delivered on our promise to return the proceeds from the sale of Specialty Chemicals on time and in full within 2019. Together, we sent a strong message that our transformation is on track.
Behind the scenes, a tremendous amount of work has been going on. Integrated Business Planning is up and running and is now very much the way we run our business across the organization. The deployment of one common ERP (enterprise resource planning) system for all businesses is progressing very well and on schedule. We continue to roll out initiatives focused on standardizing global policies, increasing sales force effectiveness, and improving margin and portfolio management. At times, the company feels like a big construction site, although one where its future shape and form is becoming more visible every day.
Future growth remains very much on the agenda, be it investments or acquisitions. Hence our pride in November’s announce- ment that we had completed a deal
to acquire French aerospace coatings manufacturer Mapaero, which will further strengthen our global position in aerospace coatings and enable us to provide our customers with a much wider portfolio of innovative and sustainable products. A month later, we announced our intention to acquire 100% of the shares of Mauvilac Industries – a leading paints and coatings company in Mauritius.
Another key development was the kickstart of a €50 million investment at our North American wood coatings facility in High Point, North Carolina (see page 6). This will bring world class manufacturing capability to the site, as well as the construction of a new research lab and technical application center. It’s all about further strengthening our commitment to our customers in North America, where
we’ve been part of the wood coatings industry for 100 years. Earlier in the year, we officially opened a new €13 million research and innovation hub at our Felling site in the UK. This brings the latest research capabilities for testing our marine and protective coatings in conditions similar to those they face in the world’s most extreme environments.
I’m particularly energized by the revolutionary, forward-thinking approach to product development which is also at the heart of our Paint the Future innovation ecosystem (see page 22). Originally introduced as a startup challenge, it quickly grew to incorporate suppliers and academia. The initiative brilliantly showcases the power of partnerships, enabling us to combine ground-breaking research happening
On a visit to India towards the end of the year, CFO Maarten de Vries and I had the honor of officially opening our brand new offices in Gurgaon, near New Delhi.
It’s always inspiring and energizing to meet our colleagues around the world and I had the pleasure of speaking to some amazing people during the year, like here in Nashville in the US.

6 CEO statement | AkzoNobel Report 2019
outside the company with our own technologies and in-depth application knowledge.
We also refreshed our approach to sustainability, with a view to making it more relevant for a focused paints and coatings company. We captured this holistic, down-to-earth approach in what we call “People. Planet. Paint.” It’s all about reducing our impact and delivering benefits for our customers, society and the environment. It’s making sustainability an integral part of the way we do business and we’re excited and proud of the path we’re on.
Of course, the real driving force behind all the progress we’ve made has been our dedicated and diverse team of colleagues around the world. It remains deeply impressive to witness the can-do attitude and resilience of our teams during this
transformation. Despite all the changes, they got on with the job and stuck to our core values of safety, integrity and sustainability. They deserve all the thanks and credit for getting us into a position where delivering our Winning together: 15 by 20 ambition is now in sight.
For myself and the Executive Committee, it continues to be a humbling privilege to be on this journey together with them.
Thierry Vanlancker, CEO and Chairman of the Board of Management and Executive Committee
Our value over volume strategy helped us improve our bottom line performance and our share price reached a record high
LANDMARK INVESTMENT POINTS THE WAY
A milestone groundbreaking ceremony took place at our North American wood coatings facility in High Point, North Carolina, in November – officially kickstarting a €50 million investment which will transform the site’s manufacturing capability.
The extensive upgrade will include installing state-of-the-art production technology, as well as building a new raw materials warehouse, research lab and technical application center. The ceremony marked 100 years of our company being in the wood coatings industry in North America.
Known as the “Home Furnishings Capital of the World,” High Point has been home to AkzoNobel as a manufacturer of wood coatings since 1955. The facility currently covers 37 acres and employs more than 250 people. It produces wood coatings to serve the furniture, building products and flooring market segments, as well as our Chemcraft distributors.
Construction at the site is scheduled for completion in 2021, with rolling projects already underway.

7AkzoNobel Report 2019 | Our strategy
It’s not every day you get to rock the world of paintings conservation. Yet that’s exactly what Operation Night Watch is all about. We’ve teamed up with Amsterdam’s Rijksmuseum to help carry out one of the most innovative restorations in the history of art.
Now almost 380 years old, Rembrandt’s monumental masterpiece has temporarily been encased in a glass chamber. It means visitors can still see The Night Watch while the research and restoration work takes place. It’s being carried out by a dedicated team of scientists, curators and conservators from the museum, who are working in close collaboration with museums and universities in the Netherlands and abroad, as well as specialists from AkzoNobel.
“We’re incredibly proud to be the main partner for this amazing project,” says AkzoNobel CEO Thierry Vanlancker. “As a company, we believe in taking our innovation beyond generations. So we’re excited to be contributing our color
REVEALING REMBRANDT’S SECRETSwatch video on
akzo.no/NightWatch2019
expertise and passion for paint to help conserve a cultural icon.”
Adds Robert van Langh, the Rijksmuseum’s Head of Conservation and Science: “We’re going to be doing things that have never been attempted before. But first, we need to find out what we’re up against. With a partner like AkzoNobel on board, we’re confident we’ll take our understanding of paint to the next level – and I don’t just mean one level, I’m talking three or four levels.”
Operation Night Watch is using a glittering array of groundbreaking tools and techniques to help determine exactly what needs doing. As well as taking thousands of ultrahigh resolution photographs (courtesy of a purposebuilt imaging frame), sophisticated scanners and microscopes are also being used to investigate the artwork at microscopic levels. Once the research phase is over, several terabytes of data will be carefully analyzed to determine the best way to proceed in terms of conserving The Night Watch for generations to come.
The threeyear partnership continues a long association between AkzoNobel and the Rijksmuseum, with the company having supplied around 8,000 liters of paint during the museum’s decadelong renovation. And Operation Night Watch is also unfolding in full view of the watching world.
You can take a look yourself by visiting rijksmuseum.nl/en/nightwatch
“We’re incredibly proud to be the main partner for this amazing project”

AkzoNobel Report 2019
“We’re extremely proud to be part of this unprecedented investment in the heart of one of the world’s greatest cities”
Big things are expected of Hudson Yards. The massive construction project isn’t just changing the iconic skyline of New York City, it’s also creating a blueprint for the future of sustainable urban living.
The ongoing project is already attracting admiring glances, with the first phase having been awarded LEED Neighborhood Development Gold (LEED-ND) certification, making it the first neighborhood in Manhattan to receive the prestigious recognition.
Green building on this scale requires products and partners that can meet the demands of the largest private real estate development in US history. That’s where we come in. Not only did we supply coatings for two of the first towers to be completed (10 and 30 Hudson Yards), we’re also supplying products for several other new buildings in various stages of completion.
Taller than the Empire State Building, the impressive glass and steel structure of 30 Hudson Yards uses the company’s high-performance architectural powder coatings, while 10 Hudson Yards also features our products. A stand-out feature of 30 Hudson Yards is an outdoor
observation deck which is the highest in the western hemisphere. Expected to open to the public in 2020, it’s 335 meters (1,100 feet) in the air and extends 20 meters (65 feet) from the building.
“We’re extremely proud to be part of this unprecedented investment in the heart of one of the world’s greatest cities,” says Simon Parker, Managing Director of AkzoNobel’s Industrial Coatings business, which provided liquid coatings for both towers. “It underlines the trust that customers have in our ability to deliver coatings technology which can provide modern buildings with extreme levels of durability and sustainability.”
Adds Daniela Vlad, Managing Director of AkzoNobel’s Powder Coatings business: “We have a long track record of supplying market-leading products for iconic buildings all over the world and are very excited to be involved in the Hudson Yards development. Customers value our unique ability to supply top quality liquid and powder coatings and meet any specification, no matter how demanding.”
Expected to contribute nearly $19 billion to New York City’s annual GDP, Hudson Yards will eventually encompass more than 20 buildings, including residential and office space, retail outlets, restaurants and a luxury hotel.
Simon Parker Managing Director of AkzoNobel’s
Industrial Coatings business
Aligned with SDG 11 (see page 149)
GOING THE EXTRA YARDwatch video on
akzo.no/HudsonYards
8
9

Strategy

Supporting the purge on plastic
A new garbage-gathering system designed to extract plastic from rivers was launched by The Ocean Cleanup in late 2019 – and we’re providing the coatings technology for the fl oating devices.
Known as the Interceptor™, the system will be placed in 1,000 rivers over the next fi ve years to help prevent plastic debris from adding to the build up in our oceans.
Capable of extracting up to 50,000 kilos of trash per day, each Interceptor system has a storage capacity of 50m3. The devices feature protective coatings from our International product range, notably Intershield 300 – an industry-leading anti-corrosive universal primer with an extensive track record of 30 years. Our experts were also involved in the design of the Interceptor devices.
To learn more about our protective coatings, visit www.international-pc.com
11AkzoNobel Report 2019 | Our strategy
This section provides an overview of the progress we’re making on our strategy and gives details about our value creation during 2019.
Winning together: 15 by 20 ambition 12
How we created value in 2019 14
OUR STRATEGY
Our
str
ateg
y

Our strategy | AkzoNobel Report 201912
OUR WINNING TOGETHER: 15 BY 20 AMBITION
We’re global experts in the proud craft of making paints and coatings, setting the standard in color and protection since 1792. Our passion for paint means our world class portfolio of established brands is trusted by customers around the globe.
By investing in innovation, sustainable solutions, organic growth and bolt-on acquisitions, we intend to create long-term value for all our stakeholders and become the reference in paints and coatings.
We’re building our future on solid foundations – our long and proud heritage, our core principles and our values. Our success will be driven by our passion for paint, precise processes, powerful performance and proud people.
We have adopted a laser sharp focus towards delivering on our Winning together: 15 by 20 ambition as we continue our transformation into a focused paints and coatings company.
Our commercial teams are organized into business units, reporting to the Chief Operating Offi cer. Each business unit has a clear mandate to deliver on our 15 by 20 ambition.
The integration of all supply chain activities (including manufacturing and distribution)into a single, global Integrated Supply Chain (ISC) organization, has been a major transformation. We’re leveraging our scale and functional expertise more effectively, as well as accelerating continuous improvement through our AkzoNobel Leading Performance System (known as ALPS).
PUTTING PRECISE PROCESSES IN PLACE
To ensure people across our organization can effi ciently collaborate, we continue to invest in standardizing processes and aligned systems. Integrated Business Planning (IBP), a monthly decision-making process, results in a single operating plan and fi nancial forecast for the company.
During 2019, we also put more focus on our key end-to-end processes, using reliable, real-time information for decision-making and hardwiring cost consciousness. This will enable us to drive further effi ciencies, improve transparency and lower the cost of getting products to our customers.
Powerful performance
Proud people
Passion for paint
Precise processes

13AkzoNobel Report 2019 | Our strategy
pursue potential opportunities that offer a strong strategic fit with our portfolio.
PROUD PEOPLE PUSHING THE BOUNDARIES OF INNOVATION
Innovation is fundamental to our success. Our innovation group is led by our Chief Technology Officer and brings together the combined know-how of global experts who work on one, unified innovation road map. For us, innovation means going beyond conventional expectations, going beyond the imagination of our customers and going beyond generations.
A recent example of this is our Awlgrip HDT (high definition technology) topcoat, which combines protection, high performance and a stunning, long-lasting finish, all without sacrificing convenience during application.
Digital innovation is a key component. A great example of this was the two digital color innovations we introduced to the industrial and professional paint markets during 2019. Handy and compact, both the new Color Sensor and ColorFinder interact with a mobile phone to enable painters to find a precise color match for their clients in just seconds.
We’re also leading the paints and coatings industry through our Paint the Future innovation ecosystem. We began by launching an industry-first global startup challenge, which proved to be a big success. This was followed towards the
end of the year by an open collaboration event with a wide range of selected suppliers. Encouraged by this success, we are now taking Paint the Future to the next level by staging a regional startup challenge in Brazil in early 2020.
SUSTAINABILITY DRIVING BUSINESS SUCCESS
Sustainability is a core principle and shapes what happens at AkzoNobel every day. Our new holistic approach to sustainability is called “People. Planet. Paint.” It’s designed to demonstrate the positive benefits of our products and services and how we can reduce the environmental impact of our own operations, along with those of our suppliers, customers and society in general. We continue to focus on actions aligned with the most relevant UN Sustainable Development Goals (SDGs).
We aim to remain the sustainability leader in the paints and coatings industry, offering the most sustainable and best performing portfolio of products to our customers. For more details, see the Sustainability statements.
FOCUSED ON POWERFUL PERFORMANCE
In 2019, we again showed that we’re delivering on our promises. We demonstrated an impressive improve-ment in financial performance on the
The deployment of one common ERP (enterprise resource planning) system across all businesses is progressing well, enabling further cost savings and better management of operations and performance.
In addition, we continue to deliver significant cost savings by streamlining our support functions – for example by transferring activities to Global Business Services (GBS). Our Transformation Office is continuing to track all initiatives to ensure accountability of different teams for delivering cost savings and implementing new ways of working across the organization.
BUILDING ON OUR PASSION FOR PAINT
Our strategy is to build on our existing foundation by focusing on our strong brands, leading market positions, customer intimacy and innovation capabilities. We’re targeting acquisitions to boost our presence in key markets, generate synergies and give us access to new technologies.
In 2019, we strengthened our global position in aerospace coatings – notably in the structural and cabin coatings sub-segments – with the acquisition of Mapaero. We also announced the intended acquisition of Mauvilac Industries, a leading paints and coatings company in Mauritius. We continue to actively manage a pipeline of acquisition targets to proactively
previous year, despite a soft macro-economic environment.
We completed the promised €2.5 billion share buyback plan and announced a new share buyback of €500 million, to be completed in the first half of 2020. Our cost discipline has delivered significant savings, while pricing initiatives also compensated for higher raw material costs.
In September, we unveiled Tranquil Dawn as our 2020 Color of the Year. A delicate, fluid shade somewhere between green, blue and grey, it’s designed to capture the essence of what makes us human as a new decade arrives.

Our strategy | AkzoNobel Report 201914
HOW WE CREATED VALUE IN 2019
Revenue development in % versus 2018
Increase Decrease
Total Exchange rates
Acquisitions/divestments
Price/mix
Volume
4% 1% 0% 0%-5%
A
B
C
D
EF
201920182017
5,563
3,703
5,775
3,898
5,587
3,699
Revenue in € millions
Decorative Paints Performance Coatings
By delivering more value to our customers, shareholders, employees and society in general, we can better accelerate profitability while positioning ourselves for growth.
Summary of financial outcomes
In € millions 2018 2019* ∆%
Revenue 9,256 9,276 –
Adjusted operating income1 798 991 24
Operating income 605 841 39
ROS%1 2 8.6 10.7
ROS%, excluding unallocated costs1 10.6 12.0
OPI margin %1 6.5 9.1
Average invested capital1 6,340 7,026
ROI%1 3 12.6 14.1
ROI%, excluding unallocated costs1 3 16.6 17.2
Net cash from operating activities - continuing operations 162 33
Capital expenditures 184 214 16
Net debt (5,861) 802
Number of employees 34,500 33,800
Net income from continuing operations 410 517 26
Net income from discontinued operations 6,264 22
Net income attributable to shareholders 6,674 539
Earnings per share from total operations (in €) 26.19 2.53
Adjusted earnings per share from continuing operations (in €) 1.91 3.10 62
ECONOMIC VALUE
Financial overviewRevenue was flat, with price/mix up 4% overall, mainly driven by pricing initiatives. Acquisitions contributed 1%. Volumes were 5% lower due to our value over volume strategy. Adjusted operating income was up 24% at €991 million (2018: €798 million), driven by pricing initiatives and cost-saving programs. Operating income was up 39% at €841 million and includes €150 million negative impact from identified
A Mature Europe 35
B Asia Pacific 30
C North America 12
D South America 9
E Emerging Europe 10
F Other regions 4
Revenue by destination in %
* The Statement of income, Statement of cash flows and the Balance sheet for 2019 include the impact from the adoption of IFRS 16 “Leases” (as per January 1, 2019). The 2018 comparative figures have not been restated. Further details and a quantification of the impact are provided in Note 1 of the Consolidated financial statements.
1 Alternative performance measures: please refer to reconciliation to the most directly comparable IFRS measures in Note 3 of the Consolidated financial statements.
2 ROS% = Adjusted operating income/revenue. 3 ROI% = 12 months adjusted operating income/12 months average invested capital.
items (2018: €605 million, including €193 million negative impact from identified items).
RevenueRevenue was flat. Continued focus on pricing initiatives contributed to positive price/mix of 4%, while volumes were 5% lower, mainly due to our value over volume strategy. Acquisitions contributed 1% to revenues.
• In Decorative Paints, revenue was flat, and up 1% in constant currencies.
15AkzoNobel Report 2019 | Our strategy
201920182017
688
418
629
346
669
351
Adjusted operating income in € millions
Decorative Paints Performance Coatings
• Performance Coatings improved as pricing initiatives and cost savings more than offset higher raw material costs and lower volumes. ROS was up at 12.4% (2018: 11.3%)
• Other activities/eliminations improved €62 million to €115 million (2018: €177 million), mainly due to lower costs and one-off gains on disposals
Operating incomeOperating income was up 39% at €841 million, and includes €150 million negative impact from identified items, mainly related to transformation costs and non-cash impairments, partly offset by a gain on disposal of €54 million following asset network optimization (2018: €605 million, including €193 million negative impact from identified items). OPI margin improved to 9.1% (2018: 6.5%).
Net financing income and expensesNet financing expenses increased by €24 million to €76 million, mainly due to an interest benefit on a tax settlement in
Positive price/mix (4%) was more than offset by lower volumes (5%). Acquisitions contributed 2% to revenues
• In Performance Coatings, revenue was flat, and 1% lower in constant currencies. Price/mix (4%) was more than offset by lower volumes (5%), due to our value over volume strategy
Acquisitions• The acquisition of Mapaero to further
strengthen our global position in the steadily growing aerospace coatings industry was completed in Q4
• The intended acquisition of Mauvilac Industries to support our position in the African decorative paints market was also announced in Q4
Raw material price development Raw materials continued to be a headwind in the first half of 2019 and turned moderately favorable towards the end of the year. In total, raw material costs were €64 million higher than in 2018.
Adjusted operating incomeAdjusted operating income was up at €991 million (2018: €798 million), driven by pricing initiatives and cost-saving programs. ROS, excluding unallocated costs, increased to 12.0% (2018: 10.6%). ROS was up 2.1% at 10.7% (2018: 8.6%) and ROI was at 14.1% (2018: 12.6%).
• Decorative Paints continued to improve. Price/mix effects and cost savings more than offset raw material inflation and lower volumes. ROS was up at 11.3% (2018: 9.4%)
A
B
C
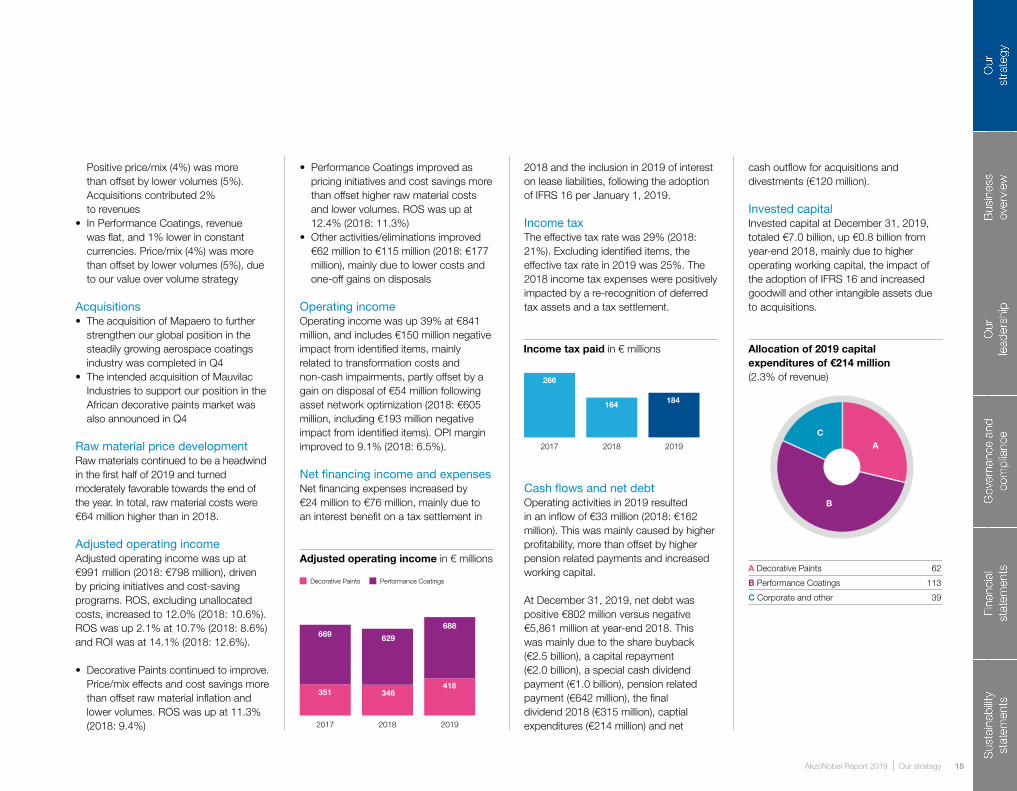
Allocation of 2019 capital expenditures of €214 million (2.3% of revenue)
cash outflow for acquisitions and divestments (€120 million).
Invested capitalInvested capital at December 31, 2019, totaled €7.0 billion, up €0.8 billion from year-end 2018, mainly due to higher operating working capital, the impact of the adoption of IFRS 16 and increased goodwill and other intangible assets due to acquisitions.
A Decorative Paints 62
B Performance Coatings 113
C Corporate and other 39
2018 and the inclusion in 2019 of interest on lease liabilities, following the adoption of IFRS 16 per January 1, 2019.
Income taxThe effective tax rate was 29% (2018: 21%). Excluding identified items, the effective tax rate in 2019 was 25%. The 2018 income tax expenses were positively impacted by a re-recognition of deferred tax assets and a tax settlement.
Cash flows and net debtOperating activities in 2019 resulted in an inflow of €33 million (2018: €162 million). This was mainly caused by higher profitability, more than offset by higher pension related payments and increased working capital.
At December 31, 2019, net debt was positive €802 million versus negative €5,861 million at year-end 2018. This was mainly due to the share buyback (€2.5 billion), a capital repayment (€2.0 billion), a special cash dividend payment (€1.0 billion), pension related payment (€642 million), the final dividend 2018 (€315 million), captial expenditures (€214 million) and net
Income tax paid in € millions
201920182017
164
266
184
Our strategy | AkzoNobel Report 201916
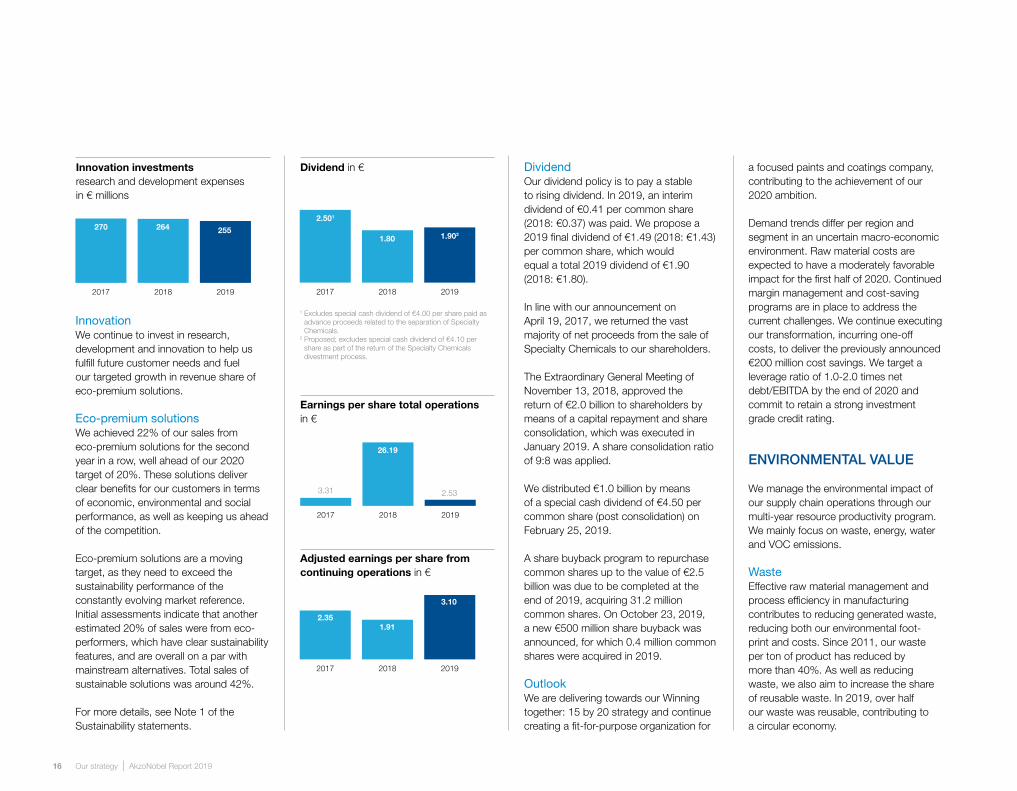
Innovation investments research and development expenses in € millions
201920182017
264270 255
Dividend in €
201920182017
1.80
2.501
1.902
201920182017
26.19
3.31 2.53
201920182017
1.912.35
3.10
Earnings per share total operations in €
Adjusted earnings per share from continuing operations in €
InnovationWe continue to invest in research, development and innovation to help us fulfill future customer needs and fuel our targeted growth in revenue share of eco-premium solutions.
Eco-premium solutionsWe achieved 22% of our sales from eco-premium solutions for the second year in a row, well ahead of our 2020 target of 20%. These solutions deliver clear benefits for our customers in terms of economic, environmental and social performance, as well as keeping us ahead of the competition.
Eco-premium solutions are a moving target, as they need to exceed the sustainability performance of the constantly evolving market reference. Initial assessments indicate that another estimated 20% of sales were from eco- performers, which have clear sustainability features, and are overall on a par with mainstream alternatives. Total sales of sustainable solutions was around 42%.
For more details, see Note 1 of the Sustainability statements.
OutlookWe are delivering towards our Winning together: 15 by 20 strategy and continue creating a fit-for-purpose organization for
1 Excludes special cash dividend of €4.00 per share paid as advance proceeds related to the separation of Specialty Chemicals.
2 Proposed; excludes special cash dividend of €4.10 per share as part of the return of the Specialty Chemicals divestment process.
DividendOur dividend policy is to pay a stable to rising dividend. In 2019, an interim dividend of €0.41 per common share (2018: €0.37) was paid. We propose a 2019 final dividend of €1.49 (2018: €1.43) per common share, which would equal a total 2019 dividend of €1.90 (2018: €1.80).
In line with our announcement on April 19, 2017, we returned the vast majority of net proceeds from the sale of Specialty Chemicals to our shareholders.
The Extraordinary General Meeting of November 13, 2018, approved the return of €2.0 billion to shareholders by means of a capital repayment and share consolidation, which was executed in January 2019. A share consolidation ratio of 9:8 was applied.
We distributed €1.0 billion by means of a special cash dividend of €4.50 per common share (post consolidation) on February 25, 2019.
A share buyback program to repurchase common shares up to the value of €2.5 billion was due to be completed at the end of 2019, acquiring 31.2 million common shares. On October 23, 2019, a new €500 million share buyback was announced, for which 0.4 million common shares were acquired in 2019.
a focused paints and coatings company, contributing to the achievement of our 2020 ambition.
Demand trends differ per region and segment in an uncertain macro-economic environment. Raw material costs are expected to have a moderately favorable impact for the first half of 2020. Continued margin management and cost-saving programs are in place to address the current challenges. We continue executing our transformation, incurring one-off costs, to deliver the previously announced €200 million cost savings. We target a leverage ratio of 1.0-2.0 times net debt/EBITDA by the end of 2020 and commit to retain a strong investment grade credit rating.
ENVIRONMENTAL VALUE
We manage the environmental impact of our supply chain operations through our multi-year resource productivity program. We mainly focus on waste, energy, water and VOC emissions.
WasteEffective raw material management and process efficiency in manufacturing contributes to reducing generated waste, reducing both our environmental foot- print and costs. Since 2011, our waste per ton of product has reduced by more than 40%. As well as reducing waste, we also aim to increase the share of reusable waste. In 2019, over half our waste was reusable, contributing to a circular economy.
17AkzoNobel Report 2019 | Our strategy
A
B
C
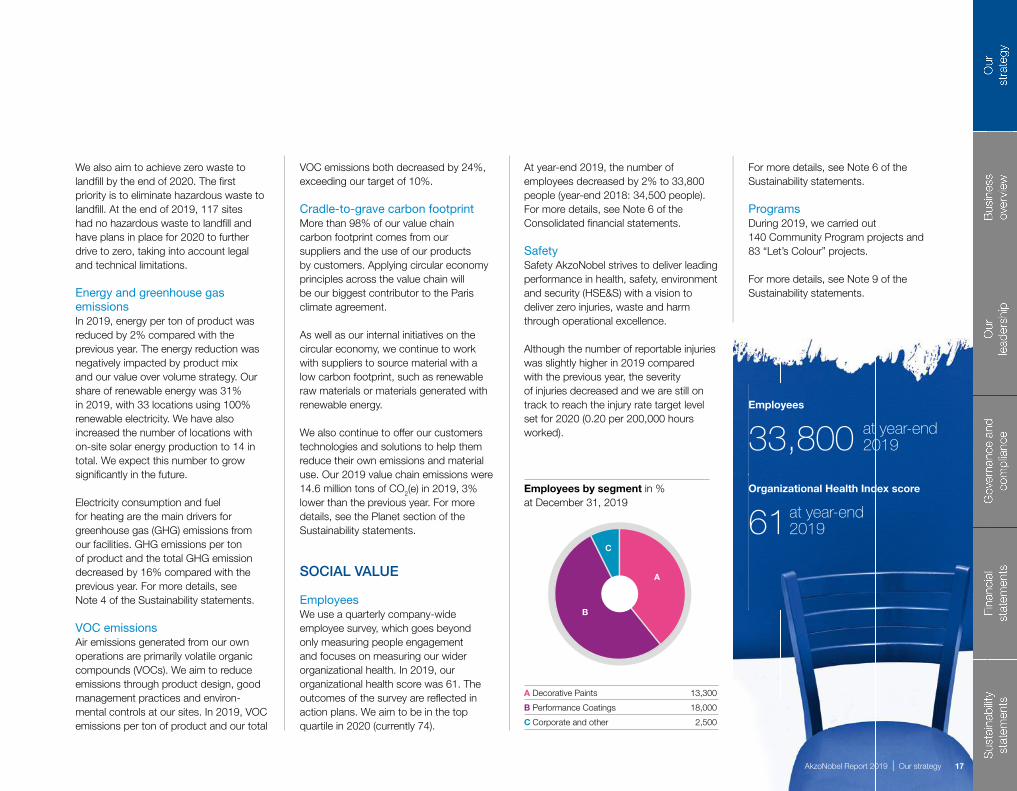
Employees
33,800 at year-end 2019
Organizational Health Index score
61 at year-end 2019
Employees by segment in %at December 31, 2019
A Decorative Paints 13,300
B Performance Coatings 18,000
C Corporate and other 2,500
We also aim to achieve zero waste to landfi ll by the end of 2020. The fi rst priority is to eliminate hazardous waste to landfi ll. At the end of 2019, 117 sites had no hazardous waste to landfi ll and have plans in place for 2020 to further drive to zero, taking into account legal and technical limitations.
Energy and greenhouse gas emissionsIn 2019, energy per ton of product was reduced by 2% compared with the previous year. The energy reduction was negatively impacted by product mix and our value over volume strategy. Our share of renewable energy was 31% in 2019, with 33 locations using 100% renewable electricity. We have also increased the number of locations with on-site solar energy production to 14 in total. We expect this number to grow signifi cantly in the future.
Electricity consumption and fuel for heating are the main drivers for greenhouse gas (GHG) emissions from our facilities. GHG emissions per ton of product and the total GHG emission decreased by 16% compared with the previous year. For more details, see Note 4 of the Sustainability statements.
VOC emissions Air emissions generated from our own operations are primarily volatile organic compounds (VOCs). We aim to reduce emissions through product design, good management practices and environ- mental controls at our sites. In 2019, VOC emissions per ton of product and our total
VOC emissions both decreased by 24%, exceeding our target of 10%.
Cradle-to-grave carbon footprintMore than 98% of our value chain carbon footprint comes from our suppliers and the use of our products by customers. Applying circular economy principles across the value chain will be our biggest contributor to the Paris climate agreement.
As well as our internal initiatives on the circular economy, we continue to work with suppliers to source material with a low carbon footprint, such as renewable raw materials or materials generated with renewable energy.
We also continue to offer our customers technologies and solutions to help them reduce their own emissions and material use. Our 2019 value chain emissions were 14.6 million tons of CO2(e) in 2019, 3% lower than the previous year. For more details, see the Planet section of the Sustainability statements.
SOCIAL VALUE
EmployeesWe use a quarterly company-wide employee survey, which goes beyond only measuring people engagement and focuses on measuring our wider organizational health. In 2019, our organizational health score was 61. The outcomes of the survey are refl ected in action plans. We aim to be in the top quartile in 2020 (currently 74).
At year-end 2019, the number of employees decreased by 2% to 33,800 people (year-end 2018: 34,500 people). For more details, see Note 6 of the Consolidated fi nancial statements.
SafetySafety AkzoNobel strives to deliver leading performance in health, safety, environment and security (HSE&S) with a vision to deliver zero injuries, waste and harm through operational excellence.
Although the number of reportable injuries was slightly higher in 2019 compared with the previous year, the severity of injuries decreased and we are still on track to reach the injury rate target level set for 2020 (0.20 per 200,000 hours worked).
For more details, see Note 6 of the Sustainability statements.
ProgramsDuring 2019, we carried out 140 Community Program projects and 83 “Let’s Colour” projects.
For more details, see Note 9 of the Sustainability statements.

Business performance
19
This section provides information about our business segments and how they performed during 2019.
Review of the year 20
Launching new innovations together 22
Key business developments 23
BUSINESS OVERVIEW
Winning designs take fl ight
United Airlines used our aerospace coatings to bring to life two stunning designs created by the winners of their fi rst-of-its-kind Her Art Here contest. The competition was launched to fi nd and uplift underrepresented women artists by providing them with a chance to have their work painted on a Boeing 757 plane.
San Francisco resident and artist Tsungwei Moo saw her design applied to a plane from United’s California fl eet. A tribute to the Golden State, the eye- catching livery uses ten colors, needed more than 250 gallons of paint and took 17 days to complete.
Meanwhile, New Jersey native Corinne Antonelli’s tribute to the New York/New Jersey region graces a second United aircraft. Her design also features ten different colors, with the 250-plus gallons of paint being applied over the course of 17 days.
To learn more about our aerospace coatings, visit aerospace.akzonobel.com
Bus
ines
s ov
ervi
ew
AkzoNobel Report 2019 | Business overview 19

Business overview | AkzoNobel Report 201920
Most of our business units realized a significant increase in return on sales during 2019. Results of our pricing discipline have been very strong, while our efficiency programs also made a major contribution.
Despite the various macro-economic headwinds we faced, some business units performed extremely well. For example, our Powder Coatings business continued to strengthen its position as market leader, driven by a number of innovative new products, including Interpon Redox – a one-stop-shop offering the simplest route to maximum corrosion protection – and Interpon D X-Pro, a scratch-resistant powder coating for the architectural market which is available in both matt and satin finishes.
It was also a strong year for the beverage can coatings activities of our Industrial Coatings business. Customers love our innovative products and they’re seeing increasing demand because consumers are turning away from single use plastic. So the drinks can manufacturers are working flat out to try and meet that demand, which in turn means there’s a huge demand for our coatings.
Our Decorative Paints Europe, Middle East and Africa (EMEA) business also delivered a very good 2019. After many years of investment and finding the right balance of central management and local freedom – as well as setting up a single supply chain – the business is now performing really well.
We also faced a few challenges as the year unfolded. Negative developments in the automotive sector impacted our Automotive and Specialty Coatings business, mainly due to the fact that around five million fewer cars were produced globally. It meant there was less demand for the products we supply for vehicle interiors, for example, despite us being less exposed to the automotive OEM (original equipment manufacturer) sector.
The number of new ships being built also continued to hover around all-time low levels, which inevitably had an effect on our Marine and Protective Coatings business. In the marine sector, we’re continuing to develop our dry docking business, which is helping us to com-
REVIEW OF THE YEAR by COO Ruud Joosten
Our ongoing transformation into a focused paints and coatings company gathered considerable momentum during 2019. We achieved significant profit improvement, based on our clear value over volume strategy, and are making progress towards delivering on our Winning together: 15 by 20 ambition.
We launched several new digital tools during the year to make color-matching easier for our customers. This included three new tools for users of our Salcomix system, one of which was the portable ColorFinder.

21AkzoNobel Report 2019 | Business overview
pensate somewhat for the lack of new- build demand. We did see more positive opportunities for our protective coatings activities during the year – in oil and gas projects, for example – where we are continuing to grow. We also remain very strong in the yacht coatings market.
extreme environments. These invest-ments show just how committed we are to innovation and making our products even more sustainable. They will help us to continue making life better for our customers, just as we did during 2019 with new introductions such as Awlfair SF,
And it was a special year for our Paint the Future innovation ecosystem, which launched with a collaborative startup challenge in May and has since expanded to include suppliers and academia.
We’re making progress towards delivering our 15 by 20 ambition and we’re already
We achieved significant profit improvement, based on our clear value over volume strategy
Early in the year, we officially opened a new €13 million R&D innovation campus at our Felling site in the UK. The lab complex enables our technical experts to test products for the marine, oil and gas industries in conditions that mimic the world’s most extreme environments.
working on longer term projects. It means we asked a lot from our people in 2019 – and they all rose to the challenge. They displayed an infectious passion for paint to help us remain on track and realize our goals.
Other major developments included the acquisition of French aerospace coatings manufacturer Mapaero in November. The deal will strengthen our global position in aerospace coatings – notably in the structural and cabin coating sub-segments – and demonstrates our commitment to continue investing in strategic growth opportunities.
Another highlight was the official opening of a €13 million R&D innovation campus at our Felling site in the UK. The trailblazing lab complex can test new products in conditions that mimic the world’s most
a high-performance filler for super- yachts, which can be applied by pressurized airless spray, rather than by hand.
We were also very proud to become the first major manufacturer to launch recycled paint, thanks to a ground-breaking partnership in the UK with resource management experts Veolia. Developed by our Dulux Trade brand, the revolutionary Evolve matt emulsion is made from other people’s paint waste, with the final product containing 35% recycled paint (see page 138).

Business overview | AkzoNobel Report 201922
Following the knockout success of our global startup challenge in the first half of 2019, our Paint the Future ecosystem is expanding to engage suppliers, academia and customers. Working together will help us enhance our products, develop groundbreaking solutions and even safeguard our planet for future generations.
The 2019 global startup challenge exceeded expectations, attracting 160 quality submissions, from which 21 startups were selected to attend the accelerator event in May. At the finale, AkzoNobel awarded joint agreements to five startups, while partner KPMG presented one award. Since then, cross-functional venture teams have been
Paints and coatings are primed for the next revolution. Covering almost everything you see around you, they represent an unparalleled opportunity for growth within a multitude of industries. Our Paint the Future ecosystem is where we can all come together in collaborative innovation.
working closely with the winners on these ongoing collaborations.
As Paint the Future grows, all programs are being designed to offer new pathways to connect with experts, accelerate ideas, bring solutions to market and deliver impact at scale.
“We want to be the launch pad for great ideas and innovations in our industry, and we see our Paint the Future ecosystem as the way to do it,” says Klaas Kruithof, AkzoNobel’s Chief Technology Officer. “As our success will depend on working with diverse partners from inside and outside the industry, we really need to look along the entire value chain. That’s why we’re extending the invitation: let’s do amazing things together.”
In November 2019, some key suppliers were invited to explore and discuss industry challenges. An online platform will eventually open for all suppliers to submit their ideas. Current and new partnerships with academia and other institutions are also joining the ecosystem.
And there’s more to come in 2020, including our first regional startup challenge in Brazil – at the very heart of South America’s entrepreneurial ecosystem.
For the latest updates and to learn about innovation at AkzoNobel, visit www.letspaintthefuture.com
The winning startups celebrate their success at the Paint the Future accelerator event held in Amsterdam in May 2019.
LAUNCHING NEW INNOVATIONS TOGETHER
Collaborative innovation by
Aligned with SDG 17 (see page 149)
watch video on akzo.no/PTF2019

23AkzoNobel Report 2019 | Business overview
Key brands
Revenue in € millions
201920182017
1,1441,289
1,084
DECORATIVE PAINTS ASIA
• Sadolin wood protector and Dulux Ambiance Velvet Touch were launched in India, along with Dulux AquaTech, a range of superior waterproofi ng products
• In Vietnam, we strengthened our leading position in the premium paint segment with the launch of Dulux Ambiance Superfl exx and Dulux EasyClean
• Dulux Aura High Gloss was introduced in Malaysia and Dulux Catylac High Gloss was launched in Indonesia
• More than 4,500 liters of Dulux Weathershield paint was donated to recoat and protect Vietnam’s Vung Tau lighthouse, which is one of the oldest lighthouses in South East Asia
• Dulux became the fi rst paint brand in Pakistan to venture into e-commerce with the launch of Far Away Places on Daraz.pk
• Colorful new homes were created for children in Tianjin, China, as part of the company’s partnership with SOS Children’s Villages. The collaboration
We’ve helped bring new life to a 400-year-old coastal village in Vietnam. As part of our global “Let’s Colour” initiative, 30 3D murals were painted onto various homes and buildings in Canh Duong. Artists used our Dulux Weathershield products, which will help to protect the structures from the elements.
KEY BUSINESS DEVELOPMENTS
• Following 2018’s deal to acquire full ownership of the AkzoNobel Swire Paints joint venture in China, we secured a number of strategic partnership agreements to provide consumers with improved painting solutions and stimulate the innovative development of China’s decorative paints market
• The Dulux Concept Store in Shanghai – the fi rst of its kind in China – offi cially opened. It uses art, technology and personalized services to create an interactive space where consumers can better experience the brand’s color expertise and sustainable products
• Dulux Forest Breath (an indoor wall paint which can purify harmful air pollutants) was upgraded with breakthrough, solvent-free technology and received several environmental certifi cations
was also extended to include Indonesia and India, focused on employability, skills training and mentoring
• Through partnerships with various NGOs and government schools, we helped provide education for more than 10,000 underprivileged children in fi ve states across India, we raised road safety awareness among 20,000 youngsters, and provided skills development training to 3,000 painters and underprivileged young people

Business overview | AkzoNobel Report 201924
DECORATIVE PAINTS EUROPE, MIDDLE EAST AND AFRICA (EMEA)
• 2019 performance was driven by positive price/mix effects, complexity reduction and cost-saving programs
• Strong profi t growth was achieved, with signifi cant improvement in return on sales
• Profi table growth was supported by recent acquisitions, such as Fabryo in Romania and Xylazel in Spain
• In the UK, we strengthened our stores footprint to improve our services for professional painters
• AkzoNobel became the fi rst major
Key brands
Revenue in € millions
201920182017
2,0932,095 2,161
Colleagues at our Ashington site in the UK hit a major milestone by producing one million liters of paint in a single week. The plant, which was offi cially launched in September 2017, manufactures paint for a variety of brands, including Dulux, Cuprinol and Hammerite.
manufacturer to launch recycled paint with the introduction of Dulux Trade Evolve in the UK. The matt white emulsion contains 35% recycled paint (see page 138)
• A digital Color Sensor was launched across ten markets. It can match customers’ color choices in seconds
• The popular Easycare washable wall paints concept was further rolled out to more markets (see page 68)
• Innovative roller testers were introduced to more countries across the region
• In collaboration with our Nordsjö brand, a major Artscape event was staged in Sweden. It involved artists creating more than 30 large-scale outdoor paintings in 12 municipalities in the Gothenburg region
• Our partnership with SOS Children’s Villages was activated in Poland and Tunisia, using education and renovation to have a positive impact on the issue of youth unemployment

25AkzoNobel Report 2019 | Business overview
Key brands
201920182017
468520
463
Revenue in € millions
DECORATIVE PAINTS SOUTH AMERICA
A
B
C
Decorative Paints revenue by destination in %
• Another year of strong pricing performance helped offset raw material infl ation and currency devaluation, leading to improved return on sales
• The Alabastine brand was introduced in the fourth quarter to help lead the development of the pre-deco category in South America
• In Brazil, we launched the premium Ambiance wall paint product line, which is being positioned as the premium range of solutions for interior design
• Digital is transforming the way we engage our key stakeholders in Brazil, so an ecosystem of digital solutions
A EMEA 58
B Americas 12
C Asia Pacifi c 30
Colleagues from our Coral brand in Brazil teamed up with young people who were taking part in our painter training program in Natal. The initiative is part of our long-standing partnership with Plan International Netherlands.
was rolled out to support consumers, customers and painters on each step of their journey
• Our “Let’s Colour” initiative in Brazil celebrated its tenth anniversary. So far, we’ve donated more than one million liters of paint to help revitalize public spaces, preserve heritage and positively impact people’s lives and communities. This represents more than 2,200 projects, the engagement
of over 45,000 volunteers and training for more than 45,000 members of local communities
• Our waste water treatment plant in Mauá (Brazil) is now reusing 95% of its waste water for production. We expect to reach 100% in early 2020. We also reduced CO2 emissions at the site by more than 15,400 tons, thanks to improvements in our water-based trim and woodcare product lines
Colleagues from our Coral brand in Brazil teamed up with young people who were taking part in our painter training program in Natal.

Business overview | AkzoNobel Report 201926
A
B
C
Revenue by destination in %
Revenue in € millions
201920182017
1,3921,426 1,388
Key brands
A EMEA 42
B Americas 30
C Asia Pacifi c 28
AUTOMOTIVE AND SPECIALTY COATINGS
• Maintained strong positions in aerospace and vehicle refi nishes (EMEA) thanks to new product and service introductions
• Challenging year in automotive OEM segments due to headwinds, in line with overall market dynamics
• Acquired French coatings manufacturer Mapaero, strengthening our position in the aerospace coatings market, particularly the cabin and structural sub-segments
• Coatings were supplied for several unique liveries and whole fl eet rebrands, including United Airlines, American Airlines, SAS, Alaska Airlines and JAL
• Airbus recognized our commitment to sustainability with a prestigious supplier award. We also launched a new chromate-free exterior primer – Aerodur HS 2121 – which was qualifi ed by Airbus, and received Boeing qualifi cation for our Aerodur 2111 chromate-free exterior primer
• Our color trends insight and expertise was shared with automotive interior and consumer electronics customers in our new Color Surfaces Edition 15 report
• The 11th anniversary of our partnership with McLaren was marked with the livery on their latest F1 car being
voted best-looking for the second year running
• Our vehicle refi nishes brand and product assortment in China was aligned with new VOC regulations
• We announced partnerships with Advance Auto Parts and Carquest – one of the largest aftermarket parts providers in the world
• Our partnership with automotive artist and TV star Dave Kindig continued through our Modern Classikk vehicle refi nishes range
• We celebrated the 85th birthday of our global Wanda vehicle refi nishes brand
We helped Alaska Airlines to create a real buzz with special livery to celebrate the release of the movie Toy Story 4. We supplied our high-performance aerospace coatings for the specially themed plane, which took 24 days to coat and features 44 primary colors.
27AkzoNobel Report 2019 | Business overview
A
B
C
Revenue by destination in %
Revenue in € millions
201920182017
1,2911,424
1,306
Key brands
A EMEA 36
B Americas 23
C Asia Pacifi c 41
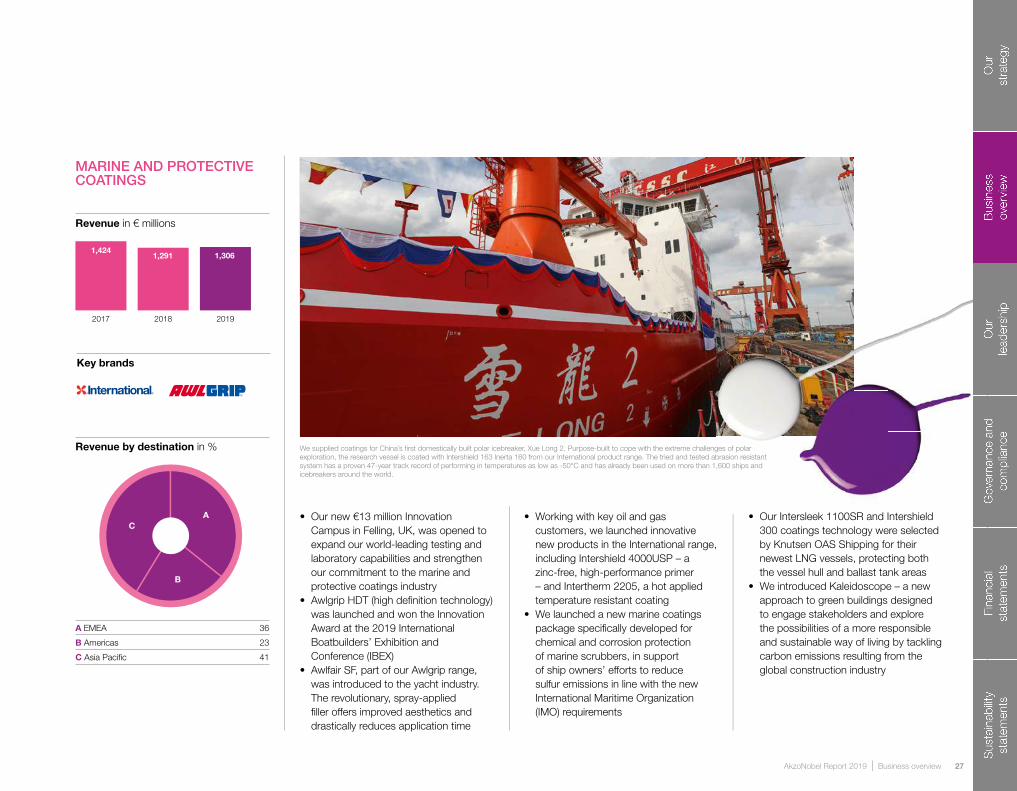
MARINE AND PROTECTIVE COATINGS
• Our new €13 million Innovation Campus in Felling, UK, was opened to expand our world-leading testing and laboratory capabilities and strengthen our commitment to the marine and protective coatings industry
• Awlgrip HDT (high defi nition technology) was launched and won the Innovation Award at the 2019 International Boatbuilders’ Exhibition and Conference (IBEX)
• Awlfair SF, part of our Awlgrip range, was introduced to the yacht industry. The revolutionary, spray-applied fi ller offers improved aesthetics and drastically reduces application time
• Working with key oil and gas customers, we launched innovative new products in the International range, including Intershield 4000USP – a zinc-free, high-performance primer – and Intertherm 2205, a hot applied temperature resistant coating
• We launched a new marine coatings package specifi cally developed for chemical and corrosion protection of marine scrubbers, in support of ship owners’ efforts to reduce sulfur emissions in line with the new International Maritime Organization (IMO) requirements
• Our Intersleek 1100SR and Intershield 300 coatings technology were selected by Knutsen OAS Shipping for their newest LNG vessels, protecting both the vessel hull and ballast tank areas
• We introduced Kaleidoscope – a new approach to green buildings designed to engage stakeholders and explore the possibilities of a more responsible and sustainable way of living by tackling carbon emissions resulting from the global construction industry
We supplied coatings for China’s fi rst domestically built polar icebreaker, Xue Long 2. Purpose-built to cope with the extreme challenges of polar exploration, the research vessel is coated with Intershield 163 Inerta 160 from our International product range. The tried and tested abrasion resistant system has a proven 47-year track record of performing in temperatures as low as -50°C and has already been used on more than 1,600 ships and icebreakers around the world.
Business overview | AkzoNobel Report 201928
Key brands
Trade names
Revenue by destination in %
Revenue in € millions
A
B
C
201920182017
1,7381,805 1,731
A EMEA 43
B Americas 32
C Asia Pacifi c 25
INDUSTRIAL COATINGS
• Aqualure• Aquaprime• Ceram-a-Star• GripPro• LignuPro
• Polydure• Trinar• Vitalac• Vitalure
• Strongly increased profi tability, driven by successfully focusing on increasing prices globally across all segments, selectively winning new business and sharpening our business focus
• Further growth of our BPANI (BPA non-intent) coatings for metal packaging was driven by high demand from beer and beverage brands for our sustainable and reliable coatings
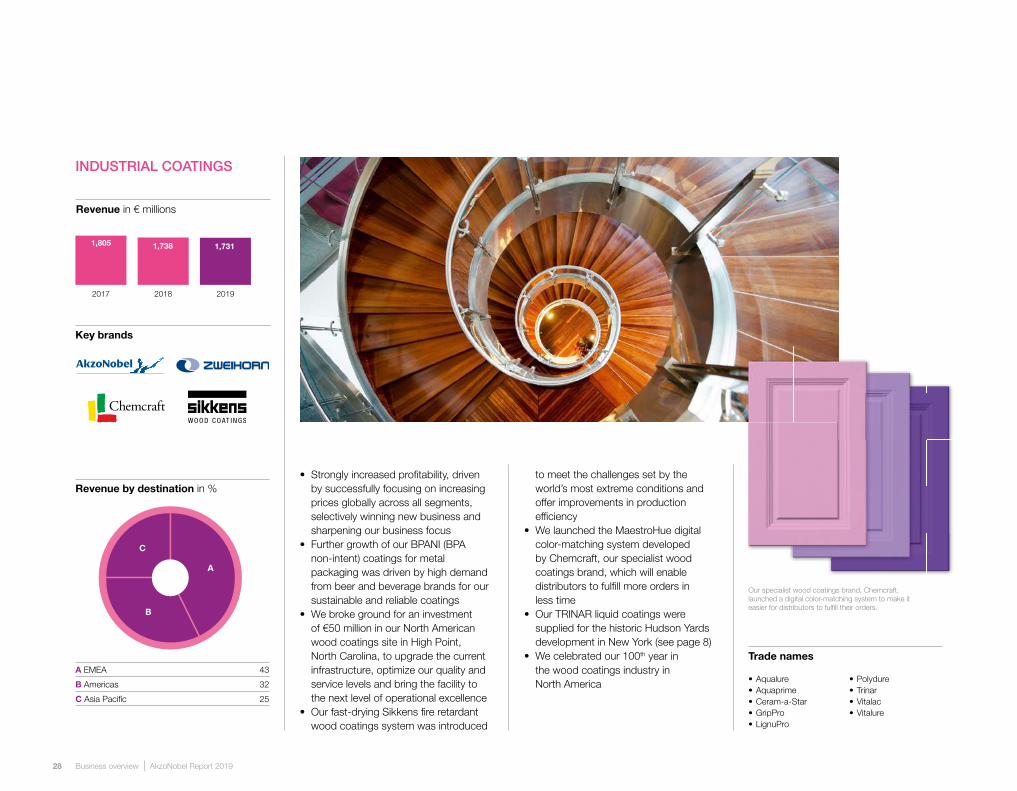
• We broke ground for an investment of €50 million in our North American wood coatings site in High Point, North Carolina, to upgrade the current infrastructure, optimize our quality and service levels and bring the facility to the next level of operational excellence
• Our fast-drying Sikkens fi re retardant wood coatings system was introduced
to meet the challenges set by the world’s most extreme conditions and offer improvements in production effi ciency
• We launched the MaestroHue digital color-matching system developed by Chemcraft, our specialist wood coatings brand, which will enable distributors to fulfi ll more orders in less time
• Our TRINAR liquid coatings were supplied for the historic Hudson Yards development in New York (see page 8)
• We celebrated our 100th year in the wood coatings industry in North America
Our specialist wood coatings brand, Chemcraft, launched a digital color-matching system to make it easier for distributors to fulfi ll their orders.

29AkzoNobel Report 2019 | Business overview
Key brands
Revenue by destination in %
Revenue in € millions
A
B
C
201920182017
1,2181,173 1,234
A EMEA 45
B Americas 21
C Asia Pacifi c 34
POWDER COATINGS
• Continued to increase our share in key market segments and developed new market opportunities by focusing on innovation and premium products
• Plans were announced to further invest in our Changzhou site in China by adding three new production lines
• Launched Interpon Structura Flex, a market fi rst range of products which combines the weatherability of superdurable powder coatings with the mechanical performance advantages of standard durable systems
• We made our products even more sustainable by launching a full range of Interpon Low-E products, which have
been specially engineered for curing at lower temperatures
• Our antimicrobial Interpon AM range, containing BioCote® antimicrobial protection, was launched. It delivers outstanding decorative characteristics while combating the growth of microbes, such as bacteria and mold
• We introduced Interpon D X-Pro, an innovative scratch-resistant powder coating for the architectural market, which is available in both matt and satin fi nishes
• We made it easier for customers to tackle complex corrosion challenges with the launch of Interpon Redox,
a global range of high-performance primers
• Launched three new state-of-the-art digital color tools for customers in the industrial sector. They all work with the Salcomix system, an on-site facility which enables customers to mix paint on demand with superior color accuracy
• Coatings were supplied for a series of prestigious building projects, including Hudson Yards in New York and the Varso Tower in Warsaw, Poland

Leadership
31AkzoNobel Report 2019 | Our leadership
OUR LEADERSHIP
In this section, we introduce our Board of Management and Executive Committee, along with our Supervisory Board. You will also fi nd the Report of the Supervisory Board and an overview of their activities during 2019.
Our Board of Management and Executive Committee 32
Statement of the Board of Management 34
Supervisory Board Chairman’s statement 35
Our Supervisory Board 36
Report of the Supervisory Board 37
From myth to urban reality
Our passion for paint was proudly displayed as a key part of one of the world’s largest ever urban art projects, which was staged in Sweden.
Artscape Saga covered 12 municipalities throughout the Gothenburg area and involved artists from all over the world creating large-scale outdoor murals, with each piece interpreting a classic folk tale.
Around 400 liters of our Nordsjö paint brand was used to create the stunning designs. It was supplied to all 26 artists, who transformed various buildings of all shapes and sizes. Using contemporary street art to bring myths and folklore to life not only helped to brighten up scores of local neighborhoods, it also met with a hugely enthusiastic response.
www.nordsjo.dk www.nordsjo.no www.nordsjo.se
Our
lead
ersh
ip

32 Our leadership | AkzoNobel Report 2019
OUR BOARD OF MANAGEMENT AND EXECUTIVE COMMITTEE
Thierry VanlanckerCEO and Chairman of the Board of Management and Executive Committee (1964, Belgian) Thierry Vanlancker joined AkzoNobel in 2016, bringing more than 28 years of experience in the chemicals industry. He led operations in polymers, performance coatings and chemicals at DuPont and was President of Fluoroproducts at Chemours. Thierry has lived and worked in Switzerland, the US, Germany, France and Belgium. He holds a degree in Chemical Engineering from the University of Ghent. In April 2019, Thierry became a non-executive member of the Board of Directors of Sika AG.
Maarten de VriesCFO and member of the Board of Management and Executive Committee (1962, Dutch)Maarten de Vries joined AkzoNobel in January 2018. He spent the previous three years as CFO at Intertrust Group and TNT Express. He was a member of the Management Board of Intertrust Group and the Executive Board of TNT Express. From 2011 to 2014, Maarten was CEO of TP Vision. Prior to this, he held various senior positions at Royal Philips Electronics, including Chief Information Offi cer and Chief Purchasing Offi cer at Group Management Committee level.
Isabelle DeschampsGeneral Counsel and member of the Executive Committee (1970, Canadian and British)Isabelle Deschamps joined AkzoNobel in 2018. Before joining the company, she was responsible for legal and compliance at Unilever’s European businesses and its Food and Refreshment division worldwide, and previously Personal Care and Intellectual Property at Nestlé. She started her career at a Canadian law fi rm after fi nishing a Master’s degree in Law at the University of Montreal. Isabelle is admitted to the England and Wales Law Society and to the Quebec (Canada) Bar, and completed an Executive Business program at the London Business School.
Marten BooismaChief Human Resources Offi cer and member of the Executive Committee(1966, Dutch)Marten Booisma joined AkzoNobel as Chief Human Resources Offi cer in 2013. He spent the previous six years in a similar position at Royal Ahold. Having graduated from the University of Amsterdam with a Master of Science in Politics, he started his career in HR at Shell and Unilever. He then moved on to assume various senior management positions at Ahold. Marten will be succeeded by Joëlle Boxus as of March 9, 2020.
Ruud JoostenChief Operating Offi cer and member of the Executive Committee (1964, Dutch)Ruud Joosten joined AkzoNobel in 1996 as International Marketing Manager for Decorative Paints, having graduated from the Vrije Universiteit in Amsterdam with a Master’s in Economics. Since then, he has held various management positions within Decorative Paints and our former Specialty Chemicals business, including Manager of the Decorative Paints North and East Europe business and Managing Director of Pulp and Performance Chemicals.
David PrinselaarChief Supply Chain Offi cer and Member of the Executive Committee(1974, French)David Prinselaar joined AkzoNobel in 2015, taking responsibility for the Performance Coatings operations and then manufacturing for AkzoNobel as a whole from January 2018. In March 2019, David took over the role of Chief Supply Chain Offi cer and became a member of the Executive Committee. Before joining AkzoNobel, David worked for more than ten years for Reckitt Benckiser after acting as a management consultant for fi ve years.
From left to right:Maarten de Vries, Thierry Vanlancker, David Prinselaar, Isabelle Deschamps, Marten Booisma, Ruud Joosten
For further information please visit our website: akzonobel.com/management
Artworks by:Robert Zandvliet, Untitled, 1994, egg tempera on linen, 225 x 412 cm; Han Schuil, Untitled, 1996-1998, alkyd on casted aluminum, 30 x 24 cm; Prudencio Irazábal, Untitled, nr. 883, 1995, acrylic paint on canvas, 91 x 91 cm. Courtesy of the AkzoNobel Art Foundation.

3333AkzoNobel Report 2019 | Our leadership

34 Our leadership | AkzoNobel Report 2019
STATEMENT OF THE BOARD OF MANAGEMENT
The Board of Management’s statement on the fi nancial statements, the management report and internal controls.
We have prepared the Report 2019, and the undertakings included in the consolidation taken as a whole, in accordance with International Financial Reporting Standards (IFRS), as adopted by the EU and additional Dutch disclosure requirements for annual reports.
To the best of our knowledge: • The fi nancial statements in this Report
2019 give a true and fair view of our assets and liabilities; our fi nancial position at December 31, 2019; and the result of our consolidated operations for the fi nancial year 2019
• The management report in this Report 2019 includes a fair review of the development and performance of our businesses and the position of AkzoNobel, as well as the undertakings included in the consolidation taken as a whole, and describes our principal risks and uncertainties
The Board of Management is responsible for the establishment and adequate functioning of a system of governance, risk management and internal controls in our company. Consequently, the Board of Management has implemented a broad range of processes and procedures designed to provide control by the Board of Management over the company’s operations.
These processes and procedures include measures regarding the general control environment, such as a Code of Conduct – including business principles and a corporate complaints procedure (SpeakUp!) – corporate directives and authority schedules, as well as specifi c measures, such as a risk management system, a system of controls and a system of letters of fi nancial representation by responsible management at various levels within our company.
All these processes and procedures are aimed at providing a reasonable level of assurance that we have identifi ed and managed the signifi cant risks of our company, and that we meet our operational and fi nancial objectives in compliance with applicable laws and regulations. The individual components of the above set of internal controls are based on the COSO Enterprise Risk Management 2017 Framework.
With respect to supporting and monitoring of compliance with laws and regulations – including our Code of Conduct – a Com-pliance Committee has been established. The Compliance function makes rules available through the Directives Portal, manages the online and face-to-face compliance training program, provides legal expert support and manages the investigation of the SpeakUp! process.
The Internal Control function maintains AkzoNobel’s Internal Control Framework, monitors the compliance and includes updates regarding the emergence of new risks. They support the annual review of the effectiveness of the system of governance, risk management and internal controls of the Board of Management. Internal Audit provides comfort to the Board of Management, as well as the Supervisory Board, that our system of risk management and internal controls – as designed and represented by management – are adequate and effective.
While we routinely work towards continuous improvement of our processes and procedures regarding fi nancial reporting, the Board of Management is of the opinion that: • The report provides insights into failings
of the internal risk management and control systems in as far as such failings occur and are considered to have a material impact on the fi nancial statements
• These systems provide reasonable assurance that the fi nancial reporting does not contain material inaccuracies
• Based on the current state of affairs, it is justifi ed that the fi nancial reporting is prepared on a going concern basis
• The report states those material risks and uncertainties that are relevant to the expectation of the company’s continuity for the period of 12 months after report preparation
For a detailed description of the risk management system and the principal risks identifi ed, reference is made to the Risk management and Integrity and compliance management chapters in the Governance and compliance section.
We have discussed the above opinion and conclusions with the Audit com-mittee, the Supervisory Board and the external auditor.
Amsterdam, February 11, 2020The Board of Management

35AkzoNobel Report 2019 | Our leadership
SUPERVISORY BOARD CHAIRMAN’S STATEMENT
In 2019, AkzoNobel continued to make progress on its trans-formation as a focused paints and coatings company and remains fully committed to further strengthening its position as a global leader in our industry.
The company’s Winning together: 15 by 20 strategy – with its ambitious target – gathered solid momentum. The focus on value over volume played a key role in driving progress. Signifi cant effort is being put into strengthening company systems and processes, as well as working on operational excellence in the supply chain organization and reinforcing our customer intimacy. We are mid-journey, although there are clear signs that the reorganization and focus on cost savings are starting to have an impact, and this should gather momentum during 2020. The Supervisory Board has been impressed by the progress made, with clear improvements in profi tability achieved in every quarter during 2019.
We are closely monitoring the ongoing transformation and focus on encouraging management to seek the right balance between delivering short-term results and long-term sustainability. It’s reassuring to see that management’s strategic priorities address both the underlying challenges and drive the necessary immediate changes. This should deliver the simplifi cation and operational excellence required to build long-term competitiveness. We are also pleased to see that the company continues to pay close attention to its core principles of safety, integrity and sustainability, despite the pressures being put on the organization by its transformation.
During the business reviews and visits to various sites, I have been excited to see the employees’ pride for AkzoNobel and their passion for paint as they continue
to contribute to the company’s ambitious targets. During these transformative years, employee engagement remains a key focus area, together with further strengthening collaboration throughout the organization.
As part of building passion for paint inside and around the company, we were particularly pleased with the success of Paint the Future. Innovation is fundamental to AkzoNobel’s future success and great strides forward are being made in terms of working with partners who share the same pioneering vision. Strongly linked to sustainability, innovation helps to ensure that the company will continue to offer customers the best performing portfolio of products and services.
Throughout the year, the leadership team – led by Thierry Vanlancker – displayed admirable drive and ambition, constantly focused on the improvement plans. The challenges ahead remain substantial and will require a determined effort by the whole organization. During the coming year, the Supervisory Board’s focus will be to work with the management team on the company strategy beyond 2020. As we deliver on our margin improvement strategy, we can raise our ambition level and lay out plans for a compelling vision to show how AkzoNobel, together with its employees and partners, will become a true global leader in our industry.
During 2019, we welcomed Jolanda Poots-Bijl to the Supervisory Board, following approval at the Annual General Meeting held in April. She is a recognized
expert in fi nance and brings a wealth of experience with her. Jolanda succeeded Peggy Bruzelius, who retired after serving for a maximum of 12 years. Peggy brought signifi cant experience to the Supervisory Board and the Audit Committee and we thank her for her excellent contribution.
Finally, I would like to thank the entire Supervisory Board, the Board of Management, the Executive Committee and all AkzoNobel employees around the world for their hard work and commitment during another busy year for the company.
Amsterdam, February 11, 2020Nils Smedegaard AndersenChairman of the Supervisory Board

36 Our leadership | AkzoNobel Report 2019
Michiel Jaski (1959, Dutch) Initial appointment: 2017 Current term of office: 2017-2021
Chairman of the Supervisory Boards of UNICA Group B.V., Faber Halbertsma Group B.V. and Rhoon, Pendrecht & Cortgene B.V.; Former CEO of OFFICEFIRST Immobilien A.G. and Grontmij N.V.; Former member of the Executive Board of ARCADIS N.V.
Byron E. Grote (1948, American and British) Vice-ChairmanInitial appointment: 2014Current term of office: 2018-2022
Non-executive Director of Anglo- American plc., Standard Chartered plc. and Tesco plc.; Former non-executive Director of Unilever N.V. and Unilever plc.; Former Board member BP plc.
Dick Sluimers (1953, Dutch) Initial appointment: 2015 Current term of office: 2019-2023
Member of the Supervisory Boards of NIBC Bank N.V. and Euronext N.V.; Member of the Board of Directors of FWD Group Limited; Trustee of the Erasmus University Trust; Member of the Board of Governors of the State Academy of Finance and Economics; Former CEO of APG Group; Former member of the Supervisory Board of Atradius N.V.
Jolanda Poots-Bijl (1969, Dutch) Initial appointment: 2019 Current term of office: 2019-2023
CFO of Royal van Oord; Member of the Supervisory Board of Pon Holdings B.V.; Former member of the Supervisory Board of N.V. Nederlandse Gasunie; Former member of the Supervisory Board of Blokker Holding B.V.
Sue Clark (1964, British) Initial appointment: 2017 Current term of office: 2017-2021
Non-executive Director of Britvic plc., Bakkavor Group plc., Tulchan Communica-tions LLP and Imperial Brands plc.; Former Managing Director Europe SABMiller plc.; Former Director of Corporate Affairs Railtrack plc. and Scottish Power plc.
Ben Verwaayen (1952, Dutch) Initial appointment: 2012 Current term of office: 2016-2020
Non-executive Director of Ofcom; Former CEO of Alcatel-Lucent; Former Chief Executive/Chairman of the Board’s Operating Committee of BT Group; Former member of the Board of Directors of Bharti Airtel Ltd.
Patrick Thomas (1957, British) Initial appointment: 2017 Current term of office: 2017-2021
Chairman of Johnson Matthey plc.; Non-executive Director Aliaxis S.A.; Former Chairman and CEO of Covestro A.G. and Bayer MaterialScience A.G.; Former non-executive Director of BG Group plc.; Former President of Specialties, Huntsman International LLC; Former CEO Polyurethanes division of ICI plc.
Pamela Kirby (1953, British) Initial appointment: 2016 Current term of office: 2016-2020
Non-executive Director at Reckitt Benckiser plc., Hikma Pharmaceuticals plc. and DCC plc.; Senior Independent Director at Victrex plc. (until February 2020); Former CEO of Quintiles Transnational Corp.; Former senior executive at Astra Zeneca plc and F. Hoffman-La Roche.
Nils Smedegaard Andersen (1958, Danish) ChairmanInitial appointment: 2018Current term of office: 2018-2022
Chairman of the Board of Directors of Unilever N.V. and Unilever plc.; and member of the Board of Directors of BP plc. (until March 18, 2020); Former CEO of A.P. Moller-Maersk A/S; Former CEO and President of Carlsberg A/S.
OUR SUPERVISORY BOARD

37AkzoNobel Report 2019 | Our leadership
REPORT OF THE SUPERVISORY BOARD
MEETINGS AND ATTENDANCE
During 2019, the Supervisory Board held eight regular, scheduled meetings and two additional meetings. The additional meetings were required to ensure the Supervisory Board was sufficiently informed and could make considered decisions regarding transactions such as the acquisition of French aerospace coatings manufacturer Mapaero.
The table on the left provides an overview of the attendance record of the individual members of the Supervisory Board. The Supervisory Board attaches great value to the attendance of its meetings by all members. However, if Supervisory Board members are unable to attend a Supervisory Board or committee meeting,
Supervisory Board attendance record
SB AC RC NC
Nils Smedegaard Andersen 10/10 5/6 2/2
Jolanda Poots-Bijl1 5/7 4/5
Peggy Bruzelius2 3/3 2/2
Sue Clark 9/10 5/6
Byron Grote 9/10 7/7 2/2
Michiel Jaski 10/10 7/7
Pamela Kirby 9/10 6/6 2/2
Dick Sluimers 7/10 6/7 6/6
Patrick Thomas 10/10 7/7
Ben Verwaayen 9/10 5/6 2/2
Supervisory Board activities 2019
Q1 Q2 Q3 Q4
• Review of Q4 2018 financials and performance• 2018 financial statements and profit allocation• Final 2018 dividend• HR strategy update• M&A strategy update• Transformation Office update• Risk Management: Risk session outcomes• HSE full-year report• 2018 external audit report
• Review Q1 2019 financials and performance• Investor Relations update• Review Winning together: 15 by 20 ambition• Business updates• Transformation Office update• Nomination of Jolanda Poots-Bijl as
a Supervisory Board member• M&A strategy update• Acquisition of French aerospace coatings manufacturer Mapaero• ISC 2025• Innovation strategy update• HR strategy update
• Review Q2 2019 financials and performance• Investor Relations update• Business updates• Transformation Office update• HR strategy update• Enterprise Risk Management update• Functional and business strategy review• Raw materials strategy update• Operational excellence• Innovation strategy update• M&A strategy update
• Review Q3 2019 financials and performance• Interim dividend 2019• Share buyback program• M&A strategy update• Information Management update• Transformation Office update• Company strategy update • Operational excellence• HR strategy update• Budget 2020• Investor Relations update
The table indicates the meeting attendance for the Supervisory Board (SB), the Audit Committee (AC), the Remuneration Committee (RC) and the Nomination Committee (NC) for regular and additional meetings.The attendance record shows the eight regular scheduled meetings and the two additional meetings of the Supervisory Board. Additional meetings are scheduled ad hoc when needed.1 Appointed at the AGM on April 25, 2019. Also appointed as an Audit Committee member on the same date.2 Stepped down on April 25, 2019, after completing a 12-year term.
The table provides an overview of relevant topics discussed and reviewed in Supervisory Board meetings in 2019.
they inform the relevant Chairman of the reason. At all times, Supervisory Board members receive the materials for the specific meeting, enabling them to provide input and have the opportunity to discuss any agenda items with the relevant Chairman and provide a proxy to act on their behalf. They also have the opportunity to discuss any agenda items with the relevant Chairman prior to the meeting. The Board of Management attended all regular meetings. The CEO attended all additional meetings, while the CFO attended one of them. The Executive Committee attended the majority of the meetings. Almost all plenary sessions of the Supervisory Board were preceded or succeeded by executive sessions of the Supervisory Board, with or without the CEO in attendance.
Strategy reviewsDuring 2019, the Supervisory Board continued to allocate adequate time to discuss strategic activities, including detailed business analyses and portfolio reviews. In light of the continuous implementation of the Winning together: 15 by 20 ambition – and forward planning beyond 2020 – along with the related transformation program, the company renewed its efforts to achieve efficiencies in operational and functional excellence. The implementation of Integrated Business Planning (IBP) and an integrated Global Process Organization (GPO) were considered key enablers for future performance improvement. In addition, functional updates were reviewed and discussed, including Finance, Information Management, Integrated

38 Our leadership | AkzoNobel Report 2019
Supply Chain, Procurement, Human Resources and Innovation.
The Supervisory Board received comprehensive market updates and advised, reviewed and approved the next phase of the company’s transformation through regular updates from the Trans-formation Office.
Strategy beyond 2020The Winning together: 15 by 20 strategy, with its ambitious targets (set in 2017) and a focus on achieving 15% ROS, has been successful in focusing on a step-change in profitability. Going forward, beyond 2020 AkzoNobel will rebalance growth and margins.
Proceeds Specialty Chemicals separationFollowing the implementation of the sale of the Specialty Chemicals business, a special cash dividend of €1 billion was paid in December 2017 as advance proceeds. The additional €5.5 billion in proceeds have been returned using different distribution methods. A capital repayment and share consolidation of €2 billion was completed in January 2019; a special cash dividend of €1 billion was paid on February 25, 2019; and a share buyback of €2.5 billion was completed in December 2019. The capital repayment and share consolidation was approved by shareholders at the EGM in November 2018.
SustainabilitySustainability is a core principle and is integral to the company’s strategy, which means delivering both short-term and
long-term value for shareholders and other stakeholders, because today’s profits are essential to invest in tomorrow. Our “People. Planet. Paint.” approach to sustainability is an investment in the future success of the company. Having sustainability as a core principle motivates employees, is a source of pride and helps to define what the company is and what it stands for. The Supervisory Board views sustainability as an intrinsic value driver in the work of all businesses and all functions.
During 2019, the Supervisory Board also assessed sustainability as part of strategy and targets. The Supervisory Board is confident that by making sustainability an explicit differentiator – part of the company’s brand – AkzoNobeI has enhanced its value proposition for stakeholders, including employees and business partners. The company also continues to develop business opportunities in alignment with relevant UN Sustainable Development Goals (SDGs).
Performance and management planningIndividual Board of Management and Executive Committee performance was addressed in Supervisory Board meetings, following recommendations from the Remuneration Committee. For more details, see the report of the Remuneration Committee on page 41.
Discussions on corporate performance were held at each regular Supervisory Board meeting and included business reviews and performance updates from corporate functions. Forward-looking targets were
also addressed in light of these reviews, and both the proposed budget and operating plan for 2020 were diligently reviewed by the Supervisory Board in Q4, taking into account prevailing market conditions. Following this assessment, the Supervisory Board has approved the proposed budget and operating plan for 2020.
During the year, the Supervisory Board was pleased to see the company continuing to benefit from management’s strategic initiatives, including cost savings. The nature of this performance provided a basis for the Supervisory Board’s approval of the dividend proposal (further details on the 2019 dividend proposal can be found in the Consolidated financial statements and Profit allocation paragraph).
Risk managementThe Supervisory Board views risk management as an essential mechanism for safeguarding the business and assets of the company, as well as securing long-term performance and value creation. Risk management updates were received during the year as the Supervisory Board sought to assure itself of the robustness of the company’s risk mitigation and internal controls.
The Board of Management and Executive Committee maintain the risk management framework and system of internal controls. Implementation of risk mitigating measures for the key risks, as identified by the Board of Management and the Executive Committee, is monitored by
Members of our Supervisory Board and Executive Committee visited the company’s sites in Barcelona, Spain, during 2019. The schedule included business reviews and site tours, and enabled senior leadership to meet employees and get a better understanding of our activities and operations.
39AkzoNobel Report 2019 | Our leadership
the Supervisory Board and the Audit Committee during the year by means of risk updates and reviews. Further details are included in the Risk management chapter in the Governance and compliance section.
Corporate governanceThe Supervisory Board continuously reviews the company’s corporate governance and its compliance with the Dutch Corporate Governance Code.
Talent management and succession planningIn 2019, the Supervisory Board, after discussing its own composition and succession plans, nominated Jolanda Poots-Bijl and re-appointed Dick Sluimers as members of the Supervisory Board. The appointment and re-appointment were approved at the AGM held on April 25, 2019. More information on the nomination process and the induction training of Supervisory Board members can be found in the Corporate governance statement.
During 2019, the Supervisory Board also discussed and supported changes to the composition of the Executive Committee. This included the appointment of David Prinselaar as Chief Supply Chain Officer (after David Allen stepped down). With Maëlys Castella stepping down as Chief Corporate Development Officer, her responsibilities were divided between the CEO and the General Counsel. The Supervisory Board also discussed the succession of Marten Booisma as Chief Human Resources Officer by Joëlle Boxus as per March 9, 2020. The requirements
of the Dutch Corporate Governance Code and the skills matrix, updated further upon recommendation by the Nomination Committee, were considered throughout the process. The updated matrix can be found later in this section.
Independence of the Supervisory BoardSupervisory Board members are required to act critically and independently of one another, the Board of Management, the Executive Committee and the company’s stakeholders.
Each member of the Supervisory Board meets the independence requirements as stated in the Code and has completed the annual independence questionnaire addressing the relevant requirements for independence. To this end, both the Supervisory Board and the company take steps to verify that:• No cross ties exist between Supervisory
Board members and members of the Board of Management
• No employment relationships were in place between Supervisory Board members and AkzoNobel during the five years preceding their last appointment
• No personal financial compensation has been paid, other than in relation to work as a Supervisory Board member
• No Supervisory Board member has had important business relationships with the company in the year prior to their last appointment
• There are no significant shareholding ties (amounting to more than 10% of the share capital of the company)
between Supervisory Board members, or their closely associated persons, and the company
Supervisory Board evaluationTo assess its effectiveness, the Supervisory Board carried out an internal performance evaluation of itself, its individual members, its Audit Committee, Remuneration Committee and Nomination Committee, the Chairman and the chairmen of these committees, as well as its relationship with the Board of Management and the Executive Committee. The process consisted of Supervisory Board members completing a confidential questionnaire.
In a separate meeting without the Board of Management, the full Supervisory Board discussed the results of the evaluation questionnaires. The Supervisory Board also discussed the functioning of the Board of Management and the performance of its individual members. The Chairman had one-on-one calls with all Supervisory Board members to discuss individual impressions on the functioning of the Supervisory Board and items covered in 2019.
During 2020, the Supervisory Board agreed to focus on an effective division of responsibilities between the different committees. Other focus areas include the governance and process on succession planning and talent management. Additional time will be spent on contributing to the development of the company strategy beyond 2020. Items addressed were overall performance
and composition of the Supervisory Board, the Audit Committee and the other committees, strategic issues and key areas for 2020. Other points discussed were the nature and impact of the discussions, strategy oversight, risk management and internal control and succession planning.
We are pleased to confirm our internal evaluation concluded that the Supervisory Board and its committees continue to operate proficiently. There is a dynamic and open atmosphere between the Supervisory Board and the Board of Management – as well as the other members of the Executive Committee – offering support and constructive challenge. It was agreed that more time will be spent on business deep dives, as well as focusing more on succession planning and company talent.
Financial statements and profit allocationThe Board of Management submitted the report and financial statements, including the report of the Board of Management, to the Supervisory Board for review and approval. The financial statements of Akzo Nobel N.V. for the financial year 2019 were audited by PricewaterhouseCoopers Accountants N.V..
The financial statements, the report and management letter of the external auditors were extensively discussed by the Audit Committee with the external auditors, in the presence of the CFO, and by the full Supervisory Board with the Board of Management and the Executive

40 Our leadership | AkzoNobel Report 2019
Committee. Based on these discussions, the Supervisory Board is of the opinion that the 2019 financial statements of Akzo Nobel N.\/. form an adequate basis to account for the supervision provided (see the Consolidated financial statements). The Audit Committee monitors the follow-up by management on the recommendations made by the external auditors.
The Supervisory Board recommends that the AGM adopts the financial statements as presented in this Report 2019 and, as proposed by the Board of Management, the proposed total dividend for 2019 of €1.90 (2018: €1.80), including a final dividend of €1.49 per share. An interim dividend of €0.41 (2018: €0.37) per share was paid in November 2019. This reflects the continued commitment to providing a stable to rising dividend. The dividend will be paid in cash.
In addition, it is requested that the AGM discharges the members of the Board of Management from their responsibility for the conduct of business in 2019 and the members of the Supervisory Board for their supervision in 2019.
AUDIT COMMITTEE
Byron Grote has been Chairman of the Audit Committee since his appointment in 2015. The other members of the Audit Committee in 2019 were Peggy Bruzelius1, Michiel Jaski, Dick Sluimers, Patrick Thomas and Jolanda Poots-Bijl2. All members of the Audit Committee
have extensive accounting and financial management expertise. The Audit Committee held seven meetings during 2019. The attendance record of the members can be seen in the attendance chart on page 37. Issues discussed in Audit Committee meetings were reported back to the full Supervisory Board in subsequent meetings.1 Until April 2019.2 Appointed to the Audit Committee as of April 25, 2019.
External auditPricewaterhouseCoopers Accountants N.V., AkzoNobel’s external auditors, reported in-depth to the Audit Committee on the scope and outcome of the annual audit of the financial statements, including the consolidated financial statements
Audit Committee activities 2019
Q1 Q2 Q3 Q4
• Review Q4 2018 financial statements and annual results
• Review 2018 annual report and accounts• External audit report• Review risk management and internal control • Auditors’ management letter• Final dividend 2018• HSE audit findings• Review full-year compliance report• Pension funds update• Finance transformation update • Review accounting for Specialty Chemicals separation• Review transition from accounting standard IAS 17-Leases to IFRS 16-Leases• Transformation to deliver towards the 15 by 20 ambition
• Review Q1 2019 financial statements• Review year-to-date audit findings • Compliance and integrity update• Follow-up on audit scope and fee 2019• Review evaluation external auditor• Treasury update• Review and approval PWC audit plan• Valuation of post-retirement benefit provisions• Transformation to deliver towards the 15 by 20 ambition
• Review Q2 2019 financial statements• Review external auditor performance evaluation FY 2018• Transformation to deliver towards the 15 by 20 ambition
• Review Q3 2019 financial statements• Recommendation on interim dividend 2019 • Share buyback program• Compliance and integrity update• Tax strategy review• Review budget 2020 and outlook• Review audit findings year-to-date • Hard close audit report• Internal Audit plan 2020• Review of legal liability exposure report• IFRS changes update• Finance transformation update• IM update• Internal Control framework update• Update to the PWC audit plan• Valuation of deferred tax assessment and uncertain tax position• Transformation to deliver towards the 15 by 20 ambition
and the company financial statements and report. The Audit Committee held independent meetings with the external auditors and critically reviewed and constructively challenged their audit approach, fees, risk assessment and audit plan for the year ahead.
Other topics discussed included:• The “hard close”, which was discussed
with the intention of continuing the improvement in the efficiency of the year-end process and to highlight important issues for the annual financial statements. AkzoNobel performed a “hard close” as of October 31, 2019
• Quality of the external audit• Impact of new accounting rules• Transformation of the Finance function
The Audit Committee performed an annual review of the services of the external auditor, and at each meeting it considered and assessed the status of the auditor’s independence. Further details on the external auditors can be found in the Governance and compliance section.
Risk management and internal control systemsThe Audit Committee reviewed AkzoNobel’s overall approach to gover-nance, risk management and internal controls, its processes, outcomes, financial reporting and disclosures. Regular updates were received from auditors and functions in this regard, and the Audit Committee was provided with comprehensive risk and internal

41AkzoNobel Report 2019 | Our leadership
control reports during the year. In addition, the Audit Committee reviewed the annual operating plan (including budget) and AkzoNobel’s dividend proposals. Upon fulfilling its oversight responsibilities in relation to governance, risk management and internal control systems, the Audit Committee met regularly with senior executives.
The General Counsel reported regularly to the Audit Committee on the company’s compliance framework and compliance matters and activities, and on major litigation, fraud and liability exposures. The Internal Auditor reported to the Audit Committee on their assessment of the status of the system of governance, risk management and internal controls throughout 2019.
Business and function reviewsIn fulfilling its oversight responsibilities in relation to risk management and internal control systems, the Audit Com mittee received updates from functions throughout the year, informing its review of the annual operating plan, including budget. During the year, updates were provided from Finance, Treasury, Information Manage-ment and Tax. The Audit Committee continued to monitor functional initiatives, such as the progress on the transformation of the Finance function and the transformation of AkzoNobel into a focused paints and coatings company. The Audit Committee also met regularly with other senior executives.
Internal Audit The Internal Auditor presented all main audit findings to the Audit Committee and discussed the progress of the audit plan. During the year, the Audit Committee approved Internal Audit’s plan and strategy, and also agreed on the budget and resource requirements for the function. The Audit Committee also met separately with the Internal Auditor during the year to discuss the results of the audits performed and the status of the follow-up on action plans identified. In 2019, the Audit Committee was satisfied with the effectiveness of the Internal Audit function. As the Corporate Director of Internal Audit left AkzoNobel as per January 1, 2020, the Audit Committee agreed on the appointment of the new Corporate Director of Internal Audit, who starts on March 1, 2020. The appointment of the new Corporate Director of Internal Audit was approved by the Supervisory Board.
Results and financial statementsBefore each publication of the quarterly results and the financial statements, the Audit Committee reviewed the financial results. In addition, the Audit Committee reviewed and commented on the interim and final dividend proposals and on reports and press releases to be published. This was in addition to the work undertaken by the company’s Disclosure Committee in reviewing the company’s disclosure of potentially price sensitive information. Based on these discussions, advice was provided by the Audit Committee to the Supervisory Board with regard to the publications and
disclosures, and to the interim and final dividends. All quarterly or annual releases of financial results, and any potentially price sensitive public disclosures, were approved by the full Supervisory Board prior to publication and release.
In order to ensure its effectiveness and expertise, the Audit Committee was provided with regular updates on IFRS developments and the anticipated impact of these developments on the financial statements. In addition, the Audit Committee reviewed and assessed management assertions made in regard to relevant accounting treatments.
Audit Committee evaluationThe Audit Committee carried out a self-assessment of its performance and concluded that it is performing effectively. Reference is made to the paragraph on the evaluation of the Supervisory Board in this chapter.
REMUNERATION COMMITTEE
The Remuneration Committee consists of five members: Dick Sluimers (Chairman), Sue Clark, Ben Verwaayen, Pamela Kirby and Nils Smedegaard Andersen.
General Counsel and Executive Committee member, Isabelle Deschamps, was named Gender Diversity Lawyer of the Year in the inaugural Chambers Diversity and Inclusion Awards: Europe 2019. She was recognized for fostering an inclusive culture throughout the company, facilitating a D&I network and strengthening AkzoNobel’s leadership diversity.

42 Our leadership | AkzoNobel Report 2019
Remuneration Committee main 2019 activities
Q1 Q2 & Q3 Q4
• Review of management performance 2018• Target setting 2019• Review of management base salaries for 2019• 2018 Remuneration report
• Remuneration Policy review• Review STI targets • Implementation of Shareholder Rights Directive II
• Forward-looking 2020 target-setting• 2019 STI and LTI performance review• Review of the remuneration policies for the Board of Management and Supervisory Board in connection with the implementation of Shareholder Rights Directive II• Review of management base salaries for 2020
The Remuneration Committee held six meetings in 2019. The attendance record of the members can be seen in the Supervisory Board attendance chart on page 37.
Management performance reviewThe work of the Remuneration Committee during the first quarter focused on performance for the year 2019, the individual performance reviews of the Board of Management members and of the Executive Committee. The Remuneration Committee also assessed the adequacy of the peer group used for benchmarking purposes.
Remuneration Policy reviewIn 2019, the Remuneration Committee reviewed the Remuneration Policy for the Board of Management, to assess whether it was still in line with the company’s strategy and financial targets. The Remuneration Committee also considered the alignment of the Remuneration Policy for the Board of Management and the Remuneration Policy of the Supervisory Board in anticipation of the implementation of
Nomination Committee main 2019 activities
Q1 Q2, Q3 and Q4
• Review (re)appointment scheme• Supervisory Board succession planning• Nomination Jolanda Poots-Bijl
• Supervisory Board succession planning• Board of Management and Executive Committee succession planning• Update skills matrix
the Shareholder Rights Directive II. For further details, reference is made to the Remuneration report.
Management salary review The Remuneration Committee reviewed the base salaries and the establishment of relevant forward-looking target ranges for variable remuneration of Board of Management members and other members of the Executive Committee. The base salaries will continue to be assessed in light of market conditions, the reward structures of peer group companies and performance. The Remuneration Committee considered the pay ratios within the company and how these compare with peer group companies.
Forward-looking target ranges for variable remuneration of the Board of Management were discussed and proposals for the remuneration of other Executive Committee members were reviewed and discussed with the CEO. For further details, reference is made to the Remuneration report and Note 25 of the Consolidated financial statements.
Remuneration Committee evaluationThe Remuneration Committee’s evaluation of performance and effectiveness formed part of the overall Supervisory Board evaluation undertaken during 2019, as explained earlier in this section.
NOMINATION COMMITTEE
The Nomination Committee consists of four members: Nils Smedegaard Andersen (Chairman), Byron Grote, Pamela Kirby and Ben Verwaayen. The Nomination Committee held two meetings in 2019. The attendance record of the members of the Nomination Committee can be seen in the chart on page 37.
Board of Management and executive successionDuring 2019, the Nomination Committee was consulted and gave its advice regarding the composition of the Executive Committee and the appointment of David Prinselaar as Chief Supply Chain Officer, as well as dividing the responsibilities of Chief Corporate Development Officer Maëlys Castella (who stepped down) between the CEO and the General Counsel. The Nomination Committee was also consulted and gave its advice on the appointment of Joëlle Boxus as Chief Human Resources Officer, as per March 9, 2020.
Supervisory Board successionDuring 2019, the Nomination Committee continued to discuss the size, structure and composition of the Supervisory Board. Following a thorough internal and external search – with the assistance of an independent and well-reputed search firm – the Nomination Committee recommended the nomination of Jolanda Poots-Bijl to the Supervisory Board for consideration by the shareholders at the AGM of April 25, 2019.

43AkzoNobel Report 2019 | Our leadership
Supervisory Board skills and profiles
N.S. Andersen
J. Poots-Bijl
S. Clark
B. Grote
M. Jaski
P. Kirby
D. Sluimers
P. Thomas
B. Verwaayen
Independent l l l l l l l l l
Consumer goods end-user segment
l l l l
Industrial end-user segment l l l l l l l l l
Buildings and infrastructure end-user segment
l l l
Transportation end-user segment l l l l l l l l
(International) business, commerce, finance/economics
l l l l l l l l l
Scientific/information technology experience
l l l l l l
Public sector experience l l lManagement experience l l l l l l l l l
Business strategy planning l l l l l l l l l
Investor relations l l l l l l l l
Manufacturing experience l l l l lSupply chain/logistics experience l l l l l l
Social, environmental or sustainability experience
l l l l l l l l
Finance expert l l l
Four or less external directorships l l l l l l l l l
Dutch/EU national l l l l l l l l l
Non-EU national lPensions experience l lBusiness-to-business sales experience
l l l
R&D experience l l l lLegal experience l l
Industrial/employment relations lRisk management l l l l lConsulting l l l l
The Supervisory Board has updated its skills matrix, as shown opposite. The skills matrix, full details of the current Supervisory Board composition, the schedule of Supervisory Board succession and the profiles of the Supervisory Board members can also be found on our website: www.akzonobel.com
The second term of Ben Verwaayen ends in 2020. The members of the Nomination Committee concluded that the required expertise is sufficiently reflected in the Supervisory Board. In connection with the current size of the company, it was deemed appropriate to reduce the number of Supervisory Board members to eight. Reducing the number of Supervisory Board members to eight following the retirement of Mr. Verywaayen was approved by the Supervisory Board.
Nomination Committee evaluationAs with the Remuneration Committee, the Nomination Committee’s evaluation of performance and effectiveness formed part of the overall Supervisory Board evaluation undertaken during 2019.
ADDITIONAL REMARKS
All members of the Supervisory Board would like to express their appreciation to the Board of Management and Executive Committee, as well as to all employees, for their dedication and hard work during 2019.
Amsterdam, February 11, 2020The Supervisory Board

Governance and compliance

4545AkzoNobel Report 2019 | Governance and compliance
This section explains our corporate governance structure and outlines the remuneration of our Board of Management. You will also fi nd information about risk management, compliance and integrity management, and AkzoNobel and the capital markets.
Corporate governance statement 46
Risk management 55
Integrity and compliance management 58
Remuneration report 61
AkzoNobel and the capital markets 66
GOVERNANCE AND COMPLIANCE
A colorful happily ever after
It almost reads like a modern day beauty and the beast story – which ends with our passion for paint coming to the rescue.
The rundown Hay Bouslama district in the city of Béja, Tunisia, was in such a bad state that Miss Tunisia approached our Astral brand for help. It was a perfect opportunity to add more color to people’s lives through our global “Let’s Colour” program.
Within weeks, the drab, colorless area had been transformed with around 800 liters of paint, which is helping to preserve the architectural heritage of the old neighborhood. Dozens of residents and several AkzoNobel employees volunteered to help during the colorful renovation, which has positively impacted the daily lives of the delighted local community.
www.astral.ma/fr www.astral.tn/fr www.letscolourproject.com
Gov
erna
nce
and
com
plia
nce
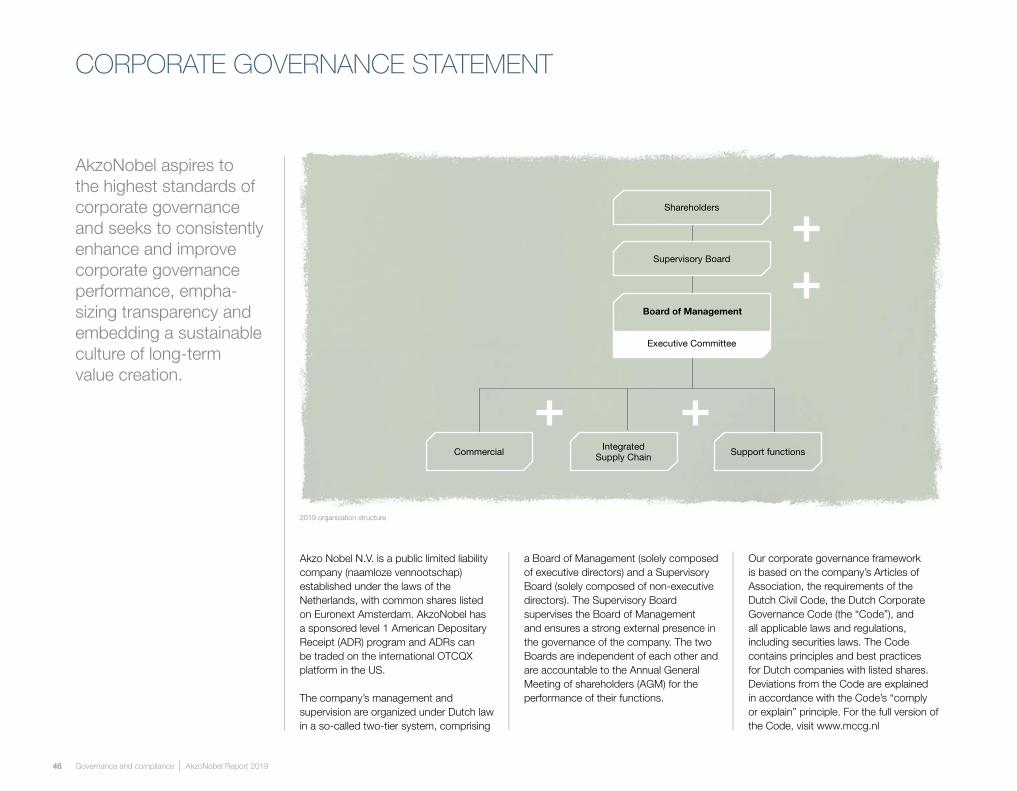
Executive Committee
Board of Management
Shareholders
Supervisory Board
Support functionsCommercial Integrated Supply Chain
46 Governance and compliance | AkzoNobel Report 2019
CORPORATE GOVERNANCE STATEMENT
AkzoNobel aspires to the highest standards of corporate governance and seeks to consistently enhance and improve corporate governance performance, empha-sizing transparency and embedding a sustainable culture of long-term value creation.
Akzo Nobel N.V. is a public limited liability company (naamloze vennootschap) established under the laws of the Netherlands, with common shares listed on Euronext Amsterdam. AkzoNobel has a sponsored level 1 American Depositary Receipt (ADR) program and ADRs can be traded on the international OTCQX platform in the US.
The company’s management and supervision are organized under Dutch law in a so -called two- tier system, comprising
a Board of Management (solely composed of executive directors) and a Supervisory Board (solely composed of non -executive directors). The Supervisory Board supervises the Board of Management and ensures a strong external presence in the governance of the company. The two Boards are independent of each other and are accountable to the Annual General Meeting of shareholders (AGM) for the performance of their functions.
Our corporate governance framework is based on the company’s Articles of Association, the requirements of the Dutch Civil Code, the Dutch Corporate Governance Code (the “Code”), and all applicable laws and regulations, including securities laws. The Code contains principles and best practices for Dutch companies with listed shares. Deviations from the Code are explained in accordance with the Code’s “comply or explain” principle. For the full version of the Code, visit www.mccg.nl
2019 organization structure
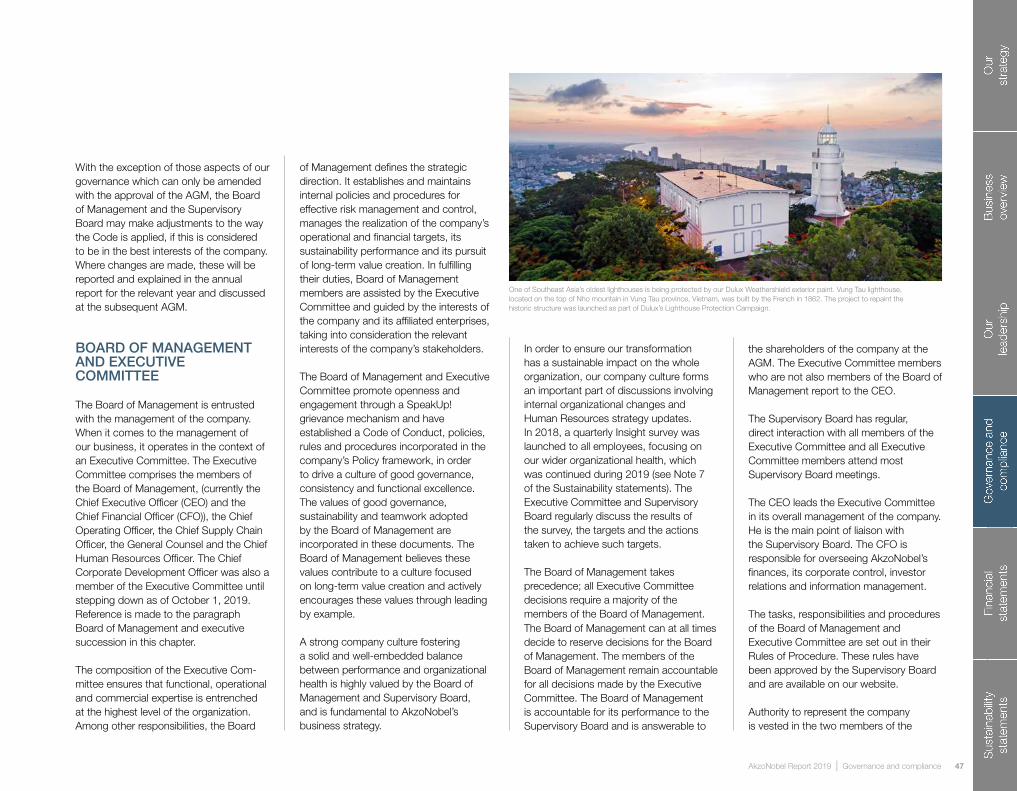
47AkzoNobel Report 2019 | Governance and compliance
With the exception of those aspects of our governance which can only be amended with the approval of the AGM, the Board of Management and the Supervisory Board may make adjustments to the way the Code is applied, if this is considered to be in the best interests of the company. Where changes are made, these will be reported and explained in the annual report for the relevant year and discussed at the subsequent AGM.
BOARD OF MANAGEMENT AND EXECUTIVE COMMITTEE
The Board of Management is entrusted with the management of the company. When it comes to the management of our business, it operates in the context of an Executive Committee. The Executive Committee comprises the members of the Board of Management, (currently the Chief Executive Officer (CEO) and the Chief Financial Officer (CFO)), the Chief Operating Officer, the Chief Supply Chain Officer, the General Counsel and the Chief Human Resources Officer. The Chief Corporate Development Officer was also a member of the Executive Committee until stepping down as of October 1, 2019. Reference is made to the paragraph Board of Management and executive succession in this chapter.
The composition of the Executive Com- mittee ensures that functional, operational and commercial expertise is entrenched at the highest level of the organization. Among other responsibilities, the Board
of Management defines the strategic direction. It establishes and maintains internal policies and procedures for effective risk management and control, manages the realization of the company’s operational and financial targets, its sustainability performance and its pursuit of long -term value creation. In fulfilling their duties, Board of Management members are assisted by the Executive Committee and guided by the interests of the company and its affiliated enterprises, taking into consideration the relevant interests of the company’s stakeholders.
The Board of Management and Executive Committee promote openness and engagement through a SpeakUp! grievance mechanism and have established a Code of Conduct, policies, rules and procedures incorporated in the company’s Policy framework, in order to drive a culture of good governance, consistency and functional excellence. The values of good governance, sustainability and teamwork adopted by the Board of Management are incorporated in these documents. The Board of Management believes these values contribute to a culture focused on long -term value creation and actively encourages these values through leading by example.
A strong company culture fostering a solid and well -embedded balance between performance and organizational health is highly valued by the Board of Management and Supervisory Board, and is fundamental to AkzoNobel’s business strategy.
In order to ensure our transformation has a sustainable impact on the whole organization, our company culture forms an important part of discussions involving internal organizational changes and Human Resources strategy updates. In 2018, a quarterly Insight survey was launched to all employees, focusing on our wider organizational health, which was continued during 2019 (see Note 7 of the Sustainability statements). The Executive Committee and Supervisory Board regularly discuss the results of the survey, the targets and the actions taken to achieve such targets.
The Board of Management takes precedence; all Executive Committee decisions require a majority of the members of the Board of Management. The Board of Management can at all times decide to reserve decisions for the Board of Management. The members of the Board of Management remain accountable for all decisions made by the Executive Committee. The Board of Management is accountable for its performance to the Supervisory Board and is answerable to
One of Southeast Asia’s oldest lighthouses is being protected by our Dulux Weathershield exterior paint. Vung Tau lighthouse, located on the top of Nho mountain in Vung Tau province, Vietnam, was built by the French in 1862. The project to repaint the historic structure was launched as part of Dulux’s Lighthouse Protection Campaign.
the shareholders of the company at the AGM. The Executive Committee members who are not also members of the Board of Management report to the CEO.
The Supervisory Board has regular, direct interaction with all members of the Executive Committee and all Executive Committee members attend most Supervisory Board meetings.
The CEO leads the Executive Committee in its overall management of the company. He is the main point of liaison with the Supervisory Board. The CFO is responsible for overseeing AkzoNobel’s finances, its corporate control, investor relations and information management.
The tasks, responsibilities and procedures of the Board of Management and Executive Committee are set out in their Rules of Procedure. These rules have been approved by the Supervisory Board and are available on our website.
Authority to represent the company is vested in the two members of the

48 Governance and compliance | AkzoNobel Report 2019
Board of Management, acting jointly. This includes the signing of documents. The Board of Management has also delegated a level of authority to corporate agents, including the other members of the Executive Committee. The list of authorized signatories is filed with the public registry and is available on request from the Dutch Chamber of Commerce.
The Managing Directors of our business units and the Corporate Directors in charge of the different functions report to individual Executive Committee members with specific responsibility for their activities and performance.
AppointmentBoard of Management members are appointed and removed from office by the AGM. The Board of Management members were appointed by EGMs (Extraordinary General Meetings) held in 2017. The other members of the Executive Committee are appointed by the CEO, after consultation with the Supervisory Board. Board of Management members are appointed for a four- year term (or less), with the possibility of re appointment.
As described later in this section, the Meeting of Holders of Priority Shares has the right to make binding nominations for the appointment of members of the Board of Management and the Supervisory Board. However, as the company subscribes to the principles of the Code in general, members of the Supervisory Board and the Board of Management are (with the exception of those
circumstances described later in this section) appointed on the basis of non -binding nominations by the Supervisory Board. In such cases, resolutions to appoint a member of the Supervisory Board or the Board of Management require a simple majority of the votes cast by shareholders.
Under certain conditions specified in the Articles of Association, shareholders may also be entitled to nominate Supervisory Board or Board of Management members for appointment. Such nominations require a two- thirds majority, representing at least 50% of the outstanding share capital, in order to be adopted at an AGM (or EGM).
DiversityAkzoNobel believes in the strength of diversity, and in accordance with the Code, a Diversity Policy has been adopted for the composition of the Board of Management and Executive Committee. The objective of the Diversity Policy is to enrich the Board of Management’s perspective, improve performance, increase member value and enhance the probability of achievement of the company’s goals and objectives. The Diversity Policy addresses concrete targets relating to diversity, including nationality, age, gender, education and work background. As part of our commitment to fostering an inclusive and respectful workplace, we introduced training to increase awareness around unconscious bias in the workplace.
A consistent and structured approach is applied to succession planning for the
Board of Management and Executive Committee, taking into account the implementation of the Diversity Policy. AkzoNobel currently diverges from the gender target of at least 30% female and at least 30% male Board of Manage- ment members. It is believed that due to the size and scale of the Board of Management (being only two members), this divergence is justified and has ensured the best candidates for the roles were nominated by the Supervisory Board and appointed by shareholders. Following the appointment of Joëlle Boxus as the new Chief Human Resources Officer as per March 9, 2020, AkzoNobel has a gender diversity of 33% female representatives at Executive Committee level.
Outside directorshipsMembers of the Executive Committee are not allowed to hold more than one supervisory board membership or non -executive directorship in another listed company. This is more stringent than the requirements of the Dutch Civil Code, which allows members of a board of management to hold two such positions.
The exception to this rule is that in the 18 months prior to their retirement, Executive Committee members are allowed to hold more than one such supervisory board membership or non -executive directorship to allow them to prepare for retirement, as long as this does not interfere with the performance of their tasks as a member of the Executive Committee. Furthermore, an exception can be made for an executive
joining the Executive Committee upon approval from the Supervisory Board. However, a maximum of two supervisory board memberships or non -executive directorships will apply. Further information on any outside board positions of the Executive Committee can be found on page 32.
Acceptance of external supervisory board memberships or non -executive directorships in other listed companies by members of the Executive Committee is always subject to approval by the Supervisory Board, for which authority has been delegated to the Chairman of the Supervisory Board.
Conflicts of interestMembers of the Board of Management and the other members of the Executive Committee shall not participate in the discussions and decision -making on a subject or transaction in relation to which they have a conflict of interest with the company. Supervisory Board approval is required for decisions to enter into transactions under which Board of Management or Executive Committee members have a conflict of interest of material significance to the company and to the relevant member. Any such decisions involving members of the Board of Management will be recorded in the annual report for the relevant year, with reference to the conflict of interest and declaring that the relevant best practice provisions of the Code have been complied with.

49AkzoNobel Report 2019 | Governance and compliance
During 2019, no transactions were reported under which a member of the Board of Management or Executive Committee had a conflict of interest which was of material significance to the company and to the relevant member.
RemunerationThe remuneration of the members of the Board of Management is set in line with the Remuneration Policy for the Board of Management, which is approved by the AGM. The Remuneration Policy of the Board of Management will be resubmitted to the 2020 AGM in line with the implementation of the Shareholder Rights Directive II. The Supervisory Board is responsible for determining the remuneration of the members of the Board of Management on the advice of the Remuneration Committee. The components of Board of Management remuneration, as well as the Remuneration Policy of the Board of Management, are described in the Remuneration report.
The service contracts of the members of the Board of Management do contain change of control provisions. Further details can be found in the Remuneration report. The service contracts of the Board of Management are compliant with the Code. The main elements of these contracts are available on our website.
Operational Control CycleExecutive Committee meetings are frequently held, at which the implemen-tation of the company’s strategy is discussed. Functional agendas are also
discussed at these Executive Committee meetings. Additional meetings are held to discuss specific topics as required.
The Board of Management and Executive Committee have delegated authorities to individual Executive Committee members and to certain committees and councils.
To help plan for success and ensure alignment within the entire AkzoNobel organization on the strategic and operational plan, the Board of Management and Executive Committee implemented an Integrated Business Planning (IBP) process across the company’s global businesses and functions. IBP provides, on a monthly basis, visibility on the long-term integrated business and financial plan, which covers the product portfolio, demand and supply. It therefore ensures early attention and remedial actions, where appropriate, on any potential gaps. The monthly IBP cycle ends with the Corporate Manage-ment Business Review (CMBR), which is chaired by the CEO. The Executive Committee attends these meetings, where it reviews the consolidated long-term company perspective, including risks and opportunities, decides on escalation and possible scenarios and supervises the key performance indicators with corrective actions, if applicable.
COMMITTEES
Sustainability CouncilThe Executive Committee has established a Sustainability Council to advise on
sustainability developments. The council monitors the integration of sustainability into management processes and oversees the company’s sustainability targets and sustainability performance. The council, which meets quarterly, consists of representative Business and Functional Directors, as well as the CEO.
Significant sustainability aspects material to the company are reviewed annually, with input from internal and external stakeholders. The Sustainability Council focuses on topics with the biggest impact on accelerating the AkzoNobel strategy to create shared value, building on our core principles of safety, integrity and sustainability, including respect for human rights.
Progress regarding sustainability objectives, development, target setting and implementation is reviewed quarterly by the Executive Committee, semi -annually by the Supervisory Board and is verified annually by PricewaterhouseCoopers Accountants N.V.. The Audit Committee takes an active role in assessing the quality and reliability of sustainability performance reporting.
Integrity and Compliance CommitteeThis committee supports the Executive Committee with its responsibility in assuring and managing compliance, and with its reporting to the Supervisory Board. The Integrity and Compliance Committee systematically identifies
The McLaren Formula 1 team enjoyed a successful 2019 season, with young racing talents Lando Norris and Carlos Sainz steering them to an admirable fourth place in the Constructors’ Championship. Scientists from our Sikkens brand once again worked with technicians at McLaren to develop the dazzling Papaya Spark livery for the team’s MCL34s. The coatings system offered numerous benefits designed to help reduce drag and contaminant adhesion, as well as improving surface slip and durability.

50 Governance and compliance | AkzoNobel Report 2019
material compliance risks, assists in assurance of compliance with laws, regulations and ethical standards, monitors compliance and report findings and recommendations to the Executive Committee. More details can be found on page 58.
Executive Pensions CommitteeThe Executive Pensions Committee oversees the general pension policies of AkzoNobel’s various pension plans and their financial consequences for the company. The committee is chaired by the CFO and includes the Chief Human Resources Officer, the General Counsel and Corporate Directors of Treasury, Pensions and Rewards.
Disclosure CommitteeThe Board of Management has established a Disclosure Committee which consists of senior executives with a background in corporate law, finance and investor relations. The task of the Disclosure Committee is to establish and maintain disclosure controls and procedures, and to advise the Board of Management and a committee comprising the CEO, CFO and General Counsel on the accurate and timely disclosure of material financial and non -financial information.
SUPERVISORY BOARD
This section provides an overview of the responsibilities and governance of the Supervisory Board. For an understanding of the activities of the Supervisory Board
over the past year, please refer to the Supervisory Board Chairman’s statement and the Report of the Supervisory Board. The responsibility of the Supervisory Board is to supervise the policies adopted by the Board of Management and the Executive Committee and to oversee the general conduct of the business of the company. In practice, this means supervising:• The corporate strategy• The achievement of the company’s
operational and financial objectives• The design and effectiveness of internal
risk management and control systems• The main financial parameters,
compliance with applicable laws and regulations and risk factors
The Supervisory Board advises the Board of Management and Executive Committee, while taking into account the interests of the company and its stakeholders. Major investments, acquisitions and functional initiatives are subject to Supervisory Board approval.
The Supervisory Board is governed by its Rules of Procedure (available on our website). The Rules of Procedure include the profile and the Charters of the Committees, which set out the tasks and responsibilities of the Supervisory Board, as well as its operational processes.
Role of the Chairman The Chairman of the Supervisory Board determines the agenda, chairs Supervisory Board meetings and the AGM, monitors the proper functioning of the Supervisory Board and its
committees, arranges for adequate provision of information to its members and acts on behalf of the Supervisory Board as the main contact for the Board of Management and Executive Committee. He initiates the evaluation of the functioning of the Supervisory Board, its committees, individual members and the functioning of the Board of Management.
Throughout the year, the Chairman of the Supervisory Board ensures that regular updates are provided to the Supervisory Board on the company’s businesses, sustainability, legal matters, social and corporate governance, accounting, investor relations, compliance, risk management and internal controls.
CompositionThe Supervisory Board members, including their biographies, can be found in the Leadership section. In compliance with the Dutch Civil Code, the Supervisory Board has a balanced composition, consisting of at least 30% female and at least 30% male members, reflecting the nature and variety of the company’s businesses, their international spread and expertise in fields such as finance, economics, information technology (IT), societal, environmental and legal aspects of business, government and public administration.
The current members represent four nationalities and have diverse experience, appropriate to the markets in which AkzoNobel operates, as well as knowledge of different markets and non- operational areas. The Supervisory Board
maintains a skills matrix, which provides an overview of the skills and experience of the individual members. The Supervisory Board skills matrix can be found in the Report of the Supervisory Board.
In addition, in accordance with the Code, a Diversity Policy has been adopted for the composition of the Supervisory Board. The objective of this policy is to ensure a balanced composition, taking account of nationality, age, gender, education and work background. During 2019, the Diversity Policy was implemented through the Supervisory Board’s consistent and structured approach to succession planning. There are no divergences to report. The policy is included in the Supervisory Board’s Rules of Procedure, which can be found on our website.
When nominating and selecting new candidates for the Supervisory Board, the Supervisory Board profile and skills matrix, the requirements of the Act on Management and Supervision, and the principles and provisions of the Code, are taken into account.
AppointmentMembers of the Supervisory Board are nominated, appointed and dismissed in accordance with procedures identical to those previously outlined for the members of the Board of Management.
In accordance with the Code, the Rules of Procedure of the Supervisory Board have been updated such that Supervisory Board members are eligible for re- election once for a period not exceeding four years.

51AkzoNobel Report 2019 | Governance and compliance
Thereafter, members may be re- elected a second time for a period of two years. This period may be extended by two years at the most. In the event of a re- appointment after an eight- year period, reasons shall be given in the Report of the Supervisory Board. Terms of appointment are based on a re- appointment scheme, available on our website. In 2019, one appointment and one re -appointment to the Supervisory Board were proposed to, and approved by, the Annual General Meeting of shareholders held on April 25, 2019.
Induction and trainingFollowing appointment to the Supervisory Board, new members receive a comprehensive induction tailored to their individual needs. This includes extensive briefings about all major business and functional aspects of the company and its corporate governance and compliance requirements. The induction includes meetings with the CEO, CFO, all other Executive Committee members and relevant members of senior management, as well as site visits. This enables new Supervisory Board members to quickly build up an understanding of AkzoNobel’s businesses and strategy, as well as the key risks and issues the company faces.
In addition, the Chairman ensures the Supervisory Board is provided with regular updates and that the Supervisory Board undertakes training, for example in the area of compliance and ethics.
Conflict of interestMembers of the Supervisory Board shall not participate in the discussions
and decision -making on a subject or transaction in relation to which they have a conflict of interest with the company. Decisions to enter into transactions under which Supervisory Board members have conflicts of interest that are of material significance to the company, and to the relevant Supervisory Board member, require the approval of the Supervisory Board. Any such decisions will be recorded in the annual report for the relevant year, with reference to the conflict of interest and a declaration that the relevant best practice provisions of the Code have been complied with. During 2019, no transactions were reported under which a member had a conflict of interest which was of material significance to the company.
Remuneration of the Supervisory BoardSupervisory Board members receive a fixed annual remuneration and attendance fee, which is determined by the AGM. According to the Code, it is not possible for members to be remunerated in shares. The Remuneration Policy for the Supervisory Board – which was adopted by the AGM in 2014 – will, with limited changes, be submitted for approval at the 2020 AGM, in line with the implementation of the Shareholder Rights Directive II.
More information on the remuneration of the members of the Supervisory Board and the Remuneration Policy of the Supervisory Board can be found in the Remuneration Report and Note 25 of the Consolidated financial statements.
SUPERVISORY BOARD COMMITTEES
The Supervisory Board has established three permanent committees – Audit Committee, Nomination Committee and Remuneration Committee. This section explains aspects of the governance and roles and responsibilities of these committees.
Information on the work, composition and attendance of the Supervisory Board members at the meetings of the committees during the year is set out in the Report of the Supervisory Board.
Each committee has a charter describing its role and responsibilities, as well as the manner in which it discharges its duties and reports to the full Supervisory Board. These charters are included in the Supervisory Board Rules of Procedure. The committees report on their deliberations and findings to the full Supervisory Board.
Audit CommitteeThe Audit Committee assists the Supervisory Board in overseeing the quality and integrity of: • Accounting, reporting, risk management
and internal control practices of the company
• Compliance with legal and regulatory requirements
• Performance of the Internal Audit function
• Qualifications, performance and independence of the external auditor
The Audit Committee has a role in assessing the quality and integrity of reporting on sustainability performance and takes an active role in reviewing the company’s sustainability performance data.
As a rule, the CFO, the Group Controller, the Internal Auditor and the lead partner of the external auditor attend all regular meetings. After most Audit Committee meetings, members hold a separate meeting with only the Internal Auditor present, a separate meeting with only the external auditor present and sessions with only Audit Committee members in attendance.
In addition, there are regular executive sessions with only Audit Committee members and the CFO present. Other members of the Executive Committee attend as and when requested. The General Counsel reports to the Audit Committee on compliance matters at every regular Audit Committee meeting and provides a claim and liability report to the Audit Committee once a year.
The Chairman of the Audit Committee is primarily responsible for the proper functioning of the Audit Committee and reports the activities and findings of the committee to the Supervisory Board, which discusses these activities and findings when necessary. The Chairman also initiates the evaluation of the functioning of the Audit Committee and its individual members, without members of the Board of Management being present.

52 Governance and compliance | AkzoNobel Report 2019
Nomination CommitteeThe Nomination Committee focuses on drawing up selection criteria and appointment procedures for Supervisory Board and Board of Management members. The Nomination Committee assesses the size and composition of both Boards, evaluates the functioning of the individual members, makes proposals for appointments and re -appointments and supervises the Board of Management on the selection of senior management. The Nomination Committee also considers appointments by the CEO of Executive Committee members who are not also a member of the Board of Management.
When selecting candidates for appointment to the Supervisory Board, account is taken of the Supervisory Board profile, the diversity requirements of the Dutch Civil Code and the Code, as well as the need for knowledge of the markets in which the company operates and insights from other markets and non -operational areas.
Remuneration CommitteeThe Remuneration Committee is responsible for making proposals to the Supervisory Board on the Remuneration Policy for the Board of Management and is involved in preparing the Remuneration Policy for the Supervisory Board, for overseeing remuneration of the individual members of the Board of Management and other members of the Executive Committee, and for overseeing the remuneration schemes for AkzoNobel executives involving the company’s shares.
The Remuneration Committee conducts periodic reviews of the performance of the members of the Board of Management and Executive Committee. The Remuneration Committee also reviews the remuneration of members of the Supervisory Board and ensures alignment with the Remuneration Policy of the Supervisory Board.
SHAREHOLDERS AND THE ANNUAL GENERAL MEETING
The Annual General Meeting of shareholders (AGM) is an integral part of the governance of the company and its system of checks and balances. The AGM reviews the annual report and decides on the adoption of the financial statements and the dividend proposal, as well as the discharge of members of the Supervisory Board and Board of Management.
The AGM is convened by public notice and the agenda, notes to the agenda and the procedure for attendance and voting at the meeting are published in advance and posted on our website. Matters proposed for consideration, approval or adoption are tabled as separate agenda items and explained in writing in advance of the meeting.
These proposals include, where relevant:• Adoption of the financial statements• Dividend proposal• Discharge of members of the
Supervisory Board and Board of Management
• Re-election of members of the Board of Management and Supervisory Board
• Remuneration of members of the Supervisory Board
• Material changes to the Remuneration Policy of the Board of Management
• Advisory vote on Remuneration report• Other important matters, such as major
acquisitions or the sale or demerger of a substantial part of the company, as required by law
• Authorization of the Board of Management to issue new shares
• Authorization of the Board of Management to repurchase shares
• Amendments to the Articles of Association
The company provides remote voting possibilities to its shareholders. Holding shares in the company on the record date determines the right to exercise voting rights and other rights relating to the AGM. All resolutions are made on the basis of the “one share, one vote” principle (assuming an equal par value for each class of shares). All resolutions are adopted by absolute majority, unless the law or the company’s Articles of Association stipulate otherwise.
Holders of common shares in aggregate representing at least 1% of the total issued capital, or, according to the Official List of Euronext Amsterdam N.V., representing a value of at least €50 million, may submit proposals for the AGM agenda. Such proposals must be adequately substantiated and submitted in writing, or electronically, to the company at least 60 calendar days in advance of
the meeting. Draft minutes of the AGM are made available on the company’s website within three months of the meeting date. The final and duly signed minutes are made available online within six months of the meeting date.
Share classesAkzoNobel has three classes of shares: common shares, cumulative preferred shares and priority shares. Common shares are traded on the Euronext Amsterdam stock exchange. Common shares are also traded over -the-counter on OTCQX in the US in the form of American Depositary Receipts (each American Depositary Receipt representing one- third of a common share). On December 31, 2019, a total of approximately 200 million common shares and 48 priority shares had been issued. This includes shares held in treasury which cannot be voted on and which are not eligible for dividend. The company has been informed that by December 31, 2019, each of Capital Research and Management Company, BlackRock Inc., and Massachusetts Financial Services Company held more than 5% of the company’s share capital.
The majority of shares in Akzo Nobel N.V. are included in a global certificate and held through the system maintained by the Dutch Central Securities Depository (Euroclear Nederland). In the past, Akzo Nobel N.V. also issued (physical) bearer share certificates (Bearer Certificates). A limited number of Bearer Certificates has not yet been surrendered to Akzo Nobel N.V., although holders

53AkzoNobel Report 2019 | Governance and compliance
of Bearer Certificates are entitled to a corresponding number of shares in Akzo Nobel N.V..
It is noted that, as a result of Dutch legislation which became effective as of July 2019, the relevant shares will be registered in the name of Akzo Nobel N.V. by operation of law as per January 1, 2021. Pursuant to this legislation, owners of Bearer Certificates will continue to be entitled to a corresponding number of shares in Akzo Nobel N.V. until January 2, 2026. On that date, their entitlement will expire by operation of law. For more information, contact Investor Relations ([email protected]).
The priority shares are held by the Foundation Akzo Nobel (Stichting Akzo Nobel). The Foundation’s Board consists of members of AkzoNobel’s Supervisory Board who are not members of the Audit Committee. The Meeting of Holders of Priority Shares has the nomination rights for the appointment of members of the Board of Management and the Supervisory Board, as well as the right to approve amendments to the Articles of Association of the company.
No cumulative preferred shares have been issued to date. Cumulative preferred shares merely have a financing function, which means if necessary, and possible, they will be issued at or near the prevailing quoted price for common shares.
The AGM held on April 25, 2019, authorized the Board of Management for a period of 18 months after that date, or,
if earlier, until the date on which the AGM again extends the authorization – subject to approval from the Supervisory Board – to issue shares in the capital of the company free from pre emptive rights, up to a maximum of 10% of the issued share capital. The Board of Management was also given a mandate to acquire common shares in the company’s share capital. The maximum number of shares that the company will hold in its own share capital at any time shall not exceed 10% of its issued share capital.
Anti-takeover provisions and controlAccording to the Code, the company is required to provide an overview of its actual or potential anti- takeover measures, and to indicate in what circumstances it is expected that they may be used.
The priority shares may be considered to constitute a form of anti- takeover measure, in relation to the right of the Meeting of Holders of Priority Shares to make binding nominations for appointments to the Board of Management and the Supervisory Board. The Foundation Akzo Nobel has confirmed that it intends to make use of such rights in exceptional circumstances only. These circumstances include situations where, in the opinion of the Board of the Foundation, the continuity of the company’s management and policies is at stake.
This may be the case if a public bid for the common shares of the company has been announced, or has been made, or the justified expectation exists that such a bid will be made, without any
agreement having been reached in relation to such a bid with the company. The same shall apply if one shareholder, or more shareholders acting in a concerted way, hold a substantial percentage of the issued common shares of the company without making an offer. Or if, in the opinion of the Board of the Foundation Akzo Nobel, the exercise of the voting rights by one shareholder or more shareholders, acting in a concerted way, is materially in conflict with the interests of the company. In such cases, the Supervisory Board and the Board of Management, in accordance with their statutory responsibility, will evaluate all available options with a view to serving the best interests of the company, its shareholders and other stakeholders.
The Board of the Foundation Akzo Nobel has reserved the right to make use of its binding nomination rights for the appointment of members of the Supervisory Board and of the Board of Management in such circumstances.Although a deviation from provision 4.3.3 of the Code, the Supervisory Board and the Board of Management are of the opinion that these provisions will enhance the continuity of the company’s management and policies.
In the event of a hostile takeover bid, or other action which the Board of Management and Supervisory Board consider adverse to the company’s interests, the two Boards reserve the right to use all available powers (including the right to invoke a response time in accordance with provisions 4.1.6 and
4.1.7 of the Code), while taking into account the relevant interests of the company and its affiliate enterprise and stakeholders.
AUDITORS
The external auditor is appointed by the AGM on proposal of the Supervisory Board. The appointment is reviewed every four years and the results of this review and assessment are reported to the AGM. The external auditor attends all regular Audit Committee meetings, as well as the majority of the additional meetings, and the meeting of the Supervisory Board at which the financial statements are approved.
During these meetings, the auditor discusses the outcome of the audit procedures and the reflections thereof in the auditors’ report and the management letter. In particular, the key audit matters are highlighted. The auditor receives the financial information and underlying reports of the quarterly figures and can comment on and respond to this information. The lead external auditor is present at the AGM and may be questioned with regard to his statement on whether the consolidated financial statements give a true and fair view of the financial position of the group (the company together with its subsidiaries).
Auditor independenceThe Audit Committee and Board of Management report their dealings with the external auditor to the Supervisory

54 Governance and compliance | AkzoNobel Report 2019
Board annually and discuss the auditor’sindependence.
As the previous lead audit partner retired in 2019, it was decided to appoint the current lead audit partner as per the start of the audit on the fi nancial year 2019. In close co-operation with PricewaterhouseCoopers Accountants N.V., and after having interviews with potential candidates, the Audit Committee decided on the succession of the current lead audit partner.
Other servicesOne area of particular focus in corporate governance is the independence of the auditors. The Audit Committee has been delegated direct responsibility for the compensation and monitoring of the auditors and the services they provide to the company. Pursuant to the Audit Profession Act, the auditors are prohibited from providing the company with services in the Netherlands other than “audit services aimed at providing reliability concerning the information supplied by the audited client for the benefi t of external users of this information and also for the benefi t of the Supervisory Board as referred to in the reports mentioned.”
The company has taken the position that no additional services may be provided by the external auditor and its global network that do not meet these requirements, unless local statutory requirements so dictate. In order to anchor this in our procedures, the Supervisory Board adopted the AkzoNobel Rules on External Auditor Independence and Selection
and the related AkzoNobeI Guidelines on Auditor Independence. These documents are available on our website.
Internal AuditThe Internal Audit function is mandated to provide the Board of Management, Executive Committee and Audit Committee with independent, objective assurance on the adequacy of the design and operating effectiveness of the internal control framework described below.
The Internal Auditor reports to the Board of Management and has direct access to the Audit Committee and its Chairman. The function performs its mandate based on a risk -based audit plan, which is approved by the Board of Management and the Audit Committee. It reports a summary of the audit fi ndings bi annually to the Board of Management and Executive Committee, and the Audit Committee, which culminates in an annual assessment of the quality and effectiveness of the company’s internal control systems. (See Audit Committee earlier in this section).
SHARE DEALING RULES AND RULES ON DISCLOSURE CONTROL
In accordance with Dutch Iaw and regulations (including the European Market Abuse Regulation), the company maintains insider lists and exercises controls around the dissemination and disclosure of potentially price sensitive information.
All employees and the members of the Board of Management, Executive Committee and Supervisory Board, are subject to the AkzoNobel Share Dealing Rules, which limit their opportunities to trade in AkzoNobel securities. Transactions in AkzoNobeI shares carried out by Board of Management, Executive Committee and Supervisory Board members (including their closely associated persons) are, as and when required, notifi ed to the Dutch Authority for the Financial Markets (AFM).
The Board of Management, Executive Committee and Supervisory Board members require authorization from the General Counsel prior to carrying out any transactions in respect of AkzoNobeI securities, even in a so -called “open period”. In relevant cases, the General Counsel can prohibit carrying out transactions in respect of other companies’ securities. In addition, all employees are subject to the AkzoNobeI Rules on Disclosure Control.
INTERNAL CONTROLS AND RISK MANAGEMENT
Internal controls The company has strict procedures for internal controls. The Board of Management and Executive Committee have established several Risk, Control and Compliance Committees, which are explained on page 58. As in previous years, we continued to work on system embedded controls, standard role design and segregation of duty monitoring.
The AkzoNobel internal control framework provides reasonable assurance in achieving business goals, including strategic, operational and reporting goals, in addition to those covering compliance. Internal control is not only about policies and procedures, but also relates strongly to people, culture and behaviors.
An integrated Risk and Internal Control department supports all businesses and functions in their work.
Risk managementOur risk management system is explained in more detail in the following section. Reference is made to the Statement of the Board of Management in the Leadership section for statements relating to internal risk management and control systems.
The AkzoNobel internal control framework
Control environment
Setting objectives
Responding to risk
Control activities
Monitoring activities
Info
rmat
ion
and
com
mun
icat
ion

55AkzoNobel Report 2019 | Governance and compliance
EnterpriseRisk Management
process
Risk identificationand assessment
Risk profiles
Risk responseper risk profile
Actions
Risk profiles andRisk responses
EnterpriseRisk Management
reporting
Risk consolidation
Risk transparency
SupervisoryBoard
Executive CommitteeTop 10 risks and risk responses
Functions and business unitsTop 10 risks and risk responses
Areas of major risk exposure(projects)
Top 10 risks and risk responses
Doing business involves risk. It’s our ambition to be a successful and respected company through managing risks as an essential element of our corporate governance and strategy.
We continuously strive to foster a high awareness of business risks and internal control to provide transparency in our operations.
The Board of Management and Executive Committee are responsible for managing the risks associated with our activities and the establishment and adequate functioning of appropriate risk management and control systems (see Statement of the Board of Management in the Leadership section).
RISK MANAGEMENT FRAMEWORK
Our risk management framework is in line with the Enterprise Risk Management – Integrated Framework of COSO and the Dutch Corporate Governance Code. It provides reasonable assurance that our business objectives can be achieved and our obligations to customers, shareholders, employees and society can be met.
For more information on our risk management framework, visit: www.akzonobel.com/risk-management-framework
RISK MANAGEMENT

56 Governance and compliance | AkzoNobel Report 2019
The table below summarizes the major risk factors for the company in the foreseeable future. The symbols represent management’s assessment of risk development compared with the previous year.
Risk has been assessed to increase.
Risk has been assessed to remain fairly stable.
RISK MANAGEMENT IN 2019
Risk management is a company-wide activity, under the responsibility of the Board of Management and Executive Committee, and we focus on the areas of major risk exposure.
During 2019, we held a significant number of enterprise risk workshops across the organization. Risk scenarios identified are prioritized by responsible management teams and functional experts and adequate mitigating actions are defined.
We consider risk assessment and mitigation a continuous process which is carried out against the background of an evolving risk landscape that includes short, medium and longer term challenges.
External – Strategic
GLOBAL ECONOMY AND THE GEO-POLITICAL CONTEXT
The unpredictable world’s geo-political situation and the highly competitive markets in which we operate require our ongoing attention to protect our financial performance.
Mitigating actions• Continued focus on operational cost
and complexity reduction• Deployment of commercial and
procurement excellence programs
External – Strategic• Global economy and the geo-political
context• Strategic moves in our value chain
Internal – Strategic• Organic growth• Innovation, identification and
successful implementation of major transforming technologies
External – Operational• Information technology and
cybersecurity
Internal – Operational• Management of change• Analytics and big data
External – Compliance• Complying with laws and regulatory
developments
• Geo-political assessment as part of investment decisions and medium-term operational planning
External – Strategic
STRATEGIC MOVES IN OUR VALUE CHAIN
An accumulation of strategic moves (horizontally and/or vertically) could impact our competitive position and/or increase the vulnerability of operations.
Mitigating actions• Competitive intelligence analysis of
(new) competitors, customers and suppliers
• Secure freedom to invest through strategic alignment with shareholders and other stakeholders
• Identify opportunities for M&A, based on strategic rationale
External – Operational
INFORMATION TECHNOLOGY AND CYBERSECURITY
Our longer-term IT strategy means we increasingly rely on fewer consolidated critical applications. With the number of digital business transactions on the increase, the non-availability of IT systems – or unauthorized access – could have a direct impact on our business processes, competitive position and reputation.
Mitigating actions• System (ERP) consolidation to increase
robustness of digital landscape• New security standards for industrial
control systems• Lifecycle planning for key applications• Embedding a cybersecurity culture
(training, awareness creation)• KPI definition around vulnerability
management • Deployment of information protection in
the new generation workplace

57AkzoNobel Report 2019 | Governance and compliance
External – Compliance
COMPLYING WITH LAWS AND REGULATORY DEVELOPMENT
As a global player, we are exposed to increasingly stringent laws and regulations covering a growing range of subjects (such as environmental releases, human rights, competition law).
Mitigating actions• Fostering an open and transparent
culture, continuously educating and training
• Implementation of a Business Partner Compliance Framework
• Defi ne ambitious standards in VOC/dust emission/energy control systems
• Operate under state-of-the-art safety requirements for our manufacturing and R&D sitesr
Internal – Strategic
ORGANIC GROWTH
Market leadership in those parts of the world where our markets are growing is one of the cornerstones of our strategy. A global presence, in combination with locally tailored go-to-market models, is an essential ingredient to success.
Mitigating actions• Clear BU strategic mandates to deliver
on growth opportunities• Deployment of commercial excellence
programs
• Digitally driven marketing• Investment in sales capability
Internal – Strategic
INNOVATION, IDENTIFICA-TION AND SUCCESSFUL IMPLEMENTATION OF MAJOR TRANSFORMING TECHNOLOGIES
Our leadership positions and future success are underpinned by investment in research, the adoption of major transforming technologies and continuous development of the talents and skills of our people.
Mitigating actions• Funding for technology road maps and
innovation strategies• Investing in promising venture funds• Partnering with innovative startups
(Paint the Future)• IT resources to support the business in
new technology applications
Internal – Operational
MANAGEMENT OF CHANGE
Our Winning together: 15 by 20 ambition is transforming the company. At the same time, we also recognize the risks associated with change, as well as the need to invest in building an organization structure which encourages and embraces change, while balancing opportunity and managing risk.
Mitigating actions• Set up a Transformation Offi ce to
support adoption of new organizational model
• Global Process Owners to implement standard solutions across the company
• Reward system to set desired behavioral changes in motion and keep momentum
• Launch of organizational health initiatives and periodic tracking of progress
• Range of programs to attract and retain talent
• Updating internal authority procedures and our control framework to refl ect changes in roles and responsibilities
Internal – Operational
ANALYTICS AND BIG DATA
In order to utilize data analytics and “big data” to support even better decision-making, we recognize the need to invest in an appropriate organizational structure and governance framework with common standards, methods and tools to deliver insightful information across the company.
Mitigating actions• Risk and mitigation ownership with
an empowered community of Global Process Owners
• Defi ne master data quality standards and priorities
• Extended set of key controls

58 Governance and compliance | AkzoNobel Report 2019
Governance and organization
Riskmanagement
Culture
Policies andcontrols
Reporting
Expertservices
Policy management
Grievance and investigation
Monitoring
Due diligence
Awareness andeducation
Integrity and compliance framework
We’re committed to leading with integrity in our industry. It’s one of our three core principles for doing business. Our robust Integrity and Compliance program helps ensure compliance with laws and regulations and guides our employees to make fair and honest decisions every day.
GOVERNANCE AND ORGANIZATION
The Executive Committee is responsible for maintaining a culture of integrity and ensuring an effective compliance control framework. The Audit Committee of the Supervisory Board supervises this responsibility. The Executive Committee has delegated certain responsibilities to
INTEGRITY AND COMPLIANCE MANAGEMENT
the following working committees (which are further explained on our website):
Integrity and Compliance Committee Reviews investigations into material violations of laws, regulations and internal rules and into SpeakUp! reports, and decides on disciplinary measures and control improvement actions. It also
monitors and responds to trends in such irregularities. In 2019, this committee was installed to replace the numerous BU and function compliance committees, thus elevating the level at which integrity and compliance irregularities are decided, while improving consistency of measures. This coincides with the initiative of streamlining company-wide end-to-end processes.
Risk, Control and Compliance Committees (RCC) Responsible for supervising the effectiveness of the control environment and for reviewing weaknesses in this environment, as well as progress on improvement actions.
Human Rights Committee Responsible for supervising the company’s human rights program (see Note 8 of the Sustainability statements).
Privacy Committee Responsible for supervising the company’s privacy control framework.
Day-to-day management of the integrity and compliance framework is delegated to the Integrity and Compliance function, which is led by the Director of Integrity and Compliance. The Director of Integrity and Compliance reports to the General Counsel and, as necessary, has access to the Chairman of the Audit Committee of the Supervisory Board. This function includes legal experts in the fi eld of competition law, bribery and corruption, export control and sanctions, fraud, privacy and human rights, who are

59AkzoNobel Report 2019 | Governance and compliance
responsible for setting the rules and making training programs available for their area of expertise, and for providing day-to-day expert guidance and support. The function’s Integrity and Compliance Managers, located in major business hubs spread over six regions, are responsible for risk identification and response, training and awareness, support and monitoring.
In 2019, the heads of the Integrity and Compliance, Internal Control and Internal Audit function met monthly to discuss findings and trends, and to align actions.
RISK MANAGEMENT
Annually, each BU and major function identifies its key compliance risks and defines actions to mitigate these risks. These actions form part of the BU/function integrity and compliance plan, which in turn forms part of a larger BU/function legal plan. The top five inherent compliance risks relate to competition law, environmental law, anti-bribery, fraud and data protection. In 2019, key focus areas were competition, bribery and privacy.
POLICY MANAGEMENT
In 2019, the company launched a new Policy Portal. This portal will become the one-stop-shop for key policies, rules and pro cedures relating to our Global Pro cesses. By reducing complexity and increasing transparency, it will become easier for employees to understand what
rules apply to their job, and will increase our effectiveness in applying the rules.
AWARENESS AND EDUCATION
We employ several methods to inform and educate employees on integrity and compliance rules and controls, including communication campaigns, e-learnings and training sessions.
Communication campaignsEmployees worldwide regularly receive communications to inform them of certain compliance risks and duties. For example, in 2019, two campaigns were run to alert employees to external fraud threats, with another two focusing on privacy requirements. We also share lessons from investigations on an anonymized basis. In November, a global Integrity Week was held with a focus on compliance in the field of gifts, hospitality and conflicts of interest. Senior leaders distributed messages and videos, articles were posted and discussions held on internal digital platforms, while teams took part in dilemma games and workshops.
E-learningThe company operates a suite of integrity and compliance related e-learnings that is mandatory for employees. E-learnings include: Code of Conduct; Life-Saving Rules; competition law; anti-bribery, gifts and entertainment; export control and sanctions; fraud; information security; and privacy. In response to an increased number of harassment and discrimination-
related SpeakUp! reports, we introduced a series of diversity and respectful treatment e-learnings in the second half of 2019.
Training sessionsNumerous face-to-face and virtual trainings are provided on integrity and compliance related topics to dedicated audiences. In 2019, we provided more than 90 trainings on competition law and around 25 on privacy.
DUE DILIGENCE
We have processes in place to perform due diligence screenings and investigations on business partners and other relevant third parties. As part of our export control and sanc tions framework, we screen customers for sanctions and screen transactions for export license requirements. In 2019, we further automated this process to increase assurance that all relevant restrictions are covered.
During 2019, we continued our extensive due diligence on risks of impact on human rights in our supply chains of mica, cobalt and tin-based raw materials and improved the related supplier self-assessment framework (see Note 5 in the Sustainability statements).
During Integrity Week, we launched a new gift and conflict of interest register, creating more transparency on gifts received and provided, and on potential conflicts between the company’s interests and one’s personal interests.
We also introduced a comprehensive registration and assessment process for personal data processing activities. This will enable us to have better visibility on all relevant personal data processing activities and help us support businesses and functions to ensure that these activi-ties comply with applicable privacy rules.
As part of our M&A program, we screen acquisition targets for past non-compliance and assess their integrity culture and compliance framework. For example, in 2019, extensive compliance due diligence was performed prior to closing the acquisition of Mapaero.
MONITORING
We have several processes to monitor compliance by employees and business partners with our rules. For example, every year we require employees to confirm that they have understood and complied with our Code of Conduct as part of the performance evaluation cycle. We also require managers to self-assess and confirm compliance by their units with our rules as part of the internal control self-assessment. We monitor supplier performance, including their control framework relating to bribery and human rights, as part of the EcoVadis self-assessment and Together for Sustainability audits.
In 2019, we ran a poll among employees to seek their feedback on our integrity culture. The results show that employees feel we have high standards

60 Governance and compliance | AkzoNobel Report 2019
of integrity and they feel comfortable to raise concerns.
Every year, we run a competition law compliance declaration program, whereby more than 14,000 employees are reminded of our competition law rules and asked to confirm compliance or raise concerns or questions with our competition law experts. In 2019, preparations were made to integrate this program with a learning program, to be run in February 2020.
Our internal audit function performs numerous audits on our operations. Their audit plan is risk-based and takes account
of prior compliance and internal control findings. In 2019, several internal audits were held at the request of the Integrity and Compliance function to validate compliance with our rules in certain units.
GRIEVANCE AND INVESTIGATION
Our SpeakUp! grievance mechanism offers employees, business partners and members of the public a means to raise concerns relating to compliance with our Code of Conduct. We apply strict principles of confidentiality, respect for anonymity, non- retaliation,
objectivity and the right to be heard. In 2019, the investigation process was further improved by introducing a strict investigation protocol, which applies to all investigations. Investigators must follow certain planning, investigation and reporting steps to safeguard the right quality and speed.
As mentioned under Governance and organization, all decisions are now taken by one committee, increasing efficiency and consistency. In 2019, the total number of reports reduced slightly, although the percentage received through SpeakUp! was significantly higher. All reports and alerts led to 25 dismissals and numerous other disciplinary measures and control improvements, confirming the value of our grievance framework.
SpeakUp! reports
20171 2018 2019
Total reports and alerts registered 261 238 222
Reports received through SpeakUp! 129 104 164
Safety 23 6 5
Integrity 53 50 59
Sustainability 53 48 100
Conclusions SpeakUp! reports: (Partially) substantiated Unsubstantiated Other (e.g. referred)
17 80 32
14 42 48
28 82 54
Dismissals resulting from SpeakUp! reports 4 5 4
1 2017 numbers include the Specialty Chemicals business.• In 2019, we abandoned the distinction between category 1 and 2 matters. All matters are now decided by one Integrity
Compliance Committee • “Referred” means that a matter does not relate to a Code of Conduct violation and is referred to another function for handling• In 2019, we closed 41 SpeakUp! reports from previous years, ten of which were (partially) substantiated, leading to 0 dismissals• In 2019, 58 reports and alerts were received outside our SpeakUp! mechanism. 28 thereof were (partially) substantiated, leading
to 21 dismissals• “Sustainability” includes reports on harassment and discrimination and other Code of Conduct employment matters
REPORTING
During 2019, the Director of Integrity and Compliance twice reported to the Executive Committee and the Audit Committee of the Supervisory Board on the material compliance matters, the results from investigations and the progress on the Integrity and Compliance plan. We also introduced a monthly reporting of investigation matters to the Executive Committee.
Through the RCC meetings, material compliance related internal control weaknesses are addressed and reported. We discuss material investigation matters quarterly with our external auditor.
“Handle with care” was the theme of our 2019 Safety Day. The annual event is an opportunity for us to celebrate our achievements, while reminding us to stay vigilant. This year, we focused on increasing awareness for the potential hazards associated with chemicals and how to handle them safely.

61AkzoNobel Report 2019 | Governance and compliance
This report describes the implementation of our Remuneration Policy in 2019 for members of the Board of Management and Supervisory Board.
To realize our strategy and create the long-term value we aim for, it is essential that AkzoNobel can attract and retain high caliber members to its Board of Management and Supervisory Board. The remuneration policies for each of these boards support this essential condition to our success.
The Remuneration Policy for the Board of Management (the “Policy”) was first adopted by shareholders at the Annual General Meeting (AGM) in 2005. It has undergone several amendments since then, most recently in 2018. Details about its implementation in 2019 can be found below in chapter 1.
The Remuneration Policy for the Super-visory Board was adopted by share-holders at the Annual General Meeting (AGM) in 2014 and will, with limited changes, be submitted for approval to the AGM in 2020. Details about the implementation of the current policy during 2019 are in chapter 2.
The implementation of the remuneration of both the Board of Management and Supervisory Board has been fully compliant with the applicable policies.
The revised European directive on the encouragement of long-term shareholder engagement (SRD II) and its codification in Dutch law have been taken into account in the disclosure presented in this report.
For a full description of the Remuneration Policy for both the Board of Management and the Supervisory Board, please visit our website: www.akzonobel.com
1. REMUNERATION FOR THE BOARD OF MANAGEMENT
In implementing the Policy as set out above, the Remuneration Committee consults with external remuneration professionals to obtain appropriate benchmark data, and on other matters where it requires independent advice. When making pay changes for members of the Board of Management, it evaluates the impact on pay differentials with other executives in the company.
Variable remuneration provides an incentive to realize long-term value creation. For the short term, the Supervisory Board sets operational targets over a one-year period that are crucial to the company and are pre-conditions to value creation. The biggest portion of the remuneration packages of Board of Management members is directly aimed at strategic priorities that will contribute to building sustainable long-term value creation, with targets for the return for shareholders and the return on invested capital. For the period 2018 to 2020, following the separation of the Specialty
Chemicals business, a one-off long-term incentive to reward bringing value creation at a higher level has been added.
Prior to agreeing on incentives, the Remuneration Committee conducted scenario analyses of the possible financial outcomes of meeting different performance levels, and how they may affect the structure and value of the Board of Management’s total remuneration.
In 2019, the labor market peer group, as referred to in the policy, consisted of the following companies:• Ahold Delhaize • Randstad• Air Liquide • RELX Group• ASML • RPM International• DSM • Sherwin-Williams• Ferro Corporation • Signify• Henkel • Sika• KPN • The Linde Group• LafargeHolcim • Vopak• PPG Industries • Wolters Kluwer
The table on page 62 gives an overview of the remuneration of the members of the Board of Management who were in office in 2019.
Base salaryThe Remuneration Committee reviewed the salaries of members of the Board of Management during the year, considering market data, inflation data and the level of increases that were to be applied for AkzoNobel employees in the Netherlands, including those who are covered by a collective labor agreement. Increases to the value of 2.75% of base salary were agreed, effective as of January 1, 2019:
REMUNERATION REPORT
• Thierry Vanlancker, CEO: €1,006,000• Maarten de Vries, CFO: €677,000
Short-term incentive (STI)In 2019, the financial objectives of the short-term incentive were return on sales (ROS) and operational cash flow (OCF). The individual and qualitative objectives reflect progress towards the achievement of long-term strategic objectives. The performance achieved is summarized in the table on page 62.
In determining the outcome of the short-term incentive elements, the Remuneration Committee applied a reasonableness test in which the actual level of the performance was critically assessed in light of the assumptions made at the beginning of the year. The test also included an assessment of the progress made with the strategic objectives under prevailing market conditions.
The Remuneration Committee subsequently determined that bonus payments for the Board of Management would be:• Thierry Vanlancker, CEO:
€886,610 (88.1% of salary)• Maarten de Vries, CFO:
€387,826 (57.3% of salary)
No matching shares were granted to the CEO or CFO in 2019 and no investment in shares under the matching arrangement were made, as this arrangement has been suspended for the period 2018 to 2020. The value of the share-matching plan for these three years is invested in the newly-created 2020 Performance Incentive Plan.

62 Governance and compliance | AkzoNobel Report 2019
Long-term incentives (LTI)The objectives of our long-term incentive plan are to encourage long-term, sustainable economic and shareholder value creation – both absolute and relative to competitors – and to align Board of Management interests with those of shareholders, as well as ensuring retention of the members of the Board of Management.
Conditional grant LTI share plan 2019-2021The Remuneration Committee determines the grant levels to be made in respect of members of the Board of Management, within the limits and plans that have been approved by shareholders. In 2019, the CEO and CFO received a conditional grant of shares equivalent to the face value of 150% of their annual base
salaries. The grant price was set based on the market closing price of an AkzoNobel common share as of January 2, 2019:• 21,379 shares were conditionally
granted to Thierry Vanlancker, CEO• 14,387 shares were conditionally
granted to Maarten de Vries, CFO
Vesting of the conditional grant is linked to two performance metrics: ROI and relative
total shareholder return (TSR), equally weighted and independently determining 50% of the LTI vesting. The Supervisory Board reviews ROI performance measure and target each year and ensures that both are directly linked to the strategic direction. The performance level determines: (i) the performance level below which no shares vest; (ii) the performance level at which the target number of shares vest; and (iii) the performance level at which the maximum number of shares vest.
TSR is measured relative to an industry peer group, consisting of the following nine companies:• Asian Paints • Axalta• Kansai Paint • Masco Corp• Nippon Paint • PPG• RPM • Sherwin Williams International • Tikkurilla
The vesting schedule that will apply to the relative TSR metric is listed in the table below. When making the performance assessment, the TSR result of AkzoNobel is included within the ranked peer group. Relative TSR vesting scheme for the conditional grants
RankVesting (as % of 50% of conditional grant)
1 150
2 135
3 120
4 100
5 75
6 50
7 25
8-10 0
Performance Board of Managment on STI metrics financial year
Information on performance targets
MetricRelative Weighing
a) Minimum target/Thresholdb) Corresponding award
a) Maximum target/Thresholdb) Corresponding award
a) Measured performance b) Actual award outcome
Thierry VanlanckerChief Executive Officer
ROS1 35% a) 8.8% a) 12.9% a) 10.7%
b) 0% b) 150% b 101.8%
OCF2 35% a) 914 a) 1,341 a) 972
b) 0% b) 150% b) 30.1%
Qualitative Targets 30% 0% 150% 140%
Maarten de VriesChief Financial Officer
ROS1 35% a) 8.8% a) 12.9% a) 10.7%
b) 0% b) 150% b) 101.8%
OCF2 35% a) 914 a) 1,341 a) 972
b) 0% b) 150% b) 30.1%
Qualitative Targets 30% 0% 150% 140%
Remuneration Board of Managment for the reported financial year
Fixed remuneration
Variable remuneration
Post-contract compensation2
Total remuneration
Proportion of fixed and variable
remuneration
Extraordinary items3
Base salary
Fringe benefits1
One-year variable
Multi-year variable
Thierry VanlanckerChief Executive Officer
1,006,000 10,106 886,610 1,488,096 170,400 3,561,212 0.33 /0.67 670,000
Maarten de VriesChief Financial Officer
677,000 10,106 387,826 636,345 132,700 1,843,977 0.44 /0.56 450,504
1 Social security contributions2 Compensation intended for build-up of retirement benefits instead of pension contributions3 Accrued amounts for the 2020 Performance Incentive Plan
1 ROS was calculated by determining the ratio of adjusted operating income over revenue. 2 OCF was calculated as adjusted EBITDA minus the change in operating working capital and minus capital expenditures, all in constant currencies and in millions.

63AkzoNobel Report 2019 | Governance and compliance
Vesting of the LTI Share Plan 2017-2019Under the LTI Share Plan 2017-2019, a conditional grant of 27,300 shares was made to the CEO. No grant was made to the CFO, as the CFO started with the company on January 1, 2018.
Vesting of the conditional grant was linked to three metrics: ROI (35%); relative TSR (35%); and the company’s average position in the DJSI ranking (30%). These targets were set by the Supervisory Board prior to the divestment of Specialty Chemicals. Following the completion of the sale, these performance targets are no longer relevant or applicable and the Supervisory Board has decided to apply the average historic performance of 85%. The final vesting percentage of the 2017 conditional grant – after including the dividend yield of 11.37% during the performance period – equaled 94.66%. The Remuneration Committee determined
that Thierry Vanlancker will vest 25,842 shares, subject to a further two-year holding requirement. At December 31, 2019, these shares had a market value of €2,342,319. An overview of all shares awarded or due to Board of Management members is shown in the table below.
2020 Performance Incentive Plan The 2020 Performance Incentive Plan is an exceptional, one-off plan to incentivize improvement of the company’s return on sales (ROS), put in place and approved by the AGM following the divestment of Specialty Chemicals. It supports achievement of 15% ROS (excluding
unallocated corporate center costs) by the end of 2020, presented to shareholders as financial guidance towards upper quartile industry performance.
The 2020 Performance Incentive Plan could award both members of the Board of Management with a cash payment of two times annual base salary, provided that 15% ROS is achieved by the end of 2020. The performance ranges are set out in the table on this page. If a change of control event were to occur during the performance period, the Remuneration Committee can test the Plan’s perfor-mance conditions and determine the
terms and conditions of any payment arising from it, including the timing of it.
Claw back and value adjustmentIn 2019, there was no cause for a claw back or value adjustment by the Remuneration Committee.
Loans The company does not grant loans, advance payments or guarantees to members of the Supervisory Board, members of the Executive Committee or any family member of such persons.
Shareholding requirements and share matchingAs of December 31, 2019, CEO Thierry Vanlancker held 19,181 shares, of which 1,924 qualified for share-matching under the Share-Matching Plan on a ratio 1:1. The matching shares were conditionally granted during 2017 and 2018 and will be released in 2020 and 2021
Performance range – 2020 Performance Incentive Plan
Below threshold Threshold Target Maximum
2020 ROS target <14% 14% 15% ≥17%
Award level 0% of base salary
100% of base salary
200% of base salary
400% of base salary
2019 remuneration of the Board of Management – Number of performance-related shares
PlanPerformance
period Award DateVesting
DateEnd of
holding periodBalance at
January 1, 2019Awarded in
2019Vested
in 2019Forfeited
in 2019Dividend in 2019
Balance at December 31,
2019
Thierry VanlanckerChief Executive Officer
ANS2017 2017-2019 January 1, 2017 February 12, 2020
February 12, 2020
30,383 – – (7,014) 2,473 25,842
ANS2018 2018-2020 January 1, 2018 February 2021
February 2023
20,813 – – 1,692 22,505
ANS2019 2019-2021 January 1, 2019 February 2022
February 2024
21,379 1,738 23,117
Maarten de VriesChief Financial Officer
ANS2018 2018-2020 January 1, 2018 February 2021
February 2023
17,722 – – 1,441 19,163
ANS2019 2019-2021 January 1, 2019 February 2022
February 2024
14,387 1,170 15,557

64 Governance and compliance | AkzoNobel Report 2019
shareholding in accordance with the Remuneration Policy.
Shares obtained by members of the Board of Management under the performance-related share plan are taken into account for share ownership purposes (but not for matching purposes) as soon as they have become unconditional. This includes vested shares that are to be retained during the blocking period of two years after vesting.
Comparative informationIn compliance with point (b), paragraph 1 of Article 9b of the EU Directive on long-term shareholder engagement, we present below: the annual change of remuneration of each individual member of the Board of Management; the performance of the company; and the average remuneration on a full-time equivalent basis of company employees over at least the five most recent financial years.
respectively, subject to the terms of the Share-Matching Plan. Shares acquired in 2019 by the CEO contribute towards his required shareholding in accordance with the Remuneration Policy.
As of December 31, 2019, CFO Maarten de Vries held 4,164 shares. The shares acquired by the CFO during 2019 contribute towards his required
Over the last few years of transition, the company’s performance fluctuated sig nificantly, as the table shows. Net income attributable to shareholders was reduced in 2014 due to higher tax and lower profit from discontinued operations and recovered again in 2015 due to the positive effects of process optimization, lower costs, favorable currency develop-ments and incidental items. In 2018, net profit increased sharply, mainly due to the divestment of Specialty Chemicals, with a deal result of €5,811 million after tax.
The transition was also reflected in the development of remuneration. Re struc-turing due to discontinued operations, for example, resulted in a reduction of the average salary per employee, followed by increases when operations stabilized and profits increased again. In 2018, the increase in average salary was also influenced by the inclusion of a one-off €57 million pension cost for the UK Guaran teed Minimum Pension equalizations.
The pay ratio between the total compen-sation of the CEO in 2019 and the total compensation of an AkzoNobel employee (calculated as an average of all employees as of December 31, 2019) is 65.0 (2018: 51.2).
Post-contract compensationBoard of Management members receive contributions towards post-contract benefits, which are defined as a percen-tage of income, as determined by the Supervisory Board. Currently, they are based on age. Contributions are paid
Comparative table of remuneration and company performance over last five reported financial years (RFY)
Divestment Specialty Chemicals
2014 2015 2016 2017 2018 2019
Remuneration CEO Ton Büchner Thierry Vanlancker
Fixed compensation 1,167,500 1,223,900 1,339,000 1,135,825 1,151,900 1,186,500
Total direct compensation 3,183,600 3,443,300 3,518,900 2,825,863 2,899,883 3,561,212
% change fixed compensation n.a. 5% 9% (15%) 1% 3%
% change total compensation n.a. 8% 2% (20%) 3% 23%
Remuneration CFO Maëlys Castella Maarten de Vries
Fixed compensation n.a.1 681,000 710,300 715,016 797,600 819,800
Total direct compensation n.a.1 1,322,700 1,586,400 2,169,290 1,515,816 1,843,977
% change fixed compensation n.a.1 n.a. 4% 1% 12% 3%
% change total compensation n.a.1 n.a. 20% 37% (30%) 22%
Company performance
Net income attributable to shareholders 546,000,000 979,000,000 970,000,000 832,000,000 6,674,000,000 539,000,000
Net income % change (25) 79 (1) (14) 702 (92)
ROI 10.9 14.0 14.4 13.9 12.6 14.1
ROI % change 21% 28% 3% (3%) (9%) 12%
Adjusted Operating Income (OPI) 1,072,000,000 1,462,000,000 928,000,000 905,000,000 798,000,000 991,000,000
Adjusted OPI % change 20% 36% (37%) (2%) (12%) 24%
Average remuneration on a full-time equivalent basis of employees
Average salary per employee2 58,589 59,176 58,559 53,453 56,619 54,825
% change average remuneration 0% 1% (1%) (9%) 6% (3%)
1 Maëlys Castella in service as of September 2014. 2014 remuneration excluded share based compensation, making an annualized figure noncomparable.
2 Calculated as employee benefits over average number of employees.
• In years of transition, the compensation for the newly appointed Board of Management member has been annualized
• The salary increase budgets for 2015 amounted to 3.4%, for 2016 to 3.8%, for 2017 to 4.1%, for 2018 to 3.5% and for 2019 to 4.26% of total salaries

65AkzoNobel Report 2019 | Governance and compliance
1 As of May 1, 2018.2 Until April 30, 2018.
3 Until April 30, 2019.4 As of May 1, 2019.
2019 remuneration of the Supervisory Board
in €2018 Total
remuneration RemunerationAttendance
feeCommittee
allowance feesEmployer’s
charges2019 Total
remuneration
Smedegaard Andersen, Chairman1 111,373 130,000 12,500 20,000 – 162,500
Antony Burgmans2 53,215 – – – – -
Peggy Bruzelius3 119,318 21,667 5,000 6,667 4,376 37,710
Byron Grote, Deputy Chairman 135,500 78,000 12,500 40,000 – 130,500
Pamela Kirby 92,500 65,000 12,500 15,000 – 92,500
Louis Hughes2 32,322 – – – – -
Dick Sluimers 107,500 65,000 2,500 40,000 – 107,500
Ben Verwaayen 95,000 65,000 12,500 15,000 – 92,500
Sue Clark 87,995 65,000 12,500 15,000 – 92,500
Patrick Thomas 90,659 65,000 12,500 20,000 – 97,500
Michiel Jaski 78,159 65,000 2,500 20,000 – 87,500
Jolanda Poots-Bijl4 – 43,333 2,500 13,333 59,166
Total 1,003,541 663,000 87,500 205,000 4,376 959,876
over the base salary in the current year and vary depending on the Board member’s age.
Board contractsAgreements for members of the Board of Management are concluded for a period not exceeding four years. After the initial term, re-appointments may take place for consecutive periods of up to four years each. The notice period by the Board member, and by the company, shall be subject to a six-month term. Members of the Board of Management normally retire in the year they reach the legal retirement age.
2. REMUNERATION FOR THE SUPERVISORY BOARD
Members of the Supervisory Board receive a fixed remuneration based on the roles and responsibilities. Travel expenses and facilities are borne by the company and reviewed by the Audit Committee. Implementation of the Remuneration Policy for the Supervisory Board in 2019 resulted in the payout as presented in the table on the right. According to the Code, members are not remunerated in shares.
3. REMUNERATION POLICIES FOR THE NEXT FINANCIAL YEAR
The Supervisory Board has evaluated the remuneration policies for the Board of Management and Supervisory Board. We have considered input from stakeholders
and the requirements of the EU Directive on the encouragement of long-term shareholder engagement (SRD II) and the Dutch regulation implementing this Directive. As a result, new policies were prepared for both boards, to be sub mitted for approval at the AGM in April 2020.
Remuneration Policy for the Board of ManagementThe Supervisory Board has concluded that the Remuneration Policy for the Board of Management – approved by the AGM in 2005 and since amended, most recently in 2018 – is in line with the objectives of the company. The remuneration it provides is balanced and adequate. The disclosure on the Policy has been extended to provide additional insight, in compliance with SRD II, and the
Remuneration Policy will be submitted to the AGM with limited changes.
For implementation in 2020, the Supervisory Board has decided that:• The one-off Performance Incentive
Plan introduced in 2018 remains in place, to be concluded this year. The suspension of the matching shares arrangement will be continued until this conclusion
• Metrics applied for the STI in 2019 were ROS and OCF, and are intended to continue for the 2020 financial year, as they remain relevant and aligned with the company’s strategy
• Metrics applied for LTI will remain in line with the strategic direction of the company. Should there be any changes to the current metrics, these
will then be submitted to shareholders for approval
Remuneration Policy for the Supervisory BoardThe Supervisory Board has concluded that the Remuneration Policy for the Super-visory Board – approved by the AGM in 2014 – is in line with the objectives of the company. The remuneration it provides is balanced and adequate and will remain unchanged. The disclosure on the Policy has been extended to provide additional insight, in compliance with SRD II, and this revised Remuneration Policy will be submitted to the AGM.

66 Governance and compliance | AkzoNobel Report 2019
Following 2019 reviews, AkzoNobel was included in a number of leading sustainability indices and continues to be the reference in the paints and coatings industry. See “Managing sustainability” in the Sustainability statements for a complete overview.
1 Based on Bloomberg share data. 2 Based on close value. 3 Based on year-end share price. Excluding special dividend of €4.00 in 2017 and €4.50 in 2019.
SHARES
AkzoNobel’s common shares are listed on Euronext Amsterdam. The company is included in the AEX Index, which consists of the top 25 listed companies in the Netherlands, ranked on the basis of their turnover in the stock market and free float. During 2019, 229 million AkzoNobel shares were traded on Euronext Amsterdam (2018: 176 million).
AkzoNobel has a sponsored level 1 ADR program and ADRs can be traded on the international OTCQX platform in the US. Please refer to the table below for stock codes and ticker symbols.
AkzoNobel has 100% free float, and a broad base of international shareholders.
Based on an independent shareholder analysis, the Distribution of shares chart (see opposite page) shows the geographical spread of AkzoNobel shareholders.
Around 3% of the company’s share capital is held by private investors, many of whom are resident in the Netherlands. Approximately 11% of the company’s share capital is held by sustainable and responsible investors*.
* As calculated by Nasdaq, according to their methodology, which is to include the sum of:• Core sustainable and responsible investor firms
where 100% of equity assets are managed with an Environmental, Social and Governance (ESG) approach
• Sustainable and responsible investor themed funds managed by broad sustainable and responsible investors
Euronext ticker symbol AKZA
ISIN common share NL0013267909
OTC ticker symbol AKZOY
ISIN ADR US0101995035
60
65
70
75
80
85
90
95
100
BB Global chem index
AEX
AkzoNobel
29 D
ec 1
8
Jan
19
Feb
19
Mar
19
Apr
19
May
19
Jun
19
Jul 1
9
Aug
19
Sep
t 19
Oct
19
Nov
19
31 D
ec 1
9
Share price performance 2019 AkzoNobel share price in €
AkzoNobel AEX index Bloomberg Global Chemicals Index
Key share data1
2017 2018 2019
Year-end (share price in €) 73.02 70.40 90.69
Year-high (share price in €)2 82.64 82.7 91.86
Year-low (share price in €)2 59.11 68.82 69.12
Number of shares outstanding at year-end (in millions) 253 256 200
Market capitalization at year-end (in € billions) 18.4 17.8 18.1
Dividend per share (in €) 2.50 1.80 1.90
Dividend yield (in %)3 3.4 2.6 2.1
AKZONOBEL AND THE CAPITAL MARKETS
The AkzoNobel share price was up 28.8% at year-end 2019, compared with 2018, out-performing both the Bloomberg Global Chemicals and AEX indices (see Share price performance graph above).
We were proud to receive recognition from the Top Employers Institute in Brazil, China, the UK, the Netherlands and the US during the course of 2019. It was the seventh year AkzoNobel had received Top Employer status in the UK, the sixth year in China (pictured) and the third year in Brazil.

67AkzoNobel Report 2019 | Governance and compliance
At year-end 2019, AkzoNobel was covered by 26 equity brokers. An overview of analyst recommendations is shown in the graph above.
DIVIDEND
The dividend policy is to pay a stable to rising dividend. In 2019, an interim dividend of €0.41 per share (2018: €0.37) was paid. The Board of Management proposes a 2019 final dividend of €1.49 per share, which would equal a total 2019 dividend of €1.90 (2018: €1.80) per share.
The dividend proposed to the 2020 Annual General Meeting of shareholders, following adoption, will be payable as of May 7, 2020. AkzoNobel’s shares will be
A
B
C
A Buy 11
B Hold 9
C Sell 6
Analyst recommendations* Distribution of shares 2019 in %
Rating agency Long-term rating Outlook
Moody’s 1 Baa1 Stable
Standard & Poor’s 2 BBB+ Stable
* Proposed. Excluding special dividend of €4.00 in 2017 and €4.50 in 2019.
* Figures indicate number of analysts.
For further information please visit our website: akzonobel.com
2019201820172016
1.43
0.37
1.28
0.37
1.94
0.56
1.49*
0.41
Dividend paid in € per share
Interim dividend
Final dividend
A US 49
B UK 20
C Rest of Europe 22
D Rest of world 9
A
B
C
D Total1.65 2.50 1.80 1.90
202620252024202320222021202020192018
500500 500
800 750
Debt maturity1 in € millions (nominal amounts)
Paid
1 At the end of 2019.
1 Rating affirmed January 2019. 2 Rating affirmed October 2018.
BONDS
On November 8, 2019, a €500 million Floating Note Rate reached maturity and was repaid. The maturity schedule of outstanding bonds is shown below.
trading ex- dividend as of April 27, 2020. In compliance with the listing requirements of Euronext Amsterdam, the record date for the final dividend will be April 28, 2020.
CREDIT RATING AND BONDS
AkzoNobel is committed to maintaining a strong investment grade credit rating. Regular review meetings are held between rating agencies and AkzoNobel senior management. See the table on the right for the current credit ratings and outlook.
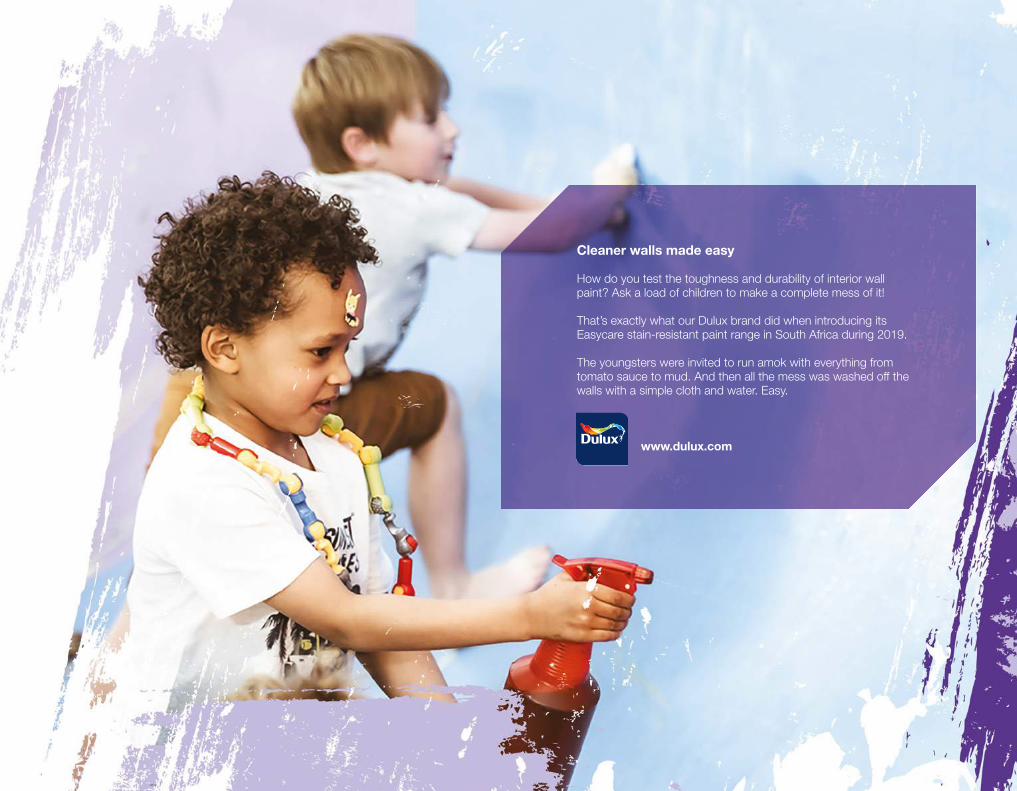
Financial information
Cleaner walls made easy
How do you test the toughness and durability of interior wall paint? Ask a load of children to make a complete mess of it! That’s exactly what our Dulux brand did when introducing its Easycare stain-resistant paint range in South Africa during 2019. The youngsters were invited to run amok with everything from tomato sauce to mud. And then all the mess was washed off the walls with a simple cloth and water. Easy.
www.dulux.com

69AkzoNobel Report 2019 | Financial information
FINANCIAL STATEMENTS
Financial statements
Consolidated statement of income 70
Consolidated statement of comprehensive income 70
Consolidated balance sheet 71
Consolidated statement of cash flows 72
Consolidated statement of changes in equity 73
Segment information 74
Notes to the Consolidated financial statements
Note 1 Summary of significant accounting policies 75
Note 2 Scope of consolidation 82
Note 3 Alternative performance measures 84
Note 4 Revenue 85
Note 5 Operating income 87
Note 6 Employee benefits 87
Note 7 Financing income and expenses 89
Note 8 Income tax 89
Note 9 Earnings per share 91
Note 10 Intangible assets 92
Note 11 Property, plant and equipment 93
Note 12 Leases 95
Note 13 Investments in associates and joint ventures 95
Note 14 Financial non-current assets 96
Note 15 Inventories 96
Note 16 Trade and other receivables 96
Note 17 Group equity 96
Note 18 Post-retirement benefit provisions 98
Note 19 Other provisions and contingent liabilities 103
Note 20 Net debt 104
Note 21 Trade and other payables 105
Note 22 Cash flow 106
Note 23 Commitments 106
Note 24 Related party transactions 106
Note 25 Remuneration of the Supervisory Board 106
and the Board of Management
Note 26 Financial risk management 107
Note 27 Subsequent events 110
Company financial statements
Statement of income 111
Balance sheet 111
Movements in shareholders’ equity 112
Note A General information 112
Note B Other results 113
Note C Financing income and expense 113
Note D Financial non-current assets 113
Note E Short-term receivables 114
Note F Shareholders’ equity 114
Note G Net debt 114
Note H Other current liabilities 115
Note I Financial instruments 115
Note J Contingent liabilities 115
Note K Auditor’s fees 116
Other information
Other information 116
Independent auditor’s report 117
Profit allocation and distributions 123
Financial summary 124
Fina
ncia
l inf
orm
atio
n

70 Financial statements | AkzoNobel Report 2019
CONSOLIDATED STATEMENT OF INCOME
CONSOLIDATED STATEMENT OF COMPREHENSIVE INCOME
In € millions, for the year ended December 31 Note 2018 2019
Continuing operations
Revenue 4 9,256 9,276
Cost of sales 5 (5,329) (5,309)
Gross profit 3,927 3,967
Selling expenses 5 (2,182) (2,179)
General and administrative expenses 5 (872) (687)
Research and development expenses 5 (264) (255)
Other results 5 (4) (5)
(3,322) (3,126)
Operating income 605 841
Financing income and expenses 7 (52) (76)
Results from associates and joint ventures
13 20 20
Profit before tax 573 785
Income tax 8 (118) (230)
Profit for the period from continuing operations
455 555
Discontinued operations
Profit for the period from discontinued operations
2 6,274 22
Profit for the period 6,729 577
Attributable to
Shareholders of the company 6,674 539
Non-controlling interests 55 38
Profit for the period 6,729 577
Earnings per share, in €
Continuing operations
Basic 9 1.61 2.43
Diluted 9 1.60 2.42
Discontinued operations
Basic 9 24.58 0.10
Diluted 9 24.47 0.10
Total operations
Basic 9 26.19 2.53
Diluted 9 26.07 2.52
In € millions, for the year ended December 31 2018 2019
Profit for the period 6,729 577
Other comprehensive income / (expense)
Items that will not be reclassified to the statement of income:
Post-retirement benefits (23) (249)
Income tax 24 24
Net effect 1 (225)
Items that may be reclassified subsequently to the statement of income:
Exchange differences arising on translation of foreign operations (110) 127
Cash flow hedges (20) –
Income tax 22 11
Net effect (108) 138
Other comprehensive expense for the period (107) (87)
Comprehensive income for the period 6,622 490
Comprehensive income attributable to
Shareholders of the company 6,578 453
Non-controlling interests 44 37
Comprehensive income for the period 6,622 490

71AkzoNobel Report 2019 | Financial statements
CONSOLIDATED BALANCE SHEET, BEFORE ALLOCATION OF PROFIT
In € millions, at December 31 Note 2018 2019
Assets
Non-current assets
Intangible assets 10 3,458 3,625
Property, plant and equipment 11 1,748 1,700
Right-of-use assets 12 – 374
Deferred tax assets 8 559 529
Investments in associates and joint ventures 13 137 150
Financial non-current assets 14 1,269 1,862
Total non-current assets 7,171 8,240
Current assets
Inventories 15 1,139 1,139
Current tax assets 8 74 63
Trade and other receivables 16 2,141 2,133
Short-term investments 20 5,460 138
Cash and cash equivalents 20 2,799 1,271
Total current assets 11,613 4,744
Total assets 18,784 12,984
Equity and liabilities
Equity
Shareholders’ equity 17 11,834 6,350
Non-controlling interests 17 204 218
Group equity 12,038 6,568
Non-current liabilities
Post-retirement benefit provisions 18 603 701
Other provisions 19 296 280
Deferred tax liabilities 8 368 391
Long-term borrowings 20 1,799 2,042
Total non-current liabilities 3,066 3,414
Current liabilities
Short-term borrowings 20 599 169
Current tax liabilities 8 225 196
Trade and other payables 21 2,645 2,406
Current portion of provisions 18, 19 211 231
Total current liabilities 3,680 3,002
Total equity and liabilities 18,784 12,984

72 Financial statements | AkzoNobel Report 2019
CONSOLIDATED STATEMENT OF CASH FLOWS
* Capital expenditures include investments in intangible assets (refer to Note 10) and investments in property, plant and equipment (refer to Note 11).
In € millions, for the year ended December 31 Note 2018 2019
Profit for the period from continuing operations 455 555
Adjustments to reconcile earnings to net cash generated from operating activities
Amortization and depreciation 10, 11, 12 239 360
Impairment losses 10, 11, 12 1 66
Financing income and expenses 7 52 76
Results from associates and joint ventures 13 (20) (20)
Pre-tax result on acquisitions and divestments 2 (42) (83)
Income tax 8 118 230
Changes in working capital 22 (177) (244)
Pension pre-funding 18, 22 – (161)
Changes in pension provisions 18 (157) (509)
Changes in other provisions 19, 22 (46) (15)
Interest paid (89) (66)
Income tax paid (164) (184)
Other changes (8) 28
Net cash generated from operating activities 162 33
Capital expenditures* 10, 11 (184) (214)
Interest received 47 13
Dividends from associates and joint ventures 7 –
Acquisition of consolidated companies 2 (128) (224)
Investments in short-term investments 20 (5,541) (2,325)
Repayments of short-term investments 20 80 7,663
Proceeds from divestments 54 104
Other changes (3) (5)
Net cash (used for ) / generated from investing activities (5,668) 5,012
Proceeds from borrowings 20 607 10
Borrowings repaid 20 (1,529) (623)
Capital repayment 17 – (2,000)
Share buyback 17 – (2,520)
Dividends paid 17 (636) (1,446)
Buy-out of non-controlling interests 2 (437) –
Other changes 5 –
Net cash used for financing activities (1,990) (6,579)
Net cash used for continuing operations (7,496) (1,534)
Net cash generated from/(used for) discontinued operations 2 8,958 (10)
Net change in cash and cash equivalents from continued and discontinued operations 1,462 (1,544)
Net cash and cash equivalents at January 1 20 1,278 2,732
Effect of exchange rate changes on cash and cash equivalents (8) 22
Net cash and cash equivalents at December 31 2,732 1,210

73AkzoNobel Report 2019 | Financial statements
* Includes a tax credit of €4 million (2018: €1 million tax charge).
CONSOLIDATED STATEMENT OF CHANGES IN EQUITY
Attributable to shareholders of the company
In € millionsSubscribed share
capitalAdditional paid-in
capitalCash flow hedge
reserveCumulative trans-
lation reserve
Other (legal) reserves and undistributed
profitShareholders’
equityNon-controlling
interests Group equity
Balance at December 31, 2017 505 769 15 (549) 5,125 5,865 442 6,307
Impact adoption IFRS 9 – – – – (3) (3) – (3)
Impact adoption IFRS 15 – – – – (48) (48) (5) (53)
Impact application IAS 29 – – – 23 – 23 – 23
Balance at January 1, 2018 505 769 15 (526) 5,074 5,837 437 6,274
Profit for the period – – – – 6,674 6,674 55 6,729
Reclassification into the statement of income – – (83) 52 – (31) – (31)
Other comprehensive income / (expense) – – 63 (151) (23) (111) (11) (122)
Tax on other comprehensive income – – 5 17 24 46 – 46
Comprehensive income for the period – – (15) (82) 6,675 6,578 44 6,622
Dividend 5 191 – – (586) (390) (57) (447)
Equity-settled transactions* – – – – 32 32 – 32
Issue of common shares 2 (2) – – – – – –
Acquisitions and divestments – – – – (223) (223) (220) (443)
Balance at December 31, 2018 512 958 – (608) 10,972 11,834 204 12,038
Profit for the period – – – – 539 539 38 577
Reclassification into the statement of income – – – – – – – –
Other comprehensive income / (expense) – – – 128 (249) (121) (1) (122)
Tax on other comprehensive income – – – 11 24 35 – 35
Comprehensive income for the period – – – 139 314 453 37 490
Dividend – – – – (1,423) (1,423) (23) (1,446)
Share buyback (14) – – – (2,520) (2,534) – (2,534)
Capital repayment and share consolidation (399) (957) – – (644) (2,000) – (2,000)
Equity-settled transactions* – – – – 20 20 – 20
Issue of common shares 1 (1) – – – – – –
Balance at December 31, 2019 100 – – (469) 6,719 6,350 218 6,568

74 Financial statements | AkzoNobel Report 2019
Decorative PaintsWhether our customers are professionals or DIY-ers, they want great paint that gives a great finish. We supply a variety of quality products for every situation and surface, including paints, lacquers and varnishes. We also offer a range of mixing machines and color concepts for the building and
renovation industry. Our specialty coatings for metal, wood and other building materials is the reference to the market.
Performance CoatingsWe are a leading supplier of performance coatings with strong brands and technologies. Our high quality products
are used to protect and enhance everything from ships, cars, aircraft, yachts and architectural components (struc-tural steel, building products, flooring) to consumer goods (mobile devices, appliances, beverage cans, furniture) and oil and gas facilities.
SEGMENT INFORMATION
1 Adjusted operating income is operating income excluding identified items.2 ldentified items are special charges and benefits, results on acquisitions and divestments, major restructuring and impairment charges,
and charges and benefits related to major legal, anti-trust, environmental and tax cases.
3 ROS% is calculated as adjusted operating income (operating income excluding identified items) as a percentage of group revenue.4 OPI margin is calculated as operating income as a percentage of group revenue.
1 Capital expenditures include investments in intangible assets (refer to Note 10) and investments in property, plant and equipment (refer to Note 11).2 ROI% is calculated as adjusted operating income (operating income excluding identified items) of the last 12 months as a percentage of average invested capital of the last 12 months. Invested capital is calculated as total assets (excluding cash and
cash equivalents, short-term investments, investments in associates, the receivable from pension funds in an asset position and assets held for sale) less current tax liabilities, deferred tax liabilities and trade and other payables.
* Capital expenditures include investments in intangible assets (refer to Note 10) and investments in property, plant and equipment (refer to Note 11).
Information per business areaRevenue
from third parties Group revenueAmortization and
depreciationAdjusted operating
income1 Identified items2 Operating income ROS%3 OPI margin4
In € millions 2018 2019 2018 2019 2018 2019 2018 2019 2018 2019 2018 2019 2018 2019 2018 2019
Decorative Paints 3,667 3,670 3,699 3,703 (92) (155) 346 418 (38) 7 308 425 9.4 11.3 8.3 11.5
Performance Coatings 5,563 5,549 5,587 5,563 (138) (183) 629 688 (52) (123) 577 565 11.3 12.4 10.3 10.2
Corporate and other 26 57 (30) 10 (9) (22) (177) (115) (103) (34) (280) (149)
Total 9,256 9,276 9,256 9,276 (239) (360) 798 991 (193) (150) 605 841 8.6 10.7 6.5 9.1
Information per business areaInvested capital Total assets Total liabilities Capital expenditures1 ROI%2
In € millions 2018 2019 2018 2019 2018 2019 2018 2019 2018 2019
Decorative Paints 2,759 2,992 4,357 5,569 1,511 3,249 50 62 12.4 13.4
Performance Coatings 2,963 3,401 4,766 6,794 1,563 2,774 107 113 20.5 20.7
Corporate and Other 481 621 9,661 621 3,672 393 27 39 – –
Total 6,203 7,014 18,784 12,984 6,746 6,416 184 214 12.6 14.1
Regional information
Revenue by region of destinationIntangible assets and property,
plant and equipment Invested capital Capital expenditures*
In € millions 2018 2019 2018 2019 2018 2019 2018 2019
The Netherlands 318 359 1,198 1,182 1,639 1,766 25 42
Other European countries 3,726 3,748 1,469 1,659 2,023 2,469 81 74
US and Canada 1,134 1,139 485 501 636 682 18 29
South America 815 815 255 239 332 347 13 15
Asia 2,704 2,656 1,698 1,642 1,386 1,528 35 44
Other regions 559 559 101 102 187 222 12 10
Total 9,256 9,276 5,206 5,325 6,203 7,014 184 214

75AkzoNobel Report 2019 | Financial statements
NOTES TO THE CONSOLIDATED FINANCIAL STATEMENTS
GENERAL INFORMATION
Akzo Nobel N.V. is a company headquartered in the Neth-erlands. The address of our registered offi ce is Christian Neefestraat 2, Amsterdam; the Chamber of Commerce number is 09007809. We have fi led a list of subsidiar-ies, associated companies and joint ventures, drawn up in conformity with Article 379 and 414 of Book 2 of the Dutch Civil Code, with the Trade Registry of Amsterdam.
We have prepared the Consolidated fi nancial statements of Akzo Nobel N.V. in accordance with International Finan-cial Reporting Standards (IFRS) as adopted by the Euro-pean Union. They also comply with the fi nancial reporting requirements included in Title 9 of Book 2 of the Dutch Civil Code, as far as applicable. The Consolidated fi nancial statements have been prepared on a going concern basis. The Management report within the meaning of Article 391 of Book 2 of the Dutch Civil Code consists of the following parts of the annual report:• 2019 facts and fi gures• 2019 summary• CEO statement• Our strategy: how we created value in 2019• Business overview• Our leadership: Statement of the Board of Management• Governance and compliance: Corporate governance
statement• Governance and compliance: Remuneration report• Financial information: Note 5 Operating income• Financial information: Note 26 Financial risk
management
The section How we created value in 2019 provides information on the developments during 2019 and the results. This section also provides information on cash fl ow and net debt, capital expenditures, innovation activities and employees.
On February 11, 2020, the Board of Management autho-rized the fi nancial statements for issue. The fi nancial statements as presented in this report are subject to adop-tion by the Annual General Meeting of shareholders on April 23, 2020.
CONSOLIDATION
The Consolidated fi nancial statements include the accounts of Akzo Nobel N.V. and its subsidiaries. Subsid-iaries are companies over which Akzo Nobel N.V. has control, because it is exposed, or has rights, to variable returns from its involvement with the subsidiary and has the ability to affect returns through its power over the subsidiary. Non-controlling interests in equity and in results are presented separately.
CHANGE IN ACCOUNTING POLICIES AND FIRST TIME APPLICATION
In 2019, the most signifi cant change in accounting policies relates to adoption of the new standard IFRS 16 “Leases”.
IFRS 16 LeasesIFRS 16 replaces the previous standard on lessee accounting for leases. It requires lessees to bring most leases on balance sheet in a single lease accounting model, recognizing a right-of-use asset and a lease liability. Compared with the previous standard for operating leases, it also impacts the classifi cation and timing of expenses and consequently the classifi cation between net cash from operating activities and net cash from fi nancing activities. AkzoNobel has adopted IFRS 16 as per January 1, 2019, applying the modifi ed retrospective approach. All right-of-use assets are measured at the amount of the lease liability at transition, adjusted for any prepaid or accrued lease expenses. Short-term and low-value leases are exempted. AkzoNobel has not restated its 2018 compara-tive fi gures. The adoption did not have an impact on group equity. IFRS 16 requires the right-of-use asset and the lease liability to be recognized at discounted value and
Note 1 Summary of signifi cant accounting policies assumptions with regards to termination and renewal options have been taken into consideration.
On transition to IFRS 16, we elected to apply the practi-cal expedient to grandfather the prior assessment of which transactions are leases. We applied IFRS 16 only to contracts that were previously identifi ed as leases. Contracts that were not identifi ed as leases under IAS 17 and IFRIC 4 were not reassessed for whether there is a lease under IFRS 16. Therefore, the defi nition of a lease under IFRS 16 was applied only to contracts entered into or changed on or after January 1, 2019. We applied judgement at the initial application of IFRS 16 and also thereafter, when assessing whether payments to be made in optional periods should be included in the calculation of the right-of-use assets and lease liability. Such payments are included in the calculations when we deem it reason-ably certain to exercise an option to extend the lease, or not to exercise an option to terminate the lease.
We used a number of practical expedients when applying IFRS 16 to leases previously classifi ed as operating leases under IAS 17, in particular: • On a lease by lease basis we decided whether to
recognize right-of-use assets and liabilities for leases for which the lease term ends within 12 months of the date of initial application
• We did not recognize right-of-use assets and liabilities for leases of low-value assets (e.g. certain IT equipment)
• We excluded initial direct costs from the measurement of the right-of-use asset at the date of initial application
• We used hindsight when determining the lease terms
In respect of the implications of IFRS 16 for tax account-ing, AkzoNobel has assessed that the right-of-use asset and the lease liability are to be considered together as a single transaction, because in the company’s view they are integrally linked. As a result, at inception of a lease and also at the IFRS 16 transition, the net lease asset or liability (without taking into account any advance payments) is nil, the tax base is nil and, therefore, the temporary difference is nil. Hence, no deferred taxes have to be accounted for at inception/IFRS 16 transition and going forward deferred tax

76 Financial statements | AkzoNobel Report 2019
is recognized when temporary differences arise after initial recognition, subject to the IAS 12 recognition principles.
The adoption of IFRS 16 as per January 1, 2019, has resulted in the recognition of right-of-use assets of €367 million, and additional lease liabilities of €363 million. In addition, assets with a book value of €65 million have been reclassified to right-of-use assets, including among others finance leases. In the Consolidated statement of income, the operating lease expenses (€113 million), previ-ously recorded in operating income, are replaced by the
depreciation charges on right-of-use assets (€105 million; remains recorded in operating income) and by Interest expenses for the lease liability (€8 million; recorded in net financing expenses). In addition, we recorded a non-cash impairment charge of right-of-use assets of €5 million. On a net basis, the adoption of IFRS 16 has led to an increase of operating income by €3 million and an increase of net financing expenses by €8 million; profit before tax was €5 million lower and profit for the period was €3 million lower. The payments for the operat-ing leases (€108 million), previously included in the net
cash from operating activities, are now included in the net cash from financing activities.
The blended incremental borrowing rate applied to the lease liabilities at January 1, 2019, was 2.2%. The follow-ing table reflects the reconciliation of the operating lease commitments as at December 31, 2018, and the lease liabilities recognized as at January 1, 2019.
Impact of adoption of IFRS 16 on the consolidated balance sheet
In € millionsAs reported at
December 31, 2018
Restatement due to adoption
of IFRS 16
Restated opening balance at
January 1, 2019
Intangible assets 3,458 (36) 3,422
Property, plant and equipment 1,748 (29) 1,719
Right-of-use assets – 432 432
Deferred tax assets 559 – 559
Investments in associates and joint ventures
137 – 137
Financial non-current assets 1,269 – 1,269
Inventories 1,139 – 1,139
Current tax assets 74 – 74
Trade and other receivables 2,141 (4) 2,137
Short-term investments 5,460 – 5,460
Cash and cash equivalents 2,799 – 2,799
Total assets 18,784 363 19,147
Shareholder’s equity 11,834 – 11,834
Non-controlling interest 204 – 204
Post-retirement benefit provisions 603 – 603
Other provisions 296 – 296
Deferred tax liabilities 368 – 368
Long-term borrowings 1,799 270 2,069
Short-term borrowings 599 93 692
Current tax liabilities 225 – 225
Trade and other payables 2,645 – 2,645
Current portion of provisions 211 – 211
Total equity and liabilities 18,784 363 19,147
Impact of adoption of IFRS 9 and IFRS 15 and application of IAS 29
In € millions2019 before
IFRS 16 Impact2019 Including
IFRS 16
Depreciation and amortization (255) (105) (360)
Adjusted operating income1 6 983 8 991
Identified items2 (145) (5) (150)
Operating income 838 3 841
Financing income and expenses (68) (8) (76)
Income tax (232) 2 (230)
Profit for the period 580 (3) 577
Net cash from operating activities 75 108 33
Net cash from financing activities (6,471) (108) (6,579)
ROS%3 6 10.6 0.1 10.7
OPI margin4 6 9.0 0.1 9.1
ROI%5 6 14.7 (0.6) 14.11 Adjusted operating income is operating income excluding identified items. 2 This identified item relates to a non-cash impairment of right-of-use assets following the implementation of our strategic
portfolio review. 3 ROS% is calculated as adjusted operating income (operating income excluding identified items) as a percentage of group revenue.4 OPI margin is operating income as percentage of revenue.5 ROI% is calculated as adjusted operating income (operating income excluding identified items) of the last 12 months as a
percentage of average invested capital of the last 12 months. Invested capital is calculated as total assets (excluding cash and cash equivalents, short-term investments, investments in associates, the receivable from pension funds in an asset position and assets held for sale) less current tax liabilities, deferred tax liabilities and trade and other payables.
6 Adjusted operating income, ROS%, OPI margin and ROI% are APM measures; a reconciilation of the alternative performance measures to the most directly comparable IFRS measures refer to Note 3.

77AkzoNobel Report 2019 | Financial statements
ALTERNATIVE PERFORMANCE MEASURES (NOTE 3)
Our Alternative Performance Measures (APM) are based on IFRS measures and exclude so-called identified items. Identified items are special charges and benefits, results on acquisitions and divestments, major restructuring and impairment charges, and charges and benefits related to major legal, anti-trust, environmental and tax cases, which are generated outside the normal course of business.
USE OF ESTIMATES
The preparation of the financial statements in compliance with IFRS requires management to make judgments, esti-mates and assumptions that affect amounts reported in the financial statements. The estimates and assumptions are based on experience and various other factors that are believed to be reasonable under the circumstances and are used to judge the carrying values of assets and liabilities that are not readily apparent from other sources. The estimates and underlying assumptions are reviewed on an ongoing basis. The most critical accounting policies involving a higher degree of judgment and complexity in applying principles of valuation and for which changes in the assumptions and estimates could result in significantly different results than those recorded in the financial state-ments are the following:• Scope of consolidation (Note 2)• Discontinued operations and held for sale (Note 2)• Income tax and deferred tax assets, including uncertain
tax positions (Note 8)• Impairment of intangible assets, property, plant and
equipment and right-of-use assets (Note 10, 11, 12)• Post-retirement benefit provisions (Note 18)• Provisions and contingent liabilities (Note 19)
STATEMENT OF CASH FLOWS
We have used the indirect method to prepare the statement of cash flows. Cash flows in foreign currencies have been
translated at transaction rates. Acquisitions or divestments of subsidiaries are presented net of cash and cash equivalents acquired or disposed of, respectively. Cash flows from derivatives are recognized in the statement of cash flows in the same category as those of the hedged items.
OPERATING SEGMENTS
We determine and present operating segments based on the information that is provided to the Executive Commit-tee, our chief operating decision-maker during 2019, to make decisions about resources to be allocated to the segments and assess their performance. Segment results reported to the Executive Committee include items directly attributable to a segment as well as those items that can be allocated on a reasonable basis. Unallocated items comprise mainly of corporate assets and corporate costs and are reported in “Corporate and other”.
FOREIGN CURRENCIES
Transactions in foreign currencies are translated into the functional currency using the foreign exchange rate at transaction date. Monetary assets and liabilities denomi-nated in foreign currencies are translated into the function-al currency using the exchange rates at the balance sheet date. Resulting foreign currency differences are included in the statement of income, whereby interest-related effects are included in financing income and expenses. Non-monetary assets and liabilities denominated in foreign currencies are translated into the functional currency at the exchange rate at acquisition date.
The assets and liabilities of entities with other functional currencies are translated into euros, the functional currency of the parent entity, using the exchange rates at the balance sheet date. The income and expenses of entities with other functional currencies are translated into the functional currency, using the exchange rates at transaction date.
Other changes in accounting policiesAccounting pronouncements, which became effective for 2019 (among others IFRIC 23 ‘‘Uncertainty over income tax treatments” and ‘‘Plan Amendment, Curtail-ment and Settlement” (Amendments to IAS 19)) had no material impact on our Consolidated financial statements as to a large extent we already complied with these pronouncements.
DISCONTINUED OPERATIONS (NOTE 2)
A discontinued operation is a component of our busi-ness that represents a separate major line of business or geographical area of operations that has been disposed of or is held for sale/held for distribution, or is a subsidiary acquired exclusively with a view to resale. Assets and liabilities are classified as held for sale if it is highly probable that the carrying value will be recovered through a sale transaction within one year rather than through continuing use. When reclassifying assets and liabilities as held for sale, we recognize the assets and liabilities at the lower of their carrying value or fair value less costs to sell. Assets held for sale are not depreciated and amortized but tested for impairment. In case of discontinued operations, the comparative figures in the Consolidated statement of income and Consolidated statement of cash flows are represented. The balance sheet comparative figures are not represented.
Changes in lease accounting
In € millions 2019
Operating lease commitments as at December 31, 2018 420
Adjustments as a result of finalizing the lease portfolio assessment
(7)
Low-value and short-term leases recognized on a straight-line basis as expense
(10)
Total undiscounted lease commitments 403
Discounting of lease commitments (40)
Lease liability recognized at January 1, 2019 363

78 Financial statements | AkzoNobel Report 2019
When a subsidiary is operating in a hyperinflationary country, the financial statements of this entity are restated into the current purchasing power at the end of the report-ing period. As of January 1, 2018, hyperinflation account-ing is applied for Argentina.
Foreign exchange differences resulting from translation into the functional currency of investments in subsidiaries and of intercompany loans of a permanent nature with other functional currencies are recorded as a separate compo-nent (cumulative translation reserve) within Other compre-hensive income. These cumulative translation adjustments are reclassified (either fully or partly) to the statement of income upon disposal (either fully or partly) or liquidation of the foreign subsidiary to which the investment or the inter-company loan with a permanent nature relates to. Foreign currency differences arising on the translation of a financial liability designated as an effective hedge of a net invest-ment in a foreign operation are recognized in the cumula-tive translation reserve (in other comprehensive income).
EXCHANGE RATES OF KEY CURRENCIES
The principal exchange rates against the euro used in preparing the balance sheet and the statement of income are:
REVENUE RECOGNITION (NOTE 4)
Sale of goodsAkzoNobel’s main business consists of straightforward selling of goods (paints and coatings) to customers at
When not separately invoiced, part of the sales price of paints or coatings is allocated to such services.
POST-RETIREMENT BENEFITS (NOTE 6, 18)
Contributions to defined contribution plans are recognized in the statement of income as incurred.
Most of our defined benefit pension plans are funded with plan assets that have been segregated in a trust or foundation. We also provide post-retirement benefits other than pensions to certain employees, which are gener-ally not funded. Valuations of both funded and unfunded plans are carried out by independent actuaries based on the projected unit credit method. Post-retirement costs primarily represent the increase in the actuarial present value of the obligation for projected benefits based on employee service during the year and interest on the net defined benefit liability/asset. When the calculation results in a benefit to AkzoNobel, the recognized asset is limited to the present value of economic benefits available in the form of any future refunds from the plan or reductions in future contributions to the plan. An economic benefit is available if it is realizable during the life of the plan, or on the settlement of the plan liabilities. The effect of these so-called asset ceiling restrictions and any changes therein is recognized in other comprehensive income. Remeasure-ment gains and losses, which arise in calculating our obli-gations, are recognized in other comprehensive income. When the benefits of a plan improve, the portion of the increased benefits related to past service by employees is recognized as an expense in the statement of income immediately. We recognize gains and losses on the curtail-ment or settlement of a defined benefit plan when the curtailment or settlement occurs.
Interest on the net defined benefit liability/asset is in- cluded in financing expenses related to post-retirement benefits. Other charges and benefits recognized are reported in operating income, unless recorded in other comprehensive income.
contractually determined prices and conditions without any additional services. Although the transfer of risks and rewards is not the only criterion to be considered to determine whether control over the goods has transferred, it is in most situations considered to be the main indicator of the customer’s ability to direct the use of and obtain the benefits from the asset and largely also coincides with the physical transfer of the goods and the obligation of the customer to pay.
Variable considerations, including among others rebates, bonuses, discounts and payments to customers, are accrued for as performance obligations are satisfied and revenue is recognized. Variable considerations are only recognized when it is highly probable that these are not subject to significant reversal. In case of expected returns, no revenue is recognized for such products, but a refund liability and an asset for the right to recover the to be returned products are recorded.
A provision for warranties is recognized when the underly-ing products or services are sold, generally based on historical warranty data.
Revenue is recognized net of rebates, discounts and similar allowances, and net of sales tax.
Equipment provided to customersAkzoNobel regularly provides mixing machines, store interior and other assets to its customers at the start of a paint delivery contract. The delivery of such assets qualifies as a separate performance obligation. Revenue can only be recognized at the moment of transfer of such assets, when there is an agreed sales price or when there is a binding take-or-pay commitment for a minimum quantity of paint to be acquired by the customer.
ServicesAkzoNobel provides certain training, technical or support services to customers as well as shipping and handling activities for its customers. Service revenue is recognized over time when the related services are being provided.
Balance sheet Statement of income
2018 2019 % 2018 2019 %
US dollar 1.143 1.121 2.0 1.182 1.120 5.5
Pound sterling 0.898 0.854 5.2 0.885 0.878 0.8
Swedish krona 10.245 10.473 (2.2) 10.257 10.589 (3.1)
Chinese yuan 7.863 7.808 0.7 7.812 7.742 0.9
Brazilian real 4.438 4.507 (1.5) 4.307 4.414 (2.4)
79AkzoNobel Report 2019 | Financial statements
OTHER EMPLOYEE BENEFITS (NOTE 6, 19)
Provisions for other long-term employee benefits are measured at present value, using actuarial assumptions and methods. Any actuarial gains and losses are recognized in the statement of income in the period in which they arise.
SHARE-BASED COMPENSATION (NOTE 6)
We have a performance-related and a restricted share plan as well as a share-matching plan, under which shares are conditionally granted to certain employees. The fair value is measured at grant date and amortized over the three-year period during which the employees normally become unconditionally entitled to the shares with a corresponding increase in shareholders’ equity. Amortization is acceler-ated in the event of earlier vesting or settlement. In case of a plan modification, the fair value is increased when the change is beneficial to the employee.
INCOME TAX (NOTE 8)
Income tax expense comprises both current and deferred tax, including effects of changes in tax rates. In determin-ing the amount of current and deferred tax we also take into account the impact of uncertain tax positions and whether additional taxes and interest may be due. Income tax is recognized in the statement of income, unless it relates to items recognized in other comprehen-sive income or equity.
Current tax includes the expected tax payable and receiv-able on the taxable income for the year, using tax rates enacted or substantially enacted at reporting date, as well as (any adjustments to) tax payables and receivables with respect to previous years.
Deferred tax is recognized using the liability method on temporary differences arising between the tax bases of assets and liabilities and their carrying amounts in the Consolidated financial statements. We do not recognize deferred tax for the initial recognition of goodwill, the initial recognition of assets or liabilities that affect neither accounting nor taxable profit, and differences related to investments in subsidiaries to the extent that they will probably not reverse in the foreseeable future. Deferred tax assets are recognized for unused tax losses, tax credits and deductible temporary differences, to the extent that it is probable that future taxable profits will be available against which they can be utilized.
Measurement of deferred tax assets and liabilities is based upon the enacted or substantially enacted tax rates expected to apply to taxable income in the years in which temporary differences are expected to be reversed. Income tax consequences are taken into account in the determination of deferred tax liabilities to the extent earnings are expected to be distributed by subsidiaries in the foreseeable future and AkzoNobel has control over dividend distribution. Deferred tax positions are not discounted.
EARNINGS PER SHARE (NOTE 9)
Basic earnings per share is calculated by dividing the profit for the period attributable to shareholders of the company by the weighted average number of common shares outstanding during the year adjusted for any repur-chased shares. Diluted earnings per share is calculated by adjusting the weighted average number of common shares outstanding during the year for the diluting effect of the shares of the performance-related share plan, the restricted share plan and the share-matching plan.
Adjusted earnings per share represents the basic earnings per share from continuing operations excluding identified items, after taxes.
GOVERNMENT GRANTS
Government grants related to costs are deducted from the relevant costs to be compensated in the same period. Government grants to compensate for the cost of an asset are deducted from the cost of the related asset. Emission rights granted by the government are recorded at cost. A provision is recorded if the actual emission is higher than the emission rights granted.
INTANGIBLE ASSETS (NOTE 10)
Intangible assets are valued at cost less accumulated amortization and impairment charges. Intangible assets with an indefinite useful life, such as goodwill and certain brands, are not amortized, but tested for impairment annu-ally using the value in use method. Goodwill in a business combination represents the excess of the consideration paid over the net fair value of the acquired identifiable assets, liabilities and contingent liabilities. If the cost of an acquisition is less than the fair value of the net assets of the subsidiary acquired, the difference is recognized directly in the statement of income. The effects of all transactions with non-controlling interest shareholders are recorded in equity if there is no change in control.
Intangible assets with a finite useful life, such as licenses, know-how, brands, customer relationships, intellectual property rights, emission rights and capitalized develop-ment and software costs, are capitalized at historical cost and amortized on a straight-line basis over the estimated useful life of the assets, which generally ranges from five to 40 years for brands with finite useful lives, five to 25 years for customer lists and three to 15 years for other intangibles. Amortization methods, useful lives and residual values are reassessed annually. Research expenditures are recognized as an expense as incurred.

80 Financial statements | AkzoNobel Report 2019
PROPERTY, PLANT AND EQUIPMENT (NOTE 11)
Property, plant and equipment are valued at cost less accumulated depreciation and impairment charges. Costs include expenditures that are directly attributable to the acquisition of the asset, including borrowing cost of capital investment projects under construction.
Depreciation is calculated using the straight-line method, based on the estimated useful life of the asset compo-nents. The useful life of plant equipment and machinery generally ranges from ten to 25 years, and for buildings ranges from 20 to 50 years. Land is not depreciated. In the majority of cases residual value is assumed to be not significant. Depreciation methods, useful lives and residualvalues are reassessed annually.
Costs of major maintenance activities are capitalized and depreciated over the estimated useful life. Maintenance costs which cannot be separately defined as a component of property, plant and equipment are expensed in the period in which they occur. We recognize conditional asset retirement obligations in the periods in which sufficient information becomes available to reasonably estimate the cash outflow.
IMPAIRMENTS (NOTE 10, 11, 12)
We assess the carrying value of intangible assets, property, plant and equipment and right-of-use assets whenever events or changes in circumstances indicate that the carrying value of an asset may not be recover-able. In addition, for goodwill and other intangible assets with an indefinite useful life, the carrying value is reviewed at least annually or when circumstances indicate the carrying amount may be impaired. If the carrying value of an asset or its cash-generating unit exceeds its estimated recoverable amount, an impairment loss is recognized in the statement of income on the function level of the asset impaired. The assessment for impairment is performed at the lowest level of assets generating largely independent
cash inflows. For goodwill and other intangible assets with an indefinite life, we have determined this to be at business unit level (one level below segment).
Except for goodwill, we reverse impairment losses in the statement of income if and to the extent we have identified a change in estimates used to determine the recoverable amount.
LEASES (NOTE 12, 20)
We applied IFRS 16 using the modified retrospective approach and therefore the comparative information for 2018 has not been restated and continues to be reported under IAS 17 and IFRIC 4. The details of accounting poli-cies under IAS 17 and IFRIC 4 are disclosed separately. Policy applicable from January 1, 2019We assess whether a contract is, or contains, a lease at inception. A contract is, or contains, a lease if the contract conveys the right to control the use of an identified asset for a period of time in exchange for a consideration.
This policy is applied to contracts entered into, on or after January 1, 2019.
As a lessee At commencement or on modification of a contract that contains a lease component, we allocate the consideration in the contract to each lease component on the basis of its relative stand-alone prices. However, for the leases of cars we have elected not to separate non-lease components and account for the lease and non-lease components as a single lease component.
We recognize a right-of-use asset and a lease liability at the lease commencement date. The right-of-use asset is initially measured at the present value of the lease liability. The right-of-use asset value contains lease prepayments, lease incentives received, the initial direct costs and an estimate of restoration, removal and dismantling costs.
The right-of-use assets are subsequently depreciated using the straight-line method from the commencement date to the end of the lease term or shorter economic life. In addition, the right-of-use assets is reduced by impair-ment losses, if any, and adjusted for certain remeasure-ments of the lease liability.
The net present value of the lease liability is measured at the discounted value of the lease payments. The liability includes payments to be made in optional periods if the lessee is reasonably certain to exercise an option to extend the lease, or not to exercise an option to terminate the lease. The lease payments comprise the following: • Fixed payments (including in substance fixed payments),
less any lease incentives• Variable lease payments that depend on an index
or a rate• The exercise price of a purchase option if it is
reasonably certain that the option will be exercised• Payments of penalties for terminating the lease, if the
lease term reflects the lessee exercising an option to terminate the lease; and
• Amounts expected to be payable under residual value guarantees.
These lease payments are discounted using the inter-est rate implicit in the lease if that rate can be readily determined. If that rate cannot be readily determined, the incremental borrowing rate is used. We determine our incremental borrowing rates by obtaining interest rates from various external financing sources and make certain adjustments to reflect the term of the lease and type of the asset leased.
At the lease commencement dates, we assess whether it is reasonably certain to exercise the extension options. We reassess whether it is reasonably certain to exercise the options if there is a significant event or significant change in circumstances within our control.

81AkzoNobel Report 2019 | Financial statements
At the commencement date, we assess whether it is reasonably certain that: • An option to extend is exercised; or• An option to purchase is exercised; or• An option to terminate the lease is not exercised
In making these assessments, all relevant facts and circumstances that create an economic incentive for us to exercise, or not to exercise, the option, including any expected changes in facts and circumstances from the commencement date until the exercise date of the option are considered.
Short-term leases and leases of low-value assets We elected not to recognize on the balance sheet right-of-use assets and lease liabilities for leases of low-value assets and short-term leases. We recognize the lease payments associated with these leases as an expense on a straight-line basis over the lease term.
Policy applicable before January 1, 2019Lease contracts in which we have substantially all the risks and rewards of ownership are classified as financial leases. Upon initial recognition, the leased asset is measured at the lower of its fair value and the present value of minimum lease payments. Subsequent to initial recognition, the asset is depreciated using a straight-line method, based on the lower of the estimated useful life or the lease term. The interest expenses are recognized as other financing expenses over the lease term.
Payments made under operational leases are recognized in the statement of income on a straight-line basis over the term of the lease.
ASSOCIATES AND JOINT VENTURES (NOTE 13)
Associates and joint ventures are accounted for using the equity method and are initially recognized at cost. The Consolidated financial statements include our share of the income and expenses of the associates and joint ventures,
whereby the result is determined using our accounting principles. When the share of losses exceeds the interest in the investee, the carrying amount is reduced to nil and recognition of further losses is discontinued, unless we have incurred legal or constructive obligations on behalf of the investee.
INVENTORIES (NOTE 15)
Inventories are measured at the lower of cost and net realizable value. Costs of inventories comprise all costs of purchase, costs of conversion and other costs incurred in bringing the inventories to the present location and condition. The costs of inventories are determined using weighted average cost.
PROVISIONS (NOTE 19)
We recognize provisions when a present legal or construc-tive obligation as a result of a past event exists, it is probable that an outflow of economic benefits is required to settle the obligation and the amount can be reliably esti-mated. Provisions are measured at net present value. The increase of provisions as a result of the passage of time is recognized in the statement of income under Financing income and expenses.
Provisions for restructuring of activities are recognized when a detailed and formal restructuring plan has been approved, and the restructuring has either commenced or has been announced publicly. We do not provide for future operating costs.
FINANCIAL INSTRUMENTS
Classification All assets are measured at amortized cost, fair value through profit or loss or fair value through other compre-hensive income. Financial assets are classified according to a model based on:
• A contractual cash flow characteristics test • A business model dictating how the reporting entity
manages its financial assets in order to generate cash flows as either: 1. Hold to collect contractual cash flows. 2. Collect contractual cash flows and sell. 3. Neither 1 or 2.
• Election of the fair value option in some specific cases in order to eliminate an accounting mismatch
The classification of a financial asset is determined at initial recognition, but if certain conditions are met, an asset might be subject to reclassification.
Valuation and impairmentFinancial assets are assessed for impairment either according to the general approach or a simplified approach.
The calculation of impairment under the general approach uses the following stages:• 12-month expected credit losses; taking in account
possible default events within one year• Lifetime expected credit losses in case of an increase in
credit risk; through recognition of expected credit losses over the remaining life of the exposure
• Lifetime expected credit losses, where interest is calculated on the net amount of the receivables less impairment loss
In all above stages, the impairment calculation used at AkzoNobel is based on external credit ratings of involved parties or default rates published by well-known credit risk agencies.
The financial assets included in the general impairment approach are long-term loans and other long-term receivables.
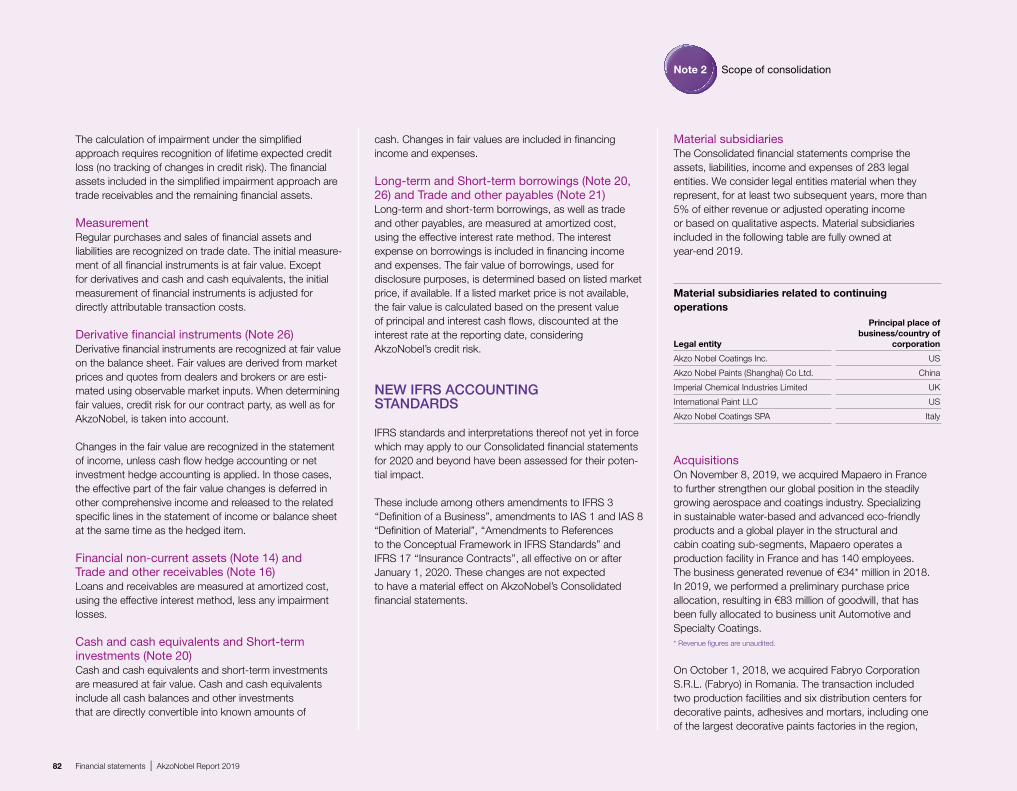
82 Financial statements | AkzoNobel Report 2019
The calculation of impairment under the simplifi ed approach requires recognition of lifetime expected credit loss (no tracking of changes in credit risk). The fi nancial assets included in the simplifi ed impairment approach are trade receivables and the remaining fi nancial assets.
MeasurementRegular purchases and sales of fi nancial assets and liabilities are recognized on trade date. The initial measure-ment of all fi nancial instruments is at fair value. Except for derivatives and cash and cash equivalents, the initial measurement of fi nancial instruments is adjusted for directly attributable transaction costs.
Derivative fi nancial instruments (Note 26)Derivative fi nancial instruments are recognized at fair value on the balance sheet. Fair values are derived from market prices and quotes from dealers and brokers or are esti-mated using observable market inputs. When determining fair values, credit risk for our contract party, as well as for AkzoNobel, is taken into account.
Changes in the fair value are recognized in the statement of income, unless cash fl ow hedge accounting or net investment hedge accounting is applied. In those cases, the effective part of the fair value changes is deferred in other comprehensive income and released to the related specifi c lines in the statement of income or balance sheet at the same time as the hedged item.
Financial non-current assets (Note 14) and Trade and other receivables (Note 16)Loans and receivables are measured at amortized cost, using the effective interest method, less any impairment losses.
Cash and cash equivalents and Short-term investments (Note 20)Cash and cash equivalents and short-term investments are measured at fair value. Cash and cash equivalents include all cash balances and other investments that are directly convertible into known amounts of
cash. Changes in fair values are included in fi nancing income and expenses.
Long-term and Short-term borrowings (Note 20, 26) and Trade and other payables (Note 21)Long-term and short-term borrowings, as well as trade and other payables, are measured at amortized cost, using the effective interest rate method. The interest expense on borrowings is included in fi nancing income and expenses. The fair value of borrowings, used for disclosure purposes, is determined based on listed market price, if available. If a listed market price is not available, the fair value is calculated based on the present value of principal and interest cash fl ows, discounted at the interest rate at the reporting date, considering AkzoNobel’s credit risk.
NEW IFRS ACCOUNTING STANDARDS
IFRS standards and interpretations thereof not yet in force which may apply to our Consolidated fi nancial statements for 2020 and beyond have been assessed for their poten-tial impact.
These include among others amendments to IFRS 3 ‘‘Defi nition of a Business”, amendments to IAS 1 and IAS 8 “Defi nition of Material”, ‘‘Amendments to References to the Conceptual Framework in IFRS Standards” and IFRS 17 ‘‘Insurance Contracts’’, all effective on or after January 1, 2020. These changes are not expected to have a material effect on AkzoNobel’s Consolidated fi nancial statements.
Material subsidiariesThe Consolidated fi nancial statements comprise the assets, liabilities, income and expenses of 283 legal entities. We consider legal entities material when they represent, for at least two subsequent years, more than 5% of either revenue or adjusted operating income or based on qualitative aspects. Material subsidiaries included in the following table are fully owned at year-end 2019.
AcquisitionsOn November 8, 2019, we acquired Mapaero in France to further strengthen our global position in the steadily growing aerospace and coatings industry. Specializing in sustainable water-based and advanced eco-friendly products and a global player in the structural and cabin coating sub-segments, Mapaero operates a production facility in France and has 140 employees. The business generated revenue of €34* million in 2018. In 2019, we performed a preliminary purchase price allocation, resulting in €83 million of goodwill, that has been fully allocated to business unit Automotive and Specialty Coatings.* Revenue fi gures are unaudited.
On October 1, 2018, we acquired Fabryo Corporation S.R.L. (Fabryo) in Romania. The transaction included two production facilities and six distribution centers for decorative paints, adhesives and mortars, including one of the largest decorative paints factories in the region,
Note 2 Scope of consolidation
Material subsidiaries related to continuing operations
Legal entity
Principal place of business/country of
corporation
Akzo Nobel Coatings Inc. US
Akzo Nobel Paints (Shanghai) Co Ltd. China
Imperial Chemical Industries Limited UK
International Paint LLC US
Akzo Nobel Coatings SPA Italy

83AkzoNobel Report 2019 | Financial statements
with capacity for further expansion. The business gener-ated revenue of €45* million in 2017 and is the only player with both a leading product portfolio for consumers as well as professional segments in the Romanian market, including brands Savana, APLA and InnenWeiss. * Revenue figures are unaudited.
In 2018, we performed a preliminary purchase price allocation, which was completed in 2019. This resulted in higher goodwill and lower intangibles for an amount of €13 million. The goodwill was fully allocated to business unit Decorative Paints Europe, Middle East and Africa.
In 2018, other smaller acquisitions included Doves Deco-rating Supplies in the UK, Xylazel S.A. in Spain and Colour-land Paints Sdn Bhd and Colourland Paints (Marketing) Sdn Bhd in Malaysia.
In December 2018, we also acquired the non-controlling interest from Swire Industrial Limited in several Akzo Nobel Swire Paints subsidiaries for €407 million. The goodwill on this transaction of €208 million was charged directly to shareholder’s equity.
DivestmentsIn 2018, the Specialty Chemicals business was classified as held for sale and discontinued operations, therefore the Consolidated statement of income and the Consolidated statement of cash flows show the results of the Specialty Chemicals business as discontinued.
The sale of the Specialty Chemicals business to the Carlyle Group and GIC for an enterprise value of €10.1 billion was completed on October 1, 2018. The Specialty Chemicals business is now called Nouryon.
At year end 2018, AkzoNobel made a best estimate of the expected deal proceeds for the sale of the Specialty Chemicals business, including the net debt/working capital settlement.
In 2018, the divestment of the Specialty Chemicals busi-ness resulted in a net gain of €5,811 million and a net cash inflow of €9,321 million.
In 2019, the profit from discontinued operations includes the final purchase price settlement of the sale of the Specialty Chemicals business, as well as a true up of related tax positions, which resulted in an after-tax gain of €22 million.
In 2018 and 2019, otherwise no other significant divest-ments occurred. Discontinued operations and held for saleThe results and cash flows from discontinued operations in 2018, as well as 2019, almost completely related to the Specialty Chemicals business.
* Including the cash inflow from the divestment of €9,321 million.
* Mainly related to finalizing the purchase accounting for Fabryo.
* Excluding deal cost incurred in 2017.
Recognized fair values at acquisition
In € millions
Mapaero Aerospace
Coatings Other* Total 2019
Other intangibles 155 (13) 142
Property, plant and equipment 13 (1) 12
Inventories 4 – 4
Trade and other receivables 19 – 19
Cash and cash equivalents 17 – 17
Investments in short-term investments
16 – 16
Long-term debt (3) 1 (2)
Deferred tax assets/(liabilities) (43) 2 (41)
Trade and other payables (8) – (8)
Net identifiable assets and liabilities
170 (11) 159
Goodwill 83 18 101
Purchase consideration 253 7 260
Cash and cash equivalents acquired
(17) – (17)
To be paid in 2020 and later years
(14) (5) (19)
Net cash outflow 222 2 224
Discontinued operations
In € millions 2018 2019
Revenue 3,791 –
Expenses (3,158) –
Profit before tax 633 –
Income tax (168) –
Profit for the period after tax 465 –
Results related to discontinued operations in previous years
(2) –
Tax related to discontinued operations in previous years
– –
Profit for the period 463 –
Gain on the sale of the Specialty Chemicals business
6,074 21
Income tax on the sale (263) 1
Total profit for the period from discontinued operations
6,274 22
Deal result
In € millions 2018 2019
Consideration received for shares sold 8,284 17
Net assets and liabilities (2,112) 5
Liabilities assumed and cost* allocated to the deal, realization of cumulative transla-tion and cash flow hedge reserves
(98) (1)
Income tax on sale (263) 1
Deal result after tax 5,811 22
Cash flows from discontinued operations
In € millions 2018 2019
Net cash from operating activities 351 (10)
Net cash from investing activities* 8,723 –
Results from financing activities (116) –
Cashflows from discontinued operations
8,958 (10)

84 Financial statements | AkzoNobel Report 2019
1 Includes costs related to the strategy to create a focused high-performing Paints and Coatings business.2 2019 includes the tax impact on APM adjustments and the net of re-recognition and derecognition of deferred tax assets. Further details are disclosed in Note 8.
1 For reconciliation to IFRS measures please refer to the table on the previous page.2 OPI margin is calculated as operating income as a percentage of group revenue.3 ROS% is calculated as adjusted operating income (operating income excluding
identifi ed items) as a percentage of group revenue.4 OPI margin and ROS% for Other activities/eliminations is not shown, as this is
not meaningful.
In presenting and discussing AkzoNobel’s operating results, management uses certain alternative perfor-mance measures not defi ned by IFRS, which exclude the so-called identifi ed items. These alternative performance measures should not be viewed in isolation as alternatives to the equivalent IFRS measures and should be used as supplementary information in conjunction with the most
Note 3 Alternative performance measures
directly comparable IFRS measures. Alternative perfor-mance measures do not have a standardized meaning under IFRS and therefore may not be comparable to similar measures presented by other companies. Where a non-fi nancial measure is used to calculate an operational or statistical ratio, this is also considered an alternative performance measure.
Alternative performance measures: Adjusted OPI, OPI margin and ROS%
In € millions 2018 2019
Group revenue
Decorative Paints 3,699 3,703
Performance Coatings 5,587 5,563
Other (30) 10
Total 9,256 9,276
Operating income
Decorative Paints 308 425
Performance Coatings 577 565
Other (280) (149)
Total 605 841
Total APM adjustments (identifi ed items)
Decorative Paints (38) 7
Performance Coatings (52) (123)
Other (103) (34)
Total (193) (150)
Adjusted operating income1
Decorative Paints 346 418
Performance Coatings 629 688
Other (177) (115)
Total 798 991
OPI margin%2
Decorative Paints 8.3 11.5
Performance Coatings 10.3 10.2
Other4
Total 6.5 9.1
ROS%3
Decorative Paints 9.4 11.3
Performance Coatings 11.3 12.4
Other4
Total 8.6 10.7
Alternative performance measures 2018 2019
In € millionsContinuing operations
Discontinued operations Total
Continuing operations
Discontinued operations Total
Operating income 605 656 1,261 841 – 841
APM adjustments to operating income
- Transformation costs1 130 29 159 204 – 204
- UK guaranteed minimum pension equalization
57 – 57 – –
- Gain on disposal – – – (54) – (54)
- Legal 6 – 6 – – –
Total APM adjustments (identifi ed items)
193 29 222 150 – 150
Adjusted operating income 798 685 1,483 991 – 991
Profi t for the period attributable to shareholders of the company
410 6,264 6,674 517 22 539
APM adjustments to operating income 193 29 222 150 _ 150
APM adjustment Interest on tax settlement
(30) – (30) – – –
APM adjustments to income tax2 (86) (6) (92) (7) – (7)
APM adjustment deal result on sale Specialty Chemicals, net of tax
– (5,811) (5,811) – (22) (22)
Total APM adjustments 77 (5,788) (5,711) 143 (22) 121
Adjusted profi t for the period attributable to shareholders of the company
487 476 963 660 – 660

85AkzoNobel Report 2019 | Financial statements
* For the reconciliation to IFRS measures please refer to the table on the previous page.
1 For reconciliation to IFRS measures please refer to the table on the previous page.2 ROI% is calculated as adjusted operating income (operating income excluding
identifi ed items) of the last 12 months as a percentage of average invested capital of the last 12 months. Invested capital is calculated as total assets (excluding cash and cash equivalents, short-term investments, investments in associates, the receivable from pension funds in an asset position and assets held for sale) less current tax liabilities, deferred tax liabilities and trade and other payables.
3 ROI% for Other activities/eliminations is not shown, as this is not meaningful.
Note 4 Revenue
AkzoNobel derives revenue from the transfer of goods and services over time and at a point in time in the major product lines and geographical regions as disclosed in the table on the next page.
For the receivables, which are included in Trade and other receivables, reference is made to Note 16.
As at December 31, 2019, and at December 31, 2018, no signifi cant contract assets were recognized.
As at December 31, 2019, the amount of contract liabilities deferred to be recognized over time in 2020 is €3 million.These contract liabilities primarily relate to shipping, train-ing and certain technical services, for which revenue is recognized over time.
The amount of €3 million included in contract liabilities at the beginning of the period has been recognized as revenue during the year 2019 (December 31, 2018: €3 million).
AkzoNobel uses alternative performance measure adjust-ments (APM adjustments) to the IFRS measures to provide supplemetary information on reporting on the underlying developments of the business. These APM adjustments may affect the IFRS measures operating income, net profi t and earnings per share. A reconciliation of the alternative performance measures to the most directly comparable IFRS measures can be found in the tables for adjusted operating income and adjusted earnings from continuing operations in this note.
The implementation of IFRS 16 as per January 1, 2019, has impacted the alternative performance measures as presented in this note. Details on the impact of the imple-mentation of IFRS 16 on these alternative performance measures are disclosed in Note 1.
Alternative performance measures:Adjusted earnings per share
In € millions 2018 2019
Profi t for the period attributable to shareholders of the company from continuing operations
410 517
APM adjustments to operating income 193 150
APM adjustment to interest (30) –
APM adjustment to income tax (86) (7)
Adjusted profi t from continuing operations attributable to share-holders of the company*
487 660
Weighted average number of shares 254.9 213.1
Earnings per share from continuing operations (in €)
1.61 2.43
Adjusted earnings per share from continuing operations (in €)
1.91 3.10
Alternative performance measures: ROI%
In € millions 2018 2019
Average invested capital
Decorative Paints 2,798 3,106
Performance Coatings 3,066 3,325
Other 476 595
Total 6,340 7,026
Adjusted operating income1
Decorative Paints 346 418
Performance Coatings 629 688
Other (177) (115)
Total 798 991
ROI%2
Decorative Paints 12.4 13.4
Performance Coatings 20.5 20.7
Other3
Total 12.6 14.1

86 Financial statements | AkzoNobel Report 2019
Revenue disaggregation
Decorative Paints Performance Coatings Other Total
In € millions 2018 2019 2018 2019 2018 2019 2018 2019
Primary geographical markets - revenue from third parties
The Netherlands 202 202 91 100 25 57 318 359
Other European countries 1,684 1,747 2,042 2,001 – – 3,726 3,748
US and Canada – – 1,134 1,139 – – 1,134 1,139
South America 461 456 353 359 1 – 815 815
Asia 1,136 1,075 1,568 1,581 – – 2,704 2,656
Other regions 184 190 375 369 – – 559 559
Total 3,667 3,670 5,563 5,549 26 57 9,256 9,276
Major goods/service lines - group revenue
Decorative Paints Europe, Middle East and Africa 2,093 2,161 – – – – 2,093 2,161
Decorative Paints South America 468 463 – – – – 468 463
Decorative Paints Asia 1,144 1,084 – – – – 1,144 1,084
Powder Coatings – – 1,218 1,234 – – 1,218 1,234
Marine and Protective Coatings – – 1,291 1,306 – – 1,291 1,306
Automotive and Specialty Coatings – – 1,392 1,388 – – 1,392 1,388
Industrial Coatings – – 1,738 1,731 – – 1,738 1,731
Other (6) (5) (52) (96) (30) 10 (88) (91)
Total 3,699 3,703 5,587 5,563 (30) 10 9,256 9,276
Timing of revenue recognition
Goods transferred at a point in time 3,638 3,621 5,374 5,311 – – 9,012 8,932
Services transferred over time 29 49 189 238 26 57 244 344
Total 3,667 3,670 5,563 5,549 26 57 9,256 9,276

87AkzoNobel Report 2019 | Financial statements
Operating incomeIn 2019, operating income was up 39% at €841 million (2018: €605 million). Price/mix effects, cost savings and lower identifi ed items more than offset raw material infl a-tion and lower volumes. Operating income as a percent-age of revenue (OPI margin) improved to 9.1% (2018: 6.5%). Operating income included €150 million (2018: €193 million) negative impact from identifi ed items, related to €204 million transformation costs to create a focused high-performing Paints and Coatings busi-ness (including €66 million non-cash impairments), partly offset by a gain on disposal of €54 million following asset network optimization.
Note 5 Operating income Note 6 Employee benefi ts
In 2018, operating income decreased 27% to €605 million (2017: €825 million). Adverse currencies, higher raw material costs, lower volumes and higher identifi ed items were partly compensated by positive price/mix effects. OPI margin decreased to 6.5% (2017: 8.6%). Operating income included €193 million (2017: €80 million) negative impact from identifi ed items, mainly related to €130 million transformation costs to create a focused high performing Paints and Coatings business and an one-off non-cash pension cost (€57 million) based on an UK legal prec-edent set in October 2018 for the Guaranteed Minimum Pensions (GMP) equalization regulations.
The average number of employees working outside the Netherlands was 31,900 (2018: 32,500).
In 2019, the number of employees decreased by 2% to 33,800 people (year-end 2018: 34,500 people). Acquisi-tions of 2019 added around 150 people.
Costs by nature 2019
In € millions Employee
benefi ts Amortization Depreciation
Depreciation right-of-use
assetsPurchases and
other costs Total
Cost of sales (536) – (136) (12) (4,625) (5,309)
Selling expenses (858) (54) (21) (65) (1,181) (2,179)
General and administrative expenses (305) (10) (20) (27) (325) (687)
Research and development expenses (176) (3) (11) (1) (64) (255)
Other results – – – – (5) (5)
Total (1,875) (67) (188) (105) (6,200) (8,435)
Costs by nature 2018
In € millions Employee
benefi ts Amortization DepreciationPurchases and
other costs Total
Cost of sales (505) (2) (117) (4,705) (5,329)
Selling expenses (883) (46) (22) (1,231) (2,182)
General and administrative expenses (396) (8) (30) (438) (872)
Research and development expenses (192) (2) (12) (58) (264)
Other results – – – (4) (4)
Total (1,976) (58) (181) (6,436) (8,651)
Salaries, wages and other employee benefi ts in operating income
In € millions 2018 2019
Salaries and wages (1,497) (1,461)
Post-retirement cost (201) (137)
Other social charges (278) (277)
Total (1,976) (1,875)
Average number of employees
Average number during the year 2018 2019
Decorative Paints 14,100 13,800
Performance Coatings 19,200 18,100
Corporate and other 1,600 2,300
Total 34,900 34,200
Employees
At year-end 2018 2019
Decorative Paints 14,300 13,300
Performance Coatings 18,600 18,000
Corporate and other 1,600 2,500
Total 34,500 33,800

88 Financial statements | AkzoNobel Report 2019
SHARE-BASED COMPENSATION
Share-based compensation relates to the equity-settled performance-related share plan and the restricted share plan, as well as the share-matching plan. Charges recog-nized in the 2019 statement of income for share-based compensation amounted to €16 million and are included in salaries and wages (2018: €19 million).
Performance-related and restricted share planUnder the performance-related share plan and the restrict-ed share plan, a number of conditional shares are granted to the members of the Board of Management, members of the Executive Committee and executives each year. The number of participants of the performance-related share plan and the restricted share plan at year-end 2019 was 294 (2018: 326). The shares of the performance-related share plan series 2016-2018 have vested and were delivered to the participants in 2019.
The original performance targets for the 2017 conditional grant of performance shares have become not relevant or applicable anymore after the sale of the Specialty Chemicals business. Therefore, the Supervisory Board decided to instead apply the average historic performance
of 85% for the 2017-2019 series. This plan modification was accounted for in 2018.
As from 2018, the plan of the members of the Board of Management and the Executive Committee has been adjusted such that the conditional grant of shares is linked
1 Concerns the fair value step-up for the plan modification on the date of the Supervisory Board decision.
2 Concerns the fair value step-up for the plan modification on the general announcement date.
3 Concerns an additional share grant.
4 Date of the AGM at which the new LTI performance criteria for the Board of Management were approved.
5 35% for the 2016-2018 and 2017-2019 grants and 50% for grants thereafter.6 65% for the 2016-2018 and 2017-2019 grants and 50% for grants thereafter.
for 50% to the relative TSR performance of the company compared with the peer group and for 50% to the ROI performance of the company, after which a two-year holding restriction will apply.
Performance-related shares of AkzoNobel executives
Plan
Performance/Vesting period
Award date
Vesting date
End of holding period
Balance at January 1,
2019 Awarded
in 2019Vested in
2019Forfeited in
2019Dividend in
2019
Subject to per-
formance condition
Unvested in 2019
Subject to holding
period
Balance at December
31, 2019
2016-2018 Performance Share Plan 3 years 1/1/2016 1/1/2019 NA 244,616 – (244,616) – – – – – –
2016-2018 Performance Share Plan 3 years 1/1/2016 1/1/2019 1/1/2021 37,042 – (37,042) – – – – – –
2017-2019 Performance Share Plan 3 years 1/1/2017 1/1/2020 NA 270,756 1,875 – (78,738) 18,075 211,968 211,968 NA 211,968
2017-2019 Performance Share Plan 3 years 1/1/2017 1/1/2020 1/1/2022 82,691 – – (19,088) 6,729 70,332 70,332 70,332 70,332
2018-2020 Restricted Share Plan 3 years 1/1/2018 1/1/2021 1/1/2022 192,962 8,876 – (31,682) 9,529 NA 179,685 179,685 179,685
2018-2020 Performance Share Plan 3 years 1/1/2018 1/1/2021 1/1/2023 81,100 – – – 9,254 90,354 90,354 90,354 90,354
2019-2021 Restricted Share Plan 3 years 1/1/2019 1/1/2022 1/1/2023 – 225,273 – (31,283) 10,863 NA 204,853 204,853 204,853
2019-2021 Performance Share Plan 3 years 1/1/2019 1/1/2022 1/1/2024 – 87,571 – – 7,120 94,691 94,691 94,691 94,691
Total 909,167 323,595 (281,658) (160,791) 61,570 467,345 851,883 639,915 851,883
Fair value performance-related shares in €
SeriesOpening share
price per: Fair Value
Market condition
(TSR)5
Non-market based
performance conditions6 Share price
Expected volatility
Risk free interest rate
2016-2018 January 4, 2016 53.69 40.20 60.96 60.96 23.82% -0.09%
2016-20181 March 7, 2018 5.13 62.02 Not applicable 78.22 22.74% -0.25%
2016-20182 July 3, 2018 12.34 37.10 Not applicable 73.56 22.12% -0.26%
2017-2019 January 2, 2017 52.42 40.14 59.03 59.03 23.94% -0.12%
2017-20193 May 9, 2017 76.34 75.63 76.72 76.72 24.13% -0.09%
2017-20193 July 28, 2017 77.16 78.88 76.23 76.23 23.77% -0.08%
2018-20204 April 26, 2018 71.65 67.51 75.78 75.78 22.66% -0.04%
2019-2021 January 2, 2019 61.09 52.57 69.60 69.60 20.12% -0.04%

89AkzoNobel Report 2019 | Financial statements
As from 2018, the plan for the executives is a restricted share plan without any performance conditions, whereby the conditional grant of shares will only vest when the executives remain in service with the company during the three-year vesting period, after which a one-year holding restriction will apply.
The conditional shares of the 2017-2019 series for the AkzoNobel participants vested for 85% (series 2016-2018: 85%), including extraordinary dividend shares of 11.37% (series 2016-2018: 5.48%), the fi nal vesting percentage amounted to 94.66% (series 2016-2018: 89.66%).
The share price of a common AkzoNobel share at year-end 2019 amounted to €90.64 (2018: €70.40).
Fair value of restricted and performance-related sharesThe fair value of the restricted shares of the 2019-2021 grant, amounting to €63.48, is based on the share price on January 2, 2019, of €69.60 and the expected dividend yield of 3.02%. The fair value of the performance-related shares of the 2019-2021 grant is for 50% based on a market condition (TSR) and for 50% based on non-market-based performance condition (ROI). The original fair value of the performance-related shares of the 2017-2019 grant was for 35% based on a market condition (TSR) and for 65% based on nonmarket based perfor-mance conditions (ROI and RobecoSAM). The fair value of the 2017-2019 plans was not amended for the above-mentioned plan modifi cation as this change was not benefi cial.
The TSR part of the award is valued applying a Monte Carlo simulation model and the other part is valued based on the share price at grant date.
The parameters applied for the fair value calculations are: share price at grant date (opening of fi rst trading date from grant date), expected volatility (based on the share price development over the past three years of AkzoNobel), and risk-free interest rate (based on a Dutch zero-coupon government bond).
Note 7 Financing income and expenses
Net fi nancing expenses for the year were €76 million (2018: €52 million). Signifi cant variances are: • Net interest on net debt decreased by €17 million to
€59 million (2018: €76 million), mainly due to lower interest on bonds as a result of repayment of a bond
Share-matching planThe members of the Board of Management and the members of the Executive Committee are eligible to participate in the share-matching plan. However, they will not be eligible for matching shares for the years 2019, 2020 and 2021. Under certain conditions, members who invest part of their short-term incentive in AkzoNobel shares may have such shares matched by the company. The investment in Akzo Nobel N.V. shares in 2019 resulted in no granted potential matching shares. During 2019, 1,786 potential matching shares were matched and 862 were forfeited due to the share consolidation, leading to a total of 5,081 potential matching shares on December 31, 2019. For an overview of the matching shares outstanding for the members of the Board of Management per Decem-ber 31, 2019, we refer to the Remuneration report.
in December 2018, partially offset by interest on lease liabilities resulting from the implementation of IFRS 16 in 2019
• Financing income related to post-retirement benefi ts increased from €10 million in 2018 to €21 million due to improved funding positions
• Interest charges on provisions increased from €3 million in 2018 to €14 million due to changes in discount rates
• Other items in 2019 mainly include interest related foreign currency results; in 2018, other items mainly included a one-off interest benefi t related to a tax settlement
The average interest rate used for capitalized interest was 1.5% (2018: 2.2%). Capitalized interest was negligible in both 2019 and 2018.
The average interest rate on total debt was 2.8% (2018: 2.6%).
Note 8 Income tax
Pre-tax income from continuing operations amounted to a profi t of €785 million (2018: €573 million). The net tax charges related to continuing operations are included in the statement of income as shown on the next page.
The total deferred tax charge including discontinued operations was €55 million (2018: €143 million). The total tax charge including discontinued operations was €229 million (2018: €549 million).
Effective tax rate reconciliationIn 2019, the effective income tax rate based on the state-ment of income is 29.3% (2018: 20.6%).
For comparative reasons, the second table on the next page presents the effective consolidated tax rate excluding the impact of results on discontinued operations. Including
Financing income and expenses
In € millions 2018 2019
Financing income 16 17
Financing expenses (92) (76)
Net interest on net debt (76) (59)
Other interest
Financing income related to post-retirement benefi ts
10 21
Interest charges on provisions (3) (14)
Other items 17 (24)
Net other fi nancing credit/(charges) 24 (17)
Total fi nancing income and expenses
(52) (76)

90 Financial statements | AkzoNobel Report 2019
these results, the effective consolidated tax rate is 28.4% (2018: 7.5%) as the result on the sale of Specialty Chemi-cals was largely tax exempted; refer to Note 2).
Following the divestment of the Specialty Chemicals business in 2018, the company is reorganizing itself into a focused Paints and Coatings company. As part of our Winning together: 15 by 20 ambition, we are simplifying our intercompany financing structure, enlarging the scope of our global business support services, centralizing R&D and supply chain functions and implementing other cost-saving initiatives. This has substantially affected the income generated and expenses incurred by subsidiaries in most countries, because intercompany interest, cost sharing and royalty flows, albeit all remaining at arm’s length, have changed following these changes in the business set up. For subsidiaries in several countries in Europe, changes in future profitability have led to the derecognition or re-recognition of deferred tax assets. In aggregate, the net effect of the derecognition and re-recognition of deferred tax assets was a charge of €47 million.
The impact of non-refundable withholding tax on the tax rate is dependent on our relative share in the profit of subsidiaries in countries that levy withholding tax on dividends and on the timing of the remittance of such divi-dends. Based on the Dutch tax system there is a limited credit for such taxes.
Deferred tax assets and liabilitiesIn assessing the recognition of the deferred tax assets, management considers whether it is probable that some portion or all of the deferred tax assets will be realized. The ultimate realization of the deferred tax assets is dependent upon the generation of future taxable income during the periods in which those temporary differences become deductible. Management considers the scheduled reversal of deferred tax liabilities, projected future taxable income, and tax planning strategies in making this assessment. The amount of deferred tax assets considered realizable, however, could change in the near term if future estimates of projected taxable income during the carryforward period are revised.
From the total amount of recognized net deferred tax assets, €345 million (2018: €393 million) is related to entities that have suffered a loss in either 2019 or 2018 and where utilization is dependent on future taxable
* Excluding discountinued operations charge of €1 million.
* Mainly related to post-retirement benefit provisions.
profit in excess of the profit arising from the reversal of existing taxable temporary differences. This assessment is based on management’s long-term projections and tax planning strategies.
A deferred tax liability is recognized for taxable temporary differences related to investments in subsidiaries, branches and associates and interests in joint arrangements, to the extent that it is probable that these will reverse in the foreseeable future. The expected net tax impact of the remaining differences for which no deferred tax liabilities have been recognized is €30 million (2018: €30 million).
Classification of current and deferred tax result
In € millions 2018 2019
Current tax expense for
The year (121) (171)
Adjustments for previous years 23 1
Separation of Specialty Chemicals business
(4) –
Total current tax expense (102) (170)
Deferred tax expense for
Separation of Specialty Chemicals business
44 –
Origination and reversal of temporary differences and tax losses
(48) (22)
(De)recognition of deferred tax assets (9) (45)
Changes in tax rates (3) 7
Total deferred tax expense (16) (60)
Total (118) (230)
Effective tax rate
in % 2018 2019
Corporate tax rate in the Netherlands 25.0 25.0
Effect of tax rates in other countries (0.1) (2.2)
Weighted average statutory income tax rate
24.9 22.8
Separation of Specialty Chemicals business
(7.0) –
Non-taxable (income)/expenses 2.4 2.2
(De)recognition of deferred tax assets 1.6 5.8
Non-refundable withholding taxes 2.3 0.4
Adjustment for prior years (4.0) (0.2)
Deferred tax adjustment due to changes in tax rates
0.4 (1.7)
Effective tax rate 20.6 29.3
Deferred tax assets and liabilities
In € millions 2018 2019
Deferred tax assets 575 559
Deferred tax liabilities (285) (368)
Balance at December 31 prior year 290 191
Impact of adoption IFRS 15 16 –
Impact of adoption IFRS 9 1 –
Impact of application IAS 29* (6) –
Balance at January 1 301 191
Movement in deferred tax:
Changes in exchange rates 9 6
Recognized in income (143) (55)
Recognized in equity/Other comprehensive income
40 37
Classified as held for sale (6) –
Acquisitions (10) (41)
Balance at December 31 191 138
Deferred tax assets 559 529
Deferred tax liabilities (368) (391)
Unrecognized deferred tax assets
In € millions 2018 2019
Tax losses and tax credits 167 242
Deductible temporary differences* 137 168
Total 304 410

91AkzoNobel Report 2019 | Financial statements
Note 9 Earnings per share
Profi t for the period attributable to the shareholders of the company was €539 million. In 2018, net profi t for the period was €6,674 million, of which €6,264 million was attributable to discontinued operations and related to the divested Specialty Chemicals business.
The number of shares for the earnings per share calcula-tion decreased as a result of the capital repayment and share consolidation and the share buyback program.
Earnings per share from continuing operations increased in 2019, mainly due to the impact of the share consolidation, the share buyback program and increased profi t before tax from continuing operations. Earnings per share from
Expiration year of loss carryforwards
In € millions 2020 2021 2022 2023 2024 Later Unlimited Total
Total loss carryforwards 2 2 11 134 141 133 2,995 3,418
Loss carryforwards not recognized in deferred tax assets
(1) (1) (8) (1) (2) (15) (1,221) (1,249)
Total recognized 1 1 3 133 139 118 1,774 2,169
Deferred tax assets and liabilities per balance sheet itemDecember 31, 2018 December 31, 2019
In € millions Net balance Assets Liabilities Net balance Assets Liabilities
Intangible assets (363) 28 391 (410) 32 442
Property, plant and equipment 47 75 28 49 83 34
Financial non-current assets (158) 9 167 (200) 10 210
Post-retirement benefi t provisions 121 124 3 158 161 3
Other provisions 37 49 12 35 44 9
Other items 79 102 23 102 147 45
Tax credits 150 150 – 173 173 –
Tax loss carryforwards 582 582 – 641 641 –
Deferred tax assets not recognized (304) (304) – (410) (410) –
Tax assets/liabilities 191 815 624 138 881 743
Set-off of tax – (256) (256) – (352) (352)
Net deferred taxes 191 559 368 138 529 391
Income tax recognized in equity
In € millions 2018 2019
Currency exchange differences on intercompany loans of a permanent nature
17 11
Cash fl ow hedges 5 –
Share-based compensation (1) 4
Post-retirement benefi ts 24 24
Impact of adoption IFRS 15 16 –
Impact of adoption IFRS 9 1 –
Impact of application IAS 29 (7) –
Total 55 39
Current tax 5 2
Deferred tax 50 37
Total 55 39
Profi t for the period
In € millions 2018 2019
Profi t before tax from continuing operations
573 785
Income tax (118) (230)
Profi t from continuing operations
455 555
Profi t for the period attributable to non-controlling interests
(45) (38)
Profi t for the period from continuing operations attributable to shareholders of the company
410 517
Profi t for the period from discontinued operations
6,274 22
Discontinued operations attribut-able to non-controlling interest
(10) –
Profi t for the period attributable to shareholders of the company
6,674 539
Weighted average number of common shares
Number of shares 2018 2019
Issued common shares at January 1
252,620,585 256,219,301
Effect of issued common shares during the year
2,252,713 249,936
Capital repayment and share consolidation
– (26,674,886)
Effect of share repurchase program – (16,720,349)
Shares for basic earnings per share for the year
254,873,298 213,074,002
Effect of dilutive shares
For performance-related and restricted shares
1,087,173 763,868
For share-matching plan 9,813 5,719
Shares for diluted earnings per share
255,970,284 213,843,589

92 Financial statements | AkzoNobel Report 2019
Note 10 Intangible assets
total operations decreased in 2019, due to the result from discontinued operations in 2018, related to the divested Specialty Chemicals business partially offset by the impact of the share consolidation, the share buyback program and increased profi t before tax from continuing operations.
Adjusted earnings per share from continuing operations increased in 2019, mainly due to the impact of the share consolidation, the share buyback program and increased profi t before tax from continuing operations.
Adjusted earnings per share from continuing operationsIn € millions 2018 2019
Profi t before tax from continuing operations
573 785
Identifi ed items reported in operating income
193 150
Interest on tax settlement (30) –
Adjusted income tax (204) (237)
Non-controlling interests (45) (38)
Adjusted profi t from continuing operations attributable to shareholders of the company
487 660
Adjusted earnings per share from continuing operations (in €)
1.91 3.10
Earnings per share
in € 2018 2019
Continuing operations
Basic 1.61 2.43
Diluted 1.60 2.42
Discontinued operations
Basic 24.58 0.10
Diluted 24.47 0.10
Total operations
Basic 26.19 2.53
Diluted 26.07 2.52
Intangible assets
In € millions Goodwill BrandsCustomer
listsOther
intangibles Total
Balance at January 1, 2017
Cost of acquisition 991 2,189 754 192 4,126
Cost of internally developed intangibles – – – 160 160
Accumulated amortization/impairment (46) (164) (439) (228) (877)
Carrying value at December 31, 2017 945 2,025 315 124 3,409
Impact application of IAS 29 1 8 – – 9
Balance at January 1, 2018 946 2,033 315 124 3,418
Movements in 2018
Acquisitions through business combinations 42 38 19 2 101
Investments – including internally developed intangibles – – 2 22 24
Amortization – (11) (32) (15) (58)
Classifi ed as held for sale – – – (4) (4)
Changes in exchange rates 2 (21) – (4) (23)
Total movements 44 6 (11) 1 40
Balance at December 31, 2018
Cost of acquisition 1,013 2,216 810 221 4,260
Cost of internally developed intangibles – – – 158 158
Accumulated amortization/impairment (23) (177) (506) (254) (960)
Carrying value at December 31, 2018 990 2,039 304 125 3,458
Impact adoption IFRS 16 – – – (36) (36)
Balance at January 1, 2019 990 2,039 304 89 3,422
Movements in 2019
Acquisitions through business combinations 101 (13) 144 11 243
Investments – including internally developed intangibles – – – 35 35
Amortization – (12) (38) (17) (67)
Impairments (12) – (21) (5) (38)
Changes in exchange rates 14 9 6 1 30
Total movements 103 (16) 91 25 203
Balance at December 31, 2019
Cost of acquisition 1,121 2,208 940 175 4,444
Cost of internally developed intangibles – – – 191 191
Accumulated amortization/impairment (28) (185) (545) (252) (1,010)
Carrying value at December 31, 2019 1,093 2,023 395 114 3,625

93AkzoNobel Report 2019 | Financial statements
Brands with indefi nite useful lives are almost fully related to Dulux, which is the major brand, due to its global pres-ence, high recognition and strategic nature. Other intan-gibles include licenses, know-how, intellectual property rights, software and development cost. Both at year-end 2019 and 2018, there were no purchase commitments for individual intangible assets. No intangible assets were registered as security for bank loans.
Annual impairment testingGoodwill and other intangibles with indefi nite useful lives are tested for impairment per business unit (one level below segment level) in the fourth quarter or whenever an impairment trigger exists, applying the value-in-use method. The impairment test is in principle based on cash fl ow projections of the fi ve-year plan. Elements considered to determine if a different approach would be more appro-priate are, among others, high growth/emerging econo-mies, geo expansion opportunities, introduction of new product ranges and opportunities from market consolida-tion. In 2019, the above exception was applied for Decora-tive Paints Asia and Decorative Paints South America, for which the revenue growth and adjusted EBITDA-margin development projections were extrapolated beyond the fi ve-year explicit forecast period for another fi ve years, applying reduced average growth rates.
The key assumptions used in the projections are: • Revenue growth: based on actual experience, analysis
of market growth and the expected market share development
• Adjusted EBITDA-margin development: based on actual experience and management’s long-term projections
For all business units, a terminal value was calculated based on the long-term infl ation expectations of 1.0%. The estimated pre-tax cash fl ows are discounted to their present value using a pre-tax weighted average cost of capital. The discount rates are determined for each business unit and range from 8.8% to 12.7% (2018: 8.6% to 12.0%), with a weighted average of 9.4% (2018: 9.3%).
Sensitivity tests were performed for growth assumptions (a 50% reduction of the revenue growth rate), adjusted EBITDA margin development assumptions (a one percent-age point decrease) and for the weighted average cost of capital (a one percentage point increase). All sensitivity tests confi rm suffi cient headroom in all businesses.
Both in 2018 and 2019, no impairment charges were recognized in relation to the annual impairment test.
Specifi c asset impairmentsIn 2019, impairments were recorded for Performance Coatings, following the implementation of our
Note 11 Property, plant and equipment
strategic portfolio review, which was determined to be a triggering event.
As this portfolio review also included certain recently acquired and not yet integrated businesses to be divested, the goodwill related to these businesses was also included in the impairment review and subsequently impaired.
Investments in property, plant and equipmentThroughout 2019, we have continued to thoroughly assess all investment proposals to ensure the right capital and capacity allotment and have taken decisions accord-ingly. With an aim to reinforce our capability to support customers and enhance our manufacturing and supply chain, we have invested in our Changzhou powder coat-ings plant in China to add new production lines. Another major investment started in High Point, North Carolina, to transform our wood coatings facility into a best-in-class manufacturing site, which is expected to further strengthen our market position in the US.
As we strongly believe in the importance of innovation to keep AkzoNobel at the forefront of the paints and coatings industry, we have continued to invest in RD&I, an example of which is our investment in the R&D innovation campus located at our Felling site in the UK.
ImpairmentsIn 2019, impairments were recognized in Performance Coatings, following the implementation of our strategic portfolio review. In 2018, no signifi cant impairments were recognized.
Average revenue growth rates
In % per year 2020-2024
Decorative Paints 2.1
Performance Coatings 2.2
Goodwill and other intangibles per segment
GoodwillBrands with indefi nite
useful lives Other intangibles
with fi nite useful lives Total intangibles
In € millions 2018 2019 2018 2019 2018 2019 2018 2019
Decorative Paints 75 92 1,830 1,838 239 193 2,144 2,123
Performance Coatings 915 1,001 – – 382 452 1,297 1,453
Corporate and other – – – – 17 49 17 49
Total 990 1,093 1,830 1,838 638 694 3,458 3,625

94 Financial statements | AkzoNobel Report 2019
Property, plant and equipment
In € millions Buildings and land Plant equipment and
machinery Other equipment
Construction in progress and prepayments on
projects Assets not used Total
Balance at December 31, 2017
Cost of acquisition 1,488 1,901 925 193 7 4,514
Accumulated depreciation/impairment (689) (1,273) (713) (2) (5) (2,682)
Carrying value at December 31, 2017 799 628 212 191 2 1,832
Impact adoption IFRS 15 – – (56) (10) – (66)
Impact application IAS 29 11 2 – 1 – 14
Balance at January 1, 2018 810 630 156 182 2 1,780
Movements in 2018
Acquisitions 18 4 2 1 2 27
Divestments (7) (1) (2) (1) – (11)
Investments 6 31 13 111 (1) 160
Transfer between categories 22 48 46 (116) – –
Depreciation (44) (93) (44) – – (181)
Impairments, including reversals (1) – – – – (1)
Changes in exchange rates (10) (8) (5) (3) – (26)
Total movements (16) (19) 10 (8) 1 (32)
Balance at December 31, 2018
Cost of acquisition 1,505 1,894 888 178 10 4,475
Accumulated depreciation/impairment (711) (1,283) (722) (4) (7) (2,727)
Carrying value at December 31, 2018 794 611 166 174 3 1,748
Impact adoption IFRS 16 (28) (1) – – – (29)
Balance at January 1, 2019 766 610 166 174 3 1,719
Movements in 2019
Acquisitions 8 4 – – – 12
Divestments (22) (1) (10) – – (33)
Investments 6 24 13 136 – 179
Transfer between categories 44 57 19 (121) 1 –
Depreciation (43) (102) (43) – – (188)
Impairments, including reversals (2) (19) (2) – – (23)
Changes in exchange rates 13 12 6 3 – 34
Total movements 4 (25) (17) 18 1 (19)
Balance at December 31, 2019
Cost of acquisition 1,528 1,974 906 193 11 4,612
Accumulated depreciation/impairment (758) (1,389) (757) (1) (7) (2,912)
Carrying value at December 31, 2019 770 585 149 192 4 1,700

95AkzoNobel Report 2019 | Financial statements
Note 12 Leases Note 13 Investments in associates and joint ventures
AkzoNobel mainly leases land, offi ce spaces, stores and cars. Some leases provide for additional rent payments that are based on changes in local price indices.
Some property leases contain extension options exercis-able by AkzoNobel up to one year before the end of the non-cancellable contract period.
We have estimated that the lease liability would increase by less than 20%, if we would exercise the extension options which are currently not included in the valuation of the lease liability. This excludes so-called “evergreens” or perpetual leases.
Total net cash outfl ow from fi nancing activities related to leases recognized on the balance sheet was €108 million.
At year-end 2019, the carrying value of equity invest-ments in associates amounted to €147 million (2018: €133 million). AkzoNobel has granted loans of €3 million in total to certain associates (2018: €4 million). In 2019, the results from associates amounted to a profi t of €20 million (2018: €20 million).
No signifi cant contingent liabilities exist related to associates.
The largest associate of AkzoNobel is Metlac S.p.a., incorporated in Italy. None of the associates are consid-ered individually material to the group.
Right-of-use assets
In € millions Land Buildings Other Total
Balance at January 1, 2019
Cost of acquisition 56 336 70 462
Accumulated depreciation/impairment (10) (20) – (30)
Opening balance January 1, 2019 46 316 70 432
Movements in 2019
Additions 1 18 32 51
Modifi cations (1) 1 – –
Disposals – (3) (1) (4)
Depreciation (4) (63) (38) (105)
Impairments – (5) – (5)
Change in exchange rates 1 3 1 5
Total movements (3) (49) (6) (58)
Cost of acquisition 57 355 102 514
Accumulated depreciation/impairment (14) (88) (38) (140)
Balance at December 31, 2019 43 267 64 374
Income/(expenses) recognized in profi t and lossIn € millions 2019
Sublease income 6
Depreciation right-of-use assets (105)
Impairments for right-of-use assets (5)
Interest expense on lease liabilities (8)
Expenses relating to short-term leases (10)
Expenses relating to low-value assets (4)
Variable lease expenses (3)
Total expenses (129)
Balance sheet information of our share in associates
In € millions 2018Associates
2019
Condensed balance sheet
Non-current assets 66 68
Current assets 120 114
Total assets 186 182
Shareholders’ equity 133 147
Non-current liabilities 5 6
Current liabilities 48 29
Total liabilities and equity 186 182
Profi t and loss of our share in associates
In € millions 2018Associates
2019
Condensed statement of income
Revenue 135 154
Profi t before tax 27 29
Profi t from continuing operations 20 20
Other comprehensive income – –
Profi t for the period 20 20

96 Financial statements | AkzoNobel Report 2019
Pension assets (€1,418 million) relate to pension plans in an asset position (2018: €947 million). For more informa-tion on post-retirement benefi t provisions, see Note 18.
Loans and receivables include the subordinated loan of €88 million (2018: €89 million) granted to the Pension Fund APF in the Netherlands and the non-current part of an escrow account related to the pre-funding of the Akzo Nobel (CPS) Pension Scheme in the UK amounting to €105 million (2018: nil), invested in corporate bonds. Under certain conditions, the minimum annual funding of this pension fund from the escrow account is €30 million (£26 million). The current portion of the escrow account is reported as other receivables within trade and other receivables, refer to Note 16.
Loans and receivables are considered to have low credit risk, and thus the impairment provision recognized during the period was limited to 12 months expected losses.
Of the total carrying value of inventories at year-end 2019, €36 million is measured at net realizable value (2018: €45 million). In 2019, €70 million was recognized in the statement of income for the write-down of inventories (2018: €79 million), while €22 million of write-downs were reversed (2018: €18 million). There are no inventories subject to retention of title clauses.
Note 14 Financial non-current assets
Note 15 Inventories
Note 16 Trade and other receivables
Note 17 Group equity
Trade receivables are presented net of an allowance for impairment of €58 million (2018: €69 million).
In 2019, €29 million of impairment losses were recognized in the statement of income (2018: €38 million). An amount of €24 million was reversed (2018: €35 million).
Since the total amount of impairment losses under IFRS 9 is not signifi cant, no separate disclosure was made in the statement of income.
Other receivables include the current portion of €30 million (£26 million) of the escrow account for the Akzo Nobel (CPS) Pension Scheme in the UK.
Financial non-current assets
In € millions 2018 2019
Pension assets 947 1,418
Loans and receivables 130 336
Other fi nancial non-current assets 192 108
Total 1,269 1,862
Trade and other receivables
In € millions 2018 2019
Trade receivables 1,843 1,812
Prepaid expenses 50 33
Tax receivables other than income tax 92 116
FX contracts 6 9
Receivables from associates – 8
Other receivables 150 155
Total 2,141 2,133
Inventories
In € millions 2018 2019
Raw materials and supplies 353 342
Work in progress 66 71
Finished products and goods for resale 720 726
Total 1,139 1,139
Ageing of trade receivables
In € millions 2018 2019
Performing trade receivables 1,657 1,625
Past due trade receivables
< 3 months 167 162
> 3 months 88 83
Allowance for impairment (69) (58)
Total trade receivables 1,843 1,812
Allowance for impairment of trade receivables
In € millions 2018 2019
Balance at January 1 under IAS 39 84
Impact adoption IFRS 9 4
Balance at January 1 under IFRS 9 88 69
Additions charged to income 38 29
Release of unused amounts (35) (24)
Utilization (22) (16)
Acquisitions 3 –
Currency exchange differences (3) –
Balance at December 31 69 58
Composition of share capital at year-end 2018
In €Authorized
share capitalSubscribed
share capital
Priority shares (48 with nominal value of €400)
19,200 19,200
Cumulative preferred shares (200 million with nominal value of €2)
400,000,000 –
Common shares (600 million with nominal value of €2)
1,200,000,000 512,438,602
Total 1,600,019,200 512,457,802
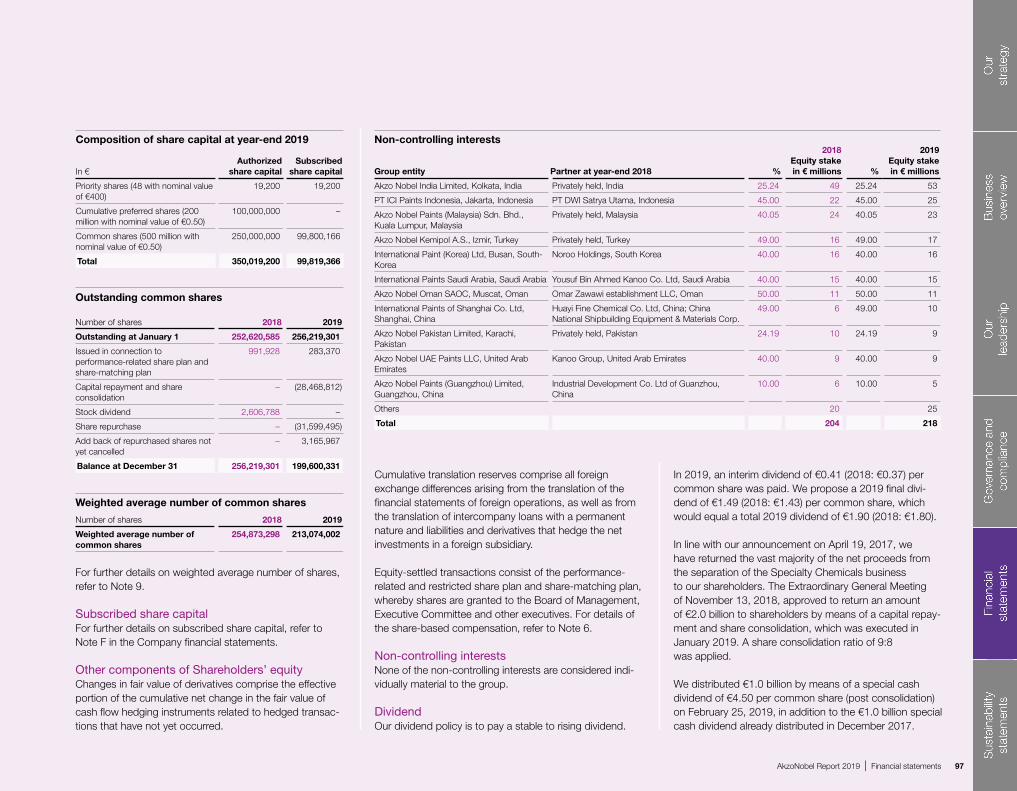
97AkzoNobel Report 2019 | Financial statements
For further details on weighted average number of shares, refer to Note 9.
Subscribed share capitalFor further details on subscribed share capital, refer to Note F in the Company financial statements.
Other components of Shareholders’ equityChanges in fair value of derivatives comprise the effective portion of the cumulative net change in the fair value of cash flow hedging instruments related to hedged transac-tions that have not yet occurred.
Cumulative translation reserves comprise all foreign exchange differences arising from the translation of the financial statements of foreign operations, as well as from the translation of intercompany loans with a permanent nature and liabilities and derivatives that hedge the net investments in a foreign subsidiary.
Equity-settled transactions consist of the performance-related and restricted share plan and share-matching plan, whereby shares are granted to the Board of Management, Executive Committee and other executives. For details of the share-based compensation, refer to Note 6.
Non-controlling interestsNone of the non-controlling interests are considered indi-vidually material to the group.
DividendOur dividend policy is to pay a stable to rising dividend.
In 2019, an interim dividend of €0.41 (2018: €0.37) per common share was paid. We propose a 2019 final divi-dend of €1.49 (2018: €1.43) per common share, which would equal a total 2019 dividend of €1.90 (2018: €1.80).
In line with our announcement on April 19, 2017, we have returned the vast majority of the net proceeds from the separation of the Specialty Chemicals business to our shareholders. The Extraordinary General Meeting of November 13, 2018, approved to return an amount of €2.0 billion to shareholders by means of a capital repay-ment and share consolidation, which was executed in January 2019. A share consolidation ratio of 9:8 was applied.
We distributed €1.0 billion by means of a special cash dividend of €4.50 per common share (post consolidation) on February 25, 2019, in addition to the €1.0 billion special cash dividend already distributed in December 2017.
Composition of share capital at year-end 2019
In €Authorized
share capitalSubscribed
share capital
Priority shares (48 with nominal value of €400)
19,200 19,200
Cumulative preferred shares (200 million with nominal value of €0.50)
100,000,000 –
Common shares (500 million with nominal value of €0.50)
250,000,000 99,800,166
Total 350,019,200 99,819,366
Outstanding common shares
Number of shares 2018 2019
Outstanding at January 1 252,620,585 256,219,301
Issued in connection to performance-related share plan and share-matching plan
991,928 283,370
Capital repayment and share consolidation
– (28,468,812)
Stock dividend 2,606,788 –
Share repurchase – (31,599,495)
Add back of repurchased shares not yet cancelled
– 3,165,967
Balance at December 31 256,219,301 199,600,331
Weighted average number of common shares
Number of shares 2018 2019
Weighted average number of common shares
254,873,298 213,074,002
Non-controlling interests
Group entity Partner at year-end 2018 %
2018 Equity stake in € millions %
2019 Equity stake in € millions
Akzo Nobel India Limited, Kolkata, India Privately held, India 25.24 49 25.24 53
PT ICI Paints Indonesia, Jakarta, Indonesia PT DWI Satrya Utama, Indonesia 45.00 22 45.00 25
Akzo Nobel Paints (Malaysia) Sdn. Bhd., Kuala Lumpur, Malaysia
Privately held, Malaysia 40.05 24 40.05 23
Akzo Nobel Kemipol A.S., Izmir, Turkey Privately held, Turkey 49.00 16 49.00 17
International Paint (Korea) Ltd, Busan, South-Korea
Noroo Holdings, South Korea 40.00 16 40.00 16
International Paints Saudi Arabia, Saudi Arabia Yousuf Bin Ahmed Kanoo Co. Ltd, Saudi Arabia 40.00 15 40.00 15
Akzo Nobel Oman SAOC, Muscat, Oman Omar Zawawi establishment LLC, Oman 50.00 11 50.00 11
International Paints of Shanghai Co. Ltd, Shanghai, China
Huayi Fine Chemical Co. Ltd, China; China National Shipbuilding Equipment & Materials Corp.
49.00 6 49.00 10
Akzo Nobel Pakistan Limited, Karachi, Pakistan
Privately held, Pakistan 24.19 10 24.19 9
Akzo Nobel UAE Paints LLC, United Arab Emirates
Kanoo Group, United Arab Emirates 40.00 9 40.00 9
Akzo Nobel Paints (Guangzhou) Limited, Guangzhou, China
Industrial Development Co. Ltd of Guanzhou, China
10.00 6 10.00 5
Others 20 25
Total 204 218

98 Financial statements | AkzoNobel Report 2019
Post-retirement benefi t provisions relate to defi ned benefi t pension and other post-retirement benefi t plans, including healthcare or welfare plans. The largest defi ned benefi t pension plans are the ICI Pension Fund (ICIPF) and the Akzo Nobel (CPS) Pension Scheme in the UK which together account for 86% of defi ned benefi t obligations (DBO) and 91% of plan assets. Other pension plans include among others the largely unfunded plans in Germany, the plans in the US and certain other smaller plans in the UK. The benefi ts of these pension plans are based primarily on years of service and employees’ compensation. The funding policy for the plans is consistent with local requirements in the countries of establishment. We also provide certain healthcare and life insurance benefi ts to retired employees, mainly in the US and the Netherlands.
Valuations of the obligations under the plans are carried out regularly by independent qualifi ed actuaries. We accrue for the expected costs of providing such post-retirement benefi ts during the service years of the employ-ees. Governance of the benefi t plans is the responsibility of the Executive Committee Pensions. This committee provides oversight of the costs and risks of the plans including oversight of the impact of the plans on the company in terms of cash fl ow, pension expenses and the balance sheet. The committee develops and maintains policies on benefi t design, funding, asset allocation and assumption setting.
Pension plansAlmost all of the defi ned benefi t plans have been closed to new members since the early to mid-2000s, although in many plans long-serving employees continue to accrue benefi ts. For plans in the US, benefi t accrual is frozen and employees participate in defi ned contribution plans for future service. In countries where plans are closed, new employees are eligible to join a defi ned contribution arrangement. In countries in high growth markets, pension schemes currently are not material. Unless mandated by law, it is our policy that any new plans are established as defi ned contribution plans.
The most signifi cant risks that we run in relation to defi ned benefi t plans are investment returns falling short of expectations, low discount rates, infl ation exceeding expectations, and retirees living longer than expected. The assets and liabilities of each of the funded plans are held outside of the company in a trust or a foundation, which is governed by a board of fi duciaries or trustees, depending on the legal arrangements in the country concerned. The primary objective with regards to the investment of pension plan assets is to ensure that each individual plan has suffi cient funds available to satisfy future benefi t obligations in accordance with local legal and legislative requirements. For this purpose, we work closely with plan trustees or fi du-ciaries to develop investment strategies. Studies are carried out periodically to analyze and understand the trade-off between expected investment returns, volatility of outcomes and the impact on cash contributions. We aim to strike a cautious balance between these factors in order to agree affordable contribution schedules with plan fi duciaries.
Plan assets principally consist of insurance (annuity) policies, long-term interest-earning investments and (investment funds with holdings primarily in) quoted equity securities. Our largest plans use derivatives (such as index futures, currency forward contracts and swaps) to reduce volatility of underlying variables, for effi cient portfolio management and to improve the liability matching char-acteristics of the assets. Limits have been set on the use of derivatives which are periodically subject to review for compliance with the pension fund’s investment strategy.
In line with our proactive pension risk management strategy, we seek to reduce risk in our pension plans over time. We continue to evaluate different potential de-risking strategies and opportunities on an ongoing basis. Some future de-risking transactions may have both cash fl ow and balance sheet impacts which may be substantial, as have some of the de-risking actions already taken. The cost of fully removing risk would exceed estimated funding defi cits.
Between 2014 and 2019, ICIPF and a smaller UK plan, the ICI Specialty Chemicals Pension Fund (ISCPF), have invested in annuity buy-in contracts that aim to hedge all key risks related to their pensioner populations. CPS has an insurance contract to hedge longevity risk in respect of a portion of its pensioners. In 2019, the Trustee of the ICIPF entered into a further annuity buy-in agree-ment with Legal and General Assurance Society Limited which covers, in aggregate, £135 million (€156 million) of pensioner liabilities (insurer valuation). The buy-in involved the purchase of a bulk annuity policy under which the insurer will pay to ICIPF amounts equivalent to the benefi ts payable to members who have recently become pension-ers. The pension liabilities remain with, and the matching annuity policies are held within, ICIPF. The accounting impact of the transaction is a lower valuation of the plan assets giving a reduction in Other comprehensive income of £26 million (€30 million).
By purchasing bulk annuities, the ICIPF and ISCPF Trust-ees have both taken signifi cant steps in actively de-risking liabilities and reducing the risk that AkzoNobel will be required to contribute additional cash in the future.
The remaining pension plans primarily represent defi ned contribution plans. This includes, among others, the Pension Fund APF in the Netherlands and the 401k Plan in the US. The ITP2 plan in Sweden is fi nanced through insurance with the Alecta insurance company and is classifi ed as a multi-employer defi ned benefi t plan. As AkzoNobel does not have access to suffi cient information from Alecta to enable a defi ned benefi t accounting treat-ment, it is accounted for as a defi ned contribution plan.
Note 18 Post-retirement benefi t provisions
The share buyback program to repurchase common shares up to the value of €2.5 billion was completed at the end of 2019, acquiring 31.2 million common shares.
On October 23, 2019, a new €500 million share buyback program was announced, for which 0.4 million common shares were acquired in 2019.

99AkzoNobel Report 2019 | Financial statements
Contributions in 2019 were €1 million (2018: €2 million). Alecta’s funding ratio in 2019 is normally allowed to vary between 125% and 175%. The most recently quoted ratio at September 2019 stood at 142%. The expenses of all plans accounted for as defined contribution plans in AkzoNobel totaled €86 million in 2019 (2018: €87 million).
Other post-retirement benefit plansAkzoNobel provides certain healthcare and life insurance benefits to retired employees, mainly in the US and the Netherlands. The risks to which the US healthcare plans expose AkzoNobel include the risk of future increases in the cost of healthcare which would increase the cost of maintaining the plans. The benefit payments to retirees under the Dutch plan are frozen. Both plans expose AkzoNobel to the risk of a further decline in discount rates, which increases the plan obligations, and longevity risk as the plans generally pay lifetime benefits.
Reconciliation balance sheetThe adjacent table details the annual movements for the total post-retirement benefit provisions. The closing net balance sheet position of €668 million (2018: €297 million) includes the pension plans (€826 million net asset; 2018: €442 million net asset) and other post-retirement plans (€158 million liability; 2018: €145 million liability).
Administrative expensesIn addition to the expenses borne by the funds them-selves, some expenses are borne directly by AkzoNobel. Administrative expenses are incurred, especially for the UK pension funds, of €19 million (2018: €14 million), which are included in operating income. In addition, we directly incurred asset management expenses of €4 million (2018: €5 million), which have been included in other comprehen-sive income.
Interest costsInterest costs on DBO for both pensions and other post-retirement benefits, together with the interest income on plan assets, comprise the net financing income related to post-retirement benefits of €21 million (2018: €10 million), see Note 7.
Reconciliation balance sheet2018 2019
In € millions DBOPlan
assets Total DBOPlan
assets Total
Balance at the beginning of the period (14,444) 14,643 199 (13,354) 13,654 300
Statement of income
Current service cost (36) – (36) (30) – (30)
Past service cost (64) – (64) (2) – (2)
Settlements – – – – – –
Net interest (charge)/income on net defined benefit (liability)/asset (345) 355 10 (361) 382 21
Cost recognized in statement of income (445) 355 (90) (393) 382 (11)
Remeasurements
Actuarial (loss)/gain due to liability experience (39) – (39) 50 – 50
Actuarial gain/(loss) due to liability financial assumption changes 430 – 430 (1,368) – (1,368)
Actuarial gain due to liability demographic assumption changes 74 – 74 189 – 189
Actuarial loss due to buy-in – (31) (31) – (30) (30)
Return on plan assets (less)/greater than discount rate – (479) (479) – 914 914
Remeasurement effects recognized in Other comprehensive income 465 (510) (45) (1,129) 884 (245)
Cash flow
Employer contributions – 257 257 – 569 569
Employee contributions (2) 2 – (2) 2 –
Benefits and administration costs paid from plan assets 927 (927) – 881 (881) –
Net cash flow 925 (668) 257 879 (310) 569
Other
Acquisitions/divestments/transfers 2 (2) – – – –
Changes in exchange rates 143 (164) (21) (619) 677 58
Total other 145 (166) (21) (619) 677 58
Balance at the end of the period (13,354) 13,654 300 (14,616) 15,287 671
Asset restriction (3) (3)
Net balance sheet position 297 668
In the balance sheet under
Other financial non-current assets 947 1,418
Post-retirement benefit provisions (603) (701)
Current portion of provisions (47) (49)
Net balance sheet position 297 668

100 Financial statements | AkzoNobel Report 2019
Pension plans in asset positionPension balances recorded under Other financial non-current assets totaled €1,418 million (2018: €947 million). The increase in 2019 was primarily due to €507 million of top-up pension contributions and €63 million of exchange rate translation gains partially offset by €134 million of net actuarial losses in the relevant plans. These assets could be recognized under IFRIC 14 because economic benefits are available in the form of future refunds from the plan or reductions in future contributions to the plan, either during the life of the plan or on the (final) settlement of the plan liabilities.
Plan assetsThe equities and government bond debt assets in the adjacent table have quoted prices in active markets, although most are held through funds comprised of such instruments which are not actively traded themselves. The total value of plan assets not quoted in active markets is €8,812 million (2018: €8,534 million, including the UK buy-in annuity policies totaling €8,018 million (2018: €7,496 million), investments in real estate, totaling €405 million (2018: €362 million) and other investments in infrastructure, catastrophe bonds, insurance policies and high-yield credit strategies. Plan assets did not directly include any of AkzoNobel’s own transferable financial instruments, nor any property occupied by or assets used by the company.
Cash flowsIn 2020, we expect to contribute €84 million (2019: €557 million) to our defined benefit pension plans. We expect to pay a further €13 million (2019: €12 million) for other post-retirement benefit plans. No allowance is made for any special one-off contributions that may arise in relation to new de-risking opportunities. The fall in expected contributions in 2020 compared to 2019 is mainly the result of no anticipated requirement to make top-up payments to the ICIPF in 2020, whereas recovery plan top-up payments were made in 2019 following agreement on the ICIPF triennial funding valuation at March 31, 2017.
* The sensitivity to price inflation assumption includes corresponding changes to all inflation-related compensation increases, pensions in payment and pensions in deferment.
The sensitivity effect on DBO shown allows for an alternative value for each assumption while the other actuarial assumptions remain unchanged. While this table illustrates the overall impact on DBO of the changes shown, the significance of the impact and the range of reasonably possible alternative assumptions may differ between the different plans that comprise the total DBO. In particular, the plans differ in benefit design, currency
and average term, meaning that different assumptions have different levels of significance for each plan. The sensitivity analysis is intended to illustrate the inherent uncertainty in the valuation of the DBO under market conditions at the measurement date. Its results cannot be extrapolated due to non-linear effects that changes in the key actuarial assumptions may have on the total DBO. Furthermore, the analysis does not indicate a
Cash flows
Pensions Other post-retirement benefits
In € millions 2019 2020 2019 2020
Regular contributions 45 45 12 13
Top-ups 512 39 – –
Total 557 84 12 13
Plan assets
2018 2019
In € millions Total Percentage of total Total Percentage of total
Equities 552 4 331 2
Debt - fixed interest government bonds 784 6 1,641 11
Debt - index-linked government bonds 2,390 18 2,728 18
Debt - corporate and other bonds 888 7 1,458 10
UK buy-in annuity policies 7,496 55 8,018 52
Cash and cash equivalents 212 2 289 2
Other 1,332 8 822 6
Total 13,654 100 15,287 100
Sensitivity of DBO to change in assumptions
In € millionsICIPF
UKCPS
UKOther
pension plans
Other post-retirement
benefits Total
Discount rate: 0.5% decrease 559 294 146 6 1,005
Price inflation: 0.5% increase* 312 88 78 – 478
Life expectancy: one year increase from age 60 722 115 72 8 917
Maturity information
Weighted average duration of DBO (years) 12.1 16.3 16.1 10.2 13.6

101AkzoNobel Report 2019 | Financial statements
probability of such changes occurring and it does not necessarily represent our view of expected future changes in DBO. Any management actions that may be taken to mitigate the inherent risks in the post-retirement defined benefit plans are not reflected in this analysis, as they would normally be reflected in plan asset changes rather than DBO changes.
The sensitivities in the table only apply to the DBO and not to the net amounts recognized in the balance sheet. Movements in the fair value of plan assets (which include the de-risking instruments) would, to a significant extent, be expected to offset movements in the DBO resulting from changes in the given assumptions. At ICIPF, the annuity buy-in contracts cover 99% of pensioner liabilities (2018: 99%) and 84% of total liabilities (2018: 84%).
At CPS, the longevity hedge contract covers 58% of pensioner liabilities (2018: 57%) and 35% of total liabilities (2018: 35%).
Key figures and assumptions by plan
2018 2019
In € millions or % ICIPF
UK CPS
UK Other pension
plans
Other post-retirement
benefits Total ICIPF
UK CPS
UK Other pension
plans
Other post-retirement
benefits Total
Percentage of total DBO 64% 23% 12% 1% 62% 24% 13% 1%
Defined Benefit Obligation at year-end (8,508) (3,083) (1,618) (145) (13,354) (9,124) (3,499) (1,835) (158) (14,616)
Fair value of plan assets at year-end 8,876 3,601 1,177 – 13,654 9,939 4,032 1,316 – 15,287
Plan funded status 368 518 (441) (145) 300 815 533 (519) (158) 671
Restriction on asset recognition – – (3) – (3) – – (3) – (3)
Amounts recognized on the balance sheet 368 518 (444) (145) 297 815 533 (522) (158) 668
Percentage of total current service cost 12% 26% 62% –% 11% 25% 63% 1%
Current service cost 4 9 23 – 36 3 8 19 – 30
Employer contributions 154 34 55 14 257 479 37 41 12 569
Discount rate 2.7% 2.8% 2.8% 3.9% 2.7% 1.9% 2.0% 1.9% 2.9% 1.9%
Rate of compensation increase 1.5% 1.4% 2.6% – 2.0% 1.5% 1.4% 2.7% – 2.0%
Inflation 3.2% 3.2% 2.2% – 3.1% 3.1% 3.0% 2.1% – 2.9%
Pension increases 3.0% 2.3% 2.1% – 2.7% 2.9% 2.3% 2.1% – 2.6%
Life expectancy (in years)
Currently aged 60
Males 26.7 26.4 26.1 26.1 26.5 26.3 25.9 25.9 26.1 26.2
Females 28.2 28.7 28.5 28.0 28.4 27.8 28.3 28.4 27.8 28.0
Currently aged 45, from age 60
Males 27.8 27.5 27.5 27.3 27.7 27.3 27.0 27.3 27.2 27.2
Females 29.5 29.9 29.8 29.3 29.6 29.0 29.5 29.7 29.0 29.2

102 Financial statements | AkzoNobel Report 2019
* Excludes other post-retirement benefit plans.
Future benefit paymentsThe figures in the table below are the estimated future benefit payments to be paid from the plans to beneficiaries over the next ten years.
DBO at funded and unfunded pension plans*
In € millions 2018 2019
Wholly or partly funded plans 13,032 14,268
Unfunded plans 177 190
Total 13,209 14,458
Future benefit payments
In € millions Pensions
Other post- retirement
benefits
2020 901 13
2021 899 12
2022 905 12
2023 915 11
2024 921 11
2025-2029 4,721 46
Key plan details for the two largest pension plans1
ICI Pension Fund, UK Akzo Nobel (CPS) Pension Scheme, UK
Type of plan Defined benefit, based upon years of service and final salary
Defined benefit, based upon years of service and final salary
Benefits Retirement pension for employee Dependents’ pensions on death of employee/pensionerOptions for ill health early retirement
Retirement pension for employee Dependents’ pensions on death of employee/pensionerOptions for ill health early retirement
Pension increases (main benefit section)
Annually linked to UK RPI with a maximum of 5 percent Annually linked to UK CPI with a maximum of 5 percent
Plan structure Plans are set up under a trust and are tax approved Plans are set up under a trust and are tax approved
Governance Trustee directors:Five member-nominated trusteesFive appointed with the agreement of Law DebentureOne independent (Law Debenture)
Trustee directors:Four member-nominated trusteesFour company-nominated trusteesOne independent (Law Debenture)
Regulatory framework The plans are tax approved and assets are held in trust for the benefit of participants. The trustees have a legal duty to manage the trust in the best interests of participants. Investment strategy is controlled by the trustees in consultation with the company
Funding basis A plan specific basis must be agreed with each trustee board in accordance with UK regulations. The basis is not the same as the IFRS calculation as it uses more prudent assumptions about life expectancy and the discount rates reflect prudent estimates of the expected return on assets actually held, thus the trustees’ investment strate-gies will impact the discounted value of liabilities
Frequency of funding reviews Normally every three years Normally every three years
Latest completed valuation March 31, 2017 March 31, 2017
Funding deficit2 at latest completed valuation
£604 million (€707 million) £123 million (€144 million)
Recovery plan £125 million (€146 million)3 in January 2019 and £290 million (€333 million)3 in March 2019, following experi-ence gains since the March 31, 2017 valuation date
£26 million (€30 million) per annum in 2019 to 2022, paid in March each year from an escrow account pre-funded with £142 million (€181 million)3 in February 2019
Next funding review March 31, 2020 March 31, 2020
Asset allocation at March 31, 2019Matching: Return seeking:
97%3%Buy-in annuity contracts cover 99% of pensioner liabilities and 84% of total liabilities
82%18%The longevity hedge contract covers 58% of pensioner liabilities and 35% of total liabilities
Membership at March 31, 2019ActiveDeferredPensionerTotal
1556,80139,84746,803
3616,76717,85724,985
1 Amounts in euro are a convenience translation using the December 31, 2019, exchange rate, unless indicated otherwise.2 Based on local valuation regulations.3 Actual rate at time of transfer.

103AkzoNobel Report 2019 | Financial statements
Note 19 Other provisions and contingent liabilities
Provisions for restructuring of activitiesProvisions for restructuring of activities comprise of accru-als for certain employee benefi ts and for costs which are directly associated with plans to exit or cease specifi c activities and closing down of facilities. For all restructuring provisions, a detailed formal plan exists and the imple-mentation of the plan has started or the plan has been announced before the balance sheet date. Most restruc-turing plans are expected to be completed within one year from the balance sheet date.
Environmental liabilitiesWe are confronted with costs arising out of environmental laws and regulations, which include obligations to eliminate or limit the effects on the environment of the disposal or release of certain wastes or substances at various sites. Proceedings involving environmental matters, such as the alleged discharge of chemicals or waste materials into the air, water, or soil, are pending against us in various countries. In some cases, this concerns sites divested in prior years or derelict sites belonging to companies acquired in the past.
Environmental liabilities can change substantially due to the emergence of additional information on the nature or extent of the contamination, the geological circumstances, the necessity of employing particular methods of remedia-tion, actions by governmental agencies or private parties, or other factors.
The provisions for environmental costs amounted to €75 million at year-end 2019 (2018: €91 million). The provision has been discounted using an average pre-tax discount rate of 1.4% (2018: 1.9%). While it is not feasible to predict the outcome of all pending environmental exposures, it is reasonably possible that there will be a need for future provisions for environmental costs which, in management’s opinion, based on information currently available, would not have a material effect on the company’s fi nancial position but could be material to the company’s results of operations in any one accounting period.
Sundry provisions and other contingent liabilitiesSundry provisions relate to a variety of provisions, including provisions for claims, antitrust cases and other long-term employee benefi ts, such as long-service leave and jubilee payments. The majority of the cash outfl ows related to sundry provisions is expected to be within one to fi ve years. In calculating the sundry provisions, a pre-tax discount rate of on average 1.3% (2018: 1.3%) has been used.
A number of claims against AkzoNobel are pending, all of which are contested. This includes a lawsuit fi led in April 2019, by PT DWI Satrya Utama (PTDSU) against Akzo Nobel N.V., certain subsidiaries as well as certain subsidiary directors at the Tangerang District Court, Indonesia. PTDSU owns a 45% interest in PT ICI Paints Indonesia (PTICIPI), an indirect subsidiary of Akzo Nobel N.V.. PTDSU alleges that it suffered damages as a result of defendants improper management of PTICIPI. The defendants seek to dismiss the lawsuit on the grounds that the claims are without merit and because the court does not have jurisdiction over the lawsuit.
We are also involved in legal disputes and disputes with tax authorities in several jurisdictions. AkzoNobel has provided various indemnities and guarantees in respect of past divestments to the relevant purchasers and their permitted assigns (if applicable), which in general are capped in time and/or amount (in proportion to the value received). The provided guarantees and indemnities have varying maturity periods. AkzoNobel has received various claims under such indemnities and guarantees. In some instances, AkzoNobel has been named as a direct defen-dant despite the divestments.
Akzo Nobel N.V. has withdrawn its declarations of joint and several liability under Article 403 of Book 2 of the Dutch Civil Code for certain Dutch former Specialty Chemicals subsidiaries divested as per October 1, 2018, and is following the procedures to terminate its residual liability under those declarations under Article 404 of Book 2 of the Dutch Civil Code. One objection against the termina-tion of residual liability is still pending and Akzo Nobel N.V. and Nouryon are cooperating to get this resolved.
Provisions are recognized when an outfl ow of economic benefi ts for settlement is probable and the amount can
Movements in other provisions
In € millionsRestructuring
of activities Environmental costs Sundry Total
Balance at January 1, 2019 86 91 283 460
Additions made during the year 89 3 60 152
Utilization (67) (13) (51) (131)
Amounts reversed during the year (13) (11) (18) (42)
Unwind of discount – 3 11 14
Acquisitions – – 1 1
Changes in exchange rates 1 2 5 8
Balance at December 31, 2019 96 75 291 462
Non-current portion of provisions – 63 217 280
Current portion of provisions 96 12 74 182
Balance at December 31, 2019 96 75 291 462

104 Financial statements | AkzoNobel Report 2019
be reliably estimated. It should be understood that, in light of possible future developments, such as: (a) potential additional lawsuits; (b) possible future settlements; and (c) rulings or judgments in pending lawsuits, certain cases may result in additional liabilities and related costs.
At this point in time, we cannot estimate any additional amount of loss or range of loss in excess of the recorded amounts with suffi cient certainty to allow such amount or range of amounts to be meaningful. While the outcome of said cases, claims and disputes cannot be predicted with certainty, we believe, based upon legal advice and information received, that the fi nal outcome will not materi-ally affect our consolidated fi nancial position but could be material to our results of operations or cash fl ows in any one accounting period.
Current portion of provisionsThe current portion of post-retirement benefi t provisions (€49 million) and the current portion of other provisions (€182 million) add up to €231 million (2018: €211 million), as refl ected in the balance sheet.
Discount ratesThe discount rates used in calculating the provisions recognized at December 31, 2019 are mentioned in the paragraphs on environmental and sundry provisions. Changes in the discount rate will affect our consolidated fi nancial position. A sensitivity test showed that a one percentage point increase or decrease of discount rates will have an impact down or up, respectively, of €10 million on the provisions recognized at December 31, 2019.
Note 20 Net debt
Net debt
in € millionsLong-term
borrowingsShort-term borrowings
Short-term investments
Cash and cash equivalents Net debt
Net debt equivalents at January 1, 2018 2,300 973 – (1,322) 1,951
Net cash from operating activities – – – (162) (162)
Net cash from investing activities – – 207 207
Proceeds from borrowings 7 600 – (607) –
Borrowings repaid – (1,529) – 1,529 –
Transfers from long-term to short-term (526) 526 – – –
Investments in short-term investments – – (5,541) 5,541 –
Repayments of short-term investments – – 80 (80) –
Dividends – – – 636 636
Movements bank overdrafts and short-term bank loans – 33 – (33) –
Net cash from discontinued operations – – – (8,958) (8,958)
Buy out of non-controlling interests – – – 437 437
Changes in exchange rates – (9) – 17 8
Other changes 18 5 1 (4) 20
Net debt at year-end 2018 1,799 599 (5,460) (2,799) (5,861)
Impact adoption IFRS 16 270 93 – – 363
Net debt at January 1, 2019 2,069 692 (5,460) (2,799) (5,498)
Net cash from operating activities – – – (33) (33)
Net cash from investing activities – – – 102 102
Acquisitions 7 – (16) 224 215
Unwind of discount and amortized cost 10 (1) – – 9
Proceeds from borrowings 3 7 – (10) –
Borrowings repaid – (623) – 623 –
New/modifi cation of lease contracts 34 18 – – 52
Transfers from long-term to short-term (86) 86 – – –
Movement bankoverdrafts and short-term bank loans – 2 – (2) –
Investments in short-term investments – – (2,325) 2,325 –
Repayments of short-term investments – – 7,663 (7,663) –
Dividends – – – 1,446 1,446
Capital repayments – – – 2,000 2,000
Share repurchase – – – 2,520 2,520
Net cash from discontinued operations – – – 10 10
Changes in exchange rates 3 (6) – (15) (18)
Other changes 2 (6) – 1 (3)
Net debt at year-end 2019 2,042 169 (138) (1,271) 802
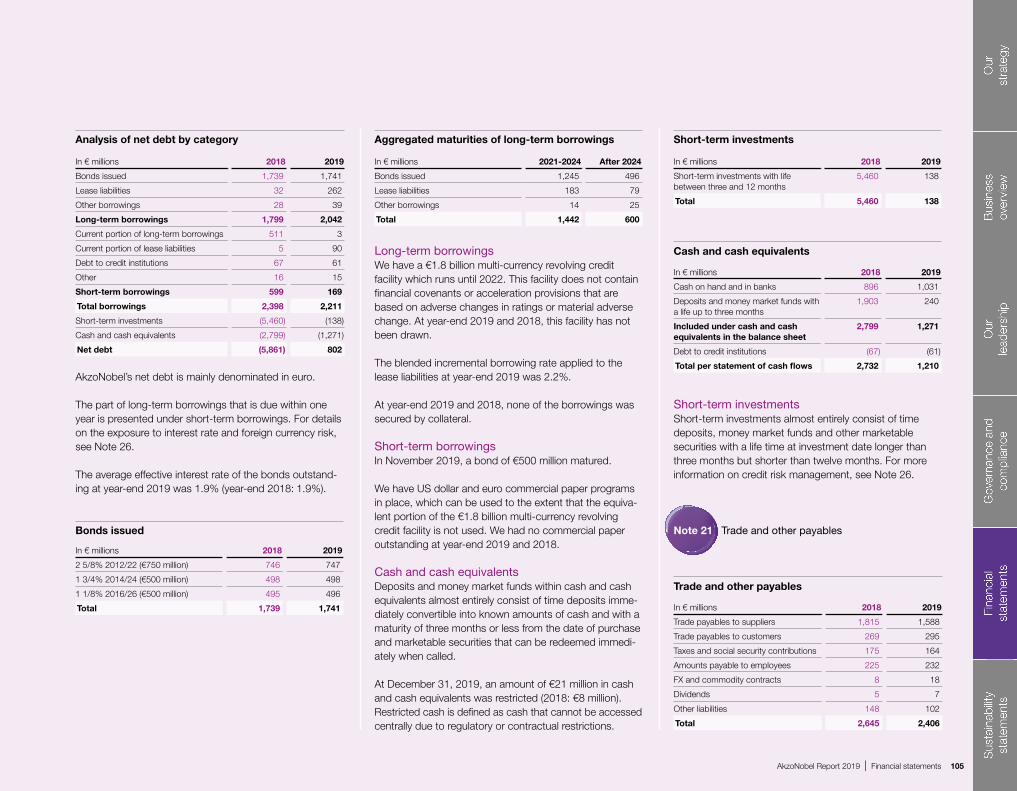
105AkzoNobel Report 2019 | Financial statements
Note 21 Trade and other payables
AkzoNobel’s net debt is mainly denominated in euro.
The part of long-term borrowings that is due within one year is presented under short-term borrowings. For details on the exposure to interest rate and foreign currency risk, see Note 26.
The average effective interest rate of the bonds outstand-ing at year-end 2019 was 1.9% (year-end 2018: 1.9%).
Long-term borrowingsWe have a €1.8 billion multi-currency revolving credit facility which runs until 2022. This facility does not contain fi nancial covenants or acceleration provisions that are based on adverse changes in ratings or material adverse change. At year-end 2019 and 2018, this facility has not been drawn.
The blended incremental borrowing rate applied to the lease liabilities at year-end 2019 was 2.2%.
At year-end 2019 and 2018, none of the borrowings was secured by collateral.
Short-term borrowingsIn November 2019, a bond of €500 million matured.
We have US dollar and euro commercial paper programs in place, which can be used to the extent that the equiva-lent portion of the €1.8 billion multi-currency revolving credit facility is not used. We had no commercial paper outstanding at year-end 2019 and 2018.
Cash and cash equivalentsDeposits and money market funds within cash and cash equivalents almost entirely consist of time deposits imme-diately convertible into known amounts of cash and with a maturity of three months or less from the date of purchase and marketable securities that can be redeemed immedi-ately when called.
At December 31, 2019, an amount of €21 million in cash and cash equivalents was restricted (2018: €8 million). Restricted cash is defi ned as cash that cannot be accessed centrally due to regulatory or contractual restrictions.
Short-term investmentsShort-term investments almost entirely consist of time deposits, money market funds and other marketable securities with a life time at investment date longer than three months but shorter than twelve months. For more information on credit risk management, see Note 26.
Analysis of net debt by category
In € millions 2018 2019
Bonds issued 1,739 1,741
Lease liabilities 32 262
Other borrowings 28 39
Long-term borrowings 1,799 2,042
Current portion of long-term borrowings 511 3
Current portion of lease liabilities 5 90
Debt to credit institutions 67 61
Other 16 15
Short-term borrowings 599 169
Total borrowings 2,398 2,211
Short-term investments (5,460) (138)
Cash and cash equivalents (2,799) (1,271)
Net debt (5,861) 802
Bonds issued
In € millions 2018 2019
2 5/8% 2012/22 (€750 million) 746 747
1 3/4% 2014/24 (€500 million) 498 498
1 1/8% 2016/26 (€500 million) 495 496
Total 1,739 1,741
Aggregated maturities of long-term borrowings
In € millions 2021-2024 After 2024
Bonds issued 1,245 496
Lease liabilities 183 79
Other borrowings 14 25
Total 1,442 600
Cash and cash equivalents
In € millions 2018 2019
Cash on hand and in banks 896 1,031
Deposits and money market funds with a life up to three months
1,903 240
Included under cash and cash equivalents in the balance sheet
2,799 1,271
Debt to credit institutions (67) (61)
Total per statement of cash fl ows 2,732 1,210
Short-term investments
In € millions 2018 2019
Short-term investments with life between three and 12 months
5,460 138
Total 5,460 138
Trade and other payables
In € millions 2018 2019
Trade payables to suppliers 1,815 1,588
Trade payables to customers 269 295
Taxes and social security contributions 175 164
Amounts payable to employees 225 232
FX and commodity contracts 8 18
Dividends 5 7
Other liabilities 148 102
Total 2,645 2,406

106 Financial statements | AkzoNobel Report 2019
Operating activities in 2019 resulted in a cash infl ow of €33 million (2018: cash infl ow of €162 million).
Pension pre-funding concerns the payment of €161 million for the funding of the escrow account for Akzo Nobel (CPS) Pension Scheme in the UK.
The above amounts cannot be reconciled directly to the respective balance sheet positions. They refl ect changes in balance sheet positions only to the extent they have a cash fl ow impact, such as utilization, or they reverse the non-cash impact as included in profi t for the period. These amounts exclude non-cash movements such as unwind of discount, movements through other comprehensive income, acquisitions and divestments, and changes in exchange rates.
Purchase commitments for property, plant and equipment aggregated €3 million (2018: €8 million).
As from January 1, 2019, for lease liabilities refer to Note 20. During 2018, lease payments amounted to €124 million.
We purchased and sold goods and services to various related parties in which we hold a 50% or less equity inter-est (associates and joint ventures). Such transactions were conducted at arm’s length with terms comparable with transactions with third parties.
During 2019, we considered the members of the Execu-tive Committee and the Supervisory Board to be the key management personnel as defi ned in IAS 24 “Related parties”. For details on their remuneration, as well as on shares held by members of the Supervisory Board or Board of Management, refer to Note 25. In the ordinary course of business, we also have transactions with various organizations with which certain members of the Super-visory Board or Executive Committee are associated. All related party transactions were conducted at arm’s length. For related party transactions with pension funds, refer to Note 14 and 18.
Total compensation for key management personnel expensed during the period amounted to €20.9 million (2018: €15.7 million). An amount of €7.9 million relates to short-term employee benefi ts (2018: €7.3 million); €0.7 million relates to post-contract benefi ts and other post-contract compensation (2018: €0.7 million); €5.9 million relates to share-based compensation (2018: €6.0 million); €3.1 million relates to other long-term incentives (2018: €1.2 million); and €3.3 million relates to payments upon termination of employment (2018: €0.5 million). Additional charges of €2.9 million (2018: €1.7 million) were accrued which relate to taxation on excessive pay (“Belastingheffi ng excessieve beloningsbestanddelen”).
This compensation includes total remuneration for the members of the Supervisory Board of €1.0 million (2018: €1.0 million) and for the members of the Board of Manage-ment of €6.5 million (2018: €5.0 million). For more details on the remuneration of the individual members of the Supervisory Board and the Board of Management refer-ence is made to the Remuneration report.
In accordance with the Articles of Association and good corporate governance practice, the remuneration of Supervisory Board members is not dependent on the results of the company. We do not grant share-based compensation to our Supervisory Board members.
An overview of shares held by the Supervisory Board members is provided on this page. A similar overview is provided of the shares held by the Board of Management.
Loans The company does not grant loans, advance payments or guarantees to members of the Supervisory Board, members of the Executive Committee or any family members of such persons.
Note 22 Cash fl ow
Note 24 Related party transactions
Note 25 Remuneration of the Supervisory Board and the Board of Management
Note 23 Commitments
Changes in other provisions as per consolidated statement of cash fl ows
In € millions 2018 2019
Restructuring provisions (4) 9
Environmental and sundry provisions (42) (24)
Total (46) (15)
Changes in working capital as per consolidated statement of cash fl ows
In € millions 2018 2019
Trade and other receivables (199) 9
Inventories (49) 9
Trade and other payables 71 (262)
Total (177) (244)
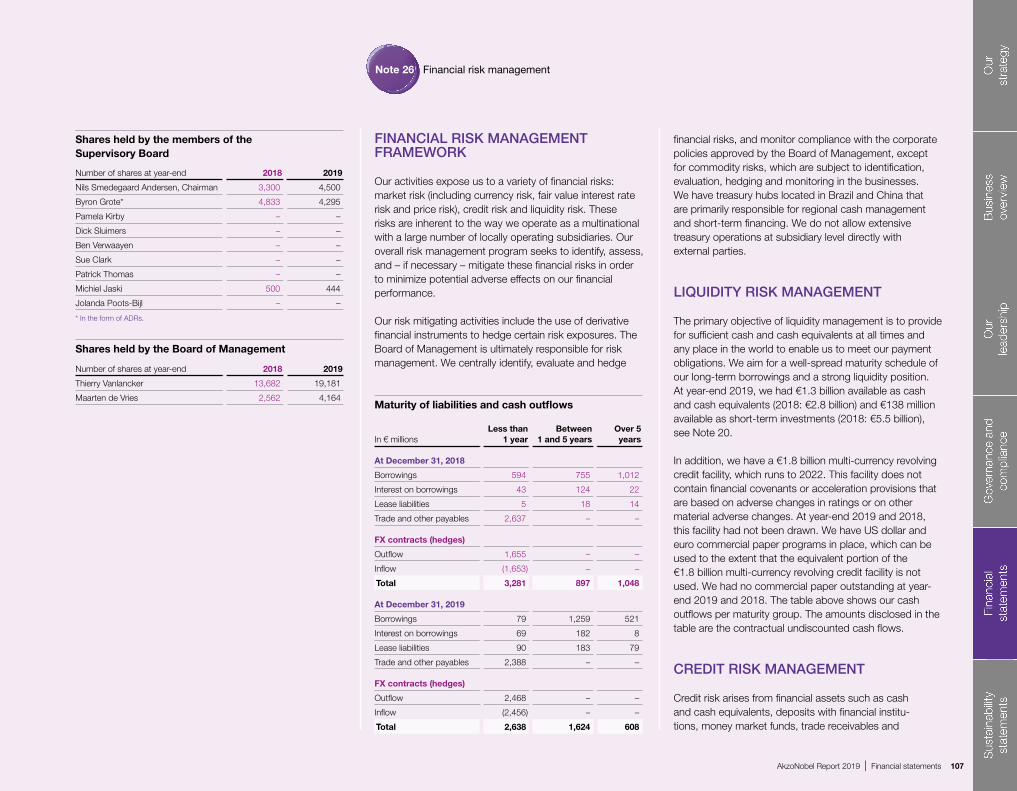
107AkzoNobel Report 2019 | Financial statements
* In the form of ADRs.
Note 26 Financial risk management
FINANCIAL RISK MANAGEMENT FRAMEWORK
Our activities expose us to a variety of fi nancial risks: market risk (including currency risk, fair value interest rate risk and price risk), credit risk and liquidity risk. These risks are inherent to the way we operate as a multinational with a large number of locally operating subsidiaries. Our overall risk management program seeks to identify, assess, and – if necessary – mitigate these fi nancial risks in order to minimize potential adverse effects on our fi nancial performance.
Our risk mitigating activities include the use of derivative fi nancial instruments to hedge certain risk exposures. The Board of Management is ultimately responsible for risk management. We centrally identify, evaluate and hedge
fi nancial risks, and monitor compliance with the corporate policies approved by the Board of Management, except for commodity risks, which are subject to identifi cation, evaluation, hedging and monitoring in the businesses. We have treasury hubs located in Brazil and China that are primarily responsible for regional cash management and short-term fi nancing. We do not allow extensive treasury operations at subsidiary level directly with external parties.
LIQUIDITY RISK MANAGEMENT
The primary objective of liquidity management is to provide for suffi cient cash and cash equivalents at all times and any place in the world to enable us to meet our payment obligations. We aim for a well-spread maturity schedule of our long-term borrowings and a strong liquidity position. At year-end 2019, we had €1.3 billion available as cash and cash equivalents (2018: €2.8 billion) and €138 million available as short-term investments (2018: €5.5 billion), see Note 20.
In addition, we have a €1.8 billion multi-currency revolving credit facility, which runs to 2022. This facility does not contain fi nancial covenants or acceleration provisions that are based on adverse changes in ratings or on other material adverse changes. At year-end 2019 and 2018, this facility had not been drawn. We have US dollar and euro commercial paper programs in place, which can be used to the extent that the equivalent portion of the €1.8 billion multi-currency revolving credit facility is not used. We had no commercial paper outstanding at year-end 2019 and 2018. The table above shows our cash outfl ows per maturity group. The amounts disclosed in the table are the contractual undiscounted cash fl ows.
CREDIT RISK MANAGEMENT
Credit risk arises from fi nancial assets such as cash and cash equivalents, deposits with fi nancial institu-tions, money market funds, trade receivables and
Shares held by the members of the Supervisory Board
Number of shares at year-end 2018 2019
Nils Smedegaard Andersen, Chairman 3,300 4,500
Byron Grote* 4,833 4,295
Pamela Kirby – –
Dick Sluimers – –
Ben Verwaayen – –
Sue Clark – –
Patrick Thomas – –
Michiel Jaski 500 444
Jolanda Poots-Bijl – –
Shares held by the Board of Management
Number of shares at year-end 2018 2019
Thierry Vanlancker 13,682 19,181
Maarten de Vries 2,562 4,164Maturity of liabilities and cash outfl ows
In € millionsLess than
1 yearBetween
1 and 5 yearsOver 5 years
At December 31, 2018
Borrowings 594 755 1,012
Interest on borrowings 43 124 22
Lease liabilities 5 18 14
Trade and other payables 2,637 – –
FX contracts (hedges)
Outfl ow 1,655 – –
Infl ow (1,653) – –
Total 3,281 897 1,048
At December 31, 2019
Borrowings 79 1,259 521
Interest on borrowings 69 182 8
Lease liabilities 90 183 79
Trade and other payables 2,388 – –
FX contracts (hedges)
Outfl ow 2,468 – –
Infl ow (2,456) – –
Total 2,638 1,624 608

108 Financial statements | AkzoNobel Report 2019
derivative financial instruments with a positive fair value. We have a credit risk management policy in place to limit credit losses due to non-performance of financial counter-parties and customers. We monitor our exposure to credit risk on an ongoing basis at various levels. We only deal with financial counterparties that have a sufficiently high credit rating.
Generally, we do not require collateral in respect of financial assets. Investments in cash and cash equivalents, short-term investments and transactions involving derivative financial instruments are entered into with counterparties that have sound credit ratings and a good reputation.Derivative transactions are concluded mostly with parties with whom we have contractual netting agree-ments and ISDA agreements in place. We set limits per counterparty for the different types of financial instruments we use. We closely monitor the acceptable financial counterparty credit ratings and credit limits and revise where required in line with the market circumstances. We do not expect non-performance by the counterparties for these financial instruments. Due to our geographical spread and the diversity of our customers, we were not subject to any significant concentration of credit risks at balance sheet date.
The credit risk from trade receivables is measured and analyzed at a local operating entity level, mainly by means of ageing analysis, see Note 16. Additionally, trade receiv-ables and financial assets measured at amortized cost are subject to the expected credit loss impairment model either using the general or the simplified approach. For more information on the applied impairment approaches per financial asset type, see Note 1.
Generally, the maximum exposure to credit risk is repre-sented by the carrying value of financial assets in the balance sheet.
At year-end 2019, the credit risk on consolidated level was €3.7 billion (2018: €10.5 billion) for cash and cash equivalents, short-term investments, loans, trade and other receivables. Our credit risk is well spread
among both global and local counterparties. Our largest counterparty risk amounted to €380 million at year-end 2018 (2018: €999 million).
FOREIGN EXCHANGE RISK MANAGEMENT
Trade and financing transactionsWe operate in a large number of countries, where we have clients and suppliers, many of whom are outside of the local functional currency environment. This creates curren-cy exposure which is partly netted out on group level. The purpose of our foreign currency hedging activities is to protect us from the risk that the functional currency net cash flows resulting from trade or financing transactions are adversely affected by changes in exchange rates. Our policy is to hedge our transactional foreign exchange rate exposures above predefined thresholds from recog-nized assets and liabilities. Cash flow hedge accounting on forecasted transactions is applied by exception. Derivative transactions with external parties are bound by limits per currency.
In general, our forward exchange contracts have a maturity of less than one year. When necessary, forward exchange contracts are rolled over at maturity. Currency derivatives are not used for speculative purposes.
Investments in foreign subsidiaries, associates and joint ventures During 2018 and 2019, net investment hedge accoun- ting was applied on hedges of certain net investments in foreign operations, which were partly hedged. The main net investments included were related to Chinese yuan (2018 and 2019), Vietnamese dong (2018 and 2019), Indian rupee (2019), which were hedged with forward exchange contracts for the same currencies. The spot results related to these hedges were recognized in other comprehensive income and accumulated in the cumulative translation reserves. At year-end 2019 one hedge of net investments in Polish zloty was outstanding. During 2018 and 2019, these hedges were fully effective.
INTEREST RATE RISK MANAGEMENT
We are partly financed with debt in order to obtain more efficient leverage. Fixed rate debt results in fair value inter-est rate risk. Floating rate debt results in cash flow interest rate risk. We treat fixed rate debt maturing within one year as floating rate debt for debt portfolio purposes. The fixed/floating rate of our outstanding bonds shifted from 78% fixed at year-end 2018 to 100% fixed at year-end 2019. During 2019 and 2018, we have not used any interest rate derivatives.
CAPITAL RISK MANAGEMENT
Our objectives when managing capital are to safeguard our ability to satisfy our capital providers and to maintain a capital structure that optimizes our cost of capital. For this we maintain a conservative financial strategy, with the objective to remain a strong investment grade company as rated by the rating agencies Moody’s and Standard & Poor’s. The capital structure can be altered, among others, by adjusting the amounts of dividends paid to sharehold-ers, return capital to capital providers, or issue new debt or shares. In November 2019, a bond of €500 million matured. Consistent with other companies in the industry,
Hedged notional amounts at year-end
Buy Sell Buy Sell
In € millions 2018 2018 2019 2019
US dollar 556 138 605 739
Pound sterling 181 112 599 136
Swedish krona 42 31 24 9
Chinese yuan 39 26 48 –
Other 186 469 214 565
Total 1,004 776 1,490 1,449

109AkzoNobel Report 2019 | Financial statements
we monitor capital headroom based on funds from operations in relation to our net borrowings level (FFO/ NB-ratio). The FFO/NB-ratio at year-end 2019 was 0.71 (2018: was not measured given the proceeds from the divestment of Specialty Chemicals). Funds from opera-tions are based on net cash from operating activities after tax, which is adjusted, among others, for the elimination of changes in working capital, top-up payments for pensions and for the effects of the underfunding of postretirement benefit obligations. Net borrowings are calculated as the total of long and short-term borrowings less cash and cash equivalents and short-term investments, adding an after-tax amount for the underfunding of postretirement benefit obligations.
Fair value of financial instruments and IFRS 9 categoriesIn the table “Fair value per financial instrument category” insight is provided in the recognition of the respec-tive financial instruments per IFRS 9 category. The total carrying value is based on the accounting principles as outlined in Note 1. Financial instruments are recognized at fair value and subsequently recognized either at fair value or at amortized cost, using the effective interest method. The financial instruments accounted for at fair value through profit or loss are derivative financial instruments and securities included in financial non-current assets, cash and cash equivalents and short-term investments. The remaining financial instruments are accounted for at amortized cost.
The following valuation methods for financial instruments carried at fair value through profit or loss are distinguished:• Level 1: quoted prices (unadjusted) in active markets for
identical assets or liabilities• Level 2: inputs other than quoted prices included within
level 1 that are observable for the asset or liability, either directly (i.e. as prices) or indirectly (i.e. derived from prices)
• Level 3: inputs for the asset or liability that are not based on observable market data (unobservable)
For the purpose of determining the fair value per financial instrument category, shown in the column “fair value”, the following valuation methods were used:
A level 1 valuation method was used to estimate the fair value of the bonds issued included in our long-term borrowings. The estimate is based on the quoted market prices for the same or similar issues or on the current rates offered to us for debt with similar maturities.
A level 2 valuation method was used to determine the fair value of marketable securities included in cash and cash equivalents and short-term investments by obtaining the market price at reporting date. The fair value of foreign currency contracts and swap contracts was determined by level 2 valuation techniques using market observ-able input (such as foreign currency interest rates based on Reuters) and by obtaining quotes from dealers and brokers. A level 2 valuation method was used to determine the fair value of time deposits included in cash and cash
Fair value per financial instrument categoryCarrying value per IFRS 9 category
In € millionsCarrying amount
Out of scope of IFRS 7
Measured at amortized
cost
Measured at fair value
through profit or loss
Total carrying value Fair value
2018 year-end
Financial non-current assets 1,269 1,093 158 18 176 197
Trade and other receivables 2,141 142 1,993 6 1,999 1,999
Short-term investments 5,460 – – 5,460 5,460 5,460
Cash and cash equivalents 2,799 – – 2,799 2,799 2,799
Total financial assets 11,669 1,235 2,151 8,283 10,434 10,455
Long-term borrowings 1,799 – 1,799 – 1,799 1,880
Short-term borrowings 599 – 599 – 599 600
Trade and other payables 2,645 400 2,237 8 2,245 2,245
Total financial liabilities 5,043 400 4,635 8 4,643 4,725
2019 year-end
Financial non-current assets 1,862 1,526 210 126 336 364
Trade and other receivables 2,133 149 1,975 9 1,984 1,984
Short-term investments 138 – – 138 138 138
Cash and cash equivalents 1,271 – – 1,271 1,271 1,271
Total financial assets 5,404 1,675 2,185 1,544 3,729 3,757
Long-term borrowings 2,042 – 2,042 – 2,042 2,174
Short-term borrowings 169 – 169 – 169 169
Trade and other payables 2,406 396 1,992 18 2,010 2,010
Total financial liabilities 4,617 396 4,203 18 4,221 4,353
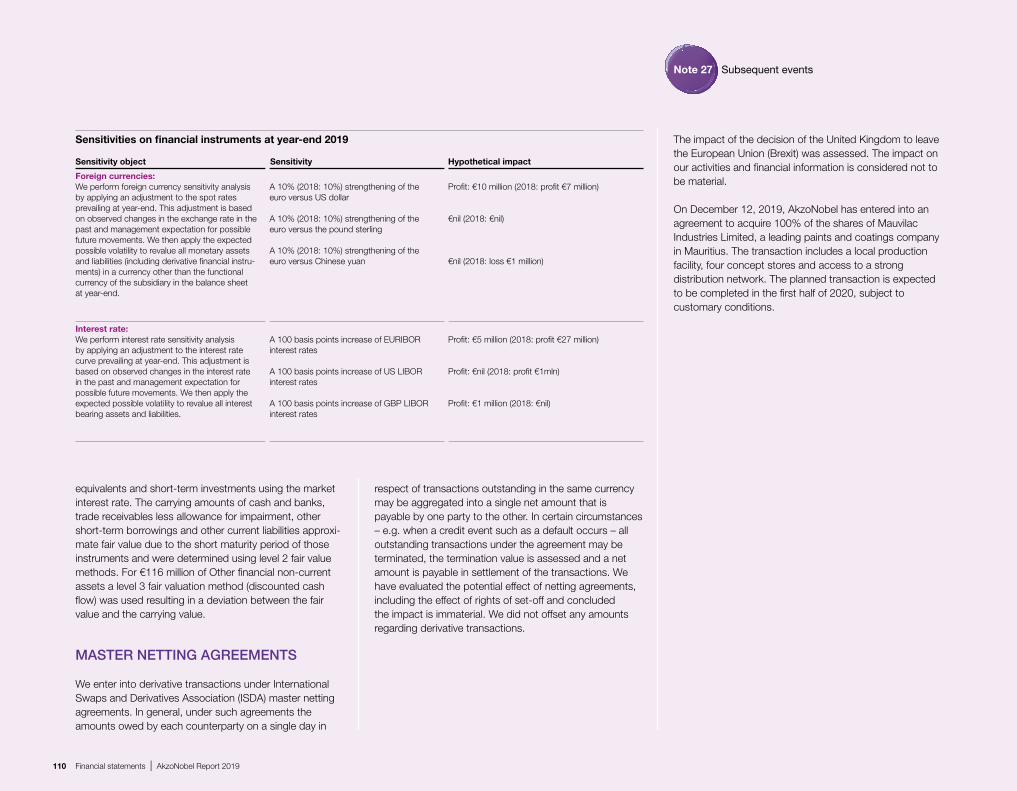
110 Financial statements | AkzoNobel Report 2019
The impact of the decision of the United Kingdom to leave the European Union (Brexit) was assessed. The impact on our activities and fi nancial information is considered not to be material.
On December 12, 2019, AkzoNobel has entered into an agreement to acquire 100% of the shares of Mauvilac Industries Limited, a leading paints and coatings company in Mauritius. The transaction includes a local production facility, four concept stores and access to a strong distribution network. The planned transaction is expected to be completed in the fi rst half of 2020, subject to customary conditions.
equivalents and short-term investments using the market interest rate. The carrying amounts of cash and banks, trade receivables less allowance for impairment, other short-term borrowings and other current liabilities approxi-mate fair value due to the short maturity period of those instruments and were determined using level 2 fair value methods. For €116 million of Other fi nancial non-current assets a level 3 fair valuation method (discounted cash fl ow) was used resulting in a deviation between the fair value and the carrying value.
MASTER NETTING AGREEMENTS
We enter into derivative transactions under International Swaps and Derivatives Association (ISDA) master netting agreements. In general, under such agreements the amounts owed by each counterparty on a single day in
respect of transactions outstanding in the same currency may be aggregated into a single net amount that is payable by one party to the other. In certain circumstances – e.g. when a credit event such as a default occurs – all outstanding transactions under the agreement may be terminated, the termination value is assessed and a net amount is payable in settlement of the transactions. We have evaluated the potential effect of netting agreements, including the effect of rights of set-off and concluded the impact is immaterial. We did not offset any amounts regarding derivative transactions.
Note 27 Subsequent events
Sensitivities on fi nancial instruments at year-end 2019
Sensitivity object Sensitivity Hypothetical impact
Foreign currencies:We perform foreign currency sensitivity analysis by applying an adjustment to the spot rates prevailing at year-end. This adjustment is based on observed changes in the exchange rate in the past and management expectation for possible future movements. We then apply the expected possible volatility to revalue all monetary assets and liabilities (including derivative fi nancial instru-ments) in a currency other than the functional currency of the subsidiary in the balance sheet at year-end.
A 10% (2018: 10%) strengthening of the euro versus US dollar
A 10% (2018: 10%) strengthening of the euro versus the pound sterling
A 10% (2018: 10%) strengthening of the euro versus Chinese yuan
Profi t: €10 million (2018: profi t €7 million)
€nil (2018: €nil)
€nil (2018: loss €1 million)
Interest rate: We perform interest rate sensitivity analysis by applying an adjustment to the interest rate curve prevailing at year-end. This adjustment is based on observed changes in the interest rate in the past and management expectation for possible future movements. We then apply the expected possible volatility to revalue all interest bearing assets and liabilities.
A 100 basis points increase of EURIBOR interest rates
A 100 basis points increase of US LIBOR interest rates
A 100 basis points increase of GBP LIBOR interest rates
Profi t: €5 million (2018: profi t €27 million)
Profi t: €nil (2018: profi t €1mln)
Profi t: €1 million (2018: €nil)

111AkzoNobel Report 2019 | Financial statements
COMPANY FINANCIAL STATEMENTS
Balance sheet as of December 31, before allocation of profit
In € millions Note 2018 2019
Assets
Non-current assets
Deferred tax assets – 30
Financial non-current assets D 11,299 11,540
Total non-current assets 11,299 11,570
Current assets
Short-term receivables E 373 160
Short-term investments G 5,460 120
Cash and cash equivalents G 1,996 458
Total current assets 7,829 738
Total assets 19,128 12,308
Equity and liabilities
Equity
Subscribed share capital 512 100
Additional paid-in capital 958 –
Other legal reserves 248 211
Cumulative translation reserves (608) (469)
Actuarial gains and losses (2,459) (2,684)
Other reserves 6,604 8,735
Undistributed results 6,579 457
Shareholders’ equity F 11,834 6,350
Non-current liabilities
Long-term borrowings G 6,471 5,682
Total non-current liabilities 6,471 5,682
Current liabilities
Short-term borrowings G 526 36
Other current liabilities H 297 240
Total current liabilities 823 276
Total equity and liabilities 19,128 12,308
Statement of income
In € millions Note 2018 2019
Revenue 30 57
Other income 78 72
Gross profit 108 129
General and administrative expenses (77) (68)
Other results B 5,126 (28)
5,049 (96)
Operating income 5,157 33
Financing income and expenses C (75) (80)
Net income from subsidiaries, associates and joint ventures
1,599 564
Profit before tax 6,681 517
Income tax (7) 22
Net income 6,674 539
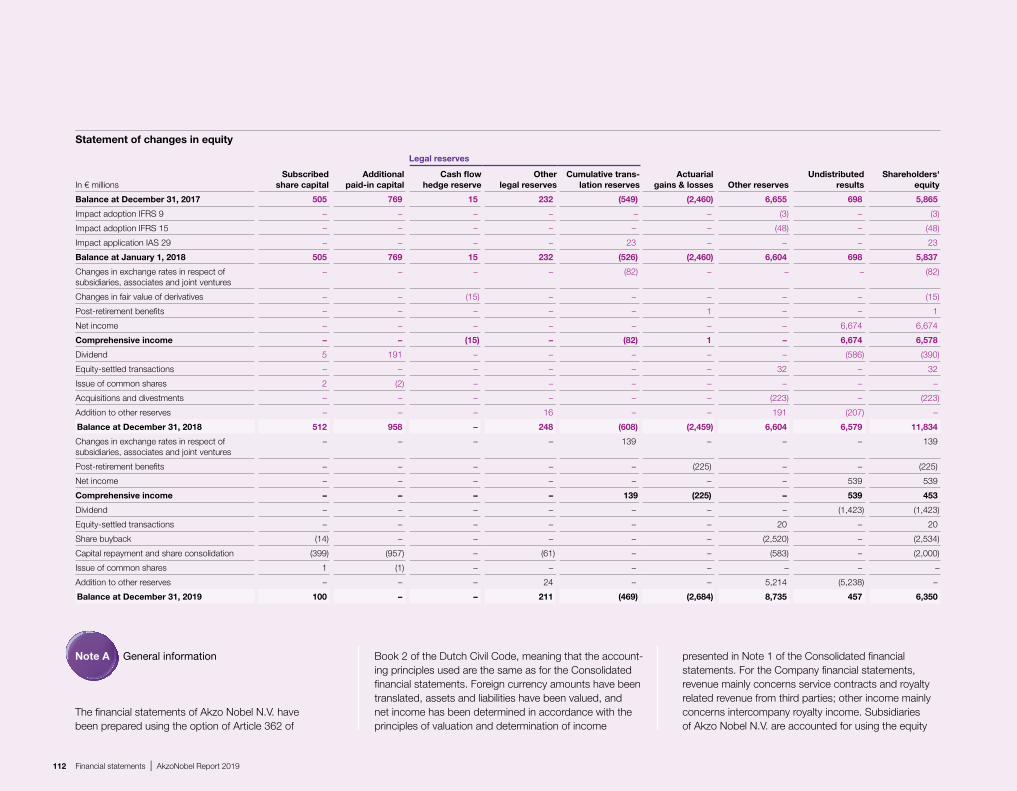
112 Financial statements | AkzoNobel Report 2019
The fi nancial statements of Akzo Nobel N.V. have been prepared using the option of Article 362 of
Note A General information Book 2 of the Dutch Civil Code, meaning that the account-ing principles used are the same as for the Consolidated fi nancial statements. Foreign currency amounts have been translated, assets and liabilities have been valued, and net income has been determined in accordance with the principles of valuation and determination of income
presented in Note 1 of the Consolidated fi nancial statements. For the Company fi nancial statements, revenue mainly concerns service contracts and royalty related revenue from third parties; other income mainly concerns intercompany royalty income. Subsidiaries of Akzo Nobel N.V. are accounted for using the equity
Statement of changes in equity
Legal reserves
In € millionsSubscribed
share capitalAdditional
paid-in capitalCash fl ow
hedge reserveOther
legal reservesCumulative trans-
lation reservesActuarial
gains & losses Other reservesUndistributed
resultsShareholders'
equity
Balance at December 31, 2017 505 769 15 232 (549) (2,460) 6,655 698 5,865
Impact adoption IFRS 9 – – – – – – (3) – (3)
Impact adoption IFRS 15 – – – – – – (48) – (48)
Impact application IAS 29 – – – – 23 – – – 23
Balance at January 1, 2018 505 769 15 232 (526) (2,460) 6,604 698 5,837
Changes in exchange rates in respect of subsidiaries, associates and joint ventures
– – – – (82) – – – (82)
Changes in fair value of derivatives – – (15) – – – – – (15)
Post-retirement benefi ts – – – – – 1 – – 1
Net income – – – – – – – 6,674 6,674
Comprehensive income – – (15) – (82) 1 – 6,674 6,578
Dividend 5 191 – – – – – (586) (390)
Equity-settled transactions – – – – – – 32 – 32
Issue of common shares 2 (2) – – – – – – –
Acquisitions and divestments – – – – – – (223) – (223)
Addition to other reserves – – – 16 – – 191 (207) –
Balance at December 31, 2018 512 958 – 248 (608) (2,459) 6,604 6,579 11,834
Changes in exchange rates in respect of subsidiaries, associates and joint ventures
– – – – 139 – – – 139
Post-retirement benefi ts – – – – – (225) – – (225)
Net income – – – – – – – 539 539
Comprehensive income – – – – 139 (225) – 539 453
Dividend – – – – – – – (1,423) (1,423)
Equity-settled transactions – – – – – – 20 – 20
Share buyback (14) – – – – – (2,520) – (2,534)
Capital repayment and share consolidation (399) (957) – (61) – – (583) – (2,000)
Issue of common shares 1 (1) – – – – – – –
Addition to other reserves – – – 24 – – 5,214 (5,238) –
Balance at December 31, 2019 100 – – 211 (469) (2,684) 8,735 457 6,350

113AkzoNobel Report 2019 | Financial statements
method, based on the pronouncements of the Dutch Accounting Standards Board.
The remuneration paragraph is included in Note 25 of the Consolidated fi nancial statements.
In 2018 and 2019, other results contain the part of the deal result on the sale of the Specialty Chemicals business directly attributable to Akzo Nobel N.V.. For details on the sale refer to Note 2 of the Consolidated fi nancial statements.
Note B Other results
Note C Financing income and expenses
Note D Financial non-current assets
* Loans to these companies have no fi xed repayment schedule.
Financing income and expenses
In € millions 2018 2019
Financing income 1 31
Financing expenses (76) (111)
Total (75) (80)
Movements in non-current assets
Subsidiaries
In € millions Share in capital Loans*Other non-
current assets Total
Balance at December 31, 2017 10,169 1,228 99 11,496
Impact adoption IFRS 9 (3) – – (3)
Impact adoption IFRS 15 (48) – – (48)
Impact application IAS 29 23 – – 23
Balance at January 1, 2018 10,141 1,228 99 11,468
Acquisitions/capital contributions – – 11 11
Divestments/capital repayments (1,177) – (4) (1,181)
Net income from subsidiaries 1,599 – – 1,599
Equity-settled transactions 26 – – 26
Transactions with non-controlling interests (223) – – (223)
Loans granted – 1,003 – 1,003
Repayment of loans – (279) – (279)
Changes in exchange rates (84) (3) – (87)
Dividends received (1,070) – – (1,070)
Other changes 34 (2) 32
Balance at December 31, 2018 9,246 1,949 104 11,299
Investments/acquisitions/capital contributions 179 – 34 213
Divestments/capital repayments (760) – – (760)
Net income from subsidiaries 564 – – 564
Equity-settled transactions 14 – – 14
Loans granted – 1,079 – 1,079
Repayment of loans – (779) – (779)
Changes in exchange rates 139 (4) – 135
Post-retirement benefi ts (223) – – (223)
Other changes – – (2) (2)
Balance at December 31, 2019 9,159 2,245 136 11,540
Included in the 2019 fi nancing expenses is a premium paid of €71 million for transferred intercompany loans. For information on this transfer see Note D Financial non-current assets.
Due to an intra-group funding restructuring, several intercompany loans were transferred in 2019 and will be transferred in 2020 from certain foreign subsidiaries to Akzo Nobel N.V..

114 Financial statements | AkzoNobel Report 2019
rights to shares) in the capital of the company up to a maximum of 10%, which in case of mergers or acquisi-tions can be increased by up to a maximum of 10%, of the total number of shares outstanding (and to restrict or exclude the pre-emptive rights to those shares) and (ii) to acquire shares in the capital of the company, provided that the shares that will at any time be held will not exceed 10% of the issued share capital. The issue or repurchase of shares requires the approval of the Supervisory Board.
We held 3,165,967 common shares at year-end 2019 (year-end 2018: nil), which will be cancelled in 2020.
Of the shareholders’ equity of €6.4 billion, an amount of €6.0 billion (2018: €11.1 billion) was unrestricted and avail-able for distribution – subject to the relevant provisions of our Articles of Association and Dutch law.
At year-end 2019, legal reserves include the €145 million reserve relating to earnings retained by subsidiaries, associates and joint ventures after 1983, to the extent that there are limitations for AkzoNobel to arrange profi t distributions; and the €66 million reserve for capitalized development costs.
DividendOur dividend policy is to pay a stable to rising dividend.
In 2019, an interim dividend of €0.41 (2018: €0.37) per common share was paid. We propose a 2019 fi nal
dividend of €1.49 (2018: €1.43) per common share, which would equal a total 2019 dividend of €1.90 (2018: €1.80).
In line with our announcement on April 19, 2017, we have returned the vast majority of the net proceeds from the separation of the Specialty Chemicals business to our shareholders. The Extraordinary General Meeting of November 13, 2018, approved to return an amount of €2.0 billion to shareholders by means of a capital repay-ment and share consolidation, which was executed in January 2019. A share consolidation ratio of 9:8 was applied.
We distributed €1.0 billion by means of a special cash dividend of €4.50 per common share (post consolidation) on February 25, 2019, in addition to the €1.0 billion special cash dividend already distributed in December 2017.
The share buyback program to repurchase common shares up to the value of €2.5 billion has been completed at the end of 2019, acquiring 31.2 million common shares, of which 28.4 million shares were cancelled.
On October 23, 2019, a new €500 million share buyback program was announced, of which 0.4 million shares were acquired in 2019.
Subscribed share capitalThe holders of common shares are entitled to receive dividends as declared from time to time and are entitled to one vote per share at the Annual General Meeting of shareholders. The holders of the priority shares are entitled to a dividend of 6% per share or the statutory interest in the Netherlands, whichever is lower, plus any accrued and unpaid dividends. They are entitled to 800 votes per share (in accordance with the 800 times higher nominal value per share) at the Annual General Meeting of share-holders. In addition, the holders of priority shares have the right to draw up binding lists of nominees for appoint-ment to the Supervisory Board and the Board of Manage-ment; amendments to the Articles of Association are subject to the approval of the Meeting of Holders of Priority Shares.
Priority shares may only be transferred to a transferee designated by a Meeting of Holders of Priority Shares and against payment of the par value of the shares, plus interest at the rate of 6 percent per annum or the statutory interest in the Netherlands, whichever is lower, for the period between the beginning of the year and the date of transfer. There are no restrictions on voting rights of holders of common or priority shares. The Articles of Association set out procedures for exercising voting rights. The Annual General Meeting of shareholders has resolved in 2019 to authorize the Board of Management for a period of 18 months (i) to issue shares (or grant
Long-term borrowingsFor the fair value of the bonds issued, refer to Note 26 of the Consolidated fi nancial statements. We estimated the fair value of the bonds issued based on the quoted market prices (level 1) for the same or similar issues or on the current rates offered to us for debt with similar maturities. At year-end 2019, the fair value of the bonds included in long-term borrowings was €1,873 million.
Note E Short-term receivables
Note F Shareholders’ equity
Note G Net debt
Unrestricted reserves at year-end
In € millions 2018 2019
Shareholders' equity at year-end 11,834 6,350
Subscribed share capital (512) (100)
Subsidiaries' restrictions to transfer funds
(145) (145)
Statutory reserve due to capital reduction
(61) –
Reserve for development costs (42) (66)
Unrestricted reserves 11,074 6,039
Short-term receivables
In € millions 2018 2019
Receivables from subsidiaries 309 117
FX contracts 6 9
Other receivables 58 34
Total 373 160

115AkzoNobel Report 2019 | Financial statements
We have a €1.8 billion multi-currency revolving credit facility which runs until 2022. This facility does not contain fi nancial covenants or acceleration provisions that are based on adverse changes in ratings or material adverse change. At year-end 2019 and 2018, this facility has not been drawn.
At year-end 2019 and 2018, none of the borrowings was secured by collateral.
Short-term borrowingsIn November 2019, a bond of €500 million matured. We have US dollar and euro commercial paper programs in place, which can be used to the extent that the equiva-lent portion of the €1.8 billion multi-currency revolving credit facility is not used. We had no commercial paper outstanding at year-end 2019 and 2018.
Note H Other current liabilities
Note I Financial instruments
Note J Contingent liabilities
Short-term investmentsShort-term investments of €120 million almost entirely consist of time deposits, money market funds and market-able securities with a life time at investment date longer than three months but shorter than twelve months.
Cash and cash equivalentsDeposits and money market funds within cash and cash equivalents almost entirely consist of time deposits imme-diately convertible into known amounts of cash and with a maturity of three months or less from the date of purchase and marketable securities that can be redeemed immedi-ately when called.
At year-end 2019, Akzo Nobel N.V. had outstanding foreign exchange contracts to buy currencies for a total of €1.5 billion (year-end 2018: €1.0 billion), while contracts to sell currencies totaled €1.4 billion (year-end 2018: €0.8 billion). The contracts mainly related to US dollars, pound sterling and Chinese yuan and all have maturi-ties within one year. These contracts offset the foreign exchange contracts concluded by the subsidiaries, and the fair value changes are recognized in the statement of income to offset the fair value changes on the contracts with the subsidiaries. For information on risk exposure and risk management, see Note 26 of the Consolidated fi nancial statements.
Akzo Nobel N.V. is parent of the group’s fi scal unity in the Netherlands, and is therefore liable for the liabilities of said fi scal unity as a whole.
Akzo Nobel N.V. has declared in writing that it accepts joint and several liability for contractual debts of certain Dutch consolidated companies (Article 403 of Book 2 of the Dutch Civil Code). These debts, at year-end 2019, aggregating €0.4 billion (2018: €0.4 billion), are included in the Consolidated balance sheet.
Akzo Nobel N.V. has withdrawn its declarations of joint and several liability under Article 403 of Book 2 of the Dutch Civil Code for certain Dutch former Specialty Chemicals subsidiaries divested as per October 1, 2018 and is follow-ing the procedures to terminate its residual liability under those declarations under Article 404 of Book 2 of the Dutch Civil Code. One objection against the termination of residual liability is still pending and Akzo Nobel N.V. and Nouryon are cooperating to get this resolved.
Bonds issued
In € millions 2018 2019
2 5/8% 2012/22 (€750 million) 746 747
1 3/4% 2014/24 (€500 million) 498 498
1 1/8% 2016/26 (€500 million) 495 496
Total 1,739 1,741
Cash and cash equivalents
In € millions 2018 2019
Cash on hand and in banks 296 343
Deposits and money markets funds with a life up to three months
1,700 115
Included under cash and cash equivalents in the balance sheet
1,996 458
Other current liabilities
In € millions 2018 2019
Payables to subsidiairies 26 53
FX contracts 8 19
Debt related to pensions 3 3
Other suppliers 54 26
Other liabilities 206 139
Total 297 240
Analysis of net debt by category
In € millions 2018 2019
Bonds issued 1,739 1,741
Debt from subsidiaries 4,732 3,941
Long-term borrowings 6,471 5,682
Current portion of long-term borrowings
500 –
Short-term loans 26 36
Short-term borrowings 526 36
Total borrowings 6,997 5,718
Short-term investments (5,460) (120)
Cash and cash equivalents (1,996) (458)
Net debt (459) 5,140
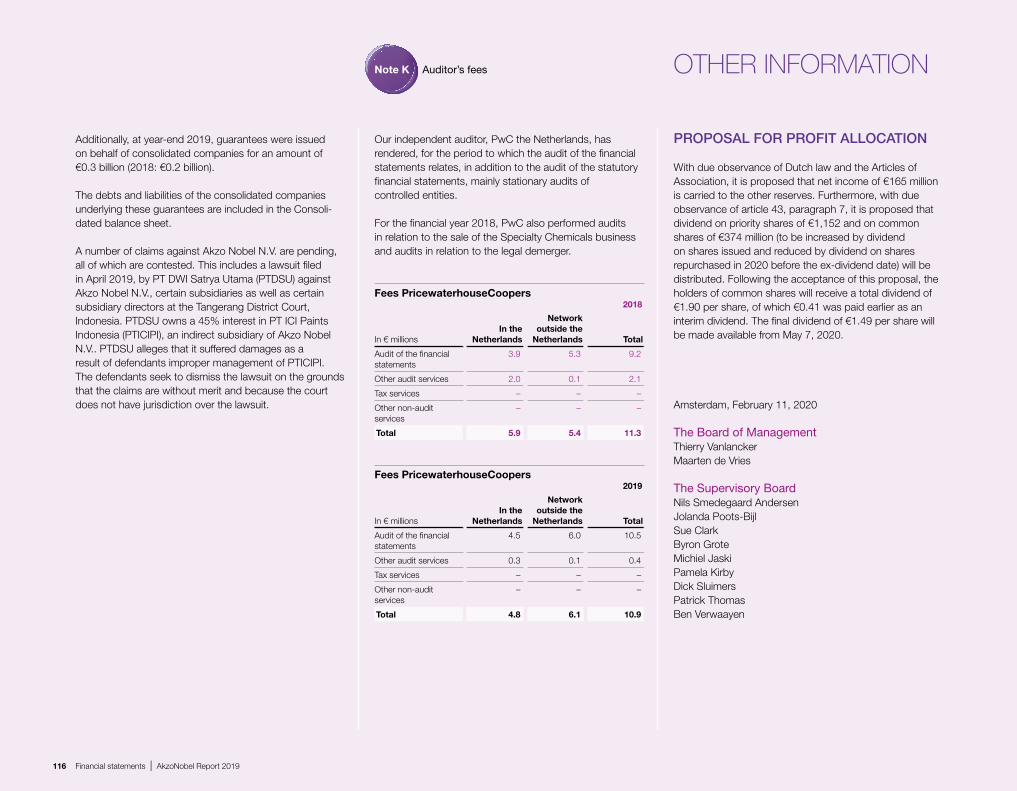
116 Financial statements | AkzoNobel Report 2019
OTHER INFORMATION
Amsterdam, February 11, 2020
The Board of ManagementThierry VanlanckerMaarten de Vries
The Supervisory BoardNils Smedegaard AndersenJolanda Poots-BijlSue ClarkByron GroteMichiel JaskiPamela KirbyDick SluimersPatrick ThomasBen Verwaayen
PROPOSAL FOR PROFIT ALLOCATION
With due observance of Dutch law and the Articles of Association, it is proposed that net income of €165 million is carried to the other reserves. Furthermore, with due observance of article 43, paragraph 7, it is proposed that dividend on priority shares of €1,152 and on common shares of €374 million (to be increased by dividend on shares issued and reduced by dividend on shares repurchased in 2020 before the ex-dividend date) will be distributed. Following the acceptance of this proposal, the holders of common shares will receive a total dividend of €1.90 per share, of which €0.41 was paid earlier as an interim dividend. The fi nal dividend of €1.49 per share will be made available from May 7, 2020.
Additionally, at year-end 2019, guarantees were issued on behalf of consolidated companies for an amount of €0.3 billion (2018: €0.2 billion).
The debts and liabilities of the consolidated companies underlying these guarantees are included in the Consoli-dated balance sheet.
A number of claims against Akzo Nobel N.V. are pending, all of which are contested. This includes a lawsuit fi led in April 2019, by PT DWI Satrya Utama (PTDSU) against Akzo Nobel N.V., certain subsidiaries as well as certain subsidiary directors at the Tangerang District Court, Indonesia. PTDSU owns a 45% interest in PT ICI Paints Indonesia (PTICIPI), an indirect subsidiary of Akzo Nobel N.V.. PTDSU alleges that it suffered damages as a result of defendants improper management of PTICIPI. The defendants seek to dismiss the lawsuit on the grounds that the claims are without merit and because the court does not have jurisdiction over the lawsuit.
Our independent auditor, PwC the Netherlands, has rendered, for the period to which the audit of the fi nancial statements relates, in addition to the audit of the statutory fi nancial statements, mainly stationary audits of controlled entities.
For the fi nancial year 2018, PwC also performed audits in relation to the sale of the Specialty Chemicals business and audits in relation to the legal demerger.
Note K Auditor’s fees
Fees PricewaterhouseCoopers2019
In € millionsIn the
Netherlands
Network outside the
Netherlands Total
Audit of the fi nancial statements
4.5 6.0 10.5
Other audit services 0.3 0.1 0.4
Tax services – – –
Other non-audit services
– – –
Total 4.8 6.1 10.9
Fees PricewaterhouseCoopers2018
In € millionsIn the
Netherlands
Network outside the
Netherlands Total
Audit of the fi nancial statements
3.9 5.3 9.2
Other audit services 2.0 0.1 2.1
Tax services – – –
Other non-audit services
– – –
Total 5.9 5.4 11.3

117AkzoNobel Report 2019 | Financial statements
To: the Annual General Meeting and the Supervisory Board of Akzo Nobel N.V.
Report on the Financial statements 2019
Our opinionIn our opinion:• The Consolidated financial statements of Akzo Nobel
N.V. (‘the Company’) give a true and fair view of the financial position of the group (the Company together with its subsidiaries) as at December 31, 2019, and of its result and its cash flows for the year then ended in accordance with International Financial Reporting Standards as adopted by the European Union (EU-IFRS) and with Part 9 of Book 2 of the Dutch Civil Code.
• The Company financial statements of Akzo Nobel N.V. give a true and fair view of the financial position of the Company as at December 31, 2019, and of its result for the year then ended in accordance with Part 9 of Book 2 of the Dutch Civil Code
What we have auditedWe have audited the accompanying financial statements 2019 of Akzo Nobel N.V., Amsterdam. The financial state-ments include the Consolidated financial statements of the group and the Company financial statements.
The Consolidated financial statements comprise:• The Consolidated balance sheet as at December 31,
2019• The following statements for 2019: the consolidated
statement of income, the consolidated statements of comprehensive income, changes in equity and of cash flows
• The notes, comprising the accounting policies and other explanatory information
The Company financial statements comprise:• The balance sheet as at December 31, 2019• The statement of income for the year then ended• The notes, comprising the accounting policies and other
explanatory information
The financial reporting framework applied in the prepara-tion of the financial statements is EU-IFRS and the relevant provisions of Part 9 of Book 2 of the Dutch Civil Code for the Consolidated financial statements and Part 9 of Book 2 of the Dutch Civil Code for the company financial statements.
The basis for our opinionWe conducted our audit in accordance with Dutch law, including the Dutch Standards on Auditing. We have further described our responsibilities under those stan-dards in the section “Our responsibilities for the audit of the financial statements” of our report.
We believe that the audit evidence we have obtained is sufficient and appropriate to provide a basis for our opinion.
IndependenceWe are independent of Akzo Nobel N.V. in accordance with the European Union Regulation on specific require-ments regarding statutory audit of public-interest entities, the “Wet toezicht accountantsorganisaties” (Wta, Audit firms supervision act), the “Verordening inzake de onafhan-kelijkheid van accountants bij assuranceopdrachten” (ViO, Code of Ethics for Professional Accountants, a regulation with respect to independence) and other relevant independence requirements in the Netherlands. Furthermore, we have complied with the “Verordening gedrags- en beroepsregels accountants” (VGBA, Dutch Code of Ethics).
Our audit approach
Overview and contextAkzo Nobel N.V. is a global paints and coatings company headquartered in the Netherlands. The group is comprised of several components and therefore we considered our group audit scope and approach as set out in the section “The scope of our group audit”. We paid specific attention to the areas of focus driven by the operations of the group, as set out below.
After the completion of the sale of the Specialty Chemi-cals business on October 1, 2018, the group is focused to transform the company as part of management’s ‘‘Winning together: 15 by 20’’ strategy, which character-ized the financial year 2019. The transformation programs include centralization of finance activities in Global Busi-ness Service hubs and simplification of the ERP envi-ronment impacting the company’s systems, processes and controls. Inherently transformation processes have the potential to disrupt the organization, processes and culture. We therefore extended our audit procedures during the planning phase of our audit, in order to evaluate the impact of the transformation. Due to the significance of the transformation to the company and the extended audit procedures, we included the transformation as a key audit matter, as set out in the section “Key audit matters” of this report.
As part of designing our audit, we determined material-ity and assessed the risks of material misstatement in the financial statements and we considered the business generating activities, the operating assets as well as the group’s global footprint. We also considered where the Board of Management made important judgements, for example, in respect of significant accounting estimates that involved making assumptions and considering future events that are inherently uncertain. In Note 1 of the Consolidated financial statements the Company describes the areas of judgement in applying accounting policies and the key sources of estimation uncertainty. Of those, given the significant estimation uncertainty and the related higher inherent risks of material misstatement, we consider the valuation of the post-retirement benefit provisions and the accounting for and valuation of deferred tax assets and uncertain tax positions as key audit matters, as set out in the section “Key audit matters” of this report.
Other areas of focus, that were not considered as key audit matters, were related to the impairment testing of goodwill and other intangibles with indefinite useful lives, the environmental, sundry, and legal provisions and infor-mation technology general controls (ITGCs). The ITGC’s are the policies and procedures used by the Company to
INDEPENDENT AUDITOR’S REPORT

118 Financial statements | AkzoNobel Report 2019
MaterialityThe scope of our audit is influenced by the application of materiality, which is further explained in the section “Our responsibilities for the audit of the financial statements”.
Based on our professional judgement we determined certain quantitative thresholds for materiality, including the overall materiality for the financial statements as a whole as set out in the table below. These, together with qualita-tive considerations, helped us to determine the nature, timing and extent of our audit procedures on the individual financial statement line items and disclosures and to evaluate the effect of identified misstatements, both individually and in aggregate, on the financial statements as a whole and on our opinion. In comparison to the 2019 materiality, the materiality in 2018 was €6 million higher reflecting 5% of total profit before tax from the continued operations and nine-month period result of the Specialty
Chemicals business discontinued operations combined, excluding the deal result and excluding separation related identified items.
We also take misstatements and/or possible misstate-ments into account that, in our judgement, are material for qualitative reasons.
We agreed with the Audit Committee of the Supervisory Board that we would report to them misstatements identified during our audit above €1.5 million (2018: €2.25 million) as well as misstatements below that amount that, in our view, warranted reporting for qualitative reasons.
The scope of our group auditAkzo Nobel N.V. is the parent company of a group of enti-ties managed by the Board of Management and Execu-tive Committee. The financial information of this group is included in the Consolidated financial statements of Akzo Nobel N.V..
We tailored the scope of our audit to ensure that it, in aggregate, provides sufficient coverage of the financial statements for us to be able to give an opinion on the financial statements as a whole, taking into account the management structure of the group, the nature of opera-tions of its components, the accounting processes and controls, and the markets in which the components of the group operate. In establishing the overall group audit strat-egy and plan, we determined the type of work required to be performed at component level by the group engage-ment team and by each component auditor.
The group audit included 23 components which were subjected to audits of their complete financial infor-mation, as those components are material to the group. 14 components were subjected to specific risk-focused audit procedures as they include higher risk areas. Addi-tionally, 14 components were selected for audit proce-dures to achieve appropriate coverage on financial line items in the Consolidated financial statements.
The outlines of our audit approach was as follows:
Materiality
Overall materiality: €39 million
Audit scopeWe conducted audit work at 51 components in 18 countries. Site reviews were conducted in eight countries – United States, Brazil, Germany, France, India, Poland, South Africa and the Netherlands. Audit coverage: 65% of consolidated revenue, 73% of consolidated total assets and 67% of consolidated profit before tax.
Key audit matters• Transformation to deliver
towards the “Winning together: 15 by 20” strategy
• Valuation of post-retirement benefit provisions
• Valuation of deferred tax assets and uncertain tax positions
ensure information technology (IT) operates as intended and provides reliable data for financial reporting purposes.
As in all our audits, we also addressed the risk of manage-ment override of controls, including evaluating whether there was evidence of bias by the Board of Management that may represent a risk of material misstatement due to fraud. We specifically considered the impact of this risk of the ambition included in the company’s stated target to achieve 15% return on sales (ROS) by 2020.
We ensured that the audit teams at both group and component level included the appropriate skills and competences which are needed for the audit of a paints and coatings company. In our team we also included specialists in the areas of tax, IT and treasury and experts in the areas of pensions, share based payments and valuations.
Materiality
Overall group materiality €39 million (2018: €45 million).
Basis for determining materiality
We used our professional judgement to determine overall materiality. As a basis for our judgement we used 5% of total profit before tax
Rationale for bench-mark applied
We used profit before tax as the primary benchmark, a generally accepted auditing practice, based on our analysis of the common information needs of users of the financial statements. On this basis, we believe that profit before tax is an important metric for the financial performance of the Company.
Component materiality To each component in our audit scope, based on our judgement, we allocate materiality that is less than our overall group materiality. The range of materiality individually allocated across components was between €5 million and €25 million. Certain components were audited to a local statutory audit materiality that was also less than our overall group materiality.

119AkzoNobel Report 2019 | Financial statements
The group engagement team physically attended meet-ings with a selection of the component teams and local management. During these meetings we discussed the strategy and financial performance of the local businesses, as well as the audit plan and execution, significant risks and other relevant audit topics. The most significant components are visited every year and other components are visited depending on specific considerations which include, amongst other audit observations, specific risks identified or other major events. In the current year, the group audit team attended meetings in the United States, Brazil, Germany, France, India, South Africa, Poland and the Netherlands. Furthermore, we reviewed selected working papers of four component teams.
The group engagement team performed the audit work on the group consolidation, financial statement disclosures and a number of complex items and processes controlled and monitored centrally by Akzo Nobel N.V.. These include impairment testing of goodwill and other intangible assets with indefinite useful lives, valuation of post-retirement benefit provisions, valuation of deferred tax assets and uncertain tax positions, environmental, sundry and legal provisions, share–based payments, treasury, ITGCs and the Akzo Nobel N.V. standalone entity.
The group engagement team also performed central procedures over controls performed by the business units and other central functions, where relevant for our audit. This included indirect entity level controls (e.g. to prevent and detect fraud), including the code of conduct, corpo-rate directives, whistleblower policy, internal representa-tions, business partnering program and internal audits.
By performing the procedures above at components, combined with additional procedures at group level, we have been able to obtain sufficient and appropriate audit evidence on the group’s financial information, as a whole, to provide a basis for our opinion on the financial statements.
Our focus on the risk of fraud and non-compliance with laws and regulationsThe primary responsibility for the prevention and detection of fraud and non-compliance with laws and regulations lies with the Board of Management and with the oversight of the Supervisory Board.
Our risk assessmentAs part of our process of identifying fraud risks, we evalu-ated fraud risk factors with respect to financial reporting fraud, misappropriation of assets and bribery and corrup-tion. We, together with our forensic specialists, evaluated the fraud risk factors to consider whether those factors indicated a risk of material misstatement due to fraud.
In addition, we performed procedures to obtain an understanding of the legal and regulatory frameworks that are applicable for the group. We identified provisions of those laws and regulations, generally recognized to have a direct effect on the determination of material amounts and disclosures in the financial statements, such as the financial reporting framework and tax and pension laws and regulations.
As in all of our audits, we addressed the risk of manage-ment override of internal controls, including evaluating whether there was evidence of bias by management that may represent a risk of material misstatement due to fraud. The audit procedures to respond to the assessed risks include, amongst others, that we evaluated the design and the implementation of internal controls that mitigate fraud risks, retrospective review of prior year’s estimates, procedures on unexpected journal entries with the support of data-analytics and we incorporated elements of unpre-dictability in our audit. In addition, we assessed matters reported on the group’s whistleblowing and complaints procedures and results of management’s investigation of such matters if deemed applicable and discussed this with the Audit Committee.
We refer to the key audit matter ‘‘Transformation to deliver towards the Winning together: 15 by 20” strategy for the impact of the transformation on the risk of management
In total, in performing these procedures, we achieved the following coverage on the financial line items:
None of the remaining components represented more than 1.5% of total group revenue, total group assets or profit before tax. For those remaining components we performed, among others, analytical procedures to corroborate our assessment that there were no significant risks of material misstatements within those components.
For all components we used component auditors who are familiar with the local laws and regulations to perform the audit work. We collectively performed hard close audit procedures on the interim October balance sheet positions and results. These hard close audit procedures included substantive audit work on certain material balances and transactions.
Where component auditors performed the work, we deter-mined our level of involvement in their audit work to be able to conclude whether we had obtained sufficient and appropriate audit evidence as a basis for our opinion on the Consolidated financial statements as a whole.
We issued instructions to the component audit teams in our group audit scope. These instructions included an explanation of the structure of the group, the main developments that are relevant for the component audi-tors, the risks identified, the materiality levels to be applied and our global audit approach. We had individual calls with each of the in-scope component audit teams throughout the audit. During these calls we discussed the instruc-tions, the significant accounting and audit issues identified by the component auditors, their reports, the findings of their procedures, and other matters which could be of relevance for the financial statements.
2019
Revenue 65%
Total assets 73%
Profit before tax 67%

120 Financial statements | AkzoNobel Report 2019
Key audit matters
Key audit matter How our audit addressed the matter
Transformation to deliver towards the “Winning together: 15 by 20 strategy” The group is focused on transforming the company as part of management’s “Winning together: 15 by 20” strategy. The transformation programs include centralization of finance activities in global business service hubs and simplification of the ERP environment, impacting the company’s systems, processes and controls. Inherently, transformation processes have the potential to lead to a disruption of the organization, processes and culture.
The specific and ambitious external target on 15% ROS by 2020 inherently increases pressure on management to achieve such targets, and as such contributes to the risk of management override of internal controls risk, which is a presumed audit risk in our audit.
In addition, the planned increase in profitability of the company is expected to be reflected in management estimates, such as the forecasts used in the valuation of deferred tax assets and goodwill impairment analysis.
We extended our audit procedures to evaluate the impact of the transformation on systems, processes and controls. During the planning phase of our audit we obtained an understanding of the transformation programs. For the transition of finance activities to global business service hubs we obtained an understanding of the project governance, detailed timeline, scope of entities and processes. We used this information as part of our risk assessment procedures, determi-nation of the scope of our audit and communication to our component teams. We visited the business service hubs in Poland, India, Brazil and the United States to build our understanding. For the simplification of the ERP environment we involved our IT specialists. We obtained an understanding of the project governance and the validation approach and we tested the data migration. We used data analytics to identify unexpected journal entries. We increased the commu-nication with our component teams, including joint calls with group and local management, and performed additional substantive testing, for example testing of data migration. In addition, for the testing of management’s estimates, such as forecasts used in the valuation of deferred tax assets and goodwill impairment analysis, we validated the planned increase in profitability supported by, amongst others, approved plans and incurred costs savings.
We incorporated our understanding of the transformation in our audit plan. From the procedures performed, we did not have material findings with respect to the balance sheet positions and results recorded and disclosed.
Valuation of post-retirement benefit provisions Note 18 The post-retirement benefit provisions consist of defined benefit obligations (€14.6 billion) more than offset by plan assets (€15.3 billion). The largest pension plans are the ICI Pension Fund (ICIPF) and the AkzoNobel (CPS) Pension Scheme in the UK which together account for 86 percent of the defined benefit obligation (DBO) and 91 percent of the plan assets. The procedures over the post-retirement benefit provisions, specifically the procedures on the DBO, the de-risking transactions during the year and updates to the assumptions were significant to our audit because the positions are significant to the company, the assessment process is complex, involves significant management judgment and is based on actuarial assumptions. The actuarial assumptions include discount rates, compensation increase, expected inflation rates, life expectancy and indexation percentages, as disclosed in Note 18 of the Consolidated financial statements. Technical expertise is required to determine the amounts and significant de-risking transactions that have occurred.
With the assistance of our actuarial experts, we evaluated actuarial assumptions, specifically the assumptions applied in the UK based plans (given their significantce) the valuation methodologies applied and we assessed the objectivity and competence of the company’s external pension experts used for the calculation of the Post-retirement benefit positions. We have challenged management, primarily on their assumptions applied to which the post-retirement benefit provisions are the most sensitive, by performing independent testing over the assumptions and methodolo-gies used and comparing to the published actuarial tables, amongst others, with support of our actuarial experts. We also tested the participant census data and the valuation of the plan assets through independent price testing (e.g. by reconciling to independently published market prices). Furthermore, we tested the transactions in the UK plans, the top-up payments in the UK, and we verified the appropriate accounting. We also assessed the adequacy of the company’s disclosure in Note 18 to the Consolidated financial statements.
Our procedures did not result in material findings with respect to the valuation and disclosure of post-retirement benefit provisions at December 31, 2019.
by our audit and that we discussed. In this section, we described the key audit matters and included a summary of the audit procedures we performed on those matters.
The following key audit matters reported in 2018 are not included in 2019:• Accounting for the sale of the Specialty Chemicals
business - the transaction was completed on October 1, 2018
• Impairment testing of goodwill and other intangibles with indefinite useful lives - due to the historical high amount of available headroom in the units tested for impairment
• Transition from the accounting standard IAS 17 –
“Leases’’ to IFRS 16 - “Leases’’ – the transformation impact was assessed in prior year as the new standard is effective from January 1, 2019
Our new key audit matter was raised – ‘‘Transformation to deliver towards the Winning together: 15 by 20” strategy.
We addressed the key audit matters in the context of our audit of the financial statements as a whole, and in forming our opinion thereon. We do not provide separate opinions on these matters or on specific elements of the financial statements. Any comment or observation we made on the results of our procedures should be read in this context.
override of internal controls. We refer to the key audit matters valuation of post-retirement benefit provisions and valuations of deferred tax assets and uncertain tax positions, that are examples of our approach related to areas of higher risk due to significant accounting estimates where management makes significant judgements.
Key audit mattersKey audit matters are those matters that, in our profession-al judgement, were of most significance in the audit of the financial statements. We have communicated the key audit matters to the Supervisory Board. The key audit matters are not a comprehensive reflection of all matters identified
121AkzoNobel Report 2019 | Financial statements
Valuation of deferred tax assets and uncertain tax positionsNote 8The group operates in various countries and is subject to income taxes in various tax jurisdictions. The assess-ment of the valuation of deferred tax assets, resulting from net operating losses, tax credits and temporary differences, and provisions for uncertain tax positions is significant to our audit as the positions are significant to the company, calculations are complex and depend on sensitive and judgmental assumptions. The key assumptions include long-term projected revenue growth, savings supported by the transformation plans and programs, margin development and local fiscal regulations and new developments. The Company’s disclosures concerning income taxes are included in Note 8 to the Consolidated financial statements.
With the assistance of our tax specialists, we tested the Board of Management’s assessment of the recoverability of the deferred tax assets, by challenging the key assumptions included in the 2019 five-year outlook as approved by the Board of Management and by evaluating the probability of future cash outflows related to the uncertain tax positions identified by the company. We specifically focused on the actual and projected savings resulting from the transforma-tion programs. We also assessed the applicable local fiscal regulations and developments, in particular those related to changes in the statutory income tax rate and the statutes of limitation, since these are key assumptions underly-ing the valuation of the deferred tax assets and uncertain tax positions. We analysed the tax positions and evaluated the assumptions and methodologies used. In addition, we assessed the adequacy of the company’s disclosures on deferred tax assets and uncertain tax positions and assumptions used. Our procedures did not result in material findings with respect to the valuation of deferred tax assets, uncertain tax positions recorded and related disclosures at December 31, 2019.
Report on the other information included in the annual reportIn addition to the financial statements and our auditor’s report thereon, the annual report contains other informa-tion (the “other information”) that consists of:• The report of the Board of Management, as defined in
Note 1 of the Consolidated financial statements• The other information pursuant to Part 9 of Book 2 of
the Dutch Civil Code• Other parts of the annual report: Business overview,
Our leadership, Governance and compliance, Financial summary and Sustainability statements.
Based on the procedures performed as set out below, we conclude that the Other information:• Is consistent with the financial statements and does not
contain material misstatements• Contains the information that is required by Part 9 of
Book 2 of the Dutch Civil Code
We have read the Other information. Based on our knowledge and understanding obtained in our audit of the financial statements or otherwise, we have consid-ered whether the Other information contains material misstatements.
By performing our procedures, we comply with the requirements of Part 9 of Book 2 of the Dutch Civil Code and the Dutch Standard 720. The scope of such
procedures was substantially less than the scope of those performed in our audit of the financial statements.
The Board of Management is responsible for the prepara-tion of the other information, including the directors’ report and the other information in accordance with Part 9 of Book 2 of the Dutch Civil Code.
Report on other legal and regulatory requirements
Our appointmentWe were appointed as auditors of Akzo Nobel N.V. on April 29, 2014, by the Supervisory Board following the passing of a resolution by the shareholders at the Annual Meeting held on April 29, 2014, and effective January 1, 2016. Our appointment has been renewed annually by shareholders representing a total period of uninterrupted engagement appointment of 4 years.
No prohibited non-audit servicesTo the best of our knowledge and belief, we have not provided prohibited non-audit services as referred to in Article 5(1) of the European Regulation on specific requirements regarding statutory audit of public- interest entities.
Services renderedThe services, in addition to the audit, that we have provided to the company and its controlled entities, for the
period to which our statutory audit relates, are disclosed in Note K to the Company financial statements.
Responsibilities for the financial statements and the audit Responsibilities of the Board of Management and the Supervisory Board for the financial statements
The Board of Management is responsible for:• The preparation and fair presentation of the financial
statements in accordance with EU-IFRS and with Part 9 of Book 2 of the Dutch Civil Code; and for
• Such internal control as the Board of Management determines is necessary to enable the preparation of the financial statements that are free from material misstatement, whether due to fraud or error
As part of the preparation of the financial statements, the Board of Management is responsible for assessing the company’s ability to continue as a going concern. Based on the financial reporting frame- works mentioned, the Board of Management should prepare the financial statements using the going-concern basis of accounting unless the Board of Management either intends to liquidate the company or to cease operations, or has no realistic alternative but to do so. The Board of Management should disclose events and circumstances that may cast significant doubt on the

122 Financial statements | AkzoNobel Report 2019
Appendix to our auditor’s report on the financial statements 2019 of Akzo Nobel N.V.
In addition to what is included in our auditor’s report we have further set out in this appendix our responsibilities for the audit of the financial statements and explained what an audit involves.
The auditor’s responsibilities for the audit of the financial statementsWe have exercised professional judgement and have maintained professional scepticism throughout the audit in accordance with Dutch Standards on Auditing, ethical requirements and independence requirements. Our audit consisted, among other things of the following:• Identifying and assessing the risks of material
misstatement of the financial statements, whether due to fraud or error, designing and performing audit procedures responsive to those risks, and obtaining audit evidence that is sufficient and appropriate to provide a basis for our opinion. The risk of not detecting a material misstatement resulting from fraud is higher than for one resulting from error, as fraud may involve collusion, forgery, intentional omissions, misrepresentations, or the intentional override of internal control
• Obtaining an understanding of internal control relevant to the audit in order to design audit procedures that are appropriate in the circumstances, but not for the purpose of expressing an opinion on the effectiveness of the company’s internal control
• Evaluating the appropriateness of accounting policies used and the reasonableness of accounting estimates and related disclosures made by the Board of Management
• Concluding on the appropriateness of the Board of Management’s use of the going-concern basis of accounting, and based on the audit evidence obtained, concluding whether a material uncertainty exists related to events and/or conditions that may cast significant doubt on the company’s ability to continue as a going concern. If we conclude that a material uncertainty exists, we are required to draw attention in our auditor’s
report to the related disclosures in the financial statements or, if such disclosures are inadequate, to modify our opinion. Our conclusions are based on the audit evidence obtained up to the date of our auditor’s report and are made in the context of our opinion on the financial statements as a whole. However, future events or conditions may cause the company to cease to continue as a going concern
• Evaluating the overall presentation, structure and content of the financial statements, including the disclosures, and evaluating whether the financial statements represent the underlying transactions and events in a manner that achieves fair presentation
Considering our ultimate responsibility for the opinion on the Consolidated financial statements, we are respon-sible for the direction, supervision and performance of the group audit. In this context, we have determined the nature and extent of the audit procedures for components of the group to ensure that we performed enough work to be able to give an opinion on the financial statements as a whole. Determining factors are the geographic struc-ture of the group, the significance and/or risk profile of group entities or activities, the accounting processes and controls, and the industry in which the group operates. On this basis, we selected group entities for which an audit or review of financial information or specific balances was considered necessary.
We communicate with the Supervisory Board regarding, among other matters, the planned scope and timing of the audit and significant audit findings, including any significant deficiencies in internal control that we identify during our audit. In this respect, we also issue an additional report to the audit committee in accordance with Article 11 of the EU Regulation on specific requirements regarding statutory audit of public-interest entities. The information included in this additional report is consistent with our audit opinion in this auditor’s report.
We provide the Supervisory Board with a statement that we have complied with relevant ethical requirements regarding independence, and to communicate with them
company’s ability to continue as a going concern in the financial statements.
The Supervisory Board is responsible for overseeing the company’s financial reporting process.
Our responsibilities for the audit of the financial statementsOur responsibility is to plan and perform an audit engage-ment in a manner that allows us to obtain sufficient and appropriate audit evidence to provide a basis for our opinion. Our objectives are to obtain reasonable assurance about whether the financial statements as a whole are free from material misstatement, whether due to fraud or error and to issue an auditor’s report that includes our opinion. Reasonable assurance is a high but not absolute level of assurance, which makes it possible that we may not detect all material misstatements. Misstatements may arise due to fraud or error. They are considered to be material if, individually or in the aggregate, they could reasonably be expected to influence the economic decisions of users taken on the basis of the financial statements.
Materiality affects the nature, timing and extent of our audit procedures and the evaluation of the effect of identified misstatements on our opinion.
A more detailed description of our responsibilities is set out in the appendix to our report.
Amsterdam, February 12, 2020PricewaterhouseCoopers Accountants N.V. Original has been signed by F.P. Izeboud RA

123AkzoNobel Report 2019 | Financial statements
all relationships and other matters that may reasonably be thought to bear on our independence, and where appli-cable, related safeguards.
From the matters communicated with the Supervisory Board, we determine those matters that were of most significance in the audit of the financial statements of the current period and are therefore the key audit matters. We describe these matters in our auditor’s report unless law or regulation precludes public disclosure about the matter or when, in extremely rare circumstances, not communicating the matter is in the public interest.
PROFIT ALLOCATION AND DISTRIBUTIONS
The following articles of our articles of association govern profit allocation and distribution:
Article 4343.6The Board of Management shall be authorized to deter-mine, with the approval of the Supervisory Board, what share of profit remaining after application of the provisions of the foregoing paragraphs shall be carried to reserves. The remaining profit shall be placed at the disposal of the Annual General Meeting of shareholders, with due observance of the provisions of paragraph 7, it being provided that no further dividends shall be paid on the preferred shares.
43.7From the remaining profit, the following distributions shall, to the extent possible, be made as follows:
(a) To the holders of priority shares: 6% per share or the statutory interest referred to in paragraph 1 of article 13, whichever is lower, plus any accrued and unpaid dividends
(b) To the holders of common shares: a dividend of such an amount per share as the remaining profit, less the aforesaid dividends and less such amounts as the Annual General Meeting of shareholders may decide to carry to reserves, shall permit
43.8Without prejudice to the provisions of paragraph 4 of this article and of paragraph 4 of article 20, the holders of common shares shall, to the exclusion of everyone else, be entitled to distributions made from reserves accrued by virtue of the provision of paragraph 7b of this article.
43.9Without prejudice to the provisions of article 42 and paragraph 8 of this article, the Annual General Meeting of shareholders may decide on the utilization of reserves only on the proposal of the Board of Management approved by the Supervisory Board.
Article 4444.7Cash dividends by virtue of paragraph 4 of article 20, article 42, or article 43 that have not been collected within five years of the commencement of the second day on which they became due and payable shall revert to the company.
SPECIAL RIGHTS TO HOLDERS OF PRIORITY SHARES
The priority shares are held by “Stichting Akzo Nobel” (Foundation Akzo Nobel), whose board is composed of the members of the Supervisory Board who are not members of the Audit Committee. They each have one vote on the board of the Foundation.
The Meeting of Holders of Priority Shares has the right to draw up binding lists of nominees for appointment to the Supervisory Board and the Board of Management. Amendments to the Articles of Association are subject to the approval of this meeting.
PROFIT ALLOCATION AND DISTRIBUTIONS

124 Financial statements | AkzoNobel Report 2019
FINANCIAL SUMMARY
1 Restated to present Decorative Paints North America as a discontinued operation and for the revised IAS19.2 Not meaningful as operating income and net income were losses.³ Cash dividend paid to shareholders of AkzoNobel.4 Adjusted operating income = operating income excluding identified items.5 ROS and ROI have been restated and are based on adjusted operating income. ROS% is calculated as adjusted operating income
(operating income excluding identified items) as a percentage of group revenue. ROI% is calculated as adjusted operating income (operating income excluding identified items) of the last 12 months as a percentage of average invested capital of the last 12 months.
Invested capital is calculated as total assets (excluding cash and cash equivalents, short-term investments, investments in associates, the receivable from pension funds in an asset position and assets held for sale) less current tax liabilities, deferred tax liabilities and trade and other payables. OPI margin is calculated as operating income as a percentage of group revenue.
6 Represented to present the Specialty Chemicals business as discontinued operations.7 Represented to the new adjusted earnings per share definition, which no longer excludes post-tax amortization charges.8 2019 includes the impact of the adoption of IFRS 16 “Leases”.
Consolidated statement of income
In € millions 20101 2011 2012 2013 2014 2015 20166 7 20177 2018 20198
Revenue 13,605 14,604 15,390 14,590 14,296 14,859 9,434 9,612 9,256 9,276
Adjusted operating income4 1,325 1,154 972 897 1,072 1,462 928 905 798 991
Operating income 1,293 1,157 (1,198) 958 987 1,573 923 825 605 841
Financing income and expenses (329) (311) (205) (200) (156) (114) (91) (78) (52) (76)
Income tax (176) (241) (203) (111) (252) (416) (234) (253) (118) (230)
Results from associates and joint ventures 25 24 13 14 21 17 18 17 20 20
Profit for the period from continuing operations 813 629 (1,593) 661 600 1,060 616 511 455 555
Discontinued operations 58 (59) (436) 131 18 6 436 393 6,274 22
Non-controlling interests (83) (64) (63) (68) (72) (87) (82) (72) (55) (38)
Net income, attributable to shareholders 788 506 (2,092) 724 546 979 970 832 6,674 539
Common shares, in millions at year-end 233.5 234.7 239.0 242.6 246.0 249.0 252.2 252.6 256.2 199.6
Dividend3 320 304 214 210 212 222 239 1,287 390 1,423
Number of employees at year-end 55,600 52,020 50,610 49,600 47,200 45,600 36,300 35,700 34,500 33,800
Average number of employees 55,100 51,100 52,200 50,200 48,200 46,100 36,200 36,200 34,900 34,200
Employee benefits 2,980 2,765 3,018 2,950 2,824 2,728 1,794 1,935 1,976 1,875
Average revenue per employee (in €1,000) 247 286 295 291 297 322 261 266 265 271
Average operating income per employee (in €1,000) 23 23 (23) 19 20 34 25 23 17 25
Ratios
ROS5 9.7 7.9 6.3 6.1 7.5 9.8 9.8 9.4 8.6 10.7
OPI margin 9.5 7.9 (7.8) 6.6 6.9 10.6 9.8 8.6 6.5 9.1
ROI5 11.6 10.0 8.2 9.0 10.9 14.0 14.4 13.9 12.6 14.1
Net income in % of shareholders’ equity 8.8 5.6 –2 12.9 9.5 15.1 14.8 14.2 56.4 8.5
Employee benefits in % of revenue 21.9 18.9 19.6 20.2 19.8 18.4 19.0 20.1 21.3 20.2
Interest coverage 6.8 4.7 –2 5.1 8.6 16.2 13.2 12.3 8.0 14.3
Per share information
Net income 3.23 2.04 (8.82) 3.00 2.23 3.95 3.87 3.31 26.19 2.53
Adjusted earnings per share 3.71 3.10 2.55 2.62 2.81 4.02 3.80 4.40 1.91 3.10
Shareholders’ equity 38.48 39.25 24.12 23.06 23.53 26.04 25.99 23.22 46.19 32.33
Highest share price during the year 47.70 53.74 49.75 56.08 60.77 74.81 64.74 82.64 82.70 91.86
Lowest share price during the year 37.18 29.25 35.16 42.65 47.63 55.65 50.17 59.11 68.82 69.12
Year-end share price 46.49 37.36 49.75 55.71 57.65 61.68 59.39 73.02 70.40 90.69

125AkzoNobel Report 2019 | Financial statements
1 Restated to present Decorative Paints North America as a discontinued operation and for the revised IAS19. 2 Operating working capital is measured against four times fourth quarter revenue.3 2016 is represented to present the Specialty Chemicals business as discontinued operations.4 2019 includes the impact of the adoption of IFRS 16 “Leases”.
5 As from 2018 trade payables include certain other payables, which were previously classified as Other working capital. Trade payables, Operating working capital and Other working capital items have been represented for this change of definition for some €240 million.
6 Capital expenditures include investments in intangible assets as from 2018.
Consolidated balance sheet
In € millions 20101 2011 2012 2013 2014 2015 2016 2017 2018 20194
Intangible assets 6,568 7,392 4,454 3,906 4,142 4,156 4,413 3,409 3,458 3,625
Property, plant and equipment 3,191 3,705 3,739 3,589 3,835 4,003 4,190 1,832 1,748 1,700
Right-of-use assets – – – – – – – – – 374
Other non-current assets 2,105 2,664 2,628 2,219 2,148 2,125 1,736 1,894 1,965 2,541
Total non-current assets 11,864 13,761 10,821 9,714 10,125 10,284 10,339 7,135 7,171 8,240
Inventories 1,482 1,924 1,545 1,426 1,545 1,504 1,532 1,094 1,139 1,139
Receivables 2,740 3,035 2,789 2,622 2,831 2,810 2,846 2,026 2,215 2,196
Short-term investments – – – – – – – – 5,460 138
Cash and cash equivalents 3,133 1,635 1,752 2,098 1,732 1,365 1,479 1,322 2,799 1,271
Assets held for sale – – 921 203 66 – – 4,601 – –
Total current assets 7,355 6,594 7,007 6,349 6,174 5,679 5,857 9,043 11,613 4,744
Shareholders’ equity 8,397 9,031 5,764 5,594 5,790 6,484 6,553 5,865 11,834 6,350
Non-controlling interests 525 529 464 427 477 496 481 442 204 218
Total equity 8,922 9,560 6,228 6,021 6,267 6,980 7,034 6,307 12,038 6,568
Provisions 1,958 2,392 2,677 1,938 2,143 1,865 1,938 964 899 981
Long-term borrowings 2,727 3,035 3,388 2,666 2,527 2,161 2,644 2,300 1,799 2,042
Other non-current liabilities 556 541 434 389 412 360 367 285 368 391
Total non-current liabilities 5,241 5,968 6,499 4,993 5,082 4,386 4,949 3,549 3,066 3,414
Short-term borrowings 904 494 662 961 811 430 87 973 599 169
Current liabilities 3,575 3,782 3,632 3,438 3,634 3,716 3,704 2,912 2,870 2,602
Current portion of provisions 577 551 455 601 494 451 422 241 211 231
Liabilities held for sale – – 352 49 11 – – 2,196 – –
Total current liabilities 5,056 4,827 5,101 5,049 4,950 4,597 4,213 6,322 3,680 3,002
Average Invested capital3 11,467 11,537 11,817 10,007 9,871 10,475 6,422 6,494 6,340 7,026
Capital expenditures6 534 658 826 666 588 651 634 613 184 214
Depreciation3 435 419 463 472 477 487 206 202 181 293
OWC5 2,016 1,891 1,572 1,384 1,418 1,385 1,405 927 898 1,068
Net debt 500 1,894 2,298 1,529 1,606 1,226 1,252 1,951 (5,861) 802
Ratios
Equity/non-current assets 0.75 0.69 0.58 0.62 0.62 0.68 0.68 0.88 1.68 0.80
Inventories and receivables/current liabilities 1.18 1.31 1.19 1.18 1.20 1.16 1.18 1.07 1.17 1.28
Operating working capital as % of revenue2 13.9 13.2 10.7 9.9 10.1 9.7 10.2 10.2 9.7 11.9
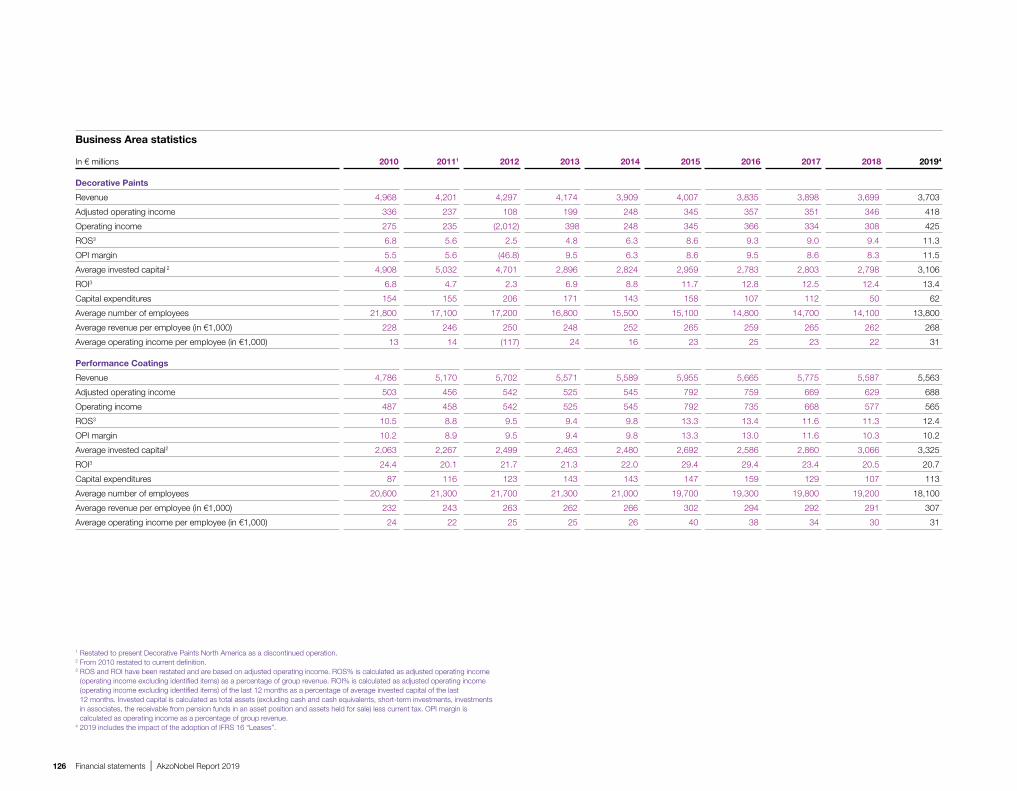
126 Financial statements | AkzoNobel Report 2019
1 Restated to present Decorative Paints North America as a discontinued operation.2 From 2010 restated to current definition.3 ROS and ROI have been restated and are based on adjusted operating income. ROS% is calculated as adjusted operating income
(operating income excluding identified items) as a percentage of group revenue. ROI% is calculated as adjusted operating income (operating income excluding identified items) of the last 12 months as a percentage of average invested capital of the last 12 months. Invested capital is calculated as total assets (excluding cash and cash equivalents, short-term investments, investments in associates, the receivable from pension funds in an asset position and assets held for sale) less current tax. OPI margin is calculated as operating income as a percentage of group revenue.
4 2019 includes the impact of the adoption of IFRS 16 “Leases”.
Business Area statistics
In € millions 2010 20111 2012 2013 2014 2015 2016 2017 2018 20194
Decorative Paints
Revenue 4,968 4,201 4,297 4,174 3,909 4,007 3,835 3,898 3,699 3,703
Adjusted operating income 336 237 108 199 248 345 357 351 346 418
Operating income 275 235 (2,012) 398 248 345 366 334 308 425
ROS3 6.8 5.6 2.5 4.8 6.3 8.6 9.3 9.0 9.4 11.3
OPI margin 5.5 5.6 (46.8) 9.5 6.3 8.6 9.5 8.6 8.3 11.5
Average invested capital 2 4,908 5,032 4,701 2,896 2,824 2,959 2,783 2,803 2,798 3,106
ROI3 6.8 4.7 2.3 6.9 8.8 11.7 12.8 12.5 12.4 13.4
Capital expenditures 154 155 206 171 143 158 107 112 50 62
Average number of employees 21,800 17,100 17,200 16,800 15,500 15,100 14,800 14,700 14,100 13,800
Average revenue per employee (in €1,000) 228 246 250 248 252 265 259 265 262 268
Average operating income per employee (in €1,000) 13 14 (117) 24 16 23 25 23 22 31
Performance Coatings
Revenue 4,786 5,170 5,702 5,571 5,589 5,955 5,665 5,775 5,587 5,563
Adjusted operating income 503 456 542 525 545 792 759 669 629 688
Operating income 487 458 542 525 545 792 735 668 577 565
ROS3 10.5 8.8 9.5 9.4 9.8 13.3 13.4 11.6 11.3 12.4
OPI margin 10.2 8.9 9.5 9.4 9.8 13.3 13.0 11.6 10.3 10.2
Average invested capital2 2,063 2,267 2,499 2,463 2,480 2,692 2,586 2,860 3,066 3,325
ROI3 24.4 20.1 21.7 21.3 22.0 29.4 29.4 23.4 20.5 20.7
Capital expenditures 87 116 123 143 143 147 159 129 107 113
Average number of employees 20,600 21,300 21,700 21,300 21,000 19,700 19,300 19,800 19,200 18,100
Average revenue per employee (in €1,000) 232 243 263 262 266 302 294 292 291 307
Average operating income per employee (in €1,000) 24 22 25 25 26 40 38 34 30 31

127AkzoNobel Report 2019 | Financial statements
1 Represented to present the Specialty Chemicals business as discontinued operations.2 At year-end.3 2019 includes the impact of the adoption of IFRS 16 “Leases”.
Regional statistics
In € millions 2015 20161 2017 2018 20193 2015 20161 2017 2018 20193 2015 20161 2017 2018 20193
The Netherlands Other European countries Other Asian countries
Revenue by destination 693 267 282 318 359 3,226 2,225 2,332 2,319 2,360 1,968 1,521 1,443 1,375 1,388
Revenue by origin 1,563 404 423 458 484 2,062 1,739 1,823 1,846 1,903 1,613 1,442 1,392 1,323 1,334
Capital expenditures 102 15 17 25 42 60 39 47 33 42 31 53 41 22 29
Average invested capital 2,154 1,497 1,528 1,560 1,622 1,024 675 700 732 918 671 561 625 656 718
Number of employees2 4,900 2,600 2,500 2,400 2,400 7,300 6,700 6,600 6,900 7,000 6,700 6,600 6,800 6,600 6,400
Germany
US and Canada Other regions
Revenue by destination 1,036 399 460 443 409 2,494 1,213 1,189 1,134 1,139 706 552 573 559 559
Revenue by origin 903 470 598 561 502 2,644 1,298 1,257 1,200 1,210 466 473 487 476 513
Capital expenditures 52 12 10 12 11 100 27 23 18 29 11 7 9 12 10
Average invested capital 854 468 662 573 634 1,949 1,037 864 699 694 87 94 87 184 218
Number of employees2 2,100 1,400 1,500 1,500 1,400 4,600 3,000 2,900 2,800 2,800 2,200 2,200 2,200 2,000 2,200
Sweden South America
Revenue by destination 414 164 162 146 141 1,483 850 900 815 815
Revenue by origin 1,329 389 408 372 366 1,210 791 840 781 742
Capital expenditures 55 9 9 7 5 34 20 23 13 15
Average invested capital 542 60 104 94 101 679 378 391 352 363
Number of employees2 2,700 1,200 1,100 1,000 900 4,100 3,100 2,900 2,800 2,600
UK China
Revenue by destination 1,011 808 777 818 838 1,828 1,435 1,494 1,329 1,268
Revenue by origin 1,109 972 891 918 951 1,960 1,456 1,493 1,321 1,271
Capital expenditures 91 43 39 29 16 115 53 32 13 15
Average invested capital 833 755 746 758 850 1,683 897 787 732 908
Number of employees2 3,500 3,300 3,200 3,200 3,200 7,500 6,200 6,000 5,300 4,900

Sustainability
129AkzoNobel Report 2019 | Sustainability statements
Our approach to sustainability 130
Paint
Note 1: Sustainable solutions 131
Note 2: Customer value 132
Note 3: Collaborative innovation 133
Planet
Note 4: Resource productivity 135
Note 5: Supplier sustainability 139
Note 6: Health and safety 141
People
Note 7: Employees 144
Note 8: Human rights 146
Note 9: AkzoNobel Cares 147
Managing sustainability 148
Independent assurance report 150
Sustainability performance summary 152
For additional information, visit:www.akzonobel.com/sustainability
The indicators that fall within the scope of limited assurance of our external auditor are marked with the following symbol:
See page 150 for the Assurance report of the independent auditor, which includes details on scoping and outcomes.
This Sustainability statements section of the Report 2019 is separate from, and does not in any way form part of, the company’s annual fi nancial reporting as defi ned in article 5:25c of the Dutch Financial Markets Super-vision Act. This section contains summarized key performance indicators (KPIs) relating to sustainability performance.
SUSTAINABILITY STATEMENTS
People. Planet. Paint. This section explains our sustainability performance in more detail. It outlines our approach to creating shared value and shows our performance on key economic, environmental and social indicators.
Russian artistry gets vote of approval
Moscow’s new Rhythmic Gymnastics Center has a fl uttering ribbon as its roof. Genius. We were delighted to supply products for the eye-catching building, which features 7,000 liters of our decorative paints, as well as Interpon products from our Powder Coatings business.
Only a few summersaults away is the futuristic, pyramid-shaped Matrex, which won a prestigious Architzer A+ Award from the global architectural community during 2019.
The unique structure is coated in Black Onyx from Interpon’s D2525 Eco portfolio, a range of heat-refl ective coatings which can bounce the sun’s rays back off the exterior of a building. It’s one of many iconic green buildings around the world that benefi t from our extensive range of world class powder coatings.
www.interpon.com
Sus
tain
abilit
y st
atem
ents

130 Sustainability statements | AkzoNobel Report 2019
At AkzoNobel, sustainability is one of our core principles. That’s why we take action every day by empowering our people, reducing our impact on the planet and consistently inno vating to deliver sustainable solutions to our customers. It’s about focusing on the things we can truly infl uence. We call it People. Planet. Paint.
OUR APPROACH TO SUSTAINABILITY
It’s our new down-to-earth approach to sustainability, which will help us deliver tangible benefi ts for our customers, society, the environment and our business. It’s how we’re making sustainability a daily priority, which we believe is the best commitment we can make if we’re serious about being sustainable in the long term. And every step we take to create a positive impact on the world enables us to enhance our position as the leader, when it comes to sustainability in the paints and coatings industry.
Building on our strong legacy, we have further developed our all inclusive, holistic sustainability approach. It high-lights how sustainability is refl ected in our product innovations with customer benefi ts, our supply chain, the way we operate and how we behave as an employer and member of society.
Our challenging ambitions are realistic and deliverable, having been developed collaboratively with our businesses and functions. They’re also designed to contribute to the global sustainability agenda represented by the United Nations Sustainable Development Goals (SDGs). We focus on the SDGs where we can have the biggest
impact through our products, processes and partnerships. By turning ambitions into actions, by innovating and creating a better world for future generations, AkzoNobel will remain at the forefront of sustainability in the paints and coatings industry.
More details will be announced during the course of 2020. Currently, our ambitions include the following:
People: Inspire and empower people and communities through our passion for paint. We positively impacted 40 million people between 2015 and 2019.
Planet: Reducing waste, energy and greenhouse gas emissions are the main environmental indicators we’re
focusing on, which includes zero waste to landfi ll by 2020. We also aim to use 100% renewable energy by 2050 and become carbon neutral, also by 2050.
Paint: Continue to maintain at least 20% of our sales from eco-premium solutions by 2020. Together with our eco-performers, we’re aiming to have more than 40% of revenue from sustainable solutions that bring benefi ts to our customers.
The future of sustainability at AkzoNobel is about further integrating and enhancing the quality of our sustainable solutions to ensure they have a positive impact on society and the environment. It’s about taking both big and small steps that truly make a difference.
Phase three of a solar installation project at our powder coatings site in Thane, India, was completed during 2019. It means nearly a third of the facility’s power is now generated through the use of renewable energy.

131AkzoNobel Report 2019 | Sustainability statements
PEOPLE. PLANET. PAINT.
INNOVATING TO SUPPLY SUSTAINABLE, IMPACTFUL SOLUTIONS
More than 40% of our revenue comes from products with a sustainability benefi t, and 22% of those are made up of eco-premium solutions. We intend to use our innovation strength and maintain our leadership position to further grow these percentages. Eco-premium solutions deliver clear benefi ts for our customers in terms of economic, environmental and social performance, as well as keeping us ahead of the competition.
Our product innovation is driven by sustainability. That means many of the new products we bring to market have sustainability benefi ts for the environment and society, as well as our customers. By choosing AkzoNobel, our customers are empowered to strengthen their own sustainability agenda.
We are leading an exciting transformation of the paints and coatings industry with our call for collaborative innovation through our Paint the Future innovation ecosystem. We believe the only way to safeguard our planet beyond generations is by developing cross-industry solutions.
SUSTAINABLE SOLUTIONS
We take great pride in ensuring that our innovation creates value for our customers and society and will result in more effective and sustainable solutions. That’s why we’re always looking for ways to develop more sustainable products that deliver clear benefi ts in terms of economic, environmental and social performance. It’s an approach which keeps us competitive and at the forefront of our industry amid a changing world of legislation and societal concern. Our sustainable solutions add value for our customers, often show faster growth rates and command higher margins than more traditional products.
Our portfolio approach promotes the use of safer and more sustainable products in all stages of the value chain. We take action to manage the use of harmful substances in advance of legislation, future-proofi ng our products against changes in regulations and public concerns. We also constantly review our existing offer in close alignment with our strategic focus and our customers’ needs. This helps to ensure the delivery of sustainable products and solutions that are fi t-for-purpose in our key markets.
SUSTAINABLE PRODUCT PORTFOLIO ASSESSMENT
We have measured the eco-premium part of our product portfolio for seven years. These are solutions with clear sustainability benefi ts that outperform the market and are best-in-class.
Eco-premium solutions present a moving target, since we measure our performance against the market reference, which is continuously evolving. Since 2016, revenues from eco-premium products have been in excess of 20%. In 2019, sales for this segment totaled 22% of our revenue. By constantly innovating, our aim is to maintain
Eco-premium solutionsin % of revenue
Target
2020201920182017201620152014
22 222021 212020
This is the Varso Tower in Warsaw, Poland – soon to be Europe’s tallest building – which is being protected by our Interpon products. Standing 310 meters tall, the offi ce building’s sleek black exterior has been created using Interpon D2525 super-durable topcoat on the cladding and profi les, while Interpon 100 primer provides a super tough core. The system will help the tower to withstand harsh conditions such as bright sunshine, fi erce winds and driving rain. Data covers November 1, 2018, until October 31, 2019 sales data.
Note 1
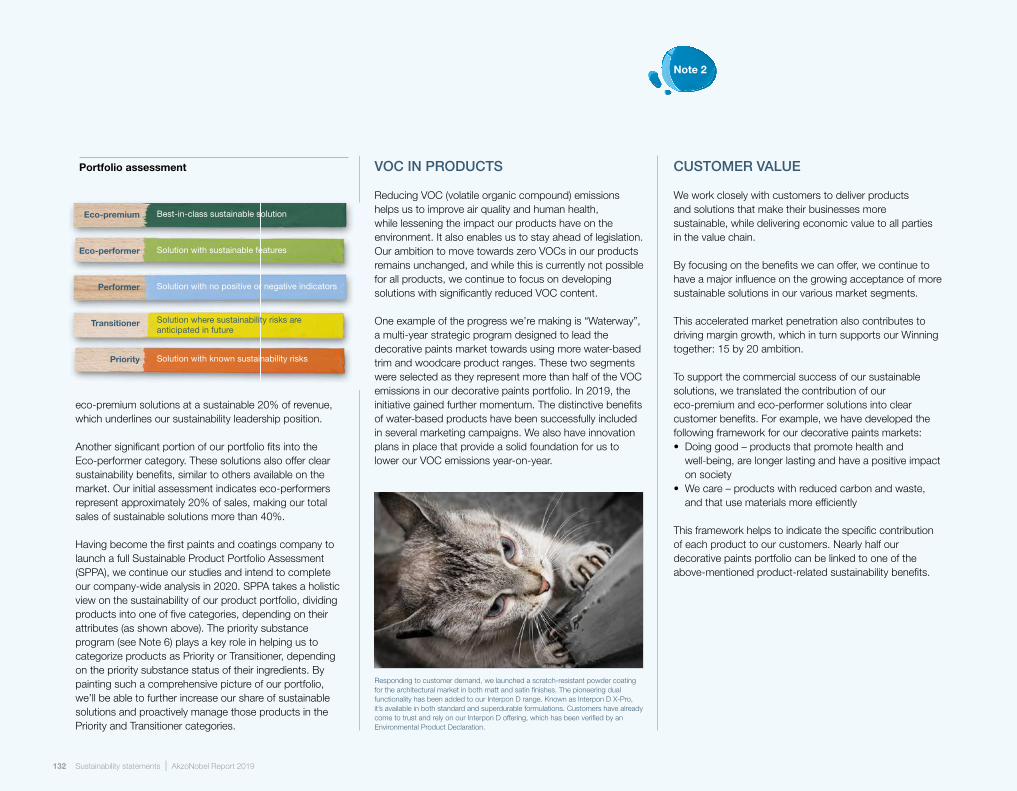
132 Sustainability statements | AkzoNobel Report 2019
eco-premium solutions at a sustainable 20% of revenue, which underlines our sustainability leadership position.
Another signifi cant portion of our portfolio fi ts into the Eco-performer category. These solutions also offer clear sustainability benefi ts, similar to others available on the market. Our initial assessment indicates eco-performers represent approximately 20% of sales, making our total sales of sustainable solutions more than 40%.
Having become the fi rst paints and coatings company to launch a full Sustainable Product Portfolio Assessment (SPPA), we continue our studies and intend to complete our company-wide analysis in 2020. SPPA takes a holistic view on the sustainability of our product portfolio, dividing products into one of fi ve categories, depending on their attributes (as shown above). The priority substance program (see Note 6) plays a key role in helping us to categorize products as Priority or Transitioner, depending on the priority substance status of their ingredients. By painting such a comprehensive picture of our portfolio, we’ll be able to further increase our share of sustainable solutions and proactively manage those products in the Priority and Transitioner categories.
Portfolio assessment
Best-in-class sustainable solution
Solution with sustainable features
Solution with no positive or negative indicators
Solution where sustainability risks are anticipated in future
Solution with known sustainability risks
Eco-premium
Eco-performer
Performer
Transitioner
Priority
VOC IN PRODUCTS
Reducing VOC (volatile organic compound) emissions helps us to improve air quality and human health, while lessening the impact our products have on the environment. It also enables us to stay ahead of legislation. Our ambition to move towards zero VOCs in our products remains unchanged, and while this is currently not possible for all products, we continue to focus on developing solutions with signifi cantly reduced VOC content.
One example of the progress we’re making is “Waterway”, a multi-year strategic program designed to lead the decorative paints market towards using more water-based trim and woodcare product ranges. These two segments were selected as they represent more than half of the VOC emissions in our decorative paints portfolio. In 2019, the initiative gained further momentum. The distinctive benefi ts of water-based products have been successfully included in several marketing campaigns. We also have innovation plans in place that provide a solid foundation for us to lower our VOC emissions year-on-year.
CUSTOMER VALUE
We work closely with customers to deliver products and solutions that make their businesses more sustainable, while delivering economic value to all parties in the value chain.
By focusing on the benefi ts we can offer, we continue to have a major infl uence on the growing acceptance of more sustainable solutions in our various market segments.
This accelerated market penetration also contributes to driving margin growth, which in turn supports our Winning together: 15 by 20 ambition.
To support the commercial success of our sustainable solutions, we translated the contribution of our eco-premium and eco-performer solutions into clear customer benefi ts. For example, we have developed the following framework for our decorative paints markets:• Doing good – products that promote health and
well-being, are longer lasting and have a positive impact on society
• We care – products with reduced carbon and waste, and that use materials more effi ciently
This framework helps to indicate the specifi c contribution of each product to our customers. Nearly half our decorative paints portfolio can be linked to one of the above-mentioned product-related sustainability benefi ts.
Responding to customer demand, we launched a scratch-resistant powder coating for the architectural market in both matt and satin fi nishes. The pioneering dual functionality has been added to our Interpon D range. Known as Interpon D X-Pro, it’s available in both standard and superdurable formulations. Customers have already come to trust and rely on our Interpon D offering, which has been verifi ed by an Environmental Product Declaration.
Note 2

133AkzoNobel Report 2019 | Sustainability statements
COLLABORATIVE INNOVATION
We’re using collaborative innovation to push the boundaries of the paints and coatings industry. Almost everything we touch is painted or coated, so there are huge opportunities to share our expertise and develop products and solutions for customers that go beyond expectation, imagination and generations.
Beyond expectation refers to the advanced functionalities offered by our products, in addition to the color and protection they provide. Beyond imagination is all about our digital innovations, which are making increasing use of robots, big data and artifi cial intelligence. Beyond generations focuses on developing sustainable solutions to safeguard our planet and create a circular value chain.
We know collaboration will help us innovate faster and better. That’s why we have created a collaborative innovation ecosystem: Paint the Future. It will enable us to explore new opportunities with others, deliver impact at scale and ensure a more sustainable future – together.
In 2019, Paint the Future launched a highly successful global startup challenge – an industry fi rst. Suppliers, academia and customers are also joining the expanding ecosystem (see page 22). Through our platform and a variety of related programs, innovators now have access to resources that can help them commercialize their solutions.
Our work with Alucha – a 2019 startup challenge winner in the circular solutions category – is a great example of how innovative collaboration could help to create a more sustainable future. We are investigating the development of recycling solutions for complex waste streams. The technology has the potential to turn the paper industry’s biggest waste stream – paper sludge – into bio-oils and minerals used in paint. These minerals will be unique, as they’ll be circular and not mined from non-renewable sources, potentially replacing the linear minerals currently used by the paint industry.
Note 3
Residents of the Sanga Funda neighborhood in Cascavel, Brazil, had their lives transformed through the power of paint thanks to a project developed by the Beyond Art association and our Coral brand. Around 25 visual and graffi ti artists from different areas of the country helped to create an open art gallery on the walls of various houses.

134 Sustainability statements | AkzoNobel Report 2019
HOW WE LOOK AFTER THE ENVIRONMENT
Doing more with less remains one of the most pressing societal challenges. At AkzoNobel, we continue to create more value from fewer resources, minimizing our environmental impact across the value chain.
We strive to achieve leading performance in our operations and manage the environmental impact of our sites through our Resource Productivity program.
More than 98% of our value chain carbon footprint comes from our suppliers and the use of our products by customers. We have improved the measurement of our Scope 3 value chain emissions – and tailored it to a focused paints and coatings company. This provided us with a new baseline for 2018. Our 2019 value chain emissions (Scope 1, 2 and 3) were 14.6 million tons of CO2(e) in 2019, 3% lower than the previous year.
We continue to work with our suppliers to minimize the environmental impact of raw materials we source. Environmental protection is one of the four innovation priorities of our Paint the Future ecosystem, which was launched in the first half of 2019 and was followed a few months later by a dedicated supplier event.
Many of our sustainable solutions (see Note 1) deliver customer benefits while having a positive impact on the environment, such as water-based products with no VOC emissions, paint that makes buildings more energy efficient and coatings that can reduce a ship’s fuel consumption.
In addition, focusing across the value chain offers many opportunities to optimize material use and limit environmental impact. Circularity is more than only promoting the recycling of paints and coatings. It means finding alternative sources for our raw materials, as well as extending the functionality of the materials in paints and coatings after their use. One of the focus areas of our
Paint the Future initiative is circular solutions, allowing us to benefit from the innovative ideas of startups to further our ambitions towards a circular economy.
We continue to monitor risks and opportunities related to climate change and the transition towards a circular economy, as recommended by the Taskforce for Climate-related Financial Disclosures (TCFD). We partnered with industry peers and the World Business Council for Sustainable Development (WBCSD) to develop guidelines for TCFD implementation as they relate to our sector. To clarify our adoption of these recommendations, we provide an index table of the TCFD recommendations on our website.
PEOPLE. PLANET. PAINT.
We’re aware that climate change may have a future impact on our business, as it may lead to more frequent and extreme weather events, resulting in supply chain disruption and changing market dynamics. In addition, it may also result in a global price on carbon and increased prices for raw materials. We’re already taking steps to address this, for example by adopting an internal carbon price for large investment decisions, introducing sustainable portfolio management to develop low-carbon and more circular solutions and making the circular economy a key element of our Paint the Future startup challenge.
We’re using the power of art to enhance the education of children in remote areas of China. It’s all part of our latest China Student Sustainability Awards program and involves student volunteers from 20 renowned universities connecting with young people in 31 isolated communities.

135AkzoNobel Report 2019 | Sustainability statements
RESOURCE PRODUCTIVITY
We launched our resource productivity program three years ago as a key accelerator to deliver on our sustainability objectives and contribute to the company’s Winning together: 15 by 20 ambition.
The program aims to maximize raw material and process effi ciency, eliminate waste and drive reduced energy, carbon footprint and VOCs (volatile organic compounds) across the whole integrated supply chain (ISC).
We use our company-wide continuous improvement program ALPS (AkzoNobel Leading Performance System) to drive the resource productivity agenda. We continuously measure and report our performance on a range of environmental and fi nancial indicators. The four key indicators are: waste, energy use, water use and VOC emissions, for which clear targets are set. Over the last few years, we’ve delivered on our targets thanks to a wide range of improvement projects introduced as part of the resource productivity program. These projects (currently more than 500), at global, regional and site levels, are monitored monthly to assess progress with regard to environmental impact and fi nancial benefi ts. The savings from projects directly related to waste and energy reduction alone totaled more than €9 million in 2019.
As well as reducing the environmental footprint of our activities, resource productivity contributes to business performance by driving continuous improvement and reducing operating costs.
We’ve increased our focus on material effi ciency and are maximizing the conversion of raw materials into fi nal product by optimizing raw material use and solving the root cause of material losses. This helps to cut down the amount of waste and waste water generated, as well as reducing the carbon footprint. It also contributes to lower manufacturing costs.
REDUCING WASTE
Waste reduction has been a focus area since 2010 and many improvements have been made at our sites which have led to signifi cant achievements. Since 2011, we have successfully reduced our waste per ton of product by nearly 40%.
Waste reduction is one of our main environmental indicators, with zero waste to landfi ll being one of our key ambitions for 2020. In 2019, total waste volume and waste per ton of production generated were down by 0.9% and up by 0.1% respectively. Recent acquisitions had a detrimental effect of 1%.
Own operations
Customeroperations
Rawmaterials
Product
By-product
Waste
34Reusable
33Non-reusable67
6
3,206
Raw material fl ow in kilotons
Total waste in kilotons
Reusable Total kg per ton of production
Non-reusable
2019201820172016
22.821.0 21.0
25.7
34 3333 3437 4042 43
Waste means any substance or object arising from our routine operations which we discard or intend to discard, or we are required to discard.
Note 4

136 Sustainability statements | AkzoNobel Report 2019
201920182017
9.8
9.1 9.1
15 14
0.4
15 14
1715
0.6 0.7
Hazardous waste in kilotons
Reusable Non-reusable to landfill
Non-reusable not landfill Total kg per ton of production
Hazardous waste is waste that is classified and regulated as such, according to the national, state or local legislation in place.
Our objective is to have zero hazardous waste to landfill at our locations in 2020.
Hazardous waste per ton of production decreased by 0.7% in 2019. The majority of our locations worldwide contributed to the reduction in waste generation. Examples of waste reduction projects include solvent recovery, reducing packaging waste by moving from smaller paper
Energy use in 1000 TJ
Energy use GJ per ton of production
2019201820172016
6.46.3 6.2 6.0
1.9 1.9 1.91.9
2019201820172016
91 89
75
96
0.06
0.18
0.06
0.23
0.07
0.24
0.07
0.24
Total greenhouse gas emissions made up of direct emissions from processes and combustion at our facilities and indirect emissions from purchased energy.We have restated our 2018 Scope 1 emissions due to a temporary database outage in the prior year leading to misstated values.
Greenhouse gas emissions in million tons
Direct CO2(e) (Scope 1) kg CO2(e) per ton of production
Indirect CO2(e) (Scope 2)
We measure halogenated and non-halogenated organic compounds discharged to air. We have improved the accuracy of our VOC modelling, which has been gradually applied at our sites. This has an impact on the reported VOC emission numbers in 2018 and 2019. In addition a significant number of VOC reduction projects were realized, therefore the reduction is a combination of both.
Volatile organic compounds in kilotons
Volatile organic compounds kg per ton of production
2019201820172016
1.72.0
1.6
1.2
0.50 0.490.37
0.60
bags or metal drums to bulk deliveries of raw materials, and reworking obsolete finished goods. To increase our contribution to the circular economy, new outlets were identified for materials which otherwise would have been disposed of, resulting in over 6 ktons less waste. In total, 34 ktons of our waste in 2019 was reusable, making our contribution to the circular economy 40 ktons.
REDUCING ENERGY AND GREENHOUSE GAS EMISSIONS
Energy use is another key environmental indicator included in our Resource Productivity program.
In 2019, our energy consumption per ton of production, as well as absolute energy consumption, were down 3% (absolute) and 2% (relative) compared with 2018. The improvement was negatively impacted by product mix and our value over volume strategy. Our total share of renewable energy use is 31%, with 33 of our locations now using 100% renewable electricity.
Since 2017, we have increased the number of locations with solar panels. By the end of 2019, 14 sites had solar panels as their own renewable energy source. We have a global program in place to install solar panels at more sites, which will significantly increase this number in the near future.
Greenhouse gas (GHG) emissions from our facilities are primarily related to electricity consumption and fuel used for heating. Total GHG emissions per ton of product and absolute GHG emissions both decreased by 16%.
DECREASING VOLATILE ORGANIC COMPOUNDS (VOC)
Air emissions generated from our operations are primarily volatile organic compounds (VOC). In 2019, we exceeded our target by decreasing both our total VOC emissions, and our VOC emissions per ton of product, by 24% (target: 10%). This reduction was delivered via product design, improved VOC modelling, driven by research and development (see Note 1), good management practices
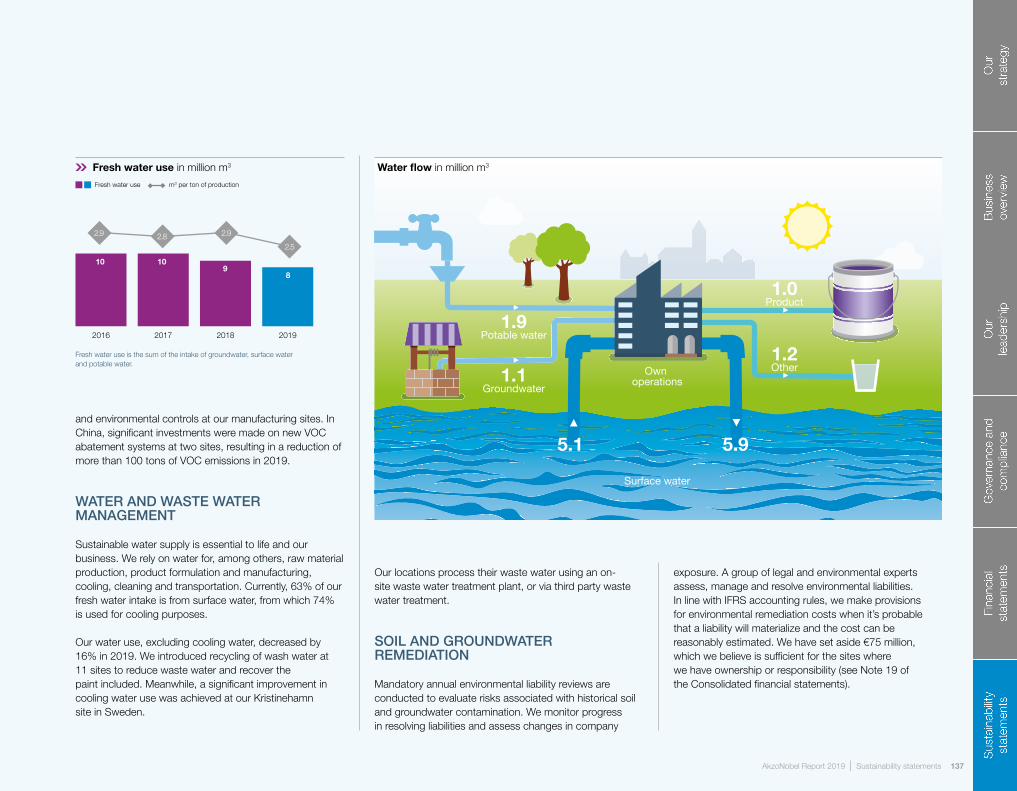
137AkzoNobel Report 2019 | Sustainability statements
and environmental controls at our manufacturing sites. In China, signifi cant investments were made on new VOC abatement systems at two sites, resulting in a reduction of more than 100 tons of VOC emissions in 2019.
WATER AND WASTE WATER MANAGEMENT
Sustainable water supply is essential to life and our business. We rely on water for, among others, raw material production, product formulation and manufacturing, cooling, cleaning and transportation. Currently, 63% of our fresh water intake is from surface water, from which 74% is used for cooling purposes.
Our water use, excluding cooling water, decreased by 16% in 2019. We introduced recycling of wash water at 11 sites to reduce waste water and recover the paint included. Meanwhile, a signifi cant improvement in cooling water use was achieved at our Kristinehamn site in Sweden.
Fresh water use in million m3
Fresh water use m3 per ton of production
2019201820172016
8
10 109
2.8 2.9
2.5
2.9
Fresh water use is the sum of the intake of groundwater, surface water and potable water.
1.2Other
1.0Product
1.9Potable water
1.1Groundwater
5.1 5.9
Surface water
Own operations
Our locations process their waste water using an on-site waste water treatment plant, or via third party waste water treatment.
SOIL AND GROUNDWATER REMEDIATION
Mandatory annual environmental liability reviews are conducted to evaluate risks associated with historical soil and groundwater contamination. We monitor progress in resolving liabilities and assess changes in company
Water fl ow in million m3
exposure. A group of legal and environmental experts assess, manage and resolve environmental liabilities. In line with IFRS accounting rules, we make provisions for environmental remediation costs when it’s probable that a liability will materialize and the cost can be reasonably estimated. We have set aside €75 million, which we believe is suffi cient for the sites where we have ownership or responsibility (see Note 19 of the Consolidated fi nancial statements).

Sustainability statements | AkzoNobel Report 2019
NEW LIFE FOR OLD PAINT
We’re always looking to push the boundaries of what paint can be and what it can do. Innovation is in our DNA – it goes hand-in-hand with our unwavering commitment to sustainability.
“We’re constantly striving to deliver the most sustainable and impactful solutions”
Rinske van Heiningen AkzoNobel Director of Sustainability
watch video on akzo.no/Evolve2019
It’s a powerful combination, one which saw us become the first major manufacturer to launch recycled paint, thanks to a groundbreaking partnership in the UK with resource management experts Veolia.
Developed by our Dulux Trade brand, Evolve is a revolutionary matt emulsion which contains 35% recycled paint. It’s made from leftovers which would otherwise most likely be destined for landfill.
Once the unused white paint has been reclaimed, it’s sorted, filtered and refined by Veolia. It’s then re-engineered with new paint by AkzoNobel and tested extensively to make sure that every tin meets the high standards expected from Dulux Trade.
“We’re always looking for new ways to drive sustainable innovation, cut down on waste and create a circular economy for paint – while offering our customers fresh solutions that don’t compromise on quality,” explains AkzoNobel’s Chief Operating Officer, Ruud Joosten. “ By introducing Evolve, we will reduce the carbon footprint of our Dulux Trade products, and help our customers reach their own sustainability goals.”
Adds the company’s Director of Sustainability, Rinske van Heiningen: “Sustainability is at the heart of our business. That’s why we focus on developing products and technologies with the biggest positive impact. We’re also well aware that people expect more than just a product from a brand, so we’re constantly striving to deliver the most sustainable – and impactful – solutions.”
Evolve was created after years of investment, hard work and commitment to improve our sustainable offering. A particular achievement was reducing the carbon footprint of each liter of Evolve paint produced by more than 10% (compared with standard vinyl matt). It’s another example of how we’re setting the pace as the leader when it comes to sustainability in the paints and coatings industry.
Aligned with SDG 12 and 17 (see page 149)
138

139AkzoNobel Report 2019 | Sustainability statements
Note 5
our threshold. We also verify our own activities against industry best practices and achieved the EcoVadis Gold rating in 2019 for the fi fth time, with an overall score of 75.
To bring this program to the next level, we started a multi-year program in 2019 and have lowered our spend threshold from €1 million to €250,000. By lowering the threshold and looking at the suppliers’ country and industry risk level, we have now identifi ed around 1,000 suppliers who are expected to participate in the program. We focus our efforts by taking a risk-based approach. A supplier’s risk level is determined by the spend, country and industry, among other factors.
Close to 60% of the identifi ed suppliers already participated in the 2018 EcoVadis assessments. In 2019, we increased this to 65% by adding suppliers prioritized
by risk. In the coming years, we aim to further increase the number of suppliers in the program. Currently 460 (47%) suppliers meet our expectations. In 2020, we aim to accelerate our program by continuing to request improvements and inviting additional suppliers to take part in the assessment.
Supplier performance managementOur supplier performance management process includes suppliers who have a contractual relationship with us and/or have an impact on our resource productivity agenda. The sustainability performance of suppliers in this group is measured using our Supplier Sustainability Balanced Scorecard (SSBS). The SSBS is designed to measure and improve our suppliers’ performance, focusing on those topics most material for our agenda.
SUPPLIER SUSTAINABILITY
We work closely with our suppliers to identify and minimize supply chain risks, create value through continuous improvement and seek out collaboration and joint development opportunities in order to ensure a secure and sustainable supply of our products.
Business Partner Code of ConductOur business partners are expected to follow the company’s core principles of safety, integrity and sustainability, as specifi ed by our Business Partner Code of Conduct (CoC). Suppliers sign the code to confi rm their compliance with environmental, social, human rights and governance requirements. Signatories cover 98% of the product related (PR) spend and 84% of the non-product related (NPR) spend.
Supplier risk managementAs a member of Together for Sustainability (TfS) we have been proactively managing the sustainability performance and risk management of our suppliers for six years.
TfS, which now has 22 members, is a chemicals sector initiative which aims to assess and improve the sustainability practices in its members’ global supply chains. We request our suppliers to perform online assessments, which are conducted by TfS partner EcoVadis, and TfS on-site audits.
Through this program, suppliers are assessed on the overall score in their EcoVadis online assessment, as well as their score on labor and human rights. To meet our expectations, suppliers need to achieve an overall EcoVadis score of at least 45 and a labor and human rights score of at least 50. Suppliers not meeting our expectations are requested to improve through annual re-assessments.
Depending on a supplier’s maturity level when joining our program, it can take several years of improvement to reach
During 2019, we were ranked as one of top 100 most sustainable businesses in Vietnam for the third consecutive year. Mr. Le Anh Dung, National Sales Director at AkzoNobel Vietnam, received the award.

140 Sustainability statements | AkzoNobel Report 2019
1 Third party online assessment on our suppliers’ CSR (Corporate Social Responsibility) performance.
2 Baseline includes suppliers across all procurement categories above €250,000 and with specific country and category risks.
3 Suppliers meet our expectations on their CSR performance if they achieve a total score of 45 and a labor and human rights score of 50 in the online assessment.
Supplier sustainability
2018 2019
Suppliers participating in CSR program1 in % against baseline2
60 65
Suppliers in line with our expectations3 in % against baseline3
38 47
High risk raw materialsWe further accelerated our due diligence program of several high risk raw materials. Initiated in 2017, these raw materials were identified as possibly impacting human rights in our supply chain, in particular regarding health and safety, working conditions and modern slavery. After analysis and prioritization, materials in scope are cobalt, mica minerals and tin, which are used in the manufacture of some additives, pigments, resins and tin packaging material that we source. In 2019, we published a conflict mineral statement. Visit our website for more information.
With regard to mica minerals, we collaborated with our suppliers to map their entire supply chain back to the mines of origin. For cobalt and tin, we have surveyed all 188 identified suppliers, using templates supplied by
During 2019, we introduced Interpon Structura Flex, the first and only powder coatings range on the market to combine the weatherability of superdurable powder coatings with the mechanical performance advantages of standard durable systems. Specifiers and architects are increasingly moving towards superior durability, so we’ve developed a pioneering solution which sets a new standard in the market.
the Responsible Minerals Initiative. Of those suppliers who confirmed using high risk materials necessary to the functionality of the product, 83% disclosed their smelters. A total of 38% of these smelters are conformant with the Responsible Mineral Assurance Process (RMAP) standard, or an equivalent standard. Suppliers with a “conflict free statement”, but who did not disclose the smelters in their supply chain, were not regarded as being conformant, since our due diligence is based on the Organization for Economic Cooperation and Development (OECD)
Suppliers in sustainability program in %
In line with our expectations Under development
20192018
38
22
47
18
Baseline of 982 suppliers across all procurement spend categories who meet our new risk criteria.
Guidance for Responsible Mineral Supply Chains. In 2020, we will continue our due diligence process to ensure our suppliers steer their supply chains towards using only smelters validated via RMAP (or equivalent).
Capability buildingHaving started in December 2018, we continued to train our procurement organization on our sustainability programs and human rights. In total, 96% of our buyers in scope have participated in the training.

141AkzoNobel Report 2019 | Sustainability statements
HEALTH AND SAFETY
At AkzoNobel, we strive to achieve leading performance in health, safety, environment and security (HSE&S). Our vision is to deliver zero injuries and harm through operational excellence.
Our strategic HSE&S priorities are aligned with the company’s Winning together: 15 by 20 ambition and are focused on driving:• Continuous improvement of HSE&S processes to
achieve leading maturity levels• The implementation of an integrated HSE&S
management system to drive continuous improvement and maintain best-in-class performance
• A commitment-based HSE&S culture and embedding operational excellence to achieve our vision of zero injuries and harm
PEOPLE SAFETY
In 2019, the total reportable rate (TRR) was 0.24, an increase compared with 2018 (0.20). This is slightly above the target level set for 2020 (0.20). In total, 65% of our manufacturing locations have been reportable injury-free for more than a year.
The most frequent causes for reportable injuries remain “struck by/against” or “caught in between” objects, and “slips, trips and falls”. The most frequent injuries sustained are cuts/lacerations, fractures and strains/sprains.
Although the TRR was up in 2019, the severity of injuries has decreased. The lost time injury rate for employees was 0.08 (2018: 0.09).
Some of the most severe incidents, including a fatality, were related to off-site motorcycle incidents that occurred in India. This prompted us to create a region-wide motorcycle safety program. It aims to reduce the use
20202019201820172016
0.24≤0.200.20 0.20
0.26
Total reportable injury rate employees/ temporary workers
Total reportable rate contractors injury rate
The total reportable injury rate (TRR) is the number of injuries resulting in a medical treatment case, restricted work case, lost time case or fatality, per 200,000 hours worked. In line with OSHA guidelines, temporary workers are reported with employees, since day-to-day management is by AkzoNobel.
Lost time injury rate employees/ temporary workers
The lost time injury rate (LTlR) is the number of injuries resulting in a lost time injury per 200,000 hours worked. Temporary workers are reported together with employees, since day-to-day management is by AkzoNobel.
20202019201820172016
0.08
≤0.040.06
0.09
0.13
of motorcycles for company business and ensure that relevant safety measures, including training, are in place.
Investing in visible safety leadership and employee involvement initiatives is critical to strengthen our safety culture and deliver continuous improvement in safety performance.
Additional measures are also being introduced. These include the implementation of Life Critical Procedures, forklift safety and machine safety “calls to action” (including cross-site validation audits). The continued embedding of injury and illness case management should also help to further prevent injuries or reduce their severity. The objective of the latter is to proactively manage injury cases
Lost time injuries contractors injury rate
The contractors lost time injury rate (LTlR) is the number of contractor injuries resulting in a lost time case, per 200,000 hours worked.
The contractors total reportable rate (TRR) is the number of contractor injuries resulting in medical treatment cases, restricted work cases, lost time injuries or fatalities, per 200,000 hours worked.
2019201820172016
0.06
0.11
0.07
0.09
2019201820172016
0.12
0.29
0.18 0.19
at an early stage, contribute to reducing the impact for the injured employee, promote return to work programs and, as a result, further reduce the lost time injury rate.
The number of contractor reportable injuries increased slightly compared with 2018, leading to a reportable injury rate of 0.19 (2018: 0.18). The contractors lost time injury rate also went up from 0.07 in 2018 to 0.09 in 2019.
Analysis revealed that inadequate/poor adherence to procedures were the main cause of contractor incidents. To help counter this trend, a contractor safety procedure and self-assessment process were introduced to target the quality of (and adherence to) key procedures, with benefi ts for our own employees, as well as contractors.
Note 6
Target
Target

142 Sustainability statements | AkzoNobel Report 2019
PROCESS SAFETY
We have developed and implemented a process safety management (PSM) framework for all our operations, which follows industry standards and best practices. A new management of change (MOC) procedure has also been introduced globally. This process has now been digitized to allow an effi cient, comprehensive approach.
Process safety performance indicators are aligned with international best practice. Loss of primary containment (LoPC) is the main process safety indicator at manufacturing sites, distinguishing between two levels of severity. As a leading indicator, sites also measure process safety events (PSEs), which are minor leaks or occurrences that could lead to more severe events.
Following the sale of our Specialty Chemicals business, resin manufacturing represents the highest remaining PSM
Process safety events2018 2019
Loss of primary containment – Level 1 6 3
Loss of primary containment – Level 2 63 64
Process safety event – Level 3 1,583 970
Process safety events (PSE) pyramid
risk in the company. To ensure these risks are properly managed and mitigated to acceptable levels across the company, a special project has been launched. It’s designed to review the reliability and integrity of all safety layers of protection and develop standards for minimum layers of protection, in particular for all our resin plants.
In 2019, the number of LoPC Level 1 incidents (highest severity) decreased to 3 (2018: 6). Reporting discipline for PSE Level 3 incidents (minor spills and leaks, which are readily controlled on site and have no regulatory notifi cation requirement) remained at a high level, clearly illustrating the drive for improvement at our manufacturing sites. All incidents are investigated to increase our focus on learning and continuous improvement.
PRODUCT STEWARDSHIP
Product stewardship is our approach to ensuring that product safety and sustainability are considered throughout the value chain – from raw material extraction, R&D, manufacturing, transport, marketing and application, all the way through to end-of-life. We aim to deliver value to AkzoNobel and our customers by ensuring regulatory compliance in every region where we operate. We’re also committed to continually developing safer and more sustainable solutions for the market while staying ahead of legislation through our proactive approach.
Continuous improvement We use our Product Stewardship Continuous Improve-ment Tool (PSCIT) to drive continuous improvement in product stewardship through collaboration at all levels.
After realigning the PSCIT to better meet the needs of a focused paints and coatings organization, a new benchmark was introduced. It measures the maturity of how product stewardship has been incorporated into each of our businesses, and within AkzoNobel as a whole. As expected, the results show that most businesses and departments are continuously improving on the key areas.
Priority substance managementOur industry-leading and multiple award-winning priority substance program is a proactive approach to the review and management of hazardous substances in our products and processes. The program continues to review substances as the regulatory status of substances change, while processes are in place to prevent the introduction of hazardous substances in our businesses. A further fi ve substances were (re)assessed in 2019, and the program has been embedded into a new Sustainable Product Portfolio Assessment process (See Note 1).
Levels 1
2
3
4
PSE
PSE
PSE below threshold (of Level 2)
and near misses
Operational discipline
A research project which aims to harness the wasted solar energy absorbed by buildings was launched in 2019 by a consortium of 13 partners – including AkzoNobel. The ENVISION initiative is attempting to harvest energy from all building surfaces, both transparent and opaque. A solution for absorbing near-infrared light (NIR) via special panels already exists, but these panels are only available in one color – black. So our coatings experts are developing technology which can capture heat using lighter and brighter colors.

143AkzoNobel Report 2019 | Sustainability statements
HEALTH
At AkzoNobel, we’re committed to providing a safe working environment and healthy work conditions for all our employees. Health and well-being are part of our occupational health strategy and we actively manage
illness-related absenteeism. A new, company-wide Industrial Hygiene (IH) framework was established in 2018. Based on this framework, we launched an IH baseline survey during the first quarter of 2019 at 144 locations. It aims to inventorize the current status of IH program implementation at our work- places. The established baseline will be the basis for further improvement.
We continue to build the IH competencies of our HSE&S professionals at local and regional level through online training courses. In 2019, online training on chemical exposure assessments and ergonomic assessments were developed and delivered.
SECURITY
Security at AkzoNobel is focused on securing people, information, assets and critical business processes against
willful security risks on-site and while traveling. The level of standardization of procedures, processes and training for employees dealing with security at all our facilities will continue to increase.
A central security committee with functional representatives coordinates the main pillars of security: personnel security, facilities, information management security, travel security and intellectual property. The readiness of our security processes is assured via internal assessments, internal audits and security drills. In 2019, 184 security incidents were reported globally, broadly in line with 2018 (177). Theft and vandalism at our stores represented the highest event sub-type (similar to normal society). Based on the incident trends and security assessment analysis, the top three security priorities to be resolved are: lone working arrangements; use of CCTV; and training on how to deal with aggressive members of the public.
HSE&S MANAGEMENT
Our leading HSE&S management system drives continuous improvement through operational excellence in all aspects of HSE&S management. This includes procedures, regular performance reviews, training, self-assessments, annual improvement planning, independent internal audit and root cause analyses of incidents. It also incorporates promoting learning across the organization, including best practice sharing. Our common processes require each site and business unit to develop their own safety improvement plan annually. Sites that are lagging in performance receive additional support from the central HSE&S organization though a road map process.
During 2019, our state-of-the-art digitized platform for supporting core HSE&S processes (known as the HSE&S suite), was further developed and embedded. Our corporate HSE&S management system was also globally certified to ISO 14001 and OHSAS 18001 standards.
Our Powder Coatings business extended its range of Interpon Low-E products during 2019. Having first introduced a selection of coarse texture products in 2018, a complete range of smooth finishes in Interpon 610 was added to the Low-E portfolio. Specially engineered for curing at temperatures lower than the current standard of 180-190°C, the new offering can save energy and help customers to improve their efficiency.
Employee health occupational illness rate
Occupational illness frequency rate (OIFR) is the total number of reportable occupational illness cases for the reporting period, per 1,000,000 hours worked. This parameter is reportable for employees and temporary workers.
2019201820172016
0.05
0.06
0.05
0.03

144 Sustainability statements | AkzoNobel Report 2019
EMPLOYEES
By focusing on the success and sustainability of our business, we’re able to attract, retain and motivate our employees. Sustainability is one of our core principles, it helps to defi ne who we are and what we stand for.
Our talent and development programs are a vital investment in our human capital – the skills and know-ledge of our employees. They’re key to ensuring that we’re equipped to drive the company’s growth and profi tability.
CULTURAL SHIFT AND SUPPORTING INITIATIVES
In 2019, we continued the roll-out of our people agenda and HR annual operating planning process across all businesses and functions. As part of this process, we introduced a set of strategic performance indicators for the HR function which allows us to measure the progress and impact of our key strategic initiatives.
We also implemented a new core HR system to deliver an employee experience that is more simple, reliable, engaging and empowering. In addition, to support our HR practices across the globe, we rolled out a workforce analytics tool which allows us to make better informed decisions about AkzoNobel and its people. With this foundation in place, we intend to build a data-driven culture during the coming years.
ATTRACTING, DEVELOPING AND RETAINING TALENT
Our renewed employer branding campaign on social media, along with our efforts to create an outstanding candidate experience, resulted in continued recognition as a leading employer in many of our key countries,
including Brazil, China, France, the Netherlands, Poland, Sweden, the UK and the US.
As part of our transition to growth-based talent management, we put signifi cant effort into creating a sustainable leadership pipeline for critical positions to ensure business continuity. This resulted in a balanced approach to promote our future senior leaders from within the organization, while continuously enriching our pipeline from external markets. The outcome was that we fi lled 53% of our executive roles internally.
In 2019, overall employee turnover was 14% (2018: 14%), while the voluntary turnover was 7% (2018: 8%). The difference between our overall and voluntary turnover was mainly caused by our continued transformation journey and resulting restructuring. High potential employee turnover totaled 4% (2018: 8%), a decrease from previous years, as we expected.
CAPABILITY BUILDING TO DRIVE OUR 2020 AMBITIONS
We’re focused on building the capabilities of our people in order to meet our strategic ambitions and ensure we drive a performance culture where our people learn quickly, grow and proudly deliver on their commitments. In 2019, we continued to build capabilities in our key functions through Marketing Development Centers, Site Manager Development Centers, our Emerging Leader Program and a Top Leadership Development Program.
Our people managers play a pivotal role in building a high-performance culture through effective onboarding, continuous feedback, recognition and engagement of their teams. We therefore continued our Manager Development Program to provide them with the right tools to build high-performing teams.
HOW WE TREAT OUR PEOPLE AND INSPIRE AND EMPOWER COMMUNITIES
Our focus on people covers many different aspects. It’s about ensuring a safe work environment, developing our talented workforce, embracing our principles and our approach to human rights and diversity. It also includes the numerous local projects we carry out that bring signifi cant benefi ts to people and communities around the world.
That’s why we’re committed to making and selling paint that positively impacts the lives of our employees, customers and communities. It’s an approach which also attracts talented and like-minded employees to work for – and remain with – the company.
PEOPLE. PLANET. PAINT. Note 7
During a visit to the US, CEO Thierry Vanlancker congratulated US employee Archie Cotcher on achieving an incredible 67 years of service with the company. Archie – who joined in 1952 – now works in Troy, Michigan, as a Senior Technician in our vehicle refi nishes product development lab.

145AkzoNobel Report 2019 | Sustainability statements
To ensure our entire workforce is fit for the future, we continued to update our competency frameworks for research and development, information management, sales and marketing, business services and finance, and offer access to online programs across the organization.
INCREASED AWARENESS OF DIVERSITY AND INCLUSION
We are developing an increasingly engaged, diverse and capable workforce to deliver our strategy. We believe it’s also important that our management teams reflect the diversity of our overall workforce, because inclusive and diverse teams are better able to understand customer needs and innovate to meet their requirements.
In 2019, we established the Diversity and Inclusion (D&I) Sounding Board, with regional teams designed to address local needs. It provides thought leadership and recommendations on significant D&I issues and ensures D&I priorities and actions support – and are aligned with – the company’s overall strategy and values. As part of our commitment to foster an inclusive and respectful working environment, we launched training to increase awareness around unconscious bias in the workplace. We revitalized our efforts around facilitating diversity and inclusion networks focusing on women in the workplace and the lesbian, gay, bisexual, transgender and intersex (LGBTI+) community. We have also become a member of the Workplace Pride organization.
In order to create strong and diverse high-performing teams across the company, we implemented a global recruitment guideline for an inclusive and unbiased hiring practice of internal and external candidates.
This year, we also rolled out a global mentoring platform; a virtual place for mentors and mentees to connect and build professional relationships to advance talent in our organization.
CHANGE MANAGEMENT IS KEY TO A HEALTHY ORGANIZATION
The ambitious transformation journey we have embarked on is well underway. The cultural shift we aspire to – one that will make us the reference in our industry – is substantial. The right balance between performance and organizational health is an instrumental part of that journey to ensure our transformation has a lasting impact. We therefore continued to survey our organizational health in 2019 by asking all employees for their input on a quarterly basis, resulting in an OHI score of 61 (2018: 58).
In total, 85% of our employees indicated they really care about the company, while 88% are willing to put in a great deal of effort – beyond what’s normally expected – in order to help AkzoNobel be successful.
Based on insights from last year’s survey results, we developed a program for our leadership teams to support them in their transformation journey to make AkzoNobel a high-performing organization. This, along with other initiatives, has led to an increased understanding among our top management (and their respective teams) of the direction the organization has taken, which is reflected in our increased organizational health scores. We also notice a positive relation between leaders who are new in their position and the health scores in their teams – the teams of newly appointed leaders show higher health scores. The insights gained from the survey also show a
Human capital ambitions
2016 2017 2018 2019Ambition
2020
Organizational health score 58 61 742
Female executives (in %)1 19 19 20 18 25
1 2016-2017 data includes discontinued operations. 2 Top quartile.
need for continued focus in four specific areas: employee involvement, inspirational leaders, rewards and recognition, and talent development.
As part of our transformation journey, we need to check our progress on a regular basis. It’s therefore vital that we continue the organizational health checks. The outcomes are reflected in action plans (overall, per business and per function), and help us steer our culture and organizational change management agenda. The culture and transformation teams – supported by a network of colleagues around the world who facilitate and drive our culture and change programs in their respective areas – will assist in the roll-out of the agenda.
Our COO, Ruud Joosten, helped to unveil a powerful new mural in Australia designed to inspire young girls to use their voice. Located beside Melbourne Central Station, the artwork – created by Daiana Ingleton – was also part of the celebrations to mark the 25-year partnership between AkzoNobel and Plan International Netherlands.

146 Sustainability statements | AkzoNobel Report 2019
HUMAN RIGHTS
As an employer, manufacturer, business partner and member of many communities, we recognize the responsibility we have to respect human rights of people in our value chain and the infl uence we have to contribute to making improvements.
As part of our core principles of safety, integrity and sustainability, we are committed to respecting human rights as set out in the International Bill of Human Rights, the International Labour Organization’s Declaration on Fundamental Principles and Rights at Work, and the OECD Guidelines for Multinational Enterprises.
We are also a member of UN Global Compact. Our Code of Conduct explains what we expect from our employees.
GOVERNANCE
The Executive Committee is responsible for our human rights program. It has delegated management of the program to a cross-function Human Rights Committee, while day-to-day work on the program is handled by the Integrity and Compliance function. Human rights-related rules and procedures are embedded in our policy framework and apply to all employees. Through our Business Partner Code of Conduct, we require our business partners to respect human rights in their operations for us.
SALIENT HUMAN RIGHTS ISSUES
While we respect and treat all human rights equally, we have prioritized certain activities based on risk. These priorities were established following internal and external stakeholder engagement. They are:
1. Health and safety in our value chain The health and safety of our people and those we work with, or offer our products to, is our fi rst priority. We have a robust health and safety program, which is explained in Note 6. With our priority substance program, we screen thousands of raw materials. We have also initiated due diligence on the impact we have on the communities around our sites. That work will continue in 2020.
2. Working conditions for our employeesWe are committed to providing good working conditions for our employees and those working at, or visiting, our sites. We have conducted due diligence and issued company-wide standards for working hours. These are being implemented throughout the company. In addition, we have conducted due diligence on the compensation we offer to our employees versus international living wage standards for the ten high risk countries. The initial results have shown us that while we comply with legal requirements, there are certain gaps between our compensation and international living wage standards that merit further due diligence. This due diligence work is ongoing.
3. Discrimination and harassmentWe are committed to offering a working environment in which people feel treated with dignity and respect, and where we foster diversity and inclusion (see Note 7). We have clear rules in place and apply strict consequence management in case of violation of these rules. In 2019, we started the implementation of a global training program for all our employees on diversity and unconscious bias. In addition, we started the implementation of a global Trusted Person network, offering employees a person to go to if they have concerns about their work environment.
4. Modern slavery in our supply chain We have zero tolerance for modern slavery, such as child labor or forced labor. We have conducted due diligence into our supply chains, initially focusing on mica, cobalt and tin (for more details, see Note 5). As a result of this due diligence, we have greater visibility of the risks and areas for improvement. We strengthened the (EcoVadis) self-assessment process for our suppliers in this area, have provided support to certain suppliers on how to improve and have taken steps to phase-out certain suppliers where necessary. We have also introduced a balanced scorecard to monitor the performance of key suppliers, of which human rights is a component.
SPEAKUP! GRIEVANCE MECHANISM
SpeakUp! offers employees and people from outside the company a way of reporting any concerns they have relating to compliance with our Code of Conduct.
Reports are investigated objectively, confi dentially and with a strict policy of non-retaliation. This helps us improve controls and processes and correct behavior where necessary.
For more details, visit akzo.no/SpeakUp
For full details and progress information on our human rights framework, please visit: www.akzonobel.com/humanrights
Note 8
147AkzoNobel Report 2019 | Sustainability statements
AKZONOBEL CARES
Caring for society and local communities is a vital part of our global activities. As a responsible company, we run various programs that show how highly we regard our role in society. As well as helping people and their surrounding neighborhoods, these programs also contribute to building employee pride and strengthening our reputation.
Our societal contribution is organized under the AkzoNobel Cares umbrella, which includes our Community Program, “Let’s Colour” initiative and long-established Education Fund.
Between 2015 and 2019, we positively impacted 40 million people by running over 900 projects in 120 countries and trained around 30,000 people.
Community ProgramConnecting with the communities that are close to our workplaces and supporting their development has always been an essential part of who we are.
In 2019, we continued to demonstrate our passion for paint and empower our people to initiate Community
Program projects all over the world. These projects create a positive impact for our communities, our employees and our brands.
During the year, 140 Community Program projects took place in 14 countries, benefi ting 148,000 people. Around 4,300 AkzoNobel volunteers were involved.
Let’s ColourThe global “Let’s Colour” program highlights our belief that paint has the power to transform lives by revitalizing communities and making living
spaces more liveable and inspiring. In 2019, we staged 83 “Let’s Colour” projects in 24 countries. Thanks to the involvement of 1,115 AkzoNobel volunteers and the donation of paint, we made a difference to countless neighborhoods and living spaces, benefi ting more than 5.3 million people.
2019 also marked the third year of our global partnership with SOS Children’s Villages. As a member of the Global YouthCan! platform, we work together to advance the employability of youth at risk in 15 countries. Through our 2019201820172016
1,1391,449 1,537
4,300
>20k
>97k
>148k
>15k
Community Program
Employees (number)
Benefi ciaries (number, estimated)
painter academies and by offering soft skills programs, mentoring and traineeships, we trained around 1,400 young people throughout the year. We also refreshed 12 SOS Children’s Villages with paint to help create happy homes. We intend to expand the partner-ship over the next few years. For more details, visit: www.letscolourproject.com
Education FundTogether with partner Plan International Netherlands, we set up the Education Fund in 1994, so 2019 was its 25th anniversary. We aim to empower the next generation by improving education in developing countries and offering young people new skills, training and mentoring.
We’re proud of the tens of thousands of young people in countries such as Bolivia, Brazil, China, Ecuador, India, the Philippines and Vietnam who use our programs to build a brighter future for themselves and their communities. During 2019, the Education Fund started supporting STEM (Science, Technology, Engineering and Mathematics) training in China and continued to support youth economic empowerment and entrepreneurship training in India.
Around 170 volunteers used 440 liters of our Dulux paint to renovate two primary schools in Hungary. Located in Nagykovács and Göd, the schools were transformed as part of our global “Let’s Colour” initiative, helping 1,500 children to benefi t from a more inspiring learning environment.
Note 9

1. Key risks andopportunities
2. Accelerationof 15 by 20
3. Sustainabilityagenda
4. Key topicsand indicators
148 Sustainability statements | AkzoNobel Report 2019
MANAGING SUSTAINABILITY
Materiality matrix
People Planet Paint
Importance for AkzoNobel
MediumLow High
Med
ium
Low
Hig
h
Imp
ort
ance
fo
r st
akeh
old
ers
F I
B C
J L
D E G H
A K
M
MANAGEMENT ACCOUNTABILITY
Our Executive Committee is responsible for incorporating the sustainability agenda into the company strategy and monitoring the performance of each business through the Operational Control Cycle. Given our focus on sustai n-ability, overall ownership of sustainability is with the CEO.
The Sustainability Council advises and updates the Executive Committee on new developments, performance and the integration of sustainability into our management processes. The Council, which meets quarterly, consists of representative Business and Functional Directors, as well as the CEO. The Director of Sustainability reports to the Executive Committee on a regular basis.
MONITORING PROGRESS
We use key indicators to track our progress in delivering on our sustainable business imperatives and continue to drive continuous value improvement processes in every function, supported by external benchmarks.
During 2019, we continued to include our core principles – including sustainability – in the personal objectives and incentives of employees. This is tailored to each employee’s role in the organization and linked to our sustainability priorities. For employees in operations and supply chain management, objectives are linked to resource productivity. For those in innovation, marketing and sales, they are linked to product portfolios of more sustainable solutions.
MATERIALITY ASSESSMENT
Sustainability topics material to our company are reviewed based on input from internal and external stakeholders. We focus on topics that have the biggest impact in terms of accelerating our strategy of creating shared value.
This approach builds on our core principles of safety, integrity and sustainability including respect for human rights. The materiality assessment is based on key risks and opportunities for the company as they relate to the acceleration of our business agenda and our approach to sustainability. The key topics identifi ed are validated annually and assessed on their relative importance.
STAKEHOLDER ENGAGEMENT
We engage and collaborate proactively with our stakeholders to identify opportunities to create shared value. Our key stakeholders are customers, employees, suppliers and communities (see previous Notes), as well as society, industry associations and investors (see opposite page).
Topic Section of the report
A Employee development Note 7: Employees
B Integrity Compliance and integrity management
C Human rights Note 8: Human rights
D Community involvement Note 9: AkzoNobel Cares
E Fair taxes Financial information Note 8
F People/process safety Note 6: Health and safety
G Circular economy Planet
H Supplier sustainability Note 5: Supplier sustainability
I Climate strategy Planet
J Resource productivity Note 4: Resource productivity
K Customer satisfaction Note 2: Customer value
L Sustainable solutions Note 1: Sustainable solutions
M Product safety Note 6: Health and safety

149AkzoNobel Report 2019 | Sustainability statements
Associations and councilsWe continued our memberships in 2019, including our active membership of the World Business Council for Sustainable Development (WBCSD) and the World Green Building Council. We have been a signatory of the UN Global Compact since 2004 and annually disclose our communication of progress. We subscribe to the UN Universal Declaration of Human Rights, the key conventions of the International Labor Organization and the OECD Guidelines for Multinational Enterprises. We are also a signatory to the Responsible Care® Global Charter and the CEO Water Mandate. Since 2017, we’ve been a member of the RE100 (a Climate Group initiative), which aims to move to 100% renewable energy. As a member of the UN Global Alliance to Eliminate Lead in Paint, we were the first major paint company to eliminate lead pigments and driers in all our paint products and continue to do so when we acquire new companies.
External benchmarksWe continue to set ambitious targets on topics most material to our company and embed them in relevant functions and businesses. This allows us to focus on driving continuous improvement. In 2019, we reviewed which benchmarks are best suited to us as a focused paints and coatings company. We prioritize our active participation in benchmarks that help drive continuous improvement and rely mostly on publicly available information. We continue to be recognized as an industry leader by Sustainalytics, MSCI, Vigeo Eiris and ISS Oekom. We also retained our EcoVadis Gold rating and are included in the Ethibel Sustainability Index (ESI) Excellence Global.
REPORTING PRINCIPLES
Our reporting principles are based on the Global Reporting Initiative (GRI) standards, complemented by internally developed guidelines. Our complete reporting principles can be found on our website, along with an index of the GRI indicators.
Society: UN Sustainable Development GoalsDeveloped by the United Nations, the Sustainable Development Goals (SDGs) are a blueprint for achieving a better and more sustainable future. All the SDGs inspire our actions and decisions. As a company, we continue to focus on those SDGs where we can have the biggest impact and integrate them into our sustainability agenda. This agenda is a key driver for business development, innovation and growth. The SDGs will therefore continue to help us take our industry forward and ensure that sustainability remains firmly at the heart of what we do. Our commitment is also reflected in the case studies included in this Report 2019. They highlight in particular how our products and ongoing innovation contribute to those SDGs where we can have the most positive impact.
Sustainable cities and communitiesThe majority of our products are used in the buildings and infrastructure sector. Our
focus on helping to create green buildings means we can have a major positive impact on cities and communities. This includes improving the energy efficiency of buildings through the use of heat-reflective coatings, as well as providing interior wall paint which can improve the health and well-being of residents. See SDG 11 in action on page 8.
Responsible consumption and productionWe’re fully aware of the huge opportunities that come with applying the principles
of the circular economy across our entire value chain (see Planet on page 134). We also know it’s a way for us to improve the performance, durability and long-term protection that our products can bring to underlying substrates. Coatings are an enabler to prevent products becoming waste. They enable furniture, transport and building materials to be reused and recycled; they can reflect heat; lower fuel use and friction; and provide insulation. It’s also about solutions being non-hazardous. See SDG 12 in action on page 138.
Partnerships for the goalsCollaboration is essential in order to scale up actions across the SDGs. We believe in the impact innovation can
have in bringing the industry forward and ultimately helping us to achieve the aims they set out. This was one of the driving forces behind us setting up our Paint the Future ecosystem, which was launched in 2019 with a global startup challenge, followed by a dedicated supplier event. See SDG 17 in action on pages 22 and 138.

150 Sustainability statements | AkzoNobel Report 2019
ASSURANCE REPORT OF THE INDEPENDENT AUDITOR
To: Supervisory Board and Board of Management of Akzo Nobel N.V.Assurance report on the selected non-financial indicators in the Sustainability statements 2019
Our conclusionWe have reviewed the selected non-financial indicators in the Sustainability statements 2019 of Akzo Nobel N.V. (“AkzoNobel” or “the company”). Based on the procedures performed and evidence obtained, nothing has come to our attention which causes us to believe that the selected non-financial indicators in the 2019 Sustainability statements are not prepared, in all material respects, in accordance with AkzoNobel’s reporting criteria.
What we have reviewedThe object of our assurance engagement concerns selected non-financial indicators for the year ended December 31, 2019. Marked with the symbol, the “indicators” included in the Sustainability statements in the Report 2019 of Akzo Nobel N.V. are as follows: • Eco-premium solutions (in % of revenue)• Energy use (in 1000 TJ)• Energy use (GJ per ton of production)• Greenhouse gas emissions (kg CO2(e) per ton of
production)• Greenhouse gas emissions – direct CO2(e) emissions
(Scope 1) (in million tons)• Greenhouse gas emissions – indirect CO2(e) emissions
(Scope 2) (in million tons)• Direct CO2(e) emissions (total kg per ton of production)• Indirect CO2(e) emissions (Scope 2) (total kg per ton of
production)• Volatile organic compounds (in kilotons)• Volatile organic compounds (kg per ton of production)• Fresh water use (in million m3)• Fresh water use (m3 per ton of production)• Total waste (total kg per ton of production)• Total waste – reusable (in kilotons)• Total waste – non-reusable (in kilotons)• Total non-reusable waste (total kg per ton of production)
• Hazardous waste (total kg per ton of production)• Hazardous waste – reusable (in kilotons)• Hazardous waste – non-reusable not landfill (in kilotons)• Hazardous waste – non-reusable to landfill (in kilotons)• Hazardous waste non-reusable (total kg per ton of
production)• Hazardous waste to landfill (in kilotons)• Hazardous waste to landfill (total kg per ton of
production)• Renewable energy – own operations (in %)• Scope 3 upstream (million tons) • Scope 3 downstream (million tons)• Cradle-to-grave carbon footprint (Scope 1, 2 and 3)
(million tons)• Suppliers in sustainability program – in line with our
expectations (in %)• Suppliers in sustainability program –
under development (in %)• Suppliers participating in CSR program (in % against
baseline)• Organizational health score• Female executives (in %)• Fatalities employees (number)• Total reportable injury rate employees/temporary
workers (per 200,000 hours worked)• Lost time injury rate employees/temporary workers (per
200,000 hours worked)• Occupational illness rate employees (per 1,000,000
hours worked)• Fatalities contractors – temporary workers plus
independent (number)• Loss of primary containment – Level 1 (number)• Loss of primary containment – Level 2 (number)• Process safety event – Level 3 (number)• Regulatory actions – Level 4 (number)• Management audits plus reassurance audits (number)
We have reviewed these indicators included in the Sustainability statements in AkzoNobel’s Report 2019. All other information in the Sustainability statements and the rest of the Report 2019 is not in scope of this
engagement. Therefore, we do not report or conclude on this other information.
The basis for our conclusionWe conducted our review in accordance with Dutch law, including the Dutch Standard 3000A “Assurance engagements, other than audits or reviews of historical financial information (attestation-engagements).” This engagement is aimed to provide limited assurance. Our responsibilities under this standard are further described in the section “Our responsibilities for the review” of our report.
We believe that the assurance information we have obtained is sufficient and appropriate to provide a basis for our conclusion.
Independence and quality controlWe are independent of Akzo Nobel N.V. in accordance with the “Verordening inzake de onafhankelijkheid van accountants bij assurance opdrachten” (ViO, Code of Ethics for Professional Accountants, a regulation with respect to independence) and other relevant independence requirements in the Netherlands. Furthermore, we have complied with the “Verordening gedrags- en beroepsregels accountants” (VGBA, Code of Ethics for Professional Accountants, a regulation with respect to rules of professional conduct).
We apply the “Nadere voorschriften kwaliteitssystemen” (NVKS, Regulations for quality systems) and accordingly maintain a comprehensive system of quality control, including documented policies and procedures regarding compliance with ethical requirements, professional standards and other applicable legal and regulatory requirements.
Reporting criteriaThe indicators need to be read and understood in conjunction with the reporting criteria. The Board of Management of AkzoNobel is solely responsible for

151AkzoNobel Report 2019 | Sustainability statements
selecting and applying these reporting criteria, taking into account applicable laws and regulations related to reporting.
The reporting criteria used for the preparation of the indicators are AkzoNobel’s reporting criteria developed by the company, as disclosed in the Managing sustainability paragraph of the Sustainability statements, and further elaborated in The Reporting Principles 2019, which were made available online at www.akzonobel.com/en/about-us/sustainability. The absence of a significant body of established practice on which to draw, to evaluate and measure non-financial information allows for different, but acceptable, measurement techniques and can affect comparability between entities and over time.
Responsibilities for the indicators and the review thereof
Responsibilities of the Board of Management and Supervisory BoardThe Board of Management of Akzo Nobel N.V. is responsible for the preparation of the indicators in accordance with AkzoNobel’s reporting criteria, including the identification of the intended users and the criteria being applicable for the purpose of these users. Furthermore, the Board of Management is responsible for such internal control as it determines is necessary to enable the preparation of the indicators that are free from material misstatement, whether due to fraud or error. The Supervisory Board is responsible for overseeing the company’s reporting process on the indicators.
Our responsibilities for the reviewOur responsibility is to plan and perform our review in a manner that allows us to obtain sufficient and appropriate evidence to provide a basis for our conclusion.
Our conclusion aims to provide limited assurance. The procedures performed in this context consisted primarily of making inquiries with officers of the entity and determining
the plausibility of the indicators. The level of assurance obtained in a limited assurance engagement is substantially lower than the assurance that would have been obtained had a reasonable assurance engagement been performed. Misstatements may arise due to fraud or error. They are considered to be material if, individually or in the aggregate, they could reasonably be expected to influence the decisions of users taken on the basis of the indicators. Materiality affects the nature, timing and extent of our assurance procedures and the evaluation of the effect of identified misstatements on our conclusion.
Procedures performedWe have exercised professional judgement and have maintained professional scepticism throughout the review in accordance with the Dutch Standard 3000A, ethical requirements and independence requirements.
Our review consisted, among other things, of the following:• Evaluating the appropriateness of the reporting
criteria used, their consistent application and related disclosures in the indicators. This includes the evaluation of the reasonableness of estimates made by the Board of Management
• Obtaining an understanding of internal control relevant to the review in order to design assurance procedures that are appropriate in the circumstances, but not for the purpose of expressing a conclusion on the effectiveness of the company’s internal control
• Identifying areas with a higher risk of material misstatement within the indicators, whether due to fraud or error, designing and performing assurance procedures responsive to those risks, and obtaining evidence that is sufficient and appropriate to provide a basis for our conclusion. These procedures consisted, among others, of:
- Interviewing management (and/or relevant staff) responsible for the sustainability strategy, policy and results
- Interviewing relevant staff responsible for providing the information for, carrying out internal control procedures on, and consolidating the data in the indicators
- Determining the nature and extent of the review procedures for the group components and locations. For this, the nature, extent and/or risk profile of these components are decisive. Based thereon, we selected the components and locations to visit. We have visited locations in Italy and Brazil to validate our understanding of local processes. In addition, during our visit to Italy, we also validated source data and evaluated the design and implementation of internal controls and validation procedures
- Obtaining assurance evidence that the indicators reconcile with underlying records of the company
- Reviewing, on a limited test basis, relevant internal and external documentation
- Performing an analytical review of the data and trends in the information submitted for consolidation at corporate level
• Evaluating the consistency of the indicators with the information in the Report 2019, which is not included in the scope of our review
• To consider whether the indicators as a whole, including the disclosures, reflect the purpose of the reporting criteria used
We communicated with the Supervisory Board and Board of Management on the planned scope and timing of the engagement and on the significant findings that result from our engagement.
Amsterdam, February 12, 2020PricewaterhouseCoopers Accountants N.V.
Original has been signed by F.P. Izeboud RA

152 Sustainability statements | AkzoNobel Report 2019
Economic
Area Unit 2015 2016 2017 2018 2019 Ambition 2020
Product/service
Eco-premium solutions % of revenue 20 21 21 22 22 20
Supplier management
Suppliers participating in CSR program % against baseline 60 65 –
Suppliers in line with our expectations % against baseline 38 47 –
Social 2015 2016 2017 2018 2019 Ambition 2020
Employees
Organizational health score score 58 61 Top quartile 74
Female executives1 % 19 19 19 20 18 25
People, process and product safety
Fatalities employees number 0 0 0 0 2 0
Total reportable injury rate employees/temporary workers /200,000 hours 0.30 0.26 0.20 0.20 0.24 ≤0.20
Lost time injury rate employees/temporary workers /200,000 hours 0.15 0.13 0.06 0.09 0.08 –
Occupational illness rate employees /1,000,000 hours 0.07 0.07 0.06 0.06 0.03 –
Fatalities contractors (temporary workers plus independent) number 0 0 1 0 0 0
Total reportable injury rate contractors /200,000 hours 0.50 0.29 0.12 0.18 0.19 –
Loss of primary containment – Level 12 number 1 5 5 6 3 –
Regulatory actions – Level 4 number 0 0 0 1 0 0
HSE management
Management audits plus reassurance audits number 27 34 32 25 32 –
Social progams
Community Program, employees number 1,577 1,449 1,139 1,537 4,300 –
Community Program, beneficiaries number (estimated) >17,000 >15,000 >20,000 >97,000 148,000 –
SUSTAINABILITY PERFORMANCE SUMMARY
1 2015-2017 data includes discontinued operations.2 Definition change 2016.

153AkzoNobel Report 2019 | Sustainability statements
Environmental
Area Unit 2015 2016 2017 2018 2019 Ambition 2020
Maintain natural resources/fresh air
Energy use 1000TJ 6.29 6.32 6.39 6.20 6.02 –
per ton of production GJ/ton 1.91 1.91 1.88 1.91 1.88 1.81
Renewable energy (own operations) % 22 27 30 31 31 –
Direct CO2(e) emissions (Scope 1)1 kiloton 80.45 72.72 69.66 62.90 58.29 –
per ton of production kg/ton 24.47 21.96 20.53 19.42 18.18 –
Indirect CO2(e) emissions (Scope 2) kiloton 258.9 244.3 237.8 226.0 183.1 –
per ton of production kg/ton 78.73 73.78 70.11 69.77 57.13 –
Volatile organic compounds kiloton 2.18 2.00 1.71 1.57 1.19 –
per ton of production kg/ton 0.66 0.60 0.50 0.49 0.37 0.45
Fresh water use million m3 10.09 9.61 9.62 9.27 8.05 –
per ton of production m3/ton 3.07 2.90 2.84 2.86 2.51 –
Raw material efficiency
Total waste kiloton 87 85 77 67 67 –
per ton of production kg/ton 26.38 25.65 22.77 20.97 21.00 21.50
Total non-reusable waste kiloton 39 43 40 34 33 –
per ton of production kg/ton 11.88 12.92 11.90 10.63 10.28 –
Hazardous waste total kiloton 35 35 33 30 29 –
per ton of production kg/ton 10.74 10.72 9.76 9.13 9.07 –
Hazardous waste non-reusable kiloton 12 15 16 15 14 –
per ton of production kg/ton 3.68 4.62 4.64 4.59 4.46 –
Hazardous waste to landfill kiloton 1.5 0.7 0.6 0.69 0.45 –
per ton of production kg/ton 0.46 0.20 0.17 0.21 0.14 –
Value chain2
Cradle-to-grave carbon footprint (Scope 1, 2 and 3) million tons 15.0 14.6 –
Scope 3 upstream3 million tons 7.3 7.1 –
Scope 3 downstream4 million tons 7.4 7.2
1 We have restated our 2018 Scope 1 emissions due to a temporary database outage in the prior year leading to misstated values. 2 Data covers October 1, 2018, until September 30, 2019. More details on the methodology and significant assumptions are provided in the reporting principles on our website.
The preparation of the Sustainability statements requires management to make judgements, estimates and assumptions that affect amounts reported. The estimates and assumptions are based on experience and various other factors that are believed to be reasonable under the circumstances. The estimates and underlying assumptions are reviewed on an ongoing basis. Mainly Scope 3 upstream and downstream have a higher degree of judgement and complexity for which changes in the assumptions and estimates could result in different results than those recorded.
3 Category 1: purchased goods and services.4 Category 10: processing of sold products; category 11: use of sold products; category 12: end-of-life treatment of sold products; VOC.

154
INDEX
2019 facts and figures cover flap
Audit Committee 40, 51
Auditor’s report 117
Automotive and Specialty Coatings 26
Board of Management 32, 47
Borrowings 104
Business overview 19
Carbon footprint/Cradle-to-grave carbon footprint 17, 134
Case studies 7, 8, 22, 138
Cash, cash flow and net debt 72, 105, 106
CEO statement 4
Circular economy 134
Code of Conduct 60, 146
Commitments 106
Community Program 147
Company financial statements 111
Compliance 58
Consolidated balance sheet 71
Consolidated statement of cash flows 72
Consolidated statement of changes in equity 73
Consolidated statement of comprehensive income 70
Consolidated statement of income 70
Continuous improvement 12
Core principles and values 12, 144
Corporate governance 46
Decorative Paints 23, 24, 25
Dividend proposal 16, 67
Earnings per share 16, 91
Eco-premium solutions 16, 131
Emissions 17, 136
Employees 144
Energy 17, 136
Executive Committee 32
Financial guidance cover flap
Financial instruments 115
Financial summary 124
How we created value 14
Human rights 146
Industrial Coatings 28
Innovation 13, 22, 133
Intangible assets 92
Integrated supply chain 12
Internal controls 54
Invested capital 15
“Let’s Colour” 147
Marine and Protective Coatings 27
Net debt 104
Nomination Committee 42
Operating income 87
Outlook 16
Paint the Future 13, 22, 133
People. Planet. Paint. 130
Pensions 98
Powder Coatings 29
Product stewardship 142
Profit allocation 123
Property, plant and equipment 93
Provisions 103
Raw materials 15, 135
Regional statistics 127
Remuneration 61, 106
Remuneration Committee 41
Report of the Supervisory Board 37
Resource productivity 135
Return on investment cover flap
Return on sales cover flap
Risk management 55
Safety 17, 141
Segment information 74
Shareholders’ equity 73, 96, 112
Stakeholder engagement 148
Strategy 12
Supervisory Board 36
Supervisory Board Chairman’s statement 35
Supplier sustainability 139
Sustainable Development Goals (SDGs) 13, 38, 130, 149
Sustainability statements 129
Talent management 39, 144
Waste 16, 135
Water 137

155
EditorDavid Lichtneker
Art DirectorClaire Jean Engelmann
Design and artworkAnnette Toeter
PhotographyJoris LugtigheidMarije Kuipers
PrintingDrukkerij Tesink B.V.
Online reportnexxar gmbh
Disclaimer In this Report 2019, great care has been taken in drawing up the properties and qualifications of the product features. No rights can be derived from these descriptions. The reader is advised to consult the available product specifications themselves. These are available through the relevant business units. In this publication the terms “AkzoNobel” and “the company” refer to Akzo Nobel N.V. and its consolidated companies in general. The company is a holding company registered in the Netherlands. Business activities are conducted by operating subsidiaries throughout the world. The terms “we”, “our” and “us” are used to describe the company; where they are used in the chapter “Business performance”, they mainly refer to the business concerned.
Safe harbor statement This Report 2019 contains statements which address such key issues as AkzoNobel’s growth strategy, future financial results, market positions, product development, products in the pipeline and product approvals. Such statements should be carefully considered, and it should be understood that many factors could cause forecast and actual results to differ from these statements. These factors include, but are not limited to, price fluctuations, currency fluctuations, developments in raw material and personnel costs, pensions, physical and environmental risks, legal issues, and legislative, fiscal, and other regulatory measures. Stated competitive positions are based on management estimates, supported by information provided by specialized external agencies.
Integrated Report 2019 AkzoNobel’s annual financial report has been combined with the sustainability report into one Report 2019. The Report 2019 includes elements of the reporting guidelines issued by the International Integrated Reporting Council (IIRC). The sustainability sections, however, in no way form part of the company’s annual report as the company is required to publish pursuant to Dutch law.
Brands and trademarks In this Report 2019, reference is made to brands and trademarks owned by, or licensed to, AkzoNobel. Unauthorized use of these is strictly prohibited.
We welcome feedback on our Report 2019. You can contact us as follows:
Akzo Nobel N.V.Christian Neefestraat 2P.O. Box 757301070 AS Amsterdam, the NetherlandsT +31 88 969 7555www.akzonobel.com
AkzoNobel Media RelationsT +31 88 969 7833E [email protected]
AkzoNobel Investor RelationsT +31 88 969 7856E [email protected]

SPICED HONEY Color of the Year 2019
AN
_204
567_
0203
20
TRANQUIL DAWN Color of the Year 2020
Akzo
No
bel R
epo
rt 2019
www.akzonobel.com
AkzoNobel has a passion for paint. We’re experts in the proud craft of making paints and coatings, setting the standard in color and protection since 1792. Our world class portfolio of brands – including Dulux, International, Sikkens and Interpon – is trusted by customers around the globe. Headquartered in the Netherlands, we are active in over 150 countries and employ around 34,000 talented people who are passionate about delivering the high-performance products and services our customers expect.
For more information please visit www.akzonobel.com
© 2020 Akzo Nobel N.V. All rights reserved.