REPORT - AnnualReports.com
100
ANNUAL REPORT 2021
-
Upload
khangminh22 -
Category
Documents
-
view
2 -
download
0
Transcript of REPORT - AnnualReports.com
ANNUALREPORT
2021

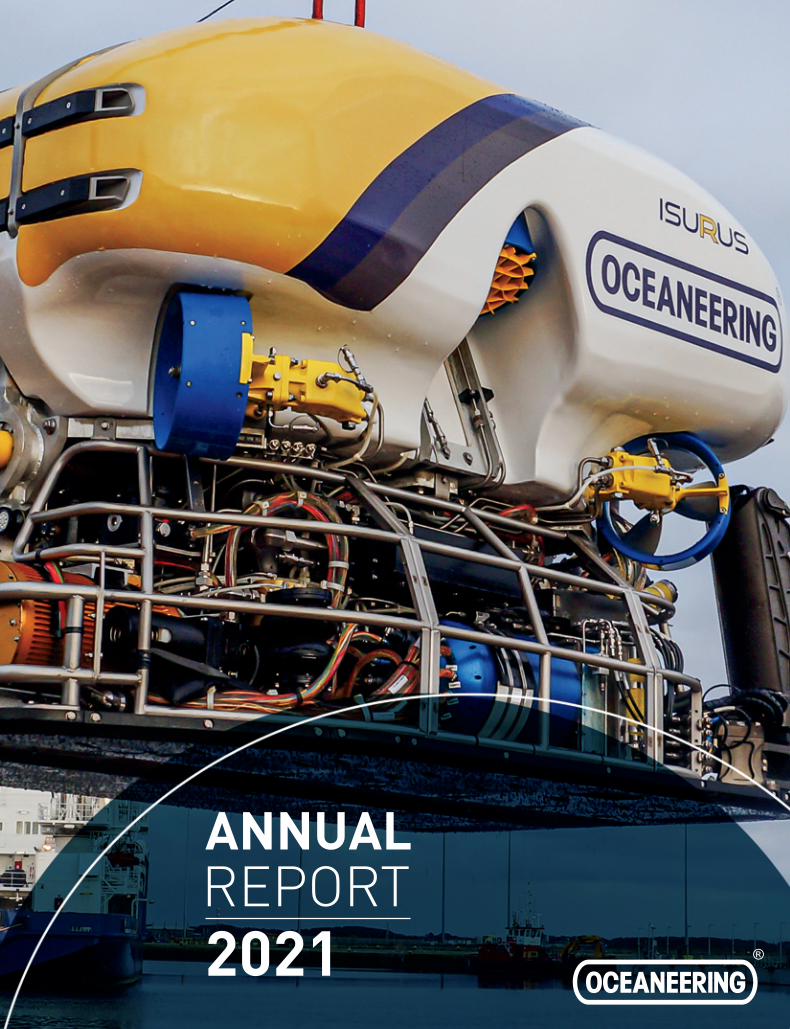
About the cover: The Isurus™ ROV is a work class ROV system designed to meet the needs of the offshore energy and renewablesmarkets operating in harsh environments where high speed currents exceed the capabilities of traditional work classROVs. Isurus™ delivers a hydrodynamic form factor and work class ROV capabilities, including dual manipulatorsand electric and hydraulic power for ROV intervention tooling. Isurus™ enables operational continuity in high-currentenvironments, shortening project durations, resulting in reduced carbon emissions and lower project costs.
Offshore Projects Group (OPG) provides a broad portfolio of integrated subsea project capabilities and solutions,including: project management; engineered solutions; subsea installation and intervention; IMR; IWOCS (Installation
and Workover Control Systems); RWOCS (ROV Workover Control Systems); drill pipe riser (DPR systems); riserless light
well intervention; hydrate remediation; well stimulation; and dredging and decommissioning. OPG provides seabed
preparation and route clearance to the renewable energy and oil and gas industries.
Project scopes are supported by:
• our five Jones Act-compliant vessels, including three dynamically positioned, multi-service vessels (MSVs) and two
other diving and support vessels. • chartered, third-party vessels • manned diving equipment and operations for
special services.
Integrity Management and Digital Solutions (IMDS) leverages software, analytics, and services that promote the safety,
efficiency, cost effectiveness, and sustainability programs of our energy and maritime customers.
Integrity Management- A range of integrity services for energy customers throughout the procurement, fabrication,
installation, commissioning, and operation of assets. We establish inspection and maintenance programs, plan and
execute inspections, evaluate, report, and make recommendations to facilitate customers’ decision-making.
Energy Intelligence- Software solutions that range from data collection, storage, organization, and reporting. We
also deliver inspection, corrosion, vibration, coating, insulation, and maintenance management along with risk-based
inspection planning.
Maritime Intelligence- Software and consulting solutions aimed at peer benchmarking, vessel performance, voyage
routing, and port operations analysis for bulk cargo maritime customers.
Aerospace and Defense Technologies (ADTech) provides engineering services and related manufacturing, principally
for the U.S. Department of Defense and NASA and their prime contractors.
Defense Subsea Technologies- Design, build, and operate unique maritime and specialized harsh environment
systems for government and commercial customers.
Marine Services- Full-service ship repair capabilities for U.S. Navy vessels, including submarines, surface ships and
craft, and deep submergence systems. Design, repair, maintenance, modification, and installation of hull, mechanical,
and electrical (HM&E) systems.
Space Systems- Turnkey design, development, manufacturing, certification, maintenance, testing, and sustaining
engineering for space-based robotics and automation, satellite servicing, human space flight systems, and thermal
protection systems.
Manufactured Products leverages our expertise and competencies around advanced technology product development,
manufacturing, and project management by aligning our energy manufactured products businesses with our mobility
solutions products, which include entertainment systems and autonomous mobile robotic systems (AMR).
Energy Manufactured Products • Distribution Systems- Production control umbilicals supply electric and hydraulic
power to subsea trees and inject chemicals into well streams. • Connection Systems- Connectors, clamps, and valves
used to connect production trees to umbilicals and flow lines; and Pipeline Connection & Repair Systems (PCRS).
Mobility Solutions Products • Entertainment Systems- Evolutionary, motion-based ride systems capable of delivering
high-energy thrills in fully immersive 3D media-based theme park attractions. • AMR Systems- Innovative, turnkey
technology-based logistic solutions on load carriers traveling the floor of a facility, minus an onboard operator.
Subsea Robotics (SSR) merges our underwater robotics and automation capabilities by combining Remotely Operated
Vehicles (ROV), ROV Tooling, and Survey Services businesses.
ROV- Remotely operated, tethered submersible vehicles for drilling support and vessel-based services, including subsea
hardware installation, construction, pipeline inspection, survey, and facilities inspection, maintenance and repair (IMR).
Our premier fleet of 250 work-class ROVs remained a leading provider of ROV services to the offshore energy industry
for drilling support, offshore wind, and vessel-based ROV services in 2021.
ROV Tooling- ROV skid-mounted tools, for rental, to support well intervention, drilling, construction, field maintenance,
and plugging and abandonment activities.
Survey Services- Mapping; Geoscience and Autonomous Underwater Vehicles (AUV); Positioning; and Remote Survey
Services for drilling rigs, pipeline lay and derrick barges, and dynamically positioned, multi-purpose construction
vessels for the marine construction process.Subsea Robotics
Manufactured Products
Offshore Projects Group
Aerospace andDefense Technologies
Integrity Managementand Digital Solutions
Courtesy of U.S. Navy
OCEANEERING Oceaneering is a global technology company deliveringengineered services and products and robotic solutions tothe offshore energy, defense, aerospace, manufacturing,and entertainment industries. At year end, Oceaneeringemployed approximately 8,500 people across the globe.AT A GLANCE

Our achievements in 2021 were solid and constructive. Our strategic priorities are to continue the foundation-building necessary for growthin our traditional businesses, to win in the energy transition, and to leverage our core competencies into new markets. In addition to our ESG
(Environmental, Social, and Governance) initiatives to define and set measurable, reportable targets, we remained focused on our enterprise strategic
objectives to enable us to grow and thrive as a technology delivery leader through product innovation and market expansion, operational excellence,
and retaining a world-class work force.
LETTER TO SHAREHOLDERS
Rod LarsonPresident and Chief Executive Officer
March 2022
I am encouraged by the supportive market fundamentals that emerged in 2021 and expect these to drive
increased activity across all our segments in 2022. Based on our year-end 2021 backlog and the timing of
anticipated 2022 order intake, we project our 2022 consolidated revenue to grow more than 10%, with increased
revenue in each of our operating segments, led by Manufactured Products. We anticipate each of our operating
segments to generate increased operating income and EBITDA as compared to 2021. We expect our full-year
2022 to yield robust free cash flow once again. These expectations assume the continuing trend of supportive
commodity prices and no significant incremental COVID-19 impacts.
Our focus has now turned to growth where we will continue to develop and deliver technologies to help our
customers produce hydrocarbons in a cleaner, safer manner while increasing our investments into new markets
including energy transition, robotic solutions, digital asset management, aerospace and defense solutions,
and mobility solutions. We anticipate commodity prices to support growth, and free cash generation from our
traditional energy businesses in 2022 to underpin our forecasted capital investments.
Thank you to our employees and management team for navigating through the many global uncertainties
to deliver a solid 2021. We are well positioned for growth in 2022 and beyond, and our success as an
organization depends on our employees. I also thank our shareholders who have shown faith in our ability
to grow and transform. I am excited about the growth opportunities we see across all our businesses over
the next several years.
• We conducted an independent ESG program assessment and instituted a project to measure greenhouse gas emissions data associated with our
global office facilities, manufacturing facilities, and vessels. This project, started in 2021, will allow us to establish a baseline to identify gaps and
develop targets for future emission reductions. We continue to develop and evolve technologies, such as remote piloting and autonomous mobile
robots, to assist our customers in mitigating carbon emissions. These technologies serve offshore environments for cleaner production
of hydrocarbons and energy transition projects, and onshore environments for manufacturing, hospital, and entertainment facilities.
• Our Board enhanced its oversight of ESG matters through its Nominating, Corporate Governance, and Sustainability Committee, supported by an
executive-led Sustainability Committee and enterprise Sustainability Working Group. Additionally in 2021, our Board increased its diversity by
gender, ethnicity, independence, and by subject-matter expertise to enhance strategic planning, supply chain management, and innovation in
robotics and automation.
• During 2021, we published our second annual Sustainability Report guided by the Sustainability Accounting Standards Board (SASB) disclosure
standard for oil and gas service companies. In 2022, we plan to publish our first annual Climate Change Report informed by Task Force on
Climate-related Financial Disclosures (TCFD) guidance.
In 2021, consolidated revenue increased 2% to $1.9 billion, with revenue increases in our Subsea Robotics (SSR), Offshore Projects Group (OPG),
Integrity Management & Digital Solutions (IMDS), and Aerospace and Defense Technologies (ADTech) segments partially offset by a decline in our
Manufactured Products revenue. Our adjusted EBITDA for 2021 slightly exceeded the top end of our initial guidance range, a 14% increase over 2020.
We delivered robust free cash flow with cash flow from operations of $225 million, which supported our ability to repurchase $100 million of our 2024
senior notes while increasing our cash position by $86 million to $538 million at December 31, 2021.
We continue to make meaningful progress on our sustainability planning and ESG initiatives.
Other notable achievements in 2021 include:
• Each of our five operating segments achieved positive adjusted operating income and positive adjusted EBITDA during each quarter in 2021.
• Our OPG segment achieved the most significant improvement of our five operating segments, growing revenue by 31% in 2021.
Adjusted operating income increased considerably, and adjusted operating income margin improved to a positive, as compared to an adjusted
operating margin loss in 2020.
• We continued to see significant improvement in our IMDS segment, with adjusted operating income substantially improving over 2020.
Recognition of the quality in the IMDS brand was evidenced by more than $300 million in contract awards during 2021.
• Our ADTech segment grew its revenue by 8% while maintaining its operating income margin over 16%, leading to a new record annual operating
income and EBITDA performance.
• We maintained our commitment and focus on safety. The team remained very focused on our life-saving rules, identifying high-hazard tasks,
and developing engineered solutions to mitigate risks. Our total recordable incident rate (TRIR) of 0.4 for 2021 was comparable with the record
performance of 0.3 achieved in 2020.
• Our long-time Chairman of the Board of Directors, John R. Huff, completed his final term after 31 years of service in that role and a period of
remarkable transformation in Oceaneering’s history. The Board of Directors appointed T. Jay Collins as the new Chairman of the Board of Directors.
• Our SSR business continued to achieve best-in-class drill support performance, with over 99% uptime achieved during the We continued
to advance our new technologies, adding three new Isurus™ systems during the year to serve the renewables market, and advancing the
technical readiness of our Freedom™ hybrid ROV/AUV, which we expect to be fully commercialized in 2022.

Oceaneering International, Inc.
FORM 10-K

UNITED STATES
SECURITIES AND EXCHANGE COMMISSIONWashington, D.C. 20549
FORM 10-K☑ ANNUAL REPORT PURSUANT TO SECTION 13 OR 15(d) OF THE SECURITIES EXCHANGE ACT OF 1934
For the fiscal year ended December 31, 2021
OR☐ TRANSITION REPORT PURSUANT TO SECTION 13 OR 15(d) OF THE SECURITIES EXCHANGE ACT OF 1934
For the transition period from to
Commission File Number: 1-10945____________________________________________
OCEANEERING INTERNATIONAL, INC.(Exact name of registrant as specified in its charter)
Delaware 95-2628227(State or other jurisdiction ofincorporation or organization)
(I.R.S. EmployerIdentification No.)
11911 FM 529
Houston, Texas 77041(Address of principal executive offices) (Zip Code)
(713) 329-4500(Registrant's telephone number, including area code)
Not Applicable(Former name, former address and former fiscal year, if changed from last report)
____________________________________________
Securities registered pursuant to Section 12(b) of the Act:
Title of each class Trading Symbol(s) Name of exchange on which registeredCommon stock, par value $0.25 per share OII New York Stock Exchange
Securities registered pursuant to Section 12(g) of the Act:None
____________________________________________
Indicate by check mark if the registrant is a well-known seasoned issuer, as defined in Rule 405 of the SecuritiesAct. ☑ Yes ☐ NoIndicate by check mark if the registrant is not required to file reports pursuant to Section 13 or Section 15(d) of theAct. ☐ Yes ☑ NoIndicate by check mark whether the registrant (1) has filed all reports required to be filed by Section 13 or 15(d) of the SecuritiesExchange Act of 1934 during the preceding 12 months (or for such shorter period that the registrant was required to file suchreports), and (2) has been subject to such filing requirements for the past 90 days. ☑ Yes ☐ No

Indicate by check mark whether the registrant has submitted electronically every Interactive Data File required to be submittedpursuant to Rule 405 of Regulation S-T (§ 232.405 of this chapter) during the preceding 12 months (or for such shorter periodthat the registrant was required to submit such files). ☑ Yes ☐ NoIndicate by check mark whether the registrant is a large accelerated filer, an accelerated filer, a non-accelerated filer, or a smallerreporting company. See definitions of “large accelerated filer,” “accelerated filer” and “smaller reporting company” in Rule 12b-2of the Exchange Act.
Large Accelerated Filer ☑ Accelerated Filer ☐Non-accelerated Filer ☐ Smaller Reporting Company ☐
Emerging Growth Company ☐If an emerging growth company, indicate by check mark if the registrant has elected not to use the extended transition period forcomplying with any new or revised financial accounting standards provided pursuant to Section 13(a) of the Exchange Act. ☐Indicate by check mark whether the company has filed a report on and attestation to its management’s assessment of theeffectiveness of its internal control over financial reporting under Section 404(b) of the Sarbanes-Oxley Act (15 U.S.C. 7262(b))by the registered public accounting firm that prepared or issued its audit report). ☑Indicate by check mark whether the registrant is a shell company (as defined in Rule 12b-2 of the Exchange Act). ☐ Yes ☑ NoAggregate market value of the voting stock held by nonaffiliates of the registrant computed by reference to the closing price of$15.57 of the Common Stock on the New York Stock Exchange as of June 30, 2021, the last business day of the registrant'smost recently completed second quarter: $1.5 billion.
Number of shares of Common Stock outstanding at February 18, 2022: 99,648,844.
Documents Incorporated by Reference:
Portions of the proxy statement relating to the registrant's 2022 annual meeting of shareholders, to be filed within 120 days ofDecember 31, 2021 pursuant to Regulation 14A of the Securities Exchange Act of 1934, are incorporated by reference to theextent set forth in Part III, Items 10-14 of this report.

Oceaneering International, Inc.
Form 10-K
Table of Contents
Part IItem 1. Business
Cautionary Statement Concerning Forward-Looking StatementsInformation About Our Executive Officers
Item 1A. Risk FactorsItem 1B. Unresolved Staff CommentsItem 2. PropertiesItem 3. Legal ProceedingsItem 4. Mine Safety Disclosures
Part IIItem 5. Market for Registrant's Common Equity, Related Stockholder Matters and Issuer Purchases of Equity
SecuritiesItem 6. [Reserved]Item 7. Management's Discussion and Analysis of Financial Condition and Results of OperationsItem 7A. Quantitative and Qualitative Disclosures About Market RiskItem 8. Financial Statements and Supplementary DataItem 9.
Changes in and Disagreements with Accountants on Accounting and Financial DisclosureItem 9A. Controls and ProceduresItem 9B. Other InformationItem 9C. Disclosure Regarding Foreign Jurisdictions that Prevent Inspections
Part IIIItem 10. Directors, Executive Officers and Corporate GovernanceItem 11. Executive CompensationItem 12. Security Ownership of Certain Beneficial Owners and Management and Related Stockholder MattersItem 13. Certain Relationships and Related Transactions, and Director IndependenceItem 14. Principal Accounting Fees and Services
Part IVItem 15. Exhibits, Financial Statement SchedulesItem 16. Form 10-K Summary
Signatures
Index to Financial Statements and SchedulesReport of Independent Registered Public Accounting FirmConsolidated Balance SheetsConsolidated Statements of OperationsConsolidated Statements of Comprehensive Income (Loss)Consolidated Statements of Cash FlowsConsolidated Statements of EquityNotes to Consolidated Financial Statements
1

PART I
Item 1. Business.
GENERAL DEVELOPMENT OF BUSINESS
Oceaneering International, Inc. (“Oceaneering,” “we,” “us” or “our”) is a global technology company deliveringengineered services and products and robotic solutions to the offshore energy, defense, aerospace, manufacturingand entertainment industries. Oceaneering was organized as a Delaware corporation in 1969 out of the combinationof three diving service companies founded in the early 1960s. Since our establishment, we have concentrated onthe development and marketing of underwater services and products to meet customer needs requiring the use ofadvanced technology. The continued evolution of applying our advanced technologies has expanded our presenceinto numerous adjacent markets focused on autonomous robotics. We believe we are one of the world's largestunderwater services contractors. The services and products we provide to the energy industry include remotelyoperated vehicles, specialty subsea hardware, engineering and project management, subsea intervention services,including manned diving, survey and positioning services, seabed preparation and asset integrity andnondestructive testing services. Our foreign operations, principally in the Africa, Norway, United Kingdom, Brazil,Asia and Australia accounted for approximately 57% of our revenue, or $1.1 billion, for the year ended December31, 2021.
Our business segments are contained within two businesses—services and products provided primarily to the oiland gas industry, and to a lesser extent, the offshore renewables and mobility solutions industries (“Energy Servicesand Products”), and services and products provided to non-energy industries (“Aerospace and DefenseTechnologies”). Our four business segments within the Energy Services and Products business are SubseaRobotics, Manufactured Products, Offshore Projects Group and Integrity Management & Digital Solutions. We reportour Aerospace and Defense Technologies business as one segment. Unallocated Expenses are expenses notassociated with a specific business segment. These consist of expenses related to our incentive and deferredcompensation plans, including restricted stock and bonuses, as well as other general expenses, including corporateadministrative expenses.
Energy Services and Products. The primary focus of our Energy Services and Products business over the lastseveral years has been toward instituting operational efficiency programs that leverage our asset base andcapabilities for providing services and products predominantly for offshore energy operations and subseacompletions, inclusive of our customers' capital and operating budgets. Increasingly, our efforts in our EnergyServices business have focused on assisting our customers to reduce their carbon emissions in exploring for,developing and producing oil and natural gas and in addressing the ongoing energy transition. We are also focusingon opportunities to develop and deploy our capabilities to grow business in offshore wind installations (both fixedand floating) and tidal energy solutions and to utilize our core competencies to provide engineered solutions to thewind, hydrogen and carbon-capture-and-sequestration (“CCS”) markets, as well as expanding our asset integritymanagement and digital solutions for those markets.
Subsea Robotics. Our Subsea Robotics segment consists of our remotely operated vehicles (“ROVs”), surveyservices and ROV tooling businesses. We provide ROVs, which are tethered submersible vehicles remotelyoperated from the surface, to customers in the offshore energy industry for drill support and vessel-based services,including subsea hardware installation, construction, pipeline inspection, survey and facilities inspection,maintenance and repair (“IMR”). We design, build, retrofit and upgrade our new and existing ROVs at in-housefacilities, the largest of which is in Morgan City, Louisiana. In 2021, we retired ten of our conventional workclassROV systems and replaced them with seven upgraded conventional workclass ROV systems and three IsurusTMworkclass ROV systems (which are capable of operating in high-current conditions and are ideal for renewablesprojects and high-speed surveys), which are currently engaged in renewables work. Our work-class ROV fleet sizewas 250 as of December 31, 2021, 2020 and 2019.
In 2019, we began deploying our battery-operated Liberty electric ROV (“E-ROV”) system, which we developed inresponse to a customer’s desire to reduce carbon dioxide and other “greenhouse gas“ (“GHG”) emissionsassociated with its offshore production operations. This system does not require a dedicated vessel to be onstandby during ROV operations and reduces the need for ROV and other vessel-based personnel to be transportedto and from marine vessels and offshore platforms. We intend to continue to expand our remote service offerings in
2

this segment given the potentially significant savings in CO₂ emissions available from the Liberty and the IsurusTMsystems and other E-ROV systems we are developing.
Manufactured Products. Our Manufactured Products segment provides distribution systems, such as productioncontrol umbilicals and connection systems made up of specialty subsea hardware, and provides turnkey solutionsthat include program management, engineering design, fabrication/assembly and installation to the commercialtheme park industry and mobile robotics solutions, including autonomous mobile robots and automated guidedvehicles (“AGV”) technology, to a variety of industries.
We provide various types of subsea umbilicals through our Umbilical Solutions division from plants in the UnitedStates, Scotland and Brazil. Offshore operators use umbilicals to control subsea wellhead hydrocarbon flow rates,monitor downhole and wellhead conditions and perform chemical injection. Subsea umbilicals are also used toprovide power and fluids to other subsea processing hardware, including pumps and gas separation equipment.
Offshore Projects Group. Our Offshore Projects Group (“OPG”) segment provides a broad portfolio of integratedsubsea project capabilities and solutions as follows:
• subsea installation and mechanical and hydraulic intervention, including riserless light well intervention(“RLWI”) services and IMR services, utilizing owned and chartered vessels;
• installation and workover control systems (“IWOCS”) and ROV workover control systems (“RWOCS”);• project management and engineering; and• drill pipe riser services and systems and wellhead load relief solutions.
Our OPG segment provides services principally in the U.S. Gulf of Mexico and offshore Angola, utilizing a fleetconsisting of three owned and three chartered dynamically positioned deepwater vessels with integrated high-specification work-class ROVs onboard, and two owned shallow-water diving support and survey vessel, other spot-chartered vessels and other assets. Our owned vessels are Jones Act-compliant. The dynamically positionedvessels are equipped with thrusters that allow them to maintain a constant position at a location without the use ofanchors. They are used in the IMR of subsea facilities, pipeline or flowline tie-ins, pipeline crossings andinstallations. These vessels can also carry and install equipment or umbilicals required to bring subsea wellcompletions into production (tie-back to production facilities). We have a mix of short-term charters where we cansee firm workload and spot charters as market opportunities arise.
In the second quarter of 2019, we placed our new-build, Jones Act-compliant, multiservice vessel (“MSV”), theOcean Evolution, into service. The Ocean Evolution is U.S.-flagged and documented with a coastwise endorsementby the U.S. Coast Guard. The vessel has an overall length of 353 feet, a Class 2 dynamic positioning system,accommodations for 110 personnel, a helideck, a 250-ton active heave-compensated crane, a working moonpool,and two of our high specification 4,000 meter work-class ROVs. The vessel has five low-emission U.S.Environmental Protection Agency (“EPA”) Tier 4 diesel engines. The Tier 4 rating is the EPA’s strictest emissionrequirements for non-road diesel engines. The vessel is also equipped with a satellite communications systemcapable of transmitting streaming video for real-time work observation by shore-based personnel. The vessel isbeing used to provide subsea installation and intervention services in the U.S. Gulf of Mexico. These services arerequired to perform IMR projects and hardware installations.
Integrity Management & Digital Solutions. Through our Integrity Management & Digital Solutions (“IMDS”)segment, we provide asset integrity management, corrosion management, inspection and non-destructive testingservices, principally to customers in the oil and gas, power generation, and petrochemical industries. We performthese services on both onshore and offshore facilities, both topside and subsea. We also provide software, digitaland connectivity solution for the energy industry and software and analytical solutions for the bulk cargo maritimeindustry.
Aerospace and Defense Technologies. Our Aerospace and Defense Technologies (“ADTech”) segment providesgovernment services and products including engineering and related manufacturing in defense and spaceexploration activities, principally to U.S. government agencies and their prime contractors. Many of the services andproducts utilized in ADTech are applied technologies based on our core competencies and knowledge derived fromdecades of working in the offshore markets and solving complex problems in harsh environments.
General.We intend to continue our strategy of acquiring, as opportunities arise, additional assets or businesses, toimprove our market position or expand into related service and product lines. Our ability to generate substantialcash flow over the last several years has allowed us to repurchase $100 million of our 4.650% Senior Notes due
3

2024 (the “2024 Senior Notes”) and shift our focus from the pending maturity to growth where we will continue todevelop and deliver technologies to help our customers produce hydrocarbons in a cleaner, safer manner whileincreasing our investments into new markets including energy transition, digital asset management, aerospace anddefense solutions, and mobility solutions.
DESCRIPTION OF BUSINESSEnergy Services and Products
Our Energy Services and Products business consists of the Subsea Robotics, Manufactured Products, OffshoreProjects Group and Integrity Management & Digital Solutions segments.
Subsea Robotics. ROVs are tethered submersible vehicles remotely operated from the surface. We use our ROVsin the offshore energy industry to perform a variety of underwater tasks, including drill support, vessel-based IMR,installation and construction support, pipeline inspection and surveys, and subsea production facility operation andmaintenance. Work-class ROVs are outfitted with manipulators, sonar and video cameras, and can operatespecialized tooling packages and other equipment or features to facilitate the performance of specific underwatertasks. As of December 31, 2021, we owned 250 work-class ROVs. We believe we own and operate the largest fleetof work-class ROVs in the world. We also believe we are the industry leader in providing ROV services for offshoredrill support, with an estimated 55% market share of the contracted floating drilling rigs at the end of 2021.
Subsea Robotics revenue: AmountPercent of TotalRevenue
(in thousands)2021 538,515 29 %2020 493,332 27 %2019 583,652 28 %
ROV tooling provides an additional operational interface between an ROV and equipment located subsea. We alsoprovide survey services, including hydrographic survey and positioning services and autonomous underwatervehicles for geoscience.
Manufactured Products.We provide advanced technology product development, manufacturing and projectmanagement for a variety of industries. These include:
• various types of subsea umbilicals utilizing steel tubes, thermoplastic hoses, and power and communicationcables, along with termination assemblies;
• production control equipment;• clamp connectors;• pipeline connector and repair systems;• subsea and topside control valves;• subsea chemical injection valves;• mobile robotics solutions, including autonomous mobile robots and AGV technology; and• entertainment systems for theme parks.
Our primary focus over the last several years has been toward instituting operational efficiency programs toleverage our asset base and capabilities for providing services and products for offshore energy operations andsubsea completions, as well as the offshore renewables energy market. Offshore well operators use subseaumbilicals and production control equipment to control subsea wellhead hydrocarbon flow, monitor downhole andwellhead conditions and perform chemical injection. They are also used to provide power and fluids to other subseaprocessing hardware, including pumps and gas/oil separation equipment. We also provide turnkey solutions thatinclude program management, engineering design, fabrication/assembly and installation to the commercial themepark industry and mobile robotics solutions, including autonomous mobile robots and AGV technology, to a varietyof industries. For both domestic and international markets, we provide engineering services and we manufacturepatented motion-based “dark ride” vehicle systems and innovative customized robotic and mechanical solutions tothe commercial theme park industry. We also develop, implement and maintain innovative, turnkey logistic solutions
4

based on utilizing autonomous mobile robots and AGV technology primarily for automotive manufacturers, hospitalsand retail warehousing markets.
Manufactured Products revenue: AmountPercent of TotalRevenue
(in thousands)2021 $ 344,251 18 %2020 477,419 26 %2019 498,350 24 %
Offshore Projects Group.We provide subsea hardware installation, intervention and IMR services for the offshoreoil and gas markets. We perform subsea IMR, intervention and hardware installation services, primarily in the U.S.Gulf of Mexico and offshore Angola from multiservice vessels that typically have Oceaneering ROVs onboard. Ourservices include: subsea well tie-backs; pipeline/flowline tie-ins and repairs; pipeline crossings; umbilical and othersubsea equipment installations; subsea interventions; and IMR activities. We also provide drill pipe riser servicesand systems and wellhead load relief solutions.
We provide RLWI services to support subsea well intervention projects and subsea work packages that facilitatehydrate remediation and well stimulation solutions. We also provide IWOCS and RWOCS that support completions,tree installation, workovers, intervention, and plug and abandonment operations.
We provide services for shallow-water projects (depths less than 1,000 feet) in the U.S. Gulf of Mexico and offshoreAngola with manned diving operations utilizing the traditional diving techniques of air, mixed gas and saturationdiving, all of which use surface-supplied breathing gas. We supply diving services from our owned diving supportvessels, offshore facilities and chartered vessels.
OPG revenue: AmountPercent of TotalRevenue
(in thousands)2021 $ 378,121 20 %2020 289,127 16 %2019 380,966 19 %
Integrity Management & Digital Solutions. Through our IMDS segment, we offer a wide range of asset integrityservices to customers worldwide to help ensure the safety of their facilities onshore and offshore, while reducingtheir unplanned maintenance and repair costs. We also provide third-party inspections to satisfy contractualstructural specifications, internal safety standards or regulatory requirements. We provide these services principallyto customers in the oil and gas, petrochemical and power generation industries. In the United Kingdom (“ U.K.”), weprovide Independent Inspection Authority services for the oil and gas industry, which include first-pass integrityevaluation and assessment and nondestructive testing services. We use a variety of technologies to performpipeline inspections, both onshore and offshore. In our digital services, we focus on maritime and energy softwareofferings and forming key partnerships to expand our capabilities and market reach.
IMDS revenue: AmountPercent of TotalRevenue
(in thousands)2021 $ 241,393 13 %2020 226,938 12 %2019 266,086 13 %
Aerospace and Defense Technologies. Our ADTech segment provides engineering services and manufacturing tothe U.S. Department of Defense, NASA and major government contractors. We work with our customers tounderstand their specialized requirements, identify and mitigate risks, and provide them value-added, maintainable,safe and certified solutions. The segment's largest customer is the U.S. Navy, for whom we perform engineeringservices, prototype design building services and repair and maintenance services on submarines and surface ships.We support space exploration and technology development by providing our products and services to NASA and
5

aerospace contractors. Our U.S. Navy and NASA-related activities substantially depend on continued governmentfunding.
ADTech revenue: AmountPercent of TotalRevenue
(in thousands)2021 $ 366,995 20 %2020 341,073 19 %2019 319,070 16 %
MARKETING
Energy Services and Products. Oil and gas exploration and development expenditures fluctuate from year to year.In particular, budgetary approval for drilling and production in deepwater, an area in which we have a high degree offocus, may be postponed or suspended during periods when exploration and production companies reduce theiroffshore capital spending. In recent years, we have focused on increasing our service and product offerings towardour oil and gas customers' operating expenses and the offshore renewables energy market.
We market our Subsea Robotics, Manufactured Products, OPG and IMDS services and products to domestic,international and foreign national oil and gas companies engaged in offshore exploration, development andproduction. We also provide services and products as a subcontractor to other oilfield service companies operatingas prime contractors. In addition, we market our Manufactured Products mobile robotic solutions to domestic andinternational theme park operators, automotive manufacturers, hospitals and retail warehousing operators.Customers for our energy services and products typically award contracts on a competitive-bid basis. Thesecontracts are typically less than one year in duration, although we enter into multi-year contracts from time to time.
In connection with the services we perform in our Energy Services and Products business, we generally seekcontracts that compensate us on a dayrate basis. Under dayrate contracts, the contractor provides the ROV, vesselor equipment and the required personnel to operate the unit and compensation is based on a rate per day for eachday the unit is used. The typical dayrate depends on market conditions, the nature of the operations to beperformed, the duration of the work, the equipment and services to be provided, the geographical areas involvedand other variables. Dayrate contracts may also contain an alternate, lower dayrate that applies when a unit ismoving to a new site or when operations are interrupted or restricted by equipment breakdowns, adverse weather orwater conditions or other conditions beyond the contractor's control. Contracts for our product sales are generallyfor a fixed price.
Aerospace and Defense Technologies.We market our engineered products and services primarily to U.S.government agencies and their prime contractors in defense and space exploration activities.
Major Customers. Our top five customers in 2021, 2020 and 2019 accounted for 36%, 32% and 32%, respectively,of our consolidated revenue. In 2021, 2020 and 2019, four of our top five customers were oil and gas explorationand production companies served by our Energy Services and Products business segments, with the other onebeing the U.S. Government, which is served by our Aerospace and Defense Technologies segment. During 2021,revenue from one customer, the U.S. Government, accounted for 12% of our total consolidated annual revenue, andno other customer accounted for more than 10% of our total consolidated revenue. No individual customeraccounted for more than 10% of our consolidated revenue during 2020. During 2019, revenue from one customer,BP plc and subsidiaries, accounted for 10% of our total consolidated annual revenue.
Although we do not depend on any one customer, the loss of one of our significant customers could, at least on ashort-term basis, have an adverse effect on our results of operations and cash flows.
RAW MATERIALSWe purchase various raw materials for use in manufacturing our products and delivering our services. The key rawmaterials we use include steel in various forms, polymers, copper wire, electronic components and plastics. Most ofthe raw materials that are critical to our business are generally readily available from multiple sources, but may besubject to price volatility. In addition, global market conditions can trigger constraints in the supply of certain rawmaterials, and our procurement personnel are always seeking ways to ensure the availability and manage the costof raw materials. In addition to raw materials, we also use the products and services of a number of other providers,such as forge companies, casting foundries, metal fabricators, machine shops and logistics providers, in order to
6
produce and deliver products to our customers. Most of these materials and services are generally available frommultiple sources.
COMPETITION
Our businesses operate in highly competitive industry segments.
Energy Services and Products
We are one of several companies that provide underwater services and specialty subsea hardware on a worldwidebasis. We compete for contracts with companies that have worldwide operations, as well as numerous othersoperating locally in various areas. We believe that our ability to safely provide a wide range of underwater servicesand products on a worldwide basis enables us to compete effectively in all phases of the offshore oilfield life cycle.In some cases involving projects that require less sophisticated equipment, small companies have been able to bidfor contracts at prices uneconomical to us. Additionally, in some jurisdictions we are subject to foreign governmentalregulations favoring or requiring the awarding of contracts to local contractors or requiring foreign contractors toemploy citizens of, or purchase supplies from, a particular jurisdiction. These regulations may adversely affect ourability to compete.
The adverse impacts of the coronavirus (“COVID-19”) pandemic and the associated supply and demand imbalancefor crude oil have resulted in periods of lower levels of activity and profitability. In response, we implemented costefficiency initiatives. We believe our energy businesses are positioned to benefit from improving global markets forour services and products.
Subsea Robotics.We believe we are the world's largest owner/operator of work-class ROVs employed in energyrelated operations. As of December 31, 2021, we owned 250 work-class ROVs. We compete with several majorcompanies on a worldwide basis and with numerous others operating locally in various areas. Competition for ROVservices, including ROV tooling, historically has been based on equipment availability, location of or ability to deploythe equipment, quality of service and price. The relative importance of these factors can vary over time based onmarket conditions. The ability to develop improved equipment and techniques and to attract, train and retain skilledpersonnel is also an important competitive factor in our markets.
Our survey and positioning services operate in a competitive environment as one of several companies that providethese services.
Manufactured Products.With our manufactured products business, we are one of several companies that competeon a worldwide basis for the provision of steel tube and thermoplastic control umbilicals, and, compared to currentand forecasted market demand, we are faced with some overcapacity in the umbilical manufacturing market. Webelieve the recent closures or reductions in capacity by some of our competitors should help with balancing ahistorically over-supplied market.
Within our mobility solutions businesses, there are many competitors offering specialized services and products,both on a regional and a global basis.
Offshore Projects Group.We perform subsea intervention and hardware installation services, principally in the U.S.Gulf of Mexico and offshore Angola, from multiservice deepwater vessels. We are one of many companies that offerthese services. In general, our competitors can move their vessels to where we operate from other locations withrelative ease. However, some of our competitors’ vessels are not Jones Act-compliant which requires that vesselsoperating in the U.S. Gulf of Mexico be built and 75% U.S. owned in order to transport merchandise between pointsin the United States. We also have many competitors that supply commercial diving services to the oil and gasindustry in the U.S. Gulf of Mexico. Within our service and rental business, there are many competitors offeringspecialized services and products both on a regional and a global basis.
Integrity Management & Digital Solutions. The worldwide asset integrity and inspection markets consist of a widerange of inspection and certification requirements in many industries. We currently compete in only selectedportions of this market. We are expanding our integrity management services into adjacent markets and aredeveloping our digitization services. We believe that our broad geographic sales and operational coverage, longhistory of operations, technical and safety reputation, application of various inspection technologies andaccreditation to international quality standards enable us to compete effectively in our selected asset integrity andinspection services market segments.
7

Aerospace and Defense TechnologiesEngineering services is a very broad market with a large number of competitors. We compete in specialized areasin which we can combine our extensive knowledge of operating in harsh environments, program managementexperience, mechanical engineering expertise and the capability to continue the development of conceptual projectdesigns into the manufacture of custom equipment for customers.
SEASONALITY AND BACKLOG
We generate a material amount of our consolidated revenue from contracts for services in the U.S. Gulf of Mexico inour OPG segment, which is usually more active in the second and third quarters, as compared to the rest of theyear. The European operations of our IMDS segment are also seasonally more active in the second and thirdquarters. Revenue in our Subsea Robotics segment is subject to seasonal variations in demand, with our firstquarter generally being the low quarter of the year. The level of our Subsea Robotics seasonality depends on thenumber of ROVs we have engaged in vessel-based subsea infrastructure IMR and installation, which is moreseasonal than drill support. Revenue in each of our Manufactured Products and ADTech segments generally hasnot been seasonal.
The amounts of backlog orders we believed to be firm as of 2021 and 2020 were as follows (in millions):
As of December 31, 2021 As of December 31, 2020Total 1+ yr (1) Total 1+ yr (1)
Energy Services and Products
Subsea Robotics $ 637 $ 256 $ 538 $ 215Manufactured Products 318 46 266 41Offshore Projects Group 158 1 160 9Integrity Management & Digital Solutions 437 — 279 413 246
Total Energy Services and Products 1,550 582 1,377 511Aerospace and Defense Technologies 149 16 144 12
Total $ 1,699 $ 598 $ 1,521 $ 523
(1) Represents amounts that were not expected to be performed within one year.
No material portion of our business is subject to renegotiation of profits or termination of contracts by the U.S.Government.
PATENTS AND LICENSESWe currently hold numerous U.S. and foreign patents and pending patent applications. We have acquired patentsand licenses and granted licenses to others when we have considered it advantageous for us to do so. Although inthe aggregate our patents and licenses are important to us, we do not regard any single patent or license or groupof related patents or licenses as critical or essential to our business as a whole. In general, we depend on ourtechnological capabilities and the application of know-how rather than patents and licenses in the conduct of ouroperations.
REGULATIONOur operations are affected from time to time and in varying degrees by foreign and domestic political developmentsand foreign, federal and local laws and regulations, including those relating to:
• operating from and around offshore drilling, production and marine facilities;• national preference for local equipment and personnel;• marine vessel safety;• protection of the environment, including pollution, GHG emissions and climate change;• workplace health and safety;• data privacy;• taxation;
8
• license requirements for exportation of our equipment and technology; and• currency conversion and repatriation.
In addition, our Energy Services and Products business primarily depends on the demand for our services andproducts from the oil and gas industry and, therefore, is affected by changing taxes, price controls and other lawsand regulations relating to the oil and gas industry generally. The adoption of laws and regulations curtailingoffshore exploration and development drilling for oil and gas for economic and other policy reasons (such asaddressing concerns about climate change) would adversely affect our operations by limiting demand for ourservices. We cannot determine the extent to which new legislation, new regulations or changes in existing laws orregulations may affect our future operations.
Our operations and properties are subject to a wide variety of increasingly complex and stringent foreign, federal,state and local environmental laws and regulations, including those governing discharges into the air and water, thehandling and disposal of solid and hazardous wastes, the remediation of soil and groundwater contaminated byhazardous substances and the health and safety of employees. Sanctions for noncompliance may includerevocation of permits, corrective action orders, administrative or civil penalties and criminal prosecution. Someenvironmental laws provide for strict, joint and several liability for remediation of spills and other releases ofhazardous substances, as well as damage to natural resources. In addition, companies may be subject to claimsalleging personal injury or property damage as a result of alleged exposure to hazardous substances. These lawsand regulations may also expose us to liability for the conduct of or conditions caused by others, or for our acts thatwere in compliance with all applicable laws at the time such acts were performed.
Environmental laws and regulations that apply to our operations include the Comprehensive EnvironmentalResponse, Compensation, and Liability Act of 1980, the Clean Air Act, the Clean Water Act, the ResourceConservation and Recovery Act (each, as amended) and similar laws that provide for responses to, and liability for,releases of hazardous substances into the environment. Environmental laws and regulations also include similarforeign, state or local counterparts to the above-mentioned federal laws, which regulate air emissions, waterdischarges, hazardous substances and waste, and require public disclosure related to the use of various hazardoussubstances. Our operations are also governed by laws and regulations relating to workplace safety and workerhealth, primarily, in the United States, the Occupational Safety and Health Act and regulations promulgatedthereunder.
Compliance with federal, state and local provisions regulating the discharge of materials into the environment orrelating to the protection of the environment has not had a material impact on our capital expenditures, earnings orcompetitive position. We cannot predict all of the environmental requirements or circumstances that will exist in thefuture but anticipate that environmental control and protection standards will become increasingly stringent andcostly. Based on our experience to date, we do not currently anticipate any material adverse effect on our businessor consolidated financial position, results of operations or cash flows as a result of future compliance with existingenvironmental laws and regulations. However, future events, such as changes in existing laws and regulations ortheir interpretation, more vigorous enforcement policies of regulatory agencies, or stricter or different interpretationsof existing laws and regulations, may require additional expenditures by us, which may be material. Accordingly,there can be no assurance that we will not incur significant environmental compliance costs in the future.
Our quality management systems are registered as being in conformance with ISO 9001:2015 and cover:
• our Subsea Robotics operations in the U.S. Gulf of Mexico, the U.K., Norway, Angola, Ghana, Brazil,Canada, India, the United Arab Emirates, Australia, Indonesia and Malaysia;
• our Manufactured Products operations in Brazil, Canada, the U.S., the U.K., Norway, Malaysia, theNetherlands and Germany;
• our Offshore Projects Group operations in the U.S. Gulf of Mexico, the U.K., Norway, Angola, Ghana, Brazil,Canada, India, the United Arab Emirates, Australia, Indonesia, Singapore, Thailand and Malaysia;
• our Integrity Management & Digital Solutions operations in the U.S. Gulf of Mexico, the U.K., Norway,Angola, the United Arab Emirates, Oman, Qatar, Australia, Malaysia, Indonesia and Azerbaijan; and
• the Oceaneering Space Systems, Oceaneering Technologies and Marine Services divisions of ourAerospace and Defense Technologies segment in the U.S.
ISO 9001 is an internationally recognized system for quality management established by the InternationalStandards Organization, and the 2015 edition emphasizes customer satisfaction, risk assessment and continualimprovement.
9

HUMAN CAPITAL RESOURCES
At Oceaneering, corporate social responsibility is built around our core values which follow:
• Do Things Right – We work safely and act with integrity in the best interest of our industry partners,employees and the environment.
• Solve Complex Problems – We provide products and services that work through listening, experience andcuriosity.
• Grow Together – We collaborate, respect and support each other so we can reach our full potential.• Outperform Expectations – We perform with excellence to serve our customers and each other.• Own the Challenge – We hold ourselves accountable for the promises we make and work we do.
Our core values and culture reflect our commitments to safety, diversity and inclusion, human health, theenvironment, ethical business practices and responsible corporate citizenship in the communities in which we liveand work around the world. All employees are responsible for upholding our core values. We believe our corevalues and culture foster employee engagement and innovation, and allow us to draw on our employees' skills andaspirations in a mutually beneficial way. We use a variety of human capital measures in managing our business,including: compensation and benefits program design, workforce composition, diversity metrics with respect torepresentation, health and safety metrics, talent attraction, and development and management considerations.
As of December 31, 2021, we had approximately 8,500 employees, of whom approximately 40% were employed inthe United States and approximately 60% were employed outside of the United States. Our workforce variesseasonally and typically peaks during the second and third quarters of each year. In 2021, we worked inapproximately 50 countries across six continents and employed people representing over 100 different nationalities.
We believe that our future success largely depends on our continued ability to attract and retain highly skilledemployees. We provide our employees with competitive compensation packages, development programs thatenable continued learning and growth, and comprehensive and competitive benefit packages worldwide. Ourcompensation and benefits arrangements generally are tailored to local markets of operation. Employee benefits,therefore, typically depend on role and work location.
As part of our retention and promotion efforts, we invest in ongoing leadership development. We have a stronghistory of internal promotion. We regularly provide our employees with training, including health, safety andenvironmental (“HSE”) awareness training, technical courses, management development seminars, and leadershipand supervisory training.
Safety is a key focus of all Oceaneering operations. We have a strong HSE program that includes processesimplemented by our functional operating groups that are aimed at preventing injuries to our employees and otherswith whom we work, as well as preventing damage to equipment and the environment. We hold our employees, andthose of our subcontractors and vendors who appear in our workplaces or job sites, accountable for compliancewith our safety standards.
As a global company, much of our success is rooted in the diversity of our workforce and our commitment toinclusion. We value diversity at all levels and continue to focus on extending our diversity and inclusion initiativesacross our entire workforce. We have established an internal Diversity & Inclusion Council, made up of 19employees, to listen, guide and support our efforts in this area.
CAUTIONARY STATEMENT CONCERNING FORWARD-LOOKING STATEMENTSWe are including the following discussion to inform our existing and potential security holders generally of some ofthe risks and uncertainties that can affect our company and to take advantage of the “safe harbor” protection forforward-looking statements that applicable federal securities law affords.
From time to time, our management or persons acting on our behalf make forward-looking statements to informexisting and potential security holders about our company. These statements may include projections and estimatesconcerning the timing and success of specific projects and our future orders, revenue, income and capital spending.Forward-looking statements are generally accompanied by words such as “estimate,” “plan,” “project,” “predict,”“believe,” “expect,” “anticipate,” “plan,” “forecast,” “budget,” “goal,” “may,” “should,” or other words that convey theuncertainty of future events or outcomes. In addition, sometimes we will specifically describe a statement as being aforward-looking statement and refer to this cautionary statement.
10

In addition, various statements this report contains, including those that express a belief, expectation or intentionare forward-looking statements. Those forward-looking statements appear in Part I of this report in Item 1—“Business,” Item 2—“Properties” and Item 3—“Legal Proceedings” and in Part II of this report in Item 7—“Management's Discussion and Analysis of Financial Condition and Results of Operations,” Item 7A—“Quantitative and Qualitative Disclosures About Market Risk” and in the Notes to Consolidated FinancialStatements incorporated into Item 8 and elsewhere in this report. These forward-looking statements speak only asof the date of this report, we disclaim any obligation to update these statements, and we caution you not to relyunduly on them. We have based these forward-looking statements on our current expectations and assumptionsabout future events. While our management considers these expectations and assumptions to be reasonable, theyare inherently subject to significant business, economic, competitive, regulatory and other risks, contingencies anduncertainties, most of which are difficult to predict and many of which are beyond our control. These risks,contingencies and uncertainties relate to, among other matters, the following:
• factors affecting the level of activity in the energy industry, including worldwide demand for and prices of oiland natural gas, oil and natural gas production growth and the supply and demand of offshore drilling rigs;
• actions by members of the Organization of Petroleum Exporting Countries, or OPEC, and other oil exportingcountries;
• decisions about offshore developments to be made by oil and gas exploration, development and productioncompanies;
• decisions about offshore developments to be made by offshore renewables companies;• the use of subsea completions and our ability to capture a share of the associated market;• factors affecting the level of activity in our government businesses, including decisions on spending and
funding by the U.S. Government;• factors affecting the level of activity in our entertainment businesses, including decisions on capital
expenditure decisions by entertainment business customers, such as theme park operators;• general economic and business conditions and industry trends, including the ongoing transition to
alternative sources of energy to reduce worldwide emissions of carbon dioxide and other “greenhousegases” and the effects of inflation;
• the strength of the industry segments in which we are involved;• the continuing effects of the COVID-19 pandemic and the governmental, customer, supplier and other
responses to the pandemic;• cancellations of contracts, change orders and other contractual modifications and the resulting adjustments
to our backlog;• collections from our customers;• the availability and increased costs of chartered vessels;• our future financial performance, including as a result of the availability, terms and deployment of capital;• the consequences of significant changes in currency exchange rates;• the volatility and uncertainties of credit markets;• our ability to comply with covenants in our credit agreements and other debt instruments and the availability,
terms and deployment of capital;• changes in tax laws, regulations and interpretation by taxing authorities;• changes in, or our ability to comply with, other laws and governmental regulations, including those relating
to the environment (including pollution and climate change);• the continued availability of qualified personnel and our ability to attract and retain those qualified
personnel;• our ability to obtain raw materials and parts on a timely basis and, in some cases, from limited sources;• increases in material costs on long-term projects at prices higher than originally forecast;• operating risks normally incident to offshore exploration, development and production operations;• hurricanes and other adverse weather and sea conditions;• cost and time associated with drydocking of our vessels;• the highly competitive nature of our businesses;• adverse outcomes from legal or regulatory proceedings;
11

• the risks associated with integrating businesses we acquire;• the risks associated with the transition to a more remote workforce;• the risks associated with the use of complex information technology systems, including cybersecurity risks
and the risks associated with failures to protect data privacy in accordance with applicable legalrequirements and contractual provisions binding upon us;
• rapid technological changes; and• social, political, military and economic situations in foreign countries where we do business and the
possibilities of civil disturbances, war, other armed conflicts or terrorist attacks.
We believe the items we have outlined above are important factors that could cause our actual results to differmaterially from those expressed in a forward-looking statement made in this report or elsewhere by us or on ourbehalf. We have discussed most of these factors in more detail elsewhere in this report. These factors are notnecessarily all the factors that could affect us. Unpredictable or unanticipated factors we have not discussed in thisreport could also have material adverse effects on actual results of matters that are the subject of our forward-looking statements. We do not intend to update our description of important factors each time a potential importantfactor arises. We advise our security holders that they should (1) be aware that important factors we do not refer toabove could affect the accuracy of our forward-looking statements and (2) use caution and common sense whenconsidering our forward-looking statements.
AVAILABLE INFORMATION
Our website address is www.oceaneering.com. We make available through this website under “Investor Relations—SEC Financial Reports,” free of charge, our annual reports on Form 10-K, quarterly reports on Form 10-Q, currentreports on Form 8-K, amendments to those reports and Section 16 filings by our directors and executive officers assoon as reasonably practicable after we, or our executive officers or directors, as the case may be, electronically filethose materials with, or furnish those materials to, the U.S. Securities and Exchange Commission (“SEC”). Inaddition, the SEC maintains a website, www.sec.gov, which contains reports, proxy and other informationstatements, and other information regarding issuers that file electronically with the SEC.
We have adopted, and posted on our website: our corporate governance guidelines; a code of ethics for our ChiefExecutive Officer and Senior Financial Officers; charters for the Audit, Nominating and Corporate Governance andCompensation Committees of our Board of Directors; and a code of business conduct and ethics that applies to allof our directors, officers and employees.
We also post on our website materials that summarize our environmental, social and governance (“ESG”) effortsand our Sustainability Accounting Standards Board (“SASB”) Reports. These materials are available in print to anystockholder that makes a written request to Oceaneering International, Inc., Attention: Corporate Secretary, 11911FM 529, Houston, Texas 77041-3000.
12

INFORMATION ABOUT OUR EXECUTIVE OFFICERSExecutive Officers. The following information relates to our executive officers as of February 18, 2022:
NAME AGE POSITION
EXECUTIVEOFFICERSINCE
EMPLOYEESINCE
Roderick A. Larson 55 President and Chief Executive Officer and Director 2012 2012
Earl F. Childress 56 Senior Vice President and Chief Commercial Officer 2020 2020
Alan R. Curtis 56 Senior Vice President and Chief Financial Officer 2015 1995
Holly D. Kriendler 57 Senior Vice President and Chief Human Resources Officer 2020 2016
David K. Lawrence 62 Senior Vice President, General Counsel and Secretary 2012 2005
Eric A. Silva 62 Senior Vice President and Chief Transformation Officer 2017 2014
Philip G. Beierl 63 Senior Vice President, Aerospace and Defense Technologies 2018 2005
Benjamin M. Laura 43 Senior Vice President, Offshore Projects Group 2020 2014
Witland J. LeBlanc, Jr. 51 Vice President and Chief Accounting Officer 2019 2010
Martin J. McDonald 58 Senior Vice President, Subsea Robotics 2015 1989
Shaun R. Roedel 54 Senior Vice President, Manufactured Products 2020 2009
Kishore Sundararajan 60 Senior Vice President, Integrity Management and Digital Solutions 2020 2020
Each executive officer serves at the discretion of our Board of Directors and is subject to reelection orreappointment each year after the annual meeting of our shareholders. We do not know of any arrangement orunderstanding between any of the above persons and any other person or persons pursuant to which they wereselected or appointed as an officer.
Business Experience. The following summarizes the business experience of our executive officers. Except wherewe otherwise indicate, each of these persons has held his or her current position with Oceaneering for at least thepast five years.
Roderick A. Larson joined Oceaneering in 2012 as Senior Vice President and Chief Operating Officer, becamePresident in February 2015 and became President and Chief Executive Officer and Director in May 2017. Mr.Larson previously held positions with Baker Hughes Incorporated from 1990 until he joined Oceaneering, servingmost recently as President, Latin America Region from January 2011. Previously, he served as Vice President ofOperations, Gulf of Mexico Region from 2009 to 2011, Gulf Coast Area Manager from 2007 to 2009, and SpecialProjects Leader Technical Training Task from 2006 to 2007.
Earl F. Childress, Senior Vice President and Chief Commercial Officer, joined Oceaneering in March 2020 as SeniorVice President, Business Development and assumed his current role in May 2020. From 2015 to 2020, he servedas Executive Vice President of Strategy and Business Development for Teledyne Marine, and as General Managerof Teledyne Seismic and Teledyne RD Instruments. Prior to 2015, Mr. Childress served in sales, marketing andstrategy roles for Teledyne, including mergers and acquisitions in marine instrumentation markets. Mr. Childress is amember of Petroleum Equipment and Services Association and the National Ocean Industries Association.
Alan R. Curtis, Senior Vice President and Chief Financial Officer, joined Oceaneering in 1995 as the Financial andOperations Controller for our Subsea Products segment, and became Vice President and Controller of SubseaProducts in 2013 and Senior Vice President, Operations Support in 2014. He was appointed to his current positionin August 2015.
Holly D. Kriendler, Senior Vice President and Chief Human Resources Officer, joined Oceaneering in October 2016as Vice President, Human Resources and was appointed as its Chief Human Resources Officer in 2018 and to hercurrent position in March 2020, with responsibility for Oceaneering’s human resources, global mobility andoperations training functions. Prior to joining Oceaneering, Ms. Kriendler served in human resources leadershippositions from 2006 to 2016 at affiliates of Tyco International Ltd. and successor entities, including most recently asVice President, Human Resources for The ADT Corporation from 2011. Ms. Kriendler has more than 25 years ofexperience in human resources management.
David K. Lawrence, Senior Vice President, General Counsel and Secretary, joined Oceaneering in 2005 asAssistant General Counsel. He was appointed Associate General Counsel effective January 2011, Vice President,
13
General Counsel and Secretary in January 2012 and to his current position in February 2014. Mr. Lawrence hasmore than 30 years of experience as in-house counsel in the oil and gas and manufacturing industries.

Eric A. Silva, Senior Vice President, Operations Support, joined Oceaneering in 2014 as Chief Information Officerand Vice President. He was appointed to his current position in August 2015 and was appointed an executive officerin 2017. Prior to joining Oceaneering, Mr. Silva was a consultant from May 2012 to February 2014 and served asthe Chief Information Officer at El Paso Corporation from 2010 to May 2012. Prior to such time, he was VicePresident of Information Technology of LyondellBasell Industries N.V. (formerly LyondellBasell Industries AF S.C.A.)from December 2007 to 2010, and was Vice President of Information Technology of Lyondell Chemical Companyfrom 2002 to 2007.
Philip G. Beierl, Senior Vice President, Aerospace and Defense Technologies, joined Oceaneering in 2005 and heldleadership positions in the Oceaneering Technologies business unit, most recently as its Vice President andGeneral Manager from 2014. Mr. Beierl was appointed as Oceaneering's Senior Vice President, AdvancedTechnologies in 2018 and to his current position in August 2020. Before joining Oceaneering, he served in the U.S.Navy for over 25 years.
Benjamin M. Laura, Senior Vice President, Offshore Projects Group, joined Oceaneering as Director of SubseaServices in 2014, was appointed as its as Vice President of Service, Technology & Rentals in 2015, as its SeniorVice President, Service and Rental in March 2020 and to his current position in May 2020. Prior to joiningOceaneering, Mr. Laura worked for Baker Hughes as the Vice-President and Managing Director for Baker Hughesdo Brasil.
Witland J. LeBlanc, Jr., Vice President and Chief Accounting Officer, joined Oceaneering in 2010 as the VicePresident, Tax, and became Vice President, Tax and Treasurer in July 2017. He was appointed to his currentposition in March 2019. He began his career in public accounting and transitioned to industry prior to joiningOceaneering.
Martin J. McDonald, Senior Vice President, Remotely Operated Vehicles, joined Oceaneering in 1989. He held avariety of domestic and international positions of increasing responsibility in our ROV segment and most recentlyserved as Vice President and General Manager for our ROV operations in the Eastern Hemisphere from 2006 untilbeing appointed to his current position effective January 2016.
Shaun R. Roedel, Senior Vice President, Manufactured Products, joined Oceaneering in 2009 as Assistant GeneralManager/Group Project Manager of the umbilical plant in Panama City, Florida, and became Vice President, SubseaManufactured Products in 2017. He was appointed to his current position in March 2020. Prior to joiningOceaneering, Mr. Roedel was the head of project management for Siemens Dematic from 1997 to 2004 and thehead of project management and construction for Vanderlande Industries from 2004 to 2009. Mr. Roedel served inthe U.S. Navy from 1990 to 1997.
Kishore Sundararajan, Senior Vice President, Integrity Management and Digital Solutions, joined Oceaneering inMarch 2020 as Senior Vice President, Asset Integrity and assumed his current role in May 2020. Before joiningOceaneering, he served as President of Engineering and Product Management, Oil Field Services with BakerHughes from 2017 to 2019. Prior to that time, he was employed by General Electric in its oil and gas business asVice President of Engineering and Technology from 2015 to 2017 and as Chief Technology Officer, Measurementand Control from 2014 to 2015. From 1988 to 2014, Mr. Sundararajan held positions of increasing responsibility inautomation, robotics and power conversion with the ABB Group, culminating in leadership of its global industrialsolutions business.
14

Item 1A. Risk Factors.
We are subject to various risks and uncertainties in the course of our business. The following summarizes the risksand uncertainties that we consider to be material and that may materially and adversely affect our business,financial condition, results of operations or cash flows and the market value of our securities. Investors in ourcompany should consider these matters, in addition to the other information we have provided in this report and thedocuments we incorporate by reference.
Business and Operational Risks
We derive most of our revenue from companies in the offshore oil and gas industry, a historically cyclicalindustry with levels of activity that are significantly affected by the levels and volatility of oil and gas prices.
We derive most of our revenue from customers in the offshore oil and gas exploration, development and productionindustry. The offshore oil and gas industry is a historically cyclical industry characterized by significant changes inthe levels of exploration and development activities. Oil and gas prices, and market expectations of potentialchanges in those prices, significantly affect the levels of those activities. Worldwide political, economic and militaryevents have contributed to oil and gas price volatility and are likely to continue to do so in the future. In 2020, manyoil and gas companies made significant reductions in their capital and operating expenditures, which adverselyimpacted demand for the services and products provided by our Energy Services and Products business, due to theimpact of the COVID-19 pandemic, which included the resulting significant reduction in global demand for oil andnatural gas, coupled with the sharp decline in oil prices following the announcement of price reductions andproduction increases in March 2020 by members of the Organization of Petroleum Exporting Countries, or OPEC,and other foreign, oil-exporting countries, as discussed below. Oil and gas prices returned to pre-pandemic levels in2021 and have remained stable so far in 2022. However, there may be downward pressure on prices due to recentor expected production increases in various countries. There is ongoing uncertainty regarding the long-term outlookfor the U.S. Gulf of Mexico, as a result of a temporary ban on leasing of U.S. federal lands imposed by the currentpresidential administration. Any prolonged reduction in the overall level of offshore oil and gas exploration anddevelopment activities, whether resulting from changes in oil and gas prices, limitations on access to capital forsuch activities, governmental actions or regulatory developments or otherwise, could materially and adversely affectour financial condition and results of operations in our operating segments within our Energy Services and Productsbusiness. Some factors that have affected and are likely to continue affecting oil and gas prices and the level ofdemand for our services and products include the following:
• worldwide demand for oil and gas;• general economic and business conditions and industry trends;• the ability of OPEC to set and maintain production levels;• the level of production by non-OPEC countries, including U.S. shale oil;• the ability of oil and gas companies to generate funds for capital expenditures;• the ongoing ability to access to external financing from financial institutions or the capital markets;• the cost of exploring for, developing and producing oil and gas as compared to alternative energy sources;• domestic and foreign tax policy;• laws and governmental regulations that restrict exploration and development of oil and gas in various
offshore jurisdictions;• technological changes that could lead to competition from new market entrances;• the political environment of oil-producing regions;• the changing environmental and social landscape; and• the price and availability of alternative energy.
The impacts and effects of the ongoing COVID-19 pandemic have adversely affected, and could continue toadversely affect, our business, financial condition and results of operations.
The COVID-19 pandemic has negatively affected our business, financial condition and results of operations. TheCOVID-19 pandemic has resulted in authorities implementing numerous measures to try to contain the disease,such as travel bans and restrictions, quarantines, shelter-in-place orders and shutdowns, among others.Restrictions of this nature have caused, and may continue to cause, us, our suppliers and other business
15

counterparties to experience operational delays, delays in the delivery of materials and supplies that are sourcedfrom around the globe, and have caused, and may continue to cause, milestones or deadlines relating to variousprojects to be missed. There have been widespread adverse impacts on the global economy and on many of ouremployees, customers, suppliers and business counterparties.
There is considerable uncertainty regarding the extent to which COVID-19 and its variants will continue to spread,the widespread availability, distribution, acceptance and efficacy of vaccines and the extent and duration ofgovernmental and other measures implemented to try to slow the spread. Further, the impact of the pandemic,including the resulting significant reduction in global demand for oil and natural gas, coupled with the sharp declinein oil prices following the announcement of price reductions and production increases in March 2020 by members ofOPEC and other foreign, oil-exporting countries has led to significant global economic contraction generally and inour industry in particular. Despite recent improvements in commodity prices, oil and natural gas prices may continueto be volatile as a result of these events and the ongoing COVID-19 pandemic, and as changes in oil and naturalgas inventories, industry demand and economic performance are reported.
We have modified certain business and workforce practices (including those related to employee travel, employeework locations, and cancellation of physical participation in meetings, events and conferences) and implementednew protocols to promote social distancing and enhance sanitary measures in our offices and facilities to conform togovernment restrictions and best practices encouraged by governmental and regulatory authorities. Although wehave experienced only limited absenteeism from employees who are required to be on-site to perform their jobs,absenteeism may increase in the future and may harm our productivity. Further, our increased reliance on remoteaccess to our information systems increases our exposure to potential cybersecurity breaches. We may take furtheractions as government authorities require or recommend or as we determine to be in the best interests of ouremployees, customers, suppliers and other business counterparties. There is no certainty that such measures willbe sufficient to mitigate the risks posed by the virus, in which case our employees or other individuals may becomesick, our ability to perform critical functions could be harmed, and we may be unable to respond to some of theneeds of our global business.
We have also received various notices from some of our suppliers and other business counterparties, and providednotices to several customers, regarding performance delays resulting from the pandemic. These actions may resultin some disputes and could strain our relations with customers and others. If and to the extent these actions were toresult in material modifications or cancellations of the underlying contracts, we could experience reductions in ourcurrently reported backlog and in the anticipated conversion of backlog into revenue in future periods. In addition,worsening economic conditions could result in reductions in backlog over time, which would impact our futurefinancial performance.
We cannot predict the full impact that COVID-19 or the significant disruption and volatility currently beingexperienced in the oil and natural gas markets will have on our business, cash flows, liquidity, financial conditionand results of operations at this time, due to numerous uncertainties. The ultimate impacts will depend on futuredevelopments beyond our control, which are highly uncertain and cannot be predicted, including, among others, theultimate geographic spread of the virus, particularly the new variants, the consequences of governmental and othermeasures designed to prevent the spread of the virus, the ongoing development, availability, distribution andacceptance of vaccines and therapeutic treatments, the duration of the pandemic, actions taken by members ofOPEC and other foreign, oil-exporting countries, actions taken by governmental authorities, customers, suppliersand other third parties, workforce availability, and the timing and extent to which normal economic and operatingconditions resume.
Our international operations involve additional risks not associated with domestic operations.
A significant portion of our revenue is attributable to operations in foreign countries. These activities accounted forapproximately 57% of our consolidated revenue in 2021. Risks associated with our operations in foreign areasinclude risks of:
• regional and global economic downturns;• public health threats, such as COVID-19, Severe Acute Respiratory Syndrome, severe influenza and other
highly communicable viruses or diseases, that could limit access to customers', vendors' or our facilities oroffices, impose travel restrictions on our personnel or otherwise adversely affect our operations or demandfor our services;
• disturbances or other risks that may limit or disrupt markets;• expropriation, confiscation or nationalization of assets;
16

• renegotiation or nullification of existing contracts;• foreign exchange restrictions;• foreign currency fluctuations, particularly in countries highly dependent on oil revenue;• foreign taxation, including the application and interpretation of tax laws;• the inability to repatriate earnings or capital;• changing political conditions;• changing foreign and domestic monetary policies; and• social, political, military and economic situations in foreign areas where we do business and the possibilities
of civil disturbances, war, other armed conflict, terrorist attacks or acts of piracy.
Additionally, in some jurisdictions we are subject to foreign governmental regulations favoring or requiring theawarding of contracts to local contractors or requiring foreign contractors to employ citizens of, or purchase suppliesfrom, a particular jurisdiction. These regulations may adversely affect our ability to compete.
Our exposure to the risks we described above varies from country to country. In recent periods, economicconditions, political instability and civil unrest in Africa and Azerbaijan have been among our greatest concerns.There is a risk that a continuation or worsening of these conditions could materially and adversely impact our futurebusiness, operations, financial condition and results of operations.
Our backlog is subject to unexpected adjustments and cancellations and is, therefore, an uncertainindicator of our future revenue and earnings.There can be no assurance that the revenue included in our backlog will be realized or, if realized, will result inprofits. Because of project cancellations or potential changes in the scope or schedule of our customers' projects,we cannot predict with certainty when or if backlog will be realized. Material delays, suspensions, cancellations orpayment defaults could materially affect our financial condition, results of operations and cash flows. We may be atrisk of delays, suspensions and cancellations in the current market environment.
Reductions in our backlog due to cancellation by a customer or for other reasons would adversely affect, potentiallyto a material extent, the revenue and earnings we actually receive from contracts included in our backlog. Many ofour ROV contracts have 30-day notice termination clauses. Some of the contracts in our backlog provide forcancellation fees in the event customers cancel projects. These cancellation fees usually provide for reimbursementof our out-of-pocket costs, revenue for work performed prior to cancellation and a varying percentage of the profitswe would have realized had the contract been completed. However, under limited circumstances, such as certainbankruptcy events, no cancellation fee would be owed to us. Further, even if a cancellation fee is owed to us, acustomer may be unable or may refuse to pay the cancellation fee. We typically have no contractual right uponcancellation to the total contract revenue as reflected in our backlog. If we experience significant projectterminations, suspensions or scope adjustments to contracts reflected in our backlog, our financial condition, resultsof operations and cash flows may be adversely impacted.
Our offshore oilfield operations involve a variety of operating hazards and risks that could cause losses.
Our operations are subject to the hazards inherent in the offshore oilfield business. These include blowouts,explosions, fires, collisions, capsizings and severe weather conditions. These hazards could result in personal injuryand loss of life, severe damage to or destruction of property and equipment, pollution or environmental damage andsuspension of operations. We may incur substantial liabilities or losses as a result of these hazards. While wemaintain insurance protection against some of these risks, and seek to obtain indemnity agreements from ourcustomers requiring the customers to hold us harmless from some of these risks, our insurance and contractualindemnity protection may not be sufficient or effective to protect us under all circumstances or against all risks. Theoccurrence of a significant event not fully insured or indemnified against or the failure of a customer to meet itsindemnification obligations to us could materially and adversely affect our results of operations and financialcondition.
17

Legal and Regulatory Risks
Climate change, climate change legislation and regulatory initiatives and the ongoing “energy transition”could result in increased operating costs and capital expenditures and decreased demand for the servicesand products of our Energy Services business.
Scientific studies have suggested that emissions of certain gases, commonly referred to as “greenhouse gases,”including carbon dioxide and methane, may be contributing to warming of the earth’s atmosphere and other climaticchanges. In response to those studies, the issue of climate change and the effects of greenhouse gas emissions, inparticular emissions from fossil fuels, has and continues to attract political and social attention. The regulatoryresponse to and physical effects of climate change have the potential to negatively affect our business in manyways, including increasing the costs to provide the services and products of our Energy Services business, reducingthe demand for and consumption of those services and products, and the economic health of the regions in whichwe operate, all of which can create financial risks. In addition, market forces, including the declining cost ofrenewables energy generation technologies and the continuing electrification of various technologies that previouslyused hydrocarbons, may impact the long-term demand for oil and natural gas and, ultimately, the demand for theservices and products of our Energy Services business.
Legislation to regulate greenhouse gas emissions has, from time to time, been introduced in the U.S. Congress andsuch legislation may be proposed or adopted in the future. In addition, the EPA has adopted regulations addressinggreenhouse gas emissions, including rules requiring the monitoring, reporting and recordkeeping of emissions ofcarbon dioxide from specified sources in the United States that cover certain onshore and offshore oil and naturalgas production facilities. There also have been international efforts seeking legally binding reductions in greenhousegas emissions. The United States was actively involved in the negotiations at the 21st Conference of the Parties ofthe United Nations Framework Convention on Climate Change in Paris, which led to the creation of the “ParisAgreement.” The Paris Agreement requires the signatory countries to review and "represent a progression" in theirnationally determined contributions, which set emissions reduction goals, every five years.
It is not possible at this time to predict the timing and effect of climate change or to predict the effect of the ParisAgreement (or similar international agreements) or whether additional greenhouse gas legislation, regulations orother measures will be adopted. However, more aggressive efforts by governments and non-governmentalorganizations to reduce greenhouse gas emissions appear likely and any such future laws and regulations couldresult in increased compliance costs or additional operating restrictions applicable to our Energy Servicescustomers and/or us.
The adoption of additional climate change laws or regulations in the future could result in increased costs for ourEnergy Services customers and us to (1) operate and maintain operating facilities, (2) install new emission controlsor abatement technologies (such as CCS technologies) on operating facilities and (3) administer and managegreenhouse gas emissions programs. If we are unable to recover or pass through a significant level of our costsrelated to complying with climate change regulatory requirements imposed on us, they could have a materialadverse effect on our results of operations and financial condition. Further, to the extent financial markets viewclimate change and the greenhouse gas emissions of our Energy Services customer base as a financial risk, thiscould negatively impact our cost of and access to capital.
Beyond financial and regulatory impacts, climate change poses potential physical risks. Scientific studies forecastthat these risks include increases in sea levels, stresses on water supply, rising average temperatures and otherchanges in weather conditions, such as increases in precipitation and extreme weather events, such as floods, heatwaves, hurricanes and other tropical storms and cyclones. The projected physical effects of climate change havethe potential to directly affect the operations we conduct for customers and result in increased costs related to ouroperations. However, because the nature and timing of changes in extreme weather events (such as increasedfrequency, duration, and severity) are uncertain, it is not possible for us to estimate reliably the future financial riskto our operations caused by these potential physical risks.
Climate change also subjects us to the risk of increased negative publicity. Negative public perception regarding usand/or the energy industry resulting from, among other things, concerns raised by advocacy groups about oil spills,greenhouse gas emissions, climate change and explosions of or leaks from pipelines carrying crude oil, refinedpetroleum products or natural gas, may lead to increased regulatory scrutiny, which may, in turn, lead to new safetyand environmental laws, regulations, guidelines and enforcement interpretations. These actions may causeoperational delays or restrictions, increased operating costs or capital expenditures, additional regulatory burdensand increased risk of litigation for us and our energy industry customers. Furthermore, governmental authorities
18

exercise considerable discretion in the timing and scope of permit issuance required for the operations conductedby or for our energy industry customers and, in many cases, the public may engage in the permitting process.Negative public perception could cause such permits to be withheld, delayed, or burdened by requirements thatrestrict our ability to profitably conduct business for our energy industry customers. Ultimately, these risks couldresult in reduced demand for the services and products of our Energy Services business, which would adverselyimpact our revenues, and increased costs that may adversely affect our profitability and cash flows.
Our operations could be adversely impacted by the effects of new regulations.During 2010, the U.S. Government established new regulations relating to the design of wells and testing of theintegrity of wellbores, the use of drilling fluids, the functionality and testing of well control equipment, includingblowout preventers, and other safety and environmental regulations. The U.S. Government requires that operatorsdemonstrate their compliance with those regulations before commencing deepwater drilling operations. In addition,as discussed above, increasing attention to issues concerning climate change as a result of the emission of carbondioxide and other “greenhouse gases” may result in the imposition of additional environmental or other legislation orregulations that seek to restrict, or otherwise impose limitations or costs upon, the emission of greenhouse gases.We cannot predict when or whether any of these various legislative and regulatory proposals may be enacted oradopted or what their effects will be on us or our customers, particularly with respect to offshore oil and gasexploration and development projects. These and other legislative or regulatory developments could increase costsfor us and our customers or, in some cases, prevent projects from going forward, thereby potentially reducing theneed for our products and services.
Employee, agent or partner misconduct or our overall failure to comply with laws or regulations couldweaken our ability to win contracts, which could result in reduced revenue and profits.
Misconduct, fraud, non-compliance with applicable laws and regulations, or other improper activities by one or moreof our employees, agents or partners could have a significant negative impact on our business and reputation. Suchmisconduct could include the failure to comply with the U.S. Foreign Corrupt Practices Act ("FCPA"), which prohibitscompanies and their intermediaries from making improper payments to non-U.S. officials, as well as the failure tocomply with government procurement regulations, regulations on lobbying or similar activities, regulations pertainingto the internal controls over financial reporting and various other applicable laws or regulations, including the U.K.Bribery Act. We operate in some countries that international corruption monitoring groups have identified as havinghigh levels of corruption. Our activities create the risk of unauthorized payments or offers of payments by one of ouremployees or agents that could be in violation of the FCPA or other applicable anti-corruption laws. The precautionswe take to prevent and detect misconduct, fraud or non-compliance with applicable laws and regulations may not beeffective, and we could face unknown risks or losses. Our failure to comply with applicable laws or regulations oracts of misconduct could subject us to fines, penalties or other sanctions, which could have a material adverseeffect on our business and our consolidated financial condition, results of operations and cash flows.
Laws and governmental regulations may add to our costs or adversely affect our operations.
Our business is affected by changes in public policy and by federal, state, local and foreign laws and regulationsrelating to the offshore oil and gas industry. Offshore oil and gas exploration and production operations are affectedby tax, environmental, safety and other laws, by changes in those laws, application or interpretation of existing laws,and changes in related administrative regulations. It is also possible that these laws and regulations may in thefuture add significantly to our operating costs or those of our customers or otherwise directly or indirectly affect ouroperations.
Environmental laws and regulations can increase our costs, and our failure to comply with those laws andregulations can expose us to significant liabilities.
Risks of substantial costs and liabilities related to environmental compliance issues are inherent in our operations.Our operations are subject to extensive federal, state, local and foreign laws and regulations relating to thegeneration, storage, handling, emission, transportation and discharge of materials into the environment. Permits arerequired for the operation of various facilities, and those permits are subject to revocation, modification and renewal.Governmental authorities have the power to enforce compliance with their regulations, and violations are subject tofines, injunctions or both. In some cases, those governmental requirements can impose liability for the entire cost ofcleanup on any responsible party without regard to negligence or fault and impose liability on us for the conduct ofor conditions others have caused, or for our acts that complied with all applicable requirements when we performedthem. It is possible that other developments, such as stricter environmental laws and regulations, and claims fordamages to property or persons resulting from our operations, would result in substantial costs and liabilities. In
19

particular, as discussed above, increasing attention to issues concerning climate change as a result of the emissionof carbon dioxide and other “greenhouse gases” may result in the imposition of additional environmental legislationor regulations that seek to restrict, or otherwise impose limitations or costs upon, the emission of greenhousegases. We cannot predict when or whether any of these various legislative and regulatory proposals may becomelaw or what their effect will be on us or our customers. Such legislation or regulations could increase costs for usand our customers or, in some cases, prevent projects from going forward, thereby potentially reducing the need forour products and services. Our insurance policies and the contractual indemnity protection we seek to obtain fromour customers may not be sufficient or effective to protect us under all circumstances or against all risks involvingcompliance with environmental laws and regulations.
Financial Risks
Foreign exchange risks and fluctuations may affect our profitability on certain projects.
We operate on a worldwide basis with substantial operations outside the U.S. that subject us to United States dollartranslation and economic risks. In order to manage some of the risks associated with foreign currency exchangerates, we may enter into foreign currency derivative (hedging) instruments, especially when there is currency riskexposure that is not naturally mitigated via our contracts. However, these actions may not always eliminate allcurrency risk exposure, in particular for our long-term contracts. A disruption in the foreign currency markets,including the markets with respect to any particular currencies, could adversely affect our hedging instruments andsubject us to additional currency risk exposure. Based on fluctuations in currency, the U.S. dollar value of ourbacklog may from time to time increase or decrease significantly. We do not enter into derivative instruments fortrading or other speculative purposes. Our operational cash flows and cash balances, though predominately held inU.S. dollars, may consist of different currencies at various points in time in order to execute our contracts globally.Non-U.S. asset and liability balances are subject to currency fluctuations when measured period to period forfinancial reporting purposes in U.S. dollars.
Maintaining adequate letter of credit and bonding capacity is necessary for us to successfully bid on andwin various contracts.
In line with industry practice, we are often required to post standby letters of credit to customers or enter into suretybond arrangements in favor of customers. Those letters of credit and surety bond arrangements generally protectcustomers against our failure to perform our obligations under the applicable contracts. However, the terms of thoseletters of credit, including terms relating to the customer’s ability to draw upon the letter of credit and the amount ofthe letter of credit required, can vary significantly. If a letter of credit or surety bond is required for a particular projectand we are unable to obtain it due to insufficient liquidity or other reasons, we may not be able to pursue thatproject. We have limited capacity for letters of credit, and we rely substantially on bilateral letters of credit fromvarious issuing banks in a number of markets. Moreover, due to events that affect the credit markets generally,letters of credit may be more difficult to obtain in the future or may only be available at significant additional cost.Letters of credit, including through our bilateral arrangements (which are cancelable in the discretion of the issuingbanks), may not continue to be available to us on reasonable terms. Our inability to obtain adequate letters of creditand surety bonds and, as a result, to bid on new work could have a material adverse effect on our business, cashflows, liquidity, financial condition and results of operations.
Significant inflation and higher interest rates could adversely affect our business and financial condition.
Inflation could have an adverse impact on our business and our financial condition by increasing costs of materialsand labor, and interest rates. All of these factors could have a negative impact on customer budgets. In a highlyinflationary environment, we may be unable to raise pricing for our energy services and products at or above therate of inflation, which could reduce our profit margins. In addition, our cost of capital, labor and materials couldincrease, which could have an adverse impact on our business and our financial condition.
Changes in the method of determining the U.S. Dollar London Interbank Offered Rate (“LIBOR”), or thereplacement of LIBOR with an alternative reference rate, may adversely affect interest rates and increaseour cost of capital.
On July 27, 2017, the Financial Conduct Authority in the United Kingdom announced that it would phase out LIBORas a benchmark rate by the end of 2021. On December 31, 2021, the ICE Benchmark Administration, the currentadministrator of LIBOR, ceased publication of 1-week and 2-month LIBOR, however, subject to compliance withapplicable regulations, including as to representativeness, it does not intend to cease publication of the remainingtenors until June 30, 2023. It is possible that LIBOR’s regulator may determine to cease publication as of an earlier
20

date, if the information used to calculate LIBOR degrades to the degree that it is no longer representative of theunderlying market. We expect that different benchmark rates used to price indebtedness will continue to bedeveloped over time. Revolving credit borrowings under our principal credit agreement, which is described in Part IIof this report in Item 7—“Management's Discussion and Analysis of Financial Condition and Results ofOperations” (the “Credit Agreement”), bear interest at rates tied to LIBOR. In the future, we may need to renegotiatethe Credit Agreement or incur indebtedness under other credit arrangements, and the phase-out of LIBOR maynegatively impact the terms of such indebtedness. We have not yet pursued an amendment of the CreditAgreement or other contractual alternative to address this matter and are currently evaluating the impact of thepotential replacement of LIBOR. If no such amendment or other contractual alternative is established on or prior tothe phase-out of LIBOR, interest on revolving credit borrowings under the Credit Agreement may bear interest athigher rates based on the prime rate, which could increase our cost of capital in the event we borrow against theCredit Agreement. The U.S. Federal Reserve, in conjunction with the Alternative Reference Rates Committee, asteering committee comprised of large U.S. financial institutions (the "ARRC"), has proposed a new index calculatedby short term repurchase agreements, backed by Treasury securities called the Secured Overnight Financing Rate("SOFR") as an alternative to LIBOR for use in contracts that are currently indexed to U.S. dollar LIBOR and hasproposed a paced market transition plan to SOFR. On July 29, 2021, the ARRC formally recommended SOFR as itspreferred alternative replacement rate for U.S. dollar LIBOR. Although SOFR appears to be the preferredreplacement rate for U.S. dollar LIBOR at this time, it is not presently known whether SOFR or any other alternativereference rates that have been proposed will attain market acceptance as replacements of LIBOR. In addition, theoverall financial markets may be disrupted as a result of the phase-out or replacement of LIBOR. Uncertainty as tothe nature of such potential phase-out and alternative reference rates could adversely affect the cost of ourborrowings. Furthermore, the overall financial market may be disrupted as a result of the phase-out or replacementof LIBOR. Disruption in the financial market could have an adverse effect on our business, cash flows, liquidity,financial condition and results of operations.
A global financial crisis could impact our business and financial condition in ways that we currently cannotpredict.
A recurrence of the credit crisis and related turmoil in the global financial system that occurred in 2008 and 2009could have an impact on our business and our financial condition. In particular, the cost of capital increasedsubstantially while the availability of funds from the capital markets diminished significantly. Although the capitalmarkets have recovered, in a recurrence, our ability to access the capital markets in the future could be restricted orbe available only on terms we do not consider favorable. Limited access to the capital markets could adverselyimpact our ability to take advantage of business opportunities or react to changing economic and businessconditions and could adversely impact our ability to continue our growth strategy. Ultimately, we could be required toreduce our future capital expenditures substantially. Such a reduction could have a material adverse effect on ourbusiness and our consolidated financial condition, results of operations and cash flows. A recurrence of such aglobal financial crisis could have further impacts on our business that we currently cannot predict or anticipate.
A global financial crisis or economic recession could have an impact on our suppliers and our customers, causingthem to fail to meet their obligations to us, which could have a material adverse effect on our revenue, income fromoperations and cash flows.
If one or more of the lenders under our revolving credit facility were to become unable or unwilling to perform theirobligations under that facility, our borrowing capacity could be reduced. Our inability to borrow under our revolvingcredit facility could limit our ability to fund our future operations and growth.
In addition, we maintain our cash balances and short-term investments primarily in accounts held by major banksand financial institutions located principally in North America, Europe, Africa and Asia, and some of those accountshold deposits that exceed available insurance. It is possible that one or more of the financial institutions in which wehold our cash and investments could become subject to bankruptcy, receivership or similar proceedings. As a result,we could be at risk of not being able to access material amounts of our cash, which could result in a temporaryliquidity crisis that could impede our ability to fund operations.
Strategic Risks Related to our Business
Our business strategy contemplates future acquisitions. Acquisitions of other businesses or assets presentvarious risks and uncertainties.
We may pursue growth through the acquisition of businesses or assets that will enable us to broaden our serviceand product offerings and expand into new markets. We may be unable to implement this element of our growth
21

strategy if we cannot identify suitable businesses or assets, reach agreement on potential strategic acquisitions onacceptable terms or for other reasons. Moreover, acquisitions involve various risks, including:
• difficulties relating to the assimilation of personnel, services and systems of an acquired business and theassimilation of marketing and other operational capabilities;
• challenges resulting from unanticipated changes in customer and other third-party relationships subsequentto acquisition;
• additional financial and accounting challenges and complexities in areas such as tax planning, treasurymanagement, financial reporting and internal controls;
• assumption of liabilities of an acquired business, including liabilities that were unknown at the time theacquisition transaction was negotiated;
• possible liabilities under the FCPA and other anti-corruption laws;• diversion of management's attention from day-to-day operations;• failure to realize anticipated benefits, such as cost savings and revenue enhancements;• potentially substantial transaction costs associated with acquisitions; and• potential impairment resulting from the overpayment for an acquisition.
Future acquisitions may require us to obtain additional equity or debt financing, which may not be available onattractive terms. Moreover, to the extent an acquisition transaction financed by non-equity consideration results ingoodwill, it will reduce our tangible net worth, which might have an adverse effect on credit availability.
Additionally, an acquisition may bring us into businesses we have not previously conducted and expose us toadditional business risks that are different from those we have previously experienced.
Our business strategy also includes development and commercialization of new technologies to supportour growth. The development and commercialization of new technologies require capital investment andinvolve various risks and uncertainties.
Our future growth will depend on our ability to continue to innovate by developing and commercializing new serviceand product offerings. Investments in new technologies involve varying degrees of uncertainties and risk.Commercial success depends on many factors, including the levels of innovation, the development costs and theavailability of capital resources to fund those costs, the levels of competition from others developing similar or othercompeting technologies, our ability to obtain or maintain government permits or certifications, the effectiveness ofproduction, distribution and marketing efforts, and the costs to customers to deploy and provide support for the newtechnologies. We may not achieve significant revenue from new service and product investments for a number ofyears, if at all. Moreover, new services and products may not be profitable, and, even if they are profitable, ouroperating margins from new services and products may not be as high as the margins we have experiencedhistorically.
The loss of the services of one or more of our key personnel, or our failure to attract, assimilate and retaintrained personnel in the future, could disrupt our operations and result in loss of revenue.
Our success depends on the continued active participation of our executive officers and key operating personnel.The unexpected loss of the services of any one of these persons could adversely affect our operations.
Our operations require the services of employees having the technical training and experience necessary to obtainthe proper operational results. As a result, if we should suffer any material loss of personnel to competitors or beunable to employ additional or replacement personnel with the requisite level of training and experience toadequately operate our equipment, our operations could be adversely affected. A significant increase in the wagespaid by other employers could result in a reduction in our workforce, increases in wage rates, or both.
We may not be able to compete successfully against current and future competitors.
Our businesses operate in highly competitive industry segments. Some of our competitors or potential competitorshave greater financial or other resources than we have. Our operations may be adversely affected if our currentcompetitors or new market entrants introduce new products or services with better features, performance, prices orother characteristics than those of our services and products. This factor is significant to our segments' operations,particularly in the operating segments within our Energy Services and Products business, where capital investmentis critical to our ability to compete.
22

Risks Related to Intellectual Property, Information Technology and Data Privacy
We rely on intellectual property law and confidentiality agreements to protect our intellectual property. Wealso rely on intellectual property we license from third parties. Our failure to protect our intellectualproperty rights, or our inability to obtain or renew licenses to use intellectual property of third parties, couldadversely affect our business.
We rely on a variety of intellectual property rights that we use in our services and products, and our successdepends, in part, on our ability to protect our proprietary information and other intellectual property. Our intellectualproperty could be challenged, invalidated, circumvented or rendered unenforceable. In addition, effective intellectualproperty protection may be limited or unavailable in some foreign countries where we operate.
Our failure to protect our intellectual property rights may result in the loss of valuable technologies or adverselyaffect our competitive business position. We rely significantly on proprietary technology, information, processes andknow-how that are not subject to patent or copyright protection. We seek to protect this information through tradesecret or confidentiality agreements with our employees, consultants, subcontractors or other parties, as well asthrough other security measures. These agreements and security measures may be inadequate to deter or preventmisappropriation of our confidential information. In the event of an infringement of our intellectual property rights, abreach of a confidentiality agreement or divulgence of proprietary information, we may not have adequate legalremedies to protect our intellectual property.
In some instances, we have augmented our technology base by licensing the proprietary intellectual property ofthird parties. However, it is possible that the tools, techniques, methodologies, programs and components we use toprovide our services or products may infringe on the intellectual property rights of others. In the future, we may notbe able to obtain necessary licenses on commercially reasonable terms. Royalty payments under licenses fromthird parties, if available, or developing non-infringing technologies could materially increase our costs. Additionally,if a license or non-infringing technology were not available, we might not be able to continue providing a particularservice or product, which could materially and adversely affect our financial condition, results of operations andcash flows.
Litigation to determine the scope of intellectual property rights, even if ultimately successful, could be costly andcould divert management's attention away from other aspects of our business. In addition, our trade secrets mayotherwise become known or be independently developed by competitors.
Our information technology systems are subject to interruption and cybersecurity risks that couldadversely impact our operations.
Our operations (both onshore and offshore) are highly dependent on information technology systems and relatedpersonnel, including systems that collect, organize, store or use personally identifiable data and other sensitiveinformation about our customers, employees, suppliers and others. Some of these systems are managed orprovided by third-party service providers, including certain cloud platform providers. As a result, our businessoperations could be negatively impacted by a breach or interruption of systems we rely on that originates from, orcompromises, third-party networks or devices outside of our control. Threats to information technology systemsassociated with cybersecurity risks and cyber incidents or attacks continue to grow. For the information technologysystems, applications and processes we rely on to operate effectively, we or our service providers must maintainand update them. Delays in maintenance, updates, upgrading, or patching of these systems, applications orprocesses could impair their effectiveness or expose us or our service providers to security risks. In addition,breaches to our systems or third-party systems utilized by us could go unnoticed for some period of time. Risksassociated with these threats include disruptions of certain systems on our vessels or systems utilized to operateour ROVs; other impairments of our ability to conduct our operations; loss of or damage to intellectual property,proprietary information or employee or customer data; disruption of our customers’ operations; loss or damage toour customer data delivery systems; damage to our reputation or customer or other business relationships; inabilityto comply with our regulatory obligations in a timely manner which could result in regulatory investigations or otheractions by governmental authorities and associated costs, fines or penalties; and increased costs to prevent,respond to or mitigate cybersecurity incidents. If such a cyber incident were to occur, it could have a materialadverse effect on our business and our consolidated financial condition, results of operations and cash flows.
While we continue to evaluate potential replacements or upgrades of existing key information technology systems,the implementation of new information technology systems or upgrades to existing systems subjects us to inherentcosts and risks associated with replacing or changing these systems, including potential disruption of our internalcontrol structure, substantial capital expenditures, demands on management time and other risks. Our possible new
23

information technology systems implementations or upgrades may not result in productivity improvements at thelevels anticipated, or at all. In addition, the implementation of new or upgraded information technology systems maycause disruptions in our business operations. Any such disruption, and any other information technology systemdisruptions, if not anticipated and appropriately mitigated, could have a material adverse effect on our operations.
Changes in data privacy laws, regulations and standards may cause our business to suffer.
Personal privacy and data security have become significant regulatory issues and the subject of rapidly evolvinglaws globally and in the United States. As a result, we may be subject to a growing patchwork of comprehensiveprivacy regulation imposed by jurisdictions where we operate, including under the European Union’s General DataProtection Regulation (“GDPR”), the United Kingdom’s Data Protection Act (the “UK GDPR”), Brazil’s General DataProtection Law (“LGPD”) and in the United States, the California Consumer Privacy Act (“CCPA”). Furthermore,foreign, federal, state and local government bodies or agencies have in the past adopted, and may in the futureadopt, more laws and regulations affecting data privacy. For example, voters in California adopted the CaliforniaPrivacy Rights Act (“CPRA”) by ballot initiative in 2020, and in 2021, Virginia and Colorado enacted the VirginiaConsumer Data Protection Act (“VCDPA”) and Colorado Privacy Act (“CPA”), respectively. The CPRA, VCDPA andCPA will take effect over the next 18 months and may impose new obligations on our business and operations.
The GDPR, UK GDPR and LGPD apply to activities related to personal data that may be conducted by us, directlyor indirectly through vendors or subcontractors, from an establishment in the EU, UK or Brazil, respectively.Although the GDPR, UK GDPR and LGPD currently impose similar obligations, interpretations and enforcement ofall three laws is still evolving. Changes to interpretations or enforcement of the GDPR, UK GDPR or LGPD couldcreate a range of new compliance obligations, which could cause us to incur additional costs. If interpretations orenforcement of the GDPR, UK GDPR or LGPD deviate significantly in the future, those costs could become evenmore severe. The GDPR, UK GDPR, LGPD and other data privacy regulations may significantly impact ourbusiness activities and require substantial compliance costs that adversely affect business, operating results,prospects and financial condition.
Our business and operations may also be impacted if the UK Parliament approves new standard contractualclauses (“SCCs) for the international transfer of personal data outside of the UK. If adopted on March 21, 2022, thenew SCCs may apply to our existing contracts involving the international transfer of personal data that is restrictedunder the UK GDPR, requiring us to renegotiate any non-conforming contracts by September 21, 2022. Ifnecessary, the renegotiation of those contracts could be time-consuming and expensive and could divert ourmanagement’s attention from our day-to-day operations.
The CCPA, which went into effect on January 1, 2020, gives California residents specific rights in relation to theirpersonal information, requires that companies take certain actions, including notifications for security incidents, andmay apply to activities regarding personal information that is collected by us, directly or indirectly, from Californiaresidents. When most of its provisions take effect on January 1, 2023, the CPRA will modify the CCPA and imposeadditional data protection obligations on companies doing business in California. Adoption of the CPRA also createdthe California Privacy Protection Agency (“CPPA”), the first state agency dedicated to the implementation andenforcement of privacy regulations. Interpretation and enforcement of the CCPA and CPRA will continue to evolve,as will the impact the CPPA’s rulemaking and enforcement actions. Those changes may entail new complianceobligations and scrutiny that may significantly impact our business activities and require substantial compliancecosts that adversely affect business, operating results, prospects and financial condition.
Additionally, Virginia’s VCDA and Colorado’s CPA will take effect on January 1, 2023 and July 1, 2023, respectively.Although the VCDPA and CPA share concepts the CCPA and CPRA, each law includes important variations, suchas inconsistent standards for determining whether businesses fall within the scope of each law. Those variationsmay raise our costs and place increased demand on our resources by creating increasingly complex monitoring,control and compliance challenges. Any failure by us to comply with these laws and regulations, including as aresult of a security or privacy breach, could result in significant penalties and liabilities for us.
Our business and operations could become subject to future legislation and regulatory requirements beyond thosecurrently proposed, adopted or contemplated in the U.S. and abroad. The cumulative effect of all of the legislationand regulations on our business, operations and profitability remains uncertain. This uncertainty necessitates that inour business planning we make certain assumptions with respect to the scope and requirements of prospective andproposed rules. If these assumptions prove incorrect, we could be subject to increased regulatory and compliancerisks and costs as well as potential reputational harm, either of which could result in negative publicity andsignificant penalties or other liabilities.
24

Furthermore, the costs of compliance with, and other burdens imposed by, the laws, regulations, and policies thatare applicable to our business may limit the use and adoption of, and reduce the overall demand for, our solutions.Additionally, if we acquire an entity that has violated or is not in compliance with applicable data privacy andprotection laws or regulations (or contractual provisions), we may experience similar adverse consequences.
Risks Related to our Organization and Structure
We may issue preferred stock whose terms could adversely affect the voting power or value of our commonstock.
Our certificate of incorporation authorizes us to issue, without the approval of our shareholders, one or more classesor series of preferred stock having such preferences, powers and relative, participating, optional and other rights,including preferences over our common stock respecting dividends and distributions, as our board of directors maydetermine. The terms of one or more classes or series of preferred stock could adversely impact the voting power orvalue of our common stock. For example, we might grant holders of preferred stock the right to elect some numberof our directors in all events or on the happening of specified events or the right to veto specified transactions.Similarly, the repurchase or redemption rights or liquidation preferences we might assign to holders of preferredstock could affect the residual value of the common stock.
Provisions in our corporate documents and Delaware law could delay or prevent a change in control of ourcompany, even if that change would be beneficial to our shareholders.
The existence of some provisions in our corporate documents and Delaware law could delay or prevent a change incontrol of our company, even if that change would be beneficial to our shareholders. Our certificate of incorporationand bylaws contain provisions that may make acquiring control of our company difficult, including:
• provisions relating to the classification, nomination and removal of our directors;• provisions regulating the ability of our shareholders to bring matters for action at annual meetings of our
shareholders;• provisions requiring the approval of the holders of at least 80% of our voting stock for a broad range of
business combination transactions with related persons; and• the authorization given to our board of directors to issue and set the terms of preferred stock.
In addition, the Delaware General Corporation Law imposes restrictions on mergers and other businesscombinations between us and any holder of 15% or more of our outstanding common stock.
General Risks
Our internal controls may not be sufficient to achieve all stated goals and objectives.
Our internal controls and procedures were developed through a process in which our management applied itsjudgment in assessing the costs and benefits of such controls and procedures, which, by their nature, can provideonly reasonable assurance regarding the control objectives. The design of any system of internal controls andprocedures is based, in part, on various assumptions about the likelihood of future events. We cannot assure thatany design will succeed in achieving its stated goals under all potential future conditions, regardless of how remote.
The use of estimates could result in future adjustments to our assets, liabilities and results of operations.
The preparation of financial statements in conformity with accounting principles generally accepted in the UnitedStates requires that our management make estimates and assumptions that affect the reported amounts of assetsand liabilities, disclosure of contingent assets and liabilities at the date of the financial statements and the reportedamounts of revenue and expense during the reporting period. Actual results could differ from those estimates.
Item 1B. Unresolved Staff Comments.None.
Item 2. Properties.
We maintain office, shop and yard facilities in various parts of the world to support our operations. We considerthese facilities, which we describe below, to be suitable for their intended use and adequate for our currentoperations. In these locations, we typically own or lease office facilities for our administrative and engineering staff,
25

shops equipped for fabrication, testing, repair and maintenance activities and warehouses and yard areas forstorage and mobilization of equipment to work sites. All sites are available to support any of our business segmentsas the need arises. The groupings that follow associate our significant offices with the primary business segmentthey serve.
Energy Services and Products. In general, our Energy Services and Products business segments share facilities.Our location in Morgan City, Louisiana consists of ROV manufacturing and training facilities, vessel dockingfacilities, open and covered warehouse space and offices. The Morgan City facilities primarily support ROV andother operations in the United States. We have regional support offices for our North Sea, Africa, Brazil andSoutheast Asia operations in: Aberdeen, Scotland; Stavanger and Bergen, Norway; Abu Dhabi and Dubai, UnitedArab Emirates; Rio de Janeiro and Macaé, Brazil; Luanda, Angola; Chandigarh, India; Perth, Australia; KualaLumpur, Malaysia; Baku, Azerbaijan; and Singapore. We also have operational bases in various other locations.
We use workshop and office space in Houston, Texas in our Manufactured Products, OPG and IMDS businesssegments. Our principal manufacturing facilities for our Manufactured Products segment are located in or near:Houston, Texas; Panama City, Florida; Aberdeen and Rosyth, Scotland; Nodeland and Stavanger, Norway; Perth,Australia; Luanda, Angola; the Netherlands; Kuala Lumpur, Malaysia; and Niterói and Macaé, Brazil. We also havean office in Orlando, Florida, which supports our commercial theme park animation activities. Each of thesemanufacturing facilities is suitable for its intended purpose and has sufficient capacity to respond to increases indemand for our subsea and theme park products and that may be reasonably anticipated in the foreseeable future.
For a description of the vessels we use in our Offshore Projects Group operations, see the discussion in Item 1.“Business” under the heading “GENERAL DEVELOPMENT OF BUSINESS—Energy Services and Products—Offshore Projects Group.”
Aerospace and Defense Technologies. Our primary facilities for our ADTech segment are offices and workshopsin Hanover, Maryland. We have regional offices in Chesapeake, Virginia; Bremerton, Washington; Pearl Harbor,Hawaii; Cataumet, Massachusetts; Charleston, South Carolina; and San Diego, California, which support ourservices for the U.S. Navy. We also have facilities near Houston, Texas, to support our space industry activities.
Item 3. Legal Proceedings.
For information regarding legal proceedings, see the discussion under the caption “Litigation” in Note 10—“Commitments and Contingencies” in the Notes to Consolidated Financial Statements included in this report,which discussion we incorporate by reference into this Item.
Item 4. Mine Safety Disclosures.Not applicable.
26

Part II
Item 5. Market for Registrant's Common Equity, Related Stockholder Matters and Issuer Purchases ofEquity Securities.
Our common stock is listed on the New York Stock Exchange under the symbol OII. Our company website addressis www.oceaneering.com.
On February 18, 2022, there were 402 holders of record of our common stock. On that date, the closing sales price,as quoted on the New York Stock Exchange, was $14.53. Our Board has not declared quarterly dividends since2017 and we do not anticipate our Board reinstating a quarterly cash dividend after considering the need to focusour resources on growth and positioning us for the future, although we will continue to review our dividend positionon a quarterly basis.
In December 2014, our Board of Directors approved a share repurchase program under which we may repurchaseup to 10 million shares of our common stock on a discretionary basis. The program calls for any repurchases to bemade in the open market, or in privately negotiated transactions from time to time, in compliance with applicablelaws, rules and regulations, including Rule 10b-18 under the Securities Exchange Act of 1934, as amended, subjectto market and business conditions, levels of available liquidity, cash requirements for other purposes, applicablelegal requirements and other relevant factors. The timing and amount of any repurchases will be determined bymanagement based on its evaluation of these factors. We expect that any shares repurchased under the programwill be held as treasury stock for future use. The program does not obligate us to repurchase any particular numberof shares. Under the program, we had repurchased 2.0 million shares of our common stock for $100 million throughDecember 31, 2015. We have not repurchased any shares under the program since December 2015.
EQUITY COMPENSATION PLAN INFORMATION
The following presents equity compensation plan information as of December 31, 2021:
Plan Category
Number ofsecurities to beissued uponexercise ofoutstanding
options, warrantsand rights
Weighted-averageexercise price of
outstanding options,warrants and rights
Number of securitiesremaining availablefor future issuanceunder equity
compensation plans(excluding securities
reflectedin the first column)
Equity compensation plans approved by securityholders 2,447,259 N/A 3,236,659
Equity compensation plans not approved by securityholders — N/A —Total 2,447,259 N/A 3,236,659
In the table above, the number of securities to be issued upon exercise of outstanding options, warrants and rightsshown as of December 31, 2021 are restricted stock units and shares of restricted stock granted under ourstockholder-approved incentive plans.
As of December 31, 2021, there were: (1) no shares of Oceaneering common stock under equity compensationplans not approved by security holders available for grant; and (2) 3,236,659 shares of Oceaneering common stockunder equity compensation plans approved by security holders available for grant in the form of stock options, stockappreciation rights or stock awards. We have not granted any stock options since 2005 and the CompensationCommittee of our Board of Directors has expressed its intention to refrain from using stock options as a componentof employee compensation for our executive officers and other employees for the foreseeable future. Additionally,our Board of Directors has expressed its intention to refrain from using stock options as a component ofnonemployee director compensation for the foreseeable future. For a description of the material features of ourequity compensation arrangements, see the discussion under the caption “Incentive Plans” in Note 12—“EmployeeBenefit Plans” in the Notes to Consolidated Financial Statements included in this report.
27

PERFORMANCE GRAPH
The following graph compares our total shareholder return to the Standard & Poor's 500 Stock Index (“S&P 500”)and the PHLX Oil Service Sector Index from December 31, 2016 through December 31, 2021. The PHLX OilService Sector Index is designed to track the performance of a set of companies involved in the oil services sector.
It is assumed in the graph that: (1) $100 was invested in Oceaneering Common Stock, the S&P 500 and the PHLXOil Service Sector Index on December 31, 2016; and (2) any Oceaneering dividends are reinvested. Theshareholder return shown is not necessarily indicative of future performance.
December 31,
2016 2017 2018 2019 2020 2021
Oceaneering International, Inc. 100.00 76.27 43.65 53.79 28.68 40.80
S&P 500 Index 100.00 121.83 116.49 153.17 181.35 233.41
PHLX Oil Service Sector Index 100.00 82.80 45.36 45.11 26.13 31.55
28
$0
$50
$100
$150
$200
$250
12/31/16 12/31/17 12/31/18 12/31/19 12/31/20 12/31/21
Comparison of Cumulative Shareholder Return
Oceaneering International, Inc. S&P 500 Index PHLX Oil Service Sector Index

Item 6. [Reserved]
29

Item 7. Management's Discussion and Analysis of Financial Condition and Results of Operations.
Certain statements in this annual report on Form 10-K, including, without limitation, statements regarding thefollowing matters, are forward-looking statements made pursuant to the safe harbor provisions of the PrivateSecurities Litigation Reform Act of 1995:
• our business strategy;• industry conditions and commodity pricing;• seasonality;• the impacts of the coronavirus (“COVID-19”) pandemic on our business;• our expectations about 2022 results of operations, items below the operating income line and segment
operating results, and the factors underlying those expectations, including our expectations about demandand pricing for our energy services and products as a result of the factors we specify in “Overview” and“Results of Operations” below;
• tax refunds under the U.S. Coronavirus Aid, Relief, and Economic Security Act (the "CARES Act") and othertax refunds;
• our backlog, to the extent backlog may be an indicator of future revenue or productivity;• projections relating to floating rig demand and subsea tree installations;• the adequacy of our liquidity, cash flows and capital resources to support our operations and internally
generated growth initiatives;• the collectability of accounts receivable and realizability of contract assets at the amounts reflected on our
most-recent balance sheet;• our projected capital expenditures for 2022;• the condition of debt markets and our possible future debt repurchases;• our plans for future operations (including planned additions to and retirements from our remotely operated
vehicle (“ROV”) fleet;• our ability and intent to redeem Angolan bonds and repatriate cash;• our expectations regarding shares that may be repurchased under our share repurchase plan;• our expectations regarding the implementation of new accounting standards and related policies,
procedures and controls;• our expectations about our ROV fleet utilization in the future;• our expectations about growth in the area of energy transition; and• our expectations regarding the effect of inflation in the near future.
These forward-looking statements are subject to various risks, uncertainties and assumptions, including those werefer to under the headings “Cautionary Statement Concerning Forward-Looking Statements” and “Risk Factors” inPart I of this report. Although we believe that the expectations reflected in such forward-looking statements arereasonable, because of the inherent limitations in the forecasting process, as well as the relatively volatile nature ofthe industries in which we operate, we can give no assurance that those expectations will prove to have beencorrect. Accordingly, evaluation of our future prospects must be made with caution when relying on forward-lookinginformation.
Impact of the COVID-19 Pandemic on Our Business
The COVID-19 pandemic has negatively impacted our business. Although we experienced improvements in 2021,the long-term implications of the pandemic on our business, financial condition and results of operations remainuncertain. The ultimate extent of the impact of the COVID-19 pandemic will depend largely on future developments,particularly within the geographic areas where we operate, and the related impact on overall economic activity, all ofwhich are currently unknown and cannot be predicted with certainty at this time. However, the adverse impacts ofthe economic effects from the COVID-19 pandemic on our business have been and may continue to be significant.
Our Engagement in the Energy Transition
Oceaneering currently generates a substantial majority of its revenue from the oil and gas sector. Due to thecontinuing development of economies in developing countries, substantial projected population growth (particularlyin developing countries), and the shortage of other sources of affordable, reliable, scalable and efficient energy, as
30

well as rising worldwide demand for a myriad of products made with petrochemicals, we expect that the need foradditional oil and gas exploration and development and IMR activities will continue for decades to come. At thesame time, due to increasing concerns about climate change, there is growing demand for cleaner hydrocarbon-based and renewables energy sources. We believe that our strategies for continuing to assist our energy-focusedcustomers to reduce their carbon emissions in exploring for, developing and producing oil and natural gas and inaddressing the ongoing energy transition, as well as diversifying our business into new strategic growth areas innon-energy markets, will keep us well positioned as a resilient company in a potentially lower-carbon environment.
Today, the impacts of climate-related risks and opportunities and the global focus on energy transition areinfluencing our strategy in the following ways:
• we are committed to working with our Energy Services customers to help them minimize their carbonfootprints in their oil and natural gas operations;
• we are deploying our competencies and capabilities to serve the energy-transition markets, including thoseutilizing offshore wind and tidal energy technologies, hydrogen and CCS technologies; and
• we are reviewing and assessing new investments to further diversify our businesses into new strategicgrowth areas outside the energy industry, such as mobility solutions, aerospace and defense and digitalasset management.
We are committed to the research and development of products and services intended to help our Energy Servicescustomers to produce energy safely and securely, with decreased risk to humans and sea life and reducedenvironmental impacts. As an example, we are working to advance remote operations, which allow customers toreduce their carbon footprints by transferring offshore workers to onshore control centers, and allows for less risk tohuman health and safety, greater collaboration and faster response to real-time events.
We are also committed to reducing our own energy consumption and the greenhouse gas emissions attributable toour operations. With the help of a third-party consultant, we are in the process of conducting a global review of ourassets and operations to identify and estimate our scope 1 and scope 2 emissions. Once we have completed thatprocess, we intend to set appropriate ambition levels for both short- and long-term emissions reduction goals. Wewill then develop action plans to achieve these goals. Our capital investments and expenses required to achieve ourgoals cannot be estimated at this time, but are expected to be significant over the long term.
Overview of our Results and Guidance
The table that follows sets out our revenue and operating results for 2021, 2020 and 2019.
Year Ended December 31,(dollars in thousands) 2021 2020 2019Revenue $ 1,869,275 $ 1,827,889 $ 2,048,124Gross Margin 264,065 163,941 98,244Gross Margin % 14 % 9 % 5 %Operating Income (Loss) 39,799 (446,079) (290,713)Operating Income (Loss) % 2 % (24)% (14)%Net Income (Loss) (49,307) (496,751) (348,444)
Our business segments are contained within two businesses—services and products provided primarily to the oiland gas industry and, to a lesser extent, the offshore renewables industry (“Energy Services and Products”) andservices and products provided to non-energy industries (“Aerospace and Defense Technologies” or “ADTech”). Ourfour business segments within the Energy Services and Products business are Subsea Robotics, ManufacturedProducts, Offshore Projects Group (“OPG”) and Integrity Management & Digital Solutions (“IMDS”). We report ourAerospace and Defense Technologies business as one segment. Unallocated Expenses are expenses notassociated with a specific business segment. These consist of expenses related to our incentive and deferredcompensation plans, including restricted stock and bonuses, as well as other general expenses, including corporateadministrative expenses.
Our business primarily depends on the level of spending on offshore developments and related operating activitiesby our customers in the energy industry. During 2021, we generated a substantial majority of our revenue fromservices and products we provided to the energy industry. Our results for 2021 reflect the impact of pre-tax charges
31

of $32 million recognized during the first, second and fourth quarters. Activity levels and operating performancewithin our energy segments improved as compared to 2020 as we continued to adapt to operating during theCOVID-19 pandemic. Our ADTech segment continued to perform steadily, delivering improved operating income forthe year. Overall, our 2021 revenue increased 2% to $1.9 billion, with revenue increases in three of our four energysegments and in our ADTech segment.
In 2021, on a consolidated level, we had a net loss of $49 million, or diluted loss of $0.49 per share, compared tonet loss of $497 million, or diluted loss of $5.01 per share, in 2020. The $447 million decrease in net loss ascompared to 2020 was primarily attributable to pre-tax charges of $467 million recorded in 2020 for impairments,write-downs and write-offs of certain equipment, intangible assets, goodwill and inventory, and other expenses,most notably in our Subsea Robotics, Manufactured Products, OPG and IMDS segments. This compares to pre-taxcharges recorded in 2021 of $32 million, for a net loss on uncollectible accounts, loss on sale of an asset and otherexpenses, most notably in our Manufactured Products segment.
We had operating income of $40 million, including charges of $32 million, in 2021 and an operating loss of $446million, including charges of $467 million in 2020. Operating results increased $486 million primarily due to chargesof $467 million recorded in 2020 for impairments, write-downs and write-offs of certain equipment, intangible assets,goodwill and inventory, and other expenses described below. The changes in operating results occurred in our:
• Subsea Robotics segment, which had a $143 million increase in operating results, primarily as a result ofcharges of $122 million in 2020 as compared to charges of $0.4 million in 2021. These charges wereprincipally due to a goodwill impairment in 2020 of $102 million, largely based on market conditions andlower pricing levels. 2020 charges also included asset write-offs and inventory write-downs, largely resultingfrom impairment and obsolescence.
• Manufactured Products segment, which had a $72 million increase in operating results, primarily as a resultof charges of $116 million in 2020 as compared to charges of $30 million in 2021. These charges in 2020included impairments and write-downs of certain equipment of $61 million and goodwill impairments of $52million, both largely based on market conditions and lower pricing levels. These charges in 2021 included anet loss of $30 million recorded in connection with the termination in the fourth quarter of 2021 of a numberof entertainment ride systems contracts with the financially embattled developer, China Evergrande Groupand its affiliated companies (collectively, “Evergrande”).
• OPG segment, which had a $137 million increase in operating results, primarily as a result of charges of$100 million in 2020 as compared to charges of $0.1 million in 2021. The charges in 2020 included agoodwill impairment of $66 million and long-lived asset impairments and write-offs of $25 million.
• IMDS segment, which had a $140 million increase in operating results, primarily as a result of charges of$128 million in 2020 as compared to charges of $0.2 million in 2021. The charges in 2020 included agoodwill impairment of $123 million, largely based on market conditions and lower pricing levels.
• ADTech segment, which had an $5.0 million increase in operating income on higher levels of revenue dueto increased activity in defense subsea technologies.
In 2021, 2020 and 2019 we incurred certain charges of $32 million, $467 million and $252 million, respectively. The2021 charges were primarily due to the net loss of $30 million related to the termination of a number ofentertainment ride systems contracts with Evergrande. The 2020 and 2019 charges were primarily due to marketconditions that no longer supported the prior valuations. Additionally, we recognized other costs, as we adapted our
32
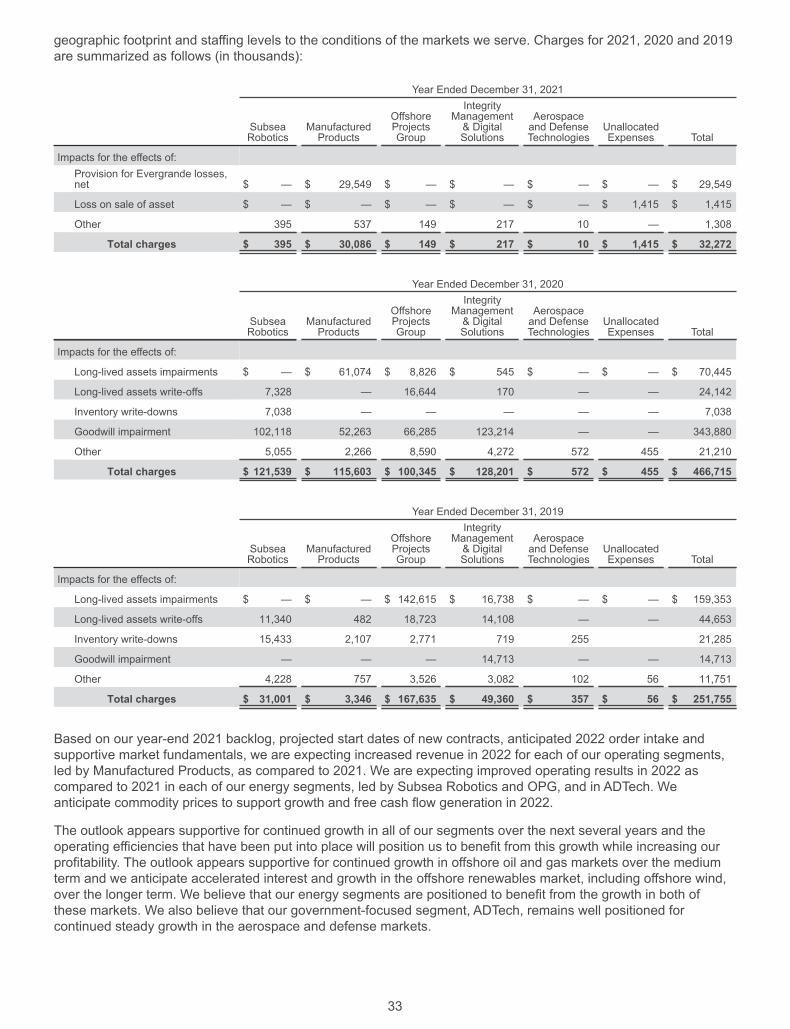
geographic footprint and staffing levels to the conditions of the markets we serve. Charges for 2021, 2020 and 2019are summarized as follows (in thousands):
Year Ended December 31, 2021
SubseaRobotics
ManufacturedProducts
OffshoreProjectsGroup
IntegrityManagement& DigitalSolutions
Aerospaceand DefenseTechnologies
UnallocatedExpenses Total
Impacts for the effects of:Provision for Evergrande losses,net $ — $ 29,549 $ — $ — $ — $ — $ 29,549
Loss on sale of asset $ — $ — $ — $ — $ — $ 1,415 $ 1,415
Other 395 537 149 217 10 — 1,308
Total charges $ 395 $ 30,086 $ 149 $ 217 $ 10 $ 1,415 $ 32,272
Year Ended December 31, 2020
SubseaRobotics
ManufacturedProducts
OffshoreProjectsGroup
IntegrityManagement& DigitalSolutions
Aerospaceand DefenseTechnologies
UnallocatedExpenses Total
Impacts for the effects of:
Long-lived assets impairments $ — $ 61,074 $ 8,826 $ 545 $ — $ — $ 70,445
Long-lived assets write-offs 7,328 — 16,644 170 — — 24,142
Inventory write-downs 7,038 — — — — — 7,038
Goodwill impairment 102,118 52,263 66,285 123,214 — — 343,880
Other 5,055 2,266 8,590 4,272 572 455 21,210
Total charges $ 121,539 $ 115,603 $ 100,345 $ 128,201 $ 572 $ 455 $ 466,715
Year Ended December 31, 2019
SubseaRobotics
ManufacturedProducts
OffshoreProjectsGroup
IntegrityManagement& DigitalSolutions
Aerospaceand DefenseTechnologies
UnallocatedExpenses Total
Impacts for the effects of:
Long-lived assets impairments $ — $ — $ 142,615 $ 16,738 $ — $ — $ 159,353
Long-lived assets write-offs 11,340 482 18,723 14,108 — — 44,653
Inventory write-downs 15,433 2,107 2,771 719 255 21,285
Goodwill impairment — — — 14,713 — — 14,713
Other 4,228 757 3,526 3,082 102 56 11,751
Total charges $ 31,001 $ 3,346 $ 167,635 $ 49,360 $ 357 $ 56 $ 251,755
Based on our year-end 2021 backlog, projected start dates of new contracts, anticipated 2022 order intake andsupportive market fundamentals, we are expecting increased revenue in 2022 for each of our operating segments,led by Manufactured Products, as compared to 2021. We are expecting improved operating results in 2022 ascompared to 2021 in each of our energy segments, led by Subsea Robotics and OPG, and in ADTech. Weanticipate commodity prices to support growth and free cash flow generation in 2022.
The outlook appears supportive for continued growth in all of our segments over the next several years and theoperating efficiencies that have been put into place will position us to benefit from this growth while increasing ourprofitability. The outlook appears supportive for continued growth in offshore oil and gas markets over the mediumterm and we anticipate accelerated interest and growth in the offshore renewables market, including offshore wind,over the longer term. We believe that our energy segments are positioned to benefit from the growth in both ofthese markets. We also believe that our government-focused segment, ADTech, remains well positioned forcontinued steady growth in the aerospace and defense markets.
33

We use our ROVs to provide drill support, vessel-based inspection, maintenance and repair, subsea hardwareinstallation, construction, and pipeline inspection services to customers in the energy industry. Most of our ROVshave historically been used to provide drill support services. Therefore, the contracted number of floating drilling rigsis a leading market indicator for this business. The following table shows average floating rigs under contract andour ROV utilization.
2021 2020 2019Average number of floating rigs under contract 131 139 154ROV days on hire (in thousands) 53 54 58ROV utilization 58% 59% 58%
Demand for floating rigs is the primary leading indicator of the strength of the deepwater market. According toindustry data published by IHS Petrodata, excluding rigs under construction, at the end of 2021 there were 193floating drilling rigs in operation or available for work throughout the world, with 137 of those rigs under contract.The average contracted offshore floating rig count in 2021 declined to approximately 131 rigs.
In addition to floating rig demand, the number of subsea tree orders and installations is another leading indicator,and the primary demand driver for our Manufactured Products lines. According to data published by Rystad Energyin December 2021, there are projected to be 317 subsea tree installations in 2022, compared to 313 in 2021, 278 in2020 and 263 in 2019.
Results of Operations and Guidance
Additional information on our business segments is shown in Note 11—“Operations by Business Segment andGeographic Area” in the Notes to Consolidated Financial Statements included in this report.
Energy Services and Products. The table that follows sets out revenue and profitability for the business segmentswithin our Energy Services and Products business. In the Subsea Robotics section of the table that follows, “ROVDays Available” includes all days from the first day that an ROV is placed in service until the ROV is retired. All daysin this period are considered available days, including periods when an ROV is undergoing maintenance or repairs.Our ROVs do not have scheduled maintenance or repair that requires significant time when the ROVs are notavailable for utilization.
34

Year ended December 31,(dollars in thousands) 2021 2020 2019Subsea Robotics
Revenue $ 538,515 $ 493,332 $ 583,652Gross Margin 112,962 78,952 57,601Gross Margin % 21 % 16 % 10 %Operating Income (Loss) 76,874 (65,817) 11,627Operating Income (Loss)% 14 % (13)% 2 %ROV Days Available 91,242 91,499 100,480ROV Days Utilized 53,113 54,411 58,347ROV Utilization % 58 % 59 % 58 %
Manufactured ProductsRevenue 344,251 477,419 498,350Gross Margin 63,455 62,962 48,865Gross Margin % 18 % 13 % 10 %Operating Income (Loss) (15,876) (88,253) 5,730Operating Income (Loss)% (5)% (18)% 1 %Backlog at end of period 318,000 266,000 548,000
Offshore Projects GroupRevenue 378,121 289,127 380,966Gross Margin 56,338 1,265 4,339Gross Margin % 15 % — % 1 %Operating Income (Loss) 31,197 (105,680) (170,013)Operating Income (Loss)% 8 % (37)% (45)%
Integrity Management & Digital SolutionsRevenue 241,393 226,938 266,086Gross Margin 42,417 29,772 15,361Gross Margin % 18 % 13 % 6 %Operating Income (Loss) 18,572 (121,675) (52,527)Operating Income (Loss)% 8 % (54)% (20)%
Total Energy Services and ProductsRevenue $1,502,280 $1,486,816 $1,729,054Gross Margin 275,172 172,951 126,166Gross Margin % 18 % 12 % 7 %Operating Income (Loss) 110,767 (381,425) (205,183)Operating Income (Loss)% 7 % (26)% (12)%
Subsea Robotics. Historically, we built new ROVs to increase the size of our fleet in response to demand tosupport deepwater drilling and vessel-based IMR and installation work. These vehicles are designed for use aroundthe world in water depths of 10,000 feet or more. In 2015, as a result of declining market conditions, we beganbuilding fewer ROVs, generally limiting additions to meet contractual commitments. During the year endedDecember 31, 2021, we retired 10 of our conventional workclass ROV systems and replaced them with sevenupgraded conventional workclass ROV systems and three IsurusTM workclass ROV systems (which are capable ofoperating in severe conditions and are ideal for renewables projects and high-speed surveys), which are currentlyengaged in renewables work. We added a total of 10, three and 13 ROVs in 2021, 2020 and 2019, respectively,while retiring 51 units over the three-year period. Our ROV fleet size was 250 as of December 31, 2021, 2020 and2019.
We believe we are the world's largest provider of ROV services and, generally, this business segment has been thelargest contributor to our Energy Services and Products business operating income. Our Subsea Robotics segment
35

revenue reflects the utilization percentages, fleet sizes and average pricing in the respective periods. Our surveyservices business provides survey and positioning, and geoscience services. The following table presents revenuefrom ROV services as a percentage of total Subsea Robotics revenue:
Year Ended December 31,2021 2020 2019
ROV 79 % 81 % 77%
Other 21 % 19 % 23%
For the year ended December 31, 2021, our Subsea Robotics operating income increased as compared to 2020,primarily due to charges of $122 million for the year ended December 31, 2020 for goodwill impairment, write-downsand write-offs of certain equipment, intangible assets and inventory, and other expenses. Exclusive of thosecharges, Subsea Robotics operating income for the year ended December 31, 2021 increased as compared to thecorresponding period of the prior year on higher revenue and margins. We had a 2% decrease in days on hire and ayear-over-year decrease in drill support days partially offset by an increase in vessel support days. Dayrates andcosts per days on hire increased on a slight decrease in utilization.
For the year ended December 31, 2020, our Subsea Robotics operating income decreased as compared to 2019,primarily due to charges of $122 million and $31 million for the years ended December 31, 2020 and 2019,respectively, for goodwill impairment, write-downs and write-offs of certain equipment, intangible assets andinventory, and other expenses. Exclusive of those charges, Subsea Robotics operating income for the year endedDecember 31, 2020 increased as compared to the corresponding period of the prior year on higher margins andimproved cost controls. We had a 7% decrease in days on hire and year-over-year decreases in both drill supportand vessel support days. Dayrates and costs per days on hire decreased on a slight increase in utilization.
For our Subsea Robotics in 2022, we expect improved results based on increased ROV days on hire, minor shifts ingeographic mix and stable to improving pricing. Results for tooling-based services are expected to improve, withactivity levels generally following ROV days on hire. Survey operating results are expected to improve on highersurvey and positioning activity. Our overall ROV fleet utilization is expected to be in the mid-60% range for the fullyear of 2022, with higher seasonal activity during the second and third quarters. Subject to quarterly variances, wecontinue to expect our drill support market share to generally approximate 55% to 60%.
Manufactured Products. For the year ended December 31, 2021, our Manufactured Products operating resultsincreased, as compared to 2020, primarily due to charges in 2020 of $116 million for asset and goodwillimpairments, and other expenses as compared to $30 million of charges in 2021 primarily for the net loss related tothe termination of a number of entertainment ride systems contracts with Evergrande. The 2021 Evergrande netloss included a reserve of $49 million in receivables and contract assets partially offset by the reclassification of $20million of contract assets into salable inventory. Exclusive of those charges, Manufactured Products adjustedoperating income for the year ended December 31, 2021 decreased as compared to the corresponding period ofthe prior year on lower revenue as we worked through backlog orders awarded prior to the COVID-19 pandemic.Our energy-related businesses year over year had decreased volume and operating margins which were partiallyoffset by our mobility solutions businesses which had less volume but higher operating margins as a result ofefficiency gains and revision of project cost estimates.
For the year ended December 31, 2020, our Manufactured Products operating results decreased, on higherrevenue as compared to 2019, primarily due to charges in 2020 of $116 million for asset and goodwill impairments,and other expenses as compared to $3.3 million of charges in 2019 for write-offs of certain equipment, intangibleassets and inventory, and other expenses. Exclusive of those charges, Manufactured Products adjusted operatingincome for the year ended December 31, 2020 increased as compared to the corresponding period of the prior year.Our energy-related businesses year over year had increased volume and operating margins due to better executionand improved operating efficiencies. Our mobility solutions businesses had significantly less volume and loweroperating margins as a result of declines in activity attributable to the COVID-19 pandemic.
We expect our Manufactured Products segment operating results in 2022 to improve on a significant increase inrevenue, primarily as a result of increased order intake in our energy businesses in 2021. We are seeing increasinginterest in our mobility solutions businesses and expect marginally higher activity and contribution from thesebusinesses in 2022. Our Manufactured Products backlog was $318 million as of December 31, 2021, a $52 million,or 20%, increase over December 31, 2020.
36

Offshore Projects Group. Our OPG operating results for the year ended December 31, 2021 increased ascompared to 2020 primarily due to decreased charges in 2021 of $100 million for vessel and other assetimpairments and write-offs, goodwill impairment, and other charges. Exclusive of those charges, our OPG operatingresults were higher for the year ended December 31, 2021, as compared to the prior year, on higher revenue due toincreased activity levels in the areas of subsea installation and intervention services.
Our OPG operating results for the year ended December 31, 2020 increased as compared to 2019 primarily due todecreased charges in 2020 of $100 million for vessel and other asset impairments and write-offs, goodwillimpairment, and other charges as compared to 2019 charges of $168 million for vessel and intangible impairments,write-downs and write-offs of certain equipment and inventory, and other expenses. Exclusive of those charges, ourOPG operating results were lower for the year ended December 31, 2020, as compared to the prior year, on lowerrevenue due to reduced activity levels in the areas of IMR, decommissioning and intervention services.
In 2022, we expect operating results for our OPG segment to improve on a marginal increase in revenue. Thisexpectation is based on better anticipated pricing, improved vessel utilization and increased diving activities morethan offsetting lower year-over-year contribution from our Angola riserless light well intervention campaign.
Integrity Management & Digital Solutions. For the year ended December 31, 2021, compared to 2020, our IMDSoperating results were higher primarily due to 2020 charges of $128 million for goodwill impairment, assetimpairment and write-offs, and other expenses. Exclusive of those charges, operating results for the year endedDecember 31, 2021 were higher, as compared to the prior year, due to operating efficiencies implemented since thebeginning of 2020.
For the year ended December 31, 2020, compared to 2019, our IMDS operating results were lower primarily due to2020 charges of $128 million for goodwill impairment, asset impairment and write-offs, and other expenses ascompared to 2019 charges of $49 million for goodwill and asset impairments, write-downs and write-offs of certainequipment, intangible assets and inventory, and other expenses. Exclusive of those charges, operating results forthe year ended December 31, 2020 were higher, as compared to the prior year, due to improved operatingefficiencies instituted in the fourth quarter of 2019 and in the first three quarters of 2020.
We anticipate our 2022 operating results for IMDS to improve on higher revenue, with consistent operating margins.We continue to see global opportunities for renewals and business expansion, particularly in the U.K. and WestAfrica.
Aerospace and Defense Technologies.
Revenue, gross margin and operating income information for our ADTech segment are as follows:
Year ended December 31,(dollars in thousands) 2021 2020 2019Revenue $ 366,995 $ 341,073 $319,070Gross Margin 82,595 71,794 60,462Gross Margin % 23 % 21 % 19 %Operating Income 60,992 56,023 42,574Operating Income % 17 % 16 % 13 %
For the year ended December 31, 2021, compared to 2020, our ADTech segment operating results were higher onhigher levels of revenue due to increased activity in defense subsea technologies.
For the year ended December 31, 2020, compared to 2019, our ADTech segment operating results were higher onhigher levels of revenue due to increased activity in both defense subsea technologies and space systems.
We project our ADTech 2022 revenue to be higher, producing improved operating results. We anticipate growth in allof our government-focused businesses.
Unallocated Expenses. Our unallocated expenses, (i.e., those not associated with a specific business segment),within gross margin consist of expenses related to our incentive and deferred compensation plans, includingrestricted stock units, performance units and bonuses, as well as other general expenses. Our unallocated
37

expenses within operating expenses consist of those expenses within gross margin plus general and administrativeexpenses related to corporate functions.
The following table sets forth our unallocated expenses for the periods indicated:
Year ended December 31,(dollars in thousands) 2021 2020 2019Gross margin expenses $ (93,702) $ (80,804) $ (88,384)% of revenue 5 % 4 % 4 %Operating expenses (131,960) (120,677) (128,104)% of revenue 7 % 7 % 6 %
Our unallocated expenses for the year ended December 31, 2021 increased compared to 2020, primarily as a resultof increased accruals in 2021 for incentive-based compensation combined with increased health care andinformation technology costs.
Our unallocated expenses for the year ended December 31, 2020 decreased compared to 2019, primarily as aresult of reduced accruals in 2020 for incentive-based compensation.
We anticipate unallocated expenses in 2022 to average in the mid-$30 million range per quarter, due primarily tohigher information technology costs and higher costs due to inflation as compared to 2021.
Other. The following table sets forth our significant financial statement items below the income (loss) fromoperations line:
Year ended December 31,(dollars in thousands) 2021 2020 2019Interest income $ 2,477 $ 3,083 $ 7,893Interest expense, net of amounts capitalized (38,810) (43,900) (42,711)Equity earnings (loss) of unconsolidated affiliates 594 2,268 1,331Other income (expense), net (9,769) (14,269) (6,621)Provision (benefit) for income taxes 43,598 (2,146) 17,623
Interest income for the years ended December 31, 2021 and 2020 as compared to prior years, decreased primarilydue to lower interest rates and reduction of interest income related to dollar-denominated Angolan bonds that havebeen redeemed.
Interest expense decreased for the year ended December 31, 2021 compared to 2020, primarily due to repurchasesof $100 million in aggregate principal amount of the 2024 Senior Notes. Interest expense increased for the yearended December 31, 2020 compared to 2019, primarily due to capitalized interest of $3.4 million in 2019 associatedwith the new-build vessel, the Ocean Evolution, described under “Liquidity and Capital Resources” below that wasnot replicated in 2020. We have not capitalized interest since 2019.
In addition to interest on borrowings, interest expense, net of amounts capitalized, includes amortization of loancosts and interest rate swap gains, fees for lender commitments under our revolving credit agreement and fees forstandby letters of credit and bank guarantees that banks issue on our behalf for performance bonds, bid bonds andself-insurance requirements.
In 2022, we expect interest expense, net of interest income, to be approximately $38 million. We do not anticipatecapitalizing interest on any long-lived assets in 2022.
Included in other income (expense), net are foreign currency transaction losses of $8.4 million, $14 million, and $6.3million for 2021, 2020 and 2019, respectively. Foreign currency losses in 2021 primarily related to the Angolankwanza and were principally due to declining exchange rates for the Angolan kwanza, which devalued its currencyby 13%. The currency losses in 2020 primarily related to the Angolan kwanza and Brazilian real. Foreign currencylosses in 2020 related to the Angolan kwanza were primarily due to declining exchange rates for the Angolankwanza, which devalued its currency by 36%. Foreign currency losses in 2020 related to the Brazilian real wereprimarily due to the remeasurement of our U.S. dollar denominated liability balances to the Brazilian real. Thecurrency losses in 2019 primarily related to declining exchange rates for the Angolan kwanza, which devalued its
38

currency by 55% in 2019. We could incur further foreign currency exchange losses in Angolan kwanza, the Brazilianreal and other currencies, if currency devaluations occur.
Our tax provision is based on (1) our earnings for the period and other factors affecting the tax provision and (2) theoperations of foreign branches and subsidiaries that are subject to local income and withholding taxes. Factors thataffect our tax rate include our profitability levels in general and the geographical mix of our results. The effective taxrate for the 12-month periods ended December 31, 2021, 2020 and 2019 was different than the U.S. federalstatutory rate of 21%, primarily due to the geographical mix of revenue and earnings, changes in valuationallowances and uncertain tax positions, and other discrete items; therefore, we do not believe a discussion of theeffective tax rate is meaningful. We continue to make an assertion to indefinitely reinvest the unrepatriated earningsof any foreign subsidiary that would incur incremental tax consequences upon the distribution of such earnings.
On March 27, 2020, the CARES Act was signed into law in the United States. In accordance with the rules andprocedures under the CARES Act, we filed certain refund claims to carry back a portion of our U.S. net operatingloss. Prior to enactment of the CARES Act, such net operating losses could only be carried forward. As a result, weexpect to receive combined refunds of approximately $33 million, of which we have received $10 million as ofDecember 31, 2021. The remaining refunds are classified as accounts receivable, net, in our consolidated balancesheet as of December 31, 2021.
We continue to believe it is more likely than not that we would not be able to utilize all of our deferred tax assets. Inaccordance with applicable accounting standards, we recorded an additional valuation allowance of $87 million and$315 million in 2021 and 2020, respectively.
In 2022, our income tax payments, estimated to total between $40 million and $45 million, which include taxesincurred in countries that impose tax on the basis of in-country revenue, without regard to the profitability of suchoperations. These cash tax payments do not include expected refunds of approximately $23 million under theCARES Act.
Liquidity and Capital Resources
We consider our liquidity and capital resources adequate to support our operations, capital commitments andgrowth initiatives. As of December 31, 2021, we had working capital of $687 million, including cash and cashequivalents of $538 million. Additionally, we had $450 million available through our revolving credit facility under acredit agreement further described below.
Amendment No. 4 to the Credit Agreement (as defined below) provided for a $500 million revolving credit facilityuntil October 25, 2021 and thereafter provides for $450 million until January 25, 2023 with a group of banks. Ourrevolving credit facility provided under the Credit Agreement was undrawn as of December 31, 2021, and remainsundrawn as of the date of this report, and our nearest maturity of indebtedness is $400 million of our 4.650% SeniorNotes due in November 2024 (the “2024 Senior Notes”). In 2021, we repurchased $100 million in aggregateprincipal amount of the 2024 Senior Notes in open-market transactions. We may, from time to time, completeadditional limited repurchases of the 2024 Notes, via open-market or privately negotiated repurchase transactionsor otherwise, prior to their maturity date. We can provide no assurances as to the timing of any such additionalrepurchases or whether we will complete any such repurchases at all. We do not intend to disclose furtherinformation regarding any such repurchase transactions, except to the extent required in our subsequent periodicfilings on Forms 10-K or 10-Q, or unless otherwise required by applicable law.
Cash flows for the years ended December 31, 2021, 2020 and 2019 are summarized as follows:
Year ended December 31,
(in thousands) 2021 2020 2019Changes in Cash:Net Cash Provided by Operating Activities $ 225,314 $ 136,647 $ 157,569Net Cash Used in Investing Activities (34,157) (52,590) (134,787)Net Cash Used in Financing Activities (101,682) (1,699) (2,299)Effect of exchange rates on cash (3,377) (3,997) (1,087)Net Increase (Decrease) in Cash and Cash Equivalents $ 86,098 $ 78,361 $ 19,396
39
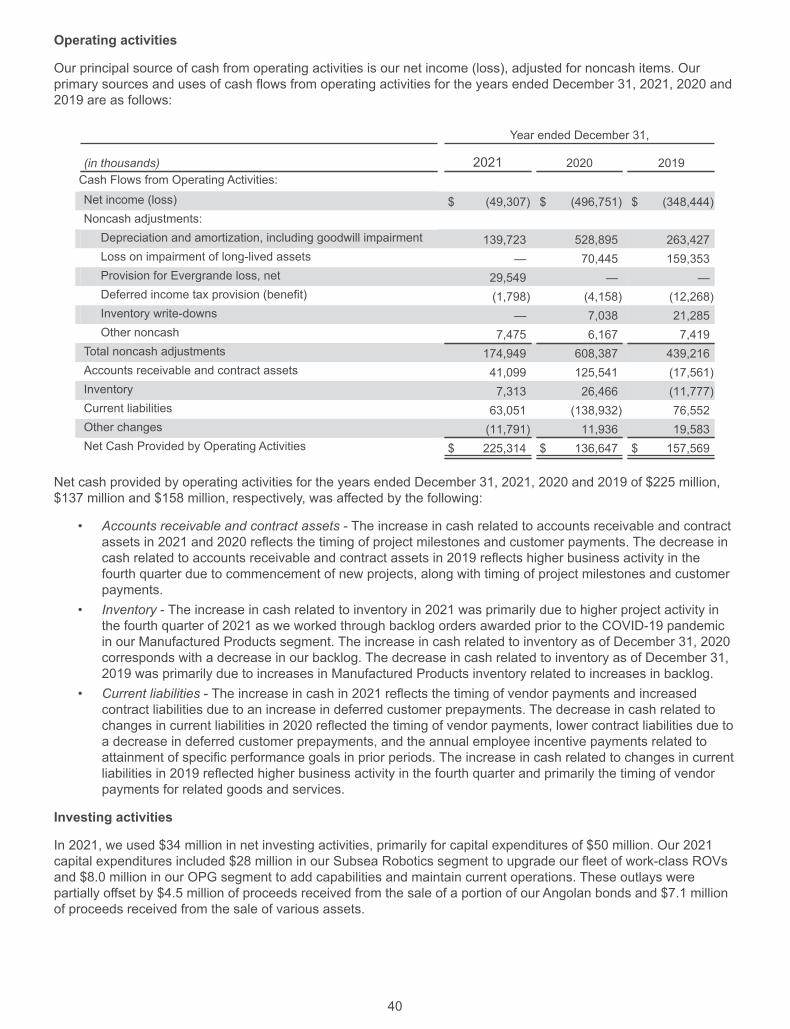
Operating activities
Our principal source of cash from operating activities is our net income (loss), adjusted for noncash items. Ourprimary sources and uses of cash flows from operating activities for the years ended December 31, 2021, 2020 and2019 are as follows:
Year ended December 31,
(in thousands) 2021 2020 2019Cash Flows from Operating Activities:
Net income (loss) $ (49,307) $ (496,751) $ (348,444)Noncash adjustments:Depreciation and amortization, including goodwill impairment 139,723 528,895 263,427Loss on impairment of long-lived assets — 70,445 159,353Provision for Evergrande loss, net 29,549 — —Deferred income tax provision (benefit) (1,798) (4,158) (12,268)Inventory write-downs — 7,038 21,285Other noncash 7,475 6,167 7,419
Total noncash adjustments 174,949 608,387 439,216Accounts receivable and contract assets 41,099 125,541 (17,561)Inventory 7,313 26,466 (11,777)Current liabilities 63,051 (138,932) 76,552Other changes (11,791) 11,936 19,583Net Cash Provided by Operating Activities $ 225,314 $ 136,647 $ 157,569
Net cash provided by operating activities for the years ended December 31, 2021, 2020 and 2019 of $225 million,$137 million and $158 million, respectively, was affected by the following:
• Accounts receivable and contract assets - The increase in cash related to accounts receivable and contractassets in 2021 and 2020 reflects the timing of project milestones and customer payments. The decrease incash related to accounts receivable and contract assets in 2019 reflects higher business activity in thefourth quarter due to commencement of new projects, along with timing of project milestones and customerpayments.
• Inventory - The increase in cash related to inventory in 2021 was primarily due to higher project activity inthe fourth quarter of 2021 as we worked through backlog orders awarded prior to the COVID-19 pandemicin our Manufactured Products segment. The increase in cash related to inventory as of December 31, 2020corresponds with a decrease in our backlog. The decrease in cash related to inventory as of December 31,2019 was primarily due to increases in Manufactured Products inventory related to increases in backlog.
• Current liabilities - The increase in cash in 2021 reflects the timing of vendor payments and increasedcontract liabilities due to an increase in deferred customer prepayments. The decrease in cash related tochanges in current liabilities in 2020 reflected the timing of vendor payments, lower contract liabilities due toa decrease in deferred customer prepayments, and the annual employee incentive payments related toattainment of specific performance goals in prior periods. The increase in cash related to changes in currentliabilities in 2019 reflected higher business activity in the fourth quarter and primarily the timing of vendorpayments for related goods and services.
Investing activities
In 2021, we used $34 million in net investing activities, primarily for capital expenditures of $50 million. Our 2021capital expenditures included $28 million in our Subsea Robotics segment to upgrade our fleet of work-class ROVsand $8.0 million in our OPG segment to add capabilities and maintain current operations. These outlays werepartially offset by $4.5 million of proceeds received from the sale of a portion of our Angolan bonds and $7.1 millionof proceeds received from the sale of various assets.
40

In 2020, we used $53 million in net investing activities, primarily for capital expenditures of $61 million. Our 2020capital expenditures included $34 million in our OPG segment to add capabilities and maintain current operationsand $15 million in our Subsea Robotics segment to upgrade our fleet of work-class ROVs.
In 2019, we used $135 million in net investing activities, primarily for capital expenditures of $148 million. Our 2019capital expenditures included $73 million in our Subsea Robotics segment to upgrade 13 of our work-class ROVs,$18 million in our Manufactured Products segment to add capabilities and maintain current operations and $42million in our Offshore Projects Group segment, which included completion of the multiservice vessel (“MSV”)Ocean Evolution, which was placed in service in the second quarter of 2019.
Our priority continues to be generating cash. In 2022, we expect our organic capital expenditures to total between$70 million and $90 million, exclusive of business acquisitions. This includes approximately $40 million to $45million of maintenance capital expenditures and $30 million to $45 million of growth capital expenditures. We remaincommitted to maintaining strong liquidity and believe that our cash position, undrawn revolving credit facility, anddebt maturity profile should provide us ample resources and time to address potential future growth opportunitiesand to improve our returns.
Our capital expenditures during 2021, 2020 and 2019 included $28 million, $15 million and $73 million, respectively,in our Subsea Robotics segment, principally for upgrades to our ROV fleet and to replace certain units we retired.We currently plan to add new ROVs only to meet contractual commitments. In 2021, we retired ten of ourconventional workclass ROV systems and replaced them with seven upgraded conventional workclass ROVsystems and three IsurusTM workclass ROV systems (which are capable of operating in severe conditions and areideal for renewables projects and high-speed surveys). We added three and 13 ROVs to our fleet and retired threeand 38 units during 2020 and 2019, respectively. Our ROV fleet size was 250 as of December 31, 2021, 2020 and2019.
We previously had several deepwater vessels under long-term charter. The last of our long-term charters expired inMarch 2018. We now have a mix of short-term charters where we can see firm workload and spot charters asmarket opportunities arise.
We placed our new-build, Jones Act-compliant, MSV Ocean Evolution into service during the second quarter of2019. The Ocean Evolution is U.S.-flagged and documented with a coastwise endorsement by the U.S. CoastGuard. The vessel has an overall length of 353 feet, a Class 2 dynamic positioning system, accommodations for 110personnel, a helideck, a 250-ton active heave-compensated crane, a working moonpool, and two of our highspecification 4,000 meter work-class ROVs. The vessel has five low-emission Environmental Protection Agency(“EPA”) Tier 4 diesel engines. The Tier 4 rating is the EPA’s strictest emission requirements for non-road dieselengines. The vessel is also equipped with a satellite communications system capable of transmitting streamingvideo for real-time work observation by shore-based personnel. The vessel is being used to augment our ability toprovide subsea intervention services in the U.S. Gulf of Mexico. These services are required to perform IMRprojects and hardware installations. Due to market conditions that no longer support the prior valuation for thisasset, in the fourth quarter of 2019, we determined that the carrying amount of the Ocean Evolution exceeded thefair value and recorded impairment expense of $101 million.
In 2010, we acquired a vessel, which we renamed the Ocean Patriot, and converted it to a dynamically positionedsaturation diving and ROV service vessel. We installed a 12-man saturation (“SAT”) diving system and one work-class ROV on the vessel, and we placed the vessel into service in December 2011. Due to market conditions thatno longer support the prior valuation for this asset, in the fourth quarter of 2019 and the 1st quarter of 2020, wedetermined that the carrying amount of the Ocean Patriot exceeded the fair value and recorded impairment expenseof $31 million and $3.9 million, respectively.
41

Financing activities
In 2021 we used $102 million of cash in financing activities primarily due to repurchases of $100 million inaggregate principal amount of the 2024 Senior Notes in open-market transactions. In 2020 and 2019, we used $1.7million and $2.3 million, respectively, in financing activities.
In November 2014, we completed the public offering of $500 million aggregate principal amount of 4.650% SeniorNotes due 2024 (the “2024 Senior Notes”). We pay interest on the 2024 Senior Notes on May 15 and November 15of each year. The 2024 Senior Notes are scheduled to mature on November 15, 2024.
In February 2018, we completed the public offering of $300 million aggregate principal amount of 6.000% SeniorNotes due 2028 (the “2028 Senior Notes”). We pay interest on the 2028 Senior Notes on February 1 and August 1of each year. The 2028 Senior Notes are scheduled to mature on February 1, 2028. We used the net proceeds fromthe 2028 Senior Notes to repay our term loan indebtedness described further below.
We may redeem some or all of the 2024 Senior Notes and 2028 Senior Notes (collectively, the “Senior Notes”) atspecified redemption prices. In 2021, we repurchased $100 million in aggregate principal amount of the 2024 SeniorNotes in open-market transactions. The aggregate purchase price in the year ended December 31, 2021 includedaccrued and unpaid interest to the repurchase date of $0.7 million and we recorded loss on extinguishment of debtof $1.1 million (including premiums and fees associated with the repurchases).
In October 2014, we entered into a credit agreement (as amended, the “Credit Agreement”) with a group of banks.The Credit Agreement initially provided for a $500 million five-year revolving credit facility (the “Revolving CreditFacility”). Subject to certain conditions, the aggregate commitments under the Revolving Credit Facility may beincreased by up to $300 million at any time upon agreement between us and existing or additional lenders.Borrowings under the Revolving Credit Facility may be used for general corporate purposes. The Credit Agreementalso provided for a $300 million term loan, which we repaid in full in February 2018, using net proceeds from theissuance of our 2028 Senior Notes referred to above, and cash on hand.
In February 2018, we entered into Agreement and Amendment No. 4 to the Credit Agreement (“Amendment No. 4”).Amendment No. 4 amended the Credit Agreement to, among other things, extend the maturity of the RevolvingCredit Facility to January 25, 2023 with the extending lenders, which represent 90% of the existing commitments ofthe lenders, such that the total commitments for the Revolving Credit Facility was $500 million untilOctober 25, 2021, and thereafter $450 million until January 25, 2023.
Borrowings under the Revolving Credit Facility bear interest at an Adjusted Base Rate or the Eurodollar Rate (bothas defined in the Credit Agreement), at our option, plus an applicable margin based on our Leverage Ratio (asdefined in the Credit Agreement) and, at our election, based on the ratings of our senior unsecured debt bydesignated ratings services, thereafter to be based on such debt ratings. The applicable margin varies: (1) in thecase of advances bearing interest at the Adjusted Base Rate, from 0.125% to 0.750%; and (2) in the case ofadvances bearing interest at the Eurodollar Rate, from 1.125% to 1.750%. The Adjusted Base Rate is the highest of(1) the per annum rate established by the administrative agent as its prime rate, (2) the federal funds rate plus0.50% and (3) the daily one-month London Interbank Offered Rate (“LIBOR”) plus 1%. We pay a commitment feeranging from 0.125% to 0.300% on the unused portion of the Revolving Credit Facility, depending on our LeverageRatio. The commitment fees are included as interest expense in our consolidated financial statements.
The Credit Agreement contains various covenants that we believe are customary for agreements of this nature,including, but not limited to, restrictions on our ability and the ability of each of our subsidiaries to incur debt, grantliens, make certain investments, make distributions, merge or consolidate, sell assets and enter into certainrestrictive agreements. We are also subject to a maximum adjusted total Capitalization Ratio (as defined in theCredit Agreement and which stipulates that, among other items, we exclude any impacts associated with currentand prior-period impairments) of 55%. The Credit Agreement includes customary events of default and associatedremedies. As of December 31, 2021, we were in compliance with all the covenants set forth in the CreditAgreement.
We had two interest rate swaps in place relating to a total of $200 million of the 2024 Senior Notes for the period toNovember 2024. The agreements swapped the fixed interest rate of 4.65% on $100 million of the 2024 SeniorNotes to the floating rate of one-month LIBOR plus 2.426% and on another $100 million to one-month LIBOR plus2.823%. In March 2020, we settled both interest rate swaps with the counterparty for cash proceeds of $13 million.The settlement resulted in a $13 million increase to our long-term debt balance that will be amortized to interestexpense prospectively through the maturity date for the 2024 Senior Notes using the effective interest method. As a
42

result, we amortized $4.3 million to interest expense, including $1.8 million for the pro-rata write-off of interest rateswap settlement gains associated with the 2024 Senior Notes repurchases discussed above, for the year endedDecember 31, 2021. We amortized $2.0 million to interest expense for the year ended December 31, 2020. SeeNote 9—”Debt” in the Notes to Consolidated Financial Statements included in this report for a description of theseinterest rate swaps.
We incurred $6.9 million and $4.2 million of issuance costs related to the 2024 Senior Notes and the 2028 SeniorNotes, respectively, and $3.0 million of new loan costs, including costs of the amendments prior to Amendment No.4, related to the Credit Agreement. These costs, net of accumulated amortization, are included as a reduction oflong-term debt in our Consolidated Balance Sheet, as they pertain to the Senior Notes, and in other noncurrentassets as they pertain to the Credit Agreement. We are amortizing these costs to interest expense through therespective maturity dates for the Senior Notes and to January 2023 for the Credit Agreement using the straight-linemethod, which approximates the effective interest rate method.
Our maximum outstanding indebtedness during 2021 under the Credit Agreement and the Senior Notes was $800million, and our total interest costs, including commitment fees, were $39 million.
We have not guaranteed any debt not reflected on our Consolidated Balance Sheets as of December 31, 2021 and2020, and we do not have any off-balance-sheet arrangements, as defined by SEC rules.
In December 2014, our Board of Directors approved a plan to repurchase up to 10 million shares of our commonstock on a discretionary basis. The program calls for any repurchases to be made in the open market, or in privatelynegotiated transactions from time to time, in compliance with applicable laws, rules and regulations, including Rule10b-18 under the Securities Exchange Act of 1934, as amended, subject to market and business conditions, levelsof available liquidity, cash requirements for other purposes, applicable legal requirements and other relevant factors.Under this program, in 2015, we repurchased 2.0 million shares of our common stock for $100 million. We have notrepurchased any shares under the program since December 2015. As of December 31, 2021, we retained 11 millionof the shares we had repurchased through this and a prior repurchase program. We account for the shares we holdin treasury under the cost method, at average cost. The timing and amount of any future repurchases will bedetermined by our management. We expect that any additional shares repurchased under the plan will be held astreasury stock for possible future use. The plan does not obligate us to repurchase any particular number of shares.
Because of our significant foreign operations, we are exposed to currency fluctuations and exchange rate risks. Astronger U.S. dollar against any of the foreign currencies where we conduct business could result in lower operatingincome. We generally minimize these risks primarily through matching, to the extent possible, revenue and expensein the various currencies in which we operate. Cumulative translation adjustments as of December 31, 2021 relateprimarily to our net investments in, including long-term loans to, our foreign subsidiaries. See Item 7A—“Quantitative and Qualitative Disclosures About Market Risk.”
Critical Accounting Policies and Estimates
We have based the following discussion and analysis of our financial condition and results of operations on ourconsolidated financial statements, which we have prepared in conformity with accounting principles generallyaccepted in the United States. These principles require us to make various estimates, judgments and assumptionsthat affect the reported amounts of assets and liabilities at the date of the financial statements and the reportedamounts of revenue and expense during the periods we present. We base our estimates on historical experience,available information and other assumptions we believe to be reasonable under the circumstances. On an ongoingbasis, we evaluate our estimates; however, our actual results may differ from these estimates under differentassumptions or conditions. The following discussion summarizes the accounting policies we believe (1) require ourmanagement's most difficult, subjective or complex judgments and (2) are the most critical to our reporting of resultsof operations and financial position. See Note 1—“Summary of Major Accounting Policies” in the Notes ToConsolidated Financial Statements included in this report for discussion of our significant accounting policies.
Revenue Recognition.We account for significant fixed-price contracts, mainly relating to our ManufacturedProducts segment, and to a lesser extent in our Offshore Projects Group and Aerospace and Defense Technologiessegments, by recognizing revenue over time using an input, cost-to-cost measurement percentage-of-completionmethod. We use the input cost-to-cost method to measure progress toward satisfaction of an over-time performanceobligation. This commonly used method is based on the premise that costs incurred are proportionate to progresstowards satisfaction of the performance obligation and is measured by comparing project costs-to-date to totalestimated costs. The performance obligation is satisfied as we create a product on behalf of the customer over the
43

life of the contract. The remainder of our revenue is recognized at the point in time when control transfers to thecustomer, thus satisfying the performance obligation.
We apply judgment in the determination and allocation of transaction price to performance obligations, and thesubsequent recognition of revenue, based on the facts and circumstances of each contract. We routinely reviewestimates related to our contracts and, where required, reflect revisions to profitability in earnings immediately. If anelement of variable consideration has the potential for a significant future reversal of revenue, we will constrain thatvariable consideration to a level intended to remove the potential future reversal. If a current estimate of totalcontract cost indicates an ultimate loss on a contract, we recognize the projected loss in full when we determine it.We did not have any material adjustments during the years ended December 31, 2021, 2020 or 2019.
Property and Equipment, Long-lived Intangible Assets and Right-of-Use Operating Lease Assets.Weperiodically, and upon the occurrence of a triggering event, review the realizability of our property and equipment,long-lived intangible assets and right-of-use operating lease assets to determine whether any events or changes incircumstances indicate that the carrying amount of the asset may not be recoverable. For long-lived assets to beheld and used, we base our evaluation on impairment indicators such as the nature of the assets, the futureeconomic benefits of the assets, any historical or future profitability measurements and other external marketconditions or factors that may be present. If such impairment indicators are present or other factors exist thatindicate that the carrying amount of an asset may not be recoverable, we determine whether an impairment hasoccurred through the use of an undiscounted cash flows analysis of the asset at the lowest level for whichidentifiable cash flows exist. If an impairment has occurred, we recognize a loss for the difference between thecarrying amount and the fair value of the asset.
Our estimates of fair values for our asset groups require us to use significant unobservable inputs, classified asLevel 3 fair value measurements, including assumptions related to future performance, risk-adjusted discount rates,future commodity prices and demand for our services and estimates of expected realizable value.
We did not identify any triggering events and, accordingly, no impairments of long-lived assets were recorded in theyear ended December 31, 2021. In the years ending December 31, 2020 and 2019, we recognized long-lived assetimpairment losses of $70 million and $159 million, respectively. See Note 5—“Impairments” and Note 11—“Operations by Business Segment and Geographic Area” in the Notes To Consolidated Financial Statementsincluded in this report for further discussion of these impairments.
Income Taxes. Our tax provisions are based on our expected taxable income, statutory rates and tax-planningopportunities available to us in the various jurisdictions in which we operate. The determination of taxable income inany jurisdiction requires the interpretation of the related tax laws. We are at risk that a taxing authority's finaldetermination of our tax liabilities may differ from our interpretation.
We account for any applicable interest and penalties on uncertain tax positions as a component of our provision forincome taxes on our financial statements. Current income tax expense represents either nonresident withholdingtaxes or the liabilities expected to be reflected on our income tax returns for the current year, while the net deferredincome tax expense or benefit represents the change in the balance of deferred tax assets or liabilities as reportedon our balance sheet.
We establish valuation allowances to reduce deferred tax assets when it is more likely than not that some portion orall of the deferred tax assets will not be realized in the future. Provisions for valuation allowances impact our incometax provision in the period in which such adjustments are identified and recorded.
Allowance for Credit Loss—Financial Assets Measured at Amortized Costs.We use the loss-rate method indeveloping the allowance for credit losses which involves identifying pools of assets with similar risk characteristics,reviewing historical loss experiences for the last three years and considering the economic environment of ourcustomers, both from a marketplace and geographic perspective, in evaluating the need for an allowance. Based onour review of these factors, we establish or adjust allowances for our customers. Our results of operations could beaffected by adjustments to the allowance for credit loss due to actual write-offs that differ from estimated amounts.During the years ended December 31, 2021 and 2020, we recognized credit losses of $53 million and $11 million,respectively for receivables and contract assets.
Contractual ObligationsAs of December 31, 2021, we had payments due under contractual obligations as follows:
44

(dollars in thousands) Payments due by periodTotal 2022 2023-2024 2025-2026 After 2026
Long-term Debt $ 700,000 $ — $ 400,000 $ — $ 300,000
Operating Lease Liabilities 236,156 28,619 47,841 44,868 114,828
Purchase Obligations 301,796 282,428 18,772 52 544Other Long-term Obligations reflected on ourBalance Sheet under U.S. GAAP 40,015 92 219 281 39,423
TOTAL $ 1,277,967 $ 311,139 $ 466,832 $ 45,201 $ 454,795
Pursuant to a service agreement we entered into with our Chairman of the Board of Directors, we are obligated toprovide for medical coverage on an after-tax basis to him, his spouse and two adult children for their lives. Our totalaccrued liabilities, current and long-term, under this post-employment benefit were $1.8 million as of both December31, 2021 and 2020.
Effects of Inflation and Changing PricesOur financial statements are prepared in accordance with generally accepted accounting principles in the UnitedStates, using historical U.S. dollar accounting, or historical cost. Statements based on historical cost, however, donot adequately reflect the cumulative effect of increasing costs and changes in the purchasing power of the dollar,especially during times of significant and continued inflation.
In order to minimize the negative impact of inflation on our operations, we attempt to cover the increased cost ofanticipated changes in labor, material and service costs, either through an estimate of those changes, which wereflect in the original price, or through price escalation clauses in our contracts. Due to the protracted downturn andover-capacity in the energy market in which we compete, pricing has been challenging; however, our success inachieving price escalation clauses has improved. Inflation has not had a material effect on our revenue or incomefrom operations in the past three years, but could have a material impact on our results in the future.
45

Item 7A. Quantitative and Qualitative Disclosures About Market Risk.We are currently exposed to certain market risks arising from transactions we have entered into in the normalcourse of business. These risks relate to interest rate changes and fluctuations in foreign exchange rates. Exceptfor our exposure in Angola, we do not believe these risks are material. We have not entered into any market-risk-sensitive instruments for speculative or trading purposes. When we have a significant amount of borrowings, wetypically manage our exposure to interest rate changes through the use of a combination of fixed- and floating-ratedebt. See Note 9—“Debt” in the Notes to Consolidated Financial Statements included in this report for a descriptionof our revolving credit facility and interest rates on our borrowings. We had two interest rate swaps in place relatingto a total of $200 million of the 2024 Senior Notes. These agreements swapped the fixed interest rate of 4.650% on$100 million of the 2024 Senior Notes to the floating rate of one-month LIBOR plus 2.426% and on another $100million to one-month LIBOR plus 2.823%. In March 2020, we terminated these interest rate swaps. See Note 9—“Debt” in the Notes to Consolidated Financial Statements included in this report for more information regardingthese interest rate swaps. We believe significant interest rate changes would not have a material near-term impacton our future earnings or cash flows.
Because we operate in various regions in the world, we conduct a portion of our business in currencies other thanthe U.S. dollar. The functional currency for most of our international operations is the applicable local currency. Astronger U.S. dollar against the U.K. pound sterling, the Norwegian kroner and the Brazilian real could result inlower operating income. We manage our exposure to changes in foreign exchange rates principally througharranging compensation in U.S. dollars or freely convertible currency and, to the extent possible, by limitingcompensation received in other currencies to amounts necessary to meet obligations denominated in thosecurrencies. We use the exchange rates in effect as of the balance sheet date to translate assets and liabilities whenthe functional currency is the local currency, resulting in translation adjustments that we reflect as accumulatedother comprehensive income or loss in the equity section of our Consolidated Balance Sheets. We recorded netadjustments to our equity accounts of $(7.3) million, $(25) million and $5.3 million in 2021, 2020 and 2019,respectively. Negative adjustments reflect the net impact of the strengthening of the U.S. dollar against variousforeign currencies for locations where the functional currency is not the U.S. dollar. Conversely, positive adjustmentsreflect the effect of a weakening U.S. dollar.
We recorded foreign currency transaction gains (losses) of $(8.4) million, $(14) million and $(6.3) million for 2021,2020 and 2019, respectively. We recorded foreign currency transaction losses related to the Angolan kwanza andBrazilian real as a component of other income (expense), net in our Consolidated Statements of Operations in thoserespective periods. Foreign currency gains (losses) related to the Brazilian real of $(0.2) million, $(7.3) million, and$(0.7) million in 2021, 2020 and 2019, respectively, were primarily due to the remeasurement of our U.S. dollardenominated liability balances to the Brazilian real. Foreign currency transaction gains (losses) related to theAngolan kwanza of $(4.5) million, $(2.8) million and $(4.8) million in 2021, 2020 and 2019, respectively, wereprimarily due to the remeasurement of our Angolan kwanza cash balances to U.S. dollars. Angola devalued itscurrency by 13%, 36% and 55% in 2021, 2020 and 2019, respectively. Any conversion of cash balances fromkwanza to U.S. dollars is controlled by the central bank in Angola. During 2021 and 2020, we were able to repatriate$4.5 million and $11 million, respectively, of cash from Angola.
As of December 31, 2021 and December 31, 2020, we had the equivalent of approximately $1.0 million and $4.7million, respectively, of kwanza cash balances in Angola, reflected on our Consolidated Balance Sheets.
To mitigate our currency exposure risk in Angola, we have used kwanza to purchase equivalent Angolan centralbank (Banco Nacional de Angola) bonds. The bonds are denominated as U.S. dollar equivalents, so that, uponpayment of semi-annual interest and principal upon maturity, payment is made in kwanza, equivalent to therespective U.S. dollars at the then-current exchange rate. As of December 31, 2021 and 2020, we had $6.2 millionand $10 million, respectively, of Angolan bonds on our Consolidated Balance Sheets. During the year endedDecember 31, 2021, we sold a portion of these bonds for $4.5 million. Because we intend to sell the bonds if we areable to repatriate the proceeds, we have classified these bonds as available-for-sale securities, and they arerecorded in other current assets on our Consolidated Balance Sheets.
We estimated the fair market value of the Angolan bonds to be $6.4 million and $10 million as of December 31,2021 and 2020, respectively, using quoted market prices. Since the market for the Angolan bonds is not an activemarket, the fair value of the Angolan bonds is classified within Level 2 in the fair value hierarchy under U.S. GAAP.As of December 31, 2021, we have $0.2 million in unrealized gains, net of tax, related to these bonds as acomponent of accumulated other comprehensive loss in our Consolidated Balance Sheets.
46

Item 8. Financial Statements and Supplementary Data.In this report, our consolidated financial statements and supplementary data appear following the signature page tothis report and are incorporated into this item by reference.
Item 9. Changes in and Disagreements With Accountants on Accounting and Financial Disclosure.None.
Item 9A. Controls and Procedures.
Disclosure Controls and Procedures
In accordance with Rules 13a-15 and 15d-15 under the Securities Exchange Act of 1934, as amended (the“Exchange Act”), we carried out an evaluation, under the supervision and with the participation of management,including our principal executive officer and principal financial officer, of the effectiveness of our disclosure controlsand procedures (as that term is defined in Rules 13a-15(e) and 15d-15(e) under the Exchange Act) as of the end ofthe period covered by this report. Based on that evaluation, our principal executive officer and principal financialofficer concluded that our disclosure controls and procedures were effective as of December 31, 2021 to providereasonable assurance that information required to be disclosed in our reports filed or submitted under the ExchangeAct is recorded, processed, summarized and reported within the time periods specified in the Securities andExchange Commission's rules and forms.
Internal Control Over Financial Reporting
There has been no change in our internal control over financial reporting that occurred during the quarter endedDecember 31, 2021 that has materially affected, or is reasonably likely to materially affect, our internal control overfinancial reporting.
Management's Report on Internal Control Over Financial ReportingOur management is responsible for establishing and maintaining adequate internal control over financial reporting(as that term is defined in Rules 13a-15(f) and 15d-15(f) under the Exchange Act). Our internal control over financialreporting is a process designed to provide reasonable, but not absolute, assurance regarding the reliability offinancial reporting and the preparation of financial statements for external reporting purposes in accordance withaccounting principles generally accepted in the United States of America. We developed our internal control overfinancial reporting through a process in which our management applied its judgment in assessing the costs andbenefits of various controls and procedures, which, by their nature, can provide only reasonable assuranceregarding the control objectives. You should note that the design of any system of controls is based in part onvarious assumptions about the likelihood of future events, and we cannot assure you that any system of controls willsucceed in achieving its stated goals under all potential future conditions, regardless of how remote. Because of itsinherent limitations, internal control over financial reporting may not prevent or detect misstatements. Also,projections of any evaluation of effectiveness to future periods are subject to the risk that controls may becomeinadequate because of changes in conditions, or that the degree of compliance with the policies and proceduresmay deteriorate.
Under the supervision and with the participation of our management, including our principal executive, financial andaccounting officers, we have conducted an evaluation of the effectiveness of our internal control over financialreporting based on the framework in Internal Control—Integrated Framework issued by the Committee ofSponsoring Organizations of the Treadway Commission (2013 framework). This evaluation included a review of thedocumentation surrounding our financial reporting controls, an evaluation of the design effectiveness of thesecontrols, testing of the operating effectiveness of these controls and an evaluation of our overall controlenvironment. Based on that evaluation, our management has concluded that our internal control over financialreporting was effective as of December 31, 2021.
Ernst & Young LLP, the independent registered public accounting firm that audited our financial statements, hasaudited our internal control over financial reporting, as stated in their report that follows.
47

Report of Independent Registered Public Accounting Firm
To the Shareholders and the Board of Directors of Oceaneering International, Inc.
Opinion on Internal Control over Financial Reporting
We have audited Oceaneering International, Inc. and subsidiaries internal control over financial reporting as of December 31, 2021, based oncriteria established in Internal Control—Integrated Framework issued by the Committee of Sponsoring Organizations of the TreadwayCommission (2013 framework) (the COSO criteria). In our opinion, Oceaneering International, Inc. and subsidiaries (the Company)maintained, in all material respects, effective internal control over financial reporting as of December 31, 2021, based on the COSO criteria.
We also have audited, in accordance with the standards of the Public Company Accounting Oversight Board (United States) (PCAOB), theconsolidated balance sheets of the Company as of December 31, 2021 and 2020, and the related consolidated statements of operations,comprehensive income (loss), equity and cash flows for each of the three years in the period ended December 31, 2021, and the relatednotes and our report dated February 25, 2022, expressed an unqualified opinion thereon.
Basis for Opinion
The Company’s management is responsible for maintaining effective internal control over financial reporting and for its assessment of theeffectiveness of internal control over financial reporting included in the accompanying Management’s Report on Internal Control overFinancial Reporting. Our responsibility is to express an opinion on the Company’s internal control over financial reporting based on our audit.We are a public accounting firm registered with the PCAOB and are required to be independent with respect to the Company in accordancewith the U.S. federal securities laws and the applicable rules and regulations of the Securities and Exchange Commission and the PCAOB.
We conducted our audit in accordance with the standards of the PCAOB. Those standards require that we plan and perform the audit toobtain reasonable assurance about whether effective internal control over financial reporting was maintained in all material respects.
Our audit included obtaining an understanding of internal control over financial reporting, assessing the risk that a material weakness exists,testing and evaluating the design and operating effectiveness of internal control based on the assessed risk, and performing such otherprocedures as we considered necessary in the circumstances. We believe that our audit provides a reasonable basis for our opinion.
Definition and Limitations of Internal Control Over Financial Reporting
A company’s internal control over financial reporting is a process designed to provide reasonable assurance regarding the reliability offinancial reporting and the preparation of financial statements for external purposes in accordance with generally accepted accountingprinciples. A company’s internal control over financial reporting includes those policies and procedures that (1) pertain to the maintenance ofrecords that, in reasonable detail, accurately and fairly reflect the transactions and dispositions of the assets of the company; (2) providereasonable assurance that transactions are recorded as necessary to permit preparation of financial statements in accordance with generallyaccepted accounting principles, and that receipts and expenditures of the company are being made only in accordance with authorizations ofmanagement and directors of the company; and (3) provide reasonable assurance regarding prevention or timely detection of unauthorizedacquisition, use, or disposition of the company’s assets that could have a material effect on the financial statements.
Because of its inherent limitations, internal control over financial reporting may not prevent or detect misstatements. Also, projections of anyevaluation of effectiveness to future periods are subject to the risk that controls may become inadequate because of changes in conditions, orthat the degree of compliance with the policies or procedures may deteriorate
/s/ Ernst & Young LLP
Houston, TexasFebruary 25, 2022
48
Item 9B. Other Information.None.
Item 9C. Disclosure Regarding Foreign Jurisdictions that Prevent Inspections.Not applicable.
Part III
Item 10. Directors, Executive Officers and Corporate Governance.
The information with respect to the directors and nominees for election to our Board of Directors is incorporated byreference from the section “Election of Directors” in our definitive proxy statement to be filed within 120 days ofDecember 31, 2021, relating to our 2022 Annual Meeting of Shareholders.
Information concerning our Audit Committee and the audit committee financial experts is incorporated by referencefrom the sections entitled “Corporate Governance” and “Committees of the Board – Audit Committee” in the proxystatement referred to in this Item 10. Information concerning our Code of Ethics is incorporated by reference fromthe section entitled “Code of Ethics” for the Chief Executive Officer and Senior Financial Officers in the proxystatement previously referred to in this Item 10.
The information with respect to our executive officers is provided under the heading “Executive Officers of theRegistrant” following Item 1 of Part I of this report. There are no family relationships between any of our directors orexecutive officers.
The information with respect to the reporting by our directors and executive officers and persons who own morethan 10% of our Common Stock under Section 16 of the Securities Exchange Act of 1934 is incorporated byreference from the section entitled "Section 16(a) Beneficial Ownership Reporting Compliance" in the proxystatement previously referred to in this Item 10.
Item 11. Executive Compensation.
The information required by Item 11 is incorporated by reference from the sections entitled “CompensationCommittee Interlocks and Insider Participation,” “Compensation Discussion and Analysis,” “Report of theCompensation Committee,” “Compensation of Executive Officers,” and “Compensation of Nonemployee Directors”in the proxy statement referred to in Item 10 above.
Item 12. Security Ownership of Certain Beneficial Owners and Management and Related StockholderMatters.
The information required by Item 12 is incorporated by reference from (1) the Equity Compensation Plan Informationtable appearing in Item 5 – “Market for Registrant's Common Equity, Related Stockholder Matters and IssuerPurchases of Equity Securities” in Part II of this report and (2) the section “Security Ownership of Management andCertain Beneficial Owners” in the proxy statement referred to in Item 10 above.
Item 13. Certain Relationships and Related Transactions, and Director Independence.The information required by Item 13 is incorporated by reference from the sections entitled “Corporate Governance”and “Certain Relationships and Related Transactions” in the proxy statement referred to in Item 10 above.
Item 14. Principal Accounting Fees and Services.The information required by Item 14 is incorporated by reference from the section entitled “Ratification ofAppointment of Independent Auditors – Fees Incurred for Audit and Other Services provided by Ernst & Young LLP”in the proxy statement referred to in Item 10 above.
49

Part IV
Item 15. Exhibits, Financial Statement Schedules.(a) Documents filed as part of this report.
1. Financial Statements:(i) Report of Independent Registered Public Accounting Firm(ii) Consolidated Balance Sheets(iii) Consolidated Statements of Operations(iv) Consolidated Statements of Comprehensive Income (Loss)(v) Consolidated Statements of Cash Flows(vi) Consolidated Statements of Equity(vii) Notes to Consolidated Financial Statements
2. Financial Statement Schedules:All schedules for which provision is made in the applicable regulations of the Securities andExchange Commission have been omitted because they are not required under the relevantinstructions or because the required information is not significant.
3. Exhibits:
Exhibit Index
Registrationor FileNumber
Form ofReport Report Date
ExhibitNumber
* 3.01 Restated Certificate of Incorporation 1-10945 10-K Dec. 2000 3.01
* 3.02 Certificate of Amendment to Restated Certificate ofIncorporation
1-10945 8-K May 2008 3.1
* 3.03 Certificate of Amendment to Restated Certificate ofIncorporation
1-10945 8-K May 2014 3.1
* 3.04 Amended and Restated Bylaws 1-10945 8-K Aug. 2020 3.01
4.01 Description of Common Stock
* 4.02 Specimen of Common Stock Certificate 1-10945 10-Q Sep. 2018 4.3
* 4.03 Credit Agreement, dated as of October 27, 2014,by and among Oceaneering International, Inc.,Wells Fargo Bank, National Association, asadministrative agent and swing line lender, andcertain lenders party thereto
1-10945 8-K Oct. 2014 4.1
* 4.04 Agreement and Amendment No. 1 to CreditAgreement
1-10945 8-K Nov. 2015 4.1
* 4.05 Agreement and Amendment No. 2 to CreditAgreement
1-10945 8-K Nov. 2016 4.1
* 4.06 Agreement and Amendment No. 3 to CreditAgreement
1-10945 8-K June 2017 4.1
* 4.07 Agreement and Amendment No. 4 to CreditAgreement
1-10945 8-K Feb. 2018 4.1
* 4.08 Indenture dated, November 21, 2014, betweenOceaneering International, Inc. and Wells FargoBank, National Association, as Trustee, relating tosenior debt securities of Oceaneering International,Inc.
1-10945 8-K Nov. 2014 4.1
50

* 4.09 First Supplemental Indenture, dated November 21,2014, between Oceaneering International, Inc. andWells Fargo Bank, National Association, asTrustee, providing for the issuance of OceaneeringInternational, Inc.’s 4.650% Senior Notes due 2024(including Form of Notes)
1-10945 8-K Nov. 2014 4.2
* 4.10 Second Supplemental Indenture, dated February 6,2018, between Oceaneering International, Inc. andWells Fargo Bank, National Association, asTrustee, providing for the issuance of OceaneeringInternational, Inc.'s 6.000% Senior Notes due 2028(including Form of Notes)
1-10945 8-K Feb. 2018 4.2
We and certain of our consolidated subsidiaries are parties to debt instruments under which the total amount of securitiesauthorized does not exceed 10% of our total consolidated assets. Pursuant to paragraph 4(iii)(A) of Item 601(b) of RegulationS-K, we agree to furnish a copy of those instruments to the Securities and Exchange Commission on request.
* 10.01 + Amended and Restated Service Agreement datedas of December 21, 2006 between Oceaneeringand John R. Huff
1-10945 8-K Dec. 2006 10.1
* 10.02 + Modification to Service Agreement dated as ofDecember 21, 2006 between Oceaneering andJohn R. Huff
1-10945 8-K Dec. 2008 10.9
* 10.03 + Trust Agreement dated as of May 12, 2006between Oceaneering and United Trust Company,National Association (the “Huff Trust Agreement”)
1-10945 8-K May 2006 10.2
* 10.04 + First Amendment to Huff Trust Agreement dated asof May 12, 2006 between OceaneeringInternational, Inc. and Bank of America NationalAssociation, as successor trustee
1-10945 8-K Dec. 2008 10.10
* 10.05 + Second Amendment to Huff Trust Agreement datedas of May 12, 2006 between OceaneeringInternational, Inc. and Evercore Trust Company,National Association, as successor trustee
1-10945 10-K Dec. 2018 10.33
* 10.06 + Third Amendment to Huff Trust Agreement datedas of May 12, 2006 between OceaneeringInternational, Inc. and Newport Trust Company, assuccessor trustee
1-10945 10-K Dec. 2018 10.34
* 10.07 + Oceaneering International, Inc. SupplementalExecutive Retirement Plan, as amended andrestated effective January 1, 2009
1-10945 8-K Dec. 2008 10.5
* 10.08 + Amended and Restated Oceaneering International,Inc. Supplemental Executive Retirement Plan, asamended and restated effective January 1, 2000(for Internal Revenue Code Section 409A-grandfathered benefits)
1-10945 8-K Dec. 2008 10.6
* 10.09 + Form of Change-of-Control Agreement and Annexfor Roderick A. Larson
1-10945 8-K Aug. 2015 10.3
* 10.10 + Form of Change-of-Control Agreement 1-10945 8-K May 2011 10.5
* 10.11 + Form of Indemnification Agreement 1-10945 8-K May 2011 10.4
* 10.12 + Second Amended and Restated 2010 IncentivePlan
1-10945 DEF 14A Mar. 2017 Appendix A
* 10.13 + Form of 2019 Performance Unit Agreement,including 2019 Performance Award: Goals andMeasures
1-10945 8-K Mar. 2019 10.1
* 10.14 + Form of 2019 Restricted Stock Unit Agreement 1-10945 8-K Mar. 2019 10.2
51

* 10.15 + Oceaneering International, Inc. RetirementInvestment Plan, amended and restated witheffective January 1, 2019
1-10945 10-K Dec. 2018 10.31
* 10.16 + Amendment No. 1 to Amended and RestatedOceaneering International, Inc. RetirementInvestment Plan
1-10945 10-K Dec. 2020 10.18
* 10.17 + Amendment No. 2 to Amended and RestatedOceaneering International, Inc. RetirementInvestment Plan
1-10945 10-K Dec. 2020 10.19
* 10.18 + Amendment No. 3 to Amended and RestatedOceaneering International, Inc. RetirementInvestment Plan
1-10945 10-Q Jun. 2021 10.01
* 10.19 + Oceaneering Retirement Investment Plan TrustAgreement with Fidelity Management TrustCompany effective January 1, 2019
1-10945 10-K Dec. 2018 10.35
* 10.20 + Change of Control Plan and Form of ParticipationAgreement
1-10945 10-K Dec. 2018 10.32
* 10.21 + Form of 2020 Performance Unit Agreement 1-10945 8-K Feb. 2020 10.1
* 10.22 + Form of 2020 Restricted Stock Unit Agreement 1-10945 8-K Feb. 2020 10.2
* 10.23 + Form of 2021 Performance Unit Agreement 1-10945 8-K Feb. 2021 10.1
* 10.24 + Form of 2021 Restricted Stock Unit Agreement 1-10945 8-K Feb. 2021 10.2
* 10.25 + Form of 2021 Nonemployee Director RestrictedStock Agreement
1-10945 8-K Feb. 2021 10.3
* 10.26 + 2021 Nonemployee Director Restricted StockAgreement for Mr. Huff
1-10945 8-K Feb. 2021 10.4
* 10.27 + 2021 Annual Cash Bonus Award ProgramSummary
1-10945 8-K Feb. 2021 10.5
* 10.28 + Employment Agreement for Mr. Davison 1-10945 10-Q Jun. 2019 10.1
* 10.29 + 2019 Performance Unit Agreement for Mr. Davison 1-10945 10-Q Jun. 2019 10.2
* 10.30 + 2019 Restricted Stock Unit Agreement for Mr.Davison
1-10945 10-Q Jun. 2019 10.3
* 10.31 + Special Restricted Stock Unit Agreement for Mr.Davison
1-10945 10-Q Jun. 2019 10.4
* 10.32 + Retention and Severance Payments Agreement forMr. Davison
1-10945 10-Q Jun. 2019 10.5
* 10.33 + 2020 Incentive Plan 333-238325 S-8 May 2020 4.06
21.01 Subsidiaries of Oceaneering
23.01 Consent of Independent Registered Public Accounting Firm
31.01 Rule 13a – 14(a)/15d – 14(a) certification of principal executive officer
31.02 Rule 13a – 14(a)/15d – 14(a) certification of principal financial officer
32.01 Section 1350 certification of principal executive officer
32.02 Section 1350 certification of principal financial officer
101.INS Inline XBRL Instance Document - The instance document does not appear in the interactive data file because itsXBRL tags are embedded within the Inline XBRL document.
101.SCH Inline XBRL Taxonomy Extension Schema Document
101.CAL Inline XBRL Taxonomy Extension Calculation Linkbase Document
101.DEF Inline XBRL Taxonomy Extension Definition Linkbase Document
101.LAB Inline XBRL Taxonomy Extension Label Linkbase Document
101.PRE Inline XBRL Taxonomy Extension Presentation Linkbase Document
104 Cover Page Interactive Data File (formatted as Inline XBRL and contained in Exhibit 101)
* Exhibit previously filed with the Securities and Exchange Commission, as indicated, andincorporated herein by reference.
+ Management contract or compensatory plan or arrangement.
52

Item 16. Form 10-K Summary.
Oceaneering has elected not to include a summary of this report.
53
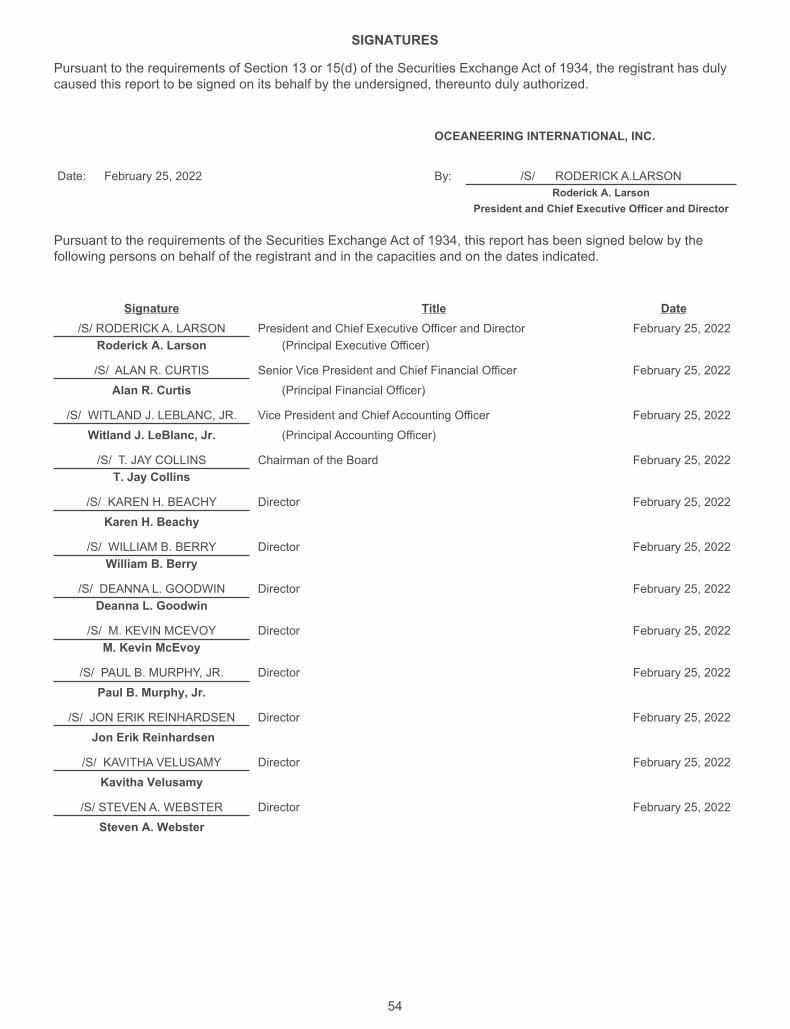
SIGNATURES
Pursuant to the requirements of Section 13 or 15(d) of the Securities Exchange Act of 1934, the registrant has dulycaused this report to be signed on its behalf by the undersigned, thereunto duly authorized.
OCEANEERING INTERNATIONAL, INC.
Date: February 25, 2022 By: /S/ RODERICK A.LARSONRoderick A. Larson
President and Chief Executive Officer and Director
Pursuant to the requirements of the Securities Exchange Act of 1934, this report has been signed below by thefollowing persons on behalf of the registrant and in the capacities and on the dates indicated.
Signature Title Date/S/ RODERICK A. LARSON President and Chief Executive Officer and Director February 25, 2022
Roderick A. Larson (Principal Executive Officer)
/S/ ALAN R. CURTIS Senior Vice President and Chief Financial Officer February 25, 2022
Alan R. Curtis (Principal Financial Officer)
/S/ WITLAND J. LEBLANC, JR. Vice President and Chief Accounting Officer February 25, 2022
Witland J. LeBlanc, Jr. (Principal Accounting Officer)
/S/ T. JAY COLLINS Chairman of the Board February 25, 2022T. Jay Collins
/S/ KAREN H. BEACHY Director February 25, 2022
Karen H. Beachy
/S/ WILLIAM B. BERRY Director February 25, 2022William B. Berry
/S/ DEANNA L. GOODWIN Director February 25, 2022Deanna L. Goodwin
/S/ M. KEVIN MCEVOY Director February 25, 2022M. Kevin McEvoy
/S/ PAUL B. MURPHY, JR. Director February 25, 2022
Paul B. Murphy, Jr.
/S/ JON ERIK REINHARDSEN Director February 25, 2022
Jon Erik Reinhardsen
/S/ KAVITHA VELUSAMY Director February 25, 2022
Kavitha Velusamy
/S/ STEVEN A. WEBSTER Director February 25, 2022
Steven A. Webster
54

INDEX TO FINANCIAL STATEMENTS AND SCHEDULES
Index to Financial Statements
Report of Independent Registered Public Accounting Firm (PCAOB ID: 42)Consolidated Balance SheetsConsolidated Statements of OperationsConsolidated Statements of Comprehensive Income (Loss)Consolidated Statements of Cash FlowsConsolidated Statements of EquityNotes to Consolidated Financial StatementsSummary of Major Accounting PoliciesAccounting Standards UpdateRevenueLeasesImpairmentsSelected Balance Sheet InformationIncome TaxesSelected Income Statement InformationDebtCommitments and ContingenciesOperations by Business Segment and Geographic AreaEmployee Benefit Plans
Index to SchedulesAll schedules for which provision is made in the applicable regulations of the Securities and Exchange Commissionhave been omitted because they are not required under the relevant instructions or because the requiredinformation is not significant.
55

REPORT OF INDEPENDENT REGISTERED PUBLIC ACCOUNTING FIRM
To the Shareholders and the Board of Directors of Oceaneering International, Inc.
Opinion on the Financial Statements
We have audited the accompanying consolidated balance sheets of Oceaneering International, Inc. and subsidiaries (the Company) as ofDecember 31, 2021 and 2020, the related consolidated statements of operations, comprehensive income (loss), equity and cash flows foreach of the three years in the period ended December 31, 2021, and the related notes (collectively referred to as the consolidated financialstatements). In our opinion, the consolidated financial statements present fairly, in all material respects, the financial position of the Companyat December 31, 2021 and 2020, and the results of its operations and its cash flows for each of the three years in the period endedDecember 31, 2021, in conformity with U.S. generally accepted accounting principles.
We also have audited, in accordance with the standards of the Public Company Accounting Oversight Board (United States) (PCAOB), theCompany's internal control over financial reporting as of December 31, 2021, based on criteria established in Internal Control-IntegratedFramework issued by the Committee of Sponsoring Organizations of the Treadway Commission (2013 framework) and our report datedFebruary 25, 2022, expressed an unqualified opinion thereon.
Basis for Opinion
These financial statements are the responsibility of the Company's management. Our responsibility is to express an opinion on theCompany’s financial statements based on our audits. We are a public accounting firm registered with the PCAOB and are required to beindependent with respect to the Company in accordance with the U.S. federal securities laws and the applicable rules and regulations of theSecurities and Exchange Commission and the PCAOB.
We conducted our audits in accordance with the standards of the PCAOB. Those standards require that we plan and perform the audit toobtain reasonable assurance about whether the financial statements are free of material misstatement, whether due to error or fraud. Ouraudits included performing procedures to assess the risks of material misstatement of the financial statements, whether due to error or fraud,and performing procedures that respond to those risks. Such procedures included examining, on a test basis, evidence regarding theamounts and disclosures in the financial statements. Our audits also included evaluating the accounting principles used and significantestimates made by management, as well as evaluating the overall presentation of the financial statements. We believe that our audits providea reasonable basis for our opinion.
Critical Audit Matter
The critical audit matter communicated below is a matter arising from the current period audit of the financial statements that wascommunicated or required to be communicated to the audit committee and that: (1) relates to accounts or disclosures that are material to thefinancial statements and (2) involved our especially challenging, subjective or complex judgments. The communication of the critical auditmatter does not alter in any way our opinion on the consolidated financial statements, taken as a whole, and we are not, by communicatingthe critical audit matter below, providing a separate opinion on the critical audit matter or on the account or disclosure to which it relates.
56

Revenues recognized over-time utilizing cost to cost inputs
Description of theMatter
For the year ended December 31, 2021, the Company recognized 16% of its revenues utilizing the cost-to-cost input method. As discussed in Note 1 of the financial statements, the Company generallyrecognizes estimated contract revenue based on costs incurred to date as a percentage of totalestimated costs.
Auditing management’s calculation of revenues recognized under the cost to cost method was complexand subjective due to the significant estimation required in determining the estimated costs remaining onthe project. In particular, the estimates of remaining costs associated with materials and labor aresensitive and may be impacted by factors outside of the Company’s control.
How WeAddressed theMatter in OurAudit
We obtained an understanding, evaluated the design and tested the operating effectiveness of controlsover the Company’s process for revenues utilizing the cost to cost input method, includingmanagement’s review of the estimated costs to complete and associated revenues.
To test the estimated costs to complete, we performed audit procedures that included, among others,assessing the appropriate application of the revenue recognition method utilized, and testing thesignificant assumptions discussed above and the underlying data used by the Company in its estimationprocess. We compared the significant assumptions used by management to external and internalinformation, such as vendor quotes and invoices, manufacturing schedules, purchase orders,manufacturing bills of lading, and other similar support. Additionally, we assessed the historical accuracyof management’s estimates through a lookback analysis of prior estimates of costs to completecompared to actual results.
/s/ Ernst & Young LLP
We have served as the Company’s auditor since 2002.Houston, TexasFebruary 25, 2022
57

OCEANEERING INTERNATIONAL, INC. AND SUBSIDIARIES
CONSOLIDATED BALANCE SHEETS
December 31,(in thousands, except share data) 2021 2020
ASSETSCurrent Assets:
Cash and cash equivalents $ 538,114 $ 452,016Accounts receivable, net of allowances for doubtful accounts of $1,210 and $4,466 262,960 296,214
Contract assets 164,847 221,997
Inventory, net 153,682 141,241
Other current assets 68,400 58,795
Total Current Assets 1,188,003 1,170,263
Property and equipment, at cost 2,452,421 2,456,602
Less accumulated depreciation 1,962,825 1,865,495
Net property and equipment 489,596 591,107
Other Assets:
Goodwill 34,908 35,016
Other noncurrent assets 104,255 108,250
Right-of-use operating lease assets 146,097 141,206
Total other assets 285,260 284,472
Total Assets $ 1,962,859 $ 2,045,842LIABILITIES AND EQUITYCurrent Liabilities:
Accounts payable $ 122,327 $ 94,207
Accrued liabilities 290,659 292,863
Contract liabilities 88,175 50,046
Total current liabilities 501,161 437,116
Long-term debt 702,067 805,251
Long-term operating lease liabilities 158,503 156,074
Other long-term liabilities 90,104 89,244
Commitments and contingencies
Equity:
Common Stock, par value $0.25 per share; 360,000,000 shares authorized;110,834,088 shares issued 27,709 27,709
Additional paid-in capital 173,608 192,492
Treasury stock; 11,033,098 and 11,525,725 shares, at cost (631,811) (660,021)
Retained earnings 1,301,913 1,351,220
Accumulated other comprehensive loss (366,458) (359,306)
Oceaneering shareholders' equity 504,961 552,094
Noncontrolling interest 6,063 6,063
Total equity 511,024 558,157
Total Liabilities and Equity $ 1,962,859 $ 2,045,842
The accompanying Notes are an integral part of these Consolidated Financial Statements.
58

OCEANEERING INTERNATIONAL, INC. AND SUBSIDIARIES
CONSOLIDATED STATEMENTS OF OPERATIONS
Year Ended December 31,(in thousands, except per share data) 2021 2020 2019
Revenue $ 1,869,275 $ 1,827,889 $ 2,048,124
Cost of services and products 1,605,210 1,663,948 1,949,880
Gross margin 264,065 163,941 98,244
Selling, general and administrative expense 224,266 195,695 214,891
Long-lived assets impairments — 70,445 159,353
Goodwill impairment — 343,880 14,713
Income (loss) from operations 39,799 (446,079) (290,713)
Interest income 2,477 3,083 7,893
Interest expense, net of amounts capitalized (38,810) (43,900) (42,711)
Equity earnings (losses) of unconsolidated affiliates 594 2,268 1,331
Other income (expense), net (9,769) (14,269) (6,621)
Income (loss) before income taxes (5,709) (498,897) (330,821)
Provision (benefit) for income taxes 43,598 (2,146) 17,623
Net Income (Loss) $ (49,307) $ (496,751) $ (348,444)
Weighted average shares outstanding
Basic 99,706 99,233 98,876
Diluted 99,706 99,233 98,876
Earnings (loss) per share
Basic $ (0.49) $ (5.01) $ (3.52)
Diluted $ (0.49) $ (5.01) $ (3.52)
The accompanying Notes are an integral part of these Consolidated Financial Statements.
59

OCEANEERING INTERNATIONAL, INC. AND SUBSIDIARIES
CONSOLIDATED STATEMENTS OF COMPREHENSIVE INCOME (LOSS)
Year Ended December 31,(in thousands) 2021 2020 2019
Net income (loss) $ (49,307) $ (496,751) $ (348,444)
Other comprehensive income (loss), net of tax:
Foreign currency translation (7,339) (25,209) 5,280Change in unrealized gains for available-for-sale debtsecurities (1) 187 — —
Total other comprehensive income (loss) (7,152) (25,209) 5,280
Comprehensive income (loss) $ (56,459) $ (521,960) $ (343,164)
(1) There is no net income tax expense or benefit associated with the year ended December 31,2021 due to a valuation allowance offset.
The accompanying Notes are an integral part of these Consolidated Financial Statements.
60

OCEANEERING INTERNATIONAL, INC. AND SUBSIDIARIES
CONSOLIDATED STATEMENTS OF CASH FLOWS
Year Ended December 31,(in thousands) 2021 2020 2019Cash Flows from Operating Activities:Net income (loss) $ (49,307) $ (496,751) $ (348,444)Adjustments to reconcile net income to net cash provided by operating activities:
Depreciation and amortization, including goodwill impairment 139,723 528,895 263,427Loss on impairment of long-lived assets — 70,445 159,353Provision for Evergrande loss, net 29,549 — —Deferred income tax provision (benefit) (1,798) (4,158) (12,268)
Inventory write-downs — 7,038 21,285Net loss (gain) on sales of property and equipment and other 769 1,521 (7,664)
Noncash compensation 11,008 8,681 11,432Noncash impact of lease accounting (4,302) (4,035) 3,651Excluding the effects of acquisitions, increase (decrease) in cash from:
Accounts receivable and contract assets 41,099 125,541 (17,561)
Inventory 7,313 26,466 (11,777)
Proceeds from interest rate swaps — 12,840 —
Other operating assets (14,498) 3,638 16,246
Currency translation effect on working capital, excluding cash 6 8,927 5,533
Current liabilities 63,051 (138,932) 76,552
Other operating liabilities 2,701 (13,469) (2,196)
Total adjustments to net income (loss) 274,621 633,398 506,013
Net Cash Provided by Operating Activities 225,314 136,647 157,569Cash Flows from Investing Activities:Purchases of property and equipment (50,199) (60,687) (147,684)Proceeds from redemption of investments in Angolan bonds 4,486 — —
Distributions of capital from unconsolidated affiliates 3,298 6,207 3,388Proceeds from sale of property and equipment 7,101 1,890 9,509Other investing activities 1,157 — —
Net Cash Used in Investing Activities (34,157) (52,590) (134,787)Cash Flows from Financing Activities:Repurchase of 2024 Senior Notes (100,000) — —
Other financing activities (1,682) (1,699) (2,299)
Net Cash Used in Financing Activities (101,682) (1,699) (2,299)
Effect of exchange rates on cash (3,377) (3,997) (1,087)
Net Increase (Decrease) in Cash and Cash Equivalents 86,098 78,361 19,396
Cash and Cash Equivalents—Beginning of Period 452,016 373,655 354,259
Cash and Cash Equivalents—End of Period $ 538,114 $ 452,016 $ 373,655
The accompanying Notes are an integral part of these Consolidated Financial Statements.
61

OCEANEERING INTERNATIONAL, INC. AND SUBSIDIARIES
CONSOLIDATED STATEMENTS OF EQUITY
CommonStock
AdditionalPaid-inCapital
TreasuryStock
RetainedEarnings
AccumulatedOther
ComprehensiveIncome (Loss)
TranslationAdjustments
OceaneeringShareholders'
EquityNoncontrolling
Interest Total Equity(in thousands)Balance, December 31, 2018 $ 27,709 $ 220,421 $ (704,066) $ 2,204,548 $ (339,377) $ 1,409,235 $ 6,063 $ 1,415,298Cumulative effect of ASC 842adoption — — — (5,860) — (5,860) — (5,860)Net income (loss) — — — (348,444) — (348,444) — (348,444)Other comprehensive income (loss) — — — — 5,280 5,280 — 5,280Restricted stock unit activity — (8,148) 17,283 — — 9,135 — 9,135Restricted stock activity — (5,143) 5,143 — — — — —Balance, December 31, 2019 27,709 207,130 (681,640) 1,850,244 (334,097) 1,069,346 6,063 1,075,409Cumulative effect of ASC 326adoption — — — (2,273) — (2,273) — (2,273)Net income (loss) — — — (496,751) — (496,751) — (496,751)Other comprehensive income (loss) — — — — (25,209) (25,209) — (25,209)Restricted stock unit activity — (8,646) 15,627 — — 6,981 — 6,981Restricted stock activity — (5,992) 5,992 — — — — —Balance, December 31, 2020 27,709 192,492 (660,021) 1,351,220 (359,306) 552,094 6,063 558,157Net income (loss) — — — (49,307) — (49,307) — (49,307)Other comprehensive income (loss) — — — — (7,152) (7,152) — (7,152)Restricted stock unit activity — (8,445) 17,771 — — 9,326 — 9,326Restricted stock activity — (10,439) 10,439 — — — — —Balance, December 31, 2021 $ 27,709 $ 173,608 $ (631,811) $ 1,301,913 $ (366,458) $ 504,961 $ 6,063 $ 511,024
The accompanying Notes are an integral part of these Consolidated Financial Statements.
62

NOTES TO CONSOLIDATED FINANCIAL STATEMENTS
1. SUMMARY OF MAJOR ACCOUNTING POLICIES
Principles of Consolidation. The consolidated financial statements include the accounts of OceaneeringInternational, Inc. (“Oceaneering,” “we,” “us” or “our”) and our 50% or more owned and controlled subsidiaries. Wealso consolidate entities that are determined to be variable interest entities if we determine that we are the primarybeneficiary; otherwise, we account for those entities using the equity method of accounting. We use the equitymethod to account for our investments in unconsolidated affiliated companies of which we own an equity interest ofbetween 20% and 50% and as to which we have significant influence, but not control, over operations. We use thecost method for all other long-term investments. Investments in entities that we do not consolidate are reflected onour balance sheet in other non-current assets. All significant intercompany accounts and transactions have beeneliminated.
Use of Estimates. The preparation of financial statements in conformity with accounting principles generallyaccepted in the United States (“U.S. GAAP”) requires that our management make estimates and assumptions thataffect the reported amounts of assets and liabilities, disclosure of contingent assets and liabilities as of the date ofthe financial statements and the reported amounts of revenue and expense during the reporting period. Actualresults could differ from those estimates.
Reclassifications. Certain amounts from prior periods have been reclassified to conform with the current yearpresentation.
Cash and Cash Equivalents. Cash and cash equivalents include demand deposits and highly liquid investmentswith original maturities of three months or less from the date of investment.
Allowance for Credit Loss—Financial Assets Measured at Amortized Costs. On January 1, 2020, we adoptedAccounting Standard Update (“ASU”) No. 2016-13, “Financial Instruments—Credit Losses (Topic 326):Measurement of Credit Losses on Financial Instruments,” as amended (“ASC 326”), which introduces a new creditreserving methodology known as the Current Expected Credit Loss (“CECL”) model. The CECL model applies tofinancial assets measured at amortized costs, including accounts receivable, contract assets and held-to-maturityloan receivables. Under the CECL model, we identify allowances for credit loss based on future expected losseswhen accounts receivable, contract assets or held-to-maturity loan receivables are created rather than when lossesare probable.
We use the loss-rate method in developing the allowance for credit losses, which involves identifying pools ofassets with similar risk characteristics, reviewing historical losses within the last three years and consideration ofreasonable supportable forecasts of economic indicators. Changes in estimates, developing trends and other newinformation could have material effects on future evaluations.
We monitor the credit quality of our accounts receivable and other financing receivable amounts by frequentcustomer interaction, following economic and industry trends and reviewing specific customer data. Our otherreceivable amounts include contract assets and held-to-maturity loans receivable, which historically we consider tohave a low risk of loss.
We are monitoring the impacts from the coronavirus (“COVID-19”) outbreak and volatility in the oil and natural gasmarkets on our customers and various counterparties. We have considered the current and expected economic andmarket conditions, as a result of COVID-19, in determining credit loss expense for the years ended December 31,2021 and 2020.
As a result of the adoption of ASC 326, we recorded a cumulative-effect adjustment of $2.3 million as of January 1,2020, which decreased retained earnings and increased the allowance for credit losses. We adopted ASC 326using the modified retrospective method. Prior periods were not restated. We had an allowance for doubtfulaccounts of $7.5 million as of December 31, 2019, which we determined using the specific identification method, inaccordance with previously applicable U.S. GAAP. As of December 31, 2021, our allowance for credit losses was$0.9 million for accounts receivable and $0.3 million for other receivables. As of December 31, 2020, our allowancefor credit losses was $3.9 million for accounts receivable and $0.6 million for other receivables.
63

Financial assets are written off when deemed uncollectible and there is no reasonable expectation of recovering thecontractual cash flows. During the years ended December 31, 2021 and 2020 , we recognized credit losses of $53million and $11 million, respectively. Approximately $50 million was reserved in the fourth quarter of 2021 and $3million in prior periods for our 2021 credit losses. The 2021 credit losses included a reserve of $49 million inreceivables and contract assets partially offset by the reclassification of $20 million of contract assets into salableinventory related to termination of a number of entertainment ride systems contracts with the China EvergrandeGroup and its affiliated companies (collectively, “Evergrande”) in our Manufactured Products segment. See Note 10—”Commitments and Contingencies” for discussion regarding Evergrande.
We have elected to apply the practical expedient available under ASC 326 to exclude the accrued interestreceivable balance that is included in our held-to-maturity loans receivable. The amount excluded as of December31, 2021 and 2020 was $1.2 million and $1.5 million, respectively.
Accounts receivable are considered to be past-due after the end of the contractual terms agreed to with thecustomer. There were no material past-due amounts that we consider uncollectible for our financial assets as ofDecember 31, 2021. We generally do not require collateral from our customers.
Inventory. Inventory is valued at the lower of cost or net realizable value. We determine cost using the weighted-average method. We periodically review the value of items in inventory and record write-downs or write-offs ofinventory based on our assessment of market conditions. Write-downs and write-offs are charged to cost of servicesand products. We did not record any write-downs or write-offs of inventory in the year ended December 31, 2021, ascompared to $7.0 million and $21 million of write-downs and write-offs in the years ended December 31, 2020 and2019, respectively.
Property and Equipment, Long-Lived Intangible Assets and Right-of-Use Operating Lease Assets.Weprovide for depreciation of property and equipment on the straight-line method over estimated useful lives of eightyears for Remotely Operated Vehicles (“ROVs”), three to 25 years for marine services equipment (such as vesselsand diving equipment) and three to 25 years for buildings, improvements and other equipment.
Long-lived intangible assets, primarily acquired in connection with business combinations, include trade names,intellectual property and customer relationships and are being amortized with a weighted average remaining life ofapproximately 2 years.
For information regarding right-of-use operating lease assets, see “Leases” below.
We charge the costs of repair and maintenance of property and equipment to operations as incurred, while wecapitalize the costs of improvements that extend asset lives or functionality.
We capitalize interest on assets where the construction period is anticipated to be more than three months. We didnot capitalize interest in 2021 and 2020 as compared to $3.4 million of interest in 2019. We do not allocate generaladministrative costs to capital projects. Upon the disposition of property and equipment, the related cost andaccumulated depreciation accounts are relieved and any resulting gain or loss is recognized in income.
Our management periodically, and upon the occurrence of a triggering event, reviews the realizability of ourproperty and equipment, long-lived intangible assets and right-of-use operating lease assets to determine whetherany events or changes in circumstances indicate that the carrying amounts of the assets may not be recoverable.For long-lived assets to be held and used, we base our evaluation on impairment indicators such as the nature ofthe assets, the future economic benefits of the assets, any historical or future profitability measurements and otherexternal market conditions or factors that may be present. If such impairment indicators are present or other factorsexist that indicate that the carrying amount of an asset may not be recoverable, we recognize a loss for thedifference between the carrying amount and the fair value of the asset. For information regarding write-downs andwrite-offs of property and equipment, long-lived intangible assets and right-of-use operating lease assets in theyears ended December 31, 2020 and 2019 see Note 5—“Impairments” and Note 11—“Operations by BusinessSegment and Geographic Area.”
For assets held for sale or disposal, the fair value of the asset is measured using fair market value less estimatedcosts to sell. Assets are classified as held-for-sale when we have a plan for disposal of certain assets and thoseassets meet the held for sale criteria.
Goodwill. Our goodwill is evaluated for impairment annually and whenever we identify certain triggering events orcircumstances that would more likely than not reduce the fair value of a reporting unit below its carrying amount.
64
In our annual evaluation of goodwill, we perform a qualitative or quantitative impairment test. Under the qualitativeapproach, if we determine that it is more likely than not that the fair value of a reporting unit is less than its carryingamount, we are required to perform the quantitative analysis to determine the fair value for the reporting unit. Wethen compare the fair value of the reporting unit with its carrying amount and recognize an impairment loss for theamount by which the carrying amount exceeds the fair value of the reporting unit. The loss recognized should notexceed the total amount of goodwill allocated to the reporting unit. We also consider income tax effects from any taxdeductible goodwill on the carrying amount of the reporting unit when measuring the goodwill impairment loss, ifapplicable. We did not identify any triggering events and, accordingly, no impairments of goodwill were recorded inthe year ended December 31, 2021. For information regarding impairments of goodwill in the years endedDecember 31, 2020 and 2019, see Note 5—“Impairments” and Note 11—“Operations by Business Segment andGeographic Area.”
Revenue Recognition. All of our revenue is realized through contracts with customers. We recognize our revenueaccording to the contract type. On a daily basis, we recognize service revenue over time for contracts that providefor specific time, material and equipment charges, which we bill periodically, ranging from weekly to monthly. Weuse the input method to faithfully depict revenue recognition, because each day of service provided representsvalue to the customer. The performance obligations in these contracts are satisfied, and revenue is recognized, asthe work is performed. When appropriate, we apply the practical expedient to recognize revenue for the amountinvoiced when the invoice corresponds directly to the value of our performance to date.
We account for significant fixed-price contracts, mainly relating to our Manufactured Products segment, and to alesser extent in our Offshore Projects Group (“OPG”) and Aerospace and Defense Technologies (“ADTech”)segments, by recognizing revenue over time using an input, cost-to-cost measurement percentage-of-completionmethod. In 2021, 2020 and 2019, we accounted for 16%, 24% and 21%, respectively, of our revenue using theinput, cost-to-cost measurement percentage-of-completion method. This commonly used method allows appropriatecalculation of progress on our contracts. A performance obligation is satisfied as we create a product on behalf ofthe customer over the life of the contract. The remainder of our revenue is recognized at the point in time whencontrol transfers to the customer, thus satisfying the performance obligation.
We have elected to recognize the cost for freight and shipping as an expense when incurred. Taxes assessed by agovernmental authority that are both imposed on and concurrent with a specific revenue-producing transaction, andthat are collected by us from customers, are excluded from revenue.
If a current estimate of total contract cost indicates an ultimate loss on a contract, we recognize the projected loss infull when we determine it. We did not have any material adjustments to earnings as a result of revisions to contractestimates during the years ended December 31, 2021, 2020 and 2019. However, there could be significantadjustments to overall contract costs in the future, due to changes in facts and circumstances.
In general, our payment terms consist of those services billed regularly as provided and those products delivered ata point in time, which are invoiced after the performance obligation is satisfied. Our product and service contractswith milestone payments due at agreed progress points during the contract are invoiced when those milestones arereached, which may differ from the timing of revenue recognition. Our payment terms generally do not providefinancing of contracts to customers, nor do we receive financing from customers as a result of these terms.
See Note 3—“Revenue” for more information on our revenue from contracts with customers.
Leases.We determine whether a contract is or contains a lease at inception, whether as a lessee or a lessor. Wetake into consideration the elements of an identified asset, right to control and the receipt of economic benefit inmaking those determinations.
As a lessor, we lease certain types of equipment along with the provision of services and utilize the expedientallowing us to combine the lease and non-lease components into a combined component that is accounted for (1)under ASC 842, when the lease component is predominant, and (2) under the accounting standard “Revenue fromContracts with Customers” (“ASC 606”), when the service component is predominant. In general, when we have aservice component, it is typically the predominant element and leads to accounting under ASC 606.
As a lessor, we lease certain types of equipment, often providing services at the same time. These leases can bepriced on a dayrate or lump-sum basis for periods ranging from a few days to multi-year contracts. These leases arenegotiated on commercial terms at market rates and many carry standard options to extend or terminate at ourcustomer's discretion. These leases generally do not contain options to purchase, material restrictions or covenantsthat impact our accounting for leases.
65

As a lessee, we lease land, buildings, vessels and equipment for the operation of our business and to support someof our service line revenue streams. These generally carry lease terms that range from days for operational andsupport equipment to 15 years for land and buildings. These leases are negotiated on commercial terms at marketrates and many carry standard options to extend or terminate at our discretion. When the exercise of those optionsis reasonably certain, we include them in the lease assessment. Our leases do not contain material restrictions orcovenants that impact our accounting for them, nor do we provide residual value guarantees.
As a lessee, we utilize the practical expedients to not recognize leases with an initial lease term of 12 months orless on the balance sheet and to combine lease and non-lease components together and account for the combinedcomponent as a lease for all asset classes, except real estate.
Right-of-use operating lease assets and operating lease liabilities are recognized based on the present value of thefuture minimum lease payments over the lease term at commencement or modification date. As most of our leasesdo not provide an implicit rate, we use our incremental borrowing rate, based on the information available atcommencement or modification date in determining the present value of future payments. In determining theincremental borrowing rate, we considered our external credit ratings, bond yields for us and our identified peers,the risk-free rate in geographic regions where we operate, and the impact associated with providing collateral over asimilar term as the lease for an amount equal to the future lease payments. Our right-of-use operating lease assetsalso include any lease prepayments made and exclude lease incentives and initial direct costs incurred. Our leaseterms may include options to extend or terminate the lease. These options are included in the lease term when it isreasonably certain that we will exercise that option. Lease expense for minimum lease payments is recognized on astraight-line basis over the lease term.
See Note 4—“Leases” for more information on our operating leases and Note 5—“Impairments” for moreinformation on determination of impairment indicators for our right-of-use assets.
Stock-Based Compensation.We recognize all share-based payments to directors, officers and employees overtheir vesting periods in the income statement based on their estimated fair values. For more information on ouremployee benefit plans, see Note 12—“Employee Benefit Plans.”
Income Taxes.We provide income taxes at appropriate tax rates in accordance with our interpretation of therespective tax laws and regulations after review and consultation with our internal tax department, tax advisors and,in some cases, legal counsel in various jurisdictions. We provide for deferred income taxes for differences betweencarrying amounts of assets and liabilities for financial and tax reporting purposes and provide a valuation allowanceagainst deferred tax assets when it is more likely than not that the asset will not be realized.
We recognize an expense or benefit for an uncertain tax position if it is more likely than not to be sustainable uponaudit by the applicable taxing authority. If this threshold is met, the uncertain tax position is then measured andrecognized at the largest amount that we believe is greater than 50% likely of being realized upon ultimatesettlement. We account for any applicable interest and penalties on these uncertain tax positions as a component ofour provision for income taxes on our financial statements.
We have elected to account for a tax on global intangible low‑taxed income (“GILTI”) as a current period expensewhen incurred.
For more information on income taxes, see Note 7—“Income Taxes.”
Foreign Currency Translation. The functional currency for most of our foreign subsidiaries is the applicable localcurrency. Results of operations for foreign subsidiaries with functional currencies other than the U.S. dollar aretranslated into U.S. dollars using average exchange rates during the period. Assets and liabilities of these foreignsubsidiaries are translated into U.S. dollars using the exchange rates in effect as of the balance sheet date, and theresulting translation adjustments are recognized, net of tax, in accumulated other comprehensive income (loss) as acomponent of shareholders' equity. All foreign currency transaction gains and losses are recognized currently in theConsolidated Statements of Operations. We recorded $(8.4) million, $(14) million and $(6.3) million of foreigncurrency transaction gains (losses) in the years ended December 31, 2021, 2020 and 2019, respectively. Thoseamounts are included as a component of other income (expense), net in our Consolidated Statement of Operations.
Earnings (Loss) per Share. For each year presented, the only difference between our annual calculated weightedaverage basic and diluted number of shares outstanding is the effect of outstanding restricted stock units.
66

Repurchase Plan. In December 2014, our Board of Directors approved a plan to repurchase up to 10 millionshares of our common stock. In 2015, we repurchased 2.0 million shares of our common stock for $100 million. Wehave not repurchased any shares under this program since December 2015. The timing and amount of any futurerepurchases will be determined by our management. As of December 31, 2021, we retained 11 million of the shareswe had repurchased through this and a prior repurchase program. We expect to hold the shares repurchased andany additional shares repurchased under the plan as treasury stock for possible future use. The plan does notobligate us to repurchase any particular number of shares. We account for the shares we hold in treasury under thecost method, at average cost.
Financial Instruments.We recognize all derivative instruments as either assets or liabilities in the balance sheetand measure those instruments at fair value. Subsequent changes in fair value are reflected in current earnings orother comprehensive income (loss), depending on whether a derivative instrument is designated as part of a hedgerelationship and, if it is, the type of hedge relationship. See Note 9—“Debt” for information relative to the interestrate swaps we had in effect.
2. ACCOUNTING STANDARDS UPDATE
Recently Adopted Accounting Standards. On January 1, 2021, we adopted ASU No. 2019-12, “Simplifying theAccounting for Income Taxes” (“ASU 2019-12”), which simplifies the accounting for income taxes, eliminates certainexceptions within Accounting Standards Codification 740 (“ASC 740”), “Income Taxes,” and clarifies certain aspectsof the current guidance to promote consistency among reporting entities. Most amendments within the standard arerequired to be applied on a prospective basis, while certain amendments must be applied on a retrospective ormodified retrospective basis. Our adoption of ASU 2019-12 on January 1, 2021, did not have a material impact onour consolidated financial statements.
Recently Issued Accounting Standards. In March 2020, the Financial Accounting Standards Board issued ASUNo. 2020-04, “Reference Rate Reform (Topic 848): Facilitation of the Effects of Reference Rate Reform on FinancialReporting,” which provides temporary optional expedients and exceptions to existing guidance on applying contractmodifications and hedge accounting to facilitate the market transition from existing reference rates, such as theLondon Interbank Offered Rate (“LIBOR”), which is scheduled to be phased out in June 2023, to alternate ratessuch as the Secured Overnight Financing Rate (“SOFR”). This ASU was effective upon issuance and can be appliedprospectively through December 31, 2022. Our five-year revolving credit facility references LIBOR-based rates. Thiscredit facility, which is scheduled to expire in January 2023, was undrawn as of December 31, 2021. We have notyet applied this guidance because we have not yet modified our existing revolving credit facility for reference ratereform. We do not expect this ASU to have a material impact on our consolidated financial statements, but willcontinue to monitor potential impacts until the transition to this standard is complete.
3. REVENUE
Revenue by Category
The following table presents revenue disaggregated by business segment, geographical region, and timing oftransfer of goods or services.
Year Ended December 31,
(in thousands) 2021 2020 2019
Business Segment:Energy Services and Products
Subsea Robotics $ 538,515 $ 493,332 $ 583,652
Manufactured Products 344,251 477,419 498,350
Offshore Projects Group 378,121 289,127 380,966
Integrity Management & Digital Solutions 241,393 226,938 266,086
Total Energy Services and Products 1,502,280 1,486,816 1,729,054
Aerospace and Defense Technologies 366,995 341,073 319,070
Total $ 1,869,275 $ 1,827,889 $ 2,048,124
67

Year Ended December 31,
(in thousands) 2021 2020 2019
Geographic Operating Areas:Foreign:
Africa $ 273,095 $ 198,505 $ 292,818
Norway 214,306 202,379 217,762
Asia and Australia 184,659 149,798 174,769
United Kingdom 181,453 241,168 256,348
Brazil 111,198 84,636 93,511
Other 93,021 90,541 91,591
Total Foreign 1,057,732 967,027 1,126,799
United States 811,543 860,862 921,325
Total $ 1,869,275 $ 1,827,889 $ 2,048,124
Year Ended December 31,
(in thousands) 2021 2020 2019
Timing of Transfer of Goods or Services:Revenue recognized over time $ 1,747,585 $ 1,702,232 $ 1,900,729
Revenue recognized at a point in time 121,690 125,657 147,395Total $ 1,869,275 $ 1,827,889 $ 2,048,124
Contract Balances
Our contracts with milestone payments have, in the aggregate, a significant impact on the contract asset and thecontract liability balances. Milestones are contractually agreed with customers and relate to significant eventsacross the contract lives. Some milestones are achieved before revenue is recognized, resulting in a contractliability, while other milestones are achieved after revenue is recognized resulting in a contract asset.
The following table provides information about contract assets and contract liabilities from contracts with customers.
Year Ended December 31,
(in thousands) 2021 2020
Total contract assets, beginning of period $ 221,997 $ 221,288
Revenue accrued 1,825,487 1,712,425
Write-off of Evergrande contract assets (38,032) —
Amounts billed (1,844,605) (1,711,716)
Total contract assets, end of period $ 164,847 $ 221,997
Total contract liabilities, beginning of period $ 50,046 $ 117,342
Deferrals of milestone payments 81,942 30,007
Recognition of revenue for goods and services (43,813) (97,303)
Total contract liabilities, end of period $ 88,175 $ 50,046
Performance Obligations
As of December 31, 2021, the aggregate amount of the transaction price allocated to remaining performanceobligations that were unsatisfied (or partially unsatisfied) was $235 million. In arriving at this value, we have usedtwo expedients available to us and are not disclosing amounts in relation to performance obligations: (1) that arepart of contracts with an original expected duration of one year or less; or (2) on contracts where we recognizerevenue in line with the billing. Of this amount, we expect to recognize revenue of $185 million over the next 12months, and we expect to recognize substantially all of the remaining balance of $50 million within the next 24
68
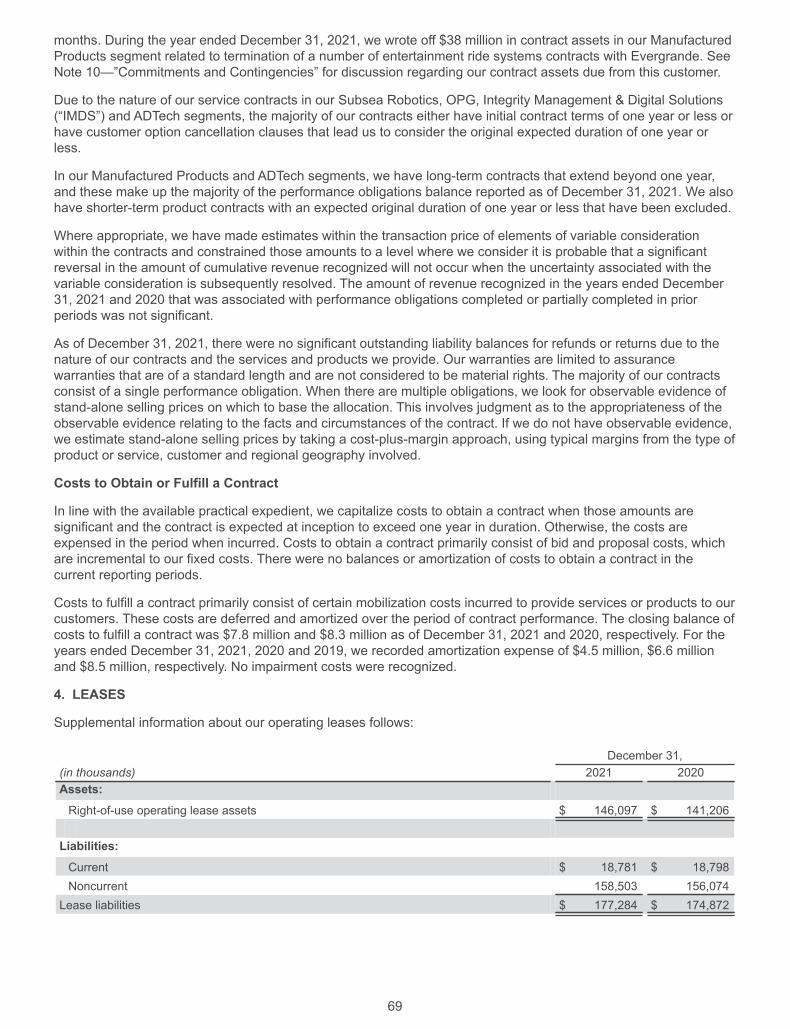
months. During the year ended December 31, 2021, we wrote off $38 million in contract assets in our ManufacturedProducts segment related to termination of a number of entertainment ride systems contracts with Evergrande. SeeNote 10—”Commitments and Contingencies” for discussion regarding our contract assets due from this customer.
Due to the nature of our service contracts in our Subsea Robotics, OPG, Integrity Management & Digital Solutions(“IMDS”) and ADTech segments, the majority of our contracts either have initial contract terms of one year or less orhave customer option cancellation clauses that lead us to consider the original expected duration of one year orless.
In our Manufactured Products and ADTech segments, we have long-term contracts that extend beyond one year,and these make up the majority of the performance obligations balance reported as of December 31, 2021. We alsohave shorter-term product contracts with an expected original duration of one year or less that have been excluded.
Where appropriate, we have made estimates within the transaction price of elements of variable considerationwithin the contracts and constrained those amounts to a level where we consider it is probable that a significantreversal in the amount of cumulative revenue recognized will not occur when the uncertainty associated with thevariable consideration is subsequently resolved. The amount of revenue recognized in the years ended December31, 2021 and 2020 that was associated with performance obligations completed or partially completed in priorperiods was not significant.
As of December 31, 2021, there were no significant outstanding liability balances for refunds or returns due to thenature of our contracts and the services and products we provide. Our warranties are limited to assurancewarranties that are of a standard length and are not considered to be material rights. The majority of our contractsconsist of a single performance obligation. When there are multiple obligations, we look for observable evidence ofstand-alone selling prices on which to base the allocation. This involves judgment as to the appropriateness of theobservable evidence relating to the facts and circumstances of the contract. If we do not have observable evidence,we estimate stand-alone selling prices by taking a cost-plus-margin approach, using typical margins from the type ofproduct or service, customer and regional geography involved.
Costs to Obtain or Fulfill a Contract
In line with the available practical expedient, we capitalize costs to obtain a contract when those amounts aresignificant and the contract is expected at inception to exceed one year in duration. Otherwise, the costs areexpensed in the period when incurred. Costs to obtain a contract primarily consist of bid and proposal costs, whichare incremental to our fixed costs. There were no balances or amortization of costs to obtain a contract in thecurrent reporting periods.
Costs to fulfill a contract primarily consist of certain mobilization costs incurred to provide services or products to ourcustomers. These costs are deferred and amortized over the period of contract performance. The closing balance ofcosts to fulfill a contract was $7.8 million and $8.3 million as of December 31, 2021 and 2020, respectively. For theyears ended December 31, 2021, 2020 and 2019, we recorded amortization expense of $4.5 million, $6.6 millionand $8.5 million, respectively. No impairment costs were recognized.
4. LEASES
Supplemental information about our operating leases follows:
December 31,(in thousands) 2021 2020Assets:
Right-of-use operating lease assets $ 146,097 $ 141,206
Liabilities:
Current $ 18,781 $ 18,798Noncurrent 158,503 156,074Lease liabilities $ 177,284 $ 174,872
69

December 31,2021 2020
Lease Term and Discount Rate:Weighted-average remaining lease term (years) 10 10
Weighted-average discount rate 5.9 % 6.1 %
No impairments of right-of-use operating leases was recorded in 2021. During the first quarter of 2020, wedetermined there were impairment indicators present for reporting units in our Subsea Products and AdvancedTechnologies segments and, as a result, we recorded a pre-tax right-of-use operating lease impairments of $17million. See Note 5—“Impairments” for more information on determination of impairment indicators for our right-of-use assets.
Operating lease cost reflects the lease expense resulting from amortization over the respective lease terms of ouroperating leases with initial lease terms greater than 12 months. Our short-term lease cost consists of expense forour operating leases with initial lease terms of 12 months or less that are not recorded on our balance sheet. Thecomponents of lease cost are as follows:
Year ended December 31,(in thousands) 2021 2020
Lease Cost:Operating lease cost $ 34,406 $ 34,030
Short-term lease cost 78,835 52,886Total Lease Cost $ 113,241 $ 86,916
As of December 31, 2021, future maturities of lease liabilities for our operating leases with an initial lease term ofmore than 12 months were as follows:
Maturities of Lease Liabilities(in thousands)For the year ended December 31,
2022 $ 28,619
2023 25,439
2024 22,402
2025 22,027
2026 22,841
Thereafter 114,828
Total lease payments 236,156
Less: Interest (58,872)
Present Value of Lease Liabilities $ 177,284
5. IMPAIRMENTS
Goodwill
We did not identify any triggering events and, accordingly, no impairments of goodwill were recorded in the yearended December 31, 2021. In our 2020 annual goodwill evaluation, we performed qualitative assessments for ourtwo reporting units, Subsea Robotics and ADTech, with remaining goodwill balances. We concluded that it wasmore likely than not that the fair value of each of these reporting units was more than the carrying value of thereporting unit.
After reallocation of our goodwill to our new segments in the third quarter of 2020, we determined that impairmentindicators were present and performed quantitative analyses for our Subsea Robotics and Manufactured Products
70

reporting units. Based on these quantitative analyses, the fair value was determined to be less than the carryingvalue for our Manufactured Products unit, but not for our Subsea Robotics reporting unit. As a result, for ourManufactured Products unit, we recorded a pre-tax goodwill impairment loss of $41 million in the three-month periodended September 30, 2020.
During the first quarter of 2020, due to the protracted energy downturn compounded by demand destructionresulting from the adverse impacts of the COVID-19 pandemic and insufficient control of crude oil supply levelsduring the quarter, as well as our customers' continued focus on cost discipline, we determined that impairmentindicators were present and we were required to perform a quantitative analysis for our Subsea Products–Service,Technology and Rentals (“ST&R”), Subsea Products–Manufactured Products, Subsea Projects, Asset Integrity andAdvanced Technologies–Commercial reporting units. Based on these quantitative analyses, the fair value wasdetermined to be less than the carrying value for each of those reporting units, with the exception of SubseaProducts–Manufactured Products. As a result, for our Subsea Products–ST&R, Subsea Projects, Asset Integrity andAdvanced Technologies–Commercial reporting units, we recorded pre-tax goodwill impairment losses of $51 million,$130 million, $111 million and $11 million, respectively. For our ROVs and Advanced Technologies–Governmentreporting units, qualitative assessments were performed; and we concluded that it was more likely than not the fairvalue of each of those reporting units was more than the carrying value of the reporting unit and, therefore, noimpairments were recorded for those reporting units.
Our estimates of fair values for our reporting units determined in the first and third quarters of 2020 required us touse significant unobservable inputs, classified as Level 3 fair value measurements, including assumptions related tofuture performance, risk-adjusted discount rates, future commodity prices and demand for our services andestimates of expected realizable values. For our cash flow projections in each of those periods, we utilized aweighted-average cost of capital ranging from 11% to 15% and a terminal value based on the Gordon GrowthModel, assuming an expected long-term growth rate of 2%.
Our third quarter 2020 change in our operating segments resulted in one reporting unit for each of our newsegments. The following table reflects goodwill impairments as recorded in the three-month period ended March 31,2020, and allocated, based on historical cost, to our new reporting segments:
Three Months Ended March 31, 2020
(in thousands)As originallyrecorded As recast to reflect segment changes
Segment/Reporting UnitGoodwillImpairment
SubseaRobotics
ManufacturedProducts OPG IMDS Total
Subsea Products/ST&R $ 51,302 $ 17,457 $ — $ 33,845 $ — $ 51,302Subsea Projects/Subsea Projects 129,562 84,661 — 32,440 12,461 129,562Asset Integrity/Asset Integrity 110,753 — — — 110,753 110,753Advanced Technologies/Commercial 11,388 — 11,388 — — 11,388Total goodwill impairment $ 303,005 $ 102,118 $ 11,388 $ 66,285 $ 123,214 $ 303,005
In our 2019 annual goodwill evaluation, we performed quantitative assessments for (1) our Subsea Projectsreporting unit, due to its fair value being less than carrying value in the prior year, and (2) our Asset Integrityreporting unit, due to deterioration in its business environment. In our quantitative analyses for the Subsea Projectsand Asset Integrity reporting units, we estimated the fair values by weighting the results from the income approachand the market approach. These valuation approaches considered a number of factors that included prospectivefinancial information, operating margins, growth rates, terminal values, discount rates and comparable multiples ofsimilar companies in our industry and required us to make certain assumptions and estimates regarding industryeconomic factors and future profitability of our business. Based on these quantitative tests, we determined that thefair value for our Subsea Projects reporting unit exceeded the carrying amount and there was no impairment. Forour Asset Integrity reporting unit, the fair value was less than the carrying value and, as a result, we recorded a pre-tax goodwill impairment loss of $15 million. For the remaining reporting units, qualitative assessments wereperformed, and we concluded that it was more likely than not that the fair value of each such reporting unit wasmore than the carrying value of the reporting unit. Our third quarter 2020 change in our operating segments resultedin goodwill impairment as recorded for the year ended December 31, 2019 to our Asset Integrity reporting unit, to beallocated, based on historical cost, to our IMDS reporting segment and unit in our new organizational structure.
Aside from the goodwill impairments discussed above, the changes in our reporting units' goodwill balances duringthe periods presented are from currency exchange rate changes.
71

For further information regarding goodwill by business segment, see Note 11–“Operations by Business Segmentand Geographic Area.”
Property and Equipment and Intangible Assets
We did not identify any triggering events and, accordingly, no impairments of long-lived assets were recorded in theyear ended December 31, 2021.
After reallocation of our long-lived assets to our new segments in the third quarter of 2020, we determined thatimpairment indicators were present and performed a quantitative assessment for our Manufactured Products assetgroups. Based on that assessment, we concluded that it was more likely than not that the fair value of the assetgroups within Manufactured Products was more than the carrying value of each asset group and, therefore, noimpairment was required. We did not identify any triggering events for our asset groups other than those included inManufactured Products during the third quarter of 2020.
During the first quarter of 2020, due to the protracted energy downturn compounded by demand destructionresulting from the adverse impacts of the COVID-19 pandemic and insufficient control of crude oil supply levelsduring the quarter, as well as our customers' continued focus on cost discipline, we determined that impairmentindicators were present within certain of our asset groups. To measure fair value for these asset groups, we usedthe following approaches:
• Subsea Distribution Solutions U.K. - We utilized the cost approach and considered economic obsolescenceunder the income approach to determine fair value of the property and equipment.
• Subsea Distribution Solutions Brazil and Angola - We utilized a combination of market and cost approachesto measure fair values.
• Shallow Water vessels - We utilized the cost approach and considered historical, current and anticipateddayrates and utilization to measure market value.
• Renewables and Special Projects - We utilized a combination of market and cost approaches to measurefair values.
• Oceaneering Entertainment Systems and Oceaneering AGV Systems - We utilized a combination of marketand cost approaches to measure fair value.
Our estimates of fair value for these asset groups required us to use significant unobservable inputs, classified asLevel 3 fair value measurements, including assumptions related to future performance, risk-adjusted discount rates,future commodity prices and demand for our services and estimates of expected realizable value. In the first quarterof 2020, our cash flow projections utilized a weighted-average cost of capital ranging from 12% to 15% and aterminal value based on the Gordon Growth Model, assuming an expected long-term growth rate of 2%.
Our third quarter 2020 change in operating segments did not result in any changes in our asset groups. Ourreporting units with long-lived asset impairments in the three-month period ended March 31, 2020, were realignedinto our new reporting segments as follows:
72
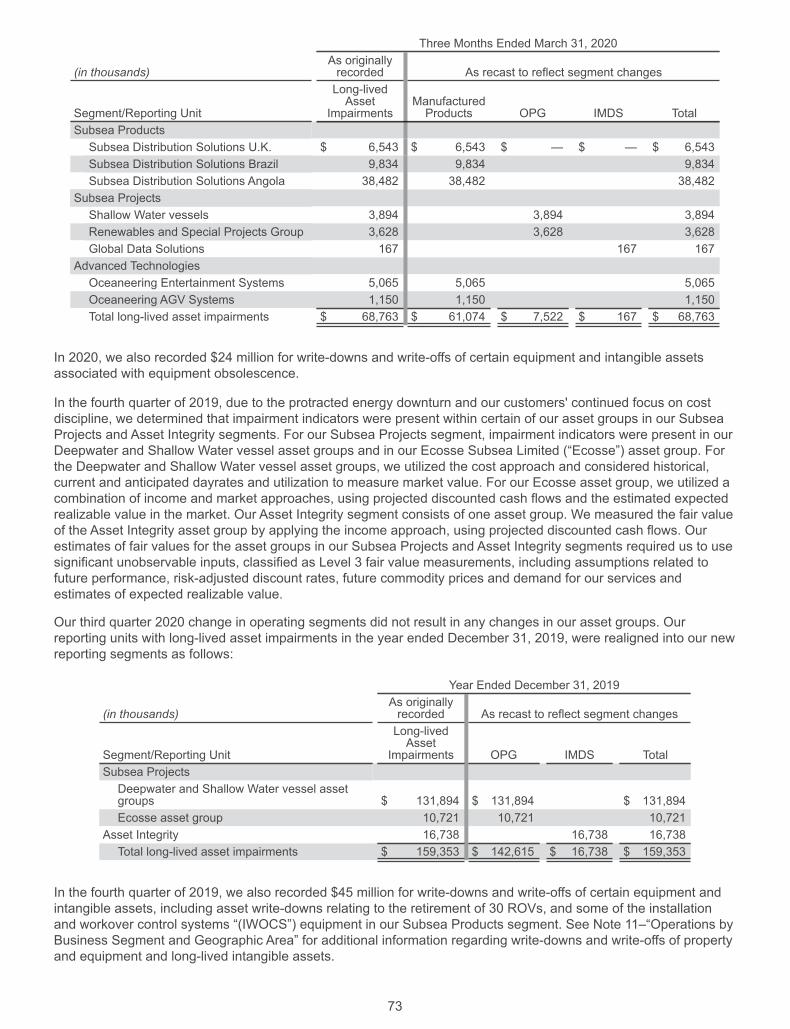
Three Months Ended March 31, 2020
(in thousands)As originallyrecorded As recast to reflect segment changes
Segment/Reporting Unit
Long-livedAsset
ImpairmentsManufacturedProducts OPG IMDS Total
Subsea ProductsSubsea Distribution Solutions U.K. $ 6,543 $ 6,543 $ — $ — $ 6,543Subsea Distribution Solutions Brazil 9,834 9,834 9,834Subsea Distribution Solutions Angola 38,482 38,482 38,482
Subsea ProjectsShallow Water vessels 3,894 3,894 3,894Renewables and Special Projects Group 3,628 3,628 3,628Global Data Solutions 167 167 167
Advanced TechnologiesOceaneering Entertainment Systems 5,065 5,065 5,065Oceaneering AGV Systems 1,150 1,150 1,150Total long-lived asset impairments $ 68,763 $ 61,074 $ 7,522 $ 167 $ 68,763
In 2020, we also recorded $24 million for write-downs and write-offs of certain equipment and intangible assetsassociated with equipment obsolescence.
In the fourth quarter of 2019, due to the protracted energy downturn and our customers' continued focus on costdiscipline, we determined that impairment indicators were present within certain of our asset groups in our SubseaProjects and Asset Integrity segments. For our Subsea Projects segment, impairment indicators were present in ourDeepwater and Shallow Water vessel asset groups and in our Ecosse Subsea Limited (“Ecosse”) asset group. Forthe Deepwater and Shallow Water vessel asset groups, we utilized the cost approach and considered historical,current and anticipated dayrates and utilization to measure market value. For our Ecosse asset group, we utilized acombination of income and market approaches, using projected discounted cash flows and the estimated expectedrealizable value in the market. Our Asset Integrity segment consists of one asset group. We measured the fair valueof the Asset Integrity asset group by applying the income approach, using projected discounted cash flows. Ourestimates of fair values for the asset groups in our Subsea Projects and Asset Integrity segments required us to usesignificant unobservable inputs, classified as Level 3 fair value measurements, including assumptions related tofuture performance, risk-adjusted discount rates, future commodity prices and demand for our services andestimates of expected realizable value.
Our third quarter 2020 change in operating segments did not result in any changes in our asset groups. Ourreporting units with long-lived asset impairments in the year ended December 31, 2019, were realigned into our newreporting segments as follows:
Year Ended December 31, 2019
(in thousands)As originallyrecorded As recast to reflect segment changes
Segment/Reporting Unit
Long-livedAsset
Impairments OPG IMDS TotalSubsea ProjectsDeepwater and Shallow Water vessel assetgroups $ 131,894 $ 131,894 $ 131,894Ecosse asset group 10,721 10,721 10,721
Asset Integrity 16,738 16,738 16,738Total long-lived asset impairments $ 159,353 $ 142,615 $ 16,738 $ 159,353
In the fourth quarter of 2019, we also recorded $45 million for write-downs and write-offs of certain equipment andintangible assets, including asset write-downs relating to the retirement of 30 ROVs, and some of the installationand workover control systems “(IWOCS”) equipment in our Subsea Products segment. See Note 11–“Operations byBusiness Segment and Geographic Area” for additional information regarding write-downs and write-offs of propertyand equipment and long-lived intangible assets.
73

For further information regarding write-downs and write-offs of property and equipment and long-lived intangibleassets by business segment, see Note 11–“Operations by Business Segment and Geographic Area.”
6. SELECTED BALANCE SHEET INFORMATIONThe following is information regarding selected balance sheet accounts:
December 31,(in thousands) 2021 2020Inventory, net:
Remotely operated vehicle parts and components $ 72,572 $ 62,788Other inventory, primarily raw materials 81,110 78,453Total $ 153,682 $ 141,241
Other current assets:Prepaid expenses $ 62,171 $ 48,616Angolan bonds 6,229 10,179Total $ 68,400 $ 58,795
Other noncurrent assets:Cash surrender value of life insurance policies $ 41,922 $ 39,562Investment in unconsolidated affiliates 30,502 34,166Intangible assets, net 12,641 14,317Other 19,190 20,205Total $ 104,255 $ 108,250
Accrued liabilities:Payroll and related costs $ 134,538 $ 135,042Accrued job costs 49,032 47,721Income taxes payable 35,826 35,929Current operating lease liability 18,781 18,798Other 52,482 55,373Total $ 290,659 $ 292,863
Other long-term liabilities:Supplemental Executive Retirement Plan $ 35,195 $ 33,982Uncertain tax positions 14,830 15,010Long-Term Incentive Plan 11,996 12,640Deferred income taxes 1,375 2,993Other 26,708 24,619Total $ 90,104 $ 89,244
74

7. INCOME TAXES
The components of income (loss) before income taxes are as follows:
Year Ended December 31,(in thousands) 2021 2020 2019Domestic $ (125,010) $ (306,354) $ (271,515)Foreign 119,301 (192,543) (59,306)Income (loss) before income taxes $ (5,709) $ (498,897) $ (330,821)
The components of the income tax provision (benefit) applicable for domestic and foreign taxes and cash taxes paidare as follows:
Year Ended December 31,(in thousands) 2021 2020 2019Current income tax expense (benefit):Domestic $ 974 $ (32,743) $ (7,571)Foreign 44,422 34,755 37,462Total current income tax expense (benefit) 45,396 2,012 29,891Deferred income tax expense (benefit):Domestic (328) (9,192) (10,860)Foreign (1,470) 5,034 (1,408)Total deferred income tax expense (benefit) (1,798) (4,158) (12,268)Total income tax expense (benefit) $ 43,598 $ (2,146) $ 17,623Cash taxes paid, net $ 29,204 $ 26,264 $ 29,806
The reconciliation between the actual income tax provision and income tax computed using the U.S. statutoryfederal income tax rate is summarized as follows:
Year Ended December 31,
(in thousands) 2021 2020 2019
Income tax provision (benefit) at the U.S. statutory rate $ (1,199) $ (104,769) $ (69,472)
Tax Act - net mandatory repatriation tax — — (8,220)
CARES Act — (4,681) —
Permanent differences for goodwill impairments — 50,435 —
Valuation allowances 33,068 46,650 74,553
Foreign tax rate differential 8,619 6,088 18,439
Stock compensation 542 1,032 989
Uncertain tax positions 158 (5,939) 3,046
Other items, net 2,410 9,038 (1,712)
Total provision (benefit) for income taxes $ 43,598 $ (2,146) $ 17,623
75

Significant components of net deferred tax assets and liabilities were as follows:
December 31,(in thousands) 2021 2020Deferred tax assets:Deferred compensation $ 17,169 $ 16,761Deferred income 7,604 1,958Accrued expenses 23,555 27,864Net operating loss and other carryforwards 551,724 521,757Long-term operating lease liabilities 34,728 40,417Goodwill and intangibles 19,623 19,357Interest 31,898 27,359Other 27,667 14,045Gross deferred tax assets 713,968 669,518Valuation allowances (679,242) (592,516)Total deferred tax assets $ 34,726 $ 77,002Deferred tax liabilities:Property and equipment $ 7,185 $ 1,343Basis difference in equity investments 1,948 2,348Right-of-use operating lease assets 26,968 28,519Interest — 47,785Total deferred tax liabilities $ 36,101 $ 79,995Net deferred income tax liability $ 1,375 $ 2,993
Our net deferred tax liability is reflected within our balance sheet as follows:
December 31,(in thousands) 2021 2020Deferred tax liabilities included in other long-term liabilities $ 1,375 $ 2,993Net deferred income tax liability $ 1,375 $ 2,993
As of December 31, 2021, we had approximately $508 million of deferred tax assets related to net operating andother loss carryforwards that were generated in various worldwide jurisdictions. The carryforwards include $197million that do not expire and $311 million that will expire from 2022 through 2040. We have recorded a totalvaluation allowance of $679 million on net operating loss and tax credit carryforwards, as well as other deferred taxassets, as our management believes that it is more likely than not that these deferred tax assets will not be realized.
The following is a reconciliation of the beginning and ending amounts of our valuation allowances:
Year Ended December 31,
(in thousands) 2021 2020 2019
Balance at beginning of year $ (592,516) $ (277,258) $ (203,040)
Increase due principally to net operating losses (83,908) (300,748) (59,596)(Increase) decrease due to foreign tax and business creditcarryforwards (5,761) (14,510) (14,622)Reduction due to utilization of foreign tax credits generatedin prior years 2,943 — —
Balance at end of year $ (679,242) $ (592,516) $ (277,258)
76

On March 27, 2020, the U.S. Coronavirus Aid, Relief, and Economic Security Act (the "CARES Act") was signed intolaw in the United States. In accordance with the rules and procedures under the CARES Act, we filed a certainrefund claim to carry back a portion of our U.S. net operating loss. Prior to enactment of the CARES Act, such netoperating losses could only be carried forward. As a result, we expect to receive combined refunds of approximately$33 million, of which we have received $10 million as of December 31, 2021. The remaining refunds are classifiedas accounts receivable, net, in the consolidated balance sheet as of December 31, 2021. In 2020, we also realizeda non-cash tax benefit of $8.4 million due to the carryback provision of the CARES Act recognized as a reduction inlong-term liabilities.
We continue to make an assertion to indefinitely reinvest the unrepatriated earnings of any foreign subsidiary thatwould incur material tax consequences upon the distribution of such earnings. As of December 31, 2021, we did notprovide for deferred taxes on earnings of our foreign subsidiaries that are indefinitely reinvested. If we were to makea distribution from the unremitted earnings of these subsidiaries, we could be subject to taxes in variousjurisdictions. However, it is not practical to estimate the amount of tax that could ultimately be due if such earningswere remitted. If our expectations were to change regarding future tax consequences, we may be required to recordadditional deferred taxes that could have a material effect on our consolidated financial statements.
We recognize the expense or benefit for an uncertain tax position if it is more likely than not to be sustainable uponaudit by the applicable taxing authority. If this threshold is met, the uncertain tax position is then measured andrecognized at the largest amount that we believe is greater than 50% likely of being realized upon ultimatesettlement. We account for any applicable interest and penalties on these positions as a component of our provisionfor income taxes in our consolidated financial statements.
A reconciliation of the beginning and ending amount of gross uncertain tax positions, excluding penalties andinterest, is as follows:
Year Ended December 31,(in thousands) 2021 2020 2019Balance at beginning of year $ 20,086 $ 16,911 $ 14,971Additions based on tax positions related to the currentyear 1,934 2,229 3,662Reductions for expiration of statutes of limitations (784) (628) (2,835)Additions based on tax positions related to prior years 2,011 1,830 2,060Reductions based on tax positions related to prior years (2,818) (68) (563)Settlements (3,062) (188) (384)Balance at end of year $ 17,367 $ 20,086 $ 16,911
We increased (decreased) income tax expense by $(1.1) million, $(1.2) million and $1.4 million in 2021, 2020 and2019, respectively, for penalties and interest on uncertain tax positions, which brought our total liabilities forpenalties and interest on uncertain tax positions to $3.4 million and $4.5 million in other long-term liabilities on ourbalance sheets as of December 31, 2021 and 2020, respectively. All additions or reductions to those liabilities wouldaffect our effective income tax rate in the periods of change.
We believe approximately $7.0 million to $8.0 million of gross uncertain tax positions will be resolved within the next12 months. A portion of our uncertain tax position liability is reflected as a reduction in our gross deferred tax assetbefore valuation allowance and the remaining balance is reflected in other long-term liabilities on our consolidatedbalance sheet. The balance of gross uncertain tax position liability included in other long-term liabilities on ourconsolidated balance sheet was $11 million and $10 million as of December 31, 2021 and December 31, 2020,respectively. The balance of gross uncertain tax position liability netted against our gross deferred tax asset beforevaluation allowance was $6.0 million and $9.6 million as of December 31, 2021 and December 31, 2020,respectively.
77

Our tax returns are subject to audit by taxing authorities in multiple jurisdictions. These audits often take years tocomplete and settle. The following table lists the earliest tax years open to examination by tax authorities where wehave significant operations:
Jurisdiction PeriodsUnited States 2014United Kingdom 2019Norway 2016Angola 2013Brazil 2017Australia 2017
8. SELECTED INCOME STATEMENT INFORMATION
The following schedule shows our revenue, costs and gross margins by services and products:
Year Ended December 31,(in thousands) 2021 2020 2019Revenue:
Services $1,503,745 $1,340,033 $1,333,787Products 365,530 487,856 714,337
Total revenue 1,869,275 1,827,889 2,048,124Cost of Services and Products:
Services 1,215,994 1,161,699 1,242,006Products 295,514 421,445 619,490Unallocated expenses 93,702 80,804 88,384
Total cost of services and products 1,605,210 1,663,948 1,949,880Gross margin:
Services 287,751 178,334 91,781Products 70,016 66,411 94,847Unallocated expenses (93,702) (80,804) (88,384)
Total gross margin $ 264,065 $ 163,941 $ 98,244
9. DEBTLong-term debt consisted of the following:
December 31,(in thousands) 2021 2020
4.650% Senior Notes due 2024 $ 400,000 $ 500,0006.000% Senior Notes due 2028 300,000 300,000Interest rate swap settlements 6,572 10,870Unamortized debt issuance costs (4,505) (5,619)Long-term Debt $ 702,067 $ 805,251
In November 2014, we completed the public offering of $500 million aggregate principal amount of 4.650% SeniorNotes due 2024 (the “2024 Senior Notes”). We pay interest on the 2024 Senior Notes on May 15 and November 15of each year. The 2024 Senior Notes are scheduled to mature on November 15, 2024.
In February 2018, we completed the public offering of $300 million aggregate principal amount of 6.000% SeniorNotes due 2028 (the “2028 Senior Notes”). We pay interest on the 2028 Senior Notes on February 1 and August 1of each year. The 2028 Senior Notes are scheduled to mature on February 1, 2028. We used the net proceeds fromthe 2028 Senior Notes to repay our term loan indebtedness described further below.
78

We may redeem some or all of the 2024 Senior Notes and 2028 Senior Notes (collectively, the “Senior Notes”) atspecified redemption prices. In the year ended December 31, 2021, we repurchased $100 million in aggregateprincipal amount of the 2024 Senior Notes in open-market transactions. The aggregate purchase price in the yearended December 31, 2021 included accrued and unpaid interest to the repurchase date of $0.7 million, and werecorded loss on extinguishment of debt of $1.1 million (including premiums and fees associated with therepurchases).
In October 2014, we entered into a credit agreement (as amended, the “Credit Agreement”) with a group of banks.The Credit Agreement initially provided for a $500 million five-year revolving credit facility (the “Revolving CreditFacility”). Subject to certain conditions, the aggregate commitments under the Revolving Credit Facility may beincreased by up to $300 million at any time upon agreement between us and existing or additional lenders.Borrowings under the Revolving Credit Facility may be used for general corporate purposes. The Credit Agreementalso provided for a $300 million term loan, which we repaid in full in February 2018, using net proceeds from theissuance of our 2028 Senior Notes referred to above, and cash on hand.
In February 2018, we entered into Agreement and Amendment No. 4 to the Credit Agreement (“Amendment No. 4”).Amendment No. 4 amended the Credit Agreement to, among other things, extend the maturity of the RevolvingCredit Facility to January 25, 2023 with the extending lenders, which represent 90% of the existing commitments ofthe lenders, such that the total commitments for the Revolving Credit Facility was $500 million untilOctober 25, 2021, and thereafter $450 million until January 25, 2023. As of December 31, 2021, we had noborrowings outstanding under the Revolving Credit Facility.
Borrowings under the Revolving Credit Facility bear interest at an Adjusted Base Rate or the Eurodollar Rate (bothas defined in the Credit Agreement), at our option, plus an applicable margin based on our Leverage Ratio (asdefined in the Credit Agreement) and, at our election, based on the ratings of our senior unsecured debt bydesignated ratings services, thereafter to be based on such debt ratings. The applicable margin varies: (1) in thecase of advances bearing interest at the Adjusted Base Rate, from 0.125% to 0.750% and (2) in the case ofadvances bearing interest at the Eurodollar Rate, from 1.125% to 1.750%. The Adjusted Base Rate is the highest of(1) the per annum rate established by the administrative agent as its prime rate, (2) the federal funds rate plus0.50% and (3) the daily one-month LIBOR plus 1%. We pay a commitment fee ranging from 0.125% to 0.300% onthe unused portion of the Revolving Credit Facility, depending on our Leverage Ratio. The commitment fees areincluded as interest expense in our consolidated financial statements.
The Credit Agreement contains various covenants that we believe are customary for agreements of this nature,including, but not limited to, restrictions on our ability and the ability of each of our subsidiaries to incur debt, grantliens, make certain investments, make distributions, merge or consolidate, sell assets and enter into certainrestrictive agreements. We are also subject to a maximum adjusted total Capitalization Ratio (as defined in theCredit Agreement and which stipulates that, among other items, we exclude any impacts associated with currentand prior period impairments) of 55%. The Credit Agreement includes customary events of default and associatedremedies. As of December 31, 2021, we were in compliance with all the covenants set forth in the CreditAgreement.
We had two interest rate swaps in place relating to a total of $200 million of the 2024 Senior Notes for the period toNovember 2024. The agreements swapped the fixed interest rate of 4.65% on $100 million of the 2024 SeniorNotes to the floating rate of one-month LIBOR plus 2.426% and on another $100 million to one-month LIBOR plus2.823%. In March 2020, we settled both interest rate swaps with the counterparty for cash proceeds of $13 million.The settlement resulted in a $13 million increase to our long-term debt balance that will be amortized to interestexpense prospectively through the maturity date for the 2024 Senior Notes using the effective interest method. As aresult, in the year ended December 31, 2021, we amortized $4.3 million to interest expense, including $1.8 million,for the pro-rata write-off of interest rate swap settlement gains associated with the 2024 Senior Notes repurchasesdiscussed above. We amortized $2.0 million to interest expense for the year ended December 31, 2020.
We incurred $6.9 million and $4.2 million of issuance costs related to the 2024 Senior Notes and the 2028 SeniorNotes, respectively, and $3.0 million of new loan costs, including costs of the amendments prior to Amendment No.4, related to the Credit Agreement. These costs, net of accumulated amortization, are included as a reduction oflong-term debt in our Consolidated Balance Sheets, as they pertain to the Senior Notes, and in other noncurrentassets, as they pertain to the Credit Agreement. We are amortizing these costs to interest expense through therespective maturity dates for the Senior Notes and to January 2023 for the Credit Agreement using the straight-linemethod, which approximates the effective interest rate method.
79

We made cash interest payments of $39 million, $44 million and $46 million in 2021, 2020 and 2019, respectively.
10. COMMITMENTS AND CONTINGENCIESLease CommitmentsAs of December 31, 2021, we occupied several facilities under noncancellable operating leases expiring at variousdates through 2035. See Note 4—“Leases” for more information on our operating leases.
InsuranceThe workers' compensation, maritime employer's liability and comprehensive general liability insurance policies thatwe purchase each include a deductible layer, for which we would be responsible, that we consider financiallyprudent. Insurance above the deductible layers can be by occurrence or in the aggregate. We determine the level ofaccruals for claims exposure by reviewing our historical experience and current year claim activity. We do not recordaccruals on a present-value basis. We review larger claims with insurance adjusters and establish specific reservesfor known liabilities. We establish an additional reserve for incidents incurred but not reported to us for each yearusing our estimates and based on prior experience. We believe we have established adequate accruals forexpected liabilities arising from those obligations. However, it is possible that future earnings could be affected bychanges in our estimates relating to these matters.
Litigation
In the ordinary course of business, we are, from time to time, involved in litigation or subject to disputes,governmental investigations or claims related to our business activities, including, among other things:
• performance- or warranty-related matters under our customer and supplier contracts and other businessarrangements; and
• workers’ compensation claims, Jones Act claims, occupational hazard claims, premises liability claims andother claims.
Although we cannot predict the ultimate outcome of these matters, we believe that our ultimate liability, if any, thatmay result from these other actions and claims will not have a material adverse effect on our consolidated financialcondition, results of operations or cash flows. However, because of the inherent uncertainty of litigation and otherdispute resolution proceedings and, in some cases, the availability and amount of potentially available insurance,we can provide no assurance that the resolution of any particular claim or proceeding to which we are a party willnot have a material effect on our consolidated financial condition, results of operations or cash flows for the fiscalperiod in which that resolution occurs.
Letters of Credit
We had $46 million and $51 million in letters of credit outstanding as of December 31, 2021 and 2020, respectively,which related to self-insurance requirements and various bid and performance bonds, which are usually for theduration of the applicable contract.
Financial Instruments and Risk Concentration
In the normal course of business, we manage risks associated with foreign exchange rates and interest ratesthrough a variety of strategies, including the use of hedging transactions. As a matter of policy, we do not usederivative instruments unless we have an underlying exposure. Other financial instruments that potentially subjectus to concentrations of credit risk are principally cash and cash equivalents and accounts receivable.
The carrying values of cash and cash equivalents approximate their fair values due to the short-term maturity of theunderlying instruments. Accounts receivable are generated from a broad group of customers, primarily from withinthe energy industry, which is our major source of revenue. Due to their short-term nature, carrying values of ouraccounts receivable and accounts payable approximate fair market values.
We estimated the aggregate fair market value of the Senior Notes to be $697 million as of December 31, 2021based on quoted prices. Since the market for the Senior Notes is not an active market, the fair value of the SeniorNotes is classified within Level 2 in the fair value hierarchy under U.S. GAAP (inputs other than quoted prices inactive markets for similar assets and liabilities that are observable or can be corroborated by observable marketdata for substantially the full terms for the assets or liabilities).
80

Foreign currency gains (losses) in the year ended December 31, 2021 and 2019 were primarily related to decliningexchange rates for the Angolan kwanza relative to the U.S. dollar. Foreign currency gain (losses in the year endedDecember 31, 2020 were primarily related to declining exchange rate for the Angolan kwanza and the Brazilian realrelative to the U.S. dollar. Foreign currency gains (losses) related to the Angolan kwanza of $(4.5) million, $(2.8)million and $(4.8) million in the years ended December 31, 2021, 2020 and 2019, were primarily due to theremeasurement of our Angolan kwanza cash balances to U.S. dollars. Foreign currency gains (losses) related to theBrazilian real of $(0.2) million, $(7.3) million and $(0.7) million in the years ended December 31, 2021, 2020 and2019, were primarily due to the remeasurement of our U.S. dollar denominated liability balances to the Brazilianreal. We recorded foreign currency transaction losses related to the Angolan kwanza and Brazilian real as acomponent of other income (expense), net in our Consolidated Statements of Operations.
Any conversion of cash balances from kwanza to U.S. dollars is controlled by the central bank in Angola. As ofDecember 31, 2021 and 2020, we had the equivalent of approximately $1.0 million and $4.7 million of kwanza cashbalances, respectively, in Angola reflected on our Consolidated Balance Sheets.
To mitigate our currency exposure risk in Angola, we have used kwanza to purchase equivalent Angolan centralbank (Banco Nacional de Angola) bonds. The bonds are denominated as U.S. dollar equivalents, so that, uponpayment of semi-annual interest and principal upon maturity, payment is made in kwanza, equivalent to therespective U.S. dollars at the then-current exchange rate. As of December 31, 2021 and 2020, we had $6.2 millionand $10 million, respectively, of Angolan bonds on our Consolidated Balance Sheets. Because we intend to sell thebonds if we are able to repatriate the proceeds, we have classified these bonds as available-for-sale securities, andthey are recorded in other current assets on our Consolidated Balance Sheets. During the year ended December31, 2021, we sold a portion of these bonds for $4.5 million and recognized a gain of $0.5 million as a component ofinterest income in our Consolidated Statement of Operations.
We estimated the fair market value of the Angolan bonds to be $6.4 million and $10 million as of December 31,2021 and 2020, respectively, using quoted market prices. Since the market for the Angolan bonds is not an activemarket, the fair value of the Angolan bonds is classified within Level 2 in the fair value hierarchy under U.S. GAAP.As of December 31, 2021, we have $0.2 million in unrealized gains, net of tax, related to these bonds as acomponent of accumulated other comprehensive loss in our Consolidated Balance Sheets.
We made the decision during the fourth quarter of 2021 to terminate a number of entertainment ride systemscontracts with Evergrande and recorded a net loss in our Manufactured Products segment. The specific elements ofthe net loss included a reserve of $49 million in receivables and contract assets partially offset by thereclassification of $20 million of contract assets into salable inventory. As of December 31, 2021, we had nooutstanding accounts receivable or contract assets for those projects. As of December 31, 2020, we hadoutstanding accounts receivable of $11 million and contract assets of $40 million for those projects.
In the three-month period ended June 30, 2021, we were notified by a customer in our Manufactured Productssegment that it was suspending a contract that is substantially complete. We billed and received $37 million ofaccounts receivable in the fourth quarter of 2021. As of December 31, 2021, we had outstanding contract assets ofapproximately $33 million for the contract and contract liabilities of $11 million prepaid for storage of components.We are in discussions with the customer concerning the timing of remaining payments. We continue to believe thatwe will realize these contract assets at their book values, although we can provide no assurance as to the timing.
11. OPERATIONS BY BUSINESS SEGMENT AND GEOGRAPHIC AREA
Business Segment Information
We are a global technology company delivering engineered services and products and robotic solutions to theoffshore energy, defense, aerospace, manufacturing and entertainment industries.
Our Energy Services and Products business leverages our asset base and capabilities for providing services andproducts for offshore energy operations, inclusive of the offshore renewables energy market. Our Energy Servicesand Products segments are:
• Subsea Robotics—Our Subsea Robotics segment provides the following:
◦ ROVs for drill support and vessel-based services, including subsea hardware installation, construction,pipeline inspection, survey and facilities inspection, maintenance and repair;
◦ ROV tooling; and
81

◦ survey services, including hydrographic survey and positioning services and autonomous underwatervehicles for geoscience.
• Manufactured Products—Our Manufactured Products segment provides the following:
◦ distribution and connection systems including production control umbilicals and field developmenthardware and pipeline connection and repair systems to the energy industry; and
◦ autonomous mobile robots and automated guided vehicle technology and entertainment systems to avariety of industries.
• Offshore Projects Group—Our OPG segment provides the following:
◦ subsea installation and intervention, including riserless light well intervention services, inspection,maintenance and repair (“IMR”) services, principally in the U.S. Gulf of Mexico and offshore Angola,utilizing owned and charter vessels;
◦ installation and workover control systems and ROV workover control systems;◦ manned diving operations utilizing owned and charter vessels;◦ project management and engineering; and◦ drill pipe riser services and systems and wellhead load relief solutions.
• Integrity Management & Digital Solutions—Our IMDS segment provides the following:
◦ asset integrity management services;◦ software and analytical solutions for the bulk cargo maritime industry; and◦ software, digital and connectivity solutions for the energy industry.
Our Aerospace and Defense Technologies segment provides services and products include engineering and relatedmanufacturing in defense and space exploration activities, principally to U.S. government agencies and their primecontractors.
Unallocated Expenses are those not associated with a specific business segment. These consist of expensesrelated to our incentive and deferred compensation plans, including restricted stock and bonuses, as well as othergeneral expenses, including corporate administrative expenses.
There are no differences in the basis of segmentation or in the basis of measurement of segment profit or loss fromthose used in our consolidated financial statements for the year ended December 31, 2020.
82

The table that follows presents revenue, income (loss) from operations and depreciation and amortization expenseincluding goodwill impairment, by business segment:
Year Ended December 31,(in thousands) 2021 2020 2019Revenue
Energy Services and ProductsSubsea Robotics $ 538,515 $ 493,332 $ 583,652Manufactured Products 344,251 477,419 498,350OPG 378,121 289,127 380,966IMDS 241,393 226,938 266,086
Total Energy Services and Products 1,502,280 1,486,816 1,729,054ADTech 366,995 341,073 319,070
Total $1,869,275 $1,827,889 $2,048,124Income (Loss) from Operations
Energy Services and ProductsSubsea Robotics $ 76,874 $ (65,817) $ 11,627Manufactured Products (15,876) (88,253) 5,730OPG 31,197 (105,680) (170,013)IMDS 18,572 (121,675) (52,527)
Total Energy Services and Products 110,767 (381,425) (205,183)ADTech 60,992 56,023 42,574Unallocated Expenses (131,960) (120,677) (128,104)
Total $ 39,799 $ (446,079) $ (290,713)Depreciation and Amortization Expense, includingGoodwill Impairment
Energy Services and ProductsSubsea Robotics $ 87,900 $ 212,621 $ 140,087Manufactured Products 12,788 66,772 20,732OPG 28,173 115,288 58,044IMDS 4,420 127,221 37,160
Total Energy Services and Products 133,281 521,902 256,023ADTech 4,783 2,666 2,644Unallocated Expenses 1,659 4,327 4,760
Total $ 139,723 $ 528,895 $ 263,427
We determine income (loss) from operations for each business segment before interest income or expense, otherincome (expense) and provision for income taxes. We do not consider an allocation of these items to be practical.
Revenue
During 2021, revenue from one customer, the U.S. Government, accounted for 12% of our total consolidated annualrevenue, and no other customer accounted for more than 10% of our total consolidated revenue. No individualcustomer accounted for more than 10% of our consolidated revenue during 2020. During 2019, revenue from onecustomer, BP plc and subsidiaries, accounted for 10% of our total consolidated annual revenue.
83

Income (Loss) from Operations
Year ended December 31, 2021—During the year ended December 31, 2021, we recorded charges and otherdiscrete impacts attributable to each of our reporting segments as follows:
For the Year Ended December 31, 2021
(in thousands)SubseaRobotics
ManufacturedProducts OPG IMDS ADTech
UnallocatedExpenses Total
Impacts for the effects of:Provision for Evergrandelosses, net $ — $ 29,549 $ — $ — $ — $ — $ 29,549Loss on sale of asset — — — — — 1,415 1,415Other 395 537 149 217 10 — 1,308Total charges $ 395 $ 30,086 $ 149 $ 217 $ 10 $ 1,415 $ 32,272
Year ended December 31, 2020—During the year ended December 31, 2020, we recorded charges and otherdiscrete impacts attributable to each of our reporting segments as follows:
For the Year Ended December 31, 2020
(in thousands)SubseaRobotics
ManufacturedProducts OPG IMDS ADTech
UnallocatedExpenses Total
Impacts for the effects of:Long-lived assetsimpairments $ — $ 61,074 $ 8,826 $ 545 $ — $ — $ 70,445Long-lived assets write-offs 7,328 — 16,644 170 — — 24,142Inventory write-downs 7,038 — — — — — 7,038Goodwill impairment 102,118 52,263 66,285 123,214 — — 343,880Other 5,055 2,266 8,590 4,272 572 455 21,210Total charges $ 121,539 $ 115,603 $ 100,345 $ 128,201 $ 572 $ 455 $ 466,715
Year ended December 31, 2019—During the year ended December 31, 2019, we recorded charges and otherdiscrete impacts attributable to each of our reporting segments as follows:
For the Year Ended December 31, 2019
(in thousands)SubseaRobotics
ManufacturedProducts OPG IMDS ADTech
UnallocatedExpenses Total
Impacts for the effects of:Long-lived assetsimpairments $ — $ — $ 142,615 $ 16,738 $ — $ — $ 159,353Long-lived assets write-offs 11,340 482 18,723 14,108 — — 44,653Inventory write-downs 15,433 2,107 2,771 719 255 21,285Goodwill impairment — — — 14,713 — — 14,713Other 4,228 757 3,526 3,082 102 56 11,751Total charges $ 31,001 $ 3,346 $ 167,635 $ 49,360 $ 357 $ 56 $ 251,755
Depreciation and Amortization Expense, including Goodwill Impairment
Depreciation expense on property and equipment, reflected in the Depreciation and Amortization Expense, includingGoodwill Impairment table above, was $136 million, $170 million and $212 million in 2021, 2020 and 2019,respectively.
Amortization expense on long-lived intangible assets, reflected in the Depreciation and Amortization Expense,including Goodwill Impairment table above, was $3.8 million, $15 million and $36 million in 2021, 2020 and 2019,respectively.
84

Goodwill impairment expense, reflected in the Depreciation and Amortization Expense, including GoodwillImpairment table above, was $344 million and $15 million in 2020 and 2019, respectively. See “Income (Loss) fromOperations” above for amounts attributable to each segment.
We recorded the write-downs and write-offs of certain equipment and intangible assets, reflected in our depreciationexpense, of $14 million and $45 million in 2020 and 2019, respectively. We also recorded the write-offs of certainintangible assets, reflected in our amortization expense, of $10 million in 2020. See “Income (Loss) fromOperations” above for amounts attributable to each segment.
Assets, Property and Equipment, Net and Goodwill
The following table presents Assets, Property and Equipment, net and Goodwill by business segment:
December 31,(in thousands) 2021 2020Assets
Energy Services and ProductsSubsea Robotics $ 447,130 $ 487,505Manufactured Products 342,978 436,835OPG 333,248 359,844IMDS 83,796 80,123
Total Energy Services and Products 1,207,152 1,364,307ADTech 107,999 112,294Corporate and Other 647,708 569,241
Total $1,962,859 $ 2,045,842Property and Equipment, Net
Energy Services and ProductsSubsea Robotics $ 190,992 $ 252,221Manufactured Products 85,190 94,600OPG 186,187 212,990IMDS 10,934 12,018
Total Energy Services and Products 473,303 571,829ADTech 7,632 7,892Corporate and Other 8,661 11,386
Total $ 489,596 $ 591,107Goodwill
Energy Services and ProductsSubsea Robotics $ 24,454 $ 24,562
Total Energy Services and Products 24,454 24,562ADTech 10,454 10,454
Total $ 34,908 $ 35,016
All assets specifically identified with a particular business segment have been segregated. Cash and cashequivalents, certain other current assets, certain investments and certain other assets have not been allocated toparticular business segments and are included in Corporate and Other.
85
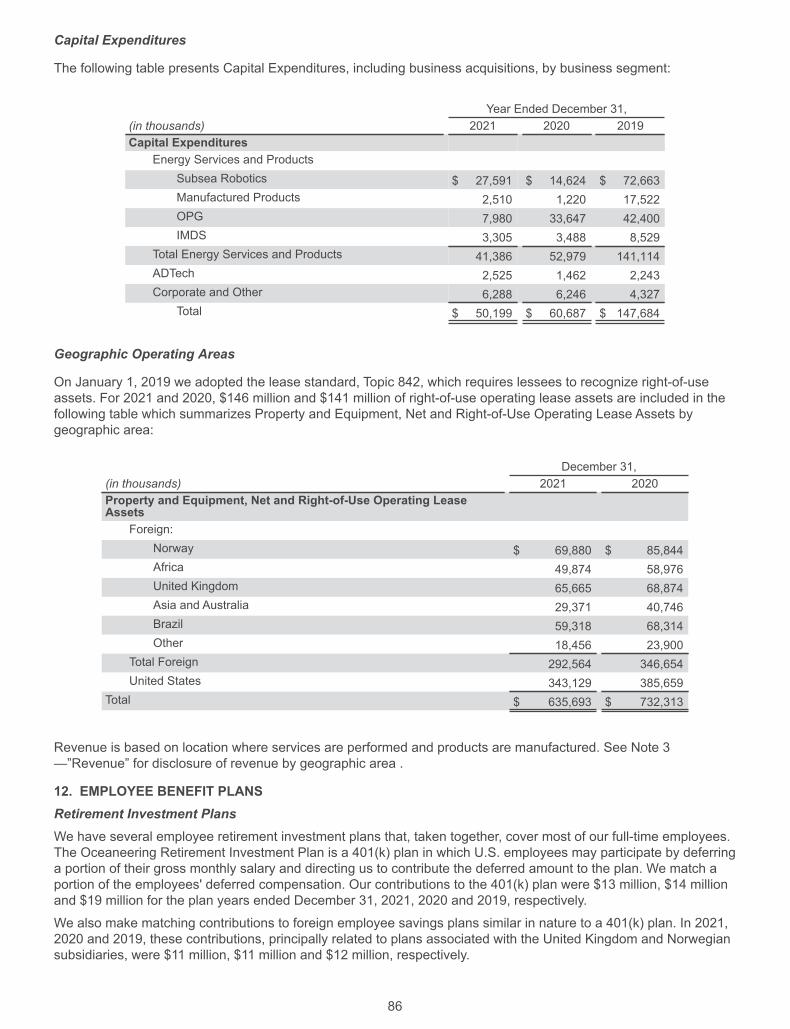
Capital Expenditures
The following table presents Capital Expenditures, including business acquisitions, by business segment:
Year Ended December 31,(in thousands) 2021 2020 2019Capital Expenditures
Energy Services and ProductsSubsea Robotics $ 27,591 $ 14,624 $ 72,663Manufactured Products 2,510 1,220 17,522OPG 7,980 33,647 42,400IMDS 3,305 3,488 8,529
Total Energy Services and Products 41,386 52,979 141,114ADTech 2,525 1,462 2,243Corporate and Other 6,288 6,246 4,327
Total $ 50,199 $ 60,687 $ 147,684
Geographic Operating Areas
On January 1, 2019 we adopted the lease standard, Topic 842, which requires lessees to recognize right-of-useassets. For 2021 and 2020, $146 million and $141 million of right-of-use operating lease assets are included in thefollowing table which summarizes Property and Equipment, Net and Right-of-Use Operating Lease Assets bygeographic area:
December 31,(in thousands) 2021 2020Property and Equipment, Net and Right-of-Use Operating LeaseAssets
Foreign:Norway $ 69,880 $ 85,844Africa 49,874 58,976United Kingdom 65,665 68,874Asia and Australia 29,371 40,746Brazil 59,318 68,314Other 18,456 23,900
Total Foreign 292,564 346,654United States 343,129 385,659
Total $ 635,693 $ 732,313
Revenue is based on location where services are performed and products are manufactured. See Note 3—”Revenue” for disclosure of revenue by geographic area .
12. EMPLOYEE BENEFIT PLANSRetirement Investment PlansWe have several employee retirement investment plans that, taken together, cover most of our full-time employees.The Oceaneering Retirement Investment Plan is a 401(k) plan in which U.S. employees may participate by deferringa portion of their gross monthly salary and directing us to contribute the deferred amount to the plan. We match aportion of the employees' deferred compensation. Our contributions to the 401(k) plan were $13 million, $14 millionand $19 million for the plan years ended December 31, 2021, 2020 and 2019, respectively.
We also make matching contributions to foreign employee savings plans similar in nature to a 401(k) plan. In 2021,2020 and 2019, these contributions, principally related to plans associated with the United Kingdom and Norwegiansubsidiaries, were $11 million, $11 million and $12 million, respectively.
86

The Oceaneering International, Inc. Supplemental Executive Retirement Plan covers selected key managementemployees and executives, as approved by the Compensation Committee of our Board of Directors (the“Compensation Committee”). Under this plan, we accrue an amount determined as a percentage of the participant'sgross monthly salary and the amounts accrued are treated as if they are invested in one or more investmentvehicles pursuant to this plan. Expenses related to this plan during 2021, 2020 and 2019 were $1.8 million, $1.9million and $3.0 million, respectively.
Incentive PlansUnder our Second Amended and Restated 2010 Incentive Plan and our 2020 Incentive Plan (together the “IncentivePlans”), shares of our common stock are made available for awards to employees and nonemployee members ofour Board of Directors.
The Incentive Plans are administered primarily by the Compensation Committee; however, the full Board ofDirectors makes determinations regarding awards to nonemployee directors under the Incentive Plans. TheCompensation Committee or our Board of Directors, as applicable, determines the type(s) of award(s) to be madeto each participant and sets forth in the related award agreement the terms, conditions and limitations applicable toeach award. Stock options, stock appreciation rights and stock and cash awards may be made under the IncentivePlans. There are no options outstanding under either Incentive Plan. We have not granted any stock options since2005 and the Compensation Committee has expressed its intention to refrain from using stock options as acomponent of employee compensation for our executive officers and other employees for the foreseeable future.Additionally, the Board of Directors has expressed its intention to refrain from using stock options as a component ofnonemployee director compensation for the foreseeable future.
In 2021, 2020 and 2019, the Compensation Committee granted awards of performance units to certain of our keyexecutives and employees. The performance units awarded are scheduled to vest in full on the third anniversary ofthe applicable award dates, or pro rata over three years if the participant meets certain age and years of servicerequirements. The Compensation Committee and the Board of Directors approved specific financial goals andmeasures (as defined), for each of the three-year periods ending December 31, 2023, 2022 and 2021 to be used asthe basis for the final value of the performance units. The final value of the performance unit granted may rangefrom $0 to $200 in each of 2021, 2020 and 2019. Upon vesting and determination of value, the value of theperformance units will be payable in cash. Compensation expense related to the performance units was $9.4million, $7.6 million and $9.7 million in 2021, 2020 and 2019, respectively. As of December 31, 2021, there were265,042 performance units outstanding.
During 2021, 2020 and 2019, the Compensation Committee granted restricted units of our common stock to certainof our key executives and employees. During 2021, 2020 and 2019, our Board of Directors granted restrictedcommon stock to our nonemployee directors. Over 85%, 80% and 80% of the grants made to our employees in2021, 2020 and 2019, respectively, vest in full on the third anniversary of the award date, conditional uponcontinued employment. The remainder of the grants made to employees vest pro rata over three years, as theseparticipants meet certain age and years-of-service requirements. For the grants of restricted stock units to each ofthe participant employees, the participant will be issued one share of our common stock for each of the participant'svested restricted stock units at the earlier of three years or, if the participant vested earlier after meeting the age andservice requirements, following termination of employment or service. The grants of restricted stock to ournonemployee directors were scheduled to vest in full on the first anniversary of the award date, conditional uponcontinued service as a director, except for the 2021 grant to one director who retired from our board of directors asof the date of our annual meeting in May 2021, which vested on that date.
The Compensation Committee has a policy that Oceaneering will not provide U.S. federal income tax gross-uppayments to any of its directors or executive officers in connection with future awards of restricted stock or stockunits.
The additional tax charge realized from tax deductions less than the financial statement expense of our restrictedstock grants was $0.5 million, $1.0 million and $1.0 million in 2021, 2020 and 2019, respectively. The 2021, 2020and 2019 charges were recognized in our Consolidated Statements of Operations.
87

The following is a summary of our restricted stock and restricted stock unit activity for 2021, 2020 and 2019:
Number
WeightedAverageFair Value
AggregateIntrinsic Value
Balance as of December 31, 2018 1,443,897 23.27Granted 957,734 18.12Issued (495,527) 48.65 $ 8,154,000Forfeited (164,769) 22.86
Balance as of December 31, 2019 1,741,335 22.62Granted 1,007,383 10.23Issued (489,035) 25.55 $ 5,821,000Forfeited (304,337) 18.13
Balance as of December 31, 2020 1,955,346 16.20Granted 1,333,689 11.80Issued (601,830) 24.46 $ 7,613,000Forfeited (239,946) 18.46
Balance as of December 31, 2021 2,447,259 16.70
The restricted stock units granted in 2021, 2020 and 2019 carry no voting rights and no dividend rights. Eachgrantee of shares of restricted common stock is deemed to be the record owner of those shares during therestriction period, with the right to vote and receive any dividends on those shares.
Grants of restricted stock units are valued at their estimated fair values as of their respective grant dates. The grantsin 2021, 2020 and 2019 were subject only to vesting conditioned on continued employment or service as anonemployee director; therefore, these grants were valued at the grant date fair market value using the closing priceof our stock on the New York Stock Exchange.
Compensation expense under the restricted stock plans was $9.6 million, $7.5 million and $10 million for 2021,2020 and 2019, respectively. As of December 31, 2021, we had $10.8 million of future expense to be recognizedrelated to our restricted stock unit plans over a weighted average remaining life of 1.7 years.
Post-Employment Benefit
Pursuant to a service agreement we entered into with our former Chairman of the Board of Directors, we areobligated to provide for medical coverage on an after-tax basis to him, his spouse and two adult children for theirlives. Our total accrued liabilities, current and long-term, under this post-employment benefit were $1.8 million as ofboth December 31, 2021 and 2020.
88


Environmental, Social, and Governance
• We are committed to working with our energy customers to help them minimize the carbon footprint of their oil and
natural gas operations.
• We are deploying our competencies and capabilities to serve the energy-transition markets, particularly those
utilizing offshore wind and tidal energy technologies, hydrogen, and carbon capture and storage.
• We are reviewing and assessing new investments to further diversify our businesses into new strategic growth areas
outside the energy industry, such as mobility solutions and digital asset management, as well as increasing our
participation in the aerospace and defense sectors.
• Oceaneering published its second annual Sustainability Report guided by the Sustainability Accounting Standards
Board (SASB) disclosure standard for oil and gas service companies. In addition, in 2022, we plan to publish our first
annual Climate Change Report informed by Task Force on Climate-related Financial Disclosures (TCFD) guidance.
• We continued to focus on employee communication and engagement, leveraging our Employee Resource Groups,
including an employee Diversity and Inclusion (D&I) Council and Oceaneering Veterans’ Network, established in 2021.
• Our Board of Directors enhanced its oversight of ESG matters through the Board’s Nominating, Corporate
Governance, and Sustainability Committee, which is supported by our executive Sustainability Committee, and
increased its diversity and independence in 2021.
As of 2021, OCEANEERING INTERNATIONAL, INC. received an MSCI ESG Rating of A.
2021 Annual Report
Financial Highlights
$300
$450
$600
$750
$150
$02018 2019 2020 2021
Cash Flow from Operations and Cash($ in millions)
Net Cash Provided by Operating ActivitiesYear End Cash
Revenue and Gross Margin($ in millions)
Revenue
$200
$300
$400
$500
$100
$0
Revenue Gross Margin
Gross Margin
$1,000
$1,500
$2,000
$2,500
$500
$02018 2019 2020 2021

Directors
Senior Management
Roderick A. LarsonPresident and
Chief Executive Officer
Earl F. ChildressSenior Vice President and
Chief Commercial Officer
Alan R. CurtisSenior Vice President and
Chief Financial Officer
Holly D. KriendlerSenior Vice President and
Chief Human Resources
Officer
David K. LawrenceSenior Vice President,
General Counsel and
Secretary
Eric A. SilvaSenior Vice President and
Chief Transformation Officer
Philip G. BeierlSenior Vice President,
Aerospace and Defense
Technologies
Benjamin M. LauraSenior Vice President,
Offshore Projects Group
Martin J. McDonaldSenior Vice President,
Subsea Robotics
Shaun R. RoedelSenior Vice President,
Manufactured Products
Kishore SundararajanSenior Vice President,
Integrity Management
and Digital Solutions
Witland J. LeBlanc, Jr.Vice President and
Chief Accounting Officer
T. Jay CollinsChairman
Director of Murphy Oil Corporation and Pason Systems Inc.
Karen H. BeachyAssociate with The Alliance Risk Group, LLC
William B. BerryChief Executive Officer and
Director of Continental Resources, Inc.
Deanna L. GoodwinDirector of Arcadis NV and Kosmos Energy Ltd.
Roderick A. LarsonDirector of Newpark Resources, Inc.
M. Kevin McEvoyDirector of EMCOR Group, Inc.
Paul B. Murphy, Jr.Executive Vice President of Cadence Bank;
and Director of the general partner
of Natural Resource Partners L.P.
Jon Erik ReinhardsenChairman of Equinor ASA; and Director of Telenor ASA
Kavitha Velusamy, Ph.D.Senior Vice President, Engineering of Robust AI, Inc.
Steven A. WebsterManaging Partner of AEC Partners L.P.;
Trust Manager of Camden Property Trust; and
Director of Callon Petroleum Company
Oceaneering International, Inc.
Forward-Looking Statements
All statements in this report that express a belief, expectation, orintention, as well as those that are not historical fact, are forward-looking statements made pursuant to the safe harbor provisions ofthe Private Securities Litigation Reform Act of 1995. The forward-looking statements in this report include the statements in the Letterto Shareholders about Oceaneering’s: efforts to establish baselinegreenhouse gas emissions data to be used to identify gaps and developtargets for future emission reductions; plan to publish in 2022 its firstreport informed by Task Force on Climate-related Financial Disclosuresguidance; references to backlog, to the extent backlog may be anindicator of future revenue, profitability, or cash flows; anticipated2022 order intake and its timing; projected consolidated and segmentrevenues; anticipated segment financial results; anticipation that 2022will yield robust free cash flow; assumptions and characterizationsof the trend of commodity prices and COVID-19 impacts; projectedcontinuation of development and delivery of technologies for cleaner,safer hydrocarbon production while increasing investments into newmarkets; anticipation that commodity prices will support its growth;anticipation that free cash generation during 2022 will underpinforecasted capital expenditures; and characterization of marketfundamentals and financials as supportive and robust. These forward-looking statements are based on current information at the time thisreport was written, and are subject to certain risks, assumptions, anduncertainties that could cause actual results to differ materially fromthose indicated by the forward-looking statements. The factors thatcould cause actual results to differ materially include, among others:factors affecting the level of activity in the oil and gas industry; supplyand demand of floating drilling rigs; oil and natural gas demand andproduction growth; oil and natural gas prices; actions by membersof OPEC and other oil exporting countries; fluctuations in currencymarkets worldwide; future global economic conditions; the loss ofmajor contracts or alliances; future performance under our customercontracts; the effects of competition; the continuing effects of theCOVID-19 pandemic and any other public health threats that couldlimit access to customers', vendors' or our facilities or offices, imposetravel restrictions on our personnel, or otherwise adversely affect ouroperations or demand for our services; and the impact of the Russia-Ukraine crisis and the global response thereto. Should one or moreof these risks or uncertainties materialize, or should the assumptionsunderlying the forward-looking statements prove incorrect, actualoutcomes could vary materially from those indicated. These and otherrisks are fully described in Oceaneering’s annual report on Form10-K for the year ended December 31, 2021 and other periodic filingswith the Securities and Exchange Commission. You should not placeundue reliance on forward-looking statements. Except as requiredby applicable law, Oceaneering undertakes no obligation to update orrevise any forward-looking statement.
General Information
Virtual Annual Shareholders’ Meetinge: May 27, 2022
Time: 8:30 a.m. CDT
Webcast Link:
virtualshareholdermeeting.com/OII2022
Corporate OfficeOceaneering International, Inc.
11911 FM 529
Houston, TX 77041-3000
Telephone: 713.329.4500
oceaneering.com
Stock Symbol: OIIOII Stock traded on NYSE
CUSIP Number: 675232102
Please direct communications
concerning stock transfer
requirements or lost certificates
to our transfer agent.
Transfer Agent and RegistrarComputershare
P.O. Box 505000
Louisville, KY 40233-5000
Overnight Deliveries:
462 South 4th Street, Suite 1600
Louisville, KY 40202
OII Account Informationcomputershare.com/investor
Telephone: 781.575.2879 or 877.373.6374
Fax: 781.575.3605
Hearing Impaired/TDD:
800.952.9245
Independent RegisteredPublic Accounting FirmErnst & Young LLP
5 Houston Center
1401 McKinney Street
Houston, TX 77010-4034
CounselBaker Botts L.L.P.
910 Louisiana Street
Houston, TX 77002-4995
Form 10-K
The entire Form 10-K for the year ended December 31, 2021,
as filed with the Securities and Exchange Commission, is
incorporated herein by reference. The report also is available
through the “SEC Filings” link on the Investor Relations page of
the Oceaneering website, oceaneering.com, or upon
written request to:
David K. Lawrence
Secretary
Oceaneering International, Inc.
11911 FM 529
Houston, TX 77041-3000

Oceaneering International, Inc.
11911 FM 529 I Houston, Texas I 77041-3000
713.329.4500 | oceaneering.com