View Annual Report - AnnualReports.com
80
-
Upload
khangminh22 -
Category
Documents
-
view
1 -
download
0
Transcript of View Annual Report - AnnualReports.com


Schlumberger in Brief
1998 19972 1996'
Operating revenue $ 11,815,553,000 $ 11,543,431,000 $ 9,701,685,000
Net income' $ 1,014,199,000 $ 1,384,549,000 $ 919,487,000
Bas ic ea rnings per share $1.87 $ 2.57 $1.72
Di luted earn ings per share' $1.81 $2.47 $ 1.69
Dividends declared per share $0.75 $0.75 $ 0.75
' The 1998 resu lts include an after-tax charge of $380 million 1$0.68 per share-d iluted). For detai ls, see "Third Quarter Charge" in the Notes to Consolidated Financial Statements on page 30.
' Restated to refl ect the acquisition, in 1998, of Cameo International Inc., which was accounted for as a pooling of interests.

Letter from the Chairman
2
S chlumberger achieved modest gains in this roller-coaster year for
the oil and gas industry. Strong results in the first half of the year
were sharply reversed when Asia's economic problems began to
depress the region's demand for oil and gas and semiconductors. When
the downturn became evident, we began consolidating resources and
making significant cuts in personnel. The after-tax charge of $380 million
taken against earnings in the third quarter reflected the expected cost of
these actions. Net income for 1998 before this charge was $1.39 billion,
1% above 1997levels; diluted earnings per share were up slightly, from
$2.47 to $2.49. Operating revenue was up 2% to $11.82 billion.
Oilfield Services revenue for the year was up 4% after increasing 15%
in the first half. By year-end, the US average rig count fell to its lowest
level in five years. The decline in activity in North America was offset by
overall gains in the rest of the world. Our acquisition of Cameo, which
was completed on August 31, and the announced joint venture with M-I,
of Smith International, strengthen our services with leading technology and
expertise in smart completions, production services and drilling products.
Test & Transactions posted mixed results. Automated Test Equipment,
after 38% growth in the first six months, declined in the second half with
the tumble in semiconductor demand which drove the book-to-bill ratio
for the industry to its lowest level in seven years . Smart Cards &
Terminals moved aggressively toward a complete solutions approach
and recorded double-digit growth in earnings and revenue. Major con
tributors were increasing demand for cellular phone, banking and finan
cial applications. Growth this year outstripped that of the market and
Schlumberger became the number one producer of smart cards. In
October 1998, we sold Retail Petroleum Systems to Tokheim Corporation,
disposing of the last business in this group that we felt did not have ade
quate growth potential.
Resource Management Services, which sells products and solutions for
electricity, gas and water service providers, was down 7% on the year as
many utilities continue struggling with deregulation and privatization.

Some of our traditional clients are already moving into the world of
competitive enterprise, and we are meeting their demands for innovative
products and services.
The second half of 1998 was rough riding for the oil service industry,
and the firs.t half of 1999 will also be challenging. After several years of
good growth, the severity of the downturn raises questions about the
future of our industry. In particular, are we experiencing a repeat of 1986
when a similar drop in the price of oil was followed by several years of
sluggish growth?
Oil demand, which had grown at about 2% per year since 1985, flat
tened in 1998 as many parts of Asia slipped into recession. By midyear,
excess capacity reached four million barrels per day, driving spot crude
prices down nearly 34% year to year. The overall situation, however, is
fundamentally different from 1986. In the last ten years there has been
a much tighter relationship between demand and exploration and pro
duction (E&P) spending than in the early 1980s when politics, long
development lead times and a severe economic recession throughout
the largest consuming nations created a huge supply overhang of at
least 12 million barrels per day. Today, the industry is more driven by
economics than politics and new technology has shortened develop
ment cycles. As a result, the flattening of demand in 1998 has created a
supply surplus of only 5% of world demand compared with 20% in
1986. The reductions in 1998 E&P spending, along with those
announced for 1999, will erode today's surplus fairly quickly. We expect that as soon as Asian demand resumes its climb, there will be an
up-tick in oil prices and E&P spending.
Unless there is a world recession in the making, we think that 2% growth
in oil demand will resume in 2000. This rate will require developing an
additional 1.5 million barrels of oil per day per year from aging oil fields
virtually a call to arms for technologists like Schlumberger. Seventy per
cent of today's production comes from fields that are more than 30 years
old, and are approaching or in their declining years. Once a field has
3
4
produced half its recoverable reserves, production can no longer be
increased. The continental United States reached that point in 1970 and
production has gradually decreased ever since, despite aggressive
drilling programs of the late 1970s.
The only way to extend the life of these fields is to increase recovery
rates. Today only about 35% of the oil discovered is produced; the rest is
left in the ground. We believe that with the appropriate technology,
recovery rates can be increased to 60%. The development of these new
methods represents an enormous challenge for our research and engi
neering communities, but the value they can bring to our clients gives
Schlumberger a unique opportunity to maintain growth rates and prof
itability well above the industry average.
While most of the drama in 1998 occurred in the oil field, important
advances were made in our other businesses.
• Resource Management Services won several contracts to provide systems
and services, starting in 1999 and fully up to speed in 2000. While these
are encouraging signs, our commitment depends on how long the utili
ties take to convert into truly competitive businesses. We will continue to
maintain our leadership in metering technology while developing
aggressively these system and service growth opportunities. However,
we will not accept the low returns of the last five years.
• Smart Cards & Terminals will provide major opportunities over the
next five years. The most proven market, Europe, continues to grow, and
investments in Asia should result in explosive expansion. The newest
market for smart card expansion, North America, shows promise: 13 mil
lion smart cards circulated in North America in 1996-a number which is
expected to grow to 240 million by 2001. After ten years in the smart card
industry, we have developed unmatched technology and know-how.
Continuing strong growth will come from building on this leadership
position through internal investments and acquisitions.

• Automated Test Equipment (ATE) has broadened extensively its prod
uct offering and we intend to grow this business aggressively. Given our
market and technology leadership, our global reach, and our entry into
new segments of the industry, we will emerge from this recession
strengthened. We are convinced that ATE will be a major growth business
for us over the next five years.
• Finally, our baby, Cable & Wireless Orrmes, is a four-year-old joint ven
ture with Cable & Wireless providing worldwide information technology
services. This combination of our technology and 14 years experience with
our intranet, and Cable & Wireless' access to the telecommunications market,
gives us tremendous leverage. Service revenue grew by 46% in 1998, and
the business now has more than 80 commercial clients in 30 countries.
Starting with our warning in January 1998 about the effect of the Asian
recession on oil demand, through the general weakness of the equity
marke ts in the third quarter, to the announced oil company reductions
in upstream expenditures for 1999, the Schlumberger s tock has been
under pressure all year. We are convinced that as soon as the relative
short-term nature of this downturn is recognized, investor confidence
will return. Short or long, Schlumberger is preparing to emerge from this
downturn as it has from others-stronger than ever, with our technical
leadership reinforced.
Euan Baird
Chairman & Chief Executive Officer
January 21, 1999
5

6
Schlumberger
Operating Revenue lBillions
Income' $Millions
94 95
96 97
9B
I Additions - Depreciation
' 1998 1ncome, Earnings Per Share and Return On Equi ty before the $380 million th ird quarter charge.
1500
2000
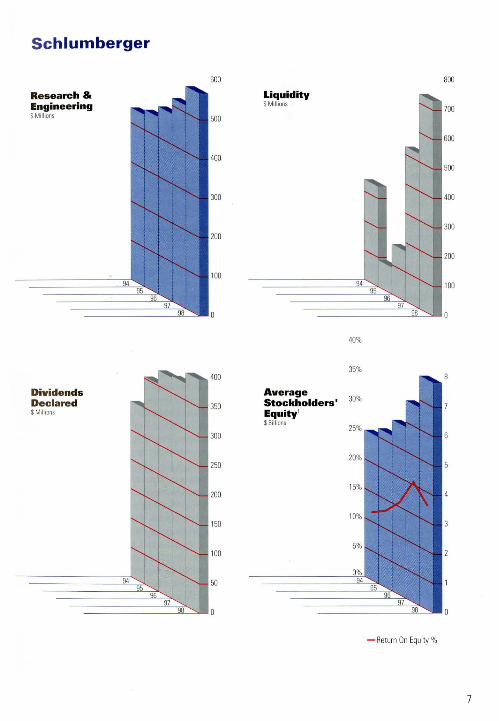
Schlumberger
Research & Engineering $Millions
Dividends Declared $Millions
600
500
400
300
200
100
Liquidity $Millions
Average Stockholders' Equity' $Billions
800
40%
35%
- Return On Equity %
7

Financial Review
MANAGEME NT'S D ISC USS ION A ND A NA LYS IS OF RESU LTS OF OPERAT IO NS The Company opera tes four bus inesses: Oilfield Serv ices, Resource Ma nagement Services, Test & Transactions and Cable & Wireless Omnes. Cable & Wireless Ornnes is not a reportable segment.
OILFIELD SERVICES
Operating Revenue Pretax Operating Income '
RESOURCE MANAGEMENT SERVICES
Operating Revenue Pretax Operating Income'
TEST & TRANSACTIONS'
Operating Revenue Pretax Operating Income'
' Pretax operat ing income is before the 1998 third quarter charge ' Excluding the Retail Petroleum Systems business sold on October 1. 1998.
Oilfield Services
199 8 Results
Afte r continued strong growth in the first half of the year, O ilfie ld Serv ices ac ti vity s lowed in the third qua rte r and reversed d irection in the fo urth qua rte r as oil companies red uced spending o r can ce lled projec ts .
Oilfield Serv ices revenue g rew 4%, matching the 4% increase in expl ora tion and production expenditures, despite a decline in the a verage rig count of 13%. The g row th resulted from continued de ployment of new technologies and the impact o f the new geographic organiza ti o n, whi ch focused on prov idin g custo mized solutions for the custome rs .
NORTH AMERICA North Ame rican revenue was 5% belo w last yea r despite a 17% d ecline in ave rage rig count. The s lowdo wn was pa rti cularly significant in the second half of the year, with the average rig count down by 38'Y. , in the fourth qua rter compa red with the same pe riod last yea r. Wireline, testing, directional drilling and seismic services ended the yea r w ith lowe r reve nue than in 1997, w hile contract drilling benefited from the trans fer of the semisubme rsible Omega to the Gulf of Mex ico from West Africa . Pretax opera ting incom e dropped 35%.
8
(Stutl'fl iu million:>)
1998 1997 % Cha n e
$ 8,895 $ 8,559 4 % $ 1,766 $ 1,765 - %
$ 1,465 $ 1,569 (7) % $ 50 $ 71 (30) %
$ 1,226 $ 1,066 15 % $ 74 $ 103 (29) 'Yo
LATIN AMERICA A revenue ga in o f 12% in La tin Ame rica resulted from strong contrac t drilling, da ta se rv ices, w ireline and tes ting services, despite the 12% fa ll in the average rig cow1t. Revenue from Mexico increased by 25% compa red w ith las t year, w ith a la rge contribution from the Burgos gas fi elds . Contrac t drilling benefited from increased activity in Brazil with the a rri va l of the semisubme rsib le Sedco 707 and a full yea r of ac ti vity on the Burgos project. Pretax opera ting income was 10% lower, m ainly due to the red uction in acti v ity in Venezuela.
EUROPE /CIS/WEST AFRICA Revenue was up 4% in the Euro pe/CIS/ West Africa region, due to increased contract drilling, directional drilling and da ta management serv ices, d espite an n o;., fa ll in the average rig count (excluding CIS rigs) . Revenue from the CIS increased 62%, due to the start-up of new projec ts in Kaza khs tan and Azerba ijan. Re venue from Algeria and Tunisia was up 22%, with all five land rigs working fo r the entire yea r in Algeria. N igeria increased 4%, re fl ecting s trong activity from direc tiona l drilling serv ices and increased dayrates fo r contract drilling . UK acti vity was up 4%, with strong contrac t drilling activity. In South Africa, revenue d ecreased 39%, mostly due to the reduced

dri lling fluid s, wireline and testing revenues. Pretax operating income increased 5%.
OTHER EASTERN HEMISPHERE Revenue grew by 8% compared with 1997, while the average rig count increased 1%. Pretax operating income increased 13%. Asia was 10% above i997, mainly due to East Asia and Indonesia w ith strong increases in all service lines, except seisrrtic services, whid1 was flat with last year. Revenue in the Middle Eas t was up 5%, with the overall growth slowing in the second half of the year. In the Middle Eas t, grow th was strong in contract drilling and seismic services.
CAM CO Cameo achieved record revenue in 1998 of $948 million, 4% higher than the prior yea r, despite an overall decline in drilling and completion activity. Pretax opera ting income grew 17%. Strong sa les growth was recorded for Reda elec trica l submersible pumps and Production Operators gas compression sys tems. Production Operators COITI111enced opera tions on the El Fu rrial project, a 20-year service opera ting contract in Venezuela. In spite of the declining rig market, Hyca log, the m arket leader in polycrys talline diamond compact (PDC) bits, showed a slight increase in reven ue due primarily to expansion in the Middle East and Africa . Sales were also up in La tin America despite lower drilling ac tivity levels. Continued efforts at Reed to expand its internationa l business with a broader product offering helped offset the 17% decline in the North American average rig count in 1998. Revenue from completion products and services was down as completion activity declined, particularly in the second half of the year.
An Advanced Completion Group was established to accelera te the development of innovative completion solutions. The Group is initially focused on multilateral completions and services, advanced instrumented completion systems and sandface completions and service support. Other complementary areas of service enhancement include drilling performance improvement and rotary steerable systems,
and additional competencies for production maximiza tion.
Highlights NEW RIGS ON ORDER AS CONTRACT DRILLING ACTIVITY CONTRIBUTED SIGNIFICANTLY TO RESULTS
Contract drilling revenue for 1998 was 22% higher than in 1997, re fl ec ting higher average dayrates for semisubmersibles and jackups, together with improved levels of the combined land and offshore rig utilization. The average rig utiliza tion rate increased from 92.1% in 1997 to 92.5% in 1998.
Average o ffshore rig utilizati on in 1998 dropped from 94.1% to 93%. This decrease in utili za tion compared with 1997 reflec ts the slowdown in acti vity which began in the second half of the year and whid1 caused utilization rates for semisubmersibles and jack ups to fall respectively from 97.1% to 95%, and from 100% to 98.5% between year-end 1997 and year-end 1998. The average land rig utiliza tion rate, however, increased from 89.9% in 1997 to 91.9% in 1998. At year-end, the Schlumberger rig cow1t consisted of 83 units, comprising 49 offshore units and 34 land rigs. The fleet includes four offshore units under bareboat charter and fi ve offshore units under management contract.
In June, Schlumberger was awarded a third long-term contract for the construction and opera tion of a new Sedco Express* semisubmersible r ig for Ma ra thon Oil. The ri g is expected to be mobilized to the Gulf of Mexico in the third quarter of 2000 for work in wa ter depths of up to 8500 feet [2.6 km]. In December, the firs t of three MPSV* multipurpose service vessels under construction, the Prisa 101, was delivered from its shipyard in Texas to Lake Maracaibo, Venezuela, for a multiyear contract. The MPSV concept uses small, purpose-built vessels, each equipped with an integra ted package of Schlumberger services fo r well intervention, such as wireline logging, CTD* coiled tubing drilling service and tubing replacement. An MPSV unit can perform a well intervention faster, and at a considerably lower cos t, than a full -size drilling unit.
9

EXPANSION OF INTEGRATED SERVICES CREATES GROWTH OPPORTUNITIES
The range of Schlumberger integrated services has expanded to include p roject engineering and project management for well construction, CTD service, MPSV units, IRO* Integrated Reservoir Optimization service and engineering and construction alliances. During the year, Schlumberger commenced more than 40 major integrated project contracts.
MAXIMIZING PRODUCTIVITY WITH MAXPRO* SERVICES
Launched in five major locations in Asia, Europe and North America, the MAX PRO initia ti ve builds on the new organiza tion and lates t technology and offers solutions spanning an entire range of production services, including perfora ting, cement evaluation, reservoir monitoring, completion services, corrosion monitoring, well repair, production monitoring and diagnosis.
In the third quar ter, Schlumberger launched the breakthrough PS PLATFORM* wireline production logging tool as one in a series of MAXPRO applica tions. The PS PLATFORM service provides monitoring and diagnosis of fluid flow in producing wells and enables oil and gas companies to benefit from more accurate measurements and grea tly enhanced operational efficiency through real-time answers, fas ter operating speed and smaller, lighter and more rugged tools. PS PLATFORM technology is one of the vehicles for future developments critical to optimal management of the reservoir.
During the fourth quarter, an innovative MAXPRO production services applica tion saved 72 hours of rig time for a major customer in the North Sea by eliminating a separate, stand-alone production logging run. The Schlumberger team successfully recorded the subsurface production of wellbore fluids while perforating a horizontal well- the first measurement of its kind in these specific conditions.
RECORD-SETIING ADVANCES IN TECHNOLOGY APPLICATION
In 1998, record-breaking advances were the hallmark of our continuing leadership in oilfield services technology deployment. Schlumberger
10
set several world records in deepwater marine seismic, drilling and coiled tubing services.
The firs t horizontal well in the Gulf of Mexico drilled with coiled tubing was achieved by an integrated services team implementing an array of new Schlumberger technologies, including the VIPER* coiled tubing drilling sys tem, STARDRILL* fluid s and SLIMACCESS* logging tools.
A new seismic coverage record was se t by Ceca Orion, equipped with the new proprietary MK2 Monowing* multistreamer towing technology, towing 6 streamers, each 8 km long in a 1-km spread [5 rni by 0.625 mi]. In addition, Ceca Orion also successfully used the MK2 Monowing technology to achieve a spread of 1400 m [4592 ft], the w ides t ever towed by a single vessel unassisted by tugboa ts.
Schlumberger seismic services achieved the firs t three-dimensional, time-lapse (called 4D seismic) volume map designed to show reservoir changes over the lifetime of an offshore oil fi eld in the North Sea . Hyd rophones were installed in the seabed over the reservoir in 1995, and both seabed and surface seismic surveys were run. Repea ting the surveys in 1998 using the alread y embedded hyd rophones provided two pairs of time-lapse 3D data sets to be evaluated by the oil company.
TECHNOLOGY TO ENHANCE PRODUCTIVITY AND EFFICIENCY
Revenue from nuclear magnetic resonance wireline logging increased substantially during the yea r, demonstrating the success of the new CMR-200* service introduced in 1998. Nuclear magnetic resonance technology allows customers to measure the volume of retrievable oil and gas in subsurface reservoirs, thereby improving the estimation of economic potential of a reservoir without costly tes ts.
Schlumberger fur ther advanced the use of high-performance 3D data visualiza tion in the oil and gas industry through the introduction of GeoViz* software and the Alternate Realities Corporation's VisionDome' system, for which Schlumberger is the exclusive licensed reseller to the industry. This combination provides geo-

scientists and engineers with the first fully irrunersive, portable, virtual-reality environment for constructing 3D models of subsurface reservoirs, selecting drilling targets and designing well trajectories to maximize oil and gas recovery.
The Drilling Office* suite of applica tions helps engineers create the optimum drilling plan by reducing costs a.nd managing uncertainty. In November, Schlumberger acquired the TDAS* Tubular Design and Analys is System and WEST* Wellbore Simulated Temperatures software from Oil Technology Services. The addition of these two applications increases drilling engineers' effi ciency and effectiveness by providing them with the most advanced tools for critical well design .
Two fluid technologies for m aximizing drilling and production efficiencies were introduced. The DeepCRETE*• cementing sys tem, designed to add ress th~ challenges associated with well construction· in deep water, helped customers improve performance and reduce overall costs in Norway, Gabon, Congo and Nigeria. The new STARDRILL drill-in fluid, used while d rilling through the reservoir, improved hydrocarbon production rates by limiting damage to the reservoir from the drilling process in wells in Equatorial Guinea, Norway and Gabon.
With the aim of improving hydrocarbon production, the revolutionary SCALE BLASTER* application has recently been tested, and proved successful at removing scale on downhole piping. In oil and gas wells, the buildup of inorganic scale can res trict, and even p revent, the fl ow of hydrocarbons to the surface. SCALE BLASTER technology, deployed on coiled tubing, has provided clients w ith a highly effective and valuable way of improving production without a rig intervention. Furthermore, to better measure multiphase production, Schlumberger and FRAMO Engineering A.S. of Norway signed a joint venture agreement to p rovide surface and subsea flow meters to measure oil, gas and water flow in producing wells. A joint technology center called 3-Phase Measurement A.S., to be located in Bergen, Norway, will design and
manufacture products and provide marke ting and technical support.
The continuing worldwide introduction of the VISION475* MWD/ LWD (measurements-whiledrilling/logging-while-d rilling) sys tem for small-diameter wells has been highly successful, resulting in 50% growth compared with the fourth quarter of 1997. This applica tion gives clients improved confidence in evaluating the growing number of horizontal and highly deviated wells and reentry wells. The use of key acoustic velocity informa tion during drilling has significantly increased following the introduction of the slimmer 6.75-inch !SONIC* LWD tool.
1997 Results Oilfield Services pretax operating income grew 55% over 1996, reaching $1.77 billion, with strong contributions from all activities. Operating revenue increased 24% to $8.56 billion . Worldwide oil demand increased by a strong 2.7%, fueled mainly by China, up 11%, Asia excluding China, up 6%, Latin America, up 5%, and by a recovering Russia, up 5%. Oil companies worldwide increased their explora tion and production expend itures by 18% over 1996 levels to meet the increase in demand. The average rig count rose 15%.
NORTH AMERICA
Nor th American revenue and pretax opera ting income grew 32% and 81%, respectively, compared w ith 1996. All services posted exceptional gains, w ith seismic services up 54%, da ta management up 50%, d irec tional drilling up 38%, pressure pumping up 27%, and wireline and testing up 25%. The average rig count rose 26%.
LATIN AMERICA
Latin America experienced a revenue increase of 34%, while pretax opera ting income grew 13%. The main contributors were seismic services, up 88%, contract drilling, up 65%, integra ted services, up 139%, and pressure pumping, up 32%. All other businesses posted gains above 15%. The average rig count declined 2%.
11

EUROPE/CIS/ WEST AFRICA
Revenue and pretax operating income were 17% and 42% higher in the Europe / CIS/ West Africa region than in 1996, largely due to higher contract drilling activity, up 31%, directiona l drilling, up 40% and wireline and testing services, up 13%. All other businesses posted ga ins above 13%, except for seismic services, which declined 8%. The average rig cmmt feU 3%.
OTHER EASTERN HEMISPHERE
Other Eas tern Hemisphere revenue climbed 24% versus 1996, mainly on increased contract drilling revenue, up 59%, directional drilling revenue, up 40%, and wireline and testing revenue, up 17%. All other businesses posted ga ins above 12%, except for data management services, which were not active in 1997. Pretax operating income was 57% higher than in 1996. The average rig coLmt grew 9%.
CAM CO
Revenue was a record $914 million in 1997, a 20% increase from the prior year, primarily due to increased market activity, improved pricing in selected markets and the year-over-year impac t of acquisitions. Geographically, sales were up in aU regions, with the exception of the CIS. Production Opera tors, acquired in june 1997, contributed $115 million in sales, a 25% increase over 1996.
Highlights In 1997, the Oilfield Services research and engineering inves tment of $354 million produced technologies for operating in harsher environments and reducing finding and development costs. Oilfield Services capital expenditure was $1.45 billion and allowed rapid deployment of these technologies.
In the fa ll of 1997, Schlurnberger introduced the IRO service, which combines new-generation reservoir characteriza tion and flow simulation tools with a team approach to evaluate various fie ld development and production strategies. Working closely with the client, an experienced multidisciplinary team selec ts and implements the optimal development plan. Reservoir monitoring and contro l processes are
12
included to head off future prod uction problems. The IRO concept offers numerous benefits because it is proac ti ve and closely links development decisions w ith a thorough understanding of reservoir architecture, fl ow dynamics and response to various well interventions with the ultimate aim of achieving near realtime, interactive reservoir management.
Construction, operati ng and intervention costs in oil fields were reduced in 1997 through the proliferation and improved placement of highly deviated and horizontal wells, and multilaterals drilled from a common trunk. New VISION475 technology is a s li m 4.75-inch MWD/ LWD service that reduces total well costs while maximizing hyd roca rbon production . This is possible by allowing a reduced wellbore diameter without giving up the rea ltime fo rmation eva lu a tion measurements needed for optimum geos teering and analysis. The VISION475 applica tion possesses unique logging sensors that a llow operators to s teer to the most p roductive zones in a formation. Worldwide deployment of this teclmology has significantly improved fi eld development returns on inves tment for clients.
Throughout 1997, drilling ac ti vity and pricing continued to increase. The average offshore rig utiliza tion of 94% was in line with the previous year. Jackup utiliza tion remained at 100%, and semisubmersible utiliza tion was 97%. The average onshore rig utiliza tion for the year increased from 57% to 90%. At year-end, the flee t consisted of 84 units: 52 offshore and 32 onshore. The flee t includes 13 offshore units Lmder bareboat charter or management contract. Schlumberger has eight deepwater drilling units capable of drilling in wa ter depths of more than 3000 feet [approxima tely 1 km] .
In July 1997, Oilfield Serv ices received a tenyear integra ted management contract in Venezuela to build and opera te, on Lake Maracaibo, three new MPSV drilling barges and three new MPSV lift boats.
In August, the Maersk Victory jackup was acquired and renamed Trident 19. In September, the Schlumberger semisubmersibles Drillstar

and Sedco Explorer were sold to a newly formed venture in which Schlumberger has a 25% interest. Schlumberger is operating the rigs under bareboat charters. The gain on the sale was deferred and is being amortized over a six-year period .
In December, Schlumberger received m ultiyear contrac ts for two new-build Sedco Express semisubmersible drilling rigs . The units will be delivered in the four th quar ter of 1999. The Sedco Express rigs represent the next generation of deepwater moderate-environment d rilling units. They have been designed to optimize the entire well construction p rocess, and are expected to drill and complete a well approximately 30% fas ter than a conventional fourth-generation rig. The rigs will be able to operate in water depths up to 7500 fee t [2.3 km].
1996 Results Oilfield Services p re tax opera ting income increased $386 million, or 51%, to $1.14 billion . Growth was due to strong demand and the price increases of oil and gas. Other fac tors included the success of new and existing services such as PLATFORM EXPRESS and LWD technologies. In addition, the strong contribution of seismic services had a significant impact. The average rig count rose 8%.
Highlights In response to favorable market conditions, Schlumberger boosted capital expenditures for Oilfield Services by 21% in 1996.
As CTD technology p rovides an effective alternative to conventional drilling in reentry drilling markets, Schlumberger pressure pumping and contract drilling service businesses combined efforts to develop CTD technology, while the directional drilling business created the new VIPER slimhole directional bottomhole assembly for coiled tubing service.
The GeoSteering* tool, which enables the driller to m ake course correc tions w hile drilling, made substantial gains in markets in the Far East. The SIMPLER* 101 drilling rig, a new modular land rig, was introduced in
Gabon, where it began a five-year integra ted services contrac t in April. Several drilling fluids products, including QUA DRILL*, VISFLEX* and ULTIDRILL * fluids, gained increased acceptance in 1996, in recognition of their contributions to drilling efficiency and well p roductivity. Marine seismic efficiency continued to improve due to aggressive deployment of the TRILOGY* onboard data managem ent system and the Monowing multistreamer towing technology. The introduction of the fourth-genera tion Nessie* marine streamer, w ith only 54-mm [2.1-inch] outside diameter, further extended the towing capacity and efficiency of Schlumberger seismic vessels. With the ECLIPSE* reservoir sim ulation software, the GeoFrame* integrated reservoir charac terization sys tem and the Finder* line of data management products, Schlumberger was able to offer the oil industry the mos t comprehensive range of integra ted software sys tems, data management solutions and processing and interp retation services. Tracking the flow of different fluids in horizontal and high-angle wells became possible with the newly in troduced p roduction logging technology, PL Flagsh ip * ad vanced well flow diagnosis service. Building on a solid track record in well tes ting, the Early Production Systems group expanded significantly. Early Production System s saw ac tivity in the North Sea and Africa .
Average offshore rig utilization grew to 94% from 89%, aided by jackup utiliza tion of 100% and semisubmersible utiliza tion of 96%. At year-end, the fleet consisted of 83 rigs.
Resource Management Services
1998 Results Ongoing deregulation , privatization and globaliza tion have created uncertainty, which continued to hamper the ability of most utilities to invest in new products and services. The exceptions in 1998 were the utilities facing competition in the US and the UK, where data collection and interpretation are competitive tools.
Revenue for Resource Management Services
13

(RMS) decreased 7% in 1998, compared with the prior year. The decrease was compounded by the difficult fin ancial environment in developing countries. Pre tax operating income declined 30%, reflecting margin deterioration due to lower sales in North and South America, France and Germany. Favorable contributions came from South and Central Europe and from savings as a result of the restructuring which was initiated in late 1996.
North American revenue was down 4%, refl ec tin g mar ket uncerta inty caused by ongoing elec tricity deregula tion in the US, which led to investment cutbacks and order delays by customers. South American revenue also d ropped as a result of lower public utility purchase requirements and furth er price deterioration .
Partly compensating for the declines was stronger demand in water metering associated with higher sa les of Automatic Meter Reading (AMR) systems. North American orders saw significant improvement, reflec ting a m ajor sys tem and equipment installation order recorded in the firs t quarter as part of the ISyear Illinois Power contract, which more than compensated for weaknesses in the residential and commercial electricity markets.
Eu ropea n revenue fell 7%. Depressed sales in France, the UK and Germany resulted from lower demand for elec tricity and gas products ca used by industrial overcapacity and price competition . Revenue from South and Central Europe also fell , although hi gher electricity sales to EDP, the Portuguese electric company, p artly offse t the reduced procurement from ENEL, Italy's national elec tric utility. In September, Schlumberger and ltron signed business agreements in Europe and North America for the mutual licensing and dis tribution of AMR technology.
Revenue from Africa and the Middle East rose 29%, driven by stronger gas and water meter shipments to North Africa and Turkey. Revenue from Asia and the CIS fell due to shrinkage of local markets caused by continuing financial turbulence.
14
Product orders were fl a t versus 1997. In Europe, bookings decl ined in France, Germany and the UK due to the soft metering markets and reduced prices. South and Central Europe was even with last year as lower orders in Spain, the Netherlands and Belgium were offset by stronger demand from the elec tricity utilities in Italy and Portuga l. Declines in Asia, South America and the CIS stemmed from the poor economic environment, especially in the second half of the year.
A series of new activities exemplify the repositioning of the RMS business to provide solutions for resource management. Among these successes is a Swedish utility on the island of Gotland, where Schlumberger is currently installing a two-way customer communica tion and network monitoring system. This solution will enable the utility to offer its customers hourly meter readings, real-time consumption billing and a wide range of va lue-added services.
The town of Smolensk in Russia selected the Schlumberger smart card prepayment sys tem for gas customers in order to secure revenue and reduce was te. In South Africa, RMS was contracted to operate a revenue management system for the region of Qwa Qwa, where, in a matter of months, revenue losses as high as 50% have been grea tly reduced .
During the year, severa l innova tive p roducts were introduced: The Flodis* wa ter meter, the first C-class, single-jet meter with super-dry register and communica tion capability; the DC3 electricity meter, a full four-quadrant, polyphase, solid-state commercial and industrial meter offering a large combination of tariff structures with integrated communication capabilities; and the high-end, high-accuracy QUANTUM* QlOOO meter, which was shipped to Electricite de France. The Ql OOO meter addresses the generation and transport market segment and allows the utility to provide new services to its customers, such as power quality measurement, system loss compensation and real-time communication . In November, at the Distributech trade show in London, RMS also launched the TaleXus• Vendor* system,

which is the world 's first prepayment system capable of selling tokens and providing account management for elec tricity, gas and water resource suppliers.
1997 Results Revenue for RMS fell ll% compared with 1996, as poor business conditions severely impacted European electricity and gas metering activity. Orders fell 8%.
The revenue decline was highest in Italy and in the UK. South American revenue grew significantly on high demand for wa ter meters and the newly introduced single-phase, electromechanical meter. North America experienced strong water and gas meter sales.
Pre tax opera ting income fell 36% as the deregulation and privatization of the world 's utilities continued accompanied by restricted procurements.
1996 Results Resource Managemen t Services revenue was fla t compared w ith 1995. The sluggish demand for electricity meters in Europe, especia lly in the UK and Germany, was offse t by sales of gas meters led by a strong CIS market. Orders were down 2%, and pre tax operating income decreased 8%, mos tly from the deterioration of the European market.
Test & Transactions
1998 Results Compared with 1997, revenue for Test & Transactions rose 15%. Smart Cards & Termina ls, including the smart card-based solutions businesses, grew 31%, while Automated Tes t Eq uipment (ATE), including SA BER (SchlLm1berger Advanced Busi11ess and Engineering Resources) services and the sys tem service ac tivities, was fla t. Though both busil1ess segments coped with volatile business cycles, they outpaced their respective ma rkets. ln 1998, smart card volume increased more than 40% compared with the industry's growth rate of 32%. Despite an industry downturn, ATE increased market share for mixed signal and logic test systems.
This year, Test & Transactions benefited from its new organiza tion, structured into three groups: Solutions, Products and Manufacturin g. Products and Manufacturing provide prod uct core expertise, while regional Solutions groups deliver integra ted solu tions and services. Each group has aligned its roles and responsibilities to p ut the customer at the center of everything it does. The transition to the new organization moved quickly and has enhanced quality, customer focus and integra ted sys tems offerings.
Also d uril1g the yeat~ the Retail Peh·oleLml Services business was sold to Tokheim Corporation.
In 1998, Smart Cards & Terminals concentra ted on growing its sha re of key sma rt ca rd markets-mobile phones, fin ance and banking, municipa lities (parking and mass transit) and hea lth care. These markets are significan t in both size and geographic presence, and provide substan tial opportunities for the smar t card-based solutions and sys tems integrati on businesses. An exa mple of the system integration business is the successful law1eh of the Cyberflex* Mobile Solu tion. This integrated produc t and service offer ing includ es a Cyberflex Simera* smar t card , a software developer 's kit wi th an easy- to-use SIM.nario* graphica l inter face for rap id prototyping, the Arem is* subscriber id entity mod ule-based (SIM) service management system and the Aremis marketil1g platform. To assis t the successful deployment of these sys te ms, Schlumberger offers a wide range of consulting, engineering and turnkey project management services. This secure and flexible smart card-based solution provides new information and e-commerce services and allows mobile phone subscribers to customize applica tion portfolios for their indi vidual business and persona l needs.
The mobile phone SIM card market exploded worldwide, as revenue grew 56% during the year. Revenue for financia l and banking ca rds also rose 56%. The Mwucipalities Solu tions business, which comprises smart card-based parkil1g, pay phone and mass transit sys tems, grew 31% during 1998. The successful introduction of the
15
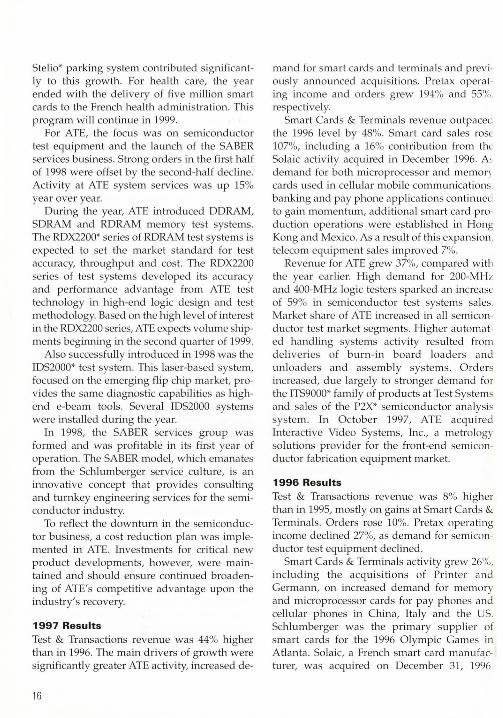
Stelio* parking system contributed significantly to this growth. For health care, the year ended with the delivery of five million smart cards to the French health administration . This program will continue in 1999.
For ATE, the focus was on semiconductor test equipment and the launch of the SABER services business. Strong orders in the first half of 1998 were offse t by the second-half decline. Activity at ATE system services was up 15% year over year.
During the year, ATE introduced DDRAM, SDRAM and RDRAM memory test systems. The RDX2200* series of RDRAM test systems is expected to set the market standard for tes t accuracy, throughput and cost. The RDX2200 series of tes t sys tems developed its accuracy and performance advan tage from ATE test technology in high-end logic design and test methodology. Based on the high level of interest i.n the RDX2200 series, ATE expects volume shipments beginning in the second quarter of 1999.
Also successfully introduced in 1998 was the IDS2000* tes t sys tem. This laser-based system, focused on the emerging flip chip market, provides the same diagnostic capabilities as highend e-beam tools. Several IDS2000 sys tems were installed during the yea r.
In 1998, the SABER services group was formed and was profitable in its first year of opera tion. The SABER model, which emanates from the Schlumberger service culture, is an innova tive concept that provides consulting and turnkey engineering services for the semiconductor industry.
To reflect the downturn in the semiconductor business, a cost reduction plan was implemented in ATE. Investments for critical new product developments, however, were maintained and should ensure continued broadening of ATE's competitive ad vantage upon the industry's recovery.
1997 Results
Test & Transactions revenue was 44% higher than in 1996. The main drivers of growth were significan tly greater ATE activity, increased de-
16
mand for smart cards and terminals and previously announced acquisi tions. Pretax operating income and orders grew 194% and 55% respectively.
Smart Cards & Terminals revenue outpaced the 1996 level by 48%. Smart ca rd sa les rose 107%, including a 16% contribution from th ~c
Sola ic activi ty acquired in December 1996. A' demand for both microprocessor and memor) cards used in cellular mobile communica tions banking and pay phone applica tions contin ue to ga in momentum, additiona l smart ca rd production operations were estab lished in Hong Kong and Mexico. As a result of this expansion, telecom equipment sa les improved 7%.
Revenue for ATE grew 37%, compared witb the yea r ear lier. High demand for 200-MHz and 400-MHz logic testers sparked an increase of 59% in semiconductor test systems sa les. Market share of ATE increased in all semiconductor test market segments. Higher automated handling systems activity resulted from deliveries of burn-in board loaders a nd unloaders and assembly sys tems. Orders increased, due largely to stronger demand for the ITS9000* family of products at Test Systems and sales of the P2X* semiconductor ana lysis sys tem. In October 1997, ATE acquired In teractive Video Systems, Inc., a metrology solutions provider for the front-end semiconductor fabrication equipment market.
1996 Results Test & Transactions revenue was 8% higher than in 1995, mostly on ga ins at Smart Ca rds & Terminals. Orders rose 10%. Pretax operating income declined 27%, as demand for semiconductor test equipment declined.
Smart Cards & Terminals activity grew 26'Yo, including the acquisitions o f Printer and Germam1, on increased demand for memory and microprocessor ca rds for pay phones and cellular phones in China, Italy and the US. Schlumberger was the primary supplier of smart cards for the 1996 Olympic Ga mes in Atlanta. Solaic, a French smart card manufacturer, was acquired on December 31, 1996

Revenue for ATE was flat as higher sa les of IDSlOOOO* diagnostic systems offset reduced demand for other prod ucts.
Net Income
(S taled i11 millio11s except per slmre amou11ts)
Earni ngs per share Net Income Basic Diluted
199_8_' __ $1014 $1.87 $1.81
1997 $1385 $2.57 $ 2.47 ---1996 $ 919 $1.72 $1.69
' Includes an after-tax charge of $380 million 1$0.68 per share- diluted!. For details, see "Third Quarter 1998 Charge" on page 18.
In 1998, opera ting income of Oilfield Services of $1.37 billion was flat, despite a 13% decrease in average rig count. The decrease in North American activity, whkh was impacted by strong pricing pressure and a slowdown in activity in the second half of the year, was offset by improvements in most other areas, notably Asia and Africa. Resource Management Services operating income decreased $15 million, or 32%, la rgely due to market weakness as a result of indus try consolidation and p riva tiza tion, compounded by the financial crisis in the emerging countries. Test & Transactions operating income of $55 million was down 28% as growth in the smart cards and terminals ac tivities was offset by a severe market decline for automated test equipment, due to curtailment of capital expenditures by the semiconductor industry in the latter half of the yea r.
In 1997, operating income of Oilfield Services increased $466 million, or 51%, to $1.39 billion. The growth reflected the s trong increase in exploration and production spending by oil companies. These w1derlying fac tors, combined with new technology, grea ter efficiencies and higher dayra tes, resu lted in stronger pricing and higher market share. The Asian and North American markets were signi fican t growth areas. Resource Management Services opera ting income decreased $41 million, or 47%, due to the adverse exchange ra te effects and to a decline in the European metering activi ties, which were impacted by increased
competition and severe price erosion. Operating income at Test & Transactions increased $38 mjllion, or 109%, reflec ting significantly increased demand for au tomated tes t equipment, smart cards and terminals, as well as hjgher activity in Asia.
In 1996, operating income of Oilfi eld Services increased $298 million, or 48%, to $920 mill ion. Growth was due to underlying economic factors, s trong demand and the price increases of oil and gas. Other factors included the success of new and existing services such as P LATFORM EXPR ESS and LWD technologies. ln addition, the strong contribution of seismic services had a s ignificant impact. Resource Management Services operating income declined 6%, to $88 million, reflecting tu rbulence in the European elec tricity metering markets caused by pricing pressure and deregulation. Test & Transactions opera ting income was down 13%, to $35 million, mainly due to a temporary weakness in the semiconductor industry, which was affected by soft market conditions and reduced customer spending leading to postponement of product deliveries.
Currency Risks Refer to page 28, "Transla tion of Non-US Currencies," in the "Notes to Consolidated Financial Statements" for a description of the Company's policy on currency hedging. There are no material unhedged asse ts, liabilities or commitments which are denominated in other than a business's functiona l currency.
While changes in exchange ra tes do affect revenue, especially in the Resource Management Services and Test & Transactions segments, they also a ffect cos ts. Genera lly speaking, the Company is currency neutral. For example, a 5% change in average exchange rates of OECD cu rrencies would have had no material effect on consolidated revenue and net income.
In genera l, w hen the US dolla r wea kens against other currencies, consolidated revenue increases, usually with no materia l effect on net income. This is principally because the fallthrough incremental margin in the Resource
17

Management Services and Test & Transactions segments offsets the h igher Oi lfield Services non-US do llar denominated expenses.
The Company's businesses opera te principa lly in US dollars, mos t European currencies and most South American currencies.
Income Tax Expense In 1996, w ith increasing profitability and a strong outlook in the US, the Compan y recognized 50% of the US income tax benefit re la ted to its US subsidia ry's tax loss carryforward and a ll temporary diffe rences. This resulted in a credit of $360 mi llion . Refer to page 34 in the "Notes to Consolidated Financial Sta tements" under "Income Tax Expense" for more infmmation.
In 1997, the Company recogni zed the remaining 50% of its US income tax benefit, which resulted in no s ignificant reduction of income tax expense.
Research & Engineering Expend itures were as follows:
(Slated in millions)
1996
Oilfield Services 354 $321
Resource Management Services 57 61 63
Test & Transactions 115 89 80
Other' 14 15 15
$ 568 $519 $ 479
' Primarily comprises the Retail Petroleum Systems business sold on October 1. 1998
Interest Expense Interest expense increased $55 million in 1998, fo llowing a $15-million increase in 1997. The increase in 1998 was mainly due to s ignificantly hi gh e r d ebt ba la nces incurred by the Company's principa l US subsidiary resulting from the financing of the Cameo acquis ition.
The increase in 1997 was due to significantly highe r debt balances, only partially offset by lower average borrowing rates.
18
Third Quarter 1998 Charge
Strong results in the first half of 1998 wer( sharp ly reversed when Asia's economic prob !ems began to depress the region's demand fm oil, gas and semiconductors . By midyea r, the Company began consolidating resources and loca tions and making significant cuts in personnel. The third qua rter after- tax charge of $380 million reflected the estimated costs of these actions. For de tails of the charge, see page 30
Liquidity A m easure of financia l position is liquidity, defin ed as cash p lus short-te rm and long- term inves tments, less debt. The followin g table summarizes the Company's change in consolida ted Liquidity for each of the pas t three yea rs:
(Stated in millions
1998 1997 1996
Net income $ 1,014 ____$_1,385 919
Third quarter charge 380
Depreciation & amortization 1,136 1,035 ____wl
Proceeds from emQ io~ee stock Qlans 139 148 182
Businesses sold !acquired) 61 (31) (185
Net proceeds on sa le of drill ing rigs' 174
Other (102) 121 61
Net increase in liquidity $ 204 $ 357 $ 79
Liguidity-end of Qeriod $ 731 $ 527 $ 17C
' In September 1997, the Schlumberger semisubmersibles Drillstaranc. Sedco Explorer were sold to a 'lewly formed venture in which Schlumberger has a 25% interest. The rigs are being operated by Schlumberger under bareboat charters. The gain on the sa le has beer deterred and is being amortized over a six-year period. This transaction had no significant eflect on 1998 and 1997 results and has no significant impact on future results of operations.
In 1997 and 1996, the increase in working capi ta l requirements followed the hi ghe r business activity. The major increases were in the worki ng capital components of receivables and

inventory. In 1998, 1997 and 1996, higher fixed asset additions reflec ted the increase in Oilfield Services activities.
The current consolidated liquidity level, combined with liquidity expected from operations, should satisfy future business requirements.
Common Stock. Market Prices and Dividends Declared per Share
Quarterly high and low prices for the Company's common stock as reported by the New York Stock Exchange (composite transactions), together with dividends declared per share in each quarter of 1998 and 1997, were:
Price .Range Dividends High Low Declared
1998 QUARTE RS
Fi rst $8U $65 % $ 0.1875
Second 86 % 66 0.1875
Third 69 "){, 43 ){, 0.1875
Fourth 58 Y. 40 Y,, 0.1875
1997 QuARTERS
First $ 58 7!, $49 $ 0.1875
Second 63 Y. 51 Ys 0.1875
Thi rd 84% 62 % 0.1875
Fourth 94 ){, 72 % 0.1875
The number of holders of record of the common stock of the Company at December 31, 1998, was approximately 24,500. There are no legal restrictions on the payment of dividends or ownership or voting of such shares, except as to shares held in the Company's Treasury. US stockholders are not subjec t to any Netherlands Antilles withholding or other Netherlands Antilles taxes attributable to ownership of such shares.
Environmental Matters
The Company and its subsidiaries comply with government laws and regulations and responsible management practices for the protection of the environment. The Consolidated Balance Sheet includes accruals for the estimated future costs associated with certain environmental remediation activities related to the past use or disposal of hazardous materials. Substantia lly all such costs rela te to dives ted operations and to facilities or loca tions that are no longer in operation. Due to a number of uncertainties, including uncertainty of timing, the scope of rem ediation, future technology, regulatory changes and other factors, it is possible that the ultimate remediation costs may exceed the amounts estimated. However, in the opinion of management, such additional cos ts are not expected to be material relative to consolidated liquidity, financial position or future resu lts of operations. Consistent with the Company's commitment to protection of the environment, safety and employee health, additional costs, including capital expenditures, are incurred related to current operations.
New Accounting Standards
In 1998, the Company adopted SFAS 131, "Disclosures about Segments of an Enterprise and Related Information." All prior periods have been restated . For details, see "Segment Information" in the "Notes to Consolidated Financial Statements" on pages 36-37.
In June 1998, the Financial Accounting Standards Board (FASB) issued SFAS 133, "Accounting for Derivative Instruments and Hedging Activities," which requires that the Company recognize all derivative instruments as either assets or liabilities in the statement of financial position and measure those instruments at fair value. The standard is effective in the year 2000 for the Company. Occasionally, the Company uses deriva tive instruments such as interest rate swaps, currency swaps, forward currency contracts and foreign currency options. Forward currency contracts provide a
19
hedge against currency fluctua tions on assets/ liabilities denominated in other than a functional currency. Options are usua ll y entered into to hedge against currency variations on firm commitments generally involving the construction of long-lived assets such as seismic vessels and drilling rigs. The Company does not anticipate that the implementation of the new standard in 2000 will have a ma teria l effect on the consolidated financial position and results of operations.
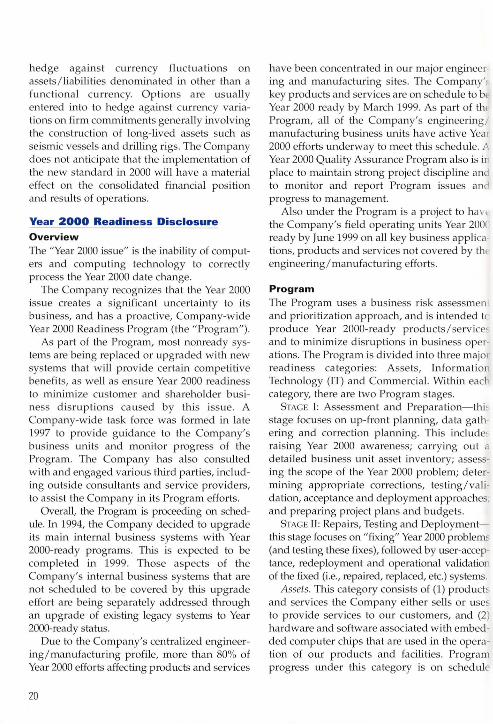
Year 2000 Readiness Disclosure
Overview The "Year 2000 issue" is the inability of computers and computing technology to correctly process the Year 2000 date change.
The Company recognizes that the Year 2000 issue crea tes a significant uncertainty to its business, and has a proactive, Company-wide Year 2000 Readiness Program (the "Program") .
As part of the Program, most nonready systems are being replaced or upgraded with new systems that will provide certain competiti ve benefi ts, as well as ensure Year 2000 readiness to minimize customer and shareholder business disruptions ca used by this issue. A Company-wide task force was formed in late 1997 to provide guidance to the Company's business w-ilts and monitor progress of the Program. The Company has also consulted with and engaged various third parties, including outside consultants and service prov iders, to assist the Company in its Program efforts.
Overall, the Program is proceeding on schedule. In 1994, the Company decided to upgrade its main internal business systems with Year 2000-ready programs. This is expected to be completed in 1999. Those aspects of the Company's internal business sys tems that are not scheduled to be covered by this upgrade effort are being separately addressed through an upgrade of existing legacy systems to Year 2000-ready status.
Due to the Company's centralized engineering/manufacturing profile, more than 80% of Year 2000 efforts affecting products and services
20
have been concentra ted in our major engineer ing and manufacturing sites. The Company'; key products and services are on schedule to b( Year 2000 ready by March 1999. As part of th( Program, all of the Company's engineering/ manufac turing business units have active Yea1 2000 efforts underway to meet this schedule. A Year 2000 Quality Assurance Program also is in place to maintain strong project discip line an to monitor and report Program issues and progress to management.
Also under the Program is a project to havL the Company's field opera ting w1its Year 200( ready by June 1999 on aLl key business applica tions, products and services not covered by th< engineering / manufacturing efforts.
Program
The Program uses a business risk assessmen and prioritiza tion approach, and is intended t(' produce Year 2000-ready products/service, and to minimize disruptions in business operations. The Program is divided into th ree major readiness ca tegories : Asse ts, Information Technology (IT) and Commercial. Within each ca tegory, there are two Program stages.
STAGE 1: Assessment a..nd Prepara tion- thi; s tage focuses on up-front planning, data gath ering and correction planning. This include; raising Year 2000 awareness; carrying out detailed business unit asse t inventory; assessing the scope of the Year 2000 problem; determining appropriate corrections, tes ting /validation, acceptance and deployment approaches, and preparing project p lan s and budgets.
STAGE II: Repairs, Testing and Deploymentthis stage focuses on "fixing" Year 2000 problems (and testing these fixes), followed by user-acceptance, redeployment and opera tional va..lidatio of the fixed (i.e., repaired, replaced, etc.) systems.
Assets. This category consists of (1) products and services the Company either sells or uses to provide services to our customers, and (2) hardware and software associated with embedded computer chips that are used in the operation of our products and facilities. Program progress under this ca tegory is on schedule

with the majority of Stage I activities completed; most business mtits are now implementing Stage II activities. The Company expects ac ti vities associated with Year 2000 readiness of assets to be completed by March 1999.
Information TeclmologJ;. This category deals with traditional IT infrastructure, such as business applications, computer hardware/ software, IT networks and communication equipment. The implementation of the MFG/PRO** system is on schedule and should be fully operational in all assigned areas by March 1999. Implementation of the SAP" system is scheduled to be completed in the United States and Canada by October 1999. The Company intends to repair associated legacy systems outside the United States and Canada. This plan uses independent contrac tors, legacy system vendors and Company employees to rewrite and test certain software modules. This program is on schedule and expected to conclude by August 1999. The ac tivities associated with other sys tems in this IT category (computer hardware/software, IT networks and communica tions equipment) also are on schedule. Stage I activities have been completed and the majority of the business units are implementing their Stage II activities. The Company expects activities associated with this ca tegory to be completed by mid-1999.
Commercial. This category deals with the Company's efforts to avoid being adversely affected by Year 2000 issues from external entities (suppliers, financial institutions, service providers, e tc.) no t affiliated with the Company. Stage I of the Program includes a process for mitiga ting the Year 2000 issues associated with key suppliers. The Company is communica ting with its key suppliers, business partners and customers seeking their assurances that they will be Year 2000 ready. Based on responses, the Company will develop contingency plans for those areas that pose significant risk from the Year 2000 issue; however, the Company could potentially experience disruptions to some aspects of its operations from noncompliant systems utilized by unrelated
third-party entities. Work in this category is on sched ule. The majority of the business units have completed their Stage I activ ities and are implementing their Stage II efforts which are expected to be completed by Apr il 1999.
Contingency Planning The Company is reviewing the activities associated with each category and is determining those activities at risk of not being completed in time· to prevent a Year 2000 disruption. Appropriate contingency plans are being designed for each of the "a t risk" ac tivities to provide an alternative means of fwKtioning which minimizes the effect of the potential Year 2000 disruption, both internally and on the Company's cus tomers . These contingencyplanning ac tivities began in December 1998 and are expected to be completed in July 1999.
Costs Year 2000 Program funding req uirements have been incorporated into the Company's capital and operating plans and are not expected to have an adverse materia l impact on the Company's financial condition, results of operations or liquidity. The Company estimates the cos t of the Program to be arow1d $60 million (approximately $41 million spent to da te), with a breakdown of cos ts estima ted at 30% for employee resources (approximately 120 manyea rs), 27% for IT-related upgrades and repair and 43% for non-IT embedded chip technology. It should be noted that these costs do not include the normal upgrading of business and financial systems that would be Year 2000 ready, such as SAP and MFG/PRO, or rationaliza tion cos ts of Year 2000-ready technology already defined by our business plans.
Risks Dates and schedules for the Compan y's Year 2000 Program are based on management's bes t estimates, which involve numerous assumptions, including, but not limited to, the results of Stage I assessments; the continued availability of certain resources; third par ties' Year 2000 status and plans; and other factors. There can
21

be no guarantee that these estimates will be achieved, or that there will not be delays in, or increased costs associated with, implementation of the Year 2000 Program. Specific factors that might cause differences between present estimates and ac tual results include, but are not limited to, the availability and cost of ski lled personnel, consultants, and independent contractors; the ability to locate and correct all relevant computer code; timely and effective action by third parties and suppliers; the ability to implement interfaces between Year 2000-ready systems and those systems not being replaced; and similar uncertainties. Because of the general uncertainty inherent in the Year 2000 issues (partially attributable to the interconnection of global businesses), the Company cannot confidently predict its ability to resolve appropriately all Year 2000 issues that may affect its operations and business or expose it to third-party liability. The fai lure to correct a Year 2000 problem could result in an interruption in, or a failure of, certain normal business activities or opera tions. Such failures could materially and adversely affect the Company's operations, liquidity and financial condition. Because of the uncertainties described above, the Company presently is unable to determine whether the consequences of such Year 2000 failures will have a material impact on the Company's results of operations, liquidity or financial condition.
Euro Disclosures On January 1, 1999, the euro became the official single currency of the European Economic and Monetary Union. As of this date, the conversion rates of the national currencies of the eleven member states adopting the euro were fixed irrevocably. The national currencies w ill initially remain in circulation as nondecimal subunits of the euro and will be replaced by euro bills and coins by July 2002. During the transition period between January 1999 and January 2002, public and private parties may pay for goods and services using either the euro or the national currency on a "no compulsion, no prohibition" basis.
22
A Euro Readiness Program has been established throughout Schlumberger to ensure that all business segments meet the euro requirements. To this effect, a Euro Steering Committee has been established and, to maintain focus on the Schlumberger euro implementation program, project teams have been set up throughout the Company. Euro implementation plans cover both phases of the euro implementation. Initially these plans will ensure that, progressively through 1999, all business units of Schlumberger will be able to transac t in the euro. Thereafter, the plans will ensure that during the transitional period all corporate, finan cial, commercial, employment and other documentation that refer to the participating currencies are converted to the euro in accordance with the regulatory requirements.
During the transition period, conversion rates can no longer be computed directly from one participating currency to another. Instead, a triangulation algorithm will be applied, which requires that national currency amOtmts be converted first to the euro according to the fixed conversion ra tes before being converted into the second national currency. This requires specific conversion modules to be included in business information systems. Furthermore, such programs will be required to provide the additional functionality needed to convert all participating currency-denominated financial data to the euro. A review of all financial information systems has commenced, and their functionality for processing euro transac tions is being tested.
Schlumberger recognizes that the euro will affect its various businesses differently. Oilfield Services operates in an essential! y US dollardenominated environment in which the introduction of the euro is expected to have limited consequences. Test & Transactions will be affected in terms of the ability of products, such as smart cards and terminals, to process euro transactions. Resource Management Services, which has now set up a pan-European manufacturing structure covering all European Union markets, expects to participate in the

general growth generated by the euro. The increased price transpanmcy created by the euro accompanied by deregula tion and increased competition among our customers, the utilities, should also contribute to providing new solutions opportunities in these businesses. The full assessment of the effec ts the euro will have on each business segment is incomplete and, hence, the Company cannot as yet make a final conclusion on the anticipated business impact the introduction of the single currency will have.
Based upon results to da te, the Company believes that the implementation of the euro can be performed according to the time frame defined by the European Union. The Company does not expect the total cost of addressing this issue to be material to financial condition, results of operations and liquidity. This cos t estima te does not include the normal upgrading of business and fin ancial systems that would be euro ready.
Market Risk The Company does not believe it has a material exposure to market risk. The Company manages the exposure to interes t rate changes by using a mix of debt maturities and va riableand fixed-rate debt together with interes t ra te swaps, where appropriate, to fix or lower borrowing costs. With regard to fo reign currency fluctuations, the Company enters into various contracts, which change in value as foreign exchange rates change, to protect the value of external and intercompany transactions in foreign currencies. The Company does not enter into foreign currency or interest ra te transactions for speculative purposes.
Forward-looking Statements The Company ca utions that, except for the historical informa tion and discussions contained herein, statements in this annual report and elsewhere may constitute forward-looking statements. These sta tements include statements as to expectations, beliefs and future financial performance, such as s tatements
regarding business prospects in the key industries in which the Company operates and grow th opportunities for the Company in those industries. These sta tements involve a number of risks, uncertainties, assumptions and other fac tors that could ca use ac tual resul ts to differ materially from those in the forwardlooking statements. While it is not possible to identify all such factors, such fac tors include: severity and dura tion of the downturn in the oil and gas and semiconductor industries, general econ.omic and business conditions in key regions of the world and changes in business s tra tegy or development plans relating to the Company's targeted growth opportunities.
23

CONSO LI DATED STATEME NT OF INCOME
Year Ended December 31,
Revenue Operating Interest and other income
Expenses
1998
$11,815,553 181,756
11,997,309
Cost of goods sold and services 9,034,409
(Stated i11 tlwusands except per share mno1111 f~J
1997 1996
$11 543 431 $ 9,701,685 111,334 72,818
11,654,765 9,774,503
8,372,714 7,282,010 Research & engineeriD_9 _____ __,~225 ____ ---------"~~"---------~'-':-"""--':-' Marketing 467 592
519 365 478 875 433 911 3CJMQ§
General 454 049 Interest 150 161 Unusual items
Income before taxes Taxes on income
Net Income
Basic earning~er share
Diluted earnings per share
Average shares outstanding Average shares outstanding
assuming di lution
10,674,436
1322 873 308,674
$ 1,014,199
___ .$
$
1.87
1.81
544,338
561,855
See Notes to Consolidated Financial Statements
428 505 95 316
9,849,811
1804 954 420,405
$ 1,384,549
$ 2.57
$ 2.47
539 330
559 653
Sch lumberger Limited (Schlumberger NV, Incorporated in the Netherlands Antilles( and Subsidiary Companies.
24
422,32? 79 86Q
333,09] 8,995,973
778 530 (140,957
$ 919,487
$ 1.7~
$ 1.69
534 29§
545 609

CO NSOLIDATED BALANCE SHEET (Stated in thousnuds)
December 31, 1998 1997
Assets Current Assets
Cash and short-term investments $ 3 956 694 1818 332 Receivables less allowance for doubtful accounts
(1998-$89,556; 1997- $76,818) 2,968,070 2,997,010 Inventories 1333 131 1 300 541 Deferred taxes on income 295 974 220 015 Other current assets 251,355 241,823
8,805,224 6,577,721
Long_-term Investments, held to maturity_ 855,172 742,751 Fixed Assets less accumulated deereciation 4,694,465 4,121,951 Excess of Investment Over Net Assets
of Comeanies Purchased less amortization 1,302,678 1,379,412 Deferred Taxes on Income 202 630 174 084 Other Assets 217,760 189,962
$ 16,077,929 $ 13,185,881
Liabilities and Stockholders' Eguit~
Current Liabilities Accounts a able and accrued liabilities 2 539 954 2 514 220 Estimated liabili for taxes on income 480123 425,318 Bank loans 708 978 750 303 Dividend ~ayable 102 891 93 821 Long-term debt due within one year 86,722 104,357
3 918,668 3,888,019
Long_-term Debt 3 285 444 1179 356 fgstretirement Benefits 432 791 414 432 Other Liabilities 321,951 322,905
7 958,854 5,804,712
Stockholders' Equity Common stock 1539 408 1428,624 Income retained for use in the business 8 882 455 8 265 642 Treasury stock at cost (2 221308) 2 249 765) Translation adjustment (81,480) (63,332)
8119 075 7 381169 $ 16 077 929 $ 13 185 881
See Notes to Consolidated Financial Statements Schlumberger Limited ISchlumberger NV, Incorporated in the Netherlands Antil les) and Subsidiary Companies.
25

CO NSO LIDATED STATE M ENT OF CAS H FLOWS (Stated i11 tlwusn11d~)
Year Ended December 31, 1998 1997 1996
Cash flows from operating activities: Net income 1014199 1384 549 919 487 Adjustments to reconci le net income to net cash provided by operating activities:
QgQreciation and amortization 1,136 290 1 035 003 940 582 Earnings of compan ies carried at equity,
less dividends received 1998- 4 996 1997-$4 934 1996-$2 948 44011
Provision for losses on accounts receivable 29 797 Third guarter charge Other ad ustments 9 291) Change in operating assets and liabilities:
Increase in receivables Increase in inventories (Increase) decrease in deferred taxes !Decrease) increase in accounts payable
and accrued liabil ities (72 940) 175 664 188 274 Increase in estimated liability
for taxes on income 79 677 51215 45192 Other- net (42,218) 25,916 (73,350)
NET CASH PROVIDED BY OPERATING ACTIVITIES 2,303,147 1,860,527 1,540,569
Cash flows from investing activities: Purchases of fixed assets 1~369) (1,591,734) (1,219 ,805) Sales/retirements of fixed assets & other 36,693 97 390 113 518 Sale (Qurchase) of businesses 61,662 (28,233) (16~5)
Net roceeds on sale of drillin ri s 174 000 Increase in investments (2,292,163) (867,894) (218,914) Decrease (increase) in other assets 4,660 19,453 (537)
NET CASH USED IN INVESTING ACTIVITI ES (4,076,517) (2,197,018) (1,487,373)
Cash flows from financing activities: Dividends Qaid (388,379 374 489) Proceeds from emQio~ee stock Qurchase Qlan 70,461 38,807 Proceeds from exercise of stock OQtions 68,780 143,660 Purchase of shares for Treasu 13 413) Proceeds from issuance of long-term debt 2,909,156 205 009 Pa~ments of QrinciQal on long-term debt (863,966 202 02n) Net !decrease) increase in short-term debt (64,756) 212,523
NET CASH PROVIDED BY FINANCING ACTIVITIES 1731296 10 071
Net (decrease) increase in cash (42,074) (9,725) 63,267 Cash, beginning of ~ear 147,395 157,120 93,853 CASH. END OF YEAR 105 321 147 395 $ 157120
See Notes to Consolidated Financ1al Statements Schlumberger Limited ISchl umberger NV, Incorporated in the Netherlands Antilles! and Subsidiary Companies.
26

CO NSOLIDATED STATE M ENT OF STOCKHO LDER S' EQUITY (Dollar nmo1mts staled;, lllousn11ds)
Common Stock Income Retained for
Issued In Treasu~ Translation Use in the Comprehensive Shares Amount Shares Amount Adjustment Business Income
Balance. Janua 1, 1996 660,746 700 $1,235146 129 976,320 $2,414,577 $(31382) $6 711298 $ Translation
adjustment 5,756 5 756 Sales to optionees less
shares exchanged 16,527 47,177 (5,314,696) (98,631) 43 Purchases for
Treasu~ (404,268) (13,413) Employee stock _llUrchase elan 1,483,494 38,807 (211) Net income 919,487 919,487 Dividends declared
($0.75 eer share) (375,509)
Balance. Qecember 31 , 1996 661,842,453 1,307,717 124,661,624 2,315,946 (25,626) 7,255,108 $ 925,243 Translation
a<ljustment (37,706) (37 706) Sales to opt ionees less
shares exchanged 395,950 37,316 (3,323,223) (61,743) Employee stock
eurchase elan 1,399,623 50,055 Net income 1 384 549 1384 549 iVs acquisition 16,324 (238,812) (4,438) Tax benefit on
stock o tions 16,600 Change in subsidiary
ear-end 612 4,560 Dividends declared
($0.75 eer share! (378,575)
Balance. December 31 , 1997 663 638 026 1,428 624 121 099,589 2 249 765 (63 332) 8 265,642 $ 1 346 843 Translation
adjustment (18,148) (18,148) Sales to optionees less
shares exchan ed 796 992 40 323 (1 531 607) (28 457) Employee stock
eurchase elan 1,266,840 70,461 Net income 1 014,199 1 014,199 Dividends declared
($0.75 eer share) (397,386)
Balance. December 31 . 1998 665,701 ,858 $1 ,539,408 119,567,982 $2,221 ,308 $(81,480) $8,882,455 $ 996,051
See Notes to Consolidated Financ1al Statements Schl umberger Limited (Schlumberger NV.. Incorporated in the Netherlands Antilles) and Subsidiary Companies.
27

Notes to Consolidated Financial Statements
Summary of Accounting Policies
The Consolid a ted Financial Statements of Schlumberger Limited and its subsidiaries have been prepared in accordance with accounting principles generally accepted in the United States.
On August 31, 1998, Schlumberger completed the merger of Schlumberger Technology Corporation, a wholly owned subsidiary of Schlumberger, and Cameo International Inc. The business combination was accounted for using the poolingof-interests method of accOLmting. Accordingly, the financial statements have been prepared as if Schlumberger and Cameo were combined at the beginning of the earliest period presented.
PRINCIPLES OF CONSOLIDATION
The Consolida ted Financial Statements include the accounts of majority-owned subsidiaries. Significant 20%-50% owned companies are carri ed on the equity method and classified in Other Assets . The Company's pro rata share of after- tax earnings is included in Interest and other incorne. Equity in undistributed earnings of all 50%-owned companies at December 31, 1998 was not material.
USE OF ESTIMATES
The preparation of financial statements in conformity with generally accepted accounting principles requires management to make estimates and assumptions that a ffec t the repor ted amounts of asse ts and liabilities, disclosure of contingent assets and liabilities at the date of the financial s tatements and the reported amounts of revenue and expenses during the reporting period. While ac tua l results could differ from these es tima tes, management believes that the es timates are reasonable.
REVENUE RECOGNITION
Generally, revenue is recognized after services are rendered and products are shipped.
TRANSLATION OF NON-US CURRENCIES
All assets and liabilities recorded in fwlCtiona l currencies other than US dollars are translated at current exchange rates. The resulting adjustments are charged or credited direc tly to the Stockholders' Equity section of the Consolidated Balance Sheet. Revenue and expenses are
28
translated at the weighted-average exchange rates for the period. All rea lized and unrealized transaction ga ins and losses are included in income in the period in which they occur. The Company policy is to hedge against unrealized gains and losses on a monthly basis. Included in the 1998 results were transaction losses of $5 million, compared with a loss of $5 million in 1997 and a ga in of $5 mi llion in 1996.
Currency exchange contracts are entered into as a hedge against the effect of future se ttlement of asse ts and liabilities denominated in other than the functional currency of the individua l businesses. Gains or losses on the contracts are recognized when the currency exchange rates fluctuate, and the resulting charge or credit offse ts the unrealized currency ga ins or losses on those assets and liabilities. At December 31, 1998, contrac ts and options were outstanding for the US dollar equivalent of $276 million in va rious foreign currencies. These contrac ts mature on var ious da tes in 1999 and 2000. INVESTMENTS
Both shor t-term and long- term investments held to maturity are s tated at cost plus accrued interest, which approximates market, and comprise primarily Eurodollar time deposits, certificates of deposit and commercia l paper, Canada treasury bills, Euronotes and Eurobonds, substantially all denominated in US dollars. Substantially all the investments designated as held to maturity tha t were purchased and sold during the year had original maturities of less than three months. Shor t-term investments that are designa ted as trading are stated at market. The Lmrealized gain on such securities at December 31, 1998 was not significant.
For purposes of the Consolidated Statement of Cash Flows, the Company does not consider short-term inves tments to be cash equivalents as they genera lly have original maturities in excess of three months. Short-term inves tments at December 31, 1998 and 1997, were $3.9 billion and $1.7 billion, respectively.
INVENTORIES
Inventories are stated principally at average or standard cost, which approximates average

cost, or at market, if lower. Inventory consists pri marily of materials and supplies.
EXCESS OF INVESTMENT OVER NET ASSETS OF COMPANIES PURCHASED
Cost in excess of net assets of purchased companies (goodwill) is amortized on a straightline basis over periods ranging from 5 to 40 years. Accumulated amortiza tion was $434 million and $389 million at December 31, 1998 and 1997, respectively. Of the goodwill at December 31, 1998, 53% is being amortized over 40 years, 21% is being amortized over 25 years and 26% is being amortized over periods of up to 25 years.
FIXED ASSETS AND DEPRECIATION
Fi xed assets are stated at cost less accumulated depreciation, which is provided for by charges to income over the es timated useful lives of the assets by the straight-line method. Fixed assets include the manufacturing cost (average cost) of oilfield technical equipment manufactured by subsidiaries of the Company. Expenditures for renewals, replacements and improvements are ca pitalized . Maintenance and repairs are charged to operating expenses as incurred. Upon sale or other disposition, the applicable amounts of asse t cost and accumulated depre- · ciation are removed fro m the accounts and the net amount, less proceeds from disposal, is charged or credited to income.
CAPITALIZED INTEREST
The Company capitalizes interest expense during the new construction or upgrade of quali fying assets. Interest expense capita lized in 1998 was $15 million. No interes t expense was capitalized in 1997 and 1996.
IMPAIRMENT OF LONG·LIVED ASSETS
The Company reviews the appropriateness of the carrying value of its long-lived assets, includ ing goodwill, whenever events or changes in circumstances indica te that the historica l cost carrying value of an asset may no longer be appropria te. The Company assesses recoverability of the carrying value of the asset by estimating the future net cash flows expected to result from the asset, including eventual disposition.' If the future net cash flows are less
than the carrying va lue of the asse t, an impairment loss is recorded equal to the difference between the asset's caHying value and fair value.
TAXES ON INCOME
The Company and its subsidiaries compute taxes on income in accordance with the tax rules and regulations of the many taxing authorities where the income is earned. The income tax rates imposed by these tax ing authorities vary substantially. Taxable income may differ from pretax income fo r financial accounting purposes. To the extent that differences are due to revenue or expense items repor ted in one period for tax purposes and in an other period for financia l accounting purposes, an appropria te provision for deferred income taxes is made.
Approxima tely $4.5 billion of consolidated income retained for use in the business at December 31, 1998 represented undistributed ea rnings of consolid ated subsidiaries and the Company's pro rata share of 20%-50% owned companies. No provision is made for deferred income taxes on those earnings considered to be indefinitely reinvested or ea rnings that would not be taxed when remi tted.
Tax cred its and other allowances are credited to current income tax expense on the flowthrough method of accounting.
EARNINGS PER SHARE
Basic earnings per share is computed by dividing net income by the average number of common shares outstanding during the year. Diluted earnings per share is computed by dividing net income by the average number of common shares outstanding assuming dilution, the calculation of which assumes that all s tock options and warrants are exercised at the begilming of the period and the proceeds used, by the Compan y, to purchase shares at the average market price for the period. The following is a reconciliation from basic earnings per share to diluted earnings per share for each of the last three years:
29

(Staled in thousand:; except per sl111 n' 1111 /Pilll b)
Net Average
Shares Ea rnings
Per Income Outstand ing Share
1998 Basic $ 1,014,199 5~4:238 _ _jil.87
Effect of di lut ion: Options 9,723
Wa rrants 7 794
Dil uted $1014199 561 855 $1.81
1997 Basic $ 1,384,549 539,330 -- $ 2.57 Effect of dilution
Optio ns 1U_85
Wa rrants 8 138
Diluted $ 1 384 549 559 653 $2.47
1996 Bas ic __ $ 919,487 534,298 $ 1.72 Effect of dil ution ____QQl iQrls_ 6,996
Wa rrants 4 315
Diluted $ 919 487 545 609 $ 1.69
RESEARCH & ENGINEERING
All research and eng ineering expenditures a re expensed as incurred, including cos ts re la ting to patents or rights that may resu lt from such expenditures.
THIRD QUARTER CHARGE
In September 1998, the Company record ed an a fter- tax cha rge of $380 millio n ($0.68 pe r sha re-di luted), consis ting of the fo llow ing:
• A cha rge of $268 mil lion re la ted to Oilfield Services, including severance cos ts o f $64 mi llion (5600 employees); fa cility closure/ re location costs of $40 mill ion; o perating asse t w riteoffs of $114 mi ll ion; and $39 million of customer recei vab le reserves where collec tion was consid ered doubtful due to the custo me rs' financial condition and/or country ri s k. This cha rge resulted from the s lowdow n in business.
• A charge of $63 m ill ion for merger-re la ted costs in connection with the acquisition of Ca meo Internationa l Inc.
• A charge of $43 m ill ion related to Resource Management Services and Tes t & Tra nsactions, cons isting primarily of emp loyee severa nce,
30
fa cility rationalization s a nd e nv ironmenta .l cos ts resu lting from a reassessm ent of o ngoing future monitor ing and ma intena nce requirements a t loca ti ons no lo nger in operation.
The pretax charge of $444 milli on is class ifi ed in Cost of goods sold and services.
At December 31, 1998, $35 mi ll ion of the Oilfi eld Services severa nce cos ts had been incurred a nd the majority of the terminations had been completed. Complex socia l/ lega l issues in certa in Europea n countries have ca used d elays in comple ting th e hea d co unt reduction. Th e reduction should be compl eted by june 30, 1999, a nd the rema ining cos ts incurred.
In 1996, the Company a nno unced a cha rge oJ $300 million after tax in the third quarter rela ted primarily to the elec tri city, gas and se ismic la nd and tra ns ition zone bu sinesses. The after-tax cha rge o f $300 million included pre ta x cha rge> of$] 12 milli on for severance costs, other fac ility closure cos ts o f $39 million, goodwill write· o ffs o f $122 million and other asset impairments/charges of $60 million.
TI1e severance cos ts rela ted to less than 5% oJ the world w ide work force, primari ly in Europe, and pertained to both manufacturing and operating personnel in abou t 30 locations. Most of the other fac ility closure cos ts re la ted to the w ritedown of buildings, equipment and other asset' to net rea lizab le va lue .
In add ition, the Compa ny recorded a cha rge o f $58 million a fter tax, including a loss o n the divestiture of the rema ining defense-re la ted activity, certa in asset impa irments a nd other cha rges. The a mo unt is cla ss ified in Cost oj goods sold and services ($47 million) a nd Taxes on inco/1 /e ($11 milli on).
A t Decembe r 31, 1998, virtua ll y a ll of the severa nce cos ts had been incurred.
Acquisitions
On Augus t 31, 1998, Sch lumberger announced tha t the me rger of Schlumberger Technology Corporation, a wholly ow ned subs idiary of Schlumberger, and Ca meo Internationa l Inc., had been completed. Under the te rms o f the me rger agreement, approxima te ly 38.2 million shares

of Cameo common stock were exchanged for 45.1 million shares o'f Schlumberger common stock at the exchange ra te of 1.18 shares of Schlumberger stock for each share of Cameo. Based on the Schlumberger average price of $47% on August 28, the transaction was valued at $2.2 billion. The business combination was accounted for using the pooling-of-interests method of accounting.
During 1997, subsidiaries of the Compan y acquired Interactive Video Systems, Inc. (IVS), a metrology solutions provider for the frontend semiconductor fabrication equipment marke t, and S.A. Holditch and Associa tes, Inc. , a petroleum and geoscience consulting services company. These acquisitions were accounted for as purchases. Costs in excess of net assets acquired were $38 million , which are being amortized on a s traight-line basis over periods of 5 and 15 years, respectively.
During 1996, subsidiaries of the Company acq uired Solaic, SA, a magnetic and smart card manufac turer; an 80% interest in Printer, a magne tic stripe card manufac turer; Oilphase Sampling Services Ltd. , a reservoir fluid sampling company; The Production Analyst* and OilField Manager* software products from OGCI Software, Inc.; Germann, a turnkey gasoline station provider; Gueant, a gas dispenser service company; and a 33% equity interes t in DAP Teclmologies Limited, a developer and manufacturer of rugged handheld computer products. The purchase prices were $75 million, $9 mi llion, $7 million, $8 million, $8 million, $7 million and $4 million, respectively. These acquisitions were accounted for as purchases. Costs in excess of net asse ts acquired were $91 million, which are being amortized on a straightline basis over periods between 7 and 25 yea rs.
Investments
The Consolid ated Balance Sheet reflects the Company's investment portfolio separated between current and long term, based on maturity. Except for $125 million of inves tments which are considered trading at December 31, 1998 ($117 million in 1997), it is the Company's
intent to hold the inves tments until maturity. Long-term investments mature as follows:
$255 million in 2000, $143 million in 2001 and $457 million thereafter.
At December 31, 1998, there were no interes t rate swap arrangements outstanding rela ted to investments. Interest rate swap arrangements had no material effect on consolidated interest income.
Fixed Assets A summary of fixed assets follows:
(S tated ill millio115)
December 31. 1998 1997
Land ~ 78 ~ 80
Buildings & Improvements 1,108 1,086
Machiner~ & EguiQment 10,472 9,759
Tota l cost 11658 10,925
Less accumulated deQreciation 6,964 6,803
$ 4 694 $ 4122
Estimated useful lives of Buildings & Improvements range from 5 to 50 years and of Machinery & Equipment from 2 to 25 years. Nearly all of the Buildings & Improvements are d epreciated between 30 and 40 years. For Machinery & Equipment, 27% is being deprecia ted over periods between 16 to 25 years, 11% over periods between 11 to 15 years and 62% over periods between 2 to 10 years.
Long-term Debt A summary of long-term debt by currency follows:
(S tated in millioHs)
December 31, 1997
US dollar 433
UK QOund 270 122
French franc 201 186
German mark 160 118
JaQanese ~en 125 111 Italian lira 91 93
Canadian do llar 80 68
Other 74 48
$3 285 $1 179
31

Long- term debt is a t var iable inte res t rates; the weighted-a verage inte res t ra te of the debt ou ts tanding at December 31, :1 998 was 5.6%. Such ra tes a re reset every s ix months o r sooner. Long- te rm d ebt a t December 31, 1998 approxima tes fair va lue.
Long- term debt a t December 31,1998, is due as follows: $486 milli on in 2000, $122 million in 2001 , $254 million in 2002, $2,243 million in 2003 and $180 million the reafter.
At December 31, 1998, there were interes t rate swap arra ngements outs tanding related to debt having a to ta l principal amount of $37 million. Inte res t rate swap arrangements had no material im pac t on consolid ated inte rest expense in 1998 a nd 1997. The exposure, in the event of nonperformance by the other pa rties to the a rrangements, would no t be s ignifi ca nt.
Lines of Credit
At December 3"1, "1998, the Company's principal US subsidi ary has an ava ilab le unused Revolving Cred it Agreement w ith a syndica te of ba nks. The Agreement provides tha t the subs id ia ry ma y borrow up to $1 bi ll ion until Aug ust 2003 at money marke t-ba sed rates. Add itiona ll y, the Company's principal US subs idia ry has available an unused fi ve-yea r syndicated capital lease facility w hereby it ca n finance up to $550 m illi on for the cons truction and subsequent ca pita l lease of two dri lling ri gs at money mar ket-based ra tes. At December 31, 1998, the Company and its subs idia ri es also had ava il ab le unused lines of credit of approximately $630 million.
Capital Stock
The Compan y is authorized to issue 1,000,000,000 sha res of common stock, par va lu e $0.01 per share, of w hich 546,133,876 and 542,538,437 shares were outs tanding on December 31, 1998 and 1997, respecti vely. The Company is a lso authori zed to issue 200,000,000 shares of cumul ati ve prefe rred stock, par va lue $0.01 per share, w hich may be issued in ser ies w ith te rms and conditions determined by the Board of Direc tors. No shares of preferred s tock have
32
been issued. Holders of common stock and prefe rred stock a re entitled to one vote fo r each share of s tock held .
In january 1993, Schlumberger acquired the re ma ining 50% inte res t in the Dowell Schlumberger group of companies. The purchase price incl uded a wa rrant, expiring in 7.5 yea rs and va lued at $100 milli on, to purchase "15,153,018 shares of Schlumberger Limited com mon stock at an exercise price of $29 .672 per share. The wa rrant is full y ves ted and nontra nsferable.
Stock Compensation Plans
As of December 31, 1998, the Company has two types of s tock-based co mpensa tion pl a ns, w hich a re described below. The Company app li es A PB Op ini on 25 a nd re la ted Interpretations in accounting for its p lans. Accord ing ly, no compensa tion cos t has been recogni zed for its s tock option plans and its stock purchase plan. Had compensation cost for the Company's stock-based plans been de te rmined based on the fa ir value at the gra nt dates fo r awa rds under those plans, consis tent w ith the method of SFAS 123, the Company's net income and ea rnings per share wou ld have been the pro form a a mounts indi ca ted below:
1998 1997 1996
Net income As reported $1,014 $1,385 $ 912 Pro forma $ 882 $1,315 $872
Basic earnings per share
As reported $ 1.87 $ 2.57 $ 1.V Pro forma $ 1.62 $ 2.44 $ 1.6)
Dilu ted ea rn ings per share
As reported $ 1.81 $2.47 $ 1.6_2
Pro forma $ 1.57 $2.35 $ 1.60
As required by SFAS :123, the above pro forma data reflect the effect of s tock option g rants and the employee stock purchase pl an during 1998, 1997 and 1996.

STOCK OPTIONS PLANS
During 1998, 1997, 1996 and in prior years, officers and key employees were granted stock options under the Company's stock option plans. For substantially all of the s tock options granted, the exercise price of each op tion equals the market price of the Company's s tock on the date of grant; an option 's maxim um term is ten years, and options generally vest in 20"1<, increments over fi ve years.
As required by SFAS 123, the fa ir va lue of each grant is es timated on the da te of grant using the multipl e option Black-Scholes option-pricing mod el with the following weighted-average assumptions used for 1998, 1997 and 1996: Dividend of $0.75; expected volatility of 21 %-25% for 1998 grants, 21°/o for 1997 grants and 20% for 1996 grants; risk-free
1998
interest ra tes for the 1998 grants of 5.59%-5.68% for officers and 4.35%-5.62% for the 1998 grants to all other emp loyees; r isk-free interes t ra tes for the 1997 grant to offi cers of 6.19% and 5.80%-6.77% for the 1997 grants to all other employees; risk-free interest rates for the 1996 grants of 5.38%-6.36% for officers and 5.09%-6.01% for the 1996 grants to all o ther employees; and expected option li ves of 6.98 years for officers and 5.02 years for other employees for 1998 grants, 7.27 years for officers and 5.09 years for other employees for 1997 grants and 8.4 years for offi cers and 5.39 years for other employees for 1996 grants.
A summary of the status of the Company's stock option plans as of December 31, 1998, 1997 and 1996, and changes d uring the years ending on those dates is presented below:
1997 1996 Weighted Weighted Weighted
Average Average Average Exercise Exercise Exercise
Shares Price Shares Price Shares Price
Outstandin 28,701,327 $43.75 26,300,825 $31.40 23,607,281 $ 28.03
Granted 1,845,143 $ 68.76 $38.40
Exercised (2,299,709) $26.54 $ 26.46
Forfeited (666,616) $ 52.32 $35.77 (495,432) $31.80
Outstanding at ~ear-end 27,580,145 $ 46.71 28}01,327 $43.75 26,300,825 $31.40
Options exercisable at ~ea r-e nd 14.480,837 1L605,965 10.292,993
24,44 25.30 11.14
The following table summarizes information concerning currently outstanding and exercisable options by three ranges of exercise prices at December 31, 1998:
O~tions Outstanding 0Qtions Exercisable Number Weighted-average Number
Range of outstanding remainmg Weigh ted-average exercisable Weighted-average exercise Qrices as ol12/31/98 contractual life exercise Qrice as of 12/31 /98 exercise [!rice
_$_4.21 - $ 32.250 11,067,118 4.56 $ 28.916 9,308,792 $28.201
1_32407 - $ 51.536 9,100,558 7.10 $39.262 3,989,682 $37.157
~ 52.688 - $ 90.500 7,412,469 8.83 $82.423 1,182,363 $84.964
27,580,145 6.55 $ 46.670 14,480,837 $36.153
33

EMPLOYEE STOCK PURCHASE PLAN
Under the Schlumberger Discounted Stock Purchase Plan, the Compan y is authorized to issue up to 22,012,245 shares of common stock to its employees. Under the terms of the Plan, employees can choose each yea r to have up to 10% of their annual earnings withheld to purchase the Company's common stock. The purchase price of the stock is 85% of the lower of its beginning or end of the Plan yea r market price. Und er the Plan, the Company sold 1,266,840, 1,399,623 and 1,483,494 shares to employees in 1998, 1997 and 1996, respectively. Compensa tion cost has been computed for the fair va lue of the employees' purchase righ ts, which was es timated us ing the Black-Scholes model wi th the following assumptions for 1998, 1997 and 1996: Di vidend of $0.75; expected life of one yea r; expected volati lity of 34% for 1998, 28% for 1997 and 20% for 1996; and risk-free interes t ra tes of 4.44% fo r 1998, 5.64% for 1997 and 5.71% for 1996. The weightedaverage fair value of those purchase rights granted in 1998, 1997 and 1996, was $19.817, $17.845 and $9.73, respectively.
34
Income Tax Expense
The Company and its subsid ia ries opera te in over 100 taxing jurisdictions where sta tutory tax rates generally va ry from 0"/.,-50%.
Pretax book income subjec t to US and foreign income taxes for each of the three yea rs ending December 31, was as follows:
(Stalt'rl inmillioiiSJ
1998 1997 1996 United States $ 29 $ 485 $ 201 Forei n 1,294 1,320 578 Pretax income ~1,323 ~ 1,805 ~ 779
The Company had net deductible tempora ry differences of $1.2 billion at December 31, 1998 and $977 million a t December 31, 1997. Signi fica nt temporary differences perta in to postretirement medica l benefits, fi xed asse ts, employee benefits and inventory.
The components of consolidated income tax expense were as fo llows:
(S tnlcd iumillious)
1998 1997 1996 Current:
United States-Federal $ 126 ~ 93 $ 42 United States-State 15 19 l_Q
Foreign 221
280
Deferred: United States-Federal ~) $ 18 $(342 United States-State (7) _(2) (~
Foreign (40)
Consolidated taxes on income $ 309 $ 420 $ (14L
Effective tax ra te 23% 23% - 0/.
For the three yea rs, the varia tions from the US sta tutory federal tax rate (35%) and the Company's effective tax ra tes were due to several factors, including the effect of the US opera ting loss carryforward in prior years and a substantial proportion of opera tions in countries w here taxa tion on income is lower than in the US.
In the third quarter of 1996, with increasing profitability and a strong ou tlook in the US, the

Company recognized 50% of the US income tax benefit related to its US subsidiary 's tax loss carryforward and all temporary differences. This resulted in a credit of $360 million.
In the second quarter of 1997, the Company released the remaining valua tion allowa nce related to its US subsidiary's tax loss carryforward and all temporary differences. The resulting reduction in income tax expense was not significant.
Leases and Lease Commitments
Total rental expense was $360 million in 1998, $295 million in 1997 and $242 million in 1996. Future minimum renta l commitments w1der noncancelable leases for years ending December 31 are: $157 million in 1999; $117 million in 2000; $99 million in 2001; $83 million in 2002; and $72 million in 2003. For the ensuing three fi ve-year periods, these commitments decrease from $105 million to $5 million. The minimum renta ls over the remaining terms of the leases aggregate to $55 million.
included in the rental expenses and future mini mum rental comnutments above are the Schl umberger senu submersibles Drillstar and Sedco Explorer. In September 1997, these rigs were sold to a newly formed venture in which the Company has a 25% interes t. The rigs are being operated by Schlumberger under bareboa t charters.
Contingencies
The Company and its subsidiaries comply with government laws and regu lations and responsible management prac tices for the protection of the environment. The Consolidated Balance Sheet includes accruals for the estimated future costs associated with certain environmental remediation activities related to the past use or disposal of hazardous materials. Substantially all such costs relate to divested opera tions and to facilities or locations that are no longer in opera tion. Due to a number of uncertainties, including wKertainty of timing, the scope of remediati on, future technology, regula tory changes and other fa ctors, it is possible that the ultima te remediation cos ts may exceed the amounts estimated. However, in the opinion of managemen t, such additional cos ts are not expected to be materia l relative to consolidated liquid ity, financial position or future results of operations.
In addition, the Company and its subsidiaries are party to various other legal proceed ings. Although the ultimate disposition of these proceedings is not currently deterrninable, in the opinion of the Company any liab ility that might ensue wou ld not be material in relation to consolidated liquidity, financial posi tion or future results of opera tions.
35

w m Segment Information
The Company opera tes four businesses: Oilfield Services (OFS), Resource Managem ent Services (RMS), Test & Transactions (T&T) and Cable & Wireless Omnes. OFS, RMS and T&T are reportable business segments; Cable & Wireless Ornnes is not a reportable segment.
The Company's OFS business falls into four clearly defined economic and geographical areas and is evaluated on the following basis: First, North America (NAM) is a major self-contained market. Second, Latin America (LAM) is composed of regional markets w hich share a common dependence on the United States. Third, Europe is ano ther major self-contained market where we include the CIS, whose economy is increasingly linked to that of Europe, and West Africa. Fourth, Other Eastern includes the remainder of the Eas tern Hemisphere, w hich consists of many countries at different stages of economic devel-
Europe/ Other
opment that share a common dependence on the oil and gas industry. Cameo is managed as a separate segment within OFS.
The OFS group provides exploration and production services required during the life of an oil and gas reservoir. The Company believes that all the products / services are interrelated and expects similar performance from each. The RMS group is a global provider of measurement solutions, products and systems for electricity, gas and water utilities worldwide. The T&T group supplies technology products, services and systems solutions to the semiconductor, banking, telecommunica tions, transportation and health care industries. The group consists of two businesses, Automated Test Equipment and Smart Cards & Terminals. Services and products are described in more detail on page 47 in this report.
Financial information for the yea rs ended December 31, 1998, 1997 and 1996, by segment, is as follows:
(Stated in millions)
Elims/ Total Elims/ 1998 NAM LAM CIS/WAfr. Eastern Cameo Other OFS RMS T&T Other Consolidated
Revenue $2,027 $1,190 $2,511 $2,218 $ 948 $ 1 $8,895 $1,465 $1,226 $ 230 $11,816 Operating Income $ 160 $ 131 $ 460 $ 549 $ 123 $(57) $1,366 $ 32 $ 55 $ (86) $ 1,367 Income Tax Expense' 84 45 74 124 66 7 400 18 19 (65) 372 Pretax Operating Income $ 244 $ 176 $ 534 $ 673 $ 189 $(50) $ 1,766 $ 50 $ 74 $(151) $ 1,739 Interest Income 167 Interest Expense $ (10) $ (1) (139) Third Quarter Charge (444) Pretax Income $ 1,323 Segment Assets $1,321 $1,037 $2,154 $1,758 $1,089 $972 $8,331 $1,184 $1,069 $ $10,584 Corporate Assets 5,493 Total Assets $16,077 Depreciation/ Amortization $ 204 $ 131 $ 271 $ 243 $ 74 $ 66 $ 989 $ 87 $ 48 $ 12 $ 1,136 Capital Expenditures $ 288 $ 272 $ 540 $ 325 $ 131 $ 189 $1,745 $ 61 $ 53 $ 28 $ 1,887
' 1998 income tax expense excludes a credit of $63 million related to the Third Quarter Charge.

(Sta ted in millions)
Europe/ Other Elims/ Total Elims/ 1997 NAM LAM CIS/W. Afr. Eastern Cameo Other OFS RMS T&T Other Consolidated
Revenue $2,129 $1,060 $2,412 $2,055 $ 914 $ (11) $8,559 $1,569 $1,066 $ 349 $11,543 Operating Income $ 263 $ 151 $ 454 $ 493 $ 104 $ (79) $1,386 $ 47 $ 73 $(130) $ 1,376 Income Tax Expense 111 45 57 104 57 5 379 24 30 (13) 420 Pretax Operating Income $ 374 $ 196 $ 511 $ 597 $ 161 $ (74) $1,765 $ 71 $ 103 $(143) $ 1,796 Interest Income 98 Interest Expense $ (5) $ (1) (89) Pretax Income $ 1,805 Segment Assets $1,502 $ 988 $1,856 $ 1,592 $1,042 $844 $7,824 $1,219 $1,088 $ $10,131 Corporate Assets 3,055 Total Assets $13,186 Depreciation/Amortization$ 187 $ 100 $ 255 $ 213 $ 62 $ 68 $ 885 $ 93 $ 44 $ 13 $ 1,035 Capital Expenditures $ 297 $ 281 $ 386 $ 337 $ 96 $ 52 $ 1,449 $ 67 $ 63 $ 13 $ 1,592
(Stated in millions)
Europe/ Other Elims/ Total Elims/ 1996 NAM LAM CIS/W. Afr. Eastern Cameo Other OFS RMS T&T Other Consolidated
Revenue $1,613 $791 $2,066 $ 1,660 $765 $ (20) $6,875 $1,765 $741 $ 321 $ 9,702 Operating Income $ 178 $138 $ 319 $ 311 $ 70 $ (96) $ 920 $ 88 $ 35 $(124) $ 919 Income Tax Expense ' 29 35 42 69 38 5 218 23 241 Pretax Operating Income $ 207 $173 $ 361 $ 380 $108 $ (91) $ 1,138 $ 111 $ 35 $(124) $ 1,160 Interest Income 73 Interest Expense $ (5) $ (1) (74) Unusual Items (380) Pretax Income $ 779 Segment Assets $1,059 $690 $1,780 $1,392 $917 $798 $6,636 $1,389 $970 $ $ 8,995 Corporate Assets 2,277 Total Assets $11,272 Depreciation/ Amortization $ 178 $ 71 $ 246 $ 198 $ 55 $ 48 $ 796 $ 102 $ 31 $ 12 $ 941 Capital Expenditures $ 210 $171 $ 284 $ 326 $ 62 $ 35 $ 1,088 $ 78 $ 39 $ 15 $ 1,220
2 1996 income tax expense excludes Iii a credit of $22 million related to the Unusual Items and Iii) a credit of $360 million related to the US tax loss carryforward recognition.
Corporate assets largely comprise short-term and long-term investments During the three years ended December 31, 1998, no single customer accounted for more than 10% of consolidated revenue. The accounting policies of the segments are the same as those described in the Summary of Accounting Policies. Oilfield Services net income eliminations include certain headquarters administrative costs which are not allocated geographically, goodwill amortization and certain costs maintained at the OFS level. The Company did not have revenue from third-party customers in its country of domicile during the last three years. In each of the three years. only revenue in the US exceeded 10% of consolidated revenue.
w Revenue in the US in 1998. 1997 and 1996 was $3.4 billion. $3.5 billion and $2.8 billion, respectively. -.J Nonoperating expenses, such as certain intersegment charges and interest expense (except as shown above). are not included in segment operating income

Pension and Other Benefit Plans
US Pension Plans The Company and its US subsidiary sponsor several defined benefit pension plans that cover substantially a ll emp loyees. The benefits are based on years of service and com pensa tion on a ca reer-average pay basis. These plans are substan tially fully funded with a trus tee in respect to pas t and current service. Charges to expense are based upon costs computed by independent actuaries. The funding policy is to contri bute annu ally amounts that are allowable for federal income tax purposes. These contributions are intend ed to p rovide for benefits ea rned to da te and those expected to be ea rned in the future.
The assumed discount rate, ra te of compensa tion increases and return on plan assets used to determine pension expense in 1998 were 7.5%, 4.5% and 9%, respectively. In 1997, the assumptions were 8%, 4.5% and 8.5%, respecti vely. In 1996, the assumptions were 7.5%, 4.5% and 8.5%, respectively.
Net pension cos t in the US for 1998, 1997 and 1996, included the following components:
(S tated inmillio11s)
1998 1997 1996 Service cost- benefits
earned during the period $ 39 $33 $31 Interest cost on projected
benefit obligation 68 61 55 Expected return on
plan assets (actual return: 1998- $167; 1997- $165; 1996- $99) (77) (63) (57)
Amortization of transition asset (2) (2) (2)
Amortization of prio r service cost/other 3 4 5
Net ~ens ion cost $ 31 $33 $32
Effec ti ve January 1, 1998, the Company and its subsidiaries amended their pension plans to improve retirement benefits for retired employees. The funded sta tus a t December 31, 1997, reflects the amendment.
38
The change in the projected benefit obli ga-tion, plan asse ts and funded sta tus of the plans at December 31, 1998 and 1997, was as fo ll ows:
(S tated in 111iflion~ J
1998 19'17
Projected benefit obligation at beginning of the year $ 906 $ 776
Service cost 39 33
Interest cost 68 61
Actuarial losses 86 54
Benefits paid (46) (41)
Amendments 2 27
§.Qecial termination benefits 9
Other (4) (4)
Projected benefit ob li gation at end of the ear $1 060 $ 906
Plan assets at market va lue at beginnin9__[Jf__ttle year $ 978 $ 835
Actual return on plan assets 167 165
Employer contribution 20 ]')
Benefits ~aid (46) (41)
Plan assets at market value at end of the ~ear $1,119 $ 978
Excess of assets over projected benefit obligation 59 72
Unrecognized net gain (198) (203)
Unrecognized prior service cost 50 59
Unrecognized net asset at transition date (4) (5)
Pens ion liab ili t~ $ (93) $ (77)
Assumed discount ra te, rate of compensation increases and the expected long-term ra te of re turn on plan asse ts used to determine the projec ted benefit obliga tions were 7%, 4.5%, and 9%, respectively, in 1998, and 7.5%, 4.5%, and 8.5% respectively, in 1997. Plan asse ts a t December 31, 1998, consis ted of common stocks ($722 million), cash or cash equi va lents ($90 million) , fixed income inves tments ($227 million) and other investments ($80 million). Less than 1% of the plan assets a t December 31, 1998 were represented by Schlumberger Limited common stock.

Non-US Pension Plans
Outside the US, subsidiaries of the Company sponsor several defined benefit and defined contribution plans tha t cover substantially all employees who are not covered by sta tutory plans. For defined benefit plans, charges to expense are based upon costs computed by independent ac tuaries. These plans are substantially fully funded with trus tees in respect to past and current service. For all defined benefit plans, pension expense was $17 million, $15 million and $16 million in 1998, 1997 and 1996, respectively. The only signifi cant defined benefit plan is in the UK.
The assumed discount rate, ra te of compensation increases and return on plan assets used to de termine pension expense in 1998 were 7.5%, 5% and 9%, respectively. In 1997, the assumptions were 8%, 5% and 8.5%, respectively. In 1996, the assumptions were 7.5%, 5% and 8.5%, respectively.
Net p ension cos t in the UK plan for 1998, 1997 and 1996 (translated into US dollars at the average exchange ra te for the periods), included the following components:
(Stated ill mil/iOIIS)
1998 1997 1996 Service cost- benefits
earned during~period ~18 ~ 16 ~ 13 Interest cost on projected
benefit obligation 18 15 9 Expected return on
plan assets (actual return: 1998- $22; 1997-$28 1996- $37 18)
Amortization of transition asset and other (3)
Net ens ion cost 1
The change in the projected benefit obligation, plan assets and funded status of the plan (translated into US dollars at year-end exchange rates) was as follows:
(S tated i11 millions)
1998 1997
Projected benefit ob ligation ~ginning of the year ~ 239 ~ 157 Service cost 18 16 Interest cost 18 15 Actuarial (gains)/losses (37) 23 Benefits ~a id (9) (7)
Acguisition 35 Projected benefit obligation
at end of the year $ 229 $239
Plan assets at market value at beginning of the year ~ 350 P 83
Actual return on ~I an assets 22 28 Em Ioyer contribution 3 5 Benefits Qa id (9) (7)
Acguisition 41 Plan assets at market value
at end of the year $ 366 $350
Excess of assets over projected benefit obligation 137 111
Unrecognized net gain (114) (91)
Unrecognized prior service cost 3 3 Unrecognized net asset
at transition date (4 4)
Pension asset ~ 22 ~ 19
The assumed discount rate and rate of compensation increases used to determine the projec ted benefit obligation were 7% and 4%, respectively, in 1998 and 7.5% and 5%, respectively, in 1997; the expected long-term rate of re turn on plan assets was 9% in 1998 and 8.5% in 1997, respectively. Plan asse ts consisted of common stocks ($283 million), cash or cash equivalents ($9 million) and fixed income investments ($74 million). None of the plan assets represented Schlumberger Limited common stock.
For defined contribution plans, funding and cost are generally based upon a predetermined percentage of employee compensation. Charges to expense in 1998, 1997 and 1996, were $25 million, $25 million and $16 million, respectively.
39

Other Deferred Benefits
In addition to providing pension benefits, the Company and its subsidiaries have other deferred benefit prog ra ms. Expenses for these programs were $128 million, $127 million and $96 million in 1998, 1997 and 1996, respec tively.
Health Care Benefits
The Company a nd its US subsidia ry provide health care benefits for certain acti ve employees. The cost of providing these benefits is recog nized as expense w hen incurred and aggrega ted $54 million, $46 million a nd $42 million in 1998, 1997 a nd 1996, respective ly. Outside the US, such benefits are mostly provided through govenunent-sponsored prog ra ms.
Postretirement Benefits Other Than Pensions
The Company and its US subsidia ry provide certain health care benefits to former employees who have retired under the US pens ion plans.
The principa l ac tuarial assumptions used to measure costs were a discount rate of 7.5% in 1998 and 8% in 1997 and 1996. The overa ll med ica l cos t trend ra te assumption beginning December 31, 1996 was 9% graded to 5% over the nex t s ix yea rs a nd 5% therea fter. Previo usly the overall assumption had been 10% g raded to 6% over the nex t s ix yea rs and 6% therea fter.
Ne t periodic pos tretirement benefit cost in the US for 1998, 1997 and 1996 included the following components:
(S tated i11 millio11s)
1998 1997 1996 Service cost-benefits
earned d urin~period $11 $ 9 $13 Interest cost on accumulated
postretirement benefi t obligation 22 22 27
Amortiza ti on of unrecognized net gain and other (6) (6)
~27 ~ 25 ~ 40
40
The change in accumulated pos tretire ment be nefit obligation and fund ed s t~tus <11
December 31, 1998 a nd 1997 was as fo llows: (Sial!'!/ i11miflin11.-./
1998 1YY7
Accumulated postreti rement benefi t obligation at beginn ing of the ~$ 313 $ 2YH
Service cost 11 '!
Interest cost 22 22
18 (5)
(11) (11 )
1
354 313
74 97
Unrecognized prior service cost 5 5 Postretirement benefit
liability at December 31 ~ 433 ~ -11 5
The components of the accumul ated postretirement benefit obligation at December 31, 1998 and 1997 were as follow s:
(SIII!.'d illmillio11-.1
1998 1'!97
Reti rees $165 $ 15-1
B!!!~ible 48 51
Actives IOH
The assumed discount rate used to de termine the accumu la ted postretirement benefit obligation was 7% for 1998 and 7.su;,, for 1'!'!7 .
If the assumed medica l cost trend ra te was increased by one percentage point, hea lth care cost in 1998 would have been $33 mil lio n, and the accumulated pos tre tirement bene fit obl igation would have bee n $416 million at December 31, 1998.
If the assumed m edical cost trend rate was decreased by one percentage point, hea lth care cost in 1998 wou ld have been $22 mi ll ion, a nd the accumulated postre tire ment benefit obligation would have been $305 mi lli o n at December 31, 1998.

Supplementary Information
Operating revenue and related cost of goods sold and serv ices comprised the following:
Year ended (S taled inmillio11s)
December 31 1998 1997 1996
0 eratin revenue
Sales $ 3,224 $ 3,273 $ 2,931 Services 8 592 8270 6771
~11,816 ~11,543 ~ 9,702
Direct o eratin costs
Cash paid for interest and income taxes was as follows:
Year ended (S taled in millions)
December 31 1998 1997 1996
Interest $ 151 $ 93 $ 78 Income taxes $ 342 $ 323 $ 213
Accounts payable and accrued liabilities are summarized as follows:
Year ended (S tated i11 millio11s)
December 31 1998 1997
Payroll, vacation and em lo ee benefits $ 582 586
Trade 820 928 Taxes, other than income 176 185 Other 815
2 514
Interest and other income includes interest income, principally from short-term and long-term investments, of $171 million, $102 million and $76 million for 1998, 1997 and 1996, respectively.
41

Report of Independent Accountants
To the Board of Directors and Stockholders of Schlumberger Limited
In our opinion, the accompanying consolidated balance sheet and the related consolida ted sta tements of income, of stockholders' equity and of cash flows present fairly, in all materia l respects, the financia l position of Schlumberger Limited and its subsidiaries at December 31, 1998 and 1997, and the results of their operations and their cash flows for each of the three years in the period ended December 31, 1998, in conformity with generally accepted accOLmting principles. These financial statements are the responsibility of the Company's management; our responsibili ty is to express an opinion on these financial s tatements based on our audits. We conducted our audits of these statements in accordance with generally accepted auditing standards which require that we plan
42
and perform the audit to obtain reasonable assurance about whether the financial s ta tements are free of material misstatement. An audit includes examining, on a test bas is, ev idence supporting the amounts and disclosures in the financial s tatements, assess ing the accounting principles used and significa nt estimates made by management, and eva luating the overall financial s tatement presentation. We believe that our audits prov ide a reasonable basis for the opinion expressed above.
PricewaterhouseCoopers LLP New York, New York January 20, 1999
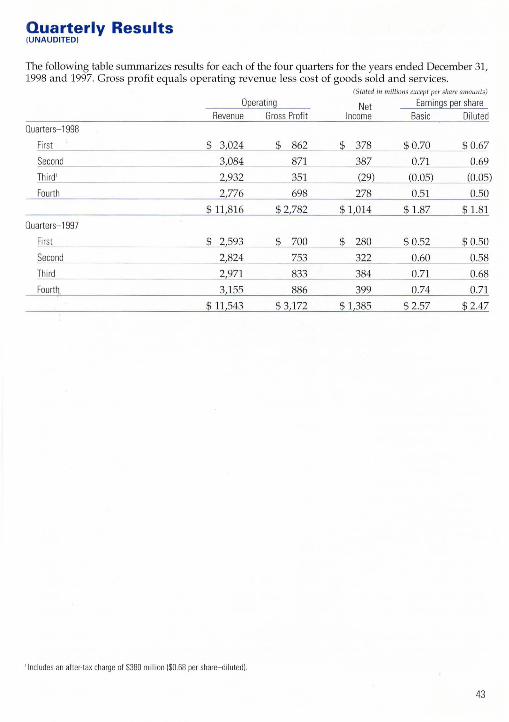
Quarterly Results {UNAUDITED)
The following table summarizes resuJts for each of the foLU quarters for the years ended December 31, 1998 and 1997. Gross profit equals operating revenue less cost of goods sold and services.
(S tated inmillio11s except per sllnre amo1111fs)
O~erating Net Earnings ~e r share Revenue Gross Profi t Income Ba sic Diluted
Ouarters- 1998
Fi rst $ 3 024 $ 862 $ 378 $0.70 $ 0.67
Second 3 084 871 387 0.71 0.69
Third ' 2,932 351 (29) (0.05) (0.05)
Fourth 2 776 698 278 0.51 0.50
$ 11 816 $ 2 782 $ 1 014 $ 1.87 $1.81
Ouarters- 1997
First ~ 2,593 $ 700 $ 280 $0.52 $0.50
Second 2824 753 322 0.60 ~ Third 2 971 833 384 0.71 0.68
Fourth 3 155 886 399 0.74 0.71
$ 11543 $3 172 $ 1 385 $2.57 $ 2.47
' Includes an aher-tax charge of $380 million ($0.68 per share-diluted).
43

Five-Year Summary
(Dollar amo11nts slated in millio11s)
Year Ended December 31, 1998 1997 1996 1995 1994 SUMMARY OF OPERATIONS
Operating revenue Oilfield Services ~ 8,895 ~ 8,559 ~ 6,875 ~ 5,514 ~ 5,001 Resource Mana ement Services 1465 1569 1765 1 771 1590 Test & Transactions 1226 1 066 741 684 493 Eliminations and other' 230 349 321 299 248
Total operating revenue $11,816 $ 11,543 $ 9,702 $ 8,268 $ 7,332 % increase over prior year 2% 19% 17 % 13% - o;;)
Operating income Oilfield Services 594 Resource Management Services 50 71 111 121 104 Test & Transactions 74 103 35 48 44 Eliminations (151) (143) (124) (90) (83)
Total o~erating income $ 1,739 $ 1,796 $ 1,160 $ 831 $ 659 %!decrease) increase over prior ~ear (3 %) 55% 40% 26% (4 o;; ,)
Interest expense 139 89 74 91 69 Third guarter charge 444 Taxes on income' 309 420 141 144 99
~ 1,385 ~ 919 ~ 692 ~ 577 27 %) 51% 33% 20% 6%)
~ 1.87 ~ 2.57 ~ 1.72 ~ 1.31 ~ 1.09 Diluted earnings Qer share ~ 1.81 ~ 2.47 ~ 1.69 ~ 1.30 ~ 1.08 Cash dividends declared ~e r share $ 0.75 $ 0.75 $ 0.75 $ 0.7125 $ 0.60 SUMMARY OF FINANCIAL DATA
12% 12% 8% 18% 11 %
~ 1,887 849 DeQreciation exQense ~ 1,060 ~ 959 ~ ~ ~ 762 Avg. number of shares outstanding:
Basic 544 539 534 529 532 Assuming dilution 562 560 546 532 534
AT DECEMBER 31,
Liguidity ~ 731 ~ 527 ~ 171 ~ 91 ~ 341 Working caQital 2,690 ~ 1,767 ~ 1,456 ~ 1,222 Total assets 13186 ~ 11,272 ~ 9,770 ~ 9,109 Long-term debt ~ 1,179 ~ 731 ~ 731 ~ 486 Stockholders' egu ity ~ 8,119 ~ 7,381 ~ 6,221 ~ 5,501 ~ 5,081 Number of emQioyees 64,000 69 000 62 000 56 000 53 000
' Includes the Retail Petroleum Systems business sold on October 1. 1998 ' In 1998, the normal recurring provision for income taxes. before the tax benefit on the third quarter charge, was $373 million. In 1996. the normal recurring provision for income taxes. before recognition of the US tax loss carryforward benefit and the tax effect of the unusual items, was $206 million.
' In 1998. excluding the third quarter charge
44
Directors
Don E. Ackerman1·2
Private Investor Bonita Springs, Florida
Euan Baird3·4
Chairman & Chief Executive Officer Schlumberger
John Deutch3
Institute Professor Massachusetts Institute of Technology Cambridge, Massachusetts
Victor E. Grijalva 3
Vice Chairman Schlumberger
Denys Henderson2
Chairman The Rank Group Pic London ·
Andre Levy-Lang1·3
Cha irman of the Executive Board Pari bas Paris
William T. McCormick, JrY Cha irman & Chief Executive Officer CMS Energy Corp Dearborn, Michigan
Didier Primat 3
President Pri mwest Holding NV Cu ra~ao. Netherlands Antill es
Nicolas Seydoux2·4
Chairman & Chief Executive Officer Gaumont Paris
Linda Gillespie Stuntz 1
Partner Stuntz, Davis & Staffier I'C Wa shington. D. C.
Sven Ullring 1,.
Pres ident & Chief txecutive Officer Det Norske Veritas Hovik, Norway
Yoshihiko Wakumoto 3
Advisor Toshiba Corporation Tokyo
Officers
Euan Baird Chairman & Chief Executive Officer
Victor E. Grijalva Vice Chai rman
Jack Liu Executive Vice President Chief Financial Offi cer
Chad Deaton Executive Vice President
Andrew Gould Executive Vice President
Clermont A. Matton Executive Vice President
Irwin Pfister Executive Vice President
James L. Gunderson Secretary & General Counsel
Pierre E. Bismuth Vice President-Personnel
Jean-Paul Bize Vice President
Jean Chevallier Vice President
Mark Danton Vice President
Jean-Dominique Percevault Vice Pres ident
Claude Suter Vice President
Jean-Marc Perraud Treasurer
Carole H. Finamore Assistant Secretary
' Member. Audit Commi1tee ' Member, Compensation Committee ' Member. f inance Committee ' Member, Nominating Committee
45

New Executives
46
James L. Gunderson Secretary & General Counsel
Jim Gunderson was previously Deputy Genera l Counsel for Schlumberger Limited , based in New York. After joining the Company in 1984, he held various positions in New York and Paris. He is admitted to the bar in New York and California. Jim has a BA degree in philosophy and a JD degree.
Jack Liu Executive Vice President Chief Financial Officer
Jack Liu previously held var ious positions in management with Measurement & Sys tems in Asia, and in finance with Dowell and Sedco Forex in Paris and London. He joined the Company in 1980. He has an MBA degree, and is a Certified Public Accountant.

The Schlumberger Organization
Schlumberg er operates four businesses Oilfie ld Services, Resource Management Services, Test & Transactions and Ca ble & Wireless Omnes.
Oilfield Services provides exploration and production services required during the life of an oil and gas reservoir: seismic data acquisition, processing and interpre tation; drilling rigs; drilling fluids; directional drilling and rea l-time drilling analysis; drill bits; cementing and stimulation of wells; completion services and equipment; wireline logging; well evaluation, testing and production; gas compression systems; integra ted data services and software; and project management. As of February 1, 1998, the bus~ness is organized in two groups, Solutions and Products. The Solutions Group is organized along geographic lines to develop, sell and implement all oilfield services, as well as customized and integra ted solutions to meet specific client needs. The Products Group is responsible for product development across the organization as well as training and tedmicaJ support for each type of service in the field to ensure the highest standards of service to clients.
Resource Management Services (RMS) is a global solutions provider to electricity, gas and water resource industry clients worldwide, helping them to manage resources and enhance transactions. The RMS group delivers innovative solutions through stra tegic consulting services combined wi th smart measurement products, systems and services for creating and sharing value with all clients. It designs systems for management of electricity distribution and usage (residential metering and energy management systems; utility revenue collection systems; commercial, industrial, transmission and distribution measurement and billing products and systems; and load management systems); systems for managemen t of gas usage (residential, commercial and industrial gas meters; regulators, governors, safety valves, stations and sys tems; gas trea tment
including filtration, odoriza tion and heating; ne twork management; and prepayment systems); meters and systems for management of residential, commercial and industrial water usage covering the range of effective water distribution management and diverse hea t distribution and industrial applications; meter communica tion systems, including remote metering and wireless communication sys tems for utility markets; distributed measurement solutions, systems integra tion and data services; and services, providing software and turnkey installa tion, repair and maintenance solutions to add value in fully managed projects.
Test & Transactions supp lies teclmology, products, services and sys tems solutions to the semiconductor, banking, telecommunications, transportation and hea lth care industries . Test & Transactions designs and implements broadbased , customized solutions to help clients improve time to market, optimize their business opportunities and improve their productivity. It designs and manufactures smart and magne tic stripe cards, terminals, equipment and management sys tems for transactions in a wide range of sectors, including telecommunications, retail and banking, network access and security, parking and mass transit, health care man agement and campus communities. It also designs and manufactures back-end manufacturing equipment for tes ting semiconductor devices, including diagnostic systems, automated handling sys tems and test equipment. It provides metrology solutions for the front-end semiconductor fabrica tion equipment market and equipment for tes ting complete elec tronic assemblies for the telecommunications and automotive industries.
Cable & Wireless Omnes provides information technology and communica tions services to oil and gas companies and to companies with opera tions in remote regions. It offers solutions for wide- and local-area networks, including satellite-based networks, network security, Internet, intranet and messaging.
47

STOCKHOLDER INFORMATION
Schlumberger common stock is listed on the New York Stock Exchange, trading symbol SLB, and on the Paris, London, Amsterdam and Swiss Stock Exchanges.
For quarterly earnings, dividend announcements and other information requests, call Schlumberger Shareholder Direct® at 1-800-99-SLB-99 from the US and Canada. International callers dial 1-402-573-9796.
Schlumberger can be accessed on the Internet at http://www.slb.com/
STOCK TRANSFER AGENT AND REGISTRAR
BankBoston, NA c/o EquiServe PO. Box 8040 Boston, Massachusetts 02266-8040 1-800-733-5001 or 1-781-575-3400
FORM 10- K
The Company's 1998 annual report on Form 1 0-K filed with the Securities and Exchange Commission is available without charge. From the US and Canada, ca ll 1-800-99-SLB-99. International callers dial 1-402-573-9796. Alternatively, write to the Secretary, Schlumberger Limited, 277 Park Avenue, New York, NY 10172. It can also be accessed on the Internet at http://www.slb.com/ir/
DUPLICATE MAILINGS
When a stockholder owns shares in more than one account, or when stockholders live at the same address, duplicate mai lings may result. If you receive duplicate reports, you can help eliminate the added expense by requesting that only one copy be sent. To eliminate duplicate mailings, contact BankBoston, N.A., c/o EquiServe, Stock Transfer Agent and Registrar, listed above.
48

SchlulbiPIIP
The Next Fifty Years

Rain fell all night and was still coming in
buckets by noon. Dinner that evening-for 150, celebrating the 50th anniversary of Schlumberger-Doll Research-was to be in a tent in the courtyard, where the downpour roared on the canvas roof. Plan B was under consideration: dinner would move from the tent to hastily assembled tables indoors. But by 2 pm, the clouds thinned and light shone through open doors.
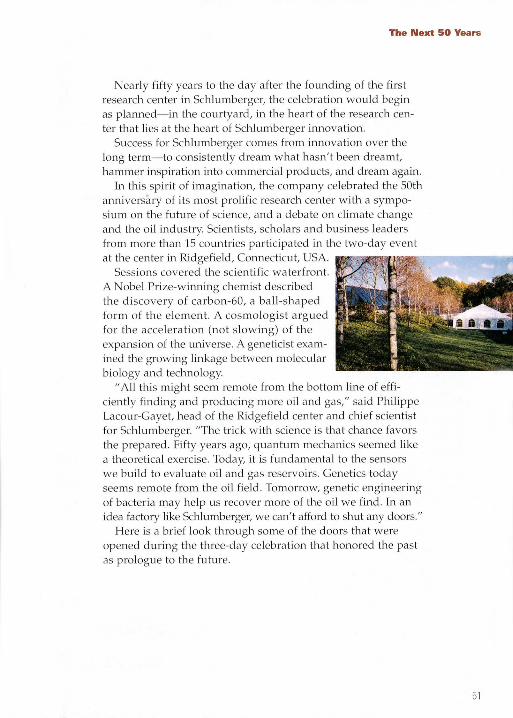
The Next 50 Years
Nearly fifty years to the day after the founding of the first research center in Schlumberger, the celebration would begin as p lanned-in the courtyard, in the heart of the research center that lies at the heart of Schlumberger im1ova tion .
Success for Schlumberge r comes from innova tion over the long term- to consistentl y dream what hasn ' t been dreamt, hammer inspiration into commercial products, and dream again.
In this spirit of imagination, the company celebra ted the 50th anniversary of its most prolific research center with a symposium on the future of science, and a debate on climate change and the oil industry. Scien tists, scholars and busin ess leaders from more than 15 co untries participated in the two-day event at the center in Ridgefield, Com1ecticut, USA. ..--------...
Sessions covered the scientific wa terfront. A Nobel Prize-winning chemist described the discovery of carbon-60, a ball-sh aped form of the element. A cosmologis t argued for the accelera tion (not s lowing) of the expansion of the universe. A geneticist examined the growing linkage between molecular biology and technology.
"All this might seem remote from the bottom line of efficiently finding and producing more oil and gas," said Philippe Lacour-Gayet, head of the Ridgefield center and chief scientist for Schlumberger. "The trick with science is that chance favors the prepared. Fifty years ago, quantum mechanics seemed like a theoretical exercise. Today, it is fundamenta l to the sensors we build to evalua te oil and gas reservo irs. Genetics today seems remote from the oil field. Tomorrow, genetic engineering of bacteri a may help us recover more of the oil we find. In an idea fa ctory like Schlwnberger, we can ' t afford to shut any doors."
Here is a brief look through some of the doors tha t were opened during the three-day celebra tion that honored the past as prologue to the future.
51

52
The Next 50 Years
Arrivals
Judy Sorenson, left, and Jeanette Gerfin prepare visitor badges.
Mary, center, and Goh Hock, arrive with the van pool.
Phi lippe Lacour-Gayet, left, and Adil Toubia. in reflection, greet arriving guests.
Welcome banner at the main entrance to Schlumberger-Ooll Research.

Wednesday 14 October
PROGRAM
~ .. om RBGBDtion WELCOME:
Euan Baird Schlumberger Chairman and CEO
Ladies and gentlemen, good evening and welcome to Ridgefield. Thank you for accepting our invitati on to thi s birthday pa rty. I hope you will have a good time and find it stimulati.ng.
I want to open wi th a few words on the origins of our company and this resea rch center. Schlumberger was founded in 1927 by two French bro thers, Conrad and Marce l Schlwnberger,
one a physicist and the other an engineer.
Early on, they were joined by a yo un g engineer from Ecole Polytechnique named Henri Doll. At th e time, Do ll was more interested in one of Conrad 's dau ghters, Annette, th an in their technology. But he was
destined to play a leading role in the futw-e of the company.
One of Doll's major achievements was the foLmding of this lab in 1948. He was determined that Schlmnberger should become part of the scientific community of the United States, which up to that time hosted most of the technical developments of the oil industry. He was committed to maintaining
strong links with the top universities and resea rch institutes. And he believed in working closely with operations and customers so that th e theore tical work done here could be verified and enhanced by field experiments.
To promote these ideas, he kept the lab small, of high quality, and porous to outside influences. To reinforce its exclusive image, he chose a yoLmg, promising architect, Philip Johnson, to design the main building. In short, Henri Doll was ahead of his time. And his ideas ha ve marked the subsequent development of teclu1ology in Schlumberger.
Since Doll's retirement in 1965, product development centers have been crea ted in the main intellectual commLmities of the world, close to the top universi ties and to some of our major customers. We don't believe that any culture has a monopoly on creativity. And we are con vinced that diversity helps produce original solutions. This global network of modestly sized centers helps us keep abreas t of teclmology developments throughout the world.
In the ea rly 1980s, we were paying a heavy overhead for this approach because of poor communications. Instead of a cooperative network, we tend ed to have islands of ac tivity where lack of knowledge of what was being undertaken elsewhere ca used huge inefficiencies. It was at that moment tha t we asked Bolt, Beranek and Newman, the designers of the original intranet for the US
53

54
Wednesday 14 October
military, to build us a global communications system to transform the flow of information around the company.
Fifteen years later, the technology they deployed for us has become a world standard. And if I really kept going, I could convince you that Schlumberger was the key enabler in creating the Internet we know today.
A 50th birthday is a time to celebrate and to take stock. The performance of this lab has made us true believers in the value of investing in new ideas. Time and again, research undertaken here has res ulted in significant improvements in services we provide to our customers. Good research not only promotes new ideas, but also limits risk in the en gin eer ing and commercialization phases.
The conviction that research is an investment in our future rather than an expense is an essential part of our culture. Our two research labs feed a product development machine that consumes more than $1 million a day. But it is the heart of our competitive advantage.
Proud as we are about what has been achieved in the las t 50 years, this celebration is inspired more by our excitement abou t the future, and
our desire to share this enthusiasm with you, customers and academics, who have contributed so much to our success.
Tomorrow's program will give you a chance to contribute your ideas about the future. The morning session will feature discussions by five distinguished scientists on the theme, "The Next 50 Years in Science and Society." The afternoon wil l be devoted to a subject of grea t importance to us all: whether human activitiesand burning of fossil fuels in particular-will produce significant and rapid climate changes. I hope that the debate and the panel discussion will generate some global warming of its own.
The evaluation of climate change will require significant and painstaking research. Sound sc ience rather than emotion needs to guide society in making the necessary decisions and trade-offs. It's a subject that cannot be trea ted at the level of a country or continent and is typical of the complex issues that the world will need to solve together, taking advantage of the improved communica tions that are forcing us together.
New commwlica tions teclmology is the enabler of our knowledge age-which is fast becoming an overused expression. I prefer to talk about the world of new ideas, wh ich will touch all our lives. It will change the way w1iversities, research institutions, companies and governments interact; the way people lea rn thrqughout their ac tive lives, whether this learning
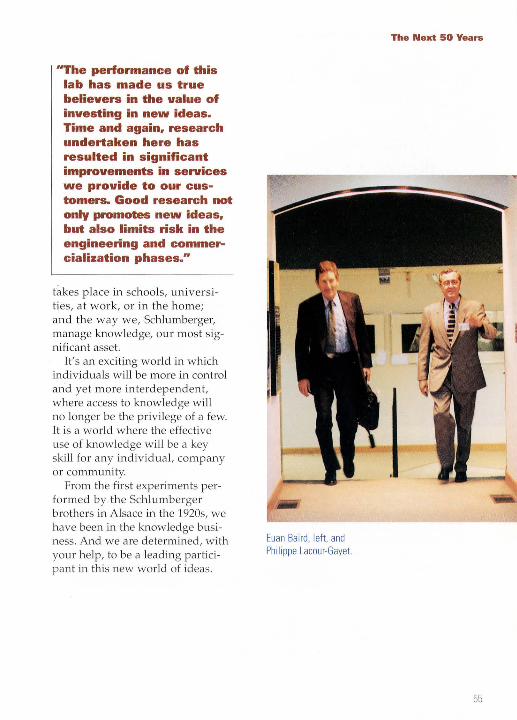
.. The performance of this lab has made us true believers in the value of investing in new ideas. Time and again, research undertaken here has resulted in significant improvements in services we provide to our customers. Good research not only promotes new ideas, but also limits risk in the engineering and commercialization phases ...
takes p lace in schools, universi ties, at work, or in the home; and the way w e, Schlumberger, manage knowledge, our most significant asset.
It's an exciting world in which individuals will be more in control and yet more interdep endent, where access to knowledge will no longer be the priv ilege of a few. It is a world where the effective use of knowledge will be a key skill for any individual, com pany or community.
From the first experiments perform ed by the Schlumberge r brothers in Alsace in the 1920s, we have been in the knowledge business. And we are de termined, with your help, to be a leading participant in this new world of ideas.
Euan Baird. left, and Philippe Lacour-Gayet.
The Next 50 Years
55

Wednesday 14 October
7:00pm []inner
56
KEYNOTE SPEECH:
Germaine Greer
Women anll Energy Germaine Greer shook perceptions of gender ro les with her 1970 book, The Female Eunuch, w hich portrayed
marriage as legalized sla very and attacked the misrepresentation of female sexuality in a male-dominated society. As a writer, lec turer and researcher, she has since continued
probing conventional assumptions about gender and identity.
Her address examined differences in how females and males expend energy and view its ownership and uses. Roughly half the world's population, for example, gets most of its small amount of energy from wood - usually gathered by women, sometimes with grea t exertion.
"If you've ever had to survive on the energy from wood," she sa id, "you begin to wonder whether more energy is going into this wood than is coming out of it. I have to find it, cut it, bind it up, carry it home, cut it to size, and stack it. "
In cultures dependent on fuelwood-and a ll others, including the developed West-women di scount the cost of their own energy exp enditure in keeping things moving.
"If a thing needs to be done, we just do it regardless of the effort," she said. "There's a completely different metaphysics about women's approach to their own energy as something they deploy, and men's approach to energy, which is something they commandeer. "
Despite their own devaluation of their effort, Greer noted that women do " two-thirds the work of the human race for ten percent of the income and one percent of the property. And this is not limited to particular civiliza tions, it's a universal principle. What ca n we do about this?"
The solution, she said, requires finding a way to let women own and control exogenous sources of energy-whether it is the right to drive oxen to mill grain, or to not wash the shower twice a week ("I wou ld argue that most housework co uld be just as well left undone," she said).
"There will be no improvement if women are not brought full y into industrial processes," she said. " If we can think of a way to present energy to women as a birthright, not something to be taken from men, or to be operated in order to belittle or humiliate men, then we have a chance for success."

The Next 50 Years
Goings On
Am in Amin with Mary Jo Caliandro.
Mike Oristaglio, left, and Brian Clark with one the Sch lumberger brothers' early potentiometers for measuring properties of the earth's crust.
From left. Catherine Brechignac of the Centre National de Ia Recherche Scientifique in Paris, Germaine Greer. Anthony Pearson, Euan Baird and Mike Sheppard.
From left, Etienne Guyon of Ecole Normale Superieure, Robert Kleinberg and Denise Freed with the CMR* Combinable Magnetic Resonance tool, which helps clients maximize oil recovery while minimizing production of water.
57

Nick Drinkwater, left, demonstrates prototype software, developed jointly by Schlumberger and the Gas Research Institute, which allows scientists to construct three-dimensional models of oil and gas reservoirs using all available measurements and an on-line store of geologic knowledge.
Simone Crook, center, with Chad Deaton, right, greet Peter Freeman of the Georgia Institute of Technology
Suleiman Shambe AI-Balushi, left, of the Oman Ministry of Oil and Gas, with Ekwere Peters, of the University of Texas.
Sett ling into the tent for dinner.
58
Lisa Stewart explains a computergenerated image of an oil reservoir in the VisionDome. This projection on a large, curved screen gives viewers a sense of immersion in earth's subsurface, and allows many people to co llaborate simultaneously on data interpretation. In this view, green is salt, forming a trap for hydrocarbons, and pink to purple represents a layer of sand that may contain oil or gas.

Hallway meeting, from left: Larry Schwartz, Robert Kleinberg, Bernard Gremil let of YPF with Howard Neal, Euan Baird with Amos Nur of Stanford University
The Next 50 Years
Darwin Ellis with an experimental linear accelerator, which is lowered into wells and generates gamma rays to determine how much oil or water a rock formation might contain .

8:00am
60
Thursday 15 October
The Next Fifty Years in Science an~ Society OPENING COMMENTS: SESSION CHAIRMAN
John Deutch Massachusetts Institute of Technology, Cambridge
I want to say a few words about this occasion, and why I enjoy being associated with Schlumberger. The first and foremost reason is that at Sch lumberger, ideas are importantthey have been so since the begin
ning of the company. Today's symposium is an example of the value the company places on ideas.
Second, this laboratory stands for technic a I excellence, and, indeed, Schlumberger manages its business by putting a
priority on technical excellence. And finally, there's an interna
tional perspective you get around Schlumberger that is unique. I believe this perspective, so deeply rooted and so envied by many in the business world, is a wellspring of the company's vi tality.
This morning's program, on th e next fifty years in science and society, is especially timely. We are embarking
on an absolutely ex traordinary period, when science and technology are making contributions to a variety of ente rprises, from the environment and human hea lth, to improving our economies and improving man's and woman's und ers tandin g of th e world in which we live. In this exciting time, nothing could be more appropriate or more stimulating than to have a morning when we hear peo ple speak about the future fifty years in sc ience and society.
We have a remarkab le set of speakers and I have the pleasure of knowing some of them personally, having been with them in a variety of contexts. I do, however, intend to be a somewhat ruthless chairman since we have five absolutely fascinating talks that we are compelled to finish by lunch time.
Our first speaker is Professor Alan Guth. 1 won't bore you with his long string of credentials. Let me just say that Alan is one of the leaders in cosmology today. He's famous for that. He's also famous for having the office at MIT directly across the hall from my own. He will speak to us on the prospects for inflationary cosmology.
It is a great pleasure to introduce my friend and colleague, Alan Guth .

Mi:IW)Ojlj~ljljl¥)£$)1·1.'('1
8,15
am Pros p B cts of Inflationary Cosmology Alan Guth Massachusetts Institute of Technology, Cambridge
Alan Guth bends forward when addressing his audien ce, as if bowed by the weight of his cosmological theory. He has the science of the origin of the Lmiverse on his mind, and a d1arged energy in his voice . His too ls are ma th em a tica l abstrac tions, transla ted w ith ease into d irec t, simple words. H e op en s with the big bang theory, a widely held view of h ow the universe began .
"Despite its name," Guth said, " the sta ndard version of the big bang theory is not really a theory of a bang at all. It's really only the theory of the aftermath of the bang. It says nothing about what ban ged, what caused it to bang, what may have happened before it banged. Inflation is essentia lly an attempt to answer th e question of wha t ca used the exp an sion. Infl a tion a lso offers a possible answer to the question : Where d id all the matter in the universe come from?"
The underlying principle of inflationary theory rests on a p redicti on from particle physics that there should be a state of matter
called the "false vacmun." This peculiar state of matter creates a gravitational repulsion. Inflation is basica lly the idea that a gravitational repulsion crea ted by this fa lse vac uum was the driving force behind the big bang itself.
Infla ti on crea tes th e initial conditions that must be assumed in the contex t of the s tandard big bang theory. In fla tion prop oses that there was initia ll y a t least a patch of the uni versenot necessarily the whole wuverse - that was filled with this peculiar false vac uum s ubstance. Th at patch could be very small:
about one-billionth the size of a proton to get the universe s tar ted . Th en , beca use of gravitational repulsion, this tiny patch wo uld begin to grow exponentially. In a ve ry short p eriod , it would become large enough to encom
pass what we now view as the entire observed universe. The expansion time wo uld be incredibly short. It would double about every lO·"seconds.
Is there any evidence that the universe might have done this? Guth said there is some. First, there's the fac t that the universe is incredibly big. The visible part of the universe contains about l090 particles. Most of these are photons that make up the cosmic background radiati on and a

.. Whoever built the universe. did it with extraordinary uniformity:•
comparable number of neutrinos - chargeless subnuclear particles. How did all these particles get here? Whatever process made them has to be one in which it's possible to do a calculation to get the answer of 1090
"The only kinds of calculations we know how to do that give those kinds of answers are when you have exponentials," Guth said. "It's the only simple fun ction in which you can put in a small number and get out a hu ge number. So inflation reduces the problem of explaining l090particles to simply explaining why the universe underwent about sixty ex ponential time constants of inflation. TI1at's important progress."
Second, inflation supports what astronomers call the Hubble expansion- that any two galaxies are moving away from each other at a speed prop ortional to the distance between them. The standard big bang theory assumes Hubble expansion, but does not explain what ca used it. It turns out that this repulsive gravity is exactly what is needed to set up the Hubble expansion pattern as tronomers observe.
Third, there's the remarkable uniformity of the universe. This uniformity is observed most clearly in the cosmic background radia tion, which has been measured with a very high accuracy
THE SCIENTIFIC SESSIONS
to have the same intensity in all directions. "Whoever built the universe," Guth said, "did it with extraordinary uniformi ty. Inflation does this very nicely and is consistent with what we see."
Fifty years from now, where will cosmology be? "Many present unknowns will probably be answered," Guth said. "We will know the value of the Hubble constant; we will know the shape of the universe-whether it is open, closed or flat; we will know whether the expansion of the universe has changed over time. But we will probably still be a little puzzled about understanding the actual origin of the universe."

Thursday 1 5 October
g,ooam The Sun, The Genome and the Internet
He draws on historical precedent in his argument for technologysolar energy, geneti c engineerin g of plants and ubiquitous Internet access-as an agent of social progress.
All too often, he said, technology carries the reputation for making life more burdensome or being a tool of evil. But history shows it often works the other way. In the West, the invention of printing catalyzed the spread of literacy and the
Freeman Dyson Institute for Advanced Study Princeton, New Jersey
For Freeman Dyson, the sun, the genome and the Internet are answers to a fundamental question of our age: How can technology build social justice?
"Teclu1ology guided by ethics has the power to help the billions of poor people a II over the
.. Universal access to the Internet would not solve our social problems, but it would be a big step in the right direction. It could become an important tool for alleviating other kinds of inequality ...
resulting Protestant Reformation. More recently, the technologies of public health, clean wa ter supply, sewage trea tment, vaccination and antibiotics broadly improve living stand ards. "These technologies couldn ' t protect the rich and powerful alone," he said. "They could be effective in protecting the r ich only if they were also ava ilab le to the poor. Even if the rich and powerfu l receive p refe rential trea tment, as they usually do, the benefits of public heal th technology are felt to some extent by everyone." Where public health technology is enforced by law, he sa id , there
earth," Dyson said . "Too much of techn ology today is making toys for the rich . Ethics can push technology in a new direction, away from toys and toward necessities for the poor."
is no large gap in life expec tancy between rich and poor.
Once basic needs of food, shelter and clothing are met, Inte rn et access will become essential if deve loping countries are to end

.. Technology guided by ethics has the power to help the billions of poor people all over the earth. Too much of technology today is making toys for the rich. Ethics can push technology in a new direction, away from toys and toward necessities for the poor:•
their cultmal isolation and compete in the fast-changing global econom y. "Universal access to the Internet would not solve our social problems," he said, "but it would be a big step in the right direction. It could become an important tool for alleviating other kinds of inequality."
A key inequality is between city and country, and the esca lating flight from rural poverty and joblessness into often worse conclitions in overcrowded megacities (ten cities now ha ve populations larger than that of New York).
Solar energy, genetic engineering and the Internet can function as tools to break this cycle of poverty. Dyson's interweaving of the three technologies goes like this: Through genetic engineering, plants might be bred that are highly efficient at converting sunlight to fuel. An energy crop could be a permanent forest of trees that convert sunlight to a liquid fuel and deliver the fuel directly from their roots to a network of under-
THE SCIENTIFIC SESSIONS
grow1d pipelines. "There's nothing in the laws of physics and chemistry to say yo u can't do that," Dyson said. "It is just a h is torical accident that plants never had an incen tive to invent ways to do this."
Since solar energy is d istributed equitably over the earth, a local energy crop could enable local crea tion of wealth in the countryside. With this energy and wealth, the Internet can become ava ilable to provide people in every village with the infonnati on and skills that they need to develop their talents.
"My dream," Dyson said, " is that so lar energy, genetic engineering and the Internet w ill work together to crea te a socially just world in which every Mexican village becomes as wealthy as Princeton, New Jersey. Of course, inequalities will persist; poverty won't disappear. But I see hope that the world will move a long this road. We need to apply a strong ethica l push to add force to the technological pull. Ethics must guid e technology in the direction of social justice."

Thursday 15 October
,O:OOam Public RBSBarch and Industry Catherine Brechignac Centre National de Ia Recherche Scientifique, Paris
The coll apse of the Berlin Wall in 1989 signaled not only the end of the Cold War, but the end of the apprehension that fueled government-sp onsored science and technology in both the East and West. Today, the scientific community built fro m Cold War fea r is looking to rein vent itself to find a p roductive role in the increasing ly free market world.
Dr. Brechignac, who has worked most of her career in publicly funded basic science, outlined three ways publi c resea rch orga niza tions can link with the priva te sec tor and crea te mutua l benefits:
• Collabora te on a project • Focus public research on
results that interest priva te industry • Allow p ublic research to pur
sue basic science that p rovides no commercial benefit but builds a reservoir of R&D expertise.
A productive collaboration, she said, must clear two hurdles. First, the public research organization must function as a partner with industry, not as a contractor. Second, there must be a mutual understanding and respect of different goals. "Students must be assured the possibility of publishing," she said, "and industry must be assured development of new technology." An example of this is the collaboration between Schlumberger and a French national lab in Montpellier on the development of the CENTRON* meter, an economical and highly accurate electricity meter that has no moving parts.
In the second instance-public research tha t leads to private inves tm ent- an example is the development of anticancer drugs from the bark and needles of the Pacific yew tree (Taxus brevifolia). Some of the early work was done by publicly funded research groups in France and the United

Sta tes, s uch as the Na tional Institutes of Health. The commercial problem was pace: from the discove ry of the potential of the yew in the 1960s to an approved and economica l drug took more than 20 years. A closer public-priva te co llaborati on, Brechi gna c said , will be essential "to try to shorten the development chain to be able to make this kind of product faster."
Her third and final exa mple deals with p ublic research that does not interest priva te companies, but builds valuable R&D reso urces. She cited the consortium of effor ts, between European and North American groups, to tes t whether Einstein's prediction of gravity waves is true. One of the pro mising tests requires a huge array of highly precise mirro rs, used to bounce laser energy to measure the hypothesized distortion of space ca used by the passage of gravity waves. The experimental set-up will cost millions of dollars and even if it does not detect gravity waves, there may be some economic gain from the development of the technology needed for the experiment.
This last example is the issue of the future, she said. The key challenge facing p ublic research will be providing the rese rvoir of knowledge, both broad enough and disinterested enough, that ca n become an engine for general economic growth. Beca use the yield of research is low and sometimes slow paced, the cost for building such a reservoir may be too burdensome for companies,
THE SCIENTIFIC SESSIONS
which are rightly focused only on wirming prospects.
"Perhaps the most useful discussion we can have," she sa id, " is about the role of the state in making this ba lance and build ing a reservoir to do research. Without that reservoir, there can be no winning discoveries."
.. A closer public-private collaboration will be essential to try to shorten the development chain to be able to make this kind of product faster.''

Thursday 15 October
,~A5am Science, A Round Peg in a sou are World Sir Harold Kroto University of Sussex. UK
Sir Harold Kroto did not share the 1996 Nobel Prize in chemistry beca use of dogged in vestigation along a linear path. It was more like insightful scientific hunches, good luck and the right experi ments at the right time. The result was the discovery of fullerenes, a form of carbon with 60 atoms arranged in the shape of a soccer ball.
"'Not all who wander are los t,"' he said of his roundabout path, quoting the writer JRR Tolkien. "I believe this is a fundamental motto of what fundamental science is all about, and must be safeguarded."
In support of "productive wandering," Kroto cited the discovery of the therapeutic effect
of platinum for the treatment of patients with cancer. The discovery came unexpectedly from studies of how Jive cells are affected by electrical fieldswhich happened to be ap plied with platinum electrodes.
"A large number o f people are alive today," Kroto said , quoting chemist Jolu1 Cornforth, "because of this unfocused but
constructive work that produced an outcome no one expected. That is the essence of research. Yet, it has always been difficult to persuade those who finance research that predictable results are worthless, and that the best hope is to employ teams that make vital connections between other
people's results and their own." Kroto himself follows this
approach. His discovery of fullerenes grew from his longstanding interest in carbon chains. Working with astronomers at the University of Chicago, Kroto's group found a carbon star-a late stage in the life of a star in which carbon is expelled-that was blowing long carbon chains into space. To simulate conditions that produced these chains, Kroto collaborated with a group at Rice University in Houston. In the laboratory, they vaporized graphite with a laser and detected what appeared to be stable, long carbon chains of 60 atoms.
This conflicted with conventional thinking, in which s table

•• •Not all who wander are lost: I believe this is a fundamental motto of what fundamental science is all about. and must be safeguarded:•
carbon forms only shorter chains or flat sheets. How can a long, stable chain be explained? The answer emerged from a string of tmexpected connections-productive wandering in action.
In 1967, Kroto had seen a geodesic dome in Montreal built by architect Buckmi.nster Fuller using pentagons and hexagons. Could the stability of the carbon be explained if it formed such a sphere? He had built this shape hirnse:f, cutting out paper hexagons and pentagons to make a threedimensional map of the sky for his children.
"Rick Smalley [of Rice University] and I and our students were sitting in a Mexican restaurant, and I was thinking, 'I'd better ring my wife to try and find this bloody thing, find out whether it had sixty vertices.' I told Rick, 'Look, I've got this thing at home. It's about the right size, and it's not only got hexagons, but pentagons as well.' That rught, Rick played around with hexagons and got nowhere. Then he remembered that I had described the pentagons. He cut those out, and the next morill.ng came in with this fantastic object. It was the symmetry we resolved. That bowled us overwe were so sure that it was right."
THE SCIENTIFIC SESSIONS
They wrote up the paper in a feverish day and a half, naming the C-60 molecule after Buckminster Fuller. In following up on the work some years later, the Sussex group managed to extract a sample of C-60. But another group, headed by Kraetschmer and Huffman, working on the same problem had submitted a paper to the journal Nature, which invited Kroto 's review. The two groups had startlingly similar observations.
"''m sitting with this fax [of the Nature paper] on my desk," Kroto said. "It was twelve noon, time to go to lunch ... or should I commit suicide? In England, often there is not a lot of difference."
In the end, although the Sussex and Rice group won the prize for the discovery, Kroto said both groups deserve credit.
Since then, Kroto has developed educational programs for television** while devoting much of his time to the science of C-60. If the molecule could be made in quantities, and extended feet, yards or miles, it would have 50 to 100 times the strength of steel at one sixth the weight. "If we can make that," he said, "we will revolutionize 21st century civil engineering and electrorucs."
••Kroto is a cofounder of the Vega Science Trust (www.vega.org.uk). a not-for-profit sc ience broadcast organization.

Thursday 1 5 October
11:30am Genes, Genomes
and Society Leroy Hood University of Washington, Seattle
To demonstrate the difficulty of looking forward 50 years, Leroy Hood looked back to a 1948 biology textbook to see what the future looked like from there. The book said: "It has been well said that genes are known more by what they do than what they are. They are thought to be large, highly complex protein molecules. They may act like enzymes to speed up or retard chemical reactions."
"In 1948," Hood said, "we knew that proteins are combinations of a class of compounds
called amino acids, but we had no idea how the amino acids were stnmg together. Knowing neither the structure of DNA [deoxyribonucleic acid], nor the structure of proteins, it would have been impossible to pick any of the major occurrences we see today-the DNA revolution or the implications that come from the genomett project."
The genome project is a rnicrorevolution in genetic mapping that will have mega-scale effects on diagnosis, treatment and prevention of disease. It will wweil not only a deeper understanding of DNA, but also of proteins coded by DNA, and clarify how cells use these proteins. The end of one goal is in sight: a complete sequence of all three billion base pairs of DNA in the human genome.
For Hood, however, the most important result of the hun1an genome project will be a series of paradigmatic changes in biology over the coming decades. He predicted these will include:
• Biology becomes an informational, not descriptive, science. It will deal with the digital information of DNA and the threedimensional information of protein folding controlled by DNA.
• A stronger marriage will emerge between applied mathematics, computer science and biology. Not only can biology
ttThe genome is the complete set of genes present in a cell. Mapping these genes will provide keys to the structure and function of cells and of the whole organism.
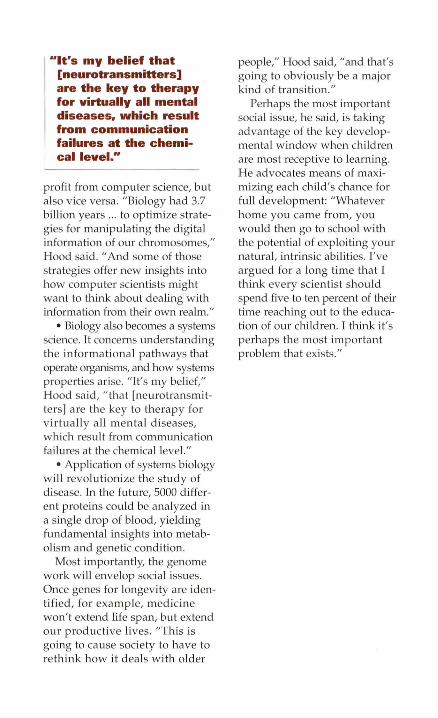
.. lt"s my belief that [neurotransmitters] are the key to therapy for virtually all mental diseases. which result from communication failures at the chemical level.""
profit from computer science, but also vice versa. "Biology had 3.7 billion years .. . to optimize strategies for manipulating the digital information of our chromosomes," Hood said. "And some of those stra tegies offer new insights into how computer scientists might want to think about dealing with information from their own realm."
• Biology also becomes a systems science. It concerns understanding th e in fo rmati onal pathways that operate organisms, and how systems properties arise. "It's my belief," Hood said, " that [neurotransmitters] are the key to therap y for virtua lly all mental diseases, which result from communica tion failures at the chemical level. "
• Application of systems biology will revolutionize the study of disease. In the future, 5000 different proteins could be ana lyzed in a single drop of blood, yielding fundamental insights into metabolism and genetic condition .
Most importantly, the genome work will envelop social issues. Once genes for longevity are identified, for example, medicine won' t extend life span, but extend our p roducti ve lives . "This is going to ca use society to have to rethink how it deals with older
people," Hood said, "and that's going to obviously be a major kind of transition ."
Perhaps the most important social issue, he said, is taking advantage of the key developmental window when children are most receptive to learning. He advocates means of maximizing each child's chance for full development: "Whatever h ome you came from, yo u would then go to school with the potential of exploiting your natural, intrinsic abilities. I've argued for a long time tha t I think every scientist should spend five to ten percent of their time reaching out to the education of our children. I think it's perh aps the most important problem that exists."

Thursday 1 5 October
DEBATE AND PANEL DISCUSSION
''3
0pm Complication, Remediation and Accommodation in Global Warming RESOLVE: Global warming demands that Earth stop burning foss il fue ls within the next 50 years (i.e., if they don't run out anyway)
OEBATE SESSION CHAIRMAN
Frank Press The Advisory Group
Global warming issues are as much about science advising as about politics. The scientistadvisor must separate his or her values, bias or ideology from adherence to the scientific method. Because decisions have to be made, advice is often based on incomplete data and their uncertain interpretation. Often we must advise a policy maker whose mind is already made up. Advising is not an easy job for any scientist. Today, we are fortunate to have this issue deba ted by two highly qualified individuals. You couldn't ask for a better team to lay out the issues for you.
THE DEBATERS
.James Hansen NASA Goddard Institute for Space Studies
Linkage is clear between carbon dioxide [COzl released into the atmosphere and global warming, since CO, retards loss of hea t to space. Greenhouse gases, including CO,, are accep ted as the largest global climate forcing (an imposed perturbation of the earth's energy balance with space, measured in wa tts per meter' ). These gases are also the fastest growing of these forcings, and it 's clear th a t human-caused climate forcings are larger than the known natural climate forcings on the time scales of decades to centuries, such as changes in solar output and volcanic dust. Doubling of CO, emission would cause an even tual warming of about 3° Celsius.
Our climate model predictions track well with the facts. Our first predictions 20 years ago forecast a warming of about 0.25°C from the late 1970s to now. This change, we argued, would be sufficient to bring the warming out of the noise level. In fact, measured data

support the prediction, and there is general agreement that the warming of the past few decades is now probably too large to be natural variability. Recession of glaciers nearly worldwide over the past cen tury is used to infer a global warming of about 0.8°C in the past hundred years.
Two courses of action are needed: (1) The energy industry must take the lead in finding energy sources other than coal which can take over as oil and gas are depleted; (2) CO, emissions should be restricted during the next few decades to limit greenhouse input and to discourage descent down the path to coal as the dominant energy alternative.
Richard Lindzen Massachusetts Institute of Technology
The nature of climate change is not simply a model of gross forcing and gross response. The climate is a three-dimensional system that has a great deal of complexity and, indeed, past climate change was not so much a change in the mean temperature as a change in the temperature difference between the equator and pole.
Noise in the data is still a problem: the natural variance in
the global mean is on the order of a few tenths of a degree. The natural variance for North America as a whole is on the order of a degree. Considered with care, climate data do show a warming trend to 1940, but afterwards, there is too much variation in the data to conclude that the trend continues. Complicating matters, satellite data measure tropospheric temperature, which is different from historic and present measures of surface temperature.
Further, the conventional model of how greenhouse gases work involves simply onedimensional convection and radiation based on average properties. In fact, this model is flawed because the real atmosphere has sharp horizontal gradients with distinct nonlinear properties. As a consequence, global temperature can wobble by just changing where the circulation deposits heat.
It's not clear that action is needed, since data about a change in temperature, or the cause of such change, are inconclusive. Further, even if warming were a fact, warm periods have been historically viewed as benign. In the end, politicization of this scientific issue ends in marginalization, trivialization and corruption of the science necessary to answer important environmental questions.

THE SCIENTIFIC SESSIONS
THE PANELISTS
Wallace Broecker Columbia University
"If we look at the climate record for the last hundred thousand years or so, there's no question that our climate is an angry beast. It has done outrageous things. The question now is whether the kind of push that we're giv· ing it has any chance of causing a similar change."
William Nordhaus Yale University
"If global warming proves to be a dangerous threat, what could we do? There are three categories of responses. First, we could slow the growth in C02 emissions by reducing energy use. The best approach here would be to raise energy prices (proportional to their carbon content). Second, we could conceivably engage in cli· matic engineering, such as pumping C02 into the bowels of the ocean. Third (which we will do in any case), societies can adapt to a warmer climate. This would involve migrations of populations and capital, research on high-C02 crops, and research on malaria and other vector-borne diseases if they start migrating into advanced countries."
V. (Ram) Ramanathan Scripps Institution of Oceanography
"When I hear the debate between Hansen and Lindzen, I think the heart of the problem is imperfect temperature records. They were not collected uniformly. They were not collected with the purpose of detecting a trend, so you can argue the case for or against warming. A priority might be to improve the quality of our observations."

.Jorge Sarmiento Princeton University
"Until about the turn of this century, most of the C02 released to the atmosphere was from deforestation. But in the last many decades, the fossil fuel emissions have been the greatest input of C0
2 to
the atmosphere."
Frank Press The Advisory Group
"The time window for hydrocarbons is longer in my belief than most people think, and that's because of new technology for exploration and production and natural gas. There is a huge amount of gas, and undeveloped gas resources, around in the world. These will take us longer than we think to use up."
PANEL DISCUSSION CHAIRMAN
Karl Turekian Yale Universi ty
"If Dick [Lindzen] is right and there's no warming, no problem. We can go on using fossil fuels. On the other hand, if the warming is greater than the models predict, then I think everybody would agree that we have to make a serious attempt to cut back [C0
2 emissions]. As
Frank [Press] suggests, the no-regrets policy seems the prudent choice."

To strengthen our culture of excellence, the Performed by Schlumberger program will be launched companywide in 1999. The program is based on the Schlumberger Promise:
Every person in Schlumberger is committed to deliver the best possible performance-anytime, anywhere. Our culturally diverse teams innovate to create new standards of excellence that surpass our customers' expectations.
At Schlumberger, what matters is getting the job done right.
The program is incorporated into personnel recruiting, training and appraisal policy and includes grassroots events to promote our culture of excellence. The program is carried forward through the recognition of people for a product or service that fulfills the Schlumberger Promise and is endorsed by the client through Client Link* or other customer-focus initiatives.
The highest level of recognition carries a Performed by Schlumberger award, symbolized by a seal of excellence, in the shape of an S. The two arms of the S symbolize the partnership between Schlumberger and its customers.
Performed by Schlumberger unites our company's sense of purpose. A new single logo derived from the seal reinforces this union by replacing the current range of product line and corporate logos.
Schlumberger The Performed by Schlumberger campaign publicizes the program declaring our pledge to be the leader in everything we do.

*Mark of Schlumberger.
1 Trademark of Alternate Realities Corporation.
** MFG/PRO is a registered trademark of OAD.
11 SAP is a registered trademark of SAP AG.
For details of the 50th anniversary of Schlumberger-Doll Research: http://www.slb.com/research/sdr50/
Downloadable transcripts of the proceedings wil l also be posted to this site.
For an on-line version of this report: http://www.slb.com/ir/ar/ar98/
Design by Milton Glaser, Inc. Photographs on page 46 by Erich Hartmann/Magnum; all other photographs by Matthew Klein.
Erich Hartmann (1922-1999): photographer, colleague, teacher, friend. We wil l miss him.
This report is printed on recycled paper. The text pages contain 10% post-consumer fiber n consisting almost entirely of wastepaper recy•. ~ cled from Schlumberger facilities in San Jose ~., and Simi Valley, California.