ANNUAL REPORT 2020 - AnnualReports.com
112
ANNUAL REPORT 2020 GUD HOLDINGS LIMITED ABN 99 004 400 891 YEAR ENDED 30 JUNE 2020
-
Upload
khangminh22 -
Category
Documents
-
view
1 -
download
0
Transcript of ANNUAL REPORT 2020 - AnnualReports.com

ANNUALREPORT2020
GUD HOLDINGS LIMITEDABN 99 004 400 891
YEAR ENDED 30 JUNE 2020
8582_GUD_Holdings_Annual Report_2020_Mono.indd 18582_GUD_Holdings_Annual Report_2020_Mono.indd 1 9/9/20 1:25 pm9/9/20 1:25 pm
Table of Contents Directors’ Report…………………………………………………………………………………………………………………………………………..1 Operating and Financial Review……………………………………..……………………………………………………………………………….7 Sustainability Review…………………………………………………………………………………………………………………………….………………….…18 Remuneration Report………………………………………………………………………………………………………………………………………………….31 Consolidated Financial Statements………………………………………………………………………………………………………………………………43 Additional Shareholder Information…………………………………………………………………………………………………………………………..108
8582_GUD_Holdings_Annual Report_2020_Mono.indd 28582_GUD_Holdings_Annual Report_2020_Mono.indd 2 9/9/20 11:59 am9/9/20 11:59 am

Directors’ Report
The Directors of GUD Holdings Limited (the Company) present their report on the consolidated entity, being the Company and its subsidiaries, for the year ended 30 June 2020.
Directors The names of the Directors who held office during the financial year and details of their qualifications, experience and special responsibilities are as follows: M G Smith* Dip. Business (Marketing) FAMI CPM FIML FAICD Appointed Non‐Executive Director on 26 May 2009, and Chairman on 15 November 2017 Mr Smith is currently a Non‐Executive Director and Chairman of Australian Pharmaceutical Industries Limited (appointed 6 September 2017). He is a former Non‐Executive Director and Chairman of Patties Foods Limited (retired September 2017), a former Non‐Executive Director of Toll Holdings Limited (retired May 2015), and a former Non‐Executive Director and Chairman of Food Holdings Limited (retired August 2011). Mr Smith was Managing Director of Cadbury Schweppes Australia and New Zealand (2003 to 2007) and a member of the Asia Pacific Regional Board. Over a 16‐year career with the Cadbury Schweppes Group, he held senior management positions in Australia, the UK and North America. Prior to joining Cadbury Schweppes, Mr Smith's career included senior management roles with Unilever and Uncle Toby's. G A Billings* BComm FCA MAICD Appointed Non‐Executive Director on 20 December 2011, and Chair of the Audit Committee Mr Billings retired from PricewaterhouseCoopers in 2011 after 34 years, where he was head of the Melbourne Assurance practice as well as heading the firm’s Australian and Global Industrial Products business. Mr Billings is currently a Non‐Executive Director of Korvest Limited (appointed May 2013) and became Chairman of that company in September 2014, a Non‐Executive Director and Chairman of Azure Healthcare Limited (appointed 21 October 2015), a Non‐Executive Director of Clover Corporation Limited (appointed 20 May 2013) where he is Chair of the Audit Committee, and a Non‐Executive Director of DomaCom Limited (appointed 23 February 2015) where he is Chair of the Audit Committee. D D Robinson* BSc MSc Appointed Non‐Executive Director on 20 December 2011, and Chair of the Remuneration, People and Culture Committee Mr Robinson spent the past 22 years, prior to joining the Board, with global automotive parts, general industrial and consumer products manufacturer and marketing company Robert Bosch GmbH. In that time, he has worked in the USA, Germany and Australia and had responsibility for sales, marketing, engineering, manufacturing, accounting and personnel. He was President of Robert Bosch Australia and Robert Bosch New Zealand. A L Templeman‐Jones* BComm MRM EMBA CA FAICD Appointed Non‐Executive Director on 1 August 2015, and Chair of the Risk and Compliance Committee Ms Templeman‐Jones is currently a Non‐Executive Director of Commonwealth Bank of Australia (appointed 5 March 2018) and a Non‐Executive Director of Worley Parsons Limited (appointed 1 November 2017). Anne previously served as a Non‐Executive Director of The Citadel Group Limited (retired May 2020), HT & E Limited (formerly APN News & Media Limited) (retired May 2018), Cuscal Limited (retired March 2018), Pioneer Credit Limited (retired November 2016), Notre Dame University (retired December 2016) and HBF Health Limited (retired October 2014). Ms Templeman‐Jones has considerable executive experience in institutional and commercial banking, wealth management and insurance, having previously held senior executive roles within Westpac and ANZ. J A Douglas* BSc LLB(Hons) LLM MBA GAICD Appointed Non‐Executive Director on 1 March 2020. Ms Douglas is currently a Non‐Executive Director of Hansen Technologies Limited (appointed 15 February 2017), a Non‐Executive Director of Opticomm Limited (appointed 21 August 2017) where she is Chair of the Remuneration Committee and a Non‐Executive Director of Essential Energy (appointed 15 March 2018) where she is Chair of the Regulatory Committee. She is also a Non‐Executive Director of St Kilda Football Club and Peter MacCallum Cancer Foundation and a former Non‐Executive Director of Telstra SNP Monitoring (retired 2016), Family Life Inc (retired 2010), Pacific Access Superannuation Fund (retired 1999) and Kilvington Girls Grammar School (retired 1994). Ms Douglas has considerable experience as an executive in the communications and technology sectors having held a diverse range of executive roles at Telstra and Sensis from 1997 to 2016. Prior to this, Ms Douglas was a lawyer with Mallesons and Allens where she specialised in intellectual property, communications and media law.
1
8582_GUD_Holdings_Annual Report_2020_Mono.indd 18582_GUD_Holdings_Annual Report_2020_Mono.indd 1 9/9/20 11:59 am9/9/20 11:59 am

Directors’ Report
G Whickman B Bus MAICD Appointed Managing Director and Chief Executive Officer of the Company with effect from 1 October 2018. Mr Whickman was previously President and Chief Executive Officer of Ford Australia and New Zealand (2015 – 2018). He had a 20‐year career with Ford with senior executive roles in Asia Pacific, Europe and North America. * All Non‐Executive Directors are independent.
Corporate Executives Chief Financial Officer M A Fraser B Bus EMBA GAICD FCA Mr Fraser’s early career was with Coopers & Lybrand in Australia, followed by over 25 years in senior finance and operational roles in Asia and Europe with McIntosh Hamson Hoare Govett, Jardine Matheson Ltd and the Schindler Group. Company Secretary M G Tyler LLB BComm (Hons) MBA FGIA MAICD
Mr Tyler is a fellow of Governance Institute Australia, a former partner with Freehills and general counsel with Southcorp Limited. He has held a legal practicing certificate in Victoria for 34 years.
Directors’ Attendances at Meetings The Board held nine scheduled meetings during the year. In addition, ad hoc meetings are called to consider specific or urgent matters. In FY20 this included seven ad hoc meetings in relation to COVID 19, which were attended by all Directors.
Board Audit CommitteeRisk & Compliance
Committee Nominations Committee
Remuneration Committee
Directors Held Attended Held Attended Held Attended Held Attended Held Attended
M G Smith 9 9 4 4 4 4 3 3 7 7
G A Billings 9 9 4 4 4 4 3 3 7 7
D D Robinson 9 9 4 4 4 4 3 3 7 7
A L Templeman‐Jones
9 9 4 4 4 4 3 3 7 7
J A Douglas1 3 3 1 1 2 2 1 1 2 2
G Whickman 9 9
1 Ms Douglas joined the Board on 1 March 2020 It is the Board’s practice that the Non‐Executive Directors meet regularly without the presence of Management.
2
8582_GUD_Holdings_Annual Report_2020_Mono.indd 28582_GUD_Holdings_Annual Report_2020_Mono.indd 2 9/9/20 11:59 am9/9/20 11:59 am

Directors’ Report
Directors’ Interests and Benefits Directors are not required to hold shares in the Company. The current shareholdings are shown in the table below.
Shares held beneficially
Directors Own name Private
company / trust Total 30 June 2020 Total 30 June 2019
M G Smith ‐ 66,000 66,000 58,000
G A Billings1 ‐ 11,250 11,250 11,250
D D Robinson1 ‐ 13,000 13,000 13,000
A L Templeman‐Jones 540 7,102 7,642 6,442
J A Douglas2 ‐ ‐ ‐ ‐
G. Whickman 27,000 ‐ 27,000 2,000
1 Messrs Billings and Robinson are participants in the Non‐Executive Share Plan, and currently hold 656 and 1,664 Share Rights respectively under that plan, which will convert
into Restricted Shares six months after grant in September 2020 and December 2020
2 Ms Douglas joined the Board on 1 March 2020
Corporate Governance Statement The Corporate Governance Statement of the Directors is separately lodged with the ASX, and forms part of this Directors’ Report. It may also be found on the Company’s website at www.gud.com.au.
Principal Activities The principal activities of the consolidated entity during the financial year were the manufacture and importation, distribution and sale of automotive products, pumps, pool and spa systems, and water pressure systems, with operations in Australia, New Zealand, and France. Other than as referred herein and in the Operating and Financial Review set out on pages 7‐17, there were no significant changes in the nature of the activities of the consolidated entity during the year.
Operating and Financial Review The Operating and Financial Review for the consolidated entity during the financial year forms part of this Directors’ Report.
COVID 19 response From late February 2020 until 30 June, the Board held seven ad hoc meetings which were attended by Management. The purpose of these meetings were to inform, update and seek guidance and direction from Board members in relation to COVID‐19 response strategies being adopted and implemented across the GUD Group with three particular themes, those of people health, operational health and financial health. These responses are more particularly outlined in the Operating and Financial Review.
Share Capital At 30 June 2020, there were 86,701,174 (2019: 86,485,972) ordinary shares on issue. The increase in shares on issue resulted from the vesting in July 2019 of 215,202 performance rights granted under the GUD Holdings 2019 Long Term Incentive Equity Plan.
3
8582_GUD_Holdings_Annual Report_2020_Mono.indd 38582_GUD_Holdings_Annual Report_2020_Mono.indd 3 9/9/20 11:59 am9/9/20 11:59 am

Directors’ Report
Dividends During and since the end of the financial year, the following dividends have been paid or declared.
A final ordinary dividend of 31 cents per share in respect of the year ended 30 June 2019 was declared on 26 July 2019 and paid on 30 August 2019, amounting to $26,877,364. This dividend was fully franked.
An interim ordinary dividend of 25 cents per share in relation to the half year ended 31 December 2019 was declared on 31 January 2020 and paid on 28 February 2020, amounting to $ 21,675,293. This dividend was fully franked.
A final ordinary dividend of 12 cents per share in respect of the year ended 30 June 2020 was determined on 28 July 2020 and is payable on 28 August 2020 to shareholders registered on 14 August 2020. This dividend will be fully franked. Shares will trade ex‐dividend on 13 August 2020. The GUD Dividend Reinvestment Plan will be available for this dividend.
Auditor Independence There is no current or former partner or director of KPMG, the Company’s auditors, who is or was at any time during the financial year an officer of the consolidated entity. The auditor’s independence declaration made under section 307C of the Corporations Act 2001 is set out on page 102 of the accompanying Financial Statements and forms part of this Report.
Non‐Audit Services Details of the amounts paid or payable to the Company’s auditors, KPMG, for non‐audit services provided during the year are shown in Note 6 to the financial statements, which accompany this Directors’ Report. The Directors are satisfied that the provision of such non‐audit services is compatible with the general standard of independence for auditors imposed by, and did not compromise the auditor independence requirements of, the Corporations Act 2001 in view of both the amount and the nature of the services provided, and that all non‐audit services were subject to the corporate governance procedures adopted by the Company and have been reviewed by the Audit Committee to ensure they do not impact the integrity and objectivity of the auditor.
Options and Rights During the year, a total of 408,451 Performance Rights were granted to executives under the GUD Holdings 2022 Long Term Incentive Equity Plan. This included 58,686 Performance Rights granted to the Managing Director in October 2019, after receiving approval of shareholders at the 2019 Annual General Meeting. As a result of failing to meet TSR targets, 206,792 performance rights granted in July 2017 lapsed in relation to the GUD Holdings 2020 Long Term Incentive Equity Plan. In addition, as a result of executives departing, or scaling back their working hours with, the Group during the year, a total of 62,092 Performance Rights were determined by the Board to have lapsed. Details of the Performance Rights outstanding in aggregate and granted to key management personnel, in particular, are included in the Remuneration Report, which forms part of this Directors’ Report. Except as above, and noted below, no options or rights were granted during the year and no options or rights have been granted or lapsed since the end of the financial year. No options were exercised during the financial year. There are no unissued shares or interests under option as at the date of this Report. During the year, the Company established a Non‐Executive Director Equity Plan, pursuant to which non‐executive directors may sacrifice some of the fees they were due to receive into Share Rights which six months later vest as Restricted Shares (subject to restrictions on dealing) for a period of time nominated by the non‐executive director at the time of making application). Shares to satisfy the vesting will be acquired on market. As at 30 June 2020, there were 2,320 Share Rights on issue.
Derivatives and Other Financial Instruments It is the consolidated entity’s policy to use derivative financial instruments to hedge cash flows subject to interest rate and foreign exchange risk according to a policy approved by the Board. Derivative financial instruments are not held for speculative purposes. Exposures, including related derivative hedges, are reported to the Board on a monthly basis. Financial facilities and operating cash flows are managed to ensure that the consolidated entity is not exposed to any adverse liquidity risks. Adequate standby facilities are maintained to provide strategic liquidity to meet cash flows in the ordinary course of business.
4
8582_GUD_Holdings_Annual Report_2020_Mono.indd 48582_GUD_Holdings_Annual Report_2020_Mono.indd 4 9/9/20 11:59 am9/9/20 11:59 am
Directors’ Report
Environmental Regulation Some of the consolidated entity’s activities are subject to various environmental regulations under both Commonwealth and State legislation. The Directors are not aware of any breaches of those environmental regulations during the financial year. The consolidated entity endorses an Environmental Policy of compliance and open communication on environmental issues.
Proceedings on behalf of the Company There were no proceedings brought on behalf of the Company, nor any persons applying for leave under section 237 of the Corporations Act 2001 to bring proceedings on behalf of the Company.
Indemnity and Insurance The Company has, pursuant to contractual arrangements, agreed to indemnify the current and a number of former Directors of the Company against all liabilities to another person (other than the Company or a related body corporate) that may arise from their position as a Director of the Company and its subsidiaries, except where the liability arises out of conduct involving a lack of good faith. The agreement stipulates that the Company will meet the full amount of any such liabilities, including costs and expenses. The Company has also agreed to indemnify the current Directors of its subsidiaries, the Company Secretary and certain Senior Executives for all liabilities to another person (other than the Company or a related body corporate) that may arise from their position, except where the liability arises out of conduct involving a lack of good faith. The agreement stipulates that the Company will meet the full amount of any such liabilities, including costs and expenses. Pursuant to this indemnification, the Company has paid a premium for an insurance policy for the benefit of Directors, Secretaries and Executives of the Company and related bodies corporate of the Company. In accordance with common practice, the insurance policy prohibits disclosure of the nature of the liability covered and the amount of the premium. The Company has not otherwise, during or since the end of the financial year, indemnified or agreed to indemnify an officer or auditor of the Company or of any related body corporate against a liability incurred as such an officer or auditor.
Remuneration Policy for Directors and Executives The policy for determining the nature and amount of remuneration for Directors and Executives is described in the Remuneration Report, which forms part of this Directors’ Report.
Director and Executive Benefits Details of the benefits paid or provided to Directors and specified Executives are included in the Remuneration Report, which forms part of this Directors’ Report, and in summary in Note 33 to the financial statements.
Rounding Off The Company is a company of the kind referred to in ASIC Corporations (Rounding in Financial/Directors’ Reports) Instrument 2016/191 and, in accordance with that Rounding Instrument, amounts in this Report and the accompanying financial statements have been rounded off to the nearest one thousand dollars unless otherwise stated.
Significant Events after Year End On 28 July 2020, the Board of Directors declared a fully franked interim dividend in respect of the 2020 financial year of 12 cents per share. Record date is 14 August 2020 and the dividend will be paid on 28 August 2020. On 1 July 2020, the Company secured additional banking facilities for $22.5 million. The maturity of this facility is 1 July 2021. Other than the matters discussed above, there has not arisen in the interval between the end of the financial year and the date of this report any item, transaction or event of a material and unusual nature likely, in the opinion of the directors of the Company, to affect significantly the operations of the Group, the results of those operations, or the state of affairs of the Group, in future financial years.
5
8582_GUD_Holdings_Annual Report_2020_Mono.indd 58582_GUD_Holdings_Annual Report_2020_Mono.indd 5 9/9/20 11:59 am9/9/20 11:59 am

Directors’ Report
This Directors’ Statutory Report is signed on behalf of the Directors in accordance with a resolution of Directors made pursuant to section 298(2) of the Corporations Act 2001.
M G Smith G Whickman Chairman of Directors Managing Director Dated at Melbourne, 28 July 2020
6
8582_GUD_Holdings_Annual Report_2020_Mono.indd 68582_GUD_Holdings_Annual Report_2020_Mono.indd 6 9/9/20 11:59 am9/9/20 11:59 am

Operating and Financial Review
In FY20, the year should be viewed in two parts. GUD’s performance was tracking to our previously announced guidance throughout much of the year. However, it was clearly impacted by the well‐documented and challenging COVID‐19 realities as we approached Q4. As sobering as these impacts were felt around Australia and the world, we are thankful to be able to confirm actions taken to date have resulted in a relatively respectable and solid financial result underpinned by careful and deliberate measures to protect the health of our people, operations and financial stability.
The Management were clear from the outset of FY20 that the year was one of consolidation. We needed to manage significant currency shifts, absorb domestic cost inflation, bed down the incremental costs in securing multi‐year supply agreements, push hard on supplier cost reductions and deliver appropriate pricing increases. The team identified and secured a ‘steady state’ on the differing financial inputs whilst architecting the refreshed Business Unit strategies for future growth and keeping up the acquisition dialogue.
This approach was well advanced and then the COVID‐19 Pandemic hit the radar screens. GUD reacted early, and in late January, the executive team started planning for both supply‐side, and then demand‐side impacts to the business. GUD were, and remain, determined to act as a good partner to our suppliers, employees and customers throughout this period. The leadership team and Board viewed the COVID‐19 impacts to be temporary in nature with no significant longer‐term structural shift in the industries we serve. We will address a number of these COVID‐19 related impacts and mitigating actions in detail in the next section of this report, where ‘controlling the controllables’ was a clear mantra amongst the Group.
It should be noted we viewed the developing and ongoing COVID‐19 situation with a lens of both ‘defence’ and ‘offence’. Meaning that we put in place mitigation plans to ensure we could ‘weather the storm’, but also played ‘offence’ and actively managed opportunities to drive product development efforts, increase product cataloguing, drive the operational fitness projects, refine our business unit strategies with a short to medium term focus and reassess any acquisition targets that might re‐emerge.
GUD have been vigilant in ensuring we maintain a safe working environment. This was made increasingly more difficult with the overlay of so many ‘off standard’ working practices brought about by the COVID‐19 situation. We increased the level of attention, engagement and communication across all businesses and were relentless in examining unforeseen hazards and risks. Consequently, the full year safety metrics improved over last year, and importantly did not deteriorate through the 2nd half of the year. Encouragingly, the GUD LTIFR rate is substantially less than half of the Safe Work Australia industry benchmark rate. GUD will not ‘sit still’ and has further plans for ongoing health and safety enhancements, with details outlined in our Sustainability Review.
Revenue for the year increased 1% to $438 million despite second half COVID‐19 volume impacts. Reported EBIT decreased 15% to $74.3 million reflecting $6.5 million of significant items of which $4.9 million were non‐cash, and principally relate to implementing Davey’s Product Cycle Plan and organisational restructuring plan, the impairment of the Monarch brand, as well as restructuring costs associated with AA Gaskets ceasing manufacturing and relocating to the Ryco facility in Altona North. Pre AASB 16 Underlying (excluding significant items) EBIT of $80.1 million was down 10% from the $88.9 million in the prior corresponding period. The result principally reflects lower end‐user demand from partial or total lock downs coupled with reseller destocking which resulted in negative operating leverage. Cost savings from government COVID‐19 subsidies and internal cash conservation efforts were more than offset by higher operating costs under COVID‐19, H2 factory load utilisation, and FX impacts given a significantly weaker AUD in much of second half of the year, as well as appropriate group provisions considering the economic climate. On a like‐for‐like basis, excluding AASB 16 impacts, underlying1 NPAT was down 16% to $50.9 million. Adjusting for a one‐off tax provision release of $2.5 million in the prior corresponding period and $0.5 million in the current period, underlying NPAT was down 14%. In addition, the current year’s result includes an interest expense of $1.1 million reflecting the final earn‐out provision in relation to the acquisition of IM Group in July 2017.
Consequently, the reported basic earnings per share on a pre‐AASB 16 basis of 53cps was down from the prior year’s result of 69 cps.
7
8582_GUD_Holdings_Annual Report_2020_Mono.indd 78582_GUD_Holdings_Annual Report_2020_Mono.indd 7 9/9/20 11:59 am9/9/20 11:59 am

Operating and Financial Review
The final dividend payment to our shareholders is 12 cps bring the full year total to 37 cps, or 67% of underlying NPAT.
Our balance sheet remained strong with gearing, being net debt against net debt and equity, of approximately 34%, and robust interest cover. Pre‐tax cash conversion of 97% was achieved for the period which was well ahead of internal targets. Our banking lines were renewed in January 2020 with staggered maturities over one, four and eight years. At the reporting date, available unused banking lines were in excess of $57 million and further short‐term facilities of $22.5 million were secured commencing July 2020. Hence, the Company is well placed to support both organic growth and further bolt‐on acquisitions.
The team at GUD are working on three areas of strategic attention, being the Core, Growth and Acquisition workstreams. As mentioned, 2019‐20 was a year of consolidation, to ensure we started to leverage the scale of the GUD businesses, drive operational fitness actions, solidify our customer relationships and embark on the next stage of planning for organic and acquisitive growth in the coming years.
At the time of writing, the business environment remains fluid with conflicting comments as to what the short‐term future holds. GUD’s efforts to improve operational fitness, outlined in our 2018‐2019 review, certainly gave us a head start before the emergence of COVID‐19. We have been working on the philosophy of ‘sovereignty with strength’, leveraging the scale of our operations without threatening the decentralised, and very accountable existing business unit culture. This gave rise to projects such as real estate footprint review, supplier cost reductions and business restructuring in the first half.
In the short term, we expect to operate within a tough general economic environment. Naturally this might impact parts of our businesses with products of a more discretionary nature. It is hard to accurately forecast any further deterioration to the miles travelled due to social distancing and mobility restrictions. However, in the automotive aftermarket, we note potential tailwinds in terms of ‘miles travelled’ with public transport and ridesharing usage dropping and domestic tourism increasing. We recognise in general consumers were already showing signs of more cautious, or frugal spending and we expect that to become more prevalent in the short term. This ’frugality’ could also be viewed as a further tailwind, as the aftermarket will likely encounter higher used car volumes, increasing DIY activity, increasing interest in repair and replacement of parts and potential migration from OEM service lanes to independent repairers to stretch their dollars further.
New vehicle sales continued to drop in 2019‐20. Whilst this has had a moderate negative impact on some of our businesses, the bigger positive impact will mean the natural scrappage rate will drop and increase the average fleet age of the car parc, therefore, increasing the 15 million plus car parc of 5‐year‐old plus vehicles in Australia.
GUD’s position on the long‐term future electric and autonomous vehicles remains unchanged. GUD modelling concludes the addressable market in 2030 of 5‐year‐old plus vehicles with internal combustion engines (ICE) would remain largely consistent with today’s 15 million units, as new vehicles continue to flow into this age category. In 2019‐20, GUD generated just above 40% of its automotive revenue from products specific to ICE vehicles.
GUD’s view on our water business remains unchanged. The impacts of bushfires and longstanding droughts certainly were felt across many geographies and sectors in Australia throughout the year. Davey moved quickly to support the rural economy with donations of bore water pumping products in the stricken areas through their master dealer network. As the bushfires abated, Davey experienced solid demand from rural infrastructure investment.
At the beginning of the year, we detailed our desire to build on the excellent existing stakeholder relationships, with attention on Suppliers, Employees and Customers. This aspiration was of course tested through the 2nd half of the year, and we will review the impacts of COVID‐19 to our stakeholders later in this Operating and Financial Review (OFR).
We were pleased with the results of our recent FY20 employee satisfaction survey. This continued our recent trend and placed GUD again in the top 25% of global companies measured in the Qualtrics study. Our leaders worked hard to ensure our employees remained connected and engaged with our business objectives and purpose.
GUD were encouraged to see the same trend in customer satisfaction repeat from prior years and we were proud to receive awards in FY20 from our customers. BWI won both the GPC Asia Pacific Supplier of the Year (the first time this award has been given to a GUD business) and GPC’s Exceptional Support to the Store Network (AUS and NZ). Ryco was awarded GPC’s Most Innovative Trade Campaign, and Supercheap Auto’s Most Innovative Trade Partner awards.
8
8582_GUD_Holdings_Annual Report_2020_Mono.indd 88582_GUD_Holdings_Annual Report_2020_Mono.indd 8 9/9/20 11:59 am9/9/20 11:59 am

Operating and Financial Review
Finally, in late 2019, Davey were excited to be awarded the overall Supplier of the Year by SPC, one the leading global wholesale distributors of swimming pool supplies, equipment and leisure related products, recognising Davey’s great traction in Europe.
The leadership team and Board remain convinced of the tangible link between employee satisfaction, customer satisfaction and subsequent financial and non‐financial business deliverables.
GUD’s portfolio is centred on the automotive and water businesses. Throughout FY20, we have examined numerous acquisition opportunities across a multitude of automotive product categories. We were careful with our analysis on the strategic fit and valuation, using the common acquisition criteria developed and implemented over the last 2 years. Our prudent approach has served us well with the unexpected impacts of the pandemic. This has meant we are not caught with an overvalued recent acquisition with high integration efforts and risk of impairment. Nevertheless, as part of our ‘offence’ actions, we have been continuing to review and speak with vendors, even throughout the COVID‐19 period. GUD remains clear that acquisition opportunities for the automotive portfolio are still available and desirable, however, appropriate caution will be exercised with the prevailing uncertainty. As always, the timing of opportunities will ultimately be dictated by the willingness of vendors.
In the FY19 OFR, we outlined a focus on five key topic areas of Customer relationships, Supplier Engagement, People Cycle Planning, Product Cycle Planning and Operational Efficiency, all with a view to strengthen our business foundations. The attention has continued, and further improvements have been made.
Customer Relationships – Building on our multi‐year preferred supplier agreements with two of our critical automotive customer reseller groups, we have experienced positive growth in a number of our own brands, seen the take up of new products and in a few cases, both in automotive and water, customers turn to the respective business for house brand supply and management. We have added further OEM customers in addition to Toyota and Paccar and worked tirelessly through COVID‐19 to assist our customers in creative ways. FY20 was also a proud year for Supplier of the Year recognition across BWI, Ryco and Davey.
Supplier Engagement – We continue to work with critical suppliers to confirm sourcing security as a priority. Additionally, our project work on COG’s cost reductions became incredibly important and proved to be successful. Utilising our Quality and Supplier Council, we also embarked on the journey to drive better Environmental Social Governance (ESG) outcomes with our supply base and announced the launch of the GUD Bronze, Silver and Gold supplier program, which is detailed later in the Sustainability Review.
People Cycle Planning – We have been working diligently to develop future leaders for our current businesses and future acquisitions to ensure the right balance and focus at the executive leadership level. In late 2019, we launched a talent development program, a first for GUD. This concentrates on emerging leaders across GUD and has two cohorts participating in a two‐year program, facilitated by a selection of external leadership and business experts. GUD remains an inclusive workplace and launched an enhanced Diversity and Inclusion program with a clear charter and vision of success. Finally, we strengthened our Ryco and BWI leadership team with a new Executive General Manager at Ryco and Chief Operating Officer at BWI. Both leaders come with decades of aftermarket experience and are well known and respected in the Australian and NZ markets.
Product Cycle Planning – We continue to bolster our innovation and product creation focus. Throughout the year, GUD released hundreds of new SKU’s. Davey and BWI each had more than 10% of revenue generated by products that did not exist 24 months ago. Amongst the new launches were Lifeguard, a connected chemical control unit for swim‐ready pool water year‐round, and Projecta’s Intelli‐RV range of plug‐and‐play, smart power management systems. Narva won a Good Design Award, Projecta took home top honour for the most innovative product at the Australian Auto Aftermarket Awards, and Ryco Filters ranked third in the consumer goods and manufacturing category in the 2019 AFR BOSS Magazine Most Innovative Companies List. Moreover, we were awarded four government grants under the Automotive Innovation Lab Access Grants scheme, matching Research and Development funding of ~$0.5 million. More details are outlined in the Sustainability Review.
9
8582_GUD_Holdings_Annual Report_2020_Mono.indd 98582_GUD_Holdings_Annual Report_2020_Mono.indd 9 9/9/20 11:59 am9/9/20 11:59 am
Operating and Financial Review
Taking the opportunity to summarise each business, it is clear GUD has been impacted by the COVID‐19 pandemic, although not uniformly across the portfolio, or even within the Automotive Business Units. Each of GUD’s automotive businesses continues to enjoy a strong and unique market position, with market‐leading brands and a healthy track record of both product and service innovation and pricing power.
Our brands continue to be demanded by end users. We took the opportunity in our October Investor Day briefing to outline information on the brand strength. As an example, our two filtration offerings, with Ryco and Wesfil combined, had 81% of the 1st choice recommendation of workshops. In recent brand surveys, we saw many of our brands in the top quartile of their respective segments. This is supported by a strong pull model, where in some businesses, an active field force visits many thousands of workshops per annum to educate workshops and conquest competing brands.
Wesfil’s strong sales growth was supported by its well‐recognised value‐orientated brand proposition. This was further supported by its comprehensive state‐based customer service and distribution strategies and the ongoing momentum of newly launched incremental product categories.
Ryco maintained their FY19 sales level. However, the demand in the second half was quite variable from month to month with the impacts of large destocking from our resellers and the NZ lockdown. Ryco maintained the ongoing tempo of filter product releases and saw increasing growth from its catch can products which was the recipient of the AFR Innovation award featured later in our Sustainability Review.
In FY20, the overall filter market was no less competitive, and collectively, Wesfil and Ryco remain proactive in defending our strong market position.
BWI experienced contraction in the top‐line, as the most impacted of the automotive businesses with the shutdown of its offshore markets and slippage in the more discretionary and OEM product channels in Australia. Encouragingly, BWI were able to add new customers and helped some existing customers with their own house‐branding programs. BWI were recognised for the new products with several awards and satisfyingly, BWI recorded more than 10% of its revenue in products less than 12 months old.
Our smaller businesses of DBA, IMG and AAG all delivered strong revenue growth. IMG experienced an uptick in the repair and remanufacturing demand, with record jobs per day. IMG also gained traction in distributing engine management parts to the independent reseller channels, increased product cataloguing substantially and launched a new website to enable better velocity in the repair process.
DBA’s performance was a result of primarily strong domestic sales with the COVID‐19 impact in Russia and other European countries being mostly offset with strong growth in the USA. DBA expanded their product range with the launch of a DBA branded disc pad program in pursuit of a larger share of the ‘wheel end’ market. DBA was delighted to gain R90 certification, which is an important Economic Commission for Europe (ECE) automotive design standard to enable further Western European market distribution.
AAG delivered strong growth, and in fact saw a stronger demand through the back end of the year as end customers started to consider engine rebuilds with a greater intensity. The AAG integration and relocation proof of concept project continued in the background, although delayed by 3 months due to practical impacts of COVID‐19. Other than the timing delay, the scope remains unchanged.
The year also saw much activity around building a foundation within Davey for profitable mid‐term growth. While revenue grew modestly, the EBIT was impacted through new product development costs, restructuring and the significant impact of government lock downs and factory load recovery variance.
Davey’s farm trials of Modular Water Treatment products (MWT) continues. In addition, MWT sales have been secured in new applications such as hospital and hospitality and other agricultural applications. Further, Davey sold out its entire allocation in Europe of its new Nipper chlorinator and delivered the launch of the Tank Sense product.
Operational Fitness – As stated in last year's OFR, the need for operational efficiencies remained paramount in a year of consolidation. This business foundation was modified to increase its remit to review the broader operational fitness levels of the business units. Part of the fitness work has been to look across the wider GUD group to achieve cost savings through leveraging greater commonality and scale. In parallel, the opportunities to improve operational fitness in revenue management, sales, ordering and purchasing (SOP) management and lean operating structures have also been embraced.
10
8582_GUD_Holdings_Annual Report_2020_Mono.indd 108582_GUD_Holdings_Annual Report_2020_Mono.indd 10 9/9/20 11:59 am9/9/20 11:59 am

Operating and Financial Review
Davey remains committed to its strategic plan and now is in execution mode. This focusses Management efforts around the strategic pillars of supply chain optimisation, commercialisation of product innovation, diversifying channels to market and improving people and culture outcomes as they roll out their strategy.
As the drought eased and fires abated, we certainly experienced the start of infrastructure rebuild, where importantly, water pumping was high on the list of remedial repair or replacement.
1. COVID‐19 Pandemic GUD’s Executive COVID‐19 task force was established in January, initially focussing on potential supply chain disruptions. This quickly progressed to a response framework for wider business impacts in countries where GUD has operations and staff such as Australia, New Zealand and Europe. Naturally, through this period, we commenced COVID‐19 meetings with the Board which, at their height, were held weekly but now are held within the monthly Board meetings.
We identified 20 key Defence and Offence actions in support of our COVID‐19 response framework, which focussed on people health, operational health, financial health, and stakeholder management.
People Health
During the second half of the year, in response to COVID‐19, the Company implemented air travel bans, heightened hygiene protocols and social distancing measures in the workplace including split shifts and staggered break times in warehouses and production facilities. We activated business continuity plans to support working from home wherever possible, consistent with the current Australian and/or New Zealand Government health advice.
In addition, where necessary, employees could access two weeks’ special COVID‐19 leave. This is to support those who needed to be isolated but cannot work from home or as an income supplement for those experiencing scaled back working days due to work hour reductions or government required lock downs.
The scale back of employee remuneration naturally included senior management in each business, who have had their salaries scaled back by between 10% and 15% if their business triggered JobKeeper, or if any subsidiary company triggered JobKeeper in the case of Group staff. The scale back of salaries for Key Management Personnel and Board members was 20%, subject to the same triggers.
These two initiatives reflected a desire to not only address cash conservation but to also, as far as possible, keep our workforce intact and engaged for a post COVID‐19 recovery. To date, this approach has avoided termination and re‐hire costs and addressed a desire to avoid employee financial hardship.
Significantly greater attention has been paid to the mental health and well‐being of our staff throughout this period. We have heightened the counselling services available, developed and implemented mental health champions in each business and rolled out wellbeing seminars across the business. Our strong employee communication with our teams was enhanced with frequent one‐on‐one contact and enhanced use of digital mediums. Information bulletins on topical matters such as ‘adjusting to our new normal’, working from home, and self‐care strategies were provided to our people.
Operational Health
Through a combination of our pre‐existing safety stock levels, strong collaborative relationship with our suppliers and early supplier engagement, we have been able to ensure a high rate of product supply throughout. In some areas, we have selectively increased safety stock levels, seeing a run up in inventory which will normalise going forward into the next fiscal year. Inventory actions also included the negotiation of deferrals of outstanding purchase orders where practical, and in a responsible manner which would not put supplier financial viability at risk.
We needed to make significant operational changes to accommodate the COVID‐19 direction from the varying government health agencies. Staggered shifts in warehouses across our businesses, split shifts in our manufacturing and assembly operations and significant health and safety changes to all workplaces, whether in‐situ or in remote places of work. This unparalleled series of changes come at a cost but measured only in dollars and not in safety outcomes.
Customer demand impacts from COVID‐19 were not evident until late March and into April. In the Water business, Australian demand was robust throughout much of the COVID‐19 period whilst virtually zero in countries experiencing government‐mandated lock downs which included New Zealand, France, and some export countries.
11
8582_GUD_Holdings_Annual Report_2020_Mono.indd 118582_GUD_Holdings_Annual Report_2020_Mono.indd 11 9/9/20 11:59 am9/9/20 11:59 am

Operating and Financial Review
Product demand increased strongly in all automotive businesses except Disc Brakes Australia from May, whilst Disc Brakes Australia saw an increase in demand from June. The performance in June across all Automotive businesses was satisfying as it grew compared to prior comparable period.
The New Zealand Automotive business experienced close to zero sales during the mandatory shut down period of 6 weeks. The NZ operations experienced an improving trend after lockdown, however the trajectory has been a slower to return to prior levels.
Financial Health
An appropriate level of careful financial modelling was completed through this period and the Company is in solid financial health. Debt facilities were renewed in January 2020 involving $150 million for the next four years, a further $50 million for eight years and $25 million of short‐term facilities that are reviewed every January. On 1 July 2020, the Company secured further short‐term facilities of $22.5 million. Although the existing borrowing facilities were not fully used during the year, the additional facilities leave the Company better placed to respond to potential organic or acquisition growth opportunities which may arise over the next year.
Although the Australian Dollar lost significant value against the US Dollar in much of the second half followed by a recovery in June, we remained largely hedged through FY20. Steps were taken in late June to hedge the vast majority of our FY21 foreign currency needs at the prevailing exchange rates. Given the hedges and a full year contribution from supplier cost reductions achieved in FY20, the Company is better placed to manage deflationary pressures in the coming year.
Financial health efforts also addressed cash conservation action plans in response to demand changes from COVID‐19 impacts, many of which have been previously outlined under Operational Health which more than offset the incremental costs of operating under COVID‐19 conditions. It is also worthy to note that some businesses have qualified for JobKeeper, and its equivalent. The FY20 subsidies amount to $179,000 for the water business and $2,771,000 for the automotive businesses.
Stakeholder Management
As part of our desire to be a good partner through this time, we put in place a strong stakeholder management plan. This was primarily across our supply, employee, customer, and financier stakeholder bases. Our level of communication naturally increased in frequency and intensity to ensure key messages and actions are not left open to interpretation and therefore lacking in urgency, efficiency or effectiveness. We are satisfied with our efforts to work with stakeholders ranging from our union partners and employees through to our investors and financiers, all which have been well recognised and proven productive.
2. Financial Performance Review Revenue Total Group revenue increased 1% on the prior year’s level. The Automotive businesses reported a slight increase while Davey’s revenue grew by 3%.
The primary drivers of the changes in revenue during the year reflect:
1. Strong growth in Davey’s Australian business from both existing and new products. 2. A significant fall away in Davey’s New Zealand and France sales during the government‐imposed lock down
periods. 3. A near collapse in the Automotive business’ sales in New Zealand during their government‐imposed lock
down periods. 4. Lower Automotive sales in the fourth quarter due to resellers destocking and end customer user demand
more than offsetting range expansions of several businesses. 5. Softer export demand in certain markets for Disc Brakes Australia in the fourth quarter. 6. Further range extensions in all automotive businesses achieving sell through.
Profitability
The Group reported a net profit after tax of $43.7 million. On a pre‐AASB 16, the NPAT result was $46.4 million which compares with the prior year’s result of a net profit after tax of $59.6 million.
The result includes a tax provision write back of $0.5 million offset compared to a $2.5 million tax provision write back in the prior comparable period. Excluding the above tax one‐off items in the respective years, the NPAT decreased by 14% on a like for like basis. In addition, the current year’s NPAT result includes an interest expense of $1.1 million in relation to the final earn‐out provision in relation to the acquisition of IM Group in July 2017.
12
8582_GUD_Holdings_Annual Report_2020_Mono.indd 128582_GUD_Holdings_Annual Report_2020_Mono.indd 12 9/9/20 11:59 am9/9/20 11:59 am

Operating and Financial Review
During the year significant one‐off costs were incurred in relation to:
Non‐cash items related to the impairment of a Davey subsidiary brand Monarch of $2.1 million, the impairment of Davey inventory of $2.5 million in line with a change to the approach to product development and life cycle maintenance, and $0.3 million of inventory mark downs associated with restructuring AA Gaskets manufacturing.
Cash costs associated with restructuring AA Gaskets manufacturing ($0.2 million) and $1.4 million associated with Davey restructuring costs.
The reported underlying NPAT was $48.2 million, or $50.9 million on a pre AASB‐16 basis, compared to the prior year’s result of $60.9 million representing a reduction of 16% or 14% excluding the one‐off tax impacts mentioned earlier.
Reported underlying Earnings Before Interest and Tax (underlying EBIT) was $80.7 million, or $80.1 million on a pre AASB‐16 basis compared to the prior year’s result of $88.9 million, a decrease of 10%. The result principally reflects lower end‐user demand from partial or total lock downs coupled with reseller destocking which resulted in negative operating leverage. Cost savings from government COVID‐19 subsidies and internal cash conservation efforts were more than offset by higher operating costs under COVID‐19, H2 factory load utilisation, and FX impacts given a significantly weaker AUD in much of second half of the year, as well as appropriate group provisions considering the economic climate.
Dividends
The total dividend for FY20 was 37 cents per share consisting of an interim dividend of 25 cents per share and a final dividend of 12 cents per share. Both dividends were fully franked and represent a 67% payout of full year underlying NPAT. This compares with total dividends of 56 cents per share in the previous financial year. The lower final dividend reflects uncertainty around prevailing trading conditions as the economy and user demand move through a recovery from the COVID‐19 pandemic.
The Board considers such prudence appropriate and notes that it leaves the Company well positioned to fund organic or acquired growth opportunities that may arise.
In line with the desire to position the Company for growth opportunities, the Board has reactivated the Dividend Reinvestment Plan for the final dividend.
Cash Generation and Capital Management Reported Cash flow from operating activities was $65.5 million, up $21.0 million from the $44.5 million reported in FY19. On a pre‐AASB‐16 basis, which was the basis of the FY19 reported result, cash flow from operating activities was $54.3 million. Measured on either a reported or pre AASB 16 basis, cash conversion result of 98% was achieved compared to 78% in the prior year. Measured on either a reported or pre AASB 16 basis, cash conversion of 98% was achieved compared to 78% in the prior year.
The cash conversion was well ahead of internal targets for the year due to the timing of supplier purchases in the last quarter of the year. This yielded a higher level of payables than usual at year end alongside efforts to tightly manage other net working capital elements.
Net debt was $142.17 million, an increase of $9.4 million over the prior year. The increased debt level is primarily from a combination of higher tax payments, a slight increase in capital expenditure to support innovation and renewal, and a loan to a key supplier to assist in building a new plant.
External Financing
During the year, the Company completed a refinancing of its debt facilities of $225.0 million. The new facilities, which are dominated in AUD or NZD were executed in January 2020 on commercially compelling terms and involve:
A core debt facility with Westpac, National Australia Bank and Citibank for 4 years totalling $150 million. Short term facilities with Westpac and National Australia Bank totalling $25 million which we expect to
renew annually, and, An 8‐year fixed term loan of $50 million with Pricoa.
In addition, on 1 July 2020, the Company secured additional short‐term facilities of $22.5 million. While the facilities are not immediately required and are available for general corporate purposes, the Board believes the renewed and additional facilities will leave the Company well positioned to quickly respond to compelling organic or acquisition growth opportunities which may arise over the coming financial year.
13
8582_GUD_Holdings_Annual Report_2020_Mono.indd 138582_GUD_Holdings_Annual Report_2020_Mono.indd 13 9/9/20 11:59 am9/9/20 11:59 am

Operating and Financial Review
3. Strategy Overview Overview
Throughout the year, the Board and Management continued to refresh and review individual business unit strategy plans. We remain comfortable with the current businesses within the GUD Holdings portfolio and are willing to make logical automotive acquisitions.
At an individual business level, we continue to apply the GUD high‐performance approach for both operational fitness actions and broad strategy execution. In 2019, we introduced the Roger Martin “where to play and how to win” framework to guide strategy development and continue to work with the Ignition Institute to embed the associated strategy framework tools and approach in the businesses. This remains critical as we reinforce the need to ‘futureproof’ our individual businesses.
We have previously mentioned the defence and offence actions guiding the businesses through the COVID‐19 period. Regardless of this period GUD continues to sharpen its strategic direction, at the GUD group‐wide, individual business unit and future acquisition efforts, focussing on three pillars being:
Our belief is the focus on these three key pillars will provide a good level of opportunity for further top and bottom‐line growth. These are not overnight solutions and require a steady and thoughtful approach across the short to medium term. Importantly, we have dedicated resources and continued to utilise cost‐efficient external expertise to leverage the wider Group Management team to pursue results in the Core, Growth and Acquisition workstreams.
4. Risk Review Overview
FY20 represented the second year since the Board created a separate Board committee to focus on Risk and Compliance. This year’s risk reviews added to the foundation work of the prior year and saw fine tuning of risk assessments and greater familiarity with the Alyne risk management tool.
The COVID‐19 pandemic provided an opportunity to test whether the risk mapping, reviews and action plans which had been prepared in the prior year were realistic, complete and effective, which proved to be the case.
This is a significant observation, given the nature of the COVID‐19 pandemic which saw customer demand, supply chain risks and cyber security risks occur in an overlapping time frame.
While we did not foresee the exact nature of the COVID‐19 event, the risk mitigation, business continuity and crisis management plans responded appropriately. As noted earlier in this report, certain levels of disruption were relatively high but at no time did the Company experience an unacceptable or undesirable liquidity event or solvency position.
• Leverage multi-year preferred supplier agreements in select automotive categories
• Quality and logistics councils to leverage scale and skills
• Internal management resources pivoted to address operational fitness opportunities in real estate, logistics, IT and revenue management
• Increased emphasis on achieving supplier costs
• First shared logistics facility opened in Auckland, build capability which could be applied elsewhere
• Individual business unit competitive strategies with appropriate Covid-19 overlays
• Addressing new organic growth pathways with existing customers and a focus on ‘low touch’ exports
• Strengthened resources dedicated to innovation and product development, under our new Chief Innovation Officer
• Established acquisition criteria and decision thresholds including returns above the cost of capital beyond initial integration
• Appropriate balance of opportunity and caution through post-COVID-19 period
• Internally, developing a pool of potential managers for acquired businesses under the leadership of our new Chief People Officer
• Securing new customers and categories through acquisition
AACCQQUUIISSIITTIIOONNPortfolio and Category Plans
GGRROOWWTTHHIndividual Business Unit Strategies
CCOORREEGroup Wide Initiatives
•Strong automotive acquisition and strategy capacity of our dedicated acquisition and strategy leader • AAG integration proof of concept to
establish blueprint for the future
14
8582_GUD_Holdings_Annual Report_2020_Mono.indd 148582_GUD_Holdings_Annual Report_2020_Mono.indd 14 9/9/20 11:59 am9/9/20 11:59 am

Operating and Financial Review
Consequently, there has not been a need to make any fundamental changes to risk themes, key risks or key mitigating action plans. They were complemented by the COVID‐19 response framework and defence actions. The enduring risk themes, key risks, and mitigating actions are:
Risk Themes Key Risks Examples of Mitigating Actions
Customer risks Over reliance on single customers, or new entrants’ routes to market, or potential disruptive existing customer behaviour
Maintain a portfolio of compelling products, broad range of customers, and continually assess both new entrants or new routes to market for GUD and respond accordingly
Production and Supply Chain risks
Over reliance on suppliers resulting on a loss in supply with potential sales impacts
Multiple parallel sourcing for critical items, utilisation of a broad range of suppliers, supplier quality control processes and Quality and Supplier council
Reputation risks Loss of confidence by end user customers or other stakeholders triggered by an event which falls short of community or stakeholder expectations
Policies, education and compliance monitoring for work health and safety, anti‐trust, ethical sourcing, modern slavery, bullying and harassment, bribery and corruption, amongst others
Disruptive Technology risks
Product technical obsolescence such as electric vehicles, new technologies such as autonomous vehicles and digital disruption impacting market and product segments
Product cycle plans, reduce over time the share of internal combustion engine component sales, and build capabilities in new segments and technologies
Financial risks Variability of financial markets impacting the value of foreign currency to nominated assets and liabilities, profits, or sustainability of debt financing
An effective financial risk management committee, long term debt financing agreements, foreign currency instruments and interest swap agreements
People and Culture risks Insufficient key personnel due to either retirement, or departure or inability to develop new talent
People cycle planning, employee engagement surveys and action plans, diversity and inclusion programmes, talent development plans
Legal & Compliance risks Failure to comply with product safety or regulatory compliance requirements leading to fines or product recalls
Maintenance of product compliance certifications, standards and processes, internal policy management reviews and updates, management of regulatory policies (e.g. privacy) and market reporting requirements
Safety risks Employee and contractor workplace physical and mental health and safety incidents leading to injuries or death
Regular safety risks assessments and audits, management of safety events or incidents using Vault, safety KPI's
Information Technology and Cyber risks
Continuity of business or loss or reputation or other assets through physical loss or cyber penetration
Security access controls, security monitoring, business continuity management, disaster recovery processes and off site back up facilities
GUD Management acknowledges that risk environments are not static and need to be monitored with appropriate responses in the risk mitigating processes and action plans. GUD maintains a series of governance and compliance forums, focussed on proactive and reactive risk mitigation initiatives. These forums include:
Regular risk reviews conducted with Business Unit Executive and Leadership team during the Monthly BusinessReviews
15
8582_GUD_Holdings_Annual Report_2020_Mono.indd 158582_GUD_Holdings_Annual Report_2020_Mono.indd 15 9/9/20 11:59 am9/9/20 11:59 am

Operating and Financial Review
Reviews of financial risks tabled with Business Unit finance leaders in Financial Risk Management forums Technology and cyber risks are reviewed regularly and monitored via both IT Council meetings and third‐party
IT security risk monitoring services Workplace safety risks and action plans reviewed during monthly WHS Steering Committee meetings Quality and Supplier council with charter to monitor and mitigate emerging and longer‐term supply and quality
challenges, including ethical sourcing
The key risk themes, key risks and mitigating actions are also periodically tabled with the Board Risk and Compliance Committee.
5. Outlook At this time, GUD would normally provide insights and thoughts on the coming year, with a view on expected industry trends and company prospects. The current COVID‐19 situation and the ever‐changing social and economic landscape gives us less certainty as to the backdrop we operate within.
That said, GUD remains well positioned for the medium to long term horizon. The Automotive division maintains strong brands, products and customer service in support of a large and proliferated car parc which is strongly defensive. The Water division continues to increase its customer intimacy and product line up as pumping and treating water remains an important societal challenge.
The short‐term prospects for GUD are still relatively positive. This is true of the automotive aftermarket, particularly as you consider the potential industry level tailwinds and headwinds.
We need to be clear that things can change daily, and we are not forecasting a return to normality in the near future. In the event the core markets of Australia and NZ don’t enter a prolonged series of lockdown levels, then we would expect vehicle service and repair to still be needed. It should not be overlooked that other structurally attractive drivers of the aftermarket industry were also at play pre‐COVID‐19. The overall car parc growth of the 5 year plus vehicles, more SUVs and Pick‐ups, increased diesel engines and the ongoing proliferation of the vehicle car parc with clearer customer access to the independent workshops through the right of repair legislation have not changed through this period.
Davey continues with its rollout of the strategic vision. We experienced improvements in the first half of the year, although clearly impacted in the latter part. We expect the plan to continue and will not relent on the 4 key strategy execution pillars of People and Culture, Supply Optimisation, Product Innovation and Channels to Market. Our view has remained unchanged as Davey progresses over the next 24 months and pulls through the potential value of the water segment.
Last year, we detailed a series of operational fitness actions such as supply base cost reductions and operating leaner in our businesses to offset large currency movements, domestic cost inflation and a tighter pricing environment. In FY21, we plan for the same level of operational fitness intensity to support our margins going forward. However, this doesn't signal any reduction in new product development or acquisition activity, as we remain committed to ensuring we have the right mid‐term foundations in place for long‐term growth and shareholder value.
16
8582_GUD_Holdings_Annual Report_2020_Mono.indd 168582_GUD_Holdings_Annual Report_2020_Mono.indd 16 9/9/20 11:59 am9/9/20 11:59 am

Operating and Financial Review
Trading and Guidance
We have seen recent Automotive sales in June and first part of July to be above prior comparable period and showing strong double‐digit demand growth. Recent empirical and anecdotal feedback suggests workshop and end customer demand coming back strongly. This is primarily from our Automotive businesses in Australia, more so than our NZ operations. In parallel with this demand, there is a sense from customers this might moderate as the year progresses and they are watching carefully on the changes in government stimulus in the middle to back end of the year. Much of this sentiment is, of course, dependent on whether countries or indeed states are in various forms of lock down or other mobility restrictions.
In this current environment with so many variables at play it is not prudent to put forward any guidance with reliability at this stage. A further update will be provided at the Annual General Meeting on 27 October 2020.
17
8582_GUD_Holdings_Annual Report_2020_Mono.indd 178582_GUD_Holdings_Annual Report_2020_Mono.indd 17 9/9/20 11:59 am9/9/20 11:59 am

Sustainability Review
Highlights
Four of GUD’s automotive businesses were successful in their Automotive Innovation Lab Access Grant applications, jointly securing more than $500k in funding and accelerating their R&D efforts.
Scope 1 emissions were estimated to be slightly in excess of 1 ktCO2e, well below reportable levels. Fuel for transport purposes comprised the major component at 80%.
Safety was rated very highly by employees. For the fourth consecutive year, we received a score that was above the global 75th percentile in our annual employee engagement survey.
Employee engagement lifted by 2 percentage points in our annual employee engagement survey and is now in the Global 75th percentile.
About this Review
This Review covers GUD’s sustainability performance across our Australian and New Zealand operations for the year ended 30 June 2020. Selected Global Reporting Initiative (GRI) Standards were leveraged to inform the content and scope of the report and accordingly, this report is GRI‐referenced. GUD seeks to continuously improve its disclosures utilising the GRI Standards to improve the comparability of our reporting. In that respect, we have sought and received feedback on our first Sustainability Review, issued last year. This feedback reinforces our existing view that we continue and deepen our consultation with stakeholders and that the impact of Climate Change on the economy is increasingly important, not only to our business.
GUD’s Board commissioned Management to prepare this Sustainability Review. The Board sees this review as an opportunity to outline and showcase the impact GUD has on the environment, its people and the communities we operate in, as well as identifying and discussing some of the longer‐term sustainability consequences for the Company. Focussing on the topics that matter Last year, we undertook our first materiality assessment to identify, prioritise and validate the topics that matter most to our stakeholders and our businesses. Whilst we have maintained for this year the list of topics considered, in future, we intend to seek input from a broader range of stakeholders in compiling the topics of materiality. This year we have introduced the topic of climate change. As a holding company, GUD comprises a range of businesses that produce diverse products. We recognise that some of our businesses are more advanced than others in terms of their sustainability practices; however, as an overarching entity we set minimum standards and expect all businesses to achieve these. We have identified and confirmed those environmental, social and governance topics that could impact upon GUD and our stakeholders. In doing so we considered a range of factors, including regulatory and legislative changes, peer benchmarking, GRI Standards, macroeconomic trends and stakeholder feedback on prior year disclosures.
Our material topics Definitions
Health and Safety Embedding a positive health and safety culture in the workplace.
Product Safety and Quality Ensuring our products are designed and manufactured to be safe and of a high quality for their intended use.
Compliance and Competitive Behaviour
Complying with relevant legal requirements and regulations including ensuring that our practices are consistent with the values and policies of the Group and do not restrict competition contrary to the law
Innovation Change that adds value ‐ focussing on new ideas and processes that create value for our customers.
Equality and Non‐Discrimination
Promoting equality and non‐discrimination across our employees and wider stakeholders.
Human Capital and Labour Management
Investing in people and culture strategies to improve employee satisfaction and retention.
Sustainable Procurement Considering legal, environmental and social factors when making procurement decisions.
18
8582_GUD_Holdings_Annual Report_2020_Mono.indd 188582_GUD_Holdings_Annual Report_2020_Mono.indd 18 9/9/20 11:59 am9/9/20 11:59 am

Sustainability Review
Water Management Managing the impacts of water use.
Climate Change The impact of climate change on our businesses, and what we may contribute towards improving the environment and society as a whole
Health and Safety
At GUD, our culture is driven by a strong level of engagement, ownership and accountability for health and safety. This year we continued to reinforce the importance of safety leadership, enhanced business safety plans including key performance indicators and consolidated use of the online reporting tool, giving us greater insight into near miss incidents and recording a wider array of metrics to improve the comparability of our safety performance. In addition, we enhanced our internal WHS audit function with further training and a simpler audit tool.
In addition, as the world headed into uncharted territory as a result of COVID‐19 and its consequences, we made the health and safety of our employees a key priority. This involved driving initiatives to ensure a steady flow of information, communication and contact with all our employees whether temporarily stood down, working from home or attending at their worksite. This level of communication, the nature of which evolved weekly, ensured that our employees were confident of continuing support from GUD throughout the challenging times. Case Study: Work Safe, Home Safe
Safety matters. But how do you make it really matter so that it becomes a personal priority for every employee? At Davey, the Work Safe / Home Safe campaign was designed to do just that. Originally designed to promote open conversation about fatal risks, the initiative used all‐hands on roadshows and interactive competitions and activities that promote safety reflections whilst
connecting teams. When COVID‐19 hit in March, the Work Safe / Home Safe campaign took on an entirely different dimension. For some of the team, the separation between work and home disappeared entirely when they started working from home. The campaign was adjusted to address relevant issues of working safely from home, covering topics ranging from home office safety to wellness and mental health topics. For others, their workplace looked entirely differently, and the support of those team members shifted towards reinforcing workplace hygiene and safety protocols, in addition to promoting wellbeing strategies for all. Taking safety into the home and personal lives of employees has transcended a focus on compliance and ‘at work’ risk mitigation. Work Safe / Home Safe has resulted in numerous examples of employees taking safety seriously at a personal level and has created increased awareness, camaraderie and respect in the Davey team. Today, the team at Davey continue to build a community of people who actively partake in challenges around specific risk areas, who share personal safety stories, and who actively engage online and in‐person to make sure everyone gets to work safe, home safe.
Safety is driven by our leaders Whilst health and safety is everyone’s responsibility, ultimate responsibility for health and safety resides with the Managing Director and Board of Directors. Health and safety is the lead item on every Board, Executive Leadership Group and monthly Business Review meeting and forms part of the standing agenda. The Group Executive and the Board conduct regular safety walks and receive a monthly report which covers a range of leading and lagging indicators including training initiatives, audits completed, corrective action plans implemented, number of work injuries, near misses and number of other incidents. This year a comprehensive safety campaign around the importance of not being complacent and emphasis on reporting of safety concerns was undertaken. A speaker, Alan Newey, shared his personal account of his workplace accident and the years following with all employees. A key message being that the impact a workplace accident has is not only on an individual, but on those around the person.
“Each of you should recognise and understand the responsibility and actions needed in the pursuit of safety for yourself, your co‐workers and anyone who comes into our workplaces. You have my commitment and support to take the right actions to enable a safe working environment, regardless of any business consequence.” Graeme Whickman, Managing Director and CEO
19
8582_GUD_Holdings_Annual Report_2020_Mono.indd 198582_GUD_Holdings_Annual Report_2020_Mono.indd 19 9/9/20 11:59 am9/9/20 11:59 am

Sustainability Review
Our health and safety management system All workers and workplaces at GUD are covered by our workplace health and safety management system. Our management system aligns to AS/NZ 4801, meeting the legislative requirements in Australia and New Zealand; and has been regularly updated to reflect the shifting business context. Key elements prescribed in our health and safety management system and implemented in our business activities include: Each of our businesses have safety business plans in place identifying key performance indicators and
comprehensive risk factors to be managed, responsible persons and timelines that have been committed to in order to improve safety performance. Performance against these are reported on and reviewed with senior management on a quarterly basis.
Employees are involved in the safety decision‐making process through communication, consultation and training. All businesses have health and safety committees comprising representatives of management and workers and individual sites or departments hold regular tool‐box meetings to ensure safety is top of mind.
Each business in the GUD group maintains risk registers and job safety analyses. To inform this process, requirements for conducting risk assessments are contained within the management system.
Key personnel are trained on safety leadership, internal auditing and incident investigation. We maintain and support the use of Vault, an online reporting system for workplace incidents and accidents.
Employees may report directly using the Vault app on mobile phones or workplace‐stationed iPads, or reporting to their supervisors, or via a member of their workplace health and safety committee. All incidents or matters reported via Vault are automatically forwarded to senior management in the business.
Where there is an incident or other safety‐related concern, our safety escalation process enables an individual to report a safety concern initially to his/her immediate supervisor, but if unresolved to progressively report to higher levels of management.
Internal audits are conducted by trained personnel from within the businesses on a rotational basis and provide opportunity for an evaluation of the effectiveness of the health and safety management system. The comprehensive internal audit schedule was updated and rationalised during the year. All businesses have emergency preparedness procedures which are audited as part of the GUD internal audit programme and are tested every six months. The provision of feedback is shared with the business being audited and with other businesses as a learning opportunity.
GUD has a WHS Steering Committee comprising thirty to forty management personnel who meet monthly for the purposes of sharing information and learnings across the Group and recommending initiatives.
A sub‐group of the WHS Steering Committee was formed in early January firstly to ensure that safety risks around the Australian Bushfires and then latterly COVID‐19 received the concentrated focus required in these extraordinary situations. The group, comprised of health, safety and wellbeing leaders from within our businesses delivered the following since January:
o Communication campaigns on health and hygiene matters related to the Australian Bushfires and then latterly COVID‐19;
o Tailored plans to ensure the needs of our people were met in returning to our workplaces; and o A comprehensive mental health and wellbeing program to support our people in adapting to the
impacts of COVID‐19 Businesses are encouraged to introduce proactive programmes focussed on engaging the complete workforce.
These have seen the adoption of exercise programmes, smoking cessation and focus on healthy eating. Focussing beyond the core elements of a health and safety management system to ensure that wider wellbeing,
including mental health, is included as a key area of focus. Offering an employee assistance programme, provided on a confidential basis by an independent third party.
Employees are encouraged to make use of this assistance whether the matter is work‐related or personal. Engaging an external provider (for example, Beyond Blue) in sessions designed to increase awareness and
understanding amongst employees in the areas of anxiety, depression and mental health, training in Mental Health First Aid, the benefits of a mentally healthy workplace and the external resources available.
Training was undertaken throughout the year on the Incident Cause Analysis Method (ICAM) and on safety auditing.
20
8582_GUD_Holdings_Annual Report_2020_Mono.indd 208582_GUD_Holdings_Annual Report_2020_Mono.indd 20 9/9/20 11:59 am9/9/20 11:59 am

Sustainability Review
How we performed
GRI Indicator 403‐9 FY20 FY19
Number Rate/1,000,000 hours worked Number
Rate/1,000,000 hours worked
For employees
Fatalities as a result of work‐related injury 0 0 0 0
High consequence work‐related injuries (excluding fatalities) – in this category we include Lost Time Injuries (LTIs)
4 2.7 5 3.4
Recordable work‐related injuries – in this category we include LTIs (from above) plus Medically Treated Injuries
10 6.8 9 6.0
Main types of work‐related injuries Manual handling, slips, trips and falls Manual handling, slips, trips and falls
Number of hours worked 1,464,942 1,489,008
For all workers who are not employees but whose work and/or workplace is controlled by the organisation (Contractors)
Fatalities as a result of work‐related injury 0 0 0 0
High consequence work‐related injuries (excluding fatalities)
0 0 0 0
Recordable work‐related injuries 0 0 0 0
Main types of work‐related injuries N/A N/A
Number of hours worked 41,189 50,893
Work‐related hazards FY20
The work‐related hazards that pose a risk of high‐consequence injury, including actions taken or underway to eliminate these hazards and minimise risks using the hierarchy of controls.
We have developed controls which respond to identified high‐risk workplace hazards in areas including: Forklift operations Driving Materials falling from heights Individuals falling from heights Electrical safety Manual Handling
21
8582_GUD_Holdings_Annual Report_2020_Mono.indd 218582_GUD_Holdings_Annual Report_2020_Mono.indd 21 9/9/20 11:59 am9/9/20 11:59 am

Sustainability Review
Celebrating our achievements Later this year GUD will be holding its 6th Annual Safety and Innovation Excellence Awards. The number and quality of the nominations for these awards continues to grow. The awards are an opportunity to recognise and celebrate individuals and teams from across the businesses who have demonstrated key attributes in safety leadership. Product Safety and Quality Designing and manufacturing safe, reliable products that meet customers’ needs is a key priority for all GUD businesses. All our products are developed and tested against stringent quality control and assurance processes. Because of the diversity of our products, product safety and quality processes are managed locally by each business unit, which is expected to comply with applicable ISO standards. GUD’s Quality & Supplier Council was established by Management to consider best practices and bring thought leadership to the Group in all aspects of product safety and quality, ethical sourcing, supplier governance, supplier risk management and sustainability. Cross‐business improvement initiatives are identified to enhance the organisation system, supply chain processes, suppliers’ capabilities and the knowledge of Council members in these aspects. Safety is held in very high regard at all GUD businesses and safety extends beyond company walls to those who handle and use our products. One way we monitor our product safety record is by actively managing product recalls. The table below shows GUD’s product recall track record compared to industry benchmarks as reported by the ACCC.
2016 2017 2018 2019
Industry sectors recalls* 201 187 217 260
GUD businesses 1 1 0 1
GUD % of total 0.5% 0.5% 0.0% 0.4%
* Relevant industry sectors to GUD are Cars (within Transport) and Pools and spas (within Outdoor) as reported online at www.productsafety.gov.au/recalls. Case Study: Unparalleled Quality Control and Testing at DBA
Stopping is the most critical function of a car. Poor brake performance or product failure can have grave consequences. And so, ensuring products meet the highest quality standards is of paramount importance. Variations in brake disc rotor thickness can compromise product performance. Disc Thickness Variation (DTV) can cause torque variation which may present itself as pulsation of the brake pedal at low‐brake efforts, vibration through the floor of the vehicle, or steering wheel oscillation. The problem is magnified as the rotor gets hotter—e.g., when carrying greater loads or after travelling downhill with the
brakes on. Over time, this can result in poor brake performance, triggering safety concerns. However, disc thickness variation is generally not visible to the human eye. To test rotor thickness with certainty, the team at Disc Brakes Australia (DBA) have taken delivery and installed a new Disc Thickness Variation (DVT) test facility. As the only test facility of its kind currently available anywhere in Australia and New Zealand, DBA can ensure its Australian designed and manufactured products meet the highest quality standards. In fact, all DBA products are subject to routine quality control and testing using the latest and most advanced equipment. The leaders in automotive braking solutions are proud to be at the forefront of providing quality products that are second to none.
Compliance and Competitive Behaviour The Board and senior management are committed to embedding compliance and competitive behaviour processes across the Group. To support this, our people, governance structures and management systems help us ensure this is part of the way we work. For many years, online training on competitive behaviour has been undertaken by all relevant employees and directors as a part of the suite of mandatory online compliance modules. The training exposes employees to the law, creates awareness around this topic and articulates how we should deal with competitors, suppliers and customers.
22
8582_GUD_Holdings_Annual Report_2020_Mono.indd 228582_GUD_Holdings_Annual Report_2020_Mono.indd 22 9/9/20 11:59 am9/9/20 11:59 am

Sustainability Review
We take this seriously and understand that mismanagement may result in regulatory and financial, as well as reputational impacts. In the past year, we have had no legal actions; hence our GRI Indicator 206‐1 is zero. Innovation
GUD is committed to innovation. Our award‐winning innovation program delivers a relentless focus on the customer. We tap into the creativity of our people to deliver better customer experiences. From the smallest tweak to an existing process to brand‐new business units that disrupt markets, innovation is instrumental in future‐proofing our businesses. Each business has its own innovation and product development framework, one that is tailored to its specific needs. Several group‐wide initiatives tie these individual programs together under a collective banner dedicated to collaboration and shared learning. For example, teams of cross‐functional innovation specialists, known as Innovation Champions internally, have all been trained in the same customer‐focussed methodologies such as design thinking and lean start‐up. The Innovation Community of Practice ties Innovation Champions from across all businesses together. It promotes collaboration and sharing of new and emerging insights. Equally, at the leadership level, GUD’s Innovation Council offers a forum for our senior team to drive innovation strategy and culture. We have partnerships with external parties including academic institutions, industry bodies, innovation labs, start‐ups and specialist agencies. This includes: Planet Innovation, Myriota, Automotive Innovation Centre, UNSW Sydney, Movus, University of Auckland and Callaghan Innovation. In FY20, four of GUD’s automotive businesses were successful in their applications for the Australian Innovation Lab Access Grants scheme. Brown & Watson International secured grant funding for the design and development of innovative trailer safety
solutions. Ryco Filters secured grant funding for the design and development of a wireless module that can transmit
information from sensors connected to various filters to a smartphone. IM Group secured grant funding for the research and development of refurbished hybrid‐electric vehicle battery
technology. Disc Brakes Australia secured grant funding for the development of a new range of rotors specifically designed
to improve the overall life and performance of brake disc rotors by substantially improving cooling performance and outgassing.
Case Study: Circular Economy for Retired HEV Battery Packs
Since 1984, Injectronics has been providing supply solutions for electronic and mechatronic components to the automotive aftermarket and original equipment manufacturers. Today, the brand enjoys a market leadership position in this market and much like those early days in 1984, the company is looking towards the future for growth. With continued focus on R&D and innovation, the team at Injectronics are turning to the next generation of vehicles: hybrid electric vehicles.
As HEVs become more commonplace, so too does the need for HEV‐specific aftermarket products and services. Notably, HEV battery packs deteriorate over time, resulting in longer charge times, lower mileage and a generally lower performance profile. HEV owners have limited choice when it comes to replacing or repairing a retired battery pack. Generical mechanics typically lack HEV‐specific knowledge and local specialist EV repairers cannot access a reputable aftermarket alternative to the original equipment (OE) replacement product. OE products are typically higher‐priced, such that it no longer warrants the investment in an ageing vehicle. As a result, there is no viable, scalable HEV battery refurbishment and resource recovery program in Australia. Injectronics wants to leverage its existing expertise in automotive component remanufacture and repair, distribution and service to provide a quality aftermarket alternative for HEV owners. With federal grant funding support under the Automotive Innovation Access Lab Grants scheme, the company will research and develop testing and balancing equipment to create a circular economy for retired HEV battery packs.
Four of GUD’s automotive businesses were successful in their Automotive Innovation Lab Access Grant applications, jointly securing more than $500k in funding and accelerating their R&D efforts.
23
8582_GUD_Holdings_Annual Report_2020_Mono.indd 238582_GUD_Holdings_Annual Report_2020_Mono.indd 23 9/9/20 11:59 am9/9/20 11:59 am

Sustainability Review
We recognise and celebrate innovation. Innovation is key to our annual Safety and Innovation Excellence Awards. Business units nominate candidates at the individual, team and business level who have exemplified innovation throughout the year. Winners are announced at the Awards night. In addition to formal recognition, winners are awarded prize money to dedicate to furthering their innovation skills or dedicate to innovation projects of their choice. Innovation Award Nomination: Smart Power Management for RVs
Projecta is a leader in automotive power management solutions. When the team at Projecta learned that manufacturers of recreational vehicles (RVs) and caravans were asking for an all‐in‐one solution for all their power needs, the team rose to the challenge. Recognising the inefficiencies and complexities that new technologies have brought to the electrical wiring stage of a caravan build, Projecta partnered with supplier TBB to develop Intelli‐RV – a range of “plug and play” power management systems. The partners vastly simplified wiring for builders, cutting labour time by half. They also reduced electrical footprint by unifying
wiring to a safe and reliable access point, thus further reducing build cost so the savings may be passed onto the end user. What’s more, Intelli‐RV provides consumers with an advanced means of monitoring and controlling the electrical circuits and appliances throughout their caravan or RV at the touch of a button, or via their smart phone. The compact and universal install nature of an Intelli‐RV system allows users with even basic electrical knowledge to retrofit these products to their own caravan or RV, enjoying the benefits of monitoring and controlling their electricals with functionality previously seen only in proprietary factory systems featured in premium models. Projecta won the Most Innovative New Aftermarket Product award at the prestigious Australian Auto Aftermarket Awards in 2019.
Equality and Non‐Discrimination We promote equal opportunity and strive to provide an equitable, inclusive and diverse work environment. In line with our Code of Conduct, this includes providing employees with a workplace free from any kind of discrimination, harassment or intimidation. We commit to promoting fair and equal treatment in employment that does not discriminate on the basis of age, politics, ethnic background, family responsibilities, gender, physical appearance, criminal record, marital status, pregnancy or potential pregnancy, race, religious beliefs or activity, social origin, physical or mental disability, trade union membership or activity, sexual preference or personal association with a person who is identified with any of the above. Our Equal Employment Opportunity Policy highlights this and is intended to set a shared understanding amongst all employees, temporary staff, independent contractors, volunteers and work experience personnel of expectations regarding acceptable and appropriate behaviour within the workplace. We are proud to disclose that there have been no incidents of discrimination reported this year; hence our GRI Indicator 406‐1 is zero. Where there is an incident, we will deal with this in line with best practice investigation procedures. Human Capital and Labour Management Our highly engaged employees enable us to deliver positive outcomes to our stakeholders. GUD’s core values are the principles which the company and individuals live by and which guide our decisions.
24
8582_GUD_Holdings_Annual Report_2020_Mono.indd 248582_GUD_Holdings_Annual Report_2020_Mono.indd 24 9/9/20 11:59 am9/9/20 11:59 am

Sustainability Review
Our focus over many years has been to ensure that our culture fosters a high‐performing and engaged workforce within each of our businesses. Increasingly we are taking strides to bring together all employees to cross‐pollinate ideas and share learnings. This helps bring a focus to teamwork when developing new products and bringing them to existing and new channels. Our workforce is made up of a range of full time, part time and temporary employees.
GRI Indicator 102‐8 FY20 FY19
Male Female Male Female
Number of full‐time employees 545 203 550 217
Number of part time employees 6 27 14 24
Number of temporary employees 13 18 21 16
Total number of employees 564 248 585 257
GRI Indicator 401‐1 FY20 FY19
Number
Rate (% of total
workforce) Number
Rate (% of total
workforce)
Employee new starters by gender
Male 76 9.4% 91 11%
Female 24 3.0% 32 4%
Employee new starters by age group
Under 30 years old 25 3.1% 27 3%
30 ‐ 50 years old 58 7.1% 70 9%
Over 50 years old 17 2.1% 26 3%
Employee new starters by region
Australia 79 9.7% 114 14%
New Zealand 21 2.6% 9 1%
Diversity is seen as a key driver of innovation and company performance. The Board is active in setting and guiding the culture of GUD and brings focus to inclusion in doing so. This year saw the Board’s commitment in this regard evidenced through the recruitment of a second female Director. This year we developed a diversity and inclusion strategy covering the period 2019 to 2022. The strategy was shared with employees through a diversity and inclusion statement signed in December by all business leaders. Our work
Our values Customer Focus – Our customers are important in our priorities; we aim to meet customers’ needs. Professionalism and Respect – We encourage constructive, candid and open communications. We are
accessible. We always treat our people with fairness and equality. We trust our colleagues. Highest Standards of Integrity – We always act honestly. We say what we mean. High Performance and Business Success – Business success secures our future. Our profits permit us to
invest for long‐term customer satisfaction, a rewarding future for our people and a return to the shareholders. We have a bias for action and for achieving results.
Innovation and Continual Improvement – We seek new ways of doing things, taking risks where necessary in pursuing new opportunities.
Teamwork – We acknowledge our interdependence. We give recognition for a job well done.
25
8582_GUD_Holdings_Annual Report_2020_Mono.indd 258582_GUD_Holdings_Annual Report_2020_Mono.indd 25 9/9/20 11:59 am9/9/20 11:59 am

Sustainability Review
aims to strengthen the open culture of each business by ensuring inclusiveness and the contribution of all employees by leveraging differences that exist. Importantly our work focusses on supporting our people to balance their work and caring responsibilities. As an enabler to this we implemented a flexible work policy in December 2019. Training and development are critical elements of our workforce planning. We support development by training our employees within the workplace as well as supporting them to undertake further education. Courses delivered this year have included topics such as safety, first aid, forklift, fire extinguisher, mobile equipment, contractor management, evacuation, manual handling and mental health. Over the past year, we continued to deliver our high‐performance systems education. A cohort of 16 employees from our businesses successfully completed the High‐Performance Masterclass program. This year saw us launch our inaugural Leadership Development Program (LDP). Running over two years, the program contains twelve modules delivered by expert faculty members covering areas of personal and professional development. In addition, open access self‐directed learning has been made available to all employees over the past year. Case Study: Narva Garage sparks DIY learning during lockdown
The team at Narva is passionate about delivering the world’s highest‐quality vehicle lighting products that meet and exceed customer expectations. This goes deeper than investing in research and development and providing outstanding customer service; it also involves educating the customer about auto‐electronics safety and best‐practice. When Australia and New Zealand went into lockdown, the team launched an online video learning series entitled ‘NARVA Garage’ to do just that. The straight‐to‐the‐point, short videos are hosted on Narva’s website,
Facebook page and YouTube channel. They are aimed at providing quick and informative answers to some of the common auto‐electrical questions that the tech support team at Narva encounter from customers, as well as safe and best‐practice DIY advice. The series has made customers feel more confident about working with auto‐electrical products, whether it is the lux and lumens of an LED lightbar, the role relays play in a vehicle starting system, or safe and simple soldering. Since launch, the series has been hosted by workshop owner‐mechanic and 4WD specialist Adam Adler, who won the ‘Face of Narva’ competition and with it the opportunity to host Narva Garage. With viewership growing rapidly plus a rapidly expanding list of topics to cover, Adam needed some help and was soon joined by co‐presenter and competition runner‐up Ross Watson, who himself has turned spanners at Nissan and Subaru and brings a wealth of industry expertise to the series.
We strive to provide our employees with market‐competitive pay rates. Annual salary reviews are conducted and multi‐tiered annual bonuses (where targets are met) are paid across the workforce. This year a comprehensive review was undertaken to ensure that, where applicable, the provisions of relevant Modern Awards are at least met through the annual salary paid. There are five collective agreements in place across the Group. Effective relationships exist between employees, unions and the organisation; and all agreements due for renewal are in the process of being renegotiated, with the following agreements being in place: Davey Water Products Enterprise Agreement dated 2017 (Production Agreement) – under negotiation Davey Water Products Warehouse Enterprise Bargaining Agreement dated 2017 – under negotiation Ryco Filters Australia Enterprise Bargaining Agreement 2018 – expires 31 March 2021 AA Gaskets Enterprise Bargaining Agreement 2018 – under negotiation We conduct an annual employee engagement survey. Six of the seventeen areas measured showed further increase against 2019 results and, whilst in some areas we retreated from a previous high, overall, the employee engagement score improved from 75% to 77%, placing the organisation in the global 75th percentile. Safety is rated very highly by employees with the score rating above the global 75th percentile, for the fourth consecutive year. The recruitment of a Chief People Officer in May 2019 led greater emphasis on talent development and to realising the full potential of the human capital of GUD. Looking forward, we will focus on the continued rollout of the following programmes over the upcoming year:
26
8582_GUD_Holdings_Annual Report_2020_Mono.indd 268582_GUD_Holdings_Annual Report_2020_Mono.indd 26 9/9/20 11:59 am9/9/20 11:59 am

Sustainability Review
Talent and succession plans for critical roles and key talent Learning and development plans to strengthen the effectiveness of leadership and leadership teams across the
businesses In December 2019, we adopted a Speak Up Policy in pursuit of an open culture to enable employees and other stakeholders to raise concerns about conduct on any level. Case Study: Community Support
This year has seen Australians battling through the harshest bushfire and drought conditions our country has ever seen. Davey Water Products has worked together with our dealer network to provide support to impacted communities and businesses. Through February to May 2020, 18 businesses or individual recipients were helped with the donation of a total of nearly $100,000 (RRP) worth of Davey product, helping to provide clean water solutions and pumping options. One such example, working in collaboration with PK Equipment in Sale, is the
support provided to the Jago Family ‐ the owners of Western Kangaroo Island Caravan Park. Kangaroo Island suffered some of the worst damage in the 2019 bushfires. Davey were able to help by donating shallow well pumps to the caravan park. The pumps are used to pump water to the office, the house, and the two camp kitchens that were destroyed in the fire. They will also move water from the dam to the holding tanks that service the caravan park.
Sustainable Procurement GUD is committed to sourcing products in a responsible manner and to supporting our suppliers improve their social and environmental practices. GUD’s businesses source products and services from a range of locations. Whilst approximately 40% of our products are supplied locally in Australia, we source from many other locations including Europe, New Zealand, Taiwan and China. Sourcing products from these regions creates shared economic benefits as well as allowing our businesses to provide affordable products to consumers. Last year we launched our Ethical Sourcing Policy and Ethical Sourcing Code. The policy articulates the minimum standards suppliers should adhere to when conducting business with GUD to ensure that products and services are sourced in a responsible and consistent manner. Our aspiration is to share our knowledge and business practices with our suppliers in an endeavour to improve the lives of workers within our supplier base as well as quality of the product. The Ethical Sourcing Code covers guidance and minimum expectations with respect to slavery practices, labour standards, health and safety, discrimination, the environment and business ethics and is available on the GUD website. This year, we received responses from many of our priority tier‐one suppliers to assess their level of alignment with the minimum standards within the Ethical Sourcing Code. We also extended the scope of our coverage beyond our initial priority suppliers, where priority was determined by geography, industry or materiality, to include less material suppliers. For suppliers that may not meet our requirements, we intend to investigate the key gaps and more importantly, work with them to improve their practices. The suppliers who have conducted their operations in accordance with the Code are categorised as ‘gold’ suppliers in our system and when making procurement decisions they are automatically identified as preferred suppliers. With the introduction of Modern Slavery legislation in late 2018, GUD took steps to integrate its initiatives on Ethical Sourcing into its programme for preparing our first Modern Slavery Statement, to be published in November 2020. Water Management We understand the challenge of water scarcity in the Australian context and through our Davey Water Products business have the capability to impact this in a positive way. To inform our product development process, we commissioned research to understand consumer attitudes toward water management and how these fit with their lives of consumers. Stemming from this, we know that water management is important to a broad cross section of our customers because of limited supply, particularly in remote areas of Australia. Water management for our customers is about knowing how much water is being used and to protect water supply through detecting leaks. We have several water management solutions in our range and are continuously investing in new opportunities that seek to meet the challenges faced by our customers.
27
8582_GUD_Holdings_Annual Report_2020_Mono.indd 278582_GUD_Holdings_Annual Report_2020_Mono.indd 27 9/9/20 11:59 am9/9/20 11:59 am

Sustainability Review
Case Study: Water Management Research for Drought Proofing
Davey Water Products has been manufacturing products that help protect and enhance lives for 85 years. So, when a research farm was looking for a system that allows scientists to test water management practices for drought proofing, the team rose to the challenge. The research farm had an ageing water infrastructure that was neither reliable, nor flexible enough to meet the growing and varying demands of the researchers. Davey delivered a sophisticated system for transferring water between dams and tanks, and even mix water, around the site to where stock is kept. A series of
solar‐powered bore pumps and vertical multi‐stage pumps is tied together with a communication system that allows scientists to monitor and control water management remotely. Today, the farm has a water management system that is largely future‐proof, very flexible and expandable. It allows scientists to study the impact of water quality on stock watering and feed quality for drought‐proofing purposes. Water management information and practices are passed on to farmers so they may take the opportunity to preserve the water resource on their farm sustainably. This is just one example of how Davey leverages its expertise to improve water management practices throughout Australia and the world.
Case Study: Water Treatment in Hospitals
Acqua by Davey is Davey Water Products’ specialised water treatment solutions business. Their team of expert water treatment engineers develops systems to monitor and manage water quality in a range of industries. Increasingly, Acqua by Davey is partnering with hospitals and day surgeries in Australia and New Zealand to improve their water management practices. One example is how Acqua by Davey helps Central Sterile Services Departments (CSSDs) become compliant with impending water standards. A hospital’s CSSD is responsible for cleaning, disinfecting and sterilising reusable medical equipment. The water used in this process must meet strict quality guidelines and standards, not in the least to safeguard patient safety. As the medical sector readies itself to meet impending regulations, many hospitals find that existing suppliers lack the water treatment expertise required to deliver a solution that meets
their unique needs, and a one‐size‐fits‐all solution simply does not exist. Acqua by Davey delivers engineered solutions to produce water quality that is compliant to the industry standard and fit seamlessly into a CSSD’s operating rhythm and unique layout. Using high‐quality water helps reduce corrosion, scale build‐up, and visible staining of instruments. This extends the useful life of these instruments by reducing the risk of micro‐organism growth. IN FY20, Acqua by Davey commissioned water treatment solutions for eight hospitals.
Energy Usage At the instigation of the Board, this year we sought assurance on the level of energy usage and greenhouse gas emissions across the businesses. A study was undertaken and the Board received a report confirming that based on the data analysed for FY19, GUD did not meet the reporting thresholds defined in the National Greenhouse and Energy Reporting Regulations at either a facility or corporate group level.
28
8582_GUD_Holdings_Annual Report_2020_Mono.indd 288582_GUD_Holdings_Annual Report_2020_Mono.indd 28 9/9/20 11:59 am9/9/20 11:59 am

Sustainability Review
Scope 1 emissions, often referred to as ‘direct emissions’, are emissions released to the atmosphere as a direct result of an activity, or series of activities, at a facility level. For GUD, scope 1 emissions were estimated to be slightly in excess of 1 ktCO2e. Fuel for transport purposes comprised the major component at 80%. Scope 2 emissions, often referred to as ‘indirect emissions’, are emissions released to the atmosphere from the indirect consumption of an energy commodity. For GUD, scope 2 emissions were estimated to be slightly in excess of 3 ktCO2e. These emissions originate from the aggregated electricity usage at each of the GUD sites. The aggregated GUD’s scope 1 and scope 2 emissions were analysed against the reporting thresholds defined in the NGER Regulations 2008. GUD is generating approximately 4.1 (scope 1 and scope 2) ktCO2e, well below the present reporting thresholds at a facility level (25 ktCO2e) or at a corporate group level (50 ktCO2e). In the absence of a significant acquisition or a reduction in the reporting thresholds, GUD does not envisage it will need to report under the NGER Regulations. Whilst this demonstrates that GUD is not a significant contributor to emissions, the Board nevertheless is cognisant of the need to reduce emissions across the whole of industry and so continue with the monitoring of the GUD emissions and encourage strategies within the businesses to reduce emissions in a sustainable way. Addressing Climate Change The GUD Board determined last year to develop a strategy integrating climate change considerations into its overall strategic planning. Once approved, this will formalise the broad acknowledgment, held over the last three to five years, of the fact of climate change and implications for the GUD businesses. Some two years ago the Board, under questioning from investors and analysts alike, determined to maintain its investment and reinvest in the water business rather than divest and become a single‐focus automotive aftermarket company. Behind this decision lay two factors: first, a realisation that there was significant value upside in the water business and that a strategy needed to be found to unlock that value for GUD shareholders; and, second, a conscious acknowledgement that water was (is) an increasingly scarce commodity although under‐valued and that the water business represented an opportunity for GUD to participate in that market. Investment over the last two years has generated sizeable opportunities for the water business as have been described in the Operating and Financial Review. Whilst the Board develops its strategic policy around climate change, the potential for the water business gives the Board a strong business on which to build one aspect of that strategy. The Board has been well cognisant of the de‐carbonisation of many aspects of industry and with the introduction of electric vehicles in the automotive industry in particular. GUD is well placed to take advantage of these changes and extract value from the decline in new internal combustion engine vehicle sales over the coming decades by providing replacement or wear parts to an ageing car parc of vehicles equipped with internal combustion engines. Further, the Board has followed a strategic path for five years now of seeking to diversify GUD’s automotive businesses away from, and dilute the impact of, exposure to the internal combustion engine. The acquisitions of Brown and Watson International and Innovative Mechatronics Group are both in the automotive replacement or aftermarket industry, but with lesser or minimal exposure to the internal combustion engine. Exposure to the internal combustion engine is but one factor the Board considers when presented with an acquisition opportunity. That does not mean the Board will not consider acquisitions of businesses wholly or largely exposed to the internal combustion engine, particularly if there is an attractive rate of return to be earned from what is regarded as a sunset industry or business. The Board recognises these beginnings of a strategy to address the impact of climate change on the future existence of GUD and now recognises it must begin to articulate a comprehensive strategy for the benefit of all stakeholders in the Company, in particular its long‐term employees and shareholders. Impact of COVID‐19 on GUD’s Material Sustainability Topics As with all businesses, the impact of COVID‐19 has necessitated significant attention since early 2020. Very early on we established a framework of People Health, Operational Health and Financial Health to guide our focussed efforts around COVID‐19. Two response groups encompassing all businesses were established – an executive leadership team and a planning and action team. These teams supported our regular updates to the Board of Directors and ensured regular communication of material information and, importantly, determined the key actions to be undertaken in a coordinated and cohesive way. Our COVID‐19 response has been undertaken in a way that balances the needs of key stakeholders and with actions to ensure the safety and wellbeing of our people. Key actions taken under our People Health, Operational Health, Financial Health framework includes the following:
29
8582_GUD_Holdings_Annual Report_2020_Mono.indd 298582_GUD_Holdings_Annual Report_2020_Mono.indd 29 9/9/20 11:59 am9/9/20 11:59 am

Sustainability Review
People Health Distribution of regular safety guidance bulletins on preventative measures and health & wellbeing information Increasing office and facility cleaning Early on establishing a transparent and mutually agreed approach around continuity of work so that our people
had certainty of how they would be supported by our businesses Regularly communicating with our people using a variety of mediums Making additional sick leave available to staff during COVID‐19 period including carers leave Provision of a comprehensive guide to travel and meeting protocols and employee support mechanisms in place Enablement of flexible working arrangements where required along with support to ensure effective remote
working Implementing revised work processes and arrangements to ensure increased social distancing for warehouse
and sales staff Operational Health Increasing our regular supplier communications and engagement Activation of dual sourcing where necessary Working closely with freight forwarders Increasing regular customer communication and engagement and closely and actively managing customer
needs Fast tracking the deployment of technology to support a remote workforce where needed Implementing business continuity measures such that we could leverage common technology platforms to limit
impact to our customers in the event of a workforce disruption due to illness Financial Health Proactive Q&A dialogue with equity analyst and institutional investors Conducting debt financier briefings Undertaking financial modelling of potential impacts on demand, EBIT and cash flow Consideration of impact on debt levels, borrowing capacity and debt covenants and acquisition funding capacity Case Study: Mental Health and Wellbeing at Ryco Filters
As the COVID‐19 pandemic hit, the health and safety leaders of GUD’s businesses joined forces to develop mental health and well‐being programmes to support their teams. At Ryco Filters, all senior managers were assigned virtual teams of employees who did not include any of their direct reports. During weekly check‐ins these teams talk about wellbeing and discuss any concerns with the mental health first aider or an appropriate senior manager. This has proven to be a positive initiative for both the leaders and their teams in getting to know each other better as well as not feeling isolated during unchartered times.
In addition, the Ryco Community Team was created, where all employees can engage in conversation and share experiences with each other, both work and social. The Community started a Friday Clean‐up routine to ensure work‐at‐homers followed a cleaning regime established at head office. Virtually together as a team, everyone worked to music to create a clean, safe workplace for the next week. Finally, the team at Ryco created a care package that was sent out to all staff in Australia and New Zealand. With a personalised note from management, the package contained a limited‐edition mouse pad with an inspirational safety message, pens, drink coasters and other ‘feel good’ components. The feedback on what seems a simple gesture, in addition to staff support available through GUD Holdings, was very well received by the team. It was important to show continuing efforts to maintain the Ryco Community. Not surprisingly, employee engagement levels at Ryco, and other GUD businesses for that matter, rank in the top quartile globally.
30
8582_GUD_Holdings_Annual Report_2020_Mono.indd 308582_GUD_Holdings_Annual Report_2020_Mono.indd 30 9/9/20 11:59 am9/9/20 11:59 am

Remuneration Report
This report forms part of the Directors’ Report and has been audited as required by Section 308(3C) of the Corporations Act 2001 and has been prepared in accordance with the Corporations Act 2001. The report is outlined in the following sections: 1. Who this Report Covers 2. Remuneration Governance 3. Senior Executive Remuneration Strategy and Structure 4. Remuneration for the Managing Director and Senior Executives 5. Link between Performance and Remuneration Outcomes 6. Service Agreements 7. Non‐Executive Directors’ Remuneration 8. Other KMP Transactions
1. Who this Report Covers The key management personnel (including Non‐Executive Directors) of GUD Holdings Ltd, and its subsidiaries, during the year FY20 have been identified as the following persons:
M G Smith (Non‐executive) A L Templeman‐Jones (Non‐executive) G A Billings (Non‐executive) D D Robinson (Non‐executive) J A Douglas (Non‐executive) – Appointed 1 March 2020 G Whickman (Managing Director) M A Fraser (Chief Financial Officer)
During the last quarter of FY19 in response to an overall strategic review and following changes in a number of executive roles and responsibilities, the Managing Director reviewed how we would best move forward supporting the five key topic areas of Customer Relationships, Supplier Engagement, People Cycle Planning, Product Cycle Planning and Operational efficiency outlined in the prior year’s Annual report. The review resulted in the Managing Director and Group CFO assuming a number of key responsibilities from the individual business unit leaders and the establishment of a flatter leadership structure complemented with a number of Group subject matter experts. This change has seen both leaders be more directly involved in key customer relationship management and decision‐making including business unit strategy formulation and execution including through group wide Councils they chair involving the topic areas of Innovation, Supply Chain, and IT. The changes also see more direct involvement in the sign‐off of People or Product Cycle Plans together with business leaders and Group subject matter experts. As a consequence, the company has reviewed the senior leadership roles and determined that Key Management Personnel (KMP) definition is now satisfied in the case of the Board, Managing Director, and the Group CFO. This report refers to these KMP as Senior Executives. For the prior financial year (FY19), the report discloses information relating to those personnel who met the KMP definition in that year. The key management personnel (including Non‐Executive Directors) of GUD Holdings Ltd, and its subsidiaries, in the prior financial year were the following persons:
M G Smith (Non‐executive) A L Templeman‐Jones (Non‐executive) G A Billings (Non‐executive) D D Robinson (Non‐executive) G Whickman (Managing Director from 1 October 2018) J Ling (Managing Director until 30 September 2018) M A Fraser (Chief Financial Officer) R Pattison (General Manager Automotive Acquisition & Strategy) D Worley (Chief Executive – Davey Water Products Pty Ltd) T Cooper (Managing Director – Wesfil Australia Pty Ltd) G Nicholls (Chief Executive ‐ Ryco Group until 6 May 2019) G Davies (Chief Executive – Brown and Watson International Pty Ltd)
31
8582_GUD_Holdings_Annual Report_2020_Mono.indd 318582_GUD_Holdings_Annual Report_2020_Mono.indd 31 9/9/20 11:59 am9/9/20 11:59 am

Remuneration Report
2. Remuneration Governance The Remuneration, People and Culture Committee is responsible for making recommendations to the Board on remuneration policies and packages applicable to the Managing Director and Senior Executives (collectively, Senior Executives). The Remuneration, People and Culture Committee consists of the five Non‐Executive Directors and is responsible for determining a framework and broad policy for remuneration. Amongst other things, it advises the Board on remuneration policies and practices in general, and makes specific recommendations on fees, remuneration packages, incentives and other terms of employment for Senior Executives. A copy of the Remuneration, People and Culture Committee Charter is available under the Governance section of the Company’s website. The Senior Executives do not participate in any decision relating to their own remuneration.
3. Senior Executive Remuneration Strategy and Structure
Remuneration Strategy
Our remuneration strategy is designed to attract, retain and motivate appropriately qualified and experienced Senior Executives. Our strategy ensures we are well positioned to deliver reasonable and market competitive rewards in a way that supports a clear performance focus and is aligned with the long‐term goals of the Group.
In determining the Senior Executives’ remuneration, we have developed remuneration guiding principles to assist in decision‐making:
The remuneration structure is relevant and simple for Senior Executives and shareholders to understand.
Our remuneration practices support the delivery of long‐term business strategy and provide a clear link between Group performance and remuneration outcomes.
Remuneration levels are sufficient to attract and retain key talent and be competitive.
We have clearly defined and disclosed remuneration processes and structures that reflect shareholder views and objectives.
Our incentive plans are carefully designed to balance the twin imperatives of short‐term performance and long‐term enhancement of shareholder value and are regularly reviewed to ensure alignment with corporate governance principles.
The Remuneration, People and Culture Committee is committed to continuing to review and refine the remuneration strategy to ensure it meets the changing needs of the Group and remains aligned to shareholder interests.
The Committee has undertaken a review of the remuneration strategy in the current financial year and resolved to make no structural change.
Remuneration Structure The remuneration framework provides a mix of fixed and variable remuneration and has five components:
Fixed remuneration; Other employment related benefits; and “at risk” remuneration including:
Short‐term incentives (STI); Long‐term incentives (LTI); and Special incentives.
These comprise the total remuneration paid to Senior Executives. Our approach is to position the maximum “at risk” components of Senior Executives’ remuneration relative to total maximum remuneration, to around 45 per cent, and 50 per cent in the case of the Managing Director. In the absence of any special incentives, the remuneration mix for the Senior Executives is as follows:
32
8582_GUD_Holdings_Annual Report_2020_Mono.indd 328582_GUD_Holdings_Annual Report_2020_Mono.indd 32 9/9/20 11:59 am9/9/20 11:59 am

Remuneration Report
Fixed Remuneration and Other Employment Related Benefits The remuneration packages for the Senior Executives contain a fixed amount that is not performance linked. The fixed remuneration consists of base salary, as well as employer contributions to superannuation funds. Fixed remuneration for Senior Executives is determined by reference to the scope of their positions and the knowledge, experience and skills required to perform their roles. Periodically, independent consultants provide benchmark information, analysis and/or advice to the Remuneration, People and Culture Committee to ensure the packages are competitive in the market with comparable roles. We have adopted a desired market positioning around the median of the peer group. The Company has not received remuneration recommendations from an independent consultant during the year ended 30 June 2020. The Remuneration, People and Culture Committee, through a process that considers individual, business unit and overall Group performance, reviews fixed remuneration annually. Fixed remuneration levels are generally not adjusted during the year unless the individual is promoted or there is a substantial change in market rates. Senior Executives receive non‐cash benefits in the form of salary continuance insurance and other benefits, refer table 4.1 for further information. In addition, Senior Executives receive annual and long service leave. COVID‐19 Impacts As a result of COVID‐19, two principle changes have been enacted in respect of fixed remuneration: 1. Senior Executives and the Board agreed to temporary monthly fixed remuneration reductions of between 10 to
20% pro rata in the fourth quarter of the year ended 30 June 2020, which will extend into the first quarter of the next financial year, subject to monthly review of trading performance.
2. A decision was made to defer annual remuneration reviews and any increases up to December 2020.
Short Term Incentive (STI) The Board considers that basing the STI payments on Cash Value Added (CVA) performance aligns the interests of the Senior Executives with the interests of shareholders in the businesses being operated profitably. The current STI plan provides an annual bonus for achieving or exceeding an agreed CVA target and is paid following the announcement of the Group’s year‐end results. CVA targets are set with reference to agreed EBIT pre significant items targets and the weighted average cost of capital employed. CVA measures a true level of performance of the business by comparing trading profit performance (being reported profit adjusted for non‐recurring items) with the return required on the net assets used by the businesses, generally a measure of weighted average cost of capital. This requires Management to drive both trading profit and carefully manage the balance sheet. Acquisition and disposal costs are excluded from the CVA calculation due to their one‐off nature, which can be difficult to budget with certainty and consequently including them could discourage growing shareholder value through business portfolio changes. For each financial year:
In respect of key management personnel– STI bonuses will only be paid where Group CVA performance exceeds the Group CVA performance of the prior year and the Group CVA target.
CVA targets for each business unit and for the Group overall will be established by the Remuneration, People and Culture Committee in the first quarter of the financial year.
The Remuneration, People and Culture Committee determines actual STI bonuses after the conclusion of the financial year in accordance with the plan rules. The Board continues to view CVA as the most appropriate annual performance measure. CVA targets and outcomes are not published because the Board regards them as commercially sensitive. STI bonuses are calculated as a percentage of fixed remuneration. When the CVA target is achieved, the target STI bonus is paid in full. If the CVA target is exceeded, the STI bonus increases up to a ceiling of no more than 150 per cent of the target STI bonus, generally upon achieving 120 per cent of CVA target. No STI is paid where CVA performance falls below the CVA target.
33
8582_GUD_Holdings_Annual Report_2020_Mono.indd 338582_GUD_Holdings_Annual Report_2020_Mono.indd 33 9/9/20 11:59 am9/9/20 11:59 am

Remuneration Report
Details of the CVA STI bonuses payable to the Senior Executives for the year ended 30 June 2020 are set out in section four of this Report. From and including the financial year commencing 1 July 2019, the Remuneration, People and Culture Committee and the Board have included two qualifying performance thresholds for STI bonuses to be awarded. Firstly, the business CVA dollars achieved must exceed the prior year, and secondly, the EBIT pre significant items dollars must grow over the prior year by hurdle growth rates endorsed by the Board on an annual basis.
Long Term Incentive (LTI) The Board considers that measuring Executives’ performance for LTI purposes by reference to the Group’s total shareholder return (TSR) relative to a comparator group closely aligns the LTI component of their remuneration with the interests of shareholders. The comparator group is the Standard and Poor’s ASX Small Ordinaries index, of which the Group forms part, modified to exclude stocks in the mining, materials and energy industries. It was chosen on the basis that it is the most effective way to measure and reward the extent to which shareholder returns are generated relative to the performance of companies that compete with the Group for capital and employees. The comparator group typically comprises over 130 companies. LTI bonuses are provided as performance rights, granted at the commencement of the relevant three‐year performance measurement period, which will convert to an equivalent number of GUD shares if the performance hurdle is achieved over the relevant three‐year performance measurement period. The performance hurdle, described in more detail below, means that no performance rights will vest as GUD shares unless the Company’s Total Shareholder Return (TSR) is equal to or better than the TSR of the median company in the comparator group. No amount is payable for the issue of performance rights, or for the shares received upon vesting of those performance rights. The plan has, for many years, been in line with market norms although in recent years, there has been experimentation in the market with other performance measures. Nevertheless, the Board continues to believe the LTI plan supports the delivery of the Group’s long‐term strategy and encourages the Senior Executives to hold an exposure to equity. We have made changes recently that enhance this last aspect, by permitting Senior Executives to defer exercise of performance rights that vest (and hence the receipt of the shares), for up to 15 years from the date of grant. This change has potential taxation advantages (in the form of income deferral) for the Executive and comes at only a slight increase in administrative cost to the Company. The maximum number of performance rights granted is set as a percentage of the Senior Executives’ fixed remuneration on grant, re‐stated as a number of performance rights, determined by applying the share price, being the Volume Weighted Average Price over the month of June immediately prior to the commencement of the relevant year of grant. Participation in the plan is subject to Remuneration, People and Culture Committee recommendation and Board approval. In the case of the Managing Director, shareholder approval is also required, and is sought at the Annual General Meeting prior to the Board formally granting the performance rights to the Managing Director. After the cessation of employment of a participating executive, the Board has the discretion whether to allow a pro rata portion of the granted performance rights to remain ‘on foot’ subject to the plan rules and the performance criteria. The remaining performance rights of a departing Executive lapse in accordance with plan rules. Following the end of the three‐year performance measurement period, the Board receives an independent calculation of the Company’s TSR performance against the comparator group over the performance measurement period. The vesting schedule for performance rights equity‐based awards is as follows:
STI STI
Bonuses as a per cent of fixed remunerationThreshold
performanceStretch
performance LTI
Managing Director 26.67 40.00 60.00
Chief Financial Officer 35.00 52.50 30.00
% of salary at
34
8582_GUD_Holdings_Annual Report_2020_Mono.indd 348582_GUD_Holdings_Annual Report_2020_Mono.indd 34 9/9/20 11:59 am9/9/20 11:59 am

Remuneration Report
TSR performance % of LTI that vests
TSR below 50th percentile Nil
TSR at 50th percentile 50
TSR between 50th and 75th percentile Progressive vesting from 50 to 100
TSR at 75th percentile and above 100
Under prevailing accounting standards, the potential cost to the Company from granting performance rights is calculated as the fair value of those performance rights at grant and that amount is accrued over the three‐year performance measurement period. The rules of the LTI plan include provisions that prohibit participants entering into transactions (whether through the use of derivatives or otherwise) which limit the economic risk of participating in the scheme. In respect of LTI grants made from and including the financial year commencing 1 July 2018, the Remuneration, People and Culture Committee and the Board have included an additional performance threshold: that the Company’s absolute TSR performance over the performance measurement period must be positive. This additional requirement will first take effect in respect of performance rights granted in July 2018, due to vest (if meeting the performance threshold) in June 2021.
Special Incentives From time to time, the Remuneration, People and Culture Committee may approve a special incentive to a selected employee aligned to the attainment of particular outcomes which align with shareholder interests and value. Special incentives may be paid as performance rights or other salary. No special incentives were offered or paid to KMP in respect of financial year ended 30 June 2020.
35
8582_GUD_Holdings_Annual Report_2020_Mono.indd 358582_GUD_Holdings_Annual Report_2020_Mono.indd 35 9/9/20 11:59 am9/9/20 11:59 am

Remun
eration Re
port
4.1
Remun
eration for the
Man
aging Director and
Sen
ior E
xecutiv
es
Details of the
nature and am
ount of e
ach major elemen
t of rem
uneration of th
e Executive Directors a
nd Sen
ior E
xecutives are:
1
Salary inclu
des b
ase and othe
r salary, net of C
OVID 19 adjustmen
ts fo
r the
2020 fin
ancia
l year.
2 Income protectio
n insurance is on
ly offe
red to age 65.
3 Th
e fair value of perform
ance rights granted
und
er th
e 2020, 2021 and 2022
perform
ance rights plans are su
bject to achievem
ent o
f TSR
hurdles and
were calcu
lated by
inde
pend
ent e
xperts usin
g a Mon
te‐Carlo simulation valuation. The
fair value is allocated
to each repo
rting pe
riod even
ly from
the date of grant to
the vesting date. The
value
disc
losed in th
e Re
mun
eration table above is the po
rtion of th
e fair value of th
e pe
rform
ance rights expen
sed du
ring the year end
ed 30 June
2020.
4 Jonathan
Ling
ceased
to be a KM
P on
30 Septem
ber 2
018
5 Gu
y Nicholls ceased
to be a KM
P on
6 M
ay 2019.
Sala
ry 1 a
nd
fees
STI b
onus
Leav
e en
title
-m
ents
Inco
me
prot
ectio
n pr
emiu
m 2
Oth
er
bene
fits
Tota
l Lo
ng s
ervi
ce
leav
e
Equi
ty fa
ir
valu
e of
pe
rfor
man
ce
righ
ts 3
Supe
ran-
nuat
ion
Tota
l
Prop
ortio
n of
to
tal r
isk
rela
ted
rem
uner
atio
n
Val
ue o
f equ
ity
rem
uner
atio
n as
a
prop
ortio
n of
to
tal
rem
uner
atio
n
$$
$$
$$
$$
$$
%%
G W
hick
man
2020
953,
342
-
48,6
71
1,9
48
-
1,0
03,9
61
16,4
17
164
,362
25
,000
1
,209
,740
13
.6
13.6
G
Whi
ckm
an20
19
71
2,50
0
- (3
50)
1,4
90
-
7
13,6
40
11,7
99
59
,410
25
,000
809
,849
7
.3
7.3
Form
er M
anag
ing
Dire
ctor
J P
Ling
420
19
23
4,25
4
- (2
4,85
0)
432
-
209
,836
(9
0,76
6)
1
55,1
34
25,0
00
2
99,2
04
51.8
51
.8
Chi
ef F
inan
cial
Off
icer
-
M F
rase
r20
20
59
6,16
1
-
32
,817
1
,787
-
630
,765
11
,658
1
03,3
10
25,0
00
7
70,7
33
13.4
13
.4
M F
rase
r20
19
59
3,88
7
-
29
,537
1
,634
-
625
,058
26
,405
1
03,1
34
25,0
00
7
79,5
97
13.2
13
.2
Prio
r Ye
ar K
MP'
sR
Patti
son
2019
575,
000
-
13,4
60
-
-
5
88,4
60
(39,
271)
98
,684
25
,000
672
,873
14
.7
14.7
G D
avie
s 20
19
47
5,00
0
-
3
,119
517
-
478
,636
27
,914
66,1
22
25,0
00
5
97,6
72
11.1
11
.1
G N
icho
lls 5
2019
550,
000
-
61,3
45
1,4
10
-
6
12,7
55
1
03,3
86
86
,055
25
,000
827
,196
10
.4
10.4
D W
orle
y20
19
48
1,47
9
- (1
,851
)
-
-
479
,628
11
,695
85,5
72
25,0
00
6
01,8
95
14.2
14
.2
T Co
oper
2019
490,
000
1
83,3
14
41,3
98
-
-
7
14,7
12
9,4
09
83
,445
25
,000
832
,566
32
.0
10.0
2020
1,
549,
503
-
81,4
88
3,7
35
-
1,6
34,7
26
28,0
75
267
,672
50
,000
1
,980
,473
20
19
4,11
2,12
0
183
,314
121
,808
5
,483
-
4
,422
,725
60
,571
7
37,5
56
2
00,0
00
5,4
20,8
52
2020
749,
751
-
-
-
-
7
49,7
51
-
-
69
,645
819
,395
20
19
70
5,49
3
-
-
-
-
705
,493
-
-
64,6
84
7
70,1
77
2020
2,
299,
254
-
81,4
88
3,7
35
-
2,3
84,4
77
28,0
75
267
,672
119
,645
2
,799
,869
20
19
4,81
7,61
3
183
,314
121
,808
5
,483
-
5
,128
,218
60
,571
7
37,5
56
2
64,6
84
6,1
91,0
29
Shor
t-ter
m e
mpl
oym
ent b
enef
itsLo
ng-te
rm b
enef
its
Tota
l rem
uner
atio
n of
the
Man
agin
g Di
rect
or a
nd S
enio
r Ex
ecut
ives
of t
he G
roup
Tot
al r
emun
erat
ion
of N
on-E
xecu
tive
Dire
ctor
s
Tot
al r
emun
erat
ion
(com
pens
atio
n of
key
man
agem
ent p
erso
nnel
of t
he G
roup
)
Year
Man
agin
g Di
rect
or
8582_GUD_Holdings_Annual Report_2020_Mono.indd 368582_GUD_Holdings_Annual Report_2020_Mono.indd 36 9/9/20 12:00 pm9/9/20 12:00 pm
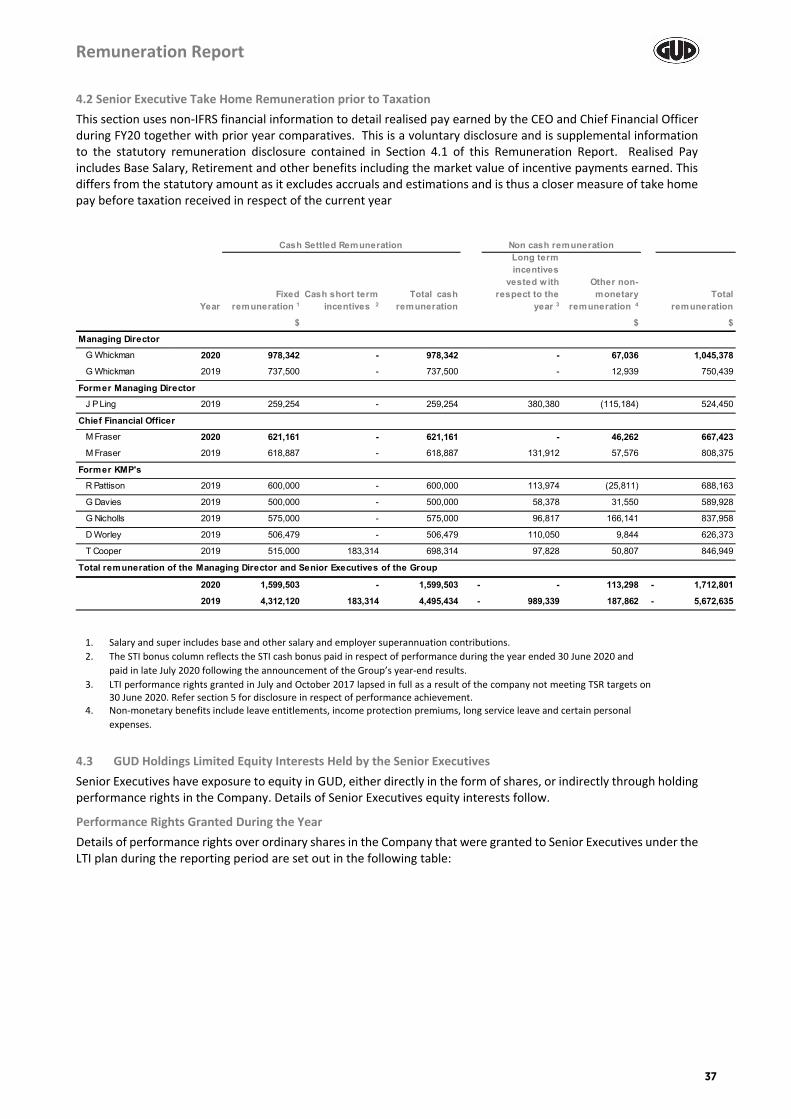
Remuneration Report
4.2 Senior Executive Take Home Remuneration prior to Taxation This section uses non‐IFRS financial information to detail realised pay earned by the CEO and Chief Financial Officer during FY20 together with prior year comparatives. This is a voluntary disclosure and is supplemental information to the statutory remuneration disclosure contained in Section 4.1 of this Remuneration Report. Realised Pay includes Base Salary, Retirement and other benefits including the market value of incentive payments earned. This differs from the statutory amount as it excludes accruals and estimations and is thus a closer measure of take home pay before taxation received in respect of the current year
1. Salary and super includes base and other salary and employer superannuation contributions. 2. The STI bonus column reflects the STI cash bonus paid in respect of performance during the year ended 30 June 2020 and
paid in late July 2020 following the announcement of the Group’s year‐end results. 3. LTI performance rights granted in July and October 2017 lapsed in full as a result of the company not meeting TSR targets on
30 June 2020. Refer section 5 for disclosure in respect of performance achievement. 4. Non‐monetary benefits include leave entitlements, income protection premiums, long service leave and certain personal
expenses.
4.3 GUD Holdings Limited Equity Interests Held by the Senior Executives Senior Executives have exposure to equity in GUD, either directly in the form of shares, or indirectly through holding performance rights in the Company. Details of Senior Executives equity interests follow.
Performance Rights Granted During the Year Details of performance rights over ordinary shares in the Company that were granted to Senior Executives under the LTI plan during the reporting period are set out in the following table:
YearFixed
remuneration 1Cash short term
incentives 2Total cash
remuneration
Long term incentives
vested with respect to the
year 3
Other non-monetary
remuneration 4Total
remuneration
$ $ $
Managing DirectorG Whickman 2020 978,342 - 978,342 - 67,036 1,045,378 G Whickman 2019 737,500 - 737,500 - 12,939 750,439
Former Managing DirectorJ P Ling 2019 259,254 - 259,254 380,380 (115,184) 524,450
Chief Financial OfficerM Fraser 2020 621,161 - 621,161 - 46,262 667,423 M Fraser 2019 618,887 - 618,887 131,912 57,576 808,375
Former KMP'sR Pattison 2019 600,000 - 600,000 113,974 (25,811) 688,163
G Davies 2019 500,000 - 500,000 58,378 31,550 589,928
G Nicholls 2019 575,000 - 575,000 96,817 166,141 837,958
D Worley 2019 506,479 - 506,479 110,050 9,844 626,373
T Cooper 2019 515,000 183,314 698,314 97,828 50,807 846,949
2020 1,599,503 - 1,599,503 - - 113,298 - 1,712,801
2019 4,312,120 183,314 4,495,434 - 989,339 187,862 - 5,672,635
Total remuneration of the Managing Director and Senior Executives of the Group
Cash Settled Remuneration Non cash remuneration
37
8582_GUD_Holdings_Annual Report_2020_Mono.indd 378582_GUD_Holdings_Annual Report_2020_Mono.indd 37 9/9/20 12:00 pm9/9/20 12:00 pm

Remuneration Report
A minimum level of performance must be achieved before any performance rights vest. Therefore, the minimum possible total value of the LTI for future financial years is nil. The following factors were used in determining the fair value of performance rights granted during the year:
Performance Rights Outstanding The following table discloses changes in the performance rights holdings of Senior Executive Key Management Personnel in the Company. The related parties of Senior Executives do not hold any performance rights.
1 Performance rights granted under the 2020 performance rights plan lapsed in full on the basis of the Company not achieving the 50th percentile TSR
hurdle as at 30 June 2020.
Table of aggregate Performance Share Rights Outstanding as at 30 June 2020
Managing DirectorG Whickman 58,686 24 October 2019 30 June 2022 5.37 315,144
Chief Financial OfficerM Fraser 18,635 25 July 2019 30 June 2022 5.41 100,815
Total 77,321 415,959
Rightsgranted
duringthe year
ended 30 June 2020
Grantdate
Vestingdate
Fairvalue per
performanceright at
grant date$
Fair valueof rightsgranted
during theyear ended
30 June 2020$
Grant date Vesting period date
Fair value per performance
right
Price of shares on grant date
Estimated volatility
Risk free interest
rateDividend
yield
$ $ % % %Grant to Managing Director
24 October 2019 30 June 2022 5.37 10.33 24.00 0.7 5.0
Grant to Senior Executives 25 July 2019 30 June 2022 5.41 10.37 24.00 0.8 5.0
Managing Director
G Whickman 30,134 58,686 - - 88,820 - - 88,820
Chief Financial OfficerM Fraser 46,216 18,635 (13,178) (6,202) 45,471 - (13,575) 31,896
Total 76,350 77,321 (13,178) (6,202) 134,291 - (13,575) 120,716
Balance at the date of this report
Rights granted
during the year
Balance at 1 July 2019
Rights vested
during the year
Rights lapsed
during the year
Balance at 30 June 2020
Rights vested
with respect to the year 1
Rights lapsed
with respect to the year 1
Year of Vesting Number Granted Number LapsedBalance
Outstanding
2017 2020 296,927 296,927 -
2018 2021 256,578 36,542 220,036
2019 2022 408,451 26,398 382,053
Total 961,956 359,867 602,089
Year of Grant
38
8582_GUD_Holdings_Annual Report_2020_Mono.indd 388582_GUD_Holdings_Annual Report_2020_Mono.indd 38 9/9/20 12:00 pm9/9/20 12:00 pm

Remuneration Report
GUD Holdings Limited Shares Held by the KMPs The following table discloses changes in the shareholdings of KMPs and their related parties in the Company.
1 Performance rights granted under the 2019 performance rights plan vested at 68%. The issue of shares was approved by the Remuneration
Committee on 25 July 2019 (as disclosed in the Remuneration Report for the year ended 30 June 2019) and were allotted on 25 July 2019. 2 Performance rights granted under the 2020 performance rights plan lapsed in full on the basis of the Company not achieving the 50th percentile TSR
hurdle. 3 Some Executives’ holdings include shares held either directly, or through other entities in which the Executive has a trustee role or controlling
interest. 4 NED Share rights will after six months be satisfied by the Company purchasing shares on market. 5 Ms Douglas joined the Board on 1 March 2020
5. Link between Performance and Remuneration Outcomes The remuneration and incentive framework, which has been put in place by the Board, has ensured that the Managing Director and Chief Financial Officer are focussed on both maximising short‐term operating performance and long‐term strategic growth. The Board continues to review and monitor the remuneration and incentive framework to ensure that performance is fairly rewarded and encouraged, and to attract, motivate and retain a high quality Senior Executive team. The Remuneration, People and Culture Committee considered the impact of COVID‐19 (felt most severely in the final quarter of the financial year) but determined not to make any changes to the vesting in respect of any STI or LTI incentives for the financial year ended 30 June 2020. No KMP was entitled to any STI or LTI in respect of FY20.
STI The Managing Director and Chief Financial Officer, did not receive an STI bonus as the Group failed to achieve its CVA target.
1 A minimum level of performance, including exceeding the previous year’s CVA, must be achieved before any STI bonus is payable.
For the year ended 30 June 2020Balance at 1 July 2019
Shares issued from
vested performance
rights 1Shares
purchasedShares
soldBalance at
30 June 2020
Shares to be issued from
vested performance
rights and share plans2
Shares to be issued from share plans4
Balance at the date of this report
Non-Executive DirectorsM G Smith 58,000 - 8,000 - 66,000 - - 66,000
A L Templeman-Jones 6,442 - 1,200 - 7,642 - - 7,642
G A Billings 11,250 - - - 11,250 - 656 11,906
D D Robinson 13,000 - - - 13,000 - 1,664 14,664
J A Douglas5 - - - - - - - -
For the year ended 30 June 2020Balance at 1 July 2019
Shares issued from
vested performance
rights 1Shares
purchasedShares
soldBalance at
30 June 2020
Shares to be issued from
vested performance
rights and share plans2
Shares to be issued from share plans4
Balance at the date of this report
Managing DirectorG Whickman 2,000 - 25,000 - 27,000 - - 27,000
Chief Financial OfficerM Fraser 3 110,657 13,178 - - 123,835 - - 123,835
112,657 13,178 25,000 - 150,835 - - 150,835
Number of shares
Number of shares
Maximum STI opportunity
Actual STI bonus
payment 1
Actual STI bonus payment
as a % of maximum STI Disentitled
STI bonus payable for the year ended 30 June 2020 $ $ % %
Managing DirectorG Whickman 397,800 - - 100
Chief Financial OfficerM Fraser 331,414 - - 100
39
8582_GUD_Holdings_Annual Report_2020_Mono.indd 398582_GUD_Holdings_Annual Report_2020_Mono.indd 39 9/9/20 12:00 pm9/9/20 12:00 pm

Remuneration Report
The Remuneration, People and Culture Committee periodically reviews the design and operation of the STI plans to ensure that they focus rewards on achieving targets that represent strong performance of the business units, which will ultimately support shareholder returns. As in prior years, the Board has tasked the Remuneration, People and Culture Committee to undertake such a review in the first quarter of the forthcoming financial year before any STI targets are confirmed for that year. The review will focus on the target setting and thresholds for minimum and maximum STI rewards rather than the quantum of potential rewards.
LTI The following table summarises key Company performance and shareholder wealth statistics over the past five years. TSR measures the return a shareholder obtains from ownership of shares in a company in a defined period, and takes into account various matters such as changes in the market value of the shares, as well as dividends on those shares. The absolute TSR performance for the three years ended 30 June 2020 was ‐1.2%, although this outcome is not determinative of vesting for the grant vesting in FY20.
1 EBIT pre significant items and basic EPS pre significant items are presented before significant one‐off items and are from continuing operations as reported in each
year.
The TSR rank for the year ended 30 June 2020 was at the 47th percentile, that is below the median company of the comparator group. In accordance with the plan rules, the Board noted the lapsing of the performance rights, which were due to vest in respect of the period ended 30 June 2020.
6. Service Agreements Remuneration and other terms of employment for Executives are formalised in a service agreement. The essential terms of the Managing Director and Chief Financial Officer contracts are shown below:
Name Notice periods/termination payment
G Whickman Unlimited in term. A notice period of six months by either party applies, except in the case of termination by the
Company for cause. On termination, Mr Whickman is entitled to receive his statutory entitlements of accrued
annual and long service leave.
M Fraser Unlimited in term. Three months’ notice by either party (or payment in lieu). On termination, Mr Fraser is entitled to receive statutory entitlements of accrued annual and
long service leave.
7. Non‐Executive Directors’ Remuneration Non‐Executive Directors’ fees are not ‘at risk’, to reflect the nature of their responsibilities. As a result of COVID‐19, and aligned with changes at executive level, two principal changes have been enacted in respect of Non‐Executive Directors’ fees: 1. Non‐Executive Directors agreed to temporary fixed remuneration reductions of 20% per annum (pro‐rata) late
in the fourth quarter of the year ended 30 June 2020. 2. A decision was made to defer any increase in Directors’ fees up to December 2020.
Underlying EBIT 1
Underlying basic EPS 1 Total DPS
Opening share price
Closing share price
Dividend yield
Financial year $m Cents Cents $ $ %
30 June 2015 51.6 45.2 42.0 6.22 8.84 4.8 56.8
30 June 2016 78.6 52.0 43.0 8.84 9.11 4.7 71.3
30 June 2017 83.6 60.5 46.0 9.11 12.91 3.6 91.2
30 June 2018 83.4 67.2 52.0 12.91 14.16 3.7 80.0
30 June 2019 88.9 70.4 56.0 14.16 10.01 5.6 59.0
30 June 2020 82.3 56.6 37.0 10.01 11.51 3.2 47.2
TSR percentile rank for the
3 year period ending
40
8582_GUD_Holdings_Annual Report_2020_Mono.indd 408582_GUD_Holdings_Annual Report_2020_Mono.indd 40 9/9/20 12:00 pm9/9/20 12:00 pm
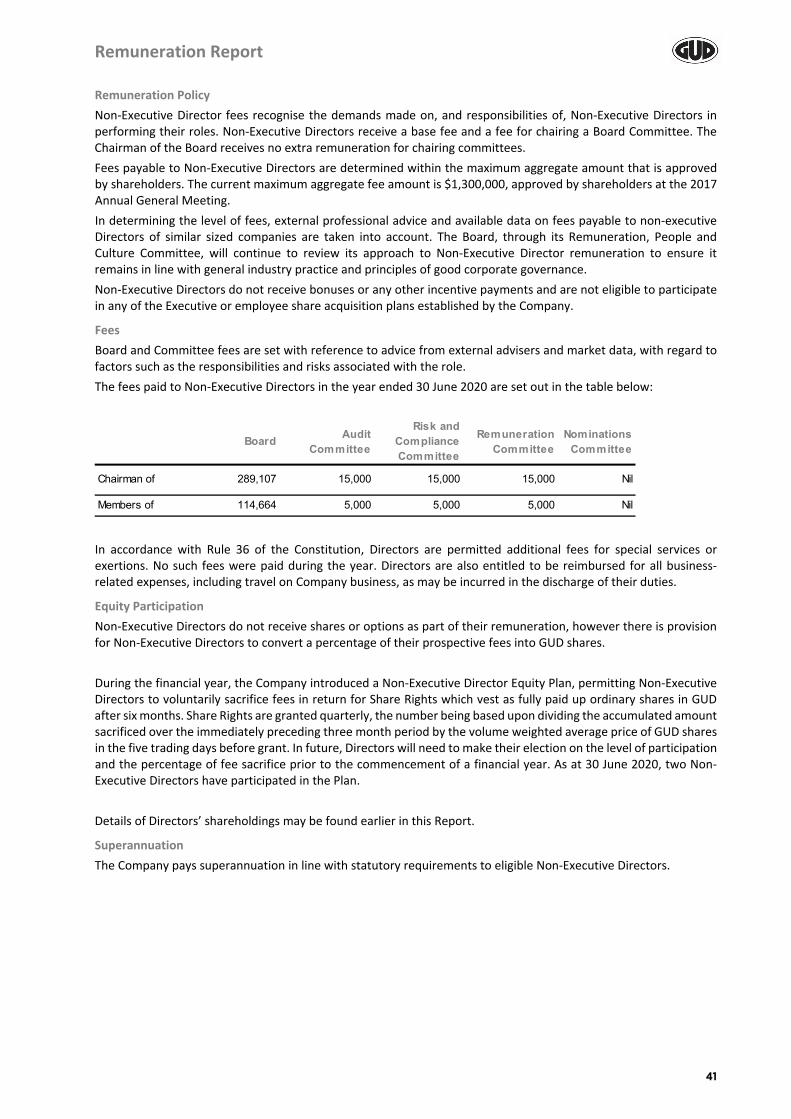
Remuneration Report
Remuneration Policy Non‐Executive Director fees recognise the demands made on, and responsibilities of, Non‐Executive Directors in performing their roles. Non‐Executive Directors receive a base fee and a fee for chairing a Board Committee. The Chairman of the Board receives no extra remuneration for chairing committees. Fees payable to Non‐Executive Directors are determined within the maximum aggregate amount that is approved by shareholders. The current maximum aggregate fee amount is $1,300,000, approved by shareholders at the 2017 Annual General Meeting. In determining the level of fees, external professional advice and available data on fees payable to non‐executive Directors of similar sized companies are taken into account. The Board, through its Remuneration, People and Culture Committee, will continue to review its approach to Non‐Executive Director remuneration to ensure it remains in line with general industry practice and principles of good corporate governance. Non‐Executive Directors do not receive bonuses or any other incentive payments and are not eligible to participate in any of the Executive or employee share acquisition plans established by the Company.
Fees Board and Committee fees are set with reference to advice from external advisers and market data, with regard to factors such as the responsibilities and risks associated with the role. The fees paid to Non‐Executive Directors in the year ended 30 June 2020 are set out in the table below:
In accordance with Rule 36 of the Constitution, Directors are permitted additional fees for special services or exertions. No such fees were paid during the year. Directors are also entitled to be reimbursed for all business‐related expenses, including travel on Company business, as may be incurred in the discharge of their duties.
Equity Participation Non‐Executive Directors do not receive shares or options as part of their remuneration, however there is provision for Non‐Executive Directors to convert a percentage of their prospective fees into GUD shares. During the financial year, the Company introduced a Non‐Executive Director Equity Plan, permitting Non‐Executive Directors to voluntarily sacrifice fees in return for Share Rights which vest as fully paid up ordinary shares in GUD after six months. Share Rights are granted quarterly, the number being based upon dividing the accumulated amount sacrificed over the immediately preceding three month period by the volume weighted average price of GUD shares in the five trading days before grant. In future, Directors will need to make their election on the level of participation and the percentage of fee sacrifice prior to the commencement of a financial year. As at 30 June 2020, two Non‐Executive Directors have participated in the Plan. Details of Directors’ shareholdings may be found earlier in this Report.
Superannuation The Company pays superannuation in line with statutory requirements to eligible Non‐Executive Directors.
Board Audit Committee
Risk and Compliance Committee
Remuneration Committee
Nominations Committee
Chairman of 289,107 15,000 15,000 15,000 Nil
Members of 114,664 5,000 5,000 5,000 Nil
41
8582_GUD_Holdings_Annual Report_2020_Mono.indd 418582_GUD_Holdings_Annual Report_2020_Mono.indd 41 9/9/20 12:00 pm9/9/20 12:00 pm

Remuneration Report
Remuneration Details of the nature and amount of each element of the remuneration of Non‐Executive Directors for the year ended 30 June 2020 are set out in the table below.
1 Superannuation contributions on behalf of Non‐Executive Directors to satisfy the Company’s obligations under applicable Superannuation
Guarantee legislation. 2 The Company introduced a Non‐Executive Directors share plan during the year, and these represent the amounts sacrificed by the Non‐Executive
Directors during the year. 3 Ms Douglas joined the Board on 1 March 2020
8. Other KMP Transactions
Loans to KMPs The Company entered into an Equity Loan Agreement in the amount of $228,000 with the Managing Director and CEO, Mr Graeme Whickman which enabled him to acquire 25,000 shares in the Company in September 2019. Mr Whickman pays interest on the loan on a quarterly basis at a rate that is set at 25 basis points above the Company’s average cost of borrowed funds. There were no other loans to KMPs at 30 June 2020 (2019: nil).
Other KMP Transactions with the Group Apart from the details disclosed in this Remuneration Report, no KMP has entered into a material contract with the Company or entities in the Group since the end of the previous financial year and there were no material contracts involving a KMP's Interest at year end. A number of KMP, or their related parties, hold positions in other entities that result in them having control or significant influence over the financial or operating policies of those entities. A number of these entities transacted with the Company or its subsidiaries in the reporting period. The terms and conditions of the transactions with KMPs and their related parties were no more favourable than those available, or which might reasonably be expected to be available, on similar transactions to non‐KMP related entities on an arms‐length basis. From time to time, KMPs of the Company or its subsidiaries, or their related parties, may purchase goods from the Group. These purchases are on the same terms and conditions as those entered into by other Group employees or customers and are trivial or domestic in nature.
Directors’ Fees Superannuation 1Fees converted to
Equity2 Total
Year $ $ $
Non-Executive Directors
M G Smith 2020 289,107 25,000 - 314,107 2019 287,752 25,000 - 312,752
A L Templeman-Jones 2020 139,664 13,493 - 153,157 2019 139,247 13,228 - 152,475
G A Billings 2020 139,664 13,493 (7,009) 146,148 2019 139,247 13,228 - 152,475
D D Robinson 2020 139,664 13,493 (17,756) 135,401 2019 139,247 13,228 - 152,475
J Douglas3 2020 41,652 4,166 - 45,818
Total Remuneration of Non-Executive Directors 2020 749,751 69,645 (24,765) 794,631 2019 705,493 64,684 - 770,177
42
8582_GUD_Holdings_Annual Report_2020_Mono.indd 428582_GUD_Holdings_Annual Report_2020_Mono.indd 42 9/9/20 12:00 pm9/9/20 12:00 pm

GUD Holdings Limited and Subsidiaries
Consolidated Financial Statements Consolidated Income Statement ..................................................................................................................................... 44 Consolidated Statement of Comprehensive Income....................................................................................................... 45 Consolidated Balance Sheet ............................................................................................................................................ 46 Consolidated Statement of Changes in Equity ................................................................................................................ 47 Consolidated Cash Flow Statement ................................................................................................................................ 48 1. Basis of preparation ............................................................................................................................................... 49 Results for the Year ......................................................................................................................................................... 53 2. Revenue .................................................................................................................................................................. 53 3. Expenses ................................................................................................................................................................. 55 4. Net finance costs .................................................................................................................................................... 56 5. Earnings per share .................................................................................................................................................. 57 6. Auditors' remuneration .......................................................................................................................................... 57 7. Segment information ............................................................................................................................................. 58 Working Capital ............................................................................................................................................................... 61 8. Trade and other receivables ................................................................................................................................... 61 9. Inventories.............................................................................................................................................................. 62 10. Trade and other payables ....................................................................................................................................... 63 11. Employee benefits .................................................................................................................................................. 63 12. Warranty provisions ............................................................................................................................................... 64 Tangible and Intangible Assets ........................................................................................................................................ 65 13. Goodwill ................................................................................................................................................................. 65 14. Other intangible assets ........................................................................................................................................... 65 15. Property, plant and equipment .............................................................................................................................. 67 16. Leases ..................................................................................................................................................................... 68 17. Impairment testing ................................................................................................................................................. 69 18. Commitments for expenditure ............................................................................................................................... 70 Capital Structure and Financing Costs ............................................................................................................................. 71 19. Cash and cash equivalents ...................................................................................................................................... 71 20. Borrowings ............................................................................................................................................................. 72 21. Derivatives .............................................................................................................................................................. 74 22. Other financial instruments .................................................................................................................................... 76 23. Financial instruments ............................................................................................................................................. 77 24. Financial risk management ..................................................................................................................................... 82 25. Share capital ........................................................................................................................................................... 86 26. Reserves ................................................................................................................................................................. 86 27. Retained earnings ................................................................................................................................................... 88 28. Dividends ................................................................................................................................................................ 88 Taxation .......................................................................................................................................................................... 89 29. Current tax ............................................................................................................................................................. 89 30. Deferred tax ........................................................................................................................................................... 90 Business Combinations ................................................................................................................................................... 93 31. Investment in subsidiaries ...................................................................................................................................... 93 Other Notes .................................................................................................................................................................... 97 32. Superannuation commitments ............................................................................................................................... 97 33. Key management personnel ................................................................................................................................... 97 34. Related parties ....................................................................................................................................................... 99 35. Parent entity disclosures ........................................................................................................................................ 99 36. Contingent liabilities ............................................................................................................................................. 100 37. Subsequent events ............................................................................................................................................... 100 Directors’ Declaration ................................................................................................................................................... 101 Lead Auditor’s Independence Declaration .................................................................................................................... 102 Independent Auditor’s Report ...................................................................................................................................... 103
43
8582_GUD_Holdings_Annual Report_2020_Mono.indd 438582_GUD_Holdings_Annual Report_2020_Mono.indd 43 9/9/20 12:00 pm9/9/20 12:00 pm

GUD Holdings Limited and Subsidiaries
Consolidated Income Statement For the year ended 30 June
2020^ 2019 Note $'000 $'000 Revenue 2 438,016 434,077 Cost of goods sold (234,981) (222,092) Gross Profit 203,035 211,985 Other income 1,020 490 Government grants 2,950 ‐ Marketing and selling (53,685) (54,778) Product development and sourcing (12,555) (11,317) Logistics expenses and outward freight (24,558) (24,502) Administration (35,011) (32,652) Impairment of brand name 7 (2,115) ‐ Other (4,820) (2,189) Results from operating activities 74,261 87,037 Net finance cost 4 (10,614) (6,792) Profit before tax 63,647 80,245 Income tax expense 29 (19,969) (20,687) Profit from operations, net of income tax 43,678 59,558 Profit attributable to owners of the Company 43,678 59,558 Earnings per share: Basic earnings per share (cents per share) 5 50.4 68.9 Diluted earnings per share (cents per share) 5 50.0 68.4 ^ The Group has initially applied AASB 16 using the modified retrospective approach. Under this approach, comparative information is not restated and the cumulative
effect of initially applying AASB 16 is recognised in retained earnings (refer note 1).
The notes on pages 49 to 100 are an integral part of these consolidated financial statements.
44
8582_GUD_Holdings_Annual Report_2020_Mono.indd 448582_GUD_Holdings_Annual Report_2020_Mono.indd 44 9/9/20 12:00 pm9/9/20 12:00 pm

GUD Holdings Limited and Subsidiaries
Consolidated Statement of Comprehensive Income For the year ended 30 June 2020^ 2019 Note $'000 $'000
Profit for the year from continuing operations 43,678 59,558 Other comprehensive income Items that will not be reclassified to profit and loss Equity investments at FVOCI – net change in fair value 23 ‐ (598) Items that may be reclassified subsequently to profit and loss Exchange differences on translating results of foreign operations 26 (537) 539 Net fair value adjustments recognised in the hedging reserve 26 3,237 1,077 Net change in fair value of cash flow hedges transferred to inventory 26 (3,578) (4,086) Equity settled share based payment transactions 26 1,796 1,761 Income tax expense/(benefit) on items that may be reclassified subsequently to profit or loss
29 102 903
Other comprehensive income / (loss) for the year, net of tax 1,020 (404) Total comprehensive Profit attributable to owners of the Company 44,698 59,154 Total comprehensive Profit 44,698 59,154 ^ The Group has initially applied AASB 16 using the modified retrospective approach. Under this approach, comparative information is not restated and the cumulative effect of initially applying AASB 16 is recognised in retained earnings (refer note 1).
The notes on pages 49 to 100 are an integral part of these consolidated financial statements.
45
8582_GUD_Holdings_Annual Report_2020_Mono.indd 458582_GUD_Holdings_Annual Report_2020_Mono.indd 45 9/9/20 12:00 pm9/9/20 12:00 pm

GUD Holdings Limited and Subsidiaries
Consolidated Balance Sheet As at 30 June
2020 Restated^
2019 Note $'000 $'000 Current assets Cash and cash equivalents 19 29,987 28,850 Trade and other receivables 8 114,479 106,827 Inventories 9 108,180 108,951 Derivative assets 21 549 898 Other financial assets 22 1,176 756 Current tax receivable 791 4 Other assets 5,261 4,579 Total current assets 260,423 250,865 Non‐current assets Goodwill^ 13 162,149 162,708 Other intangible assets 14 121,436 124,219 Property, plant and equipment 15 16,495 14,082 Right of use assets1 16 77,246 ‐ Other financial assets 22 4,111 1,978 Investments 23 1,734 1,734 Total non‐current assets 383,171 304,721 Total assets 643,594 555,586 Current liabilities Trade and other payables 10 65,100 57,636 Employee benefits 11 12,147 11,164 Restructuring provisions 51 1,189 Warranty provisions 12 468 580 Other provisions 870 617 Borrowings 20 ‐ 3,787 Lease liabilities1 10,058 ‐ Derivative liabilities 21 1,284 247 Other financial liabilities 22 3,250 1,625 Current tax payable 3,714 9,319 Total current liabilities 96,942 86,164 Non‐current liabilities Employee benefits 11 1,308 1,281 Borrowings 20 172,139 157,784 Lease liabilities1 16 69,904 ‐ Derivative liabilities 21 758 1,468 Other financial liabilities 22 ‐ 802 Deferred tax liabilities 30 27,701 29,414 Other non‐current liabilities 57 34 Total non‐current liabilities 271,867 190,783 Total liabilities 368,809 276,947 Net assets 274,785 278,639 Equity Share Capital 25 112,880 112,880 Reserves 26 11,001 9,981 Retained earnings1 27 150,904 155,778 Total equity 274,785 278,639
1 The Group has initially applied AASB 16 using the modified retrospective approach. Under this approach, comparative information is not restated and the cumulative effect of initially applying AASB 16 is recognised in retained earnings (refer note 1).
^ The Group has retrospectively applied IFRS Interpretations Committee (IFRIS IC) Multiple Tax Consequences of Recovering an Asset (IAS 12 Income taxes). As a result of the change in accounting policy, additional Goodwill has been recognised and Deferred Tax Liabilities has increased (refer note 1).
The notes on pages 49 to 100 are an integral part of these consolidated financial statements. 46
8582_GUD_Holdings_Annual Report_2020_Mono.indd 468582_GUD_Holdings_Annual Report_2020_Mono.indd 46 9/9/20 12:00 pm9/9/20 12:00 pm
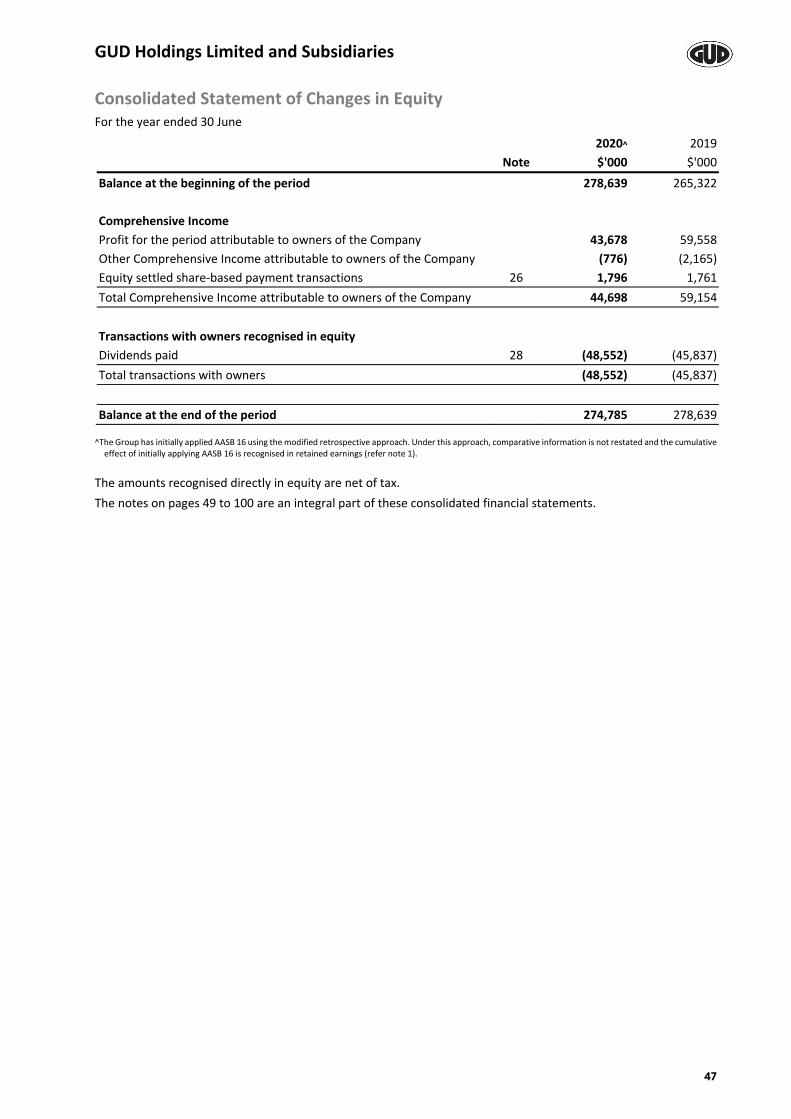
GUD Holdings Limited and Subsidiaries
Consolidated Statement of Changes in Equity For the year ended 30 June 2020^ 2019 Note $'000 $'000 Balance at the beginning of the period 278,639 265,322 Comprehensive Income Profit for the period attributable to owners of the Company 43,678 59,558 Other Comprehensive Income attributable to owners of the Company (776) (2,165) Equity settled share‐based payment transactions 26 1,796 1,761 Total Comprehensive Income attributable to owners of the Company 44,698 59,154 Transactions with owners recognised in equity Dividends paid 28 (48,552) (45,837) Total transactions with owners (48,552) (45,837) Balance at the end of the period 274,785 278,639 ^The Group has initially applied AASB 16 using the modified retrospective approach. Under this approach, comparative information is not restated and the cumulative
effect of initially applying AASB 16 is recognised in retained earnings (refer note 1).
The amounts recognised directly in equity are net of tax. The notes on pages 49 to 100 are an integral part of these consolidated financial statements.
47
8582_GUD_Holdings_Annual Report_2020_Mono.indd 478582_GUD_Holdings_Annual Report_2020_Mono.indd 47 9/9/20 12:00 pm9/9/20 12:00 pm

GUD Holdings Limited and Subsidiaries
Consolidated Cash Flow Statement For the year ended 30 June 2020 2019 Note $'000 $'000 Cash flows from operating activities Receipts from customers 470,974 474,189 Payments to suppliers and employees (380,335) (402,447) Income taxes paid (28,075) (27,218) Receipt of Government grants 2,950 ‐ Net cash provided by operating activities 19 65,514 44,524 Cash flows from investing activities Acquisition of controlled entity, net of cash acquired 31a ‐ (22,809) Acquisition of non‐controlling interests ‐ (312) Proceeds from sale of property, plant and equipment 104 285 Payments for property, plant and equipment 15 (6,489) (6,289) Payments for intangible assets 14 ‐ (1,101) Net cash provided by investing activities (6,385) (30,226) Cash flows from financing activities Proceeds from borrowings 20 175,805 46,605 Repayment of borrowings 20 (164,697) (29,096) (Advance)/Proceeds on other loans 20 (2,553) (934) Interest received 20 94 126 Interest paid 20 (6,320) (7,448) Payment of lease liabilities (2019: payment of finance lease liabilities) 16 (11,229) ‐ Dividends paid 28 (48,552) (45,837) Net cash used in financing activities 20 (57,452) (36,584) Net increase in cash held 1,677 (22,286) Cash at the beginning of the year 28,850 50,610 Effects of exchange rate changes on the balance of cash held in foreign currencies
(540) (255)
Cash at the end of the year 19 29,987 28,850
The notes on pages 49 to 100 are an integral part of these consolidated financial statements.
48
8582_GUD_Holdings_Annual Report_2020_Mono.indd 488582_GUD_Holdings_Annual Report_2020_Mono.indd 48 9/9/20 12:00 pm9/9/20 12:00 pm

GUD Holdings Limited and Subsidiaries
1. Basis of preparation This section sets out the Group’s accounting policies that relate to the consolidated financial statements as a whole. Where an accounting policy is specific to one note, the policy is described in the note to which it relates.
Reporting Entity GUD Holdings Limited (the ‘Company’) is a for profit company domiciled in Australia. The consolidated financial statements of the Company as at and for the year ended 30 June 2020 comprise the Company and its subsidiaries (together referred to as the ‘Group’). The Group is primarily involved in manufacture, importation, distribution and sale of automotive products, pumps, pool, spa and water pressure systems, with operations in Australia, New Zealand and France (Note 7). The consolidated annual financial statements of the Group as at and for the year ended 30 June 2020 are available on request from the Company’s registered office at 29 Taras Avenue, Altona North, Victoria, 3025 or at www.gud.com.au.
Basis of Accounting The consolidated financial statements are general purpose financial statements which have been prepared in accordance with the Australian Accounting Standards adopted by the Australian Accounting Standards Board (AASB) and the Corporations Act 2001. The consolidated financial statements comply with International Financial Reporting Standards (IFRS) adopted by the International Accounting Standards Board (IASB). The consolidated financial statements were authorised for issue by the Directors on 28 July 2020.
Rounding off The Company is of a kind referred to in ASIC Corporations (Rounding in Financial/Directors’ Reports) Instrument 2016/191 and in accordance with the Rounding Instrument, amounts in the consolidated financial statements have been rounded off to the nearest thousand dollars, unless otherwise stated.
Basis of measurement The consolidated financial statements have been prepared on the historical cost basis, except for the following items which have been measured at fair value: Derivatives (Note 21) Other financial instruments (Note 22)
Use of estimates and judgements In preparing these consolidated financial statements, Management has made judgements, estimates and assumptions that affect the application of the Group’s accounting policies and the reported amounts of assets, liabilities, income and expenses. Actual results may differ from these estimates, and in the current year the estimates and judgements incorporate the impact of uncertainties associated with COVID‐19 (where relevant). Estimates and underlying assumptions are reviewed on an ongoing basis. Revisions to estimates are recognised prospectively. Information about estimation, uncertainty and critical judgements in applying accounting policies that have the most significant effects on the amounts recognised in the consolidated financial statements is included in the following notes: Revenue recognition (Note 2): whether revenue from water solutions project income is recognised over time
or at a point in time Goodwill (Note 13) and other intangible assets (Notes 14, 31): impairment test of intangible assets and
goodwill Trade and other receivables (Note 8): measurement of Expected Credit Loss (ECL) allowance for trade
receivables and contract assets Inventories (Note 9): valuation of assets at net realisable value Financial instruments (Note 23) Other financial instruments (Note 22): contingent consideration Leases (Note 16): lease term “whether the Group is reasonably certain to exercise extension options”.
49
8582_GUD_Holdings_Annual Report_2020_Mono.indd 498582_GUD_Holdings_Annual Report_2020_Mono.indd 49 9/9/20 12:00 pm9/9/20 12:00 pm

GUD Holdings Limited and Subsidiaries
1. Basis of preparation (continued)
Foreign currency
Functional and presentation currency These consolidated financial statements are presented in Australian dollars which is the Company’s functional currency and the functional currency of the majority of the Group.
Foreign currency transactions Transactions in foreign currency are translated to the respective functional currencies of Group companies at the exchange rate at the date of the transaction. Monetary assets and liabilities denominated in foreign currency are translated to the functional currency at the exchange rates prevailing at the reporting date. Non‐monetary assets and liabilities that are measured at fair value in a foreign currency are translated to the functional currency at the exchange rate when the fair value was determined. Foreign currency differences are generally recognised in profit or loss. Non‐monetary items that are measured based on historical cost in a foreign currency are not translated. However, foreign currency differences arising from the translation of the following items are recognised in other comprehensive income: Qualifying cash flow hedges to the extent the hedges are effective (Note 26), and Exchange differences on translating foreign operations (Note 26).
New standards, interpretations and amendments adopted by the Group The Group initially applied AASB 16 Leases from 1 July 2019. A number of other new standards are also effective from 1 July 2019, which do not have a material effect on the Group’s financial statements. The Group applied AASB 16 using the modified retrospective approach, under which the cumulative effect of initial application is recognised in retained earnings at 1 July 2019. Accordingly, the comparative information presented for 2019 is not restated – i.e. it is presented, as previously reported, under AASB 117 and related interpretations. The details of the changes in accounting policies are disclosed below. Additionally, the disclosure requirements in AASB 16 have not generally been applied to comparative information. a) Definition of a lease Previously, the Group determined at contract inception whether an arrangement was or contained a lease under IFRIC 4 Determining whether an Arrangement contains a Lease. The Group now assesses whether a contract is or contains a lease based on the new definition of a lease. Under AASB 16, a contract is, or contains, a lease if the contract conveys a right to control the use of an identified asset for a period of time in exchange for consideration. On transition to AASB 16, the Group elected to apply the practical expedient to grandfather the assessment of which transactions are leases. It applied AASB 16 only to contracts that were previously identified as leases. Contracts that were not identified as leases under AASB 117 and IFRIC 4 were not reassessed for whether there is a lease under AASB 16. Therefore, the definition of a lease under AASB 16 has been applied only to contracts entered into or changed on or after 1 July 2019. b) As a lessee As a lessee, the Group leases many assets including property, motor vehicles, forklifts and IT equipment. The Group previously classified leases as operating or finance leases based on its assessment of whether the lease transferred significantly all of the risks and rewards incidental to ownership of the underlying asset to the Group. Under AASB 16, the Group recognises right‐of‐use assets and lease liabilities for most of these leases – i.e. these leases are on‐balance sheet. At commencement or on modification of a contract that contains a lease component, the Group allocates the consideration in the contract to each lease component on the basis of its relative stand‐alone price. However, for leases of property the Group has elected not to separate non‐lease components and account for the lease and associated non‐lease components as a single lease component. i. Leases classified as operating leases under AASB 117 Previously, the Group classified property leases as operating leases under AASB 117. On transition, for these leases, lease liabilities were measured at the present value of the remaining lease payments, discounted at the Group’s incremental borrowing rate as at 1 July 2019.
50
8582_GUD_Holdings_Annual Report_2020_Mono.indd 508582_GUD_Holdings_Annual Report_2020_Mono.indd 50 9/9/20 12:00 pm9/9/20 12:00 pm

GUD Holdings Limited and Subsidiaries
1. Basis of preparation (continued)
New standards, interpretations and amendments adopted by the Group (continued) b) As a lessee (continued) Right‐of‐use assets are measured at an amount equal to the lease liability, adjusted by the amount of any prepaid or accrued lease payments. The Group has tested its right‐of‐use assets for impairment on the date of transition and has concluded that there is no indication that the right‐of‐use assets are impaired. The Group used a number of practical expedients when applying AASB 16 to leases previously classified as operating leases under AASB 117. In particular, the Group: did not recognise right‐of‐use assets and liabilities for leases for which the lease term ends within 12 months
of the date of initial application; did not recognise right‐of‐use assets and liabilities for leases of low value assets (e.g. IT equipment); excluded initial direct costs from the measurement of the right‐of‐use asset at the date of initial application;
and used hindsight when determining the lease term.
c) Impact on financial statements i. Impact on transition On transition to AASB 16, the Group recognised additional right of use assets, including property and additional lease liabilities. The impact transition is summarised below.
1 July 2019‘000
Right of use assets 88,957Lease liabilities 88,957When measuring lease liabilities for leases that were classified as operating leases, the Group discounted lease payments using its incremental borrowing rate at 1 July 2019. The weighted average rate applied is 4.24%
1 July 2019‘000
Operating lease commitment at 30 June 2019 as disclosed in the Group’s consolidated financial statements 44,649
Discounted using the incremental borrowing rate at 1 July 2019 (9,917)
Recognition of exemption for leases with less than 12 months of lease term and low value assets attransition (421)
Extension options reasonably certain to be exercised 54,646 Lease liabilities recognised at 1 July 2019 88,957
New interpretation adopted in the current year Multiple Tax Consequences of Recovering an Asset (IAS 12) In May 2020, IFRS Interpretations Committee (IFRS IC) published its final agenda decision ‘Multiple Tax Consequences of Recovering an Asset (IAS 12 Income Taxes) which considers how an entity accounts for deferred taxes on an asset that has two distinct tax consequences over its life that cannot be offset (taxable economic benefits from use and capital gains on disposal or expiry). The IFRS IC concluded that in these circumstances, an entity identifies separate temporary differences (and deferred taxes) that reflect these distinct and separate tax consequences of recovering the assets carrying amount. The Group’s accounting policy has been to consider these two tax consequences of recovering the assets carrying amount together as they crystallised over the assets life, irrespective of how the asset was recovered. This accounting policy does not align with the IFRS IC agenda decision. As a result of the IFRS IC agenda decision, GUD Holdings Limited has changed its accounting policy, retrospectively adjusting the deferred tax accounting for impacted assets and intangibles.
51
8582_GUD_Holdings_Annual Report_2020_Mono.indd 518582_GUD_Holdings_Annual Report_2020_Mono.indd 51 9/9/20 12:00 pm9/9/20 12:00 pm

GUD Holdings Limited and Subsidiaries
1. Basis of preparation (continued)
New interpretation adopted in the current year (continued) Multiple Tax Consequences of Recovering an Asset (IAS 12) (continued) The impact of this change in accounting policy for the comparative reporting period and the beginning of the earliest period presented are presented below:
Consolidated statement of financial position (As at 30 June 2019)
Previously reported $’000
Adjustments $’000
Restated $’000
Assets
Goodwill 125,493 37,215 162,708
Deferred tax assets 7,801 (7,801) ‐
Non‐current assets 275,307 29,414 304,721
Total assets 526,172 29,414 555,586
Liabilities
Deferred tax liabilities ‐ 29,414 29,414
Non‐current liabilities 161,369 29,414 190,783
Total liabilities 247,533 29,414 276,947
Consolidated statement of financial position (As at 1 July 2018)
Previously reported $’000
Adjustments $’000
Restated $’000
Assets
Goodwill 115,396 37,215 152,611
Deferred tax assets 7,927 (7,927) ‐
Non‐current assets 256,686 29,288 285,974
Total assets 500,365 29,288 529,653
Liabilities
Deferred tax liabilities ‐ 29,288 29,288
Non‐current liabilities 148,496 29,288 177,784
Total liabilities 235,043 29,288 264,331
This change in accounting policy had no impact on the consolidated income statement or the cash flows for the years ended 30 June 2020 or 2019.
52
8582_GUD_Holdings_Annual Report_2020_Mono.indd 528582_GUD_Holdings_Annual Report_2020_Mono.indd 52 9/9/20 12:00 pm9/9/20 12:00 pm

GUD Holdings Limited and Subsidiaries
Results for the Year This section focusses on the Group’s performance. Disclosures in this section includes analysis of the Group’s profit before tax by reference to the activities performed by the Group and analysis of key revenues and operating costs, segmental information, net finance costs and earnings per share. In the segment information, the Group reports Earnings Before Significant Items, Interest and Tax (“EBIT pre significant items”), which is EBIT before exceptional items. This is a non IFRS measure of performance which reflects how the business is managed and how the Directors assess the performance of the Group.
2. Revenue a) Revenue streams The Group generates revenue primarily from the sale of automotive products (Automotive segment), pumps, pool and spa systems and water pressure systems (Davey segment).
For the year ended 30 June 2020 For the year ended 30 June 2019
Segments Automotive Davey Total Automotive Davey Total
Type of goods or services $’000 $’000 $’000 $’000 $’000 $’000
Sale of goods 330,748 105,602 436,350 330,002 102,066 432,068
Water solutions project income ‐ 1,666 1,666 ‐ 2,009 2,009
Total Revenue from contracts with customers
330,748 107,268 438,016 330,002 104,075 434,077
Geographical markets
Australia 298,978 88,334 387,312 297,053 83,646 380,699
New Zealand 31,770 11,987 43,757 32,949 13,825 46,774
Other ‐ 6,947 6,947 ‐ 6,604 6,604
Total revenue from contracts with customers
330,748 107,268 438,016 330,002 104,075 434,077
Timing of revenue recognition
Goods transferred at a point in time
330,748 105,602 436,350 330,002 102,066 432,068
Services transferred over time ‐ 1,666 1,666 ‐ 2,009 2,009
Total Revenue from contracts with customers
330,748 107,268 438,016 330,002 104,075 434,077
The Group recognised impairment losses on receivables and contract assets arising from contracts with customers, included under Administrative expenses in the Statement of Profit or Loss, amounting to $444,000 and $220,000 for the year ended 30 June 2020 and 2019 (estimated under AASB 9), respectively. Set out below, is the reconciliation of the revenue from contracts with customers with the amounts disclosed in the segment information:
For the year ended 30 June
2020 2019
Automotive Davey Automotive Davey
Revenue $’000 $’000 $’000 $’000
External customer 372,082 111,396 365,672 107,802
Rebates (41,334) (4,128) (35,670) (3,727)
Total revenue from contracts with customers 330,748 107,268 330,002 104,075
53
8582_GUD_Holdings_Annual Report_2020_Mono.indd 538582_GUD_Holdings_Annual Report_2020_Mono.indd 53 9/9/20 12:00 pm9/9/20 12:00 pm

GUD Holdings Limited and Subsidiaries
2. Revenue (continued) The following table provides information about receivables, contract assets and contract liabilities from contracts with customers. 2020 2019 $'000 $'000 Receivables, which are included in trade and other receivables Contract assets 389 883 The contract assets primarily relate to the Group’s rights to consideration for work completed but not billed at the reporting date on water solution projects. The contract assets are transferred to receivables when the rights become unconditional. This usually occurs when the Group issues an invoice to the customer. b) Performance obligations and revenue recognition policies Revenue is measured based on the consideration specified in a contract with a customer. The Group recognises revenue when it transfers control over a good or service to a customer. The following table provides information about the nature and timing of the satisfaction of performance obligations in contracts with customers, including significant payment terms, and the related revenue recognition policies.
Type of product/service
Nature and timing of satisfaction of performance obligations, including significant payment terms Revenue recognition policies
(i) Sale of automotive products, pumps, pool and spa systems and water pressure systems
Customers assume control of the products, when the goods have been delivered to, and have been accepted at their premises. Invoices are generated at that point in time. Invoices are usually payable within 30 ‐ 180 days. Customers contracts offer sales with right of return, volume rebates and marketing rebates.
Revenue from sale of goods is recognised at the point in time when control of the asset is transferred to the customer, generally on delivery of the good. Right of return For contracts that permit the customer to return an item, revenue is recognised to the extent that it is probable that a significant reversal in the cumulative revenue recognised will not occur. Therefore, the amount of revenue is adjusted for expected returns, the Group uses historical average return rates to forecast expected future returns from its customers. In these circumstances, a refund liability and a right to recover returned goods asset are recognised. The right to recover returned goods asset is measured at the former carrying amount of the inventory less any expected costs to recover goods. The refund liability is included in other payables and the right to recover returned goods is included in inventory. The Group reviews its estimate of expected returns at each reporting date and updates the amounts of the asset and liability accordingly. Volume rebates Retrospective volume rebates give rise to variable consideration. Therefore, the amount of revenue is adjusted to reflect expected volume rebates. To estimate the variable consideration, the Group uses historical average volume rebates to forecast expected volume rebates payable to its customers. Expected future rebates are recognised as contract liabilities.
54
8582_GUD_Holdings_Annual Report_2020_Mono.indd 548582_GUD_Holdings_Annual Report_2020_Mono.indd 54 9/9/20 12:00 pm9/9/20 12:00 pm

GUD Holdings Limited and Subsidiaries
2. Revenue (continued) b) Performance obligations and revenue recognition policies (continued)
Type of product/service
Nature and timing of satisfaction of performance obligations, including significant payment terms Revenue recognition policies
(i) Sale of automotive products, pumps, pool and spa systems and water pressure systems (Continued)
Marketing rebates The nature of the marketing activity will determine the treatment of the transaction, i.e. if a marketing rebate is deemed to be a separate performance obligation then it will be treated as a reduction in transaction price. If not, then it would be treated as marketing expense.
(ii) Water treatment contract revenue
Davey Water undertakes projects to design, build and install custom water systems for its customers. The length of the contract depends on the complexity of the project but usually does not extend beyond 6 months.
Revenue from water treatment solutions is recognised over time. The Group measures progress by using the output method.
3. Expenses
Accounting policies Depreciation & Amortisation Depreciation is charged to the Income Statement to reflect annual wear and tear and the reduced value of the asset over time. Depreciation is provided on property, plant and equipment, including freehold buildings but excluding land. Depreciation is calculated on a straight‐line basis over the estimated useful life of each asset to its estimated residual value. Leasehold improvements are depreciated over the period of the lease or estimated useful life, whichever is the shorter, using the straight‐line method. The estimated useful lives, residual values and depreciation method are reviewed at the end of each annual reporting period. The following estimated useful lives for current and prior periods used in the calculation of depreciation: Plant and equipment 3 to 12 years Equipment under finance lease 3 to 12 years
The value of intangible assets, except for goodwill, and indefinite life intangible assets reduces over the number of years the Group expects to use the asset, via an amortisation charge. Amortisation is recognised in the income statement over the following number of years: Patents, licences, Product development and distribution rights 3 to 5 years Customer relationships 5 to 15 years Software 5 to 7 years
Goods and services tax Expenses are recognised net of the amount of goods and services tax (GST), except where the amount of GST incurred is not recoverable from the taxation authority, it is recognised as part of an item of expense.
55
8582_GUD_Holdings_Annual Report_2020_Mono.indd 558582_GUD_Holdings_Annual Report_2020_Mono.indd 55 9/9/20 12:00 pm9/9/20 12:00 pm

GUD Holdings Limited and Subsidiaries
3. Expenses (continued)
Expenses by nature This table summarises expenses by nature from continuing operations: 2020 2019 Note $'000 $'000
Profit before income tax has been arrived at after charging the following expenses: Increase/(decrease) in inventory obsolescence provision 1,274 253 Loss/(gain) on sale of plant and equipment 340 117 Operating lease rental expense/short term or low value lease expense 905 9,423 Net foreign exchange (gain)/loss (3,336) (4,217) Employee benefits: Wages and salaries (including on‐costs) 73,184 77,394 Contributions to defined contribution plans 2,707 2,647 Movements in provisions for employee benefits (1,020) (344) Equity settled share based payment expense 26 1,796 1,761 Depreciation and amortisation: Amortisation of customer relationships 14 319 319 Amortisation of software 14 18 2 Amortisation of other intangibles 14 140 ‐ Amortisation of brand names 14 303 ‐ Depreciation of plant and equipment 15 3,632 2,958 Depreciation of leased plant and equipment 16 10,588 19 Total depreciation and amortisation 15,000 3,298 Product development and sourcing costs 12,555 11,317 Significant items: Transaction expenses1 ‐ 58 Redundancy costs1 7 1,594 1,810 Impairment of inventory1 7 2,750 ‐ Impairment of brand names 17 2,115 ‐ Total significant items 6,459 1,868
1. These costs are included as administration expenses in the Consolidated Income Statement.
4. Net finance costs
Accounting policies
Finance income Finance income is comprised of interest income, fair value gains on interest rate hedging instruments and gains on disposals of available for sale financial assets. Interest income is recognised on a time proportionate basis that takes into account the effective yield on the financial asset.
Finance costs Finance costs are classified as expenses consistent with the balance sheet classification of the related debt or equity instruments. Finance costs are comprised of interest expense on borrowings and fair value losses on interest rate hedging instruments through the income statement. Interest expense on borrowings is recognised on an effective interest basis. This table summarises net finance costs from continuing operations: 2020 2019 $'000 $'000 Finance costs: Interest income (94) (126)
Interest expense 6,320 7,448 Interest on lease liabilities 3,360 ‐ Net foreign exchange (gain) / loss (116) (530) Unwinding of discount on contingent consideration payable 1,144 ‐ Net finance costs 10,614 6,792
The ineffective portion of cash flow hedges that is recognised in the income statement is nil (2019: nil).
56
8582_GUD_Holdings_Annual Report_2020_Mono.indd 568582_GUD_Holdings_Annual Report_2020_Mono.indd 56 9/9/20 12:00 pm9/9/20 12:00 pm

GUD Holdings Limited and Subsidiaries
5. Earnings per share Earnings per share ('EPS') is the amount of profit attributable to each share. Basic EPS is calculated on the Group profit for the year attributable to equity shareholders divided by the weighted average number of shares on issue during the year. Diluted EPS reflects the Group’s commitments to issue shares in the future, such as issued upon vesting of performance rights.
Total 2020 2019 $'000 $'000 Profit / (loss) for the period 43,678 59,558 Number Number Weighted average number of ordinary shares used as the denominator for basic EPS 86,683,486 86,485,972 Effect of balance of performance rights outstanding at 30 June 684,098 629,745 Weighted average number of ordinary shares used as the denominator for diluted EPS 87,367,584 87,115,717
EPS Cents per
share Cents per
share Basic EPS 50.4 68.9 Diluted EPS 50.0 68.4
6. Auditors' remuneration This table summarises auditors’ remuneration incurred in relation to continuing operations: 2020 2019 $ $ Audit and review services: The auditor of GUD Holdings Limited ‐ audit and review of financial reports 518,422 573,000 518,422 573,000 Other services: The auditor of GUD Holdings Limited ‐ in relation to taxation advice and compliance 247,363 264,595 247,363 264,595
57
8582_GUD_Holdings_Annual Report_2020_Mono.indd 578582_GUD_Holdings_Annual Report_2020_Mono.indd 57 9/9/20 12:00 pm9/9/20 12:00 pm

GUD Holdings Limited and Subsidiaries
7. Segment information Segment reporting is presented in respect of the Group’s business and geographical segments. Operating segments are presented using the ‘management approach’, where the information presented is on the same basis as the internal reports provided to the Managing Director (Chief Operating Decision Maker ‐ ‘CODM’). The CODM is responsible for the allocation of resources to operating segments and assessing their performance. Segment results, assets and liabilities include items directly attributable to a segment as well as those that can be allocated on a reasonable basis.
Business segments The following summary describes the operations in each of the Group’s reportable segments:
Automotive Automotive and heavy‐duty filters for cars, trucks, agricultural and mining equipment, fuel pumps and associated products for the automotive after‐market.
Davey Pumps and pressure systems for household and farm water, water transfer pumps, swimming pool products, spa bath controllers and pumps and water purification equipment.
Geographical segments The Group operates primarily in two geographical segments; Australia and New Zealand. Refer Note 2 for geographical sales disclosure.
58
8582_GUD_Holdings_Annual Report_2020_Mono.indd 588582_GUD_Holdings_Annual Report_2020_Mono.indd 58 9/9/20 12:00 pm9/9/20 12:00 pm

GUD Ho
ldings Limite
d an
d Subsidiarie
s
7. S
egmen
t information (con
tinue
d)
For the
year e
nded
30 June
2020
Au
tomotive
Davey
Una
llocated1
Total
Busin
ess s
egmen
ts
$'000
$'000
$'000
$'000
Total segmen
t reven
ue (e
xterna
l) 330,748
107,268
‐ 438,016
EB
ITDA
pre‐ significan
t items
90,992
13
,006
(8,278
) 95
,720
Less: D
eprecia
tion
(9,235)
(4,274)
(711)
(14,220)
Less: A
mortisation of intangibles
(779)
‐ (1)
(780)
EBIT pre‐significan
t items
80,978
8,732
(8,990
) 80
,720
Im
pairm
ent o
f inven
tory
2 (250)
(2,500)
‐ (2,750)
Impairm
ent o
f brand
nam
es3
‐ (2,115)
‐ (2,115)
Restructuring costs4
(202)
(1,392)
‐ (1,594)
Segm
ent result (EB
IT)
80,526
2,725
(8,990
) 74
,261
Interest income
‐ 116
94
210
Interest on lease liability
(2,437)
(315)
(608)
(3,360)
Interest expen
se
(123)
(157)
(7,184)
(7,464)
Profit / (loss) b
efore tax
77,966
2,369
(16,688)
63,647
Tax e
xpen
se
(23,953)
(1,288)
5,272
(19,969)
Profit / (loss) a
ttrib
utab
le to
owne
rs of the
Com
pany
54
,013
1,081
(11,416)
43,678
Segm
ent a
ssets^
511,748
121,747
10,099
643,594
Segm
ent liabilities^
145,722
29,290
193,797
368,809
Segm
ent cap
ital expen
diture
46,802
7,098
51
53,951
^ At 1 Ju
ly 2019, th
e Grou
p has initia
lly app
lied AA
SB 16 which re
quire
s the
recognition
of right of u
se assets a
nd lease liabilities for lease contracts that w
ere previously classified as ope
ratin
g leases. A
s a re
sult, th
e Grou
p recognise
d $86.460 million rig
ht
of use assets and $87.756 million of liabilitie
s fro
m th
ose lease contracts. The assets and
liabilitie
s are inclu
ded in th
e Au
tomotive, Davey and
Unallocated segm
ents as a
t 30 June
2020. The
Group
has app
lied AA
SB 16 using the mod
ified
retrospe
ctive
approach, und
er which co
mparative inform
ation is no
t restated (see
note 1).
1.
Unallocated ite
ms c
omprise
mainly of co
rporate assets, corpo
rate expen
ses, interest, tax, corpo
rate borrowings, and
deferred tax b
alances.
2.
Associa
ted with
new
produ
ct introd
uctio
n and manufacturin
g associa
ted with
implem
entin
g prod
uct cycle plans.
3.
Impairm
ent o
f the
Mon
arch Brand
as D
avey co
ncen
trates on a sin
gle brand as it introd
uces new
produ
cts from th
e prod
uct cycle plan, re
fer n
ote 17
for further inform
ation.
4.
Associa
ted with
produ
ct outsourcin
g at AA Ga
skets a
nd re
alignm
ent o
f the
Davey business.
8582_GUD_Holdings_Annual Report_2020_Mono.indd 598582_GUD_Holdings_Annual Report_2020_Mono.indd 59 9/9/20 12:00 pm9/9/20 12:00 pm

GUD Ho
ldings Limite
d an
d Subsidiarie
s
7. S
egmen
t information (con
tinue
d)
For the
year e
nded
30 June
2019
Au
tomotive
Davey
Una
llocated4
Total
Busin
ess s
egmen
ts
$'000
$'000
$'000
$'000
Total segmen
t reven
ue (e
xterna
l) 330,002
104,075
‐ 434,077
EB
ITDA
pre‐ significan
t items 1
89,791
10
,324
(7,912
) 92
,203
Less: D
eprecia
tion
(2,059)
(901)
(17)
(2,977)
Less: A
mortisation of intangibles
(319)
‐ (2)
(321)
EBIT pre‐significan
t items
87,413
9,423
(7,931
) 88
,905
Transaction costs 1
(52)
‐ (6)
(58)
Restructuring costs2
(1,073)
(776)
39
(1,810)
Segm
ent result (EB
IT)
86,288
8,647
(7,898
) 87
,037
Interest income
2 549
124
675
Interest expen
se
(219)
(174)
(7,074)
(7,467)
Profit / (loss) b
efore tax
86,071
9,022
(14,848)
80,245
Tax e
xpen
se3
(25,281)
(2,600)
7,894
(20,687)
Profit / (loss)
60,090
6,422
(6,954
) 59
,558
Profit / (loss) a
ttributab
le to
owne
rs of the
Com
pany
60
,090
6,422
(6,954
) 59
,558
Segm
ent a
ssets
413,516
110,450
2,206
526,172
Segm
ent liabilities
51,894
20
,496
175,143
247,533
Segm
ent cap
ital expen
diture
3,798
2,452
39
6,289
1 Transaction costs in the Au
tomotive segm
ent relate to th
e acqu
isitio
n of Disc
Brakes A
ustralia.
2 Re
structuring costs in the Au
tomotive segm
ent relate to one
rous lease and moving costs a
ssociated with
a new
office and
wareh
ouse co
mplex in Auckland ($1.033 million).
3 Tax e
xpen
se in
the Un
allocated segm
ent include
s a CGT
refund
of $
2.548 million related to th
e Sunb
eam disp
osal.
4 Un
allocated ite
ms c
omprise
mainly of co
rporate assets, corpo
rate expen
ses, interest, tax, corpo
rate borrowings, and
deferred tax b
alances.
8582_GUD_Holdings_Annual Report_2020_Mono.indd 608582_GUD_Holdings_Annual Report_2020_Mono.indd 60 9/9/20 12:00 pm9/9/20 12:00 pm

GUD Holdings Limited and Subsidiaries
Working Capital Working capital represents the assets and liabilities the Group generates through its trading activity. The Group therefore defines working capital as inventory, trade and other receivables, trade and other payables and provisions. Careful management of working capital ensures that the Group can meet its trading and financing obligations within its ordinary operating cycle. This section provides further information regarding working capital management and analysis of the elements of working capital.
8. Trade and other receivables Accounting policies
Trade receivables Trade and other receivables are non‐derivative financial instruments that are initially recognised at fair value plus any directly attributable costs. After initial recognition, they are measured at amortised cost using the effective interest method, less identified impairment.
Goods and services tax Trade receivables are recognised inclusive of the amount of goods and services tax (GST) which is payable to taxation authorities. The net amount of GST payable to the taxation authority is included as part of payables.
2020
2019 $'000 $'000 Current Trade receivables 115,438 107,385 Less: Allowance for doubtful debts (959) (558) Net trade receivables 114,479 106,827
An allowance has been made for estimated irrecoverable amounts from the sale of goods and services, determined with reference to forward looking expected credit loss (ECL). The movement in the allowance for doubtful debts was recognised in the income statement in the current financial year.
2020
2019 $'000 $'000 Movement in allowance for doubtful debts Balance at the beginning of the year (558) (685) Doubtful debts recognised (436) (213) Amounts written off as uncollectible 35 340 Balance at the end of the year (959) (558)
Amounts are written off as uncollectible only after it is determined that the debts are no longer collectible either by notification from an administrator to the debtor or because the debtor has demonstrated an inability to pay. Where applicable, insurance proceeds are received to partially mitigate the loss and the net uncollectible amount is reflected above.
61
8582_GUD_Holdings_Annual Report_2020_Mono.indd 618582_GUD_Holdings_Annual Report_2020_Mono.indd 61 9/9/20 12:00 pm9/9/20 12:00 pm

GUD Holdings Limited and Subsidiaries
8. Trade and other receivables (continued) Receivables that are past due but not impaired are those receivables the Directors believe to be fully recoverable and as a result, have not recognised any amount in the doubtful debt provision for them. 2020 Gross Impairment Net Ageing of trade receivables $'000 $'000 $'000 Not past due 96,957 (68) 96,889 Past due 1 ‐ 60 days 14,331 (96) 14,235 Past due 61 ‐ 120 days 2,734 (191) 2,543 Past due 121 ‐ 365 days 1,018 (356) 662 Past due more than one year 398 (248) 150 Total trade receivables 115,438 (959) 114,479
2019 Gross Impairment Net Ageing of trade receivables $'000 $'000 $'000 Not past due 94,659 (70) 94,589 Past due 1 ‐ 60 days 9,563 (27) 9,536 Past due 61 ‐ 120 days 2,417 (99) 2,318 Past due 121 ‐ 365 days 589 (324) 265 Past due more than one year 157 (38) 119 Total trade receivables 107,385 (558) 106,827
Additional information relating to credit risk is included in Note 24.
9. Inventories Accounting policies
Inventories Inventories are valued at the lower of cost and net realisable value. Costs, including an appropriate portion of fixed and variable overhead expenses, are assigned to inventory by the method most appropriate to each particular class of inventory, with the majority being valued on a weighted average basis. Net realisable value represents the estimated selling price less all estimated costs of completion and selling costs.
Goods and services tax Non‐financial assets such as inventories are recognised net of the amount of goods and services tax (GST), except where the amount of GST incurred is not recoverable from the taxation authority, it is recognised as part of the cost of acquisition of the asset.
2020
2019 $'000 $'000 Current Raw materials and stores 18,151 15,456 Work in progress 459 429 Finished goods 100,061 99,182 Inventory – at cost 118,671 115,067 Less: Provision for slow moving inventory (10,491) (6,116) Total inventory 108,180 108,951
Inventories disclosed above are net of the provision for slow moving inventory. Increases or write‐backs of the provision are recognised in cost of goods sold (Note 3).
62
8582_GUD_Holdings_Annual Report_2020_Mono.indd 628582_GUD_Holdings_Annual Report_2020_Mono.indd 62 9/9/20 12:00 pm9/9/20 12:00 pm

GUD Holdings Limited and Subsidiaries
10. Trade and other payables
Accounting policies
Payables Trade payables and other accounts payable are non‐derivative financial instruments measured at cost.
Goods and services tax Trade payables are recognised inclusive of the amount of goods and services tax (GST) which is recoverable from taxation authorities. The net amount of GST recoverable from the taxation authority is included as part of receivables.
2020
2019 $'000 $'000 Current Accrued expenses 20,439 14,798 Trade payables 44,661 42,838 Trade payables and accrued expenses 65,100 57,636
No interest is incurred on trade payables.
11. Employee benefits
Accounting policies
Employee benefits Provision is made for benefits accruing to employees in respect of wages and salaries, annual leave, long service leave, and sick leave when it is probable that settlement will be required and they are capable of being measured reliably. Provisions made in respect of employee benefits expected to be settled within 12 months, are measured at their nominal values using the remuneration rate expected to apply at the time of settlement and including on‐costs associated with employment. Provisions made in respect of employee benefits which are not expected to be settled within 12 months are measured as the present value of the estimated future cash outflows to be made by the Group in respect of services provided by employees up to reporting date. Expected future payments are discounted using market yields at the reporting date on corporate bonds with terms to maturity and currency that match, as closely as possible, the estimated future cash outflows.
Defined contribution plans Contributions to defined contribution superannuation plans are expensed when incurred.
2020
2019 $'000 $'000 Current 12,147 11,164 Non‐current 1,308 1,281 Accrued wages and salaries 542 675 Total employee benefits 13,997 13,120
Accrued wages and salaries are included in accrued expenses in Note 10.
63
8582_GUD_Holdings_Annual Report_2020_Mono.indd 638582_GUD_Holdings_Annual Report_2020_Mono.indd 63 9/9/20 12:00 pm9/9/20 12:00 pm

GUD Holdings Limited and Subsidiaries
12. Warranty provisions
Accounting policy
Warranties Provisions for warranty costs are recognised at the date of sale of the relevant products, at the Directors’ best estimate of the expenditure required to settle the Group’s liability. The provision for warranty claims represents the present value of the Directors' best estimate of the future sacrifice of economic benefits that will be required under the Group's warranty program. The estimate has been made on the basis of historical warranty trends and may vary as a result of new materials, altered manufacturing processes or other events affecting product quality. Warranty provisions are all current. 2020 2019 $'000 $'000 Carrying amount at beginning of year 580 1,052 Provisions recognised ‐ (15) Provisions reversed (13) (352) Payments made during the year (97) (107) Net foreign currency difference arising on translation of foreign operations (2) 2 Carrying amount at end of year 468 580
64
8582_GUD_Holdings_Annual Report_2020_Mono.indd 648582_GUD_Holdings_Annual Report_2020_Mono.indd 64 9/9/20 12:00 pm9/9/20 12:00 pm

GUD Holdings Limited and Subsidiaries
Tangible and Intangible Assets The following section shows the tangible and intangible assets used by the Group to operate the business. Intangible assets include brands, customer relationships, patents, licences, software development, distribution rights and goodwill. This section explains the accounting policies applied and the specific judgements and estimates made by the Directors in arriving at the net book value of these assets.
13. Goodwill
Accounting policies
Goodwill Goodwill represents the excess of the cost of acquisition over the fair value of the identifiable assets, liabilities and contingent liabilities acquired. Goodwill is recognised as an asset and not amortised but tested for impairment annually and whenever there is an indication that the goodwill may be impaired. Any impairment is recognised immediately in the Income Statement and is not subsequently reversed. This table summarises the movement in goodwill:
2020 Restated
2019 Note $'000 $'000 Gross carrying amount Balance at the beginning of the year 162,708 115,396 Addition due to IFRIC agenda decision ‘Multiple Tax Consequences of Recovering an Asset (IAS 12 Income Taxes) 2 ‐ 37,215 Liquidation of GEL Australia (290) ‐ Acquisitions through business combinations1 31a ‐ 9,604 Net foreign currency difference arising on translation of financial statements of foreign operations (269) 493 Balance at the end of the year 162,149 162,708
1 On 2 July 2018 the Company acquired 100% of the shares in Disc Brakes Australia Pty Ltd (“DBA”), this transaction resulted in the recognition of Goodwill. For further details of the DBA acquisition refer to Note 31a. 2 As a result of the IFRS IC agenda decision, GUD Holdings Limited has changed its accounting policy, retrospectively adjusting the deferred tax accounting for impacted assets and intangibles. For further details refer to Note 1.
14. Other intangible assets
Accounting policies
Product development costs Expenditure on research activities is recognised as an expense in the Income Statement in the period in which it is incurred. Where no internally generated intangible asset can be recognised, development expenditure is recognised as an expense in the Income Statement in the period as incurred. An intangible asset arising from development (or from the development phase of an internal project) is recognised if, and only if, all of the following are demonstrated: the technical feasibility of completing the intangible asset so that it will be available for use or sale; the intention to complete the intangible asset and use or sell it; the ability to use or sell the intangible asset; how the intangible asset will generate probable future economic benefits; the availability of adequate technical, financial and other resources to complete the development and to use
or sell the intangible asset; and the ability to measure reliably the expenditure attributable to the intangible asset during its development.
The expenditure capitalised includes the cost of materials, direct labour and overhead costs that are directly attributable to preparing the asset for its intended use. Product development assets are stated at cost less accumulated amortisation and impairment, and are amortised on a straight‐line basis over their useful lives, which is up to a maximum of 5 years (Note 3).
65
8582_GUD_Holdings_Annual Report_2020_Mono.indd 658582_GUD_Holdings_Annual Report_2020_Mono.indd 65 9/9/20 12:00 pm9/9/20 12:00 pm

GUD Holdings Limited and Subsidiaries
14. Other intangible assets (continued)
Brand names and trademarks Acquired brand names and trademarks are recorded at cost. The carrying values are tested on a stand‐alone basis, based on its fair value (Note 17). The Group holds several brand names that are considered to have an indefinite useful life. The indefinite useful life reflects the Directors' view that these brands are assets that provide ongoing market access advantages for both new and existing product sales in the markets that the businesses operate. The current understanding of the industries and markets that the businesses operate in indicates that demand for products will continue in a sustainable manner, that changes in technology are not seen as a major factor impacting the brands future value, and, the brands have proven long lives in their respective markets.
Other intangible assets Other intangible assets that are acquired by the Group, which have finite lives, are measured at cost less accumulated amortisation (Note 3) and accumulated impairment losses. The carrying value is tested for impairment as part of the annual testing of cash generating units (Note 17).
$'000
Brand, Business Names &
Trademarks
Patents, Licences &
Distribution Rights Software
Customer Relationships Total
Gross carrying amount Balance at 30 June 2018 115,559 411 149 4,441 120,560 Additions from business combinations 2,664 1,457 ‐ ‐ 4,121 Acquisition of brand name 1,101 ‐ ‐ ‐ 1,101 Foreign currency movements (83) 8 ‐ ‐ (75) Balance at 30 June 2019 119,241 1,876 149 4,441 125,707 Acquisition of patents and software ‐ 47 70 ‐ 117 Foreign currency movements (4) (8) ‐ ‐ (12) Balance at 30 June 2020 119,237 1,915 219 4,441 125,812
Accumulated amortisation Balance at 30 June 2018 ‐ (391) (145) (614) (1,150) Amortisation expense ‐ ‐ (2) (319) (321) Foreign currency movements ‐ (17) ‐ ‐ (17) Balance at 30 June 2019 ‐ (408) (147) (933) (1,488) Amortisation expense (303) (140) (18) (319) (780) Foreign currency movements ‐ 7 ‐ ‐ 7 Impairment (2,115) ‐ ‐ ‐ (2,115) Balance at 30 June 2020 (2,418) (541) (165) (1,252) (4,376)
Carrying amount As at 30 June 2019 119,241 1,468 2 3,508 124,219 As at 30 June 2020 116,819 1,374 54 3,189 121,436 Amortisation is recognised as an expense in Note 3. Refer to Note 7 for allocation of the carrying amount of brand names to segments.
66
8582_GUD_Holdings_Annual Report_2020_Mono.indd 668582_GUD_Holdings_Annual Report_2020_Mono.indd 66 9/9/20 12:00 pm9/9/20 12:00 pm

GUD Holdings Limited and Subsidiaries
15. Property, plant and equipment
Accounting policies
Property, plant and equipment Property, plant and equipment and leasehold improvements are stated at cost less accumulated depreciation (Note 3) and impairment. Cost includes expenditure that is directly attributable to the acquisition of the item. If there has been a technological change or decline in business performance, the Directors review the value of the assets to ensure they have not fallen below their depreciated value. If an asset's value falls below its depreciated value, an additional one‐off impairment charge is made against profit.
Leased plant and equipment (classified as finance lease under AASB 117) As at 30 June 2020, the net carrying amount of leased equipment held under finance lease was $Nil. This table summarises the movement in gross carrying amount, accumulated amortisation and written down value of property, plant and equipment:
Leased assets Plant and Equipment Total
Note $'000 $'000 $'000 Gross carrying amount Balance at 30 June 2018 113 42,013 42,126 Additions from business combinations 31a ‐ 6,491 6,491 Additions ‐ 6,289 6,289 Disposals (113) (2,127) (2,240) Foreign currency movements ‐ 91 91 Balance at 30 June 2019 ‐ 52,757 52,757 Additions ‐ 6,489 6,489 Disposals ‐ (3,917) (3,917) Foreign currency movements ‐ (87) (87) Balance at 30 June 2020 ‐ 55,242 55,242 Accumulated depreciation and amortisation
Balance at 30 June 2018 (25) (31,463) (31,488) Additions from business combinations ‐ (6,025) (6,025) Depreciation expense (19) (2,958) (2,977) Disposals 44 1,796 1,840 Foreign currency movements ‐ (25) (25) Balance at 30 June 2019 ‐ (38,675) (38,675) Depreciation expense ‐ (3,632) (3,632) Disposals ‐ 3,528 3,528 Foreign currency movements ‐ 32 32 Balance at 30 June 2020 ‐ (38,747) (38,747) Carrying amount As at 30 June 2019 ‐ 14,082 14,082 As at 30 June 2020 ‐ 16,495 16,495 Depreciation is recognised as an expense in Note 3.
67
8582_GUD_Holdings_Annual Report_2020_Mono.indd 678582_GUD_Holdings_Annual Report_2020_Mono.indd 67 9/9/20 12:00 pm9/9/20 12:00 pm

GUD Holdings Limited and Subsidiaries
16. Leases
Leases as a Lessee (AASB 16) The Group leases warehouse and office facilities. On average the leases typically run for a period of 10 years, with an option to renew the lease after that date. Lease payments are renegotiated every 3 years to reflect market rentals. Some leases provide for additional rent payments that are based on changes in local price indices. For certain leases, the Group is restricted from entering into any sub‐lease arrangements. The warehouse and office facilities leases were entered into many years ago as combined leases of land and buildings. Previously, these leases were classified as operating leases under AASB 117. The Group leases motor vehicle and forklift leases, which were previously classified as operating leases under AASB 117. On average, the leases typically run for a period of 4 years and do not have options to extend or vary lease terms. The Group leases IT equipment with contract terms of one to three years. These leases are short term and/or leases of low‐value items. The Group has elected not to recognise right‐of‐use assets and lease liabilities for these leases. Information about leases for which the Group is a lessee is presented below. i. Right of use assets
Land and buildings $’000
Motor vehicles and forklifts $’000
Office equipment $’000
Total $’000
Balance at 1 July 2019 84,561 4,062 334 88,957
Depreciation charge for the year
(8,516) (1,877) (195) (10,588)
Lease reassessments (3,039) (80) ‐ (3,119)
Additions to right‐of‐use assets
536 1,316 144 1,996
Balance at 30 June 2020 73,542 3,421 283 77,246
ii. Amounts recognised in profit and loss
2020
$‘000
2020 – Leases under AASB 16
Interest on lease liabilities 3,360
Expenses relating to short‐term leases and low value assets 905
2019 – Operating leases under AASB 117
Lease expense 9,423
iii. Amounts recognised in statement of cash flows
2020
$‘000
Total cash outflows for leases (11,229)
68
8582_GUD_Holdings_Annual Report_2020_Mono.indd 688582_GUD_Holdings_Annual Report_2020_Mono.indd 68 9/9/20 12:00 pm9/9/20 12:00 pm

GUD Holdings Limited and Subsidiaries
16. Leases (continued)
iv. Extension options Some property leases contain extension options exercisable by the Group up to one year before the end of the non‐cancellable contract period. Where practicable, the Group seeks to include extension options in new leases to provide operational flexibility. The extension options held are exercisable only by the Group and not by the lessors. The Group assesses at lease commencement date whether it is reasonably certain to exercise the extension options. The Group reassesses whether it is reasonably certain to exercise the options if there is a significant event or significant change in circumstances within its control. The Group has included all extension options available in determining its lease liability calculations.
17. Impairment testing
Accounting policies
Impairment of property, plant, equipment and intangible assets Tangible and intangible assets are tested for impairment annually and whenever there is an indication that the asset may be impaired. If any such indication exists, the recoverable amount of the asset is estimated in order to determine the extent of the impairment loss (if any). Assets that cannot be tested individually are grouped together into cash‐generating units (CGUs) which are the smallest group of assets that generate cash inflows from continuing use that are largely independent of the cash flows of other assets or CGUs. Subject to an operating segment ceiling test, CGUs, to which goodwill has been allocated, are aggregated so that the level at which impairment testing is performed reflects the lowest level at which goodwill is monitored for internal reporting purposes. Goodwill acquired in a business combination is allocated to groups of CGUs that are expected to benefit from the synergies of the combination. The recoverable amount is the higher of fair value less costs of disposal and value in use. In assessing value in use, the estimated future cash flows are discounted to their present value using a pre‐tax discount rate that reflects current market assessments of the time value of money and the risks specific to the asset for which the estimates of future cash flows have not been adjusted. If the recoverable amount of an asset (or CGU) is estimated to be less than its carrying amount, the carrying amount of the asset (or CGU) is reduced to its recoverable amount. An impairment loss is recognised in the income statement immediately. Where an impairment loss subsequently reverses, the carrying amount of the asset (or CGU) is increased to the revised estimate of its recoverable amount, but only to the extent that the increased carrying amount does not exceed the carrying amount that would have been determined had no impairment loss been recognised for the asset (or CGU) in prior years. A reversal of an impairment loss (other than goodwill) is recognised in the Income Statement immediately. Any impairment of goodwill is not subsequently reversed.
Results The Group’s CGUs comprise the operating segments disclosed in Note 7. All intangible assets with indefinite lives (goodwill and brand names), have been allocated for impairment testing purposes to CGUs (or groups of units). We note the recoverable amount for brand names has been tested on a stand‐alone basis, based on its fair value. Each CGU's recoverable amount has been tested on the basis of its value in use. The value in use calculation uses assumptions including cash flow projections based on Board approved projections for the 2021 (2019: based on 2020 budget) year and forecasts for a further 4 years which are extrapolated in perpetuity using a long term average growth rate (average of next five years) and terminal value growth rate of 3.0% consistent with the sectors in which the CGUs operate. The values assigned reflect past experience or, if appropriate, are consistent with external sources of information. The following summarises the post‐tax discount rates applied to cash flows of each CGU for the years ended 30 June 2020 and 2019:
2020 2019 Automotive 9.3 – 9.6% 9.3 – 9.6% Davey 8.9 – 9.5% 8.9 – 9.5%
69
8582_GUD_Holdings_Annual Report_2020_Mono.indd 698582_GUD_Holdings_Annual Report_2020_Mono.indd 69 9/9/20 12:00 pm9/9/20 12:00 pm

GUD Holdings Limited and Subsidiaries
17. Impairment (continued)
Results (continued) The Directors have assessed, that except as described in the impairment section below, no impairment charge is required in relation to the tangible or intangible assets for the year ended 30 June 2020.
Monarch brand name The recoverable amount of this brand name was based on fair value less costs of disposal, estimated using discounted cash flows. The fair value measurement was categorised as a Level 3 fair value based on the inputs in the valuation technique used (see Note 1). In line with Davey’s product cycle plan, products which were sold primarily using the Monarch brand name, have been replaced with the new generation of product being sold under the Davey brand name. Consequently, the Monarch brand is no longer actively used and therefore the total value of $2.115 million has been impaired.
18. Commitments for expenditure
Plant & equipment Future contracted capital expenditure not provided for and payable are as follows: $'000 2020 2019 Within 1 year 746 1,417 Between 1 and 5 years ‐ ‐ Later than 5 years ‐ ‐ Total plant and equipment capital expenditure 746 1,417
Operating leases Future non‐cancellable operating lease commitments not provided for and payable are as follows: 2020 2020 2019 2019 $'000 Buildings Other Buildings Other Within 1 year ‐ 885 6,475 1,514 Between 1 and 5 years ‐ ‐ 18,584 2,453 Later than 5 years ‐ ‐ 15,623 ‐ Total operating leases commitments ‐ 885 40,682 3,967
The Group leases a number of premises throughout Australia, New Zealand and Europe. The rental period of each individual lease agreement varies between one and ten years with renewal options ranging from one to ten years. The majority of lease agreements are subject to rental adjustments in line with movements in the Consumer Price Index or market rentals. The leases do not include an option to purchase the leased assets at the expiry of the lease period. The Group leases the majority of its motor vehicles from external suppliers over a lease period of up to four years with monthly payments. At the end of the lease period, there are a number of options available with respect to the motor vehicles, none of which include penalty charges.
70
8582_GUD_Holdings_Annual Report_2020_Mono.indd 708582_GUD_Holdings_Annual Report_2020_Mono.indd 70 9/9/20 12:00 pm9/9/20 12:00 pm

GUD Holdings Limited and Subsidiaries
Capital Structure and Financing Costs This section outlines how the Group manages its capital structure and related financing costs, including its balance sheet liquidity and access to capital markets. The Directors determine the appropriate capital structure of the Group, how much is realised from shareholders and how much is borrowed from financial institutions to finance the Group’s activities now and in the future. This section details the interest income generated on the Group's cash and other financial assets and the interest expense incurred on borrowings and other financial assets and liabilities. The presentation of these net financing costs in this note reflects income and expenses according to the classification of the financial instruments.
19. Cash and cash equivalents
Accounting policies
Cash and cash equivalents Cash and cash equivalents comprise cash on hand, cash in banks and investments in money market instruments, net of outstanding bank overdrafts and non‐derivative financial instruments and are principally held with the same financial institutions who provide borrowing facilities to the company. Bank overdrafts, where they occur, are included as a component of cash and cash equivalents for the purpose of the statement of cash flows. Cash flows are included in the cash flow statement on a gross basis inclusive of GST. The GST component of cash flows arising from investing and financing activities which is recoverable from, or payable to, the taxation authority is classified as operating cash flows. 2020 2019 Note $'000 $'000 Current Cash and cash equivalents in the balance sheet 23 29,987 28,850 Total cash and cash equivalents 29,987 28,850
Reconciliation of profit after income tax to net cash provided by operating activities 2020 2019 $'000 $'000 Profit/(loss) from operations, net of income tax 43,678 59,558 Depreciation and amortisation 15,000 3,298 Impairment of brand names 2,115 ‐ Impairment of inventory 2,750 ‐ Impairment of capitalised product development costs ‐ (410) Unwind of discount on contingent consideration payable 1,144 ‐ Interest received (94) (126) Interest paid 6,320 7,448 Interest lease liability 3,360 ‐ (Gain)/Loss on sale of property, plant and equipment 340 49 Changes in working capital assets and liabilities: Increase/(decrease) in net tax liability (8,105) (6,532) (Increase)/decrease in inventories (1,979) (14,082) (Increase)/decrease in trade receivables (7,652) (6,448) (Increase)/decrease in other assets (682) 136 Increase/(decrease) in provisions (1,131) (670) Increase/(decrease) in payables 8,754 (1,314) Increase/(decrease) in derivatives 1,696 3,617 Net cash provided by/(used in) operating activities 65,514 44,524
71
8582_GUD_Holdings_Annual Report_2020_Mono.indd 718582_GUD_Holdings_Annual Report_2020_Mono.indd 71 9/9/20 12:00 pm9/9/20 12:00 pm

GUD Holdings Limited and Subsidiaries
20. Borrowings
Accounting policies
Borrowings Borrowings are recorded initially at fair value, net of transaction costs. Subsequent to initial recognition, borrowings are measured at amortised cost with any difference between the initial recognised amount and the redemption value being recognised in the Income Statement over the period of the borrowing using the effective interest rate method. Banking facility On 28 January 2020, the Company completed the refinancing of existing borrowing facilities. The new arrangement resulted in the existing borrowing facilities being renewed for four years and the introduction of an eight‐year fixed term loan element. A summary of the new and expired facilities follows in the sections below.
Unsecured bank loans The unsecured bank loans in accordance with the Common Terms Deed are summarised as follows:
Facilities as at 30 June 2020 Facilities as at 30 June 2019 Amount Maturity Amount Maturity $ million $ million
Bank borrowings – 5‐year facility ‐ ‐ 245.0 1/07/2020 Bank borrowings – 4‐year facility 150.0 28/01/2024 ‐ ‐ Fixed term loan 50.0 23/01/2028 ‐ ‐ Short‐term facilities 25.0 28/01/2021 ‐ ‐ Overdraft 4.9 28/01/2024 10.0 1/07/2020
Total 229.9 255.0
Overdrafts and short‐term facilities The unsecured bank overdraft and short term facilities are subject to annual review. As part of these facilities, GUD Holdings Limited and its Australian subsidiaries have entered into a deed of cross guarantee. GUD Holdings Limited has a contingent liability to the extent of the bank overdraft debt incurred by its controlled entities. Interest on bank overdrafts is charged at prevailing market rates. The weighted average interest rate for all overdrafts as at 30 June 2020 is 4.44% (30 June 2019: 4.45%). This table summarises Borrowings relating to all operations at 30 June 2020 and 30 June 2019: 2020 2019 Note $'000 $'000 Current Unsecured bank loans ‐ 3,750 Secured finance lease liabilities (1) ‐ 37 Total current borrowings 23 ‐ 3,787 Non‐current Unsecured bank loans 172,139 157,784 Total non‐current borrowings 23 172,139 157,784 (1) Secured by the assets leased (Note 15).
72
8582_GUD_Holdings_Annual Report_2020_Mono.indd 728582_GUD_Holdings_Annual Report_2020_Mono.indd 72 9/9/20 12:00 pm9/9/20 12:00 pm

GUD Holdings Limited and Subsidiaries
20. Borrowings (continued)
Financing facilities This table summarises facilities available, used and not utilised related to all operations at 30 June 2020 and 30 June 2019: 2020 2019 $'000 $'000
Total facilities available: Unsecured bank overdrafts 4,934 4,956 Unsecured bank loans 200,000 245,000 Short term facilities 25,000 ‐ Unsecured money market facilities ‐ 5,000 Balance at 30 June 229,934 254,956 Facilities used at balance date: Unsecured bank overdrafts ‐ 165 Unsecured bank loans 172,139 161,534 Short term facilities ‐ ‐ Unsecured money market facilities ‐ ‐ Balance at 30 June 172,139 161,699 Facilities not utilised at balance date: Unsecured bank overdrafts 4,934 4,791 Unsecured bank loans 27,861 83,466 Short term facilities 25,000 Unsecured money market facilities ‐ 5,000 Balance at 30 June 57,795 93,257
Reconciliation of movements of liabilities to cash flows arising from financing activities Note
Bank overdrafts used for cash manage‐ment purposes
Other loans and borrowings
Lease liabilities
Interest Rate Swaps / Forward exchange contracts used for hedging ‐ asset
Interest Rate Swaps / Forward exchange contracts used for hedging ‐ Liabilities
Reserves Retained Earnings
Total
Balance at 1 July 2019 165 158,837 ‐ 898 1,836 9,981 155,778 327,495
Proceeds from loans and borrowings
‐ 173,252 ‐ ‐ ‐ ‐ ‐ 173,252
Repayment of borrowings ‐ (164,697) ‐ ‐ ‐ ‐ ‐ (164,697)
Payment of lease liability ‐ ‐ (11,229) ‐ ‐ ‐ ‐ (11,229)
Dividend paid ‐ ‐ ‐ ‐ ‐ ‐ (48,552) (48,552)
Interest received ‐ 94 ‐ ‐ ‐ ‐ ‐ 94 Interest paid ‐ (6,320) ‐ ‐ ‐ ‐ ‐ (6,320) Total changes from financing cash flows
‐ 2,329 (11,229) ‐ ‐ ‐ (48,552) (57,452)
The effect of changes in foreign exchange rates
‐ (540) (264) (349) 871 ‐ ‐ (282)
Other changes ‐ ‐ 88,095 ‐ (665) 1,020 43,678 132,128
Change in bank overdraft (165) ‐ ‐ ‐ ‐ ‐ ‐ (165)
Interest received ‐ (94) ‐ ‐ ‐ ‐ ‐ (94)
Interest expense ‐ 6,320 3,360 ‐ ‐ ‐ ‐ 9,680
Total other changes (165) 6,226 91,455 ‐ (665) 1,020 43,678 141,549
Balance at 30 June 2020 ‐ 166,852 79,962 549 2,042 11,001 150,904
411,310
73
8582_GUD_Holdings_Annual Report_2020_Mono.indd 738582_GUD_Holdings_Annual Report_2020_Mono.indd 73 9/9/20 12:00 pm9/9/20 12:00 pm

GUD Holdings Limited and Subsidiaries
20. Borrowings (continued)
Reconciliation of movements of liabilities to cash flows arising from financing activities (continued) Note Bank
overdrafts used for cash management purposes
Other loans and borrowings
Interest Rate Swaps / Forward exchange contracts used for hedging ‐ asset
Interest Rate Swaps / Forward exchange contracts used for hedging ‐ Liabilities
Reserves Retained Earnings
Total
Balance at 1 July 2018 155 141,264 3,687 1,082 32,793 119,649 298,630
Changes from financing cash flows
‐ ‐ ‐ ‐ ‐ ‐ ‐
Proceeds from loans and borrowings
‐ 45,671 ‐ ‐ ‐ ‐ 45,671
Repayment of borrowings ‐ (29,096) ‐ ‐ ‐ ‐ (29,096)
Payment of lease liability
Dividend paid ‐ ‐ ‐ ‐ ‐ (45,837) (45,837)
Interest received ‐ 126 ‐ ‐ ‐ ‐ 126 Interest paid ‐ (7,448) ‐ ‐ ‐ ‐ (7,448) Total changes from financing cash flows
‐ 9,253 ‐ ‐ ‐ (45,837) (36,584)
The effect of changes in foreign exchange rates
‐ 998 (2,779) 364 539 ‐ (878)
Other changes ‐ ‐ (10) 390 (22,753) 82,688 60,315
Change in bank overdraft 10 ‐ ‐ ‐ ‐ ‐ 10
Interest received ‐ (126) ‐ ‐ ‐ ‐ (126)
Interest expense ‐ 7,448 ‐ ‐ ‐ ‐ 7,448
Total other changes 10 7,322 (10) 390 (22,753) 82,688 67,647
Balance at 30 June 2019 165 158,837 898 1,836 10,579 156,500 328,815
21. Derivatives
Accounting policies
Derivative financial instruments To manage its exposure to interest rate and foreign exchange rate risk, the Group may enter into a variety of derivatives including forward foreign exchange contracts, interest rate swaps, options and collars. Derivatives are recognised initially at fair value and any directly attributed transaction costs are recognised in profit or loss as they are incurred. Subsequent to initial recognition, derivatives are recognised at fair value, and changes are generally recognised in profit or loss unless designated and effective as cash flow hedging instruments.
Cash flow hedges The Group designates certain derivatives as hedges of highly probable forecast transactions (cash flow hedges). When a derivative is designated as a cash flow hedge, the effective portion of changes in the fair value of derivatives is recognised in other comprehensive income and accumulated in the hedging reserve. Any ineffective portion of changes in fair value of the derivative is recognised immediately in the profit or loss. The amounts are accumulated in other comprehensive income and reclassified in the profit or loss in the same period when the impact of the hedged item affects profit or loss. When the forecast transaction that is hedged results in the recognition of a non‐financial asset or a non‐financial liability, gains and losses previously deferred in equity are transferred from equity and included in the initial measurement of the cost of the asset or liability.
74
8582_GUD_Holdings_Annual Report_2020_Mono.indd 748582_GUD_Holdings_Annual Report_2020_Mono.indd 74 9/9/20 12:00 pm9/9/20 12:00 pm

GUD Holdings Limited and Subsidiaries
21. Derivatives (continued) Hedge accounting is discontinued on a prospective basis when the hedging instrument expires or is sold, terminated, or exercised, or no longer qualifies for hedge accounting. At this time, gain or losses accumulated in other comprehensive income are reclassified to profit or loss. An interest rate swap is an instrument to exchange a fixed rate of interest for a floating rate, or vice versa, or one type of floating rate for another.
Derivatives that do not qualify for hedge accounting Certain derivative instruments do not qualify for hedge accounting. Changes in the fair value of any derivative instruments that do not qualify for hedge accounting are recognised immediately in the income statement. A derivative is a type of financial instrument typically used to manage risk. A derivative's value changes over time in response to underlying variables such as exchange rates or interest rates and is entered into for a fixed period. A hedge is where a derivative is used to manage an underlying exposure. The Group is exposed to changes in interest rates on its net borrowings and to changes in foreign exchange rates on its foreign currency transactions and net assets. In accordance with Board approved policies, the Group uses derivatives to hedge these underlying exposures. Derivative financial instruments are initially included in the balance sheet at their fair value, either as assets or liabilities, and are subsequently remeasured at fair value or 'marked to market' at each reporting date. Movements in instruments measured at fair value are recorded in the Income Statement in net finance costs. Analysis of the derivatives used by the Group to hedge its exposure and the various methods used to calculate their respective fair values are detailed in this section.
Derivative assets This table summarises derivative assets related to all operations at 30 June 2020 and at 30 June 2019: 2020 2019 Note $'000 $'000 Current Derivatives ‐ Foreign currency forward contracts 23 549 898 Current derivative assets 549 898 Non‐current Derivatives ‐ Interest rate swaps 23 ‐ ‐ Non‐current derivative assets ‐ ‐
Derivative liabilities This table summarises derivative liabilities related to all operations at 30 June 2020 and at 30 June 2019: 2020 2019 Note $'000 $'000 Current Derivatives ‐ Foreign currency forward contracts 23 1,235 243 Derivatives ‐ Interest rate swaps at fair value 23 49 4 Current derivative liabilities 1,284 247 Non‐current Derivatives ‐ Interest rate swaps at fair value 23 758 1,468 Non‐current derivative liabilities 758 1,468
75
8582_GUD_Holdings_Annual Report_2020_Mono.indd 758582_GUD_Holdings_Annual Report_2020_Mono.indd 75 9/9/20 12:00 pm9/9/20 12:00 pm

GUD Holdings Limited and Subsidiaries
21. Derivatives (continued) The following table indicates the periods in which the cash flows associated with cash flow hedges are expected to occur and impact profit or loss and the carrying amounts of the related hedging instruments.
2020 2019
Expected cash flow and impact to profit or loss Expected cash flow and impact to profit or loss
Carrying amount
Total 1‐6 months
6‐12 months
More than one year
Carrying amount
Total 1‐6 months
6‐12 months
More than one year
Interest rate swaps
Assets ‐ ‐ ‐ ‐ ‐ ‐ ‐ ‐
Liabilities (807) (807) (49) ‐ (758) (1,472) (1,472) (4) ‐ (1,468)
Forward exchange contracts
Assets 549 549 549 ‐ ‐ 898 898 898 ‐ ‐
Liabilities 1,235 1,235 1,235 ‐ ‐ 243 243 243 ‐ ‐
Total 977 977 1,735 ‐ (758) (331) (331) 1,137 ‐ (1,468)
22. Other financial instruments
Accounting policies
Other financial instruments Financial assets and liabilities are recognised on the date when they are originated or at trade date. A financial instrument is recognised if the Group becomes a party to the contractual provisions of the instrument. Financial assets are derecognised if the Group’s contractual rights to the cash flows from the financial assets expire or if the Group transfers the financial asset to another party without retaining control or substantially all risks and rewards of the asset. Financial liabilities are derecognised if the Group’s obligations specified in the contract are discharged, expire or are cancelled. Financial assets and liabilities are offset and the net amount presented in the statement of financial position when, and only when, the Group has a legal right to offset the amounts and intends either to settle them on a net basis or to realise the asset and settle the liability simultaneously.
Loans receivable Loans receivable are non‐derivative financial instruments and are initially recognised at fair value plus any directly attributable costs. Subsequent to initial recognition, they are measured at amortised cost using the effective interest method, less identified impairment.
Contingent consideration Any contingent consideration receivable or payable is measured at fair value at the acquisition date. If the contingent consideration is classified as equity, then it is not remeasured and settlement is accounted for within equity. Otherwise, subsequent changes in the fair value of the contingent consideration are recognised in profit or loss.
76
8582_GUD_Holdings_Annual Report_2020_Mono.indd 768582_GUD_Holdings_Annual Report_2020_Mono.indd 76 9/9/20 12:00 pm9/9/20 12:00 pm

GUD Holdings Limited and Subsidiaries
22. Other financial instruments (continued)
Other financial assets This table summarises other financial assets related to all operations at 30 June 2020 and at 30 June 2019: 2020 2019 Note $'000 $'000 Current Loans receivable ‐ third parties 23 1,176 756 Other current financial assets 1,176 756 Non‐current Loans receivable ‐ third parties 23 4,111 1,978 Other non‐current financial assets 4,111 1,978
Other financial liabilities This table summarises other financial liabilities at 30 June 2020 and at 30 June 2019: 2020 2019 Note $'000 $'000 Current Contingent consideration payable 3,250 1,625 Non‐current Contingent consideration payable ‐ 802 Total other financial liabilities 23 3,250 2,427 Contingent consideration payable included in other financial liabilities is measured at fair value. Consideration payable at 30 June 2020 includes the contingent consideration payable to the vendors of Innovative Mechatronics Group.
23. Financial instruments Fair value hierarchy below analyses financial instruments carried at fair value, by valuation method. The different levels have been defined as follows:
Level 1: quoted prices (unadjusted) in active markets for identical assets or liabilities Level 2: inputs other than quoted prices included within Level 1 that are observable market values for the asset
or liability, either directly (i.e. as prices) or indirectly (i.e. derived from prices) Level 3: inputs for the asset or liability that are not based on observable market data (unobservable inputs).
The following tables show the valuation techniques used in measuring Level 2 and Level 3 fair values for financial instruments measured at fair value in the statement of financial position, as well as the significant unobservable inputs used.
77
8582_GUD_Holdings_Annual Report_2020_Mono.indd 778582_GUD_Holdings_Annual Report_2020_Mono.indd 77 9/9/20 12:00 pm9/9/20 12:00 pm

GUD Holdings Limited and Subsidiaries
23. Financial instruments (continued)
Type Valuation technique Significant unobservable inputs
Inter‐relationship between significant unobservable inputs and fair value
Interest rate swaps
Swap models: The fair value calculated as the present value of the estimated future cash flows. Estimates of future floating‐rate cash flows are based on quoted swap rates, futures prices and interbank borrowing rates. Estimated cash flows are discounted using a yield curve constructed from similar sources and which reflects the relevant benchmark interbank rate used by market participants for this purpose when pricing interest rate swaps. The fair value estimate is subject to a credit risk adjustment that reflects the credit risk of the Group and of the counterparty; this is calculated based on credit spreads derived from current credit default swap or bond prices.
Not applicable. Not applicable.
Foreign exchange contracts
Forward pricing: The fair value is determined using quoted forward exchange rates at the reporting date and present value calculations based on high credit quality yield curves in the respective currencies.
Not applicable. Not applicable.
Contingent consideration
Discounted cash flows: The valuation model considers the present value of the expected future payments, discounted using a risk‐adjusted discount rate. The expected payment is determined by considering the possible scenarios of forecast revenue and EBITDA, the amount to be paid under each scenario and the probability of each scenario.
‐The probability attached to each scenario
‐ Forecast EBIT growth (2020: 0‐30%,2019: 0‐30%)
‐ Risk adjusted discount rate (2020: 8.0%,2019: 8.0%)
The estimated fair value would increase (decrease) if:
‐ The EBITDA growth is lower/ (higher)
‐ The risk adjusted discount rate moves lower (higher).
Investments The fair values of the non‐listed equity investments have been estimated by benchmarking against the latest round of capital raises completed in the financial year.
‐ Recent capital raises
‐ Internal management information
Not applicable.
78
8582_GUD_Holdings_Annual Report_2020_Mono.indd 788582_GUD_Holdings_Annual Report_2020_Mono.indd 78 9/9/20 12:00 pm9/9/20 12:00 pm

GUD Holdings Limited and Subsidiaries
23. Financial instruments (continued)
Derivative financial instruments Level 2 fair values for simple over‐the‐counter derivative financial instruments are based on valuations from banks. These are tested for reasonableness by discounting expected future cash flows using market interest rate for a similar instrument at the measurement date.
Other financial assets ‐ Contingent consideration payable Level 3 fair values are based on the present value of expected receipt discounted using a risk adjusted discount rate. There were no transfers between any of the levels of the fair value hierarchy during the year ended 30 June 2020.
Level 3 fair value reconciliation Changes in fair value of the level 3 financial instruments is summarised below: 2020 2019 $'000 $'000 Opening balance1 693 2,032 Contingent consideration payable – acquisition of 100% of IMG (321) (1,625) Investments acquired ‐ (312) Total gains/losses recognised in the period on OCI ‐ 598 Unwinding of discount 1,144 ‐ Unrealised fair value loss included in profit and loss ‐ ‐ Closing balance 1,516 693 1. Opening balance includes Investments and Contingent consideration
79
8582_GUD_Holdings_Annual Report_2020_Mono.indd 798582_GUD_Holdings_Annual Report_2020_Mono.indd 79 9/9/20 12:00 pm9/9/20 12:00 pm

GUD Ho
ldings Limite
d an
d Subsidiarie
s
23. Fina
ncial instrum
ents (con
tinue
d)
As
at 3
0 June
2020
Ca
rrying
value
Fair value
Cu
rren
t No
n‐curren
t
Total
Level 1
Level 2
Level 3
Total
$'000
$'000
$'000
$'000
$'000
$'000
$'000
Fina
ncial assets m
easured at fa
ir value
Investmen
t ‐
1,734
1,734
‐
‐ 1,734
1,734
Deriv
atives ‐ Foreign curren
cy fo
rward contracts
549
‐
549
‐
549
‐ 549
Othe
r financia
l assets
‐ 229
229
‐
‐ 229
229
Total finan
cial assets m
easured at fa
ir value
549
1,963
2,512
‐
549
1,963
2,512
Fina
ncial assets n
ot m
easured at fa
ir value
Cash and
cash equ
ivalen
ts a
29,987
‐
29
,987
‐ ‐
‐ ‐
Trade and othe
r receivables a
114,479
‐
114,479
‐
‐ ‐
‐ Othe
r financia
l assets a
1,176
3,882
5,058
‐
‐ ‐
‐ To
tal finan
cial assets n
ot m
easured at fa
ir value
145,642
3,882
149,524
‐
‐ ‐
‐ To
tal finan
cial assets
146,191
5,845
152,036
‐
549
1,963
2,512
Fina
ncial liabilities m
easured at fa
ir value
De
rivatives ‐ Foreign curren
cy fo
rward contracts
1,235
‐
1,235
‐
1,235
‐ 1235
De
rivatives ‐ Interest ra
te sw
aps a
t fair v
alue
49
758
807
‐
807
‐ 807
Othe
r financia
l liabilities
3,250
‐
3,250
‐
‐ 3,250
3,250
Total finan
cial liabilities m
easured at fa
ir value
4,534
758
5,292
‐
2,042
3,250
5,292
Fina
ncial liabilities n
ot m
easured at fa
ir value
Bo
rrow
ings and
loans a
‐ 172,139
172,139
‐
‐ ‐
‐ To
tal finan
cial liabilities n
ot m
easured at fa
ir value
‐ 172,139
172,139
‐
‐ ‐
‐ To
tal finan
cial liabilities
4,534
172,897
177,431
‐
2,042
3,250
5,292
a.
The Grou
p has n
ot disc
losed the fair values fo
r financia
l instrum
ents su
ch as c
ash and cash equ
ivalen
ts, sho
rt te
rm trade receivables a
nd payables, be
cause their carrying am
ounts a
re a re
ason
able app
roxim
ation of fair value
8582_GUD_Holdings_Annual Report_2020_Mono.indd 808582_GUD_Holdings_Annual Report_2020_Mono.indd 80 9/9/20 12:00 pm9/9/20 12:00 pm

GUD Ho
ldings Limite
d an
d Subsidiarie
s
23. Fina
ncial instrum
ents (con
tinue
d)
As at 3
0 June
2019
Ca
rrying
value
Fair value
Cu
rren
t No
n‐curren
t
Total
Level 1
Level 2
Level 3
Total
$'000
$'000
$'000
$'000
$'000
$'000
$'000
Fina
ncial assets m
easured at fa
ir value
Investmen
t
1,734
1,734
‐
‐ 1,734
1,734
Deriv
atives ‐ Foreign curren
cy fo
rward contracts
898
‐
898
‐
898
‐ 898
Total finan
cial assets m
easured at fa
ir value
898
1,734
2,632
‐
898
1,734
2,632
Fina
ncial assets n
ot m
easured at fa
ir value
Cash and
cash equ
ivalen
ts a
28,850
‐
28
,850
‐ ‐
‐ ‐
Trade and othe
r receivables a
106,827
‐
106,827
‐
‐ ‐
‐ Othe
r financia
l assets a
756
1,978
2,734
‐
‐ ‐
‐ To
tal finan
cial assets n
ot m
easured at fa
ir value
136,433
1,978
138,411
‐
‐ ‐
‐ To
tal finan
cial assets
137,331
4,310
141,641
‐
898
1,734
2,632
Fina
ncial liabilities m
easured at fa
ir value
De
rivatives ‐ Foreign curren
cy fo
rward contracts
243
‐
243
‐
243
‐ 243
Deriv
atives ‐ Interest ra
te sw
aps a
t fair v
alue
4
1,468
1,472
‐
1,472
‐ 1,472
Othe
r financia
l liabilities
1,625
802
2,427
‐
‐ 2,427
2,427
Total finan
cial liabilities m
easured at fa
ir value
1,872
2,270
4,142
‐
1,715
2,427
4,142
Fina
ncial liabilities n
ot m
easured at fa
ir value
Bo
rrow
ings and
loans a
202
161,534
161,736
‐
‐ ‐
‐ To
tal finan
cial liabilities n
ot m
easured at fa
ir value
202
161,534
161,736
‐
‐ ‐
‐ To
tal finan
cial liabilities
2,074
163,804
165,878
‐
1,715
2,427
4,142
a.
The Grou
p has n
ot disc
losed the fair values fo
r financia
l instrum
ents su
ch as c
ash and cash equ
ivalen
ts, sho
rt te
rm trade receivables a
nd payables, be
cause their carrying am
ounts a
re a re
ason
able app
roxim
ation of fair value
8582_GUD_Holdings_Annual Report_2020_Mono.indd 818582_GUD_Holdings_Annual Report_2020_Mono.indd 81 9/9/20 12:00 pm9/9/20 12:00 pm

GUD Holdings Limited and Subsidiaries
24. Financial risk management
Overview The Group's activities expose it to a variety of financial risks: market risks (including currency risk, interest rate risk and price risk), credit risk and liquidity risk. The Group's overall risk management programme focusses on the unpredictability of financial markets and seeks to minimise potential adverse effects on the Group's financial performance. The Group uses derivative financial instruments within its policies described below as hedges to manage certain risk exposures. Treasury policies have been approved by the Board for managing each of these risks including levels of authority on the type and use of financial instruments. Transactions are only undertaken if they relate to underlying exposures, i.e. the Group does not use derivatives to speculate. The treasury function reports regularly to the Audit Committee and treasury operations are subject to periodic reviews. The Group has exposure to the following risks from their financial instruments: credit risk liquidity risk market risk
This note provides additional information about the Group’s exposures to the above risks, its objectives, policies and processes for measuring and managing the identified risk. It also outlines the objectives and approach to capital management. Financial risk management objectives The Group's Corporate Treasury function provides services to the business, co‐ordinates access to domestic and international markets, and manages the financial risks relating to the operations of the Group. The Group does not enter into or trade in financial instruments, including derivative financial instruments, for speculative purposes. The use of financial derivatives is governed by the Group's policies approved by the Board of Directors, which provide written principles on the use of financial derivatives. Compliance with policies and exposure limits is reviewed by the Financial Risk Management Committee chaired by the Chief Financial Officer. Each month, the Chief Financial Officer provides the Board of Directors with a report outlining financial exposures, hedging levels, and, financial risk management policy compliance. The Group's activities expose it primarily to the financial risks associated with changes in foreign currency exchange rates, interest rates and commodity prices. There has not been any change to the objectives, policies and processes for managing risk during the current year.
Credit risk Credit risk refers to the risk that a financial loss may be experienced by the Group if a customer or counterparty to a financial instrument fails to meet its contractual obligations. The Group’s risk is primarily in relation to receivables from customers and hedging transactions with third party counterparties. The Group’s exposure to credit risk is characterised by the following: the majority of customer sales transactions are domestic in nature, trade receivables are non‐interest bearing and domestic trade receivables are generally on 30 to 120 day
terms, the Group as a whole is exposed in a material way to several large Automotive parts resellers who are
members of publicly listed companies and a number of significant customers with individual businesses in the water and automotive aftermarket sectors,
new customers are subjected to credit assessment by the specific business within the Group that they wish to transact with and are allocated credit limits which are managed according to the needs of the customer and the risk assessment of the relevant business,
most businesses within the Group maintain credit insurance to lessen the credit risk, ageing of customer receivables is reviewed in detail each month by businesses within the Group and by the
Company in an oversight capacity.
82
8582_GUD_Holdings_Annual Report_2020_Mono.indd 828582_GUD_Holdings_Annual Report_2020_Mono.indd 82 9/9/20 12:00 pm9/9/20 12:00 pm

GUD Holdings Limited and Subsidiaries
24. Financial risk management (continued) In order to manage credit risk, goods are sold subject to retention of title clauses and, where considered appropriate, are registered under the Personal Properties Securities Act, so that in the event of non‐payment the Group may have a secured claim. The Group maintains a provision account, described in the consolidated financial statements as an allowance for doubtful debts, which represents the estimated value of specific trade receivables that may not be recovered. A general provision for doubtful debts is not maintained. Uncollectible trade receivables are charged to the allowance for doubtful debts account. Identified bad debts are submitted to the Board of Directors for approval for write off in December and June of each year. Credit insurance is maintained to partially mitigate uncollectable amounts. The maximum exposure to credit risk is the sum of cash and cash equivalents (Note 19), the total value of trade debtors and other receivables (Note 8) and other financial assets (Note 22). The majority of credit risk is within Australia and New Zealand. A material exposure arises from forward exchange contracts, options and collars that are subject to credit risk in relation to the relevant counterparties. The maximum credit risk exposure on foreign currency contracts, options and collars is the full amount of the foreign currency the Group pays when settlement occurs, should the counterparty fail to pay the amount which it is committed to pay the Group. To address this risk, the Group restricts its dealings to financial institutions with appropriate credit ratings.
Liquidity risk Liquidity risk refers to the risk that the Group will not be able to meet its financial obligations as they fall due. The Group undertakes the following activities to ensure that there will be sufficient funds available to meet obligations: prepare budgeted annual and monthly cash flows; measurement of actual Group cash flows on a regular basis with comparison to budget on a monthly basis; maintenance of standby money market facilities; and maintenance of a committed borrowing facility in excess of budgeted usage levels.
The contractual maturities of financial liabilities, including estimated interest payments on bank loans, are as follows:
Carrying amount
Contractual cash flows
Less than 1 year
1 to 2 years
2 to 5 years
Beyond 5 years
2020 $'000 $'000 $'000 $'000 $'000 $'000 Financial liabilities Trade and other payables 65,100 65,100 65,100 ‐ ‐ ‐ Derivatives 2,042 2,042 1,284 758 ‐ ‐ Unsecured bank loans 172,139 196,676 4,861 4,861 133,464 53,490 Contingent consideration 3,250 3,250 3,250 ‐ ‐ ‐ Total financial liabilities 242,531 267,068 74,495 5,619 133,464 53,490
Carrying amount
Contractual cash flows
Less than 1 year
1 to 2 years
2 to 5 years
Beyond 5 years
2019 $'000 $'000 $'000 $'000 $'000 $'000 Financial liabilities Trade and other payables 58,667 58,667 58,667 ‐ ‐ ‐ Derivatives 1,715 1,715 247 1,468 ‐ ‐ Unsecured bank loans 161,571 166,055 7,960 158,095 ‐ ‐ Contingent consideration 2,427 2,427 1,625 802 ‐ ‐ Total financial liabilities 224,380 228,864 68,499 160,365 ‐ ‐
The inflows/(outflows) disclosed in the above table represent the contractual undiscounted cash flows relating to derivative financial liabilities held for risk management purposes and which are not usually closed out before contractual maturity. The disclosure shows net cash flow amounts for derivatives that are net cash‐settled and gross cash inflow and outflow amounts for derivatives that have simultaneous gross cash settlement.
83
8582_GUD_Holdings_Annual Report_2020_Mono.indd 838582_GUD_Holdings_Annual Report_2020_Mono.indd 83 9/9/20 12:00 pm9/9/20 12:00 pm

GUD Holdings Limited and Subsidiaries
24. Financial risk management (continued) As disclosed in Note 22, the Group has an unsecured bank loan that contains a loan covenant. A future breach of covenant may require the Group to repay the loan earlier than indicated in the above table. Under the agreement, the covenant is monitored on a regular basis by the treasury department and regularly reported to Management to ensure compliance with the agreement.
Market risk Market risk for the Group refers to the risk that changes in foreign exchange rates or interest rates will affect the Group’s income or equity value. The Group enters into a variety of derivative financial instruments to manage its exposure to interest rates and foreign currency risk, including:
‐ forward foreign exchange contracts, options and collars to hedge the exchange risk arising from the importation and sale of goods purchased in foreign currency (principally US dollars); and
‐ interest rate swaps, options and collars to partially mitigate the risk of rising interest rates.
Foreign exchange risk management The Group undertakes transactions denominated in foreign currencies, hence exposures to exchange rate fluctuations arise. Exchange rate exposures are managed within approved policy parameters utilising forward foreign exchange contracts, options and collars. The Board of Directors reviews the Group’s foreign currency exposure on a monthly basis. The process includes a review of a rolling 12 month estimate of foreign currency exposure, an analysis of financial instruments contracted, an analysis of positions in relation to policy compliance and an analysis of the Group’s sensitivity to movements in the exchange rates on an annualised basis. Forward foreign exchange contracts provide certainty as specific rates are agreed at the time the contract is agreed. Purchased foreign currency options require a premium to be paid and provide a minimum (or maximum) rate at which the entity transacting will purchase (or sell) foreign currency. Foreign currency collars, being a combination of bought call and sold put options, provide the transacting entity with a minimum rate of exchange (call) and a maximum rate of exchange (put). The Group’s policy is to enter into forward foreign exchange contracts, options and collars to cover specific and anticipated purchases, specific and anticipated sales and committed capital expenditure, principally in US dollars. The terms of the Group's commitments are rarely more than one year. At 30 June 2020, the Group is exposed to $8.2 million (2019: $9.7 million) of USD denominated net trade liabilities, $2.1 million of NZD net trade receivables (2019: $8.8 million net trade receivables), $2.3 million of Euro net trade receivables (2019: $2.4 million) and $1.8 million of CNY net trade liabilities (2019: $1.9 million).
Forward foreign exchange contracts The following table summarises the significant forward foreign currency contracts outstanding as at the reporting date:
Average
Exchange Rate 1 Foreign Currency Contract Value Fair Value 2020 2019 2020 2019 2020 2019 2020 2019 Buy FC'000 FC'000 $'000 $'000 $'000 $'000 United States Dollars 0.6708 0.7096 53,250 46,550 79,385 65,600 (511) 778 Chinese Renminbi 4.7057 4.7969 23,350 36,000 4,962 7,505 (202) (123) Total forward foreign exchange contracts 83,812 73,105 (713) 655
1 Represents weighted average hedge exchange rates in the foreign currency contracts
2020 2019 Sensitivity Analysis ‐ foreign exchange AUD/USD $'000 $'000 For every 1c decrease in AUD:USD rate, total exposures increase by: Income statement 1,120 1,029 Equity 65 (91)
84
8582_GUD_Holdings_Annual Report_2020_Mono.indd 848582_GUD_Holdings_Annual Report_2020_Mono.indd 84 9/9/20 12:00 pm9/9/20 12:00 pm

GUD Holdings Limited and Subsidiaries
24. Financial risk management (continued)
Interest rate risk management The Group is exposed to interest rate risk as it borrows funds at variable interest rates. The risk is managed by maintaining an appropriate mix between fixed and floating interest rates through the use of interest rate derivatives, swap contracts, options and forward interest rate swap contracts. The Group, from time to time, enters into interest rate swaps and options, with expiration terms ranging out to three years, to protect part of the loans from exposure to increasing interest rates. Interest rate swaps allow the Group to swap floating rate borrowings into fixed rates. Maturities of swap contracts are principally between one and three years. The Group determines the level of hedging required each year based on an estimate of the underlying core debt which is represented by forecast June debt levels. The core debt level is hedged to levels ranging from a maximum of 80% in year one to a minimum of 20% in year three. The hedging of the core debt level is reviewed monthly by the Financial Risk Management Committee. These hedges are treated as cash flow hedges. Under interest rate swap contracts, the Group agrees to exchange the difference between fixed and floating rate interest amounts calculated on agreed notional principal amounts. These contracts enable the Group to partially mitigate the risk of changing interest rates. The fair values of interest rate swaps are based on counterparty exit values at the reporting date. The following table summarises the sensitivity of the Group as at the reporting date to movements in interest rates and does not take into account the offsetting impact of any hedging in place. It is important to note that this interest rate sensitivity analysis assumes that all other economic variables remain constant. The information presented includes the type of sensitivity analysis used when reporting to the Board of Directors. The table illustrates the impact of a change in rates of 100 basis points, a level that Management believes to be a reasonably possible movement. 2020 2019 Sensitivity Analysis ‐ interest rates $'000 $'000 For every 100 basis points increase in interest rates: Income statement (1,422) (1,327) Equity ‐ ‐
The following table details the notional principal amounts and remaining terms of interest rate swap and option contracts outstanding at the reporting date. Average contracted Notional principal Fixed interest rate amount Fair value 2020 2019 2020 2019 2020 2019 Outstanding floating for fixed contracts % % $'000 $'000 $'000 $'000 Less than 1 year 2.91 ‐ 80,000 ‐ (379) ‐ 1 to 2 years ‐ 2.91 ‐ 80,000 ‐ (1,482) 2 to 5 years ‐ ‐ ‐ ‐ ‐ ‐ Total floating for fixed contracts 80,000 80,000 (379) (1,482)
Capital management The Board’s policy is to maintain a strong capital base for the Group. This policy is predicated on the need to continue to present the Group favourably to various stakeholders including investors, employees, banks, suppliers and customers. This enables the Group to access capital markets, attract talented staff and negotiate favourable terms and conditions with suppliers and customers. Capital is defined as total debt and equity of the Group. The Group uses a Cash Value Added (CVA) approach when measuring returns achieved by each business. This approach involves comparing the cash profit achieved to the cost of the capital utilised by each business. This cost of capital represents a weighted average cost of debt and equity and allows a single measure to assess business performance. The Group has consistently achieved CVA returns in excess of its weighted average cost of capital resulting in positive shareholder returns. The Group is not subject to any externally imposed capital requirements. The terms and the conditions of the main debt facilities contain four financial covenants: minimum interest cover, maximum debt to earnings, and Australia and NZ subsidiaries to Group asset and earnings ratios. All covenants have been satisfied during the 2020 and 2019 financial years. There were no changes to the Group’s approach to capital management during the year.
85
8582_GUD_Holdings_Annual Report_2020_Mono.indd 858582_GUD_Holdings_Annual Report_2020_Mono.indd 85 9/9/20 12:00 pm9/9/20 12:00 pm

GUD Holdings Limited and Subsidiaries
25. Share capital
Accounting policies
Share capital The Company’s fully paid ordinary shares are classified as equity. Incremental costs directly attributable to the issue of or repurchase (buy‐back) of ordinary shares are recognised as a deduction from equity, net of any tax effects. Ordinary shares bought back by the Company are cancelled in accordance with the law. 2020 2020 2019 2019 $'000 Number $'000 Number Balance at the beginning of the year 112,880 86,485,972 112,880 86,185,698 Performance share rights vested ‐ 215,202 ‐ 300,274 Balance at the end of the year 112,880 86,701,174 112,880 86,485,972
During the year, the Company issued 215,202 shares (2019: 300,274 shares). During the year, no shares were bought back on market and cancelled by the Group (2019: nil). The Company does not have par value in respect of its issued shares, hence the $ values above represent historical amounts contributed (if any) on the new issue of shares, amounts allocated to or from retained earnings, and any amount paid on the repurchase (buy back) of ordinary shares. Fully paid ordinary shares carry one vote per share and carry the right to dividends.
26. Reserves
Accounting policies
Hedging reserve The effective portion of changes in the fair value (net of tax) of derivatives designated as hedges of highly probable forecast transactions (cash flow hedges) is recognised in other comprehensive income and accumulated in the hedging reserve and reclassified to the profit or loss in the same period when the impact of the hedged item affects profit or loss. When the forecast transaction that is hedged results in the recognition of a non‐financial asset or a non‐financial liability, gains and losses previously deferred in the hedging reserve are transferred and included in the initial measurement of the cost of the asset. Gains or losses accumulated in the hedging reserve are reclassified to profit or loss on a prospective basis when hedge accounting is discontinued, when the hedging instrument expires or is sold, terminated, or exercised, or no longer qualifies for hedge accounting.
Equity compensation reserve The Performance Rights Plan grants shares in the Company to certain employees. The fair value of performance rights granted under the Performance Rights Plan is recognised as an employee expense with a corresponding increase in the equity compensation reserve. The fair value is measured at grant date and is spread over the vesting period which is the period from the grant date to the end of the Plan period. The fair value of the performance rights granted is measured using a Monte Carlo simulation model, taking into account the terms and conditions upon which the performance rights were granted.
86
8582_GUD_Holdings_Annual Report_2020_Mono.indd 868582_GUD_Holdings_Annual Report_2020_Mono.indd 86 9/9/20 12:00 pm9/9/20 12:00 pm

GUD Holdings Limited and Subsidiaries
26. Reserves (continued)
Translation reserve Assets and liabilities of foreign operations, including goodwill and fair value adjustments arising on acquisition, are translated into the Group’s reporting currency at exchange rates at the reporting date. The income and expenses of foreign operations are translated into the Group’s reporting currency at exchange rates at the dates of the transactions. Foreign currency differences are recognised in other comprehensive income and accumulated in the translation reserve, except to the extent that the translation difference is allocated to non‐controlling interests. When a foreign operation is disposed of in its entirety such that control or significant influence is lost, the cumulative amount in the translation reserve related to the foreign operation is reclassified to profit or loss as part of the gain or loss on disposal. If the Group disposes of part of its interest in a subsidiary but retains control, then the relevant proportion of the cumulative amount is reattributed to non‐controlling interests. When the Group disposes of only part of an associate while retaining significant influence, the relevant proportion of the cumulative amount is reclassified to profit or loss. If settlement of a monetary item receivable from or payable to a foreign operation is neither planned nor likely to occur in the foreseeable future, then foreign currency differences arising from such items form part of the net investment in the foreign operation. Accordingly, such differences are recognised in other comprehensive income and accumulated in the translation reserve.
Dividend reserve The Company may from time to time set aside amounts in the dividend reserve for dividends. Any amounts set aside which are not applied to dividends are carried forward and may be applied to future dividends. This table summarises the movement in reserves: 2020 2019 $'000 $'000 Hedging Reserve Balance at the beginning of the year (663) 1,443 Fair value adjustments transferred to equity ‐ net of tax 2,266 754 Amounts transferred to inventory ‐ net of tax (2,505) (2,860) Balance at the end of the year (902) (663) Equity Compensation Reserve Balance at the beginning of the year 9,495 7,734 Equity settled share based payment transactions 1,796 1,761 Balance at the end of the year 11,291 9,495 Fair Value Reserve Balance at the beginning of the year (598) ‐ Fair value adjustments ‐ (598) Balance at the end of the year (598) (598) Translation Reserve Balance at the beginning of the year 1,747 1,208 Exchange differences on translating foreign operations (537) 539 Balance at the end of the year 1,210 1,747 Dividend Reserve Balance at the beginning of the year ‐ 22,408 Transfer to retained earnings ‐ (22,408) Amounts set aside for dividends ‐ ‐ Balance at the end of the year ‐ ‐ Reserves at the end of the year 11,001 9,981
87
8582_GUD_Holdings_Annual Report_2020_Mono.indd 878582_GUD_Holdings_Annual Report_2020_Mono.indd 87 9/9/20 12:00 pm9/9/20 12:00 pm

GUD Holdings Limited and Subsidiaries
27. Retained earnings This table summarises the movement in retained earnings: 2020 2019 $'000 $'000 Balance at the beginning of the year 155,778 119,649 Profit for the period 43,678 59,558 Transfer from dividend reserve ‐ 22,408 Dividends paid (48,552) (45,837) Balance at the end of the year 150,904 155,778
28. Dividends
Accounting policies
Dividends Dividends paid are classified as distributions of profit consistent with the balance sheet classification of the related debt or equity instruments.
Recognised amounts
Cents per Total
amount Percentage share $'000 Date of payment Tax rate franked 2020 Final dividend in respect of the 2019 financial year
31 26,877 30 August 2019 30% 100%
Interim dividend in respect of the 2020 financial year
25 21,675 28 February 2020 30% 100%
Total dividends 56 48,552 2019 Final dividend in respect of the 2018 financial year
28 24,216 31 August 2018 30% 100%
Interim dividend in respect of the 2019 financial year
25 21,621 1 March 2019 30% 100%
Total dividends 53 45,837
Unrecognised amounts
Cents per
Total amount Percentage
Fully Paid Ordinary Shares share $'000 Date of payment Tax rate franked 2020 Final dividend in respect of the 2020 financial year
12 10,404 28 August 2020 30% 100%
The Company operates a Dividend Reinvestment Plan (DRP) which allows eligible shareholders to elect to invest dividends in ordinary shares which rank equally with GUD ordinary shares. In furtherance of cash conservation measures, the GUD Dividend Reinvestment Plan will be available for this dividend.
Dividend franking account The available amounts are based on the balance of the dividend franking account at the reporting date adjusted for franking credits that will arise from the payment of the current tax liability. 2020 2019 $'000 $'000 30% (2019: 30%) franking credits available to shareholders of GUD Holdings Limited for subsequent financial years 40,295 50,121
88
8582_GUD_Holdings_Annual Report_2020_Mono.indd 888582_GUD_Holdings_Annual Report_2020_Mono.indd 88 9/9/20 12:00 pm9/9/20 12:00 pm

GUD Holdings Limited and Subsidiaries
Taxation This section outlines the tax accounting policies, current and deferred tax impacts, a reconciliation of profit before tax to the tax charge and the movements in deferred tax assets and liabilities.
29. Current tax
Accounting policies
Current and deferred tax expense Current tax is calculated by reference to the amount of income taxes payable or recoverable in respect of the taxable profit or loss for the period. It is calculated using tax rates and tax laws that have been enacted or substantively enacted by the reporting date. Current and deferred tax is recognised as an expense or income in the Income Statement, except when it relates to items credited or debited directly to equity, in which case the deferred tax is also recognised directly in equity, or where it arises from the initial accounting for a business combination, in which case it is taken into account in the determination of goodwill. Current tax for current and prior periods is recognised as a liability (or asset) to the extent that it is unpaid (or refundable).
Tax consolidation The Company and its wholly‐owned Australian resident subsidiaries have formed a tax‐consolidated group under Australian taxation law and are taxed as a single entity with effect from 1 July 2003. The head entity within the tax‐consolidated group is GUD Holdings Limited. The members of the tax consolidated group are identified in Note 31c.
Nature of tax funding arrangements and tax sharing agreements Entities within the tax‐consolidated group have entered into a tax‐funding arrangement and a tax‐sharing agreement with the head entity. Under the terms of the tax funding arrangement, GUD Holdings Limited and each of the entities in the tax‐consolidated group have agreed to pay a tax equivalent payment to or from the head entity, based on the current liability or current asset of the entity. The tax sharing agreement entered into between members of the tax‐consolidated group provides for the determination of the allocation of income tax liabilities between the entities, should the head entity default on its payment obligations. No amounts have been recognised in the consolidated financial statements in respect of this agreement as payment of any amounts under the tax sharing agreement is considered remote.
Income tax expense recognised in the income statement 2020 2019 $'000 $'000 Prima facie income tax expense calculated at 30% (2019: 30%) on profit 19,094 24,073 Increase/(decrease) in income tax expense / (benefit) due to: Non‐deductible expenditure 987 685 (Over)/under provision of income tax in prior year (122) (873) Research and development incentives (253) (255) Tax incentives not recognised in profit or loss ‐ (1,050) Non‐assessable income 263 (1,893) Income tax expense 19,969 20,687 Tax expense / (benefit) comprises: Current tax expense 21,033 20,737 Adjustments recognised in the current year in relation to tax of prior years (122) (873) Deferred tax expense from origination and reversal of temporary differences (942) 823 Total tax expense 19,969 20,687
89
8582_GUD_Holdings_Annual Report_2020_Mono.indd 898582_GUD_Holdings_Annual Report_2020_Mono.indd 89 9/9/20 12:00 pm9/9/20 12:00 pm

GUD Holdings Limited and Subsidiaries
29. Current tax (continued)
Income tax expense recognised in other comprehensive income
2020 Before tax Tax (expense)
/ benefit Net of tax Income tax on items that may be subsequently reclassified to profit or loss:
Exchange differences on translating results of foreign operations (535) ‐ (535) Fair value adjustments transferred to hedging reserve 3,237 (971) 2,266 Net change in fair value of cash flow hedges transferred to inventory (3,578) 1,073 (2,505) Income tax expense recognised in other comprehensive income (876) 102 (774)
2019 Before tax Tax (expense)
/ benefit Net of tax Income tax on items that may be subsequently reclassified to profit or loss:
Exchange differences on translating results of foreign operations 539 ‐ 539 Fair value adjustments transferred to hedging reserve 1,267 (323) 944 Net change in fair value of cash flow hedges transferred to inventory (4,086) 1,226 (2,860) Income tax expense recognised in other comprehensive income (2,280) 903 (1,377)
30. Deferred tax
Accounting policies
Deferred tax Deferred tax is recognised in respect of temporary differences between the carrying amount of assets and liabilities in the consolidated financial statements and the corresponding tax base of those items. Deferred tax assets are recognised to the extent that it is probable that sufficient taxable amounts will be available against which deductible temporary differences or unused tax losses and tax offsets can be utilised. However, deferred tax assets and liabilities are not recognised if the temporary differences giving rise to them arise from the initial recognition of assets and liabilities (other than as a result of a business combination) which affect neither taxable income nor accounting profit. Furthermore, a deferred tax liability is not recognised in relation to taxable temporary differences arising from goodwill. Deferred tax assets and liabilities are measured at the tax rates that are expected to apply to the period(s) when the asset and liability giving rise to them are realised or settled, based on tax rates (and tax laws) that have been enacted or substantively enacted by reporting date. The measurement of deferred tax liabilities and assets reflects the tax consequences that would follow from the manner in which the Company/subsidiary expects, at the reporting date, to recover or settle the carrying amount of its assets and liabilities. Deferred tax assets and liabilities are offset when they relate to income taxes levied by the same taxation authority and the Company/subsidiary intends to settle its current tax assets and liabilities on a net basis.
90
8582_GUD_Holdings_Annual Report_2020_Mono.indd 908582_GUD_Holdings_Annual Report_2020_Mono.indd 90 9/9/20 12:00 pm9/9/20 12:00 pm
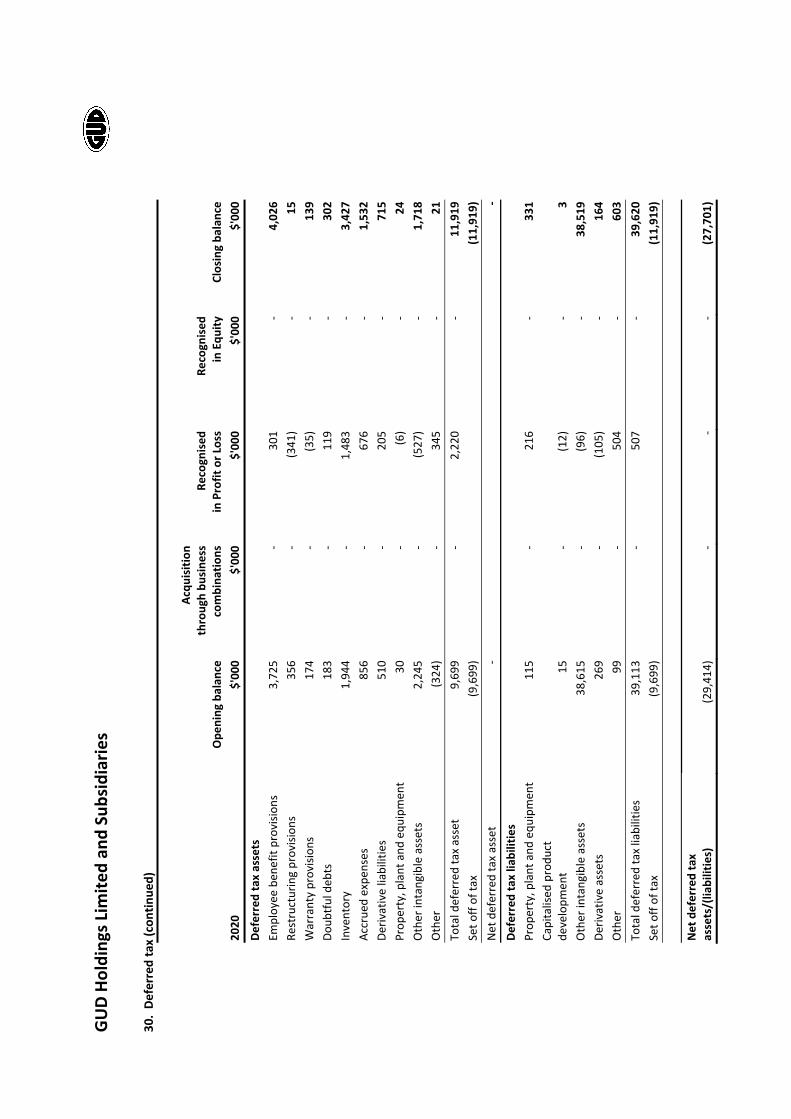
GUD Ho
ldings Limite
d an
d Subsidiarie
s
30. De
ferred
tax (continue
d)
Op
ening ba
lance
Acqu
isitio
n through bu
siness
combina
tions
Recognise
d in Profit or Loss
Recognise
d in Equ
ity
Closing ba
lance
2020
$'00
0 $'00
0 $'00
0 $'00
0 $'00
0 De
ferred
tax a
ssets
Em
ployee
ben
efit provision
s 3,725
‐ 301
‐ 4
,026
Re
structuring provision
s 356
‐ (341
) ‐
15
Warranty provision
s 174
‐ (35)
‐ 1
39
Doub
tful deb
ts
183
‐ 119
‐ 3
02
Inventory
1,944
‐ 1,483
‐ 3
,427
Accrue
d expe
nses
856
‐ 676
‐ 1
,532
De
rivative liabilities
510
‐ 205
‐ 7
15
Prop
erty, plant and
equ
ipmen
t 30
‐
(6)
‐ 24
Othe
r intangible assets
2,245
‐ (527
) ‐
1
,718
Othe
r (324
) ‐
345
‐ 21
Total deferred tax a
sset
9,699
‐ 2,220
‐ 11,91
9 Set o
ff of ta
x (9,699
)
(11,91
9)
Net d
eferred tax a
sset
‐
‐ De
ferred
tax liabilities
Prop
erty, plant and
equ
ipmen
t 115
‐ 216
‐ 331
Capitalised
produ
ct
developm
ent
15
‐ (12)
‐ 3
Othe
r intangible assets
38,615
‐
(96)
‐ 38
,519
De
rivative assets
269
‐ (105
) ‐
164
Othe
r 99
‐
504
‐ 603
Total deferred tax liabilities
39,113
‐
507
‐ 39
,620
Set o
ff of ta
x (9,699
)
(11,91
9)
Net d
eferred tax
assets/(liabilities)
(29,41
4)
‐ ‐
‐ (27,70
1)
8582_GUD_Holdings_Annual Report_2020_Mono.indd 918582_GUD_Holdings_Annual Report_2020_Mono.indd 91 9/9/20 12:00 pm9/9/20 12:00 pm

GUD Ho
ldings Limite
d an
d Subsidiarie
s
30. De
ferred
tax (continue
d)
Re
stated
Op
ening ba
lance
Acqu
isitio
n through bu
siness
combina
tions
Recognise
d in Profit or Loss
Recognise
d in Equ
ity
Restated
Closing ba
lance
2019
$'00
0 $'00
0 $'00
0 $'00
0 $'00
0 De
ferred
tax a
ssets
Em
ployee
ben
efit provision
s 3,607
187
(69)
‐ 3,72
5 Re
structuring provision
s ‐
‐ 356
‐ 356
Warranty provision
s 314
‐ (140
) ‐
174
Doub
tful deb
ts
219
‐ (36)
‐ 183
Inventory
2,358
350
(764
) ‐
1,94
4 Accrue
d expe
nses
866
15
(25)
‐ 856
Deriv
ative liabilities
324
‐ (819
) 1,005
510
Prop
erty, plant and
equ
ipmen
t 241
‐ (211
) ‐
30
Othe
r intangible assets
2,245
‐ ‐
‐ 2,24
5 Othe
r 470
‐ (794
) ‐
(324)
Total deferred tax a
sset
10,644
552
(2,502
) 1,005
9,69
9 Set o
ff of ta
x (10,64
4)
(9,699
) Ne
t deferred tax a
sset
‐
‐ De
ferred
tax liabilities
Prop
erty, plant and
equ
ipmen
t 37
‐
78
‐ 115
Capitalised
produ
ct
developm
ent
15
‐ ‐
‐ 15
Othe
r intangible assets
38,613
‐
2 ‐
38,615
De
rivative assets
1,107
‐ (938
) 100
269
Othe
r 160
‐ (61)
‐ 99
To
tal deferred tax liabilities
39,932
‐
(919
) 100
39,113
Set o
ff of ta
x (10,64
4)
(39,11
3)
Net d
eferred tax
assets/(liabilities)
(29,28
8)
(29,41
4)
8582_GUD_Holdings_Annual Report_2020_Mono.indd 928582_GUD_Holdings_Annual Report_2020_Mono.indd 92 9/9/20 12:00 pm9/9/20 12:00 pm

GUD Holdings Limited and Subsidiaries
Business Combinations This section outlines the Group’s structure and changes thereto.
31. Investment in subsidiaries
Accounting policies
Business combinations The Group accounts for business combinations using the acquisition method when control is transferred to the Group. The consideration transferred in the acquisition is generally measured at fair value, as are the identifiable net assets acquired. Any goodwill that arises is tested annually for impairment (Note 16). Any gain on a bargain purchase is recognised in profit or loss immediately. Transaction costs are expensed as incurred, except if related to the issue of debt or equity securities. The consideration transferred does not include amounts related to the settlement of pre‐existing relationships. Such amounts are generally recognised in profit or loss. Any contingent consideration is measured at fair value at the date of acquisition. If an obligation to pay contingent consideration that meets the definition of a financial instrument is classified as equity, then it is not remeasured and settlement is accounted for within equity. Otherwise, other contingent consideration is remeasured at fair value at each reporting date and subsequent changes in the fair value of the contingent consideration are recognised in profit or loss.
Basis of consolidation These consolidated financial statements are the financial statements of all the entities that comprise the Group, being the Company and its subsidiaries as defined in Accounting Standard AASB 10 Consolidated Financial Statements.
Subsidiaries Subsidiaries are entities controlled by the Group. The Group controls an entity when it is exposed to, or has rights to, variable returns from its involvement with the entity and has the ability to affect those returns through its power over the entity. The financial statements of subsidiaries are included in the consolidated financial statements from the date on which control commences until the date on which control ceases.
Transactions eliminated on consolidation Intra‐group balances and transactions arising from intra‐group transactions are eliminated.
Loss of control When the Group loses control over a subsidiary, it derecognises the assets and liabilities of the subsidiary, and any related non‐controlling interest and other components of equity. Any resulting gain or loss is recognised on profit or loss. Any interest retained in the former subsidiary is measured at fair value when the control is lost.
Discontinued operation A discontinued operation is a component of the Group’s business, the operations and cash flows of which can be clearly distinguished from the rest of the Group and which: represents a separate major line of business or geographic area of operations; is part of a single co‐ordinated plan to dispose of a separate major line of business or geographic area of
operations; or is a subsidiary acquired exclusively with a view to re‐sale.
Classification as a discontinued operation occurs at the earlier of disposal or when the operation meets the criteria to be classified as held‐for‐sale. When an operation is classified as a discontinued operation, the comparative statement of profit or loss and Other Comprehensive Income is re‐presented as if the operation had been discontinued from the start of the comparative year.
93
8582_GUD_Holdings_Annual Report_2020_Mono.indd 938582_GUD_Holdings_Annual Report_2020_Mono.indd 93 9/9/20 12:00 pm9/9/20 12:00 pm

GUD Holdings Limited and Subsidiaries
31. Investments in subsidiaries (continued)
31a Acquisitions Acquisition of Disc Brakes Australia On 2 July 2018 the Company acquired 100% of the shares in Disc Brakes Australia Pty Ltd (“DBA”). The total consideration for DBA was $22.128 million. The Group has focussed on improving DBA’s market presence by expanding and refining its product offering in the automotive aftermarket segment. For the financial year ended 30 June 2019, DBA contributed $24.734 million of revenue and $4.581 million of EBIT to the Group’s results.
Acquisition‐related costs During the financial year ended 30 June 2019, the Company incurred approximately $0.052 million of acquisition related costs including legal fees, due diligence and other advisory fees. This amount has been included in administrative expenses.
Fair values of acquired assets and liabilities The following table summarises the recognised amounts of assets acquired, and liabilities assumed at the date of acquisition with subsequent adjustment for identified intangible assets arising from the purchase price allocation exercise:
2 July 2018
Fair value adjustments 30 June 2019
$'000 $'000 $'000 Cash and cash equivalents 944 ‐ 944 Trade and other receivables 3,723 ‐ 3,723 Inventories 6,958 ‐ 6,958 Property, plant and equipment 303 ‐ 303 Brand names ‐ 2,664 2,664 Intellectual property ‐ 1,457 1,457 Leased assets 163 ‐ 163 Deferred tax assets 552 ‐ 552 Deferred tax liability1 (1,219) ‐ (1,219) Trade and other payables (2,817) ‐ (2,817) Income tax payable (660) ‐ (660) Finance lease (69) ‐ (69) Provisions (621) (73) (694) Total identifiable net assets acquired 7,257 4,048 11,305
Goodwill Goodwill arising from the acquisition has been recognised as follows:
$'000 Total consideration 22,128 Less Fair value of identifiable net assets 11,305 Goodwill 10,823
1 As a result of the IFRS IC agenda decision, GUD Holdings Limited has changed its accounting policy, retrospectively adjusting the deferred tax accounting for impacted assets and intangibles. For further details refer to Note 1.
The goodwill is largely attributable to DBA’s knowledge in brake rotor development and manufacturing, and the anticipated synergies available from incorporating the DBA business into the Group’s existing portfolio of Automotive products.
94
8582_GUD_Holdings_Annual Report_2020_Mono.indd 948582_GUD_Holdings_Annual Report_2020_Mono.indd 94 9/9/20 12:00 pm9/9/20 12:00 pm

GUD Holdings Limited and Subsidiaries
31. Investments in subsidiaries (continued)
31b Shareholdings % ownership interest Country of incorporation 2020 2019 Parent entity GUD Holdings Limited (1) Australia Subsidiaries AA Gaskets Pty Ltd(2) (3) Australia 100 100 Brown & Watson International Pty Ltd (2) (3) Australia 100 100 Davey Water Products Pty Ltd (2) (3) Australia 100 100 Disc Brakes Australia Pty Ltd(2) (3) Australia 100 100 Griffiths Equipment Pty Ltd (2) (3)(4) Australia ‐ 100 Innovative Mechatronics Group Pty Ltd (2) (3) Australia 100 100 Ryco Group Pty Ltd (2) (3) Australia 100 100 Wesfil Australia Pty Ltd (2) (3) Australia 100 100 Griffiths Equipment Limited New Zealand 100 100 GUD NZ Holdings Limited New Zealand 100 100 NZ Gaskets Limited New Zealand 100 100 Davey Water Products S.A.S. (formerly Monarch Pool Systems Europe S.A.S.)
France 100 100
Davey Water Products S.L. (formerly Monarch Pool Systems Iberica S.L.) (4)
Spain ‐ 100
All overseas subsidiaries except for Davey Water Products S.A.S. and Davey Water Products S.L. are audited by an associate firm of KPMG Australia. All entities carry on business only in the country of incorporation. (1) GUD Holdings Limited is the head entity within the Australian Tax Consolidated group. (2) Member of the Australian Tax Consolidated group while 100% owned directly or indirectly by GUD Holdings Limited. (3) Relieved from the need to prepare audited financial reports under Australian Securities Commission Class Order 98/1418 as party to a Deed of Cross Guarantee
with GUD Holdings Limited, while 100% owned directly or indirectly by GUD Holdings Limited. (4) The entities have been deregistered or dissolved.
95
8582_GUD_Holdings_Annual Report_2020_Mono.indd 958582_GUD_Holdings_Annual Report_2020_Mono.indd 95 9/9/20 12:00 pm9/9/20 12:00 pm

GUD Holdings Limited and Subsidiaries
31. Investments in subsidiaries (continued)
31c Deed of Cross Guarantee Set out below are the financial statements for the Group entities which form the 'closed group' under the Deed of Cross Guarantee: 2020 2019 Income Statement $'000 $'000 Revenue 411,508 405,449 Net finance costs (9,238) (6,012) Other expenses (340,237) (320,117) Profit before income tax 62,033 79,320 Income tax expense (19,865) (19,878) Profit 42,168 59,442 Profit/(loss) from discontinued operations, net of tax ‐ ‐ Profit for the year 42,168 59,442 Retained earnings at the beginning of the year 99,825 86,220 Dividends paid (48,552) (45,837) Retained earnings at the end of the year 93,441 99,825 Balance Sheet Current assets Cash and cash equivalents 24,940 27,478 Trade and other receivables 109,937 97,176 Other assets 6,731 5,676 Inventories 92,839 95,142 Total current assets 234,447 225,472 Non‐current assets Other financial assets 40,055 34,757 Property, plant and equipment 77,490 12,246 Deferred tax assets 10,641 8,695 Goodwill 138,606 101,680 Other intangible assets 121,548 124,022 Total non‐current assets 388,340 281,400 Total assets 622,787 506,872 Current liabilities Trade and other payables 62,058 53,704 Borrowings 11 37 Current tax payables 4,106 8,896 Provisions 12,976 11,969 Other financial liabilities 12,593 1,861 Total current liabilities 91,744 76,467 Non‐current liabilities Borrowings 154,854 141,700 Other financial liabilities 97,452 3,979 Provisions 1,291 1,281 Total non‐current liabilities 253,597 146,960 Total liabilities 345,341 223,427 Net assets 277,446 283,445 Share Capital 112,880 112,880 Reserves 71,125 70,740 Retained earnings 93,441 99,825 Total equity 277,446 283,445
96
8582_GUD_Holdings_Annual Report_2020_Mono.indd 968582_GUD_Holdings_Annual Report_2020_Mono.indd 96 9/9/20 12:00 pm9/9/20 12:00 pm
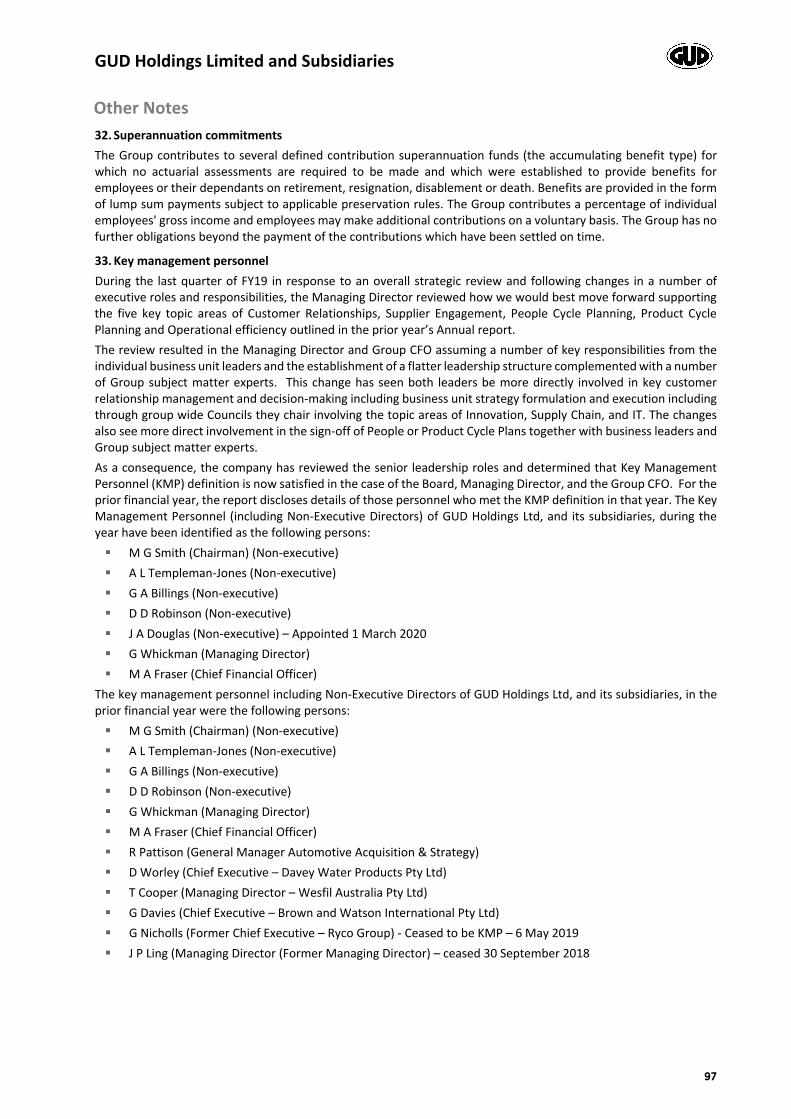
GUD Holdings Limited and Subsidiaries
Other Notes 32. Superannuation commitments The Group contributes to several defined contribution superannuation funds (the accumulating benefit type) for which no actuarial assessments are required to be made and which were established to provide benefits for employees or their dependants on retirement, resignation, disablement or death. Benefits are provided in the form of lump sum payments subject to applicable preservation rules. The Group contributes a percentage of individual employees' gross income and employees may make additional contributions on a voluntary basis. The Group has no further obligations beyond the payment of the contributions which have been settled on time.
33. Key management personnel During the last quarter of FY19 in response to an overall strategic review and following changes in a number of executive roles and responsibilities, the Managing Director reviewed how we would best move forward supporting the five key topic areas of Customer Relationships, Supplier Engagement, People Cycle Planning, Product Cycle Planning and Operational efficiency outlined in the prior year’s Annual report. The review resulted in the Managing Director and Group CFO assuming a number of key responsibilities from the individual business unit leaders and the establishment of a flatter leadership structure complemented with a number of Group subject matter experts. This change has seen both leaders be more directly involved in key customer relationship management and decision‐making including business unit strategy formulation and execution including through group wide Councils they chair involving the topic areas of Innovation, Supply Chain, and IT. The changes also see more direct involvement in the sign‐off of People or Product Cycle Plans together with business leaders and Group subject matter experts. As a consequence, the company has reviewed the senior leadership roles and determined that Key Management Personnel (KMP) definition is now satisfied in the case of the Board, Managing Director, and the Group CFO. For the prior financial year, the report discloses details of those personnel who met the KMP definition in that year. The Key Management Personnel (including Non‐Executive Directors) of GUD Holdings Ltd, and its subsidiaries, during the year have been identified as the following persons: M G Smith (Chairman) (Non‐executive) A L Templeman‐Jones (Non‐executive) G A Billings (Non‐executive) D D Robinson (Non‐executive) J A Douglas (Non‐executive) – Appointed 1 March 2020 G Whickman (Managing Director) M A Fraser (Chief Financial Officer)
The key management personnel including Non‐Executive Directors of GUD Holdings Ltd, and its subsidiaries, in the prior financial year were the following persons: M G Smith (Chairman) (Non‐executive) A L Templeman‐Jones (Non‐executive) G A Billings (Non‐executive) D D Robinson (Non‐executive) G Whickman (Managing Director) M A Fraser (Chief Financial Officer) R Pattison (General Manager Automotive Acquisition & Strategy) D Worley (Chief Executive – Davey Water Products Pty Ltd) T Cooper (Managing Director – Wesfil Australia Pty Ltd) G Davies (Chief Executive – Brown and Watson International Pty Ltd) G Nicholls (Former Chief Executive – Ryco Group) ‐ Ceased to be KMP – 6 May 2019 J P Ling (Managing Director (Former Managing Director) – ceased 30 September 2018
97
8582_GUD_Holdings_Annual Report_2020_Mono.indd 978582_GUD_Holdings_Annual Report_2020_Mono.indd 97 9/9/20 12:00 pm9/9/20 12:00 pm

GUD Holdings Limited and Subsidiaries
33. Key management personnel (continued)
Key management personnel compensation policy The aggregate compensation of the key management personnel of the Group is set out below: 2020 2019 $ $ Short‐term employment benefits 2,384,476 5,128,216 Long‐term benefits 28,075 60,571 Post‐employment benefits 119,645 264,684 Share based payments 267,672 737,556 Total key management personal compensation 2,799,868 6,191,027
Compensation of the Group’s key management personnel includes salaries, short term and long‐term incentives, and contributions to post‐employment defined contribution superannuation plans.
Performance rights arrangements Long Term Incentive bonuses are provided as performance rights, granted at the commencement of the relevant three‐year performance measurement period, which will convert to an equivalent number of GUD shares if the performance hurdle is achieved over the relevant three‐year performance measurement period. No amount is payable for the issue of performance rights, or for the shares received upon vesting of those performance rights.
The grant‐date fair value of performance rights granted to employees is generally recognised as an expense, with a corresponding increase in equity, over the vesting period of the awards. The amount recognised as an expense is adjusted to reflect the number of awards for which the related service and non‐market performance conditions are expected to be met, such that the amount ultimately recognised is based on the number of awards that meet the related service and non‐market performance conditions at the vesting date. The valuation of rights was completed by an independent consultant using a hybrid trinomial option pricing model with a relative TSR hurdle.
The inputs used in the measurement of the fair values at grant date of the equity‐settled share‐based payment plans were as follows.
Performance rights programme
Managing Director Senior Executives
2020 2019 2020 2019
Fair value at grant date 5.37 5.92 5.41 6.69
Share price at grant date 10.33 12.64 10.37 14.15
Expected volatility (weighted average) 24.00% 28.00% 24.00% 28.00%
Expected dividends 5.00% 5.00% 5.00% 5.00%
Risk free interest rate (based on government bonds)
0.70% 2.01% 0.80% 2.08%
Expected volatility has been based on an evaluation of the historical volatility of the Company’s share price, particularly over the historical period commensurate with the expected term. The expected term of the instruments has been based on historical experience and general option holder behaviour.
Expense recognised in profit or loss For details of the parent employee benefit expenses, see Note 3.
98
8582_GUD_Holdings_Annual Report_2020_Mono.indd 988582_GUD_Holdings_Annual Report_2020_Mono.indd 98 9/9/20 12:00 pm9/9/20 12:00 pm

GUD Holdings Limited and Subsidiaries
34. Related parties
Directors Details of Directors' compensation is disclosed in Note 33.
Transactions with key management personnel and their related parties The Group's policy is that the sale and purchase of goods and services with key management personnel are made under normal customer and supplier relationships and on normal commercial terms and conditions. The sale of goods to key management personnel are on terms no more favourable than made available to other employees. At 30 June 2020, key management personnel held directly, indirectly or beneficially 150,835 ordinary shares (2019: 385,842) in the Group. Performance rights issued under the 2020 plan will not vest. Key management personnel were issued 77,321 (2019: 101,175) shares for performance rights issued under the 2020 plan.
Loans to KMPs The Company entered into an Equity Loan Agreement in the amount of $228,000 with the Managing Director and CEO, Mr Graeme Whickman which enabled him to acquire 25,000 shares in the Company in September 2019. Mr Whickman pays interest on the loan on a quarterly basis at a rate that is set at 25 basis points above the Company’s average cost of borrowed funds.
Transactions with entities in the wholly owned Group GUD Holdings Limited is the ultimate parent entity in the wholly owned group comprising the Company and its wholly owned subsidiaries, as disclosed in Note 31b. Entities in the wholly owned group advanced and repaid loans, paid and received dividends, provided marketing, product sourcing, accounting and administrative assistance and sold and purchased goods to other Group companies during the current and previous financial years. The Group's policy is that these transactions are on commercial terms and conditions with the exception of loans between Australian entities and loans between New Zealand entities which are not interest bearing. Loans between entities in the wholly owned group are repayable on demand.
Other related party transactions with entities in the wholly owned Group Wesfil Australia Pty Ltd leases its Sydney premises from an entity related to a Director of Wesfil Australia Pty Ltd. Net rental expense was $455,944 excluding GST (2019: $448,444 excluding GST). The Group's policy is that related party lease arrangements are undertaken with commercial terms and conditions.
35. Parent entity disclosures As at and for the financial year ending 30 June 2020 the parent company of the Group was GUD Holdings Limited. 2020 2019 GUD Holdings Limited $'000 $'000 Results of the parent entity Profit/(loss) for the period 12,873 (3,949) Other comprehensive income ‐ ‐ Total comprehensive income/(loss) for the period 12,873 (3,949) Financial position of the parent entity at the year end Current assets 1,036 815 Total assets 315,219 309,241 Current liabilities 17,437 27,371 Total liabilities 210,191 170,394 Net assets 105,028 138,847 Total equity of the parent entity comprising of: Share capital 112,880 112,880 Retained earnings / (accumulated losses) (18,326) 17,350 Other reserves 10,474 8,617 Total equity 105,028 138,847
99
8582_GUD_Holdings_Annual Report_2020_Mono.indd 998582_GUD_Holdings_Annual Report_2020_Mono.indd 99 9/9/20 12:00 pm9/9/20 12:00 pm

GUD Holdings Limited and Subsidiaries
35. Parent entity disclosures (continued) 2020 2019 GUD Holdings Limited $'000 $'000 Parent entity contingencies Contingent liabilities 167,710 53,033
The parent entity is party to two guarantees relating to subsidiaries. The bank borrowing facility described in Note 20 requires the parent entity to guarantee the bank borrowings of GUD NZ Holdings Limited which in turn guarantees the obligations of the parent entity, i.e. a cross guarantee. No liability is recognised by the parent entity as GUD NZ Holdings Limited is expected to be able to meet its debts as they fall due. The parent entity is also party to a Deed of Cross Guarantee as described in Note 31c. There is no expectation of a liability to the parent entity as a result of this guarantee. As a result of the above assessments, the fair value has been deemed to be nil and no liability has been recorded. Other than noted above the parent entity has no material contingent liabilities at 30 June 2020.
36. Contingent liabilities The Group had no material contingent liabilities at 30 June 2020 (2019: Nil).
37. Subsequent events
Dividends declared On 28 July 2020, the Board of Directors declared a fully franked interim dividend in respect of the 2020 financial year of 12 cents per share. Record date is 14 August 2020 and the dividend will be paid on 28 August 2020.
Borrowing facilities On 1 July 2020, the Company secured additional banking facilities for $22.5 million. The maturity of this facility is 1 July 2021.
Other Other than the items discussed above, no matters or circumstances have arisen since the end of the financial period that have significantly affected or may significantly affect the operating results or state of affairs of the Group.
100
8582_GUD_Holdings_Annual Report_2020_Mono.indd 1008582_GUD_Holdings_Annual Report_2020_Mono.indd 100 9/9/20 12:00 pm9/9/20 12:00 pm

GUD Holdings Limited and Subsidiaries
Directors’ Declaration In the opinion of the Directors of GUD Holdings Limited (the “Company”):
(a) the consolidated financial statements and notes and the remuneration disclosures that are contained in the Remuneration Report included in the Directors’ report are in accordance with the Corporations Act 2001, including:
1. giving a true and fair view of the financial position of the Group as at 30 June 2020 and of its performance for the financial year ended on that date;
2. complying with Australian Accounting Standards and the Corporations Regulations 2001; and
(b) there are reasonable grounds to believe that the Group will be able to pay its debts as and when they become due and payable.
There are reasonable grounds to believe that the Company and the Group entities identified in Note 31c will be able to meet any obligations or liabilities to which they are or may become subject to by virtue of the Deed of Cross Guarantee between the Company and those Group entities pursuant to ASIC Class order 98/1418.
The Directors’ draw attention to the basis of preparation (Note 1) of the consolidated financial statements, which includes a statement of compliance with International Financial Reporting Standards.
The Directors have been given the declarations required by section 295A of the Corporations Act 2001 from the Managing Director and the Chief Financial Officer for the financial year ended 30 June 2020.
Signed in accordance with a resolution of the Directors pursuant to section 295(5) of the Corporations Act 2001.
On behalf of the Directors
M.G. Smith Chairman
G Whickman Managing Director Melbourne, 28 July 2020
101
8582_GUD_Holdings_Annual Report_2020_Mono.indd 1018582_GUD_Holdings_Annual Report_2020_Mono.indd 101 9/9/20 12:00 pm9/9/20 12:00 pm
Lead Auditor’s Independence Declaration under
Section 307C of the Corporations Act 2001
To the Directors of GUD Holdings Limited
I declare that, to the best of my knowledge and belief, in relation to the audit of GUD Holdings Limited for the financial year ended 30 June 2020 there have been:
i. no contraventions of the auditor independence requirements as set out in the Corporations Act 2001 in relation to the audit; and
ii. no contraventions of any applicable code of professional conduct in relation to the audit.
KPMG Chris Sargent
Partner
28 July 2020
KPM_INI_01
KPMG, an Australian partnership and a member firm of the KPMG network of independent member firms affiliated with KPMG International Cooperative (“KPMG International”), a Swiss entity.
Liability limited by a scheme approved under Professional Standards Legislation.
102
8582_GUD_Holdings_Annual Report_2020_Mono.indd 1028582_GUD_Holdings_Annual Report_2020_Mono.indd 102 9/9/20 12:00 pm9/9/20 12:00 pm

Independent Auditor’s Report
To the shareholders of GUD Holdings Limited
Report on the audit of the Financial Report
Opinion
We have audited the Financial Report of GUD Holdings Limited (the Company).
In our opinion, the accompanying Financial Report of the Company is in accordance with the Corporations Act 2001, including:
giving a true and fair view of the Group’s financial position as at 30 June 2020 and of its financial performance for the year ended on that date; and
complying with Australian Accounting Standards and the Corporations Regulations 2001.
The Financial Report comprises: Consolidated Balance Sheet as at 30 June 2020
Consolidated Income Statement, Consolidated Statement of Comprehensive Income, Consolidated Statement of Changes in Equity, and Consolidated Cash Flow Statement for the year then ended
Notes including a summary of significant accounting policies
Directors’ Declaration.
The Group consists of GUD Holdings Limited (the Company) and the entities it controlled at the year-end or from time to time during the financial year.
Basis for opinion
We conducted our audit in accordance with Australian Auditing Standards. We believe that the audit evidence we have obtained is sufficient and appropriate to provide a basis for our opinion.
Our responsibilities under those standards are further described in the Auditor’s responsibilities for the audit of the Financial Report section of our report.
We are independent of the Group in accordance with the Corporations Act 2001 and the ethical requirements of the Accounting Professional and Ethical Standards Board’s APES 110 Code of Ethics for Professional Accountants (the Code) that are relevant to our audit of the Financial Report in Australia. We have fulfilled our other ethical responsibilities in accordance with the Code.
Liability limited by a scheme approved under Professional Standards Legislation.
KPMG, an Australian partnership and a member firm of the KPMG network of independent member firms affiliated with KPMG International Cooperative (“KPMG International”), a Swiss entity.
103
8582_GUD_Holdings_Annual Report_2020_Mono.indd 1038582_GUD_Holdings_Annual Report_2020_Mono.indd 103 9/9/20 12:00 pm9/9/20 12:00 pm

Key Audit Matters
The Key Audit Matters we identified are:
Recoverability of goodwill and other intangible assets
Valuation of inventory
Key Audit Matters are those matters that, in our professional judgement, were of most significance in our audit of the Financial Report of the current period.
These matters were addressed in the context of our audit of the Financial Report as a whole, and in forming our opinion thereon, and we do not provide a separate opinion on these matters.
Recoverability of goodwill ($162.15 million) and other intangible assets ($121.44 million)
Refer to Note 13 Goodwill, Note 14 Other intangible assets and Note 17 Impairment testing to the Financial Report.
The key audit matter How the matter was addressed in our audit
The carrying value of goodwill and other intangible assets is considered with reference to the Group’s analysis of future cash flows for the respective Cash Generating Units (CGUs) or individual assets (as applicable).
The recoverability of these assets is a key audit matter due to the inherent complexity associated with auditing the forward looking assumptions incorporated in the Group’s “value in use” (VIU) models.
The Group’s VIU models are internally developed, and use a range of internal and external data as inputs. Forward looking assumptions may be prone to greater risk for potential bias, error and inconsistent application. Significant judgement is involved in establishing these assumptions. Where the Group has not met prior year forecasts in relation to a specific CGU or individual asset we factor this into our assessment of forecast assumptions.
The key assumptions in the VIU models include forecast cash flows, forecast growth rates during the forecast period, terminal growth rates and discount rates. The VIU models for individual intangible assets also include assumptions relating to royalty rates applicable to specific brand names.
We involved valuation specialists to supplement our senior audit team members in assessing this key audit matter
Our procedures included:
assessing the Group’s VIU models and key assumptions by:
- evaluating the appropriateness of the VIU models against accounting standard requirements;
- comparing inputs into the relevant cash flow forecasts to the Board approved budgets and projections;
- assessing the accuracy of previous Group forecasts to inform our evaluation of forecasts incorporated in the models, including assessing the impact of business changes;
- using our industry knowledge to challenge and assess the reasonableness of key assumptions. We applied increased scepticism to forecasts in the areas where previous forecasts were not achieved; and
- working with our valuation specialists, we independently developed a discount rate range considered comparable using publicly available market data for comparable entities, adjusted by risk factors specific to the Group.
considering the sensitivity of the models by varying key assumptions, such as forecast growth rates, terminal growth rates and discount rates, within a reasonably possible range, to identify those assumptions at higher risk of bias or inconsistency in application. We also assessed the related impairment breakeven points for these assumptions in
104
8582_GUD_Holdings_Annual Report_2020_Mono.indd 1048582_GUD_Holdings_Annual Report_2020_Mono.indd 104 9/9/20 12:00 pm9/9/20 12:00 pm

order to identify those assets at higher risk of impairment and to focus our further procedures;
working with our valuation specialists we compared the implied multiples from the Group’s models to multiples derived from comparable companies;
assessing the Group’s valuation of its brand names, including recalculating the impairment charge recorded against specific intangible assets, and the appropriateness of an indefinite useful life assumption; and
considering the disclosures in the financial report using our understanding of the recoverability assessment obtained from our testing and against the requirements of the accounting standards.
Valuation of inventory ($108.18 million)
Refer to Note 9 Inventories to the Financial Report.
The key audit matter How the matter was addressed in our audit
At 30 June 2020, the Group held inventory with a net carrying value of $108.18 million. The audit of inventory valuation is a key audit matter due to the extent of judgement involved in assessing the recoverable value, particularly in relation to any slow moving or excessive stock. The Group has a diverse and broad product range, and sells to different market segments, which increases the amount of judgement required in assessing the carrying value of inventory.
Our procedures included:
assessing the appropriateness of inventory valuation accounting policies applied by the different business units within the Group against the requirements of accounting standards;
understanding processes and testing key controls relating to inventory movements, standard costing, weighted average costing and valuation;
attending cycle or year-end inventory counts to ascertain the existence and condition of inventory;
evaluating the completeness of at-risk slow moving or excess stock items identified by the Group, by comparing inventory listings against historical sales information to identify any additional at-risk items;
comparing individual inventory carrying values against current selling prices to identify individual products at risk of being recorded in excess of their net realisable value; and
challenging the Group's judgements relating to the provision for stock obsolescence (including slow moving or excess stock), by comparing current inventory levels to historical and forecast sales. We assessed the level of
105
8582_GUD_Holdings_Annual Report_2020_Mono.indd 1058582_GUD_Holdings_Annual Report_2020_Mono.indd 105 9/9/20 12:00 pm9/9/20 12:00 pm

provision in light of our knowledge of the industry and businesses the Group operates in, the Group’s business strategy with respect to maintaining a wide range of products, the aging of inventory and from further inquiries with key personnel.
Other Information
Other Information is financial and non-financial information in GUD Holdings Limited’s annual reporting which is provided in addition to the Financial Report and the Auditor’s Report. The Directors are responsible for the Other Information.
Our opinion on the Financial Report does not cover the Other Information and, accordingly, we do not express an audit opinion or any form of assurance conclusion thereon, with the exception of the Remuneration Report and our related assurance opinion.
In connection with our audit of the Financial Report, our responsibility is to read the Other Information. In doing so, we consider whether the Other Information is materially inconsistent with the Financial Report or our knowledge obtained in the audit, or otherwise appears to be materially misstated.
We are required to report if we conclude that there is a material misstatement of this Other Information, and based on the work we have performed on the Other Information that we obtained prior to the date of this Auditor’s Report we have nothing to report.
Responsibilities of the Directors for the Financial Report
The Directors are responsible for:
preparing the Financial Report that gives a true and fair view in accordance with Australian Accounting Standards and the Corporations Act 2001
implementing necessary internal control to enable the preparation of a Financial Report that gives a true and fair view and is free from material misstatement, whether due to fraud or error; and
assessing the Group and Company’s ability to continue as a going concern and whether the use of the going concern basis of accounting is appropriate. This includes disclosing, as applicable, matters related to going concern and using the going concern basis of accounting unless they either intend to liquidate the Group and Company or to cease operations, or have no realistic alternative but to do so.
Auditor’s responsibilities for the audit of the Financial Report
Our objective is:
to obtain reasonable assurance about whether the Financial Report as a whole is free from material misstatement, whether due to fraud or error; and
to issue an Auditor’s Report that includes our opinion.
Reasonable assurance is a high level of assurance, but is not a guarantee that an audit conducted in accordance with Australian Auditing Standards will always detect a material misstatement when it exists.
Misstatements can arise from fraud or error. They are considered material if, individually or in the
106
8582_GUD_Holdings_Annual Report_2020_Mono.indd 1068582_GUD_Holdings_Annual Report_2020_Mono.indd 106 9/9/20 12:00 pm9/9/20 12:00 pm

aggregate, they could reasonably be expected to influence the economic decisions of users taken on the basis of the Financial Report.
A further description of our responsibilities for the audit of the Financial Report is located at the Auditing and Assurance Standards Board website at: http://www.auasb.gov.au/auditors_responsibilities/ar1.pdf This description forms part of our Auditor’s Report.
Report on the Remuneration Report
Opinion
In our opinion, the Remuneration Report of GUD Holdings Limited for the year ended 30 June 2020 complies with Section 300A of the Corporations Act 2001.
Directors’ responsibilities
The Directors of the Company are responsible for the preparation and presentation of the Remuneration Report in accordance with Section 300A of the Corporations Act 2001.
Our responsibilities
We have audited the Remuneration Report included in the Directors’ Report for the year ended 30 June 2020.
Our responsibility is to express an opinion on the Remuneration Report, based on our audit conducted in accordance with Australian Auditing Standards.
PAR_SIG_01
PAR_NAM_01 PAR_POS_01 PAR_DAT_01
KPMG Chris Sargent
Partner
Melbourne
28 July 2020
107
8582_GUD_Holdings_Annual Report_2020_Mono.indd 1078582_GUD_Holdings_Annual Report_2020_Mono.indd 107 9/9/20 12:00 pm9/9/20 12:00 pm

Additional Shareholder Information
The issued shares of the Company are of the one class with equal voting rights and are all quoted on the ASX.
Distribution of Shareholdings as at 21 August 2020
Shares held No. of Shareholders % Shares %
1 – 1,000 3,483 36.35 1,706,951 1.97
1,001 – 5,000 4,520 47.18 11,370.807 13.11
5,001 – 10,000 1,004 10.48 7,182,089 8.28
10,001 – 100,000 557 5.81 10,955,794 12.64
100,001 and over 17 0.18 55,485,533 64.00
There are 427 shareholders holding less than a marketable parcel of shares. A marketable parcel is $500.00.
Twenty Largest Shareholders as at 21 August 2020
No. of Shares %
HSBC Custody Nominees (Australia) Limited 28,442,301 32.80
Citicorp Nominees Pty Limited 9,994,194 11.53
J P Morgan Nominees Australia Pty Limited 9,307,047 10.73
Argo Investments Limited 2,066,508 2.38
National Nominees Limited 1,635,843 1.89
BNP Paribas Nominees Pty Ltd <Agency Lending DRP A/C> 1,476,008 1.70
BNP Paribas Noms Pty Ltd <DRP> 651,453 0.75
AMP Life Limited 353,750 0.41
National Nominees Limited <DB A/C> 328,572 0.38
Citicorp Nominees Pty Limited <Colonial First State Inv A/C> 255,269 0.29
Australian Executor Trustees Limited <No 1 Account> 208,124 0.24
HSBC Custody Nominees (Australia) Limited <NT‐Comnwlth Super Corp A/C> 167,109 0.19
Kulandra Pty Limited 132,749 0.15
BNP Paribas Nominees Pty Ltd <IB Au Noms Retailclient DRP> 131,836 0.15
HSBC Custody Nominees (Australia) Limited 120,927 0.14
HSBC custody Nominees (Australia) Limited – GSCO ECA 113,596 0.13
Mr Timothy Theodore Byard 100,247 0.12
BNP Paribas Nominees Pty Ltd HUB24 Custodial Serv Ltd <DRP A/C> 98,895 0.11
Mrs Jillian Anita Cobcroft 98,000 0.11
Powerwrap Limited <Scheme – IML Trades A/C> 93,360 0.11
Total Twenty Largest Shareholders of Ordinary Fully Paid Shares 55,775,788 64.31
Total Remaining Holders Balance 30,925,386 35.69
Substantial Shareholders of GUD Holdings Limited
As at 21 August 2020, the current notices of substantial shareholders were:
No. of Shares
%
Marathon Asset Management LLP 8,835,825 10.19
Perpetual Limited 6,342,689 7.32
Franklin Resources Inc 5,050,661 5.83
Vanguard Group 4,389,624 5.07
108
8582_GUD_Holdings_Annual Report_2020_Mono.indd 1088582_GUD_Holdings_Annual Report_2020_Mono.indd 108 9/9/20 12:00 pm9/9/20 12:00 pm

Shareholder Services
Dividends/Dividend Reinvestment Plan (DRP) The GUD Holdings Limited DRP Plan was reinstated on 29 July 2020.
Direct Payments to a Bank, Building Society or Credit Union Shareholders are encouraged to have cash dividends paid directly into any bank, building society or credit union account in Australia. You can update your account details by accessing the share registry Investor Centre at www.investorcentre.com.
Uncertificated Issuer Sponsored Holdings The Company register contains uncertificated holdings under the Australian Securities Exchange (ASX) CHESS system. Share certificates are not issued and shareholders receive regular statements of their holdings under the Company‐sponsored scheme.
Stock Exchange Listing GUD is listed on the ASX under the name GUD Holdings Limited and under the code GUD. Change of Address or Name It is important that shareholders notify the share registry or their broker in writing immediately when there is a change in their address or name. For issuer sponsored holdings: please notify the share registry in writing and indicate the details of your new/previous name, your new/previous address and your security reference number (SRN), or change the details online at their website at www.investorcentre.com. For CHESS/broker sponsored holdings: please notify your broker in writing if you change your name and/or address.
Shareholding Consolidation Shareholders are encouraged to consolidate shareholding into one name and identification number. Please download a ‘Request to Consolidate Holdings’ form from the share registry Investor Centre at www.investorcentre.com under Company Information. Alternatively, an application should be made to the share registry – Computershare Investor Services Pty Limited (see address below). Shareholders with broker sponsored holdings must contact their broker.
Annual Report Mailing List Shareholders are encouraged to access and view the Company’s Annual Report online at www.gud.com.au. Shareholders who do not wish to receive reports should advise the share registry in writing or by accessing the share registry Investor Centre at www.investorcentre.com. Shareholders can select the method by which they receive shareholder information, including dividend advice, Notice of Annual General Meeting and Proxy.
Tax File Number (TFN) While it is not compulsory for shareholders to provide a TFN, the Company is obliged to deduct tax from non‐fully franked dividends paid to residents in Australia who have not supplied such information. Shareholders can update their TFN by accessing the share registry Investor Centre at www.investorcentre.com.
Continuous Disclosure The Company complies with the requirements of the ASX Listing Rules. Shareholders may view all Company announcements at www.asx.com.au. Shareholders may also obtain updated information and recent announcements concerning the Company by visiting the Company’s website at www.gud.com.au.
Enquiries Shareholders with questions about their shareholding should contact Computershare Investor Services Pty Limited who maintains the share register on behalf of the Company. Enquiries should be addressed to: Computershare Investor Services Pty Limited Postal Address – GPO Box 2975, Melbourne Vic 3001 Yarra Falls, 452 Johnston Street, Abbotsford Vic 3067 Enquiries Within Australia – 1300 850 505 Enquiries Outside Australia – 61 3 9415 4000 Investor Enquiries Facsimile Number – 61 3 9473 2500 Website – www.investorcentre.com Email – www.investorcentre.com/contact
109
8582_GUD_Holdings_Annual Report_2020_Mono.indd 1098582_GUD_Holdings_Annual Report_2020_Mono.indd 109 9/9/20 12:00 pm9/9/20 12:00 pm

8582_GUD_Holdings_Annual Report_2020_Mono.indd 1108582_GUD_Holdings_Annual Report_2020_Mono.indd 110 9/9/20 12:00 pm9/9/20 12:00 pm