OMV Annual Report 2020 - AnnualReports.com
226
Annual Report 2020 The energy for a better life.
-
Upload
khangminh22 -
Category
Documents
-
view
1 -
download
0
Transcript of OMV Annual Report 2020 - AnnualReports.com

Annual Report 2020
The energy for a better life.

Five-year summary
2020 2019 2018 2017 2016
Sales revenues1 in EUR mn 16,550 23,461 22,930 20,222 19,260
Operating Result in EUR mn 1,050 3,582 3,524 1,732 (32)
Profit before tax in EUR mn 875 3,453 3,298 1,486 (230)
Taxes on income and profit in EUR mn 603 (1,306) (1,305) (634) 47
Net income for the year in EUR mn 1,478 2,147 1,993 853 (183)
Net income attributable to stockholders of the parent in EUR mn 1,258 1,678 1,438 435 (403)
Clean CCS Operating Result2 in EUR mn 1,686 3,536 3,646 2,958 1,535
Clean CCS net income2 in EUR mn 1,026 2,121 2,108 2,035 1,230
Clean CCS net income attributable to stockholders of the parent2 in EUR mn 679 1,624 1,594 1,624 995
Balance sheet total in EUR mn 49,271 40,375 36,961 31,576 32,112
Equity in EUR mn 19,899 16,863 15,342 14,334 13,925
Net debt excluding leases in EUR mn 8,130 3,632 1,726 1,713 2,691
Net debt including leases in EUR mn 9,347 4,686 2,014 2,005 2,969
Average capital employed in EUR mn 21,555 19,923 16,850 15,550 17,943
Cash flow from operating activities in EUR mn 3,137 4,056 4,396 3,448 2,878
Capital expenditure in EUR mn 6,048 4,916 3,676 3,376 1,878
Organic capital expenditure3 in EUR mn 1,884 2,251 1,893 1,636 1,868
Free cash flow before dividends in EUR mn (2,811) (583) 1,043 1,681 1,081
Free cash flow after dividends in EUR mn (3,690) (1,441) 263 1,013 615
Net Operating Profit After Tax (NOPAT) in EUR mn 1,637 2,230 2,097 987 (88)
Clean CCS NOPAT2 in EUR mn 1,185 2,204 2,196 2,169 1,325
Return On Average Capital Employed (ROACE) in % 8 11 12 6 0
Clean CCS ROACE2 in % 5 11 13 14 7
Return On Equity (ROE) in % 9 13 14 6 (1)
Equity ratio in % 40 42 42 45 43
Gearing ratio exluding leases in % 41 22 11 12 19
Leverage ratio in % 32 22 12 12 18
Earnings Per Share (EPS) in EUR 3.85 5.14 4.40 1.33 (1.24)
Clean CCS EPS2 in EUR 2.08 4.97 4.88 4.97 3.05
Cash flow per share4 in EUR 9.60 12.42 13.46 10.56 8.82
Dividend Per Share (DPS)5 in EUR 1.85 1.75 1.75 1.50 1.20
Payout ratio in % 48 34 40 113 n.m.
Employees as of December 31 25,291 19,845 20,231 20,721 22,544
Production cost6 in USD/boe 6.58 6.61 7.01 8.79 10.58
Production in kboe/d 463 487 427 348 311
Proved reserves in mn boe 1,337 1,332 1,270 1,146 1,030
Total refined product sales in mn t 18 21 20 24 31
Natural gas sales volumes in TWh 164 137 114 113 109
Lost-Time Injury Rate (LTIR)
in mn hours
worked 0.32 0.34 0.30 0.34 0.40
1 Sales revenues excluding petroleum excise tax 2 Adjusted for special items and CCS effects; further information can be found in Note 4 – Segment Reporting – of the Consolidated Financial Statements 3 Organic capital expenditure is defined as capital expenditure including capitalized Exploration and Appraisal expenditure excluding acquisitions and contingent considerations. 4 Cash flow from operating activities 5 2020: as proposed by the Executive Board and confirmed by the Supervisory Board, subject to confirmation by the Annual General Meeting 2021 6 In 2016, the reported production cost was USD 11.59/boe; effective January 1, 2017, production cost excludes administrative expenses and selling and distribution costs; the 2016
production cost figure of USD 10.58/boe presented in the table has been calculated based on the new definition for future comparability.
At a Glance

Fields of Activity
Upstream
OMV Upstream explores for and produces oil and gas in its five core regions of Central and Eastern Europe, the Middle East and Africa, the North Sea, Russia, and Asia-Pacific. In 2020, daily production was 463 kboe/d (equal to 169 mn boe). While gas output accounted for 62% of total production, oil and NGL flows made up 38%. At year-end 2020, proven reserves amounted to 1.34 bn boe.
Norway
Austria
Tunisia
Yemen United Arab Emirates
Kazakhstan 2
Russia
Romania
Libya
Upstream presence 1
New Zealand
Central and Eastern Europe
Middle East and Africa
North Sea
Russia
Asia-Pacific
Kurdistan Region of Iraq
Malaysia
Oil and NGL Natural gas
Production and oil and gas splitIn %
Central and Eastern Europe 1
Middle East and Africa North Sea Russia Asia-Pacific 1
Austria Kurdistan Region of Iraq Norway MalaysiaKazakhstan 2 Libya New ZealandRomania Tunisia
United Arab EmiratesYemen
48
52
Central and Eastern Europe
167kboe/d
48
52
North Sea
86kboe/d
79
21
Middle East and Africa
47kboe/d
100
Russia
95kboe/d
26
74
Asia-Pacific
68kboe/d
38
62
Total hydrocarbon production
463kboe/d
1 In addition, OMV holds participations in exploration licenses in Bulgaria, Australia, and Mexico.2 On December 29, 2020, OMV Petrom signed the transaction for the sale of the entirety of its operations in Kazakhstan.
The closing of the transaction is subject to certain conditions precedent and is expected for the first half of 2021.

Downstream
OMV’s Downstream business refines, markets fuels, chemicals, and gas. It operates three inland refineries in Europe and holds a strong market position within the areas of its refineries, serving a strong branded retail network and commercial customers. In the Middle East, it owns 15% of ADNOC Refining and ADNOC Global Trading. The processing capacity of its refineries amounts to more than 500 kbbl/d. In 2020, OMV increased its share in Borealis to 75%, strengthening its chemical business and extending the value chain into polymers. In gas, OMV is active along the entire gas value chain.
Burghausen Schwechat
Petrobrazi
OMV refineries
Number of filling stations
Germany 2
303Czech Republic
140
Slovakia98
Hungary202
Romania560
Moldova77
Slovenia120
Serbia63
Bulgaria93
Downstream fuels presence1
Ruwais
United Arab Emirates
Austria429
1 Downstream fuels presence comprises refining, product supply and sales, and retail.2 On December 14, 2020, OMV and EG Group reached an agreement for the acquisition of 285 filling stations in Germany
by EG Group. The transaction is subject to required regulatory approvals and closing is expected in 2021.

Germany
Austria
Hungary
Romania
Turkey
Netherlands
Belgium
Downstream gas presence
LNG terminal
Gas-fired power plant
Gas pipelines 1
Equity gas
Gas storage
CEGH
Downstream chemicals presence 1
United States
Mexico
Japan
Vietnam
Finland
Sweden Russia
Poland
Czech RepublicSlovakia
RomaniaCroatia
Hungary
SerbiaBulgaria
United Kingdom
Germany
Spain
France
Austria
TurkeyGreece
Italy
Belgium
Netherlands
Colombia
South AfricaChile
Argentina
Brazil
China
1 On September 23, 2020, OMV and VERBUND reached an agreement for the acquisition of 51% of shares Gas Connect Austria GmbH by VERBUND. Closing is subject to regulatory approval and is expected in the first half of 2021.
1 Downstream chemicals presence comprises OMV’s petrochemicals presence as well as the production plants, sales offices, and logistics hubs of Borealis and Borouge.
South Korea
Morocco Egypt
IndiaThailand
Indonesia
MalaysiaSingapore
United Arab Emirates

6
FINANCIAL CALENDAR
April 9, 2021 Trading Update Q1 2021
April 29, 2021 Results January–March 2021
July 8, 2021 Trading Update Q2 2021
July 28, 2021 Results January–June and Q2 2021
October 8, 2021 Trading Update Q3 2021
October 29, 2021 Results January–September and Q3 2021
▸ This financial calendar represents only
an extract of the planned dates in 2021.
The complete financial calendar and
confirmation of the dates can be found at:
www.omv.com/financial-calendar
▸ The HTML version of this annual report can be found here:
www.reports.omv.com/en/annual-report/2020
▸ The PDF version of this annual report can be found here:
www.omv.com/annual-report-2020

7
9 1 — TO OUR SHAREHOLDERS
10
14
16
20
Interview with the Chairman of the Executive Board
OMV Executive Board
Report of the Supervisory Board
OMV on the Capital Markets
25 2 — DIRECTORS’ REPORT
26
28
35
40
43
45
53
60
68
69
72
About OMV
Strategy
Sustainability
Health, Safety, Security, and Environment
Employees
OMV Group Business Year
Upstream
Downstream
Outlook
Risk Management
Other Information
77 3 — CONSOLIDATED CORPORATE GOVERNANCE REPORT
87 4 — CONSOLIDATED FINANCIAL STATEMENTS AND NOTES
88
98
99
100
102
104
105
Auditor’s Report
Consolidated Income Statement for 2020
Consolidated Statement of Comprehensive Income for 2020
Consolidated Statement of Financial Position as of December 31, 2020
Consolidated Statement of Changes in Equity for 2020
Consolidated Statement of Cash Flows for 2020
Notes to the Consolidated Financial Statements
213 5 — FURTHER INFORMATION
214
221
224
Consolidated Report on the Payments Made to Governments
Abbreviations and Definitions
Contacts and Imprint
Contents

8

TO OUR SHAREHOLDERS 9 – 24
10 — Interview with the Chairman of the Executive Board 14 — OMV Executive Board
16 — Report of the Supervisory Board 20 — OMV on the Capital Markets

OMV ANNUAL REPORT 2020 / INTERVIEW WITH THE CHAIRMAN OF THE EXECUTIVE BOARD
10
A conversation with Rainer Seele, Chairman of the Executive Board and CEO of OMV.
Mr. Seele, which three words would you use to describe 2020? Pandemic. Success. Sustainability. And gratitude.
It’s an unusual combination.
I would be happy to explain why I chose these three concepts and added a fourth. “Pandemic” is obvious. COVID-
19’s serious global impact on individuals, the economy, and society as a whole also posed completely new chal-
lenges for OMV. We were clearly not the only ones affected – no one has been spared – which is why I only men-
tion the pandemic to define the state of affairs.
You then said, “success,” which is less expected.
Exactly. And I chose that word deliberately. Because OMV can truly be proud of our 2020. In a year that was prob-
ably the most difficult in decades for us all and the entire global economy, we demonstrated our strength in areas
such as our operating activities. At the same time, we set the course for a new OMV with a sustainable business
model.
Let’s start with OMV’s operating activities. The macroeconomic environment was not exactly rosy...
That’s an understatement. In reality, the first quarter started out normal, when suddenly all indicators pointed
downward, except the number of infections. Worldwide demand for oil dropped by 8 percent from its 2019 level,
and a lack of agreement among the OPEC+ nations about output quotas led to considerable surplus supply. The
result was a sharp decline in oil prices. The Brent price fell from almost 70 dollars per barrel to a 21-year low of
around 13 dollars per barrel in just three months. For the year as a whole, the average price was just under
42 dollars per barrel – a decrease of 35 percent. The average gas price at the Central European Gas Hub came in
at 10 euros per megawatt hour, down 32 percent from the prior year. Developments in the Downstream business
were not uniform. Whereas the refinery margin was down 45 percent from the prior year to an average of
2.4 dollars per barrel, petrochemicals performance remained relatively stable.
How did the OMV Group react to this level of crisis?
We very quickly implemented a set of measures including cost cutting and organic investments. Above all, how-
ever, we had a key advantage: OMV’s business rests on two strong pillars and can therefore continue operating
confidently even with this kind of strong economic headwind. Our integrated business model with a diversified
portfolio again proved valuable and was able to somewhat dampen the hefty shock of negative market effects.
Naturally, the Upstream business felt a significant impact from the massive drop in oil and gas prices and was also
affected by production stoppages in Libya. Despite the unfavorable circumstances, we were able to keep produc-
tion costs at the previous year’s low level of 6.6 dollars per barrel. In contrast, Downstream sold larger volumes of
petrochemicals and additionally generated strong retail sales thanks to higher margins, along with delivering im-
pressive volume and income growth in natural gas trading. The gas business contributed earnings of 337 million
euros, up more than 70 percent year over year. This was due to factors including increased sales volumes and
market share, particularly in Germany, the Netherlands, Belgium, and Austria.
“Setting the course for a new OMV”

OMV ANNUAL REPORT 2020 / INTERVIEW WITH THE CHAIRMAN OF THE EXECUTIVE BOARD
11
»
It goes without saying
that we must do every-
thing to maximize
our economic, environ-
mental, and social
sustainability.
RAINER SEELE
Chairman of the Executive Board
And OMV’s business area of the future: chemicals?
Of course, the chemical business also felt the negative impact of the coronavirus pandemic. Nonetheless, we were
able to increase overall polyolefin sales somewhat year over year. The Borealis Group therefore generated not
only solid earnings, but also strong operating cash flow of 1.6 billion euros, up slightly from the prior year.
“Even during this crisis, every quarter was profitable.”
That means OMV remained flexible despite the crisis? Yes. That was evident in our stable cash flow performance as well. The OMV Group’s cash flow from operations
saw a year-over-year decline of 23 percent, but at 3.1 billion euros was still extremely robust. It is particularly grati-
fying that OMV was able to generate a positive clean operating result in each and every quarter. Our Clean CCS
Operating Result therefore came in at a solid 1.7 billion euros for the year as a whole.
What does that mean for shareholders?
It means that OMV again demonstrated strong profitability and can reflect this in an attractive dividend. The Exec-
utive Board resolved to propose an increased dividend of 1.85 euros per share to the Supervisory Board and the
Annual General Meeting.
Let’s turn from operations to strategy.
I am confident that 2020 will go down in the history of OMV not as the year we experienced a pandemic, but as the
year we embarked on a fundamentally new course. By acquiring a majority interest in Borealis, we began to pur-
sue a strategy that will result in a new OMV. An OMV that is even larger, more stable, and more sustainable.
Measured in terms of our sales of recent years, this transaction has already allowed us to grow by about a third.
And we will continue to grow, because an OMV with strong chemical activities with the right products and services
will be well prepared to meet market demand for the lower-carbon world of the future. The high-quality plastics ur-
gently needed for solar panels and wind turbines, power grids and digital controls, and lightweight components in
the transportation sector are just a few examples of these.

OMV ANNUAL REPORT 2020 / INTERVIEW WITH THE CHAIRMAN OF THE EXECUTIVE BOARD
12
Is OMV turning its back on its roots and its past?
No, definitely not. The new OMV will continue to be an integrated company that generates strong earnings along
the entire value chain, in the Exploration & Production, Refining & Marketing, and Chemicals & Materials seg-
ments. We will remain true to our heritage and invest approximately 3 billion euros in Austria alone by 2025. These
funds will be invested in the prudent and efficient use of domestic oil and gas reserves, in new forms of energy, in
optimizing petrochemical equipment at the Schwechat refinery, and in further developing our circular economy.
The forward integration into chemicals will provide not only momentum for the Group but also additional stability.
This extended value chain will enables us to weather cyclical market volatility even better than before. We will in-
creasingly refine our raw materials instead of processing them into fuels, and we are confident that chemical prod-
ucts and high-quality plastics will continue to be required in 2050 and well beyond. In addition, we can leverage
the strong synergy potential from the cooperation between our two companies. In this sense, expanding our value
chain is the foundation for a successful business model for the long term.
“OMV has largely achieved its strategic goals for 2025.”
Is that why you also associate “success” with 2020? Three years ago, we announced our Strategy 2025, which would increase OMV’s size and value. We largely
achieved this by the end of 2020 and can therefore declare this effort a success. Of course, many things around
us have changed in the span of just three years. That is why we have to rethink our parameters. In our Strategy
2025, we mostly defined size and value in terms of oil and gas reserves, production volumes, and refinery
capacity. We aimed to double our proved reserves, achieve output of 600,000 barrels per day, and double our
refinery capacity. Those are no longer our goals.
What are OMV’s goals then?
We will continue to pay close attention to our reserves, production volumes, and refinery capacity, and maintain
our daily oil and gas output at around the current level of 450,000 to 500,000 barrels per day with an emphasis on
gas. However, our key performance indicators will be framed in a new context, and their significance and
weighting will change as a result of the energy transition and the extension of our value chain into more highly re-
fined chemical products.
Speaking of change, the Borealis transaction wasn’t the only one in the OMV Group, was it?
A strategic reorganization does not mean that you have to spend wildly and buy everything. You also have to let
some favorite activities go and finance acquisitions. As you mentioned, we not only acquired a majority in Borealis
in 2020, we also entered into agreements to sell our investment in Gas Connect Austria to VERBUND, our filling
station network in Germany, and the Upstream business in Kazakhstan.
Looking back on all that, additionally considering the performance of our operating business, and knowing the
challenging environment in which all of that was achieved, you can understand why I chose the word “success.”
For that, hats off to the now 25,000 employees of the new OMV.

OMV ANNUAL REPORT 2020 / INTERVIEW WITH THE CHAIRMAN OF THE EXECUTIVE BOARD
13
That’s why you chose “gratitude” as your fourth concept?
Yes, it is. Team OMV is a team you can rely on. And I’m not talking about just “regular” performance, but perfor-
mance in view of the extreme challenges posed by the coronavirus. Anyone who experienced how our employees
immediately adapted to the new situation and got used to the completely upended work routine from one day to
the next can only be impressed. Our various teams took turns working at home and in the office and made sure
every day that critical infrastructure on-site was functioning to keep people warm and able to move around, that
businesses were supplied with energy, and that raw materials were available for the manufacture of medical prod-
ucts. All of that worked seamlessly thanks to their enormous flexibility and creativity, and deep commitment. We
were able to keep up the supply at all times in this difficult environment as well as also implementing all of our stra-
tegic projects. An effort deserving of high praise. And one I am grateful for.
“The Borealis deal was a decisive move.”
You mentioned sustainability. How will you make sure the new OMV is also a more sustainable OMV? We all know that there is no button we can press to rid the world of CO2 overnight. As an international oil and gas
company, we also have a statutory duty to provide a secure energy supply. Do we have to fulfill this duty? Yes.
But does that absolve us of the obligation of making our business more sustainable every day? No. It goes without
saying that we must do everything to maximize our economic, environmental, and social sustainability. I think that
the Borealis transaction in particular was the decisive step in this direction, since this turned OMV’s strategy di-
rectly toward meeting the needs of a lower-carbon world.
Early 2021 was just as challenging as the end of 2020. What are OMV’s expectations for this year?
I think that, at least for the first six months, we will continue to do business in a very challenging environment due
to the pandemic. I believe the second half will be much more positive. At that time, the production and logistics
problems affecting the COVID-19 vaccination effort should mostly be solved, and that should lead to a stronger
economic recovery.
In terms of our business, we anticipate total production in Upstream, except for Libya, of around 480,000 barrels
per day, and project a noticeable turnaround in average crude oil and gas prices. In Downstream, the capacity
utilization of our European refineries should remain around the previous year’s level, and the refinery margin is
expected to exceed the prior-year level. Our chemicals business is forecast to generate ethylene and propylene
margins at the level of the previous year. Borealis should see an uptick in polyethylene volumes and stable
polypropylene volumes; margins for both are expected to be up from the prior year.
We will continue our reorganization, which will entail selling our filling station business in Slovenia and Borealis’s
fertilizer business, including nitrogen and melamine activities. At the same time, we have budgeted organic invest-
ments of 2.7 billion euros throughout the Group, including Borealis, for 2021 – investments in a new OMV.
Vienna, March 10, 2021
Rainer Seele m.p.

RAINER SEELEChairman of the Executive Board and Chief Executive Officer
ELENA SKVORTSOVA Chief Commercial Officer
REINHARD FLOREYChief Financial Officer

JOHANN PLEININGERDeputy Chairman of the Executive Board
and Chief Upstream Operations Officer
THOMAS GANGLChief Downstream Operations Officer

OMV ANNUAL REPORT 2020 / REPORT OF THE SUPERVISORY BOARD
16
The time has come to reflect on the past year, one which was almost entirely dominated by the coronavirus
pandemic and its major adverse impact on the global economy. Low oil and gas prices and a significant drop in
demand posed enormous challenges for OMV. Nonetheless, we can still call this year a success. Thanks to
measures quickly implemented by management and the Group’s integrated business model and diversified portfo-
lio, OMV was able to generate solid earnings despite the difficult market environment.
We are not just looking back on a year of pandemic life, but also a twelve-month period in which we set the course
for a new OMV. The acquisition of a majority interest in Borealis was a milestone for OMV in the further develop-
ment of our Company’s chemical and circular economy activities. By expanding the value chain in this way, OMV
is establishing a sustainable business model that will set the direction for the Company’s development for the long
term.
Above all, however, we are reflecting on a time in which the importance of the human element was clearly evident
– more so than in any other year. Neither our solid earnings nor the implementation of important strategic projects
would have been possible without our employees who put enormous effort and a great deal of creativity into mak-
ing these results a reality under difficult conditions. They are the foundation of and the driving force behind our
success.
This performance and OMV’s stable financial position are also reflected in the proposed progressive dividend of
EUR 1.85, which allows you as our shareholders to participate in OMV’s success.
In the following, I would like to inform you about the Supervisory Board’s work during the 2020 financial year:
Composition of the Executive Board and Supervisory Board
Elena Skvortsova joined the Executive Board on June 15, 2020, and is now responsible for Marketing & Trading.
Ms. Skvortsova is a top executive with many years of international management experience and cross-industry
expertise. Since her appointment, she has been working with great enthusiasm and insight into market challenges
to ensure that her division is fit for the future. After just a few months, she completed a very important transaction
for OMV: the sale of the German filling station network.
On September 9, we resolved to reappoint Reinhard Florey as CFO. He has been able to refine and significantly
improve Finance at OMV, both in terms of organization and processes, contributing to our results. This is due not
least to efficient cost management and a clear financial strategy focused on cash flow and financial strength.
OMV’s attractiveness to investors was underscored in 2020 by the successful issue of bonds totaling
EUR 4.5 billion.
In 2020, the composition of the Supervisory Board also changed. Our long-term member Dr. Wolfgang Berndt,
who had also been Chairman since May 2019, stepped down after ten years of service on the Supervisory Board
with effect from the end of the Annual General Meeting on September 29, 2020. I wish to thank Wolfgang Berndt
on behalf of the entire Supervisory Board. During his term of office, he oversaw groundbreaking transactions and
investments that contributed substantially to OMV’s current stability and resilience. Under his chairmanship, we
completed OMV’s largest transaction to date: the increase in our stake in Borealis to 75%, which will undoubtedly
go down in our history for its strategic importance.
I, Mark Garrett, was elected to the Supervisory Board at the 2020 Annual General Meeting and at the subsequent
constitutive meeting was voted Chairman of the Supervisory Board and Chairman of the Presidential and Nomina-
tion Committee. At that meeting, Thomas Schmid was elected Chairman of the Remuneration Committee. There
were changes on the part of the employee representatives in 2020 as well. Christine Asperger stepped down from
her positions as of October 1, 2020, and Alfred Redlich left the Supervisory Board as of December 2, 2020.
Dear Shareholders,

OMV ANNUAL REPORT 2020 / REPORT OF THE SUPERVISORY BOARD
17
»
We are not just looking
back on a year of pan-
demic life, but also a
twelve-month period in
which we set the
course for a new OMV.
MARK GARRETT
Chairman of the Supervisory Board
Supervisory Board activities
The Supervisory Board carried out its activities during the financial year with great care and in accordance with the
law, the Company’s Articles of Association, and the Internal Rules. It oversaw the Executive Board’s governance
of OMV and advised it in decision-making processes on the basis of detailed written and verbal reports as well as
constructive discussions between the Supervisory Board and the Executive Board.
Early 2020 was almost entirely dominated by the Borealis transaction, which was ultimately approved at the meet-
ing on March 11, 2020. The Annual General Meeting was postponed to autumn 2020 due to COVID-19-related
restrictions. The other Supervisory Board meetings and conference calls were also heavily focused on discussions
about measures to reduce the pandemic-induced negative impact on many areas of our business, particularly with
regard to securing financing for the Borealis transaction.
Building on a survey of the Supervisory Board, a training event was held for the Supervisory Board once again
in 2020. We had to cancel a visit to the newly set-up Innovation & Technology Center in Gänserndorf due to
COVID-19 restrictions. In 2020, we again conducted a Supervisory Board self-assessment led by an external
service provider, which built on the survey-based evaluation of the previous year and was conducted by holding
personal interviews. The results were incorporated into our priority-setting and activities for 2021.
In September, the Supervisory Board approved the sale of OMV’s 51% interest in Gas Connect Austria. The sale
was the result of OMV’s pursuit of a strategy to exit the regulated gas transportation business. At the same time,
we were able to eliminate debt of more than EUR 570 million and take a major step toward improving our gearing.
Our remuneration policy was put to a vote for the first time at the Annual General Meeting in September 2020. We
attach great importance to an intensive exchange with investors. For this reason, we discussed the development
of our remuneration policy with investors at length.
At the end of the year, we took another major step forward in our divestment program – the sale of the filling
station network in Germany. The final investment decision before year-end on the Co-Processing project for the
production of biofuels in Schwechat was a key move toward implementing our sustainability strategy.

OMV ANNUAL REPORT 2020 / REPORT OF THE SUPERVISORY BOARD
18
Activities of Supervisory Board committees
The Presidential and Nomination Committee placed particular focus on the preparation of the decisions regard-
ing the appointment of Elena Skvortsova and the extension of Reinhard Florey’s Executive Board mandate. Fur-
thermore, it focused on the issue of long-term Executive Board succession planning.
In 2020, the Remuneration Committee finalized the remuneration policy for the Executive Board and Supervisory
Board based on the new requirements of Austrian Stock Corporation Act in connection with the EU Shareholder
Rights Directive and presented it to the shareholders for a vote for the first time at the Annual General Meeting on
September 29, 2020. The measure passed overwhelmingly, receiving more than 99% of the votes cast. In the con-
text of the development of the Executive Board remuneration policy, feedback from investors during the 2019 Cor-
porate Governance Roadshow was specifically considered. Thus, from 2020, the variable remuneration system
also incorporates non-financial/ESG targets – specifically, carbon reduction and a diversity target.
The next step is to prepare a remuneration report for the Executive Board and Supervisory Board based on the
new provisions of the Austrian Stock Corporation Act. A separate report was drafted for this purpose which pre-
sents the Executive Board and Supervisory Board remuneration more transparently than before and includes a
direct comparison with the Company’s performance over time and with employee salaries. The remuneration
report for the Executive Board and Supervisory Board will be presented to the shareholders for approval for the
first time at the Annual General Meeting in 2021.
In 2020, the Audit Committee looked at important topics related to accounting processes, the internal audit pro-
gram, risk management, and the Group’s internal control system. The current auditor of the OMV Group,
Ernst & Young Wirtschaftsprüfungsgesellschaft m.b.H., participated in each of the Audit Committee’s meetings,
and the Supervisory Board regularly took advantage of the opportunity to discuss matters with the auditor without
the presence of the members of the Executive Board. In addition, the Audit Committee completed the selection
procedure introduced in 2019 relating to the choice of the auditor for the 2021 financial year.
Meetings of the Portfolio and Project Committee are held regularly prior to the meetings of the Supervisory
Board. The committee used its meetings in 2020 to prepare decisions regarding key investment and M&A projects
on the basis of extensive information and intensive discussions.
Further details regarding the activities of the Supervisory Board and its committees can be found in the
(Consolidated) Corporate Governance Report.

OMV ANNUAL REPORT 2020 / REPORT OF THE SUPERVISORY BOARD
19
Annual financial statements and dividends
Following a comprehensive audit and discussions with the auditor during meetings of the Audit Committee and the
Supervisory Board, the Supervisory Board has approved the Directors’ Report and the Consolidated Annual
Report pursuant to section 96(1) of the Austrian Stock Corporation Act as well as the Annual Financial Statements
and the 2020 Consolidated Annual Financial Statements pursuant to section 96(4) of the Austrian Stock Corpora-
tion Act. Both the Annual Financial Statements and the Consolidated Annual Financial Statements for 2020 re-
ceived an unqualified opinion from the auditing company Ernst & Young Wirtschaftsprüfungsgesellschaft m.b.H.
The Supervisory Board also approved the (Consolidated) Corporate Governance Report audited by both the
Supervisory Board and the Audit Committee as well as the (Consolidated) Report on Payments Made to Govern-
ments. The Supervisory Board found no issues during the audits. Following the audit, the Supervisory Board ac-
cepted the Executive Board’s suggestion to jointly propose in the Annual General Meeting a dividend of EUR 1.85
per share, which corresponds to an increase of EUR 0.10 over the previous year. The remaining amount of the net
profit after the dividend distribution will be carried forward to new account. The Supervisory Board will audit the
separate consolidated non-financial report (Sustainability Report) individually, and this report will be published
separately and after the Annual Report together with the corresponding Supervisory Board report.
On behalf of the entire Supervisory Board, I would like to thank the Executive Board and all employees for their
commitment and successful work in the extraordinarily turbulent and challenging 2020 financial year. I would like
to give special thanks to OMV’s shareholders for their continued trust as well as to all of OMV’s customers and
partners.
Vienna, March 10, 2021
For the Supervisory Board
Mark Garrett m.p.

OMV ANNUAL REPORT 2019 / OMV ON THE CAPITAL MARKETS
20
2020 will be remembered for the COVID-19 pandemic and the economic recession, big swings in market
sentiment, as well as significant polarization across the sectors. In contrast, OMV’s stock price outper-
formed the market strongly during the year’s final two months with an impressive rally and ended the year
at EUR 33.00. For 2020 overall, OMV performed in line with the sector.
Financial markets
Efforts to stop the spread of COVID-19 infections led to
lockdown measures in spring, causing an almost un-
precedented economic decline. A number of steps
taken by the ECB and the Fed to stimulate the econ-
omy led to a minor recovery until June. However, the
STOXX 600 index was still down by 13% during the
first half of 2020, compared to a 7% decline by the
MSCI World Index in the same period.
By September, this recovery was undone by a second
lockdown wave, triggered by a resurgence in COVID-
19 case numbers. November finally marked a turning
point, as the prospect of a vaccine first arose, estab-
lishing a powerful recovery trend on global markets.
The outcome of the presidential election in the United
States and the last-minute EU-UK trade deal provided
further support. The year’s second half was dominated
by recovery, with the performance of European equities
again more subdued than the global average (MSCI
World +22% vs. STOXX 600 +11%).
For the year as a whole, global equities still managed
to gain value, albeit at a much slower pace than before
(MSCI World +14% in 2020 vs. +25% in 2019). In com-
parison, European stocks suffered a loss (STOXX 600
–4% in 2020 vs. +23% in 2019).
The oil and gas sector was hit particularly hard by the
events of 2020, on a global as well as on a European
scale. Before the effects of the pandemic hit, oil prices
were already under pressure due to disagreements
between OPEC and non-OPEC producers. However,
thanks to improving market sentiment and growing
commodity price support during the final two months of
the year, Europe’s oil and gas stocks were able to
stage an impressive comeback, strongly outperforming
the wider European and global markets. In November
and December, the FTSEurofirst E300 Oil & Gas Index
grew by over 35%, compared to a gain of around 17%
for the STOXX 600 and MSCI World. The sector was
thus able to recover a large share of previously in-
curred losses. With OPEC+ supporting the near-term
oil market, the sector is continuing its recovery during
early 2021.
At a glance
2020 2019 2018 2017 2016
Number of outstanding shares1 in mn 327.0 326.9 326.7 326.5 326.4
Market capitalization1 in EUR bn 10.8 16.4 12.5 17.3 11.0
Volume traded on the Vienna Stock Exchange in EUR bn 9.3 8.2 9.1 8.8 6.0
Year’s high in EUR 50.76 54.54 56.24 54.14 34.78
Year’s low in EUR 16.33 39.32 37.65 32.37 21.45
Year end in EUR 33.00 50.08 38.25 52.83 33.56
Earnings Per Share (EPS) in EUR 3.85 5.14 4.40 1.33 (1.24)
Book value per share1 in EUR 42.02 39.80 36.44 34.35 33.44
Cash flow per share2 in EUR 9.60 12.42 13.46 10.56 8.82
Dividend Per Share (DPS)3 in EUR 1.85 1.75 1.75 1.50 1.20
Payout ratio in % 48 34 40 113 n.m.
Dividend yield1 in % 5.6 3.5 4.6 2.8 3.6
Total Shareholder Return (TSR)4 in % (29) 36 (25) 61 34
1 As of December 31 2 Cash flow from operating activities 3 2020: as proposed by the Executive Board and confirmed by the Supervisory Board; subject to confirmation by the Annual General Meeting 2021 4 Assuming reinvestment of the dividend
OMV on the Capital Markets

OMV ANNUAL REPORT 2020 / OMV ON THE CAPITAL MARKETS
21
OMV share performance
OMV’s share price performance over the year was in
line with that of the European sector, closing 2020
down 34%. Assuming dividend reinvestment, the total
shareholder return was minus 29%. Starting the year at
EUR 50.08, OMV’s share price came under pressure
due to a number of factors. First, disagreements be-
tween OPEC and non-OPEC producer countries low-
ered the oil price. Then there were the adverse eco-
nomic effects of the lockdown measures in reaction to
the outbreak of the COVID-19 pandemic. The senti-
ment degrading drove OMV’s share price to its lowest
value in almost 16 years, to EUR 16.33 in mid-March.
However, already by June the stock had already recov-
ered more than half of this loss. The resurgence of
COVID-19 cases after the summer led to another de-
cline that lasted into late October. The closing of the
Borealis acquisition represented the inflection point.
Over the final two months of the year, the share price
strongly outperformed markets strongly with a 68%
gain, thus fully recovering the losses incurred since
summer (MSCI World and STOXX 600 each +17%).
The share closed 2020 at EUR 33.00. The OMV’s daily
trading volume of OMV shares in 2020 averaged at
621,393 shares (2019: 350,172). At year-end, OMV’s
total market capitalization was EUR 10.8 bn compared
to EUR 16.4 bn at the end of 2019.
OMV share price performance 2020
In EUR
OMV’s share price moved in line with the sector during
the year, which underperformed the wider market. The
FTSEurofirst E300 Oil & Gas index decreased by 31%,
the Austrian ATX declined by 13%, and the FTSE Eu-
rotop 100 global industry benchmark weakened by 8%.
Measured over a five-year period, the return generated
by the OMV share strongly outperformed index returns.
A 100 EUR investment in OMV stock at year-end 2015
with continuous dividend reinvestment in further OMV
stock would have grown by an average annual return
rate of 9% to EUR 155 at year-end 2020.
OMV shares: long-term performance compared with indexes
Average annual increase with dividends reinvested1
1 Source: Bloomberg. The annualized return for the holding period is assuming dividends are reinvested at spot price.

OMV ANNUAL REPORT 2019 / OMV ON THE CAPITAL MARKETS
22
Proposed dividend of EUR 1.85 per share for the business year 2020
On September 29, 2020, OMV’s Annual General Meet-
ing approved a dividend of EUR 1.75 per share for
2019 as well as all other agenda items including the
new Remuneration Policy for the Executive Board and
for the Supervisory Board, the Long Term Incentive
Plan 2020, the Equity Deferral 2020 and the elections
to the Supervisory Board. The Executive Board will pro-
pose a dividend of EUR 1.85 per share for 2020 at the
next ordinary Annual General Meeting on June 2, 2021,
an increase of 6% over the previous year. The dividend
yield, based on the closing price on the last trading day
of 2020, amounts to 5.6%.
Dividend policy
OMV is committed to delivering an attractive and pre-
dictable shareholder return through the business cycle.
According to its progressive dividend policy, OMV aims
to increase dividends every year or at least to maintain
the level of the respective previous year.
OMV shareholder structure
OMV’s shareholder structure remained relatively un-
changed in 2020 and was as follows at year-end:
43.1% free float, 31.5% Österreichische Beteiligungs
AG (ÖBAG, representing the Austrian government),
24.9% Mubadala Petroleum and Petrochemicals
Holding Company (MPPH), 0.4% employee share
programs, and 0.1% treasury shares.
Shareholder structure
In %
An analysis of our shareholder structure carried out for
the end of 2020 showed that institutional investors held
28.4% of OMV’s shares. At 28%, investors from the
United States made up the largest regional group of
institutional investors. The proportion of investors from
the United Kingdom amounted to 19%, while German
and French shareholders made up 9% and 8%, respec-
tively. The share of investors from Austria was 7%, and
Norwegian investors represented 4%.
Geographical distribution of institutional investors
In %

OMV ANNUAL REPORT 2020 / OMV ON THE CAPITAL MARKETS
23
OMV Aktiengesellschaft’s capital stock amounts to
EUR 327,272,727 and consists of 327,272,727 no-par-
value bearer shares. At year-end 2020, OMV held a to-
tal of 297,846 treasury shares. The capital stock con-
sists entirely of common shares. Due to OMV’s adher-
ence to the one-share, one-vote principle, there are no
classes of shares that bear special rights. A consortium
agreement between the two major shareholders, ÖBAG
and MPPH, contains arrangements for coordinated ac-
tion and restrictions on the transfer of shareholdings.
Environmental, Social, and Governance (ESG) performance
OMV places great importance on working with ESG rat-
ing agencies. OMV is committed to acting responsibly
towards the environment and society. Our accomplish-
ments in this regard are reflected in further improve-
ment of our already robust ESG performance in 2020.
OMV received the highest “AAA” score in the MSCI
ESG Ratings assessment for the eighth year in a row.
This places OMV among the best 10% of oil and gas
companies. OMV also maintained its Prime Status in
the ISS ESG rating with a score of B–. This positions
us among the 5% best oil and gas companies in terms
of ESG performance. OMV was also included in the
SAM Sustainability Yearbook 2021, based on its as-
sessment in the SAM Corporate Sustainability Assess-
ment (CSA) in 2020. The SAM Corporate Sustainability
Assessment (CSA), established by RobecoSAM, is
now issued by S&P Global. OMV was also recognized
by CDP with a score of A– (Leadership) in the Climate
Change category, earning us a place among the 20
best oil and gas companies in this ranking. We were
also assigned the highest Level 4 rating for carbon
management quality by the Transition Pathway Initia-
tive. Besides these outstanding achievements, OMV
has maintained its inclusion in several ESG indexes.
Most notably, OMV was included in the Dow Jones
Sustainability Index (DJSI World) for the third year in a
row as the only Austrian company in the index. The
DJSI World represents the top 10% of the largest 2,500
companies in the S&P Global Broad Market Index
based on long-term economic, environmental and so-
cial factors. OMV was also included in the S&P Europe
350, which like the DJSI is
based on the SAM CSA OMV was also reconfirmed as
a constituent of two MSCI indexes, the ACWI ESG
Leaders Index and the ACWI SRI Index. Furthermore,
OMV was affirmed as a member of the FTSE4Good
Index Series, which is used by a wide variety of market
participants to create and assess responsible invest-
ment funds. OMV was included in the Euronext Vigeo
Europe 120 index and Euronext Vigeo Eurozone 120
index, based on its ratings by V.E., an Affiliate of
Moody’s, and also maintained its inclusion in the
STOXX® Global ESG Leaders index, based on OMV’s
assessment by Sustainalytics, and in the ECPI® in-
dexes. After being reappraised by EcoVadis – a plat-
form analyzing the ESG performance of suppliers –
OMV maintained its Silver supplier status.
Solid credit ratings
The OMV Group is evaluated by rating agencies
Moody’s and Fitch. On March 20, 2020, Moody’s con-
firmed OMV’s A3 issuer rating while downgrading the
outlook to negative. Moody’s confirmed this rating in
February 2021. On March 13, 2020, Fitch confirmed
OMV’s rating of A– and revised the outlook to negative.
Fitch confirmed this rating in August 2020. The rating
affirmations reflect OMV’s earnings resilience thanks to
the economic integration of the Upstream and Down-
stream business segments, along with a track record of
conservative financial policies. The outlook revisions
were a consequence of the adverse macroeconomic
environment in combination with the greater debt as-
sumed to fund the acquisition of the additional share in
Borealis.
Analyst coverage
At the end of 2020, OMV was covered by 20 sellside
financial analysts who regularly publish research re-
ports on the company. This ensures OMV good visibil-
ity in the financial community. At the end of 2019, 59%
of these analysts had issued a “buy” recommendation,
32% advised “hold,” with the remainder proposing
“sell.” However, as 2020 came to a close, there were
no analysts left that recommended selling OMV shares.
The share of analysts recommending that their clients
buy OMV stock had risen to about two-thirds, with
about one-third issuing a “hold” recommendation.
Following the adverse economic developments of
2020, the average target price for OMV dropped to
EUR 34.49 at the end of 2020, from EUR 56.10 per
share a year earlier.

OMV ANNUAL REPORT 2019 / OMV ON THE CAPITAL MARKETS
24
Investor Relations activities
Even during the COVID-19 pandemic, ensuring active,
candid dialogue with the capital market remains a top
priority at OMV. By switching to virtual meetings, the
Investor Relations department fulfilled its mission to
provide comprehensive insight into OMV’s strategy and
business operations to all capital market participants,
thereby guaranteeing equal treatment of all stakehold-
ers. In this way, OMV’s Executive Board was able to
stay in constant dialogue with investors and analysts in
Europe, North America, and Asia throughout 2020,
regardless of the restrictions imposed to control the
pandemic.

DIRECTORS’ REPORT 25 — 76
26 — About OMV 28 — Strategy
35 — Sustainability 40 — Health, Safety, Security, and Environment
43 — Employees 45 — OMV Group Business Year
53 — Upstream 60 — Downstream
68 — Outlook 69 — Risk Management 72 — Other Information

OMV ANNUAL REPORT 2020 / DIRECTORS’ REPORT
26
OMV produces and markets oil and gas, as well as chemical solutions in a responsible way and develops
innovative solutions for a circular economy. In 2020, Group sales amounted to EUR 17 bn. With a year-end
market capitalization of around EUR 11 bn, OMV is one of Austria’s largest listed industrial companies.
The majority of OMV’s roughly 25,000 employees (including Borealis) work at its integrated European
sites.
In Upstream, OMV focuses on the exploration,
development, and production of oil and gas in its five
core regions of Central and Eastern Europe, the Middle
East and Africa, the North Sea, Russia, and Asia-
Pacific. At the end of 2020, OMV had proven reserves
(1P) of 1.33 bn boe and proven and probable reserves
(2P) of 2.37 bn boe. The Reserve Replacement Rate
(RRR) was 102% in 2020. Daily production was
463 kboe/d in 2020 (2019: 487 kboe/d), which equals a
total production of 169 mn boe. While gas accounted
for 62% of total production, oil amounted to 38%.
In Downstream, OMV operates three refineries in
Europe: Schwechat (Austria) and Burghausen
(Germany), both of which feature integrated
petrochemical production, and the Petrobrazi refinery
(Romania). In addition OMV holds a 15% share each in
ADNOC Refining, which operates the world-class
Ruwais refinery in the United Arab Emirates, and in
ADNOC Global Trading. OMV’s total global processing
capacity exceeds 500 kbbl/d annually. Total refined
product sales amounted to 17.81 mn t in 2020 (2019:
20.94 mn t). The retail network consists of around
2,100 filling stations1 in ten countries with a strong
multi-brand market portfolio.
The natural gas sales volume was 164.0 TWh in 2020
(2019: 136.7 TWh). OMV owns gas storage facilities
with a capacity of 30 TWh and a 51% share in Gas
Connect Austria, which operates a 900 km natural gas
pipeline network2. The Central European Gas Hub
(CEGH), in which OMV holds a 65% share is a well-
established gas trading platform. The node in
Baumgarten (Austria) is Central Europe’s largest entry
and distribution point for Russian gas. In addition, OMV
operates a gas-fired power plant in Romania.
On October 29, 2020, OMV completed the acquisition
of an additional 39% interest in Borealis from
Mubadala, and now holds a majority stake of 75%.
Borealis is one of the world’s leading providers of
advanced and circular polyolefin solutions and a
European market leader in base chemicals, fertilizers3
and mechanical plastics recycling. Starting in April,
OMV will be reorganized intro three reporting
segments: Exploration & Production, Refining &
Marketing, and Chemicals & Materials. The new
corporate structure will expedite the integration of
Borealis into the OMV Group and accelerate the
expansion of the Chemicals & Materials business.
Sustainability is an integral part of OMV’s corporate
strategy. OMV supports the transition to a lower-carbon
economy. The Group has set measurable targets for
reducing carbon intensity and aims to become a
leading player in the circular economy.
1 On December 14, 2020, OMV and EG Group reached an agreement for the acquisition of 285 filling stations in Germany by EG Group. The transaction is
subject to required regulatory approvals and the closing is expected in 2021. On February 4, 2021, OMV announced its intention to sell its business in Slovenia,
including around 120 filling stations. 2 On September 23, 2020, OMV and VERBUND reached an agreement for the acquisition of a 51% interest in Gas Connect Austria GmbH by VERBUND. The
closing is subject to regulatory approval and is expected in the first half of 2021. 3 On February 4, 2020 OMV announced its intention to sell the nitrogen business of Borealis, which includes the fertilizer business.
About OMV

OMV ANNUAL REPORT 2020 / DIRECTORS’ REPORT
27
Our value chain

OMV ANNUAL REPORT 2020 / DIRECTORS’ REPORT
28
The OMV 2025 Strategy builds on the proven concept of integration, which ensures strong cash flows and
resilience. Significant milestones were reached since 2018: built a high-quality gas-focused asset base in
Upstream and extended the portfolio into high-value chemicals by increasing the share in Borealis to 75%.
The Group strategic ambition now focuses on chemicals growth, maximizing value through its existing
portfolio and increasing the share of low- and zero-carbon products in the portfolio. OMV strives to
substantially increase the clean CCS Operating Result and operating cash flow, before net working capital
effects, to at least EUR 5 bn each by 2025.
Market outlook
Global energy demand continues to grow and will be
met predominantly through traditional energy sources.
Global energy demand by primary energy sources
In bn toe
Source: IEA World Energy Outlook 2020
The COVID-19 pandemic had a significant impact on
energy markets worldwide in 2020, disrupting supply
and demand dynamics. The global economy is now
bracing for a multi-year recovery with a strongly
divergent pace among different regions. In the short to
medium term, energy demand will again grow but will
be coupled with the possibility that some changes in
consumer behavior may remain, especially in strongly
affected sectors like tourism and aviation. 2020 can be
considered a landmark year for the global energy
transition, especially in the light of the European Green
Deal, the growth of renewable energy, despite the
crisis, and the fact, that many countries declared net
zero carbon ambitions.This leaves a sustainable impact
on the energy markets in the medium to long term.
Global energy demand will continue to increase
following the outlook in the IEA Stated Policies
Scenario (STEPS) which incorporates the impact of the
existing policy framework and is expected to rise 9% by
2030, on account of GDP and population growth. Oil
and gas demand continue to grow and will still account
for about 55% of global energy demand. This expected
growth trajectory might slow, however, if current
emissions target announcements materialize and the
energy transition results in declining fossil fuel demand.
This trend is in accordance with the IEA Sustainable
Development Scenario (SDS) showing a potential
trajectory towards fulfillment of the UN climate goals
factoring in high political ambitions.
Despite strong growth in renewables, oil will remain the
main source of primary energy in the next decade,
capturing a share of about 30% and exhibiting a
compound annual growth rate of 0.5% by 2030. The
increase in oil consumption will come from rising
demand for petrochemical products as well as growing
road and aviation transportation sectors in emerging
markets. While oil product consumption is expected to
decline in mature markets such as North America and
Europe, global growth beyond 2030 will come from
Asia, the Middle East and Africa. Driven by the global
climate protection ambitions, the refinery industry is
putting significant effort into partially replacing
conventional oil feedstocks with bio-based feedstocks
or recycled plastic materials. New technologies for
producing alternative fuels, initially by means of
pyrolysis or gasification are gaining traction. This will
help producers contribute to global emissions reduction
targets.
Natural gas will continue to be the fastest growing
major energy source among fossil fuels, supported by
strong global decarbonization policies and more
stringent emissions standards. Gas demand will grow
at an annual rate of 1.2% by 2030. This is attributable
to the ability of natural gas to displace coal in the power
generation sector. It also provides a reliable fuel source
for the energy transition, serving as backup for the
increasing share of renewables in the power generation
mix.
Strategy

OMV ANNUAL REPORT 2020 / DIRECTORS’ REPORT
29
Global petrochemical demand
In mn t
Source: IHS Chemical Supply & Demand (2020)
The growth in global demand for petrochemical
products is closely linked to economic development as
well as increasing prosperity and living standards in
developing economies. Therefore, the growing
petrochemicals market will continue to be an important
consumer of oil and gas and a driver of global oil
demand. Demand for olefins such as ethylene,
propylene, butadiene, and benzene is expected to
increase by 37% by 2030, mainly due to demand
growth in Asia. These petrochemicals are considered to
be the major building blocks for the chemical industry.
Their derivatives, such as polyolefins, offer unique
properties and economic benefits such as low material
costs, as well as easy and fast processing.
Petrochemicals are increasingly being used as a
substitute for other energy-intensive materials due to
their advantageous characteristics. They remain
essential for various industries such as packaging,
construction, transportation, healthcare,
pharmaceuticals, and electronics. These sectors
underpin the robust overall rise in demand, which
stems primarily from the Asia-Pacific region and is
aligned with the economic development there. Demand
in mature markets such as Europe, North America, and
Japan is expected to remain generally healthy in the
long term in line with economic development, but
growth rates are expected to slow down.
Naphtha, an oil derivative product, is expected to
remain the main feedstock for the petrochemical
industry. Other key feedstocks are associated gas in
the Middle East and shale gas in North America. In
addition, recycled products are becoming increasingly
important feedstock that will help to better manage
global plastic waste.
Strategic cornerstones – OMV set to become stronger and more valuable
The OMV 2025 Strategy builds on the proven concept
of integration, which ensures strong cash flows and
resilience. When the strategy was announced in March
2018, the Group aimed at growing both the Upstream
and the Downstream businesses. Since the strategy
was introduced, OMV has transformed its portfolio as it
achieved significant milestones. Upstream now has a
high-quality asset base with expanded production and
reserves, low production costs, and a portfolio shifted
to gas. The Downstream business saw most notable
transformations and step changes. In 2019, the
Downstream business increased its international
footprint by acquiring a 15% interest in ADNOC
Refining and ADNOC Global Trading. In 2020, OMV
embarked on a transformational journey, by acquiring
an additional 39%-share in Borealis, a leading provider
of polyolefins, base chemicals, and fertilizers. OMV
holds now 75% controlling interest in Borealis. With this
acquisition, OMV further extended its value chain into
high-value chemicals and gained access to attractive
growth markets. At the same time, this acquisition is a
decisive step toward successfully positioning OMV for a
low-carbon future, as the Company’s portfolio shifts
towards non-energy, low-carbon emissions products,
as well as an emphasis on plastics recycling and
circular economy. OMV’s cash out for the acquisition of
the 39% stake in Borealis, totaling EUR 3.9 bn, was
supported by solid cash generation, strict cost and
capital discipline, and a newly announced divestment
program amounting to EUR 2 bn by end of 2021.
In the first nine months after the launch of the program,
the Group successfully signed three major transactions:
▸ Divestment of its 51% stake in Gas Connect Austria
in order to exit its regulated gas transportation
business completely
▸ Disposal of the retail network in Germany, given its
limited integration with the Burghausen refinery
▸ Divestiture of the Upstream assets in Kazakhstan,
allowing OMV Petrom to focus on the growth
opportunities in the Black Sea region
OMV will continue to implement this program, thus
pursuing the divestments of the nitrogen business in
Borealis and the retail and commercial operations in
Slovenia.

OMV ANNUAL REPORT 2020 / DIRECTORS’ REPORT
30
OMV Group – 2020 strategic achievements
▸ Signed transformative agreement for increasing
share in Borealis to 75%
▸ Adhered to its dividend policy: distributed dividends
were at the highest, equal to prior-year level of
EUR 1.75 per share
▸ Agile reaction to the COVID-19 pandemic:
significant reduction in spending
▸ Successfully signed divestments with a net debt
effect of more than EUR 1 bn, in line with the
EUR 2 bn disposal target by the end of 2021
▸ Achieved its carbon footprint reduction target ahead
of time and set new, ambitious goals
In a continuously changing world, the Group strategic
ambition focuses on chemicals growth, maximizing
value through its existing portfolio and increasing the
share of low- and zero-carbon products in the portfolio.
In Upstream, the current organic projects pipeline will
be executed. The business will be run for generating
value, optimizing the cash flow to enable transformation
at Group level. In its transition towards a low-carbon
portfolio, Upstream production will be maintained in a
corridor of approximately 450-500 kboe/d, with
overweight on gas (around 60%). In its existing refining
operations, the output mix will be increasingly shifted
towards higher-value petrochemicals as part of the shift
towards non-energy products. In its chemicals
business, OMV will leverage Borealis as a platform for
growth, focusing on delivering organic growth projects
as well as building a sustainable chemicals portfolio by
becoming a leading player in the circular economy. To
further underscore its commitment to reducing the
carbon footprint, OMV is investing in developing
alternative sustainable feedstocks and biofuels. This
portfolio will enable OMV to increase both its clean
CCS Operating Result and its operating cash flow,
before net working capital effects, to at least EUR 5 bn
each by 2025.
In February 2021, OMV changed its corporate structure
by splitting and expanding the current area of
Downstream fuels and chemical operations in two
areas: Refining and Chemicals & Materials. In addition,
the Upstream business segment was renamed to
Exploration and Production.
OMV Group – 2025 strategic priorities
▸ Transition to become an integrated
chemical company
▸ Continue to leverage the proven concept of
integration along the value chain
▸ Maximize value of existing traditional oil and gas
portfolio
▸ Expand portfolio of low- and zero-carbon products
▸ Strive for leadership in plastics recycling and
circular economy
▸ Strengthen balance sheet and deliver attractive
shareholder returns
Upstream
The Upstream business has been significantly
transformed since the introduction of OMV’s strategy in
2018. The business aimed at building a portfolio of
higher quality that generates more cash, on the base of
a renewed and improved asset base, with double
reserves and increased production, as well as through
extending its track record of operational excellence.
The successful strategy execution enabled Upstream to
optimize its portfolio, as OMV expanded production to
the UAE and the Asia-Pacific region. At the same time,
in line with its strategy, the Group divested its
operations in Pakistan and marginal fields in Romania,
signed the divestment of the Kazakhstan upstream
assets, and oil fields in New Zealand and is advancing
the divestment of oil assets in Malaysia. The portfolio
shift focused on four core regions with the aim to create
five core regions. The fifth core region was established
by an increased footprint in Asia-Pacific, through the
SapuraOMV joint venture partnership in Malaysia and
theacquisition of Shell’s upstream business in New
Zealand.
The portfolio was further strengthened as key
development projects were brought on stream in
Malaysia (Gorek, Larak and Bakong offshore gas
fields) the and in Abu Dhabi, where Umm Lulu Super
Complex operates in full field mode since April 2020. In
reshaping its portfolio, Upstream targeted to ensure
sustainable reserve replacement with low-cost barrels
in order to improve the Company’s overall resilience.
OMV has therefore already achieved most of its
targets. By the end of 2020, it had ensured a three-year
reserve replacement rate (RRR) of 138% and low-cost
production of USD 6.6/boe, well below the initial target
of USD 8/boe. Thanks to the robust portfolio built over
the last years, Upstream reached a production volume
of 463 kboe/d in 2020. The 2020 target of 500 kboe/d
was not reached due to negative external factors such
as the security situation in Libya and COVID-19-related
production cuts imposed by governments. Moreover,
the portfolio was shifted toward gas as the bridge fuel
for the transition to a low-carbon future. In 2020, 62%
of hydrocarbon production was gas, outperforming the
initial Group target of 50%.
DigitUP, the global Upstream digitalization program
launched in 2018 to further improve and ensure OMV’s

OMV ANNUAL REPORT 2020 / DIRECTORS’ REPORT
31
competitive position, has progressed swiftly and
successfully, laying the foundation for OMV’s
transformation into a top digital player. In order to
leverage the value impact of its digitalization strategy,
OMV Upstream kicked off a key organizational initiative
called UPfront in the second half of 2020. The initiative
complements Upstream’s digital transformation and
aims to deliver a value-oriented organization as a key
pillar for business resilience and competitiveness.
Upstream – 2020 strategic achievements
▸ Production costs reduced to USD 6.6/boe
▸ Production reached 463 kboe/d, overweight on
gas (62%)
▸ Three-year average reserve replacement rate of
138%
▸ Portfolio further strengthened: key development
projects fully on stream in Malaysia and Abu Dhabi,
progress in non-core assets divestment such as
Kazakhstan and marginal fields Romania
▸ Established Upstream organization transformation
initiative UPfront, to complement the digitalization
strategy and further improve and ensure
Upstream’s competitive position
In a rapidly changing world, OMV is revising its volume
targets for 2025. The initial goal of reaching a
production volume of 600 kboe/d and 1P reserves of
2 bn boe by 2025 will no longer be pursued. Going
forward, the Upstream portfolio will be run for
generating value, optimizing the cash flow, with a
strong emphasis on gas. The delivery of key projects in
the portfolio, including those from past M&A projects,
as well as Upstream’s digital and organizational
transformation program will sustain a substantial
increase of free cash flow into and beyond 2025. With
the current portfolio, OMV expects to maintain a
relatively stable production corridor of around 450–
500 kboe/d, with around 60% gas by 2025. The exact
level of production and reserves will depend on the
cash generation capacity of the portfolio. Strengthening
value delivery and cash generation are the main goals
and criteria for managing and developing the portfolio.
In this respect, the portfolio will be further optimized,
focusing on its existing five regions: Central and
Eastern Europe, North Sea, Russia, Middle East and
Africa, and Asia-Pacific. The acquisition of Achimov
4A/5A will only be held as an option, without
commitment, and will only be realized if its value will be
attractive to OMV and the Group’s financial framework
will allow it. OMV’s exploration and appraisal activities
will focus on gas and low-cost opportunities with a total
budget of around EUR 230 mn per year.
Upstream will focus on reducing the carbon intensity of
its operations and aims to lower carbon intensity by
more than 60% by 2025 compared to 2010. This effort
will include portfolio changes, a phase out of routine
gas flaring and venting, a reduction of fugitive methane
emissions and completion of projects like the
photovoltaic plant developed with VERBUND in
Schönkirchen, Austria for the purpose of powering
OMV’s own operations. The latter is the largest ground-
mounted photovoltaic plant in Austria, with a total
capacity of 14.85 MWp expected to come fully on
stream in 2021. The first phase was completed by the
end of 2020 with a capacity of 11.4 MWp. Upon its
completion, the photovoltaic plant will generate around
14.25 GWh in Austria and will save a total of 10,000 t of
CO2 per year.
Upstream targets to reinforce its portfolio
competitiveness and resilience against market volatility
and the rapidly changing demands of the oil and gas
industry. The strong focus on operational excellence
and digitalization, in addition to portfolio optimization,
will ensure that the unit production cost will remain
below USD 7/boe beyond 2025. Upstream’s ambition is
to further establish itself as one of the top digital
players in the industry. Digital transformation will
continue to be a key enabler for Upstream’s business
resilience and competitiveness. Digital technologies like
real-time data and analytics as well as agile ways of
working will be leveraged to improve efficiency,
reliability, and safety and enhance decision-making. To
unlock the full value potential from its digital
transformation program, Upstream is also implementing
an agile organizational structure. A new organizational
set-up will emerge in the course of 2021 as a result of
the UPfront initiative. This will be reflected in
Upstream’s business structure, leadership, workflows,
and behaviors, with fully integrated, remote, digitally
collaborative multi-disciplinary teams underpinning
accelerated delivery and a value-oriented organization.
Upstream – 2025 strategic cornerstones
▸ Upstream portfolio will be run for generating value,
optimizing the cash flow
▸ Maintain production corridor of approximately 450–
500 kboe/d, with overweight on gas
▸ Manage production cost below USD 7/boe
▸ Drive digital transformation and agile organizational
structure to reinforce resilient competitiveness
▸ Aim to lower carbon intensity by more than 60% by
2025 vs. 2010

OMV ANNUAL REPORT 2020 / DIRECTORS’ REPORT
32
Downstream – fuels and chemicals
The Downstream fuels and chemicals portfolio has
undergone a major transformation since the strategy
was introduced in 2018. The Company aimed to
strengthen its competitive position in Europe, while
exporting its successful business model to international
growth markets by nearly doubling its refining capacity
and expanding its chemicals position. In this respect,
2019 and 2020 represented milestone years for
Downstream and chemicals. The Group established its
Downstream presence outside Europe by becoming a
partner in ADNOC Refining and ADNOC Global
Trading. OMV holds a 15% stake in the fourth-largest
refinery complex in the world, located on the doorstep
of attractive growth markets in the Asia-Pacific and the
Middle East regions. These international markets are
served by ADNOC Global Trading, the marketing and
trading arm for refined products from Ruwais, which
went live in December 2020.
In 2020, OMV increased its share in Borealis from 36%
to 75%. With full control of Borealis, Downstream
increases its base chemicals production and extends
its value chain to polyolefins and fertilizers. The
business has gained a superior position: a truly
international footprint with access to attractive customer
segments and growth markets, as well as strong know-
how, including proprietary multi-modal technology for
the production of polyolefins. Innovation is at the core
of Borealis, making the company a preferred partner for
the manufacturing of chemical products globally. The
geographical outreach of the OMV chemicals business
expands considerably, as Borealis has a strong
European presence and is active in the Middle East,
Asia-Pacific as well as in North and South Americas.
As a result of the Borealis acquisition, the OMV Group
expects to realize substantial synergies totaling more
than EUR 800 mn by 2025. The integration benefits will
come from operational cost savings, combined
purchasing, debottlenecking, increased capital
efficiency, and tax benefits.
In its European operations, OMV continued to
strengthen its competitive advantage. Following its
target to shift to higher-value products, OMV
successfully completed the construction of a new
isobutene extraction plant at the Burghausen refinery in
Germany in October 2020. The plant went on stream at
end of 2020 and is producing up to 45,000 t of high-
purity isobutene per year. The Group will also expand
the naphtha cracker at the Burghausen refinery by
around 50,000 t by 2022. Additionally, OMV decided to
invest EUR 200 mn in the co-processing of 160,000 t of
biofuels at the Schwechat refinery, and the production
start is planned for 2023. In its Retail business, despite
the COVID-19 crisis, the profitability per filling station
improved to more than EUR 230,000 in 2020,
significantly over-achieving the previously set target of
EUR 180,000.
Downstream fuels and chemicals –
2020 strategic achievements
▸ Closed transformative transaction increasing share
in Borealis to 75%
▸ Completed the new isobutene extraction plant at
the Burghausen refinery in Germany
▸ Achieved refinery utilization rate of 86%, despite
COVID-19 crisis
▸ Signed the divestment of the German manned retail
network
▸ Delivered record Retail results in the COVID-19
year
▸ Went live with the ADNOC Global Trading
organization
With this significantly transformed portfolio, OMV has a
new key business – chemicals. OMV is set to become
the largest producer of olefins in Europe and one of the
largest polyolefin producers worldwide, ranking second
in Europe and eighth globally. OMV will continue to
build on this position, with Borealis as a platform for
growth.The Group will therefore focus on bringing on
stream its current organic growth projects. In Kallo,
Belgium, the new propane dehydrogenation plant is
anticipated to be in operation in 2023. Through Baystar
JV (Borealis 50 %, Total 50 %) the new ethane steam
cracker unit in Bayport, Texas is expected to start
operations in 2021. The corresponding Borstar
polyethylene unit is foreseen to start production in
2022. In the UAE, Borouge is currently building a fifth
polypropylene unit to start up in 2021. Additional
organic growth opportunities are progressing as well,
such as Borouge 4, which is currently in the FEED
phase.
Through the strategic extension of its value chain into
high-value chemicals and plastics recycling, OMV is
positioning for a low-carbon future. The Group is further
integrating the Refining and Chemical’s value chains. In
order to ensure a sustainable chemical footprint, OMV
together with Borealis aims to be a leader in the
plastics recycling and circular economy. Going forward,
more products will be designed for recyclability. By
2025, the Group will invest up to EUR 1 bn in the
chemical and mechanical recycling of post-consumer
plastic waste and sustainable fuels.
In the European Refining business, OMV will continue
to be an industry leader, focusing on cost and
operational efficiency. The three refining sites in

OMV ANNUAL REPORT 2020 / DIRECTORS’ REPORT
33
Schwechat, Burghausen, and Petrobrazi will continue
to be operated as one integrated refinery system,
optimizing asset utilization and maximizing margins
through the exchange of intermediate products. OMV
will modify its European refining assets to reflect
expected demand changes and will shift to higher-value
products. OMV is actively working on energy transition
projects in the areas of conventional and advanced
biofuels, synthetic fuels, hydrogen and energy
efficiency. OMV is underway to further transform its
Downstream oil business in the face of a low-carbon
future, focusing on chemicals, alternative feedstocks,
technologies, and fuels. Consequently, OMV no longer
aims to further increase its refining capacity.
Downstream fuels and chemicals –
2025 strategic cornerstones
▸ Leverage Borealis as platform for growth: deliver
organic growth portfolio
▸ Realize integration synergies with Borealis in the
amount of more than EUR 800 mn
▸ Strive for leadership in plastics recycling and
circular economy
▸ Optimize asset utilization and maximize margin
generation across the integrated value chain
▸ Reduce operational carbon footprint
▸ Shape portfolio to focus on low- and zero-carbon
products
Downstream gas
Since March 2018, the Downstream gas business
made impressive progress in implementing its growth
strategy, building a strong market presence from
Northwest to Southeast Europe. Reliable equity gas
production, sustainable supply partnerships and a
structured and customer-centric market approach
contributed to the competitive advantage.
Record-high OMV Group natural gas sales in 2020 will
continue to grow until 2025 and beyond. OMV is well
on track to reach its target to grow the sales portfolio to
more than 250 TWh by 2025, achieving a 10% market
share in Germany, one of the largest European
markets. OMV will continue to maintain its market
leadership in Austria and Romania as well as expand
the market position in the Netherlands and Belgium. In
2020, the Central European Gas Hub in Austria
reached a new all-time high nominated gas volume of
more than 800 TWh. OMV’s gas storage business
again benefited in 2020 from high customer demand
and a favorable market price development, reaching an
all-time high storage result. The utilization of the Gate
LNG regasification terminal improved substantially.
Moreover, Downstream gas delivered its first cargo of
LNG to China.
In September 2020, OMV signed an agreement to
divest its entire 51% stake in Gas Connect Austria to
VERBUND in order to exit the regulated gas
transportation business in line with its strategy.
Downstream gas – 2020 strategic achievements
▸ Increased OMV natural gas sales by 20% year-on-
year to 164 TWh
▸ Record Downstream gas results
▸ Reached 7% market share in Germany at the end
of 2020, increased market share in the Netherlands
to more than 4% and Belgium to almost 2%
▸ Record volume of more than 800 TWh traded at
CEGH
▸ Divestment of 51% stake in Gas Connect Austria to
VERBUND
In the longer term, European natural gas demand is
expected to remain resilient while indigenous natural
gas production in Europe will decline significantly.
Larger volumes of natural gas will have to be imported.
Therefore, OMV will continue to strengthen its equity
gas volumes from Austria, Norway, and Romania as
well as long-term supply contracts from Russia in the
portfolio.
The contracts with Gazprom at the Western European
delivery points are further complemented by LNG
agreements.
Downstream gas – 2025 strategic cornerstones
▸ Become leading integrated supplier with strong
market presence from Northwest to Southeast
Europe
▸ Grow the value of gas in OMV portfolio and achieve
sales levels of at least 250 TWh
▸ Achieve 10% market share in Germany
▸ Solidify market leadership in Austria and Romania
Finance
OMV’s value-driven finance strategy aims to enable
growth, drive performance, and reward shareholders.
The strategy is supported by a solid financial
framework focused on returns and cash flow. OMV
aims to increase the clean CCS Operating Result,
clean CCS net income attributable to stockholders as
well as the operating cash flow, before net working
capital effects. The Group strives for a ROACE of at
least 12% while maintaining a strong balance sheet
and a strong investment credit rating. OMV also
continues to target attractive shareholder returns.
In 2020, OMV increased its shareholding in Borealis to
75%. The cash out for the transaction amounted to

OMV ANNUAL REPORT 2020 / DIRECTORS’ REPORT
34
EUR 3.9 bn. In an extremely challenging
macroeconomic environment due to the COVID-19
pandemic, OMV managed to successfully access the
financial markets and secure funding. This, together
with stringent cost and capital expenditure reduction,
enabled the Group to pay the entire amount in full at
closing. OMV closed the year with a gearing ratio,
excluding leases, of 41%.
Finance – 2020 strategic achievements
▸ Achieved a positive organic free cash flow after
dividends of EUR 0.4 bn
▸ Continued to adhere to its dividend policy and left
the dividend equal to the previous year’s level, at
EUR 1.75 per share
▸ Successfully accessed the financial markets to
secure funding of EUR 4.5 bn, including senior and
hybrid bonds, at attractive prices
▸ Swiftly reacted to the macroeconomic environment
and reduced spending in 2020: reduced organic
investments by around 30% to around EUR 1.7 bn
excluding Borealis, cut costs by more than EUR
300 mn (including exploration expenditure
reduction)
Capital and cost discipline remain a priority. Thus, the
Group plans for an organic capital expenditure between
EUR 2.5–3 bn per year, including Borealis. For 2021,
OMV expects total CAPEX of EUR 2.7 bn. In the short
term, OMV is focusing on deleveraging the balance
sheet, to reach a gearing ratio, excluding leases, of
around 30%, by the end of 2021. In this respect, the
Group is successfully implementing a EUR 2 bn
divestment program by the end of 2021. In addition,
OMV re-affirms its progressive dividend policy, aiming
to increase dividends every year, or to at least maintain
dividends at the respective previous year’s level.
OMV’s capital allocation priorities are as follows:
1. Organic CAPEX
2. Debt reduction
3. Progressive dividend policy
Finance – 2025 strategic cornerstones
▸ ROACE target of at least 12%
▸ Positive free cash flow after dividends
▸ Grow clean CCS net income attributable to
stockholders
▸ Increase clean CCS Operating Result to EUR ≥5 bn
by 2025
▸ Increase operating cash flow excluding net working
capital effects to EUR ≥5 bn by 2025
▸ Long-term gearing ratio, excluding leases, of ≤30%
▸ Competitive shareholder return with a progressive
dividend policy
▸ Maintain a strong investment-grade credit rating

OMV ANNUAL REPORT 2020 / DIRECTORS’ REPORT
35
We are committed to building a sustainable world worth living in – for everyone. OMV aims to provide a
secure supply of affordable energy for the sustainable development of society and the economy while
respecting the environment.
OMV’s responsible approach to business stipulates the
prevention and mitigation of sustainability risks
associated with OMV’s activities. We also aim to seize
the opportunities presented by taking a sustainable
approach to business. Growing demand for energy and
accelerating climate change pose immense challenges
for the energy sector. OMV clearly recognizes that
climate change is one of the most important global
challenges today and acknowledges the goals set forth
by the Paris Climate Change Agreement. We are
aware of our responsibility and we will live up to our
commitment to the Paris Agreement and the EU
climate targets. We are therefore transforming our
business model step by step with the aim of reducing
the carbon footprint of the Company. (Read more in
Carbon Efficiency).
The Sustainability Strategy 2025 constitutes an integral
part of the Corporate Strategy 2025 and is the
sustainable component of OMV’s business ambitions.
Sustainable business behavior is crucial for OMV to
create and protect value in the long term, to build trust-
based partnerships, and to attract customers as well as
the best employees, investors, and suppliers. The
Sustainability Strategy’s targets relating to OMV’s
operations and products are aligned with the
production, sales, and product portfolio plans set by the
Corporate Strategy. In 2020, we updated our
Sustainability Strategy to set new carbon targets,
including an ambition to be carbon neutral in our
operations by 2050.
OMV’s sustainability targets and commitments
Health, Safety, Security, and Environment (HSSE)
▸ Commitments:
▸ Health, safety, security, and protection of the
environment have the highest priority in all
activities.
▸ Proactive risk management is essential for
realizing OMV’s HSSE vision of “ZERO harm –
NO losses.”
1 Lost-Time Injury Rate is the frequency of injuries leading to lost working days, relative to one million working hours of employees and contractors. 2 See Abbreviations and Definitions for the definition of a Process Safety Event (PSE) 3 CO2 equivalent emissions produced to generate a certain business output using the following business-specific metric ‒ Upstream: t CO2 equivalent/toe
produced; refineries: t CO2 equivalent/t throughput (crude and semi-finished products without blended volumes); power: t CO2 equivalent/MWh produced ‒
consolidated into an OMV Group Carbon Intensity Operations Index, based on weighted average of the business segments’ carbon intensity 4 Including divestments. The reduction will be achieved in the 2020–2025 period. 5 Low- or zero-carbon sales comprise oil and gas to non-energy, gas to energy, renewables, power, and petrochemicals third-party sales.
▸ Targets:
▸ Achieve zero work-related fatalities
▸ Stabilize Lost-Time Injury Rate1 at below 0.30
(per 1 million hours worked)
▸ Keep leading position for Process Safety Event
Rate2
For more information, see the chapter Health, Safety,
Security, and Environment.
Carbon efficiency
▸ Commitments:
▸ OMV focuses on improving the carbon efficiency
of its operations and product portfolio.
▸ OMV is fully committed to acting on climate
change mitigation and responsible resource
management.
▸ OMV aims for net-zero operations by 2050 or
sooner.
▸ Targets for operations (scope 1):
▸ Reduce the OMV Group’s carbon intensity of
operations by ≥30% by 2025 vs. 20103
▸ Lower the carbon intensity of OMV’s Upstream
operations by ≥60% vs. 20103
▸ Lower the carbon intensity of OMV’s Refining
operations by ≥20% vs. 20103
▸ ≥1 mn t CO2 equivalent emissions reduction in
operated assets4
▸ Achieve zero routine flaring and venting of
associated gas as soon as possible, no later
than 2030
▸ Targets for products (scope 3):
▸ Reduce carbon intensity of the product portfolio
by >6%, which equates to low- or zero-carbon
products accounting for ≥60% of total products
by 20255
Sustainability

OMV ANNUAL REPORT 2020 / DIRECTORS’ REPORT
36
Innovation
▸ Commitments:
▸ OMV’s innovation efforts focus on optimizing
production, exploring high-end petrochemical
solutions, developing innovative energy
solutions, and embracing digital technologies.
▸ Innovation is supported by investment and
partnerships in research and development.
▸ Targets for ReOil®:
▸ Develop ReOil® into commercially viable
industrial-scale process (unit size of around
200,000 t per year)
▸ Targets for Co-Processing:
▸ Increase the share of sustainable feedstock co-
processed in the refineries to around 200,000 t
per year by 2025
▸ Targets for Enhanced Oil Recovery (EOR):
▸ Increase the recovery factor in the CEE region in
selected fields by 5–15 percentage points by
2025 through innovative Enhanced Oil Recovery
(EOR) methods
For more information, see the chapters Upstream and
Downstream.
Employees
▸ Commitments:
▸ OMV is committed to building and retaining a
talented team of experts for integrated and
international growth.
▸ OMV is committed to its diversity strategy with a
focus on gender equality and internationality.
▸ Targets:
▸ Increase share of women at management level1
to 25% by 2025
▸ Keep high share of executives with international
experience2 at 75%
For more information, see the chapter Employees.
Business principles and social responsibility
▸ Commitments:
▸ OMV strives to uphold equally high ethical
standards at all locations.
▸ OMV is a signatory to the United Nations (UN)
Global Compact, is fully committed to the UN
Guiding Principles on Business and Human
1 Management level: executives and advanced career level 2 Equal to or greater than three years of living and working abroad 3 Legitimate, accessible, predictable, equitable, transparent, rights-compatible, a source of continuous learning, based on engagement and dialogue 4 Employees in corporate functions managing human rights risks as well as the corresponding functions in countries with elevated human rights risks 5 Suppliers in scope for this target are active suppliers (at least one purchase order in the past year) who meet certain criteria such as procurement spend and
strategic fit.
Rights, and aims to contribute to the UN’s 2030
Agenda for Sustainable Development.
▸ Targets:
▸ Promote awareness of ethical values and
principles: conduct in-person or online business
ethics trainings for all employees
▸ Assess Community Grievance Mechanisms at all
sites against UN Effectiveness Criteria3 by 2025
▸ Conduct human rights training courses for all
employees exposed to human rights risks4 by
2025
▸ Increase the number of supplier audits covering
sustainability elements to >20 per year by 20255
In 2020, OMV acquired a majority stake in leading
polyolefins producer Borealis. Together with Borealis,
OMV is committed to playing a leading role in driving
the circular economy.
Like OMV, Borealis has set concrete sustainability
targets. Borealis’ sustainability ambition is to create a
world where there is no waste of resources, no
emissions into the environment and no harm to society,
while delivering prosperity for Borealis.
Borealis is committed to driving the transformation
towards a circular plastics economy, to ensuring
process and chemicals safety, and to reducing its
carbon footprint by means of improving energy
intensity, increasing the share of renewable energy and
zero continuous flaring and driving innovation.
In 2021, we will update our Corporate Strategy and
integrate Borealis’ targets, including sustainability
ambitions, into the overall OMV strategy. The strategic
targets referred to above do not yet include Borealis.
OMV intends to allocate significant resources to the
implementation of the Sustainability Strategy 2025. Up
to EUR 1 bn will be invested by OMV and Borealis in
innovative energy and circular economy solutions such
as ReOil® and Co-Processing by 2025.

OMV ANNUAL REPORT 2020 / DIRECTORS’ REPORT
37
Carbon efficiency performance
OMV recognizes climate change as one of the most
important global challenges and fully supports the goals
set forth by the Paris Climate Change Agreement. OMV
integrates risks and opportunities related to climate
change impacts into the development of the Company’s
business strategy and the planning of operational
activities. In this regard, OMV aims to reduce its carbon
footprint in an effort to mitigate the impact of its
operations and product portfolio on climate change.
OMV implements measures aimed at optimizing its
operational processes, increasing energy efficiency,
reducing flaring and venting, and reducing methane
emissions through leakage detection and improvement
of asset integrity. For instance, four steam turbines
generate 85% of the electricity needed to operate the
Schwechat refinery. In the course of a planned
inspection of one of these steam turbines, we
implemented a technological advance: specially
molded turbine blades that increase efficiency and
reduce CO2 emissions. By 2021, a total of three
turbines will be modernized, decreasing CO2 emissions
by some 60,000 t per year. We will continue phasing
out routine flaring and venting as soon as possible, but
no later than 2030, as part of OMV’s commitment to the
World Bank’s “Zero routine flaring by 2030” initiative.
We are also increasingly turning to renewable sources
of electricity to power our operations. OMV and
electricity producer VERBUND joined forces to build
Austria’s largest photovoltaic plant. The east-west
facing solar park, which started operating in December
2020, uses 34,600 PV modules to produce around
10.96 GWh of solar power in the first phase of
construction. This reduces emissions by around 8,000 t
of CO2 per year in the first step. This number will
increase to 10,000 t once the second construction
phase is finalized.
A cornerstone of our climate strategy is increasing the
share of low- and zero-carbon products in our product
portfolio. Natural gas is the fossil fuel with the lowest
carbon intensity and supports the integration of
renewable energy into the energy grid. Based on our
Upstream production project pipeline, we will increase
the share of natural gas in our Upstream portfolio to
around 60% by 2025. This reinforces OMV’s strategy of
placing the focus on natural gas production rather than
oil.
Oil remains a valuable and important raw material
which, however, will be refined in petrochemical
processes rather than burned as a fuel. OMV focuses
on high-quality refinery products such as low-emission
premium fuels and feedstocks for the chemical
industry. The acquisition of Borealis in 2020 was a key
step to transforming our product portfolio with the goal
of using our equity oil to produce petrochemicals.
In addition to increasing the share of natural gas and
petrochemical products in our portfolio, we also focus
on alternative fuels such as hydrogen and
electromobility options.
For instance, OMV is currently developing a first-of-its-
kind green hydrogen production system based on a 10
MW electrolysis plant at the Schwechat refinery as part
of the UpHy project. The electrolysis will be powered by
renewable electricity, producing true green, zero-
carbon hydrogen. The initial plan is to use the green
hydrogen in the refinery in Schwechat for the hydration
of vegetable oil and fossil fuels, thereby reducing the
CO2 emitted by up to 15,000 t per year. The second
step will be to use the green hydrogen for
decarbonizing hard-to-electrify transportation segments
like buses and trucks.
In 2020, OMV achieved an outstanding CDP Climate
Change score of A– (Leadership) for the fifth time in a
row. With its CDP Climate Change score, OMV is
among 20 companies in the global oil and gas sector
that achieved a leadership score and among the top 5
companies across all sectors in Austria. In addition, the
Transition Pathway Initiative (TPI) has assigned OMV
the highest level (Level 4: strategic assessment) rating
for carbon management quality.
Business principles and social responsibility performance
Business ethics and compliance
OMV is a signatory to the UN Global Compact and has
a Code of Business Ethics in place that applies to all
employees. Although we are headquartered in Austria
– a country with high business ethics standards – we
operate in several countries in the Middle East, North
Africa, Asia-Pacific, and Central and Eastern Europe
that are defined as high risk by the Transparency
International Corruption Perception Index. We strive to
avoid the risks of bribery and corruption that are
specific to our sector. We also highly value our
reputation. Therefore, our highest priority is ensuring
uniform compliance with our business ethics standards
wherever we operate. Compliance with ethical
standards is a non-negotiable value that supersedes
any business interest. Absolute commitment to this
objective is embedded at all levels at OMV from top
management to every employee. Our business
partners are also expected to share the same

OMV ANNUAL REPORT 2020 / DIRECTORS’ REPORT
38
understanding of and commitment to ethical standards.
Every activity of the Company, from planning business
strategy to daily operations, is assessed for compliance
with ethical standards, such as the Code of Conduct
and Code of Business Ethics.
A dedicated cross-regional compliance organization
consisting of 37 compliance experts ensures that OMV
standards are consistently met across the Group. In
2020, face-to-face business ethics trainings were
conducted with 496 employees. The Integrity Platform
provides an anonymous whistleblower mechanism for
OMV employees and external stakeholders, such as
suppliers. They can use this platform to report issues of
non-compliance with legal regulations, the Code of
Business Ethics, or other internal guidelines of the
OMV Group.
Supplier compliance
OMV has a Code of Conduct in place that ensures that
suppliers support OMV’s principles. Corporate and
legal HSSE requirements are communicated to
potential suppliers at the tender stage. In order to
mitigate supply chain risks including forced labor,
slavery, human trafficking, and corruption, OMV
imposes the legal requirements and internal rules and
standards applicable to OMV on its suppliers. Our
suppliers are obligated to fully comply with the content
of the Code of Conduct, and all supply chain partners
are required to sign the Code of Conduct. OMV
reserves the right to terminate relationships with
suppliers if non-compliance with applicable policies is
discovered or if non-compliance is not addressed in a
timely manner. OMV has a process in place to ensure
that parties sanctioned by the EU or international
organizations, such as the United Nations, are not
accepted as procurement partners.
OMV Procurement conducts assessments of its
strategic suppliers with respect to Environment, Social,
and Governance (ESG) issues in order to raise
awareness of OMV’s ESG commitments. In 2020,
Procurement carried out ESG assessments of 161
strategic suppliers and performed 18 audits covering
1 Data excluding Borealis
sustainability topics. In 2020, we paid considerable
attention to our climate change and carbon
management plans along the supply chain. We also
shared our strategic approach and examples for
improving carbon footprints with a view to 2021 and
beyond.
Human rights
Human rights are universal values that guide our
conduct in every aspect of our activities. We have been
a signatory to the UN Global Compact since 2003 and
are fully committed to the UN Guiding Principles on
Business and Human Rights, the OECD Guidelines for
Multinational Enterprises, and the Universal Declaration
of Human Rights. OMV considers human rights to be
an important aspect of our risk management approach,
which is integrated into our decision-making processes.
OMV recognizes its responsibility to respect, fulfill, and
support human rights in all business activities and to
ensure that OMV does not become complicit in any
human rights abuses as defined under current
international law.
In 2020, we conducted 1 human rights risk assessment
at country level to identify and assess on-going and
emerging human rights impacts and resulting potential
risks relevant to OMV business activities in the country,
in order to prevent and mitigate human rights risks and
impacts. A total of 2,304 employees received training
on human rights topics through the e-learning tool and
in-person training sessions (2019: 9,241). As
professional training is essential to ensure compliance
with our human rights commitment, we have set
ourselves the goal of training, by 2025, all employees
who are highly exposed to human rights topics, such as
security, human resources, procurement, and
community relations managers. By 2020, 79% of the
target group was trained. In addition, an internal
awareness campaign on human rights was
implemented. In 2020, 0 incidents of human rights
violations (child labor, harm to indigenous people, or
discrimination) were reported (2019: 0).

OMV ANNUAL REPORT 2020 / DIRECTORS’ REPORT
39
Community relations and development
OMV maintains an active partnership with local
communities in all countries in which the Company
does business and is committed to adding value to
these societies. As part of OMV’s stakeholder dialogue,
we have implemented community grievance
mechanisms at all operating sites. In 2020, OMV
registered 812 grievances (2019: 1,196) from the
community grievance mechanisms. All of the
grievances were handled in accordance with OMV’s
localized Community Grievance Management (CGM)
procedures, which stipulate a stringent approach to
systematically receiving, documenting, addressing, and
resolving grievances in all of the countries where we
operate.
OMV’s Sustainability Strategy 2025 has set the goal of
aligning the CGM system at all sites with the
Effectiveness Criteria of the United Nations Guiding
Principles. We are implementing this target by
conducting assessments that include reviews of
management processes and consultations with internal
and external stakeholders. The assessments result in
recommendations and tailored action plans to improve
grievance management at site level. The action plans
are implemented by local management and monitored
by headquarters. In 2020, we conducted an
assessment in New Zealand and established a CGM in
line with UN Effectiveness Criteria in Malaysia. The
assessments are performed by an independent third-
party consulting firm. The sites already assessed
represent 98% of all registered grievances at OMV in
2020.
For more information about OMV’s Environmental, Social,
and Governance (ESG) ratings and the indices in which
OMV is included, see the chapter OMV on the Capital
Markets.
For management approaches and performance details for
all material topics, see the stand-alone OMV Sustainability
Report 2020. This report also serves as the separate
consolidated non-financial report of OMV
Aktiengesellschaft in accordance with section 267a of the
Austrian Commercial Code (UGB).

OMV ANNUAL REPORT 2020 / DIRECTORS’ REPORT
40
Health, safety, security, and protection of the environment are key values at OMV. The integrity of OMV’s
operating facilities, loss prevention, proactive risk management, and climate change mitigation are
essential for attaining OMV’s HSSE vision of “ZERO harm – NO losses.”
HSSE Strategy
To achieve this vision, the OMV Group’s HSSE
Strategy 2025 was established as an integral part of
the OMV Sustainability Strategy. The HSSE Strategy
focuses on the cross-functional goals of strong HSSE
commitment and leadership, increased efficiency and
effectiveness of HSSE processes, management of
HSSE risks, and skilled people, as well as subject
matter goals in the areas of
▸ Health: improve the ability to work through
integrated health management
▸ Safety: build on sustainable safety for people and
plants
▸ Security: protect people and assets from emerging
malicious intentional threats
▸ Environment: minimize the environmental footprint
throughout the entire lifecycle of activities
Health, safety, and security
In 2020, the combined Lost-Time Injury Rate (LTIR) for
OMV employees and contractors was 0.32 (2019:
0.34), and our combined Total Recordable Injury Rate
(TRIR) was 0.60 (2019: 0.95). We had no work-related
fatalities1.
In Upstream, our combined efforts resulted in an LTIR
of 0.22 (2019: 0.43). This was a significant
improvement year-on-year. We had 12 High Potential
Incidents (HiPos) which could have resulted in serious
or even fatal injuries under slightly different
circumstances. We continued our focus on the
wellbeing of the workforce and our safety culture. We
conducted five global contractor performance meetings,
which all had a significant HSSE component. At Hub
level, contractor and supplier management continued to
offer opportunities for HSSE improvement through
auditing and review.
1 Borealis data are included as of the closing date.
Downstream’s HSSE performance in 2020 was again
very good and remained at competitive levels
compared to international benchmarks in an overall
challenging environment heavily impacted by the
COVID-19 pandemic. Process safety assessments as
well as improvement measures were always a high
priority. The number of High Potential Incidents (HiPos)
significantly dropped from 29 in 2019 to 21 in 2020.
The LTIR in 2020 was 0.41 (2019: 0.22). Special
emphasis during the year was placed on contractor
management, training on various emergency and crisis
management scenarios, and leadership engagement.
OMV Group safety performance
In mn hours worked
2020 2019
Company
Lost-Time Injury Rate 0.43 0.51
Total Recordable Injury Rate 0.83 1.26
Contractors
Lost-Time Injury Rate 0.27 0.27
Total Recordable Injury Rate 0.48 0.81
Total (Company and contractors)
Lost-Time Injury Rate 0.32 0.34
Total Recordable Injury Rate 0.60 0.95
Employee wellbeing and health are the foundation for
successful company performance as they are core
elements of ensuring the ability to work. The year 2020
was dominated by the worldwide COVID-19 pandemic.
Our medical teams and service providers were
challenged to support the emergency management
teams in updating and implementing pandemic
preparedness plans, guidelines, and health information
and supporting COVID-19-infected employees at home
and in hospitals. In addition, OMV continued its long
tradition of offering healthcare and preventive health
programs, such as cardiovascular disease prevention
programs, voluntary health checks, vaccinations
(mainly flu), and virtual health hours, which far exceed
local statutory requirements.
Health, Safety, Security, and Environment

OMV ANNUAL REPORT 2020 / DIRECTORS’ REPORT
41
During 2020, the COVID-19 pandemic also brought
significant challenges to safety management. At
operational level, we implemented protection measures
such as strictly separated teams in key areas, hygiene
measures, and constant awareness building. Despite
travel limitations and thanks to digital communication
and collaboration tools, we conducted a number of key
safety-related activities:
▸ We rolled out a newly developed e-learning module
about the Life Saving Rules to remind our
employees about simple rules to prevent hazards
that carry the greatest potential for serious injuries.
▸ The Safety Culture reassessments were completed
as planned, some of them in virtual meetings.
▸ The coordinators of the safety culture program met
quarterly in a virtual forum to exchange best
practice across the OMV Group worldwide. The
half-yearly meetings with the program owner were
conducted online.
▸ Contractor HSSE management is key to the OMV
Group’s safety performance. We therefore trained
beneficiaries and procurement staff on the updated
internal regulations framework. We conducted
strategic supplier meetings with the main
contractors to share information, experience, and
expectations.
▸ We introduced a harmonized set of KPIs for
process safety. With the goal of developing a
Group-wide process safety road map in mind, we
worked out a concept and guidance for the
ventures, assets, and refineries on how to compile
local road maps for their facilities. In addition, we
built the OMV Group’s process safety network on
an online collaboration platform and held virtual
meetings with more than 150 participants, including
senior management.
▸ The rollout of the new cloud-based HSSE reporting
tool took place successfully.
Tensions in the geopolitical landscape remained at a
consistent baseline at the close of 2020, with all threat
and risk profiles confirming previously known trends
and patterns. We continue to monitor these geopolitical
situations, accelerating our understanding of strategic
events to proactively identify any emergent threat and
risk profiles that might intersect with our regional
business planning. This included incidents of armed
conflict, civil unrest, targeted activism, and criminality
which have manifested at local, national, regional, and
international levels. The Middle East continues to
maintain a consistent geopolitical trajectory and
therefore remains a crucial region for Corporate
Security.
Our Crisis Management and Resilience procedures
proved invaluable during the early containment phases
of the 2020 COVID-19 pandemic. Local Emergency
Management Teams were quick to take the initiative,
working closely with their Corporate Management
Team to execute the Executive Board’s pandemic
strategy. Our unique Integrated Travel Security
Platform allowed us to immediately manage and, where
required, restrict travel to specific countries as they
became subject to heightened infection rates and
international travel restrictions. Effective utilization of
this platform was fundamental in the proactive
relocation of employees and families from countries
with critical infection rates.
Corporate Security continued to deliver global
operational support, governance, and oversight
throughout 2020, and will maintain a comparable and
effective security strategy for 2021. OMV will thus be
able to further operate in dynamic environments with
converging asymmetric threats.
Environmental management
Due to the nature of its operations, OMV has an impact
on the environment. The Group strives to minimize that
impact at all times, particularly in terms of spills, energy
efficiency, greenhouse gas (GHG) emissions, as well
as water and waste management. OMV aims to
optimize processes to use natural resources as
efficiently as possible and to reduce emissions and
discharges.

OMV ANNUAL REPORT 2020 / DIRECTORS’ REPORT
42
In 2020, there were two major hydrocarbon spills (level
3 out of five levels; 2019: one). The total volume of
hydrocarbon spilled decreased compared to the
previous year. OMV continued to improve its oil spill
response preparedness and capabilities.
Key environmental actions and achievements in 2020:
► Water risk assessment related to the operations of
Arpechim Terminal in Downstream and Muntenia
Asset in Upstream: Both the river basin data and
the industrial activity data were analyzed by using
an methodology developed by the World Wide
Fund for Nature.
► Significant improvement of water use efficiency: At
Oltenia Asset, freshwater withdrawal intensity
decreased by 70% in 2020 versus 2019 because
new facilities in the Hurezani and Bustuchin gas
processing and compressor stations now use
air/glycol cooling instead of water cooling.
Arpechim Terminal was able to reduce freshwater
withdrawal by 35% compared to 2019 by
optimizing the pretreated water distribution system
and the fire water system.
► Rerouting of 2.5 km of the main oil pipeline from
the Petromar offshore platform to the onshore
terminal to mitigate the potential operational risk to
an environmentally sensitive area of the Danube
Delta Biosphere Reserve: The old pipeline
segment was decommissioned, and the land
returned to its original state. The protected habitat
was not affected.
► Support of biodiversity projects in New Zealand:
Further details can be found in the Sustainability
Report.
► Update of the Group’s Environmental
Management Standard establishing minimum
requirements for odor emissions

OMV ANNUAL REPORT 2020 / DIRECTORS’ REPORT
43
We know that it is our 25,000 employees (incl. Borealis) who turn our strategy into results and success.
We are proud of the result we have achieved together. Trust and pride in the organization fuel our
employees’ energy and determination to tackle challenges and to focus on innovative solutions to make
us even stronger.
OMV’s People Strategy
In 2020, the COVID-19 situation required considerable
additional focus from our organization’s HR function.
We continue to build on our strategic priorities to unlock
our organization’s full potential and to strengthen the
foundation for growth and success:
▸ Implement a continuous listening strategy
▸ Increase organizational agility
▸ Increase focus on diversity and inclusion
▸ Ensure OMV remains a great place to work
Highlights of 2020
During the COVID-19 pandemic, many employment-
related measures were newly implemented to not only
protect the health, wellbeing, and economic situation of
our employees, but also to ensure that we foster a
supportive culture throughout the year. By closely
monitoring the immense legislative output, we
succeeded in maintaining full labor law compliance
while also offering our staff new options for relief for
their pandemic-induced personal situations and needs.
Employees were offered various new solutions
(depending on the local jurisdiction) to more flexibly
combine work duties and care obligations. Work from
home was made available to all staff where practically
and technically feasible. The “Working From Home
Guide” was created as a virtual guide with tips and
tricks to improve virtual teams and the use of
technology. Learning Collections were provided to
enable employees to learn how to lead during crisis
times, how to manage stress, and how to work virtually.
Information and advice on all employee-relevant
questions was provided on a permanent basis. Reliable
internal processes to mirror new administrative rules
were promptly implemented. Free psychological
support was offered to all employees including talking
to professionals to help cope with the COVID-19
situation. Due to the extensive organizational efforts
and the outstanding flexibility of our employees, we
were able to avoid measures like short-time work or
redundancies.
Especially in 2020, we had to ensure increased
communication with our employees. Part of this
communication effort was a continuous listening
strategy intended to improve how our organization
listens to our employees to obtain their feedback as
well as their input and ideas (through quick polls, Q&A
and listening circles). The quick poll showed that
employees feel well supported, and this resulted in an
increased engagement rate. We continued to make
“remaining a great place to work” our strategic priority:
After all, 9 out of 10 employees recommend OMV as a
workplace.
Continuing our Digital Journey, our focus last year was
on stepping up global and virtual programs that are
easily accessible and facilitated in-house. By switching
to virtual and online training, we were able to continue
these despite COVID-19 restrictions. At the end of
2020, we were proud to report that we were able to
keep the participation rate as high as in 2019.
Number of training participants1,2,3
2020 2019
Austria 3,662 3,579
Romania/rest of Europe 10,914 11,317
Middle East and Africa 769 715
Rest of the world 699 712
Total 16,044 16,323
Money spent on training per region1,2,3
In EUR
2020 2019
Austria 1,512,514 2,722,418
Romania/rest of Europe 2,477,244 4,836,744
Middle East and Africa 134,197 381,065
Rest of the world 225,262 330,999
Total 4,349,217 8,271,226
1 Excluding conferences and trainings for external employees 2 Excluding Avanti GmbH, Borealis Group, DUNATÀR Köolajtermék Tároló és
Kereskedelmi Kft. Gas Connect Austria GmbH, and SapuraOMV Upstream 3 Number of employees who received at least one training
OMV and Borealis have joined forces and will continue
to grow stronger together. A larger business means
that a broader range of professional development
opportunities are available. We focus on strategic talent
exchanges between both companies, secondments
and international assignments for critical projects
and/or personal growth, and cross-divisional transfers
for continuous career development.
Our second strategic investment entails providing
career opportunities with SapuraOMV. We are proud of
Employees

OMV ANNUAL REPORT 2020 / DIRECTORS’ REPORT
44
our partnership with SapuraOMV and our ability to offer
assignments for OMV employees into SapuraOMV and
vice versa, which strengthens our employees’
experience and skill sets.
Diversity
We have introduced several global initiatives as part of
our ongoing commitment to gender diversity at OMV.
The first highlight is the launch of a new women’s
leadership program, SHEnergy, focused on personal
advancement and developing the leadership skills of
current and future female leaders.
Secondly, we held Career Aspiration Talks to raise the
visibility of women in our Company. In doing so, we aim
to also strengthen our pipeline of future female leaders.
These individual talks with a panel of senior managers
and HR help us learn about our female employees’
career aspirations so that we in turn can support them
by providing development opportunities and job
recommendations.
As a result, the percentage of women in the Group
(including Borealis) is about 25% (2019: 26% excluding
Borealis). 20.7% (excluding Borealis; 2019: 19.6%) of
employees in advanced management and executive
positions are female.
Employee key figures
At the end of 2020, OMV employed 25,291 persons
(including Borealis). Compared with 2019, the number
of employees increased by 27.4%.
Employees1
2020 2019
Employees by region
Austria 3,938 3,965
Romania/rest of Europe 12,539 14,219
Middle East and Africa 587 686
Rest of the world 974 975
Borealis Group 7,253
Total number of employees 25,291 19,845
Diversity
Female in % 25 26
Male in % 75 74
Female Senior Vice Presidents2 in % 15 16
Number of nationalities3 101 77
1 Regional split available for the OMV Group excluding Borealis (based on legal entity) 2 Excluding Avanti GmbH, Borealis Group, DUNATÀR Köolajtermék Tároló és Kereskedelmi Kft. Gas Connect Austria GmbH, and SapuraOMV Upstream 3 Excluding Avanti GmbH, DUNATÀR Köolajtermék Tároló és Kereskedelmi Kft. Gas Connect Austria GmbH, and SapuraOMV Upstream

OMV ANNUAL REPORT 2020 / DIRECTORS’ REPORT
45
In the year 2020, OMV recorded a clean CCS Operating Result of EUR 1.7 bn. The cash flow from operating
activities amounted to EUR 3.1 bn. Despite the very challenging market environment, OMV delivered an
organic free cash flow before dividends of EUR 1.3 bn, which was more than sufficient to cover the
payment of dividends in the amount of EUR 879 mn. The inorganic cash flow from investing activities was
EUR 4.1 bn, mainly reflecting the acquisition of the additional share in Borealis.
Business environment
After years of solid global economic growth, the world
experienced a shock in 2020 from COVID-19. The
global pandemic and related health crisis caused a
strong global economic recession. Several lockdown
periods in different countries on various continents
during 2020 led to significant economic distortions
along industrial production, trade, and supply chains
and adversely affected all sectors reliant on contact-
intensive interactions (tourism, travel, hospitality,
culture, entertainment).
Global economic output fell by 3.5% in 2020, implying
reduced economic activity across all sectors and
elevated unemployment rates. In 2021, economic
performance should rebound to somewhat above 2019
levels. However, the expected recovery will be heavily
influenced by the great uncertainty as to the future
course of the pandemic and the associated disruptions
of domestic activity, the effects of government-
implemented economic support policies in response,
and global and regional economic spill-over effects.
Global trade contracted by almost 10% in 2020 caused
by substantial disruptions in global supply chains and
trade restrictions (e.g., on medical supplies). A return of
the economy to its pre-crisis framework and structure
will depend on the successful global penetration of a
vaccination and treatments.
The varying regional speed of pandemic waves has led
to huge disparities in economic performance on
different continents. The eurozone’s gross domestic
product (GDP) fell by 7.2% in 2020. In the emerging
and developing Asian countries, this figure decreased
by only 1% due to rigorous quarantine and contract
tracing measures, especially in China, which enabled a
return to growth in late 2020.
The economic environment in Central and Eastern
European countries kept pace with the EU average,
with GDP declining by between –2% (Serbia) and –
9.4% (Croatia). The difference depended on the
regional duration and scale of lockdowns, and the GDP
sector composition. Massive government spending in
all countries aimed to support economic recovery, but
increased national debt to record levels.
Germany’s GDP declined by 5.4% in 2020 as a result
of domestic COVID-19 restrictions as well as negative
effects in the country’s main export markets. The
industrial and service sectors continued to suffer, while
other sectors were able to rebound as soon as
lockdown restrictions eased. In Austria, GDP fell by
7.4% in 2020 due to stronger lockdown restrictions and
the affected tourism/service sector accounting for a
larger share of the economy. Romania’s economy
contracted by 5.5% (greater than the Eurozone
average) due to its GDP’s reduced reliance on services
and the buoyancy of the construction sector.
Global oil demand declined by 8.8 mn bbl/d in 2020
after a new record high level of 100.0 mn bbl/d in 2019.
The spread of COVID-19 from Asia to Europe and the
United States (and other continents) in the first and
second quarter 2020 led to various global containment
measures. As a result, nearly all major oil products
were impacted negatively. Road transportation fuels,
including gasoline and gasoil/diesel declined by around
5 mn bbl/d globally. However as soon as lockdown
restrictions eased, consumption slowly returned to pre-
crisis levels by the end of 2020. Jet fuel/kerosene
witnessed an exceptional decline due to air travel and
mobility restrictions, falling 3.2 mn bbl/d. It will take a
multi-year recovery to return to 2019 levels when global
tourism revives.
Regionally, European oil product demand felt a greater
impact (–13%) than Asia (–5%), where lockdown
measures were eased in the second half of 2020 and
economic growth recovered.
Global oil demand disruptions led to sudden significant
disparities in global oil production – especially in the
second quarter 2020. In March, the OPEC+ alliance
and additional oil producing countries agreed to a
significant immediate oil production cut and a stepwise
return by 2021, which was implemented with a high
production compliance rate. The oil price drop dried up
US crude oil production (–0.9 mn bbl/d vs. 2019) and
ushered in an exceptional wave of bankruptcies,
lagging investments, and consolidation. Libya,
Venezuela, and Iran, all exempt from the OPEC+ cuts,
managed to raise output. Most of this came from Libya,
which rapidly increased production from approximately
100 kbbl/d to around 1 mn bbl/d after a cease-fire
agreement was signed in September. Iran and
OMV Group Business Year

OMV ANNUAL REPORT 2020 / DIRECTORS’ REPORT
46
Venezuela remained affected by US sanctions and
infrastructure constraints, which left their production at
comparatively low levels.
The price of Brent crude started with peaks around
USD 65–70/bbl before a dramatic collapse to about
USD 13/bbl during the second quarter 2020, when the
full impact of COVID-19 lockdowns hit the United
States and Europe. Effective OPEC+ supply manage-
ment and the gradual recovery of economic activity,
particularly in Asia, led to a surge in oil prices to around
USD 50/bbl at the end of 2020. This was also fueled by
the positive mood around the start of vaccination
programs and economic stimulus measures. Overall,
the average Brent crude price was approximately USD
42/bbl in 2020, its lowest level since 2004.
Low commodity prices and an unstable financial and
liquidity environment caused an approximately 18%
decline in energy investments by energy companies in
2020. Oil and gas investments declined by nearly 40%
in 2020 (vs. 2019). This will have to be compensated
for in the coming years to ensure the required oil and
gas production for covering future global oil demand.
Oil product demand in the Central and Southeast
European countries relevant to OMV followed the
global decline trend. Transportation fuel demand fell by
around 8% for gasoline and diesel and by more than
50% for jet fuel in the relevant markets in 2020.
Austria’s market volume reached 9,6 mn t (–16%
compared to 2019), with demand for fuels down and
demand for heating oil increasing due to a favorable
cost situation. In total, Austrian energy demand likely
fell by –8% in 2020. The Romanian oil product market
seemed less exposed to the impact of COVID-19, only
declining by –3% compared to 2019.
Global gas demand declined by only around –4% in
2020 due to a milder COVID-19 impact on gas
fundamentals than was the case for oil. However, the
global gas supply (mainly LNG exports) continued to
rise significantly, triggered by an investment cycle in
recent years. The greater cyclical oversupply led to
extraordinarily low gas prices in Europe (around EUR
7/MWh during the summer months) and Asia. In
Austria, gas demand fell by some –4% in 2020, while
natural gas imports and domestic production dropped
by –12% and –18%, respectively. This was compen-
sated for by higher storage withdrawal rates after last
year’s record-high storage level of 90 TWh.
Crude price (Brent) – monthly average
In USD/bbl

OMV ANNUAL REPORT 2020 / DIRECTORS’ REPORT
47
Financial review of the year
Key financials
in EUR mn (unless otherwise stated)
2020 2019 Δ
Sales revenues1 in EUR mn 16,550 23,461 (29)%
Clean CCS Operating Result2 in EUR mn 1,686 3,536 (52)%
Clean Operating Result Upstream2 in EUR mn 145 1,951 (93)%
Clean CCS Operating Result Downstream2 in EUR mn 1,514 1,677 (10)%
Clean Operating Result Corporate and Other2 in EUR mn (47) (67) 30%
Consolidation: Elimination of inter-segmental profits in EUR mn 74 (25) n.m.
Clean CCS Group tax rate in % 32 38 (6)
Clean CCS net income2 in EUR mn 1,026 2,121 (52)%
Clean CCS net income attributable to stockholders2,3 in EUR mn 679 1,624 (58)%
Clean CCS EPS2 in EUR 2.08 4.97 (58)%
Special items4 in EUR mn (220) (64) n.m.
thereof Upstream in EUR mn (1,282) (71) n.m.
thereof Downstream in EUR mn 1,071 31 n.m.
thereof Corporate and Other in EUR mn (9) (24) n.m.
CCS effects: inventory holding gains/(losses) in EUR mn (416) 110 n.m.
Operating Result Group in EUR mn 1,050 3,582 (71)%
Operating Result Upstream in EUR mn (1,137) 1,879 n.m.
Operating Result Downstream in EUR mn 2,160 1,847 17%
Operating Result Corporate and Other in EUR mn (56) (91) 38%
Consolidation: Elimination of inter-segmental profits in EUR mn 83 (54) n.m.
Net financial result in EUR mn (175) (129) (35)%
Group tax rate in % (69) 38 n.m.
Net income in EUR mn 1,478 2,147 (31)%
Net income attributable to stockholders3 in EUR mn 1,258 1,678 (25)%
Earnings Per Share (EPS) in EUR 3.85 5.14 (25)%
Cash flow from operating activities in EUR mn 3,137 4,056 (23)%
Free cash flow before dividends in EUR mn (2,811) (583) n.m.
Free cash flow after dividends in EUR mn (3,690) (1,441) (156)%
Organic Free cash flow before dividends5 in EUR mn 1,273 2,119 (40)%
Organic Free cash flow after dividends in EUR mn 394 1,261 (69)%
Gearing ratio exluding leases in % 41 22 19
Leverage ratio in % 32 22 10
Capital expenditure6 in EUR mn 6,048 4,916 23%
Organic capital expenditure7 in EUR mn 1,884 2,251 (16)%
Clean CCS ROACE in % 5 11 (6)
ROACE in % 8 11 (4)
1 Sales revenues excluding petroleum excise tax 2 Adjusted for special items and CCS effects; further information can be found in Note 4 – Segment Reporting – of the Consolidated Financial Statements 3 After deducting net income attributable to hybrid capital owners and net income attributable to non-controlling interests 4 The disclosure of special items is considered appropriate in order to facilitate the analysis of the ordinary business performance. To reflect comparable figures,
certain items affecting the result are added back or deducted. Special items from equity-accounted companies and temporary hedging effects for material
transactions are included. 5 Organic free cash flow before dividends is cash flow from operating activities less cash flow from investing activities excluding disposals and material inorganic
cash flow components (e.g., acquisitions) 6 Capital expenditure including acquisitions 7 Organic capital expenditure is defined as capital expenditure including capitalized Exploration and Appraisal expenditure and excluding acquisitions and
contingent considerations.

OMV ANNUAL REPORT 2020 / DIRECTORS’ REPORT
48
Notes to Key Financials
Clean CCS Operating Result
Special items and CCS effect
In EUR mn
2020 2019 Δ
Clean CCS Operating Result1 1,686 3,536 (52)%
Special items (220) (64) n.m.
thereof: Personnel restructuring (39) (34) (16)%
thereof: Unscheduled depreciation / write-ups (1,084) (39) n.m.
thereof: Asset disposal 19 5 n.m.
thereof: Other 885 4 n.m.
CCS effects: inventory holding gains/(losses) (416) 110 n.m.
Operating Result Group 1,050 3,582 (71)%
1 Adjusted for special items and CCS effects
Sales revenues decreased by 29% to EUR 16,550 mn,
driven by the overall lower global commodity price
environment and fallen sales volumes for most
products, mainly caused by the effects of the COVID-
19 pandemic and partially compensated by higher
natural gas sales volumes in the Downstream segment.
The clean CCS Operating Result declined considera-
bly from EUR 3,536 mn in 2019 to EUR 1,686 mn. The
contribution from Upstream amounted to EUR 145 mn
(2019: EUR 1,951 mn). In Downstream, the clean CCS
Operating Result stood at EUR 1,514 mn (2019:
EUR 1,677 mn). The clean CCS Group tax rate in
2020 was 32% (2019: 38%), reflecting the lower
contribution from Upstream, in particular from countries
with high tax regimes. The clean CCS net income
went down to EUR 1,026 mn (2019: EUR 2,121 mn).
The clean CCS net income attributable to
stockholders amounted to EUR 679 mn (2019:
EUR 1,624 mn). Clean CCS Earnings Per Share were
EUR 2.08 (2019: EUR 4.97).
Net special items of EUR (220) mn were recorded in
2020 (2019: EUR (64) mn). In Upstream, net special
items in 2020 amounted to EUR (1,282) mn (2019:
EUR (71) mn) and were mainly related to the
impairments triggered by OMV’s revision of its long-
term price assumptions for Brent crude oil. The
Downstream net special items amounting to
EUR 1,071 mn in 2020 (2019: EUR 31 mn) mainly
included a step-up in the valuation of the previously
owned 36% share in Borealis. In Corporate and Other,
net special items amounted to EUR (9) mn in 2020
(2019: EUR (24) mn). CCS effects of EUR (416) mn
(2019: EUR 110 mn) were recognized in 2020.
The OMV Group’s reported Operating Result
decreased substantially to EUR 1,050 mn (2019:
EUR 3,582 mn). The net financial result decreased to
EUR (175) mn (2019: EUR (129) mn). The Group tax
rate was significantly affected by income coming from
tax synergies from the acquisition of additional shares
in Borealis that led to a write-up of deferred tax assets
in the Austrian tax group (among other effects). Net
income thus amounted to EUR 1,478 mn (2019:
EUR 2,147 mn). The net income attributable to
stockholders was EUR 1,258 mn compared to
EUR 1,678 mn in 2019. Earnings Per Share
decreased to EUR 3.85 compared to EUR 5.14
in 2019.
More details on special items and CCS effects can be
found in Note 4 – Segment Reporting – of the
Consolidated Financial Statements.

OMV ANNUAL REPORT 2020 / DIRECTORS’ REPORT
49
Gearing ratio excluding leases and Leverage ratio
Gearing ratio excluding leases
In EUR mn (unless otherwise stated)
2020 2019 Δ
Bonds 8,869 5,802 53%
Other interest-bearing debts1 2,130 769 177%
Debt excluding leases 10,999 6,570 67%
Cash and cash equivalents2 2,869 2,938 (2)%
Net debt excluding leases 8,130 3,632 124%
Equity 19,899 16,863 18%
Gearing ratio excluding leases in % 41% 22% 19
1 Including other interest-bearing debts that were reclassified to liabilities associated with assets held for sale 2 Including cash and cash equivalents that were reclassified to assets held for sale
Leverage ratio1
In EUR mn (unless otherwise stated)
2020 2019 Δ
Net debt excluding leases 8,130 3,632 124%
Lease Liabilities2 1,217 1,054 15%
Net debt including leases 9,347 4,686 99%
Capital employed3 29,246 21,549 36%
Leverage ratio in % 32% 22% 10
1 Defined as net debt including leases-to-capital employed 2 Including lease liabilities that were reclassified to liabilities associated with assets held for sale 3 Equity plus net debt including leases
Capital Expenditure (CAPEX)
Total CAPEX
In EUR mn
Upstream CAPEX decreased mainly as a result of a
cut-back of capitalized E&A following a widespread
effort to reduce spending in 2020. 2019 was impacted
by the acquisition of a 50% interest in SapuraOMV in
Malaysia.
Downstream CAPEX increase was mainly related to
the acquisition of an additional 39% share in Borealis
AG.
The reconciliation of total expenditure to the
investments as shown in the cash flow statement is
depicted in the following table:

OMV ANNUAL REPORT 2020 / DIRECTORS’ REPORT
50
Capital expenditure1
In EUR mn
2020 2019 ∆
Total capital expenditure 6,048 4,916 23%
+/– Changes in the consolidated Group and other adjustments (3,954) (411) n.m.
– Investments in financial assets (156) (2,155) 93%
Additions according to statement of non-current assets (intangible and tangible
assets) 1,938 2,351
(18)%
+/– Non-cash changes 21 (193) n.m.
Cash outflow from investments in intangible assets and property, plant and equipment 1,960 2,158 (9)%
+ Cash outflow from investments, loans and other financial assets 194 2,265 (91)%
+ Acquisitions of subsidiaries and businesses net of cash acquired 3,880 460 n.m.
Investments as shown in the cash flow statement 6,034 4,883 24%
1 Includes acquisitions as well as equity-accounted investments and other interests; adjusted for capitalized decommissioning costs, exploration wells that have
not found proved reserves, borrowing costs and other additions that by definition are not considered capital expenditure
Notes to the cash flow statement
Summarized cash flow statement
In EUR mn
2020 2019 ∆
Sources of funds 2,786 4,264 (35)%
Cash flow from operating activities 3,137 4,056 (23)%
Cash flow from investing activities (5,948) (4,638) 28%
Free cash flow (2,811) (583) n.m.
Cash flow from financing activities 2,808 (484) n.m.
Effect of exchange rate changes on cash and cash equivalents (66) (22) n.m.
Net (decrease)/increase in cash and cash equivalents (69) (1,088) (94)%
Cash and cash equivalents at beginning of period 2,938 4,026 (27)%
Cash and cash equivalents at end of period 2,869 2,938 (2)%
thereof cash disclosed within Assets held for sale 15 7 116%
Cash and cash equivalents presented in the consolidated statement of financial
position 2,854 2,931 (3)%
Free cash flow after dividends (3,690) (1,441) 156%
Cash flow from operating activities amounted to
EUR 3,137 mn, down by EUR 919 mn compared to
2019, significantly impacted by a worsened market
environment, mainly caused by the effects of the
COVID-19 pandemic.
Cash flow from investing activities showed an
outflow of EUR 5,948 mn in 2020, compared to
EUR 4,638 mn in 2019. 2020 included a net cash
outflow of EUR 3,870 mn related to the acquisition of
an additional 39% stake in Borealis AG while 2019
contained a cash outflow of EUR 460 mn related to the
acquisition of a 50% interest in SapuraOMV and a cash
outflow of EUR 2,095 mn related to the acquisition of a
15% stake in the ADNOC Refining business. Cash flow
from investing activities in 2020 included a cash outflow
of EUR 18 mn related to the financing agreements for
the Nord Stream 2 pipeline project (2019:
EUR 113 mn).
Cash flow from financing activities showed an inflow
of EUR 2,808 mn compared to an outflow of
EUR 484 mn in 2019 mainly attributable to the
issuance of bonds of EUR 3.25 bn and hybrid bonds of
EUR 1.25 bn in 2020, while 2019 included new bonds
of EUR 1.3 bn.

OMV ANNUAL REPORT 2020 / DIRECTORS’ REPORT
51
Notes to the income statement
Summarized income statement
In EUR mn
2020 2019 Δ
Sales revenues 16,550 23,461 (29)%
Other operating income and net income from equity-accounted investments 1,915 665 188%
Total revenues and other income 18,465 24,127 (23)%
Purchases (net of inventory variation) (9,598) (13,608) (29)%
Production and operating expenses incl. production and similar taxes (2,217) (2,191) 1%
Depreciation, amortization, impairments and write-ups (2,418) (2,302) 5%
Selling, distribution and administrative expenses (1,896) (1,892) n.m.
Exploration expenses (896) (229) n.m.
Other operating expenses (389) (322) 21%
Operating Result 1,050 3,582 (71)%
Net financial result (175) (129) 35%
Profit before tax 875 3,453 (75)%
Taxes on income and profit 603 (1,306) n.m.
Net income for the year 1,478 2,147 (31)%
thereof attributable to hybrid capital owners 84 75 11%
thereof attributable to non-controlling interests 136 393 (65)%
Net income attributable to stockholders of the parent 1,258 1,678 (25)%
Effective tax rate (%) (69) 38 (107)
Sales to third parties 2020 (2019)
In EUR mn if not otherwise stated (prior year)
Total not consolidated sales 2020 (2019)
In EUR mn if not otherwise stated (prior year)
Sales revenues decreased mainly due to overall lower
global commodity price environment and reduced sales
volumes for most products, predominantly caused by
the effects of the COVID-19 pandemic. The sales split
by geographical areas can be found in the Notes to the
Consolidated Financial Statements (Note 4 – Segment
Reporting).
Other operating income increased from EUR 280 mn
in 2019 to EUR 1,877 mn in 2020 and was mainly
impacted by EUR 1,284 mn gains from revaluation and
recycling effects related to the previously held at-equity
share of 36% in Borealis. Further details on the
Borealis acquisition can be found in the Notes to the
Consolidated Financial Statements (Note 3 – Changes
in group structure).
Net income from equity-accounted investments
decreased from EUR 386 mn to EUR 38 mn mainly due
to the negative contribution of Abu Dhabi Oil Refining
Company, driven by negative inventory effects due to
prolonged turnaround and negative market
environment. Also, there was a lower contribution from
Borealis as it was consolidated at-equity only until
October 2020 and additionally the result was negatively
impacted by a drop in petrochemical margins following
COVID-19 impact on polyolefin business and negative
inventory effects in the first half of 2020.

OMV ANNUAL REPORT 2020 / DIRECTORS’ REPORT
52
In Q3/20, OMV updated its mid-term plan and revised
its long-term planning assumptions which lead to
significant impairments, impacting the lines
“Depreciation, amortization, impairments and write-
ups” as well as “Exploration expenses”. Details can
be found in the Notes to the Consolidated Financial
Statements (Note 7– Depreciation, amortization,
impairments and write-ups).
Net financial result decreased mainly due to negative
FX result which was only partly offset by lower interest
expenses. For further details refer to the Notes to the
Consolidated Financial Statements (Note 11 – Net
financial result).
The effective tax rate was significantly affected by
income from tax synergies from the acquisition of
additional shares in Borealis that led to write-up of
deferred tax assets in the Austrian tax group (among
other effects). For further details on the group’s
effective tax rate, please refer to Note 12 – Taxes on
income and profit – of the Consolidated Financial
Statements.
Notes to statement of financial position
Summarized statement of financial position (condensed)
In EUR mn
2020 2019 Δ
Assets
Non-current assets 35,695 28,950 23%
Current assets 12,112 11,248 8%
Assets held for sale 1,464 177 n.m.
Equity and liabilities
Equity 19,899 16,863 18%
Non-current liabilities 18,020 13,961 29%
Current liabilities 10,616 9,395 13%
Liabilities associated with assets held for sale 736 156 n.m.
Total assets/equity and liabilities 49,271 40,375 22%
The statement of financial position in 2020 was overall
significantly impacted by the acquisition of 39%
additional shares in Borealis AG leading to obtaining
control and discontinuation of the equity method. For
further details refer to Note 3 – Changes in group
structure – of the Consolidated Financial Statements.
Non-current assets: Intangible assets and property,
plant and equipment increased by EUR 2,004 mn
compared to 2019 following the full consolidation of
Borealis, partly offset by impairments and held for sale
classifications. Equity- accounted investments
increased by EUR 3,170 mn to EUR 8,321 mn mainly
due to the inclusion of Abu Dhabi Polymers Company
Limited (Borouge) following the Borealis acquisition,
partly offset by the derecognition of the previously held
36% share in Borealis.
Assets held for sale and liabilities associated with
assets held for sale increased significantly mainly due
to the reclassification of the Gas Connect Group and
the OMV retail network in Germany to held for sale. For
further details please refer to Note 20 – Assets and
liabilities held for sale – of the Consolidated Financial
Statements.
Equity (including non-controlling interest) increased
mainly due to the issuance of two new hybrid bonds on
September 1, 2020 with a total size of EUR 1.25 bn.
Furthermore, non-controlling interests rose following
the Borealis acquisition, reflecting the 25% retained
interest of Mubadala Investment Company (Abu
Dhabi).
Non-current liabilities were impacted mainly by the
issuance of senior bonds with a total volume of
EUR 3.25 bn in 2020. For further details please refer to
Note 24 – Liabilities – of the Consolidated Financial
Statements.

OMV ANNUAL REPORT 2020 / DIRECTORS’ REPORT
53
In the Upstream Business Segment, OMV delivered a resilient performance despite an overall challenging
environment. Despite COVID 19-related restrictions, production reached 463 kboe/d, with production cost
at USD 6.6/boe in line with last year and the one-year Reserve Replacement Rate slightly above 100%.
At a glance
2020 2019 Δ
Clean Operating Result in EUR mn 145 1,951 (93)%
Special items in EUR mn (1,282) (71) n.m.
Operating Result in EUR mn (1,137) 1,879 n.m.
Capital expenditure¹ in EUR mn 1,090 2,070 (47)%
Exploration expenditure in EUR mn 227 360 (37)%
Exploration expenses in EUR mn 896 229 n.m.
Production cost in USD/boe 6.58 6.61 (0)%
Total hydrocarbon production in kboe/d 463 487 (5)%
Total hydrocarbon sales volumes in kboe/d 439 463.8 (5)%
Proved reserves as of December 31 in mn boe 1,337 1,332 0%
Average Brent price in USD/bbl 41.84 64.21 (35)%
Average realized crude price² in USD/bbl 37.97 61.66 (38)%
Average realized gas price² in USD/1,000 cf 3.12 4.08 (23)%
1 Capital expenditure including acquisitions, notably the acquisition of a 50% interest in the newly formed company SapuraOMV in 2019 for USD 540 mn 2 Average realized prices include hedging effects.
Financial performance
The clean Operating Result dropped sharply from
EUR 1,951 mn to EUR 145 mn in 2020. Net market
effects had a negative impact of EUR (1,846) mn as a
consequence of materially lower average realized oil
and gas prices. A reduced operational performance
lowered returns by EUR (245) mn and was mainly a
consequence of the force majeure situation and the
ensuing liftings shortfall in Libya during most of the
year. Significantly higher sales volumes in Malaysia
had a strong balancing effect. Depreciation decreased
by EUR (286) mn due to reduced production,
impairments, and reserve revisions. In 2020, OMV
Petrom contributed EUR 1 mn to the clean Operating
Result compared to EUR 599 mn in 2019.
Net special items amounted to EUR (1,282) mn in
2020 (2019: EUR (71) mn) and were mainly related to
the impairments triggered by OMV’s revision of its long-
term price assumptions for Brent crude oil. The
Operating Result contracted sharply to
EUR (1,137) mn (2019: EUR 1,879 mn).
Production cost excluding royalties was at the same
level on average in 2020 as in 2019, at USD 6.6/boe.
Further cost saving initiatives and reduced activity
during the COVID-19 lockdown were able to offset the
incremental effect stemming from lower production. At
OMV Petrom, production cost also remained stable at
USD 10.9/boe.
The total hydrocarbon production volume decreased
by 24 kboe/d to 463 kboe/d, primarily due to lower
production in Libya as a result of the force majeure
situation. Production in Malaysia rose substantially and
was able to offset some of the reduced production in
Romania, New Zealand, and Russia. OMV Petrom’s
total production was down by 7 kboe/d to 145 kboe/d
mainly due to natural decline. Total sales volumes fell
to 439 kboe/d (2019: 464 kboe/d) in line with production
volumes.
In 2020, the average Brent price reached
USD 41.8/bbl, a substantial decrease by 35%. The
Group’s average realized crude price dropped by
38%. The average realized gas price in USD/1,000 cf
receded by 23%.
Upstream

OMV ANNUAL REPORT 2020 / DIRECTORS’ REPORT
54
Capital expenditure including capitalized E&A was cut
back to EUR 1,090 mn in 2020 (2019: EUR 2,070 mn)
following a widespread effort to reduce spending.
Capital expenditure in 2019 included the purchase of a
50% interest in SapuraOMV for USD 540 mn. Organic
capital expenditure was primarily directed at projects in
Romania, Norway, the United Arab Emirates, and New
Zealand. Exploration expenditure was EUR 227 mn
in 2020, and could thus be reduced by 37% compared
to 2019. It was mainly related to activities in Norway,
New Zealand, Romania, and Malaysia.
Production
2020 2019
Oil and NGL Natural gas¹ Total Oil and NGL Natural gas¹ Total
in mn bbl in bcf in mn boe in mn boe in mn bbl in bcf in mn boe in mn boe
Romania² 23.4 146.5 27.1 50.5 24.1 156.2 28.9 53.0
Austria 3.8 24.9 4.2 8.0 4.0 29.2 4.9 8.9
Kazakhstan² 2.1 2.0 0.3 2.5 2.1 1.8 0.3 2.4
Norway 15.1 97.5 16.2 31.3 16.6 90.0 15.0 31.6
Libya 2.4 – – 2.4 11.1 – – 11.1
Tunisia 0.6 7.0 1.2 1.7 0.8 3.2 0.5 1.4
Yemen 1.3 – – 1.3 1.8 – – 1.8
Kurdistan Region
of Iraq 1.0 14.6 2.4 3.4 0.9 14.2 2.4 3.3
United Arab
Emirates 8.4 – – 8.4 8.1 – – 8.1
New Zealand 3.8 57.7 9.6 13.4 4.6 65.2 10.9 15.5
Malaysia² 2.7 53.3 8.9 11.6 2.1 15.5 2.6 4.7
Russia – 208.4 34.7 34.7 – 218.0 36.3 36.3
Total 64.7 612.0 104.7 169.4 76.1 593.1 101.7 177.9
1 To convert natural gas from cf to boe, the following conversion factor was applied in all countries: 1 boe = 6,000 cf; except for Romania, where the following
factor was used: 1 boe = 5,400 cf. 2 The figures above include 100% of all fully consolidated companies.
Portfolio developments
Despite COVID 19-related restrictions, OMV made
good progress in the implementation of the OMV
Strategy 2025. Nawara was successfully started up in
Tunisia, and in Malaysia the GoLaBa (Gorek, Larak
and Bakong) fields were commissioned. In the United
Arab Emirates, the Umm Lulu Super Complex was
brought into full field mode. Additionally, the portfolio
was streamlined by the sale of OMV Petrom’s
operations in Kazakhstan, and progress was made
toward divesting an asset in New Zealand.
Furthermore, OMV embarked on the divestment of its
oil assets in Malaysia, which are now classified as held
for sale. The transaction is expected to close in 2021.
Central and Eastern Europe
In 2020, we continued to optimize the portfolio in
Romania. OMV Petrom signed an agreement to sell 40
onshore oil and gas fields in Southern Romania,
together producing around 1,100 boe/d. In addition,
OMV Petrom signed the transaction for the sale of its
operations in Kazakhstan consisting of production
licenses for four onshore fields. The closing of the
transaction is subject to certain conditions precedent
(including authority approval) and is expected for the
first half of 2021. Following a successful bidding
process, negotiations began on a production-sharing
contract for Offshore Exploration Block II in the
Republic of Georgia and are estimated to be finalized in
the first quarter of 2021.
The global outbreak of the COVID-19 pandemic made
2020 an extremely challenging year from an
operational point of view. Nevertheless, OMV Petrom
managed to maintain uninterrupted production,
construction, workover, and turnaround operations.
Due to the difficult market environment ushered in by
the pandemic, fewer new wells and sidetracks were
drilled in 2020 compared to the previous year (63 vs.
100). In September, planned maintenance activities
took place in the Hurezani production area.
In Austria, the largest ground-mounted photovoltaic
plant was constructed in Schönkirchen-Reyersdorf in
partnership with VERBUND. This will reduce OMV’s
CO2 emissions by around 10,000 t per year.

OMV ANNUAL REPORT 2020 / DIRECTORS’ REPORT
55
Middle East and Africa
For the Middle East and Africa region, 2020 was a
challenging year marked by the effects of the COVID-
19 pandemic, the tense security situation in Libya and
Yemen, social unrest in Tunisia, and the impact of the
OPEC+ quota in the United Arab Emirates. Operations
continued safely nevertheless, HSSE performance was
outstanding, projects went ahead, and production was
maintained at levels permitted by the prevailing
conditions.
In Libya, production came to a halt for the larger part of
the year due to the political instability on the ground,
which resulted in the shut-down of oil export terminals
between January and October. Production resumed
and steadily ramped up in the last two months of the
year, almost returning to previous levels.
The most significant effects of the COVID-19 pandemic
on projects and activities in the region were delays of
the Ghasha concession development in the United
Arab Emirates and the Khor Mor development in the
Kurdistan Region of Iraq (KRI). Workover activities in
Yemen also had to be discontinued and thus
depressed production levels. However, despite these
challenges, OMV successfully managed to continue its
operations in Yemen and Tunisia, and began
commercial natural gas production at Nawara in March.
In line with the strategy to pursue further growth options
in the region, OMV signed a Memorandum of
Understanding with Sonatrach, the national state-
owned company of Algeria, in July. The MoU covers
the identification of potential upstream opportunities
where the two parties could jointly invest in exploration
or development and production projects in Algeria. The
MoU underscores the interest of both companies in
investigating collaboration options following the passing
of a new Algerian Hydrocarbon Law.
North Sea
In 2020, the Norwegian authorities approved the plan
for development and operation of the Hywind project,
which will contribute to reducing emissions from the
Snorre and Gullfaks oil and gas fields. They also
introduced a tax incentive scheme allowing immediate
expensing of CAPEX, including a 24% uplift for the
special petroleum tax in 2020 and 2021. The Wisting
and Iris/Hades projects will both benefit from this rule.
Russia
In March 2020, OMV signed an amendment to the
basic sale agreement on the potential acquisition of a
24.98% interest in the Achimov 4A/5A phase
development. This foresees an extension of the
negotiation phase for the final transaction documents
on a non-exclusive basis until June 2022. In these
negotiations, material developments and changes in
circumstances up to signing (including the planned start
of production of Achimov 4A/5A) are to be taken into
account by the parties in good faith. This relates in
particular to the economic effective date and the
purchase price.
Asia-Pacific
SapuraOMV, the strategic partnership formed with
Sapura Energy Berhad (“Sapura Energy”), delivered
substantial incremental production from the Phase
1 development (Gorek, Larak, and Bakong fields) of the
SK408 Production Sharing Contract (PSC) in 2020.
This increased SapuraOMV’s production to over
30 kboe/d.
SapuraOMV made progress on the development of its
other discovered resources, which include SK408’s
Jerun and Teja fields and SK310’s B14 field. This effort
culminated in the final investment decision by
SapuraOMV’s Board of Directors for the Jerun project
in December 2020.
SapuraOMV secured several new exploration permits
in Australia to maintain a robust exploration portfolio for
future growth of the business in the region.
In 2020, OMV embarked on the divestment of its oil
assets in Malaysia, which were reclassified as held for
sale. The transaction is expected to close in 2021.
OMV New Zealand is prioritizing the redevelopment
and optimization of the existing Maui and Pohokura
natural gas assets. Major infill drilling campaigns on
both assets also advanced during 2020, and drilling
started in Maui. OMV New Zealand will invest around
NZD 500 mn (EUR 270 mn) over the next two years to
rejuvenate production in the Maui and Pohokura natural
gas fields.
A new hydrocarbon discovery in the Taranaki Basin in
2020 that needs to be appraised and confirmed in
2022, could potentially bring new hydrocarbon volumes
to market in the 2025–2027 timeframe.
Divestment by OMV New Zealand of its 69% share of
the Maari field to Jadestone Energy is expected to be
completed in early 2021. Average production from the
asset in 2020 was 4 kboe/d net to OMV (in 2019:
5 kboe/d).

OMV ANNUAL REPORT 2020 / DIRECTORS’ REPORT
56
Key projects
Neptun (Romania, OMV 50%)
In cooperation with ExxonMobil as the operator, OMV
Petrom continued assessing the commercial and
economic viability of the Neptun Deep project in the
Romanian Black Sea. Cumulative production from
Neptun Deep was estimated at 125–250 mn boe (net to
OMV). OMV Petrom remains interested in seeing the
Black Sea resources developed. However, the final
investment decision depends on a range of factors
including a stable and competitive fiscal framework and
a liberalized natural gas market. Regarding the former,
mainly in reference to the Offshore Law, amendments
are scheduled to be made by means of a parliamentary
process according to public statements. This process
will be initiated by the new Parliament elected in
December 2020. On the liberalized natural gas market
front, some progress was made through replacement of
the central market obligation with a natural gas release
program.
Other major projects (Romania, OMV 100%)
Despite the difficult environment, some major
milestones were achieved in other projects. At the
Petromar asset, the rerouting of a section of 2.7 km of
the 12” onshore pipeline that connects the offshore
Central Platform to the onshore Midia Terminal was
successfully completed. In addition, a pilot project for
Enhanced Oil Recovery (EOR) was initiated in the
Independenta field, at the Moldova asset. This project
aims to increase the recovery factors from our mature
fields by injecting a mixture of viscous water into the
reservoir. So far, encouraging results were achieved,
and OMV Petrom is currently analyzing the possibility
of extending this technology to other fields in the
coming years.
Nawara (Tunisia, OMV 50%)
In Q1/20, OMV managed to successfully start up
operations at the onshore Nawara natural gas and
condensate field development, thereby achieving
commercial natural gas flows despite COVID 19-related
restrictions. This meant that the final phase of
commissioning and startup of the gas treatment plant
and central processing facility had to be performed
remotely. Despite the peak production level of 9 kboe/d
(OMV share) already having been achievedin 2020,
production had to be shut down for three months due to
social unrest in the country, which also affected project
close-out activities. The project unlocks South Tunisia’s
natural gas resources and supplies urgently needed
natural gas, LPG, and condensate to the Tunisian
market.
Umm Lulu and SARB (United Arab Emirates,
OMV 20%)
Umm Lulu and Satah Al Razboot (SARB) are two
offshore oil fields situated in the shallow waters of Abu
Dhabi. Pipelines connect both fields to dedicated
processing, storage, and loading facilities on Zirku
Island. In 2020, the Umm Lulu Super Complex started
up in full field mode in April, while the commissioning of
the natural gas treatment plant, the wellhead towers,
brownfield modification works, and Super Complex
performance testing are still in progress, following
delays caused by COVID-19. Development drilling is
planned to continue until 2023. Production started up at
the Umm Lulu and SARB fields in September 2018 and
reached an average level of 23 kboe/d (OMV share) in
2020. This was affected by production limitations in
connection with the OPEC+ quota. Production from the
concession area is expected to increase to 215 kboe/d
(43 kboe/d net to OMV) by 2023.
Khor Mor (KRI, OMV 10%)
The Pearl consortium develops, produces, processes,
and transports natural gas from Khor Mor, a major gas
condensate field located in the Kurdistan Region of Iraq
(KRI). The consortium plans to increase production by
drilling additional wells and by expanding the capacity
of the facilities by another 42 kboe/d (thereof 4.2
kboe/d net to OMV). The resulting additional natural
gas production will be introduced into the existing
Pearl-operated natural gas pipeline to support
increasing domestic natural gas demand. In 2020, the
engineering, procurement, and construction contract for
Khor Mor Train 1 was awarded, but project progress
was impacted by contractor force majeure related to
the COVID-19 pandemic, resulting in a delay of
one year.
Gullfaks (Norway, OMV 19%)
In 2020, the Equinor-operated Gullfaks field delivered
strong production volumes thanks to robust natural gas
exports. The planned revision stop at Gullfaks A was
finalized early in November. The Norwegian authorities
approved the plan for development and operation of the
Hywind project in April 2020. The wind farm is a
pioneering project and a contribution to reducing emis-
sions from the Snorre and Gullfaks oil and gas fields.
The offshore wind farm will consist of 11 floating wind
turbines with a total capacity of 88 MW and will meet
about 35% of the annual power demand of the plat-
forms. Construction on the wind farm started in Q4/20.

OMV ANNUAL REPORT 2020 / DIRECTORS’ REPORT
57
Gudrun (Norway, OMV 24%)
The Equinor-operated Gudrun field continued to
produce at a high efficiency level and was only slightly
affected by COVID-19 and the OPEC production cuts.
Phase 2 of the Gudrun field redevelopment is planned
to enable water injection in Q4/21, with ongoing batch
drilling and topside modifications to the existing plat-
form. During 2020, two additional infill production wells
were also drilled. The first started production in April
2020; the second is scheduled to start in early 2021.
Edvard Grieg (Norway, OMV 20%)
The Edvard Grieg offshore oil field operated by Lundin
Petroleum continued to produce above expectations in
2020, due to high production efficiency and increased
capacity in Ivar Aasen. Planned maintenance revision
stops were completed on time. The Edvard Grieg infill
drilling campaign is on track to start in Q1/21.
Aasta Hansteen (Norway, OMV 15%)
Aasta Hansteen continued steady production in 2020,
with no major impact from COVID-19. Since September
2020, Aasta Hansteen has reached close to 100%
production efficiency on its increased export capacity
of around 160 kboe/d gross.
Wisting (Norway, OMV 25%)
In 2020, the Wisting license partners awarded several
contracts for concept studies to further move the
project toward a final concept. Operator Equinor and its
partners have considered various concepts to
determine potential solutions for cost-effective field
development and will further develop a floating
production unit based on a circular FPSO solution. An
important objective for the Wisting project is reducing
the carbon footprint of production. The project will study
a power-from-shore solution for a circular FPSO. The
Wisting project is on track to deliver the plan for devel-
opment and operation by year-end 2022 to take ad-
vantage of the tax incentives introduced in spring 2020.
Hades/Iris (Norway, OMV 30%)
OMV made the Hades and Iris discoveries in 2018. The
exploration well found natural gas and condensate in
both Hades and Iris. The objective of the 2020 Hades
appraisal well was to delineate the 2018 discovery,
reduce the uncertainty of the resource estimate, and
perform a formation test. The appraisal well phase was
concluded as planned in Q3/20. The Hades/Iris project
is on track to deliver a plan for development and
operation by year-end 2022 to take advantage of the
tax incentives introduced in spring 2020.
Yuzhno-Russkoye (Russia, OMV 24.99%)
The second phase of the Turonian development project
has been completed at Yuzhno-Russkoye. A total of
45 wells were drilled, and 24 new wells in the Turonian
formation started producing. A plateau production
extension until 2023 was confirmed.
SK408 (Malaysia, OMV 40%)
In Malaysia, Phase 1 development of the SK408 Gorek,
Larak, and Bakong fields was completed by June 2020,
increasing production in Malaysia to more than
30 kboe/d in 2020. The development of the Jerun field
as Phase 2 of the SK408 development achieved a key
milestone, obtaining the final investment decision in
December 2020 with first gas planned in 2024. The
project is currently pending joint venture partner
approval. This development is expected to contribute
an additional initial production rate of over 30 kboe/d.
Maui A Crestal Infill (New Zealand, OMV 100%)
Drilling operations on the Maui A offshore platform
commenced in October, following an interruption to rig
installation and integration due to COVID-19
restrictions. First gas production was achieved late
2020 and drilling operations are continuing for the
subsequent wells in the campaign.
Maui B IRF Phase 3 (New Zealand, OMV 100%)
The Maui B IRF Phase 3 infill drilling opportunity
targets by-passed natural gas in the Maui reservoir
sands, by sidetracking shut-in wells on the Maui B
offshore platform. Up to six sidetracks are currently
under consideration with a final decision yet to
be made.
Pohokura Depletion Compression (New Zealand,
OMV 74%)
This project increases well deliverability and reserves
recovery thanks to the installation of an electric single-
stage centrifugal compressor. First gas was achieved
from the Pohokura Depletion Compression project in
September. The innovative application of remote work-
ing technologies also made it possible to recover time
lost during construction due to COVID-19 restrictions.
Toutouwai Appraisal (New Zealand, OMV 40%,
SapuraOMV 30%)
Hydrocarbons were discovered in the Toutouwai-1
exploration well during the New Zealand exploration
campaign in April 2020.The campaign was curtailed
before a full logging and testing program could be
executed due to COVID-19 restrictions. An appraisal
well is planned for early 2022 to evaluate the commer-
cial viability of the discovery and coordinate further
development planning.

OMV ANNUAL REPORT 2020 / DIRECTORS’ REPORT
58
Exploration and appraisal highlights
In 2020, OMV completed the drilling of seven
exploration and appraisal wells in five different
countries, two of which were successful.
In Austria, OMV finalized one exploration well started
in 2019.
OMV Petrom drilled one exploration well in Romania,
and two deep exploration wells were tested in the
second half of 2020. One test concluded that reservoirs
seem unlikely to produce, whereas the second
evaluation is still ongoing.
In Norway, the Hades appraisal well was successful.
OMV finalized two exploration wells in New Zealand in
2020. While Tawhaki-1 in the Great South Basin
proved dry, Toutouwai-1 in the Taranaki Basin is a
likely commercial discovery. An appraisal well is
planned for 2022.
In Malaysia, SapuraOMV completed two exploration
wells on block SK408 with non-commercial natural gas
volumes in Remayong.
OMV participated in three 3D seismic surveys
completed in 2020, one in Romania (Hunt/OMV
Petrom), one in Australia (SapuraOMV), and one in
Bulgaria (Total/OMV). In Romania, Hunt/OMV Petrom
completed the 1,583 km² 3D seismic survey (within the
VIII – Urziceni Est license) in February 2020. In March,
SapuraOMV completed a 3D offshore seismic survey
(GEM 3D) covering an area of 420 km² offshore from
Australia in the Vulcan sub-basin. In May, Total/OMV
completed a 3D offshore survey (Han Asparuh 3D)
covering an area of 5,614 km² offshore from Bulgaria.
Due to the current environment (COVID-19, oil price,
budget restrictions), drilling of several exploration wells
was shifted to 2021 or later. Exploration and appraisal
expenditures decreased to EUR 227 mn in 2020 (2019:
EUR 360 mn).
Reserves development
Proved reserves (1P) as of December 31, 2020,
increased to 1,337 mn boe (thereof OMV Petrom1: 473
mn boe). With a one-year Reserve Replacement Rate
(RRR) of 102% (2019: 135%), a value of over 100%
has now been achieved five years in a row. The three-
year RRR reached 138% (2019: 166%). Proved
1 OMV Petrom covers Romania and Kazakhstan.
reserves remained stable despite the challenging
market environment. Major contributions came from
successful drilling and development activities in the
United Arab Emirates, Russia and Norway, and the
positive production performance in Russia, Norway and
New Zealand.
Proved and probable reserves (2P) increased to
2,365 mn boe (thereof OMV Petrom1: 761 mn boe),
remaining broadly stable as well, mostly as a result of
successful development activities in Malaysia and
New Zealand.
Innovation and new technologies
OMV’s Upstream strategy is to apply state-of-the art
technologies developed in-house to well-maintained
assets, to pilot these technologies, and to promote
rapid global implementation. The current focus of
research and development is on improving recovery
rates and extending the lifetimes of mature fields.
OMV applies various enhanced oil recovery methods
which are part of the Smart Oil Recovery 3.0 (SOR 3.0)
program. This enables OMV to increase ultimate oil
recovery by up to 15 percentage points in selected
fields and thus extend the field life. Thanks to further
progress with the rollout of SOR projects, more than
440 kboe of incremental oil was produced by OMV
Austria by the end of 2020. In Austria, the program
continues with eight additional highly slanted wells
scheduled to be drilled in Q1/21.
The two Upstream laboratories OMV Tech Center &
Lab and OMV Petrom Upstream Laboratories (ICPT)
continue to strengthen their partnership for working on
the SOR projects in Romania. The exchange aims to
use the knowledge and experience gained from the
Austrian SOR projects by the Tech Center & Lab in
recent years.

OMV ANNUAL REPORT 2020 / DIRECTORS’ REPORT
59
Increasingly complex reservoir fluid conditions are
resulting in faster degradation of pipelines and
processing equipment. To address this, OMV Upstream
is growing its expertise in the application of
nanotechnology products. A first pilot application in
sucker rod pumping systems of wear- and corrosion-
reducing nanocoatings uncovered the benefits of the
technology. Promising results have also been achieved
in laboratory studies using nanofluids for enhanced oil
recovery by stabilizing emulsions and altering the
wettability of reservoir rocks.
Significant progress has been made with the launch of
the OMV Innovation & Technology Center (ITC) in
Austria. More than 100 guided tours and events were
held between June 2020 and the end of the year, all in
compliance with COVID-19 measures.
Supplementing existing partnerships with leading
international universities, OMV continues to run joint
initiatives with Gubkin Russian State University of Oil
and Gas in Moscow.
Digitalization
Over two years ago, we launched our global Upstream
digital initiative called DigitUP to bring digital
transformation to all value-added areas and regions
where OMV is active. DigitUP’s goal is to bring
innovations from a wide range of industries into OMV's
everyday work, thus making our work safer, more
sustainable, and more profitable.
In 2020, we further strengthened our partnerships with
companies such as Aker BP, Schlumberger, Aucerna,
Microsoft, and Cognite. The aim is to share
experiences and ideas on the digital journey that give
us firsthand access to the latest digital developments.
In 2020, one key area in Subsurface focused on
improving the efficiency of exploration and
development projects by connecting our subsurface
assets with surface information and production facilities
in 3D models.
In New Zealand, condensate optimization for the
Pohokura natural gas field was put into operation,
resulting in a revenue increase while freeing up
engineering time. During the COVID-19 lockdowns, we
used remote certification and virtual site visits to
continue with our offshore production in New Zealand
while complying with restrictions. This avoided
production deferments. Reducing long-distance travel
further resulted in lower risk exposure, lower external
costs, and a CO2 footprint reduction overall.
The newly constructed “Drilling Cockpit” now provides a
location-independent, cross-disciplinary collaboration
environment for critical well-engineering decisions.
Drilling activities are monitored in real time, backed by
historic simulations, and supported by Group-wide
subject matter experts. This makes drilling safer by
reducing potential incidents and keeping losses to a
minimum.
The GeoCloud rollout at all locations enables 540
employees secure access to more than 140
petrotechnical applications and 1 petabyte of data. This
ensures that we can fully utilize our people’s
capabilities while they are working remotely during
COVID-19 from any location with any device.
In December 2020, OMV and Schlumberger
announced a five-year strategic partnership to work on
an enterprise-wide deployment of artificial intelligence
and digital solutions. One aspect of the partnership will
focus on improving data search capabilities and ways
to store and access data. In Subsurface, the pilots have
proven that state-of-the-art applications will shape the
future landscape of subsurface technologies for
exploration and development. The goal is to optimize
the hydrocarbon life cycle in exploration and field
development and to utilize artificial intelligence to
identify prospects and automatically update our
reservoir models. This will contribute to shorter field
development times and improved plan development
economics.

OMV ANNUAL REPORT 2020 / DIRECTORS’ REPORT
60
OMV’s Downstream business refines and markets fuels, chemicals, and gas. It operates three inland
refineries in Europe and holds a strong market position within the areas of its refineries, serving a strong
branded retail network and commercial customers. In the Middle East, it owns 15% of ADNOC Refining
and ADNOC Global Trading. In 2020, OMV increased its share in Borealis to 75%, strengthening its
chemical business and extending the value chain into polymers. In gas, OMV is active along the entire gas
value chain.
At a glance
2020 2019 ∆
Clean CCS Operating Result1 in EUR mn 1,514 1,677 (10)%
thereof petrochemicals in EUR mn 224 241 (7)%
thereof Borealis2 in EUR mn 300 314 (5)%
thereof ADNOC Refining & Trading in EUR mn (107) 8 n.m.
thereof gas in EUR mn 337 194 73%
Special items in EUR mn 1,071 31 n.m.
CCS effects: Inventory holding gains/(losses) in EUR mn (425) 139 n.m.
Operating Result in EUR mn 2,160 1,847 17%
Capital expenditure3 in EUR mn 4,930 2,774 78%
OMV refining indicator margin4 in USD/bbl 2.44 4.44 (45)%
Ethylene/propylene net margin4,5 in EUR/t 400 433 (8)%
Utilization rate refineries 86% 97% (11)
Total refined product sales in mn t 17.81 20.94 (15)%
thereof retail sales volumes in mn t 5.88 6.53 (10)%
thereof petrochemicals in mn t 2.36 2.34 1%
Natural gas sales volumes in TWh 164.01 136.71 20%
Note: As of Q1/20, the reporting structure of the Downstream Business Segment was restructured to comprehensively reflect the operations of the Downstream
business. For comparison only, figures of previous periods are presented in the same structure. 1 Adjusted for special items and CCS effects; further information can be found in Note 4 – Segment Reporting – of the Consolidated Financial Statements 2 Borealis was fully consolidated in OMV’s financials following the closing of the acquisition of the additional 39% stake on October 29, 2020. 3 Capital expenditure including acquisitions; notably the acquisition of an additional 39% stake in Borealis in Q4/20 for USD 4.68 bn and the purchase of a 15%
stake in ADNOC Refining and Trading joint venture for USD 2.43 bn in Q3/19 4 Actual refining and petrochemical margins realized by OMV may vary from the OMV indicator refining margin, the ethylene/propylene net margin, and the market
margins due to factors including different crude oil slate, product yield, operating conditions, or feedstock. 5 Calculated based on West European Contract Prices (WECP) with naphtha as feedstock
Financial performance
At EUR 1,514 mn, the clean CCS Operating Result
declined by 10% compared to the same period of the
previous year (2019: EUR 1,677 mn). Negative effects
of COVID-19 on demand as well as on refining margins
could not be fully offset by a strong natural gas and
retail business and a significant positive contribution of
margin hedges. OMV Petrom’s input to the clean CCS
Operating Result of Downstream amounted to
EUR 448 mn (2019: EUR 387 mn).
The OMV refining indicator margin declined by 45%
to USD 2.4/bbl (2019: USD 4.4/bbl), primarily due to
the negative effects of the COVID-19 pandemic.
Substantially lower middle distillate and lower gasoline
cracks following a weak macro environment put
considerable pressure on refining margins. Lower
feedstock costs, a result of lower crude oil prices, and
improved heavy fuel oil and naphtha margins could not
offset these effects. In 2020, the utilization rate of the
refineries reached a resilient level of 86% (2019: 97%)
despite the imposed lockdown measures related to
COVID-19. At 17.8 mn t, total refined product sales
volumes were down by 15%, following lower demand
as a result of imposed travel restrictions. The
commercial business experienced lower sales volumes,
in particular demand for jet fuel dropped sharply, while
margins in the commercial business remained stable.
The result in the retail business increased despite a
reduction of 10% in retail sales volumes, following
higher margins and a larger share of premium fuels.
The contribution of the petrochemicals business
declined by 7% to EUR 224 mn (2019: EUR 241 mn)
mainly as a consequence of lower petrochemical
margins, which were partially offset by slightly higher
petrochemical sales volumes. The ethylene/propylene
net margin contracted by 8%. While the butadiene net
Downstream

OMV ANNUAL REPORT 2020 / DIRECTORS’ REPORT
61
margin weakened considerably, benzene net margin
decreased to a lesser extent.
The contribution of Borealis slightly decreased to
EUR 300 mn (2019: EUR 314 mn). Following the
acquisition of an additional 39% stake on October 29,
2020, the Borealis result was fully consolidated for the
last two months of 2020. The effect from the full
consolidation was offset by a weaker market
environment, sizeable negative inventory effects as a
consequence of this, and unplanned outages at the
Stenungsund and Porvoo crackers. While polyolefin
margins remained at a healthy level, polyolefin sales
volumes slightly increased due to higher sales in the
packaging sector, partially offset by lower sales in the
automotive sector. The fertilizer business declined
following a solid performance in 2019, mainly as a
result of weaker margins and operational issues in
Q4/20. The contribution from Borouge was down
slightly mainly due to weak market conditions in Asia in
the first half of the year.
In 2020, the contribution of ADNOC Refining &
Trading came in at EUR (107) mn (2019: EUR 8 mn).
As of Q1/20, the ADNOC Refining & Trading result is
calculated based on Current Cost of Supply (CCS) and
excludes inventory holding gains/losses. The adverse
market environment in 2020 weighed on the result. In
addition, the result was negatively impacted by an
extensive turnaround of the Ruwais refinery complex,
which started at the beginning of February and lasted
into Q2/20. Despite challenging market circumstances,
ADNOC Global Trading was successfully launched at
the beginning of December.
The contribution of the gas business grew by 73% to
EUR 337 mn (2019: EUR 194 mn) mainly as a
consequence of the substantially improved power
business in Romania as well as the greatly improved
performance of the storage business and lower
depreciation. Gas Connect Austria is reclassified as an
asset held for sale. The power business in Romania
provided strong support thanks to favorable forward
contracts, increased revenues from the electricity
balancing market, and a one-off revenue recovery
stemming from a 2019 power price regulation. Natural
gas sales volumes rose significantly from 136.7 TWh
to 164.0 TWh, driven by higher sales volumes in
Germany, the Netherlands, Belgium, and Austria.
Net special items amounted to EUR 1,071 mn (2019:
EUR 31 mn). With the closing of the Borealis
transaction, OMV realized a step-up in the valuation of
the previous 36% share in Borealis and booked a
special item of around EUR 1.3 bn. CCS effects of
EUR (425) mn were caused by the sharp drop in crude
oil prices in the first half of 2020. As a result, the
Operating Result of Downstream increased by
EUR 313 mn to EUR 2,160 mn (2019: EUR 1,847 mn).
Capital expenditure in Downstream amounted to
EUR 4,930 mn (2019: EUR 2,774 mn) and was mainly
related to the acquisition of an additional 39% stake in
Borealis for USD 4.68 bn. In 2019, capital expenditure
included the acquisition of a 15% stake in ADNOC
Refining and Trading Joint Venture for USD 2.43 bn.
Organic capital expenditure in 2020 was predominantly
related to investments in the European refineries and in
Borealis.
Business overview
Downstream refines and markets fuel products in
Central and Eastern Europe as well as in the Middle
East through OMV’s 15% interest in ADNOC Refining
and ADNOC Global Trading. OMV is strongly forward
integrated into chemicals and recently expanded its
value chain into polymers by acquiring a controlling
interest in Borealis, one of the world’s leading polyolefin
producers. Borealis has a strong European footprint
and is active in the Middle East and Asia-Pacific
through Borouge, a joint venture with ADNOC, and in
North America where Borealis and Total are partners in
the Baystar joint venture.
OMV’s European Downstream business model is
characterized by a high degree of physical integration
along the value chain from crude supply to refining,
retail, and commercial sales. Total refined product
sales amounted to 17.8 mn t. Commercial fuel
customers are mainly from industrial transportation and
construction sectors and account for more than 50% of
the sales volume. Petrochemicals customers comprise
around 13%. The strongly branded retail network
comprises 2,085 filling stations and accounts for
approximately 33% of the total marketed volume.
The gas business operates across the entire gas value
chain from the wellhead to the burner tip. It includes the
Group’s power business activities with one gas-fired
power plant in Romania. Natural gas sales volumes
amounted to 164.0 TWh.
Refining including product supply and sales
Throughout 2020, refining margins came under
significant pressure. From the second quarter onward,
demand for oil products dropped to unforeseen levels
because of the mobility restrictions associated with the
COVID-19 pandemic. At the peak of the crisis, during

OMV ANNUAL REPORT 2020 / DIRECTORS’ REPORT
62
the second quarter of 2020, global demand has fallen
by 16% compared with 2019.
The biggest contributor to the drop in oil demand was
the transportation sector, particularly jet fuel, because
air traffic was almost entirely halted as a result of
international lockdowns. Refineries quickly adapted
their processes to the new supply requirements by way
of yield shifts and run cuts, but product inventories filled
up quickly. Demand for middle distillates, primarily
diesel, partly supported by a particularly strong
economic recovery in Asia, did not compensate for this
development, and pressure on the supply-demand
balance remained in place.
Many refiners blended surplus jet fuel into diesel and
delivered this to the market, resulting in inflated stocks.
Naphtha gradually came under pressure due to
increasing competition from less expensive LPG.
Gasoline and middle distillates suffered due to difficult
market conditions, while heavy products gained an
advantage from continuous sour oil strength as OPEC+
cut supply by record high volumes. Rising crude prices
toward the end of the year added more pressure,
leading to lower-than-average refining margins.
Although demand was significantly lower, the sales
unit’s commercial margin remained close to its 2019
level. Inland premia for the spot market came under
severe pressure in 2020, due to a lack of spot demand
and the excess supply caused by COVID-19. Reduced
local demand was balanced out by increased sales in
out-trading markets, which supported refinery
utilization. The heating oil business was a significant
contributor to the overall result, since heating oil
demand was relatively strong due to favorable prices.
This was a result of weaker crude oil prices.
At OMV’s Schwechat and Burghausen refineries,
production was partly shifted toward the production of
petrochemicals to adjust to the drop in jet fuel demand.
Despite the challenging COVID-19 market situation, the
utilization rate of OMV’s European refineries still
reached 86%.
ADNOC Refining and Trading
Alongside majority shareholder ADNOC (65%) and Eni
(20%), OMV became a strategic partner in ADNOC
Refining by acquiring 15% of the company’s shares at
the end of July 2019. ADNOC Refining owns a total
capacity of 922 kbbl/d comprising its Abu Dhabi refinery
(85 kbbl/d) and its two major refineries in Ruwais.
Together these constitute the world’s fourth largest
refining complex with integrated petrochemicals.
ADNOC Refining’s business performance in 2020 was
impacted by a major planned turnaround at both
Ruwais refineries in the first half of the year. This was
compounded by the significant ripples on the refining
market caused by the global COVID-19 pandemic.
The turnaround allowed ADNOC Refining to implement
a series of technical improvements in the major plants
in the Ruwais refineries. These were put in place in the
hydroskimming and conversion sections such as the
Residue Fluid Catalytic Cracking (RFCC) plant, which
is the key unit for upgrading bottom-of-the-barrel
components. This in turn lifts the refining margin.
With the same ownership structure as ADNOC
Refining, ADNOC Global Trading (AGT) has the
mission to trade the majority of ADNOC Refining’s
export volumes of products as well as supplying non-
domestic crudes, condensates, and other liquids for
processing.
AGT extends the successful Downstream business
model into key geographies and to strategic partners.
By continuously optimizing trade flows, it allows
ADNOC Refining to access attractive non-domestic
feedstock sources, maximize netback for products on
global markets (e.g., Asia-Pacific), and implement best
practices such as risk management.
Despite unprecedented market circumstances, AGT
went live on December 8, 2020, and executed its first
trades before the end of the year.
Annual refining capacities
In kbbl/d
Schwechat (Austria) 204
Burghausen (Germany) 79
Petrobrazi (Romania) 86
ADNOC Refining (United Arab Emirates)1 138
Total 507
1 Equivalent to OMV‘s 15% share in ADNOC Refining
Petrochemicals
Petrochemical margins fell below the 2019 average,
reflecting lower global GDP growth rates and new
production capacities going online mainly in Asia. After
a strong first quarter, driven by a sharp decline in
naphtha prices, average ethylene and propylene
margins decreased. Overall, they came in below the
previous year’s level. Butadiene margins were
impacted by collapsing demand in the automotive
industry. This was because the primary use for
butadiene is the production of Styrene Butadiene
Rubber (SBR), which is mainly used in the manufacture

OMV ANNUAL REPORT 2020 / DIRECTORS’ REPORT
63
of automobile tires. The benzene oversupply and an
ever-weaker demand environment put heavy pressure
on margins, which gradually recovered from July 2020
onward. Increased petrochemical sales volumes helped
mitigate the negative margin impact from the COVID-19
crisis.
Due to the excellent flexibility of the production plants in
the Schwechat and Burghausen refineries, some
production was successfully shifted to petrochemicals
to adjust to the new market requirements caused by
COVID-19.
Borealis
Borealis is a leading provider of base chemicals,
polyolefins, and fertilizers. Its drive towards “Value
Creation through Innovation” is a cornerstone of its
successful business. The company is the second-
largest polyolefin producer in Europe and among the
top ten producers globally, with a total capacity of
5.7 mn t of polyolefins.
Key projects
In January 2020, Borealis and NOVA Chemicals
announced an agreement whereby Borealis would buy
NOVA Chemicals’ 50% ownership interest in Novealis
Holdings. The acquisition was completed in April 2020.
The two companies had established the holding
company in 2018. Subsequently, they formed a 50:50
joint venture with Total Petrochemicals & Refining USA
to create a new Houston-based company – Bayport
Polymers (also known as Baystar). The Baystar project
involves the construction of an ethane-based steam
cracker in Port Arthur, which will supply approximately
1 mn t/y of ethylene. The facility’s ethylene will be used
to feed both the existing 400 kt per year polyethylene
unit and the new 625 kt per year Borstar polyethylene
unit being built. Both Baystar projects have moved
ahead, despite disruptions to supply chains around the
world, due to the COVID-19 pandemic.
In June, a propylene splitter, one of the largest single
pieces of equipment ever shipped, arrived safely at the
construction site of the new world-scale propane
dehydrogenation (PDH) plant at the existing Borealis
production site in Kallo, Belgium. Borealis’ new PDH
plant is Borealis’ most significant investment in Europe,
amounting to approximately EUR 1 bn. The plant will
have a targeted annual production capacity of 750 kt
per year, making it one of the largest and most efficient
facilities in the world.
Borealis announced that its new naphtha cavern in
Porvoo, Finland has been safely commissioned as of
October 2020. After investing around EUR 25 mn in the
construction of this innovative 80,000 m3 facility,
Borealis has become more independent and flexible.
The company can now source naphtha for its Porvoo
operations from the global market and store it in a more
versatile, cost-efficient, and secure way. The cavern
can also accommodate renewable naphtha, making it
possible for Borealis customers to draw on certified
renewable polypropylene and polyethylene, as well as
renewable base chemicals (ethylene, propylene, and
phenol) in the future.
In August 2020, Borealis announced the successful
acquisition of a controlling stake in South Korean
compounder DYM Solution Co. Ltd. The acquisition
solidifies Borealis’ position as a partner of choice for
global wire and cable customers, helping to meet the
growing needs and requirements of the wire and cable
industry today and in the future.
At the Borouge 3 complex in Ruwais, UAE, the
construction of another major growth project, the fifth
Borstar polypropylene plant (PP5), is nearing
completion. The Borouge 4 project is also moving
ahead towards successful completion of the FEED
(Front-End Engineering and Design) phase.
Circular economy
Borealis continues to invest in its recycling technologies
and facilities. One example of recycling innovation is
the ReOil® cooperation with OMV. The patented OMV
ReOil® technology is used to chemically recycle post-
consumer plastics into raw materials, which are then
used by Borealis to produce polyolefins. Leading
European multinational Nestlé has become the first
Borealis customer to use the ISCC PLUS-compliant
polyolefins in consumer goods packaging.
In September, Borealis announced the launch of the
Bornewables™ portfolio. These premium polyolefin
products are manufactured with renewable feedstock,
derived entirely from waste and residue streams.
Bornewables boast the same material performance as
virgin polyolefins, with a smaller carbon footprint.
Borcycle™ is a proprietary state-of-the-art technology
launched in 2019. It transforms plastic waste streams
into value-adding, versatile recycled polyolefins. These
serve as the foundation for an increasing number of
more sustainable products and applications in the rigid
packaging segment. In September, Borealis and
MENSHEN, a leading specialist for plastic closures,
launched a series of new packaging closures for
laundry and homecare applications based on
Borcycle™ UG522MO, a PP compound containing
50% post-consumer-recycled content.

OMV ANNUAL REPORT 2020 / DIRECTORS’ REPORT
64
R&D
In June 2020, the Austrian business magazine trend
and ÖGVS, the Austrian society for consumer studies,
organized the inaugural Innovation Award 2020/2021
for Austria’s most imaginative companies. Borealis is
proud to have achieved second place with 12 awards
and 649 patents.
One important step-change innovation launched by
Borealis in 2014 is now powering the Energiewende –
or energy transition – in Germany. Crosslinked
polyethylene (XLPE) power cables made with Borealis
extruded high-voltage direct current (HVDC) technology
are being used for the majority of the so-called German
corridor projects. This is the first time that Borlink™
XLPE HVDC technology is being used at extra-high
levels of 525 kilovolts (kV). The Borlink cables will be
implemented in the northern part of the SuedOstLink
and along the entire SuedLink corridor, thereby
enabling the transmission of renewable energy from
north to south with minimal loss.
Retail
Despite a challenging environment due to the COVID-
19 pandemic, the retail business exceeded the 2019
Operating Result. The COVID-19-driven decline in fuel
sales was more than offset by higher fuel margins, an
increased share of premium fuels, and cost reductions.
As a result, the retail business again proved to be a
stable outlet for refinery products and a strong cash
generator. Total sales declined by 10% to 5.9 mn t,
equivalent to approximately 7.2 bn l. At the end of the
year, the network comprised 2,085 filling stations
(2019: 2,075). OMV continues to focus on its
successful multi-brand strategy. The OMV brand is
positioned as a premium brand, with VIVA representing
a strong shop, gastronomy, and service offering. The
Avanti brand of unmanned filling stations represents
the discount segment, while the Petrom brand
represents value for money. This strategy has
continued to deliver great results, and profitability per
site has increased. Sales of OMV’s premium
MaxxMotion-brand fuels have reached an all-time high
at approximately 843 mn l, proving the premium-quality
advantage, even during the COVID-19 crisis. The non-
fuel business, including the VIVA convenience stores
and car washes, continued to perform well, although
this segment experienced a 13% decline due to the
COVID-19 pandemic. The focus on high-quality
products and services in the premium filling station
network remains one of OMV’s key differentiators. Our
new VIVA private-label products, such as VIVA iced
coffee and snacks, contributed to an improved retail
result as well.
In December 2020, a divestment agreement was
signed with EG Group for 285 filling stations in the
OMV network in Germany. This will turn OMV’s
strategic focus toward sustainable and profitable
growth in petrochemicals.
Gas supply, marketing, and trading
OMV markets and trades natural gas in nine European
countries and Turkey. In 2020, natural gas sales
volumes amounted to 164.0 TWh (2019: 136.7 TWh),
an increase of 20%. The foundation for gas sales
growth is a diverse supply portfolio, which consists of
equity gas and a variety of international suppliers. In
addition to mid- and long-term activities, short-term
activities at the main international hubs (VTP, NCG,
GASPOOL, TTF, PSV) complement OMV’s dynamic
supply portfolio.
OMV Gas Marketing & Trading GmbH’s (OMV Gas)
sales activities are focused on a diverse and resilient
customer portfolio in the large-scale industry and
municipality segments. OMV Gas conducts sales
activities in Austria, Germany, Hungary, the
Netherlands, and Belgium, where 2020 sales amounted
to 114.8 TWh, up 30% over 2019. Italy, Slovenia, and
France are covered by origination activities. Increased
sales are a substantial achievement given the
challenging market environment. Margins remained
under pressure due to a competitive and increasingly
volatile European gas market, a situation expected to
continue.
In Germany, OMV Gas is well on track to reach its goal
of a 10% market share by 2025. In 2020, sales reached
52.4 TWh, an increase of 31% over 2019. Its market
share was 7% at year-end.
In Romania, OMV Petrom gas and power activities
delivered an excellent operating result, reflecting strong
power business performance and the optimization of
both product and customer portfolios. Natural gas sales
volumes to third parties reached 47.7 TWh in 2020, a
slight increase compared to 47.2 TWh in 2019. Starting
in July 2020, ANRE initiated a gas release program in
Romania, whereby gas producers are obligated to offer
30% of their production volume to the centralized
markets.
In Romania, net electrical output increased to 4.2 TWh
in 2020 (2019: 3.4 TWh), with the Brazi power plant
contributing approximately 7% of Romania’s electricity
production. It is also an important player on the power
balancing market.

OMV ANNUAL REPORT 2020 / DIRECTORS’ REPORT
65
In 2020, OMV Gas again substantially improved the
capacity utilization of the Gate regasification terminal.
Furthermore, the LNG business provides an additional
gas source to meet OMV’s ambitious sales growth
targets in Northwest Europe, while enhancing supply
security for OMV’s geographically diverse supply
portfolio. The LNG business also supports portfolio
integration of the supply, marketing, and trading
businesses.
Gas logistics
OMV operates gas storage facilities in Austria and
Germany with a storage capacity of 30 TWh.
Additionally, OMV holds a 65% stake in the Central
European Gas Hub (CEGH), the leading gas trading
hub in Central and Eastern Europe. OMV’s subsidiary
Gas Connect Austria operates an approximately 900
km-long high-pressure natural gas pipeline network in
Austria. On September 23, 2020, OMV signed an
agreement to divest its entire 51% stake in Gas
Connect Austria to VERBUND. Closing of the
transaction is subject to regulatory approvals and is
expected in the first half of 2021.
In 2020, the storage market was again characterized by
strong customer demand and higher market prices due
to large summer/winter spreads and volatility. At the
European hubs, summer/winter spreads for winter
2020/21 reached levels significantly above previous
years. After a relatively high filling level at the end of
last winter, strong customer demand meant that
Austrian storage facilities were utilized at more than
90% capacity.
At around 510 TWh, actual entry/exit transportation
volumes in Eastern Austria (Regelzone Ost) were lower
than in 2019 mainly due to generally high storage
levels at the beginning of the year and reduced
consumption as a consequence of COVID-19.
Utilization of the entries from Germany into Austria was
particularly low. The exit point to Hungary maintained
the high activity level of 2019, and the nominations at
the Baumgarten exit point into Slovakia were
surprisingly positive.
At the Central European Gas Hub, 827 TWh of natural
gas was nominated at the Virtual Trading Point (VTP)
in 2020, an increase of 10% compared with 2019 and a
new all-time high. This volume corresponds to approxi-
mately nine times Austria’s annual gas consumption.
The EEX CEGH Gas Market was successfully trans-
ferred from the PEGAS platform to EEX Gas as of
January 2020. Traded volumes totaled 165 TWh in
Austria and 13 TWh in the Czech Republic in 2020.
OMV is a financing partner of the Nord Stream 2
project. In the second quarter 2020, OMV provided
funds of EUR 17.5 mn, bringing OMV’s total payments
under the financing agreements for Nord Stream 2 to
EUR 729.3 mn.
Innovation and new technologies
OMV actively explores alternative feedstock,
technologies, and fuels with the aim of developing a
well-diversified, competitive future portfolio. Efforts and
resources focus on chemical recycling for post-
consumer plastic waste. Additional attention is given to
the production of conventional and advanced biofuels,
synthetic fuels, and green hydrogen as future fuels for
the hard-to-electrify transportation segment, and as
precursors for sustainable chemicals.
OMV’s ReOil® proprietary thermal cracking technology
was developed to meet the European Commission’s
targets for the circular economy and to fulfill future
packaging recycling quotas. The ReOil® plant with a
capacity of 100 kg/h at the Schwechat refinery is
already recycling post-consumer and post-industrial
plastics into synthetic crude oil in a pyrolysis process.
This synthetic crude is then processed mainly into
monomers and other hydrocarbons in the Schwechat
refinery. OMV and Borealis are pursuing the clear
ambition of becoming a leading player in chemical and
mechanical recycling technologies.
Furthermore, OMV has taken steps to implement the
Co-Processing technology in the Schwechat refinery.
This technology enables OMV to process biogenic
feedstocks (e.g., domestic rapeseed oil) together with
fossil-based materials in an existing refinery
hydrotreating plant during the fuel refining process. The
final investment decision of around EUR 200 mn for
converting a refinery plant to produce 160,000 t of
biofuels per year was made in 2020. This will reduce
OMV’s carbon footprint by up to 360,000 t by
substituting fossil diesel. Operations are scheduled to
begin by 2023.
OMV signed a supply contract with AustroCell Hallein
to supply OMV with advanced bioethanol totaling up to
1.5 mn l per month starting in January 2021. This will
reduce emissions by around 45,000 t of CO2 per year.
Unlike conventional biofuels, advanced fuels do not
compete with food production. The amount that can be
blended into the fuel pool is not capped, as is the case
with waste-based fuels. The principal sources of
advanced fuels include biomass fraction from mixed
municipal or industrial waste, straw, animal manure, or

OMV ANNUAL REPORT 2020 / DIRECTORS’ REPORT
66
residues from forestry and wood processing as well as
waste streams. OMV is developing its own proprietary
technology to convert one of these biomasses into
advanced fuel. The next step is a pilot plant at the
Schwechat refinery. OMV also collaborates with
technology providers, industry partners, and academic
institutions to produce advanced biofuels at scale.
Synthetic fuels, which are made of CO2 and hydrogen,
are a key technology for decarbonizing the aviation
industry. OMV is working on two development projects,
C2PAT and E-Fuels, to convert CO2 from industry off-
gases into e-fuels with the goal of reaching industry
scale by the end of the decade.
OMV and its partners working on the UpHy project,
intend to produce green hydrogen for use in both the
mobility sector and the refining process. OMV is
developing an electrolysis plant at the Schwechat
refinery for this purpose, to be powered with renewable
electricity, to produce zero-carbon hydrogen. The green
hydrogen will initially be used for fuel hydrogenation.
However, the ultimate goal is to develop commercial
hydrogen fuel cells for transportation applications such
as commercial buses and trucks. As a pioneer in
hydrogen mobility, OMV operates five hydrogen filling
stations in Austria. In 2020, OMV together with Daimler
Trucks AG, IVECO, Shell, and the Volvo Group
launched the H2Accelerate program. These partners
committed to creating the conditions necessary for a
mass-market roll-out of hydrogen trucks in Europe.
Fleets are expected to operate first in regional clusters
and along European high-capacity corridors. Over time,
the clusters are going to be interconnected into a pan-
European network.
OMV is actively involved in the development of
alternative energy sources for major mobility
applications in line with market developments for
emission reductions.
OMV holds 40% of SMATRICS, Austria’s largest e-
mobility provider, and works together with IONITY on
high-power charging solutions in the CEE region. With
the OMV e-mobility card, ROUTEX customers can
seamlessly use their energy source of choice at a
range of roaming partners all over Europe.
Compressed natural gas (CNG) and liquefied natural
gas (LNG) can reduce CO2 and particulate emissions
from vehicles by 20% and 90%, respectively. OMV will
unlock this potential by opening its first LNG station in
Austria in 2021. The station will offer LNG as an
alternative fuel for heavy-duty vehicles.
During 2020, OMV began installing photovoltaic panels
on more than 90 stations in multiple countries with the
aim of continuing this expansion in 2021. This will
reduce the stations’ carbon footprint and improve the
economic efficiency of operations.
Digitalization
In 2020, OMV anchored digitization in its business
strategy. The focus was on immediate value creation,
delivered by teams from the business units.
Digitalization projects have fostered customer retention,
excellence in optimizing processes and assets, and a
collaborative and empowered internal culture. Our
spend on digital growth and transformation initiatives
has increased to two-thirds of our digital expenditure,
making us a cross-industry digital leader.
Customer retention efforts have resulted in loyalty
growth across both segments and geographies. In
2020, nearly 50% of fuel customers regularly placed
online orders, which demonstrates our ability to scale
digital platforms through a crisis.
Another COVID-19 adaptation involved our refineries
using complex computing power to switch almost
instantly from jet fuel production to manufacturing
petrochemical raw materials. This compensated for the
diminished demand for kerosene and secured 10
percentage points of refinery utilization during the
lockdown.
A focus on data for decision-making has enabled us to
know our customers better. By combining data with
smart analysis and machine learning algorithms, the
retail business has begun identifying buying patterns at
our filling stations and making sure they never run out
of fuel or supplies. Data insights helped us reshape the
pricing framework and deliver predictable returns from
fuels and petrochemical customers.
Gas trading is using an automated tool with 15 different
algorithms to execute non-stop automated deals in
milliseconds to secure reliable gas supplies for all of
OMV’s customers.
The installation of GPS trackers in 3,000 rail tank cars
along with new software is enabling active fleet
management, fleet optimization, and reduced produc-
tion losses. This activity is forecast to bring a financial
benefit of more than EUR 2 mn within four years.

OMV ANNUAL REPORT 2020 / DIRECTORS’ REPORT
67
Across tank farms and refineries, 9 out of 22 terminal
automation roll-outs are complete. This will result in
70% (DE) and 60% (RO) reductions in equivalent
operating costs in 2021. Over five years, the savings
will be around EUR 7 mn.
Both routine work and projects have benefited from a
drive to increase automation. More than 50,000
robotics process automation hours have been logged,
resulting in better workload management and enabling
employees to give attention to activities that require
their cognitive skills.
These digitalization achievements are the result of
strong cross-disciplinary collaboration with operations,
sales, and IT teams who contribute complementary
expertise. DigitalMotion is our Downstream-wide
digitalization umbrella. It has become a collaboration
hub where tools, methodologies, and ideas are shared.
A digital enthusiast community of nearly 400 employ-
ees has been established. The community is sharing
learning and experiences about digitalization across
disciplines and business units, including Borealis. The
Digital Bootcamp has been a development gateway for
employees who are adopting customer-oriented design
thinking and agile scrum techniques, which speed up
the implementation of ideas.

OMV ANNUAL REPORT 2020 / DIRECTORS’ REPORT
68
Following the reorganization of the OMV Group,
starting with Q1/21 OMV will change its reporting
structure. The business segments will be reported as
follows: Exploration & Production, Refining &
Marketing, and Chemicals & Materials.
Market environment
For 2021, OMV expects the average Brent crude oil
price to be in the range between USD 50/bbl and
USD 55/bbl (2020: USD 42/bbl). In 2021, the average
realized gas price is anticipated to be higher than
EUR 10/MWh (2020: EUR 8.9/MWh).
Group
In 2021, organic CAPEX is projected to come in at
around EUR 2.7 bn, including non-cash effective
CAPEX related to leases of around EUR 0.2 bn.
Exploration & Production
OMV expects total production to be at around
480 kboe/d in 2021 (2020: 463 kboe/d), depending on
the security situation in Libya and production cuts
imposed by governments.
Organic CAPEX for Exploration & Production is
anticipated to come in at EUR 1.1 bn in 2021.
In 2021, Exploration and Appraisal (E&A) expenditure
is expected to be at around EUR 230 mn (2020:
EUR 227 mn).
Refining & Marketing
The OMV refining indicator margin is expected above
the previous year’s level (2020: USD 2.4/bbl).
Total refined product sales in 2021 are projected to be
higher compared to 2020 (2020: 17.8 mn t). In OMV’s
markets, retail margins are forecast to be lower than in
2020 and commercial margins are predicted to be
higher than the prior-year level.
The utilization rate of the European refineries is
expected to remain at the prior-year level (2020: 86%).
In 2021, there is no major turnaround planned for our
refineries in Europe.
Natural gas sales volumes in 2021 are projected to be
above those in 2020 (2020: 164 TWh).
Organic CAPEX in Refining & Marketing and Corporate
are forecast at around EUR 0.7 bn.
Chemicals & Materials
The European ethylene indicator margin is expected to
be at the prior year’s level (2020: EUR 435/t). The
European propylene indicator margin is projected to be
at the prior year’s level as well (2020: EUR 364/t).
The polyethylene sales volume of Borealis AG in 2021
is projected to be slightly above the prior-year level
(2020: 1.76 mn t). The polypropylene sales volume of
Borealis AG is expected to be in line with the prior-year
level (2020: 2.12 mn t).
The European polyethylene indicator margin in 2021 is
forecast to be above the previous year’s level (2020:
EUR 350/t). The European polypropylene indicator
margin is expected to be above the previous year’s
level. (2020: EUR 413/t).
Organic CAPEX related to Chemicals & Materials
amount to around EUR 0.9 bn.
For information about the longer-term outlook, see
Strategy.
Outlook

OMV ANNUAL REPORT 2020 / DIRECTORS’ REPORT
69
Like the oil, gas and petrochemical industry as a whole, OMV is exposed to a variety of risks – including
market and financial risks, operational risks, and strategic risks. The Group’s risk management processes
focus on identification, assessment, and evaluation of such risks and their impact on the Group’s financial
stability and profitability. The objective of these activities is to actively manage risks in the context of the
Group’s risk appetite and defined risk tolerance levels in order to achieve OMV’s long-term strategy.
It is OMV’s view that the Group’s overall risk is
significantly lower than the sum of the individual risks
due to its integrated nature and the fact that various
risks partially offset each other. The balancing effects
of industry risks, however, can often lag or weaken.
OMV’s risk management activities therefore focus on
the net risk exposure of the Group’s existing and future
portfolio. The interdependencies and correlations
between different risks are also reflected in the
Company’s consolidated risk profile. Risk management
and insurance activities are centrally coordinated at the
corporate level by the Treasury and Risk Management
department. This department ensures that well-defined
and consistent risk management processes, tools, and
techniques are applied across the entire organization.
Risk ownership is assigned to the managers who are
best suited to oversee and manage the respective risk.
The overall objective of the risk policy is to safeguard
the cash flows required by the Group and to maintain a
strong, investment-grade credit rating in line with the
Group’s risk appetite.
OMV is closely monitoring the development of the
consequences of the COVID-19 pandemic and
regularly evaluating the impact on the Group’s cash
flow and liquidity position. OMV is responding to the
situation with targeted measures to safeguard the
Company’s economic stability and the secure supply of
energy. The health and wellbeing of every employee is
our top priority. At the same time, OMV is implementing
targeted measures to preserve the Company’s financial
strength, namely reduction of investments, cost cutting,
and postponing acquisition projects.
Enterprise-Wide Risk Management
Non-financial and financial risks are regularly identified,
assessed, and reported through the Group-wide
Enterprise-Wide Risk Management (EWRM) process.
The main purpose of the OMV Group’s EWRM process
is to deliver value through risk-based management and
decision-making, which is ensured by applying a “three
lines of defense model” (1. business management, 2.
risk management and oversight functions, 3. internal
audit). The assessment of financial, operational, and
strategic risks helps the Group leverage business
opportunities in a systematic manner. This ensures that
OMV’s value grows sustainably. Since 2003, the
EWRM system has helped enhance risk awareness
and improve risk management skills across the entire
organization, including at subsidiaries in more than 20
countries. The OMV Group is constantly enhancing the
EWRM process based on internal and external
requirements.
A cross-functional committee chaired by the OMV
Group’s CFO with senior management members of the
OMV Group – the Risk Committee – ensures that the
EWRM process effectively captures and manages
material risks across the OMV Group.
The process is facilitated by a Group-wide IT system
supporting the established individual process steps:
risk identification, risk analysis, risk evaluation, risk
treatment, reporting, and risk review through
continuous monitoring of changes to the risk profile.
The overall risk resulting from the bottom-up risk
management process is computed using Monte Carlo
simulations and compared against planning data. This
is further combined with a top-down approach from the
senior management view to capture the risks inherent
in the strategy. The process also includes companies
that are not fully consolidated. Twice a year, the results
from this process are consolidated and presented to
the Executive Board and the Audit Committee. In
compliance with the Austrian Code of Corporate
Governance, the effectiveness of the EWRM system is
evaluated by the external auditor on an annual basis.
The key non-financial and financial risks identified with
respect to OMV’s medium-term plan are:
▸ Financial risks including market price risks and
foreign exchange risks
▸ Operational risks including all risks related to
physical assets, production risks, project risks,
personnel risks, IT risks, HSSE, and regulatory/
compliance risks
▸ Strategic risks arising, for example, from changes in
climate change, technology, risks to reputation, or
political uncertainties, including sanctions
Financial risk management
Market price and financial risks arise from volatility in
the prices of commodities including the market price
risks from European Emission Allowances, foreign
Risk Management

OMV ANNUAL REPORT 2020 / DIRECTORS’ REPORT
70
exchange (FX) rates, and interest rates. Also of
importance are credit risks, which arise from the
inability of a counterparty to meet a payment or delivery
commitment. As an oil, gas and petrochemical
company, OMV has a significant exposure to oil and
gas prices. Substantial FX exposures include the USD,
RON, NOK, NZD, SEK and RUB. The Group has a net
USD long position mainly resulting from oil production
sales. The comparatively less significant short positions
in RON, NOK, NZD, SEK and RUB originate from
expenses in local currencies in the respective
countries.
Management of market price risk, FX risk, European
Emission Allowances
The analysis and management of financial risks arising
from foreign currencies, interest rates, commodity
prices, European Emission Allowances, counterparties,
liquidity, and insurable risks are consolidated at the
corporate level. Market price risk is monitored and
analyzed centrally in respect of its potential cash flow
impact using a specific risk analysis model that
considers portfolio effects. The impact of financial risks
(e.g., market prices, currencies) on the OMV Group’s
cash flow and liquidity are reviewed quarterly by the
Risk Committee, which is chaired by the CFO and
comprises the senior management of the business
segments and corporate functions.
In the context of market price risk and FX risk, the OMV
Executive Board decides on hedging strategies to
mitigate such risks whenever deemed necessary. OMV
uses financial instruments for hedging purposes to
protect the Group’s cash flow from the potential
negative impact of falling oil and gas prices in the
Upstream business.
In the Downstream business, OMV is especially
exposed to volatile refining and petrochemical margins
and natural gas prices, as well as inventory risks.
Corresponding optimization and hedging activities are
undertaken in order to mitigate those risks. Those
include margin hedges as well as stock hedges. An
optimization, trading and hedging risk control
governance system defines clear mandates including
risk thresholds for such activities. In addition, Emission
Compliance Management ensures a balanced position
of emission allowances by selling the surplus or
covering the gap.
Management of interest rate risk
To balance the Group’s interest rate portfolio, loans can
be converted from fixed to floating rates and vice versa
according to predefined rules. OMV regularly analyzes
the impact of interest rate changes on interest income
and expense from floating rate deposits and
borrowings. Currently the effects of changes in interest
rates are not considered to be a material risk.
Management of credit risk
Significant counterparty credit risks are assessed,
monitored, and controlled at the Group and segment
level using predetermined credit limits for all
counterparties, banks, and security providers. The
procedures are governed by guidelines at the OMV
Group and OMV Petrom level. Based on the high
economic uncertainty resulting from the COVID-19
pandemic, special attention is paid to early warning
signals like changes in payment behavior.
Operational risks
The nature of OMV’s business operations exposes the
Group to various health, safety, security, and
environmental (HSSE) risks. Such risks include the
potential impact of natural disasters as well as process
safety and personal security events. Other operational
risks comprise risks related to the delivery of capital
projects or legal/regulatory non-compliance. All
operational risks are identified, analyzed, monitored,
and mitigated following the Group’s defined risk
management process.
Control and mitigation of assessed risks takes place at
all organizational levels using clearly defined risk
policies and responsibilities. The key Group risks are
governed centrally to ensure the Group’s ability to meet
planning objectives through corporate directives,
including those relating to health, safety, security,
environment, legal matters, compliance, human
resources, and sustainability.
OMV puts a special emphasis on five Sustainability
Strategy areas: HSSE; Carbon Efficiency; Innovation;
Employees; Business Principles and Social
Responsibility. OMV Executive Board members
regularly (at least quarterly) discuss current and
upcoming environmental, climate, and energy-related
policies and regulations; related developments in the
fuels and gas market; the financial implications of
carbon emissions trading obligations; the status of
innovation project implementation; and progress on
achieving sustainability-related targets. OMV focuses
on assessing the potential vulnerabilities of the
Company to climate change (e.g., water deficiency,
droughts, floods, landslides), the impact of the
Company on the environment, and the mitigation
actions that will ensure a successful transition to a low-
carbon environment (e.g., carbon emission reduction,
compliance with new regulatory requirements).

OMV ANNUAL REPORT 2020 / DIRECTORS’ REPORT
71
As OMV’s activities rely on information technology
systems, the Group may experience disruption due to
major cyber events. Security controls are therefore
implemented across the Group to protect information
and cyber assets that store and process information.
IT-related risks are assessed, monitored regularly, and
managed actively with dedicated information and
security programs across the organization.
Strategic risks
In order to identify strategic risks which might have
potential long-term effects on the Company’s objectives
OMV continuously monitors its internal and external
environment.
OMV operates and has financial investments in
countries that are subject to political uncertainties, in
particular Libya, Kazakhstan, Yemen, Russia, Brazil,
and Tunisia. Possible political changes may lead to
disruptions and limitations in production or an
increased tax burden, restrictions on foreign ownership,
or even nationalization of property. However, OMV has
extensive experience in dealing with the political
environment in emerging economies. Political
developments in all markets where OMV operates are
observed continually. Country-specific risks are
assessed before entering new countries.
OMV also evaluates the risk of potential US or EU
sanctions and their impact on planned or existing
operations. The aim here is to stay in full compliance
with all applicable sanctions. In particular, risks due to
political and regulatory developments both inside and
outside of Europe with potential unfavorable effects on
the Nord Stream 2 project and on OMV’s activities in
Russia are regularly assessed and monitored.
OMV consistently evaluates the Group’s exposure to
risks related to climate change in addition to the market
price risk from European Emission Allowances. Such
risks comprise the potential impact of acute or chronic
events like more frequent extreme weather events, or
systemic changes to our business model due to a
changing legal framework, or substitution of OMV’s
products due to changing consumer behavior. OMV
recognizes climate change as a key global challenge.
We thus integrate the related risks and opportunities
into the development of the Company’s business
strategy. Measures that we implement to manage or
mitigate such risks are set out in the relevant sections
of this report, particularly in Sustainability and Strategy.
Through systematic employee succession and
development planning, Corporate Human Resources
targets suitable managerial employees to meet future
growth requirements in order to mitigate personnel
risks.
For further details on risk management and the use of
financial instruments, please refer to Note 28 of the
Consolidated Financial Statements.
For further details on climate-change-related risks and
their management, see the OMV’s Sustainability Report.
For further details on health, safety, security, and
environmental risks, please refer to the chapter Health,
Safety, Security, and Environment in the Directors’ Report.

OMV ANNUAL REPORT 2020 / DIRECTORS’ REPORT
72
Information required by section 243a of the Unternehmensgesetzbuch (Austrian Commercial Code)
1. The capital stock amounts to EUR 327,272,727
and is divided into 327,272,727 bearer shares of
no par value. There is only one class of shares.
2. There is a consortium agreement in place
between the two core shareholders,
Österreichische Beteiligungs AG (ÖBAG) and
Mubadala Petroleum and Petrochemicals Holding
Company L.L.C (MPPH), which provides for
coordinated behavior and certain limitations on
transfers of shareholdings.
3. ÖBAG holds 31.5% and MPPH holds 24.9% of
the capital stock.
4. All shares have the same control rights.
5. Employees who are shareholders directly
exercise their voting rights at the Annual General
Meeting.
6. The Company’s Executive Board must consist of
two to six members. The Company’s Supervisory
Board must consist of at least six members
elected by the Annual General Meeting and of the
members nominated under section 110 (1) of the
Arbeitsverfassungsgesetz (Austrian Labor
Constitution Act). Resolutions concerning the
dismissal of members of the Supervisory Board
pursuant to section 87 (8) of the Aktiengesetz
(Austrian Stock Corporation Act) require a simple
majority of the votes cast. To approve capital
increases pursuant to section 149 of the Austrian
Stock Corporation Act and alterations of the
Articles of Association (except those concerning
the Company’s objects), simple majorities of the
votes and capital represented in adopting the
resolution are sufficient.
7.
7.a) As the authorized capital granted by the Annual
General Meeting on May 14, 2014 expired on
May 14, 2019, the Annual General Meeting
decided upon a new authorized capital on
September 29, 2020. Specifically, it authorized
the Executive Board until September 29, 2025 to
increase the share capital of OMV with the
consent of the Supervisory Board – at once or in
several tranches – by an amount of up to
EUR 32,727,272 by issuing up to 32,727,272 new
no-par value common voting shares in bearer
form in return for contributions in cash. The
capital increase can also be implemented by way
of indirect offer for subscription after taking over
by one or several credit institutions according to
Section 153 Paragraph 6 Austrian Stock
Corporation Act. The issue price and the
conditions of issuance can be determined by the
Executive Board with the consent of the
Supervisory Board. The Annual General Meeting
also authorized the Executive Board, subject to
the approval of the Supervisory Board, to exclude
the subscription right of the shareholders if the
capital increase serves to
(i) adjust fractional amounts or
(ii) satisfy stock transfer programs, in particular long
term incentive plans, equity deferrals or other
participation programs for employees, senior
employees and members of the Executive
Board/management boards of the Company or
one of its affiliates), or other employees’ stock
ownership plans.
In addition, the Supervisory Board was authorized
to adopt amendments to the Articles of
Association resulting from the issuance of shares
according to the authorized capital.
7.b) On May 18, 2016, the Annual General Meeting
authorized the Executive Board for a period of
five years from the adoption of the resolution,
therefore, until including) May 17, 2021, upon
approval of the Supervisory Board, to dispose of
or utilize stock repurchased or already held by the
Company to grant treasury shares to employees,
senior employees and/or members of the
Executive Board/management boards of the
Company or one of its affiliates, including for
purposes of share transfer programs – in
particular, long-term incentive plans including
matching share plans or other stock ownership
plans – under exclusion of the general purchasing
possibility of shareholders (exclusion of
subscription rights). The authorization can be
exercised as a whole or in parts or even in
several tranches by the Company, by a subsidiary
(section 189a, number 7, of the Austrian
Commercial Code) or by third parties for the
account of the Company.
7.c) On May 14, 2019 the Annual General Meeting
authorized the Executive Board to repurchase
bearer shares of no par value of the Company up
to a maximum of 5% of the Company’s nominal
capital in accordance with section 65 (1) (8)
Austrian Stock Corporation Act, over a period of
15 months from the date of adoption of the
resolution by the General Meeting, for a minimum
consideration per share being at the utmost 30%
lower than the average, unweighted stock
Other Information

OMV ANNUAL REPORT 2020 / DIRECTORS’ REPORT
73
exchange closing price over the preceding ten
trading days and a maximum consideration per
share being at the utmost 20% higher than the
average, unweighted stock exchange closing
price over the preceding ten trading days,
whereby any repurchases have to be exercised in
such a way that the Company does not hold more
than 1,300,000 treasury shares at any time. Such
repurchases may take place via the stock
exchange or a public offering or by other legal
means and for the purpose of share transfer
programs, in particular Long Term Incentive Plans
including Matching Share Plans, Equity Deferrals
or other stock ownership plans. The Executive
Board was further authorized to cancel stock
repurchased or already held by the Company
without further resolution of the Annual General
Meeting and the Supervisory Board was
authorized to adopt amendments to the Articles of
Association resulting from the cancellation of
shares. The authorization can be exercised as a
whole or in parts and also in several tranches by
the Company, by a subsidiary (Section 189a
Number 7 Commercial Code) or by third parties
for the account of the Company and shall be
exercised always in such a manner that it is to the
benefit and in the best interest of the Company.
8. OMV has issued perpetual hybrid notes in the
amount of EUR 3,250 mn which are subordinated
to all other creditors. According to IFRS, the net
proceeds of the hybrid notes in the amount of
EUR 3,228 mn are fully treated as equity because
the repayment of the principal and the payments
of interest are solely at the discretion of OMV.
On December 7, 2015, OMV issued hybrid notes
with an aggregate principal amount of
EUR 1,500 mn, in two tranches of EUR 750 mn
each with the following interest payable:
(i) The hybrid notes of tranche 1 bear a fixed interest
rate of 5.250% per annum until, but excluding,
December 9, 2021, which is the first call date of
tranche 1. From December 9, 2021 (including),
until, but excluding, December 9, 2025, the hybrid
notes of tranche 1 will bear interest per annum
according to a reset interest rate to be determined
according to the relevant five-year swap rate plus
a specified margin. From December 9, 2025
(including), the notes will bear an interest rate per
annum at the relevant five-year swap rate for the
relevant interest period plus a specified margin
and a step-up of 100 basis points.
(ii) The hybrid notes of tranche 2 bear a fixed interest
rate of 6.250% per annum until, but excluding,
December 9, 2025, which is the first call date of
tranche 2. From December 9, 2025 (including),
tranche 2 will bear an interest rate per annum at
the relevant five-year swap rate for the relevant
interest period plus a specified margin and a step-
up of 100 basis points.
Interest is due and payable annually in arrears on
December 9 of each year, unless OMV elects to
defer the relevant interest payments. The out-
standing deferred interest must be paid under
certain circumstances, in particular, if the Annual
General Meeting of OMV resolves upon a divi-
dend payment on OMV shares.
On June 19, 2018 OMV issued a hybrid bond with
a principal amount of EUR 500 mn. The hybrid
bond bears a fixed interest rate of 2.875% per an-
num until, but excluding, June 19, 2024. From
June 19, 2024 (including), until, but excluding,
June 19, 2028 the hybrid notes will bear interest
at a rate corresponding to the relevant five-year
swap rate plus a specified margin. From June 19,
2028 (including), the notes will bear an interest
rate per annum at the relevant five-year swap rate
for the relevant interest period plus a specified
margin and a step-up of 100 basis points. Interest
is due and payable annually in arrears on June 19
of each year, unless OMV elects to defer the rele-
vant interest payments. The outstanding deferred
interest must be paid under certain circumstanc-
es, in particular, if the Annual General Meeting of
OMV resolves upon a dividend payment on OMV
shares.
On September 1, 2020, OMV issued hybrid notes
with an aggregate principal amount of EUR 1,250
mn, in two tranches (Tranche 1: EUR 750 mn;
Tranche 2: EUR 500 mn) with the following
interest payable:
(iii) The hybrid notes of tranche 1 bear a fixed interest
rate of 2.500% per annum until, but excluding
September 1, 2026, which is the first reset date of
tranche 1. From the first reset date (including),
until, but excluding, September 1, 2030, the
hybrid notes of tranche 1 will bear interest per
annum at a reset interest rate which is
determined according to the relevant five-year
swap rate plus a specified margin. From
September 1, 2030 (including), the notes will bear
an interest rate per annum at the relevant five-
year swap rate for each interest period thereafter

OMV ANNUAL REPORT 2020 / DIRECTORS’ REPORT
74
plus a specified margin and a step-up of 100
basis points.
(iv) The hybrid notes of tranche 2 bear a fixed interest
rate of 2.875% per annum until, but excluding
September 1, 2029, which is the first reset date of
tranche 2. From the first reset date (including),
until, but excluding, September 1, 2030, the
hybrid notes of tranche 2 will bear interest per
annum at a reset interest rate which is
determined according to the relevant five-year
swap rate plus a specified margin. From
September 1, 2030 (including), the notes will bear
an interest rate per annum at the relevant five-
year swap rate for each interest period thereafter
plus a specified margin and a step-up of 100
basis points.
Interest is due and payable annually in arrears on
September 1 of each year, unless OMV elects to
defer the relevant interest payments. The
outstanding deferred interest must be paid under
certain circumstances, in particular, if the Annual
General Meeting of OMV resolves upon a
dividend payment on OMV shares.
The hybrid notes outstanding as of December 31,
2020 do not have a scheduled maturity date and
they may be redeemed at the option of OMV
under certain circumstances. OMV has, in
particular, the right to repay the hybrid notes at
certain call dates. Any accrued unpaid interest
becomes payable when the notes are redeemed.
In the case of a change of control, for example,
OMV may call the hybrid notes for re-demption or
else the applicable interest rate will be subject to
an increase according to the terms and conditions
of the hybrid notes.
9. The material financing agreements to which OMV
is a party and bonds issued by OMV contain
typical change of control clauses.
10. There are no agreements between the Company
and members of the Executive Board and
Supervisory Board or employees regarding the
payment of compensation in the event of a public
takeover bid.
11. The most important elements of the internal
control and risk management system regarding
the accounting process are the following:
Governance for the internal control system is
defined by internal corporate regulations (ICS
Directive and its Annexes). Corporate Internal
Audit controls the compliance with these
principles and requirements through regular
audits, based on the annual audit plan approved
by the Audit Committee of the Supervisory Board,
or through ad hoc audits.
The results of those audits are presented to the
Audit Committee of the Supervisory Board. For
the main “end-to-end” processes (e.g. purchase-
to-pay, order-to-cash), Group-wide Minimum
Control Requirements are defined. Based on a
defined time plan, the implementation and the
effectiveness are being monitored. The
establishment of Group-wide standards for the
preparation of annual and interim financial
statements by means of the corporate IFRS
Accounting Manual is also regulated by an
internal corporate regulation. The Group uses a
comprehensive risk management system. The
essential processes of the financial reporting
system have been identified and analyzed. In
addition, the effectiveness of the risk
management system is regularly evaluated by
external auditors. The results of the evaluation
are reported to the Audit Committee of the
Supervisory Board.
12. In accordance with section 267a (6) of the
Commercial Code, a separate consolidated non-
financial report will be issued.
Subsequent events
Please refer to Note 37 in the Consolidated Financial Statements.

OMV ANNUAL REPORT 2020 / DIRECTORS’ REPORT
75
Vienna, March 10, 2021
The Executive Board
Rainer Seele m.p.
Chairman of the Executive Board
and Chief Executive Officer
Johann Pleininger m.p.
Deputy Chairman of the Executive Board
and Chief Upstream Operations Officer
Reinhard Florey m.p.
Chief Financial Officer
Elena Skvortsova m.p.
Chief Commercial Officer
Thomas Gangl m.p.
Chief Downstream Operations Officer

OMV ANNUAL REPORT 2020 / DIRECTORS’ REPORT
76

CONSOLIDATED CORPORATE GOVERNANCE REPORT
77 — 86

OMV ANNUAL REPORT 2020 / CONSOLIDATED CORPORATE GOVERNANCE REPORT
78
OMV, as a publicly listed company with its headquarters in Austria, is dedicated to the principles of sound
corporate governance and has always sought to comply with best practice in corporate governance to
ensure responsible management and control of the OMV Group, a high level of transparency for every
stakeholder and, ultimately, the sustainable and long-term creation of value.
Austrian law, the Articles of Association, the Internal
Rules for the corporate bodies, and the Austrian Code
of Corporate Governance (ACCG) provide the core
legal framework for OMV’s corporate governance. OMV
adheres to the ACCG issued by the Austrian Working
Group for Corporate Governance. The code is publicly
accessible at www.corporate-governance.at. OMV’s
compliance with the ACCG in 2020 was evaluated
externally by independent advisors. The report on the
evaluation is available at www.omv.com and confirms
that OMV conformed to all of the compulsory “comply
or explain” rules (the “C-rules”) and also all of the
recommended rules (the “R-rules”). As for C-rules 27
and 28, explanations concerning the structure of the
compensation for the Executive Board and the
Supervisory Board of OMV is described in the
Remuneration Policy. The implementation of the policy
and the performance outcomes of the financial year
under review are set out in the annual Remuneration
Report for OMV’s Executive Board and Supervisory
Board prepared starting with financial year 2020. The
Remuneration Policy and the Remuneration Report are
published on www.omv.com. The next external
evaluation is scheduled to be carried out for the 2022
financial year.
For OMV Petrom S.A., a company consolidated in the
OMV Group and the shares of which are publicly listed
on the Bucharest Stock Exchange as well as on the
London Stock Exchange, the relevant Corporate
Governance Report can be found at
www.omvpetrom.com/en/about-us/corporate-
governance-aboutus.
In accordance with the recommendation in the AFRAC
opinion on the Corporate Governance Report, the
Corporate Governance Report of the parent company
and the consolidated Corporate Governance Report
are combined in one report.
1 The Supervisory Board of OMV Aktiengesellschaft has approved a reorganization of the OMV Group involving splitting and expanding the current area of
Refining & Petrochemical Operations into two areas: Refining and Chemicals & Materials. The Supervisory Board has further appointed Alfred Stern as
Executive Board member for Chemicals & Materials. The changes will take effect as of April 1, 2021.
Executive Board1
Rainer Seele, *1960
Date of initial appointment: July 1, 2015
End of the current period of tenure: June 30, 2022
Chairman of the Executive Board and Chief Executive
Officer
Responsible for the overall management and
coordination of the Group
Rainer Seele received his PhD in chemistry at the
University of Göttingen and subsequently had senior
appointments at the BASF Group where in 2000 he first
became a member of the Executive Board and then
later chairman of the Executive Board at WINGAS
GmbH. From 2009 until 2015, he was chairman of the
board of directors of Wintershall Holding GmbH.
Functions in major subsidiaries of the OMV Group
Company Function
OMV Petrom S. A. President of the Supervisory Board
Borealis AG Deputy Chairman of the
Supervisory Board
(until October 29, 2020)
Chairman of the Supervisory Board
(since October 29, 2020)
OMV Downstream GmbH Managing Director
(until June 15, 2020)
OMV Gas Logistics
Holding GmbH
Managing Director
(until June 4, 2020)
Consolidated Corporate Governance Report

OMV ANNUAL REPORT 2020 / CONSOLIDATED CORPORATE GOVERNANCE REPORT
79
Johann Pleininger, *1962
Date of initial appointment: September 1, 2015
End of the current period of tenure: August 31, 2023
Deputy Chairman of the Executive Board and
responsible for the Upstream Business Segment
Chief Upstream Operations Officer
Johann Pleininger started his professional career at
OMV in 1977 and later studied mechanical and
economic engineering. During his time at OMV, he held
various senior positions. From 2007 to 2013, he was an
Executive Board member of OMV Petrom in Bucharest,
responsible for Exploration & Production. Prior to his
appointment as Executive Board member of OMV, he
was the Senior Vice President responsible for the core
Upstream countries Romania and Austria as well as for
the development of the Black Sea region.
Member of the Supervisory Board of FK Austria Wien
AG
Functions in major subsidiaries of the OMV Group
Company Function
OMV Petrom S. A. Member of the Supervisory Board
OJSC Severneftegazprom Member of Board of Directors
SapuraOMV Upstream
Sdn. Bhd.
Deputy Chairman of Board of
Directors
OMV Exploration &
Production GmbH
Managing Director
OMV Austria Exploration &
Production GmbH
Chairman of the Supervisory Board
Reinhard Florey, *1965
Date of initial appointment: July 1, 2016
End of the current period of tenure: June 30, 2024
Chief Financial Officer
Responsible for Finance
Reinhard Florey graduated with a degree in mechanical
engineering and economics from the Graz University of
Technology while also completing his music studies at
the University of Fine Arts. He started his career in
corporate consulting and strategy consulting. From
2002 to 2012, he worked in different positions
worldwide for Thyssen Krupp AG. Until June 2016, he
was CFO and Deputy CEO of Outokumpu Oyj.
Member of the Supervisory Board of Wiener Börse AG
Functions in major subsidiaries of the OMV Group
Company Function
OMV Petrom S. A. Deputy Chairman of the
Supervisory Board
OMV Petrom Global
Solutions SRL
President of the Supervision Body
(until August 1, 2020)
Borealis AG Member of the Supervisory Board
(since October 29, 2020)

OMV ANNUAL REPORT 2020 / CONSOLIDATED CORPORATE GOVERNANCE REPORT
80
Thomas Gangl, *19711
Date of initial appointment: July 1, 2019
End of the current period of tenure: June 30, 2022
Executive Board member responsible for Refining &
Petrochemical Operations
Chief Downstream Operations Officer
Thomas Gangl began his OMV career in 1998 as a
process engineer at the Schwechat refinery after
studying process engineering at the Vienna University
of Technology and mechanical engineering at the
University of Salford (Manchester). In 2011, he became
General Manager of OMV Deutschland GmbH and Site
Manager in Burghausen. He was appointed Site
Manager in Schwechat in 2014 and took over the role
of Senior Vice President of the Refining &
Petrochemicals Business Unit with responsibility for all
three OMV refineries in 2016. On July 1, 2019, Thomas
Gangl became the Executive Board member
responsible for Refining & Petrochemical Operations.
Functions in major subsidiaries of the OMV Group
Company Function
OMV Petrom S.A. Member of the Supervisory Board
Borealis AG Member of the Supervisory Board
OMV Downstream GmbH Managing Director
OMV Gas Logistics
Holding GmbH
Managing Director
(since February 12, 2020)
Elena Skvortsova, *1970
Date of initial appointment: June 15, 2020
End of the current period of tenure: June 14, 2023
Executive Board member responsible for Marketing &
Trading
Chief Commercial Officer
Elena Skvortsova studied at Moscow State Linguistic
University and the Thunderbird School of Global
Management in the United States. She began her
professional career at Bayer in 1994 as an international
management trainee; her latest position at Bayer was
Associate Director of Bayer Corporation (Healthcare).
Starting in 2001, Elena Skvortsova held various
leadership positions at Baxter International in the
United States, Central and Eastern Europe, and the
United Kingdom for 13 years. In 2015, she moved to
Linde AG and was responsible for managing the Middle
East and Eastern Europe region. From March 2019 to
April 2020, following the merger of Linde and Praxair,
she was head of Praxair Canada Inc., a 100%
subsidiary of Linde plc. Elena Skvortsova has been a
member of OMV’s Executive Board since June 15,
2020, and is responsible for the OMV Downstream
Marketing & Trading division.
Functions in major subsidiaries of the OMV Group
Company Function
OMV Downstream GmbH Managing Director
(since June 16, 2020)
Working practices of the Executive Board
The approval requirements, responsibilities of individual
Executive Board members, decision-making
procedures, and the approach to conflicts of interest
are governed by the Internal Rules of the Executive
Board. The Executive Board holds meetings at least
every two weeks to exchange information and issue
decisions on all matters requiring plenary approval.
1 The Supervisory Board of Borealis Aktiengesellschaft has appointed Thomas Gangl to the post of Chief Executive Officer. He will take over the role from Alfred
Stern, effective April 1, 2021. Alfred Stern will join the OMV Executive Board and hold responsibility for the Chemicals & Materials division.

OMV ANNUAL REPORT 2020 / CONSOLIDATED CORPORATE GOVERNANCE REPORT
81
Supervisory Board
OMV’s Supervisory Board consists of ten members
elected by the General Meeting (shareholders’
representatives) and five members delegated by the
Group works council 1. Eight of the current
shareholders’ representatives were elected at the 2019
Annual General Meeting (AGM) and two were elected
at the 2020 AGM. The members of OMV’s Supervisory
Board in 2020 and their appointments to supervisory
boards of other domestic or foreign listed companies as
well as any management functions held are shown
below.
Wolfgang C. Berndt, * 1942
Chairman (until September 29, 2020)
Seats: no seats in domestic or foreign listed companies
Mark Garrett, * 1962
Chairman (since September 29, 2020)
(Chief Executive Officer, Marquard & Bahls AG)
Seats: Axalta Coating Systems (Chairman), Umicore
Thomas Schmid, * 1975
Deputy Chairman
(Chief Executive Officer, Österreichische
Beteiligungs AG)
Seats: Verbund AG, Telekom Austria AG
Alyazia Ali Al Kuwaiti, * 1979
Deputy Chairwoman
(Executive Director Upstream & Integrated, Mubadala
Investment Company PJSC)
Seats: no seats in domestic or foreign listed companies
Mansour Mohamed Al Mulla, * 1979
(Platform CFO Petroleum & Petrochemicals, Mubadala
Investment Company PJSC)
Seats: Aldar Properties PJSC
Stefan Doboczky, * 1967
(Chief Executive Officer, Lenzing AG)
Seats: no seats in domestic or foreign listed companies
Karl Rose, * 1961
(Strategy Advisor, Abu Dhabi National Oil Company)
Seats: no seats in domestic or foreign listed companies
1 Due to the resignation of Christine Asperger (October 1, 2020) and Alfred Redlich (December 2, 2020) there were three members delegated by the Group works
council part of the Supervisory Board at the end of 2020.
Elisabeth Stadler, * 1961
(Chief Executive Officer, VIENNA INSURANCE
GROUP AG Wiener Versicherung Gruppe)
Seats: voestalpine AG
Christoph Swarovski, * 1970
(Chief Executive Officer, Tyrolit AG)
Seats: no seats in domestic or foreign listed companies
Cathrine Trattner, * 1976
Seats: no seats in domestic or foreign listed companies
Gertrude Tumpel-Gugerell, * 1952
Seats: Commerzbank AG, VIENNA INSURANCE
GROUP AG Wiener Versicherung Gruppe, AT&S
Austria Technologie & Systemtechnik AG
Delegated by the Group works council
(employee representatives)
Christine Asperger, * 1964 (until October 1, 2020)
Herbert Lindner, * 1961
Alfred Redlich, * 1966 (until December 2, 2020)
Gerhard Singer, * 1960
Angela Schorna, * 1980
More detailed information about all members of OMV’s
Supervisory Board, including their professional careers,
can be obtained from OMV’s website at www.omv.com
> About us > Supervisory Board.
Diversity
The main considerations in selecting the members of
the Supervisory Board are relevant knowledge,
personal integrity and experience in executive
positions. Furthermore, aspects of diversity of the
Supervisory Board with respect to the internationality of
the members, the representation of both genders, and
the age structure are taken into account. The
Supervisory Board includes five women (as per
December 31, 2020) and three non-Austrian nationals.
The members of the Supervisory Board are aged
between 40 and 68.
Independence
The Supervisory Board has defined the criteria that
constitute independence (resolutions dated March 21,
2006, and March 25, 2009). In addition to the
guidelines set out in Annex 1 of the ACCG, the
Supervisory Board has established the following criteria

OMV ANNUAL REPORT 2020 / CONSOLIDATED CORPORATE GOVERNANCE REPORT
82
with regard to its members elected by the General
Meeting:
▸ A Supervisory Board member shall not serve on the
Executive Board of an OMV Group company.
▸ A Supervisory Board member shall not hold stock
options issued by the Company or any affiliated
company, or receive any other performance-related
remuneration from an OMV Group company.
▸ A Supervisory Board member shall not be a
shareholder with a controlling interest in the
meaning of EU Directive 83/349/EEC (i.e. an
interest of more than 50% of the voting rights or a
dominant influence, e.g. through the right to appoint
Board members) or represent such a shareholder.
All members elected by the General Meeting have
declared their independence from the Company and its
Executive Board during the 2020 financial year and up
to the time of making such declarations (C-rule 53 of
the ACCG). Under C-rule 54 of the ACCG, Wolfgang C.
Berndt, Mark Garrett, Stefan Doboczky, Karl Rose,
Elisabeth Stadler, Christoph Swarovski, Cathrine
Trattner, and Gertrude Tumpel-Gugerell have made
declarations to the effect that they were not
shareholders with a stake of more than 10% or
represented such shareholders’ interests during the
2020 financial year and up to the time of making such
declarations. Wolfgang C. Berndt, Mark Garrett, Stefan
Doboczky, Karl Rose, Elisabeth Stadler, Christoph
Swarovski, Cathrine Trattner, and Gertrude Tumpel-
Gugerell were nominated for the election as
Supervisory Board members by Österreichische
Beteiligungs AG, which must comply with the strict
independence and incompatibility criteria of the
Austrian Code of Corporate Governance when
nominating or appointing persons as members of the
Supervisory Boards of its affiliated companies and
ensure that they exercise their activities on the
Supervisory Boards of the affiliated companies
independently of their own interests or those of legal
entities closely associated with them.
Position and committee memberships in 20201
Name Supervisory Board and Term of office
Committees 20201
SB PNC PPC AC RC
Wolfgang C. Berndt C C M M C May 26, 2010, to September 29, 2020
Mark Garrett C C M M DC September 29, 2020, to 2023 AGM
Thomas Schmid DC DC DC M C May 14, 2019, to 2024 AGM
Alyazia Ali Al Kuwaiti DC DC DC DC DC May 22, 2018, to 2024 AGM
Mansour Mohamed Al Mulla M M M – – May 22, 2018, to 2024 AGM
Stefan Doboczky M – M2 – – May 14, 2019, to 2022 AGM
Karl Rose M – C – – May 18, 2016, to 2024 AGM
Elisabeth Stadler M – – DC – May 14, 2019, to 2022 AGM
Christoph Swarovski M – – – M May 14, 2019, to 2022 AGM
Cathrine Trattner M – – M – May 14, 2019, to 2022 AGM
Gertrude Tumpel-Gugerell M – – C M May 19, 2015, to 2022 AGM
Christine Asperger M M – – – January 1, 2013, to October 1, 2020
Herbert Lindner M M3 M M – Since June 1, 2013
Alfred Redlich M M M – – June 1, 2013, to December 2, 2020
Angela Schorna M M3 M3 M – Since March 23, 2018
Gerhard Singer M – M M – Since September 26, 2016
1 Abbreviations: SB = Supervisory Board, PNC = Presidential and Nomination, Committee, PPC = Portfolio and Project Committee, AC = Audit Committee,
RC = Remuneration Committee, C = Chairman/Chairwoman, DC = Deputy Chairman/Chairwoman, M = Member, AGM = Annual General Meeting
² Since June 19, 2020
³ Since December 3, 2020

OMV ANNUAL REPORT 2020 / CONSOLIDATED CORPORATE GOVERNANCE REPORT
83
Working practices of the Supervisory Board
The Supervisory Board fulfills its duties – in particular
supervising the Executive Board and advising it on
strategy – by discussing the Company’s situation and
objectives during board meetings. Decisions are also
taken at these meetings, except in urgent cases where
resolutions can be taken by circular vote. Four
committees ensure that the best possible use is made
of the Supervisory Board members’ expertise. Brief
descriptions of these committees are given below (see
also the Report of the Supervisory Board for an
overview of the individual committees’ main activities in
2020). In 2020, eight meetings of the Supervisory
Board and 19 Committee meetings were held. In
several of these meetings, the Executive Board and the
Supervisory Board discussed OMV’s strategy. No
member of the Supervisory Board attended fewer than
half of the meetings.
Attendance of Supervisory Board and Committee
meetings in 2020 was as follows:
Attendance of Supervisory Board and Committee Meetings in 2020 ¹
Name SB PNC PPC AC RC
Wolfgang C. Berndt2 5/5 4/4 3/3 3/3 3/3
Mark Garrett3 3/3 1/1 2/2 2/2 1/1
Thomas Schmid 8/8 5/5 4/5 4/5 4/4
Alyazia Ali Al Kuwaiti 6/8 4/5 3/5 4/5 4/4
Mansour Mohamed Al Mulla 7/8 5/5 3/5
Stefan Doboczky 6/8 3/36
Karl Rose 8/8 4/5
Elisabeth Stadler 7/8 4/5
Christoph Swarovski 5/8 2/4
Cathrine Trattner 8/8 5/5
Gertrude Tumpel-Gugerell 8/8 5/5 4/4
Christine Asperger4 3/6 2/4
Herbert Lindner 8/8 1/17 5/5 5/5
Alfred Redlich5 5/7 3/4 3/4
Angela Schorna 7/8 1/17 1/17 5/5
Gerhard Singer 7/8 5/5 4/5
1 Abbreviations: SB = Supervisory Board, PNC = Presidential and Nomination
Committee, PPC = Portfolio and Project Committee, AC = Audit Committee,
RC = Remuneration Committee 2 Until September 29, 2020 3 Since September 29, 2020 4 Until October 1, 2020 5 Until December 2, 2020 6 Since June 19, 2020 7 Since December 3, 2020
Pursuant to C-rule 36, the Supervisory Board is tasked
with discussing the efficiency of its activities annually,
in particular its organization and work procedures (self-
evaluation).
Presidential and Nomination Committee
This committee is empowered to take decisions on
matters of urgency. The Supervisory Board may
transfer other duties and powers of approval to the
Presidential and Nomination Committee on an ad hoc
or permanent basis. In its capacity as the Nomination
Committee, this body makes proposals to the
Supervisory Board for the appointment or replacement
of Executive Board members and deals with
succession planning. It also makes recommendations
to the General Meeting for appointments to the
Supervisory Board. There were five meetings of the
Presidential and Nomination Committee in 2020, in
which discussions focused on Executive and
Supervisory Board matters.
Audit Committee
This committee performs the duties established by
section 92 (4a) Austrian Stock Corporation Act. The
committee held five meetings during the year. It pre-
dominantly dealt with preparations for the audit of the
annual financial statements, a review of the auditors’
activities, internal audit, the internal control and risk
management systems, as well as the presentation of
the annual financial statements. Gertrude Tumpel-
Gugerell is the financial expert on the Audit Committee
within the meaning of section 92 (4a) (1) Austrian Stock
Corporation Act.
Auditors
The Supervisory Board monitors the auditors’
independence and reviews a breakdown of the audit
fees and fees for additional services besides auditing
activities. In 2020, the auditors Ernst & Young
Wirtschaftsprüfungsgesellschaft m.b.H. (including their
network within the meaning of section 271b Austrian
Commercial Code) received EUR 3.57 mn for the
annual audit, EUR 0.89 mn for other assurance
services, EUR 0.10 mn for tax advisory services, and
EUR 1.15 mn for other engagements.
Portfolio and Project Committee
This committee supports the Executive Board in
preparing complex decisions on key issues where
necessary and reports on these decisions and any
recommendations to the Supervisory Board. In 2020,
five meetings of the Portfolio and Project Committee
were held.
Remuneration Committee
This committee deals with all aspects of the
remuneration of Executive Board members and with
their employment contracts. The committee’s
membership does not include employee
representatives. The committee is empowered to

OMV ANNUAL REPORT 2020 / CONSOLIDATED CORPORATE GOVERNANCE REPORT
84
conclude, amend, and terminate Executive Board
members’ employment contracts and to make
decisions on the awarding of bonuses (variable
remuneration components) and other such benefits to
them. The Remuneration Committee met four times
during 2020. Executive Board members were invited to
attend parts of some of the meetings of the
Remuneration Committee.
hkp/// group was appointed by the Remuneration
Committee and provided remuneration advice to the
Committee, which included the elaboration of best
practice comparisons with regard to Executive Board
remuneration, advice on the appropriate structure and
level of Executive Board compensation in line with
regulatory requirements and market practice as well as
support for the finalization of the remuneration policy.
In 2020 hkp/// group was also appointed by OMV and
by OMV Petrom. They provided advice to OMV, in
relation to governance processes between OMV and
OMV Petrom, and to OMV Petrom on the development
and drafting of the Remuneration Policy for of the
Executive and Supervisory Board of OMV Petrom.
hkp/// group provided advise on the development of
OMV’s Remuneration Report and supported the
Remuneration Committee in discussion the
Remuneration Policy. The consultant company did not
advise the OMV Executive Board in matters relating to
remuneration, ensuring independence with respect to
the Austrian Code of Corporate Governance.
Conflicts of interest and dealings by members of
the Supervisory Board requiring approval
There were no transactions requiring approval in
accordance with section 95 (5) (12) Austrian Stock
Corporation Act. Attention is drawn to the fact that the
Supervisory Board Members Mark Garrett, Stefan
Doboczky, and Elisabeth Stadler are chairpersons of
the executive boards of companies with which supply
contracts and insurance and related contracts,
respectively, were concluded under normal market and
industry terms and conditions (including consideration).
Although these contracts do not raise concerns in
relation to a potential conflict of interest, related
Supervisory Board approvals have been obtained. The
Internal Rules of the Supervisory Board contain
detailed procedures for handling conflicts of interest on
the part of Supervisory Board members.
1 Due to the resignation of Christine Asperger (October 1, 2020) and Alfred Redlich (December 2, 2020) there were three members delegated by the Group works
council part of the Supervisory Board at the end of 2020.
Employee participation1
The Group works council holds regular meetings with
the Executive Board in order to exchange information
on developments affecting employees. Furthermore,
the Group works council has made use of its right to
delegate members to the Supervisory Board (one
employee representative for every two members
elected by the General Meeting). Therefore, out of the
15 Supervisory Board members, five members are
employee representatives.
Rights of minority shareholders
▸ General Meeting: An Extraordinary General
Meeting must be convened at the request of
shareholders holding not less than 5% of the
shares.
▸ Agenda items must be included at the request of
shareholders holding not less than 5% of the
shares.
▸ Shareholders holding not less than 1% of the
shares may submit resolution proposals on all
agenda items. Such resolution proposals must be
posted on the website upon request of the
respective shareholders.
▸ Shareholders holding not less than 10% of the
shares may require an extraordinary audit in the
event of grounds for suspicion of irregularities, or
gross violations of the law or the Articles of
Association.
▸ All shareholders having duly provided evidence of
their shareholding are entitled to attend General
Meetings, ask questions and vote.
▸ Election of the Supervisory Board: If elections for
two or more positions to the Supervisory Board are
held at the same General Meeting, separate votes
must be held for each position. If elections for three
or more seats on the Supervisory Board are held at
the same General Meeting, and if prior to the vote
on the last position to be assigned it is found that at
least one-third of all the votes have been cast in
favor of the same person but he or she has not
been elected, then this person must be declared as
Supervisory Board member.

OMV ANNUAL REPORT 2020 / CONSOLIDATED CORPORATE GOVERNANCE REPORT
85
Women’s Advancement and Diversity Concept
Diversity is an enormous strength that OMV actively
builds on now, and in the future. Consequently OMV
strives to continuously develop new initiatives and
measures that promote diversity and equal
opportunities. OMV is committed to its Group diversity
strategy focusing on gender and internationality. As a
company active in an industry with a strong technical
focus, it is particularly challenging for OMV to achieve a
satisfactory gender balance in all fields of business
activity. OMV is committed to supporting women’s
advancement to managerial positions. The strategic
objective is to achieve the best diversity mix at the
senior management level. The aim is to increase the
proportion of women in Senior Leadership roles, from
20.7%1 currently to 25% by 2025 through a number of
initiatives such as mentoring, succession planning,
specific trainings as well as initiatives to promote a
healthy work/life balance.
The proportion of women in the Group as a whole has
risen to 27%1 (2019: 26%), 20.7%1 of whom are in
management and executive positions. In OMV’s
leadership development programs, the proportion of
women was 42% in 2020 (2019: 26%). In OMV’s
Upstream integrated graduate development program
for technical skill pools, the proportion of women was
31% in 2020 (2019: 27%). The topic of diversity has
been incorporated into all Leadership Development
programs and embedded into the OMV People
Strategy.
In 2020, we launched a new women’s leadership
program, SHEnergy, focused on the personal
advancement and leadership development of current
and future female leaders. We also held Career
Aspiration Talks to make our women more visible and
in doing so to also strengthen our pipeline of future
female leaders.
OMV promotes talents from different backgrounds, thus
ensuring the best mix in diverse teams. OMV especially
supports the recruitment and development of women in
technical positions.
By using gender-neutral language in OMV’s job
advertisements and publishing all job advertisements
internally, together with the constant monitoring of
equality with regard to gender, age, employee
background, seniority as well as salaries, OMV is
1 Excluding Borealis
ensuring fair treatment and contributing to equal
opportunities among men and women at all career
stages.
Female employees initiated a Diversity Network to raise
awareness of diversity topics and to boost the careers
of women in technical fields through a collaboration site
and joint activities.
OMV’s Head Office in Vienna has two company
kindergartens attended by children of OMV employees.
The Executive Board and Supervisory Board consider
the described measures and programs to foster the
diversity of the workforce as a key factor in
strengthening the diversity of the internal pool of
Executive Board succession candidates. The
Presidential and Nomination Committee concerns itself
at least once a year with the identification and
development of high-potential employees. In addition to
internal succession planning, the Supervisory Board
also makes use of external recruitments in order to best
fill open Executive Board positions. When selecting
Executive Board members – be it internally or
externally – special attention is given to balance
gender, age, and international experience in addition to
professional skills.
Since Elena Skvortsova joined on June 15, 2020, there
is one woman on the Executive Board of OMV. The
Executive Board members of OMV Aktiengesellschaft
are between 49 and 60 years old, are from three
different nationalities, and have acquired extensive
international management experience.
Since 2019, ÖBAG has had a legal mandate to
propose candidates for the Supervisory Boards of its
shareholdings. The ÖBAG management proposal is
subject to approval by the ÖBAG presidium, before –
after submission of the proposal by the supervisory
board of OMV Aktiengesellschaft - the election by the
Annual General Meeting of OMV AG takes place. The
selection of candidates is based on various criteria,
particularly the candidates’ professional skills, personal
integrity, independence, and impartiality. In addition,
diversity aspects such as the representation of both
genders, a balanced age distribution, and
internationality of members is taken into consideration.
At the end of 2020, the Supervisory Board of OMV
includes five women, corresponding to a share of 38%.
Particular focus will be given to a further strengthening

OMV ANNUAL REPORT 2020 / CONSOLIDATED CORPORATE GOVERNANCE REPORT
86
of industry-specific expertise and the internationality of
Supervisory Board members in line with the company’s
strategic orientation. With members aged between 40
and 68 years, the Supervisory Board’s age structure is
balanced.
External evaluation of Corporate Governance
An external evaluation of OMV’s compliance with the
provisions of the ACCG is performed biennially. For the
2020 financial year, OMV engaged Deloitte Legal (Jank
Weiler Operenyi Rechtsanwälte GmbH, attorney
Johannes Lutterotti). The official questionnaire of the
Austrian Working Group for Corporate Governance was
used for the evaluation, and the result was that OMV is
in full compliance with the Austrian Code of Corporate
Governance including all non-compulsory
recommendations. The report on the evaluation is
available for download on OMV’s website
(www.omv.com).
Vienna, March 10, 2021
The Executive Board
Rainer Seele m.p.
Johann Pleininger m.p.
Reinhard Florey m.p.
Elena Skvortsova m.p.
Thomas Gangl m.p.

CONSOLIDATED FINANCIAL STATEMENTS AND NOTES
87 — 212
88 — Auditor’s Report 98 — Consolidated Income Statement for 2020
99 — Consolidated Statement of Comprehensive Income for 2020 100 — Consolidated Statement of Financial Position as of December 31, 2020
102 — Consolidated Statement of Changes in Equity for 2020 104 — Consolidated Statement of Cash Flows for 2020
Notes to the Consolidated Financial Statements
105 — Basis of Preparation and Accounting Policies 122 — Segment Reporting
126 — Notes to the Income Statement 135 — Notes to the Statement of Financial Position
170 — Supplementary Information on the Financial Position 187 — Other Information
202 — Oil and Gas Reserve Estimation and Disclosures (unaudited) 211 — Executive Board

OMV ANNUAL REPORT 2020 / FINANCIAL STATEMENTS
88
Report on the Consolidated Financial Statements
Audit Opinion
We have audited the consolidated financial statements
of
OMV Aktiengesellschaft, Vienna,
and of its subsidiaries (the Group) comprising the
consolidated statement of financial position as of
December 31, 2020, the consolidated income
statement, the consolidated statement of comprehen-
sive income, the consolidated statement of changes in
equity and the consolidated statement of cash flows for
the fiscal year then ended and the notes to the
consolidated financial statements except for “Oil and
Gas Reserve Estimation and Disclosures (unaudited)”.
Based on our audit the accompanying consolidated
financial statements were prepared in accordance with
the legal regulations and present fairly, in all material
respects, the assets and the financial position of the
Group as of December 31, 2020 and its financial
performance for the year then ended in accordance
with the International Financial Reporting Standards
(IFRSs) as adopted by EU, and the additional
requirements under Section 245a Austrian Company
Code (UGB).
Basis for Opinion
We conducted our audit in accordance with the
regulation (EU) no. 537/2014 (in the following “EU
regulation”) and in accordance with Austrian Standards
on Auditing. Those standards require that we comply
with International Standards on Auditing (ISA). Our
responsibilities under those regulations and standards
are further described in the “Auditor’s Responsibilities
for the Audit of the Consolidated Financial Statements”
section of our report. We are independent of the Group
in accordance with the Austrian General Accepted
Accounting Principles and professional requirements
and we have fulfilled our other ethical responsibilities in
accordance with these requirements. We believe that
the audit evidence we have obtained is sufficient and
appropriate to provide a basis for our opinion by this
date.
1 This report is a translation of the original report in German, which is solely valid. Publication or sharing with third parties of the consolidated financial statements
together with our auditor's opinion is only allowed if the consolidated financial statements and the directors’ report for the Group are identical with the German
audited version. This audit opinion is only applicable to the German and complete consolidated financial statements with the directors’ report for the Group.
Section 281 paragraph 2 UGB (Austrian Company Code) applies to alternated versions.
Key Audit Matters
Key audit matters are those matters that, in our
professional judgment, were of most significance in our
audit of the consolidated financial statements of the
fiscal year. These matters were addressed in the
context of our audit of the consolidated financial
statements as a whole, and in forming our opinion
thereon, and we do not provide a separate opinion on
these matters.
We considered the following matters as key audit
matters for our audit:
1. Purchase Price Allocation for the acquisition of
additional stake in Borealis AG
2. Recoverability of goodwill, property plant and
equipment and equity-accounted investments
3. Recoverability of intangible exploration and
evaluation (E&E) assets
4. Estimation of oil and gas reserves
5. Valuation of provision for decommissioning and
restoration obligations
Auditor’s Report1

OMV ANNUAL REPORT 2020 / FINANCIAL STATEMENTS
89
Key Audit Matter
Purchase Price Allocation for the acquisition of
additional stake in Borealis AG
On October 29, 2020, OMV acquired an additional 39%
stake in Borealis AG from Mubadala Investment
Company and holds now a 75% interest in Borealis AG.
Based on the agreed purchase price of USD 4,68 bn
the cash-out for OMV was EUR 3,87 bn considering
adjustments (dividends, currency effects, acquired cash
position of Borealis).
The previously held 36% stake was accounted at-
equity. The acquisition of the additional stake is to be
classified as business combination achieved in stages
according to IFRS 3: the acquirer shall remeasure its
previously held equity interest in the acquiree at its
acquisition-date fair value as well as allocate the
purchase price in recognizing the newly acquired
assets acquired and liabilities assumed at fair values at
the acquisition date. Together with the previously held
stake the acquired assets will be fully consolidated in
OMV’s group financial statements.
The valuation of assets acquired and liabilities
assumed is complex and requires significant judgement
in applying forecasts and assumptions made by
management. The principal risk relates to the estimates
of the fair values of the identifiable assets and liabilities
assumed together with the deferred taxes on
acquisition in preparing the purchase price allocation.
Given the extent of the judgment in valuing these
assets and obligations, we believe that the fair value
calculation carries significant risk of material
misstatement.
OMV management determined the fair values of the
assets acquired and liabilities assumed under IAS 28
and IFRS 3 with its own internal experts.
OMV Group’s disclosures about the acquisition of the
additional stake in Borealis AG are included in Note 3
(Changes in group structure) and Note 35 (Related
parties).
How our audit addressed the key audit matter
We assessed management’s purchase price allocation.
Specifically our work included, but was not limited to,
the following procedures:
▸ Read the purchase agreement to gain an
understanding of the key terms and conditions and
to assess the adequacy of the accounting
treatment;
▸ Assess the arm’s-length of the acquisition from a
related party;
▸ Assess the competence of OMV’s internal
specialists and their objectivity and independence,
to consider whether they were appropriately
qualified to carry out the valuation;
▸ Engage our internal valuation specialist to assist us
in the audit of the purchase price allocation and
discount rates used;
▸ Assess the valuation model, the cash flow
forecasts, cost approaches and the key
assumptions used in the calculation of the assets’
and liabilities´ fair value;
▸ Check the mathematical accuracy of the valuation
model; and
▸ Assess the adequacy of the disclosures in the
financial statements.

OMV ANNUAL REPORT 2020 / FINANCIAL STATEMENTS
90
Key Audit Matter
Recoverability of goodwill, property plant and
equipment and equity-accounted investments
As of December 31, 2020, the carrying value of
goodwill amounted to EUR 531 mn, of property, plant
and equipment to EUR 19.203 mn (after an impairment
charge of EUR 683 mn mainly for oil and gas assets)
and of equity-accounted investments to EUR 8.321 mn.
Under IFRS, an entity is required to assess, whether
impairment indicators or indications for the reversal of
impairment losses recognized in prior periods exist and
if they exist, an impairment test is required. For
goodwill an annual impairment test is required. The
assessment of the recoverability of the carrying amount
of goodwill, property, plant and equipment and equity-
accounted investments requires judgement in
assessing whether there is an indication that an asset
should be impaired and in measuring any such
impairment.
The principal risk relates to management’s estimates of
future cash flows and discount rates, which are used to
project the recoverability. For the cash generating units
to which goodwill has been allocated, management’s
annually performed impairment test did not require an
impairment.
Management did not identify impairment indicators for
property, plant and equipment in the Downstream
segment. In the Upstream segment impairment tests
for oil and gas assets were performed due to the
decreased oil and gas prices. These future cash flows
for oil and gas assets are mainly sensitive to
assumptions in future oil and gas prices and production
volumes. For one of the equity-accounted investments
impairment indicators were identified. The impairment
test performed by the management did not require an
impairment.
OMV Group’s disclosures about goodwill, property
plant and equipment and equity-accounted investments
and the impairment testing related hereto are included
in Note 2 (Accounting policies, judgements and
estimates), Note 7 (Depreciation, amortization,
impairments and write ups), Note 14 (Intangible
assets), Note 15 (Property, plant and equipment) and
Note 16 (Equity-accounted investments).
How our audit addressed the key audit matter
We assessed management’s assessment of the
recoverability of the carrying value of goodwill, property
plant and equipment and equity-accounted investments
by evaluating if and how management determines a
need of impairment or reversal. Where an impairment
test was required, we evaluated management’s
assumptions. Specifically, our work included, but was
not limited to, the following procedures:
▸ Assess the design and implementation of the
controls in the valuation process;
▸ Review and evaluation of management’s
assessment of the existence of impairment
indicators;
▸ Assess the determination of cash generating units;
▸ Reconcile the assumptions used within the future
cash flow models to approved budgets and
business plans;
▸ Reconcile production profiles to oil and gas
reserves and future short and long term oil and gas
prices to consensus analysts’ forecasts and those
adopted by other international oil companies;
▸ Assess how the long-term oil and gas price
assumptions con-sider the possible impact of
climate change and energy transition;
▸ Assess the consideration of Covid-19-pandemic
impact in the cash flow models;
▸ Check the mathematical accuracy of the cash flow
models;
▸ Compare of cash flow projections with external
market data and other available external sources
▸ Involve our valuation specialists for analyzing of the
discount-, exchange- and growth rates and
assessing the valuation models;
▸ Assess the historical accuracy of management’s
budgets and forecasts by comparing them to actual
performance and to prior year;
▸ Review of management’s sensitivity analysis over
key assumptions and perform additional own
sensitivity analysis in order to assess the impact of
possible changes of assumptions on the
recoverability; and
▸ Assess the adequacy of the Group’s disclosuresin
the financial statements.

OMV ANNUAL REPORT 2020 / FINANCIAL STATEMENTS
91
Key Audit Matter
Recoverability of intangible exploration and
evaluation (E&E) assets
The carrying value of intangible E&E assets amounted
to EUR 1,260 mn at December 31, 2020, after a write-
off (impairment) of EUR 779 mn in 2020.
Under IFRS 6, Exploration for and Evaluation of
Mineral Resources, exploration and evaluation assets
shall be assessed for impairment when facts and
circumstances suggest that the carrying value of an
exploration and evaluation asset may exceed its
recoverable amount.
The assessment of the carrying value requires
management to apply judgement and estimates in
assessing whether any impairment has arisen at year
end, and in quantifying any such impairment.
The principal risks relate to the assessment of
management’s intention to proceed with a future work
program for a prospect or license, the likelihood of
license renewal, and the success of drilling and
geological analysis to date.
OMV Group’s disclosures about intangible E&E assets
and related impairment testing are included in Note 2
(Accounting policies, judgements and estimates),
Note 7 (Depreciation, amortization, impairments and
write-ups) and Note 14 (Intangible assets).
How our audit addressed the key audit matter
We evaluated management’s assessment of the
carrying value of intangible E&E assets performed with
reference to the criteria of IFRS 6 and the Group’s
accounting policy. Specifically, our work included, but
was not limited to, the following procedures:
▸ Inquire whether management has the intention to
carry out exploration and evaluation activity in the
relevant exploration area which included the review
of management’s budget and discussions with
senior management as to the intentions and
strategy of the Group;
▸ Read Executive Board minutes of meetings and
consider whether there were negative indicators
that certain projects might be unsuccessful;
▸ Discuss with management about the status of the
largest exploration projects;
▸ Assess whether the Group has the ability to finance
any planned future exploration and evaluation
activity;
▸ Identify the existence of any fields where the
Group’s right to explore is either at, or close to,
expiry and review management’s assessment
whether there are any risks related to renewal of
the license;
▸ Review of management’s assumptions where an
E&E asset has been impaired and review of the
valuation; and
▸ Assess the adequacy of the disclosures in the
financial statements.

OMV ANNUAL REPORT 2020 / FINANCIAL STATEMENTS
92
Key Audit Matter
Estimation of oil and gas reserves
Oil and gas reserves are an indicator of the future
potential of the group’s performance. Furthermore, they
have an impact on the financial statements as they are
the basis for
▸ production profiles in future cash flow estimates;
▸ depreciation, amortization and impairment charges
and
▸ the valuation of the financial asset at the amount of
EUR 688 mn related to the reserves
redetermination right out of the acquisition of an
interest in the Yuzhno Russkoye field in 2017;
The estimation of oil and gas reserves requires
judgement and assumptions made by management
and engineers due to the technical uncertainty in
assessing quantities.
The principal risk of the oil and gas reserves estimate is
the impact on the group’s financial statements through
impairment testing, depreciation & amortization,
decommissioning provision estimate, and the valuation
of the financial asset related to the reserves
redetermination right.
OMV Group’s disclosures about oil and gas reserves
and related impairment testing are included in Note 2
(Accounting policies, judgements and estimates),
Note 7 (Depreciation, amortization, impairments and
write ups), Note 18 (Financial assets) and Note 23
(Provisions).
How our audit addressed the key audit matter
Our procedures have focused on management’s
estimation process in the determination of oil and gas
reserves. Specifically, our work included, but was not
limited to, the following procedures:
▸ Walkthrough and understand the Group’s process
and controls associated with the oil and gas
reserves estimation process;
▸ Test controls of the oil and gas reserves review
process;
▸ Analysis of the internal certification process for
technical and commercial specialists who are
responsible for oil and gas reserves estimation;
▸ Assess the competence of both internal and
external specialists and the objectivity and
independence of external specialists, to consider
whether they were appropriately qualified to carry
out the estimation of oil and gas reserves;
▸ Analyze the latest reports of DeGolyer and
MacNaughton (D&M) on their reviews performed in
2020 of the group’s estimated oil and gas reserves
in Russia and Malaysia and analyze the report of
the additional external specialist engaged by OMV
for one case;
▸ Test whether significant additions or reductions in
oil and gas reserves were made in the period in
which the new information became available and in
compliance with Group’s Reserves and Resources
Guidelines;
▸ Test that the updated oil and gas reserve estimates
were included appropriately in the Group’s
consideration of impairment, in accounting for
depreciation & amortization and the valuation of the
financial asset related to the reserves
redetermination right; and
▸ Assess the adequacy of the disclosures in the
financial statements.

OMV ANNUAL REPORT 2020 / FINANCIAL STATEMENTS
93
Key Audit Matter
Valuation of provision for decommissioning and
restoration obligations
The total provision for decommissioning and restoration
obligations amounted to EUR 3,999 mn at December
31, 2020.
Group’s core activities regularly lead to obligations
related to dismantling and removal, asset retirement
and soil remediation activities.
The principal risk relates to management’s estimates of
future costs, discount rates and inflation rates, which
are used to project the provision for decommissioning
and restoration obligations.
OMV Group’s disclosures about the provision for
decommissioning and restoration obligations are
included in Note 2 (Accounting policies, judgements
and estimates) and Note 23 (Provisions).
How our audit addressed the key audit matter
We assessed management’s estimation of the
provision for decommissioning and restoration
obligations. Specifically, our work included, but was not
limited to, the following procedures:
▸ Assess the design and implementation of the
controls over the decommissioning and restoration
obligations estimation process;
▸ Compare current estimates of costs with actual
decommissioning and restoration costs previously
incurred. Where no previous data was available, we
reconciled cost estimates to third party support or
the Group’s engineers’ estimates;
▸ Inspection of supporting evidence for any material
revisions in cost estimates during the year;
▸ Confirm whether the decommissioning dates are
consistent with the Group’s budget and business
plans;
▸ Involve our valuation specialists to assist us in the
analysis of discount rates and inflation rates; and
▸ Test the mathematical accuracy of the
decommissioning and restoration obligation
calculation; and
▸ Assess the adequacy of the disclosures in the
financial statements.

OMV ANNUAL REPORT 2020 / FINANCIAL STATEMENTS
94
Other Information
Management is responsible for the other information.
The other information comprises the information
included in the annual report and the annual financial
report, but does not include the consolidated financial
statements, the directors’ report for the Group and the
auditor’s report thereon. We received the “Consolidated
Corporate Governance Report” and the “Consolidated
Report on the Payments Made to Government” until the
date of this audit opinion, the rest of the annual report
and the annual financial report is estimated to be
provided to us after the date of the auditor's report. Our
opinion on the consolidated financial statements does
not cover the other information and we do not express
any form of assurance conclusion thereon.
In connection with our audit of the consolidated
financial statements, our responsibility is to read the
other information, and, in doing so, to consider whether
the other information is materially inconsistent with the
consolidated financial statements or otherwise appears
to be materially misstated.
If, based on the work we have performed, we conclude
that there is a material misstatement of this other
information, we are required to report that fact. We
have nothing to report in this regard.
Responsibilities of Management and of the Audit Committee for the Consolidated Financial Statements
Management is responsible for the preparation of the
consolidated financial statements in accordance with
IFRS as adopted by the EU, and the additional
requirements under Section 245a Austrian Company
Code (UGB) for them to present a true and fair view of
the assets, the financial position and the financial
performance of the Group and for such internal controls
as management determines are necessary to enable
the preparation of consolidated financial statements
that are free from material misstatement, whether due
to fraud or error.
In preparing the consolidated financial statements,
management is responsible for assessing the Group’s
ability to continue as a going concern, disclosing, as
applicable, matters related to going concern and using
the going concern basis of accounting unless
management either intends to liquidate the Group or to
cease operations, or has no realistic alternative but to
do so.
The Audit Committee is responsible for overseeing the
Group’s financial reporting process.

OMV ANNUAL REPORT 2020 / FINANCIAL STATEMENTS
95
Auditor’s Responsibilities for the Audit of the Consolidated Financial Statements
Our objectives are to obtain reasonable assurance
about whether the consolidated financial statements as
a whole are free from material misstatement, whether
due to fraud or error, and to issue an auditor’s report
that includes our opinion. Reasonable assurance is a
high level of assurance, but is not a guarantee that an
audit conducted in accordance with the EU regulation
and in accordance with Austrian Standards on Auditing,
which require the application of ISA, always detect a
material misstatement when it exists. Misstatements
can arise from fraud or error and are considered
material if, individually or in the aggregate, they could
reasonably be expected to influence the economic
decisions of users taken on the basis of these financial
statements.
As part of an audit in accordance with the EU
regulation and in accordance with Austrian Standards
on Auditing, which require the application of ISA, we
exercise professional judgment and maintain
professional scepticism throughout the audit.
We also:
▸ identify and assess the risks of material
misstatement of the consolidated financial
statements, whether due to fraud or error, design
and perform audit procedures responsive to those
risks, and obtain audit evidence that is sufficient
and appropriate to provide a basis for our opinion.
The risk of not detecting a material misstatement
resulting from fraud is higher than for one resulting
from error, as fraud may involve collusion, forgery,
intentional omissions, misrepresentations, or the
override of internal control;
▸ obtain an understanding of internal control relevant
to the audit in order to design audit procedures that
are appropriate in the circumstances, but not for the
purpose of expressing an opinion on the
effectiveness of the Group’s internal control;
▸ evaluate the appropriateness of accounting policies
used and the reasonableness of accounting
estimates and related disclosures made by
management;
▸ conclude on the appropriateness of management’s
use of the going concern basis of accounting and,
based on the audit evidence obtained, whether a
material uncertainty exists related to events or
conditions that may cast significant doubt on the
Group’s ability to continue as a going concern. If we
conclude that a material uncertainty exists, we are
required to draw attention in our auditor’s report to
the related disclosures in the consolidated financial
statements or, if such disclosures are inadequate,
to modify our opinion. Our conclusions are based
on the audit evidence obtained up to the date of our
auditor’s report. However, future events or
conditions may cause the Group to cease to
continue as a going concern;
▸ evaluate the overall presentation, structure and
content of the consolidated financial statements,
including the disclosures, and whether the
consolidated financial statements represent the
underlying transactions and events in a manner that
achieves fair presentation;
▸ obtain sufficient appropriate audit evidence
regarding the financial information of the entities or
business activities within the Group to express an
opinion on the consolidated financial statements.
We are responsible for the direction, supervision
and performance of the group audit. We remain
solely responsible for our audit opinion
We communicate with the Audit Committee regarding,
among other matters, the planned scope and timing of
the audit and significant audit findings, including any
significant deficiencies in internal control that we
identify during our audit.
We also provide the Audit Committee with a statement
that we have complied with relevant ethical
requirements regarding independence, and to
communicate with them all relationships and other
matters that may reasonably be thought to bear on our
independence, and where applicable, related
safeguards.
From the matters communicated with the Audit
Committee, we determine those matters that were of
most significance in the audit of the financial
statements of the current period and are therefore the
key audit matters. We describe these matters in our
auditor’s report unless law or regulation precludes
public disclosure about the matter or when, in
extremely rare circumstances, we determine that a
matter should not be communicated in our report
because the adverse consequences of doing so would
reasonably be expected to outweigh the public interest
benefits of such communication.

OMV ANNUAL REPORT 2020 / FINANCIAL STATEMENTS
96
Report on Other Legal and Regulatory Requirements
Comments on the Director’s Report for the Group
Pursuant to Austrian Generally Accepted Accounting
Principles, the directors’ report for the Group is to be
audited as to whether it is consistent with the
consolidated financial statements and as to whether the
directors’ report for the Group was prepared in
accordance with the applicable legal regulations.
Management is responsible for the preparation of the
directors’ report for the Group in accordance with
Austrian Generally Accepted Accounting Principles.
We conducted our audit in accordance with Austrian
Standards on Auditing for the audit of the directors’
report for the Group.
Opinion
In our opinion, the directors’ report for the Group was
prepared in accordance with the valid legal
requirements, comprising the details in accordance with
Section 243a Austrian Company Code (UGB), and is
consistent with the consolidated financial statements.
Statement
Based on the findings during the audit of the
consolidated financial statements and due to the thus
obtained understanding concerning the Group and its
circumstances no material misstatements in the
directors’ report for the Group came to our attention.
Additional information in accordance with article 10
EU regulation
We were elected as auditor by the ordinary general
meeting at September 29, 2020. We were appointed by
the Supervisory Board on November 19, 2020. We are
auditors without cease since 2011.
We confirm that the audit opinion in the Section “Report
on the consolidated financial statements” is consistent
with the additional report to the audit committee
referred to in article 11 of the EU regulation.
We declare that no prohibited non-audit services
(article 5 par. 1 of the EU regulation) were provided by
us and that we remained independent of the audited
company in conducting the audit.
Responsible Austrian Certified Public Accountant
The engagement partner on the audit resulting in this
independent auditor’s report is Mr. Gerhard Schwartz,
Certified Public Accountant.
Vienna, March 10, 2021
Ernst & Young
Wirtschaftsprüfungsgesellschaft m.b.H.
Alexander Wlasto m.p.
Wirtschaftsprüfer/Certified Public Accountant
Gerhard Schwartz m.p.
Wirtschaftsprüfer/Certified Public Accountant

OMV ANNUAL REPORT 2020 / FINANCIAL STATEMENTS
97

OMV ANNUAL REPORT 2020 / FINANCIAL STATEMENTS
98
Consolidated Income Statement
In EUR mn
Note 2020 2019
Sales revenues 4, 5 16,550 23,461
Other operating income 6 1,877 280
Net income from equity-accounted investments 6, 16 38 386
Total revenues and other income 18,465 24,127
Purchases (net of inventory variation) 17 (9,598) (13,608)
Production and operating expenses (1,892) (1,695)
Production and similar taxes (325) (496)
Depreciation, amortization, impairments and write-ups 7 (2,418) (2,302)
Selling, distribution and administrative expenses (1,896) (1,892)
Exploration expenses 7, 8 (896) (229)
Other operating expenses 9 (389) (322)
Operating Result 1,050 3,582
Dividend income 31 19 5
Interest income 11, 31 177 169
Interest expenses 11, 31 (280) (304)
Other financial income and expenses 11, 31 (91) 1
Net financial result (175) (129)
Profit before tax 875 3,453
Taxes on income and profit 12 603 (1,306)
Net income for the year 1,478 2,147
thereof attributable to stockholders of the parent 1,258 1,678
thereof attributable to hybrid capital owners 84 75
thereof attributable to non-controlling interests 136 393
Basic Earnings Per Share in EUR 13 3.85 5.14
Diluted Earnings Per Share in EUR 13 3.85 5.13
Consolidated Income Statement for 2020

OMV ANNUAL REPORT 2020 / FINANCIAL STATEMENTS
99
Consolidated Statement of Comprehensive Income
In EUR mn
Note 2020 2019
Net income for the year 1,478 2,147
Currency translation differences (1,234) 39
Gains/(losses) arising during the year, before income taxes 21 (1,233) 39
Reclassification of (gains)/losses to net income 3, 6, 9 (1) —
Gains/(losses) on hedges 28 38 (45)
Gains/(losses) arising during the year, before income taxes 419 (11)
Reclassification of (gains)/losses to net income (380) (34)
Share of other comprehensive income of equity-accounted investments 16 (102) (1)
Total of items that may be reclassified (“recycled”) subsequently to
the income statement (1,298) (7)
Remeasurement gains/(losses) on defined benefit plans 23 4 (90)
Gains/(losses) on equity investments 18 (2) 1
Gains/(losses) on hedges that are subsequently transferred to the carrying
amount of the hedged item 28 (113) 95
Share of other comprehensive income of equity-accounted investments 16 (6) (6)
Total of items that will not be reclassified (“recycled”) subsequently to
the income statement (118) 0
Income taxes relating to items that may be reclassified (“recycled”)
subsequently to the income statement (10) 10
Income taxes relating to items that will not be reclassified (“recycled”)
subsequently to the income statement 18 (7)
Total income taxes relating to components of other comprehensive income 21 8 4
Other comprehensive income for the year, net of tax 21 (1,407) (3)
Total comprehensive income for the year 70 2,144
thereof attributable to stockholders of the parent (4) 1,752
thereof attributable to hybrid capital owners 84 75
thereof attributable to non-controlling interests (9) 316
Consolidated Statement of Comprehensive Income
for 2020

OMV ANNUAL REPORT 2020 / FINANCIAL STATEMENTS
100
Assets
In EUR mn
Note 2020 2019
Intangible assets 14 3,443 4,163
Property, plant and equipment 15 19,203 16,479
Equity-accounted investments 16 8,321 5,151
Other financial assets 18 3,447 2,414
Other assets 19 103 56
Deferred taxes 25 1,179 686
Non-current assets 35,695 28,950
Inventories 17 2,352 1,845
Trade receivables 18 3,316 3,042
Other financial assets 18 3,018 3,121
Income tax receivables 36 11
Other assets 19 537 297
Cash and cash equivalents 26 2,854 2,931
Current assets 12,112 11,248
Assets held for sale 20 1,464 177
Total assets 49,271 40,375
Consolidated Statement of Financial Position
as of December 31, 2020

OMV ANNUAL REPORT 2020 / FINANCIAL STATEMENTS
101
Equity and Liabilities
In EUR mn
Note 2020 2019
Share capital 327 327
Hybrid capital 3,228 1,987
Reserves 10,184 10,698
OMV equity of the parent 13,739 13,012
Non-controlling interests 22 6,159 3,851
Total equity 21 19,899 16,863
Provisions for pensions and similar obligations 23 1,458 1,111
Bonds 24 8,019 5,262
Lease liabilities 24 943 934
Other interest-bearing debts 24 1,280 620
Provisions for decommissioning and restoration obligations 23 3,926 3,872
Other provisions 23 576 572
Other financial liabilities 24 454 301
Other liabilities 24 135 157
Deferred taxes 25 1,229 1,132
Non-current liabilities 18,020 13,961
Trade payables 24 4,304 4,155
Bonds 24 850 540
Lease liabilities 24 141 120
Other interest-bearing debts 24 703 148
Income tax liabilities 278 332
Provisions for decommissioning and restoration obligations 23 72 87
Other provisions 23 304 293
Other financial liabilities 24 3,095 2,818
Other liabilities 24 868 903
Current liabilities 10,616 9,395
Liabilities associated with assets held for sale 20 736 156
Total equity and liabilities 49,271 40,375
.

OMV ANNUAL REPORT 2020 / FINANCIAL STATEMENTS
102
Consolidated Statement of Changes in Equity in 2020¹
In EUR mn
Share
capital
Capital
reserves
Hybrid
capital
Revenue
reserves
Currency
translation
differences
January 1, 2020 327 1,506 1,987 9,832 (694)
Net income for the year — — — 1,341 —
Other comprehensive income for the year — — — (3) (1,091)
Total comprehensive income for the year — — — 1,338 (1,091)
Capital increase — — 1,241 — —
Dividend distribution and hybrid coupon — — — (673) —
Disposal of treasury shares — 3 — — —
Share-based payments — (3) — — —
Increase/(decrease) in non-controlling interest — — — 5 —
Reclassification of cash flow hedges to balance sheet — — — — —
December 31, 2020 327 1,506 3,228 10,502 (1,785)
Consolidated Statement of Changes in Equity in 2019¹
In EUR mn
Share
capital
Capital
reserves
Hybrid
capital
Revenue
reserves
Currency
translation
differences
January 1, 2019 327 1,511 1,987 8,830 (809)
Net income for the year — — — 1,753 —
Other comprehensive income for the year — — — (79) 115
Total comprehensive income for the year — — — 1,674 115
Dividend distribution and hybrid coupon — — — (673) —
Disposal of treasury shares — 3 — — —
Share-based payments — (8) — — —
Increase/(decrease) in non-controlling interests — — — — —
Reclassification of cash flow hedges to balance sheet — — — — —
December 31, 2019 327 1,506 1,987 9,832 (694)
1 See Note 21 – OMV equity of the parent
Consolidated Statement of Changes in Equity for 2020

OMV ANNUAL REPORT 2020 / FINANCIAL STATEMENTS
103
Hedges
Share of other compr.
income of equity-ac-
counted investments Treasury shares
OMV equity of the
parent
Non-controlling
interests Total equity
41 18 (4) 13,012 3,851 16,863
— — — 1,341 136 1,478
(61) (107) — (1,262) (146) (1,407)
(61) (107) — 80 (9) 70
— — — 1,241 — 1,241
— — — (673) (209) (882)
— — 1 4 — 4
— — — (3) — (3)
— — — 5 2,519 2,524
71 3 — 73 8 81
51 (86) (3) 13,739 6,159 19,899
Hedges
Share of other compr.
income of equity-ac-
counted investments Treasury shares
OMV equity of the
parent
Non-controlling
interests Total equity
39 26 (6) 11,905 3,436 15,342
— — — 1,753 393 2,147
46 (8) — 74 (77) (3)
46 (8) — 1,827 316 2,144
— — — (673) (188) (861)
— — 2 5 — 5
— — — (8) — (8)
— — — — 287 287
(43) (1) — (44) (0) (44)
41 18 (4) 13,012 3,851 16,863

OMV ANNUAL REPORT 2020 / FINANCIAL STATEMENTS
104
Consolidated Statement of Cash Flows
In EUR mn
Note 2020 2019
Net income for the year 1,478 2,147
Depreciation, amortization, impairments and write ups 7 3,197 2,395
Deferred taxes 12 (846) 100
Current taxes 12 244 1,207
Income taxes paid (402) (1,263)
Tax refunds 45 5
Losses/(gains) from disposal of non-current assets and businesses 6, 9 (12) (7)
Income from equity-accounted investments and other dividend income 6, 18, 31 (57) (391)
Dividends received from equity-accounted investments and other companies 228 354
Interest expense 11, 31 168 170
Interest paid (164) (160)
Interest income 11, 31 (160) (145)
Interest received 53 63
Increase/(decrease) in personnel provisions 23 (60) (59)
Increase/(decrease) in provisions 23 21 35
Other changes 26 (948) (187)
Sources of funds 2,786 4,264
Decrease/(increase) in inventories 17 288 (260)
Decrease/(increase) in receivables 18, 19 145 372
Increase/(decrease) in liabilities 24 (82) (320)
Changes in net working capital components 351 (208)
Cash flow from operating activities 3,137 4,056
Investments
Intangible assets and property, plant and equipment 3, 14, 15 (1,960) (2,158)
Investments, loans and other financial assets 18 (194) (2,265)
Acquisitions of subsidiaries and businesses net of cash acquired 3 (3,880) (460)
Disposals
Proceeds in relation to non-current assets 72 209
Proceeds from the sale of subsidiaries and businesses, net of cash disposed 15 36
Cash flow from investing activities (5,948) (4,638)
Increase in long-term borrowings 26 3,338 1,376
Repayments of long-term borrowings 26 (797) (980)
Increase/(decrease) in short-term borrowings 26 (96) (22)
Dividends paid to OMV equity holders (incl. hybrid coupons) 21 (673) (673)
Dividends paid to non-controlling interests 22 (206) (186)
Increase hybrid bond 21 1,241 —
Cash flow from financing activities 2,808 (484)
Effect of foreign exchange rate changes on cash and cash equivalents (66) (22)
Net increase/(decrease) in cash and cash equivalents (69) (1,088)
Cash and cash equivalents at beginning of year 26 2,938 4,026
Cash and cash equivalents at end of year 26 2,869 2,938
Thereof cash disclosed within Assets held for sale 15 7
Cash and cash equivalents presented in the consolidated statement of
financial position 26 2,854 2,931
Consolidated Statement of Cash Flows for 2020

OMV ANNUAL REPORT 2020 / FINANCIAL STATEMENTS
105
1 Basis of preparation
OMV Aktiengesellschaft (registered in the Austrian
Register of Companies with its office based at
Trabrennstraße 6–8, 1020 Vienna, Austria), is an
integrated, international oil, gas and chemical company
with activities in Upstream and Downstream.
These financial statements have been prepared and
are in compliance with International Financial
Reporting Standards (IFRSs) as adopted by the EU
and in accordance with the supplementary
accounting regulations pursuant to Sec. 245a, Para.
1 of the Austrian Commercial Code (UGB). The
financial year corresponds to the calendar year.
The consolidated financial statements are in general
based on the historical cost principle, except for certain
items that have been measured at fair value as
described in Note 2 – Accounting policies, judgements
and estimates.
The consolidated financial statements for 2020 have
been prepared in million EUR (EUR mn, EUR
1,000,000). Accordingly, there may be rounding
differences.
The consolidated financial statements comprise the
financial statements of OMV Aktiengesellschaft and the
entities it controls (its subsidiaries) as at December 31,
2020. The financial statements of all consolidated
companies are prepared in accordance with uniform
group-wide accounting policies. A list of subsidiaries,
equity-accounted investments and other investments is
included under Note 38 – Direct and indirect
investments of OMV Aktiengesellschaft – including
consolidation method, business segment, place of
business and interest held by OMV.
The consolidated financial statements for 2020 were
approved and released for publication by the
Supervisory Board on March 10, 2021.
2 Accounting policies, judgements and estimates
1) Changes in accounting policies
The accounting policies adopted are consistent with
those of the previous financial year, except for the
changes as described below.
First-time adoption of amended standards
The Group has adopted the following amended
standards with a date of initial application of January 1,
2020:
▸ Amendments to IFRS 3 Business Combinations:
Definition of a Business
▸ Amendments to IFRS 9, IAS 39 and IFRS 7:
Interest Rate Benchmark Reform
▸ Amendments to IAS 1 and IAS 8: Definition of
Material
▸ Amendments to References to the Conceptual
Framework in IFRS Standards
The amendments did not have any material impact on
OMV’s group financial statements.
Amendments to IFRS 9, IAS 39 and IFRS 7: Interest
Rate Benchmark Reform
The Group has adopted the amendments to IFRS 9
and IFRS 7 retrospectively to hedging relationships that
existed at the start of the reporting period or were
designated thereafter, and that are directly affected by
the interest rate benchmark reform. These amend-
ments also apply to the gain or loss accumulated in the
cash flow hedge reserve that existed at 1 January,
2020.
The amendments provide temporary relief from
applying specific hedge accounting requirements to
hedging relationships directly affected by interbank
offered rate (IBOR) reform. For the purpose of
evaluating whether there is an economic relationship
between the hedged items and the hedging instru-
ments, the Group assumes that the benchmark interest
rate is not altered as a result of interest rate benchmark
reform. Any hedge ineffectiveness continues to be
recorded in the income statement. The Group will
cease to apply this relief when the uncertainty arising
from interest rate benchmark reform is no longer
present.
Note 28 – Risk Management – provides information
about the uncertainty arising from IBOR reform for
hedging relationships for which the Group has applied
the reliefs. No changes were required to any of the
Notes to the Consolidated Financial Statements
Basis of Preparation and Accounting Policies

OMV ANNUAL REPORT 2020 / FINANCIAL STATEMENTS
106
amounts recognized in the current or prior period as a
result of these amendments.
Change in income statement presentation Starting with 2020, reversals of impairments on tangible
and intangible assets are reported within the line
“Depreciation, amortization, impairments and write-ups”
in order to improve the international comparability of
the income statement presentation. The prior year
figures have been adjusted accordingly. The change in
presentation has no effect on the operating result.
Adjustments to income statement items
In EUR mn
2019 (old) Reclassification 2019 (new)
Other operating income 315 (35) 280
Total revenues and other income 24,162 (35) 24,127
Depreciation, amortization, impairments and
write-ups (2,337) 35 (2,302)
2) New and revised standards not yet mandatory
OMV has not applied the following new or revised
IFRSs that have been issued but are not yet effective.
They are not expected to have any material effects on
the Group’s financial statements. EU endorsement is
still pending in some cases.
Standards and amendments IASB effective date
Amendment to IFRS 16 Leases: Covid-19-Related Rent Concessions June 1, 2020
Amendments to IFRS 9, IAS 39, IFRS 7, IFRS 4 and IFRS 16: Interest Rate Benchmark
Reform - Phase 2 January 1, 2021
Amendments to IFRS 3 Business Combinations: Reference to the Conceptual Framework January 1, 2022
Amendments to IAS 16 Property, Plant and Equipment: Proceeds before intended use January 1, 2022
Amendments to IAS 37: Onerous Contracts - Cost of Fulfilling a Contract January 1, 2022
Annual Improvements to IFRS Standards 2018-2020 January 1, 2022
IFRS 17 Insurance Contracts and Amendments to IFRS 17 January 1, 2023
Amendments to IAS 1: Classification of Liabilities as Current and Non-Current January 1, 2023
3) Significant accounting policies, judgements and
assumptions
Use of estimates and judgements
Preparation of the consolidated financial statements
requires management to make estimates and judge-
ments that affect the amounts reported for assets,
liabilities, income and expenses, as well as the
amounts disclosed in the notes. These estimates
and assumptions are based on historical experience
and other factors that are deemed reasonable at the
date of preparation of these financial statements.
Actual outcomes could differ from these estimates.
The estimates and assumptions having the most
significant impact on OMV Group results are
highlighted below and should be read together with
the relevant notes mentioned. Significant estimates
and assumptions have been made particularly with
respect to
- oil and gas reserves (see 2.3h),
- provisions for decommissioning and restoration
obligations (see 2.3s and 23),
- provisions for onerous contracts (see 2.3s and
23),
- the valuation of assets acquired and liabilities
assumed in a business combination (see 2.3a
and 3),
- the recoverability of intangible assets, property,
plant and equipment and equity-accounted
investments (see 2.3j and 7) as well as
- the recoverability of other financial assets,
which mainly refer to the contractual position
towards Gazprom with regard to the reserves
redetermination of Yuzhno Russkoye field and
the expenditure recoverable from the Romanian
State related to decommissioning, restoration
and environmental obligations (see 2.3m and
18).

OMV ANNUAL REPORT 2020 / FINANCIAL STATEMENTS
107
Effect of climate-related matters and energy
transition
The short and long-term effects of climate-related
matters and energy transition impact the significant
accounting estimates performed by management
and included in the group financial statements in
estimates such as recoverable amounts and
expected useful lifes of the Company’s assets.
These estimates incorporate the future effects of
OMV’s own strategic decisions and commitments on
having its portfolio adhered to the energy transition
targets, short and long-term impacts of climate-
related matters and energy transition to a lower-
carbon energy sources together with management’s
best estimate on global supply and demand,
including forecasted commodities prices. OMV’s
view on such future market trends is aligned with the
International Energy Agency (IEA) Stated Policies
(SP) Scenario, and in accordance with such
scenario incorporates current and announced (not
yet fully realized) policies, targets, and plans.
OMV is aware of its responsibility and will live up to
its commitment to the Paris Agreement and the EU
climate targets. OMV is committed to reach net-zero
GHG emissions of operations (scope 1 and 2) by
2050 or sooner. Nevertheless, there is significant
uncertainty around the changes in the mix of energy
sources over the next 30 years and the extent to
which such changes will meet the ambitions of the
Paris Agreement. While companies can commit to
such ambitions, financial reporting under IFRS
requires the use of assumptions that represent
management’s current best estimate of the range of
expected future economic conditions, which may
differ from such ambitions.
Consequently, in order to reflect a faster paced
energy transition, OMV revised its brent oil price
planning assumptions in 2020 which have an impact
on the recoverability of its fixed assets. It is OMV’s
view that the long long-term assumptions and the
inverse price curve applied for Brent oil take into
consideration the impacts of climate-related matters
and energy transition to lower-carbon energy
sources. The updated long term Brent oil price
assumption is USD 60/bbl vs USD 75/bbl in 2019, in
real terms. More details on the oil and gas
assumptions can be found in Note 2.3j.
a) Business combinations and goodwill
Business combinations are accounted for using the
acquisition method. Assets and liabilities of subsidiaries
acquired are included at their fair value at the time of
acquisition. For each business combination, the Group
elects whether it measures the non-controlling interest
in the acquiree either at fair value or at the proportion-
ate share of the acquiree’s identifiable net assets.
Any contingent consideration is measured at fair value
at the date of acquisition. Contingent consideration
classified as financial asset or liability is subsequently
measured at fair value with the changes in fair value
recognized in profit or loss.
Goodwill is calculated as the excess of the aggregate
of the consideration transferred, the amount recognized
for non-controlling interest and the fair value of the
equity previously held by OMV in the acquired entity
over the net identifiable assets acquired and liabilities
assumed. Goodwill is recorded as an asset and tested
for impairment at least yearly. Impairments are record-
ed immediately through profit or loss, subsequent write-
ups are not possible. Any gain on a bargain purchase is
recognized in profit or loss immediately.
Significant estimates: Business combinations
The measurement of identifiable assets acquired
and the liabilities assumed at their acquisition date
fair values requires significant estimates by
management. Such measurements are also required
for acquisitions of investments accounted for at
equity. OMV adopts the valuation techniques
generally used by market participants taking into
account the available information. Whereas
property, plant and equipment are valued using a
cost approach, intangible assets are valued on the
basis of the relief-from-royalty approach or an
income approach. The fair value of inventories is
determined on the basis of available market prices.
b) Sales revenue
Revenue is generally recognized when control over a
product or a service is transferred to a customer. It is
measured based on the consideration specified in a
contract with a customer and excludes amounts
collected on behalf of third parties.

OMV ANNUAL REPORT 2020 / FINANCIAL STATEMENTS
108
When goods such as crude oil, LNG, oil and
petrochemical products and similar goods are sold, the
delivery of each quantity unit normally represents a
single performance obligation. Revenue is recognized
when control of the goods has transferred to the
customer, which is the point in time when legal
ownership as well as the risk of loss has passed to the
customer and is determined on the basis of the
Incoterm agreed in the contract with the customer.
These sales are done with normal credit terms
according to the industry standard.
Revenue from the production of crude oil, in which
OMV has an interest with other producers, is
recognized according to the sales method. This means
that revenue is recognized based on the actual sales to
third parties, regardless of the Group’s percentage
interest or entitlement. An adjustment of production
costs is recognized at average cost for the difference
between the costs associated with the output sold and
the costs incurred based on entitlement to output, with
a counter entry in the other assets or liabilities.
In the Downstream retail business, revenues from the
sale of fuels are recognized when products are
supplied to the customers. Depending on whether OMV
is principal or agent in the sale of shop merchandise,
revenue and costs related to such sales are presented
gross or net in the income statement. OMV is principal
if it controls the goods before they are transferred to the
customer, which is mainly indicated by OMV having the
inventory risk. At filling stations, payments are due
immediately at the time of purchase.
OMV’s gas and power supply contracts include a single
performance obligation which is satisfied over the
agreed delivery period. Revenue is recognized
according to the consumption by the customer and in
line with the amount to which OMV has a right to
invoice. Only in exceptional cases long-term gas supply
contracts contain stepped prices in different periods
where the rates do not reflect the value of the goods at
the time of delivery. In these cases revenue is
recognized based on the average contractual price.
In some customer contracts for the delivery of natural
gas, the fees charged to the customer comprise a fixed
charge as well as a variable fee depending on the
volumes delivered. These contracts contain only one
performance obligation which is to stand-ready for the
delivery of gas over a certain period. The revenue from
the fixed charges and the variable fees is recognized in
line with the amount chargeable to the customer. Gas
and power deliveries are billed and paid on a monthly
basis.
Gas storage and gas transportation contracts contain a
stand-ready obligation for providing storage or
transportation services over an agreed period of time.
Revenue is recognized according to the amount to
which OMV has a right to invoice. These services are
billed and paid on a monthly basis.
There are some customer contracts in OMV for the
delivery of oil and gas as well as for the provision of
gas storage and transportation services which have a
term of more than one year. In principle, IFRS 15
requires the disclosure of the total amount of trans-
action prices allocated to unperformed performance
obligations for such contracts. Contracts for the delivery
of oil contain variable prices based on market prices as
at delivery date, as it is common in the oil industry. For
these contracts it is, therefore, not possible to allocate
the transaction price to unsatisfied performance
obligations. For gas delivery and gas storage and
transportation contracts OMV applies the practical
expedient according to IFRS 15.121 (b) according to
which this information need not be disclosed for
contracts where revenue is recognized in the amount to
which the entity has a right to invoice. OMV, therefore,
does not disclose this information.
c) Other revenues
Other revenues include revenues from commodity
contracts which are in the scope of IFRS 9. Sales and
purchases of commodities are reported net within other
revenues when the forward sales and purchase
contracts are determined to be for trading purposes
and not for the final physical delivery.
In addition, other revenues include an adjustment of
revenues from considering the national oil company’s
profit share as income tax in certain production sharing
agreements in the Upstream segment (see 2.3f),
realized and unrealized results from hedging of sales
transactions as well as lease and rental income.
d) Exploration expenses
Exploration expenses relate exclusively to the business
segment Upstream and comprise the costs associated
with unproved reserves. These include geological and
geophysical costs for the identification and investigation
of areas with possible oil and gas reserves and
administrative, legal and consulting costs in connection
with exploration. They also include all impairments on
exploration wells where no proved reserves could be
demonstrated. Depreciation of economically successful
exploration wells is reported as depreciation,
amortization, impairment charges and write-ups.

OMV ANNUAL REPORT 2020 / FINANCIAL STATEMENTS
109
e) Research and development
Expenditure related to research activities is recognized
as expense in the period in which it is incurred.
Research and development (R&D) expenses, which
are presented in the income statement within other
operating expenses, include all direct and indirect
materials, personnel and external services costs
incurred in connection with the focused search for new
insights related to the development and significant
improvement of products, services and processes and
in connection with research activities. Development
costs are capitalized if the recognition criteria according
to IAS 38 are fulfilled.
f) Exploration and production sharing agreements
Exploration and production sharing agreements
(EPSAs) are contracts for oil and gas licenses in which
the oil or gas production is shared between one or
more oil companies and the host country/national oil
company in defined proportions. Exploration
expenditures are carried by the oil companies as a rule
and recovered from the state or the national oil
company through so called “cost oil” in a successful
case only. Under certain EPSA contracts the host
country’s/national oil company’s profit share represents
imposed income taxes and is treated as such for
purposes of the income statement presentation.
g) Intangible assets and property, plant and
equipment
Intangible assets and property, plant and equipment
are recognized at costs of acquisition or construction
(including costs of major inspection and general
overhauls). The present value of the expected cost for
the decommissioning of an asset after its use is
included in the cost of the respective asset when a
decommissioning provision is recognized (see 2.3s).
Costs for replacements of components are capitalized
and carrying values of the replaced parts are
derecognized. Costs relating to minor maintenance and
repairs are treated as expenses in the year in which
they are incurred.
Intangible assets and depreciable property, plant and
equipment (except for oil and gas assets and a
contract-related intangible asset in Upstream, see 2.3h)
are amortized or depreciated on a straight-line basis
over the useful economic life.
Useful life Years
Intangible assets
Goodwill Indefinite
Software 3–7
Concessions, licenses, contract-related intangible assets etc. 3–20, contract duration or unit-of production method
Business-specific property, plant and equipment
Upstream Oil and gas wells Unit-of-production method
Downstream Pipelines 20-30
Gas power plant 8–30
Storage tanks 40
Refinery facilities 25
Petrochemical production facilities 15-20
Filling stations 5–20
Other property, plant and equipment
Production and office buildings 20–50
Other technical plant and equipment 10–20
Fixtures and fittings 3–15
h) Oil and gas assets
Upstream activities are recorded using the successful
efforts method. The acquisition costs of geological and
geophysical studies before the discovery of proved
reserves form part of expenses for the period. The
costs of wells are capitalized and reported as intangible
assets until the existence or absence of potentially
commercially viable oil or gas reserves is determined.
Wells which are not commercially viable are expensed.
The costs of exploration wells whose commercial
viability has not yet been determined continue to be
capitalized as long as the following conditions are
satisfied:

OMV ANNUAL REPORT 2020 / FINANCIAL STATEMENTS
110
▸ Sufficient oil and gas reserves have been
discovered that would justify completion as a
production well.
▸ Sufficient progress is being made in assessing the
economic and technical feasibility to justify
beginning field development in the near future.
Significant estimates and judgements:
Recoverability of unproved oil and gas assets
There may be cases when costs related to unproved
oil and gas properties remain capitalized over longer
periods while various appraisal and seismic activities
continue in order to assess the size of the reservoir
and its commerciality. Further decisions on the
optimum timing of such developments are made
from a resource and portfolio point of view. As soon
as there is no further intention to develop the
discovery, the assets are immediately impaired.
Exploratory wells in progress at year end which are
determined to be unsuccessful subsequent to the
statement of financial position date are treated as non-
adjusting events, meaning that the costs incurred for
such exploratory wells remain capitalized in the
financial statements of the reporting period under
review and will be expensed in the subsequent period.
License acquisition costs and capitalized exploration
and appraisal activities are not amortized as long as
they are related to unproved reserves, but tested for
impairment when there is an indicator for a potential
impairment. Once the reserves are proved and
commercial viability is established, the related assets
are reclassified into tangible assets. Development
expenditure on the construction, installation or
completion of infrastructure facilities such as platforms
and pipelines and drilling development wells is
capitalized within tangible assets. Once production
starts, depreciation commences. Capitalized
exploration and development costs and support
equipment are generally depreciated based on proved
developed reserves by applying the unit-of-production
method; only capitalized exploration rights and
acquired reserves are amortized on the basis of total
proved reserves, unless a different reserves basis is
more adequate.
Significant estimate: Oil and gas reserves
OMV Group’s oil and gas reserves are estimated by
the Group’s petroleum engineers in accordance with
industry standards and reassessed at least once per
year. In addition, external reviews are performed
regularly. In 2020, DeGolyer and MacNaughton
(D&M) reviewed the reserves of the oil and gas
assets in Russia and Malaysia. For the other oil and
gas assets the last review was performed in 2018 for
the reserves as of December 31, 2017. The results
of the external reviews did not show significant
deviations from the internal estimates, except for
one case. In order to obtain a reasonable assurance
on the reserves numbers of the field with a material
deviation to D&M, OMV engaged an independent
external specialist to provide an opinion on OMV’s
approach for determining the reserves, which was
deemed appropriate.
Oil and gas reserve estimates have a significant
impact on the assessment of recoverability of
carrying amounts of oil and gas assets of the Group.
Downward revisions of these estimates could lead to
impairment of the asset’s carrying.
In addition, changes to the estimates of oil and gas
reserves impact prospectively the amount of
amortization and depreciation as well as the
valuation of the financial asset related to the
reserves redetermination right out of the acquisition
of an interest in the Yuzhno Russkoye field.
i) Associated companies and joint arrangements
Associated companies are those entities in which the
Group has significant influence, but not control nor joint
control over the financial and operating policies. Joint
arrangements, which are arrangements of which the
Group has joint control together with one or more
parties, are classified into joint ventures or joint
operations. Joint ventures are joint arrangements in
which the parties that share control have rights to the
net assets of the arrangement. Joint operations are
joint arrangements in which the parties that share joint
control have rights to the assets, and obligations for the
liabilities, relating to the arrangement.
Investments in associated companies and joint
ventures are accounted for using the equity method,
under which the investment is initially recognized at
cost and subsequently adjusted for the Group’s share
of the profit or loss less dividends received and the
Group’s share of other comprehensive income and
other movements in equity.
Significant joint exploration and production activities in
the Upstream segment are conducted through joint
operations which are not structured through a separate
vehicle. For these joint operations, OMV recognizes in
the consolidated financial statements its share of the

OMV ANNUAL REPORT 2020 / FINANCIAL STATEMENTS
111
assets held and liabilities and expenses incurred jointly
with the other partners, as well as the group’s income
from the sale of its share of the output and any
liabilities and expenses that the group has incurred in
relation to the joint operation. Acquisitions of interests
in a joint operation, in which the activity of the joint
operation constitutes a business, are accounted for
according to the relevant IFRS 3 principles for business
combination accounting (see 2.3a).
In addition, there are contractual arrangements similar
to joint operations in the Group which are not jointly
controlled and therefore do not meet the definition of a
joint operation according to IFRS 11. This is the case
when the main decisions can be taken by more than
one combination of affirmative votes of the involved
parties or where one other party has control. OMV
assesses whether such arrangements are within or out
of scope of IFRS 11 on the basis of the relevant legal
arrangements such as concession, license or joint
operating agreements which define how and by whom
the relevant decisions for these activities are taken.
The accounting treatment for these arrangements is
basically the same as for joint operations. As
acquisitions of interests in such arrangements are not
within the scope of IFRS 3, OMV’s accounting policy is
to treat such transactions as asset acquisitions.
j) Impairment of assets
Intangible assets, property, plant and equipment
(including oil and gas assets) and investments in
associated companies and joint ventures are tested for
impairment whenever events or changes in
circumstances indicate that an asset may be impaired.
Impairment tests are performed on the level of the
asset or the smallest group of assets that generates
cash inflows that are largely independent of those from
other assets or groups of assets, called cash-
generating units (CGUs).
If assets are determined to be impaired, the carrying
amounts are written down to their recoverable amount,
which is the higher of fair value less costs of disposal or
value in use.
In assessing value in use, the estimated future cash
flows are discounted to their present value using a
post-tax discount rate that reflects current market
assessments of the time value of money and the risks
specific to the asset or CGU. The pre-tax discount rate
is determined by way of iteration. The cash flows are
generally derived from the recent budgets and planning
calculations, which are prepared separately for each of
the Group’s CGUs to which the individual assets are
allocated.
The fair value less costs of disposal is determined on
the basis of the recent market transactions, if available.
If no such transactions can be identified, an appropriate
valuation model is used.
If the reasons for impairment no longer apply in a
subsequent period, a reversal is recognized in profit or
loss. The increased carrying amount related to the
reversal of an impairment loss shall not exceed the
carrying amount that would have been determined (net
of amortization and depreciation) had no impairment
loss been recognized in prior years.
Significant estimates and judgements:
Recoverability of assets
Evaluating whether assets or CGUs are impaired or
whether past impairments should be reversed,
require the use of different estimates and
assumptions such as price developments,
production volumes and discount rates.
The key estimates and assumptions used bear the
risk of change due to the inherent volatile nature of
the various macro-economic factors and the
uncertainty in asset or CGU specific factors like
reserve volumes and production profiles, which can
impact the recoverable amount of assets and/or
CGUs.
The key valuation assumptions for the recoverable
amounts of Upstream assets are the oil and natural
gas prices, production volumes, exchange and
discount rates. The production profiles were
estimated based on past experience and represent
management’s best estimate of future production.
The cash flow projections for the first five years are
based on the mid-term plan and thereafter on a “life
of field” planning and therefore cover the whole life
term of the field.
In 2020, OMV revised its long-term oil and gas price
assumptions in order to take into account the
uncertainty over the pace of the energy transition to
a lower-carbon energy sources. In addition, the
short-term oil and gas price assumption were
updated in order to reflect the significant decrease in
oil and gas prices due to the impact of the COVID-
19 pandemic.
The nominal oil and gas price assumptions and the
EUR-USD exchange rates are listed below:

OMV ANNUAL REPORT 2020 / FINANCIAL STATEMENTS
112
2020
2021 2022 2023 2024 2025
Brent oil price (USD/bbl) 50 60 60 65 65
EUR-USD exchange rate 1.15 1.15 1.15 1.15 1.15
Brent oil price (EUR/bbl) 43 52 52 57 57
Realized gas price (EUR/MWh) 10 12 13 14 13
2019
2020 2021 2022 2023 2024
Brent oil price (USD/bbl) 60 70 70 75 75
EUR-USD exchange rate 1.15 1.15 1.15 1.15 1.15
Brent oil price (EUR/bbl) 52 61 61 65 65
Realized gas price (EUR/MWh) 12 13 14 15 15
For the years 2026 until 2029, OMV assumed a
Brent oil price of USD 65/bbl which is expected to
gradually decline to USD 60/bbl until 2035. From
2035 onwards, OMV applied a Brent oil price of
USD 60/bbl. All before mentioned assumptions for
the years after 2025 are based on 2025 real terms.
Gas prices are assumed to remain stable in real
terms after 2025.
The assumptions used for oil and gas prices for
short and medium term are based on management’s
best estimate and were consistent with external
sources. The long-term assumptions were
consistent with data provided by external studies
and consider long-term views of global supply and
demand. In particular, OMV’s long term assumptions
and the inverse price curve applied for Brent oil,
take into consideration the impacts of climate-
related matters and energy transition to lower-
carbon energy sources.
In the Downstream business, the main assumptions
for the calculation of the recoverable amounts are
the relevant margins, volumes as well as discount,
inflation and growth rates.
k) Assets held for sale
Non-current assets and disposal groups are classified
as held for sale if their carrying amounts are to be
realized by sale rather than through continued use.
This is the case when the sale is highly probable, and
the asset or disposal group is available for immediate
sale in its present condition. Non-current assets and
disposal groups classified as held for sale are
measured at the lower of carrying amount and fair
value less costs to sell. Property, plant and equipment
and intangible assets once classified as held for sale
are no longer amortized or depreciated.
l) Leases
OMV as a lessee recognizes lease liabilities and right-
of-use assets for lease contracts according to IFRS 16.
It applies the recognition exemption for short-term
leases and leases in which the underlying asset is of
low value and therefore does not recognize right-of-use
assets and lease liabilities for such leases. Leases to
explore for and use oil and natural gas, which comprise
mainly land leases used for such activities, are not in
the scope of IFRS 16. The rent for these contracts is
recognized as expense on a straight-line basis over the
lease term.
Non-lease components are separated from the lease
components for the measurement of right-of-use assets
and lease liabilities. Lease liabilities are recognized at
the present value of fixed lease payments and lease
payments which depend on an index or rate over the
determined lease term with the applicable discount
rate. Right-of-use assets are recognized at the value of
the lease liability plus prepayments and initial direct
costs and presented within property, plant and
equipment.
OMV as a lessor entered into contracts which were
assessed as operating leases, for which fixed and
variable rent is recognized as revenue from rents and
leases over the period of the lease.
Significant estimates and judgements: Leases
OMV has a significant number of contracts in which
it leases filling stations. Many of those contracts
include prolongation and termination options.

OMV ANNUAL REPORT 2020 / FINANCIAL STATEMENTS
113
Prolongation options or periods after termination
options are included in the lease term if it is
reasonably certain that the lease is prolonged or not
terminated. When determining the lease term the
Group takes into account all relevant facts and
circumstances that create an economic incentive for
shortening or prolonging the lease term using the
available options. When assessing the lease term of
leases in filling stations for periods covered by
prolongation or termination options, the assumption
was applied that the lease term will not exceed 20
years.
Optional periods, which have not been taken into
account in the measurement of the leases, exist
mainly for office buildings and gas storage caverns
in Germany because they can only be exercised in
the distant future.
m) Non-derivative financial assets
At initial recognition, OMV classifies its financial assets
as subsequently measured at amortized cost, fair value
through other comprehensive income (OCI) or fair
value through profit or loss. The classification depends
both on the Group’s business model for managing the
financial assets and the contractual cash flow
characteristics of the financial assets. All regular way
trades are recognized and derecognized on the trade
date, i.e., the date that the Group commits to purchase
or sell the asset.
Debt instruments are measured at amortized cost if
both of the following conditions are met:
▸ the asset is held within the business model whose
objective is to hold assets in order to collect
contractual cash flows; and
▸ the contractual terms of the financial asset give rise
on specific dates to cash flows that are solely
payments of principal and interest on the principal
amount outstanding.
These assets are subsequently measured at amortized
cost using the effective interest method less any
impairment losses. Interest income, impairment losses
and gains or losses on derecognition are recognized in
profit or loss.
OMV recognizes allowances for expected credit losses
(ECLs) for all financial assets measured at amortized
costs. The ECL calculation is based on external or
internal credit ratings of the counterparty and
associated probabilities of default. Available forward-
looking information is taken into account, if it has a
material impact on the amount of valuation allowance
recognized.
ECLs are recognized in two stages. Where there has
not been a significant increase in the credit risk since
initial recognition, credit losses are measured at 12
month ECLs. The 12 month ECL is the credit loss
which results from default events that are possible
within the next 12 months. The Group considers a
financial asset to have low credit risk when its credit
risk rating is equivalent to the definition of ‘investment
grade’.
Where there has been a significant increase in the
credit risk since initial recognition, a loss allowance is
required for the lifetime ECL, i.e. the expected credit
losses resulting from possible default events over the
expected life of a financial asset. For this assessment,
OMV considers all reasonable and supportable
information that is available without undue cost or
effort. Furthermore, OMV assumes that the credit risk
on a financial asset has significantly increased if it is
more than 30 days past due. If the credit quality
improves for a lifetime ECL asset, OMV reverts to
recognizing allowances on a 12 month ECL basis. A
financial asset is considered to be in default when the
financial asset is 90 days past due unless there is
reasonable and supportable information that
demonstrates that a more lagging default criterion is
appropriate. A financial asset is written off when there
is no reasonable expectation that the contractual cash
flows will be recovered.
For trade receivables and contract assets from
contracts with customers a simplified approach is
adopted, where the impairment losses are recognized
at an amount equal to lifetime expected credit losses.
In case there are credit insurances or securities held
against the balances outstanding, the ECL calculation
is based on the probability of default of the
insurer/securer for the insured/secured element of the
outstanding balance and the remaining amount will
take the probability of default of the counterparty.
Non-derivative financial assets classified as at fair
value through profit or loss include trade receivables
from sales contracts with provisional pricing and
investment funds because the contractual cash flows
do not represent solely payments of principal and
interest on the principal amount outstanding.
Furthermore, this measurement category includes
portfolios of trade receivables held with an intention to
sell them. These assets are measured at fair value,
with any gains or losses arising on remeasurement
recognized in profit or loss.

OMV ANNUAL REPORT 2020 / FINANCIAL STATEMENTS
114
Equity instruments are either measured at fair value
through profit or loss (FVPL) or at fair value through
OCI (FVOCI). OMV elected irrevocably to classify as
investments at FVOCI the majority of its non-listed
equity investments which are held for strategic
purposes and not trading. Gains and losses on equity
investments measured at FVOCI are never recycled to
profit or loss and they are not subject to impairment
assessment. Dividends are recognized in profit or loss
unless they represent a recovery of part of the cost of
an investment.
OMV derecognizes a financial asset when the
contractual rights to the cash flows from the asset
expire, or when it transfers the financial asset and
substantially all the risks and rewards of ownership of
the asset to another party.
Significant estimates and judgements: Fair value
and recoverability of financial assets
The management is periodically assessing the
receivable related to expenditure recoverable from
the Romanian State related to obligations for
decommissioning and restoration costs in OMV
Petrom SA. The assessment process is considering
inter alia the history of amounts claimed,
documentation process related requirements,
potential litigation or arbitration proceedings.
As part of the acquisition of the interest in Yuzhno
Russkoye gas field in 2017, OMV took over a
contractual position towards Gazprom with regard to
the reserves redetermination. The volume of gas
reserves in Yuzhno Russkoye field is contractually
agreed and, in case the reserves are higher or lower
than what was assumed in the agreement, either
OMV could be obligated to compensate Gazprom
(but would profit in the future from higher sales
volumes) or Gazprom could be obligated to
compensate OMV. The payment for the reserve
redetermination is linked to the actual amount of the
gas reserves. The actual volume of gas reserves in
Yuzhno Russkoye is expected to be agreed in 2023.
The estimated volume of gas reserves in the field is
assumed by OMV to be lower than the contractually
agreed volume and is based on the assessment of
the Group’s petroleum engineers (see Note 18 –
Financial Assets – for more details).
n) Derivative financial instruments and hedge
accounting
Derivative instruments are used to hedge risks resulting
from changes in currency exchange rates, commodity
prices and interest rates. Derivative instruments are
recognized at fair value. Unrealized gains and losses
are recognized as income or expense, except where
hedge accounting according to IFRS 9 is applied.
Those derivatives qualifying and designated as hedges
are either
▸ a fair value hedge when hedging exposure to
changes in the fair value of a recognized asset or
liability,
▸ a cash flow hedge when hedging exposure to
variability in cash flows that is attributable to a
particular risk associated with a recognized asset or
liability or a highly probable forecast transaction, or
▸ a net investment hedge when hedging the foreign
exchange risk in a net investment in a foreign
operation.
For cash flow hedges, the effective part of the changes
in fair value is recognized in other comprehensive
income, while the ineffective part is recognized
immediately in the income statement. Where the
hedging of cash flows results in the recognition of a
non-financial asset or liability, the carrying value of that
item will be adjusted for the accumulated gains or
losses recognized directly in OCI.
Hedges of net investments in foreign operations are
accounted for similarly to cash flow hedges. Any gain
or loss on the hedging instrument relating to the
effective portion of the hedge is recognised in OCI and
accumulated in the reserve for currency translation
differences. The gain or loss relating to the ineffective
portion is recognised immediately in profit or loss.
Gains and losses accumulated in equity are reclassified
to profit or loss when the foreign operation is disposed
of or sold.
The Group applies hedge accounting to hedges which
are affected by the interest rate benchmark reform. For
the purpose of evaluating whether there is an economic
relationship between the hedged items and the hedging
instruments, the Group assumes that the benchmark
interest rate is not altered as a result of interest rate
benchmark reform (see Note 2.1a).
Contracts to buy or sell a non-financial item that can be
settled net in cash or another financial instrument are
accounted for as financial instruments and measured at
fair value. Associated gains or losses are recognized in
profit or loss. However, contracts that are entered into
and continue to be held for the purpose of the receipt or
delivery of a non-financial item in accordance with the
Group’s expected purchase, sale or usage

OMV ANNUAL REPORT 2020 / FINANCIAL STATEMENTS
115
requirements are not accounted for as derivative
financial instruments, but as executory contracts.
o) Borrowing costs
Borrowing costs directly attributable to the acquisition,
construction or production of qualified assets are
capitalized until these assets are substantially ready for
their intended use or sale. All other costs of borrowing
are expensed in the period in which they are incurred.
p) Government grants
Government grants are recognized as income or
deducted from the related asset where it is reasonable
to expect that the granting conditions will be met and
that the grants will be received.
q) Inventories
Inventories are recognized at the lower of cost and net
realizable value. Costs incurred are generally
determined based on the individual costs for not
interchangeable goods, the average price method for
oil and gas inventories or the FIFO method for
petrochemical products. Costs of production comprise
directly attributable costs as well as fixed and variable
indirect material and production overhead costs.
Production-related administrative costs, the costs of
company pension schemes and voluntary employee
benefits are also included. In refineries, a carrying
capacity approach is applied according to which the
production costs are allocated to product groups on the
basis of their relative market values at the end of the
period.
r) Cash and cash equivalents
Cash and cash equivalents include cash balances,
bank accounts and highly liquid short-term investments
with low realization risk, i.e. negligible short-term
exchange and interest risks. The maximum maturity at
the time of acquisition for such investments is three
months.
s) Provisions
A provision is recorded for present obligations against
third parties when it is probable that an obligation will
occur and the settlement amount can be estimated
reliably. Provisions for individual obligations are based
on the best estimate of the amount necessary to settle
the obligation, discounted to the present value in the
case of long-term obligations.
Decommissioning and environmental obligations:
The Group’s core activities regularly lead to obligations
related to dismantling and removal, asset retirement
and soil remediation activities. These decommissioning
and restoration obligations are principally of material
importance in the Upstream segment (oil and gas wells,
surface facilities) and in connection with filling stations
on third-party property. At the time the obligation arises,
it is provided for in full by recognizing the present value
of future decommissioning and restoration expenses as
a liability. An equivalent amount is capitalized as part of
the carrying amount of long-lived assets. Any such
obligation is calculated on the basis of best estimates.
The unwinding of discounting leads to interest expense
or income (in case of a negative discount rate) and
accordingly to increased or decreased obligations at
each statement of financial position date until
decommissioning or restoration. For other
environmental risks and measures, provisions are
recognized if such obligations are probable and the
amount of the obligation can be estimated reliably.
Significant estimates and judgements:
Decommissioning provisions
The most significant decommissioning obligations of
the Group are related to the plugging of wells, the
abandonment of facilities and the removal and
disposal of offshore installations. The majority of
these activities are planned to occur many years into
the future, while decommissioning technologies,
costs, regulations and public expectations are
constantly changing. Estimates of future restoration
costs are based on reports prepared by Group
engineers and on past experience. Any significant
downward changes in the expected future costs or
postponement in the future affect both the provision
and the related asset, to the extent that there is
sufficient carrying amount, otherwise the provision is
reversed to income. Significant upward revisions
trigger the assessment of the recoverability of the
underlying asset.
Provisions for decommissioning and restoration
costs require estimates of discount rates, which
have material effects on the amounts of the
provision. The real discount rates applied for
calculating the provision for decommissioning and
restoration costs were between -2.0% and 3.10%
(2019: 0.0% and 3.25%).
Pensions and similar obligations: OMV has both
defined contribution and defined benefit pension plans.
In the case of defined contribution plans, OMV has
no obligations beyond payment of the agreed
premiums, and no provision is therefore recognized.
The reported expense corresponds to the contributions
payable for the period.

OMV ANNUAL REPORT 2020 / FINANCIAL STATEMENTS
116
In contrast, participants in defined benefit plans are
entitled to pensions at certain levels and are generally
based on years of service and the employee’s average
compensation. These defined benefit plans expose the
Group to actuarial risks, such as longevity risk, interest
rate risk, inflation risk (as a result of indexation of
pension) and market risk. Defined benefit pension
obligations are accounted for by recognizing provisions
for pensions.
Employees of Austrian Group companies whose
service began before December 31, 2002 are entitled
to receive severance payments upon termination of
employment or on reaching normal retirement age. The
entitlements depend on years of service and final
compensation levels. Entitlements to severance
payments for employees whose service began after
December 31, 2002 are covered by defined
contribution plans. Similar obligations as entitlement to
severance payments also exist in other countries,
where the Group provides employment.
Employees in Austria and Germany are entitled to
jubilee payments after completion of a given number of
years of service. These plans are non-contributory and
unfunded.
Provisions for pensions, severance payments and
jubilee payments are calculated using the projected unit
credit method, which divides the costs of the estimated
benefit entitlements over the whole period of
employment and thus takes future increases in
remuneration into account. Actuarial gains and losses
for defined benefit pension and severance payment
obligations are recognized in full in the period in which
they occur in other comprehensive income. Such
actuarial gains and losses are not reclassified to profit
or loss in subsequent periods. Actuarial gains and
losses on obligations for jubilee payments are
recognized in profit or loss. Net interest expense is
calculated on the basis of the net defined benefit
obligation and disclosed as part of the financial result.
Differences between the return on plan assets and
interest income on plan assets included in the net
interest expense is recognized in other comprehensive
income.
Provisions for voluntary and mandatory separations
under restructuring programs are recognized if a
detailed plan has been approved by management and
communicated to those affected prior to the statement
of financial position date and an irrevocable
commitment is thereby established. Voluntary
modifications to employees’ remuneration
arrangements are recognized on the basis of the
expected number of employees accepting the
employing company’s offer. Provisions for obligations
related to individual separation agreements which lead
to fixed payments over a defined period of time are
recognized at the present value of the obligation.
Significant estimates and judgements: Pensions
and similar obligations
The projected unit credit method calculation of
provisions for pensions, severance and jubilee
entitlements requires estimates for discount rates,
future increases in salaries and future increases in
pensions. For current actuarial assumptions for
calculating expected defined benefit entitlements
and their sensitivity analysis see Note 23 –
Provisions.
The biometrical basis for the calculation of
provisions for pensions, severance and jubilee
entitlements of Austrian Group companies is
provided by AVÖ 2018 P – Rechnungsgrundlagen
für die Pensionsversicherung (Biometric Tables for
Pension Insurance) – Pagler & Pagler, using the
variant for salaried employees. In other countries,
similar actuarial parameters are used. Employee
turnover was computed based on age or years of
service respectively. The expected retirement age
used for calculations is based on the relevant
country’s legislation.
Provision for onerous contracts are recognized for
contracts in which the unavoidable costs of meeting a
contractual obligation exceed the economic benefits
expected to be received under the contract. These
provisions are measured at the lower amount of the
cost of fulfilling the contract and any potential penalties
or compensation arising in the event of non-
performance.

OMV ANNUAL REPORT 2020 / FINANCIAL STATEMENTS
117
Significant estimates and judgements:
Provisions for onerous contracts
OMV concluded in the past several long-term, non-
cancellable contracts that became onerous due to
negative development of market conditions. This led
to the recognition of onerous contract provisions in
the Group’s financial statements for the unavoidable
costs of meeting the contract obligations.
The estimates used for calculating the positive
contributions that partly cover the fixed costs were
based on external sources and management
expectations. For more details see Note 23 –
Provisions.
Emission allowances received free of cost from
governmental authorities (EU Emissions Trading
Scheme for greenhouse gas emissions allowances)
reduce financial obligations related to CO2 emissions;
provisions are recognized only for shortfalls (see Note
23 – Provisions).
t) Non-derivative financial liabilities
Liabilities are carried at amortized cost, with the
exception of derivative financial instruments, which are
recognized at fair value. Long-term liabilities are
discounted using the effective interest rate method.
u) Taxes on income and deferred taxes
In addition to corporate income taxes and trade
earnings taxes, typical upstream taxes from oil and gas
production like the country’s/national oil company’s
profit share for certain EPSAs (see 2.3f) are disclosed
as income taxes. Deferred taxes are recognized for
temporary differences.
Deferred tax assets are recognized to the extent that it
is probable that taxable profit will be available against
which the unused tax losses, unused tax credits and
deductible temporary differences can be utilized.
Significant estimates and judgements:
Recoverability of deferred tax assets
The recognition of deferred tax assets requires an
assessment of when those assets are likely to
reverse, and a judgement as to whether or not there
will be sufficient taxable profits available to offset the
assets when they reverse. This assessment of
recoverability requires assumptions regarding future
profits and is therefore uncertain. In OMV, this
assessment is based on detailed tax plannings
which covers in Upstream entities the whole life of
field and a five year period in the other entities.
Changes in the assumptions regarding future profits
can lead to an increase or decrease of the amount
of deferred tax assets recognized which has an
impact on the net income in the period in which the
change occurs.
Deferred tax assets and liabilities at Group level are
shown net where there is a right of set-off and the taxes
relate to matters subject to the same tax jurisdiction.
v) Long Term Incentive (LTI) Plans and Equity
Deferral
The fair value of share-based compensation expense
arising from the Long-term Incentive Plan (LTIP) –
OMV’s main equity settled plan – is estimated using a
model which is based on the expected target
achievements and the expected share prices. For cash-
settled awards, a provision based on the fair value of
the amount payable is built up over the vesting period,
so that by the end of the vesting period the fair value of
the bonus shares to be granted is fully provided for.
The provision is remeasured at the end of each
reporting period up to the date of settlement, with any
changes in fair value recognized in profit or loss. For
share settled awards, the grant date fair value is
recognized as an expense (including income tax), with
a corresponding increase in equity, over the vesting
period of the awards. The amount recognized as
expense is adjusted to subsequent changes in
parameters other than market parameters. In addition,
the Equity Deferral part of the annual bonus is settled in
shares. Accordingly, the related expense is recognized
against equity. For share-based awards, the award is
settled net of tax to the participants.
w) Fair value measurement
The fair value is the amount for which an asset or
liability could be transferred at the measurement date,
based on the assumption that such transfers take place
between participants in principal markets and, where
applicable, taking highest and best use into account.
Fair values are determined according to the following
hierarchy:
Level 1: Quoted prices in active markets for identical
assets or liabilities. For OMV Group this
category will, in most cases, only be
relevant for securities, bonds, investment
funds and futures contracts.

OMV ANNUAL REPORT 2020 / FINANCIAL STATEMENTS
118
Level 2: Valuation technique using directly or
indirectly observables inputs. In order to
determine the fair value for financial
instruments within Level 2, usually forward
prices of crude oil or natural gas, interest
rates and foreign exchange rates are used
as inputs to the valuation model. In addition
counterparty credit risk as well as volatility
indicators, if applicable, are taken into
account.
Level 3: Valuation techniques such as discounted
cash flow models using significant
unobservable inputs (e.g. long-term price
assumptions and reserves estimates).
4) Foreign currency translation
Monetary foreign currency balances are measured at
closing rates, and exchange gains and losses accrued
at statement of financial position date are recognized in
the income statement.
The financial statements of Group companies with
functional currencies different from the Group’s
presentation currency are translated using the closing
rate method. Differences arising from statement of
financial position items translated at closing rates are
disclosed in other comprehensive income. Income
statement items are translated at average rates for the
period. The use of average rates for the income
statement creates additional differences compared to
the application of the closing rates in the statement of
financial position which are directly adjusted in other
comprehensive income.
The main rates applied in translating currencies to EUR were as follows:
Foreign currency translation
2020 2019
Statement of
financial
position date Average
Statement of
financial
position date Average
Bulgarian lev (BGN) 1.956 1.956 1.956 1.956
Czech crown (CZK) 26.242 26.455 25.408 25.671
Hungarian forint (HUF) 363.890 351.250 330.530 325.300
New Zealand dollar (NZD) 1.698 1.756 1.665 1.700
Norwegian krone (NOK) 10.470 10.723 9.864 9.851
Romanian leu (RON) 4.868 4.838 4.783 4.745
Russian ruble (RUB) 91.467 82.725 69.956 72.455
Swedish krona (SEK)1 10.034 n.a. — —
US dollar (USD) 1.227 1.142 1.123 1.120
1 Only applicable for Borealis Group (see below)
The items in the income statement related to Borealis
Group were converted by using the monthly average
rates instead of the annual average rate for the period
after the acquisition on October 29, 2020.

OMV ANNUAL REPORT 2020 / FINANCIAL STATEMENTS
119
3 Changes in group structure
A full list of OMV investments as well as changes in
consolidated group can be found in Note 38 – Direct
and indirect investments of OMV Aktiengesellschaft.
Major changes in consolidated Group are described
below.
Changes in consolidated Group – Downstream
On October 29, 2020, OMV acquired an additional
39% share in Borealis AG from Mubadala Investment
Company (Abu Dhabi) via the acquisition of
100% shares in Susana Beteiligungsverwaltungs
GmbH, increasing its stake in Borealis Group from 36%
to 75%. The purchase price of the transaction
amounted to USD 4,551 mn after customary closing
adjustments were taken into account.
The acquisition is a strategic extension of OMV´s value
chain into high value chemicals. This contributes to a
partial natural hedge against the cyclicality of each
value chain step with respect to both volumes and
market spreads, de-risking OMV’s exposure to volatile
markets.
Following the step acquisition, OMV obtained the right
to nominate the majority of the executive board
members and the most important activities in respect of
impacting the variable returns of Borealis Group are
decided by OMV. Hence, OMV has obtained control
over Borealis Group in line with IFRS 10.
Obtaining control over Borealis Group has led to the
discontinuation of the use of the equity method
according to IAS 28 and application of the rules for
business combination according to IFRS 3. OMV´s
previous 36% interest in Borealis was re-measured at
the acquisition date fair value resulting in
EUR 1,256 mn gain recognized in other operating
income. Additionally, this led to a reclassification of net
gains from other comprehensive income to other
operating income in amount of EUR 28 mn, which were
mainly related to currency translation differences.
Acquired net assets and goodwill calculation
The non-controlling interest in Borealis Group was
measured at its proportionate share of the acquiree’s
identifiable net assets. The transaction did not result in
a goodwill. The fair value of the receivables
substantially matched their carrying amount, and all
contractual cash flows less credit loss effects are
expected to be collected. The fair value of the net
assets acquired are detailed in the following tables.

OMV ANNUAL REPORT 2020 / FINANCIAL STATEMENTS
120
Fair values of net assets acquired
In EUR mn
Borealis Group
Intangible assets 887
Property, plant and equipment 4,129
Equity-accounted investments 6,134
Other financial assets 743
Other assets 45
Deferred taxes 39
Non-current assets 11,977
Inventories 1,123
Trade receivables 684
Other financial assets 132
Income tax receivable 13
Other assets 310
Cash and cash equivalents 80
Current assets 2,341
Total assets 14,318
Provisions for pensions and similar obligations 457
Bonds 324
Lease liabilities 139
Other interest-bearing debts 1,131
Decommissioning and restoration obligations 38
Other provisions 12
Other financial liabilities 32
Other liabilities 2
Deferred taxes 549
Non-current liabilities 2,683
Trade payables 719
Bonds 5
Lease liabilities 34
Other interest-bearing debts 407
Income tax liabilities 62
Other provisions 27
Other financial liabilities 154
Other liabilities 163
Current liabilities 1,571
Total liabilities 4,254
Net assets 10,064
Non-Controlling interests (2,524)
Net assets acquired 7,540
Previously held at-equity share 36% – impact on consolidated income statement
In EUR mn
Borealis Group
Fair value 3,590
Carrying amount 2,333
Revaluation result 1,256
Amount reclassified from OCI to the income statement ("recycled") 28
Total impact – other operating income 1,284

OMV ANNUAL REPORT 2020 / FINANCIAL STATEMENTS
121
Measurement of goodwill
In EUR mn
Borealis Group
Consideration 3,889
FX hedge effect 61
Fair value of previously held at-equity share 3,590
Net assets acquired 7,540
Goodwill 0
In 2020, Borealis Group contributed EUR 1,099 mn to
consolidated sales and EUR (79) mn to consolidated
net income of OMV Group since its inclusion. In 2020
Borealis net income was mainly impacted by reversal
effects from fair value adjustments for inventories from
the purchase price allocation. If the acquisition had
already taken place at the beginning of the year, the
calculated impact of Borealis Group to the OMV Group
would have been EUR 5,866 mn on consolidated sales
revenues, EUR 6,801 mn on unconsolidated sales
revenues and EUR 302 mn on net income,
respectively.
Cash flow impact of major acquisitions
The cash flow from investing activities contained
EUR 3,870 mn cash outflow related to the acquisition of
Borealis Group, reflected in the line “Acquisition of
subsidiaries and businesses net of cash acquired” as
detailed in the below table
Net cash outflows related to the acquisition
In EUR mn
Borealis
Group
Consideration paid 3,950
less cash acquired (80)
Net cash outflows from acquisition 3,870
Income tax impact of major acquisitions
Due to tax synergies from the acquisition of additional
shares in Borealis AG, deferred tax assets of the
Austrian tax group increased by approximately
EUR 500 mn, taking into consideration the 5 year
positive taxable result of Borealis tax group members.

OMV ANNUAL REPORT 2020 / FINANCIAL STATEMENTS
122
4 Segment Reporting
Business operations and key markets
For business management purposes, OMV is divided
into two operating Business Segments: Upstream and
Downstream, as well as the segment Corporate and
Other (Co&O). Each segment represents a strategic
unit with different products and markets. Each Business
Segment is managed independently. Strategic
business decisions are made by the Executive Board of
OMV. With the exception of Co&O, the reportable
segments of OMV are the same as the operating
segments.
Upstream (U/S) engages in the business of oil and gas
exploration, development and production and focuses
on the regions Central and Eastern Europe, North Sea,
Russia, Middle East and Africa and Asia-Pacific.
The Downstream (D/S) Business Segment refines and
markets crude, petrochemicals and other feedstock. It
operates the refineries Schwechat (Austria),
Burghausen (Germany) and Petrobrazi (Romania) with
an annual capacity of 17.8 mn t. In these refineries,
crude oil is processed into petroleum products, which
are sold to commercial and private customers.
Furthermore, it operates across the gas value chain
with a successful gas sales and logistics business in
Europe. OMV has operating storage capacities in
Austria and Germany. The business segments’
activities also cover supply, marketing and trading of
gas in Europe and Turkey and the Group’s power
business activities, with one gas-fired power plant in
Romania.
OMV has a strong position in the markets located
within the areas of its supply, serving commercial
customers and operating a retail network of
approximately 2,100 filling stations.
Since October 29, 2020 Borealis Group is fully-
consolidated, following the increase of the stake from
36% to 75%. Borealis is a leading provider of base
chemicals, polyolefins, and fertilizers and is the
second-largest polyolefin producer in Europe and
among the top-ten producers globally. Borealis base
chemical production capacity amounts to 3.6 mn t
(including Borouge at-equity participation)
and has a polyolefin production capacity of 5.7 mn t.
The majority of Borealis’ production is located in
Europe, with three overseas manufacturing facilities in
the United States, one in Brazil and one in South
Korea.
OMV holds minority stakes in various equity-accounted
investments, the most significant ones being the 15%
participation in ADNOC Refining (United Arab
Emirates) with annual capacity of 7.1 mn t OMV share,
Borouge (United Arab Emirates) Borealis’ joint venture
with ADNOC that operates the largest petrochemical
complex in the world and the Baystar joint venture
(United States) which serves the customer base in the
North American markets with Borstar polyethylene.
Group management, financing and insurance activities
and certain service functions are concentrated in the
Co&O segment.
The key measure of operating performance for the
Group is Clean CCS Operating Result. Total assets
include intangible assets as well as property, plant and
equipment. Sales to external customers are split up by
geographical areas on the basis of where the risk is
transferred to the customers. Accounting policies of the
operating segments are the same as those described in
the summary of significant accounting policies, with
certain exceptions for intra-group sales and cost
allocations by the parent company, which are
determined in accordance with internal OMV policies.
Management is of the opinion that the transfer prices of
goods and services exchanged between segments
correspond to market prices. Business transactions not
attributable to operating segments are included in the
results of the Co&O segment.
The disclosure of special items is considered
appropriate in order to facilitate analysis of ordinary
business performance. To reflect comparable figures,
certain items affecting the result are added back or
deducted. These items can be divided into four
subcategories: personnel restructuring, unscheduled
depreciation and write-ups, asset disposals and other.
Segment Reporting

OMV ANNUAL REPORT 2020 / FINANCIAL STATEMENTS
123
Furthermore, to enable effective performance
management in an environment of volatile prices and
comparability with peers, the Current Cost of Supply
(CCS) effect is eliminated from the result. The CCS
effect, also called inventory holding gains and losses, is
the difference between the cost of sales calculated
using the current cost of supply based on purchases
from the most recent month and the cost of sales
calculated using the weighted average method, after
adjusting for any changes in valuation allowances. In
volatile energy markets, measurement of the costs of
petroleum products sold based on historical values
(e.g. weighted average cost) can have distorting effects
on reported results. This performance measurement
indicator enhances the transparency of results and is
commonly used in the oil industry. OMV, therefore,
publishes this measure in addition to the Operating
Result determined according to IFRS.
Segment reporting
In EUR mn
2020
U/S D/S Co&O Total
Consoli-
dation
OMV
Group
Sales revenues1 3,705 15,082 352 19,139 (2,589) 16,550
Intrasegmental sales (2,178) (63) (348) (2,589) 2,589 —
Sales to third parties 1,527 15,019 4 16,550 — 16,550
Other operating income 180 1,656 56 1,892 (15) 1,877
Net income from equity-accounted investments 31 7 — 38 — 38
Depreciation and amortization 1,335 591 39 1,965 — 1,965
Impairment losses (incl. exploration & appraisal) 1,452 10 0 1,462 — 1,462
Write-ups 120 111 — 230 — 230
Operating Result (1,137) 2,160 (56) 967 83 1,050
Special items for personnel restructuring 31 4 5 39 — 39
Special items for unscheduled depreciation and write-ups 1,185 (101) — 1,084 — 1,084
Special items for asset disposal (9) (9) (1) (19) — (19)
Other special items 75 (965) 5 (885) — (885)
Special items 1,282 (1,071) 9 220 — 220
CCS effect — 425 — 425 (10) 416
Clean CCS Operating Result 145 1,514 (47) 1,612 74 1,686
Segment assets2 12,662 9,721 262 22,646 — 22,646
Additions in PPE/IA3 1,150 760 28 1,938 — 1,938
Equity-accounted investments4 389 7,932 — 8,321 — 8,321
1 Including intra-group sales 2 Property, plant and equipment (PPE), intangible assets (IA), not including assets reclassified to assets held for sale 3 Excluding additions in assets reclassified to held for sale and additions to decommissioning assets 4 Not including assets held for sale

OMV ANNUAL REPORT 2020 / FINANCIAL STATEMENTS
124
Segment reporting
In EUR mn
2019
U/S D/S Co&O Total
Consoli-
dation
OMV
Group
Sales revenues1 6,239 20,958 345 27,542 (4,081) 23,461
Intrasegmental sales (3,656) (84) (341) (4,081) 4,081 —
Sales to third parties 2,583 20,874 4 23,461 — 23,461
Other operating income 122 98 60 280 — 280
Net income from equity-accounted investments 45 341 — 386 — 386
Depreciation and amortization 1,604 544 37 2,186 — 2,186
Impairment losses (incl. exploration & appraisal) 211 32 0 243 — 243
Write-ups 35 0 0 35 — 35
Operating Result 1,879 1,847 (91) 3,636 (54) 3,582
Special items for personnel restructuring 17 5 11 34 — 34
Special items for unscheduled depreciation and write-ups 9 30 — 39 — 39
Special items for asset disposal (3) (1) — (5) — (5)
Other special items 48 (65) 13 (4) — (4)
Special items 71 (31) 24 64 — 64
CCS effect — (139) — (139) 29 (110)
Clean CCS Operating Result 1,951 1,677 (67) 3,561 (25) 3,536
Segment assets2 15,049 5,315 277 20,642 — 20,642
Additions in PPE/IA3 1,648 630 72 2,351 — 2,351
Equity-accounted investments 457 4,695 — 5,151 — 5,151
1 Including intra-group sales 2 Property, plant and equipment (PPE), intangible assets (IA), not including assets reclassified to assets held for sale 3 Excluding additions in assets reclassified to held for sale and additions to decommissioning assets
For further details on impairments see Note 7 –
Depreciation, amortization, impairments and write-ups.

OMV ANNUAL REPORT 2020 / FINANCIAL STATEMENTS
125
Other special items in Upstream mainly consisted of
the reassessment of reserves redetermination rights
related to the field Yuzhno Russkoye and temporary
hedging effects. Downstream other special items were
mainly related to the acquisition of 39% additional
shares in Borealis AG (for further details refer to Note 3
– Changes in group structure) partly offset by
temporary hedging effects.
In 2019 other special items in Upstream mainly
comprised the reassessment of reserves
redetermination rights related to the field Yuzhno
Russkoye partly offset by temporary hedging effects.
Downstream other special items consisted of
temporary hedging effects partly offset by
environmental provisions in Romania.
Information on geographical areas
In EUR mn
2020 2019
External sales
Allocated
assets1
Equity-
accounted
investments2 External sales
Allocated
assets1
Equity-
accounted
investments2
Austria 3,466 4,388 78 6,599 3,452 2,465
Germany 3,268 1,105 33 4,962 1,098 29
Romania 3,456 6,106 — 4,389 6,265 —
Russia 448 619 102 633 896 134
New Zealand 402 607 — 528 1,199 —
United Arab Emirates 325 1,479 6,874 488 1,780 2,190
Malaysia 210 1,037 — 122 1,333 —
Rest of CEE3 2,878 639 6 3,564 659 —
Rest of Europe 1,709 4,862 21 1,379 1,954 10
Rest of the world4 388 1,306 1,207 799 1,456 323
Total 16,550 22,148 8,321 23,461 20,092 5,151
Not allocated assets — 498 — — 550 —
Segment assets — 22,646 8,321 — 20,642 5,151
1 Property, plant and equipment (PPE), intangible assets (IA), not including assets reclassified to assets held for sale 2 Equity-accounted investments are allocated based on the seat of the registered office of the parent company, not including assets held for sale 3 Including Turkey4 Rest of world: Principally China, Libya, Nigeria, South Korea, Singapore, Tunisia, United States of America and Yemen
Not allocated assets contained goodwill in amount of
EUR 297 mn (2019: EUR 325 mn) related to the cash-
generating unit ‘Middle East and Africa’, EUR 183 mn
(2019: EUR 199 mn) related to the cash generating unit
‘SapuraOMV’ and EUR 18 mn (2019: EUR 26 mn)
related to the cash-generating unit ‘Refining West’ as
these CGUs are operating in more than one
geographical area.

OMV ANNUAL REPORT 2020 / FINANCIAL STATEMENTS
126
5 Sales revenues
Sales revenues
in EUR mn
2020 2019
Revenues from contracts with customers 16,076 22,616
Revenues from fixed lease payments 11 17
Revenues from variable lease payments 58 63
Revenues from other sources 406 765
Sales revenues 16,550 23,461
Revenues from contracts with customers
In EUR mn
Upstream Downstream
Corporate&
Other
OMV
Group
2020
Crude Oil, NGL, condensates 769 615 — 1,384
Natural gas and LNG 715 3,280 — 3,995
Fuel, heating oil and other refining products — 6,932 — 6,932
Petrochemicals — 2,329 — 2,329
Gas storage, transmission, distribution and transportation 11 231 — 242
Other goods and services1 27 1,164 3 1,194
Revenues from contracts with customers 1,521 14,551 3 16,076
2019
Crude Oil, NGL, condensates 1,228 1,073 — 2,302
Natural gas and LNG 876 4,973 — 5,849
Fuel, heating oil and other refining products — 11,161 — 11,161
Petrochemicals — 1,768 — 1,768
Gas storage, transmission, distribution and transportation 20 232 — 252
Other goods and services1 24 1,259 2 1,285
Revenues from contracts with customers 2,148 20,466 2 22,616
1 Mainly retail non-oil business and power sales in Downstream
6 Other operating income and net income from equity-accounted investments
Other operating income and net income from equity-accounted investments
In EUR mn
2020 2019
Foreign exchange gains from operating activities 159 80
Gains from fair value changes of financial assets 28 —
Gains from fair value changes of trading inventories 90 —
Gains from fair value changes of other derivatives 68 —
Gains on the disposal of businesses, subsidiaries, tangible and intangible assets 22 21
Residual other operating income 1,510 179
Other operating income 1,877 280
Income from equity-accounted investments 250 392
Expenses from equity-accounted investments (212) (6)
Net income from equity-accounted investments 38 386
Notes to the Income Statement

OMV ANNUAL REPORT 2020 / FINANCIAL STATEMENTS
127
Foreign exchange gains from operating activities
were mainly impacted in 2020 and 2019 by USD
development.
Gains from fair value changes of financial assets
included positive discounting effects of the asset from
reserves redetermination rights related to the
acquisition of interests in the Yuzhno Russkoye field.
For further details see Note 18 – Financial assets.
Gains from fair value changes of trading
inventories refer to emissions certificates held for
trading in Downstream (Austria, Germany and
Romania). For further details on Emissions certificates
see Note 23 – Provisions.
Gains from fair value changes of other derivatives
were related to forward contracts of emissions
certificates in Downstream (Austria and Germany).
Residual other operating income contained gains
from revaluation and recycling effects related to the
previously held 36% interest in Borealis AG (see Note 3
– Changes in group structure) as well as storage
income related to Erdöl-Lagergesellschaft m.b.H. in
amount of EUR 50 mn (2019: EUR 49 mn).
Furthermore, the position included an insurance
compensation related to a process safety incident in
Borealis cracker in Sweden in amount of EUR 41 mn.
2019 contained income related to clarification of a tax
related topic in Romania in amount of EUR 14 mn.
Income from equity-accounted investments
primarily contained income from the previously held
36% interest in Borealis AG amounting to EUR 172 mn
(2019: EUR 314 mn).
Expenses from equity-accounted investments were
mainly impacted by Abu Dhabi Oil Refining Company.
For further details see Note 16 – Equity-accounted
investments.
7 Depreciation, amortization, impairments and write-ups
Impairment losses are part of the income statement line
“Depreciation, amortization, impairments and
write-ups”, except for impairment losses related to
exploration and appraisal assets which are shown in
“Exploration expenses”. The following tables provide a
reconciliation to the amounts reported in the income
statement.
Depreciation, amortization, impairments (excluding exploration & appraisal) and write-ups
In EUR mn
2020 2019
Depreciation and amortization 1,965 2,186
Write-ups (230) (35)
Impairment losses (excl. exploration & appraisal) 683 151
Depreciation, amortization, impairment losses (excluding exploration & appraisal) and write-ups 2,418 2,302
Impairment losses (including exploration & appraisal)
In EUR mn
2020 2019
Impairment losses (excl. exploration & appraisal) 683 151
Impairment losses (exploration & appraisal) 779 92
Impairment losses (including exploration & appraisal) 1,462 243

OMV ANNUAL REPORT 2020 / FINANCIAL STATEMENTS
128
Depreciation, amortization, impairments and write-ups – split per function
In EUR mn
2020 2019
Depreciation and amortization 1,965 2,186
attributable to exploration expenses — —
attributable to production and operating expenses 1,717 1,926
attributable to selling, distribution and administrative expenses 248 259
Write-ups (230) (35)
attributable to exploration expenses — —
attributable to production and operating expenses (227) (35)
attributable to selling, distribution and administrative expenses (3) —
Impairment losses (incl. exploration & appraisal) 1,462 243
attributable to exploration expenses 779 92
attributable to production and operating expenses 673 125
attributable to selling, distribution and administrative expenses 10 26
Impairments and write-ups in Upstream
The significant drop in the oil and gas prices led to the
change in OMV’s price assumptions and have triggered
impairment testing throughout the Upstream portfolio.
For further information regarding change in price
assumptions see Note 2 – Accounting policies,
judgments and estimates.
This led to pre-tax impairments of EUR 1,222 mn
(intangible assets EUR 614 mn and tangible assets
EUR 608 mn) and pre-tax write-ups of EUR 91 mn in
2020 for exploration and appraisal, development and
production oil and gas assets. The impairments have
been recorded in different countries across the
portfolio, mainly related to assets in New Zealand,
Romania, Austria and United Arab Emirates.
An increase of 1 percentage point in the post-tax
discount rates would lead to an additional post-tax
impairment of approximately EUR 250 mn for
producing assets and assets currently in the
development phase as well as exploration and
appraisal assets. Furthermore, a Brent oil price
decrease of USD 10/bbl and gas price decrease of
EUR 3/MwH per year would lead to an additional post-
tax impairment of approximately EUR 1.7 bn.
Material upstream impairments and write-ups in 2020
In EUR mn
Country
Impairments net of
write-ups pre-tax
Value in use
of assets1
After-tax
discount
rate1
New Zealand 447 403 8.5%
United Arab Emirates 291 1,236 7.5%
Romania 196 564 9.7%
Austria 156 824 8.7%
Yemen 59 52 10.8%
Tunisia 19 29 8.4%
Malaysia 7 34 7.1%
Norway (43) 782 7.6%
1 based on performed impairment tests in Q3/20
Moreover, impairments in 2020 included mainly
unsuccessful workovers and obsolete or replaced
assets in Romania (EUR 58 mn). Furthermore,
impairment losses in 2020 included impairments of
EUR 149 mn related to unsucessfull exploration wells
and exploration licenses in Malaysia, Austria, Norway
and New Zealand.
The planned sale of assets in Kazakhstan by OMV
Petrom (51% subsidiary of OMV) in 2020 led to the
reclassification to “held for sale”, which triggered a pre-
tax write-up of EUR 28 mn. For more details please see
Note 20 – Assets and liabilities held for sale.

OMV ANNUAL REPORT 2020 / FINANCIAL STATEMENTS
129
In 2019, a divestment process of 40 marginal oil and
gas fields in Romania resulted in a pre-tax impairment
of property, plant and equipment amounting to
EUR 36 mn. Other impairments in 2019 were mainly
related to the unsuccessful workovers and obsolete or
replaced assets in Romania (EUR 76 mn) as well as
unsuccessful exploration wells in Romania, Austria,
New Zealand and Norway (EUR 92 mn). Additionally, in
2019 the reclassification to “held for sale” triggered a
pre-tax write-up of EUR 34 mn of the Maari field in New
Zealand.
Impairments and write-ups in Downstream
In 2020 there were no significant impairments in the
segment.
During Q3/20, the long-term power and CO2 price
assumptions were revised, taking into account the
improved power generation market in Romania. This
led to the full reversal of impairments for the Brazi gas-
fired power plant in Romania amounting to
EUR 107 mn pre-tax based on an after-tax discount
rate of 4.26%.
In 2019, the equity-accounted investment in Enerco
Enerji Sanayi Ve Ticaret A.Ş. was fully written off
following the termination of long term sales contracts,
leading to an impairment loss of EUR 12 mn. Other
impairments amounted to EUR 20 mn and were mainly
related to assets in the oil business.
8 Exploration expenses
The following financial information represents the
amounts included within the Group totals relating to
exploration for and appraisal of oil and natural gas
resources. All such activities are recorded within the
Upstream segment.
Exploration for and appraisal of mineral resources
In EUR mn
2020 2019
Impairment losses (exploration & appraisal) 779 92
Other exploration expenses 117 136
Exploration expenses 896 229
Total intangible assets – exploration and appraisal expenditure
incl. acquisition of unproved reserves 1,260 2,500
Net cash used in operating activities 106 138
Net cash used in investing activities1 122 261
1 2019 figures do not include the acquisition of SapuraOMV Upstream assets in Malaysia.
9 Other operating expenses
Other operating expenses
In EUR mn
2020 2019
Foreign exchange losses from operating activities 135 67
Losses on disposals of businesses, subsidiaries, tangible and intangible assets 8 14
Losses from fair value changes of financial assets (0) 5
Net impairment losses on financial assets measured at amortized cost 12 33
Personnel reduction schemes 39 26
Research and development expenses 61 49
Residual other operating expenses 134 128
Other operating expenses 389 322
Foreign exchange losses from operating activities
in 2020 and 2019 were mainly impacted by USD
development.
Net impairment losses on financial assets
measured at amortized cost were mainly related to
impairments for receivables in Tunisia amounting to
EUR 9 mn (2019: EUR 18 mn). The 2019 impairments
were triggered by a reassessment of future production.

OMV ANNUAL REPORT 2020 / FINANCIAL STATEMENTS
130
The increase in Research and development
expenses was largely owing to Borealis group. For
further details on the acquisition of additional shares in
Borealis AG see Note 3 – Changes in group structure.
Residual other operating expenses contained
expenses relating to various digitalization initiatives
amounting to EUR 36 mn (2019: EUR 44 mn) as well
as storage expenses related to Erdöl-Lagergesellschaft
m.b.H. in amount of EUR 56 mn (2019: EUR 53 mn).
10 Personnel expenses
Personnel expenses
In EUR mn
2020 2019
Wages and salaries 944 869
Costs of defined benefit plans 9 18
Costs of defined contribution plans 33 28
Net expenses for personnel reduction schemes 39 26
Other employee benefits 128 157
Taxes and social contribution 155 130
Personnel expenses 1,308 1,228
Increase of net expenses for personnel reduction
schemes was mainly related to restructuring expenses
from outsourcing activities in Romania.
Additional details on defined benefit plans are included
in Note 23 – Provisions.
11 Net financial result
Interest income
In EUR mn
2020 2019
Cash & cash equivalents 38 52
Discounted receivables 17 24
Other financial and non-financial assets 30 23
Loans 88 70
Other 3 —
Interest income 177 169
Other financial and non-financial assets mainly
included late payment interest income in relation to
successful arbitration in Romania in 2020, while 2019
primarily contained late payment interest income in
relation to clarification of a tax related topic in Romania.
Interest income from loans included EUR 84 mn
(2019: EUR 70 mn) related to the Nord Stream 2
financing agreement. For further details see Note 18 –
Financial assets.

OMV ANNUAL REPORT 2020 / FINANCIAL STATEMENTS
131
Interest expenses
In EUR mn
2020 2019
Bonds 136 129
Lease liabilities 24 23
Other financial and non-financial liabilities 20 27
Provisions for decommissioning and restoration obligations 74 91
Provisions for jubilee payments, personnel reduction plans and other employee benefits 2 2
Provisions for pensions and severance payments 11 19
Provisions for onerous contracts 15 17
Other 5 2
Interest expenses, gross 287 309
Capitalized borrowing costs (7) (6)
Interest expenses 280 304
For further details on bonds see Note 24 – Liabilities.
For OMV Petrom SA the unwinding expenses for
decommissioning provision are included net of the
unwinding income for related state receivables. For
further details see Note 18 – Financial assets.
The interest expenses on pension provisions were
netted against interest income on pension plan assets
which amounted to EUR 5 mn (2019: EUR 8 mn).
Provisions for onerous contracts included of
unwinding expenses for the Gate LNG obligation and
associated transportation commitments of OMV Gas
Marketing & Trading GmbH. For further details see
Note 23 – Provisions.
Capitalized borrowings costs applied to the carrying
value of qualifying assets and were mainly related to oil
and gas development assets in Tunisia and Norway.
Other financial income and expense
In EUR mn
2020 2019
Carrying amount of sold trade receivables (5,212) (5,771)
Proceeds on sold trade receivables 5,189 5,740
Financing charges for factoring and securitization (24) (31)
Net foreign exchange gains/(losses) (53) 40
Other (14) (8)
Other financial income and expense (91) 1
In 2020 Net foreign exchange gains/ (losses) were
predominately impacted by RUB and USD. 2019 was
additionally predominately impacted by NOK.
The position Other was mainly related to bank charges.

OMV ANNUAL REPORT 2020 / FINANCIAL STATEMENTS
132
12 Taxes on income and profit
Taxes on income and profit
In EUR mn
2020 2019
Profit before tax 875 3,453
Current taxes 244 1,207
thereof related to previous years 2 13
Deferred taxes (846) 100
Taxes on income and profit (603) 1,306
Changes in deferred taxes
In EUR mn
2020 2019
Deferred taxes January 1 (445) 28
Deferred taxes December 31 (57) (445)
Changes in deferred taxes 388 (473)
Deferred taxes accounted for in equity 17 (4)
Changes in consolidated Group, exchange differences and other changes1 441 377
Deferred taxes per income statement 846 (100)
The deferred taxes per income statement comprise the following elements:
Change in tax rate 12 5
Release of and allocation to valuation allowance for deferred taxes 320 5
Adjustments within loss carryforwards (not recognized in prior years, expired loss
carryforwards and other adjustments) 59 16
Reversal of temporary differences, including additions to and use of loss carryforwards 456 (125)
1 2020 included the acquisition of additional shares in Borealis AG in amount of EUR 510 mn. 2019 included the acquisition of SapuraOMV in amount of
EUR 336 mn.
Taxes on income and profit accounted for in other comprehensive income
In EUR mn
2020 2019
Deferred taxes (8) (4)
Current taxes (0) 0
Taxes on income and profit accounted for in other comprehensive income (8) (4)
OMV Aktiengesellschaft forms a tax group in
accordance with section 9 of the Austrian Corporate
Income Tax Act 1988 (KStG), which aggregates the
taxable profits and losses of all the Group’s main
subsidiaries in Austria and possibly arising losses of
one foreign subsidiary (OMV AUSTRALIA PTY LTD).
Dividend income from domestic subsidiaries is in
general exempt from taxation in Austria. Dividends from
EU- and EEA-participations as well as from
subsidiaries whose residence state has a
comprehensive mutual administrative assistance
agreement with Austria are exempt from taxation in
Austria if certain conditions are fulfilled. Dividends from
other foreign investments that are comparable to
Austrian corporations, for which the Group holds a 10%
investment share or more for a minimum period of one
year, are also excluded from taxation at the level of the
Austrian parent company.
Changes in valuation allowance for the Austrian tax
group was reported in the income statement, except to
the extent that the deferred tax assets arose from
transactions or events which were recognized outside
profit or loss, i.e. in other comprehensive income or
directly in equity.
The effective tax rate is the ratio of income tax to profit
before tax. The tables hereafter reconcile the effective
tax rate and the standard Austrian corporate income
tax rate of 25% showing the major influencing factors.

OMV ANNUAL REPORT 2020 / FINANCIAL STATEMENTS
133
Tax rate reconciliation
In %
2020 2019
Austrian corporate income tax rate 25.0 25.0
Tax effect of:
Differing foreign tax rates (8.3) 14.7
Non-deductible expenses 22.6 5.0
Non-taxable income (55.7) (5.3)
Change in tax rate (1.3) (0.2)
Permanent effects within tax loss carryforwards 0.1 (0.0)
Tax write-downs and write-ups on investments at parent company level (14.1) (0.6)
Change in valuation allowance for deferred taxes (36.5) (0.1)
Taxes related to previous years (6.2) (0.6)
Other 5.5 (0.1)
Effective Group income tax rate (68.8) 37.8
Tax rate reconciliation
In EUR mn
2020 2019
Theoretical taxes on income based on Austrian income tax rate 219 863
Tax effect of:
Differing foreign tax rates (73) 508
Non-deductible expenses 198 172
Non-taxable income (487) (182)
Change in tax rate (12) (5)
Permanent effects within tax loss carryforwards 1 (2)
Tax write-downs and write-ups on investments at parent company level (123) (20)
Change in valuation allowance for deferred taxes (320) (5)
Taxes related to previous years (55) (19)
Other 49 (4)
Total taxes on income and profit (603) 1,306
Non-deductible expenses contained mainly negative
result contribution from at-equity accounted
investments as well as permanent effects from
depreciation, depletion and amortization.
Non-taxable income in 2020 was predominantly
impacted by revaluation and recycling effects related to
the previously held 36% interest in Borealis AG (see
Note 3 – Changes in group structure). Furthermore the
position included mainly positive result contribution
from equity-accounted investments as well as tax
incentives in Norway.
Change in valuation allowance for deferred taxes
was predominately impacted by release of valuation
allowances on tax loss carryforwards in Austria. For
further details see Note 25 – Deferred Taxes.

OMV ANNUAL REPORT 2020 / FINANCIAL STATEMENTS
134
13 Earnings Per Share
Earnings Per Share (EPS)
In EUR mn
2020 2019
Earnings
attributable
to stockholders
of the
parent
in EUR mn
Weighted
average
number of
shares
outstanding EPS in EUR
Earnings
attributable
to stockholders
of the
parent
in EUR mn
Weighted
average
number of
shares
outstanding EPS in EUR
Basic 1,258 326,830,270 3.85 1,678 326,610,239 5.14
Diluted 1,258 326,989,851 3.85 1,678 326,863,180 5.13
The calculation of diluted Earnings per Share took into
account the weighted average number of ordinary
shares in issue following the conversion of all
potentially diluting ordinary shares. This included
159,581 (2019: 252,941) contingently issuable bonus
shares related to Long Term Incentive Plans and the
Equity Deferral.

OMV ANNUAL REPORT 2020 / FINANCIAL STATEMENTS
135
Notes to the Statement of Financial Position
14 Intangible assets
Intangible assets
In EUR mn
Concessions,
software, licenses,
rights
Oil and gas assets
with unproved
reserves Goodwill Total
2020
Development of costs
January 1 1,936 2,860 622 5,418
Currency translation differences (266) (106) (53) (425)
Changes in consolidated Group 887 — — 887
Additions 68 117 — 185
Transfers 3 (514) — (511)
Assets held for sale (91) — (38) (129)
Disposals (29) (162) — (191)
December 31 2,509 2,195 531 5,235
Development of amortization
January 1 895 360 — 1,255
Currency translation differences (61) (29) — (90)
Amortization 113 — — 113
Impairments 1 768 — 769
Transfers (0) (5) — (5)
Assets held for sale (54) — — (54)
Disposals (29) (160) — (189)
Write-ups (9) (0) — (9)
December 31 857 934 — 1,792
Carrying amount January 1 1,041 2,500 622 4,163
Carrying amount December 31 1,652 1,260 531 3,443
2019
Development of costs
January 1 1,769 2,252 420 4,441
Currency translation differences 124 20 7 150
Changes in consolidated Group 0 678 195 874
Additions 46 254 — 300
Transfers 0 (183) — (183)
Assets held for sale (0) (26) — (27)
Disposals (2) (135) — (137)
December 31 1,936 2,860 622 5,418
Development of amortization
January 1 779 346 — 1,125
Currency translation differences 6 2 — 8
Amortization 113 — — 113
Impairments 0 92 — 92
Transfers (0) (15) — (16)
Assets held for sale (0) (1) — (1)
Disposals (2) (64) — (66)
December 31 895 360 — 1,255
Carrying amount January 1 991 1,906 420 3,317
Carrying amount December 31 1,041 2,500 622 4,163

OMV ANNUAL REPORT 2020 / FINANCIAL STATEMENTS
136
Changes in consolidated group in 2020 of EUR 887 mn
were mainly related to capitalized development costs,
patents and licenses due to the acquisition of an
additional 39% share in Borealis AG. See Note 3 –
Changes in group structure – for additional details.
The transfers were mainly related to the shift of the
licence SK408 Jerun in Malaysia from intangible assets
to development assets following the final investment
decision.
Intangible assets with a total carrying amount of
EUR 75 mn (2019: EUR 26 mn) were transferred to
assets held for sale, mainly related to the planned sale
of OMV´s share in Gas Connect Austria GmbH and the
retail network in Germany. For details see Note 20 –
Assets and liabilities held for sale.
Further details on impairments and write-ups can be
found in Note 7 – Depreciation, amortization,
impairments and write-ups.
Goodwill arising from business combinations has been
allocated to the following CGUs and groups of CGUs,
for impairment testing:
Goodwill allocation
In EUR mn
2020 2019
Middle East and Africa 297 325
SapuraOMV 183 199
Goodwill allocated to Upstream 480 524
Downstream Gas Austria — 38
Refining West 18 26
Retail Slovakia 7 7
Refining Austria 26 27
Goodwill allocated to Downstream 52 98
Goodwill 531 622
In 2020, the goodwill allocated to Upstream decreased
due to unfavorable currency translation differences.
In the Downstream Segment, goodwill decreased due
to the planned sale of OMV´s 51% share in Gas
Connect Austria GmbH. As the Downstream Gas
Austria Goodwill was part of the disposal group the
goodwill was consequently reclassified to assets held
for sale. For details see Note 20 – Assets and liabilities
held for sale. Furthermore, the goodwill allocated to
Refining West and Refining Austria decreased due to
unfavorable currency translation differences.
Goodwill impairment tests based on a value in use
calculation have been performed and did not lead to
any impairments. For the impairment test of the
goodwill allocated to Middle East and Africa, an after-
tax discount rate of 9.23% (2019: 8.66%) and for
goodwill allocated to SapuraOMV an after-tax discount
rate of 7.88% was used.
There is no reasonable change in the discount rate that
would lead to an impairment of goodwill allocated to
Upstream. Furthermore, a Brent oil price decrease of
USD 10/bbl and gas price decrease of EUR 3/MwH per
year would also not lead to an impairment of the
goodwill allocated to Middle East and Africa. The
change in price assumptions would lead to an post-tax
impairment of approximately EUR 50 mn of the
goodwill allocated to SapuraOMV.
For details on contractual obligations for the acquisition
of intangible assets refer to Note 15 – Property, plant
and equipment.

OMV ANNUAL REPORT 2020 / FINANCIAL STATEMENTS
137
15 Property, plant and equipment
Property, plant and equipment including right-of-use assets
In EUR mn
Land and
buildings
Oil and
gas assets
Plant and
machinery
Other
fixtures,
fittings
and
equipment
Assets
under
construction Total
2020
Development of costs
January 1 3,520 23,974 8,987 2,120 415 39,017
Currency translation differences (33) (1,032) (21) (15) (3) (1,104)
Changes in consolidated Group 396 — 3,025 85 624 4,129
Additions 96 965 263 108 320 1,753
New obligations and change in
estimates for decommissioning 11 101 29 — — 141
Transfers 40 512 175 27 (242) 511
Assets held for sale (430) (901) (920) (300) (33) (2,584)
Disposals (15) (175) (55) (58) (0) (303)
December 31 3,584 23,445 11,483 1,967 1,081 41,560
Development of depreciation
January 1 1,714 13,433 5,875 1,504 11 22,538
Currency translation differences (17) (525) (28) (10) (0) (581)
Depreciation 142 1,182 406 129 — 1,858
Impairments 4 658 17 1 0 679
Transfers (0) 8 (0) 0 (3) 5
Assets held for sale (163) (768) (480) (221) (1) (1,633)
Disposals (9) (173) (51) (56) 0 (289)
Write-ups (1) (119) (98) (0) — (219)
December 31 1,669 13,695 5,640 1,346 7 22,358
Carrying amount January 1 1,806 10,541 3,111 616 404 16,479
Carrying amount December 31 1,915 9,750 5,843 622 1,073 19,203

OMV ANNUAL REPORT 2020 / FINANCIAL STATEMENTS
138
Property, plant and equipment
In EUR mn
Land and
buildings
Oil and
gas assets
Plant and
machinery
Other
fixtures,
fittings
and
equipment
Assets
under
construction Total
2019
Development of costs
January 1 3,394 23,033 8,694 2,018 411 37,550
Currency translation differences (21) (6) (54) (7) (4) (92)
Changes in consolidated Group 5 588 0 0 10 604
Additions 162 1,271 237 162 218 2,051
New obligations and change in
estimates for decommissioning 2 212 2 — — 216
Transfers 8 147 177 2 (212) 123
Assets held for sale 2 (1,151) (4) (1) (3) (1,157)
Disposals (33) (119) (65) (54) (6) (278)
December 31 3,520 23,974 8,987 2,120 415 39,017
Development of depreciation
January 1 1,607 13,060 5,608 1,459 12 21,747
Currency translation differences (9) (5) (31) (5) 0 (51)
Depreciation 145 1,442 366 122 — 2,075
Impairments 13 117 3 0 6 139
Transfers (25) 10 (5) (21) (1) (43)
Assets held for sale 1 (1,038) (3) (1) — (1,041)
Disposals (17) (118) (61) (51) (6) (253)
Write-ups 0 (35) (0) (0) — (35)
December 31 1,714 13,433 5,875 1,504 11 22,538
Carrying amount January 1 1,787 9,972 3,086 559 399 15,803
Carrying amount December 31 1,806 10,541 3,111 616 404 16,479
The changes in the consolidated group in 2020 of
EUR 4,129 mn were related to the acquisition of an
additional 39% share in Borealis AG. For more details
please see Note 3 – Changes in group structure.
The transfers were mainly related to the shift of the
licence SK408 Jerun in Malaysia from intangible to
development assets following the final investment
decision.
Property, plant and equipment with a total carrying
amount of EUR 950 mn (2019: EUR 116 mn) were
transferred to assets held for sale, related to the sale of
OMV´s share in Gas Connect Austria GmbH, the retail
network in Germany as well as assets in Malaysia and
Kazakhstan. For more details please see Note 20 –
Assets and liabilities held for sale.
Further details on impairments and write-ups can be
found in Note 7 – Depreciation, amortization,
impairments and write-ups.
.

OMV ANNUAL REPORT 2020 / FINANCIAL STATEMENTS
139
Contractual obligations for acquisitions
In EUR mn
2020 2019
Intangible assets 395 491
Property, plant and equipment 1,134 852
Contractual obligations 1,529 1,343
In 2020 and in 2019 the contractual commitments were
mainly related to exploration and production activities in
Upstream. The increase of contractual obligations in
2020 is mainly related to additional commitments of
Borealis group.
OMV as a lessee
Right-of-use assets included mainly leases of filling
station sites and buildings as well as office buildings. In
addition, OMV leases mainly a hydrogen plant at
Petrobrazi refinery in Romania, various types of
equipment, other land leases and vehicles.
The changes in the consolidated group in 2020 were
related to the acquisition of an additional 39% share in
Borealis AG and included mainly land leases and
vessel lease.
Right-of-use assets with a total carrying amount of
EUR 136 mn were transferred to assets held for sale,
mainly related to planned sale of the retail network in
Germany and are represented in the line other
movements.
Right-of-use assets recognized under IFRS 16
In EUR mn
Land and
buildings
Plant and
machinery
Other
fixtures,
fittings
and
equipment Total
2020
January 1 667 37 111 815
Changes in consolidated Group 75 19 76 170
Additions 62 12 57 131
Depreciation (66) (14) (46) (126)
Other movements (145) (6) (3) (155)
December 31 593 48 194 836
2019
January 1 670 33 66 768
Changes in consolidated Group 5 — — 5
Additions 81 18 79 178
Depreciation (66) (10) (32) (108)
Other movements (23) (4) (2) (28)
December 31 667 37 111 815

OMV ANNUAL REPORT 2020 / FINANCIAL STATEMENTS
140
Amounts recognized in the consolidated income statement
In EUR mn
2020 2019
Operating result
Short-term lease expenses 30 107
thereof capitalized short-term lease expenses 16 73
Low-value lease expenses 2 2
Expenses relating to variable lease payments 7 9
Net financial result
Interest expense from lease liabilities 24 23
Net foreign exchange loss on lease liabilities 3 2
The decrease in short term lease expenses was mainly
related to the first time adoption of IFRS 16 in 2019,
where OMV did not recognize any right-of-use assets
for contracts that expired in 2019 as they were treated
as short-term leases as well as reduced drilling
activities in 2020 compared to 2019.
Expenses relating to variable lease payments mainly
included rent for leased filling stations based on actual
turnover. For information on lease liabilities please see
Note 24 – Liabilities.
16 Equity-accounted investments
Material associates and joint ventures
Following the acquisition of an additional 39% share in
Borealis group (previous share: 36%) OMV has gained
control over Borealis group and discontinued the use of
the equity accounting in line with IAS 28. See Note 3 –
Changes in group structure – for further details. As a
result of the full consolidation of Borealis group, OMV
holds a 40% interest in Abu Dhabi Polymers Company
Limited (Borouge) and a 50% interest in Bayport
Polymers LLC.
Abu Dhabi Polymers Company Limited (Borouge),
registered in Abu Dhabi, is a leading provider of
innovative, value-creating plastic solutions for energy,
infrastructure, automotive, healthcare and agriculture
industries as well as advanced packaging applications.
As OMV, with its 40% interest does not have joint
control over Abu Dhabi Polymers Company Limited
(Borouge), the company is accounted for as an
associated company.
Bayport Polymers LLC, registered in Pasadena
(incorporated in Wilmington), is currently building a
polyethylene facility as well as an ethane steam cracker
with the objective of supplying the abundandtly
available and competitively priced ethane in the United
States to its polyethylene units. As OMV has joint
control over Bayport Polymers LLC (50/50 share split),
it accounts the company as joint venture.
OMV also holds a 15% interest in Abu Dhabi Oil
Refining Company (2019: 15%), registered in Abu
Dhabi, which runs a refinery hub with integrated
petrochemicals. According to the contractual
agreement between the shareholders, OMV has strong
participation rights which represent significant influence
as per IAS 28 definition.
The companies are not listed on public exchanges thus
quoted market prices do not exist.
The tables below contain summarized financial
information for the material associates and joint
ventures. Income statement and other comprehensive
income for Abu Dhabi Polymers Company Limited
(Borouge) and Bayport Polymers LLC represent
amounts since inclusion in OMV group on October 29,
2020. Income statement and other comprehensive
income for Abu Dhabi Oil Refining Company in 2019
represent amounts since acquisition on July 31, 2019.

OMV ANNUAL REPORT 2020 / FINANCIAL STATEMENTS
141
Statement of comprehensive income
In EUR mn
2020 2019
Associates
Joint
Venture Associates
Abu Dhabi
Oil Refining
Company
Abu Dhabi
Polymers
Company
Limited
(Borouge)
Bayport
Polymers
LLC
Abu Dhabi
Oil Refining
Company Borealis
Sales revenue 11,361 715 75 8,381 8,111
Net income for the year (1,296) 64 14 67 873
Other comprehensive income — (9) — (13) (23)
Total comprehensive income (1,296) 55 14 53 851
Group’s share of comprehensive income (194) 22 7 8 306
Dividends distributed — — 21 34 297
Statement of financial position
In EUR mn
2020 2019
Associates
Joint
Venture Associates
Abu Dhabi
Oil Refining
Company
Abu Dhabi
Polymers
Company
Limited
(Borouge)
Bayport
Polymers
LLC
Abu Dhabi
Oil Refining
Company Borealis
Non-current assets 17,207 6,422 2,543 18,464 7,691
Current assets 4,137 1,515 332 4,184 2,428
Non-current liabilities 4,943 335 1,515 3,683 2,182
Current liabilities 3,311 461 76 3,389 1,491
Equity 13,089 7,142 1,284 15,577 6,445
Group’s share 1,963 2,857 642 2,337 2,320
Goodwill 64 1,770 — 70 30
OMV Group adjustments (280) 436 (22) (297) (12)
Group’s carrying amount of investment 1,747 5,062 620 2,109 2,339

OMV ANNUAL REPORT 2020 / FINANCIAL STATEMENTS
142
Carrying amount reconciliation
In EUR mn
2020 2019
Associates
Joint
Ventures Associates
Abu Dhabi
Oil Refining
Company
Abu Dhabi
Polymers
Company
Limited
(Borouge)
Bayport
Polymers
LLC
Abu Dhabi
Oil Refining
Company Borealis
January 1 2,109 — — — 2,319
Changes in the consolidated group — 5,290 515 2,150 —
Additions and other changes — — 143 — —
Currency translation differences (168) (250) (24) (15) —
Net income (194) 26 7 10 314
Other comprehensive income — (3) — (2) (8)
Reclassification of cash flow hedges to balance
sheet — — — — (1)
Dividends and elimination of intercompany profits — — (21) (34) (286)
December 31 1,747 5,062 620 2,109 2,339
Individually immaterial associates and joint
ventures
OMV holds 55.6% (2019: 55.6%) of Erdöl-
Lagergesellschaft m.b.H (ELG), registered in
Lannach, which is holding the major part of the
emergency stock of crude and petroleum products in
Austria. In spite of holding the majority of voting rights
in the general assembly, OMV does not have control
over ELG. The significant decisions on the financial and
operating policies are delegated to the standing
shareholder’s committee in which a quorum of two
thirds of the share capital is required for decisions.
OMV holds 15.53% (2019: 15.53%) in Trans Austria
Gasleitung GmbH, registered in Vienna. As
unanimous consent of the parties is required for
decisions about relevant activities and OMV has rights
to the net assets of Trans Austria Gasleitung GmbH
based on the legal structure, OMV classified it as a joint
venture according to IFRS 11. In 2020 Trans Austria
Gasleitung GmbH has been reclassified to held for sale
following the planned sale of OMV´s 51% share in Gas
Connect Austria GmbH (for more details see Note 20 –
Assets and liabilities held for sale).
OMV exercises joint control over Abu Dhabi
Petroleum Investments LLC (ADPI, OMV’s interest
25%, 2019: 25%), registered in Abu Dhabi, and Pak-
Arab Refinery Limited (PARCO; indirect interest of
OMV amounts to 10%, 2019: 10%), registered in
Karachi, and accounts both investments at-equity.
ADPI is a holding company for its 40% interest in
PARCO. As unanimous consent of the parties is
required for decisions about relevant activities and
OMV has rights to the net assets based on the legal
structure, OMV classified the companies as joint
ventures according to IFRS 11.
Furthermore, OMV has a 10% interest (2019: 10%) in
Pearl Petroleum Company Limited, registered in
Road Town, British Virgin Islands, which is involved in
exploration and production of hydrocarbons in the
Kurdistan Region of Iraq. According to the contractual
agreement between OMV and Pearl Petroleum
Company Limited (Pearl), OMV has significant
influence within the meaning of IAS 28, as unanimous
consent is required for some strategic decisions.
Therefore Pearl is accounted for using the equity
method although OMV‘s share is just 10%.
Following the full consolidation of Borealis AG, OMV
now also holds 50% share in Borouge Pte.Ltd., based
in Singapore, which is responsible for marketing and
sales of the products produced by Abu Dhabi Polymers
Company Limited (Borouge). Even though OMV holds
a 50% interest in Borouge Pte. Ltd., OMV has no joint
control and thus accounts for it as an associated
company.

OMV ANNUAL REPORT 2020 / FINANCIAL STATEMENTS
143
Statement of comprehensive income for individually immaterial associates and joint ventures – Group’s share
In EUR mn
2020 2019
Associates Joint ventures Associates Joint ventures
Sales revenue 1,177 136 441 224
Net income for the year 28 0 44 17
Other comprehensive income (2) — 1 —
Total comprehensive income 25 0 44 17
Carrying amount reconciliation for individually immaterial associates and joint ventures
In EUR mn
2020 2019
Associates Joint ventures Associates Joint ventures
January 1 553 150 537 154
Currency translation differences (69) (9) 19 (8)
Changes in consolidated Group1 322 7 — —
Additions and other changes 13 — 4 1
Net income 28 0 44 17
Other comprehensive income (2) — 1 —
Disposals and other changes (1) (54) (1) —
Impairment — — (12) —
Dividends distributed (42) (5) (39) (14)
December 311 802 91 553 150
1 Includes associated companies accounted at-cost

OMV ANNUAL REPORT 2020 / FINANCIAL STATEMENTS
144
17 Inventories
Inventories
In EUR mn
2020 2019
Crude oil 427 676
Natural gas 122 180
Other raw materials 466 219
Work in progress 74 100
Finished petroleum products 540 624
Other finished products 723 47
Inventories 2,352 1,845
Purchases (net of inventory variation)
In EUR mn
2020 2019
Costs of goods and materials 8,992 13,629
Inventory changes 540 (88)
Write-downs to net realizable value and write-offs of inventories 134 74
Reversal of inventories write-downs (68) (6)
Purchases (net of inventory variation) 9,598 13,608
The reversal of inventories write-downs in 2020 were
related to the gas business resulting from increased
prices.

OMV ANNUAL REPORT 2020 / FINANCIAL STATEMENTS
145
18 Financial assets
Financial assets1
In EUR mn
Valued at fair
value
through profit
or loss
Valued at
fair value
through other
comprehen-
sive income
Valued at
amortized
cost
Total
carrying
amount
thereof
short-term
thereof
long-term
2020
Trade receivables from contracts
with customers 71 — 1,806 1,876 1,876 —
Other trade receivables — — 1,440 1,440 1,440 —
Total trade receivables 71 — 3,245 3,316 3,316 —
Investments in other companies 1 14 — 15 — 15
Investment funds 35 — — 35 — 35
Bonds — — 64 64 0 63
Derivatives designated and effective
as hedging instruments — 71 — 71 63 8
Other derivatives 2,502 — — 2,502 2,105 397
Loans — — 1,720 1,720 85 1,636
Other sundry financial assets 744 — 1,313 2,058 765 1,293
Total other financial assets 3,283 84 3,097 6,464 3,018 3,447
Financial assets 3,353 84 6,343 9,780 6,334 3,447
2019
Trade receivables from contracts with
customers 131 — 1,423 1,553 1,553 —
Other trade receivables — — 1,489 1,489 1,489 —
Total trade receivables 131 — 2,911 3,042 3,042 —
Investments in other companies — 24 — 24 — 24
Bonds — — 78 78 18 60
Derivatives designated and effective
as hedging instruments — 284 — 284 255 30
Other derivatives 2,391 — — 2,391 2,237 154
Loans — — 855 855 2 854
Other sundry financial assets 721 — 1,182 1,903 611 1,292
Total other financial assets 3,112 308 2,115 5,535 3,121 2,414
Financial assets 3,243 308 5,026 8,577 6,163 2,414
1 Excluding financial assets that were reclassified to assets held for sale, which are described in Note 20 – Assets and Liabilities held for sale.
The carrying amount of financial assets at fair value
through profit or loss as at December 31, 2020 was
EUR 3,353 mn (2019: EUR 3,243 mn). These mainly
consisted of financial assets held for trading as well as
an acquired contractual position towards Gazprom with
regard to the reserves redetermination in amount of
EUR 688 mn (2019: EUR 662 mn) in connection with
the acquisition of interests in the Yuzhno Russkoye
field. For further details see Note 6 – Other operating
income and net income from equity – accounted
investments.
Moreover, this position included financial assets
amounting to EUR 57 mn (2019: EUR 59 mn) related to
the contingent considerations from the divestment of
the 30% stake in Rosebank and from the divestment of
OMV (U.K.) Limited, which are dependent on the date
when the Rosebank project coventurers will approve
the final investment decision.
In 2020, the position Loans included drawdowns and
the related accrued interests under the financing
agreements for the Nord Stream 2 pipeline project in
amount of EUR 953 mn (2019: EUR 852 mn). The
drawdowns made during 2020 amounted to

OMV ANNUAL REPORT 2020 / FINANCIAL STATEMENTS
146
EUR 18 mn (2019: EUR 113 mn). For further details
see Note 11 – Net financial result. Following the
Borealis acquisition the position also included
drawdowns and the related accrued interests under a
member loan agreement towards Bayport Polymers
LLC. For further details see Note 35 – Related Parties.
Other sundry financial assets included expenditure
recoverable from Romanian State amounting to
EUR 493 mn (2019: EUR 410 mn) related to
obligations for decommissioning, restoration and
environmental costs in OMV Petrom SA. The
receivables consisted of EUR 442 mn (2019:
EUR 375 mn) for costs relating to decommissioning
and EUR 51 mn (2019: EUR 35 mn) for costs relating
to environmental cleanup.
On March 7, 2017, OMV AG, as party in the OMV
Petrom privatization agreement, initiated arbitration
proceedings against the Romanian Ministry of
Environment, in accordance with the International
Chamber of Commerce Rules, regarding certain claims
unpaid by this ministry for cost incurred by OMV
Petrom relating to well decommissioning and
environmental restoration works amounting to
EUR 60 mn. On July 9, 2020, the Arbitral Tribunal
issued the Final Award on the arbitration and requested
the Romanian Ministry of Environment to reimburse to
OMV Petrom the amount of EUR 59 mn and related
interest. As of December 31, 2020, the procedure for
recognition and enforcement in Romania of the Award
is ongoing. On October 2, 2020, OMV AG, as party in
the privatization agreement, initiated arbitration
proceedings against the Romanian Ministry of
Environment in accordance with the International
Chamber of Commerce Rules, regarding certain claims
unpaid by the Romanian Ministry of Environment in
relation to well decommissioning and environmental
restoration obligations amounting to EUR 32 mn. As of
December 31, 2020, the arbitration procedure is
ongoing.
Additionally, other sundry financial assets contained
receivables towards partners in the Upstream business
as well as seller participation notes in Carnuntum DAC
(see Note 36 – Unconsolidated structured entities – for
further details).
Equity investments measured at FVOCI
In EUR mn
2020 2019
Investment Fair value
Fair value
adjustment
through
OCI
Dividend
recognized
as income Fair value
Fair value
adjustment
through
OCI
Dividend
recognized
as income
APK-Pensionskasse Aktiengesellschaft 3 0 — 3 0 0
BSP Bratislava-Schwechat Pipeline GmbH — (3) — 3 — —
CEESEG Aktiengesellschaft 5 0 0 5 (1) 0
CISMO Clearing Integrated Services and
Market Operations GmbH1 — 0 0 4 1 0
FSH Flughafen-Schwechat-Hydranten-
Gesellschaft GmbH & Co OG 2 — 0 2 1 0
H2 Mobility Deutschland GmbH & Co KG1 — — — 3 — —
WAV Wärme Austria VertriebsgmbH 2 — 0 2 1 0
Other 2 0 2 2 (0) 4
Equity investments measured at FVOCI 14 (2) 3 24 1 5
1 CISMO Clearing Integrated Services and Market Operations GmbH and H2 Mobility Deutschland GmbH & Co KG were reclassified to assets held for sale in
2020.

OMV ANNUAL REPORT 2020 / FINANCIAL STATEMENTS
147
Probability of default
Equivalent to
external credit
rating Probability of default
2020 2019
Risk Class 1
AAA, AA+, AA
AA-, A+, A, A- 0.07% 0.07%
Risk Class 2 BBB+, BBB, BBB 0.25% 0.24%
Risk Class 3 BB+, BB, BB- 1.19% 1.22%
Risk Class 4 B+, B, B-, CCC/C 10.26% 10.27%
Risk Class 5 SD/D 100.00% 100.00%
For further details on the credit risk management see
Note 28 – Risk Management.
Impairment of trade receivables
In EUR mn
2020 2019
January 1 62 79
Amounts written off (2) (13)
Net remeasurement of expected credit losses 4 (3)
Currency translation differences (2) (1)
Reclassification to "assets held for sale" (1) —
December 31 61 62
Net remeasurement of expected credit losses was
mainly related to the trade receivables from contracts
with customers.
Credit Quality of trade receivables
In EUR mn
2020 2019
Risk Class 1 999 1,228
Risk Class 2 981 821
Risk Class 3 1,031 825
Risk Class 4 238 38
Risk Class 5 57 60
Total gross carrying amount 3,306 2,973
Expected credit loss (61) (62)
Total 3,245 2,911

OMV ANNUAL REPORT 2020 / FINANCIAL STATEMENTS
148
Impairment of other financial assets at amortized cost
In EUR mn
12-month ECL
Lifetime ECL not
credit impaired
Lifetime ECL
credit impaired Total
2020
January 1 5 80 154 238
Amounts written off 0 — (4) (4)
Net remeasurement of expected credit losses 2 (0) 11 13
Currency translation differences (0) (7) (3) (10)
Reclassification to "assets held for sale" — — (3) (3)
December 311 7 73 155 235
2019
January 1 4 59 158 221
Net remeasurement of expected credit losses 1 20 (1) 20
Currency translation differences 0 1 (3) (2)
December 311 5 80 154 238
1 “12-month ECL” included an amount of EUR 1 mn (2019: EUR 1 mn) and “Lifetime ECL credit impaired” an amount of EUR 9 mn (2019: EUR 14 mn) related to
expenditure recoverable from Romanian State, which are outside the scope of IFRS 9.
Credit Quality other financial assets at amortized cost
In EUR mn
12-month
ECL
Lifetime
ECL not
credit
impaired
Lifetime
ECL credit
impaired Total
12-month
ECL
Lifetime
ECL not
credit
impaired
Lifetime
ECL credit
impaired Total
2020 2019
Risk Class 1 1,252 154 9 1,415 471 174 4 649
Risk Class 21 1,554 — 9 1,563 1,398 — 14 1,412
Risk Class 3 217 — 4 221 154 — 2 156
Risk Class 4 0 — 22 22 1 — 22 22
Risk Class 5 0 — 111 111 0 — 113 114
Total gross carrying
amount 3,022 154 155 3,332 2,024 174 155 2,353
Expected credit loss2 (7) (73) (155) (235) (5) (80) (154) (238)
Total 3,016 81 (0) 3,097 2,020 94 1 2,115
1 “12-month ECL” included an amount of EUR 494 mn (2019: EUR 411 mn) and “Lifetime ECL credit impaired” an amount of EUR 9 mn (2019: EUR 14 mn)
related to expenditure recoverable from Romanian State, which are outside the scope of IFRS 9. 2 “12-month ECL” included an amount of EUR 1 mn (2019: EUR 1 mn) and “Lifetime ECL credit impaired” an amount of EUR 9 mn (2019: EUR 14 mn) related to
expenditure recoverable from Romanian State, which are outside the scope of IFRS 9.

OMV ANNUAL REPORT 2020 / FINANCIAL STATEMENTS
149
19 Other assets
Other assets
In EUR mn
2020 2019
Short-term Long-term Short-term Long-term
Prepaid expenses 57 12 45 12
Advance payments on fixed assets 38 — 19 —
Other payments on account 91 13 98 —
Receivables from other taxes and social security 227 39 64 39
Contract assets — 7 1 —
Emission rights1 37 — 41 —
Other non-financial assets 87 30 29 5
Other assets 537 103 297 56
1 For further details refer to Note 23 – Provisions.

OMV ANNUAL REPORT 2020 / FINANCIAL STATEMENTS
150
20 Assets and liabilities held for sale
Assets and liabilities held for sale
In EUR mn
Gas
Connect
Group
OMV
retail
network
Germany Other Total
Upstream Downstream
OMV
Group Upstream
Down-
stream
OMV
Group
2020 2019
Intangible assets 26 68 10 — 77 104 27 — 27
Property, plant and equipment 255 629 231 10 870 1,124 120 13 133
At-equity accounted
investments — 54 — — 54 54 — — —
Other assets incl. deferred
taxes 13 13 4 — 17 30 — — —
Non-current assets 293 763 245 10 1,018 1,312 146 13 160
Inventories 14 6 19 — 25 39 5 — 5
Trade receivables 9 17 36 — 53 62 — — —
Other assets 27 9 0 — 9 36 5 — 5
Cash in hand and at bank 15 0 — — 0 15 7 — 7
Current assets 64 32 56 — 88 152 18 — 18
Total assets 358 795 301 10 1,106 1,464 164 13 177
Provision for pensions and
similar obligations — 58 0 — 59 59 — — —
Lease liabilities 3 4 125 — 129 131 — — —
Other interest bearing debts — 147 — — 147 147 — — —
Provisions for
decommissioning and
restoration obligations 186 5 23 — 27 214 138 — 138
Other liabilities incl. provisions
and deferred taxes 7 13 — — 13 20 — — —
Non-current liabilities 197 226 148 — 374 571 138 — 138
Trade payables 21 24 52 — 76 97 17 — 17
Provisions for
decommissioning and
restoration obligations 11 — — — — 11 — — —
Other liabilities incl. provisions 15 19 22 — 42 56 1 — 1
Current liabilities 47 43 75 — 118 165 18 — 18
Total liabilities 243 269 223 — 492 736 156 — 156
Upstream
During 2020 OMV decided to divest its oil assets in
Malaysia, which led to the reclassification of assets and
liabilities to held for sale. The reclassification did not
lead to any impairment loss.
In December 2020, OMV Petrom (51% subsidiary of
OMV) signed a transaction for the sale of its assets in
Kazakhstan to Magnetic Oil Limited, which led to the
reclassification of assets and liabilities to held for sale.
The divestment plan triggered a write-up.
Details on impairments and write-ups can be found in
Note 7 – Depreciation, amortization, impairments and
write-ups.
In Upstream no disposal group has been sold in 2020.
As of December 31, 2020, assets held for sale and
liabilities associated with assets held for sale in
Upstream consisted of oil offshore assets in Malaysia,
onshore assets in Kazakhstan, a 69% interest in Maari
field, located in New Zealand’s offshore Taranaki Basin
and 40 marginal oil and gas fields in Romania.

OMV ANNUAL REPORT 2020 / FINANCIAL STATEMENTS
151
Downstream
The planned sale of OMV´s 51% stake in Gas Connect
Austria GmbH has led to the reclassification of the Gas
Connect Group and associated goodwill to assets and
liabilities held for sale without an impact on the Income
Statement at that time. As per September 23, 2020,
OMV signed the transaction contract with VERBUND.
Closing is subject to regulatory approval and is
expected in the first half of 2021.
On December 14, 2020, OMV and EG group reached
an agreement for EG Group to acquire the OMV retail
network (285 filling stations) in Germany. The
transaction is subject to required regulatory approvals
and closing is expected in 2021. The plan to divest the
German filling station business has led to the
reclassification of the assets and liabilities to held for
sale. The reclassification did not lead to any impairment
loss.
In Downstream no disposal group has been sold in
2020.
As of December 31, 2020, assets held for sale and
liabilities associated with assets held for sale in
Downstream consisted of the Gas Connect Group, the
OMV retail network and other non-core assets.

OMV ANNUAL REPORT 2020 / FINANCIAL STATEMENTS
152
21 OMV equity of the parent
Capital stock
The capital stock of OMV Aktiengesellschaft consists
of 327,272,727 (2019: 327,272,727) fully paid no par
value shares with a total nominal value of
EUR 327,272,727 (2019: EUR 327,272,727). There are
no different classes of shares and no shares with
special rights of control. All shares are entitled to
dividends for the financial year 2020, with the exception
of treasury shares held by OMV Aktiengesellschaft.
As the authorized capital granted by the Annual
General Meeting on May 14, 2014 expired on May 14,
2019, the Annual General Meeting decided upon a new
authorized capital on September 29, 2020. Specifically,
it authorized the Executive Board until September 29,
2025 to increase the share capital of OMV with the
consent of the Supervisory Board – at once or in
several tranches – by an amount of up to
EUR 32,727,272 by issuing up to 32,727,272 new no-
par value common voting shares in bearer form in
return for contributions in cash. The capital increase
can also be implemented by way of indirect offer for
subscription after taking over by one or several credit
institutions according to Section 153 Paragraph 6
Austrian Stock Corporation Act. The issue price and the
conditions of issuance can be determined by the
Executive Board with the consent of the Supervisory
Board.
Further, the Annual General Meeting authorized the
Executive Board, subject to the approval of the
Supervisory Board, to exclude the subscription right of
the shareholders if the capital increase serves to (i)
adjust fractional amounts or (ii) satisfy stock transfer
programs, in particular long term incentive plans, equity
deferrals or other participation programs for employees,
senior employees and members of the Executive
Board/management boards of the Company or one of
its affiliates, or other employees stock ownership plans.
In addition, the Supervisory Board was authorized to
adopt amendments to the Articles of Association
resulting from the issuance of shares according to the
authorized capital.
Capital reserves
Capital reserves have been formed by the contribution
of funds into OMV Aktiengesellschaft by its
shareholders over and above the capital stock, on the
basis of their ownership relationship.
Hybrid capital
The hybrid capital recognized in equity in the amount
of EUR 3,228 mn consists of perpetual, subordinated
hybrid notes. According to IFRS, the net proceeds of
the hybrid notes are fully treated as equity because the
repayment of the principal and the payments of interest
are solely at the discretion of OMV. In 2020, costs of
issuance amounting to EUR 9 mn have been
accounted as deduction from equity.
On December 7, 2015, OMV issued hybrid notes with
an aggregate principal amount of EUR 1,500 mn, in two
tranches of EUR 750 mn each with the following
interest payable:
▸ The hybrid notes of tranche 1 bear a fixed interest
rate of 5.250% per annum until, but excluding,
December 9, 2021, which is the first call date of
tranche 1. From December 9, 2021 (including),
until, but excluding, December 9, 2025, the hybrid
notes of tranche 1 will bear interest per annum
according to a reset interest rate to be determined
according to the relevant five-year swap rate plus a
specified margin. From December 9, 2025
(including), the notes will bear an interest rate per
annum at the relevant five-year swap rate for the
relevant interest period plus a specified margin and
a step-up of 100 basis points.
▸ The hybrid notes of tranche 2 bear a fixed interest
rate of 6.250% per annum until, but excluding,
December 9, 2025, which is the first call date of
tranche 2. From December 9, 2025 (including),
tranche 2 will bear an interest rate per annum at the
relevant five-year swap rate for the relevant interest
period plus a specified margin and a step-up of 100
basis points.
Interest is due and payable annually in arrears on
December 9 of each year, unless OMV elects to defer
the relevant interest payments. The outstanding
deferred interest must be paid under certain
circumstances, in particular, if the Annual General
Meeting of OMV resolves upon a dividend payment on
OMV shares.
On June 19, 2018 OMV issued a hybrid bond with a
principal amount of EUR 500 mn. The hybrid bond
bears a fixed interest rate of 2.875% per annum until,
but excluding, June 19, 2024. From June 19, 2024
(including), until, but excluding, June 19, 2028, the
hybrid notes will bear interest at a rate corresponding to
the relevant five-year swap rate plus a specified

OMV ANNUAL REPORT 2020 / FINANCIAL STATEMENTS
153
margin. From June 19, 2028 (including), the notes will
bear an interest rate per annum at the relevant five-
year swap rate for the relevant interest period plus a
specified margin and a step-up of 100 basis points.
Interest is due and payable annually in arrears on June
19 of each year, unless OMV elects to defer the
relevant interest payments. The outstanding deferred
interest must be paid under certain circumstances, in
particular, if the Annual General Meeting of OMV
resolves upon a dividend payment on OMV shares.
On September 1, 2020, OMV issued hybrid notes with
an aggregate principal amount of EUR 1,250 mn, in two
tranches (Tranche 1: EUR 750 mn; Tranche 2:
EUR 500 mn) with the following interest payable:
▸ The hybrid notes of tranche 1 bear a fixed interest
rate of 2.500% per annum until, but excluding
September 1, 2026, which is the first reset date of
tranche 1. From the first reset date (including), until,
but excluding, September 1, 2030, the hybrid notes
of tranche 1 will bear interest per annum at a reset
interest rate which is determined according to the
relevant five-year swap rate plus a specified
margin. From September 1, 2030 (including), the
notes will bear an interest rate per annum at the
relevant five-year swap rate for each interest period
thereafter plus a specified margin and a step-up of
100 basis points.
▸ The hybrid notes of tranche 2 bear a fixed interest
rate of 2.875% per annum until, but excluding
September 1, 2029, which is the first reset date of
tranche 2. From the first reset date (including), until,
but excluding, September 1, 2030, the hybrid notes
of tranche 2 will bear interest per annum at a reset
interest rate which is determined according to the
relevant five-year swap rate plus a specified
margin. From September 1, 2030 (including), the
notes will bear an interest rate per annum at the
relevant five-year swap rate for each interest period
thereafter plus a specified margin and a step-up of
100 basis points.
Interest is due and payable annually in arrears on
September 1 of each year, unless OMV elects to defer
the relevant interest payments. The outstanding
deferred interest must be paid under certain
circumstances, in particular, if the Annual General
Meeting of OMV resolves upon a dividend payment on
OMV shares.
The hybrid notes outstanding as of December 31, 2020
do not have a scheduled maturity date and they may be
redeemed at the option of OMV under certain
circumstances. OMV has, in particular, the right to
repay the hybrid notes at certain call dates. Any
accrued unpaid interest becomes payable when the
notes are redeemed. In the case of a change of control,
for example, OMV may call the hybrid notes for
redemption or else the applicable interest rate will be
subject to an increase according to the terms and
conditions of the hybrid notes.
Revenue reserves
The Group’s revenue reserves included the net
income and losses of consolidated subsidiaries and
investments included at equity, as adjusted for the
purposes of consolidation.
Treasury shares
The Annual General Meetings for the years 2000 to
2011 (with the exception of 2010) and 2019 approved
the repurchase of treasury shares. The costs of
repurchased shares have been reflected as a reduction
in equity. Gains or losses on the re-issue of treasury
shares (issue proceeds less acquisition cost) result in
an increase or a reduction in capital reserves.
On May 18, 2016, the Annual General Meeting
authorized the Executive Board for a period of five
years from the adoption of the resolution, therefore,
until (including) May 17, 2021, upon approval of the
Supervisory Board, to dispose of or utilize stock
repurchased or already held by the Company to grant
treasury shares to employees, senior employees and/or
members of the Executive Board/management boards
of the Company or one of its affiliates including for
purposes of share transfer programs, in particular long
term incentive plans including matching share plans or
other stock ownership plans, under exclusion of the
general purchasing possibility of shareholders
(exclusion of subscription rights). The authorization can
be exercised as a whole or in parts or even in several
tranches by the Company, by a subsidiary (section
189a number 7 Austrian Commercial Code) or by third
parties for the account of the Company.
On May 14, 2019 the Annual General Meeting
authorized the Executive Board to repurchase bearer
shares of no par value of the Company up to a
maximum of 5% of the Company’s nominal capital in
accordance with section 65 paragraph 1 number 8
Austrian Stock Corporation Act, over a period of 15
months from the date of adoption of the resolution by
the General Meeting, for a minimum consideration per
share being at the utmost 30% lower than the average,

OMV ANNUAL REPORT 2020 / FINANCIAL STATEMENTS
154
unweighted stock exchange closing price over the
preceding ten trading days and a maximum
consideration per share being at the utmost 20% higher
than the average, unweighted stock exchange closing
price over the preceding ten trading days, whereby any
repurchases have to be exercised in such a way that
the Company does not hold more than 1,300,000
treasury shares at any time. Such repurchases may
take place via the stock exchange or a public offering
or by other legal means and for the purpose of share
transfer programs, in particular long term incentive
plans including matching share plans, equity deferrals
or other stock ownership plans.
The Executive Board was further authorized to cancel
stock repurchased or already held by the Company
without further resolution of the Annual General
Meeting and the Supervisory Board was authorized to
adopt amendments to the Articles of Association
resulting from the cancellation of shares. The
authorization can be exercised as a whole or in parts
and also in several tranches by the Company, by a
subsidiary (Section 189a Number 7 Commercial Code)
or by third parties for the account of the Company and
shall be exercised always in such a manner that it is to
the benefit and in the best interest of the Company.
The gains and losses recognized directly in other
comprehensive income and their related tax effects
were as follows:
Tax effects relating to each component of other comprehensive income
In EUR mn
2020 2019
Before-tax
(expense)
income
Tax
(expense)
benefit1
Net-of-tax
(expense)
income)
Before-tax
(expense)
income
Tax
(expense)
benefit1
Net-of-tax
(expense)
income
Currency translation differences (1,234) (2) (1,236) 39 (0) 39
Gains/(losses) on hedges 38 (8) 31 (45) 11 (35)
Remeasurement gains/(losses)
on defined benefit plans 4 (8) (4) (90) 6 (84)
Gains/(losses) on equity
investments (2) (0) (2) 1 (0) 1
Gains/(losses) on hedges that
are subsequently transferred to
the carrying amount of the
hedged item (113) 26 (88) 95 (12) 83
Share of other comprehensive
income of equity-accounted
investments (108)2 n.a. (108) (8)2 n.a. (8)
Other comprehensive income
for the year (1,415) 8 (1,407) (7) 4 (3)
1 Includes valuation allowances for deferred tax assets for the Austrian tax group. For further details please refer to Note 12 – Taxes on income and profit. 2 Represent net-of-tax amounts
For 2020, the Executive Board of OMV
Aktiengesellschaft proposed a dividend of EUR 1.85
per eligible share, which is subject to confirmation by
the Annual General Meeting in 2021. The dividend for
2019 was paid in October 2020 and amounted to
EUR 572 mn (EUR 1.75 per share). In 2019, the
payment amounted to EUR 572 mn (EUR 1.75 per
share). The interest paid for hybrid bonds in 2020
amounted to EUR 101 mn (2019: EUR 101 mn).

OMV ANNUAL REPORT 2020 / FINANCIAL STATEMENTS
155
Treasury shares
Number of shares
Cost
EUR mn
January 1, 2019 542,151 6.0
Disposals (169,538) (1.9)
December 31, 2019 372,613 4.1
Disposals (74,767) (0.8)
December 31, 2020 297,846 3.3
Number of shares in issue
Number of shares Treasury shares Shares in issue
January 1, 2019 327,272,727 542,151 326,730,576
Used for share-based compensations — (169,538) 169,538
December 31, 2019 327,272,727 372,613 326,900,114
Used for share-based compensations — (74,767) 74,767
December 31, 2020 327,272,727 297,846 326,974,881
22 Non-controlling interests
Subgroups with material NCI
In EUR mn
2020 2019
Subgroups % NCI
Net income
allocated to
NCI
Accumulated
NCI % NCI
Net income
allocated to
NCI
Accumulated
NCI
OMV Petrom Group 49% 131 3,302 49% 372 3,411
Borealis Group 25% (21) 2,442 — — —
SapuraOMV Group 50% (27) 229 50% (18) 276
Gas Connect Group 49% 51 155 49% 35 133
Other subsidiaries n.a. 3 32 n.a. 4 31
OMV Group n.a. 136 6,159 n.a. 393 3,851
The proportion of ownership corresponds to the
proportion of voting rights of the non-controlling
interests (NCI) in all cases.
The main activities of the OMV Petrom Group are
exploration and production of hydrocarbons (in
Romania and Kazakhstan), refining of crudes (in
Romania), marketing of petroleum products (in
Romania, Bulgaria, Serbia and Moldova) and of natural
gas as well as production and the sale of electricity (in
Romania).
Since October 29, 2020 Borealis Group is fully-
consolidated, following the acquisition of an additional
39% stake in Borealis AG (see Note 3 – Changes in
group structure). Borealis Group is a leading provider
of base chemicals, polyolefins, and fertilizers and is the
second-largest polyolefin producer in Europe and
among the top-ten producers globally. The majority of
Borealis’ production is located in Europe, with three
overseas manufacturing facilities in the United States,
one in Brazil and one in South Korea.
SapuraOMV group is an oil and gas company based
in Malaysia with strong growth prospects consisting of
sizeable discovered resources and a strong portfolio of
exploration prospects. Apart from Malaysia, it has
access to exploration blocks in New Zealand, Australia
and Mexico.

OMV ANNUAL REPORT 2020 / FINANCIAL STATEMENTS
156
Gas Connect Group operates a natural gas high-
pressure pipeline grid in Austria, markets transportation
capacity to meet domestic natural gas demand and
supports export to Europe and acts as distribution or
market area manager throughout the Federal territory
of Austria. In 2020, the Gas Connect Group has been
reclassified to assets and liabilities held for sale (see
Note 20 - Assets and liabilities held for sale).
The following tables summarize the financial
information of the subgroups with material non-
controlling interests:
Statement of comprehensive income1
In EUR mn
2020 2019
OMV Petrom
Group
Borealis Group2 OMV Petrom
Group
Sales revenue 4,075 1,106 5,371
Net income for the year 267 (79) 766
Total comprehensive income 258 (320) 772
Attributable to NCI 126 (81) 378
Dividends paid to NCI 175 0 155
1 Figures refer to subgroup level, i. e. including at-equity consolidation and after elimination of intercompany transactions and balances within the subgroup. 2 Figures reflect amounts from acquisition date on October 29, 2020 until reporting date.
Statement of financial position as of December 311
In EUR mn
2020 2019
OMV Petrom
Group
Borealis Group OMV Petrom
Group
Non-current assets 7,088 11,829 7,303
Current assets 2,517 2,159 2,581
Assets held for sale 177 — 45
Non-current liabilities 1,817 2,527 1,714
Current liabilities 1,087 1,719 1,165
Liabilities associated with assets held for sale 85 — 47
1 Figures refer to subgroup level, i. e. including at-equity consolidation and after elimination of intercompany transactions and balances within the subgroup.
Statement of cash flows1
In EUR mn
2020 2019
OMV Petrom
Group
Borealis Group2 OMV Petrom
Group
Operating cash flow 1,148 280 1,434
Investing cash flow (654) (269) (749)
Financing cash flow (397) (8) (388)
Net increase /(decrease) in cash and cash equivalents 97 3 296
1 Figures refer to subgroup level, i. e. including at-equity consolidation and after elimination of intercompany transactions and balances within the subgroup. 2 Figures reflect amounts from acquisition date on October 29, 2020 until reporting date.

OMV ANNUAL REPORT 2020 / FINANCIAL STATEMENTS
157
23 Provisions
Provisions
In EUR mn
Pensions and
similar
obligations
Decom-
missioning and
restoration
obligations Other provisions Total
January 1, 2020 1,111 3,959 865 5,935
Currency translation differences 4 (138) (15) (149)
Changes in consolidated Group 457 38 39 533
Usage and releases (104) (350) (183) (637)
Payments to funds (10) — — (10)
Allocations 73 567 184 825
Transfers (13) — 13 0
Reclassified to liabilities associated with assets held
for sale
(59) (78) (22) (159)
December 31, 2020 1,458 3,999 881 6,337
thereof short-term as of December 31, 2020 — 72 304 377
thereof short-term as of January 1, 2020 — 87 293 379
Pensions and similar obligations include mainly
provisions for pensions, severances and anniversary
bonuses. More information on material IAS 19
employee benefits is included in chapter Provisions for
pensions and similar obligations.
Decommissioning and restoration details are
included in chapter Provisions for decommissioning
and restoration obligations.
Other provisions include mainly other personnel
provisions and provisions for shortfall of emission
certificates. More information is provided in chapter
Other provisions.
Provisions for pensions and similar obligations
accounted for according to IAS 19
Following tables include details on funded and
unfunded pension plans (mainly Austria, Germany and
Belgium) as well as severance plans (mainly in Austria)
and medical plans (in Belgium).
The majority of pension commitments of several OMV
companies were transferred to a country-specific
external pension funds. Pension commitments were
calculated based on country- and plan-specific
assumptions. Refer to Note 2 – Accounting policies,
judgments and estimates – for more details.
Defined benefit pension plans, obligations for severance and other plans
In EUR mn
2020 2019 2018 2017 2016
Present value of funded obligations 1,102 840 776 729 764
Market value of plan assets (589) (473) (413) (436) (453)
Provision for funded obligations 513 366 363 293 311
Present value of unfunded obligations 619 499 490 463 479
Provision for unfunded obligations 619 499 490 463 479
Present value of obligations of severance and other plans 197 141 129 135 144
Effect of asset ceiling 3
Total 1,332 1,007 982 891 935

OMV ANNUAL REPORT 2020 / FINANCIAL STATEMENTS
158
Present value of obligations
In EUR mn
2020 2019
Pensions
Severance &
other plans Pensions
Severance &
other plans
Present value of obligation as of January 1 1,339 141 1,266 129
Changes in the consolidated group 519 78 — —
Currency translation differences 4 (1) 1 (1)
Reclassification to liabilities associated with assets
held for sale
(79) (11) — —
Current service cost 8 5 7 4
Past service cost1 — (5) — 0
Interest cost 13 2 23 3
Benefits paid (72) (18) (75) (11)
Expected defined benefit obligations as per
December 31
1,733 192 1,221 126
Actual defined benefit obligations as per
December 31
1,722 197 1,339 141
Remeasurements of the period (OCI) (11) 5 118 15
thereof changes in demographic assumptions — — (25) —
thereof changes in financial assumptions (2) 2 133 14
thereof experience adjustments (9) 3 9 1
1 mainly related to outsourcing activities in Romania
Market value of plan assets
In EUR mn
2020 2019
Market value of plan assets as of January 1 473 413
Changes in the consolidated group 177 —
Reclassification to held for sale (33) —
Interest income 5 8
Allocation to funds 10 51
Benefits paid (41) (41)
Remeasurements of the period (OCI) (1) 43
Market value of plan assets as of December 31 589 473
The majority of pension commitments are attributable
to plans in Austria and Belgium and were transferred to
external pension funds managed by APK
Pensionskasse AG in Austria as well as Vivium and
KBC Asset Management in Belgium. The investment of
plan assets in Austria is governed by section 25
Austrian Pension Fund Act and the Investment Fund
Act. In addition to these regulations, the investment
guidelines of APK-Pensionskasse AG regulate the
spread of asset allocation, the use of umbrella funds
and the selection of fund managers. The investment
plans in Belgium follow the investment strategy of the
respective insurance company as well as local legal
regulations.
The allocation of plan assets was mainly in debt
securities and insurance contracts. Except for the
insurance contracts, which are not quoted, the majority
of plan assets are invested in liquid active markets for
which quoted prices are available.
In 2021, defined benefit related contributions for 2020
to exteral pension funds of EUR 2 mn are planned.

OMV ANNUAL REPORT 2020 / FINANCIAL STATEMENTS
159
Provisions and expenses
In EUR mn
2020 2019
Pensions Severance &
other plans
Pensions Severance &
other plans
Provision as of January 1 866 141 853 129
Changes in the consolidated group 345 78 — —
thereof effect of asset ceiling 3 — — —
Currency translation differences 5 (1) 0 (1)
Reclassification to liabilities associated with assets
held for sale
(45) (11) — —
Expense for the year 16 2 23 8
Benefits paid (32) (18) (34) (11)
Payments to funds (10) — (51) —
Remeasurements for the year (10) 5 75 15
thereof changes in demographic assumptions — — (25) —
thereof changes in financial assumptions (1) 2 91 14
thereof experience adjustments (10) 3 9 1
Provision as of December 31 1,135 197 866 141
thereof effect of asset ceiling 3 — — —
Current service cost 8 5 7 4
Past service cost1 — (5) — 0
Net interest cost 9 2 16 3
Expenses of defined benefit plans for the year 16 2 23 8
1 mainly related to outsourcing activities in Romania
Underlying assumptions for calculating pension expenses and expected defined benefit entitlements as of December 31
2020 2019
Pensions Severance &
other plans
Pensions Severance &
other plans
Capital market interest rate 0.79-2.60% 0.64-3.35% 1.00% 0.70-4.41%
Future increases in salaries 2.00-5.00% 2.00-3.50% 3.00% 3.00-4.19%
Future increase in pensions 1.25-2.00% — 2.00% —
The following actuarial assumptions for calculating
pension expenses and expected defined benefit
entitlements are considered as material and are stress
tested within the following ranges. The increase or
decrease compared to the values accounted for
defined benefit obligations in relative deviation terms
and in absolute values are as follows:
Sensitivities - percentage change
2020
Capital market interest rate Future increases in salaries Future increases in pensions
0.50% (0.50)% 0.25% (0.25)% 0.25% (0.25)%
Pensions (6.08)% 6.76% 0.96% (0.90)% 2.56% (2.42)%
Severance &
other plans
(5.48)% 6.13% 2.36% (2.25)% — —

OMV ANNUAL REPORT 2020 / FINANCIAL STATEMENTS
160
Sensitivities - absolute change
In EUR mn
2020
Capital market interest rate Future increases in salaries Future increases in pensions
0.50% (0.50)% 0.25% (0.25)% 0.25% (0.25)%
Pensions (106) 117 16 (15) 44 (41)
Severance &
other plans
(10) 11 4 (4) — —
Duration profiles and average duration of defined benefit obligations as of December 31
In EUR mn
2020
Duration profiles Duration
1–5 years 6–10 years >10 years in years
Pensions 392 391 939 12
Severance & other plans 53 55 88 10
Allocation of plan assets as of December 31
2020 2019
Asset category
Equity securities 18% 27%
Debt securities 37% 58%
Cash and money market investments 7% 8%
Insurance contracts 28% —
Other 10% 7%
Total 100% 100%

OMV ANNUAL REPORT 2020 / FINANCIAL STATEMENTS
161
Provisions for decommissioning and restoration obligations
Provisions for decommissioning and restoration obligations
In EUR mn
Carrying
amount
January 1, 2020 3,959
Currency translation differences (138)
Changes in consolidated Group 38
New obligations 51
Increase arising from revisions in estimates 432
Reduction arising from revisions in estimates (299)
Unwinding of discounting 84
Reclassification to liabilities associated with assets held for sale (78)
Usage, disposals and other changes (51)
December 31, 2020 3,999
thereof short-term as of December 31, 2020 72
thereof short-term as of January 1, 2020 87
The increase arising from revisions in estimates
was mainly driven by decreased real interest rates for
RON, USD and EUR compared to 2019.
Reclassifications to liabilities associated with
assets held for sale were mainly related to disposal
groups in Germany, Malaysia and Kazakhstan. For
details see Note 20 – Assets and liabilities held for
sale.
Estimation of maturities of decommissioning and restoration obligations
In EUR mn
2020
≤1 year 72
1 – 5 years 368
5 – 10 years 956
10 – 20 years 1,686
20 – 30 years 654
30 – 40 years 261
>40 years 1
Total 3,999
A decrease of 1 percentage point in the real interest
rates used to calculate the decommissioning provisions
would lead to an additional provision of EUR 545 mn.
The provision for decommissioning and restoration
costs included obligations in respect of OMV Petrom
SA amounting to EUR 1,542 mn (2019:
EUR 1,401 mn). Part of the obligations is to be
recovered from the Romanian State in accordance with
the privatization agreement. As of December 31, 2020,
OMV Petrom SA held receivables from the Romanian
state related to decommissioning and restoration costs
amounting to EUR 442 mn (2019: EUR 375 mn).

OMV ANNUAL REPORT 2020 / FINANCIAL STATEMENTS
162
Other provisions
In EUR mn
2020 2019
Short-term Long-term Short-term Long-term
Environmental costs 13 90 12 81
Onerous contracts 31 364 29 383
Other personnel provisions 134 6 119 14
Emissions Certificates 75 — 61 —
Other 51 116 71 95
Other provisions 304 576 293 572
As at December 31, 2020 the provision for
environmental costs included EUR 65 mn referring to
the provision for soil remediation in relation to the
Arpechim refinery site in Romania.
The provisions for onerous contracts were mainly
related to the Gate LNG obligation and associated
transportation commitments of OMV Gas Marketing &
Trading GmbH.
The provision for the Gate LNG obligation is related to
a long-term, non-cancellable contract for regasification
capacity and storage that became onerous due to the
negative development of market conditions for LNG
terminal capacities in Europe. The present value of the
provision as at December 31, 2020 was EUR 327 mn
(2019: EUR 327 mn). The provision represents the
unavoidable costs of meeting the contractual
obligations. Thereby, income and costs from future
purchases and sales of LNG are taken into account,
since the regasification of LNG and subsequent sale of
the gas positively contributes to the coverage of the
fixed costs. The volume assumptions are based on
management’s best estimates of available LNG
volumes in the future. The prices are based on forward
rates, where available. If no forward prices are
available, the prices represent management’s best
estimate of future prices, derived from current market
prices or forward rates of the preceding period. The
calculation is based on an interest rate of 3.96 %
(2019: 3.88 %). A 50% decrease in either LNG volumes
or margin would lead to an additional provision of
EUR 173 mn. Furthermore, a 1 percentage point
decrease in the discount rate would lead to an
additional provision of EUR 23 mn.
As per end of 2020, the provision for the related non-
cancellable transportation commitments of OMV Gas
Marketing & Trading GmbH amounted to EUR 68 mn
(2019: EUR 78 mn). The calculation is based on the
difference between the fixed costs for using the
capacities and the net profit from usage expected to be
generated by using the capacities. The discount rate
applied is 3.96 % (2019: 3.88 %). Besides the discount
rates, the key assumptions are the gas prices at the
relevant gas hubs which are based on forward rates
where available and on management’s best estimates
for the remaining contract term.
Other personnel provisions included short-term
provisions related to personnel reduction schemes of
EUR 29 mn (2019: EUR 28 mn).
Emissions certificates
Directive 2003/87/EC of the European Parliament and
of the European Council established a greenhouse gas
emissions trading scheme, requiring member states to
draw up national plans to allocate emissions
certificates. Under this scheme, affected OMV Group
companies received a total of 3,038,336 free emissions
certificates in 2020 (2019: 3,181,456).
The New Zealand Government established a
greenhouse gas emissions trading scheme under the
Climate Change Response Act 2002. Under this
scheme New Zealand companies are not entitled to
receive free emission certificates. OMV has purchased
certificates to meet its own use liability. Apart from
purchased certificates, each sale of gas to domestic
customers in New Zealand creates an obligation for
OMV. OMV receives units of emission certificates from
customers to meet this obligation.
As of December 31, 2020, the total market value of
emissions certificates amounted to EUR 400 mn
(December 31, 2019: EUR 232 mn).
OMV expects to surrender 14,325,729 emissions
certificates in 2021 for (not yet externally verified)
emissions, out of which 3,510,052 emissions
certificates are expected to be transferred to OMV from
customers in New Zealand.

OMV ANNUAL REPORT 2020 / FINANCIAL STATEMENTS
163
Emissions certificates
2020 2019
Certificates held as of January 1 9,437,367 9,077,418
Free allocation for the year 3,038,336 3,181,456
Certificates surrendered according to verified emissions for the prior year (12,238,002) (9,685,184)
Changes in consolidated Group 5,310,058 —
Net purchases and sales during the year 1,577,313 4,005,464
Certificates received from customers 5,196,819 2,858,213
Certificates held as of December 31 12,321,891 9,437,367
24 Liabilities
Liabilities1
In EUR mn
2020 2019
Short-
term
Long-
term Total
Short-
term
Long-
term Total
Bonds 850 8,019 8,869 540 5,262 5,802
Other interest-bearing debts 703 1,280 1,983 148 620 769
Lease liabilities 141 943 1,084 120 934 1,053
Trade payables 4,304 — 4,304 4,155 — 4,155
Other financial liabilities 3,095 454 3,549 2,818 301 3,120
Other liabilities 868 135 1,003 903 157 1,060
Liabilities 9,961 10,830 20,791 8,684 7,274 15,958
1 Excluding liabilities associated with assets held for sale, which are described in Note 20 – Assets and Liabilities held for sale.
Other interest-bearing debts
In EUR mn
2020 2019
Short-
term
Long-
term Total
Short-
term
Long-
term Total
Other interest-bearing debts to banks 703 1,280 1,983 148 473 622
Other sundry interest-bearing debts — — — — 147 147
Other interest-bearing debts 703 1,280 1,983 148 620 769
OMV participates in several supplier finance programs
under which its suppliers may elect to receive early
payment of their invoice from a bank by factoring their
receivable from the Group to the bank. Under the
arrangement, the bank agrees to pay amounts to a
supplier participating in the program in respect of
invoices owed by the Group and receives settlement
from OMV later. The principal purpose of those
programs is to facilitate efficient payment processing
and enable the consenting suppliers to sell their
receivables due from OMV to a bank before their
maturity. The Group has not derecognized the majority
of original liabilities to which the arrangement applies
because neither legal release was obtained nor the
original liability was substantially modified while
entering into the arrangement. Most liabilities remain
within trade payables until payment. From OMV’s
perspective, these arrangements do not significantly
extend payment terms beyond the normal terms agreed
with other suppliers that are not participating in the
programs.

OMV ANNUAL REPORT 2020 / FINANCIAL STATEMENTS
164
Bonds
Bonds issued
In EUR mn
2020 2019
Nominal Coupon Repayment
Carrying
amount
December 31
Carrying
amount
December 31
Private Placement EUR 300,000,000 0.106% floating1 06/11/2021 300 301
International corporate
bonds EUR 500,000,000 4.375% fixed 02/10/2020 — 519
EUR 500,000,000 4.25% fixed 10/12/2021 504 503
EUR 750,000,000 2.625% fixed 09/27/2022 753 752
EUR 750,000,000 0.00% fixed 06/16/2023 746 —
EUR 500,000,000 0.75% fixed 12/04/2023 498 498
EUR 500,000,000 1.50% fixed 04/09/2024 501 —
EUR 500,000,000 0.00% fixed 07/03/2025 496 495
EUR 300,000,000 1.75% fixed 12/10/2025 324 —
EUR 1,000,000,000 1.00% fixed 12/14/2026 993 992
EUR 750,000,000 3.50% fixed 09/27/2027 750 749
EUR 500,000,000 2.00% fixed 04/09/2028 505 —
EUR 500,000,000 1.875% fixed 12/04/2028 499 499
EUR 750,000,000 0.75% fixed 06/16/2030 747 —
EUR 750,000,000 2.375% fixed 04/09/2032 757 —
EUR 500,000,000 1.00% fixed 07/03/2034 495 495
Bonds issued 8,869 5,802
1 Rate as of 31.12.2020
Bonds and other interest-bearing debts
As at December 31, 2020, OMV Group was in
compliance with all financial covenants stipulated by
the loan agreements.
Bonds and other interest-bearing debts
In EUR mn
2020 2019
Short-term loan financing 143 88
Short-term component of long-term financing 1,410 600
Total short-term 1,553 688
Maturities of long-term financing
2021/2020 (short-term component of long-term financing) 1,410 600
2022/2021 937 1,158
2023/2022 1,295 769
2024/2023 850 501
2025/2024 1,112 236
2026/2025 and subsequent years 5,105 3,218
Total for 2021/2020 onwards 10,709 6,482

OMV ANNUAL REPORT 2020 / FINANCIAL STATEMENTS
165
Breakdown of bonds and other interest-bearing debts
In EUR mn
2020 2019
Weighted
average
interest rate
Weighted
average
interest rate
Bonds and other long-term interest-bearing debts1
Fixed rates EUR 9,363 1.63% 5,559 2.12%
USD 288 4.27% 14 2.28%
Other currencies 33 9.40% — —
Total 9,685 1.74% 5,573 2.12%
Variable rates2 EUR 718 0.25% 753 0.30%
USD 264 1.62% 157 3.66%
Other currencies 42 0.67% — —
Total 1,024 0.62% 910 0.88%
Other short-term interest-bearing debts
EUR 125 0.17% 4 0.50%
USD 17 0.68% 6 0.50%
NZD — — 42 1.76%
Other currencies 1 0.65% 36 0.67%
Total 143 0.24% 88 1.17%
1 Including short-term components of long-term debts 2 Rates as of year-end

OMV ANNUAL REPORT 2020 / FINANCIAL STATEMENTS
166
Other financial liabilities
Other financial liabilities
In EUR mn
Short-term Long-term Total
2020
Derivative financial liabilities 2,169 347 2,516
Liabilities on derivatives designated and effective as hedging instruments 86 12 98
Liabilities on other derivatives 2,083 335 2,418
Other sundry financial liabilities 926 106 1,033
Other financial liabilities 3,095 454 3,549
2019
Derivative financial liabilities 2,299 179 2,478
Liabilities on derivatives designated and effective as hedging instruments 209 28 237
Liabilities on other derivatives 2,090 151 2,241
Other sundry financial liabilities 519 122 642
Other financial liabilities 2,818 301 3,120
The table hereafter summarizes the maturity profile of
the Group’s financial liabilities based on contractual
undiscounted cash flows:
Financial liabilities (undiscounted cash flows)
In EUR mn
≤1 year
1 – 5
years >5 years Total
2020
Bonds 942 3,707 5,068 9,717
Other interest-bearing debt 723 881 437 2,041
Lease liabilities 169 430 777 1,377
Trade payables 4,304 — — 4,304
Derivative financial liabilities 2,169 347 — 2,516
Other sundry financial liabilities 926 22 113 1,062
Financial liabilities (undiscounted cash flows) 9,233 5,387 6,395 21,016
2019
Bonds 617 2,324 3,436 6,378
Other interest bearing debts 154 623 — 777
Lease liabilties 142 419 787 1,348
Trade payables 4,155 — — 4,155
Derivative financial liabilities 2,299 179 — 2,478
Other sundry financial liabilities 519 90 92 701
Financial liabilities (undiscounted cash flows) 7,886 3,635 4,316 15,836

OMV ANNUAL REPORT 2020 / FINANCIAL STATEMENTS
167
Other liabilities
In EUR mn
Short-term Long-term Total
2020
Other taxes and social security liabilities 607 — 607
Payments received in advance 34 15 49
Contract liabilities 96 117 214
Other sundry liabilities 131 3 134
Other liabilities 868 135 1,003
2019
Other taxes and social security liabilities 699 — 699
Payments received in advance 19 11 30
Contract liabilities 80 142 222
Other sundry liabilities 104 5 109
Other liabilities 903 157 1,060
Contract liabilities
In EUR mn
2020 2019
January 1 222 192
Currency translation differences (3) (1)
Revenue recognized that was included in the contract liability balance
at the beginning of the period (71) (78)
Increases due to cash received, excluding amounts recognized
as revenue during the period 69 109
Other changes (3) —
December 31 214 222
The contract liabilities consisted mainly of non-
refundable prepayments of storage fees received from
Erdöl-Lagergesellschaft m.b.H., Lannach on the basis
of long-term service contracts.

OMV ANNUAL REPORT 2020 / FINANCIAL STATEMENTS
168
25 Deferred tax
Deferred taxes
In EUR mn
Deferred tax
assets total
Deferred tax
assets not
recognized
Deferred tax
assets
recognized
Deferred tax
liabilities
2020
Intangible assets 209 20 188 606
Property, plant and equipment 137 89 48 2,322
Inventories 37 — 37 27
Derivatives 539 — 539 597
Receivables and other assets 55 17 38 53
Deferred taxes reclassified to assets and liabilities associated with
assets held for sale 27 22 5 12
Provisions for pensions and similar obligations 291 151 140 111
Provisions for decommissioning, restoration
obligations and environmental costs 1,318 14 1,305 —
Other provisions 121 — 121 34
Liabilities 305 60 245 23
Tax impairments according section 12 (3)/2 of the
Austrian Corporate Income Tax Act (KStG) 226 — 226 —
Tax loss carryforwards 1,654 780 875 —
Outside basis differences — — — 40
Total 4,919 1,153 3,765 3,823
Netting (same tax jurisdictions) (2,581) (2,581)
Deferred taxes reclassified to assets and liabilities associated with
assets held for sale (5) (12)
Deferred taxes as per statement of financial
position 1,179 1,229
2019
Intangible assets 114 22 91 751
Property, plant and equipment 124 68 56 1,699
Inventories 32 0 32 28
Derivatives 496 — 496 588
Receivables and other assets 51 16 34 80
Provisions for pensions and similar obligations 215 144 70 48
Provisions for decommissioning, restoration
obligations and environmental costs 1,362 39 1,323 —
Other provisions 130 0 130 32
Liabilities 265 61 204 3
Tax impairments according section 12 (3)/2 of the
Austrian Corporate Income Tax Act (KStG) 275 — 275 —
Tax loss carryforwards 1,091 1,011 80 —
Outside basis differences — — — 7
Total 4,153 1,361 2,791 3,236
Netting (same tax jurisdictions) (2,105) (2,105)
Deferred taxes as per statement of financial
position 686 1,132
Deferred taxes were mainly related to different
valuation methods, differences in impairments, write-
offs, depreciation and amortization as well as different
definition of costs.
Overall deferred taxes in 2020 were significantly
impacted by the acquisition of additional shares in
Borealis AG (see Note 3 – Changes in group structure).

OMV ANNUAL REPORT 2020 / FINANCIAL STATEMENTS
169
Deferred taxes of Borealis Group were mainly related
to intangible assets and property, plant and equipment.
The overall net deferred tax asset position of tax
jurisdictions which suffered a tax loss either in current
or preceding year amounted to EUR 720 mn, thereof
EUR 640 mn is attributable to the Austrian tax group
(2019: EUR 268 mn, thereof Austrian tax group
EUR 260 mn).
In 2020 as well as in the previous year, a valuation
allowance for deferred tax assets for the Austrian tax
group was recognized.
As of December 31, 2020, OMV recognized tax losses
carryforward of EUR 6,302 mn before allowances
(2019: EUR 4,179 mn), thereof EUR 3,331 mn (2019:
EUR 351 mn) are considered recoverable for
calculation of deferred taxes.
Due to tax synergies from the acquisition of additional
shares in Borealis AG, deferred tax assets of the
Austrian tax group increased in 2020 by approximately
EUR 500 mn, taking into consideration the expected
five-year positive taxable result of Borealis tax group
members.
Eligibility of losses for carryforward expires as follows:
Tax losses carryforward
In EUR mn
2020 2019
Base
amount
(before allo-
wances)
thereof not
recognized
Base
amount
(before allo-
wances)
thereof not
recognized
2020 — — 5 5
2021 5 5 0 0
2022 0 0 1 1
2023 2 2 1 1
2024 4 4 112 111
2025 48 17
After 2025/2024 47 24 61 14
Unlimited 6,196 2,919 3,998 3,694
Tax losses carryforward 6,302 2,971 4,179 3,827
The majority of tax losses carryforward not
recognized referred to the Austrian tax group.
As of December 31, 2020, the aggregate amount of
temporary differences associated with fully
consolidated and equity-accounted investments for
which deferred tax liabilities have not been recognized
amounted to EUR 4,657 mn (2019: EUR 4,485 mn).
Capital gains on disposals of investments may be
realized on various levels of the Group depending on
the structuring of potential divestments. Due to the
complexity of the group and the associated tax
implications simplifying assumptions for the calculation
have been made that aim to diminish cascade effects.

OMV ANNUAL REPORT 2020 / FINANCIAL STATEMENTS
170
26 Statement of cash flows
Cash and cash equivalents
In EUR mn
2020 2019
Cash at banks and on hand 741 710
Short-term deposits 2,128 2,228
Cash and cash equivalents 2,869 2,938
Significant non-cash items
The remeasurement of the previously held 36% at-
equity share in Borealis was included in the line “Other
changes” in the statement of cash flows. For further
details please see Note 3 – Changes in group
structure.
In 2020 as well as in 2019, non-cash additions to fixed
assets included mainly effects related to the
reassessment of decommissioning and restoration
obligations.
Cash flow from investing activities
For details about the cash flow effect from the Nord
Stream 2 pipeline project refer to Note 18 – Financial
assets – and for the cash flow effect from acquisitions
to Note 3 – Changes in group structure.
Cash flow from financing activities
On April 9, 2020, OMV issued senior bonds with a total
volume of EUR 1.75 bn and on June 16, 2020, senior
bonds with a total volume of EUR 1.5 bn. These
transactions were reflected in the line “Increase in long-
term borrowings”, while the line “Repayments of long-
term borrowings” included the repayment of a
EUR 500 mn bond.
The issuance of two hybrid bonds with a total size of
EUR 1.25 bn on September 1, 2020, was reflected in
the line “Increase hybrid bond”.
Changes in liabilities arising from financing activities (incl. liabilities associated with assets held for sale)
In EUR mn
2020
Bonds
Other
interest-
bearing
debts
Lease
liabilities Total
January 1 5,802 769 1,053 7,624
Increase in long-term borrowings 3,225 114 — 3,338
Repayments of long-term borrowings (500) (164) (133) (797)
Increase/(decrease) in short-term borrowings — (96) — (96)
Total cash flows related to financing activities 2,725 (146) (133) 2,446
Currency translation differences — (33) (7) (41)
Changes in consolidated group 329 1,538 174 2,041
Difference interest expenses and interest paid 13 (2) 0 12
Other changes — 4 1301 134
Total non-cash changes 342 1,508 297 2,147
December 31 8,869 2,130 1,217 12,216
1 Mainly related to new lease agreements
Supplementary Information on the Financial Position

OMV ANNUAL REPORT 2020 / FINANCIAL STATEMENTS
171
Changes in liabilities arising from financing activities (incl. liabilities associated with assets held for sale)
In EUR mn
2019
Bonds
Other
interest-
bearing
debts
Lease
liabilities Total
January 1 5,007 745 994 6,746
Increase in long-term borrowings 1,287 89 — 1,376
Repayments of long-term borrowings (500) (371) (109) (980)
Increase/(decrease) in short-term borrowings — (22) — (22)
Total cash flows related to financing activities 787 (303) (109) 374
Currency translation differences — 7 (2) 5
Changes in consolidated group — 314 5 319
Difference interest expenses and interest paid 8 5 2 15
Other changes — — 1641 164
Total non-cash changes 8 326 169 503
December 31 5,802 769 1,053 7,624
1 Mainly related to new lease agreements
The total cash outflow related to lease liabilities
amounted to EUR 157 mn (2019: EUR 131 mn).
As of December 31, 2020, the Group had available
EUR 4,332 mn of undrawn committed borrowing
facilities that can be used for future activities without
any restrictions (December 31, 2019: EUR 3,250 mn).
As of December 31, 2020, there were no financing
commitments provided to Nord Stream 2 AG for the
funding of Nord Stream 2 project (December 31, 2019:
EUR 238 mn). Financing commitments provided to
related parties are detailed in Note 35 – Related
parties.
27 Contingent liabilities
OMV recognizes provisions for litigations if these are
more likely than not to result in obligations.
Management is of the opinion that litigations, to the
extent not covered by provisions or insurance, will not
materially affect the Group’s financial position.
The production facilities and properties of all Group
companies are subject to a variety of environmental
protection laws and regulations in the countries where
they operate. The estimated cost of known
environmental obligations has been provided in
accordance with the Group’s accounting policies.
Provisions for decommissioning and restoration are
recognized if an obligation exists at the statement of
financial position date.
Management believes that compliance with current
laws and regulations and future more stringent laws
and regulations will not have a material negative impact
on the Group’s results, financial position or cash flows
in the near future.
In May 2009, OMV signed an agreement with the
sellers Crescent Petroleum International Limited
(Crescent) and Dana Gas PJSC (Dana) to acquire a
10% share in Pearl Petroleum Company Limited
(Pearl), a company that operates Khor Mor and
Chemchemal gas fields in the Kurdistan Region of Iraq.
The agreement included contingent payments to be
made by OMV which are dependent on further reserves
determinations. The reserves determinations will have
to be made by jointly appointed independent expert.
In this connection, in May 2019, OMV received an
invoice from Crescent and Dana amounting to
approximately USD 241 mn and later unsubstantiated
and rejected allegations of damages in an amount of up
to more than one billion USD. OMV rejected the invoice
due to at the time pending independent expert
determination before the International Chamber of
Commerce (ICC) and arbitrations before the London
Court of International Arbitration (LCIA) regarding inter

OMV ANNUAL REPORT 2020 / FINANCIAL STATEMENTS
172
alia revisions of the Field Development Plan (FDP) of
the Chemchemal gas field and a revision of the FDP of
Khor Mor, which were not approved at joint venture
level, and the deviating views between Crescent/Dana
and OMV inter alia about the size of an oil discovery in
Khor Mor. In September 2019, the independent expert
determination before the ICC in respect of one of the
revisions of the Chemchemal FDP was decided in favor
of OMV and the arbitration tribunal deemed the expert
determination as final and binding. In June 2020, a
second independent expert determination before the
ICC in respect of another revision of the Chemchemal
FDP was also decided in favor of OMV. Depending on
further progress of the arbitration proceedings and not
yet commenced reserve determinations under the
Share Sale Agreement arbitration, a contingent
payment could potentially arise; however, such event is
not deemed probable at this stage. Therefore, no
provision has been recognized in OMV’s Group
Financial Statements. Furthermore, at the date of these
financial statements, a reliable estimate of the potential
additional payment, if any, cannot be made.
On April 16, 2020, the Bulgarian Commission for
Protection of Competition announced the initiation of
an investigation regarding the determination of the
prices on fuel market. OMV Bulgaria EOOD is
subject to this investigation, among other major
manufacturers and retailers on Bulgarian market.
During 2020 two requests of providing information
were received from authorities and the responses
were submitted in due time. The sanctions for
antitrust infringements are up to 10% of the total
company’s turnover of the respective undertaking for
the financial year prior to the sanctioning decision.
At the date of these financial statements, OMV is not
able to evaluate the outcome of the investigation
and no provision was recorded in this respect.
28 Risk management
Capital risk
OMV’s financial steering framework is built upon the
principles of operational efficiency, capital efficiency,
financing efficiency and sustainable portfolio
management. With the focus on strengthening OMV’s
balance sheet, delivering a positive free cash flow and
growing its profitability, the financial steering framework
represents sustainable, risk-monitored and future-
oriented value creation for OMV and its stakeholders.
OMV manages its capital structure to safeguard its
capital base in order to preserve investor, creditor and
market confidence, as well as to provide a sustainable
financial foundation for the future operational
development of the Group. OMV’s financing strategy
focuses on cash flow and financial stability. Principal
targets are a positive free cash flow after dividends and
a strong investment grade credit rating on the basis of
a healthy balance sheet and a long-term gearing ratio,
excluding leases, of below 30%.
Capital Management – key performance measures
In EUR mn (unless otherwise stated)
2020 2019
Bonds 8,869 5,802
Other interest-bearing debts1 2,130 769
Debt excluding leases 10,999 6,570
Cash and cash equivalents2 2,869 2,938
Net Debt excluding leases 8,130 3,632
Equity 19,899 16,863
Gearing Ratio excluding leases in % 41 22
1 Including other interest-bearing debts that were reclassified to liabilities associated with assets held for sale 2 Including cash and cash equivalents that were reclassified to assets held for sale
Liquidity risk
For the purpose of assessing liquidity risk, yearly
budgeted operating and financial cash flows of the
Group are monitored and analyzed on a monthly basis.
Thus, every month the Group generates a forecasted
net change in liquidity which is then compared to the
total month end balances of money market deposits
and loans as well as maturities of the current portfolio
and the available liquidity reserves of the same month.

OMV ANNUAL REPORT 2020 / FINANCIAL STATEMENTS
173
This analysis provides the basis for financing decisions
and capital commitments.
To ensure that OMV Group remains solvent at all times
and retains the necessary financial flexibility, liquidity
reserves in the form of committed credit lines and short
term uncommitted money market lines are maintained.
As of December 31, 2020, the average weighted
maturity of the Group’s debt portfolio (excluding lease
liabilities) has been 5.3 years (as of December 31,
2019: 5.2 years).
OMV Group’s operational liquidity management is done
centrally via a cash pooling system, which enables
optimum use of existing cash and liquidity reserves to
the benefit of every individual member of cash pooling
system and therefore the Group as a whole.
Details of OMV Group’s financial liabilities are shown in
Note 24 – Liabilities.
Political Risk
OMV operates and has financial investments in
countries that are subject to political uncertainties in
particular Libya, Kazakhstan, Yemen, Russia, Brazil
and Tunisia. Possible political changes may lead to
disruptions and limitations in production as well as an
increased tax burden, restrictions on foreign ownership
or even nationalization of property. However, OMV has
extensive experience in dealing with the political
environment in emerging economies. Political
developments in all markets where OMV operates are
observed continually. Country-specific risks are
assessed before entering new countries.
OMV evaluates the risk of potential US or EU sanctions
and their impact on planned or existing operations.The
aim is to stay in full compliance with all applicable
sanctions. In particular risks due to political and
regulatory developments both inside and outside of
Europe having the potential of unfavorable effects on
the Nord Stream 2 project and on OMV’s activities in
Russia are regularly assessed and monitored.
Climate change risks
OMV consistently evaluates the Group’s exposure to
risks related to climate change in addition to the market
price risk from European Emission Allowances. Such
risks comprise the potential impact of acute or chronic
events like more frequent extreme weather events or
systemic changes to our business model due to a
changing legal framework or substitution of OMV’s
products due to changing consumer behavior. OMV
recognizes climate change as a key global challenge.
OMV thus integrates the related risks and opportunities
into the development of the Company’s business
strategy. Changes in the pace of energy transition
compared to OMV’s expectations and thus changes in
the future development of supply and demand could
have a negative impact on the valuation of OMV’s oil
and gas assets.
Market risk
Derivative and non-derivative instruments are used to
manage market price risks resulting from changes in
commodity prices, foreign exchange rates and interest
rates, which could have a negative effect on assets,
liabilities or expected future cash flows.
Hedges are generally placed in the legal entities where
the underlying exposure exists. When certain
conditions are met, the Group may elect to apply
IFRS 9 hedge accounting principles in order to
recognize the offsetting effects on profit or loss of
changes in the fair value of the hedging instruments at
the same time as the hedged items.
Derivatives are only used for economic hedging
purposes and not as speculative investments.
However, where derivatives are not designated as
hedging instruments (i.e. hedge accounting is not
applied), they are valued through profit or loss for
accounting purposes.
The tables hereafter show the fair values of derivative
financial instruments together with their notional
amounts. The notional amount, recorded gross, is the
amount of a derivative’s underlying asset, reference
rate or index and is the basis upon which changes in
the value of derivatives are measured. The notional
amounts indicate the volume of the transactions
outstanding at the year-end and are not indicative of
either the market risk or the credit risk.

OMV ANNUAL REPORT 2020 / FINANCIAL STATEMENTS
174
Nominal and fair value of derivative financial instruments
In EUR mn
2020 2019
Nominal
Fair
value
assets
Fair
value
liabilities Nominal
Fair
value
assets
Fair
value
liabilities
Commodity price risk
Downstream, Oil incl. oil products 515 30 (71) 7,102 284 (237)
Downstream, Gas 31 3 (7) — — —
Downstream, Power 213 24 (14) — — —
Downstream (cash-flow hedges)1 759 57 (93) 7,102 284 (237)
Upstream, Gas 150 1 (11) 56 10 (4)
Upstream 150 1 (11) 56 10 (4)
Downstream, Oil incl. oil products 6,305 445 (386) 11,496 318 (339)
Downstream, Gas 20,156 1,931 (1,985) 15,103 2,013 (1,885)
Downstream, Power 209 5 (6) 216 15 (6)
Downstream, Other 334 98 (29) 23 0 (0)
Downstream 27,003 2,478 (2,406) 26,839 2,347 (2,231)
Foreign currency risk
USD (net investment hedge) 168 9 (1) — — —
SEK (cash-flow hedges) 143 6 — — — —
Foreign currency hedges (designated in hedge
relationships)1 311 14 (1) — — —
USD 793 17 (1) 684 15 (3)
NOK 272 4 (0) 501 10 —
RUB — — — 288 8 —
NZD 69 1 (0) 153 0 (1)
RON 5 0 (0) 35 0 (0)
SEK 44 — (0) — — —
Other 108 1 (0) 118 1 (1)
Foreign currency hedges 1,290 22 (1) 1,778 35 (6)
Interest rate risk
Interest rate hedges 113 0 (4) — — —
1 Including inefficient part of hedges designated in a hedging relationship
The Group’s hedging portfolio disclosed in the
Consolidated Statement of Changes in Equity
relates to the following hedging instruments:

OMV ANNUAL REPORT 2020 / FINANCIAL STATEMENTS
175
Cash flow hedging – Impact of hedge accounting
In EUR mn
Forecast
purchases
Forecast
sales
Foreign
currency, firm
commitments
Foreign
currency,
other
Interest
rate Total
thereof cost
of hedging
reserve
Commodity price risk Foreign currency risk
Interest
rate risk
2020
Cash flow hedge reserve as of
January 1 (net of tax) 5 39 — — — 44 —
Gains/(losses) of the period
recognized in OCI (7) 364 (62) 10 0 305 16
Amounts reclassified to the
income statement (6) (353) n.a. (0) 0 (359) n.a.
Amounts reclassified to the
income statement because the
hedged future cash flows no
longer expected to occur 3 (24) — — — (21) n.a.
Amounts reclassified to
balance sheet 40 — 62 (0) — 102 (16)
Tax effects (8) 5 — (2) (0) (6) —
Cash flow hedge reserve as
of December 31 (net of tax) 26 31 — 8 0 65 —
thereof discontinued hedges — 57 — — — 57 n.a.
Hedge ineffectiveness
recognized in profit or loss (2) 2 — — — 0 —
2019
Cash flow hedge reserve as of
January 1 (net of tax) (33) 73 (1) — — 39 (1)
Gains/(losses) of the period
recognized in OCI 53 (11) 41 — — 84 (1)
Amounts reclassified to the
income statement n.a. (34) n.a. — — (34) n.a.
Amounts transferred to cost of
non-financial item (4) — (40) — — (44) 2
Tax effects (12) 11 — — — (1) —
Cash flow hedge reserve as
of December 31 (net of tax) 5 39 — — — 44 —
Hedge ineffectiveness
recognized in profit or loss (14) (0) — — — (14) —
Reserve for unrealized exchange gains/losses for net investment hedge1
In EUR mn
Foreign currency risk
2020 2019
Reserve as of January 1 (net of tax) — —
Valuation of the USD loans 10 —
Tax effects (2) —
Reserve as of December 31 (net of tax) 7 —
1 Included in currency translation differences within other comprehensive income

OMV ANNUAL REPORT 2020 / FINANCIAL STATEMENTS
176
At 31 December 2020 and 31 December 2019, the
Group held the following cash flow and net investment
hedging relationships. The table shows the profile of
the timing (maturity) of the nominal amount of the
hedging instruments.
Impact of hedge accounting on the statement of financial positions
In EUR mn
Forecast
purchases
Forecast
sales
Net
investment
hedge
Foreign
currency,
other
Interest
hedges Total
Commodity price risk Foreign currency risk Interest rate risk
2020
Nominal Value 541 218 176 311 113 1,358
Below one year 415 196 — 311 — 921
More than one year 126 22 176 — 113 437
Fair value – assets 52 5 n.a. 14 0 71
Fair value – liabilities 60 33 n.a. 1 4 98
2019
Nominal Value 66 7,036 — — — 7,102
Below one year 41 5,415 — — — 5,455
More than one year 25 1,621 — — — 1,647
Fair value – assets 6 279 — — — 284
Fair value – liabilities 0 237 — — — 237
Above shown Fair value assets and liabilities are
presented in Line item Other financial assets and Other
financial liabilities in OMV’s Consolidated statement of
financial position.
Commodity price risk
Upstream
In order to protect the Group's result and cash flow
from the potential negative impact of falling oil and gas
prices as well as to ensure sufficient liquidity headroom
in order to enable the Group’s growth strategy, OMV
uses financial derivatives to secure favorable oil and
gas prices from time to time. When doing so, OMV
enters into derivative positions selling forward parts of
its future production, thereby locking in future oil and
gas prices and reducing exposure to market prices in
the periods for which the hedges are concluded. OMV
Group adopts a flexible approach to monetize hedges
prior to their maturity with the aim to generate a positive
contribution to the results.
In 2020, oil and gas derivative contracts were
concluded, resulting in a total negative Operating result
impact of EUR (37) mn (oil: EUR (30) mn, gas:
EUR (7) mn).
In 2019, swaps for gas volumes were entered into,
resulting in a total positive Operating result impact of
EUR 2 mn.
For these derivative instruments no hedge accounting
was applied.
Downstream
Commodity price risk management in Downstream
refers to analysis, assessment, reporting and hedging
of market price risk exposure arising from non-trading
and trading activities, covering refining (refinery margin,
petrochemical margin, inventories up to a defined
threshold, market price risk from European Emission
Allowances) as well as oil and gas marketing activities
(marketing margin, inventories up to a defined
threshold) and producing power (spark spreads) in
addition to proprietary trading positions.
Limited proprietary trading activities are performed for
the purpose of creating market access within the oil,
power and gas markets. In Downstream Gas, OTC
swaps, options, futures and forwards are used to hedge
purchase and sales price risks. The aim is to hedge the
price risk on inventory fluctuations and the differences
in terms and conditions of purchases and sales.
In Downstream Oil, derivative instruments are used for
both hedging selected product sales and reducing
exposure to price risks on inventory fluctuations. Crude
oil and product swaps are used to hedge the refining
margin (crack spread), which is the difference between
crude oil prices and bulk product prices.

OMV ANNUAL REPORT 2020 / FINANCIAL STATEMENTS
177
For the petrochemical production, some of the
forecasted cracker feedstock purchases and finished
product sales are hedged through refined oil products
swaps. Cash flow hedge accounting is applied to those
derivatives, except for the derivatives that are used to
limit the price risk on the inventory held for immediate
consumption. Contracts not designated as cash flow
hedges are classified as fair value through profit or loss
and stated at fair value.
Furthermore, exchange-traded oil futures as well as
OTC contracts (contracts for difference and swaps) are
used to hedge short-term purchase and sales market
price risks.
Swaps do not involve an investment at the time the
contracts are concluded; settlement normally takes
place at the end of the quarter or month. The premiums
on options are payable when the contract is concluded;
where options are exercised, payment of the difference
between strike price and average market price for the
period takes place at contract expiration.
European Emission Allowances purchases are always
executed in due time to fulfill all legal requirements and
are carefully managed by considering the related price
risk.
Cash flow hedges in Downstream
In the Downstream Oil Business, OMV is especially
exposed to volatile refining margins, inventory risks and
emission price risk. In order to mitigate those risks
corresponding hedging activities are taken, which
include margin hedges and stock hedges. Additionally,
cash flow hedge accounting is applied to forecast
electricity purchases and forecast natural gas
purchases. Also a part of the hedges done for future
sales and purchases of the crackers has been
designated as cash flow hedge.
The risk management strategy is to harmonize the
pricing of product sales and purchases in order to
remain within an approved range of priced stocks at all
times, by means of undertaking stock hedges so as to
mitigate the price exposure. The range is a defined
maximum deviation from the target stock level, as
defined in the Annual Plan for hedging activities.
Furthermore, in respect of refinery margin hedges,
crude oil and products are hedged separately, with the
aim to protect future margins. Endorsed mandates are
documented and defined within the Annual plan for
hedging activities.
In case of refinery margin hedges only the product
crack spread is designated as the hedged item, buying
Brent Crude Oil on a fixed basis and selling the product
on a fixed basis. The crack spread for different
products is a separately identifiable component and
can therefore represent the specific risk component
designated as hedged item. There are limits set for the
volume of planned hedged sales to avoid over hedging.
In 2020 the risk management objective for the refinery
margin hedges changed and therefore most of the
hedging relationships were discontinued.The
accumulated gains and losses remain in the cash flow
hedging reserve upon realization of the hedged item. In
addition hedge accounting related to forecast sales of
specific products has been terminated because cash
flows have no longer been expected to occur due to the
impacts of the COVID-19 pandemic. The accumulated
gains and losses were immediately reclassified to profit
or loss.
Stock hedges are used to mitigate price exposure
whenever actual priced stock levels deviate from target
levels. Forecast sales and purchase transactions for
crude oil and oil products are designated as the hedged
item. Historically, Brent crude oil has formed the largest
risk component of the stock price, however in some
cases also oil products are used for stock hedges. In
such cases, Platts / Argus product price is used as the
risk component. Other components like product crack
spreads and other local market cost components are
not hedged.
The hedging relationships are established with a hedge
ratio of 1:1 as the underlying risk of the commodity
derivatives are identical to the hedged risk
components. Hedge ineffectiveness can arise from
timing differential between derivative and hedged item
delivery and pricing differentials (derivatives are valued
on the future monthly average price (or other periods)
and sales/purchases on the pricing at the date of
transaction/delivery).
For ‘Forecast purchases’ the hedge ineffectiveness is
included in line item ‘Purchases (net of inventory
variation)’ in OMV’s Consolidated income statement.
The hedge ineffectiveness and recycling of ‘Forecast
sales’ for hedges where a risk component of the non-
financial item is designated as the hedged item in the
hedging relationship is shown in line item ‘Sales
revenues’ in OMV’s Consolidated income statement.
Foreign exchange risk management
OMV operates in many countries and currencies,
therefore industry-specific activities and the

OMV ANNUAL REPORT 2020 / FINANCIAL STATEMENTS
178
corresponding foreign exchange rate risks need to be
analyzed precisely. The USD represents OMV’s
biggest risk exposure, in the form of movement of the
USD against the EUR and also against other main
OMV currencies (RON, RUB, NOK, NZD and SEK).
Movements of these currencies against the EUR are
also important sources of risk. Other currencies have
only a limited impact on cash flow and Operating result.
The transaction risk on foreign currency cash flows is
monitored on an ongoing basis. The Group’s net
position is reviewed at least on a semiannual basis and
the sensitivity is calculated. This analysis provides the
basis for management of transaction risks on
currencies. Since OMV produces commodities that are
mainly traded in USD, OMV Group has an economic
USD long position.
FX options, forwards and swaps are mainly used to
hedge foreign exchange rate risks on outstanding
receivables and payables. The market value of these
instruments will move in the opposite direction to the
value of the underlying receivable or liability if the
relevant foreign exchange rate changes. When certain
conditions are met, the Group may elect to apply
IFRS 9 hedge accounting principles in order to
recognize the offsetting effects on profit or loss of
changes in the fair value of the hedging instruments at
the same time as and the hedged items. Certain
hedges which refer to a forecasted currency position
are therefore classified as cash flow hedges and stated
at fair value through comprehensive income.
Translation risk is also monitored on an ongoing basis
at Group level, and the risk position is evaluated.
Translation risk arises on the consolidation of
subsidiaries with functional currencies different from
EUR. The largest exposures result from changes in
RON, USD, RUB, NOK, and SEK denominated assets
against the EUR.
A foreign currency exposure arises from the Group’s
long-term net investment in its subsidiaries, associated
companies and joint ventures in foreign currencies.
Foreign exchange translation differences relating to
these net investments are recognized in other
comprehensive income. Borealis has hedged part of its
investment in an associated company which has USD
as its functional currency, by designating certain
external loans in USD as hedges of the Group’s
investments in its foreign operations. The hedged risk
in the net investment hedge is the risk of a weakening
USD against the EUR that will result in a reduction in
the carrying amount of the Group’s net investment in
the associated company in USD. The EUR/USD impact
on the measurement of the loan is recognized in other
comprehensive income.
To assess hedge effectiveness, the Group determines
the economic relationship between the hedging
instrument and the hedged item by comparing changes
in the carrying amount of the debt that is attributable to
a change in the spot rate with changes in the
investment in the foreign operation due to movements
in the spot rate (the dollar- offset method). The Group’s
policy is to hedge the net investment only to the extent
of the debt principal.
There is an economic relationship between the hedged
item and the hedging instrument as the net investment
creates a translation risk that will match the foreign
exchange risk on the USD borrowing. The Group has
established a hedge ratio of 1:1 as the underlying risk
of the hedging instrument is identical to the hedged risk
component. Hedge ineffectiveness will arise when the
amount of the investment in the foreign associated
company becomes lower than the amount of the
borrowing.
Interest rate management
To facilitate management of interest rate risk, OMV’s
liabilities are analyzed in terms of fixed and floating rate
borrowings, currencies and maturities. Appropriate
ratios for the various categories are established, and
where necessary, derivative instruments are used to
hedge fluctuations outside predetermined ranges.
OMV is exposed to uncertainties resulting from the
interest rate benchmark reform in respect of its hedges
of (6 month) EURIBOR and (3 month) USD LIBOR
interest risk, related to the existence of two outstanding
USD interest rate swaps with a nominal amount of
USD 110 mn in total, and one outstanding interest rate
swap with a nominal amount of EUR 23 mn. Their
hedging period reaches beyond 2021 when
uncertainties about existence of the USD LIBOR rates
arise. OMV expects that the hedging instrument and
the hedged risk of the hedged item will not change as a
result of the reform; however, any hedge
ineffectiveness would be accounted for in profit or loss.
OMV applies the amendments to IFRS 9 issued in
September 2019 to those hedging relationships directly
affected by IBOR reform (see Note 2 – Accounting
policies, judgements and estimates).
Interest rate swaps can be used to convert fixed rate
debt into floating rate debt, and vice versa. In the year
2020 the impact of interest rate swaps has not been
material. (2019: no open position).

OMV ANNUAL REPORT 2020 / FINANCIAL STATEMENTS
179
The hedge ineffectiveness and recycling of ‘Interest
rate swaps’ are both shown in line item ‘interest
expenses’ in OMV’s Consolidated income statement.
Sensitivity analysis
For open hedging contracts sensitivity analysis is
performed to determine the effect of market price
fluctuations (+/–10%) on market value. The sensitivity
of OMV Group’s overall earnings differs from the
sensitivity shown below, since the contracts concluded
are used to hedge operational exposures.
The effect of market price fluctuations on earnings or
equity depends on the type of derivative used and on
whether hedge accounting is applied. Market price
sensitivity for derivatives to which cash flow hedge
accounting is applied is shown in the sensitivity table
for equity. Sensitivity to market price fluctuations for all
other open derivatives is shown in the sensitivity tables
for profit before tax.
Sensitivity analysis for open commodity derivatives affecting profit before tax
In EUR mn
2020 2019
Market
price +10%
Market price
(10)%
Market
price +10%
Market price
(10)%
Upstream, Gas (6) 5 (2) 2
Upstream (6) 5 (2) 2
Downstream, Oil incl. oil products (14) 14 (18) 18
Downstream, Gas (1) 0 (25) 25
Downstream, Power (20) 20 (13) 13
Downstream, other 23 (23) 2 (2)
Downstream (12) 11 (54) 54
Sensitivity analysis for open commodity derivatives affecting other comprehensive income
In EUR mn
2020 2019
Market
price +10%
Market price
(10)%
Market
price +10%
Market price
(10)%
Downstream, Oil incl. oil products (32) 32 (80) 80
Downstream, Gas (2) 2 — —
Downstream, Power 24 (24) — —
Downstream (10) 10 (80) 80
For financial instruments, sensitivity analysis is
performed for changes in foreign exchange rates. On
Group level, the EUR-RON sensitivity not only includes
the net RON exposure versus the EUR but also the net
RON exposure versus the USD, since the USD-RON
exposure can be split into a EUR-RON and EUR-USD
exposure. The same is true for the EUR-NOK, EUR-
SEK and EUR-NZD exposure.

OMV ANNUAL REPORT 2020 / FINANCIAL STATEMENTS
180
Sensitivity analysis for financial instruments affecting profit before tax1
In EUR mn
2020 2019
10%
apprecia-
tion of the
EUR
10%
deprecia-
tion of the
EUR
10%
apprecia-
tion of the
EUR
10%
deprecia-
tion of the
EUR
EUR-RON (11) 11 (20) 20
EUR-USD (27) 27 (22) 22
EUR-NZD (4) 4 (15) 15
EUR-NOK (8) 8 (6) 6
EUR-RUB (0) 0 (30) 30
1 Refers only to financial instruments and is not the same as the Group’s overall foreign exchange rate sensitivity in terms of operating result
Sensitivity analysis for financial instruments affecting other comprehensive income1
In EUR mn
2020 2019
10%
apprecia-
tion of the
EUR
10%
deprecia-
tion of the
EUR
10%
apprecia-
tion of the
EUR
10%
deprecia-
tion of the
EUR
EUR-USD 33 (33) — —
EUR-SEK (15) 15 — —
1 Including sensitivity of the net investment hedge
OMV Group holds financial assets whose market value
would be affected by changes in interest rates. The
effect of an interest rate increase of 0.5 percentage
points on the financial assets measured FVTPL as of
December 31, 2020, would have been a EUR (9) mn
reduction in the market value of these financial assets
(2019: EUR (12) mn). A 0.5 percentage points fall in
the interest rate as of December 31, 2020 would have
led to an increase in market value of EUR 9 mn (2019:
EUR 12 mn).
OMV regularly analyzes the impact of interest rate
changes on interest income and expense from floating
rate deposits and borrowings. Currently the effects of
changes in interest rate are not considered to be a
material risk.
Credit risk management
The main counterparty credit risks are assessed and
monitored at Group level and Segment level using
predetermined criteria and limits for all counterparties,
banks and security providers. On the basis of a risk
assessment, counterparties, banks and security
providers are assigned a credit limit, an internal risk
class and a specific limit validity. The risk assessments
are reviewed at least annually or on an ad-hoc basis.
The credit risk processes are governed by guidelines at
OMV Group level stipulating the group-wide minimum
requirements. The main counterparties with contracts
involving derivative financial instruments have
investment grade credit ratings. OMV uses commercial
trade insurance for parts of its receivables in some
business areas to mitigate risk. Based on the high
economic uncertainty resulting from the COVID-19
pandemic, special attention is paid to early warning
signals like changes in payment behavior.
Credit risk is the risk that OMV Group’s counterparties
will not meet their obligation under a financial
instrument or customer contract, leading to a financial
loss. The Group is exposed to credit risk arising from
credit exposures with customer accounts receivables
(see Note 18 – Financial assets), from its operating
activities as well as from its financial activities such as
financial investments, including deposits with banks
and financial institutions (see Note 26 – Statement of
cash flows), foreign exchange transactions and other
financial instruments (see Note 18 – Financial assets).

OMV ANNUAL REPORT 2020 / FINANCIAL STATEMENTS
181
29 Fair value hierarchy
Fair value hierarchy of financial assets1 and net amount of assets and liabilities held for sale at fair value
In EUR mn
Carrying amount Fair value level
At amortized
cost
At fair
value Total Level 1 Level 2 Level 3 Total
2020
Trade receivables 3,245 71 3,316 — 71 — 71
Investments in other companies — 15 15 — — 15 15
Investment funds — 35 35 35 — — 35
Bonds 64 — 64 — — — —
Derivatives designated and
effective as hedging
instruments — 71 71 — 71 — 71
Other derivatives — 2,502 2,502 69 2,433 — 2,502
Loans 1,720 — 1,720 — — — —
Other sundry financial
assets2 1,313 744 2,058 — — 744 744
Net amount of assets and
liabilities associated with
assets held for sale n.a. 98 98 — 98 — 98
Total 6,343 3,536 9,878 104 2,672 759 3,536
2019
Trade receivables 2,911 131 3,042 — 131 — 131
Investments in other companies — 24 24 — — 24 24
Bonds 78 — 78 — — — —
Derivatives designated and
effective as hedging
instruments — 284 284 — 284 — 284
Other derivatives — 2,391 2,391 241 2,150 — 2,391
Loans 855 — 855 — — — —
Other sundry financial
assets2 1,182 721 1,903 — — 721 721
Net amount of assets and
liabilities associated with
assets held for sale n.a. 8 8 — 8 — 8
Total 5,026 3,559 8,585 241 2,573 745 3,559
1 Excluding assets held for sale
2 Other sundry receivables include an asset from reserves redetermination rights related to the acquisition of interests in the field Yuzhno Russkoye and
contingent considerations from the divestments of the 30% stake in the field Rosebank and of OMV (U.K.) Limited. Please see Note 18 – Financial assets – for
further details.

OMV ANNUAL REPORT 2020 / FINANCIAL STATEMENTS
182
Fair value hierarchy of financial liabilities1
In EUR mn
Carrying amount Fair value level
At
amortized
cost
At fair
value Total Level 1 Level 2 Level 3 Total
2020
Trade payables 4,304 — 4,304 — — — —
Bonds 8,869 — 8,869 — — — —
Lease liabilities 1,084 — 1,084 — — — —
Other interest bearing debt 1,983 — 1,983 — — — —
Liabilities on derivatives
designated and effective as
hedging instruments — 98 98 — 98 — 98
Liabilities on other
derivatives — 2,418 2,418 70 2,349 — 2,418
Other sundry financial
liabilities 1,033 — 1,033 — — — —
Total 17,272 2,516 19,788 70 2,446 — 2,516
2019
Trade payables 4,155 — 4,155 — — — —
Bonds 5,802 — 5,802 — — — —
Lease liabilities 1,053 — 1,053 — — — —
Other interest bearing debt 769 — 769 — — — —
Liabilities on derivatives
designated and effective as
hedging instruments — 237 237 — 237 — 237
Liabilities on other
derivatives — 2,241 2,241 266 1,976 — 2,241
Other sundry financial
liabilities 642 — 642 — — — —
Total 12,420 2,478 14,898 266 2,213 — 2,478
1 Excluding liabilities associated with assets held for sale
Financial assets and liabilities for which fair values are disclosed1
In EUR mn
Fair Value Fair value level
Level 1 Level 2 Level 3
2020
Bonds 64 — 64 —
Financial assets 64 — 64 —
Bonds 9,652 9,352 300 —
Other interest bearing debt 2,002 — 2,002 —
Financial liabilities 11,654 9,352 2,302 —
2019
Bonds 77 5 72 —
Financial assets 77 5 72 —
Bonds 6,317 6,317 — —
Other interest bearing debt 792 — 792 —
Financial liabilities 7,109 6,317 792 —
1 Excluding assets and liabilities that were reclassified to held for sale

OMV ANNUAL REPORT 2020 / FINANCIAL STATEMENTS
183
30 Offsetting of financial assets and financial liabilities
Financial assets and financial liabilities are offset only
when the Group has a current and legally enforceable
right to set-off the recognized amounts and when there
is an intention to settle on a net basis or realize the
asset and settle the liability simultaneously.
OMV enters in the normal course of business into
various master netting arrangements in the form of
International Swaps and Derivatives Association (ISDA)
agreements or European Federation of Energy Traders
(EFET) agreements or other similar arrangements that
do not meet the criteria of offsetting in the statement of
the financial position in accordance with IAS 32.
The tables hereafter show the carrying amounts of
recognized financial assets and financial liabilities that
are subject to various netting arrangements. The net
column would be on the Group’s statement of financial
position, if all set-off rights were exercised.
Offsetting of financial assets
In EUR mn
Note
Financial
instruments
(gross)
Amounts set
off in the
statement of
financial
position
Financial
instruments in
the statement
of financial
position (net)
Liabilities with
right of set-off
(not offset) Net
2020
Derivative financial instruments 18 2,573 — 2,573 (2,023) 550
Trade receivables 18 3,325 (9) 3,316 (1,298) 2,018
Other sundry financial assets 18 2,058 — 2,058 (104) 1,954
Total 7,955 (9) 7,947 (3,424) 4,522
2019
Derivative financial instruments 18 2,676 — 2,676 (2,264) 412
Trade receivables 18 3,056 (14) 3,042 (1,204) 1,838
Other sundry financial assets 18 1,903 — 1,903 (44) 1,858
Total 7,634 (14) 7,620 (3,512) 4,108
Offsetting of financial liabilities
In EUR mn
Note
Financial
instruments
(gross)
Amounts set
off in the
statement of
financial
position
Financial
instruments in
the statement
of financial
position (net)
Assets with
right of set-off
(not offset) Net
2020
Derivative financial instruments 24 2,516 — 2,516 (2,024) 492
Trade payables 24 4,313 (9) 4,304 (1,298) 3,006
Other sundry financial liabilities 24 1,033 — 1,033 (103) 930
Total 7,861 (9) 7,853 (3,424) 4,428
2019
Derivative financial instruments 24 2,478 — 2,478 (2,288) 190
Trade payables 24 4,168 (14) 4,155 (1,204) 2,951
Other sundry financial liabilities 24 642 — 642 (20) 622
Total 7,288 (14) 7,274 (3,512) 3,762

OMV ANNUAL REPORT 2020 / FINANCIAL STATEMENTS
184
31 Result on financial instruments
Result on financial instruments
In EUR mn
Amount
Fair value
through profit
or loss
Equity instruments
designated as at
fair value through
other comprehen-
sive income
Financial
assets at
amortized
cost
Financial
liabilities at
amortized
cost
2020
Fair value changes of financial
assets, derivatives and trading inventories 36 36 — — —
Net impairment losses on financial
assets (10) — — (10) —
Result on financial instruments
within operating result 25 36 — (10) —
Dividend income 19 — 19 — —
Interest income 177 — — 165 3
Interest expense (280) 0 — — (168)
Fair value changes of FX derivatives (62) (62) — — —
Financial charges for factoring and
securitization (24) (24) — — —
Impairments of financial
instruments, net (5) — — (4) —
Other (10) — — — (10)
Result on financial instruments
within financial result (183) (85) 19 161 (175)
2019
Fair value changes of financial
assets and derivatives 241 241 — — —
Net impairment losses on financial
assets (33) — — (33) —
Result on financial instruments
within operating result 208 241 — (33) —
— — — — —
Dividend income 5 — 5 — —
Interest income 169 — — 152 —
Interest expense (304) — — — (170)
Fair value changes of FX derivatives 28 28 — — —
Financial charges for factoring and
securitization (31) (31) — — —
Impairments of financial
instruments, net (1) — — (1) —
Other (7) — — — (7)
Result on financial instruments
within financial result (141) (3) 5 151 (177)
The interest expense not allocated mainly referred to
the unwinding of provisions. For further details see
Note 11 – Net financial result.

OMV ANNUAL REPORT 2020 / FINANCIAL STATEMENTS
185
32 Share based payments
Long Term Incentive (LTI) plans
LTI plans with similar conditions have been granted to
the Executive Board and selected senior managers in
the Group yearly. At vesting date, shares will be
granted to the participants. The number of shares is
determined depending on the achievement of defined
performance criteria. The defined performance criteria
may not be amended during the performance period of
the LTI plans. However – in order to maintain the
incentivizing character of the program – the
Remuneration Committee will have discretion to adjust
the threshold/ target/maximum levels in case of
material changes in external factors such as oil and gas
prices. The adjustment is possible in both directions
and will be determined by the Remuneration
Committee. Disbursement is made in cash or in shares.
Executive Board members and senior managers as
active participants of the plans are required to build up
an appropriate volume of shares and to hold those
shares until retirement or departure from the Company.
For senior managers, if the LTIP eligibility lapses, but
they are still in an active employment with the
company, the shareholding requirement expires when
the last LTIP is paid out. The shareholding requirement
is defined as a percentage of the annual gross base
salary, for the Executive Board, and as a percentage of
the respective Target Long Term Incentive for the
senior managers. Executive Board members have to
fulfill the shareholding requirement within five years
after the initial respective appointment. Until fulfillment
of the shareholding requirement the disbursement is in
form of shares whilst thereafter the plan participants
can decide between cash or share settlement. As long
as the shareholding requirements are not fulfilled the
granted shares after deduction of taxes are transferred
to a trustee deposit, managed by the Company.
For share-based payments the grant date fair values
are spread as expenses over the three years
performance period with a corresponding increase in
shareholders’ equity. In case of assumed cash-
settlements a provision is made for the expected future
costs of the LTI plans at statement of financial position
date based on fair values.
Long Term Incentive Plans
2020 plan 2019 plan 2018 plan 2017 plan
Start of plan 01/01/2020 01/01/2019 01/01/2018 01/01/2017
End of performance period 12/31/2022 12/31/2021 12/31/2020 12/31/2019
Vesting date 03/31/2023 03/31/2022 03/31/2021 03/31/2020
Shareholding requirement
Executive Board Chairman
200% of
annual gross
base salary
200% of
annual gross
base salary
200% of
annual gross
base salary
200% of
annual gross
base salary
Executive Board Deputy Chairman
175% of
annual gross
base salary
175% of
annual gross
base salary
175% of
annual gross
base salary
175% of
annual gross
base salary
Other Executive Board members
150% of
annual gross
base salary
150% of
annual gross
base salary
150% of
annual gross
base salary
150%
of annual gross
base salary
Senior managers
75% of the
respective
Target Long
Term Incentive
75% of the
respective
Target Long
Term Incentive
75% of the
respective
Target Long
Term Incentive
75% of the
respective
Target Long
Term Incentive
Expected shares as of December 31, 2020 97,501 201,604 199,678 —
Maximum shares as of December 31, 2020 463,562 412,340 321,099 —
Fair value of plan (in EUR mn) as of
December 31, 2020¹ 3 7 7 —
Provision (in EUR mn) as of December 31,
2020¹ 1 3 5 —
Estimated tax payments related to equity
settled transactions (in EUR mn)2 1 1 1 —
1 Excluding incidental wage costs 2 This position includes estimated tax obligations of participants of the plan associated with equity settled transactions of the whole plan. This amount is paid by
OMV in cash to the tax authority on behalf of participants after vesting date.

OMV ANNUAL REPORT 2020 / FINANCIAL STATEMENTS
186
Equity Deferral
The Equity Deferral serves as a long-term
compensation instrument for the members of the
Executive Board that promotes retention and
shareholder alignment in OMV, combining the interests
of management and shareholders via a long-term
investment in restricted shares. The holding period of
the Equity Deferral is three years from vesting. The
plan also seeks to prevent inadequate risk-taking.
The Annual Bonus is capped at 180% of the target
Annual Bonus (until 2017: 200% of the annual gross
salary). A minimum of one third of the Annual Bonus
(until 2017: 50% of the granted Annual Bonus) is
granted in shares. The determined bonus achievement
is settled per March 31 following the period end
whereby at the statement of financial position date the
target achievements and the share price is estimated
(the latter on basis of market quotes). In case of major
changes in external factors the Remuneration
Committee can adjust the threshold, target and/or
maximum levels (but not the criteria as such nor the
vesting) for the Financial Targets of the Annual Bonus.
The granted shares after deduction of taxes are
transferred to a trustee deposit, managed by the
Company, to be held for three years.
In 2020 expenses amounting to EUR 1 mn were
recorded with a corresponding increase in equity (2019:
EUR 2 mn).
Personal investment held in shares1
12/31/2020 12/31/2019 12/31/2018 12/31/2017
Active Executive Board members
Seele 99,309 91,974 70,890 48,435
Pleininger 50,166 45,032 28,511 19,333
Florey 30,009 24,351 13,401 8,335
Gangl2 12,527 10,730 — —
Skvortsova3 — — — —
Former Executive Board members
Leitner 15,244 44,211 65,245 59,335
Total — Executive Board 207,255 216,298 178,047 135,438
Other senior managers 326,030 368,268 299,997 256,202
Total personal investment 533,285 584,566 478,044 391,640
1 Personal investment held in shares refer to open LTI plans as well as to Equity Deferral if shares are held in the OMV trustee deposit. 2 Thomas Gangl took part in LTIP 2017 and 2018 in his position as senior manager. In 2019 he took part in LTIP as both senior manager as well as Executive
Board member. In LTIP 2020 he took part as Executive Board member. 3 Elena Skvortsova joined the Executive Board effective June 15, 2020.
Total Expense
Expenses related to share based payment transactions
including long-term incentive plans as well as equity
deferral are summarized in the below table.
Expenses related to share based payment transactions1
In EUR mn
2020 2019
Cash settled (7) 21
Equity settled 2 4
Total expenses arising from share based payment transactions (5) 25
1 Excluding incidental wage costs

OMV ANNUAL REPORT 2020 / FINANCIAL STATEMENTS
187
33 Average number of employees
Average number of employees1
2020 2019
OMV Group excluding OMV Petrom Group and Borealis Group 7,471 7,407
OMV Petrom Group 11,790 12,720
Borealis Group2 1,813 —
OMV Group 21,074 20,127
1 Calculated as the average of the month’s end numbers of employees during the year 2 Due to the acquisition as of October 29, 2020, the average of the month´s end numbers for October – December has been taken into account for the calculation.
See Note 3 – Changes in group structure – for more details.
The decrease related to OMV Petrom Group is a result
of outsourced activities and of reorganization and
restructuring programs as a consequence of process
optimization and cost efficiency measures.
34 Expenses Group auditor
Expenses for services rendered by the Group auditor
(including the international network in terms of section
271b UGB) comprised the following:
Expenses for services rendered by the Group auditor (including the international network)
In EUR mn
2020 2019
Group auditor
thereof
Ernst&Young
Wirtschafts-
prüfungsgesell-
schaft m.b.H Group auditor
thereof
Ernst&Young
Wirtschafts-
prüfungsgesell-
schaft m.b.H
Audit of Group accounts and year-end audit 3.57 1.64 3.15 1.39
Other assurance services 0.89 0.56 0.71 0.44
Tax advisory services 0.10 — 0.09 0.00
Other services 1.15 — 0.29 0.02
Total 5.70 2.20 4.24 1.84
35 Related parties
Under IAS 24, details of relationships with related
parties and related enterprises not included in
consolidation must be disclosed. Enterprises and
individuals are considered to be related if one party is
able to control or exercise significant influence over the
business of the other. Österreichische Beteiligungs AG
(ÖBAG), Vienna, holds an interest of 31.5% and
Mubadala Petroleum and Petrochemicals Holding
Company L.L.C., (MPPH) Abu Dhabi, holds an interest
of 24.9% in OMV Aktiengesellschaft; both are related
parties under IAS 24.
In 2020, there were following arm's-length supplies of
goods and services (including the granting of licences
for the use of technologies of the Group) between the
Group and equity-accounted companies, except for gas
purchases from OJSC Severneftegazprom which are
not based on market prices but on cost plus defined
margin.
Other Information

OMV ANNUAL REPORT 2020 / FINANCIAL STATEMENTS
188
Transactions with equity-accounted investments – Sales and Receivables
In EUR mn
2020 2019
Sales and
other income
Trade
receivables
Sales and
other income
Trade
receivables
Abu Dhabi Oil Refining Company 4 1 0 0
Abu Dhabi Polymers Company Limited (Borouge) 16 22 — —
Abu Dhabi Trading LTD 1 1 — —
Bayport Polymers LLC 2 1 — —
Borealis AG 897 — 1,284 58
Borouge Pte. Ltd. 40 37 — —
Erdöl-Lagergesellschaft m.b.H. 51 0 76 5
GENOL Gesellschaft m.b.H. 1 93 13 196 20
PEGAS CEGH Gas Exchange Services GmbH 1 0 1 0
Trans Austria Gasleitung GmbH2 10 1 10 1
Total 1,116 78 1,567 84
1 In 2019 transactions with GENOL Gesellschaft m.b.H. as well as GENOL Gesellschaft m.b.H. & Co KG are included, while 2020 transactions were only with
GENOL Gesellschaft m.b.H (business of GENOL Gesellschaft m.b.H. & Co KG was transferred to GENOL Gesellschaft m.b.H in October 2019) 2 Trans Austria Gasleitung GmbH was reclassified to held for sale in 2020.
Transactions with equity-accounted investments – Purchases and Payables
In EUR mn
2020 2019
Purchases
and services
received
Trade
payables
Purchases
and services
received
Trade
payables
Borealis AG 31 — 42 9
Borouge Pte. Ltd. 51 64 — —
Chemiepark Linz Betriebsfeuerwehr GmbH 1 0 — —
Deutsche Transalpine Oelleitung GmbH 27 2 34 3
Enerco Enerji Sanayi Ve Ticaret A.Ş. — — 9 —
EPS Ethylen-Pipeline-Süd GmbH & Co KG 2 — 2 —
Erdöl-Lagergesellschaft m.b.H. 68 27 59 29
GENOL Gesellschaft m.b.H. 1 1 — 2 0
OJSC Severneftegazprom 133 12 179 20
PetroPort Holding AB 1 0 — —
Trans Austria Gasleitung GmbH2 23 2 22 1
Total 338 106 348 63
1 In 2019 transactions with GENOL Gesellschaft m.b.H. as well as GENOL Gesellschaft m.b.H. & Co KG are included, while 2020 transactions were only with
GENOL Gesellschaft m.b.H (business of GENOL Gesellschaft m.b.H. & Co KG was transferred to GENOL Gesellschaft m.b.H in October 2019). 2 Trans Austria Gasleitung GmbH was reclassified to held for sale in 2020.

OMV ANNUAL REPORT 2020 / FINANCIAL STATEMENTS
189
Dividend distributed from equity-accounted investments
In EUR mn
2020 2019
Abu Dhabi Oil Refining Company — 34
Abu Dhabi Petroleum Investments LLC 5 —
Bayport Polymers LLC 21 —
Borealis AG 108 297
Deutsche Transalpine Oelleitung GmbH 1 —
GENOL Gesellschaft m.b.H.1 0 1
OJSC SEVERNEFTEGAZPROM 14 6
Pearl Petroleum Company Limited 25 31
PEGAS CEGH Gas Exchange Services GmbH 1 1
Società Italiana per l'Oleodotto Transalpino S.p.A. 1 —
Trans Austria Gasleitung GmbH2 16 14
Dividend distributed from equity-accounted investments 191 384
1 2019 includes dividends from GENOL Gesellschaft m.b.H. & Co KG, while 2020 includes dividends from GENOL Gesellschaft m.b.H. (business of GENOL
Gesellschaft m.b.H. & Co KG was transferred to GENOL Gesellschaft m.b.H in October 2019). 2 Trans Austria Gasleitung GmbH was reclassified to held for sale in 2020.
Other balances with equity-accounted investments
In EUR mn
2020 2019
Kilpilahti Power Plant LTD 17 —
Bayport Polymers LLC 735 —
SMATRICS GmbH & Co KG 2 —
Loans receivables 753 —
Kilpilahti Power Plant LTD 13 —
Bayport Polymers LLC 3 —
Advance payments 16 —
Abu Dhabi Oil Refining Company — 34
Freya Bunde-Etzel GmbH & Co. KG 7 7
Other receivables 7 41
Abu Dhabi Polymers Company Limited (Borouge) 1 —
Bayport Polymers LLC 7 —
Contract assets 7 —
Trans Austria Gasleitung GmbH 0 1
Bayport Polymers LLC 143 —
Other payables 143 1
Contract liabilities Erdöl-Lagergesellschaft m.b.H. 144 170
The loans receivables (including the related accrued
interests) towards Bayport Polymers LLC stemmed
from drawdowns under a member loan agreement. The
undrawn financing commitments provided to Bayport
Polymers LLC amounted to EUR 407 mn as of
December 31, 2020.
At the reporting date, further financing commitments
towards Kilpilahti Power Plant LTD amounted to
EUR 16 mn. The entitlements are depending on the
fulfilment of specific events, as defined in the
underlying contracts.
The other payables towards Bayport Polymers LLC are
related to an equity contribution.
The contract liabilities towards Erdöl-Lagergesellschaft
m.b.H. are related to a long-term contract for rendering
of services.
In 2019 the other receivable balance towards Abu
Dhabi Oil Refining Company was related to an
outstanding dividend receivable.
Government-related entities
Based on the OMV ownership structure, the Republic
of Austria has an indirect relationship with OMV via
ÖBAG and is therefore, together with companies in
which the Republic of Austria is a majority shareholder,
considered a related party. OMV has transactions at
arm´s length in the normal course of business mainly

OMV ANNUAL REPORT 2020 / FINANCIAL STATEMENTS
190
with Österreichische Post Aktiengesellschaft, Verbund
AG, Österreichische Bundesbahnen-Holding
Aktiengesellschaft, Bundesbeschaffung GmbH and
their subsidiaries.
As per September 23, 2020 OMV signed the
transaction contract with Verbund AG for the planned
sale of OMV’s 51% stake in Gas Connect Austria
GmbH. Furthermore, the strategic energy cooperation
between OMV and Verbund AG finished the
construction of the largest ground-ounted photovoltaic
plant in Austria in 2020.
Via MPPH, OMV has an indirect relationship with the
Emirate of Abu Dhabi, which is, together with the
companies under control of Abu Dhabi also considered
a related party. In 2020, there were supplies of goods
and services for instance with Compañía Española de
Petróleos (CEPSA), Abu Dhabi National Oil Company
(ADNOC) and NOVA Chemicals Corporation (NOVA).
On October 29, 2020 OMV acquired an additional 39%
share in Borealis AG from Mubadala Investment
Company (Abu Dhabi). For more details see Note 3 –
Changes in group structure. OMV cooperates with
ADNOC in several Upstream arrangements. In 2019
OMV and ADNOC closed the strategic equity
partnerships covering both the existing ADNOC
Refining business and a new Trading Joint Venture.
Key management personnel compensation
Remuneration received by the Executive Board
In EUR mn
2020
active members of the Executive
Board as of December 31, 2020
former members of the
Executive Board
Seele Pleininger Florey Gangl6 Skvortsova8 Leitner10 Davies11 Roiss12 Total
Short term benefits 2.27 1.34 1.30 0.79 0.50 1.12 — — 7.33
Fixed (base salary) 1.10 0.75 0.70 0.58 0.31 — — — 3.44
Fixed (functional
allowance) 0.333 — — — — — — — 0.33
Variable (cash bonus)1 0.83 0.58 0.56 0.20 — 1.12 — — 3.29
Benefits in kind 0.01 0.01 0.054 0.01 0.199 — — — 0.27
Post employment benefits 0.28 0.19 0.18 0.14 0.08 — — — 0.86
Pension fund
contributions 0.28 0.19 0.18 0.14 0.08 — — — 0.86
Shared based benefits 0.90 0.52 0.53 0.10 — 0.82 0.06 0.27 3.20
Variable (Equity Deferral
2019) 0.41 0.29 0.28 0.10 — 0.28 — — 1.35
Variable (LTIP 2017)2 0.49 0.24 0.255 —7 — 0.55 0.06 0.27 1.85
Remuneration received by
the Executive Board 3.45 2.05 2.01 1.03 0.58 1.94 0.06 0.27 11.39
1 50% of the cash payments due in 2020 under the Annual Bonus 2019 for the active Executive Board members were postponed to January 2021. 2 50% of the cash payments due in 2020 under the LTIP 2017 for the active Executive Board members (for the cash portion, if applicable) have been postponed to
January 2021. 3 Rainer Seele received a payment for the interim responsibility for "Marketing and Trading" until February 28, 2020. 4 Including schooling costs and related taxes 5 Including 50% of LTIP 2017 cash payments and additional value of transferred shares to fulfill the shareholding requirement 6 Thomas Gangl joined the Executive Board effectively July 1, 2019. 7 Thomas Gangl received a cash payment in the amount of EUR 0.06 mn based on the Senior Manager LTIP 2017 . 8 Elena Skvortsova joined the Executive Board effectively June 15, 2020. 9 Including moving and rental costs and related taxes
10 Manfred Leitner resigned from the Executive Board effectively June 30, 2019. 11 David C. Davies resigned from the Executive Board effectively July 31, 2016. 12 Gerhard Roiss resigned from the Executive Board effectively June 30, 2015.

OMV ANNUAL REPORT 2020 / FINANCIAL STATEMENTS
191
Remuneration received by the Executive Board
In EUR mn
2019
active members of the Executive
Board as of December 31, 2019
former members of the
Executive Board
Seele Pleininger Florey Gangl5 Leitner6 Davies7 Huijskes8 Roiss9 Total
Short term benefits 3.36 1.64 1.59 0.29 1.55 — — — 8.43
Fixed (base salary) 1.10 0.75 0.70 0.29 0.70 — — — 3.54
Fixed (functional allowance) 1.002 — — — — — — — 1.00
Variable (cash bonus)1 1.25 0.87 0.84 — 0.84 — — — 3.80
Benefits in kind 0.01 0.01 0.043 0.01 0.01 — — — 0.09
Post employment benefits 0.28 0.19 0.18 0.07 0.18 — — — 0.88
Pension fund contributions 0.28 0.19 0.18 0.07 0.18 — — — 0.88
Termination benefits — — — — 0.224 — — — 0.22
Shared based benefits 3.60 1.75 1.16 — 2.08 0.25 0.42 3.13 12.39
Variable (Equity Deferral 2018) 0.70 0.49 0.47 — 0.47 — — — 2.13
Variable (LTIP 2016) 2.90 1.26 0.69 — 1.61 0.25 0.42 3.13 10.26
Remuneration received by the
Executive Board 7.23 3.58 2.93 0.37 4.03 0.25 0.42 3.13 21.92
1 The variable components relate to target achievement in 2018, for which bonuses were paid in 2019. 2 Rainer Seele received a payment for the interim responsibility for “Marketing and Trading” since July 1, 2019. 3 Including schooling costs and related taxes 4 Manfred Leitner received an annual leave compensation payment amounting to EUR 0.22 mn. 5 Thomas Gangl joined the Executive Board effectively July 1, 2019. 6 Manfred Leitner resigned from the Executive Board effectively June 30, 2019. 7 David C. Davies resigned from the Executive Board effectively July 31, 2016. 8 Jaap Huijskes resigned from the Executive Board effectively August 31, 2015. 9 Gerhard Roiss resigned from the Executive Board effectively June 30, 2015.
Remuneration received by top executives (excl. Executive Board)1
In EUR mn
2020 2019
Salaries and bonuses 19.0 17.1
Pension fund contribution 1.1 1.0
Severance benefits 0.4 0.6
Share-based benefits 3.7 15.3
Remuneration received by top executives (excl. Executive Board)1 24.2 34.0
1 In 2020 there were on average 40 top executives (2019: 38) based on the months included in the Group.
The members of the Executive Board and the members
of the Supervisory Board are covered by directors and
officers liability insurance (D&O) and criminal legal
expenses insurance. A large number of other OMV
employees also benefit from these two forms of
insurance, and the insurers levy lump-sum premiums,
which are not specifically attributed to the Board
members.
See Note 32 – Shared based payments – for details on
Long Term Incentive Plans and Equity Deferral.
In 2020, remuneration expenses for the Supervisory
Board amounted to EUR 0.6 mn (2019: EUR 0.6 mn).
36 Unconsolidated structured entities
OMV is selling trade receivables in a securitization
program to Carnuntum DAC, based in Dublin, Ireland.
In 2020, OMV transferred trade receivables amounting
in total to EUR 3,458 mn to Carnuntum DAC (2019:
EUR 4,805 mn).
As at December 31, 2020, OMV held seller
participation notes in Carnuntum DAC amounting to
EUR 88 mn (2019 seller participation and
complimentary notes: EUR 160 mn) shown in other
financial assets. As of December 31, 2020, the

OMV ANNUAL REPORT 2020 / FINANCIAL STATEMENTS
192
maximum exposure to loss from the securitization
transaction was EUR 80 mn (2019: EUR 108 mn).
The seller participation notes are senior to a loss
reserve and a third party investor participation. The
complementary notes are senior to seller participation
notes and are of the same seniority as the senior notes
issued by the program. The risk retained by OMV
Group is insignificant and therefore the trade
receivables sold are derecognized in their entirety. The
receivables are sold at their nominal amount less a
discount. The discount was recognized in profit or loss
and amounted in total to EUR 21 mn in 2020 (2019:
EUR 29 mn). Interest income on the notes held in
Carnuntum DAC amounted to EUR 2 mn in 2020
(2019: EUR 4 mn). In addition, OMV received a service
fee for the debtor management services provided for
the receivables sold.
37 Subsequent events
On February 3, 2021, the Supervisory Board of OMV
Aktiengesellschaft has approved a reorganization of the
OMV Group involving splitting and expanding the
current area of Refining & Petrochemical Operations
into two areas: Refining & Marketing and Chemicals &
Materials. This structural change facilitates the forward
integration in the chemicals sector that has been
underway ever since OMV acquired a majority stake in
Borealis. With this change, OMV is consistently
positioned across the entirety of its expanded value
chain and can bundle all relevant responsibilities for
petrochemicals and chemicals in a single board
division.
The OMV Supervisory Board has appointed Alfred
Stern (56) as Executive Board member for Chemicals &
Materials.
The changes to the OMV corporate structure and the
new Executive Board appointment will take effect as of
April 1, 2021.
Following the reorganization of the OMV Group,
starting with Q1/21 OMV will change its reporting
structure. The Business Segments will be reported as
follows: Exploration & Production, Refining &
Marketing, and Chemicals & Materials.
On February 4, 2021 OMV has announced a
divestment package with following two divestments:
The divestment of OMV’s business in Slovenia, where
OMV currently operates 120 filling stations under the
OMV, Eurotruck, Avanti and Diskont brands. With its
limited integration within the Downstream oil value
chain, the divestment of this business represents a
further step in OMV’s portfolio optimization.
OMV’s subsidiary Borealis has decided to start a
process of divesting its nitrogen business unit including
fertilizer, technical nitrogen and melamine products.
The company’s share in fertilizer production sites in
The Netherlands and Belgium (“Rosier”) is not
presently being considered within the potential sales
process. Borealis will continue to focus on its core
activities of providing innovative solutions in the fields
of polyolefins and base chemicals, thus extending
OMV’s value chain towards higher value chemical
products and the transformation towards a circular
economy.
On February 5, 2021 the Supervisory Board of Borealis
has appointed Thomas Gangl (49) to the position of
Chief Executive Officer of Borealis AG. He will take
over the role from Alfred Stern, effective April 1, 2021.
Thomas Gangl is currently member of the OMV
Executive Board and responsible for Refining &
Petrochemical Operations.

OMV ANNUAL REPORT 2020 / FINANCIAL STATEMENTS
193
38 Direct and indirect investments of OMV Aktiengesellschaft
Changes in consolidated group
Name of company Registered Office Type of Change1 Effective date
Upstream
OMV Maurice Energy GmbH Vienna Deconsolidation (I) October 31, 2020
OMV Oil and Gas Exploration GmbH Vienna Deconsolidation (I) October 31, 2020
PETROM EXPLORATION & PRODUCTION LIMITED Douglas Deconsolidation (I) October 31, 2020
Downstream
OMV Deutschland Marketing & Trading GmbH & Co. KG Burghausen First consolidation April 1, 2020
OMV Deutschland Operations GmbH & Co. KG Burghausen First consolidation April 1, 2020
OMV Gas Marketing & Trading d.o.o. Zagreb Deconsolidation (L) June 30, 2020
Susana Beteiligungsverwaltungs GmbH Vienna First consolidation (A) October 29, 2020
Borealis AG Vienna Increase in shares2 October 29, 2020
1 “First consolidation” refers to newly formed or existing subsidiaries, while “First consolidation (A)” indicates the acquisition of a company. Companies
marked with “Deconsolidation (I)” have been deconsolidated due to immateriality, while those marked with “Deconsolidation (L)” were deconsolidated
following a liquidation process. 2 Following the increase of shares in Borealis AG, via the acquisition of Susana Beteiligungsverwaltungs GmbH, multiple entities have been added to the
consolidated group of OMV Aktiengesellschaft either as fully or at-equity consolidated investments. All investments can be found in the section “List of
investments” in this Note.
For further information on acquisitions and disposals
refer to Note 3 – Changes in group structure.
Number of consolidated companies
2020 2019
Full
consolidation
Equity
consolidation
Full
consolidation
Equity
consolidation
January 1 111 19 99 17
Included for the first time 441 5 15 3
Change in consolidation type — (1)1 — —
Deconsolidated during the year (4) — (3) (1)
December 31 151 23 111 19
thereof domiciled and operating abroad 105 16 68 11
thereof domiciled in Austria and operating abroad 19 — 20 —
1 Represents the previously at-equity consolidated Borealis AG; since October 29, 2020 Borealis AG is fully consolidated, which led to multiple companies of
Borealis Group being shown in line “Included for the first time”. The section “List of investments” within this Note includes details on all changes.

OMV ANNUAL REPORT 2020 / FINANCIAL STATEMENTS
194
List of Investments
List of subsidiaries, equity-accounted investments and other investments of OMV Aktiengesellschaft with an interest of at least 20%
Parent
company
Type of
consoli-
dation1
Equity
interest
in % as of
December
31, 2020
Equity
interest
in % as of
December
31, 2019
Upstream
Energy Infrastructure Limited, Wellington NZEA C 100.00 100.00
Energy Petroleum Holdings Limited, Wellington (EPHNZ) OPLNZ C 100.00 100.00
Energy Petroleum Investments Limited, Wellington (EPILNZ) OSLNZ C 100.00 100.00
Energy Petroleum Taranaki Limited, Wellington (EPTLNZ) OPLNZ C 100.00 100.00
ENERGY PRODUCTION ENHANCEMENT SRL, Bucharest PETROM NC 99.99
ROMAN 0.01
JSC GAZPROM YRGM Development, St. Petersburg2 OMVEP C — —
KOM MUNAI LLP, Aktau PETROM C 100.00 100.00
Maui Development Limited, Wellington EPTLNZ 38.75 38.75
EPILNZ 20.00 20.00
EPHNZ NC 18.75 18.75
NZEA 16.25 16.25
TOPNZ 6.25 6.25
OJSC SEVERNEFTEGAZPROM, Krasnoselkup OMVEP AE 24.99 24.99
OMV Abu Dhabi E&P GmbH, Vienna OMVEP C 100.00 100.00
OMV Abu Dhabi Offshore GmbH, Vienna OMVEP C 100.00 100.00
OMV Abu Dhabi Production GmbH, Vienna OMVEP C 100.00 100.00
OMV AUSTRALIA PTY LTD, Perth (OAUST) OMV AG C 100.00 100.00
OMV Austria Exploration & Production GmbH, Vienna (OEPA) OMVEP C 100.00 100.00
OMV Barrow Pty Ltd, Perth OAUST NC 100.00 100.00
OMV Beagle Pty Ltd, Perth OAUST NC 100.00 100.00
OMV (Berenty) Exploration GmbH, Vienna OMVEP NC 100.00 100.00
OMV Bina Bawi GmbH, Vienna PETEX C 100.00 100.00
OMV Block 70 Upstream GmbH, Vienna OMVEP C 100.00 100.00
OMV East Abu Dhabi Exploration GmbH, Vienna OMVEP C 100.00 100.00
OMV (EGYPT) Exploration GmbH in Liqu., Vienna OMVEP NC 100.00
OMV Exploration & Production GmbH, Vienna (OMVEP) OMV AG C 100.00 100.00
OMV EXPLORATION & PRODUCTION LIMITED, Douglas OMVEP NC 100.00 100.00
OMV (FAROE ISLANDS) Exploration GmbH in Liqu., Vienna OMVEP NC 100.00
OMV GSB LIMITED, Wellington NZEA C 100.00 100.00
OMV (IRAN) onshore Exploration GmbH, Vienna OMVEP C 100.00 100.00
OMV Jardan Block 3 Upstream GmbH, Vienna OMVEP C 100.00 100.00
OMV (Mandabe) Exploration GmbH, Vienna OMVEP NC 100.00 100.00
OMV Maurice Energy GmbH, Vienna3 OMVEP NC 100.00 100.00
OMV Middle East & Africa GmbH, Vienna OMVEP C 100.00 100.00
OMV Myrre Block 86 Upstream GmbH, Vienna OMVEP C 100.00 100.00
OMV (NAMIBIA) Exploration GmbH, Vienna ONAFRU C 100.00 100.00
OMV New Zealand Limited, Wellington (NZEA) OMVEP C 100.00 100.00
OMV (NORGE) AS, Stavanger OMVEP C 100.00 100.00
OMV NZ Production Limited, Wellington (OPLNZ) NZEA C 100.00 100.00
OMV NZ Services Limited, Wellington (OSLNZ) NZEA C 100.00 100.00
OMV OF LIBYA LIMITED, Douglas OMVEP C 100.00 100.00
OMV Offshore (Namibia) GmbH, Vienna (ONAFRU) OMVEP C 100.00 100.00
OMV Offshore Bulgaria GmbH, Vienna PETROM C 100.00
OMVEP 100.00
OMV Offshore Morondava GmbH, Vienna OMVEP C 100.00 100.00

OMV ANNUAL REPORT 2020 / FINANCIAL STATEMENTS
195
List of subsidiaries, equity-accounted investments and other investments of OMV Aktiengesellschaft with an interest of at least 20%
Parent
company
Type of
consoli-
dation1
Equity
interest
in % as of
December
31, 2020
Equity
interest
in % as of
December
31, 2019
OMV Oil and Gas Exploration GmbH, Vienna3 OMVEP NC 100.00 100.00
OMV Oil Exploration GmbH, Vienna OMVEP C 100.00 100.00
OMV Oil Production GmbH, Vienna OMVEP C 100.00 100.00
OMV Orient Hydrocarbon GmbH, Vienna OMVEP NC 100.00 100.00
OMV Orient Upstream GmbH, Vienna OMVEP NC 100.00 100.00
OMV Oystercatcher Exploration GmbH in Liqu., Vienna OMVEP NC 100.00
OMV Petroleum Exploration GmbH, Vienna (PETEX) OMVEP C 100.00 100.00
OMV Petroleum Pty Ltd, Perth NZEA NC 100.00 100.00
OMV Proterra GmbH, Vienna OEPA NC 100.00 100.00
OMV Russia Upstream GmbH, Vienna OMVEP C 100.00 100.00
OMV Taranaki Limited, Wellington NZEA C 100.00 100.00
OMV (Tunesien) Production GmbH, Vienna OMVEP C 100.00 100.00
OMV (TUNESIEN) Sidi Mansour GmbH, Vienna OMVEP NC 100.00 100.00
OMV Upstream International GmbH, Vienna (OUPI) OMVEP C 100.00 100.00
OMV (West Africa) Exploration & Production GmbH in Liqu., Vienna
(OWEAFR)4 OMVEP C 100.00 100.00
OMV (YEMEN) Al Mabar Exploration GmbH, Vienna OMVEP C 100.00 100.00
OMV (Yemen Block S 2) Exploration GmbH, Vienna OMVEP C 100.00 100.00
OMV (YEMEN) South Sanau Exploration GmbH, Vienna OMVEP NC 100.00 100.00
Pearl Petroleum Company Limited, Road Town OUPI AE 10.00 10.00
PEI Venezuela Gesellschaft mit beschränkter Haftung, Burghausen OMVEP NC 100.00 100.00
Petroleum Infrastructure Limited, Wellington NZEA C 100.00 100.00
PETROM EXPLORATION & PRODUCTION LIMITED, Douglas3 PETROM NC 99.99 99.99
Preussag Energie International GmbH, Burghausen OMVEP C 100.00 100.00
SapuraOMV Block 30, S. de R.L. de C.V., Mexico City SEUPMY C 99.00 99.00
SEMXMY 1.00 1.00
SapuraOMV Upstream (Americas) Sdn. Bhd., Seri Kembangan
(SEAMMY) SEUPMY C 100.00 100.00
SapuraOMV Upstream (Australia) Sdn. Bhd., Seri Kembangan
(SEAUMY) SEOCMY C 100.00 100.00
SapuraOMV Upstream (Holding) Sdn. Bhd., Kuala Lumpur
(SEUPMY) SOUPMY C 100.00 100.00
SapuraOMV Upstream JV Sdn. Bhd., Seri Kembangan SENZMY NC 100.00 100.00
SapuraOMV Upstream (Malaysia) Inc., Nassau (SEMYBH) SESABH C 100.00 100.00
SapuraOMV Upstream (Mexico) Sdn. Bhd., Seri Kembangan
(SEMXMY) SEAMMY C 100.00 100.00
SapuraOMV Upstream (NZ) Sdn. Bhd., Seri Kembangan
(SENZMY) SEOCMY C 100.00 100.00
SapuraOMV Upstream (Oceania) Sdn. Bhd., Seri Kembangan
(SEOCMY) SEUPMY C 100.00 100.00
SapuraOMV Upstream (PM) Inc., Nassau SEMYBH C 100.00 100.00
SapuraOMV Upstream (Sarawak) Inc., Nassau SEMYBH C 100.00 100.00
SapuraOMV Upstream Sdn. Bhd., Seri Kembangan (SOUPMY) OMVEP C 50.00 50.00
SapuraOMV Upstream (Southeast Asia) Inc., Nassau (SESABH) SEUPMY C 100.00 100.00
SapuraOMV Upstream (Western Australia) Pty Ltd, Perth SEAUMY C 100.00 100.00
Taranaki Offshore Petroleum Company of New Zealand, Wellington
(TOPNZ)5 OPLNZ C 100.00 100.00
TASBULAT OIL CORPORATION LLP, Aktau PETROM C 100.00 100.00
Downstream
Abu Dhabi Oil Refining Company, Abu Dhabi OMVRM AE 15.00 15.00
Abu Dhabi Petroleum Investments LLC, Abu Dhabi (ADPINV) OMVRM AE2 25.00 25.00

OMV ANNUAL REPORT 2020 / FINANCIAL STATEMENTS
196
List of subsidiaries, equity-accounted investments and other investments of OMV Aktiengesellschaft with an interest of at least 20%
Parent
company
Type of
consoli-
dation1
Equity
interest
in % as of
December
31, 2020
Equity
interest
in % as of
December
31, 2019
Abu Dhabi Polymers Company Limited (Borouge), Abu Dhabi6 BORAAG AE 40.00
ADNOC Global Trading LTD, Abu Dhabi OMVRM AE 15.00 15.00
AGCS Gas Clearing and Settlement AG, Vienna OGG NAE 23.13 23.13
AGGM Austrian Gas Grid Management AG, Vienna OGG C 51.00 51.00
AGRIPRODUITS S.A.S., Courbevoie (BAGRFR)6 BCHIFR NC 100.00
Aircraft Refuelling Company GmbH, Vienna OMVRM NAE 33.33 33.33
Autobahn – Betriebe Gesellschaft m.b.H., Vienna OMVRM NAE 47.19 47.19
Avanti Deutschland GmbH, Berchtesgaden FETRAT C 100.00 100.00
Avanti GmbH, Anif (FETRAT) OMVRM C 100.00 100.00
AZOLOR S.A.S., Bras Sur Meuse6 BCHIFR NAE 34.00
Bayport Polymers LLC, Pasadena6, 7 BNOVUS AE2 50.00
Borealis AB, Stenungsund (BABSWE)6 BSVSWE C 100.00
Borealis AG, Vienna (BORAAG)3 BHOLAT 39.00
OMVRM C 32.67 32.67
OMV AG 3.33 3.33
Borealis Agrolinz Melamine Deutschland GmbH, Wittenberg6 BAGMAT C 100.00
Borealis Agrolinz Melamine GmbH, Linz (BAGMAT)6 BORAAG C 100.00
Borealis Antwerpen N.V., Zwijndrecht6 BPOBE C 90.00
BORAAG 10.00
Borealis Argentina SRL, Buenos Aires6 BORAAG NC 98.00
BSVSWE 2.00
Borealis Asia Ltd, Hong Kong6 BORAAG NC 100.00
Borealis BoNo Holdings LLC, Port Murray (BBNHUS)6, 7 BUS C 100.00
Borealis Brasil S.A., Itatiba6 BORAAG C 80.00
Borealis Chemicals ZA (PTY) LTD, Germiston6 BORAAG NC 100.00
Borealis Chile SpA, Santiago de Chile6 BORAAG NC 100.00
Borealis Chimie S.A.R.L., Casablanca6 BORAAG NC 100.00
Borealis Chimie S.A.S., Courbevoie (BCHIFR)6 BFR C 100.00
Borealis Colombia S.A.S., Bogota6 BORAAG NC 100.00
Borealis Compounds Inc., Port Murray (BCOMUS)6 BUS C 100.00
Borealis Denmark ApS, Copenhagen6 BORAAG NC 100.00
Borealis Digital Studios BV, Zaventem6 BORAAG NC 90.00
BPOBE 10.00
Borealis Financial Services N.V., Mechelen6 BORAAG C 100.00
BSVSWE 0.00
Borealis France S.A.S., Courbevoie (BFR)6 BORAAG C 100.00
Borealis Group Services AS, Bamble6 BABSWE C 100.00
Borealis Insurance A/S, Copenhagen6 BORAAG C 100.00
Borealis Italia S.p.A., Monza6 BORAAG C 100.00
Borealis Kallo N.V., Kallo6 BPOBE C 99.94
BORAAG 0.06
Borealis L.A.T Belgium B.V., Beringen6 BLATAT NC 100.00
Borealis L.A.T Bulgaria EOOD, Sofia6 BLATAT NC 100.00
Borealis L.A.T Czech Republic spol. s.r.o., Ceske Budejovice6 BLATAT NC 100.00
Borealis L.A.T d.o.o. Beograd, Belgrad6 BLATAT C 100.00
Borealis L.A.T France S.A.S., Courbevoie6 BFR C 100.00
Borealis L.A.T GmbH, Linz (BLATAT)6 BORAAG C 100.00
Borealis L.A.T Greece Single Member P.C., Athens6 BLATAT NC 100.00
Borealis L.A.T Hrvatska d.o.o., Klisa6 BLATAT NC 100.00
Borealis L.A.T Hungary Kft., Budapest6 BLATAT NC 100.00
Borealis L.A.T Italia s.r.l., Milan6 BORAAG NC 100.00

OMV ANNUAL REPORT 2020 / FINANCIAL STATEMENTS
197
List of subsidiaries, equity-accounted investments and other investments of OMV Aktiengesellschaft with an interest of at least 20%
Parent
company
Type of
consoli-
dation1
Equity
interest
in % as of
December
31, 2020
Equity
interest
in % as of
December
31, 2019
Borealis L.A.T Polska sp.z.o.o., Warsaw6 BLATAT NC 100.00
Borealis L.A.T Romania s.r.l., Bucharest6 BLATAT NC 100.00
Borealis L.A.T Slovakia s.r.o., Chotin6 BLATAT NC 100.00
Borealis México S.A. de C.V., Mexico City6 BORAAG NC 100.00
BCOMUS 0.00
Borealis Plasticos S.A. de C.V., Mexico City6 BORAAG NC 100.00
BABSWE 0.00
Borealis Plastik ve Kimyasal Maddeler Ticaret Limited Sirketi,
Istanbul6 BORAAG NC 100.00
Borealis Plastomers B.V., Geleen6 BORAAG C 100.00
Borealis Poliolefinas da América do Sul Ltda, Itatiba6 BORAAG NC 99.99
BSVSWE 0.01
Borealis Polska Sp. Z.o.o., Warsaw6 BORAAG NC 100.00
Borealis Polymere GmbH, Burghausen6 BORAAG C 100.00
Borealis Polymers N.V., Beringen (BPOBE)6 BORAAG C 100.00
BSVSWE 0.00
Borealis Polymers Oy, Porvoo6 BORAAG C 100.00
Borealis Polyolefine GmbH, Schwechat6 BORAAG C 100.00
BSVSWE 0.00
Borealis Produits et Engrais Chimiques du Rhin S.A.S.,
Ottmarsheim6 BFR C 100.00
Borealis Química España S.A., Barcelona6 BORAAG C 100.00
Borealis RUS LLC, Moscow6 BORAAG NC 100.00
Borealis s.r.o., Prague6 BORAAG NC 100.00
Borealis Services S.A.S., Courbevoie6 BFR NC 100.00
Borealis Sverige AB, Stenungsund (BSVSWE)6 BORAAG C 100.00
Borealis Technology Oy, Porvoo6 BORAAG C 100.00
Borealis UK Ltd, Manchester6 BORAAG C 100.00
Borealis US Holdings LLC, Port Murray6 BCOMUS C 100.00
Borealis USA Inc., Port Murray (BUS)6 BORAAG C 100.00
Borouge Pte. Ltd., Singapore6 BORAAG AE2 50.00
BSP Bratislava-Schwechat Pipeline GmbH, Vienna OMVRM NAE 26.00 26.00
BTF Industriepark Schwechat GmbH, Vienna3, 6 OMVRM NC 50.00 50.00
BORAAG 50.00
Central European Gas Hub AG, Vienna (HUB) OGI C 65.00 65.00
Chemiepark Linz Betriebsfeuerwehr GmbH, Linz6 BAGMAT NAE 47.50
Deutsche Transalpine Oelleitung GmbH, Munich OMVD AE 32.26 32.26
DUNATÀR Köolajtermék Tároló és Kereskedelmi Kft., Budapest OHUN C 48.28 48.28
PDYNHU 51.72 51.72
DYM Solution Co., Ltd, Cheonan6 BORAAG C 90.52
Ecoplast Kunststoffrecycling GmbH, Wildon6 BORAAG C 100.00
EEX CEGH Gas Exchange Services GmbH, Vienna5 HUB AE 49.00 49.00
E-Mobility Provider Austria GmbH, Vienna OMVRM AE2 40.00 40.00
Enerco Enerji Sanayi Ve Ticaret A.Ş., Istanbul OGI AE 40.00 40.00
EPS Ethylen-Pipeline-Süd Geschäftsführungs GmbH, Munich6 OMVD NAE 15.46 15.46
BORAAG 8.20
EPS Ethylen-Pipeline-Süd GmbH & Co KG, Munich6 OMVD AE 20.66 20.66
BORAAG 10.30
Erdöl-Lagergesellschaft m.b.H., Lannach OMVRM AE1 55.60 55.60
Etenförsörjning i Stenungsund AB, Stenungsund6 BABSWE C 80.00
FEBORAN EOOD, Sofia6 BORAAG C 100.00

OMV ANNUAL REPORT 2020 / FINANCIAL STATEMENTS
198
List of subsidiaries, equity-accounted investments and other investments of OMV Aktiengesellschaft with an interest of at least 20%
Parent
company
Type of
consoli-
dation1
Equity
interest
in % as of
December
31, 2020
Equity
interest
in % as of
December
31, 2019
FE-Trading trgovina d.o.o., Ljubljana6 SLOVJA C 100.00
FETRAT 100.00
Franciade Agrifluides S.A.S. (FASA), Blois8 BCHIFR NAE 40.00
BAGRFR 9.98
Freya Bunde-Etzel GmbH & Co. KG, Bonn OGSG AE 39.99 39.99
GAS CONNECT AUSTRIA GmbH, Vienna (OGG) OGI C 51.00 51.00
GENOL Gesellschaft m.b.H., Vienna OMVRM AE 29.00 29.00
Haramidere Depoculuk Anonim Şirketi, Istanbul OMVRM C 51.00 51.00
GASTR 49.00 49.00
KB Munkeröd 1:72, Stenungsund6 BABSWE NC 100.00
BSVSWE 0.00
Kilpilahti Power Plant LTD, Porvoo6 BORAAG NAE 20.00
KSW Beteiligungsgesellschaft m.b.H., Vienna (SWJS) OMVRM NC 100.00 100.00
KSW Elektro- und Industrieanlagenbau Gesellschaft m.b.H.,
Feldkirch SWJS NAE 25.10 25.10
mtm compact GmbH, Niedergebra6 BORAAG C 100.00
mtm plastics GmbH, Niedergebra6 BORAAG C 100.00
Neochim AD, Dimitrovgrad6 BFEBGR AE 20.30
Novealis Holdings LLC, Port Murray (BNOVUS)6 BBNHUS C 50.00
BSBHUS 50.00
OMV – International Services Ges.m.b.H., Vienna OMVRM C 100.00 100.00
OMV BULGARIA OOD, Sofia PETROM C 99.90 99.90
OMVRM 0.10 0.10
OMV Česká republika, s.r.o., Prague OMVRM C 100.00 100.00
OMV Deutschland GmbH, Burghausen (OMVD) OMVRM C 90.00 90.00
OMV AG 10.00 10.00
OMV Deutschland Marketing & Trading GmbH & Co. KG,
Burghausen8 OMVD C 99.99
OMVDS 0.01
OMV Deutschland Operations GmbH & Co. KG, Burghausen OMVD C 99.99
OMVDS 0.01
OMV Deutschland Services GmbH, Burghausen (OMVDS) OMVD C 100.00 100.00
OMV Downstream GmbH, Vienna (OMVRM)5 OMV AG C 100.00 100.00
OMV Enerji Ticaret Anonim Şirketi, Istanbul (GASTR) OMVRM C 100.00
OGI 100.00
OMV Gas, Marketing & Trading Belgium BVBA, Brussels ECOGAS C 100.00 99.90
ECONDE 0.01
OMV Gas Logistics Holding GmbH, Vienna (OGI)5 OMV AG C 100.00 100.00
OMV Gas Marketing & Trading d.o.o., Zagreb ECOGAS C 100.00
OMV Gas Marketing & Trading Deutschland GmbH, Regensburg
(ECONDE) ECOGAS C 100.00 100.00
OMV Gas Marketing & Trading GmbH, Vienna (ECOGAS) OMVRM C 100.00
OGI 100.00
OMV Gas Marketing & Trading Hungária Kft., Budapest ECOGAS C 100.00 100.00
OMV Gas Marketing & Trading Italia S.r.l., Milan ECOGAS C 100.00 100.00
OMV Gas Marketing Trading & Finance B.V., Amsterdam OFS C 100.00 100.00
OMV Gas Storage Germany GmbH, Cologne (OGSG) OGI C 100.00 100.00
OMV Gas Storage GmbH, Vienna OGI C 100.00 100.00
OMV Gaz Iletim A.S., Istanbul OMVRM C 100.00
OGI 100.00

OMV ANNUAL REPORT 2020 / FINANCIAL STATEMENTS
199
List of subsidiaries, equity-accounted investments and other investments of OMV Aktiengesellschaft with an interest of at least 20%
Parent
company
Type of
consoli-
dation1
Equity
interest
in % as of
December
31, 2020
Equity
interest
in % as of
December
31, 2019
OMV Hungária Ásványolaj Korlátolt Felelösségü Társaság,
Budapest (OHUN) OMVRM C 100.00 100.00
OMV Kraftwerk Haiming GmbH in Liqu., Haiming5 OGI C 100.00 100.00
OMV PETROM Aviation SRL, Otopeni PETROM C 99.99 99.99
ROMAN 0.01 0.01
OMV PETROM GAS SRL, Bucharest PETROM C 99.99 99.99
OMV PETROM MARKETING SRL, Bucharest (ROMAN) PETROM C 100.00 100.00
OMV Refining & Marketing Middle East & Asia GmbH, Vienna OMVRM C 100.00 100.00
OMV SLOVENIJA trgovina z nafto in naftnimi derivati, d.o.o., Koper
(SLOVJA) OMVRM C 92.25 92.25
OMV Slovensko s.r.o., Bratislava OMVRM C 99.96 99.96
OMV SRBIJA d.o.o., Belgrade PETROM C 99.96 99.96
OMVRM 0.04 0.04
OMV Supply & Trading AG, Baar OMVRM C 100.00 100.00
OMV Supply & Trading Italia S.r.l., Trieste OMVRM C 100.00 100.00
OMV Supply & Trading Limited, London (OTRAD) OMVRM C 100.00 100.00
OMV Supply & Trading Singapore PTE LTD., Singapore OTRAD NC 100.00 100.00
OMV Switzerland Holding AG, Zug OGI C 100.00 100.00
Pak-Arab Refinery Limited, Karachi ADPINV AE2 40.00 40.00
PETRODYNE-CSEPEL Zrt., Budapest (PDYNHU) OHUN C 100.00 100.00
Petrom-Moldova S.R.L., Chisinau PETROM C 100.00 100.00
PetroPort Holding AB, Stenungsund6 BABSWE AE2 50.00
Rosier France S.A.S., Beaumetz-Les-Loges6 BROSBE C 100.00
Rosier Nederland B.V., Sas Van Gent6 BROSBE C 100.00
Rosier S.A., Moustier (BROSBE)6 BORAAG C 77.47
Routex B.V., Amsterdam OMVRM NAE 20.00 20.00
Salzburg Fuelling GmbH, Salzburg OMVRM NAE 33.33 33.33
Silleno Limited Liability Partnership , Nur-Sultan6 BORAAG NAE 50.10
SMATRICS GmbH & Co KG, Vienna OMVRM AE2 40.00 40.00
Società Italiana per l’Oleodotto Transalpino S.p.A., Trieste OMVRM AE 32.26 32.26
Société d'Intérêt Collectif Agricole Laignes Agrifluides (SICA
Laignes Agrifluides), Monéteau6 BCHIFR NAE 39.97
BAGRFR 9.93
Société d'Intérêt Collectif Agricole par Actions Semplifiée de Gouaix
(SICA de Gouaix), Paris6 BCHIFR NAE 25.00
BLATAT 0.00
South Stream Austria GmbH, Vienna OGI NAE 50.00 50.00
Star Bridge Holdings LLC, Port Murray (BSBHUS)6, 7 BUS C 100.00
STOCKAM G.I.E., Grand-Quevilly BAGRFR NC 99.00
BCHIFR 1.00
SuperShop Marketing GmbH, Budapest OHUN NAE 50.00 50.00
Susana Beteiligungsverwaltungs GmbH, Vienna (BHOLAT) OMVRM C 100.00
TGN Tankdienst-Gesellschaft Nürnberg GbR, Nuremberg OMVD NAE 33.33 33.33
Transalpine Ölleitung in Österreich Gesellschaft m.b.H., Matrei in
Osttirol OMVRM AE 32.26 32.26
Trans Austria Gasleitung GmbH, Vienna9 OGG AE2 15.53 15.53
Corporate and Other
ASOCIATIA ROMANA PENTRU RELATIA CU INVESTITORII,
Bucharest PETROM NAE 20.00 20.00
Diramic Insurance Limited, Gibraltar OMV AG C 100.00 100.00

OMV ANNUAL REPORT 2020 / FINANCIAL STATEMENTS
200
List of subsidiaries, equity-accounted investments and other investments of OMV Aktiengesellschaft with an interest of at least 20%
Parent
company
Type of
consoli-
dation1
Equity
interest
in % as of
December
31, 2020
Equity
interest
in % as of
December
31, 2019
OMV Clearing und Treasury GmbH, Vienna SNO C 100.00 100.00
OMV Finance Services GmbH, Vienna (OFS) SNO C 100.00 100.00
OMV Finance Services NOK GmbH, Vienna SNO C 100.00 100.00
OMV Finance Solutions USD GmbH, Vienna SNO C 100.00 100.00
OMV Insurance Broker GmbH, Vienna OMV AG NC 100.00 100.00
OMV International Oil & Gas GmbH, Baar OMV AG C 100.00 100.00
OMV Petrom Global Solutions SRL, Bucharest SNO C 75.00 75.00
PETROM 25.00 25.00
OMV Solutions GmbH, Vienna (SNO) OMV AG C 100.00 100.00
PETROMED SOLUTIONS SRL, Bucharest PETROM C 99.99 99.99
Petrom
OMV PETROM SA, Bucharest (PETROM)10 OMV AG C 51.01 51.01
1 Type of consolidation:
C Consolidated subsidiary
AE Associated companies accounted at-equity
AE1 Despite majority interest not fully consolidated, but accounted for at-equity due to absence of control
AE2 Joint venture accounted at-equity
NAE Other not consolidated investment; associated companies and joint ventures of relatively little importance to the assets and earnings of the consolidated
financial statements
NC Not-consolidated subsidiary; shell or distribution companies of relative insignificance individually and collectively to the consolidated financial statements 2 Economic share 99.99% 3 Type of consolidation was changed compared to 2019. 4 In liquidation 5 Company name changed compared to 2019. 6 Part of the acquisition of additional shares in Borealis AG 7 Incorporated in Willmington 8 In the 2020 financial year, OMV Deutschland Marketing & Trading GmbH & Co. KG made use of the exemption provision pursuant to Section 264b HGB in
conjunction with Section 325 HGB.The company's exemption is mentioned in its notes and published in the Federal Gazette with reference to this provision and
an indication of the parent company. 9 Economic share 10.78% 10 OMV Petrom SA is assigned to the relevant segments in the segment reporting
All the subsidiaries, joint ventures and associated
companies which are not consolidated either have low
business volumes or are distribution companies; the
total sales, net income/lossesand equity of such
companies represent less than1% of the Group totals.
Material joint operations (IFRS 11)
Name Nature of activities
Principal
place of
business
%
ownership
2020
%
ownership
2019
Nafoora – Augila1 Onshore development of hydrocarbons Libya 100 100
Concession 1031
Onshore development and production of
hydrocarbons Libya 100 100
Pohokura Offshore production of hydrocarbons
New
Zealand 74 74
Neptun Deep Offshore exploration for hydrocarbons Romania 50 50
Nawara Onshore production of hydrocarbons Tunisia 50 50
1 The percentage disclosed represents the Second Party Share. The state owned Libyan national oil corporation NOC is entitled to 88-90% of the production
(“primary split”).

OMV ANNUAL REPORT 2020 / FINANCIAL STATEMENTS
201
Other significant arrangements
Name Nature of activities
Principal place
of business
%
ownership
2020
%
ownership
2019
NC 1151
Onshore development and production of
hydrocarbons Libya 30 30
NC 1861
Onshore development and production of
hydrocarbons Libya 24 24
SK 408 Offshore development of hydrocarbons Malaysia 40 40
Aasta Hansteen Offshore production of hydrocarbons Norway 15 15
Edvard Grieg Offshore production of hydrocarbons Norway 20 20
Gullfaks Offshore production of hydrocarbons Norway 19 19
Wisting Offshore exploration for hydrocarbons Norway 25 25
Sarb & Umm Lulu
Offshore development and production of
hydrocarbons Abu Dhabi 20 20
Ghasha
Offshore exploration for and development of
hydrocarbons Abu Dhabi 5 5
1 The percentage disclosed represents the Second Party Share. The state owned Libyan national oil corporation is entitled to 88-90% of the production (“primary
split”).

OMV ANNUAL REPORT 2020 / FINANCIAL STATEMENTS
202
The following tables provide supplementary information
in respect of the Group’s oil and gas activities. In the
absence of detailed disclosure rules in this area under
IFRS, the Group has elected to voluntarily disclose the
data that would have been required under the ASC 932
as if it was reporting under US GAAP.
To the extent that information refers to financial
statements data, the information is based on the
primary financial statements (IFRS financial
statements).
The regional structure is presented below1:
Romania and Black Sea Bulgaria, Kazakhstan and Romania
Austria Austria
Russia Russia
North Sea Norway
Middle East and Africa Iran (evaluation on hold), Kurdistan Region of Iraq, Libya, Tunisia, United
Arab Emirates, Yemen, Madagascar (until 2019), Pakistan (until 2018)
New Zealand and Australia Australia and New Zealand
Malaysia SapuraOMV2
1 Regions listed in the Director’s Report ‘Central and Eastern Europe’ (includes Romania and Black Sea as well as Austria) and ‘Asia-Pacific’ (includes New
Zealand and Australia as well as Malaysia) are split further in this disclosure to provide the information in a more detailed manner. 2 Includes not only Malaysia but also SapuraOMV subsidiaries in New Zealand, Australia and Mexico.
Acquisitions
There were no major acquisitions during 2020.
On January 31, 2019, OMV acquired a 50% stake of
the issued share capital in SapuraOMV Upstream Sdn.
Bhd. As OMV has the decision power over relevant
activities, the new entity and its subsidiaries are fully
consolidated. Besides future growth in daily production
in Malaysian offshore gas fields, this transaction gives
OMV access to exploration blocks in New Zealand,
Australia and Mexico. SapuraOMV Upstream Sdn. Bdn.
and its subsidiaries are depicted in the Malaysia region
in the upcoming tables.
On April 29, 2018 OMV acquired 20% in the offshore
concession consisting of two main fields, SARB and
Umm Lulu, in Abu Dhabi, as well as the associated
infrastructure. Futher, a concession agreement was
signed on December 19, 2018, awarding OMV with 5%
interests in the Ghasha concession offshore comprising
the Ghasha mega project.
OMV also completed the acquisition of Shell’s
Upstream business in New Zealand on December 28,
2018.
Disposals
There were no major disposals during 2020 and 2019.
On June 28, 2018 the sale of the Upstream companies
active in Pakistan was closed. Furthermore, the sale of
OMV Tunisia Upstream GmbH was finalized on
December 21, 2018, comprising part of OMV’s
Upstream business in Tunisia.
Non-controlling interest
As OMV holds 51% of OMV Petrom, it is fully
consolidated; figures therefore include 100% of OMV
Petrom assets and results.
OMV has a share of 50% in SapuraOMV and it is fully
consolidated; figures therefore include 100% of
SapuraOMV assets and results.
Equity-accounted investments
OMV holds a 10% interest in Pearl Petroleum
Company Limited (Middle East and Africa region).
OMV has a 24.99% interest in OJSC
Severneftegazprom (Russia region).
The disclosures of equity-accounted investments in
below tables represent the interest of OMV in the
companies.
The subsequent tables may contain rounding
differences.
Oil and Gas Reserve Estimation and Disclosures
(unaudited)

OMV ANNUAL REPORT 2020 / FINANCIAL STATEMENTS
203
Tables
a) Capitalized costs
Capitalized costs represent the sum of capitalized oil
and gas assets, including other intangible assets and
property, plant and equipment such as land, plant and
machinery, concessions, licenses and rights
Capitalized costs – subsidiaries
In EUR mn
2020 2019 2018
Unproved oil and gas properties 2,461 3,211 2,587
Proved oil and gas properties 26,988 26,830 24,510
Total 29,449 30,041 27,097
Accumulated depreciation (17,117) (15,484) (13,961)
Net capitalized costs 12,333 14,557 13,136
Capitalized costs – equity-accounted investments
In EUR mn
2020 2019 2018
Unproved oil and gas properties 154 173 249
Proved oil and gas properties 346 315 202
Total 501 489 451
Accumulated depreciation (76) (67) (35)
Net capitalized costs 424 421 417

OMV ANNUAL REPORT 2020 / FINANCIAL STATEMENTS
204
b) Costs incurred
Costs incurred include all costs, capitalized or
expensed, during the year in the Group’s oil and gas
property acquisition, exploration and development
activities.
Costs incurred
In EUR mn
Romania
and Black
Sea Austria Russia North Sea
Middle
East and
Africa
New
Zealand
and
Australia Malaysia Total
2020
Subsidiaries
Acquisition of
proved properties — — — — — — — —
Acquisition of
unproved
properties — — — — — — — —
Exploration costs 51 25 — 55 17 46 32 227
Development costs 330 20 — 187 163 60 19 778
Costs incurred 380 45 — 242 180 106 51 1,005
Equity-accounted
investments — — 55 — 7 — — 62
2019
Subsidiaries
Acquisition of
proved properties — — — 1 — 1 604 605
Acquisition of
unproved
properties — — — — 12 — 683 695
Exploration costs 93 53 — 121 32 40 20 360
Development costs 411 58 — 174 222 65 90 1,021
Costs incurred 504 112 — 296 266 105 1,398 2,681
Equity-accounted
investments — — 30 — 15 — — 45
2018
Subsidiaries
Acquisition of
proved properties — — — — 1,014 788 — 1,801
Acquisition of
unproved
properties — — — — 321 386 — 707
Exploration costs 118 61 — 99 12 9 — 300
Development costs 412 59 — 210 196 10 — 887
Costs incurred 531 120 — 309 1,542 1,193 — 3,695
Equity-accounted
investments — — 9 — 12 — — 21
c) Results of operations of oil and gas producing
activities
The following tables represent only those revenues and
expenses which occur directly in connection with
OMV´s oil and gas producing operations. The results of
oil and gas activities should not be equated to
Upstream net income since interest costs, general
corporate overhead costs and other costs are not
allocated. Income taxes are hypothetically calculated,
based on the statutory tax rates and the effect of tax
credits on investments and loss carryforwards.

OMV ANNUAL REPORT 2020 / FINANCIAL STATEMENTS
205
Results of operations of oil and gas producing activities
In EUR mn
Romania
and Black
Sea Austria Russia North Sea
Middle
East and
Africa
New
Zealand
and
Australia Malaysia Total
2020
Subsidiaries
Sales to unaffiliated parties 1 57 (25) 389 569 102 228 209 1,529
Intercompany sales 1,203 186 — 269 365 102 — 2,125
1,260 161 389 838 467 330 209 3,654
Production costs (472) (77) — (144) (125) (77) (24) (920)
Royalties (180) (40) — — (67) (34) (4) (325)
Exploration expenses2 (179) (96) — (56) (298) (201) (67) (896)
Depreciation, amortization,
impairments and write-ups (538) (223) (74) (309) (226) (384) (126) (1,880)
Other costs3 (63) (16) (343) (135) (14) (23) (26) (619)
(1,432) (452) (417) (644) (730) (719) (246) (4,641)
Results before income taxes (172) (291) (28) 194 (263) (389) (38) (987)
Income taxes 4 25 107 5 (122) 118 107 (16) 224
Results from oil and gas
production (148) (184) (23) 72 (145) (282) (53) (763)
Results of equity-accounted
investments — — 15 — 16 — — 31
2019
Subsidiaries
Sales to unaffiliated parties 1 94 19 550 891 527 335 171 2,586
Intercompany sales 1,909 324 — 379 822 191 — 3,624
2,002 343 550 1,270 1,348 526 171 6,210
Production costs (500) (82) — (158) (124) (98) (30) (991)
Royalties (250) (62) — — (103) (65) (16) (496)
Exploration expenses2 (53) (45) — (73) (16) (24) (18) (229)
Depreciation, amortization,
impairments and write-ups (553) (119) (91) (414) (233) (199) (73) (1,681)
Other costs3 (93) (29) (429) (132) (45) (20) (13) (761)
(1,449) (336) (520) (777) (520) (407) (149) (4,159)
Results before income taxes 553 7 30 493 828 119 21 2,051
Income taxes 4 (88) 1 (5) (402) (675) (25) (28) (1,222)
Results from oil and gas
production 465 8 24 91 153 94 (7) 829
Results of equity-accounted
investments — — 34 — 11 — — 45

OMV ANNUAL REPORT 2020 / FINANCIAL STATEMENTS
206
Results of operations of oil and gas producing activities
In EUR mn
2018
Subsidiaries
Sales to unaffiliated parties 1 105 (194) 605 1,051 520 84 — 2,172
Intercompany sales 1,981 418 — 394 427 132 — 3,351
2,086 224 605 1,445 947 216 — 5,523
Production costs (509) (86) — (156) (72) (50) — (872)
Royalties (267) (79) — — (21) (25) — (392)
Exploration expenses2 (58) (33) — (50) (26) (8) — (175)
Depreciation, amortization,
impairments and write-ups (420) (114) (90) (409) (129) (64) — (1,226)
Other costs3 (51) (21) (406) (102) (7) (10) — (598)
(1,304) (333) (496) (717) (255) (157) — (3,263)
Results before income taxes 781 (109) 109 729 691 59 — 2,261
Income taxes 4 (138) 26 (21) (549) (474) (21) — (1,178)
Results from oil and gas
production 643 (83) 89 179 217 37 — 1,083
Results of equity-accounted
investments — — 14 — 26 — — 40
1 Includes hedging effects; Austria Region includes hedging effects of centrally managed derivatives (2020: EUR (37) mn, 2019: EUR 2 mn, 2018: EUR (219) mn). 2 Including impairment losses related to exploration&appraisal 3 Includes inventory changes 4 Income taxes in North Sea and Middle East and Africa include corporation tax and special petroleum tax.
d) Oil and gas reserve quantities
Proved reserves are those quantities of oil and gas,
which, by analysis of geoscience and engineering data,
can be estimated with reasonable certainty to be
economically producible from a given date forward,
from known reservoirs, and under existing economic
conditions, operating methods, and government
regulation before the time at which contracts providing
the right to operate expire, unless evidence indicates
that renewal is reasonably certain. Proved oil and gas
reserves were estimated based on a 12-month average
price, unless prices are defined by contractual
arrangements.
Proved developed reserves are those proved reserves
that can be expected to be recovered through existing
wells with existing equipment and operating methods,
or in which the costs of the required equipment are
relatively minor compared with the cost of a new well
and through installed extraction equipment and
infrastructure operational at the time of the reserves
estimate. It should be reasonably certain that the
required future expenditure will be made to safeguard
existing equipment within the current budget.
Proved undeveloped reserves are those proved
reserves that are expected to be recovered from new
wells on undrilled acreage, or from existing wells where
a relatively major expenditure is required for
recompletion or substantial new investment is required
in order to safeguard or replace ageing facilities.

OMV ANNUAL REPORT 2020 / FINANCIAL STATEMENTS
207
Crude oil and NGL
In mn bbl
Romania
and Black
Sea Austria Russia North Sea
Middle
East and
Africa
New
Zealand
and
Australia Malaysia Total
Proved developed and undeveloped reserves – Subsidiaries
January 1, 2018 341.4 38.0 — 47.6 126.7 5.0 — 558.6
Revisions of previous estimates 9.5 3.3 — 15.8 (1.8) 1.0 — 27.7
Purchases — — — — 100.3 6.3 — 106.6
Disposal — — — — (2.4) — — (2.4)
Extensions and discoveries 0.3 — — 2.2 0.8 — — 3.3
Production (26.8) (4.3) — (17.1) (15.3) (2.1) — (65.6)
December 31, 2018 324.4 37.0 — 48.4 208.3 10.2 — 628.3
Revisions of previous estimates 20.2 2.1 — 13.3 26.7 6.0 — 68.4
Purchases — — — — — — 9.5 9.5
Disposal (3.4) — — — — — — (3.4)
Extensions and discoveries 0.1 — — 6.0 — — — 6.1
Production (26.1) (4.0) — (16.6) (21.8) (4.6) (2.1) (75.2)
December 31, 2019 315.2 35.2 — 51.1 213.2 11.6 7.4 633.7
Revisions of
previous estimates 8.6 2.7 — 8.5 69.7 0.2 1.0 90.7
Purchases — — — — — — — —
Disposal — — — — — — — —
Extensions and
discoveries 0.5 — — — — — — 0.5
Production (25.5) (3.8) — (15.1) (12.8) (3.8) (2.7) (63.7)
December 31, 2020 298.8 34.0 — 44.5 270.2 8.0 5.7 661.2
Proved developed and undeveloped reserves – Equity-accounted investments
December 31, 2018 — — — — 13.3 — — 13.3
December 31, 2019 — — — — 15.3 — — 15.3
December 31, 2020 — — — — 18.4 — — 18.4
Proved developed reserves – Subsidiaries
December 31, 2018 295.9 35.5 — 42.6 162.1 9.1 — 545.2
December 31, 2019 287.2 35.2 — 37.2 179.7 7.8 5.7 552.7
December 31, 2020 273.1 33.9 — 32.7 172.7 5.6 5.7 523.8
Proved developed reserves – Equity-accounted investments
December 31, 2018 — — — — 13.3 — — 13.3
December 31, 2019 — — — — 14.9 — — 14.9
December 31, 2020 — — — — 15.7 — — 15.7

OMV ANNUAL REPORT 2020 / FINANCIAL STATEMENTS
208
Gas
In mn bcf
Romania
and Black
Sea Austria Russia North Sea
Middle
East and
Africa
New
Zealand
and
Australia Malaysia Total
Proved developed and undeveloped reserves - Subsidiaries
January 1, 2018 1,214.1 219.1 — 375.0 74.3 58.4 — 1,941.0
Revisions of previous estimates 77.4 8.6 — 110.3 17.3 27.1 — 240.7
Purchases — — — — — 166.1 — 166.1
Disposals — — — — (26.6) — — (26.6)
Extensions and discoveries 3.5 — — 4.9 0.3 — — 8.8
Production (170.4) (30.9) — (60.9) (9.9) (16.0) — (288.1)
December 31, 2018 ¹ 1,124.7 196.8 — 429.4 55.5 235.6 — 2,041.9
Revisions of previous estimates 58.2 10.1 — 76.0 9.6 145.4 — 299.3
Purchases — — — — — — 351.2 351.2
Disposals (6.3) — — — — — — (6.3)
Extensions and discoveries 2.2 — — 7.4 — — — 9.5
Production (158.0) (29.2) — (90.0) (3.2) (65.2) (15.5) (360.9)
December 31, 2019 ¹ 1,020.7 177.8 — 422.8 61.9 315.8 335.7 2,334.7
Revisions of previous estimates 61.3 2.5 — 58.3 27.5 (62.8) 93.9 180.7
Purchases — — — — — — — —
Disposals — — — — — — — —
Extensions and discoveries 7.2 — — — — — — 7.2
Production (148.6) (24.9) — (97.5) (7.0) (57.7) (53.3) (389.0)
December 31, 2020 ¹ 940.7 155.3 — 383.6 82.4 195.3 376.3 2,133.6
Proved developed and undeveloped reserves – Equity-accounted investments
December 31, 2018 — — 1,392.0 — 212.6 — — 1,604.7
December 31, 2019 — — 1,376.8 — 277.3 — — 1,654.1
December 31, 2020 — — 1,321.0 — 383.8 — — 1,704.8
Proved developed reserves – Subsidiaries
December 31, 2018 1,026.6 120.3 — 410.6 7.3 202.3 — 1,767.1
December 31, 2019 923.0 110.2 — 407.8 57.4 203.2 124.0 1,825.5
December 31, 2020 851.9 76.1 — 335.7 55.2 143.5 376.3 1,838.7
Proved developed reserves – Equity-accounted investments
December 31, 2018 — — 997.3 — 212.6 — — 1,209.9
December 31, 2019 — — 880.2 — 262.9 — — 1,143.1
December 31, 2020 — — 1,003.1 — 293.5 — — 1,296.6
1 2020: Including approximately 67.6 bcf of cushion gas held in storage reservoirs
2019: Including approximately 67.6 bcf of cushion gas held in storage reservoirs
2018: Including approximately 68.4 bcf of cushion gas held in storage reservoirs
e) Standardized measure of discounted future net
cash flows
The future net cash flow information is based on the
assumption that the prevailing economic and operating
conditions will persist throughout the time during which
proved reserves will be produced. Neither the effects of
future pricing changes nor expected changes in
technology and operating practices are considered.
Future cash inflows represent the revenues received
from production volumes, including cushion gas held in
storage reservoirs, assuming that the future production
is sold at prices used in estimating year-end quantities
of proved reserves (12 months average price). Future
production costs include the estimated expenditures for
production of the proved reserves plus any production
taxes without consideration of future inflation. Future
decommissioning costs comprise the net costs

OMV ANNUAL REPORT 2020 / FINANCIAL STATEMENTS
209
associated with decommissioning wells and facilities.
Future development costs include the estimated costs
of development drilling and installation of production
facilities. For all three categories year-end costs without
consideration of inflation are assumed. Future income
tax payments are calculated on the basis of the income
tax rate applicable in each of the countries in which the
Group operates. The present cash value results from
the discounting of the future net cash flow at a discount
rate of 10% per year. The standardized measure does
not purport to be an estimate of the fair value of the
Group’s proven reserves. An estimate of fair value
would also take into account, amongst many other
factors, the expected recovery of reserves in excess of
proved reserves, anticipated changes in future prices
and costs as well as a discount factor representative of
the risks inherent in the production of oil and gas.
Standardized measure of discounted future net cash flows
In EUR mn
Subsidiaries and equity-accounted investments
Romania
and Black
Sea Austria Russia North Sea
Middle
East and
Africa
New
Zealand
and
Australia Malaysia Total
2020
Subsidiaries
Future cash inflows 12,167 1,513 2,497 2,628 9,914 928 959 30,607
Future production and
decommissioning costs (7,748) (1,159) (2,276) (1,857) (3,907) (1,257) (450) (18,654)
Future development costs (1,632) (297) — (373) (698) (226) (24) (3,249)
Future net cash flows, before
income taxes 2,787 58 220 399 5,308 (554) 486 8,704
Future income taxes (69) — (60) (1) (2,954) 199 (104) (2,990)
Future net cash flows, before
discount 2,718 58 160 397 2,354 (355) 382 5,714
10% annual discount for
estimated timing of cash flows (1,038) (5) 1 (40) (696) 153 (103) (1,727)
Standardized measure of
discounted future
net cash flows 1,680 53 161 357 1,659 (202) 279 3,987
Equity-accounted investments — — 100 — 233 — — 333
2019
Subsidiaries
Future cash inflows 19,932 2,554 3,402 4,432 12,597 1,972 1,246 46,135
Future production and
decommissioning costs (9,156) (1,704) (2,779) (2,196) (3,398) (1,785) (461) (21,480)
Future development costs (2,081) (370) — (527) (563) (325) (36) (3,901)
Future net cash flows, before
income taxes 8,696 479 622 1,709 8,637 (138) 749 20,754
Future income taxes (819) (21) (125) (959) (5,188) 101 (178) (7,191)
Future net cash flows, before
discount 7,877 458 497 750 3,448 (37) 570 13,563
10% annual discount for
estimated timing of cash flows (3,918) (47) (117) (286) (1,025) 184 (126) (5,334)
Standardized measure of
discounted future
net cash flows 3,960 411 381 464 2,424 147 444 8,230
Equity-accounted investments — — 101 — 136 — — 238

OMV ANNUAL REPORT 2020 / FINANCIAL STATEMENTS
210
Standardized measure of discounted future net cash flows
In EUR mn
Subsidiaries and equity-accounted investments
Romania
and Black
Sea Austria Russia North Sea
Middle
East and
Africa
New
Zealand
and
Australia Malaysia Total
2018
Subsidiaries
Future cash inflows 20,818 3,436 3,673 5,477 12,932 1,843 — 48,179
Future production and
decommissioning costs (9,738) (1,933) (2,902) (1,982) (3,154) (1,734) — (21,443)
Future development costs (1,921) (401) — (166) (613) (69) — (3,171)
Future net cash flows, before
income taxes 9,158 1,102 771 3,329 9,164 40 — 23,564
Future income taxes (846) (92) (155) (2,117) (5,422) 61 — (8,571)
Future net cash flows, before
discount 8,312 1,010 616 1,212 3,742 101 — 14,993
10% annual discount for
estimated timing of cash flows (4,036) (413) (140) (120) (1,145) 166 — (5,689)
Standardized measure of
discounted future
net cash flows 4,275 597 476 1,092 2,597 267 — 9,304
Equity-accounted investments — — 166 — 152 — — 318
f) Changes in the standardized measure of
discounted future net cash flows
Changes in the standardized measure of discounted future net cash flows
In EUR mn
2020 2019 2018
Subsidiaries
Beginning of year 8,230 9,304 6,300
Oil and gas sales produced, net of production costs (3,397) (3,942) (2,323)
Net change in prices and production costs (7,040) (1,810) 4,183
Net change due to purchases and sales of minerals in place — 531 2,706
Net change due to extensions and discoveries 22 72 133
Development and decommissioning costs incurred during the period 1,031 674 669
Changes in estimated future development and decommissioning costs 259 (398) (420)
Revisions of previous reserve estimates 757 1,216 983
Accretion of discount 732 828 550
Net change in income taxes (incl. tax effects from purchases and sales) 3,625 1,646 (3,310)
Other1 (232) 108 (168)
End of year 3,987 8,230 9,304
Equity-accounted investments 333 238 318
1 Contains movements in foreign exchange rates vs. the EUR

OMV ANNUAL REPORT 2020 / FINANCIAL STATEMENTS
211
Vienna, March 10, 2021
The Executive Board
Rainer Seele m.p.
Chairman of the Executive Board
and Chief Executive Officer
Reinhard Florey m.p.
Chief Financial Officer
Elena Skvortsova m.p.
Chief Commercial Officer
Johann Pleininger m.p.
Deputy Chairman of the Executive Board
and Chief Upstream Operations Officer
Thomas Gangl m.p. Chief Downstream Operations Officer

OMV ANNUAL REPORT 2020 / FINANCIAL STATEMENTS
212

FURTHER INFORMATION 213 — 224
214 — Consolidated Report on the Payments Made to Governments 221 — Abbreviations Definitions
224 — Contacts and Imprint

OMV ANNUAL REPORT 2020 / FURTHER INFORMATION
214
Section 267c of the Austrian Commercial Code (UGB) requires that large undertakings and public interest
entities that are active in the extractive industry or logging of primary forests prepare the following
consolidated report on payments to governments. This section implements Chapter 10 of EU Accounting
Directive (2013/34/EU). The “Basis of preparation” paragraph provides information to the reader about the
contents of the report. This also includes information on the type of payment for which disclosure is
required and how OMV has implemented the regulations in the preparation of the report.
Basis of preparation
Reporting entities
Under the requirements of the regulation, OMV
Aktiengesellschaft is required to prepare a consolidated
report covering payments made to governments for
each financial year in relation to extractive activities by
itself and any subsidiary undertakings included in the
consolidated Group financial statements.
Activities within the scope of the report
Payments made by the OMV Group (hereafter OMV) to
governments that arose from exploration, prospection,
discovery, development and extraction of minerals, oils
and natural gas deposits or other materials within
extractive activities are presented in this report.
Government
A “government” is defined as any national, regional or
local authority of a country and includes a department
agency or entity undertaking that is controlled by the
government authority and includes national oil
companies.
In cases where a state-owned entity engages in
activities outside of its designated home jurisdiction,
then it is not deemed to be a reportable governmental
body for these purposes and thus payments made to
such an entity in these circumstances are not
reportable.
Project definition
The regulation also requires payments to be reported
on a “project” basis as well as on a government and
governmental body basis. A project is defined as the
operational activities that are governed by a single
contract, license, lease, concession or similar legal
agreement and form the basis for payment liabilities to
the government. Where these agreements as per the
aforementioned definition are substantially
interconnected, these agreements are treated for the
purpose of these regulations as a single project.
“Substantially interconnected” is defined as a set of
operationally and geographically integrated contracts,
licenses, leases or concessions or related agreements
with substantially similar terms that are signed with a
government, giving rise to payment liabilities. Such
agreements can be governed by a single contract, joint
venture agreement, production sharing agreement or
other overarching legal agreement.
There may be instances – for example, corporate
income taxes, where it is not possible to attribute the
payment to a single project and therefore these
payments are shown at the country level.
Cash and payments in kind
In accordance with the regulation, payments have to be
reported on a cash basis. This means that they are
reported in the period in which they are paid and not in
the period in which they are accounted for on an
accruals basis.
Refunds are also reported in the period in which they
are received and will either be offset against payments
made in the period or be shown as negative amounts in
the report.
Payments in kind made to a government are converted
to an equivalent cash value based on the most
appropriate and relevant valuation method for each
payment type. This can be at cost or market value and
an explanation is provided in the report to help explain
the valuation method. Where applicable, the related
volumes are also included in the report.
Payment reporting methodology
The regulations require that payments are to be
reported where they are made to governments by
OMV. It is required that the report reflect the substance
of each transaction and activity. Based on these
requirements, OMV has considered its reporting
obligation as:
Consolidated Report on the Payments Made to
Governments Section 267c of the Austrian Commercial Code

OMV ANNUAL REPORT 2020 / FURTHER INFORMATION
215
▸ Where OMV makes a payment directly to the
government, these payments will be reported in full,
irrespective of whether this is made in the sole
capacity of OMV or in OMV’s capacity as the
operator of a joint operation.
▸ In cases where OMV is a member of a joint
operation for which the operator is a state-owned
entity (i.e. a government), payments made to that
state-owned entity will be disclosed where it is
possible to identify the reportable payment from
other cost recovery items.
▸ For host government production entitlements, the
terms of the agreement have to be considered; for
the purpose of reporting in this report, OMV will
disclose host government entitlements in their
entirety where it is the operator.
Materiality
Payments made as a single payment or a series of
related payments that are below EUR 100,000 within a
financial year are excluded from this report.
Reporting currency
Payments made in currencies other than euros are
translated for the purposes of this report at the average
rate of the reporting period.
Payment types disclosed
Production entitlements
Under production sharing agreements (PSAs), the host
government is entitled to a share of the oil and gas
produced and these entitlements are often paid in kind.
The report will show both the value and volume of the
government’s production entitlement for the relevant
period in barrels of oil equivalent (boe).
The government share of any production entitlement
will also include any entitlements arising from an
interest held by a state-owned entity as an investor in
projects within its sovereign jurisdiction. Production
entitlements arising from activities or interests outside
of a state-owned entity’s sovereign jurisdiction are
excluded.
Taxes
Taxes levied on income, production or profits of
companies are reported. Refunds will be netted against
payments and shown accordingly. Consumption taxes,
personal income taxes, sales taxes, property taxes and
environmental taxes are not reported under the
regulations. Although there is a tax group in place, the
reported corporate income taxes for Austria relate
entirely to the extractive activities in Austria of OMV’s
subsidiaries, with no amounts being reported relating to
OMV’s non- extractive activities in Austria.
Royalties
Royalties relating to the extraction of oil, gas and
minerals paid to a government are to be disclosed.
Where royalties are paid in kind, the value and volume
are reported.
Dividends
In accordance with the regulations, dividends are
reported when paid to a government in lieu of
production entitlements or royalties. Dividends that are
paid to a government as an ordinary shareholder are
not reported, as long as the dividends are paid on the
same terms as that of other shareholders.
For the year that ended December 31, 2020, OMV had
no such reportable dividend payments to a
government.
Bonuses
Bonuses include signature, discovery and production
bonuses in each case to the extent paid in relation to
the relevant activities.
Fees
These include license fees, rental fees, entry fees and
all other payments that are paid in consideration for
access to the area where extractive activities are
performed.
The report excludes fees paid to a government that are
not specifically related to extractive activities or access
to extractive resources. In addition payments paid in
return for services provided by a government are also
excluded.
Infrastructure improvements
The report includes payments made by OMV for
infrastructural improvements, such as the building of a
road or bridge that serves the community, irrespective
of whether OMV pays the amounts to non-government
entities. These are reported in the period during which
the infrastructure is made available for use by the local
community.

OMV ANNUAL REPORT 2020 / FURTHER INFORMATION
216
Payments overview
The overview table below shows the relevant payments
to governments that were made by OMV in the year
that ended December 31, 2020.Of the seven payment
types that are required by the Austrian regulations to be
reported upon, OMV did not pay any dividends,
bonuses or infrastructure improvements that met the
defined accounting directive definition and therefore
these categories are not shown.
Payments overview In EUR 1,000
Production
Entitlements Taxes Royalties Fees Total
Country
Austria — (3,227) 42,539 — 39,312
Kazakhstan — 11,138 — 835 11,973
Malaysia 147,548 24,479 47,569 12,341 231,937
Norway — 62,563 — 3,076 65,639
New Zealand — 18,279 60,551 7,528 86,358
Romania — 141,327 120,777 26,552 288,657
Tunisia — 3,487 2,544 — 6,031
United Arab Emirates — 22,195 72,525 836 95,556
Yemen 35,945 — 3,421 263 39,628
Total 183,493 280,241 349,926 51,431 865,091
No payments have been reported for Libya for the year
2020 as OMV was not the operator.
On November 30, 2017, OMV acquired a stake of
24.99% in OJSC Severneftegazprom (SNGP). As
SNGP is an associated company and therefore
accounted for using the equity method in OMV Group
Consolidated Financial Statements it does not meet the
definition of a reporting entity in the context of the
Austrian Commercial Code.
On January 31, 2019, OMV and Sapura Energy Berhad
closed the agreement to form a strategic partnership.
The new entity, SapuraOMV Upstream Sdn. Bhd., and
its subsidiaries are fully consolidated in OMV’s Group
financial statements.

OMV ANNUAL REPORT 2020 / FURTHER INFORMATION
217
Payments by country
Austria
In EUR 1,000
Production
Entitlements Taxes Royalties Fees Total
Governments
Federal Ministry of Agriculture,
Regions and Tourism
— —
42,539
—
42,539
Federal Ministry of Finance — (3,227) — — (3,227)
Total — (3,227) 42,539 — 39,312
Projects
Lower Austria — (3,227) 42,539 — 39,312
Total — (3,227) 42,539 — 39,312
Kazakhstan
In EUR 1,000
Production
Entitlements Taxes Royalties Fees Total
Governments
State Revenue Committee — 11,138 — 226 11,364
Training centers universities — — — 761 76
Licenced Research and Development
Organisations — — — 5332 533
Total — 11,138 — 835 11,973
Projects
Tasbulat, Turkmenoi, Aktas — 4,100 — 570 4,670
Komsomolskoe — 7,038 — 265 7,303
Total — 11,138 — 835 11,973
1 Financing of various expenses with regard to university training centers as agreed within the concession agreement 2 Various expenses with regards to research and development works
Malaysia
In EUR 1,000
Production
Entitlements Taxes Royalties Fees Total
Governments
Petroliam Nasional Berhad 59,8701 — 47,5693 10,164 117,603
Ketua Pengarah Hasil Dalem Negeri — 24,479 — 185 24,663
Petronas Carigali SDN BHD 87,6792 — — 1,992 89,671
Total 147,548 24,479 47,569 12,341 231,937
Projects
Block PM323/PM329 66,2324 6,630 12,3906 4,786 90,037
Block AAKBNLP/PM318 — 3,915 — 3,381 7,295
Block SK408/SK310 81,3175 13,935 35,1797 4,174 134,605
Total 147,548 24,479 47,569 12,341 231,937
1 Includes payments in kind for 2,137,244 bbl of crude oil valued using the average monthly price per boe 2 Includes payments in kind for 4,761,603 bbl of crude oil valued using the average monthly price per boe 3 Includes payments in kind for 2,748,949 bbl of crude oil valued using the average monthly price per boe 4 Includes payments in kind for 1,667,523 bbl of crude oil valued using the average monthly price per boe 5 Includes payments in kind for 5,231,324 bbl of crude oil valued using the average monthly price per boe 6 Includes payments in kind for 313,634 bbl of crude oil valued using the average monthly price per boe 7 Includes payments in kind for 2,435,315 bbl of crude oil valued using the average monthly price per boe

OMV ANNUAL REPORT 2020 / FURTHER INFORMATION
218
Norway
In EUR 1,000
Production
Entitlements Taxes Royalties Fees Total
Governments
Oljedirektoratet — — — 3,031 3,031
Skatteetaten — 62,563 — 34 62,598
Miljodirektoratet — — — 10 10
Total — 62,563 — 3,076 65,639
Projects
Gulfaks — 95 — — 95
Gudrun — 95 — — 95
Aasta Hansteen — 11 — — 11
Norway Exploration Projects — — — 3,069 3,069
Payments not attributable to projects — 62,362 — 6 62,368
Total — 62,563 — 3,076 65,639
New Zealand
In EUR 1,000
Production
Entitlements Taxes Royalties Fees Total
Governments
Inland Revenue — 18,279 — — 18,279
Maritime Safety Authority — — — 46 46
Ministry of Business and Innovation — — 60,551 7,166 67,718
Environmental Protection Authority — — — 316 316
Total — 18,279 60,551 7,528 86,358
Projects
Maari — — 13,303 39 13,342
Maui — — 2,780 298 3,078
Pohokura — — 44,468 15 44,483
New Zealand exploration projects — — — 347 347
Payments not attributable to projects — 18,279 — 6,829 25,107
Total — 18,279 60,551 7,528 86,358

OMV ANNUAL REPORT 2020 / FURTHER INFORMATION
219
Romania
In EUR 1,000
Production
Entitlements Taxes Royalties Fees Total
Governments
State budget — 141,327 120,777 — 262,105
Local counsils — — — 4,532 4,532
National Agency for Mineral Resources
(ANRM) — — — 2,409 2,409
National Company of Forests — — — 15,345 15,345
CONPET SA — — — 98 98
National Authority for Electricity Regulation
(ANRE) — — — 3,596 3,596
Offshore Operations Regulatory Authority
(ACROPO) — — — 573 573
Total — 141,327 120,777 26,552 288,657
Projects
Onshore production zones — — 91,846 22,242 114,088
Onshore Joint Operations — — 1,051 — 1,051
Offshore Black Sea — 12,617 27,880 714 41,211
Payments not attributable to projects — 128,710 — 3,596 132,306
Total — 141,327 120,777 26,552 288,657
Tunisia
In EUR 1,000
Production
Entitlements Taxes Royalties Fees Total
Governments
Receveur des Finances — 3,365 — — 3,365
Receveur des Douanes — 122 — — 122
Entreprise Tunisienne d’Activites Petrolieres — — 2,5441 — 2,544
Total — 3,487 2,544 — 6,031
Projects
South Tunisia — 3,487 2,5441 — 6,031
Total — 3,487 2,544 — 6,031
1 Includes payments in kind for 75,057 bbl of crude oil valued using the average monthly price per boe
United Arab Emirates
In EUR 1,000
Production
Entitlements Taxes Royalties Fees Total
Governments
Abu Dhabi National Oil Company (ADNOC) — — — 836 836
Emirate of Abu Dhabi – Finance
Department — 22,195 72,525 — 94,720
Total — 22,195 72,525 836 95,556
Projects
Umm Lulu und SARB — 22,195 72,525 836 95,556
Total — 22,195 72,525 836 95,556

OMV ANNUAL REPORT 2020 / FURTHER INFORMATION
220
Yemen
In EUR 1,000
Production
Entitlements Taxes Royalties Fees Total
Governments
Ministry of Oil & Minerals 35,9451 — 3,4212 263 39,628
Total 35,945 — 3,421 263 39,628
Projects
Block S2 35,9451 — 3,4212 263 39,628
Total 35,945 — 3,421 263 39,628
1 Includes payments in kind for 1,003,699 boe valued at prices set by the Yemen Crude Oil Marketing Directorate 2 Includes payments in kind for 95,515 boe valued at prices set by the Yemen Crude Oil Marketing Directorate
Vienna, March 10, 2021
The Executive Board
Rainer Seele m.p.
Chairman of the Executive Board
and Chief Executive Officer
Johann Pleininger m.p.
Deputy Chairman of the Executive Board
and Chief Upstream Operations Officer
Reinhard Florey m.p.
Chief Financial Officer
Elena Skvortsova m.p.
Chief Commercial Officer
Thomas Gangl m.p.
Chief Downstream Operations Officer
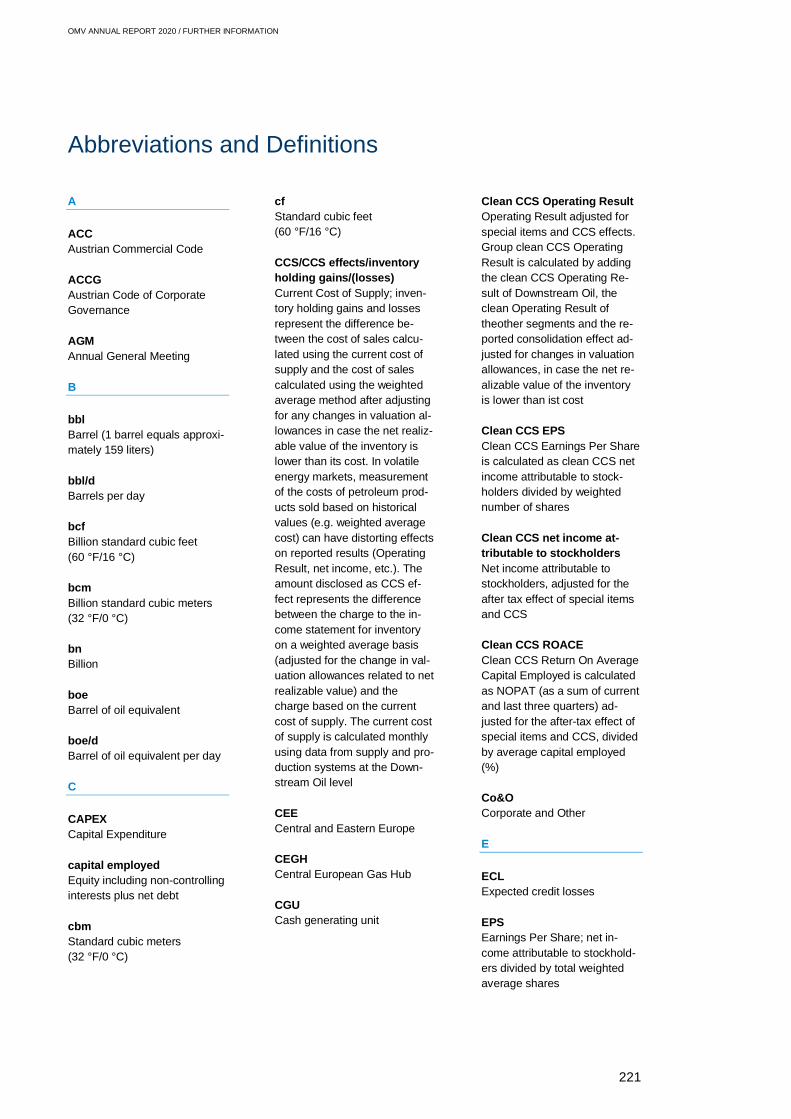
OMV ANNUAL REPORT 2020 / FURTHER INFORMATION
221
A
ACC
Austrian Commercial Code
ACCG
Austrian Code of Corporate
Governance
AGM
Annual General Meeting
B
bbl
Barrel (1 barrel equals approxi-
mately 159 liters)
bbl/d
Barrels per day
bcf
Billion standard cubic feet
(60 °F/16 °C)
bcm
Billion standard cubic meters
(32 °F/0 °C)
bn
Billion
boe
Barrel of oil equivalent
boe/d
Barrel of oil equivalent per day
C
CAPEX
Capital Expenditure
capital employed
Equity including non-controlling
interests plus net debt
cbm
Standard cubic meters
(32 °F/0 °C)
cf
Standard cubic feet
(60 °F/16 °C)
CCS/CCS effects/inventory
holding gains/(losses)
Current Cost of Supply; inven-
tory holding gains and losses
represent the difference be-
tween the cost of sales calcu-
lated using the current cost of
supply and the cost of sales
calculated using the weighted
average method after adjusting
for any changes in valuation al-
lowances in case the net realiz-
able value of the inventory is
lower than its cost. In volatile
energy markets, measurement
of the costs of petroleum prod-
ucts sold based on historical
values (e.g. weighted average
cost) can have distorting effects
on reported results (Operating
Result, net income, etc.). The
amount disclosed as CCS ef-
fect represents the difference
between the charge to the in-
come statement for inventory
on a weighted average basis
(adjusted for the change in val-
uation allowances related to net
realizable value) and the
charge based on the current
cost of supply. The current cost
of supply is calculated monthly
using data from supply and pro-
duction systems at the Down-
stream Oil level
CEE
Central and Eastern Europe
CEGH
Central European Gas Hub
CGU
Cash generating unit
Clean CCS Operating Result
Operating Result adjusted for
special items and CCS effects.
Group clean CCS Operating
Result is calculated by adding
the clean CCS Operating Re-
sult of Downstream Oil, the
clean Operating Result of
theother segments and the re-
ported consolidation effect ad-
justed for changes in valuation
allowances, in case the net re-
alizable value of the inventory
is lower than ist cost
Clean CCS EPS
Clean CCS Earnings Per Share
is calculated as clean CCS net
income attributable to stock-
holders divided by weighted
number of shares
Clean CCS net income at-
tributable to stockholders
Net income attributable to
stockholders, adjusted for the
after tax effect of special items
and CCS
Clean CCS ROACE
Clean CCS Return On Average
Capital Employed is calculated
as NOPAT (as a sum of current
and last three quarters) ad-
justed for the after-tax effect of
special items and CCS, divided
by average capital employed
(%)
Co&O
Corporate and Other
E
ECL
Expected credit losses
EPS
Earnings Per Share; net in-
come attributable to stockhold-
ers divided by total weighted
average shares
Abbreviations and Definitions

OMV ANNUAL REPORT 2020 / FURTHER INFORMATION
222
EPSA
Exploration and Production
Sharing Agreement
equity ratio
Equity divided by balance sheet
total, expressed as a percent-
age
EU
European Union
EUR
Euro
F
FVOCI
Fair value through other com-
prehensive income
FVTPL
Fair value through the state-
ment of profit or loss
FX
Foreign exchange
G
G2P
Gas-to-power
GDP
Gross Domestic Product
gearing ratio
Net debt divided by equity, ex-
pressed as a percentage
H
HSSE
Health, Safety, Security, and
Environment
I
IASs
International Accounting Stand-
ards
IFRSs
International Financial Report-
ing Standards
K
kbbl/d
Thousand barrels per day
kboe
Thousand barrels of oil equiva-
lent
kboe/d
Thousand barrels of oil equiva-
lent per day
km2
Square kilometer
KPI
Key Performance Indicator
KStG
Austrian Corporate Income Tax
Act
L
leverage ratio
Net debt divided by capital em-
ployed, expressed as a per-
centage
LNG
Liquefied Natural Gas
LTIR
Lost-Time Injury Rate per mil-
lion hours worked
M
min
Minute
mn
Million
MPPH
Mubadala Petroleum and Pet-
rochemicals Holding Company
L.L.C
MW
Megawatt
MWh
Megawatt hour
N
n.a.
Not available
NCI
Non-controlling interests
n.m.
Not meaningful
net assets
Intangible assets, property,
plant and equipment, equity-ac-
counted investments, invest-
ments in other companies,
loans granted to equity-ac-
counted investments, total net
working capital, less provisions
for decommissioning and resto-
ration obligations
net debt
Interest-bearing debts including
bonds and finance lease liabili-
ties less liquid funds (cash and
cash equivalents)
net income
Net operating profit or loss after
interest and tax
NGL
Natural Gas Liquids; natural
gas that is extracted in liquid
form during the production of
hydrocarbons
NOK
Norwegian krone
NOPAT
Net Operating Profit After Tax;
Net income
+ Net interest related to
financing
– Tax effect of net interest
related to financing
NOPAT is a KPI that shows the
financial performance after tax,
independent of the financing
structure of the company.
NZD
New Zealand dollar

OMV ANNUAL REPORT 2020 / FURTHER INFORMATION
223
O
OCI
Other comprehensive income
OECD
Organisation for Economic Co-
operation and Development
ÖBAG
Österreichische Beteiligungs
AG
P
payout ratio
Dividend per share divided by
earnings per share, expressed
as a percentage
Pearl
Pearl Petroleum Company Lim-
ited
Q
Q1, Q2, Q3, Q4
First, second, third, fourth quar-
ter of the year
R
ROACE
Return On Average Capital
Employed; NOPAT divided by
average capital employed ex-
pressed as a percentage
ROE
Return On Equity; net in-
come/loss for the year divided
by average equity, expressed
as a percentage
RON
New Romanian leu
RRR
Reserve Replacement Rate; to-
tal changes in reserves exclud-
ing production, divided by total
production
RUB
Russian ruble
S
sales revenues
Sales excluding petroleum ex-
cise tax
Special items
Special items are expenses
and income reflected in the fi-
nancial statements that are dis-
closed separately, as they are
not part of underlying ordinary
business operations. They are
being disclosed separately in
order to enable investors to
better understand and evaluate
OMV Group’s reported financial
performance
T
t
Metric ton
toe
Metric ton of oil equivalent
TSR
Total Shareholder Return
TWh
Terawatt hour
U
UAE
United Arab Emirates
USD
US dollar

OMV ANNUAL REPORT 2020 / FURTHER INFORMATION
224
OMV Aktiengesellschaft
Trabrennstrasse 6 – 8
1020 Vienna, Austria
Tel. + 43 1 40440-0
www.omv.com
OMV Petrom S.A.
Strada Coralilor 22, sector 1
013329 Bucharest, Romania
Tel. + 40 372 161930
Fax + 40 372 868518
Investor Relations
Florian Greger
OMV Aktiengesellschaft
Trabrennstrasse 6 – 8
1020 Vienna, Austria
Tel. + 43 1 40440-21600
Fax + 43 1 40440-621600
Publisher
OMV Aktiengesellschaft, Vienna
Photos
Kurt Prinz
Notes:
Figures in the tables and charts may not add up due to
rounding differences. Differences between percentages are
displayed as percentage points throughout the document.
In the interest of a fluid style that is easy to read, non-gender-
specific terms have been used in the notes chapter of this
annual report.
Disclaimer regarding forward-looking statements:
This report contains forward-looking statements. Forwardlook-
ing statements usually may be identified by the use of terms
such as “outlook,” “believe,” “expect,” “anticipate,” “intend,”
“plan,” “target,” “objective,” “estimate,” “goal,” “may,” “will” and
similar terms, or by their context. These forward-looking state-
ments are based on beliefs, estimates and assumptions cur-
rently held by and information currently available to OMV. By
their nature, forward-looking statements are subject to risks
and uncertainties, both known and unknown, because they
relate to events and depend on circumstances that will or
may occur in the future and are outside the control of OMV.
Consequently, the actual results may differ materially from
those expressed or implied by the forward-looking statements.
Therefore, recipients of this report are cautioned not to place
undue reliance on these forward-looking statements. Neither
OMV nor any other person assumes responsibility for the
accuracy and completeness of any of the forward-looking
statements contained in this report. OMV disclaims any
obligation and does not intend to update these forward-looking
statements to reflect actual results, revised assumptions and
expectations, and future developments and events. This report
does not contain any recommendation or invitation to buy or
sell securities in OMV.
Contacts and Imprint
Further publications
OMV Factbook
▸ www.omv.com/factbook
OMV Sustainability Report
▸ www.omv.com/sustainability-report

225

226
OMV Aktiengesellschaft Trabrennstrasse 6 – 81020 ViennaAustriaTel +43 1 40440-0www.omv.comwww.omv.com/socialmedia