
2000 Annual Report - AnnualReports.com
108
Annual Report and Accounts 2000
-
Upload
khangminh22 -
Category
Documents
-
view
0 -
download
0
Transcript of 2000 Annual Report - AnnualReports.com

Annual R
eport and Accounts 2000
Annual Report and Accounts 2000Advertising. Media Investment Management.Information & Consultancy. Public Relations & Public Affairs. Branding & Identity, Healthcare andSpecialist Communications.
27 Farm StreetLondon W1J 5RJTelephone 020 7408 2204Fax 020 7493 6819www.wpp.com
Who we areAbout WPP 3Our companies and associates 4
How we’re doing2000 financial summary 8Letter to share owners 10Operating and financial review 14
What we think The Clipboard and the Copywriterby Jeremy Bullmore 34Boom and Bust or Groundhog Day?by Martin Sorrell 40
The numbers in fullAccounting policies 56Consolidated profit and loss account 58Consolidated cash flow statement 60Consolidated statement of totalrecognised gains and losses 60Consolidated balance sheet 61Notes to the consolidated profit and loss account 62Notes to the consolidatedcash flow statement 64Notes to the consolidatedbalance sheet 65Company balance sheet 71Notes to the Company balance sheet 72Reconciliation to US AccountingPrinciples 73Notes to the Reconciliation to USAccounting Principles 73Five-year summary 75Consolidated profit and loss account:euro illustration 76Consolidated balance sheet:euro illustration 77Financial glossary 78Auditors’ report 79
Stewardship and remunerationBoard of directors 82Senior WPP executives andadvisors to the Board 84Directors’ responsibilities 85Directors’ remuneration and interests 87Other statutory information 90Corporate citizenship 91Compensation committee report 92
About share ownershipInformation for share owners 102
Where to find usContact points Inside back cover
WPP LondonWPP Group plc27 Farm StreetLondon W1J 5RJTel +44 (0)20 7408 2204Fax +44 (0)20 7493 6819
WPP New YorkWPP Group USA, Inc125 Park AvenueNew York NY 10017-5529Tel (212) 632 2200Fax (212) 632 2222
WPP Asia PacificStuart Neish, Hong KongTel (852) 2280 3801Fax (852) 2598 [email protected]
WPP Latin AmericaNick Read, São PauloTel +55 11 3888 [email protected]
Investor relationsPaul RichardsonGroup finance directorTel +44 (0)20 7408 2204Fax +44 (0)20 7493 [email protected]
Chris SweetlandDeputy Group finance directorTel +44 (0)20 7408 2204Fax +44 (0)20 7493 [email protected]
Media relationsFeona McEwanGroup communications directorTel +44 (0)20 7408 2204Fax +44 (0)20 7493 [email protected]
Group informationIf you would like further information about WPP, its companies or any of the programmes, publications orinitiatives mentioned in this report, please visit our website:www.wpp.com or contact:
Feona McEwan or Christian Andrewat WPP in LondonTel +44 (0)20 7408 2204Fax +44 (0)20 7493 [email protected]@wpp.com
Joan Einarsenat WPP in New YorkTel (212) 632 2200Fax (212) 632 [email protected]
Recognition for previous years’Annual Reports1999 Annual ReportSelected to appear in the D&AD 2001 Annual, ashowcase of the world’s best design work.
1999 ProShare Award for best Annual Reportand Accounts in a FTSE 100 Company, for thesecond year in a row.
1999 British Design and Art Direction Awards:Silver Award to WPP director Jeremy Bullmorefor his essay, Polishing the Apples.
1998 Stock Exchange and CharteredAccountants Annual Awards for PublishedAccounts: Highly Commended.
1998 ProShare Award for best Annual Reportand Accounts in a FTSE 100 Company.
Written and produced by WPP Group plcDesigned by Addison Corporate MarketingIllustrations by Richard BorgePortraits by Nick HigginsPrinted in the UK by Westerham Press, St Ives plc©WPPGroup plc 2001
Investor relations material andour financial statementsare available onlineat www.wppinvestor.com
Where to find us

WPP Who we are
To develop and manage talent;to apply that talent;throughout the world,for the benefit of clients;to do so in partnership;to do so with profit.
Our mission

WPP Who we are
WPP is one of the world’s leading communications services groups.Our companies provide communications services to clients aroundthe world, including more than 300 of the Fortune Global 500,over one-half of the Nasdaq 100 and over 30 of the Fortune e-50.Our 65,000 people work from 1,300 offices in 102 countries.
Every WPP company is a distinctive brand in its own right; all withtheir own identities and own areas of expertise. That is their strength.What they have in common is in harnessing intelligence, talent andexperience to bring competitive advantage to their clients.
WPP, as a parent, complements the professional activities of our individual operating companies through initiatives and programs thatprovide greater value to our clients, competitive advantage to ourcompanies, opportunities and rewards for our people.
Who we are
4 WPP Who we are
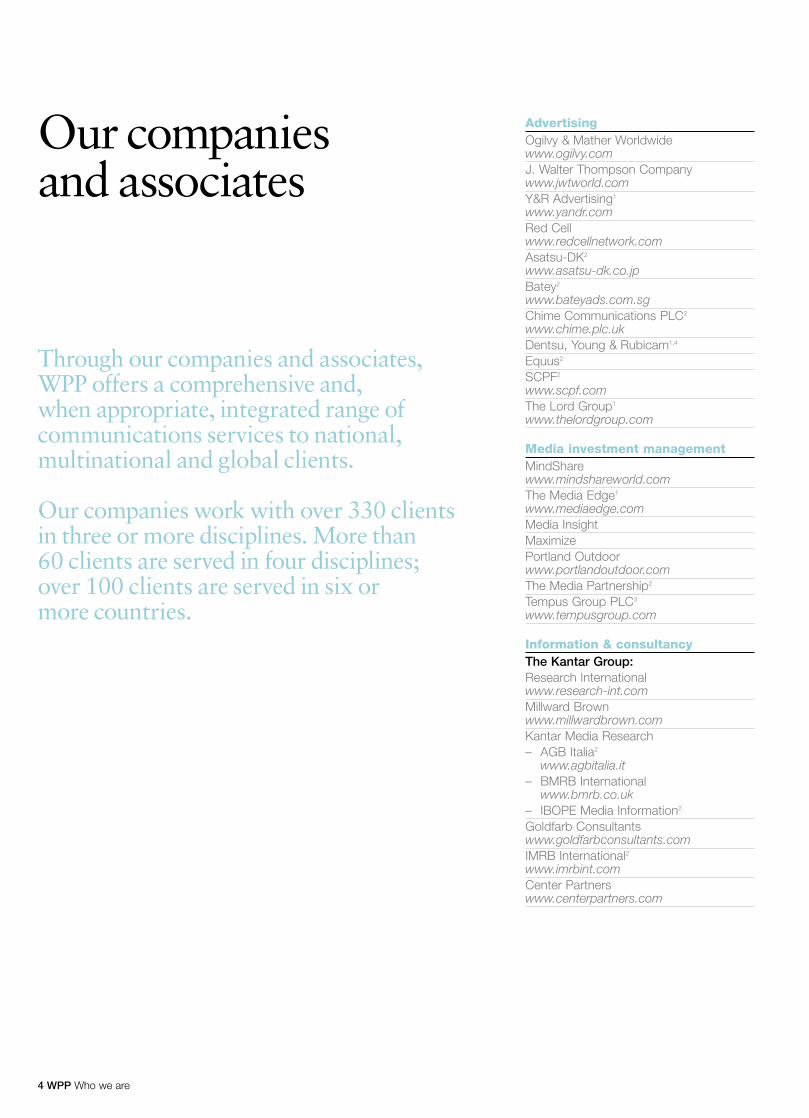
Through our companies and associates, WPP offers a comprehensive and, when appropriate, integrated range of communications services to national, multinational and global clients.
Our companies work with over 330 clientsin three or more disciplines. More than60 clients are served in four disciplines; over 100 clients are served in six or more countries.
AdvertisingOgilvy & Mather Worldwidewww.ogilvy.comJ. Walter Thompson Companywww.jwtworld.comY&R Advertising1
www.yandr.comRed Cellwww.redcellnetwork.comAsatsu-DK2
www.asatsu-dk.co.jpBatey2
www.bateyads.com.sgChime Communications PLC2
www.chime.plc.ukDentsu, Young & Rubicam1,4
Equus2
SCPF2
www.scpf.comThe Lord Group1
www.thelordgroup.com
Media investment managementMindSharewww.mindshareworld.comThe Media Edge1
www.mediaedge.comMedia InsightMaximizePortland Outdoorwww.portlandoutdoor.comThe Media Partnership2
Tempus Group PLC3
www.tempusgroup.com
Information & consultancyThe Kantar Group:Research Internationalwww.research-int.comMillward Brownwww.millwardbrown.comKantar Media Research– AGB Italia2
www.agbitalia.it– BMRB International
www.bmrb.co.uk– IBOPE Media Information2
Goldfarb Consultantswww.goldfarbconsultants.comIMRB International2www.imrbint.comCenter Partnerswww.centerpartners.com
Our companies and associates
WPP Who we are
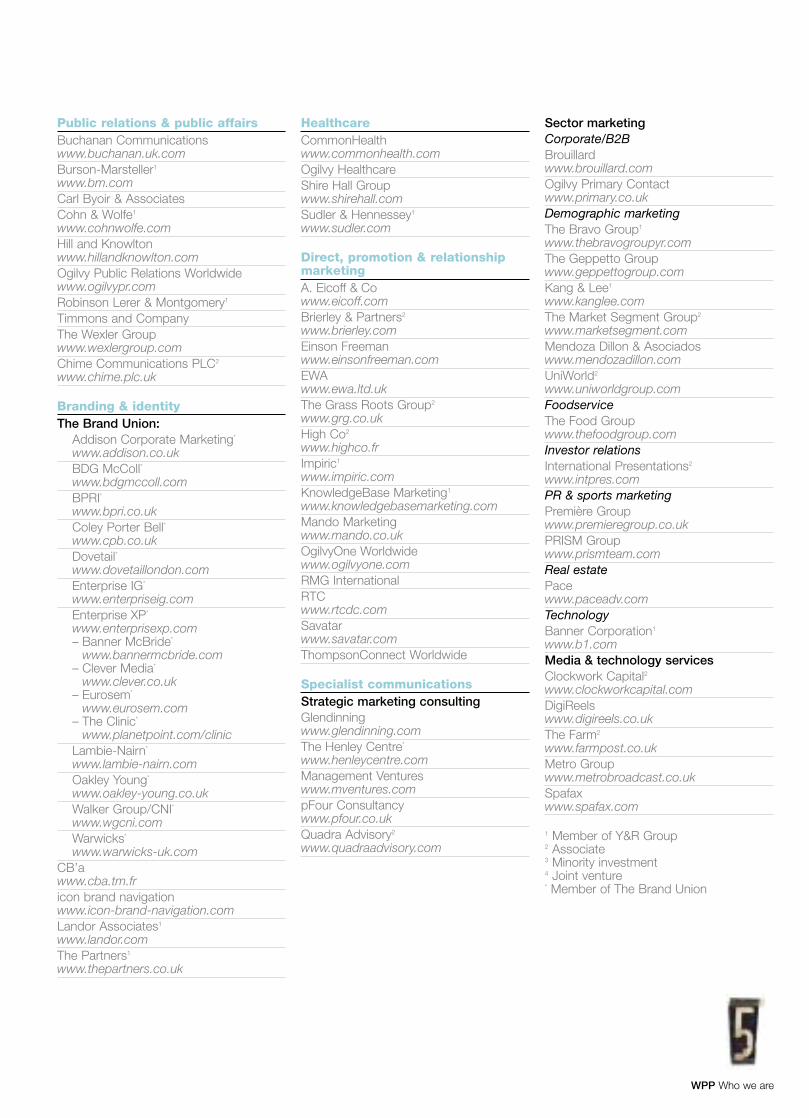
Public relations & public affairsBuchanan Communicationswww.buchanan.uk.comBurson-Marsteller1
www.bm.comCarl Byoir & AssociatesCohn & Wolfe1
www.cohnwolfe.comHill and Knowltonwww.hillandknowlton.comOgilvy Public Relations Worldwidewww.ogilvypr.comRobinson Lerer & Montgomery1
Timmons and CompanyThe Wexler Groupwww.wexlergroup.comChime Communications PLC2
www.chime.plc.uk
Branding & identityThe Brand Union:
Addison Corporate Marketing*
www.addison.co.ukBDG McColl*www.bdgmccoll.com BPRI*www.bpri.co.ukColey Porter Bell*www.cpb.co.ukDovetail*www.dovetaillondon.comEnterprise IG*
www.enterpriseig.comEnterprise XP*
www.enterprisexp.com– Banner McBride*
www.bannermcbride.com– Clever Media*
www.clever.co.uk– Eurosem*
www.eurosem.com– The Clinic*
www.planetpoint.com/clinicLambie-Nairn*
www.lambie-nairn.comOakley Young*
www.oakley-young.co.uk Walker Group/CNI*www.wgcni.comWarwicks*
www.warwicks-uk.comCB’awww.cba.tm.fr icon brand navigationwww.icon-brand-navigation.com Landor Associates1
www.landor.comThe Partners1
www.thepartners.co.uk
HealthcareCommonHealthwww.commonhealth.comOgilvy HealthcareShire Hall Groupwww.shirehall.comSudler & Hennessey1
www.sudler.com
Direct, promotion & relationship marketingA. Eicoff & Cowww.eicoff.comBrierley & Partners2
www.brierley.comEinson Freemanwww.einsonfreeman.comEWAwww.ewa.ltd.uk The Grass Roots Group2
www.grg.co.ukHigh Co2
www.highco.fr Impiric1
www.impiric.comKnowledgeBase Marketing1
www.knowledgebasemarketing.comMando Marketingwww.mando.co.ukOgilvyOne Worldwidewww.ogilvyone.comRMG International RTCwww.rtcdc.comSavatarwww.savatar.comThompsonConnect Worldwide
Specialist communicationsStrategic marketing consultingGlendinningwww.glendinning.comThe Henley Centre*
www.henleycentre.comManagement Ventureswww.mventures.compFour Consultancywww.pfour.co.ukQuadra Advisory2
www.quadraadvisory.com
Sector marketingCorporate/B2BBrouillardwww.brouillard.comOgilvy Primary Contactwww.primary.co.ukDemographic marketingThe Bravo Group1
www.thebravogroupyr.comThe Geppetto Groupwww.geppettogroup.comKang & Lee1
www.kanglee.comThe Market Segment Group2
www.marketsegment.comMendoza Dillon & Asociadoswww.mendozadillon.comUniWorld2
www.uniworldgroup.comFoodserviceThe Food Groupwww.thefoodgroup.comInvestor relationsInternational Presentations2
www.intpres.com PR & sports marketingPremière Groupwww.premieregroup.co.uk PRISM Groupwww.prismteam.com Real estatePacewww.paceadv.comTechnologyBanner Corporation1
www.b1.comMedia & technology servicesClockwork Capital2www.clockworkcapital.comDigiReelswww.digireels.co.ukThe Farm2
www.farmpost.co.uk Metro Groupwww.metrobroadcast.co.ukSpafaxwww.spafax.com
1 Member of Y&R Group2 Associate 3 Minority investment4 Joint venture* Member of The Brand Union


How we’re doing
WPP How we’re doing
2000 financial summary
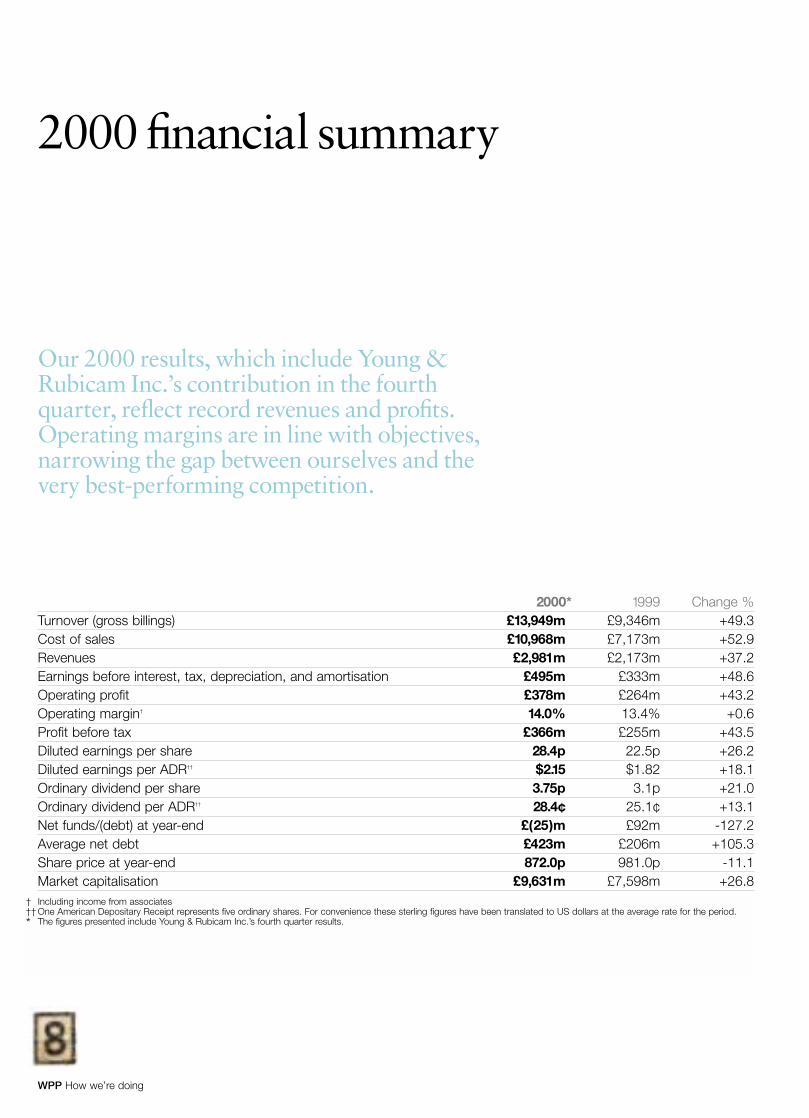
2000* 1999 Change %Turnover (gross billings) £13,949m £9,346m +49.3Cost of sales £10,968m £7,173m +52.9Revenues £2,981m £2,173m +37.2Earnings before interest, tax, depreciation, and amortisation £495m £333m +48.6Operating profit £378m £264m +43.2Operating margin† 14.0% 13.4% +0.6Profit before tax £366m £255m +43.5Diluted earnings per share 28.4p 22.5p +26.2Diluted earnings per ADR†† $2.15 $1.82 +18.1Ordinary dividend per share 3.75p 3.1p +21.0Ordinary dividend per ADR†† 28.4¢ 25.1¢ +13.1Net funds/(debt) at year-end £(25)m £92m -127.2Average net debt £423m £206m +105.3Share price at year-end 872.0p 981.0p -11.1Market capitalisation £9,631m £7,598m +26.8
Our 2000 results, which include Young &Rubicam Inc.’s contribution in the fourthquarter, reflect record revenues and profits.Operating margins are in line with objectives,narrowing the gap between ourselves and thevery best-performing competition.
† Including income from associates†† One American Depositary Receipt represents five ordinary shares. For convenience these sterling figures have been translated to US dollars at the average rate for the period.* The figures presented include Young & Rubicam Inc.’s fourth quarter results.

9 WPP How we’re doing
1691Revenue £m
96
1747 1918 2173 2981
97 98 99 00
211Earnings beforeinterest, tax,depreciation andamortisation £m
96
235 279 333 495
97 98 99 00
182PBIT £m
96
206 245 291 416
97 98 99 00
10.8PBIT margins %
96
11.8 12.8 13.4 14.0
97 98 99 00
13.5Diluted earnings per share p
96
15.7 18.8 22.5 28.4
97 98 99 00
10.1After tax return on average capital employed† %and weighted average cost of capital (WACC) %
96
11.0 11.9 12.8 13.1
97 98 99 00
WACC
†Calculated gross ofgoodwill, revaluationreserve and usingprofit after tax. The1996-1999 balanceshave been restatedas a result of theimplementation of FRS 19 in theGroup’s 2000financial statements.
12
11
10
9
8
7
6
5
4
3
2
1
0
WPP total returnto share ownersrelative to peergrouprebased to 1996
96 97 98 99 00 01
WPPPeer groupS&P 500FTSE 100
1000
0
200
400
600
800
145Average net debt£m & interest cover multiples
96
115 143 206 423
97 98 99 00
Net interest cover
9
1
2
3
4
5
6
7
8
0
2000 revenue bygeography %
44
18
20
18
North America
United Kingdom
Continental Europe
Asia Pacific, Latin America,Africa & Middle East
2000 PBIT bygeography %
48
15
20
17
North America
United Kingdom
Continental Europe
Asia Pacific, Latin America,Africa & Middle East
2000 revenue bysector %
47
17
11
25
Advertising, mediainvestment management
Public relations & public affairs
Information & consultancy
Branding & identity,healthcare and specialistcommunications
2000 PBIT by sector %
56
12
10
22
Advertising, mediainvestment management
Public relations & public affairs
Information & consultancy
Branding & identity,healthcare and specialistcommunications

WPP How we’re doing
Dear share owner
2000, our fifteenth year, was another record year.
Turnover was up over 49% to almost £14 billionreflecting strong organic growth, the first timefourth quarter inclusion of Young&Rubicam Inc.and continued rapid growth in our mediainvestment management activities.
Revenues grew over 37% to almost £3 billion for the first time. Pre-tax profits rose by over 43% to £366 million, earnings per share by over26% to 28.4p and dividends by 21% to 3.75p.
The only disappointment was that the share price,the real measure of your wealth, fell by 11.1%during 2000. However, your Company’s shareprice performance ranks third in terms of shareprice appreciation against a comparator group of 14 global competitors since 1 January 1999.
11 WPP How we’re doing
The rest of this letter is based onconstant currency comparisons, which are more meaningful given thecontinued strength of sterling in 2000.On a like-for-like basis, revenues wereup by almost 15% and gross profitsup 16%, very strong growth, albeit ina quadrennial Olympic and Presidentialyear; particularly with global inflationat 3-4%. However, growth at suchstrong pro forma levels is probablyunsustainable in the medium to longterm. If WPP were to grow consistentlyat these levels, it would be equivalent toa significant proportion of the current US GDP within 10 years. Double-digitlike-for-like revenue growth remainsyour Company’s growth objective.
All our disciplines – advertising;media investment management;information and consultancy; publicrelations and public affairs; andbranding and identity, healthcare andspecialist communications – grewstrongly. However, with advertisingand media investment managementgrowing more strongly than in 1999,the balance between advertising andmarketing services remained the sameat 47%-53%.
The same strength was seengeographically, but with ContinentalEurope and Asia Pacific, LatinAmerica, Africa and the Middle Eastsurpassing the US and the UK, asthese countries benefited from eurocurrency weakness and fully-fledgedrecovery from the 1997 Asian andLatin American recessions.
Operating margins were up by0.7%, in excess of our objective of0.6%. Productivity and efficiencyagain increased significantly as like-for-like revenues grew by almostdouble the like-for-like increase instaff numbers of 8.0%.
As a result, profit before interest andtax grew by almost 40% to £366 million.Pre-tax profits were up even more atover 40%. We generated £291 millionof free cash flow, up over 70% overlast year and which was more thanabsorbed by acquisition payments andinvestments of £247 million, sharerepurchases and cancellations of £94million and dividends of £26 million.Partly as a result, average net debt roseto £423 million, compared to £225
million in 1999 at 2000 exchange ratesand the historical target range of £200-250 million. Your Board is prepared toincrease net debt further to the rangeof £400-450 million, if there aresufficient small- to medium-sized cashacquisition opportunities available andthere are attractive opportunities forshare repurchases. Finally, earnings pershare rose by 23%.
2001 will be a more difficult year.The world’s stock markets aresignalling a recession with no oneable to determine whether there willbe a hard or soft landing, or whetherthe recession will be U-shaped orV-shaped or, worst of all, Japanese L-shaped. Softness is also notconfined to the technology, media andtelecommunications sectors. The ‘old’economy, although less affected, isstill suffering.
At WPP, reported revenues are upover 73% in the first three months of2001, reflecting organic growth, thefirst time contribution of Young &Rubicam Inc., other acquisitions andthe strength of the dollar and majorContinental European currenciesagainst sterling. On a like-for-like basis,revenues are up 6%. Operating marginsare still forecast to grow by one margin point to 15% this year in line with our objectives. Our ability to achieve this will in part depend on our ability to control variable staff costs.
We continue to seek ways ofunlocking added value for both clientsand our people and proving that thereis real value in WPP’s strategy. Ourgoal remains to become the world’smost successful, and preferred providerof communications services to bothmultinational and national companies.
Our six objectives remain as follows:● First, to continue to raise operatingmargins to the level of the bestperforming competition, from 14%last year to 15% this year and to15.5% by 2002.
We have also indicated that there islife after 15.5%, setting an objective of 20% in due course. Some agencies,such as Dentsu, have achieved this and mini-holding companies, such asMcCann, have too – so there should be scope.
● Second, to increase the flexibilityin our cost structure to cope withrecessions as they develop. Thisflexibility should act as a ‘shockabsorber’ to protect our marginswhen revenues are squeezed by aneconomic slowdown.
Our investment in people andproperty accounts for approximately60% of revenues. Variable staff costs,including incentive compensation,freelancers and consultants, nowaccount for 6.6% of revenues and weaim for 7-8%.● Third, we have achieved ourobjective of de-leveraging the Companyand interest cover of over seven times.Now we have to continue to focus onhow we can improve share owner valueby maximising the return on alternativeinvestments in capital expenditures,acquisitions and investments, dividendsor share buy-backs.
Although capital expenditures haverisen recently primarily reflectingYear 2000 issues and propertyrationalisation, they are unlikely toabsorb more than 100-150% of thedepreciation charge in the mediumand long term.
We continue to trawl carefullyfor acquisition and investmentopportunities and have addedresources to our central acquisitionteam. However, we remain concernedabout value in certain markets. We willtherefore probably remain primarilyactive in acquiring strategicallyimportant, small- to medium-sizedbusinesses of up to $300 million invalue unless exceptional strategic andfinancial opportunities, such as Young& Rubicam Inc., arise.
Increasing dividends tend to raisethe fixed charges in the business andas a result we will continue to favourshare repurchases and cancellations asa use of our free cash flow. In 2000we invested £94 million here, butcontinue to be committed to a rollingannual buy-back program of arecently increased amount of £150-200 million, equivalent toapproximately 1-2% of our sharecapital. Historical data seems toindicate that programs on this scalehave the most significant impact onshare owner returns.
Letter to share owners continued
12 WPP How we’re doing
● Fourth, to advance further the roleof the Company from that of afinancial holding or investmentcompany (concentrating solely onfinancial matters such as planning,budgeting, reporting, control, treasury,tax, mergers and acquisitions andinvestor relations) to that of a parentcompany that adds value to ourclients and our people.
We are focused on the key added-value areas that we have identified– human resources, propertymanagement, procurement,information technology and practicedevelopment. This work is done by alimited number of 150 or so parentcompany people in London and NewYork, with some support in HongKong and São Paulo, and includingthose who joined us from the Young& Rubicam Inc. holding companyfollowing the merger.
In the human resources area wecontinue to develop our short-termand long-term incentive plans, ourrenamed WPP Leaders, WPP Partnersand WPP High Potential groups, ourWorldwide Ownership Plan, ourWorldwide Partnership Program andAtticus Awards – our literary Oscars;our training and knowledge-sharingprograms and specialised seminars oncreativity, retailing and interactive;our Marketing Fellowship Program;our Group directory, Navigator, ourglobal newspaper, The WIRE and ourmonthly online news bulletin, e.wire.
In property management, wecontinue to implement the WPP SpaceProgram which seeks to improve thereturn on our annual investment of$600 million in our property, byimproving communications, speed ofresponse and efficiency, through newdesign and layout of our premises.
In procurement, we continue totake initiatives in various regions ofthe world to improve the way wepurchase goods and services andco-ordinate their buying.
In information technology, we are increasingly co-ordinating our$350 million annual investment inhardware, software and informationtechnology salaries.
Finally, in practice development wecontinue our ‘horizontal’ initiatives in
10 identified high growth areas acrossour ‘vertical’ operating brands – inmedia investment management; inhealthcare; in privatisation; in newtechnologies; in new geographicmarkets; in retailing; in internalcommunications; in entertainmentand media; in financial services; andin telecommunications and hi-tech.In addition, we are developing ourdirect investments in new media andour start-ups and internal strategicalliances, which reinforce our practicedevelopment initiatives.
All these initiatives are designed toensure that we, the parent company,really do (and are perceived to)inspire, motivate, coach, encourage,support and incentivise our operatingcompanies to achieve their strategicand operational goals.● Fifth, as we move up the margincurve we are placing greater emphasison revenue growth. A legitimatecriticism of our performance againstthe best performers in the industry isthat our internal organic growth ratehas been lower. For the four years upuntil 1999, we grew organically byapproximately 8% per annum, againstapproximately 10% for the very bestof the best-performing competition(although their definition of organicgrowth is more flattering than ours).
Our objective is to move up to thislevel by better positioning our revenueportfolio in faster-growing functionalareas. Perhaps the results for 2000 areindicative of some success, althoughone swallow does not make a summer.In 2000 we achieved the highest rate of organic growth for any groupat over 15%. If the more liberaldefinition of organic growth were used,this would have been closer to 19%.
Our practice developmentinitiatives are aimed at helping withthis, and acquisitions so far in 2001– in advertising and media investmentmanagement in the US, the UK, SouthKorea and Brazil; in information &consultancy in Germany; in publicrelations & public affairs in the US,France and South Korea; and inbranding & identity, healthcare andspecialist communications in the US,the UK, France, Japan and HongKong – are also key.
Information and consultancy, publicrelations and public affairs andspecialist communications currentlyaccount for just 53% of our revenues.We would like to see them at 662/3%in five years.
Similarly, our geographic expansionis aimed at improving our organicrevenue growth rate. Despite recentdifficulties we still believe that the keygrowth areas will be in Asia Pacific,Latin America, Central and EasternEurope, Africa and the Middle East.Currently these areas account for over18% of our revenues, versus 13% afew years ago. We would like to seethem at one-third within five years,equally balanced with North Americaand Europe.
To achieve this we will expand our strong institutional networks –Ogilvy & Mather Worldwide,J. Walter Thompson Company,Young & Rubicam Advertising,Red Cell, MindShare, The MediaEdge, Research International,Millward Brown, Kantar MediaResearch, Hill and Knowlton,Ogilvy Public Relations Worldwide,Burson-Marsteller, Cohn & Wolfe,OgilvyOne, Impiric, CommonHealth,Sudler & Hennessey, Enterprise IGand Landor in high growth markets or where their market share isinsufficient. In 2000, we tackledAustralia, Belgium, Canada, China,Denmark, France, Ireland, Israel,Italy, Mexico, the Middle East,the Netherlands, Pakistan, Poland,Portugal, Puerto Rico, Singapore,Spain, Sweden, Switzerland, Turkeyand the US. In 2001 there is morework to do in the heartland ofContinental Europe – France, Germany,Italy and Spain, for example.
We will also enhance ourleadership position in informationand consultancy by continuing todevelop our key brands withparticular emphasis on NorthAmerica, Latin America and AsiaPacific. We will also reinforce ourgrowing position in media researchthrough Kantar Media Research.This includes our investments intelevision audience research throughIBOPE and AGB Italia, whichfollowing even greater success in

WPP How we’re doing
the UK and Australia, now havestrong representation in 27 countriesin Europe, Latin America andAsia Pacific.
In addition, we will reinforce ourworldwide strength in direct andinteractive marketing and researchthrough our traditional channels suchas OgilvyOne, Impiric, digital@jwt,Alexander Ogilvy, Blanc & Otus andMB Interactive. Where the recentcompressions in financial valuationsmay offer significant opportunities,we will also invest directly in thenew channels.
Lastly, we will continue to developour specialist expertise in areas suchas healthcare, retail and interactiveand to identify new high growth areas.● Sixth, and you will be pleased toknow our final objective, is to improvestill further the quality of our creativeoutput. Of the three things we do,strategic thinking, creative executionand co-ordination, creative executionis probably the most important – butwe use the phrase in its broadest sense.Clients look for creative thinking andoutput not just from advertisingagencies, public relations and designcompanies, but also from our mediainvestment management companies,MindShare and The Media Edge andour research companies. MillwardBrown is already arguably one of ourmost creative brands.
We will do this by stepping up ourtraining and development programs;by recruiting the finest talent fromoutside; by celebrating and rewarding,both tangibly and intangibly, out-standing creative success; by acquiringstrong creative companies; and byencouraging, monitoring andpromoting our companies’ achieve-ments in winning creative awards.
A colossal amount remains to bedone – and given the pace of changethat our clients face and thereforechallenge us with, it seems certainthat once these objectives are achieved they will be replaced by new ones.
As companies grow in size, mostchairmen and CEOs becomeconcerned that their organizationsmay become flabby, slow to respond,bureaucratic and sclerotic.
Any sensible chairman or CEO wouldnot want this to be the case. Theywould want both the benefits of sizeand scale with the responsiveness andenergy of a smaller firm. For the firsttime new technologies enable this tobe achieved more effectively and easily.
WPP is no different. We want thescale and resources of the largest firmtogether with the heart and soul of asmall one.
As a parent company, we aredeveloping practical principles andpolicies for charitable giving, theenvironment and support forcommunities and the arts, based onbest practice guidelines. Our activitiesrun in parallel with our operatingcompanies’ initiatives and programs in each of these areas. A summary of the Group’s initiatives to date canbe found on page 91.
Numbers alone – which of necessitymake up the essence of an annualreport – can only poorly express thecreativity, the applied discipline andthe infinite diversity that make upyour Company. It is, of course, anintensely personal and intenselycreative business. Our many clientscome to us for the brains andinventiveness of our people. Acrossthe disciplines, around the world,project by project, each assignment is individually undertaken and eachsolution painstakingly made-to-measure. And when all the hundredsof assignments are totalled up, andexpressed as they must be in monetaryterms, they deliver the numbersreported here.
So we would ask you now, as shareowners, to look behind those numbers,to remember their origin, to recognisethe 65,000 people who work for WPP companies around the world: andto join us in respect and admirationfor their talent and gratitude for theirdedication. We hope they enjoyedthemselves.
It was an outstanding year: and inmore ways than can be measured.
2001, although a more difficultyear, should be an even better one.
WPP is delighted that AmbassadorPhilip Lader has agreed to become chairman of your Company.Businessman, government executiveand diplomat, with a wide knowledgeof the world, Philip Lader brings with him an unparallelled range of skills and contacts which will be of immeasurable benefit to us and all our operating companies.
At the same time, it is with regret,gratitude and affection that we saygoodbye to Hamish Maxwell, ourchairman for the past four years.Formerly chairman and CEO of oneof the world’s largest and mostsuccessful companies, he was anoutstanding source of wisdom, counseland kindness. We shall miss himsorely and wish him well.
Philip LaderChairman
Sir Martin SorrellGroup chief executive
14 WPP How we’re doing
Operating and financial review
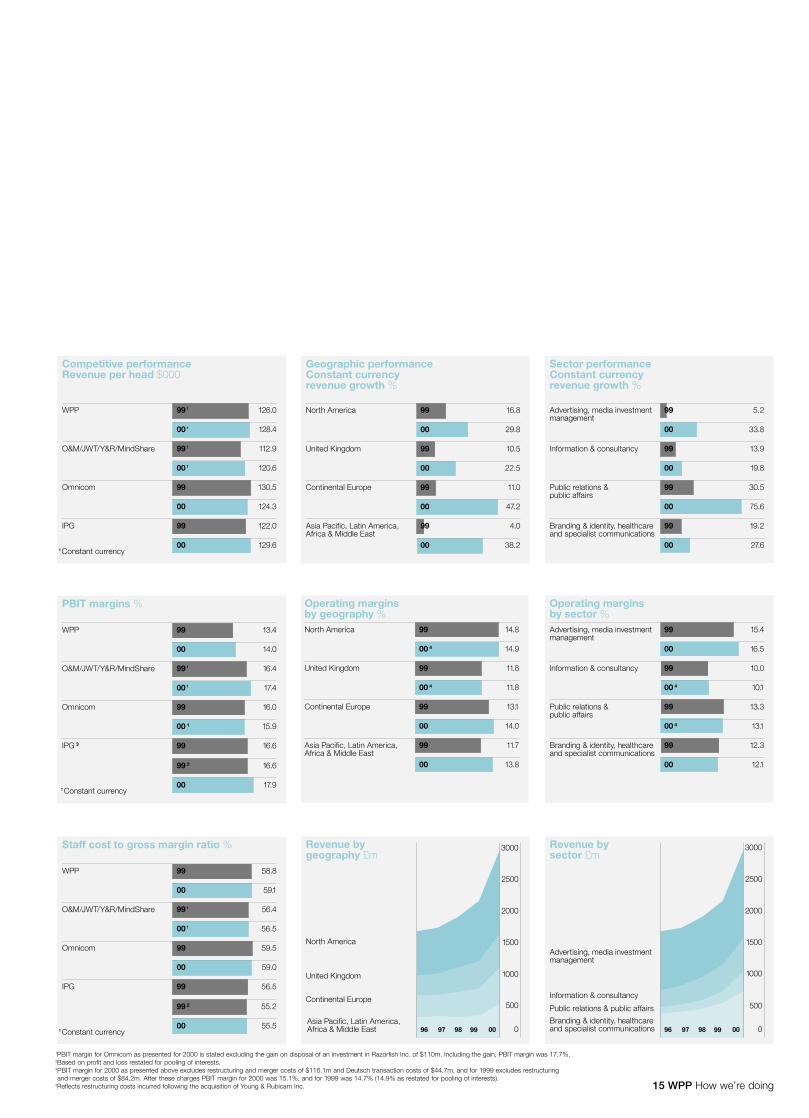
Competitive performanceThere is still a significant profitopportunity in matching the operatingmargins of the best-performingcompetition. The best-performingcompetitive listed holding companies,The Interpublic Group of CompaniesInc. (‘IPG’) and Omnicom Group Inc.(‘Omnicom’), achieve 16-18%operating margins, whilst their best-performing individual agencies suchas McCann-Erickson Worldwide andBBDO Worldwide are estimated toachieve operating margins of as muchas 20%. This compares to a WPPparent company margin of 14.0% andreported combined margins of theOgilvy & Mather Worldwide,J. Walter Thompson Company andY&R Advertising brands of 18%.
Historically, listed public relationscompanies showed operating marginsof more than 10% which have nowbeen more than matched by our ownoperations. Operating managementhas indicated that margin performancecan be improved further.
The Group is targeting animprovement in operating margin of1% in 2001 to 15% and 15.5% by2002, to bring us in line with the bestperforming of these competitors.
One of the Group’s most importantobjectives is to increase its rate oforganic revenue growth which is a keymeasure of the success of its value-added strategy. Excluding acquisitions,this was approximately 15% in 2000,a rate of growth that, althoughdelightful, is clearly unsustainable inthe long term.
Comparison with our competitorsis difficult given that, to the best ofour knowledge, they define organic
growth rates differently absorbingacquisition revenues into organicgrowth rates more quickly. If we wereto use their method of calculation,our organic growth rate would havebeen closer to 19%. Clients in thehigh revenue growth areas ofinformation and technology,telecommunications, healthcare,financial services and entertainmentand media now account for almost28% of Group revenues. As abenchmark at the end of 2000 thesesectors (excluding healthcare)accounted for approximately the samepercentage of the FTSE 100 bymarket capitalisation.
Geographic performanceEconomic conditions in NorthAmerica are now, to say the least,more challenging. The UK andContinental Europe, however,particularly France, Germany, Italyand Spain are currently stronger, alongwith Asia Pacific and Latin America.Our fourth quarter performance in2000 reflected this pattern with theUS and UK performing in line withexpectations and Continental Europe,Asia Pacific and Latin Americaperforming more strongly than forecast.Recent relaxation in monetary policyon both sides of the Atlantic maystimulate those economies in thesecond half of the year.
However, it may well be that the realeconomic challenge may come not in2001 but in 2002, if lower interest ratesand US tax cuts overheat the economyand general inflation and wages risebeyond the rates of 3-4% that we havebecome used to in the 1990s. YourBoard continues to believe that Asia
Pacific, Latin America, Africa, theMiddle East and Central and EasternEurope will offer superior opportunitiesfor growth in the medium to long term.These markets now account for morethan 18% of the Group’s revenue asopposed to 13% in 1992, and morethan 20% if our share of associates’revenues are included. These marketsare still forecast to continue to grow at significantly faster rates than those of North America and Western Europein the long term.
WPP, according to the AdvertisingAge Agency Report, ranks in the topthree in all of the 10 fastest-growingmarkets of the world.
Sector performanceOn the following pages the heads ofour nine operating brands summarisetheir operational activities andhighlights for 2000.
15 WPP How we’re doing
Competitive performanceRevenue per head $000
WPP
O&M/JWT/Y&R/MindShare
Omnicom
IPG
99 †
99 †
99
99
00 †
00 †
00
00
126.0
112.9
130.5
122.0
128.4
120.6
124.3
129.6† Constant currency
Geographic performanceConstant currencyrevenue growth %
North America
United Kingdom
Continental Europe
Asia Pacific, Latin America,Africa & Middle East
99
99
99
99
00
00
00
00
16.8
10.5
11.0
4.0
29.8
22.5
47.2
38.2
Sector performanceConstant currency revenue growth %
Advertising, media investmentmanagement
Information & consultancy
Public relations & public affairs
Branding & identity, healthcareand specialist communications
99
99
99
99
00
00
00
00
5.2
13.9
30.5
19.2
33.8
19.8
75.6
27.6
Operating marginsby geography % North America
United Kingdom
Continental Europe
Asia Pacific, Latin America,Africa & Middle East
99
99
99
99
00 4
00 4
00
00
14.8
11.8
13.1
11.7
14.9
11.8
14.0
13.8
PBIT margins %
WPP
O&M/JWT/Y&R/MindShare
Omnicom
IPG 3
99
99 †
99
99 2
99
00
00 †
00 1
00
13.4
16.4
16.0
16.6
16.6
14.0
17.4
15.9
17.9† Constant currency
Staff cost to gross margin ratio %
WPP
O&M/JWT/Y&R/MindShare
Omnicom
IPG
99
99 †
99
99 2
00
00 †
00
00
58.8
56.4
55.2
99 56.5
59.5
59.1
56.5
59.0
55.5† Constant currency
Operating marginsby sector %Advertising, media investmentmanagement
Information & consultancy
Public relations & public affairs
Branding & identity, healthcareand specialist communications
99
99
99
99
00
00 4
00 4
00
15.4
10.0
13.3
12.3
16.5
10.1
13.1
12.1
Revenue by geography £m
96 97 98 99 00
3000
0
1000
500
1500
2000
2500
Continental Europe
Asia Pacific, Latin America,Africa & Middle East
United Kingdom
North America
Revenue by sector £m
96 97 98 99 00
3000
0
1000
500
1500
2000
2500
Advertising, media investmentmanagement
Information & consultancy
Public relations & public affairs
Branding & identity, healthcareand specialist communications
1PBIT margin for Omnicom as presented for 2000 is stated excluding the gain on disposal of an investment in Razorfish Inc. of $110m. Including the gain, PBIT margin was 17.7%.2Based on profit and loss restated for pooling of interests.3PBIT margin for 2000 as presented above excludes restructuring and merger costs of $116.1m and Deutsch transaction costs of $44.7m, and for 1999 excludes restructuringand merger costs of $84.2m. After these charges PBIT margin for 2000 was 15.1%, and for 1999 was 14.7% (14.9% as restated for pooling of interests).
4Reflects restructuring costs incurred following the acquisition of Young & Rubicam Inc.
Operating and financial reviewReports from operating brands
WPP How we’re doing
Advertising and media investmentmanagementOn a reported basis, combined advertisingand media investment managementrevenues at Ogilvy & Mather Worldwide(which was named by Adweek the United States Agency of the Year in 2000),J. Walter Thompson Company, Y&RAdvertising, Red Cell (formerly Conquest),MindShare and The Media Edge rose byalmost 34%. The combined operatingmargin of this group of companies was16.5%. Combined operating costs rose by32% and the combined staff costs torevenue ratio excluding incentive paymentsfell to 52.6% from 53.7%.
In 2000, Ogilvy & Mather Worldwidegenerated net new billings of £515 million,J. Walter Thompson Company £373million and Y&R Advertising (fourth quarteronly) £28 million.
Also in 2000, MindShare generated netnew billings of £1.5 billion. Plans are beingdeveloped to create a ‘WPP media’ parentcompany which, like Kantar in informationand consultancy, will seek to add value toour clients and our people through ‘tribal’co-operation.
Red Cell’s revenues rose almost 11%and operating profits and margins were up significantly. Net new billings were £13 million.
Ogilvy & Mather WorldwideSimply put, Ogilvy had another greatyear. In a world exploding with newtechnologies, new media and newglobal markets, clients are tending totheir brands as never before, makingOgilvy more relevant than ever.
We have long been advocates ofbranding – a principle that goes backto David Ogilvy. Our revival of thisphilosophy as Brand Stewardshipseven years ago both linked us to ourpast and positioned us for our future.We have since expanded that focusbeyond traditional media to encom-pass every point of contact with theconsumer. This has become ourguiding star: creating integrated,multi-disciplined, brand-based andconsumer-focused communications.That makes 360 Degree BrandStewardship Ogilvy’s core businessstrategy and one that fits well withtoday’s marketplace.
What makes our claim solid on thisstrategy is its pedigree. For decades wehave had a multi-disciplined approachwith robust direct marketing andpublic relations divisions, and even aveteran interactive unit. We brokeground in this discipline 16 years ago,and today we are the leadinginteractive agency in terms of globalreach, financial strength, growth (50%in 2000), creativity and innovation.(Adweek named OgilvyInteractive its2000 Integrated Agency of the Year.)These units are the growth engines ofour company.
The greatest benefit of our 360Degree strategy is that it gives us aunifying point of view – one thattakes full advantage of our range oftalent and capabilities. For this
reason, we continue to expand ourservices beyond our core strengths to such growing areas as brandconsultancy, design, healthcare,mobile communications, loyaltymarketing and CRM initiatives.Through the start-up of new units,strategic acquisitions and jointventures, and our relationships withthe WPP family of companies, we are building a 360 Degree networkthat is unparalleled.
As a result, I believe the agency isin the strongest position it has been inyears. Once again, all regions areperforming well, with many key markets– the US, France, India, Philippines,Brazil, Mexico and Guatemala amongthem – being singled out for local topagency accolades.
Our continued focus on our workhas made it better. Certainly we have more offices in more countriescontributing to our creative reputation,as attested by another strong year interms of awards. Importantly, manyof these awards came from beyondadvertising, and that reflects ourgrowing weight as a creative force inmulti-discipline and integratedmarketing. All told, our people, ouroperations and our work netted wellover 250 different honours from allindustry sectors.
Our client roster continues to bethe envy of the industry, includingsuch clients as IBM, American Express,Unilever, Kraft, Kodak, Ford, Nestlé,BP, Telefonica and Terra Networks.Our share across the board with theseand other clients has been growingwith assignments that are broad andincreasingly multi-disciplined.
While growth with existing clientsis paramount, last year we addedseveral important new brands, led bythe assignment of Motorola’s globalaccount. In total, we added close to$1 billion in new billings.
I am very optimistic about thiscoming year. We have a superbstrategy, and we are committed todelivering it – everywhere it counts, ineach office, for each client, every day.That’s where the promise of 360Degree Brand Stewardship translatesinto success for our clients and for us.Shelly Lazarus
17 WPP How we’re doing
J. Walter Thompson CompanyJ. Walter Thompson continued itsstrong forward momentum in 2000.We posted one of the best newbusiness, revenue and profitperformances in our 137-year history. In addition, we acceleratedour transformation to a totalcommunications company bydeepening our roster of superior talent and capabilities in everymarketing discipline.
Net new billings (in constantcurrency) won worldwide totalled$615 million. We welcomed a host ofnew blue-chip clients including SunMicrosystems, KPMG, iPlanet,Spencer Stuart, Foster’s Beer, Avonand Telecom Italia. In addition, wewere entrusted with significant newassignments from valued currentglobal clients including Ford, Unilever,Nestlé, Diageo/UDV, Qwest, PhilipMorris and Pfizer.
Our company generated dynamicgrowth across the board in everyregion, led by the United States andEurope. Latin America reboundedstrongly after a difficult 1999 andAsia Pacific continued its sustainedimprovement.
We broadened JWT’s global reachand invested in premier resources toextend our service offering in specialisedcommunications. Our networkexpanded to 311 offices in 155 citiesin 90 countries, serving leadingmarketeers in virtually every categoryof goods and services.
Our solid financial and creativefoundation enabled us to completemore than 20 strategic acquisitionsworldwide. Top-flight companiesjoined our ranks in every disciplinewith particular emphasis on digitalbranding, direct response, databaseand promotional marketing.
JWT now holds majority stakes in:TMI, a full-service agency operatingin eight Middle East countries andAPCU Thompson Asociados, ageneral agency operating in sixCentral American countries. We alsoincreased our stake in one of Israel’spacesetting agencies, Tamir Cohen.
In addition, our line-up of digitaland technology communicationscompanies was enhanced with theaddition of Tonic 360, San Francisco;
Imagio/JWT, Seattle; Coolfire, New York; Interactive MarketingConcepts, Toronto; and ThompsonDigital Korea; as well as Go DirectMarketing, a database firm in Toronto and Vancouver.
Our diversified communicationsand marketing services companiesachieved significant growth:● ThompsonConnect, our global direct marketing subsidiary, with 600 professionals in 15 countries, grew to $76 million in revenue.● JWT Specialized Communications,our recruitment and employeecommunications firm, with a globalreach of 600 professionals in 34offices, rose to $75 million in revenue.The group continued to diversify intohigh-growth areas such as technologyadvertising and mature marketcommunications.● digital@jwt, our full-serviceinteractive and digital brandmarketing arm, made progress inforging its worldwide network anddelivered award-winning work. It isbecoming a recognised force in newmedia, with 450 professionals andnearly $50 million in revenue.
We launched several researchinitiatives to understand more deeply how people consumecommunications, extending JWT’srenowned heritage of brand learning.These efforts are driving the creationof new tools aimed at providingleading-edge brand communicationsplanning in the year ahead.
In sum, we became a strongermarketing partner better able todeliver integrated solutions for our clients, using our proprietaryapproach called Thompson TotalBranding.
The entrepreneurial spirit of ourpeople is our most valuable competitiveadvantage. Their single-minded focuson great ideas that build relationshipsbetween brands and consumers – ideaswith the power to resonate across theentire communications spectrum – willensure our leadership in a marketinglandscape whose only constant is warpspeed change.Peter Schweitzer
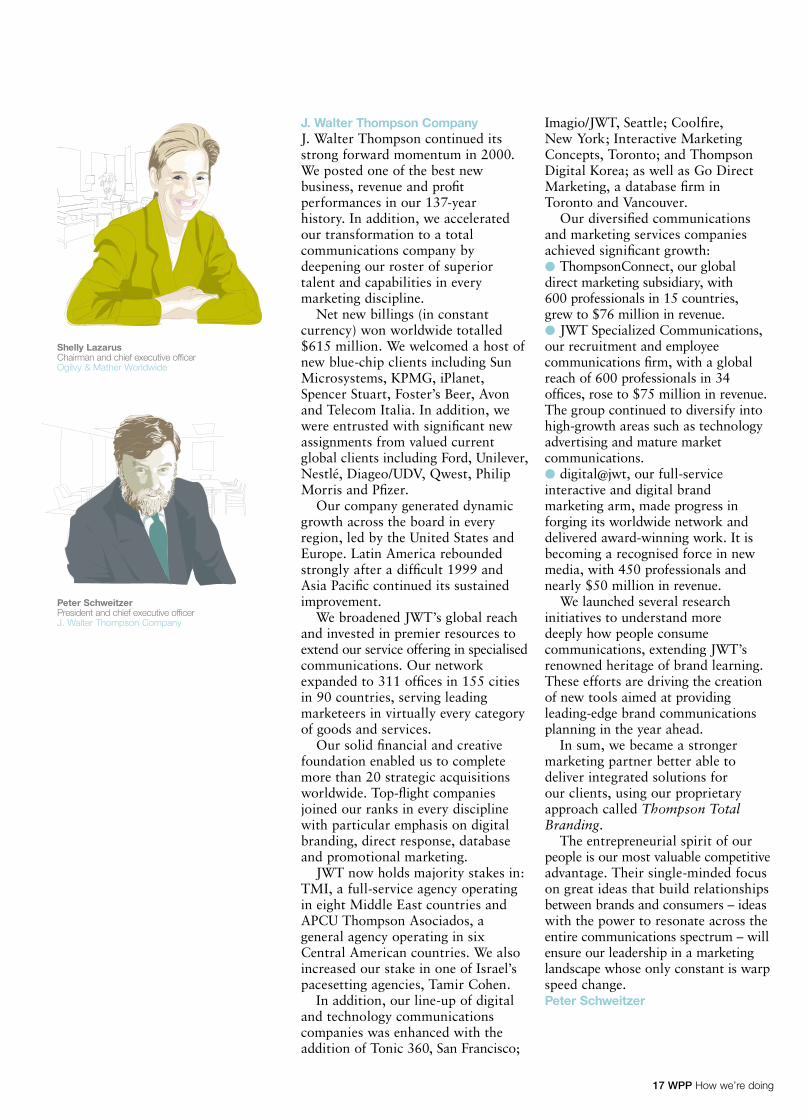
Peter SchweitzerPresident and chief executive officerJ. Walter Thompson Company
Shelly LazarusChairman and chief executive officerOgilvy & Mather Worldwide
Operating and financial review continued
18 WPP How we’re doing
Young & Rubicam Inc.The year 2000 was a year of greattransformation for Young & RubicamInc. – a year in which we defined ourstrategy for the future by joining theWPP Group of companies.
We share a number of key clientswith WPP. That makes the transitionsimpler. But even more important,we share common philosophy andvalues. Joining WPP will help usdeliver the most powerfulcommunications programs to ourclients. At the same time, we areconfident that our singular 30-yearhistory of building brands throughintegrated communications will addvalue to the entire WPP network.
Philosophically, Young & Rubicamfits easily into the Group: Young &Rubicam is a global group of people,disciplines and companies dedicatedto bringing our clients the best incommercial persuasion. Our goal is tobuild powerful, sustainable brands...to move minds, move products andhelp drive marketplace results.
We often say that our currency isideas. Ideas that are founded on anexhaustive knowledge of our audiences,executed through the industry’sbroadest range of communicationsdisciplines. That the essence of Young& Rubicam is knowing when andhow to integrate these disciplines tocreate persuasive messages that cantravel the world.
We do it by organising ourselvesaround our clients – across alldisciplines and geography. Ourdedicated brand teams give our clientsthe best of both worlds: the size andmuscle of a world leader in marketingand the nimbleness and flexibility ofan entrepreneurial enterprise.
In 2000 we reaffirmed thiscommitment to client focus throughseveral key initiatives. We namedSatish Korde president, ClientSolutions, in charge of our keycorporate accounts, and designatedtop-management accountability foreach of our major clients. Lessonslearned at this level resound with allof our clients everywhere.
Some time ago, we coined thephrase, Best Alone, Better Together.It’s still the best description of whatdrives our success. Our strength
together is predicated on theindividual strengths of our partnercompanies, each a top-ranking leaderin its field. Each lending particularexpertise to a client problem. Eachcompany profitable in its own right,with its own core group of clients,accomplishments and credentials.
At Y&R Advertising, Ed Vickreturned as chairman and CEO, after serving as chief creative officerfor Y&R Inc. In this year of change,the agency suffered some difficult andhigh profile account losses – US Kraftbusiness, United Airlines, Ericsson,KFC, USPS, Ford Europe, among them.
These were counterbalanced by astrong new business momentum.Wins included Computer Associates,Xenical, Pennzoil, Marks & Spencer,Scotts Co., Ford’s Land Rover,NASCAR, additional business fromSony, as well as Chanel’s global mediabusiness. The agency launched a newintegrated unit, Brand Buzz, that grewto be a $60 million agency in its firstyear of operation. In London, Y&Racquired The Partners, a premierbrand design firm.
At Y&R’s media planning, buyingand placement services operation, TheMedia Edge, important new globalproduct offerings gained momentum in2000, including The Digital Edge andTME 360, a total communicationsoffering that is acting as a culturalchange agent within TME. TME’sMedia Convergence was created tohelp clients wade through the dizzyingarray of interactive media options thatare available now, as well as thosesoon to come. Industry recognitionwas high: Advertising Age namedTME the Media Agency of the Year inthe US. ‘Agency of the Year’ honourswere also bestowed upon TMECanada and Australia, and numerousawards for people and work markeda strong performance.
At Impiric, new capabilities inconsulting, interactive services andcustomer dialogue were added in2000. With these forward-lookingchanges also came the recognitionthat the company must also be true to its direct marketing roots. Newregional leadership at our flagshipNew York agency and in Europehas already had a positive impact.
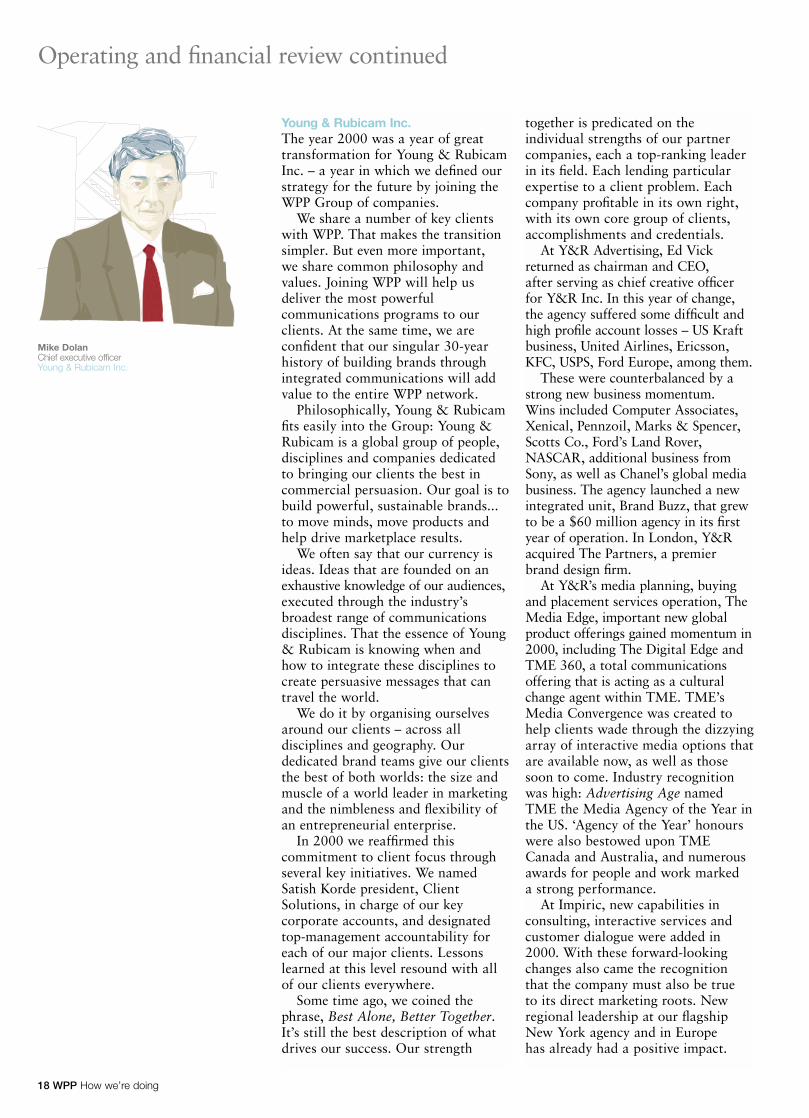
Mike DolanChief executive officerYoung & Rubicam Inc.
WPP How we’re doing
At the start of 2001, the appointmentof Daniel Morel as the new chairmanand CEO strongly positions Impiricfor the future.
Under the leadership of Ron Bess, theDiversified Communications Groupdelivered a strong performance last year.
In 2000, Burson-Marstellerstrengthened its commitment to thedistinguishing features and initiativesthat position Burson-Marsteller as anindustry leader. Global capabilities,groundbreaking research, technologyfocus, and client service have positionedthe company for continued growthand innovation.
Notable achievements included ane-fluentials study that identified, forthe first time ever, a group of opinionmakers who have an exponentialinfluence shaping and driving publicopinion through the internet. Threenew investments in technology wereBM3W, FastForward – both of whichreturned a profit in their first monthof operation – and Speed Branding.
At Cohn & Wolfe, new businesscame from Orange, Microsoft, Pfizer,DuPont and Sony. The networkexpanded to include Kendo in Parisand new offices in Madrid and SanFrancisco, and Cohn & Wolfe wasnamed Best Healthcare Agency inthe UK.
At Landor Associates, new brandidentities were launched for numerousmajor clients, including BP, FranceTelecom, NYSE (the New York StockExchange), Delta, Corning, 7UP andbmi british midland. In 2000, Landoralso strengthened its network, both inthe US, where the company acquiredthe brand strategy consulting firm ofSt. James, and globally, with theaddition of new offices in Vienna,Dubai and Singapore.
Sudler & Hennessey added Rochebusiness in the US and Europe, as wellas a global campaign for professionalsfor Roche Tamiflu. The network wasstrengthened by the addition of S&Hconsumer groups in New York, Londonand Milan; digital health strategies –Avenue-e – in Milan, Melbourne andFrankfurt; Sentrix global healthcommunications in Short Hills, Paris,Milan and Munich, as well as a Precepteducation service in Short Hills.
The Bravo Group continued toprovide critical marketing services toclients targeting Hispanic audiencesin the US. New units of the agencyincluded BravoMed, a healthcarespecialty unit; Bravo 2.1, seamlesslyintegrating on-line and off-linecommunications, as well asBravoLateeno, which helps clientsreach the bi-cultural, bilingual Latinoyouth segment.
In its 15th year of operation, Kang & Lee went to market with thelargest single campaign done by theagency: integrated advertisingprograms for the US Census Bureauthat targeted 13 ethnic groups in 14languages. Research for the campaignearned the agency the prestigiousOgilvy Research award.
Finally, Young & Rubicam acquiredRobinson Lerer & Montgomery, one of the world’s premier strategiccommunications firms.
In joining WPP, Young & Rubicamhas made important changes,restructuring the organisation tomake us leaner, more focused andbetter directed. We are a bettercompany than we were a year ago.There is a wonderful depth of talentand commitment that resides in all ofour companies across the world.
Raymond Rubicam liked to say thatevery generation of Y&R would haveto reinvent itself for its own time. We have done so in 2000. We enterthe 21st century with tremendousconfidence about our future, and a real eagerness to demonstrate the power of Young & Rubicam’sintegrated communications.Michael Dolan

WPP How we’re doing
Red Cell 2000 has been a great year for eachof the four founding companies ofRed Cell: European-based Conquest,US agency Cole & Weber, UKmarketing communications groupPerspectives and Asia Pacific alliancepartner, Batey.
Together, they have created a newglobal communications networkfocused on the needs of ‘challengerbrands.’ Individually, each companygrew in terms of revenues, awardsand client wins, including OCBCBank and TNT Air Express in Asia,Freight Traders in the UK, AtkinsNutritionals and Nike ACG in theUS, Celanese in Germany and GrapesTelecom across Europe.
To deliver global brand buildingcommunication solutions, Red Cellemploys fundamentally new rules ofengagement, consciously seeking deepand broad creative talent and having atits core the capability to react quicklyand effectively to shifting marketopportunities. A thousand talentedpeople in Düsseldorf, London, Milan,Paris, Seattle, Singapore and 16 otherkey business centres, work locally orglobally for brands such as Alfa Romeoand Ermenegildo Zegna.
Most agencies have the fundamentalskills to work for a variety of clients and established agencies have proven to be highly successful forestablished brands.
Our business focus is different.Challenger opportunities – people,brands, or companies in need of rapidchange – are seeking a new breed of agency. Red Cell’s singular focus is to deliver global communicationstrategies for these challengeropportunities.
A challenger brand can be a fastgrowing private company in theluxury business or financial servicemarket, or a group of managerswithin a large multinational fmcgcorporation with a need to revitalisean existing brand. It is not about size, but rather the brand attitude and life cycle condition that defineschallenger brands.
At Red Cell we use BrandStormto provide clients with fresh andchallenging solutions to theirbusiness opportunities.
Luca LindnerChief executive officerRed Cell (formerly Conquest)
Operating and financial review continued
BrandStorm is an inclusive forumwhich empowers clients, account andcreative managers and planners towork collaboratively from the outsetof a project. This ‘collectivepartnership’ mentality delivers resultsin half the time typically experiencedwith conventional agencies.
Finally, at Red Cell we believe that in a globalised and internet-connected world there is a fantasticopportunity to work with the besttalent in the world. The location and employment status of talent isincreasingly irrelevant. We arebuilding a community, The EclecticNetwork, of exceptional creatives,financial analysts, brand architects,and individuals from the movieindustry, all with provencommunication and brand buildingskills – Sir Bob Geldof being anexcellent example. Every Red Cellpartner in charge of a client’s brandwill have the ability to leverage thegold mine of talent represented byThe Eclectic Network.Luca Lindner
21 WPP How we’re doing
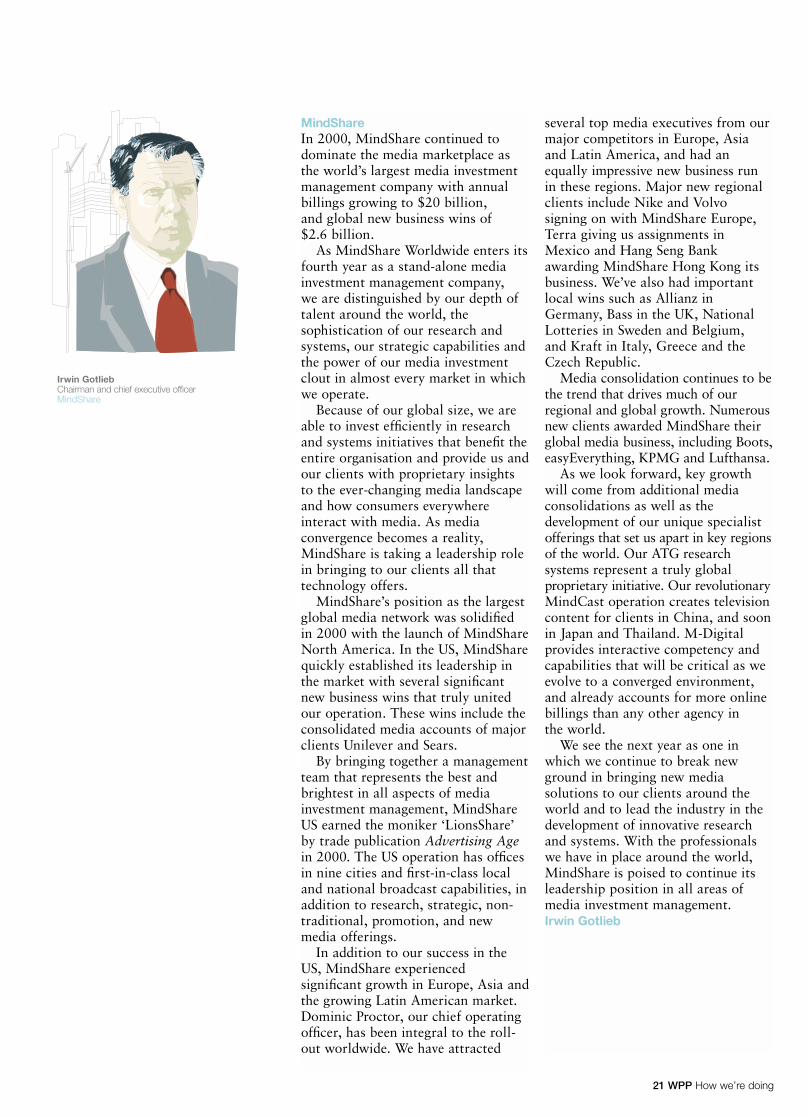
MindShareIn 2000, MindShare continued todominate the media marketplace asthe world’s largest media investmentmanagement company with annualbillings growing to $20 billion,and global new business wins of$2.6 billion.
As MindShare Worldwide enters itsfourth year as a stand-alone mediainvestment management company,we are distinguished by our depth oftalent around the world, thesophistication of our research andsystems, our strategic capabilities andthe power of our media investmentclout in almost every market in whichwe operate.
Because of our global size, we areable to invest efficiently in researchand systems initiatives that benefit theentire organisation and provide us andour clients with proprietary insightsto the ever-changing media landscapeand how consumers everywhereinteract with media. As mediaconvergence becomes a reality,MindShare is taking a leadership rolein bringing to our clients all thattechnology offers.
MindShare’s position as the largestglobal media network was solidifiedin 2000 with the launch of MindShareNorth America. In the US, MindSharequickly established its leadership inthe market with several significantnew business wins that truly unitedour operation. These wins include theconsolidated media accounts of majorclients Unilever and Sears.
By bringing together a managementteam that represents the best andbrightest in all aspects of mediainvestment management, MindShareUS earned the moniker ‘LionsShare’by trade publication Advertising Agein 2000. The US operation has officesin nine cities and first-in-class localand national broadcast capabilities, inaddition to research, strategic, non-traditional, promotion, and newmedia offerings.
In addition to our success in theUS, MindShare experiencedsignificant growth in Europe, Asia andthe growing Latin American market.Dominic Proctor, our chief operatingofficer, has been integral to the roll-out worldwide. We have attracted
several top media executives from ourmajor competitors in Europe, Asiaand Latin America, and had anequally impressive new business runin these regions. Major new regionalclients include Nike and Volvosigning on with MindShare Europe,Terra giving us assignments inMexico and Hang Seng Bankawarding MindShare Hong Kong itsbusiness. We’ve also had importantlocal wins such as Allianz inGermany, Bass in the UK, NationalLotteries in Sweden and Belgium, and Kraft in Italy, Greece and theCzech Republic.
Media consolidation continues to bethe trend that drives much of ourregional and global growth. Numerousnew clients awarded MindShare theirglobal media business, including Boots,easyEverything, KPMG and Lufthansa.
As we look forward, key growthwill come from additional mediaconsolidations as well as thedevelopment of our unique specialistofferings that set us apart in key regionsof the world. Our ATG researchsystems represent a truly globalproprietary initiative. Our revolutionaryMindCast operation creates televisioncontent for clients in China, and soonin Japan and Thailand. M-Digitalprovides interactive competency andcapabilities that will be critical as weevolve to a converged environment,and already accounts for more onlinebillings than any other agency inthe world.
We see the next year as one inwhich we continue to break newground in bringing new mediasolutions to our clients around theworld and to lead the industry in thedevelopment of innovative researchand systems. With the professionalswe have in place around the world,MindShare is poised to continue itsleadership position in all areas ofmedia investment management.Irwin Gotlieb
Irwin GotliebChairman and chief executive officerMindShare
WPP How we’re doing
Information & consultancyThe Group’s information and consultancybusinesses continued their strong revenuegrowth with gross profit rising by almost20% and operating margins up slightlyover the previous year. Particularly strongperformances were recorded by MillwardBrown in the United States, UnitedKingdom, Germany, Hungary, the CzechRepublic, Singapore, Japan and Australia;by Research International in the UnitedStates, Germany, Greece, Japan, South Africa and Brazil; by Kantar MediaResearch at BMRB in the UnitedKingdom; by IMRB in India; and byGoldfarb Consultants in Canada, Italy and the United Kingdom.
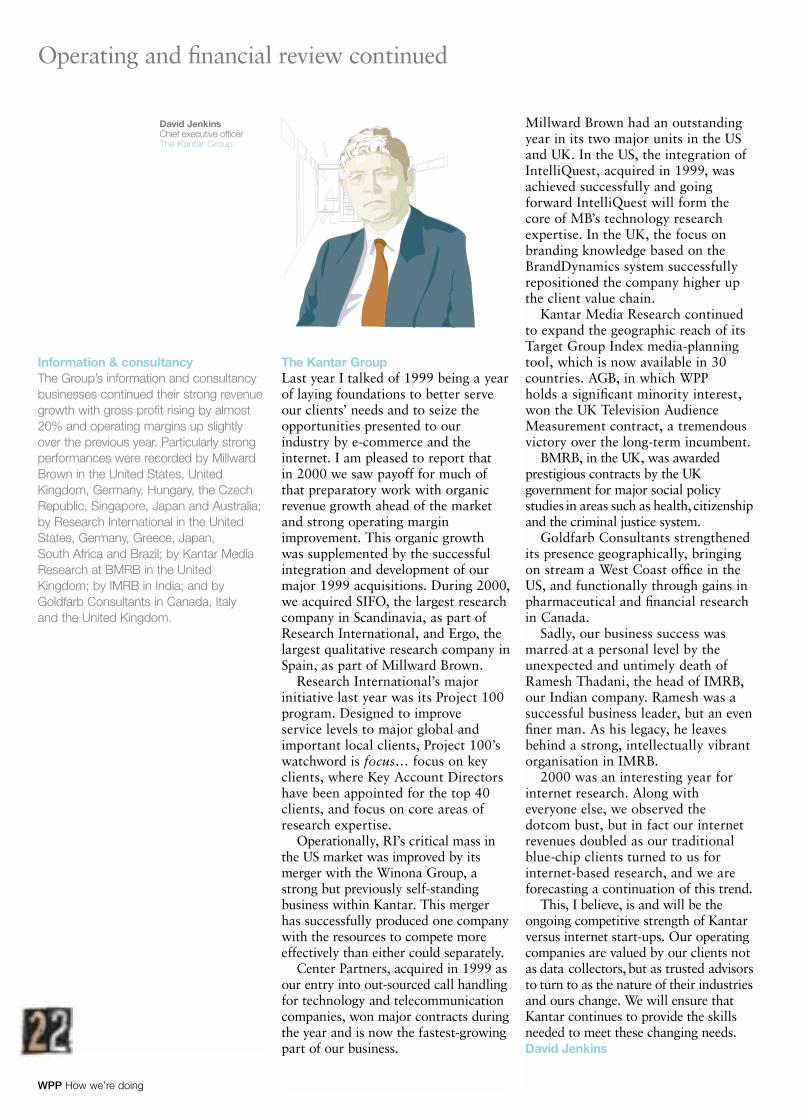
The Kantar GroupLast year I talked of 1999 being a yearof laying foundations to better serveour clients’ needs and to seize theopportunities presented to ourindustry by e-commerce and theinternet. I am pleased to report that in 2000 we saw payoff for much ofthat preparatory work with organicrevenue growth ahead of the marketand strong operating marginimprovement. This organic growthwas supplemented by the successfulintegration and development of ourmajor 1999 acquisitions. During 2000,we acquired SIFO, the largest researchcompany in Scandinavia, as part ofResearch International, and Ergo, thelargest qualitative research company inSpain, as part of Millward Brown.
Research International’s majorinitiative last year was its Project 100program. Designed to improve service levels to major global andimportant local clients, Project 100’swatchword is focus… focus on keyclients, where Key Account Directorshave been appointed for the top 40clients, and focus on core areas ofresearch expertise.
Operationally, RI’s critical mass inthe US market was improved by itsmerger with the Winona Group, astrong but previously self-standingbusiness within Kantar. This mergerhas successfully produced one companywith the resources to compete moreeffectively than either could separately.
Center Partners, acquired in 1999 asour entry into out-sourced call handlingfor technology and telecommunicationcompanies, won major contracts duringthe year and is now the fastest-growingpart of our business.
Millward Brown had an outstandingyear in its two major units in the USand UK. In the US, the integration ofIntelliQuest, acquired in 1999, wasachieved successfully and goingforward IntelliQuest will form thecore of MB’s technology researchexpertise. In the UK, the focus onbranding knowledge based on theBrandDynamics system successfullyrepositioned the company higher upthe client value chain.
Kantar Media Research continuedto expand the geographic reach of itsTarget Group Index media-planningtool, which is now available in 30countries. AGB, in which WPP holds a significant minority interest,won the UK Television AudienceMeasurement contract, a tremendousvictory over the long-term incumbent.
BMRB, in the UK, was awardedprestigious contracts by the UKgovernment for major social policystudies in areas such as health, citizenshipand the criminal justice system.
Goldfarb Consultants strengthenedits presence geographically, bringingon stream a West Coast office in theUS, and functionally through gains inpharmaceutical and financial researchin Canada.
Sadly, our business success wasmarred at a personal level by theunexpected and untimely death ofRamesh Thadani, the head of IMRB,our Indian company. Ramesh was asuccessful business leader, but an evenfiner man. As his legacy, he leavesbehind a strong, intellectually vibrantorganisation in IMRB.
2000 was an interesting year forinternet research. Along witheveryone else, we observed thedotcom bust, but in fact our internetrevenues doubled as our traditionalblue-chip clients turned to us forinternet-based research, and we areforecasting a continuation of this trend.
This, I believe, is and will be theongoing competitive strength of Kantarversus internet start-ups. Our operatingcompanies are valued by our clients notas data collectors, but as trusted advisorsto turn to as the nature of their industriesand ours change. We will ensure thatKantar continues to provide the skillsneeded to meet these changing needs. David Jenkins
David JenkinsChief executive officerThe Kantar Group
Operating and financial review continued
WPP How we’re doing
Public relations & public affairsThe Group’s public relations and publicaffairs activities continued to advancestrongly.
Hill and Knowlton’s revenues rose bymore than 31% and operating costs by more than 29%. As a result, marginsincreased to almost 13%, ahead ofpreviously established targets.
Revenues at Ogilvy Public RelationsWorldwide (which was named both byPR Week and The Holmes Group as‘Agency of the Year’) rose by almost 61%and operating costs by approximately 59%.For the fourth year in a row following thechange in leadership, profitability improvedsignificantly over the previous year.
In the final quarter of 2000, Burson-Marsteller’s revenues rose by more than8% and Cohn & Wolfe’s by more than31%. Robinson Lerer & Montgomery,which was acquired by Young & RubicamInc. in the first quarter of 2000, made astrong first time contribution to the Group.
Our public relations and public affairsbusinesses as a whole showed operatingmargins of more than 13%, in excess ofthe Group’s objective for 2000 and in linewith the best-performing publicly listedcomparables. Operating management hasdeveloped new three year plans thatindicate further significant improvement inoperating margins.
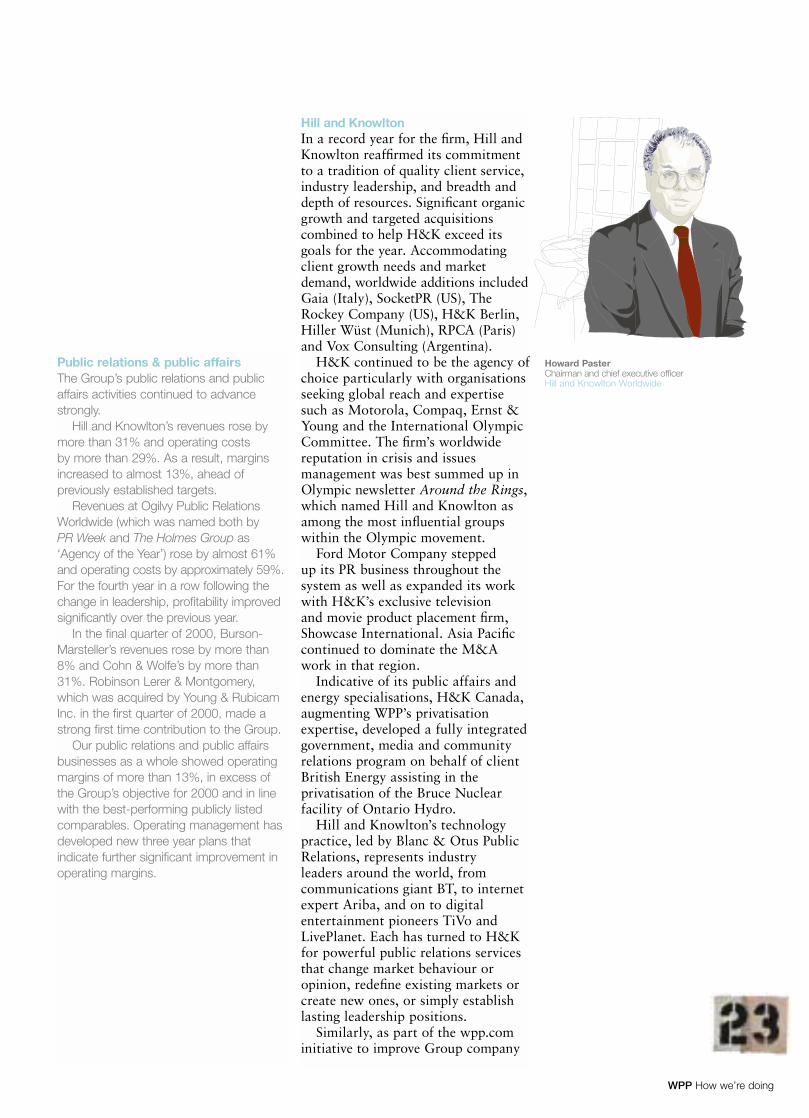
Hill and KnowltonIn a record year for the firm, Hill andKnowlton reaffirmed its commitmentto a tradition of quality client service,industry leadership, and breadth anddepth of resources. Significant organicgrowth and targeted acquisitionscombined to help H&K exceed itsgoals for the year. Accommodatingclient growth needs and marketdemand, worldwide additions includedGaia (Italy), SocketPR (US), TheRockey Company (US), H&K Berlin,Hiller Wüst (Munich), RPCA (Paris)and Vox Consulting (Argentina).
H&K continued to be the agency ofchoice particularly with organisationsseeking global reach and expertisesuch as Motorola, Compaq, Ernst &Young and the International OlympicCommittee. The firm’s worldwidereputation in crisis and issuesmanagement was best summed up inOlympic newsletter Around the Rings,which named Hill and Knowlton asamong the most influential groupswithin the Olympic movement.
Ford Motor Company stepped up its PR business throughout thesystem as well as expanded its workwith H&K’s exclusive television and movie product placement firm,Showcase International. Asia Pacificcontinued to dominate the M&Awork in that region.
Indicative of its public affairs andenergy specialisations, H&K Canada,augmenting WPP’s privatisationexpertise, developed a fully integratedgovernment, media and communityrelations program on behalf of clientBritish Energy assisting in theprivatisation of the Bruce Nuclearfacility of Ontario Hydro.
Hill and Knowlton’s technologypractice, led by Blanc & Otus PublicRelations, represents industry leaders around the world, fromcommunications giant BT, to internetexpert Ariba, and on to digitalentertainment pioneers TiVo andLivePlanet. Each has turned to H&Kfor powerful public relations servicesthat change market behaviour oropinion, redefine existing markets orcreate new ones, or simply establishlasting leadership positions.
Similarly, as part of the wpp.cominitiative to improve Group company
Howard PasterChairman and chief executive officerHill and Knowlton Worldwide
24 WPP How we’re doing
Ogilvy Public Relations Worldwide2000 was a year of strong growth,award-winning programs andunprecedented change in themarketplace. During 2000, we:● Were named ‘Agency of the Year’ by both PR Week andThe Holmes Group.● Grew organically by 35%.● Tripled in size in three years, going from $55 million in 1997 to $169 million, and codified ourposition as one of the industry’sfastest-growing firms.● Expanded geographically to51 offices by opening Ogilvy PRlocations in Bucharest, Colombo,Düsseldorf, Frankfurt, Hyderabad,Istanbul and Sydney.● As a result of our integrationefforts and synergy, all three specialtyunits grew significantly faster asintegrated units than they did asindependents – Feinstein KeanHealthcare (acquired in November1999) grew 48.6%, B|W|R (acquiredin October 1999) grew 22.2% andAlexander Ogilvy (acquired inOctober 1998) grew 43.2%.● Ranked third in size globally in thehealthcare, consumer and technologyarenas, according to the Council ofPR Firms.● Won nine PR Week Awards and six CIPRAs in 2000 (the most of any firm).
We continued to have one of thelowest client turnover rates in theindustry and added key brand namesto our roster, such as BP, Kodak,Tricon, Boehringer Ingelheim,Kimberly-Clark, Microsoft andMerrill Lynch.
Growth happened across each ofour five practices, with the technologypractice leading the way with a 44.2%growth rate in 2000.
In a marketplace bolstered byopportunity, and the talent to fulfillthose opportunities difficult to find,we launched a critical initiative in2000 to Attract, Grow and Keep theBest People (affectionately known asAGK), which helped us reduceturnover by 30% and attract 400 newstaff members. AGK componentsincluded the introduction of anemployee work-visit program;professional development fund;
Bob SeltzerChairman and chief executive officerOgilvy Public Relations Worldwide
Operating and financial review continued
interactive communicationscapabilities, Hill and Knowltonformalised the global Netcomspractice, providing clients withcutting edge internet, extranet andintranet services and strategies. The practice has created onlinecommunications programs for clientssuch as the BT Global Challengeyacht race, the California oliveindustry, and Roche treatments forAIDS and Hepatitis C.
The year was marked by bellwetherinitiatives specifically engineered toenhance quality client service. Suchofferings included the launch of theMedical Knowledge Groupthroughout Europe, Canada and theUS, and the development ofPRecision™, a toolbox that deliversagainst the age-old conundrum ofmeasuring and evaluating PR, as well as targeting and benchmarking.A Group collaboration, developersincluded a working group of H&K,and WPP partners Millward Brown,Millward Brown Precis and MindShare’sAdvanced Techniques Group.
Benchmarking internal and externalperceptions, the firm again participatedin two major transnational studies: theThomas L. Harris/Impulse ResearchEmployee Satisfaction survey and theCorporate Reputation Watch surveyconducted by Yankelovich and ChiefExecutive Magazine, targeting the chiefexecutive officer to raise the visibilityof corporate reputation among seniormanagers and boards of directors.
In recognition of its achievements,H&K scooped the PR Week Awardsfor Best Business Campaign 2000 forits work for Europe’s leading B2Bprovider of ‘e-construction’ services,BuildOnline. As well, H&K HongKong’s technology practice won‘Technology Campaign of the Year’for its work on launching internetcurrency – beenz – into the GreaterChina market.Howard Paster
WPP How we’re doing
O-village (our newly launchedcompany-wide intranet); internal jobposting database and enhancedtraining and knowledge sharingthrough Client Service College, TechBoot Camp, our Core Curriculum and mandatory Management SkillsTraining. Our anniversary celebrationon 3 September 2000 also helped usbuild a deeper appreciation of ourOgilvy heritage.
Our efforts to provide full globalcapabilities to clients progressedsignificantly, aided in large part by O-village. Its state-of-the-art searchfunction allows any employee anywherein the network to access knowledge andresources within seconds.
Ogilvy PR is well positioned tomeet the challenges of 2001, whichwill be driven by an economy verydifferent to that of the past severalyears. Nonetheless, we will continueto grow by expanding geographically,positioning ourselves as leaders in thefastest-growing industries, expandingclient relationships, broadening ourofferings, fostering employee develop-ment and enhancing our approach toclient service.
We enter 2001 ready to face thechallenges and opportunities clearlyahead of us. Bob Seltzer
Branding & identity, healthcareand specialist communicationsBranding and identity, healthcare andspecialist communications revenues roseby more than 27%. Although gross profitrose even more strongly, operating costsrose faster, resulting in overall operatingmargins declining by 0.2 margin points,chiefly due to margin erosion at ourhealthcare operations. Several of ourcompanies in this sector performedparticularly well including in promotion anddirect marketing – Einson Freeman,OgilvyOne, A Eicoff & Company; in identityand branding – Addison CorporateMarketing, Brouillard, Banner McBride,BPRI, Coley Porter Bell, Lambie-Nairn,Scott Stern and Enterprise IG Group; inhealthcare – The Shire Hall Group; and inother specialist marketing resources – The Henley Centre, pFour Consultancy,Management Ventures, Metro, The Farm,The Geppetto Group, JWT SpecializedCommunications and Perspectives Red Cell.
In 2001 this communications servicessector will be split into three parts forstrategic (but not share owner reporting)purposes – first, branding and identity,secondly, healthcare and finally specialistcommunications.
Since its formation and before it wasin vogue, WPP recognised thepotential of marketing specialists toplay a highly valued role and toproduce a concentrated impact on ourclients’ businesses. Over recent years,our strategy has evolved beyond thesimple acquisition of new specialistcapabilities, which for the most partstill characterises the approach of ourcompetitors. With ventures likeCommonHealth, first, Enterprise IGmore recently, and now the BrandUnion in 2001, we have demonstratedhow co-operative ventures can createscale and industry leadership accessibleto even the smallest of our specialistunits. These ‘focused clusters’ ofcomplementary companies are provingmore attractive to clients, creating amore sustainable competitive advantage,and proving the membership benefitsof WPP.
Some of the specific accomplishmentsin our two most sizeable sectors, aswell as a few key events among our other specialist companies, aresummarised below.
The Brand UnionThe goal of the Brand Union is to builda group of leading consulting brandscapable of meeting all the brand,identity and design needs of the world’smost demanding brand owners.
It comprises Enterprise IG; the newlyformed ‘brand experience’ offeringEnterprise XP, which brings together ina single network Banner McBride,Clever Media, Eurosem and The Clinic.Also within The Brand Union are someof the strongest independent brands in our industry – Addison CorporateMarketing, BDG McColl, BPRI, ColeyPorter Bell, Dovetail, The Henley Centre,Lambie-Nairn, Oakley Young,WalkerGroup and newly acquiredWarwicks.
John ZweigChief executive officerBranding & identity, healthcare and specialist communications
26 WPP How we’re doing
Some highlights:● Enterprise IG grew from eightoffices to 17 worldwide and set inmotion plans to open several newoffices in 2001.● Client assignments include themerger of Qwest and US West,programs for Ford Motor Company,Guardian Media Group, Holderbank,Merck’s Vaccine Division, MerrillLynch Investment Managers andWestvaco; many of these clientassignments are serviced throughGroup partnerships with ourworldwide advertising networks,J. Walter Thompson and Ogilvy & Mather.● Addison continued to build itsreputation as WPP’s corporatemarketing arm through stakeholderengagement programs for Novartisand Syngenta together with thenaming and rebranding of Caradon to Novar.● Tutssels, the award-winningLondon-based consumer brand designconsultancy, joined the Enterprise IGnetwork late in 2000.● Banner McBride launched its BrandEngagement offering which led toprograms with Gala Bingo, Getronicsand One 2 One.● BDG McColl’s environmentaldesign projects included work forAmerican Express, Argos and KPMG.● Coley Porter Bell more thandoubled its profitability, and manyof the business wins came fromnon-packaging projects including Fordand Jersey Tourism.● Lambie-Nairn continued todominate the broadcast design sectorand moved into telecommunications,securing clients like ntl and eircom.
Among the awards won were goldin Creativity 30 (Enterprise IG),silvers in the D&AD andPromax/BDG (Lambie-Nairn for BBCidentity and design work); and goldand a silver at the New York Festivals(Clever Media for Getronics video).
CommonHealthIn a year dominated by consolidationamong many of the global pharma-ceutical companies, the world’s leadinghealthcare communications network,CommonHealth, further expanded its
range of capabilities and reach intothe marketplace.
CommonHealth’s core platformsspan the spectrum from professionalto consumer advertising, relationshipmarketing, market research and medicaleducation. Beyond that, the networkoffers clients specialised expertise inbrand identity and design, experientialmarketing and ethnic marketing throughjoint ventures with sister WPPcompanies. In 2000 CommonHealthannounced four such partnerships and launched two new operatingcompanies – noesis, a full servicemedical advertising agency; and anagency uniquely focused on patient-physician communications, MBS/Vox,that was created as an alternative tothe reconstructed reality of focusgroups. A US joint venture was alsoformed with Shire Hall Group, aleading UK-based healthcare publicrelations agency within WPP.
CommonHealth’s philosophy ofnurturing discipline-specificcompanies served the organisationwell in 2000 as newly merged pharmacompanies increasingly sought toconsolidate accounts with a singleresource. We also took advantage ofthe outsourced-marketing trend,forming an alliance with a leadingcontract sales organisation to take onthe marketing of brands that otherwisewould not be significantly promoted.
In 2000, CommonHealth companiescontinued to build blockbuster brandslike Procrit (Ortho Biotech division ofJ&J), Avandia (GlaxoSmithKline) andSchering-Plough with the introductionof its new antihistamine, Clarinex. The organisation picked up major new business assignments – BectonDickinson, Knoll Pharmaceutical,Ortho Dermatological, Ortho-McNeilPharmaceutical, Inc., Novartis,Parkstone Medical InformationSystems, Inc., Ross Laboratories,Sanofi-Synthelabo and Schering-Plough– and saw a major introduction,Bristol-Myers Squibb’s Glucovance.
Technology was a focal point asWPP made minority investments inMedical Broadcasting Company(MBC) and CommonHealth formedstrategic alliances with PedagogueSolutions and SoftWatch.
Other specialist communications● WPP acquired Spafax, the leadinginflight entertainment company andcreators of award-winning programmingon behalf of such clients as BritishAirways, Air Canada, SingaporeAirlines, Delta, China Airlines, among others.● The Première Group, a sports andentertainment marketing resource,also joined the WPP group ofcompanies. ● A 49% stake was acquired inUniWorld, which was named ‘Agencyof the Year’ by Black EnterpriseMagazine for being the largest multi-cultural agency in the US. New clients included Motorola,Home Depot, and the NAACP VoterRegistration Campaign which helpedachieve the greatest African Americanvoter increase in US history.● Mendoza Dillon was awarded the‘Partners in Progress’ award fromSears, a distinction achieved in threeof the last four years. ● RTC was recognised by AdvertisingAge as the largest marketing communi-cations agency in Washington DC. ● pFour Consultancy had aremarkable growth year, with feeshaving doubled in size since itsacquisition by WPP two years ago.John Zweig
Operating and financial review continued
27 WPP How we’re doing
Lightspeed as Kantar’s internet panelwith more than 500,000 panellists byyear end; the acquisition of a minoritystake in Medical Broadcasting Company(the leader in web development strategyand implementation for pharmaceuticalcompanies); the acquisition of a number of technology firms (includingadvertising and public relations specialistImagio and e-commerce firm Imaginet)to strengthen J. Walter ThompsonCompany; the establishment of Y&R 2.1and the flotations of Concept! andSyzygy on the NeuerMarkt in Germany.
Our pure internet revenues (web-based work) for 2000 were ahead ofbudget, over 100% up on 1999 andreached $293 million. These figuresexclude our share of revenues generatedby minority and associate companiessuch as Syzygy, Concept! and Inferentia.Our budgets for 2001, using the samenarrowly based definition of interactivework, show growth rates in excess of25%, fuelled by the continuing growthin the importance which traditionalclients attach to developing newchannels and their desire to integratethose channels.
MindShare Digital, digital@jwt,Kantar, Blanc & Otus, OgilvyInteractive,The Digital Edge and Impiric continueto budget strong increases in revenuesfor 2001 – despite a softening in marketconditions and longer sales cycles.
One or two of our companies inpublic relations which have benefitedsignificantly from start-up dotcomsexpenditure are budgeting lowerrevenue growth. Our interactiveoperations, whose margins are similaror ahead of those of the Group as awhole, are likely to be strengthenedfurther as a result of not having todeal with high turnover rates and theassociated direct and indirect costs.
Major clients of wpp.com includeAccenture, American Express,Ameritrade, Ariba, AT&T, Boots,Citibank, Covisint, the DiamondTrading Company, DoubleClick,easyEverything, El Sitio!, Ericsson,FedEx, Ford Motor Company, IBM,Instinet, iPlanet, Kimberly-Clark,Merrill Lynch, MindSpring, Motorola,Nestlé, NextCard, Nike, ntl, Qwest,SAP, Sears, Siemens, Sony, SunMicrosystems, TiVo, Unilever and Ziff Davis.
wpp.comTo date wpp.com, WPP’s internal new media parent company, hasconcentrated on strengthening itsexisting operations, acquiring newactivities in areas which we think arecritically important, investing in start-up companies with whom we wish topartner and spreading knowledge oftechnology developments throughoutthe Group. We have continued to usewpp.com as a way of strengtheningthe digital capabilities of ouroperating companies.
Overall the effectiveness of thisstrategy has strengthened for threereasons. First, staff turnover rates withinour interactive business fell significantlyduring the second half of the year withpeople whom we had previously lostreturning to the Group. Secondly,valuations have fallen, making smallerinteractive acquisitions more attractive.Finally, our reliance on traditionalcompanies as our main source ofinternet and new media revenues hasenabled us to continue growing revenuesand profits beyond expectations.
The merger with Young & RubicamInc. has brought with it stronginteractive capabilities, notably at TheDigital Edge, Burson-Marsteller,Landor and Impiric. Notable featuresduring 2000 included the growth ofOgilvyInteractive, organically and byacquisition, into the leading global webdevelopment agency and its recognitionby Advertising Age International asInteractive Agency of the Year; thedevelopment of a strong interactivecapability within Impiric; theintegration of IntelliQuest and MBInteractive; the establishment of
Despite the turmoil in the markets,technology is playing a growing rolein the way we develop our business.For example, research can beimplemented more cost effectively andoffer clients valuable results morequickly. In addition, it can streamlinework processes in our advertising andmedia investment managementbusinesses and help us tap into globalcapabilities in a more structured way.
Finally it extends the effectivenessof our relationship marketingcapabilities. We continue to pursueaggressively ways of incorporatingtechnology into the operatingprocesses of all of our businesses.
Our interactive equity investmentshave been made directly and indirectlythrough venture funds. The aim ofthese indirect investments has been tokeep abreast of developments andidentify potential client relationships,thus enhancing our core capabilities.
Historically, the prime venturefunds through which we have madeindirect investments have been AllegisCapital LLC, previously known asMedia Technology Ventures, and Wit Capital’s Dawntreader II fund.The value of our investments in thesefunds has obviously declined over thepast few months but is still ahead ofits original cost.
We have only made two directinvestments in the past few months aswe are concentrating on consolidatingthe investments which Young &Rubicam Inc. had made and buildingcloser relationships between ouroperating companies and our existingminority investments.
We continue to see interestingopportunities for investments andoutright acquisitions, made easier bythe fall in valuations and the desire forstart-ups to partner with traditionalcompanies such as ourselves.
WPP How we’re doing
Group financial performanceTurnover was up 49% to £13.9 billion(reflecting in part the growth of mediainvestment management), revenues upover 37% to £2.981 billion and grossprofit up over 47% to £2.736 billion.On a constant currency basis, revenueswere up almost 33% and gross profitup almost 43%.
Operating profit (excluding incomefrom associates) rose by over 43% to£378.0 million from £263.5 million andby over 40% in constant currencies.
Profit before interest and tax wasup 43% to £416.0 million from£290.8 million and up almost 40% in constant currencies.
The Group’s tax rate on profits was30.0%, the same as in the previous year.
Diluted earnings per share roseover 26% to 28.4p from 22.5p.In constant currency earnings pershare rose by 23%.
The Board recommends an increaseof 21.4% in the final dividend to2.55p per share, which will be paid inthe form of an ordinary dividend,making a total of 3.75p per share for2000, a 21% increase over 1999.
Operating marginsReported operating margins (includingincome from associates) rose by 0.6margin points to 14.0% in line withobjectives and by 0.7 margin points ona constant currency basis.
The margin gap between the verybest-performing competition andourselves continues to narrow.
Operating margins before short and long-term incentive payments(totalling £118.0 million or over 22%of operating profit before bonus andtaxes) rose to 17.9% from 16.7%.Reported operating costs includingdirect costs rose by more than 36%and by 32% in constant currency.
The Group’s staff cost to grossmargin ratio excluding incentives fellto 54.8% from 55.0%.
Variable staff costs as a proportionof total staff costs have increased over recent years to 12.1% and as a proportion of revenues to 6.6%.This has resulted in increasedflexibility in the cost structure.
The task of eliminating surplusproperty costs has been achieved overthe last eight years. Over 650,000 sq ft
with a cash cost of approximately £14 million per annum has beensublet or absorbed.
Like-for-like performanceOn a like-for-like basis (includingYoung & Rubicam Inc. for the finalquarter of 2000), revenues rose byalmost 15% and gross profit was upalmost 16% on 1999. Total operatingand direct costs were up over 14% onthe previous year. Staff costs excludingincentives rose by over 15% andsalaries by over 14%.
On a constant currency basis, pre-taxprofits were up over 40% reflectingthe weakening of sterling against thedollar, counterbalanced to some extentby strength against the euro. If sterlinghad stayed at the same average levelsas 1999, pre-tax profits would havebeen £360.0 million.
HeadcountOur staff numbers averaged 36,157against 27,711 in 1999, up 31%. On alike-for-like basis, average headcountwas up 2,767 to 36,157 from 33,390,an increase of 8%. At the end of 2000staff numbers were 51,195 comparedwith 29,168 in 1999.
ManufacturingRevenues and operating profit were upslightly at the Group’s manufacturingdivision.
Parent company initiativesIncreasingly, WPP is concentrating onits mission of the ‘management of theimagination’, and ensuring it is a bigcompany with the heart and mind of asmall one. To aid the achievement ofthis objective and to develop the benefitsof membership of the Group for bothclients and our people, the parent com-pany continues to develop its activitiesin the areas of human resources,property, procurement, informationtechnology and practice development.
Ten practice areas which span allour brands have been developedinitially in media investment manage-ment, healthcare, privatisation, newtechnologies, new faster growingmarkets, internal communications,retailing, entertainment and media,financial services and hi-tech andtelecommunications.
Operating and financial review continued
29 WPP How we’re doing
Management stock ownershipAs part of the Group’s 100, 300 andHigh Potential club programs ofmanagement stock ownership, stockoptions have been granted each yearsince 1995 to those people with themost significant responsibility for thesuccess of our businesses. Beginning in2001, these programs will be knownas WPP Leaders, WPP Partners and the WPP High Potential Group and will be expanded in response to thesignificant growth of the Group. In addition, 50% of all awards to allparticipants in operating companylong-term incentive plans will continueto be paid in WPP restricted stock.
In 1997, WPP launched theWorldwide Ownership Plan to give allour people an opportunity to share inits success through stock ownership.Options have been granted annuallyunder this program to approximately18,000 people worldwide, and in 2001the program has been extended to alleligible Young & Rubicam Inc. people.
Including outstanding options,interests in WPP restricted stock, stockalready owned and holdings of theEmployee Stock Ownership Plan,people working in the Group currentlyown, or have interests in, in excess of71 million ordinary WPP sharesrepresenting over 6% of the Company,or approximately $750 million.
However, your Company is still at asignificant competitive disadvantagerelative to major competitors in the US,in relation to the availability of stock topromote equity ownership. Omnicomand IPG, for example, have historicallyissued 15-20% of their total sharecapital in the form of stock options orrestricted stock. Beginning in 2001,your Company will be increasing thelevel of stock option grants to meet thiscompetitive standard but will notexceed a total dilution level of 13%over any 10-year period through 2006,consistent with our commitment to UKinstitutional investors in June 1999.
The Leadership Equity AcquisitionPlan (LEAP) was approved by shareowners on 2 September 1999. Twenty-two executives of the Group have beeninvited to participate in the plan. Theseparticipants will acquire or haveacquired 3.5 million WPP ordinaryshares, currently worth over $40
out in accordance with policiesapproved by the Board of Directorsand subject to regular review and audit.
The Group’s interest ratemanagement policy recognises thatfixing rates on all its debt eliminatesthe possibility of benefiting from ratereductions and similarly, having all itsdebt at floating rates unduly exposesthe Group to increases in rates.
The Group therefore aims to limit theimpact from increases in rates whileseeking to ensure that it benefits fromrate reductions by regularly reviewing its exposure profile and deciding uponthe periods for fixing rates in the light of financial market expectations. Its principal borrowing currencies areUS dollars and pounds sterling.Borrowings in these two currencies,including amounts drawn under theworking capital facility, represented93% of the Group’s gross indebtednessat 31 December 2000 (at US$1,154million and £178 million respectively)and 94% of the Group’s average grossdebt during the course of 2000 (atUS$948 million and £194 million). 81%of the year-end US$ debt is at fixed ratesaveraging 5.37% for an average periodof 42 months. The sterling debt is all atfloating rates. Other than fixed ratedebt, the Group’s other fixed rates areachieved through interest rate swapswith the Group’s bankers.
The Group also uses forward rateagreements and interest rate caps tomanage exposure to interest ratechanges. At 31 December 2000 theGroup had one forward rate agreementin place capping short-term US$interest rates at an average rate of5.65% on $25 million of borrowings.
These interest rate derivatives areused only to hedge exposures tointerest rate movements arising fromthe Group’s borrowing and surpluscash balances arising from itscommercial activities and are nottraded independently. Payments madeunder these instruments areaccounted for on an accruals basis.An analysis of the debt and fixed ratematurities is shown in note 8.
The Group manages liquidity risk by ensuring continuity and flexibility of funding even in difficult marketconditions. Undrawn committedborrowing facilities are maintained
million, and have made a commitmentto retain them until September 2004.One-third of these share purchases hasbeen or will be made in cash or earnedbonuses, the other two-thirds being incommitted shares.
Under the terms of LEAP, theparticipants may earn matchingshares over a five-year performanceperiod, based on the Group’s relativetotal share owner return as comparedwith 14 other major listed companiesin our industry.
Acquisitions and start-upsIn addition to the completion of the$4.7 billion acquisition of Young &Rubicam Inc., in 2000 the Groupincreased its equity interests at acombined initial cost of £247 million in advertising and media investmentmanagement agencies in Belgium,China, France, Israel, Italy, the MiddleEast, The Netherlands, Pakistan,Portugal, Puerto Rico, Spain andTaiwan; in information and consultancyin Australia, Denmark, Singapore, Spainand Sweden; in public relations andpublic affairs in Italy, Poland, Turkeyand the US; and in branding andidentity, healthcare and specialistcommunications in Australia, Canada,Denmark, Ireland, Mexico, TheNetherlands, Portugal, Spain,Singapore, Switzerland and the US.
Particularly interesting functionalacquisitions and investments have beenmade in augmenting the Group’s loyaltymarketing capabilities (The LacekGroup), strengthening our creativecapabilities (SCPF), in technology(Socket Public Relations, Imagio andImaginet), in interactive (INTERFAZ401 and Absolut) and in new areas, forexample, inflight media (Spafax).
Treasury activitiesTreasury activity is managed centrally,from the parent company’s London,New York and Hong Kong offices, and is principally concerned with themonitoring of working capital,managing external and internal fundingrequirements and the monitoring andmanagement of financial market risks,in particular interest rate and foreignexchange exposures.
The treasury operation is not a profitcentre and its activities are carried

30 WPP How we’re doing
£57 million and other net cash inflows of £84 million. Free cash flow available for debt repayment,acquisitions, share buybacks anddividends was therefore £291 million.This free cash flow was more thanabsorbed by acquisition payments and investments of £247 million, sharerepurchases and cancellations of £94million and dividends of £26 million.
Your Board continues to examineways of deploying its substantial cashflow of over £500 million per annumto enhance share owner value. As necessary capital expenditurenormally approximates to 1-1.5 timesthe depreciation charge, the Companyhas concentrated on examiningpossible acquisitions or returningexcess capital to share owners in theform of dividends or share buy-backs.
As noted earlier, your Board hasdecided to increase the final dividendby 21% to 2.55p per share, taking thefull year dividend to 3.75p per sharewhich is over seven times covered. In addition, as current opportunitiesfor cash acquisitions at sensible pricesare limited particularly in the US, the Company will continue to commit£150-200 million for share buy-backsin the open market, when marketconditions are appropriate. Such annualrolling share repurchases wouldrepresent approximately 1-2% of theCompany’s share capital which seemsto have a more significant impact inimproving share owner value. Ifsufficient small to medium sized cashacquisition opportunities are availableand there are attractive opportunitiesfor share repurchases, your Board isprepared to increase net debt furtherto the range of £400-450 million incomparison with the historical targetrange of £200-250 million. This levelof debt would still represent only 4-5%of the Company’s market value.
In the first three months of 2001,the period for which information isavailable prior to printing, constantcurrency net debt averaged £470 millionversus £230 million for the sameperiod last year (2000: £239 millionat 2001 exchange rates). This includesthe £653 million spent on capitalexpenditure, acquisitions, sharepurchases and dividends in the previous12 months. The average debt figures
Operating and financial review continued
in excess of average gross borrowinglevels and debt maturities are closely monitored.
Targets for average net debt are seton an annual basis, and to assist inmeeting this, working capital targetsare set for all the Group’s majoroperations. Over the last three years,improvements in working capital havemade a significant contribution toGroup liquidity.
The Group’s significant overseasoperations give rise to an exposure tochanges in foreign exchange rates. The Group seeks to mitigate the effectof these structural currency exposuresby borrowing in the same currencies asthe operating (or ‘functional’) currenciesof its main operating units. The majorityof the Group’s debt is thereforedenominated in US dollars, as this isthe predominant currency of revenues.
Significant cross-border tradingexposures are hedged by the use offorward foreign exchange contracts.There were no such material contractsin place at 31 December 2000. Nospeculative foreign exchange tradingis undertaken.
Cash flowAs at 31 December 2000, the Grouphad net debt of £25 million comparedwith net cash of £92 million at31 December 1999, following cashexpenditure of £247 million onacquisitions, £94 million on sharerepurchases and the inclusion of long-term debt of £195 million from Young& Rubicam Inc.
Net debt averaged £423 million in2000, up £217 million against £206million in 1999. The average debtfigures for 2000 include the impact ofthe Young & Rubicam Inc. long-termconvertible bond of £195 million forthe final quarter. These net debtfigures compare with a current equitymarket capitalisation of approximately£9.0 billion giving a total enterprisevalue of approximately £9.4 billion.
Cash flow continued to improve as aresult of improved profitability andmanagement of working capital.In 2000, operating profit was £378million, capital expenditure £112million, depreciation and amortisationof £79 million, tax paid £81 million,interest and similar charges paid
490
0
70
140
210
280
350
420
2000 Cash flow £m
Cash in Cash out
8 Other79 Depreciation
378 Operatingprofit
Free cashflow £207m
65 Net Interest
112 Capital expenditure
81 Tax
1999 Cash flow £m
Cash in Cash out
21 Other42 Depreciation
264 Operatingprofit
Free cashflow £171m
33 Net Interest
65 Capital expenditure
58 Tax
0
60
120
160
240
300
360
1998 Cash flow £m
Cash in Cash out
10 Other34 Depreciation
229 Operatingprofit
Free cashflow £136m
26 Net Interest
52 Capital expenditure
59 Tax
0
50
100
150
200
250
300
31 WPP How we’re doing
for 2001 include the impact of theYoung & Rubicam Inc. long-termconvertible bond of £195 million.Free cash flow over the same periodwas £417 million.
Net balance sheet assetsNo hedging is undertaken in relation tothe accounting translation of overseasbalance sheets. In 2000 this resulted ina decrease of £133 million (1999:decrease of £31 million) in the sterlingvalue of share owners’ funds due tomovements in exchange rates. In 2000,net assets of £3,434 million comparedwith £355 million (restated) in 1999.
2001 outlookAs usual, our budgets for 2001 havebeen prepared on a conservative basislargely excluding new businessparticularly in advertising and mediainvestment management. They predictlike-for-like revenue increases of over7% in comparison to 2000 pro formanumbers, with advertising and mediainvestment management revenuegrowth of 3% and marketing servicesgrowth of over 10%. For the first timein five years it appears that ourconservative approach to budgetingmay prove correct – unlike previousyears when actual revenue growthexceeded budgeted revenue growth by significant amounts.
In the first three months of 2001,combined WPP and Y&R constantcurrency revenues were up over 9%and on a like-for-like basis, excludingacquisitions and currency fluctations,revenues rose 6%.
In these circumstances there is noreason to believe that the Groupcannot achieve the objective set in2000 of further improving margins byanother 1 margin point to 15.0% in2001 or a further 0.5 of a marginpoint in 2002.
Your Board does not believe thatthere is any functional, geographic,account concentration or structuralreason that should prevent the Groupachieving operating margins of 15.5%by 2002. After all, the two best listedperformers in the industry are at 16-18% and that is where we wouldwant to be.
Neither is there any reason whyoperating margins could not be
improved beyond this level bycontinued focus on revenue growthand careful husbandry of costs. As aresult of this confidence, your Board issetting a new operating margin plan,its sixth since 1991, to achieve furthergrowth in operating margins beyond2002. The objective will be to achieve20% margins over a period of time.
2001 has been ushered in with amultitude of gloomy prognostications.Some may prove to be justified. But early indications are that theworldwide growth of advertisingexpenditure will be around 5-6%, withmarketing services growing at 6-8% – neither significantly behind 2000.
As long as financial markets remainstable and governments do notstimulate inflation, the worldwideeconomic environment should be goodfor growth in the communicationsservices sector as a whole. The globaldominance of the American economy;over-capacity in production; the shortageof human capital; the growing impactof new technologies; and the criticalimportance of internal communications:these are all encouraging factors forour industry. Between them, they havealready stimulated growth in the ratioof advertising and marketing servicesas a proportion of gross nationalproduct to new highs. As long, again,as inflationary pressures are notallowed to build, these trends shouldcontinue into 2002.
We believe that 2001, WPP’ssixteenth year, should be anothergood one.Paul RichardsonGroup finance director


What we think
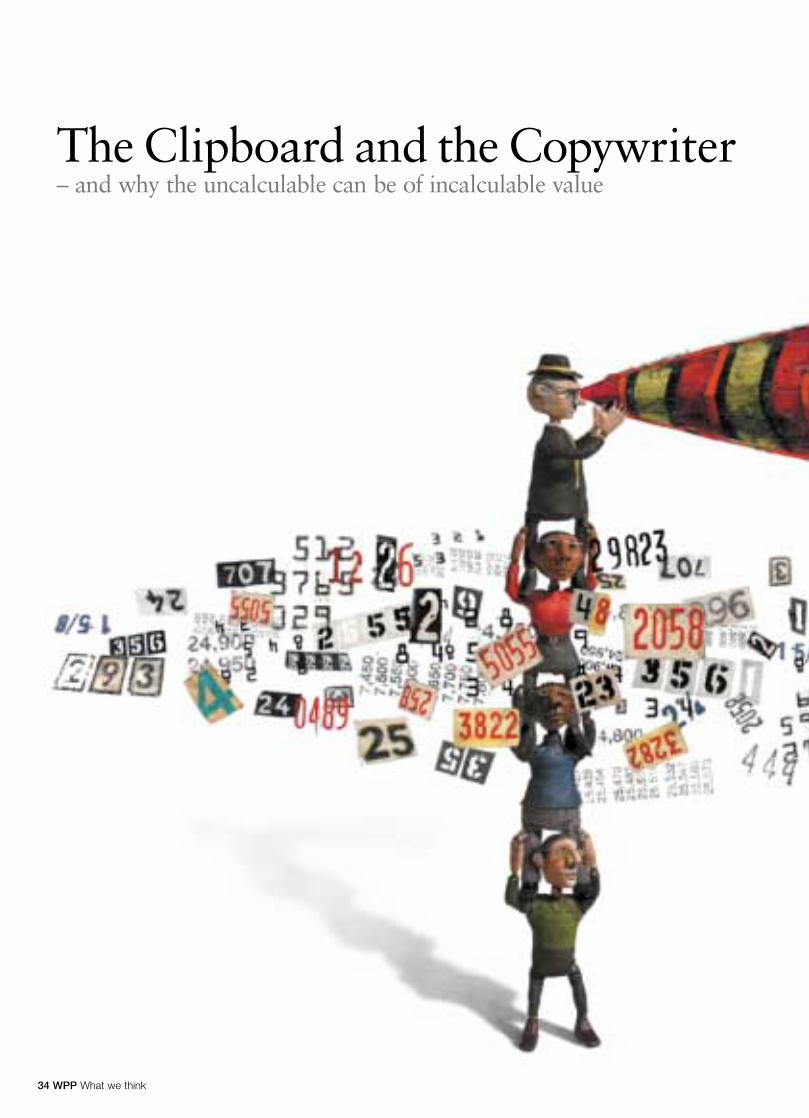
34 WPP What we think
The Clipboard and the Copywriter– and why the uncalculable can be of incalculable value
35 WPP What we think
Many years ago, when cost accounting and efficiency experts wereenjoying disproportionate popularity, a man with a clipboardinterviewed an advertising agency copywriter.
“Tell me,” said the clipboard, pencil poised, “How long does ittake to write a thirty-second commercial?”
The copywriter, a seasoned survivor of difficult client meetings,didn’t hesitate.
“Two hours and twenty-three minutes,” he replied.
The expert nodded, made a note and moved on. He later countedup the number of commercials written by the agency in the courseof a year, multiplied the figure by two hours and twenty-threeminutes, divided the total by the number of copywriters on thepayroll: and concluded in his written report that 48 per cent ofthem were surplus to requirements.
He may well, of course, have been right – but if so, through chancerather than calculation.
The book that you now hold in your hand, the WPP Group annualreport and accounts for the year 2000, contains approximately7,500 numbers. They attempt to do far more than comply with thecompany’s legal and fiduciary obligations. They strive to convey, withforensic accuracy, the anatomy of the business that its shareholdersown; its scope; its competitive performance; its 80-plus componentparts; and all this broken down by region and discipline.
It is absolutely no criticism of these figures, nor of those whopainstakingly compiled and audited them, to say that, while theyaccurately quantify the bone-structure of the company, they failalmost completely to evoke its essential character.
Of course we need numbers. Without numbers, incoherence reigns,progress goes uncharted, comparisons become impossible and acompany’s value is literally incalculable. The danger of numbers is not that they exist but that we become mesmerised by them;
The Clipboard and the Copywriter
WPP What we think
that we come to believe that the importance of things is directlyrelated to their susceptibility to measurement.
In his book The Tyranny of Numbers, David Boyle quotes theeconomist Robert Chambers:
“Quantification brings credibility. But figures and tables can deceive,and numbers construct their own realities. What can be measuredand manipulated statistically is then not only seen as real; it comesto be seen as the only or the whole reality.”And Chambers summedit all up like this:
“Economists have come to feelWhat can’t be measured isn’t real.The truth is always an amount – Count numbers; only numbers count.”
Coming to feel that only numbers count is seductive. Numbers seemso safe and scientific. Numbers protect us from making subjectivejudgments that may be open to challenge. Numbers are like securityblankets. But in our heart of hearts, we already know that noteverything that matters can be quantified: so we look for ways tomeasure the immeasurable. In certain competitive sports, judgesascribe a score to something called artistic excellence.You might as well mark a Monet out of ten.
We look, in other words – however uneasily – for ways to quantifyquality. Today there are numbers being attached to ethical behaviourand corporate citizenship. It’s probably better than ignoring themaltogether, but the numbers are not true numbers, like the number ofmetres in a kilometre; they are metaphors disguised as measurement.
In our lives as citizens and consumers, we are far less reluctant tomake judgments.When we choose a car, we may calculate theamount of baggage space we need, the future cost of fuel, ourprojected annual mileage, our disposable income; but crucially, andoften critically, we also respond to style, design, personality andhow they contribute to our own self-image: immeasurable factors,every one of them. Perhaps the most important decision we evermake is who we marry; but only if we prudently elect to marry formoney does any element of quantification enter into our decision-making process.
The way we choose brands baffles many commentators. The wholeof Naomi Klein’s bestselling book No Logo is predicated on theassumption that brands are imposed on people by the brand owners.The first paragraph of her first chapter reads: “The astronomicalgrowth in the wealth and cultural influence of multinationalcorporations over the last 15 years can arguably be traced back to
37 WPP What we think
a single, seemingly innocuous idea developed by management theoristsin the mid-1980s: that successful corporations must primarily producebrands, as opposed to products.” (That “seemingly innocuous” is anice touch.)
But you can’t, of course, produce a successful brand withoutproducing a good product first. And a successful brand, of course,exists because people want it to exist. People differentiate betweenobjects, people, animals instinctively and voluntarily – and rarely on a totally rational basis. People invented brand values in their own heads centuries before the first management theorist dared totry and classify them. Entities that can’t be said to market themselvesin any conventional sense are perceived by their supporters anddetractors to have clear brand characteristics: newspapers, politicalparties, football teams, schools and universities.
The human brain performs an astonishing act of computing whenit does something as apparently simple as choosing a brand ofpetfood. It takes into account the quantifiable: price, availability,pack size, ingredient list; and the totally immeasurable: style,character, familiarity and a wild projection of the animal’s personality.When making brand choices, the human brain has no trouble at all in reconciling the measurable and the immeasurable, the rational and the irrational, quantity and quality. It understands that evenprice is not a simple matter of low=good, high=bad. To the despairof rationalists, a high price may be seen as evidence of greaterquality and therefore greater worth.
(When that very same brain is invited to explain to a researcher thereason for its choice, it should come as no surprise that the brainwill favour the rational over the irrational, the quantifiable over theemotional. As we’ve noted before, numbers, with their beguilingprecision, provide a much more respectable justification forbehaviour than woolly old subjective affection.)
It may be doing her an injustice, but there seems to be a distinct noteof disappointment in Naomi Klein’s voice when she recounts theevents of Marlboro Friday and its aftermath. According to Klein, thedecision of Philip Morris to cut the price of its brand by 20% sentthe pundits nuts – “announcing in frenzied unison that not only wasMarlboro dead, all brand names were dead.” Surely the day of thebrand – of all brands – was over? Surely “the whole concept ofbranding had lost its currency”? “Study after study showed that babyboomers, blind to the alluring images of advertising and deaf to theempty promises of celebrity spokesperson, were breaking their lifelongbrand loyalties and choosing to feed their families with private-labelbrands from the supermarket.” After all, she reminds us, “Marlborohad always sold itself on the strength of its iconic image marketing,not on anything so prosaic as its price.”
The Clipboard and the Copywriter
38 WPP What we think
In fact, as it happened, not all the pundits were in unison. The saner ones knew perfectly well what consumers have alwaysknown: that value and price are not synonymous; that value is anindividual and subjective equation, of which price is only part; and if price is perceived to outweigh desirability, then any sense of value goes into steep decline.
Even in times of recession, when the concept of value is most likelyto tilt in favour of the rational, it is hard to find examples, in any developed market, where the brand leader by volume is also the cheapest.
Marlboro quite simply modified its recipe of appeals; and today prospers.
So we are faced with a bit of a conundrum. In our private lives asreal people, choosing things and getting married and deciding whichvacation to take, we confidently embrace both the functional and the emotional; that which we can measure and that which we can’t.
But when we come to business – to the business of making money(quantifiable), gaining brand share (quantifiable), building margins(quantifiable), maximising shareholder value (quantifiable) – we seemto lose our nerve a bit.
As long ago as 1965, David Ogilvy wrote: “The majority ofbusinessmen are incapable of original thought because they areunable to escape from the tyranny of reason.” Yet these same people, in their personal lives, shuck off the tyranny of reasonon a daily basis.
In other words, it seems that those who buy brands have a moreinstinctive sense of worth and value than those who provide them:even when they’re the same people.
The reason, of course, is the inevitable business need to argue a case, to gain support, to attract investment from a finite source.We reach, because we have to, for numbers. And we really do haveto. Imagine a business plan which read in full: “When I look at thisdesign, my heart fills with wonder and my soul soars. Please grantme $2 billion to build a prototype.”
For WPP, for its companies and its competitors, numbers are just asnecessary: yet their product – that which clients buy – is more oftenthan not unquantifiable.
A thirty-second commercial may take two hours and twenty-threeminutes to write; or three weeks; or half-an-hour. But there willbe no correlation between its time of incubation and its valueto client.
39 WPP What we think
Nor, indeed, is it possible to put a tape measure on that value toclient: either before its exposure or – with any precise certainty –even afterwards.
While it is true that some disciplines find it easier than others toput a reassuring figure on return on investment – direct marketing,for example, may find it easier than public relations – it is in thenature of marketing communications that they will, infuriatingly,remain activities requiring a departure from pure rationality toinvent and the application of judgment and subjective instinct toapprove and support.
The reason is simple. In the recipe of appeals that any brand offers,the rational ingredients will by and large come from the core productitself: from its performance, its price, its distribution. They will beinvented and selected by a rational process. In contrast, the emotionalingredients will by and large come from its communications: itsmessages, its look, its design, its voice. And the invention of eachof these demands, at least in part, an excursion into irrationality;into inspiration and creativity; into a field of fantasy where numbershave no place. Were it to be otherwise, they would fail in theirappointed task to transform that core product into an object ofeven greater value to its users.
There is probably no other area of business life that makes suchpersonal demands on business people as the purchase and evaluationof a brand’s communications. Deprived of both measurement and precedent (if it’s been done before it’s probably no good),struggling to find words to describe the non-verbal, buffeted by the winds of passionate advocacy and vehement condemnation,only judgment serves.
We may long for the comfort of the clipboard; but we need thecopywriter more.
Jeremy BullmoreDirector
The Tyranny of Numbers, David Boyle, HarperCollins, 2000.No Logo, Naomi Klein, Flamingo, 2000.
WPP What we think
Boom and Bust orGroundhog Day?
Although 2000 was a boom year for communications services, 2001 has already brought more than its fair share of storm clouds to the USeconomy in particular and, given that market’s importance to the globaleconomy, the worldwide communications industry can hardly escape the consequences.
As a result we expect US advertising expenditure to come underparticular pressure with growth of just 3% in nominal terms, flat in real terms. So will it be a case of boom followed by bust or will theideal scenario of Groundhog Day, repeated good times, reassert itself?
As a genuinely global company with slightly more revenues coming frommarketing services as opposed to advertising, well-founded forecasts ofcontinued good growth in the other major markets – Europe, Asia Pacificand Latin America – should benefit WPP and indeed the communicationsservices industry generally.
2001 will not, however, mirror the extraordinary boom of 2000. What we will see is a rather more typical picture of performance withsome markets doing better than others. Overall growth though is still on the agenda.
So the immediate future for our industry and company won’t be bustfollowing boom but neither can we expect good times of year 2000 levels tocontinue indefinitely.Butwhowants to live inGroundhogDayanyway?
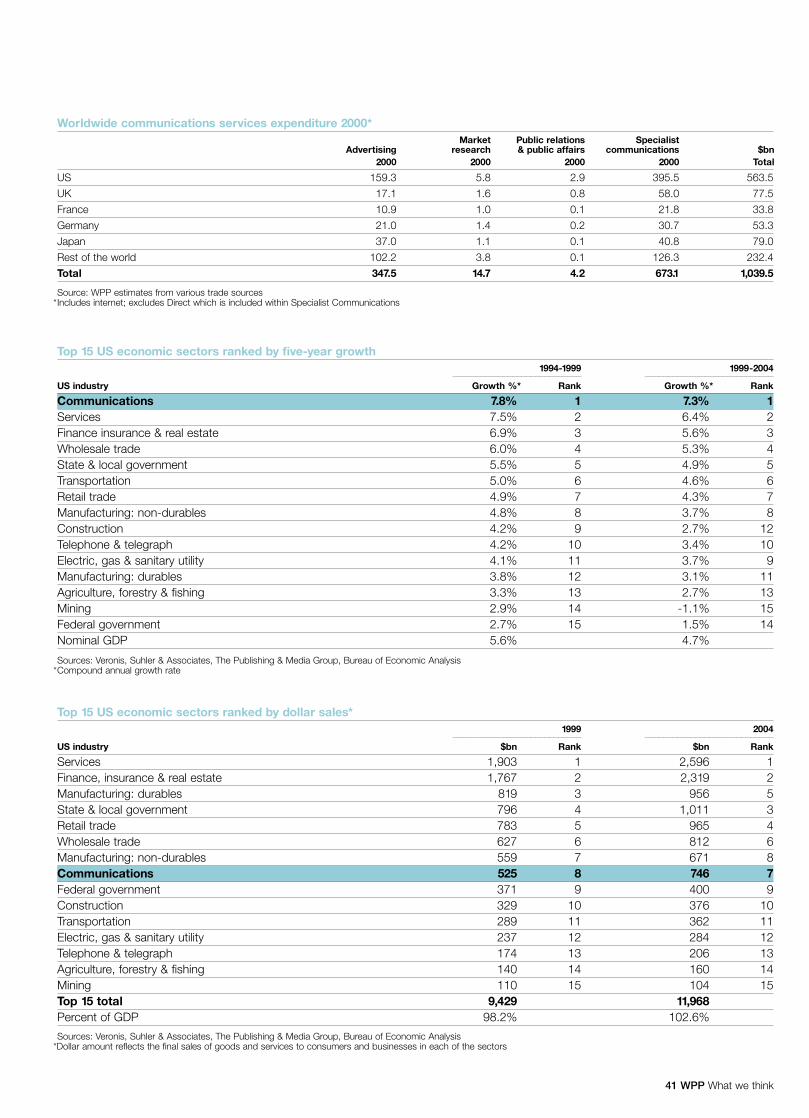
41 WPP What we think
Worldwide communications services expenditure 2000*Market Public relations Specialist
Advertising research & public affairs communications $bn2000 2000 2000 2000 Total
US 159.3 5.8 2.9 395.5 563.5
UK 17.1 1.6 0.8 58.0 77.5
France 10.9 1.0 0.1 21.8 33.8
Germany 21.0 1.4 0.2 30.7 53.3
Japan 37.0 1.1 0.1 40.8 79.0
Rest of the world 102.2 3.8 0.1 126.3 232.4
Total 347.5 14.7 4.2 673.1 1,039.5
Top 15 US economic sectors ranked by five-year growth1994-1999 1999-2004
���������������������������� ����������������������������
US industry Growth %* Rank Growth %* Rank
Communications 7.8% 1 7.3% 1Services 7.5% 2 6.4% 2Finance insurance & real estate 6.9% 3 5.6% 3Wholesale trade 6.0% 4 5.3% 4State & local government 5.5% 5 4.9% 5Transportation 5.0% 6 4.6% 6Retail trade 4.9% 7 4.3% 7Manufacturing: non-durables 4.8% 8 3.7% 8Construction 4.2% 9 2.7% 12Telephone & telegraph 4.2% 10 3.4% 10Electric, gas & sanitary utility 4.1% 11 3.7% 9Manufacturing: durables 3.8% 12 3.1% 11Agriculture, forestry & fishing 3.3% 13 2.7% 13Mining 2.9% 14 -1.1% 15Federal government 2.7% 15 1.5% 14Nominal GDP 5.6% 4.7%
Top 15 US economic sectors ranked by dollar sales*1999 2004
���������������������������� ����������������������������
US industry $bn Rank $bn Rank
Services 1,903 1 2,596 1Finance, insurance & real estate 1,767 2 2,319 2Manufacturing: durables 819 3 956 5State & local government 796 4 1,011 3Retail trade 783 5 965 4Wholesale trade 627 6 812 6Manufacturing: non-durables 559 7 671 8Communications 525 8 746 7Federal government 371 9 400 9Construction 329 10 376 10Transportation 289 11 362 11Electric, gas & sanitary utility 237 12 284 12Telephone & telegraph 174 13 206 13Agriculture, forestry & fishing 140 14 160 14Mining 110 15 104 15Top 15 total 9,429 11,968Percent of GDP 98.2% 102.6%
Sources: Veronis, Suhler & Associates, The Publishing & Media Group, Bureau of Economic Analysis*Dollar amount reflects the final sales of goods and services to consumers and businesses in each of the sectors
Sources: Veronis, Suhler & Associates, The Publishing & Media Group, Bureau of Economic Analysis*Compound annual growth rate
Source: WPP estimates from various trade sources*Includes internet; excludes Direct which is included within Specialist Communications
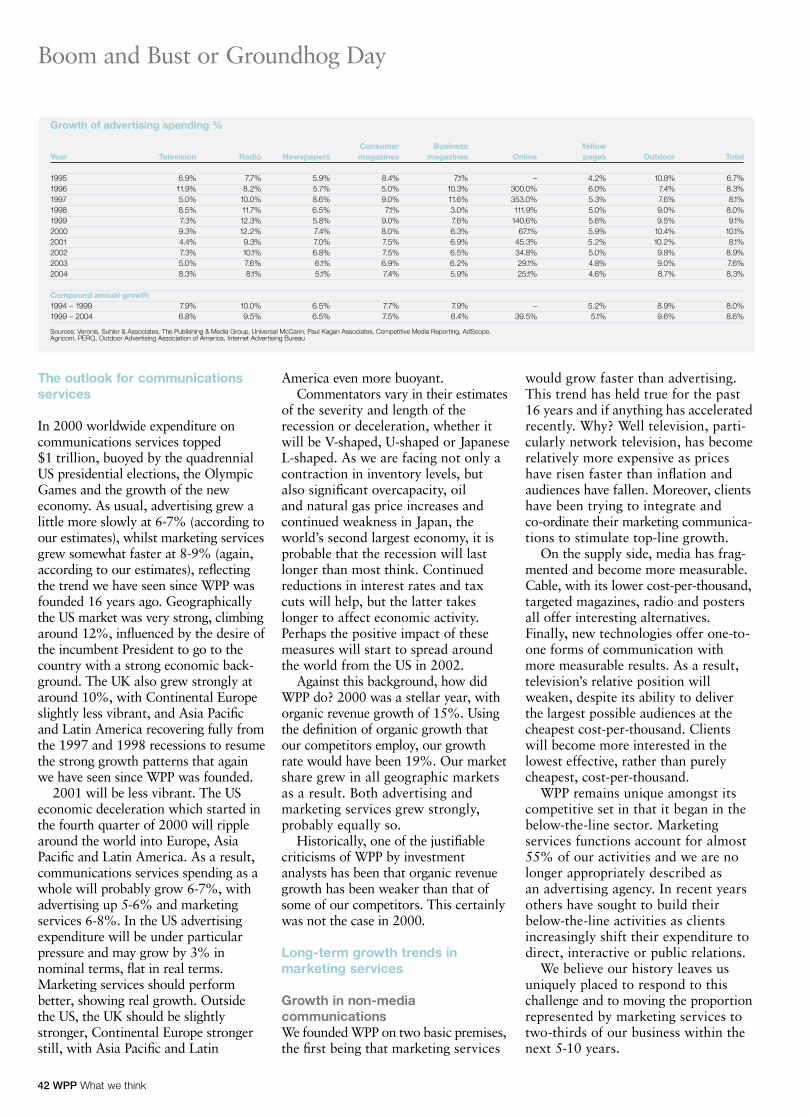
The outlook for communicationsservices
In 2000 worldwide expenditure oncommunications services topped$1 trillion, buoyed by the quadrennialUS presidential elections, the OlympicGames and the growth of the neweconomy. As usual, advertising grew alittle more slowly at 6-7% (according toour estimates), whilst marketing servicesgrew somewhat faster at 8-9% (again,according to our estimates), reflectingthe trend we have seen since WPP wasfounded 16 years ago. Geographicallythe US market was very strong, climbingaround 12%, influenced by the desire ofthe incumbent President to go to thecountry with a strong economic back-ground. The UK also grew strongly ataround 10%, with Continental Europeslightly less vibrant, and Asia Pacificand Latin America recovering fully fromthe 1997 and 1998 recessions to resumethe strong growth patterns that againwe have seen since WPP was founded.
2001 will be less vibrant. The USeconomic deceleration which started inthe fourth quarter of 2000 will ripplearound the world into Europe, AsiaPacific and Latin America. As a result,communications services spending as awhole will probably grow 6-7%, withadvertising up 5-6% and marketingservices 6-8%. In the US advertisingexpenditure will be under particularpressure and may grow by 3% innominal terms, flat in real terms.Marketing services should performbetter, showing real growth. Outsidethe US, the UK should be slightlystronger, Continental Europe strongerstill, with Asia Pacific and Latin
42 WPP What we think
America even more buoyant. Commentators vary in their estimates
of the severity and length of therecession or deceleration, whether itwill be V-shaped, U-shaped or JapaneseL-shaped. As we are facing not only acontraction in inventory levels, butalso significant overcapacity, oil and natural gas price increases andcontinued weakness in Japan, theworld’s second largest economy, it isprobable that the recession will lastlonger than most think. Continuedreductions in interest rates and taxcuts will help, but the latter takeslonger to affect economic activity.Perhaps the positive impact of thesemeasures will start to spread aroundthe world from the US in 2002.
Against this background, how didWPP do? 2000 was a stellar year, withorganic revenue growth of 15%. Usingthe definition of organic growth thatour competitors employ, our growthrate would have been 19%. Our marketshare grew in all geographic marketsas a result. Both advertising andmarketing services grew strongly,probably equally so.
Historically, one of the justifiablecriticisms of WPP by investmentanalysts has been that organic revenuegrowth has been weaker than that ofsome of our competitors. This certainlywas not the case in 2000.
Long-term growth trends inmarketing services
Growth in non-mediacommunicationsWe founded WPP on two basic premises,the first being that marketing services
would grow faster than advertising.This trend has held true for the past16 years and if anything has acceleratedrecently. Why? Well television, parti-cularly network television, has becomerelatively more expensive as priceshave risen faster than inflation andaudiences have fallen. Moreover, clientshave been trying to integrate and co-ordinate their marketing communica-tions to stimulate top-line growth.
On the supply side, media has frag-mented and become more measurable.Cable, with its lower cost-per-thousand,targeted magazines, radio and postersall offer interesting alternatives.Finally, new technologies offer one-to-one forms of communication withmore measurable results. As a result,television’s relative position willweaken, despite its ability to deliverthe largest possible audiences at thecheapest cost-per-thousand. Clientswill become more interested in thelowest effective, rather than purelycheapest, cost-per-thousand.
WPP remains unique amongst itscompetitive set in that it began in thebelow-the-line sector. Marketingservices functions account for almost55% of our activities and we are nolonger appropriately described as an advertising agency. In recent yearsothers have sought to build theirbelow-the-line activities as clientsincreasingly shift their expenditure todirect, interactive or public relations.
We believe our history leaves usuniquely placed to respond to thischallenge and to moving the proportionrepresented by marketing services totwo-thirds of our business within thenext 5-10 years.
Growth of advertising spending %
1995 6.9% 7.7% 5.9% 8.4% 7.1% – 4.2% 10.8% 6.7%1996 11.9% 8.2% 5.7% 5.0% 10.3% 300.0% 6.0% 7.4% 8.3%1997 5.0% 10.0% 8.6% 9.0% 11.6% 353.0% 5.3% 7.6% 8.1%1998 8.5% 11.7% 6.5% 7.1% 3.0% 111.9% 5.0% 9.0% 8.0%1999 7.3% 12.3% 5.8% 9.0% 7.6% 140.6% 5.6% 9.5% 9.1%2000 9.3% 12.2% 7.4% 8.0% 6.3% 67.1% 5.9% 10.4% 10.1%2001 4.4% 9.3% 7.0% 7.5% 6.9% 45.3% 5.2% 10.2% 8.1%2002 7.3% 10.1% 6.8% 7.5% 6.5% 34.8% 5.0% 9.8% 8.9%2003 5.0% 7.6% 6.1% 6.9% 6.2% 29.1% 4.8% 9.0% 7.6%2004 8.3% 8.1% 5.1% 7.4% 5.9% 25.1% 4.6% 8.7% 8.3%
Compound annual growth1994 – 1999 7.9% 10.0% 6.5% 7.7% 7.9% – 5.2% 8.9% 8.0%1999 – 2004 6.8% 9.5% 6.5% 7.5% 6.4% 39.5% 5.1% 9.6% 8.6%
Consumer Business YellowYear Television Radio Newspapers magazines magazines Online pages Outdoor Total
Sources: Veronis, Suhler & Associates, The Publishing & Media Group, Universal McCann, Paul Kagan Associates, Competitive Media Reporting, AdScope, Agricom, PERQ, Outdoor Advertising Association of America, Internet Advertising Bureau
Boom and Bust or Groundhog Day
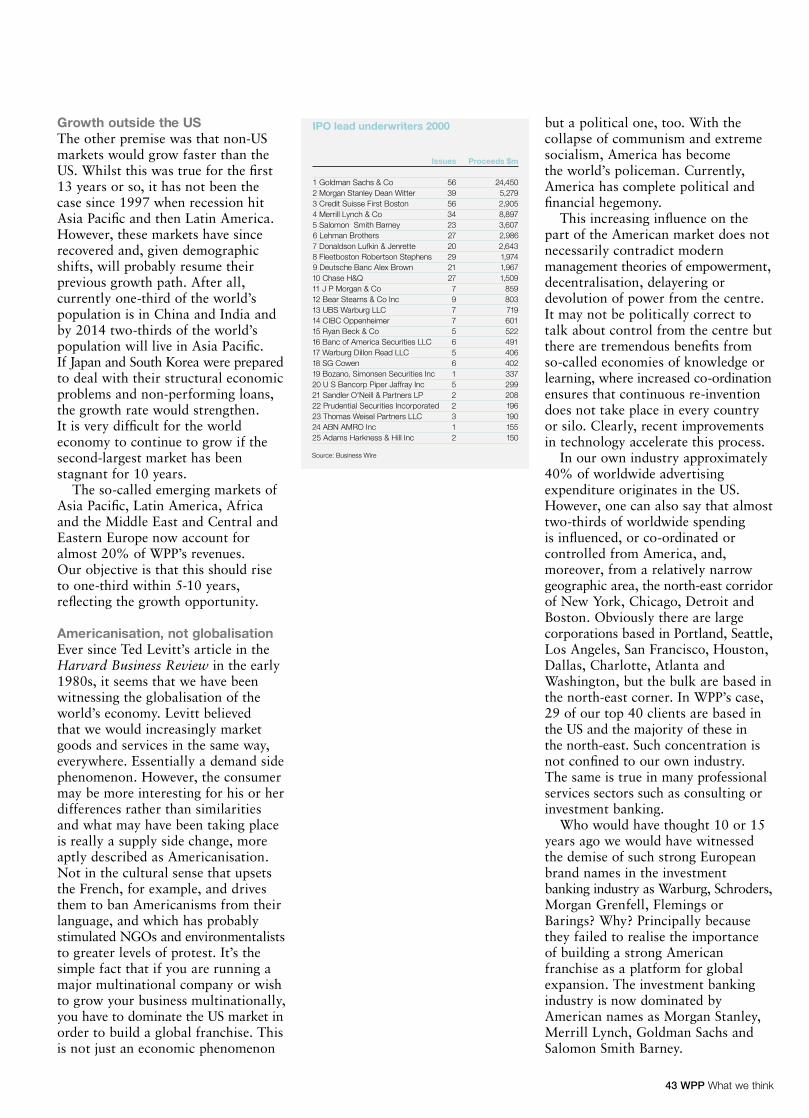
43 WPP What we think
Growth outside the USThe other premise was that non-USmarkets would grow faster than theUS. Whilst this was true for the first13 years or so, it has not been thecase since 1997 when recession hitAsia Pacific and then Latin America.However, these markets have sincerecovered and, given demographicshifts, will probably resume theirprevious growth path. After all,currently one-third of the world’spopulation is in China and India andby 2014 two-thirds of the world’spopulation will live in Asia Pacific. If Japan and South Korea were preparedto deal with their structural economicproblems and non-performing loans,the growth rate would strengthen. It is very difficult for the worldeconomy to continue to grow if thesecond-largest market has beenstagnant for 10 years.
The so-called emerging markets ofAsia Pacific, Latin America, Africaand the Middle East and Central andEastern Europe now account foralmost 20% of WPP’s revenues. Our objective is that this should riseto one-third within 5-10 years,reflecting the growth opportunity.
Americanisation, not globalisationEver since Ted Levitt’s article in theHarvard Business Review in the early1980s, it seems that we have beenwitnessing the globalisation of theworld’s economy. Levitt believed that we would increasingly marketgoods and services in the same way,everywhere. Essentially a demand sidephenomenon. However, the consumermay be more interesting for his or herdifferences rather than similaritiesand what may have been taking placeis really a supply side change, moreaptly described as Americanisation.Not in the cultural sense that upsetsthe French, for example, and drivesthem to ban Americanisms from theirlanguage, and which has probablystimulated NGOs and environmentaliststo greater levels of protest. It’s thesimple fact that if you are running amajor multinational company or wishto grow your business multinationally,you have to dominate the US market inorder to build a global franchise. Thisis not just an economic phenomenon
but a political one, too. With thecollapse of communism and extremesocialism, America has become the world’s policeman. Currently,America has complete political andfinancial hegemony.
This increasing influence on thepart of the American market does notnecessarily contradict modernmanagement theories of empowerment,decentralisation, delayering ordevolution of power from the centre.It may not be politically correct totalk about control from the centre butthere are tremendous benefits fromso-called economies of knowledge orlearning, where increased co-ordinationensures that continuous re-inventiondoes not take place in every countryor silo. Clearly, recent improvementsin technology accelerate this process.
In our own industry approximately40% of worldwide advertisingexpenditure originates in the US.However, one can also say that almosttwo-thirds of worldwide spending is influenced, or co-ordinated orcontrolled from America, and,moreover, from a relatively narrowgeographic area, the north-east corridorof New York, Chicago, Detroit andBoston. Obviously there are largecorporations based in Portland, Seattle,Los Angeles, San Francisco, Houston,Dallas, Charlotte, Atlanta andWashington, but the bulk are based inthe north-east corner. In WPP’s case,29 of our top 40 clients are based inthe US and the majority of these in the north-east. Such concentration isnot confined to our own industry. The same is true in many professionalservices sectors such as consulting orinvestment banking.
Who would have thought 10 or 15years ago we would have witnessedthe demise of such strong Europeanbrand names in the investmentbanking industry as Warburg, Schroders,Morgan Grenfell, Flemings orBarings? Why? Principally becausethey failed to realise the importanceof building a strong Americanfranchise as a platform for globalexpansion. The investment bankingindustry is now dominated byAmerican names as Morgan Stanley,Merrill Lynch, Goldman Sachs andSalomon Smith Barney.
IPO lead underwriters 2000
Issues Proceeds $m
1 Goldman Sachs & Co 24,4502 Morgan Stanley Dean Witter3 Credit Suisse First Boston4 Merrill Lynch & Co5 Salomon Smith Barney6 Lehman Brothers7 Donaldson Lufkin & Jenrette
5,2792,9058,8973,6072,9862,643
56395634232720
8 Fleetboston Robertson Stephens9 Deutsche Banc Alex Brown
1,9741,9671,509
292127
Source: Business Wire
10 Chase H&Q859711 J P Morgan & Co803912 Bear Stearns & Co Inc719713 UBS Warburg LLC601714 CIBC Oppenheimer522515 Ryan Beck & Co491616 Banc of America Securities LLC406517 Warburg Dillon Read LLC402618 SG Cowen337119 Bozano, Simonsen Securities Inc299520 U S Bancorp Piper Jaffray Inc208221 Sandler O'Neill & Partners LP196222 Prudential Securities Incorporated190323 Thomas Weisel Partners LLC155124 ABN AMRO Inc150225 Adams Harkness & Hill Inc
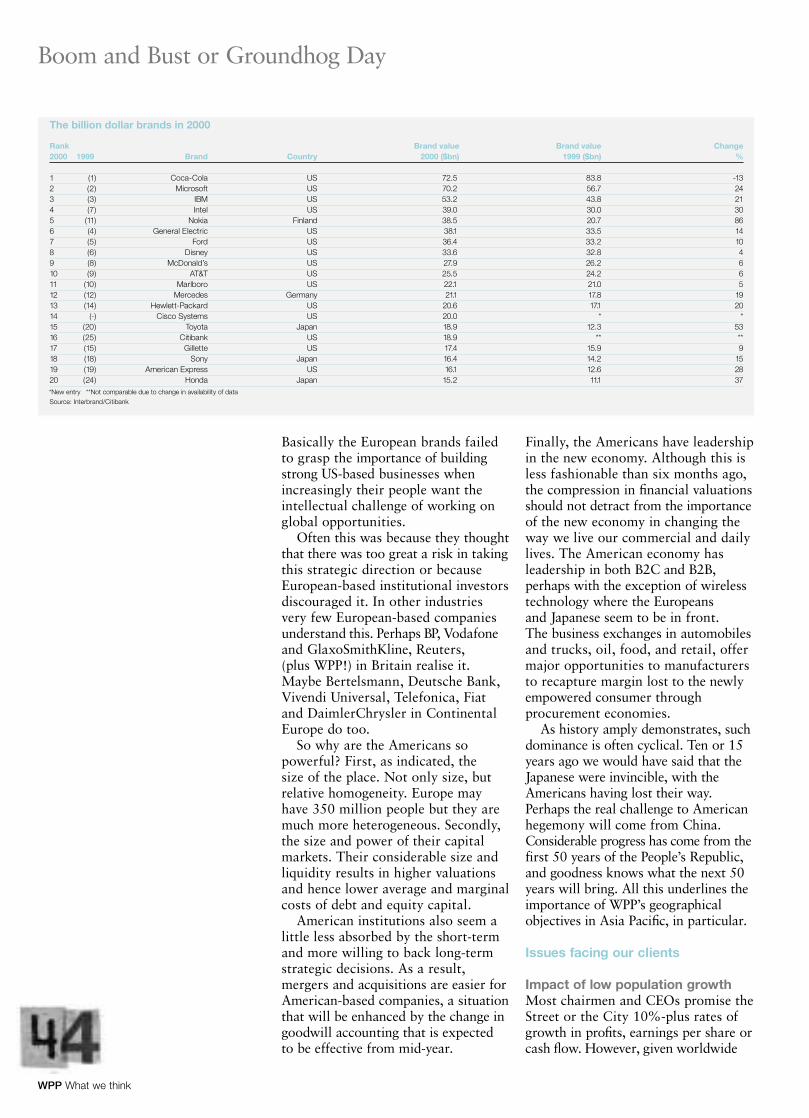
WPP What we think
Basically the European brands failedto grasp the importance of buildingstrong US-based businesses whenincreasingly their people want theintellectual challenge of working onglobal opportunities.
Often this was because they thoughtthat there was too great a risk in takingthis strategic direction or becauseEuropean-based institutional investorsdiscouraged it. In other industriesvery few European-based companiesunderstand this. Perhaps BP, Vodafoneand GlaxoSmithKline, Reuters,(plus WPP!) in Britain realise it.Maybe Bertelsmann, Deutsche Bank,Vivendi Universal, Telefonica, Fiatand DaimlerChrysler in ContinentalEurope do too.
So why are the Americans sopowerful? First, as indicated, the size of the place. Not only size, butrelative homogeneity. Europe mayhave 350 million people but they aremuch more heterogeneous. Secondly,the size and power of their capitalmarkets. Their considerable size andliquidity results in higher valuationsand hence lower average and marginalcosts of debt and equity capital.
American institutions also seem alittle less absorbed by the short-termand more willing to back long-termstrategic decisions. As a result,mergers and acquisitions are easier forAmerican-based companies, a situationthat will be enhanced by the change ingoodwill accounting that is expected to be effective from mid-year.
Finally, the Americans have leadershipin the new economy. Although this isless fashionable than six months ago,the compression in financial valuationsshould not detract from the importanceof the new economy in changing theway we live our commercial and dailylives. The American economy hasleadership in both B2C and B2B,perhaps with the exception of wirelesstechnology where the Europeans and Japanese seem to be in front. The business exchanges in automobilesand trucks, oil, food, and retail, offermajor opportunities to manufacturersto recapture margin lost to the newlyempowered consumer throughprocurement economies.
As history amply demonstrates, suchdominance is often cyclical. Ten or 15years ago we would have said that theJapanese were invincible, with theAmericans having lost their way.Perhaps the real challenge to Americanhegemony will come from China.Considerable progress has come from thefirst 50 years of the People’s Republic,and goodness knows what the next 50years will bring. All this underlines theimportance of WPP’s geographicalobjectives in Asia Pacific, in particular.
Issues facing our clients
Impact of low population growthMost chairmen and CEOs promise theStreet or the City 10%-plus rates ofgrowth in profits, earnings per share orcash flow. However, given worldwide
The billion dollar brands in 2000
1 (1) Coca-Cola US 72.5 83.8 -132 (2) Microsoft US 70.2 56.7 243 (3) IBM US 53.2 43.8 214 (7) Intel US 39.0 30.0 305 (11) Nokia Finland 38.5 20.7 866 (4) General Electric US 38.1 33.5 147 (5) Ford US 36.4 33.2 108 (6) Disney US 33.6 32.8 49 (8) McDonald’s US 27.9 26.2 610 (9) AT&T US 25.5 24.2 611 (10) Marlboro US 22.1 21.0 512 (12) Mercedes Germany 21.1 17.8 1913 (14) Hewlett-Packard US 20.6 17.1 2014 (-) Cisco Systems US 20.0 * *15 (20) Toyota Japan 18.9 12.3 5316 (25) Citibank US 18.9 ** **17 (15) Gillette US 17.4 15.9 918 (18) Sony Japan 16.4 14.2 1519 (19) American Express US 16.1 12.6 2820 (24) Honda Japan 15.2 11.1 37
Rank Brand value Brand value Change2000 1999 Brand Country 2000 ($bn) 1999 ($bn) %
Source: Interbrand/Citibank*New entry **Not comparable due to change in availability of data
Boom and Bust or Groundhog Day
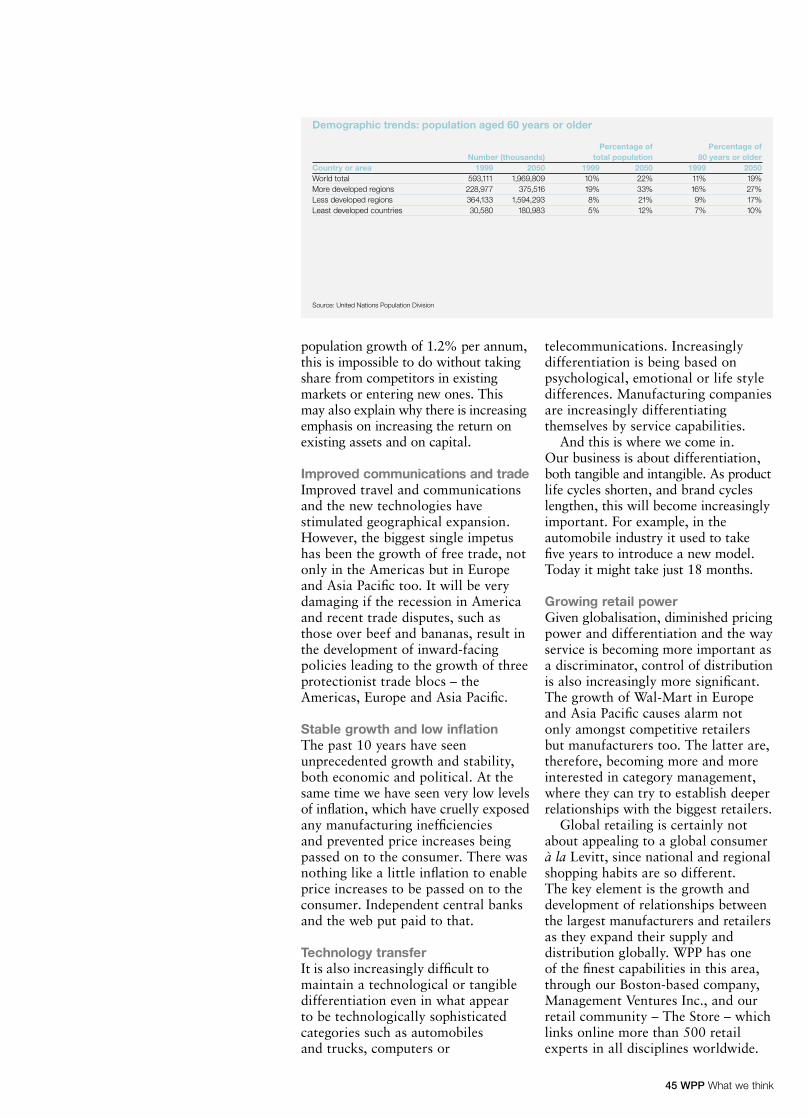
45 WPP What we think
population growth of 1.2% per annum,this is impossible to do without takingshare from competitors in existingmarkets or entering new ones. Thismay also explain why there is increasingemphasis on increasing the return onexisting assets and on capital.
Improved communications and tradeImproved travel and communicationsand the new technologies havestimulated geographical expansion.However, the biggest single impetushas been the growth of free trade, notonly in the Americas but in Europeand Asia Pacific too. It will be verydamaging if the recession in Americaand recent trade disputes, such asthose over beef and bananas, result inthe development of inward-facingpolicies leading to the growth of threeprotectionist trade blocs – theAmericas, Europe and Asia Pacific.
Stable growth and low inflationThe past 10 years have seenunprecedented growth and stability,both economic and political. At thesame time we have seen very low levelsof inflation, which have cruelly exposedany manufacturing inefficiencies and prevented price increases beingpassed on to the consumer. There wasnothing like a little inflation to enableprice increases to be passed on to theconsumer. Independent central banksand the web put paid to that.
Technology transferIt is also increasingly difficult tomaintain a technological or tangibledifferentiation even in what appear to be technologically sophisticatedcategories such as automobiles and trucks, computers or
telecommunications. Increasinglydifferentiation is being based onpsychological, emotional or life styledifferences. Manufacturing companiesare increasingly differentiatingthemselves by service capabilities.
And this is where we come in. Our business is about differentiation,both tangible and intangible. As productlife cycles shorten, and brand cycleslengthen, this will become increasinglyimportant. For example, in theautomobile industry it used to take five years to introduce a new model.Today it might take just 18 months.
Growing retail powerGiven globalisation, diminished pricingpower and differentiation and the wayservice is becoming more important asa discriminator, control of distributionis also increasingly more significant.The growth of Wal-Mart in Europeand Asia Pacific causes alarm not only amongst competitive retailersbut manufacturers too. The latter are,therefore, becoming more and moreinterested in category management,where they can try to establish deeperrelationships with the biggest retailers.
Global retailing is certainly notabout appealing to a global consumer à la Levitt, since national and regionalshopping habits are so different. The key element is the growth anddevelopment of relationships betweenthe largest manufacturers and retailersas they expand their supply anddistribution globally. WPP has one of the finest capabilities in this area,through our Boston-based company,Management Ventures Inc., and ourretail community – The Store – whichlinks online more than 500 retailexperts in all disciplines worldwide.
Demographic trends: population aged 60 years or older
More developed regions 228,977 375,516 19% 33% 16% 27%World total 593,111 1,969,809 10% 22% 11% 19%Country or area 1999 2050 1999 2050 1999 2050
Percentage of Percentage ofNumber (thousands) total population 80 years or older
Less developed regions 364,133 1,594,293 8% 21% 9% 17%Least developed countries 30,580 180,983 5% 12% 7% 10%
Source: United Nations Population Division
WPP What we think
We also have Glendinning ManagementConsultants, our sales and marketingmanagement consultancy. We are toldthat we have more retail analysts thanmost investment banks.
Retailers have reinforced this growingcontrol of distribution through thedevelopment of own label or storebrands and as a result manufacturershave had to innovate more aggressivelyand reduce price differentials,particularly as retailers have improvedthe quality of their own products.
Control of distribution will thereforebecome more important, particularlyas new technologies have increasedthe opportunities to develop one-to-onerelationships with the consumer. Hence the attempts by automobilemanufacturers to move into dealerownership, although this grab for realestate ownership is difficult to justifywhen ‘virtual’ dealerships andrelationships are being built over theweb. There is also evidence of packagedgoods manufacturers developing directrelationships with the consumer overthe web, through direct distribution.
This is encouraging since historicallyretailers have been more aggressivewith technologies, perhaps becausethey are closer to the consumer.Manufacturers tend to believe theircustomers are wholesalers or retailers.Retailers are closer to consumers on a day-to-day basis.
New competitorsNo categories are safe fromcompetition. Trustworthy brandsinvade new categories. Our ownindustry has in the past facedcompetition from talent agencies andmore recently from the consultingindustry, which, having exhausted thesupply side opportunities, is nowexamining how it can develop demand side capabilities. The newtechnologies have also helped theconsultants, as greater emphasis isbeing placed on quantitative ratherthan qualitative skills.
Geographical expansionGiven this increasingly difficultcompetitive background it is easy to see why geographical expansionhas become so much more important.However, it still has a long, long
way to go. The typical American-based multinational is still about 70%concentrated in the US. Coca-Cola,with about 60% of its business outsideAmerica, is still an exception rather thanthe rule. Pepsi-Cola, with 64% of itsbusiness in the US, is still the norm.
Clearly our geographical objectiveswill be reinforced by what is likely tohappen. Asia Pacific, Latin America,Africa and the Middle East andCentral and Eastern Europe willbecome more important as a result. If the world economy is to grow at2-3% per annum, the US and WesternEurope will grow at 1-2% and AsiaPacific and Latin America at 4-5%.
Three factors that will directlyaffect the nature of our relationshipwith our clientsOur business is great fun. Likemanagement consulting and investmentbanking it offers bright young peoplethe opportunity to see a broad rangeof industries and geographies at closehand. As we work with our clients itis becoming more obvious that theyare increasingly wrestling with threekey challenges – overcapacity, newchannels of distribution and internalcommunications.
These are challenges that face notonly our commercial clients. They alsoconfront our governmental, social and educational clients and offer ourcompanies increased opportunity too.
Overcapacity, differentiation andthe shortage of human capitalMost industries face overcapacity.Indeed this is one of the major reasonsfor the rapid deceleration in US growthin the past few months. Take theautomobile and truck industry, forexample. Manufacturers can produceapproximately 75 million vehiclesworldwide. Consumers can consume55 million. Hence the significant plantclosures and consolidation that hasbeen taking place – Ford with Jaguar,Volvo, Land Rover and Aston Martin;GM with Fiat and Daewoo; Daimlerwith Chrysler and Mitsubishi;Renault with Nissan and so on.This will continue. Most observerspredict there will be only five or sixmanufacturers left standing in a fewyears’ time. Clearly in this climate,
Boom and Bust or Groundhog Day
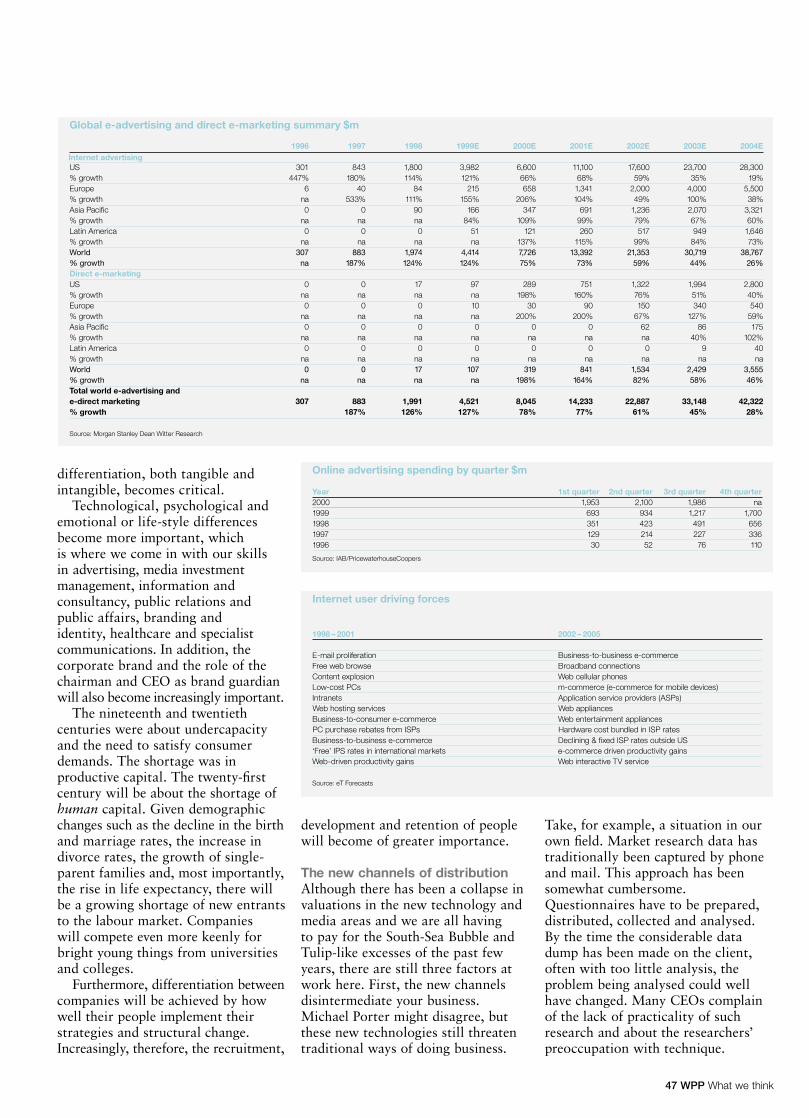
47 WPP What we think
differentiation, both tangible andintangible, becomes critical.
Technological, psychological andemotional or life-style differencesbecome more important, which is where we come in with our skills in advertising, media investmentmanagement, information andconsultancy, public relations andpublic affairs, branding and identity, healthcare and specialistcommunications. In addition, thecorporate brand and the role of thechairman and CEO as brand guardianwill also become increasingly important.
The nineteenth and twentiethcenturies were about undercapacityand the need to satisfy consumerdemands. The shortage was inproductive capital. The twenty-firstcentury will be about the shortage ofhuman capital. Given demographicchanges such as the decline in the birthand marriage rates, the increase indivorce rates, the growth of single-parent families and, most importantly,the rise in life expectancy, there willbe a growing shortage of new entrantsto the labour market. Companies will compete even more keenly forbright young things from universitiesand colleges.
Furthermore, differentiation betweencompanies will be achieved by howwell their people implement theirstrategies and structural change.Increasingly, therefore, the recruitment,
development and retention of peoplewill become of greater importance.
The new channels of distributionAlthough there has been a collapse invaluations in the new technology andmedia areas and we are all having to pay for the South-Sea Bubble andTulip-like excesses of the past fewyears, there are still three factors atwork here. First, the new channelsdisintermediate your business.Michael Porter might disagree, butthese new technologies still threatentraditional ways of doing business.
Take, for example, a situation in ourown field. Market research data hastraditionally been captured by phoneand mail. This approach has beensomewhat cumbersome.Questionnaires have to be prepared,distributed, collected and analysed.By the time the considerable datadump has been made on the client,often with too little analysis, theproblem being analysed could wellhave changed. Many CEOs complainof the lack of practicality of suchresearch and about the researchers’preoccupation with technique.
Global e-advertising and direct e-marketing summary $m
1996 1997 1998 1999E 2000E 2001E 2002E 2003E 2004E
US 301 843 1,800 3,982 6,600 11,100 17,600 23,700 28,300% growth 447% 180% 114% 121% 66% 68% 59% 35% 19%Europe 6 40 84 215 658 1,341 2,000 4,000 5,500% growth na 533% 111% 155% 206% 104% 49% 100% 38%Asia Pacific 0 0 90 166 347 691 1,236 2,070 3,321% growth na na na 84% 109% 99% 79% 67% 60%Latin America 0 0 0 51 121 260 517 949 1,646% growth na na na na 137% 115% 99% 84% 73%World 307 883 1,974 4,414 7,726 13,392 21,353 30,719 38,767% growth na 187% 124% 124% 75% 73% 59% 44% 26%Direct e-marketingUS 0 0 17 97 289 751 1,322 1,994 2,800% growth na na na na 198% 160% 76% 51% 40%Europe 0 0 0 10 30 90 150 340 540% growth na na na na 200% 200% 67% 127% 59%Asia Pacific 0 0 0 0 0 0 62 86 175% growth na na na na na na na 40% 102%Latin America 0 0 0 0 0 0 0 9 40% growth na na na na na na na na naWorld 0 0 17 107 319 841 1,534 2,429 3,555% growth na na na na 198% 164% 82% 58% 46%Total world e-advertising and e-direct marketing 307 883 1,991 4,521 8,045 14,233 22,887 33,148 42,322% growth 187% 126% 127% 78% 77% 61% 45% 28%
Source: Morgan Stanley Dean Witter Research
Internet advertising
Internet user driving forces
1998 – 2001
E-mail proliferation
Source: eT Forecasts
Free web browseContent explosionLow-cost PCsIntranetsWeb hosting servicesBusiness-to-consumer e-commercePC purchase rebates from ISPsBusiness-to-business e-commerce‘Free’ IPS rates in international marketsWeb-driven productivity gains
2002 – 2005
Business-to-business e-commerceBroadband connectionsWeb cellular phonesm-commerce (e-commerce for mobile devices)Application service providers (ASPs)Web appliancesWeb entertainment appliancesHardware cost bundled in ISP ratesDeclining & fixed ISP rates outside USe-commerce driven productivity gainsWeb interactive TV service
Online advertising spending by quarter $m
2000 1,953 2,100 1,986 na1999 693 934 1,217 1,7001998 351 423 491 6561997 129 214 227 3361996 30 52 76 110
Year 1st quarter 2nd quarter 3rd quarter 4th quarter
Source: IAB/PricewaterhouseCoopers
WPP What we think
The new technologies offer a rapidreaction alternative through, forexample, internet panels. Althoughthese currently may lack statisticalsample accuracy, they provide a farmore practical means of capturinginformation. However Michael Porteris right in that, following the prickingof the bubble, these new techniquesare being absorbed much more readily into traditional channels ofdistribution, which either moved tooslowly previously or downplayed theimportance of these changes.
Secondly, despite recent changes invaluation, these new business modelsare still evaluated in different waysfrom traditional models. Whilst burn-rates are now a concern, sales, revenuesand market remain dominant overprofitability and cash flow.
In addition, clients continue tosegregate new technology and mediabudgets from traditional investmentsof this nature, and still give greaterfreedom to the development of theseareas. It can be very frustrating to see media budgets slashed whilstexpenditure on new technologyconsulting rises inexorably.
Finally, they still steal the talent.Whilst it is true that many people are returning from the dotcom‘startdowns’ to our industry andothers, it is also probably true thatthere has been a permanent shift inthe psychology of young people.Whilst previous generations may havebelieved that loyalty to one companyover a working lifetime would berepaid, the down-sizing of the 1990sand the perceived opportunities of thenew economy have put paid to that.
Young people do not want to serveapprenticeships in large, bureaucraticcorporations. They want responsibility,opportunity and rewards earlier intheir careers. For a fleeting moment,they thought they had found this inthe new economy.
WPP responded strongly to thesechallenges. Through wpp.com we madeinvestments directly in new channels.At the same time we encouraged our traditional channels to embracethe new technologies. Ogilvy grewOgilvyInteractive, Thompson grewdigital@jwt, Y&R Advertising grew 2.1and Kantar grew MB Interactive and
Lightspeed. Hill and Knowlton acquiredBlanc & Otus, Ogilvy Public RelationsWorldwide acquired Alexander Ogilvyand Impiric strengthened its interactivecapabilities. In addition, we devisednew ways of incentivising our keyinteractive people through equity forfee and side-car cyber funds.
Although stock market enthusiasmfor these areas has weakened, we stillbelieve that these new technologieshave fundamentally altered the waywe work and the way our people think.They will remain critically importantas can be seen by the continued andgrowing involvement of our major‘traditional’ clients in these areas. It has truly been the revenge of thetraditional brands.
Internal communicationsIncreasingly the work we do is notaimed solely at external audiences. It is becoming more apparent tochairmen and CEOs that the mostimportant factor is implementation of strategy, rather than, perhaps, thestrategy itself. Making sure that theinternal audience is aligned with thestrategy or organisational structure is increasingly important.
In WPP’s case, making sure that65,000 people are facing in the samedirection at the same time is extremelydifficult, particularly with theencouragement and development ofthe operating companies or ‘tribes’.
Our most important clients realisethis too. Take our three biggest. At Ford Motor Company, chairmanBill Ford Jr. and chief executive JacNasser have provided low cost personalcomputers and intranet access to allemployees. Furthermore, Jac Nassertalks to all his people each week by email on issues he thinks important.Niall Fitzgerald and Tony Burgmansregularly use ‘Unileverage’ seminarsto encourage co-operation at Unilever.At IBM, Lou Gerstner consistently e-mails 300,000 IBMers. All understandthat people inside organisations cantransmit positive messages to customers,suppliers, potential employees, press,analysts, institutions, government,NGOs and others. Getting the internalaudiences on side is critical.
At WPP, internal communicationsis becoming an increasingly important
Boom and Bust or Groundhog Day
49 WPP What we think
practice in advertising, market research,public relations, branding and identityand specialist communications and has led to the development of a specialist firm, Banner McBride,operating on both sides of the Atlantic.
Issues facing the communicationservices industryIn response, our industry faces anumber of opportunities, which, unlessaddressed, will become threats.
The right structureOur industry is seen as being on thecutting edge of progress, closely intouch with changing cultures andtrends. Nothing could be further from the truth. Although some ofWPP’s first generation businesses are entrepreneurial, with flat and lean organisational structures, most of our institutional businesses, whilsthaving strong brands and being less fragile, remain geographically driven, silo-like structures. Somewhatsurprising, when our clients arelooking for economies of scale,knowledge and learning.
However, one strength ourinstitutional businesses do have is an ability to follow their clients and learn from them. Increasinglyagency structures will switch fromgeography first, function second andclient third to the reverse – client,function, geography. This will beaccompanied by a rigorous review ofprocess, much akin to the practices of organisational and methods experts– yes, Jeremy, numbers will becomemore important but not paramount.
Some clients, having gone throughsignificant structural change themselves,have initiated change programs intheir marketing practices too. A goodexample is Unilever’s Advanced BrandCommunications Program, whichseeks to improve and simplify theprocess of developing communicationsprograms and bringing them to marketmore quickly. Given the fact that it is impossible for agencies to act inisolation, client initiatives like thesemay be extremely effective.
WPP has developed this type ofstructural change in 21 test bedsaround the world, with the objectiveof developing better work faster.
Some challenges, such as filling intime sheets, are relatively mundanebut essential in professional servicebusinesses in order to analyse revenuestreams and costs effectively.
As WPP’s margins reach 15%, to match the very best-performingcompetition, we are constantly askedwhether there is life after 15%. With a target of 15.5% in 2002 and a general, but not time specific, targetof 20%, we have indicated that thereis. One of the interesting lessons ofour experience is that good, wellbalanced, local agencies generatemargins of 20% or so.
Reductions in general levels ofmargins seem to occur when agenciesgrow globally, as significant overheadis added in account management,human resources, informationtechnology and financial and admin-istrative activities at country, regionaland worldwide levels. Given economiesof scale and new technology, you wouldthink the opposite was the case.
Encouragingly, there are examplesof such success. BBDO used to post20% margins. McCann-Erickson,really a mini-IPG, does so currentlyand Dentsu, although rooted innetwork television in Japan, alsoachieves this level. Such levels ofmargin are probably appropriate forprofessional service businesses.Certainly management consultantsachieve them.
The right sizeIn a creatively driven business thereare probably some diseconomies ofscale. Certainly this is the perceptionamongst clients and employees. The bigger a creative businessbecomes, the more bureaucratic andunresponsive it can be. Clients worryabout their own businesses in this wayand seek to change ‘culture’, whichis often an excuse to prevent change.
We all want to run a company withthe power and resources of a largeone, and the entrepreneurial energy,heart, soul and attitude of a smallone. We all want to be customer orclient focused and share owner driven.We all want a can-do attitude wherenothing is impossible. And newtechnology is making all this easier.However, although clients want the
smaller scale planning and creativeskills, they also want economies of scale through co-ordination andconsolidation of creative, media planningand media buying. IBM, De Beers,Eastman Kodak, GlaxoSmithKline,Kimberly-Clark, Ford, Mattel, KraftFoods, American Express, Diageo,Colgate-Palmolive, Motorola andCitiGroup are examples where wehave benefited. Bayer and ReckittBenckiser were neutral. SC Johnson,Pfizer and Verizon were bad for us.
Given this tension you would thinkthere was an opportunity for mid-sizedagencies occupying the mid-groundbetween the big, global agencies and thesmall, one or two location city agencies.But the inexorable consolidationcontinues with Saatchi & Saatchi andDeutsch the latest to join the ranks ofHill Holliday, Campbell Mithun Esty,GGT, Mullen, TBWA, Chiat Day, HalRiney, Scali McCabe Sloves, Ketchumand Ammirati & Puris falling into thehands of the big battalions.
Many of these agencies were run by idiosyncratic and iconoclasticentrepreneurs who railed against thebig bureaucracies, but who joined themnot only for perfectly respectablefinancial reasons but because theyincreasingly needed strong geographicaland functional capabilities. For thebuyer there remains the problem ofwhether to consolidate these firstgeneration businesses into theirstructures or leave them on their own.
When such gaps open up in any market there are interestingopportunities. Agency structures seemto follow the old 80-20 rule. 80% ofthe sales and profits come from 20% of the offices.
As a result you would think thatthere might be an opportunity for an agency which focused on thelargest cities – such as New York,Detroit, Chicago, Los Angeles, SãoPaulo, Mexico City, Buenos Aires,London, Paris, Frankfurt, Milan,Madrid, Tokyo, Shanghai, HongKong, Mumbai and Sydney. This iscertainly the thought behind thedevelopment of Red Cell, our agencyfor ‘challenger’ brands.
WPP What we think
The big five – or is it four?Our industry has seen the emergenceof a bulge-bracket of three largecompanies. Just like the investmentbanking industry, automobiles andtrucks or pharmaceuticals, four, fiveor six companies will dominate. Threecompanies, IPG, Omnicom and WPPgenerate revenues of over $6 billion.
Two seem to be coming closertogether; Dentsu and Bcom3, withcombined revenues of $4 billion,although the postponement of thelatter’s IPO may drive them closertogether or encourage a bid. Dentsuwill both become even more powerful,through its planned IPO, and gainsignificant clout through its ownnetwork and its joint venture withYoung & Rubicam, DY&R.
Two French companies, Havas andPublicis with revenues over $2 billion,remain aggressive consolidators,hoovering up numerous targets,including Snyder Communicationsand Saatchi & Saatchi. However,weakness in the stock markets and the vicissitudes of French paper, asagainst American paper, may makethis more difficult.
This leaves Cordiant and Grey, bothwith revenues of $1-2 billion, lookingincreasingly vulnerable, as do Hakuhodoand Tokyu in Japan. Some may followthe True North course.
Increasingly market power seems to be driving consolidation. Clientsseem to be focusing on how they can generate top line growth byco-ordinating their marketingcommunications, whilst at the sametime reducing costs by focusing their resources with one provider.Both these trends were given a furtherboost by DaimlerChrysler when itplaced all its business with Omnicom,rather than True North.
This also seems to be encouraging a new phenomenon, the consolidationof business at holding or parentcompanies. With Coca-Cola andVerizon at IPG, DaimlerChrysler atOmnicom and Ford and Boots atWPP, there seems to be growing clientinterest in consolidation at this level.Yet one question remains to beanswered – given this increasing size,can these businesses be effectivelystructured and managed?
The right peopleWe just have not been recruiting enoughbright, young people. The attractions ofinvestment banking and consultancyare well known, attracting almost halfof graduating classes at universitiesand business schools. Although theweb checked this and gave us acompetitive advantage, since we were seen to be closer to the newtechnologies, the bursting of thebubble has encouraged graduates togo back to their previous heroes.
Hence, the growing importance ofour graduate and post-graduate WPP Fellowship Program. Successfulapplicants (winning through a 10-1applicant to success ratio), could, forexample, spend one of their three yearswith J. Walter Thompson in advertisingin London; a second year withOgilvyOne in direct or interactive inNew York; and a final year withBurson-Marsteller in public relationsin Continental Europe. On ‘graduating’,there would be a permanent assignmentto one of our operating companies.
When we started the program, wewere very concerned by the probabilityof competitive response. To date therehas been very little. Perhaps that isthe problem – very little interest.
Has the new technology bubblereally burst?The growth in internet advertisingslowed dramatically last year. In 1999,it grew 140% to $4.6 billion in theUS and 150% to $5.4 billion globally.In 2000 internet advertising growthwas down to 52% ($7 billion) in theUS and 65% ($9 billion) globally.Still a very small fraction of the more than $1 trillion spent oncommunications services.
The slowdown was due not only tothe excesses in valuation that occurredin the late nineties and 2000, but alsoto a failure of creative departments to deal with the creative opportunitieson the web. This was especiallypunishing, given the dependence ofthe new business models onadvertising for their revenues.
However, transactions on the webcontinued to grow significantly toover $650 billion in 2000. Thisgrowth and the growing importanceof B2B exchanges (even in our own
Boom and Bust or Groundhog Day
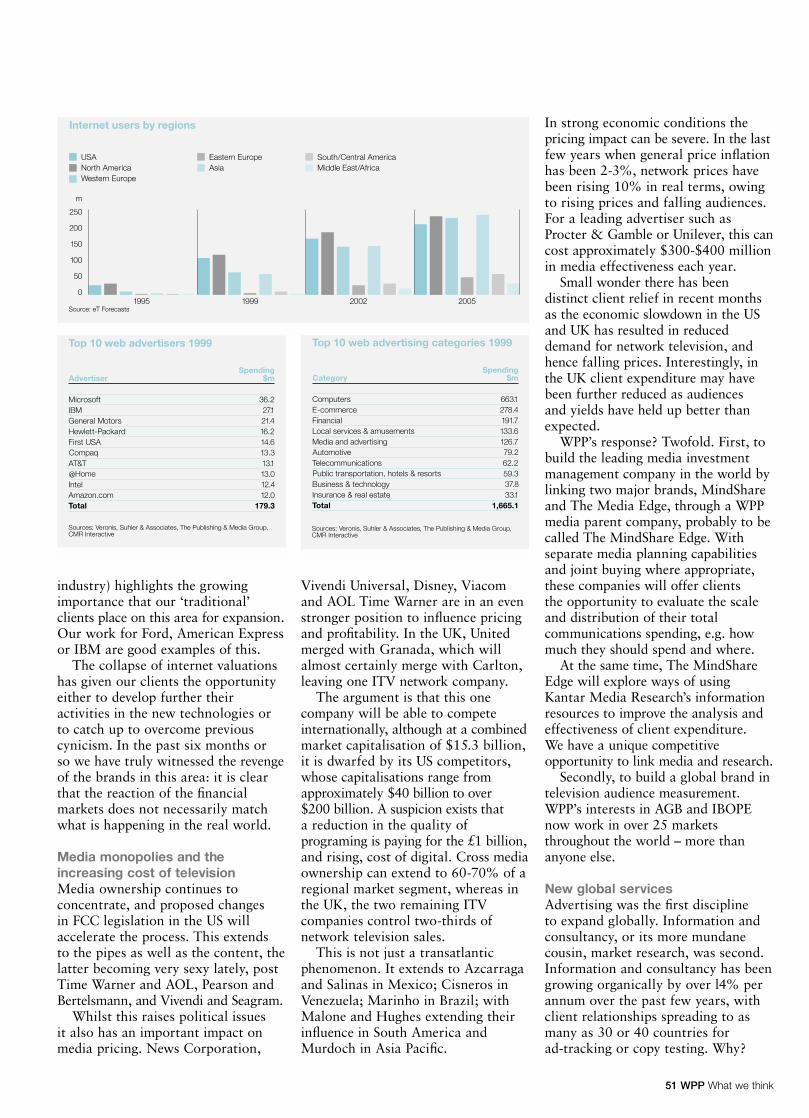
51 WPP What we think
industry) highlights the growingimportance that our ‘traditional’clients place on this area for expansion.Our work for Ford, American Expressor IBM are good examples of this.
The collapse of internet valuationshas given our clients the opportunityeither to develop further theiractivities in the new technologies orto catch up to overcome previouscynicism. In the past six months or so we have truly witnessed the revengeof the brands in this area: it is clearthat the reaction of the financialmarkets does not necessarily matchwhat is happening in the real world.
Media monopolies and theincreasing cost of televisionMedia ownership continues toconcentrate, and proposed changes in FCC legislation in the US willaccelerate the process. This extends to the pipes as well as the content, thelatter becoming very sexy lately, postTime Warner and AOL, Pearson andBertelsmann, and Vivendi and Seagram.
Whilst this raises political issues it also has an important impact onmedia pricing. News Corporation,
Vivendi Universal, Disney, Viacomand AOL Time Warner are in an evenstronger position to influence pricingand profitability. In the UK, Unitedmerged with Granada, which willalmost certainly merge with Carlton,leaving one ITV network company.
The argument is that this onecompany will be able to competeinternationally, although at a combinedmarket capitalisation of $15.3 billion, it is dwarfed by its US competitors,whose capitalisations range from approximately $40 billion to over$200 billion. A suspicion exists thata reduction in the quality ofprograming is paying for the £1 billion,and rising, cost of digital. Cross mediaownership can extend to 60-70% of aregional market segment, whereas inthe UK, the two remaining ITVcompanies control two-thirds ofnetwork television sales.
This is not just a transatlanticphenomenon. It extends to Azcarragaand Salinas in Mexico; Cisneros inVenezuela; Marinho in Brazil; withMalone and Hughes extending theirinfluence in South America andMurdoch in Asia Pacific.
In strong economic conditions thepricing impact can be severe. In the lastfew years when general price inflationhas been 2-3%, network prices havebeen rising 10% in real terms, owingto rising prices and falling audiences.For a leading advertiser such asProcter & Gamble or Unilever, this cancost approximately $300-$400 millionin media effectiveness each year.
Small wonder there has beendistinct client relief in recent monthsas the economic slowdown in the USand UK has resulted in reduceddemand for network television, andhence falling prices. Interestingly, inthe UK client expenditure may havebeen further reduced as audiences and yields have held up better thanexpected.
WPP’s response? Twofold. First, tobuild the leading media investmentmanagement company in the world bylinking two major brands, MindShareand The Media Edge, through a WPPmedia parent company, probably to becalled The MindShare Edge. Withseparate media planning capabilitiesand joint buying where appropriate,these companies will offer clientsthe opportunity to evaluate the scaleand distribution of their totalcommunications spending, e.g. howmuch they should spend and where.
At the same time, The MindShareEdge will explore ways of usingKantar Media Research’s informationresources to improve the analysis andeffectiveness of client expenditure.We have a unique competitiveopportunity to link media and research.
Secondly, to build a global brand intelevision audience measurement.WPP’s interests in AGB and IBOPEnow work in over 25 marketsthroughout the world – more thananyone else.
New global servicesAdvertising was the first discipline to expand globally. Information andconsultancy, or its more mundanecousin, market research, was second.Information and consultancy has beengrowing organically by over l4% perannum over the past few years, withclient relationships spreading to asmany as 30 or 40 countries forad-tracking or copy testing. Why?
Internet users by regions
0
50
100
150
200
250
m
Source: eT Forecasts
USANorth AmericaWestern Europe
Eastern EuropeAsia
South/Central AmericaMiddle East/Africa
1995 2002 20051999
@HomeIntelAmazon.comTotal
Top 10 web advertisers 1999
Spending$mAdvertiser
Microsoft
Sources: Veronis, Suhler & Associates, The Publishing & Media Group, CMR Interactive
36.2IBMGeneral MotorsHewlett-PackardFirst USACompaqAT&T
27.121.416.214.613.313.113.012.412.0
179.3
Public transportation, hotels & resortsBusiness & technologyInsurance & real estateTotal
Top 10 web advertising categories 1999
Spending$mCategory
Computers
Sources: Veronis, Suhler & Associates, The Publishing & Media Group, CMR Interactive
663.1E-commerceFinancialLocal services & amusementsMedia and advertisingAutomotiveTelecommunications
278.4191.7133.6126.779.262.259.337.833.1
1,665.1
WPP What we think
First, as they expand globally, clientsare looking for common languagesfor easy comparison of audiences.They require economies of knowledge.
Secondly, as competition intensifies,it is increasingly difficult to makeintuitive decisions. There has to be quantitative justification fordecision-making.
Finally, as costs have been squeezed,internal research departments have been reduced or eliminated, thus increasing the importance ofoutsourcing to market researchagencies. Perhaps the latter was notsuch an intelligent idea, since a corecompetence of most consumercompanies, particularly packagedgoods companies, is consumer insight.
As suggested previously, the marketresearch industry could be disinter-mediated by new technology. Most CEOs complain that traditionalmarket research techniques are tooslow and complicated. By the time thequestionnaire has been prepared and the data collected and analysed,the problem has changed. Marketresearchers are over-absorbed withtechnique. Internet panels will clearlyimprove this situation, through WPP’sIntelliQuest, with its 30,000 strongpanel of CIOs, or Kantar’s high speedinternet research panel with more than400,000 respondents. Virtually instantresponses can be gleaned on any issue.
Moreover, with the growth of one-to-one marketing, databasemanagement, datamining and thegrowth of digital television, wherevery accurate viewer data can begenerated, the market research anddirect marketing industries will startto converge. At WPP, OgilvyOne,ThompsonConnect and Impiric will,in a way, have more and more incommon with Kantar. Dataminingreally represents a fusion of the twoindustries, enabling clients to developa deeper understanding of customerrelationships and how to stimulateincreased longevity within them byaltering patterns of products, servicesand communications.
Another challenge for the marketresearch companies is to move up thevalue chain into the CEO’s office.Because of the frustration describedearlier concerning speed of response,
CEOs have been sceptical about thevalue of such services. WPP’sBRANDZTM, a 20-market worldwideannual survey of the strength of 8,000brands amongst 180,000 consumers,and Y&R’s BAV (Brand Asset Valuator)are two of a number of attempts toraise awareness amongst CEOs of theimportance, role and significance ofbranding. BRANDZTM is based onMillward Brown’s Brand Dynamicstechnique, which measures thestrength and potential of brands andthe factors driving that strength.
All this represents an attempt tofind the Holy Grail in advertising – to measure the return on investmenton marketing expenditure and helpclients allocate their expenditure inthe most effective way.
As well as advertising and informationand consultancy, branding andidentity has become our third globalbusiness. As companies haveexpanded geographically or by mergeror acquisition, corporate branding and identity has become a far moreimportant way of differentiating the corporation and galvanising andmotivating internal audiences.
At WPP, Enterprise IG and Landorhave been expanding aggressivelythroughout the world and offering aservice that analyses brand reputationand designs, and implementscorporate programs. The corporatebrand will become a more and moreintangible differentiator.
In the coming years, we expect mediainvestment management, public relationsand public affairs to become increasinglyglobal in nature for similar reasons.
Becoming more strategicWe do three things for clients –strategic thinking, creative executionand co-ordination. Unfortunately, as a result of increasing competitivepressures, clients have become moreinterested and reliant on the lattertwo. Creative hip-shooting hasbecome much more important thanstrategic brand development.
At the same time, managementconsultants have been turning theirattention to the demand side. For example, McKinsey & Co hassuggested that packaged goods clientsare spending too much on advertising in
Boom and Bust or Groundhog Day
53 WPP What we think
mature markets but not enough indeveloping markets. In contrast Bain& Co suggests that they spend toomuch on trade promotion and notenough on the brand.
Whichever is right, it represents anincursion into our territory and, giventhe increasing cost of televisionadvertising, the difficulty of measuringadvertising effectiveness, short-termprofit pressures and the scale ofadvertising expenditure, such advice is seductive.
Finally, realising that all businessstrategy is marketing strategy – startingwith the consumer and movingbackwards – the consultants have lefttheir quantitative world to enter thetouchy-feely areas of marketing andadvice on the size and optimisation ofcommunications service budgets.
Our industry has yet to respond.At WPP the nearest we come to a purestrategic marketing consultancy is TheHenley Centre, although we are startingto build very strong specialist practicesin retailing (Management Ventures,The Store, Glendinning ManagementConsultants), financial services(pFour), healthcare (CommonHealth),and branding (icon brand navigation).
One of the interesting currentopportunities is to develop newtechnology consulting services with major consultancies. ThroughOgilvyOne and Impiric we have enteredthis area in an attempt to harnesstechnology consulting skills, softwaredevelopment and consumer insight.
Currently, clients seem to be willingto accept that they need bothtechnology and consumer insight inthe new media space. We will continueto develop an approach based on amixture of acquisition, start-up anddevelopment of existing businesses.
Our remunerationMore than three-quarters of ourrevenues come from time-based fees,mainly concentrated in informationand consultancy, public relations andpublic affairs, identity and brandingand specialist communications. In ouradvertising business, one-half of ourrevenues or one-quarter of the totalcomes from commissions. In the case ofadvertising this is less than the industryaverage, where about two-thirds of
revenues are based on fees. This probablyreflects the nature of our client base.
In any case the drift to fees is nobad thing. Fees make us focus moreon revenue analysis and allocation ofresources and costs. In addition, theysmooth the flows of our income andgenerally give us minimum levels of revenues. Commissions are muchmore volatile, depending directly on spending levels and seasonality.
Some clients have reviewed theircommission systems and stayed withthem. Both Nestlé and Unilever havereviewed their approach and whileconducting limited experiments orpilots with other systems, have to datestuck with commissions. Both for feesand commission there is also a tendencyfor clients to introduce success feesbased on sales or market share targets,revenue growth, profitability, agencyevaluation scores or even awards.
The movement to performancebonuses, often described as payment forresults, is probably an appropriate trendand is likely to accelerate in the newmedia area where quantification andevaluation of results is much easier.It is also a meaningful way of measuringthe impact of communications serviceson brand building.
Last word from Procter & Gambleand the Harvard Business SchoolDuring the last few years we havewritten about Procter & Gamble’schanges in thinking in the areas of newtechnologies, agency compensation,media investment management andagency conflict management. As stillthe world’s largest advertiser, Proctersets the tone in these areas.
However, like many old economycompanies, P&G was sharply affectedby the changes taking place in the neweconomy. The shift of pricing powerto the consumer at a time of overallprice stability, the pressure on marginsas a result, the emergence of newcompetitors in their traditional categoriesand the growing power of retaildistribution, all conspired to pressurisethe company at the same time.
As a result, as with others, therehas been a significant impact on its market capitalisation, with adevaluation in its twelfth-largestmarket, Turkey, resulting in a profit
warning, and exceptional costsbecoming a regular feature of its incomestatement for some years to come.
Perhaps the pendulum of control orinfluence swung too far to the centre,and maybe increased decentralisation(as with Coca-Cola) will restore thecompany’s fortunes. More importantly,its strength in the engine room of theworld’s economy will probably ensurethat this is so. The latest quarterlyresults seem to indicate this.
Anybody who believes that thesetrends are confined to the business worldshould think again. They are equallyapplicable to all aspects of society,including government and education.
Take the Harvard Business School,for example. In typical B-School stylethey have written three case studies onthe development of their strategy.
The first, on whether they shoulddevelop case-writing facilities on theWest Coast, in the heart of Stanfordterritory. Why? To cope with theexplosion of technology andentrepreneurialism.
The second, whether they shouldopen a similar centre in Hong Kong,Buenos Aires or Paris. Why? To copewith globalisation.
The third, on distance learning and how new technology mightdisintermediate an established brandlike the Harvard Business School andits physical facility at Soldier’s Field.Will 27-year-olds continue to bewilling to pay the direct and oppor-tunity costs of two years in Boston,when they can receive an alternative,differently priced, differently resourcedproduct virtually?
Nice to know that everyone hassimilar problems!Martin SorrellGroup chief executive


The numbers in full
WPP The numbers in full
Accounting policies
The financial statements have been prepared in accordance with applicable accounting standards in the United Kingdom. A summary of the Group’s principal accounting policies, which havebeen applied consistently throughout the year and the precedingyear (except as disclosed in accounting policy 14), is set out below.
1 Basis of accounting and presentation of financialstatementsThe financial statements are prepared under the historical costconvention.
2 Basis of consolidationThe consolidated financial statements include the results of theCompany and all its subsidiary undertakings made up to the sameaccounting date. The results of subsidiary undertakings acquired ordisposed of during the year are included or excluded from the profitand loss account from the effective date of acquisition or disposal.
3 Goodwill and intangible fixed assetsIntangible fixed assets comprise goodwill and certain acquiredseparable corporate brand names.
Goodwill represents the excess of the fair value attributed toinvestments in businesses or subsidiary undertakings over the fairvalue of the underlying net assets at the date of their acquisition. In accordance with FRS 10, for acquisitions made on or after 1 January 1998, goodwill has been capitalised as an intangibleasset. Goodwill arising on acquisitions prior to that date was writtenoff to reserves in accordance with the accounting standard then inforce. On disposal or closure of a business, the attributable amountof goodwill previously written off to reserves is included in determiningthe profit or loss on disposal.
Corporate brand names acquired as part of acquisitions ofbusiness are capitalised separately from goodwill as intangible fixedassets if their value can be measured reliably on initial recognition.
The directors have reassessed their opinion that all the goodwilland intangible assets of the Group have an infinite life. For certainacquisitions, where the directors consider it more appropriate,goodwill is now amortised over its useful life up to a 20 year period,from the date of acquisition. The remaining goodwill and intangibleassets of the Group are considered to have an infinite economic lifebecause of the institutional nature of the corporate brand names,their proven ability to maintain market leadership and profitableoperations over long periods of time and WPP’s commitment todevelop and enhance their value. The carrying value of theseintangible assets will continue to be reviewed annually forimpairment and adjusted to the recoverable amount if required.
The financial statements depart from the specific requirement ofcompanies legislation to amortise goodwill over a finite period inorder to give a true and fair view. The directors consider this to benecessary for the reasons given above. Because of the infinite life ofthese intangible assets, it is not possible to quantify its impact.
4 Tangible fixed assetsTangible fixed assets are shown at cost less accumulated depreciationwith the exception of freehold land which is not depreciated.Depreciation is provided at rates calculated to write off the cost lessestimated residual value of each asset on a straight-line basis over itsestimated useful life, as follows:
Freehold buildings – 2% per annumLeasehold land and buildings – over the term of the leaseFixtures, fittings and equipment – 10%-33% per annumComputer equipment – 33% per annum
5 InvestmentsExcept as stated below, fixed asset investments are shown at costless provision for diminution in value.
The Group’s share of the profits less losses of associatedundertakings is included in the consolidated profit and loss accountand the investments are shown in the Group balance sheet as theGroup’s share of the net assets. The Group’s share of the profitsless losses and net assets is based on current informationproduced by the undertakings, adjusted to conform with theaccounting policies of the Group.
6 Stocks and work in progressWork in progress is valued at cost or on a percentage ofcompletion basis. Cost includes outlays incurred on behalf of clientsand an appropriate proportion of direct costs and overheads onincomplete assignments. Provision is made for irrecoverable costswhere appropriate. Stocks are stated at the lower of cost and netrealisable value.
7 DebtorsDebtors are stated net of provisions for bad and doubtful debts.
8 TaxationCorporate taxes are payable on taxable profits at current rates.
57 WPP The numbers in full
9 Incentive plansThe Group’s share based incentive plans are accounted for inaccordance with Urgent Issues Task Force (‘UITF’) Abstract 17‘Employee Share Schemes’. The cost of shares acquired by theGroup’s ESOP trusts or the fair market value of the shares at the date of the grant, less any consideration to be received from the employee, is charged to the Group’s profit and loss accountover the period to which the employee’s performance relates.Where awards are contingent upon future events (other thancontinued employment) an assessment of the likelihood of theseconditions being achieved is made at the end of each reportingperiod and an appropriate accrual made.
10 Pension costsThe charge to the profit and loss account in respect of definedbenefit pension schemes is the estimated regular cost of providingthe benefits accrued in the year, adjusted to reflect variations fromthat cost. The regular cost is calculated to achieve a substantiallylevel percentage of the current and expected future pensionablepayroll. Variations from regular costs are allocated to the profit andloss account over a period approximating to the scheme members’average remaining service lives. For defined contribution schemes,contributions are charged to the profit and loss account as payablein respect of the accounting period.
11 Operating leasesOperating lease rentals are charged to the profit and loss account on a systematic basis. Any premium or discount on the acquisitionof a lease is spread over the life of the lease or until the date of thefirst rent review.
12 Turnover, cost of sales and revenue recognitionTurnover comprises the gross amounts billed to clients in respect of commission-based income together with the total of other feesearned. Cost of sales comprises media payments and productioncosts. Revenue comprises commission and fees earned in respect of turnover. Turnover and revenue are stated exclusive of VAT, salestaxes and trade discounts.
Advertising and media investment managementRevenue is typically derived from commissions on media placementsand fees for advertising services. Traditionally, the Group’s advertisingclients were charged a standard commission on their total mediaand production expenditure. In recent years, however, thisfrequently has tended to become a matter of individual negotiation.Compensation may therefore consist of various arrangementsinvolving commissions, fees, incentive-based compensation or acombination of the three, as agreed upon with each client.
Revenue is recognised when the service is performed, inaccordance with the terms of the contractual arrangement.Incentive-based compensation typically comprises both quantitativeand qualitative elements; on the element related to quantitativetargets, revenue is recognised when the quantitative targets havebeen achieved; on the element related to qualitative targets,revenue is recognised when the incentive is received/receivable.
Public relations & public affairs and Branding & identity,healthcare and specialist communicationsRevenue is typically derived from retainer fees and services to beperformed subject to specific agreement. Revenue is recognisedwhen the service is performed, in accordance with the terms of thecontractual arrangement. Revenue is recognised on long-termcontracts, if the final outcome can be assessed with reasonablecertainty, by including in the profit and loss account revenue andrelated costs as contract activity progresses.
Information & consultancyRevenue is recognised on each market research contract inproportion to the level of service performed. Costs, including anappropriate proportion of overheads relating to contracts inprogress at the balance sheet date, are carried forward in work inprogress. Losses are recognised as soon as they are foreseen.
13 Translation of foreign currenciesForeign currency transactions arising from normal trading activitiesare recorded in local currency at current exchange rates. Monetaryassets and liabilities denominated in foreign currencies at the year-end are translated at the year-end exchange rate. Foreign currencygains and losses are credited or charged to the profit and lossaccount as they arise. The profit and loss accounts of overseassubsidiary undertakings are translated into pounds sterling ataverage exchange rates and the year-end net investments in thesecompanies are translated at year-end exchange rates. Exchangedifferences arising from retranslation at year-end exchange rates ofthe opening net investments and results for the year are dealt withas movements in reserves.
14 Changes in accounting policiesThe Group adopted FRS 19 (Deferred Tax) during the year. Deferredtax is recognised in respect of all timing differences that haveoriginated but not reversed at the balance sheet date wheretransactions or events that result in an obligation to pay more tax inthe future or a right to pay less tax in the future have occurred atthe balance sheet date. Timing differences are differences betweenthe Group’s taxable profits and its results as stated in the financialstatements that arise from the inclusion of gains and losses in taxassessments in periods different from those in which they arerecognised in the financial statements. A net deferred tax asset isregarded as recoverable and therefore recognised only when, onthe basis of all available evidence, it can be regarded as more likelythan not that there will be suitable taxable profits from which thefuture reversal of the underlying timing differences can be deducted.
The Group also adopted FRS 15 (Tangible Fixed Assets) andFRS 16 (Current Tax) during the year. There has been no materialimpact on the financial statements as a result of the adoption ofthese new standards.
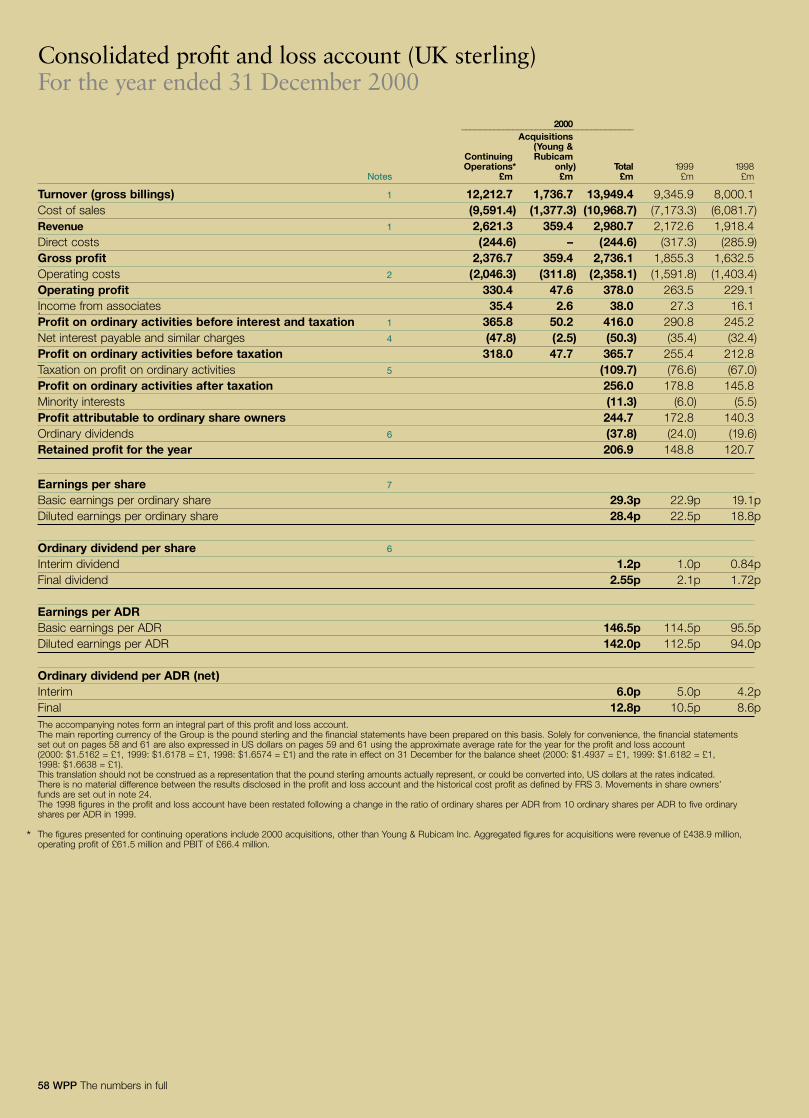
58 WPP The numbers in full 58 WPP The numbers in full58 WPP The numbers in full58 WPP The numbers in full
Consolidated profit and loss account (UK sterling)For the year ended 31 December 2000
2000�������������������������������������
Acquisitions(Young &
Continuing RubicamOperations* only) Total 1999 1998
Notes £m £m £m £m £m
Turnover (gross billings) 1 12,212.7 1,736.7 13,949.4 9,345.9 8,000.1Cost of sales (9,591.4) (1,377.3) (10,968.7) (7,173.3) (6,081.7)Revenue 1 2,621.3 359.4 2,980.7 2,172.6 1,918.4Direct costs (244.6) – (244.6) (317.3) (285.9)Gross profit 2,376.7 359.4 2,736.1 1,855.3 1,632.5Operating costs 2 (2,046.3) (311.8) (2,358.1) (1,591.8) (1,403.4)Operating profit 330.4 47.6 378.0 263.5 229.1Income from associates 35.4 2.6 38.0 27.3 16.1.Profit on ordinary activities before interest and taxation 1 365.8 50.2 416.0 290.8 245.2Net interest payable and similar charges 4 (47.8) (2.5) (50.3) (35.4) (32.4)Profit on ordinary activities before taxation 318.0 47.7 365.7 255.4 212.8Taxation on profit on ordinary activities 5 (109.7) (76.6) (67.0)Profit on ordinary activities after taxation 256.0 178.8 145.8Minority interests (11.3) (6.0) (5.5)Profit attributable to ordinary share owners 244.7 172.8 140.3Ordinary dividends 6 (37.8) (24.0) (19.6)Retained profit for the year 206.9 148.8 120.7
Earnings per share 7
Basic earnings per ordinary share 29.3p 22.9p 19.1pDiluted earnings per ordinary share 28.4p 22.5p 18.8p
Ordinary dividend per share 6
Interim dividend 1.2p 1.0p 0.84pFinal dividend 2.55p 2.1p 1.72p
Earnings per ADRBasic earnings per ADR 146.5p 114.5p 95.5pDiluted earnings per ADR 142.0p 112.5p 94.0p
Ordinary dividend per ADR (net)Interim 6.0p 5.0p 4.2pFinal 12.8p 10.5p 8.6pThe accompanying notes form an integral part of this profit and loss account.The main reporting currency of the Group is the pound sterling and the financial statements have been prepared on this basis. Solely for convenience, the financial statementsset out on pages 58 and 61 are also expressed in US dollars on pages 59 and 61 using the approximate average rate for the year for the profit and loss account (2000: $1.5162 = £1, 1999: $1.6178 = £1, 1998: $1.6574 = £1) and the rate in effect on 31 December for the balance sheet (2000: $1.4937 = £1, 1999: $1.6182 = £1,1998: $1.6638 = £1).This translation should not be construed as a representation that the pound sterling amounts actually represent, or could be converted into, US dollars at the rates indicated.There is no material difference between the results disclosed in the profit and loss account and the historical cost profit as defined by FRS 3. Movements in share owners’funds are set out in note 24.The 1998 figures in the profit and loss account have been restated following a change in the ratio of ordinary shares per ADR from 10 ordinary shares per ADR to five ordinaryshares per ADR in 1999.
* The figures presented for continuing operations include 2000 acquisitions, other than Young & Rubicam Inc. Aggregated figures for acquisitions were revenue of £438.9 million,operating profit of £61.5 million and PBIT of £66.4 million.
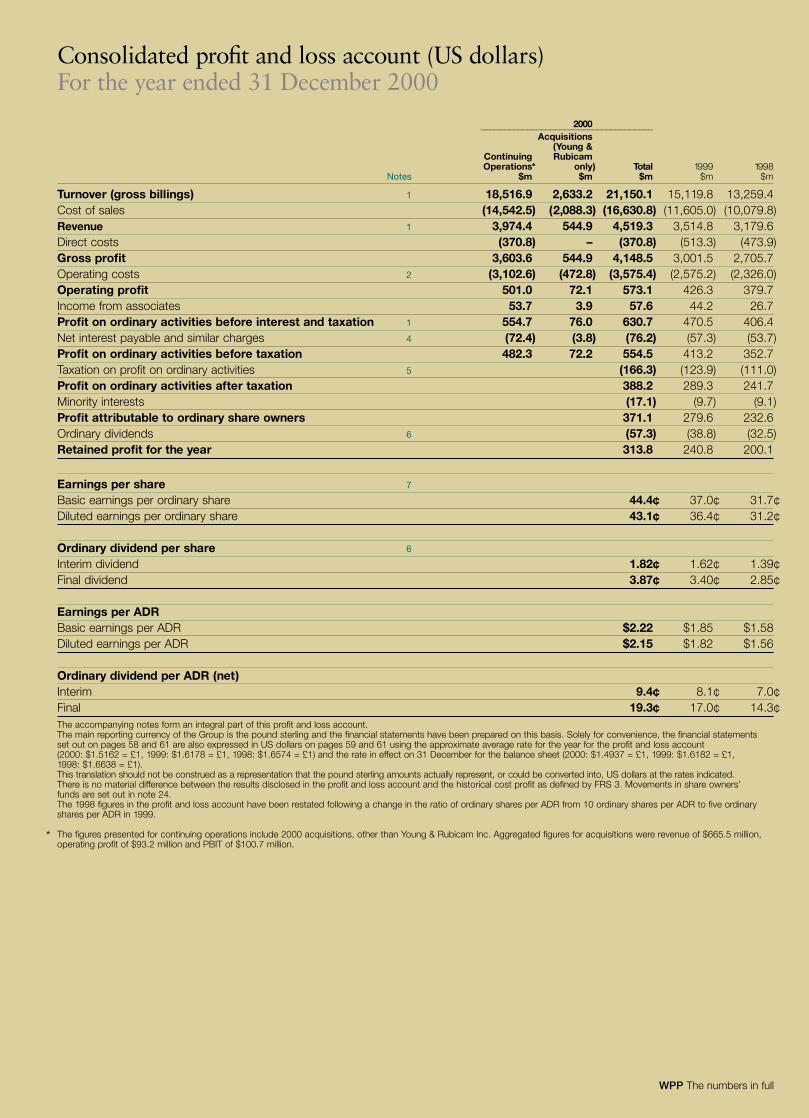
WPP The numbers in full
Consolidated profit and loss account (US dollars)For the year ended 31 December 2000
2000�������������������������������������
Acquisitions(Young &
Continuing RubicamOperations* only) Total 1999 1998
Notes $m $m $m $m $m
Turnover (gross billings) 1 18,516.9 2,633.2 21,150.1 15,119.8 13,259.4Cost of sales (14,542.5) (2,088.3) (16,630.8) (11,605.0) (10,079.8)Revenue 1 3,974.4 544.9 4,519.3 3,514.8 3,179.6Direct costs (370.8) – (370.8) (513.3) (473.9)Gross profit 3,603.6 544.9 4,148.5 3,001.5 2,705.7Operating costs 2 (3,102.6) (472.8) (3,575.4) (2,575.2) (2,326.0)Operating profit 501.0 72.1 573.1 426.3 379.7Income from associates 53.7 3.9 57.6 44.2 26.7.Profit on ordinary activities before interest and taxation 1 554.7 76.0 630.7 470.5 406.4Net interest payable and similar charges 4 (72.4) (3.8) (76.2) (57.3) (53.7)Profit on ordinary activities before taxation 482.3 72.2 554.5 413.2 352.7Taxation on profit on ordinary activities 5 (166.3) (123.9) (111.0)Profit on ordinary activities after taxation 388.2 289.3 241.7Minority interests (17.1) (9.7) (9.1)Profit attributable to ordinary share owners 371.1 279.6 232.6Ordinary dividends 6 (57.3) (38.8) (32.5)Retained profit for the year 313.8 240.8 200.1
Earnings per share 7
Basic earnings per ordinary share 44.4¢ 37.0¢ 31.7¢Diluted earnings per ordinary share 43.1¢ 36.4¢ 31.2¢
Ordinary dividend per share 6
Interim dividend 1.82¢ 1.62¢ 1.39¢Final dividend 3.87¢ 3.40¢ 2.85¢
Earnings per ADRBasic earnings per ADR $2.22 $1.85 $1.58Diluted earnings per ADR $2.15 $1.82 $1.56
Ordinary dividend per ADR (net)Interim 9.4¢ 8.1¢ 7.0¢Final 19.3¢ 17.0¢ 14.3¢The accompanying notes form an integral part of this profit and loss account.The main reporting currency of the Group is the pound sterling and the financial statements have been prepared on this basis. Solely for convenience, the financial statementsset out on pages 58 and 61 are also expressed in US dollars on pages 59 and 61 using the approximate average rate for the year for the profit and loss account (2000: $1.5162 = £1, 1999: $1.6178 = £1, 1998: $1.6574 = £1) and the rate in effect on 31 December for the balance sheet (2000: $1.4937 = £1, 1999: $1.6182 = £1,1998: $1.6638 = £1).This translation should not be construed as a representation that the pound sterling amounts actually represent, or could be converted into, US dollars at the rates indicated.There is no material difference between the results disclosed in the profit and loss account and the historical cost profit as defined by FRS 3. Movements in share owners’funds are set out in note 24.The 1998 figures in the profit and loss account have been restated following a change in the ratio of ordinary shares per ADR from 10 ordinary shares per ADR to five ordinaryshares per ADR in 1999.
* The figures presented for continuing operations include 2000 acquisitions, other than Young & Rubicam Inc. Aggregated figures for acquisitions were revenue of $665.5 million,operating profit of $93.2 million and PBIT of $100.7 million.
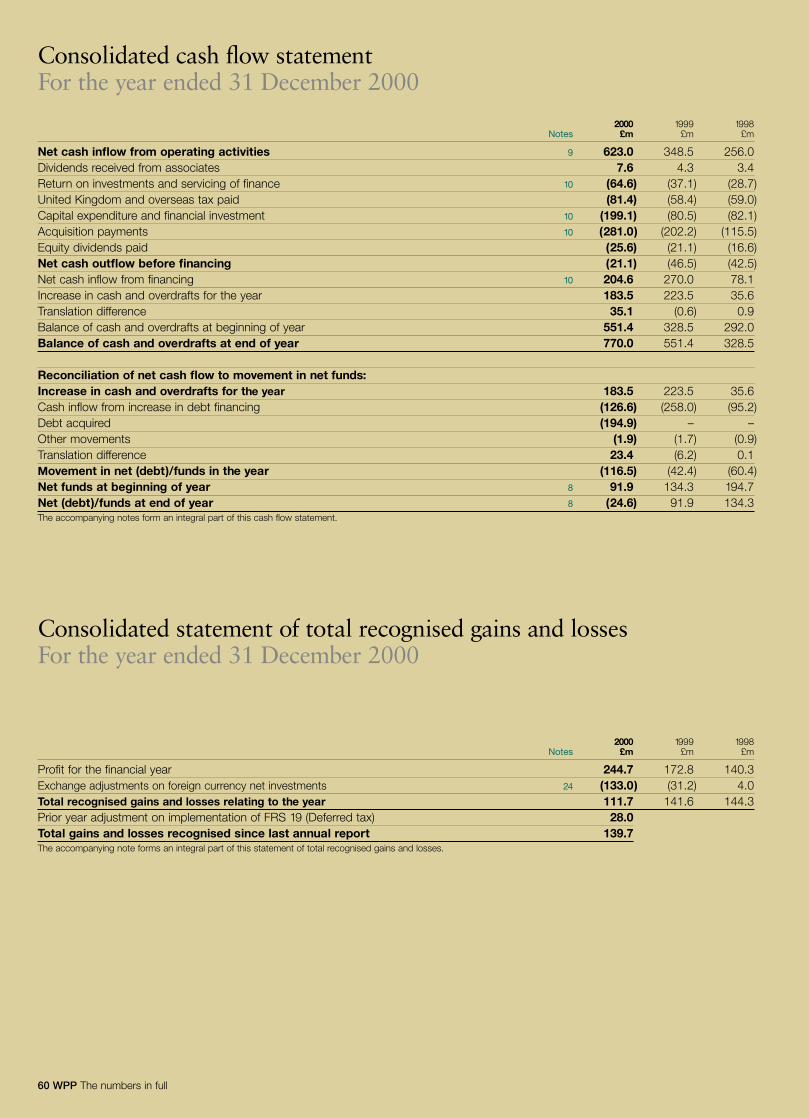
60 WPP The numbers in full
Consolidated cash flow statementFor the year ended 31 December 2000
2000 1999 1998Notes £m £m £m
Net cash inflow from operating activities 9 623.0 348.5 256.0Dividends received from associates 7.6 4.3 3.4Return on investments and servicing of finance 10 (64.6) (37.1) (28.7)United Kingdom and overseas tax paid (81.4) (58.4) (59.0)Capital expenditure and financial investment 10 (199.1) (80.5) (82.1)Acquisition payments 10 (281.0) (202.2) (115.5)Equity dividends paid (25.6) (21.1) (16.6)Net cash outflow before financing (21.1) (46.5) (42.5)Net cash inflow from financing 10 204.6 270.0 78.1Increase in cash and overdrafts for the year 183.5 223.5 35.6Translation difference 35.1 (0.6) 0.9Balance of cash and overdrafts at beginning of year 551.4 328.5 292.0Balance of cash and overdrafts at end of year 770.0 551.4 328.5
Reconciliation of net cash flow to movement in net funds:Increase in cash and overdrafts for the year 183.5 223.5 35.6Cash inflow from increase in debt financing (126.6) (258.0) (95.2)Debt acquired (194.9) – –Other movements (1.9) (1.7) (0.9)Translation difference 23.4 (6.2) 0.1Movement in net (debt)/funds in the year (116.5) (42.4) (60.4)Net funds at beginning of year 8 91.9 134.3 194.7Net (debt)/funds at end of year 8 (24.6) 91.9 134.3The accompanying notes form an integral part of this cash flow statement.
Consolidated statement of total recognised gains and lossesFor the year ended 31 December 2000
2000 1999 1998Notes £m £m £m
Profit for the financial year 244.7 172.8 140.3Exchange adjustments on foreign currency net investments 24 (133.0) (31.2) 4.0Total recognised gains and losses relating to the year 111.7 141.6 144.3Prior year adjustment on implementation of FRS 19 (Deferred tax) 28.0Total gains and losses recognised since last annual report 139.7The accompanying note forms an integral part of this statement of total recognised gains and losses.
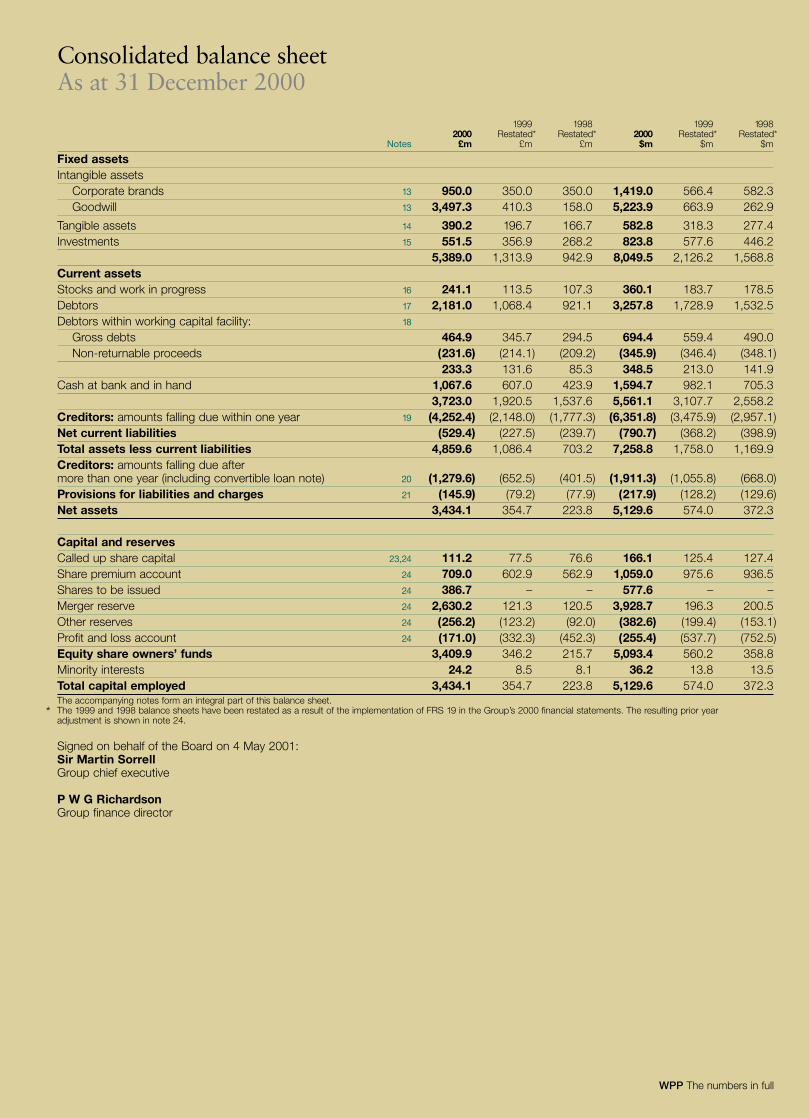
WPP The numbers in full
Consolidated balance sheetAs at 31 December 2000
1999 1998 1999 19982000 Restated* Restated* 2000 Restated* Restated*
Notes £m £m £m $m $m $m
Fixed assetsIntangible assets
Corporate brands 13 950.0 350.0 350.0 1,419.0 566.4 582.3Goodwill 13 3,497.3 410.3 158.0 5,223.9 663.9 262.9
Tangible assets 14 390.2 196.7 166.7 582.8 318.3 277.4Investments 15 551.5 356.9 268.2 823.8 577.6 446.2
5,389.0 1,313.9 942.9 8,049.5 2,126.2 1,568.8Current assetsStocks and work in progress 16 241.1 113.5 107.3 360.1 183.7 178.5Debtors 17 2,181.0 1,068.4 921.1 3,257.8 1,728.9 1,532.5Debtors within working capital facility: 18
Gross debts 464.9 345.7 294.5 694.4 559.4 490.0Non-returnable proceeds (231.6) (214.1) (209.2) (345.9) (346.4) (348.1)
233.3 131.6 85.3 348.5 213.0 141.9Cash at bank and in hand 1,067.6 607.0 423.9 1,594.7 982.1 705.3
3,723.0 1,920.5 1,537.6 5,561.1 3,107.7 2,558.2Creditors: amounts falling due within one year 19 (4,252.4) (2,148.0) (1,777.3) (6,351.8) (3,475.9) (2,957.1)Net current liabilities (529.4) (227.5) (239.7) (790.7) (368.2) (398.9)Total assets less current liabilities 4,859.6 1,086.4 703.2 7,258.8 1,758.0 1,169.9Creditors: amounts falling due after more than one year (including convertible loan note) 20 (1,279.6) (652.5) (401.5) (1,911.3) (1,055.8) (668.0)Provisions for liabilities and charges 21 (145.9) (79.2) (77.9) (217.9) (128.2) (129.6)Net assets 3,434.1 354.7 223.8 5,129.6 574.0 372.3
Capital and reservesCalled up share capital 23,24 111.2 77.5 76.6 166.1 125.4 127.4Share premium account 24 709.0 602.9 562.9 1,059.0 975.6 936.5Shares to be issued 24 386.7 – – 577.6 – –Merger reserve 24 2,630.2 121.3 120.5 3,928.7 196.3 200.5Other reserves 24 (256.2) (123.2) (92.0) (382.6) (199.4) (153.1)Profit and loss account 24 (171.0) (332.3) (452.3) (255.4) (537.7) (752.5)Equity share owners’ funds 3,409.9 346.2 215.7 5,093.4 560.2 358.8Minority interests 24.2 8.5 8.1 36.2 13.8 13.5Total capital employed 3,434.1 354.7 223.8 5,129.6 574.0 372.3The accompanying notes form an integral part of this balance sheet.
* The 1999 and 1998 balance sheets have been restated as a result of the implementation of FRS 19 in the Group’s 2000 financial statements. The resulting prior year adjustment is shown in note 24.
Signed on behalf of the Board on 4 May 2001:Sir Martin SorrellGroup chief executive
P W G RichardsonGroup finance director
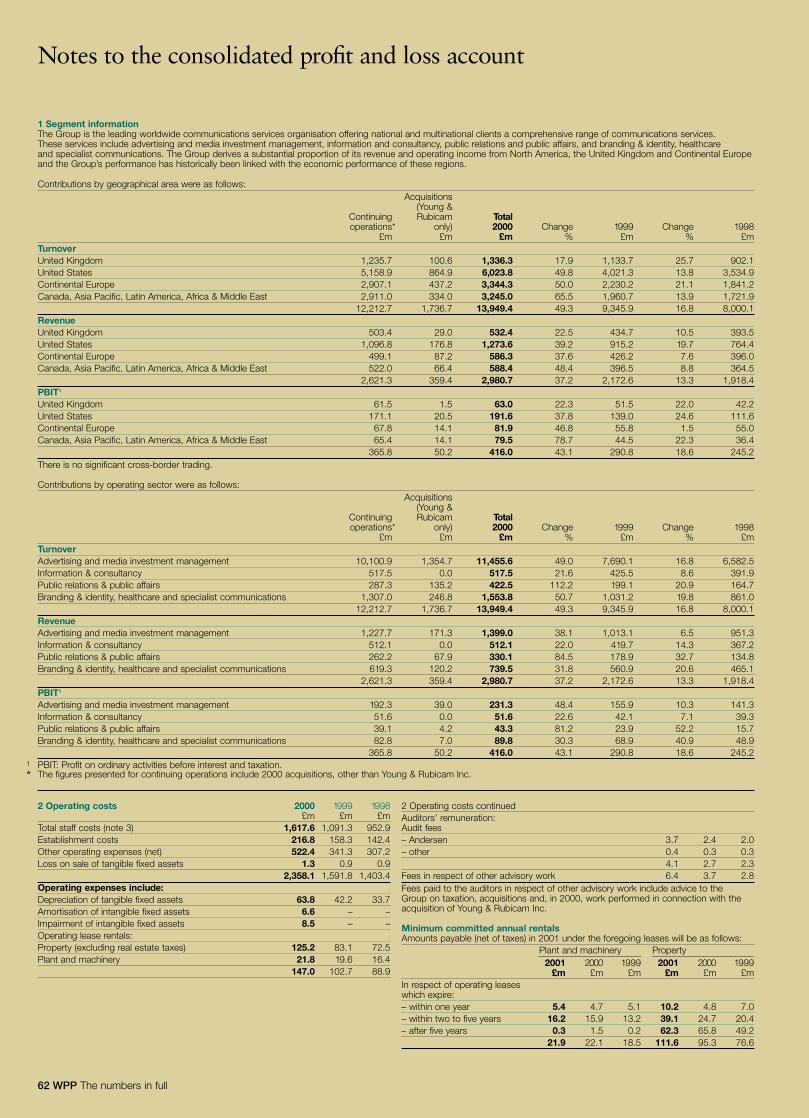
2 Operating costs 2000 1999 1998£m £m £m
Total staff costs (note 3) 1,617.6 1,091.3 952.9Establishment costs 216.8 158.3 142.4Other operating expenses (net) 522.4 341.3 307.2Loss on sale of tangible fixed assets 1.3 0.9 0.9
2,358.1 1,591.8 1,403.4Operating expenses include:Depreciation of tangible fixed assets 63.8 42.2 33.7Amortisation of intangible fixed assets 6.6 – –Impairment of intangible fixed assets 8.5 – –Operating lease rentals:Property (excluding real estate taxes) 125.2 83.1 72.5Plant and machinery 21.8 19.6 16.4
147.0 102.7 88.9
62 WPP The numbers in full
Notes to the consolidated profit and loss account
2 Operating costs continuedAuditors’ remuneration:Audit fees– Andersen 3.7 2.4 2.0– other 0.4 0.3 0.3
4.1 2.7 2.3Fees in respect of other advisory work 6.4 3.7 2.8Fees paid to the auditors in respect of other advisory work include advice to theGroup on taxation, acquisitions and, in 2000, work performed in connection with theacquisition of Young & Rubicam Inc.
Minimum committed annual rentalsAmounts payable (net of taxes) in 2001 under the foregoing leases will be as follows:
Plant and machinery Property���������������������� ����������������������
2001 2000 1999 2001 2000 1999£m £m £m £m £m £m
In respect of operating leases which expire:– within one year 5.4 4.7 5.1 10.2 4.8 7.0– within two to five years 16.2 15.9 13.2 39.1 24.7 20.4– after five years 0.3 1.5 0.2 62.3 65.8 49.2
21.9 22.1 18.5 111.6 95.3 76.6
1 Segment informationThe Group is the leading worldwide communications services organisation offering national and multinational clients a comprehensive range of communications services.These services include advertising and media investment management, information and consultancy, public relations and public affairs, and branding & identity, healthcareand specialist communications. The Group derives a substantial proportion of its revenue and operating income from North America, the United Kingdom and Continental Europeand the Group’s performance has historically been linked with the economic performance of these regions.
Contributions by geographical area were as follows:Acquisitions
(Young &Continuing Rubicam Totaloperations* only) 2000 Change 1999 Change 1998
£m £m £m % £m % £mTurnoverUnited Kingdom 1,235.7 100.6 1,336.3 17.9 1,133.7 25.7 902.1United States 5,158.9 864.9 6,023.8 49.8 4,021.3 13.8 3,534.9Continental Europe 2,907.1 437.2 3,344.3 50.0 2,230.2 21.1 1,841.2Canada, Asia Pacific, Latin America, Africa & Middle East 2,911.0 334.0 3,245.0 65.5 1,960.7 13.9 1,721.9
12,212.7 1,736.7 13,949.4 49.3 9,345.9 16.8 8,000.1RevenueUnited Kingdom 503.4 29.0 532.4 22.5 434.7 10.5 393.5United States 1,096.8 176.8 1,273.6 39.2 915.2 19.7 764.4Continental Europe 499.1 87.2 586.3 37.6 426.2 7.6 396.0Canada, Asia Pacific, Latin America, Africa & Middle East 522.0 66.4 588.4 48.4 396.5 8.8 364.5
2,621.3 359.4 2,980.7 37.2 2,172.6 13.3 1,918.4PBIT1
United Kingdom 61.5 1.5 63.0 22.3 51.5 22.0 42.2United States 171.1 20.5 191.6 37.8 139.0 24.6 111.6Continental Europe 67.8 14.1 81.9 46.8 55.8 1.5 55.0Canada, Asia Pacific, Latin America, Africa & Middle East 65.4 14.1 79.5 78.7 44.5 22.3 36.4
365.8 50.2 416.0 43.1 290.8 18.6 245.2There is no significant cross-border trading.
Contributions by operating sector were as follows:Acquisitions
(Young &Continuing Rubicam Totaloperations* only) 2000 Change 1999 Change 1998
£m £m £m % £m % £mTurnoverAdvertising and media investment management 10,100.9 1,354.7 11,455.6 49.0 7,690.1 16.8 6,582.5Information & consultancy 517.5 0.0 517.5 21.6 425.5 8.6 391.9Public relations & public affairs 287.3 135.2 422.5 112.2 199.1 20.9 164.7Branding & identity, healthcare and specialist communications 1,307.0 246.8 1,553.8 50.7 1,031.2 19.8 861.0
12,212.7 1,736.7 13,949.4 49.3 9,345.9 16.8 8,000.1RevenueAdvertising and media investment management 1,227.7 171.3 1,399.0 38.1 1,013.1 6.5 951.3Information & consultancy 512.1 0.0 512.1 22.0 419.7 14.3 367.2Public relations & public affairs 262.2 67.9 330.1 84.5 178.9 32.7 134.8Branding & identity, healthcare and specialist communications 619.3 120.2 739.5 31.8 560.9 20.6 465.1
2,621.3 359.4 2,980.7 37.2 2,172.6 13.3 1,918.4PBIT1
Advertising and media investment management 192.3 39.0 231.3 48.4 155.9 10.3 141.3Information & consultancy 51.6 0.0 51.6 22.6 42.1 7.1 39.3Public relations & public affairs 39.1 4.2 43.3 81.2 23.9 52.2 15.7Branding & identity, healthcare and specialist communications 82.8 7.0 89.8 30.3 68.9 40.9 48.9
365.8 50.2 416.0 43.1 290.8 18.6 245.21 PBIT: Profit on ordinary activities before interest and taxation.* The figures presented for continuing operations include 2000 acquisitions, other than Young & Rubicam Inc.
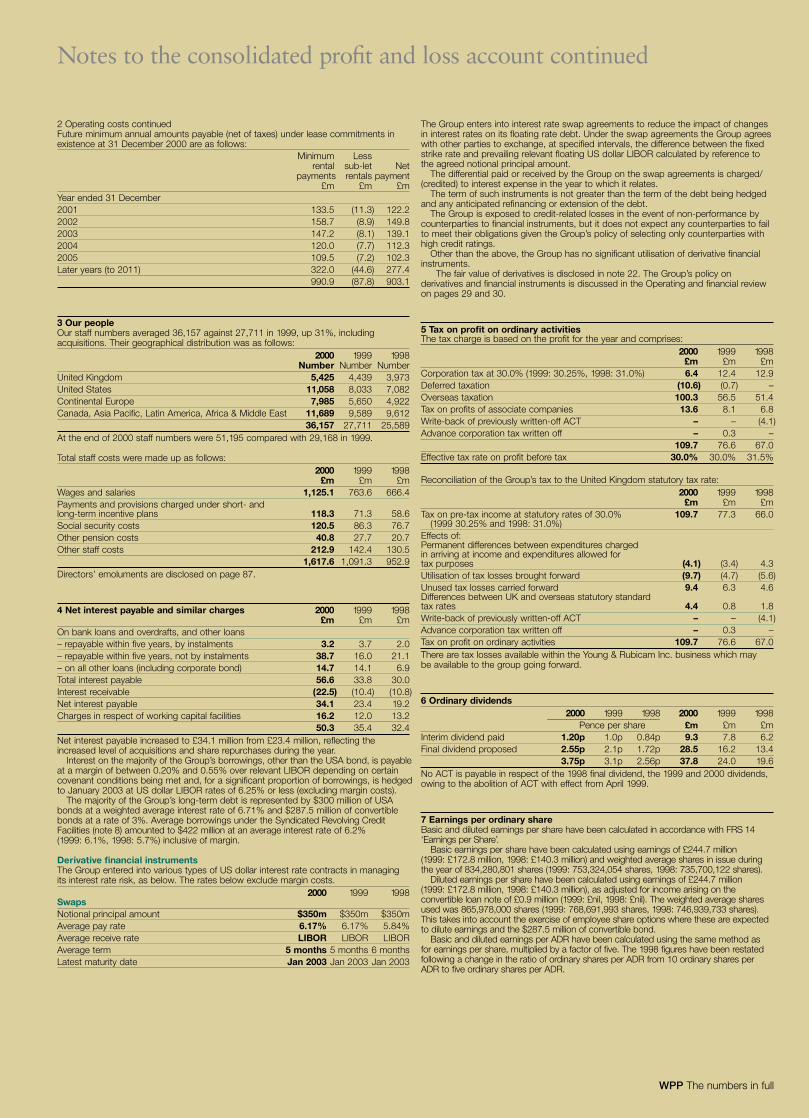
WPP The numbers in full
Notes to the consolidated profit and loss account continued
2 Operating costs continuedFuture minimum annual amounts payable (net of taxes) under lease commitments inexistence at 31 December 2000 are as follows:
Minimum Lessrental sub-let Net
payments rentals payment£m £m £m
Year ended 31 December2001 133.5 (11.3) 122.22002 158.7 (8.9) 149.82003 147.2 (8.1) 139.12004 120.0 (7.7) 112.32005 109.5 (7.2) 102.3Later years (to 2011) 322.0 (44.6) 277.4
990.9 (87.8) 903.1
3 Our peopleOur staff numbers averaged 36,157 against 27,711 in 1999, up 31%, includingacquisitions. Their geographical distribution was as follows:
2000 1999 1998Number Number Number
United Kingdom 5,425 4,439 3,973United States 11,058 8,033 7,082Continental Europe 7,985 5,650 4,922Canada, Asia Pacific, Latin America, Africa & Middle East 11,689 9,589 9,612
36,157 27,711 25,589At the end of 2000 staff numbers were 51,195 compared with 29,168 in 1999.
Total staff costs were made up as follows:2000 1999 1998
£m £m £mWages and salaries 1,125.1 763.6 666.4Payments and provisions charged under short- and long-term incentive plans 118.3 71.3 58.6Social security costs 120.5 86.3 76.7Other pension costs 40.8 27.7 20.7Other staff costs 212.9 142.4 130.5
1,617.6 1,091.3 952.9Directors’ emoluments are disclosed on page 87.
4 Net interest payable and similar charges 2000 1999 1998£m £m £m
On bank loans and overdrafts, and other loans– repayable within five years, by instalments 3.2 3.7 2.0– repayable within five years, not by instalments 38.7 16.0 21.1– on all other loans (including corporate bond) 14.7 14.1 6.9Total interest payable 56.6 33.8 30.0Interest receivable (22.5) (10.4) (10.8)Net interest payable 34.1 23.4 19.2Charges in respect of working capital facilities 16.2 12.0 13.2
50.3 35.4 32.4Net interest payable increased to £34.1 million from £23.4 million, reflecting theincreased level of acquisitions and share repurchases during the year.
Interest on the majority of the Group’s borrowings, other than the USA bond, is payableat a margin of between 0.20% and 0.55% over relevant LIBOR depending on certaincovenant conditions being met and, for a significant proportion of borrowings, is hedgedto January 2003 at US dollar LIBOR rates of 6.25% or less (excluding margin costs).
The majority of the Group’s long-term debt is represented by $300 million of USAbonds at a weighted average interest rate of 6.71% and $287.5 million of convertiblebonds at a rate of 3%. Average borrowings under the Syndicated Revolving CreditFacilities (note 8) amounted to $422 million at an average interest rate of 6.2%(1999: 6.1%, 1998: 5.7%) inclusive of margin.
Derivative financial instrumentsThe Group entered into various types of US dollar interest rate contracts in managingits interest rate risk, as below. The rates below exclude margin costs.
2000 1999 1998SwapsNotional principal amount $350m $350m $350mAverage pay rate 6.17% 6.17% 5.84%Average receive rate LIBOR LIBOR LIBORAverage term 5 months 5 months 6 monthsLatest maturity date Jan 2003 Jan 2003 Jan 2003
The Group enters into interest rate swap agreements to reduce the impact of changesin interest rates on its floating rate debt. Under the swap agreements the Group agreeswith other parties to exchange, at specified intervals, the difference between the fixedstrike rate and prevailing relevant floating US dollar LIBOR calculated by reference tothe agreed notional principal amount.
The differential paid or received by the Group on the swap agreements is charged/(credited) to interest expense in the year to which it relates.
The term of such instruments is not greater than the term of the debt being hedgedand any anticipated refinancing or extension of the debt.
The Group is exposed to credit-related losses in the event of non-performance bycounterparties to financial instruments, but it does not expect any counterparties to failto meet their obligations given the Group’s policy of selecting only counterparties withhigh credit ratings.
Other than the above, the Group has no significant utilisation of derivative financialinstruments.
The fair value of derivatives is disclosed in note 22. The Group’s policy onderivatives and financial instruments is discussed in the Operating and financial reviewon pages 29 and 30.
5 Tax on profit on ordinary activitiesThe tax charge is based on the profit for the year and comprises:
2000 1999 1998£m £m £m
Corporation tax at 30.0% (1999: 30.25%, 1998: 31.0%) 6.4 12.4 12.9Deferred taxation (10.6) (0.7) –Overseas taxation 100.3 56.5 51.4Tax on profits of associate companies 13.6 8.1 6.8Write-back of previously written-off ACT – – (4.1)Advance corporation tax written off – 0.3 –
109.7 76.6 67.0Effective tax rate on profit before tax 30.0% 30.0% 31.5%
Reconciliation of the Group’s tax to the United Kingdom statutory tax rate:2000 1999 1998
£m £m £mTax on pre-tax income at statutory rates of 30.0% 109.7 77.3 66.0
(1999 30.25% and 1998: 31.0%)Effects of:Permanent differences between expenditures chargedin arriving at income and expenditures allowed for tax purposes (4.1) (3.4) 4.3Utilisation of tax losses brought forward (9.7) (4.7) (5.6)Unused tax losses carried forward 9.4 6.3 4.6Differences between UK and overseas statutory standard tax rates 4.4 0.8 1.8Write-back of previously written-off ACT – – (4.1)Advance corporation tax written off – 0.3 –Tax on profit on ordinary activities 109.7 76.6 67.0There are tax losses available within the Young & Rubicam Inc. business which maybe available to the group going forward.
6 Ordinary dividends2000 1999 1998 2000 1999 1998
������������������������
Pence per share £m £m £mInterim dividend paid 1.20p 1.0p 0.84p 9.3 7.8 6.2Final dividend proposed 2.55p 2.1p 1.72p 28.5 16.2 13.4
3.75p 3.1p 2.56p 37.8 24.0 19.6No ACT is payable in respect of the 1998 final dividend, the 1999 and 2000 dividends,owing to the abolition of ACT with effect from April 1999.
7 Earnings per ordinary shareBasic and diluted earnings per share have been calculated in accordance with FRS 14‘Earnings per Share’.
Basic earnings per share have been calculated using earnings of £244.7 million (1999: £172.8 million, 1998: £140.3 million) and weighted average shares in issue duringthe year of 834,280,801 shares (1999: 753,324,054 shares, 1998: 735,700,122 shares).
Diluted earnings per share have been calculated using earnings of £244.7 million (1999: £172.8 million, 1998: £140.3 million), as adjusted for income arising on theconvertible loan note of £0.9 million (1999: £nil, 1998: £nil). The weighted average sharesused was 865,978,000 shares (1999: 768,691,993 shares, 1998: 746,939,733 shares).This takes into account the exercise of employee share options where these are expectedto dilute earnings and the $287.5 million of convertible bond.
Basic and diluted earnings per ADR have been calculated using the same method as for earnings per share, multiplied by a factor of five. The 1998 figures have been restatedfollowing a change in the ratio of ordinary shares per ADR from 10 ordinary shares perADR to five ordinary shares per ADR.
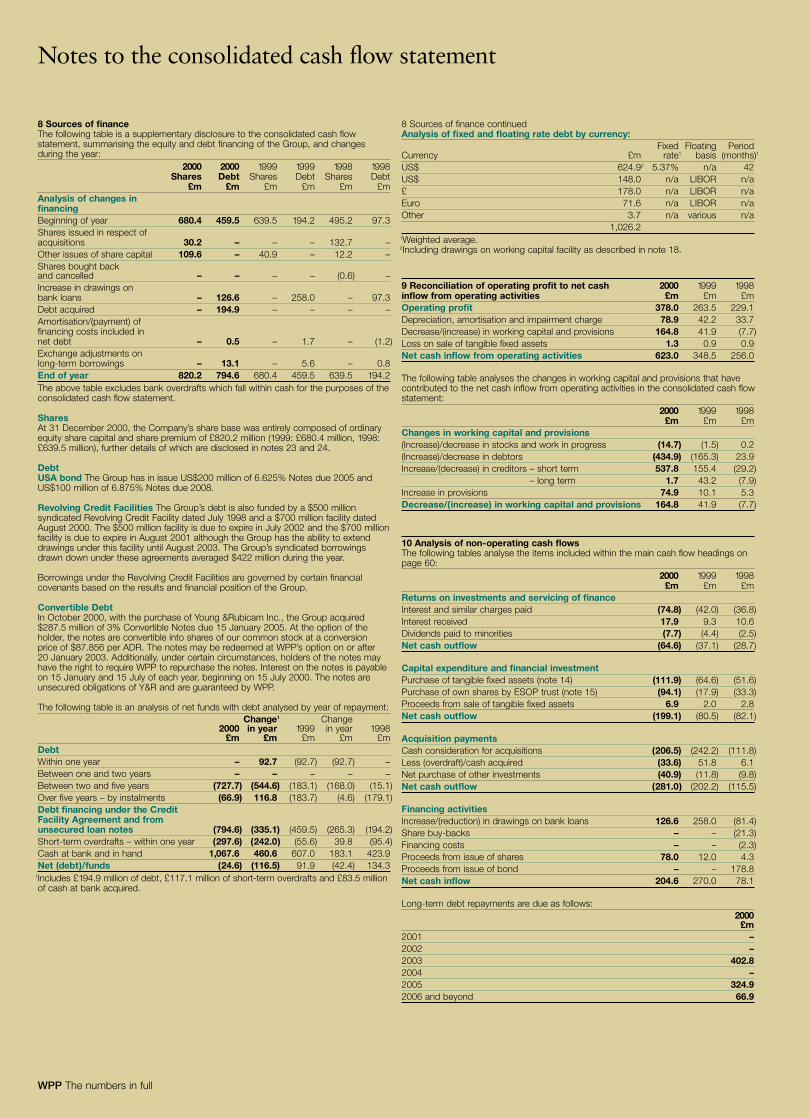
WPP The numbers in full
Notes to the consolidated cash flow statement
8 Sources of financeThe following table is a supplementary disclosure to the consolidated cash flowstatement, summarising the equity and debt financing of the Group, and changesduring the year:
2000 2000 1999 1999 1998 1998Shares Debt Shares Debt Shares Debt
£m £m £m £m £m £mAnalysis of changes in financingBeginning of year 680.4 459.5 639.5 194.2 495.2 97.3Shares issued in respect of acquisitions 30.2 – – – 132.7 –Other issues of share capital 109.6 – 40.9 – 12.2 –Shares bought backand cancelled – – – – (0.6) –Increase in drawings onbank loans – 126.6 – 258.0 – 97.3Debt acquired – 194.9 – – – –Amortisation/(payment) offinancing costs included innet debt – 0.5 – 1.7 – (1.2)Exchange adjustments onlong-term borrowings – 13.1 – 5.6 – 0.8End of year 820.2 794.6 680.4 459.5 639.5 194.2The above table excludes bank overdrafts which fall within cash for the purposes of theconsolidated cash flow statement.
SharesAt 31 December 2000, the Company’s share base was entirely composed of ordinaryequity share capital and share premium of £820.2 million (1999: £680.4 million, 1998: £639.5 million), further details of which are disclosed in notes 23 and 24.
DebtUSA bond The Group has in issue US$200 million of 6.625% Notes due 2005 andUS$100 million of 6.875% Notes due 2008.
Revolving Credit Facilities The Group’s debt is also funded by a $500 millionsyndicated Revolving Credit Facility dated July 1998 and a $700 million facility datedAugust 2000. The $500 million facility is due to expire in July 2002 and the $700 millionfacility is due to expire in August 2001 although the Group has the ability to extenddrawings under this facility until August 2003. The Group’s syndicated borrowingsdrawn down under these agreements averaged $422 million during the year.
Borrowings under the Revolving Credit Facilities are governed by certain financialcovenants based on the results and financial position of the Group.
Convertible DebtIn October 2000, with the purchase of Young &Rubicam Inc., the Group acquired $287.5 million of 3% Convertible Notes due 15 January 2005. At the option of the holder, the notes are convertible into shares of our common stock at a conversion price of $87.856 per ADR. The notes may be redeemed at WPP’s option on or after 20 January 2003. Additionally, under certain circumstances, holders of the notes mayhave the right to require WPP to repurchase the notes. Interest on the notes is payableon 15 January and 15 July of each year, beginning on 15 July 2000. The notes areunsecured obligations of Y&R and are guaranteed by WPP.
The following table is an analysis of net funds with debt analysed by year of repayment:Change1 Change
2000 in year 1999 in year 1998£m £m £m £m £m
DebtWithin one year – 92.7 (92.7) (92.7) –Between one and two years – – – – –Between two and five years (727.7) (544.6) (183.1) (168.0) (15.1)Over five years – by instalments (66.9) 116.8 (183.7) (4.6) (179.1)Debt financing under the Credit Facility Agreement and from unsecured loan notes (794.6) (335.1) (459.5) (265.3) (194.2)Short-term overdrafts – within one year (297.6) (242.0) (55.6) 39.8 (95.4)Cash at bank and in hand 1,067.6 460.6 607.0 183.1 423.9Net (debt)/funds (24.6) (116.5) 91.9 (42.4) 134.3
1Includes £194.9 million of debt, £117.1 million of short-term overdrafts and £83.5 millionof cash at bank acquired.
8 Sources of finance continuedAnalysis of fixed and floating rate debt by currency:
Fixed Floating PeriodCurrency £m rate1 basis (months)1
US$ 624.92 5.37% n/a 42US$ 148.0 n/a LIBOR n/a£ 178.0 n/a LIBOR n/aEuro 71.6 n/a LIBOR n/aOther 3.7 n/a various n/a
1,026.21Weighted average.2Including drawings on working capital facility as described in note 18.
9 Reconciliation of operating profit to net cash 2000 1999 1998inflow from operating activities £m £m £mOperating profit 378.0 263.5 229.1Depreciation, amortisation and impairment charge 78.9 42.2 33.7Decrease/(increase) in working capital and provisions 164.8 41.9 (7.7)Loss on sale of tangible fixed assets 1.3 0.9 0.9Net cash inflow from operating activities 623.0 348.5 256.0
The following table analyses the changes in working capital and provisions that havecontributed to the net cash inflow from operating activities in the consolidated cash flowstatement:
2000 1999 1998£m £m £m
Changes in working capital and provisions(Increase)/decrease in stocks and work in progress (14.7) (1.5) 0.2(Increase)/decrease in debtors (434.9) (165.3) 23.9Increase/(decrease) in creditors – short term 537.8 155.4 (29.2)
– long term 1.7 43.2 (7.9)Increase in provisions 74.9 10.1 5.3Decrease/(increase) in working capital and provisions 164.8 41.9 (7.7)
10 Analysis of non-operating cash flowsThe following tables analyse the items included within the main cash flow headings onpage 60:
2000 1999 1998£m £m £m
Returns on investments and servicing of financeInterest and similar charges paid (74.8) (42.0) (36.8)Interest received 17.9 9.3 10.6Dividends paid to minorities (7.7) (4.4) (2.5)Net cash outflow (64.6) (37.1) (28.7)
Capital expenditure and financial investmentPurchase of tangible fixed assets (note 14) (111.9) (64.6) (51.6)Purchase of own shares by ESOP trust (note 15) (94.1) (17.9) (33.3)Proceeds from sale of tangible fixed assets 6.9 2.0 2.8Net cash outflow (199.1) (80.5) (82.1)
Acquisition paymentsCash consideration for acquisitions (206.5) (242.2) (111.8)Less (overdraft)/cash acquired (33.6) 51.8 6.1Net purchase of other investments (40.9) (11.8) (9.8)Net cash outflow (281.0) (202.2) (115.5)
Financing activitiesIncrease/(reduction) in drawings on bank loans 126.6 258.0 (81.4)Share buy-backs – – (21.3)Financing costs – – (2.3)Proceeds from issue of shares 78.0 12.0 4.3Proceeds from issue of bond – – 178.8Net cash inflow 204.6 270.0 78.1
Long-term debt repayments are due as follows:2000
£m2001 –2002 –2003 402.82004 –2005 324.92006 and beyond 66.9
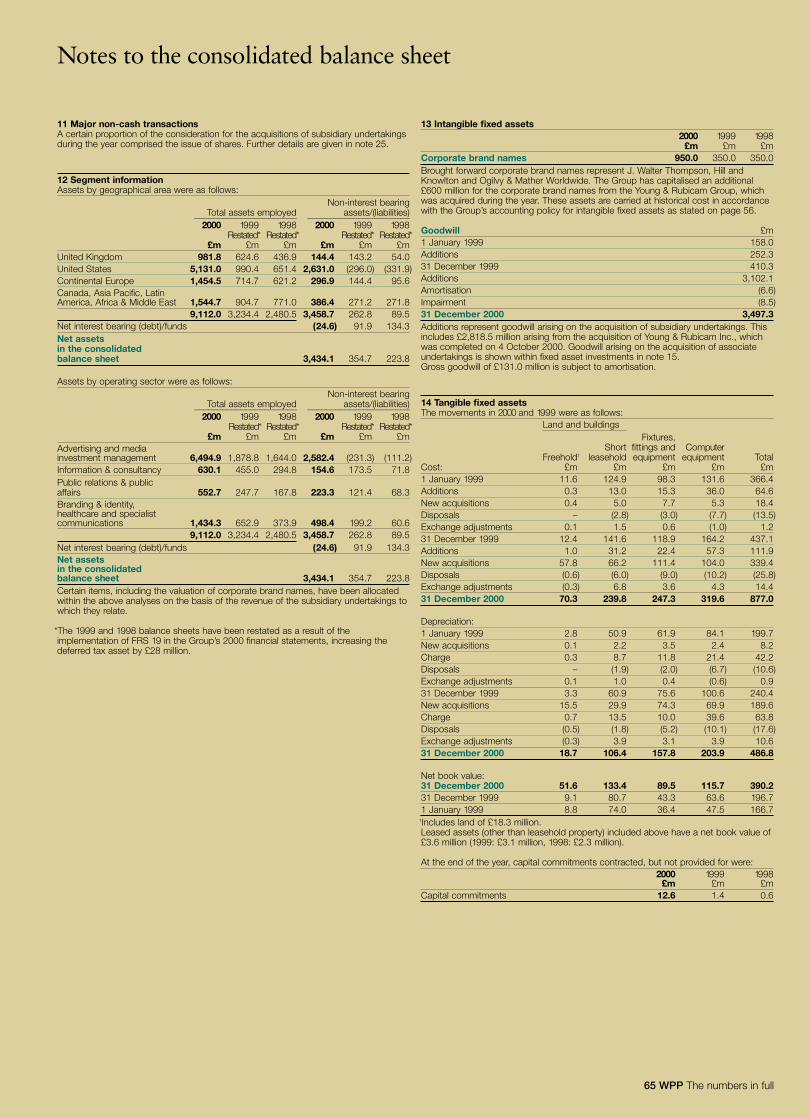
65 WPP The numbers in full
Notes to the consolidated balance sheet
11 Major non-cash transactionsA certain proportion of the consideration for the acquisitions of subsidiary undertakingsduring the year comprised the issue of shares. Further details are given in note 25.
12 Segment informationAssets by geographical area were as follows:
Non-interest bearingTotal assets employed assets/(liabilities)
���������������������� ����������������������
2000 1999 1998 2000 1999 1998Restated* Restated* Restated* Restated*
£m £m £m £m £m £mUnited Kingdom 981.8 624.6 436.9 144.4 143.2 54.0United States 5,131.0 990.4 651.4 2,631.0 (296.0) (331.9)Continental Europe 1,454.5 714.7 621.2 296.9 144.4 95.6Canada, Asia Pacific, LatinAmerica, Africa & Middle East 1,544.7 904.7 771.0 386.4 271.2 271.8
9,112.0 3,234.4 2,480.5 3,458.7 262.8 89.5Net interest bearing (debt)/funds (24.6) 91.9 134.3Net assetsin the consolidated balance sheet 3,434.1 354.7 223.8
Assets by operating sector were as follows:Non-interest bearing
Total assets employed assets/(liabilities)���������������������� ����������������������
2000 1999 1998 2000 1999 1998Restated* Restated* Restated* Restated*
£m £m £m £m £m £mAdvertising and media investment management 6,494.9 1,878.8 1,644.0 2,582.4 (231.3) (111.2)Information & consultancy 630.1 455.0 294.8 154.6 173.5 71.8Public relations & publicaffairs 552.7 247.7 167.8 223.3 121.4 68.3Branding & identity, healthcare and specialist communications 1,434.3 652.9 373.9 498.4 199.2 60.6
9,112.0 3,234.4 2,480.5 3,458.7 262.8 89.5Net interest bearing (debt)/funds (24.6) 91.9 134.3Net assetsin the consolidated balance sheet 3,434.1 354.7 223.8Certain items, including the valuation of corporate brand names, have been allocatedwithin the above analyses on the basis of the revenue of the subsidiary undertakings towhich they relate.
*The 1999 and 1998 balance sheets have been restated as a result of theimplementation of FRS 19 in the Group’s 2000 financial statements, increasing thedeferred tax asset by £28 million.
13 Intangible fixed assets2000 1999 1998
£m £m £mCorporate brand names 950.0 350.0 350.0Brought forward corporate brand names represent J. Walter Thompson, Hill andKnowlton and Ogilvy & Mather Worldwide. The Group has capitalised an additional£600 million for the corporate brand names from the Young & Rubicam Group, whichwas acquired during the year. These assets are carried at historical cost in accordancewith the Group’s accounting policy for intangible fixed assets as stated on page 56.
Goodwill £m1 January 1999 158.0Additions 252.331 December 1999 410.3Additions 3,102.1Amortisation (6.6)Impairment (8.5)31 December 2000 3,497.3Additions represent goodwill arising on the acquisition of subsidiary undertakings. Thisincludes £2,818.5 million arising from the acquisition of Young & Rubicam Inc., whichwas completed on 4 October 2000. Goodwill arising on the acquisition of associateundertakings is shown within fixed asset investments in note 15.Gross goodwill of £131.0 million is subject to amortisation.
14 Tangible fixed assetsThe movements in 2000 and 1999 were as follows:
Land and buildingsFixtures,
Short fittings and ComputerFreehold1 leasehold equipment equipment Total
Cost: £m £m £m £m £m1 January 1999 11.6 124.9 98.3 131.6 366.4Additions 0.3 13.0 15.3 36.0 64.6New acquisitions 0.4 5.0 7.7 5.3 18.4Disposals – (2.8) (3.0) (7.7) (13.5)Exchange adjustments 0.1 1.5 0.6 (1.0) 1.231 December 1999 12.4 141.6 118.9 164.2 437.1Additions 1.0 31.2 22.4 57.3 111.9New acquisitions 57.8 66.2 111.4 104.0 339.4Disposals (0.6) (6.0) (9.0) (10.2) (25.8)Exchange adjustments (0.3) 6.8 3.6 4.3 14.431 December 2000 70.3 239.8 247.3 319.6 877.0
Depreciation:1 January 1999 2.8 50.9 61.9 84.1 199.7New acquisitions 0.1 2.2 3.5 2.4 8.2Charge 0.3 8.7 11.8 21.4 42.2Disposals – (1.9) (2.0) (6.7) (10.6)Exchange adjustments 0.1 1.0 0.4 (0.6) 0.931 December 1999 3.3 60.9 75.6 100.6 240.4New acquisitions 15.5 29.9 74.3 69.9 189.6Charge 0.7 13.5 10.0 39.6 63.8Disposals (0.5) (1.8) (5.2) (10.1) (17.6)Exchange adjustments (0.3) 3.9 3.1 3.9 10.631 December 2000 18.7 106.4 157.8 203.9 486.8
Net book value:31 December 2000 51.6 133.4 89.5 115.7 390.231 December 1999 9.1 80.7 43.3 63.6 196.71 January 1999 8.8 74.0 36.4 47.5 166.7
1Includes land of £18.3 million.Leased assets (other than leasehold property) included above have a net book value of£3.6 million (1999: £3.1 million, 1998: £2.3 million).
At the end of the year, capital commitments contracted, but not provided for were:2000 1999 1998
£m £m £mCapital commitments 12.6 1.4 0.6
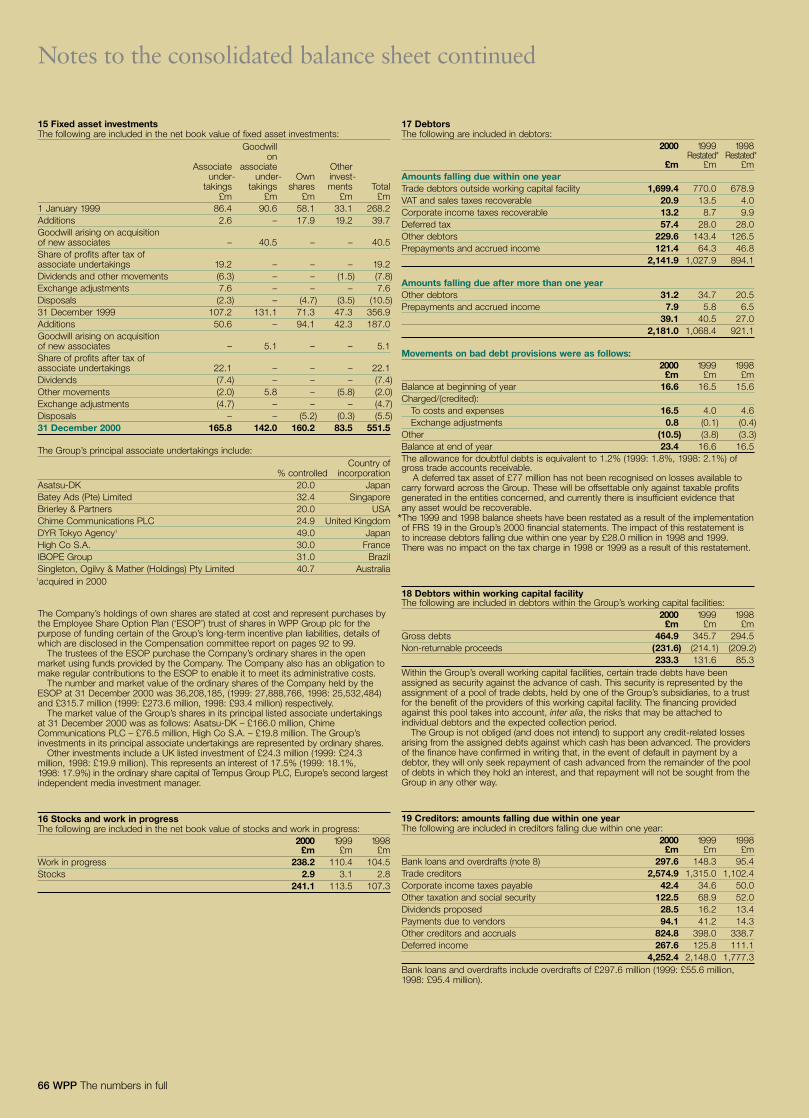
66 WPP The numbers in full
Notes to the consolidated balance sheet continued
15 Fixed asset investmentsThe following are included in the net book value of fixed asset investments:
Goodwillon
Associate associate Otherunder- under- Own invest-
takings takings shares ments Total£m £m £m £m £m
1 January 1999 86.4 90.6 58.1 33.1 268.2Additions 2.6 – 17.9 19.2 39.7Goodwill arising on acquisitionof new associates – 40.5 – – 40.5Share of profits after tax of associate undertakings 19.2 – – – 19.2Dividends and other movements (6.3) – – (1.5) (7.8)Exchange adjustments 7.6 – – – 7.6Disposals (2.3) – (4.7) (3.5) (10.5)31 December 1999 107.2 131.1 71.3 47.3 356.9Additions 50.6 – 94.1 42.3 187.0Goodwill arising on acquisitionof new associates – 5.1 – – 5.1Share of profits after tax of associate undertakings 22.1 – – – 22.1Dividends (7.4) – – – (7.4)Other movements (2.0) 5.8 – (5.8) (2.0)Exchange adjustments (4.7) – – – (4.7)Disposals – – (5.2) (0.3) (5.5)31 December 2000 165.8 142.0 160.2 83.5 551.5
The Group’s principal associate undertakings include:Country of
% controlled incorporationAsatsu-DK 20.0 JapanBatey Ads (Pte) Limited 32.4 SingaporeBrierley & Partners 20.0 USAChime Communications PLC 24.9 United KingdomDYR Tokyo Agency1 49.0 JapanHigh Co S.A. 30.0 FranceIBOPE Group 31.0 BrazilSingleton, Ogilvy & Mather (Holdings) Pty Limited 40.7 Australia
1acquired in 2000
The Company’s holdings of own shares are stated at cost and represent purchases by the Employee Share Option Plan (‘ESOP’) trust of shares in WPP Group plc for thepurpose of funding certain of the Group’s long-term incentive plan liabilities, details ofwhich are disclosed in the Compensation committee report on pages 92 to 99.
The trustees of the ESOP purchase the Company’s ordinary shares in the openmarket using funds provided by the Company. The Company also has an obligation tomake regular contributions to the ESOP to enable it to meet its administrative costs.
The number and market value of the ordinary shares of the Company held by theESOP at 31 December 2000 was 36,208,185, (1999: 27,888,766, 1998: 25,532,484)and £315.7 million (1999: £273.6 million, 1998: £93.4 million) respectively.
The market value of the Group’s shares in its principal listed associate undertakingsat 31 December 2000 was as follows: Asatsu-DK – £166.0 million, ChimeCommunications PLC – £76.5 million, High Co S.A. – £19.8 million. The Group’sinvestments in its principal associate undertakings are represented by ordinary shares.
Other investments include a UK listed investment of £24.3 million (1999: £24.3million, 1998: £19.9 million). This represents an interest of 17.5% (1999: 18.1%, 1998: 17.9%) in the ordinary share capital of Tempus Group PLC, Europe’s second largestindependent media investment manager.
16 Stocks and work in progressThe following are included in the net book value of stocks and work in progress:
2000 1999 1998£m £m £m
Work in progress 238.2 110.4 104.5Stocks 2.9 3.1 2.8
241.1 113.5 107.3
17 DebtorsThe following are included in debtors:
2000 1999 1998Restated* Restated*
£m £m £mAmounts falling due within one yearTrade debtors outside working capital facility 1,699.4 770.0 678.9VAT and sales taxes recoverable 20.9 13.5 4.0Corporate income taxes recoverable 13.2 8.7 9.9Deferred tax 57.4 28.0 28.0Other debtors 229.6 143.4 126.5Prepayments and accrued income 121.4 64.3 46.8
2,141.9 1,027.9 894.1
Amounts falling due after more than one yearOther debtors 31.2 34.7 20.5Prepayments and accrued income 7.9 5.8 6.5
39.1 40.5 27.02,181.0 1,068.4 921.1
Movements on bad debt provisions were as follows:2000 1999 1998
£m £m £mBalance at beginning of year 16.6 16.5 15.6Charged/(credited):
To costs and expenses 16.5 4.0 4.6Exchange adjustments 0.8 (0.1) (0.4)
Other (10.5) (3.8) (3.3)Balance at end of year 23.4 16.6 16.5The allowance for doubtful debts is equivalent to 1.2% (1999: 1.8%, 1998: 2.1%) ofgross trade accounts receivable.
A deferred tax asset of £77 million has not been recognised on losses available tocarry forward across the Group. These will be offsettable only against taxable profitsgenerated in the entities concerned, and currently there is insufficient evidence thatany asset would be recoverable.
*The 1999 and 1998 balance sheets have been restated as a result of the implementationof FRS 19 in the Group’s 2000 financial statements. The impact of this restatement is to increase debtors falling due within one year by £28.0 million in 1998 and 1999. There was no impact on the tax charge in 1998 or 1999 as a result of this restatement.
18 Debtors within working capital facilityThe following are included in debtors within the Group’s working capital facilities:
2000 1999 1998£m £m £m
Gross debts 464.9 345.7 294.5Non-returnable proceeds (231.6) (214.1) (209.2)
233.3 131.6 85.3Within the Group’s overall working capital facilities, certain trade debts have beenassigned as security against the advance of cash. This security is represented by theassignment of a pool of trade debts, held by one of the Group’s subsidiaries, to a trustfor the benefit of the providers of this working capital facility. The financing providedagainst this pool takes into account, inter alia, the risks that may be attached toindividual debtors and the expected collection period.
The Group is not obliged (and does not intend) to support any credit-related lossesarising from the assigned debts against which cash has been advanced. The providersof the finance have confirmed in writing that, in the event of default in payment by adebtor, they will only seek repayment of cash advanced from the remainder of the poolof debts in which they hold an interest, and that repayment will not be sought from theGroup in any other way.
19 Creditors: amounts falling due within one yearThe following are included in creditors falling due within one year:
2000 1999 1998£m £m £m
Bank loans and overdrafts (note 8) 297.6 148.3 95.4Trade creditors 2,574.9 1,315.0 1,102.4Corporate income taxes payable 42.4 34.6 50.0Other taxation and social security 122.5 68.9 52.0Dividends proposed 28.5 16.2 13.4Payments due to vendors 94.1 41.2 14.3Other creditors and accruals 824.8 398.0 338.7Deferred income 267.6 125.8 111.1
4,252.4 2,148.0 1,777.3Bank loans and overdrafts include overdrafts of £297.6 million (1999: £55.6 million, 1998: £95.4 million).
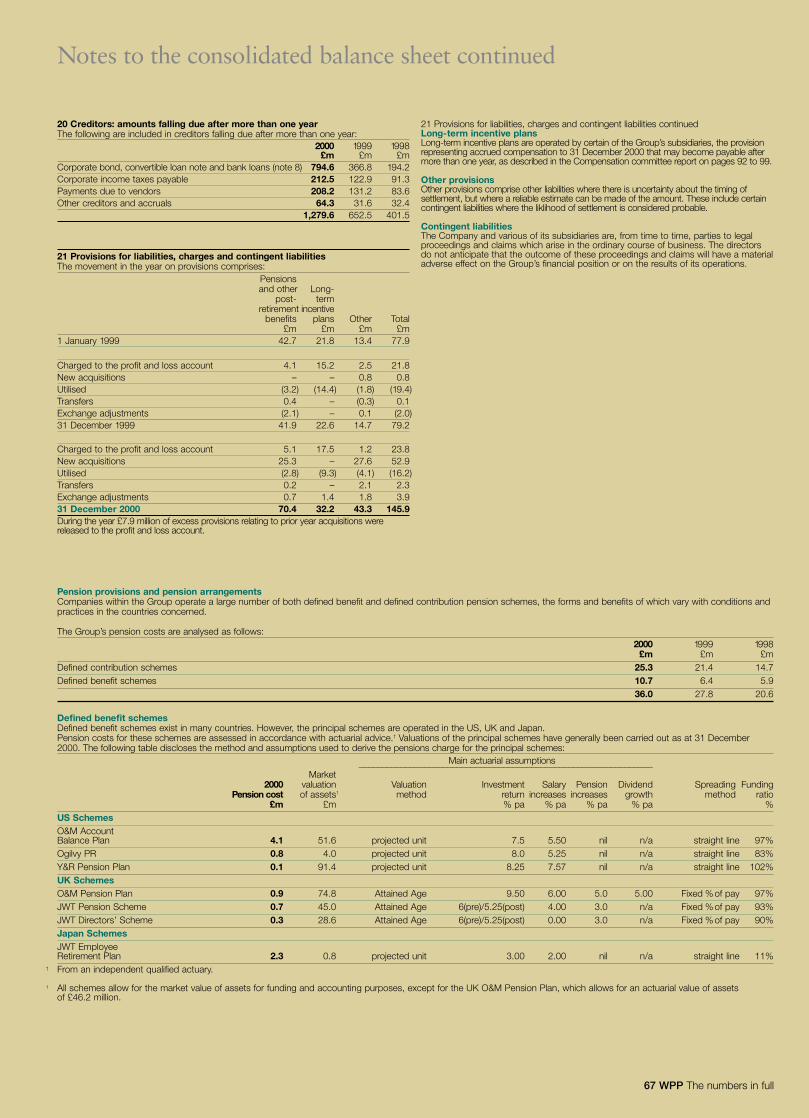
67 WPP The numbers in full
Notes to the consolidated balance sheet continued
20 Creditors: amounts falling due after more than one yearThe following are included in creditors falling due after more than one year:
2000 1999 1998£m £m £m
Corporate bond, convertible loan note and bank loans (note 8) 794.6 366.8 194.2Corporate income taxes payable 212.5 122.9 91.3Payments due to vendors 208.2 131.2 83.6Other creditors and accruals 64.3 31.6 32.4
1,279.6 652.5 401.5
21 Provisions for liabilities, charges and contingent liabilitiesThe movement in the year on provisions comprises:
Pensionsand other Long-
post- termretirement incentive
benefits plans Other Total£m £m £m £m
1 January 1999 42.7 21.8 13.4 77.9
Charged to the profit and loss account 4.1 15.2 2.5 21.8New acquisitions – – 0.8 0.8Utilised (3.2) (14.4) (1.8) (19.4)Transfers 0.4 – (0.3) 0.1Exchange adjustments (2.1) – 0.1 (2.0)31 December 1999 41.9 22.6 14.7 79.2
Charged to the profit and loss account 5.1 17.5 1.2 23.8New acquisitions 25.3 – 27.6 52.9Utilised (2.8) (9.3) (4.1) (16.2)Transfers 0.2 – 2.1 2.3Exchange adjustments 0.7 1.4 1.8 3.931 December 2000 70.4 32.2 43.3 145.9During the year £7.9 million of excess provisions relating to prior year acquisitions werereleased to the profit and loss account.
21 Provisions for liabilities, charges and contingent liabilities continuedLong-term incentive plansLong-term incentive plans are operated by certain of the Group’s subsidiaries, the provisionrepresenting accrued compensation to 31 December 2000 that may become payable aftermore than one year, as described in the Compensation committee report on pages 92 to 99.
Other provisionsOther provisions comprise other liabilities where there is uncertainty about the timing ofsettlement, but where a reliable estimate can be made of the amount. These include certaincontingent liabilities where the liklihood of settlement is considered probable.
Contingent liabilitiesThe Company and various of its subsidiaries are, from time to time, parties to legalproceedings and claims which arise in the ordinary course of business. The directorsdo not anticipate that the outcome of these proceedings and claims will have a materialadverse effect on the Group’s financial position or on the results of its operations.
Pension provisions and pension arrangementsCompanies within the Group operate a large number of both defined benefit and defined contribution pension schemes, the forms and benefits of which vary with conditions andpractices in the countries concerned.
The Group’s pension costs are analysed as follows:2000 1999 1998
£m £m £mDefined contribution schemes 25.3 21.4 14.7Defined benefit schemes 10.7 6.4 5.9
36.0 27.8 20.6
Defined benefit schemesDefined benefit schemes exist in many countries. However, the principal schemes are operated in the US, UK and Japan.Pension costs for these schemes are assessed in accordance with actuarial advice.† Valuations of the principal schemes have generally been carried out as at 31 December2000. The following table discloses the method and assumptions used to derive the pensions charge for the principal schemes:
Main actuarial assumptions���������������������������������������������������������������
Market2000 valuation Valuation Investment Salary Pension Dividend Spreading Funding
Pension cost of assets1 method return increases increases growth method ratio£m £m % pa % pa % pa % pa %
US SchemesO&M AccountBalance Plan 4.1 51.6 projected unit 7.5 5.50 nil n/a straight line 97%Ogilvy PR 0.8 4.0 projected unit 8.0 5.25 nil n/a straight line 83%Y&R Pension Plan 0.1 91.4 projected unit 8.25 7.57 nil n/a straight line 102%UK SchemesO&M Pension Plan 0.9 74.8 Attained Age 9.50 6.00 5.0 5.00 Fixed %of pay 97%JWT Pension Scheme 0.7 45.0 Attained Age 6(pre)/5.25(post) 4.00 3.0 n/a Fixed %of pay 93%JWT Directors’ Scheme 0.3 28.6 Attained Age 6(pre)/5.25(post) 0.00 3.0 n/a Fixed %of pay 90%Japan SchemesJWT EmployeeRetirement Plan 2.3 0.8 projected unit 3.00 2.00 nil n/a straight line 11%From an independent qualified actuary.
All schemes allow for the market value of assets for funding and accounting purposes, except for the UK O&M Pension Plan, which allows for an actuarial value of assets of £46.2 million.
†
1
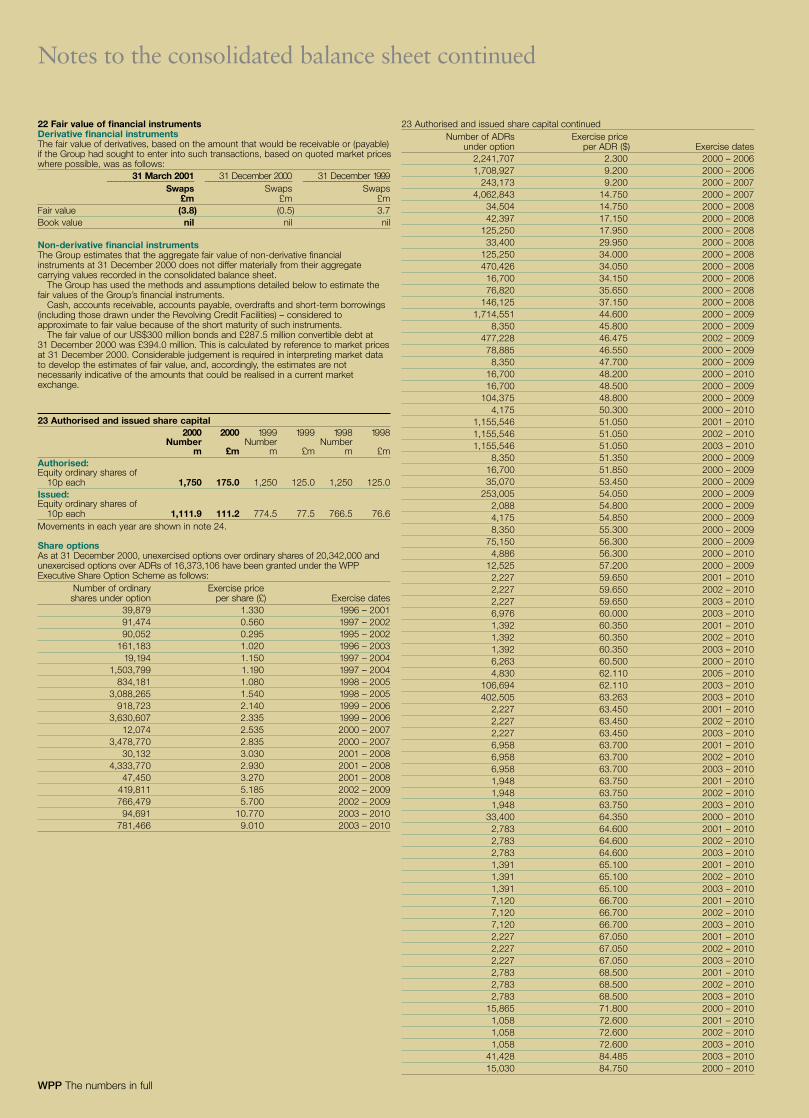
WPP The numbers in full
Notes to the consolidated balance sheet continued
22 Fair value of financial instrumentsDerivative financial instrumentsThe fair value of derivatives, based on the amount that would be receivable or (payable)if the Group had sought to enter into such transactions, based on quoted market priceswhere possible, was as follows:
31 March 2001 31 December 2000 31 December 1999������������������� ������������������� �������������������
Swaps Swaps Swaps£m £m £m
Fair value (3.8) (0.5) 3.7Book value nil nil nil
Non-derivative financial instrumentsThe Group estimates that the aggregate fair value of non-derivative financialinstruments at 31 December 2000 does not differ materially from their aggregatecarrying values recorded in the consolidated balance sheet.
The Group has used the methods and assumptions detailed below to estimate thefair values of the Group’s financial instruments.
Cash, accounts receivable, accounts payable, overdrafts and short-term borrowings(including those drawn under the Revolving Credit Facilities) – considered toapproximate to fair value because of the short maturity of such instruments.
The fair value of our US$300 million bonds and £287.5 million convertible debt at 31 December 2000 was £394.0 million. This is calculated by reference to market pricesat 31 December 2000. Considerable judgement is required in interpreting market datato develop the estimates of fair value, and, accordingly, the estimates are notnecessarily indicative of the amounts that could be realised in a current marketexchange.
23 Authorised and issued share capital2000 2000 1999 1999 1998 1998
Number Number Numberm £m m £m m £m
Authorised:Equity ordinary shares of
10p each 1,750 175.0 1,250 125.0 1,250 125.0Issued:Equity ordinary shares of
10p each 1,111.9 111.2 774.5 77.5 766.5 76.6Movements in each year are shown in note 24.
Share optionsAs at 31 December 2000, unexercised options over ordinary shares of 20,342,000 andunexercised options over ADRs of 16,373,106 have been granted under the WPPExecutive Share Option Scheme as follows:
Number of ordinary Exercise priceshares under option per share (£) Exercise dates
39,879 1.330 1996 – 200191,474 0.560 1997 – 200290,052 0.295 1995 – 2002
161,183 1.020 1996 – 200319,194 1.150 1997 – 2004
1,503,799 1.190 1997 – 2004834,181 1.080 1998 – 2005
3,088,265 1.540 1998 – 2005918,723 2.140 1999 – 2006
3,630,607 2.335 1999 – 200612,074 2.535 2000 – 2007
3,478,770 2.835 2000 – 200730,132 3.030 2001 – 2008
4,333,770 2.930 2001 – 200847,450 3.270 2001 – 2008
419,811 5.185 2002 – 2009766,479 5.700 2002 – 200994,691 10.770 2003 – 2010
781,466 9.010 2003 – 2010
23 Authorised and issued share capital continuedNumber of ADRs Exercise price
under option per ADR ($) Exercise dates2,241,707 2.300 2000 – 20061,708,927 9.200 2000 – 2006
243,173 9.200 2000 – 20074,062,843 14.750 2000 – 2007
34,504 14.750 2000 – 200842,397 17.150 2000 – 2008
125,250 17.950 2000 – 200833,400 29.950 2000 – 2008
125,250 34.000 2000 – 2008470,426 34.050 2000 – 200816,700 34.150 2000 – 200876,820 35.650 2000 – 2008
146,125 37.150 2000 – 20081,714,551 44.600 2000 – 2009
8,350 45.800 2000 – 2009477,228 46.475 2002 – 200978,885 46.550 2000 – 20098,350 47.700 2000 – 2009
16,700 48.200 2000 – 201016,700 48.500 2000 – 2009
104,375 48.800 2000 – 20094,175 50.300 2000 – 2010
1,155,546 51.050 2001 – 20101,155,546 51.050 2002 – 20101,155,546 51.050 2003 – 2010
8,350 51.350 2000 – 200916,700 51.850 2000 – 200935,070 53.450 2000 – 2009
253,005 54.050 2000 – 20092,088 54.800 2000 – 20094,175 54.850 2000 – 20098,350 55.300 2000 – 2009
75,150 56.300 2000 – 20094,886 56.300 2000 – 2010
12,525 57.200 2000 – 20092,227 59.650 2001 – 20102,227 59.650 2002 – 20102,227 59.650 2003 – 20106,976 60.000 2003 – 20101,392 60.350 2001 – 20101,392 60.350 2002 – 20101,392 60.350 2003 – 20106,263 60.500 2000 – 20104,830 62.110 2005 – 2010
106,694 62.110 2003 – 2010402,505 63.263 2003 – 2010
2,227 63.450 2001 – 20102,227 63.450 2002 – 20102,227 63.450 2003 – 20106,958 63.700 2001 – 20106,958 63.700 2002 – 20106,958 63.700 2003 – 20101,948 63.750 2001 – 20101,948 63.750 2002 – 20101,948 63.750 2003 – 2010
33,400 64.350 2000 – 20102,783 64.600 2001 – 20102,783 64.600 2002 – 20102,783 64.600 2003 – 20101,391 65.100 2001 – 20101,391 65.100 2002 – 20101,391 65.100 2003 – 20107,120 66.700 2001 – 20107,120 66.700 2002 – 20107,120 66.700 2003 – 20102,227 67.050 2001 – 20102,227 67.050 2002 – 20102,227 67.050 2003 – 20102,783 68.500 2001 – 20102,783 68.500 2002 – 20102,783 68.500 2003 – 2010
15,865 71.800 2000 – 20101,058 72.600 2001 – 20101,058 72.600 2002 – 20101,058 72.600 2003 – 2010
41,428 84.485 2003 – 201015,030 84.750 2000 – 2010
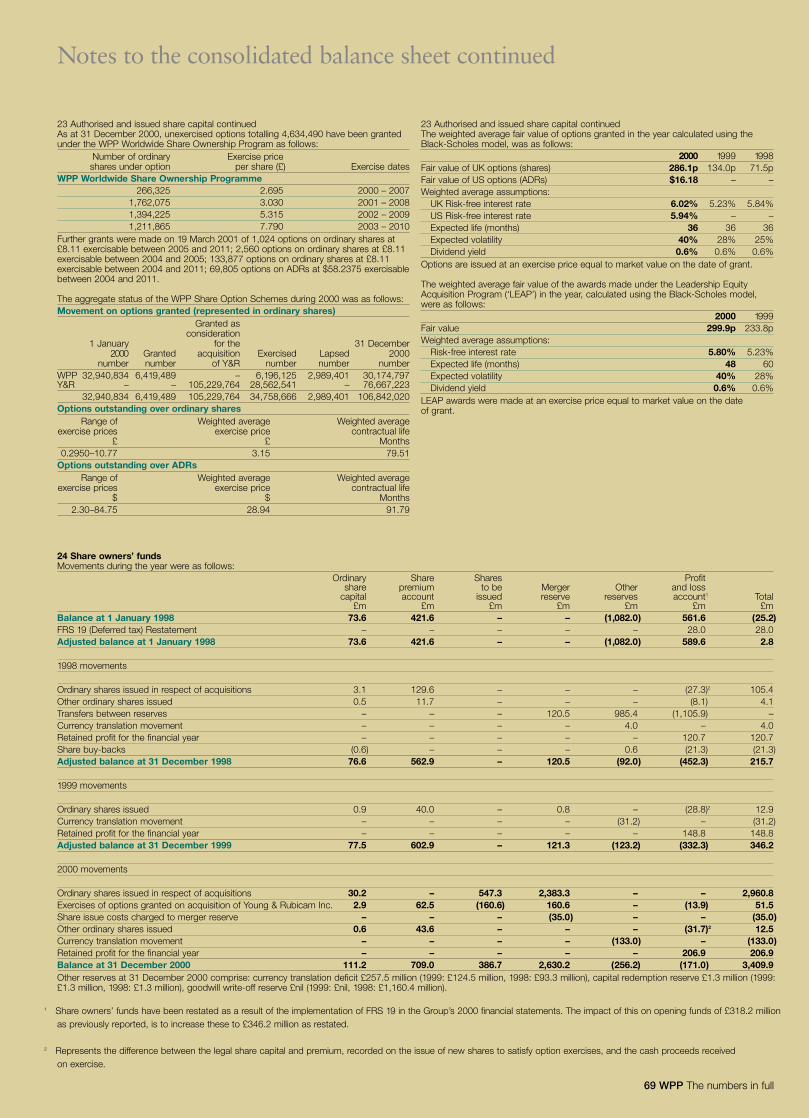
69 WPP The numbers in full
Notes to the consolidated balance sheet continued
24 Share owners’ fundsMovements during the year were as follows:
Ordinary Share Shares Profitshare premium to be Merger Other and loss
capital account issued reserve reserves account1 Total£m £m £m £m £m £m £m
Balance at 1 January 1998 73.6 421.6 – – (1,082.0) 561.6 (25.2)FRS 19 (Deferred tax) Restatement – – – – – 28.0 28.0Adjusted balance at 1 January 1998 73.6 421.6 – – (1,082.0) 589.6 2.8
1998 movements
Ordinary shares issued in respect of acquisitions 3.1 129.6 – – – (27.3)2 105.4Other ordinary shares issued 0.5 11.7 – – – (8.1) 4.1Transfers between reserves – – – 120.5 985.4 (1,105.9) –Currency translation movement – – – – 4.0 – 4.0Retained profit for the financial year – – – – – 120.7 120.7Share buy-backs (0.6) – – – 0.6 (21.3) (21.3)Adjusted balance at 31 December 1998 76.6 562.9 – 120.5 (92.0) (452.3) 215.7
1999 movements
Ordinary shares issued 0.9 40.0 – 0.8 – (28.8)2 12.9Currency translation movement – – – – (31.2) – (31.2)Retained profit for the financial year – – – – – 148.8 148.8Adjusted balance at 31 December 1999 77.5 602.9 – 121.3 (123.2) (332.3) 346.2
2000 movements
Ordinary shares issued in respect of acquisitions 30.2 – 547.3 2,383.3 – – 2,960.8Exercises of options granted on acquisition of Young & Rubicam Inc. 2.9 62.5 (160.6) 160.6 – (13.9) 51.5Share issue costs charged to merger reserve – – – (35.0) – – (35.0)Other ordinary shares issued 0.6 43.6 – – – (31.7)2 12.5Currency translation movement – – – – (133.0) – (133.0)Retained profit for the financial year – – – – – 206.9 206.9Balance at 31 December 2000 111.2 709.0 386.7 2,630.2 (256.2) (171.0) 3,409.9Other reserves at 31 December 2000 comprise: currency translation deficit £257.5 million (1999: £124.5 million, 1998: £93.3 million), capital redemption reserve £1.3 million (1999:£1.3 million, 1998: £1.3 million), goodwill write-off reserve £nil (1999: £nil, 1998: £1,160.4 million).
Share owners’ funds have been restated as a result of the implementation of FRS 19 in the Group’s 2000 financial statements. The impact of this on opening funds of £318.2 millionas previously reported, is to increase these to £346.2 million as restated.
Represents the difference between the legal share capital and premium, recorded on the issue of new shares to satisfy option exercises, and the cash proceeds receivedon exercise.
23 Authorised and issued share capital continuedAs at 31 December 2000, unexercised options totalling 4,634,490 have been grantedunder the WPP Worldwide Share Ownership Program as follows:
Number of ordinary Exercise priceshares under option per share (£) Exercise dates
WPP Worldwide Share Ownership Programme266,325 2.695 2000 – 2007
1,762,075 3.030 2001 – 20081,394,225 5.315 2002 – 20091,211,865 7.790 2003 – 2010
Further grants were made on 19 March 2001 of 1,024 options on ordinary shares at£8.11 exercisable between 2005 and 2011; 2,560 options on ordinary shares at £8.11exercisable between 2004 and 2005; 133,877 options on ordinary shares at £8.11exercisable between 2004 and 2011; 69,805 options on ADRs at $58.2375 exercisablebetween 2004 and 2011.
The aggregate status of the WPP Share Option Schemes during 2000 was as follows:Movement on options granted (represented in ordinary shares)
Granted asconsideration
1 January for the 31 December2000 Granted acquisition Exercised Lapsed 2000
number number of Y&R number number numberWPP 32,940,834 6,419,489 – 6,196,125 2,989,401 30,174,797Y&R – – 105,229,764 28,562,541 – 76,667,223
32,940,834 6,419,489 105,229,764 34,758,666 2,989,401 106,842,020Options outstanding over ordinary shares
Range of Weighted average Weighted averageexercise prices exercise price contractual life
£ £ Months0.2950–10.77 3.15 79.51
Options outstanding over ADRsRange of Weighted average Weighted average
exercise prices exercise price contractual life$ $ Months
2.30–84.75 28.94 91.79
23 Authorised and issued share capital continuedThe weighted average fair value of options granted in the year calculated using theBlack-Scholes model, was as follows:
2000 1999 1998Fair value of UK options (shares) 286.1p 134.0p 71.5pFair value of US options (ADRs) $16.18 – –Weighted average assumptions:
UK Risk-free interest rate 6.02% 5.23% 5.84%US Risk-free interest rate 5.94% – –Expected life (months) 36 36 36Expected volatility 40% 28% 25%Dividend yield 0.6% 0.6% 0.6%
Options are issued at an exercise price equal to market value on the date of grant.
The weighted average fair value of the awards made under the Leadership EquityAcquisition Program (‘LEAP’) in the year, calculated using the Black-Scholes model, were as follows:
2000 1999Fair value 299.9p 233.8pWeighted average assumptions:
Risk-free interest rate 5.80% 5.23%Expected life (months) 48 60Expected volatility 40% 28%Dividend yield 0.6% 0.6%
LEAP awards were made at an exercise price equal to market value on the dateof grant.
1
2
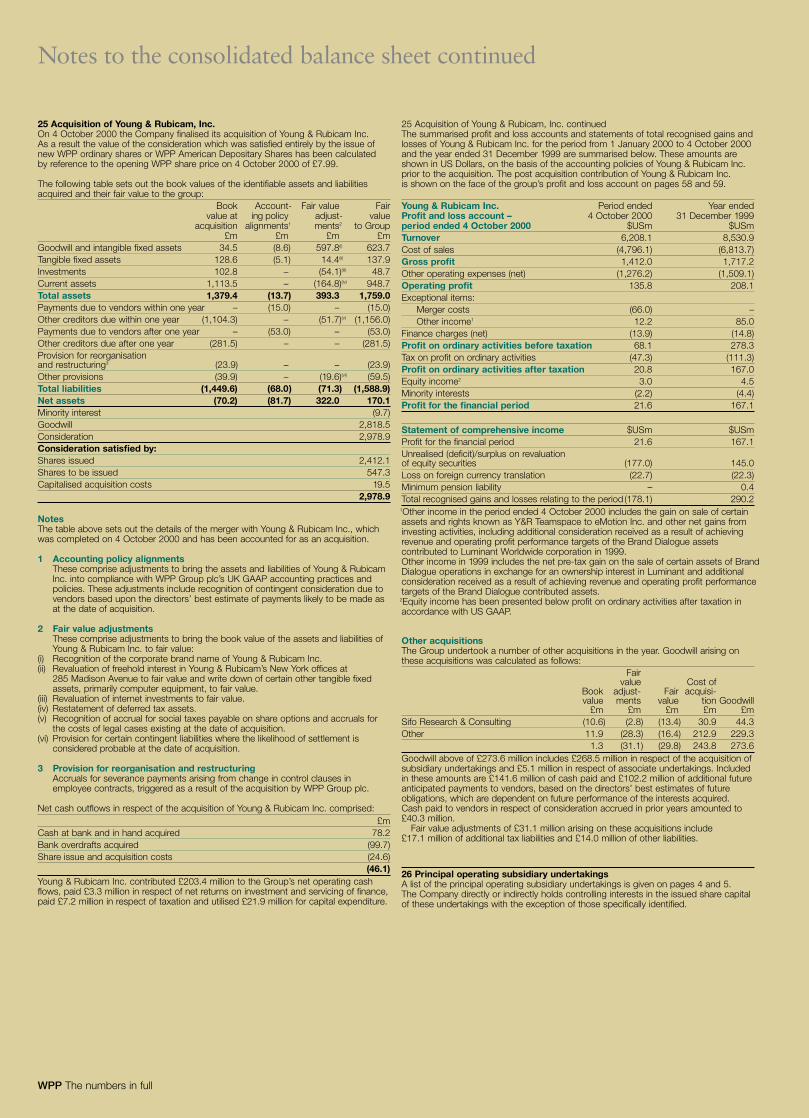
WPP The numbers in full
25 Acquisition of Young & Rubicam, Inc.On 4 October 2000 the Company finalised its acquisition of Young & Rubicam Inc.As a result the value of the consideration which was satisfied entirely by the issue ofnew WPP ordinary shares or WPP American Depositary Shares has been calculatedby reference to the opening WPP share price on 4 October 2000 of £7.99.
The following table sets out the book values of the identifiable assets and liabilitiesacquired and their fair value to the group:
Book Account- Fair value Fairvalue at ing policy adjust- value
acquisition alignments1 ments2 to Group£m £m £m £m
Goodwill and intangible fixed assets 34.5 (8.6) 597.8(i) 623.7Tangible fixed assets 128.6 (5.1) 14.4(ii) 137.9Investments 102.8 – (54.1)(iii) 48.7Current assets 1,113.5 – (164.8)(iv) 948.7Total assets 1,379.4 (13.7) 393.3 1,759.0Payments due to vendors within one year – (15.0) – (15.0)Other creditors due within one year (1,104.3) – (51.7)(v) (1,156.0)Payments due to vendors after one year – (53.0) – (53.0)Other creditors due after one year (281.5) – – (281.5)Provision for reorganisationand restructuring3 (23.9) – – (23.9)Other provisions (39.9) – (19.6)(vi) (59.5)Total liabilities (1,449.6) (68.0) (71.3) (1,588.9)Net assets (70.2) (81.7) 322.0 170.1Minority interest (9.7)Goodwill 2,818.5Consideration 2,978.9Consideration satisfied by:Shares issued 2,412.1Shares to be issued 547.3Capitalised acquisition costs 19.5
2,978.9
NotesThe table above sets out the details of the merger with Young & Rubicam Inc., whichwas completed on 4 October 2000 and has been accounted for as an acquisition.
1 Accounting policy alignmentsThese comprise adjustments to bring the assets and liabilities of Young & RubicamInc. into compliance with WPP Group plc’s UK GAAP accounting practices andpolicies. These adjustments include recognition of contingent consideration due tovendors based upon the directors’ best estimate of payments likely to be made asat the date of acquisition.
2 Fair value adjustmentsThese comprise adjustments to bring the book value of the assets and liabilities ofYoung & Rubicam Inc. to fair value:
(i) Recognition of the corporate brand name of Young & Rubicam Inc.(ii) Revaluation of freehold interest in Young & Rubicam’s New York offices at
285 Madison Avenue to fair value and write down of certain other tangible fixedassets, primarily computer equipment, to fair value.
(iii) Revaluation of internet investments to fair value.(iv) Restatement of deferred tax assets.(v) Recognition of accrual for social taxes payable on share options and accruals for
the costs of legal cases existing at the date of acquisition.(vi) Provision for certain contingent liabilities where the likelihood of settlement is
considered probable at the date of acquisition.
3 Provision for reorganisation and restructuringAccruals for severance payments arising from change in control clauses inemployee contracts, triggered as a result of the acquisition by WPP Group plc.
Net cash outflows in respect of the acquisition of Young & Rubicam Inc. comprised:£m
Cash at bank and in hand acquired 78.2Bank overdrafts acquired (99.7)Share issue and acquisition costs (24.6)
(46.1)Young & Rubicam Inc. contributed £203.4 million to the Group’s net operating cashflows, paid £3.3 million in respect of net returns on investment and servicing of finance,paid £7.2 million in respect of taxation and utilised £21.9 million for capital expenditure.
25 Acquisition of Young & Rubicam, Inc. continuedThe summarised profit and loss accounts and statements of total recognised gains andlosses of Young & Rubicam Inc. for the period from 1 January 2000 to 4 October 2000and the year ended 31 December 1999 are summarised below. These amounts areshown in US Dollars, on the basis of the accounting policies of Young & Rubicam Inc.prior to the acquisition. The post acquisition contribution of Young & Rubicam Inc. is shown on the face of the group’s profit and loss account on pages 58 and 59.
Young & Rubicam Inc. Period ended Year endedProfit and loss account – 4 October 2000 31 December 1999period ended 4 October 2000 $USm $USmTurnover 6,208.1 8,530.9Cost of sales (4,796.1) (6,813.7)Gross profit 1,412.0 1,717.2Other operating expenses (net) (1,276.2) (1,509.1)Operating profit 135.8 208.1Exceptional items:
Merger costs (66.0) –Other income1 12.2 85.0
Finance charges (net) (13.9) (14.8)Profit on ordinary activities before taxation 68.1 278.3Tax on profit on ordinary activities (47.3) (111.3)Profit on ordinary activities after taxation 20.8 167.0Equity income2 3.0 4.5Minority interests (2.2) (4.4)Profit for the financial period 21.6 167.1
Statement of comprehensive income $USm $USmProfit for the financial period 21.6 167.1Unrealised (deficit)/surplus on revaluation of equity securities (177.0) 145.0Loss on foreign currency translation (22.7) (22.3)Minimum pension liability – 0.4Total recognised gains and losses relating to the period (178.1) 290.2
1Other income in the period ended 4 October 2000 includes the gain on sale of certainassets and rights known as Y&R Teamspace to eMotion Inc. and other net gains frominvesting activities, including additional consideration received as a result of achievingrevenue and operating profit performance targets of the Brand Dialogue assetscontributed to Luminant Worldwide corporation in 1999.Other income in 1999 includes the net pre-tax gain on the sale of certain assets of BrandDialogue operations in exchange for an ownership interest in Luminant and additionalconsideration received as a result of achieving revenue and operating profit performancetargets of the Brand Dialogue contributed assets.
2Equity income has been presented below profit on ordinary activities after taxation inaccordance with US GAAP.
Other acquisitionsThe Group undertook a number of other acquisitions in the year. Goodwill arising onthese acquisitions was calculated as follows:
Fairvalue Cost of
Book adjust- Fair acquisi-value ments value tion Goodwill
£m £m £m £m £mSifo Research & Consulting (10.6) (2.8) (13.4) 30.9 44.3Other 11.9 (28.3) (16.4) 212.9 229.3
1.3 (31.1) (29.8) 243.8 273.6Goodwill above of £273.6 million includes £268.5 million in respect of the acquisition ofsubsidiary undertakings and £5.1 million in respect of associate undertakings. Includedin these amounts are £141.6 million of cash paid and £102.2 million of additional futureanticipated payments to vendors, based on the directors’ best estimates of futureobligations, which are dependent on future performance of the interests acquired.Cash paid to vendors in respect of consideration accrued in prior years amounted to£40.3 million.
Fair value adjustments of £31.1 million arising on these acquisitions include£17.1 million of additional tax liabilities and £14.0 million of other liabilities.
26 Principal operating subsidiary undertakingsA list of the principal operating subsidiary undertakings is given on pages 4 and 5.The Company directly or indirectly holds controlling interests in the issued share capitalof these undertakings with the exception of those specifically identified.
Notes to the consolidated balance sheet continued
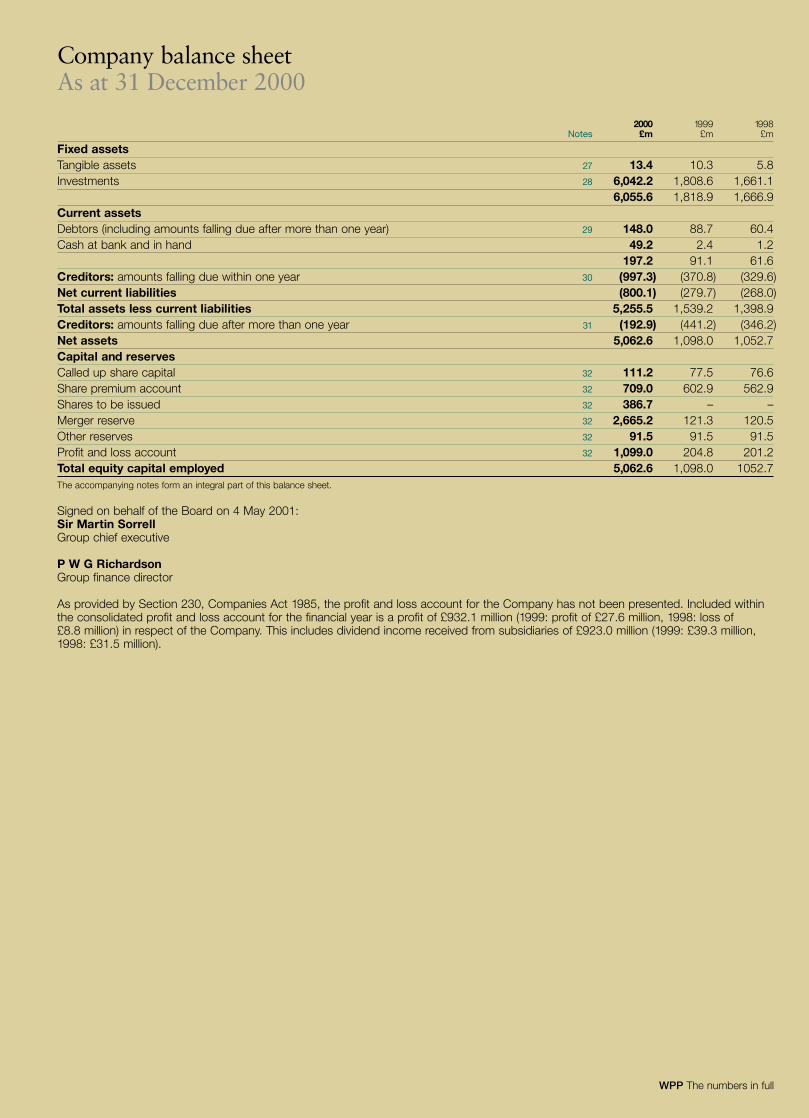
WPP The numbers in full
Company balance sheetAs at 31 December 2000
2000 1999 1998Notes £m £m £m
Fixed assetsTangible assets 27 13.4 10.3 5.8Investments 28 6,042.2 1,808.6 1,661.1
6,055.6 1,818.9 1,666.9Current assetsDebtors (including amounts falling due after more than one year) 29 148.0 88.7 60.4Cash at bank and in hand 49.2 2.4 1.2
197.2 91.1 61.6Creditors: amounts falling due within one year 30 (997.3) (370.8) (329.6)Net current liabilities (800.1) (279.7) (268.0)Total assets less current liabilities 5,255.5 1,539.2 1,398.9Creditors: amounts falling due after more than one year 31 (192.9) (441.2) (346.2)Net assets 5,062.6 1,098.0 1,052.7Capital and reservesCalled up share capital 32 111.2 77.5 76.6Share premium account 32 709.0 602.9 562.9Shares to be issued 32 386.7 – –Merger reserve 32 2,665.2 121.3 120.5Other reserves 32 91.5 91.5 91.5Profit and loss account 32 1,099.0 204.8 201.2Total equity capital employed 5,062.6 1,098.0 1052.7The accompanying notes form an integral part of this balance sheet.
Signed on behalf of the Board on 4 May 2001:Sir Martin SorrellGroup chief executive
P W G RichardsonGroup finance director
As provided by Section 230, Companies Act 1985, the profit and loss account for the Company has not been presented. Included withinthe consolidated profit and loss account for the financial year is a profit of £932.1 million (1999: profit of £27.6 million, 1998: loss of £8.8 million) in respect of the Company. This includes dividend income received from subsidiaries of £923.0 million (1999: £39.3 million,1998: £31.5 million).
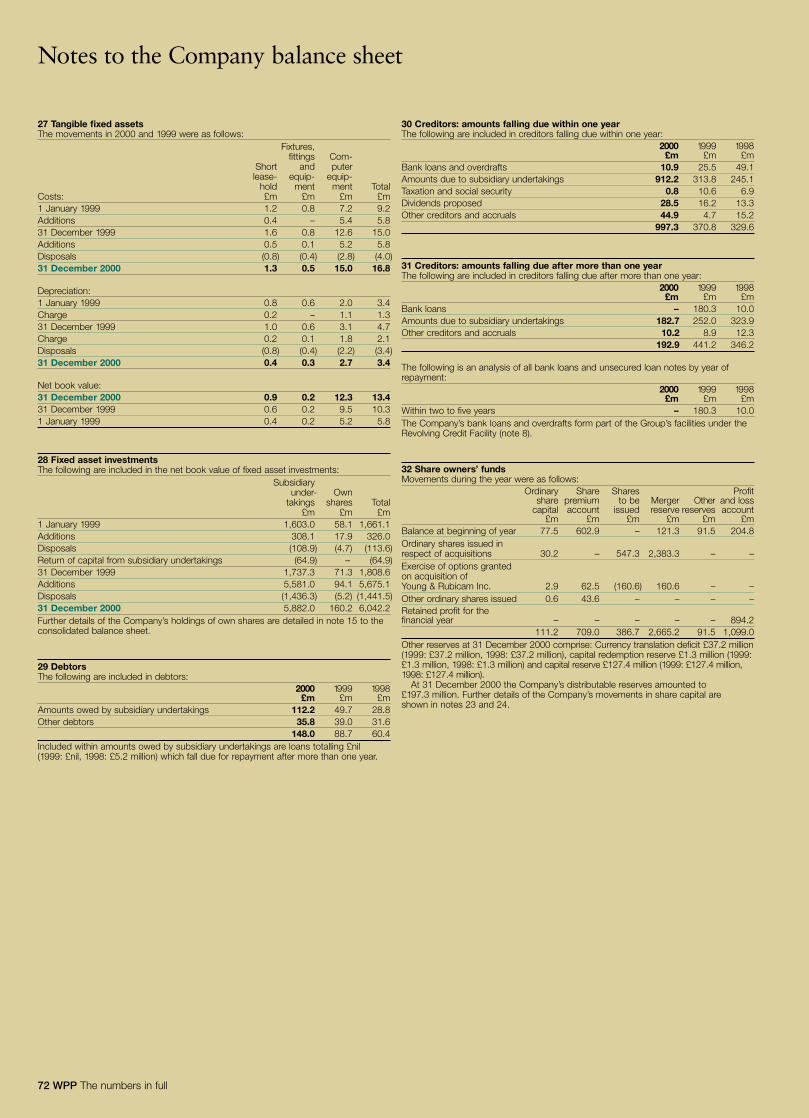
72 WPP The numbers in full
Notes to the Company balance sheet
27 Tangible fixed assetsThe movements in 2000 and 1999 were as follows:
Fixtures,fittings Com-
Short and puterlease- equip- equip-
hold ment ment TotalCosts: £m £m £m £m1 January 1999 1.2 0.8 7.2 9.2Additions 0.4 – 5.4 5.831 December 1999 1.6 0.8 12.6 15.0Additions 0.5 0.1 5.2 5.8Disposals (0.8) (0.4) (2.8) (4.0)31 December 2000 1.3 0.5 15.0 16.8
Depreciation:1 January 1999 0.8 0.6 2.0 3.4Charge 0.2 – 1.1 1.331 December 1999 1.0 0.6 3.1 4.7Charge 0.2 0.1 1.8 2.1Disposals (0.8) (0.4) (2.2) (3.4)31 December 2000 0.4 0.3 2.7 3.4
Net book value:31 December 2000 0.9 0.2 12.3 13.431 December 1999 0.6 0.2 9.5 10.31 January 1999 0.4 0.2 5.2 5.8
28 Fixed asset investmentsThe following are included in the net book value of fixed asset investments:
Subsidiaryunder- Own
takings shares Total£m £m £m
1 January 1999 1,603.0 58.1 1,661.1Additions 308.1 17.9 326.0Disposals (108.9) (4.7) (113.6)Return of capital from subsidiary undertakings (64.9) – (64.9)31 December 1999 1,737.3 71.3 1,808.6Additions 5,581.0 94.1 5,675.1Disposals (1,436.3) (5.2) (1,441.5)31 December 2000 5,882.0 160.2 6,042.2Further details of the Company’s holdings of own shares are detailed in note 15 to theconsolidated balance sheet.
29 DebtorsThe following are included in debtors:
2000 1999 1998£m £m £m
Amounts owed by subsidiary undertakings 112.2 49.7 28.8Other debtors 35.8 39.0 31.6
148.0 88.7 60.4Included within amounts owed by subsidiary undertakings are loans totalling £nil(1999: £nil, 1998: £5.2 million) which fall due for repayment after more than one year.
30 Creditors: amounts falling due within one yearThe following are included in creditors falling due within one year:
2000 1999 1998£m £m £m
Bank loans and overdrafts 10.9 25.5 49.1Amounts due to subsidiary undertakings 912.2 313.8 245.1Taxation and social security 0.8 10.6 6.9Dividends proposed 28.5 16.2 13.3Other creditors and accruals 44.9 4.7 15.2
997.3 370.8 329.6
31 Creditors: amounts falling due after more than one yearThe following are included in creditors falling due after more than one year:
2000 1999 1998£m £m £m
Bank loans – 180.3 10.0Amounts due to subsidiary undertakings 182.7 252.0 323.9Other creditors and accruals 10.2 8.9 12.3
192.9 441.2 346.2
The following is an analysis of all bank loans and unsecured loan notes by year ofrepayment:
2000 1999 1998£m £m £m
Within two to five years – 180.3 10.0The Company’s bank loans and overdrafts form part of the Group’s facilities under theRevolving Credit Facility (note 8).
32 Share owners’ fundsMovements during the year were as follows:
Ordinary Share Shares Profitshare premium to be Merger Other and loss
capital account issued reserve reserves account£m £m £m £m £m £m
Balance at beginning of year 77.5 602.9 – 121.3 91.5 204.8Ordinary shares issued inrespect of acquisitions 30.2 – 547.3 2,383.3 – –Exercise of options granted on acquisition of Young & Rubicam Inc. 2.9 62.5 (160.6) 160.6 – –Other ordinary shares issued 0.6 43.6 – – – –Retained profit for thefinancial year – – – – – 894.2
111.2 709.0 386.7 2,665.2 91.5 1,099.0Other reserves at 31 December 2000 comprise: Currency translation deficit £37.2 million(1999: £37.2 million, 1998: £37.2 million), capital redemption reserve £1.3 million (1999:£1.3 million, 1998: £1.3 million) and capital reserve £127.4 million (1999: £127.4 million,1998: £127.4 million).
At 31 December 2000 the Company’s distributable reserves amounted to £197.3 million. Further details of the Company’s movements in share capital are shown in notes 23 and 24.
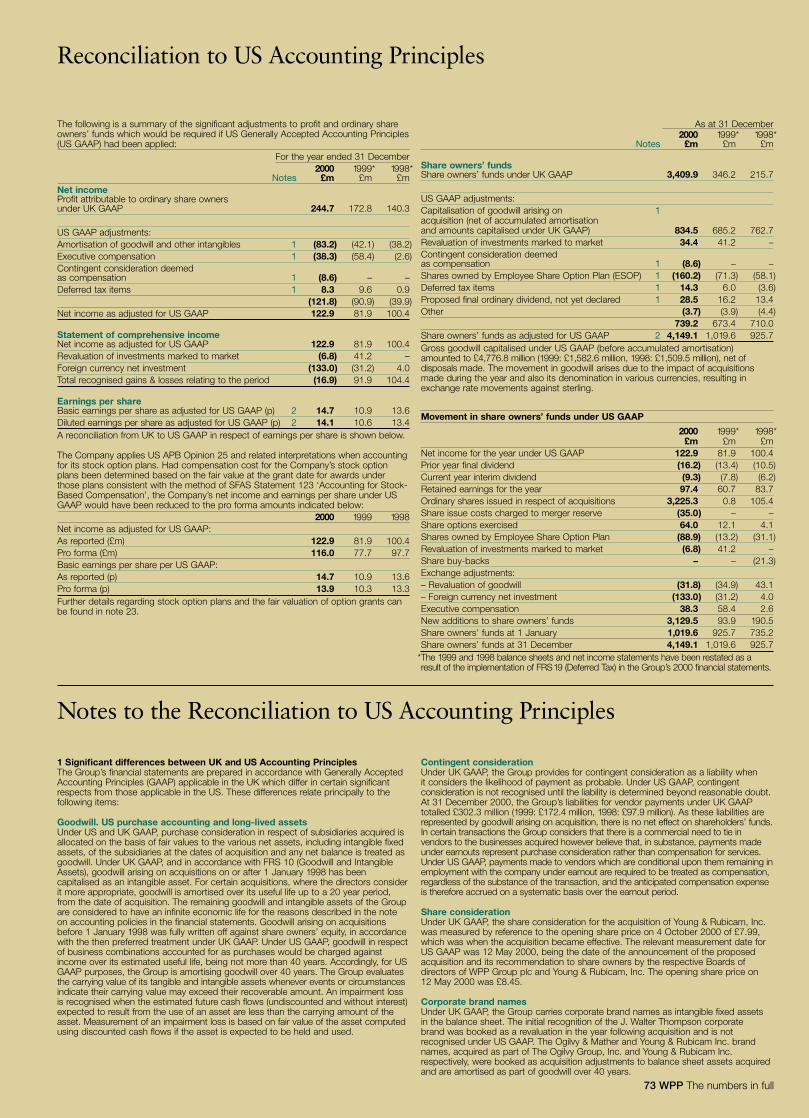
73 WPP The numbers in full
Reconciliation to US Accounting Principles
The following is a summary of the significant adjustments to profit and ordinary shareowners’ funds which would be required if US Generally Accepted Accounting Principles(US GAAP) had been applied:
For the year ended 31 December2000 1999* 1998*
Notes £m £m £mNet incomeProfit attributable to ordinary share ownersunder UK GAAP 244.7 172.8 140.3
US GAAP adjustments:Amortisation of goodwill and other intangibles 1 (83.2) (42.1) (38.2)Executive compensation 1 (38.3) (58.4) (2.6)Contingent consideration deemed as compensation 1 (8.6) – –Deferred tax items 1 8.3 9.6 0.9
(121.8) (90.9) (39.9)Net income as adjusted for US GAAP 122.9 81.9 100.4
Statement of comprehensive incomeNet income as adjusted for US GAAP 122.9 81.9 100.4Revaluation of investments marked to market (6.8) 41.2 –Foreign currency net investment (133.0) (31.2) 4.0Total recognised gains & losses relating to the period (16.9) 91.9 104.4
Earnings per shareBasic earnings per share as adjusted for US GAAP (p) 2 14.7 10.9 13.6Diluted earnings per share as adjusted for US GAAP (p) 2 14.1 10.6 13.4A reconciliation from UK to US GAAP in respect of earnings per share is shown below.
The Company applies US APB Opinion 25 and related interpretations when accountingfor its stock option plans. Had compensation cost for the Company’s stock optionplans been determined based on the fair value at the grant date for awards underthose plans consistent with the method of SFAS Statement 123 ‘Accounting for Stock-Based Compensation’, the Company’s net income and earnings per share under USGAAP would have been reduced to the pro forma amounts indicated below:
2000 1999 1998Net income as adjusted for US GAAP:As reported (£m) 122.9 81.9 100.4Pro forma (£m) 116.0 77.7 97.7Basic earnings per share per US GAAP:As reported (p) 14.7 10.9 13.6Pro forma (p) 13.9 10.3 13.3Further details regarding stock option plans and the fair valuation of option grants canbe found in note 23.
As at 31 December2000 1999* 1998*
Notes £m £m £m
Share owners’ fundsShare owners’ funds under UK GAAP 3,409.9 346.2 215.7
US GAAP adjustments:Capitalisation of goodwill arising on 1acquisition (net of accumulated amortisationand amounts capitalised under UK GAAP) 834.5 685.2 762.7Revaluation of investments marked to market 34.4 41.2 –Contingent consideration deemed as compensation 1 (8.6) – –Shares owned by Employee Share Option Plan (ESOP) 1 (160.2) (71.3) (58.1)Deferred tax items 1 14.3 6.0 (3.6)Proposed final ordinary dividend, not yet declared 1 28.5 16.2 13.4Other (3.7) (3.9) (4.4)
739.2 673.4 710.0Share owners’ funds as adjusted for US GAAP 2 4,149.1 1,019.6 925.7Gross goodwill capitalised under US GAAP (before accumulated amortisation)amounted to £4,776.8 million (1999: £1,582.6 million, 1998: £1,509.5 million), net ofdisposals made. The movement in goodwill arises due to the impact of acquisitionsmade during the year and also its denomination in various currencies, resulting inexchange rate movements against sterling.
Movement in share owners’ funds under US GAAP
2000 1999* 1998*£m £m £m
Net income for the year under US GAAP 122.9 81.9 100.4Prior year final dividend (16.2) (13.4) (10.5)Current year interim dividend (9.3) (7.8) (6.2)Retained earnings for the year 97.4 60.7 83.7Ordinary shares issued in respect of acquisitions 3,225.3 0.8 105.4Share issue costs charged to merger reserve (35.0) – –Share options exercised 64.0 12.1 4.1Shares owned by Employee Share Option Plan (88.9) (13.2) (31.1)Revaluation of investments marked to market (6.8) 41.2 –Share buy-backs – – (21.3)Exchange adjustments:– Revaluation of goodwill (31.8) (34.9) 43.1– Foreign currency net investment (133.0) (31.2) 4.0Executive compensation 38.3 58.4 2.6New additions to share owners’ funds 3,129.5 93.9 190.5Share owners’ funds at 1 January 1,019.6 925.7 735.2Share owners’ funds at 31 December 4,149.1 1,019.6 925.7The 1999 and 1998 balance sheets and net income statements have been restated as aresult of the implementation of FRS19 (Deferred Tax) in the Group’s 2000 financial statements.
1 Significant differences between UK and US Accounting PrinciplesThe Group’s financial statements are prepared in accordance with Generally AcceptedAccounting Principles (GAAP) applicable in the UK which differ in certain significantrespects from those applicable in the US. These differences relate principally to thefollowing items:
Goodwill. US purchase accounting and long-lived assetsUnder US and UK GAAP, purchase consideration in respect of subsidiaries acquired isallocated on the basis of fair values to the various net assets, including intangible fixedassets, of the subsidiaries at the dates of acquisition and any net balance is treated asgoodwill. Under UK GAAP, and in accordance with FRS 10 (Goodwill and IntangibleAssets), goodwill arising on acquisitions on or after 1 January 1998 has beencapitalised as an intangible asset. For certain acquisitions, where the directors considerit more appropriate, goodwill is amortised over its useful life up to a 20 year period,from the date of acquisition. The remaining goodwill and intangible assets of the Groupare considered to have an infinite economic life for the reasons described in the noteon accounting policies in the financial statements. Goodwill arising on acquisitionsbefore 1 January 1998 was fully written off against share owners’ equity, in accordancewith the then preferred treatment under UK GAAP. Under US GAAP, goodwill in respectof business combinations accounted for as purchases would be charged againstincome over its estimated useful life, being not more than 40 years. Accordingly, for USGAAP purposes, the Group is amortising goodwill over 40 years. The Group evaluatesthe carrying value of its tangible and intangible assets whenever events or circumstancesindicate their carrying value may exceed their recoverable amount. An impairment lossis recognised when the estimated future cash flows (undiscounted and without interest)expected to result from the use of an asset are less than the carrying amount of theasset. Measurement of an impairment loss is based on fair value of the asset computedusing discounted cash flows if the asset is expected to be held and used.
Contingent considerationUnder UK GAAP, the Group provides for contingent consideration as a liability when it considers the likelihood of payment as probable. Under US GAAP, contingentconsideration is not recognised until the liability is determined beyond reasonable doubt.At 31 December 2000, the Group’s liabilities for vendor payments under UK GAAPtotalled £302.3 million (1999: £172.4 million, 1998: £97.9 million). As these liabilities arerepresented by goodwill arising on acquisition, there is no net effect on shareholders’ funds.In certain transactions the Group considers that there is a commercial need to tie invendors to the businesses acquired however believe that, in substance, payments madeunder earnouts represent purchase consideration rather than compensation for services.Under US GAAP, payments made to vendors which are conditional upon them remaining inemployment with the company under earnout are required to be treated as compensation,regardless of the substance of the transaction, and the anticipated compensation expenseis therefore accrued on a systematic basis over the earnout period.
Share considerationUnder UK GAAP, the share consideration for the acquisition of Young & Rubicam, Inc.was measured by reference to the opening share price on 4 October 2000 of £7.99,which was when the acquisition became effective. The relevant measurement date forUS GAAP was 12 May 2000, being the date of the announcement of the proposedacquisition and its recommendation to share owners by the respective Boards ofdirectors of WPP Group plc and Young & Rubicam, Inc. The opening share price on12 May 2000 was £8.45.
Corporate brand namesUnder UK GAAP, the Group carries corporate brand names as intangible fixed assetsin the balance sheet. The initial recognition of the J. Walter Thompson corporatebrand was booked as a revaluation in the year following acquisition and is notrecognised under US GAAP. The Ogilvy & Mather and Young & Rubicam Inc. brandnames, acquired as part of The Ogilvy Group, Inc. and Young & Rubicam Inc.respectively, were booked as acquisition adjustments to balance sheet assets acquiredand are amortised as part of goodwill over 40 years.
Notes to the Reconciliation to US Accounting Principles
*
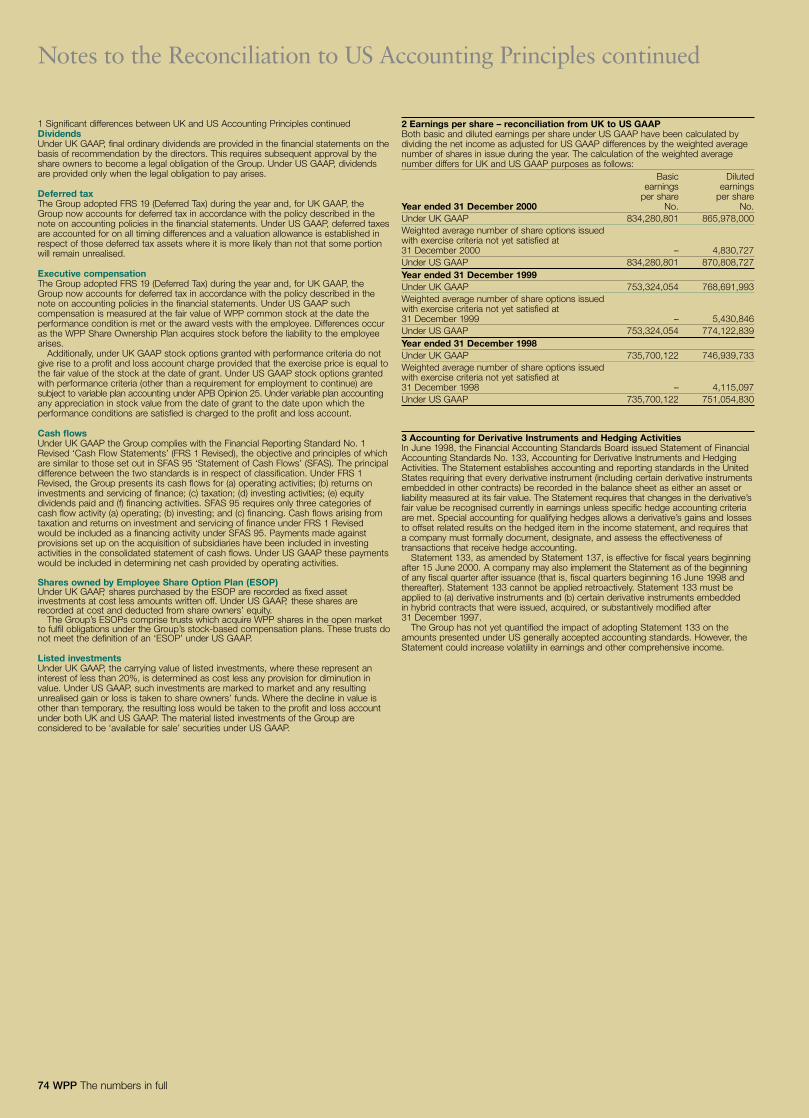
74 WPP The numbers in full
Notes to the Reconciliation to US Accounting Principles continued
1 Significant differences between UK and US Accounting Principles continuedDividendsUnder UK GAAP, final ordinary dividends are provided in the financial statements on thebasis of recommendation by the directors. This requires subsequent approval by theshare owners to become a legal obligation of the Group. Under US GAAP, dividendsare provided only when the legal obligation to pay arises.
Deferred taxThe Group adopted FRS 19 (Deferred Tax) during the year and, for UK GAAP, theGroup now accounts for deferred tax in accordance with the policy described in thenote on accounting policies in the financial statements. Under US GAAP, deferred taxesare accounted for on all timing differences and a valuation allowance is established inrespect of those deferred tax assets where it is more likely than not that some portionwill remain unrealised.
Executive compensationThe Group adopted FRS 19 (Deferred Tax) during the year and, for UK GAAP, theGroup now accounts for deferred tax in accordance with the policy described in thenote on accounting policies in the financial statements. Under US GAAP suchcompensation is measured at the fair value of WPP common stock at the date theperformance condition is met or the award vests with the employee. Differences occuras the WPP Share Ownership Plan acquires stock before the liability to the employeearises.
Additionally, under UK GAAP stock options granted with performance criteria do notgive rise to a profit and loss account charge provided that the exercise price is equal tothe fair value of the stock at the date of grant. Under US GAAP stock options grantedwith performance criteria (other than a requirement for employment to continue) aresubject to variable plan accounting under APB Opinion 25. Under variable plan accountingany appreciation in stock value from the date of grant to the date upon which theperformance conditions are satisfied is charged to the profit and loss account.
Cash flowsUnder UK GAAP the Group complies with the Financial Reporting Standard No. 1Revised ‘Cash Flow Statements’ (FRS 1 Revised), the objective and principles of whichare similar to those set out in SFAS 95 ‘Statement of Cash Flows’ (SFAS). The principaldifference between the two standards is in respect of classification. Under FRS 1Revised, the Group presents its cash flows for (a) operating activities; (b) returns on investments and servicing of finance; (c) taxation; (d) investing activities; (e) equitydividends paid and (f) financing activities. SFAS 95 requires only three categories ofcash flow activity (a) operating; (b) investing; and (c) financing. Cash flows arising fromtaxation and returns on investment and servicing of finance under FRS 1 Revisedwould be included as a financing activity under SFAS 95. Payments made againstprovisions set up on the acquisition of subsidiaries have been included in investingactivities in the consolidated statement of cash flows. Under US GAAP these paymentswould be included in determining net cash provided by operating activities.
Shares owned by Employee Share Option Plan (ESOP)Under UK GAAP, shares purchased by the ESOP are recorded as fixed assetinvestments at cost less amounts written off. Under US GAAP, these shares arerecorded at cost and deducted from share owners’ equity.
The Group’s ESOPs comprise trusts which acquire WPP shares in the open marketto fulfil obligations under the Group’s stock-based compensation plans. These trusts donot meet the definition of an ‘ESOP’ under US GAAP.
Listed investmentsUnder UK GAAP, the carrying value of listed investments, where these represent aninterest of less than 20%, is determined as cost less any provision for diminution invalue. Under US GAAP, such investments are marked to market and any resultingunrealised gain or loss is taken to share owners’ funds. Where the decline in value isother than temporary, the resulting loss would be taken to the profit and loss accountunder both UK and US GAAP. The material listed investments of the Group areconsidered to be ‘available for sale’ securities under US GAAP.
2 Earnings per share – reconciliation from UK to US GAAPBoth basic and diluted earnings per share under US GAAP have been calculated bydividing the net income as adjusted for US GAAP differences by the weighted averagenumber of shares in issue during the year. The calculation of the weighted averagenumber differs for UK and US GAAP purposes as follows:
Basic Dilutedearnings earnings
per share per shareYear ended 31 December 2000 No. No.Under UK GAAP 834,280,801 865,978,000Weighted average number of share options issued with exercise criteria not yet satisfied at 31 December 2000 – 4,830,727Under US GAAP 834,280,801 870,808,727Year ended 31 December 1999Under UK GAAP 753,324,054 768,691,993Weighted average number of share options issued with exercise criteria not yet satisfied at 31 December 1999 – 5,430,846Under US GAAP 753,324,054 774,122,839Year ended 31 December 1998Under UK GAAP 735,700,122 746,939,733Weighted average number of share options issued with exercise criteria not yet satisfied at 31 December 1998 – 4,115,097Under US GAAP 735,700,122 751,054,830
3 Accounting for Derivative Instruments and Hedging ActivitiesIn June 1998, the Financial Accounting Standards Board issued Statement of FinancialAccounting Standards No. 133, Accounting for Derivative Instruments and HedgingActivities. The Statement establishes accounting and reporting standards in the UnitedStates requiring that every derivative instrument (including certain derivative instrumentsembedded in other contracts) be recorded in the balance sheet as either an asset orliability measured at its fair value. The Statement requires that changes in the derivative’sfair value be recognised currently in earnings unless specific hedge accounting criteriaare met. Special accounting for qualifying hedges allows a derivative’s gains and lossesto offset related results on the hedged item in the income statement, and requires thata company must formally document, designate, and assess the effectiveness oftransactions that receive hedge accounting.
Statement 133, as amended by Statement 137, is effective for fiscal years beginningafter 15 June 2000. A company may also implement the Statement as of the beginningof any fiscal quarter after issuance (that is, fiscal quarters beginning 16 June 1998 andthereafter). Statement 133 cannot be applied retroactively. Statement 133 must beapplied to (a) derivative instruments and (b) certain derivative instruments embeddedin hybrid contracts that were issued, acquired, or substantively modified after31 December 1997.
The Group has not yet quantified the impact of adopting Statement 133 on theamounts presented under US generally accepted accounting standards. However, theStatement could increase volatility in earnings and other comprehensive income.
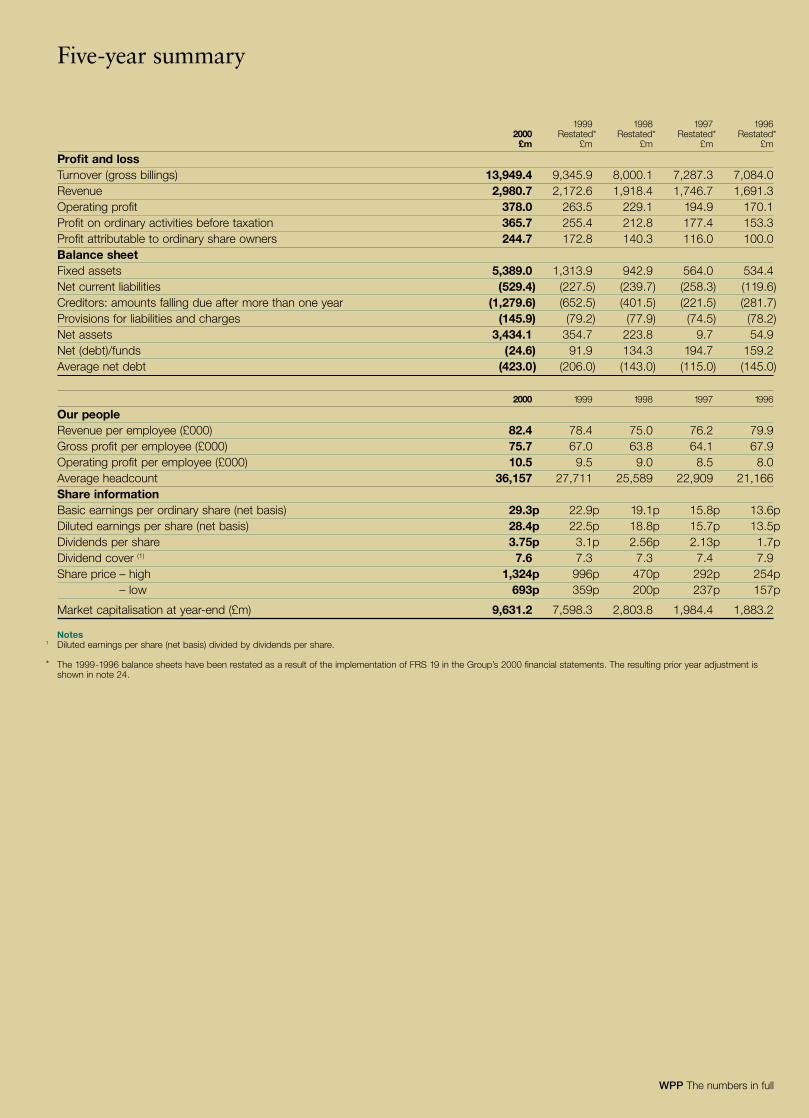
WPP The numbers in full
Five-year summary
1999 1998 1997 19962000 Restated* Restated* Restated* Restated*
£m £m £m £m £m
Profit and lossTurnover (gross billings) 13,949.4 9,345.9 8,000.1 7,287.3 7,084.0Revenue 2,980.7 2,172.6 1,918.4 1,746.7 1,691.3Operating profit 378.0 263.5 229.1 194.9 170.1Profit on ordinary activities before taxation 365.7 255.4 212.8 177.4 153.3Profit attributable to ordinary share owners 244.7 172.8 140.3 116.0 100.0Balance sheetFixed assets 5,389.0 1,313.9 942.9 564.0 534.4Net current liabilities (529.4) (227.5) (239.7) (258.3) (119.6)Creditors: amounts falling due after more than one year (1,279.6) (652.5) (401.5) (221.5) (281.7)Provisions for liabilities and charges (145.9) (79.2) (77.9) (74.5) (78.2)Net assets 3,434.1 354.7 223.8 9.7 54.9Net (debt)/funds (24.6) 91.9 134.3 194.7 159.2Average net debt (423.0) (206.0) (143.0) (115.0) (145.0)
2000 1999 1998 1997 1996
Our peopleRevenue per employee (£000) 82.4 78.4 75.0 76.2 79.9Gross profit per employee (£000) 75.7 67.0 63.8 64.1 67.9Operating profit per employee (£000) 10.5 9.5 9.0 8.5 8.0Average headcount 36,157 27,711 25,589 22,909 21,166Share informationBasic earnings per ordinary share (net basis) 29.3p 22.9p 19.1p 15.8p 13.6pDiluted earnings per share (net basis) 28.4p 22.5p 18.8p 15.7p 13.5pDividends per share 3.75p 3.1p 2.56p 2.13p 1.7pDividend cover (1) 7.6 7.3 7.3 7.4 7.9Share price – high 1,324p 996p 470p 292p 254p
– low 693p 359p 200p 237p 157p
Market capitalisation at year-end (£m) 9,631.2 7,598.3 2,803.8 1,984.4 1,883.2
NotesDiluted earnings per share (net basis) divided by dividends per share.
The 1999-1996 balance sheets have been restated as a result of the implementation of FRS 19 in the Group’s 2000 financial statements. The resulting prior year adjustment isshown in note 24.
1
*
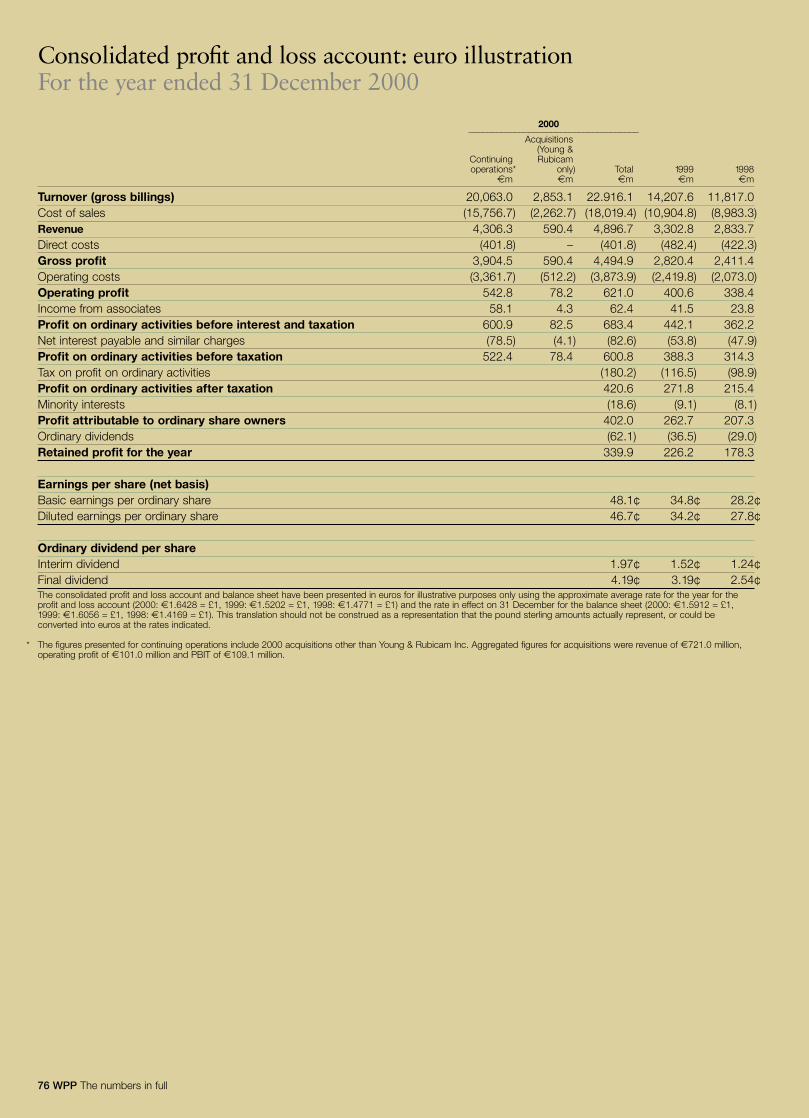
76 WPP The numbers in full
Consolidated profit and loss account: euro illustrationFor the year ended 31 December 2000
2000�������������������������������������
Acquisitions(Young &
Continuing Rubicamoperations* only) Total 1999 1998
�m �m �m �m �m
Turnover (gross billings) 20,063.0 2,853.1 22.916.1 14,207.6 11,817.0Cost of sales (15,756.7) (2,262.7) (18,019.4) (10,904.8) (8,983.3)Revenue 4,306.3 590.4 4,896.7 3,302.8 2,833.7Direct costs (401.8) – (401.8) (482.4) (422.3)Gross profit 3,904.5 590.4 4,494.9 2,820.4 2,411.4Operating costs (3,361.7) (512.2) (3,873.9) (2,419.8) (2,073.0)Operating profit 542.8 78.2 621.0 400.6 338.4Income from associates 58.1 4.3 62.4 41.5 23.8Profit on ordinary activities before interest and taxation 600.9 82.5 683.4 442.1 362.2Net interest payable and similar charges (78.5) (4.1) (82.6) (53.8) (47.9)Profit on ordinary activities before taxation 522.4 78.4 600.8 388.3 314.3Tax on profit on ordinary activities (180.2) (116.5) (98.9)Profit on ordinary activities after taxation 420.6 271.8 215.4Minority interests (18.6) (9.1) (8.1)Profit attributable to ordinary share owners 402.0 262.7 207.3Ordinary dividends (62.1) (36.5) (29.0)Retained profit for the year 339.9 226.2 178.3
Earnings per share (net basis)Basic earnings per ordinary share 48.1¢ 34.8¢ 28.2¢Diluted earnings per ordinary share 46.7¢ 34.2¢ 27.8¢
Ordinary dividend per shareInterim dividend 1.97¢ 1.52¢ 1.24¢Final dividend 4.19¢ 3.19¢ 2.54¢The consolidated profit and loss account and balance sheet have been presented in euros for illustrative purposes only using the approximate average rate for the year for the profit and loss account (2000: �1.6428 = £1, 1999: �1.5202 = £1, 1998: �1.4771 = £1) and the rate in effect on 31 December for the balance sheet (2000: �1.5912 = £1, 1999: �1.6056 = £1, 1998: �1.4169 = £1). This translation should not be construed as a representation that the pound sterling amounts actually represent, or could be converted into euros at the rates indicated.
The figures presented for continuing operations include 2000 acquisitions other than Young & Rubicam Inc. Aggregated figures for acquisitions were revenue of �721.0 million,operating profit of �101.0 million and PBIT of �109.1 million.
*
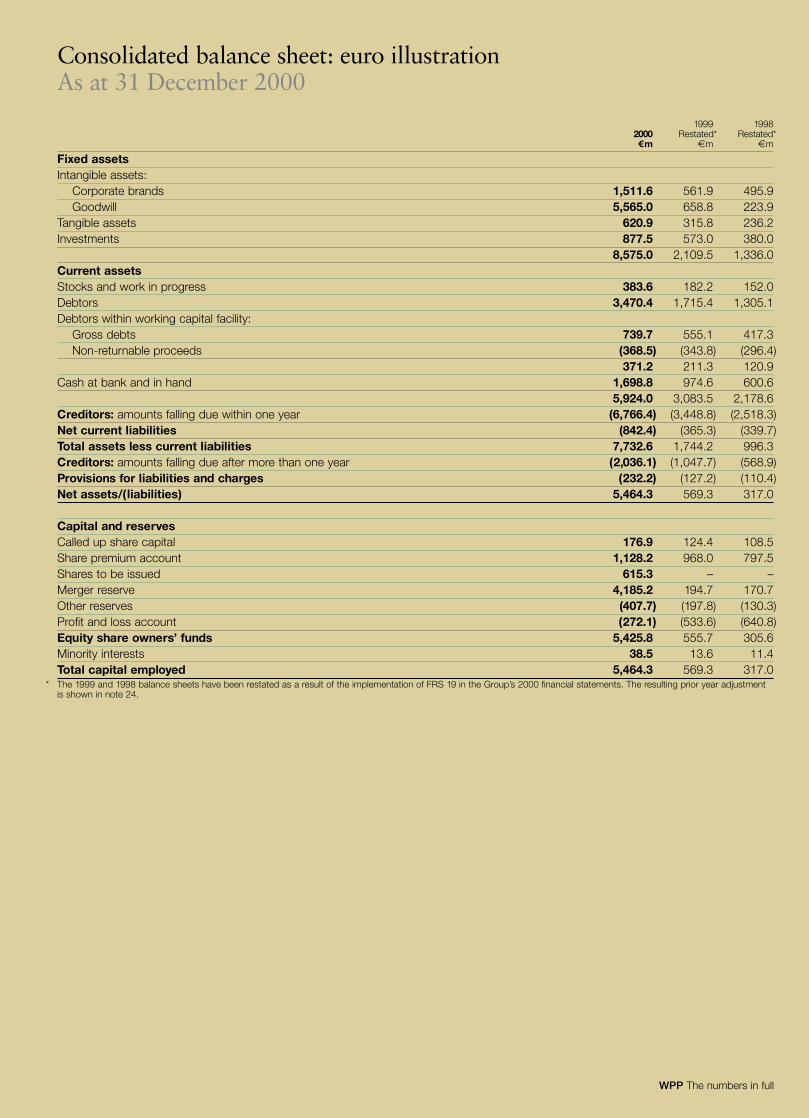
WPP The numbers in full
Consolidated balance sheet: euro illustrationAs at 31 December 2000
1999 19982000 Restated* Restated*5m �m �m
Fixed assetsIntangible assets:
Corporate brands 1,511.6 561.9 495.9Goodwill 5,565.0 658.8 223.9
Tangible assets 620.9 315.8 236.2Investments 877.5 573.0 380.0
8,575.0 2,109.5 1,336.0Current assetsStocks and work in progress 383.6 182.2 152.0Debtors 3,470.4 1,715.4 1,305.1Debtors within working capital facility:
Gross debts 739.7 555.1 417.3Non-returnable proceeds (368.5) (343.8) (296.4)
371.2 211.3 120.9Cash at bank and in hand 1,698.8 974.6 600.6
5,924.0 3,083.5 2,178.6Creditors: amounts falling due within one year (6,766.4) (3,448.8) (2,518.3)Net current liabilities (842.4) (365.3) (339.7)Total assets less current liabilities 7,732.6 1,744.2 996.3Creditors: amounts falling due after more than one year (2,036.1) (1,047.7) (568.9)Provisions for liabilities and charges (232.2) (127.2) (110.4)Net assets/(liabilities) 5,464.3 569.3 317.0
Capital and reservesCalled up share capital 176.9 124.4 108.5Share premium account 1,128.2 968.0 797.5Shares to be issued 615.3 – –Merger reserve 4,185.2 194.7 170.7Other reserves (407.7) (197.8) (130.3)Profit and loss account (272.1) (533.6) (640.8)Equity share owners’ funds 5,425.8 555.7 305.6Minority interests 38.5 13.6 11.4Total capital employed 5,464.3 569.3 317.0The 1999 and 1998 balance sheets have been restated as a result of the implementation of FRS 19 in the Group’s 2000 financial statements. The resulting prior year adjustmentis shown in note 24.
*
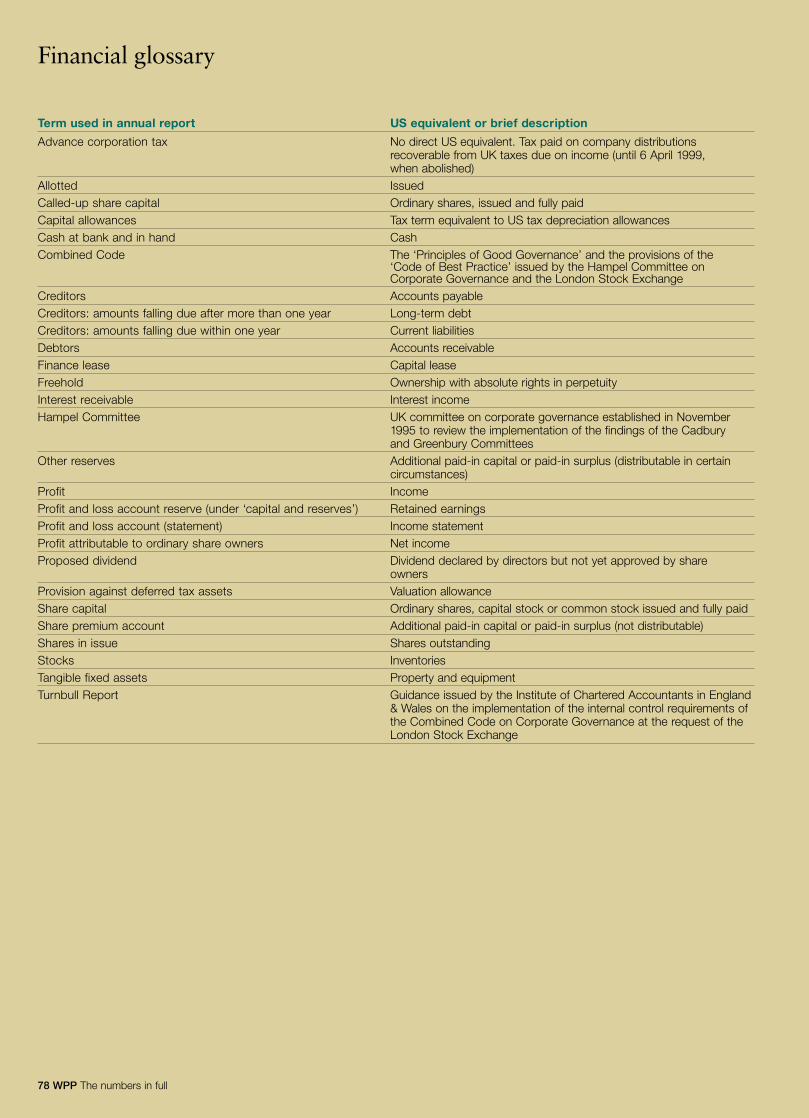
78 WPP The numbers in full
Financial glossary
Term used in annual report US equivalent or brief description
Advance corporation tax No direct US equivalent. Tax paid on company distributionsrecoverable from UK taxes due on income (until 6 April 1999,when abolished)
Allotted IssuedCalled-up share capital Ordinary shares, issued and fully paidCapital allowances Tax term equivalent to US tax depreciation allowancesCash at bank and in hand CashCombined Code The ‘Principles of Good Governance’ and the provisions of the
‘Code of Best Practice’ issued by the Hampel Committee onCorporate Governance and the London Stock Exchange
Creditors Accounts payableCreditors: amounts falling due after more than one year Long-term debtCreditors: amounts falling due within one year Current liabilitiesDebtors Accounts receivableFinance lease Capital leaseFreehold Ownership with absolute rights in perpetuityInterest receivable Interest incomeHampel Committee UK committee on corporate governance established in November
1995 to review the implementation of the findings of the Cadbury and Greenbury Committees
Other reserves Additional paid-in capital or paid-in surplus (distributable in certain circumstances)
Profit IncomeProfit and loss account reserve (under ‘capital and reserves’) Retained earningsProfit and loss account (statement) Income statementProfit attributable to ordinary share owners Net incomeProposed dividend Dividend declared by directors but not yet approved by share
ownersProvision against deferred tax assets Valuation allowanceShare capital Ordinary shares, capital stock or common stock issued and fully paidShare premium account Additional paid-in capital or paid-in surplus (not distributable)Shares in issue Shares outstandingStocks InventoriesTangible fixed assets Property and equipmentTurnbull Report Guidance issued by the Institute of Chartered Accountants in England
& Wales on the implementation of the internal control requirements ofthe Combined Code on Corporate Governance at the request of theLondon Stock Exchange
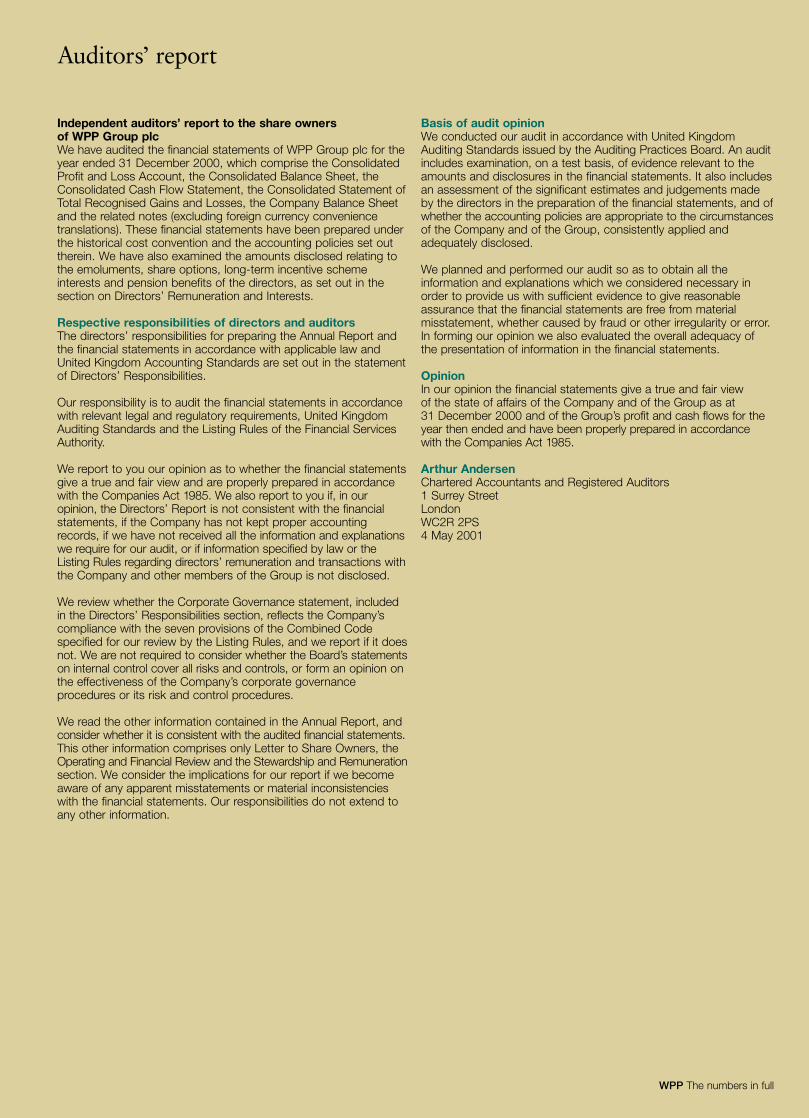
WPP The numbers in full
Auditors’ report
Independent auditors’ report to the share owners of WPP Group plcWe have audited the financial statements of WPP Group plc for theyear ended 31 December 2000, which comprise the ConsolidatedProfit and Loss Account, the Consolidated Balance Sheet, theConsolidated Cash Flow Statement, the Consolidated Statement ofTotal Recognised Gains and Losses, the Company Balance Sheetand the related notes (excluding foreign currency conveniencetranslations). These financial statements have been prepared underthe historical cost convention and the accounting policies set outtherein. We have also examined the amounts disclosed relating tothe emoluments, share options, long-term incentive schemeinterests and pension benefits of the directors, as set out in thesection on Directors’ Remuneration and Interests.
Respective responsibilities of directors and auditorsThe directors’ responsibilities for preparing the Annual Report andthe financial statements in accordance with applicable law andUnited Kingdom Accounting Standards are set out in the statementof Directors’ Responsibilities.
Our responsibility is to audit the financial statements in accordancewith relevant legal and regulatory requirements, United KingdomAuditing Standards and the Listing Rules of the Financial ServicesAuthority.
We report to you our opinion as to whether the financial statementsgive a true and fair view and are properly prepared in accordancewith the Companies Act 1985. We also report to you if, in ouropinion, the Directors’ Report is not consistent with the financialstatements, if the Company has not kept proper accountingrecords, if we have not received all the information and explanationswe require for our audit, or if information specified by law or theListing Rules regarding directors’ remuneration and transactions withthe Company and other members of the Group is not disclosed.
We review whether the Corporate Governance statement, includedin the Directors’ Responsibilities section, reflects the Company’scompliance with the seven provisions of the Combined Codespecified for our review by the Listing Rules, and we report if it doesnot. We are not required to consider whether the Board’s statementson internal control cover all risks and controls, or form an opinion onthe effectiveness of the Company’s corporate governanceprocedures or its risk and control procedures.
We read the other information contained in the Annual Report, andconsider whether it is consistent with the audited financial statements.This other information comprises only Letter to Share Owners, theOperating and Financial Review and the Stewardship and Remunerationsection. We consider the implications for our report if we becomeaware of any apparent misstatements or material inconsistencieswith the financial statements. Our responsibilities do not extend toany other information.
Basis of audit opinionWe conducted our audit in accordance with United KingdomAuditing Standards issued by the Auditing Practices Board. An auditincludes examination, on a test basis, of evidence relevant to theamounts and disclosures in the financial statements. It also includesan assessment of the significant estimates and judgements madeby the directors in the preparation of the financial statements, and ofwhether the accounting policies are appropriate to the circumstancesof the Company and of the Group, consistently applied andadequately disclosed.
We planned and performed our audit so as to obtain all theinformation and explanations which we considered necessary in order to provide us with sufficient evidence to give reasonableassurance that the financial statements are free from materialmisstatement, whether caused by fraud or other irregularity or error.In forming our opinion we also evaluated the overall adequacy ofthe presentation of information in the financial statements.
OpinionIn our opinion the financial statements give a true and fair view of the state of affairs of the Company and of the Group as at 31 December 2000 and of the Group’s profit and cash flows for theyear then ended and have been properly prepared in accordancewith the Companies Act 1985.
Arthur AndersenChartered Accountants and Registered Auditors1 Surrey StreetLondonWC2R 2PS4 May 2001


Stewardship and remuneration
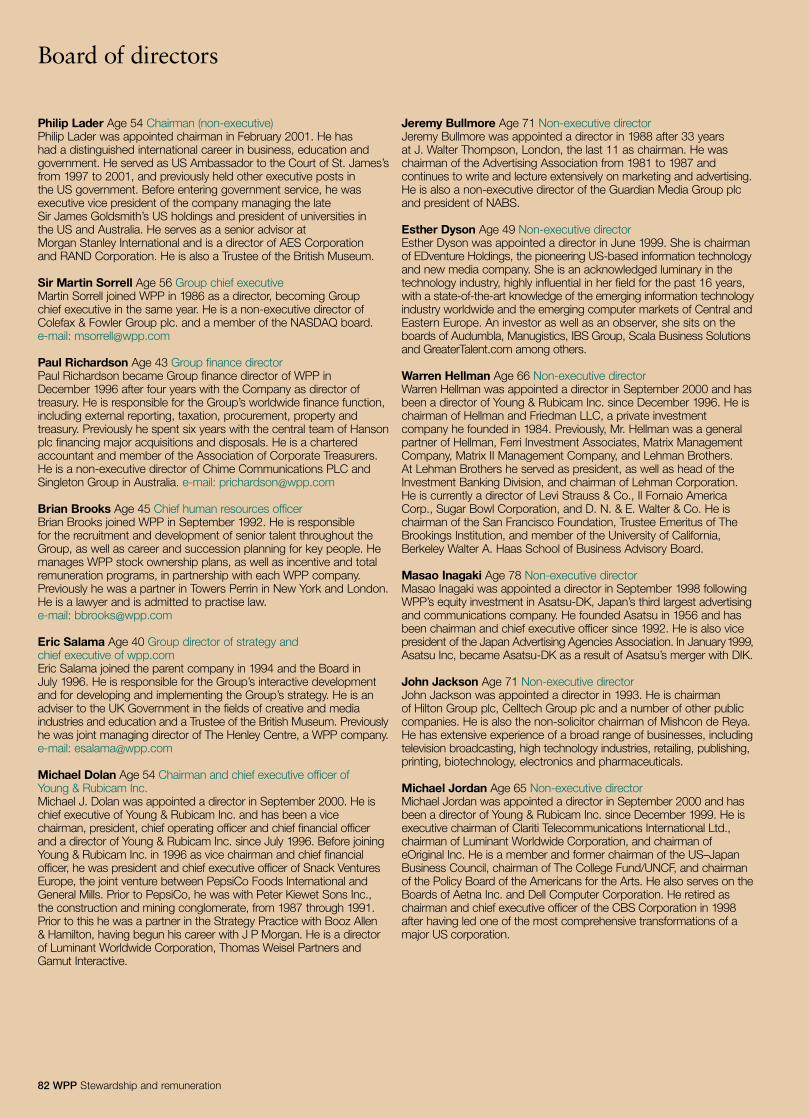
Board of directors
82 WPP Stewardship and remuneration
Philip Lader Age 54 Chairman (non-executive)Philip Lader was appointed chairman in February 2001. He has had a distinguished international career in business, education andgovernment. He served as US Ambassador to the Court of St. James’sfrom 1997 to 2001, and previously held other executive posts in the US government. Before entering government service, he wasexecutive vice president of the company managing the late Sir James Goldsmith’s US holdings and president of universities in the US and Australia. He serves as a senior advisor at Morgan Stanley International and is a director of AES Corporation and RAND Corporation. He is also a Trustee of the British Museum.
Sir Martin Sorrell Age 56 Group chief executiveMartin Sorrell joined WPP in 1986 as a director, becoming Group chief executive in the same year. He is a non-executive director ofColefax & Fowler Group plc. and a member of the NASDAQ board. e-mail: [email protected]
Paul Richardson Age 43 Group finance directorPaul Richardson became Group finance director of WPP in December 1996 after four years with the Company as director oftreasury. He is responsible for the Group’s worldwide finance function,including external reporting, taxation, procurement, property andtreasury. Previously he spent six years with the central team of Hansonplc financing major acquisitions and disposals. He is a charteredaccountant and member of the Association of Corporate Treasurers.He is a non-executive director of Chime Communications PLC andSingleton Group in Australia. e-mail: [email protected]
Brian Brooks Age 45 Chief human resources officerBrian Brooks joined WPP in September 1992. He is responsible for the recruitment and development of senior talent throughout theGroup, as well as career and succession planning for key people. Hemanages WPP stock ownership plans, as well as incentive and totalremuneration programs, in partnership with each WPP company.Previously he was a partner in Towers Perrin in New York and London.He is a lawyer and is admitted to practise law.e-mail: [email protected]
Eric Salama Age 40 Group director of strategy and chief executive of wpp.comEric Salama joined the parent company in 1994 and the Board in July 1996. He is responsible for the Group’s interactive developmentand for developing and implementing the Group’s strategy. He is anadviser to the UK Government in the fields of creative and mediaindustries and education and a Trustee of the British Museum. Previouslyhe was joint managing director of The Henley Centre, a WPP company.e-mail: [email protected]
Michael Dolan Age 54 Chairman and chief executive officer of Young & Rubicam Inc.Michael J. Dolan was appointed a director in September 2000. He ischief executive of Young & Rubicam Inc. and has been a vicechairman, president, chief operating officer and chief financial officerand a director of Young & Rubicam Inc. since July 1996. Before joiningYoung & Rubicam Inc. in 1996 as vice chairman and chief financialofficer, he was president and chief executive officer of Snack VenturesEurope, the joint venture between PepsiCo Foods International andGeneral Mills. Prior to PepsiCo, he was with Peter Kiewet Sons Inc.,the construction and mining conglomerate, from 1987 through 1991. Prior to this he was a partner in the Strategy Practice with Booz Allen & Hamilton, having begun his career with J P Morgan. He is a directorof Luminant Worldwide Corporation, Thomas Weisel Partners andGamut Interactive.
Jeremy Bullmore Age 71 Non-executive directorJeremy Bullmore was appointed a director in 1988 after 33 yearsat J. Walter Thompson, London, the last 11 as chairman. He waschairman of the Advertising Association from 1981 to 1987 andcontinues to write and lecture extensively on marketing and advertising.He is also a non-executive director of the Guardian Media Group plcand president of NABS.
Esther Dyson Age 49 Non-executive directorEsther Dyson was appointed a director in June 1999. She is chairmanof EDventure Holdings, the pioneering US-based information technologyand new media company. She is an acknowledged luminary in thetechnology industry, highly influential in her field for the past 16 years,with a state-of-the-art knowledge of the emerging information technologyindustry worldwide and the emerging computer markets of Central andEastern Europe. An investor as well as an observer, she sits on theboards of Audumbla, Manugistics, IBS Group, Scala Business Solutionsand GreaterTalent.com among others.
Warren Hellman Age 66 Non-executive directorWarren Hellman was appointed a director in September 2000 and hasbeen a director of Young & Rubicam Inc. since December 1996. He ischairman of Hellman and Friedman LLC, a private investmentcompany he founded in 1984. Previously, Mr. Hellman was a generalpartner of Hellman, Ferri Investment Associates, Matrix ManagementCompany, Matrix II Management Company, and Lehman Brothers.At Lehman Brothers he served as president, as well as head of theInvestment Banking Division, and chairman of Lehman Corporation.He is currently a director of Levi Strauss & Co., Il Fornaio AmericaCorp., Sugar Bowl Corporation, and D. N. & E. Walter & Co. He ischairman of the San Francisco Foundation, Trustee Emeritus of TheBrookings Institution, and member of the University of California,Berkeley Walter A. Haas School of Business Advisory Board.
Masao Inagaki Age 78 Non-executive directorMasao Inagaki was appointed a director in September 1998 followingWPP’s equity investment in Asatsu-DK, Japan’s third largest advertisingand communications company. He founded Asatsu in 1956 and hasbeen chairman and chief executive officer since 1992. He is also vicepresident of the Japan Advertising Agencies Association. In January1999,Asatsu Inc, became Asatsu-DK as a result of Asatsu’s merger with DIK.
John Jackson Age 71 Non-executive directorJohn Jackson was appointed a director in 1993. He is chairman of Hilton Group plc, Celltech Group plc and a number of other publiccompanies. He is also the non-solicitor chairman of Mishcon de Reya.He has extensive experience of a broad range of businesses, includingtelevision broadcasting, high technology industries, retailing, publishing,printing, biotechnology, electronics and pharmaceuticals.
Michael Jordan Age 65 Non-executive directorMichael Jordan was appointed a director in September 2000 and hasbeen a director of Young & Rubicam Inc. since December 1999. He isexecutive chairman of Clariti Telecommunications International Ltd.,chairman of Luminant Worldwide Corporation, and chairman ofeOriginal Inc. He is a member and former chairman of the US–JapanBusiness Council, chairman of The College Fund/UNCF, and chairmanof the Policy Board of the Americans for the Arts. He also serves on theBoards of Aetna Inc. and Dell Computer Corporation. He retired aschairman and chief executive officer of the CBS Corporation in 1998after having led one of the most comprehensive transformations of amajor US corporation.

WPP Stewardship and remuneration
Sir Christopher Lewinton Age 69 Non executive-directorSir Christopher Lewinton was appointed a director in September 2000and has been a director of Young & Rubicam Inc. since May 1999. He was for 14 years chairman of TI Group plc, and remains aconsultant to TI Group Automotive Systems. From 1970 to 1985 he was chief executive of the Wilkinson Sword Group and, in 1978,when Wilkinson Sword was acquired by Allegheny International, hejoined the main board of the company and chaired Allegheny’sinternational operations. He is a non-executive director of Videonet, a private company providing video-on-demand. He served as a non-executive director of Reed Elsevier from 1993 to 1999 and was a director of the Supervisory Board of Mannesman AG from 1995 to 1999.
Christopher Mackenzie Age 46 Non-executive directorChristopher Mackenzie was appointed a director in March 2000. He is president, chief executive and deputy chairman of TrizecHahnCorporation (TZH), one of North America’s largest diversified propertycompanies. He was previously a company officer of GE, leading GECapital’s international business development. He is a non-executivedirector of Global Switch, the London-based Technology Centrecompany, in which TZH is a controlling shareholder, as well as FairchildDornier GmbH, the aircraft manufacturer, and ChampagneJacquesson S.A.
Stanley Morten Age 57 Non-executive directorStanley Morten was appointed a director in 1991. He is a privateinvestor with a focus on companies in the genomics sector of thebiotechnology industry, and is currently working with Pegasus CapitalAdvisors of Cos Cob, Connecticut, to raise a new venture capital fundcalled Auxyn Biosciences Ventures. Previously he was the chiefoperating officer of Punk, Ziegel & Co, a New York investment bankingfirm with a focus on the healthcare and technology industries. Beforethat he was the managing director of the equity division of WertheimSchroder & Co, Inc in New York.
John Quelch Age 49 Non-executive directorJohn Quelch was appointed a director in 1987. He is Professor and Dean of the London Business School and was formerly theSebastian S. Kresge Professor of Marketing at Harvard BusinessSchool. A prolific writer on marketing and public policy issues, he is the author of 12 books on marketing management. He is a non-executive director of Blue Circle Industries plc, easyJet plc and the Graduate Management Admission Council. He was a founding non-executive director of Reebok International Ltd.
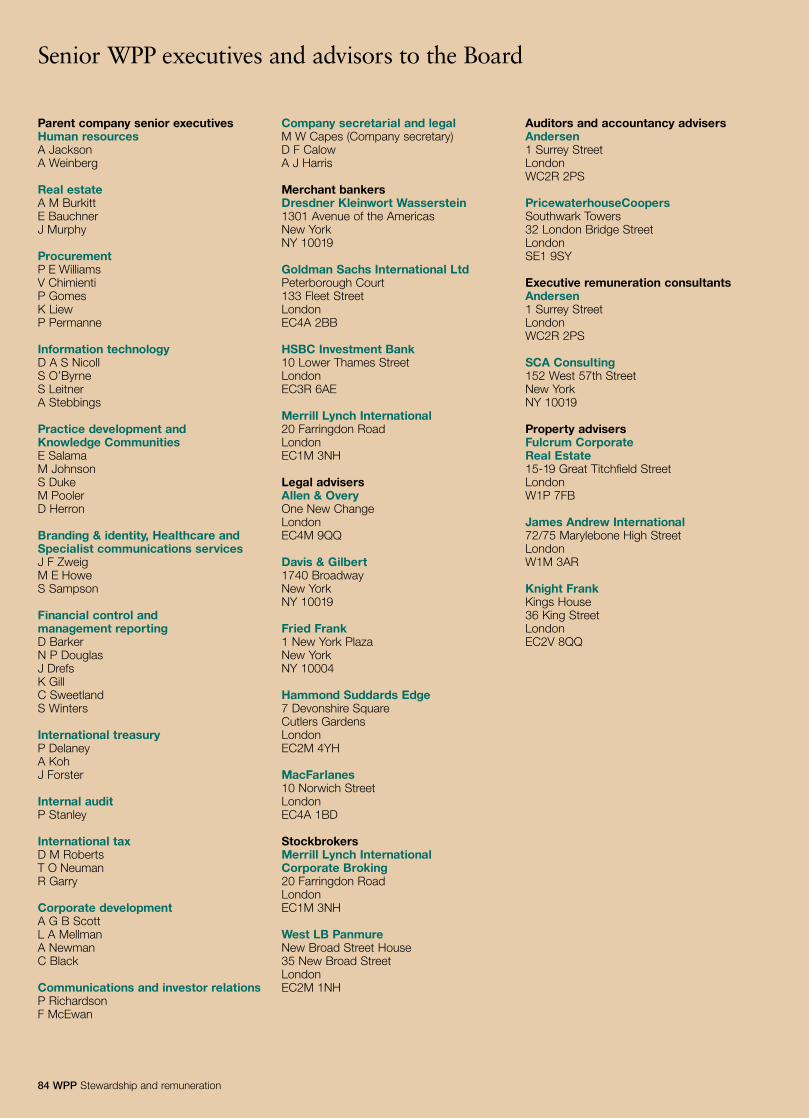
84 WPP Stewardship and remuneration
Senior WPP executives and advisors to the Board
Parent company senior executivesHuman resourcesA JacksonA Weinberg
Real estateA M BurkittE BauchnerJ Murphy
ProcurementP E WilliamsV ChimientiP GomesK LiewP Permanne
Information technologyD A S NicollS O’ByrneS LeitnerA Stebbings
Practice development and Knowledge CommunitiesE SalamaM JohnsonS DukeM PoolerD Herron
Branding & identity, Healthcare andSpecialist communications servicesJ F ZweigM E HoweS Sampson
Financial control and management reportingD BarkerN P DouglasJ DrefsK GillC SweetlandS Winters
International treasuryP DelaneyA KohJ Forster
Internal auditP Stanley
International taxD M RobertsT O NeumanR Garry
Corporate developmentA G B ScottL A MellmanA NewmanC Black
Communications and investor relationsP RichardsonF McEwan
Company secretarial and legalM W Capes (Company secretary)D F CalowA J Harris
Merchant bankersDresdner Kleinwort Wasserstein1301 Avenue of the AmericasNew YorkNY 10019
Goldman Sachs International LtdPeterborough Court133 Fleet StreetLondonEC4A 2BB
HSBC Investment Bank10 Lower Thames StreetLondonEC3R 6AE
Merrill Lynch International20 Farringdon RoadLondonEC1M 3NH
Legal advisersAllen & OveryOne New ChangeLondonEC4M 9QQ
Davis & Gilbert1740 BroadwayNew YorkNY 10019
Fried Frank1 New York PlazaNew YorkNY 10004
Hammond Suddards Edge7 Devonshire SquareCutlers GardensLondonEC2M 4YH
MacFarlanes10 Norwich StreetLondonEC4A 1BD
StockbrokersMerrill Lynch International Corporate Broking20 Farringdon RoadLondonEC1M 3NH
West LB PanmureNew Broad Street House35 New Broad StreetLondonEC2M 1NH
Auditors and accountancy advisersAndersen1 Surrey StreetLondonWC2R 2PS
PricewaterhouseCoopersSouthwark Towers32 London Bridge StreetLondonSE1 9SY
Executive remuneration consultantsAndersen1 Surrey StreetLondonWC2R 2PS
SCA Consulting152 West 57th StreetNew YorkNY 10019
Property advisersFulcrum CorporateReal Estate 15-19 Great Titchfield StreetLondonW1P 7FB
James Andrew International72/75 Marylebone High StreetLondonW1M 3AR
Knight FrankKings House36 King StreetLondonEC2V 8QQ
85 WPP Stewardship and remuneration
Directors’ responsibilities
Corporate governance provisionsThe Board of Directors is accountable to the Company’s shareowners for good corporate governance and this statement describeshow the principles identified in the Combined Code are applied bythe Company. The Board confirms that the Company has compliedthroughout the year with the provisions set out in Section 1 of theCombined Code, except that the service contracts in respect of theGroup chief executive, Sir Martin Sorrell, and Michael Dolan, the chiefexecutive of Young & Rubicam Inc., are each for periods in excess ofone year for the reasons explained on page 94.
The Auditors’ report on this statement is included in their report toshare owners, which appears on page 79.
Board of DirectorsThe Board of Directors is responsible for approving Group policy andstrategy and is responsible to share owners for the Group’s financialand operational performance. Responsibility for the development andimplementation of Group policy and strategy, and for day-to-daymanagement issues is delegated by the full Board to the executivedirectors.
For the year under review Hamish Maxwell was the non-executiveChairman of the Board. Mr Maxwell retired in February 2001 andPhilip Lader was appointed in his place as non-executive Chairman. Sir Martin Sorrell as the Group chief executive is responsible for thedevelopment and implementation of policy and strategy and for theday-to-day operations of the Group. The biographies of the Boardmembers appear on pages 82 and 83.
The Company considers that its complement of non-executivedirectors provides an effective Board with a mix of industry-specificknowledge and broad global business and commercial experience.The balance enables the Board to provide clear and effectiveleadership of the Company and to bring informed and independentjudgement to many aspects of the Company’s strategy andperformance so as to ensure that the highest standards of conductand integrity are maintained by the Company on a global basis.
All directors are kept fully informed of important developments inthe various sectors in which the Group operates worldwide and theyare also advised as necessary on regulatory and best practicerequirements which affect the Group’s businesses particularly in theUS and the UK.
The Board meets at least seven times a year, and more frequentlywhen business needs require. One meeting is devoted entirely to thedevelopment of the Company’s strategy. The Board consists of elevennon-executive directors and five executive directors.
John Quelch is the senior independent non-executive director tobe available to deal with concerns regarding the Company where itcould be inappropriate for these to be dealt with by the Chairman orGroup chief executive.
Whilst certain non-executive directors hold shares in the Companythey will not participate in the Company’s share option or other incentiveschemes. Messrs Lewinton, Hellman and Jordan participated in theYoung & Rubicam Inc. Directors Stock Option and Deferred Fee Plans.Non-executive directors may receive a part of their fees in ordinary shares.
The Company’s Articles of Association provide that a directorappointed since the last Annual General Meeting, or who has heldoffice for more than 30 months since his election or re-election by theCompany in general meeting (whether annual or extraordinary) shallretire from office but shall be eligible for re-election.
Messrs Dolan, Hellman and Jordan and Sir Christopher Lewinton wereappointed at the Extraordinary General Meeting held in September 2000and are not required to seek re-election this year. Philip Lader havingbeen appointed a director since the last General Meeting, is requiredto retire from office at the forthcoming Annual General Meeting, butbeing eligible offers himself for re-election.
The Board has also decided that those directors who are aged 70or over on the date of the Notice of Annual General Meeting, namelyMessrs Bullmore, Jackson and Inagaki, will retire from office at the
forthcoming Annual General Meeting, but being eligible, are alloffering themselves for re-election. Further, in accordance with theArticles of Association, Mr Quelch also retires but being eligible offershimself for re-election.
The Board recommends share owners to vote in favour of theResolutions to re-elect the directors to be proposed at the AnnualGeneral Meeting. Details of directors’ remuneration and servicecontracts are set out in the report of the Compensation committee on pages 92 to 99.
Board CommitteesThe Board has established an Audit committee, a Compensationcommittee and a Nominations committee.
The Audit committee meets at least three times a year and currentlycomprises the following non-executive directors: Messrs J B HJackson (Chairman), J J D Bullmore and S W Morten. The director of internal audit and the Group finance director attend the meetings of the committee, as do the Company’s auditors and GeneralCounsel. The Audit committee is responsible for overseeing theinvolvement of the Group’s auditors in the planning and review of the Group’s annual report and accounts and the half year report and also discussing with the auditors the findings of the audit.The independence and objectivity of the external auditors is alsoconsidered, and the committee reviews any recommendation relatingto the reappointment of the auditors. The committee considersaccounting and legal requirements as well as the regulations of theUK Listing Authority and the Securities Exchange Commission forproper compliance by the Company. The committee also promotesthe maintenance of effective systems of internal financial control andis responsible for the scope of internal audit.
The Compensation committee reviews the remuneration policy of the Group including base remuneration, incentive plans and terms of employment of executive directors and senior executives of theCompany, and directors and senior executives of operatingcompanies. The committee approves and monitors all of thearrangements with the Group chief executive.
The committee comprises exclusively non-executive directors:Messrs S W Morten (Chairman), C Mackenzie and J A Quelch.Each non-executive director is independent of management andfree from any business or other relationship which could materiallyinterfere with the exercise of his independent judgement.
The Compensation committee regularly consults with the Groupchief executive and the Chief human resources officer on proposalsrelating to the remuneration of other executive directors and hasaccess to professional advice inside and outside the Company,including independent executive remuneration consultants.
The Nominations committee considers appointments to the Boardof Directors and makes recommendations in this respect to theBoard. The committee comprises the following directors: Messrs P Lader, B J Brooks, S W Morten, J A Quelch and Sir Martin Sorrell.
Internal controlThe Combined Code requires that companies review all internalcontrols including financial, operational and compliance controlsand risk management. In September 1999, the Turnbull Report waspublished to offer guidance to directors in complying with theinternal control requirements of the Combined Code. In the opinionof the Board, the Company has complied throughout the year withthe guidance contained in the Turnbull Report.
The Board of Directors has overall responsibility for the system ofinternal control throughout the Group. In the context of the scope andcomplexity of this system, it can only provide reasonable but notabsolute assurance against material misstatement or loss.
The Company assesses the risks facing the business on anongoing basis and has identified a number of key business risks,
86 WPP Stewardship and remuneration
Directors’ responsibilities continued
which are subject to regular reporting to the Board. These includeclient management and operational performance, treasury matters(including management of working capital), management of staff,compensation of key executives, capital expenditure, IT and legalmatters. Also included was the integration of the Young & Rubicambusinesses into the Group.
In response to the guidance given by the Turnbull Report, theCompany has implemented risk management procedures and hasformalised documentation. These include the implementation of detailed risk analyses by the significant businesses in the Group,having regard to the potential financial and reputational impact of the risks and their likelihood. In the first instance, these detailed risks were determined in workshops held in 1999 for the seniormanagement of each of the significant businesses.
During 2000, these risks and any new risks have been reviewedand updated. Further workshops have also been held at subsidiaryand regional levels, as well as at the Young & Rubicam Group by theend of 2000.
At each Board meeting, the Group chief executive presents a‘Brand Check’ review of each of the business’ operations. This nowformally incorporates ‘Risk Monitor’, being feedback of the businessrisks identified in the workshop process, as well as details of anychange in the risk profile since the last Board Meeting.
Risk monitoring is, therefore, embedded in the operation of theBoard, in a manner which in its opinion is the correct way to respondto the Turnbull recommendations. A formal update of the process isundertaken annually in conjunction with internal audit and the self-certification questionnaire, described below.
The key elements of the system of internal control which werefollowed are:
Financial reportingThe Group has a comprehensive system for reporting financial resultsto the Board. Each operating unit updates a three-year strategic planannually which incorporates financial objectives. These are reviewedby the Group’s management and are agreed with the chief executiveof each operating unit. In addition, towards the end of each financialyear, operating units prepare detailed budgets for the following year.The Group’s budget is reviewed by the Board before being adoptedformally. Operating units’ results are reported monthly and comparedto budget and prior year, with full-year forecasts prepared quarterlythroughout the year. The Company reports to share owners fourtimes a year.
Quality and integrity of personnelQuality and integrity of personnel is regarded as vital to themaintenance of the Group’s system of internal control. Guidance onidentified key policies is provided in the WPP Policy Book, which isregularly reviewed and which includes a Code of Business Conductsetting out the principal obligations of directors and employees.Compliance with this Code of Conduct is required to be confirmedannually by all directors and senior executives in the Group.
Operating unit controlsEach operating unit completes an annual self-certification questionnaireconfirming compliance with key financial controls and procedures.These questionnaires are reviewed by internal audit, the results arereported to the Audit committee and linked into the risk managementprocedures developed as a result of the Turnbull Report.
Review of risk areasAs referred to above, the Company assesses business risks on anongoing basis. Each operating group has in place monthly andquarterly procedures, in addition to day-to-day management activities,to review their operations and business risks. These are formallycommunicated to the Group chief executive and, in turn to the Board.
Regular review meetings are also held by the Group chief executive inrespect of the key business risks that are monitored at Company level.
Monitoring of the system of internal controlThe Board is responsible for reviewing the effectiveness of the systemof internal control, which is made possible by the ‘Brand Check’ and‘Risk Monitor’ presentations by the Group chief executive.
The effectiveness of the system of internal control is monitored on an ongoing basis by the Audit committee, which receives regularreports from the director of internal audit, and, where relevant, theexternal auditors.
Going concernUnder company law, the directors are required to consider whether itis appropriate to adopt the financial statements on the basis that theCompany and the Group are going concerns. As part of its normalbusiness practice the Group prepares annual and longer-term plansand in reviewing this information and in particular the 2001 three-yearplan and budget the directors believe that the Company and theGroup have adequate resources for the foreseeable future. Thereforethe Company and the Group continue to adopt the going concernbasis in preparing the financial statements.
Responsibilities in respect of the preparationof financial statementsThe directors are required by company law to prepare financialstatements which give a true and fair view of the state of affairs of the Company and Group at the end of each financial year and of theprofit and loss of the Group for that year. The financial statements mustbe prepared in compliance with the required formats and disclosuresof the Companies Act 1985 and with applicable accounting standards.In addition, the directors are required to:
– select suitable accounting policies and apply them consistently;– make judgements and estimates that are reasonable and prudent;– state whether applicable accounting standards have been followed,
subject to any material departure disclosed and explained in thefinancial statements; and
– prepare the financial statements on a going concern basis unless itis inappropriate to presume that the Group will continue in businessfor the foreseeable future.
The directors confirm that the financial statements comply with the above requirements. The directors are also responsible formaintaining adequate accounting records to enable them to ensurethat the financial statements comply with the requirements of theCompanies Act 1985, for safeguarding the assets of the Group, andtherefore for taking reasonable steps for the prevention and detectionof fraud and other irregularities.
Share owner relationsRelations with share owners including potential share owners andinvestment analysts are regarded by the Group as extremelyimportant throughout the year.
The Group has a well-developed continuous program to addressthe needs of share owners, investment institutions and analysts for aregular flow of information about the Company, its strategy, performanceand competitive position. Given the wide geographic distribution of theGroup’s current and potential share owners, this program includesregular visits to investors, particularly by the Group chief executiveand the Group finance director, in the UK, Continental Europe and themajor financial centres in North America together with a more limitedprogram in Asia Pacific. As the US provides the single largest groupof share owners, the Company provides a quarterly trading update atthe end of the first and third quarters in addition to semi-annualreporting required in the UK. The Company also maintains a websiteproviding investors with a regular source of information.
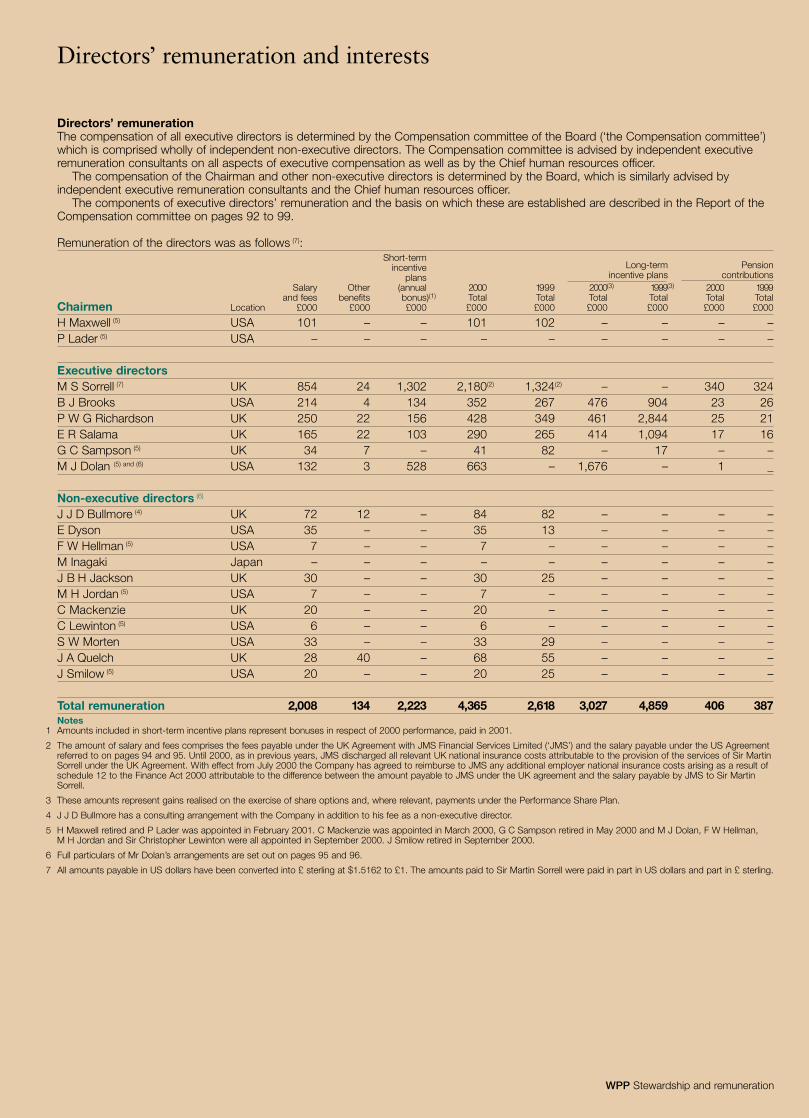
WPP Stewardship and remuneration
Directors’ remuneration and interests
Directors’ remunerationThe compensation of all executive directors is determined by the Compensation committee of the Board (‘the Compensation committee’) which is comprised wholly of independent non-executive directors. The Compensation committee is advised by independent executiveremuneration consultants on all aspects of executive compensation as well as by the Chief human resources officer.
The compensation of the Chairman and other non-executive directors is determined by the Board, which is similarly advised byindependent executive remuneration consultants and the Chief human resources officer.
The components of executive directors’ remuneration and the basis on which these are established are described in the Report of theCompensation committee on pages 92 to 99.
Remuneration of the directors was as follows (7):Short-term
incentive Long-term Pensionplans incentive plans contributions
Salary Other (annual 2000 1999 2000(3) 1999(3) 2000 1999and fees benefits bonus)(1) Total Total Total Total Total Total
Chairmen Location £000 £000 £000 £000 £000 £000 £000 £000 £000
H Maxwell (5) USA 101 – – 101 102 – – – –P Lader (5) USA – – – – – – – – –
Executive directorsM S Sorrell (7) UK 854 24 1,302 2,180(2) 1,324(2) – – 340 324B J Brooks USA 214 4 134 352 267 476 904 23 26P W G Richardson UK 250 22 156 428 349 461 2,844 25 21E R Salama UK 165 22 103 290 265 414 1,094 17 16G C Sampson (5) UK 34 7 – 41 82 – 17 – –M J Dolan (5) and (6) USA 132 3 528 663 – 1,676 – 1 _
Non-executive directors (6)
J J D Bullmore (4) UK 72 12 – 84 82 – – – –E Dyson USA 35 – – 35 13 – – – –F W Hellman (5) USA 7 – – 7 – – – – –M Inagaki Japan – – – – – – – – –J B H Jackson UK 30 – – 30 25 – – – –M H Jordan (5) USA 7 – – 7 – – – – –C Mackenzie UK 20 – – 20 – – – – –C Lewinton (5) USA 6 – – 6 – – – – –S W Morten USA 33 – – 33 29 – – – –J A Quelch UK 28 40 – 68 55 – – – –J Smilow (5) USA 20 – – 20 25 – – – –
Total remuneration 2,008 134 2,223 4,365 2,618 3,027 4,859 406 387Notes
1 Amounts included in short-term incentive plans represent bonuses in respect of 2000 performance, paid in 2001.
2 The amount of salary and fees comprises the fees payable under the UK Agreement with JMS Financial Services Limited (‘JMS’) and the salary payable under the US Agreementreferred to on pages 94 and 95. Until 2000, as in previous years, JMS discharged all relevant UK national insurance costs attributable to the provision of the services of Sir MartinSorrell under the UK Agreement. With effect from July 2000 the Company has agreed to reimburse to JMS any additional employer national insurance costs arising as a result ofschedule 12 to the Finance Act 2000 attributable to the difference between the amount payable to JMS under the UK agreement and the salary payable by JMS to Sir MartinSorrell.
3 These amounts represent gains realised on the exercise of share options and, where relevant, payments under the Performance Share Plan.
4 J J D Bullmore has a consulting arrangement with the Company in addition to his fee as a non-executive director.
5 H Maxwell retired and P Lader was appointed in February 2001. C Mackenzie was appointed in March 2000, G C Sampson retired in May 2000 and M J Dolan, F W Hellman, M H Jordan and Sir Christopher Lewinton were all appointed in September 2000. J Smilow retired in September 2000.
6 Full particulars of Mr Dolan’s arrangements are set out on pages 95 and 96.
7 All amounts payable in US dollars have been converted into £ sterling at $1.5162 to £1. The amounts paid to Sir Martin Sorrell were paid in part in US dollars and part in £ sterling.
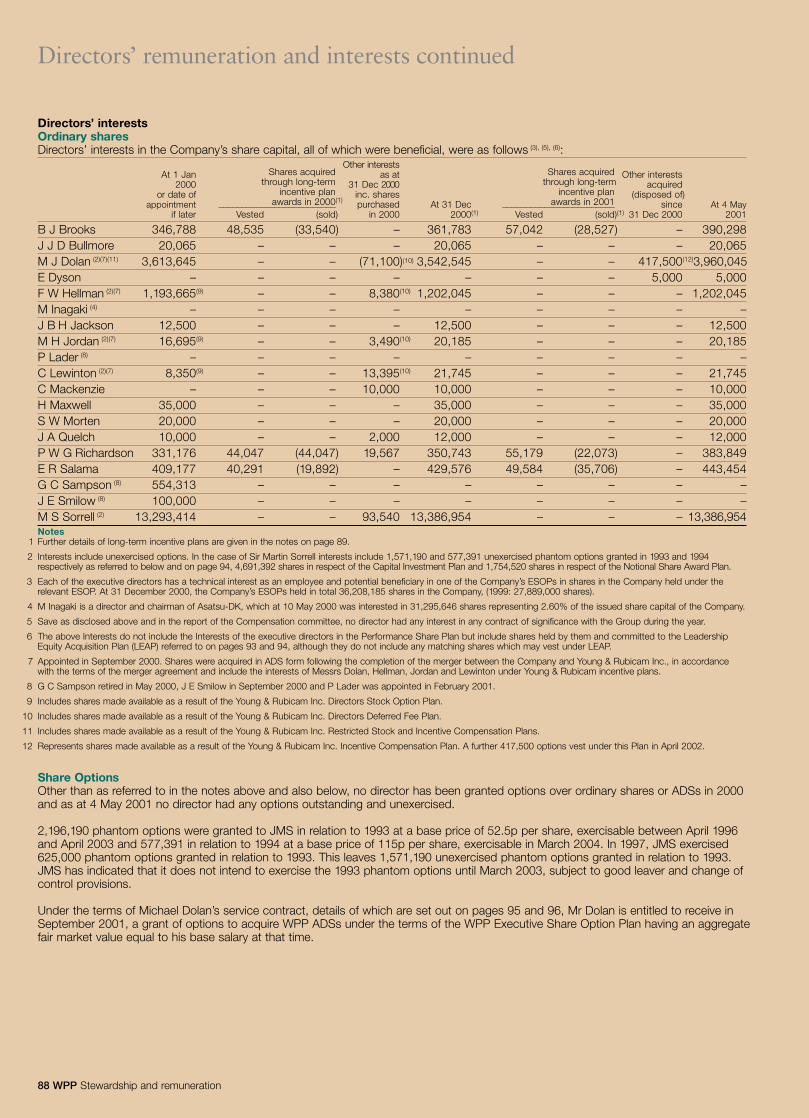
88 WPP Stewardship and remuneration
Share OptionsOther than as referred to in the notes above and also below, no director has been granted options over ordinary shares or ADSs in 2000and as at 4 May 2001 no director had any options outstanding and unexercised.
2,196,190 phantom options were granted to JMS in relation to 1993 at a base price of 52.5p per share, exercisable between April 1996 and April 2003 and 577,391 in relation to 1994 at a base price of 115p per share, exercisable in March 2004. In 1997, JMS exercised625,000 phantom options granted in relation to 1993. This leaves 1,571,190 unexercised phantom options granted in relation to 1993. JMS has indicated that it does not intend to exercise the 1993 phantom options until March 2003, subject to good leaver and change ofcontrol provisions.
Under the terms of Michael Dolan’s service contract, details of which are set out on pages 95 and 96, Mr Dolan is entitled to receive inSeptember 2001, a grant of options to acquire WPP ADSs under the terms of the WPP Executive Share Option Plan having an aggregatefair market value equal to his base salary at that time.
Directors’ remuneration and interests continued
Directors’ interestsOrdinary sharesDirectors’ interests in the Company’s share capital, all of which were beneficial, were as follows (3), (5), (6):
Shares acquiredOther interests
Shares acquiredAt 1 Janthrough long-term
as atthrough long-term
Other interests2000
incentive plan31 Dec 2000
incentive planacquired
or date ofawards in 2000
inc. sharesawards in 2001
(disposed of)At 4 Mayappointment �������������������������
(1) purchased At 31 Dec ������������������������ sinceif later Vested (sold) in 2000 2000(1) Vested (sold)(1) 31 Dec 2000 2001
B J Brooks 346,788 48,535 (33,540) – 361,783 57,042 (28,527) – 390,298J J D Bullmore 20,065 – – – 20,065 – – – 20,065M J Dolan (2)(7)(11) 3,613,645 – – (71,100)(10) 3,542,545 – – 417,500(12)3,960,045E Dyson – – – – – – – 5,000 5,000F W Hellman (2)(7) 1,193,665(9) – – 8,380(10) 1,202,045 – – – 1,202,045M Inagaki (4) – – – – – – – – –J B H Jackson 12,500 – – – 12,500 – – – 12,500M H Jordan (2)(7) 16,695(9) – – 3,490(10) 20,185 – – – 20,185P Lader (8) – – – – – – – – –C Lewinton (2)(7) 8,350(9) – – 13,395(10) 21,745 – – – 21,745C Mackenzie – – – 10,000 10,000 – – – 10,000H Maxwell 35,000 – – – 35,000 – – – 35,000S W Morten 20,000 – – – 20,000 – – – 20,000J A Quelch 10,000 – – 2,000 12,000 – – – 12,000P W G Richardson 331,176 44,047 (44,047) 19,567 350,743 55,179 (22,073) – 383,849E R Salama 409,177 40,291 (19,892) – 429,576 49,584 (35,706) – 443,454G C Sampson (8) 554,313 – – – – – – – –J E Smilow (8) 100,000 – – – – – – – –M S Sorrell (2) 13,293,414 – – 93,540 13,386,954 – – – 13,386,954Notes
1 Further details of long-term incentive plans are given in the notes on page 89.
2 Interests include unexercised options. In the case of Sir Martin Sorrell interests include 1,571,190 and 577,391 unexercised phantom options granted in 1993 and 1994 respectively as referred to below and on page 94, 4,691,392 shares in respect of the Capital Investment Plan and 1,754,520 shares in respect of the Notional Share Award Plan.
3 Each of the executive directors has a technical interest as an employee and potential beneficiary in one of the Company’s ESOPs in shares in the Company held under therelevant ESOP. At 31 December 2000, the Company’s ESOPs held in total 36,208,185 shares in the Company, (1999: 27,889,000 shares).
4 M Inagaki is a director and chairman of Asatsu-DK, which at 10 May 2000 was interested in 31,295,646 shares representing 2.60% of the issued share capital of the Company.
5 Save as disclosed above and in the report of the Compensation committee, no director had any interest in any contract of significance with the Group during the year.
6 The above Interests do not include the Interests of the executive directors in the Performance Share Plan but include shares held by them and committed to the LeadershipEquity Acquisition Plan (LEAP) referred to on pages 93 and 94, although they do not include any matching shares which may vest under LEAP.
7 Appointed in September 2000. Shares were acquired in ADS form following the completion of the merger between the Company and Young & Rubicam Inc., in accordancewith the terms of the merger agreement and include the interests of Messrs Dolan, Hellman, Jordan and Lewinton under Young & Rubicam incentive plans.
8 G C Sampson retired in May 2000, J E Smilow in September 2000 and P Lader was appointed in February 2001.
9 Includes shares made available as a result of the Young & Rubicam Inc. Directors Stock Option Plan.
10 Includes shares made available as a result of the Young & Rubicam Inc. Directors Deferred Fee Plan.
11 Includes shares made available as a result of the Young & Rubicam Inc. Restricted Stock and Incentive Compensation Plans.
12 Represents shares made available as a result of the Young & Rubicam Inc. Incentive Compensation Plan. A further 417,500 options vest under this Plan in April 2002.
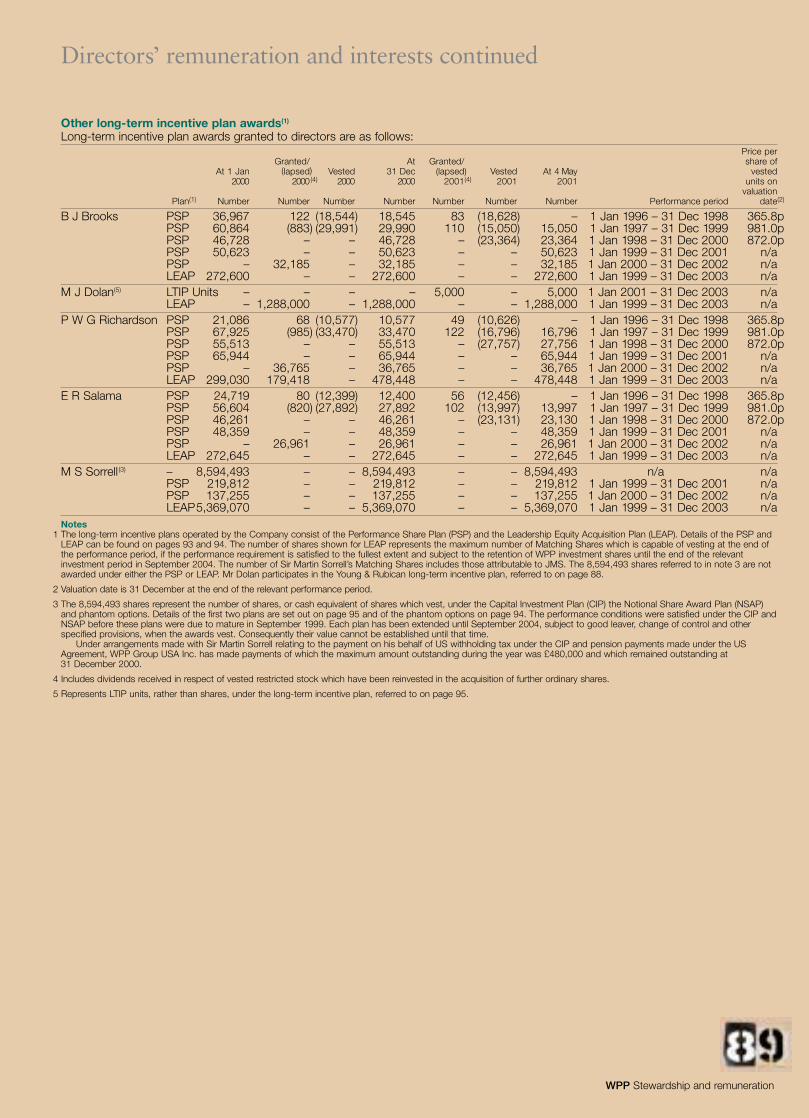
WPP Stewardship and remuneration
Directors’ remuneration and interests continued
Other long-term incentive plan awards(1)
Long-term incentive plan awards granted to directors are as follows:Price per
Granted/ At Granted/ share ofAt 1 Jan (lapsed) Vested 31 Dec (lapsed) Vested At 4 May vested
2000 2000(4) 2000 2000 2001(4) 2001 2001 units onvaluation
Plan(1) Number Number Number Number Number Number Number Performance period date(2)
B J Brooks PSP 36,967 122 (18,544) 18,545 83 (18,628) – 1 Jan 1996 – 31 Dec 1998 365.8pPSP 60,864 (883) (29,991) 29,990 110 (15,050) 15,050 1 Jan 1997 – 31 Dec 1999 981.0pPSP 46,728 – – 46,728 – (23,364) 23,364 1 Jan 1998 – 31 Dec 2000 872.0pPSP 50,623 – – 50,623 – – 50,623 1 Jan 1999 – 31 Dec 2001 n/aPSP – 32,185 – 32,185 – – 32,185 1 Jan 2000 – 31 Dec 2002 n/aLEAP 272,600 – – 272,600 – – 272,600 1 Jan 1999 – 31 Dec 2003 n/a
M J Dolan(5) LTIP Units – – – – 5,000 – 5,000 1 Jan 2001 – 31 Dec 2003 n/aLEAP – 1,288,000 – 1,288,000 – – 1,288,000 1 Jan 1999 – 31 Dec 2003 n/a
P W G Richardson PSP 21,086 68 (10,577) 10,577 49 (10,626) – 1 Jan 1996 – 31 Dec 1998 365.8pPSP 67,925 (985) (33,470) 33,470 122 (16,796) 16,796 1 Jan 1997 – 31 Dec 1999 981.0pPSP 55,513 – – 55,513 – (27,757) 27,756 1 Jan 1998 – 31 Dec 2000 872.0pPSP 65,944 – – 65,944 – – 65,944 1 Jan 1999 – 31 Dec 2001 n/aPSP – 36,765 – 36,765 – – 36,765 1 Jan 2000 – 31 Dec 2002 n/aLEAP 299,030 179,418 – 478,448 – – 478,448 1 Jan 1999 – 31 Dec 2003 n/a
E R Salama PSP 24,719 80 (12,399) 12,400 56 (12,456) – 1 Jan 1996 – 31 Dec 1998 365.8pPSP 56,604 (820) (27,892) 27,892 102 (13,997) 13,997 1 Jan 1997 – 31 Dec 1999 981.0pPSP 46,261 – – 46,261 – (23,131) 23,130 1 Jan 1998 – 31 Dec 2000 872.0pPSP 48,359 – – 48,359 – – 48,359 1 Jan 1999 – 31 Dec 2001 n/aPSP – 26,961 – 26,961 – – 26,961 1 Jan 2000 – 31 Dec 2002 n/aLEAP 272,645 – – 272,645 – – 272,645 1 Jan 1999 – 31 Dec 2003 n/a
M S Sorrell(3) – 8,594,493 – – 8,594,493 – – 8,594,493 n/a n/aPSP 219,812 – – 219,812 – – 219,812 1 Jan 1999 – 31 Dec 2001 n/aPSP 137,255 – – 137,255 – – 137,255 1 Jan 2000 – 31 Dec 2002 n/aLEAP5,369,070 – – 5,369,070 – – 5,369,070 1 Jan 1999 – 31 Dec 2003 n/a
Notes1 The long-term incentive plans operated by the Company consist of the Performance Share Plan (PSP) and the Leadership Equity Acquisition Plan (LEAP). Details of the PSP and
LEAP can be found on pages 93 and 94. The number of shares shown for LEAP represents the maximum number of Matching Shares which is capable of vesting at the end ofthe performance period, if the performance requirement is satisfied to the fullest extent and subject to the retention of WPP investment shares until the end of the relevantinvestment period in September 2004. The number of Sir Martin Sorrell’s Matching Shares includes those attributable to JMS. The 8,594,493 shares referred to in note 3 are notawarded under either the PSP or LEAP. Mr Dolan participates in the Young & Rubican long-term incentive plan, referred to on page 88.
2 Valuation date is 31 December at the end of the relevant performance period.
3 The 8,594,493 shares represent the number of shares, or cash equivalent of shares which vest, under the Capital Investment Plan (CIP) the Notional Share Award Plan (NSAP)and phantom options. Details of the first two plans are set out on page 95 and of the phantom options on page 94. The performance conditions were satisfied under the CIP andNSAP before these plans were due to mature in September 1999. Each plan has been extended until September 2004, subject to good leaver, change of control and otherspecified provisions, when the awards vest. Consequently their value cannot be established until that time.
Under arrangements made with Sir Martin Sorrell relating to the payment on his behalf of US withholding tax under the CIP and pension payments made under the USAgreement, WPP Group USA Inc. has made payments of which the maximum amount outstanding during the year was £480,000 and which remained outstanding at31 December 2000.
4 Includes dividends received in respect of vested restricted stock which have been reinvested in the acquisition of further ordinary shares.
5 Represents LTIP units, rather than shares, under the long-term incentive plan, referred to on page 95.
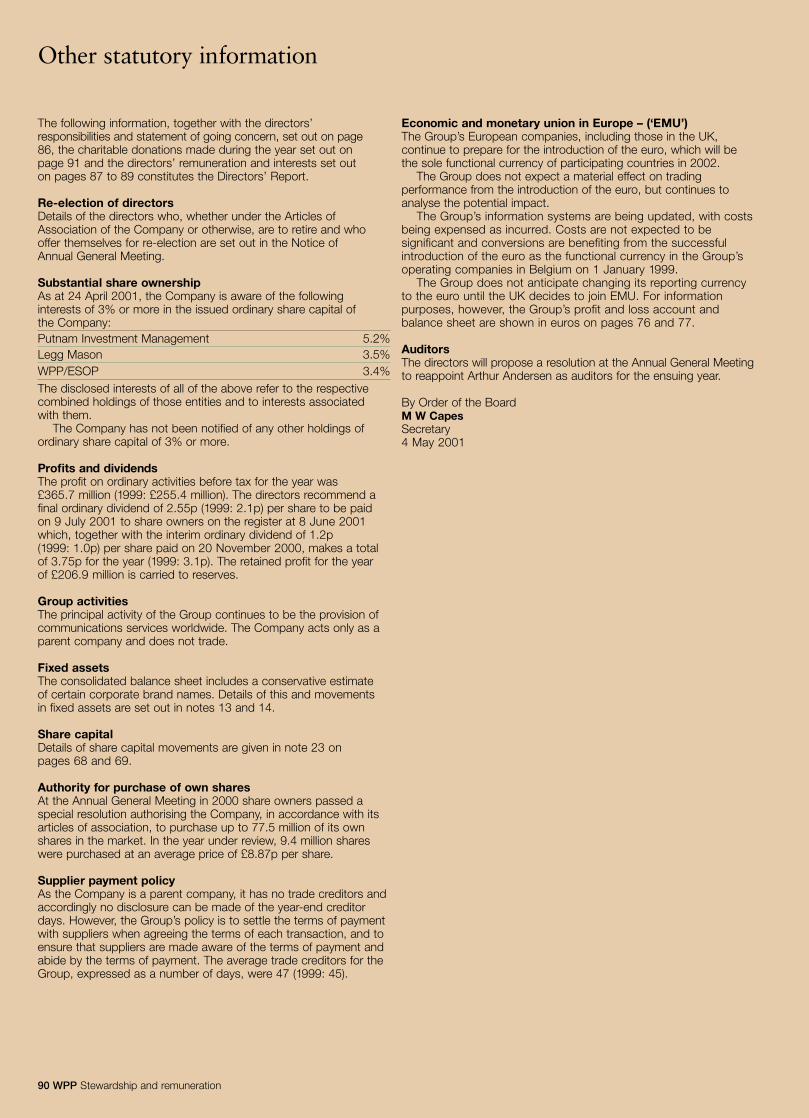
90 WPP Stewardship and remuneration
Other statutory information
The following information, together with the directors’responsibilities and statement of going concern, set out on page86, the charitable donations made during the year set out onpage 91 and the directors’ remuneration and interests set outon pages 87 to 89 constitutes the Directors’ Report.
Re-election of directorsDetails of the directors who, whether under the Articles ofAssociation of the Company or otherwise, are to retire and whooffer themselves for re-election are set out in the Notice ofAnnual General Meeting.
Substantial share ownershipAs at 24 April 2001, the Company is aware of the followinginterests of 3% or more in the issued ordinary share capital ofthe Company:Putnam Investment Management 5.2%Legg Mason 3.5%WPP/ESOP 3.4%The disclosed interests of all of the above refer to the respectivecombined holdings of those entities and to interests associatedwith them.
The Company has not been notified of any other holdings of ordinary share capital of 3% or more.
Profits and dividendsThe profit on ordinary activities before tax for the year was£365.7 million (1999: £255.4 million). The directors recommend afinal ordinary dividend of 2.55p (1999: 2.1p) per share to be paidon 9 July 2001 to share owners on the register at 8 June 2001which, together with the interim ordinary dividend of 1.2p(1999: 1.0p) per share paid on 20 November 2000, makes a totalof 3.75p for the year (1999: 3.1p). The retained profit for the yearof £206.9 million is carried to reserves.
Group activitiesThe principal activity of the Group continues to be the provision ofcommunications services worldwide. The Company acts only as aparent company and does not trade.
Fixed assetsThe consolidated balance sheet includes a conservative estimateof certain corporate brand names. Details of this and movementsin fixed assets are set out in notes 13 and 14.
Share capitalDetails of share capital movements are given in note 23 on pages 68 and 69.
Authority for purchase of own sharesAt the Annual General Meeting in 2000 share owners passed aspecial resolution authorising the Company, in accordance with itsarticles of association, to purchase up to 77.5 million of its ownshares in the market. In the year under review, 9.4 million shareswere purchased at an average price of £8.87p per share.
Supplier payment policyAs the Company is a parent company, it has no trade creditors andaccordingly no disclosure can be made of the year-end creditordays. However, the Group’s policy is to settle the terms of paymentwith suppliers when agreeing the terms of each transaction, and toensure that suppliers are made aware of the terms of payment andabide by the terms of payment. The average trade creditors for theGroup, expressed as a number of days, were 47 (1999: 45).
Economic and monetary union in Europe – (‘EMU’)The Group’s European companies, including those in the UK,continue to prepare for the introduction of the euro, which will bethe sole functional currency of participating countries in 2002.
The Group does not expect a material effect on tradingperformance from the introduction of the euro, but continues toanalyse the potential impact.
The Group’s information systems are being updated, with costsbeing expensed as incurred. Costs are not expected to besignificant and conversions are benefiting from the successfulintroduction of the euro as the functional currency in the Group’soperating companies in Belgium on 1 January 1999.
The Group does not anticipate changing its reporting currencyto the euro until the UK decides to join EMU. For informationpurposes, however, the Group’s profit and loss account andbalance sheet are shown in euros on pages 76 and 77.
AuditorsThe directors will propose a resolution at the Annual General Meetingto reappoint Arthur Andersen as auditors for the ensuing year.
By Order of the BoardM W CapesSecretary4 May 2001
WPP Stewardship and remuneration
Corporate citizenship
WPP is playing an active part in developing corporate and socialresponsibility policies and standards that are relevant to thecommunications services industry. Until robust criteria are defined,we report below on our specific policies and initiatives.
Environmental policyAs a mainly service-based company our impact on the environmentis small, but the Group recognises that the pursuit of economicgrowth and a healthy environment are inextricably linked. WPP, as aparent company to our operating companies, upholds the principleof ‘subsidiarity’ and charges our companies to adhere to bestpractice. In our worldwide operations we endeavour to adopt goodenvironmental practice in respect of premises, equipment andconsumption of resources. Environmental problems within theGroup are reportable to the Audit Committee.
Support for the artsWPP recognises that close connections with the arts world is a vitaland liberating experience for individuals, not least for those whosebusiness hinges on management of the imagination. We thereforeencourage and foster mutually beneficial partnerships between ouroperating companies and arts and creative organisations. ManyWPP employees are active in their own arts communities, givingtime and marketing counsel to a variety of arts-based organisationsand activities around the world.
WPP is a corporate patron of the National Portrait Gallery inLondon and is a founder member of the innovative Creative Forumfor Culture and the Economy, a ‘think and action tank’ founded byUK industry body Arts & Business for business leaders dedicated todeveloping dynamic relationships between business and the arts.
WPP is a co-sponsor of the Japan 2001 initiative, a year-longprogram of UK events celebrating Japanese culture and technology.
Education and trainingAs part of WPP’s strategy of supporting young people througheducation and training, the Group is active in a number of areas.WPP sponsors London’s first Arts College for the Media Arts:Charles Edward Brooke, a state secondary school for girls frommulti-ethnic backgrounds. This government-backed initiative aimsto equip young people with the skills needed to succeed inbusiness and to make learning more relevant to the needs of futureemployees. For the past seven years, WPP has sponsored youngSouth Africans, enabling them to attend Cape Town’s careerdeveloping Red & Yellow School of Logic and Magic for aspiringdesigners and copywriters.
WPP also supports the development of international businessschools. Our Group chief executive, Sir Martin Sorrell, is a Governorof the London Business School, an Advisory Board member of theJudge Institute of Management Studies at Cambridge, a member ofthe Board of Directors of Associates at the Harvard BusinessSchool and the Dean’s Advisory Council at Boston University. WPP is an active supporter of the Indian Business School, whichwill receive its first post-graduate students in July 2001.
Community partnershipsMuch of the strength of the Group springs from its significant localpresence around the world. And so by far the largest component ofour support for charities and local communities is determined andcontributed by our operating companies at local level.
At the parent company level, WPP supports a number ofcommunity programs including the Drugs Prevention Board,instituted by the Home Office of the UK Government. WPP is afounder member of the RSA’s initiative, Centre for Tomorrow’sCompany, which advances best competitive – and ethical –business practice. As a Corporate Partner of The Media Trust – themedia industry’s charity which matches the skills and resources ofmedia professionals to the communications needs of charities andcommunity organisations – WPP supports partnerships betweenthe media and charities across the UK.
WPP’s operating companies are responsible for their own charitablepolicies which enables them to support local projects andorganisations according to circumstances and employee views.Many of our operating companies, such as our advertising agenciesand public relations consultancies, have highly developedprogrammes of charitable and pro bono activity involving theirpeople at corporate and individual levels. They contribute to theircommunities and selected charities in imaginative ways: from cityclean-up operations to away days with disadvantaged youngpeople to taking roles as school governors.
The following activities of just two of WPP’s major operatingcompanies are an indication of the range of community involvementinitiated by our people.
Ogilvy & Mather’s pro bono work includes WWF and Childline inSouth Africa, UNICEF in France, The Red Cross in Greece, Mexicoand Portugal, the African Medical Research Foundation in Italy, theNational Parks Fund in Russia and Terre des Hommes in Spain.Ogilvy & Mather also supports charities around the world, includingan orphanage in Poland, the Children’s Wish Foundation and NCHin the UK, The Welcome Home Fund and Children’s Hour in Ireland,Médecins Sans Frontières in France, The Concern India Foundationin India, child charities in Brazil and numerous arts and educationcharities in the US.
J. Walter Thompson Company has for many years undertakenpro bono work around the world. Current activity includes an AIDSprevention charity in São Paulo, Partnership for a Drug FreeAmerica in Chicago, the Special Olympics and National YouthTheatre in London, Children Now and Campaign for America’sChildren in New York, UNICEF in Peru and a third-world debtcharity in Rome.
Charitable donationsWPP, the parent company, continues to concentrate its charitablegiving in the areas of education and training of young people, withparticular emphasis on those who are disadvantaged. Besidesfinancial support, WPP encourages charitable support in kindthrough its operating companies providing assistance, for instance,implementing identity, public relations and advertising programmes or other marketing campaigns.
The parent company made charitable donations of £191,000 in 2000 (1999: £159,036).
It is not the Group’s policy to make payments for political purposes.
Compensation committee report
92 WPP Stewardship and remuneration
This report is made by the Board. It sets out the Company’sstatement of how it has applied the principles of good governanceset out in the Combined Code and explains any areas of non-compliance. As in previous years, additional information onexecutive remuneration similar to a US proxy disclosure is alsoincluded in this report.
The Compensation committee has followed the requirements setout in Schedule A of the Combined Code, when determining theremuneration packages of executive directors and has followed theprovisions of Schedule B of the Combined Code when preparingthe Compensation committee report.
The Report of the Auditors on the financial statements set out onpage 79 confirms that the scope of their report covers the disclosurescontained in or referred to in this report that are specified for theirexamination by the UK Listing Authority.
Details of each individual director’s remuneration and of theirbeneficial holdings of the Company’s shares and share options areset out on pages 87 to 89.
Scope of the Compensation committeeDuring the year, the Compensation committee was comprisedexclusively of independent non-executive directors, namely:
– S W Morten (Chairman of the committee);– H Maxwell (retired February 2001);– J A Quelch; and– C Mackenzie (appointed February 2001).
No member of the committee has any personal financial interest,other than as share owners, in the matters to be decided by the committee, no potential conflicts of interest arising from cross-directorships and no day-to-day involvement in running the Group’s businesses.
The Compensation committee, which seeks the advice ofindependent remuneration consultants, is responsible forestablishing and overseeing the implementation of remunerationpolicy for the Group, with specific reference to the following:
– assessment of competitive practices and determination ofcompetitive positioning;
– base salary levels;– annual and long-term incentive awards;– policy and grants relating to WPP share ownership
(in this report referred to as ‘WPP stock’); and– pensions and executive benefits.
The Compensation committee determines awards under annualand long-term incentive plans and awards of WPP stock under anumber of plans for Group employees who are paid a base salaryof $150,000 or more.
The Compensation committee determines the remuneration of theGroup chief executive, a summary of which is set out on pages 94 and95, on the basis of a comparison with the chief executives of otherglobal, multi-agency communications companies, including theOmnicom Group (Omnicom) and The Interpublic Group (IPG). Theremuneration, stock incentive arrangements and benefits of the otherexecutive directors (other than Michael Dolan for the year under review),are based on comparable positions in multinational companies of asimilar size and complexity. The criteria established for each element oftotal remuneration are set out on the following pages. The remuneration,stock incentive arrangements and benefits of Michael Dolan, whose
service contract was entered into at the same time as the mergeragreement with Young & Rubicam Inc., are set out on pages 95 and 96.
Remuneration policyThe remuneration of executive directors and senior executives ofthe Group’s operating companies and the parent company isreviewed each year by the committee.
The Company’s remuneration policy is designed to ensure thatthe Group can attract, retain and motivate the best available talent,so that we can meet our client and share owner objectives. To achievethis, executive remuneration is designed on the following principles:
– total remuneration opportunities are designed to be fullycompetitive in the relevant market;
– all remuneration packages have a very significant performance-related element;
– incentives are based on meeting specific, measureableperformance objectives, and align executive rewards with creatingvalue for our share owners;
– the total remuneration programme includes significantopportunities to acquire WPP stock, consistent with the Groupstrategy of building a strong ownership culture.
Elements of executive remunerationThe following comprised the principal elements of executiveremuneration for the period under review:
– Base salaries;– Annual incentives;– Long-term incentives, including stock ownership and LEAP; and– Pension, life assurance, health and disability benefits.
Base salary levels are established by reference to the market medianfor similar positions in directly comparable businesses and bycomprehensive market survey information. In the case of the parentcompany, this includes other global services companies such as IPGand Omnicom and, for J. Walter Thompson Company, Ogilvy & MatherWorldwide and Young & Rubicam Inc., the competitive market includesother major multinational advertising agencies. For each of the otheroperating companies in the Group, a comparable definition of businesscompetitors is used to establish competitive median salaries. Individualsalary levels are set within a range of 15% above or below thecompetitive median, taking a number of relevant factors into account,including individual and business unit performance, level of experience,scope of responsibility and the competitiveness of total remuneration.
Salary levels for executives are reviewed every 18, 24 or 36months, depending on the level of base salary. Executive salaryadjustments are made on the recommendation of the Group chiefexecutive for operating company chief executives and parentcompany executive directors and by the chief executive officer ofeach operating company for all other executives.
Annual incentives are paid under plans established for eachoperating company and for executives of the parent company. In the case of the Group chief executive and other parent companydirectors (other than Michael Dolan) and executives, the totalamount of annual incentive payable is based on the achievementof Group operating profit or operating cash flow targets as wellas the achievement of Group operating profit margin targets.The Group chief executive is subject to additional targets. These are established by the Group chief executive and approvedby the Compensation committee. In the case of each operatingcompany, operating profit and operating profit margin targets areagreed each year.

WPP Stewardship and remuneration
Within the limits of available annual incentive funds, individualawards are paid on the basis of achievements against individualperformance objectives, encompassing key strategic and financialperformance criteria, including:
– operating profit;– profit margin;– staff costs to revenue or gross margin;– revenue or gross margin growth and conversion; – level of co-operation among operating companies; and– other key strategic goals, established annually.
In each case, the annual incentive objectives relate to the participant’sown operating company, division, client or functional responsibility.
Each executive’s annual incentive opportunity is defined at a‘target’ level for the full achievement of objectives. Higher awardsmay be paid for outstanding performance in excess of target. With effect from 1 January 2000 the target level for the Group chiefexecutive is 100% of base fees/salary and the maximum level is200%. In respect of Mr Dolan for the year under review his bonuswill be not less than $800,000 and for future years will be not lessthan $600,000 with a maximum of 200% of base salary. A one-timestay bonus of $800,000 is also payable to Mr Dolan in October2001 so long as he is then an employee of Young & Rubicam Inc.For other Group executive directors the target commencing 1 January 2000 is 50% of base salary and the maximum is 75%.
Long-term incentives, including option grants, comprise asignificant element of total remuneration for senior executives in the parent company and each operating company. During 2000,Group-wide, approximately 1,100 of those executives participatedin a long-term incentive plan.
The committee regularly reviews the operation of the Group’slong-term incentive programmes to ensure that the performancemeasures and levels of reward are appropriate and competitive.
Parent companyAnnual grants of WPP performance shares are made to allexecutive directors. For awards currently outstanding, the value ofeach performance share is equivalent to one WPP share and thenumber of shares vesting over each three-year performance periodis dependent on the growth of WPP’s total share owner returnrelative to the growth of total share owner return of major publiclytraded marketing services companies. Where the Group’s totalshare owner return is below the median level of the peer group,none of the performance shares vest. Currently, at medianperformance, 50% of the performance shares vest, with higherpercentages vesting for superior performance up to 100% if WPPranks at least equal to the second ranking peer company.
Over the 1998-2000 performance period, WPP’s performanceranked second among the peer group companies. Contingentgrants of performance shares for the 1999-2001, 2000-2002 and2001-2003 periods range from 25% to 100% of base salary.
Operating companiesSenior executives of most Group operating companies participatein long-term incentive plans, which provide awards in cash and restricted WPP stock for the achievement of three-year financial performance targets. These plans operate on a rollingthree-year basis with awards paid in March 2001 under the 1998-2000 long-term incentive plans. The value of paymentsearned by executives over each performance period is based onthe achievement of targeted improvements in the followingperformance measures:
– average operating profit or operating cash flow; and– average operating margin.
The stock portion of each payment is 50%. Restrictions on the saleof this stock are lifted after one year in respect of 50% of the stockand after two years for the balance, if the executive remainsemployed in the Group.
In addition, some executives also receive annual grants of WPPstock options through their membership of the WPP Group ‘Leaders’or ‘Partners’ or ‘High Potential Group’. These programs recognisea participant’s contribution to the achievement of WPP’s strategicaims, including business co-operation across operating companies.All members of the WPP Leaders, Partners and High Potential Groups, including the chief executive officer of each operating company(including Michael Dolan for the current financial year), receive anannual grant of fair market value WPP stock options, which areexercisable three years from the grant date assuming that specificperformance conditions are met. Each year the grant value (number ofshares times fair market value at the grant date) of these awards rangesfrom approximately 15% to 150% of base salary.
Client Equity Investment FundsTo address increasing competition for talent from new sources, aswell as the growth of client revenues from internet companies, theCompany has established a fund for each major operating groupthrough which investments can be made in the stock of pre-IPOclients. These investments are limited to a specified portion of thefee income derived from each client, and there is an overall limit on the level of client equity investments by each operating group.These client equity investments will generally be sold as soon aspossible following a public offering. Positive returns realised onclient equity investments will then be used to acquire WPP shares, which will be allocated to employees in the operating companies.The WPP shares will vest in two equal instalments over a two-year period. Since its introduction last year, only threeinvestments have been made under this fund.
Leadership Equity Acquisition Plan (‘LEAP’)In September 1999 share owners approved the introduction of LEAPto reward superior performance relative to WPP’s peer companies,so as to create strong shared interests with share owners throughsignificant personal investment and ownership in stock by executivesand to ensure competitive total rewards in the appropriate marketplace.
Under LEAP, participants must commit WPP shares (‘WPP shares’),valued at not less than their annual earnings, at the time ofacquisition, of which no more than two-thirds may be satisfied by aparticipant’s existing holding of WPP shares, in order to provide anopportunity to earn additional WPP shares (‘matching shares’).These investment shares must be committed for a five-year period(‘investment period’). The number of matching shares which aparticipant may receive at the end of the investment period willdepend on the performance of the Company measured over fivefinancial years commencing with the financial year in which the WPPshares are committed. The number of matching shares will dependon the total shareowner return achieved by the Company relative tomajor publicly traded marketing services companies. The maximumnumber of matching shares, other than in respect of the sevenparticipants, including Mr Dolan, who are executives of Young &Rubicam Inc., is five for every investment share, for which theCompany must rank first or second over the performance period.If the Company’s performance is below the median of the comparatorgroup only half a matching share will vest for every WPP share heldthroughout the investment period. Following the merger with Young
Compensation committee report continued
94 WPP Stewardship and remuneration
& Rubicam Inc., seven executives of Young & Rubicam Inc., includingMr Dolan, have accepted invitations to participate in LEAP and theirentitlement to matching shares in WPP has been pro-rated so thatthey are entitled only to four-fifths of the number of matching sharesto which the executives of WPP became entitled as a result of theiracceptance of invitations to participate made to them in September1999. Consequently the maximum number of matching shares towhich the seven executives of Young & Rubicam Inc. may becomeentitled to is four as opposed to five.
On a change of control, matching shares may be received basedon the Company’s performance to that date. The Compensationcommittee will also consider, in the light of exceptional financialcircumstances during the performance period, whether therecorded TSR (Total Shareowner Return) is consistent with theachievement of commensurate underlying performance.
Executive directors of the Company and senior executives fromseveral Group operating companies participate in LEAP. To date,awards have been made to 22 directors and executives. Sir MartinSorrell, the Group chief executive has, together with JMS,committed to LEAP shares worth $10 million calculated at a priceof £5.685 per share of which shares worth $3 million werepurchased in the market after 16 August 1999.
It is expected that the matching shares to which participants,(other than JMS) become entitled for the awards made by referenceto 1999 and 2000 will be provided from one of the Company’semployee share ownership plans (‘ESOPs’). The ESOPs haveacquired the maximum potential number of matching shares inrespect of awards made in or by reference to 1999 at an averagecost not exceeding £3.70 per share. Authority has been obtainedfrom share owners to satisfy the entitlement of JMS to matchingshares by an allotment of new shares.
Executive Stock Ownership PolicyDuring 1996, the Company introduced stock ownership goals forthe most senior executives in the Group. These range from 50% to 400% of salary. Beginning in 2000, stock option grants mayvary depending on whether an individual achieves and maintainsspecified levels of WPP stock ownership.
Executive Stock Option Plan and Worldwide Ownership PlanThe 1996 Executive Stock Option Plan has been used annuallysince its adoption to make option grants to members of the WPPLeaders, Partners and High Potential Groups including keyemployees of the parent company, but excluding parent companyexecutive directors and the Group chief executive. Under the termsof his service contract Mr Dolan will be entitled to receive a grantunder this plan in September 2001 as referred to on page 95.
In 1997 the Company broadened stock option participation byintroducing the Worldwide Ownership Plan for all employees of100%-owned Group companies with at least two years’ service,in order to develop a stronger ownership culture and greaterknowledge of Group resources. Since its adoption grants havebeen made annually under this plan also and as at 4 May 2001options under this plan had been granted to more than 18,000employees for in excess of 9.1 million ordinary shares of theCompany. Grants made under this plan to approximately 5,200employees in 1998 became exercisable in March 2001.
Retirement benefitsThe form and level of Company-sponsored retirement programsvaries depending on historical practices and local marketconsiderations. The level of retirement benefits is regularlyconsidered when reviewing executive remuneration levels.
In the two markets where the Group employs the largest number ofpeople, the US and UK, pension provision generally takes the formof defined contribution benefits, although the Group still maintainsthree defined benefit plans in the US, and three defined benefitplans in the UK. In each case, these pension plans are provided forthe benefit of employees in specific operating companies and, inthe case of the UK plans, are closed to new entrants. All pensioncoverage for the parent company’s executive directors is on adefined contribution basis and only base salary is pensionableunder any Company retirement plan. Details of pension contributionsfor the period under review in respect of parent company executivedirectors are set out on page 87.
Directors’ service contracts and notice periodsExcept for Sir Martin Sorrell and Michael Dolan, each of the parentcompany executive directors is employed under a contract underwhich the director must give the Company 12 months’ notice andthe Company must give the executive 12 months’ notice. Mr B JBrooks is employed under a service contract dated 1 June 1993,Mr P W G Richardson is employed under a service contract dated8 January 1997 and Mr E R Salama is employed under a servicecontract dated 1 April 1997.
There are no change of control provisions in the contracts forexecutive directors, other than in respect of the Group chief executive.
The Board unanimously consider that, given the specialposition of the Group chief executive and the personal investmentcommitment made by him in the Company, there are specialcircumstances for the notice period applicable to him, which is fora fixed term of three years from 1 September 2000 renewable onor before 1 September each year. The Company anticipates thatthe current term will be renewed in September 2001 on this basis.
The Board also unanimously consider, that in order to retainthe services of Michael Dolan and in the special circumstanceswhich applied to him at the time of the merger with Young &Rubicam Inc., it was necessary to depart from its normal policyon directors’ contracts and enter into a service contract withhim for an initial term of four years with a provision for a oneyear extension.
The Group chief executive: Sir Martin SorrellSir Martin Sorrell’s services to the Group outside the USA areprovided by JMS and he is directly employed by WPP Group USA,Inc. for his activities in the USA. Taken together, the agreement withJMS (‘the UK Agreement’) and the agreement with the Group chiefexecutive directly (‘the US Agreement’) provide for the followingremuneration all of which is disclosed on pages 87 to 89:
– annual salary and fees of £840,000;– annual pension contributions of £336,000;– short-term incentive (annual bonus) of 100% of annual salary and
fees at target and up to 200% maximum;– the Leadership Equity Acquisition Plan; and– the Performance Share Plan.
In addition JMS is entitled to phantom options linked to the WPP share price, granted in 1993 and 1994 as disclosed on page 88.No further phantom options have been or will be granted to JMS or toSir Martin Sorrell.
JMS has stated its intention not to exercise the phantom optionsin respect of 1993 until March 2003 and has agreed to defer itsinterest in the phantom options in respect of 1994 until March 2004.
Following the enactment of the personal service companylegislation in the Finance Act 2000, the Company has agreed to
95 WPP Stewardship and remuneration
Compensation committee report continued
reimburse JMS with the additional employer National Insurancecontribution liability which JMS incurs because of the personalservice company legislation on the basis that 63% of the annual fee,onus and pension contribution is drawn by Sir Martin Sorrell from JMS.
Pursuant to the authority conferred on the directors at theCompany’s annual general meeting in 2000, the Company and JMShave entered into a contract to satisfy JMS’ entitlements underLEAP and the phantom options, by the allotment of new shares inthe Company.
Both the UK Agreement and the US Agreement may be terminatedwithin a period of 90 days on a change of control. In these agreements‘change of control’ is as defined respectively in section 416 of theIncome and Corporation Taxes Act 1988 and the Securities ExchangeAct 1934.
On a termination of the Group chief executive and JMS, WPP isobliged to pay an amount equal to twice the annual salary and fee;bonus and pension payments payable under the UK and USAgreements; and also to continue certain benefits such as healthinsurance under the US Agreement.
Sir Martin Sorrell has also entered into covenants, which applyfor the period of 12 months following termination of the UKAgreement and the US Agreement (‘Termination’), under which hehas agreed not to compete with any business carried on by theCompany or any member of the WPP Group in any country inwhich the business of the Company or any member of the WPPGroup is carried on at the date of Termination, nor to solicit certainbusiness or custom or services from major clients or clients withwhich Sir Martin Sorrell was involved in the 12 months beforeTermination. The covenants also include an obligation not to inducesuppliers with whom he was actively involved during the 12 monthsending on Termination, nor to induce employees with whom he hadmaterial dealings in connection with the provision of services duringthe 12 months ending on Termination to cease relationship oremployment with the Company or any member of the WPP Group.
The Capital Investment Plan (CIP) and Notional Share AwardPlan (NSAP)The CIP provides the Group chief executive with a capital incentiveinitially over a five-year period with effect from 4 September 1994and which matured in September 1999.
The Group chief executive has agreed to defer entitlement to the4,691,392 Performance Shares which he would otherwise havebeen able to acquire in September 1999, subject to good leaver,change of control and other specified provisions, so as to correspondwith the investment period under LEAP. Accordingly, subject to the provisions of the CIP, the rights to acquire the Performance Shares may be exercised in the period 30 September 2004 to 31 December 2004. These Performance Shares were acquired byan ESOP in 1994 at a total cost of approximately £5.5 million.
JMS has agreed, subject to good leaver, change of control and other specified provisions, to defer its interest under the NSAPon a similar basis to that on which the Group chief executive hasagreed to defer his interest under the CIP. Accordingly, subject tothe provisions of the NSAP, JMS’s right to receive a sum under the NSAP may be exercised in the period 30 September 2004 to 31 December 2004 and will be calculated by reference to theaverage price of a WPP share for the five dealing days before JMS’s right under the NSAP is exercised. The NSAP relates to1,754,520 notional WPP shares.
Awards made to the Group chief executive or JMS under theCIP; the Notional Share Award Plan and the phantom options,become immediately exercisable on a change of control. Under theseplans, ‘change of control’ is defined as the acquisition by a personor persons of more than 20% of the issued share capital of WPP
where this is followed within 12 months by the appointment of adirector with neither the Group chief executive’s nor JMS’s approval.
The rights of the Group chief executive and JMS respectivelyunder the CIP and the NSAP are dependent on Sir Martin Sorrellremaining interested until September 2004 in 747,252 shares inwhich he invested in September 1994. Pursuant to the authorityconferred on the directors at the Company’s annual generalmeeting in 2000, the Company and JMS have entered into acontract to satisfy JMS’s entitlement under the NSAP by theallotment of new shares in the Company.
Mr Michael Dolan’s Service ContractAt the time of the execution of the merger agreement, Young &Rubicam Inc. entered into a service agreement with Mr Dolan, aschief executive officer of Young & Rubicam Inc. following the merger.
Mr Dolan’s service agreement provides for an initial four yearterm of employment which begins upon completion of the merger.The service agreement also provides for a one year extension of theterm of employment. Under his service agreement, the remunerationwill comprise:
– a starting annual base salary of US$800,000, subject to increaseby WPP;
– an annual cash bonus with a target bonus amount ofUS$600,000 (but with an opportunity to earn up to 200% of hisbase salary) to be determined based on the achievement ofannual targets provided that for the year 2000, Mr Dolan’s annualbonus will not be less than US$800,000;
– a one-time stay bonus of US$800,000 payable on the firstanniversary of completion of the merger if Mr Dolan is then anemployee of Young & Rubicam Inc.;
– on 1 January 2001, an award of 5,000 units pursuant andsubject to the terms and conditions of a long-term incentive planto be established. This plan is modelled on the WPP OperatingCompany Long Term Incentive Plans;
– in September 2001, the grant of stock options to acquire WPPADSs with an aggregate fair market value equal to his annualbase salary at that time, subject to the terms of the Executive Plan;
– on 20 September 2000 the Board resolved (in the light ofprovisions contained in Mr Dolan’s service contract) that in orderto retain his services and in the special circumstances whichapplied to him at the time of the merger with Young & RubicamInc. it was necessary to make a separate award to him underLEAP. Consequently Mr Dolan has been invited to participate inLEAP on the basis that he commits 64,400 WPP ADRs (322,000shares). Mr Dolan’s participation in LEAP covers a four yearperiod, so that the maximum number of matching shares towhich he may become entitled will be pro-rated to 80% of thestandard level or 257,600 WPP ADRs (1,288,000 shares).
Mr Dolan’s service agreement also provides that if his employmentis terminated by Young & Rubicam Inc. without cause (as defined inthe service agreement) or he leaves Young & Rubicam Inc. for goodreason (as defined in the service agreement) within two yearsfollowing completion of the merger, he will be entitled to receive:
– a pro rata bonus for the performance year in which his contractis terminated;
– a severance benefit equal to three times the sum of:– his highest annual base salary at any time during the
12 months immediately preceding the date of termination ofhis contract; and
– the greater of his annual target bonus immediately precedingthe date of termination of his contract and the average of his
Compensation committee report continued
WPP Stewardship and remuneration
annual bonuses earned during the three year periodpreceding the merger; and
– insurance and supplemental retirement benefits.
If, however, Mr Dolan’s employment is terminated by Young &Rubicam Inc. without cause or he leaves Young & Rubicam Inc.for good reason within the third or fourth year of the initial term ofhis service agreement, he will be entitled to a severance benefitequal to, depending upon the time of termination, no less thanone times but no more than two times the sum of:
– the greater of his annual base salary during the year precedingthe termination of his employment; and
– the greater of his annual target bonus amount immediatelypreceding the date of termination of his contract and the averageof his annual bonuses earned during the three year periodpreceding the merger.
The service agreement provides that if any payments to Mr Dolanunder the agreement or otherwise would be subject to tax underSection 4999 of the US Code, Young & Rubicam Inc. will provide anadditional payment so that Mr Dolan will receive a net amount equalto the payment he would have received if the tax had not applied.
Mr Dolan’s service agreement also provides that in relation to anyawards of performance shares granted to him under the Young &Rubicam 1997 Incentive Compensation Plan, performance goalsand other conditions will be deemed to be met as of the effectivetime of the merger and Young & Rubicam Inc. will pay him a lumpsum cash payment equal to the value of these performance shares.The benefits payable under his service agreement are in lieu of anyseverance benefits to Mr Dolan under any other agreements or sever-ance plans of Young & Rubicam Inc. Mr Dolan has also entered intocovenants which apply for 12 months following termination of hisservice agreement.
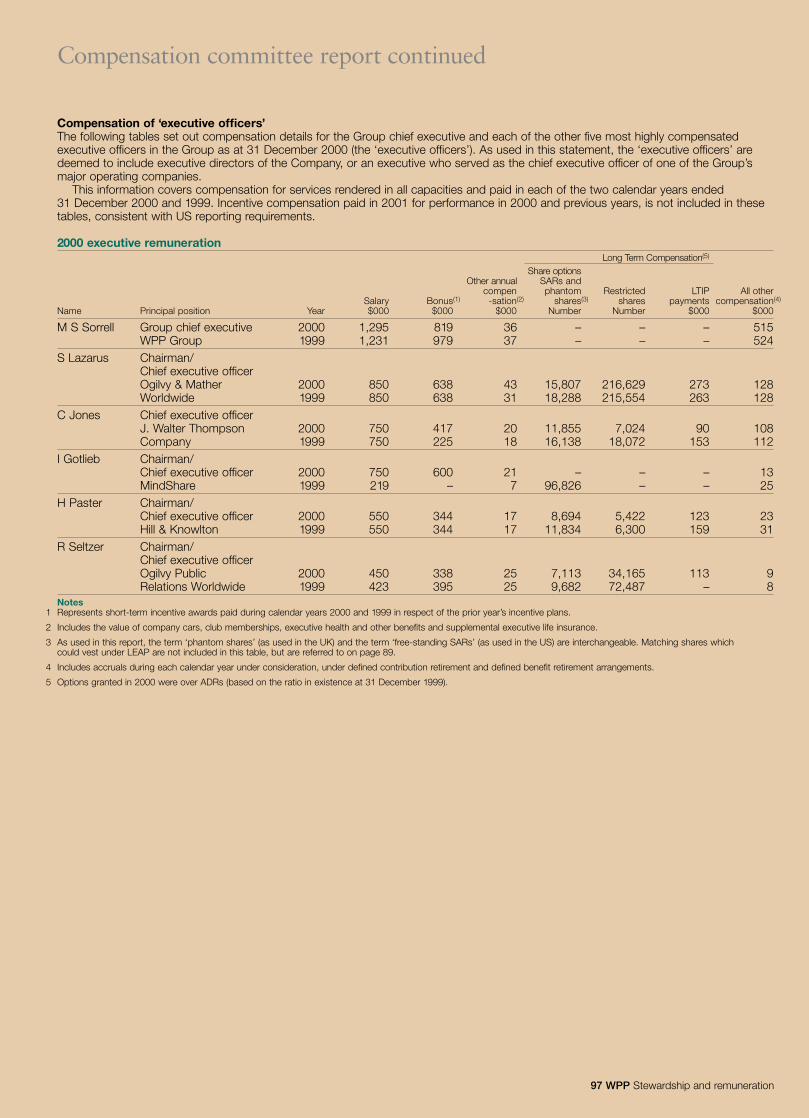
97 WPP Stewardship and remuneration
Compensation committee report continued
Compensation of ‘executive officers’The following tables set out compensation details for the Group chief executive and each of the other five most highly compensatedexecutive officers in the Group as at 31 December 2000 (the ‘executive officers’). As used in this statement, the ‘executive officers’ aredeemed to include executive directors of the Company, or an executive who served as the chief executive officer of one of the Group’smajor operating companies.
This information covers compensation for services rendered in all capacities and paid in each of the two calendar years ended31 December 2000 and 1999. Incentive compensation paid in 2001 for performance in 2000 and previous years, is not included in thesetables, consistent with US reporting requirements.
2000 executive remunerationLong Term Compensation(5)
Share optionsOther annual SARs and
compen phantom Restricted LTIP All otherSalary Bonus(1) -sation(2) shares(3) shares payments compensation(4)
Name Principal position Year $000 $000 $000 Number Number $000 $000
M S Sorrell Group chief executive 2000 1,295 819 36 – – – 515WPP Group 1999 1,231 979 37 – – – 524
S Lazarus Chairman/ Chief executive officerOgilvy & Mather 2000 850 638 43 15,807 216,629 273 128Worldwide 1999 850 638 31 18,288 215,554 263 128
C Jones Chief executive officerJ. Walter Thompson 2000 750 417 20 11,855 7,024 90 108Company 1999 750 225 18 16,138 18,072 153 112
I Gotlieb Chairman/Chief executive officer 2000 750 600 21 – – – 13MindShare 1999 219 – 7 96,826 – – 25
H Paster Chairman/Chief executive officer 2000 550 344 17 8,694 5,422 123 23Hill & Knowlton 1999 550 344 17 11,834 6,300 159 31
R Seltzer Chairman/Chief executive officerOgilvy Public 2000 450 338 25 7,113 34,165 113 9Relations Worldwide 1999 423 395 25 9,682 72,487 – 8
Notes1 Represents short-term incentive awards paid during calendar years 2000 and 1999 in respect of the prior year’s incentive plans.
2 Includes the value of company cars, club memberships, executive health and other benefits and supplemental executive life insurance.
3 As used in this report, the term ‘phantom shares’ (as used in the UK) and the term ‘free-standing SARs’ (as used in the US) are interchangeable. Matching shares whichcould vest under LEAP are not included in this table, but are referred to on page 89.
4 Includes accruals during each calendar year under consideration, under defined contribution retirement and defined benefit retirement arrangements.
5 Options granted in 2000 were over ADRs (based on the ratio in existence at 31 December 1999).
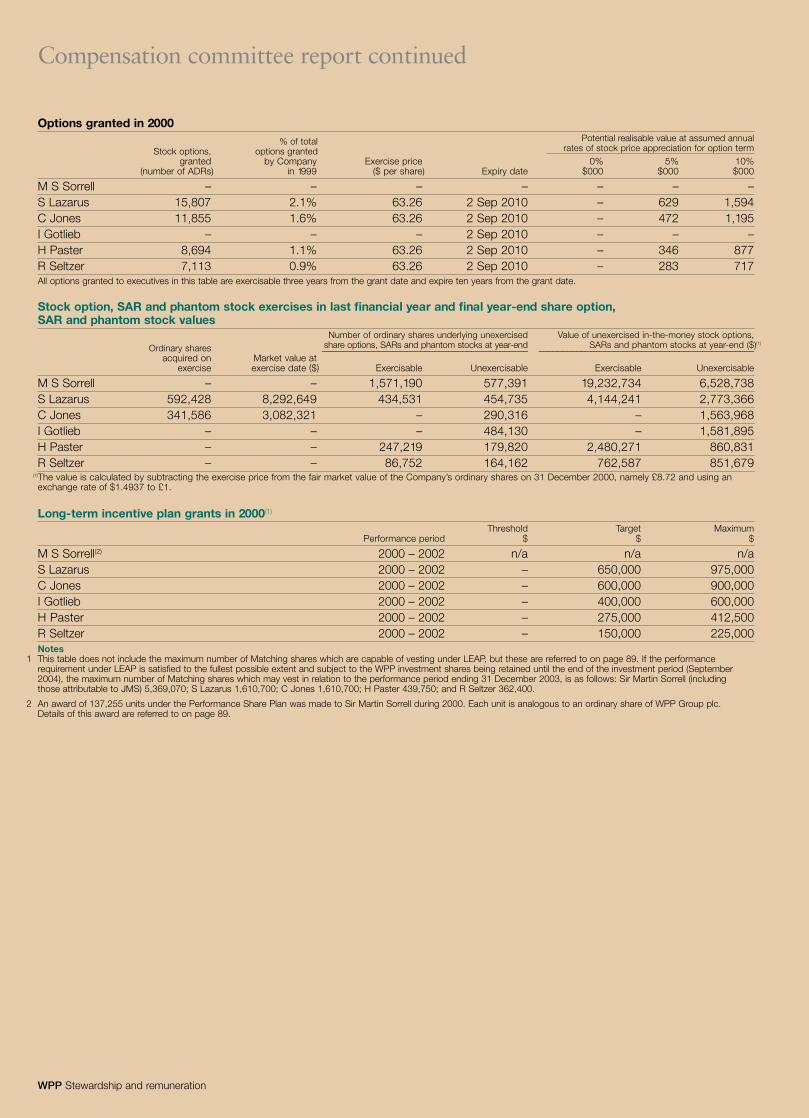
Compensation committee report continued
WPP Stewardship and remuneration
Options granted in 2000% of total Potential realisable value at assumed annual
Stock options, options granted rates of stock price appreciation for option termgranted by Company Exercise price 0% 5% 10%
(number of ADRs) in 1999 ($ per share) Expiry date $000 $000 $000
M S Sorrell – – – – – – –S Lazarus 15,807 2.1% 63.26 2 Sep 2010 – 629 1,594C Jones 11,855 1.6% 63.26 2 Sep 2010 – 472 1,195I Gotlieb – – – 2 Sep 2010 – – –H Paster 8,694 1.1% 63.26 2 Sep 2010 – 346 877R Seltzer 7,113 0.9% 63.26 2 Sep 2010 – 283 717All options granted to executives in this table are exercisable three years from the grant date and expire ten years from the grant date.
Stock option, SAR and phantom stock exercises in last financial year and final year-end share option,SAR and phantom stock values
Number of ordinary shares underlying unexercised Value of unexercised in-the-money stock options,
Ordinary shares share options, SARs and phantom stocks at year-end SARs and phantom stocks at year-end ($)(1)�������������������������������������������� ����������������������������������������������
acquired on Market value atexercise exercise date ($) Exercisable Unexercisable Exercisable Unexercisable
M S Sorrell – – 1,571,190 577,391 19,232,734 6,528,738S Lazarus 592,428 8,292,649 434,531 454,735 4,144,241 2,773,366C Jones 341,586 3,082,321 – 290,316 – 1,563,968I Gotlieb – – – 484,130 – 1,581,895H Paster – – 247,219 179,820 2,480,271 860,831R Seltzer – – 86,752 164,162 762,587 851,679
(1)The value is calculated by subtracting the exercise price from the fair market value of the Company’s ordinary shares on 31 December 2000, namely £8.72 and using anexchange rate of $1.4937 to £1.
Long-term incentive plan grants in 2000(1)
Threshold Target MaximumPerformance period $ $ $
M S Sorrell(2) 2000 – 2002 n/a n/a n/aS Lazarus 2000 – 2002 – 650,000 975,000C Jones 2000 – 2002 – 600,000 900,000I Gotlieb 2000 – 2002 – 400,000 600,000H Paster 2000 – 2002 – 275,000 412,500R Seltzer 2000 – 2002 – 150,000 225,000Notes
1 This table does not include the maximum number of Matching shares which are capable of vesting under LEAP, but these are referred to on page 89. If the performancerequirement under LEAP is satisfied to the fullest possible extent and subject to the WPP investment shares being retained until the end of the investment period (September2004), the maximum number of Matching shares which may vest in relation to the performance period ending 31 December 2003, is as follows: Sir Martin Sorrell (includingthose attributable to JMS) 5,369,070; S Lazarus 1,610,700; C Jones 1,610,700; H Paster 439,750; and R Seltzer 362,400.
2 An award of 137,255 units under the Performance Share Plan was made to Sir Martin Sorrell during 2000. Each unit is analogous to an ordinary share of WPP Group plc.Details of this award are referred to on page 89.
99 WPP Stewardship and remuneration
Compensation committee report continued
Policy on external appointmentsThe Company recognises that its directors and senior executivesmay be invited to become non-executive directors of othercompanies and that such exposure may be beneficial to theCompany. Consequently, executives are allowed to accept non-executive appointments with non-competing companiessubject to obtaining the approval of the Group chief executive in the case of senior executives and the approval of the Board in the case of executive directors. Any fees receivable out of suchappointments are retained by the individuals concerned.
Non-executive directorsRemuneration for non-executive directors consists of fees for theirservices in connection with the Board and Board committeemeetings and where appropriate, for devoting additional time andexpertise for the benefit of the Group. Non-executive directors arenot eligible for membership of any Company pension plans, and donot participate in any of the Group’s short- or long-term incentiveprograms. Non-executive directors may receive a part of their feesin ordinary shares of the Company, including in the form of optionsexercisable, at par value of the shares on completion of thenon-executive directors’ services.
Philip Lader’s letter of appointment is for a term of three yearssubject to review after two years. All other non-executive directorshave letters of appointment, which are renewable for a two-year period.
On behalf of the BoardS W MortenChairman of the WPP Group plcCompensation committee4 May 2001
Employee relationsSuccess depends on the quality and performance of all of ourpeople worldwide. The Group’s employment policies are designedto attract, retain and motivate the most talented individuals and weinvest significantly in communications, training and developmentprogrammes at both parent and operating company level as well asencouraging an ownership culture through WPP stock option andother incentive plans.
Equal opportunitiesThe Compensation committee and the Group endorses and supportsthe principles of Equal Employment Opportunity. It is the policy ofthe Group in its businesses throughout the world to provide equalemployment opportunities to all appropriately qualified individualsirrespective of race, creed, colour, age, religion, sex, disability,sexual orientation, marital status, military service, national originor ancestry.
The purpose of the Group’s policy is to ensure that all employmentdecisions are made, subject to its legal obligations, on a non-discriminatory basis, whether at the time of employment, in promotion,training, remuneration, termination of employment or whenever anyterms and conditions of employment are being considered.
Employee ownershipThe Group’s Worldwide Ownership Plan, introduced in 1997, hasgiven more than 18,000 of our people a direct stake in WPP’sfinancial success. Details of this Plan and other executive stockoption plans can be found on page 94.
People working in the Group currently own, or have interests in,in excess of 71 million shares representing over 6% of the issuedshare capital of the Company.
Employee communicationsWPP places great importance in keeping people in our operatingcompanies informed about the Group’s progress, activities and allmatters affecting them and our business. Encouraging people toexpand their knowledge of the Group is achieved through a numberof communications initiatives:
– formal and informal meetings at the individual company level;– periodic reports from the Group’s chief executive to all people
participating in short- and long-term incentive plans;– distribution of the annual report, the Navigator,
The Catalog, the Atticus journal and WPP’s global newspaper –The WIRE – to all companies worldwide;
– a monthly online news bulletin – e.wire; and– regular communications on major WPP initiatives such as the
Worldwide Partnership Program, BRANDZ™, the Atticus Awards,the WPP Fellowship Program and professional developmentworkshops.
Professional developmentThe parent company runs a dynamic program of cross-companyforums, courses and workshops to inform, stimulate and inspirepeople in operating companies around the world. Some 3,600Group professionals have now participated in a wide range ofmanagement, sector-specific and mind-stretching developmentworkshops.
Most of our operating companies have well-established careerdevelopment programs, as well as regular appraisal processes suchas 360 degree feedback. Research International, J. Walter Thompsonand Coley Porter Bell in London were among the first in their sectorsto gain the Investors In People accreditation for the training anddevelopment of their people. Many companies also offer formalstudent placement programs to nurture new talent within our business.
More information about our people programs can be found onour website.


About share ownership
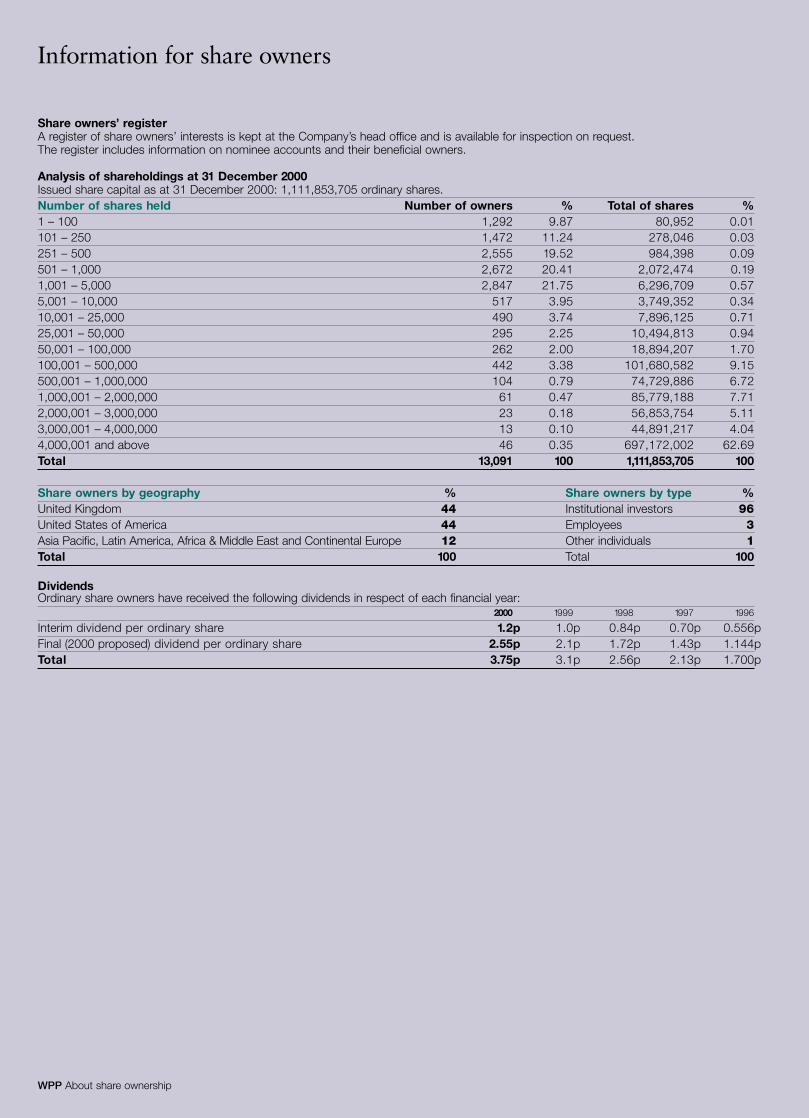
Information for share owners
WPP About share ownership
Share owners’ registerA register of share owners’ interests is kept at the Company’s head office and is available for inspection on request.The register includes information on nominee accounts and their beneficial owners.
Analysis of shareholdings at 31 December 2000Issued share capital as at 31 December 2000: 1,111,853,705 ordinary shares.Number of shares held Number of owners % Total of shares %1 – 100 1,292 9.87 80,952 0.01101 – 250 1,472 11.24 278,046 0.03251 – 500 2,555 19.52 984,398 0.09501 – 1,000 2,672 20.41 2,072,474 0.191,001 – 5,000 2,847 21.75 6,296,709 0.575,001 – 10,000 517 3.95 3,749,352 0.3410,001 – 25,000 490 3.74 7,896,125 0.7125,001 – 50,000 295 2.25 10,494,813 0.9450,001 – 100,000 262 2.00 18,894,207 1.70100,001 – 500,000 442 3.38 101,680,582 9.15500,001 – 1,000,000 104 0.79 74,729,886 6.721,000,001 – 2,000,000 61 0.47 85,779,188 7.712,000,001 – 3,000,000 23 0.18 56,853,754 5.113,000,001 – 4,000,000 13 0.10 44,891,217 4.044,000,001 and above 46 0.35 697,172,002 62.69Total 13,091 100 1,111,853,705 100
Share owners by geography % Share owners by type %United Kingdom 44 Institutional investors 96United States of America 44 Employees 3Asia Pacific, Latin America, Africa & Middle East and Continental Europe 12 Other individuals 1Total 100 Total 100
DividendsOrdinary share owners have received the following dividends in respect of each financial year:
2000 1999 1998 1997 1996
Interim dividend per ordinary share 1.2p 1.0p 0.84p 0.70p 0.556pFinal (2000 proposed) dividend per ordinary share 2.55p 2.1p 1.72p 1.43p 1.144pTotal 3.75p 3.1p 2.56p 2.13p 1.700p
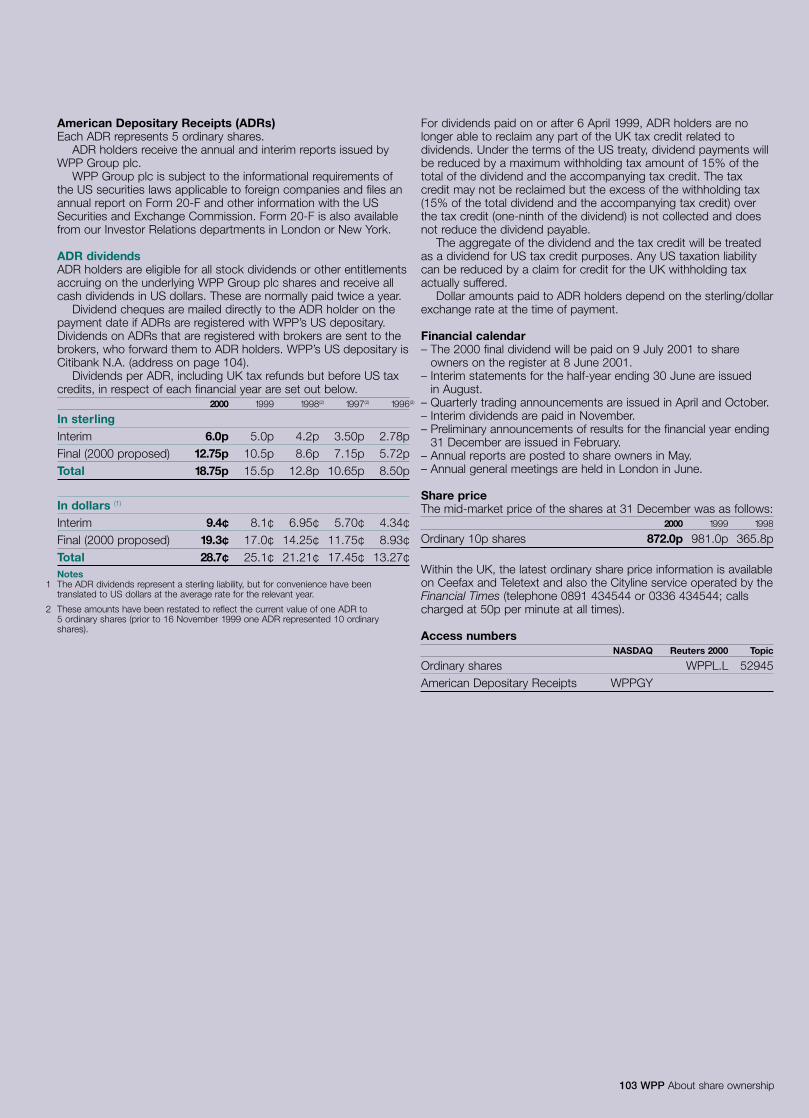
103 WPP About share ownership
American Depositary Receipts (ADRs)Each ADR represents 5 ordinary shares.
ADR holders receive the annual and interim reports issued byWPP Group plc.
WPP Group plc is subject to the informational requirements ofthe US securities laws applicable to foreign companies and files anannual report on Form 20-F and other information with the USSecurities and Exchange Commission. Form 20-F is also availablefrom our Investor Relations departments in London or New York.
ADR dividendsADR holders are eligible for all stock dividends or other entitlementsaccruing on the underlying WPP Group plc shares and receive allcash dividends in US dollars. These are normally paid twice a year.
Dividend cheques are mailed directly to the ADR holder on thepayment date if ADRs are registered with WPP’s US depositary.Dividends on ADRs that are registered with brokers are sent to thebrokers, who forward them to ADR holders. WPP’s US depositary isCitibank N.A. (address on page 104).
Dividends per ADR, including UK tax refunds but before US taxcredits, in respect of each financial year are set out below.
2000 1999 1998(2) 1997(2) 1996(2)
In sterlingInterim 6.0p 5.0p 4.2p 3.50p 2.78pFinal (2000 proposed) 12.75p 10.5p 8.6p 7.15p 5.72pTotal 18.75p 15.5p 12.8p 10.65p 8.50p
In dollars (1)
Interim 9.4¢ 8.1¢ 6.95¢ 5.70¢ 4.34¢Final (2000 proposed) 19.3¢ 17.0¢ 14.25¢ 11.75¢ 8.93¢Total 28.7¢ 25.1¢ 21.21¢ 17.45¢ 13.27¢NotesThe ADR dividends represent a sterling liability, but for convenience have beentranslated to US dollars at the average rate for the relevant year.
These amounts have been restated to reflect the current value of one ADR to 5 ordinary shares (prior to 16 November 1999 one ADR represented 10 ordinaryshares).
For dividends paid on or after 6 April 1999, ADR holders are nolonger able to reclaim any part of the UK tax credit related todividends. Under the terms of the US treaty, dividend payments willbe reduced by a maximum withholding tax amount of 15% of thetotal of the dividend and the accompanying tax credit. The taxcredit may not be reclaimed but the excess of the withholding tax(15% of the total dividend and the accompanying tax credit) overthe tax credit (one-ninth of the dividend) is not collected and doesnot reduce the dividend payable.
The aggregate of the dividend and the tax credit will be treatedas a dividend for US tax credit purposes. Any US taxation liabilitycan be reduced by a claim for credit for the UK withholding taxactually suffered.
Dollar amounts paid to ADR holders depend on the sterling/dollarexchange rate at the time of payment.
Financial calendar– The 2000 final dividend will be paid on 9 July 2001 to share
owners on the register at 8 June 2001.– Interim statements for the half-year ending 30 June are issued
in August. – Quarterly trading announcements are issued in April and October.– Interim dividends are paid in November.– Preliminary announcements of results for the financial year ending
31 December are issued in February.– Annual reports are posted to share owners in May.– Annual general meetings are held in London in June.
Share priceThe mid-market price of the shares at 31 December was as follows:
2000 1999 1998
Ordinary 10p shares 872.0p 981.0p 365.8p
Within the UK, the latest ordinary share price information is availableon Ceefax and Teletext and also the Cityline service operated by theFinancial Times (telephone 0891 434544 or 0336 434544; callscharged at 50p per minute at all times).
Access numbersNASDAQ Reuters 2000 Topic
Ordinary shares WPPL.L 52945American Depositary Receipts WPPGY
1
2

WPP About share ownership
Registrar and transfer officeComputershare Services PLCPO Box 82The PavilionsBridgwater RoadBristol BS99 7NH
American Depositary Receipts (ADRs)Citibank N.A.111 Wall Street5th FloorNew YorkNY 10043
WPP registered officePennypot Industrial EstateHytheKent CT21 6PEThe Company’s registered number is 1003653.
Reclaiming income tax on dividendsFor dividends paid on or after 6 April 1999, the tax credit available to individual share owners resident in the UK is reduced by 1/9th of the dividend, and tax credits are no longer repayable to UKholders with no tax liability. Also with effect from 6 April 1999,individuals whose income is within the lower or basic tax rate bandsare liable to tax at 10% on the dividend income and the tax credit willcontinue to satisfy their income tax liability on UK dividends. Thehigher rate of tax on dividend income was also reduced to 32.5%from 6 April 1999, which is intended to leave higher rate tax payersthe same amount of after tax income as they would have receivedprior to the changes.
Capital gains taxThe market value of an ordinary share at 31 March 1982 was 39p.Since that date rights issues have occurred in September 1986,August 1987 and April 1993. For capital gains tax purposes theacquisition cost of ordinary shares is adjusted to take account ofsuch rights issues. Since any adjustments will depend on individualcircumstances, share owners are advised to consult their professional advisers.
Information for share owners continued
Who we areAbout WPP 3Our companies and associates 4
How we’re doing2000 financial summary 8Letter to share owners 10Operating and financial review 14
What we think The Clipboard and the Copywriterby Jeremy Bullmore 34Boom and Bust or Groundhog Day?by Martin Sorrell 40
The numbers in fullAccounting policies 56Consolidated profit and loss account 58Consolidated cash flow statement 60Consolidated statement of totalrecognised gains and losses 60Consolidated balance sheet 61Notes to the consolidated profit and loss account 62Notes to the consolidatedcash flow statement 64Notes to the consolidatedbalance sheet 65Company balance sheet 71Notes to the Company balance sheet 72Reconciliation to US AccountingPrinciples 73Notes to the Reconciliation to USAccounting Principles 73Five-year summary 75Consolidated profit and loss account:euro illustration 76Consolidated balance sheet:euro illustration 77Financial glossary 78Auditors’ report 79
Stewardship and remunerationBoard of directors 82Senior WPP executives andadvisors to the Board 84Directors’ responsibilities 85Directors’ remuneration and interests 87Other statutory information 90Corporate citizenship 91Compensation committee report 92
About share ownershipInformation for share owners 102
Where to find usContact points Inside back cover
WPP LondonWPP Group plc27 Farm StreetLondon W1J 5RJTel +44 (0)20 7408 2204Fax +44 (0)20 7493 6819
WPP New YorkWPP Group USA, Inc125 Park AvenueNew York NY 10017-5529Tel (212) 632 2200Fax (212) 632 2222
WPP Asia PacificStuart Neish, Hong KongTel (852) 2280 3801Fax (852) 2598 [email protected]
WPP Latin AmericaNick Read, São PauloTel +55 11 3888 [email protected]
Investor relationsPaul RichardsonGroup finance directorTel +44 (0)20 7408 2204Fax +44 (0)20 7493 [email protected]
Chris SweetlandDeputy Group finance directorTel +44 (0)20 7408 2204Fax +44 (0)20 7493 [email protected]
Media relationsFeona McEwanGroup communications directorTel +44 (0)20 7408 2204Fax +44 (0)20 7493 [email protected]
Group informationIf you would like further information about WPP, its companies or any of the programmes, publications orinitiatives mentioned in this report, please visit our website:www.wpp.com or contact:
Feona McEwan or Christian Andrewat WPP in LondonTel +44 (0)20 7408 2204Fax +44 (0)20 7493 [email protected]@wpp.com
Joan Einarsenat WPP in New YorkTel (212) 632 2200Fax (212) 632 [email protected]
Recognition for previous years’Annual Reports1999 Annual ReportSelected to appear in the D&AD 2001 Annual, ashowcase of the world’s best design work.
1999 ProShare Award for best Annual Reportand Accounts in a FTSE 100 Company, for thesecond year in a row.
1999 British Design and Art Direction Awards:Silver Award to WPP director Jeremy Bullmorefor his essay, Polishing the Apples.
1998 Stock Exchange and CharteredAccountants Annual Awards for PublishedAccounts: Highly Commended.
1998 ProShare Award for best Annual Reportand Accounts in a FTSE 100 Company.
Written and produced by WPP Group plcDesigned by Addison Corporate MarketingIllustrations by Richard BorgePortraits by Nick HigginsPrinted in the UK by Westerham Press, St Ives plc©WPPGroup plc 2001
Investor relations material andour financial statementsare available onlineat www.wppinvestor.com
Where to find us

Annual R
eport and Accounts 2000
Annual Report and Accounts 2000Advertising. Media Investment Management.Information & Consultancy. Public Relations & Public Affairs. Branding & Identity, Healthcare andSpecialist Communications.
27 Farm StreetLondon W1J 5RJTelephone 020 7408 2204Fax 020 7493 6819www.wpp.com