NASDAQ_CME_2002.pdf - AnnualReports.com
91
2002 Annual Report THE START OF A NEW FUTURE
-
Upload
khangminh22 -
Category
Documents
-
view
2 -
download
0
Transcript of NASDAQ_CME_2002.pdf - AnnualReports.com

2002 Annual Report
THE START OF A NEW FUTURE
Chicago M
ercantile Exchange H
oldings Inc. 2002 A
nn
ual R
epo
rt
Chicago
Chicago Mercantile Exchange Holdings Inc.
Chicago Mercantile Exchange Inc.
30 South Wacker Drive
Chicago, Illinois 60606-7499
T:312 930 -1000
F:312 466-4410
Washington
Chicago Mercantile Exchange Inc.
1299 Pennsylvania Avenue, N.W.
Washington, DC 20004
T:202 638-3838
F:202 638-5799
London
Chicago Mercantile Exchange Inc.
Pinnacle House
23-26 St. Dunstan’s Hill
London EC3R 8HN England
T:44 20 7623-2550
F:44 20 7623-2565
Tokyo
Chicago Mercantile Exchange Inc.
Level 16, Shiroyama JT Mori Building
4-3-1 Toranomon Minato-ku
Tokyo 105-6016 Japan
T:813 5403-4828
F:813 5403-4646
Internet
www.cme.com
e-mail: [email protected]

On the cover: On December 6, 2002, Class A shares of Chicago Mercantile Exchange Holdings Inc. began trading
on the New York Stock Exchange (NYSE). We were the first U.S. financial exchange to complete an initial public offering
and publicly list its stock. CME Chairman Terry Duffy rang The Opening Bell™ at the NYSE to mark the first day of trading
for CME stock as CME simultaneously broadcast the opening of its S&P 500® Index futures trading pit in Chicago onto
the bell podium of the NYSE. From left: Craig Donohue, Executive Vice President and Chief Administrative Officer;
Dave Gomach, Managing Director and Chief Financial Officer; Pat Lynch, Treasurer; Jim Oliff, Vice Chairman;
Dick Grasso, NYSE Chairman and CEO; Leo Melamed, Chairman Emeritus and Senior Policy Advisor; Terry Duffy;
Catherine Kinney, NYSE Executive Vice Chairman, President and Co-COO; Jack Sandner, Special Policy Advisor;
Jim McNulty, President and CEO; and Marty Gepsman, Secretary.
Chicago Mercantile Exchange Holdings Inc.
(CME Holdings) is the parent company of Chicago
Mercantile Exchange Inc. (CME), one of the world’s
leading exchanges for the trading of futures and
options on futures. CME offers futures contracts
and options on futures primarily in four product
areas: interest rates, stock indexes, foreign
exchange and commodities. We bring together
buyers and sellers of derivative products on our
open outcry trading floors, on our GLOBEX®
electronic trading platform and through privately
negotiated transactions that we clear. Our wholly
owned Clearing House settles trading accounts,
clears trades, collects and maintains performance
bond funds, regulates delivery and reports trading
data. On average, we process nearly 554,000
clearing trade transactions, act as custodian for
$27.4 billion in collateral and move $1.8 billion of
settlement funds through our clearing system
each day.
Founded as a not-for-profit corporation in1898,
we became the first publicly traded U.S. financial
exchange in December 2002 when the Class A
shares of CME Holdings began trading on the
New York Stock Exchange under the ticker
symbol CME. Our Web site is www.cme.com.
CME’s competitive position:
#1 futures exchange in the United States in
volume (558.4 million contracts in 2002, or
an average of 2.2 million contracts a day)
#2 exchange in the world in volume of futures
and options on futures
#1 futures exchange in the world in notional
(underlying) value ($328.6 trillion in 2002)
#1 futures exchange in the world in open
interest of futures and options on futures
(reaching a record of 24.8 million open
positions in December 2002)
Commodities
Foreign Exchange
Equities
Interest Rates
2002 Volume by Product Group
2002 Clearing and Transaction
Fee Revenue by Product Group
02 AR Editorial 2/27/03 1:32 PM Page 1

Net Revenues*(dollars in millions)
*Demutualization occurred in 2000
01 029998 000
100
200
$500
300
400
0
(25)
50
25
75
$100
01 029998 00
Net Income*(dollars in millions)
*Demutualization occurred in 2000
FOR YEAR ENDED OR AT DECEMBER 31
2002 2001 CHANGE(in thousands, except per share data) (restated)
Income Statement Data:
Net revenues $«453,177 $«387,153 17%
Income before taxes1 154,229 125,766 23
Net income1 94,067 75,108 25
Earnings per share:1, 2
Basic $÷÷÷«3.24 $÷÷÷«2.61 24
Diluted 3.13 2.57 22
Balance Sheet Data:
Current assets3 $«401,640 $«208,328 93%
Total assets2, 3 541,525 329,096 65
Current liabilities3 76,003 64,063 19
Shareholders’ equity1 0,446,139 248,366 80
Other Data:
Total trading volume (round turn trades) 558,448 411,712 36%
GLOBEX volume (round turn trades) 197,975 81,895 142
Open interest at year-end (contracts) 18,792 15,039 25
Notional value of trading volume (in trillions) $«««÷328.6 ««÷$«««÷293.9 12
Key Ratios:
Return on average equity 27.1% 36.2%
Return on average assets3 21.6% 27.0%
Operating margin 34.0% 32.5%
1 Income statement and balance sheet data for 2001 has been restated to reflect the adoption of Statement of FinancialAccounting Standards No. 123, “Accounting for Stock-Based Compensation.” As previously reported, net income was$68.3 million, and basic and diluted earnings per share were $2.37 and $2.33, respectively.
2 Earnings per share are presented as if common stock issued on December 3, 2001 had been outstanding for all periods presented.
3 Amounts exclude cash performance bonds and security deposits and securities lending transactions.
1
02 AR Editorial 2/27/03 1:32 PM Page 2

2Chairman of the Board Terrence A. Duffy
02 AR Editorial 2/27/03 1:32 PM Page 3

To Our Shareholders:
I could not have asked for a more exciting year to begin my Chairmanship
following seven years on our Board of Directors, including four years as
Vice Chairman. Our Board has worked tirelessly over the last several years
to set a course for our future that would position us solidly in the rapidly
changing global competitive landscape. That strategy included implementation
of a plan to demutualize our exchange, structure the company to prepare
for an initial public offering (IPO), invest heavily in technology and ensure that
we become a leader in electronic execution services. We have spent the
last five years doing just that.
The year 2002 was exciting for another reason: our IPO, which was
my top priority when I was elected Chairman in April 2002. On behalf of my
fellow shareholders of Chicago Mercantile Exchange Holdings Inc., I rang the
opening bell at the New York Stock Exchange on December 6, 2002, to mark
the first day that our company’s stock traded on the NYSE. It was truly an
awe-inspiring, historic moment. With that bell-ringing, we became the first
publicly traded financial exchange in the United States. We also reached an
important milestone in our history and set the stage for the continued growth
and higher visibility of our business.
As I welcome our new shareholders, I also want to thank our
long-standing members for their foresight and progressive thinking. When
they voted to demutualize CME in June 2000, they gave us the green light
to transform CME from a not-for-profit, membership-owned exchange to a
for-profit, shareholder-owned company. However, it took more than a single
vote to achieve a successful initial public offering.
02 AR Editorial 2/27/03 1:32 PM Page 4

During the past three years, we invested in
technology and made strategic and operational
changes to our business model to optimize both
trading liquidity and profits. We established the
discipline of being accountable to shareholders,
managing for performance and focusing on a
strategy that would position us to compete
successfully in an increasingly competitive
environment. At the same time, we built on our
reputation for market transparency and integrity
and reinforced the strengths that have made
this exchange great, such as responsiveness
to our customers’ needs. This year, we also
strengthened our leadership and governance
by forming a new Office of the CEO led by
President and CEO Jim McNulty and Executive
Vice President and Chief Administrative Officer
Craig Donohue. Largely as a result of these
changes, we established a track record as a
successful, growing, for-profit enterprise. We’re
committed to continuing that record now that
the IPO is over.
While we always have been a highly visible
exchange, our IPO broadened awareness of CME
as a company and as a brand. It also helped us
educate investors about our top six competitive
strengths:
1 We are a leading global futures exchange in
a growing industry. In fact, our volume has grown
faster than our industry— at a 23% compound
annual rate compared with 15% for the other
exchanges in our peer group, according to CME
and Futures Industry Association data for 1997 to
2002. We are #1 in the United States by more
than 200 million contracts and a close #2 in the
world for futures and options on futures, based
on trading volume. Our deep, liquid markets
attract additional customers, which further
enhances our liquidity.
2 We have a unique market position based
on our diverse product line, benchmark products
and wholly owned clearing house. Our benchmark
products include our Eurodollar futures, the
world’s most actively traded futures contract,
and our S&P 500® Index and NASDAQ-100®
Index contracts. Our customers use these
products to manage and hedge their interest
rate and equity market risks.
3 We have proven technology and operational
capabilities, particularly in our fast, reliable and
fully integrated trading and clearing systems.
In fact, we have become one of the world’s
leading electronic exchanges, with average daily
volume on GLOBEX of nearly 800,000 contracts,
and an average of nearly 554,000 transactions
processed daily. Our high quality, integrated
trading, market surveillance and clearing capabili-
ties help differentiate us from our competitors.
4
02 AR Editorial 2/27/03 1:32 PM Page 5

In my 21 years of association with CME, I have
never been more proud of our achievements
and decisions.
I am committed to furthering our success by facing
new challenges and opportunities, including:
• Successfully building upon our newly introduced
Eagle Project for Eurodollar customers who desire
electronic transaction execution capabilities;
• Improving our product development capabilities
so we can more effectively bring additional
innovative products to market;
• Working hard to ensure constructive dialogue and
the pursuit of mutually beneficial industry growth
opportunities with our clearing member firms;
• Finalizing the development of a global strategy
that capitalizes on the international appeal of our
benchmark products, the expanding international
distribution of our GLOBEX system and our
proven track record of working successfully
with other exchanges.
It is a true honor and a privilege for me to continue
leading CME through these new challenges
and opportunities.
Sincerely,
Terrence A. Duffy
CHAIRMAN OF THE BOARD
February 10, 2003
5
4 We continue to build on our long track record of
leading the industry in innovation that transformed
us in the last three decades from an agricultural
commodity exchange to one of the world’s leading
financial exchanges. The E-mini™ stock index
contracts we introduced in the late 1990s have
grown significantly in the last two years and have
captured the attention of the industry and investors
alike. In 2002, we introduced a non-traditional
futures contract called TRAKRSSM that was devel-
oped with Merrill Lynch & Co., representing the
first time that broad-based index products traded
on a U.S. futures exchange can be sold by a
securities broker. And our OneChicago joint venture
to trade single stock futures with the Chicago
Board Options Exchange® and Chicago Board of
Trade® successfully launched in November.
5 We have enhanced—and begun to educate the
marketplace about— the strength of our corporate
governance model. Our independent Board, our
long-standing tradition of separating the Chairman
and CEO roles, and our willingness to challenge
management reflect the evolving best practices
of corporate goverance.
6 We have demonstrated strong operating
leverage, profitability and cash flow since
demutualizing in 2000, as described in the financial
section of this report.
02 AR Editorial 2/27/03 1:32 PM Page 6

6
By any measure, 2002 was a historic year for
CME. Our IPO was just one of many significant
achievements that we believe will pave the way
for our continued success.
CME’s trading volume rose 36% to a record
558.4 million contracts for 2002 versus 2001.
We continue to be the largest futures exchange
in the United States and second largest in the
world for futures and options on futures based
on trading volume. Average daily volume was
2.2 million contracts, compared with fewer than
900,000 in 1998. In addition, both of our trading
venues set records in 2002. Open outcry trading
increased 10% from 2001 levels to 352.5 million
contracts, and volume on our GLOBEX electronic
trading platform climbed 142% to nearly 198
million contracts. For the first time, GLOBEX
volume exceeded 1 million contracts a day in June
2002. This achievement was a regular occurrence
by the time the fourth quarter rolled around.
While economic and geopolitical uncertainty
created demand for risk management products, our
trading volume also rose because we enhanced
our product offerings and expanded electronic
and other trade execution choices. In notional
value and open interest, CME continues to be
the largest futures exchange in the world. In
2002, trading in our contracts had an underlying
value of $328.6 trillion. On December 12, 2002,
we set an open interest record of 24.8 million
contracts. Open interest is the number of positions
outstanding at the close of trading. Before 2002,
CME’s open interest record was 18.9 million
positions, set in 2001.
All this activity made 2002 a record year for
our financial performance, as well. Net revenues
increased 17% to $453.2 million for 2002 versus
2001. Net income climbed 25% to $94.1 million.
Working capital rose 126% to $325.6 million, due
in part to the IPO. The strength of our working
capital enabled us to commit to shareholders
that we would begin paying a regular quarterly
dividend in the first quarter of 2003.
In August 2002, we agreed to pay $15 million
to eSpeed, Inc. to settle litigation related to the
Wagner patent on automated futures trading
systems. The settlement allowed us to complete
our initial public offering without legal uncertainty.
In January 2003, we announced that Euronext-
Paris would reimburse us for $7.5 million of that
eSpeed settlement. Euronext-Paris also agreed
to expand our license rights to the electronic
trading software it owns, which is incorporated
into our GLOBEX electronic trading platform.
This agreement can help us further grow our
electronic trading business via offering a broad
range of services to other exchanges, clearing
organizations and e-marketplaces.
Dear Shareholders:
James J. McNulty (left) and Craig S. Donohue
02 AR Editorial 2/27/03 1:32 PM Page 7

Also in 2002, we proved yet again that
innovation is a hallmark of CME. For example, we
partnered with Merrill Lynch & Co., Inc. to develop
and introduce an entirely new type of futures
contract. Our innovative TRAKRS futures (Total
Return Asset ContractsSM) are designed to enable
securities account customers to efficiently track
an index of stocks, bonds, currencies or other
financial instruments — in many cases, without
having to make daily performance bond settle-
ment variation payments. This new product line
has been well-received to date, and we believe
it will open up our markets to an entirely new
group of customers.
Operational Outlook
In 2003, we intend to work diligently on several
fronts, including:
Enhancing Our Markets Through Technology.
Technology investments have been critical to
our success. The most recent example is the
remote data center we opened in September
2002, which helped reduce average customer
response time on GLOBEX to 0.3 seconds at
year-end 2002 from 1.2 seconds at year-end
2001. In 2003, we intend to make additional
improvements to the functionality, quality,
consistency and speed of GLOBEX. In January
2003, we implemented our Eagle Project to
facilitate electronic calendar spread trading of
Eurodollar futures— for the first time, in a way
that replicates floor trading.
Growing Existing Business. Open outcry and
GLOBEX volumes have increased significantly
over the past three years. We’re working to
continue that growth. In 2003, we are focusing
on increasing GLOBEX distribution, improving
customer service and growing volume in key
products— including our E-mini futures, electroni-
cally traded foreign exchange contracts and
Eurodollar futures.
Broadening Our Product Range. Time and
time again, we have successfully expanded our
business through innovative new products. In
2003, you can expect to see new CME futures,
options on futures and market data offerings
that will be developed in collaboration with our
customers and financial services firms. Based
on our research, we see a number of exciting
possibilities for new products and line extensions,
both within and outside our current trading
product lines.
New Business Opportunities. We plan to
supplement internal growth with joint ventures,
alliances and selective acquisitions of businesses
and technologies. Our goal is to explore new
markets, provide services we do not presently
offer or improve our technology in order to meet
customer needs and increase our profitability.
In short, we have ambitious plans for 2003
and look forward to informing you about our
progress during the year.
Sincerely,
James J. McNulty
PRESIDENT AND CHIEF EXECUTIVE OFFICER
Craig S. Donohue
EXECUTIVE VICE PRESIDENT
AND CHIEF ADMINISTRATIVE OFFICER
Office of the CEO
February 10, 2003
7
02 AR Editorial 2/27/03 1:32 PM Page 8

Chicago Mercantile Exchange
Eurex Euronext / LIFFE
Chicago Board of Trade
Chicago Mercantile Exchange
Eurex Euronext / LIFFE
Chicago Board of Trade
0.75
1.5
2.25
0
Growth in Volume, 2002(average daily volume of futures and options on futures)
01
+35%
02
2.22
01
+20%
02
2.24
01
+8%
02
1.04
01
+32%
02
1.37
24% 19%32%
23% 30%
21% 17%34%
20%
32%
15%33%
In 2002, trading volume of futures and options on futures grew faster at CME
than at any of its three largest competitors.
Over the last three years, the four largest exchanges’ combined average
daily volume of futures and options on futures increased from 4.0 million to
6.9 million. Our market share grew from 23% in 2000 to 32% in 2002.
2000 ADV: 4.0 million 2001 ADV: 5.5 million 2002 ADV: 6.9 million
Growth in Market Share, 2000 – 2002 (average daily volume as percentage of group total)
8
02 AR Editorial 2/27/03 1:32 PM Page 9

9
20 Years of S&P 500 Futures
On April 21, 1982, CME launched a product that revolutionized risk management
for fund managers, institutional investors and individuals seeking to mitigate risk
or allocate assets in the overall U.S. market— futures contracts on the S&P 500
stock index. They became the world’s first successful stock index futures contract
as the S&P 500 Index became a benchmark of the U.S. equity market.
Left photo: In 2002, Boeing Chairman and CEO Phil Condit (left) rang the opening
bell to commemorate our anniversary. Boeing has been a component of the
S&P 500 Index since 1934. Also pictured (from left): CME President and CEO
Jim McNulty, Melamed, and Standard & Poor’s Executive Vice President
Rik Kranenburg.
10th Anniversary of GLOBEX Trading
CME pioneered the concept of global electronic
trading of derivatives contracts in 1987. On June
25, 1992, the first 200 GLOBEX terminals went
live in Chicago, New York, London and Paris. In
its inaugural session, GLOBEX had volume of
1,939 contracts in four products. In 1998, CME
introduced the next generation of GLOBEX.
In 2002, our electronic trading volume reached
an average of about 786,000 contracts a day
and exceeded 1 million contracts a day 55 times.
Center photo: CME Chairman Terry Duffy
addresses the crowd at a gala dinner at Chicago’s
Navy Pier, expressing appreciation to customers
on the 10th anniversary of GLOBEX trading.
Three Decades of Innovation: Proudly Celebrating CME Milestones in 2002
30th Anniversary of Financial Futures
CME introduced the world’s first financial futures contracts on May 16,1972,
when its newly formed International Monetary Market (IMM) began trading in
futures contracts on seven global currencies. This innovation fundamentally
changed the nature and scope of futures markets, transforming them from
agricultural hedging mechanisms to hedging and risk management markets
applied to financial instruments and financial risks. Right photo: Nobel Laureate
and Professor Milton Friedman (center) was a champion of financial futures
from the time he first heard of the idea from Leo Melamed (left), our Chairman
Emeritus and Senior Policy Advisor. Also shown: CME Board Member Yra Harris.
02 AR Editorial 2/27/03 1:32 PM Page 10

10
02 AR Editorial 2/27/03 1:32 PM Page 11

Chairman Emeritus and Senior Policy
Advisor Leo Melamed and Special
Policy Advisor Jack Sandner made
the first ceremonial trade in CME
stock. Top photo from left: Fleet
Specialist CEO Chris Quick, Melamed,
CME Chairman Terry Duffy, NYSE
Chairman Dick Grasso, Sandner,
and CME President and CEO
Jim McNulty.
On Dec. 6, 2002, CME stock first
traded for $39 per share and closed
at $42.90, up 22.6% from the $35
IPO price. At year-end 2002, CME
stock closed at $43.66, an increase
of nearly 25% from the IPO price.
11
The roar of a trading floor. The rapid-fire clicking of keyboards and hum of
computers transmitting data around the world. These are the sounds of risk
management at work at Chicago Mercantile Exchange (CME), the largest
futures exchange in the United States—and, as of this year, the first publicly
traded U.S. financial exchange.
Institutions and individuals are managing their financial risks more actively
than ever before, as global equity markets react to world and corporate events…
as interest rates and currency values rise and fall with changing economic
indicators…as commodity prices fluctuate in response to supply and demand.
CME futures and options on futures hedge against these financial risks, and
provide important investment and asset allocation opportunities.
Our customers vary by product line. Our benchmark Eurodollar futures
contract—based on bank deposits in U.S. dollars outside the United States—
may be used by a major international bank to control short-term interest rate
risks generated by lending and borrowing. Our benchmark S&P 500 stock
index futures contract might be used by a portfolio manager to help protect
against price changes in U.S. stocks, and our E-mini NASDAQ-100 futures
contract might be used by an individual looking to quickly and efficiently take
an equity market position. A hedge fund may use our markets to speculate
on changes in the value of the Euro. A restaurant chain could purchase live
cattle futures to hedge against an increase in the price of hamburger meat.
These customers are among the professional traders, financial institutions,
institutional and individual investors, major corporations, manufacturers,
producers and governments that use CME futures and options on futures.
Operations Review
02 AR Editorial 2/27/03 1:32 PM Page 12

At CME, our goal is to provide investment
products or market opportunities that meet the
diverse needs of our customers. We do this
by offering liquid markets for our products,
which trade via “open outcry,” electronically on
our GLOBEX electronic trading platform, and
through privately negotiated transactions. Our
trading venues are supported by state-of-the-art
technology for order routing, trade reporting,
market data dissemination, clearing, market
surveillance and market regulation.
Our Trading Venues: High-Level Synergy
Working for Our Customers
“Synergy” means “working together”— and the
implication is that the whole is greater than the
sum of its parts. That’s true of CME’s trading
venues. As one example, we began “side-by-side”
open outcry and electronic trading of foreign
exchange products in April 2001. We credit this
step with increasing foreign exchange trading
volume in 2001 and 2002 — reversing a four-
year trend of volume declines due in part
to electronic trading offered by competing
over-the-counter markets.
Synergy between our trading venues helps
increase liquidity. This is a key component to
attracting customers and ensuring the success of
a market, because it means a contract is easy to
buy or sell with minimal price disturbance. When
markets are liquid, they tend to attract additional
customers, which in turn further enhances liquidity.
In 2002, we traded an average of 2.2 million
contracts per day, an increase of 35% from 2001
and up from an average of 899,000 in 1998.
Trading volume is a major component of our
financial performance. About 79% of our 2002
net revenues were generated by fees assessed
on each contract traded or “cleared” through
our exchange. The sale of market data generated
another 11% of 2002 net revenues.
Open Outcry. In our open outcry trading pits in
Chicago, traders and brokers meet to auction
CME contracts for immediate trade execution.
Only members who own or lease the right to
trade on our exchange may trade in the pits.
Typically, each trading pit is devoted to a particular
CME contract. Tiered booths surrounding the
pits are staffed by member firm personnel who
monitor market activity and receive orders either
electronically or by telephone. In turn, floor
brokers in the pits receive customer orders
electronically, by wireless headsets or through
hand signals flashed into the pits.
12
0
5
20
10
15
01 029998 00
Open Interest at Year End(in millions)
0
600
200
300
500
100
400
01 029998 0096 979493 95
Total Trading Volume(in millions)
02 AR Editorial 2/27/03 1:32 PM Page 13

GLOBEX, our innovative electronic
trading platform, began providing
after-hours trading in June 1992.
Ten years later, GLOBEX offers
trading about 23 hours a day, five
days a week, to customers around
the world.
Electronic Trading. Our GLOBEX electronic trading
platform is key to our future, as it allows market
participants around the world to monitor market
activity and execute orders nearly 23 hours a
day, five days a week. Today, nearly all of our
contracts can be traded side-by-side via either
open outcry or GLOBEX. At the same time, an
increasing number of market participants trade
both via open outcry and electronically.
In 2002, open outcry trading volume of
352.5 million contracts represented about 63%
of CME’s trading volume. Electronic trading
generated most of the remaining volume— 35%
or nearly 198 million contracts. That percentage
has increased from 15% just two years ago, as
electronic futures trading becomes more widely
accepted and we introduce new products and
services to encourage its further growth. In fact,
GLOBEX volume exceeded 1 million contracts a
day for the first time in June 2002. By the fourth
quarter of 2002, this was a regular occurrence.
In December 2002, GLOBEX trading volume
represented 49% of total exchange volume.
Clearing and Market Surveillance:
Guaranteeing Integrity
CME safeguards its market integrity, transparency
and integrity through market surveillance, com-
pliance and our wholly owned Clearing House,
which guarantees each and every trade on CME
by acting as a buyer to every sell order and a seller
to every buy order. We back up our guarantee
with a $3.7 billion financial safeguards package.
In addition, the Clearing House settles trade
accounts, regulates delivery, reports trade data,
and both collects and maintains performance
bond funds.
We safeguard against default by setting
customer requirements. At each settlement
cycle— at least twice daily— we value open
positions at the market price prevailing at that
time, then require payments from clearing
members whose positions have lost value and
make payments to clearing members whose
positions have gained value. In comparison,
the equity market settles four days after a trade
occurs. We also set a minimum performance
bond or margin that is posted for every CME
product traded. In fact, we developed the industry
standard software to determine appropriate
performance bond requirements for each product
by simulating the gains and losses of complex
portfolios. This software, called SPAN® or
Standard Portfolio Analysis of Risk®, has been
licensed to 39 other exchanges and clearing
13
400
2,400
1200
800
0
2,000
1,600
0098 01 0299
Open Outcry
GLOBEX
Privately Negotiated
Average Daily Volume by Venue(in thousands)
02 AR Editorial 2/27/03 1:32 PM Page 14

From our GLOBEX Control Center
(bottom photo), Remote Data Center
and two 70,000-square-foot trading
floors, CME deploys state-of-the-art
technology and communications to
facilitate trading.
organizations worldwide. We also developed a
state-of-the-art clearing system, CLEARING 21®,
which processes our trades and allows firms to
electronically manage their positions, exercise
options, manage their collateral and enter trans-
actions related to foreign exchange deliveries.
CLEARING 21 also is used by the New York
Mercantile Exchange and Euronext.
We processed an average of nearly 554,000
clearing transactions per day in 2002, with an
average transaction size of 12 contracts. We
have the capacity to clear more than 1.5 million
transactions a day. Open interest— the number
of outstanding contracts at the close of the
trading day and a leading indicator of liquidity—
reached a peak of 24.8 million contracts on
December 12, 2002. We have the largest futures
and options on futures open interest of any
exchange in the world. On average, we moved
about $1.8 billion a day in settlement funds
through our clearing system in 2002.
As of year-end 2002, we acted as custodian
for about $27.4 billion in collateral. With that
amount of collateral on deposit, firms welcome
programs that improve their capital efficiency.
We have led the derivatives industry in estab-
lishing cross-margining agreements with other
clearing houses. Under these agreements, we
recognize a clearing firm’s open positions at our
partner clearing houses, reducing the amount
of collateral that a clearing firm must keep on
deposit with us. For example, our cross-margining
program with the Options Clearing Corporation
reduces our members’ performance bond
requirements by about $472.1 million a day.
We also have cross-margining agreements
with the Government Securities Clearing Corp.,
the Board of Trade Clearing Corp., the London
Clearing House and LIFFE.
To further improve capital efficiencies for our
customers, in 2002 we expanded a program that
broadens the types of collateral we accept from
clearing firms, allowing them to enhance the
yields they receive on performance bonds posted
with us. Our Interest Earning Facility program
consists of money market funds managed by third
party investment managers.
Many other major derivatives exchanges rely
on outside companies to provide clearing services.
Providing these services ourselves generates
revenue and enables CME to better control its
costs, manage transaction capacity and support
new product development.
Products: For CME,
There is No Such Thing As ‘No Such Thing’
While our state-of-the-art trading venues and
Clearing House are major competitive advantages,
our products are the deciding factor in attracting
customers and liquidity to Chicago Mercantile
Exchange. We have led the industry in product
innovation for decades, and we are continually
looking ahead to identify customer needs and
“seed the future” with products and services
to meet those needs.
CME was strictly an agricultural commodity
futures exchange when we were founded in
1898. However, more than three decades ago, we
identified an opportunity and created the world’s
first financial futures contracts by introducing
futures on seven foreign currencies in 1972. Since
then, we have continued our role as the leading
innovator in the global futures industry. In 2002,
financial futures and options on futures were
99% of our business.
Three of our products serve as global
benchmarks for valuing and pricing risk. Our
Eurodollar futures contract was introduced in 1981
and was the first product of its type to be settled
in cash, rather than by physical delivery of the
underlying item. It is now the world’s most
actively traded futures contract and a benchmark
for measuring the relative value of U.S. dollar-
denominated short-term fixed-income securities.
In 1982, we were the first to launch a successful
stock index futures contract, the S&P 500 Index
futures contract. In 1996, we introduced the
NASDAQ-100 Index futures contract. These two
stock index futures contracts, along with smaller,
electronically traded “E-mini” versions, now serve
as global benchmarks for managing exposure to
the U.S. stock markets.
14
02 AR Editorial 2/27/03 1:32 PM Page 15

15
02 AR Editorial 2/27/03 1:32 PM Page 16
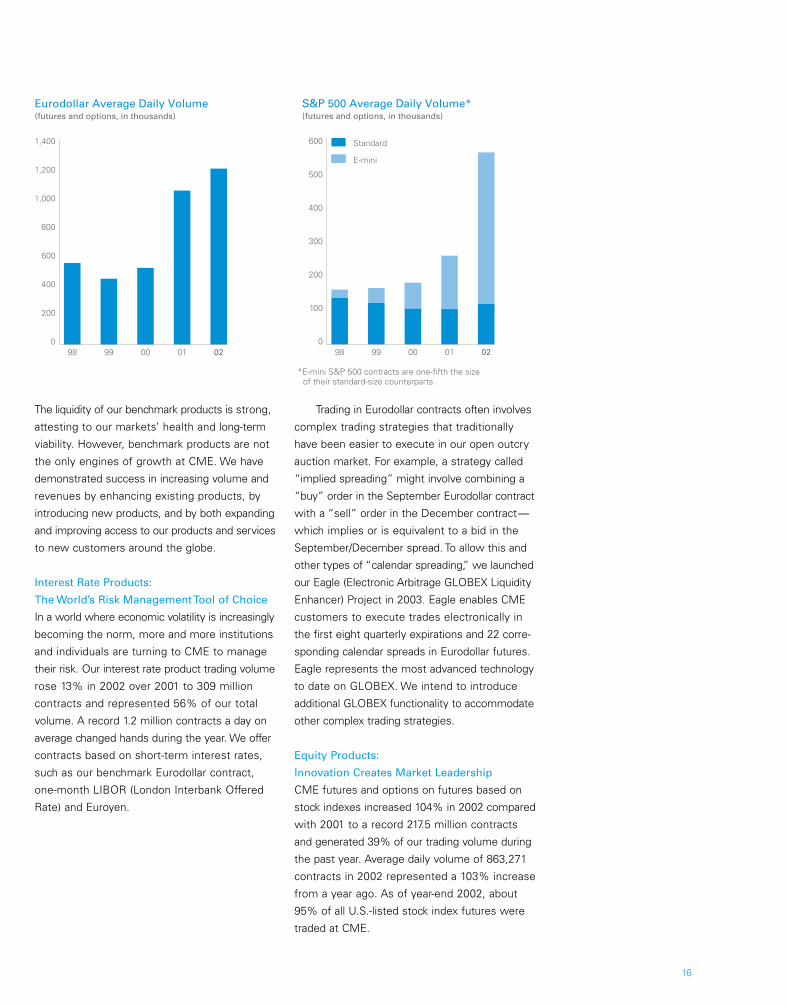
The liquidity of our benchmark products is strong,
attesting to our markets’ health and long-term
viability. However, benchmark products are not
the only engines of growth at CME. We have
demonstrated success in increasing volume and
revenues by enhancing existing products, by
introducing new products, and by both expanding
and improving access to our products and services
to new customers around the globe.
Interest Rate Products:
The World’s Risk Management Tool of Choice
In a world where economic volatility is increasingly
becoming the norm, more and more institutions
and individuals are turning to CME to manage
their risk. Our interest rate product trading volume
rose 13% in 2002 over 2001 to 309 million
contracts and represented 56% of our total
volume. A record 1.2 million contracts a day on
average changed hands during the year. We offer
contracts based on short-term interest rates,
such as our benchmark Eurodollar contract,
one-month LIBOR (London Interbank Offered
Rate) and Euroyen.
Trading in Eurodollar contracts often involves
complex trading strategies that traditionally
have been easier to execute in our open outcry
auction market. For example, a strategy called
“implied spreading” might involve combining a
“buy” order in the September Eurodollar contract
with a “sell” order in the December contract—
which implies or is equivalent to a bid in the
September/December spread. To allow this and
other types of “calendar spreading,” we launched
our Eagle (Electronic Arbitrage GLOBEX Liquidity
Enhancer) Project in 2003. Eagle enables CME
customers to execute trades electronically in
the first eight quarterly expirations and 22 corre-
sponding calendar spreads in Eurodollar futures.
Eagle represents the most advanced technology
to date on GLOBEX. We intend to introduce
additional GLOBEX functionality to accommodate
other complex trading strategies.
Equity Products:
Innovation Creates Market Leadership
CME futures and options on futures based on
stock indexes increased 104% in 2002 compared
with 2001 to a record 217.5 million contracts
and generated 39% of our trading volume during
the past year. Average daily volume of 863,271
contracts in 2002 represented a 103% increase
from a year ago. As of year-end 2002, about
95% of all U.S.-listed stock index futures were
traded at CME.
16
98 99 01 0200
Standard
E-mini
0
100
600
400
500
200
300
S&P 500 Average Daily Volume*(futures and options, in thousands)
*E-mini S&P 500 contracts are one-fifth the size of their standard-size counterparts.
98 99 01 02000
200
400
600
800
1,000
1,200
1,400
Eurodollar Average Daily Volume(futures and options, in thousands)
02 AR Editorial 2/27/03 1:32 PM Page 17

The lion’s share— 94%— of our stock index
product volume in 2002 was generated by con-
tracts based on the S&P 500 and NASDAQ-100.
This success story is due to a number of factors,
including the rise of index investing, our licenses
with S&P and NASDAQ and the appeal of our
E-mini product line. In 1997, we introduced E-mini
S&P 500 Index futures, which are smaller-sized,
electronically traded versions of our open outcry
contract. This product and the E-mini NASDAQ-100
Index futures, launched in 1999, have become
the fastest-growing futures contracts in our history,
appealing to both institutional and individual
investors. The E-mini S&P 500 futures contract
grew at an astounding 194% pace in 2002 versus
2001, while our E-mini NASDAQ-100 futures
volume rose 67%.
We also offer trading in futures contracts
based on other small-, medium- and large-capi-
talization indexes in both the U.S. and foreign
equity markets. Our index products include
contracts based on the Russell 2000® Index, the
Nikkei® 225 and the Goldman Sachs Commodity
Index® (GSCI®).
We develop new products and line extensions
based on research and in collaboration with our
customers and financial services firms. In 2002,
we introduced E-mini futures on the S&P
MidCap 400™ Index, joining the E-mini Russell
2000 futures contract launched in 2001.
In addition to our proprietary products, strategic
partnerships have been fruitful sources of new
product ideas, further expanding our markets
to new audiences and building business from
existing customers. For example, we introduced
an innovative new private label product line with
one of the oldest and most widely recognized
global financial services firms, Merrill Lynch & Co.,
Inc. Licensed exclusively to us for North America,
these new TRAKRS (Total Return Asset Contracts)
are designed to enable customers to track an
index of stocks, bonds, currencies or other
financial instruments. They differ from traditional
futures contracts in that most non-institutional
customers who purchase these contracts are
required to post 100% of the TRAKRS market
value at the time of purchase. These customers
will not be subject to margin calls or requirements
to make any additional payments throughout
the life of their TRAKRS positions. As a result,
TRAKRS are the first broad-based index product
traded on a U.S. futures exchange that can be
sold by securities brokers. We launched three
types of TRAKRS contracts in 2002: Long-Short
Technology TRAKRS in July, Select 50 TRAKRS
in October, and LMC TRAKRS in December 2002.
Through the end of December 2002, we reported
volume of nearly 9.8 million TRAKRS contracts.
We began “side-by-side” open outcry
and electronic trading of foreign
exchange products in April 2001.
This step helped increase foreign
exchange trading volume in 2001
and 2002.
17
98 99 01 02000
40
120
80
Foreign Exchange Average Daily Volume(futures and options, in thousands)
Open Outcry
GLOBEX
98 99 01 02000
250
50
150
100
200
NASDAQ-100 Average Daily Volume*(futures and options, in thousands)
*E-mini NASDAQ-100 contracts are one-fifth the size of their standard-size counterparts.
Standard
E-mini
02 AR Editorial 2/27/03 1:32 PM Page 18

18
02 AR Editorial 2/27/03 1:32 PM Page 19

Bottom photo: CME introduced its
first E-mini contract in 1997—E-mini
S&P 500 futures. This electronically
traded product is one-fifth the size of
our standard S&P 500 Index futures.
E-mini S&P 500 futures and E-mini
NASDAQ-100 futures, launched
in 1999, are the fastest-growing
contracts in CME’s history.
In addition, 2002 marked the debut of futures
based on the S&P SmallCap 600™, as well
as the first S&P 500 sector futures contracts—
SPCTR™ indexes. Technology and Financial
SPCTRs enable customers to manage the risk of
particular sectors in their overall market exposure,
or to increase their exposure to individual sectors.
OneChicago
In November 2002, trading began on OneChicago,
LLC, our joint venture exchange with the
Chicago Board Options Exchange (CBOE®)
and the Chicago Board of Trade (CBOT®).
OneChicago had introduced 83 single stock
and exchange-traded fund futures as of year-end
2002, with plans to launch additional single
stock futures and futures on narrow-based stock
indexes in early 2003. In 2002, OneChicago
traded 184,081 contracts and had open interest
of 34,226 contracts at year-end. By comparison,
competitor NASDAQ Liffe Markets, LLC
(NQLX) had launched 44 single stock futures
in November and December 2002, which
traded a total of 124,346 contracts during
2002. NQLX’s open interest was 16,726
positions at year-end 2002.
Single stock futures allow investors to obtain
exposure that is economically equivalent to owning
or shorting an individual stock without actually
buying or selling the stock, and in a manner that
can be less expensive than equity options, equity
swaps or stock lending transactions. All of
OneChicago’s products are electronically traded
through GLOBEX or CBOE’s electronic match
engine, CBOEdirect ®, and can be carried in either
securities accounts or futures accounts. Our joint
venture was made possible in late 2000 with
passage of a law that lifted an 18-year U.S. ban
against the trading of these products. CME has
a 40% ownership interest in OneChicago.
Foreign Exchange Products:
Opening Access Builds Volume
We offer futures and options on futures contracts
on major currencies, including the Euro, Japanese
yen, British pound, Swiss franc and Canadian
dollar. In 2002, trading volume in our foreign
exchange contracts increased 8% versus 2001
to 24.3 million contracts and generated 4% of
our trading volume. Average daily volume was
96,289 contracts in 2002, up 8% versus 2001.
The category’s growth was generated by GLOBEX
trading, which increased 115% in 2002 to an
average of 29,550 contracts a day.
In 2002, we introduced 11 “cross-rate”
futures contracts and two dollar-based contracts
that trade via GLOBEX and (in quantities of five
or more contracts) on the trading floor. Cross-rate
futures reflect the value of one currency in relation
to another. For example, our two British pound
cross-rates are used to relate the value of the
pound to the Japanese yen or the Swiss franc.
Banks and other financial institutions typically
use these contracts to manage the risks of— or
profit from— fluctuations in the relative value of
the two currencies associated with a particular
cross-rate contract.
Commodity Products: A Solid Franchise
Over the decades, we have maintained a strong
franchise in our commodity products, including
futures contracts based on cattle, hogs, pork
bellies, lumber and dairy products. Commodity
products accounted for 1% of our trading volume
during 2002— a total of 7.6 million contracts,
representing an average of 30,160 contracts
per day. Traditionally, these contracts have been
traded only on our open outcry markets. In 2002,
we began side-by-side electronic and open outcry
trading of lean hog, live cattle and feeder cattle
futures. We believe that increased interest in the
risk management advantages of our products
could be generated by continuing consolidation
and restructuring of commodity producers and
food processors, as well as reduction or elimina-
tion of government subsidies.
19
02 AR Editorial 2/27/03 1:32 PM Page 20

In June 2002, we joined forces with NYMEX
to introduce “e-miNYSM” crude oil and natural gas
contracts. The two contracts are smaller-sized
versions of the world’s two most actively traded
physical commodity futures contracts, which trade
at NYMEX. The new e-miNY futures trade on
GLOBEX and clear at the NYMEX Clearing House.
Market Data: Promoting the Information Age
Our markets generate valuable information about
pricing and trading activity in our various products.
We sell this data to banks, broker-dealers, pension
funds, investment companies, mutual funds,
insurance companies, other financial services
companies and individual investors. We also sell
market data via dedicated networks to about 170
quote vendors who consolidate the data with
that from other sources and resell it. Revenues
from the sale of our market data represented
11% of our net revenues in 2002.
In March 2002, we began supplying real-time
price quotes to the trading community over the
Internet. This service, called CME E-quotes™,
enables users to build customized packages
of our market data, interactive charts and news
services. CME E-quotes received a 2002
European Banking Technology Award for the best
use of information technology in the wholesale
banking sector. In August 2002, we introduced
CME E-history to automate the process of
supplying users with historical price data for our
products. We plan to further increase revenues
from our market data by developing additional
product enhancements, by ourselves or in
partnership with other firms.
CME Technology: Creating Opportunities
for Customers Around the World
CME products are in demand around the world.
Our priority is to ensure the on-demand accessi-
bility of our markets. Our new product innovations
and efficient day-to-day trading of our products
would not be possible without leading-edge
technology. Furthermore, improving our electronic
and open outcry trading platforms can help
dramatically increase liquidity, trading volume
and number of customers. For example, from
2000 through the end of 2002, we experienced
noticeable increases in trading volume after
major improvements in the GLOBEX platform’s
speed, capacity, reliability and functionality.
In particular, GLOBEX average daily volume
jumped 38% in October 2002 after implementing
our remote data center.
20
Net Revenue by Category
79%
11%
10%
Clearing and transaction fees
Quotation data fees
Other operating revenue
02 AR Editorial 2/27/03 1:32 PM Page 21
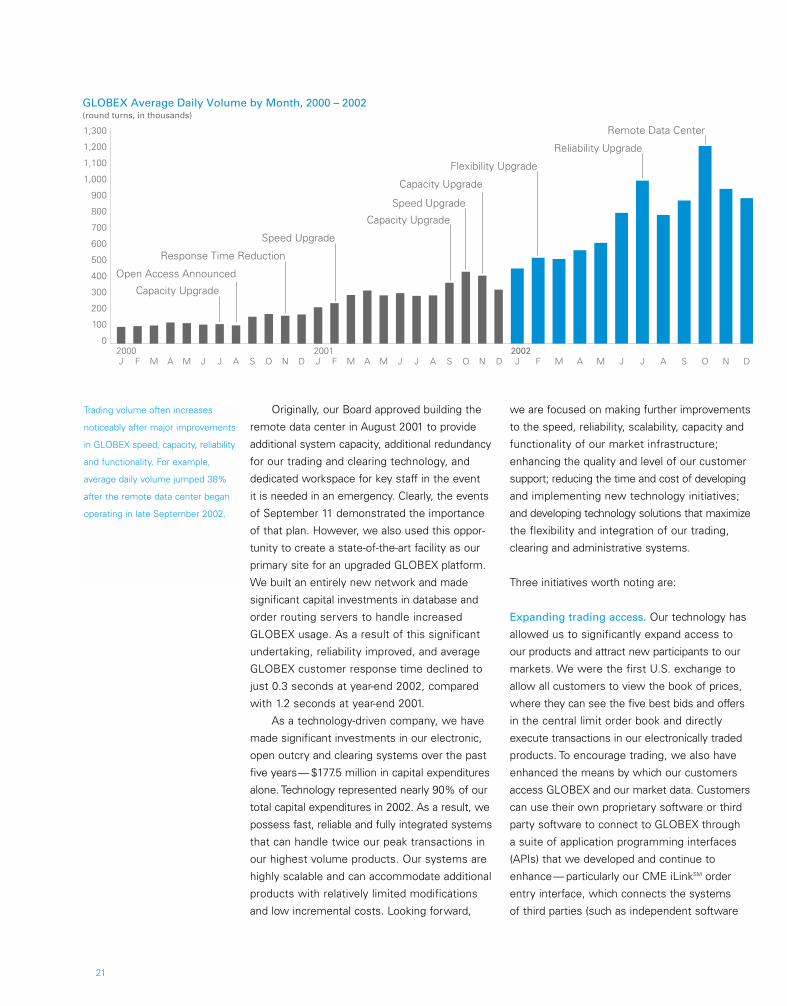
Trading volume often increases
noticeably after major improvements
in GLOBEX speed, capacity, reliability
and functionality. For example,
average daily volume jumped 38%
after the remote data center began
operating in late September 2002.
Originally, our Board approved building the
remote data center in August 2001 to provide
additional system capacity, additional redundancy
for our trading and clearing technology, and
dedicated workspace for key staff in the event
it is needed in an emergency. Clearly, the events
of September 11 demonstrated the importance
of that plan. However, we also used this oppor-
tunity to create a state-of-the-art facility as our
primary site for an upgraded GLOBEX platform.
We built an entirely new network and made
significant capital investments in database and
order routing servers to handle increased
GLOBEX usage. As a result of this significant
undertaking, reliability improved, and average
GLOBEX customer response time declined to
just 0.3 seconds at year-end 2002, compared
with 1.2 seconds at year-end 2001.
As a technology-driven company, we have
made significant investments in our electronic,
open outcry and clearing systems over the past
five years— $177.5 million in capital expenditures
alone. Technology represented nearly 90% of our
total capital expenditures in 2002. As a result, we
possess fast, reliable and fully integrated systems
that can handle twice our peak transactions in
our highest volume products. Our systems are
highly scalable and can accommodate additional
products with relatively limited modifications
and low incremental costs. Looking forward,
we are focused on making further improvements
to the speed, reliability, scalability, capacity and
functionality of our market infrastructure;
enhancing the quality and level of our customer
support; reducing the time and cost of developing
and implementing new technology initiatives;
and developing technology solutions that maximize
the flexibility and integration of our trading,
clearing and administrative systems.
Three initiatives worth noting are:
Expanding trading access. Our technology has
allowed us to significantly expand access to
our products and attract new participants to our
markets. We were the first U.S. exchange to
allow all customers to view the book of prices,
where they can see the five best bids and offers
in the central limit order book and directly
execute transactions in our electronically traded
products. To encourage trading, we also have
enhanced the means by which our customers
access GLOBEX and our market data. Customers
can use their own proprietary software or third
party software to connect to GLOBEX through
a suite of application programming interfaces
(APIs) that we developed and continue to
enhance— particularly our CME iLinkSM order
entry interface, which connects the systems
of third parties (such as independent software
F M M J A S N DJ A J O F M M J A S N DJ A J OA M J J A S O N DJ F M2000 2001 2002
0
200
100
400
300
600
800
1,000
900
700
500
1,200
1,100
1,300
Open Access Announced
Response Time Reduction
Speed Upgrade
Speed Upgrade
Capacity Upgrade
Flexibility Upgrade
Reliability Upgrade
Remote Data Center
Capacity Upgrade
Capacity Upgrade
GLOBEX Average Daily Volume by Month, 2000 – 2002(round turns, in thousands)
21
02 AR Editorial 2/27/03 1:32 PM Page 22

On Friday, December 6, 2002,
we became the first U.S. financial
exchange to be publicly traded.
In the IPO, CME sold 3,712,660
Class A shares, and the selling
shareholders sold 1,751,070
shares, for a total of nearly
5.5 million shares.
22
vendors and brokerage firms) to GLOBEX. We
also provide front-end trading terminal software
for a fee. This software includes a cost-efficient,
Web-based virtual private network solution,
GLOBEX TraderSM – Internet, for certain lower-
volume customers. As of year-end 2002, nearly
1,300 customers connected directly with us,
and thousands more connected with us through
25 independent software vendors and data
centers, as well as 28 clearing firms that have
interfaces with our systems. We are actively
seeking to attract new customers by connecting
with additional independent software vendors.
In early 2002, we established a telecommu-
nications hub in London to bring down the cost
of trading and improve both speed and access
for our growing number of European customers.
In June 2002, enhancements to our market data
interface software reduced customers’ bandwidth
requirements by up to 70%. In November 2002,
we introduced a new Market Data API 2.0 to
increase fault tolerance, improve session man-
agement and lower customers’ costs. In 2003, we
are encouraging customers to improve their ability
to access our market data and trading platforms
by migrating to this new Market Data API and
to our CME iLink 4.2 order execution interface.
Improving pit-to-booth communications.
We also are using technology to enhance our
open outcry platform. On our trading floor,
we improved pit-to-booth communications in
2002 with faster GALAX-C™ trading devices,
a common wireless infrastructure, enhanced
two-way wireless devices and additional floor
area network connections.
Enhancing block trading. Currently, customers
who wish to privately negotiate a large transaction
or “block trade” do so by telephone, and prices
are reported by telephone within a set number
of minutes. The parties to the transaction then
transmit information about the block trade to our
Clearing House for clearing and settlement. We
intend to enhance our block trading facilities to
allow users to input trade details and prices in a
single electronic transmission. Streamlining the
trade reporting process will increase efficiency
and could promote additional trading.
2002: The Start of a New Future
Built on a Legacy of Success
In summary, 2002 was a landmark year for us
based on a variety of measures. Chicago
Mercantile Exchange Holdings Inc. completed
an initial public offering and announced plans to
begin paying a quarterly dividend. The exchange
reported record trading volume, notional value,
open interest, revenues and profits. We continued
our legacy of innovation by launching a host of
new products. We significantly upgraded our
GLOBEX electronic trading platform and imple-
mented our Remote Data Center. And we laid
the groundwork for additional improvements
in products, services and growth, by investing
in the Eagle Project and other initiatives.
While 2002 was a banner year, it is also the
start of a new future for CME. As a newly public
company, we have a responsibility to our new and
current shareholders to manage for performance
and to continue delivering value to our customers
as one of the world’s leading exchanges. We
will be satisfied with nothing less than success,
for our shareholders and customers alike.
02 AR Editorial 2/27/03 1:32 PM Page 23

23
02 AR Editorial 2/27/03 1:32 PM Page 24

25 Selected Financial Data
26 Management’s Discussion and Analysis
of Financial Condition and Results of Operations
53 Management’s Financial Responsibility
and Report of Independent Auditors
54 Consolidated Balance Sheets
55 Consolidated Statements of Income
56 Consolidated Statements of Shareholders’ Equity
57 Consolidated Statements of Cash Flows
58 Notes to Consolidated Financial Statements
81 Board of Directors–Officers and Advisors
82 Board of Directors– Members
84 CME Management
85 Clearing Firms
86 Investor Information
87 Share Information
25
FINANCIALS
02 AR Editorial 2/27/03 1:32 PM Page 25

The following selected income statement and balance sheet data for the years 1998 through 2002 was
derived from the consolidated financial statements of Chicago Mercantile Exchange Holdings Inc. and
subsidiaries and should be read in conjunction with the audited financial statements, related notes and
other financial information included elsewhere herein.
FOR YEAR ENDED OR AT DECEMBER 31
2002 2001 2000 1999 1998(in thousands, except per share data) (restated) (restated)
Income Statement Data:
Net revenues1 $«÷453,177 $2,387,153 $2,226,552 $«÷210,602 $«÷197,165
Operating expenses2 298,948 261,387 241,814 203,958 182,972
Limited partners’ interest in earnings
of PMT Limited Partnership — — (1,165) (2,126) (2,849)
Net income (loss)2 94,067 75,108 (10,496) 2,663 7,029
Earnings (loss) per share:2, 3
Basic $÷÷«÷÷3.24 $÷÷«÷÷2.61 $«÷«÷÷(0.36) $÷÷«÷÷0.09 $÷÷«÷÷0.24
Diluted ÷÷«÷÷3.13 ÷÷«÷÷2.57 — ÷÷«÷÷0.09 ÷÷«÷÷0.24
Balance Sheet Data:
Shareholders’ equity2 $0,446,139 $2,248,366 $2,166,262 $«÷168,663 $«÷166,897
Total assets2 3,355,016 2,066,878 2,384,035 303,467 295,090
Other Data:
Total trading volume (round turn trades) 558,448 411,712 231,110 200,737 226,619
GLOBEX volume (round turn trades) 197,975 81,895 34,506 16,135 9,744
Open interest at year-end (contracts) 18,792 15,039 8,021 6,412 7,282
1 For the years ended December 31, 2002 and 2001, revenues are net of securities lending interest expense. Securitieslending transactions began in June 2001.
2 Income statement and balance sheet data for 2001 and 2000 have been restated to reflect the adoption of SFAS No. 123,“Accounting for Stock-Based Compensation.” As previously reported, net income (loss) was $68.3 million and ($5.9) for2001 and 2000, respectively. Basic and diluted earnings per share were $2.37 and $2.33, respectively, for 2001, and the basic loss per share was $0.21 for 2000.
3 Earnings per share are presented as if common stock issued on December 3, 2001 as part of our reorganization into a holdingcompany structure had been outstanding for all periods presented. For 2000, diluted loss per share is not presented, sinceshares issuable for stock options would have an anti-dilutive effect.
25
SELECTED FINANCIAL DATA
02 AR Financials 2/27/03 2:25 PM Page 25

26
Corporate Structure
We are the largest futures exchange in the United States and the second largest in the world for the
trading of futures and options on futures, as measured by 2002 annual trading volume. Our international
marketplace brings together buyers and sellers on our trading floors, as well as through our GLOBEX
electronic trading platform and privately negotiated transactions. We offer market participants the oppor-
tunity to trade futures contracts and options on futures primarily in four product areas: interest rates,
stock indexes, foreign exchange and commodities.
Our exchange was organized in 1898 as a not-for-profit membership organization. On November 13,
2000, we became the first U.S. financial exchange to become a for-profit corporation by converting
membership interests into shares of common stock. As a result of our conversion into a for-profit corporation,
individuals and entities who, at the time, owned trading privileges on our exchange became the owners
of all of the outstanding equity of CME. As part of our demutualization, we also purchased all of the
assets and liabilities of P-M-T Limited Partnership, or PMT, an Illinois limited partnership that operated
the GLOBEX electronic trading platform.
On December 3, 2001, we completed our reorganization into a holding company structure. As a result
of the reorganization, CME became a wholly owned subsidiary of CME Holdings. In our reorganization,
CME shareholders exchanged their shares for shares of CME Holdings. After the reorganization, these
shareholders owned the same percentage of CME Holdings common stock that they previously owned
of CME common stock. CME shareholders retained their memberships and trading privileges in CME.
Prior to the reorganization, CME Holdings had no significant assets or liabilities. Our financial statements
have been prepared as if the holding company structure had been in place for all periods presented.
On December 11, 2002, CME Holdings completed the initial public offering of its Class A common
stock. CME Holdings’ Class A common stock is now listed on the New York Stock Exchange under
the ticker symbol “CME.” All 5,463,730 shares of Class A common stock, including an aggregate of
712,660 shares of Class A common stock covered by an over-allotment option granted by CME
Holdings to the underwriters, were sold at a price to the public of $35.00 per share. Of the 5,463,730
shares sold in the offering, 3,712,660 shares were sold by CME Holdings and 1,751,070 shares were
sold by selling shareholders. The net proceeds to CME Holdings from the offering were approximately
$117.5 million, after deducting underwriting discounts and commissions paid to the underwriters and
other expenses incurred in connection with the offering. CME Holdings did not receive any proceeds
from the sale of shares by the selling shareholders.
As a not-for-profit membership organization, our business strategy and fee structure were designed
to offer profit opportunities for our members and to limit our profits beyond that necessary to provide
for sufficient working capital and infrastructure investment. Membership provided individuals and clearing
firms with exclusive direct access to our markets, allowing them to profit from proprietary trading and
customer execution. We provided some infrastructure services at a significant discount or as a membership
benefit and, on occasion, offered fee holidays or fee rebates. For example, in 1998 we paid a rebate of
$17.6 million to our clearing firms and member brokers, which had a negative impact on our profitability,
as did other fee reductions implemented prior to our demutualization. As a result, our financial results
for periods prior to our demutualization may not be indicative of such results in subsequent periods.
Consequently, comparisons of periods before and after demutualization may not be meaningful.
In conjunction with our demutualization and corporate reorganization, we adopted a for-profit
business strategy that has been integrated into our operations. As part of this integration process, we
have examined and will continue to examine the fees we charge for our products in order to increase
revenues and profitability, provide incentives for members and non-members to use our markets and
enhance the liquidity of our markets. To enhance trading volume and promote new products, we offer
discounts, some of which may be significant, to our members and non-members to use our markets.
In the fourth quarter of 2000 and first quarter of 2001, we implemented changes to our fee structure.
These changes included: increasing clearing fees for some products; increasing the daily maximum
on GLOBEX fees for our E-mini™ products; implementing fees for order routing, delivery of agricultural
MANAGEMENT’S DISCUSSION AND ANALYSIS OF FINANCIAL CONDITION AND RESULTS OF OPERATIONS
02 AR Financials 2/27/03 2:25 PM Page 26

27
products and a surcharge for trades executed by one firm and cleared by another clearing firm (“give-ups”);
increasing fees for access to our trading floor by members and their employees; increasing fees for
the use of certain facilities on our trading floor; reducing GLOBEX fees for interest rate products; and
implementing reduced clearing fees for customers achieving certain volume levels in our interest rate
products. In addition, we increased the number of GLOBEX access choices, altered the pricing for
existing GLOBEX access choices, changed the type of market data offered through our non-professional
service offering and increased the price of our professional market data service offering. In contrast to
the fee rebates and other fee reductions implemented prior to our demutualization, this new approach
to fees has had a significant positive impact on our revenues and profitability. In addition, we maintained
a focus on expense discipline and specifically focused expenditures on projects designed to enhance
our profitability. The net impact of these factors contributed to the growth in our net income from
$7.0 million in 1998 to $94.1 million in 2002.
Overview
As the largest futures exchange in the United States, our revenue is derived primarily from the clearing
and transaction fees we assess on each contract traded through our trading venues or using our clearing
house. As a result, revenues fluctuate significantly with volume changes, and thus our profitability is
tied directly to the trading volume generated. Clearing and transaction fees are assessed based on the
product traded, the membership status of the individual executing the trade and whether the trade is
completed on our trading floor, through our GLOBEX electronic trading platform or as a privately negotiated
transaction. In addition to clearing and transaction fees, revenues include quotation data fees, GLOBEX
access fees, communication fees, investment income, including securities lending activities, and other
revenue. Our securities lending activities generate interest income and related interest expense. We
present securities lending interest expense as a reduction of total revenues on our consolidated statements
of income to arrive at net revenues.
Net revenues increased from $197.2 million in 1998 to $453.2 million in 2002. As a result of the
increase in trading volume during this time period and the fee changes implemented primarily as a
result of our demutualization, the percentage of our revenues derived from clearing and transaction
fees increased and represented 78.6% of our net revenues in 2002, compared to 64.2% in 1998.
While volume has a significant impact on our clearing and transaction fees revenue, there are four
other factors that also influence this source of revenue: rate structure, mix of products traded, method
of trade and the percentage of trades executed by customers who are members compared to non-member
customers. Our fee structure is complex, and fees vary depending on the type of product traded.
Therefore, our revenue increases or decreases if there is a change in trading or usage patterns. Trades
executed through GLOBEX are charged fees for using the electronic trading platform in addition to the
clearing fees assessed on all transactions executed on our exchange. Trades executed as privately negotiated
transactions also incur additional charges beyond the clearing fees assessed on all transactions. In
addition, non-member customers are charged higher fees than customers who are members. Our
revenue decreases if the percentage of trades executed by customers who are members increases,
and increases if the percentage of trades executed by non-member customers increases, even when
our fee structure remains unchanged. As a result, there are multiple factors that can change over time,
and these changes all potentially impact our revenue from clearing and transaction fees.
Our quotation data fees represent our second largest source of revenue. Revenue from these fees
has increased a total of 21.6% from 1998 to 2002. In 2002, these fees represented 10.8% of our net
revenues. In 1998, we began to generate revenue from fees assessed for access to our GLOBEX
electronic trading platform. In June 2001, we began to engage in securities lending activities, which
has contributed modestly to our net revenues for 2002. Revenue derived from communication fees
has remained relatively constant from 1998 to 2002. However, investment income has experienced
a decline, primarily as a result of the decline in interest rates since 2000. In general, other revenue has
increased in a manner consistent with our net revenues from 1998 to 2002.
02 AR Financials 2/27/03 2:25 PM Page 27

Expenses increased from $183.0 million in 1998 to $298.9 million in 2002. The rate of increase in
expenses has been lower than the rate of increase in revenues. The majority of our expenses fall into
three categories: salaries and benefits; communications and computer and software maintenance;
and depreciation and amortization. Additional expenses are also incurred for stock-based compensation,
occupancy, professional fees, public relations and promotion and other expenses. Our salaries and
benefits expense has increased 58.7% from 1998 to 2002 and represented 38.4% of our total 2002
expenses. A significant component of the increase in expenses, stock-based compensation, began in
2000 and is a non-cash expense that results primarily from the option granted to our Chief Executive
Officer as well as other stock-based compensation resulting from stock grants to certain other employees.
In addition, in 2000, we incurred $9.8 million of expenses associated with restructuring of management,
our demutualization and the write-off of certain internally developed software that could not be utilized
as intended. Also, in 2002, we incurred $6.2 million of expense to settle certain patent litigation.
With the exception of license fees paid for the trading of our stock index contracts and a component
of our trading facility rent that is related to open outcry trading volume, most of our expenses do not
vary directly with changes in trading volume. The number of transactions processed, rather than the
number of contracts traded, tends to impact expenses as a result of technology expenses required to
process additional transactions. A trade executed on our exchange represents one transaction, regardless
of the number of contracts included in that trade. Therefore, total contract trading volume is greater
than the number of transactions processed.
Revenues
Our net revenues have grown from $197.2 million in 1998 to $453.2 million in 2002. Our clearing and
transaction fees revenues are tied directly to volume and underlying market uncertainty. We attempt
to mitigate the downside of unpredictable volume swings through various means, such as increasing
clearing fees, creating volume incentives, opening access to new markets and further diversifying the
range of products and services we offer. The annual growth in daily trading volume from 1998, when
average daily volume was 899,281 contracts, to 2002 is summarized as follows:
YEAR ENDED DECEMBER 31
(in round turn trades) 1999 2000 2001 2002
Average Daily Volume 793,425 917,120 1,640,288 2,216,063
Increase (Decrease) from Previous Year (105,856) 123,695 723,168 575,775
Percentage Increase (Decrease) from Previous Year (11.8) % 15.6% 78.9% 35.1%
Total trading volume in our interest rate products increased 12.8% in 2002 over 2001. Total trading volume
in our equity products rose 103.9% in 2002 over 2001. During 2002, total trading volume in our foreign
exchange products increased 8.3% over levels in 2001. Our commodity products total trading volume
declined 10.9% in 2002 as compared to 2001. In general, volume increased as a result of economic and
geopolitical factors, enhancements to our product and service offerings and expansion of our electronic
and other trade execution choices. Global and national economic and political uncertainty generally
results in increased trading activity, as our customers seek to hedge, manage or speculate on the risks
associated with fluctuations in interest rates, equities, foreign exchange and commodities. In recent periods,
our trading volume has been positively affected by the increased volatility in the markets for equity and
fixed-income securities. Products and services offered also have a significant effect on volume. We built
on earlier successes in our standard S&P 500 and NASDAQ-100 stock index contracts by introducing
E-mini versions of the S&P 500 contract in 1997 and the NASDAQ-100 contract in 1999. E-mini contracts
are one-fifth the size of the standard contract. These E-mini contracts are traded only through GLOBEX,
28
02 AR Financials 2/27/03 2:25 PM Page 28

29
our electronic trading platform. In addition, since 1998, we significantly upgraded our GLOBEX electronic
trading platform, and, beginning in November 2000, we modified GLOBEX policies to give more users
direct access to our markets. A comparison of our average daily trading volume by venue and the related
percentage of clearing and transaction fees associated with each venue are illustrated in the table below:
APPROXIMATE PERCENTAGE OF CLEARING AVERAGE DAILY VOLUME AND TRANSACTION FEES REVENUES
(in round turn trades) 1998 2002 Increase 1998 2002
Method of Trade:
Open Outcry 830,687 1,398,698 568,011 70% 50%
GLOBEX 38,668 785,615 746,947 9 42
Privately Negotiated 29,926 31,750 1,824 21 8
Total 899,281 2,216,063 1,316,782 100% 100%
While the increase in clearing and transaction fees generally has resulted from increased trading
volume, the largest factors contributing to the increase in clearing and transaction fees from 1999 to 2000
were the rate increases and new transaction fees implemented in the fourth quarter of 2000, after our
demutualization. Additional revenue was also generated in 2000 by the 15.1% increase in total trading
volume and an increase in the percentage of trades executed through GLOBEX. Partially offsetting these
increases was a decrease in the percentage of trades attributable to non-member customers, who are
charged higher fees than members, and a decrease in the percentage of total volume attributable to our
standard equity products, from which we earn higher clearing fees than other contracts. By contrast, the
increase in clearing and transaction fees from 2000 to 2001 resulted primarily from the increase in trading
volume and was augmented by the rate increases and new transaction fees implemented in the fourth
quarter of 2000 and first quarter of 2001. Our revenues from clearing and transaction fees would have
been higher in 2001 if the percentage of trading volume attributable to interest rate products, which are
charged lower clearing fees than some of the other products offered through our exchange, had not
increased compared to such other products. However, management believes the volume achieved, in
part as a result of this pricing structure, enhances the liquidity of these products. The increase in trading
volume was the primary reason for the increase in revenues from clearing and transaction fees in 2002
when compared to 2001. Partially offsetting this 2002 volume increase was the impact of certain volume
discounts, fee limits and a decrease in the percentage of trades executed by non-member customers.
Our clearing and transaction fees revenues, stated as an average rate per contract, are illustrated
in the table below:
YEAR ENDED DECEMBER 31
(in thousands, except rate per contract) 1998 1999 2000 2001 2002
Clearing and Transaction Revenues $«126,524 $«140,305 $«156,649 $«292,459 $«356,396
Total Contracts Traded 226,619 200,737 231,110 411,712 558,448
Average Rate per Contract $÷÷«0.558 $÷÷«0.699 $÷÷«0.678 $÷÷«0.710 $÷÷«0.638
02 AR Financials 2/27/03 2:25 PM Page 29

While the average rate per contract has increased from 1998 to 2002, it has fluctuated from $0.558 in 1998
to a peak of $0.710 in 2001. This overall increase is attributable primarily to the pricing changes implemented
in the fourth quarter of 2000 and first quarter of 2001, after our demutualization, as well as growth in the
percentage of trades executed through GLOBEX. The average rate per contract in 1998 was the lowest
of any year during the five-year period reflected in the table above as a result of fee reductions and rebates.
Despite the pricing changes in the fourth quarter of 2000, there was a decrease in the average rate per
contract in 2000 that resulted primarily from an increase in the percentage of total volume from Eurodollar
products, as these products have a lower average rate per contract, and a decline in the percentage
of trades for non-member customers. The decline in the average rate per contract from 2001 to 2002
resulted primarily from volume discounts on certain products, limits on some fees associated with trading
through the GLOBEX platform and a decrease in the percentage of trades attributed to non-members.
We believe our lower fee structure for members has resulted in the acquisition of the trading rights
associated with our Class B shares by parties intending to trade significant volumes on our exchange,
creating an increase in member volume and a decrease in non-member volume. In addition, in 2002,
our clearing and transaction revenue was reduced by $4.8 million as a result of payments to clearing
firms relating to our fee adjustment policy and clearing firm account management errors.
Our volume discounts for Eurodollar contracts will change effective March 1, 2003. The discount
for Eurodollar contracts will be $0.04 per contract for daily trading volume in excess of 10,000 contracts.
Volume for futures and options on futures will be calculated separately for purposes of applying this
discount. The current discount is $0.05 per contract for trading volume in excess of 7,500 contracts per
day, with the discount increasing to $0.07 per contract for trading volume in excess of 15,000 contracts
per day. Volume on futures and options on futures is currently combined for purposes of calculating
this discount. Also, effective March 1, 2003, we are implementing an incentive plan to promote liquidity
in the back months of our Eurodollar complex by offering incentives for high volume traders. The total
expense under this incentive plan will not exceed $4.0 million for the ten-month period ending
December 31, 2003. Future changes in fees, volume discounts, limits on fees and member discounts,
including some that may be significant, may occur periodically based on management’s review of our
operations and business environment.
Our second largest source of revenue is quotation data fees, which we receive from the sale of
our market data. Revenues from market data products represented 10.8% of our net revenues in 2002.
In general, our market data service is provided to two types of customers. Since March 2001, our non-
professional service has been provided to customers who typically only require market data provided
in one-minute snapshots or on a limited group of products, such as our E-mini products. The fee for this
service is relatively nominal and is a flat rate per month. Subscribers to our professional service receive
market data on all our products on a real-time streaming basis. Fees for the professional service are
higher than the non-professional service. Professional customers pay one price for the first device, or
screen, at each physical location displaying our market data and a lower price for each additional screen
displaying our market data at the same location. Pricing for our market data services is based on the
value of the service provided, our cost structure for the service and the price of comparable services
offered by our competitors. The pricing of quotation data services was increased on March 1, 2001 as
part of the pricing changes implemented in 2001. Increases or decreases in our quotation data revenue
will be influenced by changes in our price structure for existing market data offerings, introduction of
new market data services and changes in the number of subscribers. In addition, general economic factors
will influence revenue from our market data fees. For example, the recent downsizing in the brokerage
industry has contributed to a decline in the number of screens displaying our market data and has
adversely affected the growth in our market data revenue in 2002.
At year-end 2002, nearly 54,000 subscribers displayed our data on approximately 175,000 screens
worldwide, compared to approximately 48,000 subscribers and approximately 190,000 screens at year-end
2001. With the exception of 2000, revenues from quotation data fees have grown each year for the last
five years. In 2000, we began to offer a lower-priced non-professional service that increased the number of
30
02 AR Financials 2/27/03 2:25 PM Page 30

31
subscribers but adversely affected revenue as some of our existing customers switched to this lower-
priced service. When this service was changed from real-time streaming to one-minute snapshots of
market data in 2001, the number of subscribers to this service declined. Partially offsetting this decrease
was the effect of some subscribers to our previous non-professional service switching to our professional
service to obtain real-time streaming of market data. In addition, we began to offer a new non-profes-
sional service late in 2001 to allow subscribers to obtain market data limited to our E-mini products.
At December 31, 2002, there were approximately 16,000 subscribers to this E-mini market data service.
The combined effect of these changes was a net decline in the total number of non-professional subscribers
from nearly 25,000 at December 31, 2000 to approximately 21,000 at year-end 2002. In addition, one of
the major resellers of our quotes declared bankruptcy in February 2001. This reduced our revenue from
quotation data fees by $1.4 million in 2000 and $0.5 million in 2001.
In 2002, the two largest resellers of our market data represented approximately 48% of our quotation
data fees revenue. Should one of these vendors no longer subscribe to our market data, we believe
the majority of that firm’s customers would likely subscribe to our market data through another reseller.
Therefore, we do not believe we are exposed to significant risk from the loss of revenue received from
any particular market data reseller.
Prices for our professional market data offering will increase effective April 1, 2003. Currently, these
customers are charged $60 per month for the first screen at each location and $12 per month for each
additional screen at the same location. The new pricing will be $50 per month for the first screen and
$20 per month for each additional screen at the same location. At December 31, 2002, there were
approximately 33,000 subscribers to our professional market data offering and approximately 126,000
additional screens.
GLOBEX access fees are the connectivity charges to customers of our electronic trading platform.
The fee each customer is charged varies depending on the type of connection provided. There is a
corresponding communication expense associated with providing these connections that varies based
on the type of connection selected by the customer. Increases or decreases in revenue from GLOBEX
access fees are influenced by changes in the price structure for our existing GLOBEX access choices,
the introduction of new access choices and our ability to attract new users to our electronic trading
platform. In addition, GLOBEX access fees are affected by some of the same factors that influence
the general level of activity in electronic trading, including the products offered, quality of execution
services and general economic conditions affecting our markets.
Communication fees consist of charges to members and firms that utilize our various telecommuni-
cations networks and communications services. Revenue from communication fees is dependent on
open outcry trading, as a significant portion relates to telecommunications on the trading floor. There
is a corresponding variable expense associated with providing these services.
Investment income represents interest income and net realized gains and losses from our marketable
securities, from the trading securities in our non-qualified deferred compensation plans, and from income
generated by the short-term investment of clearing firms’ cash performance bonds and security deposits.
Investment income is influenced by our operating results, market interest rates and changes in the levels
of cash performance bonds deposited by clearing firms. The total cash performance bonds deposited by
clearing firms is a function of the type of collateral used to meet performance bond requirements, the
number of open positions held by clearing firms and volatility in our markets. As a result, the amount
of cash deposited by clearing firms is subject to significant fluctuation. For example, cash performance
bonds and security deposits totaled $156.0 million at December 31, 2000, compared to $855.2 million
at December 31, 2001 and $1.8 billion at December 31, 2002. In addition, clearing firms may choose to
deposit cash in a foreign currency. Our ability to generate investment income from clearing firms’ cash
performance bonds and security deposits is impacted by the currency received and the interest rates
prevailing in the country for that particular currency. The investment results of our non-qualified deferred
compensation plans that are included in investment income do not affect net income, as there is an equal
and offsetting impact to our salaries and benefits expense. In the third quarter of 2002, we changed our
02 AR Financials 2/27/03 2:25 PM Page 31

investment policy and converted our marketable securities to short-term investments. Therefore, beginning
with the fourth quarter of 2002, all investments are short-term in nature, and consist of institutional
money market funds and U.S. Government agency securities that mature within seven days of purchase.
Beginning late in the second quarter of 2001, we entered into securities lending transactions utilizing
a portion of the securities that clearing firms deposited to satisfy their proprietary performance bond
requirements. Securities lending interest income is presented separately in the consolidated statements
of income. Substantial interest expense is incurred as part of this securities lending activity and is
presented as a deduction from total revenues to arrive at net revenues.
Other revenue is composed of fees for trade order routing and various services to members, as
well as fees for administering our Interest Earning Facility program, or IEF, which consists of money
market funds managed by third party investment managers. We offer clearing firms the opportunity to invest
cash performance bonds in our IEF. These clearing firms receive interest income, and we receive a
fee based on total funds on deposit. In 2001, we implemented an addition to our IEF program, called
IEF2, which allows clearing firms to invest directly in public money market mutual funds through a special
facility provided by us. Other revenue also includes trading revenue generated by GFX, our wholly
owned subsidiary that trades in foreign exchange and Eurodollar futures contracts to enhance liquidity
in our markets for these products, fines assessed to members for violations of exchange rules and revenue
from the sale of our SPAN software. In 2001, we entered into a joint venture, OneChicago, to trade
single stock futures and futures on narrow-based stock indexes. We currently have a 40% ownership
interest in the joint venture. Our share of the net loss from this joint venture is included in other revenue
as well as revenue we receive for providing certain regulatory, clearing and technology services to
OneChicago.
A substantial portion of our clearing and transaction fees, telecommunications fees and various
service charges included in other revenue are billed to the clearing firms of the exchange. The majority
of clearing and transaction fees received from clearing firms represent charges for trades executed
on behalf of the customers of the various clearing firms. There are currently approximately 70 clearing
firms. In 2002, one firm, with a significant portion of customer revenue, represented approximately
11% of our net revenues. Should a clearing firm withdraw from the exchange, we believe the customer
portion of that firm’s trading activity would likely transfer to another clearing firm of the exchange.
Therefore, we do not believe we are exposed to significant risk from the loss of revenue received from
any particular clearing firm.
Expenses
Our expenses have grown from $183.0 million in 1998 to $298.9 million in 2002. The increase in total
annual expenses since 1998 is illustrated in the table below:
YEAR ENDED DECEMBER 31
(in thousands) 1999 2000 2001 2002
Total Expenses $«203,958 $«241,814 $«261,387 $«298,948
Total Increase From Previous Year ÷«20,986 37,856 19,573 ÷«37,561
Percentage Increase From Previous Year 11.5% 18.6% 8.1% 14.4%
Salaries and benefits expense is our most significant expense and includes employee wages, bonuses,
related benefits and employer taxes. Changes in this expense are driven by increases in wages as a
result of inflation or labor market conditions, the number of employees, rates for employer taxes and
price increases affecting benefit plans. This expense, combined with stock-based compensation,
accounted for $118.7 million, or 39.7% of total expenses, for 2002. Annual bonus payments also vary
from year to year and have a significant impact on total salaries and benefits expense. This expense has
increased each year for the years 1998 to 2001 and remained relatively constant from 2001 to 2002.
The number of employees increased from 940 at December 31, 1998 to 1,152 at December 14, 2002.
32
02 AR Financials 2/27/03 2:25 PM Page 32

33
Stock-based compensation is a non-cash expense related to stock options and restricted stock grants.
The most significant portion of this expense relates to our CEO’s stock option, granted in February 2000
for 5% of all classes of our common stock outstanding at the date of demutualization. For accounting
purposes, the option was treated as a stock appreciation right prior to our demutualization. At year-end
2002, we adopted the fair value recognition provisions of Statement of Financial Accounting Standards
(SFAS) No. 123, “Accounting for Stock-Based Compensation,” as amended by SFAS No. 148. As a result,
all prior periods presented have been restated to reflect stock-based compensation expense that would
have been recognized had the provisions of SFAS No. 123 been applied to all options granted to employees
during those periods. Stock-based compensation expense totaled $8.2 million in 2000, $6.2 million in 2001
and $3.8 million in 2002 and did not occur prior to 2000. The expense related to our CEO’s option was
$8.2 million, $3.5 million and $1.8 million for the years ended December 31, 2000, 2001 and 2002,
respectively. Beginning in the second quarter of 2001, restricted stock grants and options were awarded to
certain employees. The portion of stock-based compensation expense related to these awards was $2.7
million for the year ended December 31, 2001 and $2.0 million for the year ended December 31. 2002.
Occupancy costs consist primarily of rent, maintenance and utilities for our offices, trading facilities
and remote data center. Our office space is primarily in Chicago, and we have smaller offices in
Washington, D.C., London and Tokyo. Occupancy costs are relatively stable, although our trading floor
rent fluctuates to a limited extent based on open outcry trading volume. In 2002, our occupancy costs
increased primarily as a result of the addition of the remote data center. In 2002, we also signed an
extension of our Chicago office lease. As a result, this office lease now expires in November 2008.
Professional fees, outside services and licenses expense consists primarily of consulting services
provided for major technology initiatives, license fees paid as a result of trading volume in stock index
products and legal and accounting fees. This expense fluctuates primarily as a result of changes in
requirements for consultants to complete technology initiatives, stock index product trading volume
changes that impact license fees and other undertakings that require the use of professional services.
Communications and computer and software maintenance expense consists primarily of costs
for network connections with our GLOBEX customers; maintenance of the hardware and software
required to support our technology; telecommunications costs of our exchange; and fees paid for
access to market data. This expense is affected primarily by the growth of electronic trading. Our computer
and software maintenance costs are driven by the number of transactions processed, not the volume
of contracts traded. We processed approximately 75% of total transactions electronically in 2002
compared to approximately 65% in 2001, which represented approximately 35% and 20%, respectively,
of total contracts traded.
Depreciation and amortization expense results from the depreciation of fixed assets purchased and
acquired under capitalized leases, as well as amortization of purchased and internally developed software.
This expense increased as a result of significant technology investments in equipment and software
that began in late 1998 and has led to additional depreciation and amortization in the following years.
Public relations and promotion expense consists primarily of media, print and other advertising
expenses, as well as expenses incurred to introduce new products and promote our existing products
and services. Also included are seminar, conference and convention expenses for attending trade shows.
Expenses of this nature have decreased from $9.6 million in 1998 to $6.5 million in 2002. During this time
period, the emphasis of our promotion efforts shifted from print advertising and brochures to direct contact
with our primary customers and Internet availability of our promotional materials. We also discontinued
certain incentive programs. In 1999, additional expenses were incurred to promote the introduction
of our E-mini stock index products and the introduction of daytime electronic trading in our Eurodollar
contracts on a limited basis. These products were introduced to increase our trading volume as well
as to respond to increased competition. We expect public relations and promotion expense to increase
in the near term to enhance brand awareness. Specifically, in the first quarter of 2003, we initiated a
brand advertising campaign that will result in approximately $6 million of additional expense for the
year. Approximately $5.5 million of this additional expense will occur in the first quarter of 2003.
02 AR Financials 2/27/03 2:25 PM Page 33
Other expense consists primarily of travel, staff training, fees incurred in providing product delivery
services to customers, stipends for our board of directors, interest for equipment purchased under capital
leases, meals and entertainment, fees for our credit facility, supplies, postage and various state and
local taxes. Other expense fluctuates, in part, due to changes in demand for our product delivery services
and decisions regarding the manner in which to purchase capital equipment. Certain expenses, such as
those for travel and entertainment, are more discretionary in nature and can fluctuate from year to year
as a result of management decisions. In 2003, we anticipate an increase in certain insurance expenses
included primarily in other expense. This is the result of increased provisions and rates for certain coverage,
including directors and officers liability insurance.
Net Income
Net income for 1998 was $7.0 million, declined in the next two years to a loss of $10.5 million in 2000
and rebounded to net income of $75.1 million in 2001 and $94.1 million in 2002. The decline from 1998
through 2000 resulted from a variety of factors. Trading volume declined from 1998 to 1999, but the
percentage of trades executed through GLOBEX continued to increase. A significant portion of the
expense increase in 1999 was for depreciation and amortization that resulted from capital expenditures
related to our technology. The net loss in 2000 resulted primarily from our management restructuring,
the expense associated with the stock option granted to our CEO, demutualization and the write-off of
certain internally developed software that could not be used as intended. Increased volume combined
with the change in our pricing structure following our demutualization drove the change in operating
results from 2000 to 2002.
Net income from 1998 through 2000 was adversely affected by the limited partners’ interest in the
earnings of PMT. Prior to our demutualization, PMT owned all rights to electronic trading of our products,
received the revenue generated from electronic trading and was charged for our services to support
electronic trading. The limited partners were entitled to a portion of the income of PMT, which totaled
$2.8 million in 1998, $2.1 million in 1999 and $1.2 million in 2000. We purchased PMT’s net assets as
part of our demutualization.
Our initial public offering was completed in December 2002 and resulted in the issuance of an
additional 3.7 million shares of Class A common stock. As a result, our earnings per share in 2003 will
be adversely impacted by the increase in the number of shares outstanding.
Restatement
At year-end 2002, we adopted the fair value expense recognition provisions of Statement of Financial
Accounting Standards (SFAS) No. 123, “Accounting for Stock-Based Compensation,” as amended by
SFAS No. 148, and we elected the retroactive restatement method of adoption. As a result, we have
restated our consolidated financial statements for the years 2000 and 2001 and our quarterly results
for 2002 through the nine months ended September 30, 2002 to reflect the fair value expense of all
employee stock options, rather than the intrinsic value method that had previously been utilized under
Accounting Principles Board (APB) Opinion No. 25, “Accounting for Stock Issued to Employees.”
34
02 AR Financials 2/27/03 2:25 PM Page 34

35
Critical Accounting Policies
The notes to our consolidated financial statements include disclosure of our significant accounting policies.
In establishing these policies within the framework of accounting principles generally accepted in the
United States, management must make certain assessments, estimates and choices that will result
in the application of these principles in a manner that appropriately reflects our financial condition and
results of operations. Critical accounting policies are those policies that we believe present the most
complex or subjective measurements and have the most potential to impact our financial position and
operating results. While all decisions regarding accounting policies are important, we believe there are
two accounting policies that could be considered critical. These two critical policies, which are presented
in detail in the notes to our consolidated financial statements, relate to stock-based compensation and
clearing and transaction fees.
The accounting for stock-based compensation is complex, and under certain circumstances,
accounting principles generally accepted in the United States allow for alternative methods. As permitted,
through September 30, 2002, we elected to account for stock-based compensation using the intrinsic
value method in accordance with APB Opinion No. 25 rather than the alternative fair value method
prescribed in SFAS No. 123, “Accounting for Stock-Based Compensation.” As a result, variable accounting
was required for the options granted to our CEO as a result of certain provisions of the option agreement.
Through September 30, 2002, the expense related to this option fluctuated based on the change in the
value of our Class A shares and the underlying trading rights on our exchange associated with our Class
B common stock. At year-end 2002, we adopted the fair value method for expensing stock options under
the provisions of SFAS No. 123, as amended, and elected the retroactive restatement method of adoption.
All prior periods presented have been restated to reflect stock-based compensation expense that would
have been recognized had the provisions of SFAS No. 123 been applied to all stock options granted to
employees, including the option granted to our CEO, during the periods presented. As a result of this
retroactive restatement, our previously reported net loss for 2000 increased from $5.9 million to a restated
loss of $10.5 million, and our previously reported net income for 2001 increased from $68.3 million to a
restated net income of $75.1 million. For 2002, stock-based compensation expense using the fair value
method totaled $3.8 million. If the provisions of SFAS No. 123 had not been adopted at year-end 2002,
stock-based compensation expense for the year 2002 would have totaled $36.9 million, resulting in
a reduction in net income of $20.2 million from the net income reflected in our consolidated financial
statements. We have elected the accelerated method for recognizing the expense related to stock
options. As a result of this election and the vesting provisions of our stock grants, a greater percentage
of the total expense for all options is recognized in the first year of the vesting period than would be
recorded if we used the straight-line method.
Clearing and transaction fees are recorded as revenue and collected from clearing firms on a monthly
basis. Several factors affect the fees charged for a trade, including whether the individual making the
trade has trading privileges on our exchange. In the event inaccurate information provided by the clearing
firm has resulted in an incorrect fee, the clearing firm has a period of three months following the month
in which the trade occurred to submit the correction and have the fee adjusted. When preparing financial
statements for a reporting period, an estimate is made of anticipated fee adjustments applicable to the
three months prior to the end of the reporting period. This estimate is recorded as a liability with a
corresponding reduction to clearing and transaction fees revenue and is based on historical trends for
such adjustments. Our estimate of anticipated fee adjustments at year-end 2002 was $3.1 million.
02 AR Financials 2/27/03 2:25 PM Page 35

Key Statistical Information
The following table presents key information on volume of contracts traded, expressed in round turn
trades, as well as information on open interest and notional value of contracts traded.
YEAR ENDED DECEMBER 31
(in thousands) 2002 2001 2000 1999 1998
Average Daily Volume
Product Areas:
Interest Rate 1,226,343 1,091,846 550,810 475,023 574,829
Equity 863,271 425,149 258,120 189,984 174,840
Foreign Exchange 96,289 89,290 76,615 94,747 113,948
Commodity 30,160 34,003 31,575 33,671 35,664
Total Average Daily Volume 2,216,063 1,640,288 917,120 793,425 899,281
Method of Trade:
Open Outcry 1,398,698 1,282,147 754,049 698,011 830,687
GLOBEX 785,615 326,274 136,928 63,782 38,668
Privately Negotiated 31,750 31,867 26,143 31,632 29,926
Total Average Daily Volume 2,216,063 1,640,288 917,120 793,425 899,281
Largest Open Interest (contracts) 24,804,321 18,900,911 9,324,154 8,799,641 10,174,734
Total Notional Value (in trillions) $«328.6 $«293.9 $«155.0 $«138.3 $«161.7
36
02 AR Financials 2/27/03 2:25 PM Page 36

37
Year Ended December 31, 2002 Compared to Year Ended December 31, 2001
Overview
Our operations for the year ended December 31, 2002 resulted in net income of $94.1 million compared
to net income of $75.1 million for the year ended December 31, 2001. The increase in net income resulted
primarily from a 17.1% increase in net revenues that was only partially offset by a 14.4% increase in
operating expenses. The increase in net revenues was driven by a 35.6% increase in total trading volume
during 2002 when compared to 2001. However, the percentage growth in volume did not result in an
equal percentage growth in revenue as volume incentive programs, which include limits on GLOBEX fees
for E-mini contracts and volume discounts for customers trading large volumes of our Eurodollar products,
had a greater impact on revenue from clearing and transaction fees during 2002. Contributing to the
overall increase in expenses was the settlement of the Wagner patent litigation in August 2002, and a
subsequent agreement in December 2002 with Euronext for reimbursement of one-half of the settlement
amount. The net result of these two agreements was a one-time expense of $6.2 million for 2002. Partially
offsetting the overall increase in expenses was a decrease in stock-based compensation, a non-cash
expense, from $6.2 million in 2001 to $3.8 million in 2002. Our operating margin was 34.0% for 2002
compared to 32.5% for 2001. Excluding stock-based compensation, our operating margin would have
been 34.9% in 2002 compared to 34.1% in 2001. Excluding both the Wagner patent litigation settlement
and stock-based compensation, our operating margin for 2002 would have increased to 36.3%.
Trading volume for 2002 totaled a record 558.4 million contracts, representing an average daily trading
volume of 2.2 million contracts. This was a 35.6% increase over the 411.7 million contracts traded during
2001, representing an average daily trading volume of 1.6 million contracts. On October 31, 2002, we
experienced a new single-day total trading volume record of nearly 5.9 million contracts, surpassing the
previous record of nearly 4.3 million contracts established on June 27, 2002. This volume record on
October 31, 2002 included 2.6 million contracts from the launch of an additional TRAKRS contract (Total
Return Assets Contracts), a product line developed with Merrill Lynch that first traded on July 31, 2002.
The launch date of each new TRAKRS contract includes orders taken since the product was announced.
In addition, the month of October 2002 represented our busiest month ever with total trading volume
of 61.5 million contracts, and total trading volume excluding TRAKRS of 58.7 million contracts. GLOBEX
volume exceeded one million contracts for a single day for the first time on June 12, 2002 and exceeded
one million contracts on 42 days through the end of 2002. A new GLOBEX volume record was estab-
lished on July 24, 2002, when 1.5 million contracts were traded. These GLOBEX volume records
exclude the volume related to TRAKRS contracts.
Revenues
Total revenues increased $72.5 million, or 18.3%, from $396.6 million for 2001 to $469.1 million for 2002.
Net revenues increased $66.0 million, or 17.1%, from 2001 to 2002. The increase in revenues was attrib-
utable primarily to a 35.1% increase in average daily trading volume in 2002. The increase represented
our third consecutive year of record trading volume and marked the second year our exchange was the
largest futures exchange in the United States, based on annual trading volume. In 2002, electronic trading
volume represented 35.5% of total trading volume, or 785,615 contracts per day, a 140.8% increase
over the year 2001. Open outcry trading volume averaged 1,398,698 contracts per day in 2002, a 9.1%
increase over the year 2001. Increased trading volume levels resulted from continued volatility in U.S.
stocks and currencies; the anticipation of possible changes in interest rates; increased customer demand
for the liquidity provided by our markets; product offerings that allowed customers to manage their
risks; and enhanced access choices to our products. Partially offsetting these volume increases, and
02 AR Financials 2/27/03 2:25 PM Page 37

the related increase in clearing and transaction fees, was a decline in investment income resulting
primarily from a decrease in rates earned on our marketable securities, short-term investments and the
short-term investment of clearing firms’ cash performance bonds and security deposits; a decrease in
the trading revenue generated by our trading subsidiary, GFX; and our share of the net loss of OneChicago,
our joint venture in single stock futures and futures on narrow-based stock indexes that initiated trading
in November 2002.
Clearing and Transaction Fees. Clearing and transaction fees, which include clearing fees, GLOBEX
electronic trading fees and other volume-related charges increased $63.9 million, or 21.9%, from
$292.5 million in 2001 to $356.4 million in 2002. A significant portion of the increase was attributable
to the 35.1% increase in average daily trading volume. Also, in 2002, 39.0% of our trading volume related
to equity products, compared to 25.9% in 2001. This contrasts with our interest rate product volume, which
represented 55.3% of our trading volume in 2002, a decline from 66.6% in 2001. This shift in product
mix resulted in additional revenue in 2002 as the average rate per contract for equity products is greater
than the average rate per contract for interest rate products. In 2002, the additional revenue resulting from
these volume increases and product mix change was partially offset by a $4.8 million one-time payment
to clearing firms relating to our fee adjustment policy and clearing firm account management errors.
Despite the increase in revenue from clearing and transaction fees, the average rate, or revenue,
per contract decreased $0.072 from $0.710 in 2001 to $0.638 in 2002. Management believes the fee
limits for our E-mini equity products and volume discounts offered to large users of our Eurodollar products
contributed to increased overall trading volume but had a negative impact on our average rate per contract.
While volume discounts and limits on certain GLOBEX fees were in effect during both 2001 and 2002,
the average rate per contract for 2002 was more adversely impacted by these programs as increased
trading volume resulted in more trades being executed at the discounted levels. In addition, the volume
discounts for our Eurodollar products that were implemented in January 2001 were expanded in the
third quarter of 2001. While volume in Eurodollar contracts has grown, the larger volume discounts have
partially offset the additional revenue generated by the increased trading volume in this product. The
average rate per contract was also affected by the lower percentage of trades attributed to non-member
customers. The percentage of trades by non-members decreased to approximately 22% of total trading
volume in 2002 compared to approximately 25% in 2001. We believe our lower fee structure for members
has resulted in the acquisition of trading rights by parties intending to trade significant volumes on our
exchange, creating an increase in member volume. In addition, on July 31, 2002, we began trading a new
contract, Long-Short Technology TRAKRS, that was followed by two additional TRAKRS contracts in the
fourth quarter of 2002. Similar to limits on certain GLOBEX fees, transaction fees for this contract are
limited based on the size of the order and generally averaged $0.007 per contract. As a result, TRAKRS
volume has had an adverse impact on our overall rate per contract in 2002. If volume and fees for
TRAKRS were excluded from the 2002 rate per contract calculation, our average rate per contract
would have increased by approximately $0.011 to $0.649 from $0.638. Finally, the $4.8 million payment
to clearing firms relating to our fee adjustment policy and clearing firm account management errors
reduced our average rate per contract by $0.009 in 2002.
38
02 AR Financials 2/27/03 2:25 PM Page 38

39
The following table shows the average daily trading volume in our four product areas, the portion that
was traded electronically through the GLOBEX platform, and clearing and transaction fees revenues
expressed in total dollars and as an average rate per contract:
YEAR ENDED DECEMBER 31
PercentageIncrease/
Product Area 2002 2001 (Decrease)
Interest Rate 1,226,343 1,091,846 12.3%
Equity 863,271 425,149 103.1
Foreign Exchange 96,289 89,290 7.8
Commodity 30,160 34,003 (11.3)
Total Volume 2,216,063 1,640,288 35.1
GLOBEX Volume 785,615 326,274 140.8
GLOBEX Volume as a Percent of Total Volume 35.5% 19.9%%
Clearing and Transaction Fees Revenues (in thousands) $«356,396 $«292,459
Average Rate per Contract $÷÷«0.638 $÷÷«0.710
During 2002, volatility in U.S. equity markets continued. This volatility, combined with increased distri-
bution to customers through the available access choices to our GLOBEX platform and marketing efforts
to increase awareness of our product offerings, drove the growth in volume in our equity products.
Approximately 83% of our stock index product volume is traded through the GLOBEX platform. While the
U.S. Federal Reserve Board left interest rates unchanged until the fourth quarter of 2002, compared to 11
interest rate reductions in 2001, we continued to experience increased volume in our interest rate products.
Continued uncertainty over interest rates and volatility in U.S. stocks has led to increased use of our interest
rate products. With respect to foreign exchange products, the increase in trading volume was attributable
to the impact of instituting side-by-side trading of these products on our GLOBEX platform during open
outcry trading hours in April 2001, and additional volatility in the foreign exchange markets during 2002.
The decrease in average daily volume for the commodity products was primarily the result of the extensive
long-term drought that has depressed trading activity in our livestock products.
Quotation Data Fees. Quotation data fees increased $0.4 million, or 1.0%, from $48.3 million in 2001
to $48.7 million in 2002. The increase principally reflects the effect of fee increases, implemented in
March 2001, for the full year 2002 and an increase in the administrative fee for our quote vendor services,
effective January 2002. These increases were partially offset by a decline in the number of users of our
professional market data service that began in the second quarter of 2002, primarily as a result of recent
downsizing at a number of major brokerage firms. As a result, the number of screens displaying our
market data decreased from approximately 190,000 at December 31, 2001 to approximately 175,000
screens at December 31, 2002. This decline was partially offset by an increase in the number of subscribers
from approximately 48,000 at December 31, 2001 to approximately 54,000 at December 31, 2002. The
increase in subscribers occurred in our lower-priced non-professional E-mini market data service. Quotation
data fees for 2001 were adversely impacted by $0.5 million as a result of the bankruptcy filing of a vendor
that serves as a large distributor of our market data. There was no similar adverse event in 2002.
02 AR Financials 2/27/03 2:25 PM Page 39

GLOBEX Access Fees. GLOBEX access fees increased $0.9 million, or 8.0%, from $12.0 million in 2001
to $12.9 million in 2002. This increase resulted primarily from the additional monthly access fees generated
by an increased number of GLOBEX users during 2002. Partially offsetting this increase was a $0.5 million
decrease in installation revenue during 2002 when compared to 2001. When our pricing structure was
changed in February 2001, we increased our installation charges for certain access choices. Many customers
elected those access choices when they were first introduced. This resulted in an increase in installation
revenue in the second and third quarters of 2001 that was not repeated during 2002. In addition, some
new customers in 2002 selected access choices that do not require installation fees, such as our virtual
private network.
Communication Fees. Communication fees increased $0.4 million, or 4.3%, from $9.3 million in 2001
to $9.7 million in 2002. The increase resulted primarily from an increase in telecommunication services
and equipment provided on our trading floor and modest increases in fees for some of the wireless
services we provide.
Investment Income. Investment income decreased $1.3 million, or 13.6%, from $9.0 million in 2001 to
$7.7 million in 2002. The decline resulted primarily from a reduction in rates earned on our marketable
securities, short-term investments of available funds and the investment of clearing firms’ cash per-
formance bonds and security deposits. Through the third quarter of 2002, a significant portion of these
investments were short-term in nature. In the third quarter of 2002, we changed our investment policy
and converted all of our marketable securities to short-term investments. Therefore, in the fourth quarter
of 2002, all investments were short-term in nature. The average rate earned on all investments declined
from approximately 3.8% in 2001 to approximately 2.6% in 2002, representing a decrease in investment
income of approximately $6.3 million. The decrease in rates earned resulted from the actions taken by
the Federal Reserve Board in 2001 and 2002 to lower the Fed funds rate and the change in our investment
policy in the third quarter of 2002. Another component of the decrease in investment income was the
$0.6 million decrease in the investment results of our non-qualified deferred compensation plan that
is included in investment income but does not affect our net income, as there is an equal decrease
in our salaries and benefits expense. Partially offsetting these decreases in investment income was
an increase of approximately $3.3 million in interest income as a result of increased balances in
marketable securities, short-term investments of available funds and cash performance bonds and security
deposits, as well as the investment of the net proceeds of our initial public offering that was completed
in December 2002. In addition, as a result of the change in our investment policy in the third quarter
of 2002, we sold the marketable securities owned at the time the investment policy was changed,
resulting in one-time realized gains of $2.7 million, compared to realized gains of $0.3 million in 2001.
Securities Lending Interest Income and Expense. Securities lending interest income increased
$7.5 million, or 69.1%, from $10.7 million in 2001 to $18.2 million in 2002. Our securities lending activity
began late in June 2001. Therefore, the revenue generated in 2001 does not represent a full year of
securities lending activity. Our securities lending is limited to a portion of the securities that clearing
firms deposit to satisfy their proprietary performance bond requirements. The average balance of proceeds
from securities lending activity was $924.1 million in 2002 and $632.6 million in 2001 from the time this
activity began to the end of the year. In 2001, the securities from one clearing firm were used to launch
this program. By year-end 2002, securities of four clearing firms were being utilized in the securities lending
40
02 AR Financials 2/27/03 2:25 PM Page 40

41
program. Securities lending interest expense increased $6.4 million, or 67.8%, from $9.5 million in 2001 to
$15.9 million in 2002. This expense is an integral part of our securities lending program and is required
to engage in securities lending transactions. Therefore, this expense is presented in the consolidated
statements of income as a reduction of total revenues. The net revenue from securities lending repre-
sented a return of 0.20% on the average daily balance in 2001 compared to 0.25% in 2002.
Other Revenue. Other revenue increased $0.5 million, or 3.2%, from $14.9 million in 2001 to $15.4 million
in 2002. This increase is attributed primarily to a $2.3 million increase in fees associated with managing
our Interest Earning Facility program, $0.7 million of revenue for providing certain communication and
regulatory services to OneChicago that began in the third quarter of 2002 and a $0.3 million increase
in fees generated for providing order routing services. In addition, two additional exchanges adopted
CLEARING 21 in 2002, resulting in $0.3 million of revenue. Partially offsetting these increases was a
$2.6 million increase in our share of the net loss of OneChicago. The increase in the net loss for 2002
represented an entire year of activity, whereas 2001 only represented activity from August 2001, the
date of our initial capital contribution. OneChicago began trading operations in November 2002. However,
fees for trades executed were waived for 2002. In addition, the trading revenue generated by GFX
declined $0.6 million from 2001 to 2002.
Expenses
Total operating expenses increased $37.5 million, or 14.4%, from $261.4 million in 2001 to $298.9 million
in 2002. This increase was primarily attributable to increases in depreciation resulting from recent capital
expenditures, increases in salaries and benefits and professional fees, as well as the settlement of the
Wagner patent litigation. These expense increases were partially offset by a reduction in stock-based
compensation expense.
Salaries and Benefits Expense. Salaries and benefits expense increased $9.7 million, or 9.2%, from
$105.2 million in 2001 to $114.9 million in 2002. There are two significant components to this increase.
The average number of employees increased approximately 7%, or by 70 employees, from 2001 to
2002. We had 1,152 employees at December 14, 2002. This increased headcount resulted in increased
salaries and benefits of approximately $6.3 million. In addition, salaries and benefits increased approxi-
mately $6.2 million as a result of annual salary increases and related increases in employer taxes,
pension and benefits. Partially offsetting these increases was a $2.0 million increase in the capitalization
of salaries and benefits relating to internally developed software and a $0.6 million increase in the losses
experienced in our non-qualified deferred compensation plan during 2002 when compared to 2001.
Stock-Based Compensation Expense. Stock-based compensation, a non-cash expense, decreased
$2.4 million, or 38.9%, from $6.2 million in 2001 to $3.8 million in 2002. The stock option granted in
2000 to our CEO represents $1.8 million of stock-based compensation expense in 2002. Employee
stock options, granted primarily in 2001, and restricted stock granted in 2001 comprise the balance of
this expense. The total expense associated with a stock option is calculated at the date of grant based
on its fair value. Since we have elected an accelerated method for recognizing this expense, a greater
percentage of the total expense for all stock awards is recognized in the first year of the vesting period.
The decline in expense in 2002 is a direct result of the time that has lapsed since the options were
granted and the expense previously recognized in the year immediately following the date of grant.
02 AR Financials 2/27/03 2:25 PM Page 41

Occupancy Expense. Occupancy expense increased $2.0 million, or 9.7%, from $20.4 million in 2001
to $22.4 million in 2002. This increase resulted primarily from the additional rent and utility expense
incurred in 2002 for a remote data center leased in the fourth quarter of 2001 and an increase in rent
for our trading floors. A portion of the trading floor rent is determined based on total open outcry trading
volume, which increased 9.5% in 2002 when compared to 2001. In addition, the operating expenses
related to our office space in Chicago increased during 2002.
Professional Fees, Outside Services and Licenses Expense. Professional fees, outside services and
licenses increased $5.2 million, or 19.3%, from $27.3 million in 2001 to $32.5 million in 2002. This
increase is attributed primarily to two factors. There was a $3.2 million increase in legal fees associated
with our defense of the Wagner patent litigation in 2002 and a $2.2 million increase in license fees
resulting from growth in our equity product trading volume. Additional expenses totaling $1.0 million
also were incurred in 2002 for building security in response to the September 11, 2001 terrorist attacks,
temporary employees, services to support our Web site and shareholder services. Partially offsetting
these increases was a $0.6 million decrease in professional fees for technology initiatives, net of the
portion that relates to development of internal use software and is capitalized rather than expensed.
Total professional fees for technology increased $2.0 million; however, the nature of the projects
requiring the use of professional services resulted in increased capitalization of $2.6 million. New
initiatives during 2002 included work on the capacity of our clearing and trade processing systems,
adaptation of certain systems to accommodate single stock futures transactions and technology
work to prepare for our E-quotes market data offering. In addition, our expenses related to recruiting
employees declined $1.0 million from 2001 to 2002. This decrease resulted primarily from using
internal resources to hire new employees rather than using outside search firms.
Communications and Computer and Software Maintenance Expense. Communications and computer
and software maintenance expense increased $3.0 million, or 6.8%, from $43.6 million in 2001 to
$46.6 million in 2002. The increase in 2002 resulted primarily from greater communications expense
and communications-related expense of $2.1 million associated with our remote data facility and $0.9
million of expenses for news and quote services and software maintenance to support our E-quotes
offering that began in March 2001. In addition, we incurred $1.1 million in hardware and software mainte-
nance costs in 2002 as a result of new hardware purchases and initiatives, such as single stock futures.
Partially offsetting these increases was a $0.6 million reduction in communication expense associated
with connections to our GLOBEX platform that resulted from the renegotiation of a contract with one of
our vendors in the second half of 2001 and our decision to not renew our agreement with Euronext-Paris
for maintenance of our matching engine software. This agreement expired at the end of 2001, and in
2002 we assumed the maintenance utilizing our technology staff. The expense relating to this maintenance
agreement was $1.0 million in 2001.
Depreciation and Amortization Expense. Depreciation and amortization expense increased $10.9 million,
or 28.9%, from $37.6 million in 2001 to $48.5 million in 2002. Capital expenditures totaled $27.1 million
in 2000, $36.5 million in 2001, and $56.9 million in 2002, with technology-related purchases representing
approximately 80% to 90% of total purchases. Equipment and software represent the greatest portion
of these technology-related purchases and are depreciated over a three- to four-year period. Therefore,
these recent purchases, which include the development of software for internal use, have resulted in
increased depreciation and amortization expense.
42
02 AR Financials 2/27/03 2:25 PM Page 42

43
Patent Litigation Settlement. Patent litigation settlement expense totaled $6.2 million in 2002. This
expense includes $13.7 million for the August 2002 settlement with e-Speed of the Wagner patent
litigation. This expense was subsequently reduced as a result of the December 2002 settlement of a
dispute with Euronext-Paris, our licensor of the NSC software that was the subject of the patent litigation,
whereby Euronext-Paris agreed to pay us an amount equal to one-half of the amount of the settlement
with e-Speed. Our settlement with e-Speed required a $5.0 million payment in September 2002 with
five subsequent payments of $2.0 million each beginning in August 2003. In turn, Euronext-Paris has
agreed to make two payments to us for $3.75 million each, the first of which was received in January
2003 and the second payment is to be received in December 2003. The expense recorded in 2002
represents the present value of these payments. No similar expense occurred in 2001.
Public Relations and Promotion Expense. Public relations and promotion expense increased $0.2 million,
or 3.0%, from $6.3 million in 2001 to $6.5 million in 2002. Two offsetting changes resulted in this total
expense remaining relatively unchanged from 2001 to 2002. Advertising and promotional activities
increased from 2001 to 2002 as a result of greater expenditures for print advertising, focused primarily
on our E-mini stock index and our foreign exchange products, as well as trade shows and conventions.
These increases were partially offset by a decrease in charitable contributions. In response to the terrorist
attacks of September 11, 2001, we established the Chicago Mercantile Exchange Foundation and made
an initial contribution of $1.0 million in the third quarter of 2001. No similar expense was incurred in 2002.
Other Expense. Other expense increased $2.8 million, or 19.2%, from $14.7 million in 2001 to $17.5
million in 2002. Fees paid to our Board of Directors increased during 2002 when compared to 2001 due
to two changes in our Board fee structure that became effective on July 1, 2001 and October 1, 2002.
In addition, expenses related to travel, meals and entertainment increased $0.9 million, primarily as a
result of increased customer visits and sales efforts by our products and services division. Bank fees
increased $0.6 million as a result of the fees associated with securities lending that began late in the
second quarter of 2001. Expense increases also occurred in other categories, such as supplies, bad
debts and interest expense. Partially offsetting these increases was a decrease in the expense related
to the settlement of certain litigation in 2001, for which there was no similar expense in 2002.
Income Tax Provision
We recorded a tax provision of $50.7 million in 2001, compared to $60.2 million in 2002. The effective tax
rate was 40.3% in 2001 and 39.0% in 2002. The decline in the effective tax rate in 2002 resulted primarily
from the favorable resolution of an outstanding income tax matter with the Internal Revenue Service.
02 AR Financials 2/27/03 2:25 PM Page 43

Year Ended December 31, 2001 Compared to Year Ended December 31, 2000
Overview
Our operations for the year ended December 31, 2001 resulted in net income of $75.1 million compared
to a net loss of $10.5 million for the year ended December 31, 2000. Our improved operating results were
driven by a $170.0 million, or 75.1%, increase in total revenues. Net revenues increased $160.6 million,
or 70.9%. This increase in revenues was partially offset by a $19.6 million, or 8.1%, increase in expenses
in 2001 when compared to 2000. Excluding stock-based compensation, which represented a non-cash
expense of $6.2 million in 2001 and $8.2 million in 2000, our net income for 2001 would have been
$78.8 million compared to a loss of $5.3 million for 2000.
During 2001, the U.S. Federal Reserve Board lowered the Fed funds rate on 11 occasions, resulting
in a total reduction of 4.75%. The increased need for risk management instruments resulting from this
interest rate volatility led to increased volume in our Eurodollar contract. Our Eurodollar contract also
became a benchmark for the industry, contributing to its volume growth. Concerns and uncertainty about
the global and national economy, interest rates and the performance of U.S. stocks that had resulted
in increased trading volume throughout 2001 were magnified after the terrorist attacks of September 11.
In addition, opening access to our electronic trading platform and improved performance of that platform,
coupled with uncertainty over the economy and interest rates, resulted in increased trading volume in
our stock index products.
Revenues
Total revenues increased $170.0 million, or 75.1%, from $226.6 million for 2000 to $396.6 million for 2001.
Net revenues increased $160.6 million, or 70.9%, from 2000 to 2001. The increase in revenues was
attributable primarily to a 78.9% increase in average daily trading volume in 2001, establishing an exchange
record and making our exchange the largest futures exchange in the United States, based on annual
trading volume, for the first time. In 2001, we also experienced record levels of electronic trading that
resulted in average daily GLOBEX volume of 326,274 contracts, representing 19.9% of our trading volume
and an increase of 138.3% compared to 2000. These increased volume levels resulted from uncertainty
over interest rates and volatility in U.S. stocks, a diverse product offering, our new open access policy
for GLOBEX and volume discounts available to customers using our markets to manage their financial
risk. Finally, a new pricing framework announced in December 2000 that took effect in the first quarter
of 2001 resulted in additional revenue.
Clearing and Transaction Fees. Clearing and transaction fees and other volume-related charges increased
$135.9 million, or 86.7%, from $156.6 million in 2000 to $292.5 million in 2001. Total trading volume
increased 78.1% from 231.1 million contracts, our previous trading volume record established in 2000,
to 411.7 million contracts for 2001. Many other volume records were established in 2001. Trading volume
of 3.3 million contracts on November 15, 2001 established a new single-day trading volume record.
Trading volume for the month of November 2001 also established a new monthly record, with 45.3 million
contracts traded. This growth in total volume, and the related increase in clearing fees, was compounded
by additional GLOBEX transaction fees resulting from a 138.3% increase in electronic trading volume
from 2000 to 2001. In addition to increased volume, revenue was favorably impacted by changes to our
pricing structure that were implemented in the first quarter of 2001.
In response to the terrorist attacks in the United States, our markets closed early on September 11,
2001, and our exchange remained closed on September 12, 2001. Trading resumed on September 13, 2001.
However, equity products did not trade for an additional two business days, until September 17, 2001,
when the equity markets in the United States resumed trading.
44
02 AR Financials 2/27/03 2:25 PM Page 44

45
In addition to the increase in trading volume, the average rate per contract increased $0.032 from
$0.678 for the year ended December 31, 2000 to $0.710 for the year ended December 31, 2001. The
increase in 2001 reflects increases in pricing, which were partially offset by volume discounts for our
Eurodollar products. These discounts were implemented in January 2001 and expanded in the third
quarter of 2001. Also, as a result of the limits on certain GLOBEX fees, the additional trading volume
generated through GLOBEX has increased clearing fees but has not necessarily resulted in additional
GLOBEX fees.
The following table shows the average daily trading volume in our four product areas, the portion that
was traded electronically through the GLOBEX platform, and clearing and transaction fees revenues
expressed in total dollars and as an average rate per contract:
YEAR ENDED DECEMBER 31
Percentage
Product Area 2001 2000 Increase
Interest Rate 1,091,846 550,810 98.2%
Equity 425,149 258,120 64.7
Foreign Exchange 89,290 76,615 16.5
Commodity 34,003 31,575 7.7
Total Volume 1,640,288 917,120 78.9
GLOBEX Volume 326,274 136,928 138.3
GLOBEX Volume as a Percent of Total Volume 19.9% 14.9%
Clearing and Transaction Fees Revenues (in thousands) $292,459 $156,649
Average Rate per Contract $0.710 $0.678
While we experienced increased volume in all products, the most significant increases occurred in interest
rate and equity products. This increased volume reflected market dynamics in U.S. stocks and interest
rates, as well as the effect of volume discounts and increased access to our electronic trading platform.
These measures were designed to stimulate additional activity in a time of volatility in interest rates and
U.S. equities.
Quotation Data Fees. Quotation data fees increased $12.0 million, or 33.0%, from $36.3 million in 2000
to $48.3 million in 2001. On March 1, 2001, we implemented a fee increase for professional subscribers.
At year-end 2001, more than 48,000 subscribers displayed our data on approximately 190,000 screens
worldwide. This represented a modest decrease from year-end 2000 when we had approximately 54,000
subscribers displaying our data on more than 196,000 screens. In addition, while we maintained our
non-professional market data offering, the service was changed from real-time streaming to one-minute
snapshots of market data. This led some of our subscribers to convert to the higher-priced professional
service. In addition, our 2000 revenue was adversely impacted by the bankruptcy filing of one of the
larger resellers of our quotes.
02 AR Financials 2/27/03 2:25 PM Page 45

GLOBEX Access Fees. GLOBEX access fees increased $8.0 million, or 201.9%, from $4.0 million in 2000
to $12.0 million in 2001. This increase was primarily attributable to the growth in the number of GLOBEX
connections. Our FIX API connections increased from approximately 60 at December 31, 2000 to
approximately 175 at December 31, 2001. These connections generally are used by clearing firms and allow
multiple users to access GLOBEX. In addition, our GLOBEX Trader-Internet connections, a new access
choice in 2001, grew to approximately 250 connections. Also contributing to the increase in revenue
were changes to fees charged for access to GLOBEX in 2001 that were partially offset by a decrease
in dedicated terminals accessing GLOBEX.
Communication Fees. Communication fees were relatively constant, experiencing a decrease of
$0.1 million, from $9.4 million in 2000 to $9.3 million in 2001.
Investment Income. Investment income decreased $0.7 million, or 8.0%, from $9.7 million in 2000 to
$9.0 million in 2001. The decline resulted primarily from a decrease in interest rates, which had a negative
impact on the rate earned on funds invested. Also, there was a $0.2 million decrease in the investment
results of our non-qualified deferred compensation plan, which did not impact our net income as there
was an equal reduction to our salaries and benefits expense. Partially offsetting these decreases was
investment income generated by additional funds available for investment in marketable securities as a
result of our improved financial performance. Also, cash performance bonds deposited by clearing firms
increased from 2000 to 2001, resulting in additional investment income in 2001.
Securities Lending Interest Income and Expense. Securities lending interest income was $10.7 million
in 2001. There was no similar income for 2000, as our securities lending activity began in June 2001.
Securities lending is limited to a portion of the securities that clearing firms deposit to satisfy their
proprietary performance bond requirements. Securities lending interest expense was $9.5 million in 2001.
There was no similar expense for 2000. This expense is an integral part of our securities lending program
and is required to engage in securities lending transactions. Therefore, this expense is presented in the
consolidated statements of income as a reduction of total revenues.
Other Revenue. Other revenue increased $4.4 million, or 41.7%, from $10.5 million in 2000 to $14.9 million
in 2001. The majority of this increase, or $2.3 million, was attributable to increased fees associated with
managing our IEF program. Fees earned are directly related to amounts deposited in each IEF. In addition,
the comprehensive pricing changes implemented in the first quarter of 2001 resulted in additional revenue
from floor access charges, booth rental on our trading floors and order routing services. Finally, sales of
our SPAN software increased by $0.3 million in 2001 compared to 2000. Partially offsetting these increases
was a $0.6 million decrease in the trading revenue generated by GFX and our share of the net loss of
OneChicago, the joint venture established in August 2001 for the trading of single stock futures.
Expenses
Total operating expenses increased $19.6 million, or 8.1%, from $241.8 million in 2000 to $261.4 million
in 2001. The most significant components of this increase were the increase in salaries and benefits
expense, professional fees and depreciation and amortization.
Salaries and Benefits Expense. Salaries and benefits expense increased $11.1 million, or 11.9%, from
$94.1 million in 2000 to $105.2 million in 2001. Included in this expense in 2000 was $4.3 million of
one-time expenses relating to the restructuring of management that included a sign-on bonus for our new
President and CEO hired in February 2000 and expenses related to severance payments to departing
46
02 AR Financials 2/27/03 2:25 PM Page 46

47
executives with employment contracts. Excluding these one-time charges, salaries and benefits increased
$15.5 million, or 17.3%, in 2001 primarily as a result of an increase in overall compensation levels and
employee bonus expense, coupled with related increases in pension expense, employment taxes and
employee benefits costs. In addition, the average number of employees increased approximately 1%
during 2001. This increased headcount resulted in additional salaries and benefits expense of approximately
$1.4 million. These increases were compounded by a reduction in the number of technology staff utilized
for internally developed software initiatives in 2001 when compared to 2000. As a result, more
employee-related costs were expensed, rather than being capitalized as part of the development of
internal use software.
Stock-Based Compensation Expense. Stock-based compensation, a non-cash expense, decreased
$2.0 million, from $8.2 million in 2000 to $6.2 million in 2001. The stock option granted in 2000 to our
CEO represents $3.5 million of stock-based compensation expense in 2001. Employee stock options,
granted in May and July 2001, and restricted stock granted in May 2001 comprise the balance of this
expense. The total expense associated with a stock option is calculated at the date of grant using the
fair value method. Since we have elected an accelerated method for recognizing this expense, a greater
percentage of the total expense is recognized in the first year of the vesting period. The decline in expense
in 2001 is a result of the higher expense recognized in 2000 related to the CEO option, which is partially
offset by the employee grants awarded in 2001.
Occupancy Expense. Occupancy expense increased $0.8 million, or 4.0%, from $19.6 million in 2000
to $20.4 million in 2001. This is primarily the result of an increase in rent expense related to our trading
floors, as a portion of this rent is directly related to increased open outcry trading volume.
Professional Fees, Outside Services and Licenses Expense. Professional fees, outside services and
licenses increased $4.2 million, or 18.0%, from $23.1 million in 2000 to $27.3 million in 2001. Professional
fees for technology-related initiatives, net of the reduction for the portion that relates to the development
of internal use software and is capitalized rather than expensed, increased $4.5 million in 2001 when
compared to 2000. Major initiatives in 2001 included improvements to the Application Program Interface
(API) to GLOBEX, work on enhancing the ability to execute sophisticated spread trades in GLOBEX and
improvements to our Web site. In addition, there was a $0.9 million increase in license fees resulting from
increased stock index product trading volume. We also incurred fees in 2001 relating to our reorganization
into a holding company structure. In 2000, we completed our management restructuring and demutual-
ization that resulted in recruiting, legal and other professional fees that were not repeated in 2001.
Communications and Computer and Software Maintenance Expense. Communications and computer
and software maintenance expense increased $1.7 million, or 4.0%, from $41.9 million in 2000 to
$43.6 million in 2001. As a result of a new contract with our communications provider, communication
costs related to GLOBEX connections increased modestly despite the increased number of customers
utilizing our electronic trading platform. In addition, our hardware and software maintenance costs
increased in 2001 as a result of technology-related purchases.
Depreciation and Amortization Expense. Depreciation and amortization expense increased $4.1 million,
or 12.4%, from $33.5 million in 2000 to $37.6 million in 2001. This increase was attributable primarily to
depreciation of the cost of equipment and software purchased late in 2000, as well as amortization on
internally developed software completed in 2001 and the second half of 2000.
02 AR Financials 2/27/03 2:25 PM Page 47

Public Relations and Promotion Expense. Public relations and promotion expense increased $1.1 million,
or 21.2%, from $5.2 million in 2000 to $6.3 million in 2001. In response to the terrorist attacks on
September 11, 2001, we established the Chicago Mercantile Exchange Foundation with an initial
contribution of $1.0 million to be distributed to those affected by the events of September 11, 2001.
In addition, in 2001 promotion expense was affected by increased spending on direct advertising
offset by reduced expenditures for trade shows and specific product promotions.
Other Expense. Other expense decreased $1.4 million, or 9.3%, from $16.1 million in 2000 to $14.7 million
in 2001. This decrease was due primarily to a $2.7 million write-off of previously capitalized software
development costs during 2000. It was determined that the software would not be utilized as intended.
A similar write-off of $0.3 million occurred in 2001. Other factors affecting these expenses in 2001
included a reduction in travel and entertainment when compared to 2000, offset by the expense associated
with the settlement of certain litigation in 2001.
During 2000, the limited partners’ interest in the earnings of PMT was $1.2 million. We purchased the
net assets of PMT on November 13, 2000 as part of our demutualization. Therefore, there was no reduction
in earnings during 2001 as a result of the sharing of profits with the limited partners of this entity.
Income Tax Provision
We recorded a tax provision of $50.7 million in 2001, compared to a tax benefit of $5.9 million in 2000.
The effective tax rate was 40.3% in 2001 and 36.1% in 2000.
Liquidity and Capital Resources
Cash and cash equivalents totaled $339.3 million at December 31, 2002 compared to $69.1 million at
December 31, 2001. The $270.2 million increase from December 31, 2001 to December 31, 2002
resulted primarily from the change in our investment policy to convert our marketable securities to
more short-term investments. Our revised investment policy, implemented in the third quarter of 2002,
allows us to invest in institutional money market funds with a fund balance over $1.0 billion and certain
U.S. Treasury and Government agency securities, provided these securities will mature at par value
within seven days of purchase. This new policy resulted in a $148.6 million increase in the balances
invested in money market funds and securities that are treated as cash equivalents. In addition, our initial
public offering was completed on December 11, 2002 and resulted in net proceeds of approximately
$117.5 million. Our operations for the year ended December 31, 2002 also contributed to the increase
in cash and cash equivalents since December 31, 2001. Partially offsetting these increases was the June
28, 2002 payment of a $17.3 million dividend to owners of our common stock. During 2002 and 2001, the
balance retained in cash and cash equivalents was a function of anticipated or possible short-term cash
needs, prevailing interest rates, our investment policy and alternative investment choices.
Other current assets readily convertible into cash include accounts receivable. When combined with
cash and cash equivalents, these assets represented 72.0% of our total assets at December 31, 2002,
excluding cash performance bonds and security deposits and investment of securities lending proceeds,
compared to 33.4% at December 31, 2001. The increase from December 31, 2001 to year-end 2002
resulted primarily from the net proceeds of our initial public offering and cash generated by operations
during 2002, and was partially offset by purchases of capital assets and the dividend payment. Cash
performance bonds and security deposits, as well as investment of securities lending proceeds, are
excluded from total assets and total liabilities for purposes of this comparison.
48
02 AR Financials 2/27/03 2:25 PM Page 48

Each clearing firm is required to deposit and maintain a specified performance bond balance based
on the number of open contracts at the end of each trading day. Performance bond requirements can be
satisfied with cash, U.S. Government securities, bank letters of credit or other approved investments.
Cash performance bonds and security deposits are included in our consolidated balance sheets and
fluctuate due to the investment choices available to clearing firms and changes in the amount of deposits
required. Securities lending transactions utilize a portion of the securities that clearing firms have
deposited to satisfy their proprietary performance bond requirements. The balance in our securities
lending activity fluctuates based on the amount of securities that clearing firms have deposited and
the demand for securities lending activity in the particular securities available to us. As a result of
these factors, the balances in cash performance bonds and security deposits, as well as the balances
in our securities lending program, may fluctuate significantly over time. In general, the balance of
cash performance bonds and security deposits has increased in recent years. Our securities lending
program began in June 2001. Since that time, our securities lending balances have, as of the end of
each quarter, ranged from a low of approximately $131.3 million at September 30, 2001 to a high of
$985.5 million at December 31, 2002.
Cash performance bonds and security deposits and securities lending proceeds consisted of the
following at December 31, 2002 and 2001:
(in thousands) 2002 2001
Cash Performance Bonds $«1,805,052 $÷««848,391
Cash Security Deposits 22,939 6,836
Total Cash Performance Bonds and Security Deposits $«1,827,991 $÷««855,227
Proceeds from Securities Lending and Payable Under
Securities Lending Agreements 985,500 882,555
Total $«2,813,491 $«1,737,782
As discussed above, clearing firms may also deposit U.S. Government securities and other approved
investments, including deposits in our IEF program, to satisfy their performance bond and security
deposit requirements. With the exception of the portion of securities deposited that are utilized in our
securities lending program, assets of this nature are not included in our consolidated balance sheets.
We are required under the Commodity Exchange Act to segregate cash and securities deposited by
clearing firms on behalf of customers. In addition, our exchange rules require a segregation of all funds
and securities deposited by clearing firms from exchange operating funds and securities. As with cash
performance bonds and security deposits, these balances will fluctuate due to the investment choices
available to clearing firms and the change in the amount of total deposits required. Securities, at fair
market value, and IEF funds were deposited for the following purposes at December 31, 2002 and 2001:
(in thousands) 2002 2001
Performance Bonds $«25,278,903 $«27,208,994
Security Deposits 896,192 694,323
Cross-margin Securities Held Jointly with
Options Clearing Corporation 636,848 422,996
Total $«26,811,943 $«28,326,313
49
02 AR Financials 2/27/03 2:25 PM Page 49

Included in other assets at December 31, 2002 is $17.3 million of deferred tax assets resulting
primarily from depreciation, stock-based compensation and deferred compensation. There is no valuation
reserve for these assets as we expect to fully realize their value in the future based on our expectation
of future taxable income.
Historically, we have met our funding requirements from operations. Net cash provided by operating
activities was $141.1 million for 2002 and $120.6 million for 2001. The cash provided by operations increased
in 2002 as a result of our improved operating results. The net cash provided by operating activities
exceeded our net income in 2002 primarily as a result of non-cash expenses, such as depreciation,
which do not adversely impact our cash flow.
Cash provided by investing activities was $34.4 million for 2002 compared to cash used in investing
activities of $78.2 million for 2001. The increase of $112.6 million is primarily due to the $93.8 million
of proceeds received from the sale of marketable securities in excess of the cash required to purchase
marketable securities as a result of the change in our investment policy. By comparison, purchases of
securities exceeded sales and maturities in 2001, resulting in a net use of cash of $46.5 million. Cash
used to acquire property and software increased $25.9 million, from $30.4 million for 2001 to $56.3 million
for 2002. Purchases of software and equipment and leasehold improvements in 2002 included $14.5 million
for our remote data center, which became operational in late September 2002, and $4.5 million to
accommodate trading in single stock futures. An additional investment in OneChicago of $3.1 million
was made in 2002. We continue to fund capital expenditures from current operating funds.
Cash provided by financing activities was $94.7 million for the year ended December 31, 2002
compared to cash used in financing activities of $3.9 million for 2001. The increase is due to the net
proceeds received from our initial public offering in December 2002. Partially offsetting this increase
was the cash dividend of $0.60 per share on Class A and Class B shares of common stock that was
declared by our Board of Directors on June 4, 2002 for shareholders of record on June 17, 2002. The
dividend was paid on June 28, 2002 and totaled $17.3 million. In addition, cash used in financing activities
for both periods includes regularly scheduled payments on long-term debt related to our capital lease
obligations.
We intend to pay regular quarterly dividends to our shareholders beginning in the first quarter of
2003. The annual dividend target will be approximately 20% of prior year’s cash earnings. The decision
to pay a dividend, however, remains within the discretion of our Board of Directors and may be affected
by various factors, including our earnings, financial condition, capital requirements, level of indebtedness
and other considerations our Board of Directors deem relevant. On February 5, 2003 the Board of
Directors declared a regular quarterly dividend of $0.14 per share to be paid on March 25, 2003 for
shareholders of record on March 10, 2003. The dividend payment will total $4.6 million.
We maintain a $500.0 million line of credit with a consortium of banks to be used in certain situations,
such as a disruption in the domestic payments system that would delay settlement between our
exchange and our clearing firms or in the event of a clearing firm default. The line of credit has never
been utilized. On October 18, 2002, at the annual renewal date, the line of credit was renewed for the
same amount and with substantially the same terms. The credit agreement continues to be collateralized
by clearing firm security deposits held by us in the form of U.S. Treasury or agency securities, as well
as security deposit funds in IEF2.
In addition, as of December 31, 2002, we were contingently liable on irrevocable letters of credit
totaling $55.0 million in connection with our mutual offset system with The Singapore Derivatives
Exchange Ltd. We also guarantee the principal for funds invested in the first IEF facility, which had
a balance of $350.0 million as of December 31, 2002.
CME also guarantees a $2.5 million standby letter of credit for GFX. The beneficiary of the letter of
credit is the clearing firm that is used by GFX to execute and maintain its foreign exchange and Eurodollar
futures position. The letter of credit will be utilized in the event that GFX defaults in meeting requirements
to its clearing firm. Per exchange requirements, GFX is required to place performance bond deposits
with its clearing firm. In the unlikely event of a payment default by GFX, GFX’s performance bond would
50
02 AR Financials 2/27/03 2:25 PM Page 50

51
first be used to cover the deficit. If this amount is not sufficient, the letter of credit would be used, and
finally CME would guarantee the remaining deficit, if any.
In August 2002, the lawsuit relating to Wagner patent 4,903,201 entitled “Automated Futures Trade
Exchange” was settled for $15.0 million. The settlement required an initial payment of $5.0 million in
September 2002 and requires five subsequent annual payments of $2.0 million each beginning in
August 2003. The entire expense related to this settlement was recognized in the third quarter of 2002,
at its present value of $13.7 million. In December 2002, we settled a dispute with Euronext-Paris, our
licensor of the NSC software, that was the subject of the patent litigation. Under the terms of this
settlement, Euronext-Paris has agreed to make payments to us totaling $7.5 million, representing one-half
of the total payments agreed to in our settlement of the Wagner patent litigation. These funds will be
received in two payments of $3.75 million each, with the first payment received in January 2003
followed by a final payment to be received in December 2003. The present value of the payments to
be received was recognized in the fourth quarter of 2002 as a reduction of the patent litigation settlement
expense recognized in the third quarter of 2002.
Capital expenditures, which includes expenditures for purchased and internally developed software
as well as equipment acquired utilizing capital leases, have varied significantly from 2000 through 2002,
as demonstrated in the table below:
YEAR ENDED DECEMBER 31
(in millions, except percentages) 2002 2001 2000
Total Capital Expenditures $«56.9 $«36.5 $«27.1
Technology «50.9 «32.3 21.6
Percent for Technology 89.4% 88.3% 79.9%%%
This highlights our commitment to continual enhancements to the technology we employ. In 2002, capital
expenditures included $19.1 million for purchased and internally developed software, $28.1 million for
equipment purchased for our data centers and $3.1 million for leasehold improvements at our remote
data center. In 2001, capital expenditures for technology included $13.9 million for purchased and internally
developed software, as well as $17.3 million in equipment purchases for our data centers. These purchases
were attributable primarily to increased capacity requirements and performance enhancements to our
electronic platform as a result of higher trading volume. This necessitated additional equipment and
software licenses. Continued capital expenditures for technology are anticipated as we continue to expand
our electronic trading platform and improve the technology utilized as part of our open outcry facilities.
Each year capital expenditures also are incurred for improvements to our trading floor facilities,
offices, telecommunications capabilities and other operating equipment.
If operations do not provide sufficient funds to complete capital expenditures, short-term investments
can be reduced to provide the needed funds, or assets can be acquired through capital leases.
Quantitative and Qualitative Disclosures About Market Risk
Market risk represents interest rate risk relating to the marketable securities that are available for sale,
as well as derivatives trading risk associated with GFX. With respect to interest rate risk, a change in
market interest rates would impact interest income from temporary cash investments, cash performance
bonds and security deposits, variable rate marketable securities and new purchases of marketable
securities. Changes in market interest rates also would have an effect on the fair value of any marketable
securities owned. However, as a result of our new investment policy that became effective in the third
quarter of 2002, we invest only in cash equivalents composed primarily of institutional money market
mutual funds and obligations of the U.S. Government and its agencies with maturities of seven days or
less. Prior to the recent change in our investment policy, we monitored interest rate risk by completing
regular reviews of our marketable securities portfolio and its sensitivity to changes in the general level
of interest rates, commonly referred to as a portfolio’s duration. We controlled the duration of the portfolio
primarily through the purchase of individual marketable securities having a duration consistent with our
02 AR Financials 2/27/03 2:25 PM Page 51

overall investment policy. In addition, under our prior investment policy, we would generally hold marketable
securities to maturity, which acted as a further mitigating factor with respect to interest rate risk. GFX
engages in the purchase and sale of our foreign exchange and Eurodollar futures contracts on the GLOBEX
electronic trading platform to promote liquidity in our products and subsequently enters into offsetting
transactions using futures contracts or spot foreign exchange transactions with approved counterparties
in the interbank market to limit market risk. Any potential impact on earnings from a change in foreign
exchange rates would not be significant. Net position limits are established for each trader and currently
amount to $12.0 million in aggregate notional value.
Interest Rate Risk. Interest income from marketable securities, temporary cash investments, cash
performance bonds and security deposits was $5.9 million in 2002, $8.9 million in 2001 and $9.7 million
in 2000. Our marketable securities experienced net realized and unrealized gains of $2.2 million in 2002,
$0.7 million in 2001 and $0.6 million in 2000. At December 31, 2002, we owned no marketable securities.
As a result of a change in our investment policy, marketable securities previously owned were sold during
the third quarter of 2002. The proceeds from the sale of these securities have been invested in other
short-term liquid investments, primarily in institutional money market mutual funds and U.S. Government
and agency securities that mature within seven days of purchase.
Derivatives Trading Risk. At December 31, 2002, GFX held futures positions with a notional value of
$51.9 million, offset by a similar amount of spot foreign exchange positions. All positions are marked to
market through a charge or credit to other revenue on a daily basis. Net trading gains were $3.2 million
for the year ended December 31, 2002 and $3.8 million for the year ended 2001.
At December 31, 2001, futures positions held by GFX had a notional value of $102.3 million, offset
by a similar amount of spot foreign exchange positions, resulting in a zero net position.
Accounting Matters
Recent Accounting Pronouncements. In November 2002, the FASB issued Interpretation (FIN) No. 45,
“Guarantor’s Accounting and Disclosure Requirements for Guarantees, Including Indirect Guarantees of
Indebtedness of Others.” FIN No. 45 requires certain guarantees, including indemnification arrangements,
to be recorded at fair value at inception, and also requires a guarantor to make significant new disclosures.
For those arrangements where the company receives an explicit fee for the guarantee, FIN No. 45 requires
that the company defer the fee and recognize it over the life of the arrangement. For arrangements
where no explicit fee is received, FIN No. 45 requires a liability to be recorded and amortized over the
life of the arrangement, along with an offsetting asset, depending on the arrangement. The company
will adopt the accounting provisions of FIN No. 45 for guarantees issued beginning January 1, 2003, and
has adopted the disclosure provisions for all existing guarantees as of December 31, 2002. The company
is currently evaluating the impact of adopting the accounting provisions of FIN No. 45 on its consolidated
financial statements.
In January 2003, the FASB issued Interpretation (FIN) No. 46, “Consolidation of Variable Interest Entities.”
The objective of FIN No. 46 is to improve financial reporting by achieving more consistent application of
consolidation policies to variable interest entities (also referred to as special-purpose entities) and, thus,
to improve comparability between enterprises engaged in similar activities even if some of those activities
are conducted through variable interest entities. Prior to the issuance of FIN No. 46, a company would
generally not have to include another entity in its consolidated financial statements unless it controlled
the entity through voting interest. FIN No. 46 changes that by requiring a variable interest entity to be
consolidated by a company if that company is subject to a majority of the risk of loss from the variable
interest entity’s activities or entitled to receive a majority of the entity’s residual returns or both.
The company will adopt FIN No. 46 on July 1, 2003 and is currently evaluating the impact of adopting
FIN No. 46 on its consolidated financial statements.
52
02 AR Financials 2/27/03 2:25 PM Page 52

53
Management is responsible for preparation of the accompanying consolidated financial statements.
The statements were prepared in accordance with accounting principles generally accepted in the
United States, which included amounts based on management’s best estimates and judgments.
Ernst & Young LLP, independent auditor, audited our consolidated financial statements as described
in their report.
The Company maintains financial control systems designed to provide reasonable assurance, at
appropriate cost, that transactions authorized by management are recorded and reported properly in the
consolidated financial statements, and that assets are adequately safeguarded. The control environment
is complemented by the Company’s internal audit function, which evaluates the adequacy of controls,
policies and procedures, as well as adherence to them, and recommends improvements when applicable.
The Audit Committee of the Board of Directors meets with Ernst & Young LLP and the internal auditors
in the presence of management, as well as privately, without management present. It monitors and reviews
matters relating to internal controls, accounting, auditing, financial reporting and auditor independence.
Both the internal auditors and the independent auditors have unrestricted access to the Committee.
James J. McNulty David G. Gomach Nancy W. Goble
President and Managing Director and Managing Director and
Chief Executive Officer Chief Financial Officer Chief Accounting Officer
To the Board of Directors and Shareholders of Chicago Mercantile Exchange Holdings Inc.:
We have audited the accompanying consolidated balance sheets of Chicago Mercantile Exchange
Holdings Inc. (a Delaware corporation) and subsidiaries (the Company) as of December 31, 2002 and 2001,
and the related consolidated statements of income, shareholders’ equity, and cash flows for each of the
three years in the period ended December 31, 2002. These financial statements are the responsibility of
the Company’s management. Our responsibility is to express an opinion on these financial statements
based on our audits.
We conducted our audits in accordance with auditing standards generally accepted in the United
States. Those standards require that we plan and perform the audit to obtain reasonable assurance
about whether the financial statements are free of material misstatement. An audit includes examining,
on a test basis, evidence supporting the amounts and disclosures in the financial statements. An audit
also includes assessing the accounting principles used and significant estimates made by management,
as well as evaluating the overall financial statement presentation. We believe that our audits provide
a reasonable basis for our opinion.
In our opinion, the financial statements referred to above present fairly, in all material respects, the
consolidated financial position of Chicago Mercantile Exchange Holdings Inc. and subsidiaries at
December 31, 2002 and 2001, and the consolidated results of their operations and their cash flows
for each of the three years in the period ended December 31, 2002, in conformity with accounting
principles generally accepted in the United States.
As discussed in Note 16 to the financial statements, in 2002 the Company changed its method of
accounting for stock-based compensation.
Ernst & Young LLP
Chicago, Illinois
January 28, 2003
MANAGEMENT’S FINANCIAL RESPONSIBILITY AND REPORT OF INDEPENDENT AUDITORS
02 AR Financials 2/27/03 2:25 PM Page 53

AT DECEMBER 31
2002 2001(in thousands, except share data) (restated)
Assets
Current Assets:
Cash and cash equivalents $«÷«339,260 $÷«÷«69,101
Proceeds from securities lending activities 985,500 882,555
Marketable securities — 91,570
Accounts receivable, net of allowance of $1,232 and $962 50,865 40,986
Other current assets 11,515 6,671
Cash performance bonds and security deposits 1,827,991 855,227
Total current assets 3,215,131 1,946,110
Property, net of accumulated depreciation and amortization 109,563 100,991
Other assets 30,322 19,777
Total Assets $«3,355,016 $«2,066,878
Liabilities and Shareholders’ Equity
Current Liabilities:
Accounts payable $÷«÷«27,607 $÷«÷«23,834
Payable under securities lending agreements 985,500 882,555
Other current liabilities 48,396 40,229
Cash performance bonds and security deposits 1,827,991 855,227
Total current liabilities 2,889,494 1,801,845
Long-term debt 2,328 6,650
Other liabilities 17,055 10,017
Total liabilities 2,908,877 1,818,512
Shareholders’ Equity:
Preferred stock, $0.01 par value, 9,860,000 shares
authorized, none issued and outstanding — —
Series A junior participating preferred stock, $0.01 par value,
140,000 shares authorized, none issued and outstanding — —
Class A common stock, $0.01 par value, 138,000,000 shares
authorized, 32,530,372 shares issued and outstanding as
of December 31, 2002 and 28,771,562 shares issued
and outstanding as of December 31, 2001 325 288
Class B common stock, $0.01 par value, 3,138 shares
authorized, issued and outstanding — —
Additional paid-in capital 179,669 59,229
Unearned restricted stock compensation (665) (1,461)
Retained earnings 266,810 190,033
Accumulated net unrealized gains on securities — 277
Total shareholders’ equity 446,139 248,366
Total LiabilIties and Shareholders’ Equity $«3,355,016 $«2,066,878
See accompanying notes to consolidated financial statements.
54
CHICAGO MERCANTILE EXCHANGE HOLDINGS INC. AND SUBSIDIARIESCONSOLIDATED BALANCE SHEETS
02 AR Financials 2/27/03 2:25 PM Page 54

55
YEAR ENDED DECEMBER 31
2002 2001 2000(in thousands, except share and per share data) (restated) (restated)
Revenues
Clearing and transaction fees $«356,396 $«292,459 $«156,649
Quotation data fees 48,717 48,250 36,285
GLOBEX access fees 12,945 11,987 3,971
Communication fees 9,733 9,330 9,391
Investment income 7,740 8,956 9,736
Securities lending interest income 18,169 10,744 —
Other 15,379 14,904 10,520
Total Revenues 469,079 396,630 226,552
Securities lending interest expense (15,902) (9,477) —
Net Revenues 453,177 387,153 226,552
Expenses
Salaries and benefits 114,899 105,227 94,067
Stock-based compensation 3,811 6,238 8,211
Occupancy 22,400 20,420 19,629
Professional fees, outside services and licenses 32,549 27,289 23,131
Communications and computer and software maintenance 46,569 43,598 41,920
Depreciation and amortization 48,509 37,639 33,489
Patent litigation settlement 6,240 — —
Public relations and promotion 6,514 6,326 5,219
Other 17,457 14,650 16,148
Total Expenses 298,948 261,387 241,814
Income (loss) before limited partners’
interest in PMT and income taxes 154,229 125,766 (15,262)
Limited partners’ interest in earnings of PMT — — (1,165)
Income tax (provision) benefit (60,162) (50,658) 5,931
Net Income (Loss) $÷«94,067 $÷«75,108 $÷(10,496)
Earnings (Loss) per Common Share:
Basic $÷÷÷«3.24 $÷÷÷«2.61 $÷÷÷(0.36)
Diluted ÷÷÷«3.13 ÷÷÷«2.57 —
Weighted average number of common shares:
Basic 29,066,242 28,774,700 28,774,700
Diluted 30,060,537 29,240,432 —
See accompanying notes to consolidated financial statements.
CHICAGO MERCANTILE EXCHANGE HOLDINGS INC. AND SUBSIDIARIESCONSOLIDATED STATEMENTS OF INCOME
02 AR Financials 2/27/03 2:25 PM Page 55

AccumulatedCommon Net
Class A Class B Stock and Unearned UnrealizedCommon Common Additional Restricted Securities Total
(in thousands, Stock Stock Paid-In Capital Stock Retained Gains Shareholders’except share and per share data) Shares Shares Amount Compensation Earnings (Losses) Equity
Balance Dec. 31, 1999 — — $÷«43,605 $÷÷÷«— $«125,421 $«(363) $«168,663
Comprehensive income:Net loss (10,496) (10,496)
Change in net unrealizedgain on securities, net of tax of $234 352 352
Total comprehensive income (10,144)
Stock-based compensation 7,743 7,743
Issuance of Class A common stock 28,771,562
Issuance of Class B common stock 3,138
Balance Dec. 31, 2000 (restated) 28,771,562 3,138 $÷«51,348 — $«114,925 $«÷(11) $«166,262
Comprehensive income:Net income 75,108 75,108
Change in net unrealizedgain on securities, netof tax of $192 288 288
Total comprehensive income 75,396
Stock-based compensation 5,734 5,734
Grant of 119,000 shares of restricted Class A common stock 2,435 (2,435) —
Amortization of unearned restricted Class A common stock 974 974
Balance Dec. 31, 2001 (restated) 28,771,562 3,138 $÷«59,517 $«(1,461) $«190,033 $««277 $«248,366
Comprehensive income:Net income 94,067 94,067
Change in net unrealizedgain on securities, netof tax of $184 (277) (277)
Total comprehensive income 93,790
Net proceeds from initial public offering 3,712,660 117,459 117,459
Exercise of stock options 150 3 3
Cash dividend on commonstock of $0.60 per share (17,290) (17,290)
Vesting of issued restrictedClass A common stock 46,000
Stock-based compensation 3,015 3,015
Amortization of unearned restricted Class A common stock 796 796
Balance Dec. 31, 2002 32,530,372 3,138 $«179,994 $÷÷(665) $«266,810 $÷÷— $«446,139
See accompanying notes to consolidated financial statements.
56
CHICAGO MERCANTILE EXCHANGE HOLDINGS INC. AND SUBSIDIARIESCONSOLIDATED STATEMENTS OF SHAREHOLDERS’ EQUITY
02 AR Financials 2/27/03 2:25 PM Page 56
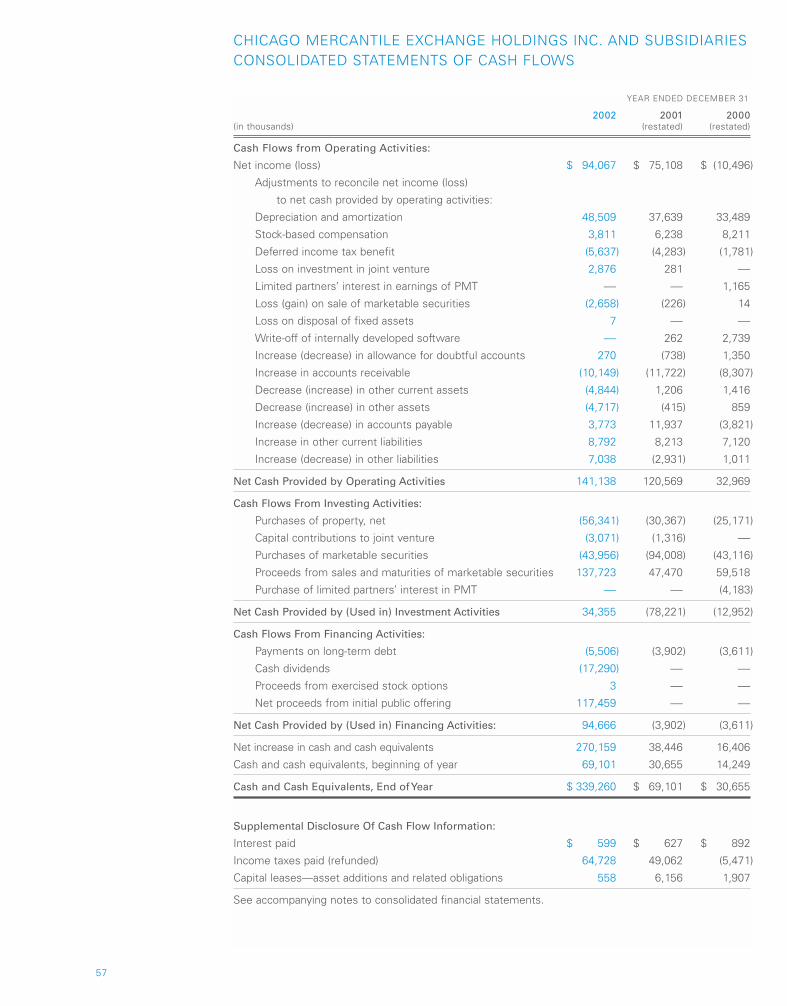
57
YEAR ENDED DECEMBER 31
2002 2001 2000(in thousands) (restated) (restated)
Cash Flows from Operating Activities:
Net income (loss) $÷«94,067 $÷«75,108 $÷(10,496)
Adjustments to reconcile net income (loss)
to net cash provided by operating activities:
Depreciation and amortization 48,509 37,639 33,489
Stock-based compensation 3,811 6,238 8,211
Deferred income tax benefit (5,637) (4,283) (1,781)
Loss on investment in joint venture 2,876 281 —
Limited partners’ interest in earnings of PMT — — 1,165
Loss (gain) on sale of marketable securities (2,658) (226) 14
Loss on disposal of fixed assets 7 — —
Write-off of internally developed software — 262 2,739
Increase (decrease) in allowance for doubtful accounts 270 (738) 1,350
Increase in accounts receivable (10,149) (11,722) (8,307)
Decrease (increase) in other current assets (4,844) 1,206 1,416
Decrease (increase) in other assets (4,717) (415) 859
Increase (decrease) in accounts payable 3,773 11,937 (3,821)
Increase in other current liabilities 8,792 8,213 7,120
Increase (decrease) in other liabilities 7,038 (2,931) 1,011
Net Cash Provided by Operating Activities 141,138 120,569 32,969
Cash Flows From Investing Activities:
Purchases of property, net (56,341) (30,367) (25,171)
Capital contributions to joint venture (3,071) (1,316) —
Purchases of marketable securities (43,956) (94,008) (43,116)
Proceeds from sales and maturities of marketable securities 137,723 47,470 59,518
Purchase of limited partners’ interest in PMT — — (4,183)
Net Cash Provided by (Used in) Investment Activities 34,355 (78,221) (12,952)
Cash Flows From Financing Activities:
Payments on long-term debt (5,506) (3,902) (3,611)
Cash dividends (17,290) — —
Proceeds from exercised stock options 3 — —
Net proceeds from initial public offering 117,459 — —
Net Cash Provided by (Used in) Financing Activities: 94,666 (3,902) (3,611)
Net increase in cash and cash equivalents 270,159 38,446 16,406
Cash and cash equivalents, beginning of year 69,101 30,655 14,249
Cash and Cash Equivalents, End of Year $«339,260 $÷«69,101 $÷«30,655
Supplemental Disclosure Of Cash Flow Information:
Interest paid $«÷÷÷«599 $«÷÷÷«627 $«÷÷÷«892
Income taxes paid (refunded) 64,728 49,062 (5,471)
Capital leases—asset additions and related obligations 558 6,156 1,907
See accompanying notes to consolidated financial statements.
CHICAGO MERCANTILE EXCHANGE HOLDINGS INC. AND SUBSIDIARIESCONSOLIDATED STATEMENTS OF CASH FLOWS
02 AR Financials 2/27/03 2:25 PM Page 57

1. Basis of Presentation and Description of Business
Chicago Mercantile Exchange Holdings Inc. (CME Holdings) is a Delaware stock corporation organized in
August 2001 to be the holding company for Chicago Mercantile Exchange Inc. and its subsidiaries (CME
or the exchange). CME became a wholly owned subsidiary of CME Holdings through a merger of a
subsidiary of CME Holdings with and into CME that was completed on December 3, 2001. At that time,
existing shareholders received stock in CME Holdings for stock in CME. On December 11, 2002, CME
Holdings completed an initial public offering of an additional 3.7 million shares of Class A common stock,
and the Class A common stock not subject to transfer restrictions is now traded on the New York Stock
Exchange (note 15). The consolidated financial statements include Chicago Mercantile Exchange Inc. and
its controlled subsidiaries, which include P-M-T Limited Partnership (PMT) and GFX Corporation (GFX) as
well as the holding company, CME Holdings (collectively, the company). All intercompany transactions
have been eliminated in consolidation.
The merger of CME into CME Holdings was accounted for as a pooling of interests because of the
common owners before and after the transaction. These financial statements have been prepared as
if the current holding company structure had been in place for all periods presented. The assets of CME
Holdings consist of the net proceeds of the initial public offering and its investment in CME. CME Holdings
has no liabilities other than income tax liabilities arising from investment income.
CME is a designated contract market for the trading of futures and options on futures contracts.
Trades are executed through open outcry, an electronic trading platform and privately negotiated transactions.
Through its in-house Clearing House Division, CME clears, settles, nets and guarantees performance of
all matched transactions in its products.
CME resulted from the completion of a demutualization process whereby Chicago Mercantile Exchange,
an Illinois not-for-profit membership organization, became a Delaware for-profit stock corporation. The
transaction resulted in the conversion of membership interests in the Illinois corporation into stock
ownership in the Delaware corporation and was completed on November 13, 2000. When the membership
of the exchange approved the demutualization process, the holders of the units of PMT also approved
the cash purchase of the assets and business of PMT by the exchange (note 17).
2. Summary of Significant Accounting Policies
Cash and Cash Equivalents. Cash equivalents consist of money market mutual funds and highly liquid
investments with maturities of three months or less when purchased.
Marketable Securities. Marketable securities generally have been classified as available for sale and are
carried at fair value based on quoted market prices, with net unrealized gains and losses reported net
of tax as a component of shareholders’ equity. Interest on marketable securities is recognized as income
when earned and includes accreted discount less amortized premium. Realized gains and losses are
calculated using specific identification.
Additional securities held in connection with non-qualified deferred compensation plans have been
classified as trading securities. These securities are included in other assets in the accompanying
consolidated balance sheets at fair value, and net unrealized gains and losses are reflected in
investment income.
58
CHICAGO MERCANTILE EXCHANGE HOLDINGS INC. AND SUBSIDIARIESNOTES TO CONSOLIDATED FINANCIAL STATEMENTS
02 AR Financials 2/27/03 2:25 PM Page 58

59
Fair Value of Financial Instruments. Statement of Financial Accounting Standards (SFAS) No. 107,
“Disclosures about Fair Value of Financial Instruments,” requires disclosure of the fair value of financial
instruments. The carrying values of financial instruments included in assets and liabilities in the accom-
panying consolidated balance sheets are reasonable estimates of their fair values.
Accounts Receivable. In the ordinary course of business, a significant portion of accounts receivable
and revenues are from shareholders of the company. At December 31, 2002, there were approximately
70 clearing firms that are also shareholders. One firm with a significant portion of customer revenue,
represented approximately 11% of our net revenues in 2002. Should a clearing firm withdraw from the
exchange, management believes the customer portion of that firm’s trading activity would likely transfer
to another clearing firm. Therefore, management does not believe the company is exposed to significant
risk from the loss of revenue received from a particular clearing firm.
Performance Bonds and Security Deposits. Performance bonds and security deposits held by the exchange
for clearing firms may be in the form of cash or securities. Cash performance bonds and security deposits
are reflected in the accompanying consolidated balance sheets. Cash received may be invested, and any
interest received accrues to the exchange. These investments are overnight transactions in U.S. Government
securities acquired through and held by a broker-dealer of a subsidiary of a bank.
Securities deposited by clearing firms consist primarily of short-term U.S. Treasury securities and are
not reflected in the accompanying consolidated balance sheets. These securities are held in safekeeping,
although a portion of the clearing firms’ proprietary performance bond deposits may be utilized in securities
lending transactions. Interest and gain or loss on securities deposited to satisfy performance bond and
security deposit requirements accrues to the clearing firm.
Property. Property is stated at cost less accumulated depreciation and amortization. Depreciation on
furniture, fixtures and equipment is provided on the straight-line method over the estimated useful lives
of the assets, generally three to seven years. Leasehold improvements are amortized over the lesser
of their estimated useful lives or the remaining term of the applicable leases. Maintenance and repair
items as well as certain minor purchases are charged to expense as incurred. Renewals and betterments
are capitalized.
Software. The company capitalizes certain costs of developing internal software in accordance with the
American Institute of Certified Public Accountants Statement of Position 98-1, “Accounting for the Costs
of Computer Software Developed or Obtained for Internal Use” (SOP 98-1). Capitalized costs generally
are amortized over three years, commencing with the completion of the project. The depreciable life of
purchased software is four years.
Impairment of Assets. The company reviews its long-lived assets and intangible assets for impairment
whenever events or changes in circumstances indicate that the carrying amounts may not be recoverable.
If such assets are considered to be impaired, the impairment to be recognized is measured by the amount
by which the carrying amount of the assets exceeds the fair value of the assets.
Revenue Recognition. The company’s revenue recognition policies comply with Staff Accounting Bulletin
No. 101 on revenue recognition.
02 AR Financials 2/27/03 2:25 PM Page 59

Clearing and Transaction Fees. Clearing and transaction fees include per contract charges for trade
execution, clearing and GLOBEX fees. Fees are charged at various rates based on the product traded,
the method of trade and the exchange trading privileges of the customer making the trade. Clearing
and transaction fees are recognized as revenue when a buy and sell order are matched and the trade
is cleared. Therefore, cancelled buy and sell orders have no impact on revenue recognition. On occasion,
the customer’s exchange trading privileges may not be properly entered by the clearing firm, and incorrect
fees are charged for the transactions in the affected accounts. When this information is corrected within
the time period allowed by the exchange, a fee adjustment is provided to the clearing firm. An accrual is
established for estimated fee adjustments to reflect corrections to customer exchange trading privileges.
The accrual is based on the historical pattern of adjustments processed. CME believes the allowances
are adequate to cover potential adjustments. Exposure to losses on receivables for clearing and trans-
action fees is dependent on each clearing firm’s financial condition as well as the Class A and B shares
that collateralize fees owed to the exchange. The exchange retains the right to liquidate shares to satisfy
a clearing firm’s receivable.
Quotation Data Fees. Quotation data fees represent revenue received for the dissemination of market
information. Revenues are accrued each month based on the number of subscribers reported by vendors.
CME conducts periodic audits of the information provided and assesses additional fees as necessary.
An allowance is established to cover uncollectible receivables from the market data vendors.
GLOBEX Access Fees. GLOBEX access fees represent fees for connections to the electronic trading
platform and include line charges, license fees for GLOBEX software and hardware rental charges.
The fees vary depending on the type of connection provided. An additional installation fee may be charged
depending on the type of service requested and a disconnection fee may also be charged if certain
conditions are met. Revenue is recognized monthly as the service is provided. An allowance is estab-
lished to cover uncollectible receivables relating to GLOBEX access fees.
Communication Fees. Communication fees consist of equipment rental and usage charges to members
and firms that utilize the various telecommunications networks and services in the Chicago facility.
Revenue is billed and recognized on a monthly basis.
Stock-Based Compensation. As part of the demutualization, the company established an Omnibus
Stock Plan. In 2000, a stock option was granted to the Chief Executive Officer, and stock awards were
granted to certain other employees in 2001 and 2002 (note 16). Through September 30, 2002, the
company accounted for these stock grants under the recognition and measurement provisions of APB
Opinion No. 25, “Accounting for Stock Issued to Employees” and related interpretations. Stock-based
compensation was reflected in the financial statements as a result of restricted stock granted to certain
employees and the required variable accounting treatment for the option granted to the Chief Executive
Officer. At year-end 2002, the company adopted the fair value recognition provisions of SFAS No. 123,
“Accounting for Stock-Based Compensation,” as amended. Under provisions of SFAS No. 148, “Accounting
for Stock-Based Compensation–Transition and Disclosure,” the company also elected to adopt the
retroactive restatement method. All prior periods presented have been restated to reflect the stock-based
compensation expense that would have been recognized had the recognition provisions of SFAS No. 123
been applied to all options granted to employees. The company has elected to recognize expense relating
to stock-based compensation on an accelerated basis. As a result, the expense associated with each vesting
date within a stock grant is recognized over the period of time that each portion of the grant vested.
60
02 AR Financials 2/27/03 2:25 PM Page 60

61
Marketing Costs. Marketing costs are incurred for production and communication of advertising as well
as other marketing activities. These costs are expensed when incurred, except for costs related to the
production of broadcast advertising, which are expensed when the first broadcast occurs.
Income Taxes. Deferred income taxes are determined in accordance with SFAS No. 109, “Accounting
for Income Taxes,” and arise from temporary differences between amounts reported for income tax and
financial statement purposes. A valuation allowance is recognized if it is anticipated that some or all of
a deferred tax asset may not be realized.
Segment Reporting. The company operates in two segments, CME and GFX. Based on materiality, GFX
is not a reportable segment, and as a result there is no disclosure of segment information.
Use of Estimates. The preparation of financial statements in conformity with accounting principles generally
accepted in the United States requires management to make estimates and assumptions that affect
the amounts of assets and liabilities at the date of the financial statements, as well as the amounts of
revenues and expenses reported during the period, and to disclose contingent assets and liabilities as
of the date of the financial statements. Actual results could differ from those estimates.
Reclassifications. Certain reclassifications have been made to the consolidated financial statements to
provide consistent presentation for all periods presented.
Recent Accounting Pronouncements. In November 2002, the FASB issued Interpretation (FIN) No. 45,
“Guarantor’s Accounting and Disclosure Requirements for Guarantees, Including Indirect Guarantees of
Indebtedness of Others.” FIN No. 45 requires certain guarantees, including indemnification arrangements,
to be recorded at fair value at inception, and also requires a guarantor to make significant new disclosures.
For those arrangements where the company receives an explicit fee for the guarantee, FIN No. 45
requires that the company defer the fee and recognize it over the life of the arrangement. For arrangements
where no explicit fee is received, FIN No. 45 requires a liability to be recorded and amortized over the
life of the arrangement, along with an offsetting asset, depending on the arrangement. The company
will adopt the accounting provisions of FIN No. 45 for guarantees issued beginning January 1, 2003,
and has adopted the disclosure provisions for all existing guarantees as of December 31, 2002. The
company is currently evaluating the impact of adopting the accounting provisions of FIN No. 45 on its
consolidated financial statements.
In January 2003, the FASB issued Interpretation (FIN) No. 46, “Consolidation of Variable Interest
Entities.” The objective of FIN No. 46 is to improve financial reporting by achieving more consistent
application of consolidation policies to variable interest entities (also referred to as special-purpose entities)
and, thus, to improve comparability between enterprises engaged in similar activities even if some
of those activities are conducted through variable interest entities. Prior to the issuance of FIN No. 46,
a company would generally not have to include another entity in its consolidated financial statements
unless it controlled the entity through voting interest. FIN No. 46 changes that by requiring a variable
interest entity to be consolidated by a company if that company is subject to a majority of the risk of
loss from the variable interest entity’s activities or entitled to receive a majority of the entity’s residual
returns or both. The company will adopt FIN No. 46 on July 1, 2003 and is currently evaluating the impact
of adopting FIN No. 46 on its consolidated financial statements.
02 AR Financials 2/27/03 2:25 PM Page 61

3. Securities Lending
Securities lending transactions utilize a portion of the securities that clearing firms have deposited to satisfy
their proprietary performance bond requirements. Under this securities lending program, CME lends a
security to a third party and receives collateral in the form of cash. The majority of the cash is then invested
on an overnight basis to generate interest income. The related interest expense represents payment to
the borrower of the security for the cash collateral retained during the duration of the lending transaction.
Securities on loan are marked to market daily and compared to collateral received. At December 31, 2002
and 2001, the fair value of securities on loan was $985.5 million and $882.6 million, respectively. CME’s
policy allows lending of up to 75% of total available securities. At December 31, 2002 and 2001, securities
available totaled $3.5 billion and $4.6 billion, respectively. The average daily amount of securities on
loan for the year ended December 31, 2002 was $924.1 million. The average daily amount of securities
on loan from commencement of the program on June 18, 2001 to December 31, 2001 was $632.6 million.
The securities lending activity utilized some of the securities deposited by four clearing firms, one of
which is a subsidiary of the bank used for executing this securities lending program. Proceeds from
securities lending at December 31, 2002 were invested in a money market mutual fund sponsored by
the bank used in executing this program or held in the form of cash.
4. Marketable Securities
In the third quarter of 2002, CME changed its investment policy and converted its marketable securities
to short-term investments, resulting in realized gains from the sale of marketable securities of $2.7 million
that is included in investment income. The revised investment policy allows CME to invest in institutional
money market funds with a fund balance over $1.0 billion and certain U.S. Treasury and Government
agency securities, provided these securities will mature at par value within seven days of purchase.
Balances in these short-term investments are included in cash and cash equivalents and, as a result,
there are no investments classified as marketable securities at December 31, 2002.
Marketable securities included in current assets at December 31, 2001 were classified as available for
sale. The amortized cost and fair value of these securities at December 31, 2001, were as follows:
(in thousands) Amortized Cost Fair Value
U.S. Government agency $«26,507 $«26,818
State and municipal 57,231 57,390
Corporate debt 7,371 7,362
Total $«91,109 $«91,570
Net unrealized gains (losses) on marketable securities classified as available for sale were reported as a
component of comprehensive income and included in the accompanying consolidated statements of
shareholders’ equity.
5. Other Current Assets
Other current assets consisted of the following at December 31:
(in thousands) 2002 2001
Refundable income taxes $÷««1,214 $÷««1,215
Prepaid pension 2,518 –
Prepaid insurance 2,656 549
Other prepaid expenses 4,572 2.609
Accrued interest receivable 264 1,637
Other 291 661
Total $«11,515 $÷««6,671
62
02 AR Financials 2/27/03 2:25 PM Page 62

63
6. Performance Bonds and Security Deposits
The exchange is a designated contract market for futures and options on futures, and clears and guarantees
the settlement of all contracts traded in its markets. In its guarantor role, the exchange has precisely equal
and offsetting claims to and from clearing firms on opposite sides of each contract. CME bears counterparty
credit risk in the event that future market movements create conditions that could lead to clearing firms failing
to meet their obligations to the exchange. CME reduces its exposure through a risk management program
that includes rigorous initial and ongoing financial standards for designation as a clearing firm, initial and
maintenance performance bond requirements and mandatory security deposits. Each clearing firm is required
to deposit and maintain specified margin in the form of cash, U.S. Government securities, bank letters of
credit or other approved investments. All obligations and non-cash margin deposits are marked to market
on a daily basis, and haircuts are applied for margin and risk management purposes. Cash performance
bonds and security deposits are included in the consolidated balance sheets, and balances may fluctuate
significantly over time due to the investment choices available to clearing firms and the change in the
amount of deposits required.
Clearing firms, at their option, may instruct CME to invest cash on deposit for performance bond
purposes in a portfolio of securities that is part of the Interest Earning Facility (IEF) program. The first
IEF was organized in 1997 as two limited liability companies. Interest earned, net of expenses, is passed
on to participating clearing firms. The principal of the first IEF totaled $350.0 million at December 31, 2002
and is guaranteed by the exchange. The investment portfolio of these facilities is managed by two of the
exchange’s approved settlement banks, and eligible investments include U.S. Treasury bills and notes, U.S.
Treasury strips and reverse repurchase agreements. The maximum average portfolio maturity is 90 days,
and the maximum maturity for an individual security is 13 months. Management believes that the market
risk exposure relating to its guarantee is not material to the consolidated financial statements taken as a
whole. In 2001, IEF2 was organized. IEF2 offers clearing firms the opportunity to invest cash performance
bonds in shares of CME-approved money market mutual funds. Dividends earned on these shares, net of
fees, are solely for the account of the clearing firm on whose behalf the shares were purchased. The principal
of IEF2 funds is not guaranteed by the exchange. The total principal in all IEF programs was approximately
$12.2 billion at December 31, 2002 and $8.3 billion at December 31, 2001. The exchange earned fees under
the IEF program in the amount of $5.6 million, $3.3 million and $1.0 million during 2002, 2001 and 2000,
respectively. These fees are included as other revenue.
CME, Options Clearing Corporation (OCC) and New York Clearing Corporation (NYCC) have a cross-
margin arrangement, whereby a common clearing firm may maintain a cross-margin account in which
the clearing firm’s positions in certain CME futures and options on futures are combined with certain
positions cleared by OCC and NYCC for purposes of calculating performance bond requirements. The
performance bond deposits are held jointly by CME, OCC and NYCC. In addition, CME has a cross-margin
agreement with the London Clearing House (LCH), whereby clearing firms’ offsetting positions with CME
and LCH are subject to reduced margin requirements. Clearing firms maintain separate performance
bond deposits with each clearing house, but depending on the net offsetting positions between CME
and LCH, each clearing house may reduce the firm’s performance bond requirements. In April 2002, a
cross-margin agreement with the Government Securities Clearing Corporation (GSCC) became effective,
whereby clearing firms’ offsetting positions with CME and GSCC are subject to reduced margin require-
ments. Clearing firms maintain separate performance bond deposits with each clearing house, but
depending on the net offsetting positions between CME and GSCC, each clearing house may reduce
the firm’s performance bond requirements.
Each clearing firm also is required to deposit and maintain specified security deposits in the form of
cash or approved securities. In the event that performance bonds and security deposits of a defaulting
clearing firm are inadequate to fulfill that clearing firm’s outstanding financial obligation, the entire security
deposit fund is available to cover potential losses after first utilizing operating funds of the exchange in
excess of amounts needed for normal operations (surplus funds).
02 AR Financials 2/27/03 2:25 PM Page 63

The exchange maintains a $500.0 million secured line of credit with a consortium of banks to provide
liquidity and capacity to pay settlement variation to all clearing firms, even if a clearing firm may have
failed to meet its financial obligations to CME, or in the event of a temporary disruption with the domestic
payments system that would delay payment of settlement variation between the exchange and its clearing
firms (note 18). Clearing firm security deposits received in the form of U.S. Treasury or agency securities, or
in money market funds purchased through IEF2, are used to collateralize the secured line of credit.
The exchange is required under the Commodity Exchange Act to segregate cash and securities
deposited by clearing firms on behalf of their customers. In addition, exchange rules require a segregation
of all funds deposited by clearing firms from exchange operating funds.
Cash and securities held as performance bonds and security deposits at fair market value at
December 31 were as follows:
2002 2001Securities and Securities and
(in thousands) Cash IEF Funds Cash IEF Funds
Performance bonds $«1,805,052 $«25,278,903 $÷«848,391 $«27,208,994
Security deposits 22,939 896,192 6,836 694,323
Cross-margin securities, held jointly with OCC — 636,848 — 422,996
Total $«1,827,991 $«26,811,943 $÷«855,227 $«28,326,313
With the exception of amounts jointly held with OCC under cross-margin agreements, these performance
bonds are available to meet only the financial obligations of that clearing firm to the exchange.
In addition to cash and securities, irrevocable letters of credit may be used as performance bond
deposits. At December 31, these letters of credit, which are not included in the accompanying consolidated
balance sheets, were as follows:
(in thousands) 2002 2001
Performance bonds $÷«495,750 $«÷÷«908,250
Cross-margin accounts 208,900 144,000
Total Letters of Credit $÷«704,650 $÷«1,052,250
64
02 AR Financials 2/27/03 2:25 PM Page 64
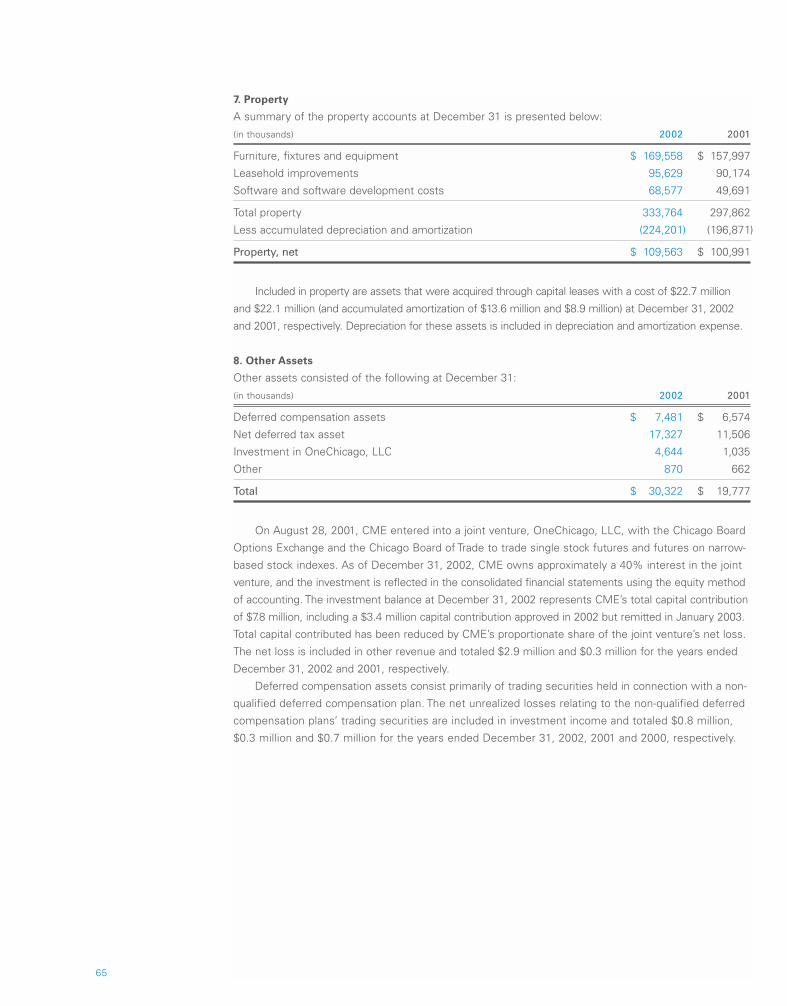
65
7. Property
A summary of the property accounts at December 31 is presented below:
(in thousands) 2002 2001
Furniture, fixtures and equipment $««169,558 $««157,997
Leasehold improvements 95,629 90,174
Software and software development costs 68,577 49,691
Total property 333,764 297,862
Less accumulated depreciation and amortization (224,201) (196,871)
Property, net $««109,563 $««100,991
Included in property are assets that were acquired through capital leases with a cost of $22.7 million
and $22.1 million (and accumulated amortization of $13.6 million and $8.9 million) at December 31, 2002
and 2001, respectively. Depreciation for these assets is included in depreciation and amortization expense.
8. Other Assets
Other assets consisted of the following at December 31:
(in thousands) 2002 2001
Deferred compensation assets $÷÷««7,481 $÷÷««6,574
Net deferred tax asset 17,327 11,506
Investment in OneChicago, LLC 4,644 1,035
Other 870 662
Total $÷««30,322 $÷««19,777
On August 28, 2001, CME entered into a joint venture, OneChicago, LLC, with the Chicago Board
Options Exchange and the Chicago Board of Trade to trade single stock futures and futures on narrow-
based stock indexes. As of December 31, 2002, CME owns approximately a 40% interest in the joint
venture, and the investment is reflected in the consolidated financial statements using the equity method
of accounting. The investment balance at December 31, 2002 represents CME’s total capital contribution
of $7.8 million, including a $3.4 million capital contribution approved in 2002 but remitted in January 2003.
Total capital contributed has been reduced by CME’s proportionate share of the joint venture’s net loss.
The net loss is included in other revenue and totaled $2.9 million and $0.3 million for the years ended
December 31, 2002 and 2001, respectively.
Deferred compensation assets consist primarily of trading securities held in connection with a non-
qualified deferred compensation plan. The net unrealized losses relating to the non-qualified deferred
compensation plans’ trading securities are included in investment income and totaled $0.8 million,
$0.3 million and $0.7 million for the years ended December 31, 2002, 2001 and 2000, respectively.
futures on narrow-based stock indexes. As of December 31, 2002, CME owns approximately a 40%
02 AR Financials 2/27/03 2:25 PM Page 65

9. Income Taxes
The provision (benefit) for income taxes is composed of the following:
YEAR ENDED DECEMBER 31
(in thousands) 2002 2001 2000
Current:
Federal $«53,811 $«45,031 $««(3,544)
State 11,988 9,910 (606)
Total 65,799 54,941 (4,150)
Deferred:
Federal (4,617) (3,263) (1,502)
State (1,020) (1,020) (279)
Total (5,637) (4,283) (1,781)
Total Provision (Benefit) for Income Taxes $«60,162 $«50,658 $««(5,931)
Reconciliation of the statutory U.S. federal income tax rate to the effective tax rate is as follows:
YEAR ENDED DECEMBER 31
2002 2001 2000
Statutory U.S. federal tax rate 35.0% 35.0% (35.0) %
State taxes, net of federal benefit 4.6% 4.6 (3.5)
Tax-exempt interest income (0.3)% (0.5) (3.0)
Nondeductible expenses 0.2% 0.6 6.8
Other, net (0.5)% 0.6 (1.4)
Effective Tax Rate—Provision (Benefit) 39.0% 40.3% (36.1) %
At December 31, the components of deferred tax assets (liabilities) were as follows:
(in thousands) 2002 2001
Deferred Tax Assets:
Depreciation and amortization $÷«7,685 $÷«7,730
Deferred compensation 3,369 2,678
Accrued expenses 6,525 1,755
Stock-based compensation 5,732 5,404
Other 887 218
Subtotal 24,198 17,785
Valuation allowance — —
Deferred Tax Assets 24,198 17,785
Deferred Tax Liabilities:
Software development costs (6,440) (5,664)
Net unrealized gains on securities — (184)
Other (431) (431)
Deferred Tax Liabilities (6,871) (6,279)
Net Deferred Tax Asset $«17,327 $«11,506
The company expects to realize the benefit of all deferred tax assets based on the expectation of
future taxable income and, therefore, no valuation allowance has been established at December 31, 2002
or 2001. 66
02 AR Financials 2/27/03 2:25 PM Page 66

67
10. Other Current Liabilities
Other current liabilities consisted of the following at December 31:
(in thousands) 2002 2001
Accrued salaries and benefits $«24,143 $«23,331
Accrued fee adjustments 3,137 2,241
Current portion of long-term debt 4,669 5,294
Accrued operating expenses 9,844 4,413
Accrued federal and state income taxes 6,312 4,943
Other 291 7
Total $«48,396 $«40,229
11. Commitments
Leases. The exchange has commitments under operating and capital leases for certain facilities and
equipment that are accounted for in accordance with SFAS No. 13, “Accounting for Leases.” Lease
commitments for office space at the main location in Chicago expire in the year 2008, with annual
minimum rentals ranging from $8.8 million to $9.4 million. The exchange leases trading facilities from
the Chicago Mercantile Exchange Trust through October 2005, with annual minimum rentals of approxi-
mately $1.3 million, and has an option to extend the term of the lease through October 2026 with three
successive seven-year extensions. Minimum annual rent for these extensions begins at $0.7 million
for the period from November 2005 through October 2012 and declines to $0.2 million for the last
extension from November 2019 through October 2026. Additional rental expense is incurred in connection
with the trading facilities based on annual trading volume. This expense totaled $1.2 million, $1.0 million
and $0.6 million for the years ended December 31, 2002, 2001 and 2000, respectively. The CME Trust
is an entity that was established to provide financial assistance, on a discretionary basis, to customers
of any clearing firm that becomes insolvent. No outside parties have any residual interest in the assets
of the CME Trust. Leases for other locations where the exchange maintains offices expire at various times
through the year 2012 with annual minimum rentals that will not exceed $0.8 million in any year. Total
rental expense was approximately $19.9 million in 2002, $18.5 million in 2001 and $17.4 million in 2000.
Commitments. Commitments includes long-term liabilities (note 13) as well as contractual obligations
that are non-cancelable. These contractual obligations relate to software licenses and maintenance, and
telecommunication services. These amounts are expensed as the related services are used.
Future obligations under commitments in effect at December 31, 2002, including the minimum for
operating leases, were as follows:
Capitalized Operating (in thousands) Leases Leases Commitments
2003 $÷«4,992 $«10,765 $÷«10,046
2004 2,361 10,277 6,949
2005 — 10,079 3,714
2006 — 9,178 3,253
2007 — 9,401 2,496
Thereafter — 11,557 —
Total minimum payments 7,353 61,257 26,458
Less sublease commitments — (223) —
Less amount representing interest (356) — (1,272))
Total $÷«6,997 $«61,034 $«25,186
02 AR Financials 2/27/03 2:25 PM Page 67

Licensing Agreements. The exchange has licensing agreements relating to certain stock index products.
The license agreement with NASDAQ, relating to the NASDAQ-100 product that is traded on the exchange,
expires in 2006, with a five-year extension unless either party gives notice of termination. The licensing
agreement with Standard & Poor’s Corporation terminates in 2013 and includes a clause to renegotiate
potential extensions.
12. Long-Term Debt
Long-term debt consists of the long-term portion of capitalized lease obligations.
13. Other Liabilities
Other liabilities consisted of the following at December 31:
(in thousands) 2002 2001
Deferred compensation liabilities $«÷7,481 $«÷6,574
Litigation settlement payable 6,803 —
Software maintenance contract 744 380
Accrued pension liability — 715
Deferred rent 370 586
Other 1,657 1,762
Total $«17,055 $«10,017
14. Employee Benefit Plans
Pension Plan. The exchange maintains a noncontributory defined benefit cash balance pension plan for
eligible employees. Employees who have completed a continuous twelve-month period of employment
and have reached the age of 21 are eligible to participate. The plan provides for an age-based contribution
to the cash balance account and includes salary and cash bonuses in the definition of earnings. Participant
cash balance accounts receive an interest credit equal to the greater of the one-year U.S. Treasury bill rate
or 4%. Participants become vested in their accounts after five years. The exchange’s policy is to currently
fund required pension costs by the due dates specified under the Employee Retirement Income
Security Act.
68
02 AR Financials 2/27/03 2:25 PM Page 68

69
A reconciliation of beginning and ending balances of the benefit obligation and fair value of plan assets,
the funded status of the plan, certain actuarial assumptions and the components of pension cost are
indicated below:
(dollars in thousands) 2002 2001
Change In Benefit Obligation:
Benefit obligation at beginning of year $«19,566 $«16,101
Service cost 2,963 2,483
Interest cost 1,661 1,393
Actuarial loss 2,295 1,080
Benefits paid (1,218) (1,491)
Benefit Obligation at End of the Year $«25,267 $«19,566
Change In Plan Assets:
Fair value of plan assets at beginning of year $«17,898 $«13,968
Actual return on plan assets (934) (708)
Employer contribution 6,402 6,129
Benefits paid (1,218) (1,491)
Fair Value of Assets at End of the Year $«22,148 $«17,898
Funded Status at December 31:
Plan assets less than benefit obligation $÷(3,119) $÷(1,668)
Unrecognized transition asset (112) (187)
Unrecognized prior service cost (credit) 1 (125)
Unrecognized net actuarial loss 5,748 1,265
Prepaid (Accrued) Benefit Cost $«÷2,518 $÷÷«(715)
2002 2001 2000
Actuarial Assumptions as of December 31:
Discount rate 6.75% 7.25% 7.50%
Rate of compensation increase 5.00% 5.00% 5.00%
Expected return on plan assets 9.00% 9.00% 8.00%
Components of Pension Cost:
Service cost $««2,963 $««2,483 $««2,235
Interest cost 1,661 1,393 1,207
Expected return on plan assets (1,443) (1,145) (1,017)
Amortization of prior service cost (44) (51) (51)
Amortization of transition asset (74) (74) (74)
Recognized net actuarial gain 106 — —
Net Pension Cost $÷3,169 $÷2,606 $÷2,300
02 AR Financials 2/27/03 2:25 PM Page 69

Savings Plan. The exchange maintains a savings plan pursuant to Section 401(k) of the Internal Revenue
Code, whereby all employees are participants and have the option to contribute to this plan. The exchange
matches employee contributions up to 3% of the employee’s base salary and makes an additional discre-
tionary contribution of up to 2% of salary. Prior to 2001, this additional contribution was based on increases
in annual trading volume. Total expense for the savings plan amounted to $3.1 million, $2.5 million and
$2.1 million in 2002, 2001 and 2000, respectively.
Non-Qualified Plans. The following non-qualified plans, under which participants may make assumed
investment choices with respect to amounts contributed on their behalf, are maintained by the exchange.
Although not required to do so, the exchange invests such contributions in assets which mirror the
assumed investment choices. The balances in these plans are subject to the claims of general creditors
of the exchange, and totaled approximately $7.5 million and $6.6 million at December 31, 2002 and
2001, respectively.
Supplemental Plan—The exchange maintains a non-qualified supplemental plan to provide benefits
for certain officers who have been impacted by statutory limits under the provisions of the qualified
pension and savings plans. Total expense for the supplemental plan was $0.6 million, $0.4 million
and $0.3 million in 2002, 2001 and 2000, respectively.
Deferred Compensation Plan—A deferred compensation plan is maintained by the exchange, under
which eligible officers and members of the Board of Directors may contribute a percentage of their
compensation or stipends and defer income taxes thereon until the time of distribution.
Supplemental Executive Retirement Plan—The exchange maintains a non-qualified defined contri-
bution plan for senior officers. Under this plan, the exchange makes an annual contribution of 8%
of salary and bonus for eligible employees. Contributions made after 1996 are subject to a vesting
schedule, under which each annual contribution begins to vest after three years and is fully vested
after five years. Unvested contributions are returned to the exchange if a participant leaves the
employment of the exchange. Total expense for the plan, net of any forfeitures, was $0.8 million,
$0.5 million and $42,000 in 2002, 2001 and 2000, respectively.
15. Capital Stock
On December 11, 2002, CME Holdings completed the initial public offering of Class A common stock.
All 5,463,730 shares of Class A common stock, including an aggregate of 712,660 shares of Class A
common stock covered by an over-allotment option granted by CME Holdings to the underwriters, were
sold at a price to the public of $35.00 per share. Of the 5,463,730 shares sold in the offering, 3,712,660
shares were sold by CME Holdings and 1,751,070 shares were sold by selling shareholders. The aggregate
proceeds to CME Holdings from the offering were approximately $129.9 million, before deducting
approximately $9.1 million in underwriting discounts and commissions and an estimated $3.3 million
in other expenses incurred in connection with the offering. CME Holdings did not receive any proceeds
from the sale of shares by the selling shareholders.
70
02 AR Financials 2/27/03 2:25 PM Page 70

71
Shares Outstanding. As of December 31, 2002, 5,463,730 shares of Class A common stock, 6,981,394
shares of Class A-1 common stock, 6,944,087 shares of Class A-2 common stock, 6,751,869 shares of
Class A-3 common stock, 6,389,292 shares of Class A-4 common stock, 625 shares of Class B-1 common
stock, 813 shares of Class B-2 common stock, 1,287 shares of Class B-3 common stock and 413 shares
of Class B-4 common stock were issued and outstanding. CME Holdings has no shares of preferred
stock issued and outstanding.
Associated Trading Rights. Each class of CME Holdings Class B common stock is associated with a
membership in a specific division of the exchange. CME’s rules provide exchange members with trading
rights and the ability to use or lease these trading rights. Trading rights are maintained at CME and are
not part of or evidenced by the Class B common stock of CME Holdings. The Class B common stock
of CME Holdings is intended only to ensure that the former Class B shareholders of CME retain Board
representation rights and approval rights with respect to the core rights described below.
Voting Rights. With the exception of the matters reserved to holders of CME Holdings Class B common
stock, holders of common stock vote together on all matters for which a vote of common shareholders
is required. In these votes, each holder of shares of Class A or Class B common stock of CME Holdings
has one vote per share.
Election of Directors. The CME Holdings Board of Directors is composed of 20 members. Holders
of Class A and Class B common stock have the right to vote together in the election of 14 directors.
Holders of Class B-1, Class B-2 and Class B-3 common stock have the right to elect the remaining
six directors, of which three are elected by Class B-1 shareholders, two are elected by Class B-2
shareholders and one is elected by Class B-3 shareholders.
Core Rights. Holders of Class B shares have the right to approve changes in specified rights relating to
the trading privileges associated with those shares. These core rights include allocation of products that
a holder of trading rights is permitted to trade through the exchange; the trading floor access rights and
privileges that a member has; the number of memberships in each membership class and the number
of authorized and issued shares of Class B common stock associated with that class; and eligibility
requirements to exercise trading rights associated with Class B shares. Votes on changes to these core
rights are weighted by class. Each class of Class B common stock has the following number of votes
on matters relating to core rights: Class B-1, six votes per share; Class B-2, two votes per share; Class
B-3, one vote per share, and Class B-4, 1/6th of one vote per share. The approval of a majority of the
votes cast by the holders of shares of Class B common stock is required in order to approve any changes
to core rights. Holders of shares of Class A common stock do not have the right to vote on changes to
core rights.
Dividends. Holders of Class A and Class B common stock of CME Holdings are entitled to receive
proportionately such dividends, if any, as may be declared by the CME Holdings Board of Directors.
02 AR Financials 2/27/03 2:25 PM Page 71

Transfer Restrictions.
Class A Common Stock—Each class of CME Holdings Class A common stock is identical, except
that the shares of Class A-1, A-2, A-3 and A-4 common stock are subject to transfer restrictions
contained in CME Holdings’ Certificate of Incorporation. The number of shares outstanding at
December 31, 2002 and the timing of the expiration of the transfer restrictions are set forth below.
Until these transfer restrictions lapse, shares of Class A-1, A-2, A-3 and A-4 common stock may
not be sold or transferred separately from a share of Class B common stock, subject to limited
exceptions specified in CME Holdings’ Certificate of Incorporation. There are no restrictions on
the shares of Class A common stock sold in the initial public offering.
Shares Outstanding Transfer Restrictions Expire
Class A 5,463,730 Not restricted
Class A-1 6,981,394 June 10, 2003
Class A-2 6,944,087 December 7, 2003
Class A-3 6,751,869 June 4, 2004
Class A-4 6,389,292 June 4, 2004
Total Class A Shares Outstanding 32,530,372
The expiration of the transfer restrictions on Class A-1 and A-2 stock may be extended an additional
60 days to allow for the completion of a secondary sale of company stock, provided notice is given
no later than 30 days prior to the expiration date of the transfer restrictions. Under certain circum-
stances, transfer restrictions for Class A-1 and A-2 stock may continue until the final expiration date
if a shareholder elects not to participate in a successful secondary sale.
Class B Common Stock—Each class of CME Holdings Class B common stock is subject to transfer
restrictions contained in the Certificate of Incorporation of CME Holdings. These transfer restrictions
prohibit the sale or transfer of any shares of Class B common stock separate from the sale of the
associated trading rights in the exchange.
Shareholder Rights Provisions. The Board of Directors of CME Holdings has adopted a plan creating
rights that entitle CME Holdings’ shareholders to purchase shares of CME Holdings stock in the event
that a third party initiates a transaction designed to take over the company. This rights plan is intended
to encourage persons seeking to acquire control of CME Holdings to engage in arms-length negotiations
with the Board of Directors and management. The rights are attached to all outstanding shares of CME
Holdings common stock, and each right entitles the shareholder to purchase one one-thousandth of a
share of Series A Junior Participating Preferred Stock at a purchase price of $105 per unit. The rights will
separate from the common stock of the company; (1) 10 days after a person or group seeks to acquire
CME Holdings through a public announcement by such person or group that they have acquired 15%
or more of the outstanding shares of CME Holdings; or (2) 10 business days after the commencement
of a tender offer by such person or group. If either of these two events occur, each holder of a right
shall receive, upon exercise, Class A common stock having a value equal to two times the exercise
price of the right.
Omnibus Stock Plan. CME Holdings has adopted an Omnibus Stock Plan under which stock-based awards
may be made to employees. A total of 2.7 million Class A shares have been reserved for awards under the
plan. Awards totaling 2.6 million shares are outstanding under this plan at December 31, 2002 (note 16).
72
02 AR Financials 2/27/03 2:25 PM Page 72
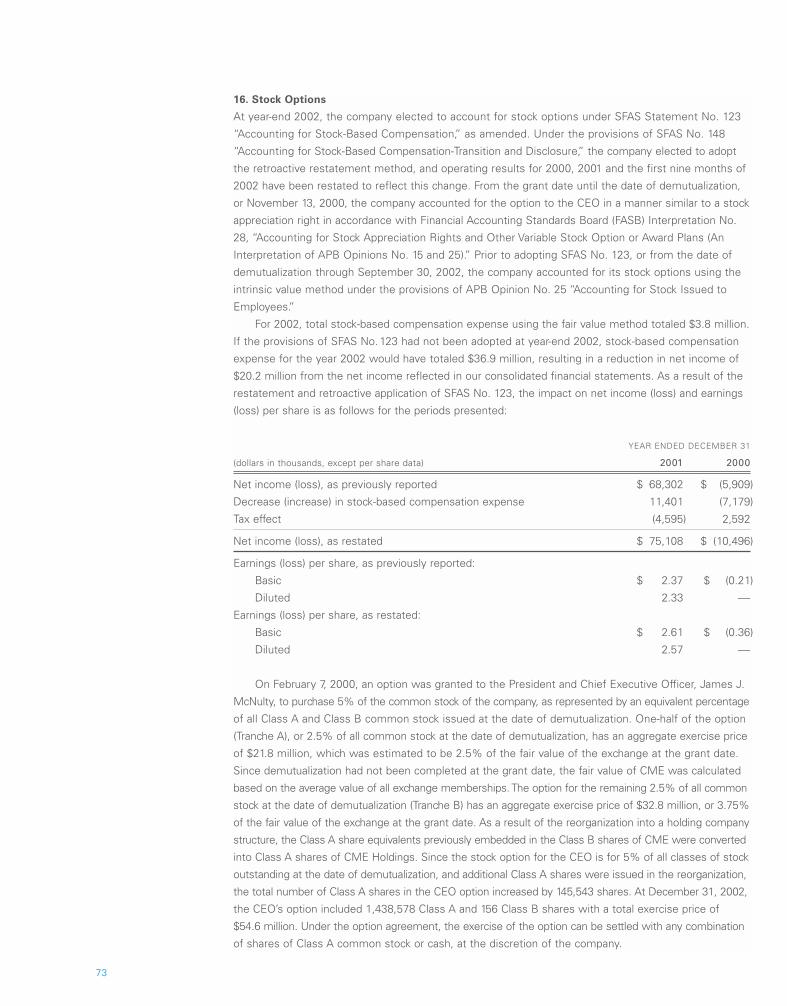
73
16. Stock Options
At year-end 2002, the company elected to account for stock options under SFAS Statement No. 123
“Accounting for Stock-Based Compensation,” as amended. Under the provisions of SFAS No. 148
“Accounting for Stock-Based Compensation-Transition and Disclosure,” the company elected to adopt
the retroactive restatement method, and operating results for 2000, 2001 and the first nine months of
2002 have been restated to reflect this change. From the grant date until the date of demutualization,
or November 13, 2000, the company accounted for the option to the CEO in a manner similar to a stock
appreciation right in accordance with Financial Accounting Standards Board (FASB) Interpretation No.
28, “Accounting for Stock Appreciation Rights and Other Variable Stock Option or Award Plans (An
Interpretation of APB Opinions No. 15 and 25).” Prior to adopting SFAS No. 123, or from the date of
demutualization through September 30, 2002, the company accounted for its stock options using the
intrinsic value method under the provisions of APB Opinion No. 25 “Accounting for Stock Issued to
Employees.”
For 2002, total stock-based compensation expense using the fair value method totaled $3.8 million.
If the provisions of SFAS No. 123 had not been adopted at year-end 2002, stock-based compensation
expense for the year 2002 would have totaled $36.9 million, resulting in a reduction in net income of
$20.2 million from the net income reflected in our consolidated financial statements. As a result of the
restatement and retroactive application of SFAS No. 123, the impact on net income (loss) and earnings
(loss) per share is as follows for the periods presented:
YEAR ENDED DECEMBER 31
(dollars in thousands, except per share data) 2001 2000
Net income (loss), as previously reported $««68,302 $÷««(5,909)
Decrease (increase) in stock-based compensation expense 11,401 (7,179)
Tax effect (4,595) 2,592
Net income (loss), as restated $««75,108 $÷(10,496)
Earnings (loss) per share, as previously reported:
Basic $«÷÷«2.37 $÷÷«(0.21)
Diluted 2.33 —
Earnings (loss) per share, as restated:
Basic $«÷÷«2.61 $÷÷«(0.36)
Diluted 2.57 —
On February 7, 2000, an option was granted to the President and Chief Executive Officer, James J.
McNulty, to purchase 5% of the common stock of the company, as represented by an equivalent percentage
of all Class A and Class B common stock issued at the date of demutualization. One-half of the option
(Tranche A), or 2.5% of all common stock at the date of demutualization, has an aggregate exercise price
of $21.8 million, which was estimated to be 2.5% of the fair value of the exchange at the grant date.
Since demutualization had not been completed at the grant date, the fair value of CME was calculated
based on the average value of all exchange memberships. The option for the remaining 2.5% of all common
stock at the date of demutualization (Tranche B) has an aggregate exercise price of $32.8 million, or 3.75%
of the fair value of the exchange at the grant date. As a result of the reorganization into a holding company
structure, the Class A share equivalents previously embedded in the Class B shares of CME were converted
into Class A shares of CME Holdings. Since the stock option for the CEO is for 5% of all classes of stock
outstanding at the date of demutualization, and additional Class A shares were issued in the reorganization,
the total number of Class A shares in the CEO option increased by 145,543 shares. At December 31, 2002,
the CEO’s option included 1,438,578 Class A and 156 Class B shares with a total exercise price of
$54.6 million. Under the option agreement, the exercise of the option can be settled with any combination
of shares of Class A common stock or cash, at the discretion of the company.
02 AR Financials 2/27/03 2:25 PM Page 73

The CEO option vests over a four-year period, with 40% vesting one year after the grant date and
20% vesting on that same date in each of the following three years. The term of the option is 10 years.
As of December 31, 2002, all of the option remained outstanding. Although the option is for all classes
of common stock outstanding, any exercise of the option must be for all or a portion of the option that
is vested at the date of exercise. The CEO cannot elect to exercise the option for only certain classes of
stock included in the option. The CEO option represented $1.8 million of stock-based compensation
expense in 2002.
In 2001 and in December 2002, concurrent with the company’s initial public offering, CME granted
stock options to various employees under the Omnibus Stock Plan. The options vest over a four-year
period, with 40% vesting one year after the grant date and 20% vesting on that same date in each of the
following three years. The options have a 10-year term. Compensation expense of $4.6 million relating
to employee stock options will be recognized over the vesting period. Restricted stock grants of 119,000
shares were also awarded to certain executives in 2001 that have the same vesting provisions as the
stock options. Compensation expense of $2.4 million relating to restricted stock will be recognized
over the vesting period. The employee options and restricted stock grants represented $1.2 million and
$0.8 million, respectively, of stock-based compensation expense in 2002.
The fair value of the Chief Executive Officer’s option was $14.4 million, measured at the demutual-
ization date under the minimum value method. This method was used since, at the date of demutualization,
there was not an independent established public trading market for Class A shares. Significant assumptions
used to calculate fair value included: risk-free interest rate of 5.11%, expected life equal to the maximum
term of the option and no expected dividends. The fair value of the option granted to employees in 2001
was $4.2 million, measured at the grant date under the minimum value method. A risk-free interest rate
of 5.40% was used over a period of five years with no expected dividends. The fair value of the options
granted to employees in 2002 was $0.4 million, measured at the grant date using the Black-Scholes
method of valuation, as a public market for the Class A shares had been established as a result of the
completion of the initial public offering. A risk-free rate of 3.50% was used over a period of six years
with a 41% volatility factor and a 1.43% dividend yield.
The following table summarizes stock option activity for the three-year period ended December 31, 2002:
Number of Shares
Class A Class B
Balance at December 31, 1999 — —
Granted 1,293,035 156
Exercised — —
Cancelled — —
Balance at December 31, 2000 1,293,035 156
Granted 1,176,500 —
Adjustment for reorganization 145,543 —
Exercised — —
Cancelled (3,750) —
Balance at December 31, 2001 2,611,328 156
Granted 27,000 —
Exercised (150) —
Cancelled (115,200) —
Balance at December 31, 2002 2,522,978 156
74
02 AR Financials 2/27/03 2:25 PM Page 74

Total stock options outstanding and the portion of each option that can be exercised at December 31,
2002 are as follows:
Total Options Outstanding Exercisable Shares
CEO Option
Tranche A:
Class A shares 719,289 431,573
Class B shares 78 47
Tranche B:
Class A shares 719,289 431,573
Class B shares 78 47
Employee Options
Class A shares 1,084,400 422,960
Total Stock Options 2,523,134 1,286,200
Employee options granted in 2001 all have an exercise price of $22.00 per share, and options granted
in 2002 have an exercise price of $35.00 per share, the offering price of the initial public offering. The
employee options granted in 2001 are 40% vested at December 31, 2002. No portion of the 2002
options are vested at December 31, 2002. If the CEO exercised his option at December 31, 2002 for
the 60% that was vested at that date, the vested exercise price of $32.8 million was paid in cash and
only Class A shares were issued to satisfy the option, the CEO would have received 768,273 Class A
shares for each Tranche, or a total of 1,536,546 Class A shares, based on the value of the option and
the closing price of our publicly traded Class A shares on that date. The CEO option has a total exercise
price of $54.6 million. A total of 2,560,912 Class A shares would be required at December 31, 2002 to
satisfy the total CEO option outstanding with Class A shares, based on the value of the option and closing
price of our publicly traded shares at that date. This total also assumes that cash is received for the
entire exercise price of the option.
17. P-M-T Limited Partnership
CME was the general partner, and members and clearing firms of CME were limited partners, in P-M-T
Limited Partnership (PMT), an Illinois limited partnership. PMT was formed in 1987 to initiate the devel-
opment of the GLOBEX global electronic trading platform. Since December 1998, the current version
of this system has been operated by the exchange using electronic trading software licensed from
ParisBoursesbfSA (now Euronext-Paris). CME charged PMT for services provided.
The limited partners of PMT approved the sale of all of the assets and business of PMT to the exchange
as part of the demutualization process. The sale was effective November 13, 2000. The purchase price was
$5.1 million and was based on an independent appraisal of PMT. Total distribution to the partners of PMT
was the purchase price plus interest of 1% over prime from the date of sale to the date of distribution,
and included a payment to CME as general partner of $1.1 million. The transaction was recorded using
the purchase method of accounting and was effected at an amount approximately equal to the net
assets of PMT. As a result, no goodwill or adjustment to the carrying value of assets was required.
PMT reported net income of $1.4 million for the period from January 1, 2000 to November 13, 2000.
If the assets and business of PMT had been purchased by the exchange as of January 1, 2000, the net
operating loss of CME for 2000 would have been reduced by approximately $0.6 million, or a reduction
of the basic loss per share of $0.02.
75
02 AR Financials 2/27/03 2:25 PM Page 75

18. Credit Facility
On October 18, 2002, the exchange renewed its $500.0 million secured committed line of credit with a
consortium of banks. The secured credit agreement, which expires on October 18, 2003, is collateralized
by clearing firm security deposits held by the exchange in the form of U.S. Treasury or agency securities,
as well as security deposit funds in IEF2. The amount held as collateral at December 31, 2002 was
$882.4 million. The facility, which has never been used, may be utilized in certain situations, such as
a temporary disruption of the domestic payments system that would delay settlement between the
exchange and its clearing firms, or in the event of a clearing firm default. Under the terms of the credit
agreement, there are a number of covenants with which the exchange must comply. Among these
covenants, the exchange is required to submit quarterly reports to the participating banks and maintain
at all times a consolidated tangible net worth of not less than $90.0 million. Interest on amounts borrowed
is calculated at the Fed Funds Rate plus 45/100 of 1% per annum. Commitment fees for the line of
credit were $0.5 million for each of the years ended December 31, 2002, 2001 and 2000.
19. Contingencies and Guarantees
Legal Matters. In November 2002, a former employee filed a charge of discrimination with the Illinois
Department of Human Rights and Equal Employment Opportunity Commission claiming that CME
terminated his employment because of his race. On or about November 25, 2002, this individual also
filed a three-count complaint in the Circuit Court of Cook County, Illinois alleging common law claims
of retaliatory discharge, promissory estoppel, and unjust enrichment relating to termination of his
employment by CME and is seeking damages in excess of $3 million. Based on its investigation to
date and advice from legal counsel, management believes these claims are without merit and will
defend them vigorously.
In addition, the exchange is a defendant in, and has potential for, various other legal proceedings
arising from its regular business activities. While the ultimate results of such proceedings against the
exchange cannot be predicted with certainty, management believes that the resolution of these matters
will not have a material adverse effect on the consolidated financial position or results of operations.
Employment-Related Agreements. The exchange has an employment agreement with James J. McNulty,
as its President and Chief Executive Officer, through December 31, 2003, subject to renewal by mutual
agreement of the parties. Mr. McNulty’s base salary for the year ended December 31, 2002 was $1.0
million. His employment agreement provides that during the agreement term his annual base salary
shall be no less than $1.0 million and his annual bonus may not exceed the lesser of $1.5 million or 10%
of CME's net income. Mr. McNulty is entitled to participate in CME’s benefits programs and is eligible
for other perquisites as approved by the Board in an amount not to exceed $50,000 for each calendar
year. He was granted a Non-Qualified Stock Option and Long-Term Incentive Award in the employment
agreement, which has been defined and modified through a supplement and amendments to the
agreement (note 16).
In the event of a termination without cause by the exchange, Mr. McNulty shall be entitled to receive
his base salary plus one-third of the maximum annual incentive bonus for the remainder of the agreement
term. In addition, in the event of termination without cause by the exchange, the unvested portion of
the stock option granted to Mr. McNulty would become fully vested.
Under the contract, if within two years of a “change in control”of the exchange, Mr. McNulty is
terminated by the exchange or he terminates the agreement as a result of the occurrence of one of the
matters defined in the agreement as “good reason,” he shall be entitled to two times his base salary
plus one and one-third times the maximum annual incentive bonus for which he would have been eligible,
provided that the severance payments do not exceed $8.0 million. The payment would be subject to
reduction to the extent that it would otherwise result in the payment of tax under Section 4999 of
the Internal Revenue Code. Also, the unvested portion of Mr. McNulty’s stock option would become
fully vested.
76
02 AR Financials 2/27/03 2:25 PM Page 76

The contract also provides that in the event of termination due to death or permanent disability,
the exchange shall for a period of six months following such termination, continue to pay Mr. McNulty’s
annual base salary, as then in effect. Any unvested portion of the stock option granted to Mr. McNulty
would become fully vested upon termination due to death or permanent disability, and his estate or
designated beneficiary has the continued right to exercise the stock option through the end of the
term of the option.
The exchange also has an employment agreement with Craig S. Donohue, as its Executive Vice
President and Chief Administrative Officer, through December 31, 2004, subject to renewal by mutual
agreement of the parties. Effective October 9, 2002, Mr. Donohue’s annual base salary was increased to
$550,000. His employment agreement provides that during the term of the agreement, his base salary
shall be no less than $550,000 per year. He is entitled to participate in CME’s benefits programs.
In the event of a termination without cause by the exchange, Mr. Donohue shall be entitled to
receive a one-time lump sum severance payment equal to 24 months of his base salary as of the date
of his termination.
Mutual Offset System. At December 31, 2002, CME was contingently liable on irrevocable letters of
credit totaling $55.0 million that relate to the mutual offset agreement between CME and Singapore
Exchange Derivatives Trading Ltd. (SGX). This mutual offset agreement allows a clearing firm of either
exchange to execute after-hours trades at the other exchange. When a clearing firm of CME executes
an after-hours trade at SGX, the resulting trade is transferred from SGX to CME, and CME assumes the
financial obligation to SGX for the transferred trade. A similar obligation occurs when a clearing firm of
SGX executes a trade at CME. The net position of each exchange to the other is marked-to-market daily
based on the settlement prices of the applicable exchange, and settlement is made between the
exchanges in cash. Since settlement prices at each exchange may differ at the end of any given trading
day and Singapore is 13 to 14 hours ahead of Chicago, there may be a difference between the two
settlement amounts, and there will be a difference in the timing of the settlement. To allow for adequate
and timely funding of the settlement and in the unlikely event of a payment default by a clearing firm,
CME and SGX each maintain irrevocable standby letters of credit payable to the other exchange. Regardless
of the irrevocable letter of credit, CME guarantees all cleared transactions submitted by its members
through SGX and would initiate procedures designed to satisfy these financial obligations in the event
of a default, such as the use of security deposits and performance bonds of the defaulting clearing firm.
GFX Letter of Credit. CME guarantees a $2.5 million standby letter of credit for GFX. The beneficiary of
the letter of credit is the clearing firm that is used by GFX to execute and maintain its foreign exchange
and Eurodollar futures position. The letter of credit will be utilized in the event that GFX defaults in meeting
requirements to its clearing firm. Per exchange requirements, GFX is required to place a performance
bond on deposit with its clearing firm. In the unlikely event of a payment default by GFX, GFX’s performance
bond would first be used to cover the deficit. If this amount is not sufficient, the letter of credit would
be used, and finally CME would guarantee the remaining deficit, if any.
Cross-Margin Agreements. CME, Options Clearing Corporation (OCC) and New York Clearing Corporation
(NYCC) have a cross-margin arrangement, whereby a common clearing firm may maintain a cross-margin
account in which the clearing firm’s positions in certain CME futures and options on futures are combined
with certain positions cleared by OCC and NYCC for purposes of calculating performance bond require-
ments. The performance bond deposits are held jointly by CME, OCC and NYCC. If a participating firm
defaults, the gain or loss on the liquidation of the firm’s open position and the proceeds from the liquidation
of the cross-margin account are split 47.5% each to OCC and CME and 5% to NYCC.
77
02 AR Financials 2/27/03 2:25 PM Page 77

A cross-margin agreement with the London Clearing House (LCH) became effective in March 2000,
whereby clearing firms’ offsetting positions with CME and LCH are subject to reduced margin requirements.
Clearing firms maintain separate performance bond deposits with each clearing house, but depending
on the net offsetting positions between CME and LCH, each clearing house may reduce the firm’s
performance bond requirement. In the event of a firm default, the total liquidation net gain or loss on the
firm’s offsetting open positions and the proceeds from the liquidation of the performance bond collateral
held by each clearing house’s supporting offsetting positions are split evenly between CME and LCH.
A cross-margin agreement with the Government Securities Clearing Corporation (GSCC) became
effective in April 2002, whereby clearing firms’ offsetting positions with CME and GSCC are subject to
reduced margin requirements. Clearing firms maintain separate performance bond deposits with each
clearing house, but depending on the net offsetting positions between CME and GSCC, each clearing
house may reduce the firm’s performance bond requirement. In the event of a firm default, the total
liquidation net gain or loss on the firm’s offsetting open position is split evenly between CME and GSCC.
Additionally, for both the LCH and the GSCC cross-margining agreements, if, after liquidation of all
the positions and collateral of the defaulting firm at each respective clearing organization, and taking
into account any cross-margining loss sharing payments, if any of the participating clearing organizations
has a remaining liquidating surplus, and any other participating clearing organization has a remaining
liquidating deficit, any additional surplus from the liquidation will be shared with the other clearing
houses to the extent that they have a remaining liquidating deficit. Any remaining surplus funds will
be passed to the bankruptcy trustee.
Interest Earning Facility Program. Clearing firms, at their option, may instruct CME to invest cash on
deposit for performance bond and security deposit purposes in a portfolio of securities that is part of
the Interest Earning Facility (IEF) program. The first IEF was organized in 1997 as two limited liability
companies. Interest earned, net of expenses, is passed on to participating clearing firms. The principal
of the first IEF totaled $350.0 million at December 31, 2002 and is guaranteed by the exchange as long as
clearing firms maintain investment balances in this portfolio. The investment portfolio of these facilities
is managed by two of the exchange’s approved settlement banks, and eligible investments include U.S.
Treasury bills and notes, U.S. Treasury strips and reverse repurchase agreements. The maximum average
portfolio maturity is 90 days, and the maximum maturity for an individual security is 13 months. If funds
invested in the IEF are unavailable due to lack of liquidity in the investment portfolio, default of a repurchase
counterparty, or loss in market value, CME guarantees the amount deposited by the clearing firm.
Management believes that the market risk exposure relating to its guarantee is not material to the
consolidated financial statements taken as a whole.
78
02 AR Financials 2/27/03 2:25 PM Page 78

20. GFX Derivatives Transactions
GFX Corporation engages in the purchase and sale of CME foreign exchange and Eurodollar futures
contracts. GFX posts bids and offers in these products on the GLOBEX electronic trading platform to
maintain a market and promote liquidity in these futures products. GFX limits risk from these transac-
tions through offsetting transactions using futures contracts or spot foreign exchange transactions with
approved counterparties in the interbank market. Formal trading limits have been established. Futures
transactions are cleared by an independent clearing firm. Any residual open positions are marked to
market on a daily basis, and all net realized and unrealized gains and losses are included in other revenue
in the accompanying consolidated statements of income. Net trading gains amounted to $3.2 million in
2002, $3.8 million in 2001 and $4.4 million in 2000. At December 31, 2002, futures positions held by
GFX had a notional value of $51.9 million, offset by a similar amount of spot foreign exchange positions,
resulting in a zero net position.
21. Earnings per Share
Basic earnings per share is computed by dividing net income (loss) by the weighted average number of
all classes of common stock outstanding for each reporting period. Shares outstanding are calculated as
if the current holding company structure was in place for all periods presented. Diluted earnings per share
is computed in a manner similar to basic earnings per share, except that the weighted average shares
outstanding is increased to include additional shares from restricted stock grants and the assumed
exercise of stock options, if dilutive. The number of additional shares is calculated assuming that outstanding
stock options with an exercise price less than the current market price of that class of stock would be exercised,
and that proceeds from such exercises would be used to acquire shares of common stock at the average
market price during the reporting period. The dilutive effect of the option granted to the CEO is calculated
as if the entire option, including the Class A share and Class B share portions of the option, would be
satisfied through the issuance of Class A shares.
2002 2001 2000(in thousands, except share and per share data) (restated) (restated)
Net Income (Loss) $«94,067 $«75,108 $«(10,496)
Weighted Average Number of Common Shares:
Basic 29,066,242 28,774,700 28,774,700
Effect of stock options 959,253 443,028 —
Effect of restricted stock grants 35,042 22,704 —
Diluted 30,060,537 29,240,432 —
Earnings (Loss) per Share:
Basic $«÷÷3.24 $«÷÷2.61 $÷÷«(0.36)
Diluted «÷÷3.13 2.57 «««÷÷÷—
79
02 AR Financials 2/27/03 2:25 PM Page 79
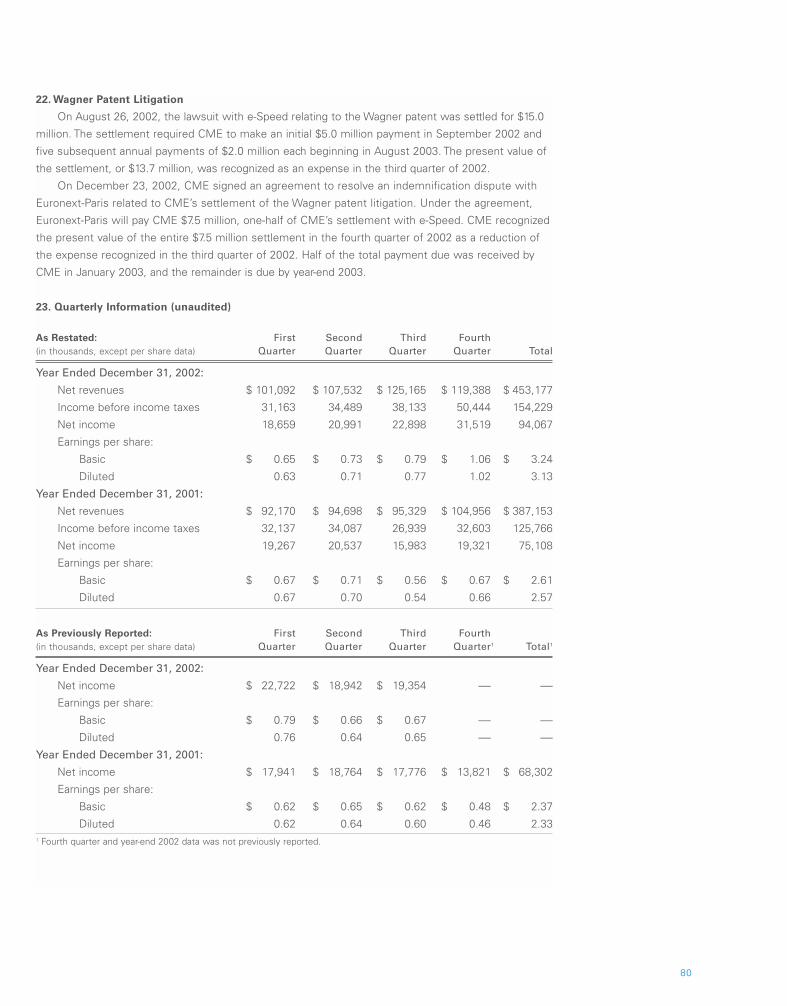
22. Wagner Patent Litigation
On August 26, 2002, the lawsuit with e-Speed relating to the Wagner patent was settled for $15.0
million. The settlement required CME to make an initial $5.0 million payment in September 2002 and
five subsequent annual payments of $2.0 million each beginning in August 2003. The present value of
the settlement, or $13.7 million, was recognized as an expense in the third quarter of 2002.
On December 23, 2002, CME signed an agreement to resolve an indemnification dispute with
Euronext-Paris related to CME’s settlement of the Wagner patent litigation. Under the agreement,
Euronext-Paris will pay CME $7.5 million, one-half of CME’s settlement with e-Speed. CME recognized
the present value of the entire $7.5 million settlement in the fourth quarter of 2002 as a reduction of
the expense recognized in the third quarter of 2002. Half of the total payment due was received by
CME in January 2003, and the remainder is due by year-end 2003.
23. Quarterly Information (unaudited)
As Restated: First Second Third Fourth(in thousands, except per share data) Quarter Quarter Quarter Quarter Total
Year Ended December 31, 2002:
Net revenues $«101,092 $«107,532 $«125,165 $«119,388 $«453,177
Income before income taxes 31,163 34,489 38,133 50,444 154,229
Net income 18,659 20,991 22,898 31,519 94,067
Earnings per share:
Basic $«÷÷÷0.65 $«÷÷÷0.73 $«÷÷÷0.79 $«÷÷÷1.06 $«÷÷÷3.24
Diluted 0.63 0.71 0.77 1.02 3.13
Year Ended December 31, 2001:
Net revenues $÷«92,170 $÷«94,698 $÷«95,329 $«104,956 $«387,153
Income before income taxes 32,137 34,087 26,939 32,603 125,766
Net income 19,267 20,537 15,983 19,321 75,108
Earnings per share:
Basic $«÷÷÷0.67 $«÷÷÷0.71 $«÷÷÷0.56 $«÷÷÷0.67 $«÷÷÷2.61
Diluted 0.67 0.70 0.54 0.66 2.57
As Previously Reported: First Second Third Fourth(in thousands, except per share data) Quarter Quarter Quarter Quarter1 Total1
Year Ended December 31, 2002:
Net income $«÷22,722 $«÷18,942 $«÷19,354 — —
Earnings per share:
Basic $«÷÷÷0.79 $«÷÷÷0.66 $«÷÷÷0.67 — —
Diluted 0.76 0.64 0.65 — —
Year Ended December 31, 2001:
Net income $«÷17,941 $«÷18,764 $«÷17,776 $«÷13,821 $«÷68,302
Earnings per share:
Basic $«÷÷÷0.62 $«÷÷÷0.65 $«÷÷÷0.62 $«÷÷÷0.48 $«÷÷÷2.37
Diluted 0.62 0.64 0.60 0.46 2.33
1 Fourth quarter and year-end 2002 data was not previously reported.
80
02 AR Financials 2/27/03 2:25 PM Page 80

BOARD OF DIRECTORS Officers and Advisors
81
JAMES J. MCNULTYPresident and CEO
Chicago Mercantile Exchange Holdings Inc.Chicago Mercantile Exchange Inc.
JAMES E. OLIFFVice Chairman
President and CEO, FFast Trade U.S., LLCChief Operating Officer, FFastFill Inc.Executive Director, International Futures and Options Associates
PATRICK B. LYNCHTreasurer
Independent Trader
MARTIN J. GEPSMANSecretary
Independent Floor Broker and Trader
LEO MELAMEDChairman Emeritus and Senior Policy Advisor
Chairman and CEO, Melamed and Associates, Inc.
JOHN F. SANDNERSpecial Policy Advisor
Chairman and CEO, RB&H Financial Services, LP
WILLIAM R. SHEPARD*Second Vice Chairman
President, Shepard International, Inc.*Not available for photo
TERRENCE A. DUFFYChairman of the Board
President, T.D.A. Trading, Inc.
02 AR Board/Investor 2/27/03 2:28 PM Page 81

BOARD OF DIRECTORS Members
DANIEL R. GLICKMANU.S. Secretary of Agriculture (1995-2001)Member of Congress, Kansas (1977-1995)Director, Institute of Politics, John F. Kennedy School of Government,
Harvard University, Cambridge, MASenior Advisor and Consultant, Akin, Gump, Strauss, Hauer & Feld LLP, Washington, D.C.
JOHN W. CROGHANManaging Director, CMF Capital Management, LLC, Chicago, IL
TIMOTHY R. BRENNANExecutive Vice President, RB&H Financial Services, LP
BRUCE F. JOHNSONIndependent Trader
YRA G. HARRISIndependent Floor Trader
SCOTT GORDONPresident and COO, Tokyo-Mitsubishi Futures (USA), Inc.
82
02 AR Board/Investor 2/27/03 2:28 PM Page 82
JOHN D. NEWHOUSEPresident, John F. Newhouse
WILLIAM G. SALATICH, JR.Independent Floor Broker and Trader
MYRON S. SCHOLES1997 Nobel Laureate - EconomicsFrank E. Buck Professor of Finance, Emeritus, Graduate School of Business,
Stanford University, Stanford, CAChairman, Oak Hill Platinum Partners, New York, NY
VERNE O. SEDLACEKExecutive Vice President and COO, Commonfund Group, Wilton, CT
HOWARD J. SIEGELFloor Trader
GARY M. KATLERVice President, O’Connor & Co., LLC
83
02 AR Board/Investor 2/27/03 2:28 PM Page 83
JAMES J. MCNULTYPresident and Chief Executive Officer
CRAIG S. DONOHUEExecutive Vice President and Chief Administrative Officer
PHUPINDER S. GILLManaging Director and President, CME Clearing House Division
DAVID G. GOMACHManaging Director and Chief Financial Officer
SCOTT L. JOHNSTONManaging Director and Chief Information Officer
EILEEN (BETH) KEEVEManaging Director, Organizational Development
JAMES R. KRAUSEManaging Director, Operations and Enterprise Computing
SATISH NANDAPURKARManaging Director, Products and Services
MAZEN A. CHADIDManaging Director, Trading Operations
JOHN E. FALCKManaging Director, Information Technology
ARMAN FALSAFIManaging Director, Global Electronic Trading and Data
NANCY W. GOBLEManaging Director andChief Accounting Officer
JULIE HOLZRICHTERManaging Director, GLOBEX Control Center and Trading Floor Technology
RICHARD J. MCDONALDManaging Director, Product Research and Development
RICHARD H. REDDINGManaging Director, Equities
GERALD P. ROBERTSManaging Director, ASP Development and Commodity Products
RICHARD E. SEARSManaging Director, Foreign Exchange
KIMBERLY S. TAYLORManaging Director, Risk Management
CHARLES E. TROXEL, JR. Managing Director, Electronic Trading Systems and Chief Technology Officer
ERIC S. WOLFFManaging Director, Regulatory Affairs
CME MANAGEMENT
84
02 AR Board/Investor 2/27/03 2:28 PM Page 84

CLEARING FIRMS*
85
The clearing firms of CME are among the largest,
most prestigious financial and agribusiness organi-
zations in the world. For more information on these
firms, consult our Web site at www.cme.com.
ABN AMRO Incorporated
ADM Investor Services, Inc.
AGE Commodity Clearing Corp.
AIG Clearing Corporation
Alaron Trading Corporation
Banc of America Futures, Incorporated
Banc One Capital Markets, Inc.
Barclays Capital Inc.
Bear, Stearns Securities Corp.
Blue Capital Group LLC***
BNP Paribas Brokerage Services, Inc.
Cantor Fitzgerald & Co.
Cargill Investor Services, Inc.
Carr Futures Inc.
CIBC World Markets Corp.
Commerz Futures, L.L.C.
Credit Lyonnais Rouse (USA) Limited
Credit Suisse First Boston Corporation
Daiwa Securities America Inc.
Deutsche Bank Securities Inc.
Dorman Trading, L.L.C.
DRW Holdings, LLC***
Enskilda Futures Limited
FC Stone, L.L.C.
FCT Group, L.L.C.**
FIMAT USA, Inc.
First Options of Chicago, Inc.
Fortis Clearing Chicago LLC
Gelber Group, LLC
GNI Incorporated
Goldman, Sachs & Co.
Greenwich Capital Markets, Inc.
HSBC Securities (USA) Inc.
Iowa Grain Company
J.P. Morgan Futures Inc.
Jump Trading, LLC***
KC-CO II, L.L.C.***
Kingstree Trading, LLC***
Kottke Associates, L.L.C.
Lehman Brothers Inc.
Man Financial Inc
Marquette Partners, L.P.***
Merrill Lynch, Pierce, Fenner
& Smith Incorporated
Mizuho Securities USA Inc.
Morgan Stanley & Co. Incorporated
Nomura Securities International, Inc.
O’Connor & Company L.L.C.
Pax Clearing Corporation
Pioneer Futures, Inc.
Prudential Securities Incorporated
Quiet Light Securities, LLC***
R.J. O’Brien & Associates, Inc.
Rand Financial Services Inc.
RB&H Financial Services, L.P.
RBC Dominion Securities Corporation
Refco, LLC
Rosenthal Collins Group, L.L.C.
Salomon Smith Barney Inc.
SMW Trading Company, Inc.
Sumitomo Mitsui Banking Corporation**
Timber Hill LLC
Tokyo-Mitsubishi Futures (USA), Inc.
TradeLink L.L.C.
TransMarket Group L.L.C**
UBS Warburg LLC
UFJ Futures L.L.C.
Wachovia Securities, Inc.**
* As of December 31, 2002
** Not actively clearing
*** Class A – Inactive
02 AR Board/Investor 2/27/03 2:28 PM Page 85
Shareholder Inquiries About Class A Shares:
Transfer Agent
Computershare Investor Services
Stock Transfer Department
2 North LaSalle Street
Chicago, IL 60602
(312) 360-5104
(Automated Interactive Voice Response systems are
available 24 x 7. Press zero for live customer support
8 a.m. to 5 p.m. CST on any day the New York Stock
Exchange is open.)
www.computershare.com
(For information regarding your account or a specific
company, click on INVESTORS and follow the instruc-
tions on the screen.)
Shareholder Inquiries About Class A or B Shares:
Shareholder Relations and Membership Services
Chicago Mercantile Exchange Inc.
30 South Wacker Drive
Chicago, IL 60606-7499
(312) 930-3409
Investor Relations
John Peschier
Director, Investor Relations
Chicago Mercantile Exchange Inc.
30 South Wacker Drive
Chicago, IL 60606-7499
(312) 930-8491
Form 10-K Report
For a free copy of CME Holdings’ annual report to the
Securities and Exchange Commission (Form 10-K),
contact Shareholder Relations and Membership Services
at the above address. Our Form 10-K and other SEC
filings are also available through our Web site.
INVESTOR INFORMATION
86
02 AR Board/Investor 2/27/03 2:28 PM Page 86

Class A Common Stock
Initial Public Offering
On December 6, 2002, our Class A common stock began trading on the New York Stock Exchange
under the ticker symbol “CME.” From December 6, 2002 to December 31, 2002, the quoted price on
the New York Stock Exchange for our Class A common stock fluctuated between $38.96 and $45.50
per share. The closing price of our Class A common stock on February 10, 2003 was $43.00 per share.
Prior Market
Prior to December 2002, there was no independent established public trading market for our Class A
common stock. Pursuant to our charter, shares of our Class A common stock could only be sold or
acquired as part of a bundle with the trading rights on our exchange and the related Class B shares.
Therefore, the value of the Class A shares for periods prior to December 2002 is imputed based on
prices for the bundle and prices relating to trading rights only. From December 3, 2001 to December 5,
2002, the price of our Class A common stock fluctuated between $10.49 and $33.09 per share, with
an imputed price on December 5, 2002 of $33.09 per share.
Class B Common Stock
Our Class B common stock is not listed on a national securities exchange or traded in an organized
over-the-counter market. Each class of CME Holdings Class B common stock is associated with a
membership in a specific division of the exchange. CME’s rules provide exchange members with trading
rights and the ability to use or lease these trading rights. Each share of our Class B common stock can
be transferred only in connection with the transfer of the associated trading rights. The memberships
by class are:
• CME (Chicago Mercantile Exchange full trading rights);
• IMM (International Monetary Market);
• IOM (Index and Option Market); and
• GEM (Growth and Emerging Markets).
Class B shares and the associated trading rights are bought and sold through our Shareholder Relations
and Membership Services Department. In addition, trading rights may be leased through the department.
Trading rights sales are reported on our Web site at www.cme.com. Although our Class B shareholders
have special voting rights, because our Class B shares have the same equitable interest in our earnings
and the same dividend payments as our Class A shares, we expect that the market price of our Class B
common stock, if reported separate of the associated trading rights, would be determined by the value
of our Class A common stock.
Dividends
On June 4, 2002, our Board of Directors declared a special cash dividend on each outstanding and
restricted share of our Class A and Class B common stock in the amount of 60 cents per share to
shareholders of record as of June 17, 2002. The aggregate amount of the dividend was $17.3 million,
which was paid on June 28, 2002. We did not pay a dividend in 2001.
We intend to pay regular quarterly dividends to our shareholders beginning in the first quarter of
2003. The annual dividend target will be approximately 20% of the prior year’s cash earnings. CME
declared its first regular quarterly dividend of 14 cents per share, payable on March 25, 2003 to Class A
and Class B shareholders of record on March 10, 2003. The decision to pay a dividend remains within
the discretion of our Board of Directors and may be affected by various factors, including our earnings,
financial condition, capital requirements, level of indebtedness and other considerations our Board of
Directors deems relevant. Our existing credit facility, as well as future credit facilities, other future debt
obligations and statutory provisions, may limit our ability to pay dividends.
SHARE INFORMATION
87
02 AR Board/Investor 2/27/03 2:28 PM Page 87

From time to time, in written reports and oral statements, we discuss our expectations regarding future
performance. For example, these “forward-looking statements” are included in this 2002 Annual Report
in the letters to shareholders from our Chairman, Chief Executive Officer and Chief Administrative Officer
(pages 2-7); Operations Review (page 10); and Financial Review, including Management’s Discussion
and Analysis (page 26). Forward-looking statements are based on currently available competitive, financial
and economic data, current expectations, estimates, forecasts and projections about the industries in
which we operate and management's beliefs and assumptions. These statements are not guarantees
of future performance and involve risks, uncertainties and assumptions that are difficult to predict.
Therefore, actual outcomes and results may differ materially from what is expressed or implied in any
forward-looking statements. We want to caution you to not place undue reliance on any forward-looking
statements. We undertake no obligation to publicly update any forward-looking statements, whether
as a result of new information, future events or otherwise.
Among the factors that might affect our performance are: increasing competition by foreign and domestic
competitors, including new entrants into our markets; our ability to keep pace with rapid technological
developments; our ability to continue introducing competitive new products and services on a timely,
cost-effective basis, including through our electronic trading capabilities; our ability to maintain the
competitiveness of our existing products and services; our ability to efficiently and simultaneously
operate both open outcry trading and electronic trade execution facilities; our ability to adjust our fixed
costs and expenses if our revenues decline; changes in domestic and foreign regulations; changes in
government policy, including interest rate policy; the costs associated with protecting our intellectual
property rights and our ability to operate our business without violating the intellectual property rights
of others; the ability of our joint venture, OneChicago, to obtain market acceptance of its products
and achieve sufficient trading volume to operate profitably; and the continued availability of financial
resources in the amounts and on the terms required to support our future business. In addition, our
performance could be affected by our ability to realize the benefits or efficiencies we expect from our
for-profit initiatives, such as fee increases, volume and member discounts and new access rules to
our markets; our ability to recover market data fees that may be reduced or eliminated by the growth
of electronic trading; changes in the level of trading activity, price levels and volatility in the derivatives
markets and in underlying fixed income, equity, foreign exchange and commodities markets; economic,
political and market conditions; our ability to accommodate increases in trading volume without failure
or degradation of performance of our trading systems; our ability to manage the risks associated with
our acquisition, investment and alliance strategy; industry and customer consolidation; decreases in
member trading and clearing activity and seasonality of the futures business.
Further information about Chicago Mercantile Exchange Inc. and its products is available on the CME
Web site at www.cme.com. CME, GLOBEX, E-mini, SPCTR, CME E-quotes, CLEARING 21, SPAN,
CME iLink, GLOBEX Trader and GALAX-C are trademarks or service marks of Chicago Mercantile
Exchange, Inc. e-miNY is a service mark of Chicago Mercantile Exchange and the New York Mercantile
Exchange pursuant to an agreement. Standard & Poor’s®,S&P ®,S&P 500®, Standard & Poor’s 500, S&P
MidCap 400 and S&P SmallCap 600 are trademarks of The McGraw-Hill Companies, Inc. NASDAQ® and
NASDAQ-100 Index® are trademarks of The NASDAQ Stock Market, Inc. Russell 2000® is a trademark of
the Frank Russell Company. TRAKRSSM and Total Return Asset ContractsSM are service marks of Merrill
Lynch & Co., Inc. TRAKRS are patent pending. GSCI® is a trademark of Goldman Sachs & Co. Nikkei®
is a trademark of Nihon Keizai Shimbun. These trademarks are used herein under license.
88
02 AR Board/Investor 2/27/03 2:28 PM Page 88

Chicago
Chicago Mercantile Exchange Holdings Inc.
Chicago Mercantile Exchange Inc.
30 South Wacker Drive
Chicago, Illinois 60606-7499
T:312 930 -1000
F:312 466-4410
Washington
Chicago Mercantile Exchange Inc.
1299 Pennsylvania Avenue, N.W.
Washington, DC 20004
T:202 638-3838
F:202 638-5799
London
Chicago Mercantile Exchange Inc.
Pinnacle House
23-26 St. Dunstan’s Hill
London EC3R 8HN England
T:44 20 7623-2550
F:44 20 7623-2565
Tokyo
Chicago Mercantile Exchange Inc.
Level 16, Shiroyama JT Mori Building
4-3-1 Toranomon Minato-ku
Tokyo 105-6016 Japan
T:813 5403-4828
F:813 5403-4646
Internet
www.cme.com
e-mail: [email protected]
Cover 2/25/03 2:20 PM Page 4