NASDAQ_FSCT_2017.pdf - AnnualReports.com
143
Table of Contents UNITED STATES SECURITIES AND EXCHANGE COMMISSION Washington, D.C. 20549 ——————————————— FORM 10-K ——————————————— (Mark One) x ANNUAL REPORT PURSUANT TO SECTION 13 OR 15(d) OF THE SECURITIES EXCHANGE ACT OF 1934 For the fiscal year ended December 31, 2017 or ☐ TRANSITION REPORT PURSUANT TO SECTION 13 OR 15(d) OF THE SECURITIES EXCHANGE ACT OF 1934 For the transition period from __________ to __________ Commission File Number 001-38253 FORESCOUT TECHNOLOGIES, INC. (Exact name of registrant as specified in its charter) ——————————————— Delaware 51-0406800 State or other jurisdiction of incorporation or organization (I.R.S. Employer Identification No.) 190 West Tasman Drive San Jose, California 95134 (Address of principal executive offices, including zip code) (408) 213-3191 (Registrants telephone number, including area code) Securities registered pursuant to Section 12(b) of the Act: Title of each class Name of each exchange on which registered Common Stock, par value $0.001 per share The NASDAQ Global Market Securities registered pursuant to Section 12(g) of the Act: None Indicate by check mark if the registrant is a well-known seasoned issuer, as defined in Rule 405 of the Securities Act. Yes ☐ No x Indicate by check mark if the registrant is not required to file reports pursuant to Section 13 or Section 15(d) of the Act. Yes ☐ No x Indicate by check mark whether the registrant (1) has filed all reports required to be filed by Section 13 or 15(d) of the Securities Exchange Act of 1934 during the preceding 12 months (or for such shorter period that the registrant was required to file such reports), and (2) has been subject to such filing requirements for the past 90 days. Yes x No ☐ Indicate by check mark whether the registrant has submitted electronically and posted on its corporate Web site, if any, every Interactive Data File required to be submitted and posted pursuant to Rule 405 of Regulation S-T (§232.405 of this chapter) during the preceding 12 months (or for such shorter period that the registrant was required to submit and post such files). Yes x No ☐ Indicate by check mark if disclosure of delinquent filers pursuant to Item 405 of Regulation S-K (§229.405 of this chapter) is not contained herein, and will not be contained, to the best of registrant’s knowledge, in definitive proxy or information statements incorporated by reference in Part III of this Form 10-K or any amendment to this Form 10-K. x
-
Upload
khangminh22 -
Category
Documents
-
view
0 -
download
0
Transcript of NASDAQ_FSCT_2017.pdf - AnnualReports.com
Table of Contents
UNITED STATESSECURITIES AND EXCHANGE COMMISSION
Washington, D.C. 20549———————————————
FORM 10-K———————————————
(Mark One)
x ANNUAL REPORT PURSUANT TO SECTION 13 OR 15(d) OF THE SECURITIES EXCHANGE ACT OF 1934For the fiscal year ended December 31, 2017
or
☐ TRANSITION REPORT PURSUANT TO SECTION 13 OR 15(d) OF THE SECURITIES EXCHANGE ACT OF 1934
For the transition period from __________ to __________ Commission File Number 001-38253
FORESCOUT TECHNOLOGIES, INC.(Exact name of registrant as specified in its charter)
———————————————
Delaware 51-0406800State or other jurisdiction of
incorporation or organization(I.R.S. Employer
Identification No.)
190 West Tasman DriveSan Jose, California 95134
(Address of principal executive offices, including zip code)(408) 213-3191
(Registrants telephone number, including area code)Securities registered pursuant to Section 12(b) of the Act:
Title of each class Name of each exchange on which registered
Common Stock, par value $0.001 per share The NASDAQ Global Market
Securities registered pursuant to Section 12(g) of the Act:None
Indicate by check mark if the registrant is a well-known seasoned issuer, as defined in Rule 405 of the Securities Act. Yes ☐ No x Indicate by check mark if the registrant is not required to file reports pursuant to Section 13 or Section 15(d) of the Act. Yes ☐ No x
Indicate by check mark whether the registrant (1) has filed all reports required to be filed by Section 13 or 15(d) of the Securities Exchange Act of 1934 during the preceding12 months (or for such shorter period that the registrant was required to file such reports), and (2) has been subject to such filing requirements for the past 90days. Yes x No ☐
Indicate by check mark whether the registrant has submitted electronically and posted on its corporate Web site, if any, every Interactive Data File required to be submitted andposted pursuant to Rule 405 of Regulation S-T (§232.405 of this chapter) during the preceding 12 months (or for such shorter period that the registrant was required to submitand post such files). Yes x No ☐
Indicate by check mark if disclosure of delinquent filers pursuant to Item 405 of Regulation S-K (§229.405 of this chapter) is not contained herein, and will not be contained, tothe best of registrant’s knowledge, in definitive proxy or information statements incorporated by reference in Part III of this Form 10-K or any amendment to this Form 10-K. x
Table of Contents
Indicate by check mark whether the registrant is a large accelerated filer, an accelerated filer, a non-accelerated filer, a smaller reporting company, or an emerging growthcompany. See the definitions of “large accelerated filer,” “accelerated filer,” “smaller reporting company,” and “emerging growth company” in Rule 12b-2 of the ExchangeAct.
Large accelerated filer ☐ Accelerated filer ☐
Non-accelerated filer x (Do not check if a smaller reporting company) Smaller reporting company ☐
Emerging growth company x
If an emerging growth company, indicate by check mark if the registrant has elected not to use the extended transition period for complying with any new or revised financialaccounting standards provided pursuant to Section 13(a) of the Exchange Act. x
Indicate by check mark whether the registrant is a shell company (as defined in Rule 12b-2 of the Act). Yes ☐ No x The aggregate market value of voting stock held by non-affiliates of the registrant, based on the closing price of a share of the registrant’s common stock on December 29,2017, as reported by The NASDAQ Global Market on such date was approximately $493,541,535. The registrant has elected to use December 29, 2017, which was the lastbusiness day of the registrant’s most recently completed fiscal year, as the calculation date because on June 29, 2017 (the last business day of the registrant’s most recentlycompleted second fiscal quarter), the registrant was a privately-held company. Shares of common stock held by each executive officer, director, and holder of 5% or more ofthe outstanding common stock have been excluded in that such persons may be deemed to be affiliates. This determination of affiliate status is not necessarily a conclusivedetermination for other purposes.
On February 19, 2018, 38,367,757 shares of the registrant’s common stock, $0.001 par value, were outstanding.
DOCUMENTS INCORPORATED BY REFERENCE
Portions of the information called for by Part III of this Annual Report on Form 10-K are hereby incorporated by reference where indicated from the definitive proxy statementfor the registrant’s annual meeting of stockholders, which will be filed with the Securities and Exchange Commission not later than 120 days after the registrant’s fiscal yearended December 31, 2017.

FORESCOUT TECHNOLOGIES, INC.
ANNUAL REPORT ON FORM 10-K
FOR THE YEAR ENDED DECEMBER 31, 2017
TABLE OF CONTENTS
Page
Special Note Regarding Forward-Looking Statements
4
PART I Item 1. Business 6Item 1A. Risk Factors 23Item 1B. Unresolved Staff Comments 50Item 2. Properties 50Item 3. Legal Proceedings 50Item 4. Mine Safety Disclosures 51 PART II Item 5. Market for Registrant’s Common Equity, Related Stockholder Matters and Issuer Purchases of Equity Securities 52Item 6. Selected Consolidated Financial and Other Data 55Item 7. Management’s Discussion and Analysis of Financial Condition and Results of Operations 58Item 7A. Quantitative and Qualitative Disclosures About Market Risk 81Item 8. Financial Statements and Supplementary Data 82Item 9. Change in and Disagreements with Accountants on Accounting and Financial Disclosure 115Item 9A. Controls and Procedures 115Item 9B. Other Information 116 PART III Item 10. Directors, Executive Officers, and Corporate Governance 117Item 11. Executive Compensation 117Item 12. Security Ownership of Certain Beneficial Owners and Management and Related Stockholder Matters 117Item 13. Certain Relationships and Related Transactions, and Director Independence 117Item 14. Principal Accountant Fees and Services 117 PART IV Item 15. Exhibits and Financial Statement Schedules 118Item 16. Form 10-K Summary 118 Exhibit Index 119 Signatures 121
3
Table of Contents
SPECIAL NOTE REGARDING FORWARD-LOOKING STATEMENTS
This Annual Report on Form 10-K contains forward-looking statements within the meaning of Section 27A of the Securities Act of 1933, as amended,and Section 21E of the Securities and Exchange Act of 1934, as amended, which statements involve substantial risks and uncertainties. Forward-lookingstatements generally relate to future events or our future financial or operating performance. In some cases, you can identify forward-looking statementsbecause they contain words such as “may,” “will,” “should,” “expects,” “plans,” “anticipates,” “could,” “intends,” “target,” “projects,” “contemplates,”“believes,” “estimates,” “predicts,” “potential” or “continue” or the negative of these words or other similar terms or expressions that concern ourexpectations, strategy, plans or intentions. Forward-looking statements contained in this Annual Report on Form 10-K include, but are not limited to,statements about:
• the evolution of the cyberthreat landscape facing enterprises in the United States and other countries;
• developments and trends in the domestic and international markets for network security products and related services;
• our expectations regarding the size of our target market;
• our ability to educate prospective end-customers about our technical capabilities and the use and benefits of our products and to achieveincreased market acceptance of our solution;
• our beliefs and objectives regarding our prospects and our future results of operations and financial condition;
• the effects of increased competition in our target markets and our ability to compete effectively;
• our business plan and our ability to manage our growth effectively;
• our expectations concerning the productivity of our expanding sales force as our sales representatives become more seasoned;
• our growth strategy to maintain and extend our technology leadership, expand and diversify our end-customer base, deepen our existing end-customer relationships, and attract and retain highly skilled security professionals;
• our ability to enhance our existing products and technologies and develop or acquire new products and technologies;
• our plans to attract new end-customers, retain existing end-customers, and increase our annual revenue;
• our expectations concerning renewal rates for services and maintenance by existing end-customers and growth of our recurring revenueretention;
• our expectations regarding our relationships with third parties, including further development of our relationships with our manufacturer, value-added resellers and channel partners, alliance partners, and our technology and distribution partners;
• our plans to expand our international operations;
• our expectations regarding future acquisitions of, or investments in, complementary companies, services, or technologies;
• our ability to continue to generate a significant portion of our revenue from public sector customers;
• the effects on our business of evolving information security and data privacy laws and regulations, government export or import controls andany failure to comply with the U.S. Foreign Corrupt Practices Act and similar laws;
• our ability to maintain, protect, and enhance our brand and intellectual property;
4
Table of Contents
• fluctuations in our results of operations and other operating measures;
• our expectations regarding changes in our cost of revenue, gross margins, and operating costs and expenses;
• our expectations regarding the portions of our revenue represented by product revenue and maintenance and professional services revenue;
• our expectations concerning the impact on our results of operations of development of our distribution programs and sales through our channelpartners;
• the impact on our revenue, gross margin, and profitability of future investments in the enhancement of ForeScout CounterACT, ForeScoutEnterprise Manager, and ForeScout Extended Modules and expansion of our sales and marketing programs;
• sufficiency of our existing liquidity sources to meet our cash needs; and
• our potential use of foreign exchange forward contracts to hedge our foreign currency risk.
We caution you that the foregoing list may not contain all of the forward-looking statements made in this Annual Report on Form 10-K.
You should not rely upon forward-looking statements as predictions of future events. We have based the forward-looking statements contained in thisAnnual Report on Form 10-K primarily on our current expectations and projections about future events and trends that we believe may affect our business,financial condition, operating results, cash flows, or prospects. The outcome of the events described in these forward-looking statements is subject to risks,uncertainties, and other factors described in the section titled “Risk Factors” and elsewhere in this Annual Report on Form 10-K. Moreover, we operate in avery competitive and rapidly changing environment. New risks and uncertainties emerge from time to time and it is not possible for us to predict all risks anduncertainties that could have an impact on the forward-looking statements contained in this Annual Report on Form 10-K. We cannot assure you that theresults, events, and circumstances reflected in the forward-looking statements will be achieved or occur, and actual results, events or circumstances coulddiffer materially from those described in the forward-looking statements.
The forward-looking statements made in this Annual Report on Form 10-K relate only to events as of the date on which the statements are made. Weundertake no obligation to update any forward-looking statements made in this Annual Report on Form 10-K to reflect events or circumstances after the dateof this Annual Report on Form 10-K or to reflect new information or the occurrence of unanticipated events, except as required by law. We may not actuallyachieve the plans, intentions or expectations disclosed in our forward-looking statements and you should not place undue reliance on our forward-lookingstatements. Our forward-looking statements do not reflect the potential impact of any future acquisitions, mergers, dispositions, joint ventures, or investmentswe may make.
You should read this Annual Report on Form 10-K and the documents that we reference in this Annual Report on Form 10-K and have filed with theSecurities and Exchange Commission as exhibits to this Annual Report on Form 10-K with the understanding that our actual future results, levels of activity,performance, and events and circumstances may be materially different from what we expect.
5

Table of Contents
PART I
ITEM 1. BUSINESS
Overview
We transform security through visibility. We have pioneered an agentless approach to network security to protect organizations against the emergingthreats that exploit the billions of Internet of Things, or IoT, devices connected to organizations’ networks. Over 28 billion devices will be connected to theinternet by the year 2020, according to ABI Research, and a growing percentage of them will be used for business purposes through Bring Your Own Device,or BYOD, and Enterprise IoT initiatives. According to the 2017 Strategic Roadmap for IoT Network Technology by Gartner, Inc., or Gartner, (January 2017),63 million IoT devices will be attempting to connect to the enterprise network each second by 2020. While IoT brings tremendous value to an organization,the traditional approach of relying on a corporate-installed software agent to secure a device has significant limitations in today’s world. Organizations cannoteffectively deploy agents on non-corporate-issued devices and many Enterprise IoT devices are developed using a wide variety of platforms and operatingsystems that cannot support agents. As the volume and variety of devices increases, organizations’ abilities to manage devices decreases, creating a major gapin visibility.
The threat landscape is rapidly evolving, and attackers are now leveraging the gap in device visibility to gain access to organizations. New attacks arestealthy, targeted, and pervasive and can target known and unknown software vulnerabilities that can persist undetected inside a network for months. Asorganizations invest billions of dollars to protect their traditional devices—personal computers, servers, and mobile systems—attackers are shifting theirfocus to the less secure BYOD and IoT devices, which have exponentially increased the attack surface within organizations. Attackers use these unsecureddevices and a lack of IT control to enter a network and traverse through systems, gathering information before executing an attack. The response to suchattacks is often both uncoordinated and manual because existing security systems operate in silos and security teams often lack the ability to share informationand coordinate an attack response.
Organizations need a new approach to security that gives them the ability to see and control the devices connected to their networks. Over the past tenyears, ForeScout has developed proprietary agentless technology that discovers and classifies IP-based devices in real time as they connect to the network andcontinuously monitors and assesses their security posture. Our solution supports heterogeneous wired and wireless networks, as well as both virtual and cloudinfrastructures, while scaling to meet the needs of globally distributed organizations. We have built an extensive repository of policies that control howdevices are expected to behave on the network. When a device deviates from a policy, we can immediately take action. Additionally, we offer more than 70bi-directional workflow integrations with third-party systems that allow us to share contextual data on devices, enforce access policies, and automate securityresponses.
Our solution is sold as either a physical or virtual appliance through a perpetual software license, with each appliance designed to manage a certainnumber of connected devices within an organization. As the number of devices in the organization increases, customers purchase additional appliances. Werecently started offering, in limited quantities to a small number of large enterprises, CounterACT and Enterprise Manager together as a software-only license,or Enterprise License Software. Our Enterprise License Software is either sold with separate hardware or without hardware, depending on the end-customer’sselection. End-customers typically initially deploy our solution across a region or across their wired or wireless network, then expand their usage to coveradditional regions and networks. After customers achieve enhanced visibility and control of their devices, they can deploy new use cases that leverage third-party integrations licensed as add-on modules. Increasingly, we are seeing larger initial roll outs as customers recognize their significant visibility gaps andour ease of deployment. We had 48 annual end-customer deals over $1.0 million in fiscal 2017 as compared to 26 and 28 annual end-customer deals over $1.0million in fiscal 2015 and 2016, respectively.
We sell into all industries and into organizations of all sizes, with a focus on those that are highly regulated or with a large footprint of transient devices.Our largest industries include financial services, healthcare, government agencies, high tech, and manufacturing. We target the largest accounts in eachindustry first to establish reference accounts for that sector. As of December 31, 2017, we have sold to over 2,700 end-customers in over 80 countries,including 18% of the Global 2000, since our inception, with more than 52 million devices under management. We utilize a high-touch direct sales force withdeep security expertise and strong industry relationships. We are one of the only security providers in our market that is not part of a larger networkingorganization. This allows our sales representatives to solely focus on selling the value proposition of visibility and control. We sell our productspredominantly through a network of value added resellers and systems integrators that provide a broad reach into various segments of the market acrossgeographies.
6
Table of Contents
We have experienced rapid growth in recent periods. For the years ended December 31, 2015, 2016, and 2017, our revenue was $126.0 million, $166.8million, and $220.9 million, respectively, representing year-over-year growth of 32% and 32%, respectively. For the years ended December 31, 2015, 2016,and 2017, our net loss was $27.3 million, $74.8 million, and $91.2 million respectively.
Industry Background
Enterprises lack full visibility into devices connected to their networks
Increase in the number and diversity of devices
An increasing number and variety of devices are entering and connecting to enterprise networks every day that are not manageable by IT departments.These devices include employee BYOD, such as smartphones, laptops, and tablets that are not owned by organizations, non-employee BYOD, such asdevices owned by third-party contractors and others doing business within enterprises, and an increasing number of IoT devices used for corporate purposes,including point-of-sale machines, heating and air conditioning systems, printers, security cameras, and medical devices. While once a small percentage of theIT landscape, we believe that as of December 31, 2017, these types of devices can account for up to 75% of devices connected to an organization’s network.Historically, enterprises have been able to install an agent, or small piece of software, onto a corporate-managed device to secure and manage the device, andto gather characteristics about the device when it connects to a network. By integrating with an agent, organizations have been able to make a determinationas to whether or not to allow a device onto a network. However, as corporate-managed devices become a smaller percentage of the total population and asBYOD and IoT become a larger percentage of the total population, this agent-based approach no longer works. IT departments cannot force users to installagents on BYOD devices and many IoT devices do not have the ability to install agents.
Increase in operating system diversity and standards
The increase in volume and diversity of connected devices has coincided with the rapid growth of new operating systems running on these devices.Traditional corporate devices typically run on open standard operating systems such as Windows, Linux, iOS, and Android. For decades, agent-based systemshave worked with standard operating systems because there were few options available and it was possible to create different versions of software for eachoperating system. However, new device types are increasingly developed with specialized operating systems specific to each device and closed tointegrations, which can lead to a vast number of operating systems in the market. This trend has made it technically unfeasible and impractical to builddifferent versions of agent-based software for each new operating system in the market. The diversity of operating systems further complicates themanagement of new devices by IT departments.
Pace of new technology adoption
The fast pace of new technology adoption further complicates the visibility and manageability problem. Technology is refreshed continuously andemployees expect to use new technology and have real-time access to systems, regardless of the device they are using. IT departments cannot test newtechnologies fast enough to keep up with the pace of change, and the default action is often to allow devices onto the network, without a consistent securitypolicy. As more unsecured devices are allowed onto the network, the surface area of attack grows.
Adoption of cloud technologies has resulted in more complex IT environments further reducing visibility
Enterprise networks are undergoing significant change, contributing to the lack of visibility and control over IT assets. The disappearing enterpriseperimeter, increase in virtualization technology and movement of workloads to the public cloud have resulted in decentralized management of IT assets asmore people have direct access to virtual and cloud-based resources. The rapid adoption of cloud service providers, such as Amazon Web Services, GoogleCloud, and Microsoft Azure, for applications and computing has changed the data center from a fairly static and controlled environment to a more dynamicand de-centralized environment. With increasing frequency, organizations are accessing devices in the cloud, including physical and virtual servers, and usersare connecting to cloud-based environments from disparate locations. Unlike on-premise data centers which can favor infrastructure from a single vendor,cloud environments are heterogeneous, integrating a wide variety of system types and vendors. Device visibility and control needs to apply to all devices, nomatter where they are located, and be able to integrate into a heterogeneous network and computing environment.
7
Table of Contents
Convergence of IT and OT expands the attack surface
Companies run their physical operations in their operational networks. Devices on those networks include SCADA devices and industrial control systemsthat you typically find in dams, bridges, oil and gas pipelines, manufacturing assembly lines and much of U.S. critical infrastructure. Given the criticality ofthese devices, they seldom can be taken offline for maintenance or patching, and agents are often impossible to install. This leaves them vulnerable tocyberattacks.
To protect themselves, companies have ‘air-gapped’ these networks by isolating them from external systems. However, as the Industrial IoT revolution istaking place, organizations have a need to connect these devices to the rest of their IT network and the cloud in order to monitor and improve businessperformance. As they connect these networks to the outside world, organizations are realizing they do not understand what they have connected, underminingthe security of these networks and greatly increasing the risks they face.
Existing security solutions operate in silos
The average enterprise uses 75 distinct security products, according to public statements by a representative of Symantec Corporation. These solutionscan be effective at determining what is good and bad based on their own intelligence and preventing an attack if it falls within the scope of their specificcapability. However, point solutions generally have limited ability to leverage information generated by other solutions in order to gain a better understandingof a potential threat or coordinate a multi-system response to a threat.
Many security solutions generate alerts when they sense an attack, triggering human involvement by security teams to review alert data and determine thebest course of action based on judgment. These security solutions often generate false positives and a high volume of alerts, which can result in no response,or a manual and slow response, as IT teams must gather data from multiple systems to piece together a storyline and make a determination about how torespond. In many cases, gaps in the manual review process can result in alerts not being properly investigated and followed through to completion. Human-based processes face significant challenges scaling to meet the demands of an increasingly complex and dynamic security environment.
More cyberattacks are entering organizations by leveraging gaps in network visibility and vendor silos
The significant increase in undetected and unmanaged devices on a network has increased the surface area of attack for enterprises as cybercriminalstarget less secure devices with the same access levels as corporate-managed devices (i.e., desktops and corporate laptops). Today, organizations faceadversaries that are more sophisticated and keenly aware of safeguards designed to defend networks from malicious threats. These adversaries seek to exploitareas of vulnerability where threats can enter undetected and remain within a network for an extended period of time before executing an attack. Once in,hackers can move laterally, communicating across a distributed network and infiltrating a wide range of devices with malicious malware. Examples of recentcyberattacks illustrating these trends include:
• NotPetya (IT ransomware disrupts OT systems)—June 2017: The ransomware was designed to exploit a vulnerability in MS Windows. While anearlier variant called WannaCry primarily impacted IT systems throughout the world, the NotPetya attack infiltrated OT networks, crippling supplychains in manufacturing, transportation, utilities and other industries.
• FedEx delivery in Europe interrupted
• Maersk lost $300 million because they couldn’t remove cargo from their ships
• Reckitt Benckiser, a British consumer company, suffered production disruptions with an estimated $135 million in lost revenue
• Mondelez, a multinational confectionery, food and beverage company, (Cadbury, Nabisco) incurred a loss of three percentage pointsfrom its second-quarter sales growth
• Renault and Nissan had to shut down auto manufacturing plants
8
Table of Contents
• The Chernobyl Nuclear Power Plant had to disconnect Microsoft Windows systems and manually conducted radiation monitoring
• Ukraine’s national bank, state power company and largest airport all saw their networks crash. “The official site of the airport and thescoreboard with the schedule of flights aren't working!” Boryspil International Airport Acting Director Pavel Ryabikin wrote onFacebook. ATMs and supermarket tills were also left inoperable, flashing a message left by the hackers
• Merck experienced $300 million in lost revenues and had to adjust financial guidance to the SEC
• Equifax, Inc. (unauthorized entry)—March-July 2017: Hackers gained access to the data of credit reporting agency Equifax because an individual inEquifax’s technology department had failed to heed security warnings and did not ensure the implementation of software fixes that could haveprevented the breach. By taking advantage of the security lapse, hackers compromised the personal data of over 143 million people.
• Dyn, Inc. (DDoS attack using IoT)—October 2016: Hackers executed a massive Distributed Denial of Service, or DDoS, attack on Dyn, a companyused to provide core internet services to a number of web-based businesses including Amazon, Twitter, Netflix, Spotify, Airbnb, and the New YorkTimes, among many others. Using approximately 100,000 IoT devices such as security cameras, printers, cell phones, and DVRs, hackers were ableto direct an overwhelming amount of traffic at Dyn servers, overloading the servers and taking down the services reliant upon Dyn. Critical businessapplications were unavailable for hours, affecting thousands of businesses. Since then, the same Mirai Botnet used in the Dyn attack has been used toperpetuate several other IoT-led DDoS attacks.
Addressing the device visibility problem is one of the next major enterprise priorities in the evolution of the security industry
Over time, the evolution of new threat vectors has resulted in the introduction of new markets in security and caused a major change in cybersecurityspend.
• In the 1990s, the transition from mainframe to client-server architecture, in conjunction with the introduction of the Windows OS, led to theproliferation of new viruses that would infiltrate computer systems and spread throughout a network. The anti-virus market developed in response tothese threats, protecting predominantly Windows PCs with signature-based defense. According to IDC, this market grew to $4.2 billion in 2015.
• In the mid-2000s, more prevalent instances of data exfiltration from organizations by company insiders and Nation States led to significant newspend on data loss prevention and encryption software to prevent data breaches.
• In the 2010s, the onset of more sophisticated and zero-day attacks directed at specific companies led to a shift in security spend. The attack on SonyPictures Entertainment, believed to be by North Korea to prevent the release of the film “The Interview,” is an example of such an advanced threat.New industry-wide spending related to advanced and persistent threats and endpoint detection and response emerged to combat these new and moredamaging threats.
Today, the lack of visibility caused by the proliferation of new devices and operating systems has created the need for a new control point in security. Thenumber of IP-based devices is rising at the same time manageability of those devices is declining. The gap demonstrates increasing vulnerability and awidening surface area of attack. We believe solving the visibility problem will become the first and most important line of defense in preventing previouslyundetected attacks.
Traditional NAC technology has significant limitations
The Network Access Control, or NAC, market began in 2003 as a means to drive the sales of network infrastructure products. The core technology andfunctionality of traditional NAC technology still exists today, but has seen limited innovation by large networking vendors since its inception and hassignificant limitations in today’s world.
Reliant on agents to detect devices
NAC technology relies on an 802.1x supplicant, or agent, installed on a device to allow companies to authenticate corporate-managed devices as theyattempt to connect to the network. These solutions cannot detect certain devices, including BYOD and
9
Table of Contents
IoT devices, which do not have a corporate-installed agent, or run operating systems that cannot integrate with agents. To address this problem withtraditional NAC technologies, enterprises have to whitelist all of the devices that cannot accept an agent, which is administratively impractical.
Limited functionality
The core functionality of a NAC solution is control, or the ability to allow or deny access to a network based on the authentication of the device at asingle point in time. This “on or off” determination often does not provide organizations the flexibility to move a device to a more secure network, limit thedevice access to the network, or alert third-party security systems or IT administrators to a problem. Further, these systems do not continuously assess thesecurity posture of the device after a connection is made. Because the core functionality is control, NAC does not coordinate with other third-party systems toautomate a response to a threat.
Dependent on vendor-specific systems
Because the NAC market was established to drive sales of network infrastructure products, traditional NAC solutions are often dependent on vendor-specific switches and routers and are designed to only work with these systems. Organizations are then limited in their ability to adopt new technologies, orrun in heterogeneous environments, such as the public cloud. Traditional vendors often bundle NAC products into a broad network solution, so they lack theability or motivation to enable these products to work across heterogeneous environments.
Enterprises need a solution that addresses today’s network complexities and dynamic threat environment
Enterprises must address the device visibility problem and close the gap between device proliferation and device manageability. We believe that effectivesolutions to solve this problem require the following characteristics:
• Agentless. Ability to detect a broad range of devices connecting to a network by integrating directly with network infrastructure, without relying on acorporate-installed agent.
• Continuous. Ability to provide continuous visibility into connected devices after initial authentication.
• Automated. Ability to immediately and automatically determine what to do with a device based on policy and behaviors.
• Integrated. Ability to share and enrich data among systems to better understand the context of an environment and of device posture to automate aresponse.
• Heterogeneous. Ability to work across multi-vendor platforms and provide the same level of visibility and control to devices on-premise, in thecloud, or in hybrid environments.
• Scalable. Ability to scale within an enterprise, providing the same level of service across an environment as the number of devices grows.
Our Solution
We provide visibility and control solutions to a broad range of organizations. We have spent over a decade developing proprietary technology that allowsus to discover IP-based devices as they connect to a network, classify them based on characteristics, assess their security posture based on policy andbehaviors, and take action on those devices, all without the use of an agent.
10
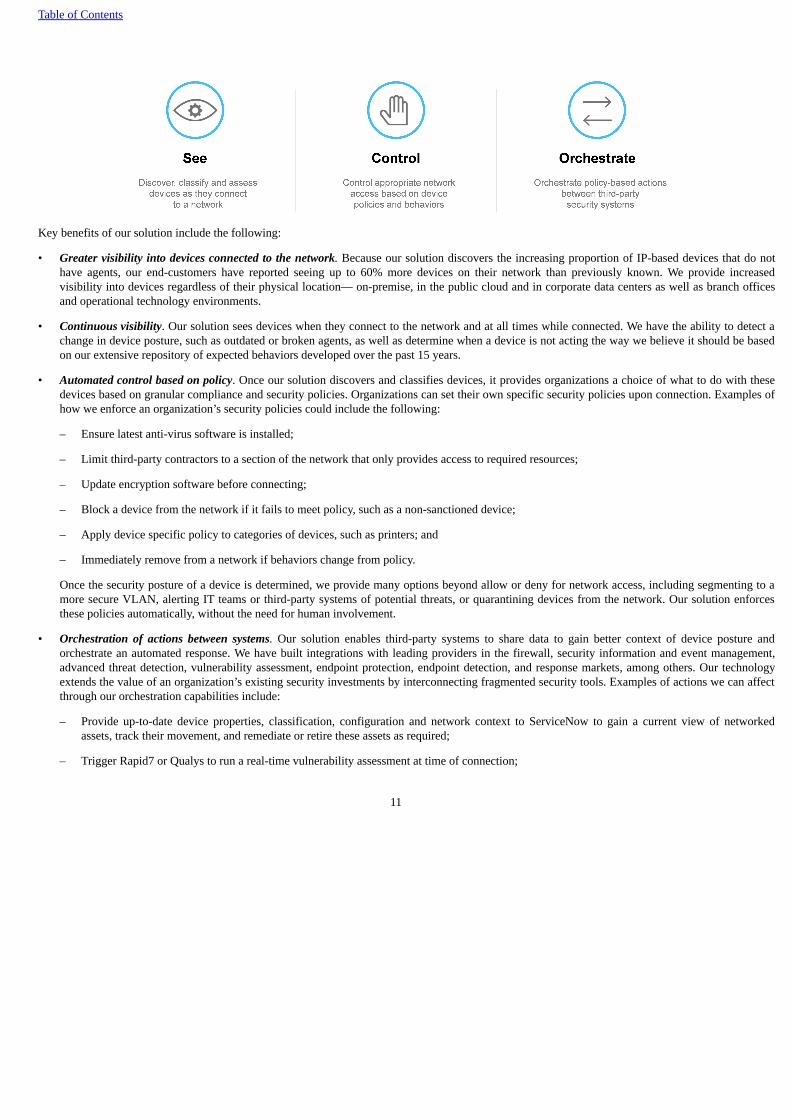
Table of Contents
Key benefits of our solution include the following:
• Greater visibility into devices connected to the network. Because our solution discovers the increasing proportion of IP-based devices that do nothave agents, our end-customers have reported seeing up to 60% more devices on their network than previously known. We provide increasedvisibility into devices regardless of their physical location— on-premise, in the public cloud and in corporate data centers as well as branch officesand operational technology environments.
• Continuous visibility. Our solution sees devices when they connect to the network and at all times while connected. We have the ability to detect achange in device posture, such as outdated or broken agents, as well as determine when a device is not acting the way we believe it should be basedon our extensive repository of expected behaviors developed over the past 15 years.
• Automated control based on policy. Once our solution discovers and classifies devices, it provides organizations a choice of what to do with thesedevices based on granular compliance and security policies. Organizations can set their own specific security policies upon connection. Examples ofhow we enforce an organization’s security policies could include the following:
– Ensure latest anti-virus software is installed;
– Limit third-party contractors to a section of the network that only provides access to required resources;
– Update encryption software before connecting;
– Block a device from the network if it fails to meet policy, such as a non-sanctioned device;
– Apply device specific policy to categories of devices, such as printers; and
– Immediately remove from a network if behaviors change from policy.
Once the security posture of a device is determined, we provide many options beyond allow or deny for network access, including segmenting to amore secure VLAN, alerting IT teams or third-party systems of potential threats, or quarantining devices from the network. Our solution enforcesthese policies automatically, without the need for human involvement.
• Orchestration of actions between systems. Our solution enables third-party systems to share data to gain better context of device posture andorchestrate an automated response. We have built integrations with leading providers in the firewall, security information and event management,advanced threat detection, vulnerability assessment, endpoint protection, endpoint detection, and response markets, among others. Our technologyextends the value of an organization’s existing security investments by interconnecting fragmented security tools. Examples of actions we can affectthrough our orchestration capabilities include:
– Provide up-to-date device properties, classification, configuration and network context to ServiceNow to gain a current view of networkedassets, track their movement, and remediate or retire these assets as required;
– Trigger Rapid7 or Qualys to run a real-time vulnerability assessment at time of connection;
11
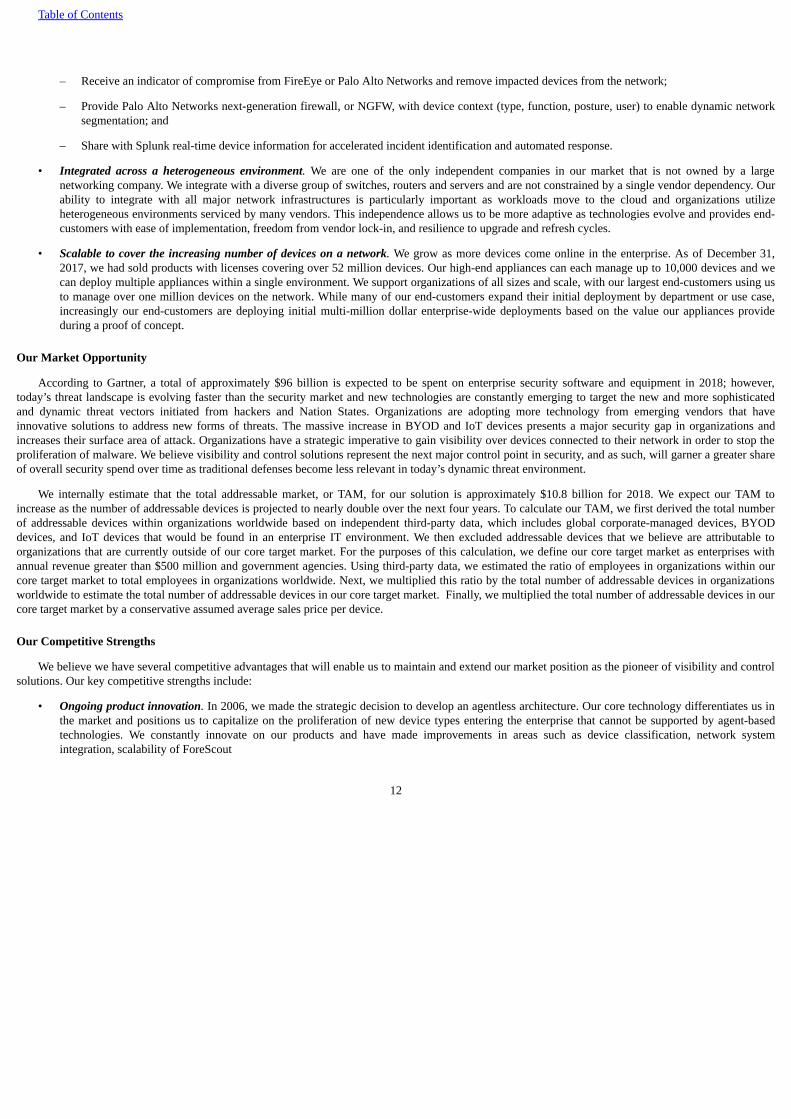
Table of Contents
– Receive an indicator of compromise from FireEye or Palo Alto Networks and remove impacted devices from the network;
– Provide Palo Alto Networks next-generation firewall, or NGFW, with device context (type, function, posture, user) to enable dynamic networksegmentation; and
– Share with Splunk real-time device information for accelerated incident identification and automated response.
• Integrated across a heterogeneous environment. We are one of the only independent companies in our market that is not owned by a largenetworking company. We integrate with a diverse group of switches, routers and servers and are not constrained by a single vendor dependency. Ourability to integrate with all major network infrastructures is particularly important as workloads move to the cloud and organizations utilizeheterogeneous environments serviced by many vendors. This independence allows us to be more adaptive as technologies evolve and provides end-customers with ease of implementation, freedom from vendor lock-in, and resilience to upgrade and refresh cycles.
• Scalable to cover the increasing number of devices on a network. We grow as more devices come online in the enterprise. As of December 31,2017, we had sold products with licenses covering over 52 million devices. Our high-end appliances can each manage up to 10,000 devices and wecan deploy multiple appliances within a single environment. We support organizations of all sizes and scale, with our largest end-customers using usto manage over one million devices on the network. While many of our end-customers expand their initial deployment by department or use case,increasingly our end-customers are deploying initial multi-million dollar enterprise-wide deployments based on the value our appliances provideduring a proof of concept.
Our Market Opportunity
According to Gartner, a total of approximately $96 billion is expected to be spent on enterprise security software and equipment in 2018; however,today’s threat landscape is evolving faster than the security market and new technologies are constantly emerging to target the new and more sophisticatedand dynamic threat vectors initiated from hackers and Nation States. Organizations are adopting more technology from emerging vendors that haveinnovative solutions to address new forms of threats. The massive increase in BYOD and IoT devices presents a major security gap in organizations andincreases their surface area of attack. Organizations have a strategic imperative to gain visibility over devices connected to their network in order to stop theproliferation of malware. We believe visibility and control solutions represent the next major control point in security, and as such, will garner a greater shareof overall security spend over time as traditional defenses become less relevant in today’s dynamic threat environment.
We internally estimate that the total addressable market, or TAM, for our solution is approximately $10.8 billion for 2018. We expect our TAM toincrease as the number of addressable devices is projected to nearly double over the next four years. To calculate our TAM, we first derived the total numberof addressable devices within organizations worldwide based on independent third-party data, which includes global corporate-managed devices, BYODdevices, and IoT devices that would be found in an enterprise IT environment. We then excluded addressable devices that we believe are attributable toorganizations that are currently outside of our core target market. For the purposes of this calculation, we define our core target market as enterprises withannual revenue greater than $500 million and government agencies. Using third-party data, we estimated the ratio of employees in organizations within ourcore target market to total employees in organizations worldwide. Next, we multiplied this ratio by the total number of addressable devices in organizationsworldwide to estimate the total number of addressable devices in our core target market. Finally, we multiplied the total number of addressable devices in ourcore target market by a conservative assumed average sales price per device.
Our Competitive Strengths
We believe we have several competitive advantages that will enable us to maintain and extend our market position as the pioneer of visibility and controlsolutions. Our key competitive strengths include:
• Ongoing product innovation. In 2006, we made the strategic decision to develop an agentless architecture. Our core technology differentiates us inthe market and positions us to capitalize on the proliferation of new device types entering the enterprise that cannot be supported by agent-basedtechnologies. We constantly innovate on our products and have made improvements in areas such as device classification, network systemintegration, scalability of ForeScout
12
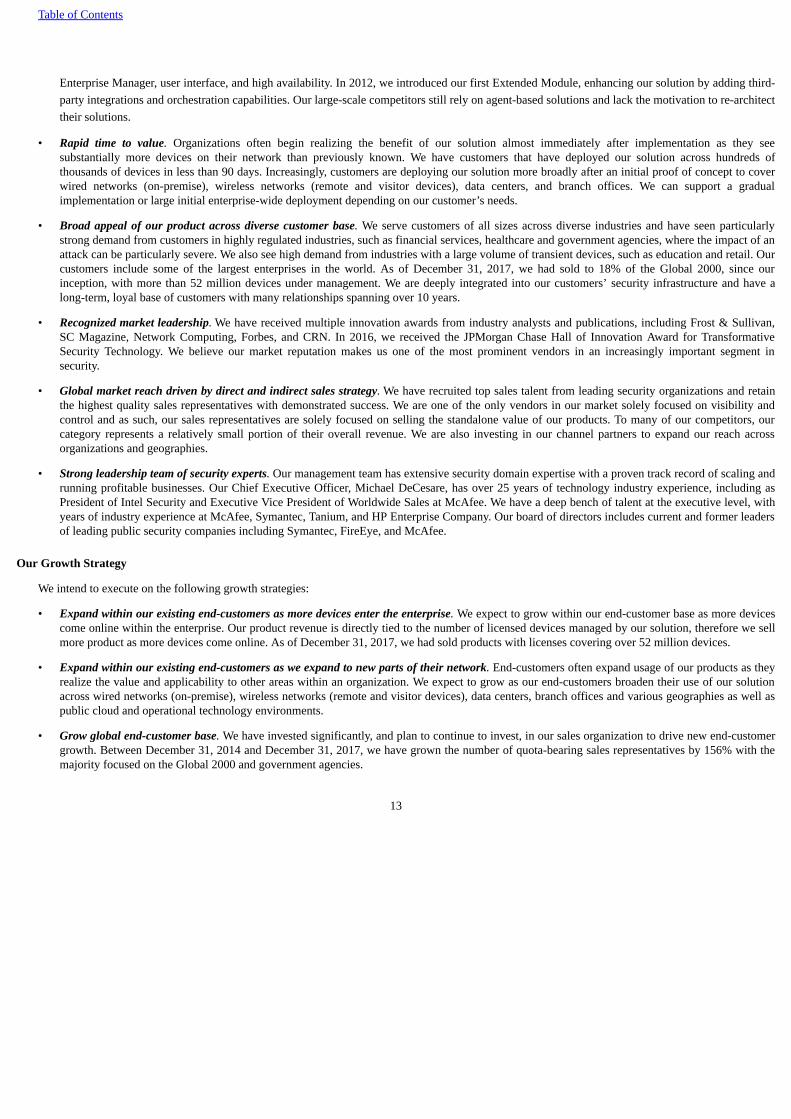
Table of Contents
Enterprise Manager, user interface, and high availability. In 2012, we introduced our first Extended Module, enhancing our solution by adding third-party integrations and orchestration capabilities. Our large-scale competitors still rely on agent-based solutions and lack the motivation to re-architecttheir solutions.
• Rapid time to value. Organizations often begin realizing the benefit of our solution almost immediately after implementation as they seesubstantially more devices on their network than previously known. We have customers that have deployed our solution across hundreds ofthousands of devices in less than 90 days. Increasingly, customers are deploying our solution more broadly after an initial proof of concept to coverwired networks (on-premise), wireless networks (remote and visitor devices), data centers, and branch offices. We can support a gradualimplementation or large initial enterprise-wide deployment depending on our customer’s needs.
• Broad appeal of our product across diverse customer base. We serve customers of all sizes across diverse industries and have seen particularlystrong demand from customers in highly regulated industries, such as financial services, healthcare and government agencies, where the impact of anattack can be particularly severe. We also see high demand from industries with a large volume of transient devices, such as education and retail. Ourcustomers include some of the largest enterprises in the world. As of December 31, 2017, we had sold to 18% of the Global 2000, since ourinception, with more than 52 million devices under management. We are deeply integrated into our customers’ security infrastructure and have along-term, loyal base of customers with many relationships spanning over 10 years.
• Recognized market leadership. We have received multiple innovation awards from industry analysts and publications, including Frost & Sullivan,SC Magazine, Network Computing, Forbes, and CRN. In 2016, we received the JPMorgan Chase Hall of Innovation Award for TransformativeSecurity Technology. We believe our market reputation makes us one of the most prominent vendors in an increasingly important segment insecurity.
• Global market reach driven by direct and indirect sales strategy. We have recruited top sales talent from leading security organizations and retainthe highest quality sales representatives with demonstrated success. We are one of the only vendors in our market solely focused on visibility andcontrol and as such, our sales representatives are solely focused on selling the standalone value of our products. To many of our competitors, ourcategory represents a relatively small portion of their overall revenue. We are also investing in our channel partners to expand our reach acrossorganizations and geographies.
• Strong leadership team of security experts. Our management team has extensive security domain expertise with a proven track record of scaling andrunning profitable businesses. Our Chief Executive Officer, Michael DeCesare, has over 25 years of technology industry experience, including asPresident of Intel Security and Executive Vice President of Worldwide Sales at McAfee. We have a deep bench of talent at the executive level, withyears of industry experience at McAfee, Symantec, Tanium, and HP Enterprise Company. Our board of directors includes current and former leadersof leading public security companies including Symantec, FireEye, and McAfee.
Our Growth Strategy
We intend to execute on the following growth strategies:
• Expand within our existing end-customers as more devices enter the enterprise. We expect to grow within our end-customer base as more devicescome online within the enterprise. Our product revenue is directly tied to the number of licensed devices managed by our solution, therefore we sellmore product as more devices come online. As of December 31, 2017, we had sold products with licenses covering over 52 million devices.
• Expand within our existing end-customers as we expand to new parts of their network. End-customers often expand usage of our products as theyrealize the value and applicability to other areas within an organization. We expect to grow as our end-customers broaden their use of our solutionacross wired networks (on-premise), wireless networks (remote and visitor devices), data centers, branch offices and various geographies as well aspublic cloud and operational technology environments.
• Grow global end-customer base. We have invested significantly, and plan to continue to invest, in our sales organization to drive new end-customergrowth. Between December 31, 2014 and December 31, 2017, we have grown the number of quota-bearing sales representatives by 156% with themajority focused on the Global 2000 and government agencies.
13

Table of Contents
As of December 31, 2017, our current base of end-customers includes 18% of the Global 2000, representing a significant opportunity to expand ourmarket reach. In the future, we also plan to increase sales to mid-size enterprises.
• Increase sales of our Extended Modules. We are seeing strong demand for our Extended Modules as end-customers increasingly requirecoordinated information sharing and policy-based security enforcement across their networks. Our Extended Modules had an attach rate ofapproximately 38% for the year ended December 31, 2017, which represents the annual value of Extended Modules as a percentage of CounterACTsales on orders where both products are sold together or subsequent stand-alone Extended Module sales. As of December 31, 2017, we had aportfolio of over 20 Extended Modules. We have also established an Alliance Partner program that allows us to productize these integrations andleverage joint go-to-market efforts. Today, we have an Alliance Partnerships with CrowdStrike, CyberArk, FireEye, Fortinet, Juniper Networks, PaloAlto Networks, ServiceNow and Splunk.
• Expand our presence in the market by leveraging our ecosystem of channel partners. We will continue to broaden and invest in our channelpartner relationships to increase distribution of our products. We are focused on educating existing partners and investing in sales enablement toexpand our market reach through our channel partner network, particularly into mid-market enterprises.
Our Products
We offer our solution across three products: (i) ForeScout CounterACT, (ii) ForeScout CounterACT Enterprise Manager, and (iii) ForeScout ExtendedModules.
ForeScout CounterACT®
CounterACT agentless technology discovers, classifies, and assesses IP-based devices. CounterACT interrogates the network infrastructure to discoverdevices immediately as they attempt to connect to the network. Since it does not rely on agents, our end-customers have reported seeing up to 60% moredevices on their networks than previously known.
After discovering a device, CounterACT uses a combination of passive and active methods to classify the device based on its type and ownership—e.g.,corporate-managed Windows, un-managed iPhone, digital security camera, or MRI device. Based on its classification, CounterACT then assesses the devicesecurity posture and allows organizations to set policies that establish the specific behavior the device is allowed to have while connected to a network.
14
Table of Contents
CounterACT collects a rich set of data for each of the devices it sees. A sample of the types of data CounterACT collects include:
Once CounterACT discovers a security problem on a device, its sophisticated policy manager can automatically execute a range of responses dependingon the severity of the problem. Minor violations might result in a warning message sent to the end user. Employees and contractors who bring their own
devices can be redirected to an automated onboarding portal. Serious violations could result in actions such as blocking or quarantining the device,reinstallation of a security agent, re-starting of an agent (such as third-party antivirus software) or process, triggering the device to retrieve an operating
system patch, segmenting to a more secure VLAN, or performing other remediation actions.
The following are examples of various control actions we can take:
15
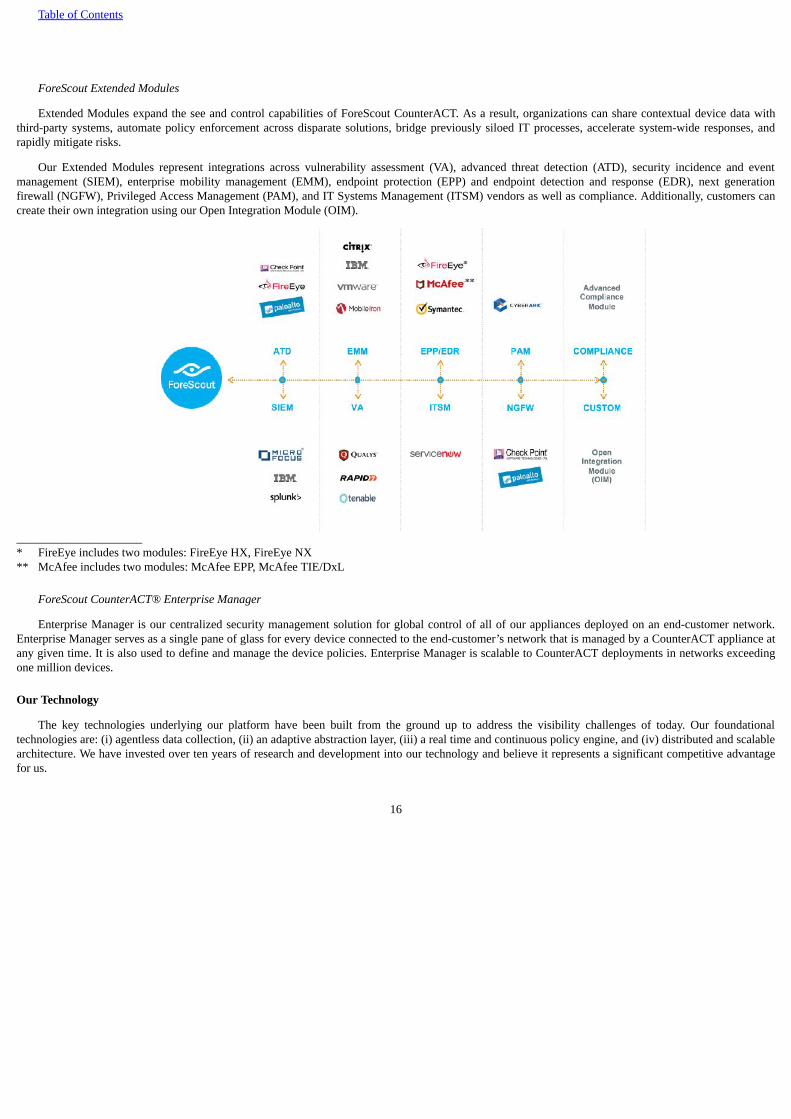
Table of Contents
ForeScout Extended Modules
Extended Modules expand the see and control capabilities of ForeScout CounterACT. As a result, organizations can share contextual device data withthird-party systems, automate policy enforcement across disparate solutions, bridge previously siloed IT processes, accelerate system-wide responses, andrapidly mitigate risks.
Our Extended Modules represent integrations across vulnerability assessment (VA), advanced threat detection (ATD), security incidence and eventmanagement (SIEM), enterprise mobility management (EMM), endpoint protection (EPP) and endpoint detection and response (EDR), next generationfirewall (NGFW), Privileged Access Management (PAM), and IT Systems Management (ITSM) vendors as well as compliance. Additionally, customers cancreate their own integration using our Open Integration Module (OIM).
_____________________* FireEye includes two modules: FireEye HX, FireEye NX** McAfee includes two modules: McAfee EPP, McAfee TIE/DxL
ForeScout CounterACT® Enterprise Manager
Enterprise Manager is our centralized security management solution for global control of all of our appliances deployed on an end-customer network.Enterprise Manager serves as a single pane of glass for every device connected to the end-customer’s network that is managed by a CounterACT appliance atany given time. It is also used to define and manage the device policies. Enterprise Manager is scalable to CounterACT deployments in networks exceedingone million devices.
Our Technology
The key technologies underlying our platform have been built from the ground up to address the visibility challenges of today. Our foundationaltechnologies are: (i) agentless data collection, (ii) an adaptive abstraction layer, (iii) a real time and continuous policy engine, and (iv) distributed and scalablearchitecture. We have invested over ten years of research and development into our technology and believe it represents a significant competitive advantagefor us.
16

Table of Contents
Agentless data collection. Our appliances use a combination of both active and passive methods to discover, classify and assess devices in anorganization’s network. Utilizing active discovery methods, we can poll switches, VPN concentrators, and wireless controllers for a list of connected devices.Using NBT scans and NMAP, or via WMI for deeper inspection of corporate-managed devices, we can inspect workstations running Windows, Mac or Linux,without the use of agents. We also deploy passive inspection methods which allows our appliances to receive SNMP traps from switches and wirelesscontrollers, monitor a network SPAN port to see network traffic, and leverage information such as TCP window sizes, session information, HTTP traffic, andDHCP information banners as well as NetFlow traffic data. If 802.1x is implemented, our technology can authenticate 802.1x requests to a built-in or externalRADIUS server, and authorize network access. In addition, our technology can import external MAC classification data or request LDAP data. We continueto expand the methods we make available, such as the recently added Power over Ethernet (PoE).
Adaptive abstraction layer. Our abstraction layer is able to ingest billions of packets of raw data across a wide array of heterogeneous network systems.We then consolidate this data into a single pane of glass showing our end-customers a real-time depiction of the devices on their networks by type. Oursolution does not require vendor-specific network equipment, upgrades of existing infrastructure, or reconfiguration of each switch and switch port to support802.1x. As organizations adopt virtual and cloud environments, our technology has the flexibility to integrate with hypervisor technologies and cloudplatforms.
The abstraction layer adapts to the IT enterprise environment and continuously enriches its information as organizations make more data available. As anexample, organizations can choose to consume only NetFlow data, which is only the metadata of the actual network traffic. With this information, we canexpedite detection of new devices, collect device properties such as IP address and session protocols, and understand which devices are talking to each other.If organizations choose to give our technology full access to their network traffic through a SPAN port, we can build on this and provide very granularinformation such as MAC address, HTTP user agent, device type, applications in use, and the ability to identify malicious traffic.
Real-time and continuous policy engine. CounterACT’s policy engine continuously checks devices against a set of policies that control how devices areexpected to behave on the network. While other vendor technologies rely on periodic checks, or queries from an operator, our policy engine can do thiscontinuously and in real-time for over one million devices. Our policies are triggered in real-time based on events occurring on a specific device. These canbe network admission events, such as plugging into a switch port or change of IP address, authentication events like those received by RADIUS servers ordetected by network traffic, changes in device attributes like user, opening/closing of ports, and specific traffic behavior such as how the device iscommunicating and what protocol it is using.
The policy engine leverages both infrastructure and host-based controls. At the network switch, our technology can change a Virtual Local AreaNetwork, or VLAN, add an Access Control List, or ACL, or disable a switch port. At a wireless controller, we can blacklist a MAC address or change the roleof a user. In addition, our technology can restrict remote VPN users. At the host, our technology can start and stop applications, update anti-virus securityagents, disable peripheral devices, and request end-user acknowledgment. The policy engine applies these policies automatically regardless of a device’slocation. As the device moves, the policy engine can follow it within the corporate network, cloud, or data center. We determine the type of infrastructure and,based on policy, apply the appropriate control actions.
Distributed, scalable architecture. Enterprise Manager uses distributed computing algorithms so each appliance can independently manage deviceswithin its control. This enables organizations to expand their deployment by simply adding more appliances. Enterprise Manager virtually consolidates thedevice information from all appliances into a single pane of a glass view for the administrator. The algorithms allow the administrator to search for securityrelated information such as users, processes, services across the entire deployment in real time and retrieve it in seconds.
Our Services
Maintenance and Support Services
We offer technical maintenance and support for our solution, including our Extended Modules, to our end-customers. We provide two levels ofmaintenance and support, including premium-level support for coverage 24 hours a day, seven days a week on a global basis. Our end-customers receive post-sale support through online portals, email and telephone, managed by a single point of contact.
17
Table of Contents
Professional Services
We offer professional services to end-customers to help them design, plan, deploy, and optimize our solution. We also provide training on CounterACTadministration and emerging security best practices. We also provide professional services through our channel partners.
Our Customers
Since our inception, we have sold to over 2,700 end-customers in over 80 countries, including 18% of the Global 2000, with more than 52 milliondevices under management. We sell into all industries and into organizations of all sizes, including corporations and government agencies. Our end-customersgenerally purchase from distributors and/or VARs. For fiscal 2015, one distributor, one VAR, and one end-customer represented 14%, 11%, and 10% of ourtotal revenue, respectively. For the year ended December 31, 2016, three distributors represented 24%, 14%, and 13% of our total revenue, respectively. Forthe year ended December 31, 2017, three distributors represented 30%, 21%, and 17% of our total revenue.
Customer Case Studies
The following are examples of how certain of our representative end-customers have selected, deployed, and benefited from the use of our solution.
E*Trade
Problem: E*Trade’s primary challenges revolved around visibility, specifically for a real-time asset inventory to identify devices accessing its network,while routing out rogue devices with malicious intent.
Solution and Benefits: After an evaluation period and proof of concept with three vendors, ForeScout was chosen for its ease of use and vendor agnosticdesign in 2014, which is ideal for E*Trade’s complex, heterogeneous network environment. Additionally, with many managed and unmanaged devices,various networking equipment, and IoT devices including printers, security cameras, badge scanners, and more, ForeScout’s agentless approach could provideE*Trade with all the visibility and control it needed to discover and classify devices across its diverse infrastructure. E*Trade initially rolled out CounterACTto deliver visibility into the devices accessing its network. In the second phase to eradicate the threat of rogue devices attempting to infiltrate the network forconfidential data, E*Trade moved into asset control. Deploying ForeScout has helped E*Trade eliminate the threat of rogue devices, by identifying and thenblocking their access to the network, alleviating a big gap in its security spectrum. Additionally, ForeScout has helped E*Trade realize even greater valuefrom its existing investments with Rapid7, Inc., HP Enterprise Company’s ArcSight, and VMware, Inc.’s Airwatch by sharing information for better visibilityand control using ForeScout as the real-time enforcement point.
RWJBarnabas Health
Problem: RWJBarnabas Health (RWJBarnabas) is New Jersey's largest integrated healthcare delivery system comprised of hospitals, clinics, andambulatory centers throughout the state. RWJBarnabas needed real-time visibility to identify, classify, and control the devices that access its network. Inaddition, RWJBarnabas had compliance requirements, like HIPAA and HITECH, and needed to maintain a strong security posture without impeding medicalcare, automate endpoint policy compliance and remediation, and accommodate vendor-owned-and-managed systems. Furthermore, as RWJBarnabascontinues to grow through acquisitions, it needed a way to identify, classify, and control devices so as to quickly and securely integrate acquired networks intoRWJBarnabas.
Solution and Benefits: In 2015, RWJBarnabas first selected and deployed CounterACT. Leveraging CounterACT, RWJBarnabas has gained visibility andcontrol across a diverse set of devices accessing its network, including laptops, mobile devices, medical devices, virtual machines, and more. CounterACThelps to ensure these devices meet endpoint compliance through automated remediation. And with its mergers and acquisitions activity, CounterACT providesan efficient and secure way for RWJBarnabas to classify, grant, limit, or block network access to the devices on the new entity's network while at the sametime providing a comprehensive inventory of acquired IP-based device assets. Lastly, RWJBarnabas has gained additional value from its existing securitytools by deploying Extended Modules to share information with its security information and event management and mobile service management solutions aswell as other network monitoring tools across both wired and wireless networks.
18
Table of Contents
United States Army Medical Command
Problem: The United States Army Medical Command (MEDCOM) provides a variety of medical, training, and research services to military beneficiariesworldwide through 39 medical facilities and over 20 research labs and administrative agencies. This includes more than 70,000 personnel and 300,000network connected devices within MEDCOM facilities, organizations and field operating agencies that require access to the MEDCOM network for thedelivery of healthcare services. MEDCOM’s challenge revolved around endpoint security and the need to identify and authenticate devices as they connect, inreal-time, to the network while quarantining non-compliant devices.
Solution and Benefits: In 2012, MEDCOM first selected and deployed CounterACT. In its initial deployment phase, CounterACT was used to providevisibility into devices accessing MEDCOM’s network. Following its success with device visibility, MEDCOM then moved forward with real-time, on-demand application and software inventorying to identify applications on each device and ensure they met defined criteria. This included leveragingCounterACT to enforce policy driven access control, enabling MEDCOM to grant, limit, or block access for wired, WiFi, mobile, and IoT devices accessingthe network. In its latest phase, MEDCOM rolled out two of the ForeScout Extended Modules, McAfee’s ePolicy Orchestrator and Microsoft’s SystemsCenter Configuration Manager.
United States Marine Corps
Problem: The U.S. Marine Corps (USMC) faced the challenge of getting comprehensive visibility over the millions of devices connected to its networkacross hundreds of locations across the globe. The USMC also viewed their existing security solutions as lacking the ability to provide real-time networkdevice visibility, critical to eliminating potential network and device vulnerabilities and acting as a fundamental means of protecting both non-classified andclassified enclaves across the organization.
Solution and Benefits: U.S. Marine Corps Installations East (MCIEAST) under the direction and authority of HQMC C4 began a project in 2011, knownas Comply to Connect. This project determined that ForeScout CounterACT was the foundation product of choice for discovery and classification. TheUSMC realized rapid benefits of ForeScout’s agentless solution and was able to identify a range of devices connected to its network that were previouslyhidden from the USMC’s IT department and then continuously profile the devices in order to gain greater insights into the devices connected onto itsnetworks. Comply to Connect, or C2C, was incorporated into the 2017 National Defense Authorization Act, or NDAA, and was signed into law in February2017. After recognizing the benefits of the ForeScout solution, the USMC expanded ForeScout’s deployment across the organization in a phased approach,with over 180,000 devices accessing the USMC networks under ForeScout management.
Sales and Marketing
Sales
We deploy a direct-touch channel-fulfilled strategy. Our sales cycle is typically six to 12 months, depending on the industry and size and scope ofdeployment. We have a direct field sales team and a dedicated team focused on managing relationships with our channel partners and working with ourchannel partners to support our end-customers. We expect to continue to grow our sales headcount in areas of highest demand for our solution. Generally, oursales representatives have become more productive the longer they are with us, with limited productivity in their first few quarters as they learn to sell ourproducts and participate in field training. We focus our sales management efforts on helping our sales representatives increase productivity as they becomemore seasoned. As of December 31, 2017, 65% of our sales representatives have been with us for less than two years.
Our sales team is supported by sales engineers with deep technical expertise who are responsible for pre-sales technical support, solutions engineering forour end-customers, proof of concept work and technical training for our channel partners.
Marketing
Our marketing efforts are focused on building brand reputation and awareness to generate customer demand and build a strong sales pipeline, working inconjunction with our channel partners around the globe. Our team consists of corporate marketing, product marketing, partner marketing, field and digitalmarketing, account/lead development, operations, social media, public relations, and corporate communications. Marketing activities include demandgeneration, managing our corporate website and partner portal, trade shows and conferences, press, and analyst relations. Our sales developmentrepresentatives also qualify sales leads and facilitate face-to-face meetings with potential customers. We actively drive thought leadership and
19
Table of Contents
tell our technology story by engaging industry analysts and top journalists at business and trade publications, as well as direct to customers via social mediaand other digital marketing channels.
Partner Ecosystem
We actively foster and develop our partner ecosystem to find and work with high quality partners who provide our solution to end-customers. Our salesforce and strategic alliance group are responsible for cultivating these partnerships to establish new opportunities for delivering our solution to new andexisting customers.
Channel Partners
We leverage the global breadth and reach of the channel ecosystem, including value-added resellers and distributors, to fulfill orders and sell to our mid-market customers. We dedicate significant resources to building in-depth relationships with our channel partners, including marketing, technical, and salessupport to assist in jointly sourcing and closing sales opportunities. Our channel partners include Optiv Security, Inc., Westcon Group Inc., Dimension DataHoldings plc, and Forsythe Solutions Group Inc.
Alliances Partners
We have established an Alliance Partner program that allows us to productize technical integrations with third-party security vendors and leverage jointgo-to-market efforts. Today we have an Alliance Partnerships with CrowdStrike, CyberArk, FireEye, Fortinet, Juniper Networks, Palo Alto Networks,ServiceNow and Splunk.
Research and Development
We invest substantial resources in research and development to consistently enhance features and capabilities of our solution. Our research anddevelopment team is located in Tel Aviv, Israel, San Jose, California, and Dallas, Texas. Research and development expense totaled approximately $17.8million, $31.5 million, and $47.4 million for the years ended December 31, 2015, 2016, and 2017, respectively. We plan to continue to significantly invest inresources to conduct our research and development effort.
Competition
We operate in the intensely competitive network security market that is characterized by constant change and innovation. The threat landscape is growingfaster than the security market, drawing new providers and new functionality from existing providers to address dynamic threat vectors. We compete withsecurity providers in the following categories:
• the large networking vendors, Cisco and HP Enterprise Company; and
• independent security vendors that offer products that perform some of the functions of our solution.
The principal competitive factors in our market include:
• effectiveness;
• features and functionality;
• global support capabilities;
• scalability and overall performance;
• time to value;
• integration capabilities with heterogeneous network infrastructure and security tools;
• brand awareness and reputation;
• strength of sales and marketing efforts;
20

Table of Contents
• size and scale of organization;
• price and total cost of ownership; and
• customer return on investment.
We believe we compete favorably with our competitors on the basis of these factors as a result of the features and performance of our solution, the easeof integration of our products with network infrastructure, and the breadth of our capabilities. However, many of our competitors have substantially greaterfinancial, technical and other resources, greater name recognition, larger sales and marketing budgets, deeper customer relationships, broader distribution, andlarger and more mature intellectual property portfolios.
Manufacturing
The manufacturing of our products is outsourced to a single third-party contract manufacturer, Arrow Electronics, Inc., or Arrow. This approach allowsus to reduce our costs by decreasing our manufacturing overhead and inventory and also allows us to adjust more quickly to changing end-customer demand.Arrow assembles our product using design specifications, quality assurance programs and standards that we establish, and it procures components andassembles our products based on our demand forecasts. These forecasts represent our estimates of future demand for our products based on historical trendsand analysis from our sales and product management functions as adjusted for overall market conditions.
We have entered into a written agreement with Arrow pursuant to which Arrow manufactures our product. This agreement continues in effect until eitherparty terminates, with or without cause, by giving 90 days prior written notice.
Information about Segment and Geographic Revenue
Information about segment and geographic revenue is set forth in Note 14 in the Notes to our Consolidated Financial Statements included in Part II ofthis Annual Report on Form 10-K.
Seasonality and Backlog
We experience seasonality in our business, with sales generally stronger in our third and fourth fiscal quarters. For this reason, we do not believe that ourproduct backlog at any particular time is meaningful because it is not necessarily indicative of future revenue in any given period as such orders may berescheduled by our partners without penalty or delayed due to inventory constraints.
Intellectual Property
Our success depends in part upon our ability to protect our core technology and intellectual property. We rely on, among other things, patents,trademarks, copyrights, and trade secret laws, confidentiality safeguards and procedures, and employee non-disclosure and invention assignment agreementsto protect our intellectual property rights. We have five U.S-issued patents, which expire between November 24, 2019 and November 13, 2033, eleven patentapplications pending in the United States, and six pending foreign counterpart patent applications in a non-U.S. jurisdiction. We also have two issued foreigncounterparts of one of these patents. We also license software from third parties for integration into our products, including open source software and othersoftware available on commercially reasonable terms.
We control access to and use of our proprietary software, technology and other proprietary information through the use of internal and external controls,including contractual protections with employees, contractors, end-customers, and partners, and our software is protected by U.S. and international copyright,patent, and trade secret laws. In addition, we intend to expand our international operations and effective patent, copyright, trademark, and trade secretprotection may not be available or may be limited in foreign countries.
See the section titled “Risk Factors—Failure to protect our proprietary technology and intellectual property rights could substantially harm our businessand results of operations” for additional information.
Employees
As of December 31, 2017, we had 823 employees, including 813 full-time employees.
21

Table of Contents
None of our U.S or Israeli employees are represented by a labor organization or are a party to any collective bargaining arrangement. None of ouremployees located in France, Spain, and Germany are currently covered by industry-wide collective bargaining agreements. We have never had a workstoppage, and we consider our relationship with our employees to be good.
Corporate Information
We were incorporated in Delaware in April 2000. We completed our initial public offering in October 2017 and our common stock is listed on TheNASDAQ Global Market. Our principal executive offices are located at 190 West Tasman Drive, San Jose, California 95134. Our main telephone number is(408) 213-3191.
Several trademarks and trade names appear in this prospectus. “ForeScout” and “CounterACT” are the exclusive properties of ForeScout Technologies,Inc., are registered with the U.S. Patent and Trademark Office, and may be registered or pending registration in other countries. Other trademarks, servicemarks, or trade names appearing in this Annual Report on Form 10-K are the property of their respective owners.
Our website address is located at www.forescout.com, and our investor relations website is located at http://investors.forescout.com/investor-relations.Copies of our Annual Reports on Form 10-K, Quarterly Reports on Form 10-Q, Current Reports on Form 8-K, and amendments to these reports filed orfurnished pursuant to Section 13(a) or 15(d) of the Securities Exchange Act of 1934, as amended, or the Exchange Act, are available, free of charge, on ourinvestor relations website as soon as reasonably practicable after we file such material electronically with or furnish it to the Securities and ExchangeCommission, or the SEC. The SEC also maintains a website that contains our SEC filings. The address of the site is www.sec.gov. Further, a copy of thisAnnual Report on Form 10-K is located at the SEC’s Public Reference Room at 100 F Street, NE, Washington, D.C. 20549. Information on the operation ofthe Public Reference Room can be obtained by calling the SEC at 1-800-SEC-0330.
We also use our investor relations website as a channel of distribution for important company information. Important information, including pressreleases, analyst presentations and financial information regarding us, as well as corporate governance information, is routinely posted and accessible on ourinvestor relations website. Information contained on, or that can be accessed through, our website or social medial sites does not constitute part of this AnnualReport on Form 10-K or any other report or document we file with the SEC, and any references to our website and social media sits are intended to beinactive textual references only.
We are an emerging growth company within the meaning of the Jumpstart Our Business Startups Act of 2012, or the JOBS Act, and, as such, we haveelected to comply with certain reduced public company reporting requirements. We will remain an emerging growth company until the earliest to occur of (i)the last day of the fiscal year in which we have more than $1.07 billion in annual revenue; (ii) the date we qualify as a “large accelerated filer,” with at least$700 million of equity securities held by non-affiliates; (iii) the date on which we have issued, in any three-year period, more than $1.0 billion in non-convertible debt securities; and (iv) the last day of the fiscal year ending after the fifth anniversary of the completion of this offering.
22

Table of Contents
ITEM 1A. RISK FACTORS
You should carefully consider the following risks and uncertainties described below, together with all of the other information contained in this AnnualReport on Form 10-K, including the section titled “Management’s Discussion and Analysis of Financial Condition and Results of Operations” and ourfinancial statements and related notes. Any of the risks, if realized, could have a material adverse effect on our business, results of operations, prospects, andfinancial condition, and could cause the trading price of our common stock to decline, which would cause you to lose all or part of your investment. The risksand uncertainties described below are not the only ones we face. Additional risks and uncertainties not presently known to us or deemed to be material by usmay impair our operations and performance.
Risks Related to Our Business
As a result of recent changes in our market, sales organization, and go-to-market strategy, our ability to forecast our future results of operations andplan for and model future growth is limited and subject to a number of uncertainties.
Although we were founded in 2000 and launched ForeScout CounterACT in 2006, much of our growth has occurred in recent periods. Our growthreflects a number of macro changes impacting the cyber security market, particularly through Bring Your Own Device, or BYOD, initiatives and theemergence of the Internet of Things, or IoT, both of which have contributed to a significant increase in the number of unmanaged devices accessing ITnetworks and resulted in growing demand for our products. To address this demand, we have made substantial investments in our sales force, which hasalmost tripled the size of our quota-bearing sales representatives from the beginning of 2015 to December 31, 2017. In addition, we are focusing on buildingrelationships with Alliance Partners such as CrowdStrike and CyberArk to utilize their sales force resources to reach new end-customers. As a result of theserecent changes in our market, sales organization and go-to-market strategies, coupled with our limited operating history, our ability to forecast our futureresults of operations and plan for and model future growth is limited and subject to a number of uncertainties. We have encountered and will continue toencounter risks and uncertainties frequently encountered by rapidly growing companies in developing markets. If our assumptions regarding these risks anduncertainties are incorrect or change in response to developments in the security market, our results of operations and financial results could differ materiallyfrom our plans and forecasts. If we are unable to achieve our key objectives, our business and results of operations will be adversely affected and the fairmarket value of our common stock could decline.
Our revenue growth rate in recent periods may not be indicative of our future performance.
Our revenue growth rate in recent periods should not be viewed as an indication of our future performance. For the years ended December 31, 2015,2016, and 2017, our revenue was $126.0 million, $166.8 million, and $220.9 million, respectively, representing year-over-year growth of 32% and 32%,respectively. We may not achieve similar revenue growth rates in future periods. Factors that could impact our ability to increase our revenue include ourability to increase the size or efficiency of our sales force, which has expanded rapidly in recent years, our ability to achieve repeat purchases by existing end-customers, and the extent to which we are successful in securing large scale deployments, particularly among Global 2000 enterprises and public sectororganizations. If we are unable to maintain consistent revenue or revenue growth, our stock price could experience volatility, and our ability to achieve andmaintain profitability could be adversely affected.
We have a history of losses and may be unable to achieve or maintain profitability in the future.
We have incurred significant net losses in each year since our inception, including net losses of $27.3 million, $74.8 million, and $91.2 million for theyears ended December 31, 2015, 2016, and 2017, respectively. While we have experienced revenue growth over these same periods, we may not be able tosustain or increase our growth or achieve profitability in the future or on a consistent basis. We expect our operating expenses to increase over the next severalyears as we continue to expend substantial financial resources on, among other things, expanding and improving the functionality of our solution through theaddition of new ForeScout Extended Modules, investments in research and development and sales and marketing, and the hiring of additional employees. Thereturn on these investments, if any, will only be realized over time and may not result in increased revenue commensurate with increases in our expenses, or atall.
23
Table of Contents
In addition, we completed our initial public offering in October 2017, and as a public company, we will incur significant accounting, legal, and otherexpenses that we did not incur as a private company. Achieving profitability will require us to increase revenue, manage our cost structure, and avoidsignificant liabilities. Revenue growth may slow, revenue may decline, or we may incur significant losses in the future for a number of reasons, includinggeneral macroeconomic conditions, increasing competition, a decrease in the growth of the markets in which we operate, the inability to expand our salesforce and increase its productivity, or if we fail for any reason to continue to capitalize on growth opportunities. Additionally, we may encounter unforeseenoperating expenses, difficulties, complications, delays, and other unknown factors that may result in losses in future periods. If these losses exceed ourexpectations or our revenue growth expectations are not met in future periods, our financial performance will be harmed and our stock price could decline.
If we are unable to increase sales of our solution to large organizations and public sector entities, while mitigating the risks associated with servingsuch end-customers, our business, financial position, and results of operations may suffer.
Our growth strategy is dependent, in part, upon increasing sales of our solution to large organizations and public sector entities. Sales to largeorganizations and public sector entities involve risks that may not be present (or that are present to a lesser extent) with sales to smaller entities. These risksinclude:
• increased purchasing power and leverage held by large end-customers in negotiating contractual arrangements with us, including, in certain cases,clauses that provide preferred pricing of configurations with similar specifications;
• more stringent or costly requirements imposed upon us in our maintenance and support contracts with such end-customers, including stricterresponse times and penalties for any failure to meet maintenance and support requirements (which penalties may include termination of ourmaintenance and support contracts with such end-customer, or refunds of amounts paid);
• more complicated and costly implementation processes and network infrastructure;
• longer sales cycles and the associated risk that substantial time and resources may be spent on a potential end-customer that ultimately elects not topurchase our products or purchases fewer products than we anticipated;
• closer relationships with, and increased dependence upon, large technology companies who offer competitive products and have stronger brandrecognition; and
• increased pressure for pricing discounts.
In addition, because security breaches with respect to larger, high-profile organizations, or public sector entities are likely to be heavily publicized andbecause they are more likely to be targeted by cyberattackers, there is increased reputational risk associated with serving such end-customers. If we are unableto increase sales of our solution and products to large organizations and public sector entities while mitigating the risks associated with serving such end-customers, our business, results of operations, prospects, and financial condition may suffer.
Our business and operations have experienced rapid growth, and if we do not appropriately manage any future growth, or are unable to improve oursystems and processes, our results of operations will be harmed.
We have experienced rapid growth over the last several years, which has placed and will continue to place significant demands on our management,administrative, operational, and financial infrastructure. As we have grown, we have had to manage an increasingly larger and more complex array of internalsystems and processes to scale all aspects of our business in proportion to such rapid growth, including an expanded sales force, additional end-customerservice personnel, and a new corporate headquarters, as well as more complex administrative systems related to managing increased headcount, particularlywithin our sales force. For instance, from January 1, 2016 to December 31, 2017, our headcount grew from 513 employees to 823 employees, and we expectto continue to expand our headcount. Our success will depend in part upon our ability to manage our growth effectively. To do so, we must continue toincrease the productivity of our existing employees, particularly our sales force, and hire, train, and manage new employees as needed.
To manage the domestic and international growth of our operations and personnel, we will need to continue to improve our operational, financial, andmanagement controls, as well as our reporting processes and procedures. In addition, we will need to implement more extensive and integrated financial andbusiness information systems, including a new software license
24
Table of Contents
management system. These additional investments will increase our operating costs, which will make it more difficult for us to offset any future revenueshortfalls by reducing expenses in the short term. We may not be able to successfully acquire or implement these or other improvements to our systems andprocesses in an efficient or timely manner, or once implemented, we may discover deficiencies in their capabilities or effectiveness. We may experiencedifficulties in managing improvements to our systems and processes or in integrating with third-party technology. In addition, our systems and processes mayfail to prevent or detect errors, omissions, or fraud. Our failure to improve our systems and processes, or their failure to operate effectively and in the intendedmanner, may result in the disruption of our current operations and end-customer relationships, our inability to manage the growth of our business and ourinability to accurately forecast and report our revenue, expenses and earnings, any of which may materially harm our business, results of operations,prospects, and financial condition.
If we are unable to increase market awareness of our company and our solution, or fail to successfully promote or protect our brand, our competitivemarket position and revenue may not continue to grow or may decline.
Market awareness of the value proposition of our solution will be essential to our continued growth and our success. If our marketing efforts areunsuccessful in creating market awareness of our company and our solution, then our business, results of operations, prospects, and financial condition will beadversely affected, and we will not be able to achieve sustained growth.
Moreover, due to the intensely competitive nature of our market, we believe that building and maintaining our brand and reputation is critical to oursuccess and that the importance of positive brand recognition will increase as competition in our market further intensifies. While we believe that we aresuccessfully building a well-established brand and have invested and expect to continue to invest substantial resources to promote and maintain our brand,both domestically and internationally, there can be no assurances that our brand development strategies will enhance our reputation or brand recognition orlead to increased revenue.
Furthermore, an increasing number of independent industry analysts and researchers, such as Gartner, International Data Corporation, and ForresterResearch, Inc., regularly evaluate, compare, and publish reviews regarding the functionality of security products and services, including our solution. Themarket’s perception of our solution may be significantly influenced by these reviews. We do not have any control over the content of these independentindustry analysts and researchers’ reports, and our reputation and brand could be harmed if they publish negative reviews of our solution or do not view us asa market leader. The strength of our brand may also be negatively impacted by the marketing efforts of our competitors, which may include incomplete,inaccurate, and misleading statements about us, or our products and services. If we are unable to maintain a strong brand and reputation, sales to new andexisting end-customers could be adversely affected, and our financial performance could be harmed.
We operate in a highly competitive market, with certain competitors having greater resources than we do, and competitive pressures from existingand new companies may adversely impact our business, results of operations, prospects, and financial condition.
The market in which we compete is highly fragmented, intensely competitive, and evolving in response to changes in the threat landscape and corporatenetwork security infrastructures. We expect competition to intensify in the future as existing competitors bundle new and more competitive offerings withtheir existing products and services, and as new market entrants introduce new products into the security market. This competition could result in increasedpricing pressure, reduced profit margins, increased sales and marketing expenses, and our failure to increase, or the loss of, market share, any of which couldseriously harm our business, results of operations, prospects, and financial condition. If we do not keep pace with product and technology advances andotherwise keep our products and services competitive, there could be a material and adverse effect on our competitive position, revenue, and prospects forgrowth.
Our competitors and potential competitors include large networking vendors such as Cisco Systems, Inc., or Cisco, and HP Enterprise Company that mayemulate or integrate features similar to ours into their own products; independent network security vendors that offer products that claim to perform similarfunctions to our solution; and small and large companies that offer point solutions that compete with some of the features present in our solution. We may alsoface competition from highly specialized vendors as well as larger vendors that may continue to acquire or bundle their products more effectively as ourmarket grows and IT budgets are increased or created to support next-generation threat protection.
25

Table of Contents
Many of our current and potential competitors, such as Cisco and HP Enterprise Company, have longer operating histories, are substantially larger andhave greater financial, technical, research and development, sales and marketing, manufacturing, distribution, and other resources, and greater namerecognition. Such competitors also may have well-established relationships with our current and potential end-customers, extensive knowledge of ourindustry and the market in which we compete and intend to compete, and such competitors may emulate or integrate product features similar to ours into theirown products. As a result, our competitors may be able to respond more quickly to new or emerging technologies and changes in customer requirements, or todevote greater resources to the development, marketing, promotion, and sale of their products and services than we can with respect to our products andservices. They also may make strategic acquisitions or establish cooperative relationships among themselves or with other providers, thereby increasing theirability to provide a broader suite of products and services, and potentially causing our end-customers to decrease purchases of, or defer purchasing decisionswith respect to, our products and services. In addition, some of our larger competitors have substantially broader product offerings and may be able toleverage their relationships with distribution partners and customers based on other products or incorporate functionality into existing products to gainbusiness in a manner that discourages potential end-customers from purchasing our products and services, including by selling at zero or negative margins,product bundling, or offering closed technology solutions. Potential end-customers may also prefer to purchase from their existing vendors rather than a newsupplier regardless of product performance or features. Further, to the extent that one of our competitors acquires, or establishes or strengthens a cooperativerelationship with, one or more of our channel partners, it could adversely affect our ability to compete. We may be required to make substantial additionalinvestments in research and development and sales and marketing to respond to these competitive pressures, and we may not be able to compete successfullyin the future. Any of the foregoing may limit our ability to compete effectively in the market and adversely affect our business, results of operations,prospects, and financial condition.
If we are unable to successfully expand our sales force while maintaining sales productivity, sales of our products, maintenance, and professionalservices and the growth of our business and financial performance could be harmed.
We continue to be substantially dependent on our sales force to obtain new end-customers and increase sales to existing end-customers, and we plan tocontinue to grow our sales force in the future. There is significant competition for sales personnel with the skills and technical knowledge that we require. Ourability to achieve significant revenue growth and profitability will depend, in large part, on our success in recruiting, training, and retaining a sufficientnumber of sales personnel to support our growth, particularly in international markets. New sales representative hires require significant training and mayrequire a lengthy on-boarding process before they achieve adequate levels of productivity. Generally, our sales representatives become more productive thelonger they are with us, with limited productivity in their first few quarters as they learn to sell our products and participate in field training.
Our recent hires and planned hires may not become productive as quickly as we expect, or at all, and we may be unable to hire or retain a sufficientnumber of qualified personnel in the markets where we do business or plan to do business. If we are unable to recruit, train, and retain a sufficient number ofproductive sales personnel, sales of our products, maintenance, and professional services and the growth of our business would be harmed. Additionally, ifour efforts to expand our sales force do not result in increased revenue, our results of operations could be negatively impacted due to increased operatingexpenses associated with an expanded sales force.
Our end-customers’ purchasing cycles may cause fluctuations in our revenue.
Our business is affected by cyclical fluctuations in end-customer spending patterns, which result in some seasonal trends in the sale of our solution.Revenue in our third and fourth fiscal quarters, particularly in the last two weeks of the fourth quarter, is typically stronger due to the calendar year-end. Ourpublic sector end-customers typically end their fiscal years during our third quarter, while many of our other end-customers end their fiscal years during ourfourth quarter. Our first and second fiscal quarters typically experience lower sales, with aggregate revenue historically significantly lower in our first fiscalquarter when compared to our third and fourth fiscal quarters. Furthermore, our rapid growth rate over recent years may have made these fluctuations moredifficult to detect. If our growth rate slows over time, cyclical variations in our operations may become more pronounced, and our business, results ofoperations, prospects, and financial condition may be adversely affected.
Reliance on shipments at the end of the quarter could cause our revenue for the applicable period to fall below expected levels.
As a result of end-customer buying patterns and the efforts of our sales force and channel partners to meet or exceed their quarterly sales objectives, wehave historically received a substantial portion of sales orders and generated a substantial portion
26
Table of Contents
of revenue during the last few weeks of each fiscal quarter. If expected revenue at the end of any fiscal quarter is delayed for any reason, our revenue for thatquarter could fall below our expectations and the estimates of analysts, which could adversely impact our business, results of operations, prospects, andfinancial condition and cause a decline in the trading price of our common stock. The reasons our expected revenue may be delayed include:
• the failure of anticipated purchase orders to materialize;
• our logistics partners’ inability to deliver products prior to fiscal quarter-end to fulfill purchase orders received near the end of the fiscal quarter;
• our failure to manage inventory to meet demand;
• our inability to release new products on schedule;
• any failure of our systems related to order review and processing; or
• any delays in shipments based on trade compliance requirements.
We are dependent upon lead generation strategies to drive our sales and revenue. If these marketing strategies fail to continue to generate salesopportunities, our ability to grow our revenue will be adversely affected.
We are dependent upon lead generation strategies to generate sales opportunities, such as sponsored events, tradeshows, webinars, and productdemonstrations. These strategies may not be successful in continuing to generate sufficient sales opportunities necessary to increase our revenue. To theextent that targeted leads do not become, or we are unable to successfully attract, end-customers, we will not realize the intended benefits of these marketingstrategies, and our ability to grow our revenue will be adversely affected.
Our business depends substantially on our ability to retain end-customers and expand our offerings to them. A decline in our end-customer retentionor in our ability to expand sales to existing end-customers could harm our future results of operations.
Many organizations seek security solutions that are among the best available in the industry. For us to maintain or improve our results of operations in anindustry that is rapidly evolving and places a premium on market leading solutions, it is important that we retain existing end-customers and that our end-customers expand their use of our products and services. An increasing portion of our revenue is derived from additional sales to our end-customers for boththe management of additional existing devices on their networks and the influx of new devices that are added to their networks each day. During the yearended December 31, 2017, the majority of our revenue came from existing end-customers, and it is important for us to increase sales into this base. Our end-customers also have no obligation to renew their maintenance and support contracts with us upon the expiration of the initial maintenance and supportcontract period, which is typically a one-year or three-year term, and even if end-customers do renew, they may not renew with a similar maintenance andsupport contract period, or they may renew on terms that are less economically beneficial to us.
Our end-customer retention rates may decline or fluctuate as a result of a number of factors, including the level of our end-customers’ satisfaction withour solution, services and support, our prices and the prices of competing solutions or products, mergers and acquisitions affecting our end-customer base, theeffects of global economic conditions, new technologies, changes in our end-customers’ spending levels, and changes in how our end-customers perceive thesecurity threats to their organizations and the importance of our offerings to the security of their organizations.
In addition to increasing sales from our end-customers through sales of additional products, maintenance, and professional services, our sales mayincrease when end-customers refresh their installed base of our physical appliances, or Physical Appliances, with our latest equipment, replacing olderversions of the Physical Appliances that reach the end of their useful life and are no longer supported under service contracts. Our end-customers typicallyrefresh their installed base of our hardware appliance products every five years. Historically, these refresh cycles triggered buying cycles for new versions ofour hardware appliances, which typically offer greater capacity and additional features than older versions, as well as new service contracts. If end-customerschoose not to replace older versions of our products with newer products supported under our service contracts, our business, results of operations, prospects,and financial condition will be adversely affected. A refresh cycle also creates an opportunity for our competitors to try to displace our existing productdeployments at our end-customers, who may be more
27

Table of Contents
inclined to consider other product solutions when they otherwise have to replace our existing products that have reached the end of their useful lives. Theextent to which end-customers decide to refresh by purchasing products from our current or future competitors, as opposed to purchasing our new products,may significantly impact our current period product revenue, as well as future service revenue.
Our future success depends substantially on our ability to expand our sales to our existing end-customers with solutions we develop or acquire. If we areunable to expand our presence within our end-customer base by expanding the scope of their usage or adopting additional products, our business and revenuewill be adversely affected.
If we are unable to attract new end-customers, our revenue growth and profitability will be adversely affected.
To increase our revenue and achieve and maintain profitability, we must regularly add new end-customers. In fiscal 2017, we sold our products toapproximately 400 new end-customers. Numerous factors, however, may impede our ability to add new end-customers, including our inability to convertprospective end-customers that have been referred to us by our existing network into end-customers, failure to attract and effectively train new sales andmarketing personnel, failure to retain and motivate our current sales and marketing personnel, failure to develop relationships with resellers, or failure toensure the effectiveness of our marketing programs. In addition, if prospective end-customers do not perceive our solution to be of superior value and quality,we will not be able to attract the number and types of new end-customers that we are seeking.
Our results of operations may fluctuate significantly, be difficult to predict, and may not meet investor expectations.
Our results of operations have varied significantly in the past and may vary significantly in the future, from period to period due to a number of factors,many of which are outside of our control, including macroeconomic factors. These factors limit our ability to accurately predict our results of operations andinclude factors discussed throughout this “Risk Factors” section, including the following:
• macroeconomic conditions in our markets, both domestic and international, as well as the level of discretionary IT spending available toorganizations;
• the timing, size, and mix of orders from, and shipments to, end-customers, including the timing of large orders, and timing of shipments;
• fluctuation in demand for our products, maintenance, and professional services;
• evolving conditions in the markets in which we compete;
• variability and unpredictability in the rate of growth in the markets in which we compete;
• our ability to continue to acquire new end-customers and increase our market share;
• our sales cycles, which may lengthen as the complexity of products and competition in our markets increases and in response to macroeconomicconditions;
• the level of competition in our markets, including the effect of new entrants, price competition, consolidation, and technological innovation;
• market acceptance of our products, maintenance, and professional services;
• any disruption in our channel or termination of our relationship with important channel partners;
• product announcements, introductions, transitions, and enhancements by us or our competitors, which could result in deferrals of end-customerorders;
• technological changes in our markets;
• the quality and level of our execution of our business strategy and operating plan, and the effectiveness of our sales and marketing programs;
• the impact of future acquisitions or divestitures;
28
Table of Contents
• the cost of potential and existing litigation, which could have a material adverse effect on our business;
• seasonality or cyclical fluctuations in our markets;
• the need to change our pricing model or make pricing concessions to large end-customers;
• changes in accounting rules and policies; and
• the need to recognize certain revenue ratably over a defined period or to defer recognition of revenue to a later period.
Furthermore, a high percentage of our expenses, including those related to overhead, service and maintenance, research and development, sales andmarketing, and general and administrative functions are generally fixed in the short term. As a result, if our revenue is less than forecasted, we may not beable to effectively reduce such expenses to compensate for the revenue shortfall and our results of operations will be adversely affected.
Sales to U.S. federal, state, and local government agencies and other public sector entities are subject to a number of challenges and risks that mayadversely impact our business.
We currently sell our solution to various government agencies and other public sector entities, and we may in the future increase sales to governmentagencies and other public sector entities. For example, sales to U.S. federal, state, and local government agencies and other public sector entities accountedfor 23%, 36%, and 26%, of our total revenue for the years ended December 31, 2015, 2016, and 2017, respectively, and may in the future account for agreater percentage of our total revenue. Sales to such government agencies and other public sector entities are subject to certain risks. Selling to governmentagencies and other public sector entities can be highly competitive, expensive, and time consuming, and can require certification requirements, often requiringsignificant upfront time and expense without any assurance that these efforts will result in a sale. Additionally, public sector demand and payment for ourproducts, maintenance, and professional services may be impacted by public sector budgetary cycles, government shutdowns, and/or funding authorizations.Funding reductions, budget constraints, or delays may adversely affect public sector demand for our products, maintenance, and professional services. Thevast majority of our sales to government agencies and other public sector entities are completed through our network of channel partners, and governmentagencies and other public sector entities may have statutory, contractual, or other legal rights to terminate contracts with our distributors and resellers forconvenience or due to a default. The public sector routinely investigates and audits public sector contractors’ administrative processes, and any unfavorableaudit could result in the public sector refusing to continue buying our products, maintenance, and professional services, a reduction of revenue, fines, or civilor criminal liability if the audit uncovers improper or illegal activities, which could adversely impact our results of operations.
Because we derive substantially all of our revenue and cash flows from one product, ForeScout CounterACT, the failure to achieve increased marketacceptance of CounterACT would adversely affect our business, results of operations, prospects, and financial condition.
We derive and expect to continue to generate most of our revenue from our ForeScout CounterACT product and related maintenance and professionalservices for CounterACT for the foreseeable future. As a result, the market acceptance of CounterACT is critical to our continued success. Demand forCounterACT is affected by a number of factors beyond our control, including continued market acceptance of CounterACT by referenceable accounts forexisting and new use cases, the timing of development and release of new products by our competitors, technological change, and growth or contraction inour market. Our inability to expand our sales of CounterACT to existing end-customers or increase our sales of CounterACT to new end-customers wouldharm our business and results of operations more seriously than if we derived significant revenue from a variety of sources.
Real or perceived defects, errors or vulnerabilities in our products, the misconfiguration of our products, the failure of our products to detect orprevent a security breach, the failure of end-customers to take action on attacks identified by our products, or the failure of our products to detect newlydeveloped devices could harm our reputation and adversely impact our business, results of operations, prospects, and financial condition.
Because our products are complex, they have contained, and may in the future contain, design or manufacturing defects or errors that are not detectedbefore their deployment. Our products also provide our end-customers with the ability to customize a multitude of settings, and it is possible that an end-customer could misconfigure our products or otherwise fail to configure
29
Table of Contents
our products in an optimal manner. Such defects, errors, and misconfigurations of our products could cause our products to be vulnerable to security attacks,cause them to fail to secure networks and detect and block threats, or temporarily interrupt the networking traffic of our end-customers. In addition, becausethe devices and techniques used by computer hackers to access or sabotage networks change frequently and generally are not recognized until widelydeployed, there is a risk that an advanced attack could emerge through a device that our products are unable to detect, particularly devices without IPaddresses. Moreover, as our products are adopted by an increasing number of large organizations and public sector entities, it is possible that the individualsand organizations behind cyberattacks will begin to focus on finding ways to defeat our products. If this happens, our products could be targeted by attacksspecifically designed to disrupt our business and undermine the perception that our products are capable of providing superior network security, which, inturn, could have a serious impact on our reputation. Any security vulnerability or perceived security vulnerability of our products could materially andadversely affect our business, results of operations, prospects, and financial condition.
If any of our end-customers become infected with malware after using our products, such end-customer could be dissatisfied with our products orperceive that our products failed to perform their intended purpose, regardless of whether our products mitigated the actual harm of malware, blocked thetheft of any of such end-customer’s data, or would have blocked such theft if the product had been configured properly. If any of our end-customersexperience a security breach, such end-customers and the general public may believe that our products failed even if the cause of the breach is unrelated to theperformance of our products. Furthermore, if any organizations or public sector entities that are publicly known to use our products are the subject of acyberattack that becomes publicized, our other current or potential end-customers may believe that our products failed and be inclined to purchase alternativesolutions from our competitors. Real or perceived security breaches of our end-customers’ networks could cause disruption or damage to their networks orother negative consequences and could result in negative publicity about us, damage to our brand and reputation, decreased sales, increased expenses, andend-customer relations problems.
Furthermore, our existing products are designed to detect existing IP-based devices and may fail to detect newly developed IP-based devices or devicesthat operate on newly developed protocols for any number of reasons, including our failure to enhance and expand our products and services to reflectindustry trends, the advancement of new and existing technologies and new operating environments, the complexity of our end-customers’ network andenvironment, and the sophistication of malware, viruses, and other threats. To the extent potential end-customers, industry analysts or testing firms believethat the failure of our products to detect certain networked devices indicates that our products or services do not provide significant value, our reputation andbusiness could be harmed. Failure to keep pace with technological changes in the security industry and the threat landscape could adversely affect our abilityto protect against security breaches and could cause us to lose end-customers.
Any real or perceived defects, errors, or vulnerabilities in our products, or any other failure of our products to detect devices that introduce threats to anend-customer’s network, could result in:
• a loss of existing or potential end-customers or channel partners;
• delayed or lost revenue and harm to our financial condition and results of operations;
• a delay in attaining, or the failure to attain, market acceptance for new products;
• the expenditure of significant financial and product development resources in efforts to analyze, correct, eliminate, or work around errors or defects,to address and eliminate vulnerabilities, or to identify and ramp up production with alternative third-party manufacturers;
• an increase in warranty claims or an increase in the cost of servicing warranty claims, either of which would adversely affect our gross margins;
• harm to our reputation or brand; or
• litigation, regulatory inquiries, or investigations that may be costly and further harm our reputation.
Because our products are highly complex and are subject to real or perceived defects, our business is subject to risks related to warranty claims,product returns and product liability.
We may incur significant costs in connection with a product recall and any related indemnification obligations, which could materially and adverselyaffect our results of operations. In addition, many of our products operate on our internally developed
30

Table of Contents
operating system, and any error in the operating system may affect those products. We have experienced in the past, and may continue to experience in thefuture, errors or quality problems in connection with new products and enhancements to existing products. We expect that errors or quality problems will befound from time to time in our products after commencement of commercial shipments, which could seriously harm our business.
Historically, the amount of warranty claims we have received has not been significant, but there is a risk that errors or problems with the quality of ourproducts could result in material claims in the future. Because our end-customers install our appliances directly into their network infrastructures, any errors,defects, or other problems with our products could negatively impact their networks or other internet users, resulting in financial or other losses to our end-customers. While we typically seek by contract to limit our exposure to such damages, liability limitation provisions in our standard terms and conditions ofsale, and those of our channel partners, may not be enforceable under some circumstances as a result of federal, state, or local laws or ordinances, orunfavorable judicial decisions in the United States or other countries or may not fully or effectively protect us from end-customer claims and related liabilitiesand costs, including indemnification obligations under our agreements with channel partners or end-customers. The sale and support of our products alsoentail the risk of product liability claims. We maintain insurance to protect against certain types of claims associated with the use of our products, but ourinsurance coverage may not adequately cover any such claims. In addition, even claims that ultimately are unsuccessful could require us to incur costs inconnection with litigation, which could divert management’s time and other resources away from our business and could significantly harm the reputation ofour business and products.
We rely on revenue from maintenance and professional services, which may decline, and because we recognize revenue from our support andmaintenance contracts over the term of the relevant service period, downturns or upturns in sales of our support and maintenance services are notimmediately reflected in full in our results of operations.
Our maintenance and professional services revenue accounted for 43%, 41%, and 45% of our revenue during the years ended December 31, 2015, 2016,and 2017, respectively. Sales of new or renewal service contracts may decline and fluctuate as a result of a number of factors, including our end-customers’level of satisfaction with our maintenance and support services or our professional services, the prices of our services, and reductions in our end-customers’spending levels. If our sales of new or renewal maintenance and support contracts or professional services contracts decline, our revenue and revenue growthmay decline and our business will suffer. While we typically bill for support and maintenance services upfront, we recognize revenue from support andmaintenance services ratably over the contractual service period, which is typically either one or three years. Our professional services revenue is generallyrecognized as the services are rendered. As a result, much of the service revenue from our maintenance and support contracts that we report each fiscalquarter is the recognition of deferred revenue from maintenance and support contracts entered into during previous fiscal quarters. Consequently, a decline innew or renewed maintenance and support contracts in any one fiscal quarter will not be fully or immediately reflected in revenue in that fiscal quarter but willnegatively affect our revenue in future fiscal quarters. Accordingly, the effect of significant downturns in new or renewed sales of our maintenance andsupport services is not reflected in full in our results of operations until future periods. Also, it is difficult for us to rapidly increase our services revenuethrough additional sales of maintenance and support services in any period, as revenue from new and renewal maintenance and support contracts must berecognized over the applicable term of the contract. Furthermore, any increase in the average term of our maintenance and support contracts would result inrevenue for such contracts being recognized over longer periods of time.
The security market is rapidly evolving and difficult to predict within the increasingly challenging cyberthreat landscape. If the security market doesnot evolve as we anticipate or if our target end-customers do not adopt our solution, our sales will not grow as quickly as anticipated and our stock pricecould decline.
We are in a new, rapidly-evolving category within the security market that focuses on providing organizations with enhanced visibility and control overtheir networks through an agentless and continuous monitoring solution. As such, it is difficult to predict important market trends, including how large thesecurity market will be or when and what products end-customers will adopt. For example, organizations that currently use traditional approaches maybelieve that these approaches already provide them with sufficient network security. Therefore, they may continue spending their network infrastructurebudgets on these products and may not adopt our solution in addition to or in lieu of such traditional products.
The introduction of new products by others, market acceptance of products based on new or alternative technologies, or the emergence of new industrystandards could render our existing products obsolete or make it easier for other products to compete with our products. Moreover, many of our end-customers operate in markets characterized by rapidly changing
31
Table of Contents
technologies and cyberthreats, which require them to add numerous devices and adopt increasingly complex network infrastructures, incorporating a varietyof hardware devices, software applications, operating systems, and networking protocols. As their technologies and business plans grow more complex, weexpect these end-customers to face new and increasingly sophisticated methods of cyberattack. We face significant challenges in ensuring that our solutioneffectively identifies and responds to these advanced and evolving attacks without disrupting our end-customers’ network performance. Changes in the natureof advanced cyberthreats could result in a shift in IT budgets away from solutions such as ours. In addition, any changes in government regulation,compliance standards, or audit requirements that deemphasize the types of visibility, controls, and monitoring that our solution provides would adverselyimpact demand for our offerings. If solutions such as ours are not viewed by organizations as necessary, or if end-customers do not recognize the benefit ofour solution as a critical layer of an effective security strategy, then our revenue may not grow as quickly as expected, or may decline, and our business couldsuffer.
Our future success will depend in part upon our ability to:
• develop, acquire, and/or maintain competitive products;
• enhance our products by adding innovative features that differentiate our products from those of our competitors;
• bring products to market on a timely basis at competitive prices;
• identify and respond to emerging technological trends in the market; and
• respond effectively to new technological changes or new product announcements by others.
If the market for network security products does not evolve in the way we anticipate or if organizations do not recognize the benefits our solution offersin addition to or in place of existing network security products, and as a result we are unable to increase sales of our solution to end-customers, then ourrevenue may not grow as expected or may decline, which could adversely impact our stock price.
Our sales cycles can be long and unpredictable, and our sales efforts require considerable time and expense. As a result, our sales and the timing ofour sales are difficult to predict and may vary substantially from period to period, which may cause our results of operations to fluctuate significantly.
The decision makers within our end-customers are primarily IT departments that are managing a growing set of user and compliance demands, whichincreases the complexity of end-customer requirements to be met in the sales cycle. The length of our sales cycle, from identification of an opportunity todelivery of and payment for our products, maintenance, and professional services, typically ranges from six to 12 months but can be longer and may varysignificantly from customer to customer, with sales to large organizations and public sector entities typically taking longer to complete. To the extent ourcompetitors develop products that our prospective end-customers view as comparable to ours, our average sales cycle may increase. Additionally, acombination of legal, procurement, development, and IT departments are involved in testing, evaluating, and finally approving purchases, which can alsomake the sales cycle longer and less predictable. Moreover, sales to large organizations and public sector entities, which we target, will contribute to thegrowth of our revenue and involve challenges that could further increase the complexity and length of our sales cycle, such as complicated certification andbidding processes. As a result, large individual sales have, in some cases, occurred in quarters subsequent to those we anticipated or have not occurred at all.The loss or delay of one or more large transactions in a quarter could impact our results of operations for that quarter and any future quarters for whichrevenue from that transaction is delayed.
We may not be able to accurately predict or forecast the timing of sales, which could cause our results to vary significantly. In addition, we might devotesubstantial time and effort to a particular unsuccessful sales effort, and as a result we could lose other sales opportunities or incur expenses that are not offsetby an increase in revenue, which could harm our business.
If our products do not successfully interoperate with our end-customers’ infrastructure, sales of our products, maintenance, and professional servicescould be negatively affected, which would harm our business.
Our products must interoperate with our end-customers’ existing or future infrastructures, which often have different specifications, utilize multipleprotocol standards, deploy products from multiple vendors and contain multiple generations of products that have been added over time. As a result, whenproblems occur in a network, it may be difficult to identify the sources of these problems. If we are unable to successfully manage and interpret new protocolstandards and versions or if we encounter
32
Table of Contents
problematic network configurations or settings, we may have to modify our software or hardware so that our products will interoperate with our end-customers’ infrastructures and can manage our end-customers’ traffic in the manner intended, which may divert substantial time and resources. If we finddefects in the hardware installed with an end-customer, as we have in the past, we will replace the hardware as part of our normal warranty process. If we finderrors or bugs in existing software that create problematic network configurations or settings, as we have in the past, we may have to issue software updatesas part of our normal maintenance process. Any delays in identifying the sources of problems or in providing necessary modifications to our software orhardware could have a negative impact on our reputation and our end-customers’ satisfaction with our products, maintenance, and professional services andour ability to sell products and services could be adversely affected. In addition, public sector entities and other end-customers may require our products tocomply with certain additional security or other certifications and standards. If our products are late in achieving or fail to achieve compliance with thesecertifications and standards, or our competitors achieve compliance with these certifications and standards, we may be disqualified from selling our productsto such end-customers or at a competitive disadvantage, which would harm our business, results of operations, prospects, and financial condition.
Failure to protect our proprietary technology and intellectual property rights could substantially harm our business and results of operations.
The success of our business depends on our ability to protect and enforce our trade secrets, trademarks, copyrights, patents, and other intellectualproperty rights. We attempt to protect our intellectual property under patent, trademark, copyright, and trade secret laws, and through a combination ofconfidentiality procedures, contractual provisions, and other methods, all of which can offer only limited protection. We have five issued patents in the UnitedStates, eleven pending U.S. patent applications, two issued foreign counterpart patents and six pending foreign counterpart patent applications in a non-U.S.jurisdiction, and we plan to file additional patent applications in the future. Our issued patents expire between 2019 and 2033. Valid patents may not issuefrom our pending applications, and the claims eventually allowed on any patents may not be sufficiently broad to prevent competitors from using technologysimilar to our patented technology.
Any issued patents may be challenged, invalidated, or circumvented, and any rights granted under these patents may not actually provide adequatedefensive protection or competitive advantages to us. Patent applications in the United States are typically not published until 18 months after filing or, insome cases, not at all, and publications of discoveries in industry-related literature lag behind actual discoveries. At the time of filing a patent application, wecannot be certain that we were the first to make the inventions claimed in our pending patent applications or that we were the first to file for patent protection,which could prevent our patent applications from issuing as patents or invalidate our patents following issuance. Additionally, the process of obtaining patentprotection is expensive and time-consuming, and we may not be able to prosecute all necessary or desirable patent applications or pursue patent protection inall countries and jurisdictions in which we do business at a reasonable cost or in a timely manner. In addition, recent changes to the patent laws in the UnitedStates may bring into question the validity of certain categories of software patents. As a result, we may not be able to obtain adequate patent protection forour software or effectively enforce any issued patents relating to software.
Many aspects of our business rely on our unpatented or unpatentable proprietary technology and trade secrets. Despite our efforts to protect ourproprietary technology and trade secrets, unauthorized parties may attempt to misappropriate, reverse engineer, or otherwise obtain and use them. Thecontractual provisions that we enter into with employees, consultants, partners, vendors, and end-customers may not prevent unauthorized use or disclosure ofour proprietary technology or intellectual property rights and may not provide an adequate remedy in the event of unauthorized use or disclosure of ourproprietary technology or intellectual property rights, which may substantially harm our business. In addition, we cannot assure you that we have entered intosuch agreements with all parties who may have or have had access to our confidential information, that such agreements will be fully enforceable, or that theagreements we have entered into will not be breached by the counterparty. Some license provisions protecting against unauthorized use, copying, transfer, anddisclosure of our technology may be unenforceable under the laws of certain jurisdictions and foreign countries. We cannot guarantee that any of the measureswe have taken will prevent misappropriation of our technology. Because we, as a provider of network security solutions, may be an attractive target forcomputer hackers, we may have a greater risk of unauthorized access to, and misappropriation of, our proprietary information. Moreover, policingunauthorized use of our technologies, products and intellectual property is difficult, expensive and time-consuming, particularly in foreign countries wherethe laws may not be as protective of intellectual property rights as those in the United States and where mechanisms for enforcement of intellectual propertyrights may be weak. We may be unable to determine the extent of any unauthorized use or infringement of our products, technologies or intellectual propertyrights, and may not be able to take appropriate steps to mitigate harms resulting from any unauthorized use or infringement.
33

Table of Contents
From time to time, we may need to bring legal action to enforce our patents, trademarks, and other intellectual property rights, to protect our tradesecrets, to determine the validity and scope of the intellectual property rights of others, or to defend against claims of infringement or invalidity. Suchlitigation could result in substantial costs and diversion of resources and could negatively affect our business, results of operations, financial condition, andcash flows. If we are unable to protect our intellectual property rights, we may find ourselves at a competitive disadvantage to others who need not incur theadditional expense, time, and effort required to create the innovative products that have enabled us to be successful to date.
Assertions by third parties of infringement or other violations by us of their intellectual property rights, or other lawsuits asserted against us, couldresult in significant costs and substantially harm our business and results of operations.
Patent and other intellectual property disputes are common in the security industry. Some companies in the security industry, including some of ourcompetitors, own large numbers of patents, copyrights, trademarks, and trade secrets, which they may use to assert claims against us or to prevent us fromdeveloping certain technologies. Third parties may assert claims of infringement, misappropriation, or other violations of intellectual property rights againstus. They may also assert such claims against our end-customers whom our standard license and other agreements obligate us to indemnify against claims thatour products infringe, misappropriate, or otherwise violate the intellectual property rights of third parties. As the number of products and competitors in ourmarket increase, the number of products with overlapping functionality may increase, which in turn may result in more claims of infringement,misappropriation, and other violations of intellectual property rights. Further, as we gain an increasingly high profile, the possibility of intellectual propertyrights claims against us grows. Any claim of infringement, misappropriation, or other violation of intellectual property rights by a third party, even thosewithout merit, could cause us to incur substantial costs defending against the claim and could distract our management from our business. As an example, in2012, a non-operating entity brought a patent infringement action against us, which we settled in 2012 for a nominal amount, but which required the paymentof legal fees and diverted management’s time and attention.
For example, on October 24, 2017, Network Security Technologies, LLC, or NST, filed a lawsuit against us in the United States District Court for theDistrict of Delaware, alleging that we infringed certain patents owned by it and sought unspecified damages. Based upon our review of these patents, webelieved we had meritorious defenses to NST’s claims and intended to vigorously defend the lawsuit; however, the outcome of any litigation, such as this, isinherently unpredictable, and as a result of this litigation, we could have been required to pay damages or seek a license or other right to continue to deliver anunmodified version of CounterACT, which may not have been made available to us at all or which may have required us to pay ongoing royalties and complywith unfavorable terms. Regardless, on February 1, 2018, NST filed a notice of voluntary dismissal without prejudice to dismiss ForeScout from thecomplaint.
While we expect to increase the size of our patent portfolio, the patent portfolios of our most significant competitors and potential competitors are largerthan ours. This disparity between our patent portfolio and the patent portfolios of our most significant competitors may increase the risk that they may sue usfor patent infringement and may limit our ability to counterclaim for patent infringement or settle through patent cross-licenses. In addition, future assertionsof patent rights by third parties, and any resulting litigation, may involve other non-operating entities or other adverse patent owners who have no relevantproduct revenue and against whom our own patents may therefore provide little or no deterrence or protection. Given the competitive nature of the market inwhich we operate, there is a risk that we are infringing or otherwise violating third-party intellectual property rights.
An adverse outcome of a dispute may require us to:
• pay substantial damages, including treble damages if we are found to have willfully infringed a third party’s patents or copyrights;
• cease making, licensing, or using solutions that are alleged to infringe or misappropriate the intellectual property of others;
• expend additional development resources to attempt to redesign our products or services or otherwise to develop non-infringing technology, whichmay not be successful;
• enter into potentially unfavorable royalty or license agreements to obtain the right to use necessary technologies or intellectual property rights; or
34
Table of Contents
• indemnify our partners and other third parties.
Any damages or royalty obligations we may become subject to and any third-party indemnity we may need to provide that result from an adverseoutcome could harm our results of operations. Royalty or licensing agreements, if required or desirable, may be unavailable on terms acceptable to us or at all,and may require significant expense and expenditures. In addition, some licenses may be non-exclusive, and therefore our competitors may have access to thesame technology licensed to us. Any of these events could seriously harm our business, results of operations, prospects, and financial condition.
We rely on technology that we license from third parties, including software that is integrated with our internally developed software and used withour products.
We rely on technology that we license from third parties, including third-party commercial software and open source software, which is used with certainof our products. We cannot be certain that our licensors are not infringing the intellectual property rights of third parties or that our licensors have sufficientrights to the licensed intellectual property in all jurisdictions in which we may sell our products. Some of our agreements with our licensors may beterminated for convenience by them. If we are unable to continue to license any of this software on commercially reasonable terms, we will face delays inreleases of our software or we will be required to delete this functionality from our software until equivalent, non-infringing technology can be licensed ordeveloped and integrated into our current products. This effort could take significant time (during which we would be unable to continue to offer our affectedproducts or services) and expense and may ultimately not be successful. In addition, our inability to obtain certain licenses or other rights might require us toengage in litigation regarding these matters, which could have a material adverse effect on our business, results of operations, prospects, and financialcondition.
Our use of open source software could negatively affect our ability to sell our solution, require us to reengineer our products and possibly subject usto litigation.
We use open source software in our products and our development environments and expect to continue to use open source software in the future. Opensource software is typically provided without assurances of any kind. Some open source licenses contain requirements that we make available source code formodifications or derivative works we create based upon the type of open source software we use. If we combine our proprietary software with open sourcesoftware in a certain manner that is not intended under our policies or monitoring practices, we could, under certain open source licenses, be required torelease the source code of our proprietary software to the public. This would allow our competitors to create similar products quickly with lower developmenteffort and ultimately could result in a loss of sales for us. This could also result in litigation, require us to purchase costly licenses, or require us to devoteadditional research and development resources to change our products or services, any of which would have a negative effect on our business and results ofoperations. In addition, if the license terms for the open source software we utilize change, we may be forced to reengineer our offerings or incur additionalcosts. Although we regulate the use and incorporation of open source software into our products, we cannot be certain that we have, in all cases, incorporatedopen source software in our products in a manner that is consistent with the applicable open source license terms.
We are dependent on a single third-party manufacturer and a limited number of third-party logistics providers to design and manufacture ourproducts and to fulfill orders for our products.
We depend on a single third-party manufacturer, Arrow Electronics, Inc., to manufacture and develop the hardware for our products. Our reliance on thisthird-party manufacturer reduces our control over the manufacturing process and exposes us to risks, including reduced control over quality assurance,product costs, and product supply and timing. This manufacturer typically fulfills our supply requirements on the basis of individual orders. We do not have along-term contract with our third-party manufacturer that guarantees capacity, the continuation of particular pricing terms, or the extension of credit limits.Accordingly, it is not obligated to continue to fulfill our supply requirements, which could result in supply shortages, and the prices we are charged formanufacturing services could be increased on short notice. There are alternative manufacturers that could provide components and manufacture our hardware,as our agreements do not provide for exclusivity or minimum purchase quantities, but the transition and qualification from our single third-party manufacturerto another could be lengthy, costly, and difficult, diverting substantial time and resources from our operations.
35
Table of Contents
We also depend on third-party logistics providers to fulfill orders for our products. Our supply chain partners are not committed to design or manufactureour products, or to fulfill orders for our products, on a long-term basis in any specific quantity or at any specific price. From time to time, we may be requiredto add new supply chain partner relationships or new manufacturing or fulfillment sites to accommodate growth in orders or the addition of new products. It istime consuming and costly to qualify and implement new supply chain partner relationships and new manufacturing or fulfillment sites, and such additionsincrease the complexity of our supply chain management. Our ability to ship products to our end-customers could be delayed, and our business and results ofoperations could be adversely affected if:
• we fail to effectively manage our supply chain partner relationships;
• our third-party manufacturer does not meet our development schedules;
• our third-party manufacturer experiences delays, disruptions, or quality control problems in manufacturing our products;
• one or more of our third-party logistics providers experiences delays or disruptions or otherwise fails to meet our fulfillment schedules; or
• we are required to add or replace our third-party manufacturer, third-party logistics providers, or fulfillment sites.
In addition, these supply chain partners have access to certain of our critical confidential information and could wrongly disclose or misuse suchinformation or be subject to a breach or other compromise that introduces a vulnerability or other defect in the products manufactured by our supply chainpartners, which risks cannot be fully mitigated. While we take precautions to ensure that our hardware obtained or manufactured by our supply chain partnersis inspected, any espionage acts, malware attacks, theft of confidential information, or other malicious incidents perpetrated either directly or indirectlythrough our supply chain partners, may compromise our system infrastructure, expose us to litigation and associated expenses and lead to reputational harmthat could result in a material adverse effect on our financial condition and results of operations. In addition, we are subject to risks resulting from theperception that certain jurisdictions do not comply with internationally recognized rights of freedom of expression and privacy and may permit labor practicesthat are deemed unacceptable under evolving standards of social responsibility. If manufacturing or logistics in these foreign countries is disrupted for anyreason, including natural disasters, IT system failures, military, or government actions or economic, business, labor, environmental, public health, or politicalissues, or if the purchase or sale of products from such foreign countries is prohibited or disfavored, our business, results of operations, prospects, andfinancial condition could be adversely affected.
We rely on third-party channel partners to sell our products, maintenance, and professional services. If our partners fail to perform, or if we fail tomanage and retain such partners, our ability to sell our products, maintenance, and professional services would be limited, and if we fail to optimize ourchannel partner model going forward, our results of operations would be harmed.
We market and sell our products, maintenance, and professional services through a direct touch, channel fulfilled model. We currently have over 600channel partners, including system integrators, value-added resellers, and distributors. During the years ended December 31, 2015, 2016, and 2017,approximately 80%, 86%, and 90%, respectively, of our revenue was attributable to sales fulfilled through our channel partners. If we lost any of our channelpartners, or if any of the channel partners responsible for a significant portion of our business becomes insolvent or suffers a deterioration in its financial orbusiness condition and is unable to pay for our products, our results of operations could be harmed. Although we provide support to these channel partnersthrough our direct sales and marketing activities, we depend upon these partners to generate sales opportunities and to independently manage the sales processfor opportunities with which they are involved. In order to increase our revenue, we expect we will need to maintain our existing channel partners andcontinue to train and support them, as well as add new channel partners and effectively train, support, and integrate them with our sales process. Additionally,our entry into any new markets will require us to develop appropriate channel partners and to train them to effectively address these markets. If we areunsuccessful in these efforts, our ability to grow our business will be limited, and our business, results of operations, prospects, and financial condition will beadversely affected.
Our current system of channel distribution may not prove effective in maximizing sales of our products, maintenance, and professional services. Ourproducts are complex and certain sales can require substantial effort and outlay of cost and resources, either by us or our channel partners. It is possible thatour channel partners will be unable or unwilling to dedicate appropriate
36

Table of Contents
resources to support those sales. Furthermore, most of our channel partners do not have minimum purchase or resale requirements and may terminate ouragreements with only a short notice period or otherwise cease selling our products at any time. If we are unable to develop and maintain effective salesincentive programs for our third-party channel partners, we may not be able to incentivize these partners to sell our products to end-customers and, inparticular, to large organizations. They also may market, sell, and support products and services that are competitive with ours and may devote more resourcesto the marketing, sales, and support of those competitive products. There is no assurance that we will retain these channel partners or that we will be able toadd additional or replacement channel partners in the future. The loss of one or more of our key channel partners in a given geographic area could harm ourresults of operations within that area, as new channel partners typically require extensive training and take several months to achieve acceptable productivity.
We also depend on some of our channel partners and our end-customers’ outsourced IT vendors to deliver professional services for our products. Onceour products are deployed within our end-customers’ networks, many of our end-customers depend on the support of our channel partners and theiroutsourced IT vendors to resolve any issues relating to the implementation and maintenance of our solution. If our channel partners and our end-customers’outsourced IT vendors do not effectively assist our end-customers in deploying our products, succeed in helping our end-customers quickly resolve post-deployment issues or provide effective ongoing support, our end-customer satisfaction and future sales of our products could be adversely affected.
While we require that our channel partners comply with applicable laws and regulations, they could engage in behavior or practices that expose us tolegal or reputational risk.
Managing the supply of our products is complex. Insufficient supply and inventory may result in lost sales opportunities or delayed revenue, whileexcess inventory may harm our gross margins.
Our third-party manufacturer procures components and builds our products based on our forecasts, and we generally do not hold inventory. Theseforecasts are based on estimates of future demand for our products, which can be adjusted based on historical trends and analysis and for overall marketconditions, and we cannot guarantee the accuracy of our forecasts. In order to reduce manufacturing lead times and plan for adequate component supply, fromtime to time we may issue forecasts for components and products that are non-cancelable and nonreturnable.
Our inventory management systems and related supply chain visibility tools may be inadequate to enable us to forecast accurately and effectively managesupply of our products and product components. Supply management remains an increased area of focus as we balance the need to maintain supply levels thatare sufficient to ensure competitive lead times against the risk of obsolescence because of rapidly changing technology and end-customer requirements. Weaccrue for manufacturing cost commitments in excess of our forecasted demand. If we ultimately determine that we have excess supply, we may have torecord a reserve for excess manufacturing costs or reduce our prices and write-down inventory, either of which in turn could result in lower gross margins.Alternatively, insufficient supply levels may lead to shortages that result in delayed revenue or loss of sales opportunities altogether as potential end-customers turn to competitors’ products that are readily available. Additionally, any increases in the time required to manufacture our products or shipproducts could result in supply shortfalls. If we are unable to effectively manage our supply and inventory, our results of operations could be adverselyaffected.
Our failure to adequately protect personal information in compliance with evolving legal requirements could harm our business.
A wide variety of state, federal, and international laws and regulations apply to the collection, use, retention, protection, disclosure, transfer, and otherprocessing of personal data. For instance, in order for our solution to detect devices on a network, our solution gathers and tracks IP addresses to monitor eachdevice on our end-customer’s networks. While we do not have immediate access to these IP addresses and other personal information, we have access to thisinformation from time to time in connection with our maintenance and professional services. These data protection and privacy-related laws and regulationsare evolving and may result in ever-increasing regulatory and public scrutiny and escalating levels of enforcement and sanctions. Our failure to comply withapplicable laws and regulations, or to protect such data, could result in enforcement actions against us, including fines, imprisonment of company officialsand public censure, claims for damages by end-customers and other affected individuals, damage to our reputation and loss of goodwill (both in relation toexisting end-customers and prospective end-customers), any of which could harm on our operations, financial performance, and business. Evolving andchanging definitions of personal data and personal information, within the European Union, the United States, and elsewhere, especially relating toclassification of IP addresses, machine identification, location data, and other information, may limit or inhibit our ability to operate or expand our business,including limiting strategic partnerships that may involve the sharing of data. Even
37

Table of Contents
the perception of privacy concerns, whether or not valid, may harm our reputation and inhibit adoption of our products by current and future end-customers.
In addition, our appliances, when configured by our end-customers, may intercept and examine data in a manner that may subject the use of thoseappliances to privacy and data protection laws and regulations in those jurisdictions in which our end-customers operate. Any failure or perceived failure byus or by our products or services to comply with these laws and regulations may subject us to legal or regulatory actions, damage our reputation or adverselyaffect our ability to sell our products or services in the jurisdiction that has enacted the law or regulation. Moreover, if these laws and regulations change, orare interpreted and applied in a manner that is inconsistent with our data practices or the operation of our products and services, we may need to expendresources in order to change our business operations, data practices, or the manner in which our products or services operate. This could adversely affect ourbusiness, results of operations, prospects, and financial condition.
Reduced information technology and network infrastructure spending or adverse economic conditions may harm our business, results of operations,prospects, and financial condition.
Our business depends on the overall demand for information technology, network infrastructure, and network security products. In addition, the purchaseof our products and services is often discretionary and may involve a significant commitment of capital and other resources. Currently, most organizations andpublic sector entities have not allocated a fixed portion of their budgets to protect against next-generation advanced cyberattacks. If we do not succeed inconvincing end-customers that our products and services should be an integral part of their overall approach to network security and that a portion of theirannual IT budgets should be allocated to our solution, general reductions in IT spending by our end-customers are likely to have a disproportionate impact onour business, results of operations, prospects, and financial condition.
Weak global economic conditions, or a reduction in information technology and network infrastructure spending even if economic conditions improve,could adversely impact our business, results of operations, prospects, and financial condition in a number of ways, including longer sales cycles, lower pricesfor our products and services, higher default rates among our distributors, reduced unit sales and lower or no growth. In addition, continued budgetarychallenges in the United States and Europe and geopolitical turmoil in many parts of the world have and may continue to put pressure on global economicconditions and overall spending on network security products.
The average sales price of our products has decreased from time to time, and may decrease in the future, which may negatively impact our grossprofits and results of operations.
From time to time, the average sales price of our products and services has decreased. In the future, it is possible that the average sales price of ourproducts will decrease in response to competitive pricing pressures, increased sales discounts, new product introductions by us or our competitors, or otherfactors. Such pricing pressures may also be dependent upon the mix of products sold, the mix of revenue between products, maintenance, and professionalservices and the degree to which products, maintenance, and professional services are bundled and sold together for a package price. Therefore, to achieveand maintain profitability, we must develop and introduce new products and product enhancements on a timely basis and continually reduce our productcosts. Our failure to do so would cause our revenue and gross profits to decline, which would harm our business and results of operations. Furthermore,currency fluctuations in certain countries and regions may negatively impact actual prices that partners and end-customers are willing to pay in thosecountries and regions. In addition, we may experience substantial period-to-period fluctuations in future results of operations in the event we experience anerosion of our average sales price.
We are dependent on the continued services and performance of our senior management and other key employees, and the loss of any of these keyemployees or any failure to hire and retain additional highly skilled employees could adversely affect our business, results of operations, prospects, andfinancial condition.
Our future performance depends on the continued services and contributions of our senior management, including our Chief Executive Officer andPresident, Michael DeCesare, and other key employees to execute on our business plan, and to identify and pursue new opportunities and productinnovations. The loss of services of senior management or other key employees could significantly delay or prevent the achievement of our development andstrategic objectives and could harm our business and our customer relationships. We do not maintain key man life insurance with respect to any officer orother employee.
38

Table of Contents
Our ability to continue to attract and retain highly skilled personnel will be critical to our future success. Competition for highly skilled personnel isfrequently intense, especially in the San Francisco Bay Area, where we have a substantial presence and need for talent. We may not be successful inattracting, assimilating or retaining qualified personnel to fulfill our current or future needs. Also, to the extent we hire personnel from competitors, we maybe subject to allegations that they have been improperly solicited or that they divulged proprietary or other confidential information.
In addition, we issue stock options and other equity awards as a key component of our overall compensation and recruiting and retention efforts. Ourcompensation arrangements, such as our equity award programs, may not always be successful in attracting new employees and retaining and motivatingexisting employees. We are also required under U.S. generally accepted accounting principles, or GAAP, to recognize compensation expense in our results ofoperations for employee stock-based compensation under our equity grant programs, which may negatively impact our results of operations and may increasethe pressure to limit stock-based compensation. Further, the ability to either exercise those options and for our employees to sell their stock and vested andsettled restricted stock units, or RSUs, in a public market after the completion of any applicable lock-up period may lead to a larger than normal turnover rate.Additionally, subject to certain limitations, an aggregate of approximately 900,000 shares underlying RSUs will vest and settle on April 25, 2018, 181 daysafter October 26, 2017, the date our Form S-1 for our initial public offering was effective with the SEC.
We are dependent on various IT systems, and failures of, or interruptions to, those systems could harm our business.
Many of our business processes depend upon our IT systems, the systems and processes of third parties and on interfaces with the systems of third partiesover which we do not have control. If those systems fail or are interrupted, or if our ability to connect to or interact with one or more networks is interrupted,our processes may function at a diminished level or not at all. This would harm our ability to maintain operations and to ship products, and our financialresults would likely be harmed. In addition, reconfiguring our IT systems or other business processes in response to changing business needs may be timeconsuming and costly. To the extent any such reconfiguration were to impact our ability to react timely to specific market or business opportunities, ourfinancial results would likely be harmed.
Governmental regulations affecting the manufacturing of products and that contain “conflict minerals” and the import or export of our productscould negatively affect our revenue and may cause reputational harm.
We may be deemed to manufacture or contract to manufacture products that contain certain minerals that have been designated as “conflict minerals”under The Dodd-Frank Wall Street Reform and Consumer Protection Act of 2010, or the Dodd-Frank Act. As a result, in future periods, we may be requiredto validate the origin of such minerals and disclose and report whether or not such minerals originated in the Democratic Republic of the Congo, or the DRC,or adjoining countries. For instance, the Dodd-Frank Act includes disclosure requirements regarding the use of certain minerals mined from the DRC andadjoining countries and procedures pertaining to a manufacturer’s efforts regarding the source of such minerals. Securities and Exchange Commission, orSEC, rules implementing these requirements and other international standards, such as the Organization for Economic Co-Operation and Development DueDiligence Guidance for Responsible Supply Chains of Minerals from Conflict-Affected and High Risk Areas, may have the effect of reducing the pool ofsuppliers who can supply DRC “conflict free” components and parts, and we may not be able to obtain DRC conflict free products or supplies in sufficientquantities for our products. In addition, we may incur additional costs to comply with the disclosure requirements, including costs related to determining thesource of any of the relevant minerals and metals used in our products. We may also face reputational challenges with our end-customers, stockholders andother stakeholders if we are unable to verify the origins for the minerals used in our products.
In addition, the U.S. government and various foreign governments, including that of Israel, where we have significant research and developmentoperations, have imposed controls, export license requirements and restrictions on the import or export of some technologies, especially encryptiontechnology. If we were to fail to comply with any of these controls or requirements, including U.S. export licensing requirements, U.S. customs regulations,U.S. economic sanctions, or other laws, we could be subject to substantial civil and criminal penalties, including fines, incarceration for responsibleemployees and managers, and the possible loss of export or import privileges. Obtaining the necessary export license or approval for a particular sale may betime-consuming and may result in the delay or loss of sales opportunities. Furthermore, U.S. export control laws and economic sanctions prohibit theshipment of certain products to U.S. embargoed or sanctioned countries, governments, and persons. Even though we take precautions to ensure that ourchannel partners, who we rely on to fulfill our product orders and deliver our products to our end-customers, comply with all relevant regulations, any failureby us or by our channel partners to comply with
39

Table of Contents
such regulations could have negative consequences, including reputational harm, government investigations, and penalties. In addition, from time to time,governmental agencies have proposed additional regulation of encryption technology, such as requiring the escrow and governmental recovery of privateencryption keys. Governmental regulation of encryption technology and regulation of imports or exports, or our failure to obtain required import or exportapproval for our products, could harm our international and domestic sales and adversely affect our revenue. In addition, failure to comply with suchregulations could result in penalties, costs and restrictions on export privileges, which would harm our results of operations.
Parts of our research and development activities are located in Israel and, therefore, our results of operations may be adversely affected by political,economic, and military instability in Israel.
Parts of our research and development facilities are located in Israel. Accordingly, political, economic, and military conditions in Israel may directlyaffect our business. Since the establishment of the State of Israel in 1948, a number of armed conflicts have taken place between Israel and its neighboringcountries. In recent years, these have included hostilities between Israel and Hezbollah in Lebanon and Hamas in the Gaza strip, both of which resulted inrockets being fired into Israel causing casualties and disruption of economic activities. In addition, Israel faces threats from more distant neighbors, inparticular, Iran. Our commercial insurance does not cover losses that may occur as a result of an event associated with the security situation in the MiddleEast. Although the Israeli government is currently committed to covering the reinstatement value of direct damages that are caused by terrorist attacks or actsof war, we cannot assure you that this government coverage will be maintained or, if maintained, will be sufficient to compensate us fully for damagesincurred. Any losses or damages incurred by us could have a material adverse effect on our business. Any armed conflict involving Israel could adverselyaffect our operations and results of operations.
Further, our operations could be disrupted by the obligations of personnel to perform military service. As of December 31, 2017, we had 179 employeesbased in Israel, certain of which may be called upon to perform up to 54 days in each three year period (and in the case of non-officers depending on theirspecific military commanders or officers, up to 70 or 84 days, respectively, in each three year period) of military reserve duty until they reach the age of 40(and in some cases, up to 49 years of age) and, in certain emergency circumstances, may be called to immediate and unlimited active duty. Our operationscould be disrupted by the absence of a significant number of employees related to military service, which could materially adversely affect our business andresults of operations.
Several countries, principally in the Middle East, restrict doing business with Israel and Israeli companies, and additional countries may imposerestrictions on doing business with Israel and Israeli companies whether as a result of hostilities in the region or otherwise. In addition, there have beenincreased efforts by activists to cause companies and consumers to boycott Israeli goods based on Israeli government policies. Such actions, particularly ifthey become more widespread, may adversely impact our ability to sell our products.
Our international operations expose us to a variety of risks.
We currently have operations in a number of foreign countries and make sales to end-customers throughout the world. Historically, the majority of oursales are into North America, Latin America, and the Americas. For example, in the years ended December 31, 2015, 2016, and 2017 approximately 18%,17%, and 24%, respectively, of our revenue was derived from outside of the Americas, but we anticipate that our sales in markets outside of the Americas willincrease as we grow and expand our international operations and sales force. In addition, we currently perform certain of our research and development andother operations in Israel and in other geographically dispersed locations outside of the United States. Our international operations and sales into internationalmarkets require significant management attention and financial resources, and subject us to certain inherent risks, including:
• technical difficulties and costs associated with product localization;
• challenges associated with coordinating product development efforts among geographically dispersed areas;
• potential loss of proprietary information due to piracy, misappropriation, or laws that may inadequately protect our intellectual property rights;
• greater difficulty in establishing, utilizing, and enforcing our intellectual property rights;
40
Table of Contents
• our limited experience in establishing a sales and marketing presence, and research and development operations, together with the appropriateinternal systems, processes, and controls, in certain geographic markets;
• political unrest or economic instability, regulatory changes, war, or terrorism, and other unpredictable and potentially long-term events in thecountries or regions where we or our end-customers do business, which could result in delayed or lost sales or interruption in our businessoperations;
• longer payment cycles for sales in certain foreign countries;
• seasonal reductions in business activity in the summer months in Europe and at other times in various countries;
• the significant presence of some of our competitors in some international markets;
• potentially adverse tax consequences or changes in applicable tax laws;
• import and export restrictions and tariffs and other trade protection initiatives;
• potential failures of our foreign employees and channel partners to comply with both U.S. and foreign laws and regulations, including antitrust laws,trade regulations, and anti-bribery and corruption laws, including the U.S. Foreign Corrupt Practices Act, or FCPA;
• compliance with foreign laws, regulations, and other government controls, such as those affecting trade, privacy and data protection, theenvironment, corporations, and employment;
• management, staffing, legal, and other costs of operating a distributed enterprise spread over various countries;
• fluctuations in foreign exchange rates, which we currently do not hedge against; and
• fears concerning travel or health risks that may adversely affect our ability to sell our products and services in any country in which the businesssales culture encourages face-to-face interactions.
To the extent we are unable to effectively manage our international operations and these risks, our international sales or operations may be adverselyaffected, we may incur additional and unanticipated costs, and we may be subject to litigation or regulatory action. As a consequence, our business, results ofoperations, prospects, and financial condition could be seriously harmed.
Due to the global nature of our business, we could be adversely affected by violations of the U.S. FCPA or similar anti-bribery laws in otherjurisdictions in which we operate and various international trade and export laws.
The global nature of our business creates various domestic and local regulatory challenges. The FCPA and similar anti-bribery laws in other jurisdictionsgenerally prohibit U.S.-based companies and their intermediaries from making improper payments for the purpose of obtaining or retaining business to non-U.S. officials. In addition, U.S.-based companies are required to maintain records that accurately and fairly represent their transactions and have an adequatesystem of internal accounting controls. We operate in areas of the world that experience corruption by government officials to some degree and, in certaincircumstances, compliance with anti-bribery laws may conflict with local customs and practices. Our global operations require us to import and export to andfrom several countries, which increases our compliance obligations. In addition, changes in such laws could result in increased regulatory requirements andcompliance costs which could adversely affect our business, financial condition and results of operations. We cannot assure you that our employees or othersoftware agents will not engage in prohibited conduct and render us responsible under the FCPA. If we are found to be in violation of the FCPA or other anti-bribery laws (either due to acts or inadvertence of our employees or due to the acts or inadvertence of others), we could suffer criminal or civil penalties orother sanctions, which could have a material adverse effect on our business.
Third parties may bring legal actions against us.
In the past, third parties have brought legal actions against us and we may, from time to time, be a party to other lawsuits in the normal course of ourbusiness. We have incurred costs to defend those lawsuits and related legal proceedings. It is likely that in the future other parties may bring legal actionsagainst us. Such actions, even if without merit, could harm our business. Litigation in general, and intellectual property and securities litigation in particular,can be expensive, lengthy, and disruptive
41

Table of Contents
to normal business operations. Moreover, the results of complex legal proceedings are difficult to predict. An unfavorable resolution of any lawsuit couldadversely affect our business, results of operations, prospects, or financial condition. Any material litigation or arbitration inevitably results in the diversion ofthe attention of our management and other relevant personnel. To the extent uninsured, such claims further require us to incur defense costs for us and forparties to whom we may have indemnification obligations. For example, we indemnify our channel partners in response to requests they receive from ourend-customers to be indemnified for patent or other intellectual property litigation brought by third parties against our end-customers with regard to our end-customers’ use of products or services sold by our channel partners, including our own products. We also may be required to pay material amounts insettlement costs or damages. Furthermore, if the matter relates to infringement of a third party’s intellectual property, we may be required to enter into royaltyor licensing agreements or to develop non-infringing technology, and injunctive relief could be entered against us. End-customer concerns with respect tomaterial litigation can result in delayed or lost sales and reputational damage. Any of the foregoing could seriously harm our business and have a materialadverse effect on our business, financial condition and results of operations.
Our operations could be significantly hindered by the occurrence of a natural disaster, terrorist attack, or other catastrophic event.
Our business operations are susceptible to outages due to fire, floods, power loss, telecommunications failures, terrorist attacks, and other events beyondour control, and our sales opportunities may also be affected by such events. In addition, a substantial portion of our facilities, including our headquarters, arelocated in Northern California, an area susceptible to earthquakes. We do not carry earthquake insurance for earthquake-related losses. Despite ourimplementation of network security measures, our servers are vulnerable to computer viruses, break-ins, and similar disruptions from unauthorized tamperingwith our computer systems. We may not carry sufficient business interruption insurance to compensate us for losses that may occur as a result of any of theseevents. In addition, acts of terrorism and other geo-political unrest could cause disruptions in our business or the business of our supply chain, manufacturers,logistics providers, partners, or end-customers or the economy as a whole. Any disruption in the business of our supply chain, manufacturers, logisticsproviders, partners, or end-customers that impacts sales at the end of a fiscal quarter could have a significant adverse impact on our financial results. To theextent that such events disrupt our business or the business of our current or prospective end-customers, or adversely impact our reputation, such events couldadversely affect our business, results of operations, prospects, and financial condition.
If we fail to comply with environmental requirements, our business, results of operations, prospects, financial condition, and reputation could beadversely affected.
Our operations and the sale of our products are subject to various federal, state, local, and foreign environmental and safety regulations, including lawsadopted by the European Union, such as the Waste Electrical and Electronic Equipment Directive, or WEEE Directive, and the Restriction of the Use ofCertain Hazardous Substances in Electrical and Electronic Equipment Directive, or EU RoHS Directive, of certain metals from global hot spots. The WEEEDirective requires electronic goods producers to be responsible for marking, collection, recycling, and treatment of such products. Changes in the WEEEDirective of the interpretation thereof may cause us to incur additional costs or meet additional regulatory requirements, which could be material.
The EU RoHS Directive and similar laws of other jurisdictions limit the content of certain hazardous materials such as lead, mercury, and cadmium in themanufacture of electrical equipment, including our products. Currently, our products comply with the EU RoHS Directive requirements. However, if there arechanges to this or other laws, or to their interpretation, or if new similar laws are passed in other jurisdictions, we may be required to reengineer our productsor to use different components to comply with these regulations. This reengineering or component substitution could result in substantial costs to us or disruptour operations or logistics.
We are also subject to environmental laws and regulations governing the management of hazardous materials, which we use in small quantities in ourengineering labs. Our failure to comply with past, present, and future environmental and safety laws could result in increased costs, reduced sales of ourproducts, substantial product inventory write-offs, reputational damage, penalties, third-party property damage, remediation costs and other sanctions, any ofwhich could harm our business and financial condition. To date, our expenditures for environmental compliance have not had a material impact on our resultsof operations or cash flows, and although we cannot predict the future impact of such laws or regulations, they will likely result in additional costs and mayincrease penalties associated with violations or require us to change the content of our products or how they are manufactured, which could have a materialadverse effect on our business, results of operations, prospects, and financial condition.
42
Table of Contents
We also expect that our business will be affected by new environmental laws and regulations on an ongoing basis, which may be more stringent, imposinggreater compliance costs and increasing risks and penalties associated with violations which could harm our business.
Our gross margin is affected by a number of factors, and we may not be able to sustain it at present levels.
Our gross margin has been and will continue to be affected by a variety of factors, including:
• market acceptance of our solution and fluctuations in demand for our solution and services;
• the mix of products and services that we sell;
• varying discounting rates among end-customers;
• our ability to increase sales to and retain existing end-customers and to sell to new end-customers;
• increased price competition and changes in product pricing;
• actions taken by our competitors;
• new product innovations and enhancements;
• manufacturing and component costs;
• availability of sufficient inventory to meet demand;
• purchase of inventory in excess of demand;
• our execution of our strategy and operating plans;
• geographies in which sales are made; and
• revenue recognition rules.
Macroeconomic factors and competitive pressures may also require us to lower prices or increase spending, and our business and results of operationsmay suffer. Even if we achieve our net revenue and operating expense objectives, our net income or loss and results of operations may be below ourexpectations and the expectations of investors if our gross margin is below expectations.
Our investments in new or enhanced products and services may not yield the benefits we anticipate.
The success of our business is predicated on our ability to develop new products and technologies and to anticipate future market requirements andapplicable industry standards. We intend to continue to invest in enhancing our products by adding personnel and other resources to our research anddevelopment function. We will likely recognize costs associated with these investments earlier than the anticipated benefits. If we do not achieve theanticipated benefits from these investments, or if the achievement of these benefits is delayed, our business, results of operations, prospects, and financialcondition may be adversely affected.
The process of developing new technologies is time consuming, complex, and uncertain, and requires the commitment of significant resources well inadvance of being able to fully determine market requirements and industry standards. Furthermore, we may not be able to timely execute new product ortechnical initiatives because of errors in product planning or timing, technical difficulties that we cannot timely resolve, or a lack of appropriate resources.This could result in competitors bringing products to market before we do and a consequent decrease in our market share and net revenue. Our inability totimely and cost-effectively introduce new products and product enhancements, or the failure of these new products or enhancements to achieve marketacceptance and comply with industry standards, could seriously harm our business, results of operations, prospects, and financial condition. Additionally,products and technologies developed by others, and our own introduction of new products and product enhancements, could result in the obsolescence andwrite-off of previously purchased or committed inventory, which would reduce our net income or increase our net loss.
43
Table of Contents
We may acquire or invest in companies, which may divert our management’s attention and result in additional dilution to our stockholders. We maybe unable to integrate acquired businesses and technologies successfully or achieve the expected benefits of such acquisitions.
Our success will depend, in part, on our ability to grow our business in response to changing technologies, end-customer demands, and competitivepressures. In some circumstances, we may choose to do so through the acquisition of complementary businesses and technologies rather than through internaldevelopment. The identification of suitable acquisition candidates can be difficult, time-consuming, and costly, and we may not be able to successfullycomplete identified acquisitions. The risks we face in connection with acquisitions include:
• encountering difficulties or unforeseen expenditures in integrating the business, technologies, products, personnel, or operations of a company that weacquire, particularly if key personnel of the acquired company decide not to work for us;
• an acquisition that may disrupt our ongoing business, divert resources, increase our expenses, and distract our management;
• our use of cash to pay for acquisitions, which would limit other potential uses for our cash;
• if we incur debt to fund an acquisition, such debt may subject us to material restrictions on our ability to conduct our business; and
• if we issue a significant amount of equity securities in connection with acquisitions, existing stockholders may be diluted and earnings per share maydecrease.
The occurrence of any of these risks could have an adverse effect on our business, results of operations, prospects, and financial condition.
We face increased exposure to foreign currency exchange rate fluctuations.
Our sales contracts are primarily denominated in U.S. Dollars, and therefore, the majority of our revenue is not currently subject to foreign currency risk.However, a strengthening of the U.S. Dollar could increase the real cost of our products to our end-customers outside of the United States, which couldadversely affect our financial condition and results of operations. In addition, increased international sales in the future, including through our channelpartners and other partnerships, may result in greater foreign currency denominated sales, increasing our foreign currency risk. Moreover, an increasingportion of our operating expenses is incurred outside the United States, is denominated in foreign currencies, and is subject to fluctuations due to changes inforeign currency exchange rates. If we are not able to successfully hedge against the risks associated with currency fluctuations, our financial condition andresults of operations could be adversely affected.
We do not currently maintain a program to hedge transactional exposures in foreign currencies. However, in the future, we may use derivativeinstruments, such as foreign currency forward and option contracts, to hedge certain exposures to fluctuations in foreign currency exchange rates. The use ofsuch hedging activities may not offset any or more than a portion of the adverse financial effects of unfavorable movements in foreign exchange rates over thelimited time the hedges are in place. Moreover, the use of hedging instruments may introduce additional risks if we are unable to structure effective hedgeswith such instruments.
If we fail to maintain an effective system of disclosure controls and internal control over financial reporting, our ability to produce timely andaccurate financial statements or comply with applicable regulations could be impaired.
As a public company, we will be required to maintain internal control over financial reporting and to report any material weaknesses in such internalcontrols. Section 404 of the Sarbanes-Oxley Act of 2002, as amended, or the Sarbanes-Oxley Act, requires that we evaluate and determine the effectivenessof our internal control over financial reporting and, beginning with our second annual report following our initial public offering, provide a managementreport on internal control over financial reporting. However, while we remain an emerging growth company, we will not be required to include an attestationreport on internal control over financial reporting issued by our independent registered public accounting firm.
Any failure to develop or maintain effective controls, or any difficulties encountered in their implementation or improvement, could harm our results ofoperations, cause us to fail to meet our reporting obligations, result in a restatement of our financial
44

Table of Contents
statements for prior periods, or adversely affect the results of management evaluations and independent registered public accounting firm audits of ourinternal control over financial reporting that we will eventually be required to include in our periodic reports that will be filed with the SEC. Ineffectivedisclosure controls and procedures and internal controls over financial reporting could also cause investors to lose confidence in our reported financial andother information, which would likely have a negative effect on the trading price of our common stock.
We are in the process of designing and implementing the internal control over financial reporting required to comply with Section 404 of the Sarbanes-Oxley Act. This process will be time consuming, costly, and complicated. If we are unable to assert that our internal control over financial reporting iseffective or when required in the future, if our independent registered public accounting firm issues an adverse opinion on the effectiveness of our internalcontrol over financial reporting, investors may lose confidence in the accuracy and completeness of our financial reports, the market price of our commonstock could be adversely affected and we could become subject to investigations by the stock exchange on which our securities are listed, the SEC, or otherregulatory authorities, which could require additional financial and management resources.
If we cannot maintain our corporate culture as we grow, we could lose the innovation, teamwork, passion, and focus on execution that we believecontribute to our success, and our business may be harmed.
We believe that our corporate culture has been a critical component to our success. We have invested substantial time and resources in building our team.As we grow and mature as a public company, we may find it difficult to maintain our corporate culture. Any failure to preserve our culture could negativelyaffect our future success, including our ability to recruit and retain personnel and effectively focus on and pursue our business strategy.
Forecasting our estimated annual effective tax rate is complex and subject to uncertainty, and there may be material differences between ourforecasted and actual tax rates.
We are currently generating operating losses and have minimal tax rate uncertainty. When we begin generating operating profit, and fully utilize our netoperating losses, or NOLs, forecasts of our effective tax rate will become more complex. As a multinational corporation we conduct our business in manycountries and are subject to different taxation in many jurisdictions. The taxation of our business is subject to the application of multiple and conflicting taxlaws and regulations as well as multinational tax conventions. Our effective tax rate will be highly dependent upon the geographic distribution of ourworldwide earnings or losses, the tax regulations in each geographic region, the availability of tax credits and carryforwards, and the effectiveness of our taxplanning strategies.
In addition, we are subject to examination of our income tax returns by the Internal Revenue Service and other tax authorities. If tax authorities challengethe relative mix of our U.S. and international income, our future effective income tax rates could be adversely affected. While we regularly assess thelikelihood of adverse outcomes from such examinations and the adequacy of our provision for income taxes, there can be no assurance that such provision issufficient and that a determination by a tax authority will not have an adverse effect on our business, results of operations, prospects, and financial condition.
Changes in U.S. tax laws could have a material adverse effect on our business, cash flow, results of operations or financial conditions.
Recently enacted U.S. tax legislation will significantly change the taxation of U.S.-based multinational corporations, by, among other things, reducing theU.S. corporate income tax rate, adopting elements of a territorial tax system, assessing a one-time transition tax on earnings of certain foreign subsidiaries thatwere previously tax deferred, and the creation of new taxes on certain foreign-sourced earnings. The legislation is unclear in some respects and will requireinterpretations and implementing regulations by the Internal Revenue Service, as well as state tax authorities, and the legislation could be subject to potentialamendments and technical corrections, any of which could lessen or increase certain impacts of the legislation.
Our ability to use our net operating loss carry-forwards and certain other tax attributes may be limited.
As of December 31, 2017, we had federal NOLs of approximately $180.1 million, which begin to expire in 2021 if not utilized, and California and otherstate NOLs of $22.0 million and $76.6 million, respectively, which begin to expire in 2028 and 2018, respectively if not utilized. Subject to the followingdiscussion, such NOLs are generally available to be carried forward to offset our future taxable income, if any, until such NOLs are used or expire.
45
Table of Contents
In general, under Section 382 of the Internal Revenue Code of 1986, as amended, or the Code, a corporation that undergoes an “ownership change”(generally defined as a greater than 50-percentage point cumulative change (by value) in the equity ownership of certain stockholders over a rolling three-yearperiod) is subject to limitations on its ability to utilize its pre-change NOLs to offset post-change taxable income. Similar rules may apply under state taxlaws. Based upon an analysis of the period from inception through November 30, 2015, we believe we may have undergone an ownership change and that aportion of our current NOLs may be subject to limitations under Section 382. Future changes in our stock ownership, some of which are outside of ourcontrol, could result in an ownership change under Section 382 of the Code. Furthermore, our ability to utilize NOLs of companies that we have acquired ormay acquire in the future may be subject to limitations. There is also a risk that due to regulatory changes, such as suspensions on the use of NOLs, or otherunforeseen reasons, our existing NOLs could expire or otherwise be unavailable to offset future income tax liabilities. For these reasons, we may not be ableto realize a tax benefit from the use of our NOLs, whether or not we attain profitability.
Risks Related to Owning Our Common Stock
Provisions of our corporate governance documents could make an acquisition of our company more difficult and may prevent attempts by ourstockholders to replace or remove our current management, even if beneficial to our stockholders.
Our amended and restated certificate of incorporation and amended and restated bylaws and the Delaware General Corporation Law, or the DGCL,contain provisions that could make it more difficult for a third party to acquire us, even if doing so might be beneficial to our stockholders.
These provisions include:
• the division of our board of directors into three classes and the election of each class for three-year terms;
• advance notice requirements for stockholder proposals and director nominations;
• the ability of the board of directors to fill a vacancy created by the expansion of the board of directors;
• the ability of our board of directors to issue new series of, and designate the terms of, preferred stock, without stockholder approval, which could beused to, among other things, institute a rights plan that would have the effect of significantly diluting the stock ownership of a potential hostileacquirer, likely preventing acquisitions that have not been approved by our board of directors;
• limitations on the ability of stockholders to call special meetings and to take action by written consent; and
• the required approval of holders of at least 66-2/3% of the voting power of the outstanding shares of our capital stock to adopt, amend, or repealcertain provisions of our amended and restated certificate of incorporation and amended and restated bylaws or remove directors for cause.
In addition, Section 203 of the DGCL may affect the ability of an “interested stockholder” to engage in certain business combinations, for a period ofthree years following the time that the stockholder becomes an “interested stockholder.”
These provisions may frustrate or prevent any attempts by our stockholders to replace or remove our current management by making it more difficult forstockholders to replace members of our board. Because our board of directors is responsible for appointing the members of our management team, theseprovisions could in turn affect any attempt to replace current members of our management team.
Our amended and restated bylaws designate courts in the State of Delaware and in the county of Santa Clara, California as the sole and exclusiveforums for certain types of actions and proceedings that may be initiated by our stockholders, which could limit our stockholders’ ability to obtain afavorable judicial forum for disputes with us or our directors, officers, or employees.
Our amended and restated bylaws provide that, subject to limited exceptions, a state or federal court located within the State of Delaware or a state orfederal court located within the county of Santa Clara, California will be the sole and exclusive forums for:
• any derivative action or proceeding brought on our behalf;
46
Table of Contents
• any action asserting a claim of breach of a fiduciary duty owed by any of our directors, officers, or other employees to us or our stockholders;
• any action asserting a claim against us arising pursuant to any provision of the DGCL, our amended and restated certificate of incorporation or ouramended and restated bylaws; or
• any other action asserting a claim against us or our directors, officers, or employees that is governed by the internal affairs doctrine.
Any person or entity purchasing or otherwise acquiring any interest in shares of our capital stock shall be deemed to have notice of and to have consentedto these provisions. These provisions may limit a stockholder’s ability to bring a claim in a judicial forum that it finds favorable for disputes with us or ourdirectors, officers, or other employees, which may discourage such lawsuits against us and our directors, officers, and employees. Alternatively, if a courtwere to find these provisions of our amended and restated bylaws inapplicable to, or unenforceable in respect of, one or more of the specified types of actionsor proceedings, we may incur additional costs associated with resolving such matters in other jurisdictions, which could adversely affect our business andfinancial condition.
Market volatility may affect the price of our common stock.
The price of our common stock may fluctuate significantly in response to a number of factors, most of which we cannot predict or control, including:
• actual or anticipated changes or fluctuations in our results of operations and whether our results of operations meet the expectations of securitiesanalysts or investors;
• actual or anticipated changes in securities analysts’ estimates and expectations of our financial performance;
• announcements of new products and solutions, services or technologies, commercial relationships, acquisitions, or other events by us or ourcompetitors;
• general market conditions, including volatility in the market price and trading volume of technology companies in general and of companies in thenetwork security industry in particular;
• changes in how current and potential end-customers perceive the effectiveness of our solution in protecting against advanced cyberattacks or otherreputational harm;
• sales of large blocks of our common stock, including sales by our executive officers, directors, and significant stockholders and significant releasesof RSUs;
• announced departures of any of our key personnel;
• lawsuits threatened or filed against us or involving our industry, or both;
• changing legal or regulatory developments in the United States and other countries;
• general economic conditions and trends; and
• other events or factors, including those resulting from major catastrophic events, war, acts of terrorism, or responses to these events.
In addition, the stock markets have experienced extreme price and volume fluctuations that have affected and continue to affect the market prices ofequity securities of many technology companies. Stock prices of many technology companies have fluctuated in a manner unrelated or disproportionate to theoperating performance of those companies. In the past, stockholders have instituted securities class action litigation following periods of market volatility. Ifwe were to become involved in securities litigation, it could subject us to substantial costs, divert resources and the attention of management from ourbusiness and adversely affect our business, results of operations, prospects, and financial condition.
47

Table of Contents
Our business could be impacted as a result of actions by activist shareholders or others.
We may be subject, from time to time, to legal and business challenges in the operation of our company due to actions instituted by activist shareholdersor others. Responding to such actions could be costly and time-consuming, may not align with our business strategies and could divert the attention of ourboard of directors and senior management from the pursuit of our business strategies. Perceived uncertainties as to our future direction as a result ofshareholder activism may lead to the perception of a change in the direction of the business or other instability and may affect our relationships with our end-customers, prospective and current employees and others.
As a public company, we are subject to additional laws, regulations, and stock exchange listing standards, which impose additional costs on us andmay strain our resources and divert our management’s attention.
We are subject to the reporting requirements of the Securities Exchange Act of 1934, as amended, or the Exchange Act, the Sarbanes-Oxley Act, theDodd-Frank Act, the listing requirements of The NASDAQ Global Market, and other applicable securities laws and regulations. Compliance with these lawsand regulations increases our legal and financial compliance costs and make some activities more difficult, time-consuming, or costly. For example, theExchange Act requires us, among other things, to file annual, quarterly, and current reports with respect to our business and results of operations and maintaineffective disclosure controls and procedures and internal control over financial reporting. Also, as a public company, it will be more expensive for us to obtaindirector and officer liability insurance, and we may be required to accept reduced coverage or incur substantially higher costs to obtain coverage. Althoughwe have already hired additional employees to comply with these requirements, we may need to hire even more employees in the future, which will increaseour costs and expenses. These factors may therefore strain our resources, divert management’s attention, and affect our ability to attract and retain qualifiedboard members.
Since we have no current plans to pay regular cash dividends on our common stock, you may not receive any return on investment unless you sellyour common stock for a price greater than that which you paid for it.
We do not anticipate paying any regular cash dividends on our common stock in the foreseeable future. Any decision to declare and pay dividends in thefuture will be made at the discretion of our board of directors and will depend on, among other things, our results of operations, financial condition, cashrequirements, contractual restrictions, and other factors that our board may deem relevant. In addition, our ability to pay dividends is, and may be, limited bycovenants of existing and any future outstanding indebtedness we or our subsidiaries incur. Therefore, any return on investment in our common stock is solelydependent upon the appreciation of the price of our common stock on the open market, which may not occur.
If securities or industry analysts do not publish research or reports about our business, if they adversely change their recommendations regardingour shares or if our results of operations do not meet their expectations, our share price and trading volume could decline.
The trading market for our shares will be influenced by the research and reports that industry or securities analysts publish about us or our business. Wedo not have any control over these analysts. If one or more of these analysts cease coverage of our company or fails to publish reports on us regularly, wecould lose visibility in the financial markets, which in turn could cause our share price or trading volume to decline. Moreover, if one or more of the analystswho cover our company downgrade our stock or if our results of operations do not meet their expectations, our share price could decline.
We are an “emerging growth company,” and the reduced disclosure requirements applicable to emerging growth companies may make our commonstock less attractive to investors.
We are an “emerging growth company,” as defined in the Jumpstart Our Business Startups Act, or JOBS Act, and may remain an emerging growthcompany for up to five years. For so long as we remain an emerging growth company, we are permitted and intend to rely on exemptions from certaindisclosure requirements that are applicable to other public companies that are not emerging growth companies. These exemptions include not being requiredto comply with the auditor attestation requirements of Section 404 of the Sarbanes-Oxley Act not being required to comply with any requirement that may beadopted by the Public Company Accounting Oversight Board regarding mandatory audit firm rotation or a supplement to the auditor’s report providingadditional information about the audit and the financial statements, reduced disclosure obligations regarding executive compensation and exemptions from therequirements of holding a nonbinding advisory vote on executive compensation and shareholder approval of any golden parachute payments not previouslyapproved. We have not yet disclosed all of the
48
Table of Contents
executive compensation-related information that would be required if we were not an emerging growth company. We cannot predict whether investors willfind our common stock less attractive if we rely on these exemptions. If some investors find our common stock less attractive as a result, there may be a lessactive trading market for our common stock and our stock price may be more volatile.
In addition, the JOBS Act provides that an emerging growth company can take advantage of an extended transition period for complying with new orrevised accounting standards. This allows an emerging growth company to delay the adoption of certain accounting standards until those standards wouldotherwise apply to private companies. We have irrevocably elected not to avail ourselves of this exemption from new or revised accounting standards and,therefore, we will be subject to the same new or revised accounting standards as other public companies that are not emerging growth companies. We willincur increased costs as a result of operating as a public company, and our management will be required to devote substantial time to new complianceinitiatives and corporate governance practices.
Our directors, executive officers, and significant stockholders have substantial control over us and could delay or prevent a change in control.
Our directors, executive officers and holders of more than 5% of our common stock, together with their affiliates, beneficially own, in the aggregate,approximately 66% of our outstanding common stock as of December 31, 2017. As a result, these stockholders, acting together, would have the ability tocontrol the outcome of matters submitted to our stockholders for approval, including the election of directors and any merger, consolidation or sale of all orsubstantially all of our assets. In addition, these stockholders, acting together, would have the ability to control the management and affairs of our company.Accordingly, this concentration of ownership might adversely affect the market price of our common stock by:
• delaying, deferring or preventing a change in control of the company;
• impeding a merger, consolidation, takeover or other business combination involving us; or
• discouraging a potential acquirer from making a tender offer or otherwise attempting to obtain control of the company.
49

Table of Contents
ITEM 1B. UNRESOLVED STAFF COMMENTS
None.
ITEM 2. PROPERTIES
Our corporate headquarters is located in San Jose, California in a facility consisting of approximately 95,950 square feet of office space under a lease thatexpires in 2026. Our major engineering center is located in Tel Aviv, Israel. We maintain additional offices throughout the United States and variousinternational locations, including Australia, Canada, China, Germany, Hong Kong, Japan, the United Arab Emirates and the United Kingdom. We lease all ofour facilities and do not own any real property. We intend to procure additional space as we add employees and expand geographically. We believe ourfacilities are adequate and suitable for our current needs and that suitable additional or alternative space will be available to accommodate the expansion ofour operations if needed.
ITEM 3. LEGAL PROCEEDINGS
The information set forth under the “Litigation” subheading in Note 5. “Commitments and Contingencies” of the Notes to Consolidated FinancialStatements in Part II, Item 8 of this Annual Report on Form 10-K is incorporated herein by reference.
50

Table of Contents
ITEM 4. MINE SAFETY DISCLOSURES
Not applicable.
51
Table of Contents
PART II
ITEM 5. MARKET FOR REGISTRANT’S COMMON EQUITY, RELATED STOCKHOLDER MATTERS AND ISSUER PURCHASES OFEQUITY SECURITITIES
Market Information for Common Stock
Our common stock, par value $0.001 per share, began trading on The NASDAQ Global Market under the symbol “FSCT” on October 27, 2017. Prior tothat date, there was no public trading market for shares of our common stock.
The following table sets forth the reported high and low sales prices of our common stock for the period indicated, as quoted on the NASDAQ GlobalMarket:
Period Ended: High Low
December 31, 2017 (from October 27, 2017) $32.58 $21.56
Holders of Record
As of December 31, 2017, there were 265 holders of record of our common stock. Because many of our shares of common stock are held by brokers andother institutions on behalf of beneficial owners of our stock, we are unable to estimate the total number of stockholders.
Dividend Policy
We have never declared or paid cash dividends on our common stock. We currently intend to retain any future earnings to fund business development andgrowth, and we do not expect to pay any dividends in the foreseeable future. Any future determination to declare cash dividends will be made at the discretionof our board of directors, subject to applicable laws, and will depend on a number of factors, including our financial condition, results of operations, capitalrequirements, contractual restrictions, general business conditions, and other factors that our board of directors may deem relevant.
Sale of Unregistered Securities
Option and Common Stock Issuances
During the fiscal year ended December 31, 2017, prior to filing our Registration Statement on Form S-8 on October 27, 2017:
• We granted to certain of our executive officers, directors, employees, consultants and other service providers an aggregate of 1,156,350 restrictedstock units to be settled in shares of our common stock under our equity compensation plans.
• We granted to certain of our executive officers, directors, employees, consultants, and other service providers options to purchase an aggregate of458,099 shares of common stock under our equity incentive plans at exercise prices ranging from $16.18 to $19.78 per share.
None of the foregoing transactions involved any underwriters, underwriting discounts or commissions, or any public offering. The Company believes theoffers, sales, and issuances of the above securities were exempt from registration under the Securities Act by virtue of (i) Section 4(a)(2) of the Securities Act(or, Regulation D promulgated thereunder) as transactions not involving a public offering, (ii) Rule 701 promulgated under the Securities Act as transactionspursuant to compensatory benefit plans or contracts relating to compensation as provided under such rule, or (iii) Regulation S promulgated under theSecurities Act as transactions made outside of the United States. The recipients of the securities in each of these transactions represented their intentions toacquire the securities for investment only and not with a view to or for sale in connection with any distribution thereof, and appropriate legends were placedupon the stock certificates issued in these transactions. All recipients had adequate access, through their relationships with the Registrant, to informationabout the Registrant. The sales of these securities were made without any general solicitation or advertising.
52

Table of Contents
Use of Proceeds
On October 26, 2017, our Registration Statement on Form S-1 (File No. 333-220767) was declared effective by the SEC for our initial public offering, orIPO, of common stock. We started trading on The NASDAQ Global Market on October 27, 2017. On October 31, 2017, we closed our IPO and sold6,072,000 shares of our common stock, including the exercise of the underwriters’ option to purchase an additional 792,000 shares, at an offering price of$22.00 per share, for an aggregate offering price of approximately $133.6 million. Upon completion of the sale of the shares of our common stock, our IPOterminated.
The underwriters for our initial public offering were Morgan Stanley & Co. LLC, J.P. Morgan Securities LLC, Citigroup Global Markets Inc., MerrillLynch, Pierce, Fenner & Smith Incorporated, UBS Securities LLC, KeyBanc Capital Markets Inc. We paid to the underwriters of our IPO underwritingdiscounts and commissions totaling approximately $9.4 million and incurred estimated offering expenses of approximately $4.5 million that, when added tothe underwriting discounts and commissions, amount to total expenses of approximately $13.9 million. Thus, the net offering proceeds, after deductingunderwriting discounts and commission and other offering expenses and including the exercise by the underwriters of their option to purchase additionalshares of our common stock, were approximately $119.7 million.
There has been no material change in the planned use of proceeds from our IPO as described in our final prospectus, dated October 26, 2017, pursuant toRule 424(b) of the Securities Act.
Purchases of Equity Securities by the Issuer and Affiliated Purchasers
None.
53
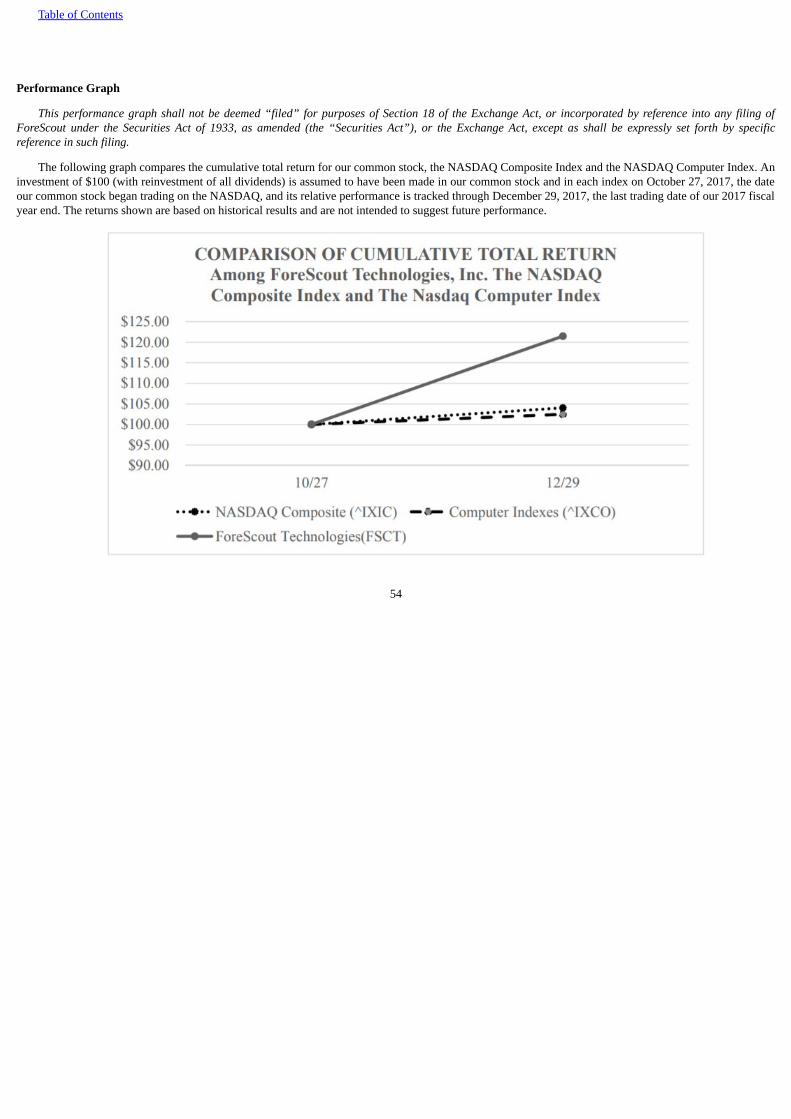
Table of Contents
Performance Graph
This performance graph shall not be deemed “filed” for purposes of Section 18 of the Exchange Act, or incorporated by reference into any filing ofForeScout under the Securities Act of 1933, as amended (the “Securities Act”), or the Exchange Act, except as shall be expressly set forth by specificreference in such filing.
The following graph compares the cumulative total return for our common stock, the NASDAQ Composite Index and the NASDAQ Computer Index. Aninvestment of $100 (with reinvestment of all dividends) is assumed to have been made in our common stock and in each index on October 27, 2017, the dateour common stock began trading on the NASDAQ, and its relative performance is tracked through December 29, 2017, the last trading date of our 2017 fiscalyear end. The returns shown are based on historical results and are not intended to suggest future performance.
54
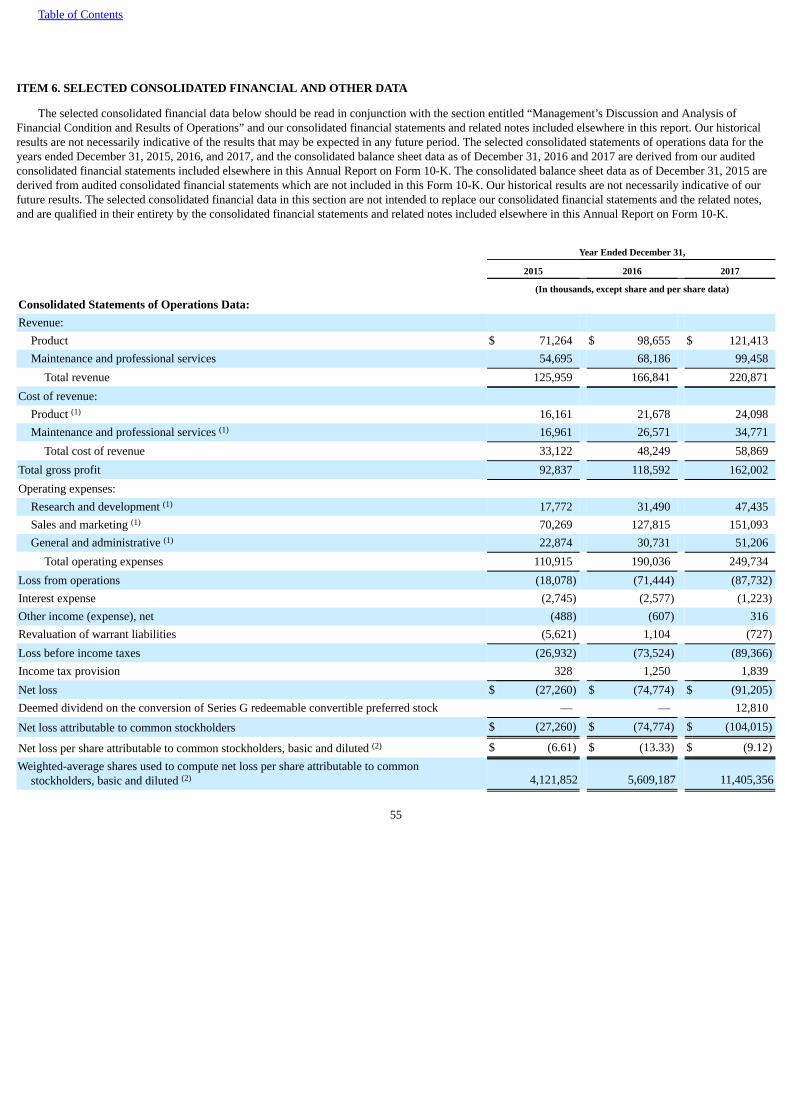
Table of Contents
ITEM 6. SELECTED CONSOLIDATED FINANCIAL AND OTHER DATA
The selected consolidated financial data below should be read in conjunction with the section entitled “Management’s Discussion and Analysis ofFinancial Condition and Results of Operations” and our consolidated financial statements and related notes included elsewhere in this report. Our historicalresults are not necessarily indicative of the results that may be expected in any future period. The selected consolidated statements of operations data for theyears ended December 31, 2015, 2016, and 2017, and the consolidated balance sheet data as of December 31, 2016 and 2017 are derived from our auditedconsolidated financial statements included elsewhere in this Annual Report on Form 10-K. The consolidated balance sheet data as of December 31, 2015 arederived from audited consolidated financial statements which are not included in this Form 10-K. Our historical results are not necessarily indicative of ourfuture results. The selected consolidated financial data in this section are not intended to replace our consolidated financial statements and the related notes,and are qualified in their entirety by the consolidated financial statements and related notes included elsewhere in this Annual Report on Form 10-K.
Year Ended December 31,
2015 2016 2017
(In thousands, except share and per share data)
Consolidated Statements of Operations Data: Revenue:
Product $ 71,264 $ 98,655 $ 121,413Maintenance and professional services 54,695 68,186 99,458
Total revenue 125,959 166,841 220,871Cost of revenue:
Product (1) 16,161 21,678 24,098Maintenance and professional services (1) 16,961 26,571 34,771
Total cost of revenue 33,122 48,249 58,869Total gross profit 92,837 118,592 162,002Operating expenses:
Research and development (1) 17,772 31,490 47,435Sales and marketing (1) 70,269 127,815 151,093General and administrative (1) 22,874 30,731 51,206
Total operating expenses 110,915 190,036 249,734Loss from operations (18,078) (71,444) (87,732)Interest expense (2,745) (2,577) (1,223)Other income (expense), net (488) (607) 316Revaluation of warrant liabilities (5,621) 1,104 (727)Loss before income taxes (26,932) (73,524) (89,366)Income tax provision 328 1,250 1,839Net loss $ (27,260) $ (74,774) $ (91,205)Deemed dividend on the conversion of Series G redeemable convertible preferred stock — — 12,810
Net loss attributable to common stockholders $ (27,260) $ (74,774) $ (104,015)
Net loss per share attributable to common stockholders, basic and diluted (2) $ (6.61) $ (13.33) $ (9.12)Weighted-average shares used to compute net loss per share attributable to common
stockholders, basic and diluted (2) 4,121,852 5,609,187 11,405,356
55
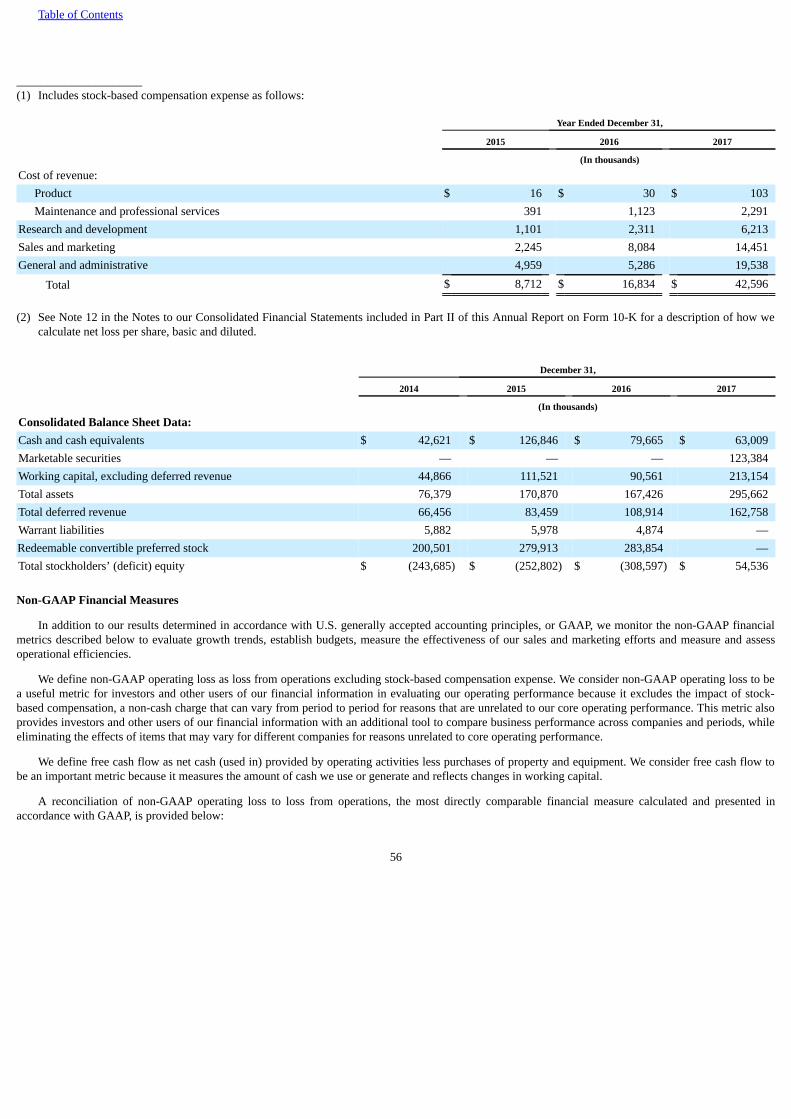
Table of Contents
_____________________ (1) Includes stock-based compensation expense as follows:
Year Ended December 31,
2015 2016 2017
(In thousands)
Cost of revenue: Product $ 16 $ 30 $ 103Maintenance and professional services 391 1,123 2,291
Research and development 1,101 2,311 6,213Sales and marketing 2,245 8,084 14,451General and administrative 4,959 5,286 19,538
Total $ 8,712 $ 16,834 $ 42,596
(2) See Note 12 in the Notes to our Consolidated Financial Statements included in Part II of this Annual Report on Form 10-K for a description of how wecalculate net loss per share, basic and diluted.
December 31,
2014 2015 2016 2017
(In thousands)
Consolidated Balance Sheet Data: Cash and cash equivalents $ 42,621 $ 126,846 $ 79,665 $ 63,009Marketable securities — — — 123,384Working capital, excluding deferred revenue 44,866 111,521 90,561 213,154Total assets 76,379 170,870 167,426 295,662Total deferred revenue 66,456 83,459 108,914 162,758Warrant liabilities 5,882 5,978 4,874 —Redeemable convertible preferred stock 200,501 279,913 283,854 —Total stockholders’ (deficit) equity $ (243,685) $ (252,802) $ (308,597) $ 54,536
Non-GAAP Financial Measures
In addition to our results determined in accordance with U.S. generally accepted accounting principles, or GAAP, we monitor the non-GAAP financialmetrics described below to evaluate growth trends, establish budgets, measure the effectiveness of our sales and marketing efforts and measure and assessoperational efficiencies.
We define non-GAAP operating loss as loss from operations excluding stock-based compensation expense. We consider non-GAAP operating loss to bea useful metric for investors and other users of our financial information in evaluating our operating performance because it excludes the impact of stock-based compensation, a non-cash charge that can vary from period to period for reasons that are unrelated to our core operating performance. This metric alsoprovides investors and other users of our financial information with an additional tool to compare business performance across companies and periods, whileeliminating the effects of items that may vary for different companies for reasons unrelated to core operating performance.
We define free cash flow as net cash (used in) provided by operating activities less purchases of property and equipment. We consider free cash flow tobe an important metric because it measures the amount of cash we use or generate and reflects changes in working capital.
A reconciliation of non-GAAP operating loss to loss from operations, the most directly comparable financial measure calculated and presented inaccordance with GAAP, is provided below:
56
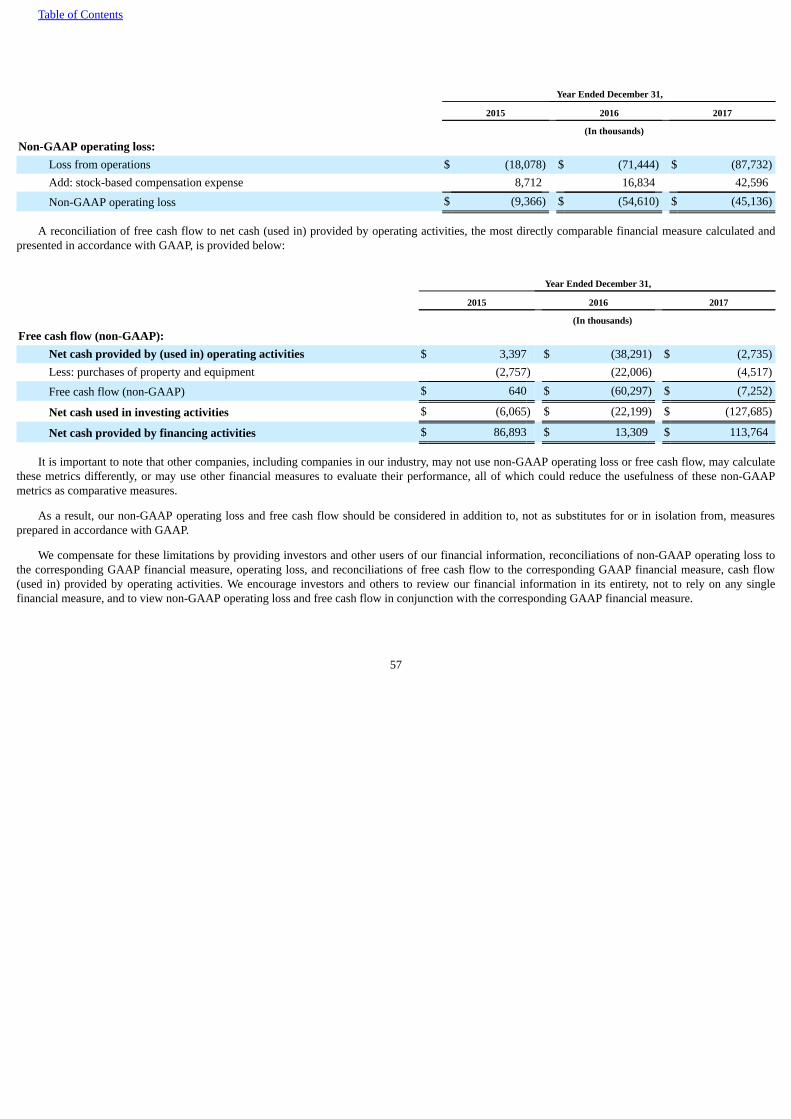
Table of Contents
Year Ended December 31,
2015 2016 2017
(In thousands)
Non-GAAP operating loss: Loss from operations $ (18,078) $ (71,444) $ (87,732)Add: stock-based compensation expense 8,712 16,834 42,596
Non-GAAP operating loss $ (9,366) $ (54,610) $ (45,136)
A reconciliation of free cash flow to net cash (used in) provided by operating activities, the most directly comparable financial measure calculated andpresented in accordance with GAAP, is provided below:
Year Ended December 31,
2015 2016 2017
(In thousands)
Free cash flow (non-GAAP): Net cash provided by (used in) operating activities $ 3,397 $ (38,291) $ (2,735)Less: purchases of property and equipment (2,757) (22,006) (4,517)
Free cash flow (non-GAAP) $ 640 $ (60,297) $ (7,252)
Net cash used in investing activities $ (6,065) $ (22,199) $ (127,685)
Net cash provided by financing activities $ 86,893 $ 13,309 $ 113,764
It is important to note that other companies, including companies in our industry, may not use non-GAAP operating loss or free cash flow, may calculatethese metrics differently, or may use other financial measures to evaluate their performance, all of which could reduce the usefulness of these non-GAAPmetrics as comparative measures.
As a result, our non-GAAP operating loss and free cash flow should be considered in addition to, not as substitutes for or in isolation from, measuresprepared in accordance with GAAP.
We compensate for these limitations by providing investors and other users of our financial information, reconciliations of non-GAAP operating loss tothe corresponding GAAP financial measure, operating loss, and reconciliations of free cash flow to the corresponding GAAP financial measure, cash flow(used in) provided by operating activities. We encourage investors and others to review our financial information in its entirety, not to rely on any singlefinancial measure, and to view non-GAAP operating loss and free cash flow in conjunction with the corresponding GAAP financial measure.
57
Table of Contents
ITEM 7. MANAGEMENT’S DISCUSSION AND ANALYSIS OF FINANCIAL CONDITION AND RESULTS OF OPERATIONS
The following discussion and analysis of our financial condition and results of operations should be read in conjunction with the section titled “SelectedConsolidated Financial Data” and our consolidated financial statements and related notes included elsewhere within this Annual Report on Form 10-K. Thisdiscussion contains forward-looking statements based upon current plans, expectations and beliefs that involve risks and uncertainties. Our actual resultsmay differ materially from those anticipated in these forward-looking statements as a result of various factors, including those set forth under “Risk Factors”and in other parts of this Annual Report on Form 10-K. Our fiscal year end is December 31.
Overview
We generate revenue from sales of our products and associated maintenance and professional services. Our products include: ForeScout CounterACT,ForeScout Enterprise Manager, and ForeScout Extended Modules. Our CounterACT and Enterprise Manager products are sold as hardware appliancesembedded with our software, or Physical Appliances, or as software only, or Virtual Appliances. We recently started offering, in limited quantities to a smallnumber of large enterprises, CounterACT and Enterprise Manager together as a software-only license, or Enterprise License Software. Our Enterprise LicenseSoftware is either sold with separate hardware or without hardware, depending on the end-customer’s selection. Our Extended Modules are sold as softwareadd-ons to the CounterACT and Enterprise Manager products. All of our products are sold with a perpetual license. End-customers typically purchasemaintenance and professional services when they purchase one or more of our products. Our support and maintenance contracts typically have a one-year orthree-year term. We offer a portfolio of professional services and extended support contract options to assist with additional deployment and ongoingadvanced technical support. We market and sell our products, maintenance, and professional services through a direct touch, channel-fulfilled model. Ourdirect sales force is responsible for cultivating relationships and selling solutions to enterprise and public sector accounts globally. We leverage the globalbreadth and reach of our channel ecosystem, including value-added resellers and distributors, to fulfill orders and sell to our mid-market end-customers.
Our CounterACT products are priced based on the number of devices managed on each Physical or Virtual Appliance. Our largest Physical and VirtualAppliance can manage up to 10,000 devices while our smallest Physical and Virtual Appliance can manage up to 100 devices. Our Enterprise LicenseSoftware generally manages a minimum of 100,000 devices and increases the number of managed devices in increments of 100 depending on the end-customer’s requirements. Our Enterprise Manager is priced based on the number of CounterACT Physical and Virtual Appliances managed. Our high-endEnterprise Manager product can manage up to 200 CounterACT Physical and Virtual Appliances while our low-end Enterprise Manager product can manageup to five Physical and Virtual Appliances. Our Extended Modules are sold in units of 100 managed devices today.
Revenue on Physical Appliances and Enterprise License Software sold with separate hardware, or Hardware Products, is recognized at the time ofdelivery, provided that all other revenue recognition criteria have been met. Revenue on Virtual Appliances, Enterprise License Software sold withouthardware, and Extended Modules, or Software Products, is recognized at the time of delivery if vendor-specific objective evidence of fair value, or VSOE, isestablished for all undelivered related items. If VSOE does not exist for one or more undelivered items, revenue from the software portion of the arrangementis deferred until the delivery of all items has begun and is then recognized ratably over the longest remaining service period, which generally is the supportand maintenance term. For additional disclosure on our revenue recognition policy, see Note 1 to our consolidated financial statements.
We have made substantial investments in our sales force in recent periods in order to address the significant enterprise opportunity caused by an increasein unmanaged devices coming onto networks. While we will continue to hire sales personnel, we do not anticipate growing our sales force at the same rate inthe future as we intend to gain leverage from our existing sales force as our sales representatives become more productive. In addition, we expect our AlliancePartners to help drive sales of our Extended Modules through joint use cases and go-to-market strategies. Today, we have an Alliance Partner program inplace with FireEye, Inc., one of our related parties. See the section titled “Certain Relationships and Related Party Transactions, and Directors Independence”for additional information.
As of December 31, 2017, we have sold to over 2,700 end-customers in over 80 countries, including 18% of the Global 2000, since our inception. For theyears ended December 31, 2015, 2016, and 2017 we sold to 10%, and 11%, and 13% of the Global 2000, respectively. Our end-customers represent a broadrange of industries, including financial services, government, healthcare, technology, manufacturing, services, energy, entertainment and retail.
58
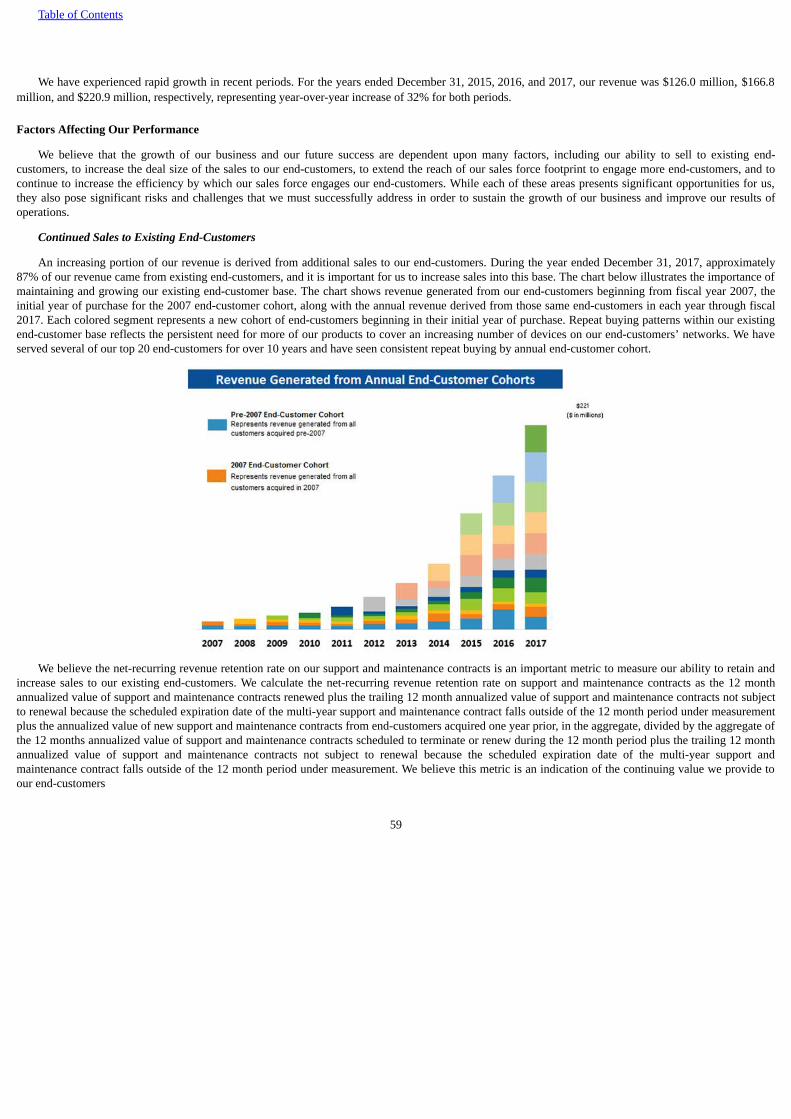
Table of Contents
We have experienced rapid growth in recent periods. For the years ended December 31, 2015, 2016, and 2017, our revenue was $126.0 million, $166.8million, and $220.9 million, respectively, representing year-over-year increase of 32% for both periods.
Factors Affecting Our Performance
We believe that the growth of our business and our future success are dependent upon many factors, including our ability to sell to existing end-customers, to increase the deal size of the sales to our end-customers, to extend the reach of our sales force footprint to engage more end-customers, and tocontinue to increase the efficiency by which our sales force engages our end-customers. While each of these areas presents significant opportunities for us,they also pose significant risks and challenges that we must successfully address in order to sustain the growth of our business and improve our results ofoperations.
Continued Sales to Existing End-Customers
An increasing portion of our revenue is derived from additional sales to our end-customers. During the year ended December 31, 2017, approximately87% of our revenue came from existing end-customers, and it is important for us to increase sales into this base. The chart below illustrates the importance ofmaintaining and growing our existing end-customer base. The chart shows revenue generated from our end-customers beginning from fiscal year 2007, theinitial year of purchase for the 2007 end-customer cohort, along with the annual revenue derived from those same end-customers in each year through fiscal2017. Each colored segment represents a new cohort of end-customers beginning in their initial year of purchase. Repeat buying patterns within our existingend-customer base reflects the persistent need for more of our products to cover an increasing number of devices on our end-customers’ networks. We haveserved several of our top 20 end-customers for over 10 years and have seen consistent repeat buying by annual end-customer cohort.
We believe the net-recurring revenue retention rate on our support and maintenance contracts is an important metric to measure our ability to retain andincrease sales to our existing end-customers. We calculate the net-recurring revenue retention rate on support and maintenance contracts as the 12 monthannualized value of support and maintenance contracts renewed plus the trailing 12 month annualized value of support and maintenance contracts not subjectto renewal because the scheduled expiration date of the multi-year support and maintenance contract falls outside of the 12 month period under measurementplus the annualized value of new support and maintenance contracts from end-customers acquired one year prior, in the aggregate, divided by the aggregate ofthe 12 months annualized value of support and maintenance contracts scheduled to terminate or renew during the 12 month period plus the trailing 12 monthannualized value of support and maintenance contracts not subject to renewal because the scheduled expiration date of the multi-year support andmaintenance contract falls outside of the 12 month period under measurement. We believe this metric is an indication of the continuing value we provide toour end-customers
59
Table of Contents
because it shows the renewal of their support and maintenance contracts on their existing IP-based devices and the expanded value to our end-customersdemonstrated by increases in the number of IP-based devices. Our net-recurring revenue retention rate on support and maintenance contracts as ofDecember 31, 2015, 2016, and 2017 were 116%, 127%, and 126%, respectively. A net retention rate over 100% indicates that our products are expandingwithin our end-customer base, whereas a rate less than 100%indicates that our products are constricting within our end-customer base. Additionally, thiscalculation includes all changes to the annualized value of the recurring revenue from support and maintenance contracts for the designated set of support andmaintenance contracts used in the calculation, which includes scheduled expiration periods, stub periods, changes in pricing, additional products purchased,lost end-customers, early renewals, decreases in the number of Physical or Virtual Appliances, decreases in the number of devices and hardware included inour Enterprise Software License and Extended Modules under contract. This metric does not take into account product revenue or professional servicesrevenue. The annualized value of our support and maintenance contracts is a legal and contractual determination made by assessing the contractual terms withour end-customers. The annualized value of our support and maintenance contracts is not determined by reference to historical revenue, deferred revenue orany other GAAP financial measure over any period.
Increasing Deal Size of Sales to Our End-Customers
The value realized from our products has led to increased adoption and larger scale deployments. The number of annual end-customer deals over $1million is increasing. For the years ended December 31, 2015, 2016, and 2017, we had 26, 28, and 48 deals, respectively, representing year-over-year growthof the collective value of those deals of 61% and 55%, respectively. We define an annual end-customer deal as the aggregate billings to an end-customerduring a calendar year. In addition, our average deal size with end-customers excluding renewals is increasing. For the year ended December 31, 2017, ouraverage deal size was over $217,000, an increase of 24% from the average annual deal size for the year ended December 31, 2015. We define the average dealsize as the aggregate sales to end-customers during a calendar year divided by the number of end-customers purchasing in that year, excluding any end-customer for which the total value of their purchases in that year were less than five thousand dollars and excluding support and maintenance renewals, as wedetermined that the majority of this population was comprised of transactions not fundamental to our end-customer group and go-to-market strategy.
Extending the Reach of Our Sales Force Footprint
We have made substantial investments in our sales force in recent periods in order to address the significant enterprise opportunity caused by an increasein unmanaged devices coming onto networks. We have almost tripled the size of our quota-bearing sales representatives from the beginning of 2015 toDecember 31, 2017. We expect to continue to make substantial investments in our sales force to increase adoption within the Global 2000 and public sector.
Increasing the Efficiency by which Our Sales Force Engages Our End-Customers
We are focused on increasing the efficiency of our sales force. Over the last 12 months, we have increased hiring in sales enablement and marketing,enhanced sales training activities, and implemented company-wide standards for product positioning in order to instill a culture of success and discipline inour sales organization. Our sales strategy depends on attracting top talent from security organizations, expanding our sales coverage, increasing our pipelineof business, and enhancing productivity. We focus on productivity per quota-carrying sales representative across different levels within the sales organization,and the time it takes our sales representatives to reach productivity. We manage our pipeline on a quarterly basis, by sales representative, to ensure sufficientcoverage of our bookings targets. Our ability to manage our sales productivity and pipeline are important factors to the success of our business.
Components of Financial Performance
Revenue
We derive revenue from sales of our products, maintenance, and professional services. Revenue is recognized when persuasive evidence of anarrangement exists, delivery has occurred, the fee is fixed or determinable, and collectability is reasonably assured.
Our revenue is comprised of the following:
60
Table of Contents
• Product Revenue. Our product revenue is derived from sales of our Physical Appliances, Virtual Appliances, Extended Modules, Enterprise LicenseSoftware, and hardware sold separately, which is recognized either up-front or ratably depending on the terms of the agreement and the productcomposition. Hardware Product revenue, which includes our Physical Appliances, Enterprise License Software sold with separate hardware andhardware sold separately, is recognized at the time of delivery, provided that all other revenue recognition criteria have been met. Software Productrevenue, which includes Virtual Appliances, Enterprise License Software sold without hardware and Extended Modules, is recognized at the time ofdelivery if VSOE is established for all undelivered related items. If VSOE does not exist for one or more undelivered items, revenue from thesoftware portion of the arrangement is deferred until the delivery of all items has begun and is then recognized ratably over the longest remainingservice period, which generally is the support and maintenance term. Beginning on January 1, 2016, we established VSOE for professional services,and support and maintenance on Software Products, except Extended Modules. As a percentage of total revenue, we expect our product revenue tovary from quarter to quarter based on seasonal and cyclical factors.
• Maintenance and Professional Services Revenue. Our maintenance revenue is derived from support and maintenance contracts with terms that aregenerally either one or three years. We typically bill for support and maintenance contracts upfront. We recognize revenue from support andmaintenance over the contractual service period. Our professional services revenue is generally recognized as the services are rendered. We intend toinvest in our professional services organization to improve the time to deliver these services. As a percentage of total revenue, we expect ourmaintenance and professional services revenue to vary from quarter to quarter based on seasonal and cyclical factors.
Cost of Revenue
• Cost of Product Revenue. Cost of product revenue primarily consists of costs paid to our third-party contract manufacturer for our PhysicalAppliances, hardware sold with our Enterprise License Software and hardware sold separately. Our cost of product revenue also includes allocatedcosts, shipping costs, and personnel costs associated with logistics. There is no direct cost of revenue associated with our Software Products becauseSoftware Products are delivered electronically. We expect our cost of product revenue to fluctuate from quarter to quarter based on product mix;however, over time, we expect our cost of product revenue to decline as a percentage of product revenue primarily due to a shift in product mixtowards increased sales of Software Products.
• Cost of Maintenance and Professional Services Revenue. Cost of maintenance and professional services revenue consists of personnel costs for ourglobal customer support and professional services organization and costs paid to third-party contractors that deliver some of our services. We expectour cost of maintenance and professional services revenue to decline over time as a percentage of our maintenance and professional services revenueas we expect to scale our customer support organization at a lower growth rate than our anticipated maintenance and professional services revenuegrowth rate.
Gross Margin
Gross margin, or gross profit as a percentage of revenue, has been and will continue to be affected by a variety of factors, including the mix of productssold between Hardware Products and Software Products; the mix of revenue between products, maintenance, and professional services; the average salesprice of our products, maintenance and professional services; and manufacturing costs. Our gross margins vary by product, with gross margin on our high-endPhysical Appliances ranging between 80% and 83% and gross margin of 62% on our low-end Physical Appliances for the years ended December 31, 2015,2016, and 2017. Gross margin on hardware sold with Enterprise License Software or sold separately ranged between 16% and 30% for the year endedDecember 31, 2017. Gross margin on our Software Products was 99% for the years ended December 31, 2015, 2016, and 2017. We expect our gross marginsto fluctuate from quarter to quarter based on product mix; however, over time, we expect our gross margins to increase as a percentage of product revenueprimarily due to a shift in product mix towards increased sales of Software Products.
Operating Expenses
Our operating expenses consist of research and development, sales and marketing, and general and administrative expenses. Personnel costs are the mostsignificant component of operating expenses and consists of salaries, benefits, bonuses, stock-based compensation, and with regard to sales and marketingexpense, sales commissions.
61
Table of Contents
• Research and Development. Research and development expense consists primarily of personnel costs. Research and development expense alsoincludes consulting expense and allocated costs including facilities and information technology related costs. We expect research and developmentexpense to increase in the near term in absolute dollars as we continue to invest in our future products and services; however, we expect our researchand development expense to decline as a percentage of total revenue in the long term as we scale the business.
• Sales and Marketing. Sales and marketing expense consists primarily of personnel costs, including commission costs. We expense commission costsas incurred. Sales and marketing expense also includes costs for market development programs, promotional and other marketing costs, travel costs,professional services, and allocated costs including facilities and information technology related costs. We expect sales and marketing expense tocontinue to increase in absolute dollars as we increase the size of our sales and marketing organizations; however, we expect our sales and marketingexpense to decline as a percentage of total revenue in the long term as we scale the business.
• General and Administrative. General and administrative expense consists of personnel costs, professional services, certain non-recurring generalexpenses, and allocated costs including facilities and information technology related costs. General and administrative personnel include ourexecutive, finance, human resources, and legal organizations. Professional services consist primarily of legal, auditing, accounting, and otherconsulting costs. We expect general and administrative expense to increase in absolute dollars due to additional costs associated with being a publiccompany, such as accounting, compliance, insurance, and investor relations, however, we expect our general and administrative expense to decline asa percentage of total revenue in the long term as we scale the business.
Interest Expense
Interest expense consists of interest on our outstanding indebtedness.
Other Income (Expense), Net
Other Income (Expense), net consists primarily of interest income earned on our cash and cash equivalents and foreign currency exchange losses relatedto transactions denominated in currencies other than the U.S. Dollar.
Revaluation of Warrant Liabilities
Revaluation of warrant liabilities includes adjustments to the estimated fair value of the preferred and common stock warrants outstanding offset by anygain realized from the exercise of outstanding warrants when the fair value of the warrants exercised is greater than the fair value of the redeemable stock. Wemark-to-market our warrant liabilities on a quarterly basis. The majority of these warrants were exercised upon our IPO.
Provision for Income Taxes
Provision for income taxes consists primarily of foreign income taxes and reserves, withholding taxes, and U.S. state income taxes. We maintain a fullvaluation allowance for domestic net deferred tax assets. Our foreign deferred tax assets are immaterial.
62
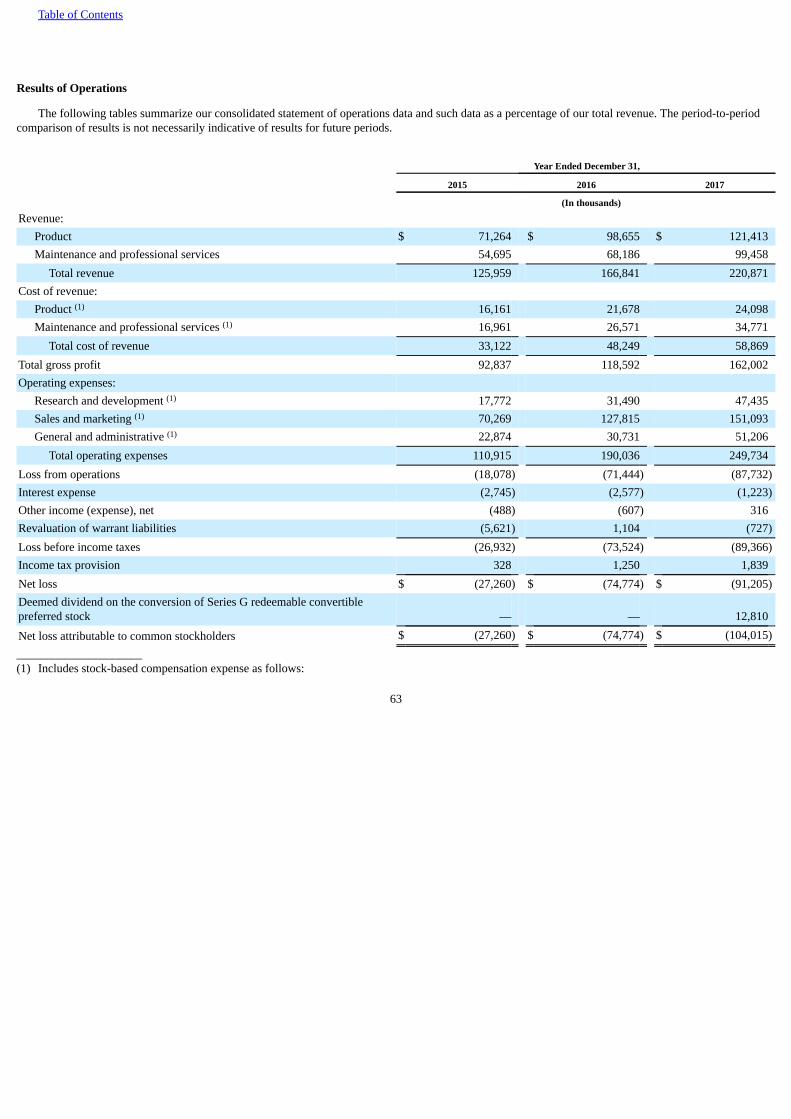
Table of Contents
Results of Operations
The following tables summarize our consolidated statement of operations data and such data as a percentage of our total revenue. The period-to-periodcomparison of results is not necessarily indicative of results for future periods.
Year Ended December 31,
2015 2016 2017
(In thousands)
Revenue: Product $ 71,264 $ 98,655 $ 121,413Maintenance and professional services 54,695 68,186 99,458
Total revenue 125,959 166,841 220,871Cost of revenue:
Product (1) 16,161 21,678 24,098Maintenance and professional services (1) 16,961 26,571 34,771
Total cost of revenue 33,122 48,249 58,869Total gross profit 92,837 118,592 162,002Operating expenses:
Research and development (1) 17,772 31,490 47,435Sales and marketing (1) 70,269 127,815 151,093General and administrative (1) 22,874 30,731 51,206
Total operating expenses 110,915 190,036 249,734Loss from operations (18,078) (71,444) (87,732)Interest expense (2,745) (2,577) (1,223)Other income (expense), net (488) (607) 316Revaluation of warrant liabilities (5,621) 1,104 (727)Loss before income taxes (26,932) (73,524) (89,366)Income tax provision 328 1,250 1,839Net loss $ (27,260) $ (74,774) $ (91,205)Deemed dividend on the conversion of Series G redeemable convertiblepreferred stock — — 12,810
Net loss attributable to common stockholders $ (27,260) $ (74,774) $ (104,015)_____________________ (1) Includes stock-based compensation expense as follows:
63
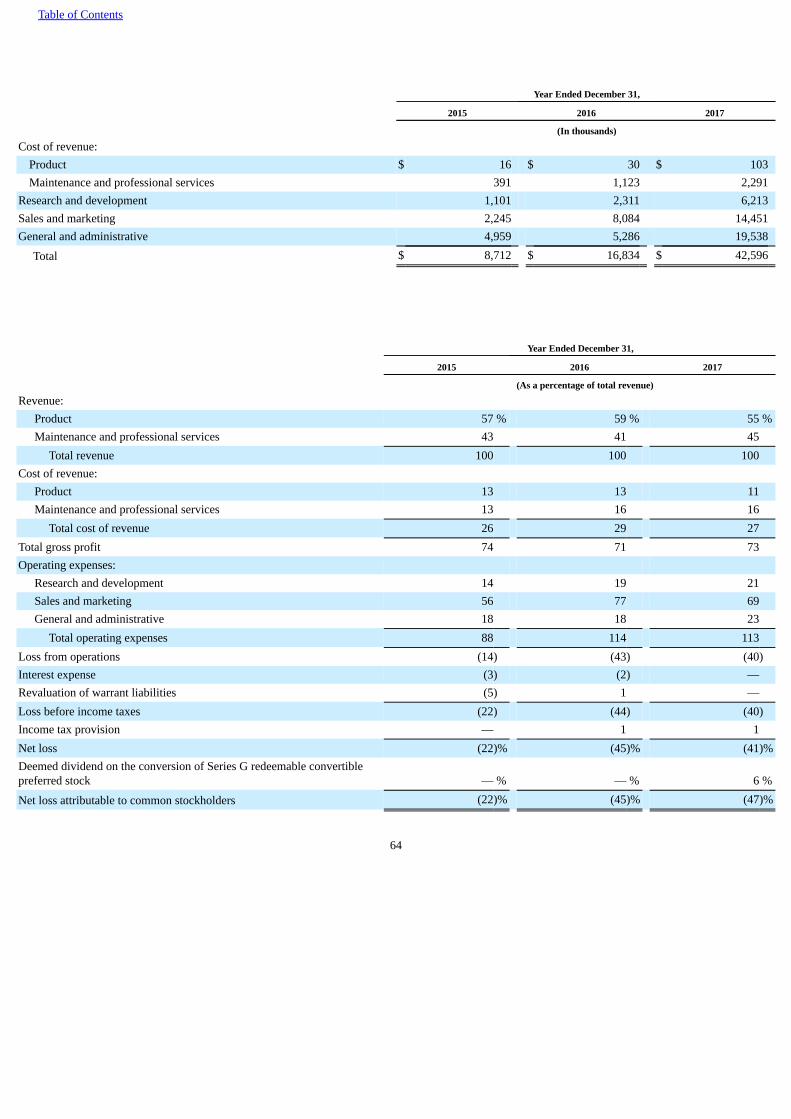
Table of Contents
Year Ended December 31,
2015 2016 2017
(In thousands)
Cost of revenue: Product $ 16 $ 30 $ 103Maintenance and professional services 391 1,123 2,291
Research and development 1,101 2,311 6,213Sales and marketing 2,245 8,084 14,451General and administrative 4,959 5,286 19,538
Total $ 8,712 $ 16,834 $ 42,596
Year Ended December 31,
2015 2016 2017
(As a percentage of total revenue)
Revenue: Product 57 % 59 % 55 %Maintenance and professional services 43 41 45
Total revenue 100 100 100Cost of revenue:
Product 13 13 11Maintenance and professional services 13 16 16
Total cost of revenue 26 29 27Total gross profit 74 71 73Operating expenses:
Research and development 14 19 21Sales and marketing 56 77 69General and administrative 18 18 23
Total operating expenses 88 114 113Loss from operations (14) (43) (40)Interest expense (3) (2) —Revaluation of warrant liabilities (5) 1 —Loss before income taxes (22) (44) (40)Income tax provision — 1 1Net loss (22)% (45)% (41)%Deemed dividend on the conversion of Series G redeemable convertiblepreferred stock — % — % 6 %
Net loss attributable to common stockholders (22)% (45)% (47)%
64
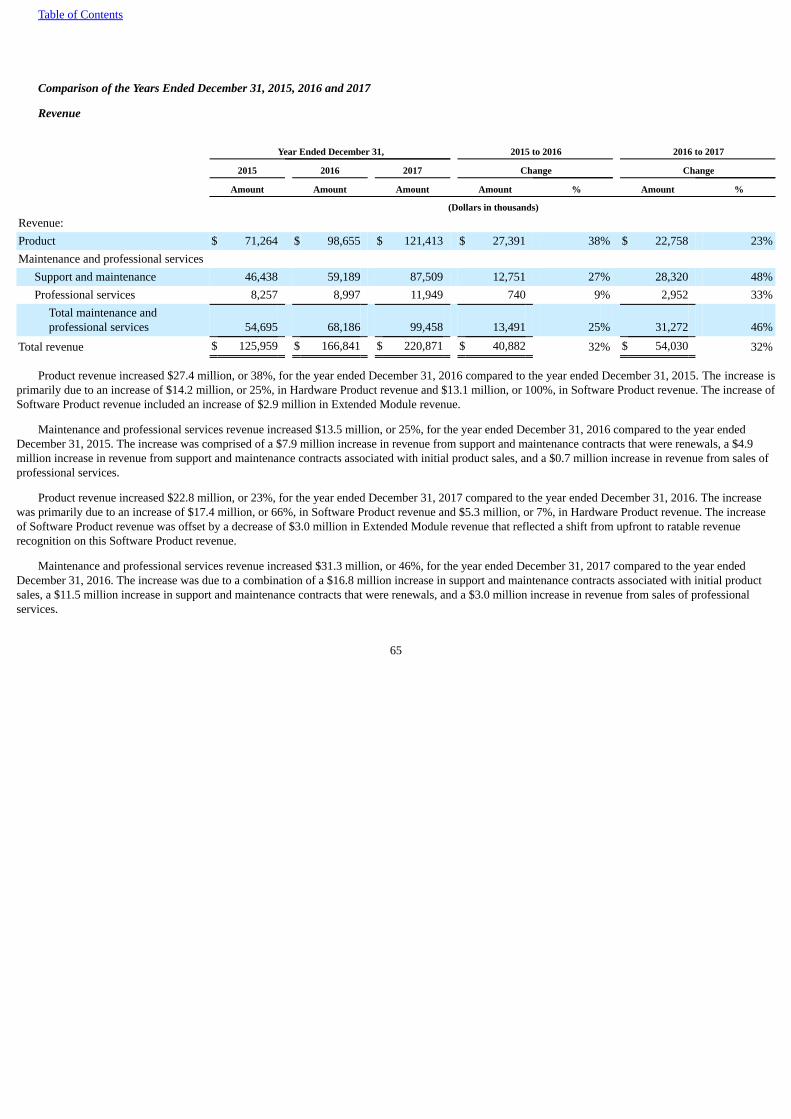
Table of Contents
Comparison of the Years Ended December 31, 2015, 2016 and 2017
Revenue
Year Ended December 31, 2015 to 2016 2016 to 2017
2015 2016 2017 Change Change
Amount Amount Amount Amount % Amount %
(Dollars in thousands)
Revenue: Product $ 71,264 $ 98,655 $ 121,413 $ 27,391 38% $ 22,758 23%Maintenance and professional services
Support and maintenance 46,438 59,189 87,509 12,751 27% 28,320 48%Professional services 8,257 8,997 11,949 740 9% 2,952 33%
Total maintenance andprofessional services 54,695 68,186 99,458 13,491 25% 31,272 46%
Total revenue $ 125,959 $ 166,841 $ 220,871 $ 40,882 32% $ 54,030 32%
Product revenue increased $27.4 million, or 38%, for the year ended December 31, 2016 compared to the year ended December 31, 2015. The increase isprimarily due to an increase of $14.2 million, or 25%, in Hardware Product revenue and $13.1 million, or 100%, in Software Product revenue. The increase ofSoftware Product revenue included an increase of $2.9 million in Extended Module revenue.
Maintenance and professional services revenue increased $13.5 million, or 25%, for the year ended December 31, 2016 compared to the year endedDecember 31, 2015. The increase was comprised of a $7.9 million increase in revenue from support and maintenance contracts that were renewals, a $4.9million increase in revenue from support and maintenance contracts associated with initial product sales, and a $0.7 million increase in revenue from sales ofprofessional services.
Product revenue increased $22.8 million, or 23%, for the year ended December 31, 2017 compared to the year ended December 31, 2016. The increasewas primarily due to an increase of $17.4 million, or 66%, in Software Product revenue and $5.3 million, or 7%, in Hardware Product revenue. The increaseof Software Product revenue was offset by a decrease of $3.0 million in Extended Module revenue that reflected a shift from upfront to ratable revenuerecognition on this Software Product revenue.
Maintenance and professional services revenue increased $31.3 million, or 46%, for the year ended December 31, 2017 compared to the year endedDecember 31, 2016. The increase was due to a combination of a $16.8 million increase in support and maintenance contracts associated with initial productsales, a $11.5 million increase in support and maintenance contracts that were renewals, and a $3.0 million increase in revenue from sales of professionalservices.
65
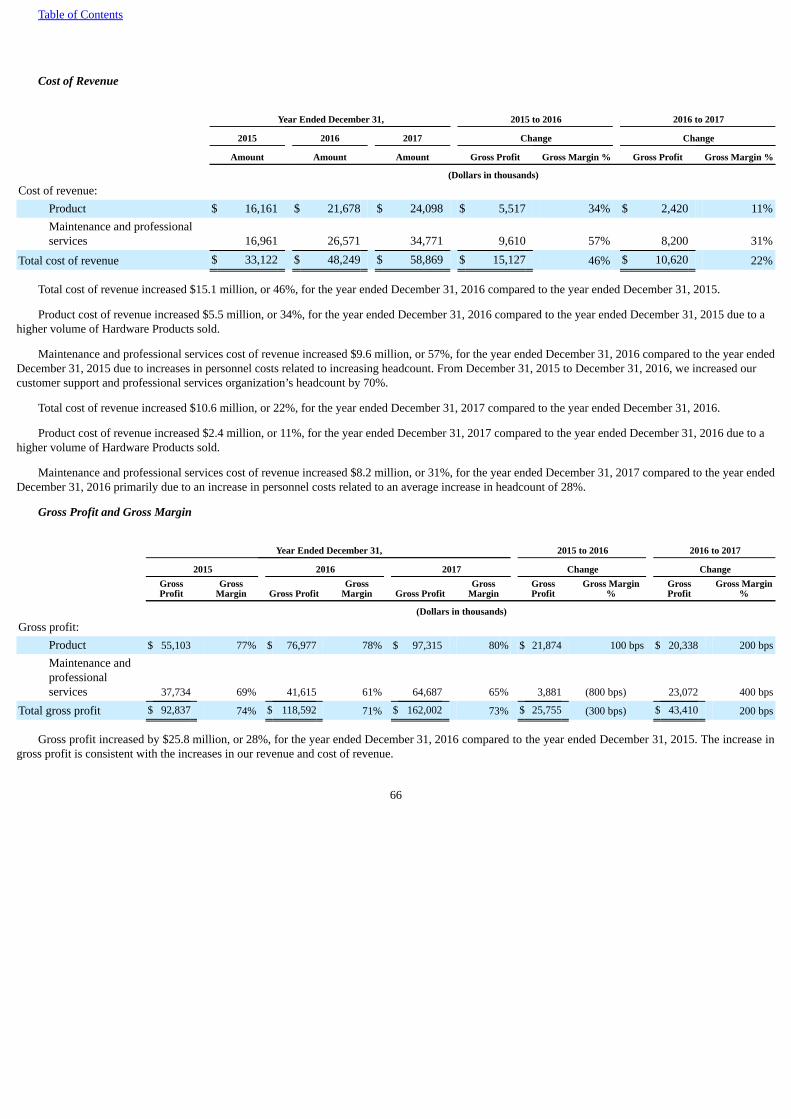
Table of Contents
Cost of Revenue
Year Ended December 31, 2015 to 2016 2016 to 2017
2015 2016 2017 Change Change
Amount Amount Amount Gross Profit Gross Margin % Gross Profit Gross Margin %
(Dollars in thousands)
Cost of revenue: Product $ 16,161 $ 21,678 $ 24,098 $ 5,517 34% $ 2,420 11%Maintenance and professionalservices 16,961 26,571 34,771 9,610 57% 8,200 31%
Total cost of revenue $ 33,122 $ 48,249 $ 58,869 $ 15,127 46% $ 10,620 22%
Total cost of revenue increased $15.1 million, or 46%, for the year ended December 31, 2016 compared to the year ended December 31, 2015.
Product cost of revenue increased $5.5 million, or 34%, for the year ended December 31, 2016 compared to the year ended December 31, 2015 due to ahigher volume of Hardware Products sold.
Maintenance and professional services cost of revenue increased $9.6 million, or 57%, for the year ended December 31, 2016 compared to the year endedDecember 31, 2015 due to increases in personnel costs related to increasing headcount. From December 31, 2015 to December 31, 2016, we increased ourcustomer support and professional services organization’s headcount by 70%.
Total cost of revenue increased $10.6 million, or 22%, for the year ended December 31, 2017 compared to the year ended December 31, 2016.
Product cost of revenue increased $2.4 million, or 11%, for the year ended December 31, 2017 compared to the year ended December 31, 2016 due to ahigher volume of Hardware Products sold.
Maintenance and professional services cost of revenue increased $8.2 million, or 31%, for the year ended December 31, 2017 compared to the year endedDecember 31, 2016 primarily due to an increase in personnel costs related to an average increase in headcount of 28%.
Gross Profit and Gross Margin
Year Ended December 31, 2015 to 2016 2016 to 2017
2015 2016 2017 Change Change
GrossProfit
GrossMargin Gross Profit
GrossMargin Gross Profit
GrossMargin
GrossProfit
Gross Margin%
GrossProfit
Gross Margin%
(Dollars in thousands)
Gross profit: Product $ 55,103 77% $ 76,977 78% $ 97,315 80% $ 21,874 100 bps $ 20,338 200 bps
Maintenance andprofessionalservices 37,734 69% 41,615 61% 64,687 65% 3,881 (800 bps) 23,072 400 bps
Total gross profit $ 92,837 74% $ 118,592 71% $ 162,002 73% $ 25,755 (300 bps) $ 43,410 200 bps
Gross profit increased by $25.8 million, or 28%, for the year ended December 31, 2016 compared to the year ended December 31, 2015. The increase ingross profit is consistent with the increases in our revenue and cost of revenue.
66
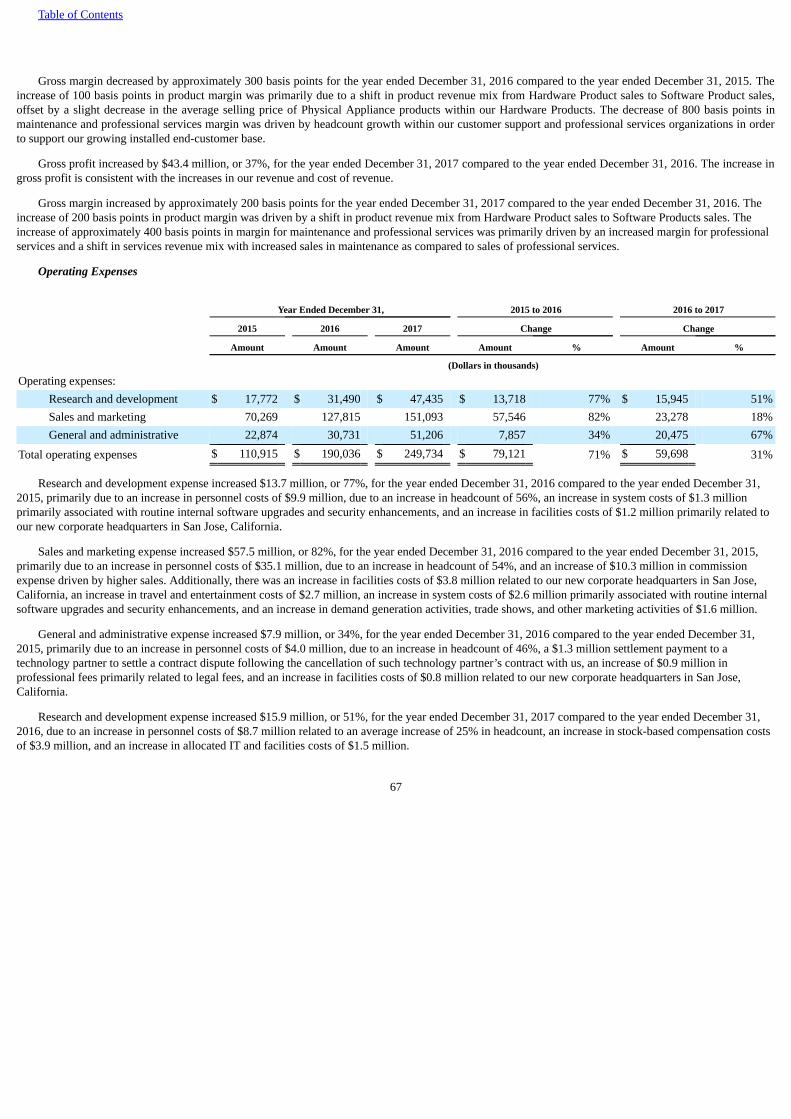
Table of Contents
Gross margin decreased by approximately 300 basis points for the year ended December 31, 2016 compared to the year ended December 31, 2015. Theincrease of 100 basis points in product margin was primarily due to a shift in product revenue mix from Hardware Product sales to Software Product sales,offset by a slight decrease in the average selling price of Physical Appliance products within our Hardware Products. The decrease of 800 basis points inmaintenance and professional services margin was driven by headcount growth within our customer support and professional services organizations in orderto support our growing installed end-customer base.
Gross profit increased by $43.4 million, or 37%, for the year ended December 31, 2017 compared to the year ended December 31, 2016. The increase ingross profit is consistent with the increases in our revenue and cost of revenue.
Gross margin increased by approximately 200 basis points for the year ended December 31, 2017 compared to the year ended December 31, 2016. Theincrease of 200 basis points in product margin was driven by a shift in product revenue mix from Hardware Product sales to Software Products sales. Theincrease of approximately 400 basis points in margin for maintenance and professional services was primarily driven by an increased margin for professionalservices and a shift in services revenue mix with increased sales in maintenance as compared to sales of professional services.
Operating Expenses
Year Ended December 31, 2015 to 2016 2016 to 2017
2015 2016 2017 Change Change
Amount Amount Amount Amount % Amount %
(Dollars in thousands)
Operating expenses: Research and development $ 17,772 $ 31,490 $ 47,435 $ 13,718 77% $ 15,945 51%Sales and marketing 70,269 127,815 151,093 57,546 82% 23,278 18%General and administrative 22,874 30,731 51,206 7,857 34% 20,475 67%
Total operating expenses $ 110,915 $ 190,036 $ 249,734 $ 79,121 71% $ 59,698 31%
Research and development expense increased $13.7 million, or 77%, for the year ended December 31, 2016 compared to the year ended December 31,2015, primarily due to an increase in personnel costs of $9.9 million, due to an increase in headcount of 56%, an increase in system costs of $1.3 millionprimarily associated with routine internal software upgrades and security enhancements, and an increase in facilities costs of $1.2 million primarily related toour new corporate headquarters in San Jose, California.
Sales and marketing expense increased $57.5 million, or 82%, for the year ended December 31, 2016 compared to the year ended December 31, 2015,primarily due to an increase in personnel costs of $35.1 million, due to an increase in headcount of 54%, and an increase of $10.3 million in commissionexpense driven by higher sales. Additionally, there was an increase in facilities costs of $3.8 million related to our new corporate headquarters in San Jose,California, an increase in travel and entertainment costs of $2.7 million, an increase in system costs of $2.6 million primarily associated with routine internalsoftware upgrades and security enhancements, and an increase in demand generation activities, trade shows, and other marketing activities of $1.6 million.
General and administrative expense increased $7.9 million, or 34%, for the year ended December 31, 2016 compared to the year ended December 31,2015, primarily due to an increase in personnel costs of $4.0 million, due to an increase in headcount of 46%, a $1.3 million settlement payment to atechnology partner to settle a contract dispute following the cancellation of such technology partner’s contract with us, an increase of $0.9 million inprofessional fees primarily related to legal fees, and an increase in facilities costs of $0.8 million related to our new corporate headquarters in San Jose,California.
Research and development expense increased $15.9 million, or 51%, for the year ended December 31, 2017 compared to the year ended December 31,2016, due to an increase in personnel costs of $8.7 million related to an average increase of 25% in headcount, an increase in stock-based compensation costsof $3.9 million, and an increase in allocated IT and facilities costs of $1.5 million.
67
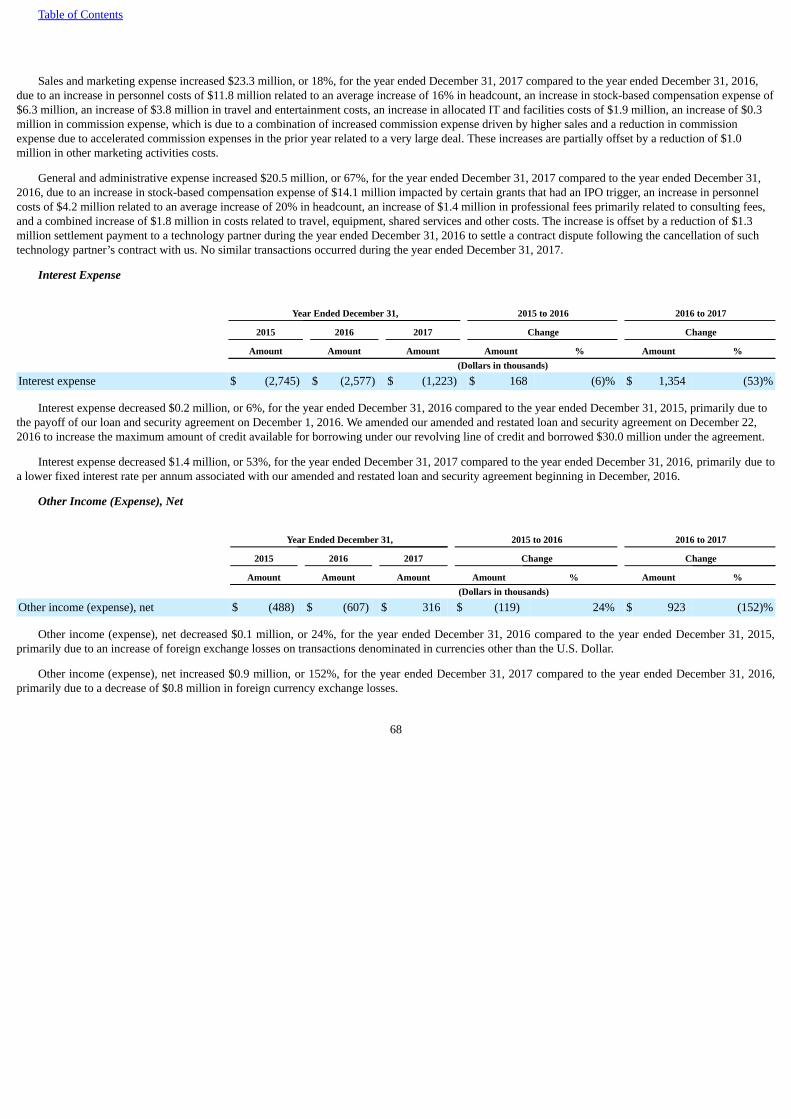
Table of Contents
Sales and marketing expense increased $23.3 million, or 18%, for the year ended December 31, 2017 compared to the year ended December 31, 2016,due to an increase in personnel costs of $11.8 million related to an average increase of 16% in headcount, an increase in stock-based compensation expense of$6.3 million, an increase of $3.8 million in travel and entertainment costs, an increase in allocated IT and facilities costs of $1.9 million, an increase of $0.3million in commission expense, which is due to a combination of increased commission expense driven by higher sales and a reduction in commissionexpense due to accelerated commission expenses in the prior year related to a very large deal. These increases are partially offset by a reduction of $1.0million in other marketing activities costs.
General and administrative expense increased $20.5 million, or 67%, for the year ended December 31, 2017 compared to the year ended December 31,2016, due to an increase in stock-based compensation expense of $14.1 million impacted by certain grants that had an IPO trigger, an increase in personnelcosts of $4.2 million related to an average increase of 20% in headcount, an increase of $1.4 million in professional fees primarily related to consulting fees,and a combined increase of $1.8 million in costs related to travel, equipment, shared services and other costs. The increase is offset by a reduction of $1.3million settlement payment to a technology partner during the year ended December 31, 2016 to settle a contract dispute following the cancellation of suchtechnology partner’s contract with us. No similar transactions occurred during the year ended December 31, 2017.
Interest Expense
Year Ended December 31, 2015 to 2016 2016 to 2017
2015 2016 2017 Change Change
Amount Amount Amount Amount % Amount % (Dollars in thousands)
Interest expense $ (2,745) $ (2,577) $ (1,223) $ 168 (6)% $ 1,354 (53)%
Interest expense decreased $0.2 million, or 6%, for the year ended December 31, 2016 compared to the year ended December 31, 2015, primarily due tothe payoff of our loan and security agreement on December 1, 2016. We amended our amended and restated loan and security agreement on December 22,2016 to increase the maximum amount of credit available for borrowing under our revolving line of credit and borrowed $30.0 million under the agreement.
Interest expense decreased $1.4 million, or 53%, for the year ended December 31, 2017 compared to the year ended December 31, 2016, primarily due toa lower fixed interest rate per annum associated with our amended and restated loan and security agreement beginning in December, 2016.
Other Income (Expense), Net
Year Ended December 31, 2015 to 2016 2016 to 2017
2015 2016 2017 Change Change
Amount Amount Amount Amount % Amount % (Dollars in thousands)
Other income (expense), net $ (488) $ (607) $ 316 $ (119) 24% $ 923 (152)%
Other income (expense), net decreased $0.1 million, or 24%, for the year ended December 31, 2016 compared to the year ended December 31, 2015,primarily due to an increase of foreign exchange losses on transactions denominated in currencies other than the U.S. Dollar.
Other income (expense), net increased $0.9 million, or 152%, for the year ended December 31, 2017 compared to the year ended December 31, 2016,primarily due to a decrease of $0.8 million in foreign currency exchange losses.
68
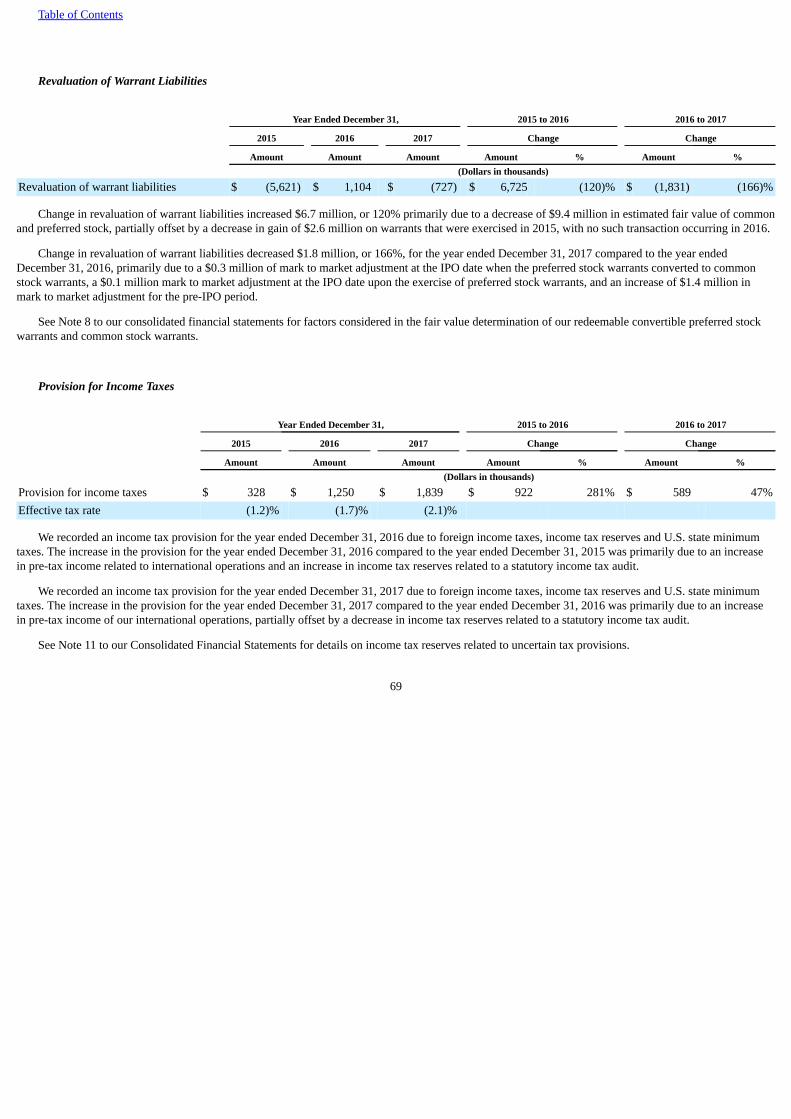
Table of Contents
Revaluation of Warrant Liabilities
Year Ended December 31, 2015 to 2016 2016 to 2017
2015 2016 2017 Change Change
Amount Amount Amount Amount % Amount % (Dollars in thousands)
Revaluation of warrant liabilities $ (5,621) $ 1,104 $ (727) $ 6,725 (120)% $ (1,831) (166)%
Change in revaluation of warrant liabilities increased $6.7 million, or 120% primarily due to a decrease of $9.4 million in estimated fair value of commonand preferred stock, partially offset by a decrease in gain of $2.6 million on warrants that were exercised in 2015, with no such transaction occurring in 2016.
Change in revaluation of warrant liabilities decreased $1.8 million, or 166%, for the year ended December 31, 2017 compared to the year endedDecember 31, 2016, primarily due to a $0.3 million of mark to market adjustment at the IPO date when the preferred stock warrants converted to commonstock warrants, a $0.1 million mark to market adjustment at the IPO date upon the exercise of preferred stock warrants, and an increase of $1.4 million inmark to market adjustment for the pre-IPO period.
See Note 8 to our consolidated financial statements for factors considered in the fair value determination of our redeemable convertible preferred stockwarrants and common stock warrants.
Provision for Income Taxes
Year Ended December 31, 2015 to 2016 2016 to 2017
2015 2016 2017 Change Change
Amount Amount Amount Amount % Amount % (Dollars in thousands)
Provision for income taxes $ 328 $ 1,250 $ 1,839 $ 922 281% $ 589 47%Effective tax rate (1.2)% (1.7)% (2.1)%
We recorded an income tax provision for the year ended December 31, 2016 due to foreign income taxes, income tax reserves and U.S. state minimumtaxes. The increase in the provision for the year ended December 31, 2016 compared to the year ended December 31, 2015 was primarily due to an increasein pre-tax income related to international operations and an increase in income tax reserves related to a statutory income tax audit.
We recorded an income tax provision for the year ended December 31, 2017 due to foreign income taxes, income tax reserves and U.S. state minimumtaxes. The increase in the provision for the year ended December 31, 2017 compared to the year ended December 31, 2016 was primarily due to an increasein pre-tax income of our international operations, partially offset by a decrease in income tax reserves related to a statutory income tax audit.
See Note 11 to our Consolidated Financial Statements for details on income tax reserves related to uncertain tax provisions.
69
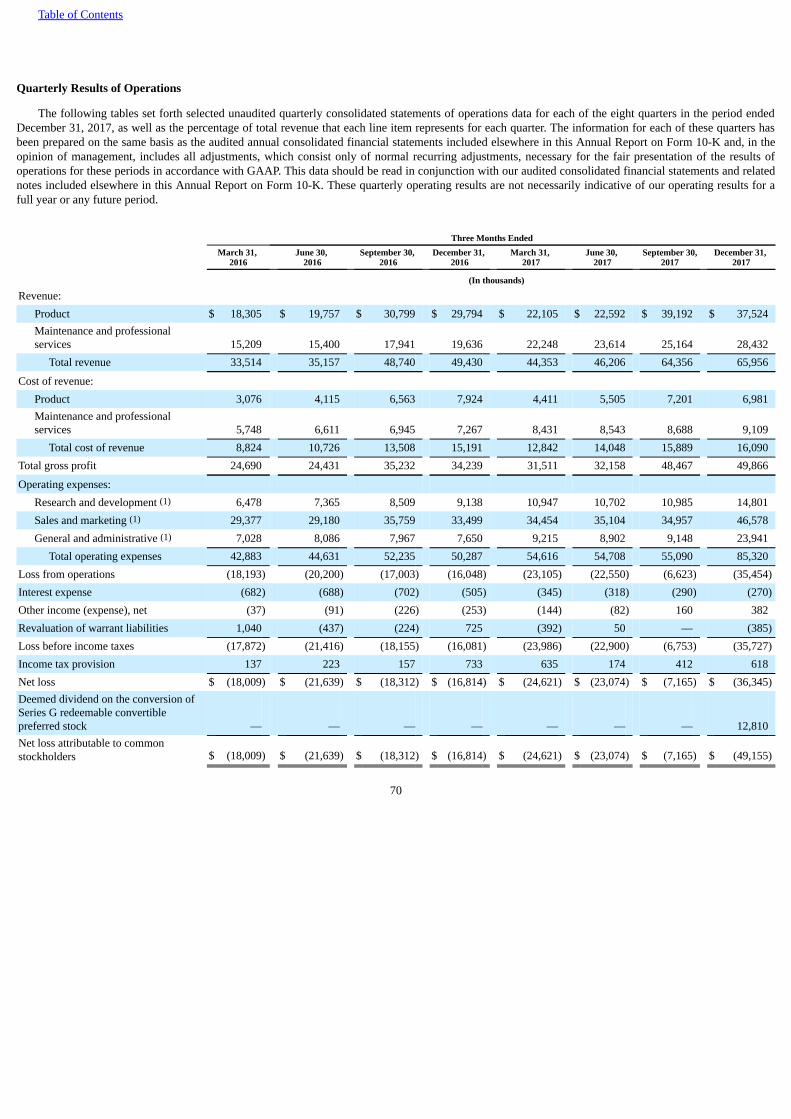
Table of Contents
Quarterly Results of Operations
The following tables set forth selected unaudited quarterly consolidated statements of operations data for each of the eight quarters in the period endedDecember 31, 2017, as well as the percentage of total revenue that each line item represents for each quarter. The information for each of these quarters hasbeen prepared on the same basis as the audited annual consolidated financial statements included elsewhere in this Annual Report on Form 10-K and, in theopinion of management, includes all adjustments, which consist only of normal recurring adjustments, necessary for the fair presentation of the results ofoperations for these periods in accordance with GAAP. This data should be read in conjunction with our audited consolidated financial statements and relatednotes included elsewhere in this Annual Report on Form 10-K. These quarterly operating results are not necessarily indicative of our operating results for afull year or any future period.
Three Months Ended
March 31,
2016 June 30,
2016 September 30,
2016 December 31,
2016 March 31,
2017 June 30,
2017 September 30,
2017 December 31,
2017
(In thousands)
Revenue: Product $ 18,305 $ 19,757 $ 30,799 $ 29,794 $ 22,105 $ 22,592 $ 39,192 $ 37,524Maintenance and professionalservices 15,209 15,400 17,941 19,636 22,248 23,614 25,164 28,432
Total revenue 33,514 35,157 48,740 49,430 44,353 46,206 64,356 65,956
Cost of revenue: Product 3,076 4,115 6,563 7,924 4,411 5,505 7,201 6,981Maintenance and professionalservices 5,748 6,611 6,945 7,267 8,431 8,543 8,688 9,109
Total cost of revenue 8,824 10,726 13,508 15,191 12,842 14,048 15,889 16,090Total gross profit 24,690 24,431 35,232 34,239 31,511 32,158 48,467 49,866
Operating expenses: Research and development (1) 6,478 7,365 8,509 9,138 10,947 10,702 10,985 14,801Sales and marketing (1) 29,377 29,180 35,759 33,499 34,454 35,104 34,957 46,578General and administrative (1) 7,028 8,086 7,967 7,650 9,215 8,902 9,148 23,941
Total operating expenses 42,883 44,631 52,235 50,287 54,616 54,708 55,090 85,320Loss from operations (18,193) (20,200) (17,003) (16,048) (23,105) (22,550) (6,623) (35,454)Interest expense (682) (688) (702) (505) (345) (318) (290) (270)Other income (expense), net (37) (91) (226) (253) (144) (82) 160 382Revaluation of warrant liabilities 1,040 (437) (224) 725 (392) 50 — (385)Loss before income taxes (17,872) (21,416) (18,155) (16,081) (23,986) (22,900) (6,753) (35,727)Income tax provision 137 223 157 733 635 174 412 618Net loss $ (18,009) $ (21,639) $ (18,312) $ (16,814) $ (24,621) $ (23,074) $ (7,165) $ (36,345)Deemed dividend on the conversion ofSeries G redeemable convertiblepreferred stock — — — — — — — 12,810Net loss attributable to commonstockholders $ (18,009) $ (21,639) $ (18,312) $ (16,814) $ (24,621) $ (23,074) $ (7,165) $ (49,155)
70

Table of Contents
_____________________ (1) Includes stock-based compensation expense as follows:
Three Months Ended
March 31,
2016 June 30,
2016 September 30,
2016 December 31,
2016 March 31,
2017 June 30,
2017 September 30,
2017 December 31,
2017
(In thousands)
Cost of revenue: Product $ 4 $ 6 $ 6 $ 14 $ 21 $ 20 $ 19 $ 43Maintenance and professionalservices 203 289 317 314 325 319 286 1,361
Research and development 490 542 613 666 800 613 630 4,170Sales and marketing 3,457 1,469 1,543 1,615 1,657 1,609 1,602 9,583General and administrative 1,261 1,323 1,339 1,363 1,415 1,372 1,372 15,379
Total $ 5,415 $ 3,629 $ 3,818 $ 3,972 $ 4,218 $ 3,933 $ 3,909 $ 30,536
71
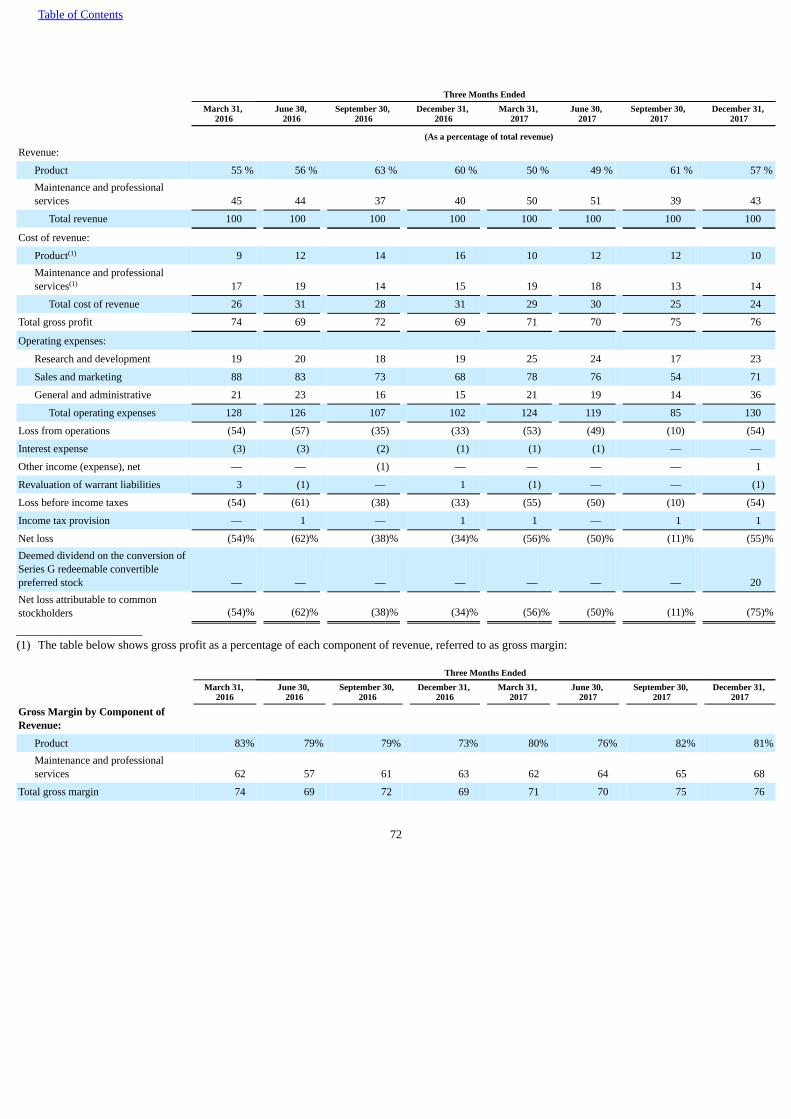
Table of Contents
Three Months Ended
March 31,
2016 June 30,
2016 September 30,
2016 December 31,
2016 March 31,
2017 June 30,
2017 September 30,
2017 December 31,
2017
(As a percentage of total revenue)
Revenue:
Product 55 % 56 % 63 % 60 % 50 % 49 % 61 % 57 %Maintenance and professionalservices 45 44 37 40 50 51 39 43
Total revenue 100 100 100 100 100 100 100 100
Cost of revenue: Product(1) 9 12 14 16 10 12 12 10Maintenance and professionalservices(1) 17 19 14 15 19 18 13 14
Total cost of revenue 26 31 28 31 29 30 25 24
Total gross profit 74 69 72 69 71 70 75 76
Operating expenses: Research and development 19 20 18 19 25 24 17 23
Sales and marketing 88 83 73 68 78 76 54 71
General and administrative 21 23 16 15 21 19 14 36
Total operating expenses 128 126 107 102 124 119 85 130
Loss from operations (54) (57) (35) (33) (53) (49) (10) (54)
Interest expense (3) (3) (2) (1) (1) (1) — —
Other income (expense), net — — (1) — — — — 1
Revaluation of warrant liabilities 3 (1) — 1 (1) — — (1)
Loss before income taxes (54) (61) (38) (33) (55) (50) (10) (54)
Income tax provision — 1 — 1 1 — 1 1
Net loss (54)% (62)% (38)% (34)% (56)% (50)% (11)% (55)%Deemed dividend on the conversion ofSeries G redeemable convertiblepreferred stock — — — — — — — 20Net loss attributable to commonstockholders (54)% (62)% (38)% (34)% (56)% (50)% (11)% (75)%
_____________________ (1) The table below shows gross profit as a percentage of each component of revenue, referred to as gross margin:
Three Months Ended
March 31,
2016 June 30,
2016 September 30,
2016 December 31,
2016 March 31,
2017 June 30,
2017 September 30,
2017 December 31,
2017
Gross Margin by Component ofRevenue:
Product 83% 79% 79% 73% 80% 76% 82% 81%Maintenance and professionalservices 62 57 61 63 62 64 65 68
Total gross margin 74 69 72 69 71 70 75 76
72
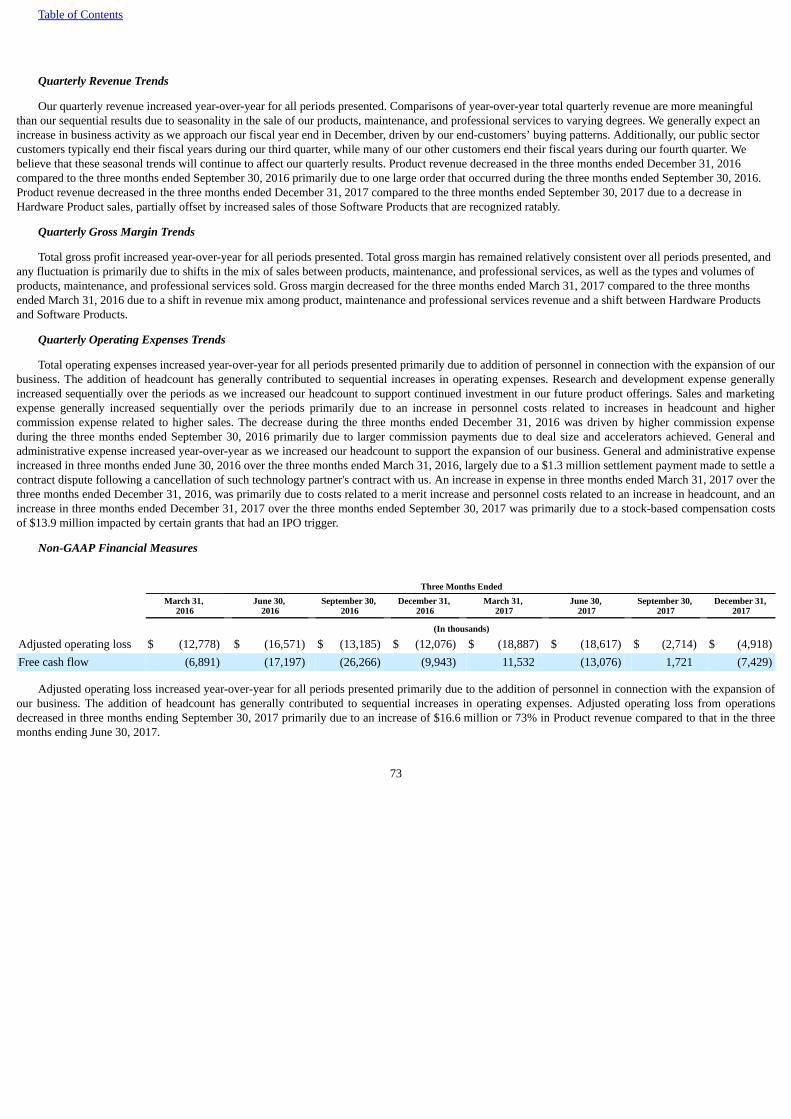
Table of Contents
Quarterly Revenue Trends
Our quarterly revenue increased year-over-year for all periods presented. Comparisons of year-over-year total quarterly revenue are more meaningfulthan our sequential results due to seasonality in the sale of our products, maintenance, and professional services to varying degrees. We generally expect anincrease in business activity as we approach our fiscal year end in December, driven by our end-customers’ buying patterns. Additionally, our public sectorcustomers typically end their fiscal years during our third quarter, while many of our other customers end their fiscal years during our fourth quarter. Webelieve that these seasonal trends will continue to affect our quarterly results. Product revenue decreased in the three months ended December 31, 2016compared to the three months ended September 30, 2016 primarily due to one large order that occurred during the three months ended September 30, 2016.Product revenue decreased in the three months ended December 31, 2017 compared to the three months ended September 30, 2017 due to a decrease inHardware Product sales, partially offset by increased sales of those Software Products that are recognized ratably.
Quarterly Gross Margin Trends
Total gross profit increased year-over-year for all periods presented. Total gross margin has remained relatively consistent over all periods presented, andany fluctuation is primarily due to shifts in the mix of sales between products, maintenance, and professional services, as well as the types and volumes ofproducts, maintenance, and professional services sold. Gross margin decreased for the three months ended March 31, 2017 compared to the three monthsended March 31, 2016 due to a shift in revenue mix among product, maintenance and professional services revenue and a shift between Hardware Productsand Software Products.
Quarterly Operating Expenses Trends
Total operating expenses increased year-over-year for all periods presented primarily due to addition of personnel in connection with the expansion of ourbusiness. The addition of headcount has generally contributed to sequential increases in operating expenses. Research and development expense generallyincreased sequentially over the periods as we increased our headcount to support continued investment in our future product offerings. Sales and marketingexpense generally increased sequentially over the periods primarily due to an increase in personnel costs related to increases in headcount and highercommission expense related to higher sales. The decrease during the three months ended December 31, 2016 was driven by higher commission expenseduring the three months ended September 30, 2016 primarily due to larger commission payments due to deal size and accelerators achieved. General andadministrative expense increased year-over-year as we increased our headcount to support the expansion of our business. General and administrative expenseincreased in three months ended June 30, 2016 over the three months ended March 31, 2016, largely due to a $1.3 million settlement payment made to settle acontract dispute following a cancellation of such technology partner's contract with us. An increase in expense in three months ended March 31, 2017 over thethree months ended December 31, 2016, was primarily due to costs related to a merit increase and personnel costs related to an increase in headcount, and anincrease in three months ended December 31, 2017 over the three months ended September 30, 2017 was primarily due to a stock-based compensation costsof $13.9 million impacted by certain grants that had an IPO trigger.
Non-GAAP Financial Measures
Three Months Ended
March 31,
2016 June 30,
2016 September 30,
2016 December 31,
2016 March 31,
2017 June 30,
2017 September 30,
2017 December 31,
2017
(In thousands)
Adjusted operating loss $ (12,778) $ (16,571) $ (13,185) $ (12,076) $ (18,887) $ (18,617) $ (2,714) $ (4,918)Free cash flow (6,891) (17,197) (26,266) (9,943) 11,532 (13,076) 1,721 (7,429)
Adjusted operating loss increased year-over-year for all periods presented primarily due to the addition of personnel in connection with the expansion ofour business. The addition of headcount has generally contributed to sequential increases in operating expenses. Adjusted operating loss from operationsdecreased in three months ending September 30, 2017 primarily due to an increase of $16.6 million or 73% in Product revenue compared to that in the threemonths ending June 30, 2017.
73
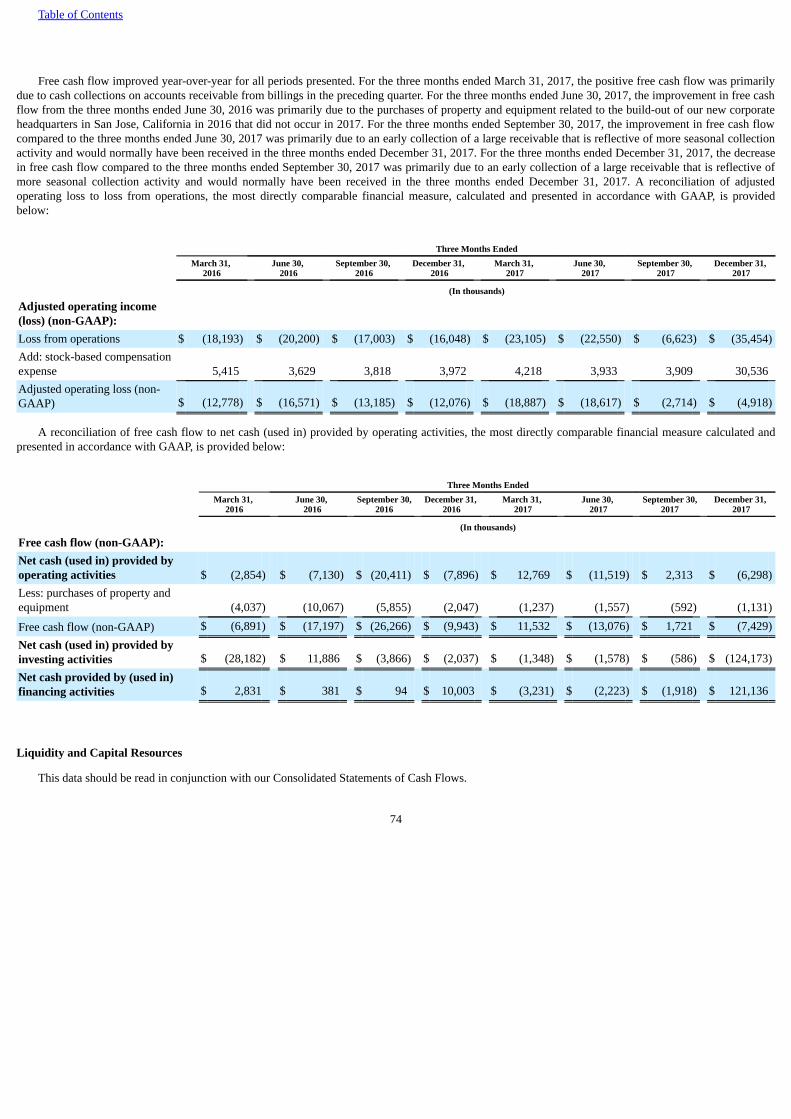
Table of Contents
Free cash flow improved year-over-year for all periods presented. For the three months ended March 31, 2017, the positive free cash flow was primarilydue to cash collections on accounts receivable from billings in the preceding quarter. For the three months ended June 30, 2017, the improvement in free cashflow from the three months ended June 30, 2016 was primarily due to the purchases of property and equipment related to the build-out of our new corporateheadquarters in San Jose, California in 2016 that did not occur in 2017. For the three months ended September 30, 2017, the improvement in free cash flowcompared to the three months ended June 30, 2017 was primarily due to an early collection of a large receivable that is reflective of more seasonal collectionactivity and would normally have been received in the three months ended December 31, 2017. For the three months ended December 31, 2017, the decreasein free cash flow compared to the three months ended September 30, 2017 was primarily due to an early collection of a large receivable that is reflective ofmore seasonal collection activity and would normally have been received in the three months ended December 31, 2017. A reconciliation of adjustedoperating loss to loss from operations, the most directly comparable financial measure, calculated and presented in accordance with GAAP, is providedbelow:
Three Months Ended
March 31,
2016 June 30,
2016 September 30,
2016 December 31,
2016 March 31,
2017 June 30,
2017 September 30,
2017 December 31,
2017
(In thousands)
Adjusted operating income(loss) (non-GAAP): Loss from operations $ (18,193) $ (20,200) $ (17,003) $ (16,048) $ (23,105) $ (22,550) $ (6,623) $ (35,454)Add: stock-based compensationexpense 5,415 3,629 3,818 3,972 4,218 3,933 3,909 30,536Adjusted operating loss (non-GAAP) $ (12,778) $ (16,571) $ (13,185) $ (12,076) $ (18,887) $ (18,617) $ (2,714) $ (4,918)
A reconciliation of free cash flow to net cash (used in) provided by operating activities, the most directly comparable financial measure calculated andpresented in accordance with GAAP, is provided below:
Three Months Ended
March 31,
2016 June 30,
2016 September 30,
2016 December 31,
2016 March 31,
2017 June 30,
2017 September 30,
2017 December 31,
2017
(In thousands)
Free cash flow (non-GAAP): Net cash (used in) provided byoperating activities $ (2,854) $ (7,130) $ (20,411) $ (7,896) $ 12,769 $ (11,519) $ 2,313 $ (6,298)Less: purchases of property andequipment (4,037) (10,067) (5,855) (2,047) (1,237) (1,557) (592) (1,131)
Free cash flow (non-GAAP) $ (6,891) $ (17,197) $ (26,266) $ (9,943) $ 11,532 $ (13,076) $ 1,721 $ (7,429)Net cash (used in) provided byinvesting activities $ (28,182) $ 11,886 $ (3,866) $ (2,037) $ (1,348) $ (1,578) $ (586) $ (124,173)Net cash provided by (used in)financing activities $ 2,831 $ 381 $ 94 $ 10,003 $ (3,231) $ (2,223) $ (1,918) $ 121,136
Liquidity and Capital Resources
This data should be read in conjunction with our Consolidated Statements of Cash Flows.
74
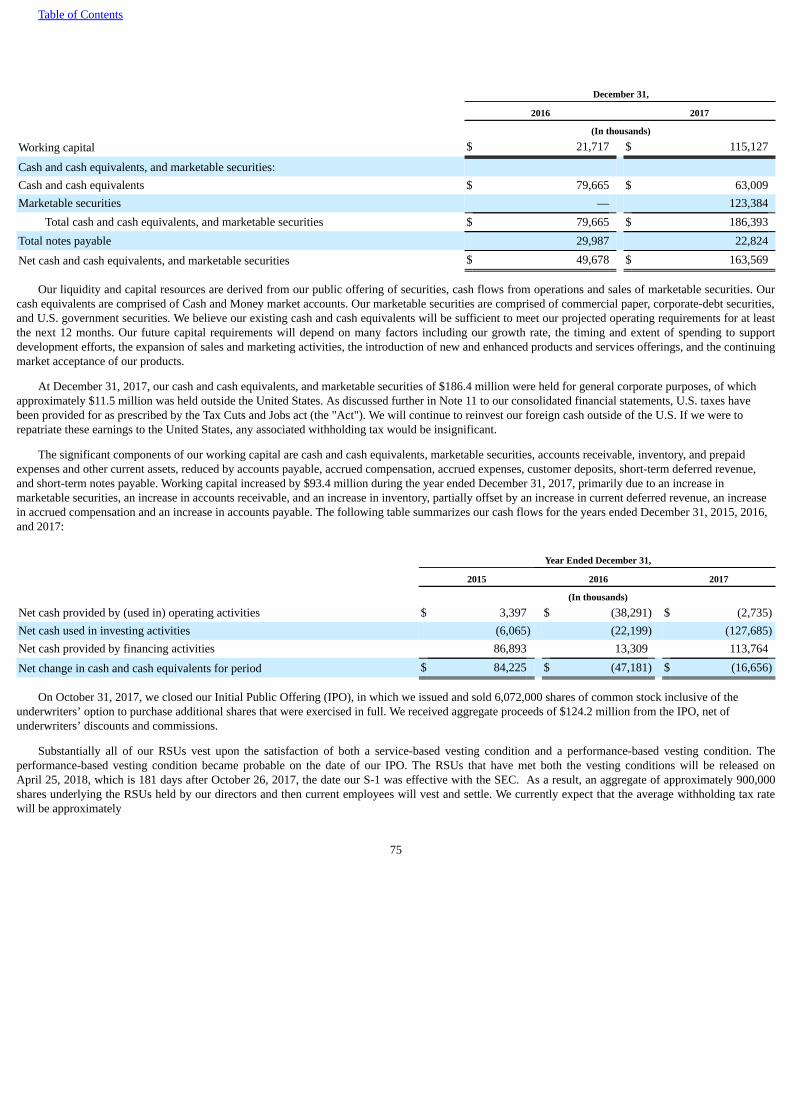
Table of Contents
December 31,
2016 2017
(In thousands)
Working capital $ 21,717 $ 115,127
Cash and cash equivalents, and marketable securities: Cash and cash equivalents $ 79,665 $ 63,009Marketable securities — 123,384 Total cash and cash equivalents, and marketable securities $ 79,665 $ 186,393Total notes payable 29,987 22,824
Net cash and cash equivalents, and marketable securities $ 49,678 $ 163,569
Our liquidity and capital resources are derived from our public offering of securities, cash flows from operations and sales of marketable securities. Ourcash equivalents are comprised of Cash and Money market accounts. Our marketable securities are comprised of commercial paper, corporate-debt securities,and U.S. government securities. We believe our existing cash and cash equivalents will be sufficient to meet our projected operating requirements for at leastthe next 12 months. Our future capital requirements will depend on many factors including our growth rate, the timing and extent of spending to supportdevelopment efforts, the expansion of sales and marketing activities, the introduction of new and enhanced products and services offerings, and the continuingmarket acceptance of our products.
At December 31, 2017, our cash and cash equivalents, and marketable securities of $186.4 million were held for general corporate purposes, of whichapproximately $11.5 million was held outside the United States. As discussed further in Note 11 to our consolidated financial statements, U.S. taxes havebeen provided for as prescribed by the Tax Cuts and Jobs act (the "Act"). We will continue to reinvest our foreign cash outside of the U.S. If we were torepatriate these earnings to the United States, any associated withholding tax would be insignificant.
The significant components of our working capital are cash and cash equivalents, marketable securities, accounts receivable, inventory, and prepaidexpenses and other current assets, reduced by accounts payable, accrued compensation, accrued expenses, customer deposits, short-term deferred revenue,and short-term notes payable. Working capital increased by $93.4 million during the year ended December 31, 2017, primarily due to an increase inmarketable securities, an increase in accounts receivable, and an increase in inventory, partially offset by an increase in current deferred revenue, an increasein accrued compensation and an increase in accounts payable. The following table summarizes our cash flows for the years ended December 31, 2015, 2016,and 2017:
Year Ended December 31,
2015 2016 2017
(In thousands)
Net cash provided by (used in) operating activities $ 3,397 $ (38,291) $ (2,735)Net cash used in investing activities (6,065) (22,199) (127,685)Net cash provided by financing activities 86,893 13,309 113,764
Net change in cash and cash equivalents for period $ 84,225 $ (47,181) $ (16,656)
On October 31, 2017, we closed our Initial Public Offering (IPO), in which we issued and sold 6,072,000 shares of common stock inclusive of theunderwriters’ option to purchase additional shares that were exercised in full. We received aggregate proceeds of $124.2 million from the IPO, net ofunderwriters’ discounts and commissions.
Substantially all of our RSUs vest upon the satisfaction of both a service-based vesting condition and a performance-based vesting condition. Theperformance-based vesting condition became probable on the date of our IPO. The RSUs that have met both the vesting conditions will be released onApril 25, 2018, which is 181 days after October 26, 2017, the date our S-1 was effective with the SEC. As a result, an aggregate of approximately 900,000shares underlying the RSUs held by our directors and then current employees will vest and settle. We currently expect that the average withholding tax ratewill be approximately
75
Table of Contents
41%. We have not determined whether we will sell shares, or Sell to Cover, or withhold a portion of the vested shares, or Withhold to Cover, to satisfy our taxobligations due at settlement for the April 25, 2018 release date. For future releases, we expect to use the Sell to Cover settlement method. If we were to electSell to Cover, approximately 41% of the vested shares would need to be sold on the settlement date with the actual percentage dependent upon the pricereceived at settlement. If we were to elect Withhold to Cover, approximately 41% of the vested shares would be withheld on the settlement date, with theequivalent value being paid by us from a portion of the net proceeds from our IPO. If the price of our common stock at the time of settlement were equal tothe closing price of our stock on December 29, 2017 of $31.89 per share, we estimate that this tax obligation would be approximately $11.7 million in theaggregate.
Loan Agreements
In December 2016, the entire loan balance of $20.1 million provided under a loan and security agreement entered into in October 2012, as amended, anda loan and security agreement entered into in December 2013 were paid in full, and the loan and security agreements entered into in October 2012 andDecember 2013 were terminated.
In December 2016, we amended our amended and restated loan and security agreement, which we originally entered into in May 2009, or the Amendedand Restated 2009 Loan and Security Agreement, to increase the maximum amount of credit available for borrowing under the revolving line of credit to 80%of qualified accounts receivable up to $40.0 million. In addition, the Amended and Restated 2009 Loan and Security Agreement provides that the combinedoutstanding balances of the revolving line of credit and the term loan cannot exceed $40.0 million. Additionally, we borrowed $30.0 million under theAmended and Restated 2009 Loan and Security Agreement, which carries a maturity date of December 2020. The agreement is subject to us maintaining anadjusted quick ratio of 1.25. The Amended and Restated 2009 Loan and Security Agreement requires us to pay equal monthly installments of principal of$625,000 and monthly interest payments at a fixed interest rate per annum of 3.25%. Concurrent with the final monthly installment payment on the maturitydate, we will be required to pay an additional payment of $825,000.
Our Amended and Restated 2009 Loan and Security Agreement contains customary affirmative covenants and certain financial and negative covenants,including restrictions on disposing of assets, entering into change of control transactions, mergers or acquisitions, incurring additional indebtedness, grantingliens on certain of our assets and paying dividends. We have pledged substantially all of our assets other than intellectual property as collateral under ourAmended and Restated 2009 Loan and Security Agreement and granted the lender a negative pledge on our intellectual property.
We were in compliance with respect to all financial-related covenants under our loan agreements as of December 31, 2016, and December 31, 2017.
Operating Activities
Our operating activities have consisted of net loss adjusted for certain non-cash items and changes in assets and liabilities.
Cash provided by operating activities of $3.4 million for the year ended December 31, 2015 was primarily due to a net loss of $27.3 million adjusted bynon-cash charges of $16.4 million primarily relating to stock-based compensation, change in revaluation of warrant liabilities, depreciation of property andequipment, and a net increase of $14.2 million in our net operating assets and liabilities. The increase in our net operating assets and liabilities was primarilythe result of an increase of $17.0 million in deferred revenue due to higher sales, a decrease of $2.5 million in deferred cost of revenue, and an increase of$2.2 million in accrued expenses for fees incurred related to the issuance of Series G redeemable convertible preferred stock, offset by an increase of $6.5million in accounts receivable due to higher sales and an increase of $1.0 million in prepaid expenses and other current assets.
Cash used in operating activities of $38.3 million for the year ended December 31, 2016 was primarily due to a net loss of $74.8 million adjusted by non-cash charges of $20.0 million primarily relating to stock-based compensation, depreciation of property and equipment, and change in revaluation of warrantliabilities, and a net increase of $16.4 million in our net operating assets and liabilities. The increase in our net operating assets and liabilities was primarilythe result of an increase of $25.5 million in deferred revenue due to higher sales, an increase of $6.8 million in other liabilities primarily related to anincentive for tenant improvements provided under the lease for our new corporate headquarters, an increase of $4.1 million in accrued compensation due toincreased headcount and higher sales resulting in higher commission payable, and an increase of $3.1
76
Table of Contents
million in accrued expenses for fees incurred related to the issuance of Series G redeemable convertible preferred stock of $1.5 million and other operationalcosts of $1.6 million as we expand our business. This increase in our net operating assets and liabilities was offset by an increase of $15.5 million in accountsreceivable resulting from higher sales, an increase of $4.9 million in prepaid expenses and other current assets, an increase of $1.8 million in other assetsprimarily related to operational costs as we expanded our business.
Cash used in operating activities of $2.7 million for the year ended December 31, 2017 was primarily due to a net loss of $91.2 million adjusted by non-cash charges of $49.3 million primarily relating to stock-based compensation, and depreciation of property and equipment, and a net increase of $39.2million in our net operating assets and liabilities. The increase in our net operating assets and liabilities was primarily the result of an increase of $53.8million in deferred revenue due to higher sales, an increase of $8.1 million in accrued compensation due to increased headcount and higher sales resulting inhigher commissions payable, and an increase of $1.7 million in accounts payable. This increase in our net operating assets and liabilities was offset by anincrease of $20.7 million in accounts receivable resulting from higher sales, an increase of $2.7 million in inventory and an increase of $1.0 million in otheroperating assets and liabilities.
Investing Activities
Our investing activities have consisted of financial instrument purchases and capital expenditures. We expect to continue such activities as our businessgrows.
Cash used in investing activities for the year ended December 31, 2015 was $6.1 million, primarily resulting from capital expenditures to purchaseproperty and equipment of $2.8 million. Additionally, there was an increase of $3.3 million in restricted cash related to the security deposit of our newcorporate headquarters.
Cash used in investing activities for the year ended December 31, 2016 was $22.2 million, primarily resulting from capital expenditures to purchaseproperty and equipment of $22.0 million, a large portion of which were related to the build-out of our new corporate headquarters in San Jose, California.Additionally, there was an increase of $24.0 million in purchases of marketable securities, which significantly increased the cash available for investment,offset by proceeds from maturities and sales of marketable securities of $24.0 million.
Cash used in investing activities during the year ended December 31, 2017 was $127.7 million, primarily resulting from an increase of $123.0 million inpurchases of marketable securities from our net IPO proceeds received in October 2017. Additionally, there was a $4.5 million increase from capitalexpenditures to purchase property and equipment
Financing Activities
Our financing activities have consisted of proceeds from the issuance of common stock through our IPO, issuance of shares through our employee equityincentive plans and repayments of notes payable.
Cash provided by financing activities for the year ended December 31, 2015 was $86.9 million, primarily from net proceeds of $75.3 million from thefirst close of our Series G redeemable convertible preferred stock offering and $11.8 million from the exercise of employee stock options.
Cash provided by financing activities for the year ended December 31, 2016 was $13.3 million, primarily from net borrowings of notes payable of $30.0million, net proceeds of $2.4 million from the final close of our Series G redeemable convertible preferred stock offering and $1.1 million from the exerciseof employee stock options, offset by repayments of notes payable of $20.1 million.
Cash provided by financing activities for the year ended December 31, 2017 was $113.8 million, primarily due to proceeds of $124.2 million receivedfrom our IPO, and proceeds of $1.6 million from the exercise of stock options, offset by $7.5 million in repayment of notes payable, $4.2 million in paymentsof deferred offering costs and $0.4 million in payment of success fees.
77
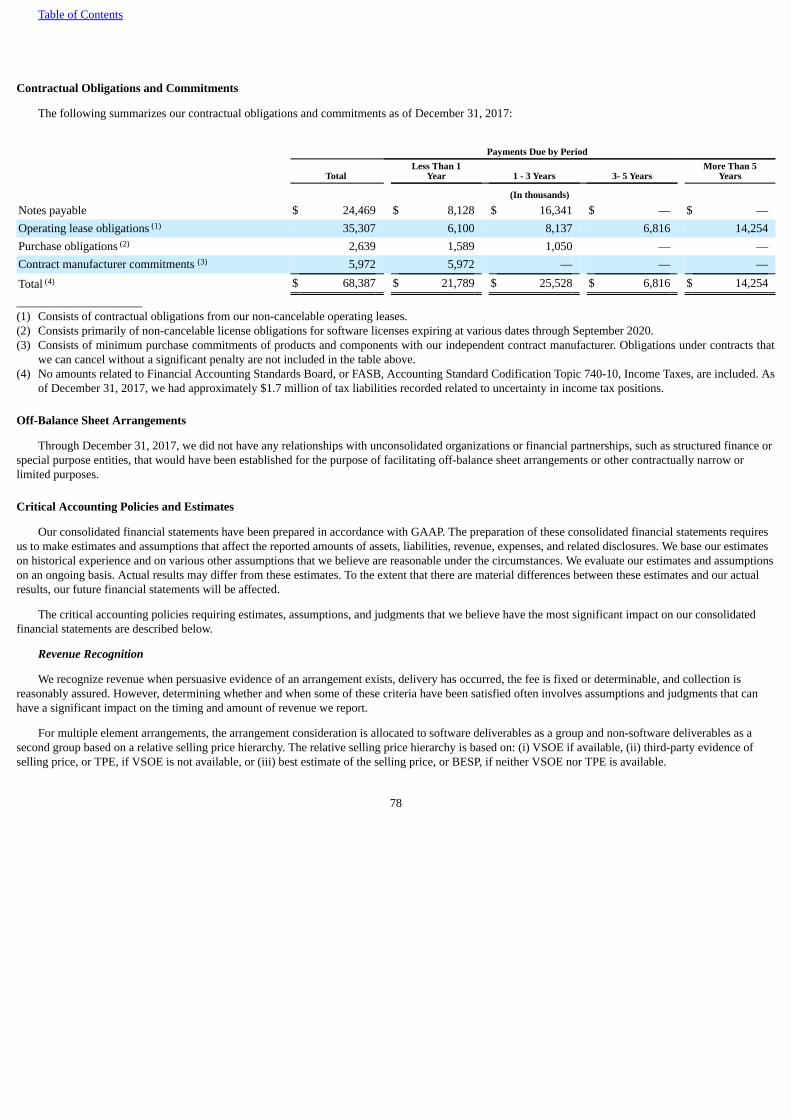
Table of Contents
Contractual Obligations and Commitments
The following summarizes our contractual obligations and commitments as of December 31, 2017:
Payments Due by Period
Total Less Than 1
Year 1 - 3 Years 3- 5 Years More Than 5
Years
(In thousands) Notes payable $ 24,469 $ 8,128 $ 16,341 $ — $ —Operating lease obligations (1) 35,307 6,100 8,137 6,816 14,254Purchase obligations (2) 2,639 1,589 1,050 — —Contract manufacturer commitments (3) 5,972 5,972 — — —
Total (4) $ 68,387 $ 21,789 $ 25,528 $ 6,816 $ 14,254_____________________ (1) Consists of contractual obligations from our non-cancelable operating leases.(2) Consists primarily of non-cancelable license obligations for software licenses expiring at various dates through September 2020.(3) Consists of minimum purchase commitments of products and components with our independent contract manufacturer. Obligations under contracts that
we can cancel without a significant penalty are not included in the table above.(4) No amounts related to Financial Accounting Standards Board, or FASB, Accounting Standard Codification Topic 740-10, Income Taxes, are included. As
of December 31, 2017, we had approximately $1.7 million of tax liabilities recorded related to uncertainty in income tax positions.
Off-Balance Sheet Arrangements
Through December 31, 2017, we did not have any relationships with unconsolidated organizations or financial partnerships, such as structured finance orspecial purpose entities, that would have been established for the purpose of facilitating off-balance sheet arrangements or other contractually narrow orlimited purposes.
Critical Accounting Policies and Estimates
Our consolidated financial statements have been prepared in accordance with GAAP. The preparation of these consolidated financial statements requiresus to make estimates and assumptions that affect the reported amounts of assets, liabilities, revenue, expenses, and related disclosures. We base our estimateson historical experience and on various other assumptions that we believe are reasonable under the circumstances. We evaluate our estimates and assumptionson an ongoing basis. Actual results may differ from these estimates. To the extent that there are material differences between these estimates and our actualresults, our future financial statements will be affected.
The critical accounting policies requiring estimates, assumptions, and judgments that we believe have the most significant impact on our consolidatedfinancial statements are described below.
Revenue Recognition
We recognize revenue when persuasive evidence of an arrangement exists, delivery has occurred, the fee is fixed or determinable, and collection isreasonably assured. However, determining whether and when some of these criteria have been satisfied often involves assumptions and judgments that canhave a significant impact on the timing and amount of revenue we report.
For multiple element arrangements, the arrangement consideration is allocated to software deliverables as a group and non-software deliverables as asecond group based on a relative selling price hierarchy. The relative selling price hierarchy is based on: (i) VSOE if available, (ii) third-party evidence ofselling price, or TPE, if VSOE is not available, or (iii) best estimate of the selling price, or BESP, if neither VSOE nor TPE is available.
78
Table of Contents
Hardware Product revenue is recognized at the time of delivery, provided that all other revenue recognition criteria have been met. Software Productrevenue is recognized at the time of delivery if VSOE is established for all undelivered related items. If VSOE does not exist for one or more undelivereditems, revenue from the software portion of the arrangement is deferred until the delivery of all items has begun and is then recognized ratably over theremaining related support and maintenance service period. Support and maintenance revenue is generally recognized ratably over the contractual serviceperiod, which is typically either one or three years, but can be up to five years. Professional services revenue is generally recognized as the services arerendered.
For Hardware Products, we cannot establish VSOE and TPE, therefore, we use BESP to determine the price at which a transaction would take place if theproduct was sold on a stand-alone basis. For Hardware Product related maintenance and professional services, we use either VSOE or BESP when VSOE andTPE cannot be established. In determining the BESP for a product or service, we consider historical data including, but not limited to, product family, pricingpractices, standalone sales, the nature and size of the end-customer, contractually stated prices, and geographical region. We limit the amount of revenuerecognized for delivered elements to an amount that is not contingent upon future delivery of additional products or services or meeting of any specifiedperformance conditions.
In multiple-element arrangements that include software, revenue is allocated to each separate unit of accounting for the non-software deliverables, as wellas the software deliverables as a group, using the relative estimated selling prices of each of the deliverables in the arrangement based on the aforementionedselling price hierarchy. The arrangement consideration allocated to the software deliverables as a group is then allocated to each software deliverableseparately using the residual method based on the fair value of each of the undelivered deliverables, using VSOE. We typically determine VSOE based on ournormal pricing and discounting practices for the specific service when sold separately. We established VSOE on software-related support and maintenanceusing the bell-shaped curve approach. Under this approach, we concluded that VSOE exists if a substantial majority of recent stand-alone renewaltransactions are priced within a narrow range. For Enterprise License Software, we established VSOE on support and maintenance prior to the occurrence ofactual renewals, based on management’s ability to establish support and maintenance renewal rates. We ensure that such established VSOE is supported bycontractually stated renewal rates. Beginning on January 1, 2016, we established VSOE for professional services, and support and maintenance on SoftwareProducts, except Extended Modules.
Stock-Based Compensation
Stock-based compensation expense is measured and recognized in the financial statements based on the grant date fair value of the award. The fair valueof a stock option is estimated on the grant date using the Black-Scholes option-pricing model. The fair value of an RSU is measured using the fair value ofour common stock on the date of the grant. Stock-based compensation expense is recognized over the requisite service periods of the awards, which isgenerally four years.
Our use of the Black-Scholes option-pricing model requires the input of highly subjective assumptions, including the fair value of our underlyingcommon stock, expected term of the option, expected volatility of the price of industry peers, risk-free interest rates, and the expected dividend yield of ourcommon stock. The assumptions used in our option-pricing model represent management’s best estimates. These estimates involve inherent uncertainties andthe application of management’s judgment. If factors change and different assumptions are used, our stock-based compensation expense could be materiallydifferent in the future.
These assumptions and estimates are as follows:
• Fair Value of Common Stock. Prior to our initial public offering in October 2017, our stock was not publicly traded and we estimated the fair valueof common stock using various methodologies, including third-party valuations. After the initial public offering, we used the publicly quoted price asthe fair value of our common stock.
• Expected Term. The expected term of employee stock options represents the weighted-average period that the stock options are expected to remainoutstanding. To determine the expected term, we generally apply the simplified approach in which the expected term of an award is presumed to bethe mid-point between the vesting date and the expiration date of the award as we do not have sufficient historical exercise data to provide areasonable basis for an estimate of expected term.
79
Table of Contents
• Risk-Free Interest Rate. We base the risk-free interest rate on the yields of U.S. Treasury securities with maturities approximately equal to theexpected term of employee stock option awards.
• Expected Volatility. As we do not have a trading history for our common stock, the expected volatility for our common stock was estimated bytaking the average historic price volatility for industry peers based on daily price observations over a period equivalent to the expected term of thestock option awards. Industry peers consist of several public companies in our industry which are either similar in size, stage of life cycle, orfinancial leverage.
• Dividend Rate. We have never declared or paid any cash dividends and do not presently plan to pay cash dividends in the foreseeable future. As aresult, we use a dividend rate of zero.
We estimate the fair value of the rights to acquire stock under our ESPP using the Black-Scholes option-pricing model. Our ESPP typically provides forconsecutive six-month offering periods and we use our peer group volatility data in the valuation of ESPP shares. We recognize such compensation expenseon a straight-line basis over the offering period.
We will continue to use judgment in evaluating the assumptions related to our stock-based compensation on a prospective basis. As we continue toaccumulate additional data related to our common stock, we may have refinements to our estimates, which could materially impact our future stock-based compensation expense.
Income Taxes
On December 22, 2017, the Tax Cuts and Jobs Act of 2017 (the “Act”) was signed into law making significant changes to the Internal Revenue Code.Changes include, but are not limited to, a decrease in federal corporate tax rate from 35% to 21% for tax years beginning after December 31, 2017, atransition of U.S international taxation from a worldwide tax system to a territorial system, and a one-time transition tax on the mandatory deemedrepatriation of foreign earnings. We have estimated our provision for income taxes in accordance with the Act and guidance available as of the date of thisfiling. Staff Accounting Bulletin No. 118 ("SAB 118") was issued to address the application of US GAAP in situations when a registrant does not have thenecessary information available, prepared, or analyzed (including computations) in reasonable detail to complete the accounting for certain income tax effectsof the Act. In accordance with SAB 118, we have determined that the impact recorded in connection with the transition tax on the mandatory deemedrepatriation of foreign earnings was a provisional amount and a reasonable estimate at December 31, 2017. Additional work is necessary for a more detailedanalysis of our historical foreign earnings as well as potential correlative adjustments. Any subsequent adjustment to these amounts will be recorded in 2018when the analysis is complete.
Recent Accounting Pronouncements
Refer to Note 1 to our consolidated financial statements for analysis of recent accounting pronouncements that are applicable to our business.
JOBS Act
Under the Jumpstart Our Business Startups Act, we meet the definition of an “emerging growth company.” As such, we may avail ourselves of anextended transition period for complying with new or revised accounting standards. However, we have chosen to “opt out” of such extended transition period,and as a result, we will comply with new or revised accounting standards on the relevant dates on which adoption of such standards is required for non-emerging growth companies. Our decision to opt out of the extended transition period for complying with new or revised accounting standards is irrevocable.
80

Table of Contents
ITEM 7A. QUANTITATIVE AND QUALITATIVE DISCLOSURES ABOUT MARKET RISK
Foreign Currency Exchange Risk
Our sales contracts are primarily denominated in U.S. Dollars. A portion of our operating expenses are incurred outside of the United States, aredenominated in foreign currencies, and are subject to fluctuations due to changes in foreign currency exchange rates, particularly changes in the IsraeliShekel, or NIS, and British Pound. Additionally, fluctuations in foreign currency exchange rates may cause us to recognize transaction gains and losses in ourstatements of operations and comprehensive loss. The effect of an immediate 10% adverse change in foreign exchange rates on foreign-denominated accountsas of December 31, 2016 and December 31, 2017 would result in a loss of $1.0 and $1.1 million, respectively, on our consolidated statements of operations.As our international operations grow, we will continue to reassess our approach to managing the risks relating to fluctuations in foreign currency.
Interest Rate Sensitivity
As of December 31, 2017, we had cash and cash equivalents, and marketable securities of $186.4 million. The primary objectives of our investmentactivities are to preserve principal, provide liquidity, and maximize income without significantly increasing risk. Some of the marketable securities we investin are subject to interest risk. To minimize this risk, we maintain our portfolio of cash and cash equivalents, and marketable securities in a variety ofsecurities, including money market accounts, commercial paper, corporate debt securities, and U.S. government securities. Due to the short duration andconservative nature of our investment portfolio, a movement of 10% in market interest rates would not have a material impact on our operating results and thetotal value of the portfolio. The effect of an immediate 10% change in interest rates at December 31, 2017 would not have been material to our operatingresults and the total value of the portfolio assuming consistent investment levels.
81

Table of Contents
ITEM 8 FINANCIAL STATEMENTS AND SUPPLEMENTARY DATA
INDEX TO CONSOLIDATED FINANCIAL STATEMENTS Page
Report of Independent Registered Public Accounting Firm 83Consolidated Balance Sheets 84Consolidated Statements of Operations 85Consolidated Statements of Comprehensive Loss 86Consolidated Statements of Redeemable Convertible Preferred Stock and Stockholders’ (Deficit) Equity 87Consolidated Statements of Cash Flows 88Notes to Consolidated Financial Statements 90
82
Table of Contents
Report of Independent Registered Public Accounting Firm
To the Shareholders and the Board of Directors of ForeScout Technologies, Inc.
Opinion on the Financial Statements
We have audited the accompanying consolidated balance sheets of ForeScout Technologies, Inc. (the Company) as of December 31, 2016 and 2017, and therelated consolidated statements of operations, comprehensive loss, redeemable convertible preferred stock and stockholders’ (deficit) equity, and cash flowsfor each of the three years in the period ended December 31, 2017, and the related notes (collectively referred to as the “consolidated financial statements”).In our opinion, the consolidated financial statements present fairly, in all material respects, the financial position of the Company at December 31, 2016 and2017, and the results of its operations and its cash flows for each of the three years in the period ended December 31, 2017, in conformity with U.S. generallyaccepted accounting principles.
Basis for Opinion
These financial statements are the responsibility of the Company's management. Our responsibility is to express an opinion on the Company’s financialstatements based on our audits. We are a public accounting firm registered with the Public Company Accounting Oversight Board (United States) (PCAOB)and are required to be independent with respect to the Company in accordance with the U.S. federal securities laws and the applicable rules and regulations ofthe Securities and Exchange Commission and the PCAOB.
We conducted our audits in accordance with the standards of the PCAOB. Those standards require that we plan and perform the audit to obtain reasonableassurance about whether the financial statements are free of material misstatement, whether due to error or fraud. The Company is not required to have, norwere we engaged to perform, an audit of its internal control over financial reporting. As part of our audits we are required to obtain an understanding ofinternal control over financial reporting but not for the purpose of expressing an opinion on the effectiveness of the Company's internal control over financialreporting. Accordingly, we express no such opinion.
Our audits included performing procedures to assess the risks of material misstatement of the financial statements, whether due to error or fraud, andperforming procedures that respond to those risks. Such procedures included examining, on a test basis, evidence regarding the amounts and disclosures in thefinancial statements. Our audits also included evaluating the accounting principles used and significant estimates made by management, as well as evaluatingthe overall presentation of the financial statements. We believe that our audits provide a reasonable basis for our opinion.
/s/ Ernst & Young LLP
We have served as the Company’s auditor since 2013
San Francisco, California
February 21, 2018
83
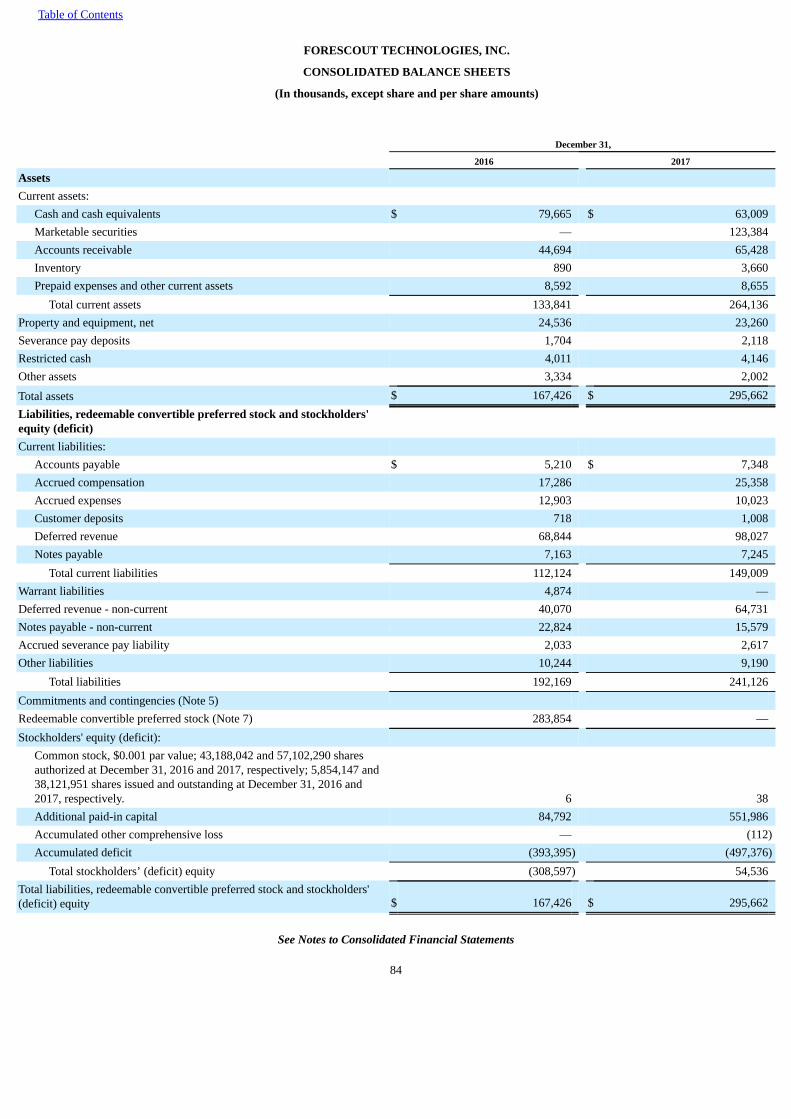
Table of Contents
FORESCOUT TECHNOLOGIES, INC.
CONSOLIDATED BALANCE SHEETS
(In thousands, except share and per share amounts)
December 31,
2016 2017
AssetsCurrent assets:
Cash and cash equivalents $ 79,665 $ 63,009Marketable securities — 123,384Accounts receivable 44,694 65,428Inventory 890 3,660Prepaid expenses and other current assets 8,592 8,655
Total current assets 133,841 264,136Property and equipment, net 24,536 23,260Severance pay deposits 1,704 2,118Restricted cash 4,011 4,146Other assets 3,334 2,002
Total assets $ 167,426 $ 295,662Liabilities, redeemable convertible preferred stock and stockholders'equity (deficit)Current liabilities:
Accounts payable $ 5,210 $ 7,348Accrued compensation 17,286 25,358Accrued expenses 12,903 10,023Customer deposits 718 1,008Deferred revenue 68,844 98,027Notes payable 7,163 7,245
Total current liabilities 112,124 149,009Warrant liabilities 4,874 —Deferred revenue - non-current 40,070 64,731Notes payable - non-current 22,824 15,579Accrued severance pay liability 2,033 2,617Other liabilities 10,244 9,190
Total liabilities 192,169 241,126Commitments and contingencies (Note 5)Redeemable convertible preferred stock (Note 7) 283,854 —Stockholders' equity (deficit):
Common stock, $0.001 par value; 43,188,042 and 57,102,290 sharesauthorized at December 31, 2016 and 2017, respectively; 5,854,147 and38,121,951 shares issued and outstanding at December 31, 2016 and2017, respectively. 6 38Additional paid-in capital 84,792 551,986Accumulated other comprehensive loss — (112)Accumulated deficit (393,395) (497,376)
Total stockholders’ (deficit) equity (308,597) 54,536Total liabilities, redeemable convertible preferred stock and stockholders'(deficit) equity $ 167,426 $ 295,662
See Notes to Consolidated Financial Statements
84
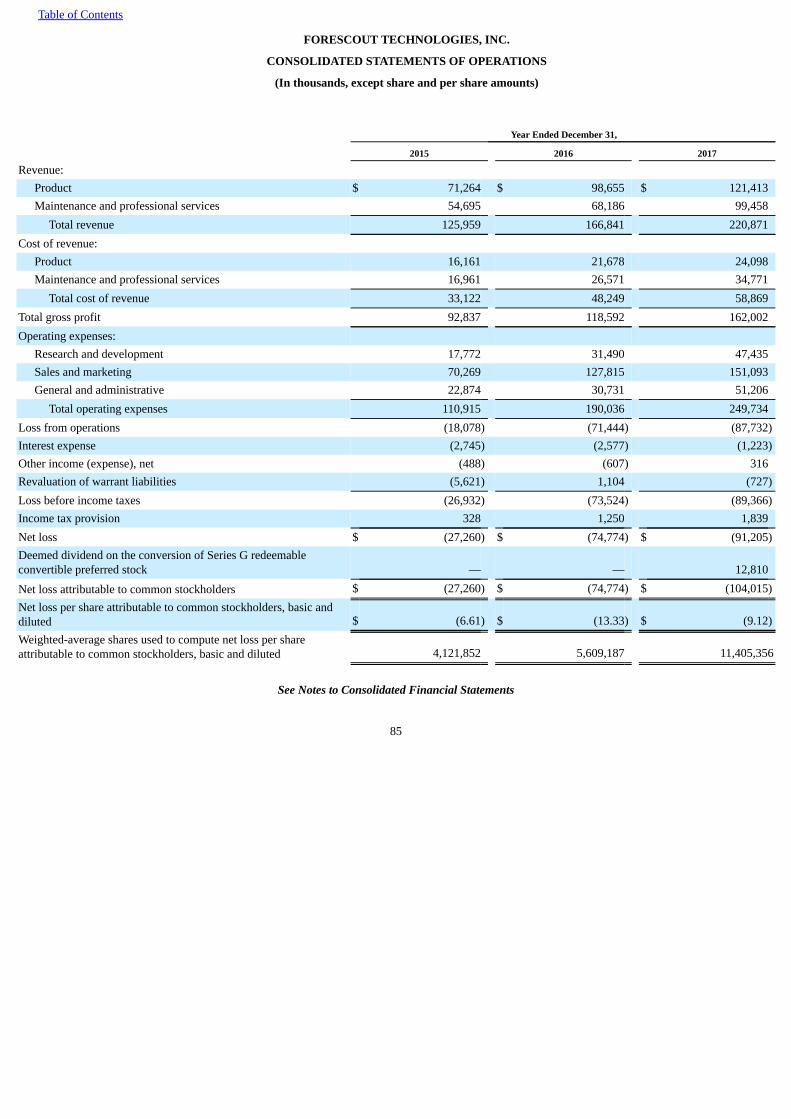
Table of Contents
FORESCOUT TECHNOLOGIES, INC.
CONSOLIDATED STATEMENTS OF OPERATIONS
(In thousands, except share and per share amounts)
Year Ended December 31,
2015 2016 2017
Revenue: Product $ 71,264 $ 98,655 $ 121,413Maintenance and professional services 54,695 68,186 99,458
Total revenue 125,959 166,841 220,871Cost of revenue:
Product 16,161 21,678 24,098Maintenance and professional services 16,961 26,571 34,771
Total cost of revenue 33,122 48,249 58,869Total gross profit 92,837 118,592 162,002Operating expenses:
Research and development 17,772 31,490 47,435Sales and marketing 70,269 127,815 151,093General and administrative 22,874 30,731 51,206
Total operating expenses 110,915 190,036 249,734Loss from operations (18,078) (71,444) (87,732)Interest expense (2,745) (2,577) (1,223)Other income (expense), net (488) (607) 316Revaluation of warrant liabilities (5,621) 1,104 (727)Loss before income taxes (26,932) (73,524) (89,366)Income tax provision 328 1,250 1,839Net loss $ (27,260) $ (74,774) $ (91,205)Deemed dividend on the conversion of Series G redeemableconvertible preferred stock — — 12,810
Net loss attributable to common stockholders $ (27,260) $ (74,774) $ (104,015)Net loss per share attributable to common stockholders, basic anddiluted $ (6.61) $ (13.33) $ (9.12)Weighted-average shares used to compute net loss per shareattributable to common stockholders, basic and diluted 4,121,852 5,609,187 11,405,356
See Notes to Consolidated Financial Statements
85

Table of Contents
FORESCOUT TECHNOLOGIES, INC.
CONSOLIDATED STATEMENTS OF COMPREHENSIVE LOSS
(In thousands)
Year Ended December 31,
2015 2016 2017
Net loss $ (27,260) $ (74,774) $ (91,205)Other comprehensive loss, net of tax: Change in unrealized gains on marketable securities — — (112)
Comprehensive loss $ (27,260) $ (74,774) $ (91,317)
See Notes to Consolidated Financial Statements
86
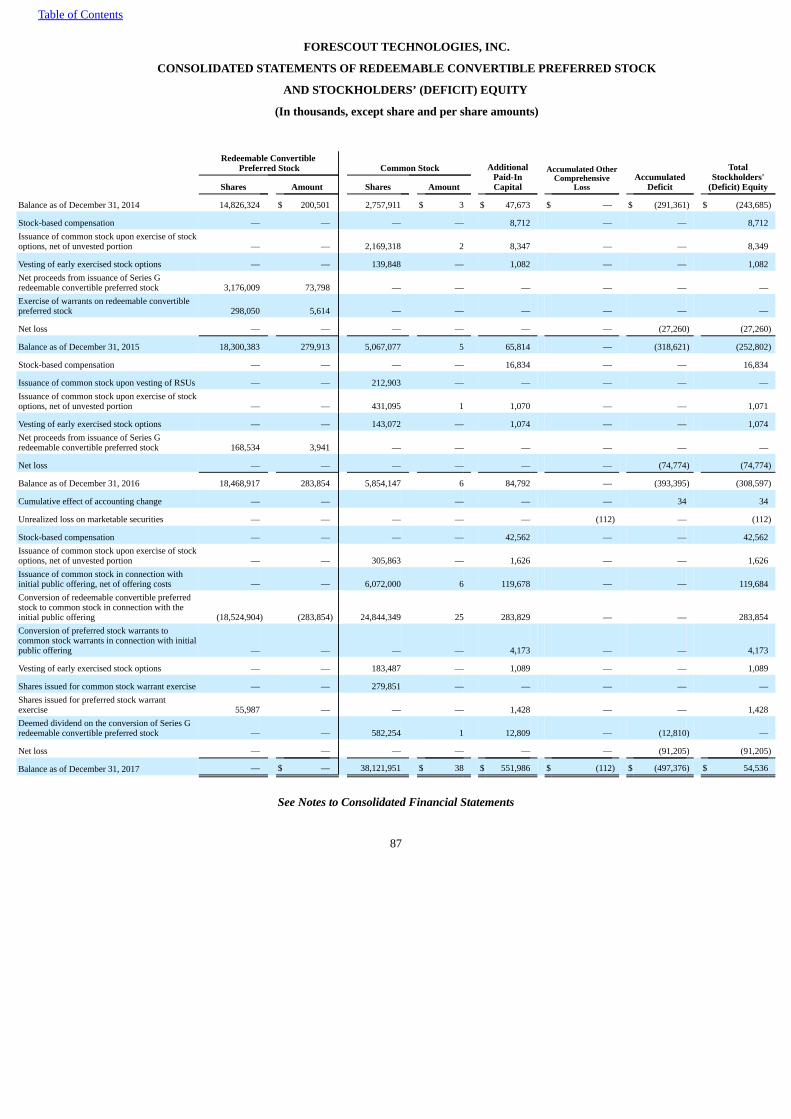
Table of Contents
FORESCOUT TECHNOLOGIES, INC.
CONSOLIDATED STATEMENTS OF REDEEMABLE CONVERTIBLE PREFERRED STOCK
AND STOCKHOLDERS’ (DEFICIT) EQUITY
(In thousands, except share and per share amounts)
Redeemable Convertible
Preferred Stock Common Stock AdditionalPaid-InCapital
Accumulated OtherComprehensive
Loss Accumulated
Deficit
TotalStockholders'
(Deficit) Equity Shares Amount Shares Amount
Balance as of December 31, 2014 14,826,324 $ 200,501 2,757,911 $ 3 $ 47,673 $ — $ (291,361) $ (243,685)
Stock-based compensation — — — — 8,712 — — 8,712Issuance of common stock upon exercise of stockoptions, net of unvested portion — — 2,169,318 2 8,347 — — 8,349
Vesting of early exercised stock options — — 139,848 — 1,082 — — 1,082Net proceeds from issuance of Series Gredeemable convertible preferred stock 3,176,009 73,798 — — — — — —Exercise of warrants on redeemable convertiblepreferred stock 298,050 5,614 — — — — — —
Net loss — — — — — — (27,260) (27,260)
Balance as of December 31, 2015 18,300,383 279,913 5,067,077 5 65,814 — (318,621) (252,802)
Stock-based compensation — — — — 16,834 — — 16,834
Issuance of common stock upon vesting of RSUs — — 212,903 — — — — —Issuance of common stock upon exercise of stockoptions, net of unvested portion — — 431,095 1 1,070 — — 1,071
Vesting of early exercised stock options — — 143,072 — 1,074 — — 1,074Net proceeds from issuance of Series Gredeemable convertible preferred stock 168,534 3,941 — — — — — —
Net loss — — — — — — (74,774) (74,774)
Balance as of December 31, 2016 18,468,917 283,854 5,854,147 6 84,792 — (393,395) (308,597)
Cumulative effect of accounting change — — — — — 34 34
Unrealized loss on marketable securities — — — — — (112) — (112)
Stock-based compensation — — — — 42,562 — — 42,562Issuance of common stock upon exercise of stockoptions, net of unvested portion — — 305,863 — 1,626 — — 1,626Issuance of common stock in connection withinitial public offering, net of offering costs — — 6,072,000 6 119,678 — — 119,684Conversion of redeemable convertible preferredstock to common stock in connection with theinitial public offering (18,524,904) (283,854) 24,844,349 25 283,829 — — 283,854Conversion of preferred stock warrants tocommon stock warrants in connection with initialpublic offering — — — — 4,173 — — 4,173
Vesting of early exercised stock options — — 183,487 — 1,089 — — 1,089
Shares issued for common stock warrant exercise — — 279,851 — — — — —Shares issued for preferred stock warrantexercise 55,987 — — — 1,428 — — 1,428Deemed dividend on the conversion of Series Gredeemable convertible preferred stock — — 582,254 1 12,809 — (12,810) —
Net loss — — — — — — (91,205) (91,205)
Balance as of December 31, 2017 — $ — 38,121,951 $ 38 $ 551,986 $ (112) $ (497,376) $ 54,536
See Notes to Consolidated Financial Statements
87
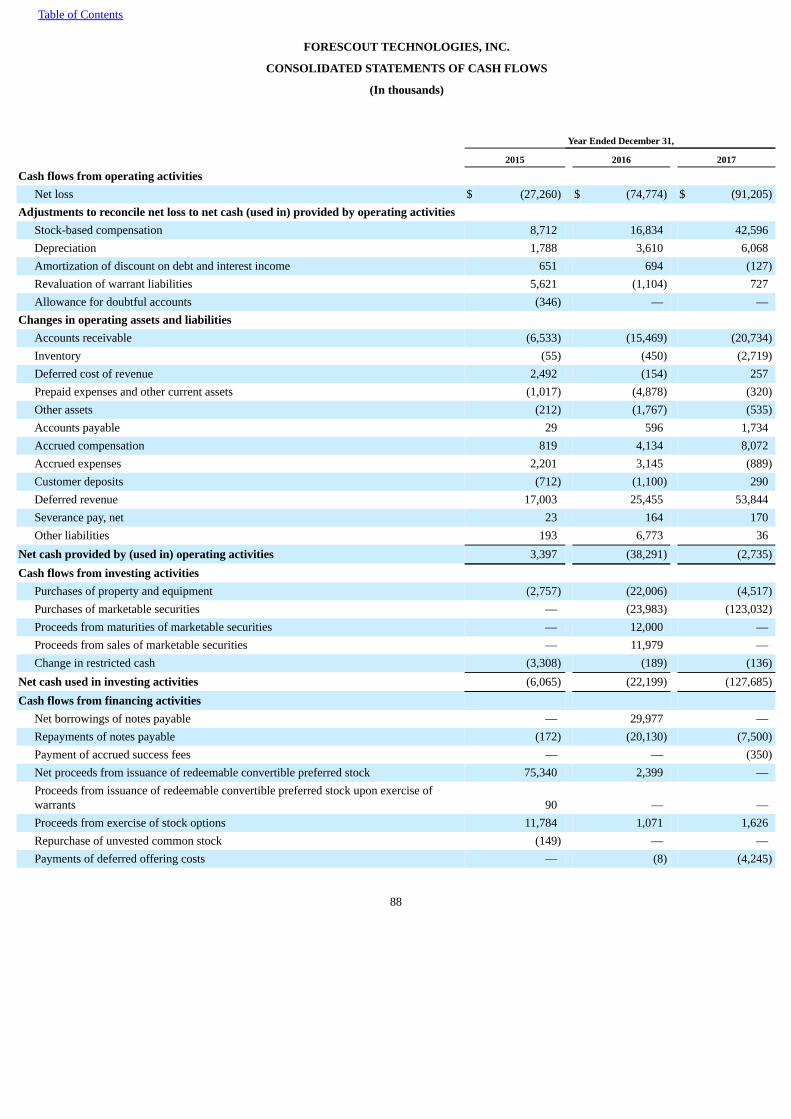
Table of Contents
FORESCOUT TECHNOLOGIES, INC.
CONSOLIDATED STATEMENTS OF CASH FLOWS
(In thousands)
Year Ended December 31,
2015 2016 2017
Cash flows from operating activities Net loss $ (27,260) $ (74,774) $ (91,205)
Adjustments to reconcile net loss to net cash (used in) provided by operating activities Stock-based compensation 8,712 16,834 42,596Depreciation 1,788 3,610 6,068Amortization of discount on debt and interest income 651 694 (127)Revaluation of warrant liabilities 5,621 (1,104) 727Allowance for doubtful accounts (346) — —
Changes in operating assets and liabilities Accounts receivable (6,533) (15,469) (20,734)Inventory (55) (450) (2,719)Deferred cost of revenue 2,492 (154) 257Prepaid expenses and other current assets (1,017) (4,878) (320)Other assets (212) (1,767) (535)Accounts payable 29 596 1,734Accrued compensation 819 4,134 8,072Accrued expenses 2,201 3,145 (889)Customer deposits (712) (1,100) 290Deferred revenue 17,003 25,455 53,844Severance pay, net 23 164 170Other liabilities 193 6,773 36
Net cash provided by (used in) operating activities 3,397 (38,291) (2,735)Cash flows from investing activities
Purchases of property and equipment (2,757) (22,006) (4,517)Purchases of marketable securities — (23,983) (123,032)Proceeds from maturities of marketable securities — 12,000 —Proceeds from sales of marketable securities — 11,979 —Change in restricted cash (3,308) (189) (136)
Net cash used in investing activities (6,065) (22,199) (127,685)Cash flows from financing activities
Net borrowings of notes payable — 29,977 —Repayments of notes payable (172) (20,130) (7,500)Payment of accrued success fees — — (350)Net proceeds from issuance of redeemable convertible preferred stock 75,340 2,399 —Proceeds from issuance of redeemable convertible preferred stock upon exercise ofwarrants 90 — —Proceeds from exercise of stock options 11,784 1,071 1,626Repurchase of unvested common stock (149) — —Payments of deferred offering costs — (8) (4,245)
88
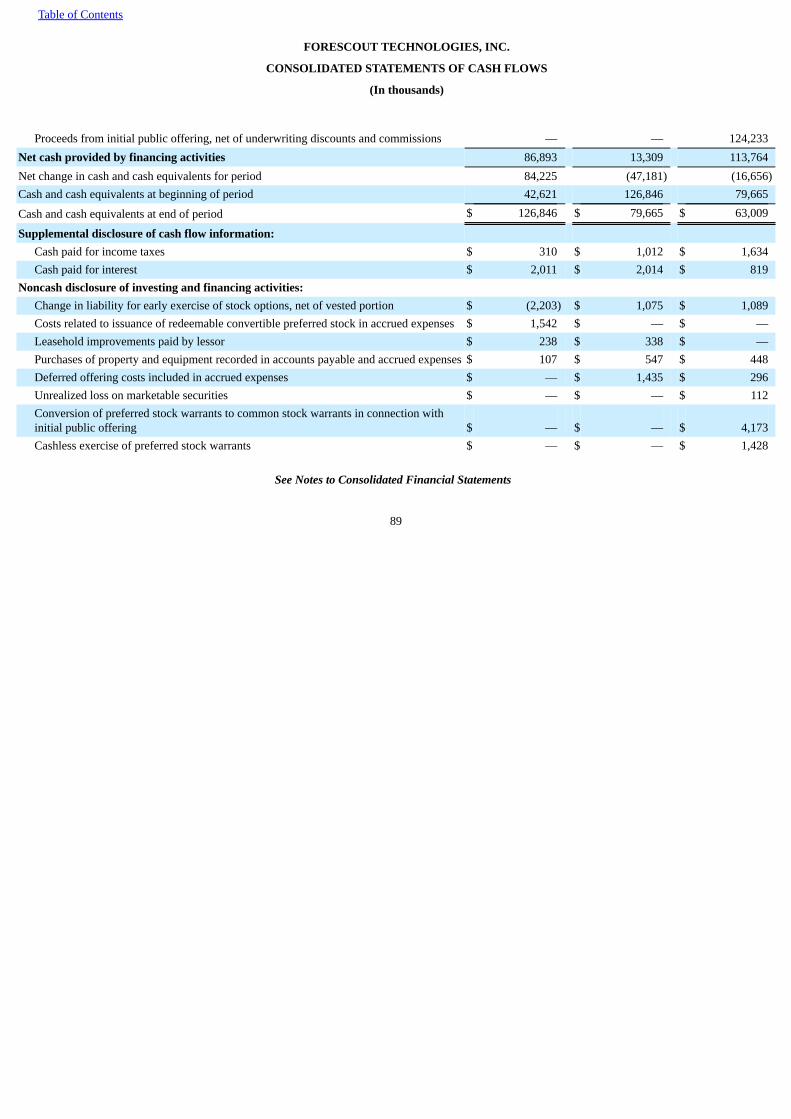
Table of Contents
FORESCOUT TECHNOLOGIES, INC.
CONSOLIDATED STATEMENTS OF CASH FLOWS
(In thousands)
Proceeds from initial public offering, net of underwriting discounts and commissions — — 124,233Net cash provided by financing activities 86,893 13,309 113,764Net change in cash and cash equivalents for period 84,225 (47,181) (16,656)Cash and cash equivalents at beginning of period 42,621 126,846 79,665
Cash and cash equivalents at end of period $ 126,846 $ 79,665 $ 63,009
Supplemental disclosure of cash flow information: Cash paid for income taxes $ 310 $ 1,012 $ 1,634Cash paid for interest $ 2,011 $ 2,014 $ 819
Noncash disclosure of investing and financing activities: Change in liability for early exercise of stock options, net of vested portion $ (2,203) $ 1,075 $ 1,089Costs related to issuance of redeemable convertible preferred stock in accrued expenses $ 1,542 $ — $ —Leasehold improvements paid by lessor $ 238 $ 338 $ —Purchases of property and equipment recorded in accounts payable and accrued expenses $ 107 $ 547 $ 448Deferred offering costs included in accrued expenses $ — $ 1,435 $ 296Unrealized loss on marketable securities $ — $ — $ 112Conversion of preferred stock warrants to common stock warrants in connection withinitial public offering $ — $ — $ 4,173Cashless exercise of preferred stock warrants $ — $ — $ 1,428
See Notes to Consolidated Financial Statements
89

Table of Contents
FORESCOUT TECHNOLOGIES, INC.
NOTES TO CONSOLIDATED FINANCIAL STATEMENTS
Note 1. Description of Business and Summary of Significant Accounting Policies
Company and Background
ForeScout Technologies, Inc. (the “Company”) was incorporated in the State of Delaware and commenced operations in April 2000. The Companyprovides an agentless approach to network security to protect organizations against the emerging threats that exploit billions of Internet of Things (“IoT”)devices connected to an organization’s networks. The Company offers its solution across three products: (i) ForeScout CounterACT®, (ii) ForeScoutCounterACT Enterprise Manager and (iii) ForeScout Extended Modules. The Company’s CounterACT product provides visibility and policy-basedmitigation of security issues. The Company’s CounterACT Enterprise Manager is a centralized security management solution for global control of allCounterACT products. The Company’s Extended Modules expand CounterACT’s see and control capabilities by sharing contextual device data with third-party systems and by automating policy enforcement across those disparate systems.
The Company sells its products, maintenance, and professional services to end-customers through distributors and resellers, who are supported by theCompany’s sales and marketing organization, and to a lesser extent directly to end-customers.
Initial Public Offering
On October 31, 2017, the Company closed its initial public offering (“IPO”), in which it issued and sold 6,072,000 shares of common stock inclusive ofthe underwriters’ option to purchase additional shares that was exercised in full. The price per share to the public was $22.00. The Company receivedaggregate proceeds of $124.2 million from the IPO, net of underwriters’ discounts and commissions, and before deducting offering costs ofapproximately $4.5 million. Upon the closing of the IPO, all shares of the Company's outstanding redeemable convertible preferred stock automaticallyconverted into 25,370,616 shares of common stock.
Basis of Presentation
The consolidated financial statements have been prepared in accordance with U.S. generally accepted accounting principles (“GAAP”). The Company’sconsolidated financial statements include the results of ForeScout Technologies, Inc. and its wholly-owned subsidiaries. All significant intercompanybalances and transactions have been eliminated in consolidation.
Use of Estimates
The preparation of financial statements in conformity with GAAP requires management to make use of estimates and assumptions that affect the reportedamounts in the consolidated financial statements and accompanying notes. These estimates form the basis of judgments made about carrying values of assetsand liabilities, which are not readily apparent from other sources. The areas where management has made estimates requiring judgment include, but are notlimited to, the allocation of revenue in multiple element arrangements, sales return reserve, accruals, stock-based compensation including the fair value ofcommon stock, redeemable convertible preferred stock warrant liabilities, and provision for income taxes, including related reserves. Actual results coulddiffer materially from those estimates.
Reverse Stock Split
On October 16, 2017, the Company amended its amended and restated certificate of incorporation to effect a two-to-one reverse stock split of its commonstock and convertible preferred stock (the “Reverse Stock Split”). Upon the filing of the amended and restated certificate of incorporation in the state ofDelaware, (i) each two shares of outstanding convertible preferred stock and each two shares of outstanding common stock were exchanged and combinedinto one share of convertible preferred stock and one share of common stock, respectively; (ii) the number of shares of common stock issuable under eachoutstanding option to purchase common stock and issuable upon vesting under each restricted stock unit was proportionately reduced on a two-to-one basis;(iii) the exercise price of each outstanding option to purchase common stock was proportionately increased on a two-to-one basis; (iv) the number of shares ofconvertible preferred stock issuable under outstanding warrants was proportionally reduced on a two-to-one basis and the exercise price of such warrants wasproportionally increased on a two-to-
90
Table of Contents
one basis; and (v) corresponding adjustments in the per share conversion prices, dividend rates and liquidation preferences of the convertible preferred stockwere made on a two-to-one basis. Accordingly, all share and per share information presented in the consolidated financial statements herein, and notesthereto, have been retroactively adjusted to reflect the Reverse Stock Split.
Segment information
The chief operating decision maker (“CODM”) is the Chief Executive Officer who reviews financial information presented on a consolidated basis. TheCompany has one business activity and there are no segment managers who are held accountable by the CODM for operations, operating results and planningfor levels or components below the consolidated level. The Company operates in one segment.
Concentrations
Financial instruments that potentially subject the Company to concentrations of credit risk consist primarily of cash, cash equivalents, marketablesecurities, accounts receivable, severance pay deposits, and restricted cash. The Company maintains all of its cash and cash equivalents in interest-bearingbank accounts and money market accounts. Management believes that the financial institutions that hold the Company’s cash and cash equivalents arefinancially sound and exposed to minimal credit risk. Deposits held with banks generally exceed the amount of insurance provided on such deposits.
Accounts receivable are primarily derived from the Company’s customers, including distributors and resellers representing various geographicallocations. The Company performs ongoing credit evaluations of its customers and generally does not require collateral on accounts receivable, and, ifnecessary, an allowance for doubtful accounts is maintained for estimated potential credit losses. As of December 31, 2016 and 2017, four customersrepresented 20%, 17%, 16%, and 12% of total accounts receivable, and two customers represented 32% and 17% of total accounts receivable, respectively.For the year ended December 31, 2015, three customers represented 14%, 11%, and 10% of the Company’s total revenue. For the year ended December 31,2016, three customers represented 24%, 14%, and 13% of the Company’s total revenue. For the year ended December 31, 2017, three customers represented30%, 21%, and 17% of the Company’s total revenue.
The Company purchases its hardware appliances from one contract manufacturer that assembles all of its products.
Foreign Currency
The functional currency of the Company’s foreign subsidiaries is the U.S. dollar. Monetary assets and liabilities are remeasured using the currentexchange rate at the balance sheet date. Non-monetary assets and liabilities and capital accounts are remeasured using historical exchange rates. Revenue andexpenses have been remeasured using the average exchange rates in effect during each period. Foreign currency remeasurement gains and losses are recordedin other expense, net. The Company recognized net foreign currency remeasurement losses of $0.4 million, $0.9 million, and $0.1 million, respectively, forthe years ended December 31, 2015, 2016 and 2017.
Cash and Cash Equivalents
The Company considers all highly liquid investments held at financial institutions with original maturities of three months or less at date of purchase tobe cash equivalents. Cash and cash equivalents are stated at cost, which approximates fair value.
Marketable Securities
The Company’s marketable securities consist primarily of commercial paper, corporate debt securities, and U.S. government agency securities. TheCompany’s marketable securities are classified as available-for-sale and are reported at fair value. The Company determines any realized gains or losses onthe sale of available-for-sale securities on a specific identification method, and such gains and losses are recorded as a component of other income (expense),net on our consolidated statements of operations. Unrealized gains and losses of the available-for-sale securities are excluded from earnings and reported as acomponent of accumulated other comprehensive income (loss).
91

Table of Contents
The Company has classified and accounted for its marketable securities as available-for-sale. After consideration of the Company’s risk versus rewardobjectives, as well as the Company’s liquidity requirements, the Company may sell these securities prior to their stated maturities. As the Company viewsthese securities as available to support current operations, the Company classifies highly liquid securities with maturities beyond 12 months as current assetsunder the caption marketable securities in the Consolidated Balance Sheets.
Marketable securities are considered impaired when a decline in fair value is judged to be other-than-temporary. The Company considers availablequantitative and qualitative evidence in evaluating potential impairment of the marketable securities on a quarterly basis. If the cost of an individualinvestment exceeds its fair value, the Company evaluates, among other factors, general market conditions, the duration and extent to which the fair value isless than cost, and the Company’s intent and ability to hold the investment. Once a decline in fair value is determined to be other-than-temporary, theCompany will record an impairment charge and establish a new cost basis in the investment. As of December 31, 2017, the Company did not consider any ofits marketable securities to be other-than-temporarily impaired.
Restricted Cash
As of December 31, 2016 and 2017, the Company had restricted cash of $0.2 million, and $0.2 million recorded as prepaid expenses and other currentassets, respectively, and $4.0 million, and $4.1 million recorded as non-current restricted cash, respectively. Restricted cash primarily consists of letters ofcredit issued as security deposits required for facility leases.
Accounts Receivable
Trade accounts receivable are recorded at the invoiced amount, net of allowances for doubtful accounts. The Company assesses its trade accountsreceivable for doubtful accounts based on the collectability of accounts. Management regularly reviews the adequacy of the allowance for doubtful accountsby considering the age of each outstanding invoice, each customer’s expected ability to pay, and the collection history with each customer, to determinewhether a specific allowance is appropriate. Accounts receivable that are deemed uncollectible are charged against the allowance for doubtful accounts. Basedon management’s assessment of its trade accounts receivable, the Company did not record an allowance for doubtful accounts as of December 31, 2016 and2017.
Inventory
Inventory primarily consists of finished goods hardware appliances and is stated at the lower of cost or market determined using the specificidentification method. Inventory that is obsolete or in excess of forecasted demand is written down to its estimated realizable value. Inventory write-downs,once established, are not reversed as they establish a new cost basis for the inventory. There were no material inventory write-downs for the years endedDecember 31, 2015, 2016, and 2017.
Property and Equipment
Property and equipment is stated at cost. Depreciation is computed using the straight-line method over the estimated useful lives of the assets, generallythree to five years. Demonstration units are not resold after use and are depreciated over the estimated useful life of three years or less. Leaseholdimprovements are depreciated over the shorter of the estimated useful lives of the improvements or the remaining lease term.
Impairment of Long-Lived Assets
Management reviews long-lived assets for events and changes in circumstances that may indicate that carrying amounts of long-lived assets, includingproperty and equipment, may not be recoverable. When such events or circumstances occur, recoverability of these assets is measured by a comparison of thecarrying value to the future undiscounted cash flows the assets are expected to generate. If long-lived assets are considered to be impaired, the impairment tobe recognized would equal the amount by which the carrying value of the asset exceeds its fair market value. To date, the Company has not recorded anysignificant impairment to its long-lived assets.
92
Table of Contents
Deferred Offering Costs
Deferred offering costs consisted of fees and expenses incurred in connection with the sale of the Company’s common stock in its IPO, including directincremental legal, consulting, accounting fees, and other IPO-related costs. Upon completion of the Company’s IPO, these deferred offering costs werereclassified to stockholders’ deficit and offset against the proceeds of the offering. As of December 31, 2016, deferred offering costs of $1.4 million wereincluded within other assets on the consolidated balance sheets. Total deferred offering costs recognized through the completion of the IPO and reclassified tostockholders' deficit and offset against the IPO proceeds were $4.5 million.
Product Warranty
The Company provides a standard 90 day warranty on its hardware and software products. The Company also offers its customers post-contract support(“PCS”), which includes a warranty of between one to five-years on hardware. The Company will also provide its customers software releases or updatesduring the PCS term. The Company accrues for estimated standard warranty costs for those customers that do not purchase PCS at the time of productshipment. These potential warranty claims are accrued as a component of product cost of revenue based on historical experience and other data, which isreviewed periodically for adequacy. Warranty costs associated with PCS are expensed as incurred. To date, the Company has not incurred nor accrued anysignificant costs associated with product warranty.
Contract Manufacturer Liabilities
Manufacturing, repair, and supply chain management operations are outsourced to a third party contract manufacturer. These costs are a significantportion of product cost of revenue. Although the Company is contractually obligated to purchase manufactured products, the Company generally does notown the manufactured products as product title transfers from the contract manufacturer to the Company and immediately to the customer upon shipment.The contract manufacturer assembles the Company’s products using design specifications, quality assurance programs, and standards that the Companyestablishes. Components are procured and assembled based on the Company’s demand forecasts. These forecasts represent management’s best estimates offuture demand for the products based upon historical trends and analysis from sales and operations functions as adjusted for overall market conditions. TheCompany accrues for costs for contractual manufacturing commitments in excess of its forecasted demand, including costs incurred for excess components orfor the carrying costs incurred by the contract manufacturer. To date, the Company has not accrued any significant contract manufacturer liabilities.
Redeemable Convertible Preferred and Common Stock Warrant Liabilities
Upon completion of the Company's IPO in October 2017, there were no freestanding warrants to purchase shares of convertible preferred stock. As such,no preferred stock warrant liability remained outstanding after the IPO. Before the Company's IPO, freestanding warrants related to shares that areredeemable or contingently redeemable were classified as a liability in the Company’s consolidated balance sheet. The convertible preferred stock warrantswere subject to re-measurement at each balance sheet date, and any change in fair value was recognized in the consolidated statements of operations. TheCompany adjusted the redeemable convertible preferred stock warrant liability to the estimated fair value of the warrants until either the exercise or thecompletion of the Company’s IPO, at which time the redeemable convertible preferred stock issuable upon exercise of the warrants became warrants topurchase common stock and the related liability was reclassified to additional paid-in capital in stockholders' equity (deficit).
At December 31, 2016, common stock warrants to purchase 233,023 shares of the Company’s common stock at a weighted-average exercise price of$6.62 per share were outstanding. During the year ended December 31, 2017, 149,786 common stock warrants of the 233,023 common stock warrants wereexercised. In lieu of payment of the aggregate warrant price, the warrant holders elected a "cashless exercise", whereby a portion of the shares equal to theaggregate warrant price were withheld. The average fair market value at the time exercise was $25.28, which resulted in 111,147 shares being issued by theCompany. As of December 31, 2017, 83,237 common stock warrants remained outstanding and exercisable.
Severance Pay Deposits and Accrued Severance Pay Liability
The Company records a severance pay asset and liability on its consolidated balance sheets related to its employees located in Israel. Under Israeli lawand labor agreements, the Company is required to make severance and pension payments to retired or dismissed employees and to employees leavingemployment in certain other circumstances.
93
Table of Contents
Liabilities for severance pay are calculated pursuant to Israeli severance pay law using the most recent monthly salary for the employees, multiplied bythe number of years of employment, and are included in accrued severance pay liability in the Company’s balance sheets. The Company’s liability at eachrespective balance sheet date for its Israeli employees is fully accrued in the accompanying consolidated financial statements. The severance liability isfunded through monthly deposits to the employee’s pension and management insurance carriers. The fair value of this deposit is recorded in severance paydeposits in the Company’s consolidated balance sheets.
Revenue Recognition
The Company derives its revenue from sales of products and associated maintenance and professional services. The Company’s CounterACT andEnterprise Manager products are sold as hardware appliances embedded with the Company’s software, or Physical Appliances, or as software only, or VirtualAppliances. The Company also recently started offering, in limited quantities to a small number of large enterprises, CounterACT and Enterprise Managertogether as a software only license (“Enterprise License Software”). The Company’s Enterprise License Software is either sold with separate hardware orwithout hardware, depending on the end-customer’s selection. The Company’s portfolio of Extended Modules are sold as software add-ons to CounterACTand Enterprise Manager. The Company accounts for the sale of Physical Appliances, and Enterprise License Software sold with separate hardware(“Hardware Products”) pursuant to Financial Accounting Standards Board, or FASB, Accounting Standard Codification Topic (“ASC”) 605-25, RevenueRecognition: Multiple Element Arrangements. The Company accounts for the sale of Virtual Appliances, Enterprise License Software sold without hardware,and Extended Modules as software deliverables (“Software Products”) pursuant to FASB, ASC Topic 985-605, Software Revenue Recognition. All of theCompany’s products are sold with a perpetual license.
The Company recognizes revenue when all of the following criteria are met:
• Persuasive Evidence of an Arrangement Exists. The Company relies upon binding sales agreements and/or purchase orders to provide evidence ofan arrangement.
• Delivery has Occurred. The Company uses shipping documents and/or electronic transmissions to evidence delivery of products.
• The Fee is Fixed or Determinable. The Company determines whether the fee is fixed or determinable based on the payment terms associated withthe transaction.
• Collectability is Reasonably Assured. The Company evaluates collectability based on credit analysis and payment history.
Payments from the Company’s distributors and resellers are not contingent on the distributors’ and resellers’ success in sales to end-customers. TheCompany’s distributors and resellers do not stock hardware appliances and have no stock rotation rights.
Most of the Company’s sales, other than renewals of support and maintenance, are multiple element arrangements with a combination of PhysicalAppliances, Virtual Appliances, Extended Modules, Enterprise License Software and hardware sold separately, support and maintenance and professionalservices. For multiple element arrangements, the arrangement consideration is allocated to software deliverables as a group and non-software deliverables as asecond group based on a relative selling price hierarchy. The relative selling price hierarchy is based on: (i) vendor-specific objective evidence of fair value(“VSOE”) if available, (ii) third-party evidence of selling price (“TPE”) if VSOE is not available, or (iii) best estimate of the selling price (“BESP”) if neitherVSOE nor TPE is available.
Hardware Product revenue is recognized at the time of delivery, provided that all other revenue recognition criteria have been met. Software Productrevenue is recognized at the time of delivery if VSOE is established for all undelivered related items. If VSOE does not exist for one or more undelivereditems, revenue from the software portion of the arrangement is deferred until the delivery of all items has begun and is then recognized ratably over theremaining related support and maintenance service period. Support and maintenance revenue is generally recognized ratably over the contractual serviceperiod, which is typically one to three years, but can be up to five years. Professional services revenue is generally recognized as the services are rendered.
94
Table of Contents
For Hardware Products, the Company determined that VSOE and TPE cannot be established. As a result, the Company uses BESP to determine therelative selling price at which a transaction would take place if the hardware product was sold on a stand-alone basis. For Hardware Product relatedmaintenance and professional services, the Company uses either VSOE or BESP when VSOE and TPE cannot be established. In determining the BESP for aproduct or service, the Company considers historical data including, but not limited to, product family, pricing practices, standalone sales, the nature and sizeof the customer, contractually stated prices, and geographical region. The Company limits the amount of revenue recognized for delivered elements to anamount that is not contingent upon future delivery of additional products or services or meeting of any specified performance conditions.
In multiple-element arrangements that include software, revenue is allocated to each separate unit of accounting for the non-software deliverables, as wellas the software deliverables as a group, using the relative estimated selling prices of each of the deliverables in the arrangement based on the aforementionedselling price hierarchy. The arrangement consideration allocated to the software deliverables as a group is then allocated to each software deliverableseparately using the residual method based on the fair value of each of the undelivered deliverables, using VSOE. The Company typically determines VSOEbased on its normal pricing and discounting practices for the specific service when sold separately. The Company establishes VSOE on software relatedsupport and maintenance using the bell-shaped curve approach. Under this approach, the Company concludes that VSOE exists if a substantial majority ofrecent stand-alone renewal transactions are priced within a narrow range. For Enterprise License Software, the Company established VSOE on support andmaintenance prior to the occurrence of actual renewals, based on management’s ability to establish support and maintenance renewal rates. The Companyensures that such established VSOE is supported by contractually stated renewal rates. Beginning on January 1, 2016, the Company has established VSOE forprofessional services, and support and maintenance on Software Products, except Extended Modules.
Revenue is reported net of sales taxes. Sales commissions and other incremental costs to acquire contracts are expensed to sales and marketing expenseas incurred.
Deferred Revenue and Deferred Cost of Revenue
After receipt of a customer order, any amounts billed in excess of revenue recognized are recorded as deferred revenue. Deferred revenue consists ofamounts that have been invoiced but that have not been recognized as revenue. Deferred revenue that is expected to be recognized within the succeeding 12month period is recorded as current deferred revenue and the remaining amount is recorded as non-current deferred revenue.
Deferred cost of revenue includes direct and incremental costs related to product sales provided for contracts under which revenue has been deferred asthe earnings process has not been completed. Deferred cost of revenue that is expected to be realized within the succeeding 12 month period is recorded ascurrent deferred cost of revenue and the remaining amount is recorded as non-current other assets.
Customer Deposits
As of December 31, 2016 and 2017, the Company had customer deposits of $0.7 million, and $1.0 million, respectively. Customer deposits representsamounts received from customers in advance for future orders of goods or services.
Software Development Costs
Software development costs are not capitalized as the software development process is essentially completed concurrent with the establishment oftechnological feasibility. As such, all software development costs are expensed as incurred and included in research and development expense in theaccompanying consolidated statements of operations.
Advertising Costs
Advertising costs include costs incurred on print, broadcast, and online advertising. Advertising costs are expensed as incurred and included in sales andmarketing expense in the accompanying consolidated statements of operations. The Company recognized advertising expenses of $7,000, $291,000, and$430,000 for the years ended December 31, 2015, 2016 and 2017, respectively.
95
Table of Contents
Stock-Based Compensation
Stock-based compensation for employees is measured based on the grant date fair value of the award and is expensed over the requisite service period,which is generally the vesting period. The Company accounts for stock-based compensation to non-employees using the fair value approach. Equity awards tonon-employees are subject to remeasurement at each reporting period over their vesting terms. The fair value of option awards is determined on the date ofgrant using the Black-Scholes option pricing model. In applying the Black-Scholes option pricing model, the Company’s determination of the fair value of theoption award on the grant date is affected by the Company’s estimated fair value of the underlying common stock, as well as assumptions relating tosubjective variables. These variables include the expected term of the award, the expected volatility of the common stock price, the risk-free interest rate, andthe expected dividend yield of common stock.
The fair value of restricted stock units (“RSUs”) is determined on the date of grant using the Company’s estimated fair value of the underlying commonstock.
Prior to January 1, 2017, for awards with a service condition only, the Company recognized stock-based compensation expense over the service period ona straight-line basis, net of forfeitures. For awards with both a service and performance condition, stock-based compensation expense is recognized over theservice period using an accelerated attribution method once the performance conditions become probable. Beginning January 1, 2017 with the adoption ofASU 2016-09, the Company elected to recognize forfeitures as they occur, and no longer estimates a forfeiture rate when calculating the stock-basedcompensation for equity awards. Stock-based compensation for the years ended December 31, 2015 and 2016 was calculated using an estimated forfeiturerate based on an analysis of the Company’s actual historical forfeitures.
Income Taxes
Deferred income taxes are recognized using the asset and liability method, whereby deferred tax assets and liabilities are recognized for the expectedfuture tax consequences attributable to differences between the Company’s (1) financial statement carrying amounts and their respective tax bases and (2)operating loss and tax credit carryforwards. Valuation allowances are provided when the expected realization of tax assets does not meet a more-likely-than-not criterion. Due to the Company’s lack of earnings history, the U.S. net deferred tax assets have been fully offset by a valuation allowance.
The Company recognizes tax benefits from uncertain tax positions if it is more likely than not that the tax position will be sustained upon examination bya taxing authority based on the technical merits of the position. The tax benefits recognized from such positions are measured based on the largest benefit thathas a greater than 50% likelihood to be realized upon settlement.
The Company recognizes accrued interest and penalties related to unrecognized tax benefits in income tax expense in the accompanying consolidatedstatements of operations, when and if incurred.
On December 22, 2017, the President of the United States signed the Tax Cuts and Jobs Act (the “Act”) into law. The legislation significantly changesU.S. tax law by, among other things, lowering corporate income tax rates, implementing a territorial tax system and imposing a mandatory repatriation tax onearnings of foreign subsidiaries. The Tax Reform Act permanently reduces the U.S. corporate income tax rate from a maximum of 35% to a flat 21% rate,effective January 1, 2018.
Recent Accounting Pronouncements
In May 2014, the Financial Accounting Standards Board (“FASB”) issued Accounting Standards Update (“ASU”) No. 2014-09 (Topic 606), Revenuefrom Contracts with Customers (“ASU 2014-09”), related to revenue from contracts with customers, which, along with amendments issued in 2015 and 2016,will supersede nearly all current GAAP guidance on this topic and eliminate industry-specific guidance. Under the new standard, revenue is recognized whena customer obtains control of promised goods or services and is recognized in an amount that reflects the consideration that the entity expects to receive inexchange for those goods or services. In addition, the standard requires disclosure of the nature, amount, timing, and uncertainty of revenue and cash flowsarising from contracts with customers.
The guidance permits two methods of adoption: retrospectively to each prior reporting period presented (“full retrospective method,”) or retrospectivelywith the cumulative effect of applying the guidance recognized in retained earnings as of the date of adoption (“modified retrospective method”). TheCompany will adopt the new standard using the full retrospective method effective January 1, 2018.
96
Table of Contents
To date, the Company has evaluated the impacts of adoption of the new standard on its accounting policies, processes, and system requirements and hasassigned internal resources, in addition to the engagement of third party service providers, to assist in the evaluation. The most significant impact relates tothe accounting for Software Products as VSOE for support and maintenance on Software Products prior to January 1, 2016 was not established, and recordedall Software Product related revenue ratably over the contractually committed support and maintenance period. Under the new standard the requirement tohave VSOE for undelivered elements is eliminated and an entity may be required to recognize Software Product revenue at the time of delivery, and anyrelated professional services revenue as services are provided to the customers. The Company expects revenue allocated from future deliverables (primarilysupport and maintenance) to Physical Appliances to be recognized upon delivery under the new guidance when the standalone selling price is different fromthe contract price. Currently, such differences are recognized over the contractual support and maintenance period. Additionally, the new standard requires thecapitalization of costs to obtain a contract, primarily sales commissions, and amortization of these costs over the contract period or estimated customer lifewhich will result in the recognition of a deferred charge on our balance sheets. The Company currently expenses all sales commissions and other incrementalcosts to acquire contracts as incurred.
The Company estimates the impacts to the following account balances after the adoption of Topic 606. Adoption of the standard will result in:
• A net increase in revenue for the years ended December 31, 2016 and 2017, respectively, due to the changes in accounting for Software Productsrevenue recognition and for revenue allocated from future deliverables to Physical Appliances;
• A decrease in sales and marketing expense for the years ended December 31, 2016 and 2017, respectively, due to a change in the accounting forcommissions;
• A decrease in loss from operations for the years ended December 31, 2016 and 2017, respectively, due to the changes above related to sales andmarketing expense and revenue;
• An increase of deferred commissions as of December 31, 2016 and 2017, respectively, driven by the change in the accounting for commissions;
• A reduction of deferred revenue as of December 31, 2016 and 2017, respectively, driven primarily by the upfront recognition of Software Productsrevenue.
In July 2015, the FASB issued ASU No. 2015-11 (Topic 330), Simplifying the Measurement of Inventory. The guidance simplifies the measurement ofinventory by requiring inventory to be measured at the lower of cost and net realizable value. The standard is effective for annual and interim periods withinthose fiscal years, beginning after December 15, 2016, and should be applied prospectively. The Company adopted this standard in the first quarter of 2017.The adoption of this standard did not have a material impact on the Company’s consolidated financial statements.
In February 2016, the FASB issued ASU No. 2016-02 (Topic 842), Leases. The new guidance requires lessees to recognize right-of-use assetsand lease liabilities for those leases classified as operating leases under previous U.S. GAAP. The standard is effective for annual and interim periods withinthose fiscal years, beginning after December 15, 2018, and will be applied on a modified retrospective basis, with the option to electcertain practical expedients. Early adoption is permitted. The Company plans to adopt this standard on January 1, 2019. The Company is currently evaluatingthe impact of the adoption of this standard on its consolidated financial statements.
In March 2016, the FASB issued ASU No. 2016-09 (Topic 718), Improvements to Employee Share-Based Payment Accounting (“ASU 2016-09”). Thisstandard is intended to simplify several areas of accounting for stock-based compensation arrangements, including the income tax impact, classification onthe statement of cash flows and forfeitures. ASU 2016-09 is effective for annual and interim periods within those fiscal years, beginning after December 15,2016. The Company adopted this standard in the first quarter of 2017 and elected to account for forfeitures as they occur, rather than estimate expectedforfeitures. The change has been applied on a modified retrospective basis that resulted in a $34,000 cumulative-effect adjustment to accumulated deficit as ofJanuary 1, 2017, the date of adoption. The adoption of this guidance also requires that excess tax benefits and tax deficiencies be recorded in the statement ofoperations as opposed to additional paid-in capital when the awards vest or are settled, and has been applied on a prospective basis. As a result, deferred taxassets increased by $2.3 million as of
97

Table of Contents
January 1, 2017, offset by valuation allowance, due to tax deductions related to equity compensation greater than compensation recognized for financialreporting.
In November 2016, the FASB issued ASU No. 2016-18 (Topic 230), Statement of Cash Flows: Restricted Cash. The new standard requires an entity toshow the changes in the total of cash, cash equivalents, restricted cash and restricted cash equivalents in the statement of cash flows, and an entity will nolonger present transfers between cash and cash equivalents and restricted cash and restricted cash equivalents in the statement of cash flows. The standard iseffective for annual and interim periods within those fiscal years, beginning after December 15, 2017, and should be applied retrospectively. The Companywill adopt this standard on January 1, 2018.
Note 2. Fair Value Measurements
Financial assets and liabilities are recorded at fair value on the consolidated balance sheets and are categorized based upon the level of judgmentassociated with inputs used to measure their fair value.
Fair value reflects the price that would be received on the sale of an asset or paid to transfer a liability in an orderly transaction between marketparticipants at the measurement date. When determining fair value measurements, the Company considers the principal or most advantageous market and alsomarket-based risk.
The accounting guidance for fair value measurements requires an entity to maximize the use of observable inputs and minimize the use of unobservableinputs when measuring fair value. The accounting guidance also establishes a fair value hierarchy based on the independence of the source and objectiveevidence of the inputs used. There are three fair value hierarchies based upon the level of inputs that are significant to fair value measurement:
• Level 1—Observable inputs that reflect quoted prices in active markets for identical assets or liabilities.
• Level 2—Observable inputs that reflect quoted prices for identical assets and liabilities in markets that are not active, quoted prices for similar assetsor liabilities in active markets, inputs other than quoted prices that are observable for the assets or liabilities, or inputs that are derived principallyfrom or corroborated by observable market data by correlation or other means.
• Level 3—Inputs that are generally unobservable and are supported by little or no market activity, and typically reflect management’s estimate ofassumptions that market participants would use in pricing the asset or liability.
98
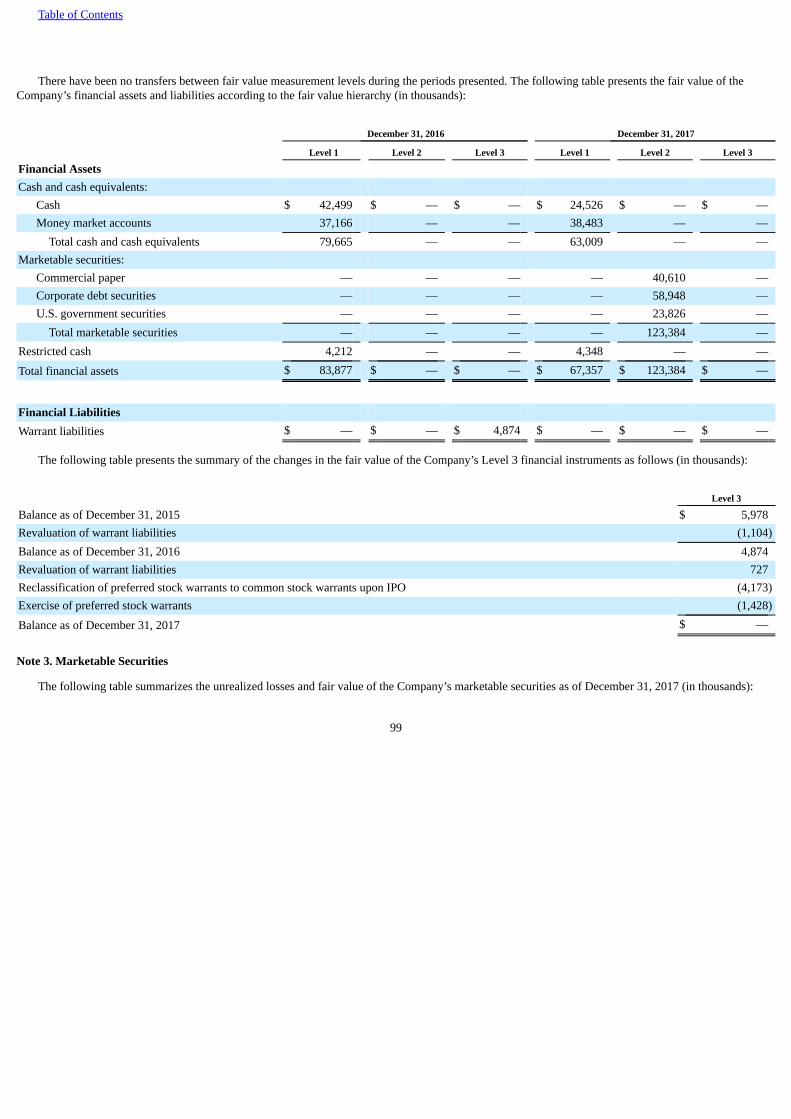
Table of Contents
There have been no transfers between fair value measurement levels during the periods presented. The following table presents the fair value of theCompany’s financial assets and liabilities according to the fair value hierarchy (in thousands):
December 31, 2016 December 31, 2017
Level 1 Level 2 Level 3 Level 1 Level 2 Level 3
Financial Assets Cash and cash equivalents: Cash $ 42,499 $ — $ — $ 24,526 $ — $ — Money market accounts 37,166 — — 38,483 — —
Total cash and cash equivalents 79,665 — — 63,009 — —Marketable securities: Commercial paper — — — — 40,610 — Corporate debt securities — — — — 58,948 — U.S. government securities — — — — 23,826 —
Total marketable securities — — — — 123,384 —Restricted cash 4,212 — — 4,348 — —
Total financial assets $ 83,877 $ — $ — $ 67,357 $ 123,384 $ —
Financial Liabilities Warrant liabilities $ — $ — $ 4,874 $ — $ — $ —
The following table presents the summary of the changes in the fair value of the Company’s Level 3 financial instruments as follows (in thousands):
Level 3
Balance as of December 31, 2015 $ 5,978Revaluation of warrant liabilities (1,104)Balance as of December 31, 2016 4,874Revaluation of warrant liabilities 727Reclassification of preferred stock warrants to common stock warrants upon IPO (4,173)Exercise of preferred stock warrants (1,428)
Balance as of December 31, 2017 $ —
Note 3. Marketable Securities
The following table summarizes the unrealized losses and fair value of the Company’s marketable securities as of December 31, 2017 (in thousands):
99
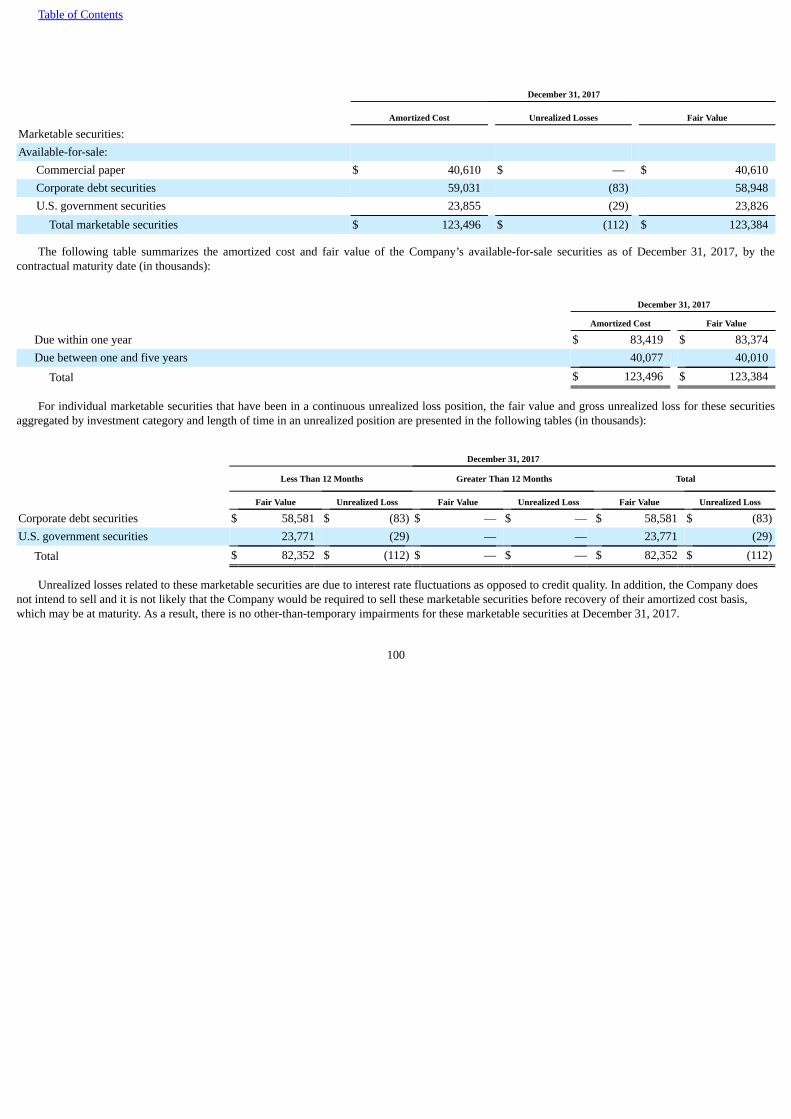
Table of Contents
December 31, 2017
Amortized Cost Unrealized Losses Fair Value
Marketable securities: Available-for-sale: Commercial paper $ 40,610 $ — $ 40,610 Corporate debt securities 59,031 (83) 58,948 U.S. government securities 23,855 (29) 23,826
Total marketable securities $ 123,496 $ (112) $ 123,384
The following table summarizes the amortized cost and fair value of the Company’s available-for-sale securities as of December 31, 2017, by thecontractual maturity date (in thousands):
December 31, 2017
Amortized Cost Fair Value
Due within one year $ 83,419 $ 83,374Due between one and five years 40,077 40,010
Total $ 123,496 $ 123,384
For individual marketable securities that have been in a continuous unrealized loss position, the fair value and gross unrealized loss for these securitiesaggregated by investment category and length of time in an unrealized position are presented in the following tables (in thousands):
December 31, 2017
Less Than 12 Months Greater Than 12 Months Total
Fair Value Unrealized Loss Fair Value Unrealized Loss Fair Value Unrealized Loss
Corporate debt securities $ 58,581 $ (83) $ — $ — $ 58,581 $ (83)U.S. government securities 23,771 (29) — — 23,771 (29)
Total $ 82,352 $ (112) $ — $ — $ 82,352 $ (112)
Unrealized losses related to these marketable securities are due to interest rate fluctuations as opposed to credit quality. In addition, the Company doesnot intend to sell and it is not likely that the Company would be required to sell these marketable securities before recovery of their amortized cost basis,which may be at maturity. As a result, there is no other-than-temporary impairments for these marketable securities at December 31, 2017.
100
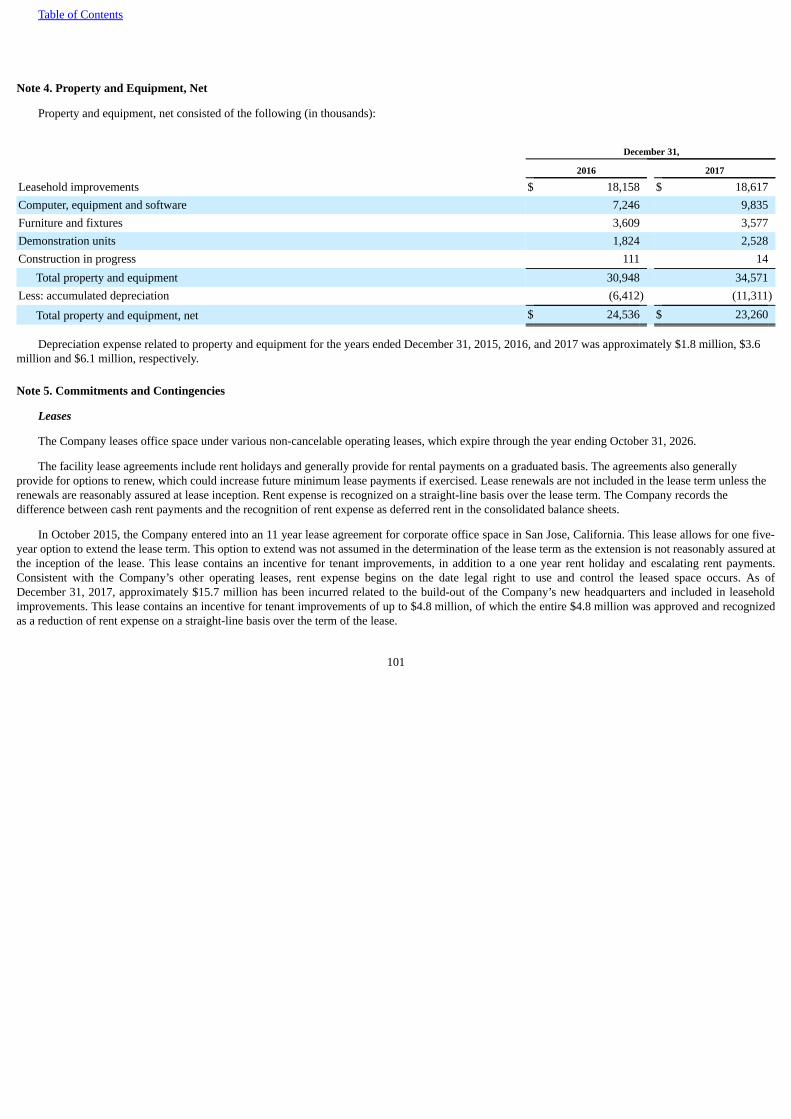
Table of Contents
Note 4. Property and Equipment, Net
Property and equipment, net consisted of the following (in thousands):
December 31,
2016 2017
Leasehold improvements $ 18,158 $ 18,617Computer, equipment and software 7,246 9,835Furniture and fixtures 3,609 3,577Demonstration units 1,824 2,528Construction in progress 111 14 Total property and equipment 30,948 34,571Less: accumulated depreciation (6,412) (11,311)
Total property and equipment, net $ 24,536 $ 23,260
Depreciation expense related to property and equipment for the years ended December 31, 2015, 2016, and 2017 was approximately $1.8 million, $3.6million and $6.1 million, respectively.
Note 5. Commitments and Contingencies
Leases
The Company leases office space under various non-cancelable operating leases, which expire through the year ending October 31, 2026.
The facility lease agreements include rent holidays and generally provide for rental payments on a graduated basis. The agreements also generallyprovide for options to renew, which could increase future minimum lease payments if exercised. Lease renewals are not included in the lease term unless therenewals are reasonably assured at lease inception. Rent expense is recognized on a straight-line basis over the lease term. The Company records thedifference between cash rent payments and the recognition of rent expense as deferred rent in the consolidated balance sheets.
In October 2015, the Company entered into an 11 year lease agreement for corporate office space in San Jose, California. This lease allows for one five-year option to extend the lease term. This option to extend was not assumed in the determination of the lease term as the extension is not reasonably assured atthe inception of the lease. This lease contains an incentive for tenant improvements, in addition to a one year rent holiday and escalating rent payments.Consistent with the Company’s other operating leases, rent expense begins on the date legal right to use and control the leased space occurs. As ofDecember 31, 2017, approximately $15.7 million has been incurred related to the build-out of the Company’s new headquarters and included in leaseholdimprovements. This lease contains an incentive for tenant improvements of up to $4.8 million, of which the entire $4.8 million was approved and recognizedas a reduction of rent expense on a straight-line basis over the term of the lease.
101
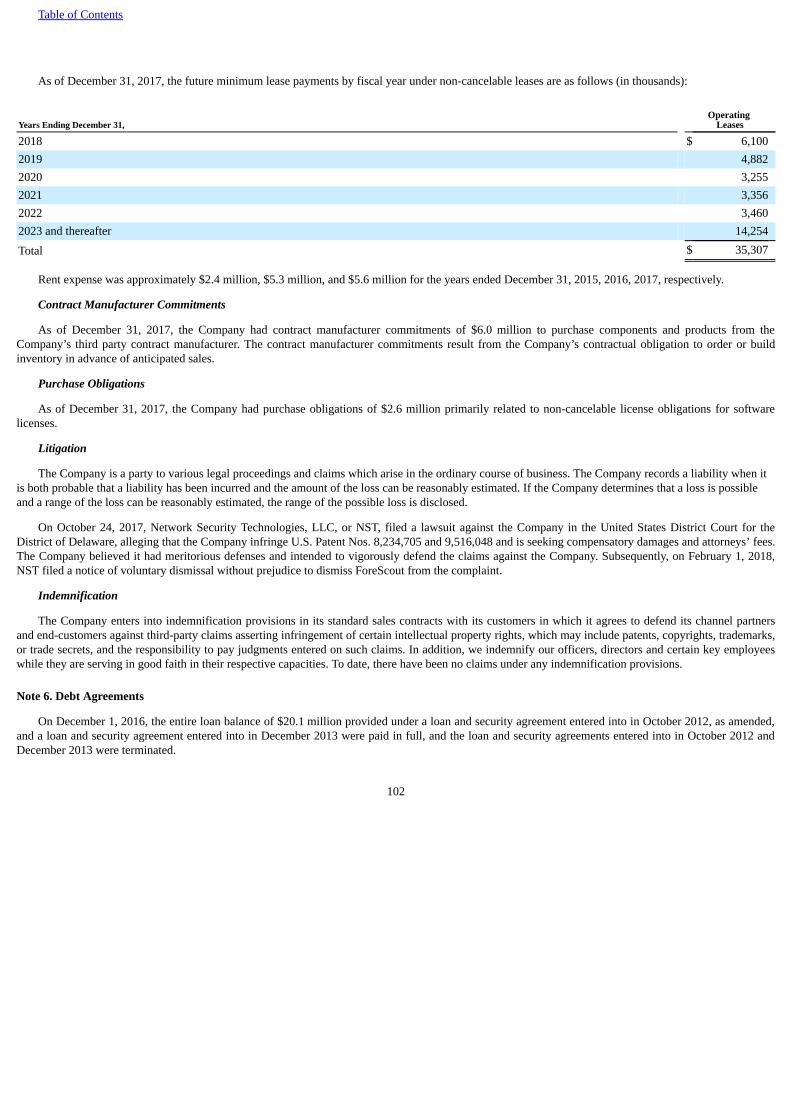
Table of Contents
As of December 31, 2017, the future minimum lease payments by fiscal year under non-cancelable leases are as follows (in thousands):
Years Ending December 31, Operating
Leases
2018 $ 6,1002019 4,8822020 3,2552021 3,3562022 3,4602023 and thereafter 14,254
Total $ 35,307
Rent expense was approximately $2.4 million, $5.3 million, and $5.6 million for the years ended December 31, 2015, 2016, 2017, respectively.
Contract Manufacturer Commitments
As of December 31, 2017, the Company had contract manufacturer commitments of $6.0 million to purchase components and products from theCompany’s third party contract manufacturer. The contract manufacturer commitments result from the Company’s contractual obligation to order or buildinventory in advance of anticipated sales.
Purchase Obligations
As of December 31, 2017, the Company had purchase obligations of $2.6 million primarily related to non-cancelable license obligations for softwarelicenses.
Litigation
The Company is a party to various legal proceedings and claims which arise in the ordinary course of business. The Company records a liability when itis both probable that a liability has been incurred and the amount of the loss can be reasonably estimated. If the Company determines that a loss is possibleand a range of the loss can be reasonably estimated, the range of the possible loss is disclosed.
On October 24, 2017, Network Security Technologies, LLC, or NST, filed a lawsuit against the Company in the United States District Court for theDistrict of Delaware, alleging that the Company infringe U.S. Patent Nos. 8,234,705 and 9,516,048 and is seeking compensatory damages and attorneys’ fees.The Company believed it had meritorious defenses and intended to vigorously defend the claims against the Company. Subsequently, on February 1, 2018,NST filed a notice of voluntary dismissal without prejudice to dismiss ForeScout from the complaint.
Indemnification
The Company enters into indemnification provisions in its standard sales contracts with its customers in which it agrees to defend its channel partnersand end-customers against third-party claims asserting infringement of certain intellectual property rights, which may include patents, copyrights, trademarks,or trade secrets, and the responsibility to pay judgments entered on such claims. In addition, we indemnify our officers, directors and certain key employeeswhile they are serving in good faith in their respective capacities. To date, there have been no claims under any indemnification provisions.
Note 6. Debt Agreements
On December 1, 2016, the entire loan balance of $20.1 million provided under a loan and security agreement entered into in October 2012, as amended,and a loan and security agreement entered into in December 2013 were paid in full, and the loan and security agreements entered into in October 2012 andDecember 2013 were terminated.
102
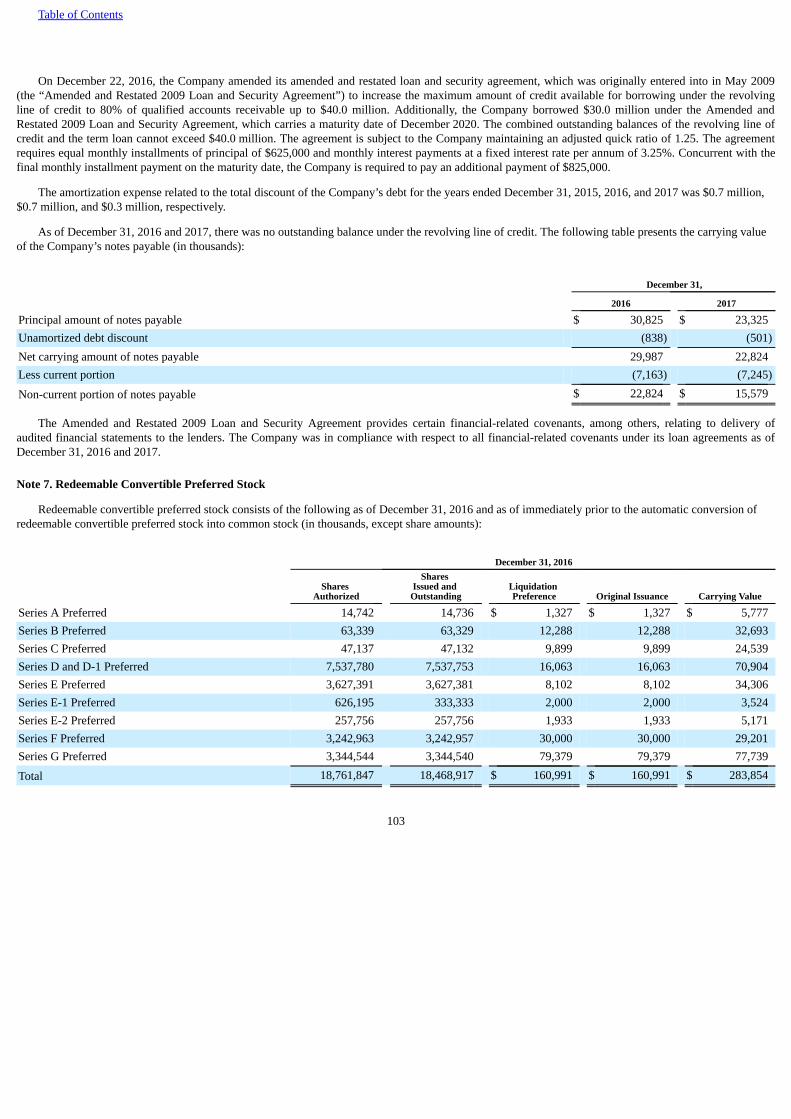
Table of Contents
On December 22, 2016, the Company amended its amended and restated loan and security agreement, which was originally entered into in May 2009(the “Amended and Restated 2009 Loan and Security Agreement”) to increase the maximum amount of credit available for borrowing under the revolvingline of credit to 80% of qualified accounts receivable up to $40.0 million. Additionally, the Company borrowed $30.0 million under the Amended andRestated 2009 Loan and Security Agreement, which carries a maturity date of December 2020. The combined outstanding balances of the revolving line ofcredit and the term loan cannot exceed $40.0 million. The agreement is subject to the Company maintaining an adjusted quick ratio of 1.25. The agreementrequires equal monthly installments of principal of $625,000 and monthly interest payments at a fixed interest rate per annum of 3.25%. Concurrent with thefinal monthly installment payment on the maturity date, the Company is required to pay an additional payment of $825,000.
The amortization expense related to the total discount of the Company’s debt for the years ended December 31, 2015, 2016, and 2017 was $0.7 million,$0.7 million, and $0.3 million, respectively.
As of December 31, 2016 and 2017, there was no outstanding balance under the revolving line of credit. The following table presents the carrying valueof the Company’s notes payable (in thousands):
December 31,
2016 2017
Principal amount of notes payable $ 30,825 $ 23,325Unamortized debt discount (838) (501)Net carrying amount of notes payable 29,987 22,824Less current portion (7,163) (7,245)
Non-current portion of notes payable $ 22,824 $ 15,579
The Amended and Restated 2009 Loan and Security Agreement provides certain financial-related covenants, among others, relating to delivery ofaudited financial statements to the lenders. The Company was in compliance with respect to all financial-related covenants under its loan agreements as ofDecember 31, 2016 and 2017.
Note 7. Redeemable Convertible Preferred Stock
Redeemable convertible preferred stock consists of the following as of December 31, 2016 and as of immediately prior to the automatic conversion ofredeemable convertible preferred stock into common stock (in thousands, except share amounts):
December 31, 2016
Shares
Authorized Shares
Issued and Outstanding
Liquidation Preference Original Issuance Carrying Value
Series A Preferred 14,742 14,736 $ 1,327 $ 1,327 $ 5,777Series B Preferred 63,339 63,329 12,288 12,288 32,693Series C Preferred 47,137 47,132 9,899 9,899 24,539Series D and D-1 Preferred 7,537,780 7,537,753 16,063 16,063 70,904Series E Preferred 3,627,391 3,627,381 8,102 8,102 34,306Series E-1 Preferred 626,195 333,333 2,000 2,000 3,524Series E-2 Preferred 257,756 257,756 1,933 1,933 5,171Series F Preferred 3,242,963 3,242,957 30,000 30,000 29,201Series G Preferred 3,344,544 3,344,540 79,379 79,379 77,739
Total 18,761,847 18,468,917 $ 160,991 $ 160,991 $ 283,854
103
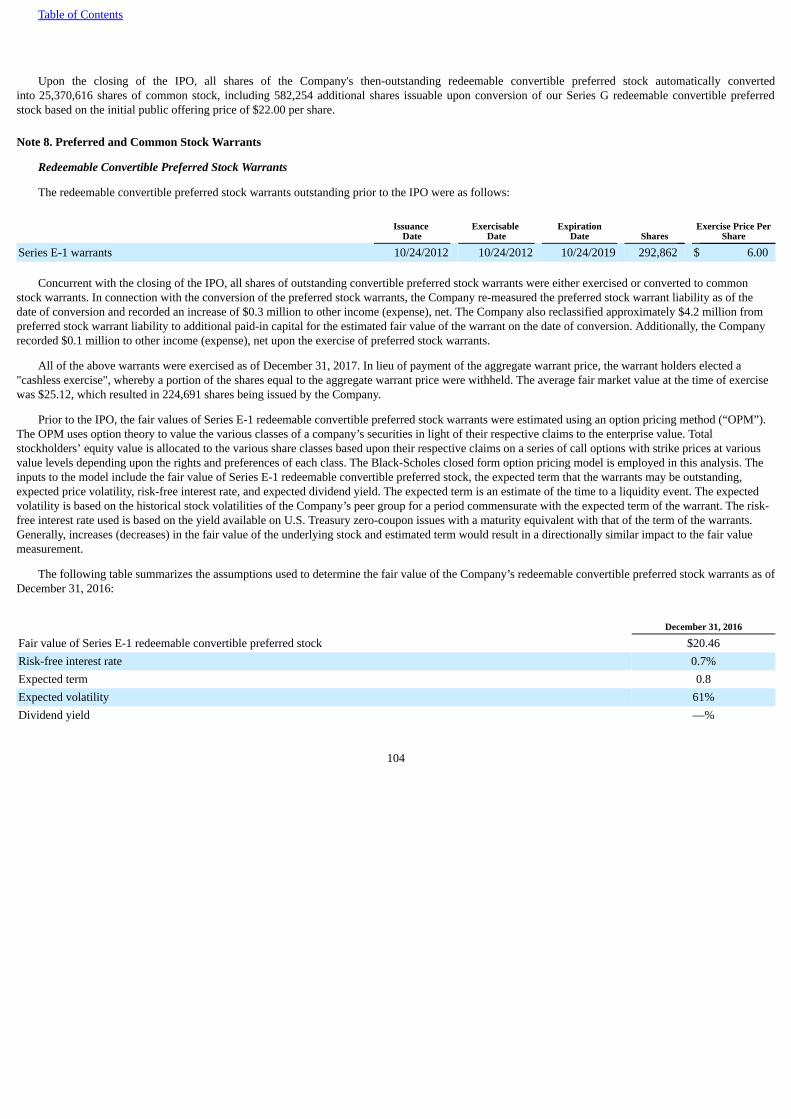
Table of Contents
Upon the closing of the IPO, all shares of the Company's then-outstanding redeemable convertible preferred stock automatically convertedinto 25,370,616 shares of common stock, including 582,254 additional shares issuable upon conversion of our Series G redeemable convertible preferredstock based on the initial public offering price of $22.00 per share.
Note 8. Preferred and Common Stock Warrants
Redeemable Convertible Preferred Stock Warrants
The redeemable convertible preferred stock warrants outstanding prior to the IPO were as follows:
Issuance
Date Exercisable
Date Expiration
Date Shares Exercise Price Per
Share
Series E-1 warrants 10/24/2012 10/24/2012 10/24/2019 292,862 $ 6.00
Concurrent with the closing of the IPO, all shares of outstanding convertible preferred stock warrants were either exercised or converted to commonstock warrants. In connection with the conversion of the preferred stock warrants, the Company re-measured the preferred stock warrant liability as of thedate of conversion and recorded an increase of $0.3 million to other income (expense), net. The Company also reclassified approximately $4.2 million frompreferred stock warrant liability to additional paid-in capital for the estimated fair value of the warrant on the date of conversion. Additionally, the Companyrecorded $0.1 million to other income (expense), net upon the exercise of preferred stock warrants.
All of the above warrants were exercised as of December 31, 2017. In lieu of payment of the aggregate warrant price, the warrant holders elected a"cashless exercise", whereby a portion of the shares equal to the aggregate warrant price were withheld. The average fair market value at the time of exercisewas $25.12, which resulted in 224,691 shares being issued by the Company.
Prior to the IPO, the fair values of Series E-1 redeemable convertible preferred stock warrants were estimated using an option pricing method (“OPM”).The OPM uses option theory to value the various classes of a company’s securities in light of their respective claims to the enterprise value. Totalstockholders’ equity value is allocated to the various share classes based upon their respective claims on a series of call options with strike prices at variousvalue levels depending upon the rights and preferences of each class. The Black-Scholes closed form option pricing model is employed in this analysis. Theinputs to the model include the fair value of Series E-1 redeemable convertible preferred stock, the expected term that the warrants may be outstanding,expected price volatility, risk-free interest rate, and expected dividend yield. The expected term is an estimate of the time to a liquidity event. The expectedvolatility is based on the historical stock volatilities of the Company’s peer group for a period commensurate with the expected term of the warrant. The risk-free interest rate used is based on the yield available on U.S. Treasury zero-coupon issues with a maturity equivalent with that of the term of the warrants.Generally, increases (decreases) in the fair value of the underlying stock and estimated term would result in a directionally similar impact to the fair valuemeasurement.
The following table summarizes the assumptions used to determine the fair value of the Company’s redeemable convertible preferred stock warrants as ofDecember 31, 2016:
December 31, 2016
Fair value of Series E-1 redeemable convertible preferred stock $20.46Risk-free interest rate 0.7%Expected term 0.8Expected volatility 61%Dividend yield —%
104
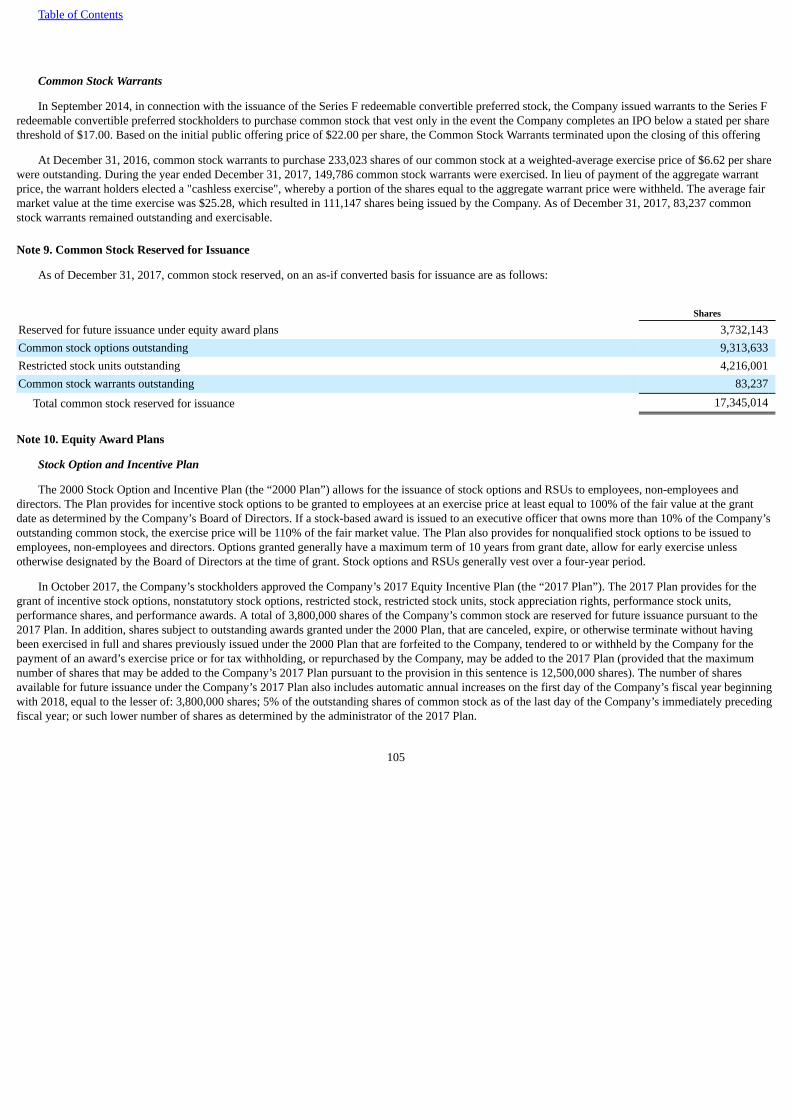
Table of Contents
Common Stock Warrants
In September 2014, in connection with the issuance of the Series F redeemable convertible preferred stock, the Company issued warrants to the Series Fredeemable convertible preferred stockholders to purchase common stock that vest only in the event the Company completes an IPO below a stated per sharethreshold of $17.00. Based on the initial public offering price of $22.00 per share, the Common Stock Warrants terminated upon the closing of this offering
At December 31, 2016, common stock warrants to purchase 233,023 shares of our common stock at a weighted-average exercise price of $6.62 per sharewere outstanding. During the year ended December 31, 2017, 149,786 common stock warrants were exercised. In lieu of payment of the aggregate warrantprice, the warrant holders elected a "cashless exercise", whereby a portion of the shares equal to the aggregate warrant price were withheld. The average fairmarket value at the time exercise was $25.28, which resulted in 111,147 shares being issued by the Company. As of December 31, 2017, 83,237 commonstock warrants remained outstanding and exercisable.
Note 9. Common Stock Reserved for Issuance
As of December 31, 2017, common stock reserved, on an as-if converted basis for issuance are as follows:
Shares
Reserved for future issuance under equity award plans 3,732,143Common stock options outstanding 9,313,633Restricted stock units outstanding 4,216,001Common stock warrants outstanding 83,237
Total common stock reserved for issuance 17,345,014
Note 10. Equity Award Plans
Stock Option and Incentive Plan
The 2000 Stock Option and Incentive Plan (the “2000 Plan”) allows for the issuance of stock options and RSUs to employees, non-employees anddirectors. The Plan provides for incentive stock options to be granted to employees at an exercise price at least equal to 100% of the fair value at the grantdate as determined by the Company’s Board of Directors. If a stock-based award is issued to an executive officer that owns more than 10% of the Company’soutstanding common stock, the exercise price will be 110% of the fair market value. The Plan also provides for nonqualified stock options to be issued toemployees, non-employees and directors. Options granted generally have a maximum term of 10 years from grant date, allow for early exercise unlessotherwise designated by the Board of Directors at the time of grant. Stock options and RSUs generally vest over a four-year period.
In October 2017, the Company’s stockholders approved the Company’s 2017 Equity Incentive Plan (the “2017 Plan”). The 2017 Plan provides for thegrant of incentive stock options, nonstatutory stock options, restricted stock, restricted stock units, stock appreciation rights, performance stock units,performance shares, and performance awards. A total of 3,800,000 shares of the Company’s common stock are reserved for future issuance pursuant to the2017 Plan. In addition, shares subject to outstanding awards granted under the 2000 Plan, that are canceled, expire, or otherwise terminate without havingbeen exercised in full and shares previously issued under the 2000 Plan that are forfeited to the Company, tendered to or withheld by the Company for thepayment of an award’s exercise price or for tax withholding, or repurchased by the Company, may be added to the 2017 Plan (provided that the maximumnumber of shares that may be added to the Company’s 2017 Plan pursuant to the provision in this sentence is 12,500,000 shares). The number of sharesavailable for future issuance under the Company’s 2017 Plan also includes automatic annual increases on the first day of the Company’s fiscal year beginningwith 2018, equal to the lesser of: 3,800,000 shares; 5% of the outstanding shares of common stock as of the last day of the Company’s immediately precedingfiscal year; or such lower number of shares as determined by the administrator of the 2017 Plan.
105

Table of Contents
The Company had an early exercise liability of approximately $2.3 million and $1.2 million as at December 31, 2016, and 2017, respectively. Includingearly exercises, the Company has 6,184,187 and 38,266,450 shares of legally outstanding common stock as at December 31, 2016, and 2017, respectively.
2017 Employee Stock Purchase Plan
In October 2017, the Company’s stockholders approved the 2017 Employee Stock Purchase Plan (the “ESPP”).
The ESPP allows eligible employees to purchase shares of the Company’s common stock through payroll deductions and is intended to qualify underSection 423 of the Internal Revenue Code. A total of 800,000 shares of the Company’s common stock are available for sale under the ESPP. The number ofshares available for issuance under the Company’s ESPP will also include an automatic, annual increase on the first day of each fiscal year of the Companybeginning in 2018, equal to the lesser of: 800,000 shares; 1% of the total number of shares of the Company’s common stock outstanding on the last day of theCompany’s immediately preceding fiscal year; or such lower number of shares as determined by the Administrator. The Company’s ESPP provides forconsecutive, six-month offering periods. The offering periods are scheduled to start on the first trading day on or after May 20 and November 20 of each year,except for the first offering period which began following the closing of the IPO, and will end on the first trading day on May 18, 2018. Participants maypurchase the Company’s common stock through payroll deductions, of up to a maximum of 15% of their eligible compensation. Participation will endautomatically upon termination of employment with the Company. The purchase price of the shares will be 85% of the lower of the fair market value of theCompany’s common stock on the first trading day of each offering period or on the exercise date.
As of December 31, 2017, no shares of common stock were purchased under the ESPP. The Company selected the Black-Scholes option-pricing modelas the method for determining the estimated fair value for the Company’s ESPP. As of December 31, 2017, total unrecognized compensation cost related tothe ESPP was $1.1 million, which will be amortized over a period of 0.4 years.
Stock Option Activity
The following table summarizes option activity under the Plan and related information (in thousands, except share, per share and contractual lifeamounts):
106
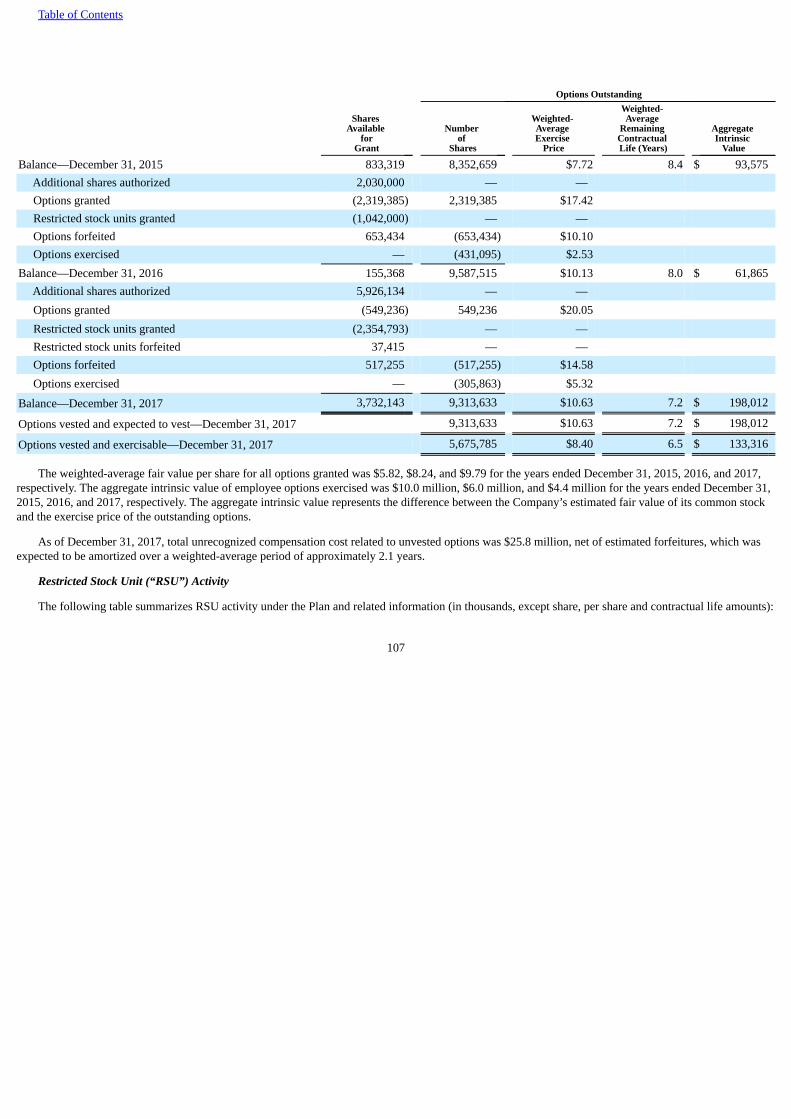
Table of Contents
Options Outstanding
Shares Available
forGrant
Number of
Shares
Weighted- Average Exercise
Price
Weighted- Average
Remaining Contractual Life (Years)
Aggregate Intrinsic
Value
Balance—December 31, 2015 833,319 8,352,659 $7.72 8.4 $ 93,575 Additional shares authorized 2,030,000 — — Options granted (2,319,385) 2,319,385 $17.42 Restricted stock units granted (1,042,000) — — Options forfeited 653,434 (653,434) $10.10 Options exercised — (431,095) $2.53 Balance—December 31, 2016 155,368 9,587,515 $10.13 8.0 $ 61,865 Additional shares authorized 5,926,134 — — Options granted (549,236) 549,236 $20.05 Restricted stock units granted (2,354,793) — — Restricted stock units forfeited 37,415 — — Options forfeited 517,255 (517,255) $14.58 Options exercised — (305,863) $5.32
Balance—December 31, 2017 3,732,143 9,313,633 $10.63 7.2 $ 198,012
Options vested and expected to vest—December 31, 2017 9,313,633 $10.63 7.2 $ 198,012
Options vested and exercisable—December 31, 2017 5,675,785 $8.40 6.5 $ 133,316
The weighted-average fair value per share for all options granted was $5.82, $8.24, and $9.79 for the years ended December 31, 2015, 2016, and 2017,respectively. The aggregate intrinsic value of employee options exercised was $10.0 million, $6.0 million, and $4.4 million for the years ended December 31,2015, 2016, and 2017, respectively. The aggregate intrinsic value represents the difference between the Company’s estimated fair value of its common stockand the exercise price of the outstanding options.
As of December 31, 2017, total unrecognized compensation cost related to unvested options was $25.8 million, net of estimated forfeitures, which wasexpected to be amortized over a weighted-average period of approximately 2.1 years.
Restricted Stock Unit (“RSU”) Activity
The following table summarizes RSU activity under the Plan and related information (in thousands, except share, per share and contractual life amounts):
107
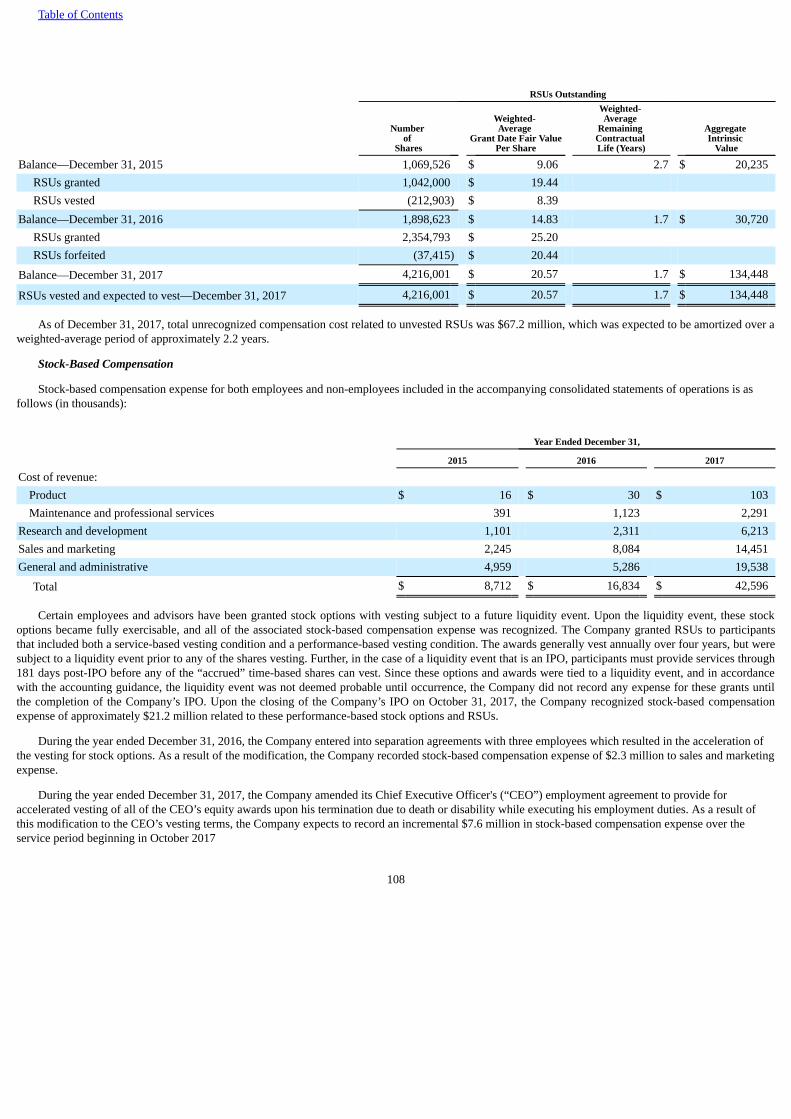
Table of Contents
RSUs Outstanding
Number
of Shares
Weighted- Average
Grant Date Fair ValuePer Share
Weighted- Average
Remaining Contractual Life (Years)
Aggregate Intrinsic
Value
Balance—December 31, 2015 1,069,526 $ 9.06 2.7 $ 20,235 RSUs granted 1,042,000 $ 19.44 RSUs vested (212,903) $ 8.39 Balance—December 31, 2016 1,898,623 $ 14.83 1.7 $ 30,720 RSUs granted 2,354,793 $ 25.20 RSUs forfeited (37,415) $ 20.44
Balance—December 31, 2017 4,216,001 $ 20.57 1.7 $ 134,448
RSUs vested and expected to vest—December 31, 2017 4,216,001 $ 20.57 1.7 $ 134,448
As of December 31, 2017, total unrecognized compensation cost related to unvested RSUs was $67.2 million, which was expected to be amortized over aweighted-average period of approximately 2.2 years.
Stock-Based Compensation
Stock-based compensation expense for both employees and non-employees included in the accompanying consolidated statements of operations is asfollows (in thousands):
Year Ended December 31,
2015 2016 2017
Cost of revenue: Product $ 16 $ 30 $ 103Maintenance and professional services 391 1,123 2,291
Research and development 1,101 2,311 6,213Sales and marketing 2,245 8,084 14,451General and administrative 4,959 5,286 19,538
Total $ 8,712 $ 16,834 $ 42,596
Certain employees and advisors have been granted stock options with vesting subject to a future liquidity event. Upon the liquidity event, these stockoptions became fully exercisable, and all of the associated stock-based compensation expense was recognized. The Company granted RSUs to participantsthat included both a service-based vesting condition and a performance-based vesting condition. The awards generally vest annually over four years, but weresubject to a liquidity event prior to any of the shares vesting. Further, in the case of a liquidity event that is an IPO, participants must provide services through181 days post-IPO before any of the “accrued” time-based shares can vest. Since these options and awards were tied to a liquidity event, and in accordancewith the accounting guidance, the liquidity event was not deemed probable until occurrence, the Company did not record any expense for these grants untilthe completion of the Company’s IPO. Upon the closing of the Company’s IPO on October 31, 2017, the Company recognized stock-based compensationexpense of approximately $21.2 million related to these performance-based stock options and RSUs.
During the year ended December 31, 2016, the Company entered into separation agreements with three employees which resulted in the acceleration ofthe vesting for stock options. As a result of the modification, the Company recorded stock-based compensation expense of $2.3 million to sales and marketingexpense.
During the year ended December 31, 2017, the Company amended its Chief Executive Officer's (“CEO”) employment agreement to provide foraccelerated vesting of all of the CEO’s equity awards upon his termination due to death or disability while executing his employment duties. As a result ofthis modification to the CEO’s vesting terms, the Company expects to record an incremental $7.6 million in stock-based compensation expense over theservice period beginning in October 2017
108

Table of Contents
(following the completion of the Company’s IPO), $6.5 million of which was recorded by the Company during the three months ended December 31, 2017.
Determining the Fair Value of Stock Options
The fair value of stock option awards granted to employees and to be purchased under ESPP are estimated using the Black-Scholes option-pricing model.The key assumptions within the model are described as follows:
Fair Value of Common Stock
Prior to the Company’s IPO, the Company’s Board of Directors considered numerous objective and subjective factors to determine the fair value of itscommon stock. These factors included, but were not limited to (i) contemporaneous third-party valuations of common stock; (ii) the rights and preferences ofredeemable convertible preferred stock relative to common stock; (iii) the lack of marketability of common stock; (iv) developments in the business; and (v)the likelihood of achieving a liquidity event, such as an initial public offering or sale of the Company, given prevailing market conditions.
Subsequent to its IPO, the Company uses the market closing price for its common stock as reported on the NASDAQ Global Select Market on the date ofgrant.
Risk-Free Interest Rate
The risk-free interest rate is based on the rate for a U.S. Treasury zero-coupon issue with a term that approximates the expected life of the option on thedate of grant.
Expected Term
The expected term represents the period that stock-based awards are expected to be outstanding. The expected term is calculated using the simplifiedmethod for stock options issued at-the-money. For stock options that have been issued out-of-the-money, the expected term was determined by calculating themidpoint of the simplified method and the contractual life of the option of 10 years, as neither historical experience nor other relevant data was available toestimate the future exercise behavior of out-of-the money stock options. The Company uses the remaining contractual life as the expected term for non-employee awards.
Volatility
The expected volatility is based on the average historic price volatility for the Company’s publicly traded industry peers based on daily price observationsover a period equivalent to the expected term of stock-based awards. The historical volatility data of a peer group is used as there is insufficient tradinghistory for the Company’s common stock.
Dividend Yield
The Company has never paid dividends and at present, does not expect to pay dividends in the foreseeable future.
The assumptions used to determine the grant date fair value of employee stock options and ESPP purchase rights for the periods presented are as follows:
109
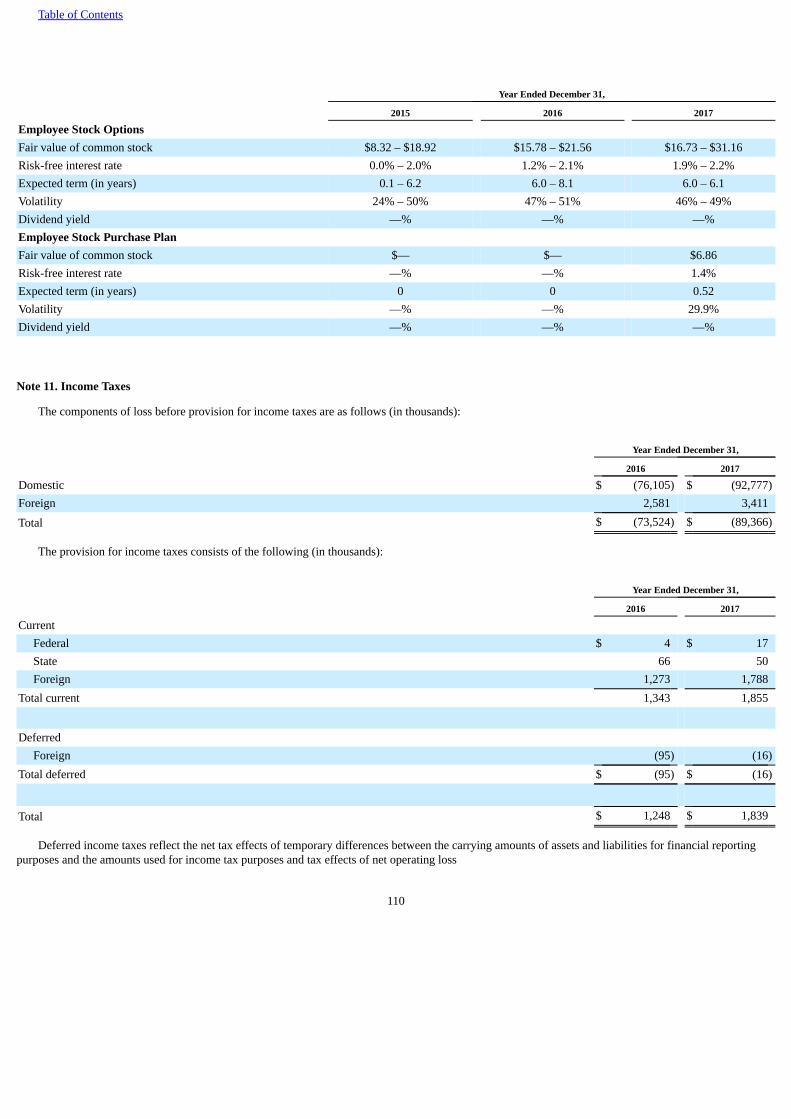
Table of Contents
Year Ended December 31,
2015 2016 2017
Employee Stock Options Fair value of common stock $8.32 – $18.92 $15.78 – $21.56 $16.73 – $31.16Risk-free interest rate 0.0% – 2.0% 1.2% – 2.1% 1.9% – 2.2%Expected term (in years) 0.1 – 6.2 6.0 – 8.1 6.0 – 6.1Volatility 24% – 50% 47% – 51% 46% – 49%Dividend yield —% —% —%Employee Stock Purchase Plan Fair value of common stock $— $— $6.86Risk-free interest rate —% —% 1.4%Expected term (in years) 0 0 0.52Volatility —% —% 29.9%Dividend yield —% —% —%
Note 11. Income Taxes
The components of loss before provision for income taxes are as follows (in thousands):
Year Ended December 31,
2016 2017
Domestic $ (76,105) $ (92,777)Foreign 2,581 3,411
Total $ (73,524) $ (89,366)
The provision for income taxes consists of the following (in thousands):
Year Ended December 31,
2016 2017
Current Federal $ 4 $ 17 State 66 50 Foreign 1,273 1,788Total current 1,343 1,855
Deferred Foreign (95) (16)Total deferred $ (95) $ (16)
Total $ 1,248 $ 1,839
Deferred income taxes reflect the net tax effects of temporary differences between the carrying amounts of assets and liabilities for financial reportingpurposes and the amounts used for income tax purposes and tax effects of net operating loss
110
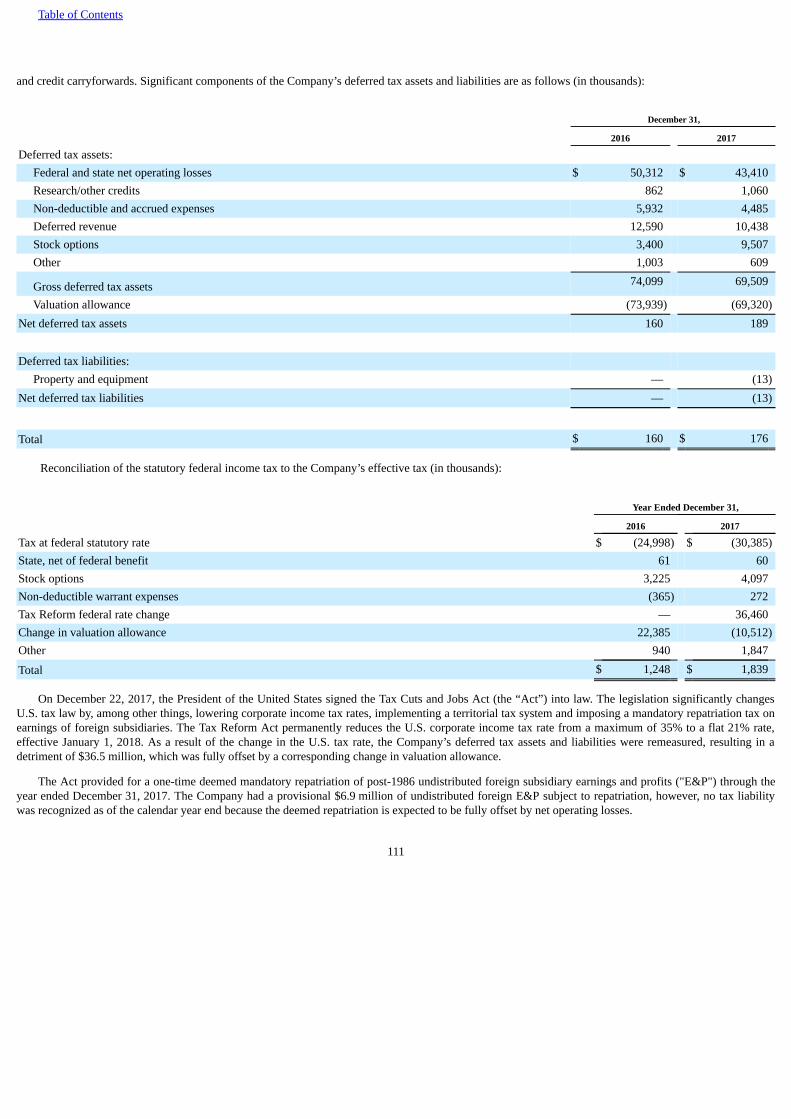
Table of Contents
and credit carryforwards. Significant components of the Company’s deferred tax assets and liabilities are as follows (in thousands):
December 31,
2016 2017
Deferred tax assets: Federal and state net operating losses $ 50,312 $ 43,410 Research/other credits 862 1,060 Non-deductible and accrued expenses 5,932 4,485 Deferred revenue 12,590 10,438 Stock options 3,400 9,507 Other 1,003 609
Gross deferred tax assets 74,099 69,509
Valuation allowance (73,939) (69,320)Net deferred tax assets 160 189
Deferred tax liabilities: Property and equipment — (13)Net deferred tax liabilities — (13)
Total $ 160 $ 176
Reconciliation of the statutory federal income tax to the Company’s effective tax (in thousands):
Year Ended December 31,
2016 2017
Tax at federal statutory rate $ (24,998) $ (30,385)State, net of federal benefit 61 60Stock options 3,225 4,097Non-deductible warrant expenses (365) 272Tax Reform federal rate change — 36,460Change in valuation allowance 22,385 (10,512)Other 940 1,847
Total $ 1,248 $ 1,839
On December 22, 2017, the President of the United States signed the Tax Cuts and Jobs Act (the “Act”) into law. The legislation significantly changesU.S. tax law by, among other things, lowering corporate income tax rates, implementing a territorial tax system and imposing a mandatory repatriation tax onearnings of foreign subsidiaries. The Tax Reform Act permanently reduces the U.S. corporate income tax rate from a maximum of 35% to a flat 21% rate,effective January 1, 2018. As a result of the change in the U.S. tax rate, the Company’s deferred tax assets and liabilities were remeasured, resulting in adetriment of $36.5 million, which was fully offset by a corresponding change in valuation allowance.
The Act provided for a one-time deemed mandatory repatriation of post-1986 undistributed foreign subsidiary earnings and profits ("E&P") through theyear ended December 31, 2017. The Company had a provisional $6.9 million of undistributed foreign E&P subject to repatriation, however, no tax liabilitywas recognized as of the calendar year end because the deemed repatriation is expected to be fully offset by net operating losses.
111

Table of Contents
The SEC staff issued Staff Accounting Bulletin No. 118 (“SAB 118”) to address the application of U.S. GAAP in situations when a registrant does nothave the necessary information available, prepared, or analyzed (including computations) in reasonable detail to complete the accounting for certain incometax effects of the Tax Reform Act. The Company has recognized the provisional tax impacts related to deemed repatriated earnings for Federal purposes. TheCompany is in the process of gathering sufficient information to calculate the tax impact for state purposes and has, therefore, not recorded any liability orutilization of state tax attributes. However, the state tax impact of the mandatory repatriation is not expected to be material. The ultimate impact of themandatory repatriation may differ from the provisional amounts due to additional analysis, changes in interpretations and assumptions the Company hasmade, or additional regulatory guidance that may be issued. The accounting is expected to be complete when the 2017 U.S. corporate income tax return isfiled in 2018.
The Company is still in the process of analyzing other provisions (Global Intangible Low-Taxed Income (“GILTI”), base erosion anti-abuse tax(“BEAT”), etc.) of this legislation which may impact the Company’s effective tax rate in future years.
For the years ended December 31, 2016 and 2017, the Company recorded a tax provision of $1.3 million and $1.8 million, respectively, representingeffective tax rate of (1.7)% and (2.1)% for the years ended December 31, 2016 and 2017, respectively. The key components of the income tax provisionprimarily consist of foreign income taxes, income tax reserves, and U.S. state minimum taxes. The difference in the effective tax rate for the years endedDecember 31, 2016 and 2017 is primarily due to change in the uncertain tax positions as a result of a statutory income tax and withholding tax audit.
A valuation allowance has been provided to reduce the deferred tax asset to an amount management believes is more likely than not to be realized. Thevaluation allowance increased by $25.0 million and decreased by $4.6 million for the years ended December 31, 2016 and 2017, respectively.
As of December 31, 2017, the Company had net operating loss carryforwards for federal income tax purposes of approximately $180.1 million, whichbegin to expire in 2021 if not utilized. The Company also has California net operating loss carryforwards of approximately $22.0 million, which begin toexpire in 2028 if not utilized. The Company also has other state net operating loss carryforwards of approximately $76.6 million, which begin to expire in2018 if not utilized. The Company has federal and California research and development credit carryforwards of $0.7 million and $0.5 million, respectively.The federal research and development credits will begin to expire in 2035, if not utilized. California research and development credits can be carried forwardindefinitely. The Company has an immaterial amount of foreign tax credits.
Utilization of the Company’s net operating loss carryforwards may be subject to substantial annual limitation due to the ownership change limitationsprovided by the Internal Revenue Code and similar state provisions. Such a limitation could result in the expiration of the net operating loss carryforwardsbefore utilization. The Company performed an ownership change analysis from inception to the balance sheet date of December 31, 2017 and $2.8 million ofnet operating loss carryforwards were written off due to the limitation.
The Company provides U.S. income taxes on the earnings of foreign subsidiaries, unless the subsidiaries’ earnings are considered indefinitely reinvestedoutside the United States. As of December 31, 2017, U.S. income taxes have been provided for on the cumulative total of $6.9 million of undistributedearnings from its foreign subsidiaries. Any earnings if distributed by the foreign subsidiary would not result in any liability since they would be offset by netoperating losses.
Uncertain Tax Positions
For benefits to be realized, a tax position must be more likely than not to be sustained upon examination. The amount recognized is measured as thelargest amount of benefit that is greater than 50 percent likely of being realized upon settlement. As a result of the implementation of these provisions, theCompany did not recognize any adjustments to retained earnings for uncertain tax positions.
112
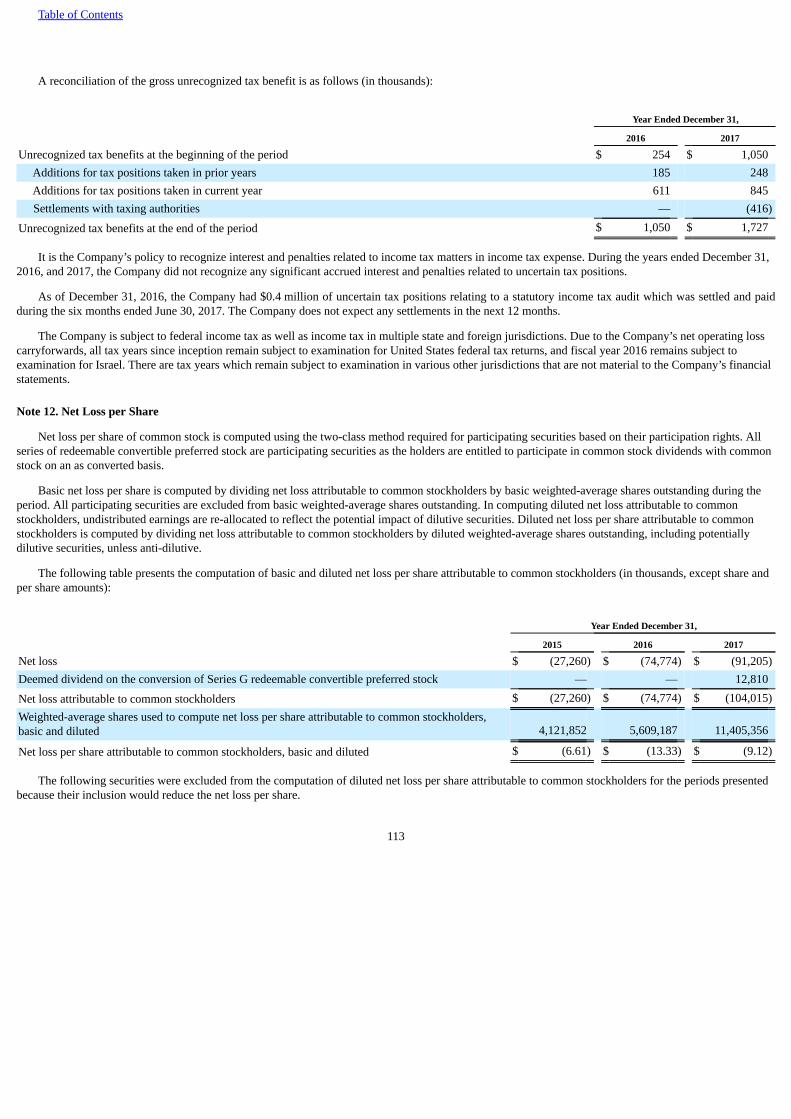
Table of Contents
A reconciliation of the gross unrecognized tax benefit is as follows (in thousands):
Year Ended December 31,
2016 2017
Unrecognized tax benefits at the beginning of the period $ 254 $ 1,050 Additions for tax positions taken in prior years 185 248 Additions for tax positions taken in current year 611 845 Settlements with taxing authorities — (416)
Unrecognized tax benefits at the end of the period $ 1,050 $ 1,727
It is the Company’s policy to recognize interest and penalties related to income tax matters in income tax expense. During the years ended December 31,2016, and 2017, the Company did not recognize any significant accrued interest and penalties related to uncertain tax positions.
As of December 31, 2016, the Company had $0.4 million of uncertain tax positions relating to a statutory income tax audit which was settled and paidduring the six months ended June 30, 2017. The Company does not expect any settlements in the next 12 months.
The Company is subject to federal income tax as well as income tax in multiple state and foreign jurisdictions. Due to the Company’s net operating losscarryforwards, all tax years since inception remain subject to examination for United States federal tax returns, and fiscal year 2016 remains subject toexamination for Israel. There are tax years which remain subject to examination in various other jurisdictions that are not material to the Company’s financialstatements.
Note 12. Net Loss per Share
Net loss per share of common stock is computed using the two-class method required for participating securities based on their participation rights. Allseries of redeemable convertible preferred stock are participating securities as the holders are entitled to participate in common stock dividends with commonstock on an as converted basis.
Basic net loss per share is computed by dividing net loss attributable to common stockholders by basic weighted-average shares outstanding during theperiod. All participating securities are excluded from basic weighted-average shares outstanding. In computing diluted net loss attributable to commonstockholders, undistributed earnings are re-allocated to reflect the potential impact of dilutive securities. Diluted net loss per share attributable to commonstockholders is computed by dividing net loss attributable to common stockholders by diluted weighted-average shares outstanding, including potentiallydilutive securities, unless anti-dilutive.
The following table presents the computation of basic and diluted net loss per share attributable to common stockholders (in thousands, except share andper share amounts):
Year Ended December 31,
2015 2016 2017
Net loss $ (27,260) $ (74,774) $ (91,205)Deemed dividend on the conversion of Series G redeemable convertible preferred stock — — 12,810
Net loss attributable to common stockholders $ (27,260) $ (74,774) $ (104,015)Weighted-average shares used to compute net loss per share attributable to common stockholders,basic and diluted 4,121,852 5,609,187 11,405,356
Net loss per share attributable to common stockholders, basic and diluted $ (6.61) $ (13.33) $ (9.12)
The following securities were excluded from the computation of diluted net loss per share attributable to common stockholders for the periods presentedbecause their inclusion would reduce the net loss per share.
113
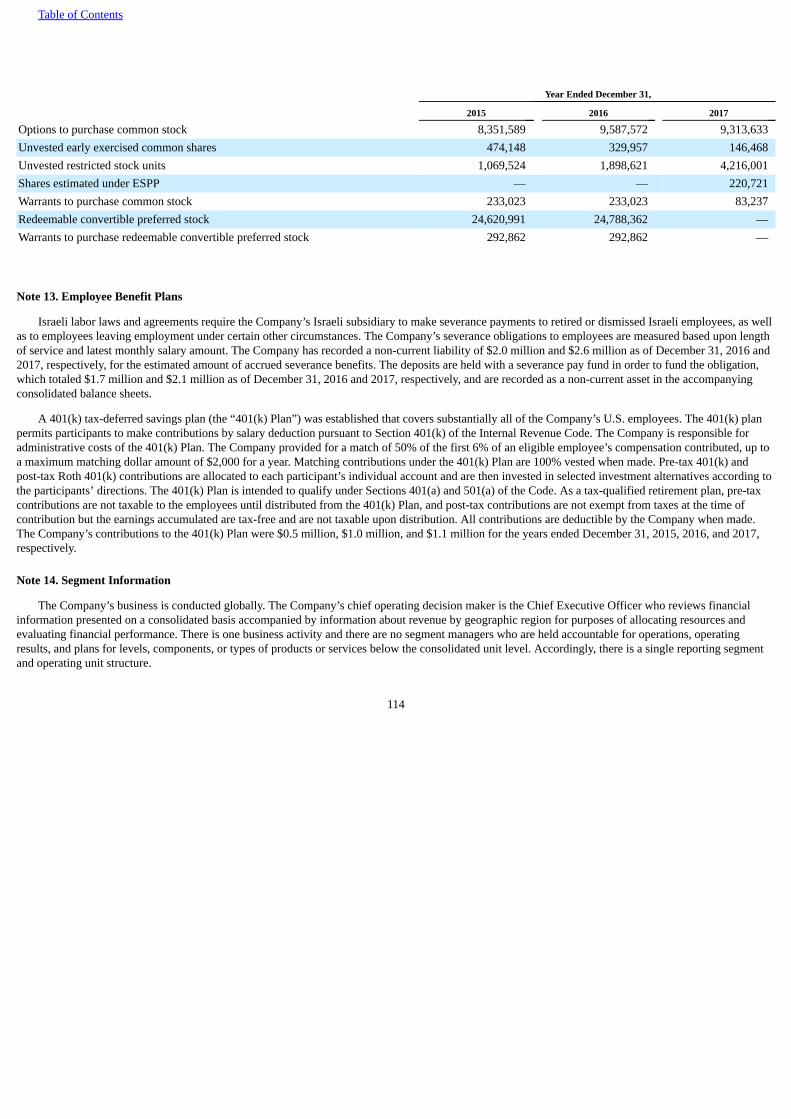
Table of Contents
Year Ended December 31,
2015 2016 2017
Options to purchase common stock 8,351,589 9,587,572 9,313,633Unvested early exercised common shares 474,148 329,957 146,468Unvested restricted stock units 1,069,524 1,898,621 4,216,001Shares estimated under ESPP — — 220,721Warrants to purchase common stock 233,023 233,023 83,237Redeemable convertible preferred stock 24,620,991 24,788,362 —Warrants to purchase redeemable convertible preferred stock 292,862 292,862 —
Note 13. Employee Benefit Plans
Israeli labor laws and agreements require the Company’s Israeli subsidiary to make severance payments to retired or dismissed Israeli employees, as wellas to employees leaving employment under certain other circumstances. The Company’s severance obligations to employees are measured based upon lengthof service and latest monthly salary amount. The Company has recorded a non-current liability of $2.0 million and $2.6 million as of December 31, 2016 and2017, respectively, for the estimated amount of accrued severance benefits. The deposits are held with a severance pay fund in order to fund the obligation,which totaled $1.7 million and $2.1 million as of December 31, 2016 and 2017, respectively, and are recorded as a non-current asset in the accompanyingconsolidated balance sheets.
A 401(k) tax-deferred savings plan (the “401(k) Plan”) was established that covers substantially all of the Company’s U.S. employees. The 401(k) planpermits participants to make contributions by salary deduction pursuant to Section 401(k) of the Internal Revenue Code. The Company is responsible foradministrative costs of the 401(k) Plan. The Company provided for a match of 50% of the first 6% of an eligible employee’s compensation contributed, up toa maximum matching dollar amount of $2,000 for a year. Matching contributions under the 401(k) Plan are 100% vested when made. Pre-tax 401(k) andpost-tax Roth 401(k) contributions are allocated to each participant’s individual account and are then invested in selected investment alternatives according tothe participants’ directions. The 401(k) Plan is intended to qualify under Sections 401(a) and 501(a) of the Code. As a tax-qualified retirement plan, pre-taxcontributions are not taxable to the employees until distributed from the 401(k) Plan, and post-tax contributions are not exempt from taxes at the time ofcontribution but the earnings accumulated are tax-free and are not taxable upon distribution. All contributions are deductible by the Company when made.The Company’s contributions to the 401(k) Plan were $0.5 million, $1.0 million, and $1.1 million for the years ended December 31, 2015, 2016, and 2017,respectively.
Note 14. Segment Information
The Company’s business is conducted globally. The Company’s chief operating decision maker is the Chief Executive Officer who reviews financialinformation presented on a consolidated basis accompanied by information about revenue by geographic region for purposes of allocating resources andevaluating financial performance. There is one business activity and there are no segment managers who are held accountable for operations, operatingresults, and plans for levels, components, or types of products or services below the consolidated unit level. Accordingly, there is a single reporting segmentand operating unit structure.
114
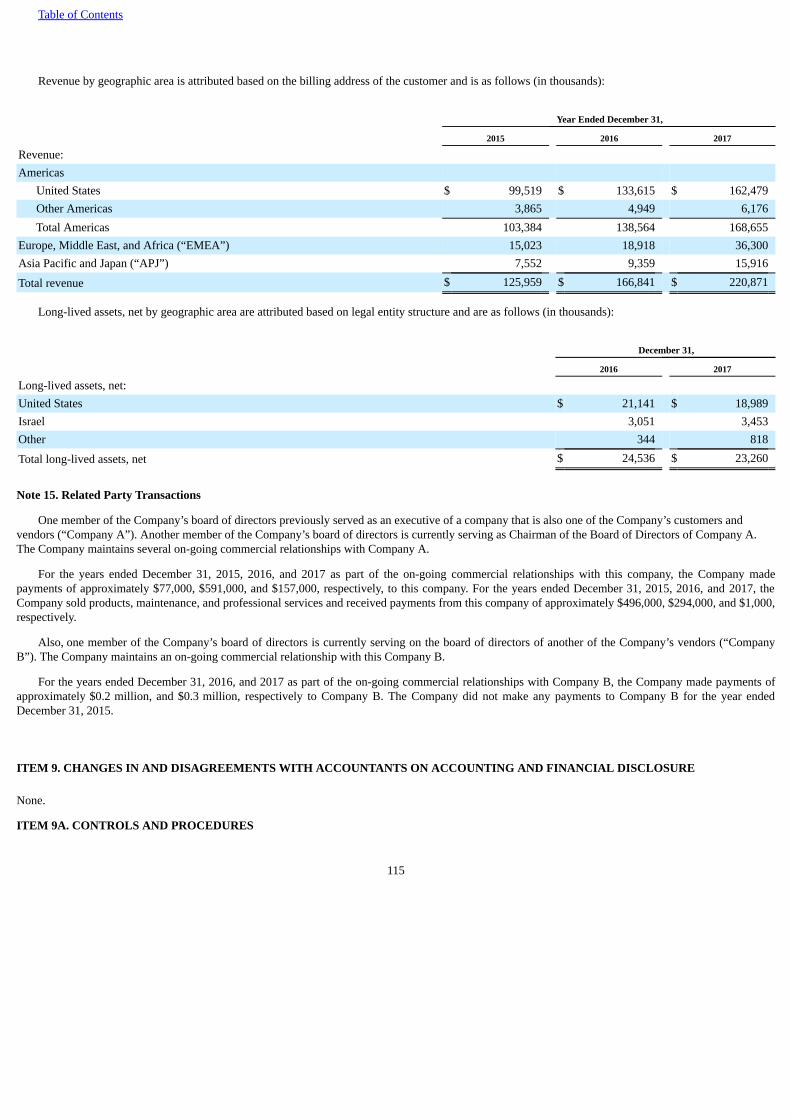
Table of Contents
Revenue by geographic area is attributed based on the billing address of the customer and is as follows (in thousands):
Year Ended December 31,
2015 2016 2017
Revenue: Americas United States $ 99,519 $ 133,615 $ 162,479 Other Americas 3,865 4,949 6,176 Total Americas 103,384 138,564 168,655Europe, Middle East, and Africa (“EMEA”) 15,023 18,918 36,300Asia Pacific and Japan (“APJ”) 7,552 9,359 15,916
Total revenue $ 125,959 $ 166,841 $ 220,871
Long-lived assets, net by geographic area are attributed based on legal entity structure and are as follows (in thousands):
December 31,
2016 2017
Long-lived assets, net: United States $ 21,141 $ 18,989Israel 3,051 3,453Other 344 818
Total long-lived assets, net $ 24,536 $ 23,260
Note 15. Related Party Transactions
One member of the Company’s board of directors previously served as an executive of a company that is also one of the Company’s customers andvendors (“Company A”). Another member of the Company’s board of directors is currently serving as Chairman of the Board of Directors of Company A.The Company maintains several on-going commercial relationships with Company A.
For the years ended December 31, 2015, 2016, and 2017 as part of the on-going commercial relationships with this company, the Company madepayments of approximately $77,000, $591,000, and $157,000, respectively, to this company. For the years ended December 31, 2015, 2016, and 2017, theCompany sold products, maintenance, and professional services and received payments from this company of approximately $496,000, $294,000, and $1,000,respectively.
Also, one member of the Company’s board of directors is currently serving on the board of directors of another of the Company’s vendors (“CompanyB”). The Company maintains an on-going commercial relationship with this Company B.
For the years ended December 31, 2016, and 2017 as part of the on-going commercial relationships with Company B, the Company made payments ofapproximately $0.2 million, and $0.3 million, respectively to Company B. The Company did not make any payments to Company B for the year endedDecember 31, 2015.
ITEM 9. CHANGES IN AND DISAGREEMENTS WITH ACCOUNTANTS ON ACCOUNTING AND FINANCIAL DISCLOSURE
None.
ITEM 9A. CONTROLS AND PROCEDURES
115

Table of Contents
Evaluation of Disclosure Controls and Procedures
Our management, with the participation of our chief executive officer and chief financial officer, evaluated the effectiveness of our disclosure controlsand procedures pursuant to Rule 13a-15 under the Securities Exchange Act of 1934, as amended (the “Exchange Act”). In designing and evaluating thedisclosure controls and procedures, management recognizes that any controls and procedures, no matter how well designed and operated, can provide onlyreasonable assurance of achieving the desired control objectives. In addition, the design of disclosure controls and procedures must reflect the fact that thereare resource constraints and that management is required to apply its judgment in evaluating the benefits of possible controls and procedures relative to theircosts.
Based on our evaluation, our chief executive officer and chief financial officer concluded that, as of December 31, 2017, our disclosure controls andprocedures are effective to provide reasonable assurance that information we are required to disclose in reports that we file or submit under the Exchange Actis recorded, processed, summarized, and reported within the time periods specified in Securities and Exchange Commission (“SEC”) rules and forms, and thatsuch information is accumulated and communicated to our management, including our chief executive officer and chief financial officer, as appropriate, toallow timely decisions regarding required disclosure.
Management’s Annual Report on Internal Control Over Financial Reporting
The Annual Report on Form 10-K does not include a report of management’s assessment regarding internal control over financial reporting or anattestation report of our independent registered public accounting firm due to a transition period established by the rules of the SEC for newly publiccompanies.
Attestation Report of the Registered Public Accounting Firm
This Annual Report on Form 10-K does not include an attestation report of our registered public accounting firm due to an exemption established by theJumpstart Our Business Startups Act, or JOBS Act, for “emerging growth companies.”
Changes in Internal Control Over Financial Reporting
There were no changes in our internal control over financial reporting identified in connection with the evaluation required by Rule 13a-15(d) and 15d-15(d) of the Exchange Act that occurred during the quarter ended December 31, 2017 that have materially affected, or are reasonably likely to materiallyaffect, our internal control over financial reporting.
ITEM 9B. OTHER INFORMATION
None.
116
Table of Contents
PART III
ITEM 10. DIRECTORS, EXECUTIVE OFFICERS AND CORPORATE GOVERNANCE
Executive Officers and Directors
The information required by this item will be contained in our definitive proxy statement to be filed with the SEC in connection with our 2018 annualmeeting of stockholders (the “Proxy Statement”), which is expected to be filed not later than 120 days after the end of our fiscal year ended December 31,2017, and is incorporated in this report by reference.
ITEM 11. EXECUTIVE COMPENSATION
The information required by this item will be set forth in the Proxy Statement and is incorporated herein by reference.
ITEM 12. SECURITY OWNERSHIP OF CERTAIN BENEFICIAL OWNERS AND MANAGEMENT AND RELATED STOCKHOLDERMATTERS
The information required by this item will be set forth in the Proxy Statement and is incorporated herein by reference.
ITEM 13. CERTAIN RELATIONSHIPS AND RELATED TRANSACTIONS, AND DIRECTOR INDEPENDENCE
The information required by this item will be set forth in the Proxy Statement and is incorporated herein by reference.
ITEM 14. PRINCIPAL ACCOUNTANT FEES AND SERVICES
The information required by this item will be set forth in the Proxy Statement and is incorporated herein by reference.
117

Table of Contents
PART IV
ITEM 15. EXHIBITS AND FINANCIAL STATEMENT SCHEDULES
Documents filed as part of this Annual Report on Form 10-K are as follows:
1. Consolidated Financial Statements
Our Consolidated Financial Statements are listed in the “Index to Consolidated Financial Statements” under Part II, Item 8 of this Annual Report onForm 10-K.
2. Financial Statement Schedules
Financial statement schedules have been omitted because they are not required, not applicable, not present in amounts sufficient to require submission ofthe schedule, or the required information is shown in the Consolidated Financial Statements or Notes thereto.
3. Exhibits
See the Exhibit Index below in this Annual Report on Form 10-K.
ITEM 16. FORM 10-K SUMMARY
Not applicable.
118
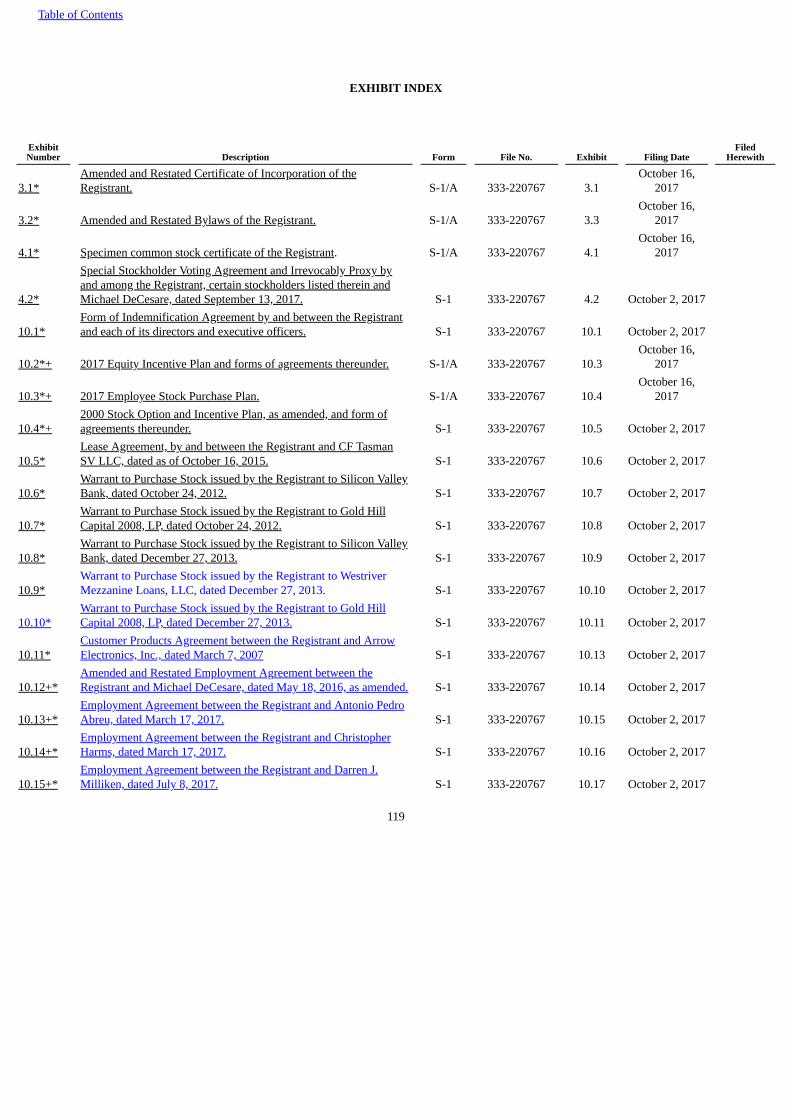
Table of Contents
EXHIBIT INDEX
ExhibitNumber Description Form File No. Exhibit Filing Date
FiledHerewith
3.1* Amended and Restated Certificate of Incorporation of theRegistrant. S-1/A 333-220767 3.1
October 16,2017
3.2* Amended and Restated Bylaws of the Registrant. S-1/A 333-220767 3.3 October 16,
2017
4.1* Specimen common stock certificate of the Registrant. S-1/A 333-220767 4.1 October 16,
2017
4.2*
Special Stockholder Voting Agreement and Irrevocably Proxy byand among the Registrant, certain stockholders listed therein andMichael DeCesare, dated September 13, 2017. S-1 333-220767 4.2 October 2, 2017
10.1* Form of Indemnification Agreement by and between the Registrantand each of its directors and executive officers. S-1 333-220767 10.1 October 2, 2017
10.2*+ 2017 Equity Incentive Plan and forms of agreements thereunder. S-1/A 333-220767 10.3 October 16,
2017
10.3*+ 2017 Employee Stock Purchase Plan. S-1/A 333-220767 10.4 October 16,
2017
10.4*+ 2000 Stock Option and Incentive Plan, as amended, and form ofagreements thereunder. S-1 333-220767 10.5 October 2, 2017
10.5* Lease Agreement, by and between the Registrant and CF TasmanSV LLC, dated as of October 16, 2015. S-1 333-220767 10.6 October 2, 2017
10.6* Warrant to Purchase Stock issued by the Registrant to Silicon ValleyBank, dated October 24, 2012. S-1 333-220767 10.7 October 2, 2017
10.7* Warrant to Purchase Stock issued by the Registrant to Gold HillCapital 2008, LP, dated October 24, 2012. S-1 333-220767 10.8 October 2, 2017
10.8* Warrant to Purchase Stock issued by the Registrant to Silicon ValleyBank, dated December 27, 2013. S-1 333-220767 10.9 October 2, 2017
10.9* Warrant to Purchase Stock issued by the Registrant to WestriverMezzanine Loans, LLC, dated December 27, 2013. S-1 333-220767 10.10 October 2, 2017
10.10* Warrant to Purchase Stock issued by the Registrant to Gold HillCapital 2008, LP, dated December 27, 2013. S-1 333-220767 10.11 October 2, 2017
10.11* Customer Products Agreement between the Registrant and ArrowElectronics, Inc., dated March 7, 2007 S-1 333-220767 10.13 October 2, 2017
10.12+* Amended and Restated Employment Agreement between theRegistrant and Michael DeCesare, dated May 18, 2016, as amended. S-1 333-220767 10.14 October 2, 2017
10.13+* Employment Agreement between the Registrant and Antonio PedroAbreu, dated March 17, 2017. S-1 333-220767 10.15 October 2, 2017
10.14+* Employment Agreement between the Registrant and ChristopherHarms, dated March 17, 2017. S-1 333-220767 10.16 October 2, 2017
10.15+* Employment Agreement between the Registrant and Darren J.Milliken, dated July 8, 2017. S-1 333-220767 10.17 October 2, 2017
119
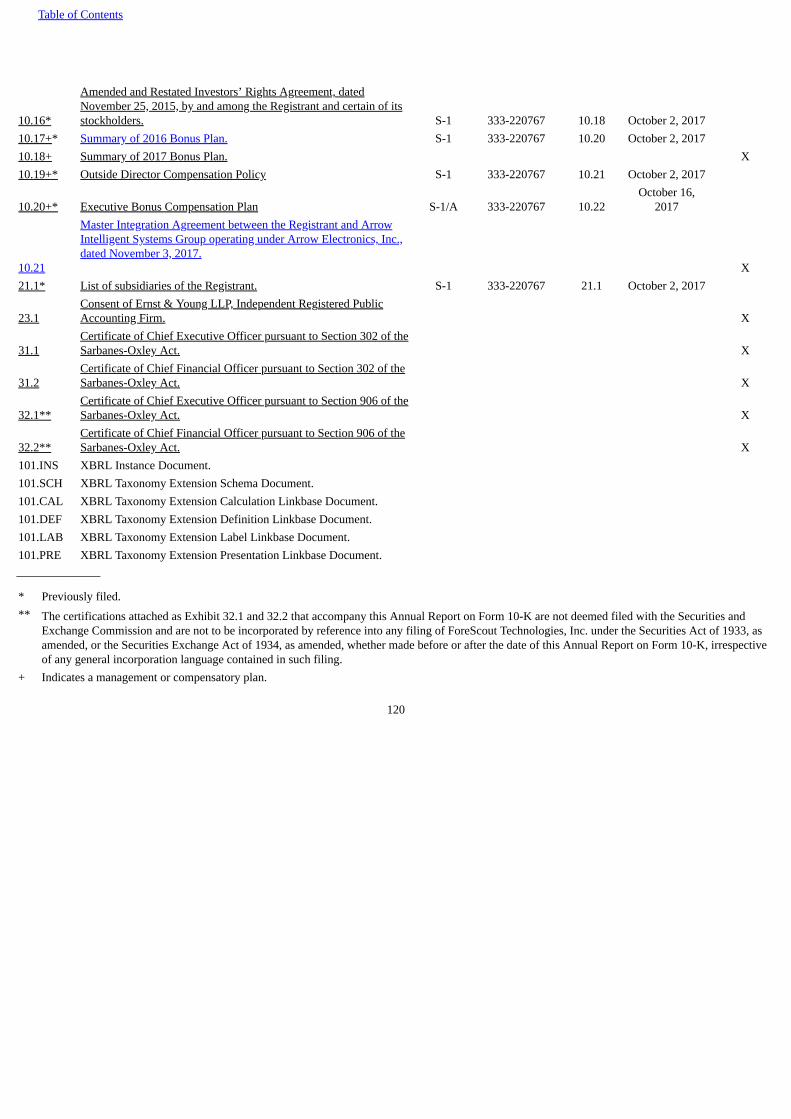
Table of Contents
10.16*
Amended and Restated Investors’ Rights Agreement, datedNovember 25, 2015, by and among the Registrant and certain of itsstockholders. S-1 333-220767 10.18 October 2, 2017
10.17+* Summary of 2016 Bonus Plan. S-1 333-220767 10.20 October 2, 2017 10.18+ Summary of 2017 Bonus Plan. X10.19+* Outside Director Compensation Policy S-1 333-220767 10.21 October 2, 2017
10.20+* Executive Bonus Compensation Plan S-1/A 333-220767 10.22 October 16,
2017
10.21
Master Integration Agreement between the Registrant and ArrowIntelligent Systems Group operating under Arrow Electronics, Inc.,dated November 3, 2017.
X21.1* List of subsidiaries of the Registrant. S-1 333-220767 21.1 October 2, 2017
23.1 Consent of Ernst & Young LLP, Independent Registered PublicAccounting Firm. X
31.1 Certificate of Chief Executive Officer pursuant to Section 302 of theSarbanes-Oxley Act. X
31.2 Certificate of Chief Financial Officer pursuant to Section 302 of theSarbanes-Oxley Act. X
32.1** Certificate of Chief Executive Officer pursuant to Section 906 of theSarbanes-Oxley Act. X
32.2** Certificate of Chief Financial Officer pursuant to Section 906 of theSarbanes-Oxley Act. X
101.INS XBRL Instance Document. 101.SCH XBRL Taxonomy Extension Schema Document. 101.CAL XBRL Taxonomy Extension Calculation Linkbase Document. 101.DEF XBRL Taxonomy Extension Definition Linkbase Document. 101.LAB XBRL Taxonomy Extension Label Linkbase Document. 101.PRE XBRL Taxonomy Extension Presentation Linkbase Document. ______________
* Previously filed.** The certifications attached as Exhibit 32.1 and 32.2 that accompany this Annual Report on Form 10-K are not deemed filed with the Securities and
Exchange Commission and are not to be incorporated by reference into any filing of ForeScout Technologies, Inc. under the Securities Act of 1933, asamended, or the Securities Exchange Act of 1934, as amended, whether made before or after the date of this Annual Report on Form 10-K, irrespectiveof any general incorporation language contained in such filing.
+ Indicates a management or compensatory plan.
120

Table of Contents
SIGNATURES
Pursuant to the requirements of Section 13 or 15(d) of the Securities Exchange Act of 1934, the Registrant has duly caused this report to be signed on itsbehalf by the undersigned, thereunto duly authorized, on February 21, 2018.
FORESCOUT TECHNOLOGIES, INC.
By: /s/ Michael DeCesare
Michael DeCesare Chief Executive Officer
121
Table of Contents
POWER OF ATTORNEY
KNOW ALL THESE PERSONS BY THESE PRESENTS, that each person whose signature appears below constitutes and appoints Mike DeCesare andChristopher Harms, and each of them, as his or her true and lawful attorney-in-fact and agent, with full power of substitution and resubstitution, for him or herand in his or her name, place and stead, in any and all capacities, to sign any and all amendments to this Annual Report on Form 10-K, and to file the same,with all exhibits thereto, and other documents in connection therewith, with the Securities and Exchange Commission, granting unto said attorneys-in-fact andagents, and each of them, full power and authority to do and perform each and every act and thing requisite and necessary to be done in connection therewith,as fully to all intents and purposes as he might or could do in person, hereby ratifying and confirming all that said attorneys-in-fact and agents, or any of them,or their or his substitutes, may lawfully do or cause to be done by virtue thereof. Pursuant to the requirements of the Securities Exchange Act of 1934, thisreport has been signed below by the following persons on behalf of the Registrant and in the capacities and on the dates indicated:
Signature Title Date
/s/ Michael DeCesare Chief Executive Officer, President & Director(Principal Executive Officer)
MICHAEL DECESARE /s/ Christopher Harms Chief Financial Officer
(Principal Financial Officer & Principal Accounting Officer)
CHRISTOPHER HARMS /s/ Yehezkel Yeshurun Co-Founder and
Chairman of the Board of Directors
YEHEZKEL YESHURUN /s/ David G. DeWalt Vice Chairman
of the Board of Directors
DAVID G. DEWALT /s/ James Beer
Director
JAMES BEER /s/ T. Kent Elliott
Director
T. KENT ELLIOTT /s/ Theresia Gouw
Director
THERESIA GOUW /s/ Mark Jensen
Director
MARK JENSEN /s/ Rami Kalish
Director
RAMI KALISH /s/ Enrique Salem
Director
ENRIQUE SALEM
122

Exhibit 10.18
SUMMARY OF 2017 BONUS PLAN
The 2017 Bonus Plan (the “2017 Bonus Plan”) of ForeScout Technologies, Inc. (the “Company”) provides for cash bonuses payablesemiannually based on the achievement of company performance goals and individual performance goals established by the Company’s boardof directors and compensation committee for fiscal 2017. The company performance goals and individual performance goals are measuredover two, semiannual performance periods during 2017. For the fiscal 2017 performance period, with bonuses payable semiannually, a progresspayment may become payable at the end of the first half of fiscal 2017, based on specified levels of achievement of the performance goals forsuch semiannual period. Any such bonus amount for the first half-portion of the year is capped at 100% of the participant’s target bonusopportunity for such half-year. If the participant exceeds his or her performance goals for the first semiannual performance period, he or shewill not receive more than 100% of his or her bonus target for the first semiannual performance period. Rather, if a participant exceeds his orher performance goals for the first semiannual performance period, such portion greater than 100% will be taken into account in determiningwhether the participant’s performance goals were met in the second semiannual performance period.
For the bonuses paid to employees, other than the CEO and senior vice presidents, the bonus pool will be funded for the performanceperiod when the Company achieves a minimum of 80% for each of revenue, operating margin, and net promoter score, or NPS, relatedcompany performance goals. For the bonuses paid to the CEO and senior vice presidents, the bonus pool will be funded for the performanceperiod when the Company achieves a minimum of 85% for each of revenue, operating margin, and net promoter score, or NPS, relatedcompany performance goals. Achievement of all three corporate goals at 100% will fund the bonus pool at the target level.
Following the end of fiscal 2017, the Company’s board of directors (or its authorized committee) reviews achievements against eachannual performance metric and determines the bonus pool funding based on the Company’s achievements against the performance metrics. Thesemiannual bonus payments for each of the Company’s named executive officers were calculated based on these determinations and, for anyparticipant that was employed for part of fiscal 2017, pro-rated based on the time of employment with the Company during fiscal 2017. The2017 Bonus Plan requires continued employment through the bonus payment date in order to receive a bonus for the applicable performanceperiod.
MASTER INTEGRATION AGREEMENT (US Only)
This Agreement is entered into as of the 3rd day of November 2017 (the “Effective Date”), by and between ForeScout Technologies, Inc. andits Affiliates ("Customer” or “FORESCOUT”) with its principal place of business at 190 West Tasman Drive, San Jose, CA 95134, and theArrow Intelligent Systems Group operating under Arrow Electronics, Inc. ("Arrow”) with a place of business at 9201 East Dry Creek Road,Centennial, CO 80112-2818.
Arrow is a distributor and assembler of electronics and computer products. Arrow desires to sell and Customer desires to purchase fromArrow products and associated services in accordance with the terms and conditions of this Agreement. Services including any COP, asdefined below, may be added to this Agreement by separate Addendum.The Customer and Arrow hereby agree as follows:
1. Definitions.
Affiliate: means with respect to any entity, any other entity directly or indirectly controlling or controlled by, or under direct orindirect common control with, such entity or one or more of the other Affiliates of that entity (or a combination thereof). Forpurposes of this definition, an entity shall control another entity if the first entity (i) owns, beneficially or of record, more than fiftypercent (50%) of the voting securities of the other entity, or (ii) has the ability to elect a majority of the directors (or other governingbody) of the other entity.
Components: means parts and materials used to assemble the finished good Product.
Blanket PO: means Customer’s blanket purchase order against which individual purchase orders are issued.
BOM: means build of materials used to identify Components used to assemble the Products Boards: means custom motherboards
modified to the Specifications.
COP: means Customer owned parts for which Customer holds title.
Customized Components: means items customized for Customer, including technical documentation and any other Customer-branded items to be included in shipments that are non- cancellable and non-returnable items.
DOA: means Products or Components that are defective within thirty (30) days from delivery to Customer’s delivery location andfor which a Customer has requested an RMA from Arrow.
EOL: means Components that the OEM intends to discontinue. FGI: means finished goods inventory of Products.
Forecast: means Customers product demand over a defined period.
MOQ: means Components for which the OEM requires a minimum order quantity.
Customized Components: means Components customized to the Specifications. OEM: means the original equipment manufacturer.
On-Hand Inventory: means Component inventory procured by Arrow for use in the assembly of the Products.
PO: means Customer’s purchase order.
Products: means finished goods assembled to the Specifications. RMA: means Return Material Authorization issued by Arrow.
Routed Transaction: means Federal Trade Regulations 30.3(e) Routed Transaction: FPPI authorizes aU.S. agent to facilitate the export shipment from the U.S. and to prepare and file the EEI (Electronic Export Information)/AES(Automated Export System).
SOW: means Statement of Work
Specifications: means Customer provided or approved drawings, specifications, instructions, supplier lists and requirements used toassemble the Products.
Services: means additional product support services agreed to in a separate SOW that will be attached to and made part of thisAgreement by Addendum.
WIP: means work in progress consisting of Components for which the boxes have been opened and the assembly process has begun.
2. Work. Arrow will procure components, tooling and other supplies required and will assemble in Arrow assembly centers Product(s)ordered by the Customer. For each Product or revision the Customer will provide Specifications including but not limited to a BOM,assembly drawings, test specifications and an approved subcontractor and vendor list. The work will be performed in accordancewith ISO-9001:2000 standards. In addition, Customer may procure Services associated with the support of the Products by executinga mutually agreed upon statement of work (“SOW”), which will define the scope of and pricing for the Services. To the extent thatthe terms of a SOW conflict with the terms of this Agreement, the terms of the SOW will prevail. Arrow’s Account team, at aminimum, will comprise of a Field Sales Representative, Inside Account Manager and Solution Architect. If there are any changes tothe Account team, for any reason, Arrow will discuss the proposed changes with ForeScout and mutually agree upon new teammember(s).
3. Parts. Arrow will identify all parts required for any BOM. Arrow shall bear the risk of loss for Customer parts while in Arrow’s careand custody. Orders for or affecting Customized Components, MOQ, WIP, and EOL Components cannot be cancelled. Parts may ormay not be procured by Arrow from suppliers for whom Arrow serves as an authorized distributor and may be designated by Arrowas non-cancelable/non- returnable (“NC/NR”). These parts shall be identified in Schedule 1 and shall be procured by Arrow inaccordance with a 90 day rolling forecast provided by Customer. From time-to-time, Arrow’s manufacturers will notify Arrow oftheir intention to designate certain Components as EOL. The parties shall agree to the purchase of EOL by signing Arrow's NC/NRParts Agreement as applicable. Customer will give Arrow its purchase order for the entire EOL quantity. Releases of such EOLComponents will be scheduled as agreed upon between the parties as agreed to on the NC/NR Parts Agreement, provided that thetotal quantity of such Components will be delivered within the schedule(s) set forth in the applicable NC/NR Parts Agreement.Should Customer not take delivery of such Components by the delivery date specified on the applicable NC/NR Parts Agreement orin the case of Blanket PO’s, as agreed upon between the parties, Customer agrees that any inventory carrying charge amountsspecified herein will apply.
Customer is responsible for purchasing from Arrow all NC/NR parts procured or on non-cancelable order by Arrow for Product(s).
4. Engineering Change Orders. Any engineering change order (“ECO”) must be made in writing, signed and dated by the Customer.Arrow will acknowledge the ECO within 24 hours and will reply with an effective date and costs within five (5) business days for a“simple” ECO and ten (10) days for a “complex” ECO. Simple ECOs are ECOs that can be processed with minimal changes to buildplans, processes or labels. Complex ECOs are ECOs that require an engineering evaluation order to validate and implement thechanges. Arrow will provide all inventory considerations and exposures to determine, with Customer approval, if the ECO will be animmediate cut-in (implementation), or a phased-in approach. If the ECO is approved by Customer for immediate implementation,implementation will be then be subject to the supplier’s ability to schedule and manufacture the change. The Customer will remainliable for any unused NC/NR inventory affected by an ECO, including any WIP or any Products on open order, which cannot bereturned to the manufacturer, in support of the Forecast.
5. Appliance Integration and Software Loading: Arrow will follow the Customer R&D approved build plans. Arrow will maintainrevision control of the software images provided. Arrow will recommend continuous process improvements to the build plansthroughout the product life-cycle and any change or deviation to such will be handled through ECOs. The Serial Number and ModelNumber programming of the appliance is one of the most important attributes of the appliance due to Customer licensing and propersupport. "In the field" is defined as the appliance being delivered to the end-user. Penalties will be determined by capturing of screenshots of the error by the end-user, or confirmed by Arrow if the appliance is returned to Arrow for Failure Analysis due to theseerrors. If an appliance return is initiated due to a Serial Number error identified at Customer's end-user location, Arrow will pay forthe related charges to replace the device.
6. Terms of Payment and Sale. Payment will be net (60) days from the date of invoice, payable in US dollars. The price for Product(s)will be as agreed upon by Arrow and Customer from time to time as set forth in purchase orders issued by Customer and accepted byArrow. Customer will be responsible for payment of all taxes relating to the sale of Products. Unless otherwise mutually agreed to asspecified on purchase orders, for domestic shipments, Products will be shipped EXWORKS (Incoterms 2010) Arrow’s dock, withfreight payment obligations and risk of loss or damage to pass to Customer upon shipment. For international shipments, Products willbe shipped FCA (Incoterms 2010) Arrow’s dock, with freight payment obligations and risk of loss or damage to pass to Customerupon shipment. Upon Customer's written request, Arrow shall use Customer's freight carrier account.
7. EXPORT GENERAL. The parties agree to comply with all applicable U.S. export control laws and regulations, specificallyincluding, but not limited to, the requirements of the Arms Export Control Act, 22 U.S.C. 2751-2799, and the Export AdministrationAct, 50 U.S.C. app.2401-2420, including the Export Administration Regulations, 15 CFR730-774; includes the requirement forobtaining an export license or agreement, if applicable. Without limiting the foregoing, the parties agree that they will not transferany export controlled item, data, or service (collectively, “Controlled Items”), to include transfer to foreign persons employed by orassociated with, or under contract to such party or to their subcontractors, without the authority of a U.S. Government export license,agreement or applicable exemption or exception.6.1. Arrow shall immediately notify Customer if Arrow is, or becomes, listed on anyDenied Parties List or if Arrow’s export privileges are otherwise denied, suspended or revoked in whole or in part by any U.S.Government entity or agency.
7.1. Any additional costs charged by Arrow for compliance with the terms in this Section 7 or those in Customer’s Trade ComplianceManual will be quoted by Arrow to Customer before Arrow implements any changes to its current export or shipping process.
8.0 AUTOMATED EXPORT SYSTEM.
8.1 For any shipment exported from the United States in which FORESCOUT is the U.S. Principal Party in Interest (USPPI),FORESCOUT prohibits the filing of Electronic Exporter Information (EEI) via the Automated Export System (AES) by anyparty except FORESCOUT or Arrow, FORESCOUT ‘s approved partner. FORESCOUT will provide Arrow with writteninstructions and authorization to facilitate Arrow filing any export paper work on behalf of FORESCOUT, except in cases of aRouted Transaction, where the Foreign Principal Party of Interest (FPPI) has power of attorney with designated freight forwarderof the FPPI. In such case their freight forwarder is responsible for the AES filing.
8.1.1 Arrow is responsible for providing all international shipping documents (Commercial Invoice, Packing list.) The commercialinvoice and packing slip will be in the form that is currently provided by Arrow to Customer as of the Effective Date.
8.1.2 All U.S. export documents and AES filings will be created and processed by Arrow when Customer is considered to be the USPrincipal Party of Interest (USPPI). Arrow shall ensure that any AES submission made on behalf of Customer in conjunctionwith the export transaction involving any Customer commodity, software, technical data or technology is properly completedbased on the information provided by Customer and adheres to the applicable filing guidelines established by the ExportAdministration Regulations (“EAR”), International Traffic in Arms Regulations (“ITAR”) and Foreign Trade Regulations(“FTR”). Such submissions should be presented to the carrier within the time frame required for inspection by U.S. Customsand Border Protection (“CBP”) for the shipments Arrow is handling on behalf of Customer.
8.1.3 Arrow shall ensure that the appropriate destination control statement as defined in (or in accordance with) the US exportregulations referenced above in 8.1.2 appears on all export documentation prepared by Arrow when applicable and required.
8.1.4 Arrow shall notify Customer’s Trade Compliance Group at [email protected] promptly if Arrow determines that there isany contradiction, inconsistency, incompleteness or inaccuracy regarding Customer’s export documentation or instructions andshall place the shipment on hold until the export documentation deficiency is resolved.
8.1.5 Arrow shall not make any changes to or substitutions for any of Customer’s export documentation or AES entry data withoutprior approval from Customer’s Trade Compliance Group.
Arrow shall return completed copies of the airway bill and proof of AES submission within a reasonable time from export inaccordance with the Customer’s Trade Compliance Manual as provided by Customer to Arrow.
8.1.6 Arrow, while acting as a forwarding agent and as required for proper and correct AES filing, will ensure the lodging of licensesprior to export to the extent required. Arrow may use its freight carrier to lodge any such license.
8.1.7 Arrow will be liable for any penalties assessed by the U.S. government against Customer which resulted solely from Arrow’snon-compliance with applicable export laws and regulations and the procedures provided by Customer.
8.1.8 USE, CONTROL, RIGHTS TO, AND MARKING OF CONTROLLED ITEMS. U.S. Government import/exportauthorization is based on the following requirements and on all applicable export licenses with which the parties agree tocomply:
8.1.9 Arrow shall use controlled items furnished by Customer only for the distribution of the Products in accordance with thisAgreement.
8.2.10 Arrow shall not disclose or provide controlled items furnished by Customer to any foreign person either in the United States orabroad before obtaining written authorization from Customer.
Arrow acquires no rights in controlled items furnished by Customer except to use them in the performance of their duties underthis Agreement. Arrow shall not purport to convey to any subcontractor or person any greater rights in the controlled items.However, Arrow may convey to its subcontractors the right to use the controlled items only as required under this Agreement.
8.2 MARKING AND SOURCING OF ITEMS. Arrow agrees to place the following legend or a legend that is materially the same asthat below on all technology obtained, used, generated, or delivered in performance of this Agreement:
WARNING—Information Subject to Export Control Laws. This document, or software, if applicable, contains information subject tothe Export Administration regulations (EAR) of 1979. This information may not be exported, released, or disclosed to foreignpersons, whether within or outside the United States without first complying with the export license requirements of the EAR. Includethis notice with any reproduced portion of this document.
8.2.1 If required by any U.S. government license application requirements or certifications, Arrow agrees to provide E-Verify statusof their personnel directly involved in providing Services hereunder. Should Arrow be made aware of any violation of theapplicable trade regulations, Arrow will promptly notify Customer and cooperate with any reasonable investigation and, ifrequired by Customer, assist with the preparation and submission of any voluntary disclosure to government authorities.
9. Term and Termination. This Agreement will commence as of the date above written and will continue for five (5) years unlessterminated by either party, with or without cause, upon ninety (90) days prior written notice to the other party. The Customer willremain liable for any committed NC/NR and/or WIP existing on the date of receipt of notice of the termination of this Agreement.Termination of this Agreement will not affect the obligations of either party that exist as of the effective date of termination. IfCustomer requests that Arrow stock any finished goods, Customer agrees to accept delivery of and pay for all finished goods upontermination of this Agreement or sixty (60) days after Customer’s last order for such finished goods (or applicable version or revisionthereof), whichever is earlier. For services performed under this Agreement(i), if Arrow terminates any SOW, or this Agreementwithout cause, Arrow will either reimburse Customer, on a pro-rated basis, the fees paid by Customer relating to that part of anyService period that extends beyond the effective date of termination or continue to support any Service commitments made by Arrowprior to the effective date of termination; (ii) if Customer terminates any SOW, Arrow will continue to support any Servicecommitments made by Arrow prior to effect date of termination.
10. Warranty and Warranty Remedy. Arrow warrants for a period of one (1) year from date of shipment to Customer that the Productsas assembled by Arrow are assembled pursuant to the Specifications and that such Products will be free from defects in Arrowworkmanship. With respect to any parts acquired by Arrow that are incorporated into the Products, Arrow agrees to pass throughto Customer the warranty, if any, originally provided to Arrow by the manufacturer of the part subject to the terms, conditionsand limitations of any such warranty. Any product returned to Arrow will be repaired or replaced, or the purchase price refundedor credited, at customer’s option, which will be Customer’s sole remedy for any Product failure. Unless otherwise specified inthe applicable SOW, Arrow warrants that the Services will be performed in a workmanlike manner and the remedy for defectiveServices will be re-performance or refund of fees paid, at customer’s option. If returned products are found free of defects,Customer may incur reasonable inspection charges at the discretion of Arrow. No warranty will apply to Products that
are altered or subjected to misuse, negligence or abnormal stress. With respect to first articles, prototypes, pre-production units,Customer provided parts, test units or other similar products, Arrow makes no representations or warranties whatsoever. ARROWMAKES NO OTHER WARRANTIES, EXPRESS OR IMPLIED, WITH RESPECT TO THE COMPONENTS, PRODUCTS ORANY SERVICES PROVIDED UNDER THIS AGREEMENT, AND DISCLAIMS ALL OTHER WARRANTIES INCLUDINGTHE WARRANTIES OF MERCHANTABILITY, FITNESS FOR A PARTICULAR PURPOSE AND NON-INFRINGEMENT.
11. Inspection, Dead on Arrival (“DOA”) and Returns
11.1 Inspection. Products will be subjected to testing and outgoing visual inspection per the Specifications. In the event that the Productsfail to pass testing procedures provided by Customer, Arrow will use available troubleshooting techniques and equipment, including anyCustomer supplied test equipment and procedures, to determine the cause of the problem.
11.2 DOA. Any dead on arrival ("DOA") must be returned to Arrow or its subcontractor at Arrow’s discretion, with a detailed failureanalysis within thirty (30) days of shipment. DOAs will be swapped for replacement products or with the parties’ mutual agreement,repaired. Arrow will take commercially reasonable steps to repair DOAs, including any serial number or programming errors, and will shiprepaired or replaced products to Customer using Arrow’s freight carrier, bearing responsibility for all freight charges with risk of loss ordamage to remain with Arrow until delivery to Customer’s dock.
11.3 Returns. Products may be returned if they do not comply with the warranty in Section 10 above, and provided Customer obtains anRMA prior to returning the Product. Unless otherwise agreed to in an SOW, any Product returned to Arrow will be repaired or replaced, orthe purchase price refunded or credited, at Arrow’s option, which will be Customer’s sole remedy for any Product failure. If returnedProducts are found free of defects, Customer will incur reasonable inspection charges at the discretion of Arrow. Customer will ship Productsreturned under an RMA using Customer’s freight carrier, bearing responsibility for all freight charges with risk of loss or damage to remainwith Customer until delivery to Arrow’s dock. Arrow will ship repaired or replaced products to Customer using Arrow’s freight carrier,bearing responsibility for all freight charges with risk of loss or damage to remain with Arrow until delivery to Customer’s dock.
12.1 Intellectual Property.
12.2 Customer is the owner (or licensee as the case may be) of any designs, drawings, software, specifications or other intellectual propertyfurnished by Customer to Arrow in connection with this Agreement. Customer grants to Arrow a limited license under any copyright, patent,trade secret or other proprietary right to the extent necessary for the sole purpose of any assembly of Products based in whole or part on suchintellectual property as contemplated in this Agreement and any SOW. Customer agrees to indemnify Arrow and defend and hold Arrowharmless from the associated costs and fees (including reasonable attorneys’ fees and court costs) finally awarded by a court of competentjurisdiction or agreed to by Customer in settlement or compromise, to the extent that such fees and costs result from a third party claim,proceeding or suit alleging that the software incorporated in the Products infringes a valid third party patent, copyright or trade secret that isprotected under U.S. laws.
12.3 Arrow is the owner of any intellectual property previously owned by Arrow. Arrow grants to Customer a perpetual, fully-paid,transferable limited license to use such intellectual property to the extent necessary for Customer and its end-users to use Products providedby Arrow hereunder. Arrow agrees to indemnify Customer and hold Customer harmless from the associated costs and fees (includingreasonable attorneys’ fees and court costs) finally awarded by a court of competent jurisdiction or agreed to by Customer in settlement orcompromise, to the extent that such fees and costs result from a third party claim, proceeding or suit alleging that the software
incorporated in the Products infringes a valid third party patent, copyright or trade secret that is protected under U.S. laws.
13. Order Fulfillment. Once per calendar month Customer will issue purchase orders or Blanket POs, which will specify the purchaseorder number, part number, applicable Specifications, quantity, and price of the Products previously identified in the Forecast Customer willauthorize Arrow to release a specific order against a purchase order or Blanket PO. Such authorization shall be in writing per email, mail orfax and will contain the delivery address. Products will be shipped in accordance with Section 6.
14. Cancellation/Rescheduling. Unless the parties agree in writing, Customer may not cancel or reschedule any order for or that willaffect WIP, EOL, Custom Components or MOQ that Arrow has procured or is on order from its suppliers to accommodate authorized buildsby Customer. Customer acknowledges that Arrow may have limited stock rotation or no return privileges with the OEM and that Customerwill be unable to cancel/reschedule purchase orders or Blanket POs without Arrow’s prior written approval. Customer will purchase any WIP,EOL, MOQ and Custom Components affected by a cancellation. Once assembled, the Products cannot be disassembled in an effort to returnthe Components to inventory. Notwithstanding the foregoing, the parties agree to use commercially reasonable efforts to implement in part,or in full, the cancellation or rescheduling of an order to the extent said actions may be accomplished with little to no impact to Arrow.
15. Finished Goods Inventory/Non-cancelable/Non-returnable Inventory.
15.1 Customer and Arrow will hold bi-weekly forecast review meetings (“Forecast Meetings”) to develop ninety (90) day rolling forecastsof Customer’s Product demand schedule (“Forecast”). The date, place and time of each Forecast Meeting shall be mutually agreed to by theParties in writing (email sufficient). Each Forecast Meeting will establish the NC/NR parts for Arrow to place on order for the forty(40) day period following the Forecast Meeting (the “NC/NR Period”). This forty (40) day leadtime represents the current estimated leadtimeof NC/NR parts for inception to final integration of FORESCOUT appliances, excluding Advantech CTR appliances. At the end of eachForecast Meeting, authorized representatives from both Parties will execute a plan of record (“POR”) that will summarize the up-to-dateForecast and, at a minimum, include the (i) NC/NR parts authorized for purchase by Customer, and (ii) the applicable dates of the NC/NRPeriod. Upon mutual written agreement by the Parties’ authorized representatives (email sufficient), each update to the POR shall be bindingon the Parties and incorporated by reference within this Agreement. For the avoidance of doubt, any parts listed on a POR that were notidentified as NC/NR shall not be purchased by or for Customer unless otherwise mutually agreed in writing by the Parties’ authorizedrepresentatives (email sufficient). In the event that the scheduled bi-weekly Forecast Meeting is not held and/or rescheduled (subject to theParties’ mutual written agreement (email sufficient)), then Arrow shall be authorized and obligated to purchase the parts for the next pendingNC/NR Period identified on the most recent POR without further action by Customer, which in most cases is the next month's forecast, andCustomer shall be obligated to purchase such parts as NC/NR. Notwithstanding the above, any Products and/or parts included in a PORForecast beyond the NC/NR Period is for Arrow’s capacity planning only, with the exception of any potential NC/NR product obligationsresulting from a Forecast Meeting that fails to take place without being rescheduled as set forth above.
15.2 In the event that, (i) FGI or (ii) On-Hand Inventory is held by Arrow in support of this Agreement for more than ninety (90) days(collectively, “Aged Goods”), Arrow will invoice Customer for such Aged Goods on a monthly basis in accordance with this Section 15.Arrow will provide to Customer on a monthly basis, within one (1) business day following the end of the relevant month, an accurateinventory aging list identifying FGI and On-Hand Inventory (by Serial Number for FGI) maintained at Arrow’s facility (“Aging Report”).Within one (1) business day following receipt, Customer will review the Aging Report and either (i) indicate its acceptance of the AgingReport provided by Arrow; or (ii) advise of discrepancies identified by Customer. Within two (2) business days following Customer’s receiptof the Aging Report, Customer will provide to Arrow a proposed disposition plan for the undisputed Aged Goods identified in the AgingReport (“Disposition Plan”). Arrow will propose any adjustment to the Disposition Plan and the parties will agree to a revised DispositionPlan no later

than three (3) business days following the end of the relevant month. Following mutual agreement to the Disposition Plan, Customer willsend Arrow a purchase order for the applicable Aged Goods against which Arrow will invoice Customer and store such Products, asapplicable. Terms of any such payments shall be net sixty (60) days from the date of invoice, payable in U.S. dollars. This charge will be inaddition to and separate from any other fees invoiced by Arrow pursuant to this Agreement.”
16. Recordkeeping and Record Retention. Arrow shall maintain complete and accurate records of, and supporting documentation for,the amounts billed to and payments made by Customer under this Agreement. Arrow shall provide Customer, at Customer’s request andexpense, with paper and electronic copies of documents and information reasonably necessary to verify Arrow’s compliance with thisAgreement. Customer and its authorized agents and representatives shall be granted access to such records for audit purposes only duringnormal business hours during the term of this Agreement; and during any relevant SOW and thereafter for the period during which Arrowmaintains such records.
17. COP Terms
17.1 Delivery of COP to Warehouse: If COP is not already located at Arrow’s integration and warehouse facility (“Warehouse”),Customer will cause the COP to be delivered to the Warehouse at Customer’s sole cost (including duties, taxes or other charges payable uponimportation) and risk of loss or damaging using a carrier of its choice. COP can be either Product or Components, including those that are lasttime buy for and EOL.
17.2 Title to COP: Title to COP will remain with Customer at all times. Arrow will take no interest, security or otherwise, in COP, orinclude COP on any balance sheet or other financial statement in a manner which indicates that COP are the property of Arrow. Arrow willnot permit any lien or encumbrance to be created or executed against the COP. Customer will further protect its right, title and interest inCOP by fully complying with provisions of Uniform Commercial Code (“UCC”), which may include filing a Consignment UCC-1 FinancingStatement with appropriate state, county, or local agencies and sending appropriate notice in accordance with the UCC. Arrow authorizesCustomer and its agents, to sign the referenced Consignment UCC-1 Financing Statement on behalf of Arrow as debtor/agentconsignee/bailee. This filing and notice will identify the COP held at the Warehouse.
17.3 Services Provided: Arrow will provide the following services in support of COP.• Unloading of trailer or containers containing COP;• Incoming inspection and note visible damage or shortage on waybill and notification to Customer;• Maintain COP inventory on a first-in, first-out basis;• Provide Warehouse security as deemed necessary by Arrow;• Provide reports as agreed to by the parties;
practices common to the industry including protection from electrostatic discharge; Regular Cycle Counts; and• Accommodate quarterly inventory audits upon reasonable notice from Customer, and paid for by Customer.
17.4 Cost of Warehouse Services: Except for Advanced Replacement and Eval/POC inventory locations, there will be no charge for COPheld for ninety (90) days in the Warehouse. After that time, Arrow will invoice Customer for Warehouse fees (pallet in/out, floor space,supplies, scrap, secure room etc.) per those currently in effect. Customer agrees to pay such invoice in accordance with the payment terms setforth in this Agreement.
17.5 Risk of Loss or Damage and Insurance Customer will maintain all-risk insurance coverage sufficient to cover the full value of theCOP stored at the Warehouse. Notwithstanding the foregoing, Arrow shall be liable for any and all loss or damage to COP stored in its care,custody or control, to the extent that such loss or damage

results from Arrow’s negligent acts or omissions or willful misconduct. Arrow’s liability for loss or damage to COP is limited to the cost ofthe COP and a cap of US $1,000,000 per occurrence and US$2,000,000 in the aggregate in any twelve (12) month period.
17.6 Disposition of Defective COP: Arrow will notify Customer of any defective COP. If COP is used for Product assembly, Customerwill provide replacements for defective parts at Customer’s discretion. Customer will work with Arrow proactively to resolve issues relatedto scrap/defective COP. Arrow will scrap the defective COP per mutual agreement with Customer and per such arrangement, Customeragrees to either pay a storage fee for scrap being held or provide Arrow with a purchase order in an amount sufficient to cover such scrapcharges according to the scrap fees provided in Exhibit A.
17.7 Final Take Date No final take date will apply for Customer COP. Parts in COP will be used until Customer determines their lifecycle.Once parts are found to be obsolete and no longer required for repair base, COP will be scrapped per Customer’s instructions.
18. Disaster Recovery Plan. Arrow represents and warrants that it shall adhere to the disaster recovery plan (“Disaster RecoveryPlan”) attached here to as Schedule 2 outlining the process and steps that it will follow to address any extended service outage, disaster orother event that prevents Arrow from delivering the required volume of Products (each an “Event”) from its Warehouse in Phoenix, Arizona.The Disaster Recovery Plan includes timelines and details of how Arrow will enable substitute operations to fulfill Product requirementsfrom its Mexico facility within no less than two (2) weeks following an Event. To the extent Arrow commences fulfillment from Mexico oranother country outside the U.S., Arrow will ensure compliance, as Customer’s agent, to legally operate and export from such location.
19. Non-Exclusive Engagement. Customer is engaging Arrow’s services hereunder on a non-exclusive basis and reserves the right tocontract with alternative vendors for the same or similar services.
20. LIABILITY LIMITATION. NOTWITHSTANDING ANYTHING ELSE IN THIS AGREEMENT TO THE CONTRARY, TOTHE MAXIMUM EXTENT PERMITTED BY APPLICABLE LAW, NEITHER PARTY WILL BE LIABLE UNDER ANY SECTION OFTHIS AGREEMENT OR UNDER ANY CONTRACT, NEGLIGENCE, STRICT LIABILITY OR OTHER LEGAL OR EQUITABLETHEORY FOR INCIDENTAL, SPECIAL, CONSEQUENTIAL OR PUNITIVE DAMAGES, INCLUDING WITHOUT LIMITATION,DAMAGES FOR LOST PROFITS, LOST BUSINESS, OR COST OF PROCUREMENT OF SUBSTITUTE GOODS OR SERVICES. INNO EVENT SHALL CUSTOMER’S AGGREGATE LIABILITY FOR DIRECT DAMAGES ARISING OUT OF OR RELATED TO THISAGREEMENT EXCEED THE FEES PAID BY CUSTOMER FOR THE SPECIFIC PRODUCTS AT ISSUE HEREUNDER.21.
21. Product Use. Unless specifically otherwise agreed in writing by Arrow, Customer acknowledges that Products sold by Arrow arenot intended for and will not be used in life support systems, human implantation, nuclear facilities or systems or any other application whereproduct failure could lead to loss of life. or catastrophic property damage. Customer will indemnify and hold Arrow harmless from any loss,cost or damage resulting from Customer's breach of the provisions of this paragraph.
22. Governing Law; Dispute Resolution. This Agreement will in all respects be governed by and construed in accordance with thelaws of the State of New York, excluding that body of laws known as conflict of laws. The prevailing party in any legal action or proceedingto enforce this Agreement will be entitled to recover from the non-prevailing party its reasonable attorneys’ fees, and related costs anddisbursements, incurred in connection with such proceeding or the enforcement of this Agreement. The application of the UN Agreementpertaining to contracts of international purchase of goods dated January 1, 1989 (UNCISG) BGBI 96/1988 and all its relevant and validamendments shall expressly be excluded. Both parties agree to waive trial by jury.
23. Miscellaneous.
24.1Independent Contractors. The parties are and will be independent contractors to one another, and nothing herein will be deemed tocause this agreement to create an agency, partnership, joint venture or any other relationship between the parties.
24.2Assignment. Neither party may assign, delegate or otherwise transfer any of its rights or obligation under this Agreement without theother party’s prior written approval. However, either party may assign this Agreement in its entirety to (i) any entity under the commoncontrol with that party; or (ii) any successor in interest to such party by way of merger or consolidation located in the United States; or(iii) a purchaser of all or substantially all of the assets of such party, provided that the assignee agrees in writing to be bound by all of theterms and conditions of this Agreement. This Agreement shall be binding on and inure to the benefit of the successors and permittedassigns of the parties.
24.3Notices. Notices or other communications under this Agreement will be in writing and will be effective when delivered personally or byovernight courier, or mailed, postage prepaid, by certified or registered mail to each party at the address set forth above (or to such otheraddress as either party may from time to time provide the other.
24.4Force Majeure. Nonperformance (other than timely payment) under this Agreement will be excused, and neither party will bear anyresulting liability to the other, to the extent that such performance is rendered commercially impracticable or delayed by an act ofGod or any other cause beyond the reasonable control of the non-performing party.
24.5 No Solicitation for Employment. The parties agree that they will not solicit for employment or hire each other’s employees duringthe term of this Agreement and for a period of one (1) year thereafter.
24.6 Government Related Orders. If Customer’s order is placed under a contract with the United States Government, Arrow agrees tocomply with those contract provisions and regulations with which, pursuant to law, it must comply and of which Customer has, at the time oforder placement, been placed on notice of. All rights in technical data and software owned or licensed by Arrow or the supplier/manufacturerare hereby reserved and deemed restricted or limited. No provision of Customer’s contract with the government will be binding on Arrow orthe suppliers/manufacturers except as expressly set forth in this paragraph.
24.7Code of Conduct. The Customer warrants and represents it complies with Arrow’s Business Partner Code of Conduct(http://www.arrow.com/about_arrow/BusinessPartnerCodeofConduct.pdf) or
has implemented and abides by a code of conduct that is substantially similar thereto (in such case, Customer shall provide a copy toArrow for review upon Arrow’s request).
24.8Equal Employment. To the extent not exempt, this contractor and subcontractor shall abide by the requirements of 41 CFR §§ 60-1.4(a),60-300.5(a) and 60-741.5(a). These regulations prohibit discrimination against qualified individuals based on their status as protectedveterans or individuals with disabilities, and prohibit discrimination against all individuals based on their race, color, religion, sex, sexualorientation, gender identity, or national origin. Moreover, these regulations require that covered prime contractors and subcontractorstake affirmative action to employ and advance in employment individuals without regard to race, color, religion, sex, national origin,protected veteran status or disability.
24.9Confidential Information. “Confidential Information” means any information which is disclosed by a party (the “Discloser”) inconnection with this Agreement, directly or indirectly, in writing, orally or by drawings or inspection of equipment or software, to theother party (the “Recipient”) or any of its employees

or agents and that is designated or marked as "confidential" or "proprietary" at the time of disclosure or that, based on the circumstancessurrounding the disclosure, the Recipient knows or reasonably should know is considered confidential. Confidential Information shallalso include the software and all documents provided with the hardware that contain Customer’s confidential trade secret information.The restrictions on disclosure set forth in this Section shall not apply to Confidential Information which: (i) becomes publicly knownwithout breach of this Agreement; or (ii) the Recipient can show by written records was rightfully in its possession prior to the disclosureby the Discloser or becomes rightfully known to the Recipient without confidential or proprietary restriction from a source other than theDiscloser; (iii) is approved for disclosure without the restriction in a written document which is signed by a duly authorized officer of theDiscloser, or (iv) is independently developed by the Recipient prior to the disclosure without reference to the Discloser’s ConfidentialInformation. Notwithstanding any other provision herein, this Section 24.9 is intended to cover Confidential Information disclosed by theDisclosing Party and received by Recipient both prior, and subsequent to, the Effective Date hereof.
24.9.1 Obligations. Recipient may use the Discloser’s Confidential Information solely for the purpose of exercising its rights andperforming its obligations under this Agreement. Recipient agrees to take the same care with the Discloser’s Confidential Information asit does with its own information of a similar nature, but in no event with less than a reasonable degree of care. Recipient shall limit accessto the Confidential Information to those persons having a need to know such information, provided that each such employee andconsultant is subject to a written agreement containing confidentiality obligations no less protective than those contained in thisAgreement. Recipient may disclose Confidential Information:(i) insofar as disclosure is reasonably necessary to carry out and effectuate the terms of this Agreement;(ii) insofar as the Recipient is required by law or legal proceedings to disclose such information provided that the Recipient providesthe Discloser with prompt written notice of such requirement to enable the Discloser to seek a protective order; (iii) insofar as disclosureis necessary to be made to the Recipient’s independent accountants for tax or audit purposes; and (iv) insofar as the parties may mutuallyagree in writing upon language to be contained in one or more press releases. In addition, neither party will
disclose to any third party the terms of this Agreement without the prior written consent of the other party.
24.10 Entire Agreement; Amendment; Severability; and Waiver. This Agreement represents the entire agreement between the partiesconcerning the subject matter hereof, and may not be modified except in a writing signed by both parties. This Agreement supersedes allproposals or quotations, oral or written, and all negotiations, conversations, or discussions between or among the parties relating to thesubject matter of this Agreement. When interpreting this Agreement precedence will be given to the respective parts in the following order:(i) an Addendum; (ii) this Agreement; and (ii) any exhibits to this Agreement; and (iv) if purchase orders are used to release product, thoseportions of the purchase order that are not pre-printed. Any waiver of any provision of this Agreement must be in writing and signed by theparty alleged to have waived such provision, and any single waiver will not operate to waive subsequent or other defaults. Theunenforceability of any provision of this Agreement will not affect the remaining provisions or any portions thereof.
IN WITNESS WHEREOF, the parties hereto have caused this Agreement to be executed by their duly authorized representatives as of theday and year first above written.

ForeScout Technologies, Inc. ARROW ELECTRONICS, INC., on behalf of its Arrow Intelligent SystemsGroup
By:Nathan J. Buelow BuelowDigitally signed by Nathan J.Date: 2017.11.15 13:18:45 -07'00'
By:
Name: Darren J. Milliken Name:
Title: SVP, General Counsel Title: 11/6/2017 | 09:54 PST
Date:
Date:

SCHEDULE 1 NC/NR PARTS LIST
Part Number MFG Description100-00010-00 CCX DB9 FEMALE TO DB9 FEMALE1090403 LANDSBERG 1090403 - CTR-131246060 LANDSBERG R620/R720 BOX1320263 LANDSBERG R730 BOX1320264 LANDSBERG R630 BOX1320265 LANDSBERG R630 FOAM1320414 LANDSBERG R630 Corner Insert700-00020-00 LANDSBERG 700-00020-00 - R6201303952 LANDSBERG R620 FoamPE2G2I35 Silicom PCI for the CT100-32PE2G4I35L Silicom PCI for the CT1000-32EIC#FTLF8519P3BNL Silicom PCI400-00100-02 PIXELPS 400-00100-02 - for the AS1000AH-32400-00200-00 PIXELPS 400-00200-00 - 30400-00201-00 PIXELPS CounterAct QIG CD DVD Kit - 40QIG 7.0.0-FRSCT PIXELPS QIG 7.0.0-FRSCTTAMPER PROOF PIXELPS TAMPER PROOF^PIXELPS400-00050-01 ALPHAGFX 400-00050-01400-00050-02 ALPHAGFX Warranty Doc/Eula401-00010-00R620 ALPHAGFX 401-00010-00R620401-00020-00R720 ALPHAGFX 401-00020-00R720401-00011-00 ALPHAGFX Nom Sheet R630,401-00021-00 ALPHAGFX Nom Sheet 7630,FSINSTALL6_3_4DOC ALPHAGFX FSINSTALL6_3_4DOC500-00010-00 DASCO Port Label500-00011-00 DASCO Port Label500-00012-00 DASCO Port Label500-00013-00 DASCO Port Label500-00014-00 DASCO Port Label500-00020-00 DASCO Port Label500-00021-00 DASCO Port Label500-00022-00 DASCO Port Label70-00010-00 JMCGT 1U Bezel R63070-00011-00 JMCGT Edge Bezel70-00012-00 JMCGT 2U BEZEL70-00014-00 JMCGT 40 1U Bezel70-00015-00 JMCGT New Edge Bezel70-00016-00 JMCGT 40 2U BezelFCLF8521P2BTL FINISAR PCIFTLF8519P3BNL FINISAR PCIFTLX8571D3BCL FINISAR PCI
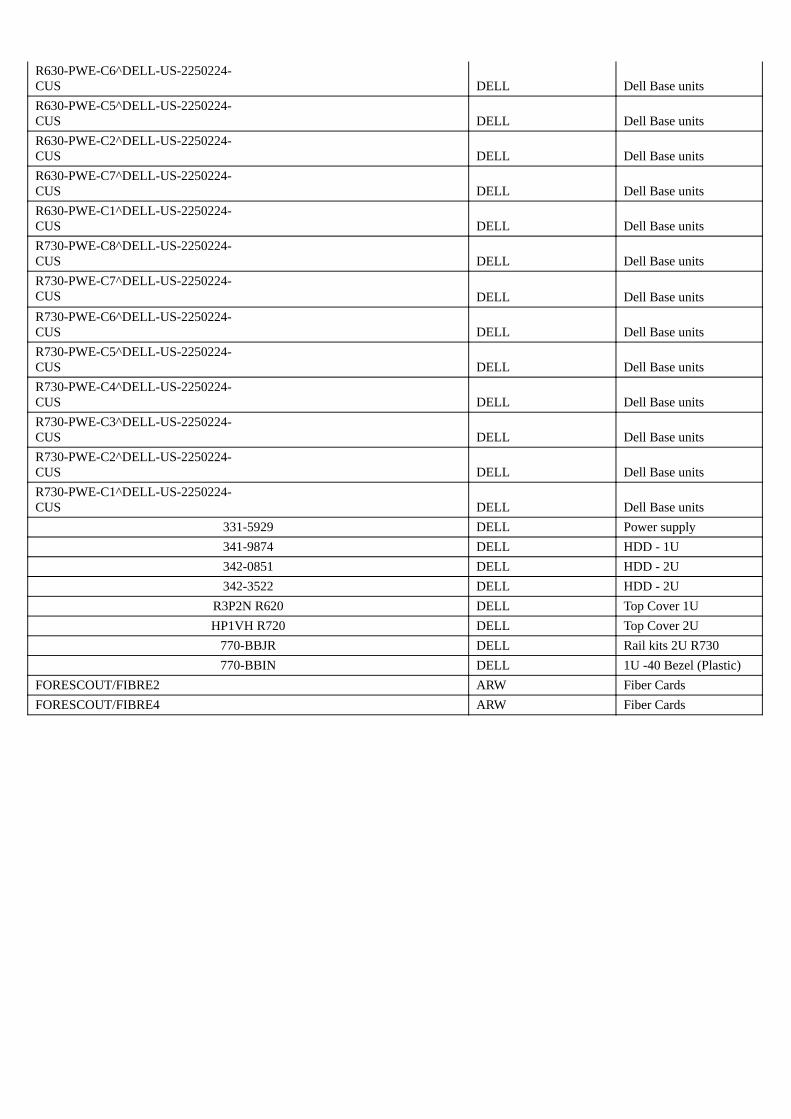
R630-PWE-C6^DELL-US-2250224-CUS DELL Dell Base unitsR630-PWE-C5^DELL-US-2250224-CUS DELL Dell Base unitsR630-PWE-C2^DELL-US-2250224-CUS DELL Dell Base unitsR630-PWE-C7^DELL-US-2250224-CUS DELL Dell Base unitsR630-PWE-C1^DELL-US-2250224-CUS DELL Dell Base unitsR730-PWE-C8^DELL-US-2250224-CUS DELL Dell Base unitsR730-PWE-C7^DELL-US-2250224-CUS DELL Dell Base unitsR730-PWE-C6^DELL-US-2250224-CUS DELL Dell Base unitsR730-PWE-C5^DELL-US-2250224-CUS DELL Dell Base unitsR730-PWE-C4^DELL-US-2250224-CUS DELL Dell Base unitsR730-PWE-C3^DELL-US-2250224-CUS DELL Dell Base unitsR730-PWE-C2^DELL-US-2250224-CUS DELL Dell Base unitsR730-PWE-C1^DELL-US-2250224-CUS DELL Dell Base units
331-5929 DELL Power supply341-9874 DELL HDD - 1U342-0851 DELL HDD - 2U342-3522 DELL HDD - 2U
R3P2N R620 DELL Top Cover 1UHP1VH R720 DELL Top Cover 2U
770-BBJR DELL Rail kits 2U R730770-BBIN DELL 1U -40 Bezel (Plastic)
FORESCOUT/FIBRE2 ARW Fiber CardsFORESCOUT/FIBRE4 ARW Fiber Cards

SCHEDULE 2
Arrow Disaster Recovery Plan
Arrow Integration Operations - Disaster Recovery Plan Summary
Arrow, as Customer’s main supplier, integrates and assembles Customer’s CounterACT® products at their integration center located inPhoenix, AZ, U.S.A.
Disaster Recovery
In the event of Arrow’s Phoenix facility becoming inoperable due to a disaster, the back-up Arrow facility that will produce Customer’sCounterACT products is located in Nogales, Sonora, Mexico:
• In the event that a disaster occurs in Phoenix, AZ, making the Arrow building safe to enter by Arrow personnel to removeexisting materials (i) said materials can be sent to the Nogales facility within one (1) business day, (ii) first articles onForeScout’s appliances will be ready within three (3) weeks; and (iii) production will start within four (4) weeks.
• In the event that a disaster occurs in Phoenix, AZ, making the Arrow building unsafe to enter by Arrow personnel to removeexisting materials, Arrow will procure new materials to fulfill Nogales for first articles and eventual production is 5-6 weeks.

Exhibit 23.1
CONSENT OF INDEPENDENT REGISTERED PUBLIC ACCOUNTING FIRM
We consent to the incorporation by reference in the Registration Statement (Form S-8 No. 333-221193) pertaining to the 2000 Stock Option and IncentivePlan, the 2017 Equity Incentive Plan, and the 2017 Employee Stock Purchase Plan of ForeScout Technologies, Inc. of our report dated February 21, 2018,with respect to the consolidated financial statements of ForeScout Technologies, Inc., included in this Annual Report (Form 10-K) for the year endedDecember 31, 2017. /s/ Ernst & Young LLPSan Francisco, CaliforniaFebruary 21, 2018
Exhibit 31.1
CERTIFICATION PURSUANT TO SECTION 302(a)OF THE SARBANES-OXLEY ACT OF 2002
I, Michael DeCesare, certify that:
1. I have reviewed this Annual Report on Form 10-K of ForeScout Technologies, Inc.;
2. Based on my knowledge, this report does not contain any untrue statement of a material fact or omit to state a material fact necessary to make thestatements made, in light of the circumstances under which such statements were made, not misleading with respect to the period covered by thisreport;
3. Based on my knowledge, the financial statements, and other financial information included in this report, fairly present in all material respects thefinancial condition, results of operations and cash flows of the registrant as of, and for, the periods presented in this report;
4. The registrant’s other certifying officer and I are responsible for establishing and maintaining disclosure controls and procedures (as defined inExchange Act Rules 13a-15(e) and 15d-15(e)) for the registrant and have:
(a) Designed such disclosure controls and procedures, or caused such disclosure controls and procedures to be designed under our supervision,to ensure that material information relating to the registrant, including its consolidated subsidiaries, is made known to us by others withinthose entities, particularly during the period in which this report is being prepared;
(b) Evaluated the effectiveness of the registrant’s disclosure controls and procedures and presented in this report our conclusions about theeffectiveness of the disclosure controls and procedures, as of the end of the period covered by this report based on such evaluation; and
(c) Disclosed in this report any change in the registrant’s internal control over financial reporting that occurred during the registrant’s mostrecent fiscal quarter (the registrant’s fourth fiscal quarter in the case of an annual report) that has materially affected, or is reasonably likelyto materially affect, the registrant’s internal control over financial reporting; and
5. The registrant’s other certifying officer and I have disclosed, based on our most recent evaluation of internal control over financial reporting, to theregistrant’s auditors and the audit committee of the registrant’s board of directors (or persons performing the equivalent functions):
(a) All significant deficiencies and material weaknesses in the design or operation of internal control over financial reporting which arereasonably likely to adversely affect the registrant’s ability to record, process, summarize and report financial information; and
(b) Any fraud, whether or not material, that involves management or other employees who have a significant role in the registrant’s internalcontrol over financial reporting.
February 21, 2018 /s/ Michael DeCesare Michael DeCesare Chief Executive Officer (Principal Executive Officer)
Exhibit 31.2
CERTIFICATION PURSUANT TO SECTION 302(a)OF THE SARBANES-OXLEY ACT OF 2002
I, Christopher Harms, certify that:
1. I have reviewed this Annual Report on Form 10-K of ForeScout Technologies, Inc.;
2. Based on my knowledge, this report does not contain any untrue statement of a material fact or omit to state a material fact necessary to make thestatements made, in light of the circumstances under which such statements were made, not misleading with respect to the period covered by thisreport;
3. Based on my knowledge, the financial statements, and other financial information included in this report, fairly present in all material respects thefinancial condition, results of operations and cash flows of the registrant as of, and for, the periods presented in this report;
4. The registrant’s other certifying officer and I are responsible for establishing and maintaining disclosure controls and procedures (as defined inExchange Act Rules 13a-15(e) and 15d-15(e)) for the registrant and have:
(a) Designed such disclosure controls and procedures, or caused such disclosure controls and procedures to be designed under our supervision,to ensure that material information relating to the registrant, including its consolidated subsidiaries, is made known to us by others withinthose entities, particularly during the period in which this report is being prepared;
(b) Evaluated the effectiveness of the registrant’s disclosure controls and procedures and presented in this report our conclusions about theeffectiveness of the disclosure controls and procedures, as of the end of the period covered by this report based on such evaluation; and
(c) Disclosed in this report any change in the registrant’s internal control over financial reporting that occurred during the registrant’s mostrecent fiscal quarter (the registrant’s fourth fiscal quarter in the case of an annual report) that has materially affected, or is reasonably likelyto materially affect, the registrant’s internal control over financial reporting; and
5. The registrant’s other certifying officer and I have disclosed, based on our most recent evaluation of internal control over financial reporting, to theregistrant’s auditors and the audit committee of the registrant’s board of directors (or persons performing the equivalent functions):
(a) All significant deficiencies and material weaknesses in the design or operation of internal control over financial reporting which arereasonably likely to adversely affect the registrant’s ability to record, process, summarize and report financial information; and
(b) Any fraud, whether or not material, that involves management or other employees who have a significant role in the registrant’s internalcontrol over financial reporting.
February 21, 2018 /s/ Christopher Harms Christopher Harms Chief Financial Officer (Principal Financial Officer)

Exhibit 32.1CERTIFICATION OF CHIEF EXECUTIVE OFFICER
PURSUANT TO18 U.S.C. SECTION 1350,
AS ADOPTED PURSUANT TOSECTION 906 OF THE SARBANES-OXLEY ACT OF 2002
I, Michael DeCesare, certify, pursuant to 18 U.S.C. Section 1350, as adopted pursuant to Section 906 of the Sarbanes-Oxley Act of 2002, that the AnnualReport on Form 10-K of ForeScout Technologies, Inc. for the year ended December 31, 2017, fully complies with the requirements of Section 13(a) or 15(d)of the Securities Exchange Act of 1934, as amended, and that information contained in such Annual Report on Form 10-K fairly presents, in all materialrespects, the financial condition and results of operations of ForeScout Technologies, Inc.
February 21, 2018 /s/ Michael DeCesare Michael DeCesare Chief Executive Officer (Principal Executive Officer)

Exhibit 32.2CERTIFICATION OF CHIEF FINANCIAL OFFICER
PURSUANT TO18 U.S.C. SECTION 1350,
AS ADOPTED PURSUANT TOSECTION 906 OF THE SARBANES-OXLEY ACT OF 2002
I, Christopher Harms, certify, pursuant to 18 U.S.C. Section 1350, as adopted pursuant to Section 906 of the Sarbanes-Oxley Act of 2002, that the AnnualReport on Form 10-K of ForeScout Technologies, Inc. for the year ended December 31, 2017, fully complies with the requirements of Section 13(a) or 15(d)of the Securities Exchange Act of 1934, as amended, and that information contained in such Annual Report on Form 10-K fairly presents, in all materialrespects, the financial condition and results of operations of ForeScout Technologies, Inc.
February 21, 2018 /s/ Christopher Harms Christopher Harms Chief Financial Officer (Principal Financial Officer)